UNITED STATES
SECURITIES AND EXCHANGE COMMISSION
Washington, D.C. 20549
FORM N-CSR
CERTIFIED SHAREHOLDER REPORT OF REGISTERED
MANAGEMENT INVESTMENT COMPANIES
Investment Company Act file number 811-215
Fidelity Hastings Street Trust
(Exact name of registrant as specified in charter)
82 Devonshire St., Boston, Massachusetts 02109
(Address of principal executive offices) (Zip code)
Eric D. Roiter, Secretary
82 Devonshire St.
Boston, Massachusetts 02109
(Name and address of agent for service)
Registrant's telephone number, including area code: 617-563-7000
Date of fiscal year end: | June 30 |
| |
Date of reporting period: | June 30, 2004 |
Item 1. Reports to Stockholders
Fidelity®
Fund
Annual Report
June 30, 2004
(2_fidelity_logos) (Registered_Trademark)
Contents
Chairman's Message | 3 | Ned Johnson's message to shareholders. |
Performance | 4 | How the fund has done over time. |
Management's Discussion | 5 | The manager's review of fund performance, strategy and outlook. |
Investment Changes | 6 | A summary of major shifts in the fund's investments over the past six months. |
Investments | 7 | A complete list of the fund's investments with their market values. |
Financial Statements | 15 | Statements of assets and liabilities, operations, and changes in net assets,
as well as financial highlights. |
Notes | 19 | Notes to the financial statements. |
Report of Independent Registered Public Accounting Firm | 24 | |
Trustees and Officers | 25 | |
Distributions | 36 | |
Proxy Voting Results | 37 | |
For a free copy of the fund's proxy voting guidelines visit www.fidelity.com/goto/proxyguidelines, call 1-800-544-8544, or visit the Securities and Exchange Commission (SEC)'s web site at www.sec.gov.
Standard & Poor's, S&P and S&P 500 are registered service marks of The McGraw-Hill Companies, Inc. and have been licensed for use by Fidelity Distributors Corporation.
Other third party marks appearing herein are the property of their respective owners.
All other marks appearing herein are registered or unregistered trademarks or service marks of FMR Corp. or an affiliated company.
(Recycle graphic) This report is printed on recycled paper using soy-based inks.
This report and the financial statements contained herein are submitted for the general information of the shareholders of the fund. This report is not authorized for distribution to prospective investors in the fund unless preceded or accompanied by an effective prospectus.
Mutual fund shares are not deposits or obligations of, or guaranteed by, any depository institution. Shares are not insured by the FDIC, Federal Reserve Board or any other agency, and are subject to investment risks, including possible loss of principal amount invested.
Neither the fund nor Fidelity Distributors Corporation is a bank.
For more information on any Fidelity fund, including charges and expenses, call 1-800-544-6666 for a free prospectus. Read it carefully before you invest or send money.
Annual Report
Chairman's Message
(photo_of_Edward_C_Johnson_3d)
Dear Shareholder:
Many of you have read or heard news stories recently that were critical of mutual funds and made allegations that the mutual fund industry has been less than forthright. I find these reports unsettling and not necessarily an accurate picture of the overall industry, and I would like you to know where we at Fidelity stand.
With specific regard to allegations that certain mutual fund companies were violating the Securities and Exchange Commission's forward pricing rules or were involved in so-called "market timing" activities, I want to say two things:
First, Fidelity does not have agreements that permit customers who buy fund shares after 4 p.m. to obtain the 4 p.m. price. This is not to say that someone could not deceive the company through fraudulent acts. But I underscore that we have no so-called "agreements" which would permit this illegal practice.
Second, Fidelity has been on record for years opposing predatory short-term trading which adversely affects other shareholders in a mutual fund. In fact, in the 1980s, we began charging a fee - which is returned to the fund and, therefore, to investors - to discourage this activity. What's more, several years ago we took the industry lead in developing a Fair Value Pricing Policy to prevent market timing on foreign securities in our funds. It is reasonable to assume that another structure can be developed that would alter the system to make it much more difficult for predatory traders to operate. This, however, will only be achieved through close cooperation among regulators, legislators and the industry.
Certainly no industry is perfect, and there have been instances of unethical and illegal activity from time to time within the mutual fund industry. When this occurs, confessed or convicted offenders should be dealt with appropriately. Clearly, every system can be improved. We applaud well thought out improvements by regulators, legislators and industry representatives that achieve the common goal of building and protecting the value of investors' holdings. But we remain concerned about the risk of over-regulation and the quick application of simplistic solutions to intricate problems.
For more than 57 years, Fidelity Investments has worked very hard to improve its products and service to justify your trust. When our family founded this company in 1946, we had only a few hundred customers. Many of them were family and friends. Today, we serve more than 18 million customers including individual investors and participants in retirement plans across America.
Let me close by saying that we do not take your trust in us for granted, and we realize that we must always work to improve all aspects of our service to you. In turn, we urge you to continue your active participation with your financial matters, so that your interests can be well served.
Best regards,
/s/Edward C. Johnson 3d
Edward C. Johnson 3d
Annual Report
Performance: The Bottom Line
Average annual total return reflects the change in the value of an investment, assuming reinvestment of the fund's dividend income and capital gains (the profits earned upon the sale of securities that have grown in value) and assuming a constant rate of performance each year. The $10,000 table and the fund's returns do not reflect the deduction of taxes that a shareholder would pay on fund distributions or the redemption of fund shares. During periods of reimbursement by Fidelity, a fund's total return will be greater than it would be had the reimbursement not occurred. How a fund did yesterday is no guarantee of how it will do tomorrow.
Average Annual Total Returns
Periods ended June 30, 2004 | Past 1
year | Past 5
years | Past 10 years |
Fidelity ® Fund | 18.81% | -1.98% | 11.24% |
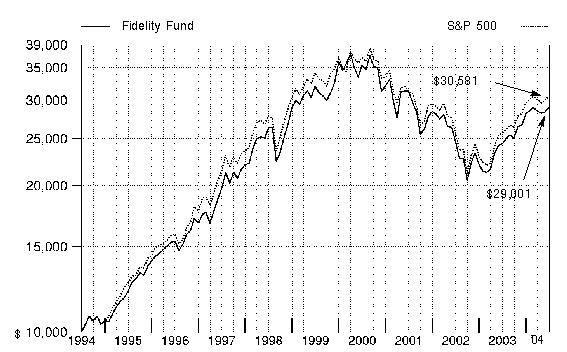
$10,000 Over 10 years
Let's say hypothetically that $10,000 was invested in Fidelity® Fund on June 30, 1994. The chart shows how the value of your investment would have grown, and also shows how the Standard & Poor's 500SM Index did over the same period.
Annual Report
Management's Discussion of Fund Performance
Comments from John Avery, Portfolio Manager of Fidelity® Fund
The major U.S. equity benchmarks posted double-digit returns for the 12 months ending June 30, 2004. But it could have been even better had most of the gains not been accrued in the first half of the period. Stocks slipped in the second half on concerns about the effects of potential interest rate hikes and rising inflation on corporate profits, an unsettled geopolitical environment and threats of terrorism. The Dow Jones Industrial AverageSM, for example, gained 18.60% for the year overall, but rose just 0.86% in the second half. Technology also had a big influence on market performance. Red hot in the first half, tech fell hard in the second as investors avoided stocks with future earnings potential, and focused instead on companies with steady current earnings amid the volatile investment backdrop. The Goldman Sachs® Technology Index soared 27.49% for the year, but crawled ahead just 0.74% year to date through June. Elsewhere, the Standard & Poor's 500SM Index gained 19.11% and the NASDAQ Composite® Index returned 26.78% for the overall year.
For the 12 months ending June 30, 2004, the fund returned 18.81%, slightly trailing the Standard & Poor's 500 Index but edging the 18.79% return of the LipperSM Growth & Income Funds Average. Overweighting the relatively weak media industry did some damage to the fund's relative performance, as did stock picking in telecommunication services. Two media stocks, Viacom and Clear Channel Communications, were prominent detractors. Both were affected by the lack of advertising dollars flowing into radio broadcasting, and I reduced the fund's holdings in both cases. Conversely, the largest positive influence was favorable stock picking in capital goods along with an overweighting in that group. Tyco International provided the biggest boost to performance versus the index and also helped in absolute terms. A number of its businesses benefited from the improving economy, and the restructuring taking place under CEO Ed Breen continued to make significant progress. In the aerospace industry, Boeing was a strong relative contributor, as I overweighted the stock and it outperformed the index by a considerable margin on the strength of a major contract win with the U.S. Navy.
The views expressed in this statement reflect those of the portfolio manager only through the end of the period of the report as stated on the cover and do not necessarily represent the views of Fidelity or any other person in the Fidelity organization. Any such views are subject to change at any time based upon market or other conditions and Fidelity disclaims any responsibility to update such views. These views may not be relied on as investment advice and, because investment decisions for a Fidelity fund are based on numerous factors, may not be relied on as an indication of trading intent on behalf of any Fidelity fund.
Annual Report
Investment Changes
Top Ten Stocks as of June 30, 2004 |
| % of fund's
net assets | % of fund's net assets
6 months ago |
Microsoft Corp. | 4.1 | 4.0 |
General Electric Co. | 3.3 | 3.1 |
Pfizer, Inc. | 3.3 | 3.6 |
Citigroup, Inc. | 3.1 | 3.5 |
American International Group, Inc. | 2.8 | 2.8 |
Exxon Mobil Corp. | 2.0 | 2.1 |
Gillette Co. | 2.0 | 1.4 |
3M Co. | 1.9 | 2.0 |
American Express Co. | 1.9 | 1.6 |
Tyco International Ltd. | 1.8 | 1.1 |
| 26.2 | |
Top Five Market Sectors as of June 30, 2004 |
| % of fund's
net assets | % of fund's net assets
6 months ago |
Financials | 17.2 | 19.2 |
Information Technology | 15.4 | 13.7 |
Health Care | 14.7 | 13.3 |
Industrials | 14.6 | 17.9 |
Consumer Staples | 12.5 | 8.0 |
Asset Allocation (% of fund's net assets) |
As of June 30, 2004 * | As of December 31, 2003 ** |
 | Stocks 98.1% | | | Stocks 99.9% | |
 | Short-Term
Investments and
Net Other Assets 1.9% | | | Short-Term
Investments and
Net Other Assets 0.1% | |
* Foreign investments | 3.7% | | ** Foreign
investments | 5.6% | |

Annual Report
Investments June 30, 2004
Showing Percentage of Net Assets
Common Stocks - 98.1% |
| Shares | | Value (Note 1) (000s) |
CONSUMER DISCRETIONARY - 9.2% |
Automobiles - 0.5% |
Harley-Davidson, Inc. | 795,200 | | $ 49,255 |
Household Durables - 0.3% |
Fortune Brands, Inc. | 446,000 | | 33,642 |
Internet & Catalog Retail - 0.3% |
Amazon.com, Inc. (a) | 457,800 | | 24,904 |
eBay, Inc. (a) | 118,500 | | 10,896 |
| | 35,800 |
Media - 5.8% |
Clear Channel Communications, Inc. | 506,293 | | 18,708 |
Comcast Corp.: | | | |
Class A (a) | 513,423 | | 14,391 |
Class A (special) (a) | 1,684,500 | | 46,509 |
Dow Jones & Co., Inc. | 550,600 | | 24,832 |
Fox Entertainment Group, Inc. Class A (a) | 1,097,000 | | 29,290 |
McGraw-Hill Companies, Inc. | 713,300 | | 54,617 |
News Corp. Ltd. ADR | 2,236,300 | | 79,210 |
Time Warner, Inc. (a) | 6,005,660 | | 105,580 |
Viacom, Inc. Class B (non-vtg.) | 3,812,713 | | 136,190 |
Walt Disney Co. | 3,790,600 | | 96,622 |
| | 605,949 |
Specialty Retail - 2.3% |
Gap, Inc. | 1,914,000 | | 46,415 |
Home Depot, Inc. | 2,802,000 | | 98,630 |
Staples, Inc. | 3,191,400 | | 93,540 |
| | 238,585 |
TOTAL CONSUMER DISCRETIONARY | | 963,231 |
CONSUMER STAPLES - 12.5% |
Beverages - 2.9% |
Anheuser-Busch Companies, Inc. | 609,100 | | 32,891 |
PepsiCo, Inc. | 2,404,990 | | 129,581 |
The Coca-Cola Co. | 2,931,900 | | 148,002 |
| | 310,474 |
Food & Staples Retailing - 2.7% |
Albertsons, Inc. | 2,087,400 | | 55,400 |
CVS Corp. | 1,120,100 | | 47,067 |
Common Stocks - continued |
| Shares | | Value (Note 1) (000s) |
CONSUMER STAPLES - continued |
Food & Staples Retailing - continued |
Sysco Corp. | 730,529 | | $ 26,204 |
Wal-Mart Stores, Inc. | 2,893,520 | | 152,662 |
| | 281,333 |
Food Products - 1.9% |
Dean Foods Co. (a) | 1,192,200 | | 44,481 |
Hershey Foods Corp. | 956,600 | | 44,262 |
Kellogg Co. | 2,075,900 | | 86,876 |
Smithfield Foods, Inc. (a) | 1,024,700 | | 30,126 |
| | 205,745 |
Household Products - 2.5% |
Clorox Co. | 494,900 | | 26,616 |
Colgate-Palmolive Co. | 1,595,600 | | 93,263 |
Procter & Gamble Co. | 2,552,600 | | 138,964 |
| | 258,843 |
Personal Products - 2.0% |
Gillette Co. | 4,857,720 | | 205,967 |
Tobacco - 0.5% |
Altria Group, Inc. | 1,065,200 | | 53,313 |
TOTAL CONSUMER STAPLES | | 1,315,675 |
ENERGY - 6.7% |
Energy Equipment & Services - 2.5% |
Baker Hughes, Inc. | 1,923,200 | | 72,408 |
BJ Services Co. (a) | 1,265,500 | | 58,011 |
Nabors Industries Ltd. (a) | 982,600 | | 44,433 |
Schlumberger Ltd. (NY Shares) | 1,406,800 | | 89,346 |
| | 264,198 |
Oil & Gas - 4.2% |
ChevronTexaco Corp. | 569,600 | | 53,605 |
ConocoPhillips | 1,048,046 | | 79,955 |
Exxon Mobil Corp. | 4,665,100 | | 207,177 |
Occidental Petroleum Corp. | 636,000 | | 30,789 |
Valero Energy Corp. | 942,800 | | 69,541 |
| | 441,067 |
TOTAL ENERGY | | 705,265 |
Common Stocks - continued |
| Shares | | Value (Note 1) (000s) |
FINANCIALS - 17.2% |
Capital Markets - 3.8% |
Bear Stearns Companies, Inc. | 618,400 | | $ 52,137 |
Goldman Sachs Group, Inc. | 773,700 | | 72,852 |
Lehman Brothers Holdings, Inc. | 259,900 | | 19,557 |
Merrill Lynch & Co., Inc. | 2,255,900 | | 121,773 |
Morgan Stanley | 2,482,600 | | 131,007 |
| | 397,326 |
Commercial Banks - 3.8% |
Bank of America Corp. | 2,238,100 | | 189,388 |
Bank of Hawaii Corp. | 700,500 | | 31,677 |
Wells Fargo & Co. | 3,179,400 | | 181,957 |
| | 403,022 |
Consumer Finance - 2.2% |
American Express Co. | 3,754,692 | | 192,916 |
SLM Corp. | 796,450 | | 32,216 |
| | 225,132 |
Diversified Financial Services - 3.1% |
Citigroup, Inc. | 7,099,232 | | 330,114 |
Insurance - 4.1% |
AFLAC, Inc. | 2,051,000 | | 83,701 |
Allstate Corp. | 1,146,200 | | 53,356 |
American International Group, Inc. | 4,146,300 | | 295,548 |
| | 432,605 |
Real Estate - 0.2% |
Vornado Realty Trust | 398,300 | | 22,747 |
TOTAL FINANCIALS | | 1,810,946 |
HEALTH CARE - 14.7% |
Health Care Equipment & Supplies - 5.2% |
Becton, Dickinson & Co. | 1,410,000 | | 73,038 |
Biomet, Inc. | 1,498,500 | | 66,593 |
Boston Scientific Corp. (a) | 1,608,300 | | 68,835 |
C.R. Bard, Inc. | 1,025,400 | | 58,089 |
Medtronic, Inc. | 1,764,100 | | 85,947 |
Respironics, Inc. (a) | 736,100 | | 43,246 |
St. Jude Medical, Inc. (a) | 1,321,850 | | 99,998 |
Zimmer Holdings, Inc. (a) | 501,432 | | 44,226 |
| | 539,972 |
Common Stocks - continued |
| Shares | | Value (Note 1) (000s) |
HEALTH CARE - continued |
Health Care Providers & Services - 0.3% |
Cardinal Health, Inc. | 473,100 | | $ 33,141 |
Pharmaceuticals - 9.2% |
Allergan, Inc. | 301,800 | | 27,017 |
AstraZeneca PLC sponsored ADR | 1,148,100 | | 52,399 |
Eli Lilly & Co. | 495,500 | | 34,640 |
GlaxoSmithKline PLC sponsored ADR | 491,200 | | 20,365 |
Johnson & Johnson | 2,874,500 | | 160,110 |
Merck & Co., Inc. | 1,929,000 | | 91,628 |
Novartis AG sponsored ADR | 1,301,200 | | 57,903 |
Pfizer, Inc. | 10,149,320 | | 347,919 |
Roche Holding AG (participation certificate) | 353,577 | | 35,092 |
Schering-Plough Corp. | 2,969,000 | | 54,867 |
Wyeth | 2,303,940 | | 83,310 |
| | 965,250 |
TOTAL HEALTH CARE | | 1,538,363 |
INDUSTRIALS - 14.6% |
Aerospace & Defense - 3.6% |
Honeywell International, Inc. | 3,150,700 | | 115,410 |
Lockheed Martin Corp. | 2,023,330 | | 105,375 |
The Boeing Co. | 3,120,000 | | 159,401 |
| | 380,186 |
Air Freight & Logistics - 0.8% |
CNF, Inc. | 690,000 | | 28,676 |
United Parcel Service, Inc. Class B | 683,800 | | 51,401 |
| | 80,077 |
Building Products - 0.2% |
American Standard Companies, Inc. (a) | 482,100 | | 19,433 |
Commercial Services & Supplies - 0.3% |
R.R. Donnelley & Sons Co. | 994,300 | | 32,832 |
Industrial Conglomerates - 7.0% |
3M Co. | 2,145,400 | | 193,107 |
General Electric Co. | 10,809,426 | | 350,225 |
Tyco International Ltd. | 5,718,800 | | 189,521 |
| | 732,853 |
Machinery - 2.4% |
Crane Co. | 447,400 | | 14,044 |
Common Stocks - continued |
| Shares | | Value (Note 1) (000s) |
INDUSTRIALS - continued |
Machinery - continued |
Deere & Co. | 636,400 | | $ 44,637 |
Dover Corp. | 1,195,200 | | 50,318 |
Illinois Tool Works, Inc. | 277,300 | | 26,590 |
Ingersoll-Rand Co. Ltd. Class A | 683,020 | | 46,657 |
ITT Industries, Inc. | 629,600 | | 52,257 |
Pall Corp. | 853,100 | | 22,343 |
| | 256,846 |
Trading Companies & Distributors - 0.3% |
Fastenal Co. | 522,900 | | 29,716 |
TOTAL INDUSTRIALS | | 1,531,943 |
INFORMATION TECHNOLOGY - 15.4% |
Communications Equipment - 3.7% |
Cisco Systems, Inc. (a) | 6,982,800 | | 165,492 |
Motorola, Inc. | 5,301,600 | | 96,754 |
QUALCOMM, Inc. | 1,341,900 | | 97,932 |
Telefonaktiebolaget LM Ericsson ADR (a) | 954,400 | | 28,556 |
| | 388,734 |
Computers & Peripherals - 3.2% |
Dell, Inc. (a) | 3,173,500 | | 113,675 |
Diebold, Inc. | 625,100 | | 33,049 |
Hewlett-Packard Co. | 1,035,400 | | 21,847 |
International Business Machines Corp. | 1,584,100 | | 139,638 |
Lexmark International, Inc. Class A (a) | 341,400 | | 32,955 |
| | 341,164 |
Electronic Equipment & Instruments - 0.3% |
Amphenol Corp. Class A (a) | 1,024,700 | | 34,143 |
Internet Software & Services - 1.1% |
Yahoo!, Inc. (a) | 3,101,400 | | 112,674 |
Semiconductors & Semiconductor Equipment - 2.7% |
Applied Materials, Inc. (a) | 1,916,800 | | 37,608 |
ASML Holding NV (NY Shares) (a) | 1,076,200 | | 18,414 |
Intel Corp. | 6,554,630 | | 180,908 |
National Semiconductor Corp. (a) | 1,545,600 | | 33,988 |
Texas Instruments, Inc. | 462,300 | | 11,178 |
| | 282,096 |
Common Stocks - continued |
| Shares | | Value (Note 1) (000s) |
INFORMATION TECHNOLOGY - continued |
Software - 4.4% |
Microsoft Corp. | 14,812,800 | | $ 423,059 |
Oracle Corp. (a) | 2,834,400 | | 33,814 |
| | 456,873 |
TOTAL INFORMATION TECHNOLOGY | | 1,615,684 |
MATERIALS - 3.9% |
Chemicals - 3.1% |
Dow Chemical Co. | 2,672,130 | | 108,756 |
E.I. du Pont de Nemours & Co. | 659,624 | | 29,300 |
Ecolab, Inc. | 1,676,100 | | 53,132 |
Praxair, Inc. | 3,318,576 | | 132,444 |
| | 323,632 |
Containers & Packaging - 0.6% |
Ball Corp. | 592,757 | | 42,708 |
Packaging Corp. of America | 925,600 | | 22,122 |
| | 64,830 |
Metals & Mining - 0.2% |
CONSOL Energy, Inc. | 504,300 | | 18,155 |
TOTAL MATERIALS | | 406,617 |
TELECOMMUNICATION SERVICES - 3.6% |
Diversified Telecommunication Services - 3.6% |
BellSouth Corp. | 3,889,600 | | 101,985 |
SBC Communications, Inc. | 5,454,900 | | 132,281 |
Verizon Communications, Inc. | 3,933,900 | | 142,368 |
| | 376,634 |
UTILITIES - 0.3% |
Electric Utilities - 0.3% |
PG&E Corp. (a) | 1,289,800 | | 36,037 |
TOTAL COMMON STOCKS (Cost $9,139,830) | 10,300,395 |
Preferred Stocks - 0.0% |
| Shares | | Value (Note 1) (000s) |
Convertible Preferred Stocks - 0.0% |
INFORMATION TECHNOLOGY - 0.0% |
Communications Equipment - 0.0% |
Procket Networks, Inc. Series C (a)(c) | 1,612,868 | | $ 0 |
Nonconvertible Preferred Stocks - 0.0% |
HEALTH CARE - 0.0% |
Biotechnology - 0.0% |
Geneprot, Inc. Series A (c)
(Cost $19,834) | 710,000 | | 2,485 |
Money Market Funds - 1.4% |
| | | |
Fidelity Cash Central Fund, 1.16% (b)
(Cost $143,254) | 143,253,991 | | 143,254 |
TOTAL INVESTMENT PORTFOLIO - 99.5% (Cost $9,302,918) | | 10,446,134 |
NET OTHER ASSETS - 0.5% | | 53,339 |
NET ASSETS - 100% | $ 10,499,473 |
Legend |
(a) Non-income producing |
(b) Affiliated fund that is available only to investment companies and other accounts managed by Fidelity Investments. The rate quoted is the annualized seven-day yield of the fund at period end. A complete listing of the fund's holdings as of its most recent fiscal year end is available upon request. |
(c) Restricted securities - Investment in securities not registered under the Securities Act of 1933 (excluding 144A issues). At the end of the period, the value of restricted securities (excluding 144A issues) amounted to $2,485,000 or 0.0% of net assets. |
Additional information on each holding is as follows: |
Security | Acquisition Date | Acquisition Cost (000s) |
Geneprot, Inc. Series A | 7/7/00 | $ 3,905 |
Procket Networks, Inc. Series C | 11/15/00 - 2/9/01 | $ 15,929 |
Other Information |
Purchases and sales of securities, other than short-term securities, aggregated $5,236,920,000 and $5,686,859,000, respectively. |
The fund placed a portion of its portfolio transactions with brokerage firms which are affiliates of the investment adviser. The commissions paid to these affiliated firms were $118,000 for the period. |
Income Tax Information |
At June 30, 2004, the fund had a capital loss carryforward of approximately $2,039,738,000 of which $943,331,000 and $1,096,407,000 will expire on June 30, 2010 and 2011, respectively. |
Annual Report
See accompanying notes which are an integral part of the financial statements.
Financial Statements
Statement of Assets and Liabilities
Amounts in thousands (except per-share amount) | June 30, 2004 |
| | |
Assets | | |
Investment in securities, at value (cost $9,302,918) - See accompanying schedule | | $ 10,446,134 |
Receivable for investments sold | | 118,165 |
Receivable for fund shares sold | | 6,402 |
Dividends receivable | | 7,967 |
Interest receivable | | 230 |
Prepaid expenses | | 23 |
Other affiliated receivables | | 36 |
Other receivables | | 513 |
Total assets | | 10,579,470 |
| | |
Liabilities | | |
Payable for investments purchased | $ 65,691 | |
Payable for fund shares redeemed | 8,395 | |
Accrued management fee | 3,178 | |
Other affiliated payables | 2,185 | |
Other payables and accrued expenses | 548 | |
Total liabilities | | 79,997 |
| | |
Net Assets | | $ 10,499,473 |
Net Assets consist of: | | |
Paid in capital | | $ 11,435,663 |
Undistributed net investment income | | 8,568 |
Accumulated undistributed net realized gain (loss) on investments and foreign currency transactions | | (2,087,974) |
Net unrealized appreciation (depreciation) on investments | | 1,143,216 |
Net Assets, for 364,447 shares outstanding | | $ 10,499,473 |
Net Asset Value, offering price and redemption price per share ($10,499,473 ÷ 364,447 shares) | | $ 28.81 |
See accompanying notes which are an integral part of the financial statements.
Annual Report
Financial Statements - continued
Statement of Operations
Amounts in thousands | Year ended June 30, 2004 |
| | |
Investment Income | | |
Dividends | | $ 146,529 |
Interest | | 2,233 |
Security lending | | 303 |
Total income | | 149,065 |
| | |
Expenses | | |
Management fee | $ 37,004 | |
Transfer agent fees | 22,205 | |
Accounting and security lending fees | 1,062 | |
Non-interested trustees' compensation | 52 | |
Appreciation in deferred trustee compensation account | 40 | |
Custodian fees and expenses | 132 | |
Registration fees | 39 | |
Audit | 98 | |
Legal | 36 | |
Miscellaneous | 597 | |
Total expenses before reductions | 61,265 | |
Expense reductions | (1,725) | 59,540 |
Net investment income (loss) | | 89,525 |
Realized and Unrealized Gain (Loss) Net realized gain (loss) on: | | |
Investment securities | 978,121 | |
Foreign currency transactions | 138 | |
Total net realized gain (loss) | | 978,259 |
Change in net unrealized appreciation (depreciation) on investment securities | | 647,143 |
Net gain (loss) | | 1,625,402 |
Net increase (decrease) in net assets resulting from operations | | $ 1,714,927 |
See accompanying notes which are an integral part of the financial statements.
Annual Report
Statement of Changes in Net Assets
Amounts in thousands | Year ended
June 30,
2004 | Year ended
June 30,
2003 |
Increase (Decrease) in Net Assets | | |
Operations | | |
Net investment income (loss) | $ 89,525 | $ 83,315 |
Net realized gain (loss) | 978,259 | (756,783) |
Change in net unrealized appreciation (depreciation) | 647,143 | 403,721 |
Net increase (decrease) in net assets resulting
from operations | 1,714,927 | (269,747) |
Distributions to shareholders from net investment income | (89,068) | (82,413) |
Share transactions
Net proceeds from sales of shares | 1,419,655 | 1,436,330 |
Reinvestment of distributions | 84,378 | 77,554 |
Cost of shares redeemed | (1,965,079) | (2,312,652) |
Net increase (decrease) in net assets resulting from share transactions | (461,046) | (798,768) |
Total increase (decrease) in net assets | 1,164,813 | (1,150,928) |
| | |
Net Assets | | |
Beginning of period | 9,334,660 | 10,485,588 |
End of period (including undistributed net investment income of $8,568 and undistributed net investment income of $7,973, respectively) | $ 10,499,473 | $ 9,334,660 |
Other Information Shares | | |
Sold | 52,303 | 65,924 |
Issued in reinvestment of distributions | 3,064 | 3,455 |
Redeemed | (72,621) | (106,676) |
Net increase (decrease) | (17,254) | (37,297) |
See accompanying notes which are an integral part of the financial statements.
Annual Report
Financial Highlights
Years ended June 30, | 2004 | 2003 | 2002 | 2001 | 2000 |
Selected Per-Share Data | | | | | |
Net asset value, beginning of period | $ 24.46 | $ 25.03 | $ 31.84 | $ 41.81 | $ 40.39 |
Income from Investment Operations | | | | | |
Net investment income (loss) B | .24 | .21 | .23 | .19 | .23 |
Net realized and unrealized gain (loss) | 4.35 | (.57) | (6.83) | (4.72) | 3.61 |
Total from investment operations | 4.59 | (.36) | (6.60) | (4.53) | 3.84 |
Distributions from net investment income | (.24) | (.21) | (.21) | (.21) | (.21) |
Distributions in excess of net investment income | - | - | - | (.03) | - |
Distributions from net realized gain | - | - | - | (2.87) | (2.21) |
Distributions in excess of net realized gain | - | - | - | (2.33) | - |
Total distributions | (.24) | (.21) | (.21) | (5.44) | (2.42) |
Net asset value, end of period | $ 28.81 | $ 24.46 | $ 25.03 | $ 31.84 | $ 41.81 |
Total Return A | 18.81% | (1.36)% | (20.78)% | (11.76)% | 10.47% |
Ratios to Average Net Assets C | | | | | |
Expenses before expense reductions | .61% | .63% | .59% | .56% | .56% |
Expenses net of voluntary waivers, if any | .61% | .63% | .59% | .56% | .56% |
Expenses net of all reductions | .59% | .61% | .53% | .51% | .53% |
Net investment income (loss) | .89% | .93% | .82% | .55% | .57% |
Supplemental Data | | | | | |
Net assets, end of period (in millions) | $ 10,499 | $ 9,335 | $ 10,486 | $ 14,294 | $ 17,379 |
Portfolio turnover rate | 53% | 32% | 155% | 217% | 113% |
A Total returns would have been lower had certain expenses not been reduced during the periods shown.
B Calculated based on average shares outstanding during the period.
C Expense ratios reflect operating expenses of the fund. Expenses before reductions do not reflect amounts reimbursed by the investment adviser or reductions from brokerage service arrangements or other expense offset arrangements and do not represent the amount paid by the fund during periods when reimbursements or reductions occur. Expenses net of any voluntary waivers reflect expenses after reimbursement by the investment adviser but prior to reductions from brokerage service arrangements or other expense offset arrangements. Expenses net of all reductions represent the net expenses paid by the fund.
See accompanying notes which are an integral part of the financial statements.
Annual Report
Notes to Financial Statements
For the period ended June 30, 2004
(Amounts in thousands except ratios)
1. Significant Accounting Policies.
Fidelity Fund (the fund) is a fund of Fidelity Hastings Street Trust (the trust) and is authorized to issue an unlimited number of shares. The trust is registered under the Investment Company Act of 1940, as amended (the 1940 Act), as an open-end management investment company organized as a Massachusetts business trust. The financial statements have been prepared in conformity with accounting principles generally accepted in the United States of America, which require management to make certain estimates and assumptions at the date of the financial statements. The following summarizes the significant accounting policies of the fund:
Security Valuation. Net asset value per share (NAV calculation) is calculated as of the close of business of the New York Stock Exchange, normally 4:00 p.m. Eastern time. Equity securities, including restricted securities, for which market quotations are available are valued at the last sale price or official closing price (closing bid price or last evaluated quote if no sale has occurred) on the primary market or exchange on which they trade. If prices are not readily available or do not accurately reflect fair value for a security, or if a security's value has been materially affected by events occurring after the close of the exchange or market on which the security is principally traded, that security may be valued by another method that the Board of Trustees believes accurately reflects fair value. A security's valuation may differ depending on the method used for determining value. Price movements in futures contracts and ADRs, market and trading trends, the bid/ask quotes of brokers and off-exchange institutional trading may be reviewed in the course of making a good faith determination of a security's fair value. Short-term securities with remaining maturities of sixty days or less for which quotations are not readily available are valued on the basis of amortized cost. Investments in open-end investment companies are valued at their net asset value each business day.
Foreign Currency. The fund uses foreign currency contracts to facilitate transactions in foreign-denominated securities. Losses from these transactions may arise from changes in the value of the foreign currency or if the counterparties do not perform under the contracts' terms.
Foreign-denominated assets, including investment securities, and liabilities are translated into U.S. dollars at the exchange rate at period end. Purchases and sales of investment securities, income and dividends received and expenses denominated in foreign currencies are translated into U.S. dollars at the exchange rate in effect on the transaction date.
The effects of exchange rate fluctuations on investments are included with the net realized and unrealized gain (loss) on investment securities. Other foreign currency transactions resulting in realized and unrealized gain (loss) are disclosed separately.
Annual Report
Notes to Financial Statements - continued
(Amounts in thousands except ratios)
1. Significant Accounting Policies - continued
Investment Transactions and Income. Security transactions are accounted for as of trade date. Gains and losses on securities sold are determined on the basis of identified cost. Dividend income is recorded on the ex-dividend date, except for certain dividends from foreign securities where the ex-dividend date may have passed, which are recorded as soon as the fund is informed of the ex-dividend date. Non-cash dividends included in dividend income, if any, are recorded at the fair market value of the securities received. Distributions received on securities that represent a return of capital or capital gain are recorded as a reduction of cost of investments and/or as a realized gain. The fund estimates the components of distributions received that may be considered nontaxable distributions or capital gain distributions for income tax purposes. Interest income is accrued as earned. Interest income includes coupon interest and amortization of premium and accretion of discount on debt securities. Investment income is recorded net of foreign taxes withheld where recovery of such taxes is uncertain.
Expenses. Most expenses of the trust can be directly attributed to a fund. Expenses which cannot be directly attributed are apportioned among the funds in the trust.
Deferred Trustee Compensation. Under a Deferred Compensation Plan (the Plan), non-interested Trustees must defer receipt of a portion of, and may elect to defer receipt of an additional portion of, their annual compensation. Deferred amounts are treated as though equivalent dollar amounts had been invested in shares of the fund or are invested in a cross-section of other Fidelity funds, and are marked-to-market. Deferred amounts remain in the fund until distributed in accordance with the Plan.
Income Tax Information and Distributions to Shareholders. Each year, the fund intends to qualify as a regulated investment company by distributing all of its taxable income and realized gains under Subchapter M of the Internal Revenue Code. As a result, no provision for income taxes is required in the accompanying financial statements. Foreign taxes are provided for based on the fund's understanding of the tax rules and rates that exist in the foreign markets in which it invests.
Distributions are recorded on the ex-dividend date. Income and capital gain distributions are determined in accordance with income tax regulations, which may differ from generally accepted accounting principles.
Capital accounts within the financial statements are adjusted for permanent book-tax differences. These adjustments have no impact on net assets or the results of operations. Temporary book-tax differences will reverse in a subsequent period.
Book-tax differences are primarily due to foreign currency transactions, nontaxable dividends, capital loss carryforwards and losses deferred due to wash sales and excise tax regulations.
Annual Report
1. Significant Accounting Policies - continued
Income Tax Information and Distributions to Shareholders - continued
The tax-basis components of distributable earnings and the federal tax cost as of period end were as follows:
Unrealized appreciation | $ 1,467,438 | | |
Unrealized depreciation | (372,458) | |
Net unrealized appreciation (depreciation) | 1,094,980 | |
Undistributed ordinary income | 8,760 | |
Capital loss carryforward | (2,039,738) | |
| | |
Cost for federal income tax purposes | $ 9,351,154 | |
The tax character of distributions paid was as follows:
| June 30,
2004 | June 30,
2003 |
| | |
Ordinary Income | $ 89,068 | $ 82,413 |
2. Operating Policies.
Repurchase Agreements. Fidelity Management & Research Company (FMR) has received an Exemptive Order from the Securities and Exchange Commission (the SEC) which permits the fund and other affiliated entities of FMR to transfer uninvested cash balances into joint trading accounts. These accounts are then invested in repurchase agreements that are collateralized by U.S. Treasury or Government obligations. The fund may also invest directly with institutions, in repurchase agreements that are collateralized by commercial paper obligations and corporate obligations. Collateral is held in segregated accounts with custodian banks and may be obtained in the event of a default of the counterparty. Collateral is marked-to-market daily and maintained at a value at least equal to the principal amount of the repurchase agreement (including accrued interest).
Restricted Securities. The fund may invest in securities that are subject to legal or contractual restrictions on resale. These securities generally may be resold in transactions exempt from registration or to the public if the securities are registered. Disposal of these securities may involve time-consuming negotiations and expense, and prompt sale at an acceptable price may be difficult. Information regarding restricted securities is included at the end of the fund's Schedule of Investments.
Annual Report
Notes to Financial Statements - continued
(Amounts in thousands except ratios)
3. Purchases and Sales of Investments.
Information regarding purchases and sales of securities is included under the caption "Other Information" at the end of the fund's Schedule of Investments.
4. Fees and Other Transactions with Affiliates.
Management Fee. FMR and its affiliates provide the fund with investment management related services for which the fund pays a monthly management fee. The management fee is the sum of an individual fund fee rate that is based on an annual rate of .09% of the fund's average net assets and a group fee rate that averaged .28% during the period. The group fee rate is based upon the average net assets of all the mutual funds advised by FMR. The group fee rate decreases as assets under management increase and increases as assets under management decrease. For the period, the total annual management fee rate was .37% of the fund's average net assets.
Transfer Agent Fees. Fidelity Service Company, Inc. (FSC), an affiliate of FMR, is the fund's transfer, dividend disbursing and shareholder servicing agent. FSC receives account fees and asset-based fees that vary according to account size and type of account. FSC pays for typesetting, printing and mailing of shareholder reports, except proxy statements. For the period, the transfer agent fees were equivalent to an annual rate of .22% of average net assets.
Accounting and Security Lending Fees. FSC maintains the fund's accounting records. The accounting fee is based on the level of average net assets for the month. Under a separate contract, FSC administers the security lending program. The security lending fee is based on the number and duration of lending transactions.
Central Funds. The fund may invest in affiliated Central Funds managed by Fidelity Investments Money Management, Inc. (FIMM), an affiliate of FMR. The Central Funds are open-end investment companies available only to investment companies and other accounts managed by FMR and its affiliates. The Central Funds seek preservation of capital and current income and do not pay a management fee. Income distributions earned by the fund are recorded as income in the accompanying financial statements and totaled $2,228 for the period.
Brokerage Commissions. The fund placed a portion of its portfolio transactions with brokerage firms which are affiliates of the investment adviser. The commissions paid to these affiliated firms are shown under the caption "Other Information" at the end of the fund's Schedule of Investments.
Annual Report
5. Committed Line of Credit.
The fund participates with other funds managed by FMR in a $4.2 billion credit facility (the "line of credit") to be utilized for temporary or emergency purposes to fund shareholder redemptions or for other short-term liquidity purposes. The participating fund has agreed to pay commitment fees on its pro rata portion of the line of credit. During the period, there were no borrowings on this line of credit.
6. Security Lending.
The fund lends portfolio securities from time to time in order to earn additional income. The fund receives collateral (in the form of U.S. Treasury obligations, letters of credit and/or cash) against the loaned securities and maintains collateral in an amount not less than 100% of the market value of the loaned securities during the period of the loan. The market value of the loaned securities is determined at the close of business of the fund and any additional required collateral is delivered to the fund on the next business day. If the borrower defaults on its obligation to return the securities loaned because of insolvency or other reasons, a fund could experience delays and costs in recovering the securities loaned or in gaining access to the collateral. Cash collateral is invested in cash equivalents. At period end there were no security loans outstanding.
7. Expense Reductions.
Many of the brokers with whom FMR places trades on behalf of the fund provided services to the fund in addition to trade execution. These services included payments of certain expenses on behalf of the fund totaling $1,676 for the period. In addition, through arrangements with the fund's custodian and transfer agent, credits realized as a result of uninvested cash balances were used to reduce the fund's expenses. During the period, these credits reduced the fund's custody and transfer agent expenses by $1 and $48, respectively.
Annual Report
Report of Independent Registered Public Accounting Firm
To the Trustees of Fidelity Hastings Street Trust and the Shareholders of Fidelity Fund:
In our opinion, the accompanying statement of assets and liabilities, including the schedule of investments, and the related statements of operations and of changes in net assets and the financial highlights present fairly, in all material respects, the financial position of Fidelity Fund (a fund of Fidelity Hastings Street Trust) at June 30, 2004 and the results of its operations, the changes in its net assets and the financial highlights for the periods indicated, in conformity with accounting principles generally accepted in the United States of America. These financial statements and financial highlights (hereafter referred to as "financial statements") are the responsibility of the Fidelity Fund's management; our responsibility is to express an opinion on these financial statements based on our audits. We conducted our audits of these financial statements in accordance with the standards of the Public Company Accounting Oversight Board (United States), which require that we plan and perform the audit to obtain reasonable assurance about whether the financial statements are free of material misstatement. An audit includes examining, on a test basis, evidence supporting the amounts and disclosures in the financial statements, assessing the accounting principles used and significant estimates made by management, and evaluating the overall financial statement presentation. We believe that our audits, which included confirmation of securities at June 30, 2004 by correspondence with the custodian and brokers, provide a reasonable basis for our opinion.
/s/PricewaterhouseCoopers LLP
PricewaterhouseCoopers LLP
Boston, Massachusetts
August 6, 2004
Annual Report
Trustees and Officers
The Trustees, Members of the Advisory Board, and executive officers of the trust and fund, as applicable, are listed below. The Board of Trustees governs the fund and is responsible for protecting the interests of shareholders. The Trustees are experienced executives who meet periodically throughout the year to oversee the fund's activities, review contractual arrangements with companies that provide services to the fund, and review the fund's performance. Except for William O. McCoy, each of the Trustees oversees 292 funds advised by FMR or an affiliate. Mr. McCoy oversees 294 funds advised by FMR or an affiliate.
The Trustees hold office without limit in time except that (a) any Trustee may resign; (b) any Trustee may be removed by written instrument, signed by at least two-thirds of the number of Trustees prior to such removal; (c) any Trustee who requests to be retired or who has become incapacitated by illness or injury may be retired by written instrument signed by a majority of the other Trustees; and (d) any Trustee may be removed at any special meeting of shareholders by a two-thirds vote of the outstanding voting securities of the trust. In any event, each non-interested Trustee shall retire not later than the last day of the calendar year in which his or her 72nd birthday occurs. The executive officers and Advisory Board Members hold office without limit in time, except that any officer and Advisory Board Member may resign or may be removed by a vote of a majority of the Trustees at any regular meeting or any special meeting of the Trustees. Except as indicated, each individual has held the office shown or other offices in the same company for the past five years.
The fund's Statement of Additional Information (SAI) includes more information about the Trustees. To request a free copy, call Fidelity at 1-800-544-8544.
Interested Trustees*:
Correspondence intended for each Trustee who is an "interested person" (as defined in the 1940 Act) may be sent to Fidelity Investments, 82 Devonshire Street, Boston, Massachusetts 02109.
Name, Age; Principal Occupation |
Edward C. Johnson 3d (74)** |
| Year of Election or Appointment: 1984 Mr. Johnson is Chairman of the Board of Trustees. Mr. Johnson serves
as Chief Executive Officer, Chairman, and a Director of FMR Corp.; a Director and Chairman of the Board and of the Executive Committee
of FMR; Chairman and a Director of Fidelity Management & Research (Far East) Inc.; Chairman (1998) and a Director of Fidelity Investments Money Management, Inc.; and Chairman (2001) and a Director (2000) of FMR Co., Inc. |
Abigail P. Johnson (42)** |
| Year of Election or Appointment: 2001 Senior Vice President of Fidelity Fund (2001). Ms. Johnson also serves as Senior Vice President of other Fidelity funds (2001). She is President and a Director of FMR (2001), Fidelity Investments Money Management, Inc. (2001), FMR Co., Inc. (2001), and a Director of FMR Corp. Previously, Ms. Johnson managed a number of Fidelity funds. |
Laura B. Cronin (50) |
| Year of Election or Appointment: 2003 Ms. Cronin is an Executive Vice President (2002) and Chief Financial Officer (2002) of FMR Corp. and is a member of the Fidelity Management Committee (2003). Previously, Ms. Cronin served as Vice President of Finance of FMR (1997-1999), and Chief Financial Officer of FMR (1999-2001), Fidelity Personal Investments (2001), and Fidelity Brokerage Company (2001-2002). |
Robert L. Reynolds (52) |
| Year of Election or Appointment: 2003 Mr. Reynolds is a Director (2003) and Chief Operating Officer (2002) of FMR Corp. and is the head of the Fidelity Management Committee (2003). He also serves on the Board at Fidelity Investments Canada, Ltd. (2000). Previously, Mr. Reynolds served as President of Fidelity Investments Institutional Retirement Group (1996-2000). |
* Trustees have been determined to be "Interested Trustees" by virtue of, among other things, their affiliation with the trust or various entities under common control with FMR.
** Edward C. Johnson 3d, Trustee, is Abigail P. Johnson's father.
Annual Report
Non-Interested Trustees:
Correspondence intended for each non-interested Trustee (that is, the Trustees other than the Interested Trustees) may be sent to Fidelity Investments, P.O. Box 55235, Boston, Massachusetts 02205-5235.
Name, Age; Principal Occupation |
J. Michael Cook (61) |
| Year of Election or Appointment: 2001 Prior to Mr. Cook's retirement in May 1999, he served as Chairman and Chief Executive Officer of Deloitte & Touche LLP (accounting/consulting), Chairman of the Deloitte & Touche Foundation, and a member of the Board of Deloitte Touche Tohmatsu. He currently serves as a Director of Comcast (telecommunications, 2002), International Flavors & Fragrances, Inc. (2000), The Dow Chemical Company (2000), and Northrop Grumman Corporation (global defense technology, 2003). He is a Member of the Diversity Advisory Council of Marakon (2003) and the Advisory Council of the Public Company Accounting Oversight Board (PCAOB), Chairman Emeritus of the Board of Catalyst (a leading organization for the advancement of women in business), and is Chairman of the Accountability Advisory Council to the Comptroller General of the United States. He also serves as a Member of the Advisory Board of the Graduate School of Business of the University of Florida, his alma mater. |
Ralph F. Cox (72) |
| Year of Election or Appointment: 1991 Mr. Cox is President of RABAR Enterprises (management consulting for the petroleum industry). Prior to February 1994, he was President of Greenhill Petroleum Corporation (petroleum exploration and production). Until March 1990, Mr. Cox was President and Chief Operating Officer of Union Pacific Resources Company (exploration and production). He is a Director of CH2M Hill Companies (engineering), and Abraxas Petroleum (petroleum exploration and production, 1999). In addition, he is a member of advisory boards of Texas A&M University and the University of Texas at Austin. |
Robert M. Gates (60) |
| Year of Election or Appointment: 1997 Dr. Gates is President of Texas A&M University (2002). He was Director of the Central Intelligence Agency (CIA) from 1991 to 1993. From 1989 to 1991, Dr. Gates served as Assistant to the President of the United States and Deputy National Security Advisor. Dr. Gates is a Director of NACCO Industries, Inc. (mining and manufacturing), Parker Drilling Co., Inc. (drilling and rental tools for the energy industry, 2001), and Brinker International (restaurant management, 2003). He also serves as a member of the Advisory Board of VoteHere.net (secure Internet voting, 2001). Previously, Dr. Gates served as a Director of LucasVarity PLC (automotive components and diesel engines), a Director of TRW Inc. (automotive, space, defense, and information technology), and Dean of the George Bush School of Government and Public Service at Texas A&M University (1999-2001). Dr. Gates also is a Trustee of the Forum for International Policy. |
George H. Heilmeier (68) |
| Year of Election or Appointment: 2004 Dr. Heilmeier is Chairman Emeritus of Telcordia Technologies (communication software and systems), where prior to his retirement, he served as company Chairman and Chief Executive Officer. He currently serves on the Boards of Directors of The Mitre Corporation (systems engineering and information technology support for the government), INET Technologies Inc. (telecommunications network surveillance, 2001) and Teletech Holdings (customer management services, 1998). He is Chairman of the General Motors Technology Advisory Committee and a Life Fellow of the IEEE (2000). Dr. Heilmeier is a member of the Defense Science Board and the National Security Agency Advisory Board. He is also a member of the National Academy of Engineering, the American Academy of Arts and Sciences and The Board of Overseers of the School of Engineering and Applied Science of the University of Pennsylvania. Previously, Dr. Heilmeier served as a Director of TRW Inc. (automotive, space, defense, and information technology, 1992-2002) and Compaq (1994-2002). |
Donald J. Kirk (71) |
| Year of Election or Appointment: 1987 Mr. Kirk is a Governor of the American Stock Exchange (2001), a Trustee and former Chairman of the Board of Trustees of the Greenwich Hospital Association, a Director of the Yale-New Haven Health Services Corp. (1998), and a Director Emeritus and former Chairman of the Board of Directors of National Arts Strategies Inc. Mr. Kirk was an Executive-in-Residence (1995-2000) and a Professor (1987-1995) at Columbia University Graduate School of Business. Prior to 1987, he was Chairman of the Financial Accounting Standards Board. Previously, Mr. Kirk served as a Governor of the National Association of Securities Dealers, Inc. (1996-2002), a member and Vice Chairman of the Public Oversight Board of the American Institute of Certified Public Accountants' SEC Practice Section (1995-2002), a Director of General Re Corporation (reinsurance, 1987-1998) and as a Director of Valuation Research Corp. (appraisals and valuations). |
Marie L. Knowles (57) |
| Year of Election or Appointment: 2001 Prior to Ms. Knowles' retirement in June 2000, she served as Executive Vice President and Chief Financial Officer of Atlantic Richfield Company (ARCO) (diversified energy, 1996-2000). From 1993 to 1996, she was a Senior Vice President of ARCO and President of ARCO Transportation Company. She served as a Director of ARCO from 1996 to 1998. She currently serves as a Director of Phelps Dodge Corporation (copper mining and manufacturing) and McKesson Corporation (healthcare service, 2002). Ms. Knowles is a Trustee of the Brookings Institution and the Catalina Island Conservancy and also serves as a member of the Advisory Board for the School of Engineering of the University of Southern California. |
Ned C. Lautenbach (60) |
| Year of Election or Appointment: 2000 Mr. Lautenbach has been a partner of Clayton, Dubilier & Rice, Inc. (private equity investment firm) since September 1998. Previously, Mr. Lautenbach was with the International Business Machines Corporation (IBM) from 1968 until his retirement in 1998. He was most recently Senior Vice President and Group Executive of Worldwide Sales and Services. From 1993 to 1995, he was Chairman of IBM World Trade Corporation, and from 1994 to 1998 was a member of IBM's Corporate Executive Committee. Mr. Lautenbach serves as Co-Chairman and a Director of Covansys, Inc. (global provider of business and technology solutions, 2000). In addition, he is a Director of Italtel Holding S.p.A. (telecommunications (Milan, Italy), 2004) and Eaton Corporation (diversified industrial) as well as the Philharmonic Center for the Arts in Naples, Florida (1999). He also is a member of the Council on Foreign Relations. |
Marvin L. Mann (71) |
| Year of Election or Appointment: 1993 Mr. Mann is Chairman of the non-interested Trustees (2001). He is Chairman Emeritus of Lexmark International, Inc. (computer peripherals) where he served as CEO until April 1998 and retired as Chairman May 1999, and remains a member of the Board. Prior to 1991, he held the positions of Vice President of International Business Machines Corporation (IBM) and President and General Manager of various IBM divisions and subsidiaries. He is also a member of the Executive Committee and Chairman of the Policy Committee of the Independent Director's Council of the Investment Company Institute. In addition, Mr. Mann is a member of the President's Cabinet at the University of Alabama and the Board of Visitors of the Culverhouse College of Commerce and Business Administration at the University of Alabama. |
William O. McCoy (70) |
| Year of Election or Appointment: 1997 Prior to his retirement in December 1994, Mr. McCoy was Vice Chairman of the Board of BellSouth Corporation (telecommunications) and President of BellSouth Enterprises. He is currently a Director of Liberty Corporation (holding company), Duke Realty Corporation (real estate), and Progress Energy, Inc. (electric utility). He is also a partner of Franklin Street Partners (private investment management firm) and a member of the Research Triangle Foundation Board. In addition, Mr. McCoy served as the Interim Chancellor (1999-2000) and a member of the Board of Visitors (1994-1998) for the University of North Carolina at Chapel Hill and currently serves on the Board of Directors of the University of North Carolina Health Care System and the Board of Visitors of the Kenan-Flagler Business School (University of North Carolina at Chapel Hill). He also served as Vice President of Finance for the University of North Carolina (16-school system, 1995-1998). |
William S. Stavropoulos (65) |
| Year of Election or Appointment: 2001 Mr. Stavropoulos is Chairman of the Board (2000), CEO (2002), a position he previously held from 1995-2000, Chairman of the Executive Committee (2000), and a Member of the Board of Directors of The Dow Chemical Company. Since joining The Dow Chemical Company in 1967, Mr. Stavropoulos served in numerous senior management positions, including President (1993-2000; 2002-2003). Currently, he is a Director of NCR Corporation (data warehousing and technology solutions), BellSouth Corporation (telecommunications), Chemical Financial Corporation, and Maersk Inc. (industrial conglomerate, 2002). He also serves as a member of the Board of Trustees of the American Enterprise Institute for Public Policy Research. In addition, Mr. Stavropoulos is a member of The Business Council, J.P. Morgan International Council and the University of Notre Dame Advisory Council for the College of Science. |
Advisory Board Members and Executive Officers:
Correspondence intended for Mr. Dirks and Ms. Small may be sent to Fidelity Investments, P.O. Box 55235, Boston, Massachusetts 02205-5235. Correspondence intended for each executive officer and Mr. Lynch may be sent to Fidelity Investments, 82 Devonshire Street, Boston, Massachusetts 02109.
Name, Age; Principal Occupation |
Dennis J. Dirks (56) |
| Year of Election or Appointment: 2004 Member of the Advisory Board of Fidelity Hastings Street Trust. Prior to his retirement in May 2003, Mr. Dirks was Chief Operating Officer and a member of the Board of The Depository Trust & Clearing Corporation (DTCC) (1999-2003). He also served as President, Chief Operating Officer, and Board member of The Depository Trust Company (DTC) (1999-2003) and President and Board member of the National Securities Clearing Corporation (NSCC) (1999-2003). In addition, Mr. Dirks served as Chief Executive Officer and Board member of the Government Securities Clearing Corporation (2001-2003) and Chief Executive Officer and Board member of the Mortgage-Backed Securities Clearing Corporation (2001-2003). |
Peter S. Lynch (61) |
| Year of Election or Appointment: 2003 Member of the Advisory Board of Fidelity Hastings Street Trust. Vice Chairman and a Director of FMR, and Vice Chairman (2001) and a Director (2000) of FMR Co., Inc. Previously, Mr. Lynch served as a Trustee of the Fidelity funds (1990-2003). Prior to May 31, 1990, he was a Director of FMR and Executive Vice President of FMR (a position he held until March 31, 1991), Vice President of Fidelity® Magellan® Fund and FMR Growth Group Leader, and Managing Director of FMR Corp. Mr. Lynch was also Vice President of Fidelity Investments Corporate Services. In addition, he serves as a Trustee of Boston College, Massachusetts Eye & Ear Infirmary, Historic Deerfield, John F. Kennedy Library, and the Museum of Fine Arts of Boston. |
Cornelia M. Small (59) |
| Year of Election or Appointment: 2004 Member of the Advisory Board of Fidelity Hastings Street Trust. Ms. Small is a member (2000) and Chairperson (2002) of the Investment Committee, and a member (2002) of the Board of Trustees of Smith College. Previously, she served as Chief Investment Officer (1999-2000), Director of Global Equity Investments (1996-1999), and a member of the Board of Directors of Scudder, Stevens & Clark (1990-1997) and Scudder Kemper Investments (1997-1998). In addition, Ms. Small served as Co-Chair (2000-2003) of the Annual Fund for the Fletcher School of Law and Diplomacy. |
Bart A. Grenier (45) |
| Year of Election or Appointment: 2001 Vice President of Fidelity Fund. Mr. Grenier also serves as Vice President of certain Equity Funds (2001), a position he previously held from 1999 to 2000, and Vice President of certain High Income Funds (2002). He is Senior Vice President of FMR (1999) and FMR Co., Inc. (2001), and President and Director of Strategic Advisers, Inc. (2002). He also heads Fidelity's Asset Allocation Group (2000), Fidelity's Growth and Income Group (2001), Fidelity's Value Group (2001), and Fidelity's High Income Division (2001). Previously, Mr. Grenier served as President of Fidelity Ventures (2000), Vice President of certain High Income Funds (1997-2000), High Income Division Head (1997-2000), Group Leader of the Income-Growth and Asset Allocation-Income Groups (1996-2000), and Assistant Equity Division Head (1997-2000). |
John D. Avery (39) |
| Year of Election or Appointment: 2002 Vice President of Fidelity Fund. Mr. Avery also serves as Vice President of other funds advised by FMR. Prior to assuming his current responsibilities, Mr. Avery worked as a research analyst and portfolio manager. |
Eric D. Roiter (55) |
| Year of Election or Appointment: 1998 Secretary of Fidelity Fund. He also serves as Secretary of other Fidelity funds (1998); Vice President, General Counsel, and Clerk of FMR Co., Inc. (2001) and FMR (1998); Vice President and Clerk of FDC (1998); Assistant Clerk of Fidelity Management & Research (U.K.) Inc. (2001) and Fidelity Management & Research (Far East) Inc. (2001); and Assistant Secretary of Fidelity Investments Money Management, Inc. (2001). Prior to joining Fidelity, Mr. Roiter was with the law firm of Debevoise & Plimpton, as an associate (1981-1984) and as a partner (1985-1997), and served as an Assistant General Counsel of the U.S. Securities and Exchange Commission (1979-1981). Mr. Roiter is an Adjunct Member, Faculty of Law, at Boston College Law School (2003). |
Stuart Fross (44) |
| Year of Election or Appointment: 2003 Assistant Secretary of Fidelity Fund. Mr. Fross also serves as Assistant Secretary of other Fidelity funds (2003) and is an employee of FMR. |
Christine Reynolds (45) |
| Year of Election or Appointment: 2004 President, Treasurer, and Anti-Money Laundering (AML) officer of Fidelity Fund. Ms. Reynolds also serves as President, Treasurer, and AML officer of other Fidelity funds (2004) and is a Vice President (2003) and an employee (2002) of FMR. Before joining Fidelity Investments, Ms. Reynolds worked at PricewaterhouseCoopers LLP (PwC) (1980-2002), where she was most recently an audit partner with PwC's investment management practice. |
Timothy F. Hayes (53) |
| Year of Election or Appointment: 2002 Chief Financial Officer of Fidelity Fund. Mr. Hayes also serves as Chief Financial Officer of other Fidelity funds (2002). Recently he was appointed President of Fidelity Service Company (2003) where he also serves as a Director. Mr. Hayes also serves as President of Fidelity Investments Operations Group (FIOG, 2002), which includes Fidelity Pricing and Cash Management Services Group (FPCMS), where he was appointed President in 1998. Previously, Mr. Hayes served as Chief Financial Officer of Fidelity Investments Corporate Systems and Service Group (1998) and Fidelity Systems Company (1997-1998). |
John R. Hebble (46) |
| Year of Election or Appointment: 2003 Deputy Treasurer of Fidelity Fund. Mr. Hebble also serves as Deputy Treasurer of other Fidelity funds (2003), and is an employee of FMR. Before joining Fidelity Investments, Mr. Hebble worked at Deutsche Asset Management where he served as Director of Fund Accounting (2002-2003) and Assistant Treasurer of the Scudder Funds (1998-2003). |
Kimberley H. Monasterio (40) |
| Year of Election or Appointment: 2004 Deputy Treasurer of Fidelity Fund. Ms. Monasterio also serves as Deputy Treasurer of other Fidelity funds (2004) and is an employee of FMR (2004). Before joining Fidelity Investments, Ms. Monasterio served as Treasurer (2000-2004) and Chief Financial Officer (2002-2004) of the Franklin Templeton Funds and Senior Vice President of Franklin Templeton Services, LLC (2000-2004). |
John H. Costello (57) |
| Year of Election or Appointment: 1986 Assistant Treasurer of Fidelity Fund. Mr. Costello also serves as Assistant Treasurer of other Fidelity funds and is an employee of FMR. |
Francis V. Knox, Jr. (57) |
| Year of Election or Appointment: 2002 Assistant Treasurer of Fidelity Fund. Mr. Knox also serves as Assistant Treasurer of other Fidelity funds (2002), and is a Vice President and an employee of FMR. Previously, Mr. Knox served as Vice President of Investment & Advisor Compliance (1990-2001), and Compliance Officer of Fidelity Management & Research (U.K.) Inc. (1992-2002), Fidelity Management & Research (Far East) Inc. (1991-2002), and FMR Corp. (1995-2002). |
Peter L. Lydecker (50) |
| Year of Election or Appointment: 2004 Assistant Treasurer of Fidelity Fund. Mr. Lydecker also serves as Assistant Treasurer of other Fidelity funds (2004) and is an employee of FMR. |
Mark Osterheld (49) |
| Year of Election or Appointment: 2002 Assistant Treasurer of Fidelity Fund. Mr. Osterheld also serves as Assistant Treasurer of other Fidelity funds (2002) and is an employee of FMR. |
Kenneth B. Robins (34) |
| Year of Election or Appointment: 2004 Assistant Treasurer of Fidelity Fund. Mr. Robins also serves as Assistant Treasurer of other Fidelity funds (2004) and is an employee of FMR (2004). Before joining Fidelity Investments, Mr. Robins worked at KPMG LLP, where he was a partner in KPMG's department of professional practice (2002-2004) and a Senior Manager (1999-2000). In addition, Mr. Robins served as Assistant Chief Accountant, United States Securities and Exchange Commission (2000-2002). |
Thomas J. Simpson (46) |
| Year of Election or Appointment: 2000 Assistant Treasurer of Fidelity Fund. Mr. Simpson is Assistant Treasurer of other Fidelity funds (2000) and an employee of FMR (1996). Prior to joining FMR, Mr. Simpson was Vice President and Fund Controller of Liberty Investment Services (1987-1995). |
Annual Report
Distributions
A total of .13% of the dividends distributed during the fiscal year was derived from interest on U.S. Government securities which is generally exempt from state income tax.
The fund designates 100% of the dividends distributed during the fiscal year as qualifying for the dividends-received deduction for corporate shareholders.
The fund designates 100% of the dividends distributed in September, December, March and June during the fiscal year as amounts which may be taken into account as a dividend for purposes of the maximum rate under section 1(h)(11) of the Internal Revenue Code.
The fund will notify shareholders in January 2005 of amounts for use in preparing 2004 income tax returns.
Annual Report
Proxy Voting Results
A special meeting of the fund's shareholders was held on March 24, 2004. The results of votes taken among shareholders on proposals before them are reported below. Each vote reported represents one dollar of net asset value held on the record date for the meeting.
PROPOSAL 1 |
To amend the Declaration of Trust to allow the Board of Trustees, if permitted by applicable law, to authorize fund mergers without shareholder approval.* |
| # of
Votes | % of
Votes |
Affirmative | 5,641,899,809.90 | 76.930 |
Against | 1,195,910,893.93 | 16.307 |
Abstain | 258,684,030.15 | 3.527 |
Broker Non-Votes | 237,317,184.17 | 3.236 |
TOTAL | 7,333,811,918.15 | 100.000 |
PROPOSAL 2 |
To approve the inclusion of language inadvertently omitted from the Amended and Restated Declaration of Trust presented to shareholders in June 2001.* |
| # of
Votes | % of
Votes |
Affirmative | 6,758,135,344.08 | 92.150 |
Against | 290,380,904.34 | 3.960 |
Abstain | 285,295,669.73 | 3.890 |
TOTAL | 7,333,811,918.15 | 100.000 |
PROPOSAL 3 |
To elect a Board of Trustees.* |
| # of
Votes | % of
Votes |
J. Michael Cook |
Affirmative | 6,986,573,775.53 | 95.265 |
Withheld | 347,238,142.62 | 4.735 |
TOTAL | 7,333,811,918.15 | 100.000 |
| # of
Votes | % of
Votes |
Ralph F. Cox |
Affirmative | 6,972,215,836.08 | 95.069 |
Withheld | 361,596,082.07 | 4.931 |
TOTAL | 7,333,811,918.15 | 100.000 |
Laura B. Cronin |
Affirmative | 6,984,375,675.44 | 95.235 |
Withheld | 349,436,242.71 | 4.765 |
TOTAL | 7,333,811,918.15 | 100.000 |
Robert M. Gates |
Affirmative | 6,981,063,293.96 | 95.190 |
Withheld | 352,748,624.19 | 4.810 |
TOTAL | 7,333,811,918.15 | 100.000 |
George H. Heilmeier |
Affirmative | 6,981,086,173.64 | 95.190 |
Withheld | 352,725,744.51 | 4.810 |
TOTAL | 7,333,811,918.15 | 100.000 |
Abigail P. Johnson |
Affirmative | 6,970,753,191.54 | 95.050 |
Withheld | 363,058,726.61 | 4.950 |
TOTAL | 7,333,811,918.15 | 100.000 |
Edward C. Johnson 3d |
Affirmative | 6,970,410,843.13 | 95.045 |
Withheld | 363,401,075.02 | 4.955 |
TOTAL | 7,333,811,918.15 | 100.000 |
Donald J. Kirk |
Affirmative | 6,977,181,783.66 | 95.137 |
Withheld | 356,630,134.49 | 4.863 |
TOTAL | 7,333,811,918.15 | 100.000 |
| # of
Votes | % of
Votes |
Marie L. Knowles |
Affirmative | 6,987,619,394.87 | 95.280 |
Withheld | 346,192,523.28 | 4.720 |
TOTAL | 7,333,811,918.15 | 100.000 |
Ned C. Lautenbach |
Affirmative | 6,991,038,771.41 | 95.326 |
Withheld | 342,773,146.74 | 4.674 |
TOTAL | 7,333,811,918.15 | 100.000 |
Marvin L. Mann |
Affirmative | 6,976,048,339.97 | 95.122 |
Withheld | 357,763,578.18 | 4.878 |
TOTAL | 7,333,811,918.15 | 100.000 |
William O. McCoy |
Affirmative | 6,976,743,035.70 | 95.131 |
Withheld | 357,068,882.45 | 4.869 |
TOTAL | 7,333,811,918.15 | 100.000 |
Robert L. Reynolds |
Affirmative | 6,989,941,130.39 | 95.311 |
Withheld | 343,870,787.76 | 4.689 |
TOTAL | 7,333,811,918.15 | 100.000 |
William S. Stavropoulos |
Affirmative | 6,987,371,028.43 | 95.276 |
Withheld | 346,440,889.72 | 4.724 |
TOTAL | 7,333,811,918.15 | 100.000 |
* Denotes trust-wide proposals and voting results. |
Annual Report
Managing Your Investments
Fidelity offers several ways to conveniently manage your personal investments via your telephone or PC. You can access your account information, conduct trades and research your investments 24 hours a day.
By Phone
Fidelity Automated Service Telephone provides a single toll-free number to access account balances, positions, quotes and trading. It's easy to navigate the service, and on your first call, the system will help you create a personal identification number (PIN) for security.
(phone_graphic)Fidelity Automated
Service Telephone (FAST®)
1-800-544-5555
Press
1 For mutual fund and brokerage trading.
2 For quotes.*
3 For account balances and holdings.
4 To review orders and mutual
fund activity.
5 To change your PIN.
*0 To speak to a Fidelity representative.
By PC
Fidelity's web site on the Internet provides a wide range of information, including daily financial news, fund performance, interactive planning tools and news about Fidelity products and services.
(computer_graphic)Fidelity's Web Site
www.fidelity.com
* When you call the quotes line, please remember that a fund's yield and return will vary and, except for money market funds, share price will also vary. This means that you may have a gain or loss when you sell your shares. There is no assurance that money market funds will be able to maintain a stable $1 share price; an investment in a money market fund is not insured or guaranteed by the U.S. government. Total returns are historical and include changes in share price, reinvestment of dividends and capital gains, and the effects of any sales charges.
Annual Report
Investment Adviser
Fidelity Management &
Research Company
Boston, MA
Investment Sub-Advisers
FMR Co., Inc.
Fidelity Management & Research
(U.K.) Inc.
Fidelity Management & Research
(Far East) Inc.
Fidelity Investments Japan Limited
Fidelity International Investment
Advisors
Fidelity International Investment
Advisors (U.K.) Limited
General Distributor
Fidelity Distributors Corporation
Boston, MA
Transfer and Shareholder
Servicing Agent
Fidelity Service Company, Inc.
Boston, MA
Custodian
JPMorgan Chase Bank
New York, NY
Fidelity's Growth and Income Funds
Balanced Fund
Convertible Securities Fund
Equity-Income Fund
Equity-Income II Fund
Fidelity® Fund
Global Balanced Fund
Growth & Income Portfolio
Growth & Income II Portfolio
Puritan® Fund
Real Estate Income Fund
Real Estate Investment Portfolio
Utilities Fund
The Fidelity Telephone Connection
Mutual Fund 24-Hour Service
Exchanges/Redemptions
and Account Assistance 1-800-544-6666
Product Information 1-800-544-6666
Retirement Accounts 1-800-544-4774
(8 a.m. - 9 p.m.)
TDD Service 1-800-544-0118
for the deaf and hearing impaired
(9 a.m. - 9 p.m. Eastern time)
Fidelity Automated Service
Telephone (FAST®) (automated graphic) 1-800-544-5555
(automated graphic) Automated line for quickest service
(Fidelity Investment logo)(registered trademark)
Corporate Headquarters
82 Devonshire St., Boston, MA 02109
www.fidelity.com
FID-UANN-0804
1.787731.101
Fidelity®
Growth & Income II
Portfolio
Annual Report
June 30, 2004
(2_fidelity_logos) (Registered_Trademark)
Contents
Chairman's Message | 3 | Ned Johnson's message to shareholders. |
Performance | 4 | How the fund has done over time. |
Management's Discussion | 5 | The manager's review of fund performance, strategy and outlook. |
Investment Changes | 6 | A summary of major shifts in the fund's investments over the past six months. |
Investments | 7 | A complete list of the fund's investments with their market values. |
Financial Statements | 12 | Statements of assets and liabilities, operations, and changes in net assets,
as well as financial highlights. |
Notes | 16 | Notes to the financial statements. |
Report of Independent Registered Public Accounting Firm | 21 | |
Trustees and Officers | 22 | |
Distributions | 33 | |
Proxy Voting Results | 34 | |
For a free copy of the fund's proxy voting guidelines visit www.fidelity.com/goto/proxyguidelines, call 1-800-544-8544, or visit the Securities and Exchange Commission (SEC)'s web site at www.sec.gov.
Standard & Poor's, S&P and S&P 500 are registered service marks of The McGraw-Hill Companies, Inc. and have been licensed for use by Fidelity Distributors Corporation.
Other third party marks appearing herein are the property of their respective owners.
All other marks appearing herein are registered or unregistered trademarks or service marks of FMR Corp. or an affiliated company.
(Recycle graphic) This report is printed on recycled paper using soy-based inks.
This report and the financial statements contained herein are submitted for the general information of the shareholders of the fund. This report is not authorized for distribution to prospective investors in the fund unless preceded or accompanied by an effective prospectus.
Mutual fund shares are not deposits or obligations of, or guaranteed by, any depository institution. Shares are not insured by the FDIC, Federal Reserve Board or any other agency, and are subject to investment risks, including possible loss of principal amount invested.
Neither the fund nor Fidelity Distributors Corporation is a bank.
For more information on any Fidelity fund, including charges and expenses, call 1-800-544-6666 for a free prospectus. Read it carefully before you invest or send money.
Chairman's Message
(photo_of_Edward_C_Johnson_3d)
Dear Shareholder:
Many of you have read or heard news stories recently that were critical of mutual funds and made allegations that the mutual fund industry has been less than forthright. I find these reports unsettling and not necessarily an accurate picture of the overall industry, and I would like you to know where we at Fidelity stand.
With specific regard to allegations that certain mutual fund companies were violating the Securities and Exchange Commission's forward pricing rules or were involved in so-called "market timing" activities, I want to say two things:
First, Fidelity does not have agreements that permit customers who buy fund shares after 4 p.m. to obtain the 4 p.m. price. This is not to say that someone could not deceive the company through fraudulent acts. But I underscore that we have no so-called "agreements" which would permit this illegal practice.
Second, Fidelity has been on record for years opposing predatory short-term trading which adversely affects other shareholders in a mutual fund. In fact, in the 1980s, we began charging a fee - which is returned to the fund and, therefore, to investors - to discourage this activity. What's more, several years ago we took the industry lead in developing a Fair Value Pricing Policy to prevent market timing on foreign securities in our funds. It is reasonable to assume that another structure can be developed that would alter the system to make it much more difficult for predatory traders to operate. This, however, will only be achieved through close cooperation among regulators, legislators and the industry.
Certainly no industry is perfect, and there have been instances of unethical and illegal activity from time to time within the mutual fund industry. When this occurs, confessed or convicted offenders should be dealt with appropriately. Clearly, every system can be improved. We applaud well thought out improvements by regulators, legislators and industry representatives that achieve the common goal of building and protecting the value of investors' holdings. But we remain concerned about the risk of over-regulation and the quick application of simplistic solutions to intricate problems.
For more than 57 years, Fidelity Investments has worked very hard to improve its products and service to justify your trust. When our family founded this company in 1946, we had only a few hundred customers. Many of them were family and friends. Today, we serve more than 18 million customers including individual investors and participants in retirement plans across America.
Let me close by saying that we do not take your trust in us for granted, and we realize that we must always work to improve all aspects of our service to you. In turn, we urge you to continue your active participation with your financial matters, so that your interests can be well served.
Best regards,
/s/Edward C. Johnson 3d
Edward C. Johnson 3d
Annual Report
Performance: The Bottom Line
Average annual total return reflects the change in the value of an investment, assuming reinvestment of the fund's dividend income and capital gains (the profits earned upon the sale of securities that have grown in value) and assuming a constant rate of performance each year. The $10,000 table and the fund's returns do not reflect the deduction of taxes that a shareholder would pay on fund distributions or the redemption of fund shares. During periods of reimbursement by Fidelity, a fund's total return will be greater than it would be had the reimbursement not occurred. How a fund did yesterday is no guarantee of how it will do tomorrow.
Average Annual Total Returns
Periods ended June 30, 2004 | Past 1
year | Past 5
years | Life of
fundA |
Fidelity® Growth & Income II Portfolio | 9.68% | -2.04% | -0.50% |
A From December 28, 1998.
$10,000 Over Life of Fund
Let's say hypothetically that $10,000 was invested in Fidelity® Growth & Income II Portfolio on December 28, 1998, when the fund started. The chart shows how the value of your investment would have changed, and also shows how the S&P 500® Index did over the same period.

Annual Report
Management's Discussion of Fund Performance
Comments from Louis Salemy, Portfolio Manager of Fidelity® Growth & Income II Portfolio
The major U.S. equity benchmarks posted double-digit returns for the 12 months ending June 30, 2004. But it could have been even better had most of the gains not been accrued in the first half of the period. Stocks slipped in the second half on concerns about the effects of potential interest rate hikes and rising inflation on corporate profits, an unsettled geopolitical environment and threats of terrorism. The Dow Jones Industrial AverageSM, for example, gained 18.60% for the year overall, but rose just 0.86% in the second half. Technology also had a big influence on market performance. Red hot in the first half, tech fell hard in the second as investors avoided stocks with future earnings potential, and focused instead on companies with steady current earnings amid the volatile investment backdrop. The Goldman Sachs® Technology Index soared 27.49% for the year, but crawled ahead just 0.74% year to date through June. Elsewhere, the Standard & Poor's 500SM Index gained 19.11% and the NASDAQ Composite® Index returned 26.78% for the overall year.
The fund rose 9.68% during the past year, trailing the S&P 500® and the LipperSM Growth & Income Funds Average, which returned 18.79%. It was a frustrating period in that several large holdings struggled despite their strong and improving fundamentals. The fund's big overweighting in media hurt a lot versus the index. There was a general malaise within the industry as traditional TV and radio outlets continued to lose advertising dollars to cable networks and the Internet. I avoided the heavy TV and radio names and instead focused on companies such as ad conglomerate Omnicom Group, which makes money by winning new accounts regardless of what medium is doing well. Unfortunately, the stock failed to respond despite strong revenue and earnings gains. Also disappointing was satellite broadcaster EchoStar, which fell on concerns about increased competition and higher customer acquisition costs. Elsewhere, stock selection in retailing and telecommunication services detracted - led by Kohl's and BellSouth, respectively - as did underweighting technology for the year overall. Conversely, shying away from weak large-cap pharmaceutical stocks helped, as did a good pick in health care equipment, eye care company Alcon. Several stable-growth holdings - including Gillette - also did well as investors rotated into more-defensive areas of the market. Another boost came from materials stocks such as Smurfit-Stone Container and brokerage stocks such as Morgan Stanley during the first half of the period.
The views expressed in this statement reflect those of the portfolio manager only through the end of the period of the report as stated on the cover and do not necessarily represent the views of Fidelity or any other person in the Fidelity organization. Any such views are subject to change at any time based upon market or other conditions and Fidelity disclaims any responsibility to update such views. These views may not be relied on as investment advice and, because investment decisions for a Fidelity fund are based on numerous factors, may not be relied on as an indication of trading intent on behalf of any Fidelity fund.
Annual Report
Investment Changes
Top Ten Stocks as of June 30, 2004 |
| % of fund's
net assets | % of fund's net assets
6 months ago |
EchoStar Communications Corp. Class A | 6.5 | 4.9 |
Omnicom Group, Inc. | 6.1 | 6.4 |
BellSouth Corp. | 5.3 | 5.3 |
Morgan Stanley | 5.2 | 5.3 |
Wells Fargo & Co. | 4.7 | 4.6 |
Verizon Communications, Inc. | 4.3 | 1.6 |
Microsoft Corp. | 3.8 | 3.3 |
Merrill Lynch & Co., Inc. | 3.7 | 3.6 |
Wal-Mart Stores, Inc. | 3.6 | 3.3 |
Exxon Mobil Corp. | 3.5 | 3.0 |
| 46.7 | |
Top Five Market Sectors as of June 30, 2004 |
| % of fund's
net assets | % of fund's net assets
6 months ago |
Financials | 21.8 | 21.2 |
Consumer Discretionary | 19.6 | 20.1 |
Consumer Staples | 16.0 | 16.8 |
Telecommunication Services | 11.2 | 8.3 |
Information Technology | 7.1 | 5.9 |
Asset Allocation (% of fund's net assets) |
As of June 30, 2004 * | As of December 31, 2003 ** |
| Stocks 97.0% | | | Stocks 88.5% | |
| Short-Term
Investments and
Net Other Assets 3.0% | | | Short-Term
Investments and
Net Other Assets 11.5% | |
* Foreign
investments | 4.8% | | ** Foreign
investments | 4.3% | |

Annual Report
Investments June 30, 2004
Showing Percentage of Net Assets
Common Stocks - 97.0% |
| Shares | | Value (Note 1) |
CONSUMER DISCRETIONARY - 19.6% |
Hotels, Restaurants & Leisure - 0.5% |
Carnival Corp. unit | 23,800 | | $ 1,118,600 |
Media - 16.0% |
E.W. Scripps Co. Class A | 43,300 | | 4,546,500 |
EchoStar Communications Corp. Class A (a) | 442,400 | | 13,603,798 |
News Corp. Ltd. ADR | 71,700 | | 2,539,614 |
Omnicom Group, Inc. | 169,500 | | 12,863,355 |
| | 33,553,267 |
Multiline Retail - 2.5% |
Dollar Tree Stores, Inc. (a) | 19,500 | | 534,885 |
Kohl's Corp. (a) | 109,100 | | 4,612,748 |
| | 5,147,633 |
Textiles Apparel & Luxury Goods - 0.6% |
Liz Claiborne, Inc. | 33,300 | | 1,198,134 |
TOTAL CONSUMER DISCRETIONARY | | 41,017,634 |
CONSUMER STAPLES - 16.0% |
Beverages - 1.1% |
The Coca-Cola Co. | 44,900 | | 2,266,552 |
Food & Staples Retailing - 6.1% |
Costco Wholesale Corp. | 61,900 | | 2,542,233 |
Wal-Mart Stores, Inc. | 141,920 | | 7,487,699 |
Walgreen Co. | 73,500 | | 2,661,435 |
| | 12,691,367 |
Food Products - 1.1% |
McCormick & Co., Inc. (non-vtg.) | 65,100 | | 2,213,400 |
Household Products - 3.2% |
Colgate-Palmolive Co. | 47,700 | | 2,788,065 |
Kimberly-Clark Corp. | 59,600 | | 3,926,448 |
| | 6,714,513 |
Personal Products - 3.4% |
Gillette Co. | 167,900 | | 7,118,960 |
Tobacco - 1.1% |
Altria Group, Inc. | 48,330 | | 2,418,917 |
TOTAL CONSUMER STAPLES | | 33,423,709 |
Common Stocks - continued |
| Shares | | Value (Note 1) |
ENERGY - 5.4% |
Oil & Gas - 5.4% |
BP PLC sponsored ADR | 72,600 | | $ 3,889,182 |
Exxon Mobil Corp. | 166,692 | | 7,402,792 |
| | 11,291,974 |
FINANCIALS - 21.8% |
Capital Markets - 11.5% |
Goldman Sachs Group, Inc. | 57,700 | | 5,433,032 |
Merrill Lynch & Co., Inc. | 144,000 | | 7,773,120 |
Morgan Stanley | 204,500 | | 10,791,465 |
| | 23,997,617 |
Commercial Banks - 4.7% |
Wells Fargo & Co. | 172,700 | | 9,883,621 |
Consumer Finance - 0.9% |
American Express Co. | 36,600 | | 1,880,508 |
Insurance - 4.7% |
Allstate Corp. | 44,600 | | 2,076,130 |
American International Group, Inc. | 70,030 | | 4,991,738 |
PartnerRe Ltd. | 17,900 | | 1,015,467 |
St. Paul Travelers Companies, Inc. | 44,281 | | 1,795,152 |
| | 9,878,487 |
TOTAL FINANCIALS | | 45,640,233 |
HEALTH CARE - 3.9% |
Biotechnology - 0.9% |
Amgen, Inc. (a) | 33,200 | | 1,811,724 |
Health Care Equipment & Supplies - 1.0% |
Alcon, Inc. | 18,800 | | 1,478,620 |
Medtronic, Inc. | 14,500 | | 706,440 |
| | 2,185,060 |
Health Care Providers & Services - 0.0% |
Wellcare Group, Inc. | 100 | | 1,700 |
Pharmaceuticals - 2.0% |
Allergan, Inc. | 14,900 | | 1,333,848 |
Pfizer, Inc. | 82,400 | | 2,824,672 |
| | 4,158,520 |
TOTAL HEALTH CARE | | 8,157,004 |
Common Stocks - continued |
| Shares | | Value (Note 1) |
INDUSTRIALS - 5.5% |
Aerospace & Defense - 1.1% |
Lockheed Martin Corp. | 17,500 | | $ 911,400 |
Northrop Grumman Corp. | 25,200 | | 1,353,240 |
| | 2,264,640 |
Airlines - 1.4% |
Continental Airlines, Inc. Class B (a) | 108,600 | | 1,234,782 |
MAIR Holdings, Inc. (a) | 65,900 | | 537,744 |
Northwest Airlines Corp. (a) | 48,500 | | 539,320 |
Southwest Airlines Co. | 30,000 | | 503,100 |
| | 2,814,946 |
Commercial Services & Supplies - 0.4% |
Avery Dennison Corp. | 14,000 | | 896,140 |
Industrial Conglomerates - 2.0% |
General Electric Co. | 131,020 | | 4,245,048 |
Road & Rail - 0.6% |
Union Pacific Corp. | 20,600 | | 1,224,670 |
TOTAL INDUSTRIALS | | 11,445,444 |
INFORMATION TECHNOLOGY - 7.1% |
Communications Equipment - 2.0% |
Cisco Systems, Inc. (a) | 175,500 | | 4,159,350 |
Computers & Peripherals - 0.7% |
Diebold, Inc. | 27,300 | | 1,443,351 |
IT Services - 0.6% |
Paychex, Inc. | 36,600 | | 1,240,008 |
Software - 3.8% |
Microsoft Corp. | 279,500 | | 7,982,520 |
TOTAL INFORMATION TECHNOLOGY | | 14,825,229 |
MATERIALS - 5.6% |
Containers & Packaging - 3.1% |
Packaging Corp. of America | 27,400 | | 654,860 |
Smurfit-Stone Container Corp. (a) | 292,018 | | 5,825,759 |
| | 6,480,619 |
Paper & Forest Products - 2.5% |
International Paper Co. | 119,100 | | 5,323,770 |
TOTAL MATERIALS | | 11,804,389 |
Common Stocks - continued |
| Shares | | Value (Note 1) |
TELECOMMUNICATION SERVICES - 11.2% |
Diversified Telecommunication Services - 11.2% |
BellSouth Corp. | 424,730 | | $ 11,136,421 |
SBC Communications, Inc. | 137,990 | | 3,346,258 |
Verizon Communications, Inc. | 247,800 | | 8,967,882 |
| | 23,450,561 |
UTILITIES - 0.9% |
Electric Utilities - 0.9% |
Entergy Corp. | 35,300 | | 1,977,153 |
TOTAL COMMON STOCKS (Cost $191,424,451) | 203,033,330 |
Money Market Funds - 3.6% |
| | | |
Fidelity Cash Central Fund, 1.16% (b) | 6,216,791 | | 6,216,791 |
Fidelity Securities Lending Cash Central Fund, 1.18% (b) | 1,284,200 | | 1,284,200 |
TOTAL MONEY MARKET FUNDS (Cost $7,500,991) | 7,500,991 |
TOTAL INVESTMENT PORTFOLIO - 100.6% (Cost $198,925,442) | | 210,534,321 |
NET OTHER ASSETS - (0.6)% | | (1,190,785) |
NET ASSETS - 100% | $ 209,343,536 |
Legend |
(a) Non-income producing |
(b) Affiliated fund that is available only to investment companies and other accounts managed by Fidelity Investments. The rate quoted is the annualized seven-day yield of the fund at period end. A complete listing of the fund's holdings as of its most recent fiscal year end is available upon request. |
Other Information |
Purchases and sales of securities, other than short-term securities, aggregated $67,545,942 and $50,900,337, respectively. |
The fund placed a portion of its portfolio transactions with brokerage firms which are affiliates of the investment adviser. The commissions paid to these affiliated firms were $4,334 for the period. |
Income Tax Information |
At June 30, 2004, the fund had a capital loss carryforward of approximately $19,001,000 of which $5,333,000 and $13,668,000 will expire on June 30, 2010 and 2011, respectively. |
See accompanying notes which are an integral part of the financial statements.
Annual Report
Financial Statements
Statement of Assets and Liabilities
June 30, 2004 |
| | |
Assets | | |
Investment in securities, at value (including securities loaned of $1,306,526) (cost $198,925,442) - See accompanying schedule | | $ 210,534,321 |
Receivable for investments sold | | 856,267 |
Receivable for fund shares sold | | 57,343 |
Dividends receivable | | 171,137 |
Interest receivable | | 8,820 |
Prepaid expenses | | 512 |
Other receivables | | 4,335 |
Total assets | | 211,632,735 |
| | |
Liabilities | | |
Payable to custodian bank | $ 174,126 | |
Payable for investments purchased | 1,700 | |
Payable for fund shares redeemed | 642,626 | |
Accrued management fee | 83,850 | |
Other affiliated payables | 57,683 | |
Other payables and accrued expenses | 45,014 | |
Collateral on securities loaned, at value | 1,284,200 | |
Total liabilities | | 2,289,199 |
| | |
Net Assets | | $ 209,343,536 |
Net Assets consist of: | | |
Paid in capital | | $ 217,807,161 |
Undistributed net investment income | | 189,278 |
Accumulated undistributed net realized gain (loss) on investments and foreign currency transactions | | (20,261,782) |
Net unrealized appreciation (depreciation) on investments | | 11,608,879 |
Net Assets, for 22,655,988 shares outstanding | | $ 209,343,536 |
Net Asset Value, offering price and redemption price per share ($209,343,536 ÷ 22,655,988 shares) | | $ 9.24 |
See accompanying notes which are an integral part of the financial statements.
Annual Report
Financial Statements - continued
Statement of Operations
Year ended June 30, 2004 |
| | |
Investment Income | | |
Dividends | | $ 3,223,076 |
Interest | | 245,772 |
Security lending | | 16,071 |
Total income | | 3,484,919 |
| | |
Expenses | | |
Management fee | $ 1,058,766 | |
Transfer agent fees | 645,606 | |
Accounting and security lending fees | 82,731 | |
Non-interested trustees' compensation | 984 | |
Custodian fees and expenses | 7,364 | |
Registration fees | 37,849 | |
Audit | 50,462 | |
Legal | 808 | |
Miscellaneous | 20,998 | |
Total expenses before reductions | 1,905,568 | |
Expense reductions | (10,804) | 1,894,764 |
Net investment income (loss) | | 1,590,155 |
Realized and Unrealized Gain (Loss) Net realized gain (loss) on: | | |
Investment securities | 5,618,337 | |
Foreign currency transactions | (1,854) | |
Total net realized gain (loss) | | 5,616,483 |
Change in net unrealized appreciation (depreciation) on investment securities | | 13,174,610 |
Net gain (loss) | | 18,791,093 |
Net increase (decrease) in net assets resulting from operations | | $ 20,381,248 |
See accompanying notes which are an integral part of the financial statements.
Annual Report
Statement of Changes in Net Assets
| Year ended
June 30,
2004 | Year ended
June 30,
2003 |
Increase (Decrease) in Net Assets | | |
Operations | | |
Net investment income (loss) | $ 1,590,155 | $ 1,265,645 |
Net realized gain (loss) | 5,616,483 | (4,635,160) |
Change in net unrealized appreciation (depreciation) | 13,174,610 | 18,217,884 |
Net increase (decrease) in net assets resulting
from operations | 20,381,248 | 14,848,369 |
Distributions to shareholders from net investment income | (1,483,590) | (1,228,566) |
Share transactions
Net proceeds from sales of shares | 96,697,405 | 133,378,891 |
Reinvestment of distributions | 1,403,454 | 1,165,487 |
Cost of shares redeemed | (103,371,871) | (84,988,867) |
Net increase (decrease) in net assets resulting from share transactions | (5,271,012) | 49,555,511 |
Total increase (decrease) in net assets | 13,626,646 | 63,175,314 |
| | |
Net Assets | | |
Beginning of period | 195,716,890 | 132,541,576 |
End of period (including undistributed net investment income of $189,278 and undistributed net investment income of $106,621, respectively) | $ 209,343,536 | $ 195,716,890 |
Other Information Shares | | |
Sold | 10,785,017 | 16,835,640 |
Issued in reinvestment of distributions | 153,412 | 151,071 |
Redeemed | (11,372,872) | (10,706,560) |
Net increase (decrease) | (434,443) | 6,280,151 |
See accompanying notes which are an integral part of the financial statements.
Annual Report
Financial Highlights
Years ended June 30, | 2004 | 2003 | 2002 | 2001 | 2000 |
Selected Per-Share Data | | | | | |
Net asset value, beginning of period | $ 8.48 | $ 7.88 | $ 9.63 | $ 10.49 | $ 10.75 |
Income from Investment Operations | | | | | |
Net investment income (loss) B | .06 | .07 | .08 | .11 | .09 |
Net realized and unrealized gain (loss) | .76 | .60 | (1.75) | (.86) | (.22) |
Total from investment operations | .82 | .67 | (1.67) | (.75) | (.13) |
Distributions from net investment income | (.06) | (.07) | (.08) | (.11) | (.08) |
Distributions from net realized gain | - | - | - | - | (.04) |
Distributions in excess of net realized gain | - | - | - | - | (.01) |
Total distributions | (.06) | (.07) | (.08) | (.11) | (.13) |
Net asset value, end of period | $ 9.24 | $ 8.48 | $ 7.88 | $ 9.63 | $ 10.49 |
Total Return A | 9.68% | 8.60% | (17.42)% | (7.19)% | (1.17)% |
Ratios to Average Net Assets C | | | | | |
Expenses before expense reductions | .86% | .94% | .90% | .88% | .85% |
Expenses net of voluntary waivers, if any | .86% | .94% | .90% | .88% | .85% |
Expenses net of all reductions | .85% | .93% | .89% | .86% | .84% |
Net investment income (loss) | .72% | .90% | .94% | 1.12% | .83% |
Supplemental Data | | | | | |
Net assets, end of period (000 omitted) | $ 209,344 | $ 195,717 | $ 132,542 | $ 158,467 | $ 174,372 |
Portfolio turnover rate | 26% | 51% | 54% | 79% | 59% |
A Total returns would have been lower had certain expenses not been reduced during the periods shown.
B Calculated based on average shares outstanding during the period.
C Expense ratios reflect operating expenses of the fund. Expenses before reductions do not reflect amounts reimbursed by the investment adviser or reductions from brokerage service arrangements or other expense offset arrangements and do not represent the amount paid by the fund during periods when reimbursements or reductions occur. Expenses net of any voluntary waivers reflect expenses after reimbursement by the investment adviser but prior to reductions from brokerage service arrangements or other expense offset arrangements. Expenses net of all reductions represent the net expenses paid by the fund.
See accompanying notes which are an integral part of the financial statements.
Annual Report
Notes to Financial Statements
For the period ended June 30, 2004
1. Significant Accounting Policies.
Fidelity Growth & Income II Portfolio (the fund) is a fund of Fidelity Hastings Street Trust (the trust) and is authorized to issue an unlimited number of shares. The trust is registered under the Investment Company Act of 1940, as amended (the 1940 Act), as an open-end management investment company organized as a Massachusetts business trust. The financial statements have been prepared in conformity with accounting principles generally accepted in the United States of America, which require management to make certain estimates and assumptions at the date of the financial statements. The following summarizes the significant accounting policies of the fund:
Security Valuation. Net asset value per share (NAV calculation) is calculated as of the close of business of the New York Stock Exchange, normally 4:00 p.m. Eastern time. Equity securities, including restricted securities, for which market quotations are available are valued at the last sale price or official closing price (closing bid price or last evaluated quote if no sale has occurred) on the primary market or exchange on which they trade. If prices are not readily available or do not accurately reflect fair value for a security, or if a security's value has been materially affected by events occurring after the close of the exchange or market on which the security is principally traded, that security may be valued by another method that the Board of Trustees believes accurately reflects fair value. A security's valuation may differ depending on the method used for determining value. Price movements in futures contracts and ADRs, market and trading trends, the bid/ask quotes of brokers and off-exchange institutional trading may be reviewed in the course of making a good faith determination of a security's fair value. Short-term securities with remaining maturities of sixty days or less for which quotations are not readily available are valued on the basis of amortized cost. Investments in open-end investment companies are valued at their net asset value each business day.
Foreign Currency. The fund uses foreign currency contracts to facilitate transactions in foreign-denominated securities. Losses from these transactions may arise from changes in the value of the foreign currency or if the counterparties do not perform under the contracts' terms.
Foreign-denominated assets, including investment securities, and liabilities are translated into U.S. dollars at the exchange rate at period end. Purchases and sales of investment securities, income and dividends received and expenses denominated in foreign currencies are translated into U.S. dollars at the exchange rate in effect on the transaction date.
The effects of exchange rate fluctuations on investments are included with the net realized and unrealized gain (loss) on investment securities. Other foreign currency transactions resulting in realized and unrealized gain (loss) are disclosed separately.
Annual Report
Notes to Financial Statements - continued
1. Significant Accounting Policies - continued
Investment Transactions and Income. Security transactions are accounted for as of trade date. Gains and losses on securities sold are determined on the basis of identified cost. Dividend income is recorded on the ex-dividend date, except for certain dividends from foreign securities where the ex-dividend date may have passed, which are recorded as soon as the fund is informed of the ex-dividend date. Non-cash dividends included in dividend income, if any, are recorded at the fair market value of the securities received. Distributions received on securities that represent a return of capital or capital gain are recorded as a reduction of cost of investments and/or as a realized gain. The fund estimates the components of distributions received that may be considered nontaxable distributions or capital gain distributions for income tax purposes. Interest income is accrued as earned. Interest income includes coupon interest and amortization of premium and accretion of discount on debt securities. Investment income is recorded net of foreign taxes withheld where recovery of such taxes is uncertain.
Expenses. Most expenses of the trust can be directly attributed to a fund. Expenses which cannot be directly attributed are apportioned among the funds in the trust.
Income Tax Information and Distributions to Shareholders. Each year, the fund intends to qualify as a regulated investment company by distributing all of its taxable income and realized gains under Subchapter M of the Internal Revenue Code. As a result, no provision for income taxes is required in the accompanying financial statements. Foreign taxes are provided for based on each fund's understanding of the tax rules and rates that exist in the foreign markets in which it invests.
Distributions are recorded on the ex-dividend date. Income and capital gain distributions are determined in accordance with income tax regulations, which may differ from generally accepted accounting principles.
Capital accounts within the financial statements are adjusted for permanent book-tax differences. These adjustments have no impact on net assets or the results of operations. Temporary book-tax differences will reverse in a subsequent period.
Book-tax differences are primarily due to foreign currency transactions, capital loss carryforwards, and losses deferred due to wash sales and excise tax regulations.
Annual Report
1. Significant Accounting Policies - continued
Income Tax Information and Distributions to Shareholders - continued
The tax-basis components of distributable earnings and the federal tax cost as of period end were as follows:
Unrealized appreciation | $ 22,498,418 |
Unrealized depreciation | (12,150,682) |
Net unrealized appreciation (depreciation) | 10,347,736 |
Undistributed ordinary income | 189,278 |
Capital loss carryforward | (19,000,636) |
| |
Cost for federal income tax purposes | $ 200,186,585 |
The tax character of distributions paid was as follows:
| June 30,
2004 | June 30,
2003 |
Ordinary Income | $ 1,483,590 | $ 1,228,566 |
2. Operating Policies.
Repurchase Agreements. Fidelity Management & Research Company (FMR) has received an Exemptive Order from the Securities and Exchange Commission (the SEC) which permits the fund and other affiliated entities of FMR to transfer uninvested cash balances into joint trading accounts. These accounts are then invested in repurchase agreements that are collateralized by U.S. Treasury or Government obligations. The fund may also invest directly with institutions, in repurchase agreements that are collateralized by commercial paper obligations and corporate obligations. Collateral is held in segregated accounts with custodian banks and may be obtained in the event of a default of the counterparty. Collateral is marked-to-market daily and maintained at a value at least equal to the principal amount of the repurchase agreement (including accrued interest).
3. Purchases and Sales of Investments.
Information regarding purchases and sales of securities is included under the caption "Other Information" at the end of the fund's Schedule of Investments.
4. Fees and Other Transactions with Affiliates.
Management Fee. FMR and its affiliates provide the fund with investment management related services for which the fund pays a monthly management fee. The management fee is the sum of an individual fund fee rate that is based on an annual rate of .20% of the fund's average net assets and a group fee rate that averaged ..28%
Annual Report
Notes to Financial Statements - continued
4. Fees and Other Transactions with Affiliates - continued
Management Fee - continued
during the period. The group fee rate is based upon the average net assets of all the mutual funds advised by FMR. The group fee rate decreases as assets under management increase and increases as assets under management decrease. For the period, the total annual management fee rate was .48% of the fund's average net assets.
Transfer Agent Fees. Fidelity Service Company, Inc. (FSC), an affiliate of FMR, is the fund's transfer, dividend disbursing and shareholder servicing agent. FSC receives account fees and asset-based fees that vary according to account size and type of account. FSC pays for typesetting, printing and mailing of shareholder reports, except proxy statements. For the period, the transfer agent fees were equivalent to an annual rate of .29% of average net assets.
Accounting and Security Lending Fees. FSC maintains the fund's accounting records. The accounting fee is based on the level of average net assets for the month. Under a separate contract, FSC administers the security lending program. The security lending fee is based on the number and duration of lending transactions.
Central Funds. The fund may invest in affiliated Central Funds managed by Fidelity Investments Money Management, Inc. (FIMM), an affiliate of FMR. The Central Funds are open-end investment companies available only to investment companies and other accounts managed by FMR and its affiliates. The Central Funds seek preservation of capital and current income and do not pay a management fee. Income distributions earned by the fund are recorded as income in the accompanying financial statements and totaled $245,702 for the period.
Brokerage Commissions. The fund placed a portion of its portfolio transactions with brokerage firms which are affiliates of the investment adviser. The commissions paid to these affiliated firms are shown under the caption "Other Information" at the end of the fund's Schedule of Investments.
5. Committed Line of Credit.
The fund participates with other funds managed by FMR in a $4.2 billion credit facility (the "line of credit") to be utilized for temporary or emergency purposes to fund shareholder redemptions or for other short-term liquidity purposes. The participating fund has agreed to pay commitment fees on its pro rata portion of the line of credit. During the period, there were no borrowings on this line of credit.
Annual Report
6. Security Lending.
The fund lends portfolio securities from time to time in order to earn additional income. The fund receives collateral (in the form of U.S. Treasury obligations, letters of credit and/or cash) against the loaned securities and maintains collateral in an amount not less than 100% of the market value of the loaned securities during the period of the loan. The market value of the loaned securities is determined at the close of business of the fund and any additional required collateral is delivered to the fund on the next business day. If the borrower defaults on its obligation to return the securities loaned because of insolvency or other reasons, a fund could experience delays and costs in recovering the securities loaned or in gaining access to the collateral. Cash collateral is invested in cash equivalents. The value of loaned securities and cash collateral at period end are disclosed on the fund's Statement of Assets and Liabilities.
7. Expense Reductions.
Many of the brokers with whom FMR places trades on behalf of the fund provided services to the fund in addition to trade execution. These services included payments of certain expenses on behalf of the fund totaling $10,804 for the period.
Annual Report
Report of Independent Registered Public Accounting Firm
To the Trustees of Fidelity Hastings Street Trust and the Shareholders of Fidelity Growth & Income II Portfolio:
In our opinion, the accompanying statement of assets and liabilities, including the schedule of investments, and the related statements of operations and of changes in net assets and the financial highlights present fairly, in all material respects, the financial position of Fidelity Growth & Income II Portfolio (a fund of Fidelity Hastings Street Trust) at June 30, 2004 and the results of its operations, the changes in its net assets and the financial highlights for the periods indicated, in conformity with accounting principles generally accepted in the United States of America. These financial statements and financial highlights (hereafter referred to as "financial statements") are the responsibility of the Fidelity Growth & Income II Portfolio's management; our responsibility is to express an opinion on these financial statements based on our audits. We conducted our audits of these financial statements in accordance with the standards of the Public Company Accounting Oversight Board (United States), which require that we plan and perform the audit to obtain reasonable assurance about whether the financial statements are free of material misstatement. An audit includes examining, on a test basis, evidence supporting the amounts and disclosures in the financial statements, assessing the accounting principles used and significant estimates made by management, and evaluating the overall financial statement presentation. We believe that our audits, which included confirmation of securities at June 30, 2004 by correspondence with the custodian and brokers, provide a reasonable basis for our opinion.
/s/PricewaterhouseCoopers LLP
PricewaterhouseCoopers LLP
Boston, Massachusetts
August 6, 2004
Annual Report
Trustees and Officers
The Trustees, Members of the Advisory Board, and executive officers of the trust and fund, as applicable, are listed below. The Board of Trustees governs the fund and is responsible for protecting the interests of shareholders. The Trustees are experienced executives who meet periodically throughout the year to oversee the fund's activities, review contractual arrangements with companies that provide services to the fund, and review the fund's performance. Except for William O. McCoy, each of the Trustees oversees 292 funds advised by FMR or an affiliate. Mr. McCoy oversees 294 funds advised by FMR or an affiliate.
The Trustees hold office without limit in time except that (a) any Trustee may resign; (b) any Trustee may be removed by written instrument, signed by at least two-thirds of the number of Trustees prior to such removal; (c) any Trustee who requests to be retired or who has become incapacitated by illness or injury may be retired by written instrument signed by a majority of the other Trustees; and (d) any Trustee may be removed at any special meeting of shareholders by a two-thirds vote of the outstanding voting securities of the trust. In any event, each non-interested Trustee shall retire not later than the last day of the calendar year in which his or her 72nd birthday occurs. The executive officers and Advisory Board Members hold office without limit in time, except that any officer and Advisory Board Member may resign or may be removed by a vote of a majority of the Trustees at any regular meeting or any special meeting of the Trustees. Except as indicated, each individual has held the office shown or other offices in the same company for the past five years.
The fund's Statement of Additional Information (SAI) includes more information about the Trustees. To request a free copy, call Fidelity at 1-800-544-8544.
Interested Trustees*:
Correspondence intended for each Trustee who is an "interested person" (as defined in the 1940 Act) may be sent to Fidelity Investments, 82 Devonshire Street, Boston, Massachusetts 02109.
Name, Age; Principal Occupation |
Edward C. Johnson 3d (74)** |
| Year of Election or Appointment: 1984 Mr. Johnson is Chairman of the Board of Trustees. Mr. Johnson serves as Chief Executive Officer, Chairman, and a Director of FMR Corp.; a Director and Chairman of the Board and of the Executive Committee of FMR; Chairman and a Director of Fidelity Management & Research (Far East) Inc.; Chairman (1998) and a Director of Fidelity Investments Money Management, Inc.; and Chairman (2001) and a Director (2000) of FMR Co., Inc. |
Abigail P. Johnson (42)** |
| Year of Election or Appointment: 2001 Senior Vice President of Growth & Income II (2001). Ms. Johnson also serves as Senior Vice President of other Fidelity funds (2001). She is President and a Director of FMR (2001), Fidelity Investments Money Management, Inc. (2001), FMR Co., Inc. (2001), and a Director of FMR Corp. Previously, Ms. Johnson managed a number of Fidelity funds. |
Laura B. Cronin (50) |
| Year of Election or Appointment: 2003 Ms. Cronin is an Executive Vice President (2002) and Chief Financial Officer (2002) of FMR Corp. and is a member of the Fidelity Management Committee (2003). Previously, Ms. Cronin served as Vice President of Finance of FMR (1997-1999), and Chief Financial Officer of FMR (1999-2001), Fidelity Personal Investments (2001), and Fidelity Brokerage Company (2001-2002). |
Robert L. Reynolds (52) |
| Year of Election or Appointment: 2003 Mr. Reynolds is a Director (2003) and Chief Operating Officer (2002) of FMR Corp. and is the head of the Fidelity Management Committee (2003). He also serves on the Board at Fidelity Investments Canada, Ltd. (2000). Previously, Mr. Reynolds served as President of Fidelity Investments Institutional Retirement Group (1996-2000). |
* Trustees have been determined to be "Interested Trustees" by virtue of, among other things, their affiliation with the trust or various entities under common control with FMR.
** Edward C. Johnson 3d, Trustee, is Abigail P. Johnson's father.
Annual Report
Non-Interested Trustees:
Correspondence intended for each non-interested Trustee (that is, the Trustees other than the Interested Trustees) may be sent to Fidelity Investments, P.O. Box 55235, Boston, Massachusetts 02205-5235.
Name, Age; Principal Occupation |
J. Michael Cook (61) |
| Year of Election or Appointment: 2001 Prior to Mr. Cook's retirement in May 1999, he served as Chairman and Chief Executive Officer of Deloitte & Touche LLP (accounting/consulting), Chairman of the Deloitte & Touche Foundation, and a member of the Board of Deloitte Touche Tohmatsu. He currently serves as a Director of Comcast (telecommunications, 2002), International Flavors & Fragrances, Inc. (2000), The Dow Chemical Company (2000), and Northrop Grumman Corporation (global defense technology, 2003). He is a Member of the Diversity Advisory Council of Marakon (2003) and the Advisory Council of the Public Company Accounting Oversight Board (PCAOB), Chairman Emeritus of the Board of Catalyst (a leading organization for the advancement of women in business), and is Chairman of the Accountability Advisory Council to the Comptroller General of the United States. He also serves as a Member of the Advisory Board of the Graduate School of Business of the University of Florida, his alma mater. |
Ralph F. Cox (72) |
| Year of Election or Appointment: 1991 Mr. Cox is President of RABAR Enterprises (management consulting for the petroleum industry). Prior to February 1994, he was President of Greenhill Petroleum Corporation (petroleum exploration and production). Until March 1990, Mr. Cox was President and Chief Operating Officer of Union Pacific Resources Company (exploration and production). He is a Director of CH2M Hill Companies (engineering), and Abraxas Petroleum (petroleum exploration and production, 1999). In addition, he is a member of advisory boards of Texas A&M University and the University of Texas at Austin. |
Robert M. Gates (60) |
| Year of Election or Appointment: 1997 Dr. Gates is President of Texas A&M University (2002). He was Director of the Central Intelligence Agency (CIA) from 1991 to 1993. From 1989 to 1991, Dr. Gates served as Assistant to the President of the United States and Deputy National Security Advisor. Dr. Gates is a Director of NACCO Industries, Inc. (mining and manufacturing), Parker Drilling Co., Inc. (drilling and rental tools for the energy industry, 2001), and Brinker International (restaurant management, 2003). He also serves as a member of the Advisory Board of VoteHere.net (secure internet voting, 2001). Previously, Dr. Gates served as a Director of LucasVarity PLC (automotive components and diesel engines), a Director of TRW Inc. (automotive, space, defense, and information technology), and Dean of the George Bush School of Government and Public Service at Texas A&M University (1999-2001). Dr. Gates also is a Trustee of the Forum for International Policy. |
George H. Heilmeier (68) |
| Year of Election or Appointment: 2004 Dr. Heilmeier is Chairman Emeritus of Telcordia Technologies (communication software and systems), where prior to his retirement, he served as company Chairman and Chief Executive Officer. He currently serves on the Boards of Directors of The Mitre Corporation (systems engineering and information technology support for the government), INET Technologies Inc. (telecommunications network surveillance, 2001) and Teletech Holdings (customer management services, 1998). He is Chairman of the General Motors Technology Advisory Committee and a Life Fellow of the IEEE (2000). Dr. Heilmeier is a member of the Defense Science Board and the National Security Agency Advisory Board. He is also a member of the National Academy of Engineering, the American Academy of Arts and Sciences and The Board of Overseers of the School of Engineering and Applied Science of the University of Pennsylvania. Previously, Dr. Heilmeier served as a Director of TRW Inc. (automotive, space, defense, and information technology, 1992-2002), Compaq (1994-2002), and Automatic Data Processing, Inc. (ADP) (technology-based business outsourcing, 1995-2002). |
Donald J. Kirk (71) |
| Year of Election or Appointment: 1987 Mr. Kirk is a Governor of the American Stock Exchange (2001), a Trustee and former Chairman of the Board of Trustees of the Greenwich Hospital Association, a Director of the Yale-New Haven Health Services Corp. (1998), and a Director Emeritus and former Chairman of the Board of Directors of National Arts Strategies Inc. (leadership education for arts and culture). Mr. Kirk was an Executive-in-Residence (1995-2000) and a Professor (1987-1995) at Columbia University Graduate School of Business. Prior to 1987, he was Chairman of the Financial Accounting Standards Board. Previously, Mr. Kirk served as a Governor of the National Association of Securities Dealers, Inc. (1996-2002), a member and Vice Chairman of the Public Oversight Board of the American Institute of Certified Public Accountants' SEC Practice Section (1995-2002), a Director of General Re Corporation (reinsurance, 1987-1998) and as a Director of Valuation Research Corp. (appraisals and valuations). |
Marie L. Knowles (57) |
| Year of Election or Appointment: 2001 Prior to Ms. Knowles' retirement in June 2000, she served as Executive Vice President and Chief Financial Officer of Atlantic Richfield Company (ARCO) (diversified energy, 1996-2000). From 1993 to 1996, she was a Senior Vice President of ARCO and President of ARCO Transportation Company. She served as a Director of ARCO from 1996 to 1998. She currently serves as a Director of Phelps Dodge Corporation (copper mining and manufacturing) and McKesson Corporation (healthcare service, 2002). Ms. Knowles is a Trustee of the Brookings Institution and the Catalina Island Conservancy and also serves as a member of the Advisory Board for the School of Engineering of the University of Southern California. |
Ned C. Lautenbach (60) |
| Year of Election or Appointment: 2000 Mr. Lautenbach has been a partner of Clayton, Dubilier & Rice, Inc. (private equity investment firm) since September 1998. Previously, Mr. Lautenbach was with the International Business Machines Corporation (IBM) from 1968 until his retirement in 1998. He was most recently Senior Vice President and Group Executive of Worldwide Sales and Services. From 1993 to 1995, he was Chairman of IBM World Trade Corporation, and from 1994 to 1998 was a member of IBM's Corporate Executive Committee. Mr. Lautenbach serves as Co-Chairman and a Director of Covansys, Inc. (global provider of business and technology solutions, 2000). In addition, he is a Director of Italtel Holding S.p.A. (telecommunications (Milan, Italy), 2004) and Eaton Corporation (diversified industrial) as well as the Philharmonic Center for the Arts in Naples, Florida (1999). He also is a member of the Council on Foreign Relations. |
Marvin L. Mann (71) |
| Year of Election or Appointment: 1993 Mr. Mann is Chairman of the non-interested Trustees (2001). He is Chairman Emeritus of Lexmark International, Inc. (computer peripherals) where he served as CEO until April 1998 and retired as Chairman May 1999, and remains a member of the Board. Prior to 1991, he held the positions of Vice President of International Business Machines Corporation (IBM) and President and General Manager of various IBM divisions and subsidiaries. He is also a member of the Executive Committee and Chairman of the Policy Committee of the Independent Director's Council of the Investment Company Institute. In addition, Mr. Mann is a member of the President's Cabinet at the University of Alabama and the Board of Visitors of the Culverhouse College of Commerce and Business Administration at the University of Alabama. |
William O. McCoy (70) |
| Year of Election or Appointment: 1997 Prior to his retirement in December 1994, Mr. McCoy was Vice Chairman of the Board of BellSouth Corporation (telecommunications) and President of BellSouth Enterprises. He is currently a Director of Liberty Corporation (holding company), Duke Realty Corporation (real estate), and Progress Energy, Inc. (electric utility). He is also a partner of Franklin Street Partners (private investment management firm) and a member of the Research Triangle Foundation Board. In addition, Mr. McCoy served as the Interim Chancellor (1999-2000) and a member of the Board of Visitors (1994-1998) for the University of North Carolina at Chapel Hill and currently serves on the Board of Directors of the University of North Carolina Health Care System and the Board of Visitors of the Kenan-Flagler Business School (University of North Carolina at Chapel Hill). He also served as Vice President of Finance for the University of North Carolina (16-school system, 1995-1998). |
William S. Stavropoulos (65) |
| Year of Election or Appointment: 2001 Mr. Stavropoulos is Chairman of the Board (2000), CEO (2002), a position he previously held from 1995-2000, Chairman of the Executive Committee (2000), and a Member of the Board of Directors of The Dow Chemical Company. Since joining The Dow Chemical Company in 1967, Mr. Stavropoulos served in numerous senior management positions, including President (1993-2000; 2002-2003). Currently, he is a Director of NCR Corporation (data warehousing and technology solutions), BellSouth Corporation (telecommunications), Chemical Financial Corporation, and Maersk Inc. (industrial conglomerate, 2002). He also serves as a member of the Board of Trustees of the American Enterprise Institute for Public Policy Research. In addition, Mr. Stavropoulos is a member of The Business Council, J.P. Morgan International Council and the University of Notre Dame Advisory Council for the College of Science. |
Annual Report
Trustees and Officers - continued
Advisory Board Members and Executive Officers:
Correspondence intended for Mr. Dirks and Ms. Small may be sent to Fidelity Investments, P.O. Box 55235, Boston, Massachusetts 02205-5235. Correspondence intended for each executive officer and Mr. Lynch may be sent to Fidelity Investments, 82 Devonshire Street, Boston, Massachusetts 02109.
Name, Age; Principal Occupation |
Dennis J. Dirks (56) |
| Year of Election or Appointment: 2004 Member of the Advisory Board of Fidelity Hastings Street Trust. Prior to his retirement in May 2003, Mr. Dirks was Chief Operating Officer and a member of the Board of The Depository Trust & Clearing Corporation (DTCC) (1999-2003). He also served as President, Chief Operating Officer, and Board member of The Depository Trust Company (DTC) (1999-2003) and President and Board member of the National Securities Clearing Corporation (NSCC) (1999-2003). In addition, Mr. Dirks served as Chief Executive Officer and Board member of the Government Securities Clearing Corporation (2001-2003) and Chief Executive Officer and Board member of the Mortgage-Backed Securities Clearing Corporation (2001-2003). |
Peter S. Lynch (61) |
| Year of Election or Appointment: 2003 Member of the Advisory Board of Fidelity Hastings Street Trust. Vice Chairman and a Director of FMR, and Vice Chairman (2001) and a Director (2000) of FMR Co., Inc. Previously, Mr. Lynch served as a Trustee of the Fidelity funds (1990-2003). Prior to May 31, 1990, he was a Director of FMR and Executive Vice President of FMR (a position he held until March 31, 1991), Vice President of Fidelity® Magellan® Fund and FMR Growth Group Leader, and Managing Director of FMR Corp. Mr. Lynch was also Vice President of Fidelity Investments Corporate Services. In addition, he serves as a Trustee of Boston College, Massachusetts Eye & Ear Infirmary, Historic Deerfield, John F. Kennedy Library, and the Museum of Fine Arts of Boston. |
Cornelia M. Small (59) |
| Year of Election or Appointment: 2004 Member of the Advisory Board of Fidelity Hastings Street Trust. Ms. Small is a member (2000) and Chairperson (2002) of the Investment Committee, and a member (2002) of the Board of Trustees of Smith College. Previously, she served as Chief Investment Officer (1999-2000), Director of Global Equity Investments (1996-1999), and a member of the Board of Directors of Scudder, Stevens & Clark (1990-1997) and Scudder Kemper Investments (1997-1998). In addition, Ms. Small served as Co-Chair (2000-2003) of the Annual Fund for the Fletcher School of Law and Diplomacy. |
Bart A. Grenier (45) |
| Year of Election or Appointment: 2001 Vice President of Growth & Income II. Mr. Grenier also serves as Vice President of certain Equity Funds (2001), a position he previously held from 1999 to 2000, and Vice President of certain High Income Funds (2002). He is Senior Vice President of FMR (1999) and FMR Co., Inc. (2001), and President and Director of Strategic Advisers, Inc. (2002). He also heads Fidelity's Asset Allocation Group (2000), Fidelity's Growth and Income Group (2001), Fidelity's Value Group (2001), and Fidelity's High Income Division (2001). Previously, Mr. Grenier served as President of Fidelity Ventures (2000), Vice President of certain High Income Funds (1997-2000), High Income Division Head (1997-2000), Group Leader of the Income-Growth and Asset Allocation-Income Groups (1996-2000), and Assistant Equity Division Head (1997-2000).] |
Louis Salemy (42) |
| Year of Election or Appointment: 2000 Vice President of Growth & Income II. Mr. Salemy also serves as Vice President of other funds advised by FMR. Prior to assuming his current responsibilities, Mr. Salemy worked as a research analyst and portfolio manager. |
Eric D. Roiter (55) |
| Year of Election or Appointment: 1998 Secretary of Growth & Income II. He also serves as Secretary of other Fidelity funds (1998); Vice President, General Counsel, and Clerk of FMR Co., Inc. (2001) and FMR (1998); Vice President and Clerk of FDC (1998); Assistant Clerk of Fidelity Management & Research (U.K.) Inc. (2001) and Fidelity Management & Research (Far East) Inc. (2001); and Assistant Secretary of Fidelity Investments Money Management, Inc. (2001). Prior to joining Fidelity, Mr. Roiter was with the law firm of Debevoise & Plimpton, as an associate (1981-1984) and as a partner (1985-1997), and served as an Assistant General Counsel of the U.S. Securities and Exchange Commission (1979-1981). Mr. Roiter is an Adjunct Member, Faculty of Law, at Boston College Law School (2003). |
Stuart Fross (44) |
| Year of Election or Appointment: 2003 Assistant Secretary of Growth & Income II. Mr. Fross also serves as Assistant Secretary of other Fidelity funds (2003) and is an employee of FMR. |
Christine Reynolds (45) |
| Year of Election or Appointment: 2004 President, Treasurer, and Anti-Money Laundering (AML) officer of Growth & Income II. Ms. Reynolds also serves as President, Treasurer, and AML officer of other Fidelity funds (2004) and is a Vice President (2003) and an employee (2002) of FMR. Before joining Fidelity Investments, Ms. Reynolds worked at PricewaterhouseCoopers LLP (PwC) (1980-2002), where she was most recently an audit partner with PwC's investment management practice. |
Timothy F. Hayes (53) |
| Year of Election or Appointment: 2002 Chief Financial Officer of Growth & Income II. Mr. Hayes also serves as Chief Financial Officer of other Fidelity funds (2002). Recently he was appointed President of Fidelity Service Company (2003) where he also serves as a Director. Mr. Hayes also serves as President of Fidelity Investments Operations Group (FIOG, 2002), which includes Fidelity Pricing and Cash Management Services Group (FPCMS), where he was appointed President in 1998. Previously, Mr. Hayes served as Chief Financial Officer of Fidelity Investments Corporate Systems and Service Group (1998) and Fidelity Systems Company (1997-1998). |
John R. Hebble (46) |
| Year of Election or Appointment: 2003 Deputy Treasurer of Growth & Income II. Mr. Hebble also serves as Deputy Treasurer of other Fidelity funds (2003), and is an employee of FMR. Before joining Fidelity Investments, Mr. Hebble worked at Deutsche Asset Management where he served as Director of Fund Accounting (2002-2003) and Assistant Treasurer of the Scudder Funds (1998-2003). |
Kimberley H. Monasterio (40) |
| Year of Election or Appointment: 2004 Deputy Treasurer of Growth & Income II. Ms. Monasterio also serves as Deputy Treasurer of other Fidelity funds (2004) and is an employee of FMR (2004). Before joining Fidelity Investments, Ms. Monasterio served as Treasurer (2000-2004) and Chief Financial Officer (2002-2004) of the Franklin Templeton Funds and Senior Vice President of Franklin Templeton Services, LLC (2000-2004). |
John H. Costello (57) |
| Year of Election or Appointment: 1988 Assistant Treasurer of Growth & Income II. Mr. Costello also serves as Assistant Treasurer of other Fidelity funds and is an employee of FMR. |
Francis V. Knox, Jr. (57) |
| Year of Election or Appointment: 2002 Assistant Treasurer of Growth & Income II. Mr. Knox also serves as Assistant Treasurer of other Fidelity funds (2002), and is a Vice President and an employee of FMR. Previously, Mr. Knox served as Vice President of Investment & Advisor Compliance (1990-2001), and Compliance Officer of Fidelity Management & Research (U.K.) Inc. (1992-2002), Fidelity Management & Research (Far East) Inc. (1991-2002), and FMR Corp. (1995-2002). |
Peter L. Lydecker (50) |
| Year of Election or Appointment: 2004 Assistant Treasurer of Growth & Income II. Mr. Lydecker also serves as Assistant Treasurer of other Fidelity funds (2004) and is an employee of FMR. |
Mark Osterheld (49) |
| Year of Election or Appointment: 2002 Assistant Treasurer of Growth & Income II. Mr. Osterheld also serves as Assistant Treasurer of other Fidelity funds (2002) and is an employee of FMR. |
Kenneth B. Robins (34) |
| Year of Election or Appointment: 2004
Assistant Treasurer of Growth & Income II. Mr. Robins also serves as Assistant Treasurer of other Fidelity funds (2004) and is an employee of FMR (2004). Before joining Fidelity Investments, Mr. Robins worked at KPMG LLP, where he was a partner in KPMG's department of professional practice (2002-2004) and a Senior Manager (1999-2000). In addition, Mr. Robins served as Assistant Chief Accountant, United States Securities and Exchange Commission (2000-2002). |
Thomas J. Simpson (46) |
| Year of Election or Appointment: 2000 Assistant Treasurer of Growth & Income II. Mr. Simpson is Assistant Treasurer of other Fidelity funds (2000) and an employee of FMR (1996). Prior to joining FMR, Mr. Simpson was Vice President and Fund Controller of Liberty Investment Services (1987-1995). |
Annual Report
Distributions
A total of 0.54% of the dividends distributed during the fiscal year was derived from interest on U.S. Government securities which is generally exempt from state income tax.
The fund designates 100% of the dividends distributed during the fiscal year as qualifying for the dividends-received deduction for corporate shareholders.
The fund designates 100% of each dividend distributed during the fiscal year as amounts which may be taken into account as a dividend for purposes of the maximum rate under section 1(h)(11) of the Internal Revenue Code.
The fund will notify shareholders in January 2005 of amounts for use in preparing 2004 income tax returns.
Annual Report
Proxy Voting Results
A special meeting of the fund's shareholders was held on March 24, 2004. The results of votes taken among shareholders on proposals before them are reported below. Each vote reported represents one dollar of net asset value held on the record date for the meeting.
PROPOSAL 1 |
To amend the Declaration of Trust to allow the Board of Trustees, if permitted by applicable law, to authorize fund mergers without shareholder approval.* |
| # of
Votes | % of
Votes |
Affirmative | 5,641,899,809.90 | 76.930 |
Against | 1,195,910,893.93 | 16.307 |
Abstain | 258,684,030.15 | 3.527 |
Broker Non-Votes | 237,317,184.17 | 3.236 |
TOTAL | 7,333,811,918.15 | 100.000 |
PROPOSAL 2 |
To approve the inclusion of language inadvertently omitted from the Amended and Restated Declaration of Trust presented to shareholders in June 2001.* |
| # of
Votes | % of
Votes |
Affirmative | 6,758,135,344.08 | 92.150 |
Against | 290,380,904.34 | 3.960 |
Abstain | 285,295,669.73 | 3.890 |
TOTAL | 7,333,811,918.15 | 100.000 |
PROPOSAL 3 |
To elect a Board of Trustees.* |
| # of
Votes | % of
Votes |
J. Michael Cook |
Affirmative | 6,986,573,775.53 | 95.265 |
Withheld | 347,238,142.62 | 4.735 |
TOTAL | 7,333,811,918.15 | 100.000 |
| # of
Votes | % of
Votes |
Ralph F. Cox |
Affirmative | 6,972,215,836.08 | 95.069 |
Withheld | 361,596,082.07 | 4.931 |
TOTAL | 7,333,811,918.15 | 100.000 |
Laura B. Cronin |
Affirmative | 6,984,375,675.44 | 95.235 |
Withheld | 349,436,242.71 | 4.765 |
TOTAL | 7,333,811,918.15 | 100.000 |
Robert M. Gates |
Affirmative | 6,981,063,293.96 | 95.190 |
Withheld | 352,748,624.19 | 4.810 |
TOTAL | 7,333,811,918.15 | 100.000 |
George H. Heilmeier |
Affirmative | 6,981,086,173.64 | 95.190 |
Withheld | 352,725,744.51 | 4.810 |
TOTAL | 7,333,811,918.15 | 100.000 |
Abigail P. Johnson |
Affirmative | 6,970,753,191.54 | 95.050 |
Withheld | 363,058,726.61 | 4.950 |
TOTAL | 7,333,811,918.15 | 100.000 |
Edward C. Johnson 3d |
Affirmative | 6,970,410,843.13 | 95.045 |
Withheld | 363,401,075.02 | 4.955 |
TOTAL | 7,333,811,918.15 | 100.000 |
Donald J. Kirk |
Affirmative | 6,977,181,783.66 | 95.137 |
Withheld | 356,630,134.49 | 4.863 |
TOTAL | 7,333,811,918.15 | 100.000 |
| # of
Votes | % of
Votes |
Marie L. Knowles |
Affirmative | 6,987,619,394.87 | 95.280 |
Withheld | 346,192,523.28 | 4.720 |
TOTAL | 7,333,811,918.15 | 100.000 |
Ned C. Lautenbach |
Affirmative | 6,991,038,771.41 | 95.326 |
Withheld | 342,773,146.74 | 4.674 |
TOTAL | 7,333,811,918.15 | 100.000 |
Marvin L. Mann |
Affirmative | 6,976,048,339.97 | 95.122 |
Withheld | 357,763,578.18 | 4.878 |
TOTAL | 7,333,811,918.15 | 100.000 |
William O. McCoy |
Affirmative | 6,976,743,035.70 | 95.131 |
Withheld | 357,068,882.45 | 4.869 |
TOTAL | 7,333,811,918.15 | 100.000 |
Robert L. Reynolds |
Affirmative | 6,989,941,130.39 | 95.311 |
Withheld | 343,870,787.76 | 4.689 |
TOTAL | 7,333,811,918.15 | 100.000 |
William S. Stavropoulos |
Affirmative | 6,987,371,028.43 | 95.276 |
Withheld | 346,440,889.72 | 4.724 |
TOTAL | 7,333,811,918.15 | 100.000 |
* Denotes trust-wide proposals and voting results. |
Annual Report
Managing Your Investments
Fidelity offers several ways to conveniently manage your personal investments via your telephone or PC. You can access your account information, conduct trades and research your investments 24 hours a day.
By Phone
Fidelity Automated Service Telephone provides a single toll-free number to access account balances, positions, quotes and trading. It's easy to navigate the service, and on your first call, the system will help you create a personal identification number (PIN) for security.
(phone_graphic)Fidelity Automated
Service Telephone (FAST®)
1-800-544-5555
Press
1 For mutual fund and brokerage trading.
2 For quotes.*
3 For account balances and holdings.
4 To review orders and mutual
fund activity.
5 To change your PIN.
*0 To speak to a Fidelity representative.
By PC
Fidelity's web site on the Internet provides a wide range of information, including daily financial news, fund performance, interactive planning tools and news about Fidelity products and services.
(computer_graphic)Fidelity's Web Site
www.fidelity.com
* When you call the quotes line, please remember that a fund's yield and return will vary and, except for money market funds, share price will also vary. This means that you may have a gain or loss when you sell your shares. There is no assurance that money market funds will be able to maintain a stable $1 share price; an investment in a money market fund is not insured or guaranteed by the U.S. government. Total returns are historical and include changes in share price, reinvestment of dividends and capital gains, and the effects of any sales charges.
Annual Report
To Write Fidelity
We'll give your correspondence immediate attention and send you written confirmation upon completion of your request.
(letter_graphic)Making Changes
To Your Account
(such as changing name, address, bank, etc.)
Fidelity Investments
P.O. Box 770001
Cincinnati, OH 45277-0002
(letter_graphic)For Non-Retirement
Accounts
Buying shares
Fidelity Investments
P.O. Box 770001
Cincinnati, OH 45277-0003
Overnight Express
Fidelity Investments
Attn: Distribution Services
100 Crosby Parkway - KC1H
Covington, KY 41015
Selling shares
Fidelity Investments
P.O. Box 770001
Cincinnati, OH 45277-0035
Overnight Express
Fidelity Investments
Attn: Distribution Services
100 Crosby Parkway - KC1H
Covington, KY 41015
General Correspondence
Fidelity Investments
P.O. Box 500
Merrimack, NH 03054-0500
(letter_graphic)For Retirement
Accounts
Buying shares
Fidelity Investments
P.O. Box 770001
Cincinnati, OH 45277-0003
Selling shares
Fidelity Investments
P.O. Box 770001
Cincinnati, OH 45277-0035
Overnight Express
Fidelity Investments
Attn: Distribution Services
100 Crosby Parkway - KC1H
Covington, KY 41015
General Correspondence
Fidelity Investments
P.O. Box 500
Merrimack, NH 03054-0500
Annual Report
To Visit Fidelity
For directions and hours,
please call 1-800-544-9797.
Arizona
7001 West Ray Road
Chandler, AZ
7373 N. Scottsdale Road
Scottsdale, AZ
California
815 East Birch Street
Brea, CA
1411 Chapin Avenue
Burlingame, CA
851 East Hamilton Avenue
Campbell, CA
123 South Lake Avenue
Pasadena, CA
19200 Von Karman Avenue
Irvine, CA
601 Larkspur Landing Circle
Larkspur, CA
10100 Santa Monica Blvd.
Los Angeles, CA
27101 Puerta Real
Mission Viejo, CA
73-575 El Paseo
Palm Desert, CA
251 University Avenue
Palo Alto, CA
1760 Challenge Way
Sacramento, CA
7676 Hazard Center Drive
San Diego, CA
8 Montgomery Street
San Francisco, CA
21701 Hawthorne Boulevard
Torrance, CA
2001 North Main Street
Walnut Creek, CA
6300 Canoga Avenue
Woodland Hills, CA
Colorado
1625 Broadway
Denver, CO
9185 East Westview Road
Littleton, CO
Connecticut
48 West Putnam Avenue
Greenwich, CT
265 Church Street
New Haven, CT
300 Atlantic Street
Stamford, CT
29 South Main Street
West Hartford, CT
Delaware
222 Delaware Avenue
Wilmington, DE
Florida
4400 N. Federal Highway
Boca Raton, FL
121 Alhambra Plaza
Coral Gables, FL
2948 N. Federal Highway
Ft. Lauderdale, FL
1907 West State Road 434
Longwood, FL
8880 Tamiami Trail, North
Naples, FL
3501 PGA Boulevard
West Palm Beach, FL
8065 Beneva Road
Sarasota, FL
1502 N. Westshore Blvd.
Tampa, FL
Georgia
3445 Peachtree Road, N.E.
Atlanta, GA
1000 Abernathy Road
Atlanta, GA
Illinois
One North LaSalle Street
Chicago, IL
1415 West 22nd Street
Oak Brook, IL
1700 East Golf Road
Schaumburg, IL
3232 Lake Avenue
Wilmette, IL
Indiana
4729 East 82nd Street
Indianapolis, IN
Kansas
5400 College Boulevard
Overland Park, KS
Maine
Three Canal Plaza
Portland, ME
Maryland
7401 Wisconsin Avenue
Bethesda, MD
One W. Pennsylvania Ave.
Towson, MD
Massachusetts
801 Boylston Street
Boston, MA
155 Congress Street
Boston, MA
300 Granite Street
Braintree, MA
44 Mall Road
Burlington, MA
405 Cochituate Road
Framingham, MA
416 Belmont Street
Worcester, MA
Annual Report
Michigan
280 Old N. Woodward Ave.
Birmingham, MI
43420 Grand River Avenue
Novi, MI
29155 Northwestern Hwy.
Southfield, MI
Minnesota
7600 France Avenue South
Edina, MN
Missouri
8885 Ladue Road
Ladue, MO
New Jersey
150 Essex Street
Millburn, NJ
56 South Street
Morristown, NJ
501 Route 17, South
Paramus, NJ
3518 Route 1 North
Princeton, NJ
New York
1055 Franklin Avenue
Garden City, NY
37 West Jericho Turnpike
Huntington Station, NY
1271 Avenue of the Americas
New York, NY
61 Broadway
New York, NY
350 Park Avenue
New York, NY
North Carolina
4611 Sharon Road
Charlotte, NC
Ohio
3805 Edwards Road
Cincinnati, OH
28699 Chagrin Boulevard
Woodmere Village, OH
1324 Polaris Parkway
Columbus, OH
Oregon
16850 SW 72nd Avenue
Tigard, OR
Pennsylvania
600 West DeKalb Pike
King of Prussia, PA
1735 Market Street
Philadelphia, PA
12001 Perry Highway
Wexford, PA
Rhode Island
47 Providence Place
Providence, RI
Tennessee
6150 Poplar Avenue
Memphis, TN
Texas
10000 Research Boulevard
Austin, TX
4017 Northwest Parkway
Dallas, TX
12532 Memorial Drive
Houston, TX
2701 Drexel Drive
Houston, TX
400 East Las Colinas Blvd.
Irving, TX
14100 San Pedro
San Antonio, TX
19740 IH 45 North
Spring, TX
6005 West Park Boulevard
Plano, TX
Utah
215 South State Street
Salt Lake City, UT
Virginia
1861 International Drive
McLean, VA
Washington
411 108th Avenue, N.E.
Bellevue, WA
1518 6th Avenue
Seattle, WA
Washington, DC
1900 K Street, N.W.
Washington, DC
Wisconsin
595 North Barker Road
Brookfield, WI
Fidelity Brokerage Services, Inc., 100 Summer St., Boston, MA 02110 Member NYSE/SIPC
Annual Report
Investment Adviser
Fidelity Management & Research Company
Boston, MA
Investment Sub-Advisers
FMR Co., Inc.
Fidelity Management & Research
(U.K.) Inc.
Fidelity Management & Research
(Far East) Inc.
Fidelity Investments Japan Limited
Fidelity International Investment
Advisors
Fidelity International Investment
Advisors (U.K.) Limited
General Distributor
Fidelity Distributors Corporation
Boston, MA
Transfer and Shareholder
Servicing Agent
Fidelity Service Company, Inc.
Boston, MA
Custodian
JPMorgan Chase Bank
New York, NY
Fidelity's Growth and Income Funds
Balanced Fund
Convertible Securities Fund
Equity-Income Fund
Equity-Income II Fund
Fidelity® Fund
Global Balanced Fund
Growth & Income Portfolio
Growth & Income II Portfolio
Puritan ® Fund
Real Estate Income Fund
Real Estate Investment Portfolio
Utilities Fund
The Fidelity Telephone Connection
Mutual Fund 24-Hour Service
Exchanges/Redemptions
and Account Assistance 1-800-544-6666
Product Information 1-800-544-6666
Retirement Accounts 1-800-544-4774
(8 a.m. - 9 p.m.)
TDD Service 1-800-544-0118
for the deaf and hearing impaired
(9 a.m. - 9 p.m. Eastern time)
Fidelity Automated Service
Telephone (FAST®) (automated graphic) 1-800-544-5555
(automated graphic) Automated line for quickest service
(Fidelity Investment logo)(registered trademark)
Corporate Headquarters
82 Devonshire St., Boston, MA 02109
www.fidelity.com
GII-UANN-0804
1.787733.101
Fidelity®
Discovery Fund
Annual Report
June 30, 2004
(2_fidelity_logos) (Registered_Trademark)
Contents
Chairman's Message | 3 | Ned Johnson's message to shareholders. |
Performance | 4 | How the fund has done over time. |
Management's Discussion | 5 | The manager's review of fund performance, strategy and outlook. |
Investment Changes | 6 | A summary of major shifts in the fund's investments over the past six months. |
Investments | 7 | A complete list of the fund's investments with their market values. |
Financial Statements | 15 | Statements of assets and liabilities, operations, and changes in net assets,
as well as financial highlights. |
Notes | 19 | Notes to the financial statements. |
Report of Independent Registered Public Accounting Firm | 24 | |
Trustees and Officers | 25 | |
Distributions | 36 | |
Proxy Voting Results | 37 | |
For a free copy of the fund's proxy voting guidelines visit www.fidelity.com/goto/proxyguidelines, call 1-800-544-8544, or visit the Securites and Exchange Commission (SEC)'s web site at www.sec.gov.
Standard & Poor's, S&P and S&P 500 are registered service marks of The McGraw-Hill Companies, Inc. and have been licensed for use by Fidelity Distributors Corporation.
Other third party marks appearing herein are the property of their respective owners.
All other marks appearing herein are registered or unregistered trademarks or service marks of FMR Corp. or an affiliated company.
(Recycle graphic) This report is printed on recycled paper using soy-based inks.
This report and the financial statements contained herein are submitted for the general information of the shareholders of the fund. This report is not authorized for distribution to prospective investors in the fund unless preceded or accompanied by an effective prospectus.
Mutual fund shares are not deposits or obligations of, or guaranteed by, any depository institution. Shares are not insured by the FDIC, Federal Reserve Board or any other agency, and are subject to investment risks, including possible loss of principal amount invested.
Neither the fund nor Fidelity Distributors Corporation is a bank.
For more information on any Fidelity fund, including charges and expenses, call 1-800-544-6666 for a free prospectus. Read it carefully before you invest or send money.
Annual Report
Chairman's Message
(photo_of_Edward_C_Johnson_3d)
Dear Shareholder:
Many of you have read or heard news stories recently that were critical of mutual funds and made allegations that the mutual fund industry has been less than forthright. I find these reports unsettling and not necessarily an accurate picture of the overall industry, and I would like you to know where we at Fidelity stand.
With specific regard to allegations that certain mutual fund companies were violating the Securities and Exchange Commission's forward pricing rules or were involved in so-called "market timing" activities, I want to say two things:
First, Fidelity does not have agreements that permit customers who buy fund shares after 4 p.m. to obtain the 4 p.m. price. This is not to say that someone could not deceive the company through fraudulent acts. But I underscore that we have no so-called "agreements" which would permit this illegal practice.
Second, Fidelity has been on record for years opposing predatory short-term trading which adversely affects other shareholders in a mutual fund. In fact, in the 1980s, we began charging a fee - which is returned to the fund and, therefore, to investors - to discourage this activity. What's more, several years ago we took the industry lead in developing a Fair Value Pricing Policy to prevent market timing on foreign securities in our funds. It is reasonable to assume that another structure can be developed that would alter the system to make it much more difficult for predatory traders to operate. This, however, will only be achieved through close cooperation among regulators, legislators and the industry.
Certainly no industry is perfect, and there have been instances of unethical and illegal activity from time to time within the mutual fund industry. When this occurs, confessed or convicted offenders should be dealt with appropriately. Clearly, every system can be improved. We applaud well thought out improvements by regulators, legislators and industry representatives that achieve the common goal of building and protecting the value of investors' holdings. But we remain concerned about the risk of over-regulation and the quick application of simplistic solutions to intricate problems.
For more than 57 years, Fidelity Investments has worked very hard to improve its products and service to justify your trust. When our family founded this company in 1946, we had only a few hundred customers. Many of them were family and friends. Today, we serve more than 18 million customers including individual investors and participants in retirement plans across America.
Let me close by saying that we do not take your trust in us for granted, and we realize that we must always work to improve all aspects of our service to you. In turn, we urge you to continue your active participation with your financial matters, so that your interests can be well served.
Best regards,
/s/Edward C. Johnson 3d
Edward C. Johnson 3d
Annual Report
Performance: The Bottom Line
Average annual total return reflects the change in the value of an investment, assuming reinvestment of the fund's dividend income and capital gains (the profits earned upon the sale of securities that have grown in value) and assuming a constant rate of performance each year. The $10,000 table and the fund's returns do not reflect the deduction of taxes that a shareholder would pay on fund distributions or the redemption of fund shares. During periods of reimbursement by Fidelity, a fund's total return will be greater than it would be had the reimbursement not occurred. How a fund did yesterday is no guarantee of how it will do tomorrow.
Average Annual Total Returns
Periods ended June 30, 2004 | Past 1
year | Past 5
years | Life of
fundA |
Fidelity® Discovery Fund | 10.67% | 1.04% | 4.63% |
A From March 31, 1998
$10,000 Over Life of Fund
Let's say hypothetically that $10,000 was invested in Fidelity® Discovery Fund on March 31, 1998. The chart shows how the value of your investment would have grown, and also shows how the Standard & Poor's 500SM Index did over the same period.

Annual Report
Management's Discussion of Fund Performance
Comments from Adam Hetnarski, Portfolio Manager of Fidelity® Discovery Fund
The major U.S. equity benchmarks posted double-digit returns for the 12 months ending June 30, 2004. But it could have been even better had most of the gains not been accrued in the first half of the period. Stocks slipped in the second half on concerns about the effects of potential interest rate hikes and rising inflation on corporate profits, an unsettled geopolitical environment and threats of terrorism. The Dow Jones Industrial AverageSM, for example, gained 18.60% for the year overall, but rose just 0.86% in the second half. Technology also had a big influence on market performance. Red hot in the first half, tech fell hard in the second as investors avoided stocks with future earnings potential, and focused instead on companies with steady current earnings amid the volatile investment backdrop. The Goldman Sachs® Technology Index soared 27.49% for the year, but crawled ahead just 0.74% year to date through June. Elsewhere, the Standard & Poor's 500SM Index gained 19.11% and the NASDAQ Composite® Index returned 26.78% for the overall year.
For the 12 months ending June 30, 2004, the fund returned 10.67%, trailing the Standard & Poor's 500 Index and the 18.54% return of the LipperSM Growth Funds Average. The fund was penalized for its overweighted exposure to pharmaceutical and biotechnology stocks, as well as for my stock picking in that group. The problem was traceable mainly to three pharmaceutical holdings that did most of their damage in the first half of the period - Merck, Johnson & Johnson and Barr Pharmaceuticals. Secondarily, stock selection in both energy and technology hardware, along with underweighting the latter, was detrimental to our results. Positive factors included an overweighting in capital goods and good picks in software and services. Tyco International once again topped the fund's list of contributors, both compared with the index and in absolute terms. Aerospace stock Northrop Grumman also performed well, as investors rotating money out of more aggressive stocks were attracted to the company's prospects for relatively stable earnings growth. Additionally, well-run consumer products company Procter & Gamble gained market share in virtually all product segments, driving its stock price higher.
The views expressed in this statement reflect those of the portfolio manager only through the end of the period of the report as stated on the cover and do not necessarily represent the views of Fidelity or any other person in the Fidelity organization. Any such views are subject to change at any time based upon market or other conditions and Fidelity disclaims any responsibility to update such views. These views may not be relied on as investment advice and, because investment decisions for a Fidelity fund are based on numerous factors, may not be relied on as an indication of trading intent on behalf of any Fidelity fund.
Annual Report
Investment Changes
Top Ten Stocks as of June 30, 2004 |
| % of fund's
net assets | % of fund's net assets
6 months ago |
Verizon Communications, Inc. | 6.1 | 4.7 |
SBC Communications, Inc. | 5.2 | 5.9 |
SLM Corp. | 4.4 | 3.2 |
Microsoft Corp. | 3.9 | 4.5 |
Roche Holding AG (participation certificate) | 3.6 | 0.0 |
Procter & Gamble Co. | 3.4 | 3.1 |
BellSouth Corp. | 3.0 | 1.1 |
Pfizer, Inc. | 3.0 | 1.1 |
Lockheed Martin Corp. | 2.9 | 4.1 |
Northrop Grumman Corp. | 2.7 | 3.4 |
| 38.2 | |
Top Five Market Sectors as of June 30, 2004 |
| % of fund's
net assets | % of fund's net assets
6 months ago |
Health Care | 22.8 | 20.5 |
Telecommunication Services | 14.4 | 13.0 |
Industrials | 13.7 | 16.3 |
Consumer Discretionary | 13.1 | 7.2 |
Consumer Staples | 9.4 | 6.3 |
Asset Allocation (% of fund's net assets) |
As of June 30, 2004 * | As of December 31, 2003 ** |
 | Stocks 93.5% | | | Stocks 90.7% | |
 | Convertible
Securities 0.7% | | | Convertible
Securities 0.7% | |
 | Short-Term
Investments and
Net Other Assets 5.8% | | | Short-Term
Investments and
Net Other Assets 8.6% | |
* Foreign
investments | 12.2% | | ** Foreign
investments | 9.5% | |

Annual Report
Investments June 30, 2004
Showing Percentage of Net Assets
Common Stocks - 93.5% |
| Shares | | Value (Note 1) (000s) |
CONSUMER DISCRETIONARY - 13.1% |
Automobiles - 0.1% |
Winnebago Industries, Inc. | 14,100 | | $ 526 |
Hotels, Restaurants & Leisure - 0.5% |
International Game Technology | 8,700 | | 336 |
McDonald's Corp. | 42,700 | | 1,110 |
Shuffle Master, Inc. (a) | 28,461 | | 1,033 |
| | 2,479 |
Media - 11.8% |
British Sky Broadcasting Group PLC (BSkyB) | 844,976 | | 9,562 |
Fox Entertainment Group, Inc. Class A (a) | 228,000 | | 6,088 |
Lamar Advertising Co. Class A (a) | 139,293 | | 6,038 |
Liberty Media Corp. Class A (a) | 807,400 | | 7,259 |
Liberty Media International, Inc. Class A (a) | 40,370 | | 1,498 |
News Corp. Ltd.: | | | |
ADR | 154,200 | | 5,462 |
sponsored ADR | 86,300 | | 2,838 |
Pixar (a) | 133,552 | | 9,283 |
Playboy Enterprises, Inc. Class B (non-vtg.) (a) | 27,700 | | 322 |
Sogecable SA (a) | 134,015 | | 5,418 |
The DIRECTV Group, Inc. (a) | 403,733 | | 6,904 |
Viacom, Inc. Class B (non-vtg.) | 73,200 | | 2,615 |
XM Satellite Radio Holdings, Inc. Class A (a) | 22,000 | | 600 |
| | 63,887 |
Specialty Retail - 0.7% |
Abercrombie & Fitch Co. Class A | 30,200 | | 1,170 |
Cabela's, Inc. Class A | 200 | | 5 |
Dixons Group PLC | 4,357 | | 13 |
Monro Muffler Brake, Inc. (a) | 50,134 | | 1,216 |
Staples, Inc. | 1,900 | | 56 |
Urban Outfitters, Inc. (a) | 19,400 | | 1,182 |
| | 3,642 |
TOTAL CONSUMER DISCRETIONARY | | 70,534 |
CONSUMER STAPLES - 9.4% |
Beverages - 1.7% |
PepsiCo, Inc. | 175,000 | | 9,429 |
Food & Staples Retailing - 0.3% |
Wal-Mart Stores, Inc. | 30,000 | | 1,583 |
Common Stocks - continued |
| Shares | | Value (Note 1) (000s) |
CONSUMER STAPLES - continued |
Food Products - 3.9% |
Bunge Ltd. | 43,840 | | $ 1,707 |
Hormel Foods Corp. | 129,725 | | 4,034 |
Kellogg Co. | 50,700 | | 2,122 |
Kraft Foods, Inc. Class A | 201,000 | | 6,368 |
McCormick & Co., Inc. (non-vtg.) | 87,300 | | 2,968 |
SunOpta, Inc. (a) | 58,200 | | 499 |
The J.M. Smucker Co. | 71,300 | | 3,273 |
| | 20,971 |
Household Products - 3.4% |
Procter & Gamble Co. | 336,800 | | 18,335 |
Personal Products - 0.1% |
Avon Products, Inc. | 7,800 | | 360 |
TOTAL CONSUMER STAPLES | | 50,678 |
ENERGY - 4.2% |
Energy Equipment & Services - 2.5% |
ENSCO International, Inc. | 49,000 | | 1,426 |
Pride International, Inc. (a) | 221,210 | | 3,785 |
Rowan Companies, Inc. (a) | 109,462 | | 2,663 |
Schlumberger Ltd. (NY Shares) | 87,200 | | 5,538 |
| | 13,412 |
Oil & Gas - 1.7% |
Exxon Mobil Corp. | 153,400 | | 6,812 |
Sibneft sponsored ADR | 86,300 | | 2,365 |
| | 9,177 |
TOTAL ENERGY | | 22,589 |
FINANCIALS - 9.0% |
Commercial Banks - 0.7% |
Boston Private Financial Holdings, Inc. | 87,600 | | 2,029 |
Wintrust Financial Corp. | 40,200 | | 2,031 |
| | 4,060 |
Consumer Finance - 4.4% |
SLM Corp. | 588,800 | | 23,817 |
Diversified Financial Services - 0.0% |
Citigroup, Inc. | 100 | | 5 |
Common Stocks - continued |
| Shares | | Value (Note 1) (000s) |
FINANCIALS - continued |
Insurance - 3.0% |
AMBAC Financial Group, Inc. | 39,700 | | $ 2,916 |
American International Group, Inc. | 54,700 | | 3,899 |
Berkshire Hathaway, Inc.: | | | |
Class A (a) | 15 | | 1,334 |
Class B (a) | 356 | | 1,052 |
Hartford Financial Services Group, Inc. | 89,400 | | 6,145 |
Scottish Re Group Ltd. | 28,100 | | 653 |
| | 15,999 |
Real Estate - 0.6% |
Spirit Financial Corp. (c) | 310,300 | | 3,103 |
Thrifts & Mortgage Finance - 0.3% |
New York Community Bancorp, Inc. | 95,400 | | 1,873 |
TOTAL FINANCIALS | | 48,857 |
HEALTH CARE - 22.8% |
Biotechnology - 5.0% |
Alnylam Pharmaceuticals, Inc. | 16,200 | | 122 |
Biogen Idec, Inc. (a) | 73,000 | | 4,617 |
Dendreon Corp. (a) | 121,397 | | 1,487 |
Genentech, Inc. (a) | 261,400 | | 14,691 |
Gilead Sciences, Inc. (a) | 23,700 | | 1,588 |
Millennium Pharmaceuticals, Inc. (a) | 180,000 | | 2,484 |
ONYX Pharmaceuticals, Inc. (a) | 18,800 | | 796 |
OSI Pharmaceuticals, Inc. (a) | 14,200 | | 1,000 |
| | 26,785 |
Health Care Equipment & Supplies - 2.0% |
Biomet, Inc. | 246,050 | | 10,934 |
Medtronic, Inc. | 2,400 | | 117 |
| | 11,051 |
Health Care Providers & Services - 5.7% |
Caremark Rx, Inc. (a) | 419,200 | | 13,808 |
Covance, Inc. (a) | 110,300 | | 4,255 |
UnitedHealth Group, Inc. | 206,000 | | 12,824 |
Wellcare Group, Inc. | 300 | | 5 |
| | 30,892 |
Pharmaceuticals - 10.1% |
Barr Pharmaceuticals, Inc. (a) | 210,675 | | 7,100 |
Cipla Ltd. | 704,225 | | 3,247 |
Common Stocks - continued |
| Shares | | Value (Note 1) (000s) |
HEALTH CARE - continued |
Pharmaceuticals - continued |
Merck & Co., Inc. | 25,900 | | $ 1,230 |
Novartis AG sponsored ADR | 106,400 | | 4,735 |
Pfizer, Inc. | 467,500 | | 16,026 |
Ranbaxy Laboratories Ltd. | 126,786 | | 2,509 |
Roche Holding AG (participation certificate) | 198,697 | | 19,720 |
| | 54,567 |
TOTAL HEALTH CARE | | 123,295 |
INDUSTRIALS - 13.7% |
Aerospace & Defense - 8.8% |
DRS Technologies, Inc. (a) | 6,900 | | 220 |
General Dynamics Corp. | 41,500 | | 4,121 |
Honeywell International, Inc. | 214,300 | | 7,850 |
Lockheed Martin Corp. | 296,900 | | 15,463 |
Northrop Grumman Corp. | 275,200 | | 14,778 |
United Defense Industries, Inc. (a) | 147,400 | | 5,159 |
| | 47,591 |
Airlines - 0.3% |
AirTran Holdings, Inc. (a) | 59,800 | | 846 |
Southwest Airlines Co. | 43,700 | | 733 |
| | 1,579 |
Industrial Conglomerates - 1.8% |
General Electric Co. | 182,680 | | 5,919 |
Tyco International Ltd. | 123,400 | | 4,089 |
| | 10,008 |
Machinery - 2.8% |
Cummins, Inc. | 28,500 | | 1,781 |
ITT Industries, Inc. | 159,900 | | 13,272 |
| | 15,053 |
Road & Rail - 0.0% |
Union Pacific Corp. | 100 | | 6 |
TOTAL INDUSTRIALS | | 74,237 |
INFORMATION TECHNOLOGY - 6.6% |
Communications Equipment - 0.8% |
CIENA Corp. (a) | 818,300 | | 3,044 |
Common Stocks - continued |
| Shares | | Value (Note 1) (000s) |
INFORMATION TECHNOLOGY - continued |
Communications Equipment - continued |
Cisco Systems, Inc. (a) | 2,200 | | $ 52 |
Harris Corp. | 29,800 | | 1,512 |
| | 4,608 |
Computers & Peripherals - 1.4% |
Dell, Inc. (a) | 100 | | 4 |
Diebold, Inc. | 143,700 | | 7,597 |
| | 7,601 |
Internet Software & Services - 0.1% |
Yahoo!, Inc. (a) | 10,100 | | 367 |
IT Services - 0.3% |
Computer Sciences Corp. (a) | 1,693 | | 79 |
Infosys Technologies Ltd. | 11,319 | | 1,360 |
| | 1,439 |
Semiconductors & Semiconductor Equipment - 0.0% |
Samsung Electronics Co. Ltd. | 10 | | 4 |
Semiconductor Manufacturing International Corp. sponsored ADR | 80 | | 1 |
United Microelectronics Corp. sponsored ADR (a) | 68 | | 0 |
| | 5 |
Software - 4.0% |
Microsoft Corp. | 744,860 | | 21,273 |
NDS Group PLC sponsored ADR (a) | 19,600 | | 494 |
| | 21,767 |
TOTAL INFORMATION TECHNOLOGY | | 35,787 |
MATERIALS - 0.3% |
Chemicals - 0.0% |
Dow Chemical Co. | 300 | | 12 |
Nitto Denko Corp. | 2,300 | | 119 |
| | 131 |
Metals & Mining - 0.3% |
Peabody Energy Corp. | 23,500 | | 1,316 |
TOTAL MATERIALS | | 1,447 |
Common Stocks - continued |
| Shares | | Value (Note 1) (000s) |
TELECOMMUNICATION SERVICES - 14.4% |
Diversified Telecommunication Services - 14.4% |
BellSouth Corp. | 612,000 | | $ 16,047 |
Citizens Communications Co. (a) | 45,000 | | 545 |
SBC Communications, Inc. | 1,169,900 | | 28,370 |
Verizon Communications, Inc. | 907,330 | | 32,838 |
| | 77,800 |
TOTAL COMMON STOCKS (Cost $499,311) | 505,224 |
Preferred Stocks - 0.2% |
| | | |
Convertible Preferred Stocks - 0.2% |
ENERGY - 0.2% |
Oil & Gas - 0.2% |
Chesapeake Energy Corp. 6.00% (c) | 14,600 | | 1,107 |
INFORMATION TECHNOLOGY - 0.0% |
Communications Equipment - 0.0% |
Chorum Technologies, Inc. Series E (a)(d) | 6,900 | | 3 |
TOTAL CONVERTIBLE PREFERRED STOCKS | | 1,110 |
Nonconvertible Preferred Stocks - 0.0% |
HEALTH CARE - 0.0% |
Biotechnology - 0.0% |
Geneprot, Inc. Series A (d) | 64,000 | | 224 |
TOTAL PREFERRED STOCKS (Cost $1,365) | 1,334 |
Convertible Bonds - 0.5% |
| Principal Amount (000s) | | |
INFORMATION TECHNOLOGY - 0.5% |
Communications Equipment - 0.5% |
CIENA Corp. 3.75% 2/1/08 | | $ 2,960 | | 2,560 |
TOTAL CONVERTIBLE BONDS (Cost $2,672) | 2,560 |
U.S. Treasury Obligations - 0.1% |
| Principal Amount (000s) | | Value (Note 1) (000s) |
U.S. Treasury Bills, yield at date of purchase 0.92% 7/22/04
(Cost $400) | | $ 400 | | $ 400 |
Money Market Funds - 7.5% |
| Shares | | |
Fidelity Cash Central Fund, 1.16% (b) | 31,752,430 | | 31,752 |
Fidelity Securities Lending Cash Central Fund, 1.18% (b) | 8,980,250 | | 8,980 |
TOTAL MONEY MARKET FUNDS (Cost $40,732) | 40,732 |
TOTAL INVESTMENT PORTFOLIO - 101.8% (Cost $544,480) | | 550,250 |
NET OTHER ASSETS - (1.8)% | | (9,618) |
NET ASSETS - 100% | $ 540,632 |
Legend |
(a) Non-income producing |
(b) Affiliated fund that is available only to investment companies and other accounts managed by Fidelity Investments. The rate quoted is the annualized seven-day yield of the fund at period end. A complete listing of the fund's holdings as of its most recent fiscal year end is available upon request. |
(c) Security exempt from registration under Rule 144A of the Securities Act of 1933. These securities may be resold in transactions exempt from registration, normally to qualified institutional buyers. At the period end, the value of these securities amounted to $4,210,000 or 0.8% of net assets. |
(d) Restricted securities - Investment in securities not registered under the Securities Act of 1933 (excluding 144A issues). At the end of the period, the value of restricted securities (excluding 144A issues) amounted to $227,000 or 0.0% of net assets. |
Additional information on each holding is as follows: |
Security | Acquisition
Date | Acquisition
Cost (000s) |
Chorum Technologies, Inc. Series E | 9/19/00 | $ 119 |
Geneprot, Inc. Series A | 7/7/00 | $ 352 |
Distribution of investments by country of issue, as a percentage of total net assets, is as follows: |
United States of America | 87.8% |
Switzerland | 4.5% |
United Kingdom | 1.9% |
Australia | 1.5% |
India | 1.4% |
Netherlands Antilles | 1.0% |
Spain | 1.0% |
Others (individually less than 1%) | 0.9% |
| 100.0% |
Other Information |
Purchases and sales of securities, other than short-term securities, aggregated $1,418,799,000 and $1,558,304,000, respectively. |
The fund placed a portion of its portfolio transactions with brokerage firms which are affiliates of the investment adviser. The commissions paid to these affiliated firms were $56,000 for the period. |
Income Tax Information |
At June 30, 2004, the fund had a capital loss carryforward of approximately $258,055,000 of which $167,964,000 and $90,091,000 will expire on June 30, 2010 and 2011, respectively. |
See accompanying notes which are an integral part of the financial statements.
Annual Report
Financial Statements
Statement of Assets and Liabilities
Amounts in thousands (except per-share amount) J | June 30, 2004 |
| | |
Assets | | |
Investment in securities, at value (including securities loaned of $8,777) (cost $544,480) - See accompanying schedule | | $ 550,250 |
Foreign currency held at value (cost $ 234) | | 232 |
Receivable for investments sold | | 1,078 |
Receivable for fund shares sold | | 144 |
Dividends receivable | | 226 |
Interest receivable | | 82 |
Prepaid expenses | | 2 |
Other receivables | | 68 |
Total assets | | 552,082 |
| | |
Liabilities | | |
Payable for investments purchased | $ 664 | |
Payable for fund shares redeemed | 1,394 | |
Accrued management fee | 187 | |
Other affiliated payables | 143 | |
Other payables and accrued expenses | 82 | |
Collateral on securities loaned, at value | 8,980 | |
Total liabilities | | 11,450 |
| | |
Net Assets | | $ 540,632 |
Net Assets consist of: | | |
Paid in capital | | $ 794,153 |
Undistributed net investment income | | 2,235 |
Accumulated undistributed net realized gain (loss) on investments and foreign currency transactions | | (261,524) |
Net unrealized appreciation (depreciation) on investments and assets and liabilities in foreign currencies | | 5,768 |
Net Assets, for 52,229 shares outstanding | | $ 540,632 |
Net Asset Value, offering price and redemption price per share ($540,632 ÷ 52,229 shares) | | $ 10.35 |
See accompanying notes which are an integral part of the financial statements.
Annual Report
Financial Statements - continued
Statement of Operations
Amounts in thousands | Year ended June 30, 2004 |
| | |
Investment Income | | |
Dividends | | $ 8,974 |
Interest | | 732 |
Security lending | | 57 |
Total income | | 9,763 |
| | |
Expenses | | |
Management fee
Basic fee | $ 3,601 | |
Performance adjustment | (122) | |
Transfer agent fees | 1,694 | |
Accounting and security lending fees | 211 | |
Non-interested trustees' compensation | 3 | |
Custodian fees and expenses | 133 | |
Registration fees | 29 | |
Audit | 55 | |
Legal | 5 | |
Miscellaneous | 52 | |
Total expenses before reductions | 5,661 | |
Expense reductions | (426) | 5,235 |
Net investment income (loss) | | 4,528 |
Realized and Unrealized Gain (Loss) Net realized gain (loss) on: | | |
Investment securities (net of foreign taxes of $(1,052)) | 78,514 | |
Foreign currency transactions | (2) | |
Futures contracts | 28 | |
Total net realized gain (loss) | | 78,540 |
Change in net unrealized appreciation (depreciation) on: Investment securities | (16,806) | |
Assets and liabilities in foreign currencies | (5) | |
Total change in net unrealized appreciation (depreciation) | | (16,811) |
Net gain (loss) | | 61,729 |
Net increase (decrease) in net assets resulting from operations | | $ 66,257 |
See accompanying notes which are an integral part of the financial statements.
Annual Report
Statement of Changes in Net Assets
Amounts in thousands | Year ended
June 30,
2004 | Year ended
June 30,
2003 |
Increase (Decrease) in Net Assets | | |
Operations | | |
Net investment income (loss) | $ 4,528 | $ 2,906 |
Net realized gain (loss) | 78,540 | (58,015) |
Change in net unrealized appreciation (depreciation) | (16,811) | 52,624 |
Net increase (decrease) in net assets resulting
from operations | 66,257 | (2,485) |
Distributions to shareholders from net investment income | (3,347) | (2,374) |
Share transactions
Net proceeds from sales of shares | 68,301 | 108,856 |
Reinvestment of distributions | 3,261 | 2,315 |
Cost of shares redeemed | (284,094) | (221,879) |
Net increase (decrease) in net assets resulting from share transactions | (212,532) | (110,708) |
Total increase (decrease) in net assets | (149,622) | (115,567) |
| | |
Net Assets | | |
Beginning of period | 690,254 | 805,821 |
End of period (including undistributed net investment income of $2,235 and undistributed net investment income of $1,291, respectively) | $ 540,632 | $ 690,254 |
Other Information Shares | | |
Sold | 6,825 | 12,558 |
Issued in reinvestment of distributions | 334 | 272 |
Redeemed | (28,329) | (25,819) |
Net increase (decrease) | (21,170) | (12,989) |
See accompanying notes which are an integral part of the financial statements.
Annual Report
Financial Highlights
Years ended June 30, | 2004 | 2003 | 2002 | 2001 | 2000 |
Selected Per-Share Data | | | | | |
Net asset value, beginning of period | $ 9.40 | $ 9.33 | $ 11.36 | $ 15.84 | $ 12.60 |
Income from Investment Operations | | | | | |
Net investment income (loss) B | .07 | .04 | .03 | .02 | (.01) |
Net realized and unrealized gain (loss) | .93 | .06 C | (2.02) | (2.05) | 3.97 |
Total from investment operations | 1.00 | .10 | (1.99) | (2.03) | 3.96 |
Distributions from net investment income | (.05) | (.03) | (.04) | - | - |
Distributions from net realized gain | - | - | - | (1.93) | (.72) |
Distributions in excess of net realized gain | - | - | - | (.52) | - |
Total distributions | (.05) | (.03) | (.04) | (2.45) | (.72) |
Net asset value, end of period | $ 10.35 | $ 9.40 | $ 9.33 | $ 11.36 | $ 15.84 |
Total Return A | 10.67% | 1.11% | (17.56)% | (14.70)% | 33.87% |
Ratios to Average Net Assets D | | | | | |
Expenses before expense reductions | .91% | 1.17% | 1.11% | .95% | .91% |
Expenses net of voluntary waivers, if any | .91% | 1.17% | 1.11% | .95% | .91% |
Expenses net of all reductions | .84% | .97% | .99% | .91% | .86% |
Net investment income (loss) | .73% | .43% | .32% | .19% | (.08)% |
Supplemental Data | | | | | |
Net assets, end of period (in millions) | $ 541 | $ 690 | $ 806 | $ 1,344 | $ 1,577 |
Portfolio turnover rate | 249% | 367% | 259% | 168% | 291% |
A Total returns would have been lower had certain expenses not been reduced during the periods shown.
B Calculated based on average shares outstanding during the period.
C The amount shown for a share outstanding does not correspond with the aggregate net gain (loss) on investments for the period due to the timing of sales and repurchases of shares in relation to fluctuating market values of the investments of the fund.
D Expense ratios reflect operating expenses of the fund. Expenses before reductions do not reflect amounts reimbursed by the investment adviser or reductions from brokerage service arrangements or other expense offset arrangements and do not represent the amount paid by the fund during periods when reimbursements or reductions occur. Expenses net of any voluntary waivers reflect expenses after reimbursement by the investment adviser but prior to reductions from brokerage service arrangements or other expense offset arrangements. Expenses net of all reductions represent the net expenses paid by the fund.
See accompanying notes which are an integral part of the financial statements.
Annual Report
Notes to Financial Statements
For the period ended June 30, 2004
(Amounts in thousands except ratios)
1. Significant Accounting Policies.
Fidelity Discovery Fund (the fund) (formerly Fidelity Contrafund II) is a fund of Fidelity Hastings Street Trust (the trust) and is authorized to issue an unlimited number of shares. The trust is registered under the Investment Company Act of 1940, as amended (the 1940 Act), as an open-end management investment company organized as a Massachusetts business trust. The financial statements have been prepared in conformity with accounting principles generally accepted in the United States of America, which require management to make certain estimates and assumptions at the date of the financial statements. The following summarizes the significant accounting policies of the fund:
Security Valuation. Net asset value per share (NAV calculation) is calculated as of the close of business of the New York Stock Exchange, normally 4:00 p.m. Eastern time. Equity securities, including restricted securities, for which market quotations are available are valued at the last sale price or official closing price (closing bid price or last evaluated quote if no sale has occurred) on the primary market or exchange on which they trade. Debt securities, including restricted securities, for which quotations are readily available are valued at their most recent bid prices (sales prices if the principal market is an exchange) in the principal market in which such securities are normally traded, as determined by recognized dealers in such securities, or securities are valued on the basis of information provided by a pricing service. Pricing services use valuation matrices that incorporate both dealer-supplied valuations and valuation models. If prices are not readily available or do not accurately reflect fair value for a security, or if a security's value has been materially affected by events occurring after the close of the exchange or market on which the security is principally traded, that security may be valued by another method that the Board of Trustees believes accurately reflects fair value. A security's valuation may differ depending on the method used for determining value. Price movements in futures contracts and ADRs, market and trading trends, the bid/ask quotes of brokers and off-exchange institutional trading may be reviewed in the course of making a good faith determination of a security's fair value. Short-term securities with remaining maturities of sixty days or less for which quotations are not readily available are valued on the basis of amortized cost. Investments in open-end investment companies are valued at their net asset value each business day.
Foreign Currency. The fund uses foreign currency contracts to facilitate transactions in foreign-denominated securities. Losses from these transactions may arise from changes in the value of the foreign currency or if the counterparties do not perform under the contracts' terms.
Foreign-denominated assets, including investment securities, and liabilities are translated into U.S. dollars at the exchange rate at period end. Purchases and sales of investment securities, income and dividends received and expenses denominated in foreign currencies are translated into U.S. dollars at the exchange rate in effect on the transaction date.
Annual Report
Notes to Financial Statements - continued
(Amounts in thousands except ratios)
1. Significant Accounting Policies - continued
Foreign Currency - continued
The effects of exchange rate fluctuations on investments are included with the net realized and unrealized gain (loss) on investment securities. Other foreign currency transactions resulting in realized and unrealized gain (loss) are disclosed separately.
Investment Transactions and Income. Security transactions are accounted for as of trade date. Gains and losses on securities sold are determined on the basis of identified cost. Dividend income is recorded on the ex-dividend date, except for certain dividends from foreign securities where the ex-dividend date may have passed, which are recorded as soon as the fund is informed of the ex-dividend date. Non-cash dividends included in dividend income, if any, are recorded at the fair market value of the securities received. Distributions received on securities that represent a return of capital or capital gain are recorded as a reduction of cost of investments and/ or as a realized gain. The fund estimates the components of distributions received that may be considered nontaxable distributions or capital gain distributions for income tax purposes. Interest income is accrued as earned. Interest income includes coupon interest and amortization of premium and accretion of discount on debt securities. Investment income is recorded net of foreign taxes withheld where recovery of such taxes is uncertain.
Expenses. Most expenses of the trust can be directly attributed to a fund. Expenses which cannot be directly attributed are apportioned among the funds in the trust.
Income Tax Information and Distributions to Shareholders. Each year, the fund intends to qualify as a regulated investment company by distributing all of its taxable income and realized gains under Subchapter M of the Internal Revenue Code. As a result, no provision for income taxes is required in the accompanying financial statements. Foreign taxes are provided for based on each fund's understanding of the tax rules and rates that exist in the foreign markets in which it invests.
Distributions are recorded on the ex-dividend date. Income and capital gain distributions are determined in accordance with income tax regulations, which may differ from generally accepted accounting principles. In addition, the fund will treat a portion of the proceeds from shares redeemed as a distribution from net investment income and realized gain for income tax purposes.
Capital accounts within the financial statements are adjusted for permanent book-tax differences. These adjustments have no impact on net assets or the results of operations. Temporary book-tax differences will reverse in a subsequent period.
Book-tax differences are primarily due to futures transactions, foreign currency transactions, passive foreign investment companies (PFIC), market discount, capital loss carryforwards and losses deferred due to wash sales and excise tax regulations.
Annual Report
1. Significant Accounting Policies - continued
Income Tax Information and Distributions to Shareholders - continued
The tax-basis components of distributable earnings and the federal tax cost as of period end were as follows:
Unrealized appreciation | $ 22,216 | |
Unrealized depreciation | (19,577) | |
Net unrealized appreciation (depreciation) | 2,639 | |
Undistributed ordinary income | 1,893 | |
Capital loss carryforward | (258,055) | |
| | |
Cost for federal income tax purposes | $ 547,611 | |
The tax character of distributions paid was as follows:
| June 30,
2004 | June 30,
2003 |
Ordinary Income | $ 3,347 | $ 2,374 |
2. Operating Policies.
Repurchase Agreements. Fidelity Management & Research Company (FMR) has received an Exemptive Order from the Securities and Exchange Commission (the SEC) which permits the fund and other affiliated entities of FMR to transfer uninvested cash balances into joint trading accounts. These accounts are then invested in repurchase agreements that are collateralized by U.S. Treasury or Government obligations. The fund may also invest directly with institutions, in repurchase agreements that are collateralized by commercial paper obligations and corporate obligations. Collateral is held in segregated accounts with custodian banks and may be obtained in the event of a default of the counterparty. Collateral is marked-to-market daily and maintained at a value at least equal to the principal amount of the repurchase agreement (including accrued interest).
Futures Contracts. The fund may use futures contracts to manage its exposure to the stock market. Buying futures tends to increase the fund's exposure to the underlying instrument, while selling futures tends to decrease the fund's exposure to the underlying instrument or hedge other fund investments. Losses may arise from changes in the value of the underlying instruments or if the counter-parties do not perform under the contracts' terms. Gains (losses) are realized upon the expiration or closing of the futures contracts. Futures contracts are valued at the settlement price established each day by the board of trade or exchange on which they are traded.
Annual Report
Notes to Financial Statements - continued
(Amounts in thousands except ratios)
2. Operating Policies - continued
Restricted Securities. The fund may invest in securities that are subject to legal or contractual restrictions on resale. These securities generally may be resold in transactions exempt from registration or to the public if the securities are registered. Disposal of these securities may involve time-consuming negotiations and expense, and prompt sale at an acceptable price may be difficult. Information regarding restricted securities is included at the end of the fund's Schedule of Investments.
3. Purchases and Sales of Investments.
Information regarding purchases and sales of securities is included under the caption "Other Information" at the end of the fund's Schedule of Investments.
4. Fees and Other Transactions with Affiliates.
Management Fee. FMR and its affiliates provide the fund with investment management related services for which the fund pays a monthly management fee. The management fee is the sum of an individual fund fee rate that is based on an annual rate of .30% of the fund's average net assets and a group fee rate that averaged .28% during the period. The group fee rate is based upon the average net assets of all the mutual funds advised by FMR. The group fee rate decreases as assets under management increase and increases as assets under management decrease. In addition, the management fee is subject to a performance adjustment (up to a maximum of ± .20% of the fund's average net assets over a 36 month performance period). The upward or downward adjustment to the management fee is based on the fund's relative investment performance as compared to an appropriate benchmark index. For the period, the total annual management fee rate, including the performance adjustment, was .56% of the fund's average net assets.
Transfer Agent Fees. Fidelity Service Company, Inc. (FSC), an affiliate of FMR, is the fund's transfer, dividend disbursing and shareholder servicing agent. FSC receives account fees and asset-based fees that vary according to account size and type of account. FSC pays for typesetting, printing and mailing of shareholder reports, except proxy statements. For the period, the transfer agent fees were equivalent to an annual rate of .27% of average net assets.
Accounting and Security Lending Fees. FSC maintains the fund's accounting records. The accounting fee is based on the level of average net assets for the month. Under a separate contract, FSC administers the security lending program. The security lending fee is based on the number and duration of lending transactions.
Central Funds. The fund may invest in affiliated Central Funds managed by Fidelity Investments Money Management, Inc. (FIMM), an affiliate of FMR. The Central Funds are open-end investment companies available only to investment companies and other
Annual Report
4. Fees and Other Transactions with Affiliates - continued
Central Funds - continued
accounts managed by FMR and its affiliates. The Central Funds seek preservation of capital and current income and do not pay a management fee. Income distributions earned by the fund are recorded as income in the accompanying financial statements and totaled $614 for the period.
Brokerage Commissions. The fund placed a portion of its portfolio transactions with brokerage firms which are affiliates of the investment adviser. The commissions paid to these affiliated firms are shown under the caption "Other Information" at the end of the fund's Schedule of Investments.
5. Committed Line of Credit.
The fund participates with other funds managed by FMR in a $4.2 billion credit facility (the "line of credit") to be utilized for temporary or emergency purposes to fund shareholder redemptions or for other short-term liquidity purposes. The participating fund has agreed to pay commitment fees on its pro rata portion of the line of credit. During the period, there were no borrowings on this line of credit.
6. Security Lending.
The fund lends portfolio securities from time to time in order to earn additional income. The fund receives collateral (in the form of U.S. Treasury obligations, letters of credit and/or cash) against the loaned securities and maintains collateral in an amount not less than 100% of the market value of the loaned securities during the period of the loan. The market value of the loaned securities is determined at the close of business of the fund and any additional required collateral is delivered to the fund on the next business day. If the borrower defaults on its obligation to return the securities loaned because of insolvency or other reasons, a fund could experience delays and costs in recovering the securities loaned or in gaining access to the collateral. Cash collateral is invested in cash equivalents. The value of loaned securities and cash collateral at period end are disclosed on the fund's Statement of Assets and Liabilities.
7. Expense Reductions.
Many of the brokers with whom FMR places trades on behalf of the fund provided services to the fund in addition to trade execution. These services included payments of certain expenses on behalf of the fund totaling $425 for the period. In addition, through arrangements with the fund's custodian, credits realized as a result of uninvested cash balances were used to reduce the fund's expenses. During the period, these credits reduced the fund's custody expenses by $1.
Annual Report
Report of Independent Registered Public Accounting Firm
To the Trustees of Fidelity Hastings Street Trust and the Shareholders of Fidelity Discovery Fund (formerly Fidelity Contrafund II):
In our opinion, the accompanying statement of assets and liabilities, including the schedule of investments, and the related statements of operations and of changes in net assets and the financial highlights present fairly, in all material respects, the financial position of Fidelity Discovery Fund (formerly Fidelity Contrafund II) (a fund of Fidelity Hastings Street Trust) at June 30, 2004 and the results of its operations, the changes in its net assets and the financial highlights for the periods indicated, in conformity with accounting principles generally accepted in the United States of America. These financial statements and financial highlights (hereafter referred to as "financial statements") are the responsibility of the Fidelity Discovery Fund's management; our responsibility is to express an opinion on these financial statements based on our audits. We conducted our audits of these financial statements in accordance with the standards of the Public Company Accounting Oversight Board (United States), which require that we plan and perform the audit to obtain reasonable assurance about whether the financial statements are free of material misstatement. An audit includes examining, on a test basis, evidence supporting the amounts and disclosures in the financial statements, assessing the accounting principles used and significant estimates made by management, and evaluating the overall financial statement presentation. We believe that our audits, which included confirmation of securities at June 30, 2004 by correspondence with the custodian and brokers, provide a reasonable basis for our opinion.
/s/PricewaterhouseCoopers LLP
PricewaterhouseCoopers LLP
Boston, Massachusetts
August 6, 2004
Annual Report
Trustees and Officers
The Trustees, Members of the Advisory Board, and executive officers of the trust and fund, as applicable, are listed below. The Board of Trustees governs the fund and is responsible for protecting the interests of shareholders. The Trustees are experienced executives who meet periodically throughout the year to oversee the fund's activities, review contractual arrangements with companies that provide services to the fund, and review the fund's performance. Except for William O. McCoy, each of the Trustees oversees 292 funds advised by FMR or an affiliate. Mr. McCoy oversees 294 funds advised by FMR or an affiliate.
The Trustees hold office without limit in time except that (a) any Trustee may resign; (b) any Trustee may be removed by written instrument, signed by at least two-thirds of the number of Trustees prior to such removal; (c) any Trustee who requests to be retired or who has become incapacitated by illness or injury may be retired by written instrument signed by a majority of the other Trustees; and (d) any Trustee may be removed at any special meeting of shareholders by a two-thirds vote of the outstanding voting securities of the trust. In any event, each non-interested Trustee shall retire not later than the last day of the calendar year in which his or her 72nd birthday occurs. The executive officers and Advisory Board Members hold office without limit in time, except that any officer and Advisory Board Member may resign or may be removed by a vote of a majority of the Trustees at any regular meeting or any special meeting of the Trustees. Except as indicated, each individual has held the office shown or other offices in the same company for the past five years.
The fund's Statement of Additional Information (SAI) includes more information about the Trustees. To request a free copy, call Fidelity at 1-800-544-8544.
Interested Trustees*:
Correspondence intended for each Trustee who is an "interested person" (as defined in the 1940 Act) may be sent to Fidelity Investments, 82 Devonshire Street, Boston, Massachusetts 02109.
Name, Age; Principal Occupation |
Edward C. Johnson 3d (74)** |
| Year of Election or Appointment: 1984 Mr. Johnson is Chairman of the Board of Trustees. Mr. Johnson serves as Chief Executive Officer, Chairman, and a Director of FMR Corp.; a Director and Chairman of the Board and of the Executive Committee of FMR; Chairman and a Director of Fidelity Management & Research (Far East) Inc.; Chairman (1998) and a Director of Fidelity Investments Money Management, Inc.; and Chairman (2001) and a Director (2000) of FMR Co., Inc. |
Abigail P. Johnson (42)** |
| Year of Election or Appointment: 2001 Senior Vice President of Discovery (2001). Ms. Johnson also serves as Senior Vice President of other Fidelity funds (2001). She is President and a Director of FMR (2001), Fidelity Investments Money Management, Inc. (2001), FMR Co., Inc. (2001), and a Director of FMR Corp. Previously, Ms. Johnson managed a number of Fidelity funds. |
Laura B. Cronin (50) |
| Year of Election or Appointment: 2003 Ms. Cronin is an Executive Vice President (2002) and Chief Financial Officer (2002) of FMR Corp. and is a member of the Fidelity Management Committee (2003). Previously, Ms. Cronin served as Vice President of Finance of FMR (1997-1999), and Chief Financial Officer of FMR (1999-2001), Fidelity Personal Investments (2001), and Fidelity Brokerage Company (2001-2002). |
Robert L. Reynolds (52) |
| Year of Election or Appointment: 2003 Mr. Reynolds is a Director (2003) and Chief Operating Officer (2002) of FMR Corp. and is the head of the Fidelity Management Committee (2003). He also serves on the Board at Fidelity Investments Canada, Ltd. (2000). Previously, Mr. Reynolds served as President of Fidelity Investments Institutional Retirement Group (1996-2000). |
* Trustees have been determined to be "Interested Trustees" by virtue of, among other things, their affiliation with the trust or various entities under common control with FMR.
** Edward C. Johnson 3d, Trustee, is Abigail P. Johnson's father.
Annual Report
Non-Interested Trustees:
Correspondence intended for each non-interested Trustee (that is, the Trustees other than the Interested Trustees) may be sent to Fidelity Investments, P.O. Box 55235, Boston, Massachusetts 02205-5235.
Name, Age; Principal Occupation |
J. Michael Cook (61) |
| Year of Election or Appointment: 2001 Prior to Mr. Cook's retirement in May 1999, he served as Chairman and Chief Executive Officer of Deloitte & Touche LLP (accounting/consulting), Chairman of the Deloitte & Touche Foundation, and a member of the Board of Deloitte Touche Tohmatsu. He currently serves as a Director of Comcast (telecommunications, 2002), International Flavors & Fragrances, Inc. (2000), The Dow Chemical Company (2000), and Northrop Grumman Corporation (global defense technology, 2003). He is a Member of the Diversity Advisory Council of Marakon (2003) and the Advisory Council of the Public Company Accounting Oversight Board (PCAOB), Chairman Emeritus of the Board of Catalyst (a leading organization for the advancement of women in business), and is Chairman of the Accountability Advisory Council to the Comptroller General of the United States. He also serves as a Member of the Advisory Board of the Graduate School of Business of the University of Florida, his alma mater. |
Ralph F. Cox (72) |
| Year of Election or Appointment: 1991 Mr. Cox is President of RABAR Enterprises (management consulting for the petroleum industry). Prior to February 1994, he was President of Greenhill Petroleum Corporation (petroleum exploration and production). Until March 1990, Mr. Cox was President and Chief Operating Officer of Union Pacific Resources Company (exploration and production). He is a Director of CH2M Hill Companies (engineering), and Abraxas Petroleum (petroleum exploration and production, 1999). In addition, he is a member of advisory boards of Texas A&M University and the University of Texas at Austin. |
Robert M. Gates (60) |
| Year of Election or Appointment: 1997 Dr. Gates is President of Texas A&M University (2002). He was Director of the Central Intelligence Agency (CIA) from 1991 to 1993. From 1989 to 1991, Dr. Gates served as Assistant to the President of the United States and Deputy National Security Advisor. Dr. Gates is a Director of NACCO Industries, Inc. (mining and manufacturing), Parker Drilling Co., Inc. (drilling and rental tools for the energy industry, 2001), and Brinker International (restaurant management, 2003). He also serves as a member of the Advisory Board of VoteHere.net (secure Internet voting, 2001). Previously, Dr. Gates served as a Director of LucasVarity PLC (automotive components and diesel engines), a Director of TRW Inc. (automotive, space, defense, and information technology), and Dean of the George Bush School of Government and Public Service at Texas A&M University (1999-2001). Dr. Gates also is a Trustee of the Forum for International Policy. |
George H. Heilmeier (68) |
| Year of Election or Appointment: 2004 Dr. Heilmeier is Chairman Emeritus of Telcordia Technologies (communication software and systems), where prior to his retirement, he served as company Chairman and Chief Executive Officer. He currently serves on the Boards of Directors of The Mitre Corporation (systems engineering and information technology support for the government), INET Technologies Inc. (telecommunications network surveillance, 2001) and Teletech Holdings (customer management services, 1998). He is Chairman of the General Motors Technology Advisory Committee and a Life Fellow of the IEEE (2000). Dr. Heilmeier is a member of the Defense Science Board and the National Security Agency Advisory Board. He is also a member of the National Academy of Engineering, the American Academy of Arts and Sciences and The Board of Overseers of the School of Engineering and Applied Science of the University of Pennsylvania. Previously, Dr. Heilmeier served as a Director of TRW Inc. (automotive, space, defense, and information technology, 1992-2002), Compaq (1994-2002), and Automatic Data Processing, Inc. (ADP) (technology-based business outsourcing, 1995-2002). |
Donald J. Kirk (71) |
| Year of Election or Appointment: 1987 Mr. Kirk is a Governor of the American Stock Exchange (2001), a Trustee and former Chairman of the Board of Trustees of the Greenwich Hospital Association, a Director of the Yale-New Haven Health Services Corp. (1998), and a Director Emeritus and former Chairman of the Board of Directors of National Arts Strategies Inc. (leadership education for arts and culture). Mr. Kirk was an Executive-in-Residence (1995-2000) and a Professor (1987-1995) at Columbia University Graduate School of Business. Prior to 1987, he was Chairman of the Financial Accounting Standards Board. Previously, Mr. Kirk served as a Governor of the National Association of Securities Dealers, Inc. (1996-2002), a member and Vice Chairman of the Public Oversight Board of the American Institute of Certified Public Accountants' SEC Practice Section (1995-2002), a Director of General Re Corporation (reinsurance, 1987-1998) and as a Director of Valuation Research Corp. (appraisals and valuations). |
Marie L. Knowles (57) |
| Year of Election or Appointment: 2001 Prior to Ms. Knowles' retirement in June 2000, she served as Executive Vice President and Chief Financial Officer of Atlantic Richfield Company (ARCO) (diversified energy, 1996-2000). From 1993 to 1996, she was a Senior Vice President of ARCO and President of ARCO Transportation Company. She served as a Director of ARCO from 1996 to 1998. She currently serves as a Director of Phelps Dodge Corporation (copper mining and manufacturing) and McKesson Corporation (healthcare service, 2002). Ms. Knowles is a Trustee of the Brookings Institution and the Catalina Island Conservancy and also serves as a member of the Advisory Board for the School of Engineering of the University of Southern California. |
Ned C. Lautenbach (60) |
| Year of Election or Appointment: 2000 Mr. Lautenbach has been a partner of Clayton, Dubilier & Rice, Inc. (private equity investment firm) since September 1998. Previously, Mr. Lautenbach was with the International Business Machines Corporation (IBM) from 1968 until his retirement in 1998. He was most recently Senior Vice President and Group Executive of Worldwide Sales and Services. From 1993 to 1995, he was Chairman of IBM World Trade Corporation, and from 1994 to 1998 was a member of IBM's Corporate Executive Committee. Mr. Lautenbach serves as Co-Chairman and a Director of Covansys, Inc. (global provider of business and technology solutions, 2000). In addition, he is a Director of Italtel Holding S.p.A. (telecommunications (Milan, Italy), 2004) and Eaton Corporation (diversified industrial) as well as the Philharmonic Center for the Arts in Naples, Florida (1999). He also is a member of the Council on Foreign Relations. |
Marvin L. Mann (71) |
| Year of Election or Appointment: 1993 Mr. Mann is Chairman of the non-interested Trustees (2001). He is Chairman Emeritus of Lexmark International, Inc. (computer peripherals) where he served as CEO until April 1998 and retired as Chairman May 1999, and remains a member of the Board. Prior to 1991, he held the positions of Vice President of International Business Machines Corporation (IBM) and President and General Manager of various IBM divisions and subsidiaries. He is also a member of the Executive Committee and Chairman of the Policy Committee of the Independent Director's Council of the Investment Company Institute. In addition, Mr. Mann is a member of the President's Cabinet at the University of Alabama and the Board of Visitors of the Culverhouse College of Commerce and Business Administration at the University of Alabama. |
William O. McCoy (70) |
| Year of Election or Appointment: 1997 Prior to his retirement in December 1994, Mr. McCoy was Vice Chairman of the Board of BellSouth Corporation (telecommunications) and President of BellSouth Enterprises. He is currently a Director of Liberty Corporation (holding company), Duke Realty Corporation (real estate), and Progress Energy, Inc. (electric utility). He is also a partner of Franklin Street Partners (private investment management firm) and a member of the Research Triangle Foundation Board. In addition, Mr. McCoy served as the Interim Chancellor (1999-2000) and a member of the Board of Visitors (1994-1998) for the University of North Carolina at Chapel Hill and currently serves on the Board of Directors of the University of North Carolina Health Care System and the Board of Visitors of the Kenan-Flagler Business School (University of North Carolina at Chapel Hill). He also served as Vice President of Finance for the University of North Carolina (16-school system, 1995-1998). |
William S. Stavropoulos (65) |
| Year of Election or Appointment: 2001 Mr. Stavropoulos is Chairman of the Board (2000), CEO (2002), a position he previously held from 1995-2000, Chairman of the Executive Committee (2000), and a Member of the Board of Directors of The Dow Chemical Company. Since joining The Dow Chemical Company in 1967, Mr. Stavropoulos served in numerous senior management positions, including President (1993-2000; 2002-2003). Currently, he is a Director of NCR Corporation (data warehousing and technology solutions), BellSouth Corporation (telecommunications), Chemical Financial Corporation, and Maersk Inc. (industrial conglomerate, 2002). He also serves as a member of the Board of Trustees of the American Enterprise Institute for Public Policy Research. In addition, Mr. Stavropoulos is a member of The Business Council, J.P. Morgan International Council and the University of Notre Dame Advisory Council for the College of Science. |
Annual Report
Trustees and Officers - continued
Advisory Board Members and Executive Officers:
Correspondence intended for Mr. Dirks and Ms. Small may be sent to Fidelity Investments, P.O. Box 55235, Boston, Massachusetts 02205-5235. Correspondence intended for each executive officer and Mr. Lynch may be sent to Fidelity Investments, 82 Devonshire Street, Boston, Massachusetts 02109.
Name, Age; Principal Occupation |
Dennis J. Dirks (56) |
| Year of Election or Appointment: 2004 Member of the Advisory Board of Fidelity Hastings Street Trust. Prior to his retirement in May 2003, Mr. Dirks was Chief Operating Officer and a member of the Board of The Depository Trust & Clearing Corporation (DTCC) (1999-2003). He also served as President, Chief Operating Officer, and Board member of The Depository Trust Company (DTC) (1999-2003) and President and Board member of the National Securities Clearing Corporation (NSCC) (1999-2003). In addition, Mr. Dirks served as Chief Executive Officer and Board member of the Government Securities Clearing Corporation (2001-2003) and Chief Executive Officer and Board member of the Mortgage-Backed Securities Clearing Corporation (2001-2003). |
Peter S. Lynch (61) |
| Year of Election or Appointment: 2003 Member of the Advisory Board of Fidelity Hastings Street Trust. Vice Chairman and a Director of FMR, and Vice Chairman (2001) and a Director (2000) of FMR Co., Inc. Previously, Mr. Lynch served as a Trustee of the Fidelity funds (1990-2003). Prior to May 31, 1990, he was a Director of FMR and Executive Vice President of FMR (a position he held until March 31, 1991), Vice President of Fidelity® Magellan® Fund and FMR Growth Group Leader, and Managing Director of FMR Corp. Mr. Lynch was also Vice President of Fidelity Investments Corporate Services. In addition, he serves as a Trustee of Boston College, Massachusetts Eye & Ear Infirmary, Historic Deerfield, John F. Kennedy Library, and the Museum of Fine Arts of Boston. |
Cornelia M. Small (59) |
| Year of Election or Appointment: 2004 Member of the Advisory Board of Fidelity Hastings Street Trust. Ms. Small is a member (2000) and Chairperson (2002) of the Investment Committee, and a member (2002) of the Board of Trustees of Smith College. Previously, she served as Chief Investment Officer (1999-2000), Director of Global Equity Investments (1996-1999), and a member of the Board of Directors of Scudder, Stevens & Clark (1990-1997) and Scudder Kemper Investments (1997-1998). In addition, Ms. Small served as Co-Chair (2000-2003) of the Annual Fund for the Fletcher School of Law and Diplomacy. |
John B. McDowell (45) |
| Year of Election or Appointment: 2002 Vice President of Discovery. Mr. McDowell also serves as Vice President of certain Equity Funds (2002). He is Senior Vice President of FMR (1999), FMR Co., Inc. (2001), and Fidelity Management Trust Company (FMTC). Since joining Fidelity Investments in 1985, Mr. McDowell has worked as a research analyst and manager. |
Adam Hetnarski (40) |
| Year of Election or Appointment: 2000 Vice President of Discovery Fund. Mr. Hetnarski also serves as Vice President of another fund advised by FMR. Prior to assuming his current responsibilities, Mr. Hetnarski worked as a research analyst and portfolio manager. |
Eric D. Roiter (55) |
| Year of Election or Appointment: 1998 Secretary of Discovery. He also serves as Secretary of other Fidelity funds (1998); Vice President, General Counsel, and Clerk of FMR Co., Inc. (2001) and FMR (1998); Vice President and Clerk of FDC (1998); Assistant Clerk of Fidelity Management & Research (U.K.) Inc. (2001) and Fidelity Management & Research (Far East) Inc. (2001); and Assistant Secretary of Fidelity Investments Money Management, Inc. (2001). Prior to joining Fidelity, Mr. Roiter was with the law firm of Debevoise & Plimpton, as an associate (1981-1984) and as a partner (1985-1997), and served as an Assistant General Counsel of the U.S. Securities and Exchange Commission (1979-1981). Mr. Roiter is an Adjunct Member, Faculty of Law, at Boston College Law School (2003). |
Stuart Fross (44) |
| Year of Election or Appointment: 2003 Assistant Secretary of Discovery. Mr. Fross also serves as Assistant Secretary of other Fidelity funds (2003) and is an employee of FMR. |
Christine Reynolds (45) |
| Year of Election or Appointment: 2004 President, Treasurer, and Anti-Money Laundering (AML) officer of Discovery. Ms. Reynolds also serves as President, Treasurer, and AML officer of other Fidelity funds (2004) and is a Vice President (2003) and an employee (2002) of FMR. Before joining Fidelity Investments, Ms. Reynolds worked at PricewaterhouseCoopers LLP (PwC) (1980-2002), where she was most recently an audit partner with PwC's investment management practice. |
Timothy F. Hayes (53) |
| Year of Election or Appointment: 2002 Chief Financial Officer of Discovery. Mr. Hayes also serves as Chief Financial Officer of other Fidelity funds (2002). Recently he was appointed President of Fidelity Service Company (2003) where he also serves as a Director. Mr. Hayes also serves as President of Fidelity Investments Operations Group (FIOG, 2002), which includes Fidelity Pricing and Cash Management Services Group (FPCMS), where he was appointed President in 1998. Previously, Mr. Hayes served as Chief Financial Officer of Fidelity Investments Corporate Systems and Service Group (1998) and Fidelity Systems Company (1997-1998). |
John R. Hebble (46) |
| Year of Election or Appointment: 2003 Deputy Treasurer of Discovery. Mr. Hebble also serves as Deputy Treasurer of other Fidelity funds (2003), and is an employee of FMR. Before joining Fidelity Investments, Mr. Hebble worked at Deutsche Asset Management where he served as Director of Fund Accounting (2002-2003) and Assistant Treasurer of the Scudder Funds (1998-2003). |
Kimberley H. Monasterio (40) |
| Year of Election or Appointment: 2004 Deputy Treasurer of Discovery. Ms. Monasterio also serves as Deputy Treasurer of other Fidelity funds (2004) and is an employee of FMR (2004). Before joining Fidelity Investments, Ms. Monasterio served as Treasurer (2000-2004) and Chief Financial Officer (2002-2004) of the Franklin Templeton Funds and Senior Vice President of Franklin Templeton Services, LLC (2000-2004). |
John H. Costello (57) |
| Year of Election or Appointment: 1998 Assistant Treasurer of Discovery. Mr. Costello also serves as Assistant Treasurer of other Fidelity funds and is an employee of FMR. |
Francis V. Knox, Jr. (57) |
| Year of Election or Appointment: 2002 Assistant Treasurer of Discovery. Mr. Knox also serves as Assistant Treasurer of other Fidelity funds (2002), and is a Vice President and an employee of FMR. Previously, Mr. Knox served as Vice President of Investment & Advisor Compliance (1990-2001), and Compliance Officer of Fidelity Management & Research (U.K.) Inc. (1992-2002), Fidelity Management & Research (Far East) Inc. (1991-2002), and FMR Corp. (1995-2002). |
Peter L. Lydecker (50) |
| Year of Election or Appointment: 2004 Assistant Treasurer of Discovery. Mr. Lydecker also serves as Assistant Treasurer of other Fidelity funds (2004) and is an employee of FMR. |
Mark Osterheld (49) |
| Year of Election or Appointment: 2002 Assistant Treasurer of Discovery. Mr. Osterheld also serves as Assistant Treasurer of other Fidelity funds (2002) and is an employee of FMR. |
Kenneth B. Robins (34) |
| Year of Election or Appointment: 2004 Assistant Treasurer of Discovery. Mr. Robins also serves as Assistant Treasurer of other Fidelity funds (2004) and is an employee of FMR (2004). Before joining Fidelity Investments, Mr. Robins worked at KPMG LLP, where he was a partner in KPMG's department of professional practice (2002-2004) and a Senior Manager (1999-2000). In addition, Mr. Robins served as Assistant Chief Accountant, United States Securities and Exchange Commission (2000-2002). |
Thomas J. Simpson (46) |
| Year of Election or Appointment: 2000 Assistant Treasurer of Discovery. Mr. Simpson is Assistant Treasurer of other Fidelity funds (2000) and an employee of FMR (1996). Prior to joining FMR, Mr. Simpson was Vice President and Fund Controller of Liberty Investment Services (1987-1995). |
Annual Report
Distributions
The fund designates 100% of the dividends distributed during the fiscal year as qualifying for the dividends-received deduction for corporate shareholders.
The fund designates 100% of each dividend distributed during the fiscal year as amounts which may be taken into account as a dividend for purposes of the maximum rate under section 1(h)(11) of the Internal Revenue Code.
The fund will notify shareholders in January 2005 of amounts for use in preparing 2004 income tax returns.
Annual Report
Proxy Voting Results
A special meeting of the fund's shareholders was held on March 24, 2004. The results of votes taken among shareholders on proposals before them are reported below. Each vote reported represents one dollar of net asset value held on the record date for the meeting.
PROPOSAL 1 |
To amend the Declaration of Trust to allow the Board of Trustees, if permitted by applicable law, to authorize fund mergers without shareholder approval.* |
| # of
Votes | % of
Votes |
Affirmative | 5,641,899,809.90 | 76.930 |
Against | 1,195,910,893.93 | 16.307 |
Abstain | 258,684,030.15 | 3.527 |
Broker Non-Votes | 237,317,184.17 | 3.236 |
TOTAL | 7,333,811,918.15 | 100.000 |
PROPOSAL 2 |
To approve the inclusion of language inadvertently omitted from the Amended and Restated Declaration of Trust presented to shareholders in June 2001.* |
| # of
Votes | % of
Votes |
Affirmative | 6,758,135,344.08 | 92.150 |
Against | 290,380,904.34 | 3.960 |
Abstain | 285,295,669.73 | 3.890 |
TOTAL | 7,333,811,918.15 | 100.000 |
PROPOSAL 3 |
To elect a Board of Trustees.* |
| # of
Votes | % of
Votes |
J. Michael Cook |
Affirmative | 6,986,573,775.53 | 95.265 |
Withheld | 347,238,142.62 | 4.735 |
TOTAL | 7,333,811,918.15 | 100.000 |
| # of
Votes | % of
Votes |
Ralph F. Cox |
Affirmative | 6,972,215,836.08 | 95.069 |
Withheld | 361,596,082.07 | 4.931 |
TOTAL | 7,333,811,918.15 | 100.000 |
Laura B. Cronin |
Affirmative | 6,984,375,675.44 | 95.235 |
Withheld | 349,436,242.71 | 4.765 |
TOTAL | 7,333,811,918.15 | 100.000 |
Robert M. Gates |
Affirmative | 6,981,063,293.96 | 95.190 |
Withheld | 352,748,624.19 | 4.810 |
TOTAL | 7,333,811,918.15 | 100.000 |
George H. Heilmeier |
Affirmative | 6,981,086,173.64 | 95.190 |
Withheld | 352,725,744.51 | 4.810 |
TOTAL | 7,333,811,918.15 | 100.000 |
Abigail P. Johnson |
Affirmative | 6,970,753,191.54 | 95.050 |
Withheld | 363,058,726.61 | 4.950 |
TOTAL | 7,333,811,918.15 | 100.000 |
Edward C. Johnson 3d |
Affirmative | 6,970,410,843.13 | 95.045 |
Withheld | 363,401,075.02 | 4.955 |
TOTAL | 7,333,811,918.15 | 100.000 |
Donald J. Kirk |
Affirmative | 6,977,181,783.66 | 95.137 |
Withheld | 356,630,134.49 | 4.863 |
TOTAL | 7,333,811,918.15 | 100.000 |
| # of
Votes | % of
Votes |
Marie L. Knowles |
Affirmative | 6,987,619,394.87 | 95.280 |
Withheld | 346,192,523.28 | 4.720 |
TOTAL | 7,333,811,918.15 | 100.000 |
Ned C. Lautenbach |
Affirmative | 6,991,038,771.41 | 95.326 |
Withheld | 342,773,146.74 | 4.674 |
TOTAL | 7,333,811,918.15 | 100.000 |
Marvin L. Mann |
Affirmative | 6,976,048,339.97 | 95.122 |
Withheld | 357,763,578.18 | 4.878 |
TOTAL | 7,333,811,918.15 | 100.000 |
William O. McCoy |
Affirmative | 6,976,743,035.70 | 95.131 |
Withheld | 357,068,882.45 | 4.869 |
TOTAL | 7,333,811,918.15 | 100.000 |
Robert L. Reynolds |
Affirmative | 6,989,941,130.39 | 95.311 |
Withheld | 343,870,787.76 | 4.689 |
TOTAL | 7,333,811,918.15 | 100.000 |
William S. Stavropoulos |
Affirmative | 6,987,371,028.43 | 95.276 |
Withheld | 346,440,889.72 | 4.724 |
TOTAL | 7,333,811,918.15 | 100.000 |
* Denotes trust-wide proposals and voting results. |
Annual Report
Managing Your Investments
Fidelity offers several ways to conveniently manage your personal investments via your telephone or PC. You can access your account information, conduct trades and research your investments 24 hours a day.
By Phone
Fidelity Automated Service Telephone provides a single toll-free number to access account balances, positions, quotes and trading. It's easy to navigate the service, and on your first call, the system will help you create a personal identification number (PIN) for security.
(phone_graphic)Fidelity Automated
Service Telephone (FAST®)
1-800-544-5555
Press
1 For mutual fund and brokerage trading.
2 For quotes.*
3 For account balances and holdings.
4 To review orders and mutual
fund activity.
5 To change your PIN.
*0 To speak to a Fidelity representative.
By PC
Fidelity's web site on the Internet provides a wide range of information, including daily financial news, fund performance, interactive planning tools and news about Fidelity products and services.
(computer_graphic)Fidelity's Web Site
www.fidelity.com
* When you call the quotes line, please remember that a fund's yield and return will vary and, except for money market funds, share price will also vary. This means that you may have a gain or loss when you sell your shares. There is no assurance that money market funds will be able to maintain a stable $1 share price; an investment in a money market fund is not insured or guaranteed by the U.S. government. Total returns are historical and include changes in share price, reinvestment of dividends and capital gains, and the effects of any sales charges.
Annual Report
Investment Adviser
Fidelity Management &
Research Company
Boston, MA
Investment Sub-Advisers
FMR Co., Inc.
Fidelity Management & Research
(U.K.) Inc.
Fidelity Management & Research
(Far East) Inc.
Fidelity Investments Japan Limited
Fidelity International Investment
Advisor
Fidelity International Investment
Advisor (U.K.) Limited
General Distributor
Fidelity Distributors Corporation
Boston, MA
Transfer and Shareholder
Servicing Agent
Fidelity Service Company, Inc.
Boston, MA
Custodian
Brown Brothers Harriman & Co.
Boston, MA
Fidelity's Growth Funds
Aggressive Growth Fund
Blue Chip Growth Fund
Blue Chip Value Fund
Capital Appreciation Fund
Contrafund ®
Disciplined Equity Fund
Discovery Fund
Dividend Growth Fund
Export and Multinational Fund
Fidelity Fifty®
Fidelity Value Discovery Fund
Focused Stock Fund
Growth Company Fund
Independence Fund
Large Cap Stock Fund
Leveraged Company Stock Fund
Low-Priced Stock Fund
Magellan® Fund
Mid-Cap Stock Fund
New Millennium Fund ®
OTC Portfolio
Small Cap Independence Fund
Small Cap Stock Fund
Stock Selector
Structured Large Cap Growth Fund
Structured Large Cap Value Fund
Structured Mid Cap Growth Fund
Structured Mid Cap Value Fund
Tax Managed Stock Fund
Trend Fund
Value Fund
The Fidelity Telephone Connection
Mutual Fund 24-Hour Service
Exchanges/Redemptions
and Account Assistance 1-800-544-6666
Product Information 1-800-544-6666
Retirement Accounts 1-800-544-4774
(8 a.m. - 9 p.m.)
TDD Service 1-800-544-0118
for the deaf and hearing impaired
(9 a.m. - 9 p.m. Eastern time)
Fidelity Automated Service
Telephone (FAST®) (automated graphic) 1-800-544-5555
(automated graphic) Automated line for quickest service
(Fidelity Investment logo)(registered trademark)
Corporate Headquarters
82 Devonshire St., Boston, MA 02109
www.fidelity.com
CII-UANN-0804
1.787730.101
Fidelity Fifty®
Annual Report
June 30, 2004
(2_fidelity_logos) (Registered_Trademark)
Contents
Chairman's Message | 3 | Ned Johnson's message to shareholders. |
Performance | 4 | How the fund has done over time. |
Management's Discussion | 5 | The manager's review of fund performance, strategy and outlook. |
Investment Changes | 6 | A summary of major shifts in the fund's investments over the past six months. |
Investments | 7 | A complete list of the fund's investments with their market values. |
Financial Statements | 12 | Statements of assets and liabilities, operations, and changes in net assets,
as well as financial highlights. |
Notes | 16 | Notes to the financial statements. |
Report of Independent Registered Public Accounting Firm | 21 | |
Trustees and Officers | 22 | |
Distributions | 33 | |
Proxy Voting Results | 34 | |
For a free copy of the fund's proxy voting guidelines visit www.fidelity.com/goto/proxyguidelines, call 1-800-544-8544, or visit the Securities and Exchange Commission (SEC)'s web site at www.sec.gov.
Standard & Poor's, S&P and S&P 500 are registered service marks of The McGraw-Hill Companies, Inc. and have been licensed for use by Fidelity Distributors Corporation.
Other third party marks appearing herein are the property of their respective owners.
All other marks appearing herein are registered or unregistered trademarks or service marks of FMR Corp. or an affiliated company.
This report and the financial statements contained herein are submitted for the general information of the shareholders of the fund. This report is not authorized for distribution to prospective investors in the fund unless preceded or accompanied by an effective prospectus.
Mutual fund shares are not deposits or obligations of, or guaranteed by, any depository institution. Shares are not insured by the FDIC, Federal Reserve Board or any other agency, and are subject to investment risks, including possible loss of principal amount invested.
Neither the fund nor Fidelity Distributors Corporation is a bank.
For more information on any Fidelity fund, including charges and expenses, call 1-800-544-6666 for a free prospectus. Read it carefully before you invest or send money.
(Recycle graphic) This report is printed on recycled paper using soy-based inks.
Annual Report
Chairman's Message
(photo_of_Edward_C_Johnson_3d)
Dear Shareholder:
Many of you have read or heard news stories recently that were critical of mutual funds and made allegations that the mutual fund industry has been less than forthright. I find these reports unsettling and not necessarily an accurate picture of the overall industry, and I would like you to know where we at Fidelity stand.
With specific regard to allegations that certain mutual fund companies were violating the Securities and Exchange Commission's forward pricing rules or were involved in so-called "market timing" activities, I want to say two things:
First, Fidelity does not have agreements that permit customers who buy fund shares after 4 p.m. to obtain the 4 p.m. price. This is not to say that someone could not deceive the company through fraudulent acts. But I underscore that we have no so-called "agreements" which would permit this illegal practice.
Second, Fidelity has been on record for years opposing predatory short-term trading which adversely affects other shareholders in a mutual fund. In fact, in the 1980s, we began charging a fee - which is returned to the fund and, therefore, to investors - to discourage this activity. What's more, several years ago we took the industry lead in developing a Fair Value Pricing Policy to prevent market timing on foreign securities in our funds. It is reasonable to assume that another structure can be developed that would alter the system to make it much more difficult for predatory traders to operate. This, however, will only be achieved through close cooperation among regulators, legislators and the industry.
Certainly no industry is perfect, and there have been instances of unethical and illegal activity from time to time within the mutual fund industry. When this occurs, confessed or convicted offenders should be dealt with appropriately. Clearly, every system can be improved. We applaud well thought out improvements by regulators, legislators and industry representatives that achieve the common goal of building and protecting the value of investors' holdings. But we remain concerned about the risk of over-regulation and the quick application of simplistic solutions to intricate problems.
For more than 57 years, Fidelity Investments has worked very hard to improve its products and service to justify your trust. When our family founded this company in 1946, we had only a few hundred customers. Many of them were family and friends. Today, we serve more than 18 million customers including individual investors and participants in retirement plans across America.
Let me close by saying that we do not take your trust in us for granted, and we realize that we must always work to improve all aspects of our service to you. In turn, we urge you to continue your active participation with your financial matters, so that your interests can be well served.
Best regards,
/s/Edward C. Johnson 3d
Edward C. Johnson 3d
Annual Report
Performance: The Bottom Line
Average annual total return reflects the change in the value of an investment, assuming reinvestment of the fund's dividend income and capital gains (the profits earned upon the sale of securities that have grown in value) and assuming a constant rate of performance each year. The $10,000 table and the fund's returns do not reflect the deduction of taxes that a shareholder would pay on fund distributions or the redemption of fund shares. During periods of reimbursement by Fidelity, a fund's total return will be greater than it would be had the reimbursement not occurred. How a fund did yesterday is no guarantee of how it will do tomorrow.
Average Annual Total Returns
Periods ended June 30, 2004 | Past 1
year | Past 5
years | Past 10
years |
Fidelity Fifty® | 9.63% | 3.36% | 13.43% |
$10,000 Over 10 Years
Let's say hypothetically that $10,000 was invested in Fidelity Fifty® on June 30, 1994. The chart shows how the value of your investment would have grown, and also shows how the Standard & Poor's 500SM Index did over the same period.

Annual Report
Management's Discussion of Fund Performance
Comments from Jason Weiner, Portfolio Manager of Fidelity Fifty®
The major U.S. equity benchmarks posted double-digit returns for the 12 months ending June 30, 2004. But it could have been even better had most of the gains not been accrued in the first half of the period. Stocks slipped in the second half on concerns about the effects of potential interest rate hikes and rising inflation on corporate profits, an unsettled geopolitical environment and threats of terrorism. The Dow Jones Industrial AverageSM, for example, gained 18.60% for the year overall, but rose just 0.86% in the second half. Technology also had a big influence on market performance. Red hot in the first half, tech fell hard in the second as investors avoided stocks with future earnings potential, and focused instead on companies with steady current earnings amid the volatile investment backdrop. The Goldman Sachs® Technology Index soared 27.49% for the year, but crawled ahead just 0.74% year to date through June. Elsewhere, the Standard & Poor's 500SM Index gained 19.11% and the NASDAQ Composite® Index returned 26.78% for the overall year.
The fund gained 9.63% during the past year, underperforming the S&P 500® and the LipperSM Capital Appreciation Funds Average, which rose 16.38%. The biggest drag came from our holdings in pharmaceuticals and biotechnology - most notably Biovail and Trimeris - which trailed those in the index by a considerable margin. Overweighting traditional media stocks, such as Viacom and radio broadcaster Clear Channel Communications, also hurt amid a slow recovery in advertising activity. Focusing on lagging energy services stocks such as BJ Services further detracted, as did security selection in transportation, where airlines such as Ryanair disappointed. Other laggards included Qwest Communications and enterprise software firm Siebel Systems. Conversely, good stock picking in technology helped the most. Wireless was a big theme for the fund, as I emphasized hardware and equipment companies both domestically and overseas that benefited from improving fundamentals in the mobile telecommunications industry. Telecom gear maker Ericsson was a big beneficiary of the recovery in wireless infrastructure, as was tower company Crown Castle. Other standouts were Research in Motion - maker of the BlackBerry mobile data device - and wireless chipset maker QUALCOMM, which I sold to take profits. Elsewhere, security selection in Internet services helped, led by portal Yahoo!, as did several consumer-related holdings, including cruise giant Carnival and technical training provider Universal Technical Institute.
The views expressed in this statement reflect those of the portfolio manager only through the end of the period of the report as stated on the cover and do not necessarily represent the views of Fidelity or any other person in the Fidelity organization. Any such views are subject to change at any time based upon market or other conditions and Fidelity disclaims any responsibility to update such views. These views may not be relied on as investment advice and, because investment decisions for a Fidelity fund are based on numerous factors, may not be relied on as an indication of trading intent on behalf of any Fidelity fund.
Annual Report
Investment Changes
Top Ten Stocks as of June 30, 2004 |
| % of fund's
net assets | % of fund's net assets
6 months ago |
Pfizer, Inc. | 5.2 | 0.0 |
Microsoft Corp. | 4.0 | 2.9 |
Yahoo!, Inc. | 4.0 | 2.3 |
Clear Channel Communications, Inc. | 3.9 | 4.8 |
Siebel Systems, Inc. | 3.3 | 1.8 |
Nabors Industries Ltd. | 3.3 | 3.2 |
American Express Co. | 3.2 | 2.7 |
Carnival Corp. unit | 2.7 | 1.8 |
Crown Castle International Corp. | 2.7 | 2.6 |
Seagate Technology | 2.6 | 0.0 |
| 34.9 | |
Top Five Market Sectors as of June 30, 2004 |
| % of fund's
net assets | % of fund's net assets
6 months ago |
Information Technology | 26.7 | 31.6 |
Consumer Discretionary | 19.0 | 17.6 |
Health Care | 18.0 | 8.3 |
Financials | 10.3 | 20.5 |
Industrials | 7.4 | 6.8 |
Asset Allocation (% of fund's net assets) |
As of June 30, 2004* | As of December 31, 2003** |
 | Stocks 94.5% | | | Stocks 97.9% | |
 | Short-Term
Investments and
Net Other Assets 5.5% | | | Short-Term
Investments and
Net Other Assets 2.1% | |
* Foreign
investments | 20.5% | | **Foreign
investments | 14.5% | |

Annual Report
Investments June 30, 2004
Showing Percentage of Net Assets
Common Stocks - 94.5% |
| Shares | | Value (Note 1) |
CONSUMER DISCRETIONARY - 19.0% |
Auto Components - 0.1% |
Gentex Corp. | 25,000 | | $ 992,000 |
Hotels, Restaurants & Leisure - 5.8% |
Carnival Corp. unit | 539,900 | | 25,375,300 |
Kerzner International Ltd. (a) | 402,400 | | 19,138,144 |
McDonald's Corp. | 353,700 | | 9,196,200 |
| | 53,709,644 |
Internet & Catalog Retail - 1.0% |
Amazon.com, Inc. (a) | 173,000 | | 9,411,200 |
Media - 8.0% |
Clear Channel Communications, Inc. | 969,000 | | 35,804,550 |
Radio One, Inc. Class D (non-vtg.) (a) | 1,024,175 | | 16,397,042 |
Viacom, Inc. Class B (non-vtg.) | 613,200 | | 21,903,504 |
| | 74,105,096 |
Specialty Retail - 4.1% |
Best Buy Co., Inc. | 182,600 | | 9,265,124 |
Chico's FAS, Inc. (a) | 20,500 | | 925,780 |
Ross Stores, Inc. | 200,100 | | 5,354,676 |
The Pep Boys - Manny, Moe & Jack | 205,500 | | 5,209,425 |
Weight Watchers International, Inc. (a) | 439,500 | | 17,202,030 |
| | 37,957,035 |
TOTAL CONSUMER DISCRETIONARY | | 176,174,975 |
ENERGY - 5.4% |
Energy Equipment & Services - 5.4% |
BJ Services Co. (a) | 436,900 | | 20,027,496 |
Nabors Industries Ltd. (a) | 670,400 | | 30,315,488 |
| | 50,342,984 |
FINANCIALS - 10.3% |
Commercial Banks - 1.6% |
Wells Fargo & Co. | 256,800 | | 14,696,664 |
Consumer Finance - 3.2% |
American Express Co. | 573,000 | | 29,440,740 |
Diversified Financial Services - 1.5% |
Citigroup, Inc. | 291,800 | | 13,568,700 |
Common Stocks - continued |
| Shares | | Value (Note 1) |
FINANCIALS - continued |
Insurance - 3.9% |
AFLAC, Inc. | 404,500 | | $ 16,507,645 |
American International Group, Inc. | 277,500 | | 19,780,200 |
| | 36,287,845 |
Thrifts & Mortgage Finance - 0.1% |
New York Community Bancorp, Inc. | 41,300 | | 810,719 |
TOTAL FINANCIALS | | 94,804,668 |
HEALTH CARE - 18.0% |
Biotechnology - 2.4% |
Angiotech Pharmaceuticals, Inc. (a) | 476,200 | | 9,717,493 |
QLT, Inc. (a) | 602,000 | | 12,004,798 |
| | 21,722,291 |
Health Care Equipment & Supplies - 1.2% |
ResMed, Inc. (a) | 222,100 | | 11,318,216 |
Health Care Providers & Services - 4.7% |
Health Management Associates, Inc. Class A | 497,300 | | 11,149,466 |
Henry Schein, Inc. (a) | 133,800 | | 8,448,132 |
Tenet Healthcare Corp. (a) | 910,100 | | 12,204,441 |
UnitedHealth Group, Inc. | 191,200 | | 11,902,200 |
| | 43,704,239 |
Pharmaceuticals - 9.7% |
Barr Pharmaceuticals, Inc. (a) | 68,600 | | 2,311,820 |
Elan Corp. PLC sponsored ADR (a) | 867,100 | | 21,452,054 |
Pfizer, Inc. | 1,398,200 | | 47,930,295 |
Schering-Plough Corp. | 995,500 | | 18,396,840 |
| | 90,091,009 |
TOTAL HEALTH CARE | | 166,835,755 |
INDUSTRIALS - 7.4% |
Airlines - 0.8% |
AirTran Holdings, Inc. (a) | 509,100 | | 7,198,674 |
Commercial Services & Supplies - 3.9% |
Korn/Ferry International (a) | 178,500 | | 3,457,545 |
Monster Worldwide, Inc. (a) | 794,900 | | 20,444,828 |
Robert Half International, Inc. | 18,300 | | 544,791 |
Common Stocks - continued |
| Shares | | Value (Note 1) |
INDUSTRIALS - continued |
Commercial Services & Supplies - continued |
Sothebys Holdings, Inc. Class A (ltd. vtg.) (a) | 592,000 | | $ 9,448,320 |
Universal Technical Institute, Inc. | 67,600 | | 2,701,972 |
| | 36,597,456 |
Industrial Conglomerates - 2.7% |
3M Co. | 177,600 | | 15,985,776 |
Tyco International Ltd. | 265,100 | | 8,785,414 |
| | 24,771,190 |
TOTAL INDUSTRIALS | | 68,567,320 |
INFORMATION TECHNOLOGY - 26.7% |
Communications Equipment - 5.2% |
Cisco Systems, Inc. (a) | 988,100 | | 23,417,970 |
Research in Motion Ltd. (a) | 96,100 | | 6,574,050 |
Telefonaktiebolaget LM Ericsson ADR (a) | 615,800 | | 18,424,736 |
| | 48,416,756 |
Computers & Peripherals - 3.1% |
Seagate Technology | 1,647,900 | | 23,779,197 |
UNOVA, Inc. (a) | 217,700 | | 4,408,425 |
| | 28,187,622 |
Internet Software & Services - 4.6% |
SkillSoft PLC sponsored ADR (a) | 715,400 | | 5,437,040 |
Yahoo!, Inc. (a) | 1,017,800 | | 36,976,674 |
| | 42,413,714 |
IT Services - 4.7% |
Ceridian Corp. (a) | 239,600 | | 5,391,000 |
First Data Corp. | 505,100 | | 22,487,052 |
Infosys Technologies Ltd. | 130,765 | | 15,711,995 |
| | 43,590,047 |
Semiconductors & Semiconductor Equipment - 1.1% |
Analog Devices, Inc. | 10,700 | | 503,756 |
Sigmatel, Inc. | 338,700 | | 9,842,622 |
| | 10,346,378 |
Software - 8.0% |
Microsoft Corp. | 1,305,500 | | 37,285,080 |
Common Stocks - continued |
| Shares | | Value (Note 1) |
INFORMATION TECHNOLOGY - continued |
Software - continued |
Siebel Systems, Inc. (a) | 2,877,379 | | $ 30,730,408 |
Synopsys, Inc. (a) | 206,100 | | 5,859,423 |
| | 73,874,911 |
TOTAL INFORMATION TECHNOLOGY | | 246,829,428 |
MATERIALS - 3.3% |
Chemicals - 0.9% |
Nitto Denko Corp. | 153,800 | | 7,980,359 |
Metals & Mining - 2.4% |
Arch Coal, Inc. | 416,300 | | 15,232,417 |
Companhia Vale do Rio Doce sponsored ADR | 155,300 | | 7,384,515 |
| | 22,616,932 |
TOTAL MATERIALS | | 30,597,291 |
TELECOMMUNICATION SERVICES - 4.4% |
Wireless Telecommunication Services - 4.4% |
Crown Castle International Corp. (a) | 1,702,600 | | 25,113,350 |
Vodafone Group PLC sponsored ADR | 708,800 | | 15,664,480 |
| | 40,777,830 |
TOTAL COMMON STOCKS (Cost $798,414,970) | 874,930,251 |
Money Market Funds - 6.3% |
Fidelity Cash Central Fund, 1.16% (b) | 49,542,572 | | 49,542,572 |
Fidelity Securities Lending Cash Central Fund, 1.18% (b) | 8,790,750 | | 8,790,750 |
TOTAL MONEY MARKET FUNDS (Cost $58,333,322) | 58,333,322 |
TOTAL INVESTMENT PORTFOLIO - 100.8% (Cost $856,748,292) | | 933,263,573 |
NET OTHER ASSETS - (0.8)% | | (7,089,432) |
NET ASSETS - 100% | $ 926,174,141 |
Legend |
(a) Non-income producing |
(b) Affiliated fund that is available only to investment companies and other accounts managed by Fidelity Investments. The rate quoted is the annualized seven-day yield of the fund at period end. A complete listing of the fund's holdings as of its most recent fiscal year end is available upon request. |
Other Information |
Distribution of investments by country of issue, as a percentage of total net assets, is as follows: |
United States of America | 79.5% |
Canada | 3.1% |
Ireland | 2.9% |
Panama | 2.7% |
Cayman Islands | 2.6% |
Bahamas (Nassau) | 2.1% |
Sweden | 2.0% |
India | 1.7% |
United Kingdom | 1.7% |
Others (individually less than 1%) | 1.7% |
| 100.0% |
Purchases and sales of securities, other than short-term securities, aggregated $1,424,967,556 and $1,444,649,198, respectively. |
The fund placed a portion of its portfolio transactions with brokerage firms which are affiliates of the investment adviser. The commissions paid to these affiliated firms were $78,255 for the period. |
Income Tax Information |
At June 30, 2004, the fund had a capital loss carryforward of approximately $6,528,000 all of which will expire on June 30, 2011. |
See accompanying notes which are an integral part of the financial statements.
Annual Report
Financial Statements
Statement of Assets and Liabilities
June 30, 2004 |
| | |
Assets | | |
Investment in securities, at value (including securities loaned of $8,401,176) (cost $856,748,292) - See accompanying schedule | | $ 933,263,573 |
Receivable for investments sold | | 14,939,960 |
Receivable for fund shares sold | | 873,604 |
Dividends receivable | | 363,262 |
Interest receivable | | 26,683 |
Prepaid expenses | | 2,205 |
Other affiliated receivables | | 593 |
Other receivables | | 87,999 |
Total assets | | 949,557,879 |
| | |
Liabilities | | |
Payable for investments purchased | $ 12,178,430 | |
Payable for fund shares redeemed | 1,255,264 | |
Accrued management fee | 558,254 | |
Other affiliated payables | 235,352 | |
Other payables and accrued expenses | 365,688 | |
Collateral on securities loaned, at value | 8,790,750 | |
Total liabilities | | 23,383,738 |
| | |
Net Assets | | $ 926,174,141 |
Net Assets consist of: | | |
Paid in capital | | $ 858,393,814 |
Accumulated net investment loss | | (679) |
Accumulated undistributed net realized gain (loss) on investments and foreign currency transactions | | (8,493,194) |
Net unrealized appreciation (depreciation) on investments and assets and liabilities in foreign currencies | | 76,274,200 |
Net Assets, for 47,266,818 shares outstanding | | $ 926,174,141 |
Net Asset Value, offering price and redemption price per share ($926,174,141 ÷ 47,266,818 shares) | | $ 19.59 |
See accompanying notes which are an integral part of the financial statements.
Annual Report
Financial Statements - continued
Statement of Operations
Year ended June 30, 2004 |
| | |
Investment Income | | |
Dividends | | $ 6,025,313 |
Interest | | 393,978 |
Security lending | | 139,599 |
Total income | | 6,558,890 |
| | |
Expenses | | |
Management fee
Basic fee | $ 5,363,636 | |
Performance adjustment | 1,272,184 | |
Transfer agent fees | 2,552,555 | |
Accounting and security lending fees | 279,791 | |
Non-interested trustees' compensation | 4,900 | |
Custodian fees and expenses | 53,309 | |
Registration fees | 62,749 | |
Audit | 42,785 | |
Legal | 5,026 | |
Miscellaneous | 107,367 | |
Total expenses before reductions | 9,744,302 | |
Expense reductions | (501,527) | 9,242,775 |
Net investment income (loss) | | (2,683,885) |
Realized and Unrealized Gain (Loss) Net realized gain (loss) on: | | |
Investment securities | 120,157,730 | |
Foreign currency transactions | (46,690) | |
Total net realized gain (loss) | | 120,111,040 |
Change in net unrealized appreciation (depreciation) on: Investment securities (net of increase in deferred foreign taxes of $235,911) | (32,523,657) | |
Assets and liabilities in foreign currencies | (5,925) | |
Total change in net unrealized appreciation (depreciation) | | (32,529,582) |
Net gain (loss) | | 87,581,458 |
Net increase (decrease) in net assets resulting from operations | | $ 84,897,573 |
See accompanying notes which are an integral part of the financial statements.
Annual Report
Statement of Changes in Net Assets
| Year ended
June 30, 2004 | Year ended
June 30, 2003 |
Increase (Decrease) in Net Assets | | |
Operations | | |
Net investment income (loss) | $ (2,683,885) | $ 4,767,586 |
Net realized gain (loss) | 120,111,040 | (57,001,130) |
Change in net unrealized appreciation (depreciation) | (32,529,582) | 88,682,598 |
Net increase (decrease) in net assets resulting
from operations | 84,897,573 | 36,449,054 |
Distributions to shareholders from net investment income | (1,497,204) | (5,562,450) |
Share transactions
Net proceeds from sales of shares | 344,230,001 | 495,715,958 |
Reinvestment of distributions | 1,457,228 | 5,399,334 |
Cost of shares redeemed | (395,504,496) | (381,115,433) |
Net increase (decrease) in net assets resulting from share transactions | (49,817,267) | 119,999,859 |
Redemption fees | 67,037 | 191,393 |
Total increase (decrease) in net assets | 33,650,139 | 151,077,856 |
| | |
Net Assets | | |
Beginning of period | 892,524,002 | 741,446,146 |
End of period (including accumulated net investment loss of $679 and undistributed net investment income of $1,093,482, respectively) | $ 926,174,141 | $ 892,524,002 |
Other Information Shares | | |
Sold | 18,165,322 | 30,421,468 |
Issued in reinvestment of distributions | 83,175 | 339,125 |
Redeemed | (20,829,558) | (24,052,813) |
Net increase (decrease) | (2,581,061) | 6,707,780 |
See accompanying notes which are an integral part of the financial statements.
Annual Report
Financial Highlights
Years ended June 30, | 2004 | 2003 | 2002 | 2001 | 2000 |
Selected Per-Share Data | | | | | |
Net asset value, beginning of period | $ 17.90 | $ 17.19 | $ 16.80 | $ 21.68 | $ 21.39 |
Income from Investment Operations | | | | | |
Net investment income (loss)C | (.05) | .11 | .10 | .12 | .15 |
Net realized and unrealized gain (loss) | 1.77 | .73 | .36 | (1.86) | 1.60 |
Total from investment operations | 1.72 | .84 | .46 | (1.74) | 1.75 |
Distributions from net investment income | (.03) | (.13) | (.08) | (.25) | (.03) |
Distributions from net realized gain | - | - | - | (2.30) | (1.43) |
Distributions in excess of net realized gain | - | - | - | (.60) | - |
Total distributions | (.03) | (.13) | (.08) | (3.15) | (1.46) |
Redemption fees added to paid in capitalC | -E | -E | .01 | .01 | - |
Net asset value, end of period | $ 19.59 | $ 17.90 | $ 17.19 | $ 16.80 | $ 21.68 |
Total ReturnA,B | 9.63% | 4.98% | 2.83% | (8.76)% | 9.22% |
Ratios to Average Net AssetsD | | | | |
Expenses before expense reductions | 1.05% | 1.08% | 1.12% | .95% | .88% |
Expenses net of voluntary waivers, if any | 1.05% | 1.08% | 1.12% | .95% | .88% |
Expenses net of all reductions | .99% | .93% | 1.09% | .90% | .80% |
Net investment income (loss) | (.29)% | .66% | .61% | .66% | .70% |
Supplemental Data | | | | | |
Net assets, end of period (000 omitted) | $ 926,174 | $ 892,524 | $ 741,446 | $ 429,373 | $ 536,085 |
Portfolio turnover rate | 161% | 230% | 50% | 158% | 295% |
A Total returns would have been lower had certain expenses not been reduced during the periods shown.
B Total returns do not include the effect of the former sales charges.
C Calculated based on average shares outstanding during the period.
D Expense ratios reflect operating expenses of the fund. Expenses before reductions do not reflect amounts reimbursed by the investment adviser or reductions from brokerage service arrangements or other expense offset arrangements and do not represent the amount paid by the fund during periods when reimbursements or reductions occur. Expenses net of any voluntary waivers reflect expenses after reimbursement by the investment adviser but prior to reductions from brokerage service arrangements or other expense offset arrangements. Expenses net of all reductions represent the net expenses paid by the fund.
E Amount represents less than $.01 per share.
See accompanying notes which are an integral part of the financial statements.
Annual Report
Notes to Financial Statements
For the period ended June 30, 2004
1. Significant Accounting Policies.
Fidelity Fifty (the fund) is a fund of Fidelity Hastings Street Trust (the trust) and is authorized to issue an unlimited number of shares. The trust is registered under the Investment Company Act of 1940, as amended (the 1940 Act), as an open-end management investment company organized as a Massachusetts business trust. The financial statements have been prepared in conformity with accounting principles generally accepted in the United States of America, which require management to make certain estimates and assumptions at the date of the financial statements. The following summarizes the significant accounting policies of the fund:
Security Valuation. Net asset value per share (NAV calculation) is calculated as of the close of business of the New York Stock Exchange, normally 4:00 p.m. Eastern time. Equity securities, including restricted securities, for which market quotations are available are valued at the last sale price or official closing price (closing bid price or last evaluated quote if no sale has occurred) on the primary market or exchange on which they trade. If prices are not readily available or do not accurately reflect fair value for a security, or if a security's value has been materially affected by events occurring after the close of the exchange or market on which the security is principally traded, that security may be valued by another method that the Board of Trustees believes accurately reflects fair value. A security's valuation may differ depending on the method used for determining value. Price movements in futures contracts and ADRs, market and trading trends, the bid/ask quotes of brokers and off-exchange institutional trading may be reviewed in the course of making a good faith determination of a security's fair value. Short-term securities with remaining maturities of sixty days or less for which quotations are not readily available are valued on the basis of amortized cost. Investments in open-end investment companies are valued at their net asset value each business day.
Foreign Currency. The fund uses foreign currency contracts to facilitate transactions in foreign-denominated securities. Losses from these transactions may arise from changes in the value of the foreign currency or if the counterparties do not perform under the contracts' terms.
Foreign-denominated assets, including investment securities, and liabilities are translated into U.S. dollars at the exchange rate at period end. Purchases and sales of investment securities, income and dividends received and expenses denominated in foreign currencies are translated into U.S. dollars at the exchange rate in effect on the transaction date.
The effects of exchange rate fluctuations on investments are included with the net realized and unrealized gain (loss) on investment securities. Other foreign currency transactions resulting in realized and unrealized gain (loss) are disclosed separately.
Annual Report
Notes to Financial Statements - continued
1. Significant Accounting Policies - continued
Investment Transactions and Income. Security transactions are accounted for as of trade date. Gains and losses on securities sold are determined on the basis of identified cost. Dividend income is recorded on the ex-dividend date, except for certain dividends from foreign securities where the ex-dividend date may have passed, which are recorded as soon as the fund is informed of the ex-dividend date. Non-cash dividends included in dividend income, if any, are recorded at the fair market value of the securities received. Distributions received on securities that represent a return of capital or capital gain are recorded as a reduction of cost of investments and/or as a realized gain. The fund estimates the components of distributions received that may be considered nontaxable distributions or capital gain distributions for income tax purposes. Interest income is accrued as earned. Interest income includes coupon interest and amortization of premium and accretion of discount on debt securities. Investment income is recorded net of foreign taxes withheld where recovery of such taxes is uncertain.
Expenses. Most expenses of the trust can be directly attributed to a fund. Expenses which cannot be directly attributed are apportioned among the funds in the trust.
Income Tax Information and Distributions to Shareholders. Each year, the fund intends to qualify as a regulated investment company by distributing all of its taxable income and realized gains under Subchapter M of the Internal Revenue Code. As a result, no provision for income taxes is required in the accompanying financial statements. Foreign taxes are provided for based on each fund's understanding of the tax rules and rates that exist in the foreign markets in which it invests.
Distributions are recorded on the ex-dividend date. Income and capital gain distributions are determined in accordance with income tax regulations, which may differ from generally accepted accounting principles.
Capital accounts within the financial statements are adjusted for permanent book-tax differences. These adjustments have no impact on net assets or the results of operations. Temporary book-tax differences will reverse in a subsequent period.
Book-tax differences are primarily due to foreign currency transactions, capital loss carryforwards and losses deferred due to wash sales and excise tax regulations.
The tax-basis components of distributable earnings and the federal tax cost as of period end were as follows:
Unrealized appreciation | $ 108,784,660 |
Unrealized depreciation | (34,476,045) |
Net unrealized appreciation (depreciation) | 74,308,615 |
Capital loss carryforward | (6,528,291) |
| |
Cost for federal income tax purposes | $ 858,954,958 |
Annual Report
1. Significant Accounting Policies - continued
Income Tax Information and Distributions to Shareholders - continued
The tax character of distributions paid was as follows:
| June 30, 2004 | June 30, 2003 |
Ordinary Income | $ 1,497,204 | $ 5,562,450 |
Short-Term Trading (Redemption) Fees. Shares held in the fund less than 30 days are subject to a redemption fee equal to .75% of the proceeds of the redeemed shares. All redemption fees, including any estimated redemption fees paid by Fidelity Management & Research Company (FMR), are retained by the fund and accounted for as an addition to paid in capital.
2. Operating Policies.
Repurchase Agreements. FMR has received an Exemptive Order from the Securities and Exchange Commission (the SEC) which permits the fund and other affiliated entities of FMR to transfer uninvested cash balances into joint trading accounts. These accounts are then invested in repurchase agreements that are collateralized by U.S. Treasury or Government obligations. The fund may also invest directly with institutions, in repurchase agreements that are collateralized by commercial paper obligations and corporate obligations. Collateral is held in segregated accounts with custodian banks and may be obtained in the event of a default of the counterparty. Collateral is marked-to-market daily and maintained at a value at least equal to the principal amount of the repurchase agreement (including accrued interest).
3. Purchases and Sales of Investments.
Information regarding purchases and sales of securities is included under the caption "Other Information" at the end of the fund's Schedule of Investments.
4. Fees and Other Transactions with Affiliates.
Management Fee. FMR and its affiliates provide the fund with investment management related services for which the fund pays a monthly management fee. The management fee is the sum of an individual fund fee rate that is based on an annual rate of .30% of the fund's average net assets and a group fee rate that averaged .28% during the period. The group fee rate is based upon the average net assets of all the mutual funds advised by FMR. The group fee rate decreases as assets under management increase and increases as assets under management decrease. In addition, the management fee is subject to a performance adjustment (up to a maximum of ±.20% of the fund's average net assets over a 36 month performance period). The upward or downward adjustment to
Annual Report
Notes to Financial Statements - continued
4. Fees and Other Transactions with Affiliates - continued
Management Fee - continued
the management fee is based on the fund's relative investment performance as compared to an appropriate benchmark index. For the period, the total annual management fee rate, including the performance adjustment, was .71% of the fund's average net assets.
Transfer Agent Fees. Fidelity Service Company, Inc. (FSC), an affiliate of FMR, is the fund's transfer, dividend disbursing and shareholder servicing agent. FSC receives account fees and asset-based fees that vary according to account size and type of account. FSC pays for typesetting, printing and mailing of shareholder reports, except proxy statements. For the period, the transfer agent fees were equivalent to an annual rate of .27% of average net assets.
Accounting and Security Lending Fees. FSC maintains the fund's accounting records. The accounting fee is based on the level of average net assets for the month. Under a separate contract, FSC administers the security lending program. The security lending fee is based on the number and duration of lending transactions.
Central Funds. The fund may invest in affiliated Central Funds managed by Fidelity Investments Money Management, Inc. (FIMM), an affiliate of FMR. The Central Funds are open-end investment companies available only to investment companies and other accounts managed by FMR and its affiliates. The Central Funds seek preservation of capital and current income and do not pay a management fee. Income distributions earned by the fund are recorded as income in the accompanying financial statements and totaled $392,854 for the period.
Brokerage Commissions. The fund placed a portion of its portfolio transactions with brokerage firms which are affiliates of the investment adviser. The commissions paid to these affiliated firms are shown under the caption "Other Information" at the end of the fund's Schedule of Investments.
5. Committed Line of Credit.
The fund participates with other funds managed by FMR in a $4.2 billion credit facility (the "line of credit") to be utilized for temporary or emergency purposes to fund shareholder redemptions or for other short-term liquidity purposes. The participating fund has agreed to pay commitment fees on its pro rata portion of the line of credit. During the period, there were no borrowings on this line of credit.
Annual Report
6. Security Lending.
The fund lends portfolio securities from time to time in order to earn additional income. The fund receives collateral (in the form of U.S. Treasury obligations, letters of credit and/or cash) against the loaned securities and maintains collateral in an amount not less than 100% of the market value of the loaned securities during the period of the loan. The market value of the loaned securities is determined at the close of business of the fund and any additional required collateral is delivered to the fund on the next business day. If the borrower defaults on its obligation to return the securities loaned because of insolvency or other reasons, a fund could experience delays and costs in recovering the securities loaned or in gaining access to the collateral. Cash collateral is invested in cash equivalents. The value of loaned securities and cash collateral at period end are disclosed on the fund's Statement of Assets and Liabilities.
7. Expense Reductions.
Many of the brokers with whom FMR places trades on behalf of the fund provided services to the fund in addition to trade execution. These services included payments of certain expenses on behalf of the fund totaling $498,432 for the period. In addition, through arrangements with the fund's transfer agent, credits realized as a result of uninvested cash balances were used to reduce the fund's expenses. During the period, these credits reduced the fund's transfer agent expenses by $3,095.
Annual Report
Report of Independent Registered Public Accounting Firm
To the Trustees of Fidelity Hastings Street Trust and the Shareholders of Fidelity Fifty:
In our opinion, the accompanying statement of assets and liabilities, including the schedule of investments, and the related statements of operations and of changes in net assets and the financial highlights present fairly, in all material respects, the financial position of Fidelity Fifty (a fund of Fidelity Hastings Street Trust) at June 30, 2004 and the results of its operations, the changes in its net assets and the financial highlights for the periods indicated, in conformity with accounting principles generally accepted in the United States of America. These financial statements and financial highlights (hereafter referred to as "financial statements") are the responsibility of the Fidelity Fifty's management; our responsibility is to express an opinion on these financial statements based on our audits. We conducted our audits of these financial statements in accordance with the standards of the Public Company Accounting Oversight Board (United States), which require that we plan and perform the audit to obtain reasonable assurance about whether the financial statements are free of material misstatement. An audit includes examining, on a test basis, evidence supporting the amounts and disclosures in the financial statements, assessing the accounting principles used and significant estimates made by management, and evaluating the overall financial statement presentation. We believe that our audits, which included confirmation of securities at June 30, 2004 by correspondence with the custodian and brokers, provide a reasonable basis for our opinion.
/s/PricewaterhouseCoopers LLP
PricewaterhouseCoopers LLP
Boston, Massachusetts
August 6, 2004
Annual Report
Trustees and Officers
The Trustees, Members of the Advisory Board, and executive officers of the trust and fund, as applicable, are listed below. The Board of Trustees governs the fund and is responsible for protecting the interests of shareholders. The Trustees are experienced executives who meet periodically throughout the year to oversee the fund's activities, review contractual arrangements with companies that provide services to the fund, and review the fund's performance. Except for William O. McCoy, each of the Trustees oversees 292 funds advised by FMR or an affiliate. Mr. McCoy oversees 294 funds advised by FMR or an affiliate.
The Trustees hold office without limit in time except that (a) any Trustee may resign; (b) any Trustee may be removed by written instrument, signed by at least two-thirds of the number of Trustees prior to such removal; (c) any Trustee who requests to be retired or who has become incapacitated by illness or injury may be retired by written instrument signed by a majority of the other Trustees; and (d) any Trustee may be removed at any special meeting of shareholders by a two-thirds vote of the outstanding voting securities of the trust. In any event, each non-interested Trustee shall retire not later than the last day of the calendar year in which his or her 72nd birthday occurs. The executive officers and Advisory Board Members hold office without limit in time, except that any officer and Advisory Board Member may resign or may be removed by a vote of a majority of the Trustees at any regular meeting or any special meeting of the Trustees. Except as indicated, each individual has held the office shown or other offices in the same company for the past five years.
The fund's Statement of Additional Information (SAI) includes more information about the Trustees. To request a free copy, call Fidelity at 1-800-544-8544.
Interested Trustees*:
Correspondence intended for each Trustee who is an "interested person" (as defined in the 1940 Act) may be sent to Fidelity Investments, 82 Devonshire Street, Boston, Massachusetts 02109.
Name, Age; Principal Occupation |
Edward C. Johnson 3d (74)** |
| Year of Election or Appointment: 1984 Mr. Johnson is Chairman of the Board of Trustees. Mr. Johnson serves as Chief Executive Officer, Chairman, and a Director of FMR Corp.; a Director and Chairman of the Board and of the Executive Committee of FMR; Chairman and a Director of Fidelity Management & Research (Far East) Inc.; Chairman (1998) and a Director of Fidelity Investments Money Management, Inc.; and Chairman (2001) and a Director (2000) of FMR Co., Inc. |
Abigail P. Johnson (42)** |
| Year of Election or Appointment: 2001 Senior Vice President of Fidelity Fifty (2001). Ms. Johnson also serves as Senior Vice President of other Fidelity funds (2001). She is President and a Director of FMR (2001), Fidelity Investments Money Management, Inc. (2001), FMR Co., Inc. (2001), and a Director of FMR Corp. Previously, Ms. Johnson managed a number of Fidelity funds. |
Laura B. Cronin (50) |
| Year of Election or Appointment: 2003 Ms. Cronin is an Executive Vice President (2002) and Chief Financial Officer (2002) of FMR Corp. and is a member of the Fidelity Management Committee (2003). Previously, Ms. Cronin served as Vice President of Finance of FMR (1997-1999), and Chief Financial Officer of FMR (1999-2001), Fidelity Personal Investments (2001), and Fidelity Brokerage Company (2001-2002). |
Robert L. Reynolds (52) |
| Year of Election or Appointment: 2003 Mr. Reynolds is a Director (2003) and Chief Operating Officer (2002) of FMR Corp. and is the head of the Fidelity Management Committee (2003). He also serves on the Board at Fidelity Investments Canada, Ltd. (2000). Previously, Mr. Reynolds served as President of Fidelity Investments Institutional Retirement Group (1996-2000). |
* Trustees have been determined to be "Interested Trustees" by virtue of, among other things, their affiliation with the trust or various entities under common control with FMR.
** Edward C. Johnson 3d, Trustee, is Abigail P. Johnson's father.
Annual Report
Non-Interested Trustees:
Correspondence intended for each non-interested Trustee (that is, the Trustees other than the Interested Trustees) may be sent to Fidelity Investments, P.O. Box 55235, Boston, Massachusetts 02205-5235.
Name, Age; Principal Occupation |
J. Michael Cook (61) |
| Year of Election or Appointment: 2001 Prior to Mr. Cook's retirement in May 1999, he served as Chairman and Chief Executive Officer of Deloitte & Touche LLP (accounting/consulting), Chairman of the Deloitte & Touche Foundation, and a member of the Board of Deloitte Touche Tohmatsu. He currently serves as a Director of Comcast (telecommunications, 2002), International Flavors & Fragrances, Inc. (2000), The Dow Chemical Company (2000), and Northrop Grumman Corporation (global defense technology, 2003). He is a Member of the Diversity Advisory Council of Marakon (2003) and the Advisory Board of the Directorship Search Group, Chairman Emeritus of the Board of Catalyst (a leading organization for the advancement of women in business), and is Chairman of the Accountability Advisory Council to the Comptroller General of the United States. He also serves as a Member of the Advisory Board of the Graduate School of Business of the University of Florida, his alma mater. |
Ralph F. Cox (72) |
| Year of Election or Appointment: 1991 Mr. Cox is President of RABAR Enterprises (management consulting for the petroleum industry). Prior to February 1994, he was President of Greenhill Petroleum Corporation (petroleum exploration and production). Until March 1990, Mr. Cox was President and Chief Operating Officer of Union Pacific Resources Company (exploration and production). He is a Director of CH2M Hill Companies (engineering), and Abraxas Petroleum (petroleum exploration and production, 1999). In addition, he is a member of advisory boards of Texas A&M University and the University of Texas at Austin. |
Robert M. Gates (60) |
| Year of Election or Appointment: 1997 Dr. Gates is President of Texas A&M University (2002). He was Director of the Central Intelligence Agency (CIA) from 1991 to 1993. From 1989 to 1991, Dr. Gates served as Assistant to the President of the United States and Deputy National Security Advisor. Dr. Gates is a Director of NACCO Industries, Inc. (mining and manufacturing), Parker Drilling Co., Inc. (drilling and rental tools for the energy industry, 2001), and Brinker International (restaurant management, 2003). He also serves as a member of the Advisory Board of VoteHere.net (secure Internet voting, 2001). Previously, Dr. Gates served as a Director of LucasVarity PLC (automotive components and diesel engines), a Director of TRW Inc. (automotive, space, defense, and information technology), and Dean of the George Bush School of Government and Public Service at Texas A&M University (1999-2001). Dr. Gates also is a Trustee of the Forum for International Policy. |
George H. Heilmeier (68) |
| Year of Election or Appointment: 2004 Dr. Heilmeier is Chairman Emeritus of Telcordia Technologies (communication software and systems), where prior to his retirement, he served as company Chairman and Chief Executive Officer. He currently serves on the Boards of Directors of The Mitre Corporation (systems engineering and information technology support for the government), INET Technologies Inc. (telecommunications network surveillance, 2001) and Teletech Holdings (customer management services, 1998). He is Chairman of the General Motors Technology Advisory Committee and a Life Fellow of the IEEE (2000). Dr. Heilmeier is a member of the Defense Science Board and the National Security Agency Advisory Board. He is also a member of the National Academy of Engineering, the American Academy of Arts and Sciences and The Board of Overseers of the School of Engineering and Applied Science of the University of Pennsylvania. Previously, Dr. Heilmeier served as a Director of TRW Inc. (automotive, space, defense, and information technology, 1992-2002), Compaq (1994-2002), and Automatic Data Processing, Inc. (ADP) (technology-based business outsourcing, 1995-2002). |
Donald J. Kirk (71) |
| Year of Election or Appointment: 1987 Mr. Kirk is a Governor of the American Stock Exchange (2001), a Trustee and former Chairman of the Board of Trustees of the Greenwich Hospital Association, a Director of the Yale-New Haven Health Services Corp. (1998), and a Director Emeritus and former Chairman of the Board of Directors of National Arts Strategies Inc. (leadership education for arts and culture). Mr. Kirk was an Executive-in-Residence (1995-2000) and a Professor (1987-1995) at Columbia University Graduate School of Business. Prior to 1987, he was Chairman of the Financial Accounting Standards Board. Previously, Mr. Kirk served as a Governor of the National Association of Securities Dealers, Inc. (1996-2002), a member and Vice Chairman of the Public Oversight Board of the American Institute of Certified Public Accountants' SEC Practice Section (1995-2002), a Director of General Re Corporation (reinsurance, 1987-1998) and as a Director of Valuation Research Corp. (appraisals and valuations). |
Marie L. Knowles (57) |
| Year of Election or Appointment: 2001 Prior to Ms. Knowles' retirement in June 2000, she served as Executive Vice President and Chief Financial Officer of Atlantic Richfield Company (ARCO) (diversified energy, 1996-2000). From 1993 to 1996, she was a Senior Vice President of ARCO and President of ARCO Transportation Company. She served as a Director of ARCO from 1996 to 1998. She currently serves as a Director of Phelps Dodge Corporation (copper mining and manufacturing) and McKesson Corporation (healthcare service, 2002). Ms. Knowles is a Trustee of the Brookings Institution and the Catalina Island Conservancy and also serves as a member of the Advisory Board for the School of Engineering of the University of Southern California. |
Ned C. Lautenbach (60) |
| Year of Election or Appointment: 2000 Mr. Lautenbach has been a partner of Clayton, Dubilier & Rice, Inc. (private equity investment firm) since September 1998. Previously, Mr. Lautenbach was with the International Business Machines Corporation (IBM) from 1968 until his retirement in 1998. He was most recently Senior Vice President and Group Executive of Worldwide Sales and Services. From 1993 to 1995, he was Chairman of IBM World Trade Corporation, and from 1994 to 1998 was a member of IBM's Corporate Executive Committee. Mr. Lautenbach serves as Co-Chairman and a Director of Covansys, Inc. (global provider of business and technology solutions, 2000). In addition, he is a Director of Eaton Corporation (diversified industrial) and the Philharmonic Center for the Arts in Naples, Florida (1999). He also is a member of the Council on Foreign Relations. |
Marvin L. Mann (71) |
| Year of Election or Appointment: 1993 Mr. Mann is Chairman of the non-interested Trustees (2001). He is Chairman Emeritus of Lexmark International, Inc. (computer peripherals) where he served as CEO until April 1998 and retired as Chairman May 1999, and remains a member of the Board. Prior to 1991, he held the positions of Vice President of International Business Machines Corporation (IBM) and President and General Manager of various IBM divisions and subsidiaries. He is also a member of the Director Services Committee of the Investment Company Institute. In addition, Mr. Mann is a member of the President's Cabinet at the University of Alabama and the Board of Visitors of the Culverhouse College of Commerce and Business Administration at the University of Alabama. |
William O. McCoy (70) |
| Year of Election or Appointment: 1997 Prior to his retirement in December 1994, Mr. McCoy was Vice Chairman of the Board of BellSouth Corporation (telecommunications) and President of BellSouth Enterprises. He is currently a Director of Liberty Corporation (holding company), Duke Realty Corporation (real estate), and Progress Energy, Inc. (electric utility). He is also a partner of Franklin Street Partners (private investment management firm) and a member of the Research Triangle Foundation Board. In addition, Mr. McCoy served as the Interim Chancellor (1999-2000) and a member of the Board of Visitors (1994-1998) for the University of North Carolina at Chapel Hill and currently serves on the Board of Directors of the University of North Carolina Health Care System and the Board of Visitors of the Kenan-Flagler Business School (University of North Carolina at Chapel Hill). He also served as Vice President of Finance for the University of North Carolina (16-school system, 1995-1998). |
William S. Stavropoulos (65) |
| Year of Election or Appointment: 2001 Mr. Stavropoulos is Chairman of the Board (2000), CEO (2002), a position he previously held from 1995-2000, Chairman of the Executive Committee (2000), and a Member of the Board of Directors of The Dow Chemical Company. Since joining The Dow Chemical Company in 1967, Mr. Stavropoulos served in numerous senior management positions, including President (1993-2000; 2002-2003). Currently, he is a Director of NCR Corporation (data warehousing and technology solutions), BellSouth Corporation (telecommunications), Chemical Financial Corporation, and Maersk Inc. (industrial conglomerate, 2002). He also serves as a member of the Board of Trustees of the American Enterprise Institute for Public Policy Research. In addition, Mr. Stavropoulos is a member of The Business Council, J.P. Morgan International Council and the University of Notre Dame Advisory Council for the College of Science. |
Annual Report
Trustees and Officers - continued
Advisory Board Members and Executive Officers:
Correspondence intended for Mr. Dirks and Ms. Small may be sent to Fidelity Investments, P.O. Box 55235, Boston, Massachusetts 02205-5235. Correspondence intended for each executive officer and Mr. Lynch may be sent to Fidelity Investments, 82 Devonshire Street, Boston, Massachusetts 02109.
Name, Age; Principal Occupation |
Dennis J. Dirks (56) |
| Year of Election or Appointment: 2004 Member of the Advisory Board of Fidelity Hastings Street Trust. Prior to his retirement in May 2003, Mr. Dirks was Chief Operating Officer and a member of the Board of The Depository Trust & Clearing Corporation (DTCC) (1999-2003). He also served as President, Chief Operating Officer, and Board member of The Depository Trust Company (DTC) (1999-2003) and President and Board member of the National Securities Clearing Corporation (NSCC) (1999-2003). In addition, Mr. Dirks served as Chief Executive Officer and Board member of the Government Securities Clearing Corporation (2001-2003) and Chief Executive Officer and Board member of the Mortgage-Backed Securities Clearing Corporation (2001-2003). |
Peter S. Lynch (61) |
| Year of Election or Appointment: 2003 Member of the Advisory Board of Fidelity Hastings Street Trust. Vice Chairman and a Director of FMR, and Vice Chairman (2001) and a Director (2000) of FMR Co., Inc. Previously, Mr. Lynch served as a Trustee of the Fidelity funds (1990-2003). Prior to May 31, 1990, he was a Director of FMR and Executive Vice President of FMR (a position he held until March 31, 1991), Vice President of Fidelity® Magellan® Fund and FMR Growth Group Leader, and Managing Director of FMR Corp. Mr. Lynch was also Vice President of Fidelity Investments Corporate Services. In addition, he serves as a Trustee of Boston College, Massachusetts Eye & Ear Infirmary, Historic Deerfield, John F. Kennedy Library, and the Museum of Fine Arts of Boston. |
Cornelia M. Small (59) |
| Year of Election or Appointment: 2004 Member of the Advisory Board of Fidelity Hastings Street Trust. Ms. Small is a member (2000) and Chairperson (2002) of the Investment Committee, and a member (2002) of the Board of Trustees of Smith College. Previously, she served as Chief Investment Officer (1999-2000), Director of Global Equity Investments (1996-1999), and a member of the Board of Directors of Scudder, Stevens & Clark (1990-1997) and Scudder Kemper Investments (1997-1998). In addition, Ms. Small served as Co-Chair (2000-2003) of the Annual Fund for the Fletcher School of Law and Diplomacy. |
John B. McDowell (45) |
| Year of Election or Appointment: 2002 Vice President of Fidelity Fifty. Mr. McDowell also serves as Vice President of certain Equity Funds (2002). He is Senior Vice President of FMR (1999), FMR Co., Inc. (2001), and Fidelity Management Trust Company (FMTC). Since joining Fidelity Investments in 1985, Mr. McDowell has worked as a research analyst and manager. |
Jason L. Weiner (34) |
| Year of Election or Appointment: 2002 Vice President of Fidelity Fifty. Mr. Weiner also serves as Vice President of other funds advised by FMR. Prior to assuming his current responsibilities, Mr. Weiner managed a variety of Fidelity funds. Mr. Weiner also serves as Vice President of FMR and FMR Co., Inc. (2001). |
Eric D. Roiter (55) |
| Year of Election or Appointment: 1998 Secretary of Fidelity Fifty. He also serves as Secretary of other Fidelity funds (1998); Vice President, General Counsel, and Clerk of FMR Co., Inc. (2001) and FMR (1998); Vice President and Clerk of FDC (1998); Assistant Clerk of Fidelity Management & Research (U.K.) Inc. (2001) and Fidelity Management & Research (Far East) Inc. (2001); and Assistant Secretary of Fidelity Investments Money Management, Inc. (2001). Prior to joining Fidelity, Mr. Roiter was with the law firm of Debevoise & Plimpton, as an associate (1981-1984) and as a partner (1985-1997), and served as an Assistant General Counsel of the U.S. Securities and Exchange Commission (1979-1981). Mr. Roiter is an Adjunct Member, Faculty of Law, at Boston College Law School (2003). |
Stuart Fross (44) |
| Year of Election or Appointment: 2003 Assistant Secretary of Fidelity Fifty. Mr. Fross also serves as Assistant Secretary of other Fidelity funds (2003) and is an employee of FMR. |
Christine Reynolds (45) |
| Year of Election or Appointment: 2004 President, Treasurer, and Anti-Money Laundering (AML) officer of Fidelity Fifty. Ms. Reynolds also serves as President, Treasurer, and AML officer of other Fidelity funds (2004) and is a Vice President (2003) and an employee (2002) of FMR. Before joining Fidelity Investments, Ms. Reynolds worked at PricewaterhouseCoopers LLP (PwC) (1980-2002), where she was most recently an audit partner with PwC's investment management practice. |
Timothy F. Hayes (53) |
| Year of Election or Appointment: 2002 Chief Financial Officer of Fidelity Fifty. Mr. Hayes also serves as Chief Financial Officer of other Fidelity funds (2002). Recently he was appointed President of Fidelity Service Company (2003) where he also serves as a Director. Mr. Hayes also serves as President of Fidelity Investments Operations Group (FIOG, 2002), which includes Fidelity Pricing and Cash Management Services Group (FPCMS), where he was appointed President in 1998. Previously, Mr. Hayes served as Chief Financial Officer of Fidelity Investments Corporate Systems and Service Group (1998) and Fidelity Systems Company (1997-1998). |
John R. Hebble (46) |
| Year of Election or Appointment: 2003 Deputy Treasurer of Fidelity Fifty. Mr. Hebble also serves as Deputy Treasurer of other Fidelity funds (2003), and is an employee of FMR. Before joining Fidelity Investments, Mr. Hebble worked at Deutsche Asset Management where he served as Director of Fund Accounting (2002-2003) and Assistant Treasurer of the Scudder Funds (1998-2003). |
Kimberley H. Monasterio (40) |
| Year of Election or Appointment: 2004 Deputy Treasurer of Fidelity Fifty. Ms. Monasterio also serves as Deputy Treasurer of other Fidelity funds (2004) and is an employee of FMR (2004). Before joining Fidelity Investments, Ms. Monasterio served as Treasurer (2000-2004) and Chief Financial Officer (2002-2004) of the Franklin Templeton Funds and Senior Vice President of Franklin Templeton Services, LLC (2000-2004). |
John H. Costello (57) |
| Year of Election or Appointment: 1993 Assistant Treasurer of Fidelity Fifty. Mr. Costello also serves as Assistant Treasurer of other Fidelity funds and is an employee of FMR. |
Francis V. Knox, Jr. (57) |
| Year of Election or Appointment: 2002 Assistant Treasurer of Fidelity Fifty. Mr. Knox also serves as Assistant Treasurer of other Fidelity funds (2002), and is a Vice President and an employee of FMR. Previously, Mr. Knox served as Vice President of Investment & Advisor Compliance (1990-2001), and Compliance Officer of Fidelity Management & Research (U.K.) Inc. (1992-2002), Fidelity Management & Research (Far East) Inc. (1991-2002), and FMR Corp. (1995-2002). |
Peter L. Lydecker (50) |
| Year of Election or Appointment: 2004 Assistant Treasurer of Fidelity Fifty. Mr. Lydecker also serves as Assistant Treasurer of other Fidelity funds (2004) and is an employee of FMR. |
Mark Osterheld (49) |
| Year of Election or Appointment: 2002 Assistant Treasurer of Fidelity Fifty. Mr. Osterheld also serves as Assistant Treasurer of other Fidelity funds (2002) and is an employee of FMR. |
Kenneth Robins (34) |
| Year of Election or Appointment: 2004 Assistant Treasurer of Fidelity Fifty. Mr. Robins also serves as Assistant Treasurer of other Fidelity funds (2004) and is an employee of FMR (2004). Before joining Fidelity Investments, Mr. Robins worked at KPMG LLP, where he was a partner in KPMG's department of professional practice (2000-2004) and a Senior Manager (1999-2000). In addition, Mr. Robins served as Assistant Chief Accountant, United States Securities and Exchange Commission (2000-2002). |
Thomas J. Simpson (46) |
| Year of Election or Appointment: 2000 Assistant Treasurer of Fidelity Fifty. Mr. Simpson is Assistant Treasurer of other Fidelity funds (2000) and an employee of FMR (1996). Prior to joining FMR, Mr. Simpson was Vice President and Fund Controller of Liberty Investment Services (1987-1995). |
Annual Report
Distributions
The fund designates 100% of the dividends distributed during the fiscal year as qualifying for the dividends-received deduction for corporate shareholders.
The fund will notify shareholders in January 2005 of amounts for use in preparing 2004 income tax returns.
Annual Report
Proxy Voting Results
A special meeting of the fund's shareholders was held on March 24, 2004. The results of votes taken among shareholders on proposals before them are reported below. Each vote reported represents one dollar of net asset value held on the record date for the meeting.
PROPOSAL 1 |
To amend the Declaration of Trust to allow the Board of Trustees, if permitted by applicable law, to authorize fund mergers without shareholder approval.* |
| # of
Votes | % of
Votes |
Affirmative | 5,641,899,809.90 | 76.930 |
Against | 1,195,910,893.93 | 16.307 |
Abstain | 258,684,030.15 | 3.527 |
Broker Non-Votes | 237,317,184.17 | 3.236 |
TOTAL | 7,333,811,918.15 | 100.000 |
PROPOSAL 2 |
To approve the inclusion of language inadvertently omitted from the Amended and Restated Declaration of Trust presented to shareholders in June 2001.* |
| # of
Votes | % of
Votes |
Affirmative | 6,758,135,344.08 | 92.150 |
Against | 290,380,904.34 | 3.960 |
Abstain | 285,295,669.73 | 3.890 |
TOTAL | 7,333,811,918.15 | 100.000 |
PROPOSAL 3 |
To elect a Board of Trustees.* |
| # of
Votes | % of
Votes |
J. Michael Cook |
Affirmative | 6,986,573,775.53 | 95.265 |
Withheld | 347,238,142.62 | 4.735 |
TOTAL | 7,333,811,918.15 | 100.000 |
| # of
Votes | % of
Votes |
Ralph F. Cox |
Affirmative | 6,972,215,836.08 | 95.069 |
Withheld | 361,596,082.07 | 4.931 |
TOTAL | 7,333,811,918.15 | 100.000 |
Laura B. Cronin |
Affirmative | 6,984,375,675.44 | 95.235 |
Withheld | 349,436,242.71 | 4.765 |
TOTAL | 7,333,811,918.15 | 100.000 |
Robert M. Gates |
Affirmative | 6,981,063,293.96 | 95.190 |
Withheld | 352,748,624.19 | 4.810 |
TOTAL | 7,333,811,918.15 | 100.000 |
George H. Heilmeier |
Affirmative | 6,981,086,173.64 | 95.190 |
Withheld | 352,725,744.51 | 4.810 |
TOTAL | 7,333,811,918.15 | 100.000 |
Abigail P. Johnson |
Affirmative | 6,970,753,191.54 | 95.050 |
Withheld | 363,058,726.61 | 4.950 |
TOTAL | 7,333,811,918.15 | 100.000 |
Edward C. Johnson 3d |
Affirmative | 6,970,410,843.13 | 95.045 |
Withheld | 363,401,075.02 | 4.955 |
TOTAL | 7,333,811,918.15 | 100.000 |
Donald J. Kirk |
Affirmative | 6,977,181,783.66 | 95.137 |
Withheld | 356,630,134.49 | 4.863 |
TOTAL | 7,333,811,918.15 | 100.000 |
| # of
Votes | % of
Votes |
Marie L. Knowles |
Affirmative | 6,987,619,394.87 | 95.280 |
Withheld | 346,192,523.28 | 4.720 |
TOTAL | 7,333,811,918.15 | 100.000 |
Ned C. Lautenbach |
Affirmative | 6,991,038,771.41 | 95.326 |
Withheld | 342,773,146.74 | 4.674 |
TOTAL | 7,333,811,918.15 | 100.000 |
Marvin L. Mann |
Affirmative | 6,976,048,339.97 | 95.122 |
Withheld | 357,763,578.18 | 4.878 |
TOTAL | 7,333,811,918.15 | 100.000 |
William O. McCoy |
Affirmative | 6,976,743,035.70 | 95.131 |
Withheld | 357,068,882.45 | 4.869 |
TOTAL | 7,333,811,918.15 | 100.000 |
Robert L. Reynolds |
Affirmative | 6,989,941,130.39 | 95.311 |
Withheld | 343,870,787.76 | 4.689 |
TOTAL | 7,333,811,918.15 | 100.000 |
William S. Stavropoulos |
Affirmative | 6,987,371,028.43 | 95.276 |
Withheld | 346,440,889.72 | 4.724 |
TOTAL | 7,333,811,918.15 | 100.000 |
* Denotes trust-wide proposals and voting results. |
Annual Report
Annual Report
Annual Report
Investment Adviser
Fidelity Management & Research Company
Boston, MA
Investment Sub-Advisers
FMR Co., Inc.
Fidelity Management &
Research Company (U.K.) Inc.
Fidelity Management & Research
(Far East) Inc.
Fidelity Investments Japan Limited
Fidelity International Investment Advisors
Fidelity International Investment Advisors (U.K.) Limited
General Distributor
Fidelity Distributors Corporation
Boston, MA
Transfer and Shareholder
Servicing Agent
Fidelity Service Company, Inc.
Boston, MA
Custodian
Citibank, N.A.
New York, NY
Fidelity's Growth Funds
Aggressive Growth Fund
Blue Chip Growth Fund
Blue Chip Value Fund
Capital Appreciation Fund
Contrafund ®
Disciplined Equity Fund
Discovery Fund
Dividend Growth Fund
Export and Multinational Fund
Fidelity Fifty®
Fidelity Value Discovery Fund
Focused Stock Fund
Growth Company Fund
Independence Fund
Large Cap Stock Fund
Leveraged Company Stock Fund
Low-Priced Stock Fund
Magellan® Fund
Mid-Cap Stock Fund
New Millennium Fund ®
OTC Portfolio
Small Cap Independence Fund
Small Cap Stock Fund
Stock Selector
Structured Large Cap Growth Fund
Structured Large Cap Value Fund
Structured Mid Cap Growth Fund
Structured Mid Cap Value Fund
Tax Managed Stock Fund
Trend Fund
Value Fund
The Fidelity Telephone Connection
Mutual Fund 24-Hour Service
Exchanges/Redemptions
and Account Assistance 1-800-544-6666
Product Information 1-800-544-6666
Retirement Accounts 1-800-544-4774
(8 a.m. - 9 p.m.)
TDD Service 1-800-544-0118
for the deaf and hearing impaired
(9 a.m. - 9 p.m. Eastern time)
Fidelity Automated Service
Telephone (FAST®) (automated graphic) 1-800-544-5555
(automated graphic) Automated line for quickest service
(Fidelity Investment logo)(registered trademark)
Corporate Headquarters
82 Devonshire St., Boston, MA 02109
www.fidelity.com
FIF-UANN-0804
1.787732.101
Item 2. Code of Ethics
As of the end of the period, June 30, 2004, Fidelity Hastings Street Trust (the trust) has adopted a code of ethics, as defined in Item 2 of Form N-CSR, that applies to its President and Treasurer and its Chief Financial Officer. A copy of the code of ethics is filed as an exhibit to this Form N-CSR.
Item 3. Audit Committee Financial Expert
The Board of Trustees of the trust has determined that Marie L. Knowles and Donald J. Kirk are each audit committee financial experts, as defined in Item 3 of Form N-CSR. Ms. Knowles and Mr. Kirk are each independent for purposes of Item 3 of Form N-CSR.
Item 4. Principal Accountant Fees and Services
(a) Audit Fees.
For the fiscal years ended June 30, 2004 and June 30, 2003, the aggregate Audit Fees billed by PricewaterhouseCoopers LLP (PwC) for professional services rendered for the audits of the financial statements, or services that are normally provided in connection with statutory and regulatory filings or engagements for those fiscal years, for the Fidelity Discovery Fund, Fidelity Fifty, Fidelity Fund and Fidelity Growth & Income II Portfolio (the funds) and for all funds in the Fidelity Group of Funds are shown in the table below.
Fund | 2004A | 2003A |
Fidelity Discovery Fund | $37,000 | $34,000 |
Fidelity Fifty | $31,000 | $26,000 |
Fidelity Fund | $69,000 | $66,000 |
Fidelity Growth & Income II Portfolio | $36,000 | $32,000 |
All funds in the Fidelity Group of Funds audited by PwC | $10,600,000 | $9,200,000 |
A | Aggregate amounts may reflect rounding. |
(b) Audit-Related Fees.
In each of the fiscal years ended June 30, 2004 and June 30, 2003 the aggregate Audit-Related Fees billed by PwC for services rendered for assurance and related services to each fund that are reasonably related to the performance of the audit or review of the fund's financial statements, but not reported as Audit Fees, are shown in the table below.
Fund | 2004A | 2003A,B |
Fidelity Discovery Fund | $0 | $0 |
Fidelity Fifty | $0 | $0 |
Fidelity Fund | $0 | $0 |
Fidelity Growth & Income II Portfolio | $0 | $0 |
A | Aggregate amounts may reflect rounding. |
B | Includes amounts related to non-audit services prior to May 6, 2003 that would have been subject to pre-approval if the SEC rules relating to the pre-approval of non-audit services had been in effect at that time. |
In each of the fiscal years ended June 30, 2004 and June 30, 2003, the aggregate Audit-Related Fees that were billed by PwC that were required to be approved by the Audit Committee for services rendered on behalf of Fidelity Management & Research Company (FMR) and entities controlling, controlled by, or under common control with FMR (not including any sub-adviser whose role is primarily portfolio management and is subcontracted with or overseen by another investment adviser) that provide ongoing services to the funds ("Fund Service Providers") for assurance and related services that relate directly to the operations and financial reporting of each fund that are reasonably related to the performance of the audit or review of the fund's financial statements, but not reported as Audit Fees, are shown in the table below.
Billed By | 2004A | 2003A,B |
PwC | $50,000 | $0 |
A | Aggregate amounts may reflect rounding. |
B | Includes amounts related to non-audit services prior to May 6, 2003 that would have been subject to pre-approval if the SEC rules relating to the pre-approval of non-audit services had been in effect at that time. |
Fees included in the audit-related category comprise assurance and related services (e.g., due diligence services) that are traditionally performed by the independent accountant. These audit-related services include due diligence related to mergers and acquisitions, accounting consultations and audits in connection with acquisitions, internal control reviews, attest services that are not required by statute or regulation and consultation concerning financial accounting and reporting standards.
(c) Tax Fees.
In each of the fiscal years ended June 30, 2004 and June 30, 2003, the aggregate Tax Fees billed by PwC for professional services rendered for tax compliance, tax advice, and tax planning for each fund is shown in the table below.
Fund | 2004A | 2003A,B |
Fidelity Discovery Fund | $2,300 | $2,100 |
Fidelity Fifty | $2,300 | $2,100 |
Fidelity Fund | $3,100 | $2,800 |
Fidelity Growth & Income II Portfolio | $2,300 | $2,100 |
A | Aggregate amounts may reflect rounding. |
B | Includes amounts related to non-audit services prior to May 6, 2003 that would have been subject to pre-approval if the SEC rules relating to the pre-approval of non-audit services had been in effect at that time. |
In each of the fiscal years ended June 30, 2004 and June 30, 2003, the aggregate Tax Fees billed by PwC that were required to be approved by the Audit Committee for professional services rendered on behalf of the Fund Service Providers for tax compliance, tax advice, and tax planning that relate directly to the operations and financial reporting of each fund is shown in the table below.
Billed By | 2004A | 2003A,B |
PwC | $0 | $0 |
A | Aggregate amounts may reflect rounding. |
B | Includes amounts related to non-audit services prior to May 6, 2003 that would have been subject to pre-approval if the SEC rules relating to the pre-approval of non-audit services had been in effect at that time. |
Fees included in the Tax Fees category comprise all services performed by professional staff in the independent accountant's tax division except those services related to the audit. Typically, this category would include fees for tax compliance, tax planning, and tax advice. Tax compliance, tax advice, and tax planning services include preparation of original and amended tax returns, claims for refund and tax payment-planning services, assistance with tax audits and appeals, tax advice related to mergers and acquisitions and requests for rulings or technical advice from taxing authorities.
(d) All Other Fees.
In each of the fiscal years ended June 30, 2004 and June 30, 2003, the aggregate Other Fees billed by PwC for all other non-audit services rendered to the funds is shown in the table below.
Fund | 2004A | 2003A,B |
Fidelity Discovery Fund | $1,700 | $2,000 |
Fidelity Fifty | $2,000 | $1,800 |
Fidelity Fund | $9,700 | $10,400 |
Fidelity Growth & Income II Portfolio | $1,400 | $1,400 |
A | Aggregate amounts may reflect rounding. |
B | Includes amounts related to non-audit services prior to May 6, 2003 that would have been subject to pre-approval if the SEC rules relating to the pre-approval of non-audit services had been in effect at that time. |
In each of the fiscal years ended June 30, 2004 and June 30, 2003, the aggregate Other Fees billed by PwC that were required to be approved by the Audit Committee for all other non-audit services rendered on behalf of the Fund Service Providers that relate directly to the operations and financial reporting of each fund is shown in the table below.
Billed By | 2004A | 2003A,B |
PwC | $330,000 | $250,000 |
A | Aggregate amounts may reflect rounding. |
B | Includes amounts related to non-audit services prior to May 6, 2003 that would have been subject to pre-approval if the SEC rules relating to the pre-approval of non-audit services had been in effect at that time. |
Fees included in the All Other Fees category include services related to internal control reviews, strategy and other consulting, financial information systems design and implementation, consulting on other information systems, and other tax services unrelated to the fund.
(e) (1) | Audit Committee Pre-Approval Policies and Procedures: |
The trust's Audit Committee must pre-approve all audit and non-audit services provided by the independent accountant relating to the operations or financial reporting of the funds. Prior to the commencement of any audit or non-audit services to a fund, the Audit Committee reviews the services to determine whether they are appropriate and permissible under applicable law.
The trust's Audit Committee has adopted policies and procedures to, among other purposes, provide a framework for the Committee's consideration of non-audit services by the audit firms that audit the Fidelity funds. The policies and procedures require that any non-audit service provided by a fund audit firm to a Fidelity Fund and any non-audit service provided by a fund auditor to a Fund Service Provider that relates directly to the operations and financial reporting of a Fidelity fund (Covered Service) are subject to approval by the Audit Committee before such service is provided. Non-audit services provided by a fund audit firm for a Fund Service Provider that do not relate directly to the operations and financial reporting of a Fidelity fund (Non-Covered Service) but that are expected to exceed $50,000 are also subject to pre-approval by the Audit Committee.
All Covered Services, as well as Non-Covered Services that are expected to exceed $50,000, must be approved in advance of provision of the service either: (i) by formal resolution of the Audit Committee, or (ii) by oral or written approval of the service by the Chair of the Audit Committee (or if the Chair is unavailable, such other member of the Audit Committee as may be designated by the Chair to act in the Chair's absence). The approval contemplated by (ii) above is permitted where the Treasurer determines that action on such an engagement is necessary before the next meeting of the Audit Committee. Neither pre-approval nor advance notice of Non-Covered Service engagements for which fees are not expected to exceed $50,000 is required; such engagements are to be reported to the Audit Committee monthly.
(e) (2) | Services approved pursuant to paragraph (c)(7)(i)(C) of Rule 2-01 of Regulation S-X: |
Audit-Related Fees:
There were no amounts, including amounts related to non-audit services prior to May 6, 2003 that would have been subject to pre-approval if the SEC rules relating to the pre-approval of non-audit services had been in effect at that time, that were approved by the Audit Committee pursuant to the de minimis exception for the fiscal years ended June 30, 2004 and June 30, 2003 on behalf of each fund.
There were no amounts, including amounts related to non-audit services prior to May 6, 2003 that would have been subject to pre-approval if the SEC rules relating to the pre-approval of non-audit services had been in effect at that time, that were required to be approved by the Audit Committee pursuant to the de minimis exception for the fiscal years ended June 30, 2004 and June 30, 2003 on behalf of the Fund Service Providers that relate directly to the operations and financial reporting of each fund.
Tax Fees:
There were no amounts, including amounts related to non-audit services prior to May 6, 2003 that would have been subject to pre-approval if the SEC rules relating to the pre-approval of non-audit services had been in effect at that time, that were approved by the Audit Committee pursuant to the de minimis exception for the fiscal years ended June 30, 2004 and June 30, 2003 on behalf of each fund.
There were no amounts, including amounts related to non-audit services prior to May 6, 2003 that would have been subject to pre-approval if the SEC rules relating to the pre-approval of non-audit services had been in effect at that time, that were required to be approved by the Audit Committee pursuant to the de minimis exception for the fiscal years ended June 30, 2004 and June 30, 2003 on behalf of the Fund Service Providers that relate directly to the operations and financial reporting of each fund.
All Other Fees:
There were no amounts, including amounts related to non-audit services prior to May 6, 2003 that would have been subject to pre-approval if the SEC rules relating to the pre-approval of non-audit services had been in effect at that time, that were approved by the Audit Committee pursuant to the de minimis exception for the fiscal years ended June 30, 2004 and June 30, 2003 on behalf of each fund.
There were no amounts, including amounts related to non-audit services prior to May 6, 2003 that would have been subject to pre-approval if the SEC rules relating to the pre-approval of non-audit services had been in effect at that time, that were required to be approved by the Audit Committee pursuant to the de minimis exception for the fiscal years ended June 30, 2004 and June 30, 2003 on behalf of the Fund Service Providers that relate directly to the operations and financial reporting of each fund.
(f) According to PwC for the fiscal year ended June 30, 2004, the percentage of hours spent on the audit of each fund's financial statements for the most recent fiscal year that were attributed to work performed by persons who are not full-time, permanent employees of PwC is as follows:
Fund | 2004 |
Fidelity Discovery Fund | 0% |
Fidelity Fifty | 0% |
Fidelity Fund | 0% |
Fidelity Growth & Income II Portfolio | 0% |
(g) For the fiscal years ended June 30, 2004 and June 30, 2003, the aggregate fees billed by PwC of $1,800,000A and $1,950,000A,B for non-audit services rendered on behalf of the funds, FMR (not including any sub-adviser whose role is primarily portfolio management and is subcontracted with or overseen by another investment adviser) and Fund Service Providers relating to Covered Services and Non-Covered Services are shown in the table below.
| 2004A | 2003A,B |
Covered Services | $400,000 | $300,000 |
Non-Covered Services | $1,400,000 | $1,650,000 |
A | Aggregate amounts may reflect rounding. |
B | Includes amounts related to non-audit services prior to May 6, 2003 that would have been subject to pre-approval if the SEC rules relating to the pre-approval of non-audit services had been in effect at that time. |
(h) The trust's Audit Committee has considered Non-Covered Services that were not pre-approved that were provided by PwC to Fund Service Providers to be compatible with maintaining the independence of PwC in its audit of the funds, taking into account representations from PwC, in accordance with Independence Standards Board Standard No.1, regarding its independence from the funds and their related entities.
Item 5. Audit Committee of Listed Registrants
Not applicable.
Item 6. Schedule of Investments
Not applicable.
Item 7. Disclosure of Proxy Voting Policies and Procedures for Closed-End Management Investment Companies
Not applicable.
Item 8. Purchase of Equity Securities by Closed-End Management Investment Company and Affiliated Purchasers
Not applicable.
Item 9. Submission of Matters to a Vote of Security Holders
There were no material changes to the procedures by which shareholders may recommend nominees to the trust's Board of Trustees.
Item 10. Controls and Procedures
(a)(i) The President and Treasurer and the Chief Financial Officer have concluded that the trust's disclosure controls and procedures (as defined in Rule 30a-3(c) under the Investment Company Act) provide reasonable assurances that material information relating to the trust is made known to them by the appropriate persons, based on their evaluation of these controls and procedures as of a date within 90 days of the filing date of this report.
(a)(ii) There was no change in the trust's internal control over financial reporting (as defined in Rule 30a-3(d) under the Investment Company Act) that occurred during the trust's second fiscal half-year that has materially affected, or is reasonably likely to materially affect, the trust's internal control over financial reporting.
Item 11. Exhibits
(a) | (1) | Code of Ethics pursuant to Item 2 of Form N-CSR is filed and attached hereto as EX-99.CODE ETH. |
(a) | (2) | Certification pursuant to Rule 30a-2(a) under the Investment Company Act of 1940 (17 CFR 270.30a-2(a)) is filed and attached hereto as Exhibit 99.CERT. |
(a) | (3) | Not applicable. |
(b) | | Certification pursuant to Rule 30a-2(b) under the Investment Company Act of 1940 (17 CFR 270.30a-2(b)) is furnished and attached hereto as Exhibit 99.906CERT. |
SIGNATURES
Pursuant to the requirements of the Securities Exchange Act of 1934 and the Investment Company Act of 1940, the registrant has duly caused this report to be signed on its behalf by the undersigned, thereunto duly authorized.
Fidelity Hastings Street Trust
By: | /s/Christine Reynolds |
| Christine Reynolds |
| President and Treasurer |
| |
Date: | August 10, 2004 |
Pursuant to the requirements of the Securities Exchange Act of 1934 and the Investment Company Act of 1940, this report has been signed below by the following persons on behalf of the registrant and in the capacities and on the dates indicated.
By: | /s/Christine Reynolds |
| Christine Reynolds |
| President and Treasurer |
| |
Date: | August 10, 2004 |
By: | /s/Timothy F. Hayes |
| Timothy F. Hayes |
| Chief Financial Officer |
| |
Date: | August 10, 2004 |