UNITED STATES
SECURITIES AND EXCHANGE COMMISSION
Washington, D.C. 20549
FORM N-CSR
CERTIFIED SHAREHOLDER REPORT OF REGISTERED
MANAGEMENT INVESTMENT COMPANIES
Investment Company Act file number 811-215
Fidelity Hastings Street Trust
(Exact name of registrant as specified in charter)
82 Devonshire St., Boston, Massachusetts 02109
(Address of principal executive offices) (Zip code)
Eric D. Roiter, Secretary
82 Devonshire St.
Boston, Massachusetts 02109
(Name and address of agent for service)
Registrant's telephone number, including area code: 617-563-7000
Date of fiscal year end: | June 30 |
| |
Date of reporting period: | June 30, 2006 |
Item 1. Reports to Stockholders
Fidelity®
Discovery Fund
Annual Report
June 30, 2006
(2_fidelity_logos) (Registered_Trademark)
Contents
Chairman's Message | <Click Here> | Ned Johnson's message to shareholders. |
Performance | <Click Here> | How the fund has done over time. |
Management's Discussion | <Click Here> | The manager's review of fund performance, strategy and outlook. |
Shareholder Expense Example | <Click Here> | An example of shareholder expenses. |
Investment Changes | <Click Here> | A summary of major shifts in the fund's investments over the past six months. |
Investments | <Click Here> | A complete list of the fund's investments with their market values. |
Financial Statements | <Click Here> | Statements of assets and liabilities, operations, and changes in net assets,
as well as financial highlights. |
Notes | <Click Here> | Notes to the financial statements. |
Report of Independent Registered Public Accounting Firm | <Click Here> | |
Trustees and Officers | <Click Here> | |
Distributions | <Click Here> | |
Proxy Voting Results | <Click Here> | |
Board Approval of Investment Advisory Contracts and Management Fees | <Click Here> | |
To view a fund's proxy voting guidelines and proxy voting record for the 12-month period ended June 30, visit www.fidelity.com/proxyvotingresults or visit the Securities and Exchange Commission's (SEC) web site at www.sec.gov. You may also call 1-800-544-8544 to request a free copy of the proxy voting guidelines.
Standard & Poor's, S&P and S&P 500 are registered service marks of The McGraw-Hill Companies, Inc. and have been licensed for use by Fidelity Distributors Corporation.
Other third party marks appearing herein are the property of their respective owners.
All other marks appearing herein are registered or unregistered trademarks or service marks of FMR Corp. or an affiliated company.
Annual Report
This report and the financial statements contained herein are submitted for the general information of the shareholders of the fund. This report is not authorized for distribution to prospective investors in the fund unless preceded or accompanied by an effective prospectus.
A fund files its complete schedule of portfolio holdings with the SEC for the first and third quarters of each fiscal year on Form N-Q. Forms N-Q are available on the SEC's web site at http://www.sec.gov. A fund's Forms N-Q may be reviewed and copied at the SEC's Public Reference Room in Washington, DC. Information regarding the operation of the SEC's Public Reference Room may be obtained by calling 1-800-SEC-0330. For a complete list of a fund's portfolio holdings, view the most recent quarterly holdings report, semiannual report, or annual report on Fidelity's web site at http://www.fidelity.com/holdings.
NOT FDIC INSURED · MAY LOSE VALUE · NO BANK GUARANTEE
Neither the fund nor Fidelity Distributors Corporation is a bank.
Annual Report
Chairman's Message
(photo_of_Edward_C_Johnson_3d)
Dear Shareholder:
Although many securities markets made gains in early 2006, inflation concerns led to mixed results through the year's mid-point. Financial markets are always unpredictable. There are, however, a number of time-tested principles that can put the historical odds in your favor.
One of the basic tenets is to invest for the long term. Over time, riding out the markets' inevitable ups and downs has proven much more effective than selling into panic or chasing the hottest trend. Even missing only a few of the markets' best days can significantly diminish investor returns. Patience also affords the benefits of compounding - of earning interest on additional income or reinvested dividends and capital gains. There are tax advantages and cost benefits to consider as well. The more you sell, the more taxes you pay, and the more you trade, the higher the costs. While staying the course doesn't eliminate risk, it can considerably lessen the effect of short-term declines.
You can further manage your investing risk through diversification. And today, more than ever, geographic diversification should be taken into account. Studies indicate that asset allocation is the single most important determinant of a portfolio's long-term success. The right mix of stocks, bonds and cash - aligned to your particular risk tolerance and investment objective - is very important. Age-appropriate rebalancing is also an essential aspect of asset allocation. For younger investors, an emphasis on equities - which historically have been the best performing asset class over time - is encouraged. As investors near their specific goal, such as retirement or sending a child to college, consideration may be given to replacing volatile assets (e.g. common stocks) with more-stable fixed investments (bonds or savings plans).
A third investment principle - investing regularly - can help lower the average cost of your purchases. Investing a certain amount of money each month or quarter helps ensure you won't pay for all your shares at market highs. This strategy - known as dollar cost averaging - also reduces unconstructive "emotion" from investing, helping shareholders avoid selling weak performers just prior to an upswing, or chasing a hot performer just before a correction.
We invite you to contact us via the Internet, through our Investor Centers or over the phone. It is our privilege to provide you the information you need to make the investments that are right for you.
Sincerely,
/s/Edward C. Johnson 3d
Edward C. Johnson 3d
Annual Report
Performance: The Bottom Line
Average annual total return reflects the change in the value of an investment, assuming reinvestment of the fund's dividend income and capital gains (the profits earned upon the sale of securities that have grown in value) and assuming a constant rate of performance each year. The $10,000 table and the fund's returns do not reflect the deduction of taxes that a shareholder would pay on fund distributions or the redemption of fund shares. During periods of reimbursement by Fidelity, a fund's total return will be greater than it would be had the reimbursement not occurred. How a fund did yesterday is no guarantee of how it will do tomorrow.
Average Annual Total Returns
Periods ended June 30, 2006 | Past 1
year | Past 5
years | Life of
fundA |
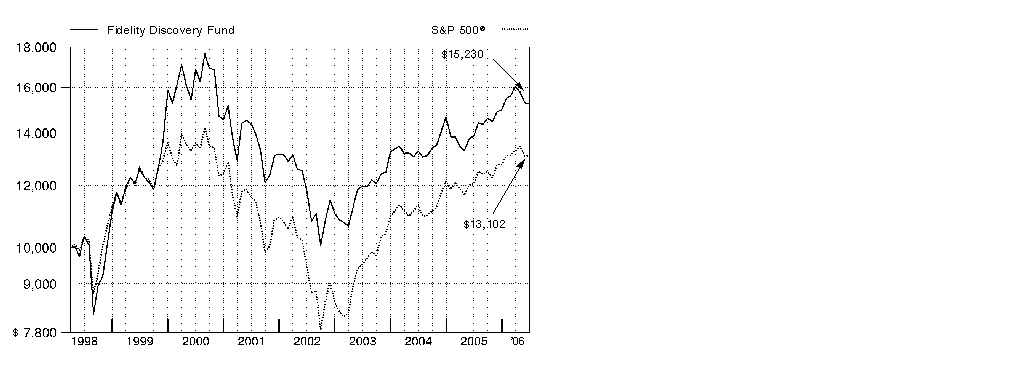
Fidelity Discovery Fund | 9.67% | 1.14% | 5.23% |
A From March 31, 1998
$10,000 Over Life of Fund
Let's say hypothetically that $10,000 was invested in Fidelity® Discovery Fund on March 31, 1998, when the fund started. The chart shows how the value of your investment would have changed, and also shows how the Standard & Poor's 500SM Index performed over the same period.
Annual Report
Management's Discussion of Fund Performance
Comments from Adam Hetnarski, Portfolio Manager of Fidelity® Discovery Fund
After generating sizable gains early on, stock values eroded late in the 12-month period ending June 30, 2006. Worrisome signals of rising inflation took a bite out of many portfolios, as investors wondered about the intentions of the Federal Reserve Board. Many on Wall Street believed the U.S. central bank had nearly concluded its interest-rate-hike crusade. But in announcing its May rate hike, the Board warned of more increases to come. Then, in June, the Fed announced inflation was running at the upper end of the normal range, inducing yet another sell-off and demonstrating investors' anxiety about the Board's future course. Prior to that, stocks were in good shape, riding the momentum of steady economic and corporate earnings growth. Equity benchmarks approached or exceeded multiyear highs, and the Dow Jones Industrial AverageSM nearly topped its record from January 2000. Despite the late difficulties, the Dow rose 11.09% for the 12 months overall, while the Standard & Poor's 500SM Index returned 8.63% and the NASDAQ Composite® Index was up 6.48%.
The fund returned 9.67% during the past year, beating the S&P 500®. Favorable stock selection in information technology provided the biggest boost versus the index. My picks in materials and health care also added value, although in the latter case the benefits were largely offset by overweighting the sector, which was relatively weak. Wireline equipment provider CIENA and optical components maker Finisar were the fund's top contributors, their gains driven by a resurgence in spending by telecommunication services companies. Swiss pharmaceutical stock Roche Holding also delivered a solid gain, as did Newmont Mining. Underweighting two index components that fared poorly, Dell and Intel, further benefited the fund's results. On the negative side, the fund's results were hampered by unfavorable stock picking in industrials, financials and telecommunication services, along with underweightings in energy and the diversified financials segment of the broader financials sector. UnitedHealth Group was the period's biggest detractor, sidetracked by questions about its options pricing policies and concerns about increasingly competitive pricing in the HMO industry. Another detractor was Charles River Laboratories International, which posted disappointing first-quarter earnings. Also hampering performance was a pair of companies that ran into serious financial difficulties during the period: Delta Airlines and auto parts maker Delphi. I sold Finisar, Dell, Delta and Delphi by period end.
The views expressed above reflect those of the portfolio manager(s) only through the end of the period as stated on the cover of this report and do not necessarily represent the views of Fidelity or any other person in the Fidelity organization. Any such views are subject to change at any time based upon market or other conditions and Fidelity disclaims any responsibility to update such views. These views may not be relied on as investment advice and, because investment decisions for a Fidelity fund are based on numerous factors, may not be relied on as an indication of trading intent on behalf of any Fidelity fund.
Annual Report
Shareholder Expense Example
As a shareholder of the Fund, you incur two types of costs: (1) transaction costs, and (2) ongoing costs, including management fees and other Fund expenses. This Example is intended to help you understand your ongoing costs (in dollars) of investing in the Fund and to compare these costs with the ongoing costs of investing in other mutual funds.
The Example is based on an investment of $1,000 invested at the beginning of the period and held for the entire period (January 1, 2006 to June 30, 2006).
Actual Expenses
The first line of the accompanying table provides information about actual account values and actual expenses. You may use the information in this line, together with the amount you invested, to estimate the expenses that you paid over the period. Simply divide your account value by $1,000.00 (for example, an $8,600 account value divided by $1,000.00 = 8.6), then multiply the result by the number in the first line under the heading entitled "Expenses Paid During Period" to estimate the expenses you paid on your account during this period. A small balance maintenance fee of $12.00 that is charged once a year may apply for certain accounts with a value of less than $2,000. This fee is not included in the table below. If it was, the estimate of expenses you paid during the period would be higher, and your ending account value lower, by this amount.
Hypothetical Example for Comparison Purposes
The second line of the accompanying table provides information about hypothetical account values and hypothetical expenses based on the Fund's actual expense ratio and an assumed rate of return of 5% per year before expenses, which is not the Fund's actual return. The hypothetical account values and expenses may not be used to estimate the actual ending account balance or expenses you paid for the period. You may use this information to compare the ongoing costs of investing in the Fund and other funds. To do so, compare this 5% hypothetical example with the 5% hypothetical examples that appear in the shareholder reports of the other funds. A small balance maintenance fee of $12.00 that is charged once a year may apply for certain accounts with a value of less than $2,000. This fee is not included in the table below. If it was, the estimate of expenses you paid during the period would be higher, and your ending account value lower, by this amount.
Please note that the expenses shown in the table are meant to highlight your ongoing costs only and do not reflect any transaction costs. Therefore, the second line of the table is useful in comparing ongoing costs only, and will not help you determine the relative total costs of owning different funds.
| Beginning
Account Value
January 1, 2006 | Ending
Account Value
June 30, 2006 | Expenses Paid
During Period*
January 1, 2006
to June 30, 2006 |
Actual | $ 1,000.00 | $ 1,016.70 | $ 3.35 |
Hypothetical (5% return per year before expenses) | $ 1,000.00 | $ 1,021.47 | $ 3.36 |
* Expenses are equal to the Fund's annualized expense ratio of .67%; multiplied by the average account value over the period, multiplied by 181/365 (to reflect the onehalf year period).
Annual Report
Investment Changes
Top Ten Stocks as of June 30, 2006 |
| % of fund's
net assets | % of fund's net assets
6 months ago |
General Electric Co. | 6.9 | 4.0 |
American International Group, Inc. | 6.8 | 8.2 |
Johnson & Johnson | 4.9 | 3.2 |
Microsoft Corp. | 4.3 | 5.4 |
Altria Group, Inc. | 4.0 | 4.0 |
SLM Corp. | 3.8 | 3.2 |
CIENA Corp. | 3.1 | 2.2 |
Honeywell International, Inc. | 2.8 | 1.4 |
Roche Holding AG (participation certificate) | 2.8 | 2.1 |
Wyeth | 2.2 | 3.3 |
| 41.6 | |
Top Five Market Sectors as of June 30, 2006 |
| % of fund's
net assets | % of fund's net assets
6 months ago |
Health Care | 21.1 | 27.3 |
Information Technology | 17.5 | 21.6 |
Financials | 14.7 | 18.2 |
Industrials | 13.5 | 6.8 |
Consumer Staples | 8.6 | 11.6 |
Asset Allocation (% of fund's net assets) |
As of June 30, 2006 * | As of December 31, 2005 ** |
 | Stocks 91.4% | | | Stocks 97.1% | |
 | Convertible
Securities 0.7% | | | Convertible
Securities 0.7% | |
 | Short-Term
Investments and
Net Other Assets 7.9% | | | Short-Term
Investments and
Net Other Assets 2.2% | |
* Foreign
investments | 10.1% | | ** Foreign
investments | 15.4% | |

Annual Report
Investments June 30, 2006
Showing Percentage of Net Assets
Common Stocks - 91.4% |
| Shares | | Value (Note 1) (000s) |
CONSUMER DISCRETIONARY - 3.3% |
Auto Components - 0.2% |
Gentex Corp. | 59,700 | | $ 836 |
Hotels, Restaurants & Leisure - 0.4% |
International Game Technology | 37,900 | | 1,438 |
Media - 1.3% |
DreamWorks Animation SKG, Inc. Class A (a) | 120,400 | | 2,757 |
McGraw-Hill Companies, Inc. | 15,100 | | 758 |
News Corp. Class B | 7,600 | | 153 |
Viacom, Inc. Class B (non-vtg.) (a) | 48,200 | | 1,727 |
| | 5,395 |
Specialty Retail - 1.4% |
Best Buy Co., Inc. | 600 | | 33 |
Gamestop Corp. Class B (a) | 90,655 | | 3,105 |
Staples, Inc. | 81,450 | | 1,981 |
The Game Group PLC | 506,331 | | 766 |
| | 5,885 |
TOTAL CONSUMER DISCRETIONARY | | 13,554 |
CONSUMER STAPLES - 8.6% |
Beverages - 0.5% |
The Coca-Cola Co. | 48,300 | | 2,078 |
Food & Staples Retailing - 0.7% |
CVS Corp. | 53,600 | | 1,646 |
Wal-Mart Stores, Inc. | 23,700 | | 1,142 |
| | 2,788 |
Food Products - 2.3% |
McCormick & Co., Inc. (non-vtg.) | 42,900 | | 1,439 |
Nestle SA: | | | |
(Reg.) | 7,209 | | 2,264 |
sponsored ADR | 74,400 | | 5,796 |
| | 9,499 |
Household Products - 1.1% |
Colgate-Palmolive Co. | 74,600 | | 4,469 |
Tobacco - 4.0% |
Altria Group, Inc. | 227,800 | | 16,727 |
TOTAL CONSUMER STAPLES | | 35,561 |
Common Stocks - continued |
| Shares | | Value (Note 1) (000s) |
ENERGY - 4.4% |
Energy Equipment & Services - 1.2% |
Halliburton Co. | 33,500 | | $ 2,486 |
Schlumberger Ltd. (NY Shares) | 37,100 | | 2,416 |
| | 4,902 |
Oil, Gas & Consumable Fuels - 3.2% |
ConocoPhillips | 87,400 | | 5,727 |
Exxon Mobil Corp. | 92,900 | | 5,699 |
Ultra Petroleum Corp. (a) | 33,600 | | 1,991 |
| | 13,417 |
TOTAL ENERGY | | 18,319 |
FINANCIALS - 14.7% |
Capital Markets - 0.0% |
Northern Trust Corp. | 1,400 | | 77 |
Commercial Banks - 0.0% |
Boston Private Financial Holdings, Inc. | 2,800 | | 78 |
Consumer Finance - 3.8% |
SLM Corp. | 298,450 | | 15,794 |
Diversified Financial Services - 1.7% |
Bank of America Corp. | 145,760 | | 7,011 |
Insurance - 9.2% |
ACE Ltd. | 63,000 | | 3,187 |
AFLAC, Inc. | 62,480 | | 2,896 |
American International Group, Inc. | 474,950 | | 28,046 |
Aspen Insurance Holdings Ltd. | 5,700 | | 133 |
Platinum Underwriters Holdings Ltd. | 8,800 | | 246 |
The St. Paul Travelers Companies, Inc. | 74,200 | | 3,308 |
| | 37,816 |
TOTAL FINANCIALS | | 60,776 |
HEALTH CARE - 21.1% |
Biotechnology - 0.9% |
Biogen Idec, Inc. (a) | 18,700 | | 866 |
Cephalon, Inc. (a) | 10,200 | | 613 |
Gilead Sciences, Inc. (a) | 36,600 | | 2,165 |
| | 3,644 |
Health Care Equipment & Supplies - 1.6% |
Advanced Medical Optics, Inc. (a) | 50,300 | | 2,550 |
Common Stocks - continued |
| Shares | | Value (Note 1) (000s) |
HEALTH CARE - continued |
Health Care Equipment & Supplies - continued |
Alcon, Inc. | 6,700 | | $ 660 |
C.R. Bard, Inc. | 41,700 | | 3,055 |
Inverness Medical Innovations, Inc. (a) | 13,600 | | 384 |
| | 6,649 |
Health Care Providers & Services - 3.7% |
Aetna, Inc. | 59,500 | | 2,376 |
Humana, Inc. (a) | 126,300 | | 6,782 |
UnitedHealth Group, Inc. | 135,130 | | 6,051 |
| | 15,209 |
Life Sciences Tools & Services - 1.4% |
Charles River Laboratories International, Inc. (a) | 157,700 | | 5,803 |
Pharmaceuticals - 13.5% |
Allergan, Inc. | 31,500 | | 3,379 |
Barr Pharmaceuticals, Inc. (a) | 16,490 | | 786 |
Cipla Ltd. | 278,331 | | 1,310 |
Endo Pharmaceuticals Holdings, Inc. (a) | 65,189 | | 2,150 |
Johnson & Johnson | 339,700 | | 20,355 |
Novartis AG sponsored ADR | 49,000 | | 2,642 |
Pfizer, Inc. | 84,000 | | 1,971 |
Roche Holding AG (participation certificate) | 70,087 | | 11,587 |
Teva Pharmaceutical Industries Ltd. sponsored ADR | 75,903 | | 2,398 |
Wyeth | 204,600 | | 9,086 |
| | 55,664 |
TOTAL HEALTH CARE | | 86,969 |
INDUSTRIALS - 13.5% |
Aerospace & Defense - 5.4% |
General Dynamics Corp. | 96,600 | | 6,323 |
Honeywell International, Inc. | 289,630 | | 11,672 |
Raytheon Co. | 72,700 | | 3,240 |
United Technologies Corp. | 14,700 | | 932 |
| | 22,167 |
Commercial Services & Supplies - 0.0% |
Allied Waste Industries, Inc. (a) | 11,000 | | 125 |
Waste Management, Inc. | 3,600 | | 129 |
| | 254 |
Common Stocks - continued |
| Shares | | Value (Note 1) (000s) |
INDUSTRIALS - continued |
Construction & Engineering - 1.2% |
Chicago Bridge & Iron Co. NV (NY Shares) | 8,200 | | $ 198 |
Jacobs Engineering Group, Inc. (a) | 58,200 | | 4,635 |
| | 4,833 |
Industrial Conglomerates - 6.9% |
General Electric Co. | 860,550 | | 28,368 |
TOTAL INDUSTRIALS | | 55,622 |
INFORMATION TECHNOLOGY - 16.8% |
Communications Equipment - 5.5% |
CIENA Corp. (a) | 2,634,400 | | 12,671 |
Cisco Systems, Inc. (a) | 87,200 | | 1,703 |
Corning, Inc. (a) | 18,300 | | 443 |
CSR PLC (a) | 1,800 | | 42 |
Harris Corp. | 92,800 | | 3,852 |
Lucent Technologies, Inc. (a) | 1,168,800 | | 2,828 |
NMS Communications Corp. (a) | 287,666 | | 1,041 |
| | 22,580 |
Computers & Peripherals - 0.6% |
EMC Corp. (a) | 55,400 | | 608 |
NCR Corp. (a) | 50,100 | | 1,836 |
| | 2,444 |
Electronic Equipment & Instruments - 0.0% |
Universal Display Corp. (a) | 9,205 | | 123 |
Internet Software & Services - 2.1% |
eBay, Inc. (a) | 238,553 | | 6,987 |
Yahoo!, Inc. (a) | 51,700 | | 1,706 |
| | 8,693 |
IT Services - 0.0% |
NCI, Inc. Class A | 11,103 | | 145 |
Semiconductors & Semiconductor Equipment - 2.4% |
Applied Materials, Inc. | 71,700 | | 1,167 |
Applied Micro Circuits Corp. (a) | 320,388 | | 875 |
ARM Holdings PLC sponsored ADR | 115,300 | | 722 |
ASML Holding NV (NY Shares) (a) | 520 | | 11 |
Broadcom Corp. Class A (a) | 700 | | 21 |
Cymer, Inc. (a) | 374 | | 17 |
Exar Corp. (a) | 89,194 | | 1,184 |
Common Stocks - continued |
| Shares | | Value (Note 1) (000s) |
INFORMATION TECHNOLOGY - continued |
Semiconductors & Semiconductor Equipment - continued |
Integrated Device Technology, Inc. (a) | 128,009 | | $ 1,815 |
Intel Corp. | 22,300 | | 423 |
Linear Technology Corp. | 76,337 | | 2,557 |
PMC-Sierra, Inc. (a) | 119,651 | | 1,125 |
Trident Microsystems, Inc. (a) | 500 | | 9 |
| | 9,926 |
Software - 6.2% |
Activision, Inc. (a) | 148,328 | | 1,688 |
Cadence Design Systems, Inc. (a) | 16,533 | | 284 |
Electronic Arts, Inc. (a) | 39,154 | | 1,685 |
Microsoft Corp. | 763,860 | | 17,798 |
NDS Group PLC sponsored ADR (a) | 26,583 | | 1,237 |
Nintendo Co. Ltd. | 2,000 | | 336 |
THQ, Inc. (a) | 113,258 | | 2,446 |
| | 25,474 |
TOTAL INFORMATION TECHNOLOGY | | 69,385 |
MATERIALS - 1.6% |
Metals & Mining - 1.6% |
Goldcorp, Inc. | 76,000 | | 2,291 |
Newmont Mining Corp. | 79,800 | | 4,224 |
| | 6,515 |
TELECOMMUNICATION SERVICES - 7.1% |
Diversified Telecommunication Services - 3.5% |
Alaska Communication Systems Group, Inc. | 42,900 | | 543 |
AT&T, Inc. | 162,500 | | 4,532 |
Qwest Communications International, Inc. (a) | 283,500 | | 2,294 |
Verizon Communications, Inc. | 213,730 | | 7,158 |
| | 14,527 |
Wireless Telecommunication Services - 3.6% |
ALLTEL Corp. | 44,500 | | 2,840 |
American Tower Corp. Class A (a) | 208,498 | | 6,488 |
Sprint Nextel Corp. | 268,900 | | 5,375 |
| | 14,703 |
TOTAL TELECOMMUNICATION SERVICES | | 29,230 |
Common Stocks - continued |
| Shares | | Value (Note 1) (000s) |
UTILITIES - 0.3% |
Independent Power Producers & Energy Traders - 0.3% |
TXU Corp. | 17,500 | | $ 1,046 |
TOTAL COMMON STOCKS (Cost $378,815) | 376,977 |
Preferred Stocks - 0.0% |
| | | |
Convertible Preferred Stocks - 0.0% |
INFORMATION TECHNOLOGY - 0.0% |
Communications Equipment - 0.0% |
Chorum Technologies, Inc. Series E (a)(c) | 6,900 | | 0 |
Nonconvertible Preferred Stocks - 0.0% |
HEALTH CARE - 0.0% |
Life Sciences Tools & Services - 0.0% |
GeneProt, Inc. Series A (a)(c) | 64,000 | | 0 |
TOTAL PREFERRED STOCKS (Cost $451) | 0 |
Convertible Bonds - 0.7% |
| Principal Amount (000s) | | |
INFORMATION TECHNOLOGY - 0.7% |
Communications Equipment - 0.7% |
CIENA Corp. 3.75% 2/1/08 | $ 2,960 | | 2,846 |
TOTAL CONVERTIBLE BONDS (Cost $2,824) | 2,846 |
Money Market Funds - 8.7% |
| Shares | | Value (Note 1)
(000s) |
Fidelity Cash Central Fund, 5.11% (b)
(Cost $35,824) | 35,824,227 | | $ 35,824 |
TOTAL INVESTMENT PORTFOLIO - 100.8% (Cost $417,914) | | 415,647 |
NET OTHER ASSETS - (0.8)% | | (3,495) |
NET ASSETS - 100% | $ 412,152 |
Legend |
(a) Non-income producing |
(b) Affiliated fund that is available only to investment companies and other accounts managed by Fidelity Investments. The rate quoted is the annualized seven-day yield of the fund at period end. A complete unaudited listing of the fund's holdings as of its most recent quarter end is available upon request. |
(c) Restricted securities - Investment in securities not registered under the Securities Act of 1933 (excluding 144A issues). At the end of the period, the value of restricted securities (excluding 144A issues) amounted to $0 or 0.0% of net assets. |
Additional information on each holding is as follows: |
Security | Acquisition Date | Acquisition Cost (000s) |
Chorum Technologies, Inc. Series E | 9/19/00 | $ 104 |
GeneProt, Inc. Series A | 7/7/00 | $ 347 |
Affiliated Central Funds |
Information regarding fiscal year to date income earned by the fund from the affiliated Central funds is as follows: |
Fund | Income earned
(Amounts in thousands) |
Fidelity Cash Central Fund | $ 1,238 |
Fidelity Securities Lending Cash Central Fund | 158 |
Total | $ 1,396 |
Other Information |
Distribution of investments by country of issue, as a percentage of total net assets, is as follows: |
United States of America | 89.9% |
Switzerland | 5.7% |
Canada | 1.1% |
Others (individually less than 1%) | 3.3% |
| 100.0% |
Income Tax Information |
At June 30, 2006, the fund had a capital loss carryforward of approximately $198,331,000 of which $108,240,000 and $90,091,000 will expire on June 30, 2010 and 2011, respectively. |
See accompanying notes which are an integral part of the financial statements.
Annual Report
Financial Statements
Statement of Assets and Liabilities
Amounts in thousands (except per-share amount) | June 30, 2006 |
| | |
Assets | | |
Investment in securities, at value - See accompanying schedule: Unaffiliated issuers (cost $382,090) | $ 379,823 | |
Affiliated Central Funds (cost $35,824) | 35,824 | |
Total Investments (cost $417,914) | | $ 415,647 |
Foreign currency held at value (cost $361) | | 361 |
Receivable for investments sold | | 3,302 |
Receivable for fund shares sold | | 141 |
Dividends receivable | | 541 |
Interest receivable | | 159 |
Prepaid expenses | | 1 |
Other receivables | | 6 |
Total assets | | 420,158 |
| | |
Liabilities | | |
Payable for investments purchased | $ 7,099 | |
Payable for fund shares redeemed | 500 | |
Accrued management fee | 106 | |
Other affiliated payables | 112 | |
Other payables and accrued expenses | 189 | |
Total liabilities | | 8,006 |
| | |
Net Assets | | $ 412,152 |
Net Assets consist of: | | |
Paid in capital | | $ 611,752 |
Undistributed net investment income | | 2,615 |
Accumulated undistributed net realized gain (loss) on investments and foreign currency transactions | | (199,820) |
Net unrealized appreciation (depreciation) on investments and assets and liabilities in foreign currencies | | (2,395) |
Net Assets, for 35,521 shares outstanding | | $ 412,152 |
Net Asset Value, offering price and redemption price per share ($412,152 ÷ 35,521 shares) | | $ 11.60 |
See accompanying notes which are an integral part of the financial statements.
Annual Report
Financial Statements - continued
Statement of Operations
Amounts in thousands | Year ended June 30, 2006 |
| | |
Investment Income | | |
Dividends | | $ 5,671 |
Interest | | 190 |
Income from affiliated Central Funds | | 1,396 |
Total income | | 7,257 |
| | |
Expenses | | |
Management fee
Basic fee | $ 2,487 | |
Performance adjustment | (1,113) | |
Transfer agent fees | 1,184 | |
Accounting and security lending fees | 166 | |
Independent trustees' compensation | 2 | |
Custodian fees and expenses | 102 | |
Registration fees | 26 | |
Audit | 56 | |
Legal | 13 | |
Miscellaneous | 47 | |
Total expenses before reductions | 2,970 | |
Expense reductions | (285) | 2,685 |
Net investment income (loss) | | 4,572 |
Realized and Unrealized Gain (Loss) Net realized gain (loss) on: | | |
Investment securities: | | |
Unaffiliated issuers (net of foreign taxes of $18) | 31,500 | |
Foreign currency transactions | 44 | |
Total net realized gain (loss) | | 31,544 |
Change in net unrealized appreciation (depreciation) on investment securities (net of increase in deferred foreign taxes of $93) | | 5,524 |
Net gain (loss) | | 37,068 |
Net increase (decrease) in net assets resulting from operations | | $ 41,640 |
See accompanying notes which are an integral part of the financial statements.
Annual Report
Statement of Changes in Net Assets
Amounts in thousands | Year ended
June 30,
2006 | Year ended
June 30,
2005 |
Increase (Decrease) in Net Assets | | |
Operations | | |
Net investment income (loss) | $ 4,572 | $ 7,836 |
Net realized gain (loss) | 31,544 | 29,781 |
Change in net unrealized appreciation (depreciation) | 5,524 | (13,687) |
Net increase (decrease) in net assets resulting
from operations | 41,640 | 23,930 |
Distributions to shareholders from net investment income | (5,199) | (6,449) |
Share transactions
Proceeds from sales of shares | 47,668 | 45,954 |
Reinvestment of distributions | 5,074 | 6,299 |
Cost of shares redeemed | (136,024) | (151,373) |
Net increase (decrease) in net assets resulting from share transactions | (83,282) | (99,120) |
Total increase (decrease) in net assets | (46,841) | (81,639) |
| | |
Net Assets | | |
Beginning of period | 458,993 | 540,632 |
End of period (including undistributed net investment income of $2,615 and undistributed net investment income of $3,239, respectively) | $ 412,152 | $ 458,993 |
Other Information Shares | | |
Sold | 4,041 | 4,366 |
Issued in reinvestment of distributions | 451 | 590 |
Redeemed | (11,861) | (14,295) |
Net increase (decrease) | (7,369) | (9,339) |
See accompanying notes which are an integral part of the financial statements.
Annual Report
Financial Highlights
Years ended June 30, | 2006 | 2005 | 2004 | 2003 | 2002 |
Selected Per-Share Data | | | | | |
Net asset value, beginning of period | $ 10.70 | $ 10.35 | $ 9.40 | $ 9.33 | $ 11.36 |
Income from Investment Operations | | | | | |
Net investment income (loss) B | .12 | .16 C | .07 | .04 | .03 |
Net realized and unrealized gain (loss) | .91 | .32 | .93 | .06 | (2.02) |
Total from investment operations | 1.03 | .48 | 1.00 | .10 | (1.99) |
Distributions from net investment income | (.13) | (.13) | (.05) | (.03) | (.04) |
Net asset value, end of period | $ 11.60 | $ 10.70 | $ 10.35 | $ 9.40 | $ 9.33 |
Total Return A | 9.67% | 4.64% | 10.67% | 1.11% | (17.56)% |
Ratios to Average Net Assets D | | | | | |
Expenses before reductions | .68% | .81% | .91% | 1.17% | 1.11% |
Expenses net of fee waivers, if any | .68% | .81% | .91% | 1.17% | 1.11% |
Expenses net of all reductions | .61% | .70% | .84% | .97% | .99% |
Net investment income (loss) | 1.04% | 1.54% C | .73% | .43% | .32% |
Supplemental Data | | | | | |
Net assets, end of period (in millions) | $ 412 | $ 459 | $ 541 | $ 690 | $ 806 |
Portfolio turnover rate | 184% | 229% | 249% | 367% | 259% |
A Total returns would have been lower had certain expenses not been reduced during the periods shown.
B Calculated based on average shares outstanding during the period.
C Investment income per share reflects a special dividend which amounted to $.04 per share. Excluding the special dividend, the ratio of net investment income (loss) to average net assets would have been 1.13%.
D Expense ratios reflect operating expenses of the fund. Expenses before reductions do not reflect amounts reimbursed by the investment adviser or reductions from brokerage service arrangements or other expense offset arrangements and do not represent the amount paid by the fund during periods when reimbursements or reductions occur. Expenses net of fee waivers reflect expenses after reimbursement by the investment adviser but prior to reductions from brokerage service arrangements or other expense offset arrangements. Expenses net of all reductions represent the net expenses paid by the fund.
See accompanying notes which are an integral part of the financial statements.
Annual Report
Notes to Financial Statements
For the period ended June 30, 2006
(Amounts in thousands except ratios)
1. Significant Accounting Policies.
Fidelity Discovery Fund (the Fund) is a fund of Fidelity Hastings Street Trust (the trust) and is authorized to issue an unlimited number of shares. The trust is registered under the Investment Company Act of 1940, as amended (the 1940 Act), as an open-end management investment company organized as a Massachusetts business trust. The Fund may invest in affiliated money market central funds (Money Market Central Funds), which are open-end investment companies available to investment companies and other accounts managed by Fidelity Management & Research Company (FMR) and its affiliates. The financial statements have been prepared in conformity with accounting principles generally accepted in the United States of America, which require management to make certain estimates and assumptions at the date of the financial statements. The following summarizes the significant accounting policies of the Fund:
Security Valuation. Investments are valued and net asset value (NAV) per share is calculated (NAV calculation) as of the close of business of the New York Stock Exchange (NYSE), normally 4:00 p.m. Eastern time. Wherever possible, the Fund uses independent pricing services approved by the Board of Trustees to value its investments.
Equity securities, including restricted securities, for which market quotations are readily available, are valued at the last reported sale price or official closing price as reported by an independent pricing service on the primary market or exchange on which they are traded. In the event there were no sales during the day or closing prices are not available, securities are valued at the last quoted bid price. Debt securities, including restricted securities, for which quotations are readily available, are valued by independent pricing services or by dealers who make markets in such securities. Pricing services consider yield or price of bonds of comparable quality, coupon, maturity and type as well as dealer supplied prices. Investments in open-end mutual funds are valued at their closing net asset value each business day. Short-term securities with remaining maturities of sixty days or less for which quotations are not readily available are valued at amortized cost, which approximates value.
When current market prices or quotations are not readily available or do not accurately reflect fair value, valuations may be determined in accordance with procedures adopted by the Board of Trustees. For example, when developments occur between the close of a market and the close of the NYSE that may materially affect the value of some or all of the securities, or when trading in a security is halted, those securities may be fair valued. Factors used in the determination of fair value may include monitoring news to identify significant market or security specific events such as changes in the value of U.S. securities markets, reviewing developments in foreign markets and evaluating the performance of ADRs, futures contracts and exchange-traded funds. Because the Fund's utilization of fair value pricing depends on market activity, the frequency with which fair value pricing is used can not be predicted and may be utilized to a significant extent. The
Annual Report
Notes to Financial Statements - continued
(Amounts in thousands except ratios)
1. Significant Accounting Policies - continued
Security Valuation - continued
value of securities used for NAV calculation under fair value pricing may differ from published prices for the same securities.
Foreign Currency. The Fund uses foreign currency contracts to facilitate transactions in foreign-denominated securities. Losses from these transactions may arise from changes in the value of the foreign currency or if the counterparties do not perform under the contracts' terms.
Foreign-denominated assets, including investment securities, and liabilities are translated into U.S. dollars at the exchange rate at period end. Purchases and sales of investment securities, income and dividends received and expenses denominated in foreign currencies are translated into U.S. dollars at the exchange rate in effect on the transaction date.
The effects of exchange rate fluctuations on investments are included with the net realized and unrealized gain (loss) on investment securities. Other foreign currency transactions resulting in realized and unrealized gain (loss) are disclosed separately.
Investment Transactions and Income. Security transactions are accounted for as of trade date. Gains and losses on securities sold are determined on the basis of identified cost and may include proceeds received from litigation. Dividend income is recorded on the ex-dividend date, except for certain dividends from foreign securities where the ex-dividend date may have passed, which are recorded as soon as the Fund is informed of the ex-dividend date. Non-cash dividends included in dividend income, if any, are recorded at the fair market value of the securities received. Distributions received on securities that represent a return of capital or capital gain are recorded as a reduction of cost of investments and/or as a realized gain. The Fund estimates the components of distributions received that may be considered return of capital distributions or capital gain distributions. Interest income is accrued as earned. Interest income includes coupon interest and amortization of premium and accretion of discount on debt securities. Investment income is recorded net of foreign taxes withheld where recovery of such taxes is uncertain.
Expenses. Most expenses of the trust can be directly attributed to a fund. Expenses which cannot be directly attributed are apportioned among each Fund in the trust.
Income Tax Information and Distributions to Shareholders. Each year, the Fund intends to qualify as a regulated investment company by distributing all of its taxable income and realized gains under Subchapter M of the Internal Revenue Code. As a result, no provision for income taxes is required in the accompanying financial statements.
Annual Report
1. Significant Accounting Policies - continued
Income Tax Information and Distributions to Shareholder - continued
Foreign taxes are provided for based on the Fund's understanding of the tax rules and rates that exist in the foreign markets in which it invests. Distributions are recorded on the ex-dividend date. Income and capital gain distributions are determined in accordance with income tax regulations, which may differ from generally accepted accounting principles.
Capital accounts within the financial statements are adjusted for permanent book-tax differences. These adjustments have no impact on net assets or the results of operations. Temporary book-tax differences will reverse in a subsequent period.
Book-tax differences are primarily due to foreign currency transactions, passive foreign investment companies (PFIC), market discount, capital loss carryforwards and losses deferred due to wash sales.
The tax-basis components of distributable earnings and the federal tax cost as of period end were as follows:
Unrealized appreciation | $ 19,393 | |
Unrealized depreciation | (23,585) | |
Net unrealized appreciation (depreciation) | (4,192) | |
Undistributed ordinary income | 2,923 | |
Capital loss carryforward | (198,331) | |
| | |
Cost for federal income tax purposes | $ 419,839 | |
The tax character of distributions paid was as follows:
| June 30, 2006 | June 30, 2005 |
Ordinary Income | $ 5,199 | $ 6,449 |
New Accounting Pronouncement. In July 2006, Financial Accounting Standards Board Interpretation No. 48, Accounting for Uncertainty in Income Taxes - an interpretation of FASB Statement 109 (FIN 48) was issued and is effective for fiscal years beginning after December 15, 2006. FIN 48 sets forth a threshold for financial statement recognition, measurement and disclosure of a tax position taken or expected to be taken on a tax return. Management is currently evaluating the impact, if any, the adoption of FIN 48 will have on the Fund's net assets and results of operations.
2. Operating Policies.
Repurchase Agreements. FMR has received an Exemptive Order from the Securities and Exchange Commission (the SEC) which permits the Fund and other affiliated entities of FMR to transfer uninvested cash balances into joint trading accounts which
Annual Report
Notes to Financial Statements - continued
(Amounts in thousands except ratios)
2. Operating Policies - continued
Repurchase Agreements - continued
are then invested in repurchase agreements. The Fund may also invest directly with institutions in repurchase agreements. Repurchase agreements are collateralized by government or non-government securities. Upon settlement date, collateral is held in segregated accounts with custodian banks and may be obtained in the event of a default of the counterparty. The Fund monitors, on a daily basis, the value of the collateral to ensure it is at least equal to the principal amount of the repurchase agreement (including accrued interest). In the event of a default by the counterparty, realization of the collateral proceeds could be delayed, during which time the value of the collateral may decline.
Restricted Securities. The Fund may invest in securities that are subject to legal or contractual restrictions on resale. These securities generally may be resold in transactions exempt from registration or to the public if the securities are registered. Disposal of these securities may involve time-consuming negotiations and expense, and prompt sale at an acceptable price may be difficult. Information regarding restricted securities is included at the end of the Fund's Schedule of Investments.
3. Purchases and Sales of Investments.
Purchases and sales of securities, other than short-term securities and U.S. government securities, aggregated $755,747 and $835,828, respectively.
4. Fees and Other Transactions with Affiliates.
Management Fee. FMR and its affiliates provide the Fund with investment management related services for which the Fund pays a monthly management fee. The management fee is the sum of an individual fund fee rate that is based on an annual rate of .30% of the Fund's average net assets and a group fee rate that averaged ..27% during the period. The group fee rate is based upon the average net assets of all the mutual funds advised by FMR. The group fee rate decreases as assets under management increase and increases as assets under management decrease. In addition, the management fee is subject to a performance adjustment (up to a maximum of ± .20% of the Fund's average net assets over a 36 month performance period). The upward or downward adjustment to the management fee is based on the Fund's relative investment performance as compared to an appropriate benchmark index. For the period, the total annual management fee rate, including the performance adjustment, was .31% of the Fund's average net assets.
Annual Report
4. Fees and Other Transactions with Affiliates - continued
Transfer Agent Fees. Fidelity Service Company, Inc. (FSC), an affiliate of FMR, is the Fund's transfer, dividend disbursing and shareholder servicing agent. FSC receives account fees and asset-based fees that vary according to account size and type of account. FSC pays for typesetting, printing and mailing of shareholder reports, except proxy statements. For the period, the transfer agent fees were equivalent to an annual rate of .27% of average net assets.
Accounting and Security Lending Fees. FSC maintains the Fund's accounting records. The accounting fee is based on the level of average net assets for the month. Under a separate contract, FSC administers the security lending program. The security lending fee is based on the number and duration of lending transactions.
Affiliated Central Funds. The Fund may invest in Money Market Central Funds which seek preservation of capital and current income and are managed by Fidelity Investments Money Management, Inc. (FIMM), an affiliate of FMR.
The Money Market Central Funds do not pay a management fee.
Brokerage Commissions. The Fund placed a portion of its portfolio transactions with brokerage firms which are affiliates of the investment adviser. The commissions paid to these affiliated firms were $20 for the period.
5. Committed Line of Credit.
The Fund participates with other funds managed by FMR in a $4.2 billion credit facility (the "line of credit") to be utilized for temporary or emergency purposes to fund shareholder redemptions or for other short-term liquidity purposes. The Fund has agreed to pay commitment fees on its pro rata portion of the line of credit, which amounts to $1 and is reflected in Miscellaneous Expense on the Statement of Operations. During the period, there were no borrowings on this line of credit.
6. Security Lending.
The Fund lends portfolio securities from time to time in order to earn additional income. On the settlement date of the loan, the Fund receives collateral (in the form of U.S. Treasury obligations, letters of credit and/or cash) against the loaned securities and maintains collateral in an amount not less than 100% of the market value of the loaned securities during the period of the loan. The market value of the loaned securities is determined at the close of business of the Fund and any additional required collateral is delivered to the Fund on the next business day. If the borrower defaults on its obligation to return the securities loaned because of insolvency or other reasons, a fund could experience delays and costs in recovering the securities loaned or in gaining access to the collateral. Any cash collateral received is invested in the Fidelity Securities Lending
Annual Report
Notes to Financial Statements - continued
(Amounts in thousands except ratios)
6. Security Lending - continued
Cash Central Fund. At period end there were no security loans outstanding. Security lending income represents the income earned on investing cash collateral, less fees and expenses associated with the loan, plus any premium payments that may be received on the loan of certain types of securities. Security lending income is presented in the Statement of Operations as a component of income from affiliated central funds. Net income from lending portfolio securities during the period amounted to $158.
7. Expense Reductions.
Many of the brokers with whom FMR places trades on behalf of the Fund provided services to the Fund in addition to trade execution. These services included payments of certain expenses on behalf of the Fund totaling $277 for the period. In addition, through arrangements with the Fund's custodian and transfer agent, credits realized as a result of uninvested cash balances were used to reduce the Fund's expenses. During the period, these credits reduced the Fund's custody and transfer agent expenses by $2 and $6, respectively.
8. Other.
The Fund's organizational documents provide former and current trustees and officers with a limited indemnification against liabilities arising in connection with the performance of their duties to the Fund. In the normal course of business, the Fund may also enter into contracts that provide general indemnifications. The Fund's maximum exposure under these arrangements is unknown as this would be dependent on future claims that may be made against the Fund. The risk of material loss from such claims is considered remote.
Annual Report
Report of Independent Registered Public Accounting Firm
To the Trustees of Fidelity Hastings Street Trust and the Shareholders of Fidelity Discovery Fund:
In our opinion, the accompanying statement of assets and liabilities, including the schedule of investments, and the related statements of operations and of changes in net assets and the financial highlights present fairly, in all material respects, the financial position of Fidelity Discovery Fund (a fund of Fidelity Hastings Street Trust) at June 30, 2006, and the results of its operations for the year then ended, the changes in its net assets for each of the two years in the period then ended and the financial highlights for each of the five years in the period then ended, in conformity with accounting principles generally accepted in the United States of America. These financial statements and financial highlights (hereafter referred to as "financial statements") are the responsibility of the Fidelity Discovery Fund's management; our responsibility is to express an opinion on these financial statements based on our audits. We conducted our audits of these financial statements in accordance with the standards of the Public Company Accounting Oversight Board (United States). Those standards require that we plan and perform the audit to obtain reasonable assurance about whether the financial statements are free of material misstatement. An audit includes examining, on a test basis, evidence supporting the amounts and disclosures in the financial statements, assessing the accounting principles used and significant estimates made by management, and evaluating the overall financial statement presentation. We believe that our audits, which included confirmation of securities at June 30, 2006 by correspondence with the custodian and brokers, provide a reasonable basis for our opinion.
/s/ PricewaterhouseCoopers LLP
PricewaterhouseCoopers LLP
Boston, Massachusetts
August 14, 2006
Annual Report
Trustees and Officers
The Trustees, Members of the Advisory Board, and executive officers of the trust and fund, as applicable, are listed below. The Board of Trustees governs the fund and is responsible for protecting the interests of shareholders. The Trustees are experienced executives who meet periodically throughout the year to oversee the fund's activities, review contractual arrangements with companies that provide services to the fund, and review the fund's performance. Except for William O. McCoy and Albert R. Gamper, Jr., each of the Trustees oversees 336 funds advised by FMR or an affiliate. Mr. McCoy oversees 338 funds advised by FMR or an affiliate. Mr. Gamper oversees 281 funds advised by FMR or an affiliate.
The Trustees hold office without limit in time except that (a) any Trustee may resign; (b) any Trustee may be removed by written instrument, signed by at least two-thirds of the number of Trustees prior to such removal; (c) any Trustee who requests to be retired or who has become incapacitated by illness or injury may be retired by written instrument signed by a majority of the other Trustees; and (d) any Trustee may be removed at any special meeting of shareholders by a two-thirds vote of the outstanding voting securities of the trust. Each Trustee who is not an interested person (as defined in the 1940 Act) (Independent Trustee), shall retire not later than the last day of the calendar year in which his or her 72nd birthday occurs. The Independent Trustees may waive this mandatory retirement age policy with respect to individual Trustees. The executive officers and Advisory Board Members hold office without limit in time, except that any officer and Advisory Board Member may resign or may be removed by a vote of a majority of the Trustees at any regular meeting or any special meeting of the Trustees. Except as indicated, each individual has held the office shown or other offices in the same company for the past five years.
The fund's Statement of Additional Information (SAI) includes more information about the Trustees. To request a free copy, call Fidelity at 800-544-8544.
Interested Trustees*:
Correspondence intended for each Trustee who is an interested person may be sent to Fidelity Investments, 82 Devonshire Street, Boston, Massachusetts 02109.
Name, Age; Principal Occupation |
Edward C. Johnson 3d (76) |
| Year of Election or Appointment: 1984 Mr. Johnson is Chairman of the Board of Trustees. Mr. Johnson serves as President (2006-present), Chief Executive Officer, Chairman, and a Director of FMR Corp.; Chairman and a Director of FMR; Chairman and a Director of Fidelity Research & Analysis Company (FRAC); Chairman and a Director of Fidelity Investments Money Management, Inc.; and Chairman (2001-present) and a Director (1999-present) of FMR Co., Inc. In addition, Mr. Johnson serves as Chairman and Director of Fidelity International Limited (FIL). |
Stephen P. Jonas (53) |
| Year of Election or Appointment: 2005 Mr. Jonas is Senior Vice President of Discovery (2005-present). He also serves as Senior Vice President of other Fidelity funds (2005-present). Mr. Jonas is Executive Director of FMR (2005-present) and FMR Co., Inc. (2005-present). He also serves as a Director of Fidelity Investments Money Management, Inc. (2005-present) and FMR Corp. (2003-present). Previously, Mr. Jonas served as President of Fidelity Enterprise Operations and Risk Services (2004-2005), Chief Administrative Officer (2002-2004), and Chief Financial Officer of FMR Corp. (1998-2002). In addition, he serves on the Boards of Boston Ballet (2003-present) and Simmons College (2003-present). |
Robert L. Reynolds (54) |
| Year of Election or Appointment: 2003 Mr. Reynolds is President and a Director of FMR (2005-present), Fidelity Investments Money Management, Inc. (2005-present), and FMR Co., Inc. (2005-present). Mr. Reynolds also serves as a Director (2003-present) and Chief Operating Officer (2000-present) of FMR Corp. and a Director of Strategic Advisers, Inc. (2005-present). He also serves on the Board at Fidelity Investments Canada, Ltd. (2000-present). Previously, Mr. Reynolds served as President of Fidelity Investments Institutional Retirement Group (1996-2000). |
* Trustees have been determined to be "Interested Trustees" by virtue of, among other things, their affiliation with the trust or various entities under common control with FMR.
Annual Report
Independent Trustees:
Correspondence intended for each Independent Trustee (that is, the Trustees other than the Interested Trustees) may be sent to Fidelity Investments, P.O. Box 55235, Boston, Massachusetts 02205-5235.
Name, Age; Principal Occupation |
Dennis J. Dirks (58) |
| Year of Election or Appointment: 2005 Prior to his retirement in May 2003, Mr. Dirks was Chief Operating Officer and a member of the Board of The Depository Trust & Clearing Corporation (DTCC) (1999-2003). He also served as President, Chief Operating Officer, and Board member of The Depository Trust Company (DTC) (1999-2003) and President and Board member of the National Securities Clearing Corporation (NSCC) (1999-2003). In addition, Mr. Dirks served as Chief Executive Officer and Board member of the Government Securities Clearing Corporation (2001-2003) and Chief Executive Officer and Board member of the Mortgage-Backed Securities Clearing Corporation (2001-2003). Mr. Dirks also serves as a Trustee and a member of the Finance Committee of Manhattan College (2005-present) and a Trustee and a member of the Finance Committee of AHRC of Nassau County (2006-present). |
|
Albert R. Gamper, Jr. (64) |
| Year of Election or Appointment: 2006 Mr. Gamper also serves as a Trustee (2006-present) or Member of the Advisory Board (2005-present) of other investment companies advised by FMR. Prior to his retirement in December 2004, Mr. Gamper served as Chairman of the Board of CIT Group Inc. (commercial finance). During his tenure with CIT Group Inc. Mr. Gamper served in numerous senior management positions, including Chairman (1987-1989; 1999-2001; 2002-2004), Chief Executive Officer (1987-2004), and President (1989-2002). He currently serves as a member of the Board of Directors of Public Service Enterprise Group (utilities, 2001-present), Chairman of the Board of Governors, Rutgers University (2004-present), and Chairman of the Board of Saint Barnabas Health Care System. |
Robert M. Gates (62) |
| Year of Election or Appointment: 1997 Dr. Gates is Chairman of the Independent Trustees (2006-present). Dr. Gates is President of Texas A&M University (2002-present). He was Director of the Central Intelligence Agency (CIA) from 1991 to 1993. From 1989 to 1991, Dr. Gates served as Assistant to the President of the United States and Deputy National Security Advisor. Dr. Gates is a Director of NACCO Industries, Inc. (mining and manufacturing), Parker Drilling Co., Inc. (drilling and rental tools for the energy industry, 2001-present), and Brinker International (restaurant management, 2003-present). Previously, Dr. Gates served as a Director of LucasVarity PLC (automotive components and diesel engines), a Director of TRW Inc. (automotive, space, defense, and information technology), and Dean of the George Bush School of Government and Public Service at Texas A&M University (1999-2001). |
George H. Heilmeier (70) |
| Year of Election or Appointment: 2004 Dr. Heilmeier is Chairman Emeritus of Telcordia Technologies (communication software and systems), where prior to his retirement, he served as company Chairman and Chief Executive Officer. He currently serves on the Boards of Directors of The Mitre Corporation (systems engineering and information technology support for the government), and HRL Laboratories (private research and development, 2004-present). He is Chairman of the General Motors Science & Technology Advisory Board and a Life Fellow of the Institute of Electrical and Electronics Engineers (IEEE). Dr. Heilmeier is a member of the Defense Science Board and the National Security Agency Advisory Board. He is also a member of the National Academy of Engineering, the American Academy of Arts and Sciences, and the Board of Overseers of the School of Engineering and Applied Science of the University of Pennsylvania. Previously, Dr. Heilmeier served as a Director of TRW Inc. (automotive, space, defense, and information technology, 1992-2002), Compaq (1994-2002), Automatic Data Processing, Inc. (ADP) (technology-based business outsourcing, 1995-2002), INET Technologies Inc. (telecommunications network surveillance, 2001-2004), and Teletech Holdings (customer management services). He is the recipient of the 2005 Kyoto Prize in Advanced Technology for his invention of the liquid crystal display. |
Marie L. Knowles (59) |
| Year of Election or Appointment: 2001 Prior to Ms. Knowles' retirement in June 2000, she served as Executive Vice President and Chief Financial Officer of Atlantic Richfield Company (ARCO) (diversified energy, 1996-2000). From 1993 to 1996, she was a Senior Vice President of ARCO and President of ARCO Transportation Company. She served as a Director of ARCO from 1996 to 1998. She currently serves as a Director of Phelps Dodge Corporation (copper mining and manufacturing) and McKesson Corporation (healthcare service, 2002-present). Ms. Knowles is a Trustee of the Brookings Institution and the Catalina Island Conservancy and also serves as a member of the Advisory Board for the School of Engineering of the University of Southern California. |
Ned C. Lautenbach (62) |
| Year of Election or Appointment: 2000 Mr. Lautenbach has been a partner of Clayton, Dubilier & Rice, Inc. (private equity investment firm) since September 1998. Previously, Mr. Lautenbach was with the International Business Machines Corporation (IBM) from 1968 until his retirement in 1998. Mr. Lautenbach serves as a Director of Italtel Holding S.p.A. (telecommunications (Milan, Italy), 2004-present) and Eaton Corporation (diversified industrial) as well as the Philharmonic Center for the Arts in Naples, Florida. He also is a member of the Board of Trustees of Fairfield University (2005-present), as well as a member of the Council on Foreign Relations. |
William O. McCoy (72) |
| Year of Election or Appointment: 1997 Prior to his retirement in December 1994, Mr. McCoy was Vice Chairman of the Board of BellSouth Corporation (telecommunications) and President of BellSouth Enterprises. He is currently a Director of Duke Realty Corporation (real estate). He is also a partner of Franklin Street Partners (private investment management firm). In addition, Mr. McCoy served as the Interim Chancellor (1999-2000) and a member of the Board of Visitors for the University of North Carolina at Chapel Hill and currently serves as Chairman of the Board of Directors of the University of North Carolina Health Care System. He also served as Vice President of Finance for the University of North Carolina (16-school system). |
Cornelia M. Small (61) |
| Year of Election or Appointment: 2005 Ms. Small is a member (2000-present) and Chairperson (2002-present) of the Investment Committee, and a member (2002-present) of the Board of Trustees of Smith College. Previously, she served as Chief Investment Officer (1999-2000), Director of Global Equity Investments (1996-1999), and a member of the Board of Directors of Scudder, Stevens & Clark (1990-1997) and Scudder Kemper Investments (1997-1999). In addition, Ms. Small served as Co-Chair (2000-2003) of the Annual Fund for the Fletcher School of Law and Diplomacy. |
William S. Stavropoulos (67) |
| Year of Election or Appointment: 2001 Mr. Stavropoulos is Chairman Emeritus of the Board of Directors of The Dow Chemical Company. Since joining The Dow Chemical Company in 1967, Mr. Stavropoulos served in numerous senior management positions, including President (1993-2000; 2002-2003), CEO (1995-2000; 2002-2004), and Chairman of the Executive Committee (2000-2004). Currently, he is a Director of NCR Corporation (data warehousing and technology solutions), BellSouth Corporation (telecommunications), Chemical Financial Corporation, Maersk Inc. (industrial conglomerate, 2002-present), and Metalmark Capital (private equity investment firm, 2005-present). He also serves as a member of the Board of Trustees of the American Enterprise Institute for Public Policy Research. In addition, Mr. Stavropoulos is a member of The Business Council, J.P. Morgan International Council and the University of Notre Dame Advisory Council for the College of Science. |
Kenneth L. Wolfe (67) |
| Year of Election or Appointment: 2005 Prior to his retirement in 2001, Mr. Wolfe was Chairman and Chief Executive Officer of Hershey Foods Corporation (1993-2001). He currently serves as a member of the boards of Adelphia Communications Corporation (2003-present), Bausch & Lomb, Inc., and Revlon Inc. (2004-present). |
Annual Report
Advisory Board Members and Executive Officers:
Correspondence intended for Mr. Keyes may be sent to Fidelity Investments, P.O. Box 55235, Boston, Massachusetts 02205-5235. Correspondence intended for each executive officer and Mr. Lynch may be sent to Fidelity Investments, 82 Devonshire Street, Boston, Massachusetts 02109.
Name, Age; Principal Occupation |
James H. Keyes (65) |
| Year of Election or Appointment: 2006 Member of the Advisory Board of Fidelity Hastings Street Trust. Prior to his retirement in 2003, Mr. Keyes was Chairman, President, and Chief Executive Officer of Johnson Controls, Inc. (automotive supplier, 1993-2003). He currently serves as a member of the boards of LSI Logic Corporation (semiconductor technologies, 1984-present), Navistar International Corporation (manufacture and sale of trucks, buses, and diesel engines, 2002-present), and Pitney Bowes, Inc. (integrated mail, messaging, and document management solutions, 1998-present). |
Peter S. Lynch (62) |
| Year of Election or Appointment: 2003 Member of the Advisory Board of Fidelity Hastings Street Trust. Mr. Lynch is Vice Chairman and a Director of FMR, and Vice Chairman (2001-present) and a Director (1999-present) of FMR Co., Inc. Previously, Mr. Lynch served as a Trustee of the Fidelity funds (1990-2003). In addition, he serves as the Chairman of the Inner-City Scholarship Fund. |
Philip Bullen (46) |
| Year of Election or Appointment: 2006 Vice President of Discovery. Mr. Bullen also serves as Vice President of certain Equity Funds (2006-present). Mr. Bullen is Senior Vice President of FMR (2001-present) and FMR Co., Inc. (2001-present). Previously, Mr. Bullen served as President and a Director of Fidelity Research & Analysis Company (2001-2005), President and a Director of Fidelity Management & Research (U.K.) Inc. (2002-2006), and a Director of Strategic Advisers, Inc. (2002-2005). |
Dwight D. Churchill (52) |
| Year of Election or Appointment: 2006 Vice President of Discovery. Mr. Churchill also serves as Vice President of certain Equity Funds (2005-present). Mr. Churchill is Executive Vice President of FMR (2005-present) and FMR Co., Inc. (2005-present). Previously, Mr. Churchill served as Senior Vice President of Fidelity Investments Money Management, Inc. (2005-2006), Head of Fidelity's Fixed-Income Division (2000-2005), Vice President of Fidelity's Money Market Funds (2000-2005), Vice President of Fidelity's Bond Funds, and Senior Vice President of FMR. |
Adam P. Hetnarski (42) |
| Year of Election or Appointment: 2000 Vice President of Discovery. Mr. Hetnarski also serves as Vice President of another fund advised by FMR. Prior to assuming his current responsibilities, Mr. Hetnarski worked as a research analyst and portfolio manager. Mr. Hetnarski also serves as Vice President of FMR (2000) and FMR Co., Inc. (2001). |
Eric D. Roiter (57) |
| Year of Election or Appointment: 1998 Secretary of Discovery. He also serves as Secretary of other Fidelity funds; Vice President, General Counsel, and Secretary of FMR Co., Inc. (2001-present) and FMR; Assistant Secretary of Fidelity Management & Research (U.K.) Inc. (2001-present), Fidelity Research & Analysis Company (2001-present), and Fidelity Investments Money Management, Inc. (2001-present). Mr. Roiter is an Adjunct Member, Faculty of Law, at Boston College Law School (2003-present). Previously, Mr. Roiter served as Vice President and Secretary of Fidelity Distributors Corporation (FDC) (1998-2005). |
Stuart Fross (46) |
| Year of Election or Appointment: 2003 Assistant Secretary of Discovery. Mr. Fross also serves as Assistant Secretary of other Fidelity funds (2003-present), Vice President and Secretary of FDC (2005-present), and is an employee of FMR. |
Christine Reynolds (47) |
| Year of Election or Appointment: 2004 President and Treasurer of Discovery. Ms. Reynolds also serves as President and Treasurer of other Fidelity funds (2004-present) and is a Vice President (2003-present) and an employee (2002-present) of FMR. Before joining Fidelity Investments, Ms. Reynolds worked at PricewaterhouseCoopers LLP (PwC) (1980-2002), where she was most recently an audit partner with PwC's investment management practice. |
R. Stephen Ganis (40) |
| Year of Election or Appointment: 2006 Anti-Money Laundering (AML) officer of Discovery. Mr. Ganis also serves as AML officer of other Fidelity funds (2006-present) and FMR Corp. (2003-present). Before joining Fidelity Investments, Mr. Ganis practiced law at Goodwin Procter, LLP (2000-2002). |
Joseph B. Hollis (58) |
| Year of Election or Appointment: 2006 Chief Financial Officer of Discovery. Mr. Hollis also serves as Chief Financial Officer of other Fidelity funds. Mr. Hollis is President of Fidelity Pricing and Cash Management Services (FPCMS) (2005-present). Mr. Hollis also serves as President and Director of Fidelity Service Company, Inc. (2006-present). Previously, Mr. Hollis served as Senior Vice President of Cash Management Services (1999-2002) and Investment Management Operations (2002-2005). |
Kenneth A. Rathgeber (59) |
| Year of Election or Appointment: 2004 Chief Compliance Officer of Discovery. Mr. Rathgeber also serves as Chief Compliance Officer of other Fidelity funds (2004-present) and Executive Vice President of Risk Oversight for Fidelity Investments (2002-present). He is Chief Compliance Officer of FMR (2005-present), FMR Co., Inc. (2005-present), Fidelity Management & Research (U.K.) Inc. (2005-present), Fidelity Research & Analysis Company (2005-present), Fidelity Investments Money Management, Inc. (2005-present), and Strategic Advisers, Inc. (2005-present). Previously, Mr. Rathgeber served as Executive Vice President and Chief Operating Officer for Fidelity Investments Institutional Services Company, Inc. (1998-2002). |
Bryan A. Mehrmann (45) |
| Year of Election or Appointment: 2005 Deputy Treasurer of Discovery. Mr. Mehrmann also serves as Deputy Treasurer of other Fidelity funds (2005-present) and is an employee of FMR. Previously, Mr. Mehrmann served as Vice President of Fidelity Investments Institutional Services Group (FIIS)/Fidelity Investments Institutional Operations Corporation, Inc. (FIIOC) Client Services (1998-2004). |
Kimberley H. Monasterio (42) |
| Year of Election or Appointment: 2004 Deputy Treasurer of Discovery. Ms. Monasterio also serves as Deputy Treasurer of other Fidelity funds (2004) and is an employee of FMR (2004). Before joining Fidelity Investments, Ms. Monasterio served as Treasurer (2000-2004) and Chief Financial Officer (2002-2004) of the Franklin Templeton Funds and Senior Vice President of Franklin Templeton Services, LLC (2000-2004). |
Kenneth B. Robins (36) |
| Year of Election or Appointment: 2005 Deputy Treasurer of Discovery. Mr. Robins also serves as Deputy Treasurer of other Fidelity funds (2005-present) and is an employee of FMR (2004-present). Before joining Fidelity Investments, Mr. Robins worked at KPMG LLP, where he was a partner in KPMG's department of professional practice (2002-2004) and a Senior Manager (1999-2000). In addition, Mr. Robins served as Assistant Chief Accountant, United States Securities and Exchange Commission (2000-2002). |
Robert G. Byrnes (39) |
| Year of Election or Appointment: 2005 Assistant Treasurer of Discovery. Mr. Byrnes also serves as Assistant Treasurer of other Fidelity funds (2005-present) and is an employee of FMR (2005-present). Previously, Mr. Byrnes served as Vice President of FPCMS (2003-2005). Before joining Fidelity Investments, Mr. Byrnes worked at Deutsche Asset Management where he served as Vice President of the Investment Operations Group (2000-2003). |
John H. Costello (59) |
| Year of Election or Appointment: 1998 Assistant Treasurer of Discovery. Mr. Costello also serves as Assistant Treasurer of other Fidelity funds and is an employee of FMR. |
Peter L. Lydecker (52) |
| Year of Election or Appointment: 2004 Assistant Treasurer of Discovery. Mr. Lydecker also serves as Assistant Treasurer of other Fidelity funds (2004) and is an employee of FMR. |
Mark Osterheld (51) |
| Year of Election or Appointment: 2002 Assistant Treasurer of Discovery. Mr. Osterheld also serves as Assistant Treasurer of other Fidelity funds (2002) and is an employee of FMR. |
Gary W. Ryan (47) |
| Year of Election or Appointment: 2005 Assistant Treasurer of Discovery. Mr. Ryan also serves as Assistant Treasurer of other Fidelity funds (2005-present) and is an employee of FMR (2005-present). Previously, Mr. Ryan served as Vice President of Fund Reporting in FPCMS (1999-2005). |
Salvatore Schiavone (40) |
| Year of Election or Appointment: 2005 Assistant Treasurer of Discovery. Mr. Schiavone also serves as Assistant Treasurer of other Fidelity funds (2005-present) and is an employee of FMR (2005-present). Before joining Fidelity Investments, Mr. Schiavone worked at Deutsche Asset Management, where he most recently served as Assistant Treasurer (2003-2005) of the Scudder Funds and Vice President and Head of Fund Reporting (1996-2003). |
Annual Report
Distributions
The Board of Trustees of Discovery Fund voted to pay on August 7, 2006 to shareholders of record at the opening of business on August 4, 2006, a distribution of $0.02 per share derived from capital gains realized from sales of portfolio securities and a dividend of $0.07 per share from net investment income.
The fund designates 100% of the dividends distributed during the fiscal year as qualifying for the dividends-received deduction for corporate shareholders.
The fund designates 100% of the dividends distributed during the fiscal year as amounts which may be taken into account as a dividend for the purposes of the maximum rate under section 1(h)(11) of the Internal Revenue Code.
The fund will notify shareholders in January 2007 of amounts for use in preparing 2006 income tax returns.
Annual Report
Proxy Voting Results
A special meeting of the fund's shareholders was held on November 16, 2005. The results of votes taken among shareholders on proposals before them are reported below. Each vote reported represents one dollar of net asset value held on the record date for the meeting.
PROPOSAL 1 |
To elect a Board of Trustees. A |
| # of
Votes | % of
Votes |
Dennis J. Dirks |
Affirmative | 6,466,243,048.91 | 95.846 |
Withheld | 280,219,946.87 | 4.154 |
TOTAL | 6,746,462,995.78 | 100.000 |
Albert R. Gamper, Jr. B |
Affirmative | 6,459,041,833.49 | 95.740 |
Withheld | 287,421,162.29 | 4.260 |
TOTAL | 6,746,462,995.78 | 100.000 |
Robert M. Gates |
Affirmative | 6,441,052,528.46 | 95.473 |
Withheld | 305,410,467.32 | 4.527 |
TOTAL | 6,746,462,995.78 | 100.000 |
George H. Heilmeier |
Affirmative | 6,458,026,916.90 | 95.725 |
Withheld | 288,436,078.88 | 4.275 |
TOTAL | 6,746,462,995.78 | 100.000 |
Abigail P. Johnson |
Affirmative | 6,427,896,599.31 | 95.278 |
Withheld | 318,566,396.47 | 4.722 |
TOTAL | 6,746,462,995.78 | 100.000 |
Edward C. Johnson 3d |
Affirmative | 6,419,116,877.24 | 95.148 |
Withheld | 327,346,118.54 | 4.852 |
TOTAL | 6,746,462,995.78 | 100.000 |
Stephen P. Jonas |
Affirmative | 6,459,780,830.40 | 95.751 |
Withheld | 286,682,165.38 | 4.249 |
TOTAL | 6,746,462,995.78 | 100.000 |
Marie L. Knowles |
Affirmative | 6,461,769,188.96 | 95.780 |
Withheld | 284,693,806.82 | 4.220 |
TOTAL | 6,746,462,995.78 | 100.000 |
| # of
Votes | % of
Votes |
Ned C. Lautenbach |
Affirmative | 6,460,406,353.14 | 95.760 |
Withheld | 286,056,642.64 | 4.240 |
TOTAL | 6,746,462,995.78 | 100.000 |
Marvin L. Mann |
Affirmative | 6,440,555,199.19 | 95.466 |
Withheld | 305,907,796.59 | 4.534 |
TOTAL | 6,746,462,995.78 | 100.000 |
William O. McCoy |
Affirmative | 6,440,823,478.66 | 95.470 |
Withheld | 305,639,517.12 | 4.530 |
TOTAL | 6,746,462,995.78 | 100.000 |
Robert L. Reynolds |
Affirmative | 6,463,763,182.86 | 95.810 |
Withheld | 282,699,812.92 | 4.190 |
TOTAL | 6,746,462,995.78 | 100.000 |
Cornelia M. Small |
Affirmative | 6,462,121,463.05 | 95.785 |
Withheld | 284,341,532.73 | 4.215 |
TOTAL | 6,746,462,995.78 | 100.000 |
William S. Stavropoulos |
Affirmative | 6,453,499,157.83 | 95.658 |
Withheld | 292,963,837.95 | 4.342 |
TOTAL | 6,746,462,995.78 | 100.000 |
Kenneth L. Wolfe |
Affirmative | 6,457,041,632.10 | 95.710 |
Withheld | 289,421,363.68 | 4.290 |
TOTAL | 6,746,462,995.78 | 100.000 |
A Denotes trust-wide proposals and voting results. B Effective on or about January 1, 2006. |
Annual Report
Board Approval of Investment Advisory Contracts and Management Fees
Fidelity Discovery Fund
On January 19, 2006, the Board of Trustees, including the Independent Trustees (together, the Board), voted to approve a general research services agreement (the Agreement) between FMR, FMR Co., Inc. (FMRC), Fidelity Investments Money Management, Inc. (FIMM), and Fidelity Research & Analysis Company (FRAC) (together, the Investment Advisers) for the fund, effective January 20, 2006, pursuant to which FRAC may provide general research and investment advisory support services to FMRC and FIMM. The Board considered that it has approved previously various sub-advisory agreements for the fund with affiliates of FMR that allow FMR to obtain research, non-discretionary advice, or discretionary portfolio management at no additional expense to the fund. The Board, assisted by the advice of fund counsel and independent Trustees' counsel, considered a broad range of information and determined that it would be beneficial for the fund to access the research and investment advisory support services supplied by FRAC at no additional expense to the fund.
The Board reached this determination in part because the new arrangement will involve no changes in (i) the contractual terms of and fees payable under the fund's management contract or sub-advisory agreements; (ii) the investment process or strategies employed in the management of the fund's assets; (iii) the nature or level of services provided under the fund's management contract or sub-advisory agreements; (iv) the day-to-day management of the fund or the persons primarily responsible for such management; or (v) the ultimate control or beneficial ownership of FMR, FMRC, or FIMM. The Board also considered that the establishment of the Agreement would not necessitate prior shareholder approval of the Agreement or result in an assignment and termination of the fund's management contract or sub-advisory agreements under the Investment Company Act of 1940.
Because the Board was approving an arrangement with FRAC under which the fund will not bear any additional management fees or expenses and under which the fund's portfolio manager would not change, it did not consider the fund's investment performance, competitiveness of management fee and total expenses, costs of services and profitability, or economies of scale to be significant factors in its decision.
In connection with its future renewal of the fund's management contract and sub-advisory agreements, the Board will consider: (i) the nature, extent, and quality of services provided to the fund, including shareholder and administrative services and investment performance; (ii) the competitiveness of the fund's management fee and total expenses; (iii) the costs of the services and profitability, including the revenues earned and the expenses incurred by Fidelity in conducting the business of developing, marketing, distributing, managing, administering, and servicing the fund and its shareholders; and (iv) whether there have been economies of scale in respect of the management of the Fidelity funds, whether the Fidelity funds (including the fund) have appropriately benefited from any such economies of scale, and whether there is potential for realization of any further economies.
Annual Report
Board Approval of Investment Advisory Contracts and
Management Fees - continued
Based on its evaluation of all of the conclusions noted above, and after considering all material factors, the Board ultimately concluded that the fund's Agreement is fair and reasonable, and that the fund's Agreement should be approved.
Annual Report
Managing Your Investments
Fidelity offers several ways to conveniently manage your personal investments via your telephone or PC. You can access your account information, conduct trades and research your investments 24 hours a day.
By Phone
Fidelity Automated Service Telephone provides a single toll-free number to access account balances, positions, quotes and trading. It's easy to navigate the service, and on your first call, the system will help you create a personal identification number (PIN) for security.
(phone_graphic)
Fidelity Automated
Service Telephone (FAST®)
1-800-544-5555
Press
1 For mutual fund and brokerage trading.
2 For quotes.*
3 For account balances and holdings.
4 To review orders and mutual
fund activity.
5 To change your PIN.
*0 To speak to a Fidelity representative.
By PC
Fidelity's web site on the Internet provides a wide range of information, including daily financial news, fund performance, interactive planning tools and news about Fidelity products and services.
(computer_graphic)
Fidelity's Web Site
www.fidelity.com
* When you call the quotes line, please remember that a fund's yield and return will vary and, except for money market funds, share price will also vary. This means that you may have a gain or loss when you sell your shares. There is no assurance that money market funds will be able to maintain a stable $1 share price; an investment in a money market fund is not insured or guaranteed by the U.S. government. Total returns are historical and include changes in share price, reinvestment of dividends and capital gains, and the effects of any sales charges.
Annual Report
To Visit Fidelity
For directions and hours,
please call 1-800-544-9797.
Arizona
7001 West Ray Road
Chandler, AZ
15445 N. Scottsdale Road
Scottsdale, AZ
California
815 East Birch Street
Brea, CA
1411 Chapin Avenue
Burlingame, CA
851 East Hamilton Avenue
Campbell, CA
19200 Von Karman Avenue
Irvine, CA
601 Larkspur Landing Circle
Larkspur, CA
10100 Santa Monica Blvd.
Los Angeles, CA
27101 Puerta Real
Mission Viejo, CA
73-575 El Paseo
Palm Desert, CA
251 University Avenue
Palo Alto, CA
123 South Lake Avenue
Pasadena, CA
16995 Bernardo Ctr. Drive
Rancho Bernardo, CA
1220 Roseville Parkway
Roseville, CA
1740 Arden Way
Sacramento, CA
7676 Hazard Center Drive
San Diego, CA
11943 El Camino Real
San Diego, CA
8 Montgomery Street
San Francisco, CA
3793 State Street
Santa Barbara, CA
1200 Wilshire Boulevard
Santa Monica, CA
21701 Hawthorne Boulevard
Torrance, CA
2001 North Main Street
Walnut Creek, CA
6300 Canoga Avenue
Woodland Hills, CA
Colorado
1625 Broadway
Denver, CO
9185 Westview Road
Lone Tree, CO
Connecticut
48 West Putnam Avenue
Greenwich, CT
265 Church Street
New Haven, CT
300 Atlantic Street
Stamford, CT
29 South Main Street
West Hartford, CT
Delaware
400 Delaware Avenue
Wilmington, DE
Florida
4400 N. Federal Highway
Boca Raton, FL
121 Alhambra Plaza
Coral Gables, FL
2948 N. Federal Highway
Ft. Lauderdale, FL
4671 Town Center Parkway
Jacksonville, FL
1907 West State Road 434
Longwood, FL
8880 Tamiami Trail, North
Naples, FL
3501 PGA Boulevard
Palm Beach Gardens, FL
3550 Tamiami Trail, South
Sarasota, FL
1502 N. Westshore Blvd.
Tampa, FL
2465 State Road 7
Wellington, FL
Georgia
3445 Peachtree Road, N.E.
Atlanta, GA
1000 Abernathy Road
Atlanta, GA
Illinois
One North LaSalle Street
Chicago, IL
875 North Michigan Ave.
Chicago, IL
1415 West 22nd Street
Oak Brook, IL
1572 East Golf Road
Schaumburg, IL
3232 Lake Avenue
Wilmette, IL
Indiana
4729 East 82nd Street
Indianapolis, IN
Kansas
5400 College Boulevard
Overland Park, KS
Maine
Three Canal Plaza
Portland, ME
Maryland
7315 Wisconsin Avenue
Bethesda, MD
One W. Pennsylvania Ave.
Towson, MD
Massachusetts
801 Boylston Street
Boston, MA
155 Congress Street
Boston, MA
300 Granite Street
Braintree, MA
44 Mall Road
Burlington, MA
238 Main Street
Cambridge, MA
405 Cochituate Road
Framingham, MA
416 Belmont Street
Worcester, MA
Annual Report
Michigan
500 E. Eisenhower Pkwy.
Ann Arbor, MI
280 Old N. Woodward Ave.
Birmingham, MI
43420 Grand River Avenue
Novi, MI
29155 Northwestern Hwy.
Southfield, MI
Minnesota
7600 France Avenue South
Edina, MN
Missouri
1524 South Lindbergh Blvd.
St. Louis, MO
Nevada
2225 Village Walk Drive
Henderson, NV
New Jersey
150 Essex Street
Millburn, NJ
56 South Street
Morristown, NJ
396 Route 17, North
Paramus, NJ
3518 Route 1 North
Princeton, NJ
530 Broad Street
Shrewsbury, NJ
New York
1055 Franklin Avenue
Garden City, NY
37 West Jericho Turnpike
Huntington Station, NY
1271 Avenue of the Americas
New York, NY
980 Madison Avenue
New York, NY
61 Broadway
New York, NY
350 Park Avenue
New York, NY
200 Fifth Avenue
New York, NY
733 Third Avenue
New York, NY
11 Penn Plaza
New York, NY
2070 Broadway
New York, NY
1075 Northern Blvd.
Roslyn, NY
799 Central Park Avenue
Scarsdale, NY
North Carolina
4611 Sharon Road
Charlotte, NC
7011 Fayetteville Road
Durham, NC
Ohio
3805 Edwards Road
Cincinnati, OH
1324 Polaris Parkway
Columbus, OH
28699 Chagrin Boulevard
Woodmere Village, OH
Oregon
7493 SW Bridgeport Road
Tigard, OR
Pennsylvania
600 West DeKalb Pike
King of Prussia, PA
1735 Market Street
Philadelphia, PA
12001 Perry Highway
Wexford, PA
Rhode Island
47 Providence Place
Providence, RI
Tennessee
6150 Poplar Avenue
Memphis, TN
Texas
10000 Research Boulevard
Austin, TX
4001 Northwest Parkway
Dallas, TX
12532 Memorial Drive
Houston, TX
2701 Drexel Drive
Houston, TX
6560 Fannin Street
Houston, TX
6500 N. MacArthur Blvd.
Irving, TX
6005 West Park Boulevard
Plano, TX
14100 San Pedro
San Antonio, TX
1576 East Southlake Blvd.
Southlake, TX
19740 IH 45 North
Spring, TX
Utah
279 West South Temple
Salt Lake City, UT
Virginia
1861 International Drive
McLean, VA
Washington
411 108th Avenue, N.E.
Bellevue, WA
1518 6th Avenue
Seattle, WA
Washington, DC
1900 K Street, N.W.
Washington, DC
Wisconsin
595 North Barker Road
Brookfield, WI
Fidelity Brokerage Services, Inc., 100 Summer St., Boston, MA 02110 Member NYSE/SIPC
Annual Report
To Write Fidelity
We'll give your correspondence immediate attention and send you written confirmation upon completion of your request.
(letter_graphic)
Making Changes
To Your Account
(such as changing name, address, bank, etc.)
Fidelity Investments
P.O. Box 770001
Cincinnati, OH 45277-0002
(letter_graphic)
For Non-Retirement
Accounts
Buying shares
Fidelity Investments
P.O. Box 770001
Cincinnati, OH 45277-0003
Overnight Express
Fidelity Investments
Attn: Distribution Services
100 Crosby Parkway - KC1H
Covington, KY 41015
Selling shares
Fidelity Investments
P.O. Box 770001
Cincinnati, OH 45277-0035
Overnight Express
Fidelity Investments
Attn: Distribution Services
100 Crosby Parkway - KC1H
Covington, KY 41015
General Correspondence
Fidelity Investments
P.O. Box 500
Merrimack, NH 03054-0500
(letter_graphic)
For Retirement
Accounts
Buying shares
Fidelity Investments
P.O. Box 770001
Cincinnati, OH 45277-0003
Selling shares
Fidelity Investments
P.O. Box 770001
Cincinnati, OH 45277-0035
Overnight Express
Fidelity Investments
Attn: Distribution Services
100 Crosby Parkway - KC1H
Covington, KY 41015
General Correspondence
Fidelity Investments
P.O. Box 500
Merrimack, NH 03054-0500
Annual Report
Annual Report
Investment Adviser
Fidelity Management &
Research Company
Boston, MA
Investment Sub-Advisers
FMR Co., Inc.
Fidelity Management & Research
(U.K.) Inc.
Fidelity Research & Analysis Company
(formerly Fidelity Management &
Research (Far East) Inc.)
Fidelity Investments Japan Limited
Fidelity International Investment
Advisor
Fidelity International Investment
Advisor (U.K.) Limited
General Distributor
Fidelity Distributors Corporation
Boston, MA
Transfer and Service Agent
Fidelity Service Company, Inc.
Boston, MA
Custodian
Brown Brothers Harriman & Co.
Boston, MA
The Fidelity Telephone Connection
Mutual Fund 24-Hour Service
Exchanges/Redemptions
and Account Assistance 1-800-544-6666
Product Information 1-800-544-6666
Retirement Accounts 1-800-544-4774
(8 a.m. - 9 p.m.)
TDD Service 1-800-544-0118
for the deaf and hearing impaired
(9 a.m. - 9 p.m. Eastern time)
Fidelity Automated Service
Telephone (FAST®) (automated graphic) 1-800-544-5555
(automated graphic) Automated line for quickest service
CII-UANN-0806
1.787730.103
(Fidelity Investment logo)(registered trademark)
Corporate Headquarters
82 Devonshire St., Boston, MA 02109
www.fidelity.com
Fidelity Fifty®
Annual Report
June 30, 2006
(2_fidelity_logos) (Registered_Trademark)
Contents
Chairman's Message | <Click Here> | Ned Johnson's message to shareholders. |
Performance | <Click Here> | How the fund has done over time. |
Management's Discussion | <Click Here> | The manager's review of fund performance, strategy and outlook. |
Shareholder Expense Example | <Click Here> | An example of shareholder expenses. |
Investment Changes | <Click Here> | A summary of major shifts in the fund's investments over the past six months. |
Investments | <Click Here> | A complete list of the fund's investments with their market values. |
Financial Statements | <Click Here> | Statements of assets and liabilities, operations, and changes in net assets,
as well as financial highlights. |
Notes | <Click Here> | Notes to the financial statements. |
Report of Independent Registered Public Accounting Firm | <Click Here> | |
Trustees and Officers | <Click Here> | |
Distributions | <Click Here> | |
Proxy Voting Results | <Click Here> | |
Board Approval of Investment Advisory Contracts and Management Fees | <Click Here> | |
To view a fund's proxy voting guidelines and proxy voting record for the 12-month period ended June 30, visit www.fidelity.com/proxyvotingresults or visit the Securities and Exchange Commission's (SEC) web site at www.sec.gov. You may also call 1-800-544-8544 to request a free copy of the proxy voting guidelines.
Standard & Poor's, S&P and S&P 500 are registered service marks of The McGraw-Hill Companies, Inc. and have been licensed for use by Fidelity Distributors Corporation.
Other third party marks appearing herein are the property of their respective owners.
All other marks appearing herein are registered or unregistered trademarks or service marks of FMR Corp. or an affiliated company.
Annual Report
This report and the financial statements contained herein are submitted for the general information of the shareholders of the fund. This report is not authorized for distribution to prospective investors in the fund unless preceded or accompanied by an effective prospectus.
A fund files its complete schedule of portfolio holdings with the SEC for the first and third quarters of each fiscal year on Form N-Q. Forms N-Q are available on the SEC's web site at http://www.sec.gov. A fund's Forms N-Q may be reviewed and copied at the SEC's Public Reference Room in Washington, DC. Information regarding the operation of the SEC's Public Reference Room may be obtained by calling 1-800-SEC-0330. For a complete list of a fund's portfolio holdings, view the most recent quarterly holdings report, semiannual report, or annual report on Fidelity's web site at http://www.fidelity.com/holdings.
NOT FDIC INSURED · MAY LOSE VALUE · NO BANK GUARANTEE
Neither the fund nor Fidelity Distributors Corporation is a bank.
Annual Report
Chairman's Message
(photo_of_Edward_C_Johnson_3d)
Dear Shareholder:
Although many securities markets made gains in early 2006, inflation concerns led to mixed results through the year's mid-point. Financial markets are always unpredictable. There are, however, a number of time-tested principles that can put the historical odds in your favor.
One of the basic tenets is to invest for the long term. Over time, riding out the markets' inevitable ups and downs has proven much more effective than selling into panic or chasing the hottest trend. Even missing only a few of the markets' best days can significantly diminish investor returns. Patience also affords the benefits of compounding - of earning interest on additional income or reinvested dividends and capital gains. There are tax advantages and cost benefits to consider as well. The more you sell, the more taxes you pay, and the more you trade, the higher the costs. While staying the course doesn't eliminate risk, it can considerably lessen the effect of short-term declines.
You can further manage your investing risk through diversification. And today, more than ever, geographic diversification should be taken into account. Studies indicate that asset allocation is the single most important determinant of a portfolio's long-term success. The right mix of stocks, bonds and cash - aligned to your particular risk tolerance and investment objective - is very important. Age-appropriate rebalancing is also an essential aspect of asset allocation. For younger investors, an emphasis on equities - which historically have been the best performing asset class over time - is encouraged. As investors near their specific goal, such as retirement or sending a child to college, consideration may be given to replacing volatile assets (e.g. common stocks) with more-stable fixed investments (bonds or savings plans).
A third investment principle - investing regularly - can help lower the average cost of your purchases. Investing a certain amount of money each month or quarter helps ensure you won't pay for all your shares at market highs. This strategy - known as dollar cost averaging - also reduces unconstructive "emotion" from investing, helping shareholders avoid selling weak performers just prior to an upswing, or chasing a hot performer just before a correction.
We invite you to contact us via the Internet, through our Investor Centers or over the phone. It is our privilege to provide you the information you need to make the investments that are right for you.
Sincerely,
/s/Edward C. Johnson 3d
Edward C. Johnson 3d
Annual Report
Performance: The Bottom Line
Average annual total return reflects the change in the value of an investment, assuming reinvestment of the fund's dividend income and capital gains (the profits earned upon the sale of securities that have grown in value) and assuming a constant rate of performance each year. The $10,000 table and the fund's returns do not reflect the deduction of taxes that a shareholder would pay on fund distributions or the redemption of fund shares. During periods of reimbursement by Fidelity, a fund's total return will be greater than it would be had the reimbursement not occurred. How a fund did yesterday is no guarantee of how it will do tomorrow.
Average Annual Total Returns
Periods ended June 30, 2006 | Past 1
year | Past 5
years | Past 10
years |
Fidelity Fifty® | 18.56% | 7.61% | 10.79% |
$10,000 Over 10 Years
Let's say hypothetically that $10,000 was invested in Fidelity Fifty® on June 30, 1996. The chart shows how the value of your investment would have grown, and also shows how the Standard & Poor's 500SM Index did over the same period.
Annual Report
Management's Discussion of Fund Performance
Comments from Jason Weiner, Portfolio Manager of Fidelity Fifty®
After generating sizable gains early on, stock values eroded late in the 12-month period ending June 30, 2006. Worrisome signals of rising inflation took a bite out of many portfolios, as investors wondered about the intentions of the Federal Reserve Board. Many on Wall Street believed the U.S. central bank had nearly concluded its interest-rate-hike crusade. But in announcing its May rate hike, the Board warned of more increases to come. Then, in June, the Fed announced inflation was running at the upper end of the normal range, inducing yet another sell-off and demonstrating investors' anxiety about the Board's future course. Prior to that, stocks were in good shape, riding the momentum of steady economic and corporate earnings growth. Equity benchmarks approached or exceeded multiyear highs, and the Dow Jones Industrial AverageSM nearly topped its record from January 2000. Despite the late difficulties, the Dow rose 11.09% for the 12 months overall, while the Standard & Poor's 500SM Index returned 8.63% and the NASDAQ Composite® Index was up 6.48%.
The fund returned 18.56% during the past year, far surpassing the S&P 500®. Stock selection added value across a broad range of sectors, with information technology having by far the most positive impact versus the index. Other sectors boosting the fund's results were industrials, materials, energy, consumer discretionary and consumer staples. Internet search engine Google - the fund's largest holding at period end - topped our list of contributors. The company continued to churn out impressive earnings growth. Also boosting the fund's results was Carpenter Technology, a maker of industrial metal alloys used in the booming aerospace industry. Hard-disk-drive maker Seagate Technology was another significant contributor, as were discount airline AirTran Holdings and energy services provider Halliburton - all sold during the period. A further performance boost came from semiconductor maker MEMC Electronic Materials. Conversely, the fund's gains were curbed somewhat by an underweighting in the strong financials sector, especially in the diversified financials group. That said, broker TD Ameritrade faltered, reflecting concerns about reduced trading volumes in a declining market, and I liquidated the position. Universal Technical Institute, a provider of vocational training, slumped in April after the company warned of disappointing sales for the second quarter and full calendar year. Software giant Microsoft also hampered performance.
The views expressed above reflect those of the portfolio manager(s) only through the end of the period as stated on the cover of this report and do not necessarily represent the views of Fidelity or any other person in the Fidelity organization. Any such views are subject to change at any time based upon market or other conditions and Fidelity disclaims any responsibility to update such views. These views may not be relied on as investment advice and, because investment decisions for a Fidelity fund are based on numerous factors, may not be relied on as an indication of trading intent on behalf of any Fidelity fund.
Annual Report
Shareholder Expense Example
As a shareholder of the Fund, you incur two types of costs: (1) transaction costs, including redemption fees, and (2) ongoing costs, including management fees and other Fund expenses. This Example is intended to help you understand your ongoing costs (in dollars) of investing in the Fund and to compare these costs with the ongoing costs of investing in other mutual funds.
The Example is based on an investment of $1,000 invested at the beginning of the period and held for the entire period (January 1, 2006 to June 30, 2006).
Actual Expenses
The first line of the accompanying table provides information about actual account values and actual expenses. You may use the information in this line, together with the amount you invested, to estimate the expenses that you paid over the period. Simply divide your account value by $1,000.00 (for example, an $8,600 account value divided by $1,000.00 = 8.6), then multiply the result by the number in the first line under the heading entitled "Expenses Paid During Period" to estimate the expenses you paid on your account during this period. A small balance maintenance fee of $12.00 that is charged once a year may apply for certain accounts with a value of less than $2,000. This fee is not included in the table below. If it was, the estimate of expenses you paid during the period would be higher, and your ending account value lower, by this amount.
Hypothetical Example for Comparison Purposes
The second line of the accompanying table provides information about hypothetical account values and hypothetical expenses based on the Fund's actual expense ratio and an assumed rate of return of 5% per year before expenses, which is not the Fund's actual return. The hypothetical account values and expenses may not be used to estimate the actual ending account balance or expenses you paid for the period. You may use this information to compare the ongoing costs of investing in the Fund and other funds. To do so, compare this 5% hypothetical example with the 5% hypothetical examples that appear in the shareholder reports of the other funds. A small balance maintenance fee of $12.00 that is charged once a year may apply for certain accounts with a value of less than $2,000. This fee is not included in the table below. If it was, the estimate of expenses you paid during the period would be higher, and your ending account value lower, by this amount.
Please note that the expenses shown in the table are meant to highlight your ongoing costs only and do not reflect any transaction costs. Therefore, the second line of the table is useful in comparing ongoing costs only, and will not help you determine the relative total costs of owning different funds. In addition, if these transactional costs were included, your costs would have been higher.
| Beginning
Account Value
January 1, 2006 | Ending
Account Value
June 30, 2006 | Expenses Paid
During Period*
January 1, 2006
to June 30, 2006 |
Actual | $ 1,000.00 | $ 1,039.20 | $ 4.04 |
Hypothetical (5% return per year before expenses) | $ 1,000.00 | $ 1,020.83 | $ 4.01 |
* Expenses are equal to the Fund's annualized expense ratio of .80%; multiplied by the average account value over the period, multiplied by 181/365 (to reflect the one-half year period).
Annual Report
Investment Changes
Top Ten Stocks as of June 30, 2006 |
| % of fund's
net assets | % of fund's net assets
6 months ago |
Google, Inc. Class A (sub. vtg.) | 7.3 | 5.1 |
Colgate-Palmolive Co. | 3.5 | 2.6 |
Wells Fargo & Co. | 3.3 | 1.0 |
American International Group, Inc. | 3.2 | 3.8 |
Carpenter Technology Corp. | 3.1 | 2.0 |
Infosys Technologies Ltd. | 2.6 | 3.3 |
Herbalife Ltd. | 2.5 | 0.7 |
Ultra Petroleum Corp. | 2.5 | 0.0 |
Henry Schein, Inc. | 2.4 | 2.3 |
McDermott International, Inc. | 2.3 | 0.0 |
| 32.7 | |
Top Five Market Sectors as of June 30, 2006 |
| % of fund's
net assets | % of fund's net assets
6 months ago |
Information Technology | 26.1 | 27.4 |
Financials | 15.9 | 13.1 |
Industrials | 11.7 | 15.7 |
Consumer Discretionary | 10.5 | 9.6 |
Consumer Staples | 9.6 | 6.4 |
Asset Allocation (% of fund's net assets) |
As of June 30, 2006 * | As of December 31, 2005 ** |
| Stocks 98.9% | | | Stocks 94.6% | |
| Short-Term
Investments and
Net Other Assets 1.1% | | | Short-Term
Investments and
Net Other Assets 5.4% | |
* Foreign
investments | 19.4% | | ** Foreign investments | 14.5% | |

Annual Report
Investments June 30, 2006
Showing Percentage of Net Assets
Common Stocks - 98.9% |
| Shares | | Value (Note 1) |
CONSUMER DISCRETIONARY - 10.5% |
Diversified Consumer Services - 2.3% |
Sothebys Holdings, Inc. Class A (ltd. vtg.) (a) | 758,900 | | $ 19,921,125 |
Universal Technical Institute, Inc. (a) | 331,300 | | 7,295,226 |
| | 27,216,351 |
Hotels, Restaurants & Leisure - 0.7% |
International Game Technology | 210,400 | | 7,982,576 |
Household Durables - 1.2% |
Garmin Ltd. (d) | 136,600 | | 14,403,104 |
Internet & Catalog Retail - 1.7% |
Coldwater Creek, Inc. (a) | 756,700 | | 20,249,292 |
Media - 1.3% |
Focus Media Holding Ltd. ADR (d) | 247,700 | | 16,140,132 |
Multiline Retail - 1.5% |
Target Corp. (d) | 356,900 | | 17,441,703 |
Specialty Retail - 0.9% |
Best Buy Co., Inc. | 205,500 | | 11,269,620 |
J. Crew Group, Inc. | 2,900 | | 79,605 |
| | 11,349,225 |
Textiles, Apparel & Luxury Goods - 0.9% |
Volcom, Inc. | 348,300 | | 11,142,117 |
TOTAL CONSUMER DISCRETIONARY | | 125,924,500 |
CONSUMER STAPLES - 9.6% |
Food & Staples Retailing - 1.6% |
Walgreen Co. | 422,700 | | 18,953,868 |
Household Products - 3.5% |
Colgate-Palmolive Co. | 706,000 | | 42,289,400 |
Personal Products - 4.5% |
Avon Products, Inc. | 777,300 | | 24,096,300 |
Herbalife Ltd. (a) | 749,200 | | 29,893,080 |
| | 53,989,380 |
TOTAL CONSUMER STAPLES | | 115,232,648 |
ENERGY - 6.2% |
Energy Equipment & Services - 1.6% |
Schlumberger Ltd. (NY Shares) | 288,300 | | 18,771,213 |
Common Stocks - continued |
| Shares | | Value (Note 1) |
ENERGY - continued |
Oil, Gas & Consumable Fuels - 4.6% |
Ultra Petroleum Corp. (a) | 500,700 | | $ 29,676,489 |
Valero Energy Corp. | 383,400 | | 25,503,768 |
| | 55,180,257 |
TOTAL ENERGY | | 73,951,470 |
FINANCIALS - 15.9% |
Commercial Banks - 3.7% |
Wachovia Corp. | 100,000 | | 5,408,000 |
Wells Fargo & Co. | 583,400 | | 39,134,472 |
| | 44,542,472 |
Consumer Finance - 1.3% |
American Express Co. | 297,900 | | 15,854,238 |
Diversified Financial Services - 1.0% |
Bank of America Corp. | 248,500 | | 11,952,850 |
Insurance - 6.8% |
American International Group, Inc. | 649,200 | | 38,335,260 |
Aon Corp. | 500,700 | | 17,434,374 |
Prudential Financial, Inc. | 329,700 | | 25,617,690 |
| | 81,387,324 |
Real Estate Investment Trusts - 1.2% |
CapitalSource, Inc. | 589,700 | | 13,834,362 |
Thrifts & Mortgage Finance - 1.9% |
Countrywide Financial Corp. | 593,300 | | 22,592,864 |
TOTAL FINANCIALS | | 190,164,110 |
HEALTH CARE - 9.6% |
Biotechnology - 2.4% |
Biogen Idec, Inc. (a) | 244,400 | | 11,323,052 |
Genentech, Inc. (a) | 206,300 | | 16,875,340 |
| | 28,198,392 |
Health Care Equipment & Supplies - 2.8% |
Alcon, Inc. | 101,600 | | 10,012,680 |
ResMed, Inc. (a) | 335,500 | | 15,751,725 |
St. Jude Medical, Inc. (a) | 252,300 | | 8,179,566 |
| | 33,943,971 |
Common Stocks - continued |
| Shares | | Value (Note 1) |
HEALTH CARE - continued |
Health Care Providers & Services - 4.4% |
Henry Schein, Inc. (a) | 608,600 | | $ 28,439,878 |
UnitedHealth Group, Inc. | 548,000 | | 24,539,440 |
| | 52,979,318 |
TOTAL HEALTH CARE | | 115,121,681 |
INDUSTRIALS - 11.7% |
Aerospace & Defense - 1.0% |
Rockwell Collins, Inc. | 214,000 | | 11,956,180 |
Airlines - 1.2% |
Ryanair Holdings PLC sponsored ADR (a)(d) | 265,400 | | 13,991,888 |
Construction & Engineering - 1.8% |
Jacobs Engineering Group, Inc. (a) | 277,500 | | 22,100,100 |
Electrical Equipment - 0.9% |
Q-Cells AG (d) | 127,200 | | 10,700,088 |
Industrial Conglomerates - 3.6% |
3M Co. | 198,900 | | 16,065,153 |
McDermott International, Inc. (a) | 597,800 | | 27,181,966 |
| | 43,247,119 |
Machinery - 2.2% |
Danaher Corp. | 217,200 | | 13,970,304 |
Deere & Co. | 143,600 | | 11,989,164 |
| | 25,959,468 |
Trading Companies & Distributors - 1.0% |
WESCO International, Inc. (a) | 164,900 | | 11,378,100 |
TOTAL INDUSTRIALS | | 139,332,943 |
INFORMATION TECHNOLOGY - 26.1% |
Communications Equipment - 4.4% |
Comverse Technology, Inc. (a) | 1,058,100 | | 20,918,637 |
Nice Systems Ltd. sponsored ADR (a) | 499,200 | | 14,047,488 |
QUALCOMM, Inc. | 429,600 | | 17,214,072 |
| | 52,180,197 |
Internet Software & Services - 10.4% |
eBay, Inc. (a) | 572,400 | | 16,765,596 |
Google, Inc. Class A (sub. vtg.) (a) | 207,300 | | 86,927,109 |
VeriSign, Inc. (a) | 896,100 | | 20,762,637 |
| | 124,455,342 |
Common Stocks - continued |
| Shares | | Value (Note 1) |
INFORMATION TECHNOLOGY - continued |
IT Services - 6.0% |
First Data Corp. | 400,200 | | $ 18,025,008 |
Infosys Technologies Ltd. | 466,147 | | 31,282,549 |
Paychex, Inc. | 567,100 | | 22,105,558 |
| | 71,413,115 |
Semiconductors & Semiconductor Equipment - 3.4% |
MEMC Electronic Materials, Inc. (a) | 717,000 | | 26,887,500 |
SiRF Technology Holdings, Inc. (a)(d) | 436,420 | | 14,061,452 |
| | 40,948,952 |
Software - 1.9% |
Microsoft Corp. | 1,004,200 | | 23,397,860 |
TOTAL INFORMATION TECHNOLOGY | | 312,395,466 |
MATERIALS - 7.0% |
Chemicals - 2.6% |
Monsanto Co. | 180,400 | | 15,187,876 |
Praxair, Inc. | 289,700 | | 15,643,800 |
| | 30,831,676 |
Metals & Mining - 4.4% |
Carpenter Technology Corp. | 320,300 | | 36,994,650 |
Mittal Steel Co. NV Class A (NY Shares) (d) | 512,300 | | 15,630,273 |
| | 52,624,923 |
TOTAL MATERIALS | | 83,456,599 |
TELECOMMUNICATION SERVICES - 2.3% |
Diversified Telecommunication Services - 1.0% |
AT&T, Inc. | 409,200 | | 11,412,588 |
Wireless Telecommunication Services - 1.3% |
American Tower Corp. Class A (a) | 494,100 | | 15,376,392 |
TOTAL TELECOMMUNICATION SERVICES | | 26,788,980 |
TOTAL COMMON STOCKS (Cost $1,059,869,611) | 1,182,368,397 |
Money Market Funds - 5.1% |
| Shares | | Value (Note 1) |
Fidelity Cash Central Fund, 5.11% (b) | 17,911,398 | | $ 17,911,398 |
Fidelity Securities Lending Cash Central Fund, 5.14% (b)(c) | 43,706,950 | | 43,706,950 |
TOTAL MONEY MARKET FUNDS (Cost $61,618,348) | 61,618,348 |
TOTAL INVESTMENT PORTFOLIO - 104.0% (Cost $1,121,487,959) | | 1,243,986,745 |
NET OTHER ASSETS - (4.0)% | | (48,338,845) |
NET ASSETS - 100% | $ 1,195,647,900 |
Legend |
(a) Non-income producing |
(b) Affiliated fund that is available only to investment companies and other accounts managed by Fidelity Investments. The rate quoted is the annualized seven-day yield of the fund at period end. A complete unaudited listing of the fund's holdings as of its most recent quarter end is available upon request. |
(c) Investment made with cash collateral received from securities on loan. |
(d) Security or a portion of the security is on loan at period end. |
Affiliated Central Funds |
Information regarding fiscal year to date income earned by the fund from the affiliated Central funds is as follows: |
Fund | Income earned |
Fidelity Cash Central Fund | $ 2,443,159 |
Fidelity Securities Lending Cash Central Fund | 476,127 |
Total | $ 2,919,286 |
Other Information |
Distribution of investments by country of issue, as a percentage of total net assets, is as follows: |
United States of America | 80.6% |
Cayman Islands | 3.7% |
India | 2.6% |
Canada | 2.5% |
| |
Panama | 2.3% |
Netherlands Antilles | 1.6% |
China | 1.3% |
Netherlands | 1.3% |
Israel | 1.2% |
Ireland | 1.2% |
Others (individually less than 1%) | 1.7% |
| 100.0% |
See accompanying notes which are an integral part of the financial statements.
Annual Report
Financial Statements
Statement of Assets and Liabilities
| June 30, 2006 |
Assets | | |
Investment in securities, at value (including securities loaned of $41,871,895) - See accompanying schedule: Unaffiliated issuers (cost $1,059,869,611) | $ 1,182,368,397 | |
Affiliated Central Funds (cost $61,618,348) | 61,618,348 | |
Total Investments (cost $1,121,487,959) | | $ 1,243,986,745 |
Receivable for investments sold | | 6,529,985 |
Receivable for fund shares sold | | 2,855,857 |
Dividends receivable | | 190,507 |
Interest receivable | | 228,324 |
Prepaid expenses | | 1,622 |
Other receivables | | 366,465 |
Total assets | | 1,254,159,505 |
| | |
Liabilities | | |
Payable for investments purchased | $ 13,039,566 | |
Payable for fund shares redeemed | 972,940 | |
Accrued management fee | 466,639 | |
Other affiliated payables | 274,259 | |
Other payables and accrued expenses | 51,251 | |
Collateral on securities loaned, at value | 43,706,950 | |
Total liabilities | | 58,511,605 |
| | |
Net Assets | | $ 1,195,647,900 |
Net Assets consist of: | | |
Paid in capital | | $ 973,222,733 |
Undistributed net investment income | | 4,205,558 |
Accumulated undistributed net realized gain (loss) on investments and foreign currency transactions | | 95,720,823 |
Net unrealized appreciation (depreciation) on investments and assets and liabilities in foreign currencies | | 122,498,786 |
Net Assets, for 50,613,433 shares outstanding | | $ 1,195,647,900 |
Net Asset Value, offering price and redemption price per share ($1,195,647,900 ÷ 50,613,433 shares) | | $ 23.62 |
See accompanying notes which are an integral part of the financial statements.
Annual Report
Financial Statements - continued
Statement of Operations
| Year ended June 30, 2006 |
Investment Income | | |
Dividends | | $ 7,281,991 |
Special dividends | | 1,910,655 |
Interest | | 2,527 |
Income from affiliated Central Funds | | 2,919,286 |
Total income | | 12,114,459 |
| | |
Expenses | | |
Management fee
Basic fee | $ 5,589,841 | |
Performance adjustment | (975,108) | |
Transfer agent fees | 2,517,304 | |
Accounting and security lending fees | 318,641 | |
Independent trustees' compensation | 3,894 | |
Custodian fees and expenses | 109,309 | |
Registration fees | 67,766 | |
Audit | 49,274 | |
Legal | 15,185 | |
Miscellaneous | 69,846 | |
Total expenses before reductions | 7,765,952 | |
Expense reductions | (219,758) | 7,546,194 |
Net investment income (loss) | | 4,568,265 |
Realized and Unrealized Gain (Loss) Net realized gain (loss) on: | | |
Investment securities: | | |
Unaffiliated issuers | 125,177,561 | |
Foreign currency transactions | (2,364) | |
Total net realized gain (loss) | | 125,175,197 |
Change in net unrealized appreciation (depreciation) on: Investment securities (net of decrease in deferred foreign taxes of $2,451,888) | 13,892,826 | |
Assets and liabilities in foreign currencies | (1,806) | |
Total change in net unrealized appreciation (depreciation) | | 13,891,020 |
Net gain (loss) | | 139,066,217 |
Net increase (decrease) in net assets resulting from operations | | $ 143,634,482 |
See accompanying notes which are an integral part of the financial statements.
Annual Report
Statement of Changes in Net Assets
| Year ended
June 30,
2006 | Year ended
June 30,
2005 |
Increase (Decrease) in Net Assets | | |
Operations | | |
Net investment income (loss) | $ 4,568,265 | $ 2,939,756 |
Net realized gain (loss) | 125,175,197 | (14,877,083) |
Change in net unrealized appreciation (depreciation) | 13,891,020 | 32,333,566 |
Net increase (decrease) in net assets resulting
from operations | 143,634,482 | 20,396,239 |
Distributions to shareholders from net investment income | (389,287) | (3,465,273) |
Distributions to shareholders from net realized gain | (6,228,409) | - |
Total distributions | (6,617,696) | (3,465,273) |
Share transactions
Proceeds from sales of shares | 458,115,692 | 122,958,183 |
Reinvestment of distributions | 6,473,994 | 3,385,192 |
Cost of shares redeemed | (201,045,014) | (274,410,739) |
Net increase (decrease) in net assets resulting from share transactions | 263,544,672 | (148,067,364) |
Redemption fees | 28,643 | 20,056 |
Total increase (decrease) in net assets | 400,590,101 | (131,116,342) |
| | |
Net Assets | | |
Beginning of period | 795,057,799 | 926,174,141 |
End of period (including undistributed net investment income of $4,205,558 and accumulated net investment loss of $525, respectively) | $ 1,195,647,900 | $ 795,057,799 |
Other Information Shares | | |
Sold | 19,587,055 | 6,338,234 |
Issued in reinvestment of distributions | 282,091 | 166,267 |
Redeemed | (8,861,415) | (14,165,617) |
Net increase (decrease) | 11,007,731 | (7,661,116) |
See accompanying notes which are an integral part of the financial statements.
Annual Report
Financial Highlights
Years ended June 30, | 2006 | 2005 | 2004 | 2003 | 2002 |
Selected Per-Share Data | | | | | |
Net asset value, beginning of period | $ 20.07 | $ 19.59 | $ 17.90 | $ 17.19 | $ 16.80 |
Income from Investment Operations | | | | | |
Net investment income (loss) B | .11 C | .07 D | (.05) | .11 | .10 |
Net realized and unrealized gain (loss) | 3.61 | .49 | 1.77 | .73 | .36 |
Total from investment operations | 3.72 | .56 | 1.72 | .84 | .46 |
Distributions from net investment income | (.01) | (.08) | (.03) | (.13) | (.08) |
Distributions from net realized gain | (.16) | - | - | - | - |
Total distributions | (.17) | (.08) | (.03) | (.13) | (.08) |
Redemption fees added to paid in capital B | - F | - F | - F | - F | .01 |
Net asset value, end of period | $ 23.62 | $ 20.07 | $ 19.59 | $ 17.90 | $ 17.19 |
Total Return A, G | 18.56% | 2.85% | 9.63% | 4.98% | 2.83% |
Ratios to Average Net Assets E | | | | | |
Expenses before reductions | .79% | .97% | 1.05% | 1.08% | 1.12% |
Expenses net of fee waivers, if any | .79% | .97% | 1.05% | 1.08% | 1.12% |
Expenses net of all reductions | .77% | .92% | .99% | .93% | 1.09% |
Net investment income (loss) | .46% C | .35% D | (.29)% | .66% | .61% |
Supplemental Data | | | | | |
Net assets, end of period (000 omitted) | $ 1,195,648 | $ 795,058 | $ 926,174 | $ 892,524 | $ 741,446 |
Portfolio turnover rate | 107% | 110% | 161% | 230% | 50% |
A Total returns would have been lower had certain expenses not been reduced during the periods shown.
B Calculated based on average shares outstanding during the period.
C Investment income per share reflects a special dividend which amounted to $.04 per share. Excluding the special dividend, the ratio of net investment income (loss) to average net assets would have been .27%.
D Investment income per share reflects a special dividend which amounted to $.10 per share. Excluding the special dividend, the ratio of net investment income (loss) to average net assets would have been (.14)%.
E Expense ratios reflect operating expenses of the fund. Expenses before reductions do not reflect amounts reimbursed by the investment adviser or reductions from brokerage service arrangements or other expense offset arrangements and do not represent the amount paid by the fund during periods when reimbursements or reductions occur. Expenses net of fee waivers reflect expenses after reimbursement by the investment adviser but prior to reductions from brokerage service arrangements or other expense offset arrangements. Expenses net of all reductions represent the net expenses paid by the fund.
F Amount represents less than $.01 per share.
G Total returns do not include the effect of the former sales charges.
See accompanying notes which are an integral part of the financial statements.
Annual Report
Notes to Financial Statements
For the period ended June 30, 2006
1. Significant Accounting Policies.
Fidelity Fifty (the Fund) is a non-diversified fund of Fidelity Hastings Street Trust (the trust) and is authorized to issue an unlimited number of shares. The trust is registered under the Investment Company Act of 1940, as amended (the 1940 Act), as an open-end management investment company organized as a Massachusetts business trust. The Fund's investments in emerging markets can be subject to social, economic, regulatory, and political uncertainties and can be extremely volatile. The Fund may invest in affiliated money market central funds (Money Market Central Funds), which are open-end investment companies available to investment companies and other accounts managed by Fidelity Management & Research Company (FMR) and its affiliates. The financial statements have been prepared in conformity with accounting principles generally accepted in the United States of America, which require management to make certain estimates and assumptions at the date of the financial statements. The following summarizes the significant accounting policies of the Fund:
Security Valuation. Investments are valued and net asset value (NAV) per share is calculated (NAV calculation) as of the close of business of the New York Stock Exchange (NYSE), normally 4:00 p.m. Eastern time. Wherever possible, the Fund uses independent pricing services approved by the Board of Trustees to value its investments.
Equity securities, including restricted securities, for which market quotations are readily available, are valued at the last reported sale price or official closing price as reported by an independent pricing service on the primary market or exchange on which they are traded. In the event there were no sales during the day or closing prices are not available, securities are valued at the last quoted bid price. Investments in open-end mutual funds are valued at their closing net asset value each business day. Short-term securities with remaining maturities of sixty days or less for which quotations are not readily available are valued at amortized cost, which approximates value.
When current market prices or quotations are not readily available or do not accurately reflect fair value, valuations may be determined in accordance with procedures adopted by the Board of Trustees. For example, when developments occur between the close of a market and the close of the NYSE that may materially affect the value of some or all of the securities, or when trading in a security is halted, those securities may be fair valued. Factors used in the determination of fair value may include monitoring news to identify significant market or security specific events such as changes in the value of U.S. securities markets, reviewing developments in foreign markets and evaluating the performance of ADRs, futures contracts and exchange-traded funds. Because the Fund's utilization of fair value pricing depends on market activity, the frequency with which fair value pricing is used can not be predicted and may be utilized to a significant extent. The value of securities used for NAV calculation under fair value pricing may differ from published prices for the same securities.
Annual Report
Notes to Financial Statements - continued
1. Significant Accounting Policies - continued
Foreign Currency. The Fund uses foreign currency contracts to facilitate transactions in foreign-denominated securities. Losses from these transactions may arise from changes in the value of the foreign currency or if the counterparties do not perform under the contracts' terms.
Foreign-denominated assets, including investment securities, and liabilities are translated into U.S. dollars at the exchange rate at period end. Purchases and sales of investment securities, income and dividends received and expenses denominated in foreign currencies are translated into U.S. dollars at the exchange rate in effect on the transaction date.
The effects of exchange rate fluctuations on investments are included with the net realized and unrealized gain (loss) on investment securities. Other foreign currency transactions resulting in realized and unrealized gain (loss) are disclosed separately.
Investment Transactions and Income. Security transactions are accounted for as of trade date. Gains and losses on securities sold are determined on the basis of identified cost and may include proceeds received from litigation. Dividend income is recorded on the ex-dividend date, except for certain dividends from foreign securities where the ex-dividend date may have passed, which are recorded as soon as the Fund is informed of the ex-dividend date. Non-cash dividends included in dividend income, if any, are recorded at the fair market value of the securities received. Distributions received on securities that represent a return of capital or capital gain are recorded as a reduction of cost of investments and/or as a realized gain. The Fund estimates the components of distributions received that may be considered return of capital distributions or capital gain distributions. Large, non-recurring dividends recognized by the Fund are presented separately on the Statement of Operations as "Special Dividends" and the impact of these dividends is presented in the Financial Highlights. Interest income is accrued as earned. Interest income includes coupon interest and amortization of premium and accretion of discount on debt securities. Investment income is recorded net of foreign taxes withheld where recovery of such taxes is uncertain.
Expenses. Most expenses of the trust can be directly attributed to a fund. Expenses which cannot be directly attributed are apportioned among each Fund in the trust.
Income Tax Information and Distributions to Shareholders. Each year, the Fund intends to qualify as a regulated investment company by distributing all of its taxable income and realized gains under Subchapter M of the Internal Revenue Code. As a result, no provision for income taxes is required in the accompanying financial statements. Foreign taxes are provided for based on the Fund's understanding of the tax rules and rates that exist in the foreign markets in which it invests.
Annual Report
1. Significant Accounting Policies - continued
Income Tax Information and Distributions to Shareholders - continued
Distributions are recorded on the ex-dividend date. Income and capital gain distributions are determined in accordance with income tax regulations, which may differ from generally accepted accounting principles. In addition, the Fund will claim a portion of the payment made to redeeming shareholders as a distribution for income tax purposes.
Capital accounts within the financial statements are adjusted for permanent book-tax differences. These adjustments have no impact on net assets or the results of operations. Temporary book-tax differences will reverse in a subsequent period.
Book-tax differences are primarily due to foreign currency transactions, deferred trustees compensation, capital loss carryforwards, losses deferred due to wash sales and excise tax regulations.
The tax-basis components of distributable earnings and the federal tax cost as of period end were as follows:
Unrealized appreciation | $ 156,724,889 | |
Unrealized depreciation | (36,660,115) | |
Net unrealized appreciation (depreciation) | 120,064,774 | |
Undistributed ordinary income | 24,489,157 | |
Undistributed long-term capital gain | 70,403,275 | |
| | |
Cost for federal income tax purposes | $ 1,123,921,971 | |
The tax character of distributions paid was as follows:
| June 30, 2006 | June 30, 2005 |
Ordinary Income | $ 389,287 | $ 3,465,273 |
Long-term Capital Gains | 6,228,409 | - |
Total | $ 6,617,696 | $ 3,465,273 |
New Accounting Pronouncement. In July 2006, Financial Accounting Standards Board Interpretation No. 48, Accounting for Uncertainty in Income Taxes - an interpretation of FASB Statement 109 (FIN 48) was issued and is effective for fiscal years beginning after December 15, 2006. FIN 48 sets forth a threshold for financial statement recognition, measurement and disclosure of a tax position taken or expected to be taken on a tax return. Management is currently evaluating the impact, if any, the adoption of FIN 48 will have on the Fund's net assets and results of operations.
Short-Term Trading (Redemption) Fees. During the period, shares held in the Fund less than 30 days were subject to a redemption fee equal to .75% of the proceeds of the redeemed shares. All redemption fees, including any estimated redemption fees paid by FMR, are retained by the Fund and accounted for as an addition to paid in capital. On
Annual Report
Notes to Financial Statements - continued
1. Significant Accounting Policies - continued
Short-Term Trading (Redemption) Fees - continued
July 20, 2006, the Board of Trustees approved the removal of the redemption fee beginning July 24, 2006 for shares redeemed from accounts held directly with Fidelity, and on or before September 1, 2006 for shares redeemed through intermediaries.
2. Operating Policies.
Repurchase Agreements. FMR has received an Exemptive Order from the Securities and Exchange Commission (the SEC) which permits the Fund and other affiliated entities of FMR to transfer uninvested cash balances into joint trading accounts which are then invested in repurchase agreements. The Fund may also invest directly with institutions in repurchase agreements. Repurchase agreements are collateralized by government or non-government securities. Upon settlement date, collateral is held in segregated accounts with custodian banks and may be obtained in the event of a default of the counterparty. The Fund monitors, on a daily basis, the value of the collateral to ensure it is at least equal to the principal amount of the repurchase agreement (including accrued interest). In the event of a default by the counterparty, realization of the collateral proceeds could be delayed, during which time the value of the collateral may decline.
3. Purchases and Sales of Investments.
Purchases and sales of securities, other than short-term securities, aggregated $1,277,992,971 and $998,852,710, respectively.
4. Fees and Other Transactions with Affiliates.
Management Fee. FMR and its affiliates provide the Fund with investment management related services for which the Fund pays a monthly management fee. The management fee is the sum of an individual fund fee rate that is based on an annual rate of .30% of the Fund's average net assets and a group fee rate that averaged .27% during the period. The group fee rate is based upon the average net assets of all the mutual funds advised by FMR. The group fee rate decreases as assets under management increase and increases as assets under management decrease. In addition, the management fee is subject to a performance adjustment (up to a maximum of ±.20% of the Fund's average net assets over a 36 month performance period). The upward or downward adjustment to the management fee is based on the Fund's relative investment performance as compared to an appropriate benchmark index. For the period, the total annual management fee rate, including the performance adjustment, was .47% of the Fund's average net assets.
Transfer Agent Fees. Fidelity Service Company, Inc. (FSC), an affiliate of FMR, is the Fund's transfer, dividend disbursing and shareholder servicing agent. FSC receives
Annual Report
4. Fees and Other Transactions with Affiliates - continued
Transfer Agent Fees - continued
account fees and asset-based fees that vary according to account size and type of account. FSC pays for typesetting, printing and mailing of shareholder reports, except proxy statements. For the period, the transfer agent fees were equivalent to an annual rate of .26% of average net assets.
Accounting and Security Lending Fees. FSC maintains the Fund's accounting records. The accounting fee is based on the level of average net assets for the month. Under a separate contract, FSC administers the security lending program. The security lending fee is based on the number and duration of lending transactions.
Affiliated Central Funds. The Fund may invest in Money Market Central Funds which seek preservation of capital and current income and are managed by Fidelity Investments Money Management, Inc. (FIMM), an affiliate of FMR.
The Money Market Central Funds do not pay a management fee.
Brokerage Commissions. The Fund placed a portion of its portfolio transactions with brokerage firms which are affiliates of the investment adviser. The commissions paid to these affiliated firms were $15,030 for the period.
5. Committed Line of Credit.
The Fund participates with other funds managed by FMR in a $4.2 billion credit facility (the "line of credit") to be utilized for temporary or emergency purposes to fund shareholder redemptions or for other short-term liquidity purposes. The Fund has agreed to pay commitment fees on its pro rata portion of the line of credit, which amounts to $2,667 and is reflected in Miscellaneous Expense on the Statement of Operations. During the period, there were no borrowings on this line of credit.
6. Security Lending.
The Fund lends portfolio securities from time to time in order to earn additional income. On the settlement date of the loan, the Fund receives collateral (in the form of U.S. Treasury obligations, letters of credit and/or cash) against the loaned securities and maintains collateral in an amount not less than 100% of the market value of the loaned securities during the period of the loan. The market value of the loaned securities is determined at the close of business of the Fund and any additional required collateral is delivered to the Fund on the next business day. If the borrower defaults on its obligation to return the securities loaned because of insolvency or other reasons, a fund could experience delays and costs in recovering the securities loaned or in gaining access to the collateral. Any cash collateral received is invested in the Fidelity Securities Lending
Annual Report
Notes to Financial Statements - continued
6. Security Lending - continued
Cash Central Fund. The value of loaned securities and cash collateral at period end are disclosed on the Fund's Statement of Assets and Liabilities. Security lending income represents the income earned on investing cash collateral, less fees and expenses associated with the loan, plus any premium payments that may be received on the loan of certain types of securities. Security lending income is presented in the Statement of Operations as a component of income from affiliated central funds. Net income from lending portfolio securities during the period amounted to $476,127.
7. Expense Reductions.
Many of the brokers with whom FMR places trades on behalf of the Fund provided services to the Fund in addition to trade execution. These services included payments of certain expenses on behalf of the Fund totaling $188,496 for the period. In addition, through arrangements with the Fund's custodian and transfer agent, credits realized as a result of uninvested cash balances were used to reduce the Fund's expenses. During the period, these credits reduced the Fund's custody and transfer agent expenses by $963 and $30,299, respectively.
8. Other.
The Fund's organizational documents provide former and current trustees and officers with a limited indemnification against liabilities arising in connection with the performance of their duties to the Fund. In the normal course of business, the Fund may also enter into contracts that provide general indemnifications. The Fund's maximum exposure under these arrangements is unknown as this would be dependent on future claims that may be made against the Fund. The risk of material loss from such claims is considered remote.
Annual Report
Report of Independent Registered Public Accounting Firm
To the Trustees of Fidelity Hastings Street Trust and the Shareholders of Fidelity Fifty:
In our opinion, the accompanying statement of assets and liabilities, including the schedule of investments, and the related statements of operations and of changes in net assets and the financial highlights present fairly, in all material respects, the financial position of Fidelity Fifty (a fund of Fidelity Hastings Street Trust) at June 30, 2006, and the results of its operations for the year then ended, the changes in its net assets for each of the two years in the period then ended and the financial highlights for each of the five years in the period then ended, in conformity with accounting principles generally accepted in the United States of America. These financial statements and financial highlights (hereafter referred to as "financial statements") are the responsibility of the Fidelity Fifty's management; our responsibility is to express an opinion on these financial statements based on our audits. We conducted our audits of these financial statements in accordance with the standards of the Public Company Accounting Oversight Board (United States). Those standards require that we plan and perform the audit to obtain reasonable assurance about whether the financial statements are free of material misstatement. An audit includes examining, on a test basis, evidence supporting the amounts and disclosures in the financial statements, assessing the accounting principles used and significant estimates made by management, and evaluating the overall financial statement presentation. We believe that our audits, which included confirmation of securities at June 30, 2006 by correspondence with the custodian and brokers, provide a reasonable basis for our opinion.
/s/ PricewaterhouseCoopers LLP
PricewaterhouseCoopers LLP
Boston, Massachusetts
August 14, 2006
Annual Report
Trustees and Officers
The Trustees, Member of the Advisory Board, and executive officers of the trust and funds, as applicable, are listed below. The Board of Trustees governs each fund and is responsible for protecting the interests of shareholders. The Trustees are experienced executives who meet periodically throughout the year to oversee each fund's activities, review contractual arrangements with companies that provide services to each fund, and review each fund's performance. Except for William O. McCoy and Albert R. Gamper, Jr., each of the Trustees oversees 336 funds advised by FMR or an affiliate. Mr. McCoy oversees 338 funds advised by FMR or an affiliate. Mr. Gamper oversees 281 funds advised by FMR or an affiliate.
The Trustees hold office without limit in time except that (a) any Trustee may resign; (b) any Trustee may be removed by written instrument, signed by at least two-thirds of the number of Trustees prior to such removal; (c) any Trustee who requests to be retired or who has become incapacitated by illness or injury may be retired by written instrument signed by a majority of the other Trustees; and (d) any Trustee may be removed at any special meeting of shareholders by a two-thirds vote of the outstanding voting securities of the trust. Each Trustee who is not an interested person (as defined in the 1940 Act) (Independent Trustee), shall retire not later than the last day of the calendar year in which his or her 72nd birthday occurs. The Independent Trustees may waive this mandatory retirement age policy with respect to individual Trustees. The executive officers and Advisory Board Member hold office without limit in time, except that any officer and Advisory Board Member may resign or may be removed by a vote of a majority of the Trustees at any regular meeting or any special meeting of the Trustees. Except as indicated, each individual has held the office shown or other offices in the same company for the past five years.
The fund's Statement of Additional Information (SAI) includes more information about the Trustees. To request a free copy, call Fidelity at 1-800-554-8544.
Interested Trustees*:
Correspondence intended for each Trustee who is an interested person may be sent to Fidelity Investments, 82 Devonshire Street, Boston, Massachusetts 02109.
Name, Age; Principal Occupation |
Edward C. Johnson 3d (76) |
| Year of Election or Appointment: 1984 Mr. Johnson is Chairman of the Board of Trustees. Mr. Johnson serves as President (2006-present), Chief Executive Officer, Chairman, and a Director of FMR Corp.; Chairman and a Director of FMR; Chairman and a Director of Fidelity Research & Analysis Company (FRAC); Chairman and a Director of Fidelity Investments Money Management, Inc.; and Chairman (2001-present) and a Director (1999-present) of FMR Co., Inc. In addition, Mr. Johnson serves as Chairman and Director of Fidelity International Limited (FIL). |
Stephen P. Jonas (53) |
| Year of Election or Appointment: 2005 Mr. Jonas is Senior Vice President of Fidelity Fifty (2005-present). He also serves as Senior Vice President of other Fidelity funds (2005-present). Mr. Jonas is Executive Director of FMR (2005-present) and FMR Co., Inc. (2005-present). He also serves as a Director of Fidelity Investments Money Management, Inc. (2005-present) and FMR Corp. (2003-present). Previously, Mr. Jonas served as President of Fidelity Enterprise Operations and Risk Services (2004-2005), Chief Administrative Officer (2002-2004), and Chief Financial Officer of FMR Corp. (1998-2002). In addition, he serves on the Boards of Boston Ballet (2003-present) and Simmons College (2003-present). |
Robert L. Reynolds (54) |
| Year of Election or Appointment: 2003 Mr. Reynolds is President and a Director of FMR (2005-present), Fidelity Investments Money Management, Inc. (2005-present), and FMR Co., Inc. (2005-present). Mr. Reynolds also serves as a Director (2003-present) and Chief Operating Officer (2000-present) of FMR Corp. and a Director of Strategic Advisers, Inc. (2005-present). He also serves on the Board at Fidelity Investments Canada, Ltd. (2000-present). Previously, Mr. Reynolds served as President of Fidelity Investments Institutional Retirement Group (1996-2000). |
* Trustees have been determined to be "Interested Trustees" by virtue of, among other things, their affiliation with the trust or various entities under common control with FMR.
Annual Report
Independent Trustees:
Correspondence intended for each Independent Trustee (that is, the Trustees other than the Interested Trustees) may be sent to Fidelity Investments, P.O. Box 55235, Boston, Massachusetts 02205-5235.
Name, Age; Principal Occupation |
Dennis J. Dirks (58) |
| Year of Election or Appointment: 2005 Prior to his retirement in May 2003, Mr. Dirks was Chief Operating Officer and a member of the Board of The Depository Trust & Clearing Corporation (DTCC) (1999-2003). He also served as President, Chief Operating Officer, and Board member of The Depository Trust Company (DTC) (1999-2003) and President and Board member of the National Securities Clearing Corporation (NSCC) (1999-2003). In addition, Mr. Dirks served as Chief Executive Officer and Board member of the Government Securities Clearing Corporation (2001-2003) and Chief Executive Officer and Board member of the Mortgage-Backed Securities Clearing Corporation (2001-2003). Mr. Dirks also serves as a Trustee and a member of the Finance Committee of Manhattan College (2005-present) and a Trustee and a member of the Finance Committee of AHRC of Nassau County (2006-present). |
Albert R. Gamper, Jr. (64) |
| Year of Election or Appointment: 2006 Mr. Gamper also serves as a Trustee (2006-present) or Member of the Advisory Board (2005-present) of other investment companies advised by FMR. Prior to his retirement in December 2004, Mr. Gamper served as Chairman of the Board of CIT Group Inc. (commercial finance). During his tenure with CIT Group Inc. Mr. Gamper served in numerous senior management positions, including Chairman (1987-1989; 1999-2001; 2002-2004), Chief Executive Officer (1987-2004), and President (1989-2002). He currently serves as a member of the Board of Directors of Public Service Enterprise Group (utilities, 2001-present), Chairman of the Board of Governors, Rutgers University (2004-present), and Chairman of the Board of Saint Barnabas Health Care System. |
Robert M. Gates (62) |
| Year of Election or Appointment: 1997 Dr. Gates is Chairman of the Independent Trustees (2006-present). Dr. Gates is President of Texas A&M University (2002-present). He was Director of the Central Intelligence Agency (CIA) from 1991 to 1993. From 1989 to 1991, Dr. Gates served as Assistant to the President of the United States and Deputy National Security Advisor. Dr. Gates is a Director of NACCO Industries, Inc. (mining and manufacturing), Parker Drilling Co., Inc. (drilling and rental tools for the energy industry, 2001-present), and Brinker International (restaurant management, 2003-present). Previously, Dr. Gates served as a Director of LucasVarity PLC (automotive components and diesel engines), a Director of TRW Inc. (automotive, space, defense, and information technology), and Dean of the George Bush School of Government and Public Service at Texas A&M University (1999-2001). |
George H. Heilmeier (70) |
| Year of Election or Appointment: 2004 Dr. Heilmeier is Chairman Emeritus of Telcordia Technologies (communication software and systems), where prior to his retirement, he served as company Chairman and Chief Executive Officer. He currently serves on the Boards of Directors of The Mitre Corporation (systems engineering and information technology support for the government), and HRL Laboratories (private research and development, 2004-present). He is Chairman of the General Motors Science & Technology Advisory Board and a Life Fellow of the Institute of Electrical and Electronics Engineers (IEEE). Dr. Heilmeier is a member of the Defense Science Board and the National Security Agency Advisory Board. He is also a member of the National Academy of Engineering, the American Academy of Arts and Sciences, and the Board of Overseers of the School of Engineering and Applied Science of the University of Pennsylvania. Previously, Dr. Heilmeier served as a Director of TRW Inc. (automotive, space, defense, and information technology, 1992-2002), Compaq (1994-2002), Automatic Data Processing, Inc. (ADP) (technology-based business outsourcing, 1995-2002), INET Technologies Inc. (telecommunications network surveillance, 2001-2004), and Teletech Holdings (customer management services). He is the recipient of the 2005 Kyoto Prize in Advanced Technology for his invention of the liquid crystal display. |
Marie L. Knowles (59) |
| Year of Election or Appointment: 2001 Prior to Ms. Knowles' retirement in June 2000, she served as Executive Vice President and Chief Financial Officer of Atlantic Richfield Company (ARCO) (diversified energy, 1996-2000). From 1993 to 1996, she was a Senior Vice President of ARCO and President of ARCO Transportation Company. She served as a Director of ARCO from 1996 to 1998. She currently serves as a Director of Phelps Dodge Corporation (copper mining and manufacturing) and McKesson Corporation (healthcare service, 2002-present). Ms. Knowles is a Trustee of the Brookings Institution and the Catalina Island Conservancy and also serves as a member of the Advisory Board for the School of Engineering of the University of Southern California. |
Ned C. Lautenbach (62) |
| Year of Election or Appointment: 2000 Mr. Lautenbach has been a partner of Clayton, Dubilier & Rice, Inc. (private equity investment firm) since September 1998. Previously, Mr. Lautenbach was with the International Business Machines Corporation (IBM) from 1968 until his retirement in 1998. Mr. Lautenbach serves as a Director of Italtel Holding S.p.A. (telecommunications (Milan, Italy), 2004-present) and Eaton Corporation (diversified industrial) as well as the Philharmonic Center for the Arts in Naples, Florida. He also is a member of the Board of Trustees of Fairfield University (2005-present), as well as a member of the Council on Foreign Relations. |
William O. McCoy (72) |
| Year of Election or Appointment: 1997 Prior to his retirement in December 1994, Mr. McCoy was Vice Chairman of the Board of BellSouth Corporation (telecommunications) and President of BellSouth Enterprises. He is currently a Director of Duke Realty Corporation (real estate). He is also a partner of Franklin Street Partners (private investment management firm). In addition, Mr. McCoy served as the Interim Chancellor (1999-2000) and a member of the Board of Visitors for the University of North Carolina at Chapel Hill and currently serves as Chairman of the Board of Directors of the University of North Carolina Health Care System. He also served as Vice President of Finance for the University of North Carolina (16-school system). |
Cornelia M. Small (62) |
| Year of Election or Appointment: 2005 Ms. Small is a member (2000-present) and Chairperson (2002-present) of the Investment Committee, and a member (2002-present) of the Board of Trustees of Smith College. Previously, she served as Chief Investment Officer (1999-2000), Director of Global Equity Investments (1996-1999), and a member of the Board of Directors of Scudder, Stevens & Clark (1990-1997) and Scudder Kemper Investments (1997-1999). In addition, Ms. Small served as Co-Chair (2000-2003) of the Annual Fund for the Fletcher School of Law and Diplomacy. |
William S. Stavropoulos (67) |
| Year of Election or Appointment: 2001 Mr. Stavropoulos is Chairman Emeritus of the Board of Directors of The Dow Chemical Company. Since joining The Dow Chemical Company in 1967, Mr. Stavropoulos served in numerous senior management positions, including President (1993-2000; 2002-2003), CEO (1995-2000; 2002-2004), and Chairman of the Executive Committee (2000-2004). Currently, he is a Director of NCR Corporation (data warehousing and technology solutions), BellSouth Corporation (telecommunications), Chemical Financial Corporation, Maersk Inc. (industrial conglomerate, 2002-present), and Metalmark Capital (private equity investment firm, 2005-present). He also serves as a member of the Board of Trustees of the American Enterprise Institute for Public Policy Research. In addition, Mr. Stavropoulos is a member of The Business Council, J.P. Morgan International Council and the University of Notre Dame Advisory Council for the College of Science. |
Kenneth L. Wolfe (67) |
| Year of Election or Appointment: 2005 Trustee of Fidelity Hastings Street Trust. Prior to his retirement in 2001, Mr. Wolfe was Chairman and Chief Executive Officer of Hershey Foods Corporation (1993-2001). He currently serves as a member of the boards of Adelphia Communications Corporation (2003-present), Bausch & Lomb, Inc., and Revlon Inc. (2004-present). |
Annual Report
Advisory Board Member and Executive Officers:
Correspondence intended for Mr. Keyes may be sent to Fidelity Investments, P.O. Box 55235, Boston, Massachusetts 02205-5235. Correspondence intended for each executive officer and Mr. Lynch may be sent to Fidelity Investments, 82 Devonshire Street, Boston, Massachusetts 02109.
Name, Age; Principal Occupation |
James H. Keyes (65) |
| Year of Election or Appointment: 2006 Member of the Advisory Board of Fidelity Hastings Street Trust. Prior to his retirement in 2003, Mr. Keyes was Chairman, President, and Chief Executive Officer of Johnson Controls, Inc. (automotive supplier, 1993-2003). He currently serves as a member of the boards of LSI Logic Corporation (semiconductor technologies, 1984-present), Navistar International Corporation (manufacture and sale of trucks, buses, and diesel engines, 2002-present), and Pitney Bowes, Inc. (integrated mail, messaging, and document management solutions, 1998-present). |
Peter S. Lynch (62) |
| Year of Election or Appointment: 2003 Member of the Advisory Board of Fidelity Hastings Street Trust. Mr. Lynch is Vice Chairman and a Director of FMR, and Vice Chairman (2001-present) and a Director (1999-present) of FMR Co., Inc. Previously, Mr. Lynch served as a Trustee of the Fidelity funds (1990-2003). In addition, he serves as the Chairman of the Inner-City Scholarship Fund. |
Philip L. Bullen (46) |
| Year of Election or Appointment: 2006 Vice President of Fidelity Fifty. Mr. Bullen also serves as Vice President of certain Equity Funds (2006-present). Mr. Bullen is Senior Vice President of FMR (2001-present) and FMR Co., Inc. (2001-present). Previously, Mr. Bullen served as President and a Director of Fidelity Research & Analysis Company (2001-2005), President and a Director of Fidelity Management & Research (U.K.) Inc. (2002-2006), and a Director of Strategic Advisers, Inc. (2002-2005). |
Dwight D. Churchill (52) |
| Year of Election or Appointment: 2005 Vice President of Fidelity Fifty. Mr. Churchill also serves as Vice President of certain Equity Funds (2005-present). Mr. Churchill is Executive Vice President of FMR (2005-present) and FMR Co., Inc. (2005-present). Previously, Mr. Churchill served as Senior Vice President of Fidelity Investments Money Management, Inc. (2005-2006), Head of Fidelity's Fixed-Income Division (2000-2005), Vice President of Fidelity's Money Market Funds (2000-2005), Vice President of Fidelity's Bond Funds, and Senior Vice President of FMR. |
Jason L. Weiner (36) |
| Year of Election or Appointment: 2003 Vice President of Fidelity Fifty. Mr. Weiner also serves as Vice President of other funds advised by FMR. Prior to assuming his current responsibilities, Mr. Weiner worked as a research analyst and portfolio manager. Mr. Weiner also serves as Vice President of FMR (1999) and FMR Co., Inc. (2001). |
Eric D. Roiter (57) |
| Year of Election or Appointment: 1998 Secretary of Fidelity Fifty. He also serves as Secretary of other Fidelity funds; Vice President, General Counsel, and Secretary of FMR Co., Inc. (2001-present) and FMR; Assistant Secretary of Fidelity Management & Research (U.K.) Inc. (2001-present), Fidelity Research & Analysis Company (2001-present), and Fidelity Investments Money Management, Inc. (2001-present). Mr. Roiter is an Adjunct Member, Faculty of Law, at Boston College Law School (2003-present). Previously, Mr. Roiter served as Vice President and Secretary of Fidelity Distributors Corporation (FDC) (1998-2005). |
Stuart Fross (46) |
| Year of Election or Appointment: 2003 Assistant Secretary of Fidelity Fifty. Mr. Fross also serves as Assistant Secretary of other Fidelity funds (2003-present), Vice President and Secretary of FDC (2005-present), and is an employee of FMR. |
Christine Reynolds (47) |
| Year of Election or Appointment: 2004 President and Treasurer of Fidelity Fifty. Ms. Reynolds also serves as President and Treasurer of other Fidelity funds (2004-present) and is a Vice President (2003-present) and an employee (2002-present) of FMR. Before joining Fidelity Investments, Ms. Reynolds worked at PricewaterhouseCoopers LLP (PwC) (1980-2002), where she was most recently an audit partner with PwC's investment management practice. |
R. Stephen Ganis (40) |
| Year of Election or Appointment: 2006 Anti-Money Laundering (AML) officer of Fidelity Fifty. Mr. Ganis also serves as AML officer of other Fidelity funds (2006-present) and FMR Corp. (2003-present). Before joining Fidelity Investments, Mr. Ganis practiced law at Goodwin Procter, LLP (2000-2002). |
Joseph B. Hollis (58) |
| Year of Election or Appointment: 2006 Chief Financial Officer of Fidelity Fifty. Mr. Hollis also serves as Chief Financial Officer of other Fidelity funds. Mr. Hollis is President of Fidelity Pricing and Cash Management Services (FPCMS) (2005-present). Mr. Hollis also serves as President and Director of Fidelity Service Company, Inc. (2006-present). Previously, Mr. Hollis served as Senior Vice President of Cash Management Services (1999-2002) and Investment Management Operations (2002-2005). |
Kenneth A. Rathgeber (59) |
| Year of Election or Appointment: 2004 Chief Compliance Officer of Fidelity Fifty. Mr. Rathgeber also serves as Chief Compliance Officer of other Fidelity funds (2004-present) and Executive Vice President of Risk Oversight for Fidelity Investments (2002-present). He is Chief Compliance Officer of FMR (2005-present), FMR Co., Inc. (2005-present), Fidelity Management & Research (U.K.) Inc. (2005-present), Fidelity Research & Analysis Company (2005-present), Fidelity Investments Money Management, Inc. (2005-present), and Strategic Advisers, Inc. (2005-present). Previously, Mr. Rathgeber served as Executive Vice President and Chief Operating Officer for Fidelity Investments Institutional Services Company, Inc. (1998-2002). |
Bryan A. Mehrmann (45) |
| Year of Election or Appointment: 2005 Deputy Treasurer of Fidelity Fifty. Mr. Mehrmann also serves as Deputy Treasurer of other Fidelity funds (2005-present) and is an employee of FMR. Previously, Mr. Mehrmann served as Vice President of Fidelity Investments Institutional Services Group (FIIS)/Fidelity Investments Institutional Operations Corporation, Inc. (FIIOC) Client Services (1998-2004). |
Kimberley H. Monasterio (42) |
| Year of Election or Appointment: 2004 Deputy Treasurer of Fidelity Fifty. Ms. Monasterio also serves as Deputy Treasurer of other Fidelity funds (2004) and is an employee of FMR (2004). Before joining Fidelity Investments, Ms. Monasterio served as Treasurer (2000-2004) and Chief Financial Officer (2002-2004) of the Franklin Templeton Funds and Senior Vice President of Franklin Templeton Services, LLC (2000-2004). |
Kenneth B. Robins (36) |
| Year of Election or Appointment:2005 Deputy Treasurer of Fidelity Fifty. Mr. Robins also serves as Deputy Treasurer of other Fidelity funds (2005-present) and is an employee of FMR (2004-present). Before joining Fidelity Investments, Mr. Robins worked at KPMG LLP, where he was a partner in KPMG's department of professional practice (2002-2004) and a Senior Manager (1999-2000). In addition, Mr. Robins served as Assistant Chief Accountant, United States Securities and Exchange Commission (2000-2002). |
Robert G. Byrnes (39) |
| Year of Election or Appointment: 2005 Assistant Treasurer of Fidelity Fifty. Mr. Byrnes also serves as Assistant Treasurer of other Fidelity funds (2005-present) and is an employee of FMR (2005-present). Previously, Mr. Byrnes served as Vice President of FPCMS (2003-2005). Before joining Fidelity Investments, Mr. Byrnes worked at Deutsche Asset Management where he served as Vice President of the Investment Operations Group (2000-2003). |
John H. Costello (59) |
| Year of Election or Appointment: 1993 Assistant Treasurer of Fidelity Fifty. Mr. Costello also serves as Assistant Treasurer of other Fidelity funds and is an employee of FMR. |
Peter L. Lydecker (52) |
| Year of Election or Appointment: 2004 Assistant Treasurer of Fidelity Fifty. Mr. Lydecker also serves as Assistant Treasurer of other Fidelity funds (2004) and is an employee of FMR. |
Mark Osterheld (51) |
| Year of Election or Appointment: 2002 Assistant Treasurer of Fidelity Fifty. Mr. Osterheld also serves as Assistant Treasurer of other Fidelity funds (2002) and is an employee of FMR. |
Gary W. Ryan (47) |
| Year of Election or Appointment: 2005 Assistant Treasurer of Fidelity Fifty. Mr. Ryan also serves as Assistant Treasurer of other Fidelity funds (2005-present) and is an employee of FMR (2005-present). Previously, Mr. Ryan served as Vice President of Fund Reporting in FPCMS (1999-2005). |
Salvatore Schiavone (40) |
| Year of Election or Appointment: 2005 Assistant Treasurer of Fidelity Fifty. Mr. Schiavone also serves as Assistant Treasurer of other Fidelity funds (2005-present) and is an employee of FMR (2005-present). Before joining Fidelity Investments,
Mr. Schiavone worked at Deutsche Asset Management, where he most recently served as Assistant Treasurer (2003-2005) of the Scudder Funds and Vice President and Head of Fund Reporting (1996-2003). |
Annual Report
Distributions
The Board of Trustees of Fidelity Fifty voted to pay on August 7, 2006, to shareholders of record at the opening of business on August 4, 2006, a distribution of $1.78 per share derived from capital gains realized from sales of portfolio securities and a dividend of $0.08 per share from net investment income.
The fund hereby designates as a capital gain dividend with respect to the taxable year ended June 30, 2006, $76,631,684, or, if subsequently determined to be different, the net capital gain of such year.
The fund designates 100% of the dividend distributed during the fiscal year as qualifying for the dividends-received deduction for corporate shareholders.
The fund designates 100% of the dividend distributed during the fiscal year as amounts which may be taken into account as a dividend for the purposes of the maximum rate under section 1(h)(11) of the Internal Revenue Code.
The fund will notify shareholders in January 2007 of amounts for use in preparing 2006 income tax returns.
Annual Report
Proxy Voting Results
A special meeting of the fund's shareholders was held on November 16, 2005. The results of votes taken among shareholders on proposals before them are reported below. Each vote reported represents one dollar of net asset value held on the record date for the meeting.
PROPOSAL 1 |
To elect a Board of Trustees. A |
| # of
Votes | % of
Votes |
Dennis J. Dirks |
Affirmative | 6,466,243,048.91 | 95.846 |
Withheld | 280,219,946.87 | 4.154 |
TOTAL | 6,746,462,995.78 | 100.000 |
Albert R. Gamper, Jr. B |
Affirmative | 6,459,041,833.49 | 95.740 |
Withheld | 287,421,162.29 | 4.260 |
TOTAL | 6,746,462,995.78 | 100.000 |
Robert M. Gates |
Affirmative | 6,441,052,528.46 | 95.473 |
Withheld | 305,410,467.32 | 4.527 |
TOTAL | 6,746,462,995.78 | 100.000 |
George H. Heilmeier |
Affirmative | 6,458,026,916.90 | 95.725 |
Withheld | 288,436,078.88 | 4.275 |
TOTAL | 6,746,462,995.78 | 100.000 |
Abigail P. Johnson |
Affirmative | 6,427,896,599.31 | 95.278 |
Withheld | 318,566,396.47 | 4.722 |
TOTAL | 6,746,462,995.78 | 100.000 |
Edward C. Johnson 3d |
Affirmative | 6,419,116,877.24 | 95.148 |
Withheld | 327,346,118.54 | 4.852 |
TOTAL | 6,746,462,995.78 | 100.000 |
Stephen P. Jonas |
Affirmative | 6,459,780,830.40 | 95.751 |
Withheld | 286,682,165.38 | 4.249 |
TOTAL | 6,746,462,995.78 | 100.000 |
Marie L. Knowles |
Affirmative | 6,461,769,188.96 | 95.780 |
Withheld | 284,693,806.82 | 4.220 |
TOTAL | 6,746,462,995.78 | 100.000 |
| # of
Votes | % of
Votes |
Ned C. Lautenbach |
Affirmative | 6,460,406,353.14 | 95.760 |
Withheld | 286,056,642.64 | 4.240 |
TOTAL | 6,746,462,995.78 | 100.000 |
Marvin L. Mann |
Affirmative | 6,440,555,199.19 | 95.466 |
Withheld | 305,907,796.59 | 4.534 |
TOTAL | 6,746,462,995.78 | 100.000 |
William O. McCoy |
Affirmative | 6,440,823,478.66 | 95.470 |
Withheld | 305,639,517.12 | 4.530 |
TOTAL | 6,746,462,995.78 | 100.000 |
Robert L. Reynolds |
Affirmative | 6,463,763,182.86 | 95.810 |
Withheld | 282,699,812.92 | 4.190 |
TOTAL | 6,746,462,995.78 | 100.000 |
Cornelia M. Small |
Affirmative | 6,462,121,463.05 | 95.785 |
Withheld | 284,341,532.73 | 4.215 |
TOTAL | 6,746,462,995.78 | 100.000 |
William S. Stavropoulos |
Affirmative | 6,453,499,157.83 | 95.658 |
Withheld | 292,963,837.95 | 4.342 |
TOTAL | 6,746,462,995.78 | 100.000 |
Kenneth L. Wolfe |
Affirmative | 6,457,041,632.10 | 95.710 |
Withheld | 289,421,363.68 | 4.290 |
TOTAL | 6,746,462,995.78 | 100.000 |
PROPOSAL 2 |
To change Fidelity Fifty from a diversified to a non-diversified fund. |
Fidelity Fifty |
| # of
Votes | % of
Votes |
Affirmative | 293,717,896.98 | 69.635 |
Against | 90,371,041.62 | 21.425 |
Abstain | 30,116,312.09 | 7.140 |
Broker Non-Votes | 7,593,718.32 | 1.800 |
TOTAL | 421,798,969.01 | 100.000 |
A Denotes trust-wide proposals and voting results. B Effective on or about January 1, 2006. |
Annual Report
Board Approval of Investment Advisory Contracts and Management Fees
Fidelity Fifty
On January 19, 2006, the Board of Trustees, including the Independent Trustees (together, the Board), voted to approve a general research services agreement (the Agreement) between FMR, FMR Co., Inc. (FMRC), Fidelity Investments Money Management, Inc. (FIMM), and Fidelity Research & Analysis Company (FRAC) (together, the Investment Advisers) for the fund, effective January 20, 2006, pursuant to which FRAC may provide general research and investment advisory support services to FMRC and FIMM. The Board considered that it has approved previously various sub-advisory agreements for the fund with affiliates of FMR that allow FMR to obtain research, non-discretionary advice, or discretionary portfolio management at no additional expense to the fund. The Board, assisted by the advice of fund counsel and independent Trustees' counsel, considered a broad range of information and determined that it would be beneficial for the fund to access the research and investment advisory support services supplied by FRAC at no additional expense to the fund.
The Board reached this determination in part because the new arrangement will involve no changes in (i) the contractual terms of and fees payable under the fund's management contract or sub-advisory agreements; (ii) the investment process or strategies employed in the management of the fund's assets; (iii) the nature or level of services provided under the fund's management contract or sub-advisory agreements; (iv) the day-to-day management of the fund or the persons primarily responsible for such management; or (v) the ultimate control or beneficial ownership of FMR, FMRC, or FIMM. The Board also considered that the establishment of the Agreement would not necessitate prior shareholder approval of the Agreement or result in an assignment and termination of the fund's management contract or sub-advisory agreements under the Investment Company Act of 1940.
Because the Board was approving an arrangement with FRAC under which the fund will not bear any additional management fees or expenses and under which the fund's portfolio manager would not change, it did not consider the fund's investment performance, competitiveness of management fee and total expenses, costs of services and profitability, or economies of scale to be significant factors in its decision.
In connection with its future renewal of the fund's management contract and sub-advisory agreements, the Board will consider: (i) the nature, extent, and quality of services provided to the fund, including shareholder and administrative services and investment performance; (ii) the competitiveness of the fund's management fee and total expenses; (iii) the costs of the services and profitability, including the revenues earned and the expenses incurred by Fidelity in conducting the business of developing, marketing, distributing, managing, administering, and servicing the fund and its shareholders; and (iv) whether there have been economies of scale in respect of the management of the Fidelity funds, whether the Fidelity funds (including the fund) have appropriately benefited from any such economies of scale, and whether there is potential for realization of any further economies.
Annual Report
Board Approval of Investment Advisory Contracts and
Management Fees - continued
Based on its evaluation of all of the conclusions noted above, and after considering all material factors, the Board ultimately concluded that the fund's Agreement is fair and reasonable, and that the fund's Agreement should be approved.
Annual Report
Managing Your Investments
Fidelity offers several ways to conveniently manage your personal investments via your telephone or PC. You can access your account information, conduct trades and research your investments 24 hours a day.
By Phone
Fidelity Automated Service Telephone provides a single toll-free number to access account balances, positions, quotes and trading. It's easy to navigate the service, and on your first call, the system will help you create a personal identification number (PIN) for security.
(phone_graphic)
Fidelity Automated
Service Telephone (FAST®)
1-800-544-5555
Press
1 For mutual fund and brokerage trading.
2 For quotes.*
3 For account balances and holdings.
4 To review orders and mutual
fund activity.
5 To change your PIN.
*0 To speak to a Fidelity representative.
By PC
Fidelity's web site on the Internet provides a wide range of information, including daily financial news, fund performance, interactive planning tools and news about Fidelity products and services.
(computer_graphic)
Fidelity's Web Site
www.fidelity.com
* When you call the quotes line, please remember that a fund's yield and return will vary and, except for money market funds, share price will also vary. This means that you may have a gain or loss when you sell your shares. There is no assurance that money market funds will be able to maintain a stable $1 share price; an investment in a money market fund is not insured or guaranteed by the U.S. government. Total returns are historical and include changes in share price, reinvestment of dividends and capital gains, and the effects of any sales charges.
Annual Report
To Visit Fidelity
For directions and hours,
please call 1-800-544-9797.
Arizona
7001 West Ray Road
Chandler, AZ
15445 N. Scottsdale Road
Scottsdale, AZ
California
815 East Birch Street
Brea, CA
1411 Chapin Avenue
Burlingame, CA
851 East Hamilton Avenue
Campbell, CA
19200 Von Karman Avenue
Irvine, CA
601 Larkspur Landing Circle
Larkspur, CA
10100 Santa Monica Blvd.
Los Angeles, CA
27101 Puerta Real
Mission Viejo, CA
73-575 El Paseo
Palm Desert, CA
251 University Avenue
Palo Alto, CA
123 South Lake Avenue
Pasadena, CA
16995 Bernardo Ctr. Drive
Rancho Bernardo, CA
1220 Roseville Parkway
Roseville, CA
1740 Arden Way
Sacramento, CA
7676 Hazard Center Drive
San Diego, CA
11943 El Camino Real
San Diego, CA
8 Montgomery Street
San Francisco, CA
3793 State Street
Santa Barbara, CA
1200 Wilshire Boulevard
Santa Monica, CA
21701 Hawthorne Boulevard
Torrance, CA
2001 North Main Street
Walnut Creek, CA
6300 Canoga Avenue
Woodland Hills, CA
Colorado
1625 Broadway
Denver, CO
9185 Westview Road
Lone Tree, CO
Connecticut
48 West Putnam Avenue
Greenwich, CT
265 Church Street
New Haven, CT
300 Atlantic Street
Stamford, CT
29 South Main Street
West Hartford, CT
Delaware
400 Delaware Avenue
Wilmington, DE
Florida
4400 N. Federal Highway
Boca Raton, FL
121 Alhambra Plaza
Coral Gables, FL
2948 N. Federal Highway
Ft. Lauderdale, FL
4671 Town Center Parkway
Jacksonville, FL
1907 West State Road 434
Longwood, FL
8880 Tamiami Trail, North
Naples, FL
3501 PGA Boulevard
Palm Beach Gardens, FL
3550 Tamiami Trail, South
Sarasota, FL
1502 N. Westshore Blvd.
Tampa, FL
2465 State Road 7
Wellington, FL
Georgia
3445 Peachtree Road, N.E.
Atlanta, GA
1000 Abernathy Road
Atlanta, GA
Illinois
One North LaSalle Street
Chicago, IL
875 North Michigan Ave.
Chicago, IL
1415 West 22nd Street
Oak Brook, IL
1572 East Golf Road
Schaumburg, IL
3232 Lake Avenue
Wilmette, IL
Indiana
4729 East 82nd Street
Indianapolis, IN
Kansas
5400 College Boulevard
Overland Park, KS
Maine
Three Canal Plaza
Portland, ME
Maryland
7315 Wisconsin Avenue
Bethesda, MD
One W. Pennsylvania Ave.
Towson, MD
Massachusetts
801 Boylston Street
Boston, MA
155 Congress Street
Boston, MA
300 Granite Street
Braintree, MA
44 Mall Road
Burlington, MA
238 Main Street
Cambridge, MA
405 Cochituate Road
Framingham, MA
416 Belmont Street
Worcester, MA
Annual Report
Michigan
500 E. Eisenhower Pkwy.
Ann Arbor, MI
280 Old N. Woodward Ave.
Birmingham, MI
43420 Grand River Avenue
Novi, MI
29155 Northwestern Hwy.
Southfield, MI
Minnesota
7600 France Avenue South
Edina, MN
Missouri
1524 South Lindbergh Blvd.
St. Louis, MO
Nevada
2225 Village Walk Drive
Henderson, NV
New Jersey
150 Essex Street
Millburn, NJ
56 South Street
Morristown, NJ
396 Route 17, North
Paramus, NJ
3518 Route 1 North
Princeton, NJ
530 Broad Street
Shrewsbury, NJ
New York
1055 Franklin Avenue
Garden City, NY
37 West Jericho Turnpike
Huntington Station, NY
1271 Avenue of the Americas
New York, NY
980 Madison Avenue
New York, NY
61 Broadway
New York, NY
350 Park Avenue
New York, NY
200 Fifth Avenue
New York, NY
733 Third Avenue
New York, NY
11 Penn Plaza
New York, NY
2070 Broadway
New York, NY
1075 Northern Blvd.
Roslyn, NY
799 Central Park Avenue
Scarsdale, NY
North Carolina
4611 Sharon Road
Charlotte, NC
7011 Fayetteville Road
Durham, NC
Ohio
3805 Edwards Road
Cincinnati, OH
1324 Polaris Parkway
Columbus, OH
28699 Chagrin Boulevard
Woodmere Village, OH
Oregon
7493 SW Bridgeport Road
Tigard, OR
Pennsylvania
600 West DeKalb Pike
King of Prussia, PA
1735 Market Street
Philadelphia, PA
12001 Perry Highway
Wexford, PA
Rhode Island
47 Providence Place
Providence, RI
Tennessee
6150 Poplar Avenue
Memphis, TN
Texas
10000 Research Boulevard
Austin, TX
4001 Northwest Parkway
Dallas, TX
12532 Memorial Drive
Houston, TX
2701 Drexel Drive
Houston, TX
6560 Fannin Street
Houston, TX
6500 N. MacArthur Blvd.
Irving, TX
6005 West Park Boulevard
Plano, TX
14100 San Pedro
San Antonio, TX
1576 East Southlake Blvd.
Southlake, TX
19740 IH 45 North
Spring, TX
Utah
279 West South Temple
Salt Lake City, UT
Virginia
1861 International Drive
McLean, VA
Washington
411 108th Avenue, N.E.
Bellevue, WA
1518 6th Avenue
Seattle, WA
Washington, DC
1900 K Street, N.W.
Washington, DC
Wisconsin
595 North Barker Road
Brookfield, WI
Fidelity Brokerage Services, Inc., 100 Summer St., Boston, MA 02110 Member NYSE/SIPC
Annual Report
To Write Fidelity
We'll give your correspondence immediate attention and send you written confirmation upon completion of your request.
(letter_graphic)
Making Changes
To Your Account
(such as changing name, address, bank, etc.)
Fidelity Investments
P.O. Box 770001
Cincinnati, OH 45277-0002
(letter_graphic)
For Non-Retirement
Accounts
Buying shares
Fidelity Investments
P.O. Box 770001
Cincinnati, OH 45277-0003
Overnight Express
Fidelity Investments
Attn: Distribution Services
100 Crosby Parkway - KC1H
Covington, KY 41015
Selling shares
Fidelity Investments
P.O. Box 770001
Cincinnati, OH 45277-0035
Overnight Express
Fidelity Investments
Attn: Distribution Services
100 Crosby Parkway - KC1H
Covington, KY 41015
General Correspondence
Fidelity Investments
P.O. Box 500
Merrimack, NH 03054-0500
(letter_graphic)
For Retirement
Accounts
Buying shares
Fidelity Investments
P.O. Box 770001
Cincinnati, OH 45277-0003
Selling shares
Fidelity Investments
P.O. Box 770001
Cincinnati, OH 45277-0035
Overnight Express
Fidelity Investments
Attn: Distribution Services
100 Crosby Parkway - KC1H
Covington, KY 41015
General Correspondence
Fidelity Investments
P.O. Box 500
Merrimack, NH 03054-0500
Annual Report
Annual Report
Annual Report
Annual Report
Investment Adviser
Fidelity Management & Research Company
Boston, MA
Investment Sub-Advisers
FMR Co., Inc.
Fidelity Management &
Research Company (U.K.) Inc.
Fidelity Research & Analysis Company
(formerly Fidelity Management &
Research (Far East) Inc.)
Fidelity Investments Japan Limited
Fidelity International Investment Advisors
Fidelity International Investment Advisors (U.K.) Limited
General Distributor
Fidelity Distributors Corporation
Boston, MA
Transfer and Service Agent
Fidelity Service Company, Inc.
Boston, MA
Custodian
Citibank, N.A.
New York, NY
The Fidelity Telephone Connection
Mutual Fund 24-Hour Service
Exchanges/Redemptions
and Account Assistance 1-800-544-6666
Product Information 1-800-544-6666
Retirement Accounts 1-800-544-4774
(8 a.m. - 9 p.m.)
TDD Service 1-800-544-0118
for the deaf and hearing impaired
(9 a.m. - 9 p.m. Eastern time)
Fidelity Automated Service
Telephone (FAST®) (automated graphic) 1-800-544-5555
(automated graphic) Automated line for quickest service
FIF-UANN-0806
1.787732.103
(Fidelity Investment logo)(registered trademark)
Corporate Headquarters
82 Devonshire St., Boston, MA 02109
www.fidelity.com
Fidelity®
Fund
Annual Report
June 30, 2006
(2_fidelity_logos) (Registered_Trademark)
Contents
Chairman's Message | <Click Here> | Ned Johnson's message to shareholders. |
Performance | <Click Here> | How the fund has done over time. |
Management's Discussion | <Click Here> | The manager's review of fund performance, strategy and outlook. |
Shareholder Expense Example | <Click Here> | An example of shareholder expenses. |
Investment Changes | <Click Here> | A summary of major shifts in the fund's investments over the past six months. |
Investments | <Click Here> | A complete list of the fund's investments with their market values. |
Financial Statements | <Click Here> | Statements of assets and liabilities, operations, and changes in net assets,
as well as financial highlights. |
Notes | <Click Here> | Notes to the financial statements. |
Report of Independent Registered Public Accounting Firm | <Click Here> | |
Trustees and Officers | <Click Here> | |
Distributions | <Click Here> | |
Proxy Voting Results | <Click Here> | |
Board Approval of Investment Advisory Contracts and Management Fees | <Click Here> | |
To view a fund's proxy voting guidelines and proxy voting record for the 12-month period ended June 30, visit www.fidelity.com/proxyvotingresults or visit the Securities and Exchange Commission's (SEC) web site at www.sec.gov. You may also call 1-800-544-8544 to request a free copy of the proxy voting guidelines.
Standard & Poor's, S&P and S&P 500 are registered service marks of The McGraw-Hill Companies, Inc. and have been licensed for use by Fidelity Distributors Corporation.
Other third party marks appearing herein are the property of their respective owners.
All other marks appearing herein are registered or unregistered trademarks or service marks of FMR Corp. or an affiliated company.
Annual Report
This report and the financial statements contained herein are submitted for the general information of the shareholders of the fund. This report is not authorized for distribution to prospective investors in the fund unless preceded or accompanied by an effective prospectus.
A fund files its complete schedule of portfolio holdings with the SEC for the first and third quarters of each fiscal year on Form N-Q. Forms N-Q are available on the SEC's web site at http://www.sec.gov. A fund's Forms N-Q may be reviewed and copied at the SEC's Public Reference Room in Washington, DC. Information regarding the operation of the SEC's Public Reference Room may be obtained by calling 1-800-SEC-0330. For a complete list of a fund's portfolio holdings, view the most recent quarterly holdings report, semiannual report, or annual report on Fidelity's web site at http://www.fidelity.com/holdings.
NOT FDIC INSURED · MAY LOSE VALUE · NO BANK GUARANTEE
Neither the fund nor Fidelity Distributors Corporation is a bank.
Annual Report
Chairman's Message
(photo_of_Edward_C_Johnson_3d)
Dear Shareholder:
Although many securities markets made gains in early 2006, inflation concerns led to mixed results through the year's mid-point. Financial markets are always unpredictable. There are, however, a number of time-tested principles that can put the historical odds in your favor.
One of the basic tenets is to invest for the long term. Over time, riding out the markets' inevitable ups and downs has proven much more effective than selling into panic or chasing the hottest trend. Even missing only a few of the markets' best days can significantly diminish investor returns. Patience also affords the benefits of compounding - of earning interest on additional income or reinvested dividends and capital gains. There are tax advantages and cost benefits to consider as well. The more you sell, the more taxes you pay, and the more you trade, the higher the costs. While staying the course doesn't eliminate risk, it can considerably lessen the effect of short-term declines.
You can further manage your investing risk through diversification. And today, more than ever, geographic diversification should be taken into account. Studies indicate that asset allocation is the single most important determinant of a portfolio's long-term success. The right mix of stocks, bonds and cash - aligned to your particular risk tolerance and investment objective - is very important. Age-appropriate rebalancing is also an essential aspect of asset allocation. For younger investors, an emphasis on equities - which historically have been the best performing asset class over time - is encouraged. As investors near their specific goal, such as retirement or sending a child to college, consideration may be given to replacing volatile assets (e.g. common stocks) with more-stable fixed investments (bonds or savings plans).
A third investment principle - investing regularly - can help lower the average cost of your purchases. Investing a certain amount of money each month or quarter helps ensure you won't pay for all your shares at market highs. This strategy - known as dollar cost averaging - also reduces unconstructive "emotion" from investing, helping shareholders avoid selling weak performers just prior to an upswing, or chasing a hot performer just before a correction.
We invite you to contact us via the Internet, through our Investor Centers or over the phone. It is our privilege to provide you the information you need to make the investments that are right for you.
Sincerely,
/s/Edward C. Johnson 3d
Edward C. Johnson 3d
Annual Report
Performance: The Bottom Line
Average annual total return reflects the change in the value of an investment, assuming reinvestment of the fund's dividend income and capital gains (the profits earned upon the sale of securities that have grown in value) and assuming a constant rate of performance each year. The $10,000 table and the fund's returns do not reflect the deduction of taxes that a shareholder would pay on fund distributions or the redemption of fund shares. During periods of reimbursement by Fidelity, a fund's total return will be greater than it would be had the reimbursement not occurred. How a fund did yesterday is no guarantee of how it will do tomorrow.
Average Annual Total Returns
Periods ended June 30, 2006 | Past 1
year | Past 5
years | Past 10 years |
Fidelity ® Fund | 10.40% | 1.40% | 8.09% |
$10,000 Over 10 years
Let's say hypothetically that $10,000 was invested in Fidelity® Fund on June 30, 1996. The chart shows how the value of your investment would have changed, and also shows how the Standard & Poor's 500SM Index performed over the same period.
Annual Report
Management's Discussion of Fund Performance
Comments from John Avery, Portfolio Manager of Fidelity® Fund
After generating sizable gains early on, stock values eroded late in the 12-month period ending June 30, 2006. Worrisome signals of rising inflation took a bite out of many portfolios, as investors wondered about the intentions of the Federal Reserve Board. Many on Wall Street believed the U.S. central bank had nearly concluded its interest-rate-hike crusade. But in announcing its May rate hike, the Board warned of more increases to come. Then, in June, the Fed announced inflation was running at the upper end of the normal range, inducing yet another sell-off and demonstrating investors' anxiety about the Board's future course. Prior to that, stocks were in good shape, riding the momentum of steady economic and corporate earnings growth. Equity benchmarks approached or exceeded multiyear highs, and the Dow Jones Industrial AverageSM nearly topped its record from January 2000. Despite the late difficulties, the Dow rose 11.09% for the 12 months overall, while the Standard & Poor's 500SM Index returned 8.63% and the NASDAQ Composite® Index was up 6.48%.
The fund returned 10.40% during the past year, comfortably outpacing the S&P 500®. Stock picking was particularly helpful versus the index in financials, information technology, energy and health care. Additionally, given the fund's exposure to foreign stocks, currency movements had a positive impact on performance. Internet search engine Google was the fund's top contributor. The company continued to report strong earnings growth and, near period end, introduced an online payment service to compete with eBay's PayPal. Swiss pharmaceutical stock Roche Holding - an out-of-index position - also aided our results. In the materials sector, Monsanto was a standout. The company continued to leverage its expertise in agricultural biotechnology. Energy services provider Schlumberger further aided fund performance, along with investment bank Goldman Sachs, both of which reported strong earnings growth. Conversely, the fund's gains versus the index were somewhat curbed by a slight underweighting in industrials - especially the surging transportation group. An underweighting in energy and a marginal overweighting in health care, along with weak picks in industrials, also hurt. Luxury homebuilder Toll Brothers - an out-of-index holding - struggled due to a softening real estate market. St. Jude Medical, a maker of cardiac pacemakers, also struggled during the period, as did network equipment manufacturer Juniper Networks. I sold Toll Brothers and Juniper Networks by period end.
The views expressed above reflect those of the portfolio manager(s) only through the end of the period as stated on the cover of this report and do not necessarily represent the views of Fidelity or any other person in the Fidelity organization. Any such views are subject to change at any time based upon market or other conditions and Fidelity disclaims any responsibility to update such views. These views may not be relied on as investment advice and, because investment decisions for a Fidelity fund are based on numerous factors, may not be relied on as an indication of trading intent on behalf of any Fidelity fund.
Annual Report
Shareholder Expense Example
As a shareholder of the Fund, you incur two types of costs: (1) transaction costs, and (2) ongoing costs, including management fees and other Fund expenses. This Example is intended to help you understand your ongoing costs (in dollars) of investing in the Fund and to compare these costs with the ongoing costs of investing in other mutual funds.
The Example is based on an investment of $1,000 invested at the beginning of the period and held for the entire period (January 1, 2006 to June 30, 2006).
Actual Expenses
The first line of the accompanying table provides information about actual account values and actual expenses. You may use the information in this line, together with the amount you invested, to estimate the expenses that you paid over the period. Simply divide your account value by $1,000.00 (for example, an $8,600 account value divided by $1,000.00 = 8.6), then multiply the result by the number in the first line under the heading entitled "Expenses Paid During Period" to estimate the expenses you paid on your account during this period. A small balance maintenance fee of $12.00 that is charged once a year may apply for certain accounts with a value of less than $2,000. This fee is not included in the table below. If it was, the estimate of expenses you paid during the period would be higher, and your ending account value lower, by this amount.
Hypothetical Example for Comparison Purposes
The second line of the accompanying table provides information about hypothetical account values and hypothetical expenses based on the Fund's actual expense ratio and an assumed rate of return of 5% per year before expenses, which is not the Fund's actual return. The hypothetical account values and expenses may not be used to estimate the actual ending account balance or expenses you paid for the period. You may use this information to compare the ongoing costs of investing in the Fund and other funds. To do so, compare this 5% hypothetical example with the 5% hypothetical examples that appear in the shareholder reports of the other funds. A small balance maintenance fee of $12.00 that is charged once a year may apply for certain accounts with a value of less than $2,000. This fee is not included in the table below. If it was, the estimate of expenses you paid during the period would be higher, and your ending account value lower, by this amount.
Please note that the expenses shown in the table are meant to highlight your ongoing costs only and do not reflect any transaction costs. Therefore, the second line of the table is useful in comparing ongoing costs only, and will not help you determine the relative total costs of owning different funds.
| Beginning
Account Value
January 1, 2006 | Ending
Account Value
June 30, 2006 | Expenses Paid
During Period *
January 1, 2006
to June 30, 2006 |
Actual | $ 1,000.00 | $ 1,025.10 | $ 2.91 |
Hypothetical (5% return per year before expenses) | $ 1,000.00 | $ 1,021.92 | $ 2.91 |
* Expenses are equal to the Fund's annualized expense ratio of .58%; multiplied by the average account value over the period, multiplied by 181/365 (to reflect the one-half year period).
Annual Report
Investment Changes
Top Ten Stocks as of June 30, 2006 |
| % of fund's
net assets | % of fund's net assets
6 months ago |
Bank of America Corp. | 2.6 | 2.0 |
American Express Co. | 2.5 | 2.4 |
Merrill Lynch & Co., Inc. | 2.4 | 2.2 |
Federated Department Stores, Inc. | 2.4 | 1.6 |
McGraw-Hill Companies, Inc. | 2.4 | 2.3 |
Staples, Inc. | 2.3 | 2.0 |
Google, Inc. Class A (sub. vtg.) | 2.2 | 2.3 |
Monsanto Co. | 2.1 | 2.0 |
PepsiCo, Inc. | 2.1 | 1.8 |
Honeywell International, Inc. | 2.1 | 1.4 |
| 23.1 | |
Top Five Market Sectors as of June 30, 2006 |
| % of fund's
net assets | % of fund's net assets
6 months ago |
Financials | 22.7 | 23.1 |
Information Technology | 15.5 | 15.5 |
Consumer Discretionary | 11.9 | 11.8 |
Health Care | 11.3 | 14.7 |
Energy | 9.8 | 8.7 |
Asset Allocation (% of fund's net assets) |
As of June 30, 2006 * | As of December 31, 2005 ** |
| Stocks 99.1% | | | Stocks 100.2% | |
 | Convertible
Securities 0.1% | | | Convertible
Securities 0.0% | |
| Short-Term
Investments and
Net Other Assets 0.8% | | | Short-Term
Investments and
Net Other Assets(dagger) (0.2)% | |
* Foreign
investments | 15.5% | | ** Foreign
investments | 16.0% | |
(dagger) Short-Term Investments and Net Other Assets are not included in the pie chart.

Annual Report
Investments June 30, 2006
Showing Percentage of Net Assets
Common Stocks - 99.1% |
| Shares | | Value (Note 1) (000s) |
CONSUMER DISCRETIONARY - 11.9% |
Auto Components - 0.4% |
Johnson Controls, Inc. | 419,400 | | $ 34,483 |
Automobiles - 0.1% |
Renault SA | 79,545 | | 8,547 |
Hotels, Restaurants & Leisure - 0.8% |
Starwood Hotels & Resorts Worldwide, Inc. | 613,100 | | 36,994 |
Wynn Resorts Ltd. (a) | 427,000 | | 31,299 |
| | 68,293 |
Household Durables - 1.1% |
Fortune Brands, Inc. | 372,100 | | 26,423 |
Garmin Ltd. (d) | 425,700 | | 44,886 |
Koninklijke Philips Electronics NV (NY Shares) | 746,000 | | 23,230 |
| | 94,539 |
Media - 2.7% |
McGraw-Hill Companies, Inc. | 3,924,300 | | 197,118 |
News Corp. Class B | 1,334,500 | | 26,930 |
| | 224,048 |
Multiline Retail - 2.4% |
Federated Department Stores, Inc. | 5,390,400 | | 197,289 |
Specialty Retail - 4.2% |
AutoZone, Inc. (a) | 243,300 | | 21,459 |
Best Buy Co., Inc. | 1,700,300 | | 93,244 |
Circuit City Stores, Inc. | 1,581,300 | | 43,043 |
Staples, Inc. | 7,658,850 | | 186,263 |
| | 344,009 |
Textiles, Apparel & Luxury Goods - 0.2% |
Adidas-Salomon AG | 336,800 | | 16,105 |
TOTAL CONSUMER DISCRETIONARY | | 987,313 |
CONSUMER STAPLES - 9.4% |
Beverages - 2.3% |
PepsiCo, Inc. | 2,866,690 | | 172,116 |
Pernod Ricard SA (d) | 82,900 | | 16,437 |
| | 188,553 |
Food & Staples Retailing - 2.1% |
CVS Corp. | 3,072,700 | | 94,332 |
Walgreen Co. | 1,855,500 | | 83,201 |
| | 177,533 |
Common Stocks - continued |
| Shares | | Value (Note 1) (000s) |
CONSUMER STAPLES - continued |
Food Products - 2.0% |
Kellogg Co. | 703,800 | | $ 34,085 |
Lindt & Spruengli AG (participation certificate) | 16,082 | | 31,822 |
Nestle SA (Reg.) | 308,629 | | 96,944 |
| | 162,851 |
Household Products - 1.2% |
Colgate-Palmolive Co. | 496,500 | | 29,740 |
Procter & Gamble Co. | 1,261,444 | | 70,136 |
| | 99,876 |
Tobacco - 1.8% |
Altria Group, Inc. | 2,002,500 | | 147,044 |
TOTAL CONSUMER STAPLES | | 775,857 |
ENERGY - 9.8% |
Energy Equipment & Services - 3.1% |
Baker Hughes, Inc. | 52,200 | | 4,273 |
GlobalSantaFe Corp. | 871,300 | | 50,318 |
Halliburton Co. | 913,700 | | 67,806 |
Schlumberger Ltd. (NY Shares) | 2,042,000 | | 132,955 |
| | 255,352 |
Oil, Gas & Consumable Fuels - 6.7% |
Chesapeake Energy Corp. | 738,300 | | 22,334 |
ConocoPhillips | 472,892 | | 30,989 |
CONSOL Energy, Inc. | 883,300 | | 41,268 |
Exxon Mobil Corp. | 2,016,500 | | 123,712 |
Hess Corp. | 801,900 | | 42,380 |
Kerr-McGee Corp. | 418,400 | | 29,016 |
Neste Oil Oyj | 249,700 | | 8,797 |
Occidental Petroleum Corp. | 1,279,500 | | 131,213 |
Ultra Petroleum Corp. (a) | 446,300 | | 26,452 |
Valero Energy Corp. | 1,463,600 | | 97,359 |
| | 553,520 |
TOTAL ENERGY | | 808,872 |
FINANCIALS - 22.7% |
Capital Markets - 5.0% |
Goldman Sachs Group, Inc. | 571,200 | | 85,926 |
Greenhill & Co., Inc. | 144,900 | | 8,804 |
Common Stocks - continued |
| Shares | | Value (Note 1) (000s) |
FINANCIALS - continued |
Capital Markets - continued |
Janus Capital Group, Inc. | 1,133,500 | | $ 20,290 |
Lazard Ltd. Class A | 217,500 | | 8,787 |
Merrill Lynch & Co., Inc. | 2,892,300 | | 201,188 |
Nomura Holdings, Inc. sponsored ADR | 2,301,800 | | 43,274 |
TD Ameritrade Holding Corp. | 1,125,431 | | 16,668 |
UBS AG (Reg.) | 271,910 | | 29,829 |
| | 414,766 |
Commercial Banks - 2.4% |
Mizuho Financial Group, Inc. | 4,389 | | 37,168 |
Standard Chartered PLC (United Kingdom) | 531,714 | | 12,981 |
Sumitomo Mitsui Financial Group, Inc. | 1,796 | | 18,992 |
Wells Fargo & Co. | 1,952,000 | | 130,940 |
| | 200,081 |
Consumer Finance - 3.2% |
American Express Co. | 3,864,292 | | 205,658 |
SLM Corp. | 1,043,250 | | 55,209 |
| | 260,867 |
Diversified Financial Services - 2.8% |
Bank of America Corp. | 4,437,765 | | 213,453 |
Moody's Corp. | 377,400 | | 20,553 |
| | 234,006 |
Insurance - 4.8% |
AFLAC, Inc. | 1,494,400 | | 69,265 |
American International Group, Inc. | 2,415,000 | | 142,606 |
Axis Capital Holdings Ltd. | 155,600 | | 4,452 |
Genworth Financial, Inc. Class A (non-vtg.) | 1,190,100 | | 41,463 |
Hartford Financial Services Group, Inc. | 861,400 | | 72,874 |
MetLife, Inc. | 413,000 | | 21,150 |
Prudential Financial, Inc. | 266,600 | | 20,715 |
Willis Group Holdings Ltd. | 813,700 | | 26,120 |
| | 398,645 |
Real Estate Investment Trusts - 0.9% |
AvalonBay Communities, Inc. | 308,900 | | 34,171 |
Developers Diversified Realty Corp. | 79,100 | | 4,127 |
Equity Residential (SBI) | 605,000 | | 27,062 |
Host Hotels & Resorts, Inc. | 375,339 | | 8,209 |
| | 73,569 |
Common Stocks - continued |
| Shares | | Value (Note 1) (000s) |
FINANCIALS - continued |
Real Estate Management & Development - 1.9% |
British Land Co. PLC | 184,300 | | $ 4,305 |
Mitsubishi Estate Co. Ltd. | 3,013,000 | | 63,986 |
Mitsui Fudosan Co. Ltd. | 4,095,000 | | 88,932 |
| | 157,223 |
Thrifts & Mortgage Finance - 1.7% |
Golden West Financial Corp., Delaware | 1,679,600 | | 124,626 |
Washington Mutual, Inc. (d) | 406,100 | | 18,510 |
| | 143,136 |
TOTAL FINANCIALS | | 1,882,293 |
HEALTH CARE - 11.3% |
Biotechnology - 1.2% |
Amgen, Inc. (a) | 252,123 | | 16,446 |
Biogen Idec, Inc. (a) | 1,354,700 | | 62,763 |
MedImmune, Inc. (a) | 824,300 | | 22,339 |
| | 101,548 |
Health Care Equipment & Supplies - 2.9% |
Becton, Dickinson & Co. | 1,938,100 | | 118,476 |
C.R. Bard, Inc. | 1,437,600 | | 105,319 |
St. Jude Medical, Inc. (a) | 491,800 | | 15,944 |
| | 239,739 |
Health Care Providers & Services - 1.0% |
Cardinal Health, Inc. | 238,800 | | 15,362 |
Medco Health Solutions, Inc. (a) | 472,600 | | 27,071 |
UnitedHealth Group, Inc. | 925,300 | | 41,435 |
| | 83,868 |
Pharmaceuticals - 6.2% |
Elan Corp. PLC sponsored ADR (a) | 1,238,800 | | 20,688 |
Johnson & Johnson | 2,488,200 | | 149,093 |
Merck & Co., Inc. | 1,164,100 | | 42,408 |
Novartis AG sponsored ADR | 1,376,300 | | 74,210 |
Roche Holding AG (participation certificate) | 969,901 | | 160,341 |
Wyeth | 1,405,640 | | 62,424 |
| | 509,164 |
TOTAL HEALTH CARE | | 934,319 |
Common Stocks - continued |
| Shares | | Value (Note 1) (000s) |
INDUSTRIALS - 9.5% |
Aerospace & Defense - 5.9% |
BAE Systems PLC | 2,136,880 | | $ 14,614 |
EADS NV | 251,000 | | 7,211 |
Goodrich Corp. | 784,900 | | 31,624 |
Hexcel Corp. (a) | 1,412,400 | | 22,189 |
Honeywell International, Inc. | 4,270,300 | | 172,093 |
Lockheed Martin Corp. | 772,330 | | 55,407 |
Raytheon Co. warrants 6/16/11 (a) | 1,177 | | 15 |
Rolls-Royce Group PLC | 5,335,866 | | 40,857 |
The Boeing Co. | 1,724,600 | | 141,262 |
| | 485,272 |
Commercial Services & Supplies - 0.1% |
Avery Dennison Corp. | 156,500 | | 9,086 |
Electrical Equipment - 0.3% |
ABB Ltd. (Reg.) | 2,012,989 | | 26,181 |
Industrial Conglomerates - 1.5% |
General Electric Co. | 3,803,326 | | 125,358 |
Machinery - 1.5% |
Illinois Tool Works, Inc. | 606,600 | | 28,814 |
ITT Industries, Inc. | 1,455,000 | | 72,023 |
Manitowoc Co., Inc. | 447,900 | | 19,932 |
Terex Corp. (a) | 51,400 | | 5,073 |
| | 125,842 |
Road & Rail - 0.2% |
Laidlaw International, Inc. | 564,710 | | 14,231 |
TOTAL INDUSTRIALS | | 785,970 |
INFORMATION TECHNOLOGY - 15.4% |
Communications Equipment - 5.4% |
CIENA Corp. (a) | 3,532,900 | | 16,993 |
Cisco Systems, Inc. (a) | 3,022,576 | | 59,031 |
Corning, Inc. (a) | 2,984,600 | | 72,197 |
Harris Corp. | 506,700 | | 21,033 |
Lucent Technologies, Inc. (a) | 17,748,700 | | 42,952 |
Motorola, Inc. | 4,039,800 | | 81,402 |
Nokia Corp. sponsored ADR | 1,002,900 | | 20,319 |
QUALCOMM, Inc. | 3,370,972 | | 135,075 |
| | 449,002 |
Common Stocks - continued |
| Shares | | Value (Note 1) (000s) |
INFORMATION TECHNOLOGY - continued |
Computers & Peripherals - 3.0% |
Apple Computer, Inc. (a) | 796,900 | | $ 45,519 |
Diebold, Inc. | 555,100 | | 22,548 |
Hewlett-Packard Co. | 1,629,800 | | 51,632 |
NCR Corp. (a) | 984,200 | | 36,061 |
Network Appliance, Inc. (a) | 1,870,875 | | 66,042 |
Sun Microsystems, Inc. (a) | 5,372,700 | | 22,297 |
| | 244,099 |
Electronic Equipment & Instruments - 1.0% |
Amphenol Corp. Class A | 1,154,900 | | 64,628 |
Nippon Electric Glass Co. Ltd. | 802,000 | | 16,086 |
| | 80,714 |
Internet Software & Services - 2.6% |
eBay, Inc. (a) | 505,100 | | 14,794 |
Google, Inc. Class A (sub. vtg.) (a) | 443,985 | | 186,176 |
Yahoo!, Inc. (a) | 538,720 | | 17,778 |
| | 218,748 |
IT Services - 0.3% |
Cognizant Technology Solutions Corp. Class A (a) | 389,900 | | 26,268 |
Office Electronics - 0.5% |
Canon, Inc. (d) | 884,550 | | 43,207 |
Semiconductors & Semiconductor Equipment - 1.1% |
Applied Materials, Inc. | 2,131,200 | | 34,696 |
Freescale Semiconductor, Inc. Class B (a) | 886,797 | | 26,072 |
Maxim Integrated Products, Inc. | 208,100 | | 6,682 |
Trident Microsystems, Inc. (a) | 1,091,900 | | 20,724 |
| | 88,174 |
Software - 1.5% |
Aspen Technology, Inc. (a) | 2,218,000 | | 29,100 |
Citrix Systems, Inc. (a) | 1,271,934 | | 51,055 |
Microsoft Corp. | 1,319,500 | | 30,744 |
Red Hat, Inc. (a) | 595,900 | | 13,944 |
| | 124,843 |
TOTAL INFORMATION TECHNOLOGY | | 1,275,055 |
MATERIALS - 6.3% |
Chemicals - 4.9% |
Ecolab, Inc. | 2,165,600 | | 87,880 |
Common Stocks - continued |
| Shares | | Value (Note 1) (000s) |
MATERIALS - continued |
Chemicals - continued |
Monsanto Co. | 2,064,927 | | $ 173,846 |
Praxair, Inc. | 2,681,276 | | 144,789 |
| | 406,515 |
Metals & Mining - 1.4% |
Alcoa, Inc. | 818,600 | | 26,490 |
Allegheny Technologies, Inc. | 876,900 | | 60,717 |
Newmont Mining Corp. | 512,900 | | 27,148 |
| | 114,355 |
TOTAL MATERIALS | | 520,870 |
TELECOMMUNICATION SERVICES - 2.0% |
Diversified Telecommunication Services - 2.0% |
AT&T, Inc. | 2,311,095 | | 64,456 |
Verizon Communications, Inc. | 3,067,400 | | 102,727 |
| | 167,183 |
UTILITIES - 0.8% |
Electric Utilities - 0.8% |
E.ON AG | 596,767 | | 68,658 |
TOTAL COMMON STOCKS (Cost $7,257,960) | 8,206,390 |
Nonconvertible Preferred Stocks - 0.0% |
| | | |
HEALTH CARE - 0.0% |
Life Sciences Tools & Services - 0.0% |
GeneProt, Inc. Series A (a)(e) (Cost $3,845) | 710,000 | | 0 |
Convertible Bonds - 0.1% |
| | Principal Amount (000s) | | Value (Note 1) (000s) |
INFORMATION TECHNOLOGY - 0.1% |
Communications Equipment - 0.1% |
CIENA Corp. 0.25% 5/1/13 (Cost $12,390) | | $ 12,390 | | $ 12,314 |
Money Market Funds - 1.7% |
| | Shares | | |
Fidelity Cash Central Fund, 5.11% (b) | | 51,116,353 | | 51,116 |
Fidelity Securities Lending Cash Central Fund, 5.14% (b)(c) | | 91,028,900 | | 91,029 |
TOTAL MONEY MARKET FUNDS (Cost $142,145) | | 142,145 |
TOTAL INVESTMENT PORTFOLIO - 100.9% (Cost $7,416,340) | | | 8,360,849 |
NET OTHER ASSETS - (0.9)% | | | (76,919) |
NET ASSETS - 100% | | $ 8,283,930 |
Legend |
(a) Non-income producing |
(b) Affiliated fund that is available only to investment companies and other accounts managed by Fidelity Investments. The rate quoted is the annualized seven-day yield of the fund at period end. A complete unaudited listing of the fund's holdings as of its most recent quarter end is available upon request. |
(c) Investment made with cash collateral received from securities on loan. |
(d) Security or a portion of the security is on loan at period end. |
(e) Restricted securities - Investment in securities not registered under the Securities Act of 1933 (excluding 144A issues). At the end of the period, the value of restricted securities (excluding 144A issues) amounted to $0 or 0.0% of net assets. |
Additional information on each holding is as follows: |
Security | Acquisition Date | Acquisition Cost (000s) |
GeneProt, Inc. Series A | 7/7/00 | $ 3,845 |
Affiliated Central Funds |
Information regarding fiscal year to date income earned by the fund from the affiliated Central funds is as follows: |
Fund | Income earned
(Amounts in thousands) |
Fidelity Cash Central Fund | $ 2,768 |
Fidelity Securities Lending Cash Central Fund | 2,360 |
Total | $ 5,128 |
Other Affiliated Issuers |
An affiliated company is a company in which the fund has ownership of at least 5% of the voting securities. Fiscal year to date transactions with companies which are or were affiliates are as follows: |
Affiliate
(Amounts in thousands) | Value,
beginning
of period | Purchases | Sales Proceeds | Dividend Income | Value, end
of period |
Aspen Technology, Inc. | $ - | $ 25,138 | $ - | $ - | $ - |
Other Information |
Distribution of investments by country of issue, as a percentage of total net assets, is as follows: |
United States of America | 84.5% |
Switzerland | 5.1% |
Japan | 3.7% |
Netherlands Antilles | 1.6% |
Cayman Islands | 1.1% |
Germany | 1.0% |
Others (individually less than 1%) | 3.0% |
| 100.0% |
Income Tax Information |
At June 30, 2006, the fund had a capital loss carryforward of approximately $659,980,000 all of which will expire on June 30, 2011. |
See accompanying notes which are an integral part of the financial statements.
Annual Report
Financial Statements
Statement of Assets and Liabilities
Amounts in thousands (except per-share amount) | June 30, 2006 |
| | |
Assets | | |
Investment in securities, at value (including securities loaned of $87,176) - See accompanying schedule: Unaffiliated issuers (cost $7,274,195) | $ 8,218,704 | |
Affiliated Central Funds (cost $142,145) | 142,145 | |
Total Investments (cost $7,416,340) | | $ 8,360,849 |
Foreign currency held at value (cost $423) | | 425 |
Receivable for investments sold | | 105,841 |
Receivable for fund shares sold | | 3,680 |
Dividends receivable | | 7,133 |
Interest receivable | | 700 |
Prepaid expenses | | 21 |
Other receivables | | 300 |
Total assets | | 8,478,949 |
| | |
Liabilities | | |
Payable for investments purchased | $ 80,920 | |
Payable for fund shares redeemed | 18,645 | |
Accrued management fee | 2,439 | |
Other affiliated payables | 1,798 | |
Other payables and accrued expenses | 188 | |
Collateral on securities loaned, at value | 91,029 | |
Total liabilities | | 195,019 |
| | |
Net Assets | | $ 8,283,930 |
Net Assets consist of: | | |
Paid in capital | | $ 7,993,347 |
Undistributed net investment income | | 27,145 |
Accumulated undistributed net realized gain (loss) on investments and foreign currency transactions | | (681,076) |
Net unrealized appreciation (depreciation) on investments and assets and liabilities in foreign currencies | | 944,514 |
Net Assets, for 254,464 shares outstanding | | $ 8,283,930 |
Net Asset Value, offering price and redemption price per share ($8,283,930 ÷ 254,464 shares) | | $ 32.55 |
See accompanying notes which are an integral part of the financial statements.
Annual Report
Financial Statements - continued
Statement of Operations
Amounts in thousands | Year ended June 30, 2006 |
| | |
Investment Income | | |
Dividends | | $ 131,120 |
Interest | | 38 |
Income from affiliated Central Funds | | 5,128 |
Total income | | 136,286 |
| | |
Expenses | | |
Management fee | $ 34,007 | |
Transfer agent fees | 19,606 | |
Accounting and security lending fees | 1,231 | |
Independent trustees' compensation | 40 | |
Appreciation in deferred trustee compensation account | 22 | |
Custodian fees and expenses | 376 | |
Registration fees | 47 | |
Audit | 113 | |
Legal | 104 | |
Interest | 141 | |
Miscellaneous | 437 | |
Total expenses before reductions | 56,124 | |
Expense reductions | (2,647) | 53,477 |
Net investment income (loss) | | 82,809 |
Realized and Unrealized Gain (Loss) Net realized gain (loss) on: | | |
Investment securities: | | |
Unaffiliated issuers | 1,011,246 | |
Foreign currency transactions | (862) | |
Total net realized gain (loss) | | 1,010,384 |
Change in net unrealized appreciation (depreciation) on: Investment securities | (116,065) | |
Assets and liabilities in foreign currencies | 6 | |
Total change in net unrealized appreciation (depreciation) | | (116,059) |
Net gain (loss) | | 894,325 |
Net increase (decrease) in net assets resulting from operations | | $ 977,134 |
See accompanying notes which are an integral part of the financial statements.
Annual Report
Statement of Changes in Net Assets
Amounts in thousands | Year ended
June 30,
2006 | Year ended
June 30,
2005 |
Increase (Decrease) in Net Assets | | |
Operations | | |
Net investment income (loss) | $ 82,809 | $ 157,377 |
Net realized gain (loss) | 1,010,384 | 394,671 |
Change in net unrealized appreciation (depreciation) | (116,059) | (82,643) |
Net increase (decrease) in net assets resulting
from operations | 977,134 | 469,405 |
Distributions to shareholders from net investment income | (83,656) | (136,110) |
Share transactions
Proceeds from sales of shares | 622,059 | 1,123,020 |
Reinvestment of distributions | 79,479 | 129,470 |
Cost of shares redeemed | (3,489,418) | (1,906,926) |
Net increase (decrease) in net assets resulting from share transactions | (2,787,880) | (654,436) |
Total increase (decrease) in net assets | (1,894,402) | (321,141) |
| | |
Net Assets | | |
Beginning of period | 10,178,332 | 10,499,473 |
End of period (including undistributed net investment income of $27,145 and undistributed net investment income of $28,802, respectively) | $ 8,283,930 | $ 10,178,332 |
Other Information Shares | | |
Sold | 19,485 | 38,805 |
Issued in reinvestment of distributions | 2,554 | 4,442 |
Redeemed | (109,855) | (65,414) |
Net increase (decrease) | (87,816) | (22,167) |
See accompanying notes which are an integral part of the financial statements.
Annual Report
Financial Highlights
Years ended June 30, | 2006 | 2005 | 2004 | 2003 | 2002 |
Selected Per-Share Data | | | | | |
Net asset value, beginning of period | $ 29.74 | $ 28.81 | $ 24.46 | $ 25.03 | $ 31.84 |
Income from Investment Operations | | | | | |
Net investment income (loss) B | .28 | .44 C | .24 | .21 | .23 |
Net realized and unrealized gain (loss) | 2.80 | .87 | 4.35 | (.57) | (6.83) |
Total from investment operations | 3.08 | 1.31 | 4.59 | (.36) | (6.60) |
Distributions from net investment income | (.27) | (.38) | (.24) | (.21) | (.21) |
Net asset value, end of period | $ 32.55 | $ 29.74 | $ 28.81 | $ 24.46 | $ 25.03 |
Total Return A | 10.40% | 4.58% | 18.81% | (1.36)% | (20.78)% |
Ratios to Average Net Assets D | | | | | |
Expenses before reductions | .59% | .60% | .61% | .63% | .59% |
Expenses net of fee waivers, if any | .59% | .60% | .61% | .63% | .59% |
Expenses net of all reductions | .56% | .57% | .59% | .61% | .53% |
Net investment income (loss) | .87% | 1.52% C | .89% | .93% | .82% |
Supplemental Data | | | | | |
Net assets, end of period (in millions) | $ 8,284 | $ 10,178 | $ 10,499 | $ 9,335 | $ 10,486 |
Portfolio turnover rate | 72% | 74% | 53% | 32% | 155% |
A Total returns would have been lower had certain expenses not been reduced during the periods shown.
B Calculated based on average shares outstanding during the period.
C Investment income per share reflects a special dividend which amounted to $.12 per share. Excluding the special dividend, the ratio of net investment income (loss) to average net assets would have been 1.09%.
D Expense ratios reflect operating expenses of the fund. Expenses before reductions do not reflect amounts reimbursed by the investment adviser or reductions from brokerage service arrangements or other expense offset arrangements and do not represent the amount paid by the fund during periods when reimbursements or reductions occur. Expenses net of fee waivers reflect expenses after reimbursement by the investment adviser but prior to reductions from brokerage service arrangements or other expense offset arrangements. Expenses net of all reductions represent the net expenses paid by the fund.
See accompanying notes which are an integral part of the financial statements.
Annual Report
Notes to Financial Statements
For the period ended June 30, 2006
(Amounts in thousands except ratios)
1. Significant Accounting Policies.
Fidelity Fund (the Fund) is a fund of Fidelity Hastings Street Trust (the trust) and is authorized to issue an unlimited number of shares. The trust is registered under the Investment Company Act of 1940, as amended (the 1940 Act), as an open-end management investment company organized as a Massachusetts business trust. The Fund may invest in affiliated money market central funds (Money Market Central Funds), which are open-end investment companies available to investment companies and other accounts managed by Fidelity Management & Research Company (FMR) and its affiliates. The financial statements have been prepared in conformity with accounting principles generally accepted in the United States of America, which require management to make certain estimates and assumptions at the date of the financial statements. The following summarizes the significant accounting policies of the Fund:
Security Valuation. Investments are valued and net asset value (NAV) per share is calculated (NAV calculation) as of the close of business of the New York Stock Exchange (NYSE), normally 4:00 p.m. Eastern time. Wherever possible, the Fund uses independent pricing services approved by the Board of Trustees to value its investments.
Equity securities, including restricted securities, for which market quotations are readily available, are valued at the last reported sale price or official closing price as reported by an independent pricing service on the primary market or exchange on which they are traded. In the event there were no sales during the day or closing prices are not available, securities are valued at the last quoted bid price. Debt securities, including restricted securities, for which quotations are readily available, are valued by independent pricing services or by dealers who make markets in such securities. Pricing services consider yield or price of bonds of comparable quality, coupon, maturity and type as well as dealer supplied prices. Investments in open-end mutual funds are valued at their closing net asset value each business day. Short-term securities with remaining maturities of sixty days or less for which quotations are not readily available are valued at amortized cost, which approximates value.
When current market prices or quotations are not readily available or do not accurately reflect fair value, valuations may be determined in accordance with procedures adopted by the Board of Trustees. For example, when developments occur between the close of a market and the close of the NYSE that may materially affect the value of some or all of the securities, or when trading in a security is halted, those securities may be fair valued. Factors used in the determination of fair value may include monitoring news to identify significant market or security specific events such as changes in the value of U.S. securities markets, reviewing developments in foreign markets and evaluating the performance of ADRs, futures contracts and exchange-traded funds. Because the Fund's utilization of fair value pricing depends on market activity, the frequency with which fair value pricing is used can not be predicted and may be utilized to a significant extent.
Annual Report
Notes to Financial Statements - continued
(Amounts in thousands except ratios)
1. Significant Accounting Policies - continued
Security Valuation - continued
The value of securities used for NAV calculation under fair value pricing may differ from published prices for the same securities.
Foreign Currency. The Fund uses foreign currency contracts to facilitate transactions in foreign-denominated securities. Losses from these transactions may arise from changes in the value of the foreign currency or if the counterparties do not perform under the contracts' terms.
Foreign-denominated assets, including investment securities, and liabilities are translated into U.S. dollars at the exchange rate at period end. Purchases and sales of investment securities, income and dividends received and expenses denominated in foreign currencies are translated into U.S. dollars at the exchange rate in effect on the transaction date.
The effects of exchange rate fluctuations on investments are included with the net realized and unrealized gain (loss) on investment securities. Other foreign currency transactions resulting in realized and unrealized gain (loss) are disclosed separately.
Investment Transactions and Income. Security transactions are accounted for as of trade date. Gains and losses on securities sold are determined on the basis of identified cost and may include proceeds received from litigation. Dividend income is recorded on the ex-dividend date, except for certain dividends from foreign securities where the ex-dividend date may have passed, which are recorded as soon as the Fund is informed of the ex-dividend date. Non-cash dividends included in dividend income, if any, are recorded at the fair market value of the securities received. Distributions received on securities that represent a return of capital or capital gain are recorded as a reduction of cost of investments and/or as a realized gain. The Fund estimates the components of distributions received that may be considered return of capital distributions or capital gain distributions. Interest income is accrued as earned. Interest income includes coupon interest and amortization of premium and accretion of discount on debt securities. Investment income is recorded net of foreign taxes withheld where recovery of such taxes is uncertain.
Expenses. Most expenses of the trust can be directly attributed to a fund. Expenses which cannot be directly attributed are apportioned among each Fund in the trust.
Deferred Trustee Compensation. Under a Deferred Compensation Plan (the Plan), independent Trustees must defer receipt of a portion of, and may elect to defer receipt of an additional portion of, their annual compensation. Prior to July 1, 2006, deferred amounts were treated as though equivalent dollar amounts had been invested in a cross-section of other Fidelity funds, and were marked-to-market. Effective July 1, 2006,
Annual Report
1. Significant Accounting Policies - continued
Deferred Trustee Compensation - continued
deferred amounts will be directly invested in a cross-section of Fidelity funds. Deferred amounts remain in the Fund until distributed in accordance with the Plan.
Income Tax Information and Distributions to Shareholders. Each year, the Fund intends to qualify as a regulated investment company by distributing all of its taxable income and realized gains under Subchapter M of the Internal Revenue Code. As a result, no provision for income taxes is required in the accompanying financial statements. Foreign taxes are provided for based on the Fund's understanding of the tax rules and rates that exist in the foreign markets in which it invests.
Distributions are recorded on the ex-dividend date. Income and capital gain distributions are determined in accordance with income tax regulations, which may differ from generally accepted accounting principles.
Capital accounts within the financial statements are adjusted for permanent book-tax differences. These adjustments have no impact on net assets or the results of operations. Temporary book-tax differences will reverse in a subsequent period.
Book-tax differences are primarily due to foreign currency transactions, deferred trustees compensation, capital loss carryforwards and losses deferred due to wash sales.
The tax-basis components of distributable earnings and the federal tax cost as of period end were as follows:
Unrealized appreciation | $ 1,188,679 | |
Unrealized depreciation | (265,261) | |
Net unrealized appreciation (depreciation) | 923,418 | |
Undistributed ordinary income | 27,399 | |
Capital loss carryforward | (659,980) | |
| | |
Cost for federal income tax purposes | $ 7,437,431 | |
The tax character of distributions paid was as follows:
| June 30, 2006 | June 30, 2005 |
Ordinary Income | $ 83,656 | $ 136,110 |
New Accounting Pronouncement. In July 2006, Financial Accounting Standards Board Interpretation No. 48, Accounting for Uncertainty in Income Taxes - an interpretation of FASB Statement 109 (FIN 48) was issued and is effective for fiscal years beginning after December 15, 2006. FIN 48 sets forth a threshold for financial statement recognition, measurement and disclosure of a tax position taken or expected to be taken
Annual Report
Notes to Financial Statements - continued
(Amounts in thousands except ratios)
1. Significant Accounting Policies - continued
New Accounting Pronouncement - continued
on a tax return. Management is currently evaluating the impact, if any, the adoption of FIN 48 will have on the Fund's net assets and results of operations.
2. Operating Policies.
Repurchase Agreements. FMR has received an Exemptive Order from the Securities and Exchange Commission (the SEC) which permits the Fund and other affiliated entities of FMR to transfer uninvested cash balances into joint trading accounts which are then invested in repurchase agreements. The Fund may also invest directly with institutions in repurchase agreements. Repurchase agreements are collateralized by government or non-government securities. Upon settlement date, collateral is held in segregated accounts with custodian banks and may be obtained in the event of a default of the counterparty. The Fund monitors, on a daily basis, the value of the collateral to ensure it is at least equal to the principal amount of the repurchase agreement (including accrued interest). In the event of a default by the counterparty, realization of the collateral proceeds could be delayed, during which time the value of the collateral may decline.
Restricted Securities. The Fund may invest in securities that are subject to legal or contractual restrictions on resale. These securities generally may be resold in transactions exempt from registration or to the public if the securities are registered. Disposal of these securities may involve time-consuming negotiations and expense, and prompt sale at an acceptable price may be difficult. Information regarding restricted securities is included at the end of the Fund's Schedule of Investments.
3. Purchases and Sales of Investments.
Purchases and sales of securities, other than short-term securities, aggregated $6,750,353 and $9,536,821, respectively.
4. Fees and Other Transactions with Affiliates.
Management Fee. FMR and its affiliates provide the Fund with investment management related services for which the Fund pays a monthly management fee. The management fee is the sum of an individual fund fee rate that is based on an annual rate of .09% of the Fund's average net assets and a group fee rate that averaged ..27% during the period. The group fee rate is based upon the average net assets of all the mutual funds advised by FMR. The group fee rate decreases as assets under management increase and increases as assets under management decrease. For the period, the total annual management fee rate was .36% of the Fund's average net assets.
Annual Report
4. Fees and Other Transactions with Affiliates - continued
Transfer Agent Fees. Fidelity Service Company, Inc. (FSC), an affiliate of FMR, is the Fund's transfer, dividend disbursing and shareholder servicing agent. FSC receives account fees and asset-based fees that vary according to account size and type of account. FSC pays for typesetting, printing and mailing of shareholder reports, except proxy statements. For the period, the transfer agent fees were equivalent to an annual rate of .21% of average net assets.
Accounting and Security Lending Fees. FSC maintains the Fund's accounting records. The accounting fee is based on the level of average net assets for the month. Under a separate contract, FSC administers the security lending program. The security lending fee is based on the number and duration of lending transactions.
Affiliated Central Funds. The Fund may invest in Money Market Central Funds which seek preservation of capital and current income and are managed by Fidelity Investments Money Management, Inc. (FIMM), an affiliate of FMR.
The Money Market Central Funds do not pay a management fee.
Brokerage Commissions. The Fund placed a portion of its portfolio transactions with brokerage firms which are affiliates of the investment adviser. The commissions paid to these affiliated firms were $134 for the period.
Interfund Lending Program. Pursuant to an Exemptive Order issued by the SEC, the Fund, along with other registered investment companies having management contracts with FMR, may participate in an interfund lending program. This program provides an alternative credit facility allowing the Funds to borrow from, or lend money to, other participating affiliated funds. At period end, there were no interfund loans outstanding. The Fund's activity in this program during the period for which loans were outstanding was as follows:
Borrower or Lender | Average Daily
Loan Balance | Weighted Average
Interest Rate | Interest
Expense |
Borrower | $ 26,958 | 4.29% | $ 141 |
5. Committed Line of Credit.
The Fund participates with other funds managed by FMR in a $4.2 billion credit facility (the "line of credit") to be utilized for temporary or emergency purposes to fund shareholder redemptions or for other short-term liquidity purposes. The Fund has agreed to pay commitment fees on its pro rata portion of the line of credit, which amounts to $30 and is reflected in Miscellaneous Expense on the Statement of Operations. During the period, there were no borrowings on this line of credit.
Annual Report
Notes to Financial Statements - continued
(Amounts in thousands except ratios)
6. Security Lending.
The Fund lends portfolio securities from time to time in order to earn additional income. On the settlement date of the loan, the Fund receives collateral (in the form of U.S. Treasury obligations, letters of credit and/or cash) against the loaned securities and maintains collateral in an amount not less than 100% of the market value of the loaned securities during the period of the loan. The market value of the loaned securities is determined at the close of business of the Fund and any additional required collateral is delivered to the Fund on the next business day. If the borrower defaults on its obligation to return the securities loaned because of insolvency or other reasons, a fund could experience delays and costs in recovering the securities loaned or in gaining access to the collateral. Any cash collateral received is invested in the Fidelity Securities Lending Cash Central Fund. The value of loaned securities and cash collateral at period end are disclosed on the Fund's Statement of Assets and Liabilities. Security lending income represents the income earned on investing cash collateral, less fees and expenses associated with the loan, plus any premium payments that may be received on the loan of certain types of securities. Security lending income is presented in the Statement of Operations as a component of income from affiliated central funds. Net income from lending portfolio securities during the period amounted to $2,360.
7. Expense Reductions.
Many of the brokers with whom FMR places trades on behalf of the Fund provided services to the Fund in addition to trade execution. These services included payments of certain expenses on behalf of the Fund totaling $2,278 for the period. In addition, through arrangements with the Fund's custodian and transfer agent, credits realized as a result of uninvested cash balances were used to reduce the Fund's expenses. During the period, these credits reduced the Fund's custody and transfer agent expenses by $2 and $367, respectively.
8. Other.
The Fund's organizational documents provide former and current trustees and officers with a limited indemnification against liabilities arising in connection with the performance of their duties to the Fund. In the normal course of business, the Fund may also enter into contracts that provide general indemnifications. The Fund's maximum exposure under these arrangements is unknown as this would be dependent on future claims that may be made against the Fund. The risk of material loss from such claims is considered remote.
Annual Report
Report of Independent Registered Public Accounting Firm
To the Trustees of Fidelity Hastings Street Trust and the Shareholders of Fidelity Fund:
In our opinion, the accompanying statement of assets and liabilities, including the schedule of investments, and the related statements of operations and of changes in net assets and the financial highlights present fairly, in all material respects, the financial position of Fidelity Fund (a fund of Fidelity Hastings Street Trust) at June 30, 2006, and the results of its operations for the year then ended, the changes in its net assets for each of the two years in the period then ended and the financial highlights for each of the five years in the period then ended, in conformity with accounting principles generally accepted in the United States of America. These financial statements and financial highlights (hereafter referred to as "financial statements") are the responsibility of the Fidelity Fund's management; our responsibility is to express an opinion on these financial statements based on our audits. We conducted our audits of these financial statements in accordance with the standards of the Public Company Accounting Oversight Board (United States). Those standards require that we plan and perform the audit to obtain reasonable assurance about whether the financial statements are free of material misstatement. An audit includes examining, on a test basis, evidence supporting the amounts and disclosures in the financial statements, assessing the accounting principles used and significant estimates made by management, and evaluating the overall financial statement presentation. We believe that our audits, which included confirmation of securities at June 30, 2006 by correspondence with the custodian and brokers, provide a reasonable basis for our opinion.
/s/ PricewaterhouseCoopers LLP
PricewaterhouseCoopers LLP
Boston, Massachusetts
August 14, 2006
Annual Report
Trustees and Officers
The Trustees, Members of the Advisory Board, and executive officers of the trust and fund, as applicable, are listed below. The Board of Trustees governs the fund and is responsible for protecting the interests of shareholders. The Trustees are experienced executives who meet periodically throughout the year to oversee the fund's activities, review contractual arrangements with companies that provide services to the fund, and review the fund's performance. Except for William O. McCoy and Albert R. Gamper, Jr., each of the Trustees oversees 336 funds advised by FMR or an affiliate. Mr. McCoy oversees 338 funds advised by FMR or an affiliate. Mr. Gamper oversees 281 funds advised by FMR or an affiliate.
The Trustees hold office without limit in time except that (a) any Trustee may resign; (b) any Trustee may be removed by written instrument, signed by at least two-thirds of the number of Trustees prior to such removal; (c) any Trustee who requests to be retired or who has become incapacitated by illness or injury may be retired by written instrument signed by a majority of the other Trustees; and (d) any Trustee may be removed at any special meeting of shareholders by a two-thirds vote of the outstanding voting securities of the trust. Each Trustee who is not an interested person (as defined in the 1940 Act) (Independent Trustee), shall retire not later than the last day of the calendar year in which his or her 72nd birthday occurs. The Independent Trustees may waive this mandatory retirement age policy with respect to individual Trustees. The executive officers and Advisory Board Members hold office without limit in time, except that any officer and Advisory Board Member may resign or may be removed by a vote of a majority of the Trustees at any regular meeting or any special meeting of the Trustees. Except as indicated, each individual has held the office shown or other offices in the same company for the past five years.
The fund's Statement of Additional Information (SAI) includes more information about the Trustees. To request a free copy, call Fidelity at 1-800-544-8544.
Interested Trustees*:
Correspondence intended for each Trustee who is an interested person may be sent to Fidelity Investments, 82 Devonshire Street, Boston, Massachusetts 02109.
Name, Age; Principal Occupation |
Edward C. Johnson 3d (76) |
| Year of Election or Appointment: 1984 Mr. Johnson is Chairman of the Board of Trustees. Mr. Johnson serves as President (2006-present), Chief Executive Officer, Chairman, and a Director of FMR Corp.; Chairman and a Director of FMR; Chairman and a Director of Fidelity Research & Analysis Company (FRAC); Chairman and a Director of Fidelity Investments Money Management, Inc.; and Chairman (2001-present) and a Director (1999-present) of FMR Co., Inc. In addition, Mr. Johnson serves as Chairman and Director of Fidelity International Limited (FIL). |
Stephen P. Jonas (53) |
| Year of Election or Appointment: 2005 Mr. Jonas is Senior Vice President of Fidelity Fund (2005-present). He also serves as Senior Vice President of other Fidelity funds (2005-present). Mr. Jonas is Executive Director of FMR (2005-present) and FMR Co., Inc. (2005-present). He also serves as a Director of Fidelity Investments Money Management, Inc. (2005-present) and FMR Corp. (2003-present). Previously, Mr. Jonas served as President of Fidelity Enterprise Operations and Risk Services (2004-2005), Chief Administrative Officer (2002-2004), and Chief Financial Officer of FMR Corp. (1998-2002). In addition, he serves on the Boards of Boston Ballet (2003-present) and Simmons College (2003-present). |
Robert L. Reynolds (54) |
| Year of Election or Appointment: 2003 Mr. Reynolds is President and a Director of FMR (2005-present), Fidelity Investments Money Management, Inc. (2005-present), and FMR Co., Inc. (2005-present). Mr. Reynolds also serves as a Director (2003-present) and Chief Operating Officer (2000-present) of FMR Corp. and a Director of Strategic Advisers, Inc. (2005-present). He also serves on the Board at Fidelity Investments Canada, Ltd. (2000-present). Previously, Mr. Reynolds served as President of Fidelity Investments Institutional Retirement Group (1996-2000). |
* Trustees have been determined to be "Interested Trustees" by virtue of, among other things, their affiliation with the trust or various entities under common control with FMR.
Annual Report
Independent Trustees:
Correspondence intended for each Independent Trustee (that is, the Trustees other than the Interested Trustees) may be sent to Fidelity Investments, P.O. Box 55235, Boston, Massachusetts 02205-5235.
Name, Age; Principal Occupation |
Dennis J. Dirks (58) |
| Year of Election or Appointment: 2005 Prior to his retirement in May 2003, Mr. Dirks was Chief Operating Officer and a member of the Board of The Depository Trust & Clearing Corporation (DTCC) (1999-2003). He also served as President, Chief Operating Officer, and Board member of The Depository Trust Company (DTC) (1999-2003) and President and Board member of the National Securities Clearing Corporation (NSCC) (1999-2003). In addition, Mr. Dirks served as Chief Executive Officer and Board member of the Government Securities Clearing Corporation (2001-2003) and Chief Executive Officer and Board member of the Mortgage-Backed Securities Clearing Corporation (2001-2003). Mr. Dirks also serves as a Trustee and a member of the Finance Committee of Manhattan College (2005-present) and a Trustee and a member of the Finance Committee of AHRC of Nassau County (2006-present). |
|
Albert R. Gamper, Jr. (64) |
| Year of Election or Appointment: 2006 Mr. Gamper also serves as a Trustee (2006-present) or Member of the Advisory Board (2005-present) of other investment companies advised by FMR. Prior to his retirement in December 2004, Mr. Gamper served as Chairman of the Board of CIT Group Inc. (commercial finance). During his tenure with CIT Group Inc. Mr. Gamper served in numerous senior management positions, including Chairman (1987-1989; 1999-2001; 2002-2004), Chief Executive Officer (1987-2004), and President (1989-2002). He currently serves as a member of the Board of Directors of Public Service Enterprise Group (utilities, 2001-present), Chairman of the Board of Governors, Rutgers University (2004-present), and Chairman of the Board of Saint Barnabas Health Care System. |
Robert M. Gates (62) |
| Year of Election or Appointment: 1997 Dr. Gates is Chairman of the Independent Trustees (2006-present). Dr. Gates is President of Texas A&M University (2002-present). He was Director of the Central Intelligence Agency (CIA) from 1991 to 1993. From 1989 to 1991, Dr. Gates served as Assistant to the President of the United States and Deputy National Security Advisor. Dr. Gates is a Director of NACCO Industries, Inc. (mining and manufacturing), Parker Drilling Co., Inc. (drilling and rental tools for the energy industry, 2001-present), and Brinker International (restaurant management, 2003-present). Previously, Dr. Gates served as a Director of LucasVarity PLC (automotive components and diesel engines), a Director of TRW Inc. (automotive, space, defense, and information technology), and Dean of the George Bush School of Government and Public Service at Texas A&M University (1999-2001). |
George H. Heilmeier (70) |
| Year of Election or Appointment: 2004 Dr. Heilmeier is Chairman Emeritus of Telcordia Technologies (communication software and systems), where prior to his retirement, he served as company Chairman and Chief Executive Officer. He currently serves on the Boards of Directors of The Mitre Corporation (systems engineering and information technology support for the government), and HRL Laboratories (private research and development, 2004-present). He is Chairman of the General Motors Science & Technology Advisory Board and a Life Fellow of the Institute of Electrical and Electronics Engineers (IEEE). Dr. Heilmeier is a member of the Defense Science Board and the National Security Agency Advisory Board. He is also a member of the National Academy of Engineering, the American Academy of Arts and Sciences, and the Board of Overseers of the School of Engineering and Applied Science of the University of Pennsylvania. Previously, Dr. Heilmeier served as a Director of TRW Inc. (automotive, space, defense, and information technology, 1992-2002), Compaq (1994-2002), Automatic Data Processing, Inc. (ADP) (technology-based business outsourcing, 1995-2002), INET Technologies Inc. (telecommunications network surveillance, 2001-2004), and Teletech Holdings (customer management services). He is the recipient of the 2005 Kyoto Prize in Advanced Technology for his invention of the liquid crystal display. |
Marie L. Knowles (59) |
| Year of Election or Appointment: 2001 Prior to Ms. Knowles' retirement in June 2000, she served as Executive Vice President and Chief Financial Officer of Atlantic Richfield Company (ARCO) (diversified energy, 1996-2000). From 1993 to 1996, she was a Senior Vice President of ARCO and President of ARCO Transportation Company. She served as a Director of ARCO from 1996 to 1998. She currently serves as a Director of Phelps Dodge Corporation (copper mining and manufacturing) and McKesson Corporation (healthcare service, 2002-present). Ms. Knowles is a Trustee of the Brookings Institution and the Catalina Island Conservancy and also serves as a member of the Advisory Board for the School of Engineering of the University of Southern California. |
Ned C. Lautenbach (62) |
| Year of Election or Appointment: 2000 Mr. Lautenbach has been a partner of Clayton, Dubilier & Rice, Inc. (private equity investment firm) since September 1998. Previously, Mr. Lautenbach was with the International Business Machines Corporation (IBM) from 1968 until his retirement in 1998. Mr. Lautenbach serves as a Director of Italtel Holding S.p.A. (telecommunications (Milan, Italy), 2004-present) and Eaton Corporation (diversified industrial) as well as the Philharmonic Center for the Arts in Naples, Florida. He also is a member of the Board of Trustees of Fairfield University (2005-present), as well as a member of the Council on Foreign Relations. |
William O. McCoy (72) |
| Year of Election or Appointment: 1997 Prior to his retirement in December 1994, Mr. McCoy was Vice Chairman of the Board of BellSouth Corporation (telecommunications) and President of BellSouth Enterprises. He is currently a Director of Duke Realty Corporation (real estate). He is also a partner of Franklin Street Partners (private investment management firm). In addition, Mr. McCoy served as the Interim Chancellor (1999-2000) and a member of the Board of Visitors for the University of North Carolina at Chapel Hill and currently serves as Chairman of the Board of Directors of the University of North Carolina Health Care System. He also served as Vice President of Finance for the University of North Carolina (16-school system). |
Cornelia M. Small (61) |
| Year of Election or Appointment: 2005 Ms. Small is a member (2000-present) and Chairperson (2002-present) of the Investment Committee, and a member (2002-present) of the Board of Trustees of Smith College. Previously, she served as Chief Investment Officer (1999-2000), Director of Global Equity Investments (1996-1999), and a member of the Board of Directors of Scudder, Stevens & Clark (1990-1997) and Scudder Kemper Investments (1997-1999). In addition, Ms. Small served as Co-Chair (2000-2003) of the Annual Fund for the Fletcher School of Law and Diplomacy. |
William S. Stavropoulos (67) |
| Year of Election or Appointment: 2001 Mr. Stavropoulos is Chairman Emeritus of the Board of Directors of The Dow Chemical Company. Since joining The Dow Chemical Company in 1967, Mr. Stavropoulos served in numerous senior management positions, including President (1993-2000; 2002-2003), CEO (1995-2000; 2002-2004), and Chairman of the Executive Committee (2000-2004). Currently, he is a Director of NCR Corporation (data warehousing and technology solutions), BellSouth Corporation (telecommunications), Chemical Financial Corporation, Maersk Inc. (industrial conglomerate, 2002-present), and Metalmark Capital (private equity investment firm, 2005-present). He also serves as a member of the Board of Trustees of the American Enterprise Institute for Public Policy Research. In addition, Mr. Stavropoulos is a member of The Business Council, J.P. Morgan International Council and the University of Notre Dame Advisory Council for the College of Science. |
Kenneth L. Wolfe (67) |
| Year of Election or Appointment: 2005 Prior to his retirement in 2001, Mr. Wolfe was Chairman and Chief Executive Officer of Hershey Foods Corporation (1993-2001). He currently serves as a member of the boards of Adelphia Communications Corporation (2003-present), Bausch & Lomb, Inc., and Revlon Inc. (2004-present). |
Annual Report
Advisory Board Members and Executive Officers:
Correspondence intended for Mr. Keyes may be sent to Fidelity Investments, P.O. Box 55235, Boston, Massachusetts 02205-5235. Correspondence intended for each executive officer and Mr. Lynch may be sent to Fidelity Investments, 82 Devonshire Street, Boston, Massachusetts 02109.
Name, Age; Principal Occupation |
James H. Keyes (65) |
| Year of Election or Appointment: 2006 Member of the Advisory Board of Fidelity Hastings Street Trust. Prior to his retirement in 2003, Mr. Keyes was Chairman, President, and Chief Executive Officer of Johnson Controls, Inc. (automotive supplier, 1993-2003). He currently serves as a member of the boards of LSI Logic Corporation (semiconductor technologies, 1984-present), Navistar International Corporation (manufacture and sale of trucks, buses, and diesel engines, 2002-present), and Pitney Bowes, Inc. (integrated mail, messaging, and document management solutions, 1998-present). |
Peter S. Lynch (62) |
| Year of Election or Appointment: 2003 Member of the Advisory Board of Fidelity Hastings Street Trust. Mr. Lynch is Vice Chairman and a Director of FMR, and Vice Chairman (2001-present) and a Director (1999-present) of FMR Co., Inc. Previously, Mr. Lynch served as a Trustee of the Fidelity funds (1990-2003). In addition, he serves as the Chairman of the Inner-City Scholarship Fund. |
Dwight D. Churchill (52) |
| Year of Election or Appointment: 2005 Vice President of Fidelity Fund. Mr. Churchill also serves as Vice President of certain Equity Funds (2005-present). Mr. Churchill is Executive Vice President of FMR (2005-present) and FMR Co., Inc. (2005-present). Previously, Mr. Churchill served as Senior Vice President of Fidelity Investments Money Management, Inc. (2005-2006), Head of Fidelity's Fixed-Income Division (2000-2005), Vice President of Fidelity's Money Market Funds (2000-2005), Vice President of Fidelity's Bond Funds, and Senior Vice President of FMR. |
Philip L. Bullen (46) |
| Year of Election or Appointment: 2006 Vice President of Fidelity Fund. Mr. Bullen also serves as Vice President of certain Equity Funds (2006-present). Mr. Bullen is Senior Vice President of FMR (2001-present) and FMR Co., Inc. (2001-present). Previously, Mr. Bullen served as President and a Director of Fidelity Research & Analysis Company (2001-2005), President and a Director of Fidelity Management & Research (U.K.) Inc. (2002-2006), and a Director of Strategic Advisers, Inc. (2002-2005). |
John D. Avery (41) |
| Year of Election or Appointment: 2002 Vice President of Fidelity Fund. Prior to assuming his current responsibilities, Mr. Avery worked as a research analyst and portfolio manager. Mr. Avery also serves as Vice President of FMR (1999) and FMR Co., Inc. (2001). |
Eric D. Roiter (57) |
| Year of Election or Appointment: 1998 Secretary of Fidelity Fund. He also serves as Secretary of other Fidelity funds; Vice President, General Counsel, and Secretary of FMR Co., Inc. (2001-present) and FMR; Assistant Secretary of Fidelity Management & Research (U.K.) Inc. (2001-present), Fidelity Research & Analysis Company (2001-present), and Fidelity Investments Money Management, Inc. (2001-present). Mr. Roiter is an Adjunct Member, Faculty of Law, at Boston College Law School (2003-present). Previously, Mr. Roiter served as Vice President and Secretary of Fidelity Distributors Corporation (FDC) (1998-2005). |
Stuart Fross (46) |
| Year of Election or Appointment: 2003 Assistant Secretary of Fidelity Fund. Mr. Fross also serves as Assistant Secretary of other Fidelity funds (2003-present), Vice President and Secretary of FDC (2005-present), and is an employee of FMR. |
Christine Reynolds (47) |
| Year of Election or Appointment: 2004 President and Treasurer of Fidelity Fund. Ms. Reynolds also serves as President and Treasurer of other Fidelity funds (2004-present) and is a Vice President (2003-present) and an employee (2002-present) of FMR. Before joining Fidelity Investments, Ms. Reynolds worked at PricewaterhouseCoopers LLP (PwC) (1980-2002), where she was most recently an audit partner with PwC's investment management practice. |
R. Stephen Ganis (40) |
| Year of Election or Appointment: 2006 Anti-Money Laundering (AML) officer of Fidelity Fund. Mr. Ganis also serves as AML officer of other Fidelity funds (2006-present) and FMR Corp. (2003-present). Before joining Fidelity Investments, Mr. Ganis practiced law at Goodwin Procter, LLP (2000-2002). |
Joseph B. Hollis (59) |
| Year of Election or Appointment: 2006 Chief Financial Officer of Fidelity Fund. Mr. Hollis also serves as Chief Financial Officer of other Fidelity funds. Mr. Hollis is President of Fidelity Pricing and Cash Management Services (FPCMS) (2005-present). Mr. Hollis also serves as President and Director of Fidelity Service Company, Inc. (2006-present). Previously, Mr. Hollis served as Senior Vice President of Cash Management Services (1999-2002) and Investment Management Operations (2002-2005). |
Kenneth A. Rathgeber (59) |
| Year of Election or Appointment: 2004 Chief Compliance Officer of Fidelity Fund. Mr. Rathgeber also serves as Chief Compliance Officer of other Fidelity funds (2004-present) and Executive Vice President of Risk Oversight for Fidelity Investments (2002-present). He is Chief Compliance Officer of FMR (2005-present), FMR Co., Inc. (2005-present), Fidelity Management & Research (U.K.) Inc. (2005-present), Fidelity Research & Analysis Company (2005-present), Fidelity Investments Money Management, Inc. (2005-present), and Strategic Advisers, Inc. (2005-present). Previously, Mr. Rathgeber served as Executive Vice President and Chief Operating Officer for Fidelity Investments Institutional Services Company, Inc. (1998-2002). |
Bryan A. Mehrmann (45) |
| Year of Election or Appointment: 2005 Deputy Treasurer of Fidelity Fund. Mr. Mehrmann also serves as Deputy Treasurer of other Fidelity funds (2005-present) and is an employee of FMR. Previously, Mr. Mehrmann served as Vice President of Fidelity Investments Institutional Services Group (FIIS)/Fidelity Investments Institutional Operations Corporation, Inc. (FIIOC) Client Services (1998-2004). |
Kimberley H. Monasterio (42) |
| Year of Election or Appointment: 2004 Deputy Treasurer of Fidelity Fund. Ms. Monasterio also serves as Deputy Treasurer of other Fidelity funds (2004) and is an employee of FMR (2004). Before joining Fidelity Investments, Ms. Monasterio served as Treasurer (2000-2004) and Chief Financial Officer (2002-2004) of the Franklin Templeton Funds and Senior Vice President of Franklin Templeton Services, LLC (2000-2004). |
Kenneth B. Robins (36) |
| Year of Election or Appointment: 2005 Deputy Treasurer of Fidelity Fund. Mr. Robins also serves as Deputy Treasurer of other Fidelity funds (2005-present) and is an employee of FMR (2004-present). Before joining Fidelity Investments, Mr. Robins worked at KPMG LLP, where he was a partner in KPMG's department of professional practice (2002-2004) and a Senior Manager (1999-2000). In addition, Mr. Robins served as Assistant Chief Accountant, United States Securities and Exchange Commission (2000-2002). |
Robert G. Byrnes (39) |
| Year of Election or Appointment: 2005 Assistant Treasurer of Fidelity Fund. Mr. Byrnes also serves as Assistant Treasurer of other Fidelity funds (2005-present) and is an employee of FMR (2005-present). Previously, Mr. Byrnes served as Vice President of FPCMS (2003-2005). Before joining Fidelity Investments, Mr. Byrnes worked at Deutsche Asset Management where he served as Vice President of the Investment Operations Group (2000-2003). |
John H. Costello (59) |
| Year of Election or Appointment: 1986 Assistant Treasurer of Fidelity Fund. Mr. Costello also serves as Assistant Treasurer of other Fidelity funds and is an employee of FMR. |
Peter L. Lydecker (52) |
| Year of Election or Appointment: 2004 Assistant Treasurer of Fidelity Fund. Mr. Lydecker also serves as Assistant Treasurer of other Fidelity funds (2004) and is an employee of FMR. |
Mark Osterheld (51) |
| Year of Election or Appointment: 2002 Assistant Treasurer of Fidelity Fund. Mr. Osterheld also serves as Assistant Treasurer of other Fidelity funds (2002) and is an employee of FMR. |
Gary W. Ryan (47) |
| Year of Election or Appointment: 2005 Assistant Treasurer of Fidelity Fund. Mr. Ryan also serves as Assistant Treasurer of other Fidelity funds (2005-present) and is an employee of FMR (2005-present). Previously, Mr. Ryan served as Vice President of Fund Reporting in FPCMS (1999-2005). |
Salvatore Schiavone (40) |
| Year of Election or Appointment: 2005 Assistant Treasurer of Fidelity Fund. Mr. Schiavone also serves as Assistant Treasurer of other Fidelity funds (2005-present) and is an employee of FMR (2005-present). Before joining Fidelity Investments, Mr. Schiavone worked at Deutsche Asset Management, where he most recently served as Assistant Treasurer (2003-2005) of the Scudder Funds and Vice President and Head of Fund Reporting (1996-2003). |
Annual Report
Distributions
A total of 0.05% of the dividends distributed during the fiscal year was derived from interest on U.S. Government securities which is generally exempt from state income tax.
The fund designates 100% of the dividends distributed during the fiscal year as qualifying for the dividends-received deduction for corporate shareholders.
The fund designates 100% of the dividends distributed during the fiscal year as amounts which may be taken into account as a dividend for the purposes of the maximum rate under section 1(h)(11) of the Internal Revenue Code.
The fund will notify shareholders in January 2007 of amounts for use in preparing 2006 income tax returns.
Annual Report
Proxy Voting Results
A special meeting of the fund's shareholders was held on November 16, 2005. The results of votes taken among shareholders on proposals before them are reported below. Each vote reported represents one dollar of net asset value held on the record date for the meeting.
PROPOSAL 1 |
To elect a Board of Trustees. A |
| # of
Votes | % of
Votes |
Dennis J. Dirks |
Affirmative | 6,466,243,048.91 | 95.846 |
Withheld | 280,219,946.87 | 4.154 |
TOTAL | 6,746,462,995.78 | 100.000 |
Albert R. Gamper, Jr. B |
Affirmative | 6,459,041,833.49 | 95.740 |
Withheld | 287,421,162.29 | 4.260 |
TOTAL | 6,746,462,995.78 | 100.000 |
Robert M. Gates |
Affirmative | 6,441,052,528.46 | 95.473 |
Withheld | 305,410,467.32 | 4.527 |
TOTAL | 6,746,462,995.78 | 100.000 |
George H. Heilmeier |
Affirmative | 6,458,026,916.90 | 95.725 |
Withheld | 288,436,078.88 | 4.275 |
TOTAL | 6,746,462,995.78 | 100.000 |
Abigail P. Johnson |
Affirmative | 6,427,896,599.31 | 95.278 |
Withheld | 318,566,396.47 | 4.722 |
TOTAL | 6,746,462,995.78 | 100.000 |
Edward C. Johnson 3d |
Affirmative | 6,419,116,877.24 | 95.148 |
Withheld | 327,346,118.54 | 4.852 |
TOTAL | 6,746,462,995.78 | 100.000 |
Stephen P. Jonas |
Affirmative | 6,459,780,830.40 | 95.751 |
Withheld | 286,682,165.38 | 4.249 |
TOTAL | 6,746,462,995.78 | 100.000 |
Marie L. Knowles |
Affirmative | 6,461,769,188.96 | 95.780 |
Withheld | 284,693,806.82 | 4.220 |
TOTAL | 6,746,462,995.78 | 100.000 |
| # of
Votes | % of
Votes |
Ned C. Lautenbach |
Affirmative | 6,460,406,353.14 | 95.760 |
Withheld | 286,056,642.64 | 4.240 |
TOTAL | 6,746,462,995.78 | 100.000 |
Marvin L. Mann |
Affirmative | 6,440,555,199.19 | 95.466 |
Withheld | 305,907,796.59 | 4.534 |
TOTAL | 6,746,462,995.78 | 100.000 |
William O. McCoy |
Affirmative | 6,440,823,478.66 | 95.470 |
Withheld | 305,639,517.12 | 4.530 |
TOTAL | 6,746,462,995.78 | 100.000 |
Robert L. Reynolds |
Affirmative | 6,463,763,182.86 | 95.810 |
Withheld | 282,699,812.92 | 4.190 |
TOTAL | 6,746,462,995.78 | 100.000 |
Cornelia M. Small |
Affirmative | 6,462,121,463.05 | 95.785 |
Withheld | 284,341,532.73 | 4.215 |
TOTAL | 6,746,462,995.78 | 100.000 |
William S. Stavropoulos |
Affirmative | 6,453,499,157.83 | 95.658 |
Withheld | 292,963,837.95 | 4.342 |
TOTAL | 6,746,462,995.78 | 100.000 |
Kenneth L. Wolfe |
Affirmative | 6,457,041,632.10 | 95.710 |
Withheld | 289,421,363.68 | 4.290 |
TOTAL | 6,746,462,995.78 | 100.000 |
A Denotes trust-wide proposals and voting results. B Effective on or about January 1, 2006. |
Annual Report
Board Approval of Investment Advisory Contracts and Management Fees
Fidelity Fund
On January 19, 2006, the Board of Trustees, including the Independent Trustees (together, the Board), voted to approve a general research services agreement (the Agreement) between FMR, FMR Co., Inc. (FMRC), Fidelity Investments Money Management, Inc. (FIMM), and Fidelity Research & Analysis Company (FRAC) (together, the Investment Advisers) for the fund, effective January 20, 2006, pursuant to which FRAC may provide general research and investment advisory support services to FMRC and FIMM. The Board considered that it has approved previously various sub-advisory agreements for the fund with affiliates of FMR that allow FMR to obtain research, non-discretionary advice, or discretionary portfolio management at no additional expense to the fund. The Board, assisted by the advice of fund counsel and independent Trustees' counsel, considered a broad range of information and determined that it would be beneficial for the fund to access the research and investment advisory support services supplied by FRAC at no additional expense to the fund.
The Board reached this determination in part because the new arrangement will involve no changes in (i) the contractual terms of and fees payable under the fund's management contract or sub-advisory agreements; (ii) the investment process or strategies employed in the management of the fund's assets; (iii) the nature or level of services provided under the fund's management contract or sub-advisory agreements; (iv) the day-to-day management of the fund or the persons primarily responsible for such management; or (v) the ultimate control or beneficial ownership of FMR, FMRC, or FIMM. The Board also considered that the establishment of the Agreement would not necessitate prior shareholder approval of the Agreement or result in an assignment and termination of the fund's management contract or sub-advisory agreements under the Investment Company Act of 1940.
Because the Board was approving an arrangement with FRAC under which the fund will not bear any additional management fees or expenses and under which the fund's portfolio manager would not change, it did not consider the fund's investment performance, competitiveness of management fee and total expenses, costs of services and profitability, or economies of scale to be significant factors in its decision.
In connection with its future renewal of the fund's management contract and sub-advisory agreements, the Board will consider: (i) the nature, extent, and quality of services provided to the fund, including shareholder and administrative services and investment performance; (ii) the competitiveness of the fund's management fee and total expenses; (iii) the costs of the services and profitability, including the revenues earned and the expenses incurred by Fidelity in conducting the business of developing, marketing, distributing, managing, administering, and servicing the fund and its shareholders; and (iv) whether there have been economies of scale in respect of the management of the Fidelity funds, whether the Fidelity funds (including the fund) have appropriately benefited from any such economies of scale, and whether there is potential for realization of any further economies.
Annual Report
Board Approval of Investment Advisory Contracts and
Management Fees - continued
Based on its evaluation of all of the conclusions noted above, and after considering all material factors, the Board ultimately concluded that the fund's Agreement is fair and reasonable, and that the fund's Agreement should be approved.
Annual Report
Managing Your Investments
Fidelity offers several ways to conveniently manage your personal investments via your telephone or PC. You can access your account information, conduct trades and research your investments 24 hours a day.
By Phone
Fidelity Automated Service Telephone provides a single toll-free number to access account balances, positions, quotes and trading. It's easy to navigate the service, and on your first call, the system will help you create a personal identification number (PIN) for security.
(phone_graphic)
Fidelity Automated
Service Telephone (FAST®)
1-800-544-5555
Press
1 For mutual fund and brokerage trading.
2 For quotes.*
3 For account balances and holdings.
4 To review orders and mutual
fund activity.
5 To change your PIN.
*0 To speak to a Fidelity representative.
By PC
Fidelity's web site on the Internet provides a wide range of information, including daily financial news, fund performance, interactive planning tools and news about Fidelity products and services.
(computer_graphic)
Fidelity's Web Site
www.fidelity.com
* When you call the quotes line, please remember that a fund's yield and return will vary and, except for money market funds, share price will also vary. This means that you may have a gain or loss when you sell your shares. There is no assurance that money market funds will be able to maintain a stable $1 share price; an investment in a money market fund is not insured or guaranteed by the U.S. government. Total returns are historical and include changes in share price, reinvestment of dividends and capital gains, and the effects of any sales charges.
Annual Report
To Write Fidelity
We'll give your correspondence immediate attention and send you written confirmation upon completion of your request.
(letter_graphic)
Making Changes
To Your Account
(such as changing name, address, bank, etc.)
Fidelity Investments
P.O. Box 770001
Cincinnati, OH 45277-0002
(letter_graphic)
For Non-Retirement
Accounts
Buying shares
Fidelity Investments
P.O. Box 770001
Cincinnati, OH 45277-0003
Overnight Express
Fidelity Investments
Attn: Distribution Services
100 Crosby Parkway - KC1H
Covington, KY 41015
Selling shares
Fidelity Investments
P.O. Box 770001
Cincinnati, OH 45277-0035
Overnight Express
Fidelity Investments
Attn: Distribution Services
100 Crosby Parkway - KC1H
Covington, KY 41015
General Correspondence
Fidelity Investments
P.O. Box 500
Merrimack, NH 03054-0500
(letter_graphic)
For Retirement
Accounts
Buying shares
Fidelity Investments
P.O. Box 770001
Cincinnati, OH 45277-0003
Selling shares
Fidelity Investments
P.O. Box 770001
Cincinnati, OH 45277-0035
Overnight Express
Fidelity Investments
Attn: Distribution Services
100 Crosby Parkway - KC1H
Covington, KY 41015
General Correspondence
Fidelity Investments
P.O. Box 500
Merrimack, NH 03054-0500
Annual Report
To Visit Fidelity
For directions and hours,
please call 1-800-544-9797.
Arizona
7001 West Ray Road
Chandler, AZ
15445 N. Scottsdale Road
Scottsdale, AZ
California
815 East Birch Street
Brea, CA
1411 Chapin Avenue
Burlingame, CA
851 East Hamilton Avenue
Campbell, CA
19200 Von Karman Avenue
Irvine, CA
601 Larkspur Landing Circle
Larkspur, CA
10100 Santa Monica Blvd.
Los Angeles, CA
27101 Puerta Real
Mission Viejo, CA
73-575 El Paseo
Palm Desert, CA
251 University Avenue
Palo Alto, CA
123 South Lake Avenue
Pasadena, CA
16995 Bernardo Ctr. Drive
Rancho Bernardo, CA
1220 Roseville Parkway
Roseville, CA
1740 Arden Way
Sacramento, CA
7676 Hazard Center Drive
San Diego, CA
11943 El Camino Real
San Diego, CA
8 Montgomery Street
San Francisco, CA
3793 State Street
Santa Barbara, CA
1200 Wilshire Boulevard
Santa Monica, CA
21701 Hawthorne Boulevard
Torrance, CA
2001 North Main Street
Walnut Creek, CA
6300 Canoga Avenue
Woodland Hills, CA
Colorado
1625 Broadway
Denver, CO
9185 Westview Road
Lone Tree, CO
Connecticut
48 West Putnam Avenue
Greenwich, CT
265 Church Street
New Haven, CT
300 Atlantic Street
Stamford, CT
29 South Main Street
West Hartford, CT
Delaware
400 Delaware Avenue
Wilmington, DE
Florida
4400 N. Federal Highway
Boca Raton, FL
121 Alhambra Plaza
Coral Gables, FL
2948 N. Federal Highway
Ft. Lauderdale, FL
4671 Town Center Parkway
Jacksonville, FL
1907 West State Road 434
Longwood, FL
8880 Tamiami Trail, North
Naples, FL
3501 PGA Boulevard
Palm Beach Gardens, FL
3550 Tamiami Trail, South
Sarasota, FL
1502 N. Westshore Blvd.
Tampa, FL
2465 State Road 7
Wellington, FL
Georgia
3445 Peachtree Road, N.E.
Atlanta, GA
1000 Abernathy Road
Atlanta, GA
Illinois
One North LaSalle Street
Chicago, IL
875 North Michigan Ave.
Chicago, IL
1415 West 22nd Street
Oak Brook, IL
1572 East Golf Road
Schaumburg, IL
3232 Lake Avenue
Wilmette, IL
Indiana
4729 East 82nd Street
Indianapolis, IN
Kansas
5400 College Boulevard
Overland Park, KS
Maine
Three Canal Plaza
Portland, ME
Maryland
7315 Wisconsin Avenue
Bethesda, MD
One W. Pennsylvania Ave.
Towson, MD
Massachusetts
801 Boylston Street
Boston, MA
155 Congress Street
Boston, MA
300 Granite Street
Braintree, MA
44 Mall Road
Burlington, MA
238 Main Street
Cambridge, MA
405 Cochituate Road
Framingham, MA
416 Belmont Street
Worcester, MA
Annual Report
Michigan
500 E. Eisenhower Pkwy.
Ann Arbor, MI
280 Old N. Woodward Ave.
Birmingham, MI
43420 Grand River Avenue
Novi, MI
29155 Northwestern Hwy.
Southfield, MI
Minnesota
7600 France Avenue South
Edina, MN
Missouri
1524 South Lindbergh Blvd.
St. Louis, MO
Nevada
2225 Village Walk Drive
Henderson, NV
New Jersey
150 Essex Street
Millburn, NJ
56 South Street
Morristown, NJ
396 Route 17, North
Paramus, NJ
3518 Route 1 North
Princeton, NJ
530 Broad Street
Shrewsbury, NJ
New York
1055 Franklin Avenue
Garden City, NY
37 West Jericho Turnpike
Huntington Station, NY
1271 Avenue of the Americas
New York, NY
980 Madison Avenue
New York, NY
61 Broadway
New York, NY
350 Park Avenue
New York, NY
200 Fifth Avenue
New York, NY
733 Third Avenue
New York, NY
11 Penn Plaza
New York, NY
2070 Broadway
New York, NY
1075 Northern Blvd.
Roslyn, NY
799 Central Park Avenue
Scarsdale, NY
North Carolina
4611 Sharon Road
Charlotte, NC
7011 Fayetteville Road
Durham, NC
Ohio
3805 Edwards Road
Cincinnati, OH
1324 Polaris Parkway
Columbus, OH
28699 Chagrin Boulevard
Woodmere Village, OH
Oregon
7493 SW Bridgeport Road
Tigard, OR
Pennsylvania
600 West DeKalb Pike
King of Prussia, PA
1735 Market Street
Philadelphia, PA
12001 Perry Highway
Wexford, PA
Rhode Island
47 Providence Place
Providence, RI
Tennessee
6150 Poplar Avenue
Memphis, TN
Texas
10000 Research Boulevard
Austin, TX
4001 Northwest Parkway
Dallas, TX
12532 Memorial Drive
Houston, TX
2701 Drexel Drive
Houston, TX
6560 Fannin Street
Houston, TX
6500 N. MacArthur Blvd.
Irving, TX
6005 West Park Boulevard
Plano, TX
14100 San Pedro
San Antonio, TX
1576 East Southlake Blvd.
Southlake, TX
19740 IH 45 North
Spring, TX
Utah
279 West South Temple
Salt Lake City, UT
Virginia
1861 International Drive
McLean, VA
Washington
411 108th Avenue, N.E.
Bellevue, WA
1518 6th Avenue
Seattle, WA
Washington, DC
1900 K Street, N.W.
Washington, DC
Wisconsin
595 North Barker Road
Brookfield, WI
Fidelity Brokerage Services, Inc., 100 Summer St., Boston, MA 02110 Member NYSE/SIPC
Annual Report
Investment Adviser
Fidelity Management &
Research Company
Boston, MA
Investment Sub-Advisers
FMR Co., Inc.
Fidelity Management & Research
(U.K.) Inc.
Fidelity Research & Analysis Company
(formerly Fidelity Management &
Research (Far East) Inc.)
Fidelity Investments Japan Limited
Fidelity International Investment
Advisors
Fidelity International Investment
Advisors (U.K.) Limited
General Distributor
Fidelity Distributors Corporation
Boston, MA
Transfer and Service Agent
Fidelity Service Company, Inc.
Boston, MA
Custodian
The Northern Trust Company
Chicago, IL
The Fidelity Telephone Connection
Mutual Fund 24-Hour Service
Exchanges/Redemptions
and Account Assistance 1-800-544-6666
Product Information 1-800-544-6666
Retirement Accounts 1-800-544-4774
(8 a.m. - 9 p.m.)
TDD Service 1-800-544-0118
for the deaf and hearing impaired
(9 a.m. - 9 p.m. Eastern time)
Fidelity Automated Service
Telephone (FAST®) (automated graphic) 1-800-544-5555
(automated graphic) Automated line for quickest service
FID-UANN-0806
1.787731.103
(Fidelity Investment logo)(registered trademark)
Corporate Headquarters
82 Devonshire St., Boston, MA 02109
www.fidelity.com
Fidelity®
Growth & Income II
Portfolio
Annual Report
June 30, 2006
(2_fidelity_logos) (Registered_Trademark)
Contents
Chairman's Message | <Click Here> | Ned Johnson's message to shareholders. |
Performance | <Click Here> | How the fund has done over time. |
Management's Discussion | <Click Here> | The manager's review of fund performance, strategy and outlook. |
Shareholder Expense Example | <Click Here> | An example of shareholder expenses. |
Investment Changes | <Click Here> | A summary of major shifts in the fund's investments over the past six months. |
Investments | <Click Here> | A complete list of the fund's investments with their market values. |
Financial Statements | <Click Here> | Statements of assets and liabilities, operations, and changes in net assets,
as well as financial highlights. |
Notes | <Click Here> | Notes to the financial statements. |
Report of Independent Registered Public Accounting Firm | <Click Here> | |
Trustees and Officers | <Click Here> | |
Distributions | <Click Here> | |
Proxy Voting Results | <Click Here> | |
Board Approval of Investment Advisory Contracts and Management Fees | <Click Here> | |
To view a fund's proxy voting guidelines and proxy voting record for the 12-month period ended June 30, visit www.fidelity.com/proxyvotingresults or visit the Securities and Exchange Commission's (SEC) web site at www.sec.gov. You may also call 1-800-544-8544 to request a free copy of the proxy voting guidelines.
Standard & Poor's, S&P and S&P 500 are registered service marks of The McGraw-Hill Companies, Inc. and have been licensed for use by Fidelity Distributors Corporation.
Other third party marks appearing herein are the property of their respective owners.
All other marks appearing herein are registered or unregistered trademarks or service marks of FMR Corp. or an affiliated company.
Annual Report
This report and the financial statements contained herein are submitted for the general information of the shareholders of the fund. This report is not authorized for distribution to prospective investors in the fund unless preceded or accompanied by an effective prospectus.
A fund files its complete schedule of portfolio holdings with the SEC for the first and third quarters of each fiscal year on Form N-Q. Forms N-Q are available on the SEC's web site at http://www.sec.gov. A fund's Forms N-Q may be reviewed and copied at the SEC's Public Reference Room in Washington, DC. Information regarding the operation of the SEC's Public Reference Room may be obtained by calling 1-800-SEC-0330. For a complete list of a fund's portfolio holdings, view the most recent quarterly holdings report, semiannual report, or annual report on Fidelity's web site at http://www.fidelity.com/holdings.
NOT FDIC INSURED · MAY LOSE VALUE · NO BANK GUARANTEE
Neither the fund nor Fidelity Distributors Corporation is a bank.
Annual Report
Chairman's Message
(photo_of_Edward_C_Johnson_3d)
Dear Shareholder:
Although many securities markets made gains in early 2006, inflation concerns led to mixed results through the year's mid-point. Financial markets are always unpredictable. There are, however, a number of time-tested principles that can put the historical odds in your favor.
One of the basic tenets is to invest for the long term. Over time, riding out the markets' inevitable ups and downs has proven much more effective than selling into panic or chasing the hottest trend. Even missing only a few of the markets' best days can significantly diminish investor returns. Patience also affords the benefits of compounding - of earning interest on additional income or reinvested dividends and capital gains. There are tax advantages and cost benefits to consider as well. The more you sell, the more taxes you pay, and the more you trade, the higher the costs. While staying the course doesn't eliminate risk, it can considerably lessen the effect of short-term declines.
You can further manage your investing risk through diversification. And today, more than ever, geographic diversification should be taken into account. Studies indicate that asset allocation is the single most important determinant of a portfolio's long-term success. The right mix of stocks, bonds and cash - aligned to your particular risk tolerance and investment objective - is very important. Age-appropriate rebalancing is also an essential aspect of asset allocation. For younger investors, an emphasis on equities - which historically have been the best performing asset class over time - is encouraged. As investors near their specific goal, such as retirement or sending a child to college, consideration may be given to replacing volatile assets (e.g. common stocks) with more-stable fixed investments (bonds or savings plans).
A third investment principle - investing regularly - can help lower the average cost of your purchases. Investing a certain amount of money each month or quarter helps ensure you won't pay for all your shares at market highs. This strategy - known as dollar cost averaging - also reduces unconstructive "emotion" from investing, helping shareholders avoid selling weak performers just prior to an upswing, or chasing a hot performer just before a correction.
We invite you to contact us via the Internet, through our Investor Centers or over the phone. It is our privilege to provide you the information you need to make the investments that are right for you.
Sincerely,
/s/Edward C. Johnson 3d
Edward C. Johnson 3d
Annual Report
Performance: The Bottom Line
Average annual total return reflects the change in the value of an investment, assuming reinvestment of the fund's dividend income and capital gains (the profits earned upon the sale of securities that have grown in value) and assuming a constant rate of performance each year. The $10,000 table and the fund's returns do not reflect the deduction of taxes that a shareholder would pay on fund distributions or the redemption of fund shares. During periods of reimbursement by Fidelity, a fund's total return will be greater than it would be had the reimbursement not occurred. How a fund did yesterday is no guarantee of how it will do tomorrow.
Average Annual Total Returns
Periods ended June 30, 2006 | Past 1
year | Past 5
years | Life of
fundA |
Fidelity® Growth & Income II Portfolio | 13.63% | 2.60% | 1.57% |
A From December 28, 1998.
$10,000 Over Life of Fund
Let's say hypothetically that $10,000 was invested in Fidelity® Growth & Income II Portfolio on December 28, 1998, when the fund started. The chart shows how the value of your investment would have changed, and also shows how the S&P 500® Index performed over the same period.
Annual Report
Management's Discussion of Fund Performance
Comments from James Catudal, Portfolio Manager of Fidelity® Growth & Income II Portfolio
After generating sizable gains early on, stock values eroded late in the 12-month period ending June 30, 2006. Worrisome signals of rising inflation took a bite out of many portfolios, as investors wondered about the intentions of the Federal Reserve Board. Many on Wall Street believed the U.S. central bank had nearly concluded its interest-rate-hike crusade. But in announcing its May rate hike, the Board warned of more increases to come. Then, in June, the Fed announced inflation was running at the upper end of the normal range, inducing yet another sell-off and demonstrating investors' anxiety about the Board's future course. Prior to that, stocks were in good shape, riding the momentum of steady economic and corporate earnings growth. Equity benchmarks approached or exceeded multiyear highs, and the Dow Jones Industrial AverageSM nearly topped its record from January 2000. Despite the late difficulties, the Dow rose 11.09% for the 12 months overall, while the Standard & Poor's 500SM Index returned 8.63% and the NASDAQ Composite® Index was up 6.48%.
Fidelity Growth & Income II produced a total return of 13.63% for the 12 months that ended June 30, 2006, outperforming the S&P 500®. Stock picking drove the fund's outperformance of its index during the year, with particularly good choices in energy as well as in information technology, an area that was particularly hard hit amid the May-June market decline. We also had a solid showing in industrials, telecommunication services, consumer staples and health care. These gains were tempered a bit, however, by unfavorable industry positioning in financials and weak results in retailing. Internet search leader Google was the top individual contributor. Energy investments that made notable positive impacts on performance included production company Ultra Petroleum, refiner Valero Energy and oil field services companies Halliburton and Schlumberger. The investment in diversified capital goods company McDermott International also provided a boost. Conversely, homebuilder Toll Brothers suffered as housing construction starts slowed, while software industry leader Microsoft reported disappointing earnings. Among health care investments, HMO UnitedHealth Group slipped both because of controversy over the possible backdating of stock options for senior management and because of concerns about future profitability. Affymetrix, another health care position, declined because of stiff competition as well as manufacturing difficulties in its production of scientific instruments used to analyze DNA.
The views expressed above reflect those of the portfolio manager(s) only through the end of the period as stated on the cover of this report and do not necessarily represent the views of Fidelity or any other person in the Fidelity organization. Any such views are subject to change at any time based upon market or other conditions and Fidelity disclaims any responsibility to update such views. These views may not be relied on as investment advice and, because investment decisions for a Fidelity fund are based on numerous factors, may not be relied on as an indication of trading intent on behalf of any Fidelity fund.
Annual Report
Shareholder Expense Example
As a shareholder of the Fund, you incur two types of costs: (1) transaction costs, and (2) ongoing costs, including management fees and other Fund expenses. This Example is intended to help you understand your ongoing costs (in dollars) of investing in the Fund and to compare these costs with the ongoing costs of investing in other mutual funds.
The Example is based on an investment of $1,000 invested at the beginning of the period and held for the entire period (January 1, 2006 to June 30, 2006).
Actual Expenses
The first line of the accompanying table provides information about actual account values and actual expenses. You may use the information in this line, together with the amount you invested, to estimate the expenses that you paid over the period. Simply divide your account value by $1,000.00 (for example, an $8,600 account value divided by $1,000.00 = 8.6), then multiply the result by the number in the first line under the heading entitled "Expenses Paid During Period" to estimate the expenses you paid on your account during this period. A small balance maintenance fee of $12.00 that is charged once a year may apply for certain accounts with a value of less than $2,000. This fee is not included in the table below. If it was, the estimate of expenses you paid during the period would be higher, and your ending account value lower, by this amount.
Hypothetical Example for Comparison Purposes
The second line of the accompanying table provides information about hypothetical account values and hypothetical expenses based on the Fund's actual expense ratio and an assumed rate of return of 5% per year before expenses, which is not the Fund's actual return. The hypothetical account values and expenses may not be used to estimate the actual ending account balance or expenses you paid for the period. You may use this information to compare the ongoing costs of investing in the Fund and other funds. To do so, compare this 5% hypothetical example with the 5% hypothetical examples that appear in the shareholder reports of the other funds. A small balance maintenance fee of $12.00 that is charged once a year may apply for certain accounts with a value of less than $2,000. This fee is not included in the table below. If it was, the estimate of expenses you paid during the period would be higher, and your ending account value lower, by this amount.
Please note that the expenses shown in the table are meant to highlight your ongoing costs only and do not reflect any transaction costs. Therefore, the second line of the table is useful in comparing ongoing costs only, and will not help you determine the relative total costs of owning different funds.
| Beginning
Account Value
January 1, 2006 | Ending
Account Value
June 30, 2006 | Expenses Paid
During Period*
January 1, 2006
to June 30, 2006 |
Actual | $ 1,000.00 | $ 1,015.70 | $ 4.20 |
Hypothetical (5% return per year before expenses) | $ 1,000.00 | $ 1,020.63 | $ 4.21 |
* E xpenses are equal to the Fund's annualized expense ratio of .84%; multiplied by the average account value over the period, multiplied by 181/365 (to reflect the one-half year period).
Annual Report
Investment Changes
Top Ten Stocks as of June 30, 2006 |
| % of fund's
net assets | % of fund's net assets
6 months ago |
General Electric Co. | 4.8 | 4.1 |
American International Group, Inc. | 3.3 | 3.2 |
Microsoft Corp. | 3.0 | 4.4 |
Exxon Mobil Corp. | 2.8 | 2.2 |
Bank of America Corp. | 2.4 | 1.9 |
Johnson & Johnson | 2.2 | 2.2 |
Schlumberger Ltd. (NY Shares) | 1.9 | 1.4 |
Google, Inc. Class A (sub. vtg.) | 1.6 | 0.9 |
United Technologies Corp. | 1.5 | 1.4 |
Cisco Systems, Inc. | 1.5 | 0.7 |
| 25.0 | |
Top Five Market Sectors as of June 30, 2006 |
| % of fund's
net assets | % of fund's net assets
6 months ago |
Financials | 20.9 | 19.2 |
Information Technology | 18.7 | 18.4 |
Industrials | 14.4 | 13.4 |
Health Care | 14.0 | 15.8 |
Energy | 9.8 | 8.8 |
Asset Allocation (% of fund's net assets) |
As of June 30, 2006 * | As of December 31, 2005 ** |
| Stocks 97.5% | | | Stocks 95.8% | |
| Short-Term
Investments and
Net Other Assets 2.5% | | | Short-Term
Investments and
Net Other Assets 4.2% | |
* Foreign
investments | 9.9% | | ** Foreign investments | 9.3% | |

Annual Report
Investments June 30, 2006
Showing Percentage of Net Assets
Common Stocks - 97.5% |
| Shares | | Value (Note 1) |
CONSUMER DISCRETIONARY - 6.4% |
Hotels, Restaurants & Leisure - 0.6% |
Ctrip.com International Ltd. sponsored ADR | 100 | | $ 5,105 |
Sonic Corp. (a) | 15,550 | | 323,285 |
Starbucks Corp. (a) | 17,700 | | 668,352 |
Wynn Resorts Ltd. (a) | 2,106 | | 154,370 |
| | 1,151,112 |
Household Durables - 0.5% |
Sharp Corp. | 34,000 | | 537,225 |
Whirlpool Corp. | 3,700 | | 305,805 |
| | 843,030 |
Media - 1.9% |
Clear Channel Communications, Inc. | 10,000 | | 309,500 |
E.W. Scripps Co. Class A | 9,600 | | 414,144 |
Lamar Advertising Co. Class A (a) | 5,400 | | 290,844 |
News Corp. Class B | 82,600 | | 1,666,868 |
Scholastic Corp. (a) | 4,558 | | 118,371 |
The Walt Disney Co. | 12,600 | | 378,000 |
Time Warner, Inc. | 17,300 | | 299,290 |
| | 3,477,017 |
Multiline Retail - 0.9% |
Target Corp. | 32,300 | | 1,578,501 |
Specialty Retail - 2.3% |
Best Buy Co., Inc. | 8,300 | | 455,172 |
Chico's FAS, Inc. (a) | 4,100 | | 110,618 |
Esprit Holdings Ltd. | 33,500 | | 273,478 |
Home Depot, Inc. | 26,200 | | 937,698 |
J. Crew Group, Inc. | 400 | | 10,980 |
Lowe's Companies, Inc. | 200 | | 12,134 |
PETsMART, Inc. | 18,800 | | 481,280 |
Staples, Inc. | 47,743 | | 1,161,110 |
Tiffany & Co., Inc. | 12,500 | | 412,750 |
TJX Companies, Inc. | 19,300 | | 441,198 |
| | 4,296,418 |
Textiles, Apparel & Luxury Goods - 0.2% |
Liz Claiborne, Inc. | 8,000 | | 296,480 |
TOTAL CONSUMER DISCRETIONARY | | 11,642,558 |
Common Stocks - continued |
| Shares | | Value (Note 1) |
CONSUMER STAPLES - 6.7% |
Beverages - 1.3% |
PepsiCo, Inc. | 39,000 | | $ 2,341,560 |
Food & Staples Retailing - 1.0% |
CVS Corp. | 46,800 | | 1,436,760 |
Safeway, Inc. | 11,900 | | 309,400 |
| | 1,746,160 |
Food Products - 0.8% |
Nestle SA sponsored ADR | 19,600 | | 1,526,840 |
Household Products - 2.2% |
Colgate-Palmolive Co. | 28,300 | | 1,695,170 |
Procter & Gamble Co. | 43,000 | | 2,390,800 |
| | 4,085,970 |
Tobacco - 1.4% |
Altria Group, Inc. | 35,130 | | 2,579,596 |
TOTAL CONSUMER STAPLES | | 12,280,126 |
ENERGY - 9.8% |
Energy Equipment & Services - 5.0% |
Baker Hughes, Inc. | 4,530 | | 370,781 |
Cameron International Corp. (a) | 31,100 | | 1,485,647 |
ENSCO International, Inc. | 1,700 | | 78,234 |
Halliburton Co. | 37,300 | | 2,768,033 |
Schlumberger Ltd. (NY Shares) | 52,200 | | 3,398,742 |
Smith International, Inc. | 22,300 | | 991,681 |
| | 9,093,118 |
Oil, Gas & Consumable Fuels - 4.8% |
ConocoPhillips | 100 | | 6,553 |
Exxon Mobil Corp. | 84,900 | | 5,208,615 |
Peabody Energy Corp. | 17,000 | | 947,750 |
Plains Exploration & Production Co. (a) | 16,400 | | 664,856 |
Ultra Petroleum Corp. (a) | 11,600 | | 687,532 |
Valero Energy Corp. | 20,200 | | 1,343,704 |
| | 8,859,010 |
TOTAL ENERGY | | 17,952,128 |
FINANCIALS - 20.9% |
Capital Markets - 2.5% |
Ameriprise Financial, Inc. | 14,000 | | 625,380 |
Common Stocks - continued |
| Shares | | Value (Note 1) |
FINANCIALS - continued |
Capital Markets - continued |
Charles Schwab Corp. | 35,200 | | $ 562,496 |
Franklin Resources, Inc. | 4,400 | | 381,964 |
Goldman Sachs Group, Inc. | 3,300 | | 496,419 |
Investors Financial Services Corp. | 13,100 | | 588,190 |
Merrill Lynch & Co., Inc. | 700 | | 48,692 |
Nomura Holdings, Inc. sponsored ADR | 38,300 | | 720,040 |
State Street Corp. | 18,700 | | 1,086,283 |
TD Ameritrade Holding Corp. | 9,900 | | 146,619 |
| | 4,656,083 |
Commercial Banks - 2.5% |
Bank of China Ltd. (H Shares) | 142,000 | | 64,452 |
Mizuho Financial Group, Inc. | 28 | | 237,116 |
Standard Chartered PLC (United Kingdom) | 31,723 | | 774,487 |
Sumitomo Mitsui Financial Group, Inc. | 20 | | 211,492 |
Wachovia Corp. | 20,200 | | 1,092,416 |
Wells Fargo & Co. | 31,400 | | 2,106,312 |
| | 4,486,275 |
Consumer Finance - 1.7% |
American Express Co. | 22,800 | | 1,213,416 |
Capital One Financial Corp. | 22,900 | | 1,956,805 |
| | 3,170,221 |
Diversified Financial Services - 3.7% |
Bank of America Corp. | 91,400 | | 4,396,340 |
Citigroup, Inc. | 32,300 | | 1,558,152 |
NETeller PLC (a) | 11,700 | | 128,973 |
The NASDAQ Stock Market, Inc. (a) | 20,500 | | 612,950 |
| | 6,696,415 |
Insurance - 8.9% |
ACE Ltd. | 15,300 | | 774,027 |
AFLAC, Inc. | 10,100 | | 468,135 |
American International Group, Inc. | 103,430 | | 6,107,542 |
Berkshire Hathaway, Inc. Class A (a) | 11 | | 1,008,249 |
Endurance Specialty Holdings Ltd. | 6,997 | | 223,904 |
Everest Re Group Ltd. | 9,500 | | 822,415 |
Fidelity National Title Group, Inc. Class A (d) | 21,900 | | 430,773 |
Hartford Financial Services Group, Inc. | 20,400 | | 1,725,840 |
Lincoln National Corp. | 12,299 | | 694,156 |
National Financial Partners Corp. | 20,700 | | 917,217 |
PartnerRe Ltd. | 5,100 | | 326,655 |
Common Stocks - continued |
| Shares | | Value (Note 1) |
FINANCIALS - continued |
Insurance - continued |
Prudential Financial, Inc. | 16,400 | | $ 1,274,280 |
W.R. Berkley Corp. | 21,929 | | 748,437 |
XL Capital Ltd. Class A | 11,900 | | 729,470 |
| | 16,251,100 |
Real Estate Investment Trusts - 0.3% |
Equity Residential (SBI) | 8,700 | | 389,151 |
Vornado Realty Trust | 1,900 | | 185,345 |
| | 574,496 |
Real Estate Management & Development - 0.1% |
Mitsui Fudosan Co. Ltd. | 12,000 | | 260,607 |
Thrifts & Mortgage Finance - 1.2% |
Countrywide Financial Corp. | 4,600 | | 175,168 |
Freddie Mac | 100 | | 5,701 |
Golden West Financial Corp., Delaware | 15,300 | | 1,135,260 |
Hudson City Bancorp, Inc. | 51,100 | | 681,163 |
Washington Mutual, Inc. | 4,100 | | 186,878 |
| | 2,184,170 |
TOTAL FINANCIALS | | 38,279,367 |
HEALTH CARE - 14.0% |
Biotechnology - 1.8% |
Alexion Pharmaceuticals, Inc. (a) | 1,500 | | 54,180 |
Amgen, Inc. (a) | 12,800 | | 834,944 |
Biogen Idec, Inc. (a) | 7,400 | | 342,842 |
Celgene Corp. (a) | 2,700 | | 128,061 |
Cephalon, Inc. (a) | 4,900 | | 294,490 |
Genentech, Inc. (a) | 2,400 | | 196,320 |
Gilead Sciences, Inc. (a) | 12,700 | | 751,332 |
PDL BioPharma, Inc. (a) | 35,000 | | 644,350 |
| | 3,246,519 |
Health Care Equipment & Supplies - 2.2% |
Alcon, Inc. | 800 | | 78,840 |
Baxter International, Inc. | 23,600 | | 867,536 |
Becton, Dickinson & Co. | 16,700 | | 1,020,871 |
C.R. Bard, Inc. | 7,000 | | 512,820 |
Conor Medsystems, Inc. (a) | 9,800 | | 270,382 |
Cooper Companies, Inc. | 10,500 | | 465,045 |
Common Stocks - continued |
| Shares | | Value (Note 1) |
HEALTH CARE - continued |
Health Care Equipment & Supplies - continued |
DJ Orthopedics, Inc. (a) | 12,400 | | $ 456,692 |
St. Jude Medical, Inc. (a) | 12,930 | | 419,191 |
| | 4,091,377 |
Health Care Providers & Services - 2.4% |
Brookdale Senior Living, Inc. | 100 | | 4,474 |
Chemed Corp. | 3,600 | | 196,308 |
Health Net, Inc. (a) | 15,700 | | 709,169 |
Healthways, Inc. (a) | 1,100 | | 57,904 |
Henry Schein, Inc. (a) | 16,400 | | 766,372 |
I-trax, Inc. (a)(d) | 29,000 | | 90,770 |
UnitedHealth Group, Inc. | 56,500 | | 2,530,070 |
| | 4,355,067 |
Health Care Technology - 0.3% |
Emdeon Corp. (a) | 21,900 | | 271,779 |
IMS Health, Inc. | 11,600 | | 311,460 |
| | 583,239 |
Life Sciences Tools & Services - 1.6% |
Affymetrix, Inc. (a) | 14,600 | | 373,760 |
Charles River Laboratories International, Inc. (a) | 18,400 | | 677,120 |
Invitrogen Corp. (a) | 18,500 | | 1,222,295 |
Millipore Corp. (a) | 5,300 | | 333,847 |
Waters Corp. (a) | 8,900 | | 395,160 |
| | 3,002,182 |
Pharmaceuticals - 5.7% |
Johnson & Johnson | 67,300 | | 4,032,616 |
Merck & Co., Inc. | 30,900 | | 1,125,687 |
Novartis AG sponsored ADR | 13,500 | | 727,920 |
Pfizer, Inc. | 44,500 | | 1,044,415 |
Roche Holding AG (participation certificate) | 8,929 | | 1,476,115 |
Sepracor, Inc. (a) | 3,500 | | 199,990 |
Wyeth | 38,500 | | 1,709,785 |
| | 10,316,528 |
TOTAL HEALTH CARE | | 25,594,912 |
INDUSTRIALS - 14.4% |
Aerospace & Defense - 3.8% |
Aviall, Inc. (a) | 18,300 | | 869,616 |
EDO Corp. | 21,800 | | 530,612 |
Common Stocks - continued |
| Shares | | Value (Note 1) |
INDUSTRIALS - continued |
Aerospace & Defense - continued |
Honeywell International, Inc. | 57,600 | | $ 2,321,280 |
L-3 Communications Holdings, Inc. | 3,600 | | 271,512 |
The Boeing Co. | 1,400 | | 114,674 |
United Technologies Corp. | 44,600 | | 2,828,532 |
| | 6,936,226 |
Air Freight & Logistics - 0.7% |
Expeditors International of Washington, Inc. | 4,892 | | 274,001 |
FedEx Corp. | 8,900 | | 1,040,054 |
| | 1,314,055 |
Airlines - 0.2% |
UAL Corp. (a) | 11,100 | | 344,322 |
Commercial Services & Supplies - 0.4% |
Robert Half International, Inc. | 7,000 | | 294,000 |
Services Acquisition Corp. International (a)(d) | 35,000 | | 346,500 |
| | 640,500 |
Electrical Equipment - 0.4% |
Evergreen Solar, Inc. (a) | 14,000 | | 181,720 |
Suntech Power Holdings Co. Ltd. sponsored ADR | 9,900 | | 279,675 |
Vestas Wind Systems AS (a) | 7,600 | | 207,891 |
| | 669,286 |
Industrial Conglomerates - 6.2% |
3M Co. | 10,200 | | 823,854 |
General Electric Co. | 268,800 | | 8,859,645 |
McDermott International, Inc. (a) | 38,300 | | 1,741,501 |
| | 11,425,000 |
Machinery - 1.2% |
Danaher Corp. | 6,200 | | 398,784 |
Deere & Co. | 15,900 | | 1,327,491 |
Pentair, Inc. | 13,000 | | 444,470 |
| | 2,170,745 |
Road & Rail - 1.5% |
Laidlaw International, Inc. | 22,200 | | 559,440 |
Landstar System, Inc. | 9,000 | | 425,070 |
Norfolk Southern Corp. | 31,700 | | 1,687,074 |
| | 2,671,584 |
Common Stocks - continued |
| Shares | | Value (Note 1) |
INDUSTRIALS - continued |
Transportation Infrastructure - 0.0% |
Grupo Aeroportuario del Pacifico SA de CV sponsored ADR | 1,800 | | $ 57,330 |
TOTAL INDUSTRIALS | | 26,229,048 |
INFORMATION TECHNOLOGY - 18.7% |
Communications Equipment - 4.7% |
Alcatel SA sponsored ADR (a) | 38,900 | | 490,529 |
Cisco Systems, Inc. (a) | 143,000 | | 2,792,790 |
Comverse Technology, Inc. (a) | 21,100 | | 417,147 |
Corning, Inc. (a) | 68,800 | | 1,664,272 |
Harris Corp. | 13,900 | | 576,989 |
Juniper Networks, Inc. (a) | 17,500 | | 279,825 |
Lucent Technologies, Inc. (a) | 83,700 | | 202,554 |
Motorola, Inc. | 51,700 | | 1,041,755 |
Nortel Networks Corp. (a) | 142,100 | | 317,848 |
QUALCOMM, Inc. | 12,300 | | 492,861 |
Research In Motion Ltd. (a) | 3,800 | | 264,746 |
| | 8,541,316 |
Computers & Peripherals - 2.1% |
Apple Computer, Inc. (a) | 17,500 | | 999,600 |
EMC Corp. (a) | 51,100 | | 560,567 |
Hewlett-Packard Co. | 55,600 | | 1,761,408 |
Network Appliance, Inc. (a) | 11,400 | | 402,420 |
Sun Microsystems, Inc. (a) | 13,300 | | 55,195 |
| | 3,779,190 |
Electronic Equipment & Instruments - 0.5% |
Agilent Technologies, Inc. (a) | 31,694 | | 1,000,263 |
Internet Software & Services - 2.9% |
eBay, Inc. (a) | 18,400 | | 538,936 |
Google, Inc. Class A (sub. vtg.) (a) | 7,000 | | 2,935,310 |
Move, Inc. (a) | 11,000 | | 60,280 |
Yahoo!, Inc. (a) | 56,300 | | 1,857,900 |
| | 5,392,426 |
IT Services - 0.8% |
First Data Corp. | 17,300 | | 779,192 |
Mastercard, Inc. Class A | 100 | | 4,800 |
Paychex, Inc. | 17,200 | | 670,456 |
| | 1,454,448 |
Common Stocks - continued |
| Shares | | Value (Note 1) |
INFORMATION TECHNOLOGY - continued |
Semiconductors & Semiconductor Equipment - 3.3% |
Analog Devices, Inc. | 21,200 | | $ 681,368 |
Applied Materials, Inc. | 76,018 | | 1,237,573 |
ARM Holdings PLC sponsored ADR | 15,000 | | 93,900 |
ASML Holding NV (NY Shares) (a) | 100 | | 2,022 |
ATI Technologies, Inc. (a) | 24,000 | | 349,898 |
Broadcom Corp. Class A (a) | 11,800 | | 354,590 |
FormFactor, Inc. (a) | 3,000 | | 133,890 |
Freescale Semiconductor, Inc. Class A (a) | 18,300 | | 530,700 |
Intel Corp. | 56,500 | | 1,070,675 |
Lam Research Corp. (a) | 600 | | 27,972 |
Maxim Integrated Products, Inc. | 13,400 | | 430,274 |
Microchip Technology, Inc. | 10,800 | | 362,340 |
National Semiconductor Corp. | 11,800 | | 281,430 |
Renewable Energy Corp. AS | 8,300 | | 118,688 |
Samsung Electronics Co. Ltd. | 510 | | 324,159 |
| | 5,999,479 |
Software - 4.4% |
Adobe Systems, Inc. (a) | 9,600 | | 291,456 |
BEA Systems, Inc. (a) | 26,700 | | 349,503 |
Cognos, Inc. (a) | 10,300 | | 292,615 |
FileNET Corp. (a) | 19,100 | | 514,363 |
Mercury Interactive Corp. (a) | 8,200 | | 286,754 |
Microsoft Corp. | 237,100 | | 5,524,430 |
Oracle Corp. (a) | 36,500 | | 528,885 |
Symantec Corp. (a) | 11,600 | | 180,264 |
| | 7,968,270 |
TOTAL INFORMATION TECHNOLOGY | | 34,135,392 |
MATERIALS - 3.2% |
Chemicals - 2.1% |
Ashland, Inc. | 17,000 | | 1,133,900 |
Monsanto Co. | 12,600 | | 1,060,794 |
Praxair, Inc. | 30,600 | | 1,652,400 |
| | 3,847,094 |
Containers & Packaging - 0.4% |
Owens-Illinois, Inc. (a) | 24,300 | | 407,268 |
Smurfit-Stone Container Corp. (a) | 27,000 | | 295,380 |
| | 702,648 |
Common Stocks - continued |
| Shares | | Value (Note 1) |
MATERIALS - continued |
Metals & Mining - 0.7% |
Alcoa, Inc. | 20,100 | | $ 650,436 |
Newmont Mining Corp. | 10,300 | | 545,179 |
| | 1,195,615 |
TOTAL MATERIALS | | 5,745,357 |
TELECOMMUNICATION SERVICES - 2.3% |
Diversified Telecommunication Services - 1.9% |
AT&T, Inc. | 74,300 | | 2,072,227 |
Qwest Communications International, Inc. (a) | 70,500 | | 570,345 |
Verizon Communications, Inc. | 23,600 | | 790,364 |
| | 3,432,936 |
Wireless Telecommunication Services - 0.4% |
American Tower Corp. Class A (a) | 17,500 | | 544,600 |
Sprint Nextel Corp. | 14,741 | | 294,673 |
| | 839,273 |
TOTAL TELECOMMUNICATION SERVICES | | 4,272,209 |
UTILITIES - 1.1% |
Electric Utilities - 0.5% |
Exelon Corp. | 15,900 | | 903,597 |
Independent Power Producers & Energy Traders - 0.6% |
TXU Corp. | 19,400 | | 1,159,926 |
TOTAL UTILITIES | | 2,063,523 |
TOTAL COMMON STOCKS (Cost $169,220,119) | 178,194,620 |
Money Market Funds - 4.4% |
| Shares | | Value (Note 1) |
Fidelity Cash Central Fund, 5.11% (b) | 7,234,677 | | $ 7,234,677 |
Fidelity Securities Lending Cash Central Fund, 5.14% (b)(c) | 843,175 | | 843,175 |
TOTAL MONEY MARKET FUNDS (Cost $8,077,852) | 8,077,852 |
TOTAL INVESTMENT PORTFOLIO - 101.9% (Cost $177,297,971) | | 186,272,472 |
NET OTHER ASSETS - (1.9)% | | (3,438,887) |
NET ASSETS - 100% | $ 182,833,585 |
Legend |
(a) Non-income producing |
(b) Affiliated fund that is available only to investment companies and other accounts managed by Fidelity Investments. The rate quoted is the annualized seven-day yield of the fund at period end. A complete unaudited listing of the fund's holdings as of its most recent quarter end is available upon request. |
(c) Investment made with cash collateral received from securities on loan. |
(d) Security or a portion of the security is on loan at period end. |
Affiliated Central Funds |
Information regarding fiscal year to date income earned by the fund from the affiliated Central funds is as follows: |
Fund | Income earned |
Fidelity Cash Central Fund | $ 243,690 |
Fidelity Securities Lending Cash Central Fund | 14,433 |
Total | $ 258,123 |
See accompanying notes which are an integral part of the financial statements.
Annual Report
Financial Statements
Statement of Assets and Liabilities
| June 30, 2006 |
Assets | | |
Investment in securities, at value (including securities loaned of $816,649) - See accompanying schedule: Unaffiliated issuers (cost $169,220,119) | $ 178,194,620 | |
Affiliated Central Funds (cost $8,077,852) | 8,077,852 | |
Total Investments (cost $177,297,971) | | $ 186,272,472 |
Cash | | 3,728 |
Receivable for investments sold | | 2,056,144 |
Receivable for fund shares sold | | 195,667 |
Dividends receivable | | 163,843 |
Interest receivable | | 27,276 |
Prepaid expenses | | 363 |
Other receivables | | 4,101 |
Total assets | | 188,723,594 |
| | |
Liabilities | | |
Payable for investments purchased | $ 4,584,231 | |
Payable for fund shares redeemed | 301,753 | |
Accrued management fee | 69,861 | |
Other affiliated payables | 48,542 | |
Other payables and accrued expenses | 42,447 | |
Collateral on securities loaned, at value | 843,175 | |
Total liabilities | | 5,890,009 |
| | |
Net Assets | | $ 182,833,585 |
Net Assets consist of: | | |
Paid in capital | | $ 170,742,311 |
Undistributed net investment income | | 448,224 |
Accumulated undistributed net realized gain (loss) on investments and foreign currency transactions | | 2,668,350 |
Net unrealized appreciation (depreciation) on investments and assets and liabilities in foreign currencies | | 8,974,700 |
Net Assets, for 17,737,818 shares outstanding | | $ 182,833,585 |
Net Asset Value, offering price and redemption price per share ($182,833,585 ÷ 17,737,818 shares) | | $ 10.31 |
See accompanying notes which are an integral part of the financial statements.
Annual Report
Financial Statements - continued
Statement of Operations
| Year ended June 30, 2006 |
Investment Income | | |
Dividends | | $ 2,202,416 |
Interest | | 17,677 |
Income from affiliated Central Funds | | 258,123 |
Total income | | 2,478,216 |
| | |
Expenses | | |
Management fee | $ 873,505 | |
Transfer agent fees | 528,143 | |
Accounting and security lending fees | 70,175 | |
Independent trustees' compensation | 768 | |
Custodian fees and expenses | 33,233 | |
Registration fees | 24,076 | |
Audit | 43,856 | |
Legal | 3,649 | |
Miscellaneous | 19,838 | |
Total expenses before reductions | 1,597,243 | |
Expense reductions | (66,732) | 1,530,511 |
Net investment income (loss) | | 947,705 |
Realized and Unrealized Gain (Loss) Net realized gain (loss) on: | | |
Investment securities: | | |
Unaffiliated issuers | 19,241,128 | |
Foreign currency transactions | (12,504) | |
Total net realized gain (loss) | | 19,228,624 |
Change in net unrealized appreciation (depreciation) on: Investment securities | 3,509,173 | |
Assets and liabilities in foreign currencies | 1,901 | |
Total change in net unrealized appreciation (depreciation) | | 3,511,074 |
Net gain (loss) | | 22,739,698 |
Net increase (decrease) in net assets resulting from operations | | $ 23,687,403 |
See accompanying notes which are an integral part of the financial statements.
Annual Report
Statement of Changes in Net Assets
| Year ended
June 30,
2006 | Year ended
June 30,
2005 |
Increase (Decrease) in Net Assets | | |
Operations | | |
Net investment income (loss) | $ 947,705 | $ 2,960,992 |
Net realized gain (loss) | 19,228,624 | 6,774,782 |
Change in net unrealized appreciation (depreciation) | 3,511,074 | (6,145,253) |
Net increase (decrease) in net assets resulting
from operations | 23,687,403 | 3,590,521 |
Distributions to shareholders from net investment income | (1,127,349) | (2,495,521) |
Distributions to shareholders from net realized gain | (3,100,158) | - |
Total distributions | (4,227,507) | (2,495,521) |
Share transactions
Proceeds from sales of shares | 30,078,523 | 26,436,162 |
Reinvestment of distributions | 4,052,304 | 2,374,972 |
Cost of shares redeemed | (50,100,941) | (59,905,867) |
Net increase (decrease) in net assets resulting from share transactions | (15,970,114) | (31,094,733) |
Total increase (decrease) in net assets | 3,489,782 | (29,999,733) |
| | |
Net Assets | | |
Beginning of period | 179,343,803 | 209,343,536 |
End of period (including undistributed net investment income of $448,224 and undistributed net investment income of $670,976, respectively) | $ 182,833,585 | $ 179,343,803 |
Other Information Shares | | |
Sold | 2,940,128 | 2,823,258 |
Issued in reinvestment of distributions | 400,446 | 250,552 |
Redeemed | (4,933,700) | (6,398,854) |
Net increase (decrease) | (1,593,126) | (3,325,044) |
See accompanying notes which are an integral part of the financial statements.
Annual Report
Financial Highlights
Years ended June 30, | 2006 | 2005 | 2004 | 2003 | 2002 |
Selected Per-Share Data | | | | | |
Net asset value, beginning of period | $ 9.28 | $ 9.24 | $ 8.48 | $ 7.88 | $ 9.63 |
Income from Investment Operations | | | | | |
Net investment income (loss) B | .05 | .14 C | .06 | .07 | .08 |
Net realized and unrealized gain (loss) | 1.21 | .02 | .76 | .60 | (1.75) |
Total from investment operations | 1.26 | .16 | .82 | .67 | (1.67) |
Distributions from net investment income | (.06) | (.12) | (.06) | (.07) | (.08) |
Distributions from net realized gain | (.17) | - | - | - | - |
Total distributions | (.23) | (.12) | (.06) | (.07) | (.08) |
Net asset value, end of period | $ 10.31 | $ 9.28 | $ 9.24 | $ 8.48 | $ 7.88 |
Total Return A | 13.63% | 1.71% | 9.68% | 8.60% | (17.42)% |
Ratios to Average Net Assets D | | | | | |
Expenses before reductions | .86% | .84% | .86% | .94% | .90% |
Expenses net of fee waivers, if any | .86% | .84% | .86% | .94% | .90% |
Expenses net of all reductions | .82% | .81% | .85% | .93% | .89% |
Net investment income (loss) | .51% | 1.52% C | .72% | .90% | .94% |
Supplemental Data | | | | | |
Net assets, end of period (000 omitted) | $ 182,834 | $ 179,344 | $ 209,344 | $ 195,717 | $ 132,542 |
Portfolio turnover rate | 180% | 79% | 26% | 51% | 54% |
A Total returns would have been lower had certain expenses not been reduced during the periods shown.
B Calculated based on average shares outstanding during the period.
C Investment income per share reflects a special dividend which amounted to $.03 per share. Excluding the special dividend, the ratio of net investment income (loss) to average net assets would have been 1.15%.
D Expense ratios reflect operating expenses of the fund. Expenses before reductions do not reflect amounts reimbursed by the investment adviser or reductions from brokerage service arrangements or other expense offset arrangements and do not represent the amount paid by the fund during periods when reimbursements or reductions occur. Expenses net of fee waivers reflect expenses after reimbursement by the investment adviser but prior to reductions from brokerage service arrangements or other expense offset arrangements. Expenses net of all reductions represent the net expenses paid by the fund.
See accompanying notes which are an integral part of the financial statements.
Annual Report
Notes to Financial Statements
For the period ended June 30, 2006
1. Significant Accounting Policies.
Fidelity Growth & Income II Portfolio (the Fund) is a fund of Fidelity Hastings Street Trust (the trust) and is authorized to issue an unlimited number of shares. The trust is registered under the Investment Company Act of 1940, as amended (the 1940 Act), as an open-end management investment company organized as a Massachusetts business trust. The Fund may invest in affiliated money market central funds (Money Market Central Funds), which are open-end investment companies available to investment companies and other accounts managed by Fidelity Management & Research Company (FMR) and its affiliates. The financial statements have been prepared in conformity with accounting principles generally accepted in the United States of America, which require management to make certain estimates and assumptions at the date of the financial statements. The following summarizes the significant accounting policies of the Fund:
Security Valuation. Investments are valued and net asset value (NAV) per share is calculated (NAV calculation) as of the close of business of the New York Stock Exchange (NYSE), normally 4:00 p.m. Eastern time. Wherever possible, the Fund uses independent pricing services approved by the Board of Trustees to value its investments.
Equity securities, including restricted securities, for which market quotations are readily available, are valued at the last reported sale price or official closing price as reported by an independent pricing service on the primary market or exchange on which they are traded. In the event there were no sales during the day or closing prices are not available, securities are valued at the last quoted bid price. Investments in open-end mutual funds are valued at their closing net asset value each business day. Short-term securities with remaining maturities of sixty days or less for which quotations are not readily available are valued at amortized cost, which approximates value.
When current market prices or quotations are not readily available or do not accurately reflect fair value, valuations may be determined in accordance with procedures adopted by the Board of Trustees. For example, when developments occur between the close of a market and the close of the NYSE that may materially affect the value of some or all of the securities, or when trading in a security is halted, those securities may be fair valued. Factors used in the determination of fair value may include monitoring news to identify significant market or security specific events such as changes in the value of U.S. securities markets, reviewing developments in foreign markets and evaluating the performance of ADRs, futures contracts and exchange-traded funds. Because the Fund's utilization of fair value pricing depends on market activity, the frequency with which fair value pricing is used can not be predicted and may be utilized to a significant extent. The value of securities used for NAV calculation under fair value pricing may differ from published prices for the same securities.
Annual Report
Notes to Financial Statements - continued
1. Significant Accounting Policies - continued
Foreign Currency. The Fund uses foreign currency contracts to facilitate transactions in foreign-denominated securities. Losses from these transactions may arise from changes in the value of the foreign currency or if the counterparties do not perform under the contracts' terms.
Foreign-denominated assets, including investment securities, and liabilities are translated into U.S. dollars at the exchange rate at period end. Purchases and sales of investment securities, income and dividends received and expenses denominated in foreign currencies are translated into U.S. dollars at the exchange rate in effect on the transaction date.
The effects of exchange rate fluctuations on investments are included with the net realized and unrealized gain (loss) on investment securities. Other foreign currency transactions resulting in realized and unrealized gain (loss) are disclosed separately.
Investment Transactions and Income. Security transactions are accounted for as of trade date. Gains and losses on securities sold are determined on the basis of identified cost and may include proceeds received from litigation. Dividend income is recorded on the ex-dividend date, except for certain dividends from foreign securities where the ex-dividend date may have passed, which are recorded as soon as the Fund is informed of the ex-dividend date. Non-cash dividends included in dividend income, if any, are recorded at the fair market value of the securities received. Distributions received on securities that represent a return of capital or capital gain are recorded as a reduction of cost of investments and/or as a realized gain. The Fund estimates the components of distributions received that may be considered return of capital distributions or capital gain distributions. Interest income is accrued as earned. Interest income includes coupon interest and amortization of premium and accretion of discount on debt securities. Investment income is recorded net of foreign taxes withheld where recovery of such taxes is uncertain.
Expenses. Most expenses of the trust can be directly attributed to a fund. Expenses which cannot be directly attributed are apportioned among each Fund in the trust.
Income Tax Information and Distributions to Shareholders. Each year, the Fund intends to qualify as a regulated investment company by distributing all of its taxable income and realized gains under Subchapter M of the Internal Revenue Code. As a result, no provision for income taxes is required in the accompanying financial statements. Foreign taxes are provided for based on the Fund's understanding of the tax rules and rates that exist in the foreign markets in which it invests.
Distributions are recorded on the ex-dividend date. Income and capital gain distributions are determined in accordance with income tax regulations, which may differ from
Annual Report
1. Significant Accounting Policies - continued
Income Tax Information and Distributions to Shareholders - continued
generally accepted accounting principles. In addition, the Fund will claim a portion of the payment made to redeeming shareholders as a distribution for income tax purposes.
Capital accounts within the financial statements are adjusted for permanent book-tax differences. These adjustments have no impact on net assets or the results of operations. Temporary book-tax differences will reverse in a subsequent period.
Book-tax differences are primarily due to foreign currency transactions, market discount, capital loss carryforwards and losses deferred due to wash sales and excise tax regulations.
The tax-basis components of distributable earnings and the federal tax cost as of period end were as follows:
Unrealized appreciation | $ 15,044,377 |
Unrealized depreciation | (6,937,695) |
Net unrealized appreciation (depreciation) | 8,106,682 |
Undistributed ordinary income | 448,224 |
Undistributed long-term capital gain | 3,180,484 |
Cost for federal income tax purposes | $ 178,165,790 |
The tax character of distributions paid was as follows:
| June 30, 2006 | June 30, 2005 |
Ordinary Income | $ 1,127,349 | $ 2,495,521 |
Long-term Capital Gains | 3,100,158 | - |
Total | $ 4,227,507 | $ 2,495,521 |
New Accounting Pronouncement. In July 2006, Financial Accounting Standards Board Interpretation No. 48, Accounting for Uncertainty in Income Taxes - an interpretation of FASB Statement 109 (FIN 48) was issued and is effective for fiscal years beginning after December 15, 2006. FIN 48 sets forth a threshold for financial statement recognition, measurement and disclosure of a tax position taken or expected to be taken on a tax return. Management is currently evaluating the impact, if any, the adoption of FIN 48 will have on the Fund's net assets and results of operations.
2. Operating Policies.
Repurchase Agreements. FMR has received an Exemptive Order from the Securities and Exchange Commission (the SEC) which permits the Fund and other affiliated entities of FMR to transfer uninvested cash balances into joint trading accounts which are then invested in repurchase agreements. The Fund may also invest directly with institutions in
Annual Report
Notes to Financial Statements - continued
2. Operating Policies - continued
Repurchase Agreements - continued
repurchase agreements. Repurchase agreements are collateralized by government or non-government securities. Upon settlement date, collateral is held in segregated accounts with custodian banks and may be obtained in the event of a default of the counterparty. The Fund monitors, on a daily basis, the value of the collateral to ensure it is at least equal to the principal amount of the repurchase agreement (including accrued interest). In the event of a default by the counterparty, realization of the collateral proceeds could be delayed, during which time the value of the collateral may decline.
3. Purchases and Sales of Investments.
Purchases and sales of securities, other than short-term securities, aggregated $324,035,338 and $339,549,257, respectively.
4. Fees and Other Transactions with Affiliates.
Management Fee. FMR and its affiliates provide the Fund with investment management related services for which the Fund pays a monthly management fee. The management fee is the sum of an individual fund fee rate that is based on an annual rate of .20% of the Fund's average net assets and a group fee rate that averaged ..27% during the period. The group fee rate is based upon the average net assets of all the mutual funds advised by FMR. The group fee rate decreases as assets under management increase and increases as assets under management decrease. For the period, the total annual management fee rate was .47% of the Fund's average net assets.
Transfer Agent Fees. Fidelity Service Company, Inc. (FSC), an affiliate of FMR, is the Fund's transfer, dividend disbursing and shareholder servicing agent. FSC receives account fees and asset-based fees that vary according to account size and type of account. FSC pays for typesetting, printing and mailing of shareholder reports, except proxy statements. For the period, the transfer agent fees were equivalent to an annual rate of .28% of average net assets.
Accounting and Security Lending Fees. FSC maintains the Fund's accounting records. The accounting fee is based on the level of average net assets for the month. Under a separate contract, FSC administers the security lending program. The security lending fee is based on the number and duration of lending transactions.
Affiliated Central Funds. The Fund may invest in Money Market Central Funds which seek preservation of capital and current income and are managed by Fidelity Investments Money Management, Inc. (FIMM), an affiliate of FMR.
The Money Market Central Funds do not pay a management fee.
Annual Report
4. Fees and Other Transactions with Affiliates - continued
Brokerage Commissions. The Fund placed a portion of its portfolio transactions with brokerage firms which are affiliates of the investment adviser. The commissions paid to these affiliated firms were $3,259 for the period.
5. Committed Line of Credit.
The Fund participates with other funds managed by FMR in a $4.2 billion credit facility (the "line of credit") to be utilized for temporary or emergency purposes to fund shareholder redemptions or for other short-term liquidity purposes. The Fund has agreed to pay commitment fees on its pro rata portion of the line of credit, which amounts to $562 and is reflected in Miscellaneous Expense on the Statement of Operations. During the period, there were no borrowings on this line of credit.
6. Security Lending.
The Fund lends portfolio securities from time to time in order to earn additional income. On the settlement date of the loan, the Fund receives collateral (in the form of U.S. Treasury obligations, letters of credit and/or cash) against the loaned securities and maintains collateral in an amount not less than 100% of the market value of the loaned securities during the period of the loan. The market value of the loaned securities is determined at the close of business of the Fund and any additional required collateral is delivered to the Fund on the next business day. If the borrower defaults on its obligation to return the securities loaned because of insolvency or other reasons, a fund could experience delays and costs in recovering the securities loaned or in gaining access to the collateral. Any cash collateral received is invested in the Fidelity Securities Lending Cash Central Fund. The value of loaned securities and cash collateral at period end are disclosed on the Fund's Statement of Assets and Liabilities. Security lending income represents the income earned on investing cash collateral, less fees and expenses associated with the loan, plus any premium payments that may be received on the loan of certain types of securities. Security lending income is presented in the Statement of Operations as a component of income from affiliated central funds. Net income from lending portfolio securities during the period amounted to $14,433.
7. Expense Reductions.
Many of the brokers with whom FMR places trades on behalf of the Fund provided services to the Fund in addition to trade execution. These services included payments of certain expenses on behalf of the Fund totaling $63,626 for the period. In addition, through arrangements with the Fund's custodian and transfer agent, credits realized as a result of uninvested cash balances were used to reduce the Fund's expenses. During the
Annual Report
Notes to Financial Statements - continued
7. Expense Reductions - continued
period, these credits reduced the Fund's custody and transfer agent expenses by $466 and $2,640, respectively.
8. Other.
The Fund's organizational documents provide former and current trustees and officers with a limited indemnification against liabilities arising in connection with the performance of their duties to the Fund. In the normal course of business, the Fund may also enter into contracts that provide general indemnifications. The Fund's maximum exposure under these arrangements is unknown as this would be dependent on future claims that may be made against the Fund. The risk of material loss from such claims is considered remote.
Annual Report
Report of Independent Registered Public Accounting Firm
To the Trustees of Fidelity Hastings Street Trust and the Shareholders of Fidelity Growth & Income II Portfolio:
In our opinion, the accompanying statement of assets and liabilities, including the schedule of investments, and the related statements of operations and of changes in net assets and the financial highlights present fairly, in all material respects, the financial position of Fidelity Growth & Income II Portfolio (a fund of Fidelity Hastings Street Trust) at June 30, 2006, and the results of its operations for the year then ended, the changes in its net assets for each of the two years in the period then ended and the financial highlights for each of the five years in the period then ended, in conformity with accounting principles generally accepted in the United States of America. These financial statements and financial highlights (hereafter referred to as "financial statements") are the responsibility of the Fidelity Growth & Income II Portfolio's management; our responsibility is to express an opinion on these financial statements based on our audits. We conducted our audits of these financial statements in accordance with the standards of the Public Company Accounting Oversight Board (United States). Those standards require that we plan and perform the audit to obtain reasonable assurance about whether the financial statements are free of material misstatement. An audit includes examining, on a test basis, evidence supporting the amounts and disclosures in the financial statements, assessing the accounting principles used and significant estimates made by management, and evaluating the overall financial statement presentation. We believe that our audits, which included confirmation of securities at June 30, 2006 by correspondence with the custodian and brokers, provide a reasonable basis for our opinion.
/s/ PricewaterhouseCoopers LLP
PricewaterhouseCoopers LLP
Boston, Massachusetts
August 14, 2006
Annual Report
Trustees and Officers
The Trustees, Members of the Advisory Board, and executive officers of the trust and fund, as applicable, are listed below. The Board of Trustees governs the fund and is responsible for protecting the interests of shareholders. The Trustees are experienced executives who meet periodically throughout the year to oversee the fund's activities, review contractual arrangements with companies that provide services to the fund, and review the fund's performance. Except for William O. McCoy and Albert R. Gamper, Jr., each of the Trustees oversees 345 funds advised by FMR or an affiliate. Mr. McCoy oversees 347 funds advised by FMR or an affiliate. Mr. Gamper oversees 290 funds advised by FMR or an affiliate.
The Trustees hold office without limit in time except that (a) any Trustee may resign; (b) any Trustee may be removed by written instrument, signed by at least two-thirds of the number of Trustees prior to such removal; (c) any Trustee who requests to be retired or who has become incapacitated by illness or injury may be retired by written instrument signed by a majority of the other Trustees; and (d) any Trustee may be removed at any special meeting of shareholders by a two-thirds vote of the outstanding voting securities of the trust. Each Trustee who is not an interested person (as defined in the 1940 Act) (Independent Trustee), shall retire not later than the last day of the calendar year in which his or her 72nd birthday occurs. The Independent Trustees may waive this mandatory retirement age policy with respect to individual Trustees. The executive officers and Advisory Board Members hold office without limit in time, except that any officer and Advisory Board Member may resign or may be removed by a vote of a majority of the Trustees at any regular meeting or any special meeting of the Trustees. Except as indicated, each individual has held the office shown or other offices in the same company for the past five years.
The fund's Statement of Additional Information (SAI) includes more information about the Trustees. To request a free copy, call Fidelity at 1-800-544-8544.
Interested Trustees*:
Correspondence intended for each Trustee who is an interested person may be sent to Fidelity Investments, 82 Devonshire Street, Boston, Massachusetts 02109.
Name, Age; Principal Occupation |
Edward C. Johnson 3d (76) |
| Year of Election or Appointment: 1984 Mr. Johnson is Chairman of the Board of Trustees. Mr. Johnson serves as President (2006-present), Chief Executive Officer, Chairman, and a Director of FMR Corp.; Chairman and a Director of FMR; Chairman and a Director of Fidelity Research & Analysis Company (FRAC); Chairman and a Director of Fidelity Investments Money Management, Inc.; and Chairman (2001-present) and a Director (1999-present) of FMR Co., Inc. In addition, Mr. Johnson serves as Chairman and Director of Fidelity International Limited (FIL). |
Stephen P. Jonas (53) |
| Year of Election or Appointment: 2005 Mr. Jonas is Senior Vice President of Growth & Income II (2005-present). He also serves as Senior Vice President of other Fidelity funds (2005-present). Mr. Jonas is Executive Director of FMR (2005-present) and FMR Co., Inc. (2005-present). He also serves as a Director of Fidelity Investments Money Management, Inc. (2005-present) and FMR Corp. (2003-present). Previously, Mr. Jonas served as President of Fidelity Enterprise Operations and Risk Services (2004-2005), Chief Administrative Officer (2002-2004), and Chief Financial Officer of FMR Corp. (1998-2002). In addition, he serves on the Boards of Boston Ballet (2003-present) and Simmons College (2003-present). |
Robert L. Reynolds (54) |
| Year of Election or Appointment: 2003 Mr. Reynolds is President and a Director of FMR (2005-present), Fidelity Investments Money Management, Inc. (2005-present), and FMR Co., Inc. (2005-present). Mr. Reynolds also serves as a Director (2003-present) and Chief Operating Officer (2000-present) of FMR Corp. and a Director of Strategic Advisers, Inc. (2005-present). He also serves on the Board at Fidelity Investments Canada, Ltd. (2000-present). Previously, Mr. Reynolds served as President of Fidelity Investments Institutional Retirement Group (1996-2000). |
* Trustees have been determined to be "Interested Trustees" by virtue of, among other things, their affiliation with the trust or various entities under common control with FMR.
Annual Report
Independent Trustees:
Correspondence intended for each Independent Trustee (that is, the Trustees other than the Interested Trustees) may be sent to Fidelity Investments, P.O. Box 55235, Boston, Massachusetts 02205-5235.
Name, Age; Principal Occupation |
Dennis J. Dirks (58) |
| Year of Election or Appointment: 2005 Prior to his retirement in May 2003, Mr. Dirks was Chief Operating Officer and a member of the Board of The Depository Trust & Clearing Corporation (DTCC) (1999-2003). He also served as President, Chief Operating Officer, and Board member of The Depository Trust Company (DTC) (1999-2003) and President and Board member of the National Securities Clearing Corporation (NSCC) (1999-2003). In addition, Mr. Dirks served as Chief Executive Officer and Board member of the Government Securities Clearing Corporation (2001-2003) and Chief Executive Officer and Board member of the Mortgage-Backed Securities Clearing Corporation (2001-2003). Mr. Dirks also serves as a Trustee and a member of the Finance Committee of Manhattan College (2005-present) and a Trustee and a member of the Finance Committee of AHRC of Nassau County (2006-present). |
Albert R. Gamper, Jr. (64) |
| Year of Election or Appointment: 2006 Mr. Gamper also serves as a Trustee (2006-present) or Member of the Advisory Board (2005-present) of other investment companies advised by FMR. Prior to his retirement in December 2004, Mr. Gamper served as Chairman of the Board of CIT Group Inc. (commercial finance). During his tenure with CIT Group Inc. Mr. Gamper served in numerous senior management positions, including Chairman (1987-1989; 1999-2001; 2002-2004), Chief Executive Officer (1987-2004), and President (1989-2002). He currently serves as a member of the Board of Directors of Public Service Enterprise Group (utilities, 2001-present), Chairman of the Board of Governors, Rutgers University (2004-present), and Chairman of the Board of Saint Barnabas Health Care System. |
Robert M. Gates (62) |
| Year of Election or Appointment: 1997 Dr. Gates is Chairman of the Independent Trustees (2006-present). Dr. Gates is President of Texas A&M University (2002-present). He was Director of the Central Intelligence Agency (CIA) from 1991 to 1993. From 1989 to 1991, Dr. Gates served as Assistant to the President of the United States and Deputy National Security Advisor. Dr. Gates is a Director of NACCO Industries, Inc. (mining and manufacturing), Parker Drilling Co., Inc. (drilling and rental tools for the energy industry, 2001-present), and Brinker International (restaurant management, 2003-present). Previously, Dr. Gates served as a Director of LucasVarity PLC (automotive components and diesel engines), a Director of TRW Inc. (automotive, space, defense, and information technology), and Dean of the George Bush School of Government and Public Service at Texas A&M University (1999-2001). |
George H. Heilmeier (70) |
| Year of Election or Appointment: 2004 Dr. Heilmeier is Chairman Emeritus of Telcordia Technologies (communication software and systems), where prior to his retirement, he served as company Chairman and Chief Executive Officer. He currently serves on the Boards of Directors of The Mitre Corporation (systems engineering and information technology support for the government), and HRL Laboratories (private research and development, 2004-present). He is Chairman of the General Motors Science & Technology Advisory Board and a Life Fellow of the Institute of Electrical and Electronics Engineers (IEEE). Dr. Heilmeier is a member of the Defense Science Board and the National Security Agency Advisory Board. He is also a member of the National Academy of Engineering, the American Academy of Arts and Sciences, and the Board of Overseers of the School of Engineering and Applied Science of the University of Pennsylvania. Previously, Dr. Heilmeier served as a Director of TRW Inc. (automotive, space, defense, and information technology, 1992-2002), Compaq (1994-2002), Automatic Data Processing, Inc. (ADP) (technology-based business outsourcing, 1995-2002), INET Technologies Inc. (telecommunications network surveillance, 2001-2004), and Teletech Holdings (customer management services). He is the recipient of the 2005 Kyoto Prize in Advanced Technology for his invention of the liquid crystal display. |
Marie L. Knowles (59) |
| Year of Election or Appointment: 2001 Prior to Ms. Knowles' retirement in June 2000, she served as Executive Vice President and Chief Financial Officer of Atlantic Richfield Company (ARCO) (diversified energy, 1996-2000). From 1993 to 1996, she was a Senior Vice President of ARCO and President of ARCO Transportation Company. She served as a Director of ARCO from 1996 to 1998. She currently serves as a Director of Phelps Dodge Corporation (copper mining and manufacturing) and McKesson Corporation (healthcare service, 2002-present). Ms. Knowles is a Trustee of the Brookings Institution and the Catalina Island Conservancy and also serves as a member of the Advisory Board for the School of Engineering of the University of Southern California. |
Ned C. Lautenbach (62) |
| Year of Election or Appointment: 2000 Mr. Lautenbach has been a partner of Clayton, Dubilier & Rice, Inc. (private equity investment firm) since September 1998. Previously, Mr. Lautenbach was with the International Business Machines Corporation (IBM) from 1968 until his retirement in 1998. Mr. Lautenbach serves as a Director of Italtel Holding S.p.A. (telecommunications (Milan, Italy), 2004-present) and Eaton Corporation (diversified industrial) as well as the Philharmonic Center for the Arts in Naples, Florida. He also is a member of the Board of Trustees of Fairfield University (2005-present), as well as a member of the Council on Foreign Relations. |
William O. McCoy (72) |
| Year of Election or Appointment: 1997 Prior to his retirement in December 1994, Mr. McCoy was Vice Chairman of the Board of BellSouth Corporation (telecommunications) and President of BellSouth Enterprises. He is currently a Director of Duke Realty Corporation (real estate). He is also a partner of Franklin Street Partners (private investment management firm). In addition, Mr. McCoy served as the Interim Chancellor (1999-2000) and a member of the Board of Visitors for the University of North Carolina at Chapel Hill and currently serves as Chairman of the Board of Directors of the University of North Carolina Health Care System. He also served as Vice President of Finance for the University of North Carolina (16-school system). |
Cornelia M. Small (61) |
| Year of Election or Appointment: 2005 Ms. Small is a member (2000-present) and Chairperson (2002-present) of the Investment Committee, and a member (2002-present) of the Board of Trustees of Smith College. Previously, she served as Chief Investment Officer (1999-2000), Director of Global Equity Investments (1996-1999), and a member of the Board of Directors of Scudder, Stevens & Clark (1990-1997) and Scudder Kemper Investments (1997-1999). In addition, Ms. Small served as Co-Chair (2000-2003) of the Annual Fund for the Fletcher School of Law and Diplomacy. |
William S. Stavropoulos (67) |
| Year of Election or Appointment: 2001 Mr. Stavropoulos is Chairman Emeritus of the Board of Directors of The Dow Chemical Company. Since joining The Dow Chemical Company in 1967, Mr. Stavropoulos served in numerous senior management positions, including President (1993-2000; 2002-2003), CEO (1995-2000; 2002-2004), and Chairman of the Executive Committee (2000-2004). Currently, he is a Director of NCR Corporation (data warehousing and technology solutions), BellSouth Corporation (telecommunications), Chemical Financial Corporation, Maersk Inc. (industrial conglomerate, 2002-present), and Metalmark Capital (private equity investment firm, 2005-present). He also serves as a member of the Board of Trustees of the American Enterprise Institute for Public Policy Research. In addition, Mr. Stavropoulos is a member of The Business Council, J.P. Morgan International Council and the University of Notre Dame Advisory Council for the College of Science. |
Kenneth L. Wolfe (67) |
| Year of Election or Appointment: 2005 Prior to his retirement in 2001, Mr. Wolfe was Chairman and Chief Executive Officer of Hershey Foods Corporation (1993-2001). He currently serves as a member of the boards of Adelphia Communications Corporation (2003-present), Bausch & Lomb, Inc., and Revlon Inc. (2004-present). |
Annual Report
Advisory Board Members and Executive Officers:
Correspondence intended for Mr. Keyes may be sent to Fidelity Investments, P.O. Box 55235, Boston, Massachusetts 02205-5235. Correspondence intended for each executive officer and Mr. Lynch may be sent to Fidelity Investments, 82 Devonshire Street, Boston, Massachusetts 02109.
Name, Age; Principal Occupation |
James H. Keyes (65) |
| Year of Election or Appointment: 2006 Member of the Advisory Board of Fidelity Hastings Street Trust. Prior to his retirement in 2003, Mr. Keyes was Chairman, President, and Chief Executive Officer of Johnson Controls, Inc. (automotive supplier, 1993-2003). He currently serves as a member of the boards of LSI Logic Corporation (semiconductor technologies, 1984-present), Navistar International Corporation (manufacture and sale of trucks, buses, and diesel engines, 2002-present), and Pitney Bowes, Inc. (integrated mail, messaging, and document management solutions, 1998-present). |
Peter S. Lynch (62) |
| Year of Election or Appointment: 2003 Member of the Advisory Board of Fidelity Hastings Street Trust. Mr. Lynch is Vice Chairman and a Director of FMR, and Vice Chairman (2001-present) and a Director (1999-present) of FMR Co., Inc. Previously, Mr. Lynch served as a Trustee of the Fidelity funds (1990-2003). In addition, he serves as the Chairman of the Inner-City Scholarship Fund. |
Philip L. Bullen (46) |
| Year of Election or Appointment: 2006 Vice President of Growth & Income II. Mr. Bullen also serves as Vice President of certain Equity Funds (2006-present). Mr. Bullen is Senior Vice President of FMR (2001-present) and FMR Co., Inc. (2001-present). Previously, Mr. Bullen served as President and a Director of Fidelity Research & Analysis Company (2001-2005), President and a Director of Fidelity Management & Research (U.K.) Inc. (2002-2006), and a Director of Strategic Advisers, Inc. (2002-2005). |
Dwight D. Churchill (52) |
| Year of Election or Appointment: 2006 Vice President of Growth & Income II. Mr. Churchill also serves as Vice President of certain Equity Funds (2005-present). Mr. Churchill is Executive Vice President of FMR (2005-present) and FMR Co., Inc. (2005-present). Previously, Mr. Churchill served as Senior Vice President of Fidelity Investments Money Management, Inc. (2005-2006), Head of Fidelity's Fixed-Income Division (2000-2005), Vice President of Fidelity's Money Market Funds (2000-2005), Vice President of Fidelity's Bond Funds, and Senior Vice President of FMR. |
James Catudal (45) |
| Year of Election or Appointment: 2005 Vice President of Growth & Income II. Mr. Catudal also serves as Vice President of other funds advised by FMR. Prior to assuming his current responsibilities, Mr. Catudal worked as a research analyst and manager. Mr. Catudal also serves as Vice President of FMR (2002) and FMR Co., Inc. (2002). |
Eric D. Roiter (57) |
| Year of Election or Appointment: 1998 Secretary of Growth & Income II. He also serves as Secretary of other Fidelity funds; Vice President, General Counsel, and Secretary of FMR Co., Inc. (2001-present) and FMR; Assistant Secretary of Fidelity Management & Research (U.K.) Inc. (2001-present), Fidelity Research & Analysis Company (2001-present), and Fidelity Investments Money Management, Inc. (2001-present). Mr. Roiter is an Adjunct Member, Faculty of Law, at Boston College Law School (2003-present). Previously, Mr. Roiter served as Vice President and Secretary of Fidelity Distributors Corporation (FDC) (1998-2005). |
Stuart Fross (46) |
| Year of Election or Appointment: 2003 Assistant Secretary of Growth & Income II. Mr. Fross also serves as Assistant Secretary of other Fidelity funds (2003-present), Vice President and Secretary of FDC (2005-present), and is an employee of FMR. |
Christine Reynolds (47) |
| Year of Election or Appointment: 2004 President and Treasurer of Growth & Income II. Ms. Reynolds also serves as President and Treasurer of other Fidelity funds (2004-present) and is a Vice President (2003-present) and an employee (2002-present) of FMR. Before joining Fidelity Investments, Ms. Reynolds worked at PricewaterhouseCoopers LLP (PwC) (1980-2002), where she was most recently an audit partner with PwC's investment management practice. |
R. Stephen Ganis (40) |
| Year of Election or Appointment: 2006 Anti-Money Laundering (AML) officer of Growth & Income II. Mr. Ganis also serves as AML officer of other Fidelity funds (2006-present) and FMR Corp. (2003-present). Before joining Fidelity Investments,
Mr. Ganis practiced law at Goodwin Procter, LLP (2000-2002). |
Joseph B. Hollis (58) |
| Year of Election or Appointment: 2006 Chief Financial Officer of Growth & Income II. Mr. Hollis also serves as Chief Financial Officer of other Fidelity funds. Mr. Hollis is President of Fidelity Pricing and Cash Management Services (FPCMS) (2005-present). Mr. Hollis also serves as President and Director of Fidelity Service Company, Inc. (2006-present). Previously, Mr. Hollis served as Senior Vice President of Cash Management Services (1999-2002) and Investment Management Operations (2002-2005). |
Kenneth A. Rathgeber (59) |
| Year of Election or Appointment: 2004 Chief Compliance Officer of Growth & Income II. Mr. Rathgeber also serves as Chief Compliance Officer of other Fidelity funds (2004-present) and Executive Vice President of Risk Oversight for Fidelity Investments (2002-present). He is Chief Compliance Officer of FMR (2005-present), FMR Co., Inc. (2005-present), Fidelity Management & Research (U.K.) Inc. (2005-present), Fidelity Research & Analysis Company (2005-present), Fidelity Investments Money Management, Inc. (2005-present), and Strategic Advisers, Inc. (2005-present). Previously, Mr. Rathgeber served as Executive Vice President and Chief Operating Officer for Fidelity Investments Institutional Services Company, Inc. (1998-2002). |
Bryan A. Mehrmann (45) |
| Year of Election or Appointment: 2005 Deputy Treasurer of Growth & Income II. Mr. Mehrmann also serves as Deputy Treasurer of other Fidelity funds (2005-present) and is an employee of FMR. Previously, Mr. Mehrmann served as Vice President of Fidelity Investments Institutional Services Group (FIIS)/Fidelity Investments Institutional Operations Corporation, Inc. (FIIOC) Client Services (1998-2004). |
Kimberley H. Monasterio (42) |
| Year of Election or Appointment: 2004 Deputy Treasurer of Growth & Income II. Ms. Monasterio also serves as Deputy Treasurer of other Fidelity funds (2004) and is an employee of FMR (2004). Before joining Fidelity Investments, Ms. Monasterio served as Treasurer (2000-2004) and Chief Financial Officer (2002-2004) of the Franklin Templeton Funds and Senior Vice President of Franklin Templeton Services, LLC (2000-2004). |
Kenneth B. Robins (36) |
| Year of Election or Appointment: 2005 Deputy Treasurer of Growth & Income II. Mr. Robins also serves as Deputy Treasurer of other Fidelity funds (2005-present) and is an employee of FMR (2004-present). Before joining Fidelity Investments, Mr. Robins worked at KPMG LLP, where he was a partner in KPMG's department of professional practice (2002-2004) and a Senior Manager (1999-2000). In addition, Mr. Robins served as Assistant Chief Accountant, United States Securities and Exchange Commission (2000-2002). |
Robert G. Byrnes (39) |
| Year of Election or Appointment: 2005 Assistant Treasurer of Growth & Income II. Mr. Byrnes also serves as Assistant Treasurer of other Fidelity funds (2005-present) and is an employee of FMR (2005-present). Previously, Mr. Byrnes served as Vice President of FPCMS (2003-2005). Before joining Fidelity Investments, Mr. Byrnes worked at Deutsche Asset Management where he served as Vice President of the Investment Operations Group (2000-2003). |
John H. Costello (59) |
| Year of Election or Appointment: 1998 Assistant Treasurer of Growth & Income II. Mr. Costello also serves as Assistant Treasurer of other Fidelity funds and is an employee of FMR. |
Peter L. Lydecker (52) |
| Year of Election or Appointment: 2004 Assistant Treasurer of Growth & Income II. Mr. Lydecker also serves as Assistant Treasurer of other Fidelity funds (2004) and is an employee of FMR. |
Mark Osterheld (51) |
| Year of Election or Appointment: 2002 Assistant Treasurer of Growth & Income II. Mr. Osterheld also serves as Assistant Treasurer of other Fidelity funds (2002) and is an employee of FMR. |
Gary W. Ryan (47) |
| Year of Election or Appointment: 2005 Assistant Treasurer of Growth & Income II. Mr. Ryan also serves as Assistant Treasurer of other Fidelity funds (2005-present) and is an employee of FMR (2005-present). Previously, Mr. Ryan served as Vice President of Fund Reporting in FPCMS (1999-2005). |
Salvatore Schiavone (40) |
| Year of Election or Appointment: 2005 Assistant Treasurer of Growth & Income II. Mr. Schiavone also serves as Assistant Treasurer of other Fidelity funds (2005-present) and is an employee of FMR (2005-present). Before joining Fidelity Investments, Mr. Schiavone worked at Deutsche Asset Management, where he most recently served as Assistant Treasurer (2003-2005) of the Scudder Funds and Vice President and Head of Fund Reporting (1996-2003). |
Annual Report
Distributions
The Board of Trustees of Fidelity Growth & Income II voted to pay on 8/7/2006, to shareholders of record at the opening of business on 8/4/2006 a distribution of $.18 per share derived from capital gains realized from sales of portfolio securities.
The fund hereby designates as a capital gain dividend with respect to the taxable year ended 6/30/2006, $7,759,420, or, if subsequently determined to be different, the net capital gain of such year.
A total of 0.25% of the dividends distributed during the fiscal year was derived from interest on U.S. Government securities which is generally exempt from state income tax.
The fund designates 100% of the dividends distributed during the fiscal year as qualifying for the dividends-received deduction for corporate shareholders.
The fund designates 100% of the dividends distributed during the fiscal year as amounts which may be taken into account as a dividend for the purposes of the maximum rate under section 1(h)(11) of the Internal Revenue Code.
The fund will notify shareholders in January 2007 of amounts for use in preparing 2006 income tax returns.
Annual Report
Proxy Voting Results
A special meeting of the fund's shareholders was held on November 16, 2005. The results of votes taken among shareholders on proposals before them are reported below. Each vote reported represents one dollar of net asset value held on the record date for the meeting.
PROPOSAL 1 |
To elect a Board of Trustees. A |
| # of
Votes | % of
Votes |
Dennis J. Dirks |
Affirmative | 6,466,243,048.91 | 95.846 |
Withheld | 280,219,946.87 | 4.154 |
TOTAL | 6,746,462,995.78 | 100.000 |
Albert R. Gamper, Jr. B |
Affirmative | 6,459,041,833.49 | 95.740 |
Withheld | 287,421,162.29 | 4.260 |
TOTAL | 6,746,462,995.78 | 100.000 |
Robert M. Gates |
Affirmative | 6,441,052,528.46 | 95.473 |
Withheld | 305,410,467.32 | 4.527 |
TOTAL | 6,746,462,995.78 | 100.000 |
George H. Heilmeier |
Affirmative | 6,458,026,916.90 | 95.725 |
Withheld | 288,436,078.88 | 4.275 |
TOTAL | 6,746,462,995.78 | 100.000 |
Abigail P. Johnson |
Affirmative | 6,427,896,599.31 | 95.278 |
Withheld | 318,566,396.47 | 4.722 |
TOTAL | 6,746,462,995.78 | 100.000 |
Edward C. Johnson 3d |
Affirmative | 6,419,116,877.24 | 95.148 |
Withheld | 327,346,118.54 | 4.852 |
TOTAL | 6,746,462,995.78 | 100.000 |
Stephen P. Jonas |
Affirmative | 6,459,780,830.40 | 95.751 |
Withheld | 286,682,165.38 | 4.249 |
TOTAL | 6,746,462,995.78 | 100.000 |
Marie L. Knowles |
Affirmative | 6,461,769,188.96 | 95.780 |
Withheld | 284,693,806.82 | 4.220 |
TOTAL | 6,746,462,995.78 | 100.000 |
| # of
Votes | % of
Votes |
Ned C. Lautenbach |
Affirmative | 6,460,406,353.14 | 95.760 |
Withheld | 286,056,642.64 | 4.240 |
TOTAL | 6,746,462,995.78 | 100.000 |
Marvin L. Mann |
Affirmative | 6,440,555,199.19 | 95.466 |
Withheld | 305,907,796.59 | 4.534 |
TOTAL | 6,746,462,995.78 | , 100.000 |
William O. McCoy |
Affirmative | 6,440,823,478.66 | 95.470 |
Withheld | 305,639,517.12 | 4.530 |
TOTAL | 6,746,462,995.78 | 100.000 |
Robert L. Reynolds |
Affirmative | 6,463,763,182.86 | 95.810 |
Withheld | 282,699,812.92 | 4.190 |
TOTAL | 6,746,462,995.78 | 100.000 |
Cornelia M. Small |
Affirmative | 6,462,121,463.05 | 95.785 |
Withheld | 284,341,532.73 | 4.215 |
TOTAL | 6,746,462,995.78 | 100.000 |
William S. Stavropoulos |
Affirmative | 6,453,499,157.83 | 95.658 |
Withheld | 292,963,837.95 | 4.342 |
TOTAL | 6,746,462,995.78 | 100.000 |
Kenneth L. Wolfe |
Affirmative | 6,457,041,632.10 | 95.710 |
Withheld | 289,421,363.68 | 4.290 |
TOTAL | 6,746,462,995.78 | 100.000 |
A Denotes trust-wide proposals and voting results. B Effective on or about January 1, 2006. |
Semiannual Report
Board Approval of Investment Advisory Contracts and Management Fees
Fidelity Growth & Income II Portfolio
On January 19, 2006, the Board of Trustees, including the Independent Trustees (together, the Board), voted to approve a general research services agreement (the Agreement) between FMR, FMR Co., Inc. (FMRC), Fidelity Investments Money Management, Inc. (FIMM), and Fidelity Research & Analysis Company (FRAC) (together, the Investment Advisers) for the fund, effective January 20, 2006, pursuant to which FRAC may provide general research and investment advisory support services to FMRC and FIMM. The Board considered that it has approved previously various sub-advisory agreements for the fund with affiliates of FMR that allow FMR to obtain research, non-discretionary advice, or discretionary portfolio management at no additional expense to the fund. The Board, assisted by the advice of fund counsel and independent Trustees' counsel, considered a broad range of information and determined that it would be beneficial for the fund to access the research and investment advisory support services supplied by FRAC at no additional expense to the fund.
The Board reached this determination in part because the new arrangement will involve no changes in (i) the contractual terms of and fees payable under the fund's management contract or sub-advisory agreements; (ii) the investment process or strategies employed in the management of the fund's assets; (iii) the nature or level of services provided under the fund's management contract or sub-advisory agreements; (iv) the day-to-day management of the fund or the persons primarily responsible for such management; or (v) the ultimate control or beneficial ownership of FMR, FMRC, or FIMM. The Board also considered that the establishment of the Agreement would not necessitate prior shareholder approval of the Agreement or result in an assignment and termination of the fund's management contract or sub-advisory agreements under the Investment Company Act of 1940.
Because the Board was approving an arrangement with FRAC under which the fund will not bear any additional management fees or expenses and under which the fund's portfolio manager would not change, it did not consider the fund's investment performance, competitiveness of management fee and total expenses, costs of services and profitability, or economies of scale to be significant factors in its decision.
In connection with its future renewal of the fund's management contract and sub-advisory agreements, the Board will consider: (i) the nature, extent, and quality of services provided to the fund, including shareholder and administrative services and investment performance; (ii) the competitiveness of the fund's management fee and total expenses; (iii) the costs of the services and profitability, including the revenues earned and the expenses incurred by Fidelity in conducting the business of developing, marketing, distributing, managing, administering, and servicing the fund and its shareholders; and (iv) whether there have been economies of scale in respect of the management of the Fidelity funds, whether the Fidelity funds (including the fund) have appropriately benefited from any such economies of scale, and whether there is potential for realization of any further economies.
Annual Report
Board Approval of Investment Advisory Contracts and
Management Fees - continued
Based on its evaluation of all of the conclusions noted above, and after considering all material factors, the Board ultimately concluded that the fund's Agreement is fair and reasonable, and that the fund's Agreement should be approved.
Annual Report
Managing Your Investments
Fidelity offers several ways to conveniently manage your personal investments via your telephone or PC. You can access your account information, conduct trades and research your investments 24 hours a day.
By Phone
Fidelity Automated Service Telephone provides a single toll-free number to access account balances, positions, quotes and trading. It's easy to navigate the service, and on your first call, the system will help you create a personal identification number (PIN) for security.
(phone_graphic)
Fidelity Automated
Service Telephone (FAST®)
1-800-544-5555
Press
1 For mutual fund and brokerage trading.
2 For quotes.*
3 For account balances and holdings.
4 To review orders and mutual
fund activity.
5 To change your PIN.
*0 To speak to a Fidelity representative.
By PC
Fidelity's web site on the Internet provides a wide range of information, including daily financial news, fund performance, interactive planning tools and news about Fidelity products and services.
(computer_graphic)
Fidelity's Web Site
www.fidelity.com
* When you call the quotes line, please remember that a fund's yield and return will vary and, except for money market funds, share price will also vary. This means that you may have a gain or loss when you sell your shares. There is no assurance that money market funds will be able to maintain a stable $1 share price; an investment in a money market fund is not insured or guaranteed by the U.S. government. Total returns are historical and include changes in share price, reinvestment of dividends and capital gains, and the effects of any sales charges.
Annual Report
To Visit Fidelity
For directions and hours,
please call 1-800-544-9797.
Arizona
7001 West Ray Road
Chandler, AZ
15445 N. Scottsdale Road
Scottsdale, AZ
California
815 East Birch Street
Brea, CA
1411 Chapin Avenue
Burlingame, CA
851 East Hamilton Avenue
Campbell, CA
19200 Von Karman Avenue
Irvine, CA
601 Larkspur Landing Circle
Larkspur, CA
10100 Santa Monica Blvd.
Los Angeles, CA
27101 Puerta Real
Mission Viejo, CA
73-575 El Paseo
Palm Desert, CA
251 University Avenue
Palo Alto, CA
123 South Lake Avenue
Pasadena, CA
16995 Bernardo Ctr. Drive
Rancho Bernardo, CA
1220 Roseville Parkway
Roseville, CA
1740 Arden Way
Sacramento, CA
7676 Hazard Center Drive
San Diego, CA
11943 El Camino Real
San Diego, CA
8 Montgomery Street
San Francisco, CA
3793 State Street
Santa Barbara, CA
1200 Wilshire Boulevard
Santa Monica, CA
21701 Hawthorne Boulevard
Torrance, CA
2001 North Main Street
Walnut Creek, CA
6300 Canoga Avenue
Woodland Hills, CA
Colorado
1625 Broadway
Denver, CO
9185 Westview Road
Lone Tree, CO
Connecticut
48 West Putnam Avenue
Greenwich, CT
265 Church Street
New Haven, CT
300 Atlantic Street
Stamford, CT
29 South Main Street
West Hartford, CT
Delaware
400 Delaware Avenue
Wilmington, DE
Florida
4400 N. Federal Highway
Boca Raton, FL
121 Alhambra Plaza
Coral Gables, FL
2948 N. Federal Highway
Ft. Lauderdale, FL
4671 Town Center Parkway
Jacksonville, FL
1907 West State Road 434
Longwood, FL
8880 Tamiami Trail, North
Naples, FL
3501 PGA Boulevard
Palm Beach Gardens, FL
3550 Tamiami Trail, South
Sarasota, FL
1502 N. Westshore Blvd.
Tampa, FL
2465 State Road 7
Wellington, FL
Georgia
3445 Peachtree Road, N.E.
Atlanta, GA
1000 Abernathy Road
Atlanta, GA
Illinois
One North LaSalle Street
Chicago, IL
875 North Michigan Ave.
Chicago, IL
1415 West 22nd Street
Oak Brook, IL
1572 East Golf Road
Schaumburg, IL
3232 Lake Avenue
Wilmette, IL
Indiana
4729 East 82nd Street
Indianapolis, IN
Kansas
5400 College Boulevard
Overland Park, KS
Maine
Three Canal Plaza
Portland, ME
Maryland
7315 Wisconsin Avenue
Bethesda, MD
One W. Pennsylvania Ave.
Towson, MD
Massachusetts
801 Boylston Street
Boston, MA
155 Congress Street
Boston, MA
300 Granite Street
Braintree, MA
44 Mall Road
Burlington, MA
238 Main Street
Cambridge, MA
405 Cochituate Road
Framingham, MA
416 Belmont Street
Worcester, MA
Annual Report
Michigan
500 E. Eisenhower Pkwy.
Ann Arbor, MI
280 Old N. Woodward Ave.
Birmingham, MI
43420 Grand River Avenue
Novi, MI
29155 Northwestern Hwy.
Southfield, MI
Minnesota
7600 France Avenue South
Edina, MN
Missouri
1524 South Lindbergh Blvd.
St. Louis, MO
Nevada
2225 Village Walk Drive
Henderson, NV
New Jersey
150 Essex Street
Millburn, NJ
56 South Street
Morristown, NJ
396 Route 17, North
Paramus, NJ
3518 Route 1 North
Princeton, NJ
530 Broad Street
Shrewsbury, NJ
New York
1055 Franklin Avenue
Garden City, NY
37 West Jericho Turnpike
Huntington Station, NY
1271 Avenue of the Americas
New York, NY
980 Madison Avenue
New York, NY
61 Broadway
New York, NY
350 Park Avenue
New York, NY
200 Fifth Avenue
New York, NY
733 Third Avenue
New York, NY
11 Penn Plaza
New York, NY
2070 Broadway
New York, NY
1075 Northern Blvd.
Roslyn, NY
799 Central Park Avenue
Scarsdale, NY
North Carolina
4611 Sharon Road
Charlotte, NC
7011 Fayetteville Road
Durham, NC
Ohio
3805 Edwards Road
Cincinnati, OH
1324 Polaris Parkway
Columbus, OH
28699 Chagrin Boulevard
Woodmere Village, OH
Oregon
7493 SW Bridgeport Road
Tigard, OR
Pennsylvania
600 West DeKalb Pike
King of Prussia, PA
1735 Market Street
Philadelphia, PA
12001 Perry Highway
Wexford, PA
Rhode Island
47 Providence Place
Providence, RI
Tennessee
6150 Poplar Avenue
Memphis, TN
Texas
10000 Research Boulevard
Austin, TX
4001 Northwest Parkway
Dallas, TX
12532 Memorial Drive
Houston, TX
2701 Drexel Drive
Houston, TX
6560 Fannin Street
Houston, TX
6500 N. MacArthur Blvd.
Irving, TX
6005 West Park Boulevard
Plano, TX
14100 San Pedro
San Antonio, TX
1576 East Southlake Blvd.
Southlake, TX
19740 IH 45 North
Spring, TX
Utah
279 West South Temple
Salt Lake City, UT
Virginia
1861 International Drive
McLean, VA
Washington
411 108th Avenue, N.E.
Bellevue, WA
1518 6th Avenue
Seattle, WA
Washington, DC
1900 K Street, N.W.
Washington, DC
Wisconsin
595 North Barker Road
Brookfield, WI
Fidelity Brokerage Services, Inc., 100 Summer St., Boston, MA 02110 Member NYSE/SIPC
Annual Report
Investment Adviser
Fidelity Management & Research Company
Boston, MA
Investment Sub-Advisers
FMR Co., Inc.
Fidelity Management & Research
(U.K.) Inc.
Fidelity Research & Analysis Company
(formerly Fidelity Management &
Research (Far East) Inc.)
Fidelity Investments Japan Limited
Fidelity International Investment
Advisors
Fidelity International Investment
Advisors (U.K.) Limited
General Distributor
Fidelity Distributors Corporation
Boston, MA
Transfer and Service Agent
Fidelity Service Company, Inc.
Boston, MA
Custodian
JPMorgan Chase Bank
New York, NY
The Fidelity Telephone Connection
Mutual Fund 24-Hour Service
Exchanges/Redemptions
and Account Assistance 1-800-544-6666
Product Information 1-800-544-6666
Retirement Accounts 1-800-544-4774
(8 a.m. - 9 p.m.)
TDD Service 1-800-544-0118
for the deaf and hearing impaired
(9 a.m. - 9 p.m. Eastern time)
Fidelity Automated Service
Telephone (FAST®) (automated graphic) 1-800-544-5555
(automated graphic) Automated line for quickest service
GII-UANN-0806
1.787733.103
(Fidelity Investment logo)(registered trademark)
Corporate Headquarters
82 Devonshire St., Boston, MA 02109
www.fidelity.com
Item 2. Code of Ethics
As of the end of the period, June 30, 2006, Fidelity Hastings Street Trust (the trust) has adopted a code of ethics, as defined in Item 2 of Form N-CSR, that applies to its President and Treasurer and its Chief Financial Officer. A copy of the code of ethics is filed as an exhibit to this Form N-CSR.
Item 3. Audit Committee Financial Expert
The Board of Trustees of the trust has determined that Marie L. Knowles is an audit committee financial expert, as defined in Item 3 of Form N-CSR. Ms. Knowles is independent for purposes of Item 3 of Form N-CSR.
Item 4. Principal Accountant Fees and Services
(a) Audit Fees.
For the fiscal years ended June 30, 2006 and June 30, 2005, the aggregate Audit Fees billed by PricewaterhouseCoopers LLP (PwC) for professional services rendered for the audits of the financial statements, or services that are normally provided in connection with statutory and regulatory filings or engagements for those fiscal years, for the Fidelity Discovery Fund, Fidelity Fifty, Fidelity Fund and Fidelity Growth & Income II Portfolio (the funds) and for all funds in the Fidelity Group of Funds are shown in the table below.
Fund | 2006A | 2005A |
Fidelity Discovery Fund | $39,000 | $34,000 |
Fidelity Fifty | $39,000 | $35,000 |
Fidelity Fund | $87,000 | $82,000 |
Fidelity Growth & Income II Portfolio | $38,000 | $33,000 |
All funds in the Fidelity Group of Funds audited by PwC | $12,600,000 | $11,300,000 |
A | Aggregate amounts may reflect rounding. |
(b) Audit-Related Fees.
In each of the fiscal years ended June 30, 2006 and June 30, 2005 the aggregate Audit-Related Fees billed by PwC for services rendered for assurance and related services to each fund that are reasonably related to the performance of the audit or review of the fund's financial statements, but not reported as Audit Fees, are shown in the table below.
Fund | 2006A | 2005A |
Fidelity Discovery Fund | $0 | $0 |
Fidelity Fifty | $0 | $0 |
Fidelity Fund | $0 | $0 |
Fidelity Growth & Income II Portfolio | $0 | $0 |
A | Aggregate amounts may reflect rounding. |
In each of the fiscal years ended June 30, 2006 and June 30, 2005, the aggregate Audit-Related Fees that were billed by PwC that were required to be approved by the Audit Committee for services rendered on behalf of Fidelity Management & Research Company (FMR) and entities controlling, controlled by, or under common control with FMR (not including any sub-adviser whose role is primarily portfolio management and is subcontracted with or overseen by another investment adviser) that provide ongoing services to the funds ("Fund Service Providers") for assurance and related services that relate directly to the operations and financial reporting of each fund that are reasonably related to the performance of the audit or review of the fund's financial statements, but not reported as Audit Fees, are shown in the table below.
Billed By | 2006A | 2005A |
PwC | $0 | $0 |
A | Aggregate amounts may reflect rounding. |
Fees included in the audit-related category comprise assurance and related services (e.g., due diligence services) that are traditionally performed by the independent registered public accounting firm. These audit-related services include due diligence related to mergers and acquisitions, accounting consultations and audits in connection with acquisitions, internal control reviews, attest services that are not required by statute or regulation and consultation concerning financial accounting and reporting standards.
(c) Tax Fees.
In each of the fiscal years ended June 30, 2006 and June 30, 2005, the aggregate Tax Fees billed by PwC for professional services rendered for tax compliance, tax advice, and tax planning for each fund is shown in the table below.
Fund | 2006A | 2005A |
Fidelity Discovery Fund | $2,700 | $2,500 |
Fidelity Fifty | $2,700 | $2,500 |
Fidelity Fund | $3,600 | $3,400 |
Fidelity Growth & Income II Portfolio | $2,700 | $2,500 |
A | Aggregate amounts may reflect rounding. |
In each of the fiscal years ended June 30, 2006 and June 30, 2005, the aggregate Tax Fees billed by PwC that were required to be approved by the Audit Committee for professional services rendered on behalf of the Fund Service Providers for tax compliance, tax advice, and tax planning that relate directly to the operations and financial reporting of each fund is shown in the table below.
Billed By | 2006A | 2005A |
PwC | $0 | $0 |
A | Aggregate amounts may reflect rounding. |
Fees included in the Tax Fees category comprise all services performed by professional staff in the independent registered public accounting firm's tax division except those services related to the audit. Typically, this category would include fees for tax compliance, tax planning, and tax advice. Tax compliance, tax advice, and tax planning services include preparation of original and amended tax returns, claims for refund and tax payment-planning services, assistance with tax audits and appeals, tax advice related to mergers and acquisitions and requests for rulings or technical advice from taxing authorities.
(d) All Other Fees.
In each of the fiscal years ended June 30, 2006 and June 30, 2005, the aggregate Other Fees billed by PwC for all other non-audit services rendered to the funds is shown in the table below.
Fund | 2006A | 2005A |
Fidelity Discovery Fund | $1,700 | $1,800 |
Fidelity Fifty | $2,200 | $2,100 |
Fidelity Fund | $9,800 | $10,600 |
Fidelity Growth & Income II Portfolio | $1,500 | $1,500 |
A | Aggregate amounts may reflect rounding. |
In each of the fiscal years ended June 30, 2006 and June 30, 2005, the aggregate Other Fees billed by PwC that were required to be approved by the Audit Committee for all other non-audit services rendered on behalf of the Fund Service Providers that relate directly to the operations and financial reporting of each fund is shown in the table below.
Billed By | 2006A | 2005A |
PwC | $155,000 | $280,000 |
A | Aggregate amounts may reflect rounding. |
Fees included in the All Other Fees category include services related to internal control reviews, strategy and other consulting, financial information systems design and implementation, consulting on other information systems, and other tax services unrelated to the fund.
(e) (1) | Audit Committee Pre-Approval Policies and Procedures: |
The trust's Audit Committee must pre-approve all audit and non-audit services provided by the independent registered public accounting firm relating to the operations or financial reporting of the funds. Prior to the commencement of any audit or non-audit services to a fund, the Audit Committee reviews the services to determine whether they are appropriate and permissible under applicable law.
The trust's Audit Committee has adopted policies and procedures to, among other purposes, provide a framework for the Committee's consideration of non-audit services by the audit firms that audit the Fidelity funds. The policies and procedures require that any non-audit service provided by a fund audit firm to a Fidelity Fund and any non-audit service provided by a fund auditor to a Fund Service Provider that relates directly to the operations and financial reporting of a Fidelity fund (Covered Service) are subject to approval by the Audit Committee before such service is provided. Non-audit services provided by a fund audit firm for a Fund Service Provider that do not relate directly to the operations and financial reporting of a Fidelity fund (Non-Covered Service) but that are expected to exceed $50,000 are also subject to pre-approval by the Audit Committee.
All Covered Services, as well as Non-Covered Services that are expected to exceed $50,000, must be approved in advance of provision of the service either: (i) by formal resolution of the Audit Committee, or (ii) by oral or written approval of the service by the Chair of the Audit Committee (or if the Chair is unavailable, such other member of the Audit Committee as may be designated by the Chair to act in the Chair's absence). The approval contemplated by (ii) above is permitted where the Treasurer determines that action on such an engagement is necessary before the next meeting of the Audit Committee. Neither pre-approval nor advance notice of Non-Covered Service engagements for which fees are not expected to exceed $50,000 is required; such engagements are to be reported to the Audit Committee monthly.
(e) (2) | Services approved pursuant to paragraph (c)(7)(i)(C) of Rule 2-01 of Regulation S-X: |
Audit-Related Fees:
There were no amounts that were approved by the Audit Committee pursuant to the de minimis exception for the fiscal years ended June 30, 2006 and June 30, 2005 on behalf of each fund.
There were no amounts that were required to be approved by the Audit Committee pursuant to the de minimis exception for the fiscal years ended June 30, 2006 and June 30, 2005 on behalf of the Fund Service Providers that relate directly to the operations and financial reporting of each fund.
Tax Fees:
There were no amounts that were approved by the Audit Committee pursuant to the de minimis exception for the fiscal years ended June 30, 2006 and June 30, 2005 on behalf of each fund.
There were no amounts that were required to be approved by the Audit Committee pursuant to the de minimis exception for the fiscal years ended June 30, 2006 and June 30, 2005 on behalf of the Fund Service Providers that relate directly to the operations and financial reporting of each fund.
All Other Fees:
There were no amounts that were approved by the Audit Committee pursuant to the de minimis exception for the fiscal years ended June 30, 2006 and June 30, 2005 on behalf of each fund.
There were no amounts that were required to be approved by the Audit Committee pursuant to the de minimis exception for the fiscal years ended June 30, 2006 and June 30, 2005 on behalf of the Fund Service Providers that relate directly to the operations and financial reporting of each fund.
(f) Not applicable.
(g) For the fiscal years ended June 30, 2006 and June 30, 2005, the aggregate fees billed by PwC of $1,180,000A and $1,400,000A,B for non-audit services rendered on behalf of the funds, FMR (not including any sub-adviser whose role is primarily portfolio management and is subcontracted with or overseen by another investment adviser) and Fund Service Providers relating to Covered Services and Non-Covered Services are shown in the table below.
| 2006A | 2005A |
Covered Services | $180,000 | $300,000 |
Non-Covered Services | $1,000,000 | $1,100,000B |
A | Aggregate amounts may reflect rounding. |
B | Reflects current period presentation. |
(h) The trust's Audit Committee has considered Non-Covered Services that were not pre-approved that were provided by PwC to Fund Service Providers to be compatible with maintaining the independence of PwC in its audit of the funds, taking into account representations from PwC, in accordance with Independence Standards Board Standard No.1, regarding its independence from the funds and their related entities.
Item 5. Audit Committee of Listed Registrants
Not applicable.
Item 6. Schedule of Investments
Not applicable.
Item 7. Disclosure of Proxy Voting Policies and Procedures for Closed-End Management Investment Companies
Not applicable.
Item 8. Portfolio Managers of Closed-End Management Investment Companies
Not applicable.
Item 9. Purchase of Equity Securities by Closed-End Management Investment Company and Affiliated Purchasers
Not applicable.
Item 10. Submission of Matters to a Vote of Security Holders
There were no material changes to the procedures by which shareholders may recommend nominees to the trust's Board of Trustees.
Item 11. Controls and Procedures
(a)(i) The President and Treasurer and the Chief Financial Officer have concluded that the trust's disclosure controls and procedures (as defined in Rule 30a-3(c) under the Investment Company Act) provide reasonable assurances that material information relating to the trust is made known to them by the appropriate persons, based on their evaluation of these controls and procedures as of a date within 90 days of the filing date of this report.
(a)(ii) There was no change in the trust's internal control over financial reporting (as defined in Rule 30a-3(d) under the Investment Company Act) that occurred during the second fiscal quarter of the period covered by this report that has materially affected, or is reasonably likely to materially affect, the trust's internal control over financial reporting.
Item 12. Exhibits
(a) | (1) | Code of Ethics pursuant to Item 2 of Form N-CSR is filed and attached hereto as EX-99.CODE ETH. |
(a) | (2) | Certification pursuant to Rule 30a-2(a) under the Investment Company Act of 1940 (17 CFR 270.30a-2(a)) is filed and attached hereto as Exhibit 99.CERT. |
(a) | (3) | Not applicable. |
(b) | | Certification pursuant to Rule 30a-2(b) under the Investment Company Act of 1940 (17 CFR 270.30a-2(b)) is furnished and attached hereto as Exhibit 99.906CERT. |
SIGNATURES
Pursuant to the requirements of the Securities Exchange Act of 1934 and the Investment Company Act of 1940, the registrant has duly caused this report to be signed on its behalf by the undersigned, thereunto duly authorized.
Fidelity Hastings Street Trust
By: | /s/Christine Reynolds |
| Christine Reynolds |
| President and Treasurer |
| |
Date: | August 17, 2006 |
Pursuant to the requirements of the Securities Exchange Act of 1934 and the Investment Company Act of 1940, this report has been signed below by the following persons on behalf of the registrant and in the capacities and on the dates indicated.
By: | /s/Christine Reynolds |
| Christine Reynolds |
| President and Treasurer |
| |
Date: | August 17, 2006 |
By: | /s/Joseph B. Hollis |
| Joseph B. Hollis |
| Chief Financial Officer |
| |
Date: | August 17, 2006 |