UNITED STATES
SECURITIES AND EXCHANGE COMMISSION
Washington, D.C. 20549
FORM N-CSR
CERTIFIED SHAREHOLDER REPORT OF REGISTERED
MANAGEMENT INVESTMENT COMPANIES
Investment Company Act file number 811-215
Fidelity Hastings Street Trust
(Exact name of registrant as specified in charter)
245 Summer St., Boston, MA 02210
(Address of principal executive offices) (Zip code)
Marc Bryant, Secretary
245 Summer St.
Boston, Massachusetts 02210
(Name and address of agent for service)
Registrant's telephone number, including area code:
617-563-7000
Date of fiscal year end: | June 30 |
Date of reporting period: | December 31, 2016 |
Item 1.
Reports to Stockholders
Fidelity Advisor® Mega Cap Stock Fund - Semi-Annual Report December 31, 2016 Class A, Class T, Class C, Class I and Class Z are classes of Fidelity® Mega Cap Stock Fund |
 |
Contents
Board Approval of Investment Advisory Contracts and Management Fees |
To view a fund's proxy voting guidelines and proxy voting record for the 12-month period ended June 30, visit http://www.fidelity.com/proxyvotingresults or visit the Securities and Exchange Commission's (SEC) web site at http://www.sec.gov.
You may also call 1-877-208-0098 to request a free copy of the proxy voting guidelines.
Standard & Poor's, S&P and S&P 500 are registered service marks of The McGraw-Hill Companies, Inc. and have been licensed for use by Fidelity Distributors Corporation.
Other third-party marks appearing herein are the property of their respective owners.
All other marks appearing herein are registered or unregistered trademarks or service marks of FMR LLC or an affiliated company. © 2017 FMR LLC. All rights reserved.
This report and the financial statements contained herein are submitted for the general information of the shareholders of the Fund. This report is not authorized for distribution to prospective investors in the Fund unless preceded or accompanied by an effective prospectus.
A fund files its complete schedule of portfolio holdings with the SEC for the first and third quarters of each fiscal year on Form N-Q. Forms N-Q are available on the SEC’s web site at http://www.sec.gov. A fund's Forms N-Q may be reviewed and copied at the SEC’s Public Reference Room in Washington, DC. Information regarding the operation of the SEC's Public Reference Room may be obtained by calling 1-800-SEC-0330.
For a complete list of a fund's portfolio holdings, view the most recent holdings listing, semiannual report, or annual report on Fidelity's web site at http://www.fidelity.com, http://www.institutional.fidelity.com, or http://www.401k.com, as applicable.
NOT FDIC INSURED •MAY LOSE VALUE •NO BANK GUARANTEE
Neither the Fund nor Fidelity Distributors Corporation is a bank.
Investment Summary (Unaudited)
Top Ten Stocks as of December 31, 2016
| % of fund's net assets | % of fund's net assets 6 months ago | |
| JPMorgan Chase & Co.(a) | 4.9 | 3.9 |
| Bank of America Corp.(a) | 4.6 | 2.9 |
| Apple, Inc. | 4.0 | 3.3 |
| Citigroup, Inc.(a) | 3.7 | 2.5 |
| Microsoft Corp. | 3.7 | 3.4 |
| General Electric Co.(a) | 3.2 | 3.6 |
| Chevron Corp. | 2.7 | 2.8 |
| Johnson & Johnson | 2.2 | 2.7 |
| Procter & Gamble Co. | 2.1 | 2.4 |
| Comcast Corp. Class A | 2.1 | 2.0 |
| 33.2 |
(a) Security or a portion of the security is pledged as collateral for call options written.
Top Five Market Sectors as of December 31, 2016
| % of fund's net assets | % of fund's net assets 6 months ago | |
| Financials | 23.3 | 17.4 |
| Information Technology | 20.6 | 23.1 |
| Health Care | 13.0 | 14.4 |
| Energy | 12.7 | 11.5 |
| Industrials | 9.7 | 11.0 |
Prior period industry classifications reflect the categories in place as of the date indicated and have not been adjusted to reflect current industry classifications.
Asset Allocation (% of fund's net assets)
| As of December 31, 2016*,** | ||
| Stocks | 99.5% | |
| Other Investments | 0.2% | |
| Short-Term Investments and Net Other Assets (Liabilities) | 0.3% | |

* Foreign investments - 8.3%
** Written options - (0.5)%
| As of June 30, 2016*,** | ||
| Stocks | 99.9% | |
| Short-Term Investments and Net Other Assets (Liabilities) | 0.1% | |

* Foreign investments - 10.0%
** Written options - (0.0)%
Investments December 31, 2016 (Unaudited)
Showing Percentage of Net Assets
| Common Stocks - 99.5% | |||
| Shares | Value | ||
| CONSUMER DISCRETIONARY - 8.7% | |||
| Automobiles - 0.4% | |||
| General Motors Co. | 396,700 | $13,821,028 | |
| Hotels, Restaurants & Leisure - 0.3% | |||
| Las Vegas Sands Corp. (a) | 112,000 | 5,981,920 | |
| Yum! Brands, Inc. | 86,200 | 5,459,046 | |
| 11,440,966 | |||
| Media - 5.5% | |||
| Comcast Corp. Class A | 1,079,800 | 74,560,190 | |
| The Walt Disney Co. | 355,600 | 37,060,632 | |
| Time Warner, Inc. | 713,700 | 68,893,461 | |
| Viacom, Inc. Class B (non-vtg.) | 423,900 | 14,878,890 | |
| 195,393,173 | |||
| Multiline Retail - 1.3% | |||
| Target Corp. | 645,400 | 46,617,242 | |
| Specialty Retail - 1.2% | |||
| Lowe's Companies, Inc. | 603,900 | 42,949,368 | |
| TOTAL CONSUMER DISCRETIONARY | 310,221,777 | ||
| CONSUMER STAPLES - 7.0% | |||
| Beverages - 2.6% | |||
| Diageo PLC | 548,273 | 14,227,604 | |
| PepsiCo, Inc. | 256,305 | 26,817,192 | |
| The Coca-Cola Co. | 1,206,500 | 50,021,490 | |
| 91,066,286 | |||
| Food & Staples Retailing - 1.7% | |||
| Costco Wholesale Corp. | 67,800 | 10,855,458 | |
| CVS Health Corp. | 412,600 | 32,558,266 | |
| Kroger Co. | 140,200 | 4,838,302 | |
| Walgreens Boots Alliance, Inc. | 157,297 | 13,017,900 | |
| 61,269,926 | |||
| Household Products - 2.1% | |||
| Procter & Gamble Co. | 895,300 | 75,276,824 | |
| Personal Products - 0.1% | |||
| Estee Lauder Companies, Inc. Class A | 27,400 | 2,095,826 | |
| Tobacco - 0.5% | |||
| Altria Group, Inc. | 68,500 | 4,631,970 | |
| Philip Morris International, Inc. | 56,830 | 5,199,377 | |
| Reynolds American, Inc. | 170,100 | 9,532,404 | |
| 19,363,751 | |||
| TOTAL CONSUMER STAPLES | 249,072,613 | ||
| ENERGY - 12.5% | |||
| Energy Equipment & Services - 0.7% | |||
| Baker Hughes, Inc. | 73,500 | 4,775,295 | |
| Schlumberger Ltd. | 243,400 | 20,433,430 | |
| 25,208,725 | |||
| Oil, Gas & Consumable Fuels - 11.8% | |||
| Anadarko Petroleum Corp. | 327,600 | 22,843,548 | |
| Apache Corp. | 603,505 | 38,304,462 | |
| Chevron Corp. | 815,200 | 95,949,040 | |
| ConocoPhillips Co. | 1,418,800 | 71,138,632 | |
| Imperial Oil Ltd. | 782,600 | 27,226,191 | |
| Kinder Morgan, Inc. | 2,149,500 | 44,516,145 | |
| Suncor Energy, Inc. | 1,909,900 | 62,447,108 | |
| The Williams Companies, Inc. | 1,963,100 | 61,130,934 | |
| 423,556,060 | |||
| TOTAL ENERGY | 448,764,785 | ||
| FINANCIALS - 23.3% | |||
| Banks - 18.1% | |||
| Bank of America Corp. (a) | 7,438,400 | 164,388,640 | |
| Citigroup, Inc. (a) | 2,217,770 | 131,802,071 | |
| JPMorgan Chase & Co. (a) | 2,053,200 | 177,170,630 | |
| PNC Financial Services Group, Inc. | 293,900 | 34,374,544 | |
| Standard Chartered PLC (United Kingdom) (b) | 409,062 | 3,345,393 | |
| U.S. Bancorp (a) | 1,247,700 | 64,094,349 | |
| Wells Fargo & Co. | 1,295,530 | 71,396,658 | |
| 646,572,285 | |||
| Capital Markets - 4.2% | |||
| Charles Schwab Corp. (a) | 697,800 | 27,542,166 | |
| Goldman Sachs Group, Inc. | 77,600 | 18,581,320 | |
| Morgan Stanley (a) | 1,113,800 | 47,058,050 | |
| State Street Corp. | 747,900 | 58,126,788 | |
| 151,308,324 | |||
| Insurance - 1.0% | |||
| American International Group, Inc. | 86,500 | 5,649,315 | |
| Marsh & McLennan Companies, Inc. | 235,880 | 15,943,129 | |
| MetLife, Inc. | 278,595 | 15,013,485 | |
| 36,605,929 | |||
| TOTAL FINANCIALS | 834,486,538 | ||
| HEALTH CARE - 13.0% | |||
| Biotechnology - 3.1% | |||
| Alexion Pharmaceuticals, Inc. (b) | 156,600 | 19,160,010 | |
| Amgen, Inc. | 197,490 | 28,875,013 | |
| Biogen, Inc. (b) | 84,700 | 24,019,226 | |
| Gilead Sciences, Inc. | 288,310 | 20,645,879 | |
| Intercept Pharmaceuticals, Inc. (b) | 9,500 | 1,032,175 | |
| Regeneron Pharmaceuticals, Inc. (b) | 19,900 | 7,305,091 | |
| Vertex Pharmaceuticals, Inc. (b) | 133,500 | 9,834,945 | |
| 110,872,339 | |||
| Health Care Equipment & Supplies - 1.8% | |||
| Abbott Laboratories | 545,200 | 20,941,132 | |
| Becton, Dickinson & Co. | 15,100 | 2,499,805 | |
| Boston Scientific Corp. (b) | 419,300 | 9,069,459 | |
| Medtronic PLC | 447,013 | 31,840,736 | |
| 64,351,132 | |||
| Health Care Providers & Services - 1.9% | |||
| Anthem, Inc. | 102,200 | 14,693,294 | |
| Cigna Corp. | 118,700 | 15,833,393 | |
| Express Scripts Holding Co. (b) | 163,262 | 11,230,793 | |
| McKesson Corp. | 192,500 | 27,036,625 | |
| 68,794,105 | |||
| Pharmaceuticals - 6.2% | |||
| Allergan PLC | 57,900 | 12,159,579 | |
| AstraZeneca PLC sponsored ADR | 238,900 | 6,526,748 | |
| Bayer AG | 15,800 | 1,646,098 | |
| Bristol-Myers Squibb Co. | 434,350 | 25,383,414 | |
| GlaxoSmithKline PLC sponsored ADR | 1,322,300 | 50,921,773 | |
| Johnson & Johnson | 674,000 | 77,651,540 | |
| Novartis AG sponsored ADR | 78,800 | 5,739,792 | |
| Sanofi SA | 125,299 | 10,132,324 | |
| Teva Pharmaceutical Industries Ltd. sponsored ADR | 823,600 | 29,855,500 | |
| 220,016,768 | |||
| TOTAL HEALTH CARE | 464,034,344 | ||
| INDUSTRIALS - 9.7% | |||
| Aerospace & Defense - 2.3% | |||
| General Dynamics Corp. | 27,900 | 4,817,214 | |
| The Boeing Co. | 223,300 | 34,763,344 | |
| United Technologies Corp. | 400,300 | 43,880,886 | |
| 83,461,444 | |||
| Air Freight & Logistics - 1.5% | |||
| FedEx Corp. | 87,100 | 16,218,020 | |
| United Parcel Service, Inc. Class B (a) | 322,800 | 37,005,792 | |
| 53,223,812 | |||
| Industrial Conglomerates - 3.2% | |||
| General Electric Co. (a) | 3,635,200 | 114,872,320 | |
| Machinery - 0.5% | |||
| Caterpillar, Inc. | 36,700 | 3,403,558 | |
| Deere & Co. | 139,700 | 14,394,688 | |
| 17,798,246 | |||
| Road & Rail - 2.2% | |||
| CSX Corp. | 868,700 | 31,212,391 | |
| Norfolk Southern Corp. | 148,400 | 16,037,588 | |
| Union Pacific Corp. | 299,190 | 31,020,019 | |
| 78,269,998 | |||
| TOTAL INDUSTRIALS | 347,625,820 | ||
| INFORMATION TECHNOLOGY - 20.6% | |||
| Communications Equipment - 1.7% | |||
| Cisco Systems, Inc. | 2,039,900 | 61,645,778 | |
| Internet Software & Services - 4.2% | |||
| Alphabet, Inc.: | |||
| Class A (b) | 83,250 | 65,971,463 | |
| Class C (b) | 78,026 | 60,222,027 | |
| Facebook, Inc. Class A (b) | 222,400 | 25,587,120 | |
| 151,780,610 | |||
| IT Services - 3.6% | |||
| Cognizant Technology Solutions Corp. Class A (b) | 213,500 | 11,962,405 | |
| First Data Corp. (c) | 695,222 | 9,865,200 | |
| IBM Corp. | 19,197 | 3,186,510 | |
| MasterCard, Inc. Class A (a) | 419,800 | 43,344,350 | |
| PayPal Holdings, Inc. (b) | 244,400 | 9,646,468 | |
| Visa, Inc. Class A | 659,700 | 51,469,794 | |
| 129,474,727 | |||
| Semiconductors & Semiconductor Equipment - 2.1% | |||
| Qualcomm, Inc. (a) | 1,135,800 | 74,054,160 | |
| Software - 5.0% | |||
| Adobe Systems, Inc. (b) | 165,500 | 17,038,225 | |
| Microsoft Corp. | 2,116,900 | 131,544,166 | |
| Oracle Corp. | 558,700 | 21,482,015 | |
| Salesforce.com, Inc. (b) | 100,500 | 6,880,230 | |
| 176,944,636 | |||
| Technology Hardware, Storage & Peripherals - 4.0% | |||
| Apple, Inc. | 1,247,407 | 144,474,679 | |
| TOTAL INFORMATION TECHNOLOGY | 738,374,590 | ||
| MATERIALS - 2.0% | |||
| Chemicals - 2.0% | |||
| E.I. du Pont de Nemours & Co. | 238,500 | 17,505,900 | |
| LyondellBasell Industries NV Class A | 220,000 | 18,871,600 | |
| Monsanto Co. | 307,110 | 32,311,043 | |
| PPG Industries, Inc. | 42,600 | 4,036,776 | |
| 72,725,319 | |||
| REAL ESTATE - 0.4% | |||
| Equity Real Estate Investment Trusts (REITs) - 0.4% | |||
| American Tower Corp. | 57,700 | 6,097,736 | |
| Crown Castle International Corp. | 24,800 | 2,151,896 | |
| Public Storage | 17,400 | 3,888,900 | |
| 12,138,532 | |||
| TELECOMMUNICATION SERVICES - 1.6% | |||
| Diversified Telecommunication Services - 1.6% | |||
| Verizon Communications, Inc. | 1,047,225 | 55,900,871 | |
| UTILITIES - 0.7% | |||
| Electric Utilities - 0.7% | |||
| Exelon Corp. | 738,000 | 26,191,620 | |
| TOTAL COMMON STOCKS | |||
| (Cost $2,652,695,367) | 3,559,536,809 | ||
| Other - 0.2% | |||
| ENERGY - 0.2% | |||
| Oil, Gas and Consumable Fuels - 0.2% | |||
| Utica Shale Drilling Program (non-operating revenue interest) unit (d)(e) | |||
| (Cost $6,161,494) | 6,161,494 | 6,161,494 | |
| Money Market Funds - 0.8% | |||
| Fidelity Cash Central Fund, 0.60% (f) | |||
| (Cost $30,280,323) | 30,274,268 | 30,280,323 | |
| TOTAL INVESTMENT PORTFOLIO - 100.5% | |||
| (Cost $2,689,137,184) | 3,595,978,626 | ||
| NET OTHER ASSETS (LIABILITIES) - (0.5)% | (17,011,348) | ||
| NET ASSETS - 100% | $3,578,967,278 |
| Written Options | ||||
| Expiration Date/Exercise Price | Number of Contracts | Premium | Value | |
| Call Options | ||||
| Bank of America Corp. | 1/20/17 - $18.00 | 7,248 | $173,948 | $(3,007,920) |
| Bank of America Corp. | 1/20/17 - $20.00 | 10,862 | 477,917 | (2,433,088) |
| Charles Schwab | 1/20/17 - $35.00 | 1,269 | 78,042 | (571,050) |
| Citigroup, Inc. | 1/20/17 - $50.00 | 1,911 | 387,924 | (1,820,228) |
| Citigroup, Inc. | 1/20/17 - $55.00 | 1,978 | 87,030 | (944,495) |
| Citigroup, Inc. | 2/17/17 - $60.00 | 1,054 | 125,423 | (223,448) |
| General Electric | 1/20/17 - $32.00 | 3,559 | 110,582 | (133,463) |
| JPMorgan Chase & Co. | 1/20/17 - $70.00 | 3,923 | 564,902 | (6,414,104) |
| JPMorgan Chase & Co. | 1/20/17 - $85.00 | 988 | 50,492 | (230,204) |
| Las Vegas Sands Corp. | 1/20/17 - $62.50 | 396 | 74,450 | (1,782) |
| MasterCard, Inc. | 1/20/17 - $105.00 | 865 | 243,369 | (93,420) |
| Morgan Stanley | 1/20/17 - $36.00 | 1,648 | 75,806 | (1,046,480) |
| Qualcomm, Inc. | 1/20/17 - $67.50 | 1,800 | 214,231 | (88,200) |
| U.S. Bancorp | 1/20/17 - $50.00 | 1,848 | 68,374 | (337,260) |
| UPS | 4/21/17 - $115.00 | 736 | 104,510 | (277,840) |
| TOTAL WRITTEN OPTIONS | $2,837,000 | $(17,622,982) |
Legend
(a) Security or a portion of the security is pledged as collateral for call options written. At period end, the value of securities pledged amounted to $175,707,192.
(b) Non-income producing
(c) Security exempt from registration under Rule 144A of the Securities Act of 1933. These securities may be resold in transactions exempt from registration, normally to qualified institutional buyers. At the end of the period, the value of these securities amounted to $9,865,200 or 0.3% of net assets.
(d) Investment is owned by a wholly-owned subsidiary (Subsidiary) that is treated as a corporation for U.S. tax purposes.
(e) Restricted securities - Investment in securities not registered under the Securities Act of 1933 (excluding 144A issues). At the end of the period, the value of restricted securities (excluding 144A issues) amounted to $6,161,494 or 0.2% of net assets.
(f) Affiliated fund that is generally available only to investment companies and other accounts managed by Fidelity Investments. The rate quoted is the annualized seven-day yield of the fund at period end. A complete unaudited listing of the fund's holdings as of its most recent quarter end is available upon request. In addition, each Fidelity Central Fund's financial statements are available on the SEC's website or upon request.
Additional information on each restricted holding is as follows:
| Security | Acquisition Date | Acquisition Cost |
| Utica Shale Drilling Program (non-operating revenue interest) unit | 10/5/16 - 11/4/16 | $6,161,494 |
Affiliated Central Funds
Information regarding fiscal year to date income earned by the Fund from investments in Fidelity Central Funds is as follows:
| Fund | Income earned |
| Fidelity Cash Central Fund | $37,475 |
| Fidelity Securities Lending Cash Central Fund | 30,341 |
| Total | $67,816 |
Investment Valuation
The following is a summary of the inputs used, as of December 31, 2016, involving the Fund's assets and liabilities carried at fair value. The inputs or methodology used for valuing securities may not be an indication of the risk associated with investing in those securities. For more information on valuation inputs, and their aggregation into the levels used below, please refer to the Investment Valuation section in the accompanying Notes to Financial Statements.
| Valuation Inputs at Reporting Date: | ||||
| Description | Total | Level 1 | Level 2 | Level 3 |
| Investments in Securities: | ||||
| Equities: | ||||
| Consumer Discretionary | $310,221,777 | $310,221,777 | $-- | $-- |
| Consumer Staples | 249,072,613 | 234,845,009 | 14,227,604 | -- |
| Energy | 448,764,785 | 448,764,785 | -- | -- |
| Financials | 834,486,538 | 834,486,538 | -- | -- |
| Health Care | 464,034,344 | 452,255,922 | 11,778,422 | -- |
| Industrials | 347,625,820 | 347,625,820 | -- | -- |
| Information Technology | 738,374,590 | 738,374,590 | -- | -- |
| Materials | 72,725,319 | 72,725,319 | -- | -- |
| Real Estate | 12,138,532 | 12,138,532 | -- | -- |
| Telecommunication Services | 55,900,871 | 55,900,871 | -- | -- |
| Utilities | 26,191,620 | 26,191,620 | -- | -- |
| Other | 6,161,494 | -- | -- | 6,161,494 |
| Money Market Funds | 30,280,323 | 30,280,323 | -- | -- |
| Total Investments in Securities: | $3,595,978,626 | $3,563,811,106 | $26,006,026 | $6,161,494 |
| Derivative Instruments: | ||||
| Liabilities | ||||
| Written Options | $(17,622,982) | $(17,622,982) | $-- | $-- |
| Total Liabilities | $(17,622,982) | $(17,622,982) | $-- | $-- |
| Total Derivative Instruments: | $(17,622,982) | $(17,622,982) | $-- | $-- |
Value of Derivative Instruments
The following table is a summary of the Fund's value of derivative instruments by primary risk exposure as of December 31, 2016. For additional information on derivative instruments, please refer to the Derivative Instruments section in the accompanying Notes to Financial Statements.
| Primary Risk Exposure / Derivative Type | Value | |
| Asset | Liability | |
| Equity Risk | ||
| Written Options(a) | $0 | $(17,622,982) |
| Total Equity Risk | 0 | (17,622,982) |
| Total Value of Derivatives | $0 | $(17,622,982) |
(a) Gross value is presented in the Statement of Assets and Liabilities in the written options, at value line-item.
See accompanying notes which are an integral part of the financial statements.
Financial Statements
Statement of Assets and Liabilities
| December 31, 2016 (Unaudited) | ||
| Assets | ||
| Investment in securities, at value — See accompanying schedule: Unaffiliated issuers (cost $2,658,856,861) | $3,565,698,303 | |
| Fidelity Central Funds (cost $30,280,323) | 30,280,323 | |
| Total Investments (cost $2,689,137,184) | $3,595,978,626 | |
| Receivable for investments sold | 5,458,844 | |
| Receivable for fund shares sold | 2,460,958 | |
| Dividends receivable | 3,929,421 | |
| Distributions receivable from Fidelity Central Funds | 21,918 | |
| Prepaid expenses | 6,712 | |
| Other receivables | 10,180 | |
| Total assets | 3,607,866,659 | |
| Liabilities | ||
| Payable for investments purchased | $6,230,584 | |
| Payable for fund shares redeemed | 2,974,303 | |
| Accrued management fee | 1,335,280 | |
| Distribution and service plan fees payable | 54,286 | |
| Written options, at value (premium received $2,837,000) | 17,622,982 | |
| Other affiliated payables | 634,228 | |
| Other payables and accrued expenses | 47,718 | |
| Total liabilities | 28,899,381 | |
| Net Assets | $3,578,967,278 | |
| Net Assets consist of: | ||
| Paid in capital | $2,701,362,254 | |
| Undistributed net investment income | 165,055 | |
| Accumulated undistributed net realized gain (loss) on investments and foreign currency transactions | (14,590,194) | |
| Net unrealized appreciation (depreciation) on investments and assets and liabilities in foreign currencies | 892,030,163 | |
| Net Assets | $3,578,967,278 | |
| Calculation of Maximum Offering Price | ||
| Class A: | ||
| Net Asset Value and redemption price per share ($70,979,356 ÷ 4,109,286 shares) | $17.27 | |
| Maximum offering price per share (100/94.25 of $17.27) | $18.32 | |
| Class T: | ||
| Net Asset Value and redemption price per share ($28,448,178 ÷ 1,647,103 shares) | $17.27 | |
| Maximum offering price per share (100/96.50 of $17.27) | $17.90 | |
| Class C: | ||
| Net Asset Value and offering price per share ($33,333,643 ÷ 1,952,716 shares)(a) | $17.07 | |
| Mega Cap Stock: | ||
| Net Asset Value, offering price and redemption price per share ($3,295,172,121 ÷ 189,395,269 shares) | $17.40 | |
| Class I: | ||
| Net Asset Value, offering price and redemption price per share ($148,613,602 ÷ 8,532,605 shares) | $17.42 | |
| Class Z: | ||
| Net Asset Value, offering price and redemption price per share ($2,420,378 ÷ 139,525 shares) | $17.35 |
(a) Redemption price per share is equal to net asset value less any applicable contingent deferred sales charge.
See accompanying notes which are an integral part of the financial statements.
Statement of Operations
| Six months ended December 31, 2016 (Unaudited) | ||
| Investment Income | ||
| Dividends | $39,037,131 | |
| Income from Fidelity Central Funds | 67,816 | |
| Total income | 39,104,947 | |
| Expenses | ||
| Management fee | $7,631,902 | |
| Transfer agent fees | 3,265,577 | |
| Distribution and service plan fees | 315,928 | |
| Accounting and security lending fees | 496,325 | |
| Custodian fees and expenses | 33,201 | |
| Independent trustees' fees and expenses | 7,144 | |
| Registration fees | 69,011 | |
| Audit | 28,616 | |
| Legal | 9,423 | |
| Interest | 8,781 | |
| Miscellaneous | 27,255 | |
| Total expenses before reductions | 11,893,163 | |
| Expense reductions | (12,551) | 11,880,612 |
| Net investment income (loss) | 27,224,335 | |
| Realized and Unrealized Gain (Loss) | ||
| Net realized gain (loss) on: | ||
| Investment securities: | ||
| Unaffiliated issuers | 26,188,583 | |
| Fidelity Central Funds | 11,344 | |
| Foreign currency transactions | (13,137) | |
| Written options | 1,291,805 | |
| Total net realized gain (loss) | 27,478,595 | |
| Change in net unrealized appreciation (depreciation) on: Investment securities | 384,293,597 | |
| Assets and liabilities in foreign currencies | (8,350) | |
| Written options | (15,103,865) | |
| Total change in net unrealized appreciation (depreciation) | 369,181,382 | |
| Net gain (loss) | 396,659,977 | |
| Net increase (decrease) in net assets resulting from operations | $423,884,312 |
See accompanying notes which are an integral part of the financial statements.
Statement of Changes in Net Assets
| Six months ended December 31, 2016 (Unaudited) | Year ended June 30, 2016 | |
| Increase (Decrease) in Net Assets | ||
| Operations | ||
| Net investment income (loss) | $27,224,335 | $58,143,372 |
| Net realized gain (loss) | 27,478,595 | 13,718,399 |
| Change in net unrealized appreciation (depreciation) | 369,181,382 | (159,153,365) |
| Net increase (decrease) in net assets resulting from operations | 423,884,312 | (87,291,594) |
| Distributions to shareholders from net investment income | (52,216,180) | (52,372,529) |
| Distributions to shareholders from net realized gain | (17,291,428) | (87,099,408) |
| Total distributions | (69,507,608) | (139,471,937) |
| Share transactions - net increase (decrease) | (112,479,848) | (102,232,897) |
| Total increase (decrease) in net assets | 241,896,856 | (328,996,428) |
| Net Assets | ||
| Beginning of period | 3,337,070,422 | 3,666,066,850 |
| End of period | $3,578,967,278 | $3,337,070,422 |
| Other Information | ||
| Undistributed net investment income end of period | $165,055 | $25,156,900 |
See accompanying notes which are an integral part of the financial statements.
Financial Highlights — Fidelity Mega Cap Stock Fund Class A
| Six months ended (Unaudited) December 31, | Years ended June 30, | |||||
| 2016 | 2016 | 2015 | 2014 | 2013 | 2012 | |
| Selected Per–Share Data | ||||||
| Net asset value, beginning of period | $15.56 | $16.56 | $16.32 | $13.51 | $11.05 | $10.37 |
| Income from Investment Operations | ||||||
| Net investment income (loss)A | .11 | .23 | .18 | .18 | .17 | .13 |
| Net realized and unrealized gain (loss) | 1.90 | (.65) | .71 | 3.00 | 2.43 | .64 |
| Total from investment operations | 2.01 | (.42) | .89 | 3.18 | 2.60 | .77 |
| Distributions from net investment income | (.22) | (.18) | (.17) | (.16) | (.14) | (.09) |
| Distributions from net realized gain | (.09) | (.40) | (.47) | (.21) | – | – |
| Total distributions | (.30)B | (.58) | (.65)C | (.37) | (.14) | (.09) |
| Net asset value, end of period | $17.27 | $15.56 | $16.56 | $16.32 | $13.51 | $11.05 |
| Total ReturnD,E,F | 12.97% | (2.56)% | 5.69% | 23.88% | 23.78% | 7.57% |
| Ratios to Average Net AssetsG,H | ||||||
| Expenses before reductions | .93%I | .95% | 1.05% | .96% | .98% | 1.02% |
| Expenses net of fee waivers, if any | .93%I | .95% | 1.05% | .96% | .98% | 1.02% |
| Expenses net of all reductions | .93%I | .95% | 1.05% | .96% | .98% | 1.02% |
| Net investment income (loss) | 1.36%I | 1.46% | 1.10% | 1.19% | 1.37% | 1.28% |
| Supplemental Data | ||||||
| Net assets, end of period (000 omitted) | $70,979 | $68,801 | $117,385 | $77,335 | $20,336 | $8,527 |
| Portfolio turnover rateJ | 24%I | 25% | 22%K | 28% | 29% | 57% |
A Calculated based on average shares outstanding during the period.
B Total distributions of $.30 per share is comprised of distributions from net investment income of $.218 and distributions from net realized gain of $.085 per share.
C Total distributions of $.65 per share is comprised of distributions from net investment income of $.174 and distributions from net realized gain of $.474 per share.
D Total returns for periods of less than one year are not annualized.
E Total returns would have been lower if certain expenses had not been reduced during the applicable periods shown.
F Total returns do not include the effect of the sales charges.
G Fees and expenses of any underlying Fidelity Central Funds are not included in the Fund's expense ratio. The Fund indirectly bears its proportionate share of the expenses of any underlying Fidelity Central Funds.
H Expense ratios reflect operating expenses of the class. Expenses before reductions do not reflect amounts reimbursed by the investment adviser or reductions from brokerage service arrangements or reductions from other expense offset arrangements and do not represent the amount paid by the class during periods when reimbursements or reductions occur. Expenses net of fee waivers reflect expenses after reimbursement by the investment adviser but prior to reductions from brokerage service arrangements or other expense offset arrangements. Expenses net of all reductions represent the net expenses paid by the class.
I Annualized
J Amount does not include the portfolio activity of any underlying Fidelity Central Funds.
K Portfolio turnover rate excludes securities received or delivered in-kind.
See accompanying notes which are an integral part of the financial statements.
Financial Highlights — Fidelity Mega Cap Stock Fund Class T
| Six months ended (Unaudited) December 31, | Years ended June 30, | |||||
| 2016 | 2016 | 2015 | 2014 | 2013 | 2012 | |
| Selected Per–Share Data | ||||||
| Net asset value, beginning of period | $15.54 | $16.57 | $16.31 | $13.51 | $11.05 | $10.38 |
| Income from Investment Operations | ||||||
| Net investment income (loss)A | .09 | .19 | .16 | .14 | .14 | .10 |
| Net realized and unrealized gain (loss) | 1.90 | (.65) | .70 | 3.00 | 2.43 | .64 |
| Total from investment operations | 1.99 | (.46) | .86 | 3.14 | 2.57 | .74 |
| Distributions from net investment income | (.18) | (.16) | (.13) | (.13) | (.11) | (.07) |
| Distributions from net realized gain | (.09) | (.40) | (.47) | (.21) | – | – |
| Total distributions | (.26)B | (.57)C | (.60) | (.34) | (.11) | (.07) |
| Net asset value, end of period | $17.27 | $15.54 | $16.57 | $16.31 | $13.51 | $11.05 |
| Total ReturnD,E,F | 12.85% | (2.83)% | 5.53% | 23.54% | 23.44% | 7.19% |
| Ratios to Average Net AssetsG,H | ||||||
| Expenses before reductions | 1.20%I | 1.21% | 1.21% | 1.22% | 1.26% | 1.32% |
| Expenses net of fee waivers, if any | 1.20%I | 1.21% | 1.20% | 1.22% | 1.26% | 1.32% |
| Expenses net of all reductions | 1.20%I | 1.20% | 1.20% | 1.22% | 1.26% | 1.32% |
| Net investment income (loss) | 1.10%I | 1.21% | .95% | .92% | 1.09% | .98% |
| Supplemental Data | ||||||
| Net assets, end of period (000 omitted) | $28,448 | $26,145 | $23,231 | $15,728 | $8,377 | $2,293 |
| Portfolio turnover rateJ | 24%I | 25% | 22%K | 28% | 29% | 57% |
A Calculated based on average shares outstanding during the period.
B Total distributions of $.26 per share is comprised of distributions from net investment income of $.178 and distributions from net realized gain of $.085 per share.
C Total distributions of $.57 per share is comprised of distributions from net investment income of $.164 and distributions from net realized gain of $.404 per share.
D Total returns for periods of less than one year are not annualized.
E Total returns would have been lower if certain expenses had not been reduced during the applicable periods shown.
F Total returns do not include the effect of the sales charges.
G Fees and expenses of any underlying Fidelity Central Funds are not included in the Fund's expense ratio. The Fund indirectly bears its proportionate share of the expenses of any underlying Fidelity Central Funds.
H Expense ratios reflect operating expenses of the class. Expenses before reductions do not reflect amounts reimbursed by the investment adviser or reductions from brokerage service arrangements or reductions from other expense offset arrangements and do not represent the amount paid by the class during periods when reimbursements or reductions occur. Expenses net of fee waivers reflect expenses after reimbursement by the investment adviser but prior to reductions from brokerage service arrangements or other expense offset arrangements. Expenses net of all reductions represent the net expenses paid by the class.
I Annualized
J Amount does not include the portfolio activity of any underlying Fidelity Central Funds.
K Portfolio turnover rate excludes securities received or delivered in-kind.
See accompanying notes which are an integral part of the financial statements.
Financial Highlights — Fidelity Mega Cap Stock Fund Class C
| Six months ended (Unaudited) December 31, | Years ended June 30, | |||||
| 2016 | 2016 | 2015 | 2014 | 2013 | 2012 | |
| Selected Per–Share Data | ||||||
| Net asset value, beginning of period | $15.32 | $16.35 | $16.12 | $13.38 | $10.93 | $10.28 |
| Income from Investment Operations | ||||||
| Net investment income (loss)A | .05 | .11 | .07 | .06 | .07 | .05 |
| Net realized and unrealized gain (loss) | 1.88 | (.64) | .71 | 2.97 | 2.42 | .64 |
| Total from investment operations | 1.93 | (.53) | .78 | 3.03 | 2.49 | .69 |
| Distributions from net investment income | (.09) | (.09) | (.08) | (.08) | (.04) | (.04) |
| Distributions from net realized gain | (.09) | (.40) | (.47) | (.21) | – | – |
| Total distributions | (.18) | (.50)B | (.55) | (.29) | (.04) | (.04) |
| Net asset value, end of period | $17.07 | $15.32 | $16.35 | $16.12 | $13.38 | $10.93 |
| Total ReturnC,D,E | 12.60% | (3.32)% | 5.05% | 22.90% | 22.83% | 6.74% |
| Ratios to Average Net AssetsF,G | ||||||
| Expenses before reductions | 1.69%H | 1.70% | 1.70% | 1.71% | 1.75% | 1.79% |
| Expenses net of fee waivers, if any | 1.69%H | 1.70% | 1.70% | 1.71% | 1.75% | 1.79% |
| Expenses net of all reductions | 1.69%H | 1.69% | 1.70% | 1.71% | 1.75% | 1.79% |
| Net investment income (loss) | .60%H | .72% | .45% | .43% | .59% | .51% |
| Supplemental Data | ||||||
| Net assets, end of period (000 omitted) | $33,334 | $31,605 | $34,790 | $16,600 | $7,938 | $2,845 |
| Portfolio turnover rateI | 24%H | 25% | 22%J | 28% | 29% | 57% |
A Calculated based on average shares outstanding during the period.
B Total distributions of $.50 per share is comprised of distributions from net investment income of $.091 and distributions from net realized gain of $.404 per share.
C Total returns for periods of less than one year are not annualized.
D Total returns would have been lower if certain expenses had not been reduced during the applicable periods shown.
E Total returns do not include the effect of the contingent deferred sales charge.
F Fees and expenses of any underlying Fidelity Central Funds are not included in the Fund's expense ratio. The Fund indirectly bears its proportionate share of the expenses of any underlying Fidelity Central Funds.
G Expense ratios reflect operating expenses of the class. Expenses before reductions do not reflect amounts reimbursed by the investment adviser or reductions from brokerage service arrangements or reductions from other expense offset arrangements and do not represent the amount paid by the class during periods when reimbursements or reductions occur. Expenses net of fee waivers reflect expenses after reimbursement by the investment adviser but prior to reductions from brokerage service arrangements or other expense offset arrangements. Expenses net of all reductions represent the net expenses paid by the class.
H Annualized
I Amount does not include the portfolio activity of any underlying Fidelity Central Funds.
J Portfolio turnover rate excludes securities received or delivered in-kind.
See accompanying notes which are an integral part of the financial statements.
Financial Highlights — Fidelity Mega Cap Stock Fund
| Six months ended (Unaudited) December 31, | Years ended June 30, | |||||
| 2016 | 2016 | 2015 | 2014 | 2013 | 2012 | |
| Selected Per–Share Data | ||||||
| Net asset value, beginning of period | $15.68 | $16.72 | $16.44 | $13.60 | $11.11 | $10.43 |
| Income from Investment Operations | ||||||
| Net investment income (loss)A | .14 | .27 | .24 | .22 | .20 | .16 |
| Net realized and unrealized gain (loss) | 1.92 | (.66) | .72 | 3.02 | 2.46 | .64 |
| Total from investment operations | 2.06 | (.39) | .96 | 3.24 | 2.66 | .80 |
| Distributions from net investment income | (.26) | (.25) | (.21) | (.19) | (.17) | (.12) |
| Distributions from net realized gain | (.09) | (.40) | (.47) | (.21) | – | – |
| Total distributions | (.34)B | (.65) | (.68) | (.40) | (.17) | (.12) |
| Net asset value, end of period | $17.40 | $15.68 | $16.72 | $16.44 | $13.60 | $11.11 |
| Total ReturnC,D | 13.20% | (2.36)% | 6.13% | 24.18% | 24.17% | 7.83% |
| Ratios to Average Net AssetsE,F | ||||||
| Expenses before reductions | .68%G | .69% | .67% | .68% | .70% | .76% |
| Expenses net of fee waivers, if any | .68%G | .69% | .67% | .68% | .70% | .76% |
| Expenses net of all reductions | .68%G | .68% | .67% | .68% | .70% | .75% |
| Net investment income (loss) | 1.61%G | 1.73% | 1.48% | 1.47% | 1.64% | 1.55% |
| Supplemental Data | ||||||
| Net assets, end of period (000 omitted) | $3,295,172 | $3,059,691 | $3,300,700 | $2,860,197 | $2,214,592 | $1,287,144 |
| Portfolio turnover rateH | 24%G | 25% | 22%I | 28% | 29% | 57% |
A Calculated based on average shares outstanding during the period.
B Total distributions of $.34 per share is comprised of distributions from net investment income of $.258 and distributions from net realized gain of $.085 per share.
C Total returns for periods of less than one year are not annualized.
D Total returns would have been lower if certain expenses had not been reduced during the applicable periods shown.
E Fees and expenses of any underlying Fidelity Central Funds are not included in the Fund's expense ratio. The Fund indirectly bears its proportionate share of the expenses of any underlying Fidelity Central Funds.
F Expense ratios reflect operating expenses of the class. Expenses before reductions do not reflect amounts reimbursed by the investment adviser or reductions from brokerage service arrangements or reductions from other expense offset arrangements and do not represent the amount paid by the class during periods when reimbursements or reductions occur. Expenses net of fee waivers reflect expenses after reimbursement by the investment adviser but prior to reductions from brokerage service arrangements or other expense offset arrangements. Expenses net of all reductions represent the net expenses paid by the class.
G Annualized
H Amount does not include the portfolio activity of any underlying Fidelity Central Funds.
I Portfolio turnover rate excludes securities received or delivered in-kind.
See accompanying notes which are an integral part of the financial statements.
Financial Highlights — Fidelity Mega Cap Stock Fund Class I
| Six months ended (Unaudited) December 31, | Years ended June 30, | |||||
| 2016 | 2016 | 2015 | 2014 | 2013 | 2012 | |
| Selected Per–Share Data | ||||||
| Net asset value, beginning of period | $15.70 | $16.73 | $16.39 | $13.55 | $11.08 | $10.40 |
| Income from Investment Operations | ||||||
| Net investment income (loss)A | .14 | .27 | .24 | .22 | .20 | .16 |
| Net realized and unrealized gain (loss) | 1.92 | (.65) | .72 | 3.02 | 2.44 | .63 |
| Total from investment operations | 2.06 | (.38) | .96 | 3.24 | 2.64 | .79 |
| Distributions from net investment income | (.26) | (.24) | (.15) | (.18) | (.17) | (.11) |
| Distributions from net realized gain | (.09) | (.40) | (.47) | (.21) | – | – |
| Total distributions | (.34)B | (.65)C | (.62) | (.40)D | (.17) | (.11) |
| Net asset value, end of period | $17.42 | $15.70 | $16.73 | $16.39 | $13.55 | $11.08 |
| Total ReturnE,F | 13.17% | (2.31)% | 6.11% | 24.23% | 24.06% | 7.77% |
| Ratios to Average Net AssetsG,H | ||||||
| Expenses before reductions | .67%I | .68% | .69% | .71% | .74% | .78% |
| Expenses net of fee waivers, if any | .67%I | .68% | .68% | .71% | .74% | .78% |
| Expenses net of all reductions | .67%I | .68% | .68% | .71% | .74% | .77% |
| Net investment income (loss) | 1.62%I | 1.73% | 1.47% | 1.43% | 1.61% | 1.53% |
| Supplemental Data | ||||||
| Net assets, end of period (000 omitted) | $148,614 | $148,414 | $186,637 | $674,416 | $312,814 | $175,833 |
| Portfolio turnover rateJ | 24%I | 25% | 22%K | 28% | 29% | 57% |
A Calculated based on average shares outstanding during the period.
B Total distributions of $.34 per share is comprised of distributions from net investment income of $.257 and distributions from net realized gain of $.085 per share.
C Total distributions of $.65 per share is comprised of distributions from net investment income of $.244 and distributions from net realized gain of $.404 per share.
D Total distributions of $.40 per share is comprised of distributions from net investment income of $.182 and distributions from net realized gain of $.213 per share.
E Total returns for periods of less than one year are not annualized.
F Total returns would have been lower if certain expenses had not been reduced during the applicable periods shown.
G Fees and expenses of any underlying Fidelity Central Funds are not included in the Fund's expense ratio. The Fund indirectly bears its proportionate share of the expenses of any underlying Fidelity Central Funds.
H Expense ratios reflect operating expenses of the class. Expenses before reductions do not reflect amounts reimbursed by the investment adviser or reductions from brokerage service arrangements or reductions from other expense offset arrangements and do not represent the amount paid by the class during periods when reimbursements or reductions occur. Expenses net of fee waivers reflect expenses after reimbursement by the investment adviser but prior to reductions from brokerage service arrangements or other expense offset arrangements. Expenses net of all reductions represent the net expenses paid by the class.
I Annualized
J Amount does not include the portfolio activity of any underlying Fidelity Central Funds.
K Portfolio turnover rate excludes securities received or delivered in-kind.
See accompanying notes which are an integral part of the financial statements.
Financial Highlights — Fidelity Mega Cap Stock Fund Class Z
| Six months ended (Unaudited) December 31, | Years ended June 30, | |||
| 2016 | 2016 | 2015 | 2014 A | |
| Selected Per–Share Data | ||||
| Net asset value, beginning of period | $15.65 | $16.69 | $16.40 | $14.31 |
| Income from Investment Operations | ||||
| Net investment income (loss)B | .15 | .29 | .27 | .21 |
| Net realized and unrealized gain (loss) | 1.92 | (.66) | .72 | 2.20 |
| Total from investment operations | 2.07 | (.37) | .99 | 2.41 |
| Distributions from net investment income | (.28) | (.27) | (.23) | (.10) |
| Distributions from net realized gain | (.09) | (.40) | (.47) | (.21) |
| Total distributions | (.37) | (.67) | (.70) | (.32)C |
| Net asset value, end of period | $17.35 | $15.65 | $16.69 | $16.40 |
| Total ReturnD,E | 13.26% | (2.21)% | 6.33% | 17.06% |
| Ratios to Average Net AssetsF,G | ||||
| Expenses before reductions | .53%H | .54% | .54% | .54%H |
| Expenses net of fee waivers, if any | .53%H | .54% | .54% | .54%H |
| Expenses net of all reductions | .53%H | .53% | .54% | .54%H |
| Net investment income (loss) | 1.76%H | 1.88% | 1.61% | 1.59%H |
| Supplemental Data | ||||
| Net assets, end of period (000 omitted) | $2,420 | $2,414 | $2,449 | $117 |
| Portfolio turnover rateI | 24%H | 25% | 22%J | 28% |
A For the period August 13, 2013 (commencement of sale of shares) to June 30, 2014.
B Calculated based on average shares outstanding during the period.
C Total distributions of $.32 per share is comprised of distributions from net investment income of $.104 and distributions from net realized gain of $.213 per share.
D Total returns for periods of less than one year are not annualized.
E Total returns would have been lower if certain expenses had not been reduced during the applicable periods shown.
F Fees and expenses of any underlying Fidelity Central Funds are not included in the Fund's expense ratio. The Fund indirectly bears its proportionate share of the expenses of any underlying Fidelity Central Funds.
G Expense ratios reflect operating expenses of the class. Expenses before reductions do not reflect amounts reimbursed by the investment adviser or reductions from brokerage service arrangements or reductions from other expense offset arrangements and do not represent the amount paid by the class during periods when reimbursements or reductions occur. Expense ratios before reductions for start-up periods may not be representative of longer-term operating periods. Expenses net of fee waivers reflect expenses after reimbursement by the investment adviser but prior to reductions from brokerage service arrangements or other expense offset arrangements. Expenses net of all reductions represent the net expenses paid by the class.
H Annualized
I Amount does not include the portfolio activity of any underlying Fidelity Central Funds.
J Portfolio turnover rate excludes securities received or delivered in-kind.
See accompanying notes which are an integral part of the financial statements.
Notes to Financial Statements (Unaudited)
For the period ended December 31, 2016
1. Organization.
Fidelity Mega Cap Stock Fund (the Fund) is a fund of Fidelity Hastings Street Trust (the Trust) and is authorized to issue an unlimited number of shares. The Trust is registered under the Investment Company Act of 1940, as amended (the 1940 Act), as an open-end management investment company organized as a Massachusetts business trust. The Fund offers Class A, Class T, Class C, Mega Cap Stock, Class I and Class Z shares, each of which has equal rights as to assets and voting privileges. Each class has exclusive voting rights with respect to matters that affect that class.
After the close of business on June 24, 2016, all outstanding Class B shares were converted to Class A shares. All prior fiscal period dollar and share amounts for Class B presented in the Notes to Financial Statements are for the period July 1, 2015 through June 24, 2016.
2. Investments in Fidelity Central Funds.
The Fund invests in Fidelity Central Funds, which are open-end investment companies generally available only to other investment companies and accounts managed by the investment adviser and its affiliates. The Fund's Schedule of Investments lists each of the Fidelity Central Funds held as of period end, if any, as an investment of the Fund, but does not include the underlying holdings of each Fidelity Central Fund. As an Investing Fund, the Fund indirectly bears its proportionate share of the expenses of the underlying Fidelity Central Funds.
The Money Market Central Funds seek preservation of capital and current income and are managed by Fidelity Investments Money Management, Inc. (FIMM), an affiliate of the investment adviser. Annualized expenses of the Money Market Central Funds as of their most recent shareholder report date are less than .005%.
A complete unaudited list of holdings for each Fidelity Central Fund is available upon request or at the Securities and Exchange Commission (the SEC) website at www.sec.gov. In addition, the financial statements of the Fidelity Central Funds are available on the SEC website or upon request.
3. Significant Accounting Policies.
The financial statements have been prepared in conformity with accounting principles generally accepted in the United States of America (GAAP), which require management to make certain estimates and assumptions at the date of the financial statements. Actual results could differ from those estimates. Subsequent events, if any, through the date that the financial statements were issued have been evaluated in the preparation of the financial statements. The following summarizes the significant accounting policies of the Fund:
Investment Valuation. Investments are valued as of 4:00 p.m. Eastern time on the last calendar day of the period. The Board of Trustees (the Board) has delegated the day to day responsibility for the valuation of the Fund's investments to the Fair Value Committee (the Committee) established by the Fund's investment adviser. In accordance with valuation policies and procedures approved by the Board, the Fund attempts to obtain prices from one or more third party pricing vendors or brokers to value its investments. When current market prices, quotations or currency exchange rates are not readily available or reliable, investments will be fair valued in good faith by the Committee, in accordance with procedures adopted by the Board. Factors used in determining fair value vary by investment type and may include market or investment specific events. The frequency with which these procedures are used cannot be predicted and they may be utilized to a significant extent. The Committee oversees the Fund's valuation policies and procedures and reports to the Board on the Committee's activities and fair value determinations. The Board monitors the appropriateness of the procedures used in valuing the Fund's investments and ratifies the fair value determinations of the Committee.
The Fund categorizes the inputs to valuation techniques used to value its investments into a disclosure hierarchy consisting of three levels as shown below:
- Level 1 – quoted prices in active markets for identical investments
- Level 2 – other significant observable inputs (including quoted prices for similar investments, interest rates, prepayment speeds, etc.)
- Level 3 – unobservable inputs (including the Fund's own assumptions based on the best information available)
Valuation techniques used to value the Fund's investments by major category are as follows:
Equity securities, including restricted securities, for which market quotations are readily available, are valued at the last reported sale price or official closing price as reported by a third party pricing vendor on the primary market or exchange on which they are traded and are categorized as Level 1 in the hierarchy. In the event there were no sales during the day or closing prices are not available, securities are valued at the last quoted bid price or may be valued using the last available price and are generally categorized as Level 2 in the hierarchy. For foreign equity securities, when market or security specific events arise, comparisons to the valuation of American Depositary Receipts (ADRs), futures contracts, Exchange-Traded Funds (ETFs) and certain indexes as well as quoted prices for similar securities may be used and would be categorized as Level 2 in the hierarchy. Utilizing these techniques may result in transfers between Level 1 and Level 2. For equity securities, including restricted securities, where observable inputs are limited, assumptions about market activity and risk are used and these securities may be categorized as Level 3 in the hierarchy.
Exchange-traded options are valued using the last sale price or, in the absence of a sale, the last offering price and are categorized as Level 1 in the hierarchy. Investments in open-end mutual funds, including the Fidelity Central Funds, are valued at their closing net asset value (NAV) each business day and are categorized as Level 1 in the hierarchy.
Changes in valuation techniques may result in transfers in or out of an assigned level within the disclosure hierarchy. The aggregate value of investments by input level as of December 31, 2016 is included at the end of the Fund's Schedule of Investments.
Foreign Currency. The Fund may use foreign currency contracts to facilitate transactions in foreign-denominated securities. Gains and losses from these transactions may arise from changes in the value of the foreign currency or if the counterparties do not perform under the contracts' terms.
Foreign-denominated assets, including investment securities, and liabilities are translated into U.S. dollars at the exchange rates at period end. Purchases and sales of investment securities, income and dividends received and expenses denominated in foreign currencies are translated into U.S. dollars at the exchange rate in effect on the transaction date.
The effects of exchange rate fluctuations on investments are included with the net realized and unrealized gain (loss) on investment securities. Other foreign currency transactions resulting in realized and unrealized gain (loss) are disclosed separately.
Investment Transactions and Income. For financial reporting purposes, the Fund's investment holdings and NAV include trades executed through the end of the last business day of the period. The NAV per share for processing shareholder transactions is calculated as of the close of business of the New York Stock Exchange (NYSE), normally 4:00 p.m. Eastern time and includes trades executed through the end of the prior business day. Gains and losses on securities sold are determined on the basis of identified cost and may include proceeds received from litigation. Dividend income is recorded on the ex-dividend date, except for certain dividends from foreign securities where the ex-dividend date may have passed, which are recorded as soon as the Fund is informed of the ex-dividend date. Non-cash dividends included in dividend income, if any, are recorded at the fair market value of the securities received. Income and capital gain distributions from Fidelity Central Funds, if any, are recorded on the ex-dividend date. Certain distributions received by the Fund represent a return of capital or capital gain. The Fund determines the components of these distributions subsequent to the ex-dividend date, based upon receipt of tax filings or other correspondence relating to the underlying investment. These distributions are recorded as a reduction of cost of investments and/or as a realized gain. Investment income is recorded net of foreign taxes withheld where recovery of such taxes is uncertain.
Class Allocations and Expenses. Investment income, realized and unrealized capital gains and losses, common expenses of the Fund, and certain fund-level expense reductions, if any, are allocated daily on a pro-rata basis to each class based on the relative net assets of each class to the total net assets of the Fund. Each class differs with respect to transfer agent and distribution and service plan fees incurred. Certain expense reductions may also differ by class. For the reporting period, the allocated portion of income and expenses to each class as a percent of its average net assets may vary due to the timing of recording these transactions in relation to fluctuating net assets of the classes. Expenses directly attributable to a fund are charged to that fund. Expenses attributable to more than one fund are allocated among the respective funds on the basis of relative net assets or other appropriate methods. Expense estimates are accrued in the period to which they relate and adjustments are made when actual amounts are known.
Income Tax Information and Distributions to Shareholders. Each year, the Fund intends to qualify as a regulated investment company under Subchapter M of the Internal Revenue Code, including distributing substantially all of its taxable income and realized gains. As a result, no provision for U.S. Federal income taxes is required. The Fund files a U.S. federal tax return, in addition to state and local tax returns as required. The Fund's federal income tax returns are subject to examination by the Internal Revenue Service (IRS) for a period of three fiscal years after they are filed. State and local tax returns may be subject to examination for an additional fiscal year depending on the jurisdiction. Foreign taxes are provided for based on the Fund's understanding of the tax rules and rates that exist in the foreign markets in which it invests.
Distributions are declared and recorded on the ex-dividend date. Income dividends and capital gain distributions are declared separately for each class. Income and capital gain distributions are determined in accordance with income tax regulations, which may differ from GAAP.
Capital accounts within the financial statements are adjusted for permanent book-tax differences. These adjustments have no impact on net assets or the results of operations. Capital accounts are not adjusted for temporary book-tax differences which will reverse in a subsequent period.
Book-tax differences are primarily due to foreign currency transactions, partnerships, and losses deferred due to wash sales and excise tax regulations.
The federal tax cost of investment securities and unrealized appreciation (depreciation) as of period end were as follows:
| Gross unrealized appreciation | $980,402,667 |
| Gross unrealized depreciation | (90,721,388) |
| Net unrealized appreciation (depreciation) on securities | $889,681,279 |
| Tax cost | $2,706,297,347 |
The Fund elected to defer to its next fiscal year approximately $4,177,604 of capital losses recognized during the period November 1, 2015 to June 30, 2016.
Restricted Securities. The Fund may invest in securities that are subject to legal or contractual restrictions on resale. These securities generally may be resold in transactions exempt from registration or to the public if the securities are registered. Disposal of these securities may involve time-consuming negotiations and expense, and prompt sale at an acceptable price may be difficult. Information regarding restricted securities is included at the end of the Fund's Schedule of Investments.
Consolidated Subsidiary. The Fund invests in certain investments through a wholly-owned subsidiary ("Subsidiary"), which may be subject to federal and state taxes upon disposition.
As of period end, the Fund held an investment of $6,161,494 in this Subsidiary, representing .17% of the Fund's net assets. The financial statements have been consolidated and include accounts of the Fund and each Subsidiary. Accordingly, all inter-company transactions and balances have been eliminated.
4. Derivative Instruments.
Risk Exposures and the Use of Derivative Instruments. The Fund's investment objective allows the Fund to enter into various types of derivative contracts, including options. Derivatives are investments whose value is primarily derived from underlying assets, indices or reference rates and may be transacted on an exchange or over-the-counter (OTC). Derivatives may involve a future commitment to buy or sell a specified asset based on specified terms, to exchange future cash flows at periodic intervals based on a notional principal amount, or for one party to make one or more payments upon the occurrence of specified events in exchange for periodic payments from the other party.
The Fund used derivatives to increase returns and to manage exposure to certain risks as defined below. The success of any strategy involving derivatives depends on analysis of numerous economic factors, and if the strategies for investment do not work as intended, the Fund may not achieve its objectives.
The Fund's use of derivatives increased or decreased its exposure to the following risk:
| Equity Risk | Equity risk relates to the fluctuations in the value of financial instruments as a result of changes in market prices (other than those arising from interest rate risk or foreign exchange risk), whether caused by factors specific to an individual investment, its issuer, or all factors affecting all instruments traded in a market or market segment. |
The Fund is also exposed to additional risks from investing in derivatives, such as liquidity risk and counterparty credit risk. Liquidity risk is the risk that the Fund will be unable to close out the derivative in the open market in a timely manner. Counterparty credit risk is the risk that the counterparty will not be able to fulfill its obligation to the Fund. Counterparty credit risk related to exchange-traded options may be mitigated by the protection provided by the exchange on which they trade.
Investing in derivatives may involve greater risks than investing in the underlying assets directly and, to varying degrees, may involve risk of loss in excess of any initial investment and collateral received and amounts recognized in the Statement of Assets and Liabilities. In addition, there may be the risk that the change in value of the derivative contract does not correspond to the change in value of the underlying instrument.
Options. Options give the purchaser the right, but not the obligation, to buy (call) or sell (put) an underlying security or financial instrument at an agreed exercise or strike price between or on certain dates. Options obligate the seller (writer) to buy (put) or sell (call) an underlying instrument at the exercise or strike price or cash settle an underlying derivative instrument if the holder exercises the option on or before the expiration date.
The Fund used exchange-traded written covered call options to manage its exposure to the market. When the Fund writes a covered call option, the Fund holds the underlying instrument which must be delivered to the holder upon the exercise of the option.
Upon entering into a written options contract, the Fund will receive a premium. Premiums received are reflected as a liability on the Statement of Assets and Liabilities. Options are valued daily and any unrealized appreciation (depreciation) is reflected on the Statement of Assets and Liabilities. When a written option is exercised, the premium is added to the proceeds from the sale of the underlying instrument in determining the gain or loss realized on that investment. When an option is closed the Fund will realize a gain or loss depending on whether the proceeds or amount paid for the closing sale transaction are greater or less than the premium received. When an option expires, gains and losses are realized to the extent of premiums received. The net realized gain (loss) on closed and expired written options and the change in net unrealized appreciation (depreciation) on written options are reflected separately on the Statement of Operations.
Writing call options tends to decrease exposure to the underlying instrument and risk of loss is the change in value in excess of the premium received.
Any open options at period end are presented in the Schedule of Investments under the caption "Written Options".
During the period, the Fund recognized net realized gain (loss) of $1,291,805 and a change in net unrealized appreciation (depreciation) of $(15,103,865) related to its investment in written options. This amount is included in the Statement of Operations.
The following is a summary of the Fund's written options activity:
| Number of Contracts | Amount of Premiums | |
| Outstanding at beginning of period | 10,200 | $772,283 |
| Options Opened | 54,905 | 3,970,163 |
| Options Exercised | (701) | (86,893) |
| Options Closed | (16,288) | (1,266,553) |
| Options Expired | (8,031) | (552,000) |
| Outstanding at end of period | 40,085 | $2,837,000 |
5. Purchases and Sales of Investments.
Purchases and sales of securities, other than short-term securities, aggregated $414,759,197 and $592,869,000, respectively.
6. Fees and Other Transactions with Affiliates.
Management Fee. Fidelity Management & Research Company (the investment adviser) and its affiliates provide the Fund with investment management related services for which the Fund pays a monthly management fee. The management fee is the sum of an individual fund fee rate that is based on an annual rate of .20% of the Fund's average net assets and an annualized group fee rate that averaged .25% during the period. The group fee rate is based upon the average net assets of all the mutual funds advised by the investment adviser, including any mutual funds previously advised by the investment adviser that are currently advised by Fidelity SelectCo, LLC, an affiliate of the investment adviser. The group fee rate decreases as assets under management increase and increases as assets under management decrease. For the reporting period, the total annualized management fee rate was .45% of the Fund's average net assets.
Distribution and Service Plan Fees. In accordance with Rule 12b-1 of the 1940 Act, the Fund has adopted separate Distribution and Service Plans for each class of shares. Certain classes pay Fidelity Distributors Corporation (FDC), an affiliate of the investment adviser, separate Distribution and Service Fees, each of which is based on an annual percentage of each class' average net assets. In addition, FDC may pay financial intermediaries for selling shares of the Fund and providing shareholder support services. For the period, the Distribution and Service Fee rates, total fees and amounts retained by FDC were as follows:
| Distribution Fee | Service Fee | Total Fees | Retained by FDC | |
| Class A | -% | .25% | $85,923 | $393 |
| Class T | .25% | .25% | 68,164 | – |
| Class C | .75% | .25% | 161,841 | 20,348 |
| $315,928 | $20,741 |
Sales Load. FDC may receive a front-end sales charge of up to 5.75% for selling Class A shares and 3.50% for selling Class T shares, some of which is paid to financial intermediaries for selling shares of the Fund. Depending on the holding period, FDC may receive contingent deferred sales charges levied on Class A, Class T and Class C redemptions. The deferred sales charges are 1.00% for Class C shares, 1.00% for certain purchases of Class A shares and .25% for certain purchases of Class T shares.
For the period, sales charge amounts retained by FDC were as follows:
| Retained by FDC | |
| Class A | $14,790 |
| Class T | 1,554 |
| Class C(a) | 1,379 |
| $17,723 |
(a) When Class C shares are initially sold, FDC pays commissions from its own resources to financial intermediaries through which the sales are made.
Transfer Agent Fees. Fidelity Investments Institutional Operations Company, Inc., (FIIOC), an affiliate of the investment adviser, is the transfer, dividend disbursing and shareholder servicing agent for each class of the Fund. FIIOC receives account fees and asset-based fees that vary according to the account size and type of account of the shareholders of the respective classes of the Fund, except for Class Z. FIIOC receives an asset-based fee of Class Z's average net assets. FIIOC pays for typesetting, printing and mailing of shareholder reports, except proxy statements.
For the period, transfer agent fees for each class were as follows:
| Amount | % of Class-Level Average Net Assets(a) | |
| Class A | $67,318 | .20 |
| Class T | 28,685 | .21 |
| Class C | 33,107 | .20 |
| Mega Cap Stock | 2,998,027 | .19 |
| Class I | 137,880 | .19 |
| Class Z | 560 | .05 |
| $3,265,577 |
(a) Annualized
Accounting and Security Lending Fees. Fidelity Service Company, Inc. (FSC), an affiliate of the investment adviser, maintains the Fund's accounting records. The accounting fee is based on the level of average net assets for each month. Under a separate contract, FSC administers the security lending program. The security lending fee is based on the number and duration of lending transactions.
Brokerage Commissions. The Fund placed a portion of its portfolio transactions with brokerage firms which are affiliates of the investment adviser. Brokerage commissions are included in net realized gain (loss) and change in net unrealized appreciation (depreciation) in the Statement of Operations. The commissions paid to these affiliated firms were $12,138 for the period.
Interfund Lending Program. Pursuant to an Exemptive Order issued by the SEC, the Fund, along with other registered investment companies having management contracts with FMR or other affiliated entities of FMR, may participate in an interfund lending program. This program provides an alternative credit facility allowing the funds to borrow from, or lend money to, other participating affiliated funds. At period end, there were no interfund loans outstanding. The Fund's activity in this program during the period for which loans were outstanding was as follows:
| Borrower or Lender | Average Loan Balance | Weighted Average Interest Rate | Interest Expense |
| Borrower | $23,142,130 | .59% | $8,781 |
Interfund Trades. The Fund may purchase from or sell securities to other Fidelity Funds under procedures adopted by the Board. The procedures have been designed to ensure these interfund trades are executed in accordance with Rule 17a-7 of the 1940 Act. Interfund trades are included within the respective purchases and sales amounts shown in the Purchases and Sales of Investments note.
7. Committed Line of Credit.
The Fund participates with other funds managed by the investment adviser or an affiliate in a $4.25 billion credit facility (the "line of credit") to be utilized for temporary or emergency purposes to fund shareholder redemptions or for other short-term liquidity purposes. The Fund has agreed to pay commitment fees on its pro-rata portion of the line of credit, which amounted to $5,587 and is reflected in Miscellaneous expenses on the Statement of Operations. During the period, the Fund did not borrow on this line of credit.
8. Security Lending.
The Fund lends portfolio securities through a lending agent from time to time in order to earn additional income. For equity securities, a lending agent is used and may loan securities to certain qualified borrowers, including Fidelity Capital Markets (FCM), a broker-dealer affiliated with the Fund. On the settlement date of the loan, the Fund receives collateral (in the form of U.S. Treasury obligations, letters of credit and/or cash) against the loaned securities and maintains collateral in an amount not less than 100% of the market value of the loaned securities during the period of the loan. The market value of the loaned securities is determined at the close of business of the Fund and any additional required collateral is delivered to the Fund on the next business day. The Fund or borrower may terminate the loan at any time, and if the borrower defaults on its obligation to return the securities loaned because of insolvency or other reasons, the Fund may apply collateral received from the borrower against the obligation. The Fund may experience delays and costs in recovering the securities loaned. Any cash collateral received is invested in the Fidelity Securities Lending Cash Central Fund. At period end, there were no security loans outstanding. Security lending income represents the income earned on investing cash collateral, less rebates paid to borrowers and any lending agent fees associated with the loan, plus any premium payments received for lending certain types of securities. Security lending income is presented in the Statement of Operations as a component of income from Fidelity Central Funds. Total security lending income during the period amounted to $30,341. During the period, there were no securities loaned to FCM.
9. Expense Reductions.
During the period the investment advisor reimbursed and/or waived a portion of fund-level operating expenses in the amount of $12,551.
10. Distributions to Shareholders.
Distributions to shareholders of each class were as follows:
| Six months ended December 31, 2016 | Year ended June 30, 2016 | |
| From net investment income | ||
| Class A | $899,152 | $1,080,757 |
| Class T | 291,258 | 237,487 |
| Class B | – | 2,701 |
| Class C | 185,400 | 200,810 |
| Mega Cap Stock | 48,569,058 | 48,178,641 |
| Class I | 2,230,910 | 2,632,093 |
| Class Z | 40,402 | 40,040 |
| Total | $52,216,180 | $52,372,529 |
| From net realized gain | ||
| Class A | $344,294 | $2,557,147 |
| Class T | 137,942 | 579,808 |
| Class B | – | 19,784 |
| Class C | 163,372 | 882,477 |
| Mega Cap Stock | 15,922,546 | 78,620,158 |
| Class I | 711,666 | 4,380,245 |
| Class Z | 11,608 | 59,789 |
| Total | $17,291,428 | $87,099,408 |
11. Share Transactions.
Share transactions for each class were as follows and may contain automatic conversions between classes or exchanges between affiliated funds:
| Shares | Shares | Dollars | Dollars | |
| Six months ended December 31, 2016 | Year ended June 30, 2016 | Six months ended December 31, 2016 | Year ended June 30, 2016 | |
| Class A | ||||
| Shares sold | 521,589 | 2,249,513 | $8,775,422 | $35,033,810 |
| Reinvestment of distributions | 70,690 | 222,669 | 1,204,586 | 3,545,701 |
| Shares redeemed | (905,790) | (5,136,376) | (14,974,471) | (81,329,239) |
| Net increase (decrease) | (313,511) | (2,664,194) | $(4,994,463) | $(42,749,728) |
| Class T | ||||
| Shares sold | 222,411 | 686,666 | $3,694,556 | $10,511,335 |
| Reinvestment of distributions | 24,971 | 51,253 | 425,999 | 811,536 |
| Shares redeemed | (282,853) | (457,036) | (4,662,106) | (6,981,965) |
| Net increase (decrease) | (35,471) | 280,883 | $(541,551) | $4,340,906 |
| Class B | ||||
| Shares sold | – | 5,282 | $– | $81,885 |
| Reinvestment of distributions | – | 1,413 | – | 22,443 |
| Shares redeemed | – | (59,664) | – | (913,434) |
| Net increase (decrease) | – | (52,969) | $– | $(809,106) |
| Class C | ||||
| Shares sold | 140,907 | 670,666 | $2,327,012 | $10,277,856 |
| Reinvestment of distributions | 20,218 | 68,302 | 342,433 | 1,069,779 |
| Shares redeemed | (271,168) | (803,589) | (4,390,620) | (12,024,954) |
| Net increase (decrease) | (110,043) | (64,621) | $(1,721,175) | $(677,319) |
| Mega Cap Stock | ||||
| Shares sold | 23,276,633 | 73,675,851 | $393,358,699 | $1,142,159,263 |
| Reinvestment of distributions | 3,517,132 | 7,313,288 | 60,338,870 | 116,494,236 |
| Shares redeemed | (32,490,405) | (83,289,947) | (543,369,144) | (1,294,330,166) |
| Net increase (decrease) | (5,696,640) | (2,300,808) | $(89,671,575) | $(35,676,667) |
| Class I | ||||
| Shares sold | 606,328 | 2,012,535 | $10,200,437 | $31,112,150 |
| Reinvestment of distributions | 170,239 | 417,290 | 2,921,152 | 6,659,834 |
| Shares redeemed | (1,697,954) | (4,128,858) | (28,439,121) | (64,549,339) |
| Net increase (decrease) | (921,387) | (1,699,033) | $(15,317,532) | $(26,777,355) |
| Class Z | ||||
| Shares sold | 6,160 | 14,166 | $103,747 | $216,431 |
| Reinvestment of distributions | 3,045 | 6,283 | 52,010 | 99,829 |
| Shares redeemed | (23,956) | (12,944) | (389,309) | (199,888) |
| Net increase (decrease) | (14,751) | 7,505 | $(233,552) | $116,372 |
12. Other.
The Fund's organizational documents provide former and current trustees and officers with a limited indemnification against liabilities arising in connection with the performance of their duties to the Fund. In the normal course of business, the Fund may also enter into contracts that provide general indemnifications. The Fund's maximum exposure under these arrangements is unknown as this would be dependent on future claims that may be made against the Fund. The risk of material loss from such claims is considered remote.
Shareholder Expense Example
As a shareholder of the Fund, you incur two types of costs: (1) transaction costs, including sales charges (loads) on purchase payments or redemption proceeds, and (2) ongoing costs, including management fees, distribution and/or service (12b-1) fees and other Fund expenses. This Example is intended to help you understand your ongoing costs (in dollars) of investing in the Fund and to compare these costs with the ongoing costs of investing in other mutual funds.
The Example is based on an investment of $1,000 invested at the beginning of the period and held for the entire period (July 1, 2016 to December 31, 2016).
Actual Expenses
The first line of the accompanying table for each class of the Fund provides information about actual account values and actual expenses. You may use the information in this line, together with the amount you invested, to estimate the expenses that you paid over the period. Simply divide your account value by $1,000.00 (for example, an $8,600 account value divided by $1,000.00 = 8.6), then multiply the result by the number in the first line for a class of the Fund under the heading entitled "Expenses Paid During Period" to estimate the expenses you paid on your account during this period. A small balance maintenance fee of $12.00 that is charged once a year may apply for certain accounts with a value of less than $2,000. This fee is not included in the table below. If it was, the estimate of expenses you paid during the period would be higher, and your ending account value lower, by this amount. In addition, the Fund, as a shareholder in the underlying Fidelity Central Funds, will indirectly bear its pro-rata share of the fees and expenses incurred by the underlying Fidelity Central Funds. These fees and expenses are not included in the Fund's annualized expense ratio used to calculate the expense estimate in the table below.
Hypothetical Example for Comparison Purposes
The second line of the accompanying table for each class of the Fund provides information about hypothetical account values and hypothetical expenses based on a Class' actual expense ratio and an assumed rate of return of 5% per year before expenses, which is not the Class' actual return. The hypothetical account values and expenses may not be used to estimate the actual ending account balance or expenses you paid for the period. You may use this information to compare the ongoing costs of investing in the Fund and other funds. To do so, compare this 5% hypothetical example with the 5% hypothetical examples that appear in the shareholder reports of the other funds. A small balance maintenance fee of $12.00 that is charged once a year may apply for certain accounts with a value of less than $2,000. This fee is not included in the table below. If it was, the estimate of expenses you paid during the period would be higher, and your ending account value lower, by this amount. In addition, the Fund, as a shareholder in the underlying Fidelity Central Funds, will indirectly bear its pro-rata share of the fees and expenses incurred by the underlying Fidelity Central Funds. These fees and expenses are not included in the Fund's annualized expense ratio used to calculate the expense estimate in the table below.
Please note that the expenses shown in the table are meant to highlight your ongoing costs only and do not reflect any transaction costs. Therefore, the second line of the table is useful in comparing ongoing costs only, and will not help you determine the relative total costs of owning different funds. In addition, if these transactional costs were included, your costs would have been higher.
| Annualized Expense Ratio-A | Beginning Account Value July 1, 2016 | Ending Account Value December 31, 2016 | Expenses Paid During Period-B July 1, 2016 to December 31, 2016 | |
| Class A | .93% | |||
| Actual | $1,000.00 | $1,129.70 | $4.99 | |
| Hypothetical-C | $1,000.00 | $1,020.52 | $4.74 | |
| Class T | 1.20% | |||
| Actual | $1,000.00 | $1,128.50 | $6.44 | |
| Hypothetical-C | $1,000.00 | $1,019.16 | $6.11 | |
| Class C | 1.69% | |||
| Actual | $1,000.00 | $1,126.00 | $9.06 | |
| Hypothetical-C | $1,000.00 | $1,016.69 | $8.59 | |
| Mega Cap Stock | .68% | |||
| Actual | $1,000.00 | $1,132.00 | $3.65 | |
| Hypothetical-C | $1,000.00 | $1,021.78 | $3.47 | |
| Class I | .67% | |||
| Actual | $1,000.00 | $1,131.70 | $3.60 | |
| Hypothetical-C | $1,000.00 | $1,021.83 | $3.41 | |
| Class Z | .53% | |||
| Actual | $1,000.00 | $1,132.60 | $2.85 | |
| Hypothetical-C | $1,000.00 | $1,022.53 | $2.70 |
A Annualized expense ratio reflects expenses net of applicable fee waivers.
B Expenses are equal to each Class' annualized expense ratio, multiplied by the average account value over the period, multiplied by 184/365 (to reflect the one-half year period).
C 5% return per year before expenses
Board Approval of Investment Advisory Contracts and Management Fees
Fidelity Mega Cap Stock Fund
Each year, the Board of Trustees, including the Independent Trustees (together, the Board), votes on the renewal of the management contract with Fidelity Management & Research Company (FMR) and the sub-advisory agreements (together, the Advisory Contracts) for the fund. The Board, assisted by the advice of fund counsel and Independent Trustees' counsel, requests and considers a broad range of information relevant to the renewal of the Advisory Contracts throughout the year.
The Board meets regularly and, at each of its meetings, covers an extensive agenda of topics and materials and considers factors that are relevant to its annual consideration of the renewal of the fund's Advisory Contracts, including the services and support provided to the fund and its shareholders. The Board has established various standing committees (Committees), each composed of and chaired by Independent Trustees with varying backgrounds, to which the Board has assigned specific subject matter responsibilities in order to enhance effective decision-making by the Board. The Board, acting directly and through its Committees, requests and receives information concerning the annual consideration of the renewal of the fund's Advisory Contracts. The Board also meets as needed to consider matters specifically related to the Board's annual consideration of the renewal of the Advisory Contracts. Members of the Board may also meet with trustees of other Fidelity funds through ad hoc joint committees to discuss certain matters relevant to all of the Fidelity funds.
At its July 2016 meeting, the Board unanimously determined to renew the fund's Advisory Contracts. In reaching its determination, the Board considered all factors it believed relevant, including (i) the nature, extent, and quality of the services to be provided to the fund and its shareholders (including the investment performance of the fund); (ii) the competitiveness of the fund's management fee and total expense ratio relative to peer funds; (iii) the total costs of the services to be provided by and the profits to be realized by Fidelity from its relationships with the fund; and (iv) the extent to which, if any, economies of scale exist and would be realized as the fund grows, and whether any economies of scale are appropriately shared with fund shareholders.
In considering whether to renew the Advisory Contracts for the fund, the Board reached a determination, with the assistance of fund counsel and Independent Trustees' counsel and through the exercise of its business judgment, that the renewal of the Advisory Contracts was in the best interests of the fund and its shareholders and that the compensation payable under the Advisory Contracts was fair and reasonable. The Board's decision to renew the Advisory Contracts was not based on any single factor, but rather was based on a comprehensive consideration of all the information provided to the Board at its meetings throughout the year. The Board, in reaching its determination to renew the Advisory Contracts, was aware that shareholders of the fund have a broad range of investment choices available to them, including a wide choice among funds offered by Fidelity's competitors, and that the fund's shareholders, who have the opportunity to review and weigh the disclosure provided by the fund in its prospectus and other public disclosures, have chosen to invest in this fund, which is part of the Fidelity family of funds.
Nature, Extent, and Quality of Services Provided. The Board considered Fidelity's staffing as it relates to the fund, including the backgrounds of investment personnel of Fidelity, and also considered the fund's investment objective, strategies, and related investment philosophy. The Independent Trustees also had discussions with senior management of Fidelity's investment operations and investment groups. The Board considered the structure of the investment personnel compensation program and whether this structure provides appropriate incentives to act in the best interests of the fund. Additionally, the Board considered the portfolio managers' investments, if any, in the funds that they manage.Resources Dedicated to Investment Management and Support Services. The Board and the Fund Oversight and Research Committees reviewed the general qualifications and capabilities of Fidelity's investment staff, including its size, education, experience, and resources, as well as Fidelity's approach to recruiting, training, managing, and compensating investment personnel. The Board noted that Fidelity has continued to increase the resources devoted to non-U.S. offices, including expansion of Fidelity's global investment organization. The Board also noted that Fidelity's analysts have extensive resources, tools and capabilities that allow them to conduct sophisticated quantitative and fundamental analysis, as well as credit analysis of issuers, counterparties and guarantors. Further, the Board considered that Fidelity's investment professionals have sufficient access to global information and data so as to provide competitive investment results over time, and that those professionals also have access to sophisticated tools that permit them to assess portfolio construction and risk and performance attribution characteristics continuously, as well as to transmit new information and research conclusions rapidly around the world. Additionally, in its deliberations, the Board considered Fidelity's trading, risk management, compliance, and technology and operations capabilities and resources, which are integral parts of the investment management process.Shareholder and Administrative Services. The Board considered (i) the nature, extent, quality, and cost of advisory, administrative, and shareholder services performed by FMR, the sub-advisers (together with FMR, the Investment Advisers), and their affiliates under the Advisory Contracts and under separate agreements covering transfer agency, pricing and bookkeeping, and securities lending services for the fund; (ii) the nature and extent of the supervision of third party service providers, principally custodians, subcustodians, and pricing vendors; and (iii) the resources devoted to, and the record of compliance with, the fund's compliance policies and procedures. The Board also reviewed the allocation of fund brokerage, including allocations to brokers affiliated with the Investment Advisers, the use of brokerage commissions to pay fund expenses, and the use of "soft" commission dollars to pay for research services.The Board noted that the growth of fund assets over time across the complex allows Fidelity to reinvest in the development of services designed to enhance the value or convenience of the Fidelity funds as investment vehicles. These services include 24-hour access to account information and market information through telephone representatives and over the Internet, investor education materials and asset allocation tools, and the expanded availability of Fidelity Investor Centers.In 2014, the Board formed an ad hoc Committee on Transfer Agency Fees to review the variety of transfer agency fee structures throughout the industry and Fidelity's competitive positioning with respect to industry participants.Investment in a Large Fund Family. The Board considered the benefits to shareholders of investing in a Fidelity fund, including the benefits of investing in a fund that is part of a large family of funds offering a variety of investment disciplines and providing a large variety of mutual fund investor services. The Board noted that Fidelity had taken, or had made recommendations that resulted in the Fidelity funds taking, a number of actions over the previous year that benefited particular funds, including: (i) continuing to dedicate additional resources to investment research and to the support of the senior management team that oversees asset management; (ii) continuing efforts to enhance Fidelity's global research capabilities; (iii) launching new funds and making other enhancements to meet client needs; (iv) broadening eligibility requirements for certain lower-priced share classes of, and streamlining the fee structure for, certain existing equity index funds; (v) lowering expense caps for certain existing funds and classes to reduce expenses paid by shareholders; (vi) eliminating redemption fees for certain variable insurance product funds and classes; (vii) continuing to launch dedicated lower cost underlying funds to meet portfolio construction needs related to expanding underlying fund options for Fidelity funds of funds, specifically for the Freedom Fund product lines; (viii) launching a lower cost share class for use by the Freedom Index Fund product line; (ix) rationalizing product lines and gaining increased efficiencies through fund mergers and share class consolidations; (x) continuing to develop, acquire and implement systems and technology to improve services to the funds and shareholders, strengthen information security, and increase efficiency; (xi) implementing investment enhancements to further strengthen Fidelity's target date product line to increase investors' probability of success in achieving their goals; (xii) accelerating the conversion of all remaining Class B shares to Class A shares, which have a lower expense structure; and (xiii) implementing changes to Fidelity's money market fund product line in response to recent regulatory reforms.Investment Performance. The Board considered whether the fund has operated in accordance with its investment objective, as well as its record of compliance with its investment restrictions and its performance history.The Board took into account discussions with representatives of the Investment Advisers about fund investment performance that occur at Board meetings throughout the year. In this regard the Board noted that as part of regularly scheduled fund reviews and other reports to the Board on fund performance, the Board considers annualized return information for the fund, for different time periods, measured against a securities market index ("benchmark index") and a peer group of funds with similar objectives ("peer group"), if any. In its evaluation of fund investment performance, the Board gave particular attention to information indicating changes in performance of certain Fidelity funds for specific time periods and discussed with the Investment Advisers the reasons for any overperformance or underperformance.In addition to reviewing absolute and relative fund performance, the Independent Trustees periodically consider the appropriateness of fund performance metrics in evaluating the results achieved. In general, the Independent Trustees believe that fund performance should be evaluated based on net performance (after fees and expenses) of both the highest performing and lowest performing fund share classes, where applicable, compared to appropriate benchmark indices, over appropriate time periods that may include full market cycles, and compared to peer groups, as applicable, over the same periods, taking into account relevant factors including the following: general market conditions; issuer-specific information; and fund cash flows and other factors.The Independent Trustees recognize that shareholders evaluate performance on a net basis over their own holding periods, for which one-, three-, and five-year periods are often used as a proxy. For this reason, the performance information reviewed by the Board also included net cumulative calendar year total return information for the fund and an appropriate benchmark index for the most recent one-, three-, and five-year periods, as shown below. A peer group is not shown below because the fund does not generally utilize a peer group for performance comparison purposes.Fidelity Mega Cap Stock Fund
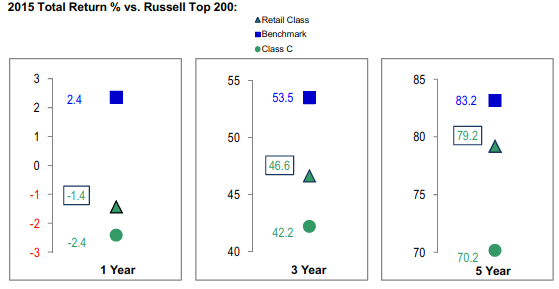
Fidelity Mega Cap Stock Fund

![]()
AGII-SANN-0217
1.855230.109
Fidelity® Mega Cap Stock Fund Semi-Annual Report December 31, 2016 |
|
Contents
Board Approval of Investment Advisory Contracts and Management Fees |
To view a fund's proxy voting guidelines and proxy voting record for the 12-month period ended June 30, visit http://www.fidelity.com/proxyvotingresults or visit the Securities and Exchange Commission's (SEC) web site at http://www.sec.gov.
You may also call 1-800-544-8544 to request a free copy of the proxy voting guidelines.
Standard & Poor's, S&P and S&P 500 are registered service marks of The McGraw-Hill Companies, Inc. and have been licensed for use by Fidelity Distributors Corporation.
Other third-party marks appearing herein are the property of their respective owners.
All other marks appearing herein are registered or unregistered trademarks or service marks of FMR LLC or an affiliated company. © 2017 FMR LLC. All rights reserved.
This report and the financial statements contained herein are submitted for the general information of the shareholders of the Fund. This report is not authorized for distribution to prospective investors in the Fund unless preceded or accompanied by an effective prospectus.
A fund files its complete schedule of portfolio holdings with the SEC for the first and third quarters of each fiscal year on Form N-Q. Forms N-Q are available on the SEC’s web site at http://www.sec.gov. A fund's Forms N-Q may be reviewed and copied at the SEC’s Public Reference Room in Washington, DC. Information regarding the operation of the SEC's Public Reference Room may be obtained by calling 1-800-SEC-0330.
For a complete list of a fund's portfolio holdings, view the most recent holdings listing, semiannual report, or annual report on Fidelity's web site at http://www.fidelity.com, http://www.institutional.fidelity.com, or http://www.401k.com, as applicable.
NOT FDIC INSURED •MAY LOSE VALUE •NO BANK GUARANTEE
Neither the Fund nor Fidelity Distributors Corporation is a bank.
Investment Summary (Unaudited)
Top Ten Stocks as of December 31, 2016
| % of fund's net assets | % of fund's net assets 6 months ago | |
| JPMorgan Chase & Co.(a) | 4.9 | 3.9 |
| Bank of America Corp.(a) | 4.6 | 2.9 |
| Apple, Inc. | 4.0 | 3.3 |
| Citigroup, Inc.(a) | 3.7 | 2.5 |
| Microsoft Corp. | 3.7 | 3.4 |
| General Electric Co.(a) | 3.2 | 3.6 |
| Chevron Corp. | 2.7 | 2.8 |
| Johnson & Johnson | 2.2 | 2.7 |
| Procter & Gamble Co. | 2.1 | 2.4 |
| Comcast Corp. Class A | 2.1 | 2.0 |
| 33.2 |
(a) Security or a portion of the security is pledged as collateral for call options written.
Top Five Market Sectors as of December 31, 2016
| % of fund's net assets | % of fund's net assets 6 months ago | |
| Financials | 23.3 | 17.4 |
| Information Technology | 20.6 | 23.1 |
| Health Care | 13.0 | 14.4 |
| Energy | 12.7 | 11.5 |
| Industrials | 9.7 | 11.0 |
Prior period industry classifications reflect the categories in place as of the date indicated and have not been adjusted to reflect current industry classifications.
Asset Allocation (% of fund's net assets)
| As of December 31, 2016*,** | ||
| Stocks | 99.5% | |
| Other Investments | 0.2% | |
| Short-Term Investments and Net Other Assets (Liabilities) | 0.3% | |

* Foreign investments - 8.3%
** Written options - (0.5)%
| As of June 30, 2016*,** | ||
| Stocks | 99.9% | |
| Short-Term Investments and Net Other Assets (Liabilities) | 0.1% | |

* Foreign investments - 10.0%
** Written options - (0.0)%
Investments December 31, 2016 (Unaudited)
Showing Percentage of Net Assets
| Common Stocks - 99.5% | |||
| Shares | Value | ||
| CONSUMER DISCRETIONARY - 8.7% | |||
| Automobiles - 0.4% | |||
| General Motors Co. | 396,700 | $13,821,028 | |
| Hotels, Restaurants & Leisure - 0.3% | |||
| Las Vegas Sands Corp. (a) | 112,000 | 5,981,920 | |
| Yum! Brands, Inc. | 86,200 | 5,459,046 | |
| 11,440,966 | |||
| Media - 5.5% | |||
| Comcast Corp. Class A | 1,079,800 | 74,560,190 | |
| The Walt Disney Co. | 355,600 | 37,060,632 | |
| Time Warner, Inc. | 713,700 | 68,893,461 | |
| Viacom, Inc. Class B (non-vtg.) | 423,900 | 14,878,890 | |
| 195,393,173 | |||
| Multiline Retail - 1.3% | |||
| Target Corp. | 645,400 | 46,617,242 | |
| Specialty Retail - 1.2% | |||
| Lowe's Companies, Inc. | 603,900 | 42,949,368�� | |
| TOTAL CONSUMER DISCRETIONARY | 310,221,777 | ||
| CONSUMER STAPLES - 7.0% | |||
| Beverages - 2.6% | |||
| Diageo PLC | 548,273 | 14,227,604 | |
| PepsiCo, Inc. | 256,305 | 26,817,192 | |
| The Coca-Cola Co. | 1,206,500 | 50,021,490 | |
| 91,066,286 | |||
| Food & Staples Retailing - 1.7% | |||
| Costco Wholesale Corp. | 67,800 | 10,855,458 | |
| CVS Health Corp. | 412,600 | 32,558,266 | |
| Kroger Co. | 140,200 | 4,838,302 | |
| Walgreens Boots Alliance, Inc. | 157,297 | 13,017,900 | |
| 61,269,926 | |||
| Household Products - 2.1% | |||
| Procter & Gamble Co. | 895,300 | 75,276,824 | |
| Personal Products - 0.1% | |||
| Estee Lauder Companies, Inc. Class A | 27,400 | 2,095,826 | |
| Tobacco - 0.5% | |||
| Altria Group, Inc. | 68,500 | 4,631,970 | |
| Philip Morris International, Inc. | 56,830 | 5,199,377 | |
| Reynolds American, Inc. | 170,100 | 9,532,404 | |
| 19,363,751 | |||
| TOTAL CONSUMER STAPLES | 249,072,613 | ||
| ENERGY - 12.5% | |||
| Energy Equipment & Services - 0.7% | |||
| Baker Hughes, Inc. | 73,500 | 4,775,295 | |
| Schlumberger Ltd. | 243,400 | 20,433,430 | |
| 25,208,725 | |||
| Oil, Gas & Consumable Fuels - 11.8% | |||
| Anadarko Petroleum Corp. | 327,600 | 22,843,548 | |
| Apache Corp. | 603,505 | 38,304,462 | |
| Chevron Corp. | 815,200 | 95,949,040 | |
| ConocoPhillips Co. | 1,418,800 | 71,138,632 | |
| Imperial Oil Ltd. | 782,600 | 27,226,191 | |
| Kinder Morgan, Inc. | 2,149,500 | 44,516,145 | |
| Suncor Energy, Inc. | 1,909,900 | 62,447,108 | |
| The Williams Companies, Inc. | 1,963,100 | 61,130,934 | |
| 423,556,060 | |||
| TOTAL ENERGY | 448,764,785 | ||
| FINANCIALS - 23.3% | |||
| Banks - 18.1% | |||
| Bank of America Corp. (a) | 7,438,400 | 164,388,640 | |
| Citigroup, Inc. (a) | 2,217,770 | 131,802,071 | |
| JPMorgan Chase & Co. (a) | 2,053,200 | 177,170,630 | |
| PNC Financial Services Group, Inc. | 293,900 | 34,374,544 | |
| Standard Chartered PLC (United Kingdom) (b) | 409,062 | 3,345,393 | |
| U.S. Bancorp (a) | 1,247,700 | 64,094,349 | |
| Wells Fargo & Co. | 1,295,530 | 71,396,658 | |
| 646,572,285 | |||
| Capital Markets - 4.2% | |||
| Charles Schwab Corp. (a) | 697,800 | 27,542,166 | |
| Goldman Sachs Group, Inc. | 77,600 | 18,581,320 | |
| Morgan Stanley (a) | 1,113,800 | 47,058,050 | |
| State Street Corp. | 747,900 | 58,126,788 | |
| 151,308,324 | |||
| Insurance - 1.0% | |||
| American International Group, Inc. | 86,500 | 5,649,315 | |
| Marsh & McLennan Companies, Inc. | 235,880 | 15,943,129 | |
| MetLife, Inc. | 278,595 | 15,013,485 | |
| 36,605,929 | |||
| TOTAL FINANCIALS | 834,486,538 | ||
| HEALTH CARE - 13.0% | |||
| Biotechnology - 3.1% | |||
| Alexion Pharmaceuticals, Inc. (b) | 156,600 | 19,160,010 | |
| Amgen, Inc. | 197,490 | 28,875,013 | |
| Biogen, Inc. (b) | 84,700 | 24,019,226 | |
| Gilead Sciences, Inc. | 288,310 | 20,645,879 | |
| Intercept Pharmaceuticals, Inc. (b) | 9,500 | 1,032,175 | |
| Regeneron Pharmaceuticals, Inc. (b) | 19,900 | 7,305,091 | |
| Vertex Pharmaceuticals, Inc. (b) | 133,500 | 9,834,945 | |
| 110,872,339 | |||
| Health Care Equipment & Supplies - 1.8% | |||
| Abbott Laboratories | 545,200 | 20,941,132 | |
| Becton, Dickinson & Co. | 15,100 | 2,499,805 | |
| Boston Scientific Corp. (b) | 419,300 | 9,069,459 | |
| Medtronic PLC | 447,013 | 31,840,736 | |
| 64,351,132 | |||
| Health Care Providers & Services - 1.9% | |||
| Anthem, Inc. | 102,200 | 14,693,294 | |
| Cigna Corp. | 118,700 | 15,833,393 | |
| Express Scripts Holding Co. (b) | 163,262 | 11,230,793 | |
| McKesson Corp. | 192,500 | 27,036,625 | |
| 68,794,105 | |||
| Pharmaceuticals - 6.2% | |||
| Allergan PLC | 57,900 | 12,159,579 | |
| AstraZeneca PLC sponsored ADR | 238,900 | 6,526,748 | |
| Bayer AG | 15,800 | 1,646,098 | |
| Bristol-Myers Squibb Co. | 434,350 | 25,383,414 | |
| GlaxoSmithKline PLC sponsored ADR | 1,322,300 | 50,921,773 | |
| Johnson & Johnson | 674,000 | 77,651,540 | |
| Novartis AG sponsored ADR | 78,800 | 5,739,792 | |
| Sanofi SA | 125,299 | 10,132,324 | |
| Teva Pharmaceutical Industries Ltd. sponsored ADR | 823,600 | 29,855,500 | |
| 220,016,768 | |||
| TOTAL HEALTH CARE | 464,034,344 | ||
| INDUSTRIALS - 9.7% | |||
| Aerospace & Defense - 2.3% | |||
| General Dynamics Corp. | 27,900 | 4,817,214 | |
| The Boeing Co. | 223,300 | 34,763,344 | |
| United Technologies Corp. | 400,300 | 43,880,886 | |
| 83,461,444 | |||
| Air Freight & Logistics - 1.5% | |||
| FedEx Corp. | 87,100 | 16,218,020 | |
| United Parcel Service, Inc. Class B (a) | 322,800 | 37,005,792 | |
| 53,223,812 | |||
| Industrial Conglomerates - 3.2% | |||
| General Electric Co. (a) | 3,635,200 | 114,872,320 | |
| Machinery - 0.5% | |||
| Caterpillar, Inc. | 36,700 | 3,403,558 | |
| Deere & Co. | 139,700 | 14,394,688 | |
| 17,798,246 | |||
| Road & Rail - 2.2% | |||
| CSX Corp. | 868,700 | 31,212,391 | |
| Norfolk Southern Corp. | 148,400 | 16,037,588 | |
| Union Pacific Corp. | 299,190 | 31,020,019 | |
| 78,269,998 | |||
| TOTAL INDUSTRIALS | 347,625,820 | ||
| INFORMATION TECHNOLOGY - 20.6% | |||
| Communications Equipment - 1.7% | |||
| Cisco Systems, Inc. | 2,039,900 | 61,645,778 | |
| Internet Software & Services - 4.2% | |||
| Alphabet, Inc.: | |||
| Class A (b) | 83,250 | 65,971,463 | |
| Class C (b) | 78,026 | 60,222,027 | |
| Facebook, Inc. Class A (b) | 222,400 | 25,587,120 | |
| 151,780,610 | |||
| IT Services - 3.6% | |||
| Cognizant Technology Solutions Corp. Class A (b) | 213,500 | 11,962,405 | |
| First Data Corp. (c) | 695,222 | 9,865,200 | |
| IBM Corp. | 19,197 | 3,186,510 | |
| MasterCard, Inc. Class A (a) | 419,800 | 43,344,350 | |
| PayPal Holdings, Inc. (b) | 244,400 | 9,646,468 | |
| Visa, Inc. Class A | 659,700 | 51,469,794 | |
| 129,474,727 | |||
| Semiconductors & Semiconductor Equipment - 2.1% | |||
| Qualcomm, Inc. (a) | 1,135,800 | 74,054,160 | |
| Software - 5.0% | |||
| Adobe Systems, Inc. (b) | 165,500 | 17,038,225 | |
| Microsoft Corp. | 2,116,900 | 131,544,166 | |
| Oracle Corp. | 558,700 | 21,482,015 | |
| Salesforce.com, Inc. (b) | 100,500 | 6,880,230 | |
| 176,944,636 | |||
| Technology Hardware, Storage & Peripherals - 4.0% | |||
| Apple, Inc. | 1,247,407 | 144,474,679 | |
| TOTAL INFORMATION TECHNOLOGY | 738,374,590 | ||
| MATERIALS - 2.0% | |||
| Chemicals - 2.0% | |||
| E.I. du Pont de Nemours & Co. | 238,500 | 17,505,900 | |
| LyondellBasell Industries NV Class A | 220,000 | 18,871,600 | |
| Monsanto Co. | 307,110 | 32,311,043 | |
| PPG Industries, Inc. | 42,600 | 4,036,776 | |
| 72,725,319 | |||
| REAL ESTATE - 0.4% | |||
| Equity Real Estate Investment Trusts (REITs) - 0.4% | |||
| American Tower Corp. | 57,700 | 6,097,736 | |
| Crown Castle International Corp. | 24,800 | 2,151,896 | |
| Public Storage | 17,400 | 3,888,900 | |
| 12,138,532 | |||
| TELECOMMUNICATION SERVICES - 1.6% | |||
| Diversified Telecommunication Services - 1.6% | |||
| Verizon Communications, Inc. | 1,047,225 | 55,900,871 | |
| UTILITIES - 0.7% | |||
| Electric Utilities - 0.7% | |||
| Exelon Corp. | 738,000 | 26,191,620 | |
| TOTAL COMMON STOCKS | |||
| (Cost $2,652,695,367) | 3,559,536,809 | ||
| Other - 0.2% | |||
| ENERGY - 0.2% | |||
| Oil, Gas and Consumable Fuels - 0.2% | |||
| Utica Shale Drilling Program (non-operating revenue interest) unit (d)(e) | |||
| (Cost $6,161,494) | 6,161,494 | 6,161,494 | |
| Money Market Funds - 0.8% | |||
| Fidelity Cash Central Fund, 0.60% (f) | |||
| (Cost $30,280,323) | 30,274,268 | 30,280,323 | |
| TOTAL INVESTMENT PORTFOLIO - 100.5% | |||
| (Cost $2,689,137,184) | 3,595,978,626 | ||
| NET OTHER ASSETS (LIABILITIES) - (0.5)% | (17,011,348) | ||
| NET ASSETS - 100% | $3,578,967,278 |
| Written Options | ||||
| Expiration Date/Exercise Price | Number of Contracts | Premium | Value | |
| Call Options | ||||
| Bank of America Corp. | 1/20/17 - $18.00 | 7,248 | $173,948 | $(3,007,920) |
| Bank of America Corp. | 1/20/17 - $20.00 | 10,862 | 477,917 | (2,433,088) |
| Charles Schwab | 1/20/17 - $35.00 | 1,269 | 78,042 | (571,050) |
| Citigroup, Inc. | 1/20/17 - $50.00 | 1,911 | 387,924 | (1,820,228) |
| Citigroup, Inc. | 1/20/17 - $55.00 | 1,978 | 87,030 | (944,495) |
| Citigroup, Inc. | 2/17/17 - $60.00 | 1,054 | 125,423 | (223,448) |
| General Electric | 1/20/17 - $32.00 | 3,559 | 110,582 | (133,463) |
| JPMorgan Chase & Co. | 1/20/17 - $70.00 | 3,923 | 564,902 | (6,414,104) |
| JPMorgan Chase & Co. | 1/20/17 - $85.00 | 988 | 50,492 | (230,204) |
| Las Vegas Sands Corp. | 1/20/17 - $62.50 | 396 | 74,450 | (1,782) |
| MasterCard, Inc. | 1/20/17 - $105.00 | 865 | 243,369 | (93,420) |
| Morgan Stanley | 1/20/17 - $36.00 | 1,648 | 75,806 | (1,046,480) |
| Qualcomm, Inc. | 1/20/17 - $67.50 | 1,800 | 214,231 | (88,200) |
| U.S. Bancorp | 1/20/17 - $50.00 | 1,848 | 68,374 | (337,260) |
| UPS | 4/21/17 - $115.00 | 736 | 104,510 | (277,840) |
| TOTAL WRITTEN OPTIONS | $2,837,000 | $(17,622,982) |
Legend
(a) Security or a portion of the security is pledged as collateral for call options written. At period end, the value of securities pledged amounted to $175,707,192.
(b) Non-income producing
(c) Security exempt from registration under Rule 144A of the Securities Act of 1933. These securities may be resold in transactions exempt from registration, normally to qualified institutional buyers. At the end of the period, the value of these securities amounted to $9,865,200 or 0.3% of net assets.
(d) Investment is owned by a wholly-owned subsidiary (Subsidiary) that is treated as a corporation for U.S. tax purposes.
(e) Restricted securities - Investment in securities not registered under the Securities Act of 1933 (excluding 144A issues). At the end of the period, the value of restricted securities (excluding 144A issues) amounted to $6,161,494 or 0.2% of net assets.
(f) Affiliated fund that is generally available only to investment companies and other accounts managed by Fidelity Investments. The rate quoted is the annualized seven-day yield of the fund at period end. A complete unaudited listing of the fund's holdings as of its most recent quarter end is available upon request. In addition, each Fidelity Central Fund's financial statements are available on the SEC's website or upon request.
Additional information on each restricted holding is as follows:
| Security | Acquisition Date | Acquisition Cost |
| Utica Shale Drilling Program (non-operating revenue interest) unit | 10/5/16 - 11/4/16 | $6,161,494 |
Affiliated Central Funds
Information regarding fiscal year to date income earned by the Fund from investments in Fidelity Central Funds is as follows:
| Fund | Income earned |
| Fidelity Cash Central Fund | $37,475 |
| Fidelity Securities Lending Cash Central Fund | 30,341 |
| Total | $67,816 |
Investment Valuation
The following is a summary of the inputs used, as of December 31, 2016, involving the Fund's assets and liabilities carried at fair value. The inputs or methodology used for valuing securities may not be an indication of the risk associated with investing in those securities. For more information on valuation inputs, and their aggregation into the levels used below, please refer to the Investment Valuation section in the accompanying Notes to Financial Statements.
| Valuation Inputs at Reporting Date: | ||||
| Description | Total | Level 1 | Level 2 | Level 3 |
| Investments in Securities: | ||||
| Equities: | ||||
| Consumer Discretionary | $310,221,777 | $310,221,777 | $-- | $-- |
| Consumer Staples | 249,072,613 | 234,845,009 | 14,227,604 | -- |
| Energy | 448,764,785 | 448,764,785 | -- | -- |
| Financials | 834,486,538 | 834,486,538 | -- | -- |
| Health Care | 464,034,344 | 452,255,922 | 11,778,422 | -- |
| Industrials | 347,625,820 | 347,625,820 | -- | -- |
| Information Technology | 738,374,590 | 738,374,590 | -- | -- |
| Materials | 72,725,319 | 72,725,319 | -- | -- |
| Real Estate | 12,138,532 | 12,138,532 | -- | -- |
| Telecommunication Services | 55,900,871 | 55,900,871 | -- | -- |
| Utilities | 26,191,620 | 26,191,620 | -- | -- |
| Other | 6,161,494 | -- | -- | 6,161,494 |
| Money Market Funds | 30,280,323 | 30,280,323 | -- | -- |
| Total Investments in Securities: | $3,595,978,626 | $3,563,811,106 | $26,006,026 | $6,161,494 |
| Derivative Instruments: | ||||
| Liabilities | ||||
| Written Options | $(17,622,982) | $(17,622,982) | $-- | $-- |
| Total Liabilities | $(17,622,982) | $(17,622,982) | $-- | $-- |
| Total Derivative Instruments: | $(17,622,982) | $(17,622,982) | $-- | $-- |
Value of Derivative Instruments
The following table is a summary of the Fund's value of derivative instruments by primary risk exposure as of December 31, 2016. For additional information on derivative instruments, please refer to the Derivative Instruments section in the accompanying Notes to Financial Statements.
| Primary Risk Exposure / Derivative Type | Value | |
| Asset | Liability | |
| Equity Risk | ||
| Written Options(a) | $0 | $(17,622,982) |
| Total Equity Risk | 0 | (17,622,982) |
| Total Value of Derivatives | $0 | $(17,622,982) |
(a) Gross value is presented in the Statement of Assets and Liabilities in the written options, at value line-item.
See accompanying notes which are an integral part of the financial statements.
Financial Statements
Statement of Assets and Liabilities
| December 31, 2016 (Unaudited) | ||
| Assets | ||
| Investment in securities, at value — See accompanying schedule: Unaffiliated issuers (cost $2,658,856,861) | $3,565,698,303 | |
| Fidelity Central Funds (cost $30,280,323) | 30,280,323 | |
| Total Investments (cost $2,689,137,184) | $3,595,978,626 | |
| Receivable for investments sold | 5,458,844 | |
| Receivable for fund shares sold | 2,460,958 | |
| Dividends receivable | 3,929,421 | |
| Distributions receivable from Fidelity Central Funds | 21,918 | |
| Prepaid expenses | 6,712 | |
| Other receivables | 10,180 | |
| Total assets | 3,607,866,659 | |
| Liabilities | ||
| Payable for investments purchased | $6,230,584 | |
| Payable for fund shares redeemed | 2,974,303 | |
| Accrued management fee | 1,335,280 | |
| Distribution and service plan fees payable | 54,286 | |
| Written options, at value (premium received $2,837,000) | 17,622,982 | |
| Other affiliated payables | 634,228 | |
| Other payables and accrued expenses | 47,718 | |
| Total liabilities | 28,899,381 | |
| Net Assets | $3,578,967,278 | |
| Net Assets consist of: | ||
| Paid in capital | $2,701,362,254 | |
| Undistributed net investment income | 165,055 | |
| Accumulated undistributed net realized gain (loss) on investments and foreign currency transactions | (14,590,194) | |
| Net unrealized appreciation (depreciation) on investments and assets and liabilities in foreign currencies | 892,030,163 | |
| Net Assets | $3,578,967,278 | |
| Calculation of Maximum Offering Price | ||
| Class A: | ||
| Net Asset Value and redemption price per share ($70,979,356 ÷ 4,109,286 shares) | $17.27 | |
| Maximum offering price per share (100/94.25 of $17.27) | $18.32 | |
| Class T: | ||
| Net Asset Value and redemption price per share ($28,448,178 ÷ 1,647,103 shares) | $17.27 | |
| Maximum offering price per share (100/96.50 of $17.27) | $17.90 | |
| Class C: | ||
| Net Asset Value and offering price per share ($33,333,643 ÷ 1,952,716 shares)(a) | $17.07 | |
| Mega Cap Stock: | ||
| Net Asset Value, offering price and redemption price per share ($3,295,172,121 ÷ 189,395,269 shares) | $17.40 | |
| Class I: | ||
| Net Asset Value, offering price and redemption price per share ($148,613,602 ÷ 8,532,605 shares) | $17.42 | |
| Class Z: | ||
| Net Asset Value, offering price and redemption price per share ($2,420,378 ÷ 139,525 shares) | $17.35 |
(a) Redemption price per share is equal to net asset value less any applicable contingent deferred sales charge.
See accompanying notes which are an integral part of the financial statements.
Statement of Operations
| Six months ended December 31, 2016 (Unaudited) | ||
| Investment Income | ||
| Dividends | $39,037,131 | |
| Income from Fidelity Central Funds | 67,816 | |
| Total income | 39,104,947 | |
| Expenses | ||
| Management fee | $7,631,902 | |
| Transfer agent fees | 3,265,577 | |
| Distribution and service plan fees | 315,928 | |
| Accounting and security lending fees | 496,325 | |
| Custodian fees and expenses | 33,201 | |
| Independent trustees' fees and expenses | 7,144 | |
| Registration fees | 69,011 | |
| Audit | 28,616 | |
| Legal | 9,423 | |
| Interest | 8,781 | |
| Miscellaneous | 27,255 | |
| Total expenses before reductions | 11,893,163 | |
| Expense reductions | (12,551) | 11,880,612 |
| Net investment income (loss) | 27,224,335 | |
| Realized and Unrealized Gain (Loss) | ||
| Net realized gain (loss) on: | ||
| Investment securities: | ||
| Unaffiliated issuers | 26,188,583 | |
| Fidelity Central Funds | 11,344 | |
| Foreign currency transactions | (13,137) | |
| Written options | 1,291,805 | |
| Total net realized gain (loss) | 27,478,595 | |
| Change in net unrealized appreciation (depreciation) on: Investment securities | 384,293,597 | |
| Assets and liabilities in foreign currencies | (8,350) | |
| Written options | (15,103,865) | |
| Total change in net unrealized appreciation (depreciation) | 369,181,382 | |
| Net gain (loss) | 396,659,977 | |
| Net increase (decrease) in net assets resulting from operations | $423,884,312 |
See accompanying notes which are an integral part of the financial statements.
Statement of Changes in Net Assets
| Six months ended December 31, 2016 (Unaudited) | Year ended June 30, 2016 | |
| Increase (Decrease) in Net Assets | ||
| Operations | ||
| Net investment income (loss) | $27,224,335 | $58,143,372 |
| Net realized gain (loss) | 27,478,595 | 13,718,399 |
| Change in net unrealized appreciation (depreciation) | 369,181,382 | (159,153,365) |
| Net increase (decrease) in net assets resulting from operations | 423,884,312 | (87,291,594) |
| Distributions to shareholders from net investment income | (52,216,180) | (52,372,529) |
| Distributions to shareholders from net realized gain | (17,291,428) | (87,099,408) |
| Total distributions | (69,507,608) | (139,471,937) |
| Share transactions - net increase (decrease) | (112,479,848) | (102,232,897) |
| Total increase (decrease) in net assets | 241,896,856 | (328,996,428) |
| Net Assets | ||
| Beginning of period | 3,337,070,422 | 3,666,066,850 |
| End of period | $3,578,967,278 | $3,337,070,422 |
| Other Information | ||
| Undistributed net investment income end of period | $165,055 | $25,156,900 |
See accompanying notes which are an integral part of the financial statements.
Financial Highlights — Fidelity Mega Cap Stock Fund Class A
| Six months ended (Unaudited) December 31, | Years ended June 30, | |||||
| 2016 | 2016 | 2015 | 2014 | 2013 | 2012 | |
| Selected Per–Share Data | ||||||
| Net asset value, beginning of period | $15.56 | $16.56 | $16.32 | $13.51 | $11.05 | $10.37 |
| Income from Investment Operations | ||||||
| Net investment income (loss)A | .11 | .23 | .18 | .18 | .17 | .13 |
| Net realized and unrealized gain (loss) | 1.90 | (.65) | .71 | 3.00 | 2.43 | .64 |
| Total from investment operations | 2.01 | (.42) | .89 | 3.18 | 2.60 | .77 |
| Distributions from net investment income | (.22) | (.18) | (.17) | (.16) | (.14) | (.09) |
| Distributions from net realized gain | (.09) | (.40) | (.47) | (.21) | – | – |
| Total distributions | (.30)B | (.58) | (.65)C | (.37) | (.14) | (.09) |
| Net asset value, end of period | $17.27 | $15.56 | $16.56 | $16.32 | $13.51 | $11.05 |
| Total ReturnD,E,F | 12.97% | (2.56)% | 5.69% | 23.88% | 23.78% | 7.57% |
| Ratios to Average Net AssetsG,H | ||||||
| Expenses before reductions | .93%I | .95% | 1.05% | .96% | .98% | 1.02% |
| Expenses net of fee waivers, if any | .93%I | .95% | 1.05% | .96% | .98% | 1.02% |
| Expenses net of all reductions | .93%I | .95% | 1.05% | .96% | .98% | 1.02% |
| Net investment income (loss) | 1.36%I | 1.46% | 1.10% | 1.19% | 1.37% | 1.28% |
| Supplemental Data | ||||||
| Net assets, end of period (000 omitted) | $70,979 | $68,801 | $117,385 | $77,335 | $20,336 | $8,527 |
| Portfolio turnover rateJ | 24%I | 25% | 22%K | 28% | 29% | 57% |
A Calculated based on average shares outstanding during the period.
B Total distributions of $.30 per share is comprised of distributions from net investment income of $.218 and distributions from net realized gain of $.085 per share.
C Total distributions of $.65 per share is comprised of distributions from net investment income of $.174 and distributions from net realized gain of $.474 per share.
D Total returns for periods of less than one year are not annualized.
E Total returns would have been lower if certain expenses had not been reduced during the applicable periods shown.
F Total returns do not include the effect of the sales charges.
G Fees and expenses of any underlying Fidelity Central Funds are not included in the Fund's expense ratio. The Fund indirectly bears its proportionate share of the expenses of any underlying Fidelity Central Funds.
H Expense ratios reflect operating expenses of the class. Expenses before reductions do not reflect amounts reimbursed by the investment adviser or reductions from brokerage service arrangements or reductions from other expense offset arrangements and do not represent the amount paid by the class during periods when reimbursements or reductions occur. Expenses net of fee waivers reflect expenses after reimbursement by the investment adviser but prior to reductions from brokerage service arrangements or other expense offset arrangements. Expenses net of all reductions represent the net expenses paid by the class.
I Annualized
J Amount does not include the portfolio activity of any underlying Fidelity Central Funds.
K Portfolio turnover rate excludes securities received or delivered in-kind.
See accompanying notes which are an integral part of the financial statements.
Financial Highlights — Fidelity Mega Cap Stock Fund Class T
| Six months ended (Unaudited) December 31, | Years ended June 30, | |||||
| 2016 | 2016 | 2015 | 2014 | 2013 | 2012 | |
| Selected Per–Share Data | ||||||
| Net asset value, beginning of period | $15.54 | $16.57 | $16.31 | $13.51 | $11.05 | $10.38 |
| Income from Investment Operations | ||||||
| Net investment income (loss)A | .09 | .19 | .16 | .14 | .14 | .10 |
| Net realized and unrealized gain (loss) | 1.90 | (.65) | .70 | 3.00 | 2.43 | .64 |
| Total from investment operations | 1.99 | (.46) | .86 | 3.14 | 2.57 | .74 |
| Distributions from net investment income | (.18) | (.16) | (.13) | (.13) | (.11) | (.07) |
| Distributions from net realized gain | (.09) | (.40) | (.47) | (.21) | – | – |
| Total distributions | (.26)B | (.57)C | (.60) | (.34) | (.11) | (.07) |
| Net asset value, end of period | $17.27 | $15.54 | $16.57 | $16.31 | $13.51 | $11.05 |
| Total ReturnD,E,F | 12.85% | (2.83)% | 5.53% | 23.54% | 23.44% | 7.19% |
| Ratios to Average Net AssetsG,H | ||||||
| Expenses before reductions | 1.20%I | 1.21% | 1.21% | 1.22% | 1.26% | 1.32% |
| Expenses net of fee waivers, if any | 1.20%I | 1.21% | 1.20% | 1.22% | 1.26% | 1.32% |
| Expenses net of all reductions | 1.20%I | 1.20% | 1.20% | 1.22% | 1.26% | 1.32% |
| Net investment income (loss) | 1.10%I | 1.21% | .95% | .92% | 1.09% | .98% |
| Supplemental Data | ||||||
| Net assets, end of period (000 omitted) | $28,448 | $26,145 | $23,231 | $15,728 | $8,377 | $2,293 |
| Portfolio turnover rateJ | 24%I | 25% | 22%K | 28% | 29% | 57% |
A Calculated based on average shares outstanding during the period.
B Total distributions of $.26 per share is comprised of distributions from net investment income of $.178 and distributions from net realized gain of $.085 per share.
C Total distributions of $.57 per share is comprised of distributions from net investment income of $.164 and distributions from net realized gain of $.404 per share.
D Total returns for periods of less than one year are not annualized.
E Total returns would have been lower if certain expenses had not been reduced during the applicable periods shown.
F Total returns do not include the effect of the sales charges.
G Fees and expenses of any underlying Fidelity Central Funds are not included in the Fund's expense ratio. The Fund indirectly bears its proportionate share of the expenses of any underlying Fidelity Central Funds.
H Expense ratios reflect operating expenses of the class. Expenses before reductions do not reflect amounts reimbursed by the investment adviser or reductions from brokerage service arrangements or reductions from other expense offset arrangements and do not represent the amount paid by the class during periods when reimbursements or reductions occur. Expenses net of fee waivers reflect expenses after reimbursement by the investment adviser but prior to reductions from brokerage service arrangements or other expense offset arrangements. Expenses net of all reductions represent the net expenses paid by the class.
I Annualized
J Amount does not include the portfolio activity of any underlying Fidelity Central Funds.
K Portfolio turnover rate excludes securities received or delivered in-kind.
See accompanying notes which are an integral part of the financial statements.
Financial Highlights — Fidelity Mega Cap Stock Fund Class C
| Six months ended (Unaudited) December 31, | Years ended June 30, | |||||
| 2016 | 2016 | 2015 | 2014 | 2013 | 2012 | |
| Selected Per–Share Data | ||||||
| Net asset value, beginning of period | $15.32 | $16.35 | $16.12 | $13.38 | $10.93 | $10.28 |
| Income from Investment Operations | ||||||
| Net investment income (loss)A | .05 | .11 | .07 | .06 | .07 | .05 |
| Net realized and unrealized gain (loss) | 1.88 | (.64) | .71 | 2.97 | 2.42 | .64 |
| Total from investment operations | 1.93 | (.53) | .78 | 3.03 | 2.49 | .69 |
| Distributions from net investment income | (.09) | (.09) | (.08) | (.08) | (.04) | (.04) |
| Distributions from net realized gain | (.09) | (.40) | (.47) | (.21) | – | – |
| Total distributions | (.18) | (.50)B | (.55) | (.29) | (.04) | (.04) |
| Net asset value, end of period | $17.07 | $15.32 | $16.35 | $16.12 | $13.38 | $10.93 |
| Total ReturnC,D,E | 12.60% | (3.32)% | 5.05% | 22.90% | 22.83% | 6.74% |
| Ratios to Average Net AssetsF,G | ||||||
| Expenses before reductions | 1.69%H | 1.70% | 1.70% | 1.71% | 1.75% | 1.79% |
| Expenses net of fee waivers, if any | 1.69%H | 1.70% | 1.70% | 1.71% | 1.75% | 1.79% |
| Expenses net of all reductions | 1.69%H | 1.69% | 1.70% | 1.71% | 1.75% | 1.79% |
| Net investment income (loss) | .60%H | .72% | .45% | .43% | .59% | .51% |
| Supplemental Data | ||||||
| Net assets, end of period (000 omitted) | $33,334 | $31,605 | $34,790 | $16,600 | $7,938 | $2,845 |
| Portfolio turnover rateI | 24%H | 25% | 22%J | 28% | 29% | 57% |
A Calculated based on average shares outstanding during the period.
B Total distributions of $.50 per share is comprised of distributions from net investment income of $.091 and distributions from net realized gain of $.404 per share.
C Total returns for periods of less than one year are not annualized.
D Total returns would have been lower if certain expenses had not been reduced during the applicable periods shown.
E Total returns do not include the effect of the contingent deferred sales charge.
F Fees and expenses of any underlying Fidelity Central Funds are not included in the Fund's expense ratio. The Fund indirectly bears its proportionate share of the expenses of any underlying Fidelity Central Funds.
G Expense ratios reflect operating expenses of the class. Expenses before reductions do not reflect amounts reimbursed by the investment adviser or reductions from brokerage service arrangements or reductions from other expense offset arrangements and do not represent the amount paid by the class during periods when reimbursements or reductions occur. Expenses net of fee waivers reflect expenses after reimbursement by the investment adviser but prior to reductions from brokerage service arrangements or other expense offset arrangements. Expenses net of all reductions represent the net expenses paid by the class.
H Annualized
I Amount does not include the portfolio activity of any underlying Fidelity Central Funds.
J Portfolio turnover rate excludes securities received or delivered in-kind.
See accompanying notes which are an integral part of the financial statements.
Financial Highlights — Fidelity Mega Cap Stock Fund
| Six months ended (Unaudited) December 31, | Years ended June 30, | |||||
| 2016 | 2016 | 2015 | 2014 | 2013 | 2012 | |
| Selected Per–Share Data | ||||||
| Net asset value, beginning of period | $15.68 | $16.72 | $16.44 | $13.60 | $11.11 | $10.43 |
| Income from Investment Operations | ||||||
| Net investment income (loss)A | .14 | .27 | .24 | .22 | .20 | .16 |
| Net realized and unrealized gain (loss) | 1.92 | (.66) | .72 | 3.02 | 2.46 | .64 |
| Total from investment operations | 2.06 | (.39) | .96 | 3.24 | 2.66 | .80 |
| Distributions from net investment income | (.26) | (.25) | (.21) | (.19) | (.17) | (.12) |
| Distributions from net realized gain | (.09) | (.40) | (.47) | (.21) | – | – |
| Total distributions | (.34)B | (.65) | (.68) | (.40) | (.17) | (.12) |
| Net asset value, end of period | $17.40 | $15.68 | $16.72 | $16.44 | $13.60 | $11.11 |
| Total ReturnC,D | 13.20% | (2.36)% | 6.13% | 24.18% | 24.17% | 7.83% |
| Ratios to Average Net AssetsE,F | ||||||
| Expenses before reductions | .68%G | .69% | .67% | .68% | .70% | .76% |
| Expenses net of fee waivers, if any | .68%G | .69% | .67% | .68% | .70% | .76% |
| Expenses net of all reductions | .68%G | .68% | .67% | .68% | .70% | .75% |
| Net investment income (loss) | 1.61%G | 1.73% | 1.48% | 1.47% | 1.64% | 1.55% |
| Supplemental Data | ||||||
| Net assets, end of period (000 omitted) | $3,295,172 | $3,059,691 | $3,300,700 | $2,860,197 | $2,214,592 | $1,287,144 |
| Portfolio turnover rateH | 24%G | 25% | 22%I | 28% | 29% | 57% |
A Calculated based on average shares outstanding during the period.
B Total distributions of $.34 per share is comprised of distributions from net investment income of $.258 and distributions from net realized gain of $.085 per share.
C Total returns for periods of less than one year are not annualized.
D Total returns would have been lower if certain expenses had not been reduced during the applicable periods shown.
E Fees and expenses of any underlying Fidelity Central Funds are not included in the Fund's expense ratio. The Fund indirectly bears its proportionate share of the expenses of any underlying Fidelity Central Funds.
F Expense ratios reflect operating expenses of the class. Expenses before reductions do not reflect amounts reimbursed by the investment adviser or reductions from brokerage service arrangements or reductions from other expense offset arrangements and do not represent the amount paid by the class during periods when reimbursements or reductions occur. Expenses net of fee waivers reflect expenses after reimbursement by the investment adviser but prior to reductions from brokerage service arrangements or other expense offset arrangements. Expenses net of all reductions represent the net expenses paid by the class.
G Annualized
H Amount does not include the portfolio activity of any underlying Fidelity Central Funds.
I Portfolio turnover rate excludes securities received or delivered in-kind.
See accompanying notes which are an integral part of the financial statements.
Financial Highlights — Fidelity Mega Cap Stock Fund Class I
| Six months ended (Unaudited) December 31, | Years ended June 30, | |||||
| 2016 | 2016 | 2015 | 2014 | 2013 | 2012 | |
| Selected Per–Share Data | ||||||
| Net asset value, beginning of period | $15.70 | $16.73 | $16.39 | $13.55 | $11.08 | $10.40 |
| Income from Investment Operations | ||||||
| Net investment income (loss)A | .14 | .27 | .24 | .22 | .20 | .16 |
| Net realized and unrealized gain (loss) | 1.92 | (.65) | .72 | 3.02 | 2.44 | .63 |
| Total from investment operations | 2.06 | (.38) | .96 | 3.24 | 2.64 | .79 |
| Distributions from net investment income | (.26) | (.24) | (.15) | (.18) | (.17) | (.11) |
| Distributions from net realized gain | (.09) | (.40) | (.47) | (.21) | – | – |
| Total distributions | (.34)B | (.65)C | (.62) | (.40)D | (.17) | (.11) |
| Net asset value, end of period | $17.42 | $15.70 | $16.73 | $16.39 | $13.55 | $11.08 |
| Total ReturnE,F | 13.17% | (2.31)% | 6.11% | 24.23% | 24.06% | 7.77% |
| Ratios to Average Net AssetsG,H | ||||||
| Expenses before reductions | .67%I | .68% | .69% | .71% | .74% | .78% |
| Expenses net of fee waivers, if any | .67%I | .68% | .68% | .71% | .74% | .78% |
| Expenses net of all reductions | .67%I | .68% | .68% | .71% | .74% | .77% |
| Net investment income (loss) | 1.62%I | 1.73% | 1.47% | 1.43% | 1.61% | 1.53% |
| Supplemental Data | ||||||
| Net assets, end of period (000 omitted) | $148,614 | $148,414 | $186,637 | $674,416 | $312,814 | $175,833 |
| Portfolio turnover rateJ | 24%I | 25% | 22%K | 28% | 29% | 57% |
A Calculated based on average shares outstanding during the period.
B Total distributions of $.34 per share is comprised of distributions from net investment income of $.257 and distributions from net realized gain of $.085 per share.
C Total distributions of $.65 per share is comprised of distributions from net investment income of $.244 and distributions from net realized gain of $.404 per share.
D Total distributions of $.40 per share is comprised of distributions from net investment income of $.182 and distributions from net realized gain of $.213 per share.
E Total returns for periods of less than one year are not annualized.
F Total returns would have been lower if certain expenses had not been reduced during the applicable periods shown.
G Fees and expenses of any underlying Fidelity Central Funds are not included in the Fund's expense ratio. The Fund indirectly bears its proportionate share of the expenses of any underlying Fidelity Central Funds.
H Expense ratios reflect operating expenses of the class. Expenses before reductions do not reflect amounts reimbursed by the investment adviser or reductions from brokerage service arrangements or reductions from other expense offset arrangements and do not represent the amount paid by the class during periods when reimbursements or reductions occur. Expenses net of fee waivers reflect expenses after reimbursement by the investment adviser but prior to reductions from brokerage service arrangements or other expense offset arrangements. Expenses net of all reductions represent the net expenses paid by the class.
I Annualized
J Amount does not include the portfolio activity of any underlying Fidelity Central Funds.
K Portfolio turnover rate excludes securities received or delivered in-kind.
See accompanying notes which are an integral part of the financial statements.
Financial Highlights — Fidelity Mega Cap Stock Fund Class Z
| Six months ended (Unaudited) December 31, | Years ended June 30, | |||
| 2016 | 2016 | 2015 | 2014 A | |
| Selected Per–Share Data | ||||
| Net asset value, beginning of period | $15.65 | $16.69 | $16.40 | $14.31 |
| Income from Investment Operations | ||||
| Net investment income (loss)B | .15 | .29 | .27 | .21 |
| Net realized and unrealized gain (loss) | 1.92 | (.66) | .72 | 2.20 |
| Total from investment operations | 2.07 | (.37) | .99 | 2.41 |
| Distributions from net investment income | (.28) | (.27) | (.23) | (.10) |
| Distributions from net realized gain | (.09) | (.40) | (.47) | (.21) |
| Total distributions | (.37) | (.67) | (.70) | (.32)C |
| Net asset value, end of period | $17.35 | $15.65 | $16.69 | $16.40 |
| Total ReturnD,E | 13.26% | (2.21)% | 6.33% | 17.06% |
| Ratios to Average Net AssetsF,G | ||||
| Expenses before reductions | .53%H | .54% | .54% | .54%H |
| Expenses net of fee waivers, if any | .53%H | .54% | .54% | .54%H |
| Expenses net of all reductions | .53%H | .53% | .54% | .54%H |
| Net investment income (loss) | 1.76%H | 1.88% | 1.61% | 1.59%H |
| Supplemental Data | ||||
| Net assets, end of period (000 omitted) | $2,420 | $2,414 | $2,449 | $117 |
| Portfolio turnover rateI | 24%H | 25% | 22%J | 28% |
A For the period August 13, 2013 (commencement of sale of shares) to June 30, 2014.
B Calculated based on average shares outstanding during the period.
C Total distributions of $.32 per share is comprised of distributions from net investment income of $.104 and distributions from net realized gain of $.213 per share.
D Total returns for periods of less than one year are not annualized.
E Total returns would have been lower if certain expenses had not been reduced during the applicable periods shown.
F Fees and expenses of any underlying Fidelity Central Funds are not included in the Fund's expense ratio. The Fund indirectly bears its proportionate share of the expenses of any underlying Fidelity Central Funds.
G Expense ratios reflect operating expenses of the class. Expenses before reductions do not reflect amounts reimbursed by the investment adviser or reductions from brokerage service arrangements or reductions from other expense offset arrangements and do not represent the amount paid by the class during periods when reimbursements or reductions occur. Expense ratios before reductions for start-up periods may not be representative of longer-term operating periods. Expenses net of fee waivers reflect expenses after reimbursement by the investment adviser but prior to reductions from brokerage service arrangements or other expense offset arrangements. Expenses net of all reductions represent the net expenses paid by the class.
H Annualized
I Amount does not include the portfolio activity of any underlying Fidelity Central Funds.
J Portfolio turnover rate excludes securities received or delivered in-kind.
See accompanying notes which are an integral part of the financial statements.
Notes to Financial Statements (Unaudited)
For the period ended December 31, 2016
1. Organization.
Fidelity Mega Cap Stock Fund (the Fund) is a fund of Fidelity Hastings Street Trust (the Trust) and is authorized to issue an unlimited number of shares. The Trust is registered under the Investment Company Act of 1940, as amended (the 1940 Act), as an open-end management investment company organized as a Massachusetts business trust. The Fund offers Class A, Class T, Class C, Mega Cap Stock, Class I and Class Z shares, each of which has equal rights as to assets and voting privileges. Each class has exclusive voting rights with respect to matters that affect that class.
After the close of business on June 24, 2016, all outstanding Class B shares were converted to Class A shares. All prior fiscal period dollar and share amounts for Class B presented in the Notes to Financial Statements are for the period July 1, 2015 through June 24, 2016.
2. Investments in Fidelity Central Funds.
The Fund invests in Fidelity Central Funds, which are open-end investment companies generally available only to other investment companies and accounts managed by the investment adviser and its affiliates. The Fund's Schedule of Investments lists each of the Fidelity Central Funds held as of period end, if any, as an investment of the Fund, but does not include the underlying holdings of each Fidelity Central Fund. As an Investing Fund, the Fund indirectly bears its proportionate share of the expenses of the underlying Fidelity Central Funds.
The Money Market Central Funds seek preservation of capital and current income and are managed by Fidelity Investments Money Management, Inc. (FIMM), an affiliate of the investment adviser. Annualized expenses of the Money Market Central Funds as of their most recent shareholder report date are less than .005%.
A complete unaudited list of holdings for each Fidelity Central Fund is available upon request or at the Securities and Exchange Commission (the SEC) website at www.sec.gov. In addition, the financial statements of the Fidelity Central Funds are available on the SEC website or upon request.
3. Significant Accounting Policies.
The financial statements have been prepared in conformity with accounting principles generally accepted in the United States of America (GAAP), which require management to make certain estimates and assumptions at the date of the financial statements. Actual results could differ from those estimates. Subsequent events, if any, through the date that the financial statements were issued have been evaluated in the preparation of the financial statements. The following summarizes the significant accounting policies of the Fund:
Investment Valuation. Investments are valued as of 4:00 p.m. Eastern time on the last calendar day of the period. The Board of Trustees (the Board) has delegated the day to day responsibility for the valuation of the Fund's investments to the Fair Value Committee (the Committee) established by the Fund's investment adviser. In accordance with valuation policies and procedures approved by the Board, the Fund attempts to obtain prices from one or more third party pricing vendors or brokers to value its investments. When current market prices, quotations or currency exchange rates are not readily available or reliable, investments will be fair valued in good faith by the Committee, in accordance with procedures adopted by the Board. Factors used in determining fair value vary by investment type and may include market or investment specific events. The frequency with which these procedures are used cannot be predicted and they may be utilized to a significant extent. The Committee oversees the Fund's valuation policies and procedures and reports to the Board on the Committee's activities and fair value determinations. The Board monitors the appropriateness of the procedures used in valuing the Fund's investments and ratifies the fair value determinations of the Committee.
The Fund categorizes the inputs to valuation techniques used to value its investments into a disclosure hierarchy consisting of three levels as shown below:
- Level 1 – quoted prices in active markets for identical investments
- Level 2 – other significant observable inputs (including quoted prices for similar investments, interest rates, prepayment speeds, etc.)
- Level 3 – unobservable inputs (including the Fund's own assumptions based on the best information available)
Valuation techniques used to value the Fund's investments by major category are as follows:
Equity securities, including restricted securities, for which market quotations are readily available, are valued at the last reported sale price or official closing price as reported by a third party pricing vendor on the primary market or exchange on which they are traded and are categorized as Level 1 in the hierarchy. In the event there were no sales during the day or closing prices are not available, securities are valued at the last quoted bid price or may be valued using the last available price and are generally categorized as Level 2 in the hierarchy. For foreign equity securities, when market or security specific events arise, comparisons to the valuation of American Depositary Receipts (ADRs), futures contracts, Exchange-Traded Funds (ETFs) and certain indexes as well as quoted prices for similar securities may be used and would be categorized as Level 2 in the hierarchy. Utilizing these techniques may result in transfers between Level 1 and Level 2. For equity securities, including restricted securities, where observable inputs are limited, assumptions about market activity and risk are used and these securities may be categorized as Level 3 in the hierarchy.
Exchange-traded options are valued using the last sale price or, in the absence of a sale, the last offering price and are categorized as Level 1 in the hierarchy. Investments in open-end mutual funds, including the Fidelity Central Funds, are valued at their closing net asset value (NAV) each business day and are categorized as Level 1 in the hierarchy.
Changes in valuation techniques may result in transfers in or out of an assigned level within the disclosure hierarchy. The aggregate value of investments by input level as of December 31, 2016 is included at the end of the Fund's Schedule of Investments.
Foreign Currency. The Fund may use foreign currency contracts to facilitate transactions in foreign-denominated securities. Gains and losses from these transactions may arise from changes in the value of the foreign currency or if the counterparties do not perform under the contracts' terms.
Foreign-denominated assets, including investment securities, and liabilities are translated into U.S. dollars at the exchange rates at period end. Purchases and sales of investment securities, income and dividends received and expenses denominated in foreign currencies are translated into U.S. dollars at the exchange rate in effect on the transaction date.
The effects of exchange rate fluctuations on investments are included with the net realized and unrealized gain (loss) on investment securities. Other foreign currency transactions resulting in realized and unrealized gain (loss) are disclosed separately.
Investment Transactions and Income. For financial reporting purposes, the Fund's investment holdings and NAV include trades executed through the end of the last business day of the period. The NAV per share for processing shareholder transactions is calculated as of the close of business of the New York Stock Exchange (NYSE), normally 4:00 p.m. Eastern time and includes trades executed through the end of the prior business day. Gains and losses on securities sold are determined on the basis of identified cost and may include proceeds received from litigation. Dividend income is recorded on the ex-dividend date, except for certain dividends from foreign securities where the ex-dividend date may have passed, which are recorded as soon as the Fund is informed of the ex-dividend date. Non-cash dividends included in dividend income, if any, are recorded at the fair market value of the securities received. Income and capital gain distributions from Fidelity Central Funds, if any, are recorded on the ex-dividend date. Certain distributions received by the Fund represent a return of capital or capital gain. The Fund determines the components of these distributions subsequent to the ex-dividend date, based upon receipt of tax filings or other correspondence relating to the underlying investment. These distributions are recorded as a reduction of cost of investments and/or as a realized gain. Investment income is recorded net of foreign taxes withheld where recovery of such taxes is uncertain.
Class Allocations and Expenses. Investment income, realized and unrealized capital gains and losses, common expenses of the Fund, and certain fund-level expense reductions, if any, are allocated daily on a pro-rata basis to each class based on the relative net assets of each class to the total net assets of the Fund. Each class differs with respect to transfer agent and distribution and service plan fees incurred. Certain expense reductions may also differ by class. For the reporting period, the allocated portion of income and expenses to each class as a percent of its average net assets may vary due to the timing of recording these transactions in relation to fluctuating net assets of the classes. Expenses directly attributable to a fund are charged to that fund. Expenses attributable to more than one fund are allocated among the respective funds on the basis of relative net assets or other appropriate methods. Expense estimates are accrued in the period to which they relate and adjustments are made when actual amounts are known.
Income Tax Information and Distributions to Shareholders. Each year, the Fund intends to qualify as a regulated investment company under Subchapter M of the Internal Revenue Code, including distributing substantially all of its taxable income and realized gains. As a result, no provision for U.S. Federal income taxes is required. The Fund files a U.S. federal tax return, in addition to state and local tax returns as required. The Fund's federal income tax returns are subject to examination by the Internal Revenue Service (IRS) for a period of three fiscal years after they are filed. State and local tax returns may be subject to examination for an additional fiscal year depending on the jurisdiction. Foreign taxes are provided for based on the Fund's understanding of the tax rules and rates that exist in the foreign markets in which it invests.
Distributions are declared and recorded on the ex-dividend date. Income dividends and capital gain distributions are declared separately for each class. Income and capital gain distributions are determined in accordance with income tax regulations, which may differ from GAAP.
Capital accounts within the financial statements are adjusted for permanent book-tax differences. These adjustments have no impact on net assets or the results of operations. Capital accounts are not adjusted for temporary book-tax differences which will reverse in a subsequent period.
Book-tax differences are primarily due to foreign currency transactions, partnerships, and losses deferred due to wash sales and excise tax regulations.
The federal tax cost of investment securities and unrealized appreciation (depreciation) as of period end were as follows:
| Gross unrealized appreciation | $980,402,667 |
| Gross unrealized depreciation | (90,721,388) |
| Net unrealized appreciation (depreciation) on securities | $889,681,279 |
| Tax cost | $2,706,297,347 |
The Fund elected to defer to its next fiscal year approximately $4,177,604 of capital losses recognized during the period November 1, 2015 to June 30, 2016.
Restricted Securities. The Fund may invest in securities that are subject to legal or contractual restrictions on resale. These securities generally may be resold in transactions exempt from registration or to the public if the securities are registered. Disposal of these securities may involve time-consuming negotiations and expense, and prompt sale at an acceptable price may be difficult. Information regarding restricted securities is included at the end of the Fund's Schedule of Investments.
Consolidated Subsidiary. The Fund invests in certain investments through a wholly-owned subsidiary ("Subsidiary"), which may be subject to federal and state taxes upon disposition.
As of period end, the Fund held an investment of $6,161,494 in this Subsidiary, representing .17% of the Fund's net assets. The financial statements have been consolidated and include accounts of the Fund and each Subsidiary. Accordingly, all inter-company transactions and balances have been eliminated.
4. Derivative Instruments.
Risk Exposures and the Use of Derivative Instruments. The Fund's investment objective allows the Fund to enter into various types of derivative contracts, including options. Derivatives are investments whose value is primarily derived from underlying assets, indices or reference rates and may be transacted on an exchange or over-the-counter (OTC). Derivatives may involve a future commitment to buy or sell a specified asset based on specified terms, to exchange future cash flows at periodic intervals based on a notional principal amount, or for one party to make one or more payments upon the occurrence of specified events in exchange for periodic payments from the other party.
The Fund used derivatives to increase returns and to manage exposure to certain risks as defined below. The success of any strategy involving derivatives depends on analysis of numerous economic factors, and if the strategies for investment do not work as intended, the Fund may not achieve its objectives.
The Fund's use of derivatives increased or decreased its exposure to the following risk:
| Equity Risk | Equity risk relates to the fluctuations in the value of financial instruments as a result of changes in market prices (other than those arising from interest rate risk or foreign exchange risk), whether caused by factors specific to an individual investment, its issuer, or all factors affecting all instruments traded in a market or market segment. |
The Fund is also exposed to additional risks from investing in derivatives, such as liquidity risk and counterparty credit risk. Liquidity risk is the risk that the Fund will be unable to close out the derivative in the open market in a timely manner. Counterparty credit risk is the risk that the counterparty will not be able to fulfill its obligation to the Fund. Counterparty credit risk related to exchange-traded options may be mitigated by the protection provided by the exchange on which they trade.
Investing in derivatives may involve greater risks than investing in the underlying assets directly and, to varying degrees, may involve risk of loss in excess of any initial investment and collateral received and amounts recognized in the Statement of Assets and Liabilities. In addition, there may be the risk that the change in value of the derivative contract does not correspond to the change in value of the underlying instrument.
Options. Options give the purchaser the right, but not the obligation, to buy (call) or sell (put) an underlying security or financial instrument at an agreed exercise or strike price between or on certain dates. Options obligate the seller (writer) to buy (put) or sell (call) an underlying instrument at the exercise or strike price or cash settle an underlying derivative instrument if the holder exercises the option on or before the expiration date.
The Fund used exchange-traded written covered call options to manage its exposure to the market. When the Fund writes a covered call option, the Fund holds the underlying instrument which must be delivered to the holder upon the exercise of the option.
Upon entering into a written options contract, the Fund will receive a premium. Premiums received are reflected as a liability on the Statement of Assets and Liabilities. Options are valued daily and any unrealized appreciation (depreciation) is reflected on the Statement of Assets and Liabilities. When a written option is exercised, the premium is added to the proceeds from the sale of the underlying instrument in determining the gain or loss realized on that investment. When an option is closed the Fund will realize a gain or loss depending on whether the proceeds or amount paid for the closing sale transaction are greater or less than the premium received. When an option expires, gains and losses are realized to the extent of premiums received. The net realized gain (loss) on closed and expired written options and the change in net unrealized appreciation (depreciation) on written options are reflected separately on the Statement of Operations.
Writing call options tends to decrease exposure to the underlying instrument and risk of loss is the change in value in excess of the premium received.
Any open options at period end are presented in the Schedule of Investments under the caption "Written Options".
During the period, the Fund recognized net realized gain (loss) of $1,291,805 and a change in net unrealized appreciation (depreciation) of $(15,103,865) related to its investment in written options. This amount is included in the Statement of Operations.
The following is a summary of the Fund's written options activity:
| Number of Contracts | Amount of Premiums | |
| Outstanding at beginning of period | 10,200 | $772,283 |
| Options Opened | 54,905 | 3,970,163 |
| Options Exercised | (701) | (86,893) |
| Options Closed | (16,288) | (1,266,553) |
| Options Expired | (8,031) | (552,000) |
| Outstanding at end of period | 40,085 | $2,837,000 |
5. Purchases and Sales of Investments.
Purchases and sales of securities, other than short-term securities, aggregated $414,759,197 and $592,869,000, respectively.
6. Fees and Other Transactions with Affiliates.
Management Fee. Fidelity Management & Research Company (the investment adviser) and its affiliates provide the Fund with investment management related services for which the Fund pays a monthly management fee. The management fee is the sum of an individual fund fee rate that is based on an annual rate of .20% of the Fund's average net assets and an annualized group fee rate that averaged .25% during the period. The group fee rate is based upon the average net assets of all the mutual funds advised by the investment adviser, including any mutual funds previously advised by the investment adviser that are currently advised by Fidelity SelectCo, LLC, an affiliate of the investment adviser. The group fee rate decreases as assets under management increase and increases as assets under management decrease. For the reporting period, the total annualized management fee rate was .45% of the Fund's average net assets.
Distribution and Service Plan Fees. In accordance with Rule 12b-1 of the 1940 Act, the Fund has adopted separate Distribution and Service Plans for each class of shares. Certain classes pay Fidelity Distributors Corporation (FDC), an affiliate of the investment adviser, separate Distribution and Service Fees, each of which is based on an annual percentage of each class' average net assets. In addition, FDC may pay financial intermediaries for selling shares of the Fund and providing shareholder support services. For the period, the Distribution and Service Fee rates, total fees and amounts retained by FDC were as follows:
| Distribution Fee | Service Fee | Total Fees | Retained by FDC | |
| Class A | -% | .25% | $85,923 | $393 |
| Class T | .25% | .25% | 68,164 | – |
| Class C | .75% | .25% | 161,841 | 20,348 |
| $315,928 | $20,741 |
Sales Load. FDC may receive a front-end sales charge of up to 5.75% for selling Class A shares and 3.50% for selling Class T shares, some of which is paid to financial intermediaries for selling shares of the Fund. Depending on the holding period, FDC may receive contingent deferred sales charges levied on Class A, Class T and Class C redemptions. The deferred sales charges are 1.00% for Class C shares, 1.00% for certain purchases of Class A shares and .25% for certain purchases of Class T shares.
For the period, sales charge amounts retained by FDC were as follows:
| Retained by FDC | |
| Class A | $14,790 |
| Class T | 1,554 |
| Class C(a) | 1,379 |
| $17,723 |
(a) When Class C shares are initially sold, FDC pays commissions from its own resources to financial intermediaries through which the sales are made.
Transfer Agent Fees. Fidelity Investments Institutional Operations Company, Inc., (FIIOC), an affiliate of the investment adviser, is the transfer, dividend disbursing and shareholder servicing agent for each class of the Fund. FIIOC receives account fees and asset-based fees that vary according to the account size and type of account of the shareholders of the respective classes of the Fund, except for Class Z. FIIOC receives an asset-based fee of Class Z's average net assets. FIIOC pays for typesetting, printing and mailing of shareholder reports, except proxy statements.
For the period, transfer agent fees for each class were as follows:
| Amount | % of Class-Level Average Net Assets(a) | |
| Class A | $67,318 | .20 |
| Class T | 28,685 | .21 |
| Class C | 33,107 | .20 |
| Mega Cap Stock | 2,998,027 | .19 |
| Class I | 137,880 | .19 |
| Class Z | 560 | .05 |
| $3,265,577 |
(a) Annualized
Accounting and Security Lending Fees. Fidelity Service Company, Inc. (FSC), an affiliate of the investment adviser, maintains the Fund's accounting records. The accounting fee is based on the level of average net assets for each month. Under a separate contract, FSC administers the security lending program. The security lending fee is based on the number and duration of lending transactions.
Brokerage Commissions. The Fund placed a portion of its portfolio transactions with brokerage firms which are affiliates of the investment adviser. Brokerage commissions are included in net realized gain (loss) and change in net unrealized appreciation (depreciation) in the Statement of Operations. The commissions paid to these affiliated firms were $12,138 for the period.
Interfund Lending Program. Pursuant to an Exemptive Order issued by the SEC, the Fund, along with other registered investment companies having management contracts with FMR or other affiliated entities of FMR, may participate in an interfund lending program. This program provides an alternative credit facility allowing the funds to borrow from, or lend money to, other participating affiliated funds. At period end, there were no interfund loans outstanding. The Fund's activity in this program during the period for which loans were outstanding was as follows:
| Borrower or Lender | Average Loan Balance | Weighted Average Interest Rate | Interest Expense |
| Borrower | $23,142,130 | .59% | $8,781 |
Interfund Trades. The Fund may purchase from or sell securities to other Fidelity Funds under procedures adopted by the Board. The procedures have been designed to ensure these interfund trades are executed in accordance with Rule 17a-7 of the 1940 Act. Interfund trades are included within the respective purchases and sales amounts shown in the Purchases and Sales of Investments note.
7. Committed Line of Credit.
The Fund participates with other funds managed by the investment adviser or an affiliate in a $4.25 billion credit facility (the "line of credit") to be utilized for temporary or emergency purposes to fund shareholder redemptions or for other short-term liquidity purposes. The Fund has agreed to pay commitment fees on its pro-rata portion of the line of credit, which amounted to $5,587 and is reflected in Miscellaneous expenses on the Statement of Operations. During the period, the Fund did not borrow on this line of credit.
8. Security Lending.
The Fund lends portfolio securities through a lending agent from time to time in order to earn additional income. For equity securities, a lending agent is used and may loan securities to certain qualified borrowers, including Fidelity Capital Markets (FCM), a broker-dealer affiliated with the Fund. On the settlement date of the loan, the Fund receives collateral (in the form of U.S. Treasury obligations, letters of credit and/or cash) against the loaned securities and maintains collateral in an amount not less than 100% of the market value of the loaned securities during the period of the loan. The market value of the loaned securities is determined at the close of business of the Fund and any additional required collateral is delivered to the Fund on the next business day. The Fund or borrower may terminate the loan at any time, and if the borrower defaults on its obligation to return the securities loaned because of insolvency or other reasons, the Fund may apply collateral received from the borrower against the obligation. The Fund may experience delays and costs in recovering the securities loaned. Any cash collateral received is invested in the Fidelity Securities Lending Cash Central Fund. At period end, there were no security loans outstanding. Security lending income represents the income earned on investing cash collateral, less rebates paid to borrowers and any lending agent fees associated with the loan, plus any premium payments received for lending certain types of securities. Security lending income is presented in the Statement of Operations as a component of income from Fidelity Central Funds. Total security lending income during the period amounted to $30,341. During the period, there were no securities loaned to FCM.
9. Expense Reductions.
During the period the investment advisor reimbursed and/or waived a portion of fund-level operating expenses in the amount of $12,551.
10. Distributions to Shareholders.
Distributions to shareholders of each class were as follows:
| Six months ended December 31, 2016 | Year ended June 30, 2016 | |
| From net investment income | ||
| Class A | $899,152 | $1,080,757 |
| Class T | 291,258 | 237,487 |
| Class B | – | 2,701 |
| Class C | 185,400 | 200,810 |
| Mega Cap Stock | 48,569,058 | 48,178,641 |
| Class I | 2,230,910 | 2,632,093 |
| Class Z | 40,402 | 40,040 |
| Total | $52,216,180 | $52,372,529 |
| From net realized gain | ||
| Class A | $344,294 | $2,557,147 |
| Class T | 137,942 | 579,808 |
| Class B | – | 19,784 |
| Class C | 163,372 | 882,477 |
| Mega Cap Stock | 15,922,546 | 78,620,158 |
| Class I | 711,666 | 4,380,245 |
| Class Z | 11,608 | 59,789 |
| Total | $17,291,428 | $87,099,408 |
11. Share Transactions.
Share transactions for each class were as follows and may contain automatic conversions between classes or exchanges between affiliated funds:
| Shares | Shares | Dollars | Dollars | |
| Six months ended December 31, 2016 | Year ended June 30, 2016 | Six months ended December 31, 2016 | Year ended June 30, 2016 | |
| Class A | ||||
| Shares sold | 521,589 | 2,249,513 | $8,775,422 | $35,033,810 |
| Reinvestment of distributions | 70,690 | 222,669 | 1,204,586 | 3,545,701 |
| Shares redeemed | (905,790) | (5,136,376) | (14,974,471) | (81,329,239) |
| Net increase (decrease) | (313,511) | (2,664,194) | $(4,994,463) | $(42,749,728) |
| Class T | ||||
| Shares sold | 222,411 | 686,666 | $3,694,556 | $10,511,335 |
| Reinvestment of distributions | 24,971 | 51,253 | 425,999 | 811,536 |
| Shares redeemed | (282,853) | (457,036) | (4,662,106) | (6,981,965) |
| Net increase (decrease) | (35,471) | 280,883 | $(541,551) | $4,340,906 |
| Class B | ||||
| Shares sold | – | 5,282 | $– | $81,885 |
| Reinvestment of distributions | – | 1,413 | – | 22,443 |
| Shares redeemed | – | (59,664) | – | (913,434) |
| Net increase (decrease) | – | (52,969) | $– | $(809,106) |
| Class C | ||||
| Shares sold | 140,907 | 670,666 | $2,327,012 | $10,277,856 |
| Reinvestment of distributions | 20,218 | 68,302 | 342,433 | 1,069,779 |
| Shares redeemed | (271,168) | (803,589) | (4,390,620) | (12,024,954) |
| Net increase (decrease) | (110,043) | (64,621) | $(1,721,175) | $(677,319) |
| Mega Cap Stock | ||||
| Shares sold | 23,276,633 | 73,675,851 | $393,358,699 | $1,142,159,263 |
| Reinvestment of distributions | 3,517,132 | 7,313,288 | 60,338,870 | 116,494,236 |
| Shares redeemed | (32,490,405) | (83,289,947) | (543,369,144) | (1,294,330,166) |
| Net increase (decrease) | (5,696,640) | (2,300,808) | $(89,671,575) | $(35,676,667) |
| Class I | ||||
| Shares sold | 606,328 | 2,012,535 | $10,200,437 | $31,112,150 |
| Reinvestment of distributions | 170,239 | 417,290 | 2,921,152 | 6,659,834 |
| Shares redeemed | (1,697,954) | (4,128,858) | (28,439,121) | (64,549,339) |
| Net increase (decrease) | (921,387) | (1,699,033) | $(15,317,532) | $(26,777,355) |
| Class Z | ||||
| Shares sold | 6,160 | 14,166 | $103,747 | $216,431 |
| Reinvestment of distributions | 3,045 | 6,283 | 52,010 | 99,829 |
| Shares redeemed | (23,956) | (12,944) | (389,309) | (199,888) |
| Net increase (decrease) | (14,751) | 7,505 | $(233,552) | $116,372 |
12. Other.
The Fund's organizational documents provide former and current trustees and officers with a limited indemnification against liabilities arising in connection with the performance of their duties to the Fund. In the normal course of business, the Fund may also enter into contracts that provide general indemnifications. The Fund's maximum exposure under these arrangements is unknown as this would be dependent on future claims that may be made against the Fund. The risk of material loss from such claims is considered remote.
Shareholder Expense Example
As a shareholder of the Fund, you incur two types of costs: (1) transaction costs, including sales charges (loads) on purchase payments or redemption proceeds, and (2) ongoing costs, including management fees, distribution and/or service (12b-1) fees and other Fund expenses. This Example is intended to help you understand your ongoing costs (in dollars) of investing in the Fund and to compare these costs with the ongoing costs of investing in other mutual funds.
The Example is based on an investment of $1,000 invested at the beginning of the period and held for the entire period (July 1, 2016 to December 31, 2016).
Actual Expenses
The first line of the accompanying table for each class of the Fund provides information about actual account values and actual expenses. You may use the information in this line, together with the amount you invested, to estimate the expenses that you paid over the period. Simply divide your account value by $1,000.00 (for example, an $8,600 account value divided by $1,000.00 = 8.6), then multiply the result by the number in the first line for a class of the Fund under the heading entitled "Expenses Paid During Period" to estimate the expenses you paid on your account during this period. A small balance maintenance fee of $12.00 that is charged once a year may apply for certain accounts with a value of less than $2,000. This fee is not included in the table below. If it was, the estimate of expenses you paid during the period would be higher, and your ending account value lower, by this amount. In addition, the Fund, as a shareholder in the underlying Fidelity Central Funds, will indirectly bear its pro-rata share of the fees and expenses incurred by the underlying Fidelity Central Funds. These fees and expenses are not included in the Fund's annualized expense ratio used to calculate the expense estimate in the table below.
Hypothetical Example for Comparison Purposes
The second line of the accompanying table for each class of the Fund provides information about hypothetical account values and hypothetical expenses based on a Class' actual expense ratio and an assumed rate of return of 5% per year before expenses, which is not the Class' actual return. The hypothetical account values and expenses may not be used to estimate the actual ending account balance or expenses you paid for the period. You may use this information to compare the ongoing costs of investing in the Fund and other funds. To do so, compare this 5% hypothetical example with the 5% hypothetical examples that appear in the shareholder reports of the other funds. A small balance maintenance fee of $12.00 that is charged once a year may apply for certain accounts with a value of less than $2,000. This fee is not included in the table below. If it was, the estimate of expenses you paid during the period would be higher, and your ending account value lower, by this amount. In addition, the Fund, as a shareholder in the underlying Fidelity Central Funds, will indirectly bear its pro-rata share of the fees and expenses incurred by the underlying Fidelity Central Funds. These fees and expenses are not included in the Fund's annualized expense ratio used to calculate the expense estimate in the table below.
Please note that the expenses shown in the table are meant to highlight your ongoing costs only and do not reflect any transaction costs. Therefore, the second line of the table is useful in comparing ongoing costs only, and will not help you determine the relative total costs of owning different funds. In addition, if these transactional costs were included, your costs would have been higher.
| Annualized Expense Ratio-A | Beginning Account Value July 1, 2016 | Ending Account Value December 31, 2016 | Expenses Paid During Period-B July 1, 2016 to December 31, 2016 | |
| Class A | .93% | |||
| Actual | $1,000.00 | $1,129.70 | $4.99 | |
| Hypothetical-C | $1,000.00 | $1,020.52 | $4.74 | |
| Class T | 1.20% | |||
| Actual | $1,000.00 | $1,128.50 | $6.44 | |
| Hypothetical-C | $1,000.00 | $1,019.16 | $6.11 | |
| Class C | 1.69% | |||
| Actual | $1,000.00 | $1,126.00 | $9.06 | |
| Hypothetical-C | $1,000.00 | $1,016.69 | $8.59 | |
| Mega Cap Stock | .68% | |||
| Actual | $1,000.00 | $1,132.00 | $3.65 | |
| Hypothetical-C | $1,000.00 | $1,021.78 | $3.47 | |
| Class I | .67% | |||
| Actual | $1,000.00 | $1,131.70 | $3.60 | |
| Hypothetical-C | $1,000.00 | $1,021.83 | $3.41 | |
| Class Z | .53% | |||
| Actual | $1,000.00 | $1,132.60 | $2.85 | |
| Hypothetical-C | $1,000.00 | $1,022.53 | $2.70 |
A Annualized expense ratio reflects expenses net of applicable fee waivers.
B Expenses are equal to each Class' annualized expense ratio, multiplied by the average account value over the period, multiplied by 184/365 (to reflect the one-half year period).
C 5% return per year before expenses
Board Approval of Investment Advisory Contracts and Management Fees
Fidelity Mega Cap Stock Fund
Each year, the Board of Trustees, including the Independent Trustees (together, the Board), votes on the renewal of the management contract with Fidelity Management & Research Company (FMR) and the sub-advisory agreements (together, the Advisory Contracts) for the fund. The Board, assisted by the advice of fund counsel and Independent Trustees' counsel, requests and considers a broad range of information relevant to the renewal of the Advisory Contracts throughout the year.
The Board meets regularly and, at each of its meetings, covers an extensive agenda of topics and materials and considers factors that are relevant to its annual consideration of the renewal of the fund's Advisory Contracts, including the services and support provided to the fund and its shareholders. The Board has established various standing committees (Committees), each composed of and chaired by Independent Trustees with varying backgrounds, to which the Board has assigned specific subject matter responsibilities in order to enhance effective decision-making by the Board. The Board, acting directly and through its Committees, requests and receives information concerning the annual consideration of the renewal of the fund's Advisory Contracts. The Board also meets as needed to consider matters specifically related to the Board's annual consideration of the renewal of the Advisory Contracts. Members of the Board may also meet with trustees of other Fidelity funds through ad hoc joint committees to discuss certain matters relevant to all of the Fidelity funds.
At its July 2016 meeting, the Board unanimously determined to renew the fund's Advisory Contracts. In reaching its determination, the Board considered all factors it believed relevant, including (i) the nature, extent, and quality of the services to be provided to the fund and its shareholders (including the investment performance of the fund); (ii) the competitiveness of the fund's management fee and total expense ratio relative to peer funds; (iii) the total costs of the services to be provided by and the profits to be realized by Fidelity from its relationships with the fund; and (iv) the extent to which, if any, economies of scale exist and would be realized as the fund grows, and whether any economies of scale are appropriately shared with fund shareholders.
In considering whether to renew the Advisory Contracts for the fund, the Board reached a determination, with the assistance of fund counsel and Independent Trustees' counsel and through the exercise of its business judgment, that the renewal of the Advisory Contracts was in the best interests of the fund and its shareholders and that the compensation payable under the Advisory Contracts was fair and reasonable. The Board's decision to renew the Advisory Contracts was not based on any single factor, but rather was based on a comprehensive consideration of all the information provided to the Board at its meetings throughout the year. The Board, in reaching its determination to renew the Advisory Contracts, was aware that shareholders of the fund have a broad range of investment choices available to them, including a wide choice among funds offered by Fidelity's competitors, and that the fund's shareholders, who have the opportunity to review and weigh the disclosure provided by the fund in its prospectus and other public disclosures, have chosen to invest in this fund, which is part of the Fidelity family of funds.
Nature, Extent, and Quality of Services Provided. The Board considered Fidelity's staffing as it relates to the fund, including the backgrounds of investment personnel of Fidelity, and also considered the fund's investment objective, strategies, and related investment philosophy. The Independent Trustees also had discussions with senior management of Fidelity's investment operations and investment groups. The Board considered the structure of the investment personnel compensation program and whether this structure provides appropriate incentives to act in the best interests of the fund. Additionally, the Board considered the portfolio managers' investments, if any, in the funds that they manage.Resources Dedicated to Investment Management and Support Services. The Board and the Fund Oversight and Research Committees reviewed the general qualifications and capabilities of Fidelity's investment staff, including its size, education, experience, and resources, as well as Fidelity's approach to recruiting, training, managing, and compensating investment personnel. The Board noted that Fidelity has continued to increase the resources devoted to non-U.S. offices, including expansion of Fidelity's global investment organization. The Board also noted that Fidelity's analysts have extensive resources, tools and capabilities that allow them to conduct sophisticated quantitative and fundamental analysis, as well as credit analysis of issuers, counterparties and guarantors. Further, the Board considered that Fidelity's investment professionals have sufficient access to global information and data so as to provide competitive investment results over time, and that those professionals also have access to sophisticated tools that permit them to assess portfolio construction and risk and performance attribution characteristics continuously, as well as to transmit new information and research conclusions rapidly around the world. Additionally, in its deliberations, the Board considered Fidelity's trading, risk management, compliance, and technology and operations capabilities and resources, which are integral parts of the investment management process.Shareholder and Administrative Services. The Board considered (i) the nature, extent, quality, and cost of advisory, administrative, and shareholder services performed by FMR, the sub-advisers (together with FMR, the Investment Advisers), and their affiliates under the Advisory Contracts and under separate agreements covering transfer agency, pricing and bookkeeping, and securities lending services for the fund; (ii) the nature and extent of the supervision of third party service providers, principally custodians, subcustodians, and pricing vendors; and (iii) the resources devoted to, and the record of compliance with, the fund's compliance policies and procedures. The Board also reviewed the allocation of fund brokerage, including allocations to brokers affiliated with the Investment Advisers, the use of brokerage commissions to pay fund expenses, and the use of "soft" commission dollars to pay for research services.The Board noted that the growth of fund assets over time across the complex allows Fidelity to reinvest in the development of services designed to enhance the value or convenience of the Fidelity funds as investment vehicles. These services include 24-hour access to account information and market information through telephone representatives and over the Internet, investor education materials and asset allocation tools, and the expanded availability of Fidelity Investor Centers.In 2014, the Board formed an ad hoc Committee on Transfer Agency Fees to review the variety of transfer agency fee structures throughout the industry and Fidelity's competitive positioning with respect to industry participants.Investment in a Large Fund Family. The Board considered the benefits to shareholders of investing in a Fidelity fund, including the benefits of investing in a fund that is part of a large family of funds offering a variety of investment disciplines and providing a large variety of mutual fund investor services. The Board noted that Fidelity had taken, or had made recommendations that resulted in the Fidelity funds taking, a number of actions over the previous year that benefited particular funds, including: (i) continuing to dedicate additional resources to investment research and to the support of the senior management team that oversees asset management; (ii) continuing efforts to enhance Fidelity's global research capabilities; (iii) launching new funds and making other enhancements to meet client needs; (iv) broadening eligibility requirements for certain lower-priced share classes of, and streamlining the fee structure for, certain existing equity index funds; (v) lowering expense caps for certain existing funds and classes to reduce expenses paid by shareholders; (vi) eliminating redemption fees for certain variable insurance product funds and classes; (vii) continuing to launch dedicated lower cost underlying funds to meet portfolio construction needs related to expanding underlying fund options for Fidelity funds of funds, specifically for the Freedom Fund product lines; (viii) launching a lower cost share class for use by the Freedom Index Fund product line; (ix) rationalizing product lines and gaining increased efficiencies through fund mergers and share class consolidations; (x) continuing to develop, acquire and implement systems and technology to improve services to the funds and shareholders, strengthen information security, and increase efficiency; (xi) implementing investment enhancements to further strengthen Fidelity's target date product line to increase investors' probability of success in achieving their goals; (xii) accelerating the conversion of all remaining Class B shares to Class A shares, which have a lower expense structure; and (xiii) implementing changes to Fidelity's money market fund product line in response to recent regulatory reforms.Investment Performance. The Board considered whether the fund has operated in accordance with its investment objective, as well as its record of compliance with its investment restrictions and its performance history.The Board took into account discussions with representatives of the Investment Advisers about fund investment performance that occur at Board meetings throughout the year. In this regard the Board noted that as part of regularly scheduled fund reviews and other reports to the Board on fund performance, the Board considers annualized return information for the fund, for different time periods, measured against a securities market index ("benchmark index") and a peer group of funds with similar objectives ("peer group"), if any. In its evaluation of fund investment performance, the Board gave particular attention to information indicating changes in performance of certain Fidelity funds for specific time periods and discussed with the Investment Advisers the reasons for any overperformance or underperformance.In addition to reviewing absolute and relative fund performance, the Independent Trustees periodically consider the appropriateness of fund performance metrics in evaluating the results achieved. In general, the Independent Trustees believe that fund performance should be evaluated based on net performance (after fees and expenses) of both the highest performing and lowest performing fund share classes, where applicable, compared to appropriate benchmark indices, over appropriate time periods that may include full market cycles, and compared to peer groups, as applicable, over the same periods, taking into account relevant factors including the following: general market conditions; issuer-specific information; and fund cash flows and other factors.The Independent Trustees recognize that shareholders evaluate performance on a net basis over their own holding periods, for which one-, three-, and five-year periods are often used as a proxy. For this reason, the performance information reviewed by the Board also included net cumulative calendar year total return information for the fund and an appropriate benchmark index for the most recent one-, three-, and five-year periods, as shown below. A peer group is not shown below because the fund does not generally utilize a peer group for performance comparison purposes.Fidelity Mega Cap Stock Fund
Fidelity Mega Cap Stock Fund
![]()
Corporate Headquarters
245 Summer St.
Boston, MA 02210
www.fidelity.com
GII-SANN-0217
1.714809.120
Fidelity® Fund Semi-Annual Report December 31, 2016 |
|
Contents
Board Approval of Investment Advisory Contracts and Management Fees |
To view a fund's proxy voting guidelines and proxy voting record for the 12-month period ended June 30, visit http://www.fidelity.com/proxyvotingresults or visit the Securities and Exchange Commission's (SEC) web site at http://www.sec.gov.
You may also call 1-800-544-8544 to request a free copy of the proxy voting guidelines.
Standard & Poor's, S&P and S&P 500 are registered service marks of The McGraw-Hill Companies, Inc. and have been licensed for use by Fidelity Distributors Corporation.
Other third-party marks appearing herein are the property of their respective owners.
All other marks appearing herein are registered or unregistered trademarks or service marks of FMR LLC or an affiliated company. © 2017 FMR LLC. All rights reserved.
This report and the financial statements contained herein are submitted for the general information of the shareholders of the Fund. This report is not authorized for distribution to prospective investors in the Fund unless preceded or accompanied by an effective prospectus.
A fund files its complete schedule of portfolio holdings with the SEC for the first and third quarters of each fiscal year on Form N-Q. Forms N-Q are available on the SEC’s web site at http://www.sec.gov. A fund's Forms N-Q may be reviewed and copied at the SEC’s Public Reference Room in Washington, DC. Information regarding the operation of the SEC's Public Reference Room may be obtained by calling 1-800-SEC-0330.
For a complete list of a fund's portfolio holdings, view the most recent holdings listing, semiannual report, or annual report on Fidelity's web site at http://www.fidelity.com, http://www.institutional.fidelity.com, or http://www.401k.com, as applicable.
NOT FDIC INSURED •MAY LOSE VALUE •NO BANK GUARANTEE
Neither the Fund nor Fidelity Distributors Corporation is a bank.
Investment Summary (Unaudited)
Top Ten Stocks as of December 31, 2016
| % of fund's net assets | % of fund's net assets 6 months ago | |
| Apple, Inc. | 4.4 | 1.5 |
| Microsoft Corp. | 3.2 | 1.0 |
| JPMorgan Chase & Co. | 3.1 | 1.0 |
| Bank of America Corp. | 3.0 | 0.0 |
| Chevron Corp. | 2.5 | 1.9 |
| Berkshire Hathaway, Inc. Class B | 2.4 | 2.7 |
| Wells Fargo & Co. | 2.3 | 1.3 |
| Johnson & Johnson | 2.2 | 2.2 |
| Amphenol Corp. Class A | 2.2 | 2.1 |
| Comcast Corp. Class A | 2.1 | 1.7 |
| 27.4 |
Top Five Market Sectors as of December 31, 2016
| % of fund's net assets | % of fund's net assets 6 months ago | |
| Information Technology | 20.0 | 20.3 |
| Financials | 19.9 | 11.9 |
| Consumer Discretionary | 13.1 | 12.5 |
| Health Care | 11.5 | 14.3 |
| Energy | 11.3 | 5.7 |
Prior period industry classifications reflect the categories in place as of the date indicated and have not been adjusted to reflect current industry classifications.
Asset Allocation (% of fund's net assets)
| As of December 31, 2016* | ||
| Stocks | 99.4% | |
| Short-Term Investments and Net Other Assets (Liabilities) | 0.6% | |

* Foreign investments - 6.4%
| As of June 30, 2016* | ||
| Stocks | 98.0% | |
| Short-Term Investments and Net Other Assets (Liabilities) | 2.0% | |

* Foreign investments - 8.3%
Percentages shown as 0.0% may reflect amounts less than 0.05%.
Investments December 31, 2016 (Unaudited)
Showing Percentage of Net Assets
| Common Stocks - 99.0% | |||
| Shares | Value (000s) | ||
| CONSUMER DISCRETIONARY - 12.7% | |||
| Hotels, Restaurants & Leisure - 3.2% | |||
| Domino's Pizza, Inc. | 251,400 | $40,033 | |
| Starbucks Corp. | 983,996 | 54,631 | |
| Vail Resorts, Inc. | 255,000 | 41,134 | |
| 135,798 | |||
| Internet & Direct Marketing Retail - 1.9% | |||
| Amazon.com, Inc. (a) | 110,000 | 82,486 | |
| Media - 3.1% | |||
| Comcast Corp. Class A | 1,320,700 | 91,194 | |
| The Walt Disney Co. | 400,000 | 41,688 | |
| 132,882 | |||
| Multiline Retail - 0.6% | |||
| Dollar Tree, Inc. (a) | 350,000 | 27,013 | |
| Specialty Retail - 3.1% | |||
| AutoZone, Inc. (a) | 47,300 | 37,357 | |
| Home Depot, Inc. | 500,000 | 67,040 | |
| TJX Companies, Inc. | 358,800 | 26,957 | |
| 131,354 | |||
| Textiles, Apparel & Luxury Goods - 0.8% | |||
| NIKE, Inc. Class B | 648,200 | 32,948 | |
| TOTAL CONSUMER DISCRETIONARY | 542,481 | ||
| CONSUMER STAPLES - 4.0% | |||
| Beverages - 0.6% | |||
| Molson Coors Brewing Co. Class B | 254,200 | 24,736 | |
| Food & Staples Retailing - 1.2% | |||
| Costco Wholesale Corp. | 325,000 | 52,036 | |
| Food Products - 0.8% | |||
| Mondelez International, Inc. | 779,600 | 34,560 | |
| Household Products - 0.4% | |||
| Spectrum Brands Holdings, Inc. (b) | 150,000 | 18,350 | |
| Personal Products - 0.4% | |||
| Estee Lauder Companies, Inc. Class A | 192,300 | 14,709 | |
| Tobacco - 0.6% | |||
| Reynolds American, Inc. | 450,000 | 25,218 | |
| TOTAL CONSUMER STAPLES | 169,609 | ||
| ENERGY - 11.3% | |||
| Energy Equipment & Services - 1.4% | |||
| Schlumberger Ltd. | 735,000 | 61,703 | |
| Oil, Gas & Consumable Fuels - 9.9% | |||
| Anadarko Petroleum Corp. | 870,450 | 60,696 | |
| Cheniere Energy Partners LP | 581,461 | 16,758 | |
| Chevron Corp. | 910,000 | 107,107 | |
| ConocoPhillips Co. | 1,248,100 | 62,580 | |
| Devon Energy Corp. | 800,000 | 36,536 | |
| EOG Resources, Inc. | 300,000 | 30,330 | |
| EQT Midstream Partners LP | 193,700 | 14,853 | |
| Kinder Morgan, Inc. | 1,350,000 | 27,959 | |
| Suncor Energy, Inc. | 900,000 | 29,427 | |
| Teekay LNG Partners LP | 1,000,000 | 14,450 | |
| Williams Partners LP | 550,000 | 20,917 | |
| 421,613 | |||
| TOTAL ENERGY | 483,316 | ||
| FINANCIALS - 19.9% | |||
| Banks - 11.4% | |||
| Bank of America Corp. | 5,700,000 | 125,970 | |
| Citigroup, Inc. | 1,200,000 | 71,316 | |
| JPMorgan Chase & Co. | 1,548,900 | 133,655 | |
| SunTrust Banks, Inc. | 1,041,300 | 57,115 | |
| Wells Fargo & Co. | 1,778,367 | 98,006 | |
| 486,062 | |||
| Capital Markets - 4.2% | |||
| Goldman Sachs Group, Inc. | 350,000 | 83,808 | |
| Moody's Corp. | 116,593 | 10,991 | |
| Morgan Stanley | 1,200,000 | 50,700 | |
| MSCI, Inc. | 250,000 | 19,695 | |
| S&P Global, Inc. | 115,725 | 12,445 | |
| 177,639 | |||
| Consumer Finance - 0.4% | |||
| Capital One Financial Corp. | 200,000 | 17,448 | |
| Diversified Financial Services - 2.4% | |||
| Berkshire Hathaway, Inc. Class B (a) | 638,900 | 104,128 | |
| Insurance - 1.5% | |||
| American International Group, Inc. | 577,500 | 37,717 | |
| Marsh & McLennan Companies, Inc. | 375,000 | 25,346 | |
| 63,063 | |||
| TOTAL FINANCIALS | 848,340 | ||
| HEALTH CARE - 11.5% | |||
| Biotechnology - 2.5% | |||
| Alexion Pharmaceuticals, Inc. (a) | 225,000 | 27,529 | |
| Amgen, Inc. | 551,300 | 80,606 | |
| 108,135 | |||
| Health Care Equipment & Supplies - 3.1% | |||
| Boston Scientific Corp. (a) | 1,512,000 | 32,705 | |
| Danaher Corp. | 703,200 | 54,737 | |
| Medtronic PLC | 609,700 | 43,429 | |
| 130,871 | |||
| Health Care Providers & Services - 1.1% | |||
| UnitedHealth Group, Inc. | 300,000 | 48,012 | |
| Life Sciences Tools & Services - 0.9% | |||
| Thermo Fisher Scientific, Inc. | 257,700 | 36,361 | |
| Pharmaceuticals - 3.9% | |||
| Allergan PLC | 121,900 | 25,600 | |
| Bristol-Myers Squibb Co. | 800,000 | 46,752 | |
| Johnson & Johnson | 800,000 | 92,168 | |
| 164,520 | |||
| TOTAL HEALTH CARE | 487,899 | ||
| INDUSTRIALS - 8.9% | |||
| Aerospace & Defense - 5.0% | |||
| Huntington Ingalls Industries, Inc. | 245,500 | 45,219 | |
| Northrop Grumman Corp. | 225,000 | 52,331 | |
| Raytheon Co. | 500,000 | 71,000 | |
| United Technologies Corp. | 400,000 | 43,848 | |
| 212,398 | |||
| Building Products - 1.0% | |||
| A.O. Smith Corp. | 443,980 | 21,022 | |
| Masco Corp. | 750,000 | 23,715 | |
| 44,737 | |||
| Electrical Equipment - 0.6% | |||
| Fortive Corp. | 451,600 | 24,219 | |
| Machinery - 2.3% | |||
| Caterpillar, Inc. | 550,000 | 51,007 | |
| Flowserve Corp. | 600,000 | 28,830 | |
| Xylem, Inc. | 400,000 | 19,808 | |
| 99,645 | |||
| TOTAL INDUSTRIALS | 380,999 | ||
| INFORMATION TECHNOLOGY - 20.0% | |||
| Electronic Equipment & Components - 2.2% | |||
| Amphenol Corp. Class A | 1,366,776 | 91,847 | |
| Internet Software & Services - 3.8% | |||
| Alphabet, Inc.: | |||
| Class A (a) | 110,600 | 87,645 | |
| Class C (a) | 26,027 | 20,088 | |
| Facebook, Inc. Class A (a) | 489,200 | 56,282 | |
| 164,015 | |||
| IT Services - 2.7% | |||
| CSRA, Inc. | 500,000 | 15,920 | |
| MasterCard, Inc. Class A | 460,300 | 47,526 | |
| Visa, Inc. Class A | 646,400 | 50,432 | |
| 113,878 | |||
| Semiconductors & Semiconductor Equipment - 2.3% | |||
| Lam Research Corp. | 250,000 | 26,433 | |
| NXP Semiconductors NV (a) | 305,817 | 29,973 | |
| Texas Instruments, Inc. | 575,000 | 41,958 | |
| 98,364 | |||
| Software - 4.6% | |||
| Adobe Systems, Inc. (a) | 574,400 | 59,134 | |
| Microsoft Corp. | 2,200,000 | 136,708 | |
| 195,842 | |||
| Technology Hardware, Storage & Peripherals - 4.4% | |||
| Apple, Inc. | 1,622,200 | 187,882 | |
| TOTAL INFORMATION TECHNOLOGY | 851,828 | ||
| MATERIALS - 7.3% | |||
| Chemicals - 6.7% | |||
| CF Industries Holdings, Inc. | 900,000 | 28,332 | |
| E.I. du Pont de Nemours & Co. | 725,000 | 53,215 | |
| Ecolab, Inc. | 402,500 | 47,181 | |
| LyondellBasell Industries NV Class A | 650,000 | 55,757 | |
| Monsanto Co. | 428,500 | 45,082 | |
| The Chemours Co. LLC | 500,000 | 11,045 | |
| The Scotts Miracle-Gro Co. Class A | 250,000 | 23,888 | |
| W.R. Grace & Co. | 300,000 | 20,292 | |
| 284,792 | |||
| Construction Materials - 0.6% | |||
| Vulcan Materials Co. | 212,299 | 26,569 | |
| TOTAL MATERIALS | 311,361 | ||
| REAL ESTATE - 2.2% | |||
| Equity Real Estate Investment Trusts (REITs) - 2.2% | |||
| American Tower Corp. | 244,100 | 25,796 | |
| Easterly Government Properties, Inc. | 1,211,300 | 24,250 | |
| Public Storage | 200,000 | 44,700 | |
| 94,746 | |||
| TELECOMMUNICATION SERVICES - 0.9% | |||
| Wireless Telecommunication Services - 0.9% | |||
| T-Mobile U.S., Inc. (a) | 650,000 | 37,382 | |
| UTILITIES - 0.3% | |||
| Water Utilities - 0.3% | |||
| American Water Works Co., Inc. | 175,000 | 12,663 | |
| TOTAL COMMON STOCKS | |||
| (Cost $3,278,295) | 4,220,624 | ||
| Nonconvertible Preferred Stocks - 0.4% | |||
| CONSUMER DISCRETIONARY - 0.4% | |||
| Automobiles - 0.4% | |||
| Porsche Automobil Holding SE (Germany) | |||
| (Cost $16,765) | 300,000 | 16,339 | |
| Principal Amount (000s) | Value (000s) | ||
| U.S. Treasury Obligations - 0.3% | |||
| U.S. Treasury Bills, yield at date of purchase 0.28% to 0.49% 1/12/17 to 2/16/17 (c) | |||
| (Cost $12,776) | 12,780 | 12,776 | |
| Shares | Value (000s) | ||
| Money Market Funds - 1.6% | |||
| Fidelity Cash Central Fund, 0.60% (d) | 68,397,727 | $68,411 | |
| Fidelity Securities Lending Cash Central Fund 0.65% (d)(e) | 1,443,674 | 1,444 | |
| TOTAL MONEY MARKET FUNDS | |||
| (Cost $69,855) | 69,855 | ||
| TOTAL INVESTMENT PORTFOLIO - 101.3% | |||
| (Cost $3,377,691) | 4,319,594 | ||
| NET OTHER ASSETS (LIABILITIES) - (1.3)% | (55,255) | ||
| NET ASSETS - 100% | $4,264,339 |
Legend
(a) Non-income producing
(b) Security or a portion of the security is on loan at period end.
(c) Security or a portion of the security was pledged to cover margin requirements for futures contracts. At period end, the value of securities pledged amounted to $1,275,000.
(d) Affiliated fund that is generally available only to investment companies and other accounts managed by Fidelity Investments. The rate quoted is the annualized seven-day yield of the fund at period end. A complete unaudited listing of the fund's holdings as of its most recent quarter end is available upon request. In addition, each Fidelity Central Fund's financial statements are available on the SEC's website or upon request.
(e) Investment made with cash collateral received from securities on loan.
Affiliated Central Funds
Information regarding fiscal year to date income earned by the Fund from investments in Fidelity Central Funds is as follows:
| Fund | Income earned |
| (Amounts in thousands) | |
| Fidelity Cash Central Fund | $210 |
| Fidelity Securities Lending Cash Central Fund | 16 |
| Total | $226 |
Investment Valuation
The following is a summary of the inputs used, as of December 31, 2016, involving the Fund's assets and liabilities carried at fair value. The inputs or methodology used for valuing securities may not be an indication of the risk associated with investing in those securities. For more information on valuation inputs, and their aggregation into the levels used below, please refer to the Investment Valuation section in the accompanying Notes to Financial Statements.
| Valuation Inputs at Reporting Date: | ||||
| Description | Total | Level 1 | Level 2 | Level 3 |
| (Amounts in thousands) | ||||
| Investments in Securities: | ||||
| Equities: | ||||
| Consumer Discretionary | $558,820 | $558,820 | $-- | $-- |
| Consumer Staples | 169,609 | 169,609 | -- | -- |
| Energy | 483,316 | 483,316 | -- | -- |
| Financials | 848,340 | 848,340 | -- | -- |
| Health Care | 487,899 | 487,899 | -- | -- |
| Industrials | 380,999 | 380,999 | -- | -- |
| Information Technology | 851,828 | 851,828 | -- | -- |
| Materials | 311,361 | 311,361 | -- | -- |
| Real Estate | 94,746 | 94,746 | -- | -- |
| Telecommunication Services | 37,382 | 37,382 | -- | -- |
| Utilities | 12,663 | 12,663 | -- | -- |
| U.S. Government and Government Agency Obligations | 12,776 | -- | 12,776 | -- |
| Money Market Funds | 69,855 | 69,855 | -- | -- |
| Total Investments in Securities: | $4,319,594 | $4,306,818 | $12,776 | $-- |
See accompanying notes which are an integral part of the financial statements.
Financial Statements
Statement of Assets and Liabilities
| Amounts in thousands (except per-share amounts) | December 31, 2016 (Unaudited) | |
| Assets | ||
| Investment in securities, at value (including securities loaned of $1,407) — See accompanying schedule: Unaffiliated issuers (cost $3,307,836) | $4,249,739 | |
| Fidelity Central Funds (cost $69,855) | 69,855 | |
| Total Investments (cost $3,377,691) | $4,319,594 | |
| Cash | 1 | |
| Foreign currency held at value (cost $1,073) | 1,073 | |
| Receivable for investments sold | 34,325 | |
| Receivable for fund shares sold | 1,786 | |
| Dividends receivable | 3,052 | |
| Distributions receivable from Fidelity Central Funds | 62 | |
| Prepaid expenses | 9 | |
| Other receivables | 177 | |
| Total assets | 4,360,079 | |
| Liabilities | ||
| Payable for investments purchased | $1,073 | |
| Payable for fund shares redeemed | 91,043 | |
| Accrued management fee | 1,234 | |
| Payable for daily variation margin for derivative instruments | 151 | |
| Other affiliated payables | 581 | |
| Other payables and accrued expenses | 212 | |
| Collateral on Securities Loaned | 1,446 | |
| Total liabilities | 95,740 | |
| Net Assets | $4,264,339 | |
| Net Assets consist of: | ||
| Paid in capital | $3,151,276 | |
| Distributions in excess of net investment income | (2,452) | |
| Accumulated undistributed net realized gain (loss) on investments and foreign currency transactions | 173,646 | |
| Net unrealized appreciation (depreciation) on investments and assets and liabilities in foreign currencies | 941,869 | |
| Net Assets | $4,264,339 | |
| Fidelity Fund: | ||
| Net Asset Value, offering price and redemption price per share ($3,714,899 ÷ 90,280 shares) | $41.15 | |
| Class K: | ||
| Net Asset Value, offering price and redemption price per share ($549,440 ÷ 13,358 shares) | $41.13 |
See accompanying notes which are an integral part of the financial statements.
Statement of Operations
| Amounts in thousands | Six months ended December 31, 2016 (Unaudited) | |
| Investment Income | ||
| Dividends | $35,386 | |
| Interest | 8 | |
| Income from Fidelity Central Funds | 226 | |
| Total income | 35,620 | |
| Expenses | ||
| Management fee | $7,455 | |
| Transfer agent fees | 2,998 | |
| Accounting and security lending fees | 529 | |
| Custodian fees and expenses | 42 | |
| Independent trustees' fees and expenses | 10 | |
| Registration fees | 29 | |
| Audit | 41 | |
| Legal | 13 | |
| Miscellaneous | 16 | |
| Total expenses before reductions | 11,133 | |
| Expense reductions | (52) | 11,081 |
| Net investment income (loss) | 24,539 | |
| Realized and Unrealized Gain (Loss) | ||
| Net realized gain (loss) on: | ||
| Investment securities: | ||
| Unaffiliated issuers | 273,954 | |
| Fidelity Central Funds | (11) | |
| Foreign currency transactions | 34 | |
| Futures contracts | 10,066 | |
| Total net realized gain (loss) | 284,043 | |
| Change in net unrealized appreciation (depreciation) on: Investment securities | (102,079) | |
| Assets and liabilities in foreign currencies | (10) | |
| Total change in net unrealized appreciation (depreciation) | (102,089) | |
| Net gain (loss) | 181,954 | |
| Net increase (decrease) in net assets resulting from operations | $206,493 |
See accompanying notes which are an integral part of the financial statements.
Statement of Changes in Net Assets
| Amounts in thousands | Six months ended December 31, 2016 (Unaudited) | Year ended June 30, 2016 |
| Increase (Decrease) in Net Assets | ||
| Operations | ||
| Net investment income (loss) | $24,539 | $43,748 |
| Net realized gain (loss) | 284,043 | 177,083 |
| Change in net unrealized appreciation (depreciation) | (102,089) | (272,836) |
| Net increase (decrease) in net assets resulting from operations | 206,493 | (52,005) |
| Distributions to shareholders from net investment income | (45,768) | (36,756) |
| Distributions to shareholders from net realized gain | (254,005) | (224,972) |
| Total distributions | (299,773) | (261,728) |
| Share transactions - net increase (decrease) | (99,982) | (324,381) |
| Total increase (decrease) in net assets | (193,262) | (638,114) |
| Net Assets | ||
| Beginning of period | 4,457,601 | 5,095,715 |
| End of period | $4,264,339 | $4,457,601 |
| Other Information | ||
| Undistributed net investment income end of period | $– | $18,777 |
| Distributions in excess of net investment income end of period | $(2,452) | $– |
See accompanying notes which are an integral part of the financial statements.
Financial Highlights — Fidelity Fund
| Six months ended (Unaudited) December 31, | Years ended June 30, | |||||
| 2016 | 2016 | 2015 | 2014 | 2013 | 2012 | |
| Selected Per–Share Data | ||||||
| Net asset value, beginning of period | $42.04 | $44.69 | $45.42 | $39.77 | $34.51 | $34.35 |
| Income from Investment Operations | ||||||
| Net investment income (loss)A | .23 | .38 | .34 | .35 | .44 | .37 |
| Net realized and unrealized gain (loss) | 1.77 | (.73) | 3.91 | 8.61 | 5.31 | .02 |
| Total from investment operations | 2.00 | (.35) | 4.25 | 8.96 | 5.75 | .39 |
| Distributions from net investment income | (.44) | (.31) | (.30) | (.32) | (.49) | (.23) |
| Distributions from net realized gain | (2.45) | (1.99) | (4.68) | (2.98) | – | – |
| Total distributions | (2.89) | (2.30) | (4.98) | (3.31)B | (.49) | (.23) |
| Net asset value, end of period | $41.15 | $42.04 | $44.69 | $45.42 | $39.77 | $34.51 |
| Total ReturnC,D | 4.74% | (.83)% | 10.52% | 23.70% | 16.85% | 1.21% |
| Ratios to Average Net AssetsE,F | ||||||
| Expenses before reductions | .52%G | .52% | .52% | .53% | .56% | .58% |
| Expenses net of fee waivers, if any | .52%G | .52% | .52% | .53% | .56% | .58% |
| Expenses net of all reductions | .52%G | .52% | .52% | .53% | .55% | .58% |
| Net investment income (loss) | 1.09%G | .91% | .79% | .82% | 1.18% | 1.13% |
| Supplemental Data | ||||||
| Net assets, end of period (in millions) | $3,715 | $3,762 | $4,143 | $4,811 | $4,451 | $4,364 |
| Portfolio turnover rateH | 80%G | 67% | 59%I | 93% | 113% | 102% |
A Calculated based on average shares outstanding during the period.
B Total distributions of $3.31 per share is comprised of distributions from net investment income of $.324 and distributions from net realized gain of $2.984 per share.
C Total returns for periods of less than one year are not annualized.
D Total returns would have been lower if certain expenses had not been reduced during the applicable periods shown.
E Fees and expenses of any underlying Fidelity Central Funds are not included in the Fund's expense ratio. The Fund indirectly bears its proportionate share of the expenses of any underlying Fidelity Central Funds.
F Expense ratios reflect operating expenses of the class. Expenses before reductions do not reflect amounts reimbursed by the investment adviser or reductions from brokerage service arrangements or reductions from other expense offset arrangements and do not represent the amount paid by the class during periods when reimbursements or reductions occur. Expenses net of fee waivers reflect expenses after reimbursement by the investment adviser but prior to reductions from brokerage service arrangements or other expense offset arrangements. Expenses net of all reductions represent the net expenses paid by the class.
G Annualized
H Amount does not include the portfolio activity of any underlying Fidelity Central Funds.
I Portfolio turnover rate excludes securities received or delivered in-kind.
See accompanying notes which are an integral part of the financial statements.
Financial Highlights — Fidelity Fund Class K
| Six months ended (Unaudited) December 31, | Years ended June 30, | |||||
| 2016 | 2016 | 2015 | 2014 | 2013 | 2012 | |
| Selected Per–Share Data | ||||||
| Net asset value, beginning of period | $42.04 | $44.69 | $45.42 | $39.78 | $34.52 | $34.35 |
| Income from Investment Operations | ||||||
| Net investment income (loss)A | .25 | .42 | .39 | .40 | .49 | .42 |
| Net realized and unrealized gain (loss) | 1.77 | (.72) | 3.91 | 8.60 | 5.31 | .02 |
| Total from investment operations | 2.02 | (.30) | 4.30 | 9.00 | 5.80 | .44 |
| Distributions from net investment income | (.48) | (.36) | (.35) | (.38) | (.54) | (.27) |
| Distributions from net realized gain | (2.45) | (1.99) | (4.68) | (2.98) | – | – |
| Total distributions | (2.93) | (2.35) | (5.03) | (3.36) | (.54) | (.27) |
| Net asset value, end of period | $41.13 | $42.04 | $44.69 | $45.42 | $39.78 | $34.52 |
| Total ReturnB,C | 4.80% | (.72)% | 10.65% | 23.83% | 17.03% | 1.37% |
| Ratios to Average Net AssetsD,E | ||||||
| Expenses before reductions | .42%F | .41% | .41% | .41% | .42% | .43% |
| Expenses net of fee waivers, if any | .41%F | .41% | .41% | .41% | .42% | .43% |
| Expenses net of all reductions | .41%F | .41% | .41% | .41% | .41% | .42% |
| Net investment income (loss) | 1.20%F | 1.02% | .90% | .94% | 1.32% | 1.29% |
| Supplemental Data | ||||||
| Net assets, end of period (in millions) | $549 | $696 | $952 | $1,119 | $994 | $814 |
| Portfolio turnover rateG | 80%F | 67% | 59%H | 93% | 113% | 102% |
A Calculated based on average shares outstanding during the period.
B Total returns for periods of less than one year are not annualized.
C Total returns would have been lower if certain expenses had not been reduced during the applicable periods shown.
D Fees and expenses of any underlying Fidelity Central Funds are not included in the Fund's expense ratio. The Fund indirectly bears its proportionate share of the expenses of any underlying Fidelity Central Funds.
E Expense ratios reflect operating expenses of the class. Expenses before reductions do not reflect amounts reimbursed by the investment adviser or reductions from brokerage service arrangements or reductions from other expense offset arrangements and do not represent the amount paid by the class during periods when reimbursements or reductions occur. Expenses net of fee waivers reflect expenses after reimbursement by the investment adviser but prior to reductions from brokerage service arrangements or other expense offset arrangements. Expenses net of all reductions represent the net expenses paid by the class.
F Annualized
G Amount does not include the portfolio activity of any underlying Fidelity Central Funds.
H Portfolio turnover rate excludes securities received or delivered in-kind.
See accompanying notes which are an integral part of the financial statements.
Notes to Financial Statements (Unaudited)
For the period ended December 31, 2016
(Amounts in thousands except percentages)
1. Organization.
Fidelity Fund (the Fund) is a fund of Fidelity Hastings Street Trust (the Trust) and is authorized to issue an unlimited number of shares. The Trust is registered under the Investment Company Act of 1940, as amended (the 1940 Act), as an open-end management investment company organized as a Massachusetts business trust. The Fund offers Fidelity Fund and Class K shares, each of which has equal rights as to assets and voting privileges. Each class has exclusive voting rights with respect to matters that affect that class.
2. Investments in Fidelity Central Funds.
The Fund invests in Fidelity Central Funds, which are open-end investment companies generally available only to other investment companies and accounts managed by the investment adviser and its affiliates. The Fund's Schedule of Investments lists each of the Fidelity Central Funds held as of period end, if any, as an investment of the Fund, but does not include the underlying holdings of each Fidelity Central Fund. As an Investing Fund, the Fund indirectly bears its proportionate share of the expenses of the underlying Fidelity Central Funds.
The Money Market Central Funds seek preservation of capital and current income and are managed by Fidelity Investments Money Management, Inc. (FIMM), an affiliate of the investment adviser. Annualized expenses of the Money Market Central Funds as of their most recent shareholder report date are less than .005%.
A complete unaudited list of holdings for each Fidelity Central Fund is available upon request or at the Securities and Exchange Commission (the SEC) website at www.sec.gov. In addition, the financial statements of the Fidelity Central Funds are available on the SEC website or upon request.
3. Significant Accounting Policies.
The financial statements have been prepared in conformity with accounting principles generally accepted in the United States of America (GAAP), which require management to make certain estimates and assumptions at the date of the financial statements. Actual results could differ from those estimates. Subsequent events, if any, through the date that the financial statements were issued have been evaluated in the preparation of the financial statements. The following summarizes the significant accounting policies of the Fund:
Investment Valuation. Investments are valued as of 4:00 p.m. Eastern time on the last calendar day of the period. The Board of Trustees (the Board) has delegated the day to day responsibility for the valuation of the Fund's investments to the Fair Value Committee (the Committee) established by the Fund's investment adviser. In accordance with valuation policies and procedures approved by the Board, the Fund attempts to obtain prices from one or more third party pricing vendors or brokers to value its investments. When current market prices, quotations or currency exchange rates are not readily available or reliable, investments will be fair valued in good faith by the Committee, in accordance with procedures adopted by the Board. Factors used in determining fair value vary by investment type and may include market or investment specific events, changes in interest rates and credit quality. The frequency with which these procedures are used cannot be predicted and they may be utilized to a significant extent. The Committee oversees the Fund's valuation policies and procedures and reports to the Board on the Committee's activities and fair value determinations. The Board monitors the appropriateness of the procedures used in valuing the Fund's investments and ratifies the fair value determinations of the Committee.
The Fund categorizes the inputs to valuation techniques used to value its investments into a disclosure hierarchy consisting of three levels as shown below:
- Level 1 – quoted prices in active markets for identical investments
- Level 2 – other significant observable inputs (including quoted prices for similar investments, interest rates, prepayment speeds, etc.)
- Level 3 – unobservable inputs (including the Fund's own assumptions based on the best information available)
Valuation techniques used to value the Fund's investments by major category are as follows:
Equity securities, including restricted securities, for which market quotations are readily available, are valued at the last reported sale price or official closing price as reported by a third party pricing vendor on the primary market or exchange on which they are traded and are categorized as Level 1 in the hierarchy. In the event there were no sales during the day or closing prices are not available, securities are valued at the last quoted bid price or may be valued using the last available price and are generally categorized as Level 2 in the hierarchy. For foreign equity securities, when market or security specific events arise, comparisons to the valuation of American Depositary Receipts (ADRs), futures contracts, Exchange-Traded Funds (ETFs) and certain indexes as well as quoted prices for similar securities may be used and would be categorized as Level 2 in the hierarchy. Utilizing these techniques may result in transfers between Level 1 and Level 2. For equity securities, including restricted securities, where observable inputs are limited, assumptions about market activity and risk are used and these securities may be categorized as Level 3 in the hierarchy.
Debt securities, including restricted securities, are valued based on evaluated prices received from third party pricing vendors or from brokers who make markets in such securities. U.S. government and government agency obligations are valued by pricing vendors who utilize matrix pricing which considers yield or price of bonds of comparable quality, coupon, maturity and type or by broker-supplied prices. When independent prices are unavailable or unreliable, debt securities may be valued utilizing pricing methodologies which consider similar factors that would be used by third party pricing vendors. Debt securities are generally categorized as Level 2 in the hierarchy but may be Level 3 depending on the circumstances.
Investments in open-end mutual funds, including the Fidelity Central Funds, are valued at their closing net asset value (NAV) each business day and are categorized as Level 1 in the hierarchy.
Changes in valuation techniques may result in transfers in or out of an assigned level within the disclosure hierarchy. The aggregate value of investments by input level as of December 31, 2016 is included at the end of the Fund's Schedule of Investments.
Foreign Currency. The Fund may use foreign currency contracts to facilitate transactions in foreign-denominated securities. Gains and losses from these transactions may arise from changes in the value of the foreign currency or if the counterparties do not perform under the contracts' terms.
Foreign-denominated assets, including investment securities, and liabilities are translated into U.S. dollars at the exchange rates at period end. Purchases and sales of investment securities, income and dividends received and expenses denominated in foreign currencies are translated into U.S. dollars at the exchange rate in effect on the transaction date.
The effects of exchange rate fluctuations on investments are included with the net realized and unrealized gain (loss) on investment securities. Other foreign currency transactions resulting in realized and unrealized gain (loss) are disclosed separately.
Investment Transactions and Income. For financial reporting purposes, the Fund's investment holdings and NAV include trades executed through the end of the last business day of the period. The NAV per share for processing shareholder transactions is calculated as of the close of business of the New York Stock Exchange (NYSE), normally 4:00 p.m. Eastern time and includes trades executed through the end of the prior business day. Gains and losses on securities sold are determined on the basis of identified cost and may include proceeds received from litigation. Dividend income is recorded on the ex-dividend date, except for certain dividends from foreign securities where the ex-dividend date may have passed, which are recorded as soon as the Fund is informed of the ex-dividend date. Non-cash dividends included in dividend income, if any, are recorded at the fair market value of the securities received. Income and capital gain distributions from Fidelity Central Funds, if any, are recorded on the ex-dividend date. Certain distributions received by the Fund represent a return of capital or capital gain. The Fund determines the components of these distributions subsequent to the ex-dividend date, based upon receipt of tax filings or other correspondence relating to the underlying investment. These distributions are recorded as a reduction of cost of investments and/or as a realized gain. Interest income is accrued as earned and includes coupon interest and amortization of premium and accretion of discount on debt securities as applicable. Investment income is recorded net of foreign taxes withheld where recovery of such taxes is uncertain.
Class Allocations and Expenses. Investment income, realized and unrealized capital gains and losses, common expenses of the Fund, and certain fund-level expense reductions, if any, are allocated daily on a pro-rata basis to each class based on the relative net assets of each class to the total net assets of the Fund. Each class differs with respect to transfer agent fees incurred. Certain expense reductions may also differ by class. For the reporting period, the allocated portion of income and expenses to each class as a percent of its average net assets may vary due to the timing of recording these transactions in relation to fluctuating net assets of the classes. Expenses directly attributable to a fund are charged to that fund. Expenses attributable to more than one fund are allocated among the respective funds on the basis of relative net assets or other appropriate methods. Expense estimates are accrued in the period to which they relate and adjustments are made when actual amounts are known.
Deferred Trustee Compensation. Under a Deferred Compensation Plan (the Plan), independent Trustees may elect to defer receipt of a portion of their annual compensation. Deferred amounts are invested in a cross-section of Fidelity funds, are marked-to-market and remain in the Fund until distributed in accordance with the Plan. The investment of deferred amounts and the offsetting payable to the Trustees are included in the accompanying Statement of Assets and Liabilities.
Income Tax Information and Distributions to Shareholders. Each year, the Fund intends to qualify as a regulated investment company under Subchapter M of the Internal Revenue Code, including distributing substantially all of its taxable income and realized gains. As a result, no provision for U.S. Federal income taxes is required. The Fund files a U.S. federal tax return, in addition to state and local tax returns as required. The Fund's federal income tax returns are subject to examination by the Internal Revenue Service (IRS) for a period of three fiscal years after they are filed. State and local tax returns may be subject to examination for an additional fiscal year depending on the jurisdiction. Foreign taxes are provided for based on the Fund's understanding of the tax rules and rates that exist in the foreign markets in which it invests.
Distributions are declared and recorded on the ex-dividend date. Income dividends and capital gain distributions are declared separately for each class. Income and capital gain distributions are determined in accordance with income tax regulations, which may differ from GAAP.
Capital accounts within the financial statements are adjusted for permanent book-tax differences. These adjustments have no impact on net assets or the results of operations. Capital accounts are not adjusted for temporary book-tax differences which will reverse in a subsequent period.
Book-tax differences are primarily due to futures contracts, foreign currency transactions, passive foreign investment companies (PFIC), market discount, deferred trustees compensation, partnerships and losses deferred due to wash sales.
The federal tax cost of investment securities and unrealized appreciation (depreciation) as of period end were as follows:
| Gross unrealized appreciation | $967,775 |
| Gross unrealized depreciation | (32,153) |
| Net unrealized appreciation (depreciation) on securities | $935,622 |
| Tax cost | $3,383,972 |
4. Derivative Instruments.
Risk Exposures and the Use of Derivative Instruments. The Fund's investment objective allows the Fund to enter into various types of derivative contracts, including futures contracts. Derivatives are investments whose value is primarily derived from underlying assets, indices or reference rates and may be transacted on an exchange or over-the-counter (OTC). Derivatives may involve a future commitment to buy or sell a specified asset based on specified terms, to exchange future cash flows at periodic intervals based on a notional principal amount, or for one party to make one or more payments upon the occurrence of specified events in exchange for periodic payments from the other party.
The Fund used derivatives to increase returns and to manage exposure to certain risks as defined below. The success of any strategy involving derivatives depends on analysis of numerous economic factors, and if the strategies for investment do not work as intended, the Fund may not achieve its objectives.
The Fund's use of derivatives increased or decreased its exposure to the following risk:
| Equity Risk | Equity risk relates to the fluctuations in the value of financial instruments as a result of changes in market prices (other than those arising from interest rate risk or foreign exchange risk), whether caused by factors specific to an individual investment, its issuer, or all factors affecting all instruments traded in a market or market segment. |
The Fund is also exposed to additional risks from investing in derivatives, such as liquidity risk and counterparty credit risk. Liquidity risk is the risk that the Fund will be unable to close out the derivative in the open market in a timely manner. Counterparty credit risk is the risk that the counterparty will not be able to fulfill its obligation to the Fund. Counterparty credit risk related to exchange-traded futures contracts may be mitigated by the protection provided by the exchange on which they trade.
Investing in derivatives may involve greater risks than investing in the underlying assets directly and, to varying degrees, may involve risk of loss in excess of any initial investment and collateral received and amounts recognized in the Statement of Assets and Liabilities. In addition, there may be the risk that the change in value of the derivative contract does not correspond to the change in value of the underlying instrument.
Futures Contracts. A futures contract is an agreement between two parties to buy or sell a specified underlying instrument for a fixed price at a specified future date. The Fund used futures contracts to manage its exposure to the stock market.
Upon entering into a futures contract, a fund is required to deposit either cash or securities (initial margin) with a clearing broker in an amount equal to a certain percentage of the face value of the contract. Futures contracts are marked-to-market daily and subsequent daily payments (variation margin) are made or received by a fund depending on the daily fluctuations in the value of the futures contracts and are recorded as unrealized appreciation or (depreciation). This receivable and/or payable, if any, is included in daily variation margin for derivative instruments in the Statement of Assets and Liabilities. Realized gain or (loss) is recorded upon the expiration or closing of a futures contract.
Any open futures contracts at period end are presented in the Schedule of Investments under the caption "Futures Contracts". The underlying face amount at value reflects each contract's exposure to the underlying instrument or index at period end and is representative of volume activity during the period. Securities deposited to meet initial margin requirements are identified in the Schedule of Investments.
During the period the Fund recognized net realized gain (loss) of $10,066 related to its investment in futures contracts. This amount is included in the Statement of Operations.
5. Purchases and Sales of Investments.
Purchases and sales of securities, other than short-term securities, aggregated $1,739,667 and $2,042,174, respectively.
6. Fees and Other Transactions with Affiliates.
Management Fee. Fidelity Management & Research Company (the investment adviser) and its affiliates provide the Fund with investment management related services for which the Fund pays a monthly management fee. The management fee is the sum of an individual fund fee rate that is based on an annual rate of .09% of the Fund's average net assets and an annualized group fee rate that averaged .25% during the period. The group fee rate is based upon the average net assets of all the mutual funds advised by the investment adviser, including any mutual funds previously advised by the investment adviser that are currently advised by Fidelity SelectCo, LLC, an affiliate of the investment adviser. The group fee rate decreases as assets under management increase and increases as assets under management decrease. For the reporting period, the total annualized management fee rate was .34% of the Fund's average net assets.
Transfer Agent Fees. Fidelity Investments Institutional Operations Company, Inc., (FIIOC), an affiliate of the investment adviser, is the transfer, dividend disbursing and shareholder servicing agent for each class of the Fund. FIIOC receives account fees and asset-based fees that vary according to the account size and type of account of the shareholders of Fidelity Fund. FIIOC receives an asset-based fee of Class K's average net assets. FIIOC pays for typesetting, printing and mailing of shareholder reports, except proxy statements.
For the period, transfer agent fees for each class were as follows:
| Amount | % of Class-Level Average Net Assets(a) | |
| Fidelity Fund | $2,842 | .15 |
| Class K | 156 | .05 |
| $2,998 |
(a) Annualized
Accounting and Security Lending Fees. Fidelity Service Company, Inc. (FSC), an affiliate of the investment adviser, maintains the Fund's accounting records. The accounting fee is based on the level of average net assets for each month. Under a separate contract, FSC administers the security lending program. The security lending fee is based on the number and duration of lending transactions.
Brokerage Commissions. The Fund placed a portion of its portfolio transactions with brokerage firms which are affiliates of the investment adviser. Brokerage commissions are included in net realized gain (loss) and change in net unrealized appreciation (depreciation) in the Statement of Operations. The commissions paid to these affiliated firms were $38 for the period.
Interfund Lending Program. Pursuant to an Exemptive Order issued by the SEC, the Fund, along with other registered investment companies having management contracts with FMR or other affiliated entities of FMR, may participate in an interfund lending program. This program provides an alternative credit facility allowing the funds to borrow from, or lend money to, other participating affiliated funds. At period end, there were no interfund loans outstanding. The Fund's activity in this program during the period for which loans were outstanding was as follows:
| Borrower or Lender | Average Loan Balance | Weighted Average Interest Rate | Interest Expense |
| Borrower | $6,372 | .57% | $–(a) |
(a) In the amount of less than five hundred dollars.
Interfund Trades. The Fund may purchase from or sell securities to other Fidelity Funds under procedures adopted by the Board. The procedures have been designed to ensure these interfund trades are executed in accordance with Rule 17a-7 of the 1940 Act. Interfund trades are included within the respective purchases and sales amounts shown in the Purchases and Sales of Investments note.
7. Committed Line of Credit.
The Fund participates with other funds managed by the investment adviser or an affiliate in a $4.25 billion credit facility (the "line of credit") to be utilized for temporary or emergency purposes to fund shareholder redemptions or for other short-term liquidity purposes. The Fund has agreed to pay commitment fees on its pro-rata portion of the line of credit, which amounted to $7 and is reflected in Miscellaneous expenses on the Statement of Operations. During the period, the Fund did not borrow on this line of credit.
8. Security Lending.
The Fund lends portfolio securities through a lending agent from time to time in order to earn additional income. For equity securities, a lending agent is used and may loan securities to certain qualified borrowers, including Fidelity Capital Markets (FCM), a broker-dealer affiliated with the Fund. On the settlement date of the loan, the Fund receives collateral (in the form of U.S. Treasury obligations, letters of credit and/or cash) against the loaned securities and maintains collateral in an amount not less than 100% of the market value of the loaned securities during the period of the loan. The market value of the loaned securities is determined at the close of business of the Fund and any additional required collateral is delivered to the Fund on the next business day. The Fund or borrower may terminate the loan at any time, and if the borrower defaults on its obligation to return the securities loaned because of insolvency or other reasons, the Fund may apply collateral received from the borrower against the obligation. The Fund may experience delays and costs in recovering the securities loaned. Any cash collateral received is invested in the Fidelity Securities Lending Cash Central Fund. The value of loaned securities and cash collateral at period end are disclosed on the Fund's Statement of Assets and Liabilities. At period end, there were no security loans outstanding with FCM. Security lending income represents the income earned on investing cash collateral, less rebates paid to borrowers and any lending agent fees associated with the loan, plus any premium payments received for lending certain types of securities. Security lending income is presented in the Statement of Operations as a component of income from Fidelity Central Funds. Total security lending income during the period amounted to $16, including $1 from securities loaned to FCM.
9. Expense Reductions.
Commissions paid to certain brokers with whom the investment adviser, or its affiliates, places trades on behalf of the Fund include an amount in addition to trade execution, which may be rebated back to the Fund to offset certain expenses. This amount totaled $35 for the period.
In addition, during the period the investment adviser reimbursed and/or waived a portion of fund-level operating expenses in the amount of $17.
10. Distributions to Shareholders.
Distributions to shareholders of each class were as follows:
| Six months ended December 31, 2016 | Year ended June 30, 2016 | |
| From net investment income | ||
| Fidelity Fund | $38,394 | $28,914 |
| Class K | 7,374 | 7,842 |
| Total | $45,768 | $36,756 |
| From net realized gain | ||
| Fidelity Fund | $216,202 | $183,334 |
| Class K | 37,803 | 41,638 |
| Total | $254,005 | $224,972 |
11. Share Transactions.
Share transactions for each class were as follows and may contain automatic conversions between classes or exchanges between affiliated funds:
| Shares | Shares | Dollars | Dollars | |
| Six months ended December 31, 2016 | Year ended June 30, 2016 | Six months ended December 31, 2016 | Year ended June 30, 2016 | |
| Fidelity Fund | ||||
| Shares sold | 1,149 | 3,667 | $48,160 | $152,399 |
| Reinvestment of distributions | 5,609 | 4,583 | 234,849 | 196,417 |
| Shares redeemed | (5,963) | (11,490) | (250,140) | (476,458) |
| Net increase (decrease) | 795 | (3,240) | $32,869 | $(127,642) |
| Class K | ||||
| Shares sold | 752 | 7,320 | $31,607 | $293,997 |
| Reinvestment of distributions | 1,079 | 1,156 | 45,177 | 49,480 |
| Shares redeemed | (5,024) | (13,234) | (209,635) | (540,216) |
| Net increase (decrease) | (3,193) | (4,758) | $(132,851) | $(196,739) |
12. Other.
The Fund's organizational documents provide former and current trustees and officers with a limited indemnification against liabilities arising in connection with the performance of their duties to the Fund. In the normal course of business, the Fund may also enter into contracts that provide general indemnifications. The Fund's maximum exposure under these arrangements is unknown as this would be dependent on future claims that may be made against the Fund. The risk of material loss from such claims is considered remote.
Shareholder Expense Example
As a shareholder of the Fund, you incur two types of costs: (1) transaction costs, and (2) ongoing costs, including management fees and other Fund expenses. This Example is intended to help you understand your ongoing costs (in dollars) of investing in the Fund and to compare these costs with the ongoing costs of investing in other mutual funds.
The Example is based on an investment of $1,000 invested at the beginning of the period and held for the entire period (July 1, 2016 to December 31, 2016).
Actual Expenses
The first line of the accompanying table for each class of the Fund provides information about actual account values and actual expenses. You may use the information in this line, together with the amount you invested, to estimate the expenses that you paid over the period. Simply divide your account value by $1,000.00 (for example, an $8,600 account value divided by $1,000.00 = 8.6), then multiply the result by the number in the first line for a class of the Fund under the heading entitled "Expenses Paid During Period" to estimate the expenses you paid on your account during this period. A small balance maintenance fee of $12.00 that is charged once a year may apply for certain accounts with a value of less than $2,000. This fee is not included in the table below. If it was, the estimate of expenses you paid during the period would be higher, and your ending account value lower, by this amount. In addition, the Fund, as a shareholder in the underlying Fidelity Central Funds, will indirectly bear its pro-rata share of the fees and expenses incurred by the underlying Fidelity Central Funds. These fees and expenses are not included in the Fund's annualized expense ratio used to calculate the expense estimate in the table below.
Hypothetical Example for Comparison Purposes
The second line of the accompanying table for each class of the Fund provides information about hypothetical account values and hypothetical expenses based on a Class' actual expense ratio and an assumed rate of return of 5% per year before expenses, which is not the Class' actual return. The hypothetical account values and expenses may not be used to estimate the actual ending account balance or expenses you paid for the period. You may use this information to compare the ongoing costs of investing in the Fund and other funds. To do so, compare this 5% hypothetical example with the 5% hypothetical examples that appear in the shareholder reports of the other funds. A small balance maintenance fee of $12.00 that is charged once a year may apply for certain accounts with a value of less than $2,000. This fee is not included in the table below. If it was, the estimate of expenses you paid during the period would be higher, and your ending account value lower, by this amount. In addition, the Fund, as a shareholder in the underlying Fidelity Central Funds, will indirectly bear its pro-rata share of the fees and expenses incurred by the underlying Fidelity Central Funds. These fees and expenses are not included in the Fund's annualized expense ratio used to calculate the expense estimate in the table below.
Please note that the expenses shown in the table are meant to highlight your ongoing costs only and do not reflect any transaction costs. Therefore, the second line of the table is useful in comparing ongoing costs only, and will not help you determine the relative total costs of owning different funds.
| Annualized Expense Ratio-A | Beginning Account Value July 1, 2016 | Ending Account Value December 31, 2016 | Expenses Paid During Period-B July 1, 2016 to December 31, 2016 | |
| Fidelity Fund | .52% | |||
| Actual | $1,000.00 | $1,047.40 | $2.68 | |
| Hypothetical-C | $1,000.00 | $1,022.58 | $2.65 | |
| Class K | .41% | |||
| Actual | $1,000.00 | $1,048.00 | $2.12 | |
| Hypothetical-C | $1,000.00 | $1,023.14 | $2.09 |
A Annualized expense ratio reflects expenses net of applicable fee waivers.
B Expenses are equal to each Class' annualized expense ratio, multiplied by the average account value over the period, multiplied by 184/365 (to reflect the one-half year period).
C 5% return per year before expenses
Board Approval of Investment Advisory Contracts and Management Fees
Fidelity Fund
Each year, the Board of Trustees, including the Independent Trustees (together, the Board), votes on the renewal of the management contract with Fidelity Management & Research Company (FMR) and the sub-advisory agreements (together, the Advisory Contracts) for the fund. The Board, assisted by the advice of fund counsel and Independent Trustees' counsel, requests and considers a broad range of information relevant to the renewal of the Advisory Contracts throughout the year.
The Board meets regularly and, at each of its meetings, covers an extensive agenda of topics and materials and considers factors that are relevant to its annual consideration of the renewal of the fund's Advisory Contracts, including the services and support provided to the fund and its shareholders. The Board has established various standing committees (Committees), each composed of and chaired by Independent Trustees with varying backgrounds, to which the Board has assigned specific subject matter responsibilities in order to enhance effective decision-making by the Board. The Board, acting directly and through its Committees, requests and receives information concerning the annual consideration of the renewal of the fund's Advisory Contracts. The Board also meets as needed to consider matters specifically related to the Board's annual consideration of the renewal of the Advisory Contracts. Members of the Board may also meet with trustees of other Fidelity funds through ad hoc joint committees to discuss certain matters relevant to all of the Fidelity funds.
At its July 2016 meeting, the Board unanimously determined to renew the fund's Advisory Contracts. In reaching its determination, the Board considered all factors it believed relevant, including (i) the nature, extent, and quality of the services to be provided to the fund and its shareholders (including the investment performance of the fund); (ii) the competitiveness of the fund's management fee and total expense ratio relative to peer funds; (iii) the total costs of the services to be provided by and the profits to be realized by Fidelity from its relationships with the fund; and (iv) the extent to which, if any, economies of scale exist and would be realized as the fund grows, and whether any economies of scale are appropriately shared with fund shareholders.
In considering whether to renew the Advisory Contracts for the fund, the Board reached a determination, with the assistance of fund counsel and Independent Trustees' counsel and through the exercise of its business judgment, that the renewal of the Advisory Contracts was in the best interests of the fund and its shareholders and that the compensation payable under the Advisory Contracts was fair and reasonable. The Board's decision to renew the Advisory Contracts was not based on any single factor, but rather was based on a comprehensive consideration of all the information provided to the Board at its meetings throughout the year. The Board, in reaching its determination to renew the Advisory Contracts, was aware that shareholders of the fund have a broad range of investment choices available to them, including a wide choice among funds offered by Fidelity's competitors, and that the fund's shareholders, who have the opportunity to review and weigh the disclosure provided by the fund in its prospectus and other public disclosures, have chosen to invest in this fund, which is part of the Fidelity family of funds.
Nature, Extent, and Quality of Services Provided. The Board considered Fidelity's staffing as it relates to the fund, including the backgrounds of investment personnel of Fidelity, and also considered the fund's investment objective, strategies, and related investment philosophy. The Independent Trustees also had discussions with senior management of Fidelity's investment operations and investment groups. The Board considered the structure of the investment personnel compensation program and whether this structure provides appropriate incentives to act in the best interests of the fund. Additionally, the Board considered the portfolio managers' investments, if any, in the funds that they manage.Resources Dedicated to Investment Management and Support Services. The Board and the Fund Oversight and Research Committees reviewed the general qualifications and capabilities of Fidelity's investment staff, including its size, education, experience, and resources, as well as Fidelity's approach to recruiting, training, managing, and compensating investment personnel. The Board noted that Fidelity has continued to increase the resources devoted to non-U.S. offices, including expansion of Fidelity's global investment organization. The Board also noted that Fidelity's analysts have extensive resources, tools and capabilities that allow them to conduct sophisticated quantitative and fundamental analysis, as well as credit analysis of issuers, counterparties and guarantors. Further, the Board considered that Fidelity's investment professionals have sufficient access to global information and data so as to provide competitive investment results over time, and that those professionals also have access to sophisticated tools that permit them to assess portfolio construction and risk and performance attribution characteristics continuously, as well as to transmit new information and research conclusions rapidly around the world. Additionally, in its deliberations, the Board considered Fidelity's trading, risk management, compliance, and technology and operations capabilities and resources, which are integral parts of the investment management process.Shareholder and Administrative Services. The Board considered (i) the nature, extent, quality, and cost of advisory, administrative, and shareholder services performed by FMR, the sub-advisers (together with FMR, the Investment Advisers), and their affiliates under the Advisory Contracts and under separate agreements covering transfer agency, pricing and bookkeeping, and securities lending services for the fund; (ii) the nature and extent of the supervision of third party service providers, principally custodians, subcustodians, and pricing vendors; and (iii) the resources devoted to, and the record of compliance with, the fund's compliance policies and procedures. The Board also reviewed the allocation of fund brokerage, including allocations to brokers affiliated with the Investment Advisers, the use of brokerage commissions to pay fund expenses, and the use of "soft" commission dollars to pay for research services.The Board noted that the growth of fund assets over time across the complex allows Fidelity to reinvest in the development of services designed to enhance the value or convenience of the Fidelity funds as investment vehicles. These services include 24-hour access to account information and market information through telephone representatives and over the Internet, investor education materials and asset allocation tools, and the expanded availability of Fidelity Investor Centers.In 2014, the Board formed an ad hoc Committee on Transfer Agency Fees to review the variety of transfer agency fee structures throughout the industry and Fidelity's competitive positioning with respect to industry participants.Investment in a Large Fund Family. The Board considered the benefits to shareholders of investing in a Fidelity fund, including the benefits of investing in a fund that is part of a large family of funds offering a variety of investment disciplines and providing a large variety of mutual fund investor services. The Board noted that Fidelity had taken, or had made recommendations that resulted in the Fidelity funds taking, a number of actions over the previous year that benefited particular funds, including: (i) continuing to dedicate additional resources to investment research and to the support of the senior management team that oversees asset management; (ii) continuing efforts to enhance Fidelity's global research capabilities; (iii) launching new funds and making other enhancements to meet client needs; (iv) broadening eligibility requirements for certain lower-priced share classes of, and streamlining the fee structure for, certain existing equity index funds; (v) lowering expense caps for certain existing funds and classes to reduce expenses paid by shareholders; (vi) eliminating redemption fees for certain variable insurance product funds and classes; (vii) continuing to launch dedicated lower cost underlying funds to meet portfolio construction needs related to expanding underlying fund options for Fidelity funds of funds, specifically for the Freedom Fund product lines; (viii) launching a lower cost share class for use by the Freedom Index Fund product line; (ix) rationalizing product lines and gaining increased efficiencies through fund mergers and share class consolidations; (x) continuing to develop, acquire and implement systems and technology to improve services to the funds and shareholders, strengthen information security, and increase efficiency; (xi) implementing investment enhancements to further strengthen Fidelity's target date product line to increase investors' probability of success in achieving their goals; (xii) accelerating the conversion of all remaining Class B shares to Class A shares, which have a lower expense structure; and (xiii) implementing changes to Fidelity's money market fund product line in response to recent regulatory reforms.Investment Performance. The Board considered whether the fund has operated in accordance with its investment objective, as well as its record of compliance with its investment restrictions and its performance history.The Board took into account discussions with representatives of the Investment Advisers about fund investment performance that occur at Board meetings throughout the year. In this regard the Board noted that as part of regularly scheduled fund reviews and other reports to the Board on fund performance, the Board considers annualized return information for the fund, for different time periods, measured against a securities market index ("benchmark index") and a peer group of funds with similar objectives ("peer group"), if any. In its evaluation of fund investment performance, the Board gave particular attention to information indicating changes in performance of certain Fidelity funds for specific time periods and discussed with the Investment Advisers the reasons for any overperformance or underperformance.In addition to reviewing absolute and relative fund performance, the Independent Trustees periodically consider the appropriateness of fund performance metrics in evaluating the results achieved. In general, the Independent Trustees believe that fund performance should be evaluated based on net performance (after fees and expenses) of both the highest performing and lowest performing fund share classes, where applicable, compared to appropriate benchmark indices, over appropriate time periods that may include full market cycles, and compared to peer groups, as applicable, over the same periods, taking into account relevant factors including the following: general market conditions; issuer-specific information; and fund cash flows and other factors.The Independent Trustees recognize that shareholders evaluate performance on a net basis over their own holding periods, for which one-, three-, and five-year periods are often used as a proxy. For this reason, the performance information reviewed by the Board also included net cumulative calendar year total return information for the fund and an appropriate benchmark index and peer group for the most recent one-, three-, and five-year periods, as shown below. Returns are shown compared to the 25th percentile (top of box, 75% beaten) and 75th percentile (bottom of box, 25% beaten) of the peer universe.Fidelity Fund
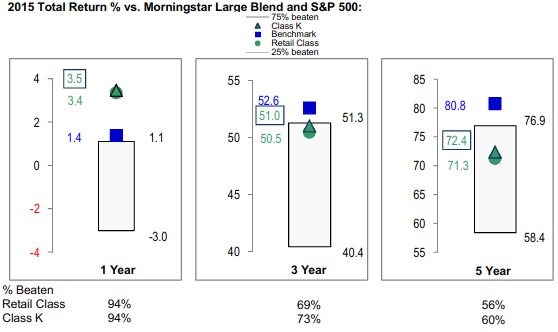
Fidelity Fund
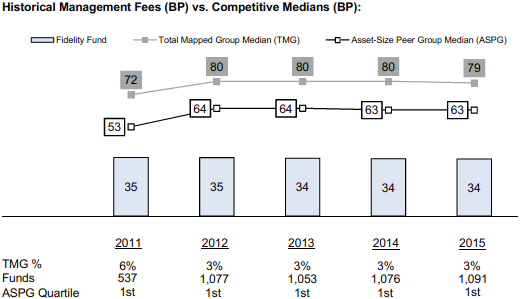
![]()
Corporate Headquarters
245 Summer St.
Boston, MA 02210
www.fidelity.com
FID-SANN-0217
1.540016.119
Fidelity® Series Growth & Income Fund Semi-Annual Report December 31, 2016 |
|
Contents
Board Approval of Investment Advisory Contracts and Management Fees |
To view a fund's proxy voting guidelines and proxy voting record for the 12-month period ended June 30, visit http://www.fidelity.com/proxyvotingresults or visit the Securities and Exchange Commission's (SEC) web site at http://www.sec.gov.
You may also call 1-800-544-8544, or for Class F, call 1-800-835-5092, to request a free copy of the proxy voting guidelines.
Standard & Poor's, S&P and S&P 500 are registered service marks of The McGraw-Hill Companies, Inc. and have been licensed for use by Fidelity Distributors Corporation.
Other third-party marks appearing herein are the property of their respective owners.
All other marks appearing herein are registered or unregistered trademarks or service marks of FMR LLC or an affiliated company. © 2017 FMR LLC. All rights reserved.
This report and the financial statements contained herein are submitted for the general information of the shareholders of the Fund. This report is not authorized for distribution to prospective investors in the Fund unless preceded or accompanied by an effective prospectus.
A fund files its complete schedule of portfolio holdings with the SEC for the first and third quarters of each fiscal year on Form N-Q. Forms N-Q are available on the SEC’s web site at http://www.sec.gov. A fund's Forms N-Q may be reviewed and copied at the SEC’s Public Reference Room in Washington, DC. Information regarding the operation of the SEC's Public Reference Room may be obtained by calling 1-800-SEC-0330.
For a complete list of a fund's portfolio holdings, view the most recent holdings listing, semiannual report, or annual report on Fidelity's web site at http://www.fidelity.com, http://www.institutional.fidelity.com, or http://www.401k.com, as applicable.
NOT FDIC INSURED •MAY LOSE VALUE •NO BANK GUARANTEE
Neither the Fund nor Fidelity Distributors Corporation is a bank.
Investment Summary (Unaudited)
Top Ten Stocks as of December 31, 2016
| % of fund's net assets | % of fund's net assets 6 months ago | |
| JPMorgan Chase & Co.(a) | 4.1 | 3.6 |
| Bank of America Corp.(a) | 3.9 | 2.6 |
| Microsoft Corp. | 3.3 | 3.1 |
| Apple, Inc. | 3.1 | 2.6 |
| Citigroup, Inc.(a) | 3.0 | 2.3 |
| General Electric Co.(a) | 2.7 | 3.3 |
| Chevron Corp. | 2.0 | 2.5 |
| Comcast Corp. Class A | 1.8 | 1.8 |
| Qualcomm, Inc.(a) | 1.8 | 1.9 |
| State Street Corp. | 1.6 | 1.2 |
| 27.3 |
(a) Security or a portion of the security is pledged as collateral for call options written.
Top Five Market Sectors as of December 31, 2016
| % of fund's net assets | % of fund's net assets 6 months ago | |
| Financials | 25.7 | 20.5 |
| Information Technology | 16.8 | 19.9 |
| Energy | 13.2 | 12.5 |
| Health Care | 12.5 | 14.1 |
| Industrials | 11.4 | 12.6 |
Prior period industry classifications reflect the categories in place as of the date indicated and have not been adjusted to reflect current industry classifications.
Asset Allocation (% of fund's net assets)
| As of December 31, 2016*,** | ||
| Stocks | 98.6% | |
| Convertible Securities | 1.3% | |
| Other Investments | 0.2% | |
| Short-Term Investments and Net Other Assets (Liabilities)*** | (0.1)% | |

* Foreign investments - 9.9%
** Written Options - (0.5)%
*** Net Other Assets (Liabilities) are not included in the pie chart
| As of June 30, 2016*,** | ||
| Stocks | 97.9% | |
| Convertible Securities | 1.5% | |
| Short-Term Investments and Net Other Assets (Liabilities) | 0.6% | |

* Foreign investments - 11.5%
** Written Options - (0.1)%
Investments December 31, 2016 (Unaudited)
Showing Percentage of Net Assets
| Common Stocks - 98.6% | |||
| Shares | Value | ||
| CONSUMER DISCRETIONARY - 8.5% | |||
| Auto Components - 0.0% | |||
| Gentex Corp. | 208,700 | $4,109,303 | |
| Automobiles - 0.1% | |||
| General Motors Co. | 162,000 | 5,644,080 | |
| Diversified Consumer Services - 0.1% | |||
| ServiceMaster Global Holdings, Inc. (a) | 133,200 | 5,017,644 | |
| Hotels, Restaurants & Leisure - 0.5% | |||
| Cedar Fair LP (depositary unit) | 49,900 | 3,203,580 | |
| Dunkin' Brands Group, Inc. | 173,900 | 9,119,316 | |
| Las Vegas Sands Corp. (b) | 202,300 | 10,804,843 | |
| Whitbread PLC | 116,762 | 5,433,569 | |
| Wingstop, Inc. | 198,100 | 5,861,779 | |
| Yum! Brands, Inc. | 205,455 | 13,011,465 | |
| 47,434,552 | |||
| Leisure Products - 0.1% | |||
| NJOY, Inc. (a)(c) | 791,469 | 8 | |
| Polaris Industries, Inc. | 156,100 | 12,861,079 | |
| 12,861,087 | |||
| Media - 4.9% | |||
| AMC Networks, Inc. Class A (a) | 89,100 | 4,663,494 | |
| Comcast Corp. Class A | 2,417,000 | 166,893,850 | |
| Scripps Networks Interactive, Inc. Class A | 730,614 | 52,143,921 | |
| Sinclair Broadcast Group, Inc. Class A | 460,523 | 15,358,442 | |
| The Walt Disney Co. | 380,600 | 39,666,132 | |
| Time Warner, Inc. | 1,353,777 | 130,680,094 | |
| Viacom, Inc. Class B (non-vtg.) | 987,100 | 34,647,210 | |
| 444,053,143 | |||
| Multiline Retail - 1.4% | |||
| Dollar General Corp. | 64,600 | 4,784,922 | |
| Kohl's Corp. | 167,600 | 8,276,088 | |
| Macy's, Inc. | 212,700 | 7,616,787 | |
| Target Corp. | 1,460,375 | 105,482,886 | |
| 126,160,683 | |||
| Specialty Retail - 1.3% | |||
| Bed Bath & Beyond, Inc. | 78,700 | 3,198,368 | |
| Foot Locker, Inc. | 302,800 | 21,465,492 | |
| L Brands, Inc. | 341,400 | 22,477,776 | |
| Lowe's Companies, Inc. | 1,064,000 | 75,671,680 | |
| 122,813,316 | |||
| Textiles, Apparel & Luxury Goods - 0.1% | |||
| Ralph Lauren Corp. | 62,200 | 5,617,904 | |
| VF Corp. | 33,800 | 1,803,230 | |
| 7,421,134 | |||
| TOTAL CONSUMER DISCRETIONARY | 775,514,942 | ||
| CONSUMER STAPLES - 6.1% | |||
| Beverages - 2.1% | |||
| Britvic PLC | 238,200 | 1,664,472 | |
| Cott Corp. | 163,600 | 1,852,098 | |
| Diageo PLC | 1,158,477 | 30,062,309 | |
| Dr. Pepper Snapple Group, Inc. | 81,800 | 7,416,806 | |
| Molson Coors Brewing Co. Class B | 281,700 | 27,412,227 | |
| PepsiCo, Inc. | 219,100 | 22,924,433 | |
| The Coca-Cola Co. | 2,341,418 | 97,075,190 | |
| 188,407,535 | |||
| Food & Staples Retailing - 1.4% | |||
| Costco Wholesale Corp. | 129,600 | 20,750,256 | |
| CVS Health Corp. | 892,220 | 70,405,080 | |
| Kroger Co. | 495,900 | 17,113,509 | |
| Walgreens Boots Alliance, Inc. | 156,693 | 12,967,913 | |
| Whole Foods Market, Inc. | 126,600 | 3,894,216 | |
| 125,130,974 | |||
| Food Products - 0.5% | |||
| B&G Foods, Inc. Class A | 231,400 | 10,135,320 | |
| Hostess Brands, Inc. Class A (a) | 734,800 | 9,552,400 | |
| Mead Johnson Nutrition Co. Class A | 388,300 | 27,476,108 | |
| 47,163,828 | |||
| Household Products - 1.6% | |||
| Procter & Gamble Co. | 1,720,700 | 144,676,456 | |
| Personal Products - 0.1% | |||
| Edgewell Personal Care Co. (a) | 130,500 | 9,525,195 | |
| Tobacco - 0.4% | |||
| Altria Group, Inc. | 159,800 | 10,805,676 | |
| Reynolds American, Inc. | 537,200 | 30,104,688 | |
| 40,910,364 | |||
| TOTAL CONSUMER STAPLES | 555,814,352 | ||
| ENERGY - 12.9% | |||
| Energy Equipment & Services - 1.0% | |||
| Baker Hughes, Inc. | 425,000 | 27,612,250 | |
| National Oilwell Varco, Inc. | 818,300 | 30,637,152 | |
| Oceaneering International, Inc. | 900,530 | 25,403,951 | |
| Schlumberger Ltd. | 119,907 | 10,066,193 | |
| 93,719,546 | |||
| Oil, Gas & Consumable Fuels - 11.9% | |||
| Amyris, Inc. (a)(d) | 228,433 | 166,756 | |
| Anadarko Petroleum Corp. | 299,300 | 20,870,189 | |
| Apache Corp. | 1,359,241 | 86,271,026 | |
| Cabot Oil & Gas Corp. | 598,400 | 13,978,624 | |
| Cenovus Energy, Inc. | 3,494,300 | 52,831,557 | |
| Chevron Corp. | 1,537,135 | 180,920,790 | |
| ConocoPhillips Co. | 2,932,880 | 147,054,603 | |
| EQT Midstream Partners LP | 60,500 | 4,639,140 | |
| Golar LNG Ltd. | 822,500 | 18,868,150 | |
| Imperial Oil Ltd. | 1,909,500 | 66,430,376 | |
| Kinder Morgan, Inc. | 4,197,700 | 86,934,367 | |
| Legacy Reserves LP (a) | 1,445,200 | 3,063,824 | |
| MPLX LP | 110,539 | 3,826,860 | |
| PrairieSky Royalty Ltd. | 890,315 | 21,179,504 | |
| Suncor Energy, Inc. | 4,390,200 | 143,544,319 | |
| Teekay LNG Partners LP | 692,700 | 10,009,515 | |
| The Williams Companies, Inc. | 4,736,057 | 147,480,815 | |
| Williams Partners LP | 1,836,491 | 69,841,753 | |
| 1,077,912,168 | |||
| TOTAL ENERGY | 1,171,631,714 | ||
| FINANCIALS - 25.7% | |||
| Banks - 18.0% | |||
| Bank of America Corp. (b) | 16,055,005 | 354,815,611 | |
| Citigroup, Inc. (b) | 4,624,378 | 274,826,785 | |
| Comerica, Inc. (b) | 772,700 | 52,628,597 | |
| Cullen/Frost Bankers, Inc. | 46,700 | 4,120,341 | |
| JPMorgan Chase & Co. (b) | 4,343,649 | 374,813,475 | |
| Lloyds Banking Group PLC | 2,122,900 | 1,630,127 | |
| M&T Bank Corp. | 343,000 | 53,655,490 | |
| PNC Financial Services Group, Inc. | 593,224 | 69,383,479 | |
| Regions Financial Corp. (b) | 4,578,400 | 65,745,824 | |
| Standard Chartered PLC (United Kingdom) (a) | 523,776 | 4,283,548 | |
| SunTrust Banks, Inc. (b) | 2,173,400 | 119,210,990 | |
| U.S. Bancorp (b) | 2,253,039 | 115,738,613 | |
| Wells Fargo & Co. | 2,553,399 | 140,717,819 | |
| 1,631,570,699 | |||
| Capital Markets - 6.6% | |||
| Apollo Global Management LLC Class A | 816,100 | 15,799,696 | |
| Ashmore Group PLC | 154,490 | 538,242 | |
| CBOE Holdings, Inc. | 294,800 | 21,782,772 | |
| Charles Schwab Corp. (b) | 1,627,881 | 64,252,463 | |
| Federated Investors, Inc. Class B (non-vtg.) | 78,300 | 2,214,324 | |
| Goldman Sachs Group, Inc. | 13,400 | 3,208,630 | |
| Intertrust NV | 250,000 | 4,400,077 | |
| KKR & Co. LP | 3,297,911 | 50,754,850 | |
| Morgan Stanley (b) | 1,785,700 | 75,445,825 | |
| Northern Trust Corp. (b) | 1,182,651 | 105,315,072 | |
| Oaktree Capital Group LLC Class A | 341,100 | 12,791,250 | |
| S&P Global, Inc. | 194,800 | 20,948,792 | |
| State Street Corp. | 1,908,251 | 148,309,268 | |
| The Blackstone Group LP | 2,585,300 | 69,880,659 | |
| 595,641,920 | |||
| Insurance - 0.7% | |||
| Marsh & McLennan Companies, Inc. | 481,607 | 32,551,817 | |
| MetLife, Inc. | 288,587 | 15,551,953 | |
| Principal Financial Group, Inc. | 222,500 | 12,873,850 | |
| Willis Group Holdings PLC | 35,800 | 4,377,624 | |
| 65,355,244 | |||
| Thrifts & Mortgage Finance - 0.4% | |||
| MGIC Investment Corp. (a) | 987,900 | 10,066,701 | |
| Radian Group, Inc. | 1,490,064 | 26,791,351 | |
| 36,858,052 | |||
| TOTAL FINANCIALS | 2,329,425,915 | ||
| HEALTH CARE - 11.5% | |||
| Biotechnology - 2.4% | |||
| Alexion Pharmaceuticals, Inc. (a) | 320,300 | 39,188,705 | |
| Amgen, Inc. | 389,319 | 56,922,331 | |
| Biogen, Inc. (a) | 148,900 | 42,225,062 | |
| Gilead Sciences, Inc. | 594,020 | 42,537,772 | |
| Grifols SA | 265,500 | 5,276,555 | |
| Intercept Pharmaceuticals, Inc. (a) | 50,000 | 5,432,500 | |
| Shire PLC sponsored ADR | 144,100 | 24,551,758 | |
| Vertex Pharmaceuticals, Inc. (a) | 20,900 | 1,539,703 | |
| 217,674,386 | |||
| Health Care Equipment & Supplies - 1.7% | |||
| Abbott Laboratories | 827,349 | 31,778,475 | |
| Becton, Dickinson & Co. | 29,200 | 4,834,060 | |
| Medtronic PLC | 1,095,436 | 78,027,906 | |
| Meridian Bioscience, Inc. | 67,157 | 1,188,679 | |
| Zimmer Biomet Holdings, Inc. | 344,100 | 35,511,120 | |
| 151,340,240 | |||
| Health Care Providers & Services - 1.7% | |||
| Anthem, Inc. | 256,900 | 36,934,513 | |
| Cigna Corp. | 332,300 | 44,325,497 | |
| McKesson Corp. | 362,047 | 50,849,501 | |
| Patterson Companies, Inc. (d) | 492,338 | 20,200,628 | |
| 152,310,139 | |||
| Life Sciences Tools & Services - 0.4% | |||
| Agilent Technologies, Inc. | 816,900 | 37,217,964 | |
| Pharmaceuticals - 5.3% | |||
| Allergan PLC | 39,700 | 8,337,397 | |
| AstraZeneca PLC sponsored ADR | 840,900 | 22,973,388 | |
| Bayer AG | 61,100 | 6,365,609 | |
| Bristol-Myers Squibb Co. | 1,009,700 | 59,006,868 | |
| GlaxoSmithKline PLC sponsored ADR | 3,161,200 | 121,737,812 | |
| Innoviva, Inc. (a) | 361,500 | 3,868,050 | |
| Johnson & Johnson | 1,253,970 | 144,469,884 | |
| Novartis AG sponsored ADR | 36,030 | 2,624,425 | |
| Sanofi SA | 327,474 | 26,481,239 | |
| Teva Pharmaceutical Industries Ltd. sponsored ADR | 2,343,284 | 84,944,045 | |
| 480,808,717 | |||
| TOTAL HEALTH CARE | 1,039,351,446 | ||
| INDUSTRIALS - 11.3% | |||
| Aerospace & Defense - 2.1% | |||
| General Dynamics Corp. | 130,100 | 22,463,066 | |
| Meggitt PLC | 321,073 | 1,814,636 | |
| Rolls-Royce Holdings PLC | 1,556,900 | 12,787,599 | |
| The Boeing Co. | 460,941 | 71,759,295 | |
| United Technologies Corp. | 704,500 | 77,227,290 | |
| 186,051,886 | |||
| Air Freight & Logistics - 1.3% | |||
| C.H. Robinson Worldwide, Inc. | 376,100 | 27,553,086 | |
| Expeditors International of Washington, Inc. | 237,700 | 12,588,592 | |
| United Parcel Service, Inc. Class B (b) | 676,745 | 77,582,047 | |
| 117,723,725 | |||
| Airlines - 0.2% | |||
| Copa Holdings SA Class A | 195,238 | 17,733,468 | |
| Commercial Services & Supplies - 0.1% | |||
| Aggreko PLC | 162,700 | 1,840,695 | |
| KAR Auction Services, Inc. | 244,300 | 10,412,066 | |
| 12,252,761 | |||
| Construction & Engineering - 0.1% | |||
| Fluor Corp. | 152,400 | 8,004,048 | |
| Electrical Equipment - 0.5% | |||
| AMETEK, Inc. | 383,700 | 18,647,820 | |
| Hubbell, Inc. Class B | 259,703 | 30,307,340 | |
| 48,955,160 | |||
| Industrial Conglomerates - 2.7% | |||
| General Electric Co. (b) | 7,775,456 | 245,704,410 | |
| Machinery - 1.1% | |||
| Burckhardt Compression Holding AG (d) | 16,990 | 4,467,321 | |
| Caterpillar, Inc. | 24,000 | 2,225,760 | |
| Deere & Co. | 230,900 | 23,791,936 | |
| Donaldson Co., Inc. | 307,900 | 12,956,432 | |
| Flowserve Corp. | 703,200 | 33,788,760 | |
| IMI PLC | 102,200 | 1,309,893 | |
| Wabtec Corp. | 217,400 | 18,048,548 | |
| 96,588,650 | |||
| Professional Services - 0.3% | |||
| Nielsen Holdings PLC | 382,900 | 16,062,655 | |
| Robert Half International, Inc. | 230,700 | 11,253,546 | |
| 27,316,201 | |||
| Road & Rail - 2.4% | |||
| CSX Corp. | 2,196,408 | 78,916,939 | |
| J.B. Hunt Transport Services, Inc. | 677,688 | 65,783,174 | |
| Kansas City Southern | 200,400 | 17,003,940 | |
| Norfolk Southern Corp. | 279,534 | 30,209,239 | |
| Union Pacific Corp. | 228,400 | 23,680,512 | |
| 215,593,804 | |||
| Trading Companies & Distributors - 0.5% | |||
| Fastenal Co. | 173,900 | 8,169,822 | |
| Howden Joinery Group PLC | 153,000 | 723,683 | |
| W.W. Grainger, Inc. | 41,700 | 9,684,825 | |
| Watsco, Inc. | 209,447 | 31,023,290 | |
| 49,601,620 | |||
| TOTAL INDUSTRIALS | 1,025,525,733 | ||
| INFORMATION TECHNOLOGY - 16.8% | |||
| Communications Equipment - 1.5% | |||
| Cisco Systems, Inc. | 4,482,133 | 135,450,059 | |
| Internet Software & Services - 2.8% | |||
| Alphabet, Inc.: | |||
| Class A (a) | 174,509 | 138,289,657 | |
| Class C (a) | 148,265 | 114,433,892 | |
| 252,723,549 | |||
| IT Services - 3.6% | |||
| First Data Corp. Class A (a) | 1,308,987 | 18,574,526 | |
| MasterCard, Inc. Class A (b) | 804,900 | 83,105,925 | |
| Paychex, Inc. | 1,332,341 | 81,112,920 | |
| Sabre Corp. | 683,000 | 17,040,850 | |
| Unisys Corp. (a)(d) | 1,682,788 | 25,157,681 | |
| Visa, Inc. Class A | 1,356,400 | 105,826,328 | |
| 330,818,230 | |||
| Semiconductors & Semiconductor Equipment - 1.8% | |||
| Qualcomm, Inc. (b) | 2,535,100 | 165,288,520 | |
| Software - 3.6% | |||
| Microsoft Corp. | 4,848,017 | 301,255,776 | |
| Oracle Corp. | 324,069 | 12,460,453 | |
| SS&C Technologies Holdings, Inc. | 401,300 | 11,477,180 | |
| 325,193,409 | |||
| Technology Hardware, Storage & Peripherals - 3.5% | |||
| Apple, Inc. | 2,439,360 | 282,526,675 | |
| Western Digital Corp. | 484,200 | 32,901,390 | |
| 315,428,065 | |||
| TOTAL INFORMATION TECHNOLOGY | 1,524,901,832 | ||
| MATERIALS - 2.9% | |||
| Chemicals - 2.4% | |||
| CF Industries Holdings, Inc. | 801,900 | 25,243,812 | |
| E.I. du Pont de Nemours & Co. | 328,031 | 24,077,475 | |
| Johnson Matthey PLC | 23,600 | 925,473 | |
| LyondellBasell Industries NV Class A | 452,100 | 38,781,138 | |
| Monsanto Co. | 604,921 | 63,643,738 | |
| Olin Corp. | 125,400 | 3,211,494 | |
| Potash Corp. of Saskatchewan, Inc. | 2,306,900 | 41,734,332 | |
| PPG Industries, Inc. | 32,500 | 3,079,700 | |
| W.R. Grace & Co. | 275,300 | 18,621,292 | |
| 219,318,454 | |||
| Containers & Packaging - 0.5% | |||
| Ball Corp. | 86,200 | 6,471,034 | |
| Graphic Packaging Holding Co. | 66,100 | 824,928 | |
| Packaging Corp. of America | 83,000 | 7,040,060 | |
| WestRock Co. | 566,100 | 28,740,897 | |
| 43,076,919 | |||
| TOTAL MATERIALS | 262,395,373 | ||
| REAL ESTATE - 0.8% | |||
| Equity Real Estate Investment Trusts (REITs) - 0.8% | |||
| American Tower Corp. | 123,900 | 13,093,752 | |
| Crown Castle International Corp. | 321,700 | 27,913,909 | |
| First Potomac Realty Trust | 78,131 | 857,097 | |
| Omega Healthcare Investors, Inc. | 161,000 | 5,032,860 | |
| Public Storage | 81,400 | 18,192,900 | |
| Sabra Health Care REIT, Inc. | 283,700 | 6,927,954 | |
| 72,018,472 | |||
| TELECOMMUNICATION SERVICES - 1.2% | |||
| Diversified Telecommunication Services - 1.2% | |||
| Verizon Communications, Inc. | 1,976,723 | 105,517,474 | |
| UTILITIES - 0.9% | |||
| Electric Utilities - 0.9% | |||
| Exelon Corp. | 2,214,600 | 78,596,154 | |
| Multi-Utilities - 0.0% | |||
| Sempra Energy | 700 | 70,448 | |
| TOTAL UTILITIES | 78,666,602 | ||
| TOTAL COMMON STOCKS | |||
| (Cost $7,220,871,884) | 8,940,763,855 | ||
| Preferred Stocks - 1.1% | |||
| Convertible Preferred Stocks - 1.1% | |||
| HEALTH CARE - 0.9% | |||
| Health Care Equipment & Supplies - 0.9% | |||
| Alere, Inc. 3.00% (a) | 245,741 | 79,128,602 | |
| INDUSTRIALS - 0.1% | |||
| Commercial Services & Supplies - 0.1% | |||
| Stericycle, Inc. 2.25% | 199,200 | 12,603,384 | |
| UTILITIES - 0.1% | |||
| Independent Power and Renewable Electricity Producers - 0.1% | |||
| Dynegy, Inc. 7.00% (a) | 59,000 | 3,666,260 | |
| TOTAL CONVERTIBLE PREFERRED STOCKS | 95,398,246 | ||
| Nonconvertible Preferred Stocks - 0.0% | |||
| INDUSTRIALS - 0.0% | |||
| Aerospace & Defense - 0.0% | |||
| Rolls-Royce Holdings PLC (C Shares) | 227,415,800 | 280,267 | |
| TOTAL PREFERRED STOCKS | |||
| (Cost $97,459,791) | 95,678,513 | ||
| Principal Amount(e) | Value | ||
| Convertible Bonds - 0.2% | |||
| ENERGY - 0.1% | |||
| Oil, Gas & Consumable Fuels - 0.1% | |||
| Amyris, Inc.: | |||
| 5% 10/15/18 pay-in-kind (c)(f) | 2,729,711 | 1,511,905 | |
| 9.5% 4/15/19 pay-in-kind | 5,081,000 | 3,185,152 | |
| 4,697,057 | |||
| HEALTH CARE - 0.1% | |||
| Pharmaceuticals - 0.1% | |||
| Bayer Capital Corp. BV 5.625% 11/22/19 (g) | EUR | 9,500,000 | 10,878,490 |
| TOTAL CONVERTIBLE BONDS | |||
| (Cost $17,958,611) | 15,575,547 | ||
| Shares | Value | ||
| Other - 0.2% | |||
| ENERGY - 0.2% | |||
| Oil, Gas & Consumable Fuels - 0.2% | |||
| Utica Shale Drilling Program (non-operating revenue interest) unit (c)(h) | |||
| (Cost $17,170,118) | 17,170,118 | 17,170,118 | |
| Money Market Funds - 1.0% | |||
| Fidelity Cash Central Fund, 0.60% (i) | 78,723,861 | 78,739,606 | |
| Fidelity Securities Lending Cash Central Fund 0.65% (i)(j) | 15,340,444 | 15,341,978 | |
| TOTAL MONEY MARKET FUNDS | |||
| (Cost $94,081,510) | 94,081,584 | ||
| TOTAL INVESTMENT PORTFOLIO - 101.1% | |||
| (Cost $7,447,541,914) | 9,163,269,617 | ||
| NET OTHER ASSETS (LIABILITIES) - (1.1)% | (98,089,436) | ||
| NET ASSETS - 100% | $9,065,180,181 |
| Written Options | ||||
| Expiration Date/Exercise Price | Number of Contracts | Premium | Value | |
| Call Options | ||||
| Bank of America Corp. | 1/20/17 - $18.00 | 16,042 | $384,999 | $(6,657,430) |
| Bank of America Corp. | 1/20/17 - $20.00 | 24,041 | 1,057,780 | (5,385,184) |
| Charles Schwab | 1/20/17 - $35.00 | 3,003 | 184,680 | (1,351,350) |
| Citigroup, Inc. | 1/20/17 - $50.00 | 4,399 | 892,977 | (4,190,048) |
| Citigroup, Inc. | 1/20/17 - $55.00 | 4,440 | 195,356 | (2,120,100) |
| Citigroup, Inc. | 2/17/17 - $60.00 | 2,225 | 264,769 | (471,700) |
| Comerica, Inc. | 1/20/17 - $55.00 | 1,530 | 191,246 | (2,046,375) |
| General Electric | 1/20/17 - $32.00 | 8,013 | 248,974 | (300,488) |
| JPMorgan Chase & Co. | 1/20/17 - $72.50 | 8,920 | 615,728 | (12,354,200) |
| JPMorgan Chase & Co. | 2/17/17 - $85.00 | 4,357 | 507,083 | (1,481,380) |
| Las Vegas Sands Corp. | 1/20/17 - $62.50 | 742 | 139,499 | (3,339) |
| MasterCard, Inc. Class A | 1/20/17 - $105.00 | 1,611 | 453,258 | (173,988) |
| Morgan Stanley | 1/20/17 - $36.00 | 2,679 | 123,231 | (1,701,165) |
| Northern Trust Corp. | 1/20/17 - $75.00 | 1,204 | 176,984 | (1,685,600) |
| Qualcomm, Inc. | 1/20/17 - $67.50 | 4,197 | 499,516 | (205,653) |
| Regions Financial Corp. | 1/20/17 - $11.00 | 112 | 3,700 | (37,520) |
| Regions Financial Corp. | 2/17/17 - $13.00 | 8,617 | 293,547 | (1,370,103) |
| Regions Financial Corp. | 1/20/17 - $14.00 | 11,355 | 397,416 | (715,365) |
| SunTrust Banks, Inc. | 1/20/17 - $46.00 | 4,453 | 496,320 | (3,952,038) |
| SunTrust Banks, Inc. | 1/20/17 - $50.00 | 2,219 | 135,417 | (1,126,143) |
| SunTrust Banks, Inc. | 1/20/17 - $55.00 | 2,131 | 147,036 | (277,030) |
| U.S. Bancorp | 1/20/17 - $50.00 | 3,428 | 126,833 | (625,610) |
| United Parcel Service, Inc. Class B | 4/21/17 - $115.00 | 1,193 | 169,403 | (450,356) |
| TOTAL WRITTEN OPTIONS | $7,705,752 | $(48,682,165) |
Legend
(a) Non-income producing
(b) Security or a portion of the security is pledged as collateral for call options written. At period end, the value of securities pledged amounted to $494,911,465.
(c) Restricted securities - Investment in securities not registered under the Securities Act of 1933 (excluding 144A issues). At the end of the period, the value of restricted securities (excluding 144A issues) amounted to $18,682,031 or 0.2% of net assets.
(d) Security or a portion of the security is on loan at period end.
(e) Amount is stated in United States dollars unless otherwise noted.
(f) Coupon rates for floating and adjustable rate securities reflect the rates in effect at period end.
(g) Security exempt from registration under Rule 144A of the Securities Act of 1933. These securities may be resold in transactions exempt from registration, normally to qualified institutional buyers. At the end of the period, the value of these securities amounted to $10,878,490 or 0.1% of net assets.
(h) Investment is owned by a wholly-owned subsidiary (Subsidiary) that is treated as a corporation for U.S. tax purposes.
(i) Affiliated fund that is generally available only to investment companies and other accounts managed by Fidelity Investments. The rate quoted is the annualized seven-day yield of the fund at period end. A complete unaudited listing of the fund's holdings as of its most recent quarter end is available upon request. In addition, each Fidelity Central Fund's financial statements are available on the SEC's website or upon request.
(j) Investment made with cash collateral received from securities on loan.
Additional information on each restricted holding is as follows:
| Security | Acquisition Date | Acquisition Cost |
| Amyris, Inc. 5% 10/15/18 pay-in-kind | 10/16/13 - 10/17/16 | $2,729,711 |
| NJOY, Inc. | 2/14/14 | $1,372,724 |
| Utica Shale Drilling Program (non-operating revenue interest) unit | 10/5/16 - 11/4/16 | $17,170,118 |
Affiliated Central Funds
Information regarding fiscal year to date income earned by the Fund from investments in Fidelity Central Funds is as follows:
| Fund | Income earned |
| Fidelity Cash Central Fund | $204,864 |
| Fidelity Securities Lending Cash Central Fund | 161,895 |
| Total | $366,759 |
Investment Valuation
The following is a summary of the inputs used, as of December 31, 2016, involving the Fund's assets and liabilities carried at fair value. The inputs or methodology used for valuing securities may not be an indication of the risk associated with investing in those securities. For more information on valuation inputs, and their aggregation into the levels used below, please refer to the Investment Valuation section in the accompanying Notes to Financial Statements.
| Valuation Inputs at Reporting Date: | ||||
| Description | Total | Level 1 | Level 2 | Level 3 |
| Investments in Securities: | ||||
| Equities: | ||||
| Consumer Discretionary | $775,514,942 | $775,514,934 | $-- | $8 |
| Consumer Staples | 555,814,352 | 525,752,043 | 30,062,309 | -- |
| Energy | 1,171,631,714 | 1,171,631,714 | -- | -- |
| Financials | 2,329,425,915 | 2,327,795,788 | 1,630,127 | -- |
| Health Care | 1,118,480,048 | 1,006,504,598 | 111,975,450 | -- |
| Industrials | 1,038,409,384 | 1,025,621,785 | 12,787,599 | -- |
| Information Technology | 1,524,901,832 | 1,524,901,832 | -- | -- |
| Materials | 262,395,373 | 262,395,373 | -- | -- |
| Real Estate | 72,018,472 | 72,018,472 | -- | -- |
| Telecommunication Services | 105,517,474 | 105,517,474 | -- | -- |
| Utilities | 82,332,862 | 82,332,862 | -- | -- |
| Corporate Bonds | 15,575,547 | -- | 14,063,642 | 1,511,905 |
| Other | 17,170,118 | -- | -- | 17,170,118 |
| Money Market Funds | 94,081,584 | 94,081,584 | -- | -- |
| Total Investments in Securities: | $9,163,269,617 | $8,974,068,459 | $170,519,127 | $18,682,031 |
| Derivative Instruments: | ||||
| Liabilities | ||||
| Written Options | $(48,682,165) | $(48,682,165) | $-- | $-- |
| Total Liabilities | $(48,682,165) | $(48,682,165) | $-- | $-- |
| Total Derivative Instruments: | $(48,682,165) | $(48,682,165) | $-- | $-- |
Value of Derivative Instruments
The following table is a summary of the Fund's value of derivative instruments by primary risk exposure as of December 31, 2016. For additional information on derivative instruments, please refer to the Derivative Instruments section in the accompanying Notes to Financial Statements.
| Primary Risk Exposure / Derivative Type | Value | |
| Asset | Liability | |
| Equity Risk | ||
| Written Options(a) | $0 | $(48,682,165) |
| Total Equity Risk | 0 | (48,682,165) |
| Total Value of Derivatives | $0 | $(48,682,165) |
(a) Gross value is presented in the Statement of Assets and Liabilities in the written options, at value line-item.
See accompanying notes which are an integral part of the financial statements.
Financial Statements
Statement of Assets and Liabilities
| December 31, 2016 (Unaudited) | ||
| Assets | ||
| Investment in securities, at value (including securities loaned of $14,902,441) — See accompanying schedule: Unaffiliated issuers (cost $7,353,460,404) | $9,069,188,033 | |
| Fidelity Central Funds (cost $94,081,510) | 94,081,584 | |
| Total Investments (cost $7,447,541,914) | $9,163,269,617 | |
| Foreign currency held at value (cost $111,536) | 111,554 | |
| Receivable for investments sold | 22,898,383 | |
| Receivable for fund shares sold | 45,185 | |
| Dividends receivable | 11,719,009 | |
| Interest receivable | 190,269 | |
| Distributions receivable from Fidelity Central Funds | 47,615 | |
| Prepaid expenses | 17,582 | |
| Other receivables | 17,344 | |
| Total assets | 9,198,316,558 | |
| Liabilities | ||
| Payable for investments purchased | $1,132,100 | |
| Payable for fund shares redeemed | 63,914,798 | |
| Accrued management fee | 3,415,108 | |
| Written options, at value (premium received $7,705,752) | 48,682,165 | |
| Other affiliated payables | 591,611 | |
| Other payables and accrued expenses | 64,150 | |
| Collateral on Securities Loaned | 15,336,445 | |
| Total liabilities | 133,136,377 | |
| Net Assets | $9,065,180,181 | |
| Net Assets consist of: | ||
| Paid in capital | $7,421,315,394 | |
| Distributions in excess of net investment income | (26,516,910) | |
| Accumulated undistributed net realized gain (loss) on investments and foreign currency transactions | (4,304,649) | |
| Net unrealized appreciation (depreciation) on investments and assets and liabilities in foreign currencies | 1,674,686,346 | |
| Net Assets | $9,065,180,181 | |
| Series Growth and Income: | ||
| Net Asset Value, offering price and redemption price per share ($3,538,250,222 ÷ 249,668,752 shares) | $14.17 | |
| Class F: | ||
| Net Asset Value, offering price and redemption price per share ($5,526,929,959 ÷ 389,432,997 shares) | $14.19 |
See accompanying notes which are an integral part of the financial statements.
Statement of Operations
| Six months ended December 31, 2016 (Unaudited) | ||
| Investment Income | ||
| Dividends | $106,846,896 | |
| Interest | 424,002 | |
| Income from Fidelity Central Funds | 366,759 | |
| Total income | 107,637,657 | |
| Expenses | ||
| Management fee | $20,642,277 | |
| Transfer agent fees | 2,860,715 | |
| Accounting and security lending fees | 629,911 | |
| Custodian fees and expenses | 102,863 | |
| Independent trustees' fees and expenses | 19,435 | |
| Audit | 27,881 | |
| Legal | 22,612 | |
| Interest | 8,268 | |
| Miscellaneous | 40,327 | |
| Total expenses before reductions | 24,354,289 | |
| Expense reductions | (33,729) | 24,320,560 |
| Net investment income (loss) | 83,317,097 | |
| Realized and Unrealized Gain (Loss) | ||
| Net realized gain (loss) on: | ||
| Investment securities: | ||
| Unaffiliated issuers | 104,524,199 | |
| Fidelity Central Funds | 58,379 | |
| Foreign currency transactions | (53,965) | |
| Futures contracts | (1,849,323) | |
| Written options | 1,842,903 | |
| Total net realized gain (loss) | 104,522,193 | |
| Change in net unrealized appreciation (depreciation) on: Investment securities | 1,086,372,159 | |
| Assets and liabilities in foreign currencies | (5,213) | |
| Written options | (39,867,399) | |
| Total change in net unrealized appreciation (depreciation) | 1,046,499,547 | |
| Net gain (loss) | 1,151,021,740 | |
| Net increase (decrease) in net assets resulting from operations | $1,234,338,837 |
See accompanying notes which are an integral part of the financial statements.
Statement of Changes in Net Assets
| Six months ended December 31, 2016 (Unaudited) | Year ended June 30, 2016 | |
| Increase (Decrease) in Net Assets | ||
| Operations | ||
| Net investment income (loss) | $83,317,097 | $177,481,238 |
| Net realized gain (loss) | 104,522,193 | (11,521,139) |
| Change in net unrealized appreciation (depreciation) | 1,046,499,547 | (381,309,562) |
| Net increase (decrease) in net assets resulting from operations | 1,234,338,837 | (215,349,463) |
| Distributions to shareholders from net investment income | (121,253,233) | (193,648,252) |
| Distributions to shareholders from net realized gain | (12,492,488) | (338,147,916) |
| Total distributions | (133,745,721) | (531,796,168) |
| Share transactions - net increase (decrease) | (752,590,440) | 10,054,432 |
| Total increase (decrease) in net assets | 348,002,676 | (737,091,199) |
| Net Assets | ||
| Beginning of period | 8,717,177,505 | 9,454,268,704 |
| End of period | $9,065,180,181 | $8,717,177,505 |
| Other Information | ||
| Undistributed net investment income end of period | $– | $11,419,226 |
| Distributions in excess of net investment income end of period | $(26,516,910) | $– |
See accompanying notes which are an integral part of the financial statements.
Financial Highlights — Fidelity Series Growth & Income Fund Series Growth and Income
| Six months ended (Unaudited) December 31, | Years ended June 30, | ||||
| 2016 | 2016 | 2015 | 2014 | 2013 A | |
| Selected Per–Share Data | |||||
| Net asset value, beginning of period | $12.57 | $13.67 | $13.58 | $11.53 | $10.00 |
| Income from Investment Operations | |||||
| Net investment income (loss)B | .11 | .24 | .25 | .24 | .09 |
| Net realized and unrealized gain (loss) | 1.68 | (.59) | .43 | 2.29 | 1.45 |
| Total from investment operations | 1.79 | (.35) | .68 | 2.53 | 1.54 |
| Distributions from net investment income | (.17) | (.26) | (.24) | (.21) | (.01) |
| Distributions from net realized gain | (.02) | (.49) | (.36) | (.27) | – |
| Total distributions | (.19) | (.75) | (.59)C | (.48) | (.01) |
| Net asset value, end of period | $14.17 | $12.57 | $13.67 | $13.58 | $11.53 |
| Total ReturnD,E | 14.32% | (2.56)% | 5.21% | 22.40% | 15.41% |
| Ratios to Average Net AssetsF,G | |||||
| Expenses before reductions | .63%H | .63% | .63% | .66% | .78%H |
| Expenses net of fee waivers, if any | .62%H | .63% | .63% | .66% | .78%H |
| Expenses net of all reductions | .62%H | .63% | .63% | .66% | .77%H |
| Net investment income (loss) | 1.71%H | 1.89% | 1.82% | 1.87% | 1.42%H |
| Supplemental Data | |||||
| Net assets, end of period (000 omitted) | $3,538,250 | $3,411,837 | $3,849,841 | $3,910,455 | $1,000,854 |
| Portfolio turnover rateI | 38%H | 36% | 40% | 53%J | 80%H |
A For the period December 6, 2012 (commencement of operations) to June 30, 2013.
B Calculated based on average shares outstanding during the period.
C Total distributions of $.59 per share is comprised of distributions from net investment income of $.235 and distributions from net realized gain of $.359 per share.
D Total returns for periods of less than one year are not annualized.
E Total returns would have been lower if certain expenses had not been reduced during the applicable periods shown.
F Fees and expenses of any underlying Fidelity Central Funds are not included in the Fund's expense ratio. The Fund indirectly bears its proportionate share of the expenses of any underlying Fidelity Central Funds.
G Expense ratios reflect operating expenses of the class. Expenses before reductions do not reflect amounts reimbursed by the investment adviser or reductions from brokerage service arrangements or reductions from other expense offset arrangements and do not represent the amount paid by the class during periods when reimbursements or reductions occur. Expense ratios before reductions for start-up periods may not be representative of longer-term operating periods. Expenses net of fee waivers reflect expenses after reimbursement by the investment adviser but prior to reductions from brokerage service arrangements or other expense offset arrangements. Expenses net of all reductions represent the net expenses paid by the class.
H Annualized
I Amount does not include the portfolio activity of any underlying Fidelity Central Funds.
J Portfolio turnover rate excludes securities received or delivered in-kind.
See accompanying notes which are an integral part of the financial statements.
Financial Highlights — Fidelity Series Growth & Income Fund Class F
| Six months ended (Unaudited) December 31, | Years ended June 30, | ||||
| 2016 | 2016 | 2015 | 2014 | 2013 A | |
| Selected Per–Share Data | |||||
| Net asset value, beginning of period | $12.59 | $13.69 | $13.60 | $11.54 | $10.00 |
| Income from Investment Operations | |||||
| Net investment income (loss)B | .13 | .26 | .27 | .26 | .10 |
| Net realized and unrealized gain (loss) | 1.68 | (.59) | .44 | 2.29 | 1.45 |
| Total from investment operations | 1.81 | (.33) | .71 | 2.55 | 1.55 |
| Distributions from net investment income | (.19) | (.28) | (.26) | (.23) | (.01) |
| Distributions from net realized gain | (.02) | (.49) | (.36) | (.27) | – |
| Total distributions | (.21) | (.77) | (.62) | (.49)C | (.01) |
| Net asset value, end of period | $14.19 | $12.59 | $13.69 | $13.60 | $11.54 |
| Total ReturnD,E | 14.42% | (2.40)% | 5.37% | 22.61% | 15.53% |
| Ratios to Average Net AssetsF,G | |||||
| Expenses before reductions | .47%H | .47% | .47% | .48% | .59%H |
| Expenses net of fee waivers, if any | .47%H | .47% | .47% | .48% | .59%H |
| Expenses net of all reductions | .46%H | .46% | .47% | .48% | .58%H |
| Net investment income (loss) | 1.87%H | 2.05% | 1.98% | 2.04% | 1.60%H |
| Supplemental Data | |||||
| Net assets, end of period (000 omitted) | $5,526,930 | $5,305,340 | $5,604,428 | $5,360,603 | $1,227,712 |
| Portfolio turnover rateI | 38%H | 36% | 40% | 53%J | 80%H |
A For the period December 6, 2012 (commencement of operations) to June 30, 2013.
B Calculated based on average shares outstanding during the period.
C Total distributions of $.49 per share is comprised of distributions from net investment income of $.228 and distributions from net realized gain of $.266 per share.
D Total returns for periods of less than one year are not annualized.
E Total returns would have been lower if certain expenses had not been reduced during the applicable periods shown.
F Fees and expenses of any underlying Fidelity Central Funds are not included in the Fund's expense ratio. The Fund indirectly bears its proportionate share of the expenses of any underlying Fidelity Central Funds.
G Expense ratios reflect operating expenses of the class. Expenses before reductions do not reflect amounts reimbursed by the investment adviser or reductions from brokerage service arrangements or reductions from other expense offset arrangements and do not represent the amount paid by the class during periods when reimbursements or reductions occur. Expense ratios before reductions for start-up periods may not be representative of longer-term operating periods. Expenses net of fee waivers reflect expenses after reimbursement by the investment adviser but prior to reductions from brokerage service arrangements or other expense offset arrangements. Expenses net of all reductions represent the net expenses paid by the class.
H Annualized
I Amount does not include the portfolio activity of any underlying Fidelity Central Funds.
J Portfolio turnover rate excludes securities received or delivered in-kind.
See accompanying notes which are an integral part of the financial statements.
Notes to Financial Statements (Unaudited)
For the period ended December 31, 2016
1. Organization.
Fidelity Series Growth & Income Fund (the Fund) is a fund of Fidelity Hastings Street Trust (the Trust) and is authorized to issue an unlimited number of shares. Shares of the Fund are only available for purchase by mutual funds for which Fidelity Management & Research Company (FMR) or an affiliate serves as an investment manager. The Trust is registered under the Investment Company Act of 1940, as amended (the 1940 Act), as an open-end management investment company organized as a Massachusetts business trust. The Fund offers Series Growth & Income and Class F shares, each of which has equal rights as to assets and voting privileges. Each class has exclusive voting rights with respect to matters that affect that class.
2. Investments in Fidelity Central Funds.
The Fund invests in Fidelity Central Funds, which are open-end investment companies generally available only to other investment companies and accounts managed by the investment adviser and its affiliates. The Fund's Schedule of Investments lists each of the Fidelity Central Funds held as of period end, if any, as an investment of the Fund, but does not include the underlying holdings of each Fidelity Central Fund. As an Investing Fund, the Fund indirectly bears its proportionate share of the expenses of the underlying Fidelity Central Funds.
The Money Market Central Funds seek preservation of capital and current income and are managed by Fidelity Investments Money Management, Inc. (FIMM), an affiliate of the investment adviser. Annualized expenses of the Money Market Central Funds as of their most recent shareholder report date are less than .005%.
A complete unaudited list of holdings for each Fidelity Central Fund is available upon request or at the Securities and Exchange Commission (the SEC) website at www.sec.gov. In addition, the financial statements of the Fidelity Central Funds are available on the SEC website or upon request.
3. Significant Accounting Policies.
The financial statements have been prepared in conformity with accounting principles generally accepted in the United States of America (GAAP), which require management to make certain estimates and assumptions at the date of the financial statements. Actual results could differ from those estimates. Subsequent events, if any, through the date that the financial statements were issued have been evaluated in the preparation of the financial statements. The following summarizes the significant accounting policies of the Fund:
Investment Valuation. Investments are valued as of 4:00 p.m. Eastern time on the last calendar day of the period. The Board of Trustees (the Board) has delegated the day to day responsibility for the valuation of the Fund's investments to the Fair Value Committee (the Committee) established by the Fund's investment adviser. In accordance with valuation policies and procedures approved by the Board, the Fund attempts to obtain prices from one or more third party pricing vendors or brokers to value its investments. When current market prices, quotations or currency exchange rates are not readily available or reliable, investments will be fair valued in good faith by the Committee, in accordance with procedures adopted by the Board. Factors used in determining fair value vary by investment type and may include market or investment specific events, changes in interest rates and credit quality. The frequency with which these procedures are used cannot be predicted and they may be utilized to a significant extent. The Committee oversees the Fund's valuation policies and procedures and reports to the Board on the Committee's activities and fair value determinations. The Board monitors the appropriateness of the procedures used in valuing the Fund's investments and ratifies the fair value determinations of the Committee.
The Fund categorizes the inputs to valuation techniques used to value its investments into a disclosure hierarchy consisting of three levels as shown below:
- Level 1 – quoted prices in active markets for identical investments
- Level 2 – other significant observable inputs (including quoted prices for similar investments, interest rates, prepayment speeds, etc.)
- Level 3 – unobservable inputs (including the Fund's own assumptions based on the best information available)
Valuation techniques used to value the Fund's investments by major category are as follows:
Equity securities, including restricted securities, for which market quotations are readily available, are valued at the last reported sale price or official closing price as reported by a third party pricing vendor on the primary market or exchange on which they are traded and are categorized as Level 1 in the hierarchy. In the event there were no sales during the day or closing prices are not available, securities are valued at the last quoted bid price or may be valued using the last available price and are generally categorized as Level 2 in the hierarchy. For foreign equity securities, when market or security specific events arise, comparisons to the valuation of American Depositary Receipts (ADRs), futures contracts, Exchange-Traded Funds (ETFs) and certain indexes as well as quoted prices for similar securities may be used and would be categorized as Level 2 in the hierarchy. Utilizing these techniques may result in transfers between Level 1 and Level 2. For equity securities, including restricted securities, where observable inputs are limited, assumptions about market activity and risk are used and these securities may be categorized as Level 3 in the hierarchy.
Debt securities, including restricted securities, are valued based on evaluated prices received from third party pricing vendors or from brokers who make markets in such securities. Corporate bonds are valued by pricing vendors who utilize matrix pricing which considers yield or price of bonds of comparable quality, coupon, maturity and type or by broker-supplied prices. When independent prices are unavailable or unreliable, debt securities may be valued utilizing pricing methodologies which consider similar factors that would be used by third party pricing vendors. Debt securities are generally categorized as Level 2 in the hierarchy but may be Level 3 depending on the circumstances.
Exchange-traded options are valued using the last sale price or, in the absence of a sale, the last offering price and are categorized as Level 1 in the hierarchy. Investments in open-end mutual funds, including the Fidelity Central Funds, are valued at their closing net asset value (NAV) each business day and are categorized as Level 1 in the hierarchy.
Changes in valuation techniques may result in transfers in or out of an assigned level within the disclosure hierarchy. The aggregate value of investments by input level as of December 31, 2016 is included at the end of the Fund's Schedule of Investments.
Foreign Currency. The Fund may use foreign currency contracts to facilitate transactions in foreign-denominated securities. Gains and losses from these transactions may arise from changes in the value of the foreign currency or if the counterparties do not perform under the contracts' terms.
Foreign-denominated assets, including investment securities, and liabilities are translated into U.S. dollars at the exchange rates at period end. Purchases and sales of investment securities, income and dividends received and expenses denominated in foreign currencies are translated into U.S. dollars at the exchange rate in effect on the transaction date.
The effects of exchange rate fluctuations on investments are included with the net realized and unrealized gain (loss) on investment securities. Other foreign currency transactions resulting in realized and unrealized gain (loss) are disclosed separately.
Investment Transactions and Income. For financial reporting purposes, the Fund's investment holdings and NAV include trades executed through the end of the last business day of the period. The NAV per share for processing shareholder transactions is calculated as of the close of business of the New York Stock Exchange (NYSE), normally 4:00 p.m. Eastern time and includes trades executed through the end of the prior business day. Gains and losses on securities sold are determined on the basis of identified cost and may include proceeds received from litigation. Dividend income is recorded on the ex-dividend date, except for certain dividends from foreign securities where the ex-dividend date may have passed, which are recorded as soon as the Fund is informed of the ex-dividend date. Non-cash dividends included in dividend income, if any, are recorded at the fair market value of the securities received. Income and capital gain distributions from Fidelity Central Funds, if any, are recorded on the ex-dividend date. Certain distributions received by the Fund represent a return of capital or capital gain. The Fund determines the components of these distributions subsequent to the ex-dividend date, based upon receipt of tax filings or other correspondence relating to the underlying investment. These distributions are recorded as a reduction of cost of investments and/or as a realized gain. Interest income is accrued as earned and includes coupon interest and amortization of premium and accretion of discount on debt securities as applicable. Investment income is recorded net of foreign taxes withheld where recovery of such taxes is uncertain.
Class Allocations and Expenses. Investment income, realized and unrealized capital gains and losses, common expenses of the Fund, and certain fund-level expense reductions, if any, are allocated daily on a pro-rata basis to each class based on the relative net assets of each class to the total net assets of the Fund. Each class differs with respect to transfer agent fees incurred. Certain expense reductions may also differ by class. For the reporting period, the allocated portion of income and expenses to each class as a percent of its average net assets may vary due to the timing of recording these transactions in relation to fluctuating net assets of the classes. Expenses directly attributable to a fund are charged to that fund. Expenses attributable to more than one fund are allocated among the respective funds on the basis of relative net assets or other appropriate methods. Expense estimates are accrued in the period to which they relate and adjustments are made when actual amounts are known.
Income Tax Information and Distributions to Shareholders. Each year, the Fund intends to qualify as a regulated investment company under Subchapter M of the Internal Revenue Code, including distributing substantially all of its taxable income and realized gains. As a result, no provision for U.S. Federal income taxes is required. The Fund files a U.S. federal tax return, in addition to state and local tax returns as required. The Fund's federal income tax returns are subject to examination by the Internal Revenue Service (IRS) for a period of three fiscal years after they are filed. State and local tax returns may be subject to examination for an additional fiscal year depending on the jurisdiction. Foreign taxes are provided for based on the Fund's understanding of the tax rules and rates that exist in the foreign markets in which it invests.
Distributions are declared and recorded on the ex-dividend date. Income dividends and capital gain distributions are declared separately for each class. Income and capital gain distributions are determined in accordance with income tax regulations, which may differ from GAAP.
Capital accounts within the financial statements are adjusted for permanent book-tax differences. These adjustments have no impact on net assets or the results of operations. Capital accounts are not adjusted for temporary book-tax differences which will reverse in a subsequent period.
Book-tax differences are primarily due to foreign currency transactions, passive foreign investment companies (PFIC), market discount, partnerships, certain conversion ratio adjustments, equity-debt classifications and losses due to wash sales and excise tax regulations.
The federal tax cost of investment securities and unrealized appreciation (depreciation) as of period end were as follows:
| Gross unrealized appreciation | $2,035,851,460 |
| Gross unrealized depreciation | (364,343,386) |
| Net unrealized appreciation (depreciation) on securities | $1,671,508,074 |
| Tax cost | $7,491,761,543 |
At the prior fiscal period end, the Fund was required to defer approximately $181,701 of losses on options. The Fund elected to defer to its next fiscal year approximately $51,652,763 of capital losses recognized during the period November 1, 2015 to June 30, 2016.
Restricted Securities. The Fund may invest in securities that are subject to legal or contractual restrictions on resale. These securities generally may be resold in transactions exempt from registration or to the public if the securities are registered. Disposal of these securities may involve time-consuming negotiations and expense, and prompt sale at an acceptable price may be difficult. Information regarding restricted securities is included at the end of the Fund's Schedule of Investments.
Consolidated Subsidiary. The Fund invests in certain investments through a wholly-owned subsidiary ("Subsidiary"), which may be subject to federal and state taxes upon disposition.
As of period end, the Fund held an investment of $17,170,118 in this Subsidiary, representing .19% of the Fund's net assets. The financial statements have been consolidated and include accounts of the Fund and each Subsidiary. Accordingly, all inter-company transactions and balances have been eliminated.
4. Derivative Instruments.
Risk Exposures and the Use of Derivative Instruments. The Fund's investment objective allows the Fund to enter into various types of derivative contracts, including futures contracts and options. Derivatives are investments whose value is primarily derived from underlying assets, indices or reference rates and may be transacted on an exchange or over-the-counter (OTC). Derivatives may involve a future commitment to buy or sell a specified asset based on specified terms, to exchange future cash flows at periodic intervals based on a notional principal amount, or for one party to make one or more payments upon the occurrence of specified events in exchange for periodic payments from the other party.
The Fund used derivatives to increase returns and to manage exposure to certain risks as defined below. The success of any strategy involving derivatives depends on analysis of numerous economic factors, and if the strategies for investment do not work as intended, the Fund may not achieve its objectives.
The Fund's use of derivatives increased or decreased its exposure to the following risk:
| Equity Risk | Equity risk relates to the fluctuations in the value of financial instruments as a result of changes in market prices (other than those arising from interest rate risk or foreign exchange risk), whether caused by factors specific to an individual investment, its issuer, or all factors affecting all instruments traded in a market or market segment. |
The Fund is also exposed to additional risks from investing in derivatives, such as liquidity risk and counterparty credit risk. Liquidity risk is the risk that the Fund will be unable to close out the derivative in the open market in a timely manner. Counterparty credit risk is the risk that the counterparty will not be able to fulfill its obligation to the Fund. Counterparty credit risk related to exchange-traded futures contracts and exchange-traded options may be mitigated by the protection provided by the exchange on which they trade.
Investing in derivatives may involve greater risks than investing in the underlying assets directly and, to varying degrees, may involve risk of loss in excess of any initial investment and collateral received and amounts recognized in the Statement of Assets and Liabilities. In addition, there may be the risk that the change in value of the derivative contract does not correspond to the change in value of the underlying instrument.
Net Realized Gain (Loss) and Change in Net Unrealized Appreciation (Depreciation) on Derivatives. The table below, which reflects the impacts of derivatives on the financial performance of the Fund, summarizes the net realized gain (loss) and change in net unrealized appreciation (depreciation) for derivatives during the period as presented in the Statement of Operations.
| Primary Risk Exposure / Derivative Type | Net Realized Gain (Loss) | Change in Net Unrealized Appreciation (Depreciation) |
| Equity Risk | ||
| Futures | $(1,849,323) | $– |
| Written Options | 1,842,903 | (39,867,399) |
| Totals | $(6,420) | $(39,867,399) |
A summary of the value of derivatives by primary risk exposure as of period end, if any, is included at the end of the Schedule of Investments.
Futures Contracts. A futures contract is an agreement between two parties to buy or sell a specified underlying instrument for a fixed price at a specified future date. The Fund used futures contracts to manage its exposure to the stock market.
Upon entering into a futures contract, a fund is required to deposit either cash or securities (initial margin) with a clearing broker in an amount equal to a certain percentage of the face value of the contract. Futures contracts are marked-to-market daily and subsequent daily payments (variation margin) are made or received by a fund depending on the daily fluctuations in the value of the futures contracts and are recorded as unrealized appreciation or (depreciation). This receivable and/or payable, if any, is included in daily variation margin for derivative instruments in the Statement of Assets and Liabilities. Realized gain or (loss) is recorded upon the expiration or closing of a futures contract.
Any open futures contracts at period end are presented in the Schedule of Investments under the caption "Futures Contracts". The underlying face amount at value reflects each contract's exposure to the underlying instrument or index at period end.
Options. Options give the purchaser the right, but not the obligation, to buy (call) or sell (put) an underlying security or financial instrument at an agreed exercise or strike price between or on certain dates. Options obligate the seller (writer) to buy (put) or sell (call) an underlying instrument at the exercise or strike price or cash settle an underlying derivative instrument if the holder exercises the option on or before the expiration date.
The Fund used exchange-traded written covered call options to manage its exposure to the market. When the Fund writes a covered call option, the Fund holds the underlying instrument which must be delivered to the holder upon the exercise of the option.
Upon entering into a written options contract, the Fund will receive a premium. Premiums received are reflected as a liability on the Statement of Assets and Liabilities. Options are valued daily and any unrealized appreciation (depreciation) is reflected on the Statement of Assets and Liabilities. When a written option is exercised, the premium is added to the proceeds from the sale of the underlying instrument in determining the gain or loss realized on that investment. When an option is closed the Fund will realize a gain or loss depending on whether the proceeds or amount paid for the closing sale transaction are greater or less than the premium received. When an option expires, gains and losses are realized to the extent of premiums received. The net realized gain (loss) on closed and expired written options and the change in net unrealized appreciation (depreciation) on written options are reflected separately on the Statement of Operations.
Writing call options tends to decrease exposure to the underlying instrument and risk of loss is the change in value in excess of the premium received.
Any open options at period end are presented in the Schedule of Investments under the caption "Written Options".
The following is a summary of the Fund's written options activity:
| Number of Contracts | Amount of Premiums | |
| Outstanding at beginning of period | 51,594 | $4,458,981 |
| Options Opened | 192,589 | 13,039,541 |
| Options Exercised | (25,013) | (2,214,769) |
| Options Closed | (87,055) | (6,584,474) |
| Options Expired | (11,204) | (993,527) |
| Outstanding at end of period | 120,911 | $7,705,752 |
5. Purchases and Sales of Investments.
Purchases and sales of securities, other than short-term securities, aggregated $1,713,999,929 and $2,493,048,868, respectively.
6. Fees and Other Transactions with Affiliates.
Management Fee. Fidelity Management & Research Company (the investment adviser) and its affiliates provide the Fund with investment management related services for which the Fund pays a monthly management fee. The management fee is the sum of an individual fund fee rate that is based on an annual rate of .20% of the Fund's average net assets and an annualized group fee rate that averaged .25% during the period. The group fee rate is based upon the average net assets of all the mutual funds advised by the investment adviser, including any mutual funds previously advised by the investment adviser that are currently advised by Fidelity SelectCo, LLC, an affiliate of the investment adviser. The group fee rate decreases as assets under management increase and increases as assets under management decrease. For the reporting period, the total annualized management fee rate was .45% of the Fund's average net assets.
Transfer Agent Fees. Fidelity Investments Institutional Operations Company, Inc., (FIIOC), an affiliate of the investment adviser, is the transfer, dividend disbursing and shareholder servicing agent for each class of the Fund. FIIOC receives account fees and asset-based fees that vary according to the account size and type of account of the shareholders of Series Growth & Income. FIIOC receives no fees for providing transfer agency services to Class F. FIIOC pays for typesetting, printing and mailing of shareholder reports, except proxy statements.
For the period, transfer agent fees for each applicable class were as follows:
| Amount | % of Class-Level Average Net Assets(a) | |
| Series Growth and Income | $2,860,715 | .16 |
(a) Annualized
Accounting and Security Lending Fees. Fidelity Service Company, Inc. (FSC), an affiliate of the investment adviser, maintains the Fund's accounting records. The accounting fee is based on the level of average net assets for each month. Under a separate contract, FSC administers the security lending program. The security lending fee is based on the number and duration of lending transactions.
Brokerage Commissions. The Fund placed a portion of its portfolio transactions with brokerage firms which are affiliates of the investment adviser. Brokerage commissions are included in net realized gain (loss) and change in net unrealized appreciation (depreciation) in the Statement of Operations. The commissions paid to these affiliated firms were $57,123 for the period.
Interfund Lending Program. Pursuant to an Exemptive Order issued by the SEC, the Fund, along with other registered investment companies having management contracts with FMR or other affiliated entities of FMR, may participate in an interfund lending program. This program provides an alternative credit facility allowing the funds to borrow from, or lend money to, other participating affiliated funds. At period end, there were no interfund loans outstanding. The Fund's activity in this program during the period for which loans were outstanding was as follows:
| Borrower or Lender | Average Loan Balance | Weighted Average Interest Rate | Interest Expense |
| Borrower | $36,313,357 | .59% | $8,268 |
Interfund Trades. The Fund may purchase from or sell securities to other Fidelity Funds under procedures adopted by the Board. The procedures have been designed to ensure these interfund trades are executed in accordance with Rule 17a-7 of the 1940 Act. Interfund trades are included within the respective purchases and sales amounts shown in the Purchases and Sales of Investments note.
7. Committed Line of Credit.
The Fund participates with other funds managed by the investment adviser or an affiliate in a $4.25 billion credit facility (the "line of credit") to be utilized for temporary or emergency purposes to fund shareholder redemptions or for other short-term liquidity purposes. The Fund has agreed to pay commitment fees on its pro-rata portion of the line of credit, which amounted to $14,993 and is reflected in Miscellaneous expenses on the Statement of Operations. During the period, the Fund did not borrow on this line of credit.
8. Security Lending.
The Fund lends portfolio securities through a lending agent from time to time in order to earn additional income. For equity securities, a lending agent is used and may loan securities to certain qualified borrowers, including Fidelity Capital Markets (FCM), a broker-dealer affiliated with the Fund. On the settlement date of the loan, the Fund receives collateral (in the form of U.S. Treasury obligations, letters of credit and/or cash) against the loaned securities and maintains collateral in an amount not less than 100% of the market value of the loaned securities during the period of the loan. The market value of the loaned securities is determined at the close of business of the Fund and any additional required collateral is delivered to the Fund on the next business day. The Fund or borrower may terminate the loan at any time, and if the borrower defaults on its obligation to return the securities loaned because of insolvency or other reasons, the Fund may apply collateral received from the borrower against the obligation. The Fund may experience delays and costs in recovering the securities loaned. Any cash collateral received is invested in the Fidelity Securities Lending Cash Central Fund. The value of loaned securities and cash collateral at period end are disclosed on the Fund's Statement of Assets and Liabilities. At period end, there were no security loans outstanding with FCM. Security lending income represents the income earned on investing cash collateral, less rebates paid to borrowers and any lending agent fees associated with the loan, plus any premium payments received for lending certain types of securities. Security lending income is presented in the Statement of Operations as a component of income from Fidelity Central Funds. Total security lending income during the period amounted to $161,895, including $180 from securities loaned to FCM.
9. Expense Reductions.
Through arrangements with the Fund's custodian, credits realized as a result of certain uninvested cash balances were used to reduce the Fund's expenses. During the period, these credits reduced the Fund's custody expenses by $1,286.
In addition, during the period the investment adviser reimbursed and/or waived a portion of fund-level operating expenses in the amount of $32,443.
10. Distributions to Shareholders.
Distributions to shareholders of each class were as follows:
| Six months ended December 31, 2016 | Year ended June 30, 2016 | |
| From net investment income | ||
| Series Growth and Income | $44,892,121 | $74,235,384 |
| Class F | 76,361,112 | 119,412,868 |
| Total | $121,253,233 | $193,648,252 |
| From net realized gain | ||
| Series Growth and Income | $4,884,467 | $137,333,169 |
| Class F | 7,608,021 | 200,814,747 |
| Total | $12,492,488 | $338,147,916 |
11. Share Transactions.
Transactions for each class of shares were as follows:
| Shares | Shares | Dollars | Dollars | |
| Six months ended December 31, 2016 | Year ended June 30, 2016 | Six months ended December 31, 2016 | Year ended June 30, 2016 | |
| Series Growth and Income | ||||
| Shares sold | 8,261,653 | 28,151,373 | $113,213,553 | $346,630,621 |
| Reinvestment of distributions | 3,682,808 | 16,551,780 | 49,776,588 | 211,568,553 |
| Shares redeemed | (33,722,590) | (54,900,476) | (465,401,546) | (691,270,727) |
| Net increase (decrease) | (21,778,129) | (10,197,323) | $(302,411,405) | $(133,071,553) |
| Class F | ||||
| Shares sold | 19,725,766 | 74,341,299 | $264,853,351 | $921,192,271 |
| Reinvestment of distributions | 6,203,089 | 25,047,819 | 83,969,133 | 320,227,615 |
| Shares redeemed | (57,860,679) | (87,369,438) | (799,001,519) | (1,098,293,901) |
| Net increase (decrease) | (31,931,824) | 12,019,680 | $(450,179,035) | $143,125,985 |
12. Other.
The Fund's organizational documents provide former and current trustees and officers with a limited indemnification against liabilities arising in connection with the performance of their duties to the Fund. In the normal course of business, the Fund may also enter into contracts that provide general indemnifications. The Fund's maximum exposure under these arrangements is unknown as this would be dependent on future claims that may be made against the Fund. The risk of material loss from such claims is considered remote.
At the end of the period, mutual funds managed by the investment adviser or its affiliates were the owners of record of all of the outstanding shares of the Fund.
Shareholder Expense Example
As a shareholder of the Fund, you incur two types of costs: (1) transaction costs, and (2) ongoing costs, including management fees and other Fund expenses. This Example is intended to help you understand your ongoing costs (in dollars) of investing in the Fund and to compare these costs with the ongoing costs of investing in other mutual funds.
The Example is based on an investment of $1,000 invested at the beginning of the period and held for the entire period (July 1, 2016 to December 31, 2016).
Actual Expenses
The first line of the accompanying table for each class of the Fund provides information about actual account values and actual expenses. You may use the information in this line, together with the amount you invested, to estimate the expenses that you paid over the period. Simply divide your account value by $1,000.00 (for example, an $8,600 account value divided by $1,000.00 = 8.6), then multiply the result by the number in the first line for a class of the Fund under the heading entitled "Expenses Paid During Period" to estimate the expenses you paid on your account during this period. In addition, the Fund, as a shareholder in the underlying Fidelity Central Funds, will indirectly bear its pro-rata share of the fees and expenses incurred by the underlying Fidelity Central Funds. These fees and expenses are not included in the Fund's annualized expense ratio used to calculate the expense estimate in the table below.
Hypothetical Example for Comparison Purposes
The second line of the accompanying table for each class of the Fund provides information about hypothetical account values and hypothetical expenses based on a Class' actual expense ratio and an assumed rate of return of 5% per year before expenses, which is not the Class' actual return. The hypothetical account values and expenses may not be used to estimate the actual ending account balance or expenses you paid for the period. You may use this information to compare the ongoing costs of investing in the Fund and other funds. To do so, compare this 5% hypothetical example with the 5% hypothetical examples that appear in the shareholder reports of the other funds. In addition, the Fund, as a shareholder in the underlying Fidelity Central Funds, will indirectly bear its pro-rata share of the fees and expenses incurred by the underlying Fidelity Central Funds. These fees and expenses are not included in the Fund's annualized expense ratio used to calculate the expense estimate in the table below.
Please note that the expenses shown in the table are meant to highlight your ongoing costs only and do not reflect any transaction costs. Therefore, the second line of the table is useful in comparing ongoing costs only, and will not help you determine the relative total costs of owning different funds.
| Annualized Expense Ratio-A | Beginning Account Value July 1, 2016 | Ending Account Value December 31, 2016 | Expenses Paid During Period-B July 1, 2016 to December 31, 2016 | |
| Series Growth and Income | .62% | |||
| Actual | $1,000.00 | $1,143.20 | $3.35 | |
| Hypothetical-C | $1,000.00 | $1,022.08 | $3.16 | |
| Class F | .47% | |||
| Actual | $1,000.00 | $1,144.20 | $2.54 | |
| Hypothetical-C | $1,000.00 | $1,022.84 | $2.40 |
A Annualized expense ratio reflects expenses net of applicable fee waivers.
B Expenses are equal to each Class' annualized expense ratio, multiplied by the average account value over the period, multiplied by 184/365 (to reflect the one-half year period).
C 5% return per year before expenses
Board Approval of Investment Advisory Contracts and Management Fees
Fidelity Series Growth & Income Fund
Each year, the Board of Trustees, including the Independent Trustees (together, the Board), votes on the renewal of the management contract with Fidelity Management & Research Company (FMR) and the sub-advisory agreements (together, the Advisory Contracts) for the fund. The Board, assisted by the advice of fund counsel and Independent Trustees' counsel, requests and considers a broad range of information relevant to the renewal of the Advisory Contracts throughout the year.
The Board meets regularly and, at each of its meetings, covers an extensive agenda of topics and materials and considers factors that are relevant to its annual consideration of the renewal of the fund's Advisory Contracts, including the services and support provided to the fund and its shareholders. The Board has established various standing committees (Committees), each composed of and chaired by Independent Trustees with varying backgrounds, to which the Board has assigned specific subject matter responsibilities in order to enhance effective decision-making by the Board. The Board, acting directly and through its Committees, requests and receives information concerning the annual consideration of the renewal of the fund's Advisory Contracts. The Board also meets as needed to consider matters specifically related to the Board's annual consideration of the renewal of the Advisory Contracts. Members of the Board may also meet with trustees of other Fidelity funds through ad hoc joint committees to discuss certain matters relevant to all of the Fidelity funds.
At its July 2016 meeting, the Board unanimously determined to renew the fund's Advisory Contracts. In reaching its determination, the Board considered all factors it believed relevant, including (i) the nature, extent, and quality of the services to be provided to the fund and its shareholders (including the investment performance of the fund); (ii) the competitiveness of the fund's management fee and total expense ratio relative to peer funds; (iii) the total costs of the services to be provided by and the profits to be realized by Fidelity from its relationships with the fund; and (iv) the extent to which, if any, economies of scale exist and would be realized as the fund grows, and whether any economies of scale are appropriately shared with fund shareholders.
In considering whether to renew the Advisory Contracts for the fund, the Board reached a determination, with the assistance of fund counsel and Independent Trustees' counsel and through the exercise of its business judgment, that the renewal of the Advisory Contracts was in the best interests of the fund and its shareholders and that the compensation payable under the Advisory Contracts was fair and reasonable. The Board's decision to renew the Advisory Contracts was not based on any single factor, but rather was based on a comprehensive consideration of all the information provided to the Board at its meetings throughout the year. The Board, in reaching its determination to renew the Advisory Contracts, was aware that shareholders of the fund have a broad range of investment choices available to them, including a wide choice among funds offered by Fidelity's competitors, and that the fund's shareholders, who have the opportunity to review and weigh the disclosure provided by the fund in its prospectus and other public disclosures, have chosen to invest in this fund, which is part of the Fidelity family of funds.
Nature, Extent, and Quality of Services Provided. The Board considered Fidelity's staffing as it relates to the fund, including the backgrounds of investment personnel of Fidelity, and also considered the fund's investment objective, strategies, and related investment philosophy. The Independent Trustees also had discussions with senior management of Fidelity's investment operations and investment groups. The Board considered the structure of the investment personnel compensation program and whether this structure provides appropriate incentives to act in the best interests of the fund. Additionally, the Board considered the portfolio managers' investments, if any, in the funds that they manage.Resources Dedicated to Investment Management and Support Services. The Board and the Fund Oversight and Research Committees reviewed the general qualifications and capabilities of Fidelity's investment staff, including its size, education, experience, and resources, as well as Fidelity's approach to recruiting, training, managing, and compensating investment personnel. The Board noted that Fidelity has continued to increase the resources devoted to non-U.S. offices, including expansion of Fidelity's global investment organization. The Board also noted that Fidelity's analysts have extensive resources, tools and capabilities that allow them to conduct sophisticated quantitative and fundamental analysis, as well as credit analysis of issuers, counterparties and guarantors. Further, the Board considered that Fidelity's investment professionals have sufficient access to global information and data so as to provide competitive investment results over time, and that those professionals also have access to sophisticated tools that permit them to assess portfolio construction and risk and performance attribution characteristics continuously, as well as to transmit new information and research conclusions rapidly around the world. Additionally, in its deliberations, the Board considered Fidelity's trading, risk management, compliance, and technology and operations capabilities and resources, which are integral parts of the investment management process.Shareholder and Administrative Services. The Board considered (i) the nature, extent, quality, and cost of advisory, administrative, and shareholder services performed by FMR, the sub-advisers (together with FMR, the Investment Advisers), and their affiliates under the Advisory Contracts and under separate agreements covering transfer agency, pricing and bookkeeping, and securities lending services for the fund; (ii) the nature and extent of the supervision of third party service providers, principally custodians, subcustodians, and pricing vendors; and (iii) the resources devoted to, and the record of compliance with, the fund's compliance policies and procedures. The Board also reviewed the allocation of fund brokerage, including allocations to brokers affiliated with the Investment Advisers, the use of brokerage commissions to pay fund expenses, and the use of "soft" commission dollars to pay for research services.The Board noted that the growth of fund assets over time across the complex allows Fidelity to reinvest in the development of services designed to enhance the value or convenience of the Fidelity funds as investment vehicles. These services include 24-hour access to account information and market information through telephone representatives and over the Internet, investor education materials and asset allocation tools, and the expanded availability of Fidelity Investor Centers.In 2014, the Board formed an ad hoc Committee on Transfer Agency Fees to review the variety of transfer agency fee structures throughout the industry and Fidelity's competitive positioning with respect to industry participants.Investment in a Large Fund Family. The Board considered the benefits to shareholders of investing in a Fidelity fund, including the benefits of investing in a fund that is part of a large family of funds offering a variety of investment disciplines and providing a large variety of mutual fund investor services. The Board noted that Fidelity had taken, or had made recommendations that resulted in the Fidelity funds taking, a number of actions over the previous year that benefited particular funds, including: (i) continuing to dedicate additional resources to investment research and to the support of the senior management team that oversees asset management; (ii) continuing efforts to enhance Fidelity's global research capabilities; (iii) launching new funds and making other enhancements to meet client needs; (iv) broadening eligibility requirements for certain lower-priced share classes of, and streamlining the fee structure for, certain existing equity index funds; (v) lowering expense caps for certain existing funds and classes to reduce expenses paid by shareholders; (vi) eliminating redemption fees for certain variable insurance product funds and classes; (vii) continuing to launch dedicated lower cost underlying funds to meet portfolio construction needs related to expanding underlying fund options for Fidelity funds of funds, specifically for the Freedom Fund product lines; (viii) launching a lower cost share class for use by the Freedom Index Fund product line; (ix) rationalizing product lines and gaining increased efficiencies through fund mergers and share class consolidations; (x) continuing to develop, acquire and implement systems and technology to improve services to the funds and shareholders, strengthen information security, and increase efficiency; (xi) implementing investment enhancements to further strengthen Fidelity's target date product line to increase investors' probability of success in achieving their goals; (xii) accelerating the conversion of all remaining Class B shares to Class A shares, which have a lower expense structure; and (xiii) implementing changes to Fidelity's money market fund product line in response to recent regulatory reforms.Investment Performance. The Board considered whether the fund has operated in accordance with its investment objective, as well as its record of compliance with its investment restrictions and its performance history.The Board took into account discussions with representatives of the Investment Advisers about fund investment performance that occur at Board meetings throughout the year. In this regard the Board noted that as part of regularly scheduled fund reviews and other reports to the Board on fund performance, the Board considers annualized return information for the fund, for different time periods, measured against a securities market index ("benchmark index") and a peer group of funds with similar objectives ("peer group"), if any. In its evaluation of fund investment performance, the Board gave particular attention to information indicating changes in performance of certain Fidelity funds for specific time periods and discussed with the Investment Advisers the reasons for any overperformance or underperformance.In addition to reviewing absolute and relative fund performance, the Independent Trustees periodically consider the appropriateness of fund performance metrics in evaluating the results achieved. In general, the Independent Trustees believe that fund performance should be evaluated based on net performance (after fees and expenses) of both the highest performing and lowest performing fund share classes, where applicable, compared to appropriate benchmark indices, over appropriate time periods that may include full market cycles, and compared to peer groups, as applicable, over the same periods, taking into account relevant factors including the following: general market conditions; issuer-specific information; and fund cash flows and other factors.The Independent Trustees recognize that shareholders evaluate performance on a net basis over their own holding periods, for which one-, three-, and five-year periods are often used as a proxy. For this reason, the performance information reviewed by the Board also included net cumulative calendar year total return information for the fund and an appropriate benchmark index and peer group for the most recent one- and three-year periods, as shown below. Returns are shown compared to the 25th percentile (top of box, 75% beaten) and 75th percentile (bottom of box, 25% beaten) of the peer universe.Fidelity Series Growth & Income Fund
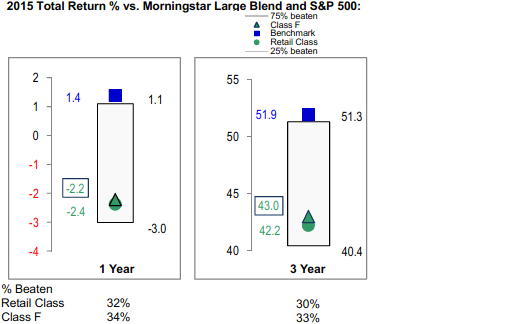
Fidelity Series Growth & Income Fund
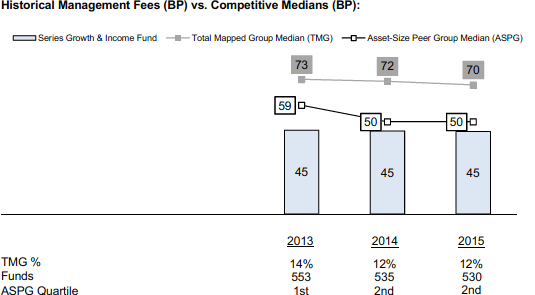
![]()
Corporate Headquarters
245 Summer St.
Boston, MA 02210
www.fidelity.com
MHT-SANN-0217
1.951032.104
Fidelity® Growth Discovery Fund Semi-Annual Report December 31, 2016 |
|
Contents
Board Approval of Investment Advisory Contracts and Management Fees |
To view a fund's proxy voting guidelines and proxy voting record for the 12-month period ended June 30, visit http://www.fidelity.com/proxyvotingresults or visit the Securities and Exchange Commission's (SEC) web site at http://www.sec.gov.
You may also call 1-800-544-8544 to request a free copy of the proxy voting guidelines.
Standard & Poor's, S&P and S&P 500 are registered service marks of The McGraw-Hill Companies, Inc. and have been licensed for use by Fidelity Distributors Corporation.
Other third-party marks appearing herein are the property of their respective owners.
All other marks appearing herein are registered or unregistered trademarks or service marks of FMR LLC or an affiliated company. © 2017 FMR LLC. All rights reserved.
This report and the financial statements contained herein are submitted for the general information of the shareholders of the Fund. This report is not authorized for distribution to prospective investors in the Fund unless preceded or accompanied by an effective prospectus.
A fund files its complete schedule of portfolio holdings with the SEC for the first and third quarters of each fiscal year on Form N-Q. Forms N-Q are available on the SEC’s web site at http://www.sec.gov. A fund's Forms N-Q may be reviewed and copied at the SEC’s Public Reference Room in Washington, DC. Information regarding the operation of the SEC's Public Reference Room may be obtained by calling 1-800-SEC-0330.
For a complete list of a fund's portfolio holdings, view the most recent holdings listing, semiannual report, or annual report on Fidelity's web site at http://www.fidelity.com, http://www.institutional.fidelity.com, or http://www.401k.com, as applicable.
NOT FDIC INSURED •MAY LOSE VALUE •NO BANK GUARANTEE
Neither the Fund nor Fidelity Distributors Corporation is a bank.
Investment Summary (Unaudited)
Top Ten Stocks as of December 31, 2016
| % of fund's net assets | % of fund's net assets 6 months ago | |
| Facebook, Inc. Class A | 8.9 | 12.6 |
| Alphabet, Inc. Class A | 6.3 | 7.8 |
| Amazon.com, Inc. | 3.9 | 3.1 |
| Electronic Arts, Inc. | 3.2 | 2.4 |
| Charter Communications, Inc. Class A | 3.1 | 0.5 |
| Home Depot, Inc. | 2.8 | 2.5 |
| Reynolds American, Inc. | 2.1 | 1.9 |
| UnitedHealth Group, Inc. | 1.9 | 0.0 |
| Global Payments, Inc. | 1.7 | 0.8 |
| Adobe Systems, Inc. | 1.6 | 1.3 |
| 35.5 |
Top Five Market Sectors as of December 31, 2016
| % of fund's net assets | % of fund's net assets 6 months ago | |
| Information Technology | 36.1 | 38.2 |
| Consumer Discretionary | 19.0 | 16.0 |
| Health Care | 14.0 | 13.2 |
| Consumer Staples | 8.8 | 7.0 |
| Financials | 7.7 | 8.0 |
Prior period industry classifications reflect the categories in place as of the date indicated and have not been adjusted to reflect current industry classifications.
Asset Allocation (% of fund's net assets)
| As of December 31, 2016* | ||
| Stocks | 98.1% | |
| Convertible Securities | 0.9% | |
| Short-Term Investments and Net Other Assets (Liabilities) | 1.0% | |

* Foreign investments - 7.8%
| As of June 30, 2016* | ||
| Stocks | 94.0% | |
| Convertible Securities | 0.8% | |
| Short-Term Investments and Net Other Assets (Liabilities) | 5.2% | |

* Foreign investments - 8.0%
Percentages shown as 0.0% may reflect amounts less than 0.05%.
Investments December 31, 2016 (Unaudited)
Showing Percentage of Net Assets
| Common Stocks - 98.1% | |||
| Shares | Value (000s) | ||
| CONSUMER DISCRETIONARY - 18.9% | |||
| Automobiles - 0.6% | |||
| Tesla Motors, Inc. (a) | 30,600 | $6,539 | |
| Diversified Consumer Services - 0.8% | |||
| Bright Horizons Family Solutions, Inc. (a) | 66,000 | 4,621 | |
| Houghton Mifflin Harcourt Co. (a) | 98,800 | 1,072 | |
| Nord Anglia Education, Inc. (a) | 111,372 | 2,595 | |
| ServiceMaster Global Holdings, Inc. (a) | 29,600 | 1,115 | |
| 9,403 | |||
| Hotels, Restaurants & Leisure - 3.9% | |||
| Buffalo Wild Wings, Inc. (a) | 5,500 | 849 | |
| Dave & Buster's Entertainment, Inc. (a) | 174,300 | 9,813 | |
| Domino's Pizza, Inc. | 27,723 | 4,415 | |
| Papa John's International, Inc. | 72,000 | 6,162 | |
| Popeyes Louisiana Kitchen, Inc. (a) | 52,400 | 3,169 | |
| Starbucks Corp. | 307,852 | 17,092 | |
| Wingstop, Inc. | 66,600 | 1,971 | |
| 43,471 | |||
| Household Durables - 0.0% | |||
| Gree Electric Appliances, Inc. of Zhuhai Class A | 140,800 | 499 | |
| Internet & Direct Marketing Retail - 5.0% | |||
| Amazon.com, Inc. (a) | 59,100 | 44,317 | |
| Ctrip.com International Ltd. ADR (a) | 129,900 | 5,196 | |
| Netflix, Inc. (a) | 36,300 | 4,494 | |
| NutriSystem, Inc. | 54,500 | 1,888 | |
| 55,895 | |||
| Leisure Products - 0.0% | |||
| NJOY, Inc. (a)(b) | 56,145 | 0 | |
| Media - 3.7% | |||
| Charter Communications, Inc. Class A (a) | 118,700 | 34,176 | |
| Cinemark Holdings, Inc. | 60,200 | 2,309 | |
| Sirius XM Holdings, Inc. (c) | 1,015,400 | 4,519 | |
| 41,004 | |||
| Multiline Retail - 0.5% | |||
| Dollar Tree, Inc. (a) | 44,400 | 3,427 | |
| Ollie's Bargain Outlet Holdings, Inc. (a) | 94,300 | 2,683 | |
| 6,110 | |||
| Specialty Retail - 3.5% | |||
| AutoZone, Inc. (a) | 9,100 | 7,187 | |
| Five Below, Inc. (a) | 2,600 | 104 | |
| Home Depot, Inc. | 230,424 | 30,895 | |
| MarineMax, Inc. (a) | 49,000 | 948 | |
| 39,134 | |||
| Textiles, Apparel & Luxury Goods - 0.9% | |||
| Kate Spade & Co. (a) | 361,470 | 6,749 | |
| LVMH Moet Hennessy - Louis Vuitton SA | 17,809 | 3,396 | |
| 10,145 | |||
| TOTAL CONSUMER DISCRETIONARY | 212,200 | ||
| CONSUMER STAPLES - 8.8% | |||
| Beverages - 3.7% | |||
| Anheuser-Busch InBev SA NV ADR | 50,300 | 5,304 | |
| Constellation Brands, Inc. Class A (sub. vtg.) | 31,900 | 4,891 | |
| Kweichow Moutai Co. Ltd. (A Shares) | 28,829 | 1,387 | |
| Molson Coors Brewing Co. Class B | 92,600 | 9,011 | |
| PepsiCo, Inc. | 55,300 | 5,786 | |
| Pernod Ricard SA ADR | 107,700 | 2,324 | |
| The Coca-Cola Co. | 324,236 | 13,443 | |
| 42,146 | |||
| Food & Staples Retailing - 0.9% | |||
| Costco Wholesale Corp. | 47,100 | 7,541 | |
| Whole Foods Market, Inc. | 71,351 | 2,195 | |
| 9,736 | |||
| Food Products - 0.5% | |||
| Danone SA | 84,100 | 5,322 | |
| Hostess Brands, Inc. Class A (a) | 25,300 | 329 | |
| 5,651 | |||
| Household Products - 0.5% | |||
| Procter & Gamble Co. | 72,400 | 6,087 | |
| Personal Products - 1.1% | |||
| Estee Lauder Companies, Inc. Class A | 78,700 | 6,020 | |
| Herbalife Ltd. (a) | 124,800 | 6,008 | |
| 12,028 | |||
| Tobacco - 2.1% | |||
| Reynolds American, Inc. | 419,600 | 23,514 | |
| TOTAL CONSUMER STAPLES | 99,162 | ||
| ENERGY - 0.9% | |||
| Energy Equipment & Services - 0.7% | |||
| Baker Hughes, Inc. | 117,200 | 7,614 | |
| Oil, Gas & Consumable Fuels - 0.2% | |||
| Golar LNG Ltd. (c) | 108,961 | 2,500 | |
| TOTAL ENERGY | 10,114 | ||
| FINANCIALS - 7.7% | |||
| Banks - 2.9% | |||
| First Republic Bank | 134,800 | 12,420 | |
| HDFC Bank Ltd. | 31,265 | 607 | |
| JPMorgan Chase & Co. | 209,200 | 18,052 | |
| Metro Bank PLC | 22,400 | 807 | |
| 31,886 | |||
| Capital Markets - 4.0% | |||
| BlackRock, Inc. Class A | 13,694 | 5,211 | |
| CME Group, Inc. | 148,245 | 17,100 | |
| E*TRADE Financial Corp. (a) | 263,859 | 9,143 | |
| JMP Group, Inc. | 64,700 | 397 | |
| MSCI, Inc. | 85,100 | 6,704 | |
| S&P Global, Inc. | 60,712 | 6,529 | |
| 45,084 | |||
| Diversified Financial Services - 0.5% | |||
| Bats Global Markets, Inc. | 38,500 | 1,290 | |
| Berkshire Hathaway, Inc. Class B (a) | 24,800 | 4,042 | |
| Quantenna Communications, Inc. | 36,800 | 667 | |
| 5,999 | |||
| Thrifts & Mortgage Finance - 0.3% | |||
| Essent Group Ltd. (a) | 102,100 | 3,305 | |
| TOTAL FINANCIALS | 86,274 | ||
| HEALTH CARE - 14.0% | |||
| Biotechnology - 6.5% | |||
| Advanced Accelerator Applications SA sponsored ADR (a) | 45,600 | 1,220 | |
| Alexion Pharmaceuticals, Inc. (a) | 74,900 | 9,164 | |
| Amgen, Inc. | 102,800 | 15,030 | |
| Biogen, Inc. (a) | 15,100 | 4,282 | |
| BioMarin Pharmaceutical, Inc. (a) | 72,196 | 5,981 | |
| Cytokinetics, Inc. (a) | 36,200 | 440 | |
| Cytokinetics, Inc. warrants 6/25/17 (a) | 288,420 | 332 | |
| Gilead Sciences, Inc. | 75,763 | 5,425 | |
| Insmed, Inc. (a) | 342,678 | 4,534 | |
| Regeneron Pharmaceuticals, Inc. (a) | 19,300 | 7,085 | |
| Samsung Biologics Co. Ltd. (a) | 926 | 116 | |
| TESARO, Inc. (a) | 48,700 | 6,549 | |
| Vertex Pharmaceuticals, Inc. (a) | 175,600 | 12,936 | |
| 73,094 | |||
| Health Care Equipment & Supplies - 4.1% | |||
| Boston Scientific Corp. (a) | 428,700 | 9,273 | |
| Danaher Corp. | 129,355 | 10,069 | |
| DexCom, Inc. (a) | 33,400 | 1,994 | |
| Intuitive Surgical, Inc. (a) | 15,500 | 9,830 | |
| Medtronic PLC | 104,700 | 7,458 | |
| Novadaq Technologies, Inc. (a) | 304,600 | 2,160 | |
| ResMed, Inc. | 62,100 | 3,853 | |
| The Cooper Companies, Inc. | 6,600 | 1,155 | |
| 45,792 | |||
| Health Care Providers & Services - 2.5% | |||
| HealthEquity, Inc. (a) | 99,100 | 4,016 | |
| Henry Schein, Inc. (a) | 11,500 | 1,745 | |
| UnitedHealth Group, Inc. | 137,200 | 21,957 | |
| VCA, Inc. (a) | 11,100 | 762 | |
| 28,480 | |||
| Pharmaceuticals - 0.9% | |||
| Allergan PLC | 24,000 | 5,040 | |
| Collegium Pharmaceutical, Inc. (a) | 30,900 | 481 | |
| Patheon NV | 16,800 | 482 | |
| Zoetis, Inc. Class A | 85,400 | 4,571 | |
| 10,574 | |||
| TOTAL HEALTH CARE | 157,940 | ||
| INDUSTRIALS - 7.5% | |||
| Aerospace & Defense - 0.9% | |||
| Rolls-Royce Holdings PLC | 122,000 | 1,002 | |
| Taser International, Inc. (a) | 202,000 | 4,896 | |
| TransDigm Group, Inc. | 14,927 | 3,716 | |
| 9,614 | |||
| Airlines - 0.3% | |||
| Ryanair Holdings PLC sponsored ADR (a) | 47,464 | 3,952 | |
| Building Products - 0.3% | |||
| A.O. Smith Corp. | 73,488 | 3,480 | |
| Commercial Services & Supplies - 0.8% | |||
| KAR Auction Services, Inc. | 206,700 | 8,810 | |
| Electrical Equipment - 1.6% | |||
| Acuity Brands, Inc. | 27,300 | 6,302 | |
| Fortive Corp. | 210,427 | 11,285 | |
| 17,587 | |||
| Industrial Conglomerates - 0.8% | |||
| Honeywell International, Inc. | 44,000 | 5,097 | |
| Roper Technologies, Inc. | 22,314 | 4,085 | |
| 9,182 | |||
| Machinery - 0.4% | |||
| Allison Transmission Holdings, Inc. | 114,500 | 3,858 | |
| Rational AG | 1,500 | 669 | |
| 4,527 | |||
| Professional Services - 2.4% | |||
| Equifax, Inc. | 57,600 | 6,810 | |
| Robert Half International, Inc. | 77,100 | 3,761 | |
| TransUnion Holding Co., Inc. (a) | 110,500 | 3,418 | |
| WageWorks, Inc. (a) | 174,173 | 12,628 | |
| 26,617 | |||
| TOTAL INDUSTRIALS | 83,769 | ||
| INFORMATION TECHNOLOGY - 35.3% | |||
| Electronic Equipment & Components - 0.2% | |||
| CDW Corp. | 44,100 | 2,297 | |
| Internet Software & Services - 18.3% | |||
| Akamai Technologies, Inc. (a) | 113,800 | 7,588 | |
| Alphabet, Inc. Class A (a) | 89,652 | 71,045 | |
| CommerceHub, Inc.: | |||
| Series A (a) | 168,370 | 2,527 | |
| Series C (a) | 130,540 | 1,962 | |
| Facebook, Inc. Class A (a) | 872,891 | 100,426 | |
| GoDaddy, Inc. (a) | 131,900 | 4,610 | |
| Just Dial Ltd. (a) | 61,822 | 308 | |
| Just Eat Holding Ltd. (a) | 367,603 | 2,643 | |
| Shopify, Inc. Class A (a) | 19,900 | 853 | |
| Stamps.com, Inc. (a) | 56,300 | 6,455 | |
| Twilio, Inc. Class A (c) | 61,000 | 1,760 | |
| VeriSign, Inc. (a)(c) | 75,800 | 5,766 | |
| 205,943 | |||
| IT Services - 4.9% | |||
| Cognizant Technology Solutions Corp. Class A (a) | 51,800 | 2,902 | |
| Fidelity National Information Services, Inc. | 45,700 | 3,457 | |
| Gartner, Inc. (a) | 13,000 | 1,314 | |
| Global Payments, Inc. | 274,500 | 19,053 | |
| Square, Inc. (a) | 520,800 | 7,099 | |
| Vantiv, Inc. (a) | 69,400 | 4,138 | |
| Visa, Inc. Class A | 224,196 | 17,492 | |
| 55,455 | |||
| Semiconductors & Semiconductor Equipment - 1.1% | |||
| Maxim Integrated Products, Inc. | 123,305 | 4,756 | |
| Monolithic Power Systems, Inc. | 56,118 | 4,598 | |
| Qualcomm, Inc. | 51,500 | 3,358 | |
| 12,712 | |||
| Software - 10.2% | |||
| Activision Blizzard, Inc. | 126,687 | 4,575 | |
| Adobe Systems, Inc. (a) | 177,900 | 18,315 | |
| Autodesk, Inc. (a) | 39,900 | 2,953 | |
| Blackbaud, Inc. | 18,300 | 1,171 | |
| Computer Modelling Group Ltd. (c) | 241,400 | 1,638 | |
| CyberArk Software Ltd. (a) | 24,200 | 1,101 | |
| Electronic Arts, Inc. (a) | 454,334 | 35,783 | |
| Intuit, Inc. | 36,100 | 4,137 | |
| Microsoft Corp. | 191,100 | 11,875 | |
| Mobileye NV (a) | 341,269 | 13,009 | |
| RealPage, Inc. (a) | 50,600 | 1,518 | |
| Red Hat, Inc. (a) | 86,200 | 6,008 | |
| Salesforce.com, Inc. (a) | 188,964 | 12,936 | |
| 115,019 | |||
| Technology Hardware, Storage & Peripherals - 0.6% | |||
| Samsung Electronics Co. Ltd. | 4,034 | 6,021 | |
| TOTAL INFORMATION TECHNOLOGY | 397,447 | ||
| MATERIALS - 1.7% | |||
| Chemicals - 1.0% | |||
| Monsanto Co. | 57,200 | 6,018 | |
| Sherwin-Williams Co. | 19,800 | 5,321 | |
| 11,339 | |||
| Construction Materials - 0.7% | |||
| Eagle Materials, Inc. | 79,700 | 7,853 | |
| TOTAL MATERIALS | 19,192 | ||
| REAL ESTATE - 3.1% | |||
| Equity Real Estate Investment Trusts (REITs) - 1.6% | |||
| American Tower Corp. | 164,900 | 17,427 | |
| Real Estate Management & Development - 1.5% | |||
| Realogy Holdings Corp. | 657,781 | 16,925 | |
| TOTAL REAL ESTATE | 34,352 | ||
| TELECOMMUNICATION SERVICES - 0.2% | |||
| Diversified Telecommunication Services - 0.2% | |||
| SBA Communications Corp. Class A (a) | 23,800 | 2,458 | |
| TOTAL COMMON STOCKS | |||
| (Cost $926,226) | 1,102,908 | ||
| Convertible Preferred Stocks - 0.9% | |||
| CONSUMER DISCRETIONARY - 0.1% | |||
| Household Durables - 0.1% | |||
| Blu Homes, Inc. Series A, 5.00% (a)(b) | 239,736 | 520 | |
| INFORMATION TECHNOLOGY - 0.8% | |||
| Internet Software & Services - 0.7% | |||
| Uber Technologies, Inc. Series D, 8.00% (a)(b) | 162,572 | 7,929 | |
| IT Services - 0.1% | |||
| AppNexus, Inc. Series E (a)(b) | 48,212 | 1,254 | |
| TOTAL INFORMATION TECHNOLOGY | 9,183 | ||
| TOTAL CONVERTIBLE PREFERRED STOCKS | |||
| (Cost $4,596) | 9,703 | ||
| Principal Amount (000s) | Value (000s) | ||
| U.S. Treasury Obligations - 0.2% | |||
| U.S. Treasury Bills, yield at date of purchase 0.32% to 0.37% 1/19/17 to 2/2/17 | |||
| (Cost $2,680) | 2,680 | 2,679 | |
| Shares | Value (000s) | ||
| Money Market Funds - 1.3% | |||
| Fidelity Cash Central Fund, 0.60% (d) | 197,822 | $198 | |
| Fidelity Securities Lending Cash Central Fund 0.65% (d)(e) | 14,994,614 | 14,996 | |
| TOTAL MONEY MARKET FUNDS | |||
| (Cost $15,195) | 15,194 | ||
| TOTAL INVESTMENT PORTFOLIO - 100.5% | |||
| (Cost $948,697) | 1,130,484 | ||
| NET OTHER ASSETS (LIABILITIES) - (0.5)% | (5,795) | ||
| NET ASSETS - 100% | $1,124,689 |
Values shown as $0 may reflect amounts less than $500.
Legend
(a) Non-income producing
(b) Restricted securities - Investment in securities not registered under the Securities Act of 1933 (excluding 144A issues). At the end of the period, the value of restricted securities (excluding 144A issues) amounted to $9,703,000 or 0.9% of net assets.
(c) Security or a portion of the security is on loan at period end.
(d) Affiliated fund that is generally available only to investment companies and other accounts managed by Fidelity Investments. The rate quoted is the annualized seven-day yield of the fund at period end. A complete unaudited listing of the fund's holdings as of its most recent quarter end is available upon request. In addition, each Fidelity Central Fund's financial statements are available on the SEC's website or upon request.
(e) Investment made with cash collateral received from securities on loan.
Additional information on each restricted holding is as follows:
| Security | Acquisition Date | Acquisition Cost (000s) |
| AppNexus, Inc. Series E | 8/1/14 | $966 |
| Blu Homes, Inc. Series A, 5.00% | 6/21/13 | $1,108 |
| NJOY, Inc. | 9/11/13 | $454 |
| Uber Technologies, Inc. Series D, 8.00% | 6/6/14 | $2,522 |
Affiliated Central Funds
Information regarding fiscal year to date income earned by the Fund from investments in Fidelity Central Funds is as follows:
| Fund | Income earned |
| (Amounts in thousands) | |
| Fidelity Cash Central Fund | $172 |
| Fidelity Securities Lending Cash Central Fund | 227 |
| Total | $399 |
Investment Valuation
The following is a summary of the inputs used, as of December 31, 2016, involving the Fund's assets and liabilities carried at fair value. The inputs or methodology used for valuing securities may not be an indication of the risk associated with investing in those securities. For more information on valuation inputs, and their aggregation into the levels used below, please refer to the Investment Valuation section in the accompanying Notes to Financial Statements.
| Valuation Inputs at Reporting Date: | ||||
| Description | Total | Level 1 | Level 2 | Level 3 |
| (Amounts in thousands) | ||||
| Investments in Securities: | ||||
| Equities: | ||||
| Consumer Discretionary | $212,720 | $208,804 | $3,396 | $520 |
| Consumer Staples | 99,162 | 93,840 | 5,322 | -- |
| Energy | 10,114 | 10,114 | -- | -- |
| Financials | 86,274 | 85,667 | 607 | -- |
| Health Care | 157,940 | 157,608 | 332 | -- |
| Industrials | 83,769 | 82,767 | 1,002 | -- |
| Information Technology | 406,630 | 397,447 | -- | 9,183 |
| Materials | 19,192 | 19,192 | -- | -- |
| Real Estate | 34,352 | 34,352 | -- | -- |
| Telecommunication Services | 2,458 | 2,458 | -- | -- |
| U.S. Government and Government Agency Obligations | 2,679 | -- | 2,679 | -- |
| Money Market Funds | 15,194 | 15,194 | -- | -- |
| Total Investments in Securities: | $1,130,484 | $1,107,443 | $13,338 | $9,703 |
See accompanying notes which are an integral part of the financial statements.
Financial Statements
Statement of Assets and Liabilities
| Amounts in thousands (except per-share amounts) | December 31, 2016 (Unaudited) | |
| Assets | ||
| Investment in securities, at value (including securities loaned of $14,395) — See accompanying schedule: Unaffiliated issuers (cost $933,502) | $1,115,290 | |
| Fidelity Central Funds (cost $15,195) | 15,194 | |
| Total Investments (cost $948,697) | $1,130,484 | |
| Receivable for investments sold | 10,057 | |
| Receivable for fund shares sold | 1,196 | |
| Dividends receivable | 1,022 | |
| Distributions receivable from Fidelity Central Funds | 36 | |
| Prepaid expenses | 2 | |
| Other receivables | 30 | |
| Total assets | 1,142,827 | |
| Liabilities | ||
| Payable for investments purchased | $6 | |
| Payable for fund shares redeemed | 2,543 | |
| Accrued management fee | 384 | |
| Other affiliated payables | 177 | |
| Other payables and accrued expenses | 36 | |
| Collateral on Securities Loaned | 14,992 | |
| Total liabilities | 18,138 | |
| Net Assets | $1,124,689 | |
| Net Assets consist of: | ||
| Paid in capital | $995,690 | |
| Distributions in excess of net investment income | (27) | |
| Accumulated undistributed net realized gain (loss) on investments and foreign currency transactions | (52,749) | |
| Net unrealized appreciation (depreciation) on investments and assets and liabilities in foreign currencies | 181,775 | |
| Net Assets | $1,124,689 | |
| Growth Discovery: | ||
| Net Asset Value, offering price and redemption price per share ($961,820 ÷ 37,832 shares) | $25.42 | |
| Class K: | ||
| Net Asset Value, offering price and redemption price per share ($162,869 ÷ 6,404 shares) | $25.43 |
See accompanying notes which are an integral part of the financial statements.
Statement of Operations
| Amounts in thousands | Six months ended December 31, 2016 (Unaudited) | |
| Investment Income | ||
| Dividends | $5,073 | |
| Income from Fidelity Central Funds | 399 | |
| Total income | 5,472 | |
| Expenses | ||
| Management fee | ||
| Basic fee | $3,233 | |
| Performance adjustment | (603) | |
| Transfer agent fees | 897 | |
| Accounting and security lending fees | 194 | |
| Custodian fees and expenses | 20 | |
| Independent trustees' fees and expenses | 3 | |
| Registration fees | 22 | |
| Audit | 33 | |
| Legal | 5 | |
| Interest | 1 | |
| Miscellaneous | 2 | |
| Total expenses before reductions | 3,807 | |
| Expense reductions | (16) | 3,791 |
| Net investment income (loss) | 1,681 | |
| Realized and Unrealized Gain (Loss) | ||
| Net realized gain (loss) on: | ||
| Investment securities: | ||
| Unaffiliated issuers | 104,336 | |
| Fidelity Central Funds | 34 | |
| Foreign currency transactions | (46) | |
| Futures contracts | 367 | |
| Total net realized gain (loss) | 104,691 | |
| Change in net unrealized appreciation (depreciation) on: Investment securities | (59,226) | |
| Total change in net unrealized appreciation (depreciation) | (59,226) | |
| Net gain (loss) | 45,465 | |
| Net increase (decrease) in net assets resulting from operations | $47,146 |
See accompanying notes which are an integral part of the financial statements.
Statement of Changes in Net Assets
| Amounts in thousands | Six months ended December 31, 2016 (Unaudited) | Year ended June 30, 2016 |
| Increase (Decrease) in Net Assets | ||
| Operations | ||
| Net investment income (loss) | $1,681 | $625 |
| Net realized gain (loss) | 104,691 | 20,107 |
| Change in net unrealized appreciation (depreciation) | (59,226) | (42,764) |
| Net increase (decrease) in net assets resulting from operations | 47,146 | (22,032) |
| Distributions to shareholders from net investment income | (1,135) | (1,789) |
| Distributions to shareholders from net realized gain | – | (555) |
| Total distributions | (1,135) | (2,344) |
| Share transactions - net increase (decrease) | (97,040) | (80,061) |
| Total increase (decrease) in net assets | (51,029) | (104,437) |
| Net Assets | ||
| Beginning of period | 1,175,718 | 1,280,155 |
| End of period | $1,124,689 | $1,175,718 |
| Other Information | ||
| Distributions in excess of net investment income end of period | $(27) | $(573) |
See accompanying notes which are an integral part of the financial statements.
Financial Highlights — Fidelity Growth Discovery Fund
| Six months ended (Unaudited) December 31, | Years ended June 30, | |||||
| 2016 | 2016 | 2015 | 2014 | 2013 | 2012 | |
| Selected Per–Share Data | ||||||
| Net asset value, beginning of period | $24.47 | $24.93 | $23.07 | $17.45 | $15.09 | $14.88 |
| Income from Investment Operations | ||||||
| Net investment income (loss)A | .03 | .01 | .07 | .02 | .07 | .04 |
| Net realized and unrealized gain (loss) | .94 | (.43) | 1.81 | 5.63 | 2.35 | .26 |
| Total from investment operations | .97 | (.42) | 1.88 | 5.65 | 2.42 | .30 |
| Distributions from net investment income | (.02) | (.03) | (.02) | (.02) | (.06) | (.03) |
| Distributions from net realized gain | – | (.01) | – | (.01) | – | (.06) |
| Total distributions | (.02) | (.04) | (.02) | (.03) | (.06) | (.09) |
| Net asset value, end of period | $25.42 | $24.47 | $24.93 | $23.07 | $17.45 | $15.09 |
| Total ReturnB,C | 3.98% | (1.68)% | 8.17% | 32.40% | 16.09% | 2.07% |
| Ratios to Average Net AssetsD,E | ||||||
| Expenses before reductions | .66%F | .78% | .77% | .81% | .88% | .81% |
| Expenses net of fee waivers, if any | .66%F | .78% | .77% | .81% | .88% | .81% |
| Expenses net of all reductions | .66%F | .78% | .77% | .81% | .87% | .80% |
| Net investment income (loss) | .27%F | .03% | .27% | .10% | .42% | .27% |
| Supplemental Data | ||||||
| Net assets, end of period (in millions) | $962 | $1,000 | $1,078 | $1,072 | $767 | $875 |
| Portfolio turnover rateG | 72%F | 57% | 51% | 70% | 62% | 74% |
A Calculated based on average shares outstanding during the period.
B Total returns for periods of less than one year are not annualized.
C Total returns would have been lower if certain expenses had not been reduced during the applicable periods shown.
D Fees and expenses of any underlying Fidelity Central Funds are not included in the Fund's expense ratio. The Fund indirectly bears its proportionate share of the expenses of any underlying Fidelity Central Funds.
E Expense ratios reflect operating expenses of the class. Expenses before reductions do not reflect amounts reimbursed by the investment adviser or reductions from brokerage service arrangements or reductions from other expense offset arrangements and do not represent the amount paid by the class during periods when reimbursements or reductions occur. Expenses net of fee waivers reflect expenses after reimbursement by the investment adviser but prior to reductions from brokerage service arrangements or other expense offset arrangements. Expenses net of all reductions represent the net expenses paid by the class.
F Annualized
G Amount does not include the portfolio activity of any underlying Fidelity Central Funds.
See accompanying notes which are an integral part of the financial statements.
Financial Highlights — Fidelity Growth Discovery Fund Class K
| Six months ended (Unaudited) December 31, | Years ended June 30, | |||||
| 2016 | 2016 | 2015 | 2014 | 2013 | 2012 | |
| Selected Per–Share Data | ||||||
| Net asset value, beginning of period | $24.48 | $24.94 | $23.09 | $17.45 | $15.09 | $14.88 |
| Income from Investment Operations | ||||||
| Net investment income (loss)A | .05 | .04 | .10 | .05 | .09 | .06 |
| Net realized and unrealized gain (loss) | .94 | (.43) | 1.82 | 5.63 | 2.36 | .26 |
| Total from investment operations | .99 | (.39) | 1.92 | 5.68 | 2.45 | .32 |
| Distributions from net investment income | (.04) | (.06) | (.07) | (.04) | (.09) | (.06) |
| Distributions from net realized gain | – | (.01) | – | (.01) | – | (.06) |
| Total distributions | (.04) | (.07) | (.07) | (.04)B | (.09) | (.11)C |
| Net asset value, end of period | $25.43 | $24.48 | $24.94 | $23.09 | $17.45 | $15.09 |
| Total ReturnD,E | 4.04% | (1.57)% | 8.32% | 32.62% | 16.28% | 2.27% |
| Ratios to Average Net AssetsF,G | ||||||
| Expenses before reductions | .54%H | .66% | .64% | .68% | .72% | .64% |
| Expenses net of fee waivers, if any | .54%H | .66% | .64% | .68% | .72% | .64% |
| Expenses net of all reductions | .54%H | .65% | .64% | .67% | .71% | .63% |
| Net investment income (loss) | .39%H | .16% | .40% | .24% | .58% | .44% |
| Supplemental Data | ||||||
| Net assets, end of period (in millions) | $163 | $176 | $202 | $190 | $137 | $144 |
| Portfolio turnover rateI | 72%H | 57% | 51% | 70% | 62% | 74% |
A Calculated based on average shares outstanding during the period.
B Total distributions of $.04 per share is comprised of distributions from net investment income of $.036 and distributions from net realized gain of $.006 per share.
C Total distributions of $.11 per share is comprised of distributions from net investment income of $.058 and distributions from net realized gain of $.055 per share.
D Total returns for periods of less than one year are not annualized.
E Total returns would have been lower if certain expenses had not been reduced during the applicable periods shown.
F Fees and expenses of any underlying Fidelity Central Funds are not included in the Fund's expense ratio. The Fund indirectly bears its proportionate share of the expenses of any underlying Fidelity Central Funds.
G Expense ratios reflect operating expenses of the class. Expenses before reductions do not reflect amounts reimbursed by the investment adviser or reductions from brokerage service arrangements or reductions from other expense offset arrangements and do not represent the amount paid by the class during periods when reimbursements or reductions occur. Expenses net of fee waivers reflect expenses after reimbursement by the investment adviser but prior to reductions from brokerage service arrangements or other expense offset arrangements. Expenses net of all reductions represent the net expenses paid by the class.
H Annualized
I Amount does not include the portfolio activity of any underlying Fidelity Central Funds.
See accompanying notes which are an integral part of the financial statements.
Notes to Financial Statements (Unaudited)
For the period ended December 31, 2016
(Amounts in thousands except percentages)
1. Organization.
Fidelity Growth Discovery Fund (the Fund) is a fund of Fidelity Hastings Street Trust (the Trust) and is authorized to issue an unlimited number of shares. The Trust is registered under the Investment Company Act of 1940, as amended (the 1940 Act), as an open-end management investment company organized as a Massachusetts business trust. The Fund offers Growth Discovery and Class K shares, each of which has equal rights as to assets and voting privileges. Each class has exclusive voting rights with respect to matters that affect that class.
2. Investments in Fidelity Central Funds.
The Fund invests in Fidelity Central Funds, which are open-end investment companies generally available only to other investment companies and accounts managed by the investment adviser and its affiliates. The Fund's Schedule of Investments lists each of the Fidelity Central Funds held as of period end, if any, as an investment of the Fund, but does not include the underlying holdings of each Fidelity Central Fund. As an Investing Fund, the Fund indirectly bears its proportionate share of the expenses of the underlying Fidelity Central Funds.
The Money Market Central Funds seek preservation of capital and current income and are managed by Fidelity Investments Money Management, Inc. (FIMM), an affiliate of the investment adviser. Annualized expenses of the Money Market Central Funds as of their most recent shareholder report date are less than .005%.
A complete unaudited list of holdings for each Fidelity Central Fund is available upon request or at the Securities and Exchange Commission (the SEC) website at www.sec.gov. In addition, the financial statements of the Fidelity Central Funds are available on the SEC website or upon request.
3. Significant Accounting Policies.
The financial statements have been prepared in conformity with accounting principles generally accepted in the United States of America (GAAP), which require management to make certain estimates and assumptions at the date of the financial statements. Actual results could differ from those estimates. Subsequent events, if any, through the date that the financial statements were issued have been evaluated in the preparation of the financial statements. The following summarizes the significant accounting policies of the Fund:
Investment Valuation. Investments are valued as of 4:00 p.m. Eastern time on the last calendar day of the period. The Board of Trustees (the Board) has delegated the day to day responsibility for the valuation of the Fund's investments to the Fair Value Committee (the Committee) established by the Fund's investment adviser. In accordance with valuation policies and procedures approved by the Board, the Fund attempts to obtain prices from one or more third party pricing vendors or brokers to value its investments. When current market prices, quotations or currency exchange rates are not readily available or reliable, investments will be fair valued in good faith by the Committee, in accordance with procedures adopted by the Board. Factors used in determining fair value vary by investment type and may include market or investment specific events. The frequency with which these procedures are used cannot be predicted and they may be utilized to a significant extent. The Committee oversees the Fund's valuation policies and procedures and reports to the Board on the Committee's activities and fair value determinations. The Board monitors the appropriateness of the procedures used in valuing the Fund's investments and ratifies the fair value determinations of the Committee.
The Fund categorizes the inputs to valuation techniques used to value its investments into a disclosure hierarchy consisting of three levels as shown below:
- Level 1 – quoted prices in active markets for identical investments
- Level 2 – other significant observable inputs (including quoted prices for similar investments, interest rates, prepayment speeds, etc.)
- Level 3 – unobservable inputs (including the Fund's own assumptions based on the best information available)
Valuation techniques used to value the Fund's investments by major category are as follows:
Equity securities, including restricted securities, for which market quotations are readily available, are valued at the last reported sale price or official closing price as reported by a third party pricing vendor on the primary market or exchange on which they are traded and are categorized as Level 1 in the hierarchy. In the event there were no sales during the day or closing prices are not available, securities are valued at the last quoted bid price or may be valued using the last available price and are generally categorized as Level 2 in the hierarchy. For foreign equity securities, when market or security specific events arise, comparisons to the valuation of American Depositary Receipts (ADRs), futures contracts, Exchange-Traded Funds (ETFs) and certain indexes as well as quoted prices for similar securities may be used and would be categorized as Level 2 in the hierarchy. Utilizing these techniques may result in transfers between Level 1 and Level 2. For equity securities, including restricted securities, where observable inputs are limited, assumptions about market activity and risk are used and these securities may be categorized as Level 3 in the hierarchy.
Investments in open-end mutual funds are valued at their closing net asset value (NAV) each business day and are categorized as Level 1 in the hierarchy.
Changes in valuation techniques may result in transfers in or out of an assigned level within the disclosure hierarchy. The aggregate value of investments by input level as of December 31, 2016 is included at the end of the Fund's Schedule of Investments.
Foreign Currency. The Fund may use foreign currency contracts to facilitate transactions in foreign-denominated securities. Gains and losses from these transactions may arise from changes in the value of the foreign currency or if the counterparties do not perform under the contracts' terms.
Foreign-denominated assets, including investment securities, and liabilities are translated into U.S. dollars at the exchange rates at period end. Purchases and sales of investment securities, income and dividends received and expenses denominated in foreign currencies are translated into U.S. dollars at the exchange rate in effect on the transaction date.
The effects of exchange rate fluctuations on investments are included with the net realized and unrealized gain (loss) on investment securities. Other foreign currency transactions resulting in realized and unrealized gain (loss) are disclosed separately.
Investment Transactions and Income. For financial reporting purposes, the Fund's investment holdings and NAV include trades executed through the end of the last business day of the period. The NAV per share for processing shareholder transactions is calculated as of the close of business of the New York Stock Exchange (NYSE), normally 4:00 p.m. Eastern time and includes trades executed through the end of the prior business day. Gains and losses on securities sold are determined on the basis of identified cost and may include proceeds received from litigation. Dividend income is recorded on the ex-dividend date, except for certain dividends from foreign securities where the ex-dividend date may have passed, which are recorded as soon as the Fund is informed of the ex-dividend date. Non-cash dividends included in dividend income, if any, are recorded at the fair market value of the securities received. Income and capital gain distributions from Fidelity Central Funds, if any, are recorded on the ex-dividend date. Certain distributions received by the Fund represent a return of capital or capital gain. The Fund determines the components of these distributions subsequent to the ex-dividend date, based upon receipt of tax filings or other correspondence relating to the underlying investment. These distributions are recorded as a reduction of cost of investments and/or as a realized gain. Investment income is recorded net of foreign taxes withheld where recovery of such taxes is uncertain.
Class Allocations and Expenses. Investment income, realized and unrealized capital gains and losses, common expenses of the Fund, and certain fund-level expense reductions, if any, are allocated daily on a pro-rata basis to each class based on the relative net assets of each class to the total net assets of the Fund. Each class differs with respect to transfer agent fees incurred. Certain expense reductions may also differ by class. For the reporting period, the allocated portion of income and expenses to each class as a percent of its average net assets may vary due to the timing of recording these transactions in relation to fluctuating net assets of the classes. Expenses directly attributable to a fund are charged to that fund. Expenses attributable to more than one fund are allocated among the respective funds on the basis of relative net assets or other appropriate methods. Expense estimates are accrued in the period to which they relate and adjustments are made when actual amounts are known.
Income Tax Information and Distributions to Shareholders. Each year, the Fund intends to qualify as a regulated investment company under Subchapter M of the Internal Revenue Code, including distributing substantially all of its taxable income and realized gains. As a result, no provision for U.S. Federal income taxes is required. The Fund files a U.S. federal tax return, in addition to state and local tax returns as required. The Fund's federal income tax returns are subject to examination by the Internal Revenue Service (IRS) for a period of three fiscal years after they are filed. State and local tax returns may be subject to examination for an additional fiscal year depending on the jurisdiction. Foreign taxes are provided for based on the Fund's understanding of the tax rules and rates that exist in the foreign markets in which it invests.
Distributions are declared and recorded on the ex-dividend date. Income dividends and capital gain distributions are declared separately for each class. Income and capital gain distributions are determined in accordance with income tax regulations, which may differ from GAAP.
Capital accounts within the financial statements are adjusted for permanent book-tax differences. These adjustments have no impact on net assets or the results of operations. Capital accounts are not adjusted for temporary book-tax differences which will reverse in a subsequent period.
Book-tax differences are primarily due to futures contracts, foreign currency transactions, partnerships, capital loss carryforwards, and losses deferred due to wash sales and excise tax regulations.
The federal tax cost of investment securities and unrealized appreciation (depreciation) as of period end were as follows:
| Gross unrealized appreciation | $233,638 |
| Gross unrealized depreciation | (51,886) |
| Net unrealized appreciation (depreciation) on securities | $181,752 |
| Tax cost | $948,732 |
Capital loss carryforwards are only available to offset future capital gains of the Fund to the extent provided by regulations and may be limited. Under the Regulated Investment Company Modernization Act of 2010 (the Act), the Fund is permitted to carry forward capital losses incurred in taxable years beginning after December 22, 2010 for an unlimited period and such capital losses are required to be used prior to any losses that expire. The capital loss carryforward information presented below, including any applicable limitation, is estimated as of prior fiscal period end and is subject to adjustment.
| Fiscal year of expiration | |
| 2018 | $(136,052) |
The Fund elected to defer to its next fiscal year approximately $20,072 of capital losses recognized during the period November 1, 2015 to June 30, 2016.
Restricted Securities. The Fund may invest in securities that are subject to legal or contractual restrictions on resale. These securities generally may be resold in transactions exempt from registration or to the public if the securities are registered. Disposal of these securities may involve time-consuming negotiations and expense, and prompt sale at an acceptable price may be difficult. Information regarding restricted securities is included at the end of the Fund's Schedule of Investments.
4. Derivative Instruments.
Risk Exposures and the Use of Derivative Instruments. The Fund's investment objective allows the Fund to enter into various types of derivative contracts, including futures contracts. Derivatives are investments whose value is primarily derived from underlying assets, indices or reference rates and may be transacted on an exchange or over-the-counter (OTC). Derivatives may involve a future commitment to buy or sell a specified asset based on specified terms, to exchange future cash flows at periodic intervals based on a notional principal amount, or for one party to make one or more payments upon the occurrence of specified events in exchange for periodic payments from the other party.
The Fund used derivatives to increase returns and to manage exposure to certain risks as defined below. The success of any strategy involving derivatives depends on analysis of numerous economic factors, and if the strategies for investment do not work as intended, the Fund may not achieve its objectives.
The Fund's use of derivatives increased or decreased its exposure to the following risk:
| Equity Risk | Equity risk relates to the fluctuations in the value of financial instruments as a result of changes in market prices (other than those arising from interest rate risk or foreign exchange risk), whether caused by factors specific to an individual investment, its issuer, or all factors affecting all instruments traded in a market or market segment. |
The Fund is also exposed to additional risks from investing in derivatives, such as liquidity risk and counterparty credit risk. Liquidity risk is the risk that the Fund will be unable to close out the derivative in the open market in a timely manner. Counterparty credit risk is the risk that the counterparty will not be able to fulfill its obligation to the Fund. Derivative counterparty credit risk is managed through formal evaluation of the creditworthiness of all potential counterparties. Counterparty credit risk related to exchange-traded futures contracts may be mitigated by the protection provided by the exchange on which they trade.
Investing in derivatives may involve greater risks than investing in the underlying assets directly and, to varying degrees, may involve risk of loss in excess of any initial investment and collateral received and amounts recognized in the Statement of Assets and Liabilities. In addition, there may be the risk that the change in value of the derivative contract does not correspond to the change in value of the underlying instrument.
Futures Contracts. A futures contract is an agreement between two parties to buy or sell a specified underlying instrument for a fixed price at a specified future date. The Fund used futures contracts to manage its exposure to the stock market.
Upon entering into a futures contract, a fund is required to deposit either cash or securities (initial margin) with a clearing broker in an amount equal to a certain percentage of the face value of the contract. Futures contracts are marked-to-market daily and subsequent daily payments (variation margin) are made or received by a fund depending on the daily fluctuations in the value of the futures contracts and are recorded as unrealized appreciation or (depreciation). This receivable and/or payable, if any, is included in daily variation margin for derivative instruments in the Statement of Assets and Liabilities. Realized gain or (loss) is recorded upon the expiration or closing of a futures contract.
Any open futures contracts at period end are presented in the Schedule of Investments under the caption "Futures Contracts". The underlying face amount at value reflects each contract's exposure to the underlying instrument or index at period end. During the period the Fund recognized net realized gain (loss) of $367 related to its investment in futures contracts. These amounts are included in the Statement of Operations.
5. Purchases and Sales of Investments.
Purchases and sales of securities, other than short-term securities, aggregated $398,634 and $445,821, respectively.
6. Fees and Other Transactions with Affiliates.
Management Fee. Fidelity Management & Research Company (the investment adviser) and its affiliates provide the Fund with investment management related services for which the Fund pays a monthly management fee. The management fee is the sum of an individual fund fee rate that is based on an annual rate of .30% of the Fund's average net assets and an annualized group fee rate that averaged .25% during the period. The group fee rate is based upon the average net assets of all the mutual funds advised by the investment adviser, including any mutual funds previously advised by the investment adviser that are currently advised by Fidelity SelectCo, LLC, an affiliate of the investment adviser. The group fee rate decreases as assets under management increase and increases as assets under management decrease. In addition, the management fee is subject to a performance adjustment (up to a maximum of +/- .20% of the Fund's average net assets over a 36 month performance period). The upward or downward adjustment to the management fee is based on the relative investment performance of Growth Discovery as compared to its benchmark index, the Russell 3000 Growth Index, over the same 36 month performance period. For the reporting period, the total annualized management fee rate, including the performance adjustment, was .45% of the Fund's average net assets. The performance adjustment included in the management fee rate may be higher or lower than the maximum performance adjustment rate due to the difference between the average net assets for the reporting and performance periods.
Transfer Agent Fees. Fidelity Investments Institutional Operations Company, Inc., (FIIOC), an affiliate of the investment adviser, is the transfer, dividend disbursing and shareholder servicing agent for each class of the Fund. FIIOC receives account fees and asset-based fees that vary according to the account size and type of account of the shareholders of Growth Discovery. FIIOC receives an asset-based fee of Class K's average net assets. FIIOC pays for typesetting, printing and mailing of shareholder reports, except proxy statements.
For the period, transfer agent fees for each class were as follows:
| Amount | % of Class-Level Average Net Assets(a) | |
| Growth Discovery | $856 | .17 |
| Class K | 41 | .05 |
| $897 |
(a) Annualized
Accounting and Security Lending Fees. Fidelity Service Company, Inc. (FSC), an affiliate of the investment adviser, maintains the Fund's accounting records. The accounting fee is based on the level of average net assets for each month. Under a separate contract, FSC administers the security lending program. The security lending fee is based on the number and duration of lending transactions.
Brokerage Commissions. The Fund placed a portion of its portfolio transactions with brokerage firms which are affiliates of the investment adviser. Brokerage commissions are included in net realized gain (loss) and change in net unrealized appreciation (depreciation) in the Statement of Operations. The commissions paid to these affiliated firms were $8 for the period.
Interfund Lending Program. Pursuant to an Exemptive Order issued by the SEC, the Fund, along with other registered investment companies having management contracts with FMR or other affiliated entities of FMR, may participate in an interfund lending program. This program provides an alternative credit facility allowing the funds to borrow from, or lend money to, other participating affiliated funds. At period end, there were no interfund loans outstanding. The Fund's activity in this program during the period for which loans were outstanding was as follows:
| Borrower or Lender | Average Loan Balance | Weighted Average Interest Rate | Interest Expense |
| Borrower | $5,529 | .74% | $1 |
Interfund Trades. The Fund may purchase from or sell securities to other Fidelity Funds under procedures adopted by the Board. The procedures have been designed to ensure these interfund trades are executed in accordance with Rule 17a-7 of the 1940 Act. Interfund trades are included within the respective purchases and sales amounts shown in the Purchases and Sales of Investments note.
7. Committed Line of Credit.
The Fund participates with other funds managed by the investment adviser or an affiliate in a $4.25 billion credit facility (the "line of credit") to be utilized for temporary or emergency purposes to fund shareholder redemptions or for other short-term liquidity purposes. The Fund has agreed to pay commitment fees on its pro-rata portion of the line of credit, which amounted to $2 and is reflected in Miscellaneous expenses on the Statement of Operations. During the period, the Fund did not borrow on this line of credit.
8. Security Lending.
The Fund lends portfolio securities through a lending agent from time to time in order to earn additional income. For equity securities, a lending agent is used and may loan securities to certain qualified borrowers, including Fidelity Capital Markets (FCM), a broker-dealer affiliated with the Fund. On the settlement date of the loan, the Fund receives collateral (in the form of U.S. Treasury obligations, letters of credit and/or cash) against the loaned securities and maintains collateral in an amount not less than 100% of the market value of the loaned securities during the period of the loan. The market value of the loaned securities is determined at the close of business of the Fund and any additional required collateral is delivered to the Fund on the next business day. The Fund or borrower may terminate the loan at any time, and if the borrower defaults on its obligation to return the securities loaned because of insolvency or other reasons, the Fund may apply collateral received from the borrower against the obligation. The Fund may experience delays and costs in recovering the securities loaned. Any cash collateral received is invested in the Fidelity Securities Lending Cash Central Fund. The value of loaned securities and cash collateral at period end are disclosed on the Fund's Statement of Assets and Liabilities. At period end, there were no security loans outstanding with FCM. Security lending income represents the income earned on investing cash collateral, less rebates paid to borrowers and any lending agent fees associated with the loan, plus any premium payments received for lending certain types of securities. Security lending income is presented in the Statement of Operations as a component of income from Fidelity Central Funds. Total security lending income during the period amounted to $227, including $28 from securities loaned to FCM.
9. Expense Reductions.
Commissions paid to certain brokers with whom the investment adviser, or its affiliates, places trades on behalf of the Fund include an amount in addition to trade execution, which may be rebated back to the Fund to offset certain expenses. This amount totaled $11 for the period.
In addition, during the period the investment adviser reimbursed and/or waived a portion of fund-level operating expenses in the amount of $5.
10. Distributions to Shareholders.
Distributions to shareholders of each class were as follows:
| Six months ended December 31, 2016 | Year ended June 30, 2016 | |
| From net investment income | ||
| Growth Discovery | $880 | $1,330 |
| Class K | 255 | 459 |
| Total | $1,135 | $1,789 |
| From net realized gain | ||
| Growth Discovery | $– | $471 |
| Class K | – | 84 |
| Total | $– | $555 |
11. Share Transactions.
Share transactions for each class were as follows and may contain automatic conversions between classes or exchanges between affiliated funds:
| Shares | Shares | Dollars | Dollars | |
| Six months ended December 31, 2016 | Year ended June 30, 2016 | Six months ended December 31, 2016 | Year ended June 30, 2016 | |
| Growth Discovery | ||||
| Shares sold | 1,304 | 5,290 | $33,269 | $128,658 |
| Reinvestment of distributions | 32 | 68 | 821 | 1,697 |
| Shares redeemed | (4,355) | (7,766) | (110,966) | (188,307) |
| Net increase (decrease) | (3,019) | (2,408) | $(76,876) | $(57,952) |
| Class K | ||||
| Shares sold | 476 | 1,980 | $12,034 | $48,709 |
| Reinvestment of distributions | 10 | 22 | 255 | 543 |
| Shares redeemed | (1,271) | (2,901) | (32,453) | (71,361) |
| Net increase (decrease) | (785) | (899) | $(20,164) | $(22,109) |
12. Other.
The Fund's organizational documents provide former and current trustees and officers with a limited indemnification against liabilities arising in connection with the performance of their duties to the Fund. In the normal course of business, the Fund may also enter into contracts that provide general indemnifications. The Fund's maximum exposure under these arrangements is unknown as this would be dependent on future claims that may be made against the Fund. The risk of material loss from such claims is considered remote.
Shareholder Expense Example
As a shareholder of a Fund, you incur two types of costs: (1) transaction costs and (2) ongoing costs, including management fees and other Fund expenses. This Example is intended to help you understand your ongoing costs (in dollars) of investing in the Funds and to compare these costs with the ongoing costs of investing in other mutual funds.
The Example is based on an investment of $1,000 invested at the beginning of the period and held for the entire period (July 1, 2016 to December 31, 2016).
Actual Expenses
The first line of the accompanying table for each class of the Fund provides information about actual account values and actual expenses. You may use the information in this line, together with the amount you invested, to estimate the expenses that you paid over the period. Simply divide your account value by $1,000.00 (for example, an $8,600 account value divided by $1,000.00 = 8.6), then multiply the result by the number in the first line for a class of the Fund under the heading entitled "Expenses Paid During Period" to estimate the expenses you paid on your account during this period. A small balance maintenance fee of $12.00 that is charged once a year may apply for certain accounts with a value of less than $2,000. This fee is not included in the table below. If it was, the estimate of expenses you paid during the period would be higher, and your ending account value lower, by this amount. In addition, the Fund, as a shareholder in the underlying Fidelity Central Funds, will indirectly bear its pro-rata share of the fees and expenses incurred by the underlying Fidelity Central Funds. These fees and expenses are not included in the Fund's annualized expense ratio used to calculate the expense estimate in the table below.
Hypothetical Example for Comparison Purposes
The second line of the accompanying table for each class of the Fund provides information about hypothetical account values and hypothetical expenses based on a Class' actual expense ratio and an assumed rate of return of 5% per year before expenses, which is not the Class' actual return. The hypothetical account values and expenses may not be used to estimate the actual ending account balance or expenses you paid for the period. You may use this information to compare the ongoing costs of investing in the Fund and other funds. To do so, compare this 5% hypothetical example with the 5% hypothetical examples that appear in the shareholder reports of the other funds. A small balance maintenance fee of $12.00 that is charged once a year may apply for certain accounts with a value of less than $2,000. This fee is not included in the table below. If it was, the estimate of expenses you paid during the period would be higher, and your ending account value lower, by this amount. In addition, the Fund, as a shareholder in the underlying Fidelity Central Funds, will indirectly bear its pro-rata share of the fees and expenses incurred by the underlying Fidelity Central Funds. These fees and expenses are not included in the Fund's annualized expense ratio used to calculate the expense estimate in the table below.
Please note that the expenses shown in the table are meant to highlight your ongoing costs only and do not reflect any transaction costs. Therefore, the second line of the table is useful in comparing ongoing costs only, and will not help you determine the relative total costs of owning different funds.
| Annualized Expense Ratio-A | Beginning Account Value July 1, 2016 | Ending Account Value December 31, 2016 | Expenses Paid During Period-B July 1, 2016 to December 31, 2016 | |
| Growth Discovery | .66% | |||
| Actual | $1,000.00 | $1,039.80 | $3.39 | |
| Hypothetical-C | $1,000.00 | $1,021.88 | $3.36 | |
| Class K | .54% | |||
| Actual | $1,000.00 | $1,040.40 | $2.78 | |
| Hypothetical-C | $1,000.00 | $1,022.48 | $2.75 |
A Annualized expense ratio reflects expenses net of applicable fee waivers.
B Expenses are equal to each Class' annualized expense ratio, multiplied by the average account value over the period, multiplied by 184/365 (to reflect the one-half year period).
C 5% return per year before expenses
Board Approval of Investment Advisory Contracts and Management Fees
Fidelity Growth Discovery Fund
Each year, the Board of Trustees, including the Independent Trustees (together, the Board), votes on the renewal of the management contract with Fidelity Management & Research Company (FMR) and the sub-advisory agreements (together, the Advisory Contracts) for the fund. The Board, assisted by the advice of fund counsel and Independent Trustees' counsel, requests and considers a broad range of information relevant to the renewal of the Advisory Contracts throughout the year.
The Board meets regularly and, at each of its meetings, covers an extensive agenda of topics and materials and considers factors that are relevant to its annual consideration of the renewal of the fund's Advisory Contracts, including the services and support provided to the fund and its shareholders. The Board has established various standing committees (Committees), each composed of and chaired by Independent Trustees with varying backgrounds, to which the Board has assigned specific subject matter responsibilities in order to enhance effective decision-making by the Board. The Board, acting directly and through its Committees, requests and receives information concerning the annual consideration of the renewal of the fund's Advisory Contracts. The Board also meets as needed to consider matters specifically related to the Board's annual consideration of the renewal of the Advisory Contracts. Members of the Board may also meet with trustees of other Fidelity funds through ad hoc joint committees to discuss certain matters relevant to all of the Fidelity funds.
At its July 2016 meeting, the Board unanimously determined to renew the fund's Advisory Contracts. In reaching its determination, the Board considered all factors it believed relevant, including (i) the nature, extent, and quality of the services to be provided to the fund and its shareholders (including the investment performance of the fund); (ii) the competitiveness of the fund's management fee and total expense ratio relative to peer funds; (iii) the total costs of the services to be provided by and the profits to be realized by Fidelity from its relationships with the fund; and (iv) the extent to which, if any, economies of scale exist and would be realized as the fund grows, and whether any economies of scale are appropriately shared with fund shareholders.
In considering whether to renew the Advisory Contracts for the fund, the Board reached a determination, with the assistance of fund counsel and Independent Trustees' counsel and through the exercise of its business judgment, that the renewal of the Advisory Contracts was in the best interests of the fund and its shareholders and that the compensation payable under the Advisory Contracts was fair and reasonable. The Board's decision to renew the Advisory Contracts was not based on any single factor, but rather was based on a comprehensive consideration of all the information provided to the Board at its meetings throughout the year. The Board, in reaching its determination to renew the Advisory Contracts, was aware that shareholders of the fund have a broad range of investment choices available to them, including a wide choice among funds offered by Fidelity's competitors, and that the fund's shareholders, who have the opportunity to review and weigh the disclosure provided by the fund in its prospectus and other public disclosures, have chosen to invest in this fund, which is part of the Fidelity family of funds.
Nature, Extent, and Quality of Services Provided. The Board considered Fidelity's staffing as it relates to the fund, including the backgrounds of investment personnel of Fidelity, and also considered the fund's investment objective, strategies, and related investment philosophy. The Independent Trustees also had discussions with senior management of Fidelity's investment operations and investment groups. The Board considered the structure of the investment personnel compensation program and whether this structure provides appropriate incentives to act in the best interests of the fund. Additionally, the Board considered the portfolio managers' investments, if any, in the funds that they manage.Resources Dedicated to Investment Management and Support Services. The Board and the Fund Oversight and Research Committees reviewed the general qualifications and capabilities of Fidelity's investment staff, including its size, education, experience, and resources, as well as Fidelity's approach to recruiting, training, managing, and compensating investment personnel. The Board noted that Fidelity has continued to increase the resources devoted to non-U.S. offices, including expansion of Fidelity's global investment organization. The Board also noted that Fidelity's analysts have extensive resources, tools and capabilities that allow them to conduct sophisticated quantitative and fundamental analysis, as well as credit analysis of issuers, counterparties and guarantors. Further, the Board considered that Fidelity's investment professionals have sufficient access to global information and data so as to provide competitive investment results over time, and that those professionals also have access to sophisticated tools that permit them to assess portfolio construction and risk and performance attribution characteristics continuously, as well as to transmit new information and research conclusions rapidly around the world. Additionally, in its deliberations, the Board considered Fidelity's trading, risk management, compliance, and technology and operations capabilities and resources, which are integral parts of the investment management process.Shareholder and Administrative Services. The Board considered (i) the nature, extent, quality, and cost of advisory, administrative, and shareholder services performed by FMR, the sub-advisers (together with FMR, the Investment Advisers), and their affiliates under the Advisory Contracts and under separate agreements covering transfer agency, pricing and bookkeeping, and securities lending services for the fund; (ii) the nature and extent of the supervision of third party service providers, principally custodians, subcustodians, and pricing vendors; and (iii) the resources devoted to, and the record of compliance with, the fund's compliance policies and procedures. The Board also reviewed the allocation of fund brokerage, including allocations to brokers affiliated with the Investment Advisers, the use of brokerage commissions to pay fund expenses, and the use of "soft" commission dollars to pay for research services.The Board noted that the growth of fund assets over time across the complex allows Fidelity to reinvest in the development of services designed to enhance the value or convenience of the Fidelity funds as investment vehicles. These services include 24-hour access to account information and market information through telephone representatives and over the Internet, investor education materials and asset allocation tools, and the expanded availability of Fidelity Investor Centers.In 2014, the Board formed an ad hoc Committee on Transfer Agency Fees to review the variety of transfer agency fee structures throughout the industry and Fidelity's competitive positioning with respect to industry participants.Investment in a Large Fund Family. The Board considered the benefits to shareholders of investing in a Fidelity fund, including the benefits of investing in a fund that is part of a large family of funds offering a variety of investment disciplines and providing a large variety of mutual fund investor services. The Board noted that Fidelity had taken, or had made recommendations that resulted in the Fidelity funds taking, a number of actions over the previous year that benefited particular funds, including: (i) continuing to dedicate additional resources to investment research and to the support of the senior management team that oversees asset management; (ii) continuing efforts to enhance Fidelity's global research capabilities; (iii) launching new funds and making other enhancements to meet client needs; (iv) broadening eligibility requirements for certain lower-priced share classes of, and streamlining the fee structure for, certain existing equity index funds; (v) lowering expense caps for certain existing funds and classes to reduce expenses paid by shareholders; (vi) eliminating redemption fees for certain variable insurance product funds and classes; (vii) continuing to launch dedicated lower cost underlying funds to meet portfolio construction needs related to expanding underlying fund options for Fidelity funds of funds, specifically for the Freedom Fund product lines; (viii) launching a lower cost share class for use by the Freedom Index Fund product line; (ix) rationalizing product lines and gaining increased efficiencies through fund mergers and share class consolidations; (x) continuing to develop, acquire and implement systems and technology to improve services to the funds and shareholders, strengthen information security, and increase efficiency; (xi) implementing investment enhancements to further strengthen Fidelity's target date product line to increase investors' probability of success in achieving their goals; (xii) accelerating the conversion of all remaining Class B shares to Class A shares, which have a lower expense structure; and (xiii) implementing changes to Fidelity's money market fund product line in response to recent regulatory reforms.Investment Performance. The Board considered whether the fund has operated in accordance with its investment objective, as well as its record of compliance with its investment restrictions and its performance history.The Board took into account discussions with representatives of the Investment Advisers about fund investment performance that occur at Board meetings throughout the year. In this regard the Board noted that as part of regularly scheduled fund reviews and other reports to the Board on fund performance, the Board considers annualized return information for the fund, for different time periods, measured against a securities market index ("benchmark index") and a peer group of funds with similar objectives ("peer group"), if any. In its evaluation of fund investment performance, the Board gave particular attention to information indicating changes in performance of certain Fidelity funds for specific time periods and discussed with the Investment Advisers the reasons for any overperformance or underperformance.In addition to reviewing absolute and relative fund performance, the Independent Trustees periodically consider the appropriateness of fund performance metrics in evaluating the results achieved. In general, the Independent Trustees believe that fund performance should be evaluated based on net performance (after fees and expenses) of both the highest performing and lowest performing fund share classes, where applicable, compared to appropriate benchmark indices, over appropriate time periods that may include full market cycles, and compared to peer groups, as applicable, over the same periods, taking into account relevant factors including the following: general market conditions; issuer-specific information; and fund cash flows and other factors.The Independent Trustees recognize that shareholders evaluate performance on a net basis over their own holding periods, for which one-, three-, and five-year periods are often used as a proxy. For this reason, the performance information reviewed by the Board also included net cumulative calendar year total return information for the fund and an appropriate benchmark index and peer group for the most recent one-, three-, and five-year periods, as shown below. Returns are shown compared to the 25th percentile (top of box, 75% beaten) and 75th percentile (bottom of box, 25% beaten) of the peer universe.Fidelity Growth Discovery Fund
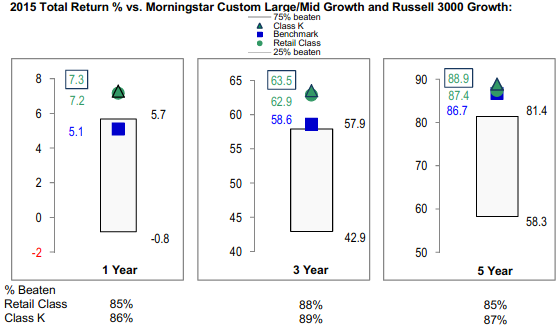
Fidelity Growth Discovery Fund

![]()
Corporate Headquarters
245 Summer St.
Boston, MA 02210
www.fidelity.com
CII-SANN-0217
1.714430.118
Fidelity Advisor® Series Growth & Income Fund Semi-Annual Report December 31, 2016 |
|
Contents
Board Approval of Investment Advisory Contracts and Management Fees |
To view a fund's proxy voting guidelines and proxy voting record for the 12-month period ended June 30, visit http://www.fidelity.com/proxyvotingresults or visit the Securities and Exchange Commission's (SEC) web site at http://www.sec.gov.
You may also call 1-877-208-0098 to request a free copy of the proxy voting guidelines.
Standard & Poor's, S&P and S&P 500 are registered service marks of The McGraw-Hill Companies, Inc. and have been licensed for use by Fidelity Distributors Corporation.
Other third-party marks appearing herein are the property of their respective owners.
All other marks appearing herein are registered or unregistered trademarks or service marks of FMR LLC or an affiliated company. © 2017 FMR LLC. All rights reserved.
This report and the financial statements contained herein are submitted for the general information of the shareholders of the Fund. This report is not authorized for distribution to prospective investors in the Fund unless preceded or accompanied by an effective prospectus.
A fund files its complete schedule of portfolio holdings with the SEC for the first and third quarters of each fiscal year on Form N-Q. Forms N-Q are available on the SEC’s web site at http://www.sec.gov. A fund's Forms N-Q may be reviewed and copied at the SEC’s Public Reference Room in Washington, DC. Information regarding the operation of the SEC's Public Reference Room may be obtained by calling 1-800-SEC-0330.
For a complete list of a fund's portfolio holdings, view the most recent holdings listing, semiannual report, or annual report on Fidelity's web site at http://www.fidelity.com, http://www.institutional.fidelity.com, or http://www.401k.com, as applicable.
NOT FDIC INSURED •MAY LOSE VALUE •NO BANK GUARANTEE
Neither the Fund nor Fidelity Distributors Corporation is a bank.
Investment Summary (Unaudited)
Top Ten Stocks as of December 31, 2016
| % of fund's net assets | % of fund's net assets 6 months ago | |
| JPMorgan Chase & Co.(a) | 4.2 | 3.5 |
| Bank of America Corp.(a) | 3.9 | 2.6 |
| Microsoft Corp. | 3.3 | 3.1 |
| Apple, Inc. | 3.1 | 2.6 |
| Citigroup, Inc.(a) | 3.0 | 2.3 |
| General Electric Co.(a) | 2.7 | 3.3 |
| Chevron Corp. | 2.0 | 2.5 |
| Comcast Corp. Class A | 1.9 | 1.8 |
| Qualcomm, Inc.(a) | 1.8 | 1.9 |
| The Williams Companies, Inc. | 1.6 | 1.1 |
| 27.5 |
(a) Security or a portion of the security is pledged as collateral for call options written.
Top Five Market Sectors as of December 31, 2016
| % of fund's net assets | % of fund's net assets 6 months ago | |
| Financials | 25.7 | 20.5 |
| Information Technology | 16.8 | 19.9 |
| Energy | 13.3 | 12.5 |
| Health Care | 12.5 | 14.2 |
| Industrials | 11.4 | 12.6 |
Prior period industry classifications reflect the categories in place as of the date indicated and have not been adjusted to reflect current industry classifications.
Asset Allocation (% of fund's net assets)
| As of December 31, 2016*,** | ||
| Stocks | 98.7% | |
| Convertible Securities | 1.3% | |
| Other Investments | 0.2% | |
| Short-Term Investments and Net Other Assets (Liabilities)*** | (0.2)% | |

* Foreign investment - 9.8%
** Written Options - (0.5)%
*** Net Other Assets (Liabilities) are not included in the pie chart
| As of June 30, 2016*,** | ||
| Stocks | 98.1% | |
| Convertible Securities | 1.5% | |
| Short-Term Investments and Net Other Assets (Liabilities) | 0.4% | |

* Foreign investments - 11.4%
** Written Options - (0.1)%
Investments December 31, 2016 (Unaudited)
Showing Percentage of Net Assets
| Common Stocks - 98.7% | |||
| Shares | Value | ||
| CONSUMER DISCRETIONARY - 8.6% | |||
| Auto Components - 0.0% | |||
| Gentex Corp. | 26,200 | $515,878 | |
| Automobiles - 0.1% | |||
| General Motors Co. | 20,400 | 710,736 | |
| Diversified Consumer Services - 0.1% | |||
| ServiceMaster Global Holdings, Inc. (a) | 16,700 | 629,089 | |
| Hotels, Restaurants & Leisure - 0.5% | |||
| Cedar Fair LP (depositary unit) | 6,200 | 398,040 | |
| Dunkin' Brands Group, Inc. | 21,900 | 1,148,436 | |
| Las Vegas Sands Corp. (b) | 23,400 | 1,249,794 | |
| Whitbread PLC | 14,820 | 689,655 | |
| Wingstop, Inc. | 22,800 | 674,652 | |
| Yum! Brands, Inc. | 25,901 | 1,640,310 | |
| 5,800,887 | |||
| Leisure Products - 0.1% | |||
| NJOY, Inc. (a)(c) | 121,929 | 1 | |
| Polaris Industries, Inc. (d) | 19,700 | 1,623,083 | |
| 1,623,084 | |||
| Media - 4.9% | |||
| AMC Networks, Inc. Class A (a) | 11,200 | 586,208 | |
| Comcast Corp. Class A | 306,690 | 21,176,945 | |
| Scripps Networks Interactive, Inc. Class A | 92,150 | 6,576,746 | |
| Sinclair Broadcast Group, Inc. Class A | 57,971 | 1,933,333 | |
| The Walt Disney Co. | 48,000 | 5,002,560 | |
| Time Warner, Inc. | 171,141 | 16,520,241 | |
| Viacom, Inc. Class B (non-vtg.) | 124,500 | 4,369,950 | |
| 56,165,983 | |||
| Multiline Retail - 1.4% | |||
| Dollar General Corp. | 8,200 | 607,374 | |
| Kohl's Corp. | 21,100 | 1,041,918 | |
| Macy's, Inc. | 26,600 | 952,546 | |
| Target Corp. | 185,463 | 13,395,992 | |
| 15,997,830 | |||
| Specialty Retail - 1.4% | |||
| Bed Bath & Beyond, Inc. | 9,900 | 402,336 | |
| Foot Locker, Inc. | 38,100 | 2,700,909 | |
| L Brands, Inc. | 43,000 | 2,831,120 | |
| Lowe's Companies, Inc. | 132,577 | 9,428,876 | |
| 15,363,241 | |||
| Textiles, Apparel & Luxury Goods - 0.1% | |||
| Ralph Lauren Corp. | 7,700 | 695,464 | |
| VF Corp. | 4,200 | 224,070 | |
| 919,534 | |||
| TOTAL CONSUMER DISCRETIONARY | 97,726,262 | ||
| CONSUMER STAPLES - 6.1% | |||
| Beverages - 2.1% | |||
| Britvic PLC | 29,900 | 208,932 | |
| Cott Corp. | 20,500 | 232,078 | |
| Diageo PLC | 146,096 | 3,791,170 | |
| Dr. Pepper Snapple Group, Inc. | 10,300 | 933,901 | |
| Molson Coors Brewing Co. Class B | 35,400 | 3,444,774 | |
| PepsiCo, Inc. | 27,094 | 2,834,845 | |
| The Coca-Cola Co. | 295,448 | 12,249,274 | |
| 23,694,974 | |||
| Food & Staples Retailing - 1.4% | |||
| Costco Wholesale Corp. | 16,300 | 2,609,793 | |
| CVS Health Corp. | 112,890 | 8,908,150 | |
| Kroger Co. | 62,500 | 2,156,875 | |
| Walgreens Boots Alliance, Inc. | 17,138 | 1,418,341 | |
| Whole Foods Market, Inc. | 16,100 | 495,236 | |
| 15,588,395 | |||
| Food Products - 0.5% | |||
| B&G Foods, Inc. Class A | 29,100 | 1,274,580 | |
| Hostess Brands, Inc. Class A (a) | 92,200 | 1,198,600 | |
| Mead Johnson Nutrition Co. Class A | 49,000 | 3,467,240 | |
| 5,940,420 | |||
| Household Products - 1.6% | |||
| Procter & Gamble Co. | 217,317 | 18,272,013 | |
| Personal Products - 0.1% | |||
| Edgewell Personal Care Co. (a) | 16,500 | 1,204,335 | |
| Tobacco - 0.4% | |||
| Altria Group, Inc. | 20,300 | 1,372,686 | |
| Reynolds American, Inc. | 67,700 | 3,793,908 | |
| 5,166,594 | |||
| TOTAL CONSUMER STAPLES | 69,866,731 | ||
| ENERGY - 13.0% | |||
| Energy Equipment & Services - 1.1% | |||
| Baker Hughes, Inc. | 53,600 | 3,482,392 | |
| National Oilwell Varco, Inc. | 102,900 | 3,852,576 | |
| Oceaneering International, Inc. | 117,000 | 3,300,570 | |
| Schlumberger Ltd. | 13,920 | 1,168,584 | |
| 11,804,122 | |||
| Oil, Gas & Consumable Fuels - 11.9% | |||
| Amyris, Inc. (a) | 33,644 | 24,560 | |
| Anadarko Petroleum Corp. | 37,800 | 2,635,794 | |
| Apache Corp. | 171,847 | 10,907,129 | |
| Cabot Oil & Gas Corp. | 75,100 | 1,754,336 | |
| Cenovus Energy, Inc. | 440,600 | 6,661,587 | |
| Chevron Corp. | 194,588 | 22,903,008 | |
| ConocoPhillips Co. | 368,900 | 18,496,646 | |
| EQT Midstream Partners LP | 6,700 | 513,756 | |
| Golar LNG Ltd. | 104,000 | 2,385,760 | |
| Imperial Oil Ltd. | 238,600 | 8,300,753 | |
| Kinder Morgan, Inc. | 527,000 | 10,914,170 | |
| Legacy Reserves LP (a) | 189,300 | 401,316 | |
| MPLX LP | 13,940 | 482,603 | |
| PrairieSky Royalty Ltd. | 112,260 | 2,670,528 | |
| Suncor Energy, Inc. | 557,690 | 18,234,529 | |
| Teekay LNG Partners LP | 87,600 | 1,265,820 | |
| The Williams Companies, Inc. | 598,674 | 18,642,708 | |
| Williams Partners LP | 232,480 | 8,841,214 | |
| 136,036,217 | |||
| TOTAL ENERGY | 147,840,339 | ||
| FINANCIALS - 25.7% | |||
| Banks - 18.0% | |||
| Bank of America Corp. (b) | 2,023,737 | 44,724,588 | |
| Citigroup, Inc. (b) | 582,836 | 34,637,943 | |
| Comerica, Inc. (b) | 98,800 | 6,729,268 | |
| Cullen/Frost Bankers, Inc. | 5,900 | 520,557 | |
| JPMorgan Chase & Co. (b) | 548,088 | 47,294,514 | |
| Lloyds Banking Group PLC | 267,700 | 205,561 | |
| M&T Bank Corp. | 43,200 | 6,757,776 | |
| PNC Financial Services Group, Inc. | 74,544 | 8,718,666 | |
| Regions Financial Corp. (b) | 579,600 | 8,323,056 | |
| Standard Chartered PLC (United Kingdom) (a) | 66,479 | 543,679 | |
| SunTrust Banks, Inc. (b) | 273,850 | 15,020,673 | |
| U.S. Bancorp (b) | 285,771 | 14,680,056 | |
| Wells Fargo & Co. | 321,700 | 17,728,887 | |
| 205,885,224 | |||
| Capital Markets - 6.6% | |||
| Apollo Global Management LLC Class A | 103,600 | 2,005,696 | |
| Ashmore Group PLC | 18,579 | 64,729 | |
| CBOE Holdings, Inc. | 37,100 | 2,741,319 | |
| Charles Schwab Corp. (b) | 206,054 | 8,132,951 | |
| Federated Investors, Inc. Class B (non-vtg.) | 9,800 | 277,144 | |
| Goldman Sachs Group, Inc. | 1,700 | 407,065 | |
| Intertrust NV | 31,700 | 557,930 | |
| KKR & Co. LP | 419,378 | 6,454,227 | |
| Morgan Stanley (b) | 225,480 | 9,526,530 | |
| Northern Trust Corp. (b) | 149,310 | 13,296,056 | |
| Oaktree Capital Group LLC Class A | 43,800 | 1,642,500 | |
| S&P Global, Inc. | 25,000 | 2,688,500 | |
| State Street Corp. | 238,374 | 18,526,427 | |
| The Blackstone Group LP | 321,700 | 8,695,551 | |
| 75,016,625 | |||
| Insurance - 0.7% | |||
| Marsh & McLennan Companies, Inc. | 60,719 | 4,103,997 | |
| MetLife, Inc. | 36,339 | 1,958,309 | |
| Principal Financial Group, Inc. | 28,100 | 1,625,866 | |
| Willis Group Holdings PLC | 4,500 | 550,260 | |
| 8,238,432 | |||
| Thrifts & Mortgage Finance - 0.4% | |||
| MGIC Investment Corp. (a) | 62,400 | 635,856 | |
| Radian Group, Inc. | 192,252 | 3,456,691 | |
| 4,092,547 | |||
| TOTAL FINANCIALS | 293,232,828 | ||
| HEALTH CARE - 11.5% | |||
| Biotechnology - 2.4% | |||
| Alexion Pharmaceuticals, Inc. (a) | 40,200 | 4,918,470 | |
| Amgen, Inc. | 48,965 | 7,159,173 | |
| Biogen, Inc. (a) | 18,700 | 5,302,946 | |
| Gilead Sciences, Inc. | 75,000 | 5,370,750 | |
| Grifols SA | 33,700 | 669,755 | |
| Intercept Pharmaceuticals, Inc. (a) | 7,900 | 858,335 | |
| Shire PLC sponsored ADR | 18,200 | 3,100,916 | |
| Vertex Pharmaceuticals, Inc. (a) | 2,600 | 191,542 | |
| 27,571,887 | |||
| Health Care Equipment & Supplies - 1.7% | |||
| Abbott Laboratories | 104,191 | 4,001,976 | |
| Becton, Dickinson & Co. | 3,600 | 595,980 | |
| Medtronic PLC | 132,468 | 9,435,696 | |
| Meridian Bioscience, Inc. | 9,400 | 166,380 | |
| Zimmer Biomet Holdings, Inc. | 43,400 | 4,478,880 | |
| 18,678,912 | |||
| Health Care Providers & Services - 1.7% | |||
| Anthem, Inc. | 32,300 | 4,643,771 | |
| Cigna Corp. | 41,900 | 5,589,041 | |
| McKesson Corp. | 45,525 | 6,393,986 | |
| Patterson Companies, Inc. (d) | 60,777 | 2,493,680 | |
| 19,120,478 | |||
| Life Sciences Tools & Services - 0.4% | |||
| Agilent Technologies, Inc. | 101,700 | 4,633,452 | |
| Pharmaceuticals - 5.3% | |||
| Allergan PLC | 5,000 | 1,050,050 | |
| AstraZeneca PLC sponsored ADR | 106,000 | 2,895,920 | |
| Bayer AG | 7,600 | 791,794 | |
| Bristol-Myers Squibb Co. | 126,300 | 7,380,972 | |
| GlaxoSmithKline PLC sponsored ADR | 402,640 | 15,505,666 | |
| Innoviva, Inc. (a) | 45,900 | 491,130 | |
| Johnson & Johnson | 158,474 | 18,257,790 | |
| Novartis AG sponsored ADR | 4,532 | 330,111 | |
| Sanofi SA | 41,293 | 3,339,165 | |
| Teva Pharmaceutical Industries Ltd. sponsored ADR | 294,849 | 10,688,276 | |
| 60,730,874 | |||
| TOTAL HEALTH CARE | 130,735,603 | ||
| INDUSTRIALS - 11.3% | |||
| Aerospace & Defense - 2.0% | |||
| General Dynamics Corp. | 16,400 | 2,831,624 | |
| Meggitt PLC | 40,473 | 228,745 | |
| Rolls-Royce Holdings PLC | 196,300 | 1,612,310 | |
| The Boeing Co. | 57,779 | 8,995,035 | |
| United Technologies Corp. | 88,420 | 9,692,600 | |
| 23,360,314 | |||
| Air Freight & Logistics - 1.3% | |||
| C.H. Robinson Worldwide, Inc. | 46,500 | 3,406,590 | |
| Expeditors International of Washington, Inc. | 30,000 | 1,588,800 | |
| United Parcel Service, Inc. Class B (b) | 85,270 | 9,775,353 | |
| 14,770,743 | |||
| Airlines - 0.2% | |||
| Copa Holdings SA Class A | 24,600 | 2,234,418 | |
| Commercial Services & Supplies - 0.1% | |||
| Aggreko PLC | 20,500 | 231,925 | |
| KAR Auction Services, Inc. | 30,800 | 1,312,696 | |
| 1,544,621 | |||
| Construction & Engineering - 0.1% | |||
| Fluor Corp. | 19,100 | 1,003,132 | |
| Electrical Equipment - 0.5% | |||
| AMETEK, Inc. | 48,700 | 2,366,820 | |
| Hubbell, Inc. Class B | 32,737 | 3,820,408 | |
| 6,187,228 | |||
| Industrial Conglomerates - 2.7% | |||
| General Electric Co. (b) | 977,466 | 30,887,926 | |
| Machinery - 1.1% | |||
| Burckhardt Compression Holding AG | 2,140 | 562,688 | |
| Caterpillar, Inc. | 2,400 | 222,576 | |
| Deere & Co. | 29,700 | 3,060,288 | |
| Donaldson Co., Inc. | 40,300 | 1,695,824 | |
| Flowserve Corp. | 88,300 | 4,242,815 | |
| IMI PLC | 13,800 | 176,874 | |
| Wabtec Corp. | 27,200 | 2,258,144 | |
| 12,219,209 | |||
| Professional Services - 0.3% | |||
| Nielsen Holdings PLC | 48,300 | 2,026,185 | |
| Robert Half International, Inc. | 29,000 | 1,414,620 | |
| 3,440,805 | |||
| Road & Rail - 2.4% | |||
| CSX Corp. | 277,912 | 9,985,378 | |
| J.B. Hunt Transport Services, Inc. | 85,665 | 8,315,502 | |
| Kansas City Southern | 24,600 | 2,087,310 | |
| Norfolk Southern Corp. | 35,280 | 3,812,710 | |
| Union Pacific Corp. | 28,800 | 2,985,984 | |
| 27,186,884 | |||
| Trading Companies & Distributors - 0.6% | |||
| Fastenal Co. | 21,700 | 1,019,466 | |
| Howden Joinery Group PLC | 18,800 | 88,923 | |
| W.W. Grainger, Inc. | 5,300 | 1,230,925 | |
| Watsco, Inc. | 26,651 | 3,947,546 | |
| 6,286,860 | |||
| TOTAL INDUSTRIALS | 129,122,140 | ||
| INFORMATION TECHNOLOGY - 16.8% | |||
| Communications Equipment - 1.5% | |||
| Cisco Systems, Inc. | 566,340 | 17,114,795 | |
| Internet Software & Services - 2.8% | |||
| Alphabet, Inc.: | |||
| Class A (a) | 21,959 | 17,401,410 | |
| Class C (a) | 18,734 | 14,459,276 | |
| 31,860,686 | |||
| IT Services - 3.6% | |||
| First Data Corp. Class A (a) | 160,637 | 2,279,439 | |
| MasterCard, Inc. Class A (b) | 101,550 | 10,485,038 | |
| Paychex, Inc. | 167,814 | 10,216,516 | |
| Sabre Corp. (d) | 85,900 | 2,143,205 | |
| Unisys Corp. (a)(d) | 214,000 | 3,199,300 | |
| Visa, Inc. Class A | 170,480 | 13,300,850 | |
| 41,624,348 | |||
| Semiconductors & Semiconductor Equipment - 1.8% | |||
| Qualcomm, Inc. (b) | 320,010 | 20,864,652 | |
| Software - 3.6% | |||
| Microsoft Corp. | 609,608 | 37,881,041 | |
| Oracle Corp. | 37,813 | 1,453,910 | |
| SS&C Technologies Holdings, Inc. | 50,600 | 1,447,160 | |
| 40,782,111 | |||
| Technology Hardware, Storage & Peripherals - 3.5% | |||
| Apple, Inc. | 307,806 | 35,650,091 | |
| Western Digital Corp. | 60,800 | 4,131,360 | |
| 39,781,451 | |||
| TOTAL INFORMATION TECHNOLOGY | 192,028,043 | ||
| MATERIALS - 2.9% | |||
| Chemicals - 2.4% | |||
| CF Industries Holdings, Inc. | 101,100 | 3,182,628 | |
| E.I. du Pont de Nemours & Co. | 40,530 | 2,974,902 | |
| Johnson Matthey PLC | 2,900 | 113,723 | |
| LyondellBasell Industries NV Class A | 55,100 | 4,726,478 | |
| Monsanto Co. | 74,514 | 7,839,618 | |
| Olin Corp. | 15,700 | 402,077 | |
| Potash Corp. of Saskatchewan, Inc. | 290,310 | 5,252,024 | |
| PPG Industries, Inc. | 4,100 | 388,516 | |
| W.R. Grace & Co. | 34,600 | 2,340,344 | |
| 27,220,310 | |||
| Containers & Packaging - 0.5% | |||
| Ball Corp. | 10,900 | 818,263 | |
| Graphic Packaging Holding Co. | 8,100 | 101,088 | |
| Packaging Corp. of America | 10,500 | 890,610 | |
| WestRock Co. | 71,400 | 3,624,978 | |
| 5,434,939 | |||
| TOTAL MATERIALS | 32,655,249 | ||
| REAL ESTATE - 0.8% | |||
| Equity Real Estate Investment Trusts (REITs) - 0.8% | |||
| American Tower Corp. | 15,600 | 1,648,608 | |
| Crown Castle International Corp. | 40,600 | 3,522,862 | |
| First Potomac Realty Trust | 9,679 | 106,179 | |
| Omega Healthcare Investors, Inc. | 20,200 | 631,452 | |
| Public Storage | 10,300 | 2,302,050 | |
| Sabra Health Care REIT, Inc. | 35,300 | 862,026 | |
| 9,073,177 | |||
| TELECOMMUNICATION SERVICES - 1.1% | |||
| Diversified Telecommunication Services - 1.1% | |||
| Verizon Communications, Inc. | 248,459 | 13,262,741 | |
| UTILITIES - 0.9% | |||
| Electric Utilities - 0.9% | |||
| Exelon Corp. | 278,100 | 9,869,769 | |
| Multi-Utilities - 0.0% | |||
| Sempra Energy | 100 | 10,064 | |
| TOTAL UTILITIES | 9,879,833 | ||
| TOTAL COMMON STOCKS | |||
| (Cost $907,456,921) | 1,125,422,946 | ||
| Preferred Stocks - 1.1% | |||
| Convertible Preferred Stocks - 1.1% | |||
| HEALTH CARE - 0.9% | |||
| Health Care Equipment & Supplies - 0.9% | |||
| Alere, Inc. 3.00% (a) | 31,387 | 10,106,614 | |
| INDUSTRIALS - 0.1% | |||
| Commercial Services & Supplies - 0.1% | |||
| Stericycle, Inc. 2.25% | 25,100 | 1,588,077 | |
| UTILITIES - 0.1% | |||
| Independent Power and Renewable Electricity Producers - 0.1% | |||
| Dynegy, Inc. 7.00% (a) | 7,300 | 453,622 | |
| TOTAL CONVERTIBLE PREFERRED STOCKS | 12,148,313 | ||
| Nonconvertible Preferred Stocks - 0.0% | |||
| INDUSTRIALS - 0.0% | |||
| Aerospace & Defense - 0.0% | |||
| Rolls-Royce Holdings PLC (C Shares) | 28,859,070 | 35,566 | |
| TOTAL PREFERRED STOCKS | |||
| (Cost $11,548,363) | 12,183,879 | ||
| Principal Amount(e) | Value | ||
| Convertible Bonds - 0.2% | |||
| ENERGY - 0.1% | |||
| Oil, Gas & Consumable Fuels - 0.1% | |||
| Amyris, Inc.: | |||
| 5% 10/15/18 pay-in-kind (c)(f) | 871,182 | 482,522 | |
| 9.5% 4/15/19 pay-in-kind | 741,000 | 464,514 | |
| 947,036 | |||
| HEALTH CARE - 0.1% | |||
| Pharmaceuticals - 0.1% | |||
| Bayer Capital Corp. BV 5.625% 11/22/19 (g) | EUR | 1,200,000 | 1,374,125 |
| TOTAL CONVERTIBLE BONDS | |||
| (Cost $2,894,022) | 2,321,161 | ||
| Shares | Value | ||
| Other - 0.2% | |||
| ENERGY - 0.2% | |||
| Oil, Gas & Consumable Fuels - 0.2% | |||
| Utica Shale Drilling Program (non-operating revenue interest) unit (c)(h) | |||
| (Cost $2,131,572) | 2,131,572 | 2,131,572 | |
| Money Market Funds - 1.2% | |||
| Fidelity Cash Central Fund, 0.60% (i) | 7,220,998 | 7,222,442 | |
| Fidelity Securities Lending Cash Central Fund 0.65% (i)(j) | 6,695,083 | 6,695,752 | |
| TOTAL MONEY MARKET FUNDS | |||
| (Cost $13,918,098) | 13,918,194 | ||
| TOTAL INVESTMENT PORTFOLIO - 101.4% | |||
| (Cost $937,948,976) | 1,155,977,752 | ||
| NET OTHER ASSETS (LIABILITIES) - (1.4)% | (15,726,672) | ||
| NET ASSETS - 100% | $1,140,251,080 |
| Written Options | ||||
| Expiration Date/Exercise Price | Number of Contracts | Premium | Value | |
| Call Options | ||||
| Bank of America Corp. | 1/20/17 - $18.00 | 2,059 | $49,415 | $(854,485) |
| Bank of America Corp. | 1/20/17 - $20.00 | 3,071 | 135,121 | (687,904) |
| Charles Schwab | 1/20/17 - $35.00 | 387 | 23,800 | (174,150) |
| Citigroup, Inc. | 1/20/17 - $50.00 | 565 | 114,692 | (538,163) |
| Citigroup, Inc. | 1/20/17 - $55.00 | 570 | 25,079 | (272,175) |
| Citigroup, Inc. | 2/17/17 - $60.00 | 284 | 33,795 | (60,208) |
| Comerica, Inc. | 1/20/17 - $55.00 | 196 | 24,499 | (262,150) |
| General Electric | 1/20/17 - $32.00 | 1,023 | 31,786 | (38,363) |
| JPMorgan Chase & Co. | 1/20/17 - $72.50 | 1,144 | 78,968 | (1,584,440) |
| JPMorgan Chase & Co. | 2/17/17 - $85.00 | 556 | 64,709 | (189,040) |
| Las Vegas Sands Corp. | 1/20/17 - $62.50 | 95 | 17,860 | (428) |
| MasterCard, Inc. Class A | 1/20/17 - $105.00 | 209 | 58,803 | (22,572) |
| Morgan Stanley | 1/20/17 - $36.00 | 345 | 15,870 | (219,075) |
| Northern Trust Corp. | 1/20/17 - $75.00 | 154 | 22,638 | (215,600) |
| Qualcomm, Inc. | 1/20/17 - $67.50 | 543 | 64,626 | (26,607) |
| Regions Financial Corp. | 1/20/17 - $11.00 | 14 | 463 | (4,690) |
| Regions Financial Corp. | 2/17/17 - $13.00 | 1,101 | 37,507 | (175,059) |
| Regions Financial Corp. | 1/20/17 - $14.00 | 1,451 | 50,784 | (91,413) |
| SunTrust Banks, Inc. | 1/20/17 - $46.00 | 570 | 63,531 | (505,875) |
| SunTrust Banks, Inc. | 1/20/17 - $50.00 | 285 | 17,393 | (144,638) |
| SunTrust Banks, Inc. | 1/20/17 - $55.00 | 272 | 18,768 | (35,360) |
| U.S. Bancorp | 1/20/17 - $50.00 | 437 | 16,169 | (79,753) |
| United Parcel Service, Inc. Class B | 4/21/17 - $115.00 | 153 | 21,724 | (57,755) |
| TOTAL WRITTEN OPTIONS | $988,000 | $(6,239,903) |
Legend
(a) Non-income producing
(b) Security or a portion of the security is pledged as collateral for call options written. At period end, the value of securities pledged amounted to $63,434,749.
(c) Restricted securities - Investment in securities not registered under the Securities Act of 1933 (excluding 144A issues). At the end of the period, the value of restricted securities (excluding 144A issues) amounted to $2,614,095 or 0.2% of net assets.
(d) Security or a portion of the security is on loan at period end.
(e) Amount is stated in United States dollars unless otherwise noted.
(f) Coupon rates for floating and adjustable rate securities reflect the rates in effect at period end.
(g) Security exempt from registration under Rule 144A of the Securities Act of 1933. These securities may be resold in transactions exempt from registration, normally to qualified institutional buyers. At the end of the period, the value of these securities amounted to $1,374,125 or 0.1% of net assets.
(h) Investment is owned by a wholly-owned subsidiary (Subsidiary) that is treated as a corporation for U.S. tax purposes.
(i) Affiliated fund that is generally available only to investment companies and other accounts managed by Fidelity Investments. The rate quoted is the annualized seven-day yield of the fund at period end. A complete unaudited listing of the fund's holdings as of its most recent quarter end is available upon request. In addition, each Fidelity Central Fund's financial statements are available on the SEC's website or upon request.
(j) Investment made with cash collateral received from securities on loan.
Additional information on each restricted holding is as follows:
| Security | Acquisition Date | Acquisition Cost |
| Amyris, Inc. 5% 10/15/18 pay-in-kind | 10/16/13 - 10/17/16 | $871,182 |
| NJOY, Inc. | 2/14/14 | $211,475 |
| Utica Shale Drilling Program (non-operating revenue interest) unit | 10/5/16 - 11/4/16 | $2,131,572 |
Affiliated Central Funds
Information regarding fiscal year to date income earned by the Fund from investments in Fidelity Central Funds is as follows:
| Fund | Income earned |
| Fidelity Cash Central Fund | $16,378 |
| Fidelity Securities Lending Cash Central Fund | 35,556 |
| Total | $51,934 |
Investment Valuation
The following is a summary of the inputs used, as of December 31, 2016, involving the Fund's assets and liabilities carried at fair value. The inputs or methodology used for valuing securities may not be an indication of the risk associated with investing in those securities. For more information on valuation inputs, and their aggregation into the levels used below, please refer to the Investment Valuation section in the accompanying Notes to Financial Statements.
| Valuation Inputs at Reporting Date: | ||||
| Description | Total | Level 1 | Level 2 | Level 3 |
| Investments in Securities: | ||||
| Equities: | ||||
| Consumer Discretionary | $97,726,262 | $97,726,261 | $-- | $1 |
| Consumer Staples | 69,866,731 | 66,075,561 | 3,791,170 | -- |
| Energy | 147,840,339 | 147,840,339 | -- | -- |
| Financials | 293,232,828 | 293,027,267 | 205,561 | -- |
| Health Care | 140,842,217 | 126,604,644 | 14,237,573 | -- |
| Industrials | 130,745,783 | 129,133,473 | 1,612,310 | -- |
| Information Technology | 192,028,043 | 192,028,043 | -- | -- |
| Materials | 32,655,249 | 32,655,249 | -- | -- |
| Real Estate | 9,073,177 | 9,073,177 | -- | -- |
| Telecommunication Services | 13,262,741 | 13,262,741 | -- | -- |
| Utilities | 10,333,455 | 10,333,455 | -- | -- |
| Corporate Bonds | 2,321,161 | -- | 1,838,639 | 482,522 |
| Other | 2,131,572 | -- | -- | 2,131,572 |
| Money Market Funds | 13,918,194 | 13,918,194 | -- | -- |
| Total Investments in Securities: | $1,155,977,752 | $1,131,678,404 | $21,685,253 | $2,614,095 |
| Derivative Instruments: | ||||
| Liabilities | ||||
| Written Options | $(6,239,903) | $(6,239,903) | $-- | $-- |
| Total Liabilities | $(6,239,903) | $(6,239,903) | $-- | $-- |
| Total Derivative Instruments: | $(6,239,903) | $(6,239,903) | $-- | $-- |
Value of Derivative Instruments
The following table is a summary of the Fund's value of derivative instruments by primary risk exposure as of December 31, 2016. For additional information on derivative instruments, please refer to the Derivative Instruments section in the accompanying Notes to Financial Statements.
| Primary Risk Exposure / Derivative Type | Value | |
| Asset | Liability | |
| Equity Risk | ||
| Written Options(a) | $0 | $(6,239,903) |
| Total Equity Risk | 0 | (6,239,903) |
| Total Value of Derivatives | $0 | $(6,239,903) |
(a) Gross value is presented in the Statement of Assets and Liabilities in the written options, at value line-item.
See accompanying notes which are an integral part of the financial statements.
Financial Statements
Statement of Assets and Liabilities
| December 31, 2016 (Unaudited) | ||
| Assets | ||
| Investment in securities, at value (including securities loaned of $6,521,873) — See accompanying schedule: Unaffiliated issuers (cost $924,030,878) | $1,142,059,558 | |
| Fidelity Central Funds (cost $13,918,098) | 13,918,194 | |
| Total Investments (cost $937,948,976) | $1,155,977,752 | |
| Foreign currency held at value (cost $14,065) | 14,067 | |
| Receivable for investments sold | 4,091,087 | |
| Receivable for fund shares sold | 101,479 | |
| Dividends receivable | 1,496,717 | |
| Interest receivable | 31,766 | |
| Distributions receivable from Fidelity Central Funds | 8,115 | |
| Prepaid expenses | 2,218 | |
| Other receivables | 2,101 | |
| Total assets | 1,161,725,302 | |
| Liabilities | ||
| Payable for investments purchased | $147,446 | |
| Payable for fund shares redeemed | 7,724,292 | |
| Accrued management fee | 429,848 | |
| Written options, at value (premium received $988,000) | 6,239,903 | |
| Other affiliated payables | 200,395 | |
| Other payables and accrued expenses | 37,988 | |
| Collateral on Securities Loaned | 6,694,350 | |
| Total liabilities | 21,474,222 | |
| Net Assets | $1,140,251,080 | |
| Net Assets consist of: | ||
| Paid in capital | $929,862,447 | |
| Distributions in excess of net investment income | (4,431,029) | |
| Accumulated undistributed net realized gain (loss) on investments and foreign currency transactions | 2,052,724 | |
| Net unrealized appreciation (depreciation) on investments and assets and liabilities in foreign currencies | 212,766,938 | |
| Net Assets, for 81,445,054 shares outstanding | $1,140,251,080 | |
| Net Asset Value, offering price and redemption price per share ($1,140,251,080 ÷ 81,445,054 shares) | $14.00 |
See accompanying notes which are an integral part of the financial statements.
Statement of Operations
| Six months ended December 31, 2016 (Unaudited) | ||
| Investment Income | ||
| Dividends | $13,388,297 | |
| Interest | 68,967 | |
| Income from Fidelity Central Funds | 51,934 | |
| Total income | 13,509,198 | |
| Expenses | ||
| Management fee | $2,581,139 | |
| Transfer agent fees | 1,010,599 | |
| Accounting and security lending fees | 187,808 | |
| Custodian fees and expenses | 39,686 | |
| Independent trustees' fees and expenses | 2,429 | |
| Audit | 26,075 | |
| Legal | 4,335 | |
| Interest | 1,086 | |
| Miscellaneous | 6,125 | |
| Total expenses before reductions | 3,859,282 | |
| Expense reductions | (4,190) | 3,855,092 |
| Net investment income (loss) | 9,654,106 | |
| Realized and Unrealized Gain (Loss) | ||
| Net realized gain (loss) on: | ||
| Investment securities: | ||
| Unaffiliated issuers | 15,565,376 | |
| Fidelity Central Funds | 5,198 | |
| Foreign currency transactions | (6,626) | |
| Futures contracts | (151,055) | |
| Written options | 326,159 | |
| Total net realized gain (loss) | 15,739,052 | |
| Change in net unrealized appreciation (depreciation) on: Investment securities | 133,565,461 | |
| Assets and liabilities in foreign currencies | (1,409) | |
| Written options | (5,114,254) | |
| Total change in net unrealized appreciation (depreciation) | 128,449,798 | |
| Net gain (loss) | 144,188,850 | |
| Net increase (decrease) in net assets resulting from operations | $153,842,956 |
See accompanying notes which are an integral part of the financial statements.
Statement of Changes in Net Assets
| Six months ended December 31, 2016 (Unaudited) | Year ended June 30, 2016 | |
| Increase (Decrease) in Net Assets | ||
| Operations | ||
| Net investment income (loss) | $9,654,106 | $21,495,947 |
| Net realized gain (loss) | 15,739,052 | 5,063,127 |
| Change in net unrealized appreciation (depreciation) | 128,449,798 | (59,062,930) |
| Net increase (decrease) in net assets resulting from operations | 153,842,956 | (32,503,856) |
| Distributions to shareholders from net investment income | (16,048,453) | (22,858,947) |
| Distributions to shareholders from net realized gain | (3,590,086) | (58,610,461) |
| Total distributions | (19,638,539) | (81,469,408) |
| Share transactions | ||
| Proceeds from sales of shares | 55,491,349 | 142,429,892 |
| Reinvestment of distributions | 19,638,539 | 81,469,408 |
| Cost of shares redeemed | (166,800,134) | (286,985,503) |
| Net increase (decrease) in net assets resulting from share transactions | (91,670,246) | (63,086,203) |
| Total increase (decrease) in net assets | 42,534,171 | (177,059,467) |
| Net Assets | ||
| Beginning of period | 1,097,716,909 | 1,274,776,376 |
| End of period | $1,140,251,080 | $1,097,716,909 |
| Other Information | ||
| Undistributed net investment income end of period | $– | $1,963,318 |
| Distributions in excess of net investment income end of period | $(4,431,029) | $– |
| Shares | ||
| Sold | 4,179,212 | 11,644,177 |
| Issued in reinvestment of distributions | 1,475,031 | 6,393,573 |
| Redeemed | (12,355,757) | (22,877,424) |
| Net increase (decrease) | (6,701,514) | (4,839,674) |
See accompanying notes which are an integral part of the financial statements.
Financial Highlights — Fidelity Advisor Series Growth & Income Fund
| Six months ended (Unaudited) December 31, | Years ended June 30, | ||||
| 2016 | 2016 | 2015 | 2014 | 2013 A | |
| Selected Per–Share Data | |||||
| Net asset value, beginning of period | $12.45 | $13.71 | $13.73 | $11.57 | $10.00 |
| Income from Investment Operations | |||||
| Net investment income (loss)B | .11 | .23 | .25 | .23 | .08 |
| Net realized and unrealized gain (loss) | 1.67 | (.60) | .45 | 2.33 | 1.50 |
| Total from investment operations | 1.78 | (.37) | .70 | 2.56 | 1.58 |
| Distributions from net investment income | (.19) | (.25) | (.23) | (.15) | (.01) |
| Distributions from net realized gain | (.04) | (.64) | (.49) | (.25) | – |
| Total distributions | (.23) | (.89) | (.72) | (.40) | (.01) |
| Net asset value, end of period | $14.00 | $12.45 | $13.71 | $13.73 | $11.57 |
| Total ReturnC,D | 14.40% | (2.75)% | 5.29% | 22.48% | 15.80% |
| Ratios to Average Net AssetsE,F | |||||
| Expenses before reductions | .67%G | .67% | .67% | .69% | .84%G |
| Expenses net of fee waivers, if any | .67%G | .67% | .67% | .69% | .84%G |
| Expenses net of all reductions | .67%G | .67% | .67% | .69% | .83%G |
| Net investment income (loss) | 1.67%G | 1.86% | 1.80% | 1.83% | 1.33%G |
| Supplemental Data | |||||
| Net assets, end of period (000 omitted) | $1,140,251 | $1,097,717 | $1,274,776 | $1,357,854 | $169,956 |
| Portfolio turnover rateH | 36%G | 33% | 38% | 60%I | 50%G |
A For the period December 6, 2012 (commencement of operations) to June 30, 2013.
B Calculated based on average shares outstanding during the period.
C Total returns for periods of less than one year are not annualized.
D Total returns would have been lower if certain expenses had not been reduced during the applicable periods shown.
E Fees and expenses of any underlying Fidelity Central Funds are not included in the Fund's expense ratio. The Fund indirectly bears its proportionate share of the expenses of any underlying Fidelity Central Funds.
F Expense ratios reflect operating expenses of the Fund. Expenses before reductions do not reflect amounts reimbursed by the investment adviser or reductions from brokerage service arrangements or reductions from other expense offset arrangements and do not represent the amount paid by the Fund during periods when reimbursements or reductions occur. Expense ratios before reductions for start-up periods may not be representative of longer term operating periods. Expenses net of fee waivers reflect expenses after reimbursement by the investment adviser but prior to reductions from brokerage service arrangements or other expense offset arrangements. Expenses net of all reductions represent the net expenses paid by the Fund.
G Annualized
H Amount does not include the portfolio activity of any underlying Fidelity Central Funds.
I Portfolio turnover rate excludes securities received or delivered in-kind.
See accompanying notes which are an integral part of the financial statements.
Notes to Financial Statements (Unaudited)
For the period ended December 31, 2016
1. Organization.
Fidelity Advisor Series Growth & Income Fund (the Fund) is a fund of Fidelity Hastings Street Trust (the Trust) and is authorized to issue an unlimited number of shares. Shares of the Fund are only available for purchase by mutual funds for which Fidelity Management & Research Company (FMR) or an affiliate serves as an investment manager. The Trust is registered under the Investment Company Act of 1940, as amended (the 1940 Act), as an open-end management investment company organized as a Massachusetts business trust.
2. Investments in Fidelity Central Funds.
The Fund invests in Fidelity Central Funds, which are open-end investment companies generally available only to other investment companies and accounts managed by the investment adviser and its affiliates. The Fund's Schedule of Investments lists each of the Fidelity Central Funds held as of period end, if any, as an investment of the Fund, but does not include the underlying holdings of each Fidelity Central Fund. As an Investing Fund, the Fund indirectly bears its proportionate share of the expenses of the underlying Fidelity Central Funds.
The Money Market Central Funds seek preservation of capital and current income and are managed by Fidelity Investments Money Management, Inc. (FIMM), an affiliate of the investment adviser. Annualized expenses of the Money Market Central Funds as of their most recent shareholder report date are less than .005%.
A complete unaudited list of holdings for each Fidelity Central Fund is available upon request or at the Securities and Exchange Commission (the SEC) website at www.sec.gov. In addition, the financial statements of the Fidelity Central Funds are available on the SEC website or upon request.
3. Significant Accounting Policies.
The financial statements have been prepared in conformity with accounting principles generally accepted in the United States of America (GAAP), which require management to make certain estimates and assumptions at the date of the financial statements. Actual results could differ from those estimates. Subsequent events, if any, through the date that the financial statements were issued have been evaluated in the preparation of the financial statements. The following summarizes the significant accounting policies of the Fund:
Investment Valuation. Investments are valued as of 4:00 p.m. Eastern time on the last calendar day of the period. The Board of Trustees (the Board) has delegated the day to day responsibility for the valuation of the Fund's investments to the Fair Value Committee (the Committee) established by the Fund's investment adviser. In accordance with valuation policies and procedures approved by the Board, the Fund attempts to obtain prices from one or more third party pricing vendors or brokers to value its investments. When current market prices, quotations or currency exchange rates are not readily available or reliable, investments will be fair valued in good faith by the Committee, in accordance with procedures adopted by the Board. Factors used in determining fair value vary by investment type and may include market or investment specific events, changes in interest rates and credit quality. The frequency with which these procedures are used cannot be predicted and they may be utilized to a significant extent. The Committee oversees the Fund's valuation policies and procedures and reports to the Board on the Committee's activities and fair value determinations. The Board monitors the appropriateness of the procedures used in valuing the Fund's investments and ratifies the fair value determinations of the Committee.
The Fund categorizes the inputs to valuation techniques used to value its investments into a disclosure hierarchy consisting of three levels as shown below:
- Level 1 – quoted prices in active markets for identical investments
- Level 2 – other significant observable inputs (including quoted prices for similar investments, interest rates, prepayment speeds, etc.)
- Level 3 – unobservable inputs (including the Fund's own assumptions based on the best information available)
Valuation techniques used to value the Fund's investments by major category are as follows:
Equity securities, including restricted securities, for which market quotations are readily available, are valued at the last reported sale price or official closing price as reported by a third party pricing vendor on the primary market or exchange on which they are traded and are categorized as Level 1 in the hierarchy. In the event there were no sales during the day or closing prices are not available, securities are valued at the last quoted bid price or may be valued using the last available price and are generally categorized as Level 2 in the hierarchy. For foreign equity securities, when market or security specific events arise, comparisons to the valuation of American Depositary Receipts (ADRs), futures contracts, Exchange-Traded Funds (ETFs) and certain indexes as well as quoted prices for similar securities may be used and would be categorized as Level 2 in the hierarchy. Utilizing these techniques may result in transfers between Level 1 and Level 2. For equity securities, including restricted securities, where observable inputs are limited, assumptions about market activity and risk are used and these securities may be categorized as Level 3 in the hierarchy.
Debt securities, including restricted securities, are valued based on evaluated prices received from third party pricing vendors or from brokers who make markets in such securities. Corporate bonds are valued by pricing vendors who utilize matrix pricing which considers yield or price of bonds of comparable quality, coupon, maturity and type or by broker-supplied prices. When independent prices are unavailable or unreliable, debt securities may be valued utilizing pricing methodologies which consider similar factors that would be used by third party pricing vendors. Debt securities are generally categorized as Level 2 in the hierarchy but may be Level 3 depending on the circumstances.
Exchange-traded options are valued using the last sale price or, in the absence of a sale, the last offering price and are categorized as Level 1 in the hierarchy. Investments in open-end mutual funds, including the Fidelity Central Funds, are valued at their closing net asset value (NAV) each business day and are categorized as Level 1 in the hierarchy.
Changes in valuation techniques may result in transfers in or out of an assigned level within the disclosure hierarchy. The aggregate value of investments by input level as of December 31, 2016 is included at the end of the Fund's Schedule of Investments.
Foreign Currency. The Fund may use foreign currency contracts to facilitate transactions in foreign-denominated securities. Gains and losses from these transactions may arise from changes in the value of the foreign currency or if the counterparties do not perform under the contracts' terms.
Foreign-denominated assets, including investment securities, and liabilities are translated into U.S. dollars at the exchange rates at period end. Purchases and sales of investment securities, income and dividends received and expenses denominated in foreign currencies are translated into U.S. dollars at the exchange rate in effect on the transaction date.
The effects of exchange rate fluctuations on investments are included with the net realized and unrealized gain (loss) on investment securities. Other foreign currency transactions resulting in realized and unrealized gain (loss) are disclosed separately.
Investment Transactions and Income. For financial reporting purposes, the Fund's investment holdings and NAV include trades executed through the end of the last business day of the period. The NAV per share for processing shareholder transactions is calculated as of the close of business of the New York Stock Exchange (NYSE), normally 4:00 p.m. Eastern time and includes trades executed through the end of the prior business day. Gains and losses on securities sold are determined on the basis of identified cost and may include proceeds received from litigation. Dividend income is recorded on the ex-dividend date, except for certain dividends from foreign securities where the ex-dividend date may have passed, which are recorded as soon as the Fund is informed of the ex-dividend date. Non-cash dividends included in dividend income, if any, are recorded at the fair market value of the securities received. Income and capital gain distributions from Fidelity Central Funds, if any, are recorded on the ex-dividend date. Certain distributions received by the Fund represent a return of capital or capital gain. The Fund determines the components of these distributions subsequent to the ex-dividend date, based upon receipt of tax filings or other correspondence relating to the underlying investment. These distributions are recorded as a reduction of cost of investments and/or as a realized gain. Interest income is accrued as earned and includes coupon interest and amortization of premium and accretion of discount on debt securities as applicable. Investment income is recorded net of foreign taxes withheld where recovery of such taxes is uncertain.
Expenses. Expenses directly attributable to a fund are charged to that fund. Expenses attributable to more than one fund are allocated among the respective funds on the basis of relative net assets or other appropriate methods. Expense estimates are accrued in the period to which they relate and adjustments are made when actual amounts are known.
Income Tax Information and Distributions to Shareholders. Each year, the Fund intends to qualify as a regulated investment company under Subchapter M of the Internal Revenue Code, including distributing substantially all of its taxable income and realized gains. As a result, no provision for U.S. Federal income taxes is required. The Fund files a U.S. federal tax return, in addition to state and local tax returns as required. The Fund's federal income tax returns are subject to examination by the Internal Revenue Service (IRS) for a period of three fiscal years after they are filed. State and local tax returns may be subject to examination for an additional fiscal year depending on the jurisdiction. Foreign taxes are provided for based on the Fund's understanding of the tax rules and rates that exist in the foreign markets in which it invests.
Distributions are declared and recorded on the ex-dividend date. Income and capital gain distributions are determined in accordance with income tax regulations, which may differ from GAAP.
Capital accounts within the financial statements are adjusted for permanent book-tax differences. These adjustments have no impact on net assets or the results of operations. Capital accounts are not adjusted for temporary book-tax differences which will reverse in a subsequent period.
Book-tax differences are primarily due to foreign currency transactions, market discount, partnerships, passive foreign investment companies (PFIC), certain conversion ratio adjustments, equity-debt classifications and losses deferred due to wash sales, options transactions and excise tax regulations.
The federal tax cost of investment securities and unrealized appreciation (depreciation) as of period end were as follows:
| Gross unrealized appreciation | $259,680,648 |
| Gross unrealized depreciation | (47,145,783) |
| Net unrealized appreciation (depreciation) on securities | $212,534,865 |
| Tax cost | $943,442,887 |
At the prior fiscal period end, the Fund was required to defer approximately $18,967 of losses on options. The Fund elected to defer to its next fiscal year approximately $5,173,308 of capital losses recognized during the period November 1, 2015 to June 30, 2016.
Restricted Securities. The Fund may invest in securities that are subject to legal or contractual restrictions on resale. These securities generally may be resold in transactions exempt from registration or to the public if the securities are registered. Disposal of these securities may involve time-consuming negotiations and expense, and prompt sale at an acceptable price may be difficult. Information regarding restricted securities is included at the end of the Fund's Schedule of Investments.
Consolidated Subsidiary. The Fund invests in certain investments through a wholly-owned subsidiary ("Subsidiary"), which may be subject to federal and state taxes upon disposition.
As of period end, the Fund held an investment of $2,131,572 in this Subsidiary, representing .19% of the Fund's net assets. The financial statements have been consolidated and include accounts of the Fund and each Subsidiary. Accordingly, all inter-company transactions and balances have been eliminated.
4. Derivative Instruments.
Risk Exposures and the Use of Derivative Instruments. The Fund's investment objective allows the Fund to enter into various types of derivative contracts, including futures contracts and options. Derivatives are investments whose value is primarily derived from underlying assets, indices or reference rates and may be transacted on an exchange or over-the-counter (OTC). Derivatives may involve a future commitment to buy or sell a specified asset based on specified terms, to exchange future cash flows at periodic intervals based on a notional principal amount, or for one party to make one or more payments upon the occurrence of specified events in exchange for periodic payments from the other party.
The Fund used derivatives to increase returns and to manage exposure to certain risks as defined below. The success of any strategy involving derivatives depends on analysis of numerous economic factors, and if the strategies for investment do not work as intended, the Fund may not achieve its objectives.
The Fund's use of derivatives increased or decreased its exposure to the following risk:
| Equity Risk | Equity risk relates to the fluctuations in the value of financial instruments as a result of changes in market prices (other than those arising from interest rate risk or foreign exchange risk), whether caused by factors specific to an individual investment, its issuer, or all factors affecting all instruments traded in a market or market segment. |
The Fund is also exposed to additional risks from investing in derivatives, such as liquidity risk and counterparty credit risk. Liquidity risk is the risk that the Fund will be unable to close out the derivative in the open market in a timely manner. Counterparty credit risk is the risk that the counterparty will not be able to fulfill its obligation to the Fund. Counterparty credit risk related to exchange-traded futures contracts and exchange-traded options may be mitigated by the protection provided by the exchange on which they trade.
Investing in derivatives may involve greater risks than investing in the underlying assets directly and, to varying degrees, may involve risk of loss in excess of any initial investment and collateral received and amounts recognized in the Statement of Assets and Liabilities. In addition, there may be the risk that the change in value of the derivative contract does not correspond to the change in value of the underlying instrument.
Net Realized Gain (Loss) and Change in Net Unrealized Appreciation (Depreciation) on Derivatives. The table below, which reflects the impacts of derivatives on the financial performance of the Fund, summarizes the net realized gain (loss) and change in net unrealized appreciation (depreciation) for derivatives during the period as presented in the Statement of Operations.
| Primary Risk Exposure / Derivative Type | Net Realized Gain (Loss) | Change in Net Unrealized Appreciation (Depreciation) |
| Equity Risk | ||
| Futures | $(151,055) | $– |
| Written Options | 326,159 | (5,114,254) |
| Totals | $175,104 | $(5,114,254) |
A summary of the value of derivatives by primary risk exposure as of period end, if any, is included at the end of the Schedule of Investments.
Futures Contracts. A futures contract is an agreement between two parties to buy or sell a specified underlying instrument for a fixed price at a specified future date. The Fund used futures contracts to manage its exposure to the stock market.
Upon entering into a futures contract, a fund is required to deposit either cash or securities (initial margin) with a clearing broker in an amount equal to a certain percentage of the face value of the contract. Futures contracts are marked-to-market daily and subsequent daily payments (variation margin) are made or received by a fund depending on the daily fluctuations in the value of the futures contracts and are recorded as unrealized appreciation or (depreciation). This receivable and/or payable, if any, is included in daily variation margin for derivative instruments in the Statement of Assets and Liabilities. Realized gain or (loss) is recorded upon the expiration or closing of a futures contract.
Any open futures contracts at period end are presented in the Schedule of Investments under the caption "Futures Contracts". The underlying face amount at value reflects each contract's exposure to the underlying instrument or index at period end.
Options. Options give the purchaser the right, but not the obligation, to buy (call) or sell (put) an underlying security or financial instrument at an agreed exercise or strike price between or on certain dates. Options obligate the seller (writer) to buy (put) or sell (call) an underlying instrument at the exercise or strike price or cash settle an underlying derivative instrument if the holder exercises the option on or before the expiration date.
The Fund used exchange-traded written covered call options to manage its exposure to the market. When the Fund writes a covered call option, the Fund holds the underlying instrument which must be delivered to the holder upon the exercise of the option.
Upon entering into a written options contract, the Fund will receive a premium. Premiums received are reflected as a liability on the Statement of Assets and Liabilities. Options are valued daily and any unrealized appreciation (depreciation) is reflected on the Statement of Assets and Liabilities. When a written option is exercised, the premium is added to the proceeds from the sale of the underlying instrument in determining the gain or loss realized on that investment. When an option is closed the Fund will realize a gain or loss depending on whether the proceeds or amount paid for the closing sale transaction are greater or less than the premium received. When an option expires, gains and losses are realized to the extent of premiums received. The net realized gain (loss) on closed and expired written options and the change in net unrealized appreciation (depreciation) on written options are reflected separately on the Statement of Operations.
Writing call options tends to decrease exposure to the underlying instrument and risk of loss is the change in value in excess of the premium received.
Any open options at period end are presented in the Schedule of Investments under the caption "Written Options".
The following is a summary of the Fund's written options activity:
| Number of Contracts | Amount of Premiums | |
| Outstanding at beginning of period | 6,479 | $561,191 |
| Options Opened | 23,986 | 1,625,453 |
| Options Exercised | (3,166) | (279,798) |
| Options Closed | (10,403) | (793,112) |
| Options Expired | (1,412) | (125,734) |
| Outstanding at end of period | 15,484 | $988,000 |
5. Purchases and Sales of Investments.
Purchases and sales of securities, other than short-term securities, aggregated $201,730,113 and $301,194,735, respectively.
6. Fees and Other Transactions with Affiliates.
Management Fee. Fidelity Management & Research Company (the investment adviser) and its affiliates provide the Fund with investment management related services for which the Fund pays a monthly management fee. The management fee is the sum of an individual fund fee rate that is based on an annual rate of .20% of the Fund's average net assets and an annualized group fee rate that averaged .25% during the period. The group fee rate is based upon the average net assets of all the mutual funds advised by the investment adviser, including any mutual funds previously advised by the investment adviser that are currently advised by Fidelity SelectCo, LLC, an affiliate of the investment adviser. The group fee rate decreases as assets under management increase and increases as assets under management decrease. For the reporting period, the total annualized management fee rate was .45% of the Fund's average net assets.
Transfer Agent Fees. Fidelity Investments Institutional Operations Company, Inc. (FIIOC), an affiliate of the investment adviser, is the Fund's transfer, dividend disbursing and shareholder servicing agent. FIIOC receives account fees and asset-based fees that vary according to account size and type of account. FIIOC pays for typesetting, printing and mailing of shareholder reports, except proxy statements. For the period, the transfer agent fees were equivalent to an annualized rate of .18% of average net assets.
Accounting and Security Lending Fees. Fidelity Service Company, Inc. (FSC), an affiliate of the investment adviser, maintains the Fund's accounting records. The accounting fee is based on the level of average net assets for each month. Under a separate contract, FSC administers the security lending program. The security lending fee is based on the number and duration of lending transactions.
Brokerage Commissions. The Fund placed a portion of its portfolio transactions with brokerage firms which are affiliates of the investment adviser. Brokerage commissions are included in net realized gain (loss) and change in net unrealized appreciation (depreciation) in the Statement of Operations. The commissions paid to these affiliated firms were $6,851 for the period.
Interfund Lending Program. Pursuant to an Exemptive Order issued by the SEC, the Fund, along with other registered investment companies having management contracts with FMR or other affiliated entities of FMR, may participate in an interfund lending program. This program provides an alternative credit facility allowing the funds to borrow from, or lend money to, other participating affiliated funds. At period end, there were no interfund loans outstanding. The Fund's activity in this program during the period for which loans were outstanding was as follows:
| Borrower or Lender | Average Loan Balance | Weighted Average Interest Rate | Interest Expense |
| Borrower | $11,297,000 | .58% | $1,086 |
Interfund Trades. The Fund may purchase from or sell securities to other Fidelity Funds under procedures adopted by the Board. The procedures have been designed to ensure these interfund trades are executed in accordance with Rule 17a-7 of the 1940 Act. Interfund trades are included within the respective purchases and sales amounts shown in the Purchases and Sales of Investments note.
7. Committed Line of Credit.
The Fund participates with other funds managed by the investment adviser or an affiliate in a $4.25 billion credit facility (the "line of credit") to be utilized for temporary or emergency purposes to fund shareholder redemptions or for other short-term liquidity purposes. The Fund has agreed to pay commitment fees on its pro-rata portion of the line of credit, which amounted to $1,884 and is reflected in Miscellaneous expenses on the Statement of Operations. During the period, the Fund did not borrow on this line of credit.
8. Security Lending.
The Fund lends portfolio securities through a lending agent from time to time in order to earn additional income. For equity securities, a lending agent is used and may loan securities to certain qualified borrowers, including Fidelity Capital Markets (FCM), a broker-dealer affiliated with the Fund. On the settlement date of the loan, the Fund receives collateral (in the form of U.S. Treasury obligations, letters of credit and/or cash) against the loaned securities and maintains collateral in an amount not less than 100% of the market value of the loaned securities during the period of the loan. The market value of the loaned securities is determined at the close of business of the Fund and any additional required collateral is delivered to the Fund on the next business day. The Fund or borrower may terminate the loan at any time, and if the borrower defaults on its obligation to return the securities loaned because of insolvency or other reasons, the Fund may apply collateral received from the borrower against the obligation. The Fund may experience delays and costs in recovering the securities loaned. Any cash collateral received is invested in the Fidelity Securities Lending Cash Central Fund. The value of loaned securities and cash collateral at period end are disclosed on the Fund's Statement of Assets and Liabilities. At period end, there were no security loans outstanding with FCM. Security lending income represents the income earned on investing cash collateral, less rebates paid to borrowers and any lending agent fees associated with the loan, plus any premium payments received for lending certain types of securities. Security lending income is presented in the Statement of Operations as a component of income from Fidelity Central Funds. Total security lending income during the period amounted to $35,556, including $246 from securities loaned to FCM.
9. Expense Reductions.
During the period the investment adviser reimbursed and/or waived a portion of operating expenses in the amount of $4,190.
10. Other.
The Fund's organizational documents provide former and current trustees and officers with a limited indemnification against liabilities arising in connection with the performance of their duties to the Fund. In the normal course of business, the Fund may also enter into contracts that provide general indemnifications. The Fund's maximum exposure under these arrangements is unknown as this would be dependent on future claims that may be made against the Fund. The risk of material loss from such claims is considered remote.
At the end of the period, mutual funds managed by the investment adviser or its affiliates were the owners of record of all of the outstanding shares of the Fund.
Shareholder Expense Example
As a shareholder of the Fund, you incur two types of costs: (1) transaction costs, and (2) ongoing costs, including management fees and other Fund expenses. This Example is intended to help you understand your ongoing costs (in dollars) of investing in the Fund and to compare these costs with the ongoing costs of investing in other mutual funds.
The Example is based on an investment of $1,000 invested at the beginning of the period and held for the entire period (July 1, 2016 to December 31, 2016).
Actual Expenses
The first line of the accompanying table provides information about actual account values and actual expenses. You may use the information in this line, together with the amount you invested, to estimate the expenses that you paid over the period. Simply divide your account value by $1,000.00 (for example, an $8,600 account value divided by $1,000.00 = 8.6), then multiply the result by the number in the first line under the heading entitled "Expenses Paid During Period" to estimate the expenses you paid on your account during this period. In addition, the Fund, as a shareholder in the underlying Fidelity Central Funds, will indirectly bear its pro-rata share of the fees and expenses incurred by the underlying Fidelity Central Funds. These fees and expenses are not included in the Fund's annualized expense ratio used to calculate the expense estimate in the table below.
Hypothetical Example for Comparison Purposes
The second line of the accompanying table provides information about hypothetical account values and hypothetical expenses based on the Fund's actual expense ratio and an assumed rate of return of 5% per year before expenses, which is not the Fund's actual return. The hypothetical account values and expenses may not be used to estimate the actual ending account balance or expenses you paid for the period. You may use this information to compare the ongoing costs of investing in the Fund and other funds. To do so, compare this 5% hypothetical example with the 5% hypothetical examples that appear in the shareholder reports of the other funds. In addition, the Fund, as a shareholder in the underlying Fidelity Central Funds, will indirectly bear its pro-rata share of the fees and expenses incurred by the underlying Fidelity Central Funds. These fees and expenses are not included in the Fund's annualized expense ratio used to calculate the expense estimate in the table below.
Please note that the expenses shown in the table are meant to highlight your ongoing costs only and do not reflect any transaction costs. Therefore, the second line of the table is useful in comparing ongoing costs only, and will not help you determine the relative total costs of owning different funds.
| Annualized Expense Ratio-A | Beginning Account Value July 1, 2016 | Ending Account Value December 31, 2016 | Expenses Paid During Period-B July 1, 2016 to December 31, 2016 | |
| Actual | .67% | $1,000.00 | $1,144.00 | $3.62 |
| Hypothetical-C | $1,000.00 | $1,021.83 | $3.41 |
A Annualized expense ratio reflects expenses net of applicable fee waivers.
B Expenses are equal to the Fund's annualized expense ratio, multiplied by the average account value over the period, multiplied by 184/365 (to reflect the one-half year period).
C 5% return per year before expenses
Board Approval of Investment Advisory Contracts and Management Fees
Fidelity Advisor Series Growth & Income Fund
Each year, the Board of Trustees, including the Independent Trustees (together, the Board), votes on the renewal of the management contract with Fidelity Management & Research Company (FMR) and the sub-advisory agreements (together, the Advisory Contracts) for the fund. The Board, assisted by the advice of fund counsel and Independent Trustees' counsel, requests and considers a broad range of information relevant to the renewal of the Advisory Contracts throughout the year.
The Board meets regularly and, at each of its meetings, covers an extensive agenda of topics and materials and considers factors that are relevant to its annual consideration of the renewal of the fund's Advisory Contracts, including the services and support provided to the fund and its shareholders. The Board has established various standing committees (Committees), each composed of and chaired by Independent Trustees with varying backgrounds, to which the Board has assigned specific subject matter responsibilities in order to enhance effective decision-making by the Board. The Board, acting directly and through its Committees, requests and receives information concerning the annual consideration of the renewal of the fund's Advisory Contracts. The Board also meets as needed to consider matters specifically related to the Board's annual consideration of the renewal of the Advisory Contracts. Members of the Board may also meet with trustees of other Fidelity funds through ad hoc joint committees to discuss certain matters relevant to all of the Fidelity funds.
At its July 2016 meeting, the Board unanimously determined to renew the fund's Advisory Contracts. In reaching its determination, the Board considered all factors it believed relevant, including (i) the nature, extent, and quality of the services to be provided to the fund and its shareholders (including the investment performance of the fund); (ii) the competitiveness of the fund's management fee and total expense ratio relative to peer funds; (iii) the total costs of the services to be provided by and the profits to be realized by Fidelity from its relationships with the fund; and (iv) the extent to which, if any, economies of scale exist and would be realized as the fund grows, and whether any economies of scale are appropriately shared with fund shareholders.
In considering whether to renew the Advisory Contracts for the fund, the Board reached a determination, with the assistance of fund counsel and Independent Trustees' counsel and through the exercise of its business judgment, that the renewal of the Advisory Contracts was in the best interests of the fund and its shareholders and that the compensation payable under the Advisory Contracts was fair and reasonable. The Board's decision to renew the Advisory Contracts was not based on any single factor, but rather was based on a comprehensive consideration of all the information provided to the Board at its meetings throughout the year. The Board, in reaching its determination to renew the Advisory Contracts, was aware that shareholders of the fund have a broad range of investment choices available to them, including a wide choice among funds offered by Fidelity's competitors, and that the fund's shareholders, who have the opportunity to review and weigh the disclosure provided by the fund in its prospectus and other public disclosures, have chosen to invest in this fund, which is part of the Fidelity family of funds.
Nature, Extent, and Quality of Services Provided. The Board considered Fidelity's staffing as it relates to the fund, including the backgrounds of investment personnel of Fidelity, and also considered the fund's investment objective, strategies, and related investment philosophy. The Independent Trustees also had discussions with senior management of Fidelity's investment operations and investment groups. The Board considered the structure of the investment personnel compensation program and whether this structure provides appropriate incentives to act in the best interests of the fund. Additionally, the Board considered the portfolio managers' investments, if any, in the funds that they manage.Resources Dedicated to Investment Management and Support Services. The Board and the Fund Oversight and Research Committees reviewed the general qualifications and capabilities of Fidelity's investment staff, including its size, education, experience, and resources, as well as Fidelity's approach to recruiting, training, managing, and compensating investment personnel. The Board noted that Fidelity has continued to increase the resources devoted to non-U.S. offices, including expansion of Fidelity's global investment organization. The Board also noted that Fidelity's analysts have extensive resources, tools and capabilities that allow them to conduct sophisticated quantitative and fundamental analysis, as well as credit analysis of issuers, counterparties and guarantors. Further, the Board considered that Fidelity's investment professionals have sufficient access to global information and data so as to provide competitive investment results over time, and that those professionals also have access to sophisticated tools that permit them to assess portfolio construction and risk and performance attribution characteristics continuously, as well as to transmit new information and research conclusions rapidly around the world. Additionally, in its deliberations, the Board considered Fidelity's trading, risk management, compliance, and technology and operations capabilities and resources, which are integral parts of the investment management process.Shareholder and Administrative Services. The Board considered (i) the nature, extent, quality, and cost of advisory, administrative, and shareholder services performed by FMR, the sub-advisers (together with FMR, the Investment Advisers), and their affiliates under the Advisory Contracts and under separate agreements covering transfer agency, pricing and bookkeeping, and securities lending services for the fund; (ii) the nature and extent of the supervision of third party service providers, principally custodians, subcustodians, and pricing vendors; and (iii) the resources devoted to, and the record of compliance with, the fund's compliance policies and procedures. The Board also reviewed the allocation of fund brokerage, including allocations to brokers affiliated with the Investment Advisers, the use of brokerage commissions to pay fund expenses, and the use of "soft" commission dollars to pay for research services.The Board noted that the growth of fund assets over time across the complex allows Fidelity to reinvest in the development of services designed to enhance the value or convenience of the Fidelity funds as investment vehicles. These services include 24-hour access to account information and market information through telephone representatives and over the Internet, investor education materials and asset allocation tools, and the expanded availability of Fidelity Investor Centers.In 2014, the Board formed an ad hoc Committee on Transfer Agency Fees to review the variety of transfer agency fee structures throughout the industry and Fidelity's competitive positioning with respect to industry participants.Investment in a Large Fund Family. The Board considered the benefits to shareholders of investing in a Fidelity fund, including the benefits of investing in a fund that is part of a large family of funds offering a variety of investment disciplines and providing a large variety of mutual fund investor services. The Board noted that Fidelity had taken, or had made recommendations that resulted in the Fidelity funds taking, a number of actions over the previous year that benefited particular funds, including: (i) continuing to dedicate additional resources to investment research and to the support of the senior management team that oversees asset management; (ii) continuing efforts to enhance Fidelity's global research capabilities; (iii) launching new funds and making other enhancements to meet client needs; (iv) broadening eligibility requirements for certain lower-priced share classes of, and streamlining the fee structure for, certain existing equity index funds; (v) lowering expense caps for certain existing funds and classes to reduce expenses paid by shareholders; (vi) eliminating redemption fees for certain variable insurance product funds and classes; (vii) continuing to launch dedicated lower cost underlying funds to meet portfolio construction needs related to expanding underlying fund options for Fidelity funds of funds, specifically for the Freedom Fund product lines; (viii) launching a lower cost share class for use by the Freedom Index Fund product line; (ix) rationalizing product lines and gaining increased efficiencies through fund mergers and share class consolidations; (x) continuing to develop, acquire and implement systems and technology to improve services to the funds and shareholders, strengthen information security, and increase efficiency; (xi) implementing investment enhancements to further strengthen Fidelity's target date product line to increase investors' probability of success in achieving their goals; (xii) accelerating the conversion of all remaining Class B shares to Class A shares, which have a lower expense structure; and (xiii) implementing changes to Fidelity's money market fund product line in response to recent regulatory reforms.Investment Performance. The Board considered whether the fund has operated in accordance with its investment objective, as well as its record of compliance with its investment restrictions and its performance history.The Board took into account discussions with representatives of the Investment Advisers about fund investment performance that occur at Board meetings throughout the year. In this regard the Board noted that as part of regularly scheduled fund reviews and other reports to the Board on fund performance, the Board considers annualized return information for the fund, for different time periods, measured against a securities market index ("benchmark index") and a peer group of funds with similar objectives ("peer group"), if any. In its evaluation of fund investment performance, the Board gave particular attention to information indicating changes in performance of certain Fidelity funds for specific time periods and discussed with the Investment Advisers the reasons for any overperformance or underperformance.In addition to reviewing absolute and relative fund performance, the Independent Trustees periodically consider the appropriateness of fund performance metrics in evaluating the results achieved. In general, the Independent Trustees believe that fund performance should be evaluated based on net performance (after fees and expenses) of both the highest performing and lowest performing fund share classes, where applicable, compared to appropriate benchmark indices, over appropriate time periods that may include full market cycles, and compared to peer groups, as applicable, over the same periods, taking into account relevant factors including the following: general market conditions; issuer-specific information; and fund cash flows and other factors.The Independent Trustees recognize that shareholders evaluate performance on a net basis over their own holding periods, for which one-, three-, and five-year periods are often used as a proxy. For this reason, the performance information reviewed by the Board also included net cumulative calendar year total return information for the fund and an appropriate benchmark index and peer group for the most recent one- and three-year periods, as shown below. Returns are shown compared to the 25th percentile (top of box, 75% beaten) and 75th percentile (bottom of box, 25% beaten) of the peer universe.Fidelity Advisor Series Growth & Income Fund
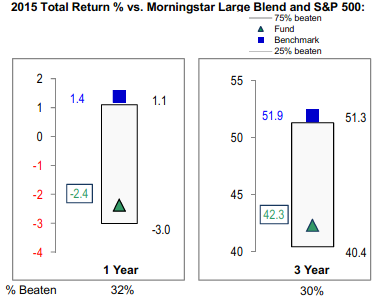
Fidelity Advisor Series Growth & Income Fund

![]()
Corporate Headquarters
245 Summer St.
Boston, MA 02210
www.fidelity.com
AMHTI-SANN-0217
1.950944.104
Fidelity® Growth Discovery Fund Semi-Annual Report December 31, 2016 |
|
Contents
Board Approval of Investment Advisory Contracts and Management Fees |
To view a fund's proxy voting guidelines and proxy voting record for the 12-month period ended June 30, visit http://www.fidelity.com/proxyvotingresults or visit the Securities and Exchange Commission's (SEC) web site at http://www.sec.gov.
You may also call 1-800-835-5092 to request a free copy of the proxy voting guidelines.
Standard & Poor's, S&P and S&P 500 are registered service marks of The McGraw-Hill Companies, Inc. and have been licensed for use by Fidelity Distributors Corporation.
Other third-party marks appearing herein are the property of their respective owners.
All other marks appearing herein are registered or unregistered trademarks or service marks of FMR LLC or an affiliated company. © 2017 FMR LLC. All rights reserved.
This report and the financial statements contained herein are submitted for the general information of the shareholders of the Fund. This report is not authorized for distribution to prospective investors in the Fund unless preceded or accompanied by an effective prospectus.
A fund files its complete schedule of portfolio holdings with the SEC for the first and third quarters of each fiscal year on Form N-Q. Forms N-Q are available on the SEC’s web site at http://www.sec.gov. A fund's Forms N-Q may be reviewed and copied at the SEC’s Public Reference Room in Washington, DC. Information regarding the operation of the SEC's Public Reference Room may be obtained by calling 1-800-SEC-0330.
For a complete list of a fund's portfolio holdings, view the most recent holdings listing, semiannual report, or annual report on Fidelity's web site at http://www.fidelity.com, http://www.institutional.fidelity.com, or http://www.401k.com, as applicable.
NOT FDIC INSURED •MAY LOSE VALUE •NO BANK GUARANTEE
Neither the Fund nor Fidelity Distributors Corporation is a bank.
Investment Summary (Unaudited)
Top Ten Stocks as of December 31, 2016
| % of fund's net assets | % of fund's net assets 6 months ago | |
| Facebook, Inc. Class A | 8.9 | 12.6 |
| Alphabet, Inc. Class A | 6.3 | 7.8 |
| Amazon.com, Inc. | 3.9 | 3.1 |
| Electronic Arts, Inc. | 3.2 | 2.4 |
| Charter Communications, Inc. Class A | 3.1 | 0.5 |
| Home Depot, Inc. | 2.8 | 2.5 |
| Reynolds American, Inc. | 2.1 | 1.9 |
| UnitedHealth Group, Inc. | 1.9 | 0.0 |
| Global Payments, Inc. | 1.7 | 0.8 |
| Adobe Systems, Inc. | 1.6 | 1.3 |
| 35.5 |
Top Five Market Sectors as of December 31, 2016
| % of fund's net assets | % of fund's net assets 6 months ago | |
| Information Technology | 36.1 | 38.2 |
| Consumer Discretionary | 19.0 | 16.0 |
| Health Care | 14.0 | 13.2 |
| Consumer Staples | 8.8 | 7.0 |
| Financials | 7.7 | 8.0 |
Prior period industry classifications reflect the categories in place as of the date indicated and have not been adjusted to reflect current industry classifications.
Asset Allocation (% of fund's net assets)
| As of December 31, 2016* | ||
| Stocks | 98.1% | |
| Convertible Securities | 0.9% | |
| Short-Term Investments and Net Other Assets (Liabilities) | 1.0% | |

* Foreign investments - 7.8%
| As of June 30, 2016* | ||
| Stocks | 94.0% | |
| Convertible Securities | 0.8% | |
| Short-Term Investments and Net Other Assets (Liabilities) | 5.2% | |

* Foreign investments - 8.0%
Percentages shown as 0.0% may reflect amounts less than 0.05%.
Investments December 31, 2016 (Unaudited)
Showing Percentage of Net Assets
| Common Stocks - 98.1% | |||
| Shares | Value (000s) | ||
| CONSUMER DISCRETIONARY - 18.9% | |||
| Automobiles - 0.6% | |||
| Tesla Motors, Inc. (a) | 30,600 | $6,539 | |
| Diversified Consumer Services - 0.8% | |||
| Bright Horizons Family Solutions, Inc. (a) | 66,000 | 4,621 | |
| Houghton Mifflin Harcourt Co. (a) | 98,800 | 1,072 | |
| Nord Anglia Education, Inc. (a) | 111,372 | 2,595 | |
| ServiceMaster Global Holdings, Inc. (a) | 29,600 | 1,115 | |
| 9,403 | |||
| Hotels, Restaurants & Leisure - 3.9% | |||
| Buffalo Wild Wings, Inc. (a) | 5,500 | 849 | |
| Dave & Buster's Entertainment, Inc. (a) | 174,300 | 9,813 | |
| Domino's Pizza, Inc. | 27,723 | 4,415 | |
| Papa John's International, Inc. | 72,000 | 6,162 | |
| Popeyes Louisiana Kitchen, Inc. (a) | 52,400 | 3,169 | |
| Starbucks Corp. | 307,852 | 17,092 | |
| Wingstop, Inc. | 66,600 | 1,971 | |
| 43,471 | |||
| Household Durables - 0.0% | |||
| Gree Electric Appliances, Inc. of Zhuhai Class A | 140,800 | 499 | |
| Internet & Direct Marketing Retail - 5.0% | |||
| Amazon.com, Inc. (a) | 59,100 | 44,317 | |
| Ctrip.com International Ltd. ADR (a) | 129,900 | 5,196 | |
| Netflix, Inc. (a) | 36,300 | 4,494 | |
| NutriSystem, Inc. | 54,500 | 1,888 | |
| 55,895 | |||
| Leisure Products - 0.0% | |||
| NJOY, Inc. (a)(b) | 56,145 | 0 | |
| Media - 3.7% | |||
| Charter Communications, Inc. Class A (a) | 118,700 | 34,176 | |
| Cinemark Holdings, Inc. | 60,200 | 2,309 | |
| Sirius XM Holdings, Inc. (c) | 1,015,400 | 4,519 | |
| 41,004 | |||
| Multiline Retail - 0.5% | |||
| Dollar Tree, Inc. (a) | 44,400 | 3,427 | |
| Ollie's Bargain Outlet Holdings, Inc. (a) | 94,300 | 2,683 | |
| 6,110 | |||
| Specialty Retail - 3.5% | |||
| AutoZone, Inc. (a) | 9,100 | 7,187 | |
| Five Below, Inc. (a) | 2,600 | 104 | |
| Home Depot, Inc. | 230,424 | 30,895 | |
| MarineMax, Inc. (a) | 49,000 | 948 | |
| 39,134 | |||
| Textiles, Apparel & Luxury Goods - 0.9% | |||
| Kate Spade & Co. (a) | 361,470 | 6,749 | |
| LVMH Moet Hennessy - Louis Vuitton SA | 17,809 | 3,396 | |
| 10,145 | |||
| TOTAL CONSUMER DISCRETIONARY | 212,200 | ||
| CONSUMER STAPLES - 8.8% | |||
| Beverages - 3.7% | |||
| Anheuser-Busch InBev SA NV ADR | 50,300 | 5,304 | |
| Constellation Brands, Inc. Class A (sub. vtg.) | 31,900 | 4,891 | |
| Kweichow Moutai Co. Ltd. (A Shares) | 28,829 | 1,387 | |
| Molson Coors Brewing Co. Class B | 92,600 | 9,011 | |
| PepsiCo, Inc. | 55,300 | 5,786 | |
| Pernod Ricard SA ADR | 107,700 | 2,324 | |
| The Coca-Cola Co. | 324,236 | 13,443 | |
| 42,146 | |||
| Food & Staples Retailing - 0.9% | |||
| Costco Wholesale Corp. | 47,100 | 7,541 | |
| Whole Foods Market, Inc. | 71,351 | 2,195 | |
| 9,736 | |||
| Food Products - 0.5% | |||
| Danone SA | 84,100 | 5,322 | |
| Hostess Brands, Inc. Class A (a) | 25,300 | 329 | |
| 5,651 | |||
| Household Products - 0.5% | |||
| Procter & Gamble Co. | 72,400 | 6,087 | |
| Personal Products - 1.1% | |||
| Estee Lauder Companies, Inc. Class A | 78,700 | 6,020 | |
| Herbalife Ltd. (a) | 124,800 | 6,008 | |
| 12,028 | |||
| Tobacco - 2.1% | |||
| Reynolds American, Inc. | 419,600 | 23,514 | |
| TOTAL CONSUMER STAPLES | 99,162 | ||
| ENERGY - 0.9% | |||
| Energy Equipment & Services - 0.7% | |||
| Baker Hughes, Inc. | 117,200 | 7,614 | |
| Oil, Gas & Consumable Fuels - 0.2% | |||
| Golar LNG Ltd. (c) | 108,961 | 2,500 | |
| TOTAL ENERGY | 10,114 | ||
| FINANCIALS - 7.7% | |||
| Banks - 2.9% | |||
| First Republic Bank | 134,800 | 12,420 | |
| HDFC Bank Ltd. | 31,265 | 607 | |
| JPMorgan Chase & Co. | 209,200 | 18,052 | |
| Metro Bank PLC | 22,400 | 807 | |
| 31,886 | |||
| Capital Markets - 4.0% | |||
| BlackRock, Inc. Class A | 13,694 | 5,211 | |
| CME Group, Inc. | 148,245 | 17,100 | |
| E*TRADE Financial Corp. (a) | 263,859 | 9,143 | |
| JMP Group, Inc. | 64,700 | 397 | |
| MSCI, Inc. | 85,100 | 6,704 | |
| S&P Global, Inc. | 60,712 | 6,529 | |
| 45,084 | |||
| Diversified Financial Services - 0.5% | |||
| Bats Global Markets, Inc. | 38,500 | 1,290 | |
| Berkshire Hathaway, Inc. Class B (a) | 24,800 | 4,042 | |
| Quantenna Communications, Inc. | 36,800 | 667 | |
| 5,999 | |||
| Thrifts & Mortgage Finance - 0.3% | |||
| Essent Group Ltd. (a) | 102,100 | 3,305 | |
| TOTAL FINANCIALS | 86,274 | ||
| HEALTH CARE - 14.0% | |||
| Biotechnology - 6.5% | |||
| Advanced Accelerator Applications SA sponsored ADR (a) | 45,600 | 1,220 | |
| Alexion Pharmaceuticals, Inc. (a) | 74,900 | 9,164 | |
| Amgen, Inc. | 102,800 | 15,030 | |
| Biogen, Inc. (a) | 15,100 | 4,282 | |
| BioMarin Pharmaceutical, Inc. (a) | 72,196 | 5,981 | |
| Cytokinetics, Inc. (a) | 36,200 | 440 | |
| Cytokinetics, Inc. warrants 6/25/17 (a) | 288,420 | 332 | |
| Gilead Sciences, Inc. | 75,763 | 5,425 | |
| Insmed, Inc. (a) | 342,678 | 4,534 | |
| Regeneron Pharmaceuticals, Inc. (a) | 19,300 | 7,085 | |
| Samsung Biologics Co. Ltd. (a) | 926 | 116 | |
| TESARO, Inc. (a) | 48,700 | 6,549 | |
| Vertex Pharmaceuticals, Inc. (a) | 175,600 | 12,936 | |
| 73,094 | |||
| Health Care Equipment & Supplies - 4.1% | |||
| Boston Scientific Corp. (a) | 428,700 | 9,273 | |
| Danaher Corp. | 129,355 | 10,069 | |
| DexCom, Inc. (a) | 33,400 | 1,994 | |
| Intuitive Surgical, Inc. (a) | 15,500 | 9,830 | |
| Medtronic PLC | 104,700 | 7,458 | |
| Novadaq Technologies, Inc. (a) | 304,600 | 2,160 | |
| ResMed, Inc. | 62,100 | 3,853 | |
| The Cooper Companies, Inc. | 6,600 | 1,155 | |
| 45,792 | |||
| Health Care Providers & Services - 2.5% | |||
| HealthEquity, Inc. (a) | 99,100 | 4,016 | |
| Henry Schein, Inc. (a) | 11,500 | 1,745 | |
| UnitedHealth Group, Inc. | 137,200 | 21,957 | |
| VCA, Inc. (a) | 11,100 | 762 | |
| 28,480 | |||
| Pharmaceuticals - 0.9% | |||
| Allergan PLC | 24,000 | 5,040 | |
| Collegium Pharmaceutical, Inc. (a) | 30,900 | 481 | |
| Patheon NV | 16,800 | 482 | |
| Zoetis, Inc. Class A | 85,400 | 4,571 | |
| 10,574 | |||
| TOTAL HEALTH CARE | 157,940 | ||
| INDUSTRIALS - 7.5% | |||
| Aerospace & Defense - 0.9% | |||
| Rolls-Royce Holdings PLC | 122,000 | 1,002 | |
| Taser International, Inc. (a) | 202,000 | 4,896 | |
| TransDigm Group, Inc. | 14,927 | 3,716 | |
| 9,614 | |||
| Airlines - 0.3% | |||
| Ryanair Holdings PLC sponsored ADR (a) | 47,464 | 3,952 | |
| Building Products - 0.3% | |||
| A.O. Smith Corp. | 73,488 | 3,480 | |
| Commercial Services & Supplies - 0.8% | |||
| KAR Auction Services, Inc. | 206,700 | 8,810 | |
| Electrical Equipment - 1.6% | |||
| Acuity Brands, Inc. | 27,300 | 6,302 | |
| Fortive Corp. | 210,427 | 11,285 | |
| 17,587 | |||
| Industrial Conglomerates - 0.8% | |||
| Honeywell International, Inc. | 44,000 | 5,097 | |
| Roper Technologies, Inc. | 22,314 | 4,085 | |
| 9,182 | |||
| Machinery - 0.4% | |||
| Allison Transmission Holdings, Inc. | 114,500 | 3,858 | |
| Rational AG | 1,500 | 669 | |
| 4,527 | |||
| Professional Services - 2.4% | |||
| Equifax, Inc. | 57,600 | 6,810 | |
| Robert Half International, Inc. | 77,100 | 3,761 | |
| TransUnion Holding Co., Inc. (a) | 110,500 | 3,418 | |
| WageWorks, Inc. (a) | 174,173 | 12,628 | |
| 26,617 | |||
| TOTAL INDUSTRIALS | 83,769 | ||
| INFORMATION TECHNOLOGY - 35.3% | |||
| Electronic Equipment & Components - 0.2% | |||
| CDW Corp. | 44,100 | 2,297 | |
| Internet Software & Services - 18.3% | |||
| Akamai Technologies, Inc. (a) | 113,800 | 7,588 | |
| Alphabet, Inc. Class A (a) | 89,652 | 71,045 | |
| CommerceHub, Inc.: | |||
| Series A (a) | 168,370 | 2,527 | |
| Series C (a) | 130,540 | 1,962 | |
| Facebook, Inc. Class A (a) | 872,891 | 100,426 | |
| GoDaddy, Inc. (a) | 131,900 | 4,610 | |
| Just Dial Ltd. (a) | 61,822 | 308 | |
| Just Eat Holding Ltd. (a) | 367,603 | 2,643 | |
| Shopify, Inc. Class A (a) | 19,900 | 853 | |
| Stamps.com, Inc. (a) | 56,300 | 6,455 | |
| Twilio, Inc. Class A (c) | 61,000 | 1,760 | |
| VeriSign, Inc. (a)(c) | 75,800 | 5,766 | |
| 205,943 | |||
| IT Services - 4.9% | |||
| Cognizant Technology Solutions Corp. Class A (a) | 51,800 | 2,902 | |
| Fidelity National Information Services, Inc. | 45,700 | 3,457 | |
| Gartner, Inc. (a) | 13,000 | 1,314 | |
| Global Payments, Inc. | 274,500 | 19,053 | |
| Square, Inc. (a) | 520,800 | 7,099 | |
| Vantiv, Inc. (a) | 69,400 | 4,138 | |
| Visa, Inc. Class A | 224,196 | 17,492 | |
| 55,455 | |||
| Semiconductors & Semiconductor Equipment - 1.1% | |||
| Maxim Integrated Products, Inc. | 123,305 | 4,756 | |
| Monolithic Power Systems, Inc. | 56,118 | 4,598 | |
| Qualcomm, Inc. | 51,500 | 3,358 | |
| 12,712 | |||
| Software - 10.2% | |||
| Activision Blizzard, Inc. | 126,687 | 4,575 | |
| Adobe Systems, Inc. (a) | 177,900 | 18,315 | |
| Autodesk, Inc. (a) | 39,900 | 2,953 | |
| Blackbaud, Inc. | 18,300 | 1,171 | |
| Computer Modelling Group Ltd. (c) | 241,400 | 1,638 | |
| CyberArk Software Ltd. (a) | 24,200 | 1,101 | |
| Electronic Arts, Inc. (a) | 454,334 | 35,783 | |
| Intuit, Inc. | 36,100 | 4,137 | |
| Microsoft Corp. | 191,100 | 11,875 | |
| Mobileye NV (a) | 341,269 | 13,009 | |
| RealPage, Inc. (a) | 50,600 | 1,518 | |
| Red Hat, Inc. (a) | 86,200 | 6,008 | |
| Salesforce.com, Inc. (a) | 188,964 | 12,936 | |
| 115,019 | |||
| Technology Hardware, Storage & Peripherals - 0.6% | |||
| Samsung Electronics Co. Ltd. | 4,034 | 6,021 | |
| TOTAL INFORMATION TECHNOLOGY | 397,447 | ||
| MATERIALS - 1.7% | |||
| Chemicals - 1.0% | |||
| Monsanto Co. | 57,200 | 6,018 | |
| Sherwin-Williams Co. | 19,800 | 5,321 | |
| 11,339 | |||
| Construction Materials - 0.7% | |||
| Eagle Materials, Inc. | 79,700 | 7,853 | |
| TOTAL MATERIALS | 19,192 | ||
| REAL ESTATE - 3.1% | |||
| Equity Real Estate Investment Trusts (REITs) - 1.6% | |||
| American Tower Corp. | 164,900 | 17,427 | |
| Real Estate Management & Development - 1.5% | |||
| Realogy Holdings Corp. | 657,781 | 16,925 | |
| TOTAL REAL ESTATE | 34,352 | ||
| TELECOMMUNICATION SERVICES - 0.2% | |||
| Diversified Telecommunication Services - 0.2% | |||
| SBA Communications Corp. Class A (a) | 23,800 | 2,458 | |
| TOTAL COMMON STOCKS | |||
| (Cost $926,226) | 1,102,908 | ||
| Convertible Preferred Stocks - 0.9% | |||
| CONSUMER DISCRETIONARY - 0.1% | |||
| Household Durables - 0.1% | |||
| Blu Homes, Inc. Series A, 5.00% (a)(b) | 239,736 | 520 | |
| INFORMATION TECHNOLOGY - 0.8% | |||
| Internet Software & Services - 0.7% | |||
| Uber Technologies, Inc. Series D, 8.00% (a)(b) | 162,572 | 7,929 | |
| IT Services - 0.1% | |||
| AppNexus, Inc. Series E (a)(b) | 48,212 | 1,254 | |
| TOTAL INFORMATION TECHNOLOGY | 9,183 | ||
| TOTAL CONVERTIBLE PREFERRED STOCKS | |||
| (Cost $4,596) | 9,703 | ||
| Principal Amount (000s) | Value (000s) | ||
| U.S. Treasury Obligations - 0.2% | |||
| U.S. Treasury Bills, yield at date of purchase 0.32% to 0.37% 1/19/17 to 2/2/17 | |||
| (Cost $2,680) | 2,680 | 2,679 | |
| Shares | Value (000s) | ||
| Money Market Funds - 1.3% | |||
| Fidelity Cash Central Fund, 0.60% (d) | 197,822 | $198 | |
| Fidelity Securities Lending Cash Central Fund 0.65% (d)(e) | 14,994,614 | 14,996 | |
| TOTAL MONEY MARKET FUNDS | |||
| (Cost $15,195) | 15,194 | ||
| TOTAL INVESTMENT PORTFOLIO - 100.5% | |||
| (Cost $948,697) | 1,130,484 | ||
| NET OTHER ASSETS (LIABILITIES) - (0.5)% | (5,795) | ||
| NET ASSETS - 100% | $1,124,689 |
Values shown as $0 may reflect amounts less than $500.
Legend
(a) Non-income producing
(b) Restricted securities - Investment in securities not registered under the Securities Act of 1933 (excluding 144A issues). At the end of the period, the value of restricted securities (excluding 144A issues) amounted to $9,703,000 or 0.9% of net assets.
(c) Security or a portion of the security is on loan at period end.
(d) Affiliated fund that is generally available only to investment companies and other accounts managed by Fidelity Investments. The rate quoted is the annualized seven-day yield of the fund at period end. A complete unaudited listing of the fund's holdings as of its most recent quarter end is available upon request. In addition, each Fidelity Central Fund's financial statements are available on the SEC's website or upon request.
(e) Investment made with cash collateral received from securities on loan.
Additional information on each restricted holding is as follows:
| Security | Acquisition Date | Acquisition Cost (000s) |
| AppNexus, Inc. Series E | 8/1/14 | $966 |
| Blu Homes, Inc. Series A, 5.00% | 6/21/13 | $1,108 |
| NJOY, Inc. | 9/11/13 | $454 |
| Uber Technologies, Inc. Series D, 8.00% | 6/6/14 | $2,522 |
Affiliated Central Funds
Information regarding fiscal year to date income earned by the Fund from investments in Fidelity Central Funds is as follows:
| Fund | Income earned |
| (Amounts in thousands) | |
| Fidelity Cash Central Fund | $172 |
| Fidelity Securities Lending Cash Central Fund | 227 |
| Total | $399 |
Investment Valuation
The following is a summary of the inputs used, as of December 31, 2016, involving the Fund's assets and liabilities carried at fair value. The inputs or methodology used for valuing securities may not be an indication of the risk associated with investing in those securities. For more information on valuation inputs, and their aggregation into the levels used below, please refer to the Investment Valuation section in the accompanying Notes to Financial Statements.
| Valuation Inputs at Reporting Date: | ||||
| Description | Total | Level 1 | Level 2 | Level 3 |
| (Amounts in thousands) | ||||
| Investments in Securities: | ||||
| Equities: | ||||
| Consumer Discretionary | $212,720 | $208,804 | $3,396 | $520 |
| Consumer Staples | 99,162 | 93,840 | 5,322 | -- |
| Energy | 10,114 | 10,114 | -- | -- |
| Financials | 86,274 | 85,667 | 607 | -- |
| Health Care | 157,940 | 157,608 | 332 | -- |
| Industrials | 83,769 | 82,767 | 1,002 | -- |
| Information Technology | 406,630 | 397,447 | -- | 9,183 |
| Materials | 19,192 | 19,192 | -- | -- |
| Real Estate | 34,352 | 34,352 | -- | -- |
| Telecommunication Services | 2,458 | 2,458 | -- | -- |
| U.S. Government and Government Agency Obligations | 2,679 | -- | 2,679 | -- |
| Money Market Funds | 15,194 | 15,194 | -- | -- |
| Total Investments in Securities: | $1,130,484 | $1,107,443 | $13,338 | $9,703 |
See accompanying notes which are an integral part of the financial statements.
Financial Statements
Statement of Assets and Liabilities
| Amounts in thousands (except per-share amounts) | December 31, 2016 (Unaudited) | |
| Assets | ||
| Investment in securities, at value (including securities loaned of $14,395) — See accompanying schedule: Unaffiliated issuers (cost $933,502) | $1,115,290 | |
| Fidelity Central Funds (cost $15,195) | 15,194 | |
| Total Investments (cost $948,697) | $1,130,484 | |
| Receivable for investments sold | 10,057 | |
| Receivable for fund shares sold | 1,196 | |
| Dividends receivable | 1,022 | |
| Distributions receivable from Fidelity Central Funds | 36 | |
| Prepaid expenses | 2 | |
| Other receivables | 30 | |
| Total assets | 1,142,827 | |
| Liabilities | ||
| Payable for investments purchased | $6 | |
| Payable for fund shares redeemed | 2,543 | |
| Accrued management fee | 384 | |
| Other affiliated payables | 177 | |
| Other payables and accrued expenses | 36 | |
| Collateral on Securities Loaned | 14,992 | |
| Total liabilities | 18,138 | |
| Net Assets | $1,124,689 | |
| Net Assets consist of: | ||
| Paid in capital | $995,690 | |
| Distributions in excess of net investment income | (27) | |
| Accumulated undistributed net realized gain (loss) on investments and foreign currency transactions | (52,749) | |
| Net unrealized appreciation (depreciation) on investments and assets and liabilities in foreign currencies | 181,775 | |
| Net Assets | $1,124,689 | |
| Growth Discovery: | ||
| Net Asset Value, offering price and redemption price per share ($961,820 ÷ 37,832 shares) | $25.42 | |
| Class K: | ||
| Net Asset Value, offering price and redemption price per share ($162,869 ÷ 6,404 shares) | $25.43 |
See accompanying notes which are an integral part of the financial statements.
Statement of Operations
| Amounts in thousands | Six months ended December 31, 2016 (Unaudited) | |
| Investment Income | ||
| Dividends | $5,073 | |
| Income from Fidelity Central Funds | 399 | |
| Total income | 5,472 | |
| Expenses | ||
| Management fee | ||
| Basic fee | $3,233 | |
| Performance adjustment | (603) | |
| Transfer agent fees | 897 | |
| Accounting and security lending fees | 194 | |
| Custodian fees and expenses | 20 | |
| Independent trustees' fees and expenses | 3 | |
| Registration fees | 22 | |
| Audit | 33 | |
| Legal | 5 | |
| Interest | 1 | |
| Miscellaneous | 2 | |
| Total expenses before reductions | 3,807 | |
| Expense reductions | (16) | 3,791 |
| Net investment income (loss) | 1,681 | |
| Realized and Unrealized Gain (Loss) | ||
| Net realized gain (loss) on: | ||
| Investment securities: | ||
| Unaffiliated issuers | 104,336 | |
| Fidelity Central Funds | 34 | |
| Foreign currency transactions | (46) | |
| Futures contracts | 367 | |
| Total net realized gain (loss) | 104,691 | |
| Change in net unrealized appreciation (depreciation) on: Investment securities | (59,226) | |
| Total change in net unrealized appreciation (depreciation) | (59,226) | |
| Net gain (loss) | 45,465 | |
| Net increase (decrease) in net assets resulting from operations | $47,146 |
See accompanying notes which are an integral part of the financial statements.
Statement of Changes in Net Assets
| Amounts in thousands | Six months ended December 31, 2016 (Unaudited) | Year ended June 30, 2016 |
| Increase (Decrease) in Net Assets | ||
| Operations | ||
| Net investment income (loss) | $1,681 | $625 |
| Net realized gain (loss) | 104,691 | 20,107 |
| Change in net unrealized appreciation (depreciation) | (59,226) | (42,764) |
| Net increase (decrease) in net assets resulting from operations | 47,146 | (22,032) |
| Distributions to shareholders from net investment income | (1,135) | (1,789) |
| Distributions to shareholders from net realized gain | – | (555) |
| Total distributions | (1,135) | (2,344) |
| Share transactions - net increase (decrease) | (97,040) | (80,061) |
| Total increase (decrease) in net assets | (51,029) | (104,437) |
| Net Assets | ||
| Beginning of period | 1,175,718 | 1,280,155 |
| End of period | $1,124,689 | $1,175,718 |
| Other Information | ||
| Distributions in excess of net investment income end of period | $(27) | $(573) |
See accompanying notes which are an integral part of the financial statements.
Financial Highlights — Fidelity Growth Discovery Fund
| Six months ended (Unaudited) December 31, | Years ended June 30, | |||||
| 2016 | 2016 | 2015 | 2014 | 2013 | 2012 | |
| Selected Per–Share Data | ||||||
| Net asset value, beginning of period | $24.47 | $24.93 | $23.07 | $17.45 | $15.09 | $14.88 |
| Income from Investment Operations | ||||||
| Net investment income (loss)A | .03 | .01 | .07 | .02 | .07 | .04 |
| Net realized and unrealized gain (loss) | .94 | (.43) | 1.81 | 5.63 | 2.35 | .26 |
| Total from investment operations | .97 | (.42) | 1.88 | 5.65 | 2.42 | .30 |
| Distributions from net investment income | (.02) | (.03) | (.02) | (.02) | (.06) | (.03) |
| Distributions from net realized gain | – | (.01) | – | (.01) | – | (.06) |
| Total distributions | (.02) | (.04) | (.02) | (.03) | (.06) | (.09) |
| Net asset value, end of period | $25.42 | $24.47 | $24.93 | $23.07 | $17.45 | $15.09 |
| Total ReturnB,C | 3.98% | (1.68)% | 8.17% | 32.40% | 16.09% | 2.07% |
| Ratios to Average Net AssetsD,E | ||||||
| Expenses before reductions | .66%F | .78% | .77% | .81% | .88% | .81% |
| Expenses net of fee waivers, if any | .66%F | .78% | .77% | .81% | .88% | .81% |
| Expenses net of all reductions | .66%F | .78% | .77% | .81% | .87% | .80% |
| Net investment income (loss) | .27%F | .03% | .27% | .10% | .42% | .27% |
| Supplemental Data | ||||||
| Net assets, end of period (in millions) | $962 | $1,000 | $1,078 | $1,072 | $767 | $875 |
| Portfolio turnover rateG | 72%F | 57% | 51% | 70% | 62% | 74% |
A Calculated based on average shares outstanding during the period.
B Total returns for periods of less than one year are not annualized.
C Total returns would have been lower if certain expenses had not been reduced during the applicable periods shown.
D Fees and expenses of any underlying Fidelity Central Funds are not included in the Fund's expense ratio. The Fund indirectly bears its proportionate share of the expenses of any underlying Fidelity Central Funds.
E Expense ratios reflect operating expenses of the class. Expenses before reductions do not reflect amounts reimbursed by the investment adviser or reductions from brokerage service arrangements or reductions from other expense offset arrangements and do not represent the amount paid by the class during periods when reimbursements or reductions occur. Expenses net of fee waivers reflect expenses after reimbursement by the investment adviser but prior to reductions from brokerage service arrangements or other expense offset arrangements. Expenses net of all reductions represent the net expenses paid by the class.
F Annualized
G Amount does not include the portfolio activity of any underlying Fidelity Central Funds.
See accompanying notes which are an integral part of the financial statements.
Financial Highlights — Fidelity Growth Discovery Fund Class K
| Six months ended (Unaudited) December 31, | Years ended June 30, | |||||
| 2016 | 2016 | 2015 | 2014 | 2013 | 2012 | |
| Selected Per–Share Data | ||||||
| Net asset value, beginning of period | $24.48 | $24.94 | $23.09 | $17.45 | $15.09 | $14.88 |
| Income from Investment Operations | ||||||
| Net investment income (loss)A | .05 | .04 | .10 | .05 | .09 | .06 |
| Net realized and unrealized gain (loss) | .94 | (.43) | 1.82 | 5.63 | 2.36 | .26 |
| Total from investment operations | .99 | (.39) | 1.92 | 5.68 | 2.45 | .32 |
| Distributions from net investment income | (.04) | (.06) | (.07) | (.04) | (.09) | (.06) |
| Distributions from net realized gain | – | (.01) | – | (.01) | – | (.06) |
| Total distributions | (.04) | (.07) | (.07) | (.04)B | (.09) | (.11)C |
| Net asset value, end of period | $25.43 | $24.48 | $24.94 | $23.09 | $17.45 | $15.09 |
| Total ReturnD,E | 4.04% | (1.57)% | 8.32% | 32.62% | 16.28% | 2.27% |
| Ratios to Average Net AssetsF,G | ||||||
| Expenses before reductions | .54%H | .66% | .64% | .68% | .72% | .64% |
| Expenses net of fee waivers, if any | .54%H | .66% | .64% | .68% | .72% | .64% |
| Expenses net of all reductions | .54%H | .65% | .64% | .67% | .71% | .63% |
| Net investment income (loss) | .39%H | .16% | .40% | .24% | .58% | .44% |
| Supplemental Data | ||||||
| Net assets, end of period (in millions) | $163 | $176 | $202 | $190 | $137 | $144 |
| Portfolio turnover rateI | 72%H | 57% | 51% | 70% | 62% | 74% |
A Calculated based on average shares outstanding during the period.
B Total distributions of $.04 per share is comprised of distributions from net investment income of $.036 and distributions from net realized gain of $.006 per share.
C Total distributions of $.11 per share is comprised of distributions from net investment income of $.058 and distributions from net realized gain of $.055 per share.
D Total returns for periods of less than one year are not annualized.
E Total returns would have been lower if certain expenses had not been reduced during the applicable periods shown.
F Fees and expenses of any underlying Fidelity Central Funds are not included in the Fund's expense ratio. The Fund indirectly bears its proportionate share of the expenses of any underlying Fidelity Central Funds.
G Expense ratios reflect operating expenses of the class. Expenses before reductions do not reflect amounts reimbursed by the investment adviser or reductions from brokerage service arrangements or reductions from other expense offset arrangements and do not represent the amount paid by the class during periods when reimbursements or reductions occur. Expenses net of fee waivers reflect expenses after reimbursement by the investment adviser but prior to reductions from brokerage service arrangements or other expense offset arrangements. Expenses net of all reductions represent the net expenses paid by the class.
H Annualized
I Amount does not include the portfolio activity of any underlying Fidelity Central Funds.
See accompanying notes which are an integral part of the financial statements.
Notes to Financial Statements (Unaudited)
For the period ended December 31, 2016
(Amounts in thousands except percentages)
1. Organization.
Fidelity Growth Discovery Fund (the Fund) is a fund of Fidelity Hastings Street Trust (the Trust) and is authorized to issue an unlimited number of shares. The Trust is registered under the Investment Company Act of 1940, as amended (the 1940 Act), as an open-end management investment company organized as a Massachusetts business trust. The Fund offers Growth Discovery and Class K shares, each of which has equal rights as to assets and voting privileges. Each class has exclusive voting rights with respect to matters that affect that class.
2. Investments in Fidelity Central Funds.
The Fund invests in Fidelity Central Funds, which are open-end investment companies generally available only to other investment companies and accounts managed by the investment adviser and its affiliates. The Fund's Schedule of Investments lists each of the Fidelity Central Funds held as of period end, if any, as an investment of the Fund, but does not include the underlying holdings of each Fidelity Central Fund. As an Investing Fund, the Fund indirectly bears its proportionate share of the expenses of the underlying Fidelity Central Funds.
The Money Market Central Funds seek preservation of capital and current income and are managed by Fidelity Investments Money Management, Inc. (FIMM), an affiliate of the investment adviser. Annualized expenses of the Money Market Central Funds as of their most recent shareholder report date are less than .005%.
A complete unaudited list of holdings for each Fidelity Central Fund is available upon request or at the Securities and Exchange Commission (the SEC) website at www.sec.gov. In addition, the financial statements of the Fidelity Central Funds are available on the SEC website or upon request.
3. Significant Accounting Policies.
The financial statements have been prepared in conformity with accounting principles generally accepted in the United States of America (GAAP), which require management to make certain estimates and assumptions at the date of the financial statements. Actual results could differ from those estimates. Subsequent events, if any, through the date that the financial statements were issued have been evaluated in the preparation of the financial statements. The following summarizes the significant accounting policies of the Fund:
Investment Valuation. Investments are valued as of 4:00 p.m. Eastern time on the last calendar day of the period. The Board of Trustees (the Board) has delegated the day to day responsibility for the valuation of the Fund's investments to the Fair Value Committee (the Committee) established by the Fund's investment adviser. In accordance with valuation policies and procedures approved by the Board, the Fund attempts to obtain prices from one or more third party pricing vendors or brokers to value its investments. When current market prices, quotations or currency exchange rates are not readily available or reliable, investments will be fair valued in good faith by the Committee, in accordance with procedures adopted by the Board. Factors used in determining fair value vary by investment type and may include market or investment specific events. The frequency with which these procedures are used cannot be predicted and they may be utilized to a significant extent. The Committee oversees the Fund's valuation policies and procedures and reports to the Board on the Committee's activities and fair value determinations. The Board monitors the appropriateness of the procedures used in valuing the Fund's investments and ratifies the fair value determinations of the Committee.
The Fund categorizes the inputs to valuation techniques used to value its investments into a disclosure hierarchy consisting of three levels as shown below:
- Level 1 – quoted prices in active markets for identical investments
- Level 2 – other significant observable inputs (including quoted prices for similar investments, interest rates, prepayment speeds, etc.)
- Level 3 – unobservable inputs (including the Fund's own assumptions based on the best information available)
Valuation techniques used to value the Fund's investments by major category are as follows:
Equity securities, including restricted securities, for which market quotations are readily available, are valued at the last reported sale price or official closing price as reported by a third party pricing vendor on the primary market or exchange on which they are traded and are categorized as Level 1 in the hierarchy. In the event there were no sales during the day or closing prices are not available, securities are valued at the last quoted bid price or may be valued using the last available price and are generally categorized as Level 2 in the hierarchy. For foreign equity securities, when market or security specific events arise, comparisons to the valuation of American Depositary Receipts (ADRs), futures contracts, Exchange-Traded Funds (ETFs) and certain indexes as well as quoted prices for similar securities may be used and would be categorized as Level 2 in the hierarchy. Utilizing these techniques may result in transfers between Level 1 and Level 2. For equity securities, including restricted securities, where observable inputs are limited, assumptions about market activity and risk are used and these securities may be categorized as Level 3 in the hierarchy.
Investments in open-end mutual funds are valued at their closing net asset value (NAV) each business day and are categorized as Level 1 in the hierarchy.
Changes in valuation techniques may result in transfers in or out of an assigned level within the disclosure hierarchy. The aggregate value of investments by input level as of December 31, 2016 is included at the end of the Fund's Schedule of Investments.
Foreign Currency. The Fund may use foreign currency contracts to facilitate transactions in foreign-denominated securities. Gains and losses from these transactions may arise from changes in the value of the foreign currency or if the counterparties do not perform under the contracts' terms.
Foreign-denominated assets, including investment securities, and liabilities are translated into U.S. dollars at the exchange rates at period end. Purchases and sales of investment securities, income and dividends received and expenses denominated in foreign currencies are translated into U.S. dollars at the exchange rate in effect on the transaction date.
The effects of exchange rate fluctuations on investments are included with the net realized and unrealized gain (loss) on investment securities. Other foreign currency transactions resulting in realized and unrealized gain (loss) are disclosed separately.
Investment Transactions and Income. For financial reporting purposes, the Fund's investment holdings and NAV include trades executed through the end of the last business day of the period. The NAV per share for processing shareholder transactions is calculated as of the close of business of the New York Stock Exchange (NYSE), normally 4:00 p.m. Eastern time and includes trades executed through the end of the prior business day. Gains and losses on securities sold are determined on the basis of identified cost and may include proceeds received from litigation. Dividend income is recorded on the ex-dividend date, except for certain dividends from foreign securities where the ex-dividend date may have passed, which are recorded as soon as the Fund is informed of the ex-dividend date. Non-cash dividends included in dividend income, if any, are recorded at the fair market value of the securities received. Income and capital gain distributions from Fidelity Central Funds, if any, are recorded on the ex-dividend date. Certain distributions received by the Fund represent a return of capital or capital gain. The Fund determines the components of these distributions subsequent to the ex-dividend date, based upon receipt of tax filings or other correspondence relating to the underlying investment. These distributions are recorded as a reduction of cost of investments and/or as a realized gain. Investment income is recorded net of foreign taxes withheld where recovery of such taxes is uncertain.
Class Allocations and Expenses. Investment income, realized and unrealized capital gains and losses, common expenses of the Fund, and certain fund-level expense reductions, if any, are allocated daily on a pro-rata basis to each class based on the relative net assets of each class to the total net assets of the Fund. Each class differs with respect to transfer agent fees incurred. Certain expense reductions may also differ by class. For the reporting period, the allocated portion of income and expenses to each class as a percent of its average net assets may vary due to the timing of recording these transactions in relation to fluctuating net assets of the classes. Expenses directly attributable to a fund are charged to that fund. Expenses attributable to more than one fund are allocated among the respective funds on the basis of relative net assets or other appropriate methods. Expense estimates are accrued in the period to which they relate and adjustments are made when actual amounts are known.
Income Tax Information and Distributions to Shareholders. Each year, the Fund intends to qualify as a regulated investment company under Subchapter M of the Internal Revenue Code, including distributing substantially all of its taxable income and realized gains. As a result, no provision for U.S. Federal income taxes is required. The Fund files a U.S. federal tax return, in addition to state and local tax returns as required. The Fund's federal income tax returns are subject to examination by the Internal Revenue Service (IRS) for a period of three fiscal years after they are filed. State and local tax returns may be subject to examination for an additional fiscal year depending on the jurisdiction. Foreign taxes are provided for based on the Fund's understanding of the tax rules and rates that exist in the foreign markets in which it invests.
Distributions are declared and recorded on the ex-dividend date. Income dividends and capital gain distributions are declared separately for each class. Income and capital gain distributions are determined in accordance with income tax regulations, which may differ from GAAP.
Capital accounts within the financial statements are adjusted for permanent book-tax differences. These adjustments have no impact on net assets or the results of operations. Capital accounts are not adjusted for temporary book-tax differences which will reverse in a subsequent period.
Book-tax differences are primarily due to futures contracts, foreign currency transactions, partnerships, capital loss carryforwards, and losses deferred due to wash sales and excise tax regulations.
The federal tax cost of investment securities and unrealized appreciation (depreciation) as of period end were as follows:
| Gross unrealized appreciation | $233,638 |
| Gross unrealized depreciation | (51,886) |
| Net unrealized appreciation (depreciation) on securities | $181,752 |
| Tax cost | $948,732 |
Capital loss carryforwards are only available to offset future capital gains of the Fund to the extent provided by regulations and may be limited. Under the Regulated Investment Company Modernization Act of 2010 (the Act), the Fund is permitted to carry forward capital losses incurred in taxable years beginning after December 22, 2010 for an unlimited period and such capital losses are required to be used prior to any losses that expire. The capital loss carryforward information presented below, including any applicable limitation, is estimated as of prior fiscal period end and is subject to adjustment.
| Fiscal year of expiration | |
| 2018 | $(136,052) |
The Fund elected to defer to its next fiscal year approximately $20,072 of capital losses recognized during the period November 1, 2015 to June 30, 2016.
Restricted Securities. The Fund may invest in securities that are subject to legal or contractual restrictions on resale. These securities generally may be resold in transactions exempt from registration or to the public if the securities are registered. Disposal of these securities may involve time-consuming negotiations and expense, and prompt sale at an acceptable price may be difficult. Information regarding restricted securities is included at the end of the Fund's Schedule of Investments.
4. Derivative Instruments.
Risk Exposures and the Use of Derivative Instruments. The Fund's investment objective allows the Fund to enter into various types of derivative contracts, including futures contracts. Derivatives are investments whose value is primarily derived from underlying assets, indices or reference rates and may be transacted on an exchange or over-the-counter (OTC). Derivatives may involve a future commitment to buy or sell a specified asset based on specified terms, to exchange future cash flows at periodic intervals based on a notional principal amount, or for one party to make one or more payments upon the occurrence of specified events in exchange for periodic payments from the other party.
The Fund used derivatives to increase returns and to manage exposure to certain risks as defined below. The success of any strategy involving derivatives depends on analysis of numerous economic factors, and if the strategies for investment do not work as intended, the Fund may not achieve its objectives.
The Fund's use of derivatives increased or decreased its exposure to the following risk:
| Equity Risk | Equity risk relates to the fluctuations in the value of financial instruments as a result of changes in market prices (other than those arising from interest rate risk or foreign exchange risk), whether caused by factors specific to an individual investment, its issuer, or all factors affecting all instruments traded in a market or market segment. |
The Fund is also exposed to additional risks from investing in derivatives, such as liquidity risk and counterparty credit risk. Liquidity risk is the risk that the Fund will be unable to close out the derivative in the open market in a timely manner. Counterparty credit risk is the risk that the counterparty will not be able to fulfill its obligation to the Fund. Derivative counterparty credit risk is managed through formal evaluation of the creditworthiness of all potential counterparties. Counterparty credit risk related to exchange-traded futures contracts may be mitigated by the protection provided by the exchange on which they trade.
Investing in derivatives may involve greater risks than investing in the underlying assets directly and, to varying degrees, may involve risk of loss in excess of any initial investment and collateral received and amounts recognized in the Statement of Assets and Liabilities. In addition, there may be the risk that the change in value of the derivative contract does not correspond to the change in value of the underlying instrument.
Futures Contracts. A futures contract is an agreement between two parties to buy or sell a specified underlying instrument for a fixed price at a specified future date. The Fund used futures contracts to manage its exposure to the stock market.
Upon entering into a futures contract, a fund is required to deposit either cash or securities (initial margin) with a clearing broker in an amount equal to a certain percentage of the face value of the contract. Futures contracts are marked-to-market daily and subsequent daily payments (variation margin) are made or received by a fund depending on the daily fluctuations in the value of the futures contracts and are recorded as unrealized appreciation or (depreciation). This receivable and/or payable, if any, is included in daily variation margin for derivative instruments in the Statement of Assets and Liabilities. Realized gain or (loss) is recorded upon the expiration or closing of a futures contract.
Any open futures contracts at period end are presented in the Schedule of Investments under the caption "Futures Contracts". The underlying face amount at value reflects each contract's exposure to the underlying instrument or index at period end. During the period the Fund recognized net realized gain (loss) of $367 related to its investment in futures contracts. These amounts are included in the Statement of Operations.
5. Purchases and Sales of Investments.
Purchases and sales of securities, other than short-term securities, aggregated $398,634 and $445,821, respectively.
6. Fees and Other Transactions with Affiliates.
Management Fee. Fidelity Management & Research Company (the investment adviser) and its affiliates provide the Fund with investment management related services for which the Fund pays a monthly management fee. The management fee is the sum of an individual fund fee rate that is based on an annual rate of .30% of the Fund's average net assets and an annualized group fee rate that averaged .25% during the period. The group fee rate is based upon the average net assets of all the mutual funds advised by the investment adviser, including any mutual funds previously advised by the investment adviser that are currently advised by Fidelity SelectCo, LLC, an affiliate of the investment adviser. The group fee rate decreases as assets under management increase and increases as assets under management decrease. In addition, the management fee is subject to a performance adjustment (up to a maximum of +/- .20% of the Fund's average net assets over a 36 month performance period). The upward or downward adjustment to the management fee is based on the relative investment performance of Growth Discovery as compared to its benchmark index, the Russell 3000 Growth Index, over the same 36 month performance period. For the reporting period, the total annualized management fee rate, including the performance adjustment, was .45% of the Fund's average net assets. The performance adjustment included in the management fee rate may be higher or lower than the maximum performance adjustment rate due to the difference between the average net assets for the reporting and performance periods.
Transfer Agent Fees. Fidelity Investments Institutional Operations Company, Inc., (FIIOC), an affiliate of the investment adviser, is the transfer, dividend disbursing and shareholder servicing agent for each class of the Fund. FIIOC receives account fees and asset-based fees that vary according to the account size and type of account of the shareholders of Growth Discovery. FIIOC receives an asset-based fee of Class K's average net assets. FIIOC pays for typesetting, printing and mailing of shareholder reports, except proxy statements.
For the period, transfer agent fees for each class were as follows:
| Amount | % of Class-Level Average Net Assets(a) | |
| Growth Discovery | $856 | .17 |
| Class K | 41 | .05 |
| $897 |
(a) Annualized
Accounting and Security Lending Fees. Fidelity Service Company, Inc. (FSC), an affiliate of the investment adviser, maintains the Fund's accounting records. The accounting fee is based on the level of average net assets for each month. Under a separate contract, FSC administers the security lending program. The security lending fee is based on the number and duration of lending transactions.
Brokerage Commissions. The Fund placed a portion of its portfolio transactions with brokerage firms which are affiliates of the investment adviser. Brokerage commissions are included in net realized gain (loss) and change in net unrealized appreciation (depreciation) in the Statement of Operations. The commissions paid to these affiliated firms were $8 for the period.
Interfund Lending Program. Pursuant to an Exemptive Order issued by the SEC, the Fund, along with other registered investment companies having management contracts with FMR or other affiliated entities of FMR, may participate in an interfund lending program. This program provides an alternative credit facility allowing the funds to borrow from, or lend money to, other participating affiliated funds. At period end, there were no interfund loans outstanding. The Fund's activity in this program during the period for which loans were outstanding was as follows:
| Borrower or Lender | Average Loan Balance | Weighted Average Interest Rate | Interest Expense |
| Borrower | $5,529 | .74% | $1 |
Interfund Trades. The Fund may purchase from or sell securities to other Fidelity Funds under procedures adopted by the Board. The procedures have been designed to ensure these interfund trades are executed in accordance with Rule 17a-7 of the 1940 Act. Interfund trades are included within the respective purchases and sales amounts shown in the Purchases and Sales of Investments note.
7. Committed Line of Credit.
The Fund participates with other funds managed by the investment adviser or an affiliate in a $4.25 billion credit facility (the "line of credit") to be utilized for temporary or emergency purposes to fund shareholder redemptions or for other short-term liquidity purposes. The Fund has agreed to pay commitment fees on its pro-rata portion of the line of credit, which amounted to $2 and is reflected in Miscellaneous expenses on the Statement of Operations. During the period, the Fund did not borrow on this line of credit.
8. Security Lending.
The Fund lends portfolio securities through a lending agent from time to time in order to earn additional income. For equity securities, a lending agent is used and may loan securities to certain qualified borrowers, including Fidelity Capital Markets (FCM), a broker-dealer affiliated with the Fund. On the settlement date of the loan, the Fund receives collateral (in the form of U.S. Treasury obligations, letters of credit and/or cash) against the loaned securities and maintains collateral in an amount not less than 100% of the market value of the loaned securities during the period of the loan. The market value of the loaned securities is determined at the close of business of the Fund and any additional required collateral is delivered to the Fund on the next business day. The Fund or borrower may terminate the loan at any time, and if the borrower defaults on its obligation to return the securities loaned because of insolvency or other reasons, the Fund may apply collateral received from the borrower against the obligation. The Fund may experience delays and costs in recovering the securities loaned. Any cash collateral received is invested in the Fidelity Securities Lending Cash Central Fund. The value of loaned securities and cash collateral at period end are disclosed on the Fund's Statement of Assets and Liabilities. At period end, there were no security loans outstanding with FCM. Security lending income represents the income earned on investing cash collateral, less rebates paid to borrowers and any lending agent fees associated with the loan, plus any premium payments received for lending certain types of securities. Security lending income is presented in the Statement of Operations as a component of income from Fidelity Central Funds. Total security lending income during the period amounted to $227, including $28 from securities loaned to FCM.
9. Expense Reductions.
Commissions paid to certain brokers with whom the investment adviser, or its affiliates, places trades on behalf of the Fund include an amount in addition to trade execution, which may be rebated back to the Fund to offset certain expenses. This amount totaled $11 for the period.
In addition, during the period the investment adviser reimbursed and/or waived a portion of fund-level operating expenses in the amount of $5.
10. Distributions to Shareholders.
Distributions to shareholders of each class were as follows:
| Six months ended December 31, 2016 | Year ended June 30, 2016 | |
| From net investment income | ||
| Growth Discovery | $880 | $1,330 |
| Class K | 255 | 459 |
| Total | $1,135 | $1,789 |
| From net realized gain | ||
| Growth Discovery | $– | $471 |
| Class K | – | 84 |
| Total | $– | $555 |
11. Share Transactions.
Share transactions for each class were as follows and may contain automatic conversions between classes or exchanges between affiliated funds:
| Shares | Shares | Dollars | Dollars | |
| Six months ended December 31, 2016 | Year ended June 30, 2016 | Six months ended December 31, 2016 | Year ended June 30, 2016 | |
| Growth Discovery | ||||
| Shares sold | 1,304 | 5,290 | $33,269 | $128,658 |
| Reinvestment of distributions | 32 | 68 | 821 | 1,697 |
| Shares redeemed | (4,355) | (7,766) | (110,966) | (188,307) |
| Net increase (decrease) | (3,019) | (2,408) | $(76,876) | $(57,952) |
| Class K | ||||
| Shares sold | 476 | 1,980 | $12,034 | $48,709 |
| Reinvestment of distributions | 10 | 22 | 255 | 543 |
| Shares redeemed | (1,271) | (2,901) | (32,453) | (71,361) |
| Net increase (decrease) | (785) | (899) | $(20,164) | $(22,109) |
12. Other.
The Fund's organizational documents provide former and current trustees and officers with a limited indemnification against liabilities arising in connection with the performance of their duties to the Fund. In the normal course of business, the Fund may also enter into contracts that provide general indemnifications. The Fund's maximum exposure under these arrangements is unknown as this would be dependent on future claims that may be made against the Fund. The risk of material loss from such claims is considered remote.
Shareholder Expense Example
As a shareholder of a Fund, you incur two types of costs: (1) transaction costs and (2) ongoing costs, including management fees and other Fund expenses. This Example is intended to help you understand your ongoing costs (in dollars) of investing in the Funds and to compare these costs with the ongoing costs of investing in other mutual funds.
The Example is based on an investment of $1,000 invested at the beginning of the period and held for the entire period (July 1, 2016 to December 31, 2016).
Actual Expenses
The first line of the accompanying table for each class of the Fund provides information about actual account values and actual expenses. You may use the information in this line, together with the amount you invested, to estimate the expenses that you paid over the period. Simply divide your account value by $1,000.00 (for example, an $8,600 account value divided by $1,000.00 = 8.6), then multiply the result by the number in the first line for a class of the Fund under the heading entitled "Expenses Paid During Period" to estimate the expenses you paid on your account during this period. A small balance maintenance fee of $12.00 that is charged once a year may apply for certain accounts with a value of less than $2,000. This fee is not included in the table below. If it was, the estimate of expenses you paid during the period would be higher, and your ending account value lower, by this amount. In addition, the Fund, as a shareholder in the underlying Fidelity Central Funds, will indirectly bear its pro-rata share of the fees and expenses incurred by the underlying Fidelity Central Funds. These fees and expenses are not included in the Fund's annualized expense ratio used to calculate the expense estimate in the table below.
Hypothetical Example for Comparison Purposes
The second line of the accompanying table for each class of the Fund provides information about hypothetical account values and hypothetical expenses based on a Class' actual expense ratio and an assumed rate of return of 5% per year before expenses, which is not the Class' actual return. The hypothetical account values and expenses may not be used to estimate the actual ending account balance or expenses you paid for the period. You may use this information to compare the ongoing costs of investing in the Fund and other funds. To do so, compare this 5% hypothetical example with the 5% hypothetical examples that appear in the shareholder reports of the other funds. A small balance maintenance fee of $12.00 that is charged once a year may apply for certain accounts with a value of less than $2,000. This fee is not included in the table below. If it was, the estimate of expenses you paid during the period would be higher, and your ending account value lower, by this amount. In addition, the Fund, as a shareholder in the underlying Fidelity Central Funds, will indirectly bear its pro-rata share of the fees and expenses incurred by the underlying Fidelity Central Funds. These fees and expenses are not included in the Fund's annualized expense ratio used to calculate the expense estimate in the table below.
Please note that the expenses shown in the table are meant to highlight your ongoing costs only and do not reflect any transaction costs. Therefore, the second line of the table is useful in comparing ongoing costs only, and will not help you determine the relative total costs of owning different funds.
| Annualized Expense Ratio-A | Beginning Account Value July 1, 2016 | Ending Account Value December 31, 2016 | Expenses Paid During Period-B July 1, 2016 to December 31, 2016 | |
| Growth Discovery | .66% | |||
| Actual | $1,000.00 | $1,039.80 | $3.39 | |
| Hypothetical-C | $1,000.00 | $1,021.88 | $3.36 | |
| Class K | .54% | |||
| Actual | $1,000.00 | $1,040.40 | $2.78 | |
| Hypothetical-C | $1,000.00 | $1,022.48 | $2.75 |
A Annualized expense ratio reflects expenses net of applicable fee waivers.
B Expenses are equal to each Class' annualized expense ratio, multiplied by the average account value over the period, multiplied by 184/365 (to reflect the one-half year period).
C 5% return per year before expenses
Board Approval of Investment Advisory Contracts and Management Fees
Fidelity Growth Discovery Fund
Each year, the Board of Trustees, including the Independent Trustees (together, the Board), votes on the renewal of the management contract with Fidelity Management & Research Company (FMR) and the sub-advisory agreements (together, the Advisory Contracts) for the fund. The Board, assisted by the advice of fund counsel and Independent Trustees' counsel, requests and considers a broad range of information relevant to the renewal of the Advisory Contracts throughout the year.
The Board meets regularly and, at each of its meetings, covers an extensive agenda of topics and materials and considers factors that are relevant to its annual consideration of the renewal of the fund's Advisory Contracts, including the services and support provided to the fund and its shareholders. The Board has established various standing committees (Committees), each composed of and chaired by Independent Trustees with varying backgrounds, to which the Board has assigned specific subject matter responsibilities in order to enhance effective decision-making by the Board. The Board, acting directly and through its Committees, requests and receives information concerning the annual consideration of the renewal of the fund's Advisory Contracts. The Board also meets as needed to consider matters specifically related to the Board's annual consideration of the renewal of the Advisory Contracts. Members of the Board may also meet with trustees of other Fidelity funds through ad hoc joint committees to discuss certain matters relevant to all of the Fidelity funds.
At its July 2016 meeting, the Board unanimously determined to renew the fund's Advisory Contracts. In reaching its determination, the Board considered all factors it believed relevant, including (i) the nature, extent, and quality of the services to be provided to the fund and its shareholders (including the investment performance of the fund); (ii) the competitiveness of the fund's management fee and total expense ratio relative to peer funds; (iii) the total costs of the services to be provided by and the profits to be realized by Fidelity from its relationships with the fund; and (iv) the extent to which, if any, economies of scale exist and would be realized as the fund grows, and whether any economies of scale are appropriately shared with fund shareholders.
In considering whether to renew the Advisory Contracts for the fund, the Board reached a determination, with the assistance of fund counsel and Independent Trustees' counsel and through the exercise of its business judgment, that the renewal of the Advisory Contracts was in the best interests of the fund and its shareholders and that the compensation payable under the Advisory Contracts was fair and reasonable. The Board's decision to renew the Advisory Contracts was not based on any single factor, but rather was based on a comprehensive consideration of all the information provided to the Board at its meetings throughout the year. The Board, in reaching its determination to renew the Advisory Contracts, was aware that shareholders of the fund have a broad range of investment choices available to them, including a wide choice among funds offered by Fidelity's competitors, and that the fund's shareholders, who have the opportunity to review and weigh the disclosure provided by the fund in its prospectus and other public disclosures, have chosen to invest in this fund, which is part of the Fidelity family of funds.
Nature, Extent, and Quality of Services Provided. The Board considered Fidelity's staffing as it relates to the fund, including the backgrounds of investment personnel of Fidelity, and also considered the fund's investment objective, strategies, and related investment philosophy. The Independent Trustees also had discussions with senior management of Fidelity's investment operations and investment groups. The Board considered the structure of the investment personnel compensation program and whether this structure provides appropriate incentives to act in the best interests of the fund. Additionally, the Board considered the portfolio managers' investments, if any, in the funds that they manage.Resources Dedicated to Investment Management and Support Services. The Board and the Fund Oversight and Research Committees reviewed the general qualifications and capabilities of Fidelity's investment staff, including its size, education, experience, and resources, as well as Fidelity's approach to recruiting, training, managing, and compensating investment personnel. The Board noted that Fidelity has continued to increase the resources devoted to non-U.S. offices, including expansion of Fidelity's global investment organization. The Board also noted that Fidelity's analysts have extensive resources, tools and capabilities that allow them to conduct sophisticated quantitative and fundamental analysis, as well as credit analysis of issuers, counterparties and guarantors. Further, the Board considered that Fidelity's investment professionals have sufficient access to global information and data so as to provide competitive investment results over time, and that those professionals also have access to sophisticated tools that permit them to assess portfolio construction and risk and performance attribution characteristics continuously, as well as to transmit new information and research conclusions rapidly around the world. Additionally, in its deliberations, the Board considered Fidelity's trading, risk management, compliance, and technology and operations capabilities and resources, which are integral parts of the investment management process.Shareholder and Administrative Services. The Board considered (i) the nature, extent, quality, and cost of advisory, administrative, and shareholder services performed by FMR, the sub-advisers (together with FMR, the Investment Advisers), and their affiliates under the Advisory Contracts and under separate agreements covering transfer agency, pricing and bookkeeping, and securities lending services for the fund; (ii) the nature and extent of the supervision of third party service providers, principally custodians, subcustodians, and pricing vendors; and (iii) the resources devoted to, and the record of compliance with, the fund's compliance policies and procedures. The Board also reviewed the allocation of fund brokerage, including allocations to brokers affiliated with the Investment Advisers, the use of brokerage commissions to pay fund expenses, and the use of "soft" commission dollars to pay for research services.The Board noted that the growth of fund assets over time across the complex allows Fidelity to reinvest in the development of services designed to enhance the value or convenience of the Fidelity funds as investment vehicles. These services include 24-hour access to account information and market information through telephone representatives and over the Internet, investor education materials and asset allocation tools, and the expanded availability of Fidelity Investor Centers.In 2014, the Board formed an ad hoc Committee on Transfer Agency Fees to review the variety of transfer agency fee structures throughout the industry and Fidelity's competitive positioning with respect to industry participants.Investment in a Large Fund Family. The Board considered the benefits to shareholders of investing in a Fidelity fund, including the benefits of investing in a fund that is part of a large family of funds offering a variety of investment disciplines and providing a large variety of mutual fund investor services. The Board noted that Fidelity had taken, or had made recommendations that resulted in the Fidelity funds taking, a number of actions over the previous year that benefited particular funds, including: (i) continuing to dedicate additional resources to investment research and to the support of the senior management team that oversees asset management; (ii) continuing efforts to enhance Fidelity's global research capabilities; (iii) launching new funds and making other enhancements to meet client needs; (iv) broadening eligibility requirements for certain lower-priced share classes of, and streamlining the fee structure for, certain existing equity index funds; (v) lowering expense caps for certain existing funds and classes to reduce expenses paid by shareholders; (vi) eliminating redemption fees for certain variable insurance product funds and classes; (vii) continuing to launch dedicated lower cost underlying funds to meet portfolio construction needs related to expanding underlying fund options for Fidelity funds of funds, specifically for the Freedom Fund product lines; (viii) launching a lower cost share class for use by the Freedom Index Fund product line; (ix) rationalizing product lines and gaining increased efficiencies through fund mergers and share class consolidations; (x) continuing to develop, acquire and implement systems and technology to improve services to the funds and shareholders, strengthen information security, and increase efficiency; (xi) implementing investment enhancements to further strengthen Fidelity's target date product line to increase investors' probability of success in achieving their goals; (xii) accelerating the conversion of all remaining Class B shares to Class A shares, which have a lower expense structure; and (xiii) implementing changes to Fidelity's money market fund product line in response to recent regulatory reforms.Investment Performance. The Board considered whether the fund has operated in accordance with its investment objective, as well as its record of compliance with its investment restrictions and its performance history.The Board took into account discussions with representatives of the Investment Advisers about fund investment performance that occur at Board meetings throughout the year. In this regard the Board noted that as part of regularly scheduled fund reviews and other reports to the Board on fund performance, the Board considers annualized return information for the fund, for different time periods, measured against a securities market index ("benchmark index") and a peer group of funds with similar objectives ("peer group"), if any. In its evaluation of fund investment performance, the Board gave particular attention to information indicating changes in performance of certain Fidelity funds for specific time periods and discussed with the Investment Advisers the reasons for any overperformance or underperformance.In addition to reviewing absolute and relative fund performance, the Independent Trustees periodically consider the appropriateness of fund performance metrics in evaluating the results achieved. In general, the Independent Trustees believe that fund performance should be evaluated based on net performance (after fees and expenses) of both the highest performing and lowest performing fund share classes, where applicable, compared to appropriate benchmark indices, over appropriate time periods that may include full market cycles, and compared to peer groups, as applicable, over the same periods, taking into account relevant factors including the following: general market conditions; issuer-specific information; and fund cash flows and other factors.The Independent Trustees recognize that shareholders evaluate performance on a net basis over their own holding periods, for which one-, three-, and five-year periods are often used as a proxy. For this reason, the performance information reviewed by the Board also included net cumulative calendar year total return information for the fund and an appropriate benchmark index and peer group for the most recent one-, three-, and five-year periods, as shown below. Returns are shown compared to the 25th percentile (top of box, 75% beaten) and 75th percentile (bottom of box, 25% beaten) of the peer universe.Fidelity Growth Discovery Fund
Fidelity Growth Discovery Fund
![]()
Corporate Headquarters
245 Summer St.
Boston, MA 02210
www.fidelity.com
CII-K-SANN-0217
1.863274.108
Fidelity® Fund Semi-Annual Report December 31, 2016 |
|
Contents
Board Approval of Investment Advisory Contracts and Management Fees |
To view a fund's proxy voting guidelines and proxy voting record for the 12-month period ended June 30, visit http://www.fidelity.com/proxyvotingresults or visit the Securities and Exchange Commission's (SEC) web site at http://www.sec.gov.
You may also call 1-800-835-5092 to request a free copy of the proxy voting guidelines.
Standard & Poor's, S&P and S&P 500 are registered service marks of The McGraw-Hill Companies, Inc. and have been licensed for use by Fidelity Distributors Corporation.
Other third-party marks appearing herein are the property of their respective owners.
All other marks appearing herein are registered or unregistered trademarks or service marks of FMR LLC or an affiliated company. © 2017 FMR LLC. All rights reserved.
This report and the financial statements contained herein are submitted for the general information of the shareholders of the Fund. This report is not authorized for distribution to prospective investors in the Fund unless preceded or accompanied by an effective prospectus.
A fund files its complete schedule of portfolio holdings with the SEC for the first and third quarters of each fiscal year on Form N-Q. Forms N-Q are available on the SEC’s web site at http://www.sec.gov. A fund's Forms N-Q may be reviewed and copied at the SEC’s Public Reference Room in Washington, DC. Information regarding the operation of the SEC's Public Reference Room may be obtained by calling 1-800-SEC-0330.
For a complete list of a fund's portfolio holdings, view the most recent holdings listing, semiannual report, or annual report on Fidelity's web site at http://www.fidelity.com, http://www.institutional.fidelity.com, or http://www.401k.com, as applicable.
NOT FDIC INSURED •MAY LOSE VALUE •NO BANK GUARANTEE
Neither the Fund nor Fidelity Distributors Corporation is a bank.
Investment Summary (Unaudited)
Top Ten Stocks as of December 31, 2016
| % of fund's net assets | % of fund's net assets 6 months ago | |
| Apple, Inc. | 4.4 | 1.5 |
| Microsoft Corp. | 3.2 | 1.0 |
| JPMorgan Chase & Co. | 3.1 | 1.0 |
| Bank of America Corp. | 3.0 | 0.0 |
| Chevron Corp. | 2.5 | 1.9 |
| Berkshire Hathaway, Inc. Class B | 2.4 | 2.7 |
| Wells Fargo & Co. | 2.3 | 1.3 |
| Johnson & Johnson | 2.2 | 2.2 |
| Amphenol Corp. Class A | 2.2 | 2.1 |
| Comcast Corp. Class A | 2.1 | 1.7 |
| 27.4 |
Top Five Market Sectors as of December 31, 2016
| % of fund's net assets | % of fund's net assets 6 months ago | |
| Information Technology | 20.0 | 20.3 |
| Financials | 19.9 | 11.9 |
| Consumer Discretionary | 13.1 | 12.5 |
| Health Care | 11.5 | 14.3 |
| Energy | 11.3 | 5.7 |
Prior period industry classifications reflect the categories in place as of the date indicated and have not been adjusted to reflect current industry classifications.
Asset Allocation (% of fund's net assets)
| As of December 31, 2016* | ||
| Stocks | 99.4% | |
| Short-Term Investments and Net Other Assets (Liabilities) | 0.6% | |

* Foreign investments - 6.4%
| As of June 30, 2016* | ||
| Stocks | 98.0% | |
| Short-Term Investments and Net Other Assets (Liabilities) | 2.0% | |

* Foreign investments - 8.3%
Percentages shown as 0.0% may reflect amounts less than 0.05%.
Investments December 31, 2016 (Unaudited)
Showing Percentage of Net Assets
| Common Stocks - 99.0% | |||
| Shares | Value (000s) | ||
| CONSUMER DISCRETIONARY - 12.7% | |||
| Hotels, Restaurants & Leisure - 3.2% | |||
| Domino's Pizza, Inc. | 251,400 | $40,033 | |
| Starbucks Corp. | 983,996 | 54,631 | |
| Vail Resorts, Inc. | 255,000 | 41,134 | |
| 135,798 | |||
| Internet & Direct Marketing Retail - 1.9% | |||
| Amazon.com, Inc. (a) | 110,000 | 82,486 | |
| Media - 3.1% | |||
| Comcast Corp. Class A | 1,320,700 | 91,194 | |
| The Walt Disney Co. | 400,000 | 41,688 | |
| 132,882 | |||
| Multiline Retail - 0.6% | |||
| Dollar Tree, Inc. (a) | 350,000 | 27,013 | |
| Specialty Retail - 3.1% | |||
| AutoZone, Inc. (a) | 47,300 | 37,357 | |
| Home Depot, Inc. | 500,000 | 67,040 | |
| TJX Companies, Inc. | 358,800 | 26,957 | |
| 131,354 | |||
| Textiles, Apparel & Luxury Goods - 0.8% | |||
| NIKE, Inc. Class B | 648,200 | 32,948 | |
| TOTAL CONSUMER DISCRETIONARY | 542,481 | ||
| CONSUMER STAPLES - 4.0% | |||
| Beverages - 0.6% | |||
| Molson Coors Brewing Co. Class B | 254,200 | 24,736 | |
| Food & Staples Retailing - 1.2% | |||
| Costco Wholesale Corp. | 325,000 | 52,036 | |
| Food Products - 0.8% | |||
| Mondelez International, Inc. | 779,600 | 34,560 | |
| Household Products - 0.4% | |||
| Spectrum Brands Holdings, Inc. (b) | 150,000 | 18,350 | |
| Personal Products - 0.4% | |||
| Estee Lauder Companies, Inc. Class A | 192,300 | 14,709 | |
| Tobacco - 0.6% | |||
| Reynolds American, Inc. | 450,000 | 25,218 | |
| TOTAL CONSUMER STAPLES | 169,609 | ||
| ENERGY - 11.3% | |||
| Energy Equipment & Services - 1.4% | |||
| Schlumberger Ltd. | 735,000 | 61,703 | |
| Oil, Gas & Consumable Fuels - 9.9% | |||
| Anadarko Petroleum Corp. | 870,450 | 60,696 | |
| Cheniere Energy Partners LP | 581,461 | 16,758 | |
| Chevron Corp. | 910,000 | 107,107 | |
| ConocoPhillips Co. | 1,248,100 | 62,580 | |
| Devon Energy Corp. | 800,000 | 36,536 | |
| EOG Resources, Inc. | 300,000 | 30,330 | |
| EQT Midstream Partners LP | 193,700 | 14,853 | |
| Kinder Morgan, Inc. | 1,350,000 | 27,959 | |
| Suncor Energy, Inc. | 900,000 | 29,427 | |
| Teekay LNG Partners LP | 1,000,000 | 14,450 | |
| Williams Partners LP | 550,000 | 20,917 | |
| 421,613 | |||
| TOTAL ENERGY | 483,316 | ||
| FINANCIALS - 19.9% | |||
| Banks - 11.4% | |||
| Bank of America Corp. | 5,700,000 | 125,970 | |
| Citigroup, Inc. | 1,200,000 | 71,316 | |
| JPMorgan Chase & Co. | 1,548,900 | 133,655 | |
| SunTrust Banks, Inc. | 1,041,300 | 57,115 | |
| Wells Fargo & Co. | 1,778,367 | 98,006 | |
| 486,062 | |||
| Capital Markets - 4.2% | |||
| Goldman Sachs Group, Inc. | 350,000 | 83,808 | |
| Moody's Corp. | 116,593 | 10,991 | |
| Morgan Stanley | 1,200,000 | 50,700 | |
| MSCI, Inc. | 250,000 | 19,695 | |
| S&P Global, Inc. | 115,725 | 12,445 | |
| 177,639 | |||
| Consumer Finance - 0.4% | |||
| Capital One Financial Corp. | 200,000 | 17,448 | |
| Diversified Financial Services - 2.4% | |||
| Berkshire Hathaway, Inc. Class B (a) | 638,900 | 104,128 | |
| Insurance - 1.5% | |||
| American International Group, Inc. | 577,500 | 37,717 | |
| Marsh & McLennan Companies, Inc. | 375,000 | 25,346 | |
| 63,063 | |||
| TOTAL FINANCIALS | 848,340 | ||
| HEALTH CARE - 11.5% | |||
| Biotechnology - 2.5% | |||
| Alexion Pharmaceuticals, Inc. (a) | 225,000 | 27,529 | |
| Amgen, Inc. | 551,300 | 80,606 | |
| 108,135 | |||
| Health Care Equipment & Supplies - 3.1% | |||
| Boston Scientific Corp. (a) | 1,512,000 | 32,705 | |
| Danaher Corp. | 703,200 | 54,737 | |
| Medtronic PLC | 609,700 | 43,429 | |
| 130,871 | |||
| Health Care Providers & Services - 1.1% | |||
| UnitedHealth Group, Inc. | 300,000 | 48,012 | |
| Life Sciences Tools & Services - 0.9% | |||
| Thermo Fisher Scientific, Inc. | 257,700 | 36,361 | |
| Pharmaceuticals - 3.9% | |||
| Allergan PLC | 121,900 | 25,600 | |
| Bristol-Myers Squibb Co. | 800,000 | 46,752 | |
| Johnson & Johnson | 800,000 | 92,168 | |
| 164,520 | |||
| TOTAL HEALTH CARE | 487,899 | ||
| INDUSTRIALS - 8.9% | |||
| Aerospace & Defense - 5.0% | |||
| Huntington Ingalls Industries, Inc. | 245,500 | 45,219 | |
| Northrop Grumman Corp. | 225,000 | 52,331 | |
| Raytheon Co. | 500,000 | 71,000 | |
| United Technologies Corp. | 400,000 | 43,848 | |
| 212,398 | |||
| Building Products - 1.0% | |||
| A.O. Smith Corp. | 443,980 | 21,022 | |
| Masco Corp. | 750,000 | 23,715 | |
| 44,737 | |||
| Electrical Equipment - 0.6% | |||
| Fortive Corp. | 451,600 | 24,219 | |
| Machinery - 2.3% | |||
| Caterpillar, Inc. | 550,000 | 51,007 | |
| Flowserve Corp. | 600,000 | 28,830 | |
| Xylem, Inc. | 400,000 | 19,808 | |
| 99,645 | |||
| TOTAL INDUSTRIALS | 380,999 | ||
| INFORMATION TECHNOLOGY - 20.0% | |||
| Electronic Equipment & Components - 2.2% | |||
| Amphenol Corp. Class A | 1,366,776 | 91,847 | |
| Internet Software & Services - 3.8% | |||
| Alphabet, Inc.: | |||
| Class A (a) | 110,600 | 87,645 | |
| Class C (a) | 26,027 | 20,088 | |
| Facebook, Inc. Class A (a) | 489,200 | 56,282 | |
| 164,015 | |||
| IT Services - 2.7% | |||
| CSRA, Inc. | 500,000 | 15,920 | |
| MasterCard, Inc. Class A | 460,300 | 47,526 | |
| Visa, Inc. Class A | 646,400 | 50,432 | |
| 113,878 | |||
| Semiconductors & Semiconductor Equipment - 2.3% | |||
| Lam Research Corp. | 250,000 | 26,433 | |
| NXP Semiconductors NV (a) | 305,817 | 29,973 | |
| Texas Instruments, Inc. | 575,000 | 41,958 | |
| 98,364 | |||
| Software - 4.6% | |||
| Adobe Systems, Inc. (a) | 574,400 | 59,134 | |
| Microsoft Corp. | 2,200,000 | 136,708 | |
| 195,842 | |||
| Technology Hardware, Storage & Peripherals - 4.4% | |||
| Apple, Inc. | 1,622,200 | 187,882 | |
| TOTAL INFORMATION TECHNOLOGY | 851,828 | ||
| MATERIALS - 7.3% | |||
| Chemicals - 6.7% | |||
| CF Industries Holdings, Inc. | 900,000 | 28,332 | |
| E.I. du Pont de Nemours & Co. | 725,000 | 53,215 | |
| Ecolab, Inc. | 402,500 | 47,181 | |
| LyondellBasell Industries NV Class A | 650,000 | 55,757 | |
| Monsanto Co. | 428,500 | 45,082 | |
| The Chemours Co. LLC | 500,000 | 11,045 | |
| The Scotts Miracle-Gro Co. Class A | 250,000 | 23,888 | |
| W.R. Grace & Co. | 300,000 | 20,292 | |
| 284,792 | |||
| Construction Materials - 0.6% | |||
| Vulcan Materials Co. | 212,299 | 26,569 | |
| TOTAL MATERIALS | 311,361 | ||
| REAL ESTATE - 2.2% | |||
| Equity Real Estate Investment Trusts (REITs) - 2.2% | |||
| American Tower Corp. | 244,100 | 25,796 | |
| Easterly Government Properties, Inc. | 1,211,300 | 24,250 | |
| Public Storage | 200,000 | 44,700 | |
| 94,746 | |||
| TELECOMMUNICATION SERVICES - 0.9% | |||
| Wireless Telecommunication Services - 0.9% | |||
| T-Mobile U.S., Inc. (a) | 650,000 | 37,382 | |
| UTILITIES - 0.3% | |||
| Water Utilities - 0.3% | |||
| American Water Works Co., Inc. | 175,000 | 12,663 | |
| TOTAL COMMON STOCKS | |||
| (Cost $3,278,295) | 4,220,624 | ||
| Nonconvertible Preferred Stocks - 0.4% | |||
| CONSUMER DISCRETIONARY - 0.4% | |||
| Automobiles - 0.4% | |||
| Porsche Automobil Holding SE (Germany) | |||
| (Cost $16,765) | 300,000 | 16,339 | |
| Principal Amount (000s) | Value (000s) | ||
| U.S. Treasury Obligations - 0.3% | |||
| U.S. Treasury Bills, yield at date of purchase 0.28% to 0.49% 1/12/17 to 2/16/17 (c) | |||
| (Cost $12,776) | 12,780 | 12,776 | |
| Shares | Value (000s) | ||
| Money Market Funds - 1.6% | |||
| Fidelity Cash Central Fund, 0.60% (d) | 68,397,727 | $68,411 | |
| Fidelity Securities Lending Cash Central Fund 0.65% (d)(e) | 1,443,674 | 1,444 | |
| TOTAL MONEY MARKET FUNDS | |||
| (Cost $69,855) | 69,855 | ||
| TOTAL INVESTMENT PORTFOLIO - 101.3% | |||
| (Cost $3,377,691) | 4,319,594 | ||
| NET OTHER ASSETS (LIABILITIES) - (1.3)% | (55,255) | ||
| NET ASSETS - 100% | $4,264,339 |
Legend
(a) Non-income producing
(b) Security or a portion of the security is on loan at period end.
(c) Security or a portion of the security was pledged to cover margin requirements for futures contracts. At period end, the value of securities pledged amounted to $1,275,000.
(d) Affiliated fund that is generally available only to investment companies and other accounts managed by Fidelity Investments. The rate quoted is the annualized seven-day yield of the fund at period end. A complete unaudited listing of the fund's holdings as of its most recent quarter end is available upon request. In addition, each Fidelity Central Fund's financial statements are available on the SEC's website or upon request.
(e) Investment made with cash collateral received from securities on loan.
Affiliated Central Funds
Information regarding fiscal year to date income earned by the Fund from investments in Fidelity Central Funds is as follows:
| Fund | Income earned |
| (Amounts in thousands) | |
| Fidelity Cash Central Fund | $210 |
| Fidelity Securities Lending Cash Central Fund | 16 |
| Total | $226 |
Investment Valuation
The following is a summary of the inputs used, as of December 31, 2016, involving the Fund's assets and liabilities carried at fair value. The inputs or methodology used for valuing securities may not be an indication of the risk associated with investing in those securities. For more information on valuation inputs, and their aggregation into the levels used below, please refer to the Investment Valuation section in the accompanying Notes to Financial Statements.
| Valuation Inputs at Reporting Date: | ||||
| Description | Total | Level 1 | Level 2 | Level 3 |
| (Amounts in thousands) | ||||
| Investments in Securities: | ||||
| Equities: | ||||
| Consumer Discretionary | $558,820 | $558,820 | $-- | $-- |
| Consumer Staples | 169,609 | 169,609 | -- | -- |
| Energy | 483,316 | 483,316 | -- | -- |
| Financials | 848,340 | 848,340 | -- | -- |
| Health Care | 487,899 | 487,899 | -- | -- |
| Industrials | 380,999 | 380,999 | -- | -- |
| Information Technology | 851,828 | 851,828 | -- | -- |
| Materials | 311,361 | 311,361 | -- | -- |
| Real Estate | 94,746 | 94,746 | -- | -- |
| Telecommunication Services | 37,382 | 37,382 | -- | -- |
| Utilities | 12,663 | 12,663 | -- | -- |
| U.S. Government and Government Agency Obligations | 12,776 | -- | 12,776 | -- |
| Money Market Funds | 69,855 | 69,855 | -- | -- |
| Total Investments in Securities: | $4,319,594 | $4,306,818 | $12,776 | $-- |
See accompanying notes which are an integral part of the financial statements.
Financial Statements
Statement of Assets and Liabilities
| Amounts in thousands (except per-share amounts) | December 31, 2016 (Unaudited) | |
| Assets | ||
| Investment in securities, at value (including securities loaned of $1,407) — See accompanying schedule: Unaffiliated issuers (cost $3,307,836) | $4,249,739 | |
| Fidelity Central Funds (cost $69,855) | 69,855 | |
| Total Investments (cost $3,377,691) | $4,319,594 | |
| Cash | 1 | |
| Foreign currency held at value (cost $1,073) | 1,073 | |
| Receivable for investments sold | 34,325 | |
| Receivable for fund shares sold | 1,786 | |
| Dividends receivable | 3,052 | |
| Distributions receivable from Fidelity Central Funds | 62 | |
| Prepaid expenses | 9 | |
| Other receivables | 177 | |
| Total assets | 4,360,079 | |
| Liabilities | ||
| Payable for investments purchased | $1,073 | |
| Payable for fund shares redeemed | 91,043 | |
| Accrued management fee | 1,234 | |
| Payable for daily variation margin for derivative instruments | 151 | |
| Other affiliated payables | 581 | |
| Other payables and accrued expenses | 212 | |
| Collateral on Securities Loaned | 1,446 | |
| Total liabilities | 95,740 | |
| Net Assets | $4,264,339 | |
| Net Assets consist of: | ||
| Paid in capital | $3,151,276 | |
| Distributions in excess of net investment income | (2,452) | |
| Accumulated undistributed net realized gain (loss) on investments and foreign currency transactions | 173,646 | |
| Net unrealized appreciation (depreciation) on investments and assets and liabilities in foreign currencies | 941,869 | |
| Net Assets | $4,264,339 | |
| Fidelity Fund: | ||
| Net Asset Value, offering price and redemption price per share ($3,714,899 ÷ 90,280 shares) | $41.15 | |
| Class K: | ||
| Net Asset Value, offering price and redemption price per share ($549,440 ÷ 13,358 shares) | $41.13 |
See accompanying notes which are an integral part of the financial statements.
Statement of Operations
| Amounts in thousands | Six months ended December 31, 2016 (Unaudited) | |
| Investment Income | ||
| Dividends | $35,386 | |
| Interest | 8 | |
| Income from Fidelity Central Funds | 226 | |
| Total income | 35,620 | |
| Expenses | ||
| Management fee | $7,455 | |
| Transfer agent fees | 2,998 | |
| Accounting and security lending fees | 529 | |
| Custodian fees and expenses | 42 | |
| Independent trustees' fees and expenses | 10 | |
| Registration fees | 29 | |
| Audit | 41 | |
| Legal | 13 | |
| Miscellaneous | 16 | |
| Total expenses before reductions | 11,133 | |
| Expense reductions | (52) | 11,081 |
| Net investment income (loss) | 24,539 | |
| Realized and Unrealized Gain (Loss) | ||
| Net realized gain (loss) on: | ||
| Investment securities: | ||
| Unaffiliated issuers | 273,954 | |
| Fidelity Central Funds | (11) | |
| Foreign currency transactions | 34 | |
| Futures contracts | 10,066 | |
| Total net realized gain (loss) | 284,043 | |
| Change in net unrealized appreciation (depreciation) on: Investment securities | (102,079) | |
| Assets and liabilities in foreign currencies | (10) | |
| Total change in net unrealized appreciation (depreciation) | (102,089) | |
| Net gain (loss) | 181,954 | |
| Net increase (decrease) in net assets resulting from operations | $206,493 |
See accompanying notes which are an integral part of the financial statements.
Statement of Changes in Net Assets
| Amounts in thousands | Six months ended December 31, 2016 (Unaudited) | Year ended June 30, 2016 |
| Increase (Decrease) in Net Assets | ||
| Operations | ||
| Net investment income (loss) | $24,539 | $43,748 |
| Net realized gain (loss) | 284,043 | 177,083 |
| Change in net unrealized appreciation (depreciation) | (102,089) | (272,836) |
| Net increase (decrease) in net assets resulting from operations | 206,493 | (52,005) |
| Distributions to shareholders from net investment income | (45,768) | (36,756) |
| Distributions to shareholders from net realized gain | (254,005) | (224,972) |
| Total distributions | (299,773) | (261,728) |
| Share transactions - net increase (decrease) | (99,982) | (324,381) |
| Total increase (decrease) in net assets | (193,262) | (638,114) |
| Net Assets | ||
| Beginning of period | 4,457,601 | 5,095,715 |
| End of period | $4,264,339 | $4,457,601 |
| Other Information | ||
| Undistributed net investment income end of period | $– | $18,777 |
| Distributions in excess of net investment income end of period | $(2,452) | $– |
See accompanying notes which are an integral part of the financial statements.
Financial Highlights — Fidelity Fund
| Six months ended (Unaudited) December 31, | Years ended June 30, | |||||
| 2016 | 2016 | 2015 | 2014 | 2013 | 2012 | |
| Selected Per–Share Data | ||||||
| Net asset value, beginning of period | $42.04 | $44.69 | $45.42 | $39.77 | $34.51 | $34.35 |
| Income from Investment Operations | ||||||
| Net investment income (loss)A | .23 | .38 | .34 | .35 | .44 | .37 |
| Net realized and unrealized gain (loss) | 1.77 | (.73) | 3.91 | 8.61 | 5.31 | .02 |
| Total from investment operations | 2.00 | (.35) | 4.25 | 8.96 | 5.75 | .39 |
| Distributions from net investment income | (.44) | (.31) | (.30) | (.32) | (.49) | (.23) |
| Distributions from net realized gain | (2.45) | (1.99) | (4.68) | (2.98) | – | – |
| Total distributions | (2.89) | (2.30) | (4.98) | (3.31)B | (.49) | (.23) |
| Net asset value, end of period | $41.15 | $42.04 | $44.69 | $45.42 | $39.77 | $34.51 |
| Total ReturnC,D | 4.74% | (.83)% | 10.52% | 23.70% | 16.85% | 1.21% |
| Ratios to Average Net AssetsE,F | ||||||
| Expenses before reductions | .52%G | .52% | .52% | .53% | .56% | .58% |
| Expenses net of fee waivers, if any | .52%G | .52% | .52% | .53% | .56% | .58% |
| Expenses net of all reductions | .52%G | .52% | .52% | .53% | .55% | .58% |
| Net investment income (loss) | 1.09%G | .91% | .79% | .82% | 1.18% | 1.13% |
| Supplemental Data | ||||||
| Net assets, end of period (in millions) | $3,715 | $3,762 | $4,143 | $4,811 | $4,451 | $4,364 |
| Portfolio turnover rateH | 80%G | 67% | 59%I | 93% | 113% | 102% |
A Calculated based on average shares outstanding during the period.
B Total distributions of $3.31 per share is comprised of distributions from net investment income of $.324 and distributions from net realized gain of $2.984 per share.
C Total returns for periods of less than one year are not annualized.
D Total returns would have been lower if certain expenses had not been reduced during the applicable periods shown.
E Fees and expenses of any underlying Fidelity Central Funds are not included in the Fund's expense ratio. The Fund indirectly bears its proportionate share of the expenses of any underlying Fidelity Central Funds.
F Expense ratios reflect operating expenses of the class. Expenses before reductions do not reflect amounts reimbursed by the investment adviser or reductions from brokerage service arrangements or reductions from other expense offset arrangements and do not represent the amount paid by the class during periods when reimbursements or reductions occur. Expenses net of fee waivers reflect expenses after reimbursement by the investment adviser but prior to reductions from brokerage service arrangements or other expense offset arrangements. Expenses net of all reductions represent the net expenses paid by the class.
G Annualized
H Amount does not include the portfolio activity of any underlying Fidelity Central Funds.
I Portfolio turnover rate excludes securities received or delivered in-kind.
See accompanying notes which are an integral part of the financial statements.
Financial Highlights — Fidelity Fund Class K
| Six months ended (Unaudited) December 31, | Years ended June 30, | |||||
| 2016 | 2016 | 2015 | 2014 | 2013 | 2012 | |
| Selected Per–Share Data | ||||||
| Net asset value, beginning of period | $42.04 | $44.69 | $45.42 | $39.78 | $34.52 | $34.35 |
| Income from Investment Operations | ||||||
| Net investment income (loss)A | .25 | .42 | .39 | .40 | .49 | .42 |
| Net realized and unrealized gain (loss) | 1.77 | (.72) | 3.91 | 8.60 | 5.31 | .02 |
| Total from investment operations | 2.02 | (.30) | 4.30 | 9.00 | 5.80 | .44 |
| Distributions from net investment income | (.48) | (.36) | (.35) | (.38) | (.54) | (.27) |
| Distributions from net realized gain | (2.45) | (1.99) | (4.68) | (2.98) | – | – |
| Total distributions | (2.93) | (2.35) | (5.03) | (3.36) | (.54) | (.27) |
| Net asset value, end of period | $41.13 | $42.04 | $44.69 | $45.42 | $39.78 | $34.52 |
| Total ReturnB,C | 4.80% | (.72)% | 10.65% | 23.83% | 17.03% | 1.37% |
| Ratios to Average Net AssetsD,E | ||||||
| Expenses before reductions | .42%F | .41% | .41% | .41% | .42% | .43% |
| Expenses net of fee waivers, if any | .41%F | .41% | .41% | .41% | .42% | .43% |
| Expenses net of all reductions | .41%F | .41% | .41% | .41% | .41% | .42% |
| Net investment income (loss) | 1.20%F | 1.02% | .90% | .94% | 1.32% | 1.29% |
| Supplemental Data | ||||||
| Net assets, end of period (in millions) | $549 | $696 | $952 | $1,119 | $994 | $814 |
| Portfolio turnover rateG | 80%F | 67% | 59%H | 93% | 113% | 102% |
A Calculated based on average shares outstanding during the period.
B Total returns for periods of less than one year are not annualized.
C Total returns would have been lower if certain expenses had not been reduced during the applicable periods shown.
D Fees and expenses of any underlying Fidelity Central Funds are not included in the Fund's expense ratio. The Fund indirectly bears its proportionate share of the expenses of any underlying Fidelity Central Funds.
E Expense ratios reflect operating expenses of the class. Expenses before reductions do not reflect amounts reimbursed by the investment adviser or reductions from brokerage service arrangements or reductions from other expense offset arrangements and do not represent the amount paid by the class during periods when reimbursements or reductions occur. Expenses net of fee waivers reflect expenses after reimbursement by the investment adviser but prior to reductions from brokerage service arrangements or other expense offset arrangements. Expenses net of all reductions represent the net expenses paid by the class.
F Annualized
G Amount does not include the portfolio activity of any underlying Fidelity Central Funds.
H Portfolio turnover rate excludes securities received or delivered in-kind.
See accompanying notes which are an integral part of the financial statements.
Notes to Financial Statements (Unaudited)
For the period ended December 31, 2016
(Amounts in thousands except percentages)
1. Organization.
Fidelity Fund (the Fund) is a fund of Fidelity Hastings Street Trust (the Trust) and is authorized to issue an unlimited number of shares. The Trust is registered under the Investment Company Act of 1940, as amended (the 1940 Act), as an open-end management investment company organized as a Massachusetts business trust. The Fund offers Fidelity Fund and Class K shares, each of which has equal rights as to assets and voting privileges. Each class has exclusive voting rights with respect to matters that affect that class.
2. Investments in Fidelity Central Funds.
The Fund invests in Fidelity Central Funds, which are open-end investment companies generally available only to other investment companies and accounts managed by the investment adviser and its affiliates. The Fund's Schedule of Investments lists each of the Fidelity Central Funds held as of period end, if any, as an investment of the Fund, but does not include the underlying holdings of each Fidelity Central Fund. As an Investing Fund, the Fund indirectly bears its proportionate share of the expenses of the underlying Fidelity Central Funds.
The Money Market Central Funds seek preservation of capital and current income and are managed by Fidelity Investments Money Management, Inc. (FIMM), an affiliate of the investment adviser. Annualized expenses of the Money Market Central Funds as of their most recent shareholder report date are less than .005%.
A complete unaudited list of holdings for each Fidelity Central Fund is available upon request or at the Securities and Exchange Commission (the SEC) website at www.sec.gov. In addition, the financial statements of the Fidelity Central Funds are available on the SEC website or upon request.
3. Significant Accounting Policies.
The financial statements have been prepared in conformity with accounting principles generally accepted in the United States of America (GAAP), which require management to make certain estimates and assumptions at the date of the financial statements. Actual results could differ from those estimates. Subsequent events, if any, through the date that the financial statements were issued have been evaluated in the preparation of the financial statements. The following summarizes the significant accounting policies of the Fund:
Investment Valuation. Investments are valued as of 4:00 p.m. Eastern time on the last calendar day of the period. The Board of Trustees (the Board) has delegated the day to day responsibility for the valuation of the Fund's investments to the Fair Value Committee (the Committee) established by the Fund's investment adviser. In accordance with valuation policies and procedures approved by the Board, the Fund attempts to obtain prices from one or more third party pricing vendors or brokers to value its investments. When current market prices, quotations or currency exchange rates are not readily available or reliable, investments will be fair valued in good faith by the Committee, in accordance with procedures adopted by the Board. Factors used in determining fair value vary by investment type and may include market or investment specific events, changes in interest rates and credit quality. The frequency with which these procedures are used cannot be predicted and they may be utilized to a significant extent. The Committee oversees the Fund's valuation policies and procedures and reports to the Board on the Committee's activities and fair value determinations. The Board monitors the appropriateness of the procedures used in valuing the Fund's investments and ratifies the fair value determinations of the Committee.
The Fund categorizes the inputs to valuation techniques used to value its investments into a disclosure hierarchy consisting of three levels as shown below:
- Level 1 – quoted prices in active markets for identical investments
- Level 2 – other significant observable inputs (including quoted prices for similar investments, interest rates, prepayment speeds, etc.)
- Level 3 – unobservable inputs (including the Fund's own assumptions based on the best information available)
Valuation techniques used to value the Fund's investments by major category are as follows:
Equity securities, including restricted securities, for which market quotations are readily available, are valued at the last reported sale price or official closing price as reported by a third party pricing vendor on the primary market or exchange on which they are traded and are categorized as Level 1 in the hierarchy. In the event there were no sales during the day or closing prices are not available, securities are valued at the last quoted bid price or may be valued using the last available price and are generally categorized as Level 2 in the hierarchy. For foreign equity securities, when market or security specific events arise, comparisons to the valuation of American Depositary Receipts (ADRs), futures contracts, Exchange-Traded Funds (ETFs) and certain indexes as well as quoted prices for similar securities may be used and would be categorized as Level 2 in the hierarchy. Utilizing these techniques may result in transfers between Level 1 and Level 2. For equity securities, including restricted securities, where observable inputs are limited, assumptions about market activity and risk are used and these securities may be categorized as Level 3 in the hierarchy.
Debt securities, including restricted securities, are valued based on evaluated prices received from third party pricing vendors or from brokers who make markets in such securities. U.S. government and government agency obligations are valued by pricing vendors who utilize matrix pricing which considers yield or price of bonds of comparable quality, coupon, maturity and type or by broker-supplied prices. When independent prices are unavailable or unreliable, debt securities may be valued utilizing pricing methodologies which consider similar factors that would be used by third party pricing vendors. Debt securities are generally categorized as Level 2 in the hierarchy but may be Level 3 depending on the circumstances.
Investments in open-end mutual funds, including the Fidelity Central Funds, are valued at their closing net asset value (NAV) each business day and are categorized as Level 1 in the hierarchy.
Changes in valuation techniques may result in transfers in or out of an assigned level within the disclosure hierarchy. The aggregate value of investments by input level as of December 31, 2016 is included at the end of the Fund's Schedule of Investments.
Foreign Currency. The Fund may use foreign currency contracts to facilitate transactions in foreign-denominated securities. Gains and losses from these transactions may arise from changes in the value of the foreign currency or if the counterparties do not perform under the contracts' terms.
Foreign-denominated assets, including investment securities, and liabilities are translated into U.S. dollars at the exchange rates at period end. Purchases and sales of investment securities, income and dividends received and expenses denominated in foreign currencies are translated into U.S. dollars at the exchange rate in effect on the transaction date.
The effects of exchange rate fluctuations on investments are included with the net realized and unrealized gain (loss) on investment securities. Other foreign currency transactions resulting in realized and unrealized gain (loss) are disclosed separately.
Investment Transactions and Income. For financial reporting purposes, the Fund's investment holdings and NAV include trades executed through the end of the last business day of the period. The NAV per share for processing shareholder transactions is calculated as of the close of business of the New York Stock Exchange (NYSE), normally 4:00 p.m. Eastern time and includes trades executed through the end of the prior business day. Gains and losses on securities sold are determined on the basis of identified cost and may include proceeds received from litigation. Dividend income is recorded on the ex-dividend date, except for certain dividends from foreign securities where the ex-dividend date may have passed, which are recorded as soon as the Fund is informed of the ex-dividend date. Non-cash dividends included in dividend income, if any, are recorded at the fair market value of the securities received. Income and capital gain distributions from Fidelity Central Funds, if any, are recorded on the ex-dividend date. Certain distributions received by the Fund represent a return of capital or capital gain. The Fund determines the components of these distributions subsequent to the ex-dividend date, based upon receipt of tax filings or other correspondence relating to the underlying investment. These distributions are recorded as a reduction of cost of investments and/or as a realized gain. Interest income is accrued as earned and includes coupon interest and amortization of premium and accretion of discount on debt securities as applicable. Investment income is recorded net of foreign taxes withheld where recovery of such taxes is uncertain.
Class Allocations and Expenses. Investment income, realized and unrealized capital gains and losses, common expenses of the Fund, and certain fund-level expense reductions, if any, are allocated daily on a pro-rata basis to each class based on the relative net assets of each class to the total net assets of the Fund. Each class differs with respect to transfer agent fees incurred. Certain expense reductions may also differ by class. For the reporting period, the allocated portion of income and expenses to each class as a percent of its average net assets may vary due to the timing of recording these transactions in relation to fluctuating net assets of the classes. Expenses directly attributable to a fund are charged to that fund. Expenses attributable to more than one fund are allocated among the respective funds on the basis of relative net assets or other appropriate methods. Expense estimates are accrued in the period to which they relate and adjustments are made when actual amounts are known.
Deferred Trustee Compensation. Under a Deferred Compensation Plan (the Plan), independent Trustees may elect to defer receipt of a portion of their annual compensation. Deferred amounts are invested in a cross-section of Fidelity funds, are marked-to-market and remain in the Fund until distributed in accordance with the Plan. The investment of deferred amounts and the offsetting payable to the Trustees are included in the accompanying Statement of Assets and Liabilities.
Income Tax Information and Distributions to Shareholders. Each year, the Fund intends to qualify as a regulated investment company under Subchapter M of the Internal Revenue Code, including distributing substantially all of its taxable income and realized gains. As a result, no provision for U.S. Federal income taxes is required. The Fund files a U.S. federal tax return, in addition to state and local tax returns as required. The Fund's federal income tax returns are subject to examination by the Internal Revenue Service (IRS) for a period of three fiscal years after they are filed. State and local tax returns may be subject to examination for an additional fiscal year depending on the jurisdiction. Foreign taxes are provided for based on the Fund's understanding of the tax rules and rates that exist in the foreign markets in which it invests.
Distributions are declared and recorded on the ex-dividend date. Income dividends and capital gain distributions are declared separately for each class. Income and capital gain distributions are determined in accordance with income tax regulations, which may differ from GAAP.
Capital accounts within the financial statements are adjusted for permanent book-tax differences. These adjustments have no impact on net assets or the results of operations. Capital accounts are not adjusted for temporary book-tax differences which will reverse in a subsequent period.
Book-tax differences are primarily due to futures contracts, foreign currency transactions, passive foreign investment companies (PFIC), market discount, deferred trustees compensation, partnerships and losses deferred due to wash sales.
The federal tax cost of investment securities and unrealized appreciation (depreciation) as of period end were as follows:
| Gross unrealized appreciation | $967,775 |
| Gross unrealized depreciation | (32,153) |
| Net unrealized appreciation (depreciation) on securities | $935,622 |
| Tax cost | $3,383,972 |
4. Derivative Instruments.
Risk Exposures and the Use of Derivative Instruments. The Fund's investment objective allows the Fund to enter into various types of derivative contracts, including futures contracts. Derivatives are investments whose value is primarily derived from underlying assets, indices or reference rates and may be transacted on an exchange or over-the-counter (OTC). Derivatives may involve a future commitment to buy or sell a specified asset based on specified terms, to exchange future cash flows at periodic intervals based on a notional principal amount, or for one party to make one or more payments upon the occurrence of specified events in exchange for periodic payments from the other party.
The Fund used derivatives to increase returns and to manage exposure to certain risks as defined below. The success of any strategy involving derivatives depends on analysis of numerous economic factors, and if the strategies for investment do not work as intended, the Fund may not achieve its objectives.
The Fund's use of derivatives increased or decreased its exposure to the following risk:
| Equity Risk | Equity risk relates to the fluctuations in the value of financial instruments as a result of changes in market prices (other than those arising from interest rate risk or foreign exchange risk), whether caused by factors specific to an individual investment, its issuer, or all factors affecting all instruments traded in a market or market segment. |
The Fund is also exposed to additional risks from investing in derivatives, such as liquidity risk and counterparty credit risk. Liquidity risk is the risk that the Fund will be unable to close out the derivative in the open market in a timely manner. Counterparty credit risk is the risk that the counterparty will not be able to fulfill its obligation to the Fund. Counterparty credit risk related to exchange-traded futures contracts may be mitigated by the protection provided by the exchange on which they trade.
Investing in derivatives may involve greater risks than investing in the underlying assets directly and, to varying degrees, may involve risk of loss in excess of any initial investment and collateral received and amounts recognized in the Statement of Assets and Liabilities. In addition, there may be the risk that the change in value of the derivative contract does not correspond to the change in value of the underlying instrument.
Futures Contracts. A futures contract is an agreement between two parties to buy or sell a specified underlying instrument for a fixed price at a specified future date. The Fund used futures contracts to manage its exposure to the stock market.
Upon entering into a futures contract, a fund is required to deposit either cash or securities (initial margin) with a clearing broker in an amount equal to a certain percentage of the face value of the contract. Futures contracts are marked-to-market daily and subsequent daily payments (variation margin) are made or received by a fund depending on the daily fluctuations in the value of the futures contracts and are recorded as unrealized appreciation or (depreciation). This receivable and/or payable, if any, is included in daily variation margin for derivative instruments in the Statement of Assets and Liabilities. Realized gain or (loss) is recorded upon the expiration or closing of a futures contract.
Any open futures contracts at period end are presented in the Schedule of Investments under the caption "Futures Contracts". The underlying face amount at value reflects each contract's exposure to the underlying instrument or index at period end and is representative of volume activity during the period. Securities deposited to meet initial margin requirements are identified in the Schedule of Investments.
During the period the Fund recognized net realized gain (loss) of $10,066 related to its investment in futures contracts. This amount is included in the Statement of Operations.
5. Purchases and Sales of Investments.
Purchases and sales of securities, other than short-term securities, aggregated $1,739,667 and $2,042,174, respectively.
6. Fees and Other Transactions with Affiliates.
Management Fee. Fidelity Management & Research Company (the investment adviser) and its affiliates provide the Fund with investment management related services for which the Fund pays a monthly management fee. The management fee is the sum of an individual fund fee rate that is based on an annual rate of .09% of the Fund's average net assets and an annualized group fee rate that averaged .25% during the period. The group fee rate is based upon the average net assets of all the mutual funds advised by the investment adviser, including any mutual funds previously advised by the investment adviser that are currently advised by Fidelity SelectCo, LLC, an affiliate of the investment adviser. The group fee rate decreases as assets under management increase and increases as assets under management decrease. For the reporting period, the total annualized management fee rate was .34% of the Fund's average net assets.
Transfer Agent Fees. Fidelity Investments Institutional Operations Company, Inc., (FIIOC), an affiliate of the investment adviser, is the transfer, dividend disbursing and shareholder servicing agent for each class of the Fund. FIIOC receives account fees and asset-based fees that vary according to the account size and type of account of the shareholders of Fidelity Fund. FIIOC receives an asset-based fee of Class K's average net assets. FIIOC pays for typesetting, printing and mailing of shareholder reports, except proxy statements.
For the period, transfer agent fees for each class were as follows:
| Amount | % of Class-Level Average Net Assets(a) | |
| Fidelity Fund | $2,842 | .15 |
| Class K | 156 | .05 |
| $2,998 |
(a) Annualized
Accounting and Security Lending Fees. Fidelity Service Company, Inc. (FSC), an affiliate of the investment adviser, maintains the Fund's accounting records. The accounting fee is based on the level of average net assets for each month. Under a separate contract, FSC administers the security lending program. The security lending fee is based on the number and duration of lending transactions.
Brokerage Commissions. The Fund placed a portion of its portfolio transactions with brokerage firms which are affiliates of the investment adviser. Brokerage commissions are included in net realized gain (loss) and change in net unrealized appreciation (depreciation) in the Statement of Operations. The commissions paid to these affiliated firms were $38 for the period.
Interfund Lending Program. Pursuant to an Exemptive Order issued by the SEC, the Fund, along with other registered investment companies having management contracts with FMR or other affiliated entities of FMR, may participate in an interfund lending program. This program provides an alternative credit facility allowing the funds to borrow from, or lend money to, other participating affiliated funds. At period end, there were no interfund loans outstanding. The Fund's activity in this program during the period for which loans were outstanding was as follows:
| Borrower or Lender | Average Loan Balance | Weighted Average Interest Rate | Interest Expense |
| Borrower | $6,372 | .57% | $–(a) |
(a) In the amount of less than five hundred dollars.
Interfund Trades. The Fund may purchase from or sell securities to other Fidelity Funds under procedures adopted by the Board. The procedures have been designed to ensure these interfund trades are executed in accordance with Rule 17a-7 of the 1940 Act. Interfund trades are included within the respective purchases and sales amounts shown in the Purchases and Sales of Investments note.
7. Committed Line of Credit.
The Fund participates with other funds managed by the investment adviser or an affiliate in a $4.25 billion credit facility (the "line of credit") to be utilized for temporary or emergency purposes to fund shareholder redemptions or for other short-term liquidity purposes. The Fund has agreed to pay commitment fees on its pro-rata portion of the line of credit, which amounted to $7 and is reflected in Miscellaneous expenses on the Statement of Operations. During the period, the Fund did not borrow on this line of credit.
8. Security Lending.
The Fund lends portfolio securities through a lending agent from time to time in order to earn additional income. For equity securities, a lending agent is used and may loan securities to certain qualified borrowers, including Fidelity Capital Markets (FCM), a broker-dealer affiliated with the Fund. On the settlement date of the loan, the Fund receives collateral (in the form of U.S. Treasury obligations, letters of credit and/or cash) against the loaned securities and maintains collateral in an amount not less than 100% of the market value of the loaned securities during the period of the loan. The market value of the loaned securities is determined at the close of business of the Fund and any additional required collateral is delivered to the Fund on the next business day. The Fund or borrower may terminate the loan at any time, and if the borrower defaults on its obligation to return the securities loaned because of insolvency or other reasons, the Fund may apply collateral received from the borrower against the obligation. The Fund may experience delays and costs in recovering the securities loaned. Any cash collateral received is invested in the Fidelity Securities Lending Cash Central Fund. The value of loaned securities and cash collateral at period end are disclosed on the Fund's Statement of Assets and Liabilities. At period end, there were no security loans outstanding with FCM. Security lending income represents the income earned on investing cash collateral, less rebates paid to borrowers and any lending agent fees associated with the loan, plus any premium payments received for lending certain types of securities. Security lending income is presented in the Statement of Operations as a component of income from Fidelity Central Funds. Total security lending income during the period amounted to $16, including $1 from securities loaned to FCM.
9. Expense Reductions.
Commissions paid to certain brokers with whom the investment adviser, or its affiliates, places trades on behalf of the Fund include an amount in addition to trade execution, which may be rebated back to the Fund to offset certain expenses. This amount totaled $35 for the period.
In addition, during the period the investment adviser reimbursed and/or waived a portion of fund-level operating expenses in the amount of $17.
10. Distributions to Shareholders.
Distributions to shareholders of each class were as follows:
| Six months ended December 31, 2016 | Year ended June 30, 2016 | |
| From net investment income | ||
| Fidelity Fund | $38,394 | $28,914 |
| Class K | 7,374 | 7,842 |
| Total | $45,768 | $36,756 |
| From net realized gain | ||
| Fidelity Fund | $216,202 | $183,334 |
| Class K | 37,803 | 41,638 |
| Total | $254,005 | $224,972 |
11. Share Transactions.
Share transactions for each class were as follows and may contain automatic conversions between classes or exchanges between affiliated funds:
| Shares | Shares | Dollars | Dollars | |
| Six months ended December 31, 2016 | Year ended June 30, 2016 | Six months ended December 31, 2016 | Year ended June 30, 2016 | |
| Fidelity Fund | ||||
| Shares sold | 1,149 | 3,667 | $48,160 | $152,399 |
| Reinvestment of distributions | 5,609 | 4,583 | 234,849 | 196,417 |
| Shares redeemed | (5,963) | (11,490) | (250,140) | (476,458) |
| Net increase (decrease) | 795 | (3,240) | $32,869 | $(127,642) |
| Class K | ||||
| Shares sold | 752 | 7,320 | $31,607 | $293,997 |
| Reinvestment of distributions | 1,079 | 1,156 | 45,177 | 49,480 |
| Shares redeemed | (5,024) | (13,234) | (209,635) | (540,216) |
| Net increase (decrease) | (3,193) | (4,758) | $(132,851) | $(196,739) |
12. Other.
The Fund's organizational documents provide former and current trustees and officers with a limited indemnification against liabilities arising in connection with the performance of their duties to the Fund. In the normal course of business, the Fund may also enter into contracts that provide general indemnifications. The Fund's maximum exposure under these arrangements is unknown as this would be dependent on future claims that may be made against the Fund. The risk of material loss from such claims is considered remote.
Shareholder Expense Example
As a shareholder of the Fund, you incur two types of costs: (1) transaction costs, and (2) ongoing costs, including management fees and other Fund expenses. This Example is intended to help you understand your ongoing costs (in dollars) of investing in the Fund and to compare these costs with the ongoing costs of investing in other mutual funds.
The Example is based on an investment of $1,000 invested at the beginning of the period and held for the entire period (July 1, 2016 to December 31, 2016).
Actual Expenses
The first line of the accompanying table for each class of the Fund provides information about actual account values and actual expenses. You may use the information in this line, together with the amount you invested, to estimate the expenses that you paid over the period. Simply divide your account value by $1,000.00 (for example, an $8,600 account value divided by $1,000.00 = 8.6), then multiply the result by the number in the first line for a class of the Fund under the heading entitled "Expenses Paid During Period" to estimate the expenses you paid on your account during this period. A small balance maintenance fee of $12.00 that is charged once a year may apply for certain accounts with a value of less than $2,000. This fee is not included in the table below. If it was, the estimate of expenses you paid during the period would be higher, and your ending account value lower, by this amount. In addition, the Fund, as a shareholder in the underlying Fidelity Central Funds, will indirectly bear its pro-rata share of the fees and expenses incurred by the underlying Fidelity Central Funds. These fees and expenses are not included in the Fund's annualized expense ratio used to calculate the expense estimate in the table below.
Hypothetical Example for Comparison Purposes
The second line of the accompanying table for each class of the Fund provides information about hypothetical account values and hypothetical expenses based on a Class' actual expense ratio and an assumed rate of return of 5% per year before expenses, which is not the Class' actual return. The hypothetical account values and expenses may not be used to estimate the actual ending account balance or expenses you paid for the period. You may use this information to compare the ongoing costs of investing in the Fund and other funds. To do so, compare this 5% hypothetical example with the 5% hypothetical examples that appear in the shareholder reports of the other funds. A small balance maintenance fee of $12.00 that is charged once a year may apply for certain accounts with a value of less than $2,000. This fee is not included in the table below. If it was, the estimate of expenses you paid during the period would be higher, and your ending account value lower, by this amount. In addition, the Fund, as a shareholder in the underlying Fidelity Central Funds, will indirectly bear its pro-rata share of the fees and expenses incurred by the underlying Fidelity Central Funds. These fees and expenses are not included in the Fund's annualized expense ratio used to calculate the expense estimate in the table below.
Please note that the expenses shown in the table are meant to highlight your ongoing costs only and do not reflect any transaction costs. Therefore, the second line of the table is useful in comparing ongoing costs only, and will not help you determine the relative total costs of owning different funds.
| Annualized Expense Ratio-A | Beginning Account Value July 1, 2016 | Ending Account Value December 31, 2016 | Expenses Paid During Period-B July 1, 2016 to December 31, 2016 | |
| Fidelity Fund | .52% | |||
| Actual | $1,000.00 | $1,047.40 | $2.68 | |
| Hypothetical-C | $1,000.00 | $1,022.58 | $2.65 | |
| Class K | .41% | |||
| Actual | $1,000.00 | $1,048.00 | $2.12 | |
| Hypothetical-C | $1,000.00 | $1,023.14 | $2.09 |
A Annualized expense ratio reflects expenses net of applicable fee waivers.
B Expenses are equal to each Class' annualized expense ratio, multiplied by the average account value over the period, multiplied by 184/365 (to reflect the one-half year period).
C 5% return per year before expenses
Board Approval of Investment Advisory Contracts and Management Fees
Fidelity Fund
Each year, the Board of Trustees, including the Independent Trustees (together, the Board), votes on the renewal of the management contract with Fidelity Management & Research Company (FMR) and the sub-advisory agreements (together, the Advisory Contracts) for the fund. The Board, assisted by the advice of fund counsel and Independent Trustees' counsel, requests and considers a broad range of information relevant to the renewal of the Advisory Contracts throughout the year.
The Board meets regularly and, at each of its meetings, covers an extensive agenda of topics and materials and considers factors that are relevant to its annual consideration of the renewal of the fund's Advisory Contracts, including the services and support provided to the fund and its shareholders. The Board has established various standing committees (Committees), each composed of and chaired by Independent Trustees with varying backgrounds, to which the Board has assigned specific subject matter responsibilities in order to enhance effective decision-making by the Board. The Board, acting directly and through its Committees, requests and receives information concerning the annual consideration of the renewal of the fund's Advisory Contracts. The Board also meets as needed to consider matters specifically related to the Board's annual consideration of the renewal of the Advisory Contracts. Members of the Board may also meet with trustees of other Fidelity funds through ad hoc joint committees to discuss certain matters relevant to all of the Fidelity funds.
At its July 2016 meeting, the Board unanimously determined to renew the fund's Advisory Contracts. In reaching its determination, the Board considered all factors it believed relevant, including (i) the nature, extent, and quality of the services to be provided to the fund and its shareholders (including the investment performance of the fund); (ii) the competitiveness of the fund's management fee and total expense ratio relative to peer funds; (iii) the total costs of the services to be provided by and the profits to be realized by Fidelity from its relationships with the fund; and (iv) the extent to which, if any, economies of scale exist and would be realized as the fund grows, and whether any economies of scale are appropriately shared with fund shareholders.
In considering whether to renew the Advisory Contracts for the fund, the Board reached a determination, with the assistance of fund counsel and Independent Trustees' counsel and through the exercise of its business judgment, that the renewal of the Advisory Contracts was in the best interests of the fund and its shareholders and that the compensation payable under the Advisory Contracts was fair and reasonable. The Board's decision to renew the Advisory Contracts was not based on any single factor, but rather was based on a comprehensive consideration of all the information provided to the Board at its meetings throughout the year. The Board, in reaching its determination to renew the Advisory Contracts, was aware that shareholders of the fund have a broad range of investment choices available to them, including a wide choice among funds offered by Fidelity's competitors, and that the fund's shareholders, who have the opportunity to review and weigh the disclosure provided by the fund in its prospectus and other public disclosures, have chosen to invest in this fund, which is part of the Fidelity family of funds.
Nature, Extent, and Quality of Services Provided. The Board considered Fidelity's staffing as it relates to the fund, including the backgrounds of investment personnel of Fidelity, and also considered the fund's investment objective, strategies, and related investment philosophy. The Independent Trustees also had discussions with senior management of Fidelity's investment operations and investment groups. The Board considered the structure of the investment personnel compensation program and whether this structure provides appropriate incentives to act in the best interests of the fund. Additionally, the Board considered the portfolio managers' investments, if any, in the funds that they manage.Resources Dedicated to Investment Management and Support Services. The Board and the Fund Oversight and Research Committees reviewed the general qualifications and capabilities of Fidelity's investment staff, including its size, education, experience, and resources, as well as Fidelity's approach to recruiting, training, managing, and compensating investment personnel. The Board noted that Fidelity has continued to increase the resources devoted to non-U.S. offices, including expansion of Fidelity's global investment organization. The Board also noted that Fidelity's analysts have extensive resources, tools and capabilities that allow them to conduct sophisticated quantitative and fundamental analysis, as well as credit analysis of issuers, counterparties and guarantors. Further, the Board considered that Fidelity's investment professionals have sufficient access to global information and data so as to provide competitive investment results over time, and that those professionals also have access to sophisticated tools that permit them to assess portfolio construction and risk and performance attribution characteristics continuously, as well as to transmit new information and research conclusions rapidly around the world. Additionally, in its deliberations, the Board considered Fidelity's trading, risk management, compliance, and technology and operations capabilities and resources, which are integral parts of the investment management process.Shareholder and Administrative Services. The Board considered (i) the nature, extent, quality, and cost of advisory, administrative, and shareholder services performed by FMR, the sub-advisers (together with FMR, the Investment Advisers), and their affiliates under the Advisory Contracts and under separate agreements covering transfer agency, pricing and bookkeeping, and securities lending services for the fund; (ii) the nature and extent of the supervision of third party service providers, principally custodians, subcustodians, and pricing vendors; and (iii) the resources devoted to, and the record of compliance with, the fund's compliance policies and procedures. The Board also reviewed the allocation of fund brokerage, including allocations to brokers affiliated with the Investment Advisers, the use of brokerage commissions to pay fund expenses, and the use of "soft" commission dollars to pay for research services.The Board noted that the growth of fund assets over time across the complex allows Fidelity to reinvest in the development of services designed to enhance the value or convenience of the Fidelity funds as investment vehicles. These services include 24-hour access to account information and market information through telephone representatives and over the Internet, investor education materials and asset allocation tools, and the expanded availability of Fidelity Investor Centers.In 2014, the Board formed an ad hoc Committee on Transfer Agency Fees to review the variety of transfer agency fee structures throughout the industry and Fidelity's competitive positioning with respect to industry participants.Investment in a Large Fund Family. The Board considered the benefits to shareholders of investing in a Fidelity fund, including the benefits of investing in a fund that is part of a large family of funds offering a variety of investment disciplines and providing a large variety of mutual fund investor services. The Board noted that Fidelity had taken, or had made recommendations that resulted in the Fidelity funds taking, a number of actions over the previous year that benefited particular funds, including: (i) continuing to dedicate additional resources to investment research and to the support of the senior management team that oversees asset management; (ii) continuing efforts to enhance Fidelity's global research capabilities; (iii) launching new funds and making other enhancements to meet client needs; (iv) broadening eligibility requirements for certain lower-priced share classes of, and streamlining the fee structure for, certain existing equity index funds; (v) lowering expense caps for certain existing funds and classes to reduce expenses paid by shareholders; (vi) eliminating redemption fees for certain variable insurance product funds and classes; (vii) continuing to launch dedicated lower cost underlying funds to meet portfolio construction needs related to expanding underlying fund options for Fidelity funds of funds, specifically for the Freedom Fund product lines; (viii) launching a lower cost share class for use by the Freedom Index Fund product line; (ix) rationalizing product lines and gaining increased efficiencies through fund mergers and share class consolidations; (x) continuing to develop, acquire and implement systems and technology to improve services to the funds and shareholders, strengthen information security, and increase efficiency; (xi) implementing investment enhancements to further strengthen Fidelity's target date product line to increase investors' probability of success in achieving their goals; (xii) accelerating the conversion of all remaining Class B shares to Class A shares, which have a lower expense structure; and (xiii) implementing changes to Fidelity's money market fund product line in response to recent regulatory reforms.Investment Performance. The Board considered whether the fund has operated in accordance with its investment objective, as well as its record of compliance with its investment restrictions and its performance history.The Board took into account discussions with representatives of the Investment Advisers about fund investment performance that occur at Board meetings throughout the year. In this regard the Board noted that as part of regularly scheduled fund reviews and other reports to the Board on fund performance, the Board considers annualized return information for the fund, for different time periods, measured against a securities market index ("benchmark index") and a peer group of funds with similar objectives ("peer group"), if any. In its evaluation of fund investment performance, the Board gave particular attention to information indicating changes in performance of certain Fidelity funds for specific time periods and discussed with the Investment Advisers the reasons for any overperformance or underperformance.In addition to reviewing absolute and relative fund performance, the Independent Trustees periodically consider the appropriateness of fund performance metrics in evaluating the results achieved. In general, the Independent Trustees believe that fund performance should be evaluated based on net performance (after fees and expenses) of both the highest performing and lowest performing fund share classes, where applicable, compared to appropriate benchmark indices, over appropriate time periods that may include full market cycles, and compared to peer groups, as applicable, over the same periods, taking into account relevant factors including the following: general market conditions; issuer-specific information; and fund cash flows and other factors.The Independent Trustees recognize that shareholders evaluate performance on a net basis over their own holding periods, for which one-, three-, and five-year periods are often used as a proxy. For this reason, the performance information reviewed by the Board also included net cumulative calendar year total return information for the fund and an appropriate benchmark index and peer group for the most recent one-, three-, and five-year periods, as shown below. Returns are shown compared to the 25th percentile (top of box, 75% beaten) and 75th percentile (bottom of box, 25% beaten) of the peer universe.Fidelity Fund
Fidelity Fund
![]()
Corporate Headquarters
245 Summer St.
Boston, MA 02210
www.fidelity.com
FID-K-SANN-0217
1.863258.108
Item 2.
Code of Ethics
Not applicable.
Item 3.
Audit Committee Financial Expert
Not applicable.
Item 4.
Principal Accountant Fees and Services
Not applicable.
Item 5.
Audit Committee of Listed Registrants
Not applicable.
Item 6.
Investments
(a)
Not applicable.
(b)
Not applicable
Item 7.
Disclosure of Proxy Voting Policies and Procedures for Closed-End Management Investment Companies
Not applicable.
Item 8.
Portfolio Managers of Closed-End Management Investment Companies
Not applicable.
Item 9.
Purchase of Equity Securities by Closed-End Management Investment Company and Affiliated Purchasers
Not applicable.
Item 10.
Submission of Matters to a Vote of Security Holders
There were no material changes to the procedures by which shareholders may recommend nominees to the Fidelity Hastings Street Trust’s Board of Trustees.
Item 11.
Controls and Procedures
(a)(i) The President and Treasurer and the Chief Financial Officer have concluded that the Fidelity Hastings Street Trust’s (the “Trust”) disclosure controls and procedures (as defined in Rule 30a-3(c) under the Investment Company Act) provide reasonable assurances that material information relating to the Trust is made known to them by the appropriate persons, based on their evaluation of these controls and procedures as of a date within 90 days of the filing date of this report.
(a)(ii) There was no change in the Trust’s internal control over financial reporting (as defined in Rule 30a-3(d) under the Investment Company Act) that occurred during the second fiscal quarter of the period covered by this report that has materially affected, or is reasonably likely to materially affect, the Trust’s internal control over financial reporting.
Item 12.
Exhibits
(a) | (1) | Not applicable. |
(a) | (2) | Certification pursuant to Rule 30a-2(a) under the Investment Company Act of 1940 (17 CFR 270.30a-2(a)) is filed and attached hereto as Exhibit 99.CERT. |
(a) | (3) | Not applicable. |
(b) | Certification pursuant to Rule 30a-2(b) under the Investment Company Act of 1940 (17 CFR 270.30a-2(b)) is furnished and attached hereto as Exhibit 99.906CERT. |
SIGNATURES
Pursuant to the requirements of the Securities Exchange Act of 1934 and the Investment Company Act of 1940, the registrant has duly caused this report to be signed on its behalf by the undersigned, thereunto duly authorized.
Fidelity Hastings Street Trust
By: | /s/Stacie M. Smith |
Stacie M. Smith | |
President and Treasurer | |
Date: | February 22, 2017 |
Pursuant to the requirements of the Securities Exchange Act of 1934 and the Investment Company Act of 1940, this report has been signed below by the following persons on behalf of the registrant and in the capacities and on the dates indicated.
By: | /s/Stacie M. Smith |
Stacie M. Smith | |
President and Treasurer | |
Date: | February 22, 2017 |
By: | /s/Howard J. Galligan III |
Howard J. Galligan III | |
Chief Financial Officer | |
Date: | February 22, 2017 |