UNITED STATES
SECURITIES AND EXCHANGE COMMISSION
Washington, D.C. 20549
FORM N-CSR
CERTIFIED SHAREHOLDER REPORT OF REGISTERED
MANAGEMENT INVESTMENT COMPANIES
Investment Company Act file number 811-215
Fidelity Hastings Street Trust
(Exact name of registrant as specified in charter)
245 Summer St., Boston, MA 02210
(Address of principal executive offices) (Zip code)
Marc Bryant, Secretary
245 Summer St.
Boston, Massachusetts 02210
(Name and address of agent for service)
Registrant's telephone number, including area code:
617-563-7000
Date of fiscal year end: | June 30 |
Date of reporting period: | December 31, 2017 |
Item 1.
Reports to Stockholders
Fidelity® Fund Semi-Annual Report December 31, 2017 |
 |
Contents
Board Approval of Investment Advisory Contracts and Management Fees |
To view a fund's proxy voting guidelines and proxy voting record for the 12-month period ended June 30, visit http://www.fidelity.com/proxyvotingresults or visit the Securities and Exchange Commission's (SEC) web site at http://www.sec.gov.
You may also call 1-800-544-8544 to request a free copy of the proxy voting guidelines.
Standard & Poor's, S&P and S&P 500 are registered service marks of The McGraw-Hill Companies, Inc. and have been licensed for use by Fidelity Distributors Corporation.
Other third-party marks appearing herein are the property of their respective owners.
All other marks appearing herein are registered or unregistered trademarks or service marks of FMR LLC or an affiliated company. © 2018 FMR LLC. All rights reserved.
This report and the financial statements contained herein are submitted for the general information of the shareholders of the Fund. This report is not authorized for distribution to prospective investors in the Fund unless preceded or accompanied by an effective prospectus.
A fund files its complete schedule of portfolio holdings with the SEC for the first and third quarters of each fiscal year on Form N-Q. Forms N-Q are available on the SEC’s web site at http://www.sec.gov. A fund's Forms N-Q may be reviewed and copied at the SEC’s Public Reference Room in Washington, DC. Information regarding the operation of the SEC's Public Reference Room may be obtained by calling 1-800-SEC-0330.
For a complete list of a fund's portfolio holdings, view the most recent holdings listing, semiannual report, or annual report on Fidelity's web site at http://www.fidelity.com, http://www.institutional.fidelity.com, or http://www.401k.com, as applicable.
NOT FDIC INSURED •MAY LOSE VALUE •NO BANK GUARANTEE
Neither the Fund nor Fidelity Distributors Corporation is a bank.
Investment Summary (Unaudited)
Top Ten Stocks as of December 31, 2017
| % of fund's net assets | |
| Apple, Inc. | 5.4 |
| Microsoft Corp. | 4.5 |
| JPMorgan Chase & Co. | 4.1 |
| Alphabet, Inc. Class A | 3.9 |
| Bank of America Corp. | 3.5 |
| Facebook, Inc. Class A | 3.0 |
| Amazon.com, Inc. | 3.0 |
| UnitedHealth Group, Inc. | 2.5 |
| Citigroup, Inc. | 2.5 |
| Amgen, Inc. | 2.3 |
| 34.7 |
Top Five Market Sectors as of December 31, 2017
| % of fund's net assets | |
| Information Technology | 28.9 |
| Health Care | 19.1 |
| Financials | 17.8 |
| Consumer Discretionary | 9.6 |
| Industrials | 8.0 |
Asset Allocation (% of fund's net assets)
| As of December 31, 2017 * | ||
| Stocks | 98.0% | |
| Short-Term Investments and Net Other Assets (Liabilities) | 2.0% | |

* Foreign investments - 2.8%
Investments December 31, 2017 (Unaudited)
Showing Percentage of Net Assets
| Common Stocks - 98.0% | |||
| Shares | Value (000s) | ||
| CONSUMER DISCRETIONARY - 9.6% | |||
| Auto Components - 0.6% | |||
| Aptiv PLC | 322,000 | $27,315 | |
| Hotels, Restaurants & Leisure - 1.9% | |||
| Domino's Pizza, Inc. | 102,000 | 19,274 | |
| Vail Resorts, Inc. | 47,975 | 10,193 | |
| Wyndham Worldwide Corp. | 509,900 | 59,082 | |
| 88,549 | |||
| Internet & Direct Marketing Retail - 4.0% | |||
| Amazon.com, Inc. (a) | 116,395 | 136,120 | |
| Priceline Group, Inc. (a) | 27,300 | 47,440 | |
| 183,560 | |||
| Media - 0.9% | |||
| Comcast Corp. Class A | 1,100,000 | 44,055 | |
| Specialty Retail - 2.2% | |||
| Home Depot, Inc. | 389,000 | 73,727 | |
| Lowe's Companies, Inc. | 287,618 | 26,731 | |
| 100,458 | |||
| TOTAL CONSUMER DISCRETIONARY | 443,937 | ||
| CONSUMER STAPLES - 6.7% | |||
| Beverages - 1.2% | |||
| PepsiCo, Inc. | 475,054 | 56,968 | |
| Food & Staples Retailing - 2.6% | |||
| Costco Wholesale Corp. | 243,285 | 45,280 | |
| Wal-Mart Stores, Inc. | 770,000 | 76,038 | |
| 121,318 | |||
| Personal Products - 1.2% | |||
| Estee Lauder Companies, Inc. Class A | 192,300 | 24,468 | |
| Unilever NV (Certificaten Van Aandelen) (Bearer) | 500,000 | 28,152 | |
| 52,620 | |||
| Tobacco - 1.7% | |||
| British American Tobacco PLC: | |||
| (United Kingdom) | 60,000 | 4,065 | |
| sponsored ADR | 131,500 | 8,809 | |
| Philip Morris International, Inc. | 597,400 | 63,115 | |
| 75,989 | |||
| TOTAL CONSUMER STAPLES | 306,895 | ||
| ENERGY - 2.7% | |||
| Oil, Gas & Consumable Fuels - 2.7% | |||
| ConocoPhillips Co. | 748,100 | 41,063 | |
| Kinder Morgan, Inc. | 64,200 | 1,160 | |
| Phillips 66 Co. | 233,000 | 23,568 | |
| Teekay LNG Partners LP | 1,000,001 | 20,150 | |
| Valero Energy Corp. | 417,000 | 38,326 | |
| 124,267 | |||
| FINANCIALS - 17.8% | |||
| Banks - 12.2% | |||
| Bank of America Corp. | 5,420,000 | 159,998 | |
| Citigroup, Inc. | 1,555,000 | 115,708 | |
| JPMorgan Chase & Co. | 1,748,900 | 187,027 | |
| SunTrust Banks, Inc. | 1,241,300 | 80,176 | |
| Wells Fargo & Co. | 330,000 | 20,021 | |
| 562,930 | |||
| Capital Markets - 1.8% | |||
| Goldman Sachs Group, Inc. | 14,800 | 3,770 | |
| MSCI, Inc. | 250,000 | 31,635 | |
| S&P Global, Inc. | 291,200 | 49,329 | |
| 84,734 | |||
| Insurance - 3.8% | |||
| AFLAC, Inc. | 840,037 | 73,738 | |
| Allstate Corp. | 660,000 | 69,109 | |
| Marsh & McLennan Companies, Inc. | 375,000 | 30,521 | |
| 173,368 | |||
| TOTAL FINANCIALS | 821,032 | ||
| HEALTH CARE - 19.1% | |||
| Biotechnology - 5.9% | |||
| AbbVie, Inc. | 765,000 | 73,983 | |
| Amgen, Inc. | 601,000 | 104,514 | |
| Celgene Corp. (a) | 373,044 | 38,931 | |
| Gilead Sciences, Inc. | 689,000 | 49,360 | |
| Vertex Pharmaceuticals, Inc. (a) | 28,000 | 4,196 | |
| 270,984 | |||
| Health Care Equipment & Supplies - 3.6% | |||
| Baxter International, Inc. | 495,000 | 31,997 | |
| Becton, Dickinson & Co. | 235,438 | 50,398 | |
| Boston Scientific Corp. (a) | 1,110,221 | 27,522 | |
| Danaher Corp. | 590,000 | 54,764 | |
| 164,681 | |||
| Health Care Providers & Services - 6.4% | |||
| Cigna Corp. | 401,000 | 81,439 | |
| Henry Schein, Inc. (a) | 65,000 | 4,542 | |
| Humana, Inc. | 244,800 | 60,728 | |
| McKesson Corp. | 201,608 | 31,441 | |
| UnitedHealth Group, Inc. | 534,100 | 117,748 | |
| 295,898 | |||
| Life Sciences Tools & Services - 1.4% | |||
| Agilent Technologies, Inc. | 627,000 | 41,990 | |
| Waters Corp. (a) | 120,571 | 23,293 | |
| 65,283 | |||
| Pharmaceuticals - 1.8% | |||
| Johnson & Johnson | 597,300 | 83,455 | |
| TOTAL HEALTH CARE | 880,301 | ||
| INDUSTRIALS - 8.0% | |||
| Aerospace & Defense - 4.7% | |||
| Huntington Ingalls Industries, Inc. | 236,943 | 55,847 | |
| Northrop Grumman Corp. | 225,000 | 69,055 | |
| Raytheon Co. | 500,000 | 93,925 | |
| 218,827 | |||
| Airlines - 0.2% | |||
| Southwest Airlines Co. | 110,000 | 7,200 | |
| Building Products - 0.9% | |||
| A.O. Smith Corp. | 119,401 | 7,317 | |
| Masco Corp. | 750,000 | 32,955 | |
| 40,272 | |||
| Electrical Equipment - 0.7% | |||
| Fortive Corp. | 451,600 | 32,673 | |
| Industrial Conglomerates - 1.4% | |||
| 3M Co. | 278,000 | 65,433 | |
| Machinery - 0.1% | |||
| Caterpillar, Inc. | 18,100 | 2,852 | |
| TOTAL INDUSTRIALS | 367,257 | ||
| INFORMATION TECHNOLOGY - 28.9% | |||
| Electronic Equipment & Components - 1.6% | |||
| Amphenol Corp. Class A | 826,000 | 72,523 | |
| Internet Software & Services - 7.7% | |||
| Akamai Technologies, Inc. (a) | 110,094 | 7,161 | |
| Alphabet, Inc.: | |||
| Class A (a) | 172,500 | 181,712 | |
| Class C (a) | 26,027 | 27,235 | |
| Facebook, Inc. Class A (a) | 779,800 | 137,604 | |
| 353,712 | |||
| IT Services - 2.7% | |||
| MasterCard, Inc. Class A | 368,000 | 55,700 | |
| Visa, Inc. Class A | 630,000 | 71,833 | |
| 127,533 | |||
| Semiconductors & Semiconductor Equipment - 3.8% | |||
| Applied Materials, Inc. | 828,000 | 42,327 | |
| Broadcom Ltd. | 71,100 | 18,266 | |
| KLA-Tencor Corp. | 163,080 | 17,135 | |
| Lam Research Corp. | 151,738 | 27,930 | |
| Qualcomm, Inc. | 140,000 | 8,963 | |
| Texas Instruments, Inc. | 575,000 | 60,053 | |
| 174,674 | |||
| Software - 7.7% | |||
| Adobe Systems, Inc. (a) | 290,000 | 50,820 | |
| Check Point Software Technologies Ltd. (a) | 276,000 | 28,599 | |
| Citrix Systems, Inc. (a) | 370,000 | 32,560 | |
| Electronic Arts, Inc. (a) | 360,000 | 37,822 | |
| Microsoft Corp. | 2,385,000 | 204,013 | |
| 353,814 | |||
| Technology Hardware, Storage & Peripherals - 5.4% | |||
| Apple, Inc. | 1,476,701 | 249,902 | |
| TOTAL INFORMATION TECHNOLOGY | 1,332,158 | ||
| MATERIALS - 2.5% | |||
| Chemicals - 2.5% | |||
| DowDuPont, Inc. | 661,701 | 47,126 | |
| Monsanto Co. | 380,000 | 44,376 | |
| The Chemours Co. LLC | 500,000 | 25,030 | |
| 116,532 | |||
| REAL ESTATE - 0.9% | |||
| Equity Real Estate Investment Trusts (REITs) - 0.9% | |||
| American Tower Corp. | 244,100 | 34,826 | |
| Equinix, Inc. | 17,700 | 8,022 | |
| 42,848 | |||
| TELECOMMUNICATION SERVICES - 0.6% | |||
| Wireless Telecommunication Services - 0.6% | |||
| T-Mobile U.S., Inc. (a) | 450,000 | 28,580 | |
| UTILITIES - 1.2% | |||
| Electric Utilities - 1.2% | |||
| NextEra Energy, Inc. | 334,611 | 52,263 | |
| TOTAL COMMON STOCKS | |||
| (Cost $3,037,400) | 4,516,070 | ||
| Money Market Funds - 2.3% | |||
| Fidelity Cash Central Fund, 1.36% (b) | |||
| (Cost $107,610) | 107,588,624 | 107,610 | |
| TOTAL INVESTMENT IN SECURITIES - 100.3% | |||
| (Cost $3,145,010) | 4,623,680 | ||
| NET OTHER ASSETS (LIABILITIES) - (0.3)% | (13,621) | ||
| NET ASSETS - 100% | $4,610,059 |
Legend
(a) Non-income producing
(b) Affiliated fund that is generally available only to investment companies and other accounts managed by Fidelity Investments. The rate quoted is the annualized seven-day yield of the fund at period end. A complete unaudited listing of the fund's holdings as of its most recent quarter end is available upon request. In addition, each Fidelity Central Fund's financial statements are available on the SEC's website or upon request.
Affiliated Central Funds
Information regarding fiscal year to date income earned by the Fund from investments in Fidelity Central Funds is as follows:
| Fund | Income earned |
| (Amounts in thousands) | |
| Fidelity Cash Central Fund | $631 |
| Fidelity Securities Lending Cash Central Fund | 5 |
| Total | $636 |
Amounts in the income column in the above table include any capital gain distributions from underlying funds, which are presented in the corresponding line-item in the Statement of Operations if applicable.
Investment Valuation
The following is a summary of the inputs used, as of December 31, 2017, involving the Fund's assets and liabilities carried at fair value. The inputs or methodology used for valuing securities may not be an indication of the risk associated with investing in those securities. For more information on valuation inputs, and their aggregation into the levels used below, please refer to the Investment Valuation section in the accompanying Notes to Financial Statements.
| Valuation Inputs at Reporting Date: | ||||
| Description | Total | Level 1 | Level 2 | Level 3 |
| (Amounts in thousands) | ||||
| Investments in Securities: | ||||
| Equities: | ||||
| Consumer Discretionary | $443,937 | $443,937 | $-- | $-- |
| Consumer Staples | 306,895 | 278,743 | 28,152 | -- |
| Energy | 124,267 | 124,267 | -- | -- |
| Financials | 821,032 | 821,032 | -- | -- |
| Health Care | 880,301 | 880,301 | -- | -- |
| Industrials | 367,257 | 367,257 | -- | -- |
| Information Technology | 1,332,158 | 1,332,158 | -- | -- |
| Materials | 116,532 | 116,532 | -- | -- |
| Real Estate | 42,848 | 42,848 | -- | -- |
| Telecommunication Services | 28,580 | 28,580 | -- | -- |
| Utilities | 52,263 | 52,263 | -- | -- |
| Money Market Funds | 107,610 | 107,610 | -- | -- |
| Total Investments in Securities: | $4,623,680 | $4,595,528 | $28,152 | $-- |
See accompanying notes which are an integral part of the financial statements.
Financial Statements
Statement of Assets and Liabilities
| Amounts in thousands (except per-share amounts) | December 31, 2017 (Unaudited) | |
| Assets | ||
| Investment in securities, at value — See accompanying schedule: Unaffiliated issuers (cost $3,037,400) | $4,516,070 | |
| Fidelity Central Funds (cost $107,610) | 107,610 | |
| Total Investment in Securities (cost $3,145,010) | $4,623,680 | |
| Receivable for investments sold | 11,425 | |
| Receivable for fund shares sold | 845 | |
| Dividends receivable | 2,775 | |
| Distributions receivable from Fidelity Central Funds | 108 | |
| Prepaid expenses | 8 | |
| Other receivables | 203 | |
| Total assets | 4,639,044 | |
| Liabilities | ||
| Payable to custodian bank | $415 | |
| Payable for investments purchased | 8,425 | |
| Payable for fund shares redeemed | 18,030 | |
| Accrued management fee | 1,284 | |
| Other affiliated payables | 591 | |
| Other payables and accrued expenses | 240 | |
| Total liabilities | 28,985 | |
| Net Assets | $4,610,059 | |
| Net Assets consist of: | ||
| Paid in capital | $3,079,424 | |
| Distributions in excess of net investment income | (2,826) | |
| Accumulated undistributed net realized gain (loss) on investments and foreign currency transactions | 54,802 | |
| Net unrealized appreciation (depreciation) on investments and assets and liabilities in foreign currencies | 1,478,659 | |
| Net Assets | $4,610,059 | |
| Fidelity Fund: | ||
| Net Asset Value, offering price and redemption price per share ($4,155,673 ÷ 91,869 shares) | $45.23 | |
| Class K: | ||
| Net Asset Value, offering price and redemption price per share ($454,386 ÷ 10,050 shares) | $45.21 |
See accompanying notes which are an integral part of the financial statements.
Statement of Operations
| Amounts in thousands | Six months ended December 31, 2017 (Unaudited) | |
| Investment Income | ||
| Dividends | $32,939 | |
| Interest | 12 | |
| Income from Fidelity Central Funds | 636 | |
| Total income | 33,587 | |
| Expenses | ||
| Management fee | $7,581 | |
| Transfer agent fees | 2,983 | |
| Accounting and security lending fees | 532 | |
| Custodian fees and expenses | 38 | |
| Independent trustees' fees and expenses | 9 | |
| Appreciation in deferred trustee compensation account | 1 | |
| Registration fees | 23 | |
| Audit | 41 | |
| Legal | 11 | |
| Miscellaneous | 14 | |
| Total expenses before reductions | 11,233 | |
| Expense reductions | (55) | 11,178 |
| Net investment income (loss) | 22,409 | |
| Realized and Unrealized Gain (Loss) | ||
| Net realized gain (loss) on: | ||
| Investment securities: | ||
| Unaffiliated issuers | 144,724 | |
| Foreign currency transactions | 5 | |
| Futures contracts | 3,143 | |
| Total net realized gain (loss) | 147,872 | |
| Change in net unrealized appreciation (depreciation) on: | ||
| Investment securities: | ||
| Unaffiliated issuers | 403,053 | |
| Assets and liabilities in foreign currencies | 9 | |
| Futures contracts | 389 | |
| Total change in net unrealized appreciation (depreciation) | 403,451 | |
| Net gain (loss) | 551,323 | |
| Net increase (decrease) in net assets resulting from operations | $573,732 |
See accompanying notes which are an integral part of the financial statements.
Statement of Changes in Net Assets
| Amounts in thousands | Six months ended December 31, 2017 (Unaudited) | Year ended June 30, 2017 |
| Increase (Decrease) in Net Assets | ||
| Operations | ||
| Net investment income (loss) | $22,409 | $46,426 |
| Net realized gain (loss) | 147,872 | 514,093 |
| Change in net unrealized appreciation (depreciation) | 403,451 | 31,250 |
| Net increase (decrease) in net assets resulting from operations | 573,732 | 591,769 |
| Distributions to shareholders from net investment income | (45,244) | (45,768) |
| Distributions to shareholders from net realized gain | (472,239) | (254,005) |
| Total distributions | (517,483) | (299,773) |
| Share transactions - net increase (decrease) | 107,174 | (302,961) |
| Total increase (decrease) in net assets | 163,423 | (10,965) |
| Net Assets | ||
| Beginning of period | 4,446,636 | 4,457,601 |
| End of period | $4,610,059 | $4,446,636 |
| Other Information | ||
| Undistributed net investment income end of period | $– | $20,009 |
| Distributions in excess of net investment income end of period | $(2,826) | $– |
See accompanying notes which are an integral part of the financial statements.
Financial Highlights
Fidelity Fund
| Six months ended (Unaudited) December 31, | Years ended June 30, | |||||
| 2017 | 2017 | 2016 | 2015 | 2014 | 2013 | |
| Selected Per–Share Data | ||||||
| Net asset value, beginning of period | $44.92 | $42.04 | $44.69 | $45.42 | $39.77 | $34.51 |
| Income from Investment Operations | ||||||
| Net investment income (loss)A | .22 | .44 | .38 | .34 | .35 | .44 |
| Net realized and unrealized gain (loss) | 5.34 | 5.33 | (.73) | 3.91 | 8.61 | 5.31 |
| Total from investment operations | 5.56 | 5.77 | (.35) | 4.25 | 8.96 | 5.75 |
| Distributions from net investment income | (.45) | (.44) | (.31) | (.30) | (.32) | (.49) |
| Distributions from net realized gain | (4.80) | (2.45) | (1.99) | (4.68) | (2.98) | – |
| Total distributions | (5.25) | (2.89) | (2.30) | (4.98) | (3.31)B | (.49) |
| Net asset value, end of period | $45.23 | $44.92 | $42.04 | $44.69 | $45.42 | $39.77 |
| Total ReturnC,D | 13.43% | 14.34% | (.83)% | 10.52% | 23.70% | 16.85% |
| Ratios to Average Net AssetsE,F | ||||||
| Expenses before reductions | .50%G | .52% | .52% | .52% | .53% | .56% |
| Expenses net of fee waivers, if any | .50%G | .52% | .52% | .52% | .53% | .56% |
| Expenses net of all reductions | .50%G | .51% | .52% | .52% | .53% | .55% |
| Net investment income (loss) | .97%G | 1.04% | .91% | .79% | .82% | 1.18% |
| Supplemental Data | ||||||
| Net assets, end of period (in millions) | $4,156 | $3,884 | $3,762 | $4,143 | $4,811 | $4,451 |
| Portfolio turnover rateH | 28%G | 82% | 67% | 59%I | 93% | 113% |
A Calculated based on average shares outstanding during the period.
B Total distributions of $3.31 per share is comprised of distributions from net investment income of $.324 and distributions from net realized gain of $2.984 per share.
C Total returns for periods of less than one year are not annualized.
D Total returns would have been lower if certain expenses had not been reduced during the applicable periods shown.
E Fees and expenses of any underlying Fidelity Central Funds are not included in the Fund's expense ratio. The Fund indirectly bears its proportionate share of the expenses of any underlying Fidelity Central Funds.
F Expense ratios reflect operating expenses of the class. Expenses before reductions do not reflect amounts reimbursed by the investment adviser or reductions from brokerage service arrangements or reductions from other expense offset arrangements and do not represent the amount paid by the class during periods when reimbursements or reductions occur. Expenses net of fee waivers reflect expenses after reimbursement by the investment adviser but prior to reductions from brokerage service arrangements or other expense offset arrangements. Expenses net of all reductions represent the net expenses paid by the class.
G Annualized
H Amount does not include the portfolio activity of any underlying Fidelity Central Funds.
I Portfolio turnover rate excludes securities received or delivered in-kind.
See accompanying notes which are an integral part of the financial statements.
Fidelity Fund Class K
| Six months ended (Unaudited) December 31, | Years ended June 30, | |||||
| 2017 | 2017 | 2016 | 2015 | 2014 | 2013 | |
| Selected Per–Share Data | ||||||
| Net asset value, beginning of period | $44.92 | $42.04 | $44.69 | $45.42 | $39.78 | $34.52 |
| Income from Investment Operations | ||||||
| Net investment income (loss)A | .24 | .49 | .42 | .39 | .40 | .49 |
| Net realized and unrealized gain (loss) | 5.34 | 5.32 | (.72) | 3.91 | 8.60 | 5.31 |
| Total from investment operations | 5.58 | 5.81 | (.30) | 4.30 | 9.00 | 5.80 |
| Distributions from net investment income | (.49) | (.48) | (.36) | (.35) | (.38) | (.54) |
| Distributions from net realized gain | (4.80) | (2.45) | (1.99) | (4.68) | (2.98) | – |
| Total distributions | (5.29) | (2.93) | (2.35) | (5.03) | (3.36) | (.54) |
| Net asset value, end of period | $45.21 | $44.92 | $42.04 | $44.69 | $45.42 | $39.78 |
| Total ReturnB,C | 13.49% | 14.46% | (.72)% | 10.65% | 23.83% | 17.03% |
| Ratios to Average Net AssetsD,E | ||||||
| Expenses before reductions | .41%F | .41% | .41% | .41% | .41% | .42% |
| Expenses net of fee waivers, if any | .41%F | .41% | .41% | .41% | .41% | .42% |
| Expenses net of all reductions | .41%F | .41% | .41% | .41% | .41% | .41% |
| Net investment income (loss) | 1.07%F | 1.14% | 1.02% | .90% | .94% | 1.32% |
| Supplemental Data | ||||||
| Net assets, end of period (in millions) | $454 | $563 | $696 | $952 | $1,119 | $994 |
| Portfolio turnover rateG | 28%F | 82% | 67% | 59%H | 93% | 113% |
A Calculated based on average shares outstanding during the period.
B Total returns for periods of less than one year are not annualized.
C Total returns would have been lower if certain expenses had not been reduced during the applicable periods shown.
D Fees and expenses of any underlying Fidelity Central Funds are not included in the Fund's expense ratio. The Fund indirectly bears its proportionate share of the expenses of any underlying Fidelity Central Funds.
E Expense ratios reflect operating expenses of the class. Expenses before reductions do not reflect amounts reimbursed by the investment adviser or reductions from brokerage service arrangements or reductions from other expense offset arrangements and do not represent the amount paid by the class during periods when reimbursements or reductions occur. Expenses net of fee waivers reflect expenses after reimbursement by the investment adviser but prior to reductions from brokerage service arrangements or other expense offset arrangements. Expenses net of all reductions represent the net expenses paid by the class.
F Annualized
G Amount does not include the portfolio activity of any underlying Fidelity Central Funds.
H Portfolio turnover rate excludes securities received or delivered in-kind.
See accompanying notes which are an integral part of the financial statements.
Notes to Financial Statements (Unaudited)
For the period ended December 31, 2017
(Amounts in thousands except percentages)
1. Organization.
Fidelity Fund (the Fund) is a fund of Fidelity Hastings Street Trust (the Trust) and is authorized to issue an unlimited number of shares. The Trust is registered under the Investment Company Act of 1940, as amended (the 1940 Act), as an open-end management investment company organized as a Massachusetts business trust. The Fund offers Fidelity Fund and Class K shares, each of which has equal rights as to assets and voting privileges. Each class has exclusive voting rights with respect to matters that affect that class.
2. Investments in Fidelity Central Funds.
The Fund invests in Fidelity Central Funds, which are open-end investment companies generally available only to other investment companies and accounts managed by the investment adviser and its affiliates. The Fund's Schedule of Investments lists each of the Fidelity Central Funds held as of period end, if any, as an investment of the Fund, but does not include the underlying holdings of each Fidelity Central Fund. As an Investing Fund, the Fund indirectly bears its proportionate share of the expenses of the underlying Fidelity Central Funds.
The Money Market Central Funds seek preservation of capital and current income and are managed by Fidelity Investments Money Management, Inc. (FIMM), an affiliate of the investment adviser. Annualized expenses of the Money Market Central Funds as of their most recent shareholder report date are less than .005%.
A complete unaudited list of holdings for each Fidelity Central Fund is available upon request or at the Securities and Exchange Commission (the SEC) website at www.sec.gov. In addition, the financial statements of the Fidelity Central Funds are available on the SEC website or upon request.
3. Significant Accounting Policies.
The Fund is an investment company and applies the accounting and reporting guidance of the Financial Accounting Standards Board (FASB) Accounting Standards Codification Topic 946 Financial Services – Investments Companies. The financial statements have been prepared in conformity with accounting principles generally accepted in the United States of America (GAAP), which require management to make certain estimates and assumptions at the date of the financial statements. Actual results could differ from those estimates. Subsequent events, if any, through the date that the financial statements were issued have been evaluated in the preparation of the financial statements. The following summarizes the significant accounting policies of the Fund:
Investment Valuation. Investments are valued as of 4:00 p.m. Eastern time on the last calendar day of the period. The Board of Trustees (the Board) has delegated the day to day responsibility for the valuation of the Fund's investments to the Fair Value Committee (the Committee) established by the Fund's investment adviser. In accordance with valuation policies and procedures approved by the Board, the Fund attempts to obtain prices from one or more third party pricing vendors or brokers to value its investments. When current market prices, quotations or currency exchange rates are not readily available or reliable, investments will be fair valued in good faith by the Committee, in accordance with procedures adopted by the Board. Factors used in determining fair value vary by investment type and may include market or investment specific events. The frequency with which these procedures are used cannot be predicted and they may be utilized to a significant extent. The Committee oversees the Fund's valuation policies and procedures and reports to the Board on the Committee's activities and fair value determinations. The Board monitors the appropriateness of the procedures used in valuing the Fund's investments and ratifies the fair value determinations of the Committee.
The Fund categorizes the inputs to valuation techniques used to value its investments into a disclosure hierarchy consisting of three levels as shown below:
- Level 1 – quoted prices in active markets for identical investments
- Level 2 – other significant observable inputs (including quoted prices for similar investments, interest rates, prepayment speeds, etc.)
- Level 3 – unobservable inputs (including the Fund's own assumptions based on the best information available)
Valuation techniques used to value the Fund's investments by major category are as follows:
Equity securities, including restricted securities, for which market quotations are readily available, are valued at the last reported sale price or official closing price as reported by a third party pricing vendor on the primary market or exchange on which they are traded and are categorized as Level 1 in the hierarchy. In the event there were no sales during the day or closing prices are not available, securities are valued at the last quoted bid price or may be valued using the last available price and are generally categorized as Level 2 in the hierarchy. For foreign equity securities, when market or security specific events arise, comparisons to the valuation of American Depositary Receipts (ADRs), futures contracts, Exchange-Traded Funds (ETFs) and certain indexes as well as quoted prices for similar securities may be used and would be categorized as Level 2 in the hierarchy. Utilizing these techniques may result in transfers between Level 1 and Level 2. For equity securities, including restricted securities, where observable inputs are limited, assumptions about market activity and risk are used and these securities may be categorized as Level 3 in the hierarchy.
Investments in open-end mutual funds, including the Fidelity Central Funds, are valued at their closing net asset value (NAV) each business day and are categorized as Level 1 in the hierarchy.
Changes in valuation techniques may result in transfers in or out of an assigned level within the disclosure hierarchy. The aggregate value of investments by input level as of December 31, 2017 is included at the end of the Fund's Schedule of Investments.
Foreign Currency. The Fund may use foreign currency contracts to facilitate transactions in foreign-denominated securities. Gains and losses from these transactions may arise from changes in the value of the foreign currency or if the counterparties do not perform under the contracts' terms.
Foreign-denominated assets, including investment securities, and liabilities are translated into U.S. dollars at the exchange rates at period end. Purchases and sales of investment securities, income and dividends received and expenses denominated in foreign currencies are translated into U.S. dollars at the exchange rate in effect on the transaction date.
The effects of exchange rate fluctuations on investments are included with the net realized and unrealized gain (loss) on investment securities. Other foreign currency transactions resulting in realized and unrealized gain (loss) are disclosed separately.
Investment Transactions and Income. For financial reporting purposes, the Fund's investment holdings and NAV include trades executed through the end of the last business day of the period. The NAV per share for processing shareholder transactions is calculated as of the close of business of the New York Stock Exchange (NYSE), normally 4:00 p.m. Eastern time and includes trades executed through the end of the prior business day. Gains and losses on securities sold are determined on the basis of identified cost and includes proceeds received from litigation. Dividend income is recorded on the ex-dividend date, except for certain dividends from foreign securities where the ex-dividend date may have passed, which are recorded as soon as the Fund is informed of the ex-dividend date. Non-cash dividends included in dividend income, if any, are recorded at the fair market value of the securities received. Income and capital gain distributions from Fidelity Central Funds, if any, are recorded on the ex-dividend date. Certain distributions received by the Fund represent a return of capital or capital gain. The Fund determines the components of these distributions subsequent to the ex-dividend date, based upon receipt of tax filings or other correspondence relating to the underlying investment. These distributions are recorded as a reduction of cost of investments and/or as a realized gain. Interest income is accrued as earned and includes coupon interest and amortization of premium and accretion of discount on debt securities as applicable. Investment income is recorded net of foreign taxes withheld where recovery of such taxes is uncertain.
Class Allocations and Expenses. Investment income, realized and unrealized capital gains and losses, common expenses of the Fund, and certain fund-level expense reductions, if any, are allocated daily on a pro-rata basis to each class based on the relative net assets of each class to the total net assets of the Fund. Each class differs with respect to transfer agent fees incurred. Certain expense reductions may also differ by class. For the reporting period, the allocated portion of income and expenses to each class as a percent of its average net assets may vary due to the timing of recording these transactions in relation to fluctuating net assets of the classes. Expenses directly attributable to a fund are charged to that fund. Expenses attributable to more than one fund are allocated among the respective funds on the basis of relative net assets or other appropriate methods. Expense estimates are accrued in the period to which they relate and adjustments are made when actual amounts are known.
Deferred Trustee Compensation. Under a Deferred Compensation Plan (the Plan), independent Trustees may elect to defer receipt of a portion of their annual compensation. Deferred amounts are invested in a cross-section of Fidelity funds, are marked-to-market and remain in the Fund until distributed in accordance with the Plan. The investment of deferred amounts and the offsetting payable to the Trustees are included in the accompanying Statement of Assets and Liabilities.
Income Tax Information and Distributions to Shareholders. Each year, the Fund intends to qualify as a regulated investment company under Subchapter M of the Internal Revenue Code, including distributing substantially all of its taxable income and realized gains. As a result, no provision for U.S. Federal income taxes is required. The Fund files a U.S. federal tax return, in addition to state and local tax returns as required. The Fund's federal income tax returns are subject to examination by the Internal Revenue Service (IRS) for a period of three fiscal years after they are filed. State and local tax returns may be subject to examination for an additional fiscal year depending on the jurisdiction. Foreign taxes are provided for based on the Fund's understanding of the tax rules and rates that exist in the foreign markets in which it invests.
Distributions are declared and recorded on the ex-dividend date. Income dividends and capital gain distributions are declared separately for each class. Income and capital gain distributions are determined in accordance with income tax regulations, which may differ from GAAP.
Capital accounts within the financial statements are adjusted for permanent book-tax differences. These adjustments have no impact on net assets or the results of operations. Capital accounts are not adjusted for temporary book-tax differences which will reverse in a subsequent period.
Book-tax differences are primarily due to futures contracts, foreign currency transactions, passive foreign investment companies (PFIC), market discount, partnerships, deferred trustees compensation and losses deferred due to wash sales.
As of period end, the cost and unrealized appreciation (depreciation) in securities, and derivatives if applicable, for federal income tax purposes were as follows:
| Gross unrealized appreciation | $1,492,945 |
| Gross unrealized depreciation | (18,524) |
| Net unrealized appreciation (depreciation) | $1,474,421 |
| Tax cost | $3,149,259 |
4. Derivative Instruments.
Risk Exposures and the Use of Derivative Instruments. The Fund's investment objective allows the Fund to enter into various types of derivative contracts, including futures contracts. Derivatives are investments whose value is primarily derived from underlying assets, indices or reference rates and may be transacted on an exchange or over-the-counter (OTC). Derivatives may involve a future commitment to buy or sell a specified asset based on specified terms, to exchange future cash flows at periodic intervals based on a notional principal amount, or for one party to make one or more payments upon the occurrence of specified events in exchange for periodic payments from the other party.
The Fund used derivatives to increase returns and to manage exposure to certain risks as defined below. The success of any strategy involving derivatives depends on analysis of numerous economic factors, and if the strategies for investment do not work as intended, the Fund may not achieve its objectives.
The Fund's use of derivatives increased or decreased its exposure to the following risk:
| Equity Risk | Equity risk relates to the fluctuations in the value of financial instruments as a result of changes in market prices (other than those arising from interest rate risk or foreign exchange risk), whether caused by factors specific to an individual investment, its issuer, or all factors affecting all instruments traded in a market or market segment. |
The Fund is also exposed to additional risks from investing in derivatives, such as liquidity risk and counterparty credit risk. Liquidity risk is the risk that the Fund will be unable to close out the derivative in the open market in a timely manner. Counterparty credit risk is the risk that the counterparty will not be able to fulfill its obligation to the Fund. Counterparty credit risk related to exchange-traded futures contracts may be mitigated by the protection provided by the exchange on which they trade.
Investing in derivatives may involve greater risks than investing in the underlying assets directly and, to varying degrees, may involve risk of loss in excess of any initial investment and collateral received and amounts recognized in the Statement of Assets and Liabilities. In addition, there may be the risk that the change in value of the derivative contract does not correspond to the change in value of the underlying instrument.
Futures Contracts. A futures contract is an agreement between two parties to buy or sell a specified underlying instrument for a fixed price at a specified future date. The Fund used futures contracts to manage its exposure to the stock market.
Upon entering into a futures contract, a fund is required to deposit either cash or securities (initial margin) with a clearing broker in an amount equal to a certain percentage of the face value of the contract. Futures contracts are marked-to-market daily and subsequent daily payments (variation margin) are made or received by a fund depending on the daily fluctuations in the value of the futures contracts and are recorded as unrealized appreciation or (depreciation). This receivable and/or payable, if any, is included in daily variation margin on futures contracts in the Statement of Assets and Liabilities. Realized gain or (loss) is recorded upon the expiration or closing of a futures contract. The net realized gain (loss) and change in net unrealized appreciation (depreciation) on futures contracts during the period is presented in the Statement of Operations.
Any open futures contracts at period end are presented in the Schedule of Investments under the caption "Futures Contracts". The notional amount at value reflects each contract's exposure to the underlying instrument or index at period end.
5. Purchases and Sales of Investments.
Purchases and sales of securities, other than short-term securities, aggregated $628,589 and $1,000,537, respectively.
6. Fees and Other Transactions with Affiliates.
Management Fee. Fidelity Management & Research Company (the investment adviser) and its affiliates provide the Fund with investment management related services for which the Fund pays a monthly management fee. The management fee is the sum of an individual fund fee rate that is based on an annual rate of .09% of the Fund's average net assets and an annualized group fee rate that averaged .24% during the period. The group fee rate is based upon the average net assets of all the mutual funds advised by the investment adviser, including any mutual funds previously advised by the investment adviser that are currently advised by Fidelity SelectCo, LLC, an affiliate of the investment adviser. The group fee rate decreases as assets under management increase and increases as assets under management decrease. For the reporting period, the total annualized management fee rate was .33% of the Fund's average net assets.
Transfer Agent Fees. Fidelity Investments Institutional Operations Company, Inc., (FIIOC), an affiliate of the investment adviser, is the transfer, dividend disbursing and shareholder servicing agent for each class of the Fund. FIIOC receives account fees and asset-based fees that vary according to the account size and type of account of the shareholders of Fidelity Fund, except for Class K. FIIOC receives an asset-based fee of Class K's average net assets. FIIOC pays for typesetting, printing and mailing of shareholder reports, except proxy statements.
For the period, transfer agent fees for each class were as follows:
| Amount | % of Class-Level Average Net Assets(a) | |
| Fidelity Fund | $2,860 | .14 |
| Class K | 123 | .05 |
| $2,983 |
(a) Annualized
Accounting and Security Lending Fees. Fidelity Service Company, Inc. (FSC), an affiliate of the investment adviser, maintains the Fund's accounting records. The accounting fee is based on the level of average net assets for each month. Under a separate contract, FSC administers the security lending program. The security lending fee is based on the number and duration of lending transactions.
Brokerage Commissions. The Fund placed a portion of its portfolio transactions with brokerage firms which are affiliates of the investment adviser. Brokerage commissions are included in net realized gain (loss) and change in net unrealized appreciation (depreciation) in the Statement of Operations. The commissions paid to these affiliated firms were $17 for the period.
Interfund Trades. The Fund may purchase from or sell securities to other Fidelity Funds under procedures adopted by the Board. The procedures have been designed to ensure these interfund trades are executed in accordance with Rule 17a-7 of the 1940 Act. Interfund trades are included within the respective purchases and sales amounts shown in the Purchases and Sales of Investments note.
7. Committed Line of Credit.
The Fund participates with other funds managed by the investment adviser or an affiliate in a $4.25 billion credit facility (the "line of credit") to be utilized for temporary or emergency purposes to fund shareholder redemptions or for other short-term liquidity purposes. The Fund has agreed to pay commitment fees on its pro-rata portion of the line of credit, which amounted to $7 and is reflected in Miscellaneous expenses on the Statement of Operations. During the period, the Fund did not borrow on this line of credit.
8. Security Lending.
The Fund lends portfolio securities through a lending agent from time to time in order to earn additional income. For equity securities, a lending agent is used and may loan securities to certain qualified borrowers, including Fidelity Capital Markets (FCM), a broker-dealer affiliated with the Fund. On the settlement date of the loan, the Fund receives collateral (in the form of U.S. Treasury obligations, letters of credit and/or cash) against the loaned securities and maintains collateral in an amount not less than 100% of the market value of the loaned securities during the period of the loan. The market value of the loaned securities is determined at the close of business of the Fund and any additional required collateral is delivered to the Fund on the next business day. The Fund or borrower may terminate the loan at any time, and if the borrower defaults on its obligation to return the securities loaned because of insolvency or other reasons, the Fund may apply collateral received from the borrower against the obligation. The Fund may experience delays and costs in recovering the securities loaned. Any cash collateral received is invested in the Fidelity Securities Lending Cash Central Fund. At period end, there were no security loans outstanding. Security lending income represents the income earned on investing cash collateral, less rebates paid to borrowers and any lending agent fees associated with the loan, plus any premium payments received for lending certain types of securities. Security lending income is presented in the Statement of Operations as a component of income from Fidelity Central Funds. Total security lending income during the period amounted to $5. During the period, there were no securities loaned to FCM.
9. Expense Reductions.
Commissions paid to certain brokers with whom the investment adviser, or its affiliates, places trades on behalf of the Fund include an amount in addition to trade execution, which may be rebated back to the Fund to offset certain expenses. This amount totaled $35 for the period.
In addition, during the period the investment adviser reimbursed and/or waived a portion of fund-level operating expenses in the amount of $20.
10. Distributions to Shareholders.
Distributions to shareholders of each class were as follows:
| Six months ended December 31, 2017 | Year ended June 30, 2017 | |
| From net investment income | ||
| Fidelity Fund | $39,636 | $38,394 |
| Class K | 5,608 | 7,374 |
| Total | $45,244 | $45,768 |
| From net realized gain | ||
| Fidelity Fund | $414,639 | $216,202 |
| Class K | 57,600 | 37,803 |
| Total | $472,239 | $254,005 |
11. Share Transactions.
Share transactions for each class were as follows and may contain automatic conversions between classes or exchanges between affiliated funds:
| Shares | Shares | Dollars | Dollars | |
| Six months ended December 31, 2017 | Year ended June 30, 2017 | Six months ended December 31, 2017 | Year ended June 30, 2017 | |
| Fidelity Fund | ||||
| Shares sold | 1,047 | 2,301 | $46,694 | $98,348 |
| Reinvestment of distributions | 9,897 | 5,609 | 419,088 | 234,849 |
| Shares redeemed | (5,534) | (10,936) | (246,186) | (466,956) |
| Net increase (decrease) | 5,410 | (3,026) | $219,596 | $(133,759) |
| Class K | ||||
| Shares sold | 550 | 1,298 | $24,555 | $55,407 |
| Reinvestment of distributions | 1,498 | 1,079 | 63,208 | 45,177 |
| Shares redeemed | (4,527) | (6,399) | (200,185) | (269,786) |
| Net increase (decrease) | (2,479) | (4,022) | $(112,422) | $(169,202) |
12. Other.
The Fund's organizational documents provide former and current trustees and officers with a limited indemnification against liabilities arising in connection with the performance of their duties to the Fund. In the normal course of business, the Fund may also enter into contracts that provide general indemnifications. The Fund's maximum exposure under these arrangements is unknown as this would be dependent on future claims that may be made against the Fund. The risk of material loss from such claims is considered remote.
Shareholder Expense Example
As a shareholder of a Fund, you incur two types of costs: (1) transaction costs and (2) ongoing costs, including management fees and other Fund expenses. This Example is intended to help you understand your ongoing costs (in dollars) of investing in the Funds and to compare these costs with the ongoing costs of investing in other mutual funds.
The Example is based on an investment of $1,000 invested at the beginning of the period and held for the entire period (July 1, 2017 to December 31, 2017).
Actual Expenses
The first line of the accompanying table for each class of the Fund provides information about actual account values and actual expenses. You may use the information in this line, together with the amount you invested, to estimate the expenses that you paid over the period. Simply divide your account value by $1,000.00 (for example, an $8,600 account value divided by $1,000.00 = 8.6), then multiply the result by the number in the first line for a class of the Fund under the heading entitled "Expenses Paid During Period" to estimate the expenses you paid on your account during this period. A small balance maintenance fee of $12.00 that is charged once a year may apply for certain accounts with a value of less than $2,000. This fee is not included in the table below. If it was, the estimate of expenses you paid during the period would be higher, and your ending account value lower, by this amount. In addition, the Fund, as a shareholder in the underlying Fidelity Central Funds, will indirectly bear its pro-rata share of the fees and expenses incurred by the underlying Fidelity Central Funds. These fees and expenses are not included in the Fund's annualized expense ratio used to calculate the expense estimate in the table below.
Hypothetical Example for Comparison Purposes
The second line of the accompanying table for each class of the Fund provides information about hypothetical account values and hypothetical expenses based on a Class' actual expense ratio and an assumed rate of return of 5% per year before expenses, which is not the Class' actual return. The hypothetical account values and expenses may not be used to estimate the actual ending account balance or expenses you paid for the period. You may use this information to compare the ongoing costs of investing in the Fund and other funds. To do so, compare this 5% hypothetical example with the 5% hypothetical examples that appear in the shareholder reports of the other funds. A small balance maintenance fee of $12.00 that is charged once a year may apply for certain accounts with a value of less than $2,000. This fee is not included in the table below. If it was, the estimate of expenses you paid during the period would be higher, and your ending account value lower, by this amount. In addition, the Fund, as a shareholder in the underlying Fidelity Central Funds, will indirectly bear its pro-rata share of the fees and expenses incurred by the underlying Fidelity Central Funds. These fees and expenses are not included in the Fund's annualized expense ratio used to calculate the expense estimate in the table below.
Please note that the expenses shown in the table are meant to highlight your ongoing costs only and do not reflect any transaction costs. Therefore, the second line of the table is useful in comparing ongoing costs only, and will not help you determine the relative total costs of owning different funds.
| Annualized Expense Ratio-A | Beginning Account Value July 1, 2017 | Ending Account Value December 31, 2017 | Expenses Paid During Period-B July 1, 2017 to December 31, 2017 | |
| Fidelity Fund | .50% | |||
| Actual | $1,000.00 | $1,134.30 | $2.69 | |
| Hypothetical-C | $1,000.00 | $1,022.68 | $2.55 | |
| Class K | .41% | |||
| Actual | $1,000.00 | $1,134.90 | $2.21 | |
| Hypothetical-C | $1,000.00 | $1,023.14 | $2.09 |
A Annualized expense ratio reflects expenses net of applicable fee waivers.
B Expenses are equal to each Class' annualized expense ratio, multiplied by the average account value over the period, multiplied by 184/365 (to reflect the one-half year period).
C 5% return per year before expenses
Board Approval of Investment Advisory Contracts and Management Fees
Fidelity Fund
Each year, the Board of Trustees, including the Independent Trustees (together, the Board), votes on the renewal of the management contract with Fidelity Management & Research Company (FMR) and the sub-advisory agreements (together, the Advisory Contracts) for the fund. FMR and the sub-advisers are referred to herein as the Investment Advisers. The Board, assisted by the advice of fund counsel and Independent Trustees' counsel, requests and considers a broad range of information relevant to the renewal of the Advisory Contracts throughout the year.
The Board meets regularly and, at each of its meetings, covers an extensive agenda of topics and materials and considers factors that are relevant to its annual consideration of the renewal of the fund's Advisory Contracts, including the services and support provided to the fund and its shareholders. The Board has established various standing committees (Committees), each composed of and chaired by Independent Trustees with varying backgrounds, to which the Board has assigned specific subject matter responsibilities in order to enhance effective decision-making by the Board. The Board, acting directly and through its Committees, requests and receives information concerning the annual consideration of the renewal of the fund's Advisory Contracts. The Board also meets as needed to review matters specifically related to the Board's annual consideration of the renewal of the Advisory Contracts. Members of the Board may also meet with trustees of other Fidelity funds through ad hoc joint committees to discuss certain matters relevant to all of the Fidelity funds.
At its July 2017 meeting, the Board unanimously determined to renew the fund's Advisory Contracts. In reaching its determination, the Board considered all factors it believed relevant, including (i) the nature, extent, and quality of the services to be provided to the fund and its shareholders (including the investment performance of the fund); (ii) the competitiveness of the fund's management fee and total expense ratio relative to peer funds; (iii) the total costs of the services to be provided by and the profits to be realized by Fidelity from its relationships with the fund; and (iv) the extent to which, if any, economies of scale exist and would be realized as the fund grows, and whether any economies of scale are appropriately shared with fund shareholders.
In considering whether to renew the Advisory Contracts for the fund, the Board reached a determination, with the assistance of fund counsel and Independent Trustees' counsel and through the exercise of its business judgment, that the renewal of the Advisory Contracts was in the best interests of the fund and its shareholders and that the compensation payable under the Advisory Contracts was fair and reasonable. The Board's decision to renew the Advisory Contracts was not based on any single factor, but rather was based on a comprehensive consideration of all the information provided to the Board at its meetings throughout the year. The Board, in reaching its determination to renew the Advisory Contracts, was aware that shareholders of the fund have a broad range of investment choices available to them, including a wide choice among funds offered by Fidelity's competitors, and that the fund's shareholders, who have the opportunity to review and weigh the disclosure provided by the fund in its prospectus and other public disclosures, have chosen to invest in this fund, which is part of the Fidelity family of funds.
Amendment to Group Fee Rate. The Board also approved an amendment to the management contract for the fund to add an additional breakpoint to the group fee schedule, effective October 1, 2017. The Board noted that the additional breakpoint would result in lower management fee rates as Fidelity's assets under management increase.
Nature, Extent, and Quality of Services Provided. The Board considered Fidelity's staffing as it relates to the fund, including the backgrounds of investment personnel of Fidelity, and also considered the fund's investment objective, strategies, and related investment philosophy. The Independent Trustees also had discussions with senior management of Fidelity's investment operations and investment groups. The Board considered the structure of the investment personnel compensation program and whether this structure provides appropriate incentives to act in the best interests of the fund. Additionally, the Board considered the portfolio managers' investments, if any, in the funds that they manage.Resources Dedicated to Investment Management and Support Services. The Board and the Fund Oversight and Research Committees reviewed the general qualifications and capabilities of Fidelity's investment staff, including its size, education, experience, and resources, as well as Fidelity's approach to recruiting, training, managing, and compensating investment personnel. The Board noted that Fidelity has continued to increase the resources devoted to non-U.S. offices, including expansion of Fidelity's global investment organization. The Board also noted that Fidelity's analysts have extensive resources, tools and capabilities that allow them to conduct sophisticated quantitative and fundamental analysis, as well as credit analysis of issuers, counterparties and guarantors. Further, the Board considered that Fidelity's investment professionals have sufficient access to global information and data so as to provide competitive investment results over time, and that those professionals also have access to sophisticated tools that permit them to assess portfolio construction and risk and performance attribution characteristics continuously, as well as to transmit new information and research conclusions rapidly around the world. Additionally, in its deliberations, the Board considered Fidelity's trading, risk management, compliance, and technology and operations capabilities and resources, which are integral parts of the investment management process.Shareholder and Administrative Services. The Board considered (i) the nature, extent, quality, and cost of advisory, administrative, and shareholder services performed by the Investment Advisers and their affiliates under the Advisory Contracts and under separate agreements covering transfer agency, pricing and bookkeeping, and securities lending services for the fund; (ii) the nature and extent of the supervision of third party service providers, principally custodians, subcustodians, and pricing vendors; and (iii) the resources devoted to, and the record of compliance with, the fund's compliance policies and procedures. The Board also reviewed the allocation of fund brokerage, including allocations to brokers affiliated with the Investment Advisers, the use of brokerage commissions to pay fund expenses, and the use of "soft" commission dollars to pay for research services.The Board noted that the growth of fund assets over time across the complex allows Fidelity to reinvest in the development of services designed to enhance the value or convenience of the Fidelity funds as investment vehicles. These services include 24-hour access to account information and market information through telephone representatives and over the Internet, investor education materials and asset allocation tools, and the expanded availability of Fidelity Investor Centers.In 2014, the Board formed an ad hoc Committee on Transfer Agency Fees to review the variety of transfer agency fee structures throughout the industry and Fidelity's competitive positioning with respect to industry participants.Investment in a Large Fund Family. The Board considered the benefits to shareholders of investing in a Fidelity fund, including the benefits of investing in a fund that is part of a large family of funds offering a variety of investment disciplines and providing a large variety of mutual fund investor services. The Board noted that Fidelity had taken, or had made recommendations that resulted in the Fidelity funds taking, a number of actions over the previous year that benefited particular funds, including: (i) continuing to dedicate additional resources to Fidelity's investment research process, and to the support of the senior management team that oversees asset management; (ii) continuing efforts to enhance Fidelity's global research capabilities; (iii) launching new funds and making other enhancements to meet client needs; (iv) launching new share classes of existing funds; (v) eliminating purchase minimums and broadening eligibility requirements for certain lower-priced share classes; (vi) reducing management fees and total expenses for certain growth equity funds and index funds; (vii) lowering expense caps for certain existing funds and classes to reduce expenses borne by shareholders; (viii) eliminating short-term redemption fees for certain funds; (ix) introducing a new pricing structure for certain funds of funds that is expected to reduce overall expenses paid by shareholders; (x) rationalizing product lines and gaining increased efficiencies through proposals for fund mergers and share class consolidations; (xi) continuing to develop, acquire and implement systems and technology to improve services to the funds and shareholders, strengthen information security, and increase efficiency; and (xii) implementing enhancements to further strengthen Fidelity's product line to increase investors' probability of success in achieving their investment goals, including retirement income goals.Investment Performance. The Board considered whether the fund has operated in accordance with its investment objective, as well as its record of compliance with its investment restrictions and its performance history.The Board took into account discussions with representatives of the Investment Advisers about fund investment performance that occur at Board meetings throughout the year. In this regard the Board noted that as part of regularly scheduled fund reviews and other reports to the Board on fund performance, the Board considers annualized return information for the fund for different time periods, measured against a securities market index ("benchmark index") and a peer group of funds with similar objectives ("peer group"), if any. In its evaluation of fund investment performance, the Board gave particular attention to information indicating changes in performance of certain Fidelity funds for specific time periods and discussed with the Investment Advisers the reasons for any overperformance or underperformance.In addition to reviewing absolute and relative fund performance, the Independent Trustees periodically consider the appropriateness of fund performance metrics in evaluating the results achieved. In general, the Independent Trustees believe that fund performance should be evaluated based on net performance (after fees and expenses) of both the highest performing and lowest performing fund share classes, where applicable, compared to appropriate benchmark indices, over appropriate time periods that may include full market cycles, and compared to peer groups, as applicable, over the same periods, taking into account relevant factors including the following: general market conditions; issuer-specific information; and fund cash flows and other factors.The Independent Trustees recognize that shareholders evaluate performance on a net basis over their own holding periods, for which one-, three-, and five-year periods are often used as a proxy. For this reason, the performance information reviewed by the Board also included net cumulative calendar year total return information for the fund and an appropriate benchmark index and peer group for the most recent one-, three-, and five-year periods, as shown below. Returns are shown compared to the 25th percentile (top of box, 75% beaten) and 75th percentile (bottom of box, 25% beaten) of the peer universe.Fidelity Fund

Fidelity Fund

![]()
Corporate Headquarters
245 Summer St.
Boston, MA 02210
www.fidelity.com
FID-SANN-0218
1.540016.120
Fidelity® Fund Semi-Annual Report December 31, 2017 |
|
Contents
Board Approval of Investment Advisory Contracts and Management Fees |
To view a fund's proxy voting guidelines and proxy voting record for the 12-month period ended June 30, visit http://www.fidelity.com/proxyvotingresults or visit the Securities and Exchange Commission's (SEC) web site at http://www.sec.gov.
You may also call 1-800-835-5092 to request a free copy of the proxy voting guidelines.
Standard & Poor's, S&P and S&P 500 are registered service marks of The McGraw-Hill Companies, Inc. and have been licensed for use by Fidelity Distributors Corporation.
Other third-party marks appearing herein are the property of their respective owners.
All other marks appearing herein are registered or unregistered trademarks or service marks of FMR LLC or an affiliated company. © 2018 FMR LLC. All rights reserved.
This report and the financial statements contained herein are submitted for the general information of the shareholders of the Fund. This report is not authorized for distribution to prospective investors in the Fund unless preceded or accompanied by an effective prospectus.
A fund files its complete schedule of portfolio holdings with the SEC for the first and third quarters of each fiscal year on Form N-Q. Forms N-Q are available on the SEC’s web site at http://www.sec.gov. A fund's Forms N-Q may be reviewed and copied at the SEC’s Public Reference Room in Washington, DC. Information regarding the operation of the SEC's Public Reference Room may be obtained by calling 1-800-SEC-0330.
For a complete list of a fund's portfolio holdings, view the most recent holdings listing, semiannual report, or annual report on Fidelity's web site at http://www.fidelity.com, http://www.institutional.fidelity.com, or http://www.401k.com, as applicable.
NOT FDIC INSURED •MAY LOSE VALUE •NO BANK GUARANTEE
Neither the Fund nor Fidelity Distributors Corporation is a bank.
Investment Summary (Unaudited)
Top Ten Stocks as of December 31, 2017
| % of fund's net assets | |
| Apple, Inc. | 5.4 |
| Microsoft Corp. | 4.5 |
| JPMorgan Chase & Co. | 4.1 |
| Alphabet, Inc. Class A | 3.9 |
| Bank of America Corp. | 3.5 |
| Facebook, Inc. Class A | 3.0 |
| Amazon.com, Inc. | 3.0 |
| UnitedHealth Group, Inc. | 2.5 |
| Citigroup, Inc. | 2.5 |
| Amgen, Inc. | 2.3 |
| 34.7 |
Top Five Market Sectors as of December 31, 2017
| % of fund's net assets | |
| Information Technology | 28.9 |
| Health Care | 19.1 |
| Financials | 17.8 |
| Consumer Discretionary | 9.6 |
| Industrials | 8.0 |
Asset Allocation (% of fund's net assets)
| As of December 31, 2017 * | ||
| Stocks | 98.0% | |
| Short-Term Investments and Net Other Assets (Liabilities) | 2.0% | |

* Foreign investments - 2.8%
Investments December 31, 2017 (Unaudited)
Showing Percentage of Net Assets
| Common Stocks - 98.0% | |||
| Shares | Value (000s) | ||
| CONSUMER DISCRETIONARY - 9.6% | |||
| Auto Components - 0.6% | |||
| Aptiv PLC | 322,000 | $27,315 | |
| Hotels, Restaurants & Leisure - 1.9% | |||
| Domino's Pizza, Inc. | 102,000 | 19,274 | |
| Vail Resorts, Inc. | 47,975 | 10,193 | |
| Wyndham Worldwide Corp. | 509,900 | 59,082 | |
| 88,549 | |||
| Internet & Direct Marketing Retail - 4.0% | |||
| Amazon.com, Inc. (a) | 116,395 | 136,120 | |
| Priceline Group, Inc. (a) | 27,300 | 47,440 | |
| 183,560 | |||
| Media - 0.9% | |||
| Comcast Corp. Class A | 1,100,000 | 44,055 | |
| Specialty Retail - 2.2% | |||
| Home Depot, Inc. | 389,000 | 73,727 | |
| Lowe's Companies, Inc. | 287,618 | 26,731 | |
| 100,458 | |||
| TOTAL CONSUMER DISCRETIONARY | 443,937 | ||
| CONSUMER STAPLES - 6.7% | |||
| Beverages - 1.2% | |||
| PepsiCo, Inc. | 475,054 | 56,968 | |
| Food & Staples Retailing - 2.6% | |||
| Costco Wholesale Corp. | 243,285 | 45,280 | |
| Wal-Mart Stores, Inc. | 770,000 | 76,038 | |
| 121,318 | |||
| Personal Products - 1.2% | |||
| Estee Lauder Companies, Inc. Class A | 192,300 | 24,468 | |
| Unilever NV (Certificaten Van Aandelen) (Bearer) | 500,000 | 28,152 | |
| 52,620 | |||
| Tobacco - 1.7% | |||
| British American Tobacco PLC: | |||
| (United Kingdom) | 60,000 | 4,065 | |
| sponsored ADR | 131,500 | 8,809 | |
| Philip Morris International, Inc. | 597,400 | 63,115 | |
| 75,989 | |||
| TOTAL CONSUMER STAPLES | 306,895 | ||
| ENERGY - 2.7% | |||
| Oil, Gas & Consumable Fuels - 2.7% | |||
| ConocoPhillips Co. | 748,100 | 41,063 | |
| Kinder Morgan, Inc. | 64,200 | 1,160 | |
| Phillips 66 Co. | 233,000 | 23,568 | |
| Teekay LNG Partners LP | 1,000,001 | 20,150 | |
| Valero Energy Corp. | 417,000 | 38,326 | |
| 124,267 | |||
| FINANCIALS - 17.8% | |||
| Banks - 12.2% | |||
| Bank of America Corp. | 5,420,000 | 159,998 | |
| Citigroup, Inc. | 1,555,000 | 115,708 | |
| JPMorgan Chase & Co. | 1,748,900 | 187,027 | |
| SunTrust Banks, Inc. | 1,241,300 | 80,176 | |
| Wells Fargo & Co. | 330,000 | 20,021 | |
| 562,930 | |||
| Capital Markets - 1.8% | |||
| Goldman Sachs Group, Inc. | 14,800 | 3,770 | |
| MSCI, Inc. | 250,000 | 31,635 | |
| S&P Global, Inc. | 291,200 | 49,329 | |
| 84,734 | |||
| Insurance - 3.8% | |||
| AFLAC, Inc. | 840,037 | 73,738 | |
| Allstate Corp. | 660,000 | 69,109 | |
| Marsh & McLennan Companies, Inc. | 375,000 | 30,521 | |
| 173,368 | |||
| TOTAL FINANCIALS | 821,032 | ||
| HEALTH CARE - 19.1% | |||
| Biotechnology - 5.9% | |||
| AbbVie, Inc. | 765,000 | 73,983 | |
| Amgen, Inc. | 601,000 | 104,514 | |
| Celgene Corp. (a) | 373,044 | 38,931 | |
| Gilead Sciences, Inc. | 689,000 | 49,360 | |
| Vertex Pharmaceuticals, Inc. (a) | 28,000 | 4,196 | |
| 270,984 | |||
| Health Care Equipment & Supplies - 3.6% | |||
| Baxter International, Inc. | 495,000 | 31,997 | |
| Becton, Dickinson & Co. | 235,438 | 50,398 | |
| Boston Scientific Corp. (a) | 1,110,221 | 27,522 | |
| Danaher Corp. | 590,000 | 54,764 | |
| 164,681 | |||
| Health Care Providers & Services - 6.4% | |||
| Cigna Corp. | 401,000 | 81,439 | |
| Henry Schein, Inc. (a) | 65,000 | 4,542 | |
| Humana, Inc. | 244,800 | 60,728 | |
| McKesson Corp. | 201,608 | 31,441 | |
| UnitedHealth Group, Inc. | 534,100 | 117,748 | |
| 295,898 | |||
| Life Sciences Tools & Services - 1.4% | |||
| Agilent Technologies, Inc. | 627,000 | 41,990 | |
| Waters Corp. (a) | 120,571 | 23,293 | |
| 65,283 | |||
| Pharmaceuticals - 1.8% | |||
| Johnson & Johnson | 597,300 | 83,455 | |
| TOTAL HEALTH CARE | 880,301 | ||
| INDUSTRIALS - 8.0% | |||
| Aerospace & Defense - 4.7% | |||
| Huntington Ingalls Industries, Inc. | 236,943 | 55,847 | |
| Northrop Grumman Corp. | 225,000 | 69,055 | |
| Raytheon Co. | 500,000 | 93,925 | |
| 218,827 | |||
| Airlines - 0.2% | |||
| Southwest Airlines Co. | 110,000 | 7,200 | |
| Building Products - 0.9% | |||
| A.O. Smith Corp. | 119,401 | 7,317 | |
| Masco Corp. | 750,000 | 32,955 | |
| 40,272 | |||
| Electrical Equipment - 0.7% | |||
| Fortive Corp. | 451,600 | 32,673 | |
| Industrial Conglomerates - 1.4% | |||
| 3M Co. | 278,000 | 65,433 | |
| Machinery - 0.1% | |||
| Caterpillar, Inc. | 18,100 | 2,852 | |
| TOTAL INDUSTRIALS | 367,257 | ||
| INFORMATION TECHNOLOGY - 28.9% | |||
| Electronic Equipment & Components - 1.6% | |||
| Amphenol Corp. Class A | 826,000 | 72,523 | |
| Internet Software & Services - 7.7% | |||
| Akamai Technologies, Inc. (a) | 110,094 | 7,161 | |
| Alphabet, Inc.: | |||
| Class A (a) | 172,500 | 181,712 | |
| Class C (a) | 26,027 | 27,235 | |
| Facebook, Inc. Class A (a) | 779,800 | 137,604 | |
| 353,712 | |||
| IT Services - 2.7% | |||
| MasterCard, Inc. Class A | 368,000 | 55,700 | |
| Visa, Inc. Class A | 630,000 | 71,833 | |
| 127,533 | |||
| Semiconductors & Semiconductor Equipment - 3.8% | |||
| Applied Materials, Inc. | 828,000 | 42,327 | |
| Broadcom Ltd. | 71,100 | 18,266 | |
| KLA-Tencor Corp. | 163,080 | 17,135 | |
| Lam Research Corp. | 151,738 | 27,930 | |
| Qualcomm, Inc. | 140,000 | 8,963 | |
| Texas Instruments, Inc. | 575,000 | 60,053 | |
| 174,674 | |||
| Software - 7.7% | |||
| Adobe Systems, Inc. (a) | 290,000 | 50,820 | |
| Check Point Software Technologies Ltd. (a) | 276,000 | 28,599 | |
| Citrix Systems, Inc. (a) | 370,000 | 32,560 | |
| Electronic Arts, Inc. (a) | 360,000 | 37,822 | |
| Microsoft Corp. | 2,385,000 | 204,013 | |
| 353,814 | |||
| Technology Hardware, Storage & Peripherals - 5.4% | |||
| Apple, Inc. | 1,476,701 | 249,902 | |
| TOTAL INFORMATION TECHNOLOGY | 1,332,158 | ||
| MATERIALS - 2.5% | |||
| Chemicals - 2.5% | |||
| DowDuPont, Inc. | 661,701 | 47,126 | |
| Monsanto Co. | 380,000 | 44,376 | |
| The Chemours Co. LLC | 500,000 | 25,030 | |
| 116,532 | |||
| REAL ESTATE - 0.9% | |||
| Equity Real Estate Investment Trusts (REITs) - 0.9% | |||
| American Tower Corp. | 244,100 | 34,826 | |
| Equinix, Inc. | 17,700 | 8,022 | |
| 42,848 | |||
| TELECOMMUNICATION SERVICES - 0.6% | |||
| Wireless Telecommunication Services - 0.6% | |||
| T-Mobile U.S., Inc. (a) | 450,000 | 28,580 | |
| UTILITIES - 1.2% | |||
| Electric Utilities - 1.2% | |||
| NextEra Energy, Inc. | 334,611 | 52,263 | |
| TOTAL COMMON STOCKS | |||
| (Cost $3,037,400) | 4,516,070 | ||
| Money Market Funds - 2.3% | |||
| Fidelity Cash Central Fund, 1.36% (b) | |||
| (Cost $107,610) | 107,588,624 | 107,610 | |
| TOTAL INVESTMENT IN SECURITIES - 100.3% | |||
| (Cost $3,145,010) | 4,623,680 | ||
| NET OTHER ASSETS (LIABILITIES) - (0.3)% | (13,621) | ||
| NET ASSETS - 100% | $4,610,059 |
Legend
(a) Non-income producing
(b) Affiliated fund that is generally available only to investment companies and other accounts managed by Fidelity Investments. The rate quoted is the annualized seven-day yield of the fund at period end. A complete unaudited listing of the fund's holdings as of its most recent quarter end is available upon request. In addition, each Fidelity Central Fund's financial statements are available on the SEC's website or upon request.
Affiliated Central Funds
Information regarding fiscal year to date income earned by the Fund from investments in Fidelity Central Funds is as follows:
| Fund | Income earned |
| (Amounts in thousands) | |
| Fidelity Cash Central Fund | $631 |
| Fidelity Securities Lending Cash Central Fund | 5 |
| Total | $636 |
Amounts in the income column in the above table include any capital gain distributions from underlying funds, which are presented in the corresponding line-item in the Statement of Operations if applicable.
Investment Valuation
The following is a summary of the inputs used, as of December 31, 2017, involving the Fund's assets and liabilities carried at fair value. The inputs or methodology used for valuing securities may not be an indication of the risk associated with investing in those securities. For more information on valuation inputs, and their aggregation into the levels used below, please refer to the Investment Valuation section in the accompanying Notes to Financial Statements.
| Valuation Inputs at Reporting Date: | ||||
| Description | Total | Level 1 | Level 2 | Level 3 |
| (Amounts in thousands) | ||||
| Investments in Securities: | ||||
| Equities: | ||||
| Consumer Discretionary | $443,937 | $443,937 | $-- | $-- |
| Consumer Staples | 306,895 | 278,743 | 28,152 | -- |
| Energy | 124,267 | 124,267 | -- | -- |
| Financials | 821,032 | 821,032 | -- | -- |
| Health Care | 880,301 | 880,301 | -- | -- |
| Industrials | 367,257 | 367,257 | -- | -- |
| Information Technology | 1,332,158 | 1,332,158 | -- | -- |
| Materials | 116,532 | 116,532 | -- | -- |
| Real Estate | 42,848 | 42,848 | -- | -- |
| Telecommunication Services | 28,580 | 28,580 | -- | -- |
| Utilities | 52,263 | 52,263 | -- | -- |
| Money Market Funds | 107,610 | 107,610 | -- | -- |
| Total Investments in Securities: | $4,623,680 | $4,595,528 | $28,152 | $-- |
See accompanying notes which are an integral part of the financial statements.
Financial Statements
Statement of Assets and Liabilities
| Amounts in thousands (except per-share amounts) | December 31, 2017 (Unaudited) | |
| Assets | ||
| Investment in securities, at value — See accompanying schedule: Unaffiliated issuers (cost $3,037,400) | $4,516,070 | |
| Fidelity Central Funds (cost $107,610) | 107,610 | |
| Total Investment in Securities (cost $3,145,010) | $4,623,680 | |
| Receivable for investments sold | 11,425 | |
| Receivable for fund shares sold | 845 | |
| Dividends receivable | 2,775 | |
| Distributions receivable from Fidelity Central Funds | 108 | |
| Prepaid expenses | 8 | |
| Other receivables | 203 | |
| Total assets | 4,639,044 | |
| Liabilities | ||
| Payable to custodian bank | $415 | |
| Payable for investments purchased | 8,425 | |
| Payable for fund shares redeemed | 18,030 | |
| Accrued management fee | 1,284 | |
| Other affiliated payables | 591 | |
| Other payables and accrued expenses | 240 | |
| Total liabilities | 28,985 | |
| Net Assets | $4,610,059 | |
| Net Assets consist of: | ||
| Paid in capital | $3,079,424 | |
| Distributions in excess of net investment income | (2,826) | |
| Accumulated undistributed net realized gain (loss) on investments and foreign currency transactions | 54,802 | |
| Net unrealized appreciation (depreciation) on investments and assets and liabilities in foreign currencies | 1,478,659 | |
| Net Assets | $4,610,059 | |
| Fidelity Fund: | ||
| Net Asset Value, offering price and redemption price per share ($4,155,673 ÷ 91,869 shares) | $45.23 | |
| Class K: | ||
| Net Asset Value, offering price and redemption price per share ($454,386 ÷ 10,050 shares) | $45.21 |
See accompanying notes which are an integral part of the financial statements.
Statement of Operations
| Amounts in thousands | Six months ended December 31, 2017 (Unaudited) | |
| Investment Income | ||
| Dividends | $32,939 | |
| Interest | 12 | |
| Income from Fidelity Central Funds | 636 | |
| Total income | 33,587 | |
| Expenses | ||
| Management fee | $7,581 | |
| Transfer agent fees | 2,983 | |
| Accounting and security lending fees | 532 | |
| Custodian fees and expenses | 38 | |
| Independent trustees' fees and expenses | 9 | |
| Appreciation in deferred trustee compensation account | 1 | |
| Registration fees | 23 | |
| Audit | 41 | |
| Legal | 11 | |
| Miscellaneous | 14 | |
| Total expenses before reductions | 11,233 | |
| Expense reductions | (55) | 11,178 |
| Net investment income (loss) | 22,409 | |
| Realized and Unrealized Gain (Loss) | ||
| Net realized gain (loss) on: | ||
| Investment securities: | ||
| Unaffiliated issuers | 144,724 | |
| Foreign currency transactions | 5 | |
| Futures contracts | 3,143 | |
| Total net realized gain (loss) | 147,872 | |
| Change in net unrealized appreciation (depreciation) on: | ||
| Investment securities: | ||
| Unaffiliated issuers | 403,053 | |
| Assets and liabilities in foreign currencies | 9 | |
| Futures contracts | 389 | |
| Total change in net unrealized appreciation (depreciation) | 403,451 | |
| Net gain (loss) | 551,323 | |
| Net increase (decrease) in net assets resulting from operations | $573,732 |
See accompanying notes which are an integral part of the financial statements.
Statement of Changes in Net Assets
| Amounts in thousands | Six months ended December 31, 2017 (Unaudited) | Year ended June 30, 2017 |
| Increase (Decrease) in Net Assets | ||
| Operations | ||
| Net investment income (loss) | $22,409 | $46,426 |
| Net realized gain (loss) | 147,872 | 514,093 |
| Change in net unrealized appreciation (depreciation) | 403,451 | 31,250 |
| Net increase (decrease) in net assets resulting from operations | 573,732 | 591,769 |
| Distributions to shareholders from net investment income | (45,244) | (45,768) |
| Distributions to shareholders from net realized gain | (472,239) | (254,005) |
| Total distributions | (517,483) | (299,773) |
| Share transactions - net increase (decrease) | 107,174 | (302,961) |
| Total increase (decrease) in net assets | 163,423 | (10,965) |
| Net Assets | ||
| Beginning of period | 4,446,636 | 4,457,601 |
| End of period | $4,610,059 | $4,446,636 |
| Other Information | ||
| Undistributed net investment income end of period | $– | $20,009 |
| Distributions in excess of net investment income end of period | $(2,826) | $– |
See accompanying notes which are an integral part of the financial statements.
Financial Highlights
Fidelity Fund
| Six months ended (Unaudited) December 31, | Years ended June 30, | |||||
| 2017 | 2017 | 2016 | 2015 | 2014 | 2013 | |
| Selected Per–Share Data | ||||||
| Net asset value, beginning of period | $44.92 | $42.04 | $44.69 | $45.42 | $39.77 | $34.51 |
| Income from Investment Operations | ||||||
| Net investment income (loss)A | .22 | .44 | .38 | .34 | .35 | .44 |
| Net realized and unrealized gain (loss) | 5.34 | 5.33 | (.73) | 3.91 | 8.61 | 5.31 |
| Total from investment operations | 5.56 | 5.77 | (.35) | 4.25 | 8.96 | 5.75 |
| Distributions from net investment income | (.45) | (.44) | (.31) | (.30) | (.32) | (.49) |
| Distributions from net realized gain | (4.80) | (2.45) | (1.99) | (4.68) | (2.98) | – |
| Total distributions | (5.25) | (2.89) | (2.30) | (4.98) | (3.31)B | (.49) |
| Net asset value, end of period | $45.23 | $44.92 | $42.04 | $44.69 | $45.42 | $39.77 |
| Total ReturnC,D | 13.43% | 14.34% | (.83)% | 10.52% | 23.70% | 16.85% |
| Ratios to Average Net AssetsE,F | ||||||
| Expenses before reductions | .50%G | .52% | .52% | .52% | .53% | .56% |
| Expenses net of fee waivers, if any | .50%G | .52% | .52% | .52% | .53% | .56% |
| Expenses net of all reductions | .50%G | .51% | .52% | .52% | .53% | .55% |
| Net investment income (loss) | .97%G | 1.04% | .91% | .79% | .82% | 1.18% |
| Supplemental Data | ||||||
| Net assets, end of period (in millions) | $4,156 | $3,884 | $3,762 | $4,143 | $4,811 | $4,451 |
| Portfolio turnover rateH | 28%G | 82% | 67% | 59%I | 93% | 113% |
A Calculated based on average shares outstanding during the period.
B Total distributions of $3.31 per share is comprised of distributions from net investment income of $.324 and distributions from net realized gain of $2.984 per share.
C Total returns for periods of less than one year are not annualized.
D Total returns would have been lower if certain expenses had not been reduced during the applicable periods shown.
E Fees and expenses of any underlying Fidelity Central Funds are not included in the Fund's expense ratio. The Fund indirectly bears its proportionate share of the expenses of any underlying Fidelity Central Funds.
F Expense ratios reflect operating expenses of the class. Expenses before reductions do not reflect amounts reimbursed by the investment adviser or reductions from brokerage service arrangements or reductions from other expense offset arrangements and do not represent the amount paid by the class during periods when reimbursements or reductions occur. Expenses net of fee waivers reflect expenses after reimbursement by the investment adviser but prior to reductions from brokerage service arrangements or other expense offset arrangements. Expenses net of all reductions represent the net expenses paid by the class.
G Annualized
H Amount does not include the portfolio activity of any underlying Fidelity Central Funds.
I Portfolio turnover rate excludes securities received or delivered in-kind.
See accompanying notes which are an integral part of the financial statements.
Fidelity Fund Class K
| Six months ended (Unaudited) December 31, | Years ended June 30, | |||||
| 2017 | 2017 | 2016 | 2015 | 2014 | 2013 | |
| Selected Per–Share Data | ||||||
| Net asset value, beginning of period | $44.92 | $42.04 | $44.69 | $45.42 | $39.78 | $34.52 |
| Income from Investment Operations | ||||||
| Net investment income (loss)A | .24 | .49 | .42 | .39 | .40 | .49 |
| Net realized and unrealized gain (loss) | 5.34 | 5.32 | (.72) | 3.91 | 8.60 | 5.31 |
| Total from investment operations | 5.58 | 5.81 | (.30) | 4.30 | 9.00 | 5.80 |
| Distributions from net investment income | (.49) | (.48) | (.36) | (.35) | (.38) | (.54) |
| Distributions from net realized gain | (4.80) | (2.45) | (1.99) | (4.68) | (2.98) | – |
| Total distributions | (5.29) | (2.93) | (2.35) | (5.03) | (3.36) | (.54) |
| Net asset value, end of period | $45.21 | $44.92 | $42.04 | $44.69 | $45.42 | $39.78 |
| Total ReturnB,C | 13.49% | 14.46% | (.72)% | 10.65% | 23.83% | 17.03% |
| Ratios to Average Net AssetsD,E | ||||||
| Expenses before reductions | .41%F | .41% | .41% | .41% | .41% | .42% |
| Expenses net of fee waivers, if any | .41%F | .41% | .41% | .41% | .41% | .42% |
| Expenses net of all reductions | .41%F | .41% | .41% | .41% | .41% | .41% |
| Net investment income (loss) | 1.07%F | 1.14% | 1.02% | .90% | .94% | 1.32% |
| Supplemental Data | ||||||
| Net assets, end of period (in millions) | $454 | $563 | $696 | $952 | $1,119 | $994 |
| Portfolio turnover rateG | 28%F | 82% | 67% | 59%H | 93% | 113% |
A Calculated based on average shares outstanding during the period.
B Total returns for periods of less than one year are not annualized.
C Total returns would have been lower if certain expenses had not been reduced during the applicable periods shown.
D Fees and expenses of any underlying Fidelity Central Funds are not included in the Fund's expense ratio. The Fund indirectly bears its proportionate share of the expenses of any underlying Fidelity Central Funds.
E Expense ratios reflect operating expenses of the class. Expenses before reductions do not reflect amounts reimbursed by the investment adviser or reductions from brokerage service arrangements or reductions from other expense offset arrangements and do not represent the amount paid by the class during periods when reimbursements or reductions occur. Expenses net of fee waivers reflect expenses after reimbursement by the investment adviser but prior to reductions from brokerage service arrangements or other expense offset arrangements. Expenses net of all reductions represent the net expenses paid by the class.
F Annualized
G Amount does not include the portfolio activity of any underlying Fidelity Central Funds.
H Portfolio turnover rate excludes securities received or delivered in-kind.
See accompanying notes which are an integral part of the financial statements.
Notes to Financial Statements (Unaudited)
For the period ended December 31, 2017
(Amounts in thousands except percentages)
1. Organization.
Fidelity Fund (the Fund) is a fund of Fidelity Hastings Street Trust (the Trust) and is authorized to issue an unlimited number of shares. The Trust is registered under the Investment Company Act of 1940, as amended (the 1940 Act), as an open-end management investment company organized as a Massachusetts business trust. The Fund offers Fidelity Fund and Class K shares, each of which has equal rights as to assets and voting privileges. Each class has exclusive voting rights with respect to matters that affect that class.
2. Investments in Fidelity Central Funds.
The Fund invests in Fidelity Central Funds, which are open-end investment companies generally available only to other investment companies and accounts managed by the investment adviser and its affiliates. The Fund's Schedule of Investments lists each of the Fidelity Central Funds held as of period end, if any, as an investment of the Fund, but does not include the underlying holdings of each Fidelity Central Fund. As an Investing Fund, the Fund indirectly bears its proportionate share of the expenses of the underlying Fidelity Central Funds.
The Money Market Central Funds seek preservation of capital and current income and are managed by Fidelity Investments Money Management, Inc. (FIMM), an affiliate of the investment adviser. Annualized expenses of the Money Market Central Funds as of their most recent shareholder report date are less than .005%.
A complete unaudited list of holdings for each Fidelity Central Fund is available upon request or at the Securities and Exchange Commission (the SEC) website at www.sec.gov. In addition, the financial statements of the Fidelity Central Funds are available on the SEC website or upon request.
3. Significant Accounting Policies.
The Fund is an investment company and applies the accounting and reporting guidance of the Financial Accounting Standards Board (FASB) Accounting Standards Codification Topic 946 Financial Services – Investments Companies. The financial statements have been prepared in conformity with accounting principles generally accepted in the United States of America (GAAP), which require management to make certain estimates and assumptions at the date of the financial statements. Actual results could differ from those estimates. Subsequent events, if any, through the date that the financial statements were issued have been evaluated in the preparation of the financial statements. The following summarizes the significant accounting policies of the Fund:
Investment Valuation. Investments are valued as of 4:00 p.m. Eastern time on the last calendar day of the period. The Board of Trustees (the Board) has delegated the day to day responsibility for the valuation of the Fund's investments to the Fair Value Committee (the Committee) established by the Fund's investment adviser. In accordance with valuation policies and procedures approved by the Board, the Fund attempts to obtain prices from one or more third party pricing vendors or brokers to value its investments. When current market prices, quotations or currency exchange rates are not readily available or reliable, investments will be fair valued in good faith by the Committee, in accordance with procedures adopted by the Board. Factors used in determining fair value vary by investment type and may include market or investment specific events. The frequency with which these procedures are used cannot be predicted and they may be utilized to a significant extent. The Committee oversees the Fund's valuation policies and procedures and reports to the Board on the Committee's activities and fair value determinations. The Board monitors the appropriateness of the procedures used in valuing the Fund's investments and ratifies the fair value determinations of the Committee.
The Fund categorizes the inputs to valuation techniques used to value its investments into a disclosure hierarchy consisting of three levels as shown below:
- Level 1 – quoted prices in active markets for identical investments
- Level 2 – other significant observable inputs (including quoted prices for similar investments, interest rates, prepayment speeds, etc.)
- Level 3 – unobservable inputs (including the Fund's own assumptions based on the best information available)
Valuation techniques used to value the Fund's investments by major category are as follows:
Equity securities, including restricted securities, for which market quotations are readily available, are valued at the last reported sale price or official closing price as reported by a third party pricing vendor on the primary market or exchange on which they are traded and are categorized as Level 1 in the hierarchy. In the event there were no sales during the day or closing prices are not available, securities are valued at the last quoted bid price or may be valued using the last available price and are generally categorized as Level 2 in the hierarchy. For foreign equity securities, when market or security specific events arise, comparisons to the valuation of American Depositary Receipts (ADRs), futures contracts, Exchange-Traded Funds (ETFs) and certain indexes as well as quoted prices for similar securities may be used and would be categorized as Level 2 in the hierarchy. Utilizing these techniques may result in transfers between Level 1 and Level 2. For equity securities, including restricted securities, where observable inputs are limited, assumptions about market activity and risk are used and these securities may be categorized as Level 3 in the hierarchy.
Investments in open-end mutual funds, including the Fidelity Central Funds, are valued at their closing net asset value (NAV) each business day and are categorized as Level 1 in the hierarchy.
Changes in valuation techniques may result in transfers in or out of an assigned level within the disclosure hierarchy. The aggregate value of investments by input level as of December 31, 2017 is included at the end of the Fund's Schedule of Investments.
Foreign Currency. The Fund may use foreign currency contracts to facilitate transactions in foreign-denominated securities. Gains and losses from these transactions may arise from changes in the value of the foreign currency or if the counterparties do not perform under the contracts' terms.
Foreign-denominated assets, including investment securities, and liabilities are translated into U.S. dollars at the exchange rates at period end. Purchases and sales of investment securities, income and dividends received and expenses denominated in foreign currencies are translated into U.S. dollars at the exchange rate in effect on the transaction date.
The effects of exchange rate fluctuations on investments are included with the net realized and unrealized gain (loss) on investment securities. Other foreign currency transactions resulting in realized and unrealized gain (loss) are disclosed separately.
Investment Transactions and Income. For financial reporting purposes, the Fund's investment holdings and NAV include trades executed through the end of the last business day of the period. The NAV per share for processing shareholder transactions is calculated as of the close of business of the New York Stock Exchange (NYSE), normally 4:00 p.m. Eastern time and includes trades executed through the end of the prior business day. Gains and losses on securities sold are determined on the basis of identified cost and includes proceeds received from litigation. Dividend income is recorded on the ex-dividend date, except for certain dividends from foreign securities where the ex-dividend date may have passed, which are recorded as soon as the Fund is informed of the ex-dividend date. Non-cash dividends included in dividend income, if any, are recorded at the fair market value of the securities received. Income and capital gain distributions from Fidelity Central Funds, if any, are recorded on the ex-dividend date. Certain distributions received by the Fund represent a return of capital or capital gain. The Fund determines the components of these distributions subsequent to the ex-dividend date, based upon receipt of tax filings or other correspondence relating to the underlying investment. These distributions are recorded as a reduction of cost of investments and/or as a realized gain. Interest income is accrued as earned and includes coupon interest and amortization of premium and accretion of discount on debt securities as applicable. Investment income is recorded net of foreign taxes withheld where recovery of such taxes is uncertain.
Class Allocations and Expenses. Investment income, realized and unrealized capital gains and losses, common expenses of the Fund, and certain fund-level expense reductions, if any, are allocated daily on a pro-rata basis to each class based on the relative net assets of each class to the total net assets of the Fund. Each class differs with respect to transfer agent fees incurred. Certain expense reductions may also differ by class. For the reporting period, the allocated portion of income and expenses to each class as a percent of its average net assets may vary due to the timing of recording these transactions in relation to fluctuating net assets of the classes. Expenses directly attributable to a fund are charged to that fund. Expenses attributable to more than one fund are allocated among the respective funds on the basis of relative net assets or other appropriate methods. Expense estimates are accrued in the period to which they relate and adjustments are made when actual amounts are known.
Deferred Trustee Compensation. Under a Deferred Compensation Plan (the Plan), independent Trustees may elect to defer receipt of a portion of their annual compensation. Deferred amounts are invested in a cross-section of Fidelity funds, are marked-to-market and remain in the Fund until distributed in accordance with the Plan. The investment of deferred amounts and the offsetting payable to the Trustees are included in the accompanying Statement of Assets and Liabilities.
Income Tax Information and Distributions to Shareholders. Each year, the Fund intends to qualify as a regulated investment company under Subchapter M of the Internal Revenue Code, including distributing substantially all of its taxable income and realized gains. As a result, no provision for U.S. Federal income taxes is required. The Fund files a U.S. federal tax return, in addition to state and local tax returns as required. The Fund's federal income tax returns are subject to examination by the Internal Revenue Service (IRS) for a period of three fiscal years after they are filed. State and local tax returns may be subject to examination for an additional fiscal year depending on the jurisdiction. Foreign taxes are provided for based on the Fund's understanding of the tax rules and rates that exist in the foreign markets in which it invests.
Distributions are declared and recorded on the ex-dividend date. Income dividends and capital gain distributions are declared separately for each class. Income and capital gain distributions are determined in accordance with income tax regulations, which may differ from GAAP.
Capital accounts within the financial statements are adjusted for permanent book-tax differences. These adjustments have no impact on net assets or the results of operations. Capital accounts are not adjusted for temporary book-tax differences which will reverse in a subsequent period.
Book-tax differences are primarily due to futures contracts, foreign currency transactions, passive foreign investment companies (PFIC), market discount, partnerships, deferred trustees compensation and losses deferred due to wash sales.
As of period end, the cost and unrealized appreciation (depreciation) in securities, and derivatives if applicable, for federal income tax purposes were as follows:
| Gross unrealized appreciation | $1,492,945 |
| Gross unrealized depreciation | (18,524) |
| Net unrealized appreciation (depreciation) | $1,474,421 |
| Tax cost | $3,149,259 |
4. Derivative Instruments.
Risk Exposures and the Use of Derivative Instruments. The Fund's investment objective allows the Fund to enter into various types of derivative contracts, including futures contracts. Derivatives are investments whose value is primarily derived from underlying assets, indices or reference rates and may be transacted on an exchange or over-the-counter (OTC). Derivatives may involve a future commitment to buy or sell a specified asset based on specified terms, to exchange future cash flows at periodic intervals based on a notional principal amount, or for one party to make one or more payments upon the occurrence of specified events in exchange for periodic payments from the other party.
The Fund used derivatives to increase returns and to manage exposure to certain risks as defined below. The success of any strategy involving derivatives depends on analysis of numerous economic factors, and if the strategies for investment do not work as intended, the Fund may not achieve its objectives.
The Fund's use of derivatives increased or decreased its exposure to the following risk:
| Equity Risk | Equity risk relates to the fluctuations in the value of financial instruments as a result of changes in market prices (other than those arising from interest rate risk or foreign exchange risk), whether caused by factors specific to an individual investment, its issuer, or all factors affecting all instruments traded in a market or market segment. |
The Fund is also exposed to additional risks from investing in derivatives, such as liquidity risk and counterparty credit risk. Liquidity risk is the risk that the Fund will be unable to close out the derivative in the open market in a timely manner. Counterparty credit risk is the risk that the counterparty will not be able to fulfill its obligation to the Fund. Counterparty credit risk related to exchange-traded futures contracts may be mitigated by the protection provided by the exchange on which they trade.
Investing in derivatives may involve greater risks than investing in the underlying assets directly and, to varying degrees, may involve risk of loss in excess of any initial investment and collateral received and amounts recognized in the Statement of Assets and Liabilities. In addition, there may be the risk that the change in value of the derivative contract does not correspond to the change in value of the underlying instrument.
Futures Contracts. A futures contract is an agreement between two parties to buy or sell a specified underlying instrument for a fixed price at a specified future date. The Fund used futures contracts to manage its exposure to the stock market.
Upon entering into a futures contract, a fund is required to deposit either cash or securities (initial margin) with a clearing broker in an amount equal to a certain percentage of the face value of the contract. Futures contracts are marked-to-market daily and subsequent daily payments (variation margin) are made or received by a fund depending on the daily fluctuations in the value of the futures contracts and are recorded as unrealized appreciation or (depreciation). This receivable and/or payable, if any, is included in daily variation margin on futures contracts in the Statement of Assets and Liabilities. Realized gain or (loss) is recorded upon the expiration or closing of a futures contract. The net realized gain (loss) and change in net unrealized appreciation (depreciation) on futures contracts during the period is presented in the Statement of Operations.
Any open futures contracts at period end are presented in the Schedule of Investments under the caption "Futures Contracts". The notional amount at value reflects each contract's exposure to the underlying instrument or index at period end.
5. Purchases and Sales of Investments.
Purchases and sales of securities, other than short-term securities, aggregated $628,589 and $1,000,537, respectively.
6. Fees and Other Transactions with Affiliates.
Management Fee. Fidelity Management & Research Company (the investment adviser) and its affiliates provide the Fund with investment management related services for which the Fund pays a monthly management fee. The management fee is the sum of an individual fund fee rate that is based on an annual rate of .09% of the Fund's average net assets and an annualized group fee rate that averaged .24% during the period. The group fee rate is based upon the average net assets of all the mutual funds advised by the investment adviser, including any mutual funds previously advised by the investment adviser that are currently advised by Fidelity SelectCo, LLC, an affiliate of the investment adviser. The group fee rate decreases as assets under management increase and increases as assets under management decrease. For the reporting period, the total annualized management fee rate was .33% of the Fund's average net assets.
Transfer Agent Fees. Fidelity Investments Institutional Operations Company, Inc., (FIIOC), an affiliate of the investment adviser, is the transfer, dividend disbursing and shareholder servicing agent for each class of the Fund. FIIOC receives account fees and asset-based fees that vary according to the account size and type of account of the shareholders of Fidelity Fund, except for Class K. FIIOC receives an asset-based fee of Class K's average net assets. FIIOC pays for typesetting, printing and mailing of shareholder reports, except proxy statements.
For the period, transfer agent fees for each class were as follows:
| Amount | % of Class-Level Average Net Assets(a) | |
| Fidelity Fund | $2,860 | .14 |
| Class K | 123 | .05 |
| $2,983 |
(a) Annualized
Accounting and Security Lending Fees. Fidelity Service Company, Inc. (FSC), an affiliate of the investment adviser, maintains the Fund's accounting records. The accounting fee is based on the level of average net assets for each month. Under a separate contract, FSC administers the security lending program. The security lending fee is based on the number and duration of lending transactions.
Brokerage Commissions. The Fund placed a portion of its portfolio transactions with brokerage firms which are affiliates of the investment adviser. Brokerage commissions are included in net realized gain (loss) and change in net unrealized appreciation (depreciation) in the Statement of Operations. The commissions paid to these affiliated firms were $17 for the period.
Interfund Trades. The Fund may purchase from or sell securities to other Fidelity Funds under procedures adopted by the Board. The procedures have been designed to ensure these interfund trades are executed in accordance with Rule 17a-7 of the 1940 Act. Interfund trades are included within the respective purchases and sales amounts shown in the Purchases and Sales of Investments note.
7. Committed Line of Credit.
The Fund participates with other funds managed by the investment adviser or an affiliate in a $4.25 billion credit facility (the "line of credit") to be utilized for temporary or emergency purposes to fund shareholder redemptions or for other short-term liquidity purposes. The Fund has agreed to pay commitment fees on its pro-rata portion of the line of credit, which amounted to $7 and is reflected in Miscellaneous expenses on the Statement of Operations. During the period, the Fund did not borrow on this line of credit.
8. Security Lending.
The Fund lends portfolio securities through a lending agent from time to time in order to earn additional income. For equity securities, a lending agent is used and may loan securities to certain qualified borrowers, including Fidelity Capital Markets (FCM), a broker-dealer affiliated with the Fund. On the settlement date of the loan, the Fund receives collateral (in the form of U.S. Treasury obligations, letters of credit and/or cash) against the loaned securities and maintains collateral in an amount not less than 100% of the market value of the loaned securities during the period of the loan. The market value of the loaned securities is determined at the close of business of the Fund and any additional required collateral is delivered to the Fund on the next business day. The Fund or borrower may terminate the loan at any time, and if the borrower defaults on its obligation to return the securities loaned because of insolvency or other reasons, the Fund may apply collateral received from the borrower against the obligation. The Fund may experience delays and costs in recovering the securities loaned. Any cash collateral received is invested in the Fidelity Securities Lending Cash Central Fund. At period end, there were no security loans outstanding. Security lending income represents the income earned on investing cash collateral, less rebates paid to borrowers and any lending agent fees associated with the loan, plus any premium payments received for lending certain types of securities. Security lending income is presented in the Statement of Operations as a component of income from Fidelity Central Funds. Total security lending income during the period amounted to $5. During the period, there were no securities loaned to FCM.
9. Expense Reductions.
Commissions paid to certain brokers with whom the investment adviser, or its affiliates, places trades on behalf of the Fund include an amount in addition to trade execution, which may be rebated back to the Fund to offset certain expenses. This amount totaled $35 for the period.
In addition, during the period the investment adviser reimbursed and/or waived a portion of fund-level operating expenses in the amount of $20.
10. Distributions to Shareholders.
Distributions to shareholders of each class were as follows:
| Six months ended December 31, 2017 | Year ended June 30, 2017 | |
| From net investment income | ||
| Fidelity Fund | $39,636 | $38,394 |
| Class K | 5,608 | 7,374 |
| Total | $45,244 | $45,768 |
| From net realized gain | ||
| Fidelity Fund | $414,639 | $216,202 |
| Class K | 57,600 | 37,803 |
| Total | $472,239 | $254,005 |
11. Share Transactions.
Share transactions for each class were as follows and may contain automatic conversions between classes or exchanges between affiliated funds:
| Shares | Shares | Dollars | Dollars | |
| Six months ended December 31, 2017 | Year ended June 30, 2017 | Six months ended December 31, 2017 | Year ended June 30, 2017 | |
| Fidelity Fund | ||||
| Shares sold | 1,047 | 2,301 | $46,694 | $98,348 |
| Reinvestment of distributions | 9,897 | 5,609 | 419,088 | 234,849 |
| Shares redeemed | (5,534) | (10,936) | (246,186) | (466,956) |
| Net increase (decrease) | 5,410 | (3,026) | $219,596 | $(133,759) |
| Class K | ||||
| Shares sold | 550 | 1,298 | $24,555 | $55,407 |
| Reinvestment of distributions | 1,498 | 1,079 | 63,208 | 45,177 |
| Shares redeemed | (4,527) | (6,399) | (200,185) | (269,786) |
| Net increase (decrease) | (2,479) | (4,022) | $(112,422) | $(169,202) |
12. Other.
The Fund's organizational documents provide former and current trustees and officers with a limited indemnification against liabilities arising in connection with the performance of their duties to the Fund. In the normal course of business, the Fund may also enter into contracts that provide general indemnifications. The Fund's maximum exposure under these arrangements is unknown as this would be dependent on future claims that may be made against the Fund. The risk of material loss from such claims is considered remote.
Shareholder Expense Example
As a shareholder of a Fund, you incur two types of costs: (1) transaction costs and (2) ongoing costs, including management fees and other Fund expenses. This Example is intended to help you understand your ongoing costs (in dollars) of investing in the Funds and to compare these costs with the ongoing costs of investing in other mutual funds.
The Example is based on an investment of $1,000 invested at the beginning of the period and held for the entire period (July 1, 2017 to December 31, 2017).
Actual Expenses
The first line of the accompanying table for each class of the Fund provides information about actual account values and actual expenses. You may use the information in this line, together with the amount you invested, to estimate the expenses that you paid over the period. Simply divide your account value by $1,000.00 (for example, an $8,600 account value divided by $1,000.00 = 8.6), then multiply the result by the number in the first line for a class of the Fund under the heading entitled "Expenses Paid During Period" to estimate the expenses you paid on your account during this period. A small balance maintenance fee of $12.00 that is charged once a year may apply for certain accounts with a value of less than $2,000. This fee is not included in the table below. If it was, the estimate of expenses you paid during the period would be higher, and your ending account value lower, by this amount. In addition, the Fund, as a shareholder in the underlying Fidelity Central Funds, will indirectly bear its pro-rata share of the fees and expenses incurred by the underlying Fidelity Central Funds. These fees and expenses are not included in the Fund's annualized expense ratio used to calculate the expense estimate in the table below.
Hypothetical Example for Comparison Purposes
The second line of the accompanying table for each class of the Fund provides information about hypothetical account values and hypothetical expenses based on a Class' actual expense ratio and an assumed rate of return of 5% per year before expenses, which is not the Class' actual return. The hypothetical account values and expenses may not be used to estimate the actual ending account balance or expenses you paid for the period. You may use this information to compare the ongoing costs of investing in the Fund and other funds. To do so, compare this 5% hypothetical example with the 5% hypothetical examples that appear in the shareholder reports of the other funds. A small balance maintenance fee of $12.00 that is charged once a year may apply for certain accounts with a value of less than $2,000. This fee is not included in the table below. If it was, the estimate of expenses you paid during the period would be higher, and your ending account value lower, by this amount. In addition, the Fund, as a shareholder in the underlying Fidelity Central Funds, will indirectly bear its pro-rata share of the fees and expenses incurred by the underlying Fidelity Central Funds. These fees and expenses are not included in the Fund's annualized expense ratio used to calculate the expense estimate in the table below.
Please note that the expenses shown in the table are meant to highlight your ongoing costs only and do not reflect any transaction costs. Therefore, the second line of the table is useful in comparing ongoing costs only, and will not help you determine the relative total costs of owning different funds.
| Annualized Expense Ratio-A | Beginning Account Value July 1, 2017 | Ending Account Value December 31, 2017 | Expenses Paid During Period-B July 1, 2017 to December 31, 2017 | |
| Fidelity Fund | .50% | |||
| Actual | $1,000.00 | $1,134.30 | $2.69 | |
| Hypothetical-C | $1,000.00 | $1,022.68 | $2.55 | |
| Class K | .41% | |||
| Actual | $1,000.00 | $1,134.90 | $2.21 | |
| Hypothetical-C | $1,000.00 | $1,023.14 | $2.09 |
A Annualized expense ratio reflects expenses net of applicable fee waivers.
B Expenses are equal to each Class' annualized expense ratio, multiplied by the average account value over the period, multiplied by 184/365 (to reflect the one-half year period).
C 5% return per year before expenses
Board Approval of Investment Advisory Contracts and Management Fees
Fidelity Fund
Each year, the Board of Trustees, including the Independent Trustees (together, the Board), votes on the renewal of the management contract with Fidelity Management & Research Company (FMR) and the sub-advisory agreements (together, the Advisory Contracts) for the fund. FMR and the sub-advisers are referred to herein as the Investment Advisers. The Board, assisted by the advice of fund counsel and Independent Trustees' counsel, requests and considers a broad range of information relevant to the renewal of the Advisory Contracts throughout the year.
The Board meets regularly and, at each of its meetings, covers an extensive agenda of topics and materials and considers factors that are relevant to its annual consideration of the renewal of the fund's Advisory Contracts, including the services and support provided to the fund and its shareholders. The Board has established various standing committees (Committees), each composed of and chaired by Independent Trustees with varying backgrounds, to which the Board has assigned specific subject matter responsibilities in order to enhance effective decision-making by the Board. The Board, acting directly and through its Committees, requests and receives information concerning the annual consideration of the renewal of the fund's Advisory Contracts. The Board also meets as needed to review matters specifically related to the Board's annual consideration of the renewal of the Advisory Contracts. Members of the Board may also meet with trustees of other Fidelity funds through ad hoc joint committees to discuss certain matters relevant to all of the Fidelity funds.
At its July 2017 meeting, the Board unanimously determined to renew the fund's Advisory Contracts. In reaching its determination, the Board considered all factors it believed relevant, including (i) the nature, extent, and quality of the services to be provided to the fund and its shareholders (including the investment performance of the fund); (ii) the competitiveness of the fund's management fee and total expense ratio relative to peer funds; (iii) the total costs of the services to be provided by and the profits to be realized by Fidelity from its relationships with the fund; and (iv) the extent to which, if any, economies of scale exist and would be realized as the fund grows, and whether any economies of scale are appropriately shared with fund shareholders.
In considering whether to renew the Advisory Contracts for the fund, the Board reached a determination, with the assistance of fund counsel and Independent Trustees' counsel and through the exercise of its business judgment, that the renewal of the Advisory Contracts was in the best interests of the fund and its shareholders and that the compensation payable under the Advisory Contracts was fair and reasonable. The Board's decision to renew the Advisory Contracts was not based on any single factor, but rather was based on a comprehensive consideration of all the information provided to the Board at its meetings throughout the year. The Board, in reaching its determination to renew the Advisory Contracts, was aware that shareholders of the fund have a broad range of investment choices available to them, including a wide choice among funds offered by Fidelity's competitors, and that the fund's shareholders, who have the opportunity to review and weigh the disclosure provided by the fund in its prospectus and other public disclosures, have chosen to invest in this fund, which is part of the Fidelity family of funds.
Amendment to Group Fee Rate. The Board also approved an amendment to the management contract for the fund to add an additional breakpoint to the group fee schedule, effective October 1, 2017. The Board noted that the additional breakpoint would result in lower management fee rates as Fidelity's assets under management increase.
Nature, Extent, and Quality of Services Provided. The Board considered Fidelity's staffing as it relates to the fund, including the backgrounds of investment personnel of Fidelity, and also considered the fund's investment objective, strategies, and related investment philosophy. The Independent Trustees also had discussions with senior management of Fidelity's investment operations and investment groups. The Board considered the structure of the investment personnel compensation program and whether this structure provides appropriate incentives to act in the best interests of the fund. Additionally, the Board considered the portfolio managers' investments, if any, in the funds that they manage.Resources Dedicated to Investment Management and Support Services. The Board and the Fund Oversight and Research Committees reviewed the general qualifications and capabilities of Fidelity's investment staff, including its size, education, experience, and resources, as well as Fidelity's approach to recruiting, training, managing, and compensating investment personnel. The Board noted that Fidelity has continued to increase the resources devoted to non-U.S. offices, including expansion of Fidelity's global investment organization. The Board also noted that Fidelity's analysts have extensive resources, tools and capabilities that allow them to conduct sophisticated quantitative and fundamental analysis, as well as credit analysis of issuers, counterparties and guarantors. Further, the Board considered that Fidelity's investment professionals have sufficient access to global information and data so as to provide competitive investment results over time, and that those professionals also have access to sophisticated tools that permit them to assess portfolio construction and risk and performance attribution characteristics continuously, as well as to transmit new information and research conclusions rapidly around the world. Additionally, in its deliberations, the Board considered Fidelity's trading, risk management, compliance, and technology and operations capabilities and resources, which are integral parts of the investment management process.Shareholder and Administrative Services. The Board considered (i) the nature, extent, quality, and cost of advisory, administrative, and shareholder services performed by the Investment Advisers and their affiliates under the Advisory Contracts and under separate agreements covering transfer agency, pricing and bookkeeping, and securities lending services for the fund; (ii) the nature and extent of the supervision of third party service providers, principally custodians, subcustodians, and pricing vendors; and (iii) the resources devoted to, and the record of compliance with, the fund's compliance policies and procedures. The Board also reviewed the allocation of fund brokerage, including allocations to brokers affiliated with the Investment Advisers, the use of brokerage commissions to pay fund expenses, and the use of "soft" commission dollars to pay for research services.The Board noted that the growth of fund assets over time across the complex allows Fidelity to reinvest in the development of services designed to enhance the value or convenience of the Fidelity funds as investment vehicles. These services include 24-hour access to account information and market information through telephone representatives and over the Internet, investor education materials and asset allocation tools, and the expanded availability of Fidelity Investor Centers.In 2014, the Board formed an ad hoc Committee on Transfer Agency Fees to review the variety of transfer agency fee structures throughout the industry and Fidelity's competitive positioning with respect to industry participants.Investment in a Large Fund Family. The Board considered the benefits to shareholders of investing in a Fidelity fund, including the benefits of investing in a fund that is part of a large family of funds offering a variety of investment disciplines and providing a large variety of mutual fund investor services. The Board noted that Fidelity had taken, or had made recommendations that resulted in the Fidelity funds taking, a number of actions over the previous year that benefited particular funds, including: (i) continuing to dedicate additional resources to Fidelity's investment research process, and to the support of the senior management team that oversees asset management; (ii) continuing efforts to enhance Fidelity's global research capabilities; (iii) launching new funds and making other enhancements to meet client needs; (iv) launching new share classes of existing funds; (v) eliminating purchase minimums and broadening eligibility requirements for certain lower-priced share classes; (vi) reducing management fees and total expenses for certain growth equity funds and index funds; (vii) lowering expense caps for certain existing funds and classes to reduce expenses borne by shareholders; (viii) eliminating short-term redemption fees for certain funds; (ix) introducing a new pricing structure for certain funds of funds that is expected to reduce overall expenses paid by shareholders; (x) rationalizing product lines and gaining increased efficiencies through proposals for fund mergers and share class consolidations; (xi) continuing to develop, acquire and implement systems and technology to improve services to the funds and shareholders, strengthen information security, and increase efficiency; and (xii) implementing enhancements to further strengthen Fidelity's product line to increase investors' probability of success in achieving their investment goals, including retirement income goals.Investment Performance. The Board considered whether the fund has operated in accordance with its investment objective, as well as its record of compliance with its investment restrictions and its performance history.The Board took into account discussions with representatives of the Investment Advisers about fund investment performance that occur at Board meetings throughout the year. In this regard the Board noted that as part of regularly scheduled fund reviews and other reports to the Board on fund performance, the Board considers annualized return information for the fund for different time periods, measured against a securities market index ("benchmark index") and a peer group of funds with similar objectives ("peer group"), if any. In its evaluation of fund investment performance, the Board gave particular attention to information indicating changes in performance of certain Fidelity funds for specific time periods and discussed with the Investment Advisers the reasons for any overperformance or underperformance.In addition to reviewing absolute and relative fund performance, the Independent Trustees periodically consider the appropriateness of fund performance metrics in evaluating the results achieved. In general, the Independent Trustees believe that fund performance should be evaluated based on net performance (after fees and expenses) of both the highest performing and lowest performing fund share classes, where applicable, compared to appropriate benchmark indices, over appropriate time periods that may include full market cycles, and compared to peer groups, as applicable, over the same periods, taking into account relevant factors including the following: general market conditions; issuer-specific information; and fund cash flows and other factors.The Independent Trustees recognize that shareholders evaluate performance on a net basis over their own holding periods, for which one-, three-, and five-year periods are often used as a proxy. For this reason, the performance information reviewed by the Board also included net cumulative calendar year total return information for the fund and an appropriate benchmark index and peer group for the most recent one-, three-, and five-year periods, as shown below. Returns are shown compared to the 25th percentile (top of box, 75% beaten) and 75th percentile (bottom of box, 25% beaten) of the peer universe.Fidelity Fund
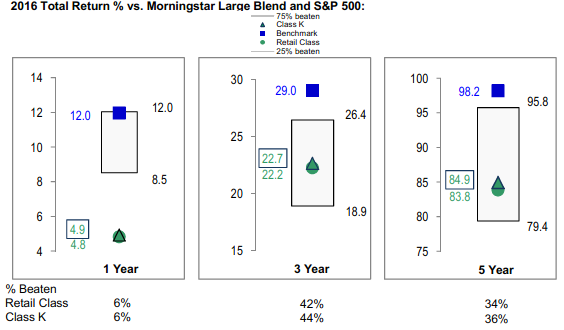
Fidelity Fund
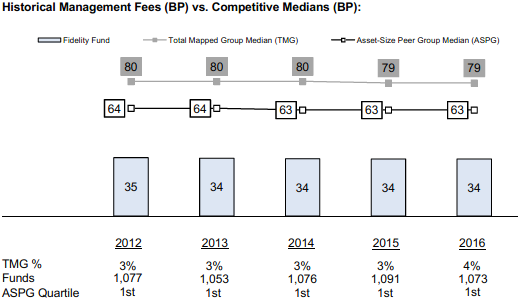
![]()
Corporate Headquarters
245 Summer St.
Boston, MA 02210
www.fidelity.com
FID-K-SANN-0218
1.863258.109
Fidelity® Growth Discovery Fund Semi-Annual Report December 31, 2017 |
|
Contents
Board Approval of Investment Advisory Contracts and Management Fees |
To view a fund's proxy voting guidelines and proxy voting record for the 12-month period ended June 30, visit http://www.fidelity.com/proxyvotingresults or visit the Securities and Exchange Commission's (SEC) web site at http://www.sec.gov.
You may also call 1-800-544-8544 to request a free copy of the proxy voting guidelines.
Standard & Poor's, S&P and S&P 500 are registered service marks of The McGraw-Hill Companies, Inc. and have been licensed for use by Fidelity Distributors Corporation.
Other third-party marks appearing herein are the property of their respective owners.
All other marks appearing herein are registered or unregistered trademarks or service marks of FMR LLC or an affiliated company. © 2018 FMR LLC. All rights reserved.
This report and the financial statements contained herein are submitted for the general information of the shareholders of the Fund. This report is not authorized for distribution to prospective investors in the Fund unless preceded or accompanied by an effective prospectus.
A fund files its complete schedule of portfolio holdings with the SEC for the first and third quarters of each fiscal year on Form N-Q. Forms N-Q are available on the SEC’s web site at http://www.sec.gov. A fund's Forms N-Q may be reviewed and copied at the SEC’s Public Reference Room in Washington, DC. Information regarding the operation of the SEC's Public Reference Room may be obtained by calling 1-800-SEC-0330.
For a complete list of a fund's portfolio holdings, view the most recent holdings listing, semiannual report, or annual report on Fidelity's web site at http://www.fidelity.com, http://www.institutional.fidelity.com, or http://www.401k.com, as applicable.
NOT FDIC INSURED •MAY LOSE VALUE •NO BANK GUARANTEE
Neither the Fund nor Fidelity Distributors Corporation is a bank.
Investment Summary (Unaudited)
Top Ten Stocks as of December 31, 2017
| % of fund's net assets | |
| Alphabet, Inc. Class A | 6.6 |
| Microsoft Corp. | 5.0 |
| Amazon.com, Inc. | 4.7 |
| Home Depot, Inc. | 3.1 |
| Charles Schwab Corp. | 2.9 |
| Facebook, Inc. Class A | 2.9 |
| Apple, Inc. | 2.8 |
| Visa, Inc. Class A | 2.4 |
| Adobe Systems, Inc. | 2.2 |
| JPMorgan Chase & Co. | 1.9 |
| 34.5 |
Top Five Market Sectors as of December 31, 2017
| % of fund's net assets | |
| Information Technology | 40.6 |
| Financials | 12.0 |
| Consumer Discretionary | 11.8 |
| Health Care | 10.0 |
| Industrials | 8.0 |
Asset Allocation (% of fund's net assets)
| As of December 31, 2017* | ||
| Stocks | 95.3% | |
| Convertible Securities | 0.5% | |
| Short-Term Investments and Net Other Assets (Liabilities) | 4.2% | |

* Foreign investments - 11.4%
Investments December 31, 2017 (Unaudited)
Showing Percentage of Net Assets
| Common Stocks - 95.1% | |||
| Shares | Value (000s) | ||
| CONSUMER DISCRETIONARY - 11.8% | |||
| Diversified Consumer Services - 0.5% | |||
| Grand Canyon Education, Inc. (a) | 104,500 | $9,356 | |
| Hotels, Restaurants & Leisure - 0.4% | |||
| Marriott International, Inc. Class A | 30,100 | 4,085 | |
| Wingstop, Inc. | 82,300 | 3,208 | |
| 7,293 | |||
| Household Durables - 1.1% | |||
| Gree Electric Appliances, Inc. of Zhuhai Class A | 168,500 | 1,132 | |
| Panasonic Corp. | 1,177,300 | 17,181 | |
| 18,313 | |||
| Internet & Direct Marketing Retail - 4.9% | |||
| Amazon.com, Inc. (a) | 70,100 | 81,980 | |
| Priceline Group, Inc.(a) | 1,800 | 3,128 | |
| 85,108 | |||
| Media - 1.1% | |||
| Charter Communications, Inc. Class A (a) | 57,200 | 19,217 | |
| China Literature Ltd. (a)(b) | 286 | 3 | |
| 19,220 | |||
| Specialty Retail - 3.1% | |||
| Home Depot, Inc. | 281,924 | 53,433 | |
| Textiles, Apparel & Luxury Goods - 0.7% | |||
| Kering SA | 2,500 | 1,179 | |
| LVMH Moet Hennessy - Louis Vuitton SA | 36,574 | 10,735 | |
| 11,914 | |||
| TOTAL CONSUMER DISCRETIONARY | 204,637 | ||
| CONSUMER STAPLES - 4.3% | |||
| Beverages - 1.1% | |||
| Constellation Brands, Inc. Class A (sub. vtg.) | 37,700 | 8,617 | |
| Fever-Tree Drinks PLC | 40,862 | 1,256 | |
| Kweichow Moutai Co. Ltd. (A Shares) | 48,329 | 5,181 | |
| Pernod Ricard SA ADR | 133,100 | 4,210 | |
| 19,264 | |||
| Food Products - 0.5% | |||
| Danone SA | 106,269 | 8,904 | |
| Hostess Brands, Inc. Class A (a) | 28,100 | 416 | |
| 9,320 | |||
| Household Products - 0.2% | |||
| Reckitt Benckiser Group PLC | 36,000 | 3,359 | |
| Personal Products - 1.8% | |||
| Coty, Inc. Class A | 343,500 | 6,832 | |
| Estee Lauder Companies, Inc. Class A | 96,200 | 12,240 | |
| Unilever NV (NY Reg.) | 223,500 | 12,588 | |
| 31,660 | |||
| Tobacco - 0.7% | |||
| British American Tobacco PLC sponsored ADR | 173,500 | 11,623 | |
| TOTAL CONSUMER STAPLES | 75,226 | ||
| ENERGY - 2.3% | |||
| Oil, Gas & Consumable Fuels - 2.3% | |||
| Cheniere Energy, Inc. (a) | 550,000 | 29,612 | |
| Reliance Industries Ltd. | 658,270 | 9,497 | |
| 39,109 | |||
| FINANCIALS - 11.8% | |||
| Banks - 5.7% | |||
| Bank of America Corp. | 673,000 | 19,867 | |
| Citigroup, Inc. | 191,000 | 14,212 | |
| First Republic Bank | 164,700 | 14,270 | |
| HDFC Bank Ltd. | 36,455 | 1,078 | |
| HDFC Bank Ltd. sponsored ADR | 33,700 | 3,426 | |
| Home Bancshares, Inc. | 149,200 | 3,469 | |
| Huntington Bancshares, Inc. | 626,300 | 9,119 | |
| JPMorgan Chase & Co. | 301,600 | 32,253 | |
| Metro Bank PLC (a) | 25,300 | 1,224 | |
| 98,918 | |||
| Capital Markets - 6.1% | |||
| CBOE Holdings, Inc. | 12,348 | 1,538 | |
| Charles Schwab Corp. | 994,600 | 51,093 | |
| CME Group, Inc. | 180,045 | 26,296 | |
| Goldman Sachs Group, Inc. | 18,300 | 4,662 | |
| JMP Group, Inc. | 75,200 | 421 | |
| MSCI, Inc. | 77,300 | 9,782 | |
| The Blackstone Group LP | 383,700 | 12,286 | |
| 106,078 | |||
| TOTAL FINANCIALS | 204,996 | ||
| HEALTH CARE - 9.9% | |||
| Biotechnology - 3.7% | |||
| Amgen, Inc. | 101,200 | 17,599 | |
| Biogen, Inc. (a) | 43,300 | 13,794 | |
| Cytokinetics, Inc. (a) | 90,471 | 737 | |
| Insmed, Inc. (a) | 343,378 | 10,707 | |
| Samsung Biologics Co. Ltd. (a)(b) | 1,076 | 374 | |
| TESARO, Inc. (a) | 59,500 | 4,931 | |
| Vertex Pharmaceuticals, Inc. (a) | 103,593 | 15,524 | |
| 63,666 | |||
| Health Care Equipment & Supplies - 4.3% | |||
| Becton, Dickinson & Co. | 54,600 | 11,688 | |
| Boston Scientific Corp. (a) | 747,300 | 18,526 | |
| Danaher Corp. | 157,955 | 14,661 | |
| Intuitive Surgical, Inc. (a) | 61,900 | 22,590 | |
| ResMed, Inc. | 54,000 | 4,573 | |
| Sartorius Stedim Biotech | 27,000 | 1,953 | |
| 73,991 | |||
| Health Care Providers & Services - 0.2% | |||
| National Vision Holdings, Inc. | 5,600 | 227 | |
| OptiNose, Inc. | 7,100 | 134 | |
| UnitedHealth Group, Inc. | 18,900 | 4,167 | |
| 4,528 | |||
| Health Care Technology - 0.1% | |||
| Veeva Systems, Inc. Class A (a) | 28,500 | 1,575 | |
| Pharmaceuticals - 1.6% | |||
| Allergan PLC | 29,200 | 4,777 | |
| Astellas Pharma, Inc. | 319,400 | 4,057 | |
| Johnson & Johnson | 117,200 | 16,375 | |
| Mallinckrodt PLC (a) | 117,600 | 2,653 | |
| 27,862 | |||
| TOTAL HEALTH CARE | 171,622 | ||
| INDUSTRIALS - 8.0% | |||
| Aerospace & Defense - 0.4% | |||
| Axon Enterprise, Inc. (a)(c) | 78,339 | 2,076 | |
| TransDigm Group, Inc. | 18,427 | 5,060 | |
| 7,136 | |||
| Commercial Services & Supplies - 0.6% | |||
| Copart, Inc. (a) | 143,200 | 6,185 | |
| Prosegur Compania de Seguridad SA (Reg.) | 445,500 | 3,501 | |
| 9,686 | |||
| Electrical Equipment - 2.4% | |||
| AMETEK, Inc. | 237,100 | 17,183 | |
| Fortive Corp. | 257,327 | 18,618 | |
| Nidec Corp. | 40,100 | 5,627 | |
| 41,428 | |||
| Industrial Conglomerates - 2.0% | |||
| 3M Co. | 117,300 | 27,609 | |
| Roper Technologies, Inc. | 27,314 | 7,074 | |
| 34,683 | |||
| Machinery - 1.2% | |||
| Allison Transmission Holdings, Inc. | 456,800 | 19,674 | |
| Rational AG | 2,000 | 1,289 | |
| 20,963 | |||
| Professional Services - 1.4% | |||
| IHS Markit Ltd. (a) | 206,900 | 9,342 | |
| Robert Half International, Inc. | 95,600 | 5,310 | |
| TransUnion Holding Co., Inc. (a) | 174,700 | 9,602 | |
| 24,254 | |||
| TOTAL INDUSTRIALS | 138,150 | ||
| INFORMATION TECHNOLOGY - 40.2% | |||
| Electronic Equipment & Components - 0.1% | |||
| CDW Corp. | 30,900 | 2,147 | |
| Internet Software & Services - 15.3% | |||
| Alibaba Group Holding Ltd. sponsored ADR (a) | 134,700 | 23,226 | |
| Alphabet, Inc. Class A (a) | 108,952 | 114,769 | |
| CommerceHub, Inc.: | |||
| Series A (a) | 76,970 | 1,693 | |
| Series C (a) | 155,840 | 3,209 | |
| Facebook, Inc. Class A (a) | 281,291 | 49,637 | |
| GoDaddy, Inc. (a) | 182,400 | 9,171 | |
| NetEase, Inc. ADR | 15,000 | 5,176 | |
| Shopify, Inc. Class A (a) | 22,500 | 2,275 | |
| Stamps.com, Inc. (a) | 135,571 | 25,487 | |
| Tencent Holdings Ltd. | 394,000 | 20,393 | |
| VeriSign, Inc. (a)(c) | 92,800 | 10,620 | |
| Wix.com Ltd. (a) | 900 | 52 | |
| 265,708 | |||
| IT Services - 7.8% | |||
| Cognizant Technology Solutions Corp. Class A | 246,830 | 17,530 | |
| Fidelity National Information Services, Inc. | 91,700 | 8,628 | |
| Global Payments, Inc. | 145,300 | 14,565 | |
| MasterCard, Inc. Class A | 67,100 | 10,156 | |
| PayPal Holdings, Inc. (a) | 423,100 | 31,149 | |
| Square, Inc. (a) | 239,200 | 8,293 | |
| Vantiv, Inc. (a) | 43,130 | 3,172 | |
| Visa, Inc. Class A | 358,896 | 40,921 | |
| 134,414 | |||
| Semiconductors & Semiconductor Equipment - 2.4% | |||
| ASML Holding NV | 40,900 | 7,109 | |
| Broadcom Ltd. | 31,900 | 8,195 | |
| Maxim Integrated Products, Inc. | 150,805 | 7,884 | |
| Monolithic Power Systems, Inc. | 36,818 | 4,137 | |
| Qualcomm, Inc. | 221,000 | 14,148 | |
| 41,473 | |||
| Software - 11.8% | |||
| Activision Blizzard, Inc. | 152,287 | 9,643 | |
| Adobe Systems, Inc. (a) | 217,500 | 38,115 | |
| Autodesk, Inc. (a) | 81,700 | 8,565 | |
| Blackbaud, Inc. | 12,200 | 1,153 | |
| Computer Modelling Group Ltd. | 298,200 | 2,277 | |
| Electronic Arts, Inc. (a) | 63,034 | 6,622 | |
| Intuit, Inc. | 111,800 | 17,640 | |
| Microsoft Corp. | 1,018,300 | 87,105 | |
| Red Hat, Inc. (a) | 82,400 | 9,896 | |
| Salesforce.com, Inc. (a) | 231,164 | 23,632 | |
| 204,648 | |||
| Technology Hardware, Storage & Peripherals - 2.8% | |||
| Apple, Inc. | 288,400 | 48,806 | |
| TOTAL INFORMATION TECHNOLOGY | 697,196 | ||
| MATERIALS - 3.8% | |||
| Chemicals - 2.3% | |||
| CF Industries Holdings, Inc. | 277,900 | 11,822 | |
| Sherwin-Williams Co. | 24,200 | 9,923 | |
| The Chemours Co. LLC | 183,200 | 9,171 | |
| Umicore SA | 196,730 | 9,313 | |
| 40,229 | |||
| Construction Materials - 1.5% | |||
| Eagle Materials, Inc. | 194,700 | 22,060 | |
| Summit Materials, Inc. | 143,854 | 4,523 | |
| 26,583 | |||
| TOTAL MATERIALS | 66,812 | ||
| REAL ESTATE - 3.0% | |||
| Equity Real Estate Investment Trusts (REITs) - 2.2% | |||
| American Tower Corp. | 202,000 | 28,819 | |
| Equinix, Inc. | 10,200 | 4,623 | |
| SBA Communications Corp. Class A (a) | 29,500 | 4,819 | |
| 38,261 | |||
| Real Estate Management & Development - 0.8% | |||
| Realogy Holdings Corp. | 505,381 | 13,393 | |
| TOTAL REAL ESTATE | 51,654 | ||
| TOTAL COMMON STOCKS | |||
| (Cost $1,251,315) | 1,649,402 | ||
| Preferred Stocks - 0.7% | |||
| Convertible Preferred Stocks - 0.5% | |||
| CONSUMER DISCRETIONARY - 0.0% | |||
| Household Durables - 0.0% | |||
| Blu Homes, Inc. Series A, 5.00% (a)(d)(e) | 239,736 | 5 | |
| HEALTH CARE - 0.1% | |||
| Biotechnology - 0.1% | |||
| BioNTech AG Series A (d)(e)(f) | 7,174 | 1,571 | |
| INFORMATION TECHNOLOGY - 0.4% | |||
| Internet Software & Services - 0.3% | |||
| Uber Technologies, Inc. Series D, 8.00% (a)(d)(e) | 162,572 | 5,677 | |
| IT Services - 0.1% | |||
| AppNexus, Inc. Series E (a)(d)(e) | 48,212 | 951 | |
| TOTAL INFORMATION TECHNOLOGY | 6,628 | ||
| TOTAL CONVERTIBLE PREFERRED STOCKS | 8,204 | ||
| Nonconvertible Preferred Stocks - 0.2% | |||
| FINANCIALS - 0.2% | |||
| Banks - 0.2% | |||
| Itau Unibanco Holding SA sponsored ADR | 341,400 | 4,438 | |
| TOTAL PREFERRED STOCKS | |||
| (Cost $10,868) | 12,642 | ||
| Money Market Funds - 4.8% | |||
| Fidelity Cash Central Fund, 1.36% (g) | 70,134,714 | 70,149 | |
| Fidelity Securities Lending Cash Central Fund 1.36% (g)(h) | 12,364,662 | 12,367 | |
| TOTAL MONEY MARKET FUNDS | |||
| (Cost $82,515) | 82,516 | ||
| TOTAL INVESTMENT IN SECURITIES - 100.6% | |||
| (Cost $1,344,698) | 1,744,560 | ||
| NET OTHER ASSETS (LIABILITIES) - (0.6)% | (11,005) | ||
| NET ASSETS - 100% | $1,733,555 |
Legend
(a) Non-income producing
(b) Security exempt from registration under Rule 144A of the Securities Act of 1933. These securities may be resold in transactions exempt from registration, normally to qualified institutional buyers. At the end of the period, the value of these securities amounted to $377,000 or 0.0% of net assets.
(c) Security or a portion of the security is on loan at period end.
(d) Restricted securities - Investment in securities not registered under the Securities Act of 1933 (excluding 144A issues). At the end of the period, the value of restricted securities (excluding 144A issues) amounted to $8,204,000 or 0.5% of net assets.
(e) Level 3 security
(f) Security or a portion of the security purchased on a delayed delivery or when-issued basis. Interest rate to be determined at settlement date.
(g) Affiliated fund that is generally available only to investment companies and other accounts managed by Fidelity Investments. The rate quoted is the annualized seven-day yield of the fund at period end. A complete unaudited listing of the fund's holdings as of its most recent quarter end is available upon request. In addition, each Fidelity Central Fund's financial statements are available on the SEC's website or upon request.
(h) Investment made with cash collateral received from securities on loan.
Additional information on each restricted holding is as follows:
| Security | Acquisition Date | Acquisition Cost (000s) |
| AppNexus, Inc. Series E | 8/1/14 | $966 |
| BioNTech AG Series A | 12/29/17 | $1,571 |
| Blu Homes, Inc. Series A, 5.00% | 6/21/13 | $1,108 |
| Uber Technologies, Inc. Series D, 8.00% | 6/6/14 | $2,522 |
Affiliated Central Funds
Information regarding fiscal year to date income earned by the Fund from investments in Fidelity Central Funds is as follows:
| Fund | Income earned |
| (Amounts in thousands) | |
| Fidelity Cash Central Fund | $401 |
| Fidelity Securities Lending Cash Central Fund | 346 |
| Total | $747 |
Amounts in the income column in the above table include any capital gain distributions from underlying funds, which are presented in the corresponding line-item in the Statement of Operations if applicable.
Investment Valuation
The following is a summary of the inputs used, as of December 31, 2017, involving the Fund's assets and liabilities carried at fair value. The inputs or methodology used for valuing securities may not be an indication of the risk associated with investing in those securities. For more information on valuation inputs, and their aggregation into the levels used below, please refer to the Investment Valuation section in the accompanying Notes to Financial Statements.
| Valuation Inputs at Reporting Date: | ||||
| Description | Total | Level 1 | Level 2 | Level 3 |
| (Amounts in thousands) | ||||
| Investments in Securities: | ||||
| Equities: | ||||
| Consumer Discretionary | $204,642 | $176,721 | $27,916 | $5 |
| Consumer Staples | 75,226 | 62,963 | 12,263 | -- |
| Energy | 39,109 | 39,109 | -- | -- |
| Financials | 209,434 | 208,356 | 1,078 | -- |
| Health Care | 173,193 | 167,565 | 4,057 | 1,571 |
| Industrials | 138,150 | 138,150 | -- | -- |
| Information Technology | 703,824 | 676,803 | 20,393 | 6,628 |
| Materials | 66,812 | 66,812 | -- | -- |
| Real Estate | 51,654 | 51,654 | -- | -- |
| Money Market Funds | 82,516 | 82,516 | -- | -- |
| Total Investments in Securities: | $1,744,560 | $1,670,649 | $65,707 | $8,204 |
Other Information
Distribution of investments by country or territory of incorporation, as a percentage of Total Net Assets, is as follows (Unaudited):
| United States of America | 88.6% |
| Cayman Islands | 2.8% |
| France | 1.5% |
| Japan | 1.5% |
| Netherlands | 1.1% |
| Others (Individually Less Than 1%) | 4.5% |
| 100.0% |
See accompanying notes which are an integral part of the financial statements.
Financial Statements
Statement of Assets and Liabilities
| Amounts in thousands (except per-share amounts) | December 31, 2017 (Unaudited) | |
| Assets | ||
| Investment in securities, at value (including securities loaned of $11,980) — See accompanying schedule: Unaffiliated issuers (cost $1,262,183) | $1,662,044 | |
| Fidelity Central Funds (cost $82,515) | 82,516 | |
| Total Investment in Securities (cost $1,344,698) | $1,744,560 | |
| Receivable for investments sold | 1,601 | |
| Receivable for fund shares sold | 4,200 | |
| Dividends receivable | 1,026 | |
| Distributions receivable from Fidelity Central Funds | 82 | |
| Prepaid expenses | 2 | |
| Other receivables | 31 | |
| Total assets | 1,751,502 | |
| Liabilities | ||
| Payable for investments purchased on a delayed delivery basis | $1,570 | |
| Payable for fund shares redeemed | 2,991 | |
| Accrued management fee | 754 | |
| Other affiliated payables | 228 | |
| Other payables and accrued expenses | 42 | |
| Collateral on securities loaned | 12,362 | |
| Total liabilities | 17,947 | |
| Net Assets | $1,733,555 | |
| Net Assets consist of: | ||
| Paid in capital | $1,289,054 | |
| Distributions in excess of net investment income | (72) | |
| Accumulated undistributed net realized gain (loss) on investments and foreign currency transactions | 44,721 | |
| Net unrealized appreciation (depreciation) on investments and assets and liabilities in foreign currencies | 399,852 | |
| Net Assets | $1,733,555 | |
| Growth Discovery: | ||
| Net Asset Value, offering price and redemption price per share ($1,350,146 ÷ 41,472 shares) | $32.56 | |
| Class K: | ||
| Net Asset Value, offering price and redemption price per share ($383,409 ÷ 11,772 shares) | $32.57 |
See accompanying notes which are an integral part of the financial statements.
Statement of Operations
| Amounts in thousands | Six months ended December 31, 2017 (Unaudited) | |
| Investment Income | ||
| Dividends | $6,143 | |
| Income from Fidelity Central Funds (including $346 from security lending) | 747 | |
| Total income | 6,890 | |
| Expenses | ||
| Management fee | ||
| Basic fee | $4,231 | |
| Performance adjustment | (187) | |
| Transfer agent fees | 1,052 | |
| Accounting and security lending fees | 247 | |
| Custodian fees and expenses | 34 | |
| Independent trustees' fees and expenses | 3 | |
| Registration fees | 52 | |
| Audit | 29 | |
| Legal | 5 | |
| Miscellaneous | 6 | |
| Total expenses before reductions | 5,472 | |
| Expense reductions | (20) | 5,452 |
| Net investment income (loss) | 1,438 | |
| Realized and Unrealized Gain (Loss) | ||
| Net realized gain (loss) on: | ||
| Investment securities: | ||
| Unaffiliated issuers | 88,024 | |
| Fidelity Central Funds | (1) | |
| Foreign currency transactions | (30) | |
| Total net realized gain (loss) | 87,993 | |
| Change in net unrealized appreciation (depreciation) on: | ||
| Investment securities: | ||
| Unaffiliated issuers | 80,785 | |
| Fidelity Central Funds | 4 | |
| Assets and liabilities in foreign currencies | 1 | |
| Total change in net unrealized appreciation (depreciation) | 80,790 | |
| Net gain (loss) | 168,783 | |
| Net increase (decrease) in net assets resulting from operations | $170,221 |
See accompanying notes which are an integral part of the financial statements.
Statement of Changes in Net Assets
| Amounts in thousands | Six months ended December 31, 2017 (Unaudited) | Year ended June 30, 2017 |
| Increase (Decrease) in Net Assets | ||
| Operations | ||
| Net investment income (loss) | $1,438 | $3,097 |
| Net realized gain (loss) | 87,993 | 192,029 |
| Change in net unrealized appreciation (depreciation) | 80,790 | 78,061 |
| Net increase (decrease) in net assets resulting from operations | 170,221 | 273,187 |
| Distributions to shareholders from net investment income | (2,802) | (1,135) |
| Distributions to shareholders from net realized gain | (76,753) | – |
| Total distributions | (79,555) | (1,135) |
| Share transactions - net increase (decrease) | 278,997 | (83,878) |
| Total increase (decrease) in net assets | 369,663 | 188,174 |
| Net Assets | ||
| Beginning of period | 1,363,892 | 1,175,718 |
| End of period | $1,733,555 | $1,363,892 |
| Other Information | ||
| Undistributed net investment income end of period | $– | $1,292 |
| Distributions in excess of net investment income end of period | $(72) | $– |
See accompanying notes which are an integral part of the financial statements.
Financial Highlights
Fidelity Growth Discovery Fund
| Six months ended (Unaudited) December 31, | Years ended June 30, | |||||
| 2017 | 2017 | 2016 | 2015 | 2014 | 2013 | |
| Selected Per–Share Data | ||||||
| Net asset value, beginning of period | $30.58 | $24.47 | $24.93 | $23.07 | $17.45 | $15.09 |
| Income from Investment Operations | ||||||
| Net investment income (loss)A | .03 | .06 | .01 | .07 | .02 | .07 |
| Net realized and unrealized gain (loss) | 3.56 | 6.07 | (.43) | 1.81 | 5.63 | 2.35 |
| Total from investment operations | 3.59 | 6.13 | (.42) | 1.88 | 5.65 | 2.42 |
| Distributions from net investment income | (.05) | (.02) | (.03) | (.02) | (.02) | (.06) |
| Distributions from net realized gain | (1.56) | – | (.01) | – | (.01) | – |
| Total distributions | (1.61) | (.02) | (.04) | (.02) | (.03) | (.06) |
| Net asset value, end of period | $32.56 | $30.58 | $24.47 | $24.93 | $23.07 | $17.45 |
| Total ReturnB,C | 11.97% | 25.08% | (1.68)% | 8.17% | 32.40% | 16.09% |
| Ratios to Average Net AssetsD,E | ||||||
| Expenses before reductions | .72%F | .66% | .78% | .77% | .81% | .88% |
| Expenses net of fee waivers, if any | .72%F | .66% | .78% | .77% | .81% | .88% |
| Expenses net of all reductions | .72%F | .65% | .78% | .77% | .81% | .87% |
| Net investment income (loss) | .16%F | .24% | .03% | .27% | .10% | .42% |
| Supplemental Data | ||||||
| Net assets, end of period (in millions) | $1,350 | $1,157 | $1,000 | $1,078 | $1,072 | $767 |
| Portfolio turnover rateG | 59%F | 65% | 57% | 51% | 70% | 62% |
A Calculated based on average shares outstanding during the period.
B Total returns for periods of less than one year are not annualized.
C Total returns would have been lower if certain expenses had not been reduced during the applicable periods shown.
D Fees and expenses of any underlying Fidelity Central Funds are not included in the Fund's expense ratio. The Fund indirectly bears its proportionate share of the expenses of any underlying Fidelity Central Funds.
E Expense ratios reflect operating expenses of the class. Expenses before reductions do not reflect amounts reimbursed by the investment adviser or reductions from brokerage service arrangements or reductions from other expense offset arrangements and do not represent the amount paid by the class during periods when reimbursements or reductions occur. Expenses net of fee waivers reflect expenses after reimbursement by the investment adviser but prior to reductions from brokerage service arrangements or other expense offset arrangements. Expenses net of all reductions represent the net expenses paid by the class.
F Annualized
G Amount does not include the portfolio activity of any underlying Fidelity Central Funds.
See accompanying notes which are an integral part of the financial statements.
Fidelity Growth Discovery Fund Class K
| Six months ended (Unaudited) December 31, | Years ended June 30, | |||||
| 2017 | 2017 | 2016 | 2015 | 2014 | 2013 | |
| Selected Per–Share Data | ||||||
| Net asset value, beginning of period | $30.61 | $24.48 | $24.94 | $23.09 | $17.45 | $15.09 |
| Income from Investment Operations | ||||||
| Net investment income (loss)A | .04 | .10 | .04 | .10 | .05 | .09 |
| Net realized and unrealized gain (loss) | 3.57 | 6.07 | (.43) | 1.82 | 5.63 | 2.36 |
| Total from investment operations | 3.61 | 6.17 | (.39) | 1.92 | 5.68 | 2.45 |
| Distributions from net investment income | (.09) | (.04) | (.06) | (.07) | (.04) | (.09) |
| Distributions from net realized gain | (1.56) | – | (.01) | – | (.01) | – |
| Total distributions | (1.65) | (.04) | (.07) | (.07) | (.04)B | (.09) |
| Net asset value, end of period | $32.57 | $30.61 | $24.48 | $24.94 | $23.09 | $17.45 |
| Total ReturnC,D | 12.01% | 25.23% | (1.57)% | 8.32% | 32.62% | 16.28% |
| Ratios to Average Net AssetsE,F | ||||||
| Expenses before reductions | .61%G | .54% | .66% | .64% | .68% | .72% |
| Expenses net of fee waivers, if any | .61%G | .54% | .66% | .64% | .68% | .72% |
| Expenses net of all reductions | .61%G | .53% | .65% | .64% | .67% | .71% |
| Net investment income (loss) | .27%G | .36% | .16% | .40% | .24% | .58% |
| Supplemental Data | ||||||
| Net assets, end of period (in millions) | $383 | $207 | $176 | $202 | $190 | $137 |
| Portfolio turnover rateH | 59%G | 65% | 57% | 51% | 70% | 62% |
A Calculated based on average shares outstanding during the period.
B Total distributions of $.04 per share is comprised of distributions from net investment income of $.036 and distributions from net realized gain of $.006 per share.
C Total returns for periods of less than one year are not annualized.
D Total returns would have been lower if certain expenses had not been reduced during the applicable periods shown.
E Fees and expenses of any underlying Fidelity Central Funds are not included in the Fund's expense ratio. The Fund indirectly bears its proportionate share of the expenses of any underlying Fidelity Central Funds.
F Expense ratios reflect operating expenses of the class. Expenses before reductions do not reflect amounts reimbursed by the investment adviser or reductions from brokerage service arrangements or reductions from other expense offset arrangements and do not represent the amount paid by the class during periods when reimbursements or reductions occur. Expenses net of fee waivers reflect expenses after reimbursement by the investment adviser but prior to reductions from brokerage service arrangements or other expense offset arrangements. Expenses net of all reductions represent the net expenses paid by the class.
G Annualized
H Amount does not include the portfolio activity of any underlying Fidelity Central Funds.
See accompanying notes which are an integral part of the financial statements.
Notes to Financial Statements (Unaudited)
For the period ended December 31, 2017
(Amounts in thousands except percentages)
1. Organization.
Fidelity Growth Discovery Fund (the Fund) is a fund of Fidelity Hastings Street Trust (the Trust) and is authorized to issue an unlimited number of shares. The Trust is registered under the Investment Company Act of 1940, as amended (the 1940 Act), as an open-end management investment company organized as a Massachusetts business trust. The Fund offers Growth Discovery and Class K shares, each of which has equal rights as to assets and voting privileges. Each class has exclusive voting rights with respect to matters that affect that class.
2. Investments in Fidelity Central Funds.
The Fund invests in Fidelity Central Funds, which are open-end investment companies generally available only to other investment companies and accounts managed by the investment adviser and its affiliates. The Fund's Schedule of Investments lists each of the Fidelity Central Funds held as of period end, if any, as an investment of the Fund, but does not include the underlying holdings of each Fidelity Central Fund. As an Investing Fund, the Fund indirectly bears its proportionate share of the expenses of the underlying Fidelity Central Funds.
The Money Market Central Funds seek preservation of capital and current income and are managed by Fidelity Investments Money Management, Inc. (FIMM), an affiliate of the investment adviser. Annualized expenses of the Money Market Central Funds as of their most recent shareholder report date are less than .005%.
A complete unaudited list of holdings for each Fidelity Central Fund is available upon request or at the Securities and Exchange Commission (the SEC) website at www.sec.gov. In addition, the financial statements of the Fidelity Central Funds are available on the SEC website or upon request.
3. Significant Accounting Policies.
The Fund is an investment company and applies the accounting and reporting guidance of the Financial Accounting Standards Board (FASB) Accounting Standards Codification Topic 946 Financial Services – Investments Companies. The financial statements have been prepared in conformity with accounting principles generally accepted in the United States of America (GAAP), which require management to make certain estimates and assumptions at the date of the financial statements. Actual results could differ from those estimates. Subsequent events, if any, through the date that the financial statements were issued have been evaluated in the preparation of the financial statements. The following summarizes the significant accounting policies of the Fund:
Investment Valuation. Investments are valued as of 4:00 p.m. Eastern time on the last calendar day of the period. The Board of Trustees (the Board) has delegated the day to day responsibility for the valuation of the Fund's investments to the Fair Value Committee (the Committee) established by the Fund's investment adviser. In accordance with valuation policies and procedures approved by the Board, the Fund attempts to obtain prices from one or more third party pricing vendors or brokers to value its investments. When current market prices, quotations or currency exchange rates are not readily available or reliable, investments will be fair valued in good faith by the Committee, in accordance with procedures adopted by the Board. Factors used in determining fair value vary by investment type and may include market or investment specific events. The frequency with which these procedures are used cannot be predicted and they may be utilized to a significant extent. The Committee oversees the Fund's valuation policies and procedures and reports to the Board on the Committee's activities and fair value determinations. The Board monitors the appropriateness of the procedures used in valuing the Fund's investments and ratifies the fair value determinations of the Committee.
The Fund categorizes the inputs to valuation techniques used to value its investments into a disclosure hierarchy consisting of three levels as shown below:
- Level 1 – quoted prices in active markets for identical investments
- Level 2 – other significant observable inputs (including quoted prices for similar investments, interest rates, prepayment speeds, etc.)
- Level 3 – unobservable inputs (including the Fund's own assumptions based on the best information available)
Valuation techniques used to value the Fund's investments by major category are as follows:
Equity securities, including restricted securities, for which market quotations are readily available, are valued at the last reported sale price or official closing price as reported by a third party pricing vendor on the primary market or exchange on which they are traded and are categorized as Level 1 in the hierarchy. In the event there were no sales during the day or closing prices are not available, securities are valued at the last quoted bid price or may be valued using the last available price and are generally categorized as Level 2 in the hierarchy. For foreign equity securities, when market or security specific events arise, comparisons to the valuation of American Depositary Receipts (ADRs), futures contracts, Exchange-Traded Funds (ETFs) and certain indexes as well as quoted prices for similar securities may be used and would be categorized as Level 2 in the hierarchy. Utilizing these techniques may result in transfers between Level 1 and Level 2. For equity securities, including restricted securities, where observable inputs are limited, assumptions about market activity and risk are used and these securities may be categorized as Level 3 in the hierarchy.
Investments in open-end mutual funds, including the Fidelity Central Funds, are valued at their closing net asset value (NAV) each business day and are categorized as Level 1 in the hierarchy.
Changes in valuation techniques may result in transfers in or out of an assigned level within the disclosure hierarchy. The aggregate value of investments by input level as of December 31, 2017 is included at the end of the Fund's Schedule of Investments.
Foreign Currency. The Fund may use foreign currency contracts to facilitate transactions in foreign-denominated securities. Gains and losses from these transactions may arise from changes in the value of the foreign currency or if the counterparties do not perform under the contracts' terms.
Foreign-denominated assets, including investment securities, and liabilities are translated into U.S. dollars at the exchange rates at period end. Purchases and sales of investment securities, income and dividends received and expenses denominated in foreign currencies are translated into U.S. dollars at the exchange rate in effect on the transaction date.
The effects of exchange rate fluctuations on investments are included with the net realized and unrealized gain (loss) on investment securities. Other foreign currency transactions resulting in realized and unrealized gain (loss) are disclosed separately.
Investment Transactions and Income. For financial reporting purposes, the Fund's investment holdings and NAV include trades executed through the end of the last business day of the period. The NAV per share for processing shareholder transactions is calculated as of the close of business of the New York Stock Exchange (NYSE), normally 4:00 p.m. Eastern time and includes trades executed through the end of the prior business day. Gains and losses on securities sold are determined on the basis of identified cost and includes proceeds received from litigation. Dividend income is recorded on the ex-dividend date, except for certain dividends from foreign securities where the ex-dividend date may have passed, which are recorded as soon as the Fund is informed of the ex-dividend date. Non-cash dividends included in dividend income, if any, are recorded at the fair market value of the securities received. Income and capital gain distributions from Fidelity Central Funds, if any, are recorded on the ex-dividend date. Certain distributions received by the Fund represent a return of capital or capital gain. The Fund determines the components of these distributions subsequent to the ex-dividend date, based upon receipt of tax filings or other correspondence relating to the underlying investment. These distributions are recorded as a reduction of cost of investments and/or as a realized gain. Investment income is recorded net of foreign taxes withheld where recovery of such taxes is uncertain.
Class Allocations and Expenses. Investment income, realized and unrealized capital gains and losses, common expenses of the Fund, and certain fund-level expense reductions, if any, are allocated daily on a pro-rata basis to each class based on the relative net assets of each class to the total net assets of the Fund. Each class differs with respect to transfer agent fees incurred. Certain expense reductions may also differ by class. For the reporting period, the allocated portion of income and expenses to each class as a percent of its average net assets may vary due to the timing of recording these transactions in relation to fluctuating net assets of the classes. Expenses directly attributable to a fund are charged to that fund. Expenses attributable to more than one fund are allocated among the respective funds on the basis of relative net assets or other appropriate methods. Expense estimates are accrued in the period to which they relate and adjustments are made when actual amounts are known.
Income Tax Information and Distributions to Shareholders. Each year, the Fund intends to qualify as a regulated investment company under Subchapter M of the Internal Revenue Code, including distributing substantially all of its taxable income and realized gains. As a result, no provision for U.S. Federal income taxes is required. The Fund files a U.S. federal tax return, in addition to state and local tax returns as required. The Fund's federal income tax returns are subject to examination by the Internal Revenue Service (IRS) for a period of three fiscal years after they are filed. State and local tax returns may be subject to examination for an additional fiscal year depending on the jurisdiction. Foreign taxes are provided for based on the Fund's understanding of the tax rules and rates that exist in the foreign markets in which it invests.
Distributions are declared and recorded on the ex-dividend date. Income dividends and capital gain distributions are declared separately for each class. Income and capital gain distributions are determined in accordance with income tax regulations, which may differ from GAAP.
Capital accounts within the financial statements are adjusted for permanent book-tax differences. These adjustments have no impact on net assets or the results of operations. Capital accounts are not adjusted for temporary book-tax differences which will reverse in a subsequent period.
Book-tax differences are primarily due to futures contracts, foreign currency transactions, market discount, partnerships, capital loss carryforwards, and losses deferred due to wash sales and excise tax regulations.
As of period end, the cost and unrealized appreciation (depreciation) in securities, and derivatives if applicable, for federal income tax purposes were as follows:
| Gross unrealized appreciation | $413,794 |
| Gross unrealized depreciation | (14,079) |
| Net unrealized appreciation (depreciation) | $399,715 |
| Tax cost | $1,344,845 |
Delayed Delivery Transactions and When-Issued Securities. During the period, the Fund transacted in securities on a delayed delivery or when-issued basis. Payment and delivery may take place after the customary settlement period for that security. The price of the underlying securities and the date when the securities will be delivered and paid for are fixed at the time the transaction is negotiated. The securities purchased on a delayed delivery or when-issued basis are identified as such in the Fund's Schedule of Investments. With respect to purchase commitments, the Fund identifies securities as segregated in its records with a value at least equal to the amount of the commitment. Losses may arise due to changes in the value of the underlying securities or if the counterparty does not perform under the contract's terms, or if the issuer does not issue the securities due to political, economic, or other factors.
Restricted Securities. The Fund may invest in securities that are subject to legal or contractual restrictions on resale. These securities generally may be resold in transactions exempt from registration or to the public if the securities are registered. Disposal of these securities may involve time-consuming negotiations and expense, and prompt sale at an acceptable price may be difficult. Information regarding restricted securities is included at the end of the Fund's Schedule of Investments.
4. Purchases and Sales of Investments.
Purchases and sales of securities, other than short-term securities, aggregated $615,618 and $443,064, respectively.
5. Fees and Other Transactions with Affiliates.
Management Fee. Fidelity Management & Research Company (the investment adviser) and its affiliates provide the Fund with investment management related services for which the Fund pays a monthly management fee. The management fee is the sum of an individual fund fee rate that is based on an annual rate of .30% of the Fund's average net assets and an annualized group fee rate that averaged .24% during the period. The group fee rate is based upon the average net assets of all the mutual funds advised by the investment adviser, including any mutual funds previously advised by the investment adviser that are currently advised by Fidelity SelectCo, LLC, an affiliate of the investment adviser. The group fee rate decreases as assets under management increase and increases as assets under management decrease. In addition, the management fee is subject to a performance adjustment (up to a maximum of +/- .20% of the Fund's average net assets over a 36 month performance period). The upward or downward adjustment to the management fee is based on the relative investment performance of Growth Discovery as compared to its benchmark index, the Russell 3000 Growth Index, over the same 36 month performance period. For the reporting period, the total annualized management fee rate, including the performance adjustment, was .52% of the Fund's average net assets. The performance adjustment included in the management fee rate may be higher or lower than the maximum performance adjustment rate due to the difference between the average net assets for the reporting and performance periods.
Transfer Agent Fees. Fidelity Investments Institutional Operations Company, Inc., (FIIOC), an affiliate of the investment adviser, is the transfer, dividend disbursing and shareholder servicing agent for each class of the Fund. FIIOC receives account fees and asset-based fees that vary according to the account size and type of account of the shareholders of Growth Discovery. FIIOC receives an asset-based fee of Class K's average net assets. FIIOC pays for typesetting, printing and mailing of shareholder reports, except proxy statements.
For the period, transfer agent fees for each class were as follows:
| Amount | % of Class-Level Average Net Assets(a) | |
| Growth Discovery | $982 | .16 |
| Class K | 70 | .05 |
| $1,052 |
(a) Annualized
Accounting and Security Lending Fees. Fidelity Service Company, Inc. (FSC), an affiliate of the investment adviser, maintains the Fund's accounting records. The accounting fee is based on the level of average net assets for each month. Under a separate contract, FSC administers the security lending program. The security lending fee is based on the number and duration of lending transactions.
Brokerage Commissions. The Fund placed a portion of its portfolio transactions with brokerage firms which are affiliates of the investment adviser. Brokerage commissions are included in net realized gain (loss) and change in net unrealized appreciation (depreciation) in the Statement of Operations. The commissions paid to these affiliated firms were $14 for the period.
Interfund Trades. The Fund may purchase from or sell securities to other Fidelity Funds under procedures adopted by the Board. The procedures have been designed to ensure these interfund trades are executed in accordance with Rule 17a-7 of the 1940 Act. Interfund trades are included within the respective purchases and sales amounts shown in the Purchases and Sales of Investments note.
6. Committed Line of Credit.
The Fund participates with other funds managed by the investment adviser or an affiliate in a $4.25 billion credit facility (the "line of credit") to be utilized for temporary or emergency purposes to fund shareholder redemptions or for other short-term liquidity purposes. The Fund has agreed to pay commitment fees on its pro-rata portion of the line of credit, which amounted to $2 and is reflected in Miscellaneous expenses on the Statement of Operations. During the period, the Fund did not borrow on this line of credit.
7. Security Lending.
The Fund lends portfolio securities through a lending agent from time to time in order to earn additional income. For equity securities, a lending agent is used and may loan securities to certain qualified borrowers, including Fidelity Capital Markets (FCM), a broker-dealer affiliated with the Fund. On the settlement date of the loan, the Fund receives collateral (in the form of U.S. Treasury obligations, letters of credit and/or cash) against the loaned securities and maintains collateral in an amount not less than 100% of the market value of the loaned securities during the period of the loan. The market value of the loaned securities is determined at the close of business of the Fund and any additional required collateral is delivered to the Fund on the next business day. The Fund or borrower may terminate the loan at any time, and if the borrower defaults on its obligation to return the securities loaned because of insolvency or other reasons, the Fund may apply collateral received from the borrower against the obligation. The Fund may experience delays and costs in recovering the securities loaned. Any cash collateral received is invested in the Fidelity Securities Lending Cash Central Fund. The value of loaned securities and cash collateral at period end are disclosed on the Fund's Statement of Assets and Liabilities. At period end, there were no security loans outstanding with FCM. Security lending income represents the income earned on investing cash collateral, less rebates paid to borrowers and any lending agent fees associated with the loan, plus any premium payments received for lending certain types of securities. Security lending income is presented in the Statement of Operations as a component of income from Fidelity Central Funds. Total security lending income during the period amounted to $346, including in the amount of less than five hundred dollars from securities loaned to FCM.
8. Expense Reductions.
Commissions paid to certain brokers with whom the investment adviser, or its affiliates, places trades on behalf of the Fund include an amount in addition to trade execution, which may be rebated back to the Fund to offset certain expenses. This amount totaled $14 for the period. Through arrangements with the Fund's custodian, credits realized as a result of certain uninvested cash balances were used to reduce the Fund's expenses. During the period, these credits reduced the Fund's custody expenses by $1.
In addition, during the period the investment adviser reimbursed and/or waived a portion of fund-level operating expenses in the amount of $5.
9. Distributions to Shareholders.
Distributions to shareholders of each class were as follows:
| Six months ended December 31, 2017 | Year ended June 30, 2017 | |
| From net investment income | ||
| Growth Discovery | $1,948 | $880 |
| Class K | 854 | 255 |
| Total | $2,802 | $1,135 |
| From net realized gain | ||
| Growth Discovery | $61,060 | $– |
| Class K | 15,693 | – |
| Total | $76,753 | $– |
10. Share Transactions.
Share transactions for each class were as follows and may contain automatic conversions between classes or exchanges between affiliated funds:
| Shares | Shares | Dollars | Dollars | |
| Six months ended December 31, 2017 | Year ended June 30, 2017 | Six months ended December 31, 2017 | Year ended June 30, 2017 | |
| Growth Discovery | ||||
| Shares sold | 4,922 | 4,332 | $158,758 | $121,287 |
| Reinvestment of distributions | 1,871 | 32 | 59,167 | 821 |
| Shares redeemed | (3,144) | (7,392) | (100,980) | (196,671) |
| Net increase (decrease) | 3,649 | (3,028) | $116,945 | $(74,563) |
| Class K | ||||
| Shares sold | 5,512 | 1,584 | $178,534 | $44,201 |
| Reinvestment of distributions | 521 | 10 | 16,547 | 255 |
| Shares redeemed | (1,027) | (2,017) | (33,029) | (53,771) |
| Net increase (decrease) | 5,006 | (423) | $162,052 | $(9,315) |
11. Other.
The Fund's organizational documents provide former and current trustees and officers with a limited indemnification against liabilities arising in connection with the performance of their duties to the Fund. In the normal course of business, the Fund may also enter into contracts that provide general indemnifications. The Fund's maximum exposure under these arrangements is unknown as this would be dependent on future claims that may be made against the Fund. The risk of material loss from such claims is considered remote.
Shareholder Expense Example
As a shareholder of the Fund, you incur two types of costs: (1) transaction costs, and (2) ongoing costs, including management fees and other Fund expenses. This Example is intended to help you understand your ongoing costs (in dollars) of investing in the Fund and to compare these costs with the ongoing costs of investing in other mutual funds.
The Example is based on an investment of $1,000 invested at the beginning of the period and held for the entire period (July 1, 2017 to December 31, 2017).
Actual Expenses
The first line of the accompanying table for each class of the Fund provides information about actual account values and actual expenses. You may use the information in this line, together with the amount you invested, to estimate the expenses that you paid over the period. Simply divide your account value by $1,000.00 (for example, an $8,600 account value divided by $1,000.00 = 8.6), then multiply the result by the number in the first line for a class of the Fund under the heading entitled "Expenses Paid During Period" to estimate the expenses you paid on your account during this period. A small balance maintenance fee of $12.00 that is charged once a year may apply for certain accounts with a value of less than $2,000. This fee is not included in the table below. If it was, the estimate of expenses you paid during the period would be higher, and your ending account value lower, by this amount. In addition, the Fund, as a shareholder in the underlying Fidelity Central Funds, will indirectly bear its pro-rata share of the fees and expenses incurred by the underlying Fidelity Central Funds. These fees and expenses are not included in the Fund's annualized expense ratio used to calculate the expense estimate in the table below.
Hypothetical Example for Comparison Purposes
The second line of the accompanying table for each class of the Fund provides information about hypothetical account values and hypothetical expenses based on a Class' actual expense ratio and an assumed rate of return of 5% per year before expenses, which is not the Class' actual return. The hypothetical account values and expenses may not be used to estimate the actual ending account balance or expenses you paid for the period. You may use this information to compare the ongoing costs of investing in the Fund and other funds. To do so, compare this 5% hypothetical example with the 5% hypothetical examples that appear in the shareholder reports of the other funds. A small balance maintenance fee of $12.00 that is charged once a year may apply for certain accounts with a value of less than $2,000. This fee is not included in the table below. If it was, the estimate of expenses you paid during the period would be higher, and your ending account value lower, by this amount. In addition, the Fund, as a shareholder in the underlying Fidelity Central Funds, will indirectly bear its pro-rata share of the fees and expenses incurred by the underlying Fidelity Central Funds. These fees and expenses are not included in the Fund's annualized expense ratio used to calculate the expense estimate in the table below.
Please note that the expenses shown in the table are meant to highlight your ongoing costs only and do not reflect any transaction costs. Therefore, the second line of the table is useful in comparing ongoing costs only, and will not help you determine the relative total costs of owning different funds.
| Annualized Expense Ratio-A | Beginning Account Value July 1, 2017 | Ending Account Value December 31, 2017 | Expenses Paid During Period-B July 1, 2017 to December 31, 2017 | |
| Growth Discovery | .72% | |||
| Actual | $1,000.00 | $1,119.70 | $3.85 | |
| Hypothetical-C | $1,000.00 | $1,021.58 | $3.67 | |
| Class K | .61% | |||
| Actual | $1,000.00 | $1,120.10 | $3.26 | |
| Hypothetical-C | $1,000.00 | $1,022.13 | $3.11 |
A Annualized expense ratio reflects expenses net of applicable fee waivers.
B Expenses are equal to each Class' annualized expense ratio, multiplied by the average account value over the period, multiplied by 184/365 (to reflect the one-half year period).
C 5% return per year before expenses
Board Approval of Investment Advisory Contracts and Management Fees
Fidelity Growth Discovery Fund
Each year, the Board of Trustees, including the Independent Trustees (together, the Board), votes on the renewal of the management contract with Fidelity Management & Research Company (FMR) and the sub-advisory agreements (together, the Advisory Contracts) for the fund. FMR and the sub-advisers are referred to herein as the Investment Advisers. The Board, assisted by the advice of fund counsel and Independent Trustees' counsel, requests and considers a broad range of information relevant to the renewal of the Advisory Contracts throughout the year.
The Board meets regularly and, at each of its meetings, covers an extensive agenda of topics and materials and considers factors that are relevant to its annual consideration of the renewal of the fund's Advisory Contracts, including the services and support provided to the fund and its shareholders. The Board has established various standing committees (Committees), each composed of and chaired by Independent Trustees with varying backgrounds, to which the Board has assigned specific subject matter responsibilities in order to enhance effective decision-making by the Board. The Board, acting directly and through its Committees, requests and receives information concerning the annual consideration of the renewal of the fund's Advisory Contracts. The Board also meets as needed to review matters specifically related to the Board's annual consideration of the renewal of the Advisory Contracts. Members of the Board may also meet with trustees of other Fidelity funds through ad hoc joint committees to discuss certain matters relevant to all of the Fidelity funds.
At its July 2017 meeting, the Board unanimously determined to renew the fund's Advisory Contracts. In reaching its determination, the Board considered all factors it believed relevant, including (i) the nature, extent, and quality of the services to be provided to the fund and its shareholders (including the investment performance of the fund); (ii) the competitiveness of the fund's management fee and total expense ratio relative to peer funds; (iii) the total costs of the services to be provided by and the profits to be realized by Fidelity from its relationships with the fund; and (iv) the extent to which, if any, economies of scale exist and would be realized as the fund grows, and whether any economies of scale are appropriately shared with fund shareholders.
In considering whether to renew the Advisory Contracts for the fund, the Board reached a determination, with the assistance of fund counsel and Independent Trustees' counsel and through the exercise of its business judgment, that the renewal of the Advisory Contracts was in the best interests of the fund and its shareholders and that the compensation payable under the Advisory Contracts was fair and reasonable. The Board's decision to renew the Advisory Contracts was not based on any single factor, but rather was based on a comprehensive consideration of all the information provided to the Board at its meetings throughout the year. The Board, in reaching its determination to renew the Advisory Contracts, was aware that shareholders of the fund have a broad range of investment choices available to them, including a wide choice among funds offered by Fidelity's competitors, and that the fund's shareholders, who have the opportunity to review and weigh the disclosure provided by the fund in its prospectus and other public disclosures, have chosen to invest in this fund, which is part of the Fidelity family of funds.
Amendment to Group Fee Rate. The Board also approved an amendment to the management contract for the fund to add an additional breakpoint to the group fee schedule, effective October 1, 2017. The Board noted that the additional breakpoint would result in lower management fee rates as Fidelity's assets under management increase.
Nature, Extent, and Quality of Services Provided. The Board considered Fidelity's staffing as it relates to the fund, including the backgrounds of investment personnel of Fidelity, and also considered the fund's investment objective, strategies, and related investment philosophy. The Independent Trustees also had discussions with senior management of Fidelity's investment operations and investment groups. The Board considered the structure of the investment personnel compensation program and whether this structure provides appropriate incentives to act in the best interests of the fund. Additionally, the Board considered the portfolio managers' investments, if any, in the funds that they manage.Resources Dedicated to Investment Management and Support Services. The Board and the Fund Oversight and Research Committees reviewed the general qualifications and capabilities of Fidelity's investment staff, including its size, education, experience, and resources, as well as Fidelity's approach to recruiting, training, managing, and compensating investment personnel. The Board noted that Fidelity has continued to increase the resources devoted to non-U.S. offices, including expansion of Fidelity's global investment organization. The Board also noted that Fidelity's analysts have extensive resources, tools and capabilities that allow them to conduct sophisticated quantitative and fundamental analysis, as well as credit analysis of issuers, counterparties and guarantors. Further, the Board considered that Fidelity's investment professionals have sufficient access to global information and data so as to provide competitive investment results over time, and that those professionals also have access to sophisticated tools that permit them to assess portfolio construction and risk and performance attribution characteristics continuously, as well as to transmit new information and research conclusions rapidly around the world. Additionally, in its deliberations, the Board considered Fidelity's trading, risk management, compliance, and technology and operations capabilities and resources, which are integral parts of the investment management process.Shareholder and Administrative Services. The Board considered (i) the nature, extent, quality, and cost of advisory, administrative, and shareholder services performed by the Investment Advisers and their affiliates under the Advisory Contracts and under separate agreements covering transfer agency, pricing and bookkeeping, and securities lending services for the fund; (ii) the nature and extent of the supervision of third party service providers, principally custodians, subcustodians, and pricing vendors; and (iii) the resources devoted to, and the record of compliance with, the fund's compliance policies and procedures. The Board also reviewed the allocation of fund brokerage, including allocations to brokers affiliated with the Investment Advisers, the use of brokerage commissions to pay fund expenses, and the use of "soft" commission dollars to pay for research services.The Board noted that the growth of fund assets over time across the complex allows Fidelity to reinvest in the development of services designed to enhance the value or convenience of the Fidelity funds as investment vehicles. These services include 24-hour access to account information and market information through telephone representatives and over the Internet, investor education materials and asset allocation tools, and the expanded availability of Fidelity Investor Centers.In 2014, the Board formed an ad hoc Committee on Transfer Agency Fees to review the variety of transfer agency fee structures throughout the industry and Fidelity's competitive positioning with respect to industry participants.Investment in a Large Fund Family. The Board considered the benefits to shareholders of investing in a Fidelity fund, including the benefits of investing in a fund that is part of a large family of funds offering a variety of investment disciplines and providing a large variety of mutual fund investor services. The Board noted that Fidelity had taken, or had made recommendations that resulted in the Fidelity funds taking, a number of actions over the previous year that benefited particular funds, including: (i) continuing to dedicate additional resources to Fidelity's investment research process, and to the support of the senior management team that oversees asset management; (ii) continuing efforts to enhance Fidelity's global research capabilities; (iii) launching new funds and making other enhancements to meet client needs; (iv) launching new share classes of existing funds; (v) eliminating purchase minimums and broadening eligibility requirements for certain lower-priced share classes; (vi) reducing management fees and total expenses for certain growth equity funds and index funds; (vii) lowering expense caps for certain existing funds and classes to reduce expenses borne by shareholders; (viii) eliminating short-term redemption fees for certain funds; (ix) introducing a new pricing structure for certain funds of funds that is expected to reduce overall expenses paid by shareholders; (x) rationalizing product lines and gaining increased efficiencies through proposals for fund mergers and share class consolidations; (xi) continuing to develop, acquire and implement systems and technology to improve services to the funds and shareholders, strengthen information security, and increase efficiency; and (xii) implementing enhancements to further strengthen Fidelity's product line to increase investors' probability of success in achieving their investment goals, including retirement income goals.Investment Performance. The Board considered whether the fund has operated in accordance with its investment objective, as well as its record of compliance with its investment restrictions and its performance history. The Board noted that there was a portfolio management change for the fund in June 2017.The Board took into account discussions with representatives of the Investment Advisers about fund investment performance that occur at Board meetings throughout the year. In this regard the Board noted that as part of regularly scheduled fund reviews and other reports to the Board on fund performance, the Board considers annualized return information for the fund for different time periods, measured against a securities market index ("benchmark index") and a peer group of funds with similar objectives ("peer group"), if any. In its evaluation of fund investment performance, the Board gave particular attention to information indicating changes in performance of certain Fidelity funds for specific time periods and discussed with the Investment Advisers the reasons for any overperformance or underperformance.In addition to reviewing absolute and relative fund performance, the Independent Trustees periodically consider the appropriateness of fund performance metrics in evaluating the results achieved. In general, the Independent Trustees believe that fund performance should be evaluated based on net performance (after fees and expenses) of both the highest performing and lowest performing fund share classes, where applicable, compared to appropriate benchmark indices, over appropriate time periods that may include full market cycles, and compared to peer groups, as applicable, over the same periods, taking into account relevant factors including the following: general market conditions; issuer-specific information; and fund cash flows and other factors.The Independent Trustees recognize that shareholders evaluate performance on a net basis over their own holding periods, for which one-, three-, and five-year periods are often used as a proxy. For this reason, the performance information reviewed by the Board also included net cumulative calendar year total return information for the fund and an appropriate benchmark index and peer group for the most recent one-, three-, and five-year periods, as shown below. Returns are shown compared to the 25th percentile (top of box, 75% beaten) and 75th percentile (bottom of box, 25% beaten) of the peer universe.Fidelity Growth Discovery Fund
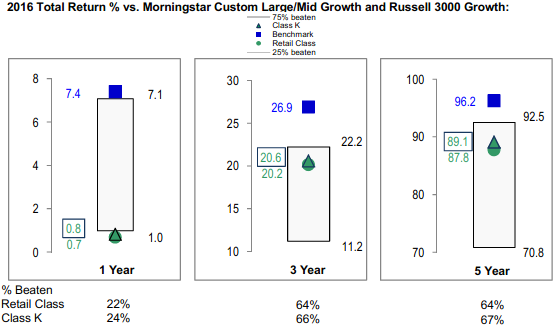
Fidelity Growth Discovery Fund

![]()
Corporate Headquarters
245 Summer St.
Boston, MA 02210
www.fidelity.com
CII-SANN-0218
1.714430.119
Fidelity® Growth Discovery Fund Semi-Annual Report December 31, 2017 |
|
Contents
Board Approval of Investment Advisory Contracts and Management Fees |
To view a fund's proxy voting guidelines and proxy voting record for the 12-month period ended June 30, visit http://www.fidelity.com/proxyvotingresults or visit the Securities and Exchange Commission's (SEC) web site at http://www.sec.gov.
You may also call 1-800-835-5092 to request a free copy of the proxy voting guidelines.
Standard & Poor's, S&P and S&P 500 are registered service marks of The McGraw-Hill Companies, Inc. and have been licensed for use by Fidelity Distributors Corporation.
Other third-party marks appearing herein are the property of their respective owners.
All other marks appearing herein are registered or unregistered trademarks or service marks of FMR LLC or an affiliated company. © 2018 FMR LLC. All rights reserved.
This report and the financial statements contained herein are submitted for the general information of the shareholders of the Fund. This report is not authorized for distribution to prospective investors in the Fund unless preceded or accompanied by an effective prospectus.
A fund files its complete schedule of portfolio holdings with the SEC for the first and third quarters of each fiscal year on Form N-Q. Forms N-Q are available on the SEC’s web site at http://www.sec.gov. A fund's Forms N-Q may be reviewed and copied at the SEC’s Public Reference Room in Washington, DC. Information regarding the operation of the SEC's Public Reference Room may be obtained by calling 1-800-SEC-0330.
For a complete list of a fund's portfolio holdings, view the most recent holdings listing, semiannual report, or annual report on Fidelity's web site at http://www.fidelity.com, http://www.institutional.fidelity.com, or http://www.401k.com, as applicable.
NOT FDIC INSURED •MAY LOSE VALUE •NO BANK GUARANTEE
Neither the Fund nor Fidelity Distributors Corporation is a bank.
Investment Summary (Unaudited)
Top Ten Stocks as of December 31, 2017
| % of fund's net assets | |
| Alphabet, Inc. Class A | 6.6 |
| Microsoft Corp. | 5.0 |
| Amazon.com, Inc. | 4.7 |
| Home Depot, Inc. | 3.1 |
| Charles Schwab Corp. | 2.9 |
| Facebook, Inc. Class A | 2.9 |
| Apple, Inc. | 2.8 |
| Visa, Inc. Class A | 2.4 |
| Adobe Systems, Inc. | 2.2 |
| JPMorgan Chase & Co. | 1.9 |
| 34.5 |
Top Five Market Sectors as of December 31, 2017
| % of fund's net assets | |
| Information Technology | 40.6 |
| Financials | 12.0 |
| Consumer Discretionary | 11.8 |
| Health Care | 10.0 |
| Industrials | 8.0 |
Asset Allocation (% of fund's net assets)
| As of December 31, 2017* | ||
| Stocks | 95.3% | |
| Convertible Securities | 0.5% | |
| Short-Term Investments and Net Other Assets (Liabilities) | 4.2% | |

* Foreign investments - 11.4%
Investments December 31, 2017 (Unaudited)
Showing Percentage of Net Assets
| Common Stocks - 95.1% | |||
| Shares | Value (000s) | ||
| CONSUMER DISCRETIONARY - 11.8% | |||
| Diversified Consumer Services - 0.5% | |||
| Grand Canyon Education, Inc. (a) | 104,500 | $9,356 | |
| Hotels, Restaurants & Leisure - 0.4% | |||
| Marriott International, Inc. Class A | 30,100 | 4,085 | |
| Wingstop, Inc. | 82,300 | 3,208 | |
| 7,293 | |||
| Household Durables - 1.1% | |||
| Gree Electric Appliances, Inc. of Zhuhai Class A | 168,500 | 1,132 | |
| Panasonic Corp. | 1,177,300 | 17,181 | |
| 18,313 | |||
| Internet & Direct Marketing Retail - 4.9% | |||
| Amazon.com, Inc. (a) | 70,100 | 81,980 | |
| Priceline Group, Inc.(a) | 1,800 | 3,128 | |
| 85,108 | |||
| Media - 1.1% | |||
| Charter Communications, Inc. Class A (a) | 57,200 | 19,217 | |
| China Literature Ltd. (a)(b) | 286 | 3 | |
| 19,220 | |||
| Specialty Retail - 3.1% | |||
| Home Depot, Inc. | 281,924 | 53,433 | |
| Textiles, Apparel & Luxury Goods - 0.7% | |||
| Kering SA | 2,500 | 1,179 | |
| LVMH Moet Hennessy - Louis Vuitton SA | 36,574 | 10,735 | |
| 11,914 | |||
| TOTAL CONSUMER DISCRETIONARY | 204,637 | ||
| CONSUMER STAPLES - 4.3% | |||
| Beverages - 1.1% | |||
| Constellation Brands, Inc. Class A (sub. vtg.) | 37,700 | 8,617 | |
| Fever-Tree Drinks PLC | 40,862 | 1,256 | |
| Kweichow Moutai Co. Ltd. (A Shares) | 48,329 | 5,181 | |
| Pernod Ricard SA ADR | 133,100 | 4,210 | |
| 19,264 | |||
| Food Products - 0.5% | |||
| Danone SA | 106,269 | 8,904 | |
| Hostess Brands, Inc. Class A (a) | 28,100 | 416 | |
| 9,320 | |||
| Household Products - 0.2% | |||
| Reckitt Benckiser Group PLC | 36,000 | 3,359 | |
| Personal Products - 1.8% | |||
| Coty, Inc. Class A | 343,500 | 6,832 | |
| Estee Lauder Companies, Inc. Class A | 96,200 | 12,240 | |
| Unilever NV (NY Reg.) | 223,500 | 12,588 | |
| 31,660 | |||
| Tobacco - 0.7% | |||
| British American Tobacco PLC sponsored ADR | 173,500 | 11,623 | |
| TOTAL CONSUMER STAPLES | 75,226 | ||
| ENERGY - 2.3% | |||
| Oil, Gas & Consumable Fuels - 2.3% | |||
| Cheniere Energy, Inc. (a) | 550,000 | 29,612 | |
| Reliance Industries Ltd. | 658,270 | 9,497 | |
| 39,109 | |||
| FINANCIALS - 11.8% | |||
| Banks - 5.7% | |||
| Bank of America Corp. | 673,000 | 19,867 | |
| Citigroup, Inc. | 191,000 | 14,212 | |
| First Republic Bank | 164,700 | 14,270 | |
| HDFC Bank Ltd. | 36,455 | 1,078 | |
| HDFC Bank Ltd. sponsored ADR | 33,700 | 3,426 | |
| Home Bancshares, Inc. | 149,200 | 3,469 | |
| Huntington Bancshares, Inc. | 626,300 | 9,119 | |
| JPMorgan Chase & Co. | 301,600 | 32,253 | |
| Metro Bank PLC (a) | 25,300 | 1,224 | |
| 98,918 | |||
| Capital Markets - 6.1% | |||
| CBOE Holdings, Inc. | 12,348 | 1,538 | |
| Charles Schwab Corp. | 994,600 | 51,093 | |
| CME Group, Inc. | 180,045 | 26,296 | |
| Goldman Sachs Group, Inc. | 18,300 | 4,662 | |
| JMP Group, Inc. | 75,200 | 421 | |
| MSCI, Inc. | 77,300 | 9,782 | |
| The Blackstone Group LP | 383,700 | 12,286 | |
| 106,078 | |||
| TOTAL FINANCIALS | 204,996 | ||
| HEALTH CARE - 9.9% | |||
| Biotechnology - 3.7% | |||
| Amgen, Inc. | 101,200 | 17,599 | |
| Biogen, Inc. (a) | 43,300 | 13,794 | |
| Cytokinetics, Inc. (a) | 90,471 | 737 | |
| Insmed, Inc. (a) | 343,378 | 10,707 | |
| Samsung Biologics Co. Ltd. (a)(b) | 1,076 | 374 | |
| TESARO, Inc. (a) | 59,500 | 4,931 | |
| Vertex Pharmaceuticals, Inc. (a) | 103,593 | 15,524 | |
| 63,666 | |||
| Health Care Equipment & Supplies - 4.3% | |||
| Becton, Dickinson & Co. | 54,600 | 11,688 | |
| Boston Scientific Corp. (a) | 747,300 | 18,526 | |
| Danaher Corp. | 157,955 | 14,661 | |
| Intuitive Surgical, Inc. (a) | 61,900 | 22,590 | |
| ResMed, Inc. | 54,000 | 4,573 | |
| Sartorius Stedim Biotech | 27,000 | 1,953 | |
| 73,991 | |||
| Health Care Providers & Services - 0.2% | |||
| National Vision Holdings, Inc. | 5,600 | 227 | |
| OptiNose, Inc. | 7,100 | 134 | |
| UnitedHealth Group, Inc. | 18,900 | 4,167 | |
| 4,528 | |||
| Health Care Technology - 0.1% | |||
| Veeva Systems, Inc. Class A (a) | 28,500 | 1,575 | |
| Pharmaceuticals - 1.6% | |||
| Allergan PLC | 29,200 | 4,777 | |
| Astellas Pharma, Inc. | 319,400 | 4,057 | |
| Johnson & Johnson | 117,200 | 16,375 | |
| Mallinckrodt PLC (a) | 117,600 | 2,653 | |
| 27,862 | |||
| TOTAL HEALTH CARE | 171,622 | ||
| INDUSTRIALS - 8.0% | |||
| Aerospace & Defense - 0.4% | |||
| Axon Enterprise, Inc. (a)(c) | 78,339 | 2,076 | |
| TransDigm Group, Inc. | 18,427 | 5,060 | |
| 7,136 | |||
| Commercial Services & Supplies - 0.6% | |||
| Copart, Inc. (a) | 143,200 | 6,185 | |
| Prosegur Compania de Seguridad SA (Reg.) | 445,500 | 3,501 | |
| 9,686 | |||
| Electrical Equipment - 2.4% | |||
| AMETEK, Inc. | 237,100 | 17,183 | |
| Fortive Corp. | 257,327 | 18,618 | |
| Nidec Corp. | 40,100 | 5,627 | |
| 41,428 | |||
| Industrial Conglomerates - 2.0% | |||
| 3M Co. | 117,300 | 27,609 | |
| Roper Technologies, Inc. | 27,314 | 7,074 | |
| 34,683 | |||
| Machinery - 1.2% | |||
| Allison Transmission Holdings, Inc. | 456,800 | 19,674 | |
| Rational AG | 2,000 | 1,289 | |
| 20,963 | |||
| Professional Services - 1.4% | |||
| IHS Markit Ltd. (a) | 206,900 | 9,342 | |
| Robert Half International, Inc. | 95,600 | 5,310 | |
| TransUnion Holding Co., Inc. (a) | 174,700 | 9,602 | |
| 24,254 | |||
| TOTAL INDUSTRIALS | 138,150 | ||
| INFORMATION TECHNOLOGY - 40.2% | |||
| Electronic Equipment & Components - 0.1% | |||
| CDW Corp. | 30,900 | 2,147 | |
| Internet Software & Services - 15.3% | |||
| Alibaba Group Holding Ltd. sponsored ADR (a) | 134,700 | 23,226 | |
| Alphabet, Inc. Class A (a) | 108,952 | 114,769 | |
| CommerceHub, Inc.: | |||
| Series A (a) | 76,970 | 1,693 | |
| Series C (a) | 155,840 | 3,209 | |
| Facebook, Inc. Class A (a) | 281,291 | 49,637 | |
| GoDaddy, Inc. (a) | 182,400 | 9,171 | |
| NetEase, Inc. ADR | 15,000 | 5,176 | |
| Shopify, Inc. Class A (a) | 22,500 | 2,275 | |
| Stamps.com, Inc. (a) | 135,571 | 25,487 | |
| Tencent Holdings Ltd. | 394,000 | 20,393 | |
| VeriSign, Inc. (a)(c) | 92,800 | 10,620 | |
| Wix.com Ltd. (a) | 900 | 52 | |
| 265,708 | |||
| IT Services - 7.8% | |||
| Cognizant Technology Solutions Corp. Class A | 246,830 | 17,530 | |
| Fidelity National Information Services, Inc. | 91,700 | 8,628 | |
| Global Payments, Inc. | 145,300 | 14,565 | |
| MasterCard, Inc. Class A | 67,100 | 10,156 | |
| PayPal Holdings, Inc. (a) | 423,100 | 31,149 | |
| Square, Inc. (a) | 239,200 | 8,293 | |
| Vantiv, Inc. (a) | 43,130 | 3,172 | |
| Visa, Inc. Class A | 358,896 | 40,921 | |
| 134,414 | |||
| Semiconductors & Semiconductor Equipment - 2.4% | |||
| ASML Holding NV | 40,900 | 7,109 | |
| Broadcom Ltd. | 31,900 | 8,195 | |
| Maxim Integrated Products, Inc. | 150,805 | 7,884 | |
| Monolithic Power Systems, Inc. | 36,818 | 4,137 | |
| Qualcomm, Inc. | 221,000 | 14,148 | |
| 41,473 | |||
| Software - 11.8% | |||
| Activision Blizzard, Inc. | 152,287 | 9,643 | |
| Adobe Systems, Inc. (a) | 217,500 | 38,115 | |
| Autodesk, Inc. (a) | 81,700 | 8,565 | |
| Blackbaud, Inc. | 12,200 | 1,153 | |
| Computer Modelling Group Ltd. | 298,200 | 2,277 | |
| Electronic Arts, Inc. (a) | 63,034 | 6,622 | |
| Intuit, Inc. | 111,800 | 17,640 | |
| Microsoft Corp. | 1,018,300 | 87,105 | |
| Red Hat, Inc. (a) | 82,400 | 9,896 | |
| Salesforce.com, Inc. (a) | 231,164 | 23,632 | |
| 204,648 | |||
| Technology Hardware, Storage & Peripherals - 2.8% | |||
| Apple, Inc. | 288,400 | 48,806 | |
| TOTAL INFORMATION TECHNOLOGY | 697,196 | ||
| MATERIALS - 3.8% | |||
| Chemicals - 2.3% | |||
| CF Industries Holdings, Inc. | 277,900 | 11,822 | |
| Sherwin-Williams Co. | 24,200 | 9,923 | |
| The Chemours Co. LLC | 183,200 | 9,171 | |
| Umicore SA | 196,730 | 9,313 | |
| 40,229 | |||
| Construction Materials - 1.5% | |||
| Eagle Materials, Inc. | 194,700 | 22,060 | |
| Summit Materials, Inc. | 143,854 | 4,523 | |
| 26,583 | |||
| TOTAL MATERIALS | 66,812 | ||
| REAL ESTATE - 3.0% | |||
| Equity Real Estate Investment Trusts (REITs) - 2.2% | |||
| American Tower Corp. | 202,000 | 28,819 | |
| Equinix, Inc. | 10,200 | 4,623 | |
| SBA Communications Corp. Class A (a) | 29,500 | 4,819 | |
| 38,261 | |||
| Real Estate Management & Development - 0.8% | |||
| Realogy Holdings Corp. | 505,381 | 13,393 | |
| TOTAL REAL ESTATE | 51,654 | ||
| TOTAL COMMON STOCKS | |||
| (Cost $1,251,315) | 1,649,402 | ||
| Preferred Stocks - 0.7% | |||
| Convertible Preferred Stocks - 0.5% | |||
| CONSUMER DISCRETIONARY - 0.0% | |||
| Household Durables - 0.0% | |||
| Blu Homes, Inc. Series A, 5.00% (a)(d)(e) | 239,736 | 5 | |
| HEALTH CARE - 0.1% | |||
| Biotechnology - 0.1% | |||
| BioNTech AG Series A (d)(e)(f) | 7,174 | 1,571 | |
| INFORMATION TECHNOLOGY - 0.4% | |||
| Internet Software & Services - 0.3% | |||
| Uber Technologies, Inc. Series D, 8.00% (a)(d)(e) | 162,572 | 5,677 | |
| IT Services - 0.1% | |||
| AppNexus, Inc. Series E (a)(d)(e) | 48,212 | 951 | |
| TOTAL INFORMATION TECHNOLOGY | 6,628 | ||
| TOTAL CONVERTIBLE PREFERRED STOCKS | 8,204 | ||
| Nonconvertible Preferred Stocks - 0.2% | |||
| FINANCIALS - 0.2% | |||
| Banks - 0.2% | |||
| Itau Unibanco Holding SA sponsored ADR | 341,400 | 4,438 | |
| TOTAL PREFERRED STOCKS | |||
| (Cost $10,868) | 12,642 | ||
| Money Market Funds - 4.8% | |||
| Fidelity Cash Central Fund, 1.36% (g) | 70,134,714 | 70,149 | |
| Fidelity Securities Lending Cash Central Fund 1.36% (g)(h) | 12,364,662 | 12,367 | |
| TOTAL MONEY MARKET FUNDS | |||
| (Cost $82,515) | 82,516 | ||
| TOTAL INVESTMENT IN SECURITIES - 100.6% | |||
| (Cost $1,344,698) | 1,744,560 | ||
| NET OTHER ASSETS (LIABILITIES) - (0.6)% | (11,005) | ||
| NET ASSETS - 100% | $1,733,555 |
Legend
(a) Non-income producing
(b) Security exempt from registration under Rule 144A of the Securities Act of 1933. These securities may be resold in transactions exempt from registration, normally to qualified institutional buyers. At the end of the period, the value of these securities amounted to $377,000 or 0.0% of net assets.
(c) Security or a portion of the security is on loan at period end.
(d) Restricted securities - Investment in securities not registered under the Securities Act of 1933 (excluding 144A issues). At the end of the period, the value of restricted securities (excluding 144A issues) amounted to $8,204,000 or 0.5% of net assets.
(e) Level 3 security
(f) Security or a portion of the security purchased on a delayed delivery or when-issued basis. Interest rate to be determined at settlement date.
(g) Affiliated fund that is generally available only to investment companies and other accounts managed by Fidelity Investments. The rate quoted is the annualized seven-day yield of the fund at period end. A complete unaudited listing of the fund's holdings as of its most recent quarter end is available upon request. In addition, each Fidelity Central Fund's financial statements are available on the SEC's website or upon request.
(h) Investment made with cash collateral received from securities on loan.
Additional information on each restricted holding is as follows:
| Security | Acquisition Date | Acquisition Cost (000s) |
| AppNexus, Inc. Series E | 8/1/14 | $966 |
| BioNTech AG Series A | 12/29/17 | $1,571 |
| Blu Homes, Inc. Series A, 5.00% | 6/21/13 | $1,108 |
| Uber Technologies, Inc. Series D, 8.00% | 6/6/14 | $2,522 |
Affiliated Central Funds
Information regarding fiscal year to date income earned by the Fund from investments in Fidelity Central Funds is as follows:
| Fund | Income earned |
| (Amounts in thousands) | |
| Fidelity Cash Central Fund | $401 |
| Fidelity Securities Lending Cash Central Fund | 346 |
| Total | $747 |
Amounts in the income column in the above table include any capital gain distributions from underlying funds, which are presented in the corresponding line-item in the Statement of Operations if applicable.
Investment Valuation
The following is a summary of the inputs used, as of December 31, 2017, involving the Fund's assets and liabilities carried at fair value. The inputs or methodology used for valuing securities may not be an indication of the risk associated with investing in those securities. For more information on valuation inputs, and their aggregation into the levels used below, please refer to the Investment Valuation section in the accompanying Notes to Financial Statements.
| Valuation Inputs at Reporting Date: | ||||
| Description | Total | Level 1 | Level 2 | Level 3 |
| (Amounts in thousands) | ||||
| Investments in Securities: | ||||
| Equities: | ||||
| Consumer Discretionary | $204,642 | $176,721 | $27,916 | $5 |
| Consumer Staples | 75,226 | 62,963 | 12,263 | -- |
| Energy | 39,109 | 39,109 | -- | -- |
| Financials | 209,434 | 208,356 | 1,078 | -- |
| Health Care | 173,193 | 167,565 | 4,057 | 1,571 |
| Industrials | 138,150 | 138,150 | -- | -- |
| Information Technology | 703,824 | 676,803 | 20,393 | 6,628 |
| Materials | 66,812 | 66,812 | -- | -- |
| Real Estate | 51,654 | 51,654 | -- | -- |
| Money Market Funds | 82,516 | 82,516 | -- | -- |
| Total Investments in Securities: | $1,744,560 | $1,670,649 | $65,707 | $8,204 |
Other Information
Distribution of investments by country or territory of incorporation, as a percentage of Total Net Assets, is as follows (Unaudited):
| United States of America | 88.6% |
| Cayman Islands | 2.8% |
| France | 1.5% |
| Japan | 1.5% |
| Netherlands | 1.1% |
| Others (Individually Less Than 1%) | 4.5% |
| 100.0% |
See accompanying notes which are an integral part of the financial statements.
Financial Statements
Statement of Assets and Liabilities
| Amounts in thousands (except per-share amounts) | December 31, 2017 (Unaudited) | |
| Assets | ||
| Investment in securities, at value (including securities loaned of $11,980) — See accompanying schedule: Unaffiliated issuers (cost $1,262,183) | $1,662,044 | |
| Fidelity Central Funds (cost $82,515) | 82,516 | |
| Total Investment in Securities (cost $1,344,698) | $1,744,560 | |
| Receivable for investments sold | 1,601 | |
| Receivable for fund shares sold | 4,200 | |
| Dividends receivable | 1,026 | |
| Distributions receivable from Fidelity Central Funds | 82 | |
| Prepaid expenses | 2 | |
| Other receivables | 31 | |
| Total assets | 1,751,502 | |
| Liabilities | ||
| Payable for investments purchased on a delayed delivery basis | $1,570 | |
| Payable for fund shares redeemed | 2,991 | |
| Accrued management fee | 754 | |
| Other affiliated payables | 228 | |
| Other payables and accrued expenses | 42 | |
| Collateral on securities loaned | 12,362 | |
| Total liabilities | 17,947 | |
| Net Assets | $1,733,555 | |
| Net Assets consist of: | ||
| Paid in capital | $1,289,054 | |
| Distributions in excess of net investment income | (72) | |
| Accumulated undistributed net realized gain (loss) on investments and foreign currency transactions | 44,721 | |
| Net unrealized appreciation (depreciation) on investments and assets and liabilities in foreign currencies | 399,852 | |
| Net Assets | $1,733,555 | |
| Growth Discovery: | ||
| Net Asset Value, offering price and redemption price per share ($1,350,146 ÷ 41,472 shares) | $32.56 | |
| Class K: | ||
| Net Asset Value, offering price and redemption price per share ($383,409 ÷ 11,772 shares) | $32.57 |
See accompanying notes which are an integral part of the financial statements.
Statement of Operations
| Amounts in thousands | Six months ended December 31, 2017 (Unaudited) | |
| Investment Income | ||
| Dividends | $6,143 | |
| Income from Fidelity Central Funds (including $346 from security lending) | 747 | |
| Total income | 6,890 | |
| Expenses | ||
| Management fee | ||
| Basic fee | $4,231 | |
| Performance adjustment | (187) | |
| Transfer agent fees | 1,052 | |
| Accounting and security lending fees | 247 | |
| Custodian fees and expenses | 34 | |
| Independent trustees' fees and expenses | 3 | |
| Registration fees | 52 | |
| Audit | 29 | |
| Legal | 5 | |
| Miscellaneous | 6 | |
| Total expenses before reductions | 5,472 | |
| Expense reductions | (20) | 5,452 |
| Net investment income (loss) | 1,438 | |
| Realized and Unrealized Gain (Loss) | ||
| Net realized gain (loss) on: | ||
| Investment securities: | ||
| Unaffiliated issuers | 88,024 | |
| Fidelity Central Funds | (1) | |
| Foreign currency transactions | (30) | |
| Total net realized gain (loss) | 87,993 | |
| Change in net unrealized appreciation (depreciation) on: | ||
| Investment securities: | ||
| Unaffiliated issuers | 80,785 | |
| Fidelity Central Funds | 4 | |
| Assets and liabilities in foreign currencies | 1 | |
| Total change in net unrealized appreciation (depreciation) | 80,790 | |
| Net gain (loss) | 168,783 | |
| Net increase (decrease) in net assets resulting from operations | $170,221 |
See accompanying notes which are an integral part of the financial statements.
Statement of Changes in Net Assets
| Amounts in thousands | Six months ended December 31, 2017 (Unaudited) | Year ended June 30, 2017 |
| Increase (Decrease) in Net Assets | ||
| Operations | ||
| Net investment income (loss) | $1,438 | $3,097 |
| Net realized gain (loss) | 87,993 | 192,029 |
| Change in net unrealized appreciation (depreciation) | 80,790 | 78,061 |
| Net increase (decrease) in net assets resulting from operations | 170,221 | 273,187 |
| Distributions to shareholders from net investment income | (2,802) | (1,135) |
| Distributions to shareholders from net realized gain | (76,753) | – |
| Total distributions | (79,555) | (1,135) |
| Share transactions - net increase (decrease) | 278,997 | (83,878) |
| Total increase (decrease) in net assets | 369,663 | 188,174 |
| Net Assets | ||
| Beginning of period | 1,363,892 | 1,175,718 |
| End of period | $1,733,555 | $1,363,892 |
| Other Information | ||
| Undistributed net investment income end of period | $– | $1,292 |
| Distributions in excess of net investment income end of period | $(72) | $– |
See accompanying notes which are an integral part of the financial statements.
Financial Highlights
Fidelity Growth Discovery Fund
| Six months ended (Unaudited) December 31, | Years ended June 30, | |||||
| 2017 | 2017 | 2016 | 2015 | 2014 | 2013 | |
| Selected Per–Share Data | ||||||
| Net asset value, beginning of period | $30.58 | $24.47 | $24.93 | $23.07 | $17.45 | $15.09 |
| Income from Investment Operations | ||||||
| Net investment income (loss)A | .03 | .06 | .01 | .07 | .02 | .07 |
| Net realized and unrealized gain (loss) | 3.56 | 6.07 | (.43) | 1.81 | 5.63 | 2.35 |
| Total from investment operations | 3.59 | 6.13 | (.42) | 1.88 | 5.65 | 2.42 |
| Distributions from net investment income | (.05) | (.02) | (.03) | (.02) | (.02) | (.06) |
| Distributions from net realized gain | (1.56) | – | (.01) | – | (.01) | – |
| Total distributions | (1.61) | (.02) | (.04) | (.02) | (.03) | (.06) |
| Net asset value, end of period | $32.56 | $30.58 | $24.47 | $24.93 | $23.07 | $17.45 |
| Total ReturnB,C | 11.97% | 25.08% | (1.68)% | 8.17% | 32.40% | 16.09% |
| Ratios to Average Net AssetsD,E | ||||||
| Expenses before reductions | .72%F | .66% | .78% | .77% | .81% | .88% |
| Expenses net of fee waivers, if any | .72%F | .66% | .78% | .77% | .81% | .88% |
| Expenses net of all reductions | .72%F | .65% | .78% | .77% | .81% | .87% |
| Net investment income (loss) | .16%F | .24% | .03% | .27% | .10% | .42% |
| Supplemental Data | ||||||
| Net assets, end of period (in millions) | $1,350 | $1,157 | $1,000 | $1,078 | $1,072 | $767 |
| Portfolio turnover rateG | 59%F | 65% | 57% | 51% | 70% | 62% |
A Calculated based on average shares outstanding during the period.
B Total returns for periods of less than one year are not annualized.
C Total returns would have been lower if certain expenses had not been reduced during the applicable periods shown.
D Fees and expenses of any underlying Fidelity Central Funds are not included in the Fund's expense ratio. The Fund indirectly bears its proportionate share of the expenses of any underlying Fidelity Central Funds.
E Expense ratios reflect operating expenses of the class. Expenses before reductions do not reflect amounts reimbursed by the investment adviser or reductions from brokerage service arrangements or reductions from other expense offset arrangements and do not represent the amount paid by the class during periods when reimbursements or reductions occur. Expenses net of fee waivers reflect expenses after reimbursement by the investment adviser but prior to reductions from brokerage service arrangements or other expense offset arrangements. Expenses net of all reductions represent the net expenses paid by the class.
F Annualized
G Amount does not include the portfolio activity of any underlying Fidelity Central Funds.
See accompanying notes which are an integral part of the financial statements.
Fidelity Growth Discovery Fund Class K
| Six months ended (Unaudited) December 31, | Years ended June 30, | |||||
| 2017 | 2017 | 2016 | 2015 | 2014 | 2013 | |
| Selected Per–Share Data | ||||||
| Net asset value, beginning of period | $30.61 | $24.48 | $24.94 | $23.09 | $17.45 | $15.09 |
| Income from Investment Operations | ||||||
| Net investment income (loss)A | .04 | .10 | .04 | .10 | .05 | .09 |
| Net realized and unrealized gain (loss) | 3.57 | 6.07 | (.43) | 1.82 | 5.63 | 2.36 |
| Total from investment operations | 3.61 | 6.17 | (.39) | 1.92 | 5.68 | 2.45 |
| Distributions from net investment income | (.09) | (.04) | (.06) | (.07) | (.04) | (.09) |
| Distributions from net realized gain | (1.56) | – | (.01) | – | (.01) | – |
| Total distributions | (1.65) | (.04) | (.07) | (.07) | (.04)B | (.09) |
| Net asset value, end of period | $32.57 | $30.61 | $24.48 | $24.94 | $23.09 | $17.45 |
| Total ReturnC,D | 12.01% | 25.23% | (1.57)% | 8.32% | 32.62% | 16.28% |
| Ratios to Average Net AssetsE,F | ||||||
| Expenses before reductions | .61%G | .54% | .66% | .64% | .68% | .72% |
| Expenses net of fee waivers, if any | .61%G | .54% | .66% | .64% | .68% | .72% |
| Expenses net of all reductions | .61%G | .53% | .65% | .64% | .67% | .71% |
| Net investment income (loss) | .27%G | .36% | .16% | .40% | .24% | .58% |
| Supplemental Data | ||||||
| Net assets, end of period (in millions) | $383 | $207 | $176 | $202 | $190 | $137 |
| Portfolio turnover rateH | 59%G | 65% | 57% | 51% | 70% | 62% |
A Calculated based on average shares outstanding during the period.
B Total distributions of $.04 per share is comprised of distributions from net investment income of $.036 and distributions from net realized gain of $.006 per share.
C Total returns for periods of less than one year are not annualized.
D Total returns would have been lower if certain expenses had not been reduced during the applicable periods shown.
E Fees and expenses of any underlying Fidelity Central Funds are not included in the Fund's expense ratio. The Fund indirectly bears its proportionate share of the expenses of any underlying Fidelity Central Funds.
F Expense ratios reflect operating expenses of the class. Expenses before reductions do not reflect amounts reimbursed by the investment adviser or reductions from brokerage service arrangements or reductions from other expense offset arrangements and do not represent the amount paid by the class during periods when reimbursements or reductions occur. Expenses net of fee waivers reflect expenses after reimbursement by the investment adviser but prior to reductions from brokerage service arrangements or other expense offset arrangements. Expenses net of all reductions represent the net expenses paid by the class.
G Annualized
H Amount does not include the portfolio activity of any underlying Fidelity Central Funds.
See accompanying notes which are an integral part of the financial statements.
Notes to Financial Statements (Unaudited)
For the period ended December 31, 2017
(Amounts in thousands except percentages)
1. Organization.
Fidelity Growth Discovery Fund (the Fund) is a fund of Fidelity Hastings Street Trust (the Trust) and is authorized to issue an unlimited number of shares. The Trust is registered under the Investment Company Act of 1940, as amended (the 1940 Act), as an open-end management investment company organized as a Massachusetts business trust. The Fund offers Growth Discovery and Class K shares, each of which has equal rights as to assets and voting privileges. Each class has exclusive voting rights with respect to matters that affect that class.
2. Investments in Fidelity Central Funds.
The Fund invests in Fidelity Central Funds, which are open-end investment companies generally available only to other investment companies and accounts managed by the investment adviser and its affiliates. The Fund's Schedule of Investments lists each of the Fidelity Central Funds held as of period end, if any, as an investment of the Fund, but does not include the underlying holdings of each Fidelity Central Fund. As an Investing Fund, the Fund indirectly bears its proportionate share of the expenses of the underlying Fidelity Central Funds.
The Money Market Central Funds seek preservation of capital and current income and are managed by Fidelity Investments Money Management, Inc. (FIMM), an affiliate of the investment adviser. Annualized expenses of the Money Market Central Funds as of their most recent shareholder report date are less than .005%.
A complete unaudited list of holdings for each Fidelity Central Fund is available upon request or at the Securities and Exchange Commission (the SEC) website at www.sec.gov. In addition, the financial statements of the Fidelity Central Funds are available on the SEC website or upon request.
3. Significant Accounting Policies.
The Fund is an investment company and applies the accounting and reporting guidance of the Financial Accounting Standards Board (FASB) Accounting Standards Codification Topic 946 Financial Services – Investments Companies. The financial statements have been prepared in conformity with accounting principles generally accepted in the United States of America (GAAP), which require management to make certain estimates and assumptions at the date of the financial statements. Actual results could differ from those estimates. Subsequent events, if any, through the date that the financial statements were issued have been evaluated in the preparation of the financial statements. The following summarizes the significant accounting policies of the Fund:
Investment Valuation. Investments are valued as of 4:00 p.m. Eastern time on the last calendar day of the period. The Board of Trustees (the Board) has delegated the day to day responsibility for the valuation of the Fund's investments to the Fair Value Committee (the Committee) established by the Fund's investment adviser. In accordance with valuation policies and procedures approved by the Board, the Fund attempts to obtain prices from one or more third party pricing vendors or brokers to value its investments. When current market prices, quotations or currency exchange rates are not readily available or reliable, investments will be fair valued in good faith by the Committee, in accordance with procedures adopted by the Board. Factors used in determining fair value vary by investment type and may include market or investment specific events. The frequency with which these procedures are used cannot be predicted and they may be utilized to a significant extent. The Committee oversees the Fund's valuation policies and procedures and reports to the Board on the Committee's activities and fair value determinations. The Board monitors the appropriateness of the procedures used in valuing the Fund's investments and ratifies the fair value determinations of the Committee.
The Fund categorizes the inputs to valuation techniques used to value its investments into a disclosure hierarchy consisting of three levels as shown below:
- Level 1 – quoted prices in active markets for identical investments
- Level 2 – other significant observable inputs (including quoted prices for similar investments, interest rates, prepayment speeds, etc.)
- Level 3 – unobservable inputs (including the Fund's own assumptions based on the best information available)
Valuation techniques used to value the Fund's investments by major category are as follows:
Equity securities, including restricted securities, for which market quotations are readily available, are valued at the last reported sale price or official closing price as reported by a third party pricing vendor on the primary market or exchange on which they are traded and are categorized as Level 1 in the hierarchy. In the event there were no sales during the day or closing prices are not available, securities are valued at the last quoted bid price or may be valued using the last available price and are generally categorized as Level 2 in the hierarchy. For foreign equity securities, when market or security specific events arise, comparisons to the valuation of American Depositary Receipts (ADRs), futures contracts, Exchange-Traded Funds (ETFs) and certain indexes as well as quoted prices for similar securities may be used and would be categorized as Level 2 in the hierarchy. Utilizing these techniques may result in transfers between Level 1 and Level 2. For equity securities, including restricted securities, where observable inputs are limited, assumptions about market activity and risk are used and these securities may be categorized as Level 3 in the hierarchy.
Investments in open-end mutual funds, including the Fidelity Central Funds, are valued at their closing net asset value (NAV) each business day and are categorized as Level 1 in the hierarchy.
Changes in valuation techniques may result in transfers in or out of an assigned level within the disclosure hierarchy. The aggregate value of investments by input level as of December 31, 2017 is included at the end of the Fund's Schedule of Investments.
Foreign Currency. The Fund may use foreign currency contracts to facilitate transactions in foreign-denominated securities. Gains and losses from these transactions may arise from changes in the value of the foreign currency or if the counterparties do not perform under the contracts' terms.
Foreign-denominated assets, including investment securities, and liabilities are translated into U.S. dollars at the exchange rates at period end. Purchases and sales of investment securities, income and dividends received and expenses denominated in foreign currencies are translated into U.S. dollars at the exchange rate in effect on the transaction date.
The effects of exchange rate fluctuations on investments are included with the net realized and unrealized gain (loss) on investment securities. Other foreign currency transactions resulting in realized and unrealized gain (loss) are disclosed separately.
Investment Transactions and Income. For financial reporting purposes, the Fund's investment holdings and NAV include trades executed through the end of the last business day of the period. The NAV per share for processing shareholder transactions is calculated as of the close of business of the New York Stock Exchange (NYSE), normally 4:00 p.m. Eastern time and includes trades executed through the end of the prior business day. Gains and losses on securities sold are determined on the basis of identified cost and includes proceeds received from litigation. Dividend income is recorded on the ex-dividend date, except for certain dividends from foreign securities where the ex-dividend date may have passed, which are recorded as soon as the Fund is informed of the ex-dividend date. Non-cash dividends included in dividend income, if any, are recorded at the fair market value of the securities received. Income and capital gain distributions from Fidelity Central Funds, if any, are recorded on the ex-dividend date. Certain distributions received by the Fund represent a return of capital or capital gain. The Fund determines the components of these distributions subsequent to the ex-dividend date, based upon receipt of tax filings or other correspondence relating to the underlying investment. These distributions are recorded as a reduction of cost of investments and/or as a realized gain. Investment income is recorded net of foreign taxes withheld where recovery of such taxes is uncertain.
Class Allocations and Expenses. Investment income, realized and unrealized capital gains and losses, common expenses of the Fund, and certain fund-level expense reductions, if any, are allocated daily on a pro-rata basis to each class based on the relative net assets of each class to the total net assets of the Fund. Each class differs with respect to transfer agent fees incurred. Certain expense reductions may also differ by class. For the reporting period, the allocated portion of income and expenses to each class as a percent of its average net assets may vary due to the timing of recording these transactions in relation to fluctuating net assets of the classes. Expenses directly attributable to a fund are charged to that fund. Expenses attributable to more than one fund are allocated among the respective funds on the basis of relative net assets or other appropriate methods. Expense estimates are accrued in the period to which they relate and adjustments are made when actual amounts are known.
Income Tax Information and Distributions to Shareholders. Each year, the Fund intends to qualify as a regulated investment company under Subchapter M of the Internal Revenue Code, including distributing substantially all of its taxable income and realized gains. As a result, no provision for U.S. Federal income taxes is required. The Fund files a U.S. federal tax return, in addition to state and local tax returns as required. The Fund's federal income tax returns are subject to examination by the Internal Revenue Service (IRS) for a period of three fiscal years after they are filed. State and local tax returns may be subject to examination for an additional fiscal year depending on the jurisdiction. Foreign taxes are provided for based on the Fund's understanding of the tax rules and rates that exist in the foreign markets in which it invests.
Distributions are declared and recorded on the ex-dividend date. Income dividends and capital gain distributions are declared separately for each class. Income and capital gain distributions are determined in accordance with income tax regulations, which may differ from GAAP.
Capital accounts within the financial statements are adjusted for permanent book-tax differences. These adjustments have no impact on net assets or the results of operations. Capital accounts are not adjusted for temporary book-tax differences which will reverse in a subsequent period.
Book-tax differences are primarily due to futures contracts, foreign currency transactions, market discount, partnerships, capital loss carryforwards, and losses deferred due to wash sales and excise tax regulations.
As of period end, the cost and unrealized appreciation (depreciation) in securities, and derivatives if applicable, for federal income tax purposes were as follows:
| Gross unrealized appreciation | $413,794 |
| Gross unrealized depreciation | (14,079) |
| Net unrealized appreciation (depreciation) | $399,715 |
| Tax cost | $1,344,845 |
Delayed Delivery Transactions and When-Issued Securities. During the period, the Fund transacted in securities on a delayed delivery or when-issued basis. Payment and delivery may take place after the customary settlement period for that security. The price of the underlying securities and the date when the securities will be delivered and paid for are fixed at the time the transaction is negotiated. The securities purchased on a delayed delivery or when-issued basis are identified as such in the Fund's Schedule of Investments. With respect to purchase commitments, the Fund identifies securities as segregated in its records with a value at least equal to the amount of the commitment. Losses may arise due to changes in the value of the underlying securities or if the counterparty does not perform under the contract's terms, or if the issuer does not issue the securities due to political, economic, or other factors.
Restricted Securities. The Fund may invest in securities that are subject to legal or contractual restrictions on resale. These securities generally may be resold in transactions exempt from registration or to the public if the securities are registered. Disposal of these securities may involve time-consuming negotiations and expense, and prompt sale at an acceptable price may be difficult. Information regarding restricted securities is included at the end of the Fund's Schedule of Investments.
4. Purchases and Sales of Investments.
Purchases and sales of securities, other than short-term securities, aggregated $615,618 and $443,064, respectively.
5. Fees and Other Transactions with Affiliates.
Management Fee. Fidelity Management & Research Company (the investment adviser) and its affiliates provide the Fund with investment management related services for which the Fund pays a monthly management fee. The management fee is the sum of an individual fund fee rate that is based on an annual rate of .30% of the Fund's average net assets and an annualized group fee rate that averaged .24% during the period. The group fee rate is based upon the average net assets of all the mutual funds advised by the investment adviser, including any mutual funds previously advised by the investment adviser that are currently advised by Fidelity SelectCo, LLC, an affiliate of the investment adviser. The group fee rate decreases as assets under management increase and increases as assets under management decrease. In addition, the management fee is subject to a performance adjustment (up to a maximum of +/- .20% of the Fund's average net assets over a 36 month performance period). The upward or downward adjustment to the management fee is based on the relative investment performance of Growth Discovery as compared to its benchmark index, the Russell 3000 Growth Index, over the same 36 month performance period. For the reporting period, the total annualized management fee rate, including the performance adjustment, was .52% of the Fund's average net assets. The performance adjustment included in the management fee rate may be higher or lower than the maximum performance adjustment rate due to the difference between the average net assets for the reporting and performance periods.
Transfer Agent Fees. Fidelity Investments Institutional Operations Company, Inc., (FIIOC), an affiliate of the investment adviser, is the transfer, dividend disbursing and shareholder servicing agent for each class of the Fund. FIIOC receives account fees and asset-based fees that vary according to the account size and type of account of the shareholders of Growth Discovery. FIIOC receives an asset-based fee of Class K's average net assets. FIIOC pays for typesetting, printing and mailing of shareholder reports, except proxy statements.
For the period, transfer agent fees for each class were as follows:
| Amount | % of Class-Level Average Net Assets(a) | |
| Growth Discovery | $982 | .16 |
| Class K | 70 | .05 |
| $1,052 |
(a) Annualized
Accounting and Security Lending Fees. Fidelity Service Company, Inc. (FSC), an affiliate of the investment adviser, maintains the Fund's accounting records. The accounting fee is based on the level of average net assets for each month. Under a separate contract, FSC administers the security lending program. The security lending fee is based on the number and duration of lending transactions.
Brokerage Commissions. The Fund placed a portion of its portfolio transactions with brokerage firms which are affiliates of the investment adviser. Brokerage commissions are included in net realized gain (loss) and change in net unrealized appreciation (depreciation) in the Statement of Operations. The commissions paid to these affiliated firms were $14 for the period.
Interfund Trades. The Fund may purchase from or sell securities to other Fidelity Funds under procedures adopted by the Board. The procedures have been designed to ensure these interfund trades are executed in accordance with Rule 17a-7 of the 1940 Act. Interfund trades are included within the respective purchases and sales amounts shown in the Purchases and Sales of Investments note.
6. Committed Line of Credit.
The Fund participates with other funds managed by the investment adviser or an affiliate in a $4.25 billion credit facility (the "line of credit") to be utilized for temporary or emergency purposes to fund shareholder redemptions or for other short-term liquidity purposes. The Fund has agreed to pay commitment fees on its pro-rata portion of the line of credit, which amounted to $2 and is reflected in Miscellaneous expenses on the Statement of Operations. During the period, the Fund did not borrow on this line of credit.
7. Security Lending.
The Fund lends portfolio securities through a lending agent from time to time in order to earn additional income. For equity securities, a lending agent is used and may loan securities to certain qualified borrowers, including Fidelity Capital Markets (FCM), a broker-dealer affiliated with the Fund. On the settlement date of the loan, the Fund receives collateral (in the form of U.S. Treasury obligations, letters of credit and/or cash) against the loaned securities and maintains collateral in an amount not less than 100% of the market value of the loaned securities during the period of the loan. The market value of the loaned securities is determined at the close of business of the Fund and any additional required collateral is delivered to the Fund on the next business day. The Fund or borrower may terminate the loan at any time, and if the borrower defaults on its obligation to return the securities loaned because of insolvency or other reasons, the Fund may apply collateral received from the borrower against the obligation. The Fund may experience delays and costs in recovering the securities loaned. Any cash collateral received is invested in the Fidelity Securities Lending Cash Central Fund. The value of loaned securities and cash collateral at period end are disclosed on the Fund's Statement of Assets and Liabilities. At period end, there were no security loans outstanding with FCM. Security lending income represents the income earned on investing cash collateral, less rebates paid to borrowers and any lending agent fees associated with the loan, plus any premium payments received for lending certain types of securities. Security lending income is presented in the Statement of Operations as a component of income from Fidelity Central Funds. Total security lending income during the period amounted to $346, including in the amount of less than five hundred dollars from securities loaned to FCM.
8. Expense Reductions.
Commissions paid to certain brokers with whom the investment adviser, or its affiliates, places trades on behalf of the Fund include an amount in addition to trade execution, which may be rebated back to the Fund to offset certain expenses. This amount totaled $14 for the period. Through arrangements with the Fund's custodian, credits realized as a result of certain uninvested cash balances were used to reduce the Fund's expenses. During the period, these credits reduced the Fund's custody expenses by $1.
In addition, during the period the investment adviser reimbursed and/or waived a portion of fund-level operating expenses in the amount of $5.
9. Distributions to Shareholders.
Distributions to shareholders of each class were as follows:
| Six months ended December 31, 2017 | Year ended June 30, 2017 | |
| From net investment income | ||
| Growth Discovery | $1,948 | $880 |
| Class K | 854 | 255 |
| Total | $2,802 | $1,135 |
| From net realized gain | ||
| Growth Discovery | $61,060 | $– |
| Class K | 15,693 | – |
| Total | $76,753 | $– |
10. Share Transactions.
Share transactions for each class were as follows and may contain automatic conversions between classes or exchanges between affiliated funds:
| Shares | Shares | Dollars | Dollars | |
| Six months ended December 31, 2017 | Year ended June 30, 2017 | Six months ended December 31, 2017 | Year ended June 30, 2017 | |
| Growth Discovery | ||||
| Shares sold | 4,922 | 4,332 | $158,758 | $121,287 |
| Reinvestment of distributions | 1,871 | 32 | 59,167 | 821 |
| Shares redeemed | (3,144) | (7,392) | (100,980) | (196,671) |
| Net increase (decrease) | 3,649 | (3,028) | $116,945 | $(74,563) |
| Class K | ||||
| Shares sold | 5,512 | 1,584 | $178,534 | $44,201 |
| Reinvestment of distributions | 521 | 10 | 16,547 | 255 |
| Shares redeemed | (1,027) | (2,017) | (33,029) | (53,771) |
| Net increase (decrease) | 5,006 | (423) | $162,052 | $(9,315) |
11. Other.
The Fund's organizational documents provide former and current trustees and officers with a limited indemnification against liabilities arising in connection with the performance of their duties to the Fund. In the normal course of business, the Fund may also enter into contracts that provide general indemnifications. The Fund's maximum exposure under these arrangements is unknown as this would be dependent on future claims that may be made against the Fund. The risk of material loss from such claims is considered remote.
Shareholder Expense Example
As a shareholder of the Fund, you incur two types of costs: (1) transaction costs, and (2) ongoing costs, including management fees and other Fund expenses. This Example is intended to help you understand your ongoing costs (in dollars) of investing in the Fund and to compare these costs with the ongoing costs of investing in other mutual funds.
The Example is based on an investment of $1,000 invested at the beginning of the period and held for the entire period (July 1, 2017 to December 31, 2017).
Actual Expenses
The first line of the accompanying table for each class of the Fund provides information about actual account values and actual expenses. You may use the information in this line, together with the amount you invested, to estimate the expenses that you paid over the period. Simply divide your account value by $1,000.00 (for example, an $8,600 account value divided by $1,000.00 = 8.6), then multiply the result by the number in the first line for a class of the Fund under the heading entitled "Expenses Paid During Period" to estimate the expenses you paid on your account during this period. A small balance maintenance fee of $12.00 that is charged once a year may apply for certain accounts with a value of less than $2,000. This fee is not included in the table below. If it was, the estimate of expenses you paid during the period would be higher, and your ending account value lower, by this amount. In addition, the Fund, as a shareholder in the underlying Fidelity Central Funds, will indirectly bear its pro-rata share of the fees and expenses incurred by the underlying Fidelity Central Funds. These fees and expenses are not included in the Fund's annualized expense ratio used to calculate the expense estimate in the table below.
Hypothetical Example for Comparison Purposes
The second line of the accompanying table for each class of the Fund provides information about hypothetical account values and hypothetical expenses based on a Class' actual expense ratio and an assumed rate of return of 5% per year before expenses, which is not the Class' actual return. The hypothetical account values and expenses may not be used to estimate the actual ending account balance or expenses you paid for the period. You may use this information to compare the ongoing costs of investing in the Fund and other funds. To do so, compare this 5% hypothetical example with the 5% hypothetical examples that appear in the shareholder reports of the other funds. A small balance maintenance fee of $12.00 that is charged once a year may apply for certain accounts with a value of less than $2,000. This fee is not included in the table below. If it was, the estimate of expenses you paid during the period would be higher, and your ending account value lower, by this amount. In addition, the Fund, as a shareholder in the underlying Fidelity Central Funds, will indirectly bear its pro-rata share of the fees and expenses incurred by the underlying Fidelity Central Funds. These fees and expenses are not included in the Fund's annualized expense ratio used to calculate the expense estimate in the table below.
Please note that the expenses shown in the table are meant to highlight your ongoing costs only and do not reflect any transaction costs. Therefore, the second line of the table is useful in comparing ongoing costs only, and will not help you determine the relative total costs of owning different funds.
| Annualized Expense Ratio-A | Beginning Account Value July 1, 2017 | Ending Account Value December 31, 2017 | Expenses Paid During Period-B July 1, 2017 to December 31, 2017 | |
| Growth Discovery | .72% | |||
| Actual | $1,000.00 | $1,119.70 | $3.85 | |
| Hypothetical-C | $1,000.00 | $1,021.58 | $3.67 | |
| Class K | .61% | |||
| Actual | $1,000.00 | $1,120.10 | $3.26 | |
| Hypothetical-C | $1,000.00 | $1,022.13 | $3.11 |
A Annualized expense ratio reflects expenses net of applicable fee waivers.
B Expenses are equal to each Class' annualized expense ratio, multiplied by the average account value over the period, multiplied by 184/365 (to reflect the one-half year period).
C 5% return per year before expenses
Board Approval of Investment Advisory Contracts and Management Fees
Fidelity Growth Discovery Fund
Each year, the Board of Trustees, including the Independent Trustees (together, the Board), votes on the renewal of the management contract with Fidelity Management & Research Company (FMR) and the sub-advisory agreements (together, the Advisory Contracts) for the fund. FMR and the sub-advisers are referred to herein as the Investment Advisers. The Board, assisted by the advice of fund counsel and Independent Trustees' counsel, requests and considers a broad range of information relevant to the renewal of the Advisory Contracts throughout the year.
The Board meets regularly and, at each of its meetings, covers an extensive agenda of topics and materials and considers factors that are relevant to its annual consideration of the renewal of the fund's Advisory Contracts, including the services and support provided to the fund and its shareholders. The Board has established various standing committees (Committees), each composed of and chaired by Independent Trustees with varying backgrounds, to which the Board has assigned specific subject matter responsibilities in order to enhance effective decision-making by the Board. The Board, acting directly and through its Committees, requests and receives information concerning the annual consideration of the renewal of the fund's Advisory Contracts. The Board also meets as needed to review matters specifically related to the Board's annual consideration of the renewal of the Advisory Contracts. Members of the Board may also meet with trustees of other Fidelity funds through ad hoc joint committees to discuss certain matters relevant to all of the Fidelity funds.
At its July 2017 meeting, the Board unanimously determined to renew the fund's Advisory Contracts. In reaching its determination, the Board considered all factors it believed relevant, including (i) the nature, extent, and quality of the services to be provided to the fund and its shareholders (including the investment performance of the fund); (ii) the competitiveness of the fund's management fee and total expense ratio relative to peer funds; (iii) the total costs of the services to be provided by and the profits to be realized by Fidelity from its relationships with the fund; and (iv) the extent to which, if any, economies of scale exist and would be realized as the fund grows, and whether any economies of scale are appropriately shared with fund shareholders.
In considering whether to renew the Advisory Contracts for the fund, the Board reached a determination, with the assistance of fund counsel and Independent Trustees' counsel and through the exercise of its business judgment, that the renewal of the Advisory Contracts was in the best interests of the fund and its shareholders and that the compensation payable under the Advisory Contracts was fair and reasonable. The Board's decision to renew the Advisory Contracts was not based on any single factor, but rather was based on a comprehensive consideration of all the information provided to the Board at its meetings throughout the year. The Board, in reaching its determination to renew the Advisory Contracts, was aware that shareholders of the fund have a broad range of investment choices available to them, including a wide choice among funds offered by Fidelity's competitors, and that the fund's shareholders, who have the opportunity to review and weigh the disclosure provided by the fund in its prospectus and other public disclosures, have chosen to invest in this fund, which is part of the Fidelity family of funds.
Amendment to Group Fee Rate. The Board also approved an amendment to the management contract for the fund to add an additional breakpoint to the group fee schedule, effective October 1, 2017. The Board noted that the additional breakpoint would result in lower management fee rates as Fidelity's assets under management increase.
Nature, Extent, and Quality of Services Provided. The Board considered Fidelity's staffing as it relates to the fund, including the backgrounds of investment personnel of Fidelity, and also considered the fund's investment objective, strategies, and related investment philosophy. The Independent Trustees also had discussions with senior management of Fidelity's investment operations and investment groups. The Board considered the structure of the investment personnel compensation program and whether this structure provides appropriate incentives to act in the best interests of the fund. Additionally, the Board considered the portfolio managers' investments, if any, in the funds that they manage.Resources Dedicated to Investment Management and Support Services. The Board and the Fund Oversight and Research Committees reviewed the general qualifications and capabilities of Fidelity's investment staff, including its size, education, experience, and resources, as well as Fidelity's approach to recruiting, training, managing, and compensating investment personnel. The Board noted that Fidelity has continued to increase the resources devoted to non-U.S. offices, including expansion of Fidelity's global investment organization. The Board also noted that Fidelity's analysts have extensive resources, tools and capabilities that allow them to conduct sophisticated quantitative and fundamental analysis, as well as credit analysis of issuers, counterparties and guarantors. Further, the Board considered that Fidelity's investment professionals have sufficient access to global information and data so as to provide competitive investment results over time, and that those professionals also have access to sophisticated tools that permit them to assess portfolio construction and risk and performance attribution characteristics continuously, as well as to transmit new information and research conclusions rapidly around the world. Additionally, in its deliberations, the Board considered Fidelity's trading, risk management, compliance, and technology and operations capabilities and resources, which are integral parts of the investment management process.Shareholder and Administrative Services. The Board considered (i) the nature, extent, quality, and cost of advisory, administrative, and shareholder services performed by the Investment Advisers and their affiliates under the Advisory Contracts and under separate agreements covering transfer agency, pricing and bookkeeping, and securities lending services for the fund; (ii) the nature and extent of the supervision of third party service providers, principally custodians, subcustodians, and pricing vendors; and (iii) the resources devoted to, and the record of compliance with, the fund's compliance policies and procedures. The Board also reviewed the allocation of fund brokerage, including allocations to brokers affiliated with the Investment Advisers, the use of brokerage commissions to pay fund expenses, and the use of "soft" commission dollars to pay for research services.The Board noted that the growth of fund assets over time across the complex allows Fidelity to reinvest in the development of services designed to enhance the value or convenience of the Fidelity funds as investment vehicles. These services include 24-hour access to account information and market information through telephone representatives and over the Internet, investor education materials and asset allocation tools, and the expanded availability of Fidelity Investor Centers.In 2014, the Board formed an ad hoc Committee on Transfer Agency Fees to review the variety of transfer agency fee structures throughout the industry and Fidelity's competitive positioning with respect to industry participants.Investment in a Large Fund Family. The Board considered the benefits to shareholders of investing in a Fidelity fund, including the benefits of investing in a fund that is part of a large family of funds offering a variety of investment disciplines and providing a large variety of mutual fund investor services. The Board noted that Fidelity had taken, or had made recommendations that resulted in the Fidelity funds taking, a number of actions over the previous year that benefited particular funds, including: (i) continuing to dedicate additional resources to Fidelity's investment research process, and to the support of the senior management team that oversees asset management; (ii) continuing efforts to enhance Fidelity's global research capabilities; (iii) launching new funds and making other enhancements to meet client needs; (iv) launching new share classes of existing funds; (v) eliminating purchase minimums and broadening eligibility requirements for certain lower-priced share classes; (vi) reducing management fees and total expenses for certain growth equity funds and index funds; (vii) lowering expense caps for certain existing funds and classes to reduce expenses borne by shareholders; (viii) eliminating short-term redemption fees for certain funds; (ix) introducing a new pricing structure for certain funds of funds that is expected to reduce overall expenses paid by shareholders; (x) rationalizing product lines and gaining increased efficiencies through proposals for fund mergers and share class consolidations; (xi) continuing to develop, acquire and implement systems and technology to improve services to the funds and shareholders, strengthen information security, and increase efficiency; and (xii) implementing enhancements to further strengthen Fidelity's product line to increase investors' probability of success in achieving their investment goals, including retirement income goals.Investment Performance. The Board considered whether the fund has operated in accordance with its investment objective, as well as its record of compliance with its investment restrictions and its performance history. The Board noted that there was a portfolio management change for the fund in June 2017.The Board took into account discussions with representatives of the Investment Advisers about fund investment performance that occur at Board meetings throughout the year. In this regard the Board noted that as part of regularly scheduled fund reviews and other reports to the Board on fund performance, the Board considers annualized return information for the fund for different time periods, measured against a securities market index ("benchmark index") and a peer group of funds with similar objectives ("peer group"), if any. In its evaluation of fund investment performance, the Board gave particular attention to information indicating changes in performance of certain Fidelity funds for specific time periods and discussed with the Investment Advisers the reasons for any overperformance or underperformance.In addition to reviewing absolute and relative fund performance, the Independent Trustees periodically consider the appropriateness of fund performance metrics in evaluating the results achieved. In general, the Independent Trustees believe that fund performance should be evaluated based on net performance (after fees and expenses) of both the highest performing and lowest performing fund share classes, where applicable, compared to appropriate benchmark indices, over appropriate time periods that may include full market cycles, and compared to peer groups, as applicable, over the same periods, taking into account relevant factors including the following: general market conditions; issuer-specific information; and fund cash flows and other factors.The Independent Trustees recognize that shareholders evaluate performance on a net basis over their own holding periods, for which one-, three-, and five-year periods are often used as a proxy. For this reason, the performance information reviewed by the Board also included net cumulative calendar year total return information for the fund and an appropriate benchmark index and peer group for the most recent one-, three-, and five-year periods, as shown below. Returns are shown compared to the 25th percentile (top of box, 75% beaten) and 75th percentile (bottom of box, 25% beaten) of the peer universe.Fidelity Growth Discovery Fund

Fidelity Growth Discovery Fund
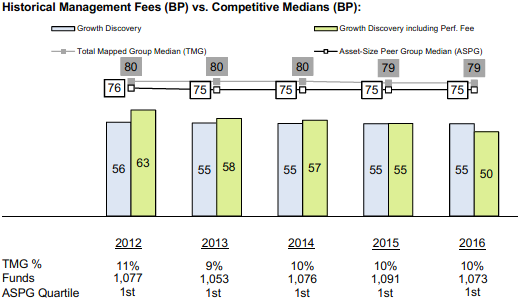
![]()
Corporate Headquarters
245 Summer St.
Boston, MA 02210
www.fidelity.com
CII-K-SANN-0218
1.863274.109
Fidelity Advisor® Mega Cap Stock Fund - Semi-Annual Report December 31, 2017 Class A, Class M, Class C, Class I and Class Z are classes of Fidelity® Mega Cap Stock Fund |
|
Contents
Board Approval of Investment Advisory Contracts and Management Fees |
To view a fund's proxy voting guidelines and proxy voting record for the 12-month period ended June 30, visit http://www.fidelity.com/proxyvotingresults or visit the Securities and Exchange Commission's (SEC) web site at http://www.sec.gov.
You may also call 1-877-208-0098 to request a free copy of the proxy voting guidelines.
Standard & Poor's, S&P and S&P 500 are registered service marks of The McGraw-Hill Companies, Inc. and have been licensed for use by Fidelity Distributors Corporation.
Other third-party marks appearing herein are the property of their respective owners.
All other marks appearing herein are registered or unregistered trademarks or service marks of FMR LLC or an affiliated company. © 2018 FMR LLC. All rights reserved.
This report and the financial statements contained herein are submitted for the general information of the shareholders of the Fund. This report is not authorized for distribution to prospective investors in the Fund unless preceded or accompanied by an effective prospectus.
A fund files its complete schedule of portfolio holdings with the SEC for the first and third quarters of each fiscal year on Form N-Q. Forms N-Q are available on the SEC’s web site at http://www.sec.gov. A fund's Forms N-Q may be reviewed and copied at the SEC’s Public Reference Room in Washington, DC. Information regarding the operation of the SEC's Public Reference Room may be obtained by calling 1-800-SEC-0330.
For a complete list of a fund's portfolio holdings, view the most recent holdings listing, semiannual report, or annual report on Fidelity's web site at http://www.fidelity.com, http://www.institutional.fidelity.com, or http://www.401k.com, as applicable.
NOT FDIC INSURED •MAY LOSE VALUE •NO BANK GUARANTEE
Neither the Fund nor Fidelity Distributors Corporation is a bank.
Investment Summary (Unaudited)
Top Ten Stocks as of December 31, 2017
| % of fund's net assets | |
| Bank of America Corp.(a) | 4.5 |
| Microsoft Corp.(a) | 4.3 |
| JPMorgan Chase & Co.(a) | 3.9 |
| Citigroup, Inc.(a) | 3.4 |
| Apple, Inc.(a) | 3.2 |
| Chevron Corp. | 2.7 |
| Wells Fargo & Co. | 2.6 |
| Comcast Corp. Class A | 2.6 |
| ConocoPhillips Co. | 2.4 |
| Johnson & Johnson(a) | 2.3 |
| 31.9 |
(a) Security or a portion of the security is pledged as collateral for call options written.
Top Five Market Sectors as of December 31, 2017
| % of fund's net assets | |
| Financials | 21.8 |
| Information Technology | 20.9 |
| Health Care | 13.7 |
| Energy | 12.9 |
| Consumer Staples | 9.5 |
Asset Allocation (% of fund's net assets)
| As of December 31, 2017*,** | ||
| Stocks | 98.7% | |
| Convertible Securities | 0.1% | |
| Other Investments | 0.3% | |
| Short-Term Investments and Net Other Assets (Liabilities) | 0.9% | |

* Foreign investments - 8.0%
** Written options - (0.1)%
Investments December 31, 2017 (Unaudited)
Showing Percentage of Net Assets
| Common Stocks - 98.7% | |||
| Shares | Value | ||
| CONSUMER DISCRETIONARY - 6.7% | |||
| Automobiles - 0.2% | |||
| General Motors Co. | 104,900 | $4,299,851 | |
| Media - 4.1% | |||
| Comcast Corp. Class A | 1,664,500 | 66,663,225 | |
| The Walt Disney Co. | 246,500 | 26,501,215 | |
| Time Warner, Inc. | 120,195 | 10,994,237 | |
| Viacom, Inc. Class B (non-vtg.) | 84,800 | 2,612,688 | |
| 106,771,365 | |||
| Multiline Retail - 0.4% | |||
| Target Corp. (a) | 164,100 | 10,707,525 | |
| Specialty Retail - 2.0% | |||
| Lowe's Companies, Inc. (a) | 448,100 | 41,646,414 | |
| TJX Companies, Inc. | 151,000 | 11,545,460 | |
| 53,191,874 | |||
| TOTAL CONSUMER DISCRETIONARY | 174,970,615 | ||
| CONSUMER STAPLES - 9.5% | |||
| Beverages - 2.0% | |||
| PepsiCo, Inc. | 105,005 | 12,592,200 | |
| The Coca-Cola Co. | 862,100 | 39,553,148 | |
| 52,145,348 | |||
| Food & Staples Retailing - 2.5% | |||
| Costco Wholesale Corp. | 21,000 | 3,908,520 | |
| CVS Health Corp. | 351,100 | 25,454,750 | |
| Kroger Co. (a) | 224,600 | 6,165,270 | |
| Wal-Mart Stores, Inc. | 306,100 | 30,227,375 | |
| 65,755,915 | |||
| Food Products - 0.0% | |||
| General Mills, Inc. | 8,300 | 492,107 | |
| Household Products - 2.4% | |||
| Kimberly-Clark Corp. | 23,800 | 2,871,708 | |
| Procter & Gamble Co. (a) | 533,100 | 48,981,228 | |
| Reckitt Benckiser Group PLC | 95,300 | 8,890,868 | |
| 60,743,804 | |||
| Personal Products - 0.4% | |||
| Estee Lauder Companies, Inc. Class A | 18,400 | 2,341,216 | |
| Unilever NV (NY Reg.) | 135,800 | 7,648,256 | |
| 9,989,472 | |||
| Tobacco - 2.2% | |||
| Altria Group, Inc. | 584,800 | 41,760,568 | |
| British American Tobacco PLC sponsored ADR | 241,600 | 16,184,784 | |
| 57,945,352 | |||
| TOTAL CONSUMER STAPLES | 247,071,998 | ||
| ENERGY - 12.6% | |||
| Energy Equipment & Services - 0.4% | |||
| Baker Hughes, a GE Co. Class A | 241,600 | 7,644,224 | |
| Schlumberger Ltd. | 47,100 | 3,174,069 | |
| 10,818,293 | |||
| Oil, Gas & Consumable Fuels - 12.2% | |||
| Anadarko Petroleum Corp. | 241,600 | 12,959,424 | |
| Apache Corp. | 419,905 | 17,728,389 | |
| BP PLC sponsored ADR | 157,900 | 6,636,537 | |
| Chevron Corp. | 561,700 | 70,319,223 | |
| ConocoPhillips Co. | 1,116,100 | 61,262,729 | |
| Exxon Mobil Corp. | 65,000 | 5,436,600 | |
| Imperial Oil Ltd. | 448,500 | 13,997,339 | |
| Kinder Morgan, Inc. | 1,197,500 | 21,638,825 | |
| Phillips 66 Co. | 89,400 | 9,042,810 | |
| Suncor Energy, Inc. | 1,333,000 | 48,940,294 | |
| The Williams Companies, Inc. | 1,310,300 | 39,951,047 | |
| Valero Energy Corp. | 104,000 | 9,558,640 | |
| 317,471,857 | |||
| TOTAL ENERGY | 328,290,150 | ||
| FINANCIALS - 21.8% | |||
| Banks - 17.0% | |||
| Bank of America Corp. (a) | 3,941,000 | 116,338,318 | |
| Citigroup, Inc. (a) | 1,192,070 | 88,701,929 | |
| JPMorgan Chase & Co. (a) | 945,400 | 101,101,076 | |
| PNC Financial Services Group, Inc. (a) | 223,600 | 32,263,244 | |
| U.S. Bancorp | 708,300 | 37,950,714 | |
| Wells Fargo & Co. | 1,116,930 | 67,764,143 | |
| 444,119,424 | |||
| Capital Markets - 4.1% | |||
| Charles Schwab Corp. (a) | 339,400 | 17,434,978 | |
| Goldman Sachs Group, Inc. | 41,900 | 10,674,444 | |
| Morgan Stanley | 575,800 | 30,212,226 | |
| State Street Corp. | 497,700 | 48,580,497 | |
| 106,902,145 | |||
| Insurance - 0.7% | |||
| Marsh & McLennan Companies, Inc. | 121,780 | 9,911,674 | |
| MetLife, Inc. | 151,900 | 7,680,064 | |
| 17,591,738 | |||
| TOTAL FINANCIALS | 568,613,307 | ||
| HEALTH CARE - 13.6% | |||
| Biotechnology - 3.4% | |||
| Alexion Pharmaceuticals, Inc. (b) | 117,600 | 14,063,784 | |
| Amgen, Inc. | 241,290 | 41,960,331 | |
| Biogen, Inc. (b) | 39,500 | 12,583,515 | |
| Gilead Sciences, Inc. | 84,110 | 6,025,640 | |
| Intercept Pharmaceuticals, Inc. (b) | 31,200 | 1,822,704 | |
| Regeneron Pharmaceuticals, Inc. (b) | 17,400 | 6,541,704 | |
| Vertex Pharmaceuticals, Inc. (b) | 45,000 | 6,743,700 | |
| 89,741,378 | |||
| Health Care Equipment & Supplies - 1.2% | |||
| Becton, Dickinson & Co. | 10,200 | 2,183,412 | |
| Boston Scientific Corp. (b) | 397,300 | 9,849,067 | |
| Danaher Corp. | 68,400 | 6,348,888 | |
| Medtronic PLC | 171,113 | 13,817,375 | |
| 32,198,742 | |||
| Health Care Providers & Services - 3.4% | |||
| Aetna, Inc. | 18,700 | 3,373,293 | |
| Anthem, Inc. | 76,400 | 17,190,764 | |
| Cardinal Health, Inc. | 111,800 | 6,849,986 | |
| Cigna Corp. | 68,900 | 13,992,901 | |
| Express Scripts Holding Co. (b) | 62,062 | 4,632,308 | |
| Humana, Inc. | 28,300 | 7,020,381 | |
| McKesson Corp. | 131,300 | 20,476,235 | |
| UnitedHealth Group, Inc. | 64,100 | 14,131,486 | |
| 87,667,354 | |||
| Pharmaceuticals - 5.6% | |||
| Allergan PLC | 62,400 | 10,207,392 | |
| AstraZeneca PLC sponsored ADR | 213,900 | 7,422,330 | |
| Bayer AG | 28,800 | 3,578,781 | |
| Bristol-Myers Squibb Co. (a) | 163,850 | 10,040,728 | |
| GlaxoSmithKline PLC sponsored ADR | 1,003,700 | 35,601,239 | |
| Johnson & Johnson (a) | 423,400 | 59,157,448 | |
| Novartis AG sponsored ADR | 51,000 | 4,281,960 | |
| Sanofi SA | 87,064 | 7,495,513 | |
| Teva Pharmaceutical Industries Ltd. sponsored ADR (c) | 479,300 | 9,082,735 | |
| 146,868,126 | |||
| TOTAL HEALTH CARE | 356,475,600 | ||
| INDUSTRIALS - 8.8% | |||
| Aerospace & Defense - 2.4% | |||
| General Dynamics Corp. | 18,100 | 3,682,445 | |
| The Boeing Co. (a) | 47,400 | 13,978,734 | |
| United Technologies Corp. | 353,100 | 45,044,967 | |
| 62,706,146 | |||
| Air Freight & Logistics - 1.6% | |||
| FedEx Corp. | 47,400 | 11,828,196 | |
| United Parcel Service, Inc. Class B | 253,000 | 30,144,950 | |
| 41,973,146 | |||
| Industrial Conglomerates - 2.0% | |||
| General Electric Co. | 3,008,500 | 52,498,325 | |
| Road & Rail - 2.8% | |||
| CSX Corp. (a) | 386,700 | 21,272,367 | |
| Norfolk Southern Corp. | 119,100 | 17,257,590 | |
| Union Pacific Corp. | 254,790 | 34,167,339 | |
| 72,697,296 | |||
| TOTAL INDUSTRIALS | 229,874,913 | ||
| INFORMATION TECHNOLOGY - 20.9% | |||
| Communications Equipment - 1.8% | |||
| Cisco Systems, Inc. (a) | 1,241,800 | 47,560,940 | |
| Internet Software & Services - 4.2% | |||
| Alphabet, Inc.: | |||
| Class A (b) | 49,750 | 52,406,650 | |
| Class C (b) | 47,026 | 49,208,006 | |
| Facebook, Inc. Class A (b) | 40,100 | 7,076,046 | |
| 108,690,702 | |||
| IT Services - 3.5% | |||
| Accenture PLC Class A | 37,800 | 5,786,802 | |
| Cognizant Technology Solutions Corp. Class A | 143,400 | 10,184,268 | |
| MasterCard, Inc. Class A (a) | 132,800 | 20,100,608 | |
| PayPal Holdings, Inc. (b) | 103,700 | 7,634,394 | |
| Visa, Inc. Class A | 420,000 | 47,888,400 | |
| 91,594,472 | |||
| Semiconductors & Semiconductor Equipment - 2.0% | |||
| Qualcomm, Inc. | 809,700 | 51,836,994 | |
| Software - 6.2% | |||
| Adobe Systems, Inc. (b) | 99,600 | 17,453,904 | |
| Microsoft Corp. (a) | 1,317,700 | 112,716,058 | |
| Oracle Corp. | 496,300 | 23,465,064 | |
| Salesforce.com, Inc. (b) | 19,200 | 1,962,816 | |
| SAP SE sponsored ADR | 51,400 | 5,775,304 | |
| 161,373,146 | |||
| Technology Hardware, Storage & Peripherals - 3.2% | |||
| Apple, Inc. (a) | 500,207 | 84,650,031 | |
| TOTAL INFORMATION TECHNOLOGY | 545,706,285 | ||
| MATERIALS - 2.0% | |||
| Chemicals - 2.0% | |||
| DowDuPont, Inc. | 133,367 | 9,498,398 | |
| LyondellBasell Industries NV Class A | 170,800 | 18,842,656 | |
| Monsanto Co. | 174,810 | 20,414,312 | |
| PPG Industries, Inc. | 20,500 | 2,394,810 | |
| 51,150,176 | |||
| Metals & Mining - 0.0% | |||
| BHP Billiton Ltd. sponsored ADR (c) | 28,500 | 1,310,715 | |
| TOTAL MATERIALS | 52,460,891 | ||
| REAL ESTATE - 0.5% | |||
| Equity Real Estate Investment Trusts (REITs) - 0.5% | |||
| American Tower Corp. | 37,600 | 5,364,392 | |
| Crown Castle International Corp. | 7,200 | 799,272 | |
| Equinix, Inc. | 6,400 | 2,900,608 | |
| Public Storage | 14,700 | 3,072,300 | |
| 12,136,572 | |||
| TELECOMMUNICATION SERVICES - 1.5% | |||
| Diversified Telecommunication Services - 1.5% | |||
| Verizon Communications, Inc. | 760,625 | 40,259,881 | |
| UTILITIES - 0.8% | |||
| Electric Utilities - 0.8% | |||
| Exelon Corp. | 506,900 | 19,976,929 | |
| TOTAL COMMON STOCKS | |||
| (Cost $1,684,281,311) | 2,575,837,141 | ||
| Convertible Preferred Stocks - 0.1% | |||
| HEALTH CARE - 0.1% | |||
| Health Care Equipment & Supplies - 0.1% | |||
| Becton, Dickinson & Co. Series A 6.125% | |||
| (Cost $2,593,525) | 50,700 | 2,949,219 | |
| Other - 0.3% | |||
| ENERGY - 0.3% | |||
| Oil, Gas & Consumable Fuels - 0.3% | |||
| Utica Shale Drilling Program (non-operating revenue interest)(d)(e)(f) | |||
| (Cost $9,242,241) | 9,242,241 | 7,116,526 | |
| Money Market Funds - 1.0% | |||
| Fidelity Cash Central Fund, 1.36% (g) | 25,776,908 | 25,782,064 | |
| Fidelity Securities Lending Cash Central Fund 1.36% (g)(h) | 1,114,558 | 1,114,781 | |
| TOTAL MONEY MARKET FUNDS | |||
| (Cost $26,896,735) | 26,896,845 | ||
| TOTAL INVESTMENT IN SECURITIES - 100.1% | |||
| (Cost $1,723,013,812) | 2,612,799,731 | ||
| NET OTHER ASSETS (LIABILITIES) - (0.1)% | (2,193,781) | ||
| NET ASSETS - 100% | $2,610,605,950 |
| Written Options | ||||||
| Counterparty | Number of Contracts | Notional Amount | Exercise Price | Expiration Date | Value | |
| Call Options | ||||||
| Apple, Inc. | Chicago Board Options Exchange | 276 | $4,670,748 | $185.00 | 2/16/18 | $(31,326) |
| Bank of America Corp. | Chicago Board Options Exchange | 6,270 | 18,509,040 | 30.00 | 1/19/18 | (260,205) |
| Bristol-Myers Squibb Co. | Chicago Board Options Exchange | 825 | 5,055,600 | 65.00 | 1/19/18 | (23,925) |
| Charles Schwab Corp. | Chicago Board Options Exchange | 336 | 1,726,032 | 55.00 | 3/16/18 | (31,080) |
| Cisco Systems, Inc. | Chicago Board Options Exchange | 1,205 | 4,615,150 | 41.00 | 3/16/18 | (39,765) |
| Cisco Systems, Inc. | Chicago Board Options Exchange | 1,205 | 4,615,150 | 40.00 | 3/16/18 | (66,878) |
| Citigroup, Inc. | Chicago Board Options Exchange | 1,148 | 8,542,268 | 80.00 | 2/16/18 | (54,530) |
| CSX Corp. | Chicago Board Options Exchange | 605 | 3,328,105 | 60.00 | 2/16/18 | (29,343) |
| CSX Corp. | Chicago Board Options Exchange | 602 | 3,311,602 | 62.50 | 2/16/18 | (11,438) |
| Johnson & Johnson | Chicago Board Options Exchange | 385 | 5,379,220 | 145.00 | 2/16/18 | (34,072) |
| JPMorgan Chase & Co. | Chicago Board Options Exchange | 1,430 | 15,292,420 | 115.00 | 3/16/18 | (132,990) |
| Kroger Co. | Chicago Board Options Exchange | 223 | 612,135 | 28.00 | 2/16/18 | (17,840) |
| Kroger Co. | Chicago Board Options Exchange | 438 | 1,202,310 | 29.00 | 2/16/18 | (20,805) |
| Lowe's Companies, Inc. | Chicago Board Options Exchange | 470 | 4,368,180 | 85.00 | 1/19/18 | (381,875) |
| MasterCard, Inc. Class A | Chicago Board Options Exchange | 156 | 2,361,216 | 150.00 | 1/19/18 | (49,686) |
| Microsoft Corp. | Chicago Board Options Exchange | 605 | 5,175,170 | 90.00 | 2/16/18 | (59,592) |
| PNC Financial Services Group, Inc. | Chicago Board Options Exchange | 165 | 2,380,785 | 145.00 | 2/16/18 | (61,050) |
| Procter & Gamble Co. | Chicago Board Options Exchange | 495 | 4,548,060 | 92.50 | 2/16/18 | (64,350) |
| Target Corp. | Chicago Board Options Exchange | 278 | 1,813,950 | 65.00 | 3/16/18 | (95,910) |
| Target Corp. | Chicago Board Options Exchange | 278 | 1,813,950 | 70.00 | 3/16/18 | (42,673) |
| The Boeing Co. | Chicago Board Options Exchange | 221 | 6,517,511 | 300.00 | 3/16/18 | (209,950) |
| TOTAL WRITTEN OPTIONS | $(1,719,283) |
Legend
(a) Security or a portion of the security is pledged as collateral for call options written. At period end, the value of securities pledged amounted to $105,838,602.
(b) Non-income producing
(c) Security or a portion of the security is on loan at period end.
(d) Investment is owned by a wholly-owned subsidiary (Subsidiary) that is treated as a corporation for U.S. tax purposes.
(e) Restricted securities - Investment in securities not registered under the Securities Act of 1933 (excluding 144A issues). At the end of the period, the value of restricted securities (excluding 144A issues) amounted to $7,116,526 or 0.3% of net assets.
(f) Level 3 security
(g) Affiliated fund that is generally available only to investment companies and other accounts managed by Fidelity Investments. The rate quoted is the annualized seven-day yield of the fund at period end. A complete unaudited listing of the fund's holdings as of its most recent quarter end is available upon request. In addition, each Fidelity Central Fund's financial statements are available on the SEC's website or upon request.
(h) Investment made with cash collateral received from securities on loan.
Additional information on each restricted holding is as follows:
| Security | Acquisition Date | Acquisition Cost |
| Utica Shale Drilling Program (non-operating revenue interest) | 10/5/16 - 9/1/17 | $9,242,241 |
Affiliated Central Funds
Information regarding fiscal year to date income earned by the Fund from investments in Fidelity Central Funds is as follows:
| Fund | Income earned |
| Fidelity Cash Central Fund | $54,631 |
| Fidelity Securities Lending Cash Central Fund | 14,384 |
| Total | $69,015 |
Amounts in the income column in the above table include any capital gain distributions from underlying funds, which are presented in the corresponding line-item in the Statement of Operations if applicable.
Investment Valuation
The following is a summary of the inputs used, as of December 31, 2017, involving the Fund's assets and liabilities carried at fair value. The inputs or methodology used for valuing securities may not be an indication of the risk associated with investing in those securities. For more information on valuation inputs, and their aggregation into the levels used below, please refer to the Investment Valuation section in the accompanying Notes to Financial Statements.
| Valuation Inputs at Reporting Date: | ||||
| Description | Total | Level 1 | Level 2 | Level 3 |
| Investments in Securities: | ||||
| Equities: | ||||
| Consumer Discretionary | $174,970,615 | $174,970,615 | $-- | $-- |
| Consumer Staples | 247,071,998 | 238,181,130 | 8,890,868 | -- |
| Energy | 328,290,150 | 328,290,150 | -- | -- |
| Financials | 568,613,307 | 568,613,307 | -- | -- |
| Health Care | 359,424,819 | 345,401,306 | 14,023,513 | -- |
| Industrials | 229,874,913 | 229,874,913 | -- | -- |
| Information Technology | 545,706,285 | 545,706,285 | -- | -- |
| Materials | 52,460,891 | 52,460,891 | -- | -- |
| Real Estate | 12,136,572 | 12,136,572 | -- | -- |
| Telecommunication Services | 40,259,881 | 40,259,881 | -- | -- |
| Utilities | 19,976,929 | 19,976,929 | -- | -- |
| Other | 7,116,526 | -- | -- | 7,116,526 |
| Money Market Funds | 26,896,845 | 26,896,845 | -- | -- |
| Total Investments in Securities: | $2,612,799,731 | $2,582,768,824 | $22,914,381 | $7,116,526 |
| Derivative Instruments: | ||||
| Liabilities | ||||
| Written Options | $(1,719,283) | $(1,719,283) | $-- | $-- |
| Total Liabilities | $(1,719,283) | $(1,719,283) | $-- | $-- |
| Total Derivative Instruments: | $(1,719,283) | $(1,719,283) | $-- | $-- |
Value of Derivative Instruments
The following table is a summary of the Fund's value of derivative instruments by primary risk exposure as of December 31, 2017. For additional information on derivative instruments, please refer to the Derivative Instruments section in the accompanying Notes to Financial Statements.
| Primary Risk Exposure / Derivative Type | Value | |
| Asset | Liability | |
| Equity Risk | ||
| Written Options(a) | $0 | $(1,719,283) |
| Total Equity Risk | 0 | (1,719,283) |
| Total Value of Derivatives | $0 | $(1,719,283) |
(a) Gross value is presented in the Statement of Assets and Liabilities in the written options, at value line-item.
See accompanying notes which are an integral part of the financial statements.
Financial Statements
Statement of Assets and Liabilities
| December 31, 2017 (Unaudited) | ||
| Assets | ||
| Investment in securities, at value (including securities loaned of $1,080,510) — See accompanying schedule: Unaffiliated issuers (cost $1,696,117,077) | $2,585,902,886 | |
| Fidelity Central Funds (cost $26,896,735) | 26,896,845 | |
| Total Investment in Securities (cost $1,723,013,812) | $2,612,799,731 | |
| Cash | 1,596 | |
| Restricted cash | 66,071 | |
| Receivable for investments sold | 3,912,316 | |
| Receivable for fund shares sold | 1,815,144 | |
| Dividends receivable | 2,641,445 | |
| Distributions receivable from Fidelity Central Funds | 28,590 | |
| Prepaid expenses | 3,805 | |
| Other receivables | 9,729 | |
| Total assets | 2,621,278,427 | |
| Liabilities | ||
| Payable for investments purchased | $4,556,378 | |
| Payable for fund shares redeemed | 1,818,217 | |
| Accrued management fee | 951,190 | |
| Distribution and service plan fees payable | 53,792 | |
| Written options, at value (premium received $1,793,967) | 1,719,283 | |
| Other affiliated payables | 427,826 | |
| Other payables and accrued expenses | 29,891 | |
| Collateral on securities loaned | 1,115,900 | |
| Total liabilities | 10,672,477 | |
| Net Assets | $2,610,605,950 | |
| Net Assets consist of: | ||
| Paid in capital | $1,712,554,520 | |
| Distributions in excess of net investment income | (1,951,165) | |
| Accumulated undistributed net realized gain (loss) on investments and foreign currency transactions | 10,147,555 | |
| Net unrealized appreciation (depreciation) on investments and assets and liabilities in foreign currencies | 889,855,040 | |
| Net Assets | $2,610,605,950 | |
| Calculation of Maximum Offering Price | ||
| Class A: | ||
| Net Asset Value and redemption price per share ($63,413,173 ÷ 3,671,250 shares) | $17.27 | |
| Maximum offering price per share (100/94.25 of $17.27) | $18.32 | |
| Class M: | ||
| Net Asset Value and redemption price per share ($28,811,300 ÷ 1,668,311 shares) | $17.27 | |
| Maximum offering price per share (100/96.50 of $17.27) | $17.90 | |
| Class C: | ||
| Net Asset Value and offering price per share ($34,798,787 ÷ 2,043,436 shares)(a) | $17.03 | |
| Mega Cap Stock: | ||
| Net Asset Value, offering price and redemption price per share ($1,980,685,119 ÷ 113,623,692 shares) | $17.43 | |
| Class I: | ||
| Net Asset Value, offering price and redemption price per share ($154,088,690 ÷ 8,833,967 shares) | $17.44 | |
| Class Z: | ||
| Net Asset Value, offering price and redemption price per share ($348,808,881 ÷ 20,094,715 shares) | $17.36 |
(a) Redemption price per share is equal to net asset value less any applicable contingent deferred sales charge.
See accompanying notes which are an integral part of the financial statements.
Statement of Operations
| Six months ended December 31, 2017 (Unaudited) | ||
| Investment Income | ||
| Dividends | $23,783,351 | |
| Income from Fidelity Central Funds | 69,015 | |
| Total income | 23,852,366 | |
| Expenses | ||
| Management fee | $5,058,682 | |
| Transfer agent fees | 2,050,063 | |
| Distribution and service plan fees | 315,848 | |
| Accounting and security lending fees | 343,091 | |
| Custodian fees and expenses | 16,577 | |
| Independent trustees' fees and expenses | 4,419 | |
| Registration fees | 57,581 | |
| Audit | 27,840 | |
| Legal | 6,366 | |
| Interest | 8,240 | |
| Miscellaneous | 8,489 | |
| Total expenses before reductions | 7,897,196 | |
| Expense reductions | (28,033) | 7,869,163 |
| Net investment income (loss) | 15,983,203 | |
| Realized and Unrealized Gain (Loss) | ||
| Net realized gain (loss) on: | ||
| Investment securities: | ||
| Unaffiliated issuers | 81,679,632 | |
| Fidelity Central Funds | (1,212) | |
| Foreign currency transactions | 11,532 | |
| Written options | 1,391,075 | |
| Total net realized gain (loss) | 83,081,027 | |
| Change in net unrealized appreciation (depreciation) on: | ||
| Investment securities: | ||
| Unaffiliated issuers | 128,912,917 | |
| Fidelity Central Funds | 110 | |
| Assets and liabilities in foreign currencies | (2,085) | |
| Written options | 1,071,744 | |
| Total change in net unrealized appreciation (depreciation) | 129,982,686 | |
| Net gain (loss) | 213,063,713 | |
| Net increase (decrease) in net assets resulting from operations | $229,046,916 |
See accompanying notes which are an integral part of the financial statements.
Statement of Changes in Net Assets
| Six months ended December 31, 2017 (Unaudited) | Year ended June 30, 2017 | |
| Increase (Decrease) in Net Assets | ||
| Operations | ||
| Net investment income (loss) | $15,983,203 | $49,096,205 |
| Net realized gain (loss) | 83,081,027 | 340,272,578 |
| Change in net unrealized appreciation (depreciation) | 129,982,686 | 237,023,573 |
| Net increase (decrease) in net assets resulting from operations | 229,046,916 | 626,392,356 |
| Distributions to shareholders from net investment income | (35,334,498) | (52,216,198) |
| Distributions to shareholders from net realized gain | (308,588,501) | (17,291,428) |
| Total distributions | (343,922,999) | (69,507,626) |
| Share transactions - net increase (decrease) | 517,097,289 | (1,685,570,408) |
| Total increase (decrease) in net assets | 402,221,206 | (1,128,685,678) |
| Net Assets | ||
| Beginning of period | 2,208,384,744 | 3,337,070,422 |
| End of period | $2,610,605,950 | $2,208,384,744 |
| Other Information | ||
| Undistributed net investment income end of period | $– | $17,400,130 |
| Distributions in excess of net investment income end of period | $(1,951,165) | $– |
See accompanying notes which are an integral part of the financial statements.
Financial Highlights
Fidelity Mega Cap Stock Fund Class A
| Six months ended (Unaudited) December 31, | Years ended June 30, | |||||
| 2017 | 2017 | 2016 | 2015 | 2014 | 2013 | |
| Selected Per–Share Data | ||||||
| Net asset value, beginning of period | $18.42 | $15.56 | $16.56 | $16.32 | $13.51 | $11.05 |
| Income from Investment Operations | ||||||
| Net investment income (loss)A | .10 | .22 | .23 | .18 | .18 | .17 |
| Net realized and unrealized gain (loss) | 1.55 | 2.94 | (.65) | .71 | 3.00 | 2.43 |
| Total from investment operations | 1.65 | 3.16 | (.42) | .89 | 3.18 | 2.60 |
| Distributions from net investment income | (.24) | (.22) | (.18) | (.17) | (.16) | (.14) |
| Distributions from net realized gain | (2.56) | (.09) | (.40) | (.47) | (.21) | – |
| Total distributions | (2.80) | (.30)B | (.58) | (.65)C | (.37) | (.14) |
| Net asset value, end of period | $17.27 | $18.42 | $15.56 | $16.56 | $16.32 | $13.51 |
| Total ReturnD,E,F | 10.16% | 20.49% | (2.56)% | 5.69% | 23.88% | 23.78% |
| Ratios to Average Net AssetsG,H | ||||||
| Expenses before reductions | .94%I | .94% | .95% | 1.05% | .96% | .98% |
| Expenses net of fee waivers, if any | .94%I | .94% | .95% | 1.05% | .96% | .98% |
| Expenses net of all reductions | .93%I | .94% | .95% | 1.05% | .96% | .98% |
| Net investment income (loss) | 1.16%I | 1.30% | 1.46% | 1.10% | 1.19% | 1.37% |
| Supplemental Data | ||||||
| Net assets, end of period (000 omitted) | $63,413 | $60,362 | $68,801 | $117,385 | $77,335 | $20,336 |
| Portfolio turnover rateJ | 33%I | 25% | 25% | 22%K | 28% | 29% |
A Calculated based on average shares outstanding during the period.
B Total distributions of $.30 per share is comprised of distributions from net investment income of $.218 and distributions from net realized gain of $.085 per share.
C Total distributions of $.65 per share is comprised of distributions from net investment income of $.174 and distributions from net realized gain of $.474 per share.
D Total returns for periods of less than one year are not annualized.
E Total returns would have been lower if certain expenses had not been reduced during the applicable periods shown.
F Total returns do not include the effect of the sales charges.
G Fees and expenses of any underlying Fidelity Central Funds are not included in the Fund's expense ratio. The Fund indirectly bears its proportionate share of the expenses of any underlying Fidelity Central Funds.
H Expense ratios reflect operating expenses of the class. Expenses before reductions do not reflect amounts reimbursed by the investment adviser or reductions from brokerage service arrangements or reductions from other expense offset arrangements and do not represent the amount paid by the class during periods when reimbursements or reductions occur. Expenses net of fee waivers reflect expenses after reimbursement by the investment adviser but prior to reductions from brokerage service arrangements or other expense offset arrangements. Expenses net of all reductions represent the net expenses paid by the class.
I Annualized
J Amount does not include the portfolio activity of any underlying Fidelity Central Funds.
K Portfolio turnover rate excludes securities received or delivered in-kind.
See accompanying notes which are an integral part of the financial statements.
Fidelity Mega Cap Stock Fund Class M
| Six months ended (Unaudited) December 31, | Years ended June 30, | |||||
| 2017 | 2017 | 2016 | 2015 | 2014 | 2013 | |
| Selected Per–Share Data | ||||||
| Net asset value, beginning of period | $18.39 | $15.54 | $16.57 | $16.31 | $13.51 | $11.05 |
| Income from Investment Operations | ||||||
| Net investment income (loss)A | .08 | .18 | .19 | .16 | .14 | .14 |
| Net realized and unrealized gain (loss) | 1.55 | 2.93 | (.65) | .70 | 3.00 | 2.43 |
| Total from investment operations | 1.63 | 3.11 | (.46) | .86 | 3.14 | 2.57 |
| Distributions from net investment income | (.19) | (.18) | (.16) | (.13) | (.13) | (.11) |
| Distributions from net realized gain | (2.56) | (.09) | (.40) | (.47) | (.21) | – |
| Total distributions | (2.75) | (.26)B | (.57)C | (.60) | (.34) | (.11) |
| Net asset value, end of period | $17.27 | $18.39 | $15.54 | $16.57 | $16.31 | $13.51 |
| Total ReturnD,E,F | 10.07% | 20.17% | (2.83)% | 5.53% | 23.54% | 23.44% |
| Ratios to Average Net AssetsG,H | ||||||
| Expenses before reductions | 1.19%I | 1.20% | 1.21% | 1.21% | 1.22% | 1.26% |
| Expenses net of fee waivers, if any | 1.19%I | 1.20% | 1.21% | 1.20% | 1.22% | 1.26% |
| Expenses net of all reductions | 1.19%I | 1.20% | 1.20% | 1.20% | 1.22% | 1.26% |
| Net investment income (loss) | .90%I | 1.04% | 1.21% | .95% | .92% | 1.09% |
| Supplemental Data | ||||||
| Net assets, end of period (000 omitted) | $28,811 | $28,248 | $26,145 | $23,231 | $15,728 | $8,377 |
| Portfolio turnover rateJ | 33%I | 25% | 25% | 22%K | 28% | 29% |
A Calculated based on average shares outstanding during the period.
B Total distributions of $.26 per share is comprised of distributions from net investment income of $.178 and distributions from net realized gain of $.085 per share.
C Total distributions of $.57 per share is comprised of distributions from net investment income of $.164 and distributions from net realized gain of $.404 per share.
D Total returns for periods of less than one year are not annualized.
E Total returns would have been lower if certain expenses had not been reduced during the applicable periods shown.
F Total returns do not include the effect of the sales charges.
G Fees and expenses of any underlying Fidelity Central Funds are not included in the Fund's expense ratio. The Fund indirectly bears its proportionate share of the expenses of any underlying Fidelity Central Funds.
H Expense ratios reflect operating expenses of the class. Expenses before reductions do not reflect amounts reimbursed by the investment adviser or reductions from brokerage service arrangements or reductions from other expense offset arrangements and do not represent the amount paid by the class during periods when reimbursements or reductions occur. Expenses net of fee waivers reflect expenses after reimbursement by the investment adviser but prior to reductions from brokerage service arrangements or other expense offset arrangements. Expenses net of all reductions represent the net expenses paid by the class.
I Annualized
J Amount does not include the portfolio activity of any underlying Fidelity Central Funds.
K Portfolio turnover rate excludes securities received or delivered in-kind.
See accompanying notes which are an integral part of the financial statements.
Fidelity Mega Cap Stock Fund Class C
| Six months ended (Unaudited) December 31, | Years ended June 30, | |||||
| 2017 | 2017 | 2016 | 2015 | 2014 | 2013 | |
| Selected Per–Share Data | ||||||
| Net asset value, beginning of period | $18.13 | $15.32 | $16.35 | $16.12 | $13.38 | $10.93 |
| Income from Investment Operations | ||||||
| Net investment income (loss)A | .03 | .09 | .11 | .07 | .06 | .07 |
| Net realized and unrealized gain (loss) | 1.54 | 2.90 | (.64) | .71 | 2.97 | 2.42 |
| Total from investment operations | 1.57 | 2.99 | (.53) | .78 | 3.03 | 2.49 |
| Distributions from net investment income | (.11) | (.09) | (.09) | (.08) | (.08) | (.04) |
| Distributions from net realized gain | (2.56) | (.09) | (.40) | (.47) | (.21) | – |
| Total distributions | (2.67) | (.18) | (.50)B | (.55) | (.29) | (.04) |
| Net asset value, end of period | $17.03 | $18.13 | $15.32 | $16.35 | $16.12 | $13.38 |
| Total ReturnC,D,E | 9.81% | 19.59% | (3.32)% | 5.05% | 22.90% | 22.83% |
| Ratios to Average Net AssetsF,G | ||||||
| Expenses before reductions | 1.69%H | 1.69% | 1.70% | 1.70% | 1.71% | 1.75% |
| Expenses net of fee waivers, if any | 1.69%H | 1.69% | 1.70% | 1.70% | 1.71% | 1.75% |
| Expenses net of all reductions | 1.68%H | 1.69% | 1.69% | 1.70% | 1.71% | 1.75% |
| Net investment income (loss) | .41%H | .55% | .72% | .45% | .43% | .59% |
| Supplemental Data | ||||||
| Net assets, end of period (000 omitted) | $34,799 | $34,205 | $31,605 | $34,790 | $16,600 | $7,938 |
| Portfolio turnover rateI | 33%H | 25% | 25% | 22%J | 28% | 29% |
A Calculated based on average shares outstanding during the period.
B Total distributions of $.50 per share is comprised of distributions from net investment income of $.091 and distributions from net realized gain of $.404 per share.
C Total returns for periods of less than one year are not annualized.
D Total returns would have been lower if certain expenses had not been reduced during the applicable periods shown.
E Total returns do not include the effect of the contingent deferred sales charge.
F Fees and expenses of any underlying Fidelity Central Funds are not included in the Fund's expense ratio. The Fund indirectly bears its proportionate share of the expenses of any underlying Fidelity Central Funds.
G Expense ratios reflect operating expenses of the class. Expenses before reductions do not reflect amounts reimbursed by the investment adviser or reductions from brokerage service arrangements or reductions from other expense offset arrangements and do not represent the amount paid by the class during periods when reimbursements or reductions occur. Expenses net of fee waivers reflect expenses after reimbursement by the investment adviser but prior to reductions from brokerage service arrangements or other expense offset arrangements. Expenses net of all reductions represent the net expenses paid by the class.
H Annualized
I Amount does not include the portfolio activity of any underlying Fidelity Central Funds.
J Portfolio turnover rate excludes securities received or delivered in-kind.
See accompanying notes which are an integral part of the financial statements.
Fidelity Mega Cap Stock Fund
| Six months ended (Unaudited) December 31, | Years ended June 30, | |||||
| 2017 | 2017 | 2016 | 2015 | 2014 | 2013 | |
| Selected Per–Share Data | ||||||
| Net asset value, beginning of period | $18.58 | $15.68 | $16.72 | $16.44 | $13.60 | $11.11 |
| Income from Investment Operations | ||||||
| Net investment income (loss)A | .12 | .27 | .27 | .24 | .22 | .20 |
| Net realized and unrealized gain (loss) | 1.57 | 2.97 | (.66) | .72 | 3.02 | 2.46 |
| Total from investment operations | 1.69 | 3.24 | (.39) | .96 | 3.24 | 2.66 |
| Distributions from net investment income | (.27) | (.26) | (.25) | (.21) | (.19) | (.17) |
| Distributions from net realized gain | (2.56) | (.09) | (.40) | (.47) | (.21) | – |
| Total distributions | (2.84)B | (.34)C | (.65) | (.68) | (.40) | (.17) |
| Net asset value, end of period | $17.43 | $18.58 | $15.68 | $16.72 | $16.44 | $13.60 |
| Total ReturnD,E | 10.29% | 20.87% | (2.36)% | 6.13% | 24.18% | 24.17% |
| Ratios to Average Net AssetsF,G | ||||||
| Expenses before reductions | .69%H | .68% | .69% | .67% | .68% | .70% |
| Expenses net of fee waivers, if any | .69%H | .68% | .69% | .67% | .68% | .70% |
| Expenses net of all reductions | .69%H | .68% | .68% | .67% | .68% | .70% |
| Net investment income (loss) | 1.41%H | 1.56% | 1.73% | 1.48% | 1.47% | 1.64% |
| Supplemental Data | ||||||
| Net assets, end of period (000 omitted) | $1,980,685 | $1,613,374 | $3,059,691 | $3,300,700 | $2,860,197 | $2,214,592 |
| Portfolio turnover rateI | 33%H | 25% | 25% | 22%J | 28% | 29% |
A Calculated based on average shares outstanding during the period.
B Total distributions of $2.84 per share is comprised of distributions from net investment income of $.274 and distributions from net realized gain of $2.562 per share.
C Total distributions of $.34 per share is comprised of distributions from net investment income of $.258 and distributions from net realized gain of $.085 per share.
D Total returns for periods of less than one year are not annualized.
E Total returns would have been lower if certain expenses had not been reduced during the applicable periods shown.
F Fees and expenses of any underlying Fidelity Central Funds are not included in the Fund's expense ratio. The Fund indirectly bears its proportionate share of the expenses of any underlying Fidelity Central Funds.
G Expense ratios reflect operating expenses of the class. Expenses before reductions do not reflect amounts reimbursed by the investment adviser or reductions from brokerage service arrangements or reductions from other expense offset arrangements and do not represent the amount paid by the class during periods when reimbursements or reductions occur. Expenses net of fee waivers reflect expenses after reimbursement by the investment adviser but prior to reductions from brokerage service arrangements or other expense offset arrangements. Expenses net of all reductions represent the net expenses paid by the class.
H Annualized
I Amount does not include the portfolio activity of any underlying Fidelity Central Funds.
J Portfolio turnover rate excludes securities received or delivered in-kind.
See accompanying notes which are an integral part of the financial statements.
Fidelity Mega Cap Stock Fund Class I
| Six months ended (Unaudited) December 31, | Years ended June 30, | |||||
| 2017 | 2017 | 2016 | 2015 | 2014 | 2013 | |
| Selected Per–Share Data | ||||||
| Net asset value, beginning of period | $18.60 | $15.70 | $16.73 | $16.39 | $13.55 | $11.08 |
| Income from Investment Operations | ||||||
| Net investment income (loss)A | .12 | .27 | .27 | .24 | .22 | .20 |
| Net realized and unrealized gain (loss) | 1.57 | 2.97 | (.65) | .72 | 3.02 | 2.44 |
| Total from investment operations | 1.69 | 3.24 | (.38) | .96 | 3.24 | 2.64 |
| Distributions from net investment income | (.29) | (.26) | (.24) | (.15) | (.18) | (.17) |
| Distributions from net realized gain | (2.56) | (.09) | (.40) | (.47) | (.21) | – |
| Total distributions | (2.85) | (.34)B | (.65)C | (.62) | (.40)D | (.17) |
| Net asset value, end of period | $17.44 | $18.60 | $15.70 | $16.73 | $16.39 | $13.55 |
| Total ReturnE,F | 10.30% | 20.84% | (2.31)% | 6.11% | 24.23% | 24.06% |
| Ratios to Average Net AssetsG,H | ||||||
| Expenses before reductions | .67%I | .67% | .68% | .69% | .71% | .74% |
| Expenses net of fee waivers, if any | .67%I | .67% | .68% | .68% | .71% | .74% |
| Expenses net of all reductions | .67%I | .67% | .68% | .68% | .71% | .74% |
| Net investment income (loss) | 1.43%I | 1.57% | 1.73% | 1.47% | 1.43% | 1.61% |
| Supplemental Data | ||||||
| Net assets, end of period (000 omitted) | $154,089 | $153,622 | $148,414 | $186,637 | $674,416 | $312,814 |
| Portfolio turnover rateJ | 33%I | 25% | 25% | 22%K | 28% | 29% |
A Calculated based on average shares outstanding during the period.
B Total distributions of $.34 per share is comprised of distributions from net investment income of $.257 and distributions from net realized gain of $.085 per share.
C Total distributions of $.65 per share is comprised of distributions from net investment income of $.244 and distributions from net realized gain of $.404 per share.
D Total distributions of $.40 per share is comprised of distributions from net investment income of $.182 and distributions from net realized gain of $.213 per share.
E Total returns for periods of less than one year are not annualized.
F Total returns would have been lower if certain expenses had not been reduced during the applicable periods shown.
G Fees and expenses of any underlying Fidelity Central Funds are not included in the Fund's expense ratio. The Fund indirectly bears its proportionate share of the expenses of any underlying Fidelity Central Funds.
H Expense ratios reflect operating expenses of the class. Expenses before reductions do not reflect amounts reimbursed by the investment adviser or reductions from brokerage service arrangements or reductions from other expense offset arrangements and do not represent the amount paid by the class during periods when reimbursements or reductions occur. Expenses net of fee waivers reflect expenses after reimbursement by the investment adviser but prior to reductions from brokerage service arrangements or other expense offset arrangements. Expenses net of all reductions represent the net expenses paid by the class.
I Annualized
J Amount does not include the portfolio activity of any underlying Fidelity Central Funds.
K Portfolio turnover rate excludes securities received or delivered in-kind.
See accompanying notes which are an integral part of the financial statements.
Fidelity Mega Cap Stock Fund Class Z
| Six months ended (Unaudited) December 31, | Years ended June 30, | ||||
| 2017 | 2017 | 2016 | 2015 | 2014 A | |
| Selected Per–Share Data | |||||
| Net asset value, beginning of period | $18.53 | $15.65 | $16.69 | $16.40 | $14.31 |
| Income from Investment Operations | |||||
| Net investment income (loss)B | .14 | .31 | .29 | .27 | .21 |
| Net realized and unrealized gain (loss) | 1.57 | 2.94 | (.66) | .72 | 2.20 |
| Total from investment operations | 1.71 | 3.25 | (.37) | .99 | 2.41 |
| Distributions from net investment income | (.31) | (.28) | (.27) | (.23) | (.10) |
| Distributions from net realized gain | (2.56) | (.09) | (.40) | (.47) | (.21) |
| Total distributions | (2.88)C | (.37) | (.67) | (.70) | (.32)D |
| Net asset value, end of period | $17.36 | $18.53 | $15.65 | $16.69 | $16.40 |
| Total ReturnE,F | 10.45% | 20.96% | (2.21)% | 6.33% | 17.06% |
| Ratios to Average Net AssetsG,H | |||||
| Expenses before reductions | .53%I | .53% | .54% | .54% | .54%I |
| Expenses net of fee waivers, if any | .53%I | .53% | .54% | .54% | .54%I |
| Expenses net of all reductions | .53%I | .53% | .53% | .54% | .54%I |
| Net investment income (loss) | 1.56%I | 1.71% | 1.88% | 1.61% | 1.59%I |
| Supplemental Data | |||||
| Net assets, end of period (000 omitted) | $348,809 | $318,575 | $2,414 | $2,449 | $117 |
| Portfolio turnover rateJ | 33%I | 25% | 25% | 22%K | 28% |
A For the period August 13, 2013 (commencement of sale of shares) to June 30, 2014.
B Calculated based on average shares outstanding during the period.
C Total distributions of $2.88 per share is comprised of distributions from net investment income of $.313 and distributions from net realized gain of $2.562 per share.
D Total distributions of $.32 per share is comprised of distributions from net investment income of $.104 and distributions from net realized gain of $.213 per share.
E Total returns for periods of less than one year are not annualized.
F Total returns would have been lower if certain expenses had not been reduced during the applicable periods shown.
G Fees and expenses of any underlying Fidelity Central Funds are not included in the Fund's expense ratio. The Fund indirectly bears its proportionate share of the expenses of any underlying Fidelity Central Funds.
H Expense ratios reflect operating expenses of the class. Expenses before reductions do not reflect amounts reimbursed by the investment adviser or reductions from brokerage service arrangements or reductions from other expense offset arrangements and do not represent the amount paid by the class during periods when reimbursements or reductions occur. Expense ratios before reductions for start-up periods may not be representative of longer-term operating periods. Expenses net of fee waivers reflect expenses after reimbursement by the investment adviser but prior to reductions from brokerage service arrangements or other expense offset arrangements. Expenses net of all reductions represent the net expenses paid by the class.
I Annualized
J Amount does not include the portfolio activity of any underlying Fidelity Central Funds.
K Portfolio turnover rate excludes securities received or delivered in-kind.
See accompanying notes which are an integral part of the financial statements.
Notes to Financial Statements (Unaudited)
For the period ended December 31, 2017
1. Organization.
Fidelity Mega Cap Stock Fund (the Fund) is a fund of Fidelity Hastings Street Trust (the Trust) and is authorized to issue an unlimited number of shares. The Trust is registered under the Investment Company Act of 1940, as amended (the 1940 Act), as an open-end management investment company organized as a Massachusetts business trust. The Fund offers Class A, Class M (formerly Class T), Class C, Mega Cap Stock, Class I and Class Z shares, each of which has equal rights as to assets and voting privileges. Each class has exclusive voting rights with respect to matters that affect that class.
2. Investments in Fidelity Central Funds.
The Fund invests in Fidelity Central Funds, which are open-end investment companies generally available only to other investment companies and accounts managed by the investment adviser and its affiliates. The Fund's Schedule of Investments lists each of the Fidelity Central Funds held as of period end, if any, as an investment of the Fund, but does not include the underlying holdings of each Fidelity Central Fund. As an Investing Fund, the Fund indirectly bears its proportionate share of the expenses of the underlying Fidelity Central Funds.
The Money Market Central Funds seek preservation of capital and current income and are managed by Fidelity Investments Money Management, Inc. (FIMM), an affiliate of the investment adviser. Annualized expenses of the Money Market Central Funds as of their most recent shareholder report date are less than .005%.
A complete unaudited list of holdings for each Fidelity Central Fund is available upon request or at the Securities and Exchange Commission (the SEC) website at www.sec.gov. In addition, the financial statements of the Fidelity Central Funds are available on the SEC website or upon request.
3. Significant Accounting Policies.
The Fund is an investment company and applies the accounting and reporting guidance of the Financial Accounting Standards Board (FASB) Accounting Standards Codification Topic 946 Financial Services – Investments Companies. The financial statements have been prepared in conformity with accounting principles generally accepted in the United States of America (GAAP), which require management to make certain estimates and assumptions at the date of the financial statements. Actual results could differ from those estimates. Subsequent events, if any, through the date that the financial statements were issued have been evaluated in the preparation of the financial statements. The following summarizes the significant accounting policies of the Fund:
Investment Valuation. Investments are valued as of 4:00 p.m. Eastern time on the last calendar day of the period. The Board of Trustees (the Board) has delegated the day to day responsibility for the valuation of the Fund's investments to the Fair Value Committee (the Committee) established by the Fund's investment adviser. In accordance with valuation policies and procedures approved by the Board, the Fund attempts to obtain prices from one or more third party pricing vendors or brokers to value its investments. When current market prices, quotations or currency exchange rates are not readily available or reliable, investments will be fair valued in good faith by the Committee, in accordance with procedures adopted by the Board. Factors used in determining fair value vary by investment type and may include market or investment specific events. The frequency with which these procedures are used cannot be predicted and they may be utilized to a significant extent. The Committee oversees the Fund's valuation policies and procedures and reports to the Board on the Committee's activities and fair value determinations. The Board monitors the appropriateness of the procedures used in valuing the Fund's investments and ratifies the fair value determinations of the Committee.
The Fund categorizes the inputs to valuation techniques used to value its investments into a disclosure hierarchy consisting of three levels as shown below:
- Level 1 – quoted prices in active markets for identical investments
- Level 2 – other significant observable inputs (including quoted prices for similar investments, interest rates, prepayment speeds, etc.)
- Level 3 – unobservable inputs (including the Fund's own assumptions based on the best information available)
Valuation techniques used to value the Fund's investments by major category are as follows:
Equity securities, including restricted securities, for which market quotations are readily available, are valued at the last reported sale price or official closing price as reported by a third party pricing vendor on the primary market or exchange on which they are traded and are categorized as Level 1 in the hierarchy. In the event there were no sales during the day or closing prices are not available, securities are valued at the last quoted bid price or may be valued using the last available price and are generally categorized as Level 2 in the hierarchy. For foreign equity securities, when market or security specific events arise, comparisons to the valuation of American Depositary Receipts (ADRs), futures contracts, Exchange-Traded Funds (ETFs) and certain indexes as well as quoted prices for similar securities may be used and would be categorized as Level 2 in the hierarchy. Utilizing these techniques may result in transfers between Level 1 and Level 2. For equity securities, including restricted securities, where observable inputs are limited, assumptions about market activity and risk are used and these securities may be categorized as Level 3 in the hierarchy.
Exchange-traded options are valued using the last sale price or, in the absence of a sale, the last offering price and are categorized as Level 1 in the hierarchy. Investments in open-end mutual funds, including the Fidelity Central Funds, are valued at their closing net asset value (NAV) each business day and are categorized as Level 1 in the hierarchy.
Changes in valuation techniques may result in transfers in or out of an assigned level within the disclosure hierarchy. The aggregate value of investments by input level as of December 31, 2017 is included at the end of the Fund's Schedule of Investments.
Foreign Currency. The Fund may use foreign currency contracts to facilitate transactions in foreign-denominated securities. Gains and losses from these transactions may arise from changes in the value of the foreign currency or if the counterparties do not perform under the contracts' terms.
Foreign-denominated assets, including investment securities, and liabilities are translated into U.S. dollars at the exchange rates at period end. Purchases and sales of investment securities, income and dividends received and expenses denominated in foreign currencies are translated into U.S. dollars at the exchange rate in effect on the transaction date.
The effects of exchange rate fluctuations on investments are included with the net realized and unrealized gain (loss) on investment securities. Other foreign currency transactions resulting in realized and unrealized gain (loss) are disclosed separately.
Investment Transactions and Income. For financial reporting purposes, the Fund's investment holdings and NAV include trades executed through the end of the last business day of the period. The NAV per share for processing shareholder transactions is calculated as of the close of business of the New York Stock Exchange (NYSE), normally 4:00 p.m. Eastern time and includes trades executed through the end of the prior business day. Gains and losses on securities sold are determined on the basis of identified cost and includes proceeds received from litigation. Dividend income is recorded on the ex-dividend date, except for certain dividends from foreign securities where the ex-dividend date may have passed, which are recorded as soon as the Fund is informed of the ex-dividend date. Non-cash dividends included in dividend income, if any, are recorded at the fair market value of the securities received. Income and capital gain distributions from Fidelity Central Funds, if any, are recorded on the ex-dividend date. Certain distributions received by the Fund represent a return of capital or capital gain. The Fund determines the components of these distributions subsequent to the ex-dividend date, based upon receipt of tax filings or other correspondence relating to the underlying investment. These distributions are recorded as a reduction of cost of investments and/or as a realized gain. Investment income is recorded net of foreign taxes withheld where recovery of such taxes is uncertain.
Class Allocations and Expenses. Investment income, realized and unrealized capital gains and losses, common expenses of the Fund, and certain fund-level expense reductions, if any, are allocated daily on a pro-rata basis to each class based on the relative net assets of each class to the total net assets of the Fund. Each class differs with respect to transfer agent and distribution and service plan fees incurred. Certain expense reductions may also differ by class. For the reporting period, the allocated portion of income and expenses to each class as a percent of its average net assets may vary due to the timing of recording these transactions in relation to fluctuating net assets of the classes. Expenses directly attributable to a fund are charged to that fund. Expenses attributable to more than one fund are allocated among the respective funds on the basis of relative net assets or other appropriate methods. Expense estimates are accrued in the period to which they relate and adjustments are made when actual amounts are known.
Income Tax Information and Distributions to Shareholders. Each year, the Fund intends to qualify as a regulated investment company under Subchapter M of the Internal Revenue Code, including distributing substantially all of its taxable income and realized gains. As a result, no provision for U.S. Federal income taxes is required. The Fund files a U.S. federal tax return, in addition to state and local tax returns as required. The Fund's federal income tax returns are subject to examination by the Internal Revenue Service (IRS) for a period of three fiscal years after they are filed. State and local tax returns may be subject to examination for an additional fiscal year depending on the jurisdiction. Foreign taxes are provided for based on the Fund's understanding of the tax rules and rates that exist in the foreign markets in which it invests.
Distributions are declared and recorded on the ex-dividend date. Income dividends and capital gain distributions are declared separately for each class. Income and capital gain distributions are determined in accordance with income tax regulations, which may differ from GAAP.
Capital accounts within the financial statements are adjusted for permanent book-tax differences. These adjustments have no impact on net assets or the results of operations. Capital accounts are not adjusted for temporary book-tax differences which will reverse in a subsequent period.
Book-tax differences are primarily due to losses deferred due to wash sales and excise tax regulations.
As of period end, the cost and unrealized appreciation (depreciation) in securities, and derivatives if applicable, for federal income tax purposes were as follows:
| Gross unrealized appreciation | $933,703,021 |
| Gross unrealized depreciation | (48,432,078) |
| Net unrealized appreciation (depreciation) | $885,270,943 |
| Tax cost | $1,727,603,472 |
Restricted Securities. The Fund may invest in securities that are subject to legal or contractual restrictions on resale. These securities generally may be resold in transactions exempt from registration or to the public if the securities are registered. Disposal of these securities may involve time-consuming negotiations and expense, and prompt sale at an acceptable price may be difficult. Information regarding restricted securities is included at the end of the Fund's Schedule of Investments.
Consolidated Subsidiary. The Fund invests in certain investments through a wholly-owned subsidiary ("Subsidiary"), which may be subject to federal and state taxes upon disposition.
As of period end, the Fund held an investment of $7,182,597 in this Subsidiary, representing .28% of the Fund's net assets. The financial statements have been consolidated and include accounts of the Fund and the Subsidiary. Accordingly, all inter-company transactions and balances have been eliminated.
Any cash held by the Subsidiary is restricted as to its use and is presented as Restricted cash in the Statement of Assets and Liabilities.
4. Derivative Instruments.
Risk Exposures and the Use of Derivative Instruments. The Fund's investment objective allows the Fund to enter into various types of derivative contracts, including options. Derivatives are investments whose value is primarily derived from underlying assets, indices or reference rates and may be transacted on an exchange or over-the-counter (OTC). Derivatives may involve a future commitment to buy or sell a specified asset based on specified terms, to exchange future cash flows at periodic intervals based on a notional principal amount, or for one party to make one or more payments upon the occurrence of specified events in exchange for periodic payments from the other party.
The Fund used derivatives to increase returns and to manage exposure to certain risks as defined below. The success of any strategy involving derivatives depends on analysis of numerous economic factors, and if the strategies for investment do not work as intended, the Fund may not achieve its objectives.
The Fund's use of derivatives increased or decreased its exposure to the following risk:
| Equity Risk | Equity risk relates to the fluctuations in the value of financial instruments as a result of changes in market prices (other than those arising from interest rate risk or foreign exchange risk), whether caused by factors specific to an individual investment, its issuer, or all factors affecting all instruments traded in a market or market segment. |
The Fund is also exposed to additional risks from investing in derivatives, such as liquidity risk and counterparty credit risk. Liquidity risk is the risk that the Fund will be unable to close out the derivative in the open market in a timely manner. Counterparty credit risk is the risk that the counterparty will not be able to fulfill its obligation to the Fund. Derivative counterparty credit risk is managed through formal evaluation of the creditworthiness of all potential counterparties. On certain OTC derivatives such as options, the Fund attempts to reduce its exposure to counterparty credit risk by entering into an International Swaps and Derivatives Association, Inc. (ISDA) Master Agreement with each of its counterparties. The ISDA Master Agreement gives the Fund the right to terminate all transactions traded under such agreement upon the deterioration in the credit quality of the counterparty beyond specified levels. The ISDA Master Agreement gives each party the right, upon an event of default by the other party or a termination of the agreement, to close out all transactions traded under such agreement and to net amounts owed under each transaction to one net payable by one party to the other. To mitigate counterparty credit risk on bi-lateral OTC derivatives, the Fund receives collateral in the form of cash or securities once the Fund's net unrealized appreciation on outstanding derivative contracts under an ISDA Master Agreement exceeds certain applicable thresholds, subject to certain minimum transfer provisions. The collateral received is held in segregated accounts with the Fund's custodian bank in accordance with the collateral agreements entered into between the Fund, the counterparty and the Fund's custodian bank. The Fund could experience delays and costs in gaining access to the collateral even though it is held by the Fund's custodian bank. The Fund's maximum risk of loss from counterparty credit risk related to bi-lateral OTC derivatives is generally the aggregate unrealized appreciation and unpaid counterparty payments in excess of any collateral pledged by the counterparty to the Fund. The Fund may be required to pledge collateral for the benefit of the counterparties on bi-lateral OTC derivatives in an amount not less than each counterparty's unrealized appreciation on outstanding derivative contracts, subject to certain minimum transfer provisions, and any such pledged collateral is identified in the Schedule of Investments. Counterparty credit risk related to exchange-traded options may be mitigated by the protection provided by the exchange on which they trade.
Investing in derivatives may involve greater risks than investing in the underlying assets directly and, to varying degrees, may involve risk of loss in excess of any initial investment and collateral received and amounts recognized in the Statement of Assets and Liabilities. In addition, there may be the risk that the change in value of the derivative contract does not correspond to the change in value of the underlying instrument.
Options. Options give the purchaser the right, but not the obligation, to buy (call) or sell (put) an underlying security or financial instrument at an agreed exercise or strike price between or on certain dates. Options obligate the seller (writer) to buy (put) or sell (call) an underlying instrument at the exercise or strike price or cash settle an underlying derivative instrument if the holder exercises the option on or before the expiration date.
The Fund used exchange-traded and OTC written covered call options to manage its exposure to the market. When the Fund writes a covered call option, the Fund holds the underlying instrument which must be delivered to the holder upon the exercise of the option.
Upon entering into a written options contract, the Fund will receive a premium. Premiums received are reflected as a liability on the Statement of Assets and Liabilities. Options are valued daily and any unrealized appreciation (depreciation) is reflected on the Statement of Assets and Liabilities. When a written option is exercised, the premium is added to the proceeds from the sale of the underlying instrument in determining the gain or loss realized on that investment. When an option is closed the Fund will realize a gain or loss depending on whether the proceeds or amount paid for the closing sale transaction are greater or less than the premium received. When an option expires, gains and losses are realized to the extent of premiums received. The net realized gain (loss) on closed and expired written options and the change in net unrealized appreciation (depreciation) on written options are presented in the Statement of Operations.
Writing call options tends to decrease exposure to the underlying instrument and risk of loss is the change in value in excess of the premium received.
Any open options at period end are presented in the Schedule of Investments under the caption "Written Options" and are representative of volume of activity during the period.
5. Purchases and Sales of Investments.
Purchases and sales of securities, other than short-term securities, aggregated $556,253,939 and $383,033,900, respectively.
6. Fees and Other Transactions with Affiliates.
Management Fee. Fidelity Management & Research Company (the investment adviser) and its affiliates provide the Fund with investment management related services for which the Fund pays a monthly management fee. The management fee is the sum of an individual fund fee rate that is based on an annual rate of .20% of the Fund's average net assets and an annualized group fee rate that averaged .24% during the period. The group fee rate is based upon the average net assets of all the mutual funds advised by the investment adviser, including any mutual funds previously advised by the investment adviser that are currently advised by Fidelity SelectCo, LLC, an affiliate of the investment adviser. The group fee rate decreases as assets under management increase and increases as assets under management decrease. For the reporting period, the total annualized management fee rate was .44% of the Fund's average net assets.
Distribution and Service Plan Fees. In accordance with Rule 12b-1 of the 1940 Act, the Fund has adopted separate Distribution and Service Plans for each class of shares. Certain classes pay Fidelity Distributors Corporation (FDC), an affiliate of the investment adviser, separate Distribution and Service Fees, each of which is based on an annual percentage of each class' average net assets. In addition, FDC may pay financial intermediaries for selling shares of the Fund and providing shareholder support services. For the period, the Distribution and Service Fee rates, total fees and amounts retained by FDC were as follows:
| Distribution Fee | Service Fee | Total Fees | Retained by FDC | |
| Class A | -% | .25% | $75,949 | $1,593 |
| Class M | .25% | .25% | 70,314 | – |
| Class C | .75% | .25% | 169,585 | 17,559 |
| $315,848 | $19,152 |
Sales Load. FDC may receive a front-end sales charge of up to 5.75% for selling Class A shares and 3.50% for selling Class M shares, some of which is paid to financial intermediaries for selling shares of the Fund. Depending on the holding period, FDC may receive contingent deferred sales charges levied on Class A, Class M and Class C redemptions. The deferred sales charges are 1.00% for Class C shares, 1.00% for certain purchases of Class A shares and .25% for certain purchases of Class M shares.
For the period, sales charge amounts retained by FDC were as follows:
| Retained by FDC | |
| Class A | $14,310 |
| Class M | 1,196 |
| Class C(a) | 1,231 |
| $16,737 |
(a) When Class C shares are initially sold, FDC pays commissions from its own resources to financial intermediaries through which the sales are made.
Transfer Agent Fees. Fidelity Investments Institutional Operations Company, Inc., (FIIOC), an affiliate of the investment adviser, is the transfer, dividend disbursing and shareholder servicing agent for each class of the Fund. FIIOC receives account fees and asset-based fees that vary according to the account size and type of account of the shareholders of the respective classes of the Fund, except for Class Z. FIIOC receives an asset-based fee of Class Z's average net assets. FIIOC pays for typesetting, printing and mailing of shareholder reports, except proxy statements.
For the period, transfer agent fees for each class were as follows:
| Amount | % of Class-Level Average Net Assets(a) | |
| Class A | $61,331 | .20 |
| Class M | 28,899 | .21 |
| Class C | 34,103 | .20 |
| Mega Cap Stock | 1,708,730 | .20 |
| Class I | 140,010 | .18 |
| Class Z | 76,990 | .05 |
| $2,050,063 |
(a) Annualized
Accounting and Security Lending Fees. Fidelity Service Company, Inc. (FSC), an affiliate of the investment adviser, maintains the Fund's accounting records. The accounting fee is based on the level of average net assets for each month. Under a separate contract, FSC administers the security lending program. The security lending fee is based on the number and duration of lending transactions.
Brokerage Commissions. The Fund placed a portion of its portfolio transactions with brokerage firms which are affiliates of the investment adviser. Brokerage commissions are included in net realized gain (loss) and change in net unrealized appreciation (depreciation) in the Statement of Operations. The commissions paid to these affiliated firms were $4,818 for the period.
Interfund Lending Program. Pursuant to an Exemptive Order issued by the SEC, the Fund, along with other registered investment companies having management contracts with Fidelity Management & Research Company (FMR) or other affiliated entities of FMR, may participate in an interfund lending program. This program provides an alternative credit facility allowing the funds to borrow from, or lend money to, other participating affiliated funds. At period end, there were no interfund loans outstanding. The Fund's activity in this program during the period for which loans were outstanding was as follows:
| Borrower or Lender | Average Loan Balance | Weighted Average Interest Rate | Interest Expense |
| Borrower | $22,106,300 | 1.34% | $8,240 |
Interfund Trades. The Fund may purchase from or sell securities to other Fidelity Funds under procedures adopted by the Board. The procedures have been designed to ensure these interfund trades are executed in accordance with Rule 17a-7 of the 1940 Act. Interfund trades are included within the respective purchases and sales amounts shown in the Purchases and Sales of Investments note.
Other. During the period, the investment adviser reimbursed the Fund for certain losses in the amount of $5,369.
7. Committed Line of Credit.
The Fund participates with other funds managed by the investment adviser or an affiliate in a $4.25 billion credit facility (the "line of credit") to be utilized for temporary or emergency purposes to fund shareholder redemptions or for other short-term liquidity purposes. The Fund has agreed to pay commitment fees on its pro-rata portion of the line of credit, which amounted to $3,422 and is reflected in Miscellaneous expenses on the Statement of Operations. During the period, the Fund did not borrow on this line of credit.
8. Security Lending.
The Fund lends portfolio securities through a lending agent from time to time in order to earn additional income. For equity securities, a lending agent is used and may loan securities to certain qualified borrowers, including Fidelity Capital Markets (FCM), a broker-dealer affiliated with the Fund. On the settlement date of the loan, the Fund receives collateral (in the form of U.S. Treasury obligations, letters of credit and/or cash) against the loaned securities and maintains collateral in an amount not less than 100% of the market value of the loaned securities during the period of the loan. The market value of the loaned securities is determined at the close of business of the Fund and any additional required collateral is delivered to the Fund on the next business day. The Fund or borrower may terminate the loan at any time, and if the borrower defaults on its obligation to return the securities loaned because of insolvency or other reasons, the Fund may apply collateral received from the borrower against the obligation. The Fund may experience delays and costs in recovering the securities loaned. Any cash collateral received is invested in the Fidelity Securities Lending Cash Central Fund. The value of loaned securities and cash collateral at period end are disclosed on the Fund's Statement of Assets and Liabilities. Security lending income represents the income earned on investing cash collateral, less rebates paid to borrowers and any lending agent fees associated with the loan, plus any premium payments received for lending certain types of securities. Security lending income is presented in the Statement of Operations as a component of income from Fidelity Central Funds. Total security lending income during the period amounted to $14,384. During the period, there were no securities loaned to FCM.
9. Expense Reductions.
Commissions paid to certain brokers with whom the investment adviser, or its affiliates, places trades on behalf of the Fund include an amount in addition to trade execution, which may be rebated back to the Fund to offset certain expenses. This amount totaled $11,924 for the period.
In addition, during the period the investment adviser reimbursed and/or waived a portion of fund-level operating expenses in the amount of $16,109.
10. Distributions to Shareholders.
Distributions to shareholders of each class were as follows:
| Six months ended December 31, 2017 | Year ended June 30, 2017 | |
| From net investment income | ||
| Class A | $796,861 | $899,180 |
| Class M | 298,321 | 291,257 |
| Class C | 202,655 | 185,391 |
| Mega Cap Stock | 25,922,901 | 48,569,058 |
| Class I | 2,395,397 | 2,230,910 |
| Class Z | 5,718,363 | 40,402 |
| Total | $35,334,498 | $52,216,198 |
| From net realized gain | ||
| Class A | $8,449,639 | $344,305 |
| Class M | 3,919,912 | 137,941 |
| Class C | 4,788,475 | 163,362 |
| Mega Cap Stock | 224,982,402 | 15,922,546 |
| Class I | 21,104,231 | 711,666 |
| Class Z | 45,343,842 | 11,608 |
| Total | $308,588,501 | $17,291,428 |
11. Share Transactions.
Share transactions for each class were as follows and may contain automatic conversions between classes or exchanges between affiliated funds:
| Shares | Shares | Dollars | Dollars | |
| Six months ended December 31, 2017 | Year ended June 30, 2017 | Six months ended December 31, 2017 | Year ended June 30, 2017 | |
| Class A | ||||
| Shares sold | 457,115 | 1,038,892 | $7,842,205 | $18,074,597 |
| Reinvestment of distributions | 559,889 | 70,692 | 9,203,300 | 1,204,625 |
| Shares redeemed | (623,215) | (2,254,920) | (10,608,382) | (39,387,612) |
| Net increase (decrease) | 393,789 | (1,145,336) | $6,437,123 | $(20,108,390) |
| Class M | ||||
| Shares sold | 82,612 | 351,517 | $1,414,717 | $6,011,579 |
| Reinvestment of distributions | 255,533 | 24,971 | 4,196,936 | 425,997 |
| Shares redeemed | (205,717) | (523,179) | (3,527,475) | (8,962,447) |
| Net increase (decrease) | 132,428 | (146,691) | $2,084,178 | $(2,524,871) |
| Class C | ||||
| Shares sold | 76,730 | 321,807 | $1,309,665 | $5,527,295 |
| Reinvestment of distributions | 306,537 | 20,217 | 4,962,564 | 342,413 |
| Shares redeemed | (226,146) | (518,468) | (3,860,472) | (8,770,183) |
| Net increase (decrease) | 157,121 | (176,444) | $2,411,757 | $(2,900,475) |
| Mega Cap Stock | ||||
| Shares sold | 25,384,106 | 37,223,324 | $440,309,968 | $643,884,050 |
| Reinvestment of distributions | 14,397,240 | 3,517,132 | 239,269,689 | 60,338,870 |
| Shares redeemed | (13,010,193) | (148,979,826) | (230,669,282) | (2,654,363,774) |
| Net increase (decrease) | 26,771,153 | (108,239,370) | $448,910,375 | $(1,950,140,854) |
| Class I | ||||
| Shares sold | 813,082 | 1,883,800 | $14,221,125 | $33,590,247 |
| Reinvestment of distributions | 1,407,682 | 170,239 | 23,366,927 | 2,921,152 |
| Shares redeemed | (1,647,939) | (3,246,889) | (28,724,789) | (56,705,836) |
| Net increase (decrease) | 572,825 | (1,192,850) | $8,863,263 | $(20,194,437) |
| Class Z | ||||
| Shares sold | 1,806,669 | 17,352,586 | $30,550,010 | $316,033,855 |
| Reinvestment of distributions | 1,742,762 | 3,045 | 28,819,243 | 52,010 |
| Shares redeemed | (643,678) | (320,945) | (10,978,660) | (5,787,246) |
| Net increase (decrease) | 2,905,753 | 17,034,686 | $48,390,593 | $310,298,619 |
12. Other.
The Fund's organizational documents provide former and current trustees and officers with a limited indemnification against liabilities arising in connection with the performance of their duties to the Fund. In the normal course of business, the Fund may also enter into contracts that provide general indemnifications. The Fund's maximum exposure under these arrangements is unknown as this would be dependent on future claims that may be made against the Fund. The risk of material loss from such claims is considered remote.
Shareholder Expense Example
As a shareholder of the Fund, you incur two types of costs: (1) transaction costs, including sales charges (loads) on purchase payments or redemption proceeds, and (2) ongoing costs, including management fees, distribution and/or service (12b-1) fees and other Fund expenses. This Example is intended to help you understand your ongoing costs (in dollars) of investing in the Fund and to compare these costs with the ongoing costs of investing in other mutual funds.
The Example is based on an investment of $1,000 invested at the beginning of the period and held for the entire period (July 1, 2017 to December 31, 2017).
Actual Expenses
The first line of the accompanying table for each class of the Fund provides information about actual account values and actual expenses. You may use the information in this line, together with the amount you invested, to estimate the expenses that you paid over the period. Simply divide your account value by $1,000.00 (for example, an $8,600 account value divided by $1,000.00 = 8.6), then multiply the result by the number in the first line for a class of the Fund under the heading entitled "Expenses Paid During Period" to estimate the expenses you paid on your account during this period. A small balance maintenance fee of $12.00 that is charged once a year may apply for certain accounts with a value of less than $2,000. This fee is not included in the table below. If it was, the estimate of expenses you paid during the period would be higher, and your ending account value lower, by this amount. In addition, the Fund, as a shareholder in the underlying Fidelity Central Funds, will indirectly bear its pro-rata share of the fees and expenses incurred by the underlying Fidelity Central Funds. These fees and expenses are not included in the Fund's annualized expense ratio used to calculate the expense estimate in the table below.
Hypothetical Example for Comparison Purposes
The second line of the accompanying table for each class of the Fund provides information about hypothetical account values and hypothetical expenses based on a Class' actual expense ratio and an assumed rate of return of 5% per year before expenses, which is not the Class' actual return. The hypothetical account values and expenses may not be used to estimate the actual ending account balance or expenses you paid for the period. You may use this information to compare the ongoing costs of investing in the Fund and other funds. To do so, compare this 5% hypothetical example with the 5% hypothetical examples that appear in the shareholder reports of the other funds. A small balance maintenance fee of $12.00 that is charged once a year may apply for certain accounts with a value of less than $2,000. This fee is not included in the table below. If it was, the estimate of expenses you paid during the period would be higher, and your ending account value lower, by this amount. In addition, the Fund, as a shareholder in the underlying Fidelity Central Funds, will indirectly bear its pro-rata share of the fees and expenses incurred by the underlying Fidelity Central Funds. These fees and expenses are not included in the Fund's annualized expense ratio used to calculate the expense estimate in the table below.
Please note that the expenses shown in the table are meant to highlight your ongoing costs only and do not reflect any transaction costs. Therefore, the second line of the table is useful in comparing ongoing costs only, and will not help you determine the relative total costs of owning different funds. In addition, if these transactional costs were included, your costs would have been higher.
| Annualized Expense Ratio-A | Beginning Account Value July 1, 2017 | Ending Account Value December 31, 2017 | Expenses Paid During Period-B July 1, 2017 to December 31, 2017 | |
| Class A | .94% | |||
| Actual | $1,000.00 | $1,101.60 | $4.98 | |
| Hypothetical-C | $1,000.00 | $1,020.47 | $4.79 | |
| Class M | 1.19% | |||
| Actual | $1,000.00 | $1,100.70 | $6.30 | |
| Hypothetical-C | $1,000.00 | $1,019.21 | $6.06 | |
| Class C | 1.69% | |||
| Actual | $1,000.00 | $1,098.10 | $8.94 | |
| Hypothetical-C | $1,000.00 | $1,016.69 | $8.59 | |
| Mega Cap Stock | .69% | |||
| Actual | $1,000.00 | $1,102.90 | $3.66 | |
| Hypothetical-C | $1,000.00 | $1,021.73 | $3.52 | |
| Class I | .67% | |||
| Actual | $1,000.00 | $1,103.00 | $3.55 | |
| Hypothetical-C | $1,000.00 | $1,021.83 | $3.41 | |
| Class Z | .53% | |||
| Actual | $1,000.00 | $1,104.50 | $2.81 | |
| Hypothetical-C | $1,000.00 | $1,022.53 | $2.70 |
A Annualized expense ratio reflects expenses net of applicable fee waivers.
B Expenses are equal to each Class' annualized expense ratio, multiplied by the average account value over the period, multiplied by 184/365 (to reflect the one-half year period).
C 5% return per year before expenses
Board Approval of Investment Advisory Contracts and Management Fees
Fidelity Mega Cap Stock Fund
Each year, the Board of Trustees, including the Independent Trustees (together, the Board), votes on the renewal of the management contract with Fidelity Management & Research Company (FMR) and the sub-advisory agreements (together, the Advisory Contracts) for the fund. FMR and the sub-advisers are referred to herein as the Investment Advisers. The Board, assisted by the advice of fund counsel and Independent Trustees' counsel, requests and considers a broad range of information relevant to the renewal of the Advisory Contracts throughout the year.
The Board meets regularly and, at each of its meetings, covers an extensive agenda of topics and materials and considers factors that are relevant to its annual consideration of the renewal of the fund's Advisory Contracts, including the services and support provided to the fund and its shareholders. The Board has established various standing committees (Committees), each composed of and chaired by Independent Trustees with varying backgrounds, to which the Board has assigned specific subject matter responsibilities in order to enhance effective decision-making by the Board. The Board, acting directly and through its Committees, requests and receives information concerning the annual consideration of the renewal of the fund's Advisory Contracts. The Board also meets as needed to review matters specifically related to the Board's annual consideration of the renewal of the Advisory Contracts. Members of the Board may also meet with trustees of other Fidelity funds through ad hoc joint committees to discuss certain matters relevant to all of the Fidelity funds.
At its July 2017 meeting, the Board unanimously determined to renew the fund's Advisory Contracts. In reaching its determination, the Board considered all factors it believed relevant, including (i) the nature, extent, and quality of the services to be provided to the fund and its shareholders (including the investment performance of the fund); (ii) the competitiveness of the fund's management fee and total expense ratio relative to peer funds; (iii) the total costs of the services to be provided by and the profits to be realized by Fidelity from its relationships with the fund; and (iv) the extent to which, if any, economies of scale exist and would be realized as the fund grows, and whether any economies of scale are appropriately shared with fund shareholders.
In considering whether to renew the Advisory Contracts for the fund, the Board reached a determination, with the assistance of fund counsel and Independent Trustees' counsel and through the exercise of its business judgment, that the renewal of the Advisory Contracts was in the best interests of the fund and its shareholders and that the compensation payable under the Advisory Contracts was fair and reasonable. The Board's decision to renew the Advisory Contracts was not based on any single factor, but rather was based on a comprehensive consideration of all the information provided to the Board at its meetings throughout the year. The Board, in reaching its determination to renew the Advisory Contracts, was aware that shareholders of the fund have a broad range of investment choices available to them, including a wide choice among funds offered by Fidelity's competitors, and that the fund's shareholders, who have the opportunity to review and weigh the disclosure provided by the fund in its prospectus and other public disclosures, have chosen to invest in this fund, which is part of the Fidelity family of funds.
Amendment to Group Fee Rate. The Board also approved an amendment to the management contract for the fund to add an additional breakpoint to the group fee schedule, effective October 1, 2017. The Board noted that the additional breakpoint would result in lower management fee rates as Fidelity's assets under management increase.
Nature, Extent, and Quality of Services Provided. The Board considered Fidelity's staffing as it relates to the fund, including the backgrounds of investment personnel of Fidelity, and also considered the fund's investment objective, strategies, and related investment philosophy. The Independent Trustees also had discussions with senior management of Fidelity's investment operations and investment groups. The Board considered the structure of the investment personnel compensation program and whether this structure provides appropriate incentives to act in the best interests of the fund. Additionally, the Board considered the portfolio managers' investments, if any, in the funds that they manage.Resources Dedicated to Investment Management and Support Services. The Board and the Fund Oversight and Research Committees reviewed the general qualifications and capabilities of Fidelity's investment staff, including its size, education, experience, and resources, as well as Fidelity's approach to recruiting, training, managing, and compensating investment personnel. The Board noted that Fidelity has continued to increase the resources devoted to non-U.S. offices, including expansion of Fidelity's global investment organization. The Board also noted that Fidelity's analysts have extensive resources, tools and capabilities that allow them to conduct sophisticated quantitative and fundamental analysis, as well as credit analysis of issuers, counterparties and guarantors. Further, the Board considered that Fidelity's investment professionals have sufficient access to global information and data so as to provide competitive investment results over time, and that those professionals also have access to sophisticated tools that permit them to assess portfolio construction and risk and performance attribution characteristics continuously, as well as to transmit new information and research conclusions rapidly around the world. Additionally, in its deliberations, the Board considered Fidelity's trading, risk management, compliance, and technology and operations capabilities and resources, which are integral parts of the investment management process.Shareholder and Administrative Services. The Board considered (i) the nature, extent, quality, and cost of advisory, administrative, and shareholder services performed by the Investment Advisers and their affiliates under the Advisory Contracts and under separate agreements covering transfer agency, pricing and bookkeeping, and securities lending services for the fund; (ii) the nature and extent of the supervision of third party service providers, principally custodians, subcustodians, and pricing vendors; and (iii) the resources devoted to, and the record of compliance with, the fund's compliance policies and procedures. The Board also reviewed the allocation of fund brokerage, including allocations to brokers affiliated with the Investment Advisers, the use of brokerage commissions to pay fund expenses, and the use of "soft" commission dollars to pay for research services.The Board noted that the growth of fund assets over time across the complex allows Fidelity to reinvest in the development of services designed to enhance the value or convenience of the Fidelity funds as investment vehicles. These services include 24-hour access to account information and market information through telephone representatives and over the Internet, investor education materials and asset allocation tools, and the expanded availability of Fidelity Investor Centers.In 2014, the Board formed an ad hoc Committee on Transfer Agency Fees to review the variety of transfer agency fee structures throughout the industry and Fidelity's competitive positioning with respect to industry participants.Investment in a Large Fund Family. The Board considered the benefits to shareholders of investing in a Fidelity fund, including the benefits of investing in a fund that is part of a large family of funds offering a variety of investment disciplines and providing a large variety of mutual fund investor services. The Board noted that Fidelity had taken, or had made recommendations that resulted in the Fidelity funds taking, a number of actions over the previous year that benefited particular funds, including: (i) continuing to dedicate additional resources to Fidelity's investment research process, and to the support of the senior management team that oversees asset management; (ii) continuing efforts to enhance Fidelity's global research capabilities; (iii) launching new funds and making other enhancements to meet client needs; (iv) launching new share classes of existing funds; (v) eliminating purchase minimums and broadening eligibility requirements for certain lower-priced share classes; (vi) reducing management fees and total expenses for certain growth equity funds and index funds; (vii) lowering expense caps for certain existing funds and classes to reduce expenses borne by shareholders; (viii) eliminating short-term redemption fees for certain funds; (ix) introducing a new pricing structure for certain funds of funds that is expected to reduce overall expenses paid by shareholders; (x) rationalizing product lines and gaining increased efficiencies through proposals for fund mergers and share class consolidations; (xi) continuing to develop, acquire and implement systems and technology to improve services to the funds and shareholders, strengthen information security, and increase efficiency; and (xii) implementing enhancements to further strengthen Fidelity's product line to increase investors' probability of success in achieving their investment goals, including retirement income goals.Investment Performance. The Board considered whether the fund has operated in accordance with its investment objective, as well as its record of compliance with its investment restrictions and its performance history.The Board took into account discussions with representatives of the Investment Advisers about fund investment performance that occur at Board meetings throughout the year. In this regard the Board noted that as part of regularly scheduled fund reviews and other reports to the Board on fund performance, the Board considers annualized return information for the fund for different time periods, measured against a securities market index ("benchmark index") and a peer group of funds with similar objectives ("peer group"), if any. In its evaluation of fund investment performance, the Board gave particular attention to information indicating changes in performance of certain Fidelity funds for specific time periods and discussed with the Investment Advisers the reasons for any overperformance or underperformance.In addition to reviewing absolute and relative fund performance, the Independent Trustees periodically consider the appropriateness of fund performance metrics in evaluating the results achieved. In general, the Independent Trustees believe that fund performance should be evaluated based on net performance (after fees and expenses) of both the highest performing and lowest performing fund share classes, where applicable, compared to appropriate benchmark indices, over appropriate time periods that may include full market cycles, and compared to peer groups, as applicable, over the same periods, taking into account relevant factors including the following: general market conditions; issuer-specific information; and fund cash flows and other factors.The Independent Trustees recognize that shareholders evaluate performance on a net basis over their own holding periods, for which one-, three-, and five-year periods are often used as a proxy. For this reason, the performance information reviewed by the Board also included net cumulative calendar year total return information for the fund and an appropriate benchmark index for the most recent one-, three-, and five-year periods, as shown below. A peer group is not shown below because the fund does not generally utilize a peer group for performance comparison purposes.Fidelity Mega Cap Stock Fund

Fidelity Mega Cap Stock Fund

![]()
AGII-SANN-0218
1.855230.110
Fidelity® Mega Cap Stock Fund Semi-Annual Report December 31, 2017 |
|
Contents
Board Approval of Investment Advisory Contracts and Management Fees |
To view a fund's proxy voting guidelines and proxy voting record for the 12-month period ended June 30, visit http://www.fidelity.com/proxyvotingresults or visit the Securities and Exchange Commission's (SEC) web site at http://www.sec.gov.
You may also call 1-800-544-8544 to request a free copy of the proxy voting guidelines.
Standard & Poor's, S&P and S&P 500 are registered service marks of The McGraw-Hill Companies, Inc. and have been licensed for use by Fidelity Distributors Corporation.
Other third-party marks appearing herein are the property of their respective owners.
All other marks appearing herein are registered or unregistered trademarks or service marks of FMR LLC or an affiliated company. © 2018 FMR LLC. All rights reserved.
This report and the financial statements contained herein are submitted for the general information of the shareholders of the Fund. This report is not authorized for distribution to prospective investors in the Fund unless preceded or accompanied by an effective prospectus.
A fund files its complete schedule of portfolio holdings with the SEC for the first and third quarters of each fiscal year on Form N-Q. Forms N-Q are available on the SEC’s web site at http://www.sec.gov. A fund's Forms N-Q may be reviewed and copied at the SEC’s Public Reference Room in Washington, DC. Information regarding the operation of the SEC's Public Reference Room may be obtained by calling 1-800-SEC-0330.
For a complete list of a fund's portfolio holdings, view the most recent holdings listing, semiannual report, or annual report on Fidelity's web site at http://www.fidelity.com, http://www.institutional.fidelity.com, or http://www.401k.com, as applicable.
NOT FDIC INSURED •MAY LOSE VALUE •NO BANK GUARANTEE
Neither the Fund nor Fidelity Distributors Corporation is a bank.
Investment Summary (Unaudited)
Top Ten Stocks as of December 31, 2017
| % of fund's net assets | |
| Bank of America Corp.(a) | 4.5 |
| Microsoft Corp.(a) | 4.3 |
| JPMorgan Chase & Co.(a) | 3.9 |
| Citigroup, Inc.(a) | 3.4 |
| Apple, Inc.(a) | 3.2 |
| Chevron Corp. | 2.7 |
| Wells Fargo & Co. | 2.6 |
| Comcast Corp. Class A | 2.6 |
| ConocoPhillips Co. | 2.4 |
| Johnson & Johnson(a) | 2.3 |
| 31.9 |
(a) Security or a portion of the security is pledged as collateral for call options written.
Top Five Market Sectors as of December 31, 2017
| % of fund's net assets | |
| Financials | 21.8 |
| Information Technology | 20.9 |
| Health Care | 13.7 |
| Energy | 12.9 |
| Consumer Staples | 9.5 |
Asset Allocation (% of fund's net assets)
| As of December 31, 2017*,** | ||
| Stocks | 98.7% | |
| Convertible Securities | 0.1% | |
| Other Investments | 0.3% | |
| Short-Term Investments and Net Other Assets (Liabilities) | 0.9% | |

* Foreign investments - 8.0%
** Written options - (0.1)%
Investments December 31, 2017 (Unaudited)
Showing Percentage of Net Assets
| Common Stocks - 98.7% | |||
| Shares | Value | ||
| CONSUMER DISCRETIONARY - 6.7% | |||
| Automobiles - 0.2% | |||
| General Motors Co. | 104,900 | $4,299,851 | |
| Media - 4.1% | |||
| Comcast Corp. Class A | 1,664,500 | 66,663,225 | |
| The Walt Disney Co. | 246,500 | 26,501,215 | |
| Time Warner, Inc. | 120,195 | 10,994,237 | |
| Viacom, Inc. Class B (non-vtg.) | 84,800 | 2,612,688 | |
| 106,771,365 | |||
| Multiline Retail - 0.4% | |||
| Target Corp. (a) | 164,100 | 10,707,525 | |
| Specialty Retail - 2.0% | |||
| Lowe's Companies, Inc. (a) | 448,100 | 41,646,414 | |
| TJX Companies, Inc. | 151,000 | 11,545,460 | |
| 53,191,874 | |||
| TOTAL CONSUMER DISCRETIONARY | 174,970,615 | ||
| CONSUMER STAPLES - 9.5% | |||
| Beverages - 2.0% | |||
| PepsiCo, Inc. | 105,005 | 12,592,200 | |
| The Coca-Cola Co. | 862,100 | 39,553,148 | |
| 52,145,348 | |||
| Food & Staples Retailing - 2.5% | |||
| Costco Wholesale Corp. | 21,000 | 3,908,520 | |
| CVS Health Corp. | 351,100 | 25,454,750 | |
| Kroger Co. (a) | 224,600 | 6,165,270 | |
| Wal-Mart Stores, Inc. | 306,100 | 30,227,375 | |
| 65,755,915 | |||
| Food Products - 0.0% | |||
| General Mills, Inc. | 8,300 | 492,107 | |
| Household Products - 2.4% | |||
| Kimberly-Clark Corp. | 23,800 | 2,871,708 | |
| Procter & Gamble Co. (a) | 533,100 | 48,981,228 | |
| Reckitt Benckiser Group PLC | 95,300 | 8,890,868 | |
| 60,743,804 | |||
| Personal Products - 0.4% | |||
| Estee Lauder Companies, Inc. Class A | 18,400 | 2,341,216 | |
| Unilever NV (NY Reg.) | 135,800 | 7,648,256 | |
| 9,989,472 | |||
| Tobacco - 2.2% | |||
| Altria Group, Inc. | 584,800 | 41,760,568 | |
| British American Tobacco PLC sponsored ADR | 241,600 | 16,184,784 | |
| 57,945,352 | |||
| TOTAL CONSUMER STAPLES | 247,071,998 | ||
| ENERGY - 12.6% | |||
| Energy Equipment & Services - 0.4% | |||
| Baker Hughes, a GE Co. Class A | 241,600 | 7,644,224 | |
| Schlumberger Ltd. | 47,100 | 3,174,069 | |
| 10,818,293 | |||
| Oil, Gas & Consumable Fuels - 12.2% | |||
| Anadarko Petroleum Corp. | 241,600 | 12,959,424 | |
| Apache Corp. | 419,905 | 17,728,389 | |
| BP PLC sponsored ADR | 157,900 | 6,636,537 | |
| Chevron Corp. | 561,700 | 70,319,223 | |
| ConocoPhillips Co. | 1,116,100 | 61,262,729 | |
| Exxon Mobil Corp. | 65,000 | 5,436,600 | |
| Imperial Oil Ltd. | 448,500 | 13,997,339 | |
| Kinder Morgan, Inc. | 1,197,500 | 21,638,825 | |
| Phillips 66 Co. | 89,400 | 9,042,810 | |
| Suncor Energy, Inc. | 1,333,000 | 48,940,294 | |
| The Williams Companies, Inc. | 1,310,300 | 39,951,047 | |
| Valero Energy Corp. | 104,000 | 9,558,640 | |
| 317,471,857 | |||
| TOTAL ENERGY | 328,290,150 | ||
| FINANCIALS - 21.8% | |||
| Banks - 17.0% | |||
| Bank of America Corp. (a) | 3,941,000 | 116,338,318 | |
| Citigroup, Inc. (a) | 1,192,070 | 88,701,929 | |
| JPMorgan Chase & Co. (a) | 945,400 | 101,101,076 | |
| PNC Financial Services Group, Inc. (a) | 223,600 | 32,263,244 | |
| U.S. Bancorp | 708,300 | 37,950,714 | |
| Wells Fargo & Co. | 1,116,930 | 67,764,143 | |
| 444,119,424 | |||
| Capital Markets - 4.1% | |||
| Charles Schwab Corp. (a) | 339,400 | 17,434,978 | |
| Goldman Sachs Group, Inc. | 41,900 | 10,674,444 | |
| Morgan Stanley | 575,800 | 30,212,226 | |
| State Street Corp. | 497,700 | 48,580,497 | |
| 106,902,145 | |||
| Insurance - 0.7% | |||
| Marsh & McLennan Companies, Inc. | 121,780 | 9,911,674 | |
| MetLife, Inc. | 151,900 | 7,680,064 | |
| 17,591,738 | |||
| TOTAL FINANCIALS | 568,613,307 | ||
| HEALTH CARE - 13.6% | |||
| Biotechnology - 3.4% | |||
| Alexion Pharmaceuticals, Inc. (b) | 117,600 | 14,063,784 | |
| Amgen, Inc. | 241,290 | 41,960,331 | |
| Biogen, Inc. (b) | 39,500 | 12,583,515 | |
| Gilead Sciences, Inc. | 84,110 | 6,025,640 | |
| Intercept Pharmaceuticals, Inc. (b) | 31,200 | 1,822,704 | |
| Regeneron Pharmaceuticals, Inc. (b) | 17,400 | 6,541,704 | |
| Vertex Pharmaceuticals, Inc. (b) | 45,000 | 6,743,700 | |
| 89,741,378 | |||
| Health Care Equipment & Supplies - 1.2% | |||
| Becton, Dickinson & Co. | 10,200 | 2,183,412 | |
| Boston Scientific Corp. (b) | 397,300 | 9,849,067 | |
| Danaher Corp. | 68,400 | 6,348,888 | |
| Medtronic PLC | 171,113 | 13,817,375 | |
| 32,198,742 | |||
| Health Care Providers & Services - 3.4% | |||
| Aetna, Inc. | 18,700 | 3,373,293 | |
| Anthem, Inc. | 76,400 | 17,190,764 | |
| Cardinal Health, Inc. | 111,800 | 6,849,986 | |
| Cigna Corp. | 68,900 | 13,992,901 | |
| Express Scripts Holding Co. (b) | 62,062 | 4,632,308 | |
| Humana, Inc. | 28,300 | 7,020,381 | |
| McKesson Corp. | 131,300 | 20,476,235 | |
| UnitedHealth Group, Inc. | 64,100 | 14,131,486 | |
| 87,667,354 | |||
| Pharmaceuticals - 5.6% | |||
| Allergan PLC | 62,400 | 10,207,392 | |
| AstraZeneca PLC sponsored ADR | 213,900 | 7,422,330 | |
| Bayer AG | 28,800 | 3,578,781 | |
| Bristol-Myers Squibb Co. (a) | 163,850 | 10,040,728 | |
| GlaxoSmithKline PLC sponsored ADR | 1,003,700 | 35,601,239 | |
| Johnson & Johnson (a) | 423,400 | 59,157,448 | |
| Novartis AG sponsored ADR | 51,000 | 4,281,960 | |
| Sanofi SA | 87,064 | 7,495,513 | |
| Teva Pharmaceutical Industries Ltd. sponsored ADR (c) | 479,300 | 9,082,735 | |
| 146,868,126 | |||
| TOTAL HEALTH CARE | 356,475,600 | ||
| INDUSTRIALS - 8.8% | |||
| Aerospace & Defense - 2.4% | |||
| General Dynamics Corp. | 18,100 | 3,682,445 | |
| The Boeing Co. (a) | 47,400 | 13,978,734 | |
| United Technologies Corp. | 353,100 | 45,044,967 | |
| 62,706,146 | |||
| Air Freight & Logistics - 1.6% | |||
| FedEx Corp. | 47,400 | 11,828,196 | |
| United Parcel Service, Inc. Class B | 253,000 | 30,144,950 | |
| 41,973,146 | |||
| Industrial Conglomerates - 2.0% | |||
| General Electric Co. | 3,008,500 | 52,498,325 | |
| Road & Rail - 2.8% | |||
| CSX Corp. (a) | 386,700 | 21,272,367 | |
| Norfolk Southern Corp. | 119,100 | 17,257,590 | |
| Union Pacific Corp. | 254,790 | 34,167,339 | |
| 72,697,296 | |||
| TOTAL INDUSTRIALS | 229,874,913 | ||
| INFORMATION TECHNOLOGY - 20.9% | |||
| Communications Equipment - 1.8% | |||
| Cisco Systems, Inc. (a) | 1,241,800 | 47,560,940 | |
| Internet Software & Services - 4.2% | |||
| Alphabet, Inc.: | |||
| Class A (b) | 49,750 | 52,406,650 | |
| Class C (b) | 47,026 | 49,208,006 | |
| Facebook, Inc. Class A (b) | 40,100 | 7,076,046 | |
| 108,690,702 | |||
| IT Services - 3.5% | |||
| Accenture PLC Class A | 37,800 | 5,786,802 | |
| Cognizant Technology Solutions Corp. Class A | 143,400 | 10,184,268 | |
| MasterCard, Inc. Class A (a) | 132,800 | 20,100,608 | |
| PayPal Holdings, Inc. (b) | 103,700 | 7,634,394 | |
| Visa, Inc. Class A | 420,000 | 47,888,400 | |
| 91,594,472 | |||
| Semiconductors & Semiconductor Equipment - 2.0% | |||
| Qualcomm, Inc. | 809,700 | 51,836,994 | |
| Software - 6.2% | |||
| Adobe Systems, Inc. (b) | 99,600 | 17,453,904 | |
| Microsoft Corp. (a) | 1,317,700 | 112,716,058 | |
| Oracle Corp. | 496,300 | 23,465,064 | |
| Salesforce.com, Inc. (b) | 19,200 | 1,962,816 | |
| SAP SE sponsored ADR | 51,400 | 5,775,304 | |
| 161,373,146 | |||
| Technology Hardware, Storage & Peripherals - 3.2% | |||
| Apple, Inc. (a) | 500,207 | 84,650,031 | |
| TOTAL INFORMATION TECHNOLOGY | 545,706,285 | ||
| MATERIALS - 2.0% | |||
| Chemicals - 2.0% | |||
| DowDuPont, Inc. | 133,367 | 9,498,398 | |
| LyondellBasell Industries NV Class A | 170,800 | 18,842,656 | |
| Monsanto Co. | 174,810 | 20,414,312 | |
| PPG Industries, Inc. | 20,500 | 2,394,810 | |
| 51,150,176 | |||
| Metals & Mining - 0.0% | |||
| BHP Billiton Ltd. sponsored ADR (c) | 28,500 | 1,310,715 | |
| TOTAL MATERIALS | 52,460,891 | ||
| REAL ESTATE - 0.5% | |||
| Equity Real Estate Investment Trusts (REITs) - 0.5% | |||
| American Tower Corp. | 37,600 | 5,364,392 | |
| Crown Castle International Corp. | 7,200 | 799,272 | |
| Equinix, Inc. | 6,400 | 2,900,608 | |
| Public Storage | 14,700 | 3,072,300 | |
| 12,136,572 | |||
| TELECOMMUNICATION SERVICES - 1.5% | |||
| Diversified Telecommunication Services - 1.5% | |||
| Verizon Communications, Inc. | 760,625 | 40,259,881 | |
| UTILITIES - 0.8% | |||
| Electric Utilities - 0.8% | |||
| Exelon Corp. | 506,900 | 19,976,929 | |
| TOTAL COMMON STOCKS | |||
| (Cost $1,684,281,311) | 2,575,837,141 | ||
| Convertible Preferred Stocks - 0.1% | |||
| HEALTH CARE - 0.1% | |||
| Health Care Equipment & Supplies - 0.1% | |||
| Becton, Dickinson & Co. Series A 6.125% | |||
| (Cost $2,593,525) | 50,700 | 2,949,219 | |
| Other - 0.3% | |||
| ENERGY - 0.3% | |||
| Oil, Gas & Consumable Fuels - 0.3% | |||
| Utica Shale Drilling Program (non-operating revenue interest)(d)(e)(f) | |||
| (Cost $9,242,241) | 9,242,241 | 7,116,526 | |
| Money Market Funds - 1.0% | |||
| Fidelity Cash Central Fund, 1.36% (g) | 25,776,908 | 25,782,064 | |
| Fidelity Securities Lending Cash Central Fund 1.36% (g)(h) | 1,114,558 | 1,114,781 | |
| TOTAL MONEY MARKET FUNDS | |||
| (Cost $26,896,735) | 26,896,845 | ||
| TOTAL INVESTMENT IN SECURITIES - 100.1% | |||
| (Cost $1,723,013,812) | 2,612,799,731 | ||
| NET OTHER ASSETS (LIABILITIES) - (0.1)% | (2,193,781) | ||
| NET ASSETS - 100% | $2,610,605,950 |
| Written Options | ||||||
| Counterparty | Number of Contracts | Notional Amount | Exercise Price | Expiration Date | Value | |
| Call Options | ||||||
| Apple, Inc. | Chicago Board Options Exchange | 276 | $4,670,748 | $185.00 | 2/16/18 | $(31,326) |
| Bank of America Corp. | Chicago Board Options Exchange | 6,270 | 18,509,040 | 30.00 | 1/19/18 | (260,205) |
| Bristol-Myers Squibb Co. | Chicago Board Options Exchange | 825 | 5,055,600 | 65.00 | 1/19/18 | (23,925) |
| Charles Schwab Corp. | Chicago Board Options Exchange | 336 | 1,726,032 | 55.00 | 3/16/18 | (31,080) |
| Cisco Systems, Inc. | Chicago Board Options Exchange | 1,205 | 4,615,150 | 41.00 | 3/16/18 | (39,765) |
| Cisco Systems, Inc. | Chicago Board Options Exchange | 1,205 | 4,615,150 | 40.00 | 3/16/18 | (66,878) |
| Citigroup, Inc. | Chicago Board Options Exchange | 1,148 | 8,542,268 | 80.00 | 2/16/18 | (54,530) |
| CSX Corp. | Chicago Board Options Exchange | 605 | 3,328,105 | 60.00 | 2/16/18 | (29,343) |
| CSX Corp. | Chicago Board Options Exchange | 602 | 3,311,602 | 62.50 | 2/16/18 | (11,438) |
| Johnson & Johnson | Chicago Board Options Exchange | 385 | 5,379,220 | 145.00 | 2/16/18 | (34,072) |
| JPMorgan Chase & Co. | Chicago Board Options Exchange | 1,430 | 15,292,420 | 115.00 | 3/16/18 | (132,990) |
| Kroger Co. | Chicago Board Options Exchange | 223 | 612,135 | 28.00 | 2/16/18 | (17,840) |
| Kroger Co. | Chicago Board Options Exchange | 438 | 1,202,310 | 29.00 | 2/16/18 | (20,805) |
| Lowe's Companies, Inc. | Chicago Board Options Exchange | 470 | 4,368,180 | 85.00 | 1/19/18 | (381,875) |
| MasterCard, Inc. Class A | Chicago Board Options Exchange | 156 | 2,361,216 | 150.00 | 1/19/18 | (49,686) |
| Microsoft Corp. | Chicago Board Options Exchange | 605 | 5,175,170 | 90.00 | 2/16/18 | (59,592) |
| PNC Financial Services Group, Inc. | Chicago Board Options Exchange | 165 | 2,380,785 | 145.00 | 2/16/18 | (61,050) |
| Procter & Gamble Co. | Chicago Board Options Exchange | 495 | 4,548,060 | 92.50 | 2/16/18 | (64,350) |
| Target Corp. | Chicago Board Options Exchange | 278 | 1,813,950 | 65.00 | 3/16/18 | (95,910) |
| Target Corp. | Chicago Board Options Exchange | 278 | 1,813,950 | 70.00 | 3/16/18 | (42,673) |
| The Boeing Co. | Chicago Board Options Exchange | 221 | 6,517,511 | 300.00 | 3/16/18 | (209,950) |
| TOTAL WRITTEN OPTIONS | $(1,719,283) |
Legend
(a) Security or a portion of the security is pledged as collateral for call options written. At period end, the value of securities pledged amounted to $105,838,602.
(b) Non-income producing
(c) Security or a portion of the security is on loan at period end.
(d) Investment is owned by a wholly-owned subsidiary (Subsidiary) that is treated as a corporation for U.S. tax purposes.
(e) Restricted securities - Investment in securities not registered under the Securities Act of 1933 (excluding 144A issues). At the end of the period, the value of restricted securities (excluding 144A issues) amounted to $7,116,526 or 0.3% of net assets.
(f) Level 3 security
(g) Affiliated fund that is generally available only to investment companies and other accounts managed by Fidelity Investments. The rate quoted is the annualized seven-day yield of the fund at period end. A complete unaudited listing of the fund's holdings as of its most recent quarter end is available upon request. In addition, each Fidelity Central Fund's financial statements are available on the SEC's website or upon request.
(h) Investment made with cash collateral received from securities on loan.
Additional information on each restricted holding is as follows:
| Security | Acquisition Date | Acquisition Cost |
| Utica Shale Drilling Program (non-operating revenue interest) | 10/5/16 - 9/1/17 | $9,242,241 |
Affiliated Central Funds
Information regarding fiscal year to date income earned by the Fund from investments in Fidelity Central Funds is as follows:
| Fund | Income earned |
| Fidelity Cash Central Fund | $54,631 |
| Fidelity Securities Lending Cash Central Fund | 14,384 |
| Total | $69,015 |
Amounts in the income column in the above table include any capital gain distributions from underlying funds, which are presented in the corresponding line-item in the Statement of Operations if applicable.
Investment Valuation
The following is a summary of the inputs used, as of December 31, 2017, involving the Fund's assets and liabilities carried at fair value. The inputs or methodology used for valuing securities may not be an indication of the risk associated with investing in those securities. For more information on valuation inputs, and their aggregation into the levels used below, please refer to the Investment Valuation section in the accompanying Notes to Financial Statements.
| Valuation Inputs at Reporting Date: | ||||
| Description | Total | Level 1 | Level 2 | Level 3 |
| Investments in Securities: | ||||
| Equities: | ||||
| Consumer Discretionary | $174,970,615 | $174,970,615 | $-- | $-- |
| Consumer Staples | 247,071,998 | 238,181,130 | 8,890,868 | -- |
| Energy | 328,290,150 | 328,290,150 | -- | -- |
| Financials | 568,613,307 | 568,613,307 | -- | -- |
| Health Care | 359,424,819 | 345,401,306 | 14,023,513 | -- |
| Industrials | 229,874,913 | 229,874,913 | -- | -- |
| Information Technology | 545,706,285 | 545,706,285 | -- | -- |
| Materials | 52,460,891 | 52,460,891 | -- | -- |
| Real Estate | 12,136,572 | 12,136,572 | -- | -- |
| Telecommunication Services | 40,259,881 | 40,259,881 | -- | -- |
| Utilities | 19,976,929 | 19,976,929 | -- | -- |
| Other | 7,116,526 | -- | -- | 7,116,526 |
| Money Market Funds | 26,896,845 | 26,896,845 | -- | -- |
| Total Investments in Securities: | $2,612,799,731 | $2,582,768,824 | $22,914,381 | $7,116,526 |
| Derivative Instruments: | ||||
| Liabilities | ||||
| Written Options | $(1,719,283) | $(1,719,283) | $-- | $-- |
| Total Liabilities | $(1,719,283) | $(1,719,283) | $-- | $-- |
| Total Derivative Instruments: | $(1,719,283) | $(1,719,283) | $-- | $-- |
Value of Derivative Instruments
The following table is a summary of the Fund's value of derivative instruments by primary risk exposure as of December 31, 2017. For additional information on derivative instruments, please refer to the Derivative Instruments section in the accompanying Notes to Financial Statements.
| Primary Risk Exposure / Derivative Type | Value | |
| Asset | Liability | |
| Equity Risk | ||
| Written Options(a) | $0 | $(1,719,283) |
| Total Equity Risk | 0 | (1,719,283) |
| Total Value of Derivatives | $0 | $(1,719,283) |
(a) Gross value is presented in the Statement of Assets and Liabilities in the written options, at value line-item.
See accompanying notes which are an integral part of the financial statements.
Financial Statements
Statement of Assets and Liabilities
| December 31, 2017 (Unaudited) | ||
| Assets | ||
| Investment in securities, at value (including securities loaned of $1,080,510) — See accompanying schedule: Unaffiliated issuers (cost $1,696,117,077) | $2,585,902,886 | |
| Fidelity Central Funds (cost $26,896,735) | 26,896,845 | |
| Total Investment in Securities (cost $1,723,013,812) | $2,612,799,731 | |
| Cash | 1,596 | |
| Restricted cash | 66,071 | |
| Receivable for investments sold | 3,912,316 | |
| Receivable for fund shares sold | 1,815,144 | |
| Dividends receivable | 2,641,445 | |
| Distributions receivable from Fidelity Central Funds | 28,590 | |
| Prepaid expenses | 3,805 | |
| Other receivables | 9,729 | |
| Total assets | 2,621,278,427 | |
| Liabilities | ||
| Payable for investments purchased | $4,556,378 | |
| Payable for fund shares redeemed | 1,818,217 | |
| Accrued management fee | 951,190 | |
| Distribution and service plan fees payable | 53,792 | |
| Written options, at value (premium received $1,793,967) | 1,719,283 | |
| Other affiliated payables | 427,826 | |
| Other payables and accrued expenses | 29,891 | |
| Collateral on securities loaned | 1,115,900 | |
| Total liabilities | 10,672,477 | |
| Net Assets | $2,610,605,950 | |
| Net Assets consist of: | ||
| Paid in capital | $1,712,554,520 | |
| Distributions in excess of net investment income | (1,951,165) | |
| Accumulated undistributed net realized gain (loss) on investments and foreign currency transactions | 10,147,555 | |
| Net unrealized appreciation (depreciation) on investments and assets and liabilities in foreign currencies | 889,855,040 | |
| Net Assets | $2,610,605,950 | |
| Calculation of Maximum Offering Price | ||
| Class A: | ||
| Net Asset Value and redemption price per share ($63,413,173 ÷ 3,671,250 shares) | $17.27 | |
| Maximum offering price per share (100/94.25 of $17.27) | $18.32 | |
| Class M: | ||
| Net Asset Value and redemption price per share ($28,811,300 ÷ 1,668,311 shares) | $17.27 | |
| Maximum offering price per share (100/96.50 of $17.27) | $17.90 | |
| Class C: | ||
| Net Asset Value and offering price per share ($34,798,787 ÷ 2,043,436 shares)(a) | $17.03 | |
| Mega Cap Stock: | ||
| Net Asset Value, offering price and redemption price per share ($1,980,685,119 ÷ 113,623,692 shares) | $17.43 | |
| Class I: | ||
| Net Asset Value, offering price and redemption price per share ($154,088,690 ÷ 8,833,967 shares) | $17.44 | |
| Class Z: | ||
| Net Asset Value, offering price and redemption price per share ($348,808,881 ÷ 20,094,715 shares) | $17.36 |
(a) Redemption price per share is equal to net asset value less any applicable contingent deferred sales charge.
See accompanying notes which are an integral part of the financial statements.
Statement of Operations
| Six months ended December 31, 2017 (Unaudited) | ||
| Investment Income | ||
| Dividends | $23,783,351 | |
| Income from Fidelity Central Funds | 69,015 | |
| Total income | 23,852,366 | |
| Expenses | ||
| Management fee | $5,058,682 | |
| Transfer agent fees | 2,050,063 | |
| Distribution and service plan fees | 315,848 | |
| Accounting and security lending fees | 343,091 | |
| Custodian fees and expenses | 16,577 | |
| Independent trustees' fees and expenses | 4,419 | |
| Registration fees | 57,581 | |
| Audit | 27,840 | |
| Legal | 6,366 | |
| Interest | 8,240 | |
| Miscellaneous | 8,489 | |
| Total expenses before reductions | 7,897,196 | |
| Expense reductions | (28,033) | 7,869,163 |
| Net investment income (loss) | 15,983,203 | |
| Realized and Unrealized Gain (Loss) | ||
| Net realized gain (loss) on: | ||
| Investment securities: | ||
| Unaffiliated issuers | 81,679,632 | |
| Fidelity Central Funds | (1,212) | |
| Foreign currency transactions | 11,532 | |
| Written options | 1,391,075 | |
| Total net realized gain (loss) | 83,081,027 | |
| Change in net unrealized appreciation (depreciation) on: | ||
| Investment securities: | ||
| Unaffiliated issuers | 128,912,917 | |
| Fidelity Central Funds | 110 | |
| Assets and liabilities in foreign currencies | (2,085) | |
| Written options | 1,071,744 | |
| Total change in net unrealized appreciation (depreciation) | 129,982,686 | |
| Net gain (loss) | 213,063,713 | |
| Net increase (decrease) in net assets resulting from operations | $229,046,916 |
See accompanying notes which are an integral part of the financial statements.
Statement of Changes in Net Assets
| Six months ended December 31, 2017 (Unaudited) | Year ended June 30, 2017 | |
| Increase (Decrease) in Net Assets | ||
| Operations | ||
| Net investment income (loss) | $15,983,203 | $49,096,205 |
| Net realized gain (loss) | 83,081,027 | 340,272,578 |
| Change in net unrealized appreciation (depreciation) | 129,982,686 | 237,023,573 |
| Net increase (decrease) in net assets resulting from operations | 229,046,916 | 626,392,356 |
| Distributions to shareholders from net investment income | (35,334,498) | (52,216,198) |
| Distributions to shareholders from net realized gain | (308,588,501) | (17,291,428) |
| Total distributions | (343,922,999) | (69,507,626) |
| Share transactions - net increase (decrease) | 517,097,289 | (1,685,570,408) |
| Total increase (decrease) in net assets | 402,221,206 | (1,128,685,678) |
| Net Assets | ||
| Beginning of period | 2,208,384,744 | 3,337,070,422 |
| End of period | $2,610,605,950 | $2,208,384,744 |
| Other Information | ||
| Undistributed net investment income end of period | $– | $17,400,130 |
| Distributions in excess of net investment income end of period | $(1,951,165) | $– |
See accompanying notes which are an integral part of the financial statements.
Financial Highlights
Fidelity Mega Cap Stock Fund Class A
| Six months ended (Unaudited) December 31, | Years ended June 30, | |||||
| 2017 | 2017 | 2016 | 2015 | 2014 | 2013 | |
| Selected Per–Share Data | ||||||
| Net asset value, beginning of period | $18.42 | $15.56 | $16.56 | $16.32 | $13.51 | $11.05 |
| Income from Investment Operations | ||||||
| Net investment income (loss)A | .10 | .22 | .23 | .18 | .18 | .17 |
| Net realized and unrealized gain (loss) | 1.55 | 2.94 | (.65) | .71 | 3.00 | 2.43 |
| Total from investment operations | 1.65 | 3.16 | (.42) | .89 | 3.18 | 2.60 |
| Distributions from net investment income | (.24) | (.22) | (.18) | (.17) | (.16) | (.14) |
| Distributions from net realized gain | (2.56) | (.09) | (.40) | (.47) | (.21) | – |
| Total distributions | (2.80) | (.30)B | (.58) | (.65)C | (.37) | (.14) |
| Net asset value, end of period | $17.27 | $18.42 | $15.56 | $16.56 | $16.32 | $13.51 |
| Total ReturnD,E,F | 10.16% | 20.49% | (2.56)% | 5.69% | 23.88% | 23.78% |
| Ratios to Average Net AssetsG,H | ||||||
| Expenses before reductions | .94%I | .94% | .95% | 1.05% | .96% | .98% |
| Expenses net of fee waivers, if any | .94%I | .94% | .95% | 1.05% | .96% | .98% |
| Expenses net of all reductions | .93%I | .94% | .95% | 1.05% | .96% | .98% |
| Net investment income (loss) | 1.16%I | 1.30% | 1.46% | 1.10% | 1.19% | 1.37% |
| Supplemental Data | ||||||
| Net assets, end of period (000 omitted) | $63,413 | $60,362 | $68,801 | $117,385 | $77,335 | $20,336 |
| Portfolio turnover rateJ | 33%I | 25% | 25% | 22%K | 28% | 29% |
A Calculated based on average shares outstanding during the period.
B Total distributions of $.30 per share is comprised of distributions from net investment income of $.218 and distributions from net realized gain of $.085 per share.
C Total distributions of $.65 per share is comprised of distributions from net investment income of $.174 and distributions from net realized gain of $.474 per share.
D Total returns for periods of less than one year are not annualized.
E Total returns would have been lower if certain expenses had not been reduced during the applicable periods shown.
F Total returns do not include the effect of the sales charges.
G Fees and expenses of any underlying Fidelity Central Funds are not included in the Fund's expense ratio. The Fund indirectly bears its proportionate share of the expenses of any underlying Fidelity Central Funds.
H Expense ratios reflect operating expenses of the class. Expenses before reductions do not reflect amounts reimbursed by the investment adviser or reductions from brokerage service arrangements or reductions from other expense offset arrangements and do not represent the amount paid by the class during periods when reimbursements or reductions occur. Expenses net of fee waivers reflect expenses after reimbursement by the investment adviser but prior to reductions from brokerage service arrangements or other expense offset arrangements. Expenses net of all reductions represent the net expenses paid by the class.
I Annualized
J Amount does not include the portfolio activity of any underlying Fidelity Central Funds.
K Portfolio turnover rate excludes securities received or delivered in-kind.
See accompanying notes which are an integral part of the financial statements.
Fidelity Mega Cap Stock Fund Class M
| Six months ended (Unaudited) December 31, | Years ended June 30, | |||||
| 2017 | 2017 | 2016 | 2015 | 2014 | 2013 | |
| Selected Per–Share Data | ||||||
| Net asset value, beginning of period | $18.39 | $15.54 | $16.57 | $16.31 | $13.51 | $11.05 |
| Income from Investment Operations | ||||||
| Net investment income (loss)A | .08 | .18 | .19 | .16 | .14 | .14 |
| Net realized and unrealized gain (loss) | 1.55 | 2.93 | (.65) | .70 | 3.00 | 2.43 |
| Total from investment operations | 1.63 | 3.11 | (.46) | .86 | 3.14 | 2.57 |
| Distributions from net investment income | (.19) | (.18) | (.16) | (.13) | (.13) | (.11) |
| Distributions from net realized gain | (2.56) | (.09) | (.40) | (.47) | (.21) | – |
| Total distributions | (2.75) | (.26)B | (.57)C | (.60) | (.34) | (.11) |
| Net asset value, end of period | $17.27 | $18.39 | $15.54 | $16.57 | $16.31 | $13.51 |
| Total ReturnD,E,F | 10.07% | 20.17% | (2.83)% | 5.53% | 23.54% | 23.44% |
| Ratios to Average Net AssetsG,H | ||||||
| Expenses before reductions | 1.19%I | 1.20% | 1.21% | 1.21% | 1.22% | 1.26% |
| Expenses net of fee waivers, if any | 1.19%I | 1.20% | 1.21% | 1.20% | 1.22% | 1.26% |
| Expenses net of all reductions | 1.19%I | 1.20% | 1.20% | 1.20% | 1.22% | 1.26% |
| Net investment income (loss) | .90%I | 1.04% | 1.21% | .95% | .92% | 1.09% |
| Supplemental Data | ||||||
| Net assets, end of period (000 omitted) | $28,811 | $28,248 | $26,145 | $23,231 | $15,728 | $8,377 |
| Portfolio turnover rateJ | 33%I | 25% | 25% | 22%K | 28% | 29% |
A Calculated based on average shares outstanding during the period.
B Total distributions of $.26 per share is comprised of distributions from net investment income of $.178 and distributions from net realized gain of $.085 per share.
C Total distributions of $.57 per share is comprised of distributions from net investment income of $.164 and distributions from net realized gain of $.404 per share.
D Total returns for periods of less than one year are not annualized.
E Total returns would have been lower if certain expenses had not been reduced during the applicable periods shown.
F Total returns do not include the effect of the sales charges.
G Fees and expenses of any underlying Fidelity Central Funds are not included in the Fund's expense ratio. The Fund indirectly bears its proportionate share of the expenses of any underlying Fidelity Central Funds.
H Expense ratios reflect operating expenses of the class. Expenses before reductions do not reflect amounts reimbursed by the investment adviser or reductions from brokerage service arrangements or reductions from other expense offset arrangements and do not represent the amount paid by the class during periods when reimbursements or reductions occur. Expenses net of fee waivers reflect expenses after reimbursement by the investment adviser but prior to reductions from brokerage service arrangements or other expense offset arrangements. Expenses net of all reductions represent the net expenses paid by the class.
I Annualized
J Amount does not include the portfolio activity of any underlying Fidelity Central Funds.
K Portfolio turnover rate excludes securities received or delivered in-kind.
See accompanying notes which are an integral part of the financial statements.
Fidelity Mega Cap Stock Fund Class C
| Six months ended (Unaudited) December 31, | Years ended June 30, | |||||
| 2017 | 2017 | 2016 | 2015 | 2014 | 2013 | |
| Selected Per–Share Data | ||||||
| Net asset value, beginning of period | $18.13 | $15.32 | $16.35 | $16.12 | $13.38 | $10.93 |
| Income from Investment Operations | ||||||
| Net investment income (loss)A | .03 | .09 | .11 | .07 | .06 | .07 |
| Net realized and unrealized gain (loss) | 1.54 | 2.90 | (.64) | .71 | 2.97 | 2.42 |
| Total from investment operations | 1.57 | 2.99 | (.53) | .78 | 3.03 | 2.49 |
| Distributions from net investment income | (.11) | (.09) | (.09) | (.08) | (.08) | (.04) |
| Distributions from net realized gain | (2.56) | (.09) | (.40) | (.47) | (.21) | – |
| Total distributions | (2.67) | (.18) | (.50)B | (.55) | (.29) | (.04) |
| Net asset value, end of period | $17.03 | $18.13 | $15.32 | $16.35 | $16.12 | $13.38 |
| Total ReturnC,D,E | 9.81% | 19.59% | (3.32)% | 5.05% | 22.90% | 22.83% |
| Ratios to Average Net AssetsF,G | ||||||
| Expenses before reductions | 1.69%H | 1.69% | 1.70% | 1.70% | 1.71% | 1.75% |
| Expenses net of fee waivers, if any | 1.69%H | 1.69% | 1.70% | 1.70% | 1.71% | 1.75% |
| Expenses net of all reductions | 1.68%H | 1.69% | 1.69% | 1.70% | 1.71% | 1.75% |
| Net investment income (loss) | .41%H | .55% | .72% | .45% | .43% | .59% |
| Supplemental Data | ||||||
| Net assets, end of period (000 omitted) | $34,799 | $34,205 | $31,605 | $34,790 | $16,600 | $7,938 |
| Portfolio turnover rateI | 33%H | 25% | 25% | 22%J | 28% | 29% |
A Calculated based on average shares outstanding during the period.
B Total distributions of $.50 per share is comprised of distributions from net investment income of $.091 and distributions from net realized gain of $.404 per share.
C Total returns for periods of less than one year are not annualized.
D Total returns would have been lower if certain expenses had not been reduced during the applicable periods shown.
E Total returns do not include the effect of the contingent deferred sales charge.
F Fees and expenses of any underlying Fidelity Central Funds are not included in the Fund's expense ratio. The Fund indirectly bears its proportionate share of the expenses of any underlying Fidelity Central Funds.
G Expense ratios reflect operating expenses of the class. Expenses before reductions do not reflect amounts reimbursed by the investment adviser or reductions from brokerage service arrangements or reductions from other expense offset arrangements and do not represent the amount paid by the class during periods when reimbursements or reductions occur. Expenses net of fee waivers reflect expenses after reimbursement by the investment adviser but prior to reductions from brokerage service arrangements or other expense offset arrangements. Expenses net of all reductions represent the net expenses paid by the class.
H Annualized
I Amount does not include the portfolio activity of any underlying Fidelity Central Funds.
J Portfolio turnover rate excludes securities received or delivered in-kind.
See accompanying notes which are an integral part of the financial statements.
Fidelity Mega Cap Stock Fund
| Six months ended (Unaudited) December 31, | Years ended June 30, | |||||
| 2017 | 2017 | 2016 | 2015 | 2014 | 2013 | |
| Selected Per–Share Data | ||||||
| Net asset value, beginning of period | $18.58 | $15.68 | $16.72 | $16.44 | $13.60 | $11.11 |
| Income from Investment Operations | ||||||
| Net investment income (loss)A | .12 | .27 | .27 | .24 | .22 | .20 |
| Net realized and unrealized gain (loss) | 1.57 | 2.97 | (.66) | .72 | 3.02 | 2.46 |
| Total from investment operations | 1.69 | 3.24 | (.39) | .96 | 3.24 | 2.66 |
| Distributions from net investment income | (.27) | (.26) | (.25) | (.21) | (.19) | (.17) |
| Distributions from net realized gain | (2.56) | (.09) | (.40) | (.47) | (.21) | – |
| Total distributions | (2.84)B | (.34)C | (.65) | (.68) | (.40) | (.17) |
| Net asset value, end of period | $17.43 | $18.58 | $15.68 | $16.72 | $16.44 | $13.60 |
| Total ReturnD,E | 10.29% | 20.87% | (2.36)% | 6.13% | 24.18% | 24.17% |
| Ratios to Average Net AssetsF,G | ||||||
| Expenses before reductions | .69%H | .68% | .69% | .67% | .68% | .70% |
| Expenses net of fee waivers, if any | .69%H | .68% | .69% | .67% | .68% | .70% |
| Expenses net of all reductions | .69%H | .68% | .68% | .67% | .68% | .70% |
| Net investment income (loss) | 1.41%H | 1.56% | 1.73% | 1.48% | 1.47% | 1.64% |
| Supplemental Data | ||||||
| Net assets, end of period (000 omitted) | $1,980,685 | $1,613,374 | $3,059,691 | $3,300,700 | $2,860,197 | $2,214,592 |
| Portfolio turnover rateI | 33%H | 25% | 25% | 22%J | 28% | 29% |
A Calculated based on average shares outstanding during the period.
B Total distributions of $2.84 per share is comprised of distributions from net investment income of $.274 and distributions from net realized gain of $2.562 per share.
C Total distributions of $.34 per share is comprised of distributions from net investment income of $.258 and distributions from net realized gain of $.085 per share.
D Total returns for periods of less than one year are not annualized.
E Total returns would have been lower if certain expenses had not been reduced during the applicable periods shown.
F Fees and expenses of any underlying Fidelity Central Funds are not included in the Fund's expense ratio. The Fund indirectly bears its proportionate share of the expenses of any underlying Fidelity Central Funds.
G Expense ratios reflect operating expenses of the class. Expenses before reductions do not reflect amounts reimbursed by the investment adviser or reductions from brokerage service arrangements or reductions from other expense offset arrangements and do not represent the amount paid by the class during periods when reimbursements or reductions occur. Expenses net of fee waivers reflect expenses after reimbursement by the investment adviser but prior to reductions from brokerage service arrangements or other expense offset arrangements. Expenses net of all reductions represent the net expenses paid by the class.
H Annualized
I Amount does not include the portfolio activity of any underlying Fidelity Central Funds.
J Portfolio turnover rate excludes securities received or delivered in-kind.
See accompanying notes which are an integral part of the financial statements.
Fidelity Mega Cap Stock Fund Class I
| Six months ended (Unaudited) December 31, | Years ended June 30, | |||||
| 2017 | 2017 | 2016 | 2015 | 2014 | 2013 | |
| Selected Per–Share Data | ||||||
| Net asset value, beginning of period | $18.60 | $15.70 | $16.73 | $16.39 | $13.55 | $11.08 |
| Income from Investment Operations | ||||||
| Net investment income (loss)A | .12 | .27 | .27 | .24 | .22 | .20 |
| Net realized and unrealized gain (loss) | 1.57 | 2.97 | (.65) | .72 | 3.02 | 2.44 |
| Total from investment operations | 1.69 | 3.24 | (.38) | .96 | 3.24 | 2.64 |
| Distributions from net investment income | (.29) | (.26) | (.24) | (.15) | (.18) | (.17) |
| Distributions from net realized gain | (2.56) | (.09) | (.40) | (.47) | (.21) | – |
| Total distributions | (2.85) | (.34)B | (.65)C | (.62) | (.40)D | (.17) |
| Net asset value, end of period | $17.44 | $18.60 | $15.70 | $16.73 | $16.39 | $13.55 |
| Total ReturnE,F | 10.30% | 20.84% | (2.31)% | 6.11% | 24.23% | 24.06% |
| Ratios to Average Net AssetsG,H | ||||||
| Expenses before reductions | .67%I | .67% | .68% | .69% | .71% | .74% |
| Expenses net of fee waivers, if any | .67%I | .67% | .68% | .68% | .71% | .74% |
| Expenses net of all reductions | .67%I | .67% | .68% | .68% | .71% | .74% |
| Net investment income (loss) | 1.43%I | 1.57% | 1.73% | 1.47% | 1.43% | 1.61% |
| Supplemental Data | ||||||
| Net assets, end of period (000 omitted) | $154,089 | $153,622 | $148,414 | $186,637 | $674,416 | $312,814 |
| Portfolio turnover rateJ | 33%I | 25% | 25% | 22%K | 28% | 29% |
A Calculated based on average shares outstanding during the period.
B Total distributions of $.34 per share is comprised of distributions from net investment income of $.257 and distributions from net realized gain of $.085 per share.
C Total distributions of $.65 per share is comprised of distributions from net investment income of $.244 and distributions from net realized gain of $.404 per share.
D Total distributions of $.40 per share is comprised of distributions from net investment income of $.182 and distributions from net realized gain of $.213 per share.
E Total returns for periods of less than one year are not annualized.
F Total returns would have been lower if certain expenses had not been reduced during the applicable periods shown.
G Fees and expenses of any underlying Fidelity Central Funds are not included in the Fund's expense ratio. The Fund indirectly bears its proportionate share of the expenses of any underlying Fidelity Central Funds.
H Expense ratios reflect operating expenses of the class. Expenses before reductions do not reflect amounts reimbursed by the investment adviser or reductions from brokerage service arrangements or reductions from other expense offset arrangements and do not represent the amount paid by the class during periods when reimbursements or reductions occur. Expenses net of fee waivers reflect expenses after reimbursement by the investment adviser but prior to reductions from brokerage service arrangements or other expense offset arrangements. Expenses net of all reductions represent the net expenses paid by the class.
I Annualized
J Amount does not include the portfolio activity of any underlying Fidelity Central Funds.
K Portfolio turnover rate excludes securities received or delivered in-kind.
See accompanying notes which are an integral part of the financial statements.
Fidelity Mega Cap Stock Fund Class Z
| Six months ended (Unaudited) December 31, | Years ended June 30, | ||||
| 2017 | 2017 | 2016 | 2015 | 2014 A | |
| Selected Per–Share Data | |||||
| Net asset value, beginning of period | $18.53 | $15.65 | $16.69 | $16.40 | $14.31 |
| Income from Investment Operations | |||||
| Net investment income (loss)B | .14 | .31 | .29 | .27 | .21 |
| Net realized and unrealized gain (loss) | 1.57 | 2.94 | (.66) | .72 | 2.20 |
| Total from investment operations | 1.71 | 3.25 | (.37) | .99 | 2.41 |
| Distributions from net investment income | (.31) | (.28) | (.27) | (.23) | (.10) |
| Distributions from net realized gain | (2.56) | (.09) | (.40) | (.47) | (.21) |
| Total distributions | (2.88)C | (.37) | (.67) | (.70) | (.32)D |
| Net asset value, end of period | $17.36 | $18.53 | $15.65 | $16.69 | $16.40 |
| Total ReturnE,F | 10.45% | 20.96% | (2.21)% | 6.33% | 17.06% |
| Ratios to Average Net AssetsG,H | |||||
| Expenses before reductions | .53%I | .53% | .54% | .54% | .54%I |
| Expenses net of fee waivers, if any | .53%I | .53% | .54% | .54% | .54%I |
| Expenses net of all reductions | .53%I | .53% | .53% | .54% | .54%I |
| Net investment income (loss) | 1.56%I | 1.71% | 1.88% | 1.61% | 1.59%I |
| Supplemental Data | |||||
| Net assets, end of period (000 omitted) | $348,809 | $318,575 | $2,414 | $2,449 | $117 |
| Portfolio turnover rateJ | 33%I | 25% | 25% | 22%K | 28% |
A For the period August 13, 2013 (commencement of sale of shares) to June 30, 2014.
B Calculated based on average shares outstanding during the period.
C Total distributions of $2.88 per share is comprised of distributions from net investment income of $.313 and distributions from net realized gain of $2.562 per share.
D Total distributions of $.32 per share is comprised of distributions from net investment income of $.104 and distributions from net realized gain of $.213 per share.
E Total returns for periods of less than one year are not annualized.
F Total returns would have been lower if certain expenses had not been reduced during the applicable periods shown.
G Fees and expenses of any underlying Fidelity Central Funds are not included in the Fund's expense ratio. The Fund indirectly bears its proportionate share of the expenses of any underlying Fidelity Central Funds.
H Expense ratios reflect operating expenses of the class. Expenses before reductions do not reflect amounts reimbursed by the investment adviser or reductions from brokerage service arrangements or reductions from other expense offset arrangements and do not represent the amount paid by the class during periods when reimbursements or reductions occur. Expense ratios before reductions for start-up periods may not be representative of longer-term operating periods. Expenses net of fee waivers reflect expenses after reimbursement by the investment adviser but prior to reductions from brokerage service arrangements or other expense offset arrangements. Expenses net of all reductions represent the net expenses paid by the class.
I Annualized
J Amount does not include the portfolio activity of any underlying Fidelity Central Funds.
K Portfolio turnover rate excludes securities received or delivered in-kind.
See accompanying notes which are an integral part of the financial statements.
Notes to Financial Statements (Unaudited)
For the period ended December 31, 2017
1. Organization.
Fidelity Mega Cap Stock Fund (the Fund) is a fund of Fidelity Hastings Street Trust (the Trust) and is authorized to issue an unlimited number of shares. The Trust is registered under the Investment Company Act of 1940, as amended (the 1940 Act), as an open-end management investment company organized as a Massachusetts business trust. The Fund offers Class A, Class M (formerly Class T), Class C, Mega Cap Stock, Class I and Class Z shares, each of which has equal rights as to assets and voting privileges. Each class has exclusive voting rights with respect to matters that affect that class.
2. Investments in Fidelity Central Funds.
The Fund invests in Fidelity Central Funds, which are open-end investment companies generally available only to other investment companies and accounts managed by the investment adviser and its affiliates. The Fund's Schedule of Investments lists each of the Fidelity Central Funds held as of period end, if any, as an investment of the Fund, but does not include the underlying holdings of each Fidelity Central Fund. As an Investing Fund, the Fund indirectly bears its proportionate share of the expenses of the underlying Fidelity Central Funds.
The Money Market Central Funds seek preservation of capital and current income and are managed by Fidelity Investments Money Management, Inc. (FIMM), an affiliate of the investment adviser. Annualized expenses of the Money Market Central Funds as of their most recent shareholder report date are less than .005%.
A complete unaudited list of holdings for each Fidelity Central Fund is available upon request or at the Securities and Exchange Commission (the SEC) website at www.sec.gov. In addition, the financial statements of the Fidelity Central Funds are available on the SEC website or upon request.
3. Significant Accounting Policies.
The Fund is an investment company and applies the accounting and reporting guidance of the Financial Accounting Standards Board (FASB) Accounting Standards Codification Topic 946 Financial Services – Investments Companies. The financial statements have been prepared in conformity with accounting principles generally accepted in the United States of America (GAAP), which require management to make certain estimates and assumptions at the date of the financial statements. Actual results could differ from those estimates. Subsequent events, if any, through the date that the financial statements were issued have been evaluated in the preparation of the financial statements. The following summarizes the significant accounting policies of the Fund:
Investment Valuation. Investments are valued as of 4:00 p.m. Eastern time on the last calendar day of the period. The Board of Trustees (the Board) has delegated the day to day responsibility for the valuation of the Fund's investments to the Fair Value Committee (the Committee) established by the Fund's investment adviser. In accordance with valuation policies and procedures approved by the Board, the Fund attempts to obtain prices from one or more third party pricing vendors or brokers to value its investments. When current market prices, quotations or currency exchange rates are not readily available or reliable, investments will be fair valued in good faith by the Committee, in accordance with procedures adopted by the Board. Factors used in determining fair value vary by investment type and may include market or investment specific events. The frequency with which these procedures are used cannot be predicted and they may be utilized to a significant extent. The Committee oversees the Fund's valuation policies and procedures and reports to the Board on the Committee's activities and fair value determinations. The Board monitors the appropriateness of the procedures used in valuing the Fund's investments and ratifies the fair value determinations of the Committee.
The Fund categorizes the inputs to valuation techniques used to value its investments into a disclosure hierarchy consisting of three levels as shown below:
- Level 1 – quoted prices in active markets for identical investments
- Level 2 – other significant observable inputs (including quoted prices for similar investments, interest rates, prepayment speeds, etc.)
- Level 3 – unobservable inputs (including the Fund's own assumptions based on the best information available)
Valuation techniques used to value the Fund's investments by major category are as follows:
Equity securities, including restricted securities, for which market quotations are readily available, are valued at the last reported sale price or official closing price as reported by a third party pricing vendor on the primary market or exchange on which they are traded and are categorized as Level 1 in the hierarchy. In the event there were no sales during the day or closing prices are not available, securities are valued at the last quoted bid price or may be valued using the last available price and are generally categorized as Level 2 in the hierarchy. For foreign equity securities, when market or security specific events arise, comparisons to the valuation of American Depositary Receipts (ADRs), futures contracts, Exchange-Traded Funds (ETFs) and certain indexes as well as quoted prices for similar securities may be used and would be categorized as Level 2 in the hierarchy. Utilizing these techniques may result in transfers between Level 1 and Level 2. For equity securities, including restricted securities, where observable inputs are limited, assumptions about market activity and risk are used and these securities may be categorized as Level 3 in the hierarchy.
Exchange-traded options are valued using the last sale price or, in the absence of a sale, the last offering price and are categorized as Level 1 in the hierarchy. Investments in open-end mutual funds, including the Fidelity Central Funds, are valued at their closing net asset value (NAV) each business day and are categorized as Level 1 in the hierarchy.
Changes in valuation techniques may result in transfers in or out of an assigned level within the disclosure hierarchy. The aggregate value of investments by input level as of December 31, 2017 is included at the end of the Fund's Schedule of Investments.
Foreign Currency. The Fund may use foreign currency contracts to facilitate transactions in foreign-denominated securities. Gains and losses from these transactions may arise from changes in the value of the foreign currency or if the counterparties do not perform under the contracts' terms.
Foreign-denominated assets, including investment securities, and liabilities are translated into U.S. dollars at the exchange rates at period end. Purchases and sales of investment securities, income and dividends received and expenses denominated in foreign currencies are translated into U.S. dollars at the exchange rate in effect on the transaction date.
The effects of exchange rate fluctuations on investments are included with the net realized and unrealized gain (loss) on investment securities. Other foreign currency transactions resulting in realized and unrealized gain (loss) are disclosed separately.
Investment Transactions and Income. For financial reporting purposes, the Fund's investment holdings and NAV include trades executed through the end of the last business day of the period. The NAV per share for processing shareholder transactions is calculated as of the close of business of the New York Stock Exchange (NYSE), normally 4:00 p.m. Eastern time and includes trades executed through the end of the prior business day. Gains and losses on securities sold are determined on the basis of identified cost and includes proceeds received from litigation. Dividend income is recorded on the ex-dividend date, except for certain dividends from foreign securities where the ex-dividend date may have passed, which are recorded as soon as the Fund is informed of the ex-dividend date. Non-cash dividends included in dividend income, if any, are recorded at the fair market value of the securities received. Income and capital gain distributions from Fidelity Central Funds, if any, are recorded on the ex-dividend date. Certain distributions received by the Fund represent a return of capital or capital gain. The Fund determines the components of these distributions subsequent to the ex-dividend date, based upon receipt of tax filings or other correspondence relating to the underlying investment. These distributions are recorded as a reduction of cost of investments and/or as a realized gain. Investment income is recorded net of foreign taxes withheld where recovery of such taxes is uncertain.
Class Allocations and Expenses. Investment income, realized and unrealized capital gains and losses, common expenses of the Fund, and certain fund-level expense reductions, if any, are allocated daily on a pro-rata basis to each class based on the relative net assets of each class to the total net assets of the Fund. Each class differs with respect to transfer agent and distribution and service plan fees incurred. Certain expense reductions may also differ by class. For the reporting period, the allocated portion of income and expenses to each class as a percent of its average net assets may vary due to the timing of recording these transactions in relation to fluctuating net assets of the classes. Expenses directly attributable to a fund are charged to that fund. Expenses attributable to more than one fund are allocated among the respective funds on the basis of relative net assets or other appropriate methods. Expense estimates are accrued in the period to which they relate and adjustments are made when actual amounts are known.
Income Tax Information and Distributions to Shareholders. Each year, the Fund intends to qualify as a regulated investment company under Subchapter M of the Internal Revenue Code, including distributing substantially all of its taxable income and realized gains. As a result, no provision for U.S. Federal income taxes is required. The Fund files a U.S. federal tax return, in addition to state and local tax returns as required. The Fund's federal income tax returns are subject to examination by the Internal Revenue Service (IRS) for a period of three fiscal years after they are filed. State and local tax returns may be subject to examination for an additional fiscal year depending on the jurisdiction. Foreign taxes are provided for based on the Fund's understanding of the tax rules and rates that exist in the foreign markets in which it invests.
Distributions are declared and recorded on the ex-dividend date. Income dividends and capital gain distributions are declared separately for each class. Income and capital gain distributions are determined in accordance with income tax regulations, which may differ from GAAP.
Capital accounts within the financial statements are adjusted for permanent book-tax differences. These adjustments have no impact on net assets or the results of operations. Capital accounts are not adjusted for temporary book-tax differences which will reverse in a subsequent period.
Book-tax differences are primarily due to losses deferred due to wash sales and excise tax regulations.
As of period end, the cost and unrealized appreciation (depreciation) in securities, and derivatives if applicable, for federal income tax purposes were as follows:
| Gross unrealized appreciation | $933,703,021 |
| Gross unrealized depreciation | (48,432,078) |
| Net unrealized appreciation (depreciation) | $885,270,943 |
| Tax cost | $1,727,603,472 |
Restricted Securities. The Fund may invest in securities that are subject to legal or contractual restrictions on resale. These securities generally may be resold in transactions exempt from registration or to the public if the securities are registered. Disposal of these securities may involve time-consuming negotiations and expense, and prompt sale at an acceptable price may be difficult. Information regarding restricted securities is included at the end of the Fund's Schedule of Investments.
Consolidated Subsidiary. The Fund invests in certain investments through a wholly-owned subsidiary ("Subsidiary"), which may be subject to federal and state taxes upon disposition.
As of period end, the Fund held an investment of $7,182,597 in this Subsidiary, representing .28% of the Fund's net assets. The financial statements have been consolidated and include accounts of the Fund and the Subsidiary. Accordingly, all inter-company transactions and balances have been eliminated.
Any cash held by the Subsidiary is restricted as to its use and is presented as Restricted cash in the Statement of Assets and Liabilities.
4. Derivative Instruments.
Risk Exposures and the Use of Derivative Instruments. The Fund's investment objective allows the Fund to enter into various types of derivative contracts, including options. Derivatives are investments whose value is primarily derived from underlying assets, indices or reference rates and may be transacted on an exchange or over-the-counter (OTC). Derivatives may involve a future commitment to buy or sell a specified asset based on specified terms, to exchange future cash flows at periodic intervals based on a notional principal amount, or for one party to make one or more payments upon the occurrence of specified events in exchange for periodic payments from the other party.
The Fund used derivatives to increase returns and to manage exposure to certain risks as defined below. The success of any strategy involving derivatives depends on analysis of numerous economic factors, and if the strategies for investment do not work as intended, the Fund may not achieve its objectives.
The Fund's use of derivatives increased or decreased its exposure to the following risk:
| Equity Risk | Equity risk relates to the fluctuations in the value of financial instruments as a result of changes in market prices (other than those arising from interest rate risk or foreign exchange risk), whether caused by factors specific to an individual investment, its issuer, or all factors affecting all instruments traded in a market or market segment. |
The Fund is also exposed to additional risks from investing in derivatives, such as liquidity risk and counterparty credit risk. Liquidity risk is the risk that the Fund will be unable to close out the derivative in the open market in a timely manner. Counterparty credit risk is the risk that the counterparty will not be able to fulfill its obligation to the Fund. Derivative counterparty credit risk is managed through formal evaluation of the creditworthiness of all potential counterparties. On certain OTC derivatives such as options, the Fund attempts to reduce its exposure to counterparty credit risk by entering into an International Swaps and Derivatives Association, Inc. (ISDA) Master Agreement with each of its counterparties. The ISDA Master Agreement gives the Fund the right to terminate all transactions traded under such agreement upon the deterioration in the credit quality of the counterparty beyond specified levels. The ISDA Master Agreement gives each party the right, upon an event of default by the other party or a termination of the agreement, to close out all transactions traded under such agreement and to net amounts owed under each transaction to one net payable by one party to the other. To mitigate counterparty credit risk on bi-lateral OTC derivatives, the Fund receives collateral in the form of cash or securities once the Fund's net unrealized appreciation on outstanding derivative contracts under an ISDA Master Agreement exceeds certain applicable thresholds, subject to certain minimum transfer provisions. The collateral received is held in segregated accounts with the Fund's custodian bank in accordance with the collateral agreements entered into between the Fund, the counterparty and the Fund's custodian bank. The Fund could experience delays and costs in gaining access to the collateral even though it is held by the Fund's custodian bank. The Fund's maximum risk of loss from counterparty credit risk related to bi-lateral OTC derivatives is generally the aggregate unrealized appreciation and unpaid counterparty payments in excess of any collateral pledged by the counterparty to the Fund. The Fund may be required to pledge collateral for the benefit of the counterparties on bi-lateral OTC derivatives in an amount not less than each counterparty's unrealized appreciation on outstanding derivative contracts, subject to certain minimum transfer provisions, and any such pledged collateral is identified in the Schedule of Investments. Counterparty credit risk related to exchange-traded options may be mitigated by the protection provided by the exchange on which they trade.
Investing in derivatives may involve greater risks than investing in the underlying assets directly and, to varying degrees, may involve risk of loss in excess of any initial investment and collateral received and amounts recognized in the Statement of Assets and Liabilities. In addition, there may be the risk that the change in value of the derivative contract does not correspond to the change in value of the underlying instrument.
Options. Options give the purchaser the right, but not the obligation, to buy (call) or sell (put) an underlying security or financial instrument at an agreed exercise or strike price between or on certain dates. Options obligate the seller (writer) to buy (put) or sell (call) an underlying instrument at the exercise or strike price or cash settle an underlying derivative instrument if the holder exercises the option on or before the expiration date.
The Fund used exchange-traded and OTC written covered call options to manage its exposure to the market. When the Fund writes a covered call option, the Fund holds the underlying instrument which must be delivered to the holder upon the exercise of the option.
Upon entering into a written options contract, the Fund will receive a premium. Premiums received are reflected as a liability on the Statement of Assets and Liabilities. Options are valued daily and any unrealized appreciation (depreciation) is reflected on the Statement of Assets and Liabilities. When a written option is exercised, the premium is added to the proceeds from the sale of the underlying instrument in determining the gain or loss realized on that investment. When an option is closed the Fund will realize a gain or loss depending on whether the proceeds or amount paid for the closing sale transaction are greater or less than the premium received. When an option expires, gains and losses are realized to the extent of premiums received. The net realized gain (loss) on closed and expired written options and the change in net unrealized appreciation (depreciation) on written options are presented in the Statement of Operations.
Writing call options tends to decrease exposure to the underlying instrument and risk of loss is the change in value in excess of the premium received.
Any open options at period end are presented in the Schedule of Investments under the caption "Written Options" and are representative of volume of activity during the period.
5. Purchases and Sales of Investments.
Purchases and sales of securities, other than short-term securities, aggregated $556,253,939 and $383,033,900, respectively.
6. Fees and Other Transactions with Affiliates.
Management Fee. Fidelity Management & Research Company (the investment adviser) and its affiliates provide the Fund with investment management related services for which the Fund pays a monthly management fee. The management fee is the sum of an individual fund fee rate that is based on an annual rate of .20% of the Fund's average net assets and an annualized group fee rate that averaged .24% during the period. The group fee rate is based upon the average net assets of all the mutual funds advised by the investment adviser, including any mutual funds previously advised by the investment adviser that are currently advised by Fidelity SelectCo, LLC, an affiliate of the investment adviser. The group fee rate decreases as assets under management increase and increases as assets under management decrease. For the reporting period, the total annualized management fee rate was .44% of the Fund's average net assets.
Distribution and Service Plan Fees. In accordance with Rule 12b-1 of the 1940 Act, the Fund has adopted separate Distribution and Service Plans for each class of shares. Certain classes pay Fidelity Distributors Corporation (FDC), an affiliate of the investment adviser, separate Distribution and Service Fees, each of which is based on an annual percentage of each class' average net assets. In addition, FDC may pay financial intermediaries for selling shares of the Fund and providing shareholder support services. For the period, the Distribution and Service Fee rates, total fees and amounts retained by FDC were as follows:
| Distribution Fee | Service Fee | Total Fees | Retained by FDC | |
| Class A | -% | .25% | $75,949 | $1,593 |
| Class M | .25% | .25% | 70,314 | – |
| Class C | .75% | .25% | 169,585 | 17,559 |
| $315,848 | $19,152 |
Sales Load. FDC may receive a front-end sales charge of up to 5.75% for selling Class A shares and 3.50% for selling Class M shares, some of which is paid to financial intermediaries for selling shares of the Fund. Depending on the holding period, FDC may receive contingent deferred sales charges levied on Class A, Class M and Class C redemptions. The deferred sales charges are 1.00% for Class C shares, 1.00% for certain purchases of Class A shares and .25% for certain purchases of Class M shares.
For the period, sales charge amounts retained by FDC were as follows:
| Retained by FDC | |
| Class A | $14,310 |
| Class M | 1,196 |
| Class C(a) | 1,231 |
| $16,737 |
(a) When Class C shares are initially sold, FDC pays commissions from its own resources to financial intermediaries through which the sales are made.
Transfer Agent Fees. Fidelity Investments Institutional Operations Company, Inc., (FIIOC), an affiliate of the investment adviser, is the transfer, dividend disbursing and shareholder servicing agent for each class of the Fund. FIIOC receives account fees and asset-based fees that vary according to the account size and type of account of the shareholders of the respective classes of the Fund, except for Class Z. FIIOC receives an asset-based fee of Class Z's average net assets. FIIOC pays for typesetting, printing and mailing of shareholder reports, except proxy statements.
For the period, transfer agent fees for each class were as follows:
| Amount | % of Class-Level Average Net Assets(a) | |
| Class A | $61,331 | .20 |
| Class M | 28,899 | .21 |
| Class C | 34,103 | .20 |
| Mega Cap Stock | 1,708,730 | .20 |
| Class I | 140,010 | .18 |
| Class Z | 76,990 | .05 |
| $2,050,063 |
(a) Annualized
Accounting and Security Lending Fees. Fidelity Service Company, Inc. (FSC), an affiliate of the investment adviser, maintains the Fund's accounting records. The accounting fee is based on the level of average net assets for each month. Under a separate contract, FSC administers the security lending program. The security lending fee is based on the number and duration of lending transactions.
Brokerage Commissions. The Fund placed a portion of its portfolio transactions with brokerage firms which are affiliates of the investment adviser. Brokerage commissions are included in net realized gain (loss) and change in net unrealized appreciation (depreciation) in the Statement of Operations. The commissions paid to these affiliated firms were $4,818 for the period.
Interfund Lending Program. Pursuant to an Exemptive Order issued by the SEC, the Fund, along with other registered investment companies having management contracts with Fidelity Management & Research Company (FMR) or other affiliated entities of FMR, may participate in an interfund lending program. This program provides an alternative credit facility allowing the funds to borrow from, or lend money to, other participating affiliated funds. At period end, there were no interfund loans outstanding. The Fund's activity in this program during the period for which loans were outstanding was as follows:
| Borrower or Lender | Average Loan Balance | Weighted Average Interest Rate | Interest Expense |
| Borrower | $22,106,300 | 1.34% | $8,240 |
Interfund Trades. The Fund may purchase from or sell securities to other Fidelity Funds under procedures adopted by the Board. The procedures have been designed to ensure these interfund trades are executed in accordance with Rule 17a-7 of the 1940 Act. Interfund trades are included within the respective purchases and sales amounts shown in the Purchases and Sales of Investments note.
Other. During the period, the investment adviser reimbursed the Fund for certain losses in the amount of $5,369.
7. Committed Line of Credit.
The Fund participates with other funds managed by the investment adviser or an affiliate in a $4.25 billion credit facility (the "line of credit") to be utilized for temporary or emergency purposes to fund shareholder redemptions or for other short-term liquidity purposes. The Fund has agreed to pay commitment fees on its pro-rata portion of the line of credit, which amounted to $3,422 and is reflected in Miscellaneous expenses on the Statement of Operations. During the period, the Fund did not borrow on this line of credit.
8. Security Lending.
The Fund lends portfolio securities through a lending agent from time to time in order to earn additional income. For equity securities, a lending agent is used and may loan securities to certain qualified borrowers, including Fidelity Capital Markets (FCM), a broker-dealer affiliated with the Fund. On the settlement date of the loan, the Fund receives collateral (in the form of U.S. Treasury obligations, letters of credit and/or cash) against the loaned securities and maintains collateral in an amount not less than 100% of the market value of the loaned securities during the period of the loan. The market value of the loaned securities is determined at the close of business of the Fund and any additional required collateral is delivered to the Fund on the next business day. The Fund or borrower may terminate the loan at any time, and if the borrower defaults on its obligation to return the securities loaned because of insolvency or other reasons, the Fund may apply collateral received from the borrower against the obligation. The Fund may experience delays and costs in recovering the securities loaned. Any cash collateral received is invested in the Fidelity Securities Lending Cash Central Fund. The value of loaned securities and cash collateral at period end are disclosed on the Fund's Statement of Assets and Liabilities. Security lending income represents the income earned on investing cash collateral, less rebates paid to borrowers and any lending agent fees associated with the loan, plus any premium payments received for lending certain types of securities. Security lending income is presented in the Statement of Operations as a component of income from Fidelity Central Funds. Total security lending income during the period amounted to $14,384. During the period, there were no securities loaned to FCM.
9. Expense Reductions.
Commissions paid to certain brokers with whom the investment adviser, or its affiliates, places trades on behalf of the Fund include an amount in addition to trade execution, which may be rebated back to the Fund to offset certain expenses. This amount totaled $11,924 for the period.
In addition, during the period the investment adviser reimbursed and/or waived a portion of fund-level operating expenses in the amount of $16,109.
10. Distributions to Shareholders.
Distributions to shareholders of each class were as follows:
| Six months ended December 31, 2017 | Year ended June 30, 2017 | |
| From net investment income | ||
| Class A | $796,861 | $899,180 |
| Class M | 298,321 | 291,257 |
| Class C | 202,655 | 185,391 |
| Mega Cap Stock | 25,922,901 | 48,569,058 |
| Class I | 2,395,397 | 2,230,910 |
| Class Z | 5,718,363 | 40,402 |
| Total | $35,334,498 | $52,216,198 |
| From net realized gain | ||
| Class A | $8,449,639 | $344,305 |
| Class M | 3,919,912 | 137,941 |
| Class C | 4,788,475 | 163,362 |
| Mega Cap Stock | 224,982,402 | 15,922,546 |
| Class I | 21,104,231 | 711,666 |
| Class Z | 45,343,842 | 11,608 |
| Total | $308,588,501 | $17,291,428 |
11. Share Transactions.
Share transactions for each class were as follows and may contain automatic conversions between classes or exchanges between affiliated funds:
| Shares | Shares | Dollars | Dollars | |
| Six months ended December 31, 2017 | Year ended June 30, 2017 | Six months ended December 31, 2017 | Year ended June 30, 2017 | |
| Class A | ||||
| Shares sold | 457,115 | 1,038,892 | $7,842,205 | $18,074,597 |
| Reinvestment of distributions | 559,889 | 70,692 | 9,203,300 | 1,204,625 |
| Shares redeemed | (623,215) | (2,254,920) | (10,608,382) | (39,387,612) |
| Net increase (decrease) | 393,789 | (1,145,336) | $6,437,123 | $(20,108,390) |
| Class M | ||||
| Shares sold | 82,612 | 351,517 | $1,414,717 | $6,011,579 |
| Reinvestment of distributions | 255,533 | 24,971 | 4,196,936 | 425,997 |
| Shares redeemed | (205,717) | (523,179) | (3,527,475) | (8,962,447) |
| Net increase (decrease) | 132,428 | (146,691) | $2,084,178 | $(2,524,871) |
| Class C | ||||
| Shares sold | 76,730 | 321,807 | $1,309,665 | $5,527,295 |
| Reinvestment of distributions | 306,537 | 20,217 | 4,962,564 | 342,413 |
| Shares redeemed | (226,146) | (518,468) | (3,860,472) | (8,770,183) |
| Net increase (decrease) | 157,121 | (176,444) | $2,411,757 | $(2,900,475) |
| Mega Cap Stock | ||||
| Shares sold | 25,384,106 | 37,223,324 | $440,309,968 | $643,884,050 |
| Reinvestment of distributions | 14,397,240 | 3,517,132 | 239,269,689 | 60,338,870 |
| Shares redeemed | (13,010,193) | (148,979,826) | (230,669,282) | (2,654,363,774) |
| Net increase (decrease) | 26,771,153 | (108,239,370) | $448,910,375 | $(1,950,140,854) |
| Class I | ||||
| Shares sold | 813,082 | 1,883,800 | $14,221,125 | $33,590,247 |
| Reinvestment of distributions | 1,407,682 | 170,239 | 23,366,927 | 2,921,152 |
| Shares redeemed | (1,647,939) | (3,246,889) | (28,724,789) | (56,705,836) |
| Net increase (decrease) | 572,825 | (1,192,850) | $8,863,263 | $(20,194,437) |
| Class Z | ||||
| Shares sold | 1,806,669 | 17,352,586 | $30,550,010 | $316,033,855 |
| Reinvestment of distributions | 1,742,762 | 3,045 | 28,819,243 | 52,010 |
| Shares redeemed | (643,678) | (320,945) | (10,978,660) | (5,787,246) |
| Net increase (decrease) | 2,905,753 | 17,034,686 | $48,390,593 | $310,298,619 |
12. Other.
The Fund's organizational documents provide former and current trustees and officers with a limited indemnification against liabilities arising in connection with the performance of their duties to the Fund. In the normal course of business, the Fund may also enter into contracts that provide general indemnifications. The Fund's maximum exposure under these arrangements is unknown as this would be dependent on future claims that may be made against the Fund. The risk of material loss from such claims is considered remote.
Shareholder Expense Example
As a shareholder of the Fund, you incur two types of costs: (1) transaction costs, including sales charges (loads) on purchase payments or redemption proceeds, and (2) ongoing costs, including management fees, distribution and/or service (12b-1) fees and other Fund expenses. This Example is intended to help you understand your ongoing costs (in dollars) of investing in the Fund and to compare these costs with the ongoing costs of investing in other mutual funds.
The Example is based on an investment of $1,000 invested at the beginning of the period and held for the entire period (July 1, 2017 to December 31, 2017).
Actual Expenses
The first line of the accompanying table for each class of the Fund provides information about actual account values and actual expenses. You may use the information in this line, together with the amount you invested, to estimate the expenses that you paid over the period. Simply divide your account value by $1,000.00 (for example, an $8,600 account value divided by $1,000.00 = 8.6), then multiply the result by the number in the first line for a class of the Fund under the heading entitled "Expenses Paid During Period" to estimate the expenses you paid on your account during this period. A small balance maintenance fee of $12.00 that is charged once a year may apply for certain accounts with a value of less than $2,000. This fee is not included in the table below. If it was, the estimate of expenses you paid during the period would be higher, and your ending account value lower, by this amount. In addition, the Fund, as a shareholder in the underlying Fidelity Central Funds, will indirectly bear its pro-rata share of the fees and expenses incurred by the underlying Fidelity Central Funds. These fees and expenses are not included in the Fund's annualized expense ratio used to calculate the expense estimate in the table below.
Hypothetical Example for Comparison Purposes
The second line of the accompanying table for each class of the Fund provides information about hypothetical account values and hypothetical expenses based on a Class' actual expense ratio and an assumed rate of return of 5% per year before expenses, which is not the Class' actual return. The hypothetical account values and expenses may not be used to estimate the actual ending account balance or expenses you paid for the period. You may use this information to compare the ongoing costs of investing in the Fund and other funds. To do so, compare this 5% hypothetical example with the 5% hypothetical examples that appear in the shareholder reports of the other funds. A small balance maintenance fee of $12.00 that is charged once a year may apply for certain accounts with a value of less than $2,000. This fee is not included in the table below. If it was, the estimate of expenses you paid during the period would be higher, and your ending account value lower, by this amount. In addition, the Fund, as a shareholder in the underlying Fidelity Central Funds, will indirectly bear its pro-rata share of the fees and expenses incurred by the underlying Fidelity Central Funds. These fees and expenses are not included in the Fund's annualized expense ratio used to calculate the expense estimate in the table below.
Please note that the expenses shown in the table are meant to highlight your ongoing costs only and do not reflect any transaction costs. Therefore, the second line of the table is useful in comparing ongoing costs only, and will not help you determine the relative total costs of owning different funds. In addition, if these transactional costs were included, your costs would have been higher.
| Annualized Expense Ratio-A | Beginning Account Value July 1, 2017 | Ending Account Value December 31, 2017 | Expenses Paid During Period-B July 1, 2017 to December 31, 2017 | |
| Class A | .94% | |||
| Actual | $1,000.00 | $1,101.60 | $4.98 | |
| Hypothetical-C | $1,000.00 | $1,020.47 | $4.79 | |
| Class M | 1.19% | |||
| Actual | $1,000.00 | $1,100.70 | $6.30 | |
| Hypothetical-C | $1,000.00 | $1,019.21 | $6.06 | |
| Class C | 1.69% | |||
| Actual | $1,000.00 | $1,098.10 | $8.94 | |
| Hypothetical-C | $1,000.00 | $1,016.69 | $8.59 | |
| Mega Cap Stock | .69% | |||
| Actual | $1,000.00 | $1,102.90 | $3.66 | |
| Hypothetical-C | $1,000.00 | $1,021.73 | $3.52 | |
| Class I | .67% | |||
| Actual | $1,000.00 | $1,103.00 | $3.55 | |
| Hypothetical-C | $1,000.00 | $1,021.83 | $3.41 | |
| Class Z | .53% | |||
| Actual | $1,000.00 | $1,104.50 | $2.81 | |
| Hypothetical-C | $1,000.00 | $1,022.53 | $2.70 |
A Annualized expense ratio reflects expenses net of applicable fee waivers.
B Expenses are equal to each Class' annualized expense ratio, multiplied by the average account value over the period, multiplied by 184/365 (to reflect the one-half year period).
C 5% return per year before expenses
Board Approval of Investment Advisory Contracts and Management Fees
Fidelity Mega Cap Stock Fund
Each year, the Board of Trustees, including the Independent Trustees (together, the Board), votes on the renewal of the management contract with Fidelity Management & Research Company (FMR) and the sub-advisory agreements (together, the Advisory Contracts) for the fund. FMR and the sub-advisers are referred to herein as the Investment Advisers. The Board, assisted by the advice of fund counsel and Independent Trustees' counsel, requests and considers a broad range of information relevant to the renewal of the Advisory Contracts throughout the year.
The Board meets regularly and, at each of its meetings, covers an extensive agenda of topics and materials and considers factors that are relevant to its annual consideration of the renewal of the fund's Advisory Contracts, including the services and support provided to the fund and its shareholders. The Board has established various standing committees (Committees), each composed of and chaired by Independent Trustees with varying backgrounds, to which the Board has assigned specific subject matter responsibilities in order to enhance effective decision-making by the Board. The Board, acting directly and through its Committees, requests and receives information concerning the annual consideration of the renewal of the fund's Advisory Contracts. The Board also meets as needed to review matters specifically related to the Board's annual consideration of the renewal of the Advisory Contracts. Members of the Board may also meet with trustees of other Fidelity funds through ad hoc joint committees to discuss certain matters relevant to all of the Fidelity funds.
At its July 2017 meeting, the Board unanimously determined to renew the fund's Advisory Contracts. In reaching its determination, the Board considered all factors it believed relevant, including (i) the nature, extent, and quality of the services to be provided to the fund and its shareholders (including the investment performance of the fund); (ii) the competitiveness of the fund's management fee and total expense ratio relative to peer funds; (iii) the total costs of the services to be provided by and the profits to be realized by Fidelity from its relationships with the fund; and (iv) the extent to which, if any, economies of scale exist and would be realized as the fund grows, and whether any economies of scale are appropriately shared with fund shareholders.
In considering whether to renew the Advisory Contracts for the fund, the Board reached a determination, with the assistance of fund counsel and Independent Trustees' counsel and through the exercise of its business judgment, that the renewal of the Advisory Contracts was in the best interests of the fund and its shareholders and that the compensation payable under the Advisory Contracts was fair and reasonable. The Board's decision to renew the Advisory Contracts was not based on any single factor, but rather was based on a comprehensive consideration of all the information provided to the Board at its meetings throughout the year. The Board, in reaching its determination to renew the Advisory Contracts, was aware that shareholders of the fund have a broad range of investment choices available to them, including a wide choice among funds offered by Fidelity's competitors, and that the fund's shareholders, who have the opportunity to review and weigh the disclosure provided by the fund in its prospectus and other public disclosures, have chosen to invest in this fund, which is part of the Fidelity family of funds.
Amendment to Group Fee Rate. The Board also approved an amendment to the management contract for the fund to add an additional breakpoint to the group fee schedule, effective October 1, 2017. The Board noted that the additional breakpoint would result in lower management fee rates as Fidelity's assets under management increase.
Nature, Extent, and Quality of Services Provided. The Board considered Fidelity's staffing as it relates to the fund, including the backgrounds of investment personnel of Fidelity, and also considered the fund's investment objective, strategies, and related investment philosophy. The Independent Trustees also had discussions with senior management of Fidelity's investment operations and investment groups. The Board considered the structure of the investment personnel compensation program and whether this structure provides appropriate incentives to act in the best interests of the fund. Additionally, the Board considered the portfolio managers' investments, if any, in the funds that they manage.Resources Dedicated to Investment Management and Support Services. The Board and the Fund Oversight and Research Committees reviewed the general qualifications and capabilities of Fidelity's investment staff, including its size, education, experience, and resources, as well as Fidelity's approach to recruiting, training, managing, and compensating investment personnel. The Board noted that Fidelity has continued to increase the resources devoted to non-U.S. offices, including expansion of Fidelity's global investment organization. The Board also noted that Fidelity's analysts have extensive resources, tools and capabilities that allow them to conduct sophisticated quantitative and fundamental analysis, as well as credit analysis of issuers, counterparties and guarantors. Further, the Board considered that Fidelity's investment professionals have sufficient access to global information and data so as to provide competitive investment results over time, and that those professionals also have access to sophisticated tools that permit them to assess portfolio construction and risk and performance attribution characteristics continuously, as well as to transmit new information and research conclusions rapidly around the world. Additionally, in its deliberations, the Board considered Fidelity's trading, risk management, compliance, and technology and operations capabilities and resources, which are integral parts of the investment management process.Shareholder and Administrative Services. The Board considered (i) the nature, extent, quality, and cost of advisory, administrative, and shareholder services performed by the Investment Advisers and their affiliates under the Advisory Contracts and under separate agreements covering transfer agency, pricing and bookkeeping, and securities lending services for the fund; (ii) the nature and extent of the supervision of third party service providers, principally custodians, subcustodians, and pricing vendors; and (iii) the resources devoted to, and the record of compliance with, the fund's compliance policies and procedures. The Board also reviewed the allocation of fund brokerage, including allocations to brokers affiliated with the Investment Advisers, the use of brokerage commissions to pay fund expenses, and the use of "soft" commission dollars to pay for research services.The Board noted that the growth of fund assets over time across the complex allows Fidelity to reinvest in the development of services designed to enhance the value or convenience of the Fidelity funds as investment vehicles. These services include 24-hour access to account information and market information through telephone representatives and over the Internet, investor education materials and asset allocation tools, and the expanded availability of Fidelity Investor Centers.In 2014, the Board formed an ad hoc Committee on Transfer Agency Fees to review the variety of transfer agency fee structures throughout the industry and Fidelity's competitive positioning with respect to industry participants.Investment in a Large Fund Family. The Board considered the benefits to shareholders of investing in a Fidelity fund, including the benefits of investing in a fund that is part of a large family of funds offering a variety of investment disciplines and providing a large variety of mutual fund investor services. The Board noted that Fidelity had taken, or had made recommendations that resulted in the Fidelity funds taking, a number of actions over the previous year that benefited particular funds, including: (i) continuing to dedicate additional resources to Fidelity's investment research process, and to the support of the senior management team that oversees asset management; (ii) continuing efforts to enhance Fidelity's global research capabilities; (iii) launching new funds and making other enhancements to meet client needs; (iv) launching new share classes of existing funds; (v) eliminating purchase minimums and broadening eligibility requirements for certain lower-priced share classes; (vi) reducing management fees and total expenses for certain growth equity funds and index funds; (vii) lowering expense caps for certain existing funds and classes to reduce expenses borne by shareholders; (viii) eliminating short-term redemption fees for certain funds; (ix) introducing a new pricing structure for certain funds of funds that is expected to reduce overall expenses paid by shareholders; (x) rationalizing product lines and gaining increased efficiencies through proposals for fund mergers and share class consolidations; (xi) continuing to develop, acquire and implement systems and technology to improve services to the funds and shareholders, strengthen information security, and increase efficiency; and (xii) implementing enhancements to further strengthen Fidelity's product line to increase investors' probability of success in achieving their investment goals, including retirement income goals.Investment Performance. The Board considered whether the fund has operated in accordance with its investment objective, as well as its record of compliance with its investment restrictions and its performance history.The Board took into account discussions with representatives of the Investment Advisers about fund investment performance that occur at Board meetings throughout the year. In this regard the Board noted that as part of regularly scheduled fund reviews and other reports to the Board on fund performance, the Board considers annualized return information for the fund for different time periods, measured against a securities market index ("benchmark index") and a peer group of funds with similar objectives ("peer group"), if any. In its evaluation of fund investment performance, the Board gave particular attention to information indicating changes in performance of certain Fidelity funds for specific time periods and discussed with the Investment Advisers the reasons for any overperformance or underperformance.In addition to reviewing absolute and relative fund performance, the Independent Trustees periodically consider the appropriateness of fund performance metrics in evaluating the results achieved. In general, the Independent Trustees believe that fund performance should be evaluated based on net performance (after fees and expenses) of both the highest performing and lowest performing fund share classes, where applicable, compared to appropriate benchmark indices, over appropriate time periods that may include full market cycles, and compared to peer groups, as applicable, over the same periods, taking into account relevant factors including the following: general market conditions; issuer-specific information; and fund cash flows and other factors.The Independent Trustees recognize that shareholders evaluate performance on a net basis over their own holding periods, for which one-, three-, and five-year periods are often used as a proxy. For this reason, the performance information reviewed by the Board also included net cumulative calendar year total return information for the fund and an appropriate benchmark index for the most recent one-, three-, and five-year periods, as shown below. A peer group is not shown below because the fund does not generally utilize a peer group for performance comparison purposes.Fidelity Mega Cap Stock Fund
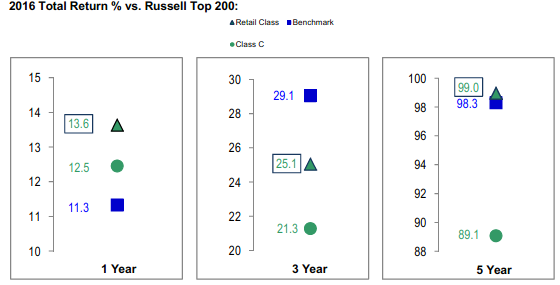
Fidelity Mega Cap Stock Fund
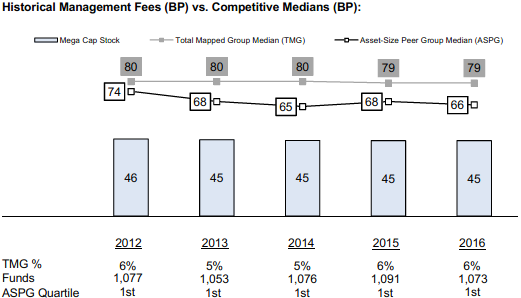
![]()
Corporate Headquarters
245 Summer St.
Boston, MA 02210
www.fidelity.com
GII-SANN-0218
1.714809.121
Fidelity® Series Growth & Income Fund Semi-Annual Report December 31, 2017 |
|
Contents
Board Approval of Investment Advisory Contracts and Management Fees |
To view a fund's proxy voting guidelines and proxy voting record for the 12-month period ended June 30, visit http://www.fidelity.com/proxyvotingresults or visit the Securities and Exchange Commission's (SEC) web site at http://www.sec.gov.
You may also call 1-800-544-8544 to request a free copy of the proxy voting guidelines.
Standard & Poor's, S&P and S&P 500 are registered service marks of The McGraw-Hill Companies, Inc. and have been licensed for use by Fidelity Distributors Corporation.
Other third-party marks appearing herein are the property of their respective owners.
All other marks appearing herein are registered or unregistered trademarks or service marks of FMR LLC or an affiliated company. © 2018 FMR LLC. All rights reserved.
This report and the financial statements contained herein are submitted for the general information of the shareholders of the Fund. This report is not authorized for distribution to prospective investors in the Fund unless preceded or accompanied by an effective prospectus.
A fund files its complete schedule of portfolio holdings with the SEC for the first and third quarters of each fiscal year on Form N-Q. Forms N-Q are available on the SEC’s web site at http://www.sec.gov. A fund's Forms N-Q may be reviewed and copied at the SEC’s Public Reference Room in Washington, DC. Information regarding the operation of the SEC's Public Reference Room may be obtained by calling 1-800-SEC-0330.
For a complete list of a fund's portfolio holdings, view the most recent holdings listing, semiannual report, or annual report on Fidelity's web site at http://www.fidelity.com, http://www.institutional.fidelity.com, or http://www.401k.com, as applicable.
NOT FDIC INSURED •MAY LOSE VALUE •NO BANK GUARANTEE
Neither the Fund nor Fidelity Distributors Corporation is a bank.
Investment Summary (Unaudited)
Top Ten Stocks as of December 31, 2017
| % of fund's net assets | |
| Bank of America Corp.(a) | 3.6 |
| Microsoft Corp.(a) | 3.6 |
| Citigroup, Inc.(a) | 3.0 |
| JPMorgan Chase & Co.(a) | 3.0 |
| Comcast Corp. Class A | 2.2 |
| Apple, Inc.(a) | 2.2 |
| Wells Fargo & Co. | 2.1 |
| ConocoPhillips Co. | 1.9 |
| Chevron Corp. | 1.9 |
| State Street Corp. | 1.9 |
| 25.4 |
(a) Security or a portion of the security is pledged as collateral for call options written.
Top Five Market Sectors as of December 31, 2017
| % of fund's net assets | |
| Financials | 22.8 |
| Information Technology | 16.4 |
| Energy | 13.1 |
| Health Care | 12.4 |
| Industrials | 11.9 |
Asset Allocation (% of fund's net assets)
| As of December 31, 2017 *,** | ||
| Stocks | 98.8% | |
| Convertible Securities | 0.4% | |
| Other Investments | 0.2% | |
| Short-Term Investments and Net Other Assets (Liabilities) | 0.6% | |

* Foreign investments - 10.5%
** Written options - (0.1)%
Investments December 31, 2017 (Unaudited)
Showing Percentage of Net Assets
| Common Stocks - 98.8% | |||
| Shares | Value | ||
| CONSUMER DISCRETIONARY - 7.7% | |||
| Auto Components - 0.2% | |||
| Gentex Corp. | 1,053,100 | $22,062,445 | |
| Hotels, Restaurants & Leisure - 0.4% | |||
| Cedar Fair LP (depositary unit) | 57,800 | 3,756,422 | |
| DineEquity, Inc. | 187,502 | 9,511,976 | |
| Dunkin' Brands Group, Inc. | 506,100 | 32,628,267 | |
| Marriott International, Inc. Class A | 38,700 | 5,252,751 | |
| 51,149,416 | |||
| Media - 3.8% | |||
| Comcast Corp. Class A | 7,410,600 | 296,794,530 | |
| Interpublic Group of Companies, Inc. | 2,787,300 | 56,191,968 | |
| Omnicom Group, Inc. | 342,700 | 24,958,841 | |
| The Walt Disney Co. | 627,300 | 67,441,023 | |
| Time Warner, Inc. | 491,700 | 44,975,799 | |
| Viacom, Inc. Class B (non-vtg.) | 329,600 | 10,154,976 | |
| 500,517,137 | |||
| Multiline Retail - 0.6% | |||
| Dollar General Corp. | 287,700 | 26,758,977 | |
| Macy's, Inc. | 477,700 | 12,033,263 | |
| Target Corp. (a) | 674,875 | 44,035,594 | |
| 82,827,834 | |||
| Specialty Retail - 2.7% | |||
| L Brands, Inc. (a) | 1,335,200 | 80,405,744 | |
| Lowe's Companies, Inc. (a) | 1,664,900 | 154,735,806 | |
| Ross Stores, Inc. | 418,900 | 33,616,725 | |
| TJX Companies, Inc. | 900,000 | 68,814,000 | |
| Williams-Sonoma, Inc. (b) | 422,400 | 21,838,080 | |
| 359,410,355 | |||
| TOTAL CONSUMER DISCRETIONARY | 1,015,967,187 | ||
| CONSUMER STAPLES - 9.6% | |||
| Beverages - 2.0% | |||
| Coca-Cola European Partners PLC | 164,900 | 6,571,265 | |
| Dr. Pepper Snapple Group, Inc. | 237,800 | 23,080,868 | |
| Molson Coors Brewing Co. Class B | 796,100 | 65,335,927 | |
| The Coca-Cola Co. | 3,616,218 | 165,912,082 | |
| 260,900,142 | |||
| Food & Staples Retailing - 2.3% | |||
| CVS Health Corp. | 1,747,520 | 126,695,200 | |
| Kroger Co. (a) | 2,209,100 | 60,639,795 | |
| Wal-Mart Stores, Inc. | 1,218,200 | 120,297,250 | |
| 307,632,245 | |||
| Food Products - 0.8% | |||
| Campbell Soup Co. | 506,500 | 24,367,715 | |
| Kellogg Co. | 447,900 | 30,448,242 | |
| Snyders-Lance, Inc. | 187,600 | 9,395,008 | |
| The J.M. Smucker Co. | 366,900 | 45,583,656 | |
| 109,794,621 | |||
| Household Products - 2.0% | |||
| Kimberly-Clark Corp. | 304,300 | 36,716,838 | |
| Procter & Gamble Co. (a) | 1,906,700 | 175,187,596 | |
| Reckitt Benckiser Group PLC | 491,100 | 45,816,425 | |
| 257,720,859 | |||
| Personal Products - 0.4% | |||
| Coty, Inc. Class A | 260,500 | 5,181,345 | |
| Unilever NV (NY Reg.) | 844,500 | 47,562,240 | |
| 52,743,585 | |||
| Tobacco - 2.1% | |||
| Altria Group, Inc. | 2,738,900 | 195,584,849 | |
| British American Tobacco PLC sponsored ADR | 1,307,500 | 87,589,425 | |
| 283,174,274 | |||
| TOTAL CONSUMER STAPLES | 1,271,965,726 | ||
| ENERGY - 12.9% | |||
| Energy Equipment & Services - 0.9% | |||
| Baker Hughes, a GE Co. Class A | 1,536,100 | 48,602,204 | |
| Nabors Industries Ltd. | 1,430,100 | 9,767,583 | |
| National Oilwell Varco, Inc. | 1,004,700 | 36,189,294 | |
| Oceaneering International, Inc. | 1,191,630 | 25,191,058 | |
| Schlumberger Ltd. | 41,100 | 2,769,729 | |
| 122,519,868 | |||
| Oil, Gas & Consumable Fuels - 12.0% | |||
| Anadarko Petroleum Corp. | 487,900 | 26,170,956 | |
| Apache Corp. | 2,055,641 | 86,789,163 | |
| BP PLC sponsored ADR | 254,600 | 10,700,838 | |
| Cabot Oil & Gas Corp. | 2,026,100 | 57,946,460 | |
| Cenovus Energy, Inc. | 9,931,500 | 90,702,959 | |
| Cenovus Energy, Inc. | 67,300 | 614,449 | |
| Chevron Corp. | 1,978,835 | 247,730,354 | |
| ConocoPhillips Co. | 4,699,580 | 257,959,946 | |
| Golar LNG Ltd. | 1,067,172 | 31,812,397 | |
| Imperial Oil Ltd. | 2,089,500 | 65,211,683 | |
| Kinder Morgan, Inc. | 5,005,600 | 90,451,192 | |
| Legacy Reserves LP (c) | 1,718,900 | 2,767,429 | |
| Phillips 66 Co. | 234,605 | 23,730,296 | |
| Suncor Energy, Inc. | 6,586,400 | 241,815,720 | |
| Teekay LNG Partners LP | 692,700 | 13,957,905 | |
| The Williams Companies, Inc. | 6,462,357 | 197,037,265 | |
| Valero Energy Corp. | 445,100 | 40,909,141 | |
| Williams Partners LP | 2,744,091 | 106,415,849 | |
| 1,592,724,002 | |||
| TOTAL ENERGY | 1,715,243,870 | ||
| FINANCIALS - 22.8% | |||
| Banks - 15.4% | |||
| Bank of America Corp. (a) | 16,253,005 | 479,788,709 | |
| Citigroup, Inc. (a) | 5,296,178 | 394,088,605 | |
| Cullen/Frost Bankers, Inc. | 29,000 | 2,744,850 | |
| JPMorgan Chase & Co. (a) | 3,678,349 | 393,362,642 | |
| M&T Bank Corp. | 40,590 | 6,940,484 | |
| PNC Financial Services Group, Inc. (a) | 821,024 | 118,465,553 | |
| Regions Financial Corp. (a) | 3,646,300 | 63,008,064 | |
| SunTrust Banks, Inc. | 2,741,840 | 177,095,446 | |
| U.S. Bancorp | 2,387,439 | 127,918,982 | |
| Wells Fargo & Co. | 4,638,199 | 281,399,533 | |
| 2,044,812,868 | |||
| Capital Markets - 6.5% | |||
| Apollo Global Management LLC Class A | 1,081,900 | 36,211,193 | |
| Charles Schwab Corp. (a) | 1,488,681 | 76,473,543 | |
| KKR & Co. LP | 3,855,711 | 81,201,274 | |
| Morgan Stanley | 2,039,500 | 107,012,565 | |
| Northern Trust Corp. (a) | 1,501,351 | 149,969,951 | |
| Oaktree Capital Group LLC Class A | 372,500 | 15,682,250 | |
| S&P Global, Inc. | 334,300 | 56,630,420 | |
| State Street Corp. | 2,501,701 | 244,191,035 | |
| TD Ameritrade Holding Corp. | 97,300 | 4,974,949 | |
| The Blackstone Group LP | 2,739,400 | 87,715,588 | |
| 860,062,768 | |||
| Insurance - 0.7% | |||
| Marsh & McLennan Companies, Inc. | 531,107 | 43,226,799 | |
| MetLife, Inc. | 912,400 | 46,130,944 | |
| 89,357,743 | |||
| Thrifts & Mortgage Finance - 0.2% | |||
| Radian Group, Inc. | 1,178,064 | 24,279,899 | |
| TOTAL FINANCIALS | 3,018,513,278 | ||
| HEALTH CARE - 12.1% | |||
| Biotechnology - 2.5% | |||
| Alexion Pharmaceuticals, Inc. (c) | 490,700 | 58,682,813 | |
| Amgen, Inc. | 1,139,219 | 198,110,184 | |
| Biogen, Inc. (c) | 101,500 | 32,334,855 | |
| Gilead Sciences, Inc. | 80,320 | 5,754,125 | |
| Intercept Pharmaceuticals, Inc. (c) | 184,646 | 10,787,019 | |
| Shire PLC sponsored ADR | 159,600 | 24,757,152 | |
| 330,426,148 | |||
| Health Care Equipment & Supplies - 1.4% | |||
| Becton, Dickinson & Co. | 33,700 | 7,213,822 | |
| Boston Scientific Corp. (c) | 938,600 | 23,267,894 | |
| ConvaTec Group PLC (d) | 934,200 | 2,591,992 | |
| Danaher Corp. | 637,800 | 59,200,596 | |
| Fisher & Paykel Healthcare Corp. | 695,247 | 7,070,554 | |
| Medtronic PLC | 392,036 | 31,656,907 | |
| ResMed, Inc. | 191,800 | 16,243,542 | |
| Steris PLC | 107,000 | 9,359,290 | |
| Zimmer Biomet Holdings, Inc. | 283,100 | 34,161,677 | |
| 190,766,274 | |||
| Health Care Providers & Services - 3.7% | |||
| Aetna, Inc. | 91,300 | 16,469,607 | |
| AmerisourceBergen Corp. | 509,500 | 46,782,290 | |
| Anthem, Inc. | 331,500 | 74,590,815 | |
| Cardinal Health, Inc. | 1,370,900 | 83,995,043 | |
| Cigna Corp. | 362,100 | 73,538,889 | |
| Fresenius Medical Care AG & Co. KGaA sponsored ADR | 311,900 | 16,390,345 | |
| Humana, Inc. | 115,200 | 28,577,664 | |
| McKesson Corp. | 527,847 | 82,317,740 | |
| Patterson Companies, Inc. | 544,138 | 19,659,706 | |
| UnitedHealth Group, Inc. | 226,300 | 49,890,098 | |
| 492,212,197 | |||
| Pharmaceuticals - 4.5% | |||
| Allergan PLC | 169,500 | 27,726,810 | |
| AstraZeneca PLC sponsored ADR | 1,056,800 | 36,670,960 | |
| Bayer AG | 227,200 | 28,232,608 | |
| Bristol-Myers Squibb Co. (a) | 208,500 | 12,776,880 | |
| Eisai Co. Ltd. | 24,700 | 1,406,481 | |
| GlaxoSmithKline PLC sponsored ADR | 5,275,000 | 187,104,250 | |
| Innoviva, Inc. (c) | 421,900 | 5,986,761 | |
| Johnson & Johnson (a) | 1,380,470 | 192,879,268 | |
| Novartis AG sponsored ADR | 76,230 | 6,400,271 | |
| Sanofi SA | 404,724 | 34,843,493 | |
| Teva Pharmaceutical Industries Ltd. sponsored ADR (b) | 3,094,184 | 58,634,787 | |
| 592,662,569 | |||
| TOTAL HEALTH CARE | 1,606,067,188 | ||
| INDUSTRIALS - 11.8% | |||
| Aerospace & Defense - 2.2% | |||
| General Dynamics Corp. | 164,800 | 33,528,560 | |
| Meggitt PLC | 374,173 | 2,436,025 | |
| Rolls-Royce Holdings PLC | 2,192,800 | 25,076,357 | |
| The Boeing Co. (a) | 107,141 | 31,596,952 | |
| United Technologies Corp. | 1,516,700 | 193,485,419 | |
| 286,123,313 | |||
| Air Freight & Logistics - 1.7% | |||
| C.H. Robinson Worldwide, Inc. (a) | 752,400 | 67,031,316 | |
| Expeditors International of Washington, Inc. | 526,000 | 34,026,940 | |
| United Parcel Service, Inc. Class B | 1,071,445 | 127,662,672 | |
| 228,720,928 | |||
| Commercial Services & Supplies - 0.1% | |||
| KAR Auction Services, Inc. | 140,800 | 7,111,808 | |
| Ritchie Brothers Auctioneers, Inc. (b) | 418,100 | 12,519,717 | |
| 19,631,525 | |||
| Construction & Engineering - 0.1% | |||
| Fluor Corp. | 262,600 | 13,563,290 | |
| Electrical Equipment - 0.7% | |||
| Acuity Brands, Inc. | 247,700 | 43,595,200 | |
| Hubbell, Inc. Class B | 342,103 | 46,300,220 | |
| 89,895,420 | |||
| Industrial Conglomerates - 1.7% | |||
| General Electric Co. | 12,962,656 | 226,198,347 | |
| Machinery - 1.1% | |||
| Donaldson Co., Inc. | 247,700 | 12,124,915 | |
| Flowserve Corp. | 1,441,300 | 60,721,969 | |
| Snap-On, Inc. | 214,300 | 37,352,490 | |
| Wabtec Corp.(b) | 393,800 | 32,067,134 | |
| Zardoya Otis SA | 209,000 | 2,287,010 | |
| 144,553,518 | |||
| Professional Services - 0.4% | |||
| Intertrust NV (d) | 639,700 | 11,996,713 | |
| Nielsen Holdings PLC | 1,029,700 | 37,481,080 | |
| 49,477,793 | |||
| Road & Rail - 2.9% | |||
| CSX Corp. (a) | 1,950,108 | 107,275,441 | |
| J.B. Hunt Transport Services, Inc. (a) | 975,493 | 112,162,185 | |
| Norfolk Southern Corp. | 454,334 | 65,832,997 | |
| Union Pacific Corp. | 751,400 | 100,762,740 | |
| 386,033,363 | |||
| Trading Companies & Distributors - 0.9% | |||
| Brenntag AG | 46,800 | 2,963,193 | |
| Bunzl PLC | 215,400 | 6,025,838 | |
| Fastenal Co. | 715,100 | 39,108,819 | |
| Howden Joinery Group PLC | 394,000 | 2,483,185 | |
| MSC Industrial Direct Co., Inc. Class A | 224,900 | 21,738,834 | |
| Watsco, Inc. | 291,409 | 49,551,186 | |
| 121,871,055 | |||
| TOTAL INDUSTRIALS | 1,566,068,552 | ||
| INFORMATION TECHNOLOGY - 16.4% | |||
| Communications Equipment - 1.4% | |||
| Cisco Systems, Inc. (a) | 5,037,333 | 192,929,854 | |
| Electronic Equipment & Components - 0.1% | |||
| Avnet, Inc. | 231,900 | 9,187,878 | |
| Philips Lighting NV (d) | 196,000 | 7,196,220 | |
| 16,384,098 | |||
| Internet Software & Services - 2.8% | |||
| Alphabet, Inc.: | |||
| Class A (c) | 179,609 | 189,200,121 | |
| Class C (c) | 168,365 | 176,177,136 | |
| 365,377,257 | |||
| IT Services - 3.1% | |||
| Accenture PLC Class A | 169,300 | 25,918,137 | |
| Cognizant Technology Solutions Corp. Class A | 35,800 | 2,542,516 | |
| MasterCard, Inc. Class A (a) | 419,100 | 63,434,976 | |
| Paychex, Inc. (a) | 1,903,541 | 129,593,071 | |
| Unisys Corp. (b)(c) | 1,758,617 | 14,332,729 | |
| Visa, Inc. Class A | 1,527,800 | 174,199,756 | |
| 410,021,185 | |||
| Semiconductors & Semiconductor Equipment - 2.0% | |||
| Maxim Integrated Products, Inc. | 246,700 | 12,897,476 | |
| Qualcomm, Inc. | 3,746,700 | 239,863,734 | |
| United Microelectronics Corp. sponsored ADR | 2,553,700 | 6,103,343 | |
| Xilinx, Inc. | 106,800 | 7,200,456 | |
| 266,065,009 | |||
| Software - 4.8% | |||
| Micro Focus International PLC | 996,572 | 33,947,512 | |
| Microsoft Corp. (a) | 5,583,017 | 477,571,274 | |
| Oracle Corp. | 1,693,669 | 80,076,670 | |
| SAP SE sponsored ADR | 378,700 | 42,550,732 | |
| 634,146,188 | |||
| Technology Hardware, Storage & Peripherals - 2.2% | |||
| Apple, Inc. (a) | 1,735,960 | 293,776,511 | |
| TOTAL INFORMATION TECHNOLOGY | 2,178,700,102 | ||
| MATERIALS - 2.1% | |||
| Chemicals - 1.9% | |||
| CF Industries Holdings, Inc. (a) | 998,400 | 42,471,936 | |
| LyondellBasell Industries NV Class A | 752,200 | 82,982,704 | |
| Monsanto Co. | 259,021 | 30,248,472 | |
| Potash Corp. of Saskatchewan, Inc. | 3,219,600 | 66,031,255 | |
| PPG Industries, Inc. | 43,100 | 5,034,942 | |
| The Scotts Miracle-Gro Co. Class A | 194,900 | 20,852,351 | |
| 247,621,660 | |||
| Containers & Packaging - 0.1% | |||
| WestRock Co. | 309,100 | 19,538,211 | |
| Metals & Mining - 0.1% | |||
| BHP Billiton Ltd. sponsored ADR (b) | 63,300 | 2,911,167 | |
| Reliance Steel & Aluminum Co. | 132,200 | 11,341,438 | |
| 14,252,605 | |||
| TOTAL MATERIALS | 281,412,476 | ||
| REAL ESTATE - 1.0% | |||
| Equity Real Estate Investment Trusts (REITs) - 1.0% | |||
| American Tower Corp. | 147,100 | 20,986,757 | |
| CoreSite Realty Corp. | 248,400 | 28,292,760 | |
| Equinix, Inc. | 44,900 | 20,349,578 | |
| Omega Healthcare Investors, Inc. (b) | 270,300 | 7,444,062 | |
| Public Storage | 147,100 | 30,743,900 | |
| Sabra Health Care REIT, Inc. | 471,200 | 8,844,424 | |
| Spirit Realty Capital, Inc. | 1,289,600 | 11,064,768 | |
| 127,726,249 | |||
| TELECOMMUNICATION SERVICES - 1.3% | |||
| Diversified Telecommunication Services - 1.3% | |||
| Verizon Communications, Inc. | 3,206,823 | 169,737,141 | |
| UTILITIES - 1.1% | |||
| Electric Utilities - 1.0% | |||
| Exelon Corp. | 3,023,400 | 119,152,194 | |
| PPL Corp. | 605,600 | 18,743,320 | |
| Southern Co. | 77,900 | 3,746,211 | |
| 141,641,725 | |||
| Multi-Utilities - 0.1% | |||
| Public Service Enterprise Group, Inc. | 233,300 | 12,014,950 | |
| TOTAL UTILITIES | 153,656,675 | ||
| TOTAL COMMON STOCKS | |||
| (Cost $10,322,301,991) | 13,105,058,444 | ||
| Preferred Stocks - 0.3% | |||
| Convertible Preferred Stocks - 0.3% | |||
| HEALTH CARE - 0.2% | |||
| Health Care Equipment & Supplies - 0.2% | |||
| Becton, Dickinson & Co. Series A 6.125% | 350,100 | 20,365,317 | |
| INDUSTRIALS - 0.1% | |||
| Commercial Services & Supplies - 0.1% | |||
| Stericycle, Inc. 2.25% | 202,999 | 10,769,097 | |
| UTILITIES - 0.0% | |||
| Independent Power and Renewable Electricity Producers - 0.0% | |||
| Dynegy, Inc. 7.00% | 85,300 | 6,725,905 | |
| TOTAL CONVERTIBLE PREFERRED STOCKS | 37,860,319 | ||
| Nonconvertible Preferred Stocks - 0.0% | |||
| INDUSTRIALS - 0.0% | |||
| Aerospace & Defense - 0.0% | |||
| Rolls-Royce Holdings PLC (C Shares) | 466,209,900 | 629,453 | |
| TOTAL PREFERRED STOCKS | |||
| (Cost $41,424,558) | 38,489,772 | ||
| Principal Amount(e) | Value | ||
| Convertible Bonds - 0.1% | |||
| HEALTH CARE - 0.1% | |||
| Pharmaceuticals - 0.1% | |||
| Bayer Capital Corp. BV 5.625% 11/22/19 (Cost $11,711,431)(d) | EUR | 10,600,000 | 14,422,804 |
| Shares | Value | ||
| Other - 0.2% | |||
| ENERGY - 0.2% | |||
| Oil, Gas & Consumable Fuels - 0.2% | |||
| Utica Shale Drilling Program (non-operating revenue interest) (f)(g)(h) | |||
| (Cost $25,755,177) | 25,755,177 | 19,831,486 | |
| Money Market Funds - 1.5% | |||
| Fidelity Cash Central Fund, 1.36% (i) | 129,227,321 | 129,253,166 | |
| Fidelity Securities Lending Cash Central Fund 1.36% (i)(j) | 73,707,822 | 73,722,564 | |
| TOTAL MONEY MARKET FUNDS | |||
| (Cost $202,968,408) | 202,975,730 | ||
| TOTAL INVESTMENT IN SECURITIES - 100.9% | |||
| (Cost $10,604,161,565) | 13,380,778,236 | ||
| NET OTHER ASSETS (LIABILITIES) - (0.9)% | (118,692,628) | ||
| NET ASSETS - 100% | $13,262,085,608 |
| Written Options | ||||||
| Counterparty | Number of Contracts | Notional Amount | Exercise Price | Expiration Date | Value | |
| Call Options | ||||||
| Apple, Inc. | Chicago Board Options Exchange | 985 | $16,669,155 | $185.00 | 2/16/18 | $(111,798) |
| Bank of America Corp. | Chicago Board Options Exchange | 26,960 | 79,585,920 | 30.00 | 1/19/18 | (1,118,840) |
| Bristol-Myers Squibb Co. | Chicago Board Options Exchange | 1,696 | 10,393,088 | 65.00 | 1/19/18 | (49,184) |
| C.H. Robinson Worldwide, Inc. | Chicago Board Options Exchange | 1,147 | 10,218,623 | 92.50 | 2/16/18 | (209,327) |
| CF Industries Holdings, Inc. | Chicago Board Options Exchange | 982 | 4,177,428 | 40.00 | 2/16/18 | (355,975) |
| Charles Schwab Corp. | Chicago Board Options Exchange | 1,455 | 7,474,335 | 55.00 | 3/16/18 | (134,587) |
| Cisco Systems, Inc. | Chicago Board Options Exchange | 5,048 | 19,333,840 | 41.00 | 3/16/18 | (166,584) |
| Cisco Systems, Inc. | Chicago Board Options Exchange | 5,048 | 19,333,840 | 40.00 | 3/16/18 | (280,164) |
| Citigroup, Inc. | Chicago Board Options Exchange | 5,257 | 39,117,337 | 80.00 | 2/16/18 | (249,707) |
| CSX Corp. | Chicago Board Options Exchange | 3,390 | 18,648,390 | 60.00 | 2/16/18 | (164,415) |
| CSX Corp. | Chicago Board Options Exchange | 3,395 | 18,675,895 | 62.50 | 2/16/18 | (64,505) |
| J.B. Hunt Transport Services, Inc. | Chicago Board Options Exchange | 979 | 11,256,542 | 120.00 | 2/16/18 | (166,430) |
| Johnson & Johnson | Chicago Board Options Exchange | 1,423 | 19,882,156 | 145.00 | 2/16/18 | (125,936) |
| JPMorgan Chase & Co. | Chicago Board Options Exchange | 5,954 | 63,672,076 | 115.00 | 3/16/18 | (553,722) |
| Kroger Co. | Chicago Board Options Exchange | 2,399 | 6,585,255 | 28.00 | 2/16/18 | (191,920) |
| Kroger Co. | Chicago Board Options Exchange | 4,450 | 12,215,250 | 29.00 | 2/16/18 | (211,375) |
| L Brands, Inc. | Chicago Board Options Exchange | 1,372 | 8,262,184 | 65.00 | 2/16/18 | (222,950) |
| Lowe's Companies, Inc. | Chicago Board Options Exchange | 1,958 | 18,197,652 | 85.00 | 1/19/18 | (1,590,875) |
| MasterCard, Inc. Class A | Chicago Board Options Exchange | 765 | 11,579,040 | 150.00 | 1/19/18 | (243,653) |
| Microsoft Corp. | Chicago Board Options Exchange | 2,841 | 24,301,914 | 90.00 | 2/16/18 | (279,839) |
| Northern Trust Corp. | Chicago Board Options Exchange | 1,461 | 14,593,929 | 110.00 | 4/20/18 | (164,362) |
| Paychex, Inc. | Chicago Board Options Exchange | 2,144 | 14,596,352 | 70.00 | 1/19/18 | (64,320) |
| PNC Financial Services Group, Inc. | Chicago Board Options Exchange | 767 | 11,067,043 | 145.00 | 2/16/18 | (283,790) |
| Procter & Gamble Co. | Chicago Board Options Exchange | 2,019 | 18,550,572 | 92.50 | 2/16/18 | (262,470) |
| Regions Financial Corp. | Chicago Board Options Exchange | 3,613 | 6,243,264 | 18.00 | 2/16/18 | (133,681) |
| Target Corp. | Chicago Board Options Exchange | 1,365 | 8,906,625 | 65.00 | 3/16/18 | (470,925) |
| Target Corp. | Chicago Board Options Exchange | 1,298 | 8,469,450 | 70.00 | 3/16/18 | (199,243) |
| The Boeing Co. | Chicago Board Options Exchange | 547 | 16,131,577 | 300.00 | 3/16/18 | (519,650) |
| TOTAL WRITTEN OPTIONS | $(8,590,227) |
Currency Abbreviations
EUR – European Monetary Unit
Legend
(a) Security or a portion of the security is pledged as collateral for call options written. At period end, the value of securities pledged amounted to $518,138,732.
(b) Security or a portion of the security is on loan at period end.
(c) Non-income producing
(d) Security exempt from registration under Rule 144A of the Securities Act of 1933. These securities may be resold in transactions exempt from registration, normally to qualified institutional buyers. At the end of the period, the value of these securities amounted to $36,207,729 or 0.3% of net assets.
(e) Amount is stated in United States dollars unless otherwise noted.
(f) Investment is owned by a wholly-owned subsidiary (Subsidiary) that is treated as a corporation for U.S. tax purposes.
(g) Restricted securities - Investment in securities not registered under the Securities Act of 1933 (excluding 144A issues). At the end of the period, the value of restricted securities (excluding 144A issues) amounted to $19,831,486 or 0.2% of net assets.
(h) Level 3 security
(i) Affiliated fund that is generally available only to investment companies and other accounts managed by Fidelity Investments. The rate quoted is the annualized seven-day yield of the fund at period end. A complete unaudited listing of the fund's holdings as of its most recent quarter end is available upon request. In addition, each Fidelity Central Fund's financial statements are available on the SEC's website or upon request.
(j) Investment made with cash collateral received from securities on loan.
Additional information on each restricted holding is as follows:
| Security | Acquisition Date | Acquisition Cost |
| Utica Shale Drilling Program (non-operating revenue interest) | 10/5/16 - 9/1/17 | $25,755,177 |
Affiliated Central Funds
Information regarding fiscal year to date income earned by the Fund from investments in Fidelity Central Funds is as follows:
| Fund | Income earned |
| Fidelity Cash Central Fund | $538,355 |
| Fidelity Securities Lending Cash Central Fund | 145,989 |
| Total | $684,344 |
Amounts in the income column in the above table include any capital gain distributions from underlying funds, which are presented in the corresponding line-item in the Statement of Operations if applicable.
Investment Valuation
The following is a summary of the inputs used, as of December 31, 2017, involving the Fund's assets and liabilities carried at fair value. The inputs or methodology used for valuing securities may not be an indication of the risk associated with investing in those securities. For more information on valuation inputs, and their aggregation into the levels used below, please refer to the Investment Valuation section in the accompanying Notes to Financial Statements.
| Valuation Inputs at Reporting Date: | ||||
| Description | Total | Level 1 | Level 2 | Level 3 |
| Investments in Securities: | ||||
| Equities: | ||||
| Consumer Discretionary | $1,015,967,187 | $1,015,967,187 | $-- | $-- |
| Consumer Staples | 1,271,965,726 | 1,226,149,301 | 45,816,425 | -- |
| Energy | 1,715,243,870 | 1,715,243,870 | -- | -- |
| Financials | 3,018,513,278 | 3,018,513,278 | -- | -- |
| Health Care | 1,626,432,505 | 1,542,991,087 | 83,441,418 | -- |
| Industrials | 1,577,467,102 | 1,566,698,005 | 10,769,097 | -- |
| Information Technology | 2,178,700,102 | 2,178,700,102 | -- | -- |
| Materials | 281,412,476 | 281,412,476 | -- | -- |
| Real Estate | 127,726,249 | 127,726,249 | -- | -- |
| Telecommunication Services | 169,737,141 | 169,737,141 | -- | -- |
| Utilities | 160,382,580 | 153,656,675 | 6,725,905 | -- |
| Corporate Bonds | 14,422,804 | -- | 14,422,804 | -- |
| Other | 19,831,486 | -- | -- | 19,831,486 |
| Money Market Funds | 202,975,730 | 202,975,730 | -- | -- |
| Total Investments in Securities: | $13,380,778,236 | $13,199,771,101 | $161,175,649 | $19,831,486 |
| Derivative Instruments: | ||||
| Liabilities | ||||
| Written Options | $(8,590,227) | $(8,590,227) | $-- | $-- |
| Total Liabilities | $(8,590,227) | $(8,590,227) | $-- | $-- |
| Total Derivative Instruments: | $(8,590,227) | $(8,590,227) | $-- | $-- |
Value of Derivative Instruments
The following table is a summary of the Fund's value of derivative instruments by primary risk exposure as of December 31, 2017. For additional information on derivative instruments, please refer to the Derivative Instruments section in the accompanying Notes to Financial Statements.
| Primary Risk Exposure / Derivative Type | Value | |
| Asset | Liability | |
| Equity Risk | ||
| Written Options(a) | $0 | $(8,590,227) |
| Total Equity Risk | 0 | (8,590,227) |
| Total Value of Derivatives | $0 | $(8,590,227) |
(a) Gross value is presented in the Statement of Assets and Liabilities in the written options, at value line-item.
Other Information
Distribution of investments by country or territory of incorporation, as a percentage of Total Net Assets, is as follows (Unaudited):
| United States of America | 89.5% |
| Canada | 3.6% |
| United Kingdom | 3.1% |
| Netherlands | 1.2% |
| Others (Individually Less Than 1%) | 2.6% |
| 100.0% |
See accompanying notes which are an integral part of the financial statements.
Financial Statements
Statement of Assets and Liabilities
| December 31, 2017 (Unaudited) | ||
| Assets | ||
| Investment in securities, at value (including securities loaned of $71,607,244) — See accompanying schedule: Unaffiliated issuers (cost $10,401,193,157) | $13,177,802,506 | |
| Fidelity Central Funds (cost $202,968,408) | 202,975,730 | |
| Total Investment in Securities (cost $10,604,161,565) | $13,380,778,236 | |
| Restricted cash | 180,225 | |
| Foreign currency held at value (cost $335,791) | 335,791 | |
| Receivable for investments sold | 15,363,586 | |
| Receivable for fund shares sold | 86,418 | |
| Dividends receivable | 15,141,643 | |
| Interest receivable | 360,800 | |
| Distributions receivable from Fidelity Central Funds | 149,644 | |
| Other receivables | 186,183 | |
| Total assets | 13,412,582,526 | |
| Liabilities | ||
| Payable to custodian bank | $1,068 | |
| Payable for investments purchased | 27,362,330 | |
| Payable for fund shares redeemed | 40,733,192 | |
| Written options, at value (premium received $8,729,235) | 8,590,227 | |
| Other payables and accrued expenses | 38,006 | |
| Collateral on securities loaned | 73,772,095 | |
| Total liabilities | 150,496,918 | |
| Net Assets | $13,262,085,608 | |
| Net Assets consist of: | ||
| Paid in capital | $10,436,974,108 | |
| Distributions in excess of net investment income | (36,950,509) | |
| Accumulated undistributed net realized gain (loss) on investments and foreign currency transactions | 85,303,887 | |
| Net unrealized appreciation (depreciation) on investments and assets and liabilities in foreign currencies | 2,776,758,122 | |
| Net Assets | $13,262,085,608 | |
| Series Growth and Income: | ||
| Net Asset Value, offering price and redemption price per share ($13,262,085,608 ÷ 842,094,752 shares) | $15.75 |
See accompanying notes which are an integral part of the financial statements.
Statement of Operations
| Six months ended December 31, 2017 (Unaudited) | ||
| Investment Income | ||
| Dividends | $150,937,177 | |
| Interest | 364,081 | |
| Income from Fidelity Central Funds | 684,344 | |
| Total income | 151,985,602 | |
| Expenses | ||
| Custodian fees and expenses | $103,895 | |
| Independent trustees' fees and expenses | 24,914 | |
| Interest | 8,774 | |
| Miscellaneous | 17,231 | |
| Total expenses before reductions | 154,814 | |
| Expense reductions | (41,195) | 113,619 |
| Net investment income (loss) | 151,871,983 | |
| Realized and Unrealized Gain (Loss) | ||
| Net realized gain (loss) on: | ||
| Investment securities: | ||
| Unaffiliated issuers | 269,397,210 | |
| Fidelity Central Funds | (738) | |
| Foreign currency transactions | 123,951 | |
| Written options | 9,748,957 | |
| Total net realized gain (loss) | 279,269,380 | |
| Change in net unrealized appreciation (depreciation) on: | ||
| Investment securities: | ||
| Unaffiliated issuers | 889,259,001 | |
| Fidelity Central Funds | 7,121 | |
| Assets and liabilities in foreign currencies | 4,928 | |
| Written options | 3,342,696 | |
| Total change in net unrealized appreciation (depreciation) | 892,613,746 | |
| Net gain (loss) | 1,171,883,126 | |
| Net increase (decrease) in net assets resulting from operations | $1,323,755,109 |
See accompanying notes which are an integral part of the financial statements.
Statement of Changes in Net Assets
| Six months ended December 31, 2017 (Unaudited) | Year ended June 30, 2017 | |
| Increase (Decrease) in Net Assets | ||
| Operations | ||
| Net investment income (loss) | $151,871,983 | $180,595,637 |
| Net realized gain (loss) | 279,269,380 | 344,658,166 |
| Change in net unrealized appreciation (depreciation) | 892,613,746 | 1,255,957,577 |
| Net increase (decrease) in net assets resulting from operations | 1,323,755,109 | 1,781,211,380 |
| Distributions to shareholders from net investment income | (228,787,282) | (133,641,340) |
| Distributions to shareholders from net realized gain | (448,205,547) | (12,492,488) |
| Total distributions | (676,992,829) | (146,133,828) |
| Share transactions - net increase (decrease) | 125,789,825 | 2,137,278,446 |
| Total increase (decrease) in net assets | 772,552,105 | 3,772,355,998 |
| Net Assets | ||
| Beginning of period | 12,489,533,503 | 8,717,177,505 |
| End of period | $13,262,085,608 | $12,489,533,503 |
| Other Information | ||
| Undistributed net investment income end of period | $– | $39,964,790 |
| Distributions in excess of net investment income end of period | $(36,950,509) | $– |
See accompanying notes which are an integral part of the financial statements.
Financial Highlights
Fidelity Series Growth & Income Fund
| Six months ended (Unaudited) December 31, | Years ended June 30, | |||||
| 2017 | 2017 | 2016 | 2015 | 2014 | 2013 A | |
| Selected Per–Share Data | ||||||
| Net asset value, beginning of period | $15.00 | $12.57 | $13.67 | $13.58 | $11.53 | $10.00 |
| Income from Investment Operations | ||||||
| Net investment income (loss)B | .18 | .26 | .24 | .25 | .24 | .09 |
| Net realized and unrealized gain (loss) | 1.38 | 2.38 | (.59) | .43 | 2.29 | 1.45 |
| Total from investment operations | 1.56 | 2.64 | (.35) | .68 | 2.53 | 1.54 |
| Distributions from net investment income | (.27) | (.19) | (.26) | (.24) | (.21) | (.01) |
| Distributions from net realized gain | (.54) | (.02) | (.49) | (.36) | (.27) | – |
| Total distributions | (.81) | (.21) | (.75) | (.59)C | (.48) | (.01) |
| Net asset value, end of period | $15.75 | $15.00 | $12.57 | $13.67 | $13.58 | $11.53 |
| Total ReturnD,E | 10.75% | 21.15% | (2.56)% | 5.21% | 22.40% | 15.41% |
| Ratios to Average Net AssetsF,G | ||||||
| Expenses before reductions | - %H,I | .56% | .63% | .63% | .66% | .78%H |
| Expenses net of fee waivers, if any | - %H,I | .56% | .63% | .63% | .66% | .78%H |
| Expenses net of all reductions | - %H,I | .56% | .63% | .63% | .66% | .77%H |
| Net investment income (loss) | 2.36%H | 1.83% | 1.89% | 1.82% | 1.87% | 1.42%H |
| Supplemental Data | ||||||
| Net assets, end of period (000 omitted) | $13,262,086 | $4,904,453 | $3,411,837 | $3,849,841 | $3,910,455 | $1,000,854 |
| Portfolio turnover rateJ | 40%H | 54%K | 36% | 40% | 53%K | 80%H |
A For the period December 6, 2012 (commencement of operations) to June 30, 2013.
B Calculated based on average shares outstanding during the period.
C Total distributions of $.59 per share is comprised of distributions from net investment income of $.235 and distributions from net realized gain of $.359 per share.
D Total returns for periods of less than one year are not annualized.
E Total returns would have been lower if certain expenses had not been reduced during the applicable periods shown.
F Fees and expenses of any underlying Fidelity Central Funds are not included in the Fund's expense ratio. The Fund indirectly bears its proportionate share of the expenses of any underlying Fidelity Central Funds.
G Expense ratios reflect operating expenses of the Fund. Expenses before reductions do not reflect amounts reimbursed by the investment adviser or reductions from brokerage service arrangements or reductions from other expense offset arrangements and do not represent the amount paid by the class during periods when reimbursements or reductions occur. Expense ratios before reductions for start-up periods may not be representative of longer-term operating periods. Expenses net of fee waivers reflect expenses after reimbursement by the investment adviser but prior to reductions from brokerage service arrangements or other expense offset arrangements. Expenses net of all reductions represent the net expenses paid by the class.
H Annualized
I Amount represents less than .005%.
J Amount does not include the portfolio activity of any underlying Fidelity Central Funds.
K Portfolio turnover rate excludes securities received or delivered in-kind.
See accompanying notes which are an integral part of the financial statements.
Notes to Financial Statements (Unaudited)
For the period ended December 31, 2017
1. Organization.
Fidelity Series Growth & Income Fund (the Fund) is a fund of Fidelity Hastings Street Trust (the Trust) and is authorized to issue an unlimited number of shares. Shares of the Fund are only available for purchase by mutual funds for which FMR or an affiliate serves as an investment manager. The Trust is registered under the Investment Company Act of 1940, as amended (the 1940 Act), as an open-end management investment company organized as a Massachusetts business trust. Effective August 28, 2017, the Fund no longer offered Class F, and all outstanding shares of Class F were exchanged for shares of Series Growth and Income.
2. Investments in Fidelity Central Funds.
The Fund invests in Fidelity Central Funds, which are open-end investment companies generally available only to other investment companies and accounts managed by the investment adviser and its affiliates. The Fund's Schedule of Investments lists each of the Fidelity Central Funds held as of period end, if any, as an investment of the Fund, but does not include the underlying holdings of each Fidelity Central Fund. As an Investing Fund, the Fund indirectly bears its proportionate share of the expenses of the underlying Fidelity Central Funds.
The Money Market Central Funds seek preservation of capital and current income and are managed by Fidelity Investments Money Management, Inc. (FIMM), an affiliate of the investment adviser. Annualized expenses of the Money Market Central Funds as of their most recent shareholder report date are less than .005%.
A complete unaudited list of holdings for each Fidelity Central Fund is available upon request or at the Securities and Exchange Commission (the SEC) website at www.sec.gov. In addition, the financial statements of the Fidelity Central Funds are available on the SEC website or upon request.
3. Significant Accounting Policies.
The Fund is an investment company and applies the accounting and reporting guidance of the Financial Accounting Standards Board (FASB) Accounting Standards Codification Topic 946 Financial Services – Investments Companies. The financial statements have been prepared in conformity with accounting principles generally accepted in the United States of America (GAAP), which require management to make certain estimates and assumptions at the date of the financial statements. Actual results could differ from those estimates. Subsequent events, if any, through the date that the financial statements were issued have been evaluated in the preparation of the financial statements. The following summarizes the significant accounting policies of the Fund:
Investment Valuation. Investments are valued as of 4:00 p.m. Eastern time on the last calendar day of the period. The Board of Trustees (the Board) has delegated the day to day responsibility for the valuation of the Fund's investments to the Fair Value Committee (the Committee) established by the Fund's investment adviser. In accordance with valuation policies and procedures approved by the Board, the Fund attempts to obtain prices from one or more third party pricing vendors or brokers to value its investments. When current market prices, quotations or currency exchange rates are not readily available or reliable, investments will be fair valued in good faith by the Committee, in accordance with procedures adopted by the Board. Factors used in determining fair value vary by investment type and may include market or investment specific events, changes in interest rates and credit quality. The frequency with which these procedures are used cannot be predicted and they may be utilized to a significant extent. The Committee oversees the Fund's valuation policies and procedures and reports to the Board on the Committee's activities and fair value determinations. The Board monitors the appropriateness of the procedures used in valuing the Fund's investments and ratifies the fair value determinations of the Committee.
The Fund categorizes the inputs to valuation techniques used to value its investments into a disclosure hierarchy consisting of three levels as shown below:
- Level 1 – quoted prices in active markets for identical investments
- Level 2 – other significant observable inputs (including quoted prices for similar investments, interest rates, prepayment speeds, etc.)
- Level 3 – unobservable inputs (including the Fund's own assumptions based on the best information available)
Valuation techniques used to value the Fund's investments by major category are as follows:
Equity securities, including restricted securities, for which market quotations are readily available, are valued at the last reported sale price or official closing price as reported by a third party pricing vendor on the primary market or exchange on which they are traded and are categorized as Level 1 in the hierarchy. In the event there were no sales during the day or closing prices are not available, securities are valued at the last quoted bid price or may be valued using the last available price and are generally categorized as Level 2 in the hierarchy. For foreign equity securities, when market or security specific events arise, comparisons to the valuation of American Depositary Receipts (ADRs), futures contracts, Exchange-Traded Funds (ETFs) and certain indexes as well as quoted prices for similar securities may be used and would be categorized as Level 2 in the hierarchy. Utilizing these techniques may result in transfers between Level 1 and Level 2. For equity securities, including restricted securities, where observable inputs are limited, assumptions about market activity and risk are used and these securities may be categorized as Level 3 in the hierarchy.
Debt securities, including restricted securities, are valued based on evaluated prices received from third party pricing vendors or from brokers who make markets in such securities. Corporate bonds are valued by pricing vendors who utilize matrix pricing which considers yield or price of bonds of comparable quality, coupon, maturity and type or by broker-supplied prices. When independent prices are unavailable or unreliable, debt securities may be valued utilizing pricing methodologies which consider similar factors that would be used by third party pricing vendors. Debt securities are generally categorized as Level 2 in the hierarchy but may be Level 3 depending on the circumstances.
Exchange-traded options are valued using the last sale price or, in the absence of a sale, the last offering price and are categorized as Level 1 in the hierarchy. Investments in open-end mutual funds, including the Fidelity Central Funds, are valued at their closing net asset value (NAV) each business day and are categorized as Level 1 in the hierarchy.
Changes in valuation techniques may result in transfers in or out of an assigned level within the disclosure hierarchy. The aggregate value of investments by input level as of December 31, 2017, is included at the end of the Fund's Schedule of Investments.
Foreign Currency. The Fund may use foreign currency contracts to facilitate transactions in foreign-denominated securities. Gains and losses from these transactions may arise from changes in the value of the foreign currency or if the counterparties do not perform under the contracts' terms.
Foreign-denominated assets, including investment securities, and liabilities are translated into U.S. dollars at the exchange rates at period end. Purchases and sales of investment securities, income and dividends received and expenses denominated in foreign currencies are translated into U.S. dollars at the exchange rate in effect on the transaction date.
The effects of exchange rate fluctuations on investments are included with the net realized and unrealized gain (loss) on investment securities. Other foreign currency transactions resulting in realized and unrealized gain (loss) are disclosed separately.
Investment Transactions and Income. For financial reporting purposes, the Fund's investment holdings and NAV include trades executed through the end of the last business day of the period. The NAV per share for processing shareholder transactions is calculated as of the close of business of the New York Stock Exchange (NYSE), normally 4:00 p.m. Eastern time and includes trades executed through the end of the prior business day. Gains and losses on securities sold are determined on the basis of identified cost and includes proceeds received from litigation. Dividend income is recorded on the ex-dividend date, except for certain dividends from foreign securities where the ex-dividend date may have passed, which are recorded as soon as the Fund is informed of the ex-dividend date. Non-cash dividends included in dividend income, if any, are recorded at the fair market value of the securities received. Income and capital gain distributions from Fidelity Central Funds, if any, are recorded on the ex-dividend date. Certain distributions received by the Fund represent a return of capital or capital gain. The Fund determines the components of these distributions subsequent to the ex-dividend date, based upon receipt of tax filings or other correspondence relating to the underlying investment. These distributions are recorded as a reduction of cost of investments and/or as a realized gain. Interest income is accrued as earned and includes coupon interest and amortization of premium and accretion of discount on debt securities as applicable. Investment income is recorded net of foreign taxes withheld where recovery of such taxes is uncertain.
Class Allocations and Expenses. Investment income, realized and unrealized capital gains and losses, common expenses of the Fund, and certain fund-level expense reductions, if any, are allocated daily on a pro-rata basis to each class based on the relative net assets of each class to the total net assets of the Fund. Each class differs with respect to fees incurred. Certain expense reductions may also differ by class. For the reporting period, the allocated portion of income and expenses to each class as a percent of its average net assets may vary due to the timing of recording these transactions in relation to fluctuating net assets of the classes. Expenses directly attributable to a fund are charged to that fund. Expenses attributable to more than one fund are allocated among the respective funds on the basis of relative net assets or other appropriate methods. Expense estimates are accrued in the period to which they relate and adjustments are made when actual amounts are known.
Income Tax Information and Distributions to Shareholders. Each year, the Fund intends to qualify as a regulated investment company under Subchapter M of the Internal Revenue Code, including distributing substantially all of its taxable income and realized gains. As a result, no provision for U.S. Federal income taxes is required. The Fund files a U.S. federal tax return, in addition to state and local tax returns as required. The Fund's federal income tax returns are subject to examination by the Internal Revenue Service (IRS) for a period of three fiscal years after they are filed. State and local tax returns may be subject to examination for an additional fiscal year depending on the jurisdiction. Foreign taxes are provided for based on the Fund's understanding of the tax rules and rates that exist in the foreign markets in which it invests.
Distributions are declared and recorded on the ex-dividend date. Income dividends and capital gain distributions are declared separately for each class. Income and capital gain distributions are determined in accordance with income tax regulations, which may differ from GAAP.
Capital accounts within the financial statements are adjusted for permanent book-tax differences. These adjustments have no impact on net assets or the results of operations. Capital accounts are not adjusted for temporary book-tax differences which will reverse in a subsequent period.
Book-tax differences are primarily due to foreign currency transactions, passive foreign investment companies (PFIC), market discount, partnerships, certain conversion ratio adjustments, equity-debt classifications and losses deferred due to wash sales and excise tax regulations.
As of period end, the cost and unrealized appreciation (depreciation) in securities, and derivatives if applicable, for federal income tax purposes were as follows:
| Gross unrealized appreciation | $3,228,353,425 |
| Gross unrealized depreciation | (504,494,017) |
| Net unrealized appreciation (depreciation) | $2,723,859,408 |
| Tax cost | $10,648,328,602 |
Restricted Securities. The Fund may invest in securities that are subject to legal or contractual restrictions on resale. These securities generally may be resold in transactions exempt from registration or to the public if the securities are registered. Disposal of these securities may involve time-consuming negotiations and expense, and prompt sale at an acceptable price may be difficult. Information regarding restricted securities is included at the end of the Fund's Schedule of Investments.
Consolidated Subsidiary. The Fund invests in certain investments through a wholly-owned subsidiary ("Subsidiary"), which may be subject to federal and state taxes upon disposition.
As of period end, the Fund held an investment of $20,011,711 in this Subsidiary, representing .15% of the Fund's net assets. The financial statements have been consolidated and include accounts of the Fund and the Subsidiary. Accordingly, all inter-company transactions and balances have been eliminated.
Any cash held by the Subsidiary is restricted as to its use and is presented as Restricted cash in the Statement of Assets and Liabilities.
4. Derivative Instruments.
Risk Exposures and the Use of Derivative Instruments. The Fund's investment objective allows the Fund to enter into various types of derivative contracts, including options. Derivatives are investments whose value is primarily derived from underlying assets, indices or reference rates and may be transacted on an exchange or over-the-counter (OTC). Derivatives may involve a future commitment to buy or sell a specified asset based on specified terms, to exchange future cash flows at periodic intervals based on a notional principal amount, or for one party to make one or more payments upon the occurrence of specified events in exchange for periodic payments from the other party.
The Fund used derivatives to increase returns and to manage exposure to certain risks as defined below. The success of any strategy involving derivatives depends on analysis of numerous economic factors, and if the strategies for investment do not work as intended, the Fund may not achieve its objectives.
The Fund's use of derivatives increased or decreased its exposure to the following risk:
| Equity Risk | Equity risk relates to the fluctuations in the value of financial instruments as a result of changes in market prices (other than those arising from interest rate risk or foreign exchange risk), whether caused by factors specific to an individual investment, its issuer, or all factors affecting all instruments traded in a market or market segment. |
The Fund is also exposed to additional risks from investing in derivatives, such as liquidity risk and counterparty credit risk. Liquidity risk is the risk that the Fund will be unable to close out the derivative in the open market in a timely manner. Counterparty credit risk is the risk that the counterparty will not be able to fulfill its obligation to the Fund. Derivative counterparty credit risk is managed through formal evaluation of the creditworthiness of all potential counterparties. On certain OTC derivatives such as options, the Fund attempts to reduce its exposure to counterparty credit risk by entering into an International Swaps and Derivatives Association, Inc. (ISDA) Master Agreement with each of its counterparties. The ISDA Master Agreement gives the Fund the right to terminate all transactions traded under such agreement upon the deterioration in the credit quality of the counterparty beyond specified levels. The ISDA Master Agreement gives each party the right, upon an event of default by the other party or a termination of the agreement, to close out all transactions traded under such agreement and to net amounts owed under each transaction to one net payable by one party to the other. To mitigate counterparty credit risk on bi-lateral OTC derivatives, the Fund receives collateral in the form of cash or securities once the Fund's net unrealized appreciation on outstanding derivative contracts under an ISDA Master Agreement exceeds certain applicable thresholds, subject to certain minimum transfer provisions. The collateral received is held in segregated accounts with the Fund's custodian bank in accordance with the collateral agreements entered into between the Fund, the counterparty and the Fund's custodian bank. The Fund could experience delays and costs in gaining access to the collateral even though it is held by the Fund's custodian bank. The Fund's maximum risk of loss from counterparty credit risk related to bi-lateral OTC derivatives is generally the aggregate unrealized appreciation and unpaid counterparty payments in excess of any collateral pledged by the counterparty to the Fund. The Fund may be required to pledge collateral for the benefit of the counterparties on bi-lateral OTC derivatives in an amount not less than each counterparty's unrealized appreciation on outstanding derivative contracts, subject to certain minimum transfer provisions, and any such pledged collateral is identified in the Schedule of Investments. Counterparty credit risk related to exchange-traded options may be mitigated by the protection provided by the exchange on which they trade.
Investing in derivatives may involve greater risks than investing in the underlying assets directly and, to varying degrees, may involve risk of loss in excess of any initial investment and collateral received and amounts recognized in the Statement of Assets and Liabilities. In addition, there may be the risk that the change in value of the derivative contract does not correspond to the change in value of the underlying instrument.
Options. Options give the purchaser the right, but not the obligation, to buy (call) or sell (put) an underlying security or financial instrument at an agreed exercise or strike price between or on certain dates. Options obligate the seller (writer) to buy (put) or sell (call) an underlying instrument at the exercise or strike price or cash settle an underlying derivative instrument if the holder exercises the option on or before the expiration date.
The Fund used exchange-traded and OTC written covered call options to manage its exposure to the market. When the Fund writes a covered call option, the Fund holds the underlying instrument which must be delivered to the holder upon the exercise of the option.
Upon entering into a written options contract, the Fund will receive a premium. Premiums received are reflected as a liability on the Statement of Assets and Liabilities. Options are valued daily and any unrealized appreciation (depreciation) is reflected on the Statement of Assets and Liabilities. When a written option is exercised, the premium is added to the proceeds from the sale of the underlying instrument in determining the gain or loss realized on that investment. When an option is closed the Fund will realize a gain or loss depending on whether the proceeds or amount paid for the closing sale transaction are greater or less than the premium received. When an option expires, gains and losses are realized to the extent of premiums received. The net realized gain (loss) on closed and expired written options and the change in net unrealized appreciation (depreciation) on written options are presented in the Statement of Operations.
Writing call options tends to decrease exposure to the underlying instrument and risk of loss is the change in value in excess of the premium received.
Any open options at period end are presented in the Schedule of Investments under the caption "Written Options", and are representative of volume of activity during the period.
5. Purchases and Sales of Investments.
Purchases and sales of securities, other than short-term securities, aggregated $2,488,417,247 and $2,807,142,632, respectively.
6. Fees and Other Transactions with Affiliates.
Management Fee. Fidelity Management & Research Company (the investment adviser) and its affiliates provide the Fund with investment management related services for which the Fund does not pay a management fee. Under the management contract, the investment adviser or an affiliate pays all ordinary operating expenses of the Fund, except custody fees, fees and expenses of the independent Trustees, and certain miscellaneous expenses such as proxy and shareholder meeting expenses.
Brokerage Commissions. The Fund placed a portion of its portfolio transactions with brokerage firms which are affiliates of the investment adviser. Brokerage commissions are included in net realized gain (loss) and change in net unrealized appreciation (depreciation) in the Statement of Operations. The commissions paid to these affiliated firms were $59,903 for the period.
Interfund Lending Program. Pursuant to an Exemptive Order issued by the SEC, the Fund, along with other registered investment companies having management contracts with Fidelity Management & Research Company (FMR) or other affiliated entities of FMR, may participate in an interfund lending program. This program provides an alternative credit facility allowing the funds to borrow from, or lend money to, other participating affiliated funds. At period end, there were no interfund loans outstanding. The Fund's activity in this program during the period for which loans were outstanding was as follows:
| Borrower or Lender | Average Loan Balance | Weighted Average Interest Rate | Interest Expense |
| Borrower | $107,577,500 | 1.47% | $8,774 |
Interfund Trades. The Fund may purchase from or sell securities to other Fidelity Funds under procedures adopted by the Board. The procedures have been designed to ensure these interfund trades are executed in accordance with Rule 17a-7 of the 1940 Act. Interfund trades are included within the respective purchases and sales amounts shown in the Purchases and Sales of Investments note.
Prior Fiscal Year Exchanges In-Kind. During the prior period, certain affiliated entities (Investing Funds) completed exchanges in-kind with the Fund. The Investing Funds delivered investments and cash valued at $3,024,754,769 in exchange for 201,755,383 shares of the Fund. The amount of in-kind exchanges is included in share transactions in the accompanying Statement of Changes in Net Assets as well as the Notes to Financial Statements. The Fund recognized no gain or loss for federal income tax purposes.
7. Committed Line of Credit.
The Fund participates with other funds managed by the investment adviser or an affiliate in a $4.25 billion credit facility (the "line of credit") to be utilized for temporary or emergency purposes to fund shareholder redemptions or for other short-term liquidity purposes. The Fund has agreed to pay commitment fees on its pro-rata portion of the line of credit, which amounted to $16,991 and is reflected in Miscellaneous expenses on the Statement of Operations. During the period, the Fund did not borrow on this line of credit.
8. Security Lending.
The Fund lends portfolio securities through a lending agent from time to time in order to earn additional income. For equity securities, a lending agent is used and may loan securities to certain qualified borrowers, including Fidelity Capital Markets (FCM), a broker-dealer affiliated with the Fund. On the settlement date of the loan, the Fund receives collateral (in the form of U.S. Treasury obligations, letters of credit and/or cash) against the loaned securities and maintains collateral in an amount not less than 100% of the market value of the loaned securities during the period of the loan. The market value of the loaned securities is determined at the close of business of the Fund and any additional required collateral is delivered to the Fund on the next business day. The Fund or borrower may terminate the loan at any time, and if the borrower defaults on its obligation to return the securities loaned because of insolvency or other reasons, the Fund may apply collateral received from the borrower against the obligation. The Fund may experience delays and costs in recovering the securities loaned. Any cash collateral received is invested in the Fidelity Securities Lending Cash Central Fund. The value of loaned securities and cash collateral at period end are disclosed on the Fund's Statement of Assets and Liabilities. The value of securities loaned to FCM at period end was $101,178. Security lending income represents the income earned on investing cash collateral, less rebates paid to borrowers and any lending agent fees associated with the loan, plus any premium payments received for lending certain types of securities. Security lending income is presented in the Statement of Operations as a component of income from Fidelity Central Funds. Total security lending income during the period amounted to $145,989, including $14,059 from securities loaned to FCM.
9. Expense Reductions.
During the period the investment adviser reimbursed and/or waived a portion of fund-level operating expenses in the amount of $41,195.
10. Distributions to Shareholders.
Distributions to shareholders of each class were as follows:
| Six months ended December 31, 2017 | Year ended June 30, 2017 | |
| From net investment income | ||
| Series Growth and Income | $200,634,656 | $48,856,189 |
| Class F | 28,152,626 | 84,785,151 |
| Total | $228,787,282 | $133,641,340 |
| From net realized gain | ||
| Series Growth and Income | $266,448,987 | $4,884,467 |
| Class F | 181,756,560 | 7,608,021 |
| Total | $448,205,547 | $12,492,488 |
11. Share Transactions.
Transactions for each class of shares were as follows:
| Shares | Shares | Dollars | Dollars | |
| Six months ended December 31, 2017 | Year ended June 30, 2017 | Six months ended December 31, 2017 | Year ended June 30, 2017 | |
| Series Growth and Income | ||||
| Shares sold | 564,373,754 | 97,037,852(a) | $8,244,317,481 | $1,440,536,935(a) |
| Reinvestment of distributions | 30,707,720 | 3,953,948 | 467,083,643 | 53,740,656 |
| Shares redeemed | (79,897,355) | (45,528,048) | (1,220,812,477) | (639,527,031) |
| Net increase (decrease) | 515,184,119 | 55,463,752 | $7,490,588,647 | $854,750,560 |
| Class F | ||||
| Shares sold | 10,170,158 | 167,724,008(a) | $153,318,165 | $2,478,334,345(a) |
| Reinvestment of distributions | 14,338,215 | 6,778,501 | 209,909,186 | 92,393,172 |
| Shares redeemed | (529,257,587) | (91,118,116) | (7,728,026,173) | (1,288,199,631) |
| Net increase (decrease) | (504,749,214) | 83,384,393 | $(7,364,798,822) | $1,282,527,886 |
(a) Amount includes in-kind exchanges (see the Exchanges In-Kind note for additional details).
12. Other.
The Fund's organizational documents provide former and current trustees and officers with a limited indemnification against liabilities arising in connection with the performance of their duties to the Fund. In the normal course of business, the Fund may also enter into contracts that provide general indemnifications. The Fund's maximum exposure under these arrangements is unknown as this would be dependent on future claims that may be made against the Fund. The risk of material loss from such claims is considered remote.
At the end of the period, mutual funds managed by the investment adviser or its affiliates were the owners of record of all of the outstanding shares of the Fund.
Shareholder Expense Example
As a shareholder of the Fund, you incur two types of costs: (1) transaction costs, and (2) ongoing costs, including other Fund expenses. This Example is intended to help you understand your ongoing costs (in dollars) of investing in the Fund and to compare these costs with the ongoing costs of investing in other mutual funds.
The Example is based on an investment of $1,000 invested at the beginning of the period and held for the entire period (July 1, 2017 to December 31, 2017).
Actual Expenses
The first line of the accompanying table provides information about actual account values and actual expenses. You may use the information in this line, together with the amount you invested, to estimate the expenses that you paid over the period. Simply divide your account value by $1,000.00 (for example, an $8,600 account value divided by $1,000.00 = 8.6), then multiply the result by the number in the first line under the heading entitled "Expenses Paid During Period" to estimate the expenses you paid on your account during this period. In addition, the Fund, as a shareholder in the underlying Fidelity Central Funds, will indirectly bear its pro-rata share of the fees and expenses incurred by the underlying Fidelity Central Funds. These fees and expenses are not included in the Fund's annualized expense ratio used to calculate the expense estimate in the table below.
Hypothetical Example for Comparison Purposes
The second line of the accompanying table provides information about hypothetical account values and hypothetical expenses based on the Fund's actual expense ratio and an assumed rate of return of 5% per year before expenses, which is not the Fund's actual return. The hypothetical account values and expenses may not be used to estimate the actual ending account balance or expenses you paid for the period. You may use this information to compare the ongoing costs of investing in the Fund and other funds. To do so, compare this 5% hypothetical example with the 5% hypothetical examples that appear in the shareholder reports of the other funds. In addition, the Fund, as a shareholder in the underlying Fidelity Central Funds, will indirectly bear its pro-rata share of the fees and expenses incurred by the underlying Fidelity Central Funds. These fees and expenses are not included in the Fund's annualized expense ratio used to calculate the expense estimate in the table below.
Please note that the expenses shown in the table are meant to highlight your ongoing costs only and do not reflect any transaction costs. Therefore, the second line of the table is useful in comparing ongoing costs only, and will not help you determine the relative total costs of owning different funds.
| Annualized Expense Ratio-A | Beginning Account Value July 1, 2017 | Ending Account Value December 31, 2017 | Expenses Paid During Period-B July 1, 2017 to December 31, 2017 | |
| Series Growth and Income | - %C | |||
| Actual | $1,000.00 | $1,107.50 | $- | |
| Hypothetical-D | $1,000.00 | $1,025.21 | $- |
A Annualized expense ratio reflects expenses net of applicable fee waivers.
B Expenses are equal to the Fund's annualized expense ratio, multiplied by the average account value over the period, multiplied by 184/365 (to reflect the one-half year period).
C Amount represents less than .005%.
D 5% return per year before expenses
Board Approval of Investment Advisory Contracts and Management Fees
Fidelity Series Growth & Income Fund
Each year, the Board of Trustees, including the Independent Trustees (together, the Board), votes on the renewal of the management contract with Fidelity Management & Research Company (FMR) and the sub-advisory agreements (together, the Advisory Contracts) for the fund. FMR and the sub-advisers are referred to herein as the Investment Advisers. The Board, assisted by the advice of fund counsel and Independent Trustees' counsel, requests and considers a broad range of information relevant to the renewal of the Advisory Contracts throughout the year.
The Board meets regularly and, at each of its meetings, covers an extensive agenda of topics and materials and considers factors that are relevant to its annual consideration of the renewal of the fund's Advisory Contracts, including the services and support provided to the fund and its shareholders. The Board has established various standing committees (Committees), each composed of and chaired by Independent Trustees with varying backgrounds, to which the Board has assigned specific subject matter responsibilities in order to enhance effective decision-making by the Board. The Board, acting directly and through its Committees, requests and receives information concerning the annual consideration of the renewal of the fund's Advisory Contracts. The Board also meets as needed to review matters specifically related to the Board's annual consideration of the renewal of the Advisory Contracts. Members of the Board may also meet with trustees of other Fidelity funds through ad hoc joint committees to discuss certain matters relevant to all of the Fidelity funds.
At its July 2017 meeting, the Board unanimously determined to renew the fund's Advisory Contracts. In reaching its determination, the Board considered that the Advisory Contracts currently in place had become effective on June 1, 2017 in connection with shareholders of certain other Fidelity funds that invest in the fund (referred to herein as Freedom Funds) voting to approve new management contracts for the Freedom Funds. The Board noted the Advisory Contracts implemented a new fee structure pursuant to which the fund does not pay a management fee to FMR. The Board also approved certain amendments to the sub-advisory agreements for the fund to ensure consistency in the sub-advisory fees paid under the new fee structure compared to the sub-advisory fees paid under the prior fee structure. The Board noted that the amendments will not result in any changes to the nature, extent, and quality of services provided to the fund.
In considering whether to renew the Advisory Contracts for the fund, the Board considered all factors it believed relevant and reached a determination, with the assistance of fund counsel and Independent Trustees' counsel and through the exercise of its business judgment, that the renewal of the Advisory Contracts was in the best interests of the fund and its shareholders and the fact that no fee is payable under the management contract was fair and reasonable.
Nature, Extent, and Quality of Services Provided. The Board considered Fidelity's staffing as it relates to the fund, including the backgrounds of investment personnel of Fidelity, and also considered the fund's investment objective, strategies, and related investment philosophy. The Independent Trustees also had discussions with senior management of Fidelity's investment operations and investment groups. The Board considered the structure of the investment personnel compensation program and whether this structure provides appropriate incentives to act in the best interests of the fund.Resources Dedicated to Investment Management and Support Services. The Board and the Fund Oversight and Research Committees reviewed the general qualifications and capabilities of Fidelity's investment staff, including its size, education, experience, and resources, as well as Fidelity's approach to recruiting, training, managing, and compensating investment personnel. The Board noted that Fidelity has continued to increase the resources devoted to non-U.S. offices, including expansion of Fidelity's global investment organization. The Board also noted that Fidelity's analysts have extensive resources, tools and capabilities that allow them to conduct sophisticated quantitative and fundamental analysis, as well as credit analysis of issuers, counterparties and guarantors. Further, the Board considered that Fidelity's investment professionals have sufficient access to global information and data so as to provide competitive investment results over time, and that those professionals also have access to sophisticated tools that permit them to assess portfolio construction and risk and performance attribution characteristics continuously, as well as to transmit new information and research conclusions rapidly around the world. Additionally, in its deliberations, the Board considered Fidelity's trading, risk management, compliance, and technology and operations capabilities and resources, which are integral parts of the investment management process.Administrative Services. The Board considered (i) the nature, extent, quality, and cost of advisory and administrative services performed by the Investment Advisers and their affiliates under the Advisory Contracts and under separate agreements covering transfer agency, pricing and bookkeeping, and securities lending services for the fund; (ii) the nature and extent of the supervision of third party service providers, principally custodians, subcustodians, and pricing vendors; and (iii) the resources devoted to, and the record of compliance with, the fund's compliance policies and procedures. The Board also reviewed the allocation of fund brokerage, including allocations to brokers affiliated with the Investment Advisers, the use of brokerage commissions to pay fund expenses, and the use of "soft" commission dollars to pay for research services.Investment Performance. The Board considered whether the fund has operated in accordance with its investment objective, as well as its record of compliance with its investment restrictions. The Board reviewed the fund's absolute investment performance, as well as the fund's relative investment performance, but did not consider performance to be a material factor in its decision to renew the fund's Advisory Contracts, as the fund is not publicly offered as a stand-alone investment product. In this regard, the Board noted that the fund is designed to offer an investment option for other investment companies managed by Fidelity and ultimately to enhance the performance of those investment companies.Based on its review, the Board concluded that the nature, extent, and quality of services provided to the fund under the Advisory Contracts should continue to benefit the shareholders of the fund.Competitiveness of Management Fee and Total Expense Ratio. The Board considered that the fund does not pay FMR a management fee for investment advisory services. The Board also noted that FMR or an affiliate undertakes to pay all operating expenses of the fund, except transfer agent fees, 12b-1 fees, Independent Trustee fees and expenses, custodian fees and expenses, proxy and shareholder meeting expenses, interest, taxes, brokerage expenses, and extraordinary expenses (such as litigation expenses).The Board further considered that, effective June 1, 2017, FMR has contractually agreed to reimburse the fund to the extent that total operating expenses (excluding interest, certain taxes, certain securities lending costs, brokerage commissions, fees and expenses of the Independent Trustees, proxy and shareholder meeting expenses, extraordinary expenses, and acquired fund fees and expenses, if any), as a percentage of its average net assets, exceed 0.014% through August 31, 2020.Based on its review, the Board considered that the fund does not pay a management fee and concluded that the total expense ratio of each class of the fund was reasonable in light of the services that the fund and its shareholders receive and the other factors considered.Costs of the Services and Profitability. The Board considered the level of Fidelity's profits in respect of all the Fidelity funds.PricewaterhouseCoopers LLP (PwC), independent registered public accounting firm and auditor to Fidelity and certain Fidelity funds, has been engaged annually by the Board as part of the Board's assessment of Fidelity's profitability analysis. PwC's engagement includes the review and assessment of the methodologies used by Fidelity in determining the revenues and expenses attributable to Fidelity's mutual fund business, and completion of agreed-upon procedures in respect of the mathematical accuracy of the fund profitability information and its conformity to established allocation methodologies. After considering PwC's reports issued under the engagement and information provided by Fidelity, the Board concluded that while other allocation methods may also be reasonable, Fidelity's profitability methodologies are reasonable in all material respects.The Board also reviewed Fidelity's non-fund businesses and potential fall-out benefits related to the mutual fund business as well as cases where Fidelity's affiliates may benefit from or be related to the fund's business.The Board concluded that the costs of the services provided by and the profits realized by Fidelity in connection with the operation of the fund were not relevant to the renewal of the Advisory Contracts because the fund pays no advisory fees and FMR or an affiliate bears all expenses of the fund, with limited exceptions.Economies of Scale. The Board concluded that because the fund pays no advisory fees and FMR or an affiliate bears all expenses of the fund, with limited exceptions, economies of scale cannot be realized by the fund.Additional Information Requested by the Board. In order to develop fully the factual basis for consideration of the Fidelity funds' advisory contracts, the Board requested and received additional information on certain topics, including: (i) fund performance trends, in particular the underperformance of certain funds, and Fidelity's long-term strategies for certain funds; (ii) Fidelity's fund profitability methodology, profitability trends for certain funds, and the impact of certain factors on fund profitability results, including the impact of market trends on actively managed funds; (iii) the use of performance fees and the calculation of performance adjustments, including the impact of underperformance and fund outflows on performance adjustments; (iv) metrics for evaluating index fund performance; (v) Fidelity's group fee structure, including the group fee breakpoint schedules; (vi) the terms of Fidelity's contractual and voluntary expense cap arrangements with the funds; (vii) the methodology with respect to evaluating competitive fund data and peer group classifications and fee comparisons; (viii) the expense structures for different funds and classes; (ix) Fidelity's arrangements with affiliated sub-advisers on behalf of the funds; (x) information regarding other accounts managed by Fidelity, including institutional accounts and collective investment trusts; (xi) recent changes to the fee structure for certain funds of funds; and (xii) the impact of the Department of Labor's new fiduciary rule on the funds' comparative expense information.Based on its evaluation of all of the conclusions noted above, and after considering all factors it believed relevant, the Board concluded that the advisory fee structures are fair and reasonable, and that the fund's Advisory Contracts should be renewed.![]()
Corporate Headquarters
245 Summer St.
Boston, MA 02210
www.fidelity.com
MHT-SANN-0218
1.951032.105
Fidelity Advisor® Series Growth & Income Fund Semi-Annual Report December 31, 2017 |
|
Contents
Board Approval of Investment Advisory Contracts and Management Fees |
To view a fund's proxy voting guidelines and proxy voting record for the 12-month period ended June 30, visit http://www.fidelity.com/proxyvotingresults or visit the Securities and Exchange Commission's (SEC) web site at http://www.sec.gov.
You may also call 1-877-208-0098 to request a free copy of the proxy voting guidelines.
Standard & Poor's, S&P and S&P 500 are registered service marks of The McGraw-Hill Companies, Inc. and have been licensed for use by Fidelity Distributors Corporation.
Other third-party marks appearing herein are the property of their respective owners.
All other marks appearing herein are registered or unregistered trademarks or service marks of FMR LLC or an affiliated company. © 2018 FMR LLC. All rights reserved.
This report and the financial statements contained herein are submitted for the general information of the shareholders of the Fund. This report is not authorized for distribution to prospective investors in the Fund unless preceded or accompanied by an effective prospectus.
A fund files its complete schedule of portfolio holdings with the SEC for the first and third quarters of each fiscal year on Form N-Q. Forms N-Q are available on the SEC’s web site at http://www.sec.gov. A fund's Forms N-Q may be reviewed and copied at the SEC’s Public Reference Room in Washington, DC. Information regarding the operation of the SEC's Public Reference Room may be obtained by calling 1-800-SEC-0330.
For a complete list of a fund's portfolio holdings, view the most recent holdings listing, semiannual report, or annual report on Fidelity's web site at http://www.fidelity.com, http://www.institutional.fidelity.com, or http://www.401k.com, as applicable.
NOT FDIC INSURED •MAY LOSE VALUE •NO BANK GUARANTEE
Neither the Fund nor Fidelity Distributors Corporation is a bank.
Investment Summary (Unaudited)
Top Ten Stocks as of December 31, 2017
| % of fund's net assets | |
| Bank of America Corp.(a) | 3.6 |
| Microsoft Corp.(a) | 3.6 |
| Citigroup, Inc.(a) | 3.0 |
| JPMorgan Chase & Co.(a) | 3.0 |
| Comcast Corp. Class A | 2.2 |
| Apple, Inc.(a) | 2.2 |
| Wells Fargo & Co. | 2.1 |
| ConocoPhillips Co. | 1.9 |
| Chevron Corp. | 1.9 |
| State Street Corp. | 1.9 |
| 25.4 |
(a) Security or a portion of the security is pledged as collateral for call options written.
Top Five Market Sectors as of December 31, 2017
| % of fund's net assets | |
| Financials | 22.8 |
| Information Technology | 16.4 |
| Energy | 13.1 |
| Health Care | 12.4 |
| Industrials | 11.9 |
Asset Allocation (% of fund's net assets)
| As of December 31, 2017*,** | ||
| Stocks | 98.9% | |
| Convertible Securities | 0.4% | |
| Other Investments | 0.2% | |
| Short-Term Investments and Net Other Assets (Liabilities) | 0.5% | |

* Foreign investments - 10.6%
** Written options - (0.1)%
Investments December 31, 2017 (Unaudited)
Showing Percentage of Net Assets
| Common Stocks - 98.9% | |||
| Shares | Value | ||
| CONSUMER DISCRETIONARY - 7.7% | |||
| Auto Components - 0.2% | |||
| Gentex Corp. | 137,900 | $2,889,005 | |
| Hotels, Restaurants & Leisure - 0.4% | |||
| Cedar Fair LP (depositary unit) | 7,600 | 493,924 | |
| DineEquity, Inc. | 27,200 | 1,379,856 | |
| Dunkin' Brands Group, Inc. | 66,400 | 4,280,808 | |
| Marriott International, Inc. Class A | 5,100 | 692,223 | |
| 6,846,811 | |||
| Media - 3.8% | |||
| Comcast Corp. Class A | 971,480 | 38,907,774 | |
| Interpublic Group of Companies, Inc. | 366,000 | 7,378,560 | |
| Omnicom Group, Inc. | 45,000 | 3,277,350 | |
| The Walt Disney Co. | 82,300 | 8,848,073 | |
| Time Warner, Inc. | 64,500 | 5,899,815 | |
| Viacom, Inc. Class B (non-vtg.) | 43,300 | 1,334,073 | |
| 65,645,645 | |||
| Multiline Retail - 0.6% | |||
| Dollar General Corp. | 37,700 | 3,506,477 | |
| Macy's, Inc. | 63,800 | 1,607,122 | |
| Target Corp. (a) | 88,563 | 5,778,736 | |
| 10,892,335 | |||
| Specialty Retail - 2.7% | |||
| L Brands, Inc. (a) | 175,200 | 10,550,544 | |
| Lowe's Companies, Inc. (a) | 218,677 | 20,323,840 | |
| Ross Stores, Inc. | 55,000 | 4,413,750 | |
| TJX Companies, Inc. | 118,200 | 9,037,572 | |
| Williams-Sonoma, Inc. (b) | 55,500 | 2,869,350 | |
| 47,195,056 | |||
| TOTAL CONSUMER DISCRETIONARY | 133,468,852 | ||
| CONSUMER STAPLES - 9.6% | |||
| Beverages - 2.0% | |||
| Coca-Cola European Partners PLC | 21,600 | 860,760 | |
| Dr. Pepper Snapple Group, Inc. | 31,200 | 3,028,272 | |
| Molson Coors Brewing Co. Class B | 104,500 | 8,576,315 | |
| The Coca-Cola Co. | 474,298 | 21,760,792 | |
| 34,226,139 | |||
| Food & Staples Retailing - 2.3% | |||
| CVS Health Corp. | 229,190 | 16,616,275 | |
| Kroger Co. (a) | 289,800 | 7,955,010 | |
| Wal-Mart Stores, Inc. | 159,600 | 15,760,500 | |
| 40,331,785 | |||
| Food Products - 0.8% | |||
| Campbell Soup Co. | 66,500 | 3,199,315 | |
| Kellogg Co. | 58,800 | 3,997,224 | |
| Snyders-Lance, Inc. | 24,300 | 1,216,944 | |
| The J.M. Smucker Co. | 48,100 | 5,975,944 | |
| 14,389,427 | |||
| Household Products - 2.0% | |||
| Kimberly-Clark Corp. | 40,000 | 4,826,400 | |
| Procter & Gamble Co. (a) | 250,087 | 22,977,994 | |
| Reckitt Benckiser Group PLC | 64,500 | 6,017,429 | |
| 33,821,823 | |||
| Personal Products - 0.4% | |||
| Coty, Inc. Class A | 34,200 | 680,238 | |
| Unilever NV (NY Reg.) | 110,800 | 6,240,256 | |
| 6,920,494 | |||
| Tobacco - 2.1% | |||
| Altria Group, Inc. | 359,700 | 25,686,177 | |
| British American Tobacco PLC sponsored ADR | 171,700 | 11,502,183 | |
| 37,188,360 | |||
| TOTAL CONSUMER STAPLES | 166,878,028 | ||
| ENERGY - 12.9% | |||
| Energy Equipment & Services - 0.9% | |||
| Baker Hughes, a GE Co. Class A | 201,400 | 6,372,296 | |
| Nabors Industries Ltd. | 188,000 | 1,284,040 | |
| National Oilwell Varco, Inc. | 131,900 | 4,751,038 | |
| Oceaneering International, Inc. | 157,000 | 3,318,980 | |
| Schlumberger Ltd. | 5,400 | 363,906 | |
| 16,090,260 | |||
| Oil, Gas & Consumable Fuels - 12.0% | |||
| Anadarko Petroleum Corp. | 64,000 | 3,432,960 | |
| Apache Corp. | 269,447 | 11,376,052 | |
| BP PLC sponsored ADR | 33,400 | 1,403,802 | |
| Cabot Oil & Gas Corp. | 265,900 | 7,604,740 | |
| Cenovus Energy, Inc. | 1,289,200 | 11,774,078 | |
| Cenovus Energy, Inc. | 8,800 | 80,344 | |
| Chevron Corp. | 259,688 | 32,510,341 | |
| ConocoPhillips Co. | 617,200 | 33,878,108 | |
| Golar LNG Ltd. | 140,400 | 4,185,324 | |
| Imperial Oil Ltd. | 274,200 | 8,557,570 | |
| Kinder Morgan, Inc. | 656,700 | 11,866,569 | |
| Legacy Reserves LP (c) | 226,800 | 365,148 | |
| Phillips 66 Co. | 30,800 | 3,115,420 | |
| Suncor Energy, Inc. | 859,590 | 31,559,331 | |
| Teekay LNG Partners LP | 87,600 | 1,765,140 | |
| The Williams Companies, Inc. | 847,674 | 25,845,580 | |
| Valero Energy Corp. | 58,400 | 5,367,544 | |
| Williams Partners LP | 360,780 | 13,991,048 | |
| 208,679,099 | |||
| TOTAL ENERGY | 224,769,359 | ||
| FINANCIALS - 22.8% | |||
| Banks - 15.4% | |||
| Bank of America Corp. (a) | 2,130,537 | 62,893,448 | |
| Citigroup, Inc. (a) | 694,036 | 51,643,219 | |
| Cullen/Frost Bankers, Inc. | 3,900 | 369,135 | |
| JPMorgan Chase & Co. (a) | 481,988 | 51,543,797 | |
| M&T Bank Corp. | 5,100 | 872,049 | |
| PNC Financial Services Group, Inc. (a) | 107,644 | 15,531,953 | |
| Regions Financial Corp. (a) | 478,500 | 8,268,480 | |
| SunTrust Banks, Inc. | 359,850 | 23,242,712 | |
| U.S. Bancorp | 313,271 | 16,785,060 | |
| Wells Fargo & Co. | 607,900 | 36,881,293 | |
| 268,031,146 | |||
| Capital Markets - 6.5% | |||
| Apollo Global Management LLC Class A | 142,100 | 4,756,087 | |
| Charles Schwab Corp. (a) | 195,354 | 10,035,335 | |
| KKR & Co. LP | 500,178 | 10,533,749 | |
| Morgan Stanley | 267,580 | 14,039,923 | |
| Northern Trust Corp. (a) | 197,010 | 19,679,329 | |
| Oaktree Capital Group LLC Class A | 49,300 | 2,075,530 | |
| S&P Global, Inc. | 43,900 | 7,436,660 | |
| State Street Corp. | 328,374 | 32,052,586 | |
| TD Ameritrade Holding Corp. | 12,900 | 659,577 | |
| The Blackstone Group LP | 355,300 | 11,376,706 | |
| 112,645,482 | |||
| Insurance - 0.7% | |||
| Marsh & McLennan Companies, Inc. | 69,719 | 5,674,429 | |
| MetLife, Inc. | 119,600 | 6,046,976 | |
| 11,721,405 | |||
| Thrifts & Mortgage Finance - 0.2% | |||
| Radian Group, Inc. | 155,252 | 3,199,744 | |
| TOTAL FINANCIALS | 395,597,777 | ||
| HEALTH CARE - 12.1% | |||
| Biotechnology - 2.5% | |||
| Alexion Pharmaceuticals, Inc. (c) | 64,400 | 7,701,596 | |
| Amgen, Inc. | 149,465 | 25,991,964 | |
| Biogen, Inc. (c) | 13,400 | 4,268,838 | |
| Gilead Sciences, Inc. | 10,500 | 752,220 | |
| Intercept Pharmaceuticals, Inc. (c) | 24,000 | 1,402,080 | |
| Shire PLC sponsored ADR | 20,900 | 3,242,008 | |
| 43,358,706 | |||
| Health Care Equipment & Supplies - 1.4% | |||
| Becton, Dickinson & Co. | 4,300 | 920,458 | |
| Boston Scientific Corp. (c) | 123,200 | 3,054,128 | |
| ConvaTec Group PLC (d) | 123,400 | 342,380 | |
| Danaher Corp. | 83,700 | 7,769,034 | |
| Fisher & Paykel Healthcare Corp. | 91,949 | 935,107 | |
| Medtronic PLC | 51,368 | 4,147,966 | |
| ResMed, Inc. | 25,200 | 2,134,188 | |
| Steris PLC | 13,800 | 1,207,086 | |
| Zimmer Biomet Holdings, Inc. | 37,100 | 4,476,857 | |
| 24,987,204 | |||
| Health Care Providers & Services - 3.7% | |||
| Aetna, Inc. | 12,000 | 2,164,680 | |
| AmerisourceBergen Corp. | 66,700 | 6,124,394 | |
| Anthem, Inc. | 43,500 | 9,787,935 | |
| Cardinal Health, Inc. | 179,500 | 10,997,965 | |
| Cigna Corp. | 47,500 | 9,646,775 | |
| Fresenius Medical Care AG & Co. KGaA sponsored ADR | 40,900 | 2,149,295 | |
| Humana, Inc. | 15,100 | 3,745,857 | |
| McKesson Corp. | 69,230 | 10,796,419 | |
| Patterson Companies, Inc. (b) | 71,372 | 2,578,670 | |
| UnitedHealth Group, Inc. | 29,700 | 6,547,662 | |
| 64,539,652 | |||
| Pharmaceuticals - 4.5% | |||
| Allergan PLC | 22,200 | 3,631,476 | |
| AstraZeneca PLC sponsored ADR | 138,700 | 4,812,890 | |
| Bayer AG | 29,800 | 3,703,045 | |
| Bristol-Myers Squibb Co. (a) | 27,300 | 1,672,944 | |
| Eisai Co. Ltd. | 3,200 | 182,216 | |
| GlaxoSmithKline PLC sponsored ADR | 685,740 | 24,323,198 | |
| Innoviva, Inc. (c) | 55,800 | 791,802 | |
| Johnson & Johnson (a) | 181,174 | 25,313,631 | |
| Novartis AG sponsored ADR | 10,032 | 842,287 | |
| Sanofi SA | 53,116 | 4,572,862 | |
| Teva Pharmaceutical Industries Ltd. sponsored ADR (b) | 406,049 | 7,694,629 | |
| 77,540,980 | |||
| TOTAL HEALTH CARE | 210,426,542 | ||
| INDUSTRIALS - 11.8% | |||
| Aerospace & Defense - 2.2% | |||
| General Dynamics Corp. | 21,600 | 4,394,520 | |
| Meggitt PLC | 49,473 | 322,090 | |
| Rolls-Royce Holdings PLC | 287,800 | 3,291,215 | |
| The Boeing Co. (a) | 14,179 | 4,181,529 | |
| United Technologies Corp. | 199,020 | 25,388,981 | |
| 37,578,335 | |||
| Air Freight & Logistics - 1.7% | |||
| C.H. Robinson Worldwide, Inc. (a) | 98,700 | 8,793,183 | |
| Expeditors International of Washington, Inc. | 69,100 | 4,470,079 | |
| United Parcel Service, Inc. Class B | 140,660 | 16,759,639 | |
| 30,022,901 | |||
| Commercial Services & Supplies - 0.1% | |||
| KAR Auction Services, Inc. | 18,500 | 934,435 | |
| Ritchie Brothers Auctioneers, Inc. (b) | 54,900 | 1,643,943 | |
| 2,578,378 | |||
| Construction & Engineering - 0.1% | |||
| Fluor Corp. | 35,100 | 1,812,915 | |
| Electrical Equipment - 0.7% | |||
| Acuity Brands, Inc. | 32,500 | 5,720,000 | |
| Hubbell, Inc. Class B | 44,937 | 6,081,774 | |
| 11,801,774 | |||
| Industrial Conglomerates - 1.7% | |||
| General Electric Co. | 1,701,266 | 29,687,092 | |
| Machinery - 1.1% | |||
| Donaldson Co., Inc. | 32,500 | 1,590,875 | |
| Flowserve Corp. | 189,100 | 7,966,783 | |
| Snap-On, Inc. | 28,100 | 4,897,830 | |
| Wabtec Corp. | 51,700 | 4,209,931 | |
| Zardoya Otis SA | 27,500 | 300,922 | |
| 18,966,341 | |||
| Professional Services - 0.4% | |||
| Intertrust NV (d) | 84,000 | 1,575,307 | |
| Nielsen Holdings PLC | 135,100 | 4,917,640 | |
| 6,492,947 | |||
| Road & Rail - 2.9% | |||
| CSX Corp. (a) | 256,712 | 14,121,727 | |
| J.B. Hunt Transport Services, Inc. (a) | 128,165 | 14,736,412 | |
| Norfolk Southern Corp. | 59,580 | 8,633,142 | |
| Union Pacific Corp. | 98,400 | 13,195,440 | |
| 50,686,721 | |||
| Trading Companies & Distributors - 0.9% | |||
| Brenntag AG | 6,100 | 386,228 | |
| Bunzl PLC | 28,300 | 791,696 | |
| Fastenal Co. | 93,900 | 5,135,391 | |
| Howden Joinery Group PLC | 52,100 | 328,360 | |
| MSC Industrial Direct Co., Inc. Class A | 29,400 | 2,841,804 | |
| Watsco, Inc. | 38,220 | 6,498,929 | |
| 15,982,408 | |||
| TOTAL INDUSTRIALS | 205,609,812 | ||
| INFORMATION TECHNOLOGY - 16.4% | |||
| Communications Equipment - 1.4% | |||
| Cisco Systems, Inc. (a) | 661,540 | 25,336,982 | |
| Electronic Equipment& Components - 0.1% | |||
| Avnet, Inc. | 29,600 | 1,172,752 | |
| Philips Lighting NV (d) | 24,700 | 906,871 | |
| 2,079,623 | |||
| Internet Software & Services - 2.8% | |||
| Alphabet, Inc.: | |||
| Class A (c) | 23,559 | 24,817,051 | |
| Class C (c) | 22,134 | 23,161,018 | |
| 47,978,069 | |||
| IT Services - 3.1% | |||
| Accenture PLC Class A | 22,200 | 3,398,598 | |
| Cognizant Technology Solutions Corp. Class A | 4,700 | 333,794 | |
| MasterCard, Inc. Class A (a) | 55,050 | 8,332,368 | |
| Paychex, Inc. (a) | 249,514 | 16,986,913 | |
| Unisys Corp. (b)(c) | 222,000 | 1,809,300 | |
| Visa, Inc. Class A | 200,480 | 22,858,730 | |
| 53,719,703 | |||
| Semiconductors & Semiconductor Equipment - 2.0% | |||
| Maxim Integrated Products, Inc. | 32,800 | 1,714,784 | |
| Qualcomm, Inc. | 492,010 | 31,498,480 | |
| United Microelectronics Corp. sponsored ADR | 335,600 | 802,084 | |
| Xilinx, Inc. | 14,000 | 943,880 | |
| 34,959,228 | |||
| Software - 4.8% | |||
| Micro Focus International PLC | 130,768 | 4,454,518 | |
| Microsoft Corp. (a) | 732,208 | 62,633,072 | |
| Oracle Corp. | 222,313 | 10,510,959 | |
| SAP SE sponsored ADR | 49,800 | 5,595,528 | |
| 83,194,077 | |||
| Technology Hardware, Storage & Peripherals - 2.2% | |||
| Apple, Inc. (a) | 228,006 | 38,585,455 | |
| TOTAL INFORMATION TECHNOLOGY | 285,853,137 | ||
| MATERIALS - 2.1% | |||
| Chemicals - 1.9% | |||
| CF Industries Holdings, Inc. (a) | 130,400 | 5,547,216 | |
| LyondellBasell Industries NV Class A | 98,700 | 10,888,584 | |
| Monsanto Co. | 34,014 | 3,972,155 | |
| Potash Corp. of Saskatchewan, Inc. | 427,710 | 8,771,968 | |
| PPG Industries, Inc. | 5,700 | 665,874 | |
| The Scotts Miracle-Gro Co. Class A | 25,600 | 2,738,944 | |
| 32,584,741 | |||
| Containers & Packaging - 0.1% | |||
| WestRock Co. | 40,600 | 2,566,326 | |
| Metals & Mining - 0.1% | |||
| BHP Billiton Ltd. sponsored ADR (b) | 8,300 | 381,717 | |
| Reliance Steel & Aluminum Co. | 17,400 | 1,492,746 | |
| 1,874,463 | |||
| TOTAL MATERIALS | 37,025,530 | ||
| REAL ESTATE - 1.0% | |||
| Equity Real Estate Investment Trusts (REITs) - 1.0% | |||
| American Tower Corp. | 19,300 | 2,753,531 | |
| CoreSite Realty Corp. | 32,600 | 3,713,140 | |
| Equinix, Inc. | 5,900 | 2,673,998 | |
| Omega Healthcare Investors, Inc. | 34,400 | 947,376 | |
| Public Storage | 19,300 | 4,033,700 | |
| Sabra Health Care REIT, Inc. | 61,800 | 1,159,986 | |
| Spirit Realty Capital, Inc. | 169,200 | 1,451,736 | |
| 16,733,467 | |||
| TELECOMMUNICATION SERVICES - 1.3% | |||
| Diversified Telecommunication Services - 1.3% | |||
| Verizon Communications, Inc. | 420,559 | 22,260,188 | |
| UTILITIES - 1.2% | |||
| Electric Utilities - 1.1% | |||
| Exelon Corp. | 396,800 | 15,637,888 | |
| PPL Corp. | 79,500 | 2,460,525 | |
| Southern Co. | 10,300 | 495,327 | |
| 18,593,740 | |||
| Multi-Utilities - 0.1% | |||
| Public Service Enterprise Group, Inc. | 30,100 | 1,550,150 | |
| TOTAL UTILITIES | 20,143,890 | ||
| TOTAL COMMON STOCKS | |||
| (Cost $1,364,740,830) | 1,718,766,582 | ||
| Preferred Stocks - 0.3% | |||
| Convertible Preferred Stocks - 0.3% | |||
| HEALTH CARE - 0.2% | |||
| Health Care Equipment & Supplies - 0.2% | |||
| Becton, Dickinson & Co. Series A 6.125% | 45,900 | 2,670,003 | |
| INDUSTRIALS - 0.1% | |||
| Commercial Services & Supplies - 0.1% | |||
| Stericycle, Inc. 2.25% | 26,600 | 1,411,130 | |
| UTILITIES - 0.0% | |||
| Independent Power and Renewable Electricity Producers - 0.0% | |||
| Dynegy, Inc. 7.00% | 10,600 | 835,810 | |
| TOTAL CONVERTIBLE PREFERRED STOCKS | 4,916,943 | ||
| Nonconvertible Preferred Stocks - 0.0% | |||
| INDUSTRIALS - 0.0% | |||
| Aerospace & Defense - 0.0% | |||
| Rolls-Royce Holdings PLC (C Shares) | 59,039,470 | 79,712 | |
| TOTAL PREFERRED STOCKS | |||
| (Cost $5,409,603) | 4,996,655 | ||
| Principal Amount(e) | Value | ||
| Convertible Bonds - 0.1% | |||
| HEALTH CARE - 0.1% | |||
| Pharmaceuticals - 0.1% | |||
| Bayer Capital Corp. BV 5.625% 11/22/19(d) | |||
| (Cost $1,566,118) | EUR 1,400,000 | 1,904,899 | |
| Shares | Value | ||
| Other - 0.2% | |||
| ENERGY - 0.2% | |||
| Oil, Gas & Consumables - 0.2% | |||
| Utica Shale Drilling Program (non-operating revenue interest) (f)(g)(h) | |||
| (Cost $3,197,358) | 3,197,358 | 2,461,966 | |
| Money Market Funds - 1.9% | |||
| Fidelity Cash Central Fund, 1.36% (i) | 18,781,679 | 18,785,436 | |
| Fidelity Securities Lending Cash Central Fund 1.36% (i)(j) | 14,876,127 | 14,879,102 | |
| TOTAL MONEY MARKET FUNDS | |||
| (Cost $33,663,051) | 33,664,538 | ||
| TOTAL INVESTMENT IN SECURITIES - 101.4% | |||
| (Cost $1,408,576,960) | 1,761,794,640 | ||
| NET OTHER ASSETS (LIABILITIES) - (1.4)% | (24,047,929) | ||
| NET ASSETS - 100% | $1,737,746,711 |
| Written Options | ||||||
| Counterparty | Number of Contracts | Notional Amount | Exercise Price | Expiration Date | Value | |
| Call Options | ||||||
| Apple, Inc. | Chicago Board Options Exchange | 129 | $2,183,067 | $185.00 | 2/16/18 | $(14,642) |
| Bank of America Corp. | Chicago Board Options Exchange | 3,529 | 10,417,608 | 30.00 | 1/19/18 | (146,454) |
| Bristol-Myers Squibb Co. | Chicago Board Options Exchange | 222 | 1,360,416 | 65.00 | 1/19/18 | (6,438) |
| C.H. Robinson Worldwide, Inc. | Chicago Board Options Exchange | 150 | 1,336,350 | 92.50 | 2/16/18 | (27,375) |
| CF Industries Holdings, Inc. | Chicago Board Options Exchange | 131 | 557,274 | 40.00 | 2/16/18 | (47,488) |
| Charles Schwab Corp. | Chicago Board Options Exchange | 191 | 981,167 | 55.00 | 3/16/18 | (17,668) |
| Cisco Systems, Inc. | Chicago Board Options Exchange | 660 | 2,527,800 | 41.00 | 3/16/18 | (21,780) |
| Cisco Systems, Inc. | Chicago Board Options Exchange | 660 | 2,527,800 | 40.00 | 3/16/18 | (36,630) |
| Citigroup, Inc. | Chicago Board Options Exchange | 689 | 5,126,849 | 80.00 | 2/16/18 | (32,728) |
| CSX Corp. | Chicago Board Options Exchange | 443 | 2,436,943 | 60.00 | 2/16/18 | (21,486) |
| CSX Corp. | Chicago Board Options Exchange | 441 | 2,425,941 | 62.50 | 2/16/18 | (8,379) |
| J.B. Hunt Transport Services, Inc. | Chicago Board Options Exchange | 128 | 1,471,744 | 120.00 | 2/16/18 | (21,760) |
| Johnson & Johnson | Chicago Board Options Exchange | 185 | 2,584,820 | 145.00 | 2/16/18 | (16,373) |
| JPMorgan Chase & Co. | Chicago Board Options Exchange | 779 | 8,330,626 | 115.00 | 3/16/18 | (72,447) |
| Kroger Co. | Chicago Board Options Exchange | 315 | 864,675 | 28.00 | 2/16/18 | (25,200) |
| Kroger Co. | Chicago Board Options Exchange | 582 | 1,597,590 | 29.00 | 2/16/18 | (27,645) |
| L Brands, Inc. | Chicago Board Options Exchange | 179 | 1,077,938 | 65.00 | 2/16/18 | (29,088) |
| Lowe's Companies, Inc. | Chicago Board Options Exchange | 257 | 2,388,558 | 85.00 | 1/19/18 | (208,813) |
| MasterCard, Inc. Class A | Chicago Board Options Exchange | 100 | 1,513,600 | 150.00 | 1/19/18 | (31,850) |
| Microsoft Corp. | Chicago Board Options Exchange | 372 | 3,182,088 | 90.00 | 2/16/18 | (36,642) |
| Northern Trust Corp. | Chicago Board Options Exchange | 192 | 1,917,888 | 110.00 | 4/20/18 | (21,600) |
| Paychex, Inc. | Chicago Board Options Exchange | 284 | 1,933,472 | 70.00 | 1/19/18 | (8,520) |
| PNC Financial Services Group, Inc. | Chicago Board Options Exchange | 100 | 1,442,900 | 145.00 | 2/16/18 | (37,000) |
| Procter & Gamble Co. | Chicago Board Options Exchange | 265 | 2,434,820 | 92.50 | 2/16/18 | (34,450) |
| Regions Financial Corp. | Chicago Board Options Exchange | 474 | 819,072 | 18.00 | 2/16/18 | (17,538) |
| Target Corp. | Chicago Board Options Exchange | 179 | 1,167,975 | 65.00 | 3/16/18 | (61,751) |
| Target Corp. | Chicago Board Options Exchange | 170 | 1,109,250 | 70.00 | 3/16/18 | (26,095) |
| The Boeing Co. | Chicago Board Options Exchange | 71 | 2,093,861 | 300.00 | 3/16/18 | (67,450) |
| TOTAL WRITTEN OPTIONS | $(1,125,290) |
Currency Abbreviations
EUR – European Monetary Unit
Legend
(a) Security or a portion of the security is pledged as collateral for call options written. At period end, the value of securities pledged amounted to $67,812,092.
(b) Security or a portion of the security is on loan at period end.
(c) Non-income producing
(d) Security exempt from registration under Rule 144A of the Securities Act of 1933. These securities may be resold in transactions exempt from registration, normally to qualified institutional buyers. At the end of the period, the value of these securities amounted to $4,729,457 or 0.3% of net assets.
(e) Amount is stated in United States dollars unless otherwise noted.
(f) Investment is owned by a wholly-owned subsidiary (Subsidiary) that is treated as a corporation for U.S. tax purposes.
(g) Restricted securities - Investment in securities not registered under the Securities Act of 1933 (excluding 144A issues). At the end of the period, the value of restricted securities (excluding 144A issues) amounted to $2,461,966 or 0.2% of net assets.
(h) Level 3 security
(i) Affiliated fund that is generally available only to investment companies and other accounts managed by Fidelity Investments. The rate quoted is the annualized seven-day yield of the fund at period end. A complete unaudited listing of the fund's holdings as of its most recent quarter end is available upon request. In addition, each Fidelity Central Fund's financial statements, which are not covered by the Fund's Report of Independent Registered Public Accounting Firm, are available on the SEC's website or upon request.
(j) Investment made with cash collateral received from securities on loan.
Additional information on each restricted holding is as follows:
| Security | Acquisition Date | Acquisition Cost |
| Utica Shale Drilling Program (non-operating revenue interest) | 10/5/16 - 10/5/17 | $3,197,358 |
Affiliated Central Funds
Information regarding fiscal year to date income earned by the Fund from investments in Fidelity Central Funds is as follows:
| Fund | Income earned |
| Fidelity Cash Central Fund | $67,914 |
| Fidelity Securities Lending Cash Central Fund | 41,923 |
| Total | $109,837 |
Amounts in the income column in the above table include any capital gain distributions from underlying funds, which are presented in the corresponding line-item in the Statement of Operations if applicable.
Investment Valuation
The following is a summary of the inputs used, as of December 31, 2017, involving the Fund's assets and liabilities carried at fair value. The inputs or methodology used for valuing securities may not be an indication of the risk associated with investing in those securities. For more information on valuation inputs, and their aggregation into the levels used below, please refer to the Investment Valuation section in the accompanying Notes to Financial Statements.
| Valuation Inputs at Reporting Date: | ||||
| Description | Total | Level 1 | Level 2 | Level 3 |
| Investments in Securities: | ||||
| Equities: | ||||
| Consumer Discretionary | $133,468,852 | $133,468,852 | $-- | $-- |
| Consumer Staples | 166,878,028 | 160,860,599 | 6,017,429 | -- |
| Energy | 224,769,359 | 224,769,359 | -- | -- |
| Financials | 395,597,777 | 395,597,777 | -- | -- |
| Health Care | 213,096,545 | 202,150,635 | 10,945,910 | -- |
| Industrials | 207,100,654 | 205,689,524 | 1,411,130 | -- |
| Information Technology | 285,853,137 | 285,853,137 | -- | -- |
| Materials | 37,025,530 | 37,025,530 | -- | -- |
| Real Estate | 16,733,467 | 16,733,467 | -- | -- |
| Telecommunication Services | 22,260,188 | 22,260,188 | -- | -- |
| Utilities | 20,979,700 | 20,143,890 | 835,810 | -- |
| Corporate Bonds | 1,904,899 | -- | 1,904,899 | -- |
| Other | 2,461,966 | -- | -- | 2,461,966 |
| Money Market Funds | 33,664,538 | 33,664,538 | -- | -- |
| Total Investments in Securities: | $1,761,794,640 | $1,738,217,496 | $21,115,178 | $2,461,966 |
| Derivative Instruments: | ||||
| Liabilities | ||||
| Written Options | $(1,125,290) | $(1,125,290) | $-- | $-- |
| Total Liabilities | $(1,125,290) | $(1,125,290) | $-- | $-- |
| Total Derivative Instruments: | $(1,125,290) | $(1,125,290) | $-- | $-- |
Value of Derivative Instruments
The following table is a summary of the Fund's value of derivative instruments by primary risk exposure as of December 31, 2017. For additional information on derivative instruments, please refer to the Derivative Instruments section in the accompanying Notes to Financial Statements.
| Primary Risk Exposure / Derivative Type | Value | |
| Asset | Liability | |
| Equity Risk | ||
| Written Options(a) | $0 | $(1,125,290) |
| Total Equity Risk | 0 | (1,125,290) |
| Total Value of Derivatives | $0 | $(1,125,290) |
(a) Gross value is presented in the Statement of Assets and Liabilities in the written options, at value line-item.
Other Information
Distribution of investments by country or territory of incorporation, as a percentage of Total Net Assets, is as follows (Unaudited):
| United States of America | 89.4% |
| Canada | 3.6% |
| United Kingdom | 3.1% |
| Netherlands | 1.2% |
| Others (Individually Less Than 1%) | 2.7% |
| 100.0% |
See accompanying notes which are an integral part of the financial statements.
Financial Statements
Statement of Assets and Liabilities
| December 31, 2017 (Unaudited) | ||
| Assets | ||
| Investment in securities, at value (including securities loaned of $14,417,860) — See accompanying schedule: Unaffiliated issuers (cost $1,374,913,909) | $1,728,130,102 | |
| Fidelity Central Funds (cost $33,663,051) | 33,664,538 | |
| Total Investment in Securities (cost $1,408,576,960) | $1,761,794,640 | |
| Cash | 5,778 | |
| Restricted cash | 23,183 | |
| Foreign currency held at value (cost $43,589) | 43,589 | |
| Receivable for investments sold | 1,863,948 | |
| Receivable for fund shares sold | 7,200 | |
| Dividends receivable | 2,005,642 | |
| Interest receivable | 46,679 | |
| Distributions receivable from Fidelity Central Funds | 17,961 | |
| Other receivables | 22,351 | |
| Total assets | 1,765,830,971 | |
| Liabilities | ||
| Payable for investments purchased | $3,150,265 | |
| Payable for fund shares redeemed | 8,912,180 | |
| Written options, at value (premium received $1,142,625) | 1,125,290 | |
| Other payables and accrued expenses | 17,469 | |
| Collateral on securities loaned | 14,879,056 | |
| Total liabilities | 28,084,260 | |
| Net Assets | $1,737,746,711 | |
| Net Assets consist of: | ||
| Paid in capital | $1,379,332,945 | |
| Distributions in excess of net investment income | (4,593,041) | |
| Accumulated undistributed net realized gain (loss) on investments and foreign currency transactions | 9,771,683 | |
| Net unrealized appreciation (depreciation) on investments and assets and liabilities in foreign currencies | 353,235,124 | |
| Net Assets, for 111,904,352 shares outstanding | $1,737,746,711 | |
| Net Asset Value, offering price and redemption price per share ($1,737,746,711 ÷ 111,904,352 shares) | $15.53 |
See accompanying notes which are an integral part of the financial statements.
Statement of Operations
| Six months ended December 31, 2017 (Unaudited) | ||
| Investment Income | ||
| Dividends | $19,954,905 | |
| Interest | 47,032 | |
| Income from Fidelity Central Funds | 109,837 | |
| Total income | 20,111,774 | |
| Expenses | ||
| Custodian fees and expenses | $37,461 | |
| Independent trustees' fees and expenses | 3,272 | |
| Interest | 1,528 | |
| Miscellaneous | 2,494 | |
| Total expenses before reductions | 44,755 | |
| Expense reductions | (29,030) | 15,725 |
| Net investment income (loss) | 20,096,049 | |
| Realized and Unrealized Gain (Loss) | ||
| Net realized gain (loss) on: | ||
| Investment securities: | ||
| Unaffiliated issuers | 32,665,216 | |
| Fidelity Central Funds | (826) | |
| Foreign currency transactions | 15,639 | |
| Written options | 1,254,250 | |
| Total net realized gain (loss) | 33,934,279 | |
| Change in net unrealized appreciation (depreciation) on: | ||
| Investment securities: | ||
| Unaffiliated issuers | 119,511,723 | |
| Fidelity Central Funds | 1,426 | |
| Assets and liabilities in foreign currencies | 1,468 | |
| Written options | 405,217 | |
| Total change in net unrealized appreciation (depreciation) | 119,919,834 | |
| Net gain (loss) | 153,854,113 | |
| Net increase (decrease) in net assets resulting from operations | $173,950,162 |
See accompanying notes which are an integral part of the financial statements.
Statement of Changes in Net Assets
| Six months ended December 31, 2017 (Unaudited) | Year ended June 30, 2017 | |
| Increase (Decrease) in Net Assets | ||
| Operations | ||
| Net investment income (loss) | $20,096,049 | $21,238,765 |
| Net realized gain (loss) | 33,934,279 | 51,187,058 |
| Change in net unrealized appreciation (depreciation) | 119,919,834 | 148,998,150 |
| Net increase (decrease) in net assets resulting from operations | 173,950,162 | 221,423,973 |
| Distributions to shareholders from net investment income | (29,722,506) | (16,048,453) |
| Distributions to shareholders from net realized gain | (63,783,542) | (3,590,086) |
| Total distributions | (93,506,048) | (19,638,539) |
| Share transactions | ||
| Proceeds from sales of shares | 81,230,448 | 616,483,504 |
| Reinvestment of distributions | 93,506,048 | 19,638,538 |
| Cost of shares redeemed | (163,503,801) | (289,554,483) |
| Net increase (decrease) in net assets resulting from share transactions | 11,232,695 | 346,567,559 |
| Total increase (decrease) in net assets | 91,676,809 | 548,352,993 |
| Net Assets | ||
| Beginning of period | 1,646,069,902 | 1,097,716,909 |
| End of period | $1,737,746,711 | $1,646,069,902 |
| Other Information | ||
| Undistributed net investment income end of period | $– | $5,033,416 |
| Distributions in excess of net investment income end of period | $(4,593,041) | $– |
| Shares | ||
| Sold | 5,421,654 | 42,126,779 |
| Issued in reinvestment of distributions | 6,333,492 | 1,475,031 |
| Redeemed | (10,820,652) | (20,778,520) |
| Net increase (decrease) | 934,494 | 22,823,290 |
See accompanying notes which are an integral part of the financial statements.
Financial Highlights
Fidelity Advisor Series Growth & Income Fund
| Six months ended (Unaudited) December 31, | Years ended June 30, | |||||
| 2017 | 2017 | 2016 | 2015 | 2014 | 2013 A | |
| Selected Per–Share Data | ||||||
| Net asset value, beginning of period | $14.83 | $12.45 | $13.71 | $13.73 | $11.57 | $10.00 |
| Income from Investment Operations | ||||||
| Net investment income (loss)B | .18 | .25 | .23 | .25 | .23 | .08 |
| Net realized and unrealized gain (loss) | 1.36 | 2.36 | (.60) | .45 | 2.33 | 1.50 |
| Total from investment operations | 1.54 | 2.61 | (.37) | .70 | 2.56 | 1.58 |
| Distributions from net investment income | (.27) | (.19) | (.25) | (.23) | (.15) | (.01) |
| Distributions from net realized gain | (.57) | (.04) | (.64) | (.49) | (.25) | – |
| Total distributions | (.84) | (.23) | (.89) | (.72) | (.40) | (.01) |
| Net asset value, end of period | $15.53 | $14.83 | $12.45 | $13.71 | $13.73 | $11.57 |
| Total ReturnC,D | 10.76% | 21.18% | (2.75)% | 5.29% | 22.48% | 15.80% |
| Ratios to Average Net AssetsE,F | ||||||
| Expenses before reductions | .01%G | .59% | .67% | .67% | .69% | .84%G |
| Expenses net of fee waivers, if any | - %G,H | .59% | .67% | .67% | .69% | .84%G |
| Expenses net of all reductions | - %G,H | .59% | .67% | .67% | .69% | .83%G |
| Net investment income (loss) | 2.37%G | 1.80% | 1.86% | 1.80% | 1.83% | 1.33%G |
| Supplemental Data | ||||||
| Net assets, end of period (000 omitted) | $1,737,747 | $1,646,070 | $1,097,717 | $1,274,776 | $1,357,854 | $169,956 |
| Portfolio turnover rateI | 39%G | 58%J | 33% | 38% | 60%J | 50%G |
A For the period December 6, 2012 (commencement of operations) to June 30, 2013.
B Calculated based on average shares outstanding during the period.
C Total returns for periods of less than one year are not annualized.
D Total returns would have been lower if certain expenses had not been reduced during the applicable periods shown.
E Fees and expenses of any underlying Fidelity Central Funds are not included in the Fund's expense ratio. The Fund indirectly bears its proportionate share of the expenses of any underlying Fidelity Central Funds.
F Expense ratios reflect operating expenses of the Fund. Expenses before reductions do not reflect amounts reimbursed by the investment adviser or reductions from brokerage service arrangements or reductions from other expense offset arrangements and do not represent the amount paid by the Fund during periods when reimbursements or reductions occur. Expense ratios before reductions for start-up periods may not be representative of longer term operating periods. Expenses net of fee waivers reflect expenses after reimbursement by the investment adviser but prior to reductions from brokerage service arrangements or other expense offset arrangements. Expenses net of all reductions represent the net expenses paid by the Fund.
G Annualized
H Amount represents less than .005%.
I Amount does not include the portfolio activity of any underlying Fidelity Central Funds.
J Portfolio turnover rate excludes securities received or delivered in-kind.
See accompanying notes which are an integral part of the financial statements.
Notes to Financial Statements (Unaudited)
For the period ended December 31, 2017
1. Organization.
Fidelity Advisor Series Growth & Income Fund (the Fund) is a fund of Fidelity Hastings Street Trust (the Trust) and is authorized to issue an unlimited number of shares. Shares of the Fund are only available for purchase by mutual funds for which Fidelity Management & Research Company (FMR) or an affiliate serves as an investment manager. The Trust is registered under the Investment Company Act of 1940, as amended (the 1940 Act), as an open-end management investment company organized as a Massachusetts business trust.
2. Investments in Fidelity Central Funds.
The Fund invests in Fidelity Central Funds, which are open-end investment companies generally available only to other investment companies and accounts managed by the investment adviser and its affiliates. The Fund's Schedule of Investments lists each of the Fidelity Central Funds held as of period end, if any, as an investment of the Fund, but does not include the underlying holdings of each Fidelity Central Fund. As an Investing Fund, the Fund indirectly bears its proportionate share of the expenses of the underlying Fidelity Central Funds.
The Money Market Central Funds seek preservation of capital and current income and are managed by Fidelity Investments Money Management, Inc. (FIMM), an affiliate of the investment adviser. Annualized expenses of the Money Market Central Funds as of their most recent shareholder report date are less than .005%.
A complete unaudited list of holdings for each Fidelity Central Fund is available upon request or at the Securities and Exchange Commission (the SEC) website at www.sec.gov. In addition, the financial statements of the Fidelity Central Funds are available on the SEC website or upon request.
3. Significant Accounting Policies.
The Fund is an investment company and applies the accounting and reporting guidance of the Financial Accounting Standards Board (FASB) Accounting Standards Codification Topic 946 Financial Services – Investments Companies. The financial statements have been prepared in conformity with accounting principles generally accepted in the United States of America (GAAP), which require management to make certain estimates and assumptions at the date of the financial statements. Actual results could differ from those estimates. Subsequent events, if any, through the date that the financial statements were issued have been evaluated in the preparation of the financial statements. The following summarizes the significant accounting policies of the Fund:
Investment Valuation. Investments are valued as of 4:00 p.m. Eastern time on the last calendar day of the period. The Board of Trustees (the Board) has delegated the day to day responsibility for the valuation of the Fund's investments to the Fair Value Committee (the Committee) established by the Fund's investment adviser. In accordance with valuation policies and procedures approved by the Board, the Fund attempts to obtain prices from one or more third party pricing vendors or brokers to value its investments. When current market prices, quotations or currency exchange rates are not readily available or reliable, investments will be fair valued in good faith by the Committee, in accordance with procedures adopted by the Board. Factors used in determining fair value vary by investment type and may include market or investment specific events, changes in interest rates and credit quality. The frequency with which these procedures are used cannot be predicted and they may be utilized to a significant extent. The Committee oversees the Fund's valuation policies and procedures and reports to the Board on the Committee's activities and fair value determinations. The Board monitors the appropriateness of the procedures used in valuing the Fund's investments and ratifies the fair value determinations of the Committee.
The Fund categorizes the inputs to valuation techniques used to value its investments into a disclosure hierarchy consisting of three levels as shown below:
- Level 1 – quoted prices in active markets for identical investments
- Level 2 – other significant observable inputs (including quoted prices for similar investments, interest rates, prepayment speeds, etc.)
- Level 3 – unobservable inputs (including the Fund's own assumptions based on the best information available)
Valuation techniques used to value the Fund's investments by major category are as follows:
Equity securities, including restricted securities, for which market quotations are readily available, are valued at the last reported sale price or official closing price as reported by a third party pricing vendor on the primary market or exchange on which they are traded and are categorized as Level 1 in the hierarchy. In the event there were no sales during the day or closing prices are not available, securities are valued at the last quoted bid price or may be valued using the last available price and are generally categorized as Level 2 in the hierarchy. For foreign equity securities, when market or security specific events arise, comparisons to the valuation of American Depositary Receipts (ADRs), futures contracts, Exchange-Traded Funds (ETFs) and certain indexes as well as quoted prices for similar securities may be used and would be categorized as Level 2 in the hierarchy. Utilizing these techniques may result in transfers between Level 1 and Level 2. For equity securities, including restricted securities, where observable inputs are limited, assumptions about market activity and risk are used and these securities may be categorized as Level 3 in the hierarchy.
Debt securities, including restricted securities, are valued based on evaluated prices received from third party pricing vendors or from brokers who make markets in such securities. Corporate bonds are valued by pricing vendors who utilize matrix pricing which considers yield or price of bonds of comparable quality, coupon, maturity and type or by broker-supplied prices. When independent prices are unavailable or unreliable, debt securities may be valued utilizing pricing methodologies which consider similar factors that would be used by third party pricing vendors. Debt securities are generally categorized as Level 2 in the hierarchy but may be Level 3 depending on the circumstances.
Exchange-traded options are valued using the last sale price or, in the absence of a sale, the last offering price and are categorized as Level 1 in the hierarchy. Investments in open-end mutual funds, including the Fidelity Central Funds, are valued at their closing net asset value (NAV) each business day and are categorized as Level 1 in the hierarchy.
Changes in valuation techniques may result in transfers in or out of an assigned level within the disclosure hierarchy. The aggregate value of investments by input level as of December 31, 2017 is included at the end of the Fund's Schedule of Investments.
Foreign Currency. The Fund may use foreign currency contracts to facilitate transactions in foreign-denominated securities. Gains and losses from these transactions may arise from changes in the value of the foreign currency or if the counterparties do not perform under the contracts' terms.
Foreign-denominated assets, including investment securities, and liabilities are translated into U.S. dollars at the exchange rates at period end. Purchases and sales of investment securities, income and dividends received and expenses denominated in foreign currencies are translated into U.S. dollars at the exchange rate in effect on the transaction date.
The effects of exchange rate fluctuations on investments are included with the net realized and unrealized gain (loss) on investment securities. Other foreign currency transactions resulting in realized and unrealized gain (loss) are disclosed separately.
Investment Transactions and Income. For financial reporting purposes, the Fund's investment holdings and NAV include trades executed through the end of the last business day of the period. The NAV per share for processing shareholder transactions is calculated as of the close of business of the New York Stock Exchange (NYSE), normally 4:00 p.m. Eastern time and includes trades executed through the end of the prior business day. Gains and losses on securities sold are determined on the basis of identified cost and includes proceeds received from litigation. Dividend income is recorded on the ex-dividend date, except for certain dividends from foreign securities where the ex-dividend date may have passed, which are recorded as soon as the Fund is informed of the ex-dividend date. Non-cash dividends included in dividend income, if any, are recorded at the fair market value of the securities received. Income and capital gain distributions from Fidelity Central Funds, if any, are recorded on the ex-dividend date. Certain distributions received by the Fund represent a return of capital or capital gain. The Fund determines the components of these distributions subsequent to the ex-dividend date, based upon receipt of tax filings or other correspondence relating to the underlying investment. These distributions are recorded as a reduction of cost of investments and/or as a realized gain. Interest income is accrued as earned and includes coupon interest and amortization of premium and accretion of discount on debt securities as applicable. Investment income is recorded net of foreign taxes withheld where recovery of such taxes is uncertain.
Expenses. Expenses directly attributable to a fund are charged to that fund. Expenses attributable to more than one fund are allocated among the respective funds on the basis of relative net assets or other appropriate methods. Expense estimates are accrued in the period to which they relate and adjustments are made when actual amounts are known.
Income Tax Information and Distributions to Shareholders. Each year, the Fund intends to qualify as a regulated investment company under Subchapter M of the Internal Revenue Code, including distributing substantially all of its taxable income and realized gains. As a result, no provision for U.S. Federal income taxes is required. The Fund files a U.S. federal tax return, in addition to state and local tax returns as required. The Fund's federal income tax returns are subject to examination by the Internal Revenue Service (IRS) for a period of three fiscal years after they are filed. State and local tax returns may be subject to examination for an additional fiscal year depending on the jurisdiction. Foreign taxes are provided for based on the Fund's understanding of the tax rules and rates that exist in the foreign markets in which it invests.
Distributions are declared and recorded on the ex-dividend date. Income and capital gain distributions are determined in accordance with income tax regulations, which may differ from GAAP.
Capital accounts within the financial statements are adjusted for permanent book-tax differences. These adjustments have no impact on net assets or the results of operations. Capital accounts are not adjusted for temporary book-tax differences which will reverse in a subsequent period.
Book-tax differences are primarily due to foreign currency transactions, future transactions, market discount, partnerships, passive foreign investment companies (PFIC), certain conversion ratio adjustments, equity-debt classifications and losses deferred due to wash sales and excise tax regulations.
As of period end, the cost and unrealized appreciation (depreciation) in securities, and derivatives if applicable, for federal income tax purposes were as follows:
| Gross unrealized appreciation | $411,646,074 |
| Gross unrealized depreciation | (63,530,318) |
| Net unrealized appreciation (depreciation) | $348,115,756 |
| Tax cost | $1,413,696,219 |
Restricted Securities. The Fund may invest in securities that are subject to legal or contractual restrictions on resale. These securities generally may be resold in transactions exempt from registration or to the public if the securities are registered. Disposal of these securities may involve time-consuming negotiations and expense, and prompt sale at an acceptable price may be difficult. Information regarding restricted securities is included at the end of the Fund's Schedule of Investments.
Consolidated Subsidiary. The Fund invests in certain investments through a wholly-owned subsidiary ("Subsidiary"), which may be subject to federal and state taxes upon disposition.
As of period end, the Fund held an investment of $2,485,149 in this Subsidiary, representing .14% of the Fund's net assets. The financial statements have been consolidated and include accounts of the Fund and the Subsidiary. Accordingly, all inter-company transactions and balances have been eliminated.
Any cash held by the Subsidiary is restricted as to its use and is presented as Restricted cash in the Statement of Assets and Liabilities.
4. Derivative Instruments.
Risk Exposures and the Use of Derivative Instruments. The Fund's investment objective allows the Fund to enter into various types of derivative contracts, including options. Derivatives are investments whose value is primarily derived from underlying assets, indices or reference rates and may be transacted on an exchange or over-the-counter (OTC). Derivatives may involve a future commitment to buy or sell a specified asset based on specified terms, to exchange future cash flows at periodic intervals based on a notional principal amount, or for one party to make one or more payments upon the occurrence of specified events in exchange for periodic payments from the other party.
The Fund used derivatives to increase returns and to manage exposure to certain risks as defined below. The success of any strategy involving derivatives depends on analysis of numerous economic factors, and if the strategies for investment do not work as intended, the Fund may not achieve its objectives.
The Fund's use of derivatives increased or decreased its exposure to the following risk:
| Equity Risk | Equity risk relates to the fluctuations in the value of financial instruments as a result of changes in market prices (other than those arising from interest rate risk or foreign exchange risk), whether caused by factors specific to an individual investment, its issuer, or all factors affecting all instruments traded in a market or market segment. |
The Fund is also exposed to additional risks from investing in derivatives, such as liquidity risk and counterparty credit risk. Liquidity risk is the risk that the Fund will be unable to close out the derivative in the open market in a timely manner. Counterparty credit risk is the risk that the counterparty will not be able to fulfill its obligation to the Fund. Derivative counterparty credit risk is managed through formal evaluation of the creditworthiness of all potential counterparties. On certain OTC derivatives such as options, the Fund attempts to reduce its exposure to counterparty credit risk by entering into an International Swaps and Derivatives Association, Inc. (ISDA) Master Agreement with each of its counterparties. The ISDA Master Agreement gives the Fund the right to terminate all transactions traded under such agreement upon the deterioration in the credit quality of the counterparty beyond specified levels. The ISDA Master Agreement gives each party the right, upon an event of default by the other party or a termination of the agreement, to close out all transactions traded under such agreement and to net amounts owed under each transaction to one net payable by one party to the other. To mitigate counterparty credit risk on bi-lateral OTC derivatives, the Fund receives collateral in the form of cash or securities once the Fund's net unrealized appreciation on outstanding derivative contracts under an ISDA Master Agreement exceeds certain applicable thresholds, subject to certain minimum transfer provisions. The collateral received is held in segregated accounts with the Fund's custodian bank in accordance with the collateral agreements entered into between the Fund, the counterparty and the Fund's custodian bank. The Fund could experience delays and costs in gaining access to the collateral even though it is held by the Fund's custodian bank. The Fund's maximum risk of loss from counterparty credit risk related to bi-lateral OTC derivatives is generally the aggregate unrealized appreciation and unpaid counterparty payments in excess of any collateral pledged by the counterparty to the Fund. The Fund may be required to pledge collateral for the benefit of the counterparties on bi-lateral OTC derivatives in an amount not less than each counterparty's unrealized appreciation on outstanding derivative contracts, subject to certain minimum transfer provisions, and any such pledged collateral is identified in the Schedule of Investments. Counterparty credit risk related to exchange-traded options may be mitigated by the protection provided by the exchange on which they trade.
Investing in derivatives may involve greater risks than investing in the underlying assets directly and, to varying degrees, may involve risk of loss in excess of any initial investment and collateral received and amounts recognized in the Statement of Assets and Liabilities. In addition, there may be the risk that the change in value of the derivative contract does not correspond to the change in value of the underlying instrument.
Options. Options give the purchaser the right, but not the obligation, to buy (call) or sell (put) an underlying security or financial instrument at an agreed exercise or strike price between or on certain dates. Options obligate the seller (writer) to buy (put) or sell (call) an underlying instrument at the exercise or strike price or cash settle an underlying derivative instrument if the holder exercises the option on or before the expiration date.
The Fund used exchange-traded and OTC written covered call options to manage its exposure to the market. When the Fund writes a covered call option, the Fund holds the underlying instrument which must be delivered to the holder upon the exercise of the option.
Upon entering into a written options contract, the Fund will receive a premium. Premiums received are reflected as a liability on the Statement of Assets and Liabilities. Options are valued daily and any unrealized appreciation (depreciation) is reflected on the Statement of Assets and Liabilities. When a written option is exercised, the premium is added to the proceeds from the sale of the underlying instrument in determining the gain or loss realized on that investment. When an option is closed the Fund will realize a gain or loss depending on whether the proceeds or amount paid for the closing sale transaction are greater or less than the premium received. When an option expires, gains and losses are realized to the extent of premiums received. The net realized gain (loss) on closed and expired written options and the change in net unrealized appreciation (depreciation) on written options are presented in the Statement of Operations.
Writing call options tends to decrease exposure to the underlying instrument and risk of loss is the change in value in excess of the premium received.
Any open options at period end are presented in the Schedule of Investments under the caption "Written Options" and are representative of volume of activity during the period.
5. Purchases and Sales of Investments.
Purchases and sales of securities, other than short-term securities, aggregated $317,783,047 and $372,087,673, respectively.
6. Fees and Other Transactions with Affiliates.
Management Fee. Fidelity Management & Research Company (the investment adviser) and its affiliates provide the Fund with investment management related services for which the Fund does not pay a management fee. Under the management contract, the investment adviser or an affiliate pays all ordinary operating expenses of the Fund, except custody fees, fees and expenses of the independent Trustees, and certain miscellaneous expenses such as proxy and shareholder meeting expenses.
Brokerage Commissions. The Fund placed a portion of its portfolio transactions with brokerage firms which are affiliates of the investment adviser. Brokerage commissions are included in net realized gain (loss) and change in net unrealized appreciation (depreciation) in the Statement of Operations. The commissions paid to these affiliated firms were $7,297 for the period.
Interfund Lending Program. Pursuant to an Exemptive Order issued by the SEC, the Fund, along with other registered investment companies having management contracts with FMR or other affiliated entities of FMR, may participate in an interfund lending program. This program provides an alternative credit facility allowing the funds to borrow from, or lend money to, other participating affiliated funds. At period end, there were no interfund loans outstanding. The Fund's activity in this program during the period for which loans were outstanding was as follows:
| Borrower or Lender | Average Loan Balance | Weighted Average Interest Rate | Interest Expense |
| Borrower | $7,792,400 | 1.41% | $1,528 |
Interfund Trades. The Fund may purchase from or sell securities to other Fidelity Funds under procedures adopted by the Board. The procedures have been designed to ensure these interfund trades are executed in accordance with Rule 17a-7 of the 1940 Act. Interfund trades are included within the respective purchases and sales amounts shown in the Purchases and Sales of Investments note.
Prior Fiscal Year Exchanges In-Kind. During the prior period, certain affiliated entities (Investing Funds) completed exchanges in-kind with the Fund. The Investing Funds delivered investments and cash valued at $504,085,301 in exchange for 34,036,820 shares of the Fund. The amount of in-kind exchanges is included in share transactions in the accompanying Statement of Changes in Net Assets. The Fund recognized no gain or loss for federal income tax purposes.
7. Committed Line of Credit.
The Fund participates with other funds managed by the investment adviser or an affiliate in a $4.25 billion credit facility (the "line of credit") to be utilized for temporary or emergency purposes to fund shareholder redemptions or for other short-term liquidity purposes. The Fund has agreed to pay commitment fees on its pro-rata portion of the line of credit, which amounted to $2,195 and is reflected in Miscellaneous expenses on the Statement of Operations. During the period, the Fund did not borrow on this line of credit.
8. Security Lending.
The Fund lends portfolio securities through a lending agent from time to time in order to earn additional income. For equity securities, a lending agent is used and may loan securities to certain qualified borrowers, including Fidelity Capital Markets (FCM), a broker-dealer affiliated with the Fund. On the settlement date of the loan, the Fund receives collateral (in the form of U.S. Treasury obligations, letters of credit and/or cash) against the loaned securities and maintains collateral in an amount not less than 100% of the market value of the loaned securities during the period of the loan. The market value of the loaned securities is determined at the close of business of the Fund and any additional required collateral is delivered to the Fund on the next business day. The Fund or borrower may terminate the loan at any time, and if the borrower defaults on its obligation to return the securities loaned because of insolvency or other reasons, the Fund may apply collateral received from the borrower against the obligation. The Fund may experience delays and costs in recovering the securities loaned. Any cash collateral received is invested in the Fidelity Securities Lending Cash Central Fund. The value of loaned securities and cash collateral at period end are disclosed on the Fund's Statement of Assets and Liabilities. The value of securities loaned to FCM at period end was $312,732. Security lending income represents the income earned on investing cash collateral, less rebates paid to borrowers and any lending agent fees associated with the loan, plus any premium payments received for lending certain types of securities. Security lending income is presented in the Statement of Operations as a component of income from Fidelity Central Funds. Total security lending income during the period amounted to $41,923, including $1,217 from securities loaned to FCM.
9. Expense Reductions.
Commissions paid to certain brokers with whom the investment adviser, or its affiliates, places trades on behalf of the Fund include an amount in addition to trade execution, which may be rebated back to the Fund to offset certain expenses. This amount totaled $23,769 for the period. Through arrangements with the Fund's custodian, credits realized as a result of certain uninvested cash balances were used to reduce the Fund's expenses. During the period, these credits reduced the Fund's custody expenses by $76.
In addition, during the period the investment adviser reimbursed and/or waived a portion of operating expenses in the amount of $5,185.
10. Other.
The Fund's organizational documents provide former and current trustees and officers with a limited indemnification against liabilities arising in connection with the performance of their duties to the Fund. In the normal course of business, the Fund may also enter into contracts that provide general indemnifications. The Fund's maximum exposure under these arrangements is unknown as this would be dependent on future claims that may be made against the Fund. The risk of material loss from such claims is considered remote.
At the end of the period, mutual funds managed by the investment adviser or its affiliates were the owners of record of all of the outstanding shares of the Fund.
Shareholder Expense Example
As a shareholder of the Fund, you incur two types of costs: (1) transaction costs and (2) ongoing costs, including other Fund expenses. This Example is intended to help you understand your ongoing costs (in dollars) of investing in the Fund and to compare these costs with the ongoing costs of investing in other mutual funds.
The Example is based on an investment of $1,000 invested at the beginning of the period and held for the entire period (July 1, 2017 to December 31, 2017).
Actual Expenses
The first line of the accompanying table provides information about actual account values and actual expenses. You may use the information in this line, together with the amount you invested, to estimate the expenses that you paid over the period. Simply divide your account value by $1,000.00 (for example, an $8,600 account value divided by $1,000.00 = 8.6), then multiply the result by the number in the first line under the heading entitled "Expenses Paid During Period" to estimate the expenses you paid on your account during this period. In addition, the Fund, as a shareholder in the underlying Fidelity Central Funds, will indirectly bear its pro-rata share of the fees and expenses incurred by the underlying Fidelity Central Funds. These fees and expenses are not included in the Fund's annualized expense ratio used to calculate the expense estimate in the table below.
Hypothetical Example for Comparison Purposes
The second line of the accompanying table provides information about hypothetical account values and hypothetical expenses based on the Fund's actual expense ratio and an assumed rate of return of 5% per year before expenses, which is not the Fund's actual return. The hypothetical account values and expenses may not be used to estimate the actual ending account balance or expenses you paid for the period. You may use this information to compare the ongoing costs of investing in the Fund and other funds. To do so, compare this 5% hypothetical example with the 5% hypothetical examples that appear in the shareholder reports of the other funds. In addition, the Fund, as a shareholder in the underlying Fidelity Central Funds, will indirectly bear its pro-rata share of the fees and expenses incurred by the underlying Fidelity Central Funds. These fees and expenses are not included in the Fund's annualized expense ratio used to calculate the expense estimate in the table below.
Please note that the expenses shown in the table are meant to highlight your ongoing costs only and do not reflect any transaction costs. Therefore, the second line of the table is useful in comparing ongoing costs only, and will not help you determine the relative total costs of owning different funds.
| Annualized Expense Ratio-A | Beginning Account Value July 1, 2017 | Ending Account Value December 31, 2017 | Expenses Paid During Period-B July 1, 2017 to December 31, 2017 | |
| Actual | - % | $1,000.00 | $1,107.60 | $- |
| Hypothetical-C | $1,000.00 | $1,025.21 | $- |
A Annualized expense ratio reflects expenses net of applicable fee waivers.
B Expenses are equal to the Fund's annualized expense ratio, multiplied by the average account value over the period, multiplied by 184/365 (to reflect the one-half year period).
C 5% return per year before expenses
Board Approval of Investment Advisory Contracts and Management Fees
Fidelity Advisor Series Growth & Income Fund
Each year, the Board of Trustees, including the Independent Trustees (together, the Board), votes on the renewal of the management contract with Fidelity Management & Research Company (FMR) and the sub-advisory agreements (together, the Advisory Contracts) for the fund. FMR and the sub-advisers are referred to herein as the Investment Advisers. The Board, assisted by the advice of fund counsel and Independent Trustees' counsel, requests and considers a broad range of information relevant to the renewal of the Advisory Contracts throughout the year.
The Board meets regularly and, at each of its meetings, covers an extensive agenda of topics and materials and considers factors that are relevant to its annual consideration of the renewal of the fund's Advisory Contracts, including the services and support provided to the fund and its shareholders. The Board has established various standing committees (Committees), each composed of and chaired by Independent Trustees with varying backgrounds, to which the Board has assigned specific subject matter responsibilities in order to enhance effective decision-making by the Board. The Board, acting directly and through its Committees, requests and receives information concerning the annual consideration of the renewal of the fund's Advisory Contracts. The Board also meets as needed to review matters specifically related to the Board's annual consideration of the renewal of the Advisory Contracts. Members of the Board may also meet with trustees of other Fidelity funds through ad hoc joint committees to discuss certain matters relevant to all of the Fidelity funds.
At its July 2017 meeting, the Board unanimously determined to renew the fund's Advisory Contracts. In reaching its determination, the Board considered that the Advisory Contracts currently in place had become effective on June 1, 2017 in connection with shareholders of certain other Fidelity funds that invest in the fund (referred to herein as Freedom Funds) voting to approve new management contracts for the Freedom Funds. The Board noted the Advisory Contracts implemented a new fee structure pursuant to which the fund does not pay a management fee to FMR. The Board also approved certain amendments to the sub-advisory agreements for the fund to ensure consistency in the sub-advisory fees paid under the new fee structure compared to the sub-advisory fees paid under the prior fee structure. The Board noted that the amendments will not result in any changes to the nature, extent, and quality of services provided to the fund.
In considering whether to renew the Advisory Contracts for the fund, the Board considered all factors it believed relevant and reached a determination, with the assistance of fund counsel and Independent Trustees' counsel and through the exercise of its business judgment, that the renewal of the Advisory Contracts was in the best interests of the fund and its shareholders and the fact that no fee is payable under the management contract was fair and reasonable.
Nature, Extent, and Quality of Services Provided. The Board considered Fidelity's staffing as it relates to the fund, including the backgrounds of investment personnel of Fidelity, and also considered the fund's investment objective, strategies, and related investment philosophy. The Independent Trustees also had discussions with senior management of Fidelity's investment operations and investment groups. The Board considered the structure of the investment personnel compensation program and whether this structure provides appropriate incentives to act in the best interests of the fund.Resources Dedicated to Investment Management and Support Services. The Board and the Fund Oversight and Research Committees reviewed the general qualifications and capabilities of Fidelity's investment staff, including its size, education, experience, and resources, as well as Fidelity's approach to recruiting, training, managing, and compensating investment personnel. The Board noted that Fidelity has continued to increase the resources devoted to non-U.S. offices, including expansion of Fidelity's global investment organization. The Board also noted that Fidelity's analysts have extensive resources, tools and capabilities that allow them to conduct sophisticated quantitative and fundamental analysis, as well as credit analysis of issuers, counterparties and guarantors. Further, the Board considered that Fidelity's investment professionals have sufficient access to global information and data so as to provide competitive investment results over time, and that those professionals also have access to sophisticated tools that permit them to assess portfolio construction and risk and performance attribution characteristics continuously, as well as to transmit new information and research conclusions rapidly around the world. Additionally, in its deliberations, the Board considered Fidelity's trading, risk management, compliance, and technology and operations capabilities and resources, which are integral parts of the investment management process.Administrative Services. The Board considered (i) the nature, extent, quality, and cost of advisory and administrative services performed by the Investment Advisers and their affiliates under the Advisory Contracts and under separate agreements covering transfer agency, pricing and bookkeeping, and securities lending services for the fund; (ii) the nature and extent of the supervision of third party service providers, principally custodians, subcustodians, and pricing vendors; and (iii) the resources devoted to, and the record of compliance with, the fund's compliance policies and procedures. The Board also reviewed the allocation of fund brokerage, including allocations to brokers affiliated with the Investment Advisers, the use of brokerage commissions to pay fund expenses, and the use of "soft" commission dollars to pay for research services.Investment Performance. The Board considered whether the fund has operated in accordance with its investment objective, as well as its record of compliance with its investment restrictions. The Board reviewed the fund's absolute investment performance, as well as the fund's relative investment performance, but did not consider performance to be a material factor in its decision to renew the fund's Advisory Contracts, as the fund is not publicly offered as a stand-alone investment product. In this regard, the Board noted that the fund is designed to offer an investment option for other investment companies managed by Fidelity and ultimately to enhance the performance of those investment companies.Based on its review, the Board concluded that the nature, extent, and quality of services provided to the fund under the Advisory Contracts should continue to benefit the shareholders of the fund.Competitiveness of Management Fee and Total Expense Ratio. The Board considered that the fund does not pay FMR a management fee for investment advisory services. The Board also noted that FMR or an affiliate undertakes to pay all operating expenses of the fund, except transfer agent fees, 12b-1 fees, Independent Trustee fees and expenses, custodian fees and expenses, proxy and shareholder meeting expenses, interest, taxes, brokerage expenses, and extraordinary expenses (such as litigation expenses).The Board further considered that, effective June 1, 2017, FMR has contractually agreed to reimburse the fund to the extent that total operating expenses (excluding interest, certain taxes, certain securities lending costs, brokerage commissions, fees and expenses of the Independent Trustees, proxy and shareholder meeting expenses, extraordinary expenses, and acquired fund fees and expenses, if any), as a percentage of its average net assets, exceed 0.014% through August 31, 2020.Based on its review, the Board considered that the fund does not pay a management fee and concluded that the fund's total expense ratio was reasonable in light of the services that the fund and its shareholders receive and the other factors considered.Costs of the Services and Profitability. The Board considered the level of Fidelity's profits in respect of all the Fidelity funds.PricewaterhouseCoopers LLP (PwC), independent registered public accounting firm and auditor to Fidelity and certain Fidelity funds, has been engaged annually by the Board as part of the Board's assessment of Fidelity's profitability analysis. PwC's engagement includes the review and assessment of the methodologies used by Fidelity in determining the revenues and expenses attributable to Fidelity's mutual fund business, and completion of agreed-upon procedures in respect of the mathematical accuracy of the fund profitability information and its conformity to established allocation methodologies. After considering PwC's reports issued under the engagement and information provided by Fidelity, the Board concluded that while other allocation methods may also be reasonable, Fidelity's profitability methodologies are reasonable in all material respects.The Board also reviewed Fidelity's non-fund businesses and potential fall-out benefits related to the mutual fund business as well as cases where Fidelity's affiliates may benefit from or be related to the fund's business.The Board concluded that the costs of the services provided by and the profits realized by Fidelity in connection with the operation of the fund were not relevant to the renewal of the Advisory Contracts because the fund pays no advisory fees and FMR or an affiliate bears all expenses of the fund, with limited exceptions.Economies of Scale. The Board concluded that because the fund pays no advisory fees and FMR or an affiliate bears all expenses of the fund, with limited exceptions, economies of scale cannot be realized by the fund.Additional Information Requested by the Board. In order to develop fully the factual basis for consideration of the Fidelity funds' advisory contracts, the Board requested and received additional information on certain topics, including: (i) fund performance trends, in particular the underperformance of certain funds, and Fidelity's long-term strategies for certain funds; (ii) Fidelity's fund profitability methodology, profitability trends for certain funds, and the impact of certain factors on fund profitability results, including the impact of market trends on actively managed funds; (iii) the use of performance fees and the calculation of performance adjustments, including the impact of underperformance and fund outflows on performance adjustments; (iv) metrics for evaluating index fund performance; (v) Fidelity's group fee structure, including the group fee breakpoint schedules; (vi) the terms of Fidelity's contractual and voluntary expense cap arrangements with the funds; (vii) the methodology with respect to evaluating competitive fund data and peer group classifications and fee comparisons; (viii) the expense structures for different funds and classes; (ix) Fidelity's arrangements with affiliated sub-advisers on behalf of the funds; (x) information regarding other accounts managed by Fidelity, including institutional accounts and collective investment trusts; (xi) recent changes to the fee structure for certain funds of funds; and (xii) the impact of the Department of Labor's new fiduciary rule on the funds' comparative expense information.Based on its evaluation of all of the conclusions noted above, and after considering all factors it believed relevant, the Board concluded that the advisory fee structures are fair and reasonable, and that the fund's Advisory Contracts should be renewed.![]()
Corporate Headquarters
245 Summer St.
Boston, MA 02210
www.fidelity.com
AMHTI-SANN-0218
1.950944.105
Item 2.
Code of Ethics
Not applicable.
Item 3.
Audit Committee Financial Expert
Not applicable.
Item 4.
Principal Accountant Fees and Services
Not applicable.
Item 5.
Audit Committee of Listed Registrants
Not applicable.
Item 6.
Investments
(a)
Not applicable.
(b)
Not applicable
Item 7.
Disclosure of Proxy Voting Policies and Procedures for Closed-End Management Investment Companies
Not applicable.
Item 8.
Portfolio Managers of Closed-End Management Investment Companies
Not applicable.
Item 9.
Purchase of Equity Securities by Closed-End Management Investment Company and Affiliated Purchasers
Not applicable.
Item 10.
Submission of Matters to a Vote of Security Holders
There were no material changes to the procedures by which shareholders may recommend nominees to the Fidelity Hastings Street Trust’s Board of Trustees.
Item 11.
Controls and Procedures
(a)(i) The President and Treasurer and the Chief Financial Officer have concluded that the Fidelity Hastings Street Trust’s (the “Trust”) disclosure controls and procedures (as defined in Rule 30a-3(c) under the Investment Company Act) provide reasonable
assurances that material information relating to the Trust is made known to them by the appropriate persons, based on their evaluation of these controls and procedures as of a date within 90 days of the filing date of this report.
(a)(ii) There was no change in the Trust’s internal control over financial reporting (as defined in Rule 30a-3(d) under the Investment Company Act) that occurred during the second fiscal quarter of the period covered by this report that has materially affected, or is reasonably likely to materially affect, the Trust’s internal control over financial reporting.
Item 12.
Exhibits
(a) | (1) | Not applicable. |
(a) | (2) | Certification pursuant to Rule 30a-2(a) under the Investment Company Act of 1940 (17 CFR 270.30a-2(a)) is filed and attached hereto as Exhibit 99.CERT. |
(a) | (3) | Not applicable. |
(b) | Certification pursuant to Rule 30a-2(b) under the Investment Company Act of 1940 (17 CFR 270.30a-2(b)) is furnished and attached hereto as Exhibit 99.906CERT. |
SIGNATURES
Pursuant to the requirements of the Securities Exchange Act of 1934 and the Investment Company Act of 1940, the registrant has duly caused this report to be signed on its behalf by the undersigned, thereunto duly authorized.
Fidelity Hastings Street Trust
By: | /s/Stacie M. Smith |
Stacie M. Smith | |
President and Treasurer | |
Date: | February 22, 2018 |
Pursuant to the requirements of the Securities Exchange Act of 1934 and the Investment Company Act of 1940, this report has been signed below by the following persons on behalf of the registrant and in the capacities and on the dates indicated.
By: | /s/Stacie M. Smith |
Stacie M. Smith | |
President and Treasurer | |
Date: | February 22, 2018 |
By: | /s/Howard J. Galligan III |
Howard J. Galligan III | |
Chief Financial Officer | |
Date: | February 22, 2018 |