UNITED STATES
SECURITIES AND EXCHANGE COMMISSION
Washington, D.C. 20549
FORM N-CSR
CERTIFIED SHAREHOLDER REPORT OF REGISTERED
MANAGEMENT INVESTMENT COMPANIES
Investment Company Act file number 811-02628
Fidelity Municipal Trust
(Exact name of registrant as specified in charter)
245 Summer St., Boston, Massachusetts 02210
(Address of principal executive offices) (Zip code)
Cynthia Lo Bessette, Secretary
245 Summer St.
Boston, Massachusetts 02210
(Name and address of agent for service)
Registrant's telephone number, including area code:
617-563-7000
| |
Date of fiscal year end: | December 31 |
|
|
Date of reporting period: | December 31, 2022 |
Item 1.
Reports to Stockholders
Fidelity® Limited Term Municipal Income Fund
Annual Report
December 31, 2022
Includes Fidelity and Fidelity Advisor share classes
Contents
To view a fund's proxy voting guidelines and proxy voting record for the 12-month period ended June 30, visit http://www.fidelity.com/proxyvotingresults or visit the Securities and Exchange Commission's (SEC) web site at http://www.sec.gov.
You may also call 1-800-544-8544 if you're an individual investing directly with Fidelity, call 1-800-835-5092 if you're a plan sponsor or participant with Fidelity as your recordkeeper or call 1-877-208-0098 on institutional accounts or if you're an advisor or invest through one to request a free copy of the proxy voting guidelines.
Standard & Poor's, S&P and S&P 500 are registered service marks of The McGraw-Hill Companies, Inc. and have been licensed for use by Fidelity Distributors Corporation.
Other third-party marks appearing herein are the property of their respective owners.
All other marks appearing herein are registered or unregistered trademarks or service marks of FMR LLC or an affiliated company. © 2023 FMR LLC. All rights reserved.
This report and the financial statements contained herein are submitted for the general information of the shareholders of the Fund. This report is not authorized for distribution to prospective investors in the Fund unless preceded or accompanied by an effective prospectus.
A fund files its complete schedule of portfolio holdings with the SEC for the first and third quarters of each fiscal year on Form N-PORT. Forms N-PORT are available on the SEC's web site at http://www.sec.gov. A fund's Forms N-PORT may be reviewed and copied at the SEC's Public Reference Room in Washington, DC. Information regarding the operation of the SEC's Public Reference Room may be obtained by calling 1-800-SEC-0330.
For a complete list of a fund's portfolio holdings, view the most recent holdings listing, semiannual report, or annual report on Fidelity's web site at http://www.fidelity.com, http://www.institutional.fidelity.com, or http://www.401k.com, as applicable.
NOT FDIC INSURED •MAY LOSE VALUE •NO BANK GUARANTEE
Neither the Fund nor Fidelity Distributors Corporation is a bank.
Average annual total return reflects the change in the value of an investment, assuming reinvestment of distributions from dividend income and capital gains (the profits earned upon the sale of securities that have grown in value, if any) and assuming a constant rate of performance each year. The hypothetical investment and the average annual total returns do not reflect the deduction of taxes that a shareholder would pay on fund distributions or the redemption of fund shares. During periods of reimbursement by Fidelity, a fund's total return will be greater than it would be had the reimbursement not occurred. How a fund did yesterday is no guarantee of how it will do tomorrow.
| Average Annual Total Returns |
| | | | |
Periods ended December 31, 2022 | Past 1 year | Past 5 years | Past 10 years |
| Class A (incl.2.75% sales charge) | -7.44% | 0.01% | 0.38% |
| Class M (incl.2.75% sales charge) | -7.44% | 0.03% | 0.40% |
Class C (incl. contingent deferred sales charge) | -6.45% | -0.16% | 0.07% |
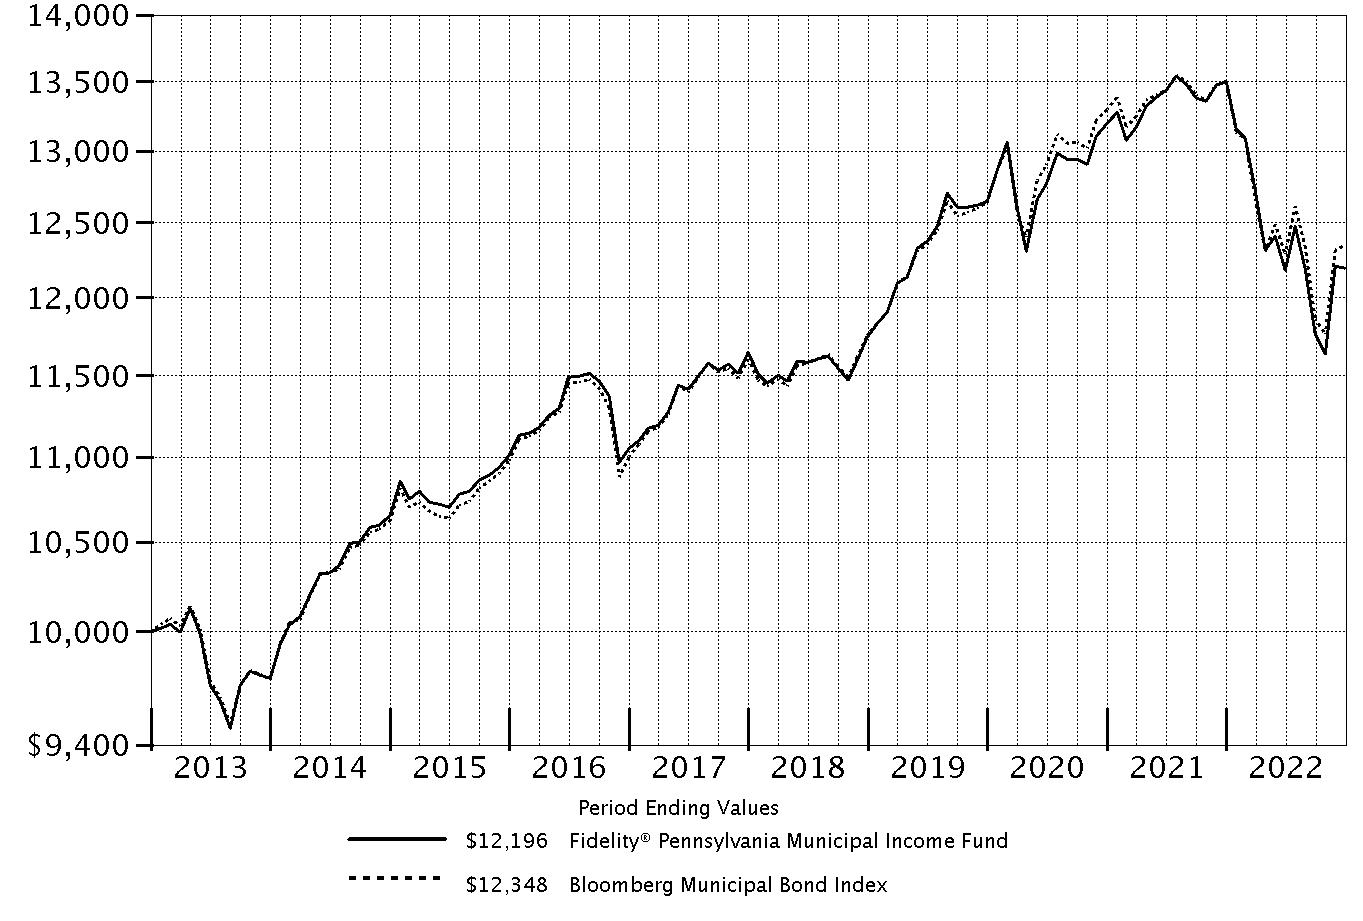
| Fidelity® Limited Term Municipal Income Fund | -4.46% | 0.89% | 0.98% |
| Class I | -4.55% | 0.87% | 0.93% |
| Class Z | -4.40% | 0.93% | 0.96% |
Class C shares' contingent deferred sales charges included in the past one year, past five years and past ten years total return figures are 1%, 0% and 0%, respectively.
The initial offering of Class Z shares took place on October 2, 2018. Returns prior to October 2, 2018, are those of Class I.
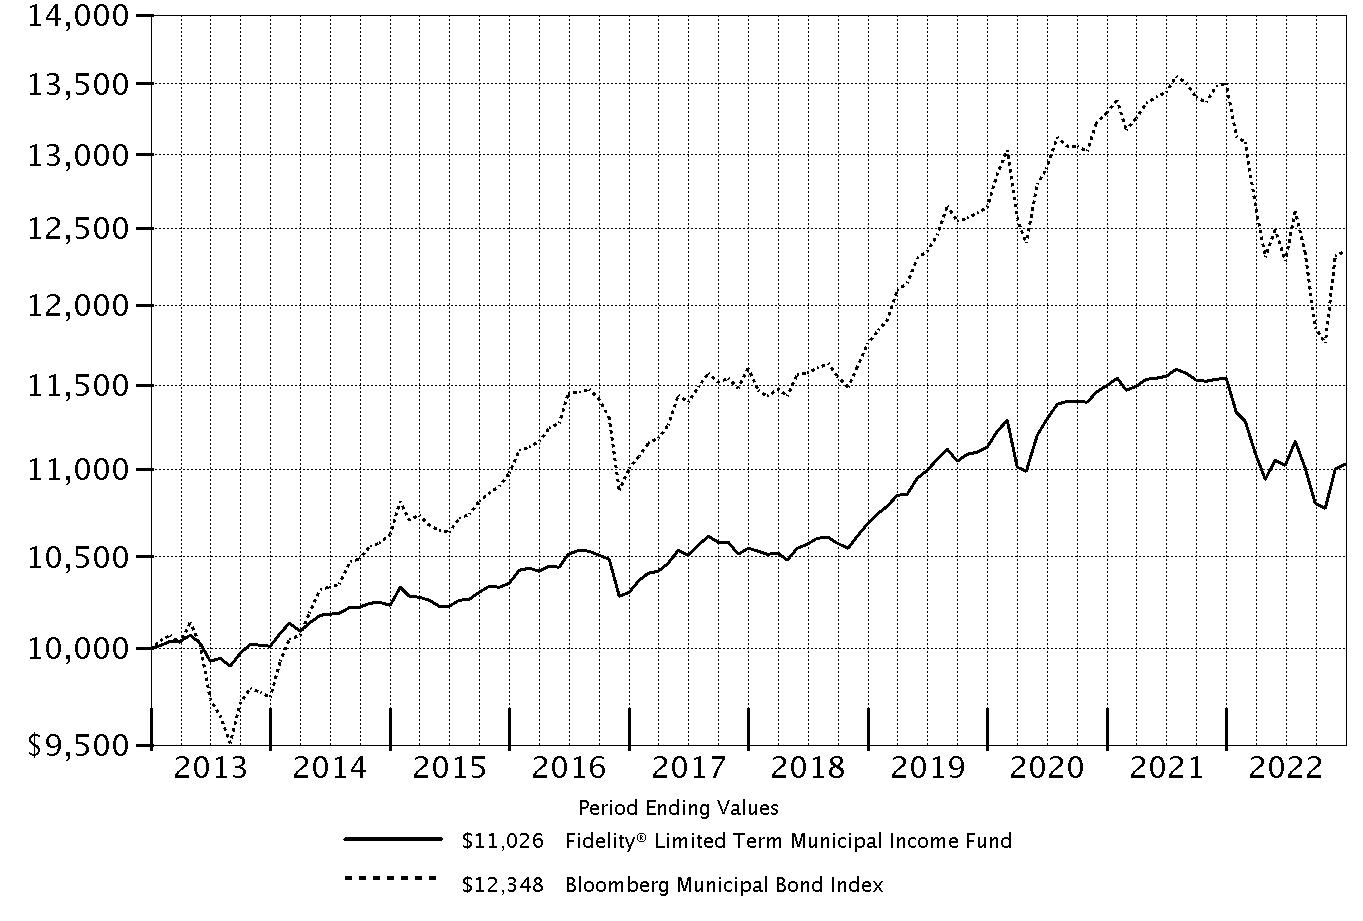
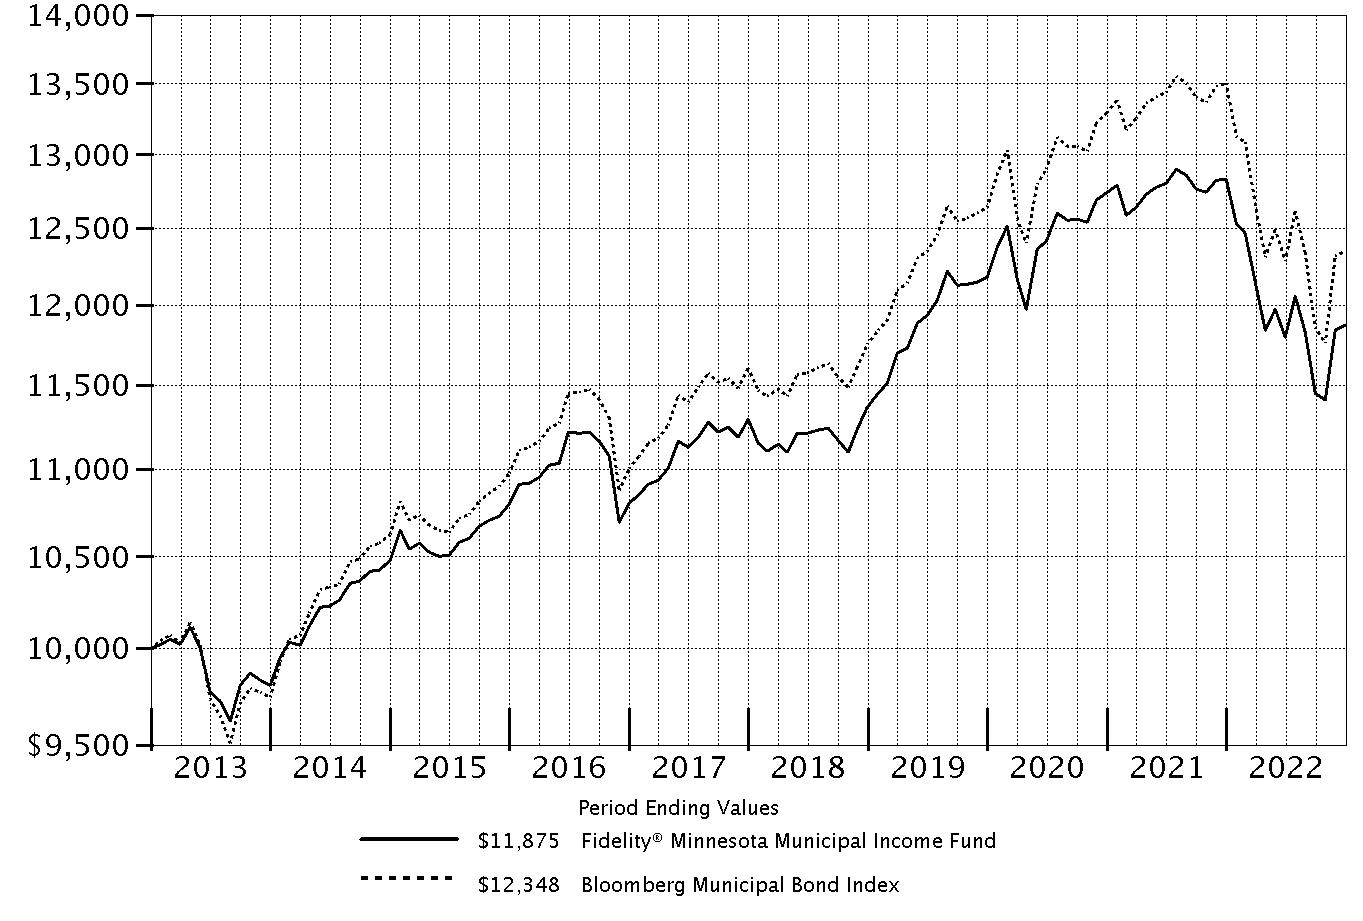
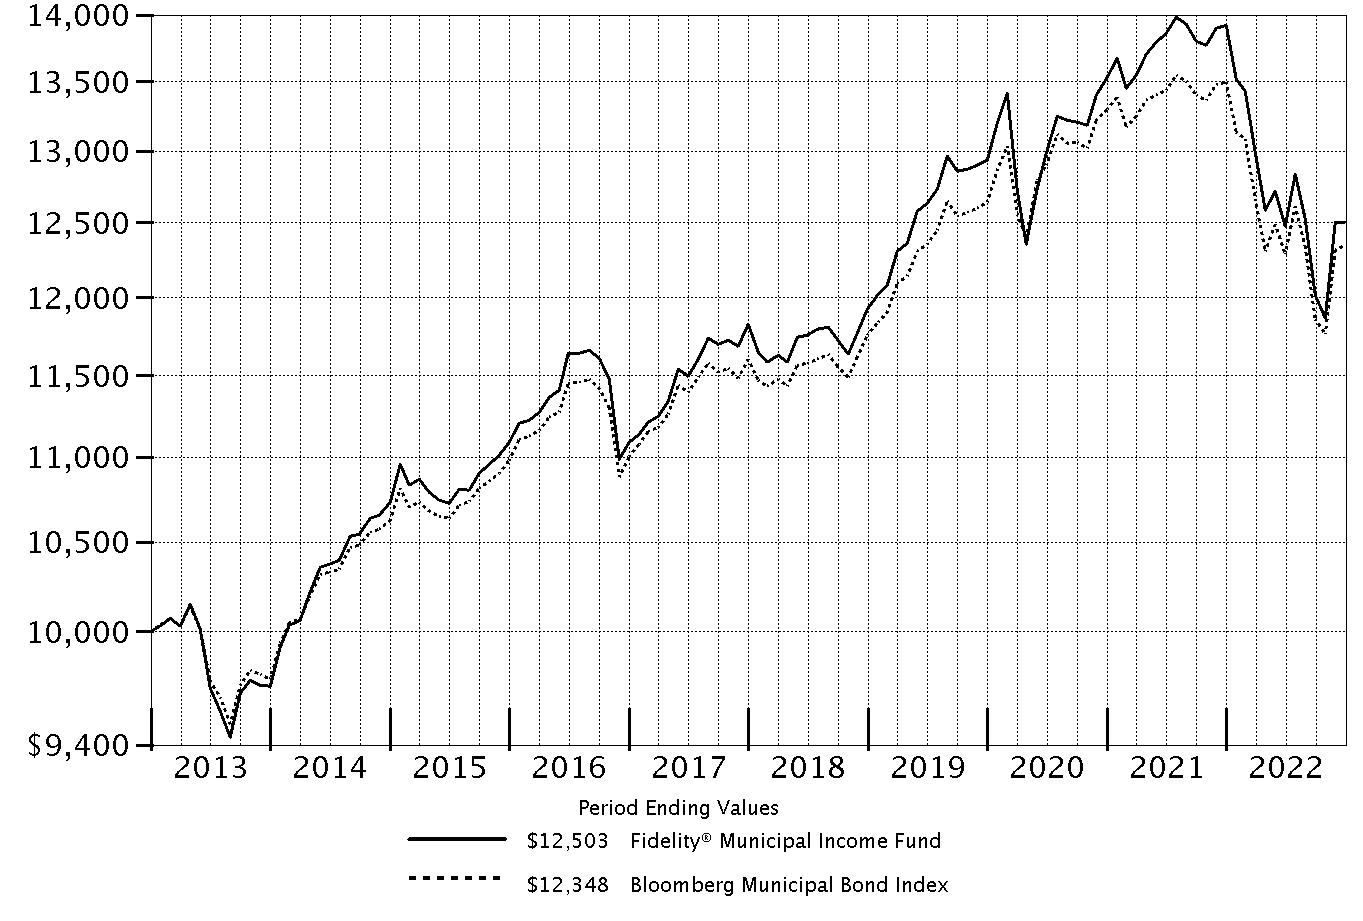
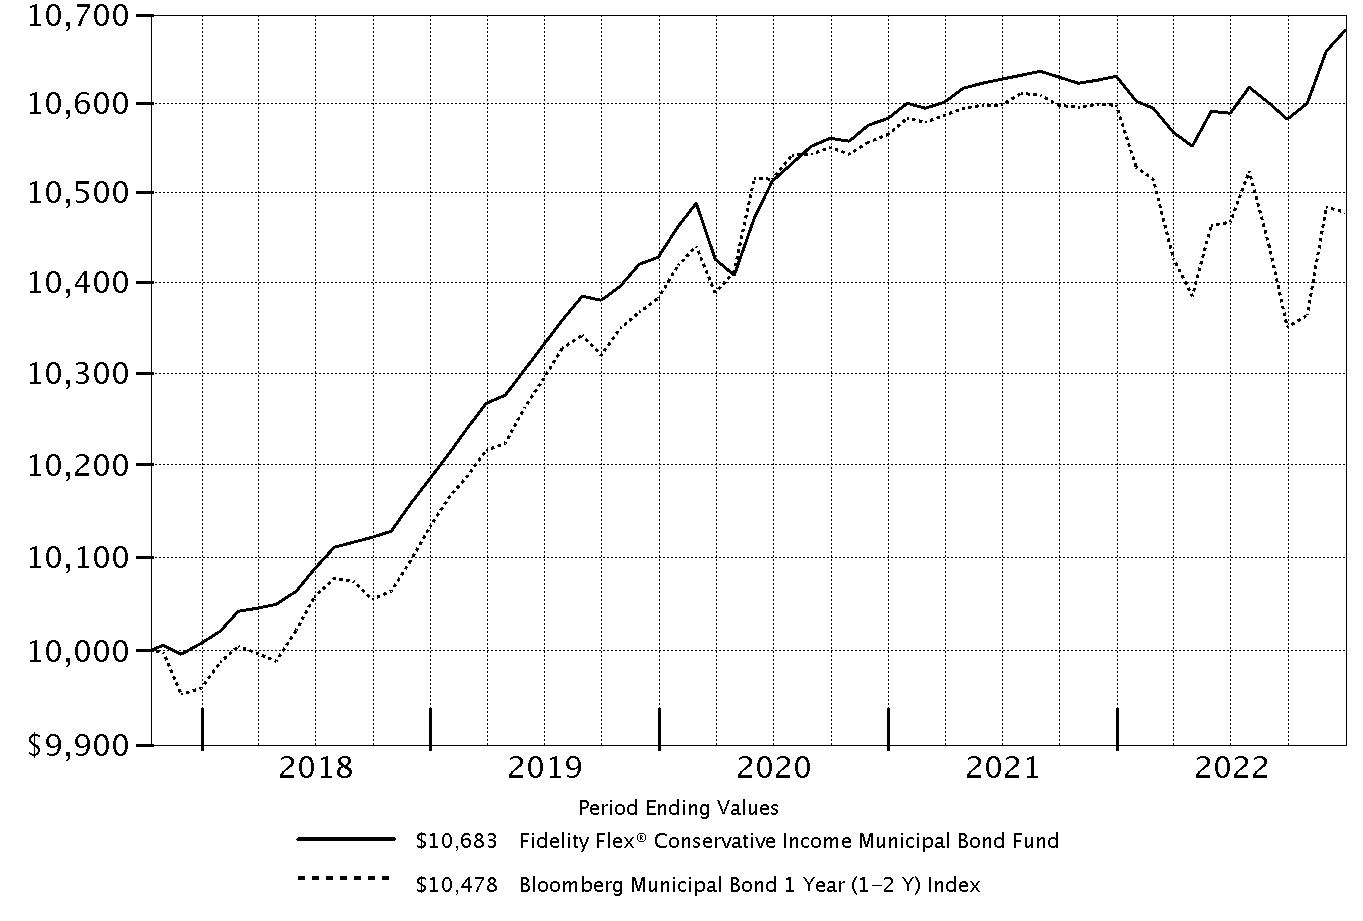
| $10,000 Over 10 Years |
| |
Let's say hypothetically that $10,000 was invested in Fidelity® Limited Term Municipal Income Fund, a class of the fund, on December 31, 2012. The chart shows how the value of your investment would have changed, and also shows how the Bloomberg Municipal Bond Index performed over the same period. |
|
|
Market Recap:
Tax-exempt municipal bonds notably declined in 2022, as a multitude of crosscurrents challenged the global economy and financial markets. The Bloomberg Municipal Bond Index returned -8.53% for the year, its third-worst annual return on record. In late 2021, the Federal Reserve began its pivot to a tighter monetary policy, tapering the large-scale asset purchases it restarted in 2020 amid the COVID-19 pandemic. In early 2022, the Fed, faced with persistent inflationary pressure, implemented an aggressive series of rate hikes, raising its benchmark interest rate seven times, by a total of 4.25 percentage points, between March and December. This helped push municipal bond yields to their highest level in more than a decade. Muni bond prices, which move inversely to yields, fell sharply. Credit spreads significantly widened, as investors demanded more yield for lower-quality munis as recession risk increased. In November and December, the tax-exempt market staged a rally when comments by Fed Chair Jerome Powell pointed to a slowdown in the pace of rate hikes and inflation data moderated. Favorable supply and demand dynamics also helped amid muted muni bond issuance and increased pockets of demand. Muni tax-backed credit fundamentals remained solid throughout the year and, for the most part, the risk of credit-rating downgrades appeared low. Shorter-duration (lower sensitivity to changes in interest rates) and higher-credit-quality munis performed best for the year.
Comments from Co-Portfolio Managers Elizah McLaughlin, Cormac Cullen and Michael Maka:
For the fiscal year ending December 31, 2022, the fund's share classes (excluding sales charges, if any) returned roughly -4.5% to -5.5%, lagging the -3.55% result of the benchmark Bloomberg 1-6 Year Municipal Bond Index. The past 12 months, we continued to focus on longer-term objectives and sought to generate attractive tax-exempt income and a competitive risk-adjusted return. Versus the index, the fund's overweight in lower-rated investment-grade bonds was a key detractor, given that they underperformed as credit spreads widened. An underweight in some of the highest-quality securities, particularly AAA-rated prerefunded bonds, also crimped the relative result because these securities typically outpaced the benchmark. Larger-than-index exposure to the airport segment detracted as well. Differences in the way fund holdings and index components were priced further hindered relative performance. In contrast, yield-curve positioning contributed to performance, relative to the benchmark. The fund was overweight the seven-year part of the curve and underweight the two-year portion, which was advantageous as the municipal yield curve flattened in the latter part of the year. A higher-than-average yield on the fund's underlying holdings provided another boost to the relative result.
The views expressed above reflect those of the portfolio manager(s) only through the end of the period as stated on the cover of this report and do not necessarily represent the views of Fidelity or any other person in the Fidelity organization. Any such views are subject to change at any time based upon market or other conditions and Fidelity disclaims any responsibility to update such views. These views may not be relied on as investment advice and, because investment decisions for a Fidelity fund are based on numerous factors, may not be relied on as an indication of trading intent on behalf of any Fidelity fund.
| Top Five States (% of Fund's net assets) |
| | |
| Texas | 11.6 |
| Illinois | 9.7 |
| New York | 8.1 |
| Florida | 6.7 |
| New Jersey | 6.2 |
| | |
| Revenue Sources (% of Fund's net assets) |
| General Obligations | 26.7% | |
| Transportation | 24.2% | |
| Health Care | 12.9% | |
| Electric Utilities | 6.1% | |
| State G.O. | 6.1% | |
| Others* (Individually Less Than 5%) | 24.0% | |
| | 100.0% | |
| |
| *Includes net other assets | | |
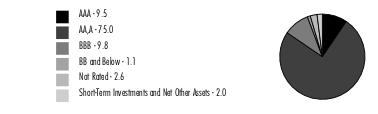
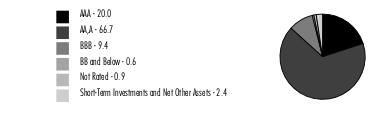
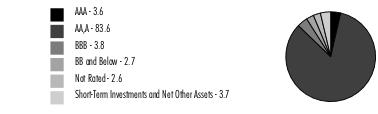
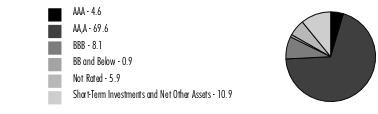
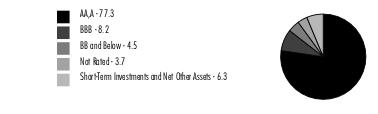
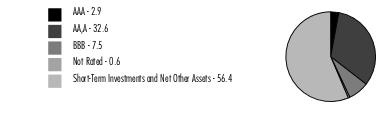
Quality Diversification (% of Fund's net assets) |
|
| |
| We have used ratings from Moody's Investors Service, Inc. Where Moody's® ratings are not available, we have used S&P® ratings. All ratings are as of the date indicated and do not reflect subsequent changes. |
Showing Percentage of Net Assets
| Municipal Bonds - 98.6% |
| | | Principal Amount (a) (000s) | Value ($) (000s) |
| Alabama - 1.4% | | | |
| Birmingham Arpt. Auth. Series 2020: | | | |
| 5% 7/1/26 (Build America Mutual Assurance Insured) | | 555 | 591 |
| 5% 7/1/27 (Build America Mutual Assurance Insured) | | 500 | 540 |
| Black Belt Energy Gas District: | | | |
| Bonds (Proj. No. 5) Series A, 4%, tender 10/1/26 (b) | | 4,000 | 3,943 |
| Series 2022 C1: | | | |
5.25% 12/1/26 | | 1,845 | 1,920 |
5.25% 6/1/27 | | 1,290 | 1,346 |
5.25% 12/1/27 | | 1,170 | 1,224 |
5.25% 6/1/28 | | 1,540 | 1,616 |
5.25% 12/1/28 | | 1,275 | 1,339 |
5.25% 6/1/29 | | 1,000 | 1,048 |
| Mobile County Board of School Commissioners: | | | |
| Series 2016 A: | | | |
5% 3/1/23 | | 830 | 832 |
5% 3/1/24 | | 1,225 | 1,253 |
5% 3/1/25 | | 1,225 | 1,281 |
| Series 2016 B, 5% 3/1/24 | | 1,210 | 1,237 |
| Mobile Indl. Dev. Board Poll. Cont. Rev. Bonds Series 2009 E, 1%, tender 6/26/25 (b) | | 5,030 | 4,770 |
| Southeast Alabama Gas Supply District Bonds (Proj. No. 2) Series 2018 A, 4%, tender 6/1/24 (b) | | 2,460 | 2,451 |
| Southeast Energy Auth. Rev. Bonds: | | | |
| (Proj. No. 2) Series 2021 B1: | | | |
4% 6/1/24 | | 600 | 601 |
4% 6/1/25 | | 725 | 728 |
4% 6/1/26 | | 1,500 | 1,507 |
4% 6/1/27 | | 2,440 | 2,444 |
4% 6/1/28 | | 3,780 | 3,768 |
| Bonds Series 2022 B1, 5%, tender 8/1/28 (b) | | 6,035 | 6,195 |
TOTAL ALABAMA | | | 40,634 |
| Alaska - 0.2% | | | |
| Alaska Hsg. Fin. Corp. Mtg. Rev. Series 2022 A, 3% 6/1/51 | | 1,230 | 1,187 |
| Alaska Muni. Bond Bank Series 2015 B, 5% 3/1/28 (c) | | 1,390 | 1,434 |
| Anchorage Gen. Oblig. Series 2014 B, 5% 9/1/24 | | 2,030 | 2,099 |
TOTAL ALASKA | | | 4,720 |
| Arizona - 3.9% | | | |
| Arizona Board of Regents Arizona State Univ. Rev.: | | | |
| Series 2016 A, 5% 7/1/26 | | 275 | 290 |
| Series 2021: | | | |
5% 8/1/26 | | 1,100 | 1,188 |
5% 8/1/27 | | 1,500 | 1,650 |
| Arizona Ctfs. of Prtn. Series 2019 A, 5% 10/1/24 (Escrowed to Maturity) | | 2,025 | 2,103 |
| Arizona Health Facilities Auth. Rev. (Scottsdale Lincoln Hospitals Proj.) Series 2014 A: | | | |
| 5% 12/1/23 | | 980 | 996 |
| 5% 12/1/24 | | 1,465 | 1,519 |
| Arizona Indl. Dev. Auth. Hosp. Rev. Series 2021 A: | | | |
| 5% 2/1/24 | | 1,200 | 1,225 |
| 5% 2/1/25 | | 1,100 | 1,146 |
| 5% 2/1/26 | | 1,200 | 1,276 |
| 5% 2/1/27 | | 1,200 | 1,299 |
| Chandler Indl. Dev. Auth. Indl. Dev. Rev.: | | | |
| (Intel Corp. Proj.) Series 2022 2, 5%, tender 9/1/27 (b)(c) | | 8,765 | 9,147 |
| Bonds (Intel Corp. Proj.): | | | |
Series 2005, 2.4%, tender 8/14/23 (b) | | 1,625 | 1,612 |
Series 2007, 2.7%, tender 8/14/23 (b)(c) | | 13,435 | 13,347 |
Series 2019, 5%, tender 6/3/24 (b)(c) | | 40,560 | 41,203 |
| Coconino County Poll. Cont. Corp. Rev. Bonds Series 2017 B, 1.65%, tender 3/31/23 (b) | | 1,505 | 1,498 |
| Glendale Union School District 205 Series A: | | | |
| 5% 7/1/26 (Assured Guaranty Muni. Corp. Insured) | | 200 | 215 |
| 5% 7/1/27 (Assured Guaranty Muni. Corp. Insured) | | 250 | 273 |
| Maricopa County Indl. Dev. Auth. Sr. Living Facilities (Christian Care Surprise, Inc. Proj.) Series 2016, 5% 1/1/26 (d) | | 985 | 906 |
| Maricopa County Rev.: | | | |
| Bonds Series 2019 D, 5%, tender 5/15/26 (b) | | 5,155 | 5,473 |
| Series 2016 A, 5% 1/1/25 | | 4,725 | 4,912 |
| Maricopa County Spl. Health Care District Gen. Oblig. Series 2021 D: | | | |
| 5% 7/1/25 | | 1,165 | 1,228 |
| 5% 7/1/26 | | 3,000 | 3,227 |
| Maricopa County Unified School District #48 Scottsdale Series D: | | | |
| 4% 7/1/24 | | 1,000 | 1,018 |
| 4% 7/1/25 | | 800 | 825 |
| 4% 7/1/26 | | 900 | 940 |
| 4% 7/1/27 | | 225 | 238 |
| Phoenix Civic Impt. Board Arpt. Rev.: | | | |
| Series 2017 D, 5% 7/1/25 | | 2,110 | 2,224 |
| Series 2019 B: | | | |
5% 7/1/24 (c) | | 1,550 | 1,585 |
5% 7/1/25 (c) | | 1,500 | 1,557 |
| Phoenix Civic Impt. Corp. Series 2019 B, 5% 7/1/28 | | 1,910 | 2,091 |
| Tucson Ctfs. of Prtn. Series 2016, 5% 7/1/27 (Assured Guaranty Muni. Corp. Insured) | | 1,245 | 1,334 |
| Univ. of Arizona Univ. Revs. Series 2019 A, 5% 6/1/26 | | 1,250 | 1,347 |
| Western Maricopa Ed. Ctr. District Series 2019 B, 5% 7/1/26 | | 2,000 | 2,152 |
TOTAL ARIZONA | | | 111,044 |
| California - 3.8% | | | |
| Bay Area Toll Auth. San Francisco Bay Toll Bridge Rev. Bonds: | | | |
| Series 2021 A, 2%, tender 4/1/28 (b) | | 7,365 | 6,805 |
| Series A, 2.95%, tender 4/1/26 (b) | | 5,000 | 4,946 |
| Series B, 2.85%, tender 4/1/25 (b) | | 4,090 | 4,053 |
| California Gen. Oblig.: | | | |
| Series 2017, 5% 8/1/26 | | 1,200 | 1,301 |
| Series 2020, 4% 11/1/26 | | 700 | 735 |
| California Muni. Fin. Auth. Ctfs. of Prtn. Series 2021, 5% 11/1/27 (d) | | 1,500 | 1,553 |
| California Muni. Fin. Auth. Solid Waste Disp. Rev. Bonds (Waste Mgmt., Inc. Proj.) Series 2017 A, 0.7%, tender 12/1/23 (b)(c) | | 4,005 | 3,882 |
| California Pub. Works Board Lease Rev. (Various Cap. Projs.) Series 2022 C, 5% 8/1/24 | | 965 | 1,000 |
| Golden State Tobacco Securitization Corp. Tobacco Settlement Rev.: | | | |
| Series 2015 A, 5% 6/1/40 (Pre-Refunded to 6/1/25 @ 100) | | 9,380 | 9,926 |
| Series 2017 A1, 5% 6/1/24 (Escrowed to Maturity) | | 1,085 | 1,122 |
| Series A, 0% 6/1/24 (Escrowed to Maturity) | | 3,390 | 3,258 |
| Los Angeles County Pub. Works Fing. Auth. Lease Rev. Series 2022 G, 5% 12/1/24 | | 1,500 | 1,568 |
| Los Angeles Dept. Arpt. Rev.: | | | |
| Series 2016 A: | | | |
5% 5/15/24 (c) | | 890 | 911 |
5% 5/15/24 (Escrowed to Maturity) (c) | | 120 | 123 |
5% 5/15/25 (c) | | 880 | 913 |
5% 5/15/25 (Escrowed to Maturity) (c) | | 120 | 126 |
| Series 2017 B, 5% 5/15/25 (c) | | 2,265 | 2,349 |
| Series 2018 B: | | | |
5% 5/15/25 (c) | | 1,305 | 1,355 |
5% 5/15/26 (c) | | 1,545 | 1,631 |
| Series 2018 C, 5% 5/15/27 (c) | | 1,615 | 1,714 |
| Series 2020 C, 5% 5/15/26 (c) | | 2,645 | 2,792 |
| Northern California Energy Auth. Bonds Series 2018, 4%, tender 7/1/24 (b) | | 10,000 | 9,992 |
| Oakland Unified School District Alameda County Series 2013, 5.5% 8/1/23 | | 515 | 522 |
| Palomar Health Rev. Series 2016: | | | |
| 5% 11/1/23 | | 1,955 | 1,978 |
| 5% 11/1/24 | | 1,955 | 2,004 |
| 5% 11/1/25 | | 1,000 | 1,040 |
| Port of Oakland Rev.: | | | |
| Series 2021 H, 5% 5/1/28 (c) | | 1,000 | 1,072 |
| Series H: | | | |
5% 5/1/26 (c) | | 1,830 | 1,915 |
5% 5/1/27 (c) | | 3,400 | 3,602 |
| San Diego County Reg'l. Arpt. Auth. Arpt. Rev. Series 2020 C, 5% 7/1/26 (c) | | 1,000 | 1,050 |
| San Francisco City & County Arpts. Commission Int'l. Arpt. Rev.: | | | |
| Series 2019 A: | | | |
5% 1/1/24 (c) | | 1,660 | 1,683 |
5% 1/1/27 (c) | | 2,405 | 2,538 |
| Series 2022 A: | | | |
5% 5/1/26 (c) | | 4,535 | 4,761 |
5% 5/1/27 (c) | | 4,590 | 4,862 |
5% 5/1/28 (c) | | 6,130 | 6,541 |
5% 5/1/29 (c) | | 4,100 | 4,405 |
| San Pablo Redev. Agcy. Series 2014 A, 5% 6/15/24 (Assured Guaranty Muni. Corp. Insured) | | 1,350 | 1,390 |
| Southern California Pub. Pwr. Auth. Rev. Bonds Series 2020 C, 0.65%, tender 7/1/25 (b) | | 8,000 | 7,472 |
TOTAL CALIFORNIA | | | 108,890 |
| Colorado - 1.7% | | | |
| Colorado Health Facilities Auth. Rev. Bonds Bonds Series 2019 B: | | | |
| 5%, tender 8/1/25 (b) | | 2,950 | 3,037 |
| 5%, tender 8/1/26 (b) | | 2,035 | 2,125 |
| 5%, tender 11/19/26 (b) | | 615 | 663 |
| 5%, tender 11/19/26 (b) | | 6,065 | 6,424 |
| Colorado Hsg. & Fin. Auth.: | | | |
| Series 2019 F, 4.25% 11/1/49 | | 1,210 | 1,221 |
| Series 2019 H, 4.25% 11/1/49 | | 620 | 626 |
| Colorado Reg'l. Trans. District Ctfs. of Prtn. Series 2020, 5% 6/1/26 | | 1,000 | 1,071 |
| Colorado Springs Utils. Rev. Series 2020: | | | |
| 5% 11/15/25 | | 1,320 | 1,407 |
| 5% 11/15/25 | | 1,020 | 1,087 |
| Colorado Univ. Co. Hosp. Auth. Rev. Bonds Series 2019 C, 5%, tender 11/15/24 (b) | | 14,940 | 15,312 |
| Denver City & County Arpt. Rev.: | | | |
| Series 2018 A, 5% 12/1/29 (c) | | 1,205 | 1,287 |
| Series 2020 B1, 5% 11/15/24 (c) | | 1,500 | 1,546 |
| E-470 Pub. Hwy. Auth. Rev. Series 2020 A, 5% 9/1/26 | | 1,750 | 1,881 |
| Univ. of Colorado Enterprise Sys. Rev. Bonds: | | | |
| Series 2019 C, 2%, tender 10/15/24 (b) | | 9,030 | 8,826 |
| Series 2021 C3A, 2%, tender 10/15/25 (b) | | 1,625 | 1,577 |
| Series 2021 C3B, 2%, tender 10/15/26 (b) | | 1,345 | 1,289 |
TOTAL COLORADO | | | 49,379 |
| Connecticut - 3.1% | | | |
| Connecticut Gen. Oblig.: | | | |
| Series 2016 A, 5% 3/15/26 | | 1,925 | 2,063 |
| Series 2019 A: | | | |
5% 4/15/25 | | 4,380 | 4,604 |
5% 4/15/26 | | 2,355 | 2,528 |
5% 4/15/30 | | 965 | 1,084 |
| Series 2020 C, 2% 6/1/25 | | 1,000 | 967 |
| Series 2021 D: | | | |
5% 7/15/24 | | 1,990 | 2,057 |
5% 7/15/25 | | 1,685 | 1,781 |
| Series 2022 A, 4% 1/15/26 | | 1,025 | 1,062 |
| Series 2022 E: | | | |
5% 11/15/25 | | 6,000 | 6,390 |
5% 11/15/26 | | 6,000 | 6,513 |
| Series 2022 G: | | | |
5% 11/15/25 | | 6,000 | 6,390 |
5% 11/15/26 | | 6,000 | 6,513 |
| Series C, 4% 6/1/26 | | 1,100 | 1,144 |
| Connecticut Health & Edl. Facilities Auth. Rev.: | | | |
| Bonds: | | | |
Series 2010 A3, 0.25%, tender 2/9/24 (b) | | 4,155 | 3,993 |
Series 2014 B, 1.8%, tender 7/1/24 (b) | | 3,150 | 3,049 |
| Series 2016 A, 2%, tender 7/1/26 (b) | | 1,725 | 1,634 |
| Series 2017 B, 5% 7/1/29 | | 7,075 | 8,111 |
| Series 2018 S: | | | |
5% 7/1/23 | | 1,455 | 1,468 |
5% 7/1/24 | | 1,000 | 1,028 |
| Series 2019 A: | | | |
4% 7/1/23 (d) | | 1,045 | 1,040 |
4% 7/1/24 (d) | | 1,090 | 1,064 |
5% 7/1/25 (d) | | 705 | 696 |
5% 7/1/28 (d) | | 1,315 | 1,281 |
5% 7/1/29 (d) | | 940 | 912 |
| Series 2022 M: | | | |
5% 7/1/24 | | 175 | 178 |
5% 7/1/27 | | 250 | 265 |
5% 7/1/28 | | 300 | 321 |
| Connecticut Spl. Tax Oblig. Trans. Infrastructure Rev.: | | | |
| Series 2012 A, 5% 1/1/24 | | 1,650 | 1,650 |
| Series 2021 C, 5% 1/1/25 | | 1,280 | 1,338 |
| Series A: | | | |
5% 5/1/24 | | 1,000 | 1,029 |
5% 9/1/26 | | 1,025 | 1,110 |
| Hartford County Metropolitan District Gen. Oblig. Series 2021 A: | | | |
| 5% 9/1/27 | | 800 | 882 |
| 5% 9/1/28 | | 775 | 870 |
| Hartford Gen. Oblig. Series 2015 C, 5% 7/15/25 (Assured Guaranty Muni. Corp. Insured) | | 2,065 | 2,180 |
| New Britain Gen. Oblig. Series 2009, 5% 4/1/24 (Escrowed to Maturity) | | 745 | 756 |
| New Haven Gen. Oblig. Series 2016 A, 5% 8/15/25 (Assured Guaranty Muni. Corp. Insured) | | 980 | 1,030 |
| Stratford Gen. Oblig. Series 2019: | | | |
| 5% 1/1/25 | | 3,890 | 4,053 |
| 5% 1/1/26 | | 3,735 | 3,958 |
| Univ. of Connecticut Gen. Oblig. Series 2019 A, 5% 11/1/26 | | 1,000 | 1,084 |
TOTAL CONNECTICUT | | | 88,076 |
| Delaware - 0.0% | | | |
| Delaware Econ. Dev. Auth. Rev. Bonds (Delmarva Pwr. & Lt. Co. Proj.) Series A, 1.05%, tender 7/1/25 (b) | | 1,475 | 1,396 |
| District Of Columbia - 2.5% | | | |
| District of Columbia Income Tax Rev.: | | | |
| Series 2020 A, 5% 3/1/24 | | 715 | 733 |
| Series 2022 C, 5% 12/1/27 | | 5,900 | 6,556 |
| District of Columbia Wtr. & Swr. Auth. Pub. Util. Rev. Bonds Series 2019 C, 1.75%, tender 10/1/24 (b) | | 7,540 | 7,287 |
| Metropolitan Washington DC Arpts. Auth. Sys. Rev.: | | | |
| Series 2014 A, 5% 10/1/23 (c) | | 1,035 | 1,046 |
| Series 2017 A, 5% 10/1/26 (c) | | 12,905 | 13,622 |
| Series 2018 A, 5% 10/1/23 (c) | | 3,000 | 3,031 |
| Series 2019 A: | | | |
5% 10/1/23 (c) | | 465 | 470 |
5% 10/1/25 (c) | | 1,410 | 1,472 |
| Series 2020 A: | | | |
5% 10/1/23 (c) | | 2,390 | 2,414 |
5% 10/1/24 (c) | | 4,470 | 4,589 |
5% 10/1/25 (c) | | 4,470 | 4,665 |
| Series 2021 A: | | | |
5% 10/1/25 (c) | | 3,000 | 3,131 |
5% 10/1/28 (c) | | 20,500 | 21,970 |
TOTAL DISTRICT OF COLUMBIA | | | 70,986 |
| Florida - 6.7% | | | |
| Brevard County Health Facilities Auth. Rev. Series 2023 A: | | | |
| 5% 4/1/26 (e) | | 1,920 | 2,000 |
| 5% 4/1/28 (e) | | 2,115 | 2,248 |
| Broward County Arpt. Sys. Rev.: | | | |
| Series 2012 P-1, 5% 10/1/25 (c) | | 6,645 | 6,652 |
| Series 2015 C, 5% 10/1/24 (c) | | 1,015 | 1,043 |
| Series 2019 A: | | | |
5% 10/1/23 (c) | | 1,200 | 1,213 |
5% 10/1/24 (c) | | 1,300 | 1,336 |
5% 10/1/25 (c) | | 1,500 | 1,563 |
| Series 2019 B: | | | |
5% 10/1/24 (c) | | 750 | 771 |
5% 10/1/25 (c) | | 755 | 787 |
| Series C, 5% 10/1/23 (c) | | 3,930 | 3,972 |
| Broward County School Board Ctfs. of Prtn. Series 2015 B, 5% 7/1/24 | | 1,120 | 1,153 |
| Cap. Projs. Fin. Auth. Student Hsg. Rev. (Cap. Projs. Ln. Prog. - Florida Univs.) Series 2020 A: | | | |
| 5% 10/1/24 | | 540 | 548 |
| 5% 10/1/26 | | 1,940 | 1,975 |
| Central Florida Expressway Auth. Sr. Lien Rev. Series 2021: | | | |
| 5% 7/1/26 (Assured Guaranty Muni. Corp. Insured) | | 1,485 | 1,597 |
| 5% 7/1/27 (Assured Guaranty Muni. Corp. Insured) | | 8,200 | 8,978 |
| Florida Hsg. Fin. Corp. Rev. Series 2021 1, 3% 1/1/52 | | 5,840 | 5,678 |
| Florida Keys Aqueduct Auth. Wtr. Rev. Series 2021 B, 5% 9/1/25 | | 2,360 | 2,501 |
| Florida Mid-Bay Bridge Auth. Rev. Series 2015 A: | | | |
| 5% 10/1/23 | | 1,240 | 1,254 |
| 5% 10/1/24 | | 1,955 | 2,001 |
| 5% 10/1/25 | | 1,710 | 1,750 |
| 5% 10/1/26 | | 1,955 | 2,000 |
| Florida Muni. Pwr. Agcy. Rev. Series 2016 A, 4% 10/1/26 | | 530 | 551 |
| Greater Orlando Aviation Auth. Arpt. Facilities Rev.: | | | |
| Series 2016 A, 5% 10/1/25 (Escrowed to Maturity) (c) | | 620 | 653 |
| Series 2016, 5% 10/1/26 (c) | | 1,300 | 1,372 |
| Series 2017 A: | | | |
5% 10/1/25 (c) | | 320 | 333 |
5% 10/1/25 (Escrowed to Maturity) (c) | | 1,675 | 1,760 |
5% 10/1/26 (c) | | 545 | 572 |
5% 10/1/26 (Escrowed to Maturity) (c) | | 2,025 | 2,164 |
5% 10/1/27 (Escrowed to Maturity) (c) | | 580 | 630 |
| Series 2019 A: | | | |
5% 10/1/24 (c) | | 12,700 | 13,070 |
5% 10/1/25 (c) | | 6,700 | 6,993 |
5% 10/1/27 (c) | | 1,940 | 2,065 |
| Halifax Hosp. Med. Ctr. Rev. Series 2015, 5% 6/1/23 | | 1,295 | 1,303 |
| Hillsborough County Aviation Auth. Rev. Series A, 5% 10/1/26 (Pre-Refunded to 10/1/23 @ 100) (c) | | 2,910 | 2,953 |
| Jacksonville Spl. Rev. Series 2022 A: | | | |
| 5% 10/1/23 | | 345 | 350 |
| 5% 10/1/24 | | 785 | 815 |
| 5% 10/1/25 | | 610 | 646 |
| 5% 10/1/26 | | 435 | 469 |
| 5% 10/1/27 | | 345 | 379 |
| 5% 10/1/28 | | 685 | 765 |
| 5% 10/1/29 | | 595 | 675 |
| 5% 10/1/30 | | 560 | 645 |
| 5% 10/1/32 | | 510 | 602 |
| Lee County Arpt. Rev. Series 2021 A: | | | |
| 5% 10/1/23 (c) | | 475 | 479 |
| 5% 10/1/24 (c) | | 1,795 | 1,833 |
| 5% 10/1/25 (c) | | 3,325 | 3,457 |
| Lee Memorial Health Sys. Hosp. Rev. Bonds Series 2019 A2, 5%, tender 4/1/26 (b) | | 4,810 | 4,917 |
| Manatee County School District Series 2017, 5% 10/1/24 (Assured Guaranty Muni. Corp. Insured) | | 1,270 | 1,317 |
| Miami-Dade County Aviation Rev.: | | | |
| Series 2012 A, 5% 10/1/24 (c) | | 1,800 | 1,810 |
| Series 2014 A, 5% 10/1/31 (c) | | 1,750 | 1,783 |
| Series 2016 A, 5% 10/1/27 | | 1,275 | 1,369 |
| Series 2020 A, 5% 10/1/23 | | 3,810 | 3,866 |
| Miami-Dade County Expressway Auth.: | | | |
| (Waste Mgmt., Inc. of Florida Proj.) Series 2013 A, 5% 7/1/23 | | 1,955 | 1,969 |
| Series 2014 B, 5% 7/1/23 | | 3,180 | 3,204 |
| Miami-Dade County School Board Ctfs. of Prtn.: | | | |
| Bonds Series 2014 A, 5%, tender 5/1/24 (b) | | 9,695 | 9,948 |
| Series 2014 D, 5% 11/1/23 | | 7,485 | 7,607 |
| Series 2015 A: | | | |
5% 5/1/23 | | 6,360 | 6,399 |
5% 5/1/27 (Assured Guaranty Muni. Corp. Insured) | | 1,880 | 1,971 |
| Series 2015 B, 5% 5/1/24 | | 29,155 | 29,950 |
| Orange County Hsg. Fin. Auth. Multi-family Rev. Bonds Series 2021 B, 0.55%, tender 7/1/24 (b) | | 9,950 | 9,409 |
| Palm Beach County Health Facilities Auth. Hosp. Rev.: | | | |
| (Jupiter Med. Ctr. Proj.) Series 2022, 5% 11/1/28 | | 150 | 160 |
| Series 2014: | | | |
5% 12/1/23 (Escrowed to Maturity) | | 190 | 194 |
5% 12/1/24 (Escrowed to Maturity) | | 380 | 394 |
| Palm Beach County Health Facilities Auth. Rev.: | | | |
| Series 2015 C: | | | |
5% 5/15/24 | | 1,000 | 1,000 |
5% 5/15/30 | | 2,490 | 2,407 |
| Series 2021 C, 4% 5/15/29 | | 1,440 | 1,315 |
| Pinellas County Hsg. Fin. Auth. Bonds Series 2021 B, 0.65%, tender 7/1/24 (b) | | 2,170 | 2,055 |
| Seminole County School Board Ctfs. of Prtn. Series 2016 C: | | | |
| 5% 7/1/25 | | 980 | 1,033 |
| 5% 7/1/26 | | 1,115 | 1,198 |
| Village Cmnty. Dev. District No. 13 Series 2019, 2.625% 5/1/24 | | 245 | 238 |
TOTAL FLORIDA | | | 192,067 |
| Georgia - 4.8% | | | |
| Atlanta Arpt. Rev.: | | | |
| Series 2014 C, 5% 1/1/29 (c) | | 900 | 912 |
| Series 2020 A, 5% 7/1/26 (c) | | 3,000 | 3,156 |
| Series 2020 B: | | | |
5% 7/1/27 (c) | | 4,000 | 4,246 |
5% 7/1/29 (c) | | 1,920 | 2,069 |
| Bartow County Dev. Auth. Poll. Cont. Rev. Bonds (Georgia Pwr. Co. Plant Bowen Proj.) Series 2009 1st, 2.75%, tender 3/15/23 (b) | | 21,200 | 21,158 |
| Burke County Indl. Dev. Auth. Poll. Cont. Rev. Bonds: | | | |
| (Georgia Pwr. Co. Plant Vogtle Proj.): | | | |
Series 1994, 2.25%, tender 5/25/23 (b) | | 6,480 | 6,444 |
Series 2012, 1.7%, tender 8/22/24 (b) | | 3,400 | 3,285 |
Series 2013 1st, 2.925%, tender 3/12/24 (b) | | 9,930 | 9,818 |
| (Oglethorpe Pwr. Corp. Vogtle Proj.) Series 2017 E, 3.25%, tender 2/3/25 (b) | | 900 | 893 |
| Columbus Med. Ctr. Hosp. Auth. Bonds (Piedmont Healthcare, Inc. Proj.) Series 2019 A, 5%, tender 7/1/26 (b) | | 4,840 | 5,087 |
| Georgia Gen. Oblig. Series 2016 A, 5% 2/1/27 | | 4,980 | 5,339 |
| Georgia Muni. Elec. Auth. Pwr. Rev. Series 2020 A: | | | |
| 4% 11/1/23 | | 920 | 925 |
| 4% 11/1/24 | | 1,420 | 1,440 |
| 5% 1/1/25 | | 1,000 | 1,035 |
| 5% 1/1/26 | | 1,125 | 1,184 |
| 5% 1/1/26 | | 1,000 | 1,052 |
| 5% 1/1/27 | | 760 | 808 |
| Georgia Muni. Gas Auth. Rev. (Gas Portfolio III Proj.) Series 2014 U, 5% 10/1/23 | | 2,365 | 2,400 |
| Georgia Road & Thruway Auth. Rev. Series 2020: | | | |
| 5% 6/1/24 | | 2,500 | 2,575 |
| 5% 6/1/25 | | 5,000 | 5,267 |
| 5% 6/1/26 | | 2,500 | 2,690 |
| Main Street Natural Gas, Inc.: | | | |
| Bonds: | | | |
Series 2018 C, 4%, tender 12/1/23 (b) | | 10,210 | 10,202 |
Series 2021 A, 4%, tender 9/1/27 (b) | | 15,000 | 14,877 |
Series 2021 C, 4%, tender 12/1/28 (b) | | 16,990 | 16,592 |
| Series 2022 A: | | | |
4% 12/1/23 | | 265 | 265 |
4% 12/1/24 | | 1,100 | 1,102 |
4% 12/1/25 | | 170 | 170 |
4% 12/1/26 | | 1,955 | 1,954 |
| Monroe County Dev. Auth. Poll. Cont. Rev. (Georgia Pwr. Co. Plant Scherer Proj.) Series 1995, 2.25% 7/1/25 | | 6,505 | 6,240 |
| Private Colleges & Univs. Auth. Rev.: | | | |
| (The Savannah College of Art & Design Projs.): | | | |
Series 2014, 5% 4/1/24 (Escrowed to Maturity) | | 1,810 | 1,856 |
Series 2021, 5% 4/1/26 | | 1,200 | 1,264 |
| Series 2020 B, 5% 9/1/25 | | 2,570 | 2,731 |
TOTAL GEORGIA | | | 139,036 |
| Hawaii - 0.8% | | | |
| Hawaii Arpts. Sys. Rev. Series 2022 B, 5% 7/1/24 (c) | | 3,500 | 3,589 |
| Hawaii Gen. Oblig. Series 2015 EZ, 5% 10/1/26 | | 10,000 | 10,631 |
| Honolulu City & County Gen. Oblig.: | | | |
| Series 2016 C, 5% 10/1/28 | | 1,000 | 1,124 |
| Series 2020 F: | | | |
5% 7/1/24 | | 1,575 | 1,627 |
5% 7/1/25 | | 1,255 | 1,327 |
5% 7/1/26 | | 800 | 864 |
| Series 2022 A, 5% 11/1/26 | | 1,985 | 2,158 |
| State of Hawaii Dept. of Trans. Series 2013, 5% 8/1/23 (c) | | 1,440 | 1,454 |
TOTAL HAWAII | | | 22,774 |
| Idaho - 0.0% | | | |
| Idaho Hsg. & Fin. Assoc. Single Family Mtg. Series 2019 A, 4% 1/1/50 | | 310 | 311 |
| Illinois - 9.7% | | | |
| Champaign County Cmnty. Unit Series 2019, 4% 6/1/24 | | 420 | 425 |
| Chicago Board of Ed.: | | | |
| Series 2017 C: | | | |
5% 12/1/26 | | 485 | 497 |
5% 12/1/27 | | 1,830 | 1,870 |
| Series 2018 C, 5% 12/1/24 | | 13,000 | 13,238 |
| Series 2019 A, 0% 12/1/26 | | 3,500 | 2,989 |
| Chicago Gen. Oblig. Series 2020 A, 5% 1/1/30 | | 2,005 | 2,113 |
| Chicago Metropolitan Wtr. Reclamation District of Greater Chicago Series 2007, 5.25% 12/1/32 | | 2,920 | 3,498 |
| Chicago Midway Arpt. Rev.: | | | |
| Series 2013 B, 5% 1/1/25 | | 1,700 | 1,702 |
| Series 2014 A: | | | |
5% 1/1/24 (c) | | 10,490 | 10,633 |
5% 1/1/26 (c) | | 3,475 | 3,520 |
| Series 2014 B, 5% 1/1/23 | | 200 | 200 |
| Series 2016 A: | | | |
5% 1/1/27 (c) | | 2,810 | 2,912 |
5% 1/1/28 (c) | | 500 | 517 |
| Chicago Motor Fuel Tax Rev. Series 2013, 5% 1/1/23 (Escrowed to Maturity) | | 525 | 525 |
| Chicago O'Hare Int'l. Arpt. Rev.: | | | |
| Series 2012 B, 4% 1/1/27 (c) | | 1,220 | 1,220 |
| Series 2013 A, 5% 1/1/23 (c) | | 2,730 | 2,730 |
| Series 2015 A: | | | |
5% 1/1/24 (c) | | 1,230 | 1,247 |
5% 1/1/26 (c) | | 1,600 | 1,645 |
5% 1/1/27 (c) | | 1,000 | 1,027 |
| Series 2015 B, 5% 1/1/24 | | 1,525 | 1,555 |
| Series 2016 A, 5% 1/1/27 (c) | | 840 | 873 |
| Series 2017 D: | | | |
5% 1/1/26 (c) | | 445 | 463 |
5% 1/1/27 (c) | | 1,595 | 1,678 |
5% 1/1/29 (c) | | 215 | 225 |
| Series 2020 B, 5% 1/1/26 | | 1,310 | 1,396 |
| Series 2022 A, 5% 1/1/26 (c) | | 830 | 864 |
| Series 2022 C: | | | |
5% 1/1/23 (c) | | 500 | 500 |
5% 1/1/24 (c) | | 2,000 | 2,027 |
5% 1/1/26 (c) | | 2,300 | 2,395 |
| Chicago Transit Auth. Cap. Grant Receipts Rev. Series 2017, 5% 6/1/25 | | 1,225 | 1,270 |
| Chicago Wastewtr. Transmission Rev. Series 2012, 5% 1/1/23 | | 1,175 | 1,175 |
| Cook County Gen. Oblig.: | | | |
| Series 2021 A: | | | |
5% 11/15/23 | | 375 | 380 |
5% 11/15/24 | | 425 | 439 |
5% 11/15/25 | | 425 | 448 |
5% 11/15/26 | | 850 | 908 |
5% 11/15/27 | | 1,075 | 1,163 |
| Series 2021 B: | | | |
4% 11/15/24 | | 1,475 | 1,496 |
4% 11/15/25 | | 1,100 | 1,127 |
4% 11/15/26 | | 555 | 571 |
4% 11/15/27 | | 565 | 584 |
4% 11/15/28 | | 285 | 295 |
| Series 2022 A: | | | |
5% 11/15/24 | | 7,590 | 7,835 |
5% 11/15/25 | | 5,585 | 5,886 |
5% 11/15/26 | | 300 | 320 |
5% 11/15/27 | | 325 | 352 |
5% 11/15/28 | | 350 | 384 |
5% 11/15/29 | | 1,315 | 1,460 |
| Cook County Sales Tax Rev.: | | | |
| Series 2022 A: | | | |
5% 11/15/26 | | 635 | 683 |
5% 11/15/27 | | 350 | 381 |
5% 11/15/28 | | 190 | 210 |
5% 11/15/29 | | 140 | 157 |
5% 11/15/30 | | 315 | 356 |
| Series 2022 B: | | | |
5% 11/15/25 | | 815 | 862 |
5% 11/15/26 | | 360 | 387 |
5% 11/15/27 | | 470 | 511 |
5% 11/15/28 | | 290 | 320 |
5% 11/15/29 | | 265 | 297 |
5% 11/15/30 | | 275 | 311 |
| Illinois Fin. Auth.: | | | |
| Bonds Series 2020 B: | | | |
5%, tender 11/15/24 (b) | | 2,125 | 2,171 |
5%, tender 11/15/26 (b) | | 2,830 | 2,984 |
| Series 2015: | | | |
5% 5/1/45 (Pre-Refunded to 5/1/25 @ 100) | | 1,190 | 1,246 |
5% 5/1/45 (Pre-Refunded to 5/1/25 @ 100) | | 7,450 | 7,827 |
| Series 2020 A, 5% 8/15/24 | | 1,080 | 1,117 |
| Series 2022 A: | | | |
5% 10/1/26 | | 265 | 271 |
5% 10/1/28 | | 330 | 340 |
| Illinois Fin. Auth. Rev.: | | | |
| (Bradley Univ. Proj.) Series 2017 C, 5% 8/1/26 | | 1,650 | 1,707 |
| (Edward-Elmhurst Healthcare) Series 2017 A, 5% 1/1/25 (Escrowed to Maturity) | | 740 | 769 |
| (OSF Healthcare Sys.) Series 2018 A: | | | |
5% 5/15/26 | | 4,300 | 4,547 |
5% 5/15/27 | | 9,260 | 9,899 |
| Series 2008 A3, 5% 11/1/30 | | 1,545 | 1,611 |
| Series 2015 A: | | | |
5% 11/15/24 | | 1,490 | 1,537 |
5% 11/15/25 | | 1,905 | 2,001 |
5% 11/15/26 | | 1,955 | 2,051 |
| Series 2015 B, 5% 11/15/24 | | 1,910 | 1,977 |
| Series 2016 A: | | | |
5% 2/15/23 | | 980 | 982 |
5% 8/15/24 (Escrowed to Maturity) | | 2,135 | 2,206 |
5.25% 8/15/28 (Pre-Refunded to 8/15/26 @ 100) | | 1,000 | 1,086 |
5.25% 8/15/29 (Pre-Refunded to 8/15/26 @ 100) | | 5,850 | 6,351 |
| Series 2016 C: | | | |
5% 2/15/24 | | 5,220 | 5,324 |
5% 2/15/27 | | 1,875 | 2,030 |
| Series 2016: | | | |
5% 5/15/25 | | 490 | 510 |
5% 5/15/26 | | 980 | 1,036 |
5% 5/15/27 | | 1,225 | 1,291 |
| Series 2017, 5% 1/1/25 | | 2,260 | 2,362 |
| Series 2019: | | | |
5% 9/1/23 | | 400 | 402 |
5% 9/1/24 | | 415 | 421 |
5% 9/1/25 | | 300 | 306 |
5% 4/1/26 | | 1,625 | 1,714 |
5% 9/1/26 | | 300 | 308 |
5% 4/1/27 | | 2,135 | 2,281 |
5% 9/1/27 | | 500 | 516 |
5% 4/1/28 | | 1,425 | 1,540 |
5% 4/1/29 | | 2,000 | 2,182 |
| Illinois Gen. Oblig.: | | | |
| Series 2012 A, 4% 1/1/23 | | 1,245 | 1,245 |
| Series 2013, 5.5% 7/1/25 | | 265 | 267 |
| Series 2014: | | | |
5% 4/1/23 | | 2,165 | 2,172 |
5% 2/1/25 | | 2,275 | 2,300 |
| Series 2016: | | | |
4% 2/1/30 (Assured Guaranty Muni. Corp. Insured) | | 3,760 | 3,791 |
5% 2/1/24 | | 3,100 | 3,140 |
5% 1/1/26 | | 2,970 | 3,047 |
| Series 2017 C, 5% 11/1/29 | | 1,000 | 1,024 |
| Series 2017 D: | | | |
5% 11/1/25 | | 6,635 | 6,801 |
5% 11/1/26 | | 4,200 | 4,329 |
| Series 2018 A, 5% 10/1/26 | | 4,615 | 4,755 |
| Series 2020 B: | | | |
5% 10/1/25 | | 5,105 | 5,231 |
5% 10/1/28 | | 6,500 | 6,719 |
| Series 2020 D, 5% 10/1/24 | | 5,000 | 5,092 |
| Series 2021 B, 5% 3/1/23 | | 2,555 | 2,560 |
| Series 2022 A: | | | |
5% 3/1/23 | | 1,205 | 1,208 |
5% 3/1/24 | | 4,660 | 4,725 |
| Series 2022 B: | | | |
5% 3/1/25 | | 9,385 | 9,583 |
5% 3/1/26 | | 6,880 | 7,066 |
5% 3/1/27 | | 6,500 | 6,709 |
| Series 2022 D1, 5% 3/1/23 | | 1,375 | 1,378 |
| Illinois Hsg. Dev. Auth. Rev. Series D, 3.75% 4/1/50 | | 620 | 617 |
| Illinois Muni. Elec. Agcy. Pwr. Supply Series 2015 A, 5% 2/1/23 | | 1,180 | 1,181 |
| Illinois Sales Tax Rev.: | | | |
| Series 2013, 5% 6/15/24 | | 2,985 | 3,002 |
| Series 2021 C: | | | |
5% 6/15/23 | | 535 | 539 |
5% 6/15/24 | | 615 | 627 |
5% 6/15/25 | | 355 | 366 |
| McHenry County Cmnty. School District #200 Series 2006 B: | | | |
| 0% 1/15/24 | | 2,540 | 2,448 |
| 0% 1/15/24 (Escrowed to Maturity) | | 2,175 | 2,108 |
| 0% 1/15/25 | | 4,915 | 4,579 |
| 0% 1/15/26 | | 3,695 | 3,331 |
| Metropolitan Pier & Exposition Series 2022 A, 3% 6/15/25 | | 2,330 | 2,293 |
| Northern Illinois Univ. Revs. Series 2020 B, 5% 4/1/24 (Build America Mutual Assurance Insured) | | 1,100 | 1,126 |
| Railsplitter Tobacco Settlement Auth. Rev. Series 2017, 5% 6/1/24 | | 4,365 | 4,479 |
TOTAL ILLINOIS | | | 279,793 |
| Indiana - 1.8% | | | |
| Indiana Fin. Auth. Envir. Facilities Rev. Bonds (Indianapolis Pwr. & Lt. Co. Proj.): | | | |
| Series 2020 A, 0.75%, tender 4/1/26 (b) | | 600 | 520 |
| Series 2020 B, 0.95%, tender 4/1/26 (b)(c) | | 1,025 | 898 |
| Indiana Fin. Auth. Health Sys. Rev. Bonds Series 2019 B, 2.25%, tender 7/1/25 (b) | | 2,005 | 1,956 |
| Indiana Fin. Auth. Hosp. Rev.: | | | |
| Bonds: | | | |
Series 2011 L, 0.7%, tender 1/1/26 (b) | | 1,105 | 1,028 |
Series 2011 M, 0.7%, tender 1/1/26 (b) | | 7,795 | 7,254 |
| Series 2013, 5% 8/15/23 | | 980 | 991 |
| Indiana Fin. Auth. Wastewtr. Util. Rev. (CWA Auth. Proj.) Series 2015 A: | | | |
| 5% 10/1/24 | | 1,460 | 1,516 |
| 5% 10/1/25 | | 1,590 | 1,643 |
| Indiana Health Facility Fing. Auth. Rev. Bonds Series 2001 A2, 2%, tender 2/1/23 (b) | | 10 | 10 |
| Indiana Hsg. & Cmnty. Dev. Auth.: | | | |
| Series 2019 B, 3.5% 1/1/49 | | 1,305 | 1,291 |
| Series 2021 B, 3% 7/1/50 | | 890 | 864 |
| Series 2021 C1, 3% 1/1/52 | | 3,735 | 3,592 |
| Indianapolis Local Pub. Impt. (Indianapolis Arpt. Auth. Proj.): | | | |
| Series 2014 D: | | | |
5% 1/1/28 (c) | | 470 | 476 |
5% 1/1/30 (c) | | 550 | 557 |
| Series 2016 A1: | | | |
5% 1/1/23 (c) | | 1,940 | 1,940 |
5% 1/1/24 (c) | | 2,715 | 2,756 |
5% 1/1/25 (c) | | 2,845 | 2,930 |
| Series 2019 D, 5% 1/1/25 (c) | | 1,710 | 1,761 |
| Whiting Envir. Facilities Rev. Bonds (BP Products North America, Inc. Proj.): | | | |
| Series 2016 A, 5%, tender 3/1/23 (b)(c) | | 1,200 | 1,202 |
| Series 2017, 5%, tender 11/1/24 (b)(c) | | 1,250 | 1,267 |
| Series 2019 A, 5%, tender 6/5/26 (b)(c) | | 15,985 | 16,362 |
TOTAL INDIANA | | | 50,814 |
| Iowa - 0.0% | | | |
| Iowa Student Ln. Liquidity Corp. Student Ln. Rev. Series 2019 B, 5% 12/1/24 (c) | | 800 | 821 |
| Kansas - 0.0% | | | |
| Wyandotte County/Kansas City Unified Govt. Util. Sys. Rev. Series 2016 A: | | | |
| 5% 9/1/23 | | 710 | 719 |
| 5% 9/1/25 | | 785 | 828 |
TOTAL KANSAS | | | 1,547 |
| Kentucky - 3.1% | | | |
| Ashland Med. Ctr. Rev.: | | | |
| (Ashland Hosp. Corp. D/B/A King's Daughters Med. Ctr. Proj.) Series 2016 A: | | | |
5% 2/1/24 | | 1,330 | 1,351 |
5% 2/1/25 | | 980 | 1,006 |
| Series 2019, 5% 2/1/23 | | 625 | 626 |
| Carroll County Envir. Facilities Rev. Bonds (Kentucky Utils. Co. Proj.) Series 2004 A, 1.75%, tender 9/1/26 (b)(c) | | 9,750 | 8,779 |
| Carroll County Poll. Ctlr Rev. Bonds (Kentucky Utils. Co. Proj.) Series 2016 A, 1.55%, tender 9/1/26 (b) | | 5,750 | 5,231 |
| Kentucky Asset/Liability Commission Gen. Fund Rev. Series 2021 A: | | | |
| 5% 11/1/24 | | 1,065 | 1,107 |
| 5% 11/1/25 | | 3,000 | 3,179 |
| 5% 11/1/26 | | 1,000 | 1,078 |
| 5% 11/1/27 | | 1,000 | 1,095 |
| Kentucky Econ. Dev. Fin. Auth. Hosp. Rev. Series 2015 A, 5% 6/1/24 | | 1,655 | 1,691 |
| Kentucky State Property & Buildings Commission Rev.: | | | |
| Series 2015, 5% 8/1/24 | | 1,850 | 1,912 |
| Series 2018, 5% 5/1/25 | | 1,605 | 1,677 |
| Series A: | | | |
5% 11/1/24 | | 1,250 | 1,299 |
5% 11/1/25 | | 1,650 | 1,741 |
| Series B, 5% 8/1/24 | | 2,645 | 2,734 |
| Kentucky, Inc. Pub. Energy: | | | |
| Bonds: | | | |
Series 2018 A, 4%, tender 4/1/24 (b) | | 4,110 | 4,103 |
Series 2019 A1, 4%, tender 6/1/25 (b) | | 10,455 | 10,359 |
Series A, 4%, tender 6/1/26 (b) | | 11,570 | 11,453 |
Series C1, 4%, tender 6/1/25 (b) | | 15,000 | 14,862 |
| Series A: | | | |
4% 12/1/23 | | 600 | 600 |
4% 12/1/25 | | 825 | 823 |
4% 6/1/26 | | 1,085 | 1,077 |
| Louisville & Jefferson County Bonds: | | | |
| Series 2020 B, 5%, tender 10/1/23 (b) | | 2,800 | 2,820 |
| Series 2020 C, 5%, tender 10/1/26 (b) | | 5,985 | 6,283 |
| Louisville Reg'l. Arpt. Auth. Sys. Rev. Series 2014 A, 5% 7/1/24 (c) | | 1,280 | 1,312 |
TOTAL KENTUCKY | | | 88,198 |
| Louisiana - 0.5% | | | |
| New Orleans Aviation Board Rev.: | | | |
| (North Term. Proj.) Series 2017 B: | | | |
5% 1/1/23 (c) | | 300 | 300 |
5% 1/1/24 (c) | | 195 | 198 |
5% 1/1/25 (c) | | 195 | 200 |
5% 1/1/26 (c) | | 490 | 510 |
| Series 2017 D2: | | | |
5% 1/1/23 (c) | | 390 | 390 |
5% 1/1/24 (c) | | 735 | 746 |
5% 1/1/25 (c) | | 1,390 | 1,429 |
| St. John Baptist Parish Rev.: | | | |
| (Marathon Oil Corp.) Series 2017, 2.2% 6/1/37 (b) | | 3,765 | 3,465 |
| Bonds (Marathon Oil Corp.) Series 2017, 2%, tender 4/1/23 (b) | | 3,555 | 3,533 |
| Tobacco Settlement Fing. Corp. Series 2013 A, 5% 5/15/23 | | 4,400 | 4,431 |
TOTAL LOUISIANA | | | 15,202 |
| Maine - 0.1% | | | |
| City of Portland Arpt. Series 2016, 5% 1/1/29 | | 690 | 721 |
| Maine Health & Higher Edl. Facilities Auth. Rev.: | | | |
| Series 2013, 5% 7/1/24 (Pre-Refunded to 7/1/23 @ 100) | | 350 | 353 |
| Series 2021 A: | | | |
5% 7/1/28 | | 555 | 603 |
5% 7/1/29 | | 600 | 660 |
5% 7/1/30 | | 500 | 557 |
TOTAL MAINE | | | 2,894 |
| Maryland - 2.0% | | | |
| Baltimore Proj. Rev. Series 2017 D: | | | |
| 5% 7/1/24 | | 3,220 | 3,322 |
| 5% 7/1/25 | | 3,380 | 3,566 |
| Hsg. Opportunities Commission of Montgomery County Series 2021 C, 0.8% 7/1/25 | | 700 | 655 |
| Maryland Cmnty. Dev. Admin Dept. Hsg. & Cmnty. Dev.: | | | |
| Series 2019 B, 4% 9/1/49 | | 1,150 | 1,152 |
| Series 2019 C, 3.5% 3/1/50 | | 1,290 | 1,276 |
| Series 2021 C: | | | |
0.375% 7/1/23 | | 640 | 631 |
0.5% 1/1/24 | | 1,000 | 972 |
0.6% 7/1/24 | | 2,840 | 2,727 |
| Maryland Dept. of Trans.: | | | |
| Series 2021 B, 5% 8/1/27 (c) | | 1,805 | 1,918 |
| Series 2022 B: | | | |
5% 12/1/23 | | 845 | 861 |
5% 12/1/27 | | 1,295 | 1,438 |
| Series 2022, 5% 12/1/26 | | 1,395 | 1,521 |
| Maryland Gen. Oblig.: | | | |
| Series 2017 A, 5% 3/15/25 | | 1,795 | 1,886 |
| Series 2022 2D, 3% 8/1/27 | | 1,575 | 1,584 |
| Maryland Health & Higher Edl. Bonds: | | | |
| Series 2020 B2, 5%, tender 7/1/27 (b) | | 2,480 | 2,636 |
| Series 2020, 5%, tender 7/1/25 (b) | | 5,250 | 5,434 |
| Maryland Health & Higher Edl. Facilities Auth. Rev. Series 2015: | | | |
| 5% 7/1/23 | | 980 | 986 |
| 5% 7/1/24 | | 1,955 | 1,994 |
| 5% 7/1/25 | | 1,730 | 1,789 |
| Montgomery County Gen. Oblig. Series 2022 A: | | | |
| 5% 8/1/24 | | 7,695 | 7,967 |
| 5% 8/1/25 | | 4,300 | 4,558 |
| 5% 8/1/26 | | 7,075 | 7,663 |
TOTAL MARYLAND | | | 56,536 |
| Massachusetts - 1.3% | | | |
| Massachusetts Bay Trans. Auth. Sales Tax Rev. Series 2016 A, 0% 7/1/29 | | 1,000 | 790 |
| Massachusetts Dev. Fin. Agcy. Rev.: | | | |
| Bonds Series 2011 N, 0.45%, tender 7/1/25 (b) | | 5,000 | 4,599 |
| Caregroup, Inc. Series 2015 H-1, 5% 7/1/25 | | 2,655 | 2,769 |
| Series 2016 I: | | | |
5% 7/1/23 | | 660 | 664 |
5% 7/1/24 | | 1,075 | 1,095 |
5% 7/1/25 | | 1,475 | 1,539 |
5% 7/1/25 | | 1,480 | 1,528 |
5% 7/1/26 | | 980 | 1,029 |
| Series 2019 A: | | | |
5% 7/1/23 | | 525 | 529 |
5% 7/1/24 | | 1,150 | 1,178 |
5% 7/1/25 | | 825 | 857 |
| Series 2021: | | | |
4% 7/1/23 | | 215 | 214 |
4% 7/1/24 | | 225 | 223 |
4% 7/1/25 | | 235 | 231 |
| Massachusetts Edl. Fing. Auth. Rev.: | | | |
| Series 2016 J, 5% 7/1/23 (c) | | 2,175 | 2,192 |
| Series 2016, 5% 7/1/24 (c) | | 2,850 | 2,913 |
| Series 2020 C: | | | |
5% 7/1/25 (c) | | 850 | 879 |
5% 7/1/26 (c) | | 1,900 | 1,993 |
| Series 2021 B, 5% 7/1/26 (c) | | 1,390 | 1,462 |
| Massachusetts Health & Edl. Facilities Auth. Rev. Bonds Series I, 0.7%, tender 7/1/25 (b) | | 2,315 | 2,148 |
| Massachusetts Port Auth. Rev.: | | | |
| Series 2017 A: | | | |
5% 7/1/24 (c) | | 3,005 | 3,090 |
5% 7/1/25 (c) | | 1,115 | 1,163 |
| Series 2021 E, 5% 7/1/27 (c) | | 500 | 532 |
| Univ. of Massachusetts Bldg. Auth. Rev. Series 2021 1, 5% 11/1/26 | | 2,445 | 2,656 |
TOTAL MASSACHUSETTS | | | 36,273 |
| Michigan - 1.7% | | | |
| Detroit Downtown Dev. Auth. Tax Series A, 5% 7/1/24 (Assured Guaranty Muni. Corp. Insured) | | 1,000 | 1,028 |
| Flint Hosp. Bldg. Auth. Rev. Series 2020, 5% 7/1/24 | | 925 | 941 |
| Grand Traverse County Hosp. Fin. Auth. Series 2021: | | | |
| 5% 7/1/26 | | 550 | 586 |
| 5% 7/1/27 | | 900 | 974 |
| 5% 7/1/28 | | 725 | 796 |
| Kalamazoo Hosp. Fin. Auth. Hosp. Facilities Rev. Series 2016: | | | |
| 5% 5/15/24 | | 635 | 650 |
| 5% 5/15/24 (Escrowed to Maturity) | | 5 | 5 |
| 5% 5/15/25 | | 1,275 | 1,327 |
| 5% 5/15/25 (Escrowed to Maturity) | | 10 | 10 |
| 5% 5/15/26 | | 1,230 | 1,301 |
| 5% 5/15/26 (Escrowed to Maturity) | | 5 | 5 |
| Lansing Board of Wtr. & Lt. Util. Rev. Bonds Series 2021 B, 2%, tender 7/1/26 (b) | | 2,000 | 1,895 |
| Michigan Bldg. Auth. Rev. (Facilities Prog.) Series 2016 I, 5% 4/15/24 | | 1,450 | 1,488 |
| Michigan Fin. Auth. Rev.: | | | |
| Bonds: | | | |
Series 2015 D2, 1.2%, tender 4/13/28 (b) | | 635 | 564 |
Series 2019 MI2, 5%, tender 2/1/25 (b) | | 4,830 | 5,027 |
| Series 2015 A, 5% 8/1/26 (Pre-Refunded to 8/1/24 @ 100) | | 300 | 310 |
| Series 2015 D1, 0.75% 10/15/25 | | 1,000 | 932 |
| Series 2015 MI, 5% 12/1/23 | | 1,020 | 1,038 |
| Series 2020 A: | | | |
5% 6/1/24 | | 1,000 | 1,016 |
5% 6/1/25 | | 2,000 | 2,050 |
| Michigan Gen. Oblig. Series 2016, 5% 3/15/24 | | 6,955 | 7,137 |
| Michigan Hosp. Fin. Auth. Rev. Bonds (Ascension Health Cr. Group Proj.) Series F5, 2.4%, tender 3/15/23 (b) | | 3,535 | 3,529 |
| Michigan Hsg. Dev. Auth. Single Family Mtg. Rev.: | | | |
| Series 2021 A, 3% 6/1/52 | | 2,200 | 2,129 |
| Series A, 3.5% 12/1/50 | | 1,130 | 1,116 |
| Michigan Strategic Fund Ltd. Oblig. Rev. Bonds (Consumer Energy Co. Proj.) Series 2019, 1.8%, tender 10/1/24 (b)(c) | | 3,140 | 3,034 |
| Novi Cmnty. School District Series I: | | | |
| 4% 5/1/24 | | 795 | 806 |
| 4% 5/1/25 | | 600 | 615 |
| Portage Pub. Schools Series 2016: | | | |
| 5% 5/1/24 | | 1,880 | 1,932 |
| 5% 11/1/24 | | 1,955 | 2,032 |
| 5% 5/1/25 | | 1,100 | 1,155 |
| 5% 11/1/25 | | 1,195 | 1,269 |
| 5% 11/1/28 | | 985 | 1,054 |
| Royal Oak Hosp. Fin. Auth. Hosp. Rev. Series 2014 D, 5% 9/1/23 (Escrowed to Maturity) | | 490 | 497 |
| Saginaw Hosp. Fin. Auth. Hosp. Rev. Series 2020 J: | | | |
| 5% 7/1/24 | | 765 | 785 |
| 5% 7/1/25 | | 500 | 522 |
| 5% 7/1/26 | | 750 | 793 |
TOTAL MICHIGAN | | | 50,348 |
| Minnesota - 0.7% | | | |
| Duluth Econ. Dev. Auth. Series 2021 A: | | | |
| 3% 7/1/24 | | 200 | 195 |
| 3% 7/1/25 | | 615 | 592 |
| Minneapolis & Saint Paul Metropolitan Arpts. Commission Arpt. Rev.: | | | |
| Series 2014 A, 5% 1/1/23 | | 980 | 980 |
| Series 2014 B, 5% 1/1/23 (c) | | 1,480 | 1,480 |
| Series 2022 B: | | | |
5% 1/1/24 (c) | | 705 | 715 |
5% 1/1/25 (c) | | 460 | 473 |
5% 1/1/26 (c) | | 1,125 | 1,172 |
5% 1/1/27 (c) | | 3,800 | 3,995 |
| Moorhead Edl. Facilities Rev. (The Concordia College Corp. Proj.) Series 2016, 5% 12/1/25 | | 2,270 | 2,323 |
| Northern Muni. Pwr. Agcy. Elec. Sys. Rev. Series 2017, 5% 1/1/24 | | 1,560 | 1,590 |
| Shakopee Sr. Hsg. Rev. Bonds Series 2018, 5.85%, tender 11/1/25 (b)(d) | | 2,530 | 2,486 |
| Southern Minnesota Muni. Pwr. Agcy. Pwr. Supply Sys. Rev. Series 2015 A, 5% 1/1/26 | | 2,065 | 2,199 |
| Western Minnesota Muni. Pwr. Agcy. Pwr. Supply Rev. Series 2014 A, 5% 1/1/24 | | 980 | 999 |
TOTAL MINNESOTA | | | 19,199 |
| Mississippi - 0.2% | | | |
| Mississippi Dev. Bank Spl. Oblig. (Magnolia Reg'l. Health Ctr. Proj.) Series 2021: | | | |
| 5% 10/1/23 (d) | | 830 | 835 |
| 5% 10/1/25 (d) | | 1,320 | 1,347 |
| 5% 10/1/27 (d) | | 900 | 929 |
| Mississippi Hosp. Equip. & Facilities Auth.: | | | |
| (Forrest County Gen. Hosp. Rfdg. Proj.) Series 2019 B, 5% 1/1/24 | | 400 | 407 |
| Bonds Series II, 5%, tender 3/1/27 (b) | | 1,130 | 1,182 |
| Series I: | | | |
5% 10/1/25 | | 600 | 628 |
5% 10/1/27 | | 800 | 858 |
TOTAL MISSISSIPPI | | | 6,186 |
| Missouri - 0.7% | | | |
| Cape Girardeau County Indl. Dev. Auth. (Southeast Hosp. Proj.) Series 2017 A: | | | |
| 5% 3/1/23 | | 980 | 981 |
| 5% 3/1/24 | | 685 | 693 |
| 5% 3/1/25 | | 710 | 727 |
| 5% 3/1/26 | | 980 | 1,015 |
| Kansas City Indl. Dev. Auth. (Kansas City Int'l. Arpt. Term. Modernization Proj.): | | | |
| Series 2020 A: | | | |
5% 3/1/26 (c) | | 1,185 | 1,237 |
5% 3/1/27 (c) | | 4,065 | 4,274 |
| Series 2020 B: | | | |
5% 3/1/26 | | 2,190 | 2,322 |
5% 3/1/27 | | 1,535 | 1,654 |
| Missouri Hsg. Dev. Commission Single Family Mtg. Rev. Series 2019, 4% 5/1/50 | | 355 | 356 |
| Saint Louis Arpt. Rev. Series A, 5.25% 7/1/26 (Assured Guaranty Muni. Corp. Insured) | | 5,370 | 5,769 |
TOTAL MISSOURI | | | 19,028 |
| Montana - 0.2% | | | |
| Montana Board Hsg. Single Family: | | | |
| Series 2019 B, 4% 6/1/50 | | 195 | 196 |
| Series 2021 B, 3% 12/1/51 | | 2,430 | 2,354 |
| Series 2022 A, 3% 6/1/52 | | 1,720 | 1,658 |
| Series A1, 3.5% 6/1/50 | | 3,025 | 2,990 |
TOTAL MONTANA | | | 7,198 |
| Nebraska - 1.0% | | | |
| Central Plains Energy Proj. Gas Supply Bonds Series 2019, 4%, tender 8/1/25 (b) | | 9,765 | 9,740 |
| Douglas County Hosp. Auth. #2 Health Facilities Rev. Bonds Series 2020, 5%, tender 11/15/25 (b) | | 2,200 | 2,308 |
| Lincoln Arpt. Auth. Series 2021: | | | |
| 5% 7/1/24 (c) | | 700 | 720 |
| 5% 7/1/26 (c) | | 750 | 788 |
| 5% 7/1/27 (c) | | 1,275 | 1,350 |
| 5% 7/1/28 (c) | | 1,830 | 1,959 |
| 5% 7/1/29 (c) | | 1,000 | 1,082 |
| Nebraska Invt. Fin. Auth. Single Family Hsg. Rev.: | | | |
| Series 2019 B, 4% 9/1/49 (c) | | 980 | 975 |
| Series 2019 E, 3.75% 9/1/49 (c) | | 1,075 | 1,065 |
| Nebraska Pub. Pwr. District Rev. Series 2017 B, 5% 1/1/26 | | 1,260 | 1,341 |
| Washington County Wstwtr Sol Bonds (Cargill, Inc. Projs.) Series 2012, 0.9%, tender 9/1/25 (b)(c) | | 7,400 | 6,995 |
TOTAL NEBRASKA | | | 28,323 |
| Nevada - 1.1% | | | |
| Clark County Arpt. Rev.: | | | |
| Series 2013 A, 5% 7/1/28 (c) | | 1,475 | 1,475 |
| Series 2014 A2: | | | |
5% 7/1/28 | | 525 | 542 |
5% 7/1/30 | | 750 | 773 |
| Series 2019 D, 5% 7/1/24 | | 1,775 | 1,832 |
| Series 2021 B: | | | |
5% 7/1/23 (c) | | 625 | 629 |
5% 7/1/24 (c) | | 985 | 1,006 |
5% 7/1/27 (c) | | 6,000 | 6,369 |
| Clark County McCarran Int'l. Arpt. Passenger Facility Charge Rev.: | | | |
| Series 2019 E: | | | |
5% 7/1/25 | | 1,275 | 1,346 |
5% 7/1/27 | | 2,245 | 2,456 |
| Series B, 5% 7/1/24 (c) | | 2,080 | 2,129 |
| Clark County Poll. Cont. Rev. Bonds Series 2017, 1.65%, tender 3/31/23 (b) | | 835 | 831 |
| Clark County School District: | | | |
| Series 2017 A, 5% 6/15/26 | | 1,285 | 1,377 |
| Series 2020 B, 5% 6/15/26 | | 5,805 | 6,221 |
| Nevada Gen. Oblig.: | | | |
| Series 2013 D1, 5% 3/1/24 | | 2,640 | 2,649 |
| Series 2015 A, 3% 8/1/29 | | 2,175 | 2,190 |
TOTAL NEVADA | | | 31,825 |
| New Hampshire - 0.5% | | | |
| Nat'l. Fin. Auth. Hosp. Rev. (St. Luke's Univ. Health Network Proj.) Series 2021 B: | | | |
| 5% 8/15/24 | | 600 | 617 |
| 5% 8/15/28 | | 1,125 | 1,235 |
| Nat'l. Fin. Auth. Solid Bonds (Waste Mgmt., Inc. Proj.): | | | |
| Series 2019 A3, 2.15%, tender 7/1/24 (b)(c) | | 4,455 | 4,291 |
| Series 2019 A4, 2.15%, tender 7/1/24 (b)(c) | | 2,250 | 2,167 |
| New Hampshire Bus. Fin. Auth. Wtr. Facility (Pennichuck Wtr. Works, Inc. Proj.) Series 2014 A: | | | |
| 5% 1/1/24 (Escrowed to Maturity) (c) | | 1,120 | 1,141 |
| 5% 1/1/25 (Escrowed to Maturity) (c) | | 1,000 | 1,040 |
| New Hampshire Health & Ed. Facilities Auth. Rev. Series 2016, 5% 10/1/23 | | 2,785 | 2,819 |
TOTAL NEW HAMPSHIRE | | | 13,310 |
| New Jersey - 6.2% | | | |
| Camden County Impt. Auth. Health Care Redev. Rev. Series 2014 A, 5% 2/15/23 | | 2,770 | 2,774 |
| Hudson County Impt. Auth. (Hudson County Courthouse Proj.) Series 2020, 4% 10/1/24 | | 1,400 | 1,428 |
| New Jersey Bldg. Auth. State Bldg. Rev. Series 2016 A, 5% 6/15/24 | | 1,720 | 1,763 |
| New Jersey Econ. Dev. Auth. Series 2013, 5% 3/1/27 | | 170 | 170 |
| New Jersey Econ. Dev. Auth. Rev.: | | | |
| (Provident Montclair Proj.) Series 2017: | | | |
5% 6/1/23 (Assured Guaranty Muni. Corp. Insured) | | 1,230 | 1,239 |
5% 6/1/24 (Assured Guaranty Muni. Corp. Insured) | | 980 | 1,007 |
| Series 2013 NN, 5% 3/1/26 | | 1,925 | 1,930 |
| Series 2013, 5% 3/1/25 | | 7,670 | 7,691 |
| Series 2014 RR, 5% 6/15/32 (Pre-Refunded to 6/15/24 @ 100) | | 375 | 387 |
| Series 2014 UU, 5% 6/15/30 (Pre-Refunded to 6/15/24 @ 100) | | 465 | 479 |
| Series 2015 XX: | | | |
4% 6/15/24 | | 550 | 556 |
5% 6/15/26 | | 975 | 1,016 |
| Series 2019, 5.25% 9/1/24 (d) | | 2,580 | 2,666 |
| New Jersey Edl. Facility: | | | |
| Series 2016 A: | | | |
5% 7/1/23 | | 3,315 | 3,343 |
5% 7/1/24 | | 7,740 | 7,944 |
| Series 2016 B, 4% 9/1/26 | | 320 | 328 |
| New Jersey Gen. Oblig.: | | | |
| Series 2020 A: | | | |
5% 6/1/24 | | 10,970 | 11,292 |
5% 6/1/25 | | 5,320 | 5,602 |
| Series 2021: | | | |
2% 6/1/23 | | 5,700 | 5,664 |
2% 6/1/29 | | 1,965 | 1,788 |
| New Jersey Health Care Facilities Fing. Auth. Rev.: | | | |
| Bonds: | | | |
Series 2019 B1, 5%, tender 7/1/24 (b) | | 3,175 | 3,255 |
Series 2019 B2, 5%, tender 7/1/25 (b) | | 3,890 | 4,075 |
Series 2019 B3, 5%, tender 7/1/26 (b) | | 2,750 | 2,929 |
| Series 2016 A: | | | |
5% 7/1/23 (Escrowed to Maturity) | | 595 | 600 |
5% 7/1/24 | | 1,200 | 1,238 |
5% 7/1/24 (Escrowed to Maturity) | | 985 | 1,015 |
5% 7/1/24 (Escrowed to Maturity) | | 475 | 489 |
5% 7/1/25 (Escrowed to Maturity) | | 515 | 542 |
5% 7/1/26 (Escrowed to Maturity) | | 170 | 182 |
5% 7/1/27 (Pre-Refunded to 7/1/26 @ 100) | | 255 | 274 |
| Series 2016, 5% 7/1/25 | | 275 | 289 |
| New Jersey Higher Ed. Student Assistance Auth. Student Ln. Rev.: | | | |
| Series 2015 1A, 5% 12/1/24 (c) | | 6,015 | 6,186 |
| Series 2017 1A, 5% 12/1/23 (c) | | 1,930 | 1,955 |
| Series 2019 A, 5% 12/1/24 | | 950 | 984 |
| Series 2020: | | | |
5% 12/1/23 (c) | | 1,830 | 1,855 |
5% 12/1/24 (c) | | 1,360 | 1,399 |
5% 12/1/25 (c) | | 2,440 | 2,540 |
5% 12/1/26 (c) | | 3,165 | 3,336 |
| Series 2021 A, 5% 12/1/25 (c) | | 130 | 135 |
| Series 2021 B: | | | |
5% 12/1/25 (c) | | 315 | 328 |
5% 12/1/26 (c) | | 1,425 | 1,504 |
| New Jersey Hsg. & Mtg. Fin. Agcy. Rev. Series 2019 D: | | | |
| 4% 4/1/23 (c) | | 1,090 | 1,091 |
| 4% 10/1/23 (c) | | 1,150 | 1,152 |
| 4% 4/1/25 (c) | | 1,405 | 1,413 |
| New Jersey Tpk. Auth. Tpk. Rev. Series D, 5% 1/1/28 | | 1,710 | 1,838 |
| New Jersey Trans. Trust Fund Auth.: | | | |
| Series 2006 C: | | | |
0% 12/15/25 | | 6,400 | 5,794 |
0% 12/15/26 (Assured Guaranty Corp. Insured) | | 1,585 | 1,389 |
0% 12/15/27 (Nat'l. Pub. Fin. Guarantee Corp. Insured) | | 1,820 | 1,517 |
0% 12/15/31 (FGIC Insured) | | 5,400 | 3,760 |
| Series 2010 A: | | | |
0% 12/15/25 | | 1,140 | 1,026 |
0% 12/15/27 | | 5,520 | 4,588 |
| Series 2013 AA, 5% 6/15/25 | | 1,280 | 1,290 |
| Series 2016 A, 5% 6/15/27 | | 3,960 | 4,183 |
| Series 2018 A, 5% 6/15/24 | | 5,000 | 5,132 |
| Series 2022 AA: | | | |
5% 6/15/23 | | 985 | 992 |
5% 6/15/25 | | 4,000 | 4,167 |
5% 6/15/26 | | 9,745 | 10,315 |
5% 6/15/27 | | 8,000 | 8,558 |
5% 6/15/28 | | 10,000 | 10,803 |
| Series A: | | | |
0% 12/15/26 | | 11,265 | 9,749 |
5% 12/15/24 | | 1,780 | 1,843 |
5% 12/15/25 | | 1,680 | 1,766 |
5% 12/15/26 | | 2,600 | 2,773 |
| Rutgers State Univ. Rev. Series Q, 5% 5/1/23 | | 540 | 543 |
TOTAL NEW JERSEY | | | 179,859 |
| New Mexico - 1.3% | | | |
| New Mexico Edl. Assistance Foundation Series 2021 1A: | | | |
| 5% 9/1/25 (c) | | 6,250 | 6,514 |
| 5% 9/1/28 (c) | | 2,000 | 2,167 |
| New Mexico Hosp. Equip. Ln. Council Rev. Bonds Series 2019 B, 5%, tender 8/1/25 (b) | | 3,135 | 3,276 |
| New Mexico Mtg. Fin. Auth. Series 2019 C, 4% 1/1/50 | | 3,350 | 3,357 |
| New Mexico Muni. Energy Acquisition Auth. Gas Supply Rev.: | | | |
| Bonds Series 2019 A, 5%, tender 5/1/25 (b) | | 15,000 | 15,374 |
| Series 2019 A: | | | |
4% 11/1/23 | | 710 | 711 |
4% 5/1/24 | | 950 | 953 |
4% 11/1/24 | | 1,450 | 1,458 |
4% 5/1/25 | | 2,790 | 2,805 |
TOTAL NEW MEXICO | | | 36,615 |
| New York - 8.1% | | | |
| Dorm. Auth. New York Univ. Rev. Series 2016 A, 5% 7/1/24 | | 1,810 | 1,853 |
| Hudson Yards Infrastructure Corp. New York Rev. Series 2017 A, 5% 2/15/25 | | 4,000 | 4,185 |
| Long Island Pwr. Auth. Elec. Sys. Rev.: | | | |
| Bonds: | | | |
Series 2019 B, 1.65%, tender 9/1/24 (b) | | 7,255 | 7,012 |
Series 2020 B, 0.85%, tender 9/1/25 (b) | | 19,810 | 18,462 |
Series 2021 B, 1.5%, tender 9/1/26 (b) | | 3,360 | 3,122 |
| Series 2021, 1% 9/1/25 | | 2,805 | 2,554 |
| Monroe County Indl. Dev. Corp. (Univ. of Rochester Proj.): | | | |
| Series 2017 A, 5% 7/1/25 | | 900 | 948 |
| Series 2020 A: | | | |
5% 7/1/25 | | 750 | 790 |
5% 7/1/26 | | 500 | 537 |
| New York Bridge Auth. Gen. Rev. Series 2021 B, 5% 1/1/27 | | 1,500 | 1,623 |
| New York City Gen. Oblig.: | | | |
| Bonds Series D, 5%, tender 2/1/24 (b) | | 2,825 | 2,847 |
| Series 2020 A1, 5% 8/1/27 | | 13,205 | 14,492 |
| Series 2021 F1, 5% 3/1/23 | | 555 | 557 |
| Series 2022 B1, 5% 8/1/28 | | 14,555 | 16,249 |
| Series A, 5% 8/1/26 | | 1,000 | 1,081 |
| Series A6, 5% 8/1/25 | | 250 | 256 |
| Series F1, 5% 6/1/25 | | 470 | 495 |
| Series I1, 5% 3/1/27 | | 615 | 630 |
| New York City Health & Hosp. Corp. Rev. Series A: | | | |
| 3% 2/15/24 | | 535 | 535 |
| 5% 2/15/24 | | 750 | 767 |
| New York City Hsg. Dev. Corp. Multifamily Hsg. Bonds: | | | |
| Series 2021 C2, 0.7%, tender 7/1/25 (b) | | 2,210 | 2,047 |
| Series 2021 K2, 0.9%, tender 1/1/26 (b) | | 12,290 | 11,232 |
| Series 2021, 0.6%, tender 7/1/25 (b) | | 2,905 | 2,683 |
| New York City Indl. Dev. Agcy. Rev. Series 2021 A: | | | |
| 5% 1/1/25 (Assured Guaranty Muni. Corp. Insured) | | 1,000 | 1,038 |
| 5% 1/1/26 (Assured Guaranty Muni. Corp. Insured) | | 1,000 | 1,057 |
| 5% 1/1/27 (Assured Guaranty Muni. Corp. Insured) | | 1,000 | 1,073 |
| New York City Muni. Wtr. Fin. Auth. Series 2021 DD, 5% 6/15/25 | | 1,535 | 1,624 |
| New York City Transitional Fin. Auth. Rev.: | | | |
| Series 2017 E1, 5% 2/1/30 | | 2,830 | 3,073 |
| Series 2021 F1, 5% 11/1/25 | | 2,060 | 2,195 |
| Series 2022 B1, 5% 11/1/25 | | 8,000 | 8,523 |
| Series E1, 5% 2/1/26 | | 475 | 497 |
| New York Dorm. Auth. Rev.: | | | |
| Bonds Series 2019 B2, 5%, tender 5/1/24 (b) | | 2,005 | 2,032 |
| Series 2015 A: | | | |
5% 7/1/28 | | 370 | 384 |
5% 7/1/28 (Pre-Refunded to 7/1/25 @ 100) | | 30 | 32 |
| Series 2022: | | | |
5% 7/1/26 | | 675 | 701 |
5% 7/1/27 | | 710 | 743 |
5% 7/1/28 | | 750 | 791 |
5% 7/1/29 | | 1,065 | 1,128 |
| New York Dorm. Auth. Sales Tax Rev. Series 2017 A, 5% 3/15/31 | | 2,745 | 2,978 |
| New York Envir. Facilities Corp. Clean Wtr. & Drinking Wtr. (NY Muni. Wtr. Fin. Auth. Projs.) Series 2020 A, 5% 6/15/24 | | 1,400 | 1,448 |
| New York Metropolitan Trans. Auth. Dedicated Tax Fund Rev.: | | | |
| Series 2012 A, 5% 11/15/25 | | 1,340 | 1,341 |
| Series 2016 A, 5% 11/15/24 | | 525 | 546 |
| Series 2016 B1: | | | |
5% 11/15/24 | | 670 | 697 |
5% 11/15/25 | | 1,000 | 1,062 |
| Series 2017 B1, 4% 11/15/25 | | 250 | 258 |
| Series 2017 B2, 5% 11/15/25 | | 1,450 | 1,539 |
| New York Metropolitan Trans. Auth. Rev.: | | | |
| Series 2015 A, 5% 11/15/24 | | 1,000 | 1,026 |
| Series 2015 A1, 5% 11/15/29 | | 765 | 778 |
| Series 2016 A: | | | |
5% 11/15/23 | | 2,680 | 2,715 |
5% 11/15/23 | | 1,450 | 1,469 |
| Series 2016 D, 5% 11/15/27 | | 1,500 | 1,558 |
| Series 2017 A2: | | | |
5% 11/15/25 | | 2,620 | 2,716 |
5% 11/15/26 | | 5,815 | 6,077 |
| Series 2017 B: | | | |
5% 11/15/23 | | 4,025 | 4,077 |
5% 11/15/24 | | 665 | 682 |
| Series 2017 C1, 5% 11/15/28 | | 4,340 | 4,505 |
| New York State Dorm. Auth.: | | | |
| Series 2018 A, 5% 3/15/27 (Escrowed to Maturity) | | 970 | 1,062 |
| Series 2019 D, 5% 2/15/25 | | 1,030 | 1,080 |
| Series 2021 A: | | | |
5% 3/15/27 | | 2,975 | 3,254 |
5% 3/15/29 | | 1,500 | 1,702 |
| New York State Hsg. Fin. Agcy. Rev.: | | | |
| Bonds: | | | |
Series 2021 D2, 0.65%, tender 11/1/25 (b) | | 2,770 | 2,534 |
Series 2021 J2: | | | |
1%, tender 11/1/26 (b) | | 1,770 | 1,597 |
1.1%, tender 5/1/27 (b) | | 6,610 | 5,890 |
| Series J, 0.75% 5/1/25 | | 3,030 | 2,842 |
| New York State Mtg. Agcy. Homeowner Mtg.: | | | |
| Series 2021 232: | | | |
5% 4/1/25 (c) | | 1,130 | 1,166 |
5% 10/1/26 (c) | | 1,580 | 1,662 |
| Series 221, 3.5% 10/1/32 (c) | | 420 | 411 |
| New York Thruway Auth. Gen. Rev. Series 2014 K, 5% 1/1/32 | | 795 | 826 |
| New York Trans. Dev. Corp.: | | | |
| (Term. 4 JFK Int'l. Arpt. Proj.): | | | |
Series 2020 A: | | | |
5% 12/1/24 (c) | | 1,500 | 1,540 |
5% 12/1/25 (c) | | 2,295 | 2,375 |
5% 12/1/26 (c) | | 1,180 | 1,235 |
Series 2020 C: | | | |
5% 12/1/24 | | 1,000 | 1,035 |
5% 12/1/25 | | 800 | 840 |
5% 12/1/26 | | 1,250 | 1,323 |
5% 12/1/27 | | 1,250 | 1,327 |
| (Term. 4 John F. Kennedy Int'l. Arpt. Proj.) Series 2022: | | | |
5% 12/1/26 (c) | | 7,810 | 8,172 |
5% 12/1/27 (c) | | 10,415 | 10,949 |
| New York Urban Dev. Corp. Rev. Series 2015 A, 5% 3/15/26 | | 250 | 265 |
| Niagara Frontier Trans. Auth. Arpt. Rev. Series 2019 A: | | | |
| 5% 4/1/25 (c) | | 625 | 644 |
| 5% 4/1/27 (c) | | 1,350 | 1,418 |
| Suffolk County Gen. Oblig.: | | | |
| Series 2022 A: | | | |
5% 6/15/24 | | 655 | 674 |
5% 6/15/25 | | 695 | 731 |
5% 6/15/29 | | 965 | 1,086 |
| Series 2022 B: | | | |
5% 10/1/23 | | 1,300 | 1,318 |
5% 10/1/25 | | 800 | 847 |
5% 10/1/26 | | 410 | 442 |
5% 10/1/28 | | 670 | 747 |
| Syracuse Reg'l. Arpt. Auth. Series 2021: | | | |
| 5% 7/1/25 (c) | | 750 | 775 |
| 5% 7/1/26 (c) | | 1,145 | 1,193 |
| 5% 7/1/27 (c) | | 1,515 | 1,592 |
| Tobacco Settlement Asset Securitization Corp. Series 2017, 5% 6/1/24 | | 1,500 | 1,527 |
| Triborough Bridge & Tunnel Auth. Bonds: | | | |
| Series 2021 A2: | | | |
2%, tender 5/15/26 (b) | | 7,870 | 7,186 |
2%, tender 5/15/28 (b) | | 2,575 | 2,309 |
| Series 2021 B, 5%, tender 5/15/26 (b) | | 2,470 | 2,626 |
TOTAL NEW YORK | | | 233,522 |
| New York And New Jersey - 0.7% | | | |
| Port Auth. of New York & New Jersey: | | | |
| Series 178, 5% 12/1/23 (c) | | 1,060 | 1,073 |
| Series 185, 5% 9/1/23 (c) | | 2,870 | 2,895 |
| Series 188, 5% 5/1/25 (c) | | 1,980 | 2,050 |
| Series 193: | | | |
5% 10/15/25 (c) | | 3,550 | 3,703 |
5% 10/15/29 (c) | | 1,350 | 1,399 |
| Series 223: | | | |
5% 7/15/25 (c) | | 1,500 | 1,558 |
5% 7/15/26 (c) | | 2,250 | 2,372 |
5% 7/15/27 (c) | | 3,055 | 3,261 |
5% 7/15/28 (c) | | 2,500 | 2,701 |
TOTAL NEW YORK AND NEW JERSEY | | | 21,012 |
| North Carolina - 2.2% | | | |
| Asheville Spl. Obligations Series 2021, 5% 4/1/25 | | 1,530 | 1,608 |
| Charlotte Int'l. Arpt. Rev.: | | | |
| Series 2019 B, 5% 7/1/27 (c) | | 735 | 780 |
| Series 2021 B: | | | |
5% 7/1/26 (c) | | 5,535 | 5,824 |
5% 7/1/27 (c) | | 4,500 | 4,777 |
5% 7/1/28 (c) | | 1,675 | 1,791 |
5% 7/1/29 (c) | | 865 | 932 |
| Charlotte-Mecklenburg Hosp. Auth. Health Care Sys. Rev. Bonds: | | | |
| Series 2021 B, 5%, tender 12/2/24 (b) | | 4,200 | 4,356 |
| Series 2021 C, 5%, tender 12/1/28 (b) | | 1,570 | 1,735 |
| New Hanover County Hosp. Rev. Series 2017: | | | |
| 5% 10/1/25 (Escrowed to Maturity) | | 1,115 | 1,181 |
| 5% 10/1/26 (Escrowed to Maturity) | | 1,360 | 1,468 |
| North Carolina Cap. Facilities Fin. Agcy. Edl. Facilities Rev. Series 2021, 5% 5/1/25 | | 260 | 271 |
| North Carolina Grant Anticipation Rev. Series 2021: | | | |
| 5% 3/1/25 | | 3,000 | 3,146 |
| 5% 3/1/27 | | 2,305 | 2,521 |
| 5% 3/1/28 | | 2,375 | 2,641 |
| North Carolina Hsg. Fin. Agcy. Home Ownership Rev. Series 43, 4% 7/1/50 | | 5,560 | 5,571 |
| North Carolina Med. Care Commission Health Care Facilities Rev. Bonds Series 2019 C, 2.55%, tender 6/1/26 (b) | | 7,335 | 7,170 |
| North Carolina Med. Care Commission Hosp. Rev. Bonds Series 2021 B, 5%, tender 2/1/26 (b) | | 1,110 | 1,174 |
| North Carolina Tpk. Auth. Triangle Expressway Sys. Series 2020 C, 5% 2/1/24 | | 13,610 | 13,863 |
| Raleigh Durham Arpt. Auth. Arpt. Rev. Series 2020 A, 5% 5/1/27 (c) | | 355 | 376 |
| Union County Enterprise Systems Rev. Series 2021: | | | |
| 5% 6/1/25 | | 1,000 | 1,055 |
| 5% 6/1/26 | | 750 | 809 |
| 5% 6/1/27 | | 775 | 850 |
TOTAL NORTH CAROLINA | | | 63,899 |
| North Dakota - 0.2% | | | |
| North Dakota Hsg. Fin. Agcy.: | | | |
| Series 2021 A, 3% 1/1/52 | | 1,540 | 1,495 |
| Series 2021 B, 3% 7/1/52 | | 4,155 | 3,994 |
TOTAL NORTH DAKOTA | | | 5,489 |
| Ohio - 2.0% | | | |
| Akron Bath Copley Hosp. District Rev.: | | | |
| Series 2016, 5% 11/15/24 | | 1,955 | 2,009 |
| Series 2020: | | | |
5% 11/15/26 | | 375 | 395 |
5% 11/15/27 | | 185 | 197 |
| Allen County Hosp. Facilities Rev. Series 2020 A, 5% 12/1/23 | | 1,045 | 1,062 |
| American Muni. Pwr., Inc. Rev.: | | | |
| Bonds Series 2021 A2, 1%, tender 8/15/24 (b) | | 2,150 | 2,061 |
| Series 2021 A: | | | |
5% 2/15/26 | | 300 | 318 |
5% 2/15/27 | | 400 | 431 |
| Cleveland Arpt. Sys. Rev. Series 2016 A: | | | |
| 5% 1/1/24 (Assured Guaranty Muni. Corp. Insured) | | 1,175 | 1,199 |
| 5% 1/1/25 (Assured Guaranty Muni. Corp. Insured) | | 1,225 | 1,273 |
| 5% 1/1/26 (Assured Guaranty Muni. Corp. Insured) | | 490 | 509 |
| Fairfield County Hosp. Facilities Rev. (Fairfield Med. Ctr. Proj.) Series 2013, 5% 6/15/23 | | 1,815 | 1,821 |
| Franklin County Hosp. Facilities Rev. Bonds (U.S. Health Corp. of Columbus Proj.) Series 2011 B, 5%, tender 5/15/23 (b) | | 965 | 971 |
| Miami County Hosp. Facilities Rev. (Kettering Health Network Obligated Group Proj.) Series 2019: | | | |
| 5% 8/1/27 | | 1,000 | 1,078 |
| 5% 8/1/28 | | 1,000 | 1,091 |
| Miami Univ. Series 2022 A: | | | |
| 5% 9/1/23 | | 735 | 745 |
| 5% 9/1/24 | | 125 | 129 |
| Montgomery County Hosp. Rev. (Kettering Health Network Obligated Group Proj.)) Series 2021: | | | |
| 5% 8/1/27 | | 575 | 620 |
| 5% 8/1/28 | | 500 | 545 |
| Ohio Cap. Facilities Lease (Adult Correctional Bldg. Fund Projs.) Series 2021 A: | | | |
| 5% 10/1/25 | | 2,000 | 2,122 |
| 5% 10/1/26 | | 1,750 | 1,896 |
| Ohio Hosp. Facilities Rev.: | | | |
| Series 2017 A, 5% 1/1/25 | | 2,035 | 2,120 |
| Series 2021 B: | | | |
5% 1/1/23 | | 450 | 450 |
5% 1/1/25 | | 1,935 | 2,016 |
| Ohio Hsg. Fin. Agcy. Residential Mtg. Rev.: | | | |
| (Mtg. Backed Securities Prog.) Series 2019 B, 4.5% 3/1/50 | | 275 | 279 |
| Series 2021 C, 3.25% 3/1/51 | | 17,755 | 17,336 |
| Ohio Tpk. Commission Tpk. Rev. (Infrastructure Projs.) Series 2022 A, 5% 2/15/24 | | 2,445 | 2,503 |
| Scioto County Hosp. Facilities Rev.: | | | |
| Series 2016: | | | |
5% 2/15/23 | | 2,075 | 2,078 |
5% 2/15/24 | | 3,215 | 3,272 |
5% 2/15/25 | | 2,065 | 2,140 |
5% 2/15/26 | | 1,285 | 1,345 |
| Series 2019, 5% 2/15/29 | | 2,020 | 2,108 |
| Univ. of Akron Gen. Receipts Series 2019 A: | | | |
| 5% 1/1/23 | | 445 | 445 |
| 5% 1/1/24 | | 760 | 775 |
| 5% 1/1/25 | | 1,100 | 1,135 |
TOTAL OHIO | | | 58,474 |
| Oklahoma - 0.0% | | | |
| Oklahoma Tpk. Auth. Tpk. Rev. Series 2017 D, 5% 1/1/25 | | 775 | 807 |
| Oregon - 0.5% | | | |
| Oregon Bus. Dev. Commission Recovery Zone Facility Bonds (Intel Corp. Proj.) Series 232, 2.4%, tender 8/14/23 (b) | | 10,405 | 10,324 |
| Oregon Facilities Auth. Rev. (Samaritan Health Svcs. Proj.): | | | |
| Series 2020 A: | | | |
5% 10/1/24 | | 200 | 206 |
5% 10/1/25 | | 225 | 234 |
5% 10/1/26 | | 150 | 158 |
| Series A, 5% 10/1/27 | | 150 | 159 |
| Oregon State Hsg. & Cmnty. Svcs. Dept. (Single Family Mtg. Prog.) Series A, 3.5% 1/1/51 | | 1,475 | 1,458 |
| Port of Portland Arpt. Rev.: | | | |
| Series 2020 27 A, 5% 7/1/29 (c) | | 430 | 463 |
| Series 27 A, 5% 7/1/26 (c) | | 1,515 | 1,594 |
TOTAL OREGON | | | 14,596 |
| Pennsylvania - 2.1% | | | |
| Allegheny County Arpt. Auth. Rev. Series 2021 A: | | | |
| 5% 1/1/26 (c) | | 1,750 | 1,823 |
| 5% 1/1/27 (c) | | 2,000 | 2,109 |
| 5% 1/1/28 (c) | | 2,250 | 2,392 |
| Allegheny County Indl. Dev. Auth. Rev. Series 2021, 3.5% 12/1/31 | | 1,075 | 887 |
| Allegheny County Sanitation Auth. Swr. Rev. Series 2020 A: | | | |
| 4% 6/1/25 | | 200 | 206 |
| 5% 6/1/26 | | 1,000 | 1,076 |
| Commonwealth Fing. Auth. Rev. Series 2020 A: | | | |
| 5% 6/1/24 | | 1,475 | 1,515 |
| 5% 6/1/25 | | 1,150 | 1,205 |
| Montgomery County Higher Ed. & Health Auth. Rev.: | | | |
| Series 2014 A, 5% 10/1/23 | | 190 | 191 |
| Series 2019, 5% 9/1/29 | | 1,000 | 1,102 |
| Pennsylvania Econ. Dev. Fing. Auth. Solid Waste Disp. Rev. Bonds: | | | |
| (Waste Mgmt., Inc. Proj.) Series 2017 A, 0.58%, tender 8/1/24 (b)(c) | | 1,100 | 1,031 |
| Series 2011, 2.15%, tender 7/1/24 (b)(c) | | 1,000 | 963 |
| Pennsylvania Gen. Oblig. Series 2019: | | | |
| 5% 7/15/25 | | 8,685 | 9,178 |
| 5% 7/15/28 | | 1,760 | 1,957 |
| 5% 7/15/29 | | 1,395 | 1,573 |
| Pennsylvania Higher Edl. Facilities Auth. Rev. Series 2016 C, 5% 8/15/25 | | 2,855 | 3,023 |
| Pennsylvania Hsg. Fin. Agcy.: | | | |
| Series 2020 13 2A, 3.5% 4/1/51 | | 860 | 852 |
| Series 2021 137, 3% 10/1/51 | | 5,850 | 5,576 |
| Pennsylvania Tpk. Commission Tpk. Rev. Series 2021 B: | | | |
| 5% 12/1/25 | | 860 | 909 |
| 5% 12/1/26 | | 1,000 | 1,075 |
| 5% 12/1/27 | | 750 | 819 |
| Philadelphia Arpt. Rev.: | | | |
| Series 2015 A, 5% 6/15/24 (c) | | 600 | 613 |
| Series 2017 A, 5% 7/1/24 | | 490 | 504 |
| Series 2017 B: | | | |
5% 7/1/24 (c) | | 4,790 | 4,897 |
5% 7/1/25 (c) | | 1,700 | 1,761 |
| Series 2021: | | | |
5% 7/1/28 (c) | | 3,100 | 3,314 |
5% 7/1/29 (c) | | 1,830 | 1,964 |
| Philadelphia School District: | | | |
| Series 2018 A: | | | |
5% 9/1/24 | | 1,000 | 1,032 |
5% 9/1/25 | | 700 | 735 |
5% 9/1/26 | | 750 | 799 |
| Series 2019 A: | | | |
5% 9/1/23 | | 315 | 319 |
5% 9/1/24 | | 1,050 | 1,083 |
5% 9/1/25 | | 1,200 | 1,260 |
| Series 2019 B, 5% 9/1/24 | | 1,000 | 1,032 |
| Reading School District Series 2017: | | | |
| 5% 3/1/25 (Assured Guaranty Muni. Corp. Insured) | | 320 | 333 |
| 5% 3/1/26 (Assured Guaranty Muni. Corp. Insured) | | 260 | 276 |
| 5% 3/1/27 (Assured Guaranty Muni. Corp. Insured) | | 250 | 270 |
| 5% 3/1/28 (Assured Guaranty Muni. Corp. Insured) | | 245 | 262 |
TOTAL PENNSYLVANIA | | | 59,916 |
| Puerto Rico - 0.9% | | | |
| Puerto Rico Commonwealth Aqueduct & Swr. Auth. Series 2022 A, 5% 7/1/28 (d) | | 7,500 | 7,415 |
| Puerto Rico Commonwealth Pub. Impt. Gen. Oblig.: | | | |
| Series 2021 A1: | | | |
0% 7/1/24 | | 1,254 | 1,162 |
5.25% 7/1/23 | | 10,132 | 10,132 |
| Series 2022 A1, 5.375% 7/1/25 | | 6,360 | 6,408 |
TOTAL PUERTO RICO | | | 25,117 |
| Rhode Island - 1.1% | | | |
| Rhode Island Health & Edl. Bldg. Corp. Higher Ed. Facilities Rev. Series 2016: | | | |
| 5% 5/15/23 | | 1,180 | 1,184 |
| 5% 5/15/24 | | 2,300 | 2,334 |
| 5% 5/15/25 | | 5,385 | 5,514 |
| Rhode Island Health & Edl. Bldg. Corp. Pub. Schools Rev. Series 2015, 5% 5/15/25 (Assured Guaranty Muni. Corp. Insured) | | 5,910 | 6,214 |
| Rhode Island Hsg. & Mtg. Fin. Corp. Series 2019 70, 4% 10/1/49 | | 600 | 601 |
| Rhode Island Hsg. & Mtg. Fin. Corp. Rev. Series 72 A, 3.5% 10/1/50 | | 1,210 | 1,196 |
| Rhode Island Student Ln. Auth. Student Ln. Rev.: | | | |
| Series 2018 A, 5% 12/1/25 (c) | | 845 | 879 |
| Series 2019 A: | | | |
5% 12/1/23 (c) | | 750 | 760 |
5% 12/1/24 (c) | | 1,275 | 1,307 |
5% 12/1/25 (c) | | 1,900 | 1,985 |
5% 12/1/26 (c) | | 1,000 | 1,056 |
5% 12/1/28 (c) | | 510 | 549 |
| Series 2021 A, 5% 12/1/27 (c) | | 900 | 960 |
| Series A: | | | |
4% 12/1/26 (c) | | 355 | 359 |
5% 12/1/26 (c) | | 1,200 | 1,267 |
| Tobacco Settlement Fing. Corp. Series 2015 A: | | | |
| 5% 6/1/24 | | 1,885 | 1,911 |
| 5% 6/1/26 | | 3,425 | 3,502 |
| 5% 6/1/27 | | 980 | 1,002 |
TOTAL RHODE ISLAND | | | 32,580 |
| South Carolina - 1.1% | | | |
| Scago Edl. Facilities Corp. for Colleton School District (School District of Colleton County Proj.) Series 2015: | | | |
| 5% 12/1/23 | | 4,345 | 4,422 |
| 5% 12/1/26 | | 1,075 | 1,126 |
| South Carolina Hsg. Fin. & Dev. Auth. Mtg. Rev. Series 2019 A, 4% 1/1/50 | | 1,030 | 1,033 |
| South Carolina Ports Auth. Ports Rev.: | | | |
| Series 2015 (AMT), 5% 7/1/45 (Pre-Refunded to 7/1/25 @ 100) (c) | | 2,810 | 2,925 |
| Series 2015: | | | |
5.25% 7/1/50 (Pre-Refunded to 7/1/25 @ 100) (c) | | 4,805 | 5,030 |
5.25% 7/1/55 (Pre-Refunded to 7/1/25 @ 100) (c) | | 2,310 | 2,418 |
| South Carolina Pub. Svc. Auth. Rev.: | | | |
| Series 2014 C, 5% 12/1/23 (Escrowed to Maturity) | | 4,890 | 4,979 |
| Series 2015 A, 5% 12/1/25 | | 1,000 | 1,041 |
| Series 2021 A: | | | |
5% 12/1/26 | | 670 | 713 |
5% 12/1/27 | | 750 | 807 |
| Series 2021 B: | | | |
5% 12/1/24 | | 1,400 | 1,448 |
5% 12/1/25 | | 500 | 525 |
5% 12/1/26 | | 500 | 532 |
5% 12/1/27 | | 450 | 484 |
5% 12/1/28 | | 800 | 869 |
| Series A, 5% 12/1/23 (Escrowed to Maturity) | | 2,995 | 3,050 |
TOTAL SOUTH CAROLINA | | | 31,402 |
| Tennessee - 1.6% | | | |
| Metropolitan Nashville Arpt. Auth. Rev. Series 2019 B: | | | |
| 5% 7/1/26 (c) | | 2,000 | 2,098 |
| 5% 7/1/27 (c) | | 2,435 | 2,585 |
| 5% 7/1/28 (c) | | 3,125 | 3,341 |
| 5% 7/1/29 (c) | | 3,800 | 4,078 |
| 5% 7/1/30 (c) | | 3,000 | 3,248 |
| Nashville and Davidson County Metropolitan Govt. Gen. Oblig. Series 2022 B, 4% 1/1/26 | | 8,000 | 8,309 |
| Tennergy Corp. Gas Rev. Bonds Series 2019 A, 5%, tender 10/1/24 (b) | | 11,590 | 11,759 |
| Tennessee Energy Acquisition Corp. Bonds (Gas Rev. Proj.) Series A, 4%, tender 5/1/23 (b) | | 6,040 | 6,050 |
| Tennessee Gen. Oblig. Series 2015 A, 5% 8/1/28 (Pre-Refunded to 8/1/25 @ 100) | | 2,000 | 2,118 |
| Tennessee Hsg. Dev. Agcy. Residential Series 2021 3A, 3% 1/1/52 | | 1,655 | 1,601 |
TOTAL TENNESSEE | | | 45,187 |
| Texas - 11.6% | | | |
| Aledo Independent School District Series 2015, 0% 2/15/24 | | 1,195 | 1,153 |
| Austin Arpt. Sys. Rev.: | | | |
| Series 2019 B: | | | |
5% 11/15/23 (c) | | 620 | 629 |
5% 11/15/24 (c) | | 675 | 696 |
5% 11/15/25 (c) | | 650 | 679 |
| Series 2019, 5% 11/15/24 (c) | | 2,500 | 2,579 |
| Birdville Independent School District Series 2021, 5% 2/15/26 | | 800 | 856 |
| Central Reg'l. Mobility Auth.: | | | |
| Series 2016: | | | |
5% 1/1/24 | | 3,295 | 3,361 |
5% 1/1/26 | | 2,800 | 2,943 |
| Series 2020 F, 5% 1/1/25 | | 4,455 | 4,571 |
| Series 2021 C, 5% 1/1/27 | | 6,865 | 7,208 |
| City of Denton Series 2020 A, 5% 2/15/26 | | 1,025 | 1,097 |
| Clear Creek Independent School District Bonds Series 2021 B, 0.28%, tender 8/15/24 (b) | | 4,370 | 4,123 |
| Clint Independent School District Series 2015 A, 5% 2/15/26 | | 1,600 | 1,672 |
| Collin County Series 2020, 5% 2/15/26 | | 1,040 | 1,113 |
| Comal County Series 2017, 4% 2/1/26 | | 1,780 | 1,848 |
| Cypress-Fairbanks Independent School District: | | | |
| Bonds: | | | |
Series 2015 B1, 0.28%, tender 8/15/24 (b) | | 6,405 | 6,129 |
Series 2015 B2, 0.28%, tender 8/15/24 (b) | | 10,080 | 9,646 |
| Series 2020 A, 5% 2/15/25 | | 1,330 | 1,393 |
| Dallas Fort Worth Int'l. Arpt. Rev.: | | | |
| Series 2014 A, 5.25% 11/1/27 (c) | | 1,175 | 1,190 |
| Series 2014 D, 5% 11/1/23 (c) | | 1,905 | 1,928 |
| Series 2020 A, 5% 11/1/26 | | 2,595 | 2,808 |
| Dallas Gen. Oblig. Series 2018, 5% 2/15/25 | | 2,060 | 2,156 |
| Dallas Independent School District Series 2021, 4% 2/15/25 | | 1,835 | 1,879 |
| Denton Independent School District: | | | |
| Bonds Series 2014 B: | | | |
2%, tender 8/1/24 (b) | | 265 | 262 |
2%, tender 8/1/24 (b) | | 3,085 | 3,008 |
| Series 2016, 0% 8/15/25 | | 1,610 | 1,496 |
| El Paso Independent School District Series 2020: | | | |
| 5% 8/15/23 | | 500 | 506 |
| 5% 8/15/24 | | 650 | 673 |
| Fort Bend Independent School District Bonds: | | | |
| Series 2020 B, 0.875%, tender 8/1/25 (b) | | 9,565 | 8,936 |
| Series 2021 B, 0.72%, tender 8/1/26 (b) | | 3,035 | 2,699 |
| Fort Worth Gen. Oblig. Series 2020, 5% 3/1/26 | | 3,800 | 4,070 |
| Fort Worth Independent School District Series 2019 B, 5% 2/15/25 | | 1,805 | 1,892 |
| Goose Creek Consolidated Independent School District Bonds Series 2021 B, 0.6%, tender 8/17/26 (b) | | 3,500 | 3,208 |
| Hallsville Independent School District Series 2020, 5% 2/15/30 | | 1,000 | 1,128 |
| Harris County Cultural Ed. Facilities Fin. Corp. Med. Facilities Rev. Series 2016, 5% 11/15/25 | | 1,500 | 1,575 |
| Harris County Cultural Ed. Facilities Fin. Corp. Rev.: | | | |
| Bonds: | | | |
Series 2019 B, 5%, tender 12/1/26 (b) | | 6,545 | 6,993 |
Series 2020 A, 0.9%, tender 5/15/25 (b) | | 1,850 | 1,714 |
Series 2020 C, 5%, tender 12/1/26 (b) | | 7,000 | 7,479 |
| Series 2014 A, 5% 12/1/26 | | 1,085 | 1,126 |
| Hays Consolidated Independent School District Series 2022: | | | |
| 5% 2/15/27 | | 650 | 709 |
| 5% 2/15/28 | | 650 | 722 |
| 5% 2/15/29 | | 1,000 | 1,130 |
| Houston Arpt. Sys. Rev.: | | | |
| Series 2018 A: | | | |
5% 7/1/23 (c) | | 750 | 755 |
5% 7/1/25 (c) | | 1,550 | 1,609 |
| Series 2018 C: | | | |
5% 7/1/23 (c) | | 1,500 | 1,509 |
5% 7/1/26 (c) | | 500 | 526 |
5% 7/1/27 (c) | | 905 | 961 |
| Series 2020 B, 5% 7/1/26 | | 2,250 | 2,420 |
| Houston Gen. Oblig. Series 2017 A, 5% 3/1/27 | | 1,545 | 1,680 |
| Houston Independent School District Bonds Series 2014 A, 4%, tender 6/1/23 (b) | | 6,270 | 6,285 |
| Kilgore Independent School District Series 2020, 5% 2/15/26 | | 1,075 | 1,149 |
| Love Field Arpt. Modernization Rev.: | | | |
| Series 2015: | | | |
5% 11/1/23 (c) | | 2,125 | 2,150 |
5% 11/1/26 (c) | | 1,075 | 1,121 |
5% 11/1/30 (c) | | 1,960 | 2,026 |
| Series 2021: | | | |
5% 11/1/23 (c) | | 895 | 906 |
5% 11/1/24 (c) | | 2,615 | 2,691 |
5% 11/1/25 (c) | | 3,920 | 4,075 |
5% 11/1/26 (c) | | 2,845 | 2,985 |
5% 11/1/27 (c) | | 2,885 | 3,048 |
5% 11/1/28 (c) | | 11,150 | 11,863 |
5% 11/1/29 (c) | | 11,705 | 12,525 |
| Lower Colorado River Auth. Rev.: | | | |
| (LCRA Transmission Svcs. Corp. Proj.) Series 2021, 5% 5/15/25 | | 1,315 | 1,373 |
| Series 2022: | | | |
5% 5/15/25 (Assured Guaranty Muni. Corp. Insured) | | 1,670 | 1,744 |
5% 5/15/26 (Assured Guaranty Muni. Corp. Insured) | | 1,805 | 1,934 |
5% 5/15/27 (Assured Guaranty Muni. Corp. Insured) | | 1,385 | 1,509 |
| Lubbock Elec. Lt. & Pwr. Sys. Rev. Series 2021, 5% 4/15/27 | | 1,450 | 1,574 |
| Mansfield Independent School District Series 2016, 5% 2/15/24 | | 4,185 | 4,285 |
| McKinney Independent School District Series 2021: | | | |
| 5% 2/15/26 | | 1,245 | 1,333 |
| 5% 2/15/27 | | 1,300 | 1,419 |
| Midlothian Independent School District Bonds Series 2013 C, 2%, tender 8/1/24 (b) | | 1,645 | 1,606 |
| Midway Independent School District Series 2021, 4% 8/1/27 | | 1,425 | 1,500 |
| Mission Econ. Dev. Corp. Solid Waste Disp. Rev. Bonds (Waste Mgmt., Inc. Proj.) Series 2018, 4.035%, tender 7/1/24 (b)(c) | | 8,320 | 8,068 |
| New Caney Independent School District Bonds Series 2018, 1.25%, tender 8/15/24 (b) | | 7,200 | 6,949 |
| Newark Higher Ed. Fin. Corp. (Abilene Christian Univ. Proj.) Series 2016 A, 5% 4/1/26 | | 2,425 | 2,555 |
| North East Texas Independent School District Bonds Series 2019, 2.2%, tender 8/1/24 (b) | | 2,345 | 2,304 |
| North Texas Tollway Auth. Rev.: | | | |
| Series 2019 B, 5% 1/1/25 | | 1,435 | 1,489 |
| Series 2021 B, 5% 1/1/29 | | 1,970 | 2,168 |
| Northside Independent School District Bonds: | | | |
| Series 2019, 1.6%, tender 8/1/24 (b) | | 7,720 | 7,476 |
| Series 2020, 0.7%, tender 6/1/25 (b) | | 9,665 | 9,109 |
| Pasadena Independent School District Bonds Series 2015 B, 1.5%, tender 8/15/24 (b) | | 6,615 | 6,469 |
| Pearland Gen. Oblig. Series 2020, 5% 3/1/24 | | 715 | 732 |
| Pflugerville Independent School District Bonds Series 2019 B, 2.5%, tender 8/15/23 (b) | | 1,480 | 1,467 |
| Pharr San Juan Alamo Independent School District Series 2016, 5% 2/1/26 | | 1,130 | 1,181 |
| Plano Wtrwks. & Swr. Sys. Rev. Series 2021, 4% 5/1/28 | | 1,110 | 1,185 |
| Prosper Independent School District: | | | |
| Bonds Series 2019 B, 2%, tender 8/15/23 (b) | | 10,000 | 9,894 |
| Series 2021 A, 5% 2/15/26 | | 1,015 | 1,087 |
| San Antonio Arpt. Sys. Rev. Series 2019 A: | | | |
| 5% 7/1/23 (c) | | 555 | 559 |
| 5% 7/1/23 (c) | | 505 | 508 |
| 5% 7/1/24 (c) | | 1,750 | 1,790 |
| 5% 7/1/24 (c) | | 1,000 | 1,023 |
| 5% 7/1/25 (c) | | 1,250 | 1,297 |
| 5% 7/1/25 (c) | | 1,350 | 1,398 |
| 5% 7/1/26 (c) | | 1,500 | 1,578 |
| 5% 7/1/26 (c) | | 1,460 | 1,530 |
| San Antonio Elec. & Gas Sys. Rev. Bonds: | | | |
| Series 2015 D, 1.125%, tender 12/1/26 (b) | | 10,810 | 9,496 |
| Series 2022, 2%, tender 12/1/27 (b) | | 3,145 | 2,951 |
| Tarrant County College Series 2022, 5% 8/15/27 | | 3,000 | 3,299 |
| Tarrant County Cultural Ed. Facilities Fin. Corp. Hosp. Rev.: | | | |
| (Scott & White Healthcare Proj.) Series 2013 A, 5% 8/15/23 (Escrowed to Maturity) | | 980 | 992 |
| Bonds (Baylor Scott & White Health Proj.) Series 2022 E, 5%, tender 5/15/26 (b) | | 4,490 | 4,740 |
| Tarrant County Cultural Ed. Facilities Fin. Corp. Rev.: | | | |
| Series 2016 A, 5% 2/15/26 | | 1,465 | 1,557 |
| Series 2017 A, 5% 2/15/24 | | 1,955 | 1,998 |
| Tarrant Reg'l. Wtr. District (City of Dallas Proj.) Series 2021 A, 4% 9/1/25 | | 2,815 | 2,912 |
| Texas Gen. Oblig. Series 2020 B: | | | |
| 3% 8/1/25 (c) | | 4,610 | 4,590 |
| 3% 8/1/26 (c) | | 4,845 | 4,786 |
| 4% 8/1/27 (c) | | 5,085 | 5,277 |
| Texas Trans. Commission Hwy. Impt. Gen. Oblig. Bonds Series 2014 B, 0.65%, tender 4/1/26 (b) | | 15,910 | 14,481 |
| Texas Wtr. Dev. Board Rev. Series 2016: | | | |
| 4% 10/15/30 | | 4,600 | 4,817 |
| 5% 4/15/29 | | 7,500 | 8,131 |
| Wichita Falls Independent School District Series 2021: | | | |
| 4% 2/1/25 | | 600 | 615 |
| 4% 2/1/26 | | 850 | 882 |
| 4% 2/1/27 | | 1,100 | 1,148 |
| 4% 2/1/28 | | 900 | 946 |
TOTAL TEXAS | | | 334,978 |
| Utah - 0.6% | | | |
| Salt Lake City Arpt. Rev.: | | | |
| Series 2017 A, 5% 7/1/27 (c) | | 510 | 541 |
| Series 2018 A, 5% 7/1/26 (c) | | 2,550 | 2,678 |
| Series 2021 B: | | | |
5% 7/1/24 | | 250 | 257 |
5% 7/1/25 | | 530 | 555 |
5% 7/1/26 | | 1,150 | 1,227 |
5% 7/1/27 | | 750 | 813 |
| Utah County Hosp. Rev. Bonds Series 2020 B2, 5%, tender 8/1/26 (b) | | 10,605 | 11,291 |
TOTAL UTAH | | | 17,362 |
| Vermont - 0.2% | | | |
| Vermont Hsg. Fin. Agcy. Series 2021 B, 3% 11/1/51 | | 1,924 | 1,841 |
| Vermont Student Assistant Corp. Ed. Ln. Rev.: | | | |
| Series 2017 A: | | | |
5% 6/15/26 (c) | | 1,045 | 1,096 |
5% 6/15/27 (c) | | 560 | 593 |
| Series 2021 A: | | | |
5% 6/15/27 (c) | | 350 | 371 |
5% 6/15/28 (c) | | 425 | 450 |
5% 6/15/29 (c) | | 400 | 426 |
TOTAL VERMONT | | | 4,777 |
| Virginia - 0.7% | | | |
| Arlington County IDA Hosp. Facilities Series 2020, 5% 7/1/25 | | 500 | 522 |
| Fredericksburg Econ. Dev. Auth. Rev. Series 2014, 5% 6/15/24 | | 2,290 | 2,346 |
| Louisa Indl. Dev. Auth. Poll. Cont. Rev. Bonds (Virginia Elec. and Pwr. Co. Proj.) Series 2008 B, 0.75%, tender 9/2/25 (b) | | 6,750 | 6,118 |
| Norfolk Arpt. Auth. Series 2021 A: | | | |
| 5% 7/1/27 | | 750 | 813 |
| 5% 7/1/28 | | 1,000 | 1,100 |
| Stafford County Econ. Dev. Auth. Hosp. Facilities Rev. Series 2016: | | | |
| 5% 6/15/24 | | 1,185 | 1,214 |
| 5% 6/15/25 | | 980 | 1,023 |
| 5% 6/15/26 | | 1,680 | 1,779 |
| Virginia Pub. School Auth. Series 2014 B, 5% 8/1/24 | | 1,000 | 1,035 |
| Wise County Indl. Dev. Auth. Waste & Sewage Rev. Bonds (Virginia Elec. and Pwr. Co. Proj.): | | | |
| Series 2009 A, 0.75%, tender 9/2/25 (b) | | 3,000 | 2,719 |
| Series 2010 A, 1.2%, tender 5/31/24 (b) | | 1,725 | 1,646 |
| York County Econ. Dev. Auth. Poll. Cont. Rev. Bonds (Virginia Elec. and Pwr. Co. Proj.) Series 2009 A, 1.9%, tender 6/1/23 (b) | | 800 | 791 |
TOTAL VIRGINIA | | | 21,106 |
| Washington - 2.7% | | | |
| King County Hsg. Auth. Rev.: | | | |
| Series 2019: | | | |
4% 11/1/24 | | 1,075 | 1,094 |
4% 11/1/25 | | 1,260 | 1,297 |
4% 11/1/30 | | 1,575 | 1,649 |
| Series 2021: | | | |
2% 12/1/23 | | 775 | 764 |
3% 6/1/25 | | 830 | 827 |
4% 12/1/28 | | 375 | 388 |
4% 12/1/30 | | 575 | 591 |
4% 12/1/31 | | 450 | 462 |
| King County Swr. Rev. Bonds Series 2020 B, 0.875%, tender 1/1/26 (b) | | 21,845 | 19,990 |
| Port of Seattle Rev.: | | | |
| Series 2013, 5% 7/1/24 (c) | | 775 | 781 |
| Series 2015 B, 5% 3/1/25 | | 450 | 465 |
| Series 2016 B, 5% 10/1/23 (c) | | 2,965 | 3,006 |
| Series 2019: | | | |
5% 4/1/23 (c) | | 1,985 | 1,991 |
5% 4/1/24 (c) | | 3,035 | 3,090 |
5% 4/1/25 (c) | | 2,700 | 2,795 |
| Series 2021 C: | | | |
5% 8/1/24 (c) | | 5,290 | 5,415 |
5% 8/1/25 (c) | | 2,660 | 2,769 |
5% 8/1/26 (c) | | 3,655 | 3,850 |
5% 8/1/27 (c) | | 2,260 | 2,404 |
5% 8/1/28 (c) | | 6,320 | 6,775 |
| Seattle Hsg. Auth. Rev. (Northgate Plaza Proj.) Series 2021, 1% 6/1/26 | | 1,545 | 1,405 |
| Tacoma Elec. Sys. Rev. Series 2017: | | | |
| 5% 1/1/25 | | 660 | 689 |
| 5% 1/1/26 | | 390 | 416 |
| Washington Gen. Oblig. Series 2018 C, 5% 8/1/25 | | 2,015 | 2,136 |
| Washington Health Care Facilities Auth. Rev.: | | | |
| (Virginia Mason Med. Ctr. Proj.) Series 2017: | | | |
5% 8/15/25 | | 1,450 | 1,496 |
5% 8/15/26 | | 2,560 | 2,673 |
5% 8/15/27 | | 2,425 | 2,559 |
| Bonds Series 2019 B, 5%, tender 8/1/24 (b) | | 4,575 | 4,639 |
| Washington Hsg. Fin. Commission Series 2021 2N: | | | |
| 5% 12/1/25 | | 915 | 969 |
| 5% 6/1/27 | | 500 | 542 |
TOTAL WASHINGTON | | | 77,927 |
| West Virginia - 0.2% | | | |
| West Virginia Econ. Dev. Auth. Solid Waste Disp. Facilities Rev. Bonds (Appalachian Pwr. Co. Amos Proj.) Series 2011 A, 1%, tender 9/1/25 (b)(c) | | 5,650 | 5,202 |
| West Virginia Gen. Oblig. Series 2018 A, 5% 6/1/26 | | 1,075 | 1,159 |
TOTAL WEST VIRGINIA | | | 6,361 |
| Wisconsin - 1.1% | | | |
| Blue Ridge Healthcare Pub. Fin. Auth. Series 2020 A, 5% 1/1/27 | | 1,085 | 1,151 |
| Milwaukee County Arpt. Rev. Series 2013 A, 5.25% 12/1/23 (c) | | 1,505 | 1,529 |
| Milwaukee Gen. Oblig. Series 2018 N4, 5% 4/1/25 | | 7,860 | 8,182 |
| Roseman Univ. of Health Series 2018 A, 5% 12/1/27 | | 925 | 949 |
| Wisconsin Gen. Oblig. Series 2014 4, 5% 5/1/25 | | 575 | 599 |
| Wisconsin Health & Edl. Facilities Bonds: | | | |
| Series 2018 B, 5%, tender 1/31/24 (b) | | 8,810 | 8,980 |
| Series 2018 C1, 5%, tender 7/29/26 (b) | | 1,210 | 1,286 |
| Series 2020 C, 5%, tender 2/15/27 (b) | | 5,000 | 5,224 |
| Wisconsin Hsg. & Econ. Dev. Auth.: | | | |
| Series 2021 A, 3% 3/1/52 | | 1,485 | 1,438 |
| Series 2021 C, 3% 9/1/52 | | 2,210 | 2,137 |
| Wisconsin Hsg. & Econ. Dev. Auth. Hsg. Rev. Bonds Series 2021 C: | | | |
| 0.61%, tender 5/1/24 (b) | | 400 | 381 |
| 0.81%, tender 5/1/25 (b) | | 1,335 | 1,258 |
TOTAL WISCONSIN | | | 33,114 |
| Wyoming - 0.0% | | | |
| Laramie County Hosp. Rev. (Cheyenne Reg'l. Med. Ctr. Proj.) Series 2021, 4% 5/1/27 | | 370 | 384 |
| TOTAL MUNICIPAL BONDS (Cost $2,969,012) | | | 2,841,292 |
| | | | |
| Money Market Funds - 0.2% |
| | | Shares | Value ($) (000s) |
Fidelity Municipal Cash Central Fund 3.72% (f)(g) (Cost $3,873) | | 3,872,235 | 3,873 |
| | | | |
| TOTAL INVESTMENT IN SECURITIES - 98.8% (Cost $2,972,885) | 2,845,165 |
NET OTHER ASSETS (LIABILITIES) - 1.2% | 35,612 |
| NET ASSETS - 100.0% | 2,880,777 |
| | |
Any values shown as $0 in the Schedule of Investments may reflect amounts less than $500.
Legend
| (a) | Amount is stated in United States dollars unless otherwise noted. |
| (b) | Coupon rates for floating and adjustable rate securities reflect the rates in effect at period end. |
| (c) | Private activity obligations whose interest is subject to the federal alternative minimum tax for individuals. |
| (d) | Security exempt from registration under Rule 144A of the Securities Act of 1933. These securities may be resold in transactions exempt from registration, normally to qualified institutional buyers. At the end of the period, the value of these securities amounted to $23,130,000 or 0.8% of net assets. |
| (e) | Security or a portion of the security purchased on a delayed delivery or when-issued basis. |
| (f) | Information in this report regarding holdings by state and security types does not reflect the holdings of the Fidelity Municipal Cash Central Fund. |
| (g) | Affiliated fund that is generally available only to investment companies and other accounts managed by Fidelity Investments. The rate quoted is the annualized seven-day yield of the fund at period end. A complete unaudited listing of the fund's holdings as of its most recent quarter end is available upon request. In addition, each Fidelity Central Fund's financial statements, which are not covered by the Fund's Report of Independent Registered Public Accounting Firm, are available on the SEC's website or upon request. |
Affiliated Central Funds
Fiscal year to date information regarding the Fund's investments in Fidelity Central Funds, including the ownership percentage, is presented below.
| Affiliate (Amounts in thousands) | Value, beginning of period ($) | Purchases ($) | Sales Proceeds ($) | Dividend Income ($) | Realized Gain (loss) ($) | Change in Unrealized appreciation (depreciation) ($) | Value, end of period ($) | % ownership, end of period |
| Fidelity Municipal Cash Central Fund 3.72% | 23,947 | 1,112,267 | 1,132,341 | 750 | 2 | (2) | 3,873 | 0.2% |
| Total | 23,947 | 1,112,267 | 1,132,341 | 750 | 2 | (2) | 3,873 | |
| | | | | | | | | |
Amounts in the dividend income column in the above table include any capital gain distributions from underlying funds, which are presented in the corresponding line item in the Statement of Operations, if applicable.
Amounts included in the purchases and sales proceeds columns may include in-kind transactions, if applicable.
Investment Valuation
The following is a summary of the inputs used, as of December 31, 2022, involving the Fund's assets and liabilities carried at fair value. The inputs or methodology used for valuing securities may not be an indication of the risk associated with investing in those securities. For more information on valuation inputs, and their aggregation into the levels used below, please refer to the Investment Valuation section in the accompanying Notes to Financial Statements.
| Valuation Inputs at Reporting Date: |
Description (Amounts in thousands) | Total ($) | Level 1 ($) | Level 2 ($) | Level 3 ($) |
Investments in Securities: | | | | |
|
| Municipal Securities | 2,841,292 | - | 2,841,292 | - |
|
| Money Market Funds | 3,873 | 3,873 | - | - |
| Total Investments in Securities: | 2,845,165 | 3,873 | 2,841,292 | - |
| Statement of Assets and Liabilities |
| Amounts in thousands (except per-share amounts) | | | | December 31, 2022 |
| | | | | |
| Assets | | | | |
| Investment in securities, at value - See accompanying schedule: | | | | |
Unaffiliated issuers (cost $2,969,012) | | $2,841,292 | | |
Fidelity Central Funds (cost $3,873) | | 3,873 | | |
| | | | | |
| Total Investment in Securities (cost $2,972,885) | | | $ | 2,845,165 |
| Cash | | | | 15,858 |
| Receivable for fund shares sold | | | | 6,147 |
| Interest receivable | | | | 32,191 |
| Distributions receivable from Fidelity Central Funds | | | | 85 |
| Prepaid expenses | | | | 3 |
| Receivable from investment adviser for expense reductions | | | | 247 |
| Other receivables | | | | 1 |
Total assets | | | | 2,899,697 |
| Liabilities | | | | |
| Payable for investments purchased on a delayed delivery basis | | $4,345 | | |
| Payable for fund shares redeemed | | 12,398 | | |
| Distributions payable | | 955 | | |
| Accrued management fee | | 838 | | |
| Distribution and service plan fees payable | | 41 | | |
| Other affiliated payables | | 278 | | |
| Other payables and accrued expenses | | 65 | | |
| Total Liabilities | | | | 18,920 |
| Net Assets | | | $ | 2,880,777 |
| Net Assets consist of: | | | | |
| Paid in capital | | | $ | 3,021,015 |
| Total accumulated earnings (loss) | | | | (140,238) |
| Net Assets | | | $ | 2,880,777 |
| | | | | |
| Net Asset Value and Maximum Offering Price | | | | |
| Class A : | | | | |
Net Asset Value and redemption price per share ($156,293 ÷ 15,379 shares) (a) | | | $ | 10.16 |
| Maximum offering price per share (100/97.25 of $10.16) | | | $ | 10.45 |
| Class M : | | | | |
Net Asset Value and redemption price per share ($8,849 ÷ 872 shares) (a)(b) | | | $ | 10.14 |
| Maximum offering price per share (100/97.25 of $10.14) | | | $ | 10.43 |
| Class C : | | | | |
Net Asset Value and offering price per share ($7,931 ÷ 782 shares) (a) | | | $ | 10.14 |
| Limited Term Municipal Income : | | | | |
Net Asset Value , offering price and redemption price per share ($2,006,296 ÷ 197,758 shares) | | | $ | 10.15 |
| Class I : | | | | |
Net Asset Value , offering price and redemption price per share ($343,244 ÷ 33,816 shares) | | | $ | 10.15 |
| Class Z : | | | | |
Net Asset Value , offering price and redemption price per share ($358,164 ÷ 35,289 shares) | | | $ | 10.15 |
(a)Redemption price per share is equal to net asset value less any applicable contingent deferred sales charge. |
(b)Corresponding Net Asset Value does not calculate due to rounding of fractional net assets and/or shares. |
| Statement of Operations |
| Amounts in thousands | | | | Year ended December 31, 2022 |
| Investment Income | | | | |
| Interest | | | $ | 52,556 |
| Income from Fidelity Central Funds | | | | 750 |
| Total Income | | | | 53,306 |
| Expenses | | | | |
| Management fee | $ | 10,799 | | |
| Transfer agent fees | | 3,052 | | |
| Distribution and service plan fees | | 564 | | |
| Accounting fees and expenses | | 535 | | |
| Custodian fees and expenses | | 31 | | |
| Independent trustees' fees and expenses | | 10 | | |
| Registration fees | | 265 | | |
| Audit | | 63 | | |
| Legal | | 3 | | |
| Miscellaneous | | 12 | | |
| Total expenses before reductions | | 15,334 | | |
| Expense reductions | | (3,513) | | |
| Total expenses after reductions | | | | 11,821 |
| Net Investment income (loss) | | | | 41,485 |
| Realized and Unrealized Gain (Loss) | | | | |
| Net realized gain (loss) on: | | | | |
| Investment Securities: | | | | |
| Unaffiliated issuers | | (12,226) | | |
| Fidelity Central Funds | | 2 | | |
| Total net realized gain (loss) | | | | (12,224) |
| Change in net unrealized appreciation (depreciation) on: | | | | |
| Investment Securities: | | | | |
| Unaffiliated issuers | | (192,392) | | |
| Fidelity Central Funds | | (2) | | |
| Total change in net unrealized appreciation (depreciation) | | | | (192,394) |
| Net gain (loss) | | | | (204,618) |
| Net increase (decrease) in net assets resulting from operations | | | $ | (163,133) |
| Statement of Changes in Net Assets |
| |
| Amount in thousands | | Year ended December 31, 2022 | | Year ended December 31, 2021 |
| Increase (Decrease) in Net Assets | | | | |
| Operations | | | | |
| Net investment income (loss) | $ | 41,485 | $ | 43,818 |
| Net realized gain (loss) | | (12,224) | | 1,386 |
| Change in net unrealized appreciation (depreciation) | | (192,394) | | (34,432) |
| Net increase (decrease) in net assets resulting from operations | | (163,133) | | 10,772 |
| Distributions to shareholders | | (41,781) | | (45,557) |
| Share transactions - net increase (decrease) | | (583,612) | | 384,852 |
| Total increase (decrease) in net assets | | (788,526) | | 350,067 |
| | | | | |
| Net Assets | | | | |
| Beginning of period | | 3,669,303 | | 3,319,236 |
| End of period | $ | 2,880,777 | $ | 3,669,303 |
| | | | | |
| | | | | |
Financial Highlights
| Fidelity Advisor® Limited Term Municipal Income Fund Class A |
| |
| Years ended December 31, | | 2022 | | 2021 | | 2020 | | 2019 | | 2018 |
Selected Per-Share Data | | | | | | | | | | |
| Net asset value, beginning of period | $ | 10.79 | $ | 10.89 | $ | 10.72 | $ | 10.49 | $ | 10.53 |
| Income from Investment Operations | | | | | | | | | | |
Net investment income (loss) A,B | | .109 | | .102 | | .141 | | .150 | | .135 |
| Net realized and unrealized gain (loss) | | (.629) | | (.094) | | .183 | | .250 | | (.038) |
| Total from investment operations | | (.520) | | .008 | | .324 | | .400 | | .097 |
| Distributions from net investment income | | (.110) | | (.103) | | (.142) | | (.150) | | (.135) |
| Distributions from net realized gain | | - | | (.005) | | (.012) | | (.020) | | (.002) |
| Total distributions | | (.110) | | (.108) | | (.154) | | (.170) | | (.137) |
| Net asset value, end of period | $ | 10.16 | $ | 10.79 | $ | 10.89 | $ | 10.72 | $ | 10.49 |
Total Return C,D | | (4.82)% | | .07% | | 3.04% | | 3.83% | | .93% |
Ratios to Average Net Assets B,E,F | | | | | | | | | | |
| Expenses before reductions | | .80% | | .80% | | .80% | | .80% | | .81% |
| Expenses net of fee waivers, if any | | .66% | | .66% | | .66% | | .78% | | .81% |
| Expenses net of all reductions | | .66% | | .66% | | .66% | | .78% | | .81% |
| Net investment income (loss) | | 1.06% | | .94% | | 1.31% | | 1.41% | | 1.28% |
| Supplemental Data | | | | | | | | | | |
| Net assets, end of period (in millions) | $ | 156 | $ | 223 | $ | 202 | $ | 180 | $ | 155 |
Portfolio turnover rate G | | 20% | | 20% | | 19% | | 43% | | 27% H |
A Calculated based on average shares outstanding during the period.
B Net investment income (loss) is affected by the timing of the declaration of dividends by any underlying mutual funds or exchange-traded funds (ETFs). Net investment income (loss) of any mutual funds or ETFs is not included in the Fund's net investment income (loss) ratio.
C Total returns would have been lower if certain expenses had not been reduced during the applicable periods shown.
D Total returns do not include the effect of the sales charges.
E Fees and expenses of any underlying mutual funds or exchange-traded funds (ETFs) are not included in the Fund's expense ratio. The Fund indirectly bears its proportionate share of these expenses. For additional expense information related to investments in Fidelity Central Funds, please refer to the "Investments in Fidelity Central Funds" note found in the Notes to Financial Statements section of the most recent Annual or Semi-Annual report.
F Expense ratios reflect operating expenses of the class. Expenses before reductions do not reflect amounts reimbursed, waived, or reduced through arrangements with the investment adviser, brokerage services, or other offset arrangements, if applicable, and do not represent the amount paid by the class during periods when reimbursements, waivers or reductions occur.
G Amount does not include the portfolio activity of any underlying mutual funds or exchange-traded funds (ETFs).
H Portfolio turnover rate excludes securities received or delivered in-kind.
| Fidelity Advisor® Limited Term Municipal Income Fund Class M |
| |
| Years ended December 31, | | 2022 | | 2021 | | 2020 | | 2019 | | 2018 |
Selected Per-Share Data | | | | | | | | | | |
| Net asset value, beginning of period | $ | 10.77 | $ | 10.87 | $ | 10.70 | $ | 10.47 | $ | 10.51 |
| Income from Investment Operations | | | | | | | | | | |
Net investment income (loss) A,B | | .110 | | .104 | | .142 | | .154 | | .139 |
| Net realized and unrealized gain (loss) | | (.629) | | (.095) | | .182 | | .250 | | (.038) |
| Total from investment operations | | (.519) | | .009 | | .324 | | .404 | | .101 |
| Distributions from net investment income | | (.111) | | (.104) | | (.142) | | (.154) | | (.139) |
| Distributions from net realized gain | | - | | (.005) | | (.012) | | (.020) | | (.002) |
| Total distributions | | (.111) | | (.109) | | (.154) | | (.174) | | (.141) |
| Net asset value, end of period | $ | 10.14 | $ | 10.77 | $ | 10.87 | $ | 10.70 | $ | 10.47 |
Total Return C,D | | (4.82)% | | .08% | | 3.06% | | 3.88% | | .98% |
Ratios to Average Net Assets B,E,F | | | | | | | | | | |
| Expenses before reductions | | .72% | | .72% | | .74% | | .75% | | .76% |
| Expenses net of fee waivers, if any | | .65% | | .65% | | .65% | | .74% | | .76% |
| Expenses net of all reductions | | .65% | | .65% | | .65% | | .74% | | .76% |
| Net investment income (loss) | | 1.07% | | .95% | | 1.32% | | 1.45% | | 1.33% |
| Supplemental Data | | | | | | | | | | |
| Net assets, end of period (in millions) | $ | 9 | $ | 8 | $ | 10 | $ | 12 | $ | 15 |
Portfolio turnover rate G | | 20% | | 20% | | 19% | | 43% | | 27% H |
A Calculated based on average shares outstanding during the period.
B Net investment income (loss) is affected by the timing of the declaration of dividends by any underlying mutual funds or exchange-traded funds (ETFs). Net investment income (loss) of any mutual funds or ETFs is not included in the Fund's net investment income (loss) ratio.
C Total returns would have been lower if certain expenses had not been reduced during the applicable periods shown.
D Total returns do not include the effect of the sales charges.
E Fees and expenses of any underlying mutual funds or exchange-traded funds (ETFs) are not included in the Fund's expense ratio. The Fund indirectly bears its proportionate share of these expenses. For additional expense information related to investments in Fidelity Central Funds, please refer to the "Investments in Fidelity Central Funds" note found in the Notes to Financial Statements section of the most recent Annual or Semi-Annual report.
F Expense ratios reflect operating expenses of the class. Expenses before reductions do not reflect amounts reimbursed, waived, or reduced through arrangements with the investment adviser, brokerage services, or other offset arrangements, if applicable, and do not represent the amount paid by the class during periods when reimbursements, waivers or reductions occur.
G Amount does not include the portfolio activity of any underlying mutual funds or exchange-traded funds (ETFs).
H Portfolio turnover rate excludes securities received or delivered in-kind.
| Fidelity Advisor® Limited Term Municipal Income Fund Class C |
| |
| Years ended December 31, | | 2022 | | 2021 | | 2020 | | 2019 | | 2018 |
Selected Per-Share Data | | | | | | | | | | |
| Net asset value, beginning of period | $ | 10.77 | $ | 10.87 | $ | 10.70 | $ | 10.47 | $ | 10.51 |
| Income from Investment Operations | | | | | | | | | | |
Net investment income (loss) A,B | | .035 | | .024 | | .064 | | .072 | | .057 |
| Net realized and unrealized gain (loss) | | (.629) | | (.094) | | .182 | | .250 | | (.038) |
| Total from investment operations | | (.594) | | (.070) | | .246 | | .322 | | .019 |
| Distributions from net investment income | | (.036) | | (.025) | | (.064) | | (.072) | | (.057) |
| Distributions from net realized gain | | - | | (.005) | | (.012) | | (.020) | | (.002) |
| Total distributions | | (.036) | | (.030) | | (.076) | | (.092) | | (.059) |
| Net asset value, end of period | $ | 10.14 | $ | 10.77 | $ | 10.87 | $ | 10.70 | $ | 10.47 |
Total Return C,D | | (5.51)% | | (.65)% | | 2.31% | | 3.08% | | .19% |
Ratios to Average Net Assets B,E,F | | | | | | | | | | |
| Expenses before reductions | | 1.50% | | 1.51% | | 1.52% | | 1.54% | | 1.55% |
| Expenses net of fee waivers, if any | | 1.38% | | 1.38% | | 1.38% | | 1.52% | | 1.55% |
| Expenses net of all reductions | | 1.38% | | 1.38% | | 1.38% | | 1.52% | | 1.54% |
| Net investment income (loss) | | .34% | | .22% | | .59% | | .67% | | .55% |
| Supplemental Data | | | | | | | | | | |
| Net assets, end of period (in millions) | $ | 8 | $ | 10 | $ | 15 | $ | 20 | $ | 32 |
Portfolio turnover rate G | | 20% | | 20% | | 19% | | 43% | | 27% H |
A Calculated based on average shares outstanding during the period.
B Net investment income (loss) is affected by the timing of the declaration of dividends by any underlying mutual funds or exchange-traded funds (ETFs). Net investment income (loss) of any mutual funds or ETFs is not included in the Fund's net investment income (loss) ratio.
C Total returns would have been lower if certain expenses had not been reduced during the applicable periods shown.
D Total returns do not include the effect of the contingent deferred sales charge.
E Fees and expenses of any underlying mutual funds or exchange-traded funds (ETFs) are not included in the Fund's expense ratio. The Fund indirectly bears its proportionate share of these expenses. For additional expense information related to investments in Fidelity Central Funds, please refer to the "Investments in Fidelity Central Funds" note found in the Notes to Financial Statements section of the most recent Annual or Semi-Annual report.
F Expense ratios reflect operating expenses of the class. Expenses before reductions do not reflect amounts reimbursed, waived, or reduced through arrangements with the investment adviser, brokerage services, or other offset arrangements, if applicable, and do not represent the amount paid by the class during periods when reimbursements, waivers or reductions occur.
G Amount does not include the portfolio activity of any underlying mutual funds or exchange-traded funds (ETFs).
H Portfolio turnover rate excludes securities received or delivered in-kind.
| Fidelity® Limited Term Municipal Income Fund |
| |
| Years ended December 31, | | 2022 | | 2021 | | 2020 | | 2019 | | 2018 |
Selected Per-Share Data | | | | | | | | | | |
| Net asset value, beginning of period | $ | 10.77 | $ | 10.87 | $ | 10.70 | $ | 10.47 | $ | 10.51 |
| Income from Investment Operations | | | | | | | | | | |
Net investment income (loss) A,B | | .139 | | .134 | | .172 | | .185 | | .170 |
| Net realized and unrealized gain (loss) | | (.619) | | (.095) | | .182 | | .250 | | (.038) |
| Total from investment operations | | (.480) | | .039 | | .354 | | .435 | | .132 |
| Distributions from net investment income | | (.140) | | (.134) | | (.172) | | (.185) | | (.170) |
| Distributions from net realized gain | | - | | (.005) | | (.012) | | (.020) | | (.002) |
| Total distributions | | (.140) | | (.139) | | (.184) | | (.205) | | (.172) |
| Net asset value, end of period | $ | 10.15 | $ | 10.77 | $ | 10.87 | $ | 10.70 | $ | 10.47 |
Total Return C | | (4.46)% | | .36% | | 3.34% | | 4.18% | | 1.28% |
Ratios to Average Net Assets B,D,E | | | | | | | | | | |
| Expenses before reductions | | .47% | | .46% | | .46% | | .46% | | .46% |
| Expenses net of fee waivers, if any | | .37% | | .37% | | .37% | | .45% | | .46% |
| Expenses net of all reductions | | .37% | | .37% | | .37% | | .45% | | .46% |
| Net investment income (loss) | | 1.35% | | 1.23% | | 1.60% | | 1.74% | | 1.63% |
| Supplemental Data | | | | | | | | | | |
| Net assets, end of period (in millions) | $ | 2,006 | $ | 2,565 | $ | 2,420 | $ | 2,245 | $ | 2,393 |
Portfolio turnover rate F | | 20% | | 20% | | 19% | | 43% | | 27% G |
A Calculated based on average shares outstanding during the period.
B Net investment income (loss) is affected by the timing of the declaration of dividends by any underlying mutual funds or exchange-traded funds (ETFs). Net investment income (loss) of any mutual funds or ETFs is not included in the Fund's net investment income (loss) ratio.
C Total returns would have been lower if certain expenses had not been reduced during the applicable periods shown.
D Fees and expenses of any underlying mutual funds or exchange-traded funds (ETFs) are not included in the Fund's expense ratio. The Fund indirectly bears its proportionate share of these expenses. For additional expense information related to investments in Fidelity Central Funds, please refer to the "Investments in Fidelity Central Funds" note found in the Notes to Financial Statements section of the most recent Annual or Semi-Annual report.
E Expense ratios reflect operating expenses of the class. Expenses before reductions do not reflect amounts reimbursed, waived, or reduced through arrangements with the investment adviser, brokerage services, or other offset arrangements, if applicable, and do not represent the amount paid by the class during periods when reimbursements, waivers or reductions occur.
F Amount does not include the portfolio activity of any underlying mutual funds or exchange-traded funds (ETFs).
G Portfolio turnover rate excludes securities received or delivered in-kind.
| Fidelity Advisor® Limited Term Municipal Income Fund Class I |
| |
| Years ended December 31, | | 2022 | | 2021 | | 2020 | | 2019 | | 2018 |
Selected Per-Share Data | | | | | | | | | | |
| Net asset value, beginning of period | $ | 10.78 | $ | 10.88 | $ | 10.71 | $ | 10.48 | $ | 10.51 |
| Income from Investment Operations | | | | | | | | | | |
Net investment income (loss) A,B | | .139 | | .133 | | .172 | | .178 | | .162 |
| Net realized and unrealized gain (loss) | | (.629) | | (.094) | | .183 | | .250 | | (.028) |
| Total from investment operations | | (.490) | | .039 | | .355 | | .428 | | .134 |
| Distributions from net investment income | | (.140) | | (.134) | | (.173) | | (.178) | | (.162) |
| Distributions from net realized gain | | - | | (.005) | | (.012) | | (.020) | | (.002) |
| Total distributions | | (.140) | | (.139) | | (.185) | | (.198) | | (.164) |
| Net asset value, end of period | $ | 10.15 | $ | 10.78 | $ | 10.88 | $ | 10.71 | $ | 10.48 |
Total Return C | | (4.55)% | | .36% | | 3.34% | | 4.11% | | 1.29% |
Ratios to Average Net Assets B,D,E | | | | | | | | | | |
| Expenses before reductions | | .55% | | .54% | | .55% | | .54% | | .54% |
| Expenses net of fee waivers, if any | | .37% | | .37% | | .37% | | .51% | | .54% |
| Expenses net of all reductions | | .37% | | .37% | | .37% | | .51% | | .54% |
| Net investment income (loss) | | 1.35% | | 1.23% | | 1.60% | | 1.68% | | 1.55% |
| Supplemental Data | | | | | | | | | | |
| Net assets, end of period (in millions) | $ | 343 | $ | 420 | $ | 335 | $ | 276 | $ | 269 |
Portfolio turnover rate F | | 20% | | 20% | | 19% | | 43% | | 27% G |
A Calculated based on average shares outstanding during the period.
B Net investment income (loss) is affected by the timing of the declaration of dividends by any underlying mutual funds or exchange-traded funds (ETFs). Net investment income (loss) of any mutual funds or ETFs is not included in the Fund's net investment income (loss) ratio.
C Total returns would have been lower if certain expenses had not been reduced during the applicable periods shown.
D Fees and expenses of any underlying mutual funds or exchange-traded funds (ETFs) are not included in the Fund's expense ratio. The Fund indirectly bears its proportionate share of these expenses. For additional expense information related to investments in Fidelity Central Funds, please refer to the "Investments in Fidelity Central Funds" note found in the Notes to Financial Statements section of the most recent Annual or Semi-Annual report.
E Expense ratios reflect operating expenses of the class. Expenses before reductions do not reflect amounts reimbursed, waived, or reduced through arrangements with the investment adviser, brokerage services, or other offset arrangements, if applicable, and do not represent the amount paid by the class during periods when reimbursements, waivers or reductions occur.
F Amount does not include the portfolio activity of any underlying mutual funds or exchange-traded funds (ETFs).
G Portfolio turnover rate excludes securities received or delivered in-kind.
| Fidelity Advisor® Limited Term Municipal Income Fund Class Z |
| |
| Years ended December 31, | | 2022 | | 2021 | | 2020 | | 2019 | | 2018 A |
Selected Per-Share Data | | | | | | | | | | |
| Net asset value, beginning of period | $ | 10.77 | $ | 10.87 | $ | 10.71 | $ | 10.48 | $ | 10.41 |
| Income from Investment Operations | | | | | | | | | | |
Net investment income (loss) B,C | | .145 | | .140 | | .178 | | .189 | | .048 |
| Net realized and unrealized gain (loss) | | (.619) | | (.094) | | .173 | | .250 | | .067 |
| Total from investment operations | | (.474) | | .046 | | .351 | | .439 | | .115 |
| Distributions from net investment income | | (.146) | | (.141) | | (.179) | | (.189) | | (.045) |
| Distributions from net realized gain | | - | | (.005) | | (.012) | | (.020) | | - |
| Total distributions | | (.146) | | (.146) | | (.191) | | (.209) | | (.045) |
| Net asset value, end of period | $ | 10.15 | $ | 10.77 | $ | 10.87 | $ | 10.71 | $ | 10.48 |
Total Return D,E | | (4.40)% | | .42% | | 3.31% | | 4.22% | | 1.11% |
Ratios to Average Net Assets C,F,G | | | | | | | | | | |
| Expenses before reductions | | .43% | | .42% | | .43% | | .43% | | .43% H |
| Expenses net of fee waivers, if any | | .31% | | .31% | | .31% | | .40% | | .43% H |
| Expenses net of all reductions | | .31% | | .31% | | .31% | | .40% | | .43% H |
| Net investment income (loss) | | 1.41% | | 1.29% | | 1.66% | | 1.79% | | 1.78% H |
| Supplemental Data | | | | | | | | | | |
| Net assets, end of period (in millions) | $ | 358 | $ | 444 | $ | 336 | $ | 214 | $ | 28 |
Portfolio turnover rate I | | 20% | | 20% | | 19% | | 43% | | 27% J |
A For the period October 2, 2018 (commencement of sale of shares) through December 31, 2018.
B Calculated based on average shares outstanding during the period.
C Net investment income (loss) is affected by the timing of the declaration of dividends by any underlying mutual funds or exchange-traded funds (ETFs). Net investment income (loss) of any mutual funds or ETFs is not included in the Fund's net investment income (loss) ratio.
D Total returns for periods of less than one year are not annualized.
E Total returns would have been lower if certain expenses had not been reduced during the applicable periods shown.
F Fees and expenses of any underlying mutual funds or exchange-traded funds (ETFs) are not included in the Fund's expense ratio. The Fund indirectly bears its proportionate share of these expenses. For additional expense information related to investments in Fidelity Central Funds, please refer to the "Investments in Fidelity Central Funds" note found in the Notes to Financial Statements section of the most recent Annual or Semi-Annual report.
G Expense ratios reflect operating expenses of the class. Expenses before reductions do not reflect amounts reimbursed, waived, or reduced through arrangements with the investment adviser, brokerage services, or other offset arrangements, if applicable, and do not represent the amount paid by the class during periods when reimbursements, waivers or reductions occur.
H Annualized.
I Amount does not include the portfolio activity of any underlying mutual funds or exchange-traded funds (ETFs).
J Portfolio turnover rate excludes securities received or delivered in-kind.
For the period ended December 31, 2022
( Amounts in thousands except percentages)
1. Organization.
Fidelity Limited Term Municipal Income Fund (the Fund) is a fund of Fidelity Municipal Trust (the Trust) and is authorized to issue an unlimited number of shares. The Trust is registered under the Investment Company Act of 1940, as amended (the 1940 Act), as an open-end management investment company organized as a Massachusetts business trust. The Fund offers Class A, Class M, Class C, Limited Term Municipal Fund, Class I and Class Z shares, each of which has equal rights as to assets and voting privileges. Each class has exclusive voting rights with respect to matters that affect that class. Class C shares will automatically convert to Class A shares after a holding period of eight years from the initial date of purchase, with certain exceptions.
2. Investments in Fidelity Central Funds.
Funds may invest in Fidelity Central Funds, which are open-end investment companies generally available only to other investment companies and accounts managed by the investment adviser and its affiliates. The Schedule of Investments lists any Fidelity Central Funds held as an investment as of period end, but does not include the underlying holdings of each Fidelity Central Fund. An investing fund indirectly bears its proportionate share of the expenses of the underlying Fidelity Central Funds.
Based on its investment objective, each Fidelity Central Fund may invest or participate in various investment vehicles or strategies that are similar to those of the investing fund. These strategies are consistent with the investment objectives of the investing fund and may involve certain economic risks which may cause a decline in value of each of the Fidelity Central Funds and thus a decline in the value of the investing fund.
| Fidelity Central Fund | Investment Manager | Investment Objective | Investment Practices | Expense Ratio A |
| Fidelity Money Market Central Funds | Fidelity Management & Research Company LLC (FMR) | Each fund seeks to obtain a high level of current income consistent with the preservation of capital and liquidity. | Short-term Investments | Less than .005% |
A Expenses expressed as a percentage of average net assets and are as of each underlying Central Fund's most recent annual or semi-annual shareholder report.
A complete unaudited list of holdings for each Fidelity Central Fund is available upon request or at the Securities and Exchange Commission website at www.sec.gov. In addition, the financial statements of the Fidelity Central Funds which contain the significant accounting policies (including investment valuation policies) of those funds, and are not covered by the Report of Independent Registered Public Accounting Firm, are available on the Securities and Exchange Commission website or upon request.
3. Significant Accounting Policies.
The Fund is an investment company and applies the accounting and reporting guidance of the Financial Accounting Standards Board (FASB) Accounting Standards Codification Topic 946 Financial Services - Investment Companies . The financial statements have been prepared in conformity with accounting principles generally accepted in the United States of America (GAAP), which require management to make certain estimates and assumptions at the date of the financial statements. Actual results could differ from those estimates. Subsequent events, if any, through the date that the financial statements were issued have been evaluated in the preparation of the financial statements. The Fund's Schedule of Investments lists any underlying mutual funds or exchange-traded funds (ETFs) but does not include the underlying holdings of these funds. The following summarizes the significant accounting policies of the Fund:
Investment Valuation. Investments are valued as of 4:00 p.m. Eastern time on the last calendar day of the period. The Board of Trustees (the Board) has designated the Fund's investment adviser as the valuation designee responsible for the fair valuation function and performing fair value determinations as needed. The investment adviser has established a Fair Value Committee (the Committee) to carry out the day-to-day fair valuation responsibilities and has adopted policies and procedures to govern the fair valuation process and the activities of the Committee. In accordance with these fair valuation policies and procedures, which have been approved by the Board, the Fund attempts to obtain prices from one or more third party pricing services or brokers to value its investments. When current market prices, quotations or currency exchange rates are not readily available or reliable, investments will be fair valued in good faith by the Committee, in accordance with the policies and procedures. Factors used in determining fair value vary by investment type and may include market or investment specific events, transaction data, estimated cash flows, and market observations of comparable investments. The frequency that the fair valuation procedures are used cannot be predicted and they may be utilized to a significant extent. The Committee manages the Fund's fair valuation practices and maintains the fair valuation policies and procedures. The Fund's investment adviser reports to the Board information regarding the fair valuation process and related material matters.
The Fund categorizes the inputs to valuation techniques used to value its investments into a disclosure hierarchy consisting of three levels as shown below:
Level 1 - unadjusted quoted prices in active markets for identical investments
Level 2 - other significant observable inputs (including quoted prices for similar investments, interest rates, prepayment speeds, etc.)
Level 3 - unobservable inputs (including the Fund's own assumptions based on the best information available)
Valuation techniques used to value the Fund's investments by major category are as follows:
Debt securities, including restricted securities, are valued based on evaluated prices received from third party pricing services or from brokers who make markets in such securities. Municipal securities are valued by pricing services who utilize matrix pricing which considers yield or price of bonds of comparable quality, coupon, maturity and type or by broker-supplied prices. When independent prices are unavailable or unreliable, debt securities may be valued utilizing pricing methodologies which consider similar factors that would be used by third party pricing services. Debt securities are generally categorized as Level 2 in the hierarchy but may be Level 3 depending on the circumstances.
Investments in open-end mutual funds, including the Fidelity Central Funds, are valued at their closing net asset value (NAV) each business day and are categorized as Level 1 in the hierarchy.
Changes in valuation techniques may result in transfers in or out of an assigned level within the disclosure hierarchy. The aggregate value of investments by input level as of December 31, 2022 is included at the end of the Fund's Schedule of Investments.
Investment Transactions and Income. For financial reporting purposes, the Fund's investment holdings and NAV include trades executed through the end of the last business day of the period. The NAV per share for processing shareholder transactions is calculated as of the close of business of the New York Stock Exchange (NYSE), normally 4:00 p.m. Eastern time and includes trades executed through the end of the prior business day. Gains and losses on securities sold are determined on the basis of identified cost. Income and capital gain distributions from Fidelity Central Funds, if any, are recorded on the ex-dividend date. Interest income is accrued as earned and includes coupon interest and amortization of premium and accretion of discount on debt securities as applicable. Debt obligations may be placed on non-accrual status and related interest income may be reduced by ceasing current accruals and writing off interest receivables when the collection of all or a portion of interest has become doubtful based on consistently applied procedures. A debt obligation is removed from non-accrual status when the issuer resumes interest payments or when collectability of interest is reasonably assured.
Class Allocations and Expenses. Investment income, realized and unrealized capital gains and losses, common expenses of a fund, and certain fund-level expense reductions, if any, are allocated daily on a pro-rata basis to each class based on the relative net assets of each class to the total net assets of a fund. Each class differs with respect to transfer agent and distribution and service plan fees incurred, as applicable. Certain expense reductions may also differ by class, if applicable. For the reporting period, the allocated portion of income and expenses to each class as a percent of its average net assets may vary due to the timing of recording these transactions in relation to fluctuating net assets of the classes. Expenses directly attributable to a fund are charged to that fund. Expenses attributable to more than one fund are allocated among the respective funds on the basis of relative net assets or other appropriate methods. Expenses included in the accompanying financial statements reflect the expenses of that fund and do not include any expenses associated with any underlying mutual funds or exchange-traded funds. Although not included in a fund's expenses, a fund indirectly bears its proportionate share of these expenses through the net asset value of each underlying mutual fund or exchange-traded fund. Expense estimates are accrued in the period to which they relate and adjustments are made when actual amounts are known.
Income Tax Information and Distributions to Shareholders. Each year, the Fund intends to qualify as a regulated investment company under Subchapter M of the Internal Revenue Code, including distributing substantially all of its taxable income and realized gains. As a result, no provision for U.S. Federal income taxes is required. As of December 31, 2022, the Fund did not have any unrecognized tax benefits in the financial statements; nor is the Fund aware of any tax positions for which it is reasonably possible that the total amounts of unrecognized tax benefits will significantly change in the next twelve months. The Fund files a U.S. federal tax return, in addition to state and local tax returns as required. The Fund's federal income tax returns are subject to examination by the Internal Revenue Service (IRS) for a period of three fiscal years after they are filed. State and local tax returns may be subject to examination for an additional fiscal year depending on the jurisdiction.
Distributions are declared and recorded daily and paid monthly from net investment income. Distributions from realized gains, if any, are declared and recorded on the ex-dividend date. Income and capital gain distributions are declared separately for each class. Income and capital gain distributions are determined in accordance with income tax regulations, which may differ from GAAP.
Capital accounts within the financial statements are adjusted for permanent book-tax differences. These adjustments have no impact on net assets or the results of operations. Capital accounts are not adjusted for temporary book-tax differences which will reverse in a subsequent period.
Book-tax differences are primarily due to market discount, capital loss carryforwards and losses deferred due to wash sales.
The Fund purchases municipal securities whose interest, in the opinion of the issuer, is free from federal income tax. There is no assurance that the IRS will agree with this opinion. In the event the IRS determines that the issuer does not comply with relevant tax requirements, interest payments from a security could become federally taxable, possibly retroactively to the date the security was issued.
As of period end, the cost and unrealized appreciation (depreciation) in securities, and derivatives if applicable, for federal income tax purposes were as follows:
| Gross unrealized appreciation | $1,063 |
| Gross unrealized depreciation | (128,719) |
| Net unrealized appreciation (depreciation) | $(127,656) |
| Tax Cost | $2,972,821 |
The tax-based components of distributable earnings as of period end were as follows:
| Capital loss carryforward | $(12,202) |
| Net unrealized appreciation (depreciation) on securities and other investments | $(127,656) |
Capital loss carryforwards are only available to offset future capital gains of the Fund to the extent provided by regulations and may be limited. The capital loss carryforward information presented below, including any applicable limitation, is estimated as of fiscal period end and is subject to adjustment.
| Short-term | $(6,323) |
| Long-term | (5,879) |
| Total capital loss carryforward | $(12,202) |
The tax character of distributions paid was as follows:
| | December 31, 2022 | December 31, 2021 |
| Tax-exempt Income | $41,781 | $43,829 |
| Long-term Capital Gains | - | 1,728 |
| Total | $41,781 | $ 45,557 |
Delayed Delivery Transactions and When-Issued Securities. During the period, certain Funds transacted in securities on a delayed delivery or when-issued basis. Payment and delivery may take place after the customary settlement period for that security. The price of the underlying securities and the date when the securities will be delivered and paid for are fixed at the time the transaction is negotiated. Securities purchased on a delayed delivery or when-issued basis are identified as such in the Schedule of Investments. Compensation for interest forgone in the purchase of a delayed delivery or when-issued debt security may be received. With respect to purchase commitments, each applicable Fund identifies securities as segregated in its records with a value at least equal to the amount of the commitment. Payables and receivables associated with the purchases and sales of delayed delivery securities having the same coupon, settlement date and broker are offset. Delayed delivery or when-issued securities that have been purchased from and sold to different brokers are reflected as both payables and receivables in the Statement of Assets and Liabilities under the caption "Delayed delivery", as applicable. Losses may arise due to changes in the value of the underlying securities or if the counterparty does not perform under the contract's terms, or if the issuer does not issue the securities due to political, economic, or other factors.
Restricted Securities (including Private Placements). Funds may invest in securities that are subject to legal or contractual restrictions on resale. These securities generally may be resold in transactions exempt from registration or to the public if the securities are registered. Disposal of these securities may involve time-consuming negotiations and expense, and prompt sale at an acceptable price may be difficult. Information regarding restricted securities held at period end is included at the end of the Schedule of Investments, if applicable.
4. Purchases and Sales of Investments.
Purchases and sales of securities, other than short-term securities and in-kind transactions, as applicable, are noted in the table below.
| | Purchases ($) | Sales ($) |
| Fidelity Limited Term Municipal Income Fund | 619,933 | 1,132,925 |
5. Fees and Other Transactions with Affiliates.
Management Fee. Fidelity Management & Research Company LLC (the investment adviser) and its affiliates provide the Fund with investment management related services for which the Fund pays a monthly management fee. The management fee is the sum of an individual fund fee rate that is based on an annual rate of .25% of the Fund's average net assets and an annualized group fee rate that averaged .10% during the period. The group fee rate is based upon the monthly average net assets of a group of registered investment companies with which the investment adviser has management contracts. The group fee rate decreases as assets under management increase and increases as assets under management decrease. For the reporting period, the total annual management fee rate was .35% of the Fund's average net assets.
Distribution and Service Plan Fees. In accordance with Rule 12b-1 of the 1940 Act, the Fund has adopted separate Distribution and Service Plans for each class of shares. Certain classes pay Fidelity Distributors Company LLC (FDC), an affiliate of the investment adviser, separate Distribution and Service Fees, each of which is based on an annual percentage of each class' average net assets. In addition, FDC may pay financial intermediaries for selling shares of the Fund and providing shareholder support services. For the period, the Distribution and Service Fee rates, total fees and amounts retained by FDC were as follows:
| | Distribution Fee | Service Fee | Total Fees | Retained by FDC |
| Class A | - % | .25% | $454 | $53 |
| Class M | - % | .25% | 19 | - B |
| Class C | .75% | .25% | 91 | 13 |
| | | | $564 | $66 |
B Amount represents less than five hundred dollars.
Sales Load. FDC may receive a front-end sales charge of up to 2.75% for selling Class A shares and Class M shares, some of which is paid to financial intermediaries for selling shares of the Fund. Depending on the holding period, FDC may receive contingent deferred sales charges levied on Class A, Class M and Class C redemptions. The deferred sales charges are 1.00% for Class C shares, .75% or .50% for certain purchases of Class A shares and .25% for certain purchases of Class M shares.
For the period, sales charge amounts retained by FDC were as follows:
| | Retained by FDC |
| Class A | $6 |
| Class M | 1 |
Class C A | - B |
| | $7 |
A When Class C shares are initially sold, FDC pays commissions from its own resources to financial intermediaries through which the sales are made.
B Amount represents less than five hundred dollars.
Transfer Agent Fees. Fidelity Investments Institutional Operations Company LLC (FIIOC), an affiliate of the investment adviser, is the transfer, dividend disbursing and shareholder servicing agent for the Fund. FIIOC receives account fees and asset-based fees that vary according to the account size and type of account of the shareholders of the respective classes of the Fund, except for Class Z. FIIOC receives an asset-based fee of Class Z's average net assets. FIIOC pays for typesetting, printing and mailing of shareholder reports, except proxy statements. For the period, transfer agent fees for each class were as follows:
| | Amount | % of Class-Level Average Net Assets |
| Class A | $320 | .18 |
| Class M | 7 | .10 |
| Class C | 11 | .12 |
| Limited Term Municipal Income | 1,900 | .09 |
| Class I | 605 | .17 |
| Class Z | 209 | .05 |
| | $3,052 | |
Accounting Fees. Fidelity Service Company, Inc. (FSC), an affiliate of the investment adviser, maintains the Fund's accounting records. The accounting fee is based on the level of average net assets for each month. For the period, the fees were equivalent to the following annual rates:
| | % of Average Net Assets |
| Fidelity Limited Term Municipal Income Fund | .02 |
Interfund Trades. Funds may purchase from or sell securities to other Fidelity Funds under procedures adopted by the Board. The procedures have been designed to ensure these interfund trades are executed in accordance with Rule 17a-7 of the 1940 Act. Any interfund trades are included within the respective purchases and sales amounts shown in the Purchases and Sales of Investments note. Interfund trades during the period are noted in the table below.
| | Purchases ($) | Sales ($) | Realized Gain (Loss) ($) |
| Fidelity Limited Term Municipal Income Fund | - | 60,706 | 1 |
6. Committed Line of Credit.
Certain Funds participate with other funds managed by the investment adviser or an affiliate in a $4.25 billion credit facility (the "line of credit") to be utilized for temporary or emergency purposes to fund shareholder redemptions or for other short-term liquidity purposes. The participating funds have agreed to pay commitment fees on their pro-rata portion of the line of credit, which are reflected in Miscellaneous expenses on the Statement of Operations, and are listed below. During the period, there were no borrowings on this line of credit.
| | Amount |
| Fidelity Limited Term Municipal Income Fund | $6 |
7. Expense Reductions.
The investment adviser contractually agreed to reimburse expenses of each class to the extent annual operating expenses exceeded certain levels of class-level average net assets as noted in the table below. This reimbursement will remain in place through April 30, 2024. Some expenses, for example the compensation of the independent Trustees and certain other expenses such as interest expense, are excluded from this reimbursement.
The following classes were in reimbursement during the period:
| | Expense Limitations | Reimbursement |
| Class A | .66% | $261 |
| Class M | .65% | 5 |
| Class C | 1.38% | 11 |
| Limited Term Municipal Income | .37% | 2,055 |
| Class I | .37% | 631 |
| Class Z | .31% | 490 |
| | | $3,453 |
Through arrangements with the Fund's custodian, credits realized as a result of certain uninvested cash balances were used to reduce the Fund's expenses. During the period, custodian credits reduced the Fund's expenses by $3.
In addition, during the period the investment adviser or an affiliate reimbursed and/or waived a portion of fund-level operating expenses in the amount of $57.
8. Distributions to Shareholders.
Distributions to shareholders of each class were as follows:
| | Year ended December 31, 2022 | Year ended December 31, 2021 |
| Fidelity Limited Term Municipal Income Fund | | |
| Distributions to shareholders | | |
| Class A | $1,933 | $2,205 |
| Class M | 82 | 84 |
| Class C | 32 | 33 |
| Limited Term Municipal Income | 28,885 | 33,020 |
| Class I | 4,897 | 5,002 |
| Class Z | 5,952 | 5,213 |
| Total | $41,781 | $45,557 |
9. Share Transactions.
Share transactions for each class were as follows and may contain in-kind transactions, automatic conversions between classes or exchanges between affiliated funds:
| | Shares | Shares | Dollars | Dollars |
| | Year ended December 31, 2022 | Year ended December 31, 2021 | Year ended December 31, 2022 | Year ended December 31, 2021 |
| Fidelity Limited Term Municipal Income Fund | | | | |
| Class A | | | | |
| Shares sold | 6,044 | 8,243 | $61,982 | $89,569 |
| Reinvestment of distributions | 180 | 195 | 1,849 | 2,111 |
| Shares redeemed | (11,521) | (6,349) | (118,312) | (68,892) |
| Net increase (decrease) | (5,297) | 2,089 | $(54,481) | $22,788 |
| Class M | | | | |
| Shares sold | 300 | 115 | $3,052 | $1,245 |
| Reinvestment of distributions | 7 | 7 | 76 | 78 |
| Shares redeemed | (148) | (295) | (1,516) | (3,195) |
| Net increase (decrease) | 159 | (173) | $1,612 | $(1,872) |
| Class C | | | | |
| Shares sold | 403 | 315 | $4,152 | $3,423 |
| Reinvestment of distributions | 3 | 3 | 28 | 30 |
| Shares redeemed | (515) | (839) | (5,255) | (9,102) |
| Net increase (decrease) | (109) | (521) | $(1,075) | $(5,649) |
| Limited Term Municipal Income | | | | |
| Shares sold | 112,135 | 90,381 | $1,145,791 | $980,282 |
| Reinvestment of distributions | 2,045 | 2,180 | 20,907 | 23,610 |
| Shares redeemed | (154,578) | (77,064) | (1,584,880) | (834,331) |
| Net increase (decrease) | (40,398) | 15,497 | $(418,182) | $169,561 |
| Class I | | | | |
| Shares sold | 31,496 | 18,053 | $322,175 | $195,847 |
| Reinvestment of distributions | 441 | 428 | 4,514 | 4,637 |
| Shares redeemed | (37,086) | (10,350) | (379,632) | (112,152) |
| Net increase (decrease) | (5,149) | 8,131 | $(52,943) | $88,332 |
| Class Z | | | | |
| Shares sold | 40,549 | 18,531 | $414,776 | $200,944 |
| Reinvestment of distributions | 402 | 356 | 4,114 | 3,852 |
| Shares redeemed | (46,884) | (8,593) | (477,433) | (93,104) |
| Net increase (decrease) | (5,933) | 10,294 | $(58,543) | $111,692 |
10. Other.
A fund's organizational documents provide former and current trustees and officers with a limited indemnification against liabilities arising in connection with the performance of their duties to the fund. In the normal course of business, a fund may also enter into contracts that provide general indemnifications. A fund's maximum exposure under these arrangements is unknown as this would be dependent on future claims that may be made against a fund. The risk of material loss from such claims is considered remote.
11. Risk and Uncertainties.
Many factors affect a fund's performance. Developments that disrupt global economies and financial markets, such as pandemics, epidemics, outbreaks of infectious diseases, war, terrorism, and environmental disasters, may significantly affect a fund's investment performance. The effects of these developments to a fund will be impacted by the types of securities in which a fund invests, the financial condition, industry, economic sector, and geographic location of an issuer, and a fund's level of investment in the securities of that issuer.
To the Board of Trustees of Fidelity Municipal Trust and Shareholders of Fidelity Limited Term Municipal Income Fund
Opinion on the Financial Statements
We have audited the accompanying statement of assets and liabilities, including the schedule of investments, of Fidelity Limited Term Municipal Income Fund (one of the funds constituting Fidelity Municipal Trust, referred to hereafter as the "Fund") as of December 31, 2022, the related statement of operations for the year ended December 31, 2022, the statement of changes in net assets for each of the two years in the period ended December 31, 2022, including the related notes, and the financial highlights for each of the periods indicated therein (collectively referred to as the "financial statements"). In our opinion, the financial statements present fairly, in all material respects, the financial position of the Fund as of December 31, 2022, the results of its operations for the year then ended, the changes in its net assets for each of the two years in the period ended December 31, 2022 and the financial highlights for each of the periods indicated therein in conformity with accounting principles generally accepted in the United States of America.
Basis for Opinion
These financial statements are the responsibility of the Fund's management. Our responsibility is to express an opinion on the Fund's financial statements based on our audits. We are a public accounting firm registered with the Public Company Accounting Oversight Board (United States) (PCAOB) and are required to be independent with respect to the Fund in accordance with the U.S. federal securities laws and the applicable rules and regulations of the Securities and Exchange Commission and the PCAOB.
We conducted our audits of these financial statements in accordance with the standards of the PCAOB. Those standards require that we plan and perform the audit to obtain reasonable assurance about whether the financial statements are free of material misstatement, whether due to error or fraud.
Our audits included performing procedures to assess the risks of material misstatement of the financial statements, whether due to error or fraud, and performing procedures that respond to those risks. Such procedures included examining, on a test basis, evidence regarding the amounts and disclosures in the financial statements. Our audits also included evaluating the accounting principles used and significant estimates made by management, as well as evaluating the overall presentation of the financial statements. Our procedures included confirmation of securities owned as of December 31, 2022 by correspondence with the custodian and brokers; when replies were not received from brokers, we performed other auditing procedures. We believe that our audits provide a reasonable basis for our opinion.
/s/ PricewaterhouseCoopers LLP
Boston, Massachusetts
February 10, 2023
We have served as the auditor of one or more investment companies in the Fidelity group of funds since 1932.
The Trustees, Members of the Advisory Board (if any), and officers of the trust and fund, as applicable, are listed below. The Board of Trustees governs the fund and is responsible for protecting the interests of shareholders. The Trustees are experienced executives who meet periodically throughout the year to oversee the fund's activities, review contractual arrangements with companies that provide services to the fund, oversee management of the risks associated with such activities and contractual arrangements, and review the fund's performance. Each of the Trustees oversees 295 funds.
The Trustees hold office without limit in time except that (a) any Trustee may resign; (b) any Trustee may be removed by written instrument, signed by at least two-thirds of the number of Trustees prior to such removal; (c) any Trustee who requests to be retired or who has become incapacitated by illness or injury may be retired by written instrument signed by a majority of the other Trustees; and (d) any Trustee may be removed at any special meeting of shareholders by a two-thirds vote of the outstanding voting securities of the trust. Each Trustee who is not an interested person (as defined in the 1940 Act) of the trust and the fund is referred to herein as an Independent Trustee. Each Independent Trustee shall retire not later than the last day of the calendar year in which his or her 75th birthday occurs. The Independent Trustees may waive this mandatory retirement age policy with respect to individual Trustees. Officers and Advisory Board Members hold office without limit in time, except that any officer or Advisory Board Member may resign or may be removed by a vote of a majority of the Trustees at any regular meeting or any special meeting of the Trustees. Except as indicated, each individual has held the office shown or other offices in the same company for the past five years.
The fund's Statement of Additional Information (SAI) includes more information about the Trustees. To request a free copy, call Fidelity at 1-800-544-8544 if you're an individual investing directly with Fidelity, call 1-800-835-5092 if you're a plan sponsor or participant with Fidelity as your recordkeeper or call 1-877-208-0098 on institutional accounts or if you're an advisor or invest through one.
Experience, Skills, Attributes, and Qualifications of the Trustees. The Governance and Nominating Committee has adopted a statement of policy that describes the experience, qualifications, attributes, and skills that are necessary and desirable for potential Independent Trustee candidates (Statement of Policy). The Board believes that each Trustee satisfied at the time he or she was initially elected or appointed a Trustee, and continues to satisfy, the standards contemplated by the Statement of Policy. The Governance and Nominating Committee also engages professional search firms to help identify potential Independent Trustee candidates who have the experience, qualifications, attributes, and skills consistent with the Statement of Policy. From time to time, additional criteria based on the composition and skills of the current Independent Trustees, as well as experience or skills that may be appropriate in light of future changes to board composition, business conditions, and regulatory or other developments, have also been considered by the professional search firms and the Governance and Nominating Committee. In addition, the Board takes into account the Trustees' commitment and participation in Board and committee meetings, as well as their leadership of standing and ad hoc committees throughout their tenure.
In determining that a particular Trustee was and continues to be qualified to serve as a Trustee, the Board has considered a variety of criteria, none of which, in isolation, was controlling. The Board believes that, collectively, the Trustees have balanced and diverse experience, qualifications, attributes, and skills, which allow the Board to operate effectively in governing the fund and protecting the interests of shareholders. Information about the specific experience, skills, attributes, and qualifications of each Trustee, which in each case led to the Board's conclusion that the Trustee should serve (or continue to serve) as a trustee of the fund, is provided below.
Board Structure and Oversight Function. Abigail P. Johnson is an interested person and currently serves as Chairman. The Trustees have determined that an interested Chairman is appropriate and benefits shareholders because an interested Chairman has a personal and professional stake in the quality and continuity of services provided to the fund. Independent Trustees exercise their informed business judgment to appoint an individual of their choosing to serve as Chairman, regardless of whether the Trustee happens to be independent or a member of management. The Independent Trustees have determined that they can act independently and effectively without having an Independent Trustee serve as Chairman and that a key structural component for assuring that they are in a position to do so is for the Independent Trustees to constitute a substantial majority for the Board. The Independent Trustees also regularly meet in executive session. Michael E. Kenneally serves as Chairman of the Independent Trustees and as such (i) acts as a liaison between the Independent Trustees and management with respect to matters important to the Independent Trustees and (ii) with management prepares agendas for Board meetings.
Fidelity ® funds are overseen by different Boards of Trustees. The fund's Board oversees Fidelity's investment-grade bond, money market, asset allocation and certain equity funds, and other Boards oversee Fidelity's high income and other equity funds. The asset allocation funds may invest in Fidelity ® funds that are overseen by such other Boards. The use of separate Boards, each with its own committee structure, allows the Trustees of each group of Fidelity ® funds to focus on the unique issues of the funds they oversee, including common research, investment, and operational issues. On occasion, the separate Boards establish joint committees to address issues of overlapping consequences for the Fidelity ® funds overseen by each Board.
The Trustees operate using a system of committees to facilitate the timely and efficient consideration of all matters of importance to the Trustees, the fund, and fund shareholders and to facilitate compliance with legal and regulatory requirements and oversight of the fund's activities and associated risks. The Board, acting through its committees, has charged FMR and its affiliates with (i) identifying events or circumstances the occurrence of which could have demonstrably adverse effects on the fund's business and/or reputation; (ii) implementing processes and controls to lessen the possibility that such events or circumstances occur or to mitigate the effects of such events or circumstances if they do occur; and (iii) creating and maintaining a system designed to evaluate continuously business and market conditions in order to facilitate the identification and implementation processes described in (i) and (ii) above. Because the day-to-day operations and activities of the fund are carried out by or through FMR, its affiliates, and other service providers, the fund's exposure to risks is mitigated but not eliminated by the processes overseen by the Trustees. While each of the Board's committees has responsibility for overseeing different aspects of the fund's activities, oversight is exercised primarily through the Operations and Audit Committees. In addition, an ad hoc Board committee of Independent Trustees has worked with FMR to enhance the Board's oversight of investment and financial risks, legal and regulatory risks, technology risks, and operational risks, including the development of additional risk reporting to the Board. Appropriate personnel, including but not limited to the fund's Chief Compliance Officer (CCO), FMR's internal auditor, the independent accountants, the fund's Treasurer and portfolio management personnel, make periodic reports to the Board's committees, as appropriate, including an annual review of Fidelity's risk management program for the Fidelity ® funds. The responsibilities of each standing committee, including their oversight responsibilities, are described further under "Standing Committees of the Trustees."
Interested Trustees*:
Correspondence intended for a Trustee who is an interested person may be sent to Fidelity Investments, 245 Summer Street, Boston, Massachusetts 02210.
Name, Year of Birth; Principal Occupations and Other Relevant Experience+
Abigail P. Johnson (1961)
Year of Election or Appointment: 2009
Trustee
Chairman of the Board of Trustees
Ms. Johnson also serves as Trustee of other Fidelity ® funds. Ms. Johnson serves as Chairman (2016-present), Chief Executive Officer (2014-present), and Director (2007-present) of FMR LLC (diversified financial services company), President of Fidelity Financial Services (2012-present) and President of Personal, Workplace and Institutional Services (2005-present). Ms. Johnson is Chairman and Director of Fidelity Management & Research Company LLC (investment adviser firm, 2011-present). Previously, Ms. Johnson served as Chairman and Director of FMR Co., Inc. (investment adviser firm, 2011-2019), Vice Chairman (2007-2016) and President (2013-2016) of FMR LLC, President and a Director of Fidelity Management & Research Company (2001-2005), a Trustee of other investment companies advised by Fidelity Management & Research Company, Fidelity Investments Money Management, Inc. (investment adviser firm), and FMR Co., Inc. (2001-2005), Senior Vice President of the Fidelity ® funds (2001-2005), and managed a number of Fidelity ® funds. Ms. Abigail P. Johnson and Mr. Arthur E. Johnson are not related.
Jennifer Toolin McAuliffe (1959)
Year of Election or Appointment: 2016
Trustee
Ms. McAuliffe also serves as Trustee of other Fidelity ® funds and as Trustee of Fidelity Charitable (2020-present). Previously, Ms. McAuliffe served as Co-Head of Fixed Income of Fidelity Investments Limited (now known as FIL Limited (FIL)) (diversified financial services company), Director of Research for FIL's credit and quantitative teams in London, Hong Kong and Tokyo and Director of Research for taxable and municipal bonds at Fidelity Investments Money Management, Inc. Ms. McAuliffe previously served as a member of the Advisory Board of certain Fidelity ® funds (2016). Ms. McAuliffe was previously a lawyer at Ropes & Gray LLP and currently serves as director or trustee of several not-for-profit entities.
* Determined to be an "Interested Trustee" by virtue of, among other things, his or her affiliation with the trust or various entities under common control with FMR.
+ The information includes the Trustee's principal occupation during the last five years and other information relating to the experience, attributes, and skills relevant to the Trustee's qualifications to serve as a Trustee, which led to the conclusion that the Trustee should serve as a Trustee for the fund.
Independent Trustees:
Correspondence intended for an Independent Trustee may be sent to Fidelity Investments, P.O. Box 55235, Boston, Massachusetts 02205-5235.
Name, Year of Birth; Principal Occupations and Other Relevant Experience+
Elizabeth S. Acton (1951)
Year of Election or Appointment: 2013
Trustee
Ms. Acton also serves as Trustee of other Fidelity ® funds. Prior to her retirement, Ms. Acton served as Executive Vice President, Finance (2011-2012), Executive Vice President, Chief Financial Officer (2002-2011) and Treasurer (2004-2005) of Comerica Incorporated (financial services). Prior to joining Comerica, Ms. Acton held a variety of positions at Ford Motor Company (1983-2002), including Vice President and Treasurer (2000-2002) and Executive Vice President and Chief Financial Officer of Ford Motor Credit Company (1998-2000). Ms. Acton currently serves as a member of the Board and Audit and Finance Committees of Beazer Homes USA, Inc. (homebuilding, 2012-present). Ms. Acton previously served as a member of the Advisory Board of certain Fidelity ® funds (2013-2016).
Ann E. Dunwoody (1953)
Year of Election or Appointment: 2018
Trustee
General Dunwoody also serves as Trustee of other Fidelity ® funds. General Dunwoody (United States Army, Retired) was the first woman in U.S. military history to achieve the rank of four-star general and prior to her retirement in 2012 held a variety of positions within the U.S. Army, including Commanding General, U.S. Army Material Command (2008-2012). General Dunwoody currently serves as President of First to Four LLC (leadership and mentoring services, 2012-present), a member of the Board and Nomination and Corporate Governance Committees of Kforce Inc. (professional staffing services, 2016-present) and a member of the Board of Automattic Inc. (software engineering, 2018-present). Previously, General Dunwoody served as a member of the Advisory Board and Nominating and Corporate Governance Committee of L3 Technologies, Inc. (communication, electronic, sensor and aerospace systems, 2013-2019) and a member of the Board and Audit and Sustainability and Corporate Responsibility Committees of Republic Services, Inc. (waste collection, disposal and recycling, 2013-2016). Ms. Dunwoody also serves on several boards for non-profit organizations, including as a member of the Board, Chair of the Nomination and Governance Committee and a member of the Audit Committee of Logistics Management Institute (consulting non-profit, 2012-present), a member of the Council of Trustees for the Association of the United States Army (advocacy non-profit, 2013-present), a member of the Board of Florida Institute of Technology (2015-present) and a member of the Board of ThanksUSA (military family education non-profit, 2014-present). General Dunwoody previously served as a member of the Advisory Board of certain Fidelity ® funds (2018).
John Engler (1948)
Year of Election or Appointment: 2014
Trustee
Mr. Engler also serves as Trustee of other Fidelity ® funds. Previously, Mr. Engler served as Governor of Michigan (1991-2003), President of the Business Roundtable (2011-2017) and interim President of Michigan State University (2018-2019). Mr. Engler currently serves as a member of the Board of Stride, Inc. (formerly K12 Inc.) (technology-based education company, 2012-present). Previously, Mr. Engler served as a member of the Board of Universal Forest Products (manufacturer and distributor of wood and wood-alternative products, 2003-2019) and Trustee of The Munder Funds (2003-2014). Mr. Engler previously served as a member of the Advisory Board of certain Fidelity ® funds (2014-2016).
Robert F. Gartland (1951)
Year of Election or Appointment: 2010
Trustee
Mr. Gartland also serves as Trustee of other Fidelity ® funds. Prior to his retirement, Mr. Gartland held a variety of positions at Morgan Stanley (financial services, 1979-2007), including Managing Director (1987-2007) and Chase Manhattan Bank (1975-1978). Mr. Gartland previously served as Chairman and an investor in Gartland & Mellina Group Corp. (consulting, 2009-2019), as a member of the Board of National Securities Clearing Corporation (1993-1996) and as Chairman of TradeWeb (2003-2004).
Arthur E. Johnson (1947)
Year of Election or Appointment: 2008
Trustee
Mr. Johnson also serves as Trustee of other Fidelity ® funds. Prior to his retirement, Mr. Johnson served as Senior Vice President of Corporate Strategic Development of Lockheed Martin Corporation (defense contractor, 1999-2009). Mr. Johnson currently serves as a member of the Board of Booz Allen Hamilton (management consulting, 2011-present). Mr. Johnson previously served as a member of the Board of Eaton Corporation plc (diversified power management, 2009-2019) and a member of the Board of AGL Resources, Inc. (holding company, 2002-2016). Mr. Johnson previously served as Chairman (2018-2021) and Vice Chairman (2015-2018) of the Independent Trustees of certain Fidelity® funds. Mr. Arthur E. Johnson is not related to Ms. Abigail P. Johnson.
Michael E. Kenneally (1954)
Year of Election or Appointment: 2009
Trustee
Chairman of the Independent Trustees
Mr. Kenneally also serves as Trustee of other Fidelity ® funds and was Vice Chairman (2018-2021) of the Independent Trustees of certain Fidelity ® funds. Prior to retirement in 2005, he was Chairman and Global Chief Executive Officer of Credit Suisse Asset Management, the worldwide fund management and institutional investment business of Credit Suisse Group. Previously, Mr. Kenneally was an Executive Vice President and the Chief Investment Officer for Bank of America. In this role, he was responsible for the investment management, strategy and products delivered to the bank's institutional, high-net-worth and retail clients. Earlier, Mr. Kenneally directed the organization's equity and quantitative research groups. He began his career as a research analyst and then spent more than a dozen years as a portfolio manager for endowments, pension plans and mutual funds. He earned the Chartered Financial Analyst (CFA) designation in 1991.
Mark A. Murray (1954)
Year of Election or Appointment: 2016
Trustee
Mr. Murray also serves as Trustee of other Fidelity ® funds. Previously, Mr. Murray served as Co-Chief Executive Officer (2013-2016), President (2006-2013) and Vice Chairman (2013-2020) of Meijer, Inc. Mr. Murray serves as a member of the Board (2009-present) and Public Policy and Responsibility Committee (2009-present) and Chair of the Nuclear Review Committee (2019-present) of DTE Energy Company (diversified energy company). Mr. Murray previously served as a member of the Board of Spectrum Health (not-for-profit health system, 2015-2019) and as a member of the Board and Audit Committee and Chairman of the Nominating and Corporate Governance Committee of Universal Forest Products, Inc. (manufacturer and distributor of wood and wood-alternative products, 2004-2016). Mr. Murray also serves as a member of the Board of many community and professional organizations. Mr. Murray previously served as a member of the Advisory Board of certain Fidelity ® funds (2016).
+ The information includes the Trustee's principal occupation during the last five years and other information relating to the experience, attributes, and skills relevant to the Trustee's qualifications to serve as a Trustee, which led to the conclusion that the Trustee should serve as a Trustee for the fund.
Advisory Board Members and Officers:
Correspondence intended for a Member of the Advisory Board (if any) may be sent to Fidelity Investments, P.O. Box 55235, Boston, Massachusetts 02205-5235. Correspondence intended for an officer may be sent to Fidelity Investments, 245 Summer Street, Boston, Massachusetts 02210. Officers appear below in alphabetical order.
Name, Year of Birth; Principal Occupation
Laura M. Bishop (1961)
Year of Election or Appointment: 2022
Member of the Advisory Board
Ms. Bishop also serves as a Member of the Advisory Board of other funds. Prior to her retirement, Ms. Bishop held a variety of positions at United Services Automobile Association (2001-2020), including Executive Vice President and Chief Financial Officer (2014-2020) and Senior Vice President and Deputy Chief Financial Officer (2012-2014). Ms. Bishop currently serves as a member of the Audit Committee and Compensation and Personnel Committee (2021-present) of the Board of Directors of Korn Ferry (global organizational consulting).
Robert W. Helm (1957)
Year of Election or Appointment: 2021
Member of the Advisory Board
Mr. Helm also serves as a Member of the Advisory Board of other Fidelity® funds. Mr. Helm was formerly Deputy Chairman (2003-2020), partner (1991-2020) and an associate (1984-1991) of Dechert LLP (formerly Dechert Price & Rhoads). Mr. Helm currently serves on boards and committees of several not-for-profit organizations.
Craig S. Brown (1977)
Year of Election or Appointment: 2019
Assistant Treasurer
Mr. Brown also serves as an officer of other funds. Mr. Brown serves as Assistant Treasurer of FIMM, LLC (2021-present) and is an employee of Fidelity Investments (2013-present). Previously, Mr. Brown served as Assistant Treasurer of certain Fidelity ® funds (2019-2022).
John J. Burke III (1964)
Year of Election or Appointment: 2018
Chief Financial Officer
Mr. Burke also serves as Chief Financial Officer of other funds. Mr. Burke serves as Head of Investment Operations for Fidelity Fund and Investment Operations (2018-present) and is an employee of Fidelity Investments (1998-present). Previously Mr. Burke served as head of Asset Management Investment Operations (2012-2018).
David J. Carter (1973)
Year of Election or Appointment: 2020
Assistant Secretary
Mr. Carter also serves as Assistant Secretary of other funds. Mr. Carter serves as Senior Vice President, Deputy General Counsel (2022-present) and is an employee of Fidelity Investments (2005-present).
Jonathan Davis (1968)
Year of Election or Appointment: 2010
Assistant Treasurer
Mr. Davis also serves as an officer of other funds. Mr. Davis serves as Assistant Treasurer of FIMM, LLC (2021-present), FMR Capital, Inc. (2017-present), FD Funds GP LLC (2021-present), FD Funds Holding LLC (2021-present), and FD Funds Management LLC (2021-present); and is an employee of Fidelity Investments. Previously, Mr. Davis served as Vice President and Associate General Counsel of FMR LLC (diversified financial services company, 2003-2010).
Laura M. Del Prato (1964)
Year of Election or Appointment: 2018
President and Treasurer
Ms. Del Prato also serves as an officer of other funds. Ms. Del Prato serves as Assistant Treasurer of FIMM, LLC (2021-present) and is an employee of Fidelity Investments (2017-present). Previously, Ms. Del Prato served as President and Treasurer of The North Carolina Capital Management Trust: Cash Portfolio and Term Portfolio (2018-2020). Prior to joining Fidelity Investments, Ms. Del Prato served as a Managing Director and Treasurer of the JPMorgan Mutual Funds (2014-2017). Prior to JPMorgan, Ms. Del Prato served as a partner at Cohen Fund Audit Services (accounting firm, 2012-2013) and KPMG LLP (accounting firm, 2004-2012).
Christopher M. Gouveia (1973)
Year of Election or Appointment: 2023
Chief Compliance Officer
Mr. Gouveia also serves as Chief Compliance Officer of other funds. Mr. Gouveia serves as Senior Vice President of Asset Management Compliance for Fidelity Investments and is an employee of Fidelity Investments. Previously, Mr. Gouveia served as Chief Compliance Officer of the North Carolina Capital Management Trust (2016-2019).
Colm A. Hogan (1973)
Year of Election or Appointment: 2016
Assistant Treasurer
Mr. Hogan also serves as an officer of other funds. Mr. Hogan serves as Assistant Treasurer of FIMM, LLC (2021-present) and FMR Capital, Inc. (2017-present) and is an employee of Fidelity Investments (2005-present). Previously, Mr. Hogan served as Deputy Treasurer of certain Fidelity ® funds (2016-2020) and Assistant Treasurer of certain Fidelity ® funds (2016-2018).
Cynthia Lo Bessette (1969)
Year of Election or Appointment: 2019
Secretary and Chief Legal Officer (CLO)
Ms. Lo Bessette also serves as an officer of other funds. Ms. Lo Bessette serves as CLO, Secretary, and Senior Vice President of Fidelity Management & Research Company LLC (investment adviser firm, 2019-present); CLO of Fidelity Management & Research (Hong Kong) Limited, FMR Investment Management (UK) Limited, and Fidelity Management & Research (Japan) Limited (investment adviser firms, 2019-present); Secretary of FD Funds GP LLC (2021-present), FD Funds Holding LLC (2021-present), FD Funds Management LLC (2021-present), and Fidelity Diversifying Solutions LLC (investment adviser firm, 2022-present); and Assistant Secretary of FIMM, LLC (2019-present). She is a Senior Vice President and Deputy General Counsel of FMR LLC (diversified financial services company, 2019-present), and is an employee of Fidelity Investments. Previously, Ms. Lo Bessette served as CLO, Secretary, and Senior Vice President of FMR Co., Inc. (investment adviser firm, 2019); Secretary of Fidelity SelectCo, LLC and Fidelity Investments Money Management, Inc. (investment adviser firms, 2019). Prior to joining Fidelity Investments, Ms. Lo Bessette was Executive Vice President, General Counsel (2016-2019) and Senior Vice President, Deputy General Counsel (2015-2016) of OppenheimerFunds (investment management company) and Deputy Chief Legal Officer (2013-2015) of Jennison Associates LLC (investment adviser firm).
Chris Maher (1972)
Year of Election or Appointment: 2013
Assistant Treasurer
Mr. Maher also serves as an officer of other funds. Mr. Maher serves as Assistant Treasurer of FIMM, LLC (2021-present) and FMR Capital, Inc. (2017-present), and is an employee of Fidelity Investments (2008-present). Previously, Mr. Maher served as Assistant Treasurer of certain funds (2013-2020); Vice President of Asset Management Compliance (2013), Vice President of the Program Management Group of FMR (investment adviser firm, 2010-2013), and Vice President of Valuation Oversight (2008-2010).
Jamie Pagliocco (1964)
Year of Election or Appointment: 2020
Vice President
Mr. Pagliocco also serves as Vice President of other funds. Mr. Pagliocco serves as President of Fixed Income (2020-present), and is an employee of Fidelity Investments (2001-present). Previously, Mr. Pagliocco served as Co-Chief Investment Officer - Bond (2017-2020), Global Head of Bond Trading (2016-2019), and as a portfolio manager.
Brett Segaloff (1972)
Year of Election or Appointment: 2021
Anti-Money Laundering (AML) Officer
Mr. Segaloff also serves as an AML Officer of other funds and other related entities. He is Director, Anti-Money Laundering (2007-present) of FMR LLC (diversified financial services company) and is an employee of Fidelity Investments (1996-present).
Stacie M. Smith (1974)
Year of Election or Appointment: 2013
Assistant Treasurer
Ms. Smith also serves as an officer of other funds. Ms. Smith serves as Assistant Treasurer of FIMM, LLC (2021-present) and FMR Capital, Inc. (2017-present), is an employee of Fidelity Investments (2009-present), and has served in other fund officer roles. Prior to joining Fidelity Investments, Ms. Smith served as Senior Audit Manager of Ernst & Young LLP (accounting firm, 1996-2009). Previously, Ms. Smith served as Assistant Treasurer (2013-2019) and Deputy Treasurer (2013-2016) of certain Fidelity ® funds.
Jim Wegmann (1979)
Year of Election or Appointment: 2021
Deputy Treasurer
Mr. Wegmann also serves as an officer of other funds. Mr. Wegmann serves as Assistant Treasurer of FIMM, LLC (2021-present) and is an employee of Fidelity Investments (2011-present). Previously, Mr. Wegmann served as Assistant Treasurer of certain Fidelity ® funds (2019-2021).
As a shareholder, you incur two types of costs: (1) transaction costs, which may include sales charges (loads) on purchase payments or redemption proceeds, as applicable and (2) ongoing costs, which generally include management fees, distribution and/or service (12b-1) fees and other Fund expenses. This Example is intended to help you understand your ongoing costs (in dollars) of investing in a fund and to compare these costs with the ongoing costs of investing in other mutual funds.
| The Example is based on an investment of $1,000 invested at the beginning of the period and held for the entire period (July 1, 2022 to December 31, 2022). |
Actual Expenses
The first line of the accompanying table provides information about actual account values and actual expenses. You may use the information in this line, together with the amount you invested, to estimate the expenses that you paid over the period. Simply divide your account value by $1,000.00 (for example, an $8,600 account value divided by $1,000.00 = 8.6), then multiply the result by the number in the first line for a class/Fund under the heading entitled "Expenses Paid During Period" to estimate the expenses you paid on your account during this period. If any fund is a shareholder of any underlying mutual funds or exchange-traded funds (ETFs) (the Underlying Funds), such fund indirectly bears its proportional share of the expenses of the Underlying Funds in addition to the direct expenses incurred presented in the table. These fees and expenses are not included in the annualized expense ratio used to calculate the expense estimate in the table below.
Hypothetical Example for Comparison Purposes
The second line of the accompanying table provides information about hypothetical account values and hypothetical expenses based on the actual expense ratio and an assumed rate of return of 5% per year before expenses, which is not the actual return. The hypothetical account values and expenses may not be used to estimate the actual ending account balance or expenses you paid for the period. You may use this information to compare the ongoing costs of investing in the Fund and other funds. To do so, compare this 5% hypothetical example with the 5% hypothetical examples that appear in the shareholder reports of the other funds. If any fund is a shareholder of any Underlying Funds, such fund indirectly bears its proportional share of the expenses of the Underlying Funds in addition to the direct expenses as presented in the table. These fees and expenses are not included in the annualized expense ratio used to calculate the expense estimate in the table below.
Please note that the expenses shown in the table are meant to highlight your ongoing costs only and do not reflect any transaction costs. Therefore, the second line of the table is useful in comparing ongoing costs only, and will not help you determine the relative total costs of owning different funds. In addition, if these transactional costs were included, your costs would have been higher.
| | | | | Annualized Expense Ratio- A | | Beginning Account Value July 1, 2022 | | Ending Account Value December 31, 2022 | | Expenses Paid During Period- C July 1, 2022 to December 31, 2022 |
| Fidelity® Limited Term Municipal Income Fund | | | | | | | | | | |
| Class A | | | | .66% | | | | | | |
| Actual | | | | | | $ 1,000 | | $ 998.00 | | $ 3.32 |
Hypothetical- B | | | | | | $ 1,000 | | $ 1,021.88 | | $ 3.36 |
| Class M | | | | .65% | | | | | | |
| Actual | | | | | | $ 1,000 | | $ 998.00 | | $ 3.27 |
Hypothetical- B | | | | | | $ 1,000 | | $ 1,021.93 | | $ 3.31 |
| Class C | | | | 1.38% | | | | | | |
| Actual | | | | | | $ 1,000 | | $ 994.40 | | $ 6.94 |
Hypothetical- B | | | | | | $ 1,000 | | $ 1,018.25 | | $ 7.02 |
| Fidelity® Limited Term Municipal Income Fund | | | | .37% | | | | | | |
| Actual | | | | | | $ 1,000 | | $ 1,000.40 | | $ 1.87 |
Hypothetical- B | | | | | | $ 1,000 | | $ 1,023.34 | | $ 1.89 |
| Class I | | | | .37% | | | | | | |
| Actual | | | | | | $ 1,000 | | $ 1,000.40 | | $ 1.87 |
Hypothetical- B | | | | | | $ 1,000 | | $ 1,023.34 | | $ 1.89 |
| Class Z | | | | .31% | | | | | | |
| Actual | | | | | | $ 1,000 | | $ 1,000.70 | | $ 1.56 |
Hypothetical- B | | | | | | $ 1,000 | | $ 1,023.64 | | $ 1.58 |
| |
A Annualized expense ratio reflects expenses net of applicable fee waivers.
B 5% return per year before expenses
C Expenses are equal to the annualized expense ratio, multiplied by the average account value over the period, multiplied by 184/ 365 (to reflect the one-half year period). The fees and expenses of any Underlying Funds are not included in each annualized expense ratio.
The dividend and capital gains distributions for the fund(s) are available on Fidelity.com or Institutional.Fidelity.com.
During fiscal year ended 2022, 100% of the fund's income dividends were free from federal income tax, and 22.52% of the fund's income dividends was subject to the federal alternative minimum tax.
The fund will notify shareholders in January 2023 of amounts for use in preparing 2022 income tax returns.
Fidelity Limited Term Municipal Income Fund
Each year, the Board of Trustees, including the Independent Trustees (together, the Board), votes on the renewal of the management contract with Fidelity Management & Research Company LLC (FMR) and the sub-advisory agreements (together, the Advisory Contracts) for the fund. FMR and the sub-advisers are referred to herein as the Investment Advisers. The Board, assisted by the advice of fund counsel and Independent Trustees' counsel, requests and considers a broad range of information relevant to the renewal of the Advisory Contracts throughout the year.
The Board meets regularly and, at each of its meetings, covers an extensive agenda of topics and materials and considers factors that are relevant to its annual consideration of the renewal of the fund's Advisory Contracts, including the services and support provided to the fund and its shareholders. The Board has established four standing committees (Committees) - Operations, Audit, Fair Valuation, and Governance and Nominating - each composed of and chaired by Independent Trustees with varying backgrounds, to which the Board has assigned specific subject matter responsibilities in order to enhance effective decision-making by the Board. The Operations Committee, of which all the Independent Trustees are members, meets regularly throughout the year and requests, receives and considers, among other matters, information related to the annual consideration of the renewal of the fund's Advisory Contracts before making its recommendation to the Board. The Board also meets as needed to review matters specifically related to the Board's annual consideration of the renewal of the Advisory Contracts. Members of the Board may also meet from time to time with trustees of other Fidelity funds through joint ad hoc committees to discuss certain matters relevant to all of the Fidelity funds.
At its September 2022 meeting, the Board unanimously determined to renew the fund's Advisory Contracts. In reaching its determination, the Board considered all factors it believed relevant, including (i) the nature, extent, and quality of the services provided to the fund and its shareholders (including the investment performance of the fund); (ii) the competitiveness relative to peer funds of the fund's management fee and the total expense ratio of a representative class (the retail class); (iii) the total costs of the services provided by and the profits realized by Fidelity from its relationships with the fund; and (iv) the extent to which, if any, economies of scale exist and are realized as the fund grows, and whether any economies of scale are appropriately shared with fund shareholders.
In considering whether to renew the Advisory Contracts for the fund, the Board reached a determination, with the assistance of fund counsel and Independent Trustees' counsel and through the exercise of its business judgment, that the renewal of the Advisory Contracts was in the best interests of the fund and its shareholders and that the compensation payable under the Advisory Contracts was fair and reasonable. The Board's decision to renew the Advisory Contracts was not based on any single factor, but rather was based on a comprehensive consideration of all the information provided to the Board at its meetings throughout the year. The Board, in reaching its determination to renew the Advisory Contracts, was aware that shareholders of the fund have a broad range of investment choices available to them, including a wide choice among funds offered by Fidelity's competitors, and that the fund's shareholders, who have the opportunity to review and weigh the disclosure provided by the fund in its prospectus and other public disclosures, have chosen to invest in this fund, which is part of the Fidelity family of funds.
Nature, Extent, and Quality of Services Provided . The Board considered Fidelity's staffing as it relates to the fund, including the backgrounds of investment personnel of Fidelity, and also considered the fund's investment objective, strategies, and related investment philosophy. The Independent Trustees also had discussions with senior management of Fidelity's investment operations and investment groups. The Board considered the structure of the investment personnel compensation program and whether this structure provides appropriate incentives to act in the best interests of the fund. Additionally, the Board considered the portfolio managers' investments, if any, in the funds that they manage. The Board also considered the steps Fidelity had taken to ensure the continued provision of high quality services to the Fidelity funds throughout the COVID-19 pandemic, including the expansion of staff in client facing positions to maintain service levels in periods of high volumes and volatility.
Resources Dedicated to Investment Management and Support Services. The Board reviewed the general qualifications and capabilities of Fidelity's investment staff, including its size, education, experience, and resources, as well as Fidelity's approach to recruiting, managing, training, and compensating investment personnel. The Board noted the resources devoted to Fidelity's global investment organization, and that Fidelity's analysts have extensive resources, tools and capabilities that allow them to conduct quantitative and fundamental analysis, as well as credit analysis of issuers, counterparties and guarantors. Further, the Board considered that Fidelity's investment professionals have sufficient access to global information and data so as to provide competitive investment results over time, and that those professionals also have access to sophisticated tools that permit them to assess portfolio construction and risk and performance attribution characteristics continuously, as well as to transmit new information and research conclusions rapidly around the world. Additionally, in its deliberations, the Board considered Fidelity's trading, risk management, compliance, cybersecurity, and technology and operations capabilities and resources, which are integral parts of the investment management process.
Shareholder and Administrative Services. The Board considered (i) the nature, extent, quality, and cost of advisory, administrative, and shareholder services performed by the Investment Advisers and their affiliates under the Advisory Contracts and under separate agreements covering transfer agency and pricing and bookkeeping services for the fund; (ii) the nature and extent of the supervision of third party service providers, principally custodians, subcustodians, and pricing vendors; and (iii) the resources devoted to, and the record of compliance with, the fund's compliance policies and procedures.
The Board noted that the growth of fund assets over time across the complex allows Fidelity to reinvest in the development of services designed to enhance the value and convenience of the Fidelity funds as investment vehicles. These services include 24-hour access to account information and market information over the Internet and through telephone representatives, investor education materials and asset allocation tools. The Board also considered that it reviews customer service metrics such as telephone response times, continuity of services on the website and metrics addressing services at Fidelity Investor Centers.
Investment in a Large Fund Family. The Board considered the benefits to shareholders of investing in a Fidelity fund, including the benefits of investing in a fund that is part of a large family of funds offering a variety of investment disciplines and providing a large variety of mutual fund investor services. The Board noted that Fidelity had taken, or had made recommendations to the Board that resulted in the Fidelity funds taking, a number of actions over the previous year that benefited particular funds, including: (i) continuing to dedicate additional resources to Fidelity's investment research process, which includes meetings with management of issuers of securities in which the funds invest; (ii) continuing efforts to enhance Fidelity's global research capabilities; (iii) launching new funds, ETFs, and share classes with innovative structures, strategies and pricing and making other enhancements to meet investor needs; (iv) broadening eligibility requirements for certain funds and share classes; (v) reducing management fees and total expenses for certain funds and classes; (vi) lowering expenses for certain existing funds and classes by implementing or lowering expense caps; (vii) rationalizing product lines and gaining increased efficiencies from fund mergers and liquidations; (viii) continuing to develop, acquire and implement systems and technology to improve services to the funds and shareholders, strengthen information security, and increase efficiency; and (ix) continuing to implement enhancements to further strengthen Fidelity's product line to increase investors' probability of success in achieving their investment goals, including their retirement income goals.
Investment Performance . The Board considered whether the fund has operated in accordance with its investment objective, as well as its record of compliance with its investment restrictions and its performance history.
The Board took into account discussions that occur at Board meetings throughout the year with representatives of the Investment Advisers about fund investment performance. In this regard the Board noted that as part of regularly scheduled fund reviews and other reports to the Board on fund performance, the Board considers annualized return information for the fund for different time periods, measured against an appropriate securities market index (benchmark index) and an appropriate peer group of funds with similar objectives (peer group). The Board also receives and considers information about performance attribution. In its evaluation of fund investment performance at meetings throughout the year, the Board gave particular attention to information indicating underperformance of certain Fidelity funds for specific time periods and discussed with the Investment Advisers the reasons for such underperformance.
In addition to reviewing absolute and relative fund performance, the Independent Trustees periodically consider the appropriateness of fund performance metrics in evaluating the results achieved. In general, the Independent Trustees believe that fund performance should be evaluated based on gross performance (before fees and expenses but after transaction costs) compared to appropriate benchmark indices, over appropriate time periods that may include full market cycles, and on net performance (after fees and expenses) compared to appropriate peer groups, as applicable, over the same periods, taking into account relevant factors including the following: general market conditions; expectations for interest rate levels and credit conditions; issuer-specific information including credit quality; the potential for incremental return versus the fund's benchmark index weighed against the risks involved in obtaining that incremental return, including the risk of diminished or negative total returns; and fund cash flows and other factors. The Independent Trustees generally give greater weight to fund performance over longer time periods than over shorter time periods. Depending on the circumstances, the Independent Trustees may be satisfied with a fund's performance notwithstanding that it lags its benchmark index or peer group for certain periods.
The Independent Trustees recognize that shareholders evaluate performance on a net basis over their own holding periods, for which one-, three-, and five-year periods are often used as a proxy. For this reason, the performance information reviewed by the Board also included net cumulative calendar year total return information for the representative class (the retail class) and an appropriate benchmark index and peer group for the most recent one-, three-, and five-year periods.
Based on its review, the Board concluded that the nature, extent, and quality of services provided to the fund under the Advisory Contracts should continue to benefit the shareholders of the fund.
Competitiveness of Management Fee and Total Expense Ratio . The Board considered the fund's management fee and total expense ratio compared to selected groups of competitive funds and classes (referred to as "mapped groups" below) for the purpose of facilitating the Trustees' competitive analysis of management fees and total expenses. Fidelity creates "mapped groups" by combining similar investment objective categories (as classified by Lipper) that have comparable investment mandates. Combining funds with similar investment objective categories aids the Board's comparison of management fees and total expense ratios by broadening the competitive group used for such comparison.
Management Fee. The Board considered two proprietary management fee comparisons for the 12-month periods shown in basis points (BP) in the chart below. The group of Lipper funds used by the Board for management fee comparisons is referred to below as the "Total Mapped Group" and is broader than the Lipper peer group used by the Board for performance comparisons. The Total Mapped Group comparison focuses on a fund's standing in terms of gross management fees before expense reimbursements or caps relative to the total universe of funds with comparable investment mandates, regardless of whether their management fee structures also are comparable. Funds with comparable investment mandates offer exposure to similar types of securities. Funds with comparable management fee structures have similar management fee contractual arrangements (e.g., flat rate charged for advisory services, all-inclusive fee rate, etc.). "TMG %" represents the percentage of funds in the Total Mapped Group that had management fees that were lower than the fund's. For example, a hypothetical TMG % of 20% would mean that 80% of the funds in the Total Mapped Group had higher, and 20% had lower, management fees than the fund. The fund's actual TMG %s and the number of funds in the Total Mapped Group are in the chart below. The "Asset-Sized Peer Group" (ASPG) comparison focuses on a fund's standing relative to a subset of non-Fidelity funds within the Total Mapped Group that are similar in size and management fee structure. For example, if a fund is in the first quartile of the ASPG, the fund's management fee ranks in the least expensive or lowest 25% of funds in the ASPG. The ASPG represents at least 15% of the funds in the Total Mapped Group with comparable asset size and management fee structures, subject to a minimum of 50 funds (or all funds in the Total Mapped Group if fewer than 50). Additional information, such as the ASPG quartile in which the fund's management fee rate ranked, is also included in the chart and was considered by the Board.
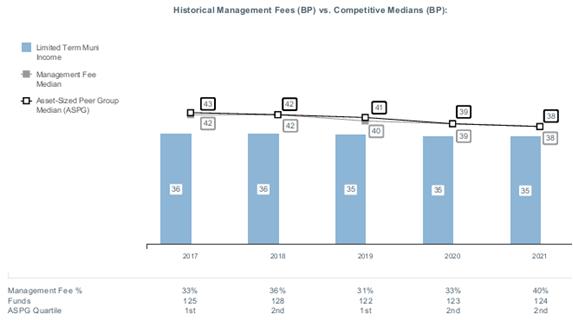
The Board noted that the fund's management fee rate ranked below the median of its Total Mapped Group and below the median of its ASPG for 2021.
Based on its review, the Board concluded that the fund's management fee is fair and reasonable in light of the services that the fund receives and the other factors considered.
Total Expense Ratio. In its review of the total expense ratio of the representative class (the retail class) of the fund, the Board considered the fund's management fee rate as well as other fund or class expenses, as applicable, such as transfer agent fees, pricing and bookkeeping fees, fund-paid 12b-1 fees, and custodial, legal, and audit fees. The Board also noted that Fidelity may agree to waive fees or reimburse expenses from time to time, and the extent to which, if any, it has done so for the fund. The fund's representative class is compared to those funds and classes in the Total Mapped Group (used by the Board for management fee comparisons) that have a similar sales load structure. The Board also considered a total expense ASPG comparison, which focuses on the total expenses of the representative class relative to a subset of non-Fidelity funds within the similar sales load structure group that are similar in size and management fee structure. The total expense ASPG is limited to 15 larger and 15 smaller classes of different funds, where possible. The total expense ASPG comparison excludes performance adjustments and fund-paid 12b-1 fees to eliminate variability in expenses relating to these items.
The Board noted that the total net expense ratio of the retail class ranked below the similar sales load structure group competitive median for 2021 and below the ASPG competitive median for 2021.
The Board further considered that FMR has contractually agreed to reimburse Class A, Class M, Class C, Class I, Class Z, and the retail class of the fund to the extent that total operating expenses, with certain exceptions, as a percentage of their respective average net assets, exceed 0.66%, 0.65%, 1.38%, 0.37%, 0.31%, and 0.37% through April 30, 2023.
Fees Charged to Other Fidelity Clients. The Board also considered Fidelity fee structures and other information with respect to clients of Fidelity, such as other funds advised or subadvised by Fidelity, pension plan clients, and other institutional clients with similar mandates. The Board noted that a joint ad hoc committee created by it and the boards of other Fidelity funds periodically reviews and compares Fidelity's institutional investment advisory business with its business of providing services to the Fidelity funds and also noted the most recent findings of the committee. The Board noted that the committee's review included a consideration of the differences in services provided, fees charged, and costs incurred, as well as competition in the markets serving the different categories of clients.
Based on its review of total expense ratios and fees charged to other Fidelity clients, the Board concluded that the total expense ratio of each class of the fund was reasonable in light of the services that the fund and its shareholders receive and the other factors considered.
Costs of the Services and Profitability. The Board considered the revenues earned and the expenses incurred by Fidelity in conducting the business of developing, marketing, distributing, managing, administering and servicing the fund and servicing the fund's shareholders. The Board also considered the level of Fidelity's profits in respect of all the Fidelity funds.
On an annual basis, Fidelity presents to the Board information about the profitability of its relationships with the fund. Fidelity calculates profitability information for each fund, as well as aggregate profitability information for groups of Fidelity funds and all Fidelity funds, using a series of detailed revenue and cost allocation methodologies which originate with the books and records of Fidelity on which Fidelity's audited financial statements are based. The Audit Committee of the Board reviews any significant changes from the prior year's methodologies and the full Board approves such changes.
A public accounting firm has been engaged annually by the Board as part of the Board's assessment of Fidelity's profitability analysis. The engagement includes the review and assessment of the methodologies used by Fidelity in determining the revenues and expenses attributable to Fidelity's mutual fund business, and completion of agreed-upon procedures in respect of the mathematical accuracy of certain fund profitability information and its conformity to established allocation methodologies. After considering the reports issued under the engagement and information provided by Fidelity, the Board concluded that while other allocation methods may also be reasonable, Fidelity's profitability methodologies are reasonable in all material respects.
The Board also reviewed Fidelity's non-fund businesses and potential indirect benefits such businesses may have received as a result of their association with Fidelity's mutual fund business (i.e., fall-out benefits) as well as cases where Fidelity's affiliates may benefit from the funds' business. The Board considered areas where potential indirect benefits to the Fidelity funds from their relationships with Fidelity may exist. The Board's consideration of these matters was informed by the findings of a joint ad hoc committee created by it and the boards of other Fidelity funds to evaluate potential fall-out benefits.
The Board considered the costs of the services provided by and the profits realized by Fidelity in connection with the operation of the fund and was satisfied that the profitability was not excessive.
Economies of Scale . The Board considered whether there have been economies of scale in respect of the management of the Fidelity funds, whether the Fidelity funds (including the fund) have appropriately benefited from any such economies of scale, and whether there is potential for realization of any further economies of scale. The Board considered the extent to which the fund will benefit from economies of scale as assets grow through increased services to the fund, through waivers or reimbursements, or through fee or expense ratio reductions. The Board also noted that a committee (the Economies of Scale Committee) created by it and the boards of other Fidelity funds periodically analyzes whether Fidelity attains economies of scale in respect of the management and servicing of the Fidelity funds, whether the Fidelity funds have appropriately benefited from such economies of scale, and whether there is potential for realization of any further economies of scale.
The Board recognized that the fund's management contract incorporates a "group fee" structure, which provides for lower group fee rates as total "group assets" increase, and for higher group fee rates as total "group assets" decrease ("group assets" as defined in the management contract). FMR calculates the group fee rates based on a tiered asset "breakpoint" schedule that varies based on asset class. The Board considered that the group fee is designed to deliver the benefits of economies of scale to fund shareholders when total Fidelity fund assets increase, even if assets of any particular fund are unchanged or have declined, because some portion of Fidelity's costs are attributable to services provided to all Fidelity funds, and all funds benefit if those costs can be allocated among more assets. The Board also considered that Fidelity agreed to impose a temporary fee waiver in the form of additional breakpoints to the current breakpoint schedule. The Board concluded that, given the group fee structure, fund shareholders will benefit from lower management fees as "group assets" increase at the fund complex level, regardless of whether Fidelity achieves any such economies of scale.
The Board concluded, taking into account the analysis of the Economies of Scale Committee, that economies of scale, if any, are being appropriately shared between fund shareholders and Fidelity.
Additional Information Requested by the Board . In order to develop fully the factual basis for consideration of the Fidelity funds' advisory contracts, the Board requested and received additional information on certain topics, including: (i) Fidelity's fund profitability methodology, profitability trends for certain funds, the allocation of various costs to different funds, and the impact of certain factors on fund profitability results; (ii) portfolio manager changes that have occurred during the past year and the amount of the investment that each portfolio manager has made in the Fidelity fund(s) that he or she manages; (iii) the extent to which current market conditions have affected retention and recruitment of personnel; (iv) the arrangements with and compensation paid to certain fund sub-advisers on behalf of the Fidelity funds and the treatment of such compensation within Fidelity's fund profitability methodology; (v) the terms of the funds' various management fee structures, including the basic group fee and the terms of Fidelity's voluntary expense limitation arrangements; (vi) Fidelity's transfer agent, pricing and bookkeeping fees, expense and service structures for different funds and classes relative to competitive trends; (vii) the impact on fund profitability of recent industry trends, such as the growth in passively managed funds and the changes in flows for different types of funds; (viii) the types of management fee and total expense comparisons provided, and the challenges and limitations associated with such information; and (ix) explanations regarding the relative total expense ratios and management fees of certain funds and classes, total expense and management fee competitive trends, and methodologies for total expense and management fee competitive comparisons. In addition, the Board considered its discussions with Fidelity regarding Fidelity's efforts to maintain the continuous investment and shareholder services necessary for the funds during the current pandemic and economic circumstances.
Based on its evaluation of all of the conclusions noted above, and after considering all factors it believed relevant, the Board concluded that the advisory fee arrangements are fair and reasonable and that the fund's Advisory Contracts should be renewed.
1.536709.126
STM-ANN-0323
Fidelity® Conservative Income Municipal Bond Fund
Annual Report
December 31, 2022
Contents
To view a fund's proxy voting guidelines and proxy voting record for the 12-month period ended June 30, visit http://www.fidelity.com/proxyvotingresults or visit the Securities and Exchange Commission's (SEC) web site at http://www.sec.gov.
You may also call 1-800-544-8544 to request a free copy of the proxy voting guidelines.
Standard & Poor's, S&P and S&P 500 are registered service marks of The McGraw-Hill Companies, Inc. and have been licensed for use by Fidelity Distributors Corporation.
Other third-party marks appearing herein are the property of their respective owners.
All other marks appearing herein are registered or unregistered trademarks or service marks of FMR LLC or an affiliated company. © 2023 FMR LLC. All rights reserved.
This report and the financial statements contained herein are submitted for the general information of the shareholders of the Fund. This report is not authorized for distribution to prospective investors in the Fund unless preceded or accompanied by an effective prospectus.
A fund files its complete schedule of portfolio holdings with the SEC for the first and third quarters of each fiscal year on Form N-PORT. Forms N-PORT are available on the SEC's web site at http://www.sec.gov. A fund's Forms N-PORT may be reviewed and copied at the SEC's Public Reference Room in Washington, DC. Information regarding the operation of the SEC's Public Reference Room may be obtained by calling 1-800-SEC-0330.
For a complete list of a fund's portfolio holdings, view the most recent holdings listing, semiannual report, or annual report on Fidelity's web site at http://www.fidelity.com, http://www.institutional.fidelity.com, or http://www.401k.com, as applicable.
NOT FDIC INSURED •MAY LOSE VALUE •NO BANK GUARANTEE
Neither the Fund nor Fidelity Distributors Corporation is a bank.
Average annual total return reflects the change in the value of an investment, assuming reinvestment of distributions from dividend income and capital gains (the profits earned upon the sale of securities that have grown in value, if any) and assuming a constant rate of performance each year. The hypothetical investment and the average annual total returns do not reflect the deduction of taxes that a shareholder would pay on fund distributions or the redemption of fund shares. During periods of reimbursement by Fidelity, a fund's total return will be greater than it would be had the reimbursement not occurred. How a fund did yesterday is no guarantee of how it will do tomorrow.
| Average Annual Total Returns |
| | | | |
Periods ended December 31, 2022 | Past 1 year | Past 5 years | Life of Fund A |
| Fidelity® Conservative Income Municipal Bond Fund | 0.17% | 0.85% | 0.69% |
| Institutional Class | 0.27% | 0.95% | 0.79% |
A From October 15, 2013
| $10,000 Over Life of Fund |
| |
Let's say hypothetically that $10,000 was invested in Fidelity® Conservative Income Municipal Bond Fund, a class of the fund, on October 15, 2013, when the fund started. The chart shows how the value of your investment would have changed, and also shows how the Bloomberg Municipal Bond 1 Year (1-2 Y) Index performed over the same period. |
|
|
Market Recap:
Tax-exempt municipal bonds notably declined in 2022, as a multitude of crosscurrents challenged the global economy and financial markets. The Bloomberg Municipal Bond Index returned -8.53% for the year, its third-worst annual return on record. In late 2021, the Federal Reserve began its pivot to a tighter monetary policy, tapering the large-scale asset purchases it restarted in 2020 amid the COVID-19 pandemic. In early 2022, the Fed, faced with persistent inflationary pressure, began implementing an aggressive series of rate hikes, raising its benchmark interest rate seven times, by a total of 4.25 percentage points, between March and December. This helped push municipal bond yields to their highest level in more than a decade. Muni bond prices, which move inversely to yields, fell sharply. Credit spreads significantly widened, as investors demanded more yield for lower-quality munis as recession risk increased. In November and December, the tax-exempt market staged a rally when comments by Fed Chair Jerome Powell pointed to a slowdown in the pace of rate hikes and inflation data moderated. Favorable supply and demand dynamics also helped amid muted muni bond issuance and increased pockets of demand. Muni tax-backed credit fundamentals remained solid throughout the year and, for the most part, the risk of credit-rating downgrades appeared low. Shorter-duration (lower sensitivity to changes in interest rates) and higher-credit-quality munis performed best for the year.
Comments from Co-Portfolio Managers Elizah McLaughlin, Ryan Brogran and Michael Maka:
For the fiscal year ending December 31, 2022, the fund's share classes (excluding sales charges, if any) had gains from about 0.2% to about 0.3%, roughly in line with the 0.01% result of the Composite index, an equal-weighted blend of the benchmark, the Bloomberg Municipal Bond 1 Year (1-2Y) Index, and the iMoneyNet Tax-Free National Retail Blend Index. The past 12 months, we continued to focus on longer-term objectives and sought to generate attractive tax-exempt income and a competitive risk-adjusted return. Versus the Composite index, the fund's duration (interest rate) positioning contributed to performance. The fund had less sensitivity to interest rates, as measured by its shorter duration, than the index and therefore was hurt less as interest rates rose. An overweight to variable-rate securities also contributed to relative performance, given that these securities outperformed fixed-rate securities for most of the year amid rising interest rates. In contrast, an overweight in lower-rated, investment-grade bonds was a key detractor, as they lagged the Composite index as credit spreads widened. Larger-than-index exposure to industrial development securities and gas pre-pay bonds, two segments that trailed the index, detracted as well. Relative performance also was crimped by the fund's exposure to bonds with a mandatory tender structure, which lagged the index. Differences in the way fund holdings and index components were priced further hindered relative performance.
The views expressed above reflect those of the portfolio manager(s) only through the end of the period as stated on the cover of this report and do not necessarily represent the views of Fidelity or any other person in the Fidelity organization. Any such views are subject to change at any time based upon market or other conditions and Fidelity disclaims any responsibility to update such views. These views may not be relied on as investment advice and, because investment decisions for a Fidelity fund are based on numerous factors, may not be relied on as an indication of trading intent on behalf of any Fidelity fund.
| Top Five States (% of Fund's net assets) |
| | |
| Texas | 12.0 |
| California | 10.4 |
| Illinois | 8.3 |
| New York | 7.8 |
| Georgia | 5.2 |
| | |
| Revenue Sources (% of Fund's net assets) |
| Synthetics | 30.2% | |
| Industrial Development | 12.8% | |
| General Obligations | 12.6% | |
| Resource Recovery | 7.4% | |
| State G.O. | 7.2% | |
| Transportation | 7.0% | |
| Electric Utilities | 6.9% | |
| Others* (Individually Less Than 5%) | 15.9% | |
| | 100.0% | |
| |
| *Includes net other assets | | |
Quality Diversification (% of Fund's net assets) |
|
| |
| We have used ratings from Moody's Investors Service, Inc. Where Moody's® ratings are not available, we have used S&P® ratings. All ratings are as of the date indicated and do not reflect subsequent changes. |
| Maturity Diversification (% of Fund's Investments) |
| Days |
| 1 - 7 | 44.6 | |
| 8 - 30 | 4.7 | |
| 31 - 60 | 11.6 | |
| 61 - 90 | 0.7 | |
| 91 - 180 | 6.8 | |
| > 180 | 31.6 | |
| The date shown for securities represents the date when principal payments must be paid, taking into account any call options exercised by the issuer and any permissible maturity shortening features other than interest rate resets. |
Showing Percentage of Net Assets
| Municipal Bonds - 47.6% |
| | | Principal Amount (a) | Value ($) |
| Alabama - 0.9% | | | |
| Black Belt Energy Gas District: | | | |
| Bonds Series 2018 A, 4%, tender 12/1/23 (b) | | 3,400,000 | 3,403,139 |
| Series 2021 C1, 4% 12/1/23 | | 1,400,000 | 1,398,581 |
| Series 2022 C: | | | |
5.25% 12/1/23 | | 530,000 | 534,881 |
5.25% 6/1/24 | | 145,000 | 147,115 |
| Series 2022 C1: | | | |
5.25% 12/1/24 | | 405,000 | 413,475 |
5.25% 12/1/25 | | 530,000 | 547,175 |
5.25% 6/1/26 | | 1,225,000 | 1,269,237 |
| Series 2022 E: | | | |
5% 6/1/23 | | 255,000 | 256,205 |
5% 6/1/24 | | 1,520,000 | 1,546,618 |
5% 6/1/25 | | 1,585,000 | 1,634,497 |
5% 6/1/26 | | 2,185,000 | 2,277,762 |
| Mobile Indl. Dev. Board Poll. Cont. Rev. Bonds (Alabama Pwr. Co. Barry Plant Proj.) Series 2008, 2.9%, tender 12/12/23 (b) | | 600,000 | 596,406 |
| Southeast Alabama Gas Supply District Bonds: | | | |
| (Proj. No. 2) Series 2018 A, 4%, tender 6/1/24 (b) | | 7,015,000 | 6,990,415 |
| Series 2018 A, 4%, tender 4/1/24 (b) | | 1,185,000 | 1,183,140 |
| Southeast Energy Auth. Rev. Bonds (Proj. No. 2) Series 2021 B1: | | | |
| 4% 6/1/24 | | 510,000 | 510,610 |
| 4% 6/1/25 | | 615,000 | 617,330 |
TOTAL ALABAMA | | | 23,326,586 |
| Alaska - 0.1% | | | |
| Alaska Int'l. Arpts. Revs. Series 2021 C, 5% 10/1/25 (c) | | 1,695,000 | 1,765,867 |
| Arizona - 1.6% | | | |
| Arizona Health Facilities Auth. Rev. (Scottsdale Lincoln Hospitals Proj.) Series 2014 A, 5% 12/1/24 | | 1,000,000 | 1,036,675 |
| Chandler Indl. Dev. Auth. Indl. Dev. Rev. Bonds (Intel Corp. Proj.): | | | |
| Series 2007, 2.7%, tender 8/14/23 (b)(c) | | 2,050,000 | 2,036,540 |
| Series 2019, 5%, tender 6/3/24 (b)(c) | | 32,185,000 | 32,698,125 |
| Coconino County Poll. Cont. Corp. Rev. Bonds Series 2017 A, 1.875%, tender 3/31/23 (b)(c) | | 1,450,000 | 1,443,650 |
| Maricopa County Rev. Bonds Series C, 5%, tender 10/18/24 (b) | | 945,000 | 971,373 |
| Phoenix Civic Impt. Board Arpt. Rev.: | | | |
| Series 2013, 5% 7/1/23 (c) | | 525,000 | 528,488 |
| Series 2017 A, 5% 7/1/23 (c) | | 500,000 | 503,322 |
| Yuma Pledged Rev. Series 2021: | | | |
| 4% 7/1/23 | | 325,000 | 326,537 |
| 4% 7/1/24 | | 300,000 | 304,757 |
TOTAL ARIZONA | | | 39,849,467 |
| California - 2.7% | | | |
| California Muni. Fin. Auth. Solid Waste Disp. Rev. Bonds: | | | |
| (Republic Svcs., Inc. Proj.): | | | |
Series 2021 A, 3.875%, tender 4/3/23 (b)(c) | | 7,300,000 | 7,298,447 |
Series 2021 B, 2.35%, tender 1/17/23 (b)(c) | | 22,300,000 | 22,287,233 |
| (Waste Mgmt., Inc. Proj.): | | | |
Series 2009 A, 1.3%, tender 2/3/25 (b)(d) | | 750,000 | 706,664 |
Series 2020, 3.5%, tender 3/1/23 (b)(c) | | 600,000 | 599,450 |
| California Poll. Cont. Fing. Auth. Solid Waste Disp. Rev. Bonds (Republic Svcs., Inc. Proj.): | | | |
| Series 2010 A, 4.1%, tender 2/1/23 (b)(c)(d) | | 4,600,000 | 4,600,356 |
| Series 2017 A2, 3.875%, tender 1/17/23 (b)(c)(d) | | 6,600,000 | 6,599,796 |
| California Pub. Works Board Lease Rev. (Various Cap. Projs.) Series 2022 C, 5% 8/1/24 | | 1,925,000 | 1,994,232 |
| California Statewide Cmntys. Dev. Auth. Series 2021, 4% 5/15/23 | | 2,500,000 | 2,506,183 |
| Los Angeles Dept. Arpt. Rev.: | | | |
| Series 2017 B, 5% 5/15/23 (c) | | 1,700,000 | 1,709,671 |
| Series 2019 A: | | | |
5% 5/15/23 (c) | | 1,865,000 | 1,875,610 |
5% 5/15/24 (c) | | 705,000 | 721,521 |
| Series 2020 C, 5% 5/15/24 (c) | | 500,000 | 511,717 |
| Series 2022 C: | | | |
5% 5/15/25 (c) | | 1,475,000 | 1,529,957 |
5% 5/15/26 (c) | | 3,595,000 | 3,775,959 |
| Series B, 5% 5/15/24 (c) | | 1,065,000 | 1,089,957 |
| San Diego County Reg'l. Arpt. Auth. Arpt. Rev. Series 2019 B: | | | |
| 5% 7/1/23 (c) | | 500,000 | 503,322 |
| 5% 7/1/24 (c) | | 500,000 | 511,129 |
| San Francisco City & County Arpts. Commission Int'l. Arpt. Rev.: | | | |
| Series 2013 A, 5% 5/1/23 (Escrowed to Maturity) (c) | | 1,310,000 | 1,318,317 |
| Series 2017 D, 5% 5/1/24 (c) | | 1,000,000 | 1,020,725 |
| Series 2019 H, 5% 5/1/24 (Escrowed to Maturity) (c) | | 550,000 | 563,847 |
| San Jose Int. Arpt. Rev.: | | | |
| Series 2014 A, 5% 3/1/23 (Escrowed to Maturity) (c) | | 3,500,000 | 3,510,866 |
| Series 2021 B, 5% 3/1/25 | | 375,000 | 393,187 |
| Vernon Elec. Sys. Rev. Series 2021 A, 5% 10/1/23 | | 1,350,000 | 1,360,426 |
TOTAL CALIFORNIA | | | 66,988,572 |
| Colorado - 0.5% | | | |
| Colorado Health Facilities Auth. Rev. Bonds: | | | |
| Bonds Series 2016 C: | | | |
5%, tender 11/15/23 (b) | | 440,000 | 446,153 |
5%, tender 11/15/23 (b) | | 155,000 | 157,473 |
| Series 2022 A: | | | |
5% 11/1/23 | | 400,000 | 405,054 |
5% 11/1/24 | | 430,000 | 443,206 |
5% 11/1/25 | | 400,000 | 417,607 |
| Colorado Univ. Co. Hosp. Auth. Rev. Bonds Series 2019 C, 5%, tender 11/15/24 (b) | | 700,000 | 717,442 |
| Denver City & County Arpt. Rev.: | | | |
| Series 2012 A, 5% 11/15/23 (c) | | 500,000 | 500,525 |
| Series 2016 A, 5% 11/15/23 | | 675,000 | 686,871 |
| Series 2017 A, 5% 11/15/24 (c) | | 825,000 | 850,217 |
| Series 2022 A: | | | |
5% 11/15/24 (c) | | 1,000,000 | 1,030,566 |
5% 11/15/25 (c) | | 1,850,000 | 1,934,731 |
| Series 2022 D: | | | |
5% 11/15/25 (c) | | 2,000,000 | 2,091,601 |
5.25% 11/15/26 (c) | | 3,500,000 | 3,731,761 |
| Vauxmont Metropolitan District Series 2020, 5% 12/1/23 (Assured Guaranty Muni. Corp. Insured) | | 195,000 | 198,092 |
TOTAL COLORADO | | | 13,611,299 |
| Connecticut - 2.4% | | | |
| Connecticut Gen. Oblig.: | | | |
| Series 2013 A, 4.65% 3/1/25 (b) | | 1,075,000 | 1,086,875 |
| Series 2016 B: | | | |
5% 5/15/23 | | 1,470,000 | 1,480,774 |
5% 5/15/25 | | 505,000 | 531,817 |
| Series 2016 D, 5% 8/15/23 | | 600,000 | 607,582 |
| Series 2016 E, 5% 10/15/23 | | 1,210,000 | 1,229,594 |
| Series 2019 A, 5% 4/15/23 | | 3,985,000 | 4,007,279 |
| Series 2020 B, 5% 1/15/23 | | 1,265,000 | 1,265,729 |
| Series 2021 D, 5% 7/15/24 | | 1,760,000 | 1,818,961 |
| Series 2022 A, 3% 1/15/23 | | 6,705,000 | 6,704,751 |
| Series A: | | | |
3% 1/15/23 | | 1,050,000 | 1,049,961 |
3% 1/15/24 | | 500,000 | 500,842 |
3% 4/15/24 | | 500,000 | 501,296 |
4% 1/15/24 | | 465,000 | 470,473 |
| Series C: | | | |
4% 6/1/23 | | 400,000 | 401,698 |
5% 12/15/23 | | 735,000 | 749,649 |
| Connecticut Health & Edl. Facilities Auth. Rev.: | | | |
| Bonds: | | | |
Series 1999 U2, 1.1%, tender 2/11/25 (b) | | 3,600,000 | 3,404,292 |
Series 2010 A3, 0.25%, tender 2/9/24 (b) | | 11,800,000 | 11,339,183 |
Series 2010 A4, 1.1%, tender 2/11/25 (b) | | 9,050,000 | 8,558,011 |
Series 2014 B, 1.8%, tender 7/1/24 (b) | | 980,000 | 948,447 |
| Series 2022 L, 5% 7/1/25 | | 450,000 | 471,601 |
| Series 2022 M, 5% 7/1/23 | | 175,000 | 176,035 |
| Connecticut Higher Ed. Supplemental Ln. Auth. Rev.: | | | |
| (Chesla Ln. Prog.) Series 2017 A, 5% 11/15/23 (Escrowed to Maturity) (c) | | 690,000 | 699,543 |
| (Chesla Loan Prog.) Series C, 5% 11/15/23 (Escrowed to Maturity) | | 225,000 | 229,077 |
| Connecticut Hsg. Fin. Auth.: | | | |
| Series A2: | | | |
0.35% 5/15/23 (c) | | 250,000 | 247,530 |
0.4% 11/15/23 (c) | | 300,000 | 293,248 |
| Series C, 5% 5/15/23 (c) | | 445,000 | 447,451 |
| Connecticut Spl. Tax Oblig. Trans. Infrastructure Rev.: | | | |
| Series 2021 C: | | | |
5% 1/1/23 | | 4,925,000 | 4,925,000 |
5% 1/1/24 | | 1,340,000 | 1,368,511 |
| Series A, 5% 5/1/23 | | 1,850,000 | 1,862,230 |
| Hartford Gen. Oblig. Series 2015 C, 5% 7/15/25 (Assured Guaranty Muni. Corp. Insured) | | 1,910,000 | 2,016,092 |
TOTAL CONNECTICUT | | | 59,393,532 |
| Delaware - 0.1% | | | |
| Delaware Econ. Dev. Auth. Rev. Bonds (Delmarva Pwr. & Lt. Co. Proj.) Series A, 1.05%, tender 7/1/25 (b) | | 580,000 | 549,076 |
| Delaware Trans. Auth. Grant Series 2020, 5% 9/1/24 | | 850,000 | 879,950 |
TOTAL DELAWARE | | | 1,429,026 |
| District Of Columbia - 0.6% | | | |
| District of Columbia Gen. Oblig.: | | | |
| Series 2021 D, 4% 2/1/24 | | 325,000 | 329,216 |
| Series 2021 E, 5% 2/1/23 | | 5,000,000 | 5,007,514 |
| Metropolitan Washington DC Arpts. Auth. Sys. Rev. Series 2020 A: | | | |
| 5% 10/1/23 (c) | | 1,910,000 | 1,929,504 |
| 5% 10/1/24 (c) | | 7,200,000 | 7,391,085 |
TOTAL DISTRICT OF COLUMBIA | | | 14,657,319 |
| Florida - 2.0% | | | |
| Broward County Arpt. Sys. Rev.: | | | |
| Series 2017, 5% 10/1/24 (c) | | 500,000 | 513,697 |
| Series 2019 A, 5% 10/1/23 (c) | | 1,250,000 | 1,263,223 |
| Duval County School Board Ctfs. of Prtn. Series 2022 A: | | | |
| 5% 7/1/25 (Assured Guaranty Muni. Corp. Insured) | | 2,795,000 | 2,939,476 |
| 5% 7/1/26 (Assured Guaranty Muni. Corp. Insured) | | 4,900,000 | 5,253,994 |
| Escambia County Poll. Cont. Rev. (Gulf Pwr. Co. Proj.) Series 2003, 2.6% 6/1/23 | | 5,150,000 | 5,129,702 |
| Florida Dev. Fin. Corp. Rev. Bonds (Brightline Florida Passenger Rail Expansion Proj.) Series 2021 A, 2.9%, tender 4/4/23 (b)(c) | | 11,000,000 | 10,968,617 |
| Greater Orlando Aviation Auth. Arpt. Facilities Rev. Series 2016 A, 5% 10/1/25 (Escrowed to Maturity) (c) | | 575,000 | 605,673 |
| Hillsborough Co. Sldwst and Resource Receivables Series 2016 A, 5% 9/1/26 (c) | | 2,260,000 | 2,385,369 |
| Hillsborough County Aviation Auth. Rev.: | | | |
| Series 2013 A, 5.5% 10/1/24 (Pre-Refunded to 10/1/23 @ 100) (c) | | 1,420,000 | 1,446,144 |
| Series 2018 E, 5% 10/1/23 (c) | | 225,000 | 227,793 |
| Series 2022 A: | | | |
5% 10/1/24 (c) | | 2,800,000 | 2,888,702 |
5% 10/1/25 (c) | | 755,000 | 787,976 |
| Jacksonville Spl. Rev. Series 2022 A: | | | |
| 5% 10/1/23 | | 260,000 | 263,957 |
| 5% 10/1/24 | | 580,000 | 602,178 |
| 5% 10/1/25 | | 455,000 | 481,985 |
| JEA Wtr. & Swr. Sys. Rev. Series A, 5% 10/1/23 | | 895,000 | 908,290 |
| Lee County Arpt. Rev. Series 2021 A: | | | |
| 5% 10/1/23 (c) | | 3,030,000 | 3,055,394 |
| 5% 10/1/24 (c) | | 1,530,000 | 1,562,533 |
| Miami-Dade County Aviation Rev.: | | | |
| Series 2012 A, 5% 10/1/24 | | 895,000 | 896,371 |
| Series 2020 A, 5% 10/1/23 | | 1,105,000 | 1,121,163 |
| Miami-Dade County Indl. Dev. Auth. Solid Waste Disp. Rev. Bonds (Waste Mgmt., Inc. of Florida Proj.) Series 2018, 0.4%, tender 8/1/23 (b)(c) | | 2,400,000 | 2,342,638 |
| Okeechobee County Solid Waste Rev. Bonds (Waste Mgmt., Inc.-Okeechobee Landfill Proj.) Series 2004 A, 0.55%, tender 7/1/24 (b) | | 1,500,000 | 1,410,710 |
| Orlando Utils. Commission Util. Sys. Rev. Series 2013 A, 5% 10/1/24 | | 500,000 | 519,119 |
| Pasco County School Board Ctfs. of Prtn. Series 2022 A, 5% 8/1/26 | | 1,045,000 | 1,119,962 |
TOTAL FLORIDA | | | 48,694,666 |
| Georgia - 4.2% | | | |
| Bartow County Dev. Auth. Poll. Cont. Rev. Bonds (Georgia Pwr. Co. Plant Bowen Proj.) Series 2009 1st, 2.75%, tender 3/15/23 (b) | | 12,025,000 | 12,001,376 |
| Burke County Indl. Dev. Auth. Poll. Cont. Rev. Bonds: | | | |
| (Georgia Pwr. Co. Plant Vogtle Proj.): | | | |
Series 1994, 2.25%, tender 5/25/23 (b) | | 1,300,000 | 1,292,729 |
Series 2012, 2.875%, tender 8/19/25 (b) | | 3,575,000 | 3,527,575 |
| Series 1995, 2.25%, tender 5/25/23 (b) | | 2,300,000 | 2,284,925 |
| Georgia Muni. Elec. Auth. Pwr. Rev.: | | | |
| Series 2020 A: | | | |
4% 11/1/23 | | 895,000 | 899,461 |
5% 1/1/23 | | 2,775,000 | 2,775,000 |
5% 1/1/23 | | 1,250,000 | 1,250,000 |
| Series 2021 A: | | | |
5% 1/1/24 | | 335,000 | 340,382 |
5% 1/1/25 (Assured Guaranty Muni. Corp. Insured) | | 200,000 | 206,998 |
| Series 2022 A: | | | |
5% 7/1/24 (Assured Guaranty Muni. Corp. Insured) | | 335,000 | 343,439 |
5% 7/1/25 (Assured Guaranty Muni. Corp. Insured) | | 350,000 | 365,515 |
5% 7/1/26 (Assured Guaranty Muni. Corp. Insured) | | 365,000 | 387,744 |
| Griffin-Spalding County Hosp. (WellStar Health Sys., Inc. Proj.) Series 2017 A, 5% 4/1/23 | | 250,000 | 250,923 |
| Main Street Natural Gas, Inc.: | | | |
| Bonds: | | | |
Series 2018 A, 4%, tender 9/1/23 (b) | | 6,305,000 | 6,303,011 |
Series 2018 B, 1 month U.S. LIBOR + 0.750% 3.51%, tender 1/4/23 (b)(e) | | 25,095,000 | 24,983,566 |
Series 2018 C, 4%, tender 12/1/23 (b) | | 2,490,000 | 2,488,116 |
Series 2018 E, SIFMA Municipal Swap Index + 0.570% 4.23%, tender 1/5/23 (b)(e) | | 40,430,000 | 40,293,929 |
Series 2019 B, 4%, tender 12/2/24 (b) | | 2,030,000 | 2,030,062 |
| Series 2018 A, 4% 3/1/23 | | 720,000 | 720,134 |
| Series 2022 A, 4% 12/1/25 | | 1,260,000 | 1,262,844 |
| Paulding County Hosp. Auth. Rev. Series 2022 A, 5% 4/1/23 | | 565,000 | 566,949 |
TOTAL GEORGIA | | | 104,574,678 |
| Guam - 0.2% | | | |
| Guam Pwr. Auth. Rev. Series 2022 A: | | | |
| 5% 10/1/23 | | 1,545,000 | 1,559,192 |
| 5% 10/1/24 | | 1,235,000 | 1,263,778 |
| 5% 10/1/25 | | 1,545,000 | 1,602,615 |
TOTAL GUAM | | | 4,425,585 |
| Hawaii - 0.0% | | | |
| State of Hawaii Dept. of Trans. Series 2013, 5% 8/1/23 (c) | | 1,250,000 | 1,261,828 |
| Illinois - 4.3% | | | |
| Champaign County Cmnty. Unit Series 2020 A, 0% 1/1/23 | | 200,000 | 200,000 |
| Chicago Metropolitan Wtr. Reclamation District of Greater Chicago Series 2021 C, 5% 12/1/23 | | 3,880,000 | 3,948,167 |
| Chicago O'Hare Int'l. Arpt. Rev.: | | | |
| Series 2013 A, 5% 1/1/23 (c) | | 4,535,000 | 4,535,000 |
| Series 2022 A, 5% 1/1/25 (c) | | 1,095,000 | 1,126,906 |
| Series 2022 C: | | | |
5% 1/1/25 (c) | | 2,250,000 | 2,315,559 |
5% 1/1/26 (c) | | 1,200,000 | 1,249,657 |
| Chicago Park District Gen. Oblig.: | | | |
| Series 2014 B, 5% 1/1/24 | | 615,000 | 625,484 |
| Series 2021 D: | | | |
4% 1/1/23 | | 375,000 | 375,000 |
4% 1/1/24 | | 100,000 | 100,736 |
| Series 2021 E, 4% 1/1/24 | | 1,340,000 | 1,349,869 |
| Chicago Transit Auth. Cap. Grant Receipts Rev. Series 2021: | | | |
| 5% 6/1/23 | | 550,000 | 553,651 |
| 5% 6/1/24 | | 625,000 | 640,616 |
| Cook County Gen. Oblig.: | | | |
| Series 2021 A: | | | |
5% 11/15/23 | | 390,000 | 395,320 |
5% 11/15/24 | | 450,000 | 464,497 |
| Series 2021 B, 4% 11/15/23 | | 1,560,000 | 1,568,122 |
| Series 2022 A: | | | |
5% 11/15/24 | | 5,940,000 | 6,131,355 |
5% 11/15/25 | | 4,370,000 | 4,605,637 |
| Cook County Sales Tax Rev. Series 2022 A, 5% 11/15/25 | | 675,000 | 713,871 |
| Illinois Dev. Fin. Auth. Solid Waste Disp. Rev. Bonds (Waste Mgmt., Inc. Proj.) Series 2019, 4.4%, tender 11/1/23 (b)(c) | | 9,750,000 | 9,777,124 |
| Illinois Fin. Auth. Series 2022 A, 5% 10/1/24 | | 160,000 | 161,838 |
| Illinois Gen. Oblig.: | | | |
| Series 2013 A, 5% 4/1/24 | | 1,705,000 | 1,712,264 |
| Series 2013, 5% 7/1/23 | | 3,265,000 | 3,286,345 |
| Series 2017 D, 5% 11/1/23 | | 5,300,000 | 5,354,988 |
| Series 2021 A, 5% 3/1/23 | | 230,000 | 230,490 |
| Series 2021 B, 5% 3/1/23 | | 275,000 | 275,586 |
| Series 2021 C, 4% 3/1/23 | | 6,960,000 | 6,964,010 |
| Series 2022 A: | | | |
5% 3/1/23 | | 1,060,000 | 1,062,259 |
5% 3/1/25 | | 2,070,000 | 2,113,577 |
| Series 2022 B: | | | |
5% 3/1/24 | | 4,105,000 | 4,161,965 |
5% 3/1/25 | | 10,270,000 | 10,486,202 |
5% 3/1/26 | | 6,060,000 | 6,224,224 |
| Series 2022 D1, 5% 3/1/23 | | 1,210,000 | 1,212,579 |
| Illinois Muni. Elec. Agcy. Pwr. Supply Series 2015 A, 5% 2/1/23 | | 280,000 | 280,331 |
| Illinois Reg'l. Trans. Auth. Series 2017 A, 5% 7/1/23 | | 595,000 | 600,491 |
| Illinois Sales Tax Rev.: | | | |
| Series 2021 A: | | | |
4% 6/15/23 | | 6,065,000 | 6,079,188 |
4% 6/15/24 | | 3,195,000 | 3,212,212 |
| Series 2021 C, 5% 6/15/25 | | 270,000 | 278,046 |
| Kendall, Kane & Will Counties Cmnty. Unit School District #308 Series 2011, 5.5% 2/1/23 | | 1,470,000 | 1,472,459 |
| Metropolitan Pier & Exposition: | | | |
| Series 2010 B1, 0% 6/15/26 (Assured Guaranty Muni. Corp. Insured) | | 1,130,000 | 998,787 |
| Series 2022 A, 3% 6/15/24 | | 1,870,000 | 1,853,807 |
| Railsplitter Tobacco Settlement Auth. Rev. Series 2017, 5% 6/1/23 | | 6,220,000 | 6,265,597 |
| Univ. of Illinois Board of Trustees Ctfs. of Prtn. Series 2014 C, 5% 3/15/23 | | 630,000 | 631,946 |
| Univ. of Illinois Rev. Series 2013 A, 5% 4/1/25 | | 250,000 | 250,923 |
TOTAL ILLINOIS | | | 105,846,685 |
| Indiana - 1.7% | | | |
| Indiana Dev. Fin. Auth. Envir. Rev. Bonds (Fulcrum Centerpoint, LLC Proj.) Series 2022, 4.5%, tender 11/15/23 (c) | | 26,350,000 | 26,333,342 |
| Indiana Dev. Fin. Auth. Solid Waste Disp. Rev. Bonds (Waste Mgmt., Inc. Proj.) Series 2001, 4%, tender 10/2/23 (b)(c) | | 2,500,000 | 2,504,715 |
| Indianapolis Local Pub. Impt.: | | | |
| (Indianapolis Arpt. Auth. Proj.): | | | |
Series 2015 I, 5% 1/1/23 (c) | | 1,660,000 | 1,660,000 |
Series 2016 A1, 5% 1/1/23 (c) | | 1,500,000 | 1,500,000 |
| Series 2021 A, 5% 6/1/23 | | 610,000 | 614,173 |
| Series 2022 G2: | | | |
5% 1/1/25 (c) | | 85,000 | 87,526 |
5% 1/1/26 (c) | | 405,000 | 423,282 |
| Whiting Envir. Facilities Rev. Bonds (BP Products North America, Inc. Proj.): | | | |
| Series 2016 A, 5%, tender 3/1/23 (b)(c) | | 8,700,000 | 8,711,359 |
| Series 2017, 5%, tender 11/1/24 (b)(c) | | 965,000 | 978,370 |
TOTAL INDIANA | | | 42,812,767 |
| Iowa - 0.0% | | | |
| Iowa Fin. Auth. Rev. Series 2018 B, 5% 2/15/23 | | 515,000 | 516,073 |
| Kentucky - 0.7% | | | |
| Kentucky Asset/Liability Commission Gen. Fund Rev. Series 2021 A, 5% 11/1/24 | | 1,000,000 | 1,039,010 |
| Kentucky State Property & Buildings Commission Rev.: | | | |
| Series 2016 B, 5% 11/1/23 | | 1,445,000 | 1,469,058 |
| Series 2017, 5% 4/1/23 | | 1,390,000 | 1,396,455 |
| Series 2018, 5% 5/1/23 | | 3,545,000 | 3,567,392 |
| Series A: | | | |
5% 8/1/23 | | 625,000 | 632,165 |
5% 11/1/23 | | 1,030,000 | 1,047,148 |
| Series B, 5% 8/1/23 | | 4,100,000 | 4,147,000 |
| Kentucky, Inc. Pub. Energy Bonds: | | | |
| Series 2018 A, 4%, tender 4/1/24 (b) | | 3,845,000 | 3,838,247 |
| Series C1, 4%, tender 6/1/25 (b) | | 585,000 | 579,601 |
| Louisville & Jefferson County Bonds Series 2020 B, 5%, tender 10/1/23 (b) | | 1,000,000 | 1,006,993 |
TOTAL KENTUCKY | | | 18,723,069 |
| Louisiana - 0.5% | | | |
| Louisiana Gen. Oblig. Series 2020 A, 5% 3/1/23 | | 835,000 | 837,659 |
| St. John Baptist Parish Rev. Bonds (Marathon Oil Corp.) Series 2017, 2%, tender 4/1/23 (b) | | 8,040,000 | 7,990,349 |
| Tobacco Settlement Fing. Corp. Series 2013 A, 5% 5/15/23 | | 2,700,000 | 2,718,720 |
TOTAL LOUISIANA | | | 11,546,728 |
| Maryland - 0.2% | | | |
| Maryland Dept. of Trans.: | | | |
| Series 2022 A, 5% 12/1/24 | | 550,000 | 574,025 |
| Series 2022 B, 5% 12/1/23 | | 635,000 | 647,361 |
| Maryland Gen. Oblig. Series 2 A, 5% 8/1/23 | | 1,130,000 | 1,143,666 |
| Maryland Stadium Auth. Built to Learn Rev. Series 2022 A: | | | |
| 5% 6/1/24 | | 730,000 | 750,479 |
| 5% 6/1/25 | | 905,000 | 950,116 |
TOTAL MARYLAND | | | 4,065,647 |
| Massachusetts - 2.7% | | | |
| Massachusetts Dept. of Trans. Metropolitan Hwy. Sys. Rev. Bonds Series 2019 A, 5%, tender 1/1/23 (b) | | 3,200,000 | 3,200,000 |
| Massachusetts Dev. Fin. Agcy. Rev.: | | | |
| Bonds: | | | |
Series 2019 DD 1, 5%, tender 4/1/24 (b) | | 1,070,000 | 1,085,493 |
Series 2019 DD 2, 5%, tender 4/1/24 (b) | | 2,295,000 | 2,328,230 |
Series S3, SIFMA Municipal Swap Index + 0.500% 4.16%, tender 1/5/23 (b)(e) | | 7,400,000 | 7,397,813 |
| Series 2016 I, 5% 7/1/25 | | 1,150,000 | 1,199,573 |
| Series 2021 I, 5% 10/1/24 | | 900,000 | 928,357 |
| Massachusetts Edl. Fing. Auth. Rev.: | | | |
| Series 2015 A, 5% 1/1/24 (c) | | 18,160,000 | 18,416,247 |
| Series 2017 A, 5% 7/1/25 (c) | | 1,430,000 | 1,479,838 |
| Series 2018 B, 5% 7/1/23 (c) | | 450,000 | 453,801 |
| Series 2020 C, 5% 7/1/24 (c) | | 600,000 | 612,040 |
| Series 2022 B: | | | |
5% 7/1/24 (c) | | 525,000 | 536,302 |
5% 7/1/25 (c) | | 1,125,000 | 1,165,840 |
| Massachusetts Gen. Oblig. Series 2021 B, 5% 11/1/23 | | 24,925,000 | 25,362,511 |
| Massachusetts Port Auth. Rev. Series 2017 A, 5% 7/1/23 (c) | | 2,660,000 | 2,684,028 |
TOTAL MASSACHUSETTS | | | 66,850,073 |
| Michigan - 0.9% | | | |
| Imlay City Cmnty. School District Series 2020 I, 4% 5/1/23 | | 555,000 | 556,566 |
| Michigan Fin. Auth. Rev.: | | | |
| (Detroit Reg'l. Convention Facility Auth. Local Proj.) Series 2014 H1, 5% 10/1/24 | | 1,895,000 | 1,923,706 |
| Series 2015 D1: | | | |
0.4% 10/15/23 | | 450,000 | 433,229 |
0.55% 10/15/24 | | 1,700,000 | 1,620,422 |
| Series 2022: | | | |
5% 4/15/25 | | 2,840,000 | 2,971,744 |
5% 4/15/26 | | 4,735,000 | 5,049,658 |
| Michigan Gen. Oblig. Series 2016, 5% 3/15/24 | | 500,000 | 513,113 |
| Michigan Hsg. Dev. Auth. Single Family Mtg. Rev. Series 2022 A: | | | |
| 1.95% 12/1/23 | | 975,000 | 963,636 |
| 2.5% 6/1/25 | | 1,215,000 | 1,195,624 |
| Oakland Univ. Rev.: | | | |
| Series 2022 A: | | | |
5% 3/1/23 | | 345,000 | 345,960 |
5% 3/1/24 | | 175,000 | 178,926 |
5% 3/1/25 | | 200,000 | 208,886 |
| Series 2022 B: | | | |
5% 3/1/24 | | 350,000 | 357,851 |
5% 3/1/25 | | 1,185,000 | 1,237,647 |
| South Lyon Cmnty. Schools Series 2016, 5% 5/1/23 | | 900,000 | 905,567 |
| Walled Lake Consolidated School District Series 2022, 4% 5/1/23 | | 1,670,000 | 1,675,256 |
| Wayne County Arpt. Auth. Rev. Series 2017 E, 4% 12/1/25 (c)(d) | | 1,725,000 | 1,744,034 |
TOTAL MICHIGAN | | | 21,881,825 |
| Minnesota - 0.4% | | | |
| Minneapolis & Saint Paul Metropolitan Arpts. Commission Arpt. Rev.: | | | |
| Series 2016 B, 5% 1/1/23 | | 1,400,000 | 1,400,000 |
| Series 2022 B: | | | |
5% 1/1/24 (c) | | 565,000 | 572,972 |
5% 1/1/25 (c) | | 370,000 | 380,781 |
5% 1/1/26 (c) | | 905,000 | 942,450 |
| Minnesota Hsg. Fin. Agcy.: | | | |
| Series 2022 A: | | | |
5% 8/1/23 | | 585,000 | 591,773 |
5% 8/1/24 | | 910,000 | 940,018 |
| Series 2022 B: | | | |
5% 8/1/24 | | 1,155,000 | 1,193,100 |
5% 8/1/25 | | 1,710,000 | 1,803,653 |
5% 8/1/26 | | 1,700,000 | 1,826,739 |
| Series H: | | | |
0.6% 7/1/23 (c) | | 225,000 | 221,768 |
0.7% 7/1/24 (c) | | 200,000 | 191,913 |
TOTAL MINNESOTA | | | 10,065,167 |
| Nebraska - 0.4% | | | |
| Central Plains Energy Proj. Gas Supply: | | | |
| Bonds Series 2019, 2.5%, tender 8/1/25 (b) | | 3,400,000 | 3,263,730 |
| Series 2019: | | | |
4% 2/1/23 | | 1,060,000 | 1,060,051 |
4% 8/1/23 | | 1,170,000 | 1,171,156 |
| Douglas County Neb Edl. Facilities Rev. (Creighton Univ. Projs.) Series 2017, 5% 7/1/23 | | 825,000 | 832,493 |
| Nebraska Pub. Pwr. District Rev.: | | | |
| Bonds Series 2020 A, 0.6%, tender 7/1/23 (b) | | 1,950,000 | 1,923,008 |
| Series 2017 B, 5% 1/1/25 | | 650,000 | 678,760 |
TOTAL NEBRASKA | | | 8,929,198 |
| Nevada - 0.7% | | | |
| Clark County Arpt. Rev. Series 2021 B, 5% 7/1/24 (c) | | 1,870,000 | 1,910,530 |
| Clark County Poll. Cont. Rev. Bonds Series 2017, 1.65%, tender 3/31/23 (b) | | 1,570,000 | 1,562,625 |
| Clark County School District: | | | |
| Series 2016 D, 5% 6/15/23 | | 2,715,000 | 2,738,382 |
| Series 2016 F, 4% 6/15/24 | | 500,000 | 500,389 |
| Series 2020 A, 3% 6/15/25 (Assured Guaranty Muni. Corp. Insured) | | 500,000 | 503,045 |
| Nevada Dept. of Bus. & Industry Bonds: | | | |
| (Republic Svcs., Inc. Proj.) Series 2001, 3.75%, tender 6/1/23 (b)(c)(d) | | 3,350,000 | 3,343,146 |
| Series 2020 A, 0.85%, tender 1/26/23 (b)(c)(d) | | 7,100,000 | 7,086,302 |
TOTAL NEVADA | | | 17,644,419 |
| New Hampshire - 0.2% | | | |
| Nat'l. Fin. Auth. Hosp. Rev. (St. Luke's Univ. Health Network Proj.) Series 2021 B, 5% 8/15/23 | | 405,000 | 409,005 |
| Nat'l. Fin. Auth. Solid Bonds (Waste Mgmt., Inc. Proj.) Series 2019 A2, 2.15%, tender 7/1/24 (b)(c) | | 4,000,000 | 3,853,028 |
TOTAL NEW HAMPSHIRE | | | 4,262,033 |
| New Jersey - 4.2% | | | |
| New Jersey Econ. Dev. Auth. Series 2022 A: | | | |
| 5% 11/1/24 | | 825,000 | 851,968 |
| 5% 11/1/25 | | 1,000,000 | 1,048,700 |
| New Jersey Econ. Dev. Auth. Rev.: | | | |
| Series 2012 II, 5% 3/1/23 | | 1,535,000 | 1,539,717 |
| Series 2013: | | | |
5% 3/1/23 | | 1,290,000 | 1,293,093 |
5% 3/1/24 | | 15,560,000 | 15,601,499 |
5% 3/1/25 | | 6,910,000 | 6,929,101 |
| Series 2014 UU, 5% 6/15/23 | | 675,000 | 679,821 |
| Series 2015 XX: | | | |
4% 6/15/24 | | 1,345,000 | 1,360,025 |
5% 6/15/23 | | 825,000 | 830,892 |
5% 6/15/24 | | 500,000 | 512,600 |
| Series 2016 AAA, 5% 6/15/23 | | 625,000 | 629,464 |
| Series 2018 FFF, 5% 6/15/23 | | 500,000 | 503,571 |
| Series 2019, 5.25% 9/1/24 (d) | | 9,740,000 | 10,064,642 |
| New Jersey Edl. Facility Series 2016 C, 5% 7/1/24 (Assured Guaranty Muni. Corp. Insured) | | 1,000,000 | 1,028,431 |
| New Jersey Gen. Oblig.: | | | |
| Series 2020 A: | | | |
4% 6/1/23 | | 11,190,000 | 11,233,415 |
5% 6/1/24 | | 1,080,000 | 1,111,656 |
5% 6/1/25 | | 4,700,000 | 4,948,893 |
| Series 2021, 2% 6/1/25 | | 1,585,000 | 1,536,672 |
| New Jersey Higher Ed. Student Assistance Auth. Student Ln. Rev.: | | | |
| Series 2016 1A: | | | |
5% 12/1/23 (c) | | 3,500,000 | 3,547,635 |
5% 12/1/24 (c) | | 4,400,000 | 4,531,630 |
| Series 2017 1A: | | | |
5% 12/1/24 (c) | | 1,500,000 | 1,543,193 |
5% 12/1/25 (c) | | 2,860,000 | 2,989,161 |
| Series 2019 A, 5% 12/1/24 | | 555,000 | 575,041 |
| Series 2020, 5% 12/1/24 (c) | | 1,100,000 | 1,131,264 |
| Series 2021 A, 5% 12/1/24 (c) | | 330,000 | 339,379 |
| Series 2022 A: | | | |
5% 12/1/24 (c) | | 430,000 | 442,221 |
5% 12/1/25 (c) | | 550,000 | 572,514 |
| Series 2022 B: | | | |
5% 12/1/24 (c) | | 885,000 | 910,153 |
5% 12/1/25 (c) | | 2,625,000 | 2,730,241 |
| New Jersey Hsg. & Mtg. Fin. Agcy. Multi-family Rev. Series 2021 B, 0.5% 11/1/23 | | 1,815,000 | 1,774,287 |
| New Jersey Tobacco Settlement Fing. Corp. Series 2018 A: | | | |
| 5% 6/1/23 | | 4,960,000 | 4,985,534 |
| 5% 6/1/24 | | 2,400,000 | 2,440,323 |
| 5% 6/1/25 | | 1,565,000 | 1,605,961 |
| New Jersey Trans. Trust Fund Auth.: | | | |
| Series 2006 C, 0% 12/15/24 (AMBAC Insured) | | 160,000 | 149,891 |
| Series 2010 A, 0% 12/15/25 | | 1,050,000 | 945,379 |
| Series 2010 D, 5.25% 12/15/23 | | 820,000 | 834,848 |
| Series 2014 AA, 5% 6/15/23 | | 2,850,000 | 2,870,355 |
| Series 2016 A1, 5% 6/15/24 | | 975,000 | 1,000,824 |
| Series 2016 A2, 5% 6/15/23 | | 1,000,000 | 1,007,543 |
| Series 2018 A: | | | |
5% 6/15/23 | | 3,240,000 | 3,264,438 |
5% 6/15/24 | | 1,205,000 | 1,236,916 |
| Series 2022 AA, 5% 6/15/24 | | 1,090,000 | 1,117,468 |
| Series A, 5.25% 12/15/23 | | 350,000 | 356,337 |
| Rutgers State Univ. Rev. Series 2018 N, 4% 5/1/23 | | 700,000 | 702,181 |
TOTAL NEW JERSEY | | | 105,308,877 |
| New Mexico - 0.1% | | | |
| New Mexico Edl. Assistance Foundation Series 2021 1A, 5% 9/1/23 (c) | | 2,040,000 | 2,058,784 |
| New York - 1.7% | | | |
| Long Island Pwr. Auth. Elec. Sys. Rev.: | | | |
| Bonds Series 2019 B, 1.65%, tender 9/1/24 (b) | | 2,550,000 | 2,464,704 |
| Series 2021, 1% 9/1/25 | | 2,195,000 | 1,998,235 |
| Nassau County Local Econ. Assistance Corp. Multifamily Hsg. Rev. Bonds (Park Lake Hempstead, L.P. Proj.) Series 2021, 0.3%, tender 11/1/23 (b) | | 7,810,000 | 7,545,532 |
| New York City Gen. Oblig.: | | | |
| Series 1, 5% 8/1/23 | | 5,060,000 | 5,118,295 |
| Series 2013 D, 5% 8/1/23 | | 475,000 | 475,732 |
| Series 2015 B, 5% 8/1/23 | | 430,000 | 434,954 |
| Series 2019 E, 5% 8/1/23 | | 685,000 | 692,892 |
| Series 2021 F1: | | | |
3% 3/1/23 | | 300,000 | 300,010 |
5% 3/1/23 | | 545,000 | 546,718 |
| Series A, 5% 8/1/23 | | 2,155,000 | 2,179,827 |
| New York City Hsg. Dev. Corp. Multifamily Hsg. Bonds Series 2021 K2, 0.9%, tender 1/1/26 (b) | | 1,250,000 | 1,142,411 |
| New York City Indl. Dev. Agcy. Rev.: | | | |
| (Queens Baseball Stadium Proj.) Series 2021 A, 5% 1/1/24 (Assured Guaranty Corp. Insured) | | 675,000 | 686,904 |
| Series 2021 A, 5% 1/1/26 (Assured Guaranty Muni. Corp. Insured) | | 600,000 | 634,264 |
| New York Metropolitan Trans. Auth. Rev.: | | | |
| Bonds: | | | |
Series 2019 A1, 5%, tender 11/15/24 (b) | | 800,000 | 814,957 |
Series 2020 A2, 5%, tender 5/15/24 (b) | | 1,600,000 | 1,629,301 |
| Series 2017 C1, 5% 11/15/25 | | 1,045,000 | 1,082,201 |
| Series 2017 D, 5% 11/15/23 | | 790,000 | 800,192 |
| Series 2020 A, 5% 2/1/23 | | 4,765,000 | 4,768,480 |
| New York State Dorm. Auth. Series 2018 A, 5% 3/15/23 (Escrowed to Maturity) | | 710,000 | 712,779 |
| New York State Urban Dev. Corp. Series 2020 C, 5% 3/15/23 | | 515,000 | 517,156 |
| New York Trans. Dev. Corp. (Term. 4 JFK Int'l. Arpt. Proj.) Series 2020 A, 5% 12/1/25 (c) | | 1,930,000 | 1,997,651 |
| Port Auth. of New York & New Jersey Series 2020 221, 5% 7/15/25 (c) | | 1,995,000 | 2,072,559 |
| St. Lawrence County Indl. Dev. (St. Lawrence Univ. Proj.) Series 2022: | | | |
| 5% 7/1/25 | | 415,000 | 435,430 |
| 5% 7/1/26 | | 400,000 | 426,563 |
| Syracuse Reg'l. Arpt. Auth. Series 2021, 5% 7/1/24 (c) | | 770,000 | 786,576 |
| Triborough Bridge & Tunnel Auth. Bonds Series 2021 A2, 2%, tender 5/15/26 (b) | | 1,000,000 | 913,102 |
TOTAL NEW YORK | | | 41,177,425 |
| New York And New Jersey - 0.7% | | | |
| Port Auth. of New York & New Jersey: | | | |
| Series 188, 5% 5/1/24 (c) | | 1,990,000 | 2,027,352 |
| Series 189, 5% 5/1/23 | | 280,000 | 281,824 |
| Series 2013, 5% 7/15/25 (c) | | 1,015,000 | 1,015,818 |
| Series 2015 194, 5% 10/15/23 | | 500,000 | 508,097 |
| Series 2018, 5% 9/15/25 (c) | | 1,970,000 | 2,051,968 |
| Series 2021 226, 5% 10/15/23 (c) | | 3,450,000 | 3,485,828 |
| Series 207, 5% 9/15/23 (c) | | 870,000 | 878,027 |
| Series 223: | | | |
5% 7/15/23 (c) | | 2,750,000 | 2,769,053 |
5% 7/15/24 (c) | | 3,250,000 | 3,322,038 |
5% 7/15/25 (c) | | 515,000 | 535,022 |
TOTAL NEW YORK AND NEW JERSEY | | | 16,875,027 |
| North Carolina - 0.3% | | | |
| Charlotte-Mecklenburg Hosp. Auth. Health Care Sys. Rev. Bonds Series 2021 B, 5%, tender 12/2/24 (b) | | 2,525,000 | 2,618,732 |
| North Carolina Grant Anticipation Rev. Series 2017, 5% 3/1/23 | | 435,000 | 436,316 |
| North Carolina Med. Care Commission Hosp. Rev. Bonds Series 2021 B, 5%, tender 2/1/26 (b) | | 3,975,000 | 4,204,295 |
TOTAL NORTH CAROLINA | | | 7,259,343 |
| Ohio - 0.3% | | | |
| Franklin County Hosp. Facilities Rev. Bonds (U.S. Health Corp. of Columbus Proj.) Series 2011 B, 5%, tender 5/15/23 (b) | | 935,000 | 940,591 |
| Miami Univ. Series 2022 A, 5% 9/1/23 | | 915,000 | 926,954 |
| Montgomery County Hosp. Rev. (Kettering Health Network Obligated Group Proj.) Series 2021, 5% 8/1/24 | | 200,000 | 205,351 |
| Northeast Ohio Med. Univ. Series 2022: | | | |
| 5% 12/1/23 (Build America Mutual Assurance Insured) | | 355,000 | 360,853 |
| 5% 12/1/24 (Build America Mutual Assurance Insured) | | 250,000 | 259,263 |
| 5% 12/1/25 (Build America Mutual Assurance Insured) | | 265,000 | 279,906 |
| Ohio Gen. Oblig. Series 2021 A: | | | |
| 5% 3/1/23 | | 510,000 | 511,633 |
| 5% 3/1/23 | | 1,000,000 | 1,003,201 |
| Ohio Hosp. Facilities Rev. Series 2017 A, 5% 1/1/23 | | 830,000 | 830,000 |
| Ohio Tpk. Commission Tpk. Rev. (Infrastructure Projs.) Series 2022 A, 5% 2/15/25 | | 1,840,000 | 1,927,742 |
TOTAL OHIO | | | 7,245,494 |
| Oklahoma - 0.0% | | | |
| Univ. of Oklahoma Gen. Rev. Series 2021 A, 5% 7/1/23 (Assured Guaranty Muni. Corp. Insured) | | 1,190,000 | 1,200,750 |
| Oregon - 0.9% | | | |
| Gilliam County Solid Waste Disp. Rev. Bonds (Waste Mgmt., Inc. Proj.): | | | |
| Series 2000 A, 3%, tender 5/1/23 (b)(c) | | 8,100,000 | 8,078,128 |
| Series 2003 A, 3%, tender 5/1/23 (b)(c) | | 9,950,000 | 9,923,133 |
| Port of Portland Arpt. Rev.: | | | |
| Series 2022: | | | |
5% 7/1/24 (c) | | 2,000,000 | 2,046,568 |
5% 7/1/25 (c) | | 1,310,000 | 1,361,686 |
| Series 24B, 5% 7/1/23 (c) | | 1,095,000 | 1,102,808 |
TOTAL OREGON | | | 22,512,323 |
| Pennsylvania - 2.9% | | | |
| Coatesville Area School District Series 2017, 5% 8/1/23 (Assured Guaranty Muni. Corp. Insured) | | 890,000 | 899,642 |
| Pennsylvania Econ. Dev. Fing. Auth.: | | | |
| Series 2021 A: | | | |
4% 10/15/23 | | 700,000 | 703,818 |
4% 10/15/24 | | 850,000 | 864,487 |
| Series 2022 A: | | | |
5% 2/15/25 | | 160,000 | 166,290 |
5% 2/15/26 | | 200,000 | 211,795 |
| Pennsylvania Econ. Dev. Fing. Auth. Indl. Dev. Rev. Series 2016, 5% 3/15/24 | | 1,250,000 | 1,277,577 |
| Pennsylvania Econ. Dev. Fing. Auth. Solid Waste Disp. Rev. Bonds: | | | |
| (Republic Svcs., Inc. Proj.): | | | |
Series 2019 A, 3.875%, tender 1/17/23 (b)(c) | | 2,100,000 | 2,099,935 |
Series 2019 B1, 3.875%, tender 1/17/23 (b)(c) | | 1,700,000 | 1,699,947 |
| (Republic Svcs., Inc. Proj.): | | | |
Series 2014, 3.8%, tender 1/3/23 (b)(c) | | 29,500,000 | 29,500,000 |
Series 2019 B2, 2.35%, tender 1/17/23 (b)(c) | | 7,200,000 | 7,195,878 |
| (Waste Mgmt., Inc. Proj.) Series 2013, 4%, tender 2/1/23 (b)(c) | | 9,100,000 | 9,099,601 |
| (Waste Mgmt., Inc. Proj.): | | | |
Series 2017 A, 0.58%, tender 8/1/24 (b)(c) | | 900,000 | 843,944 |
Series 2021 A, SIFMA Municipal Swap Index + 0.400% 4.06%, tender 6/3/24 (b)(c)(e) | | 2,845,000 | 2,765,241 |
| Series 2011, 2.15%, tender 7/1/24 (b)(c) | | 850,000 | 818,768 |
| Pennsylvania Gen. Oblig. Series 2016, 5% 2/1/23 | | 975,000 | 976,420 |
| Pennsylvania Hsg. Fin. Agcy.: | | | |
| Series 2021 135 B: | | | |
5% 4/1/23 (c) | | 330,000 | 330,857 |
5% 4/1/24 (c) | | 230,000 | 233,590 |
5% 4/1/25 (c) | | 380,000 | 391,713 |
| Series 2021 137, 0.4% 4/1/23 | | 285,000 | 282,972 |
| Series 2022 138: | | | |
5% 4/1/23 | | 840,000 | 843,819 |
5% 10/1/23 | | 1,135,000 | 1,151,183 |
5% 4/1/24 | | 1,060,000 | 1,085,634 |
5% 10/1/24 | | 1,970,000 | 2,037,496 |
5% 10/1/25 | | 1,100,000 | 1,158,382 |
| Pennsylvania Tpk. Commission Tpk. Rev. Series 2012 A, 5% 12/1/23 | | 800,000 | 801,109 |
| Philadelphia Arpt. Rev.: | | | |
| Series 2017 B, 5% 7/1/23 (c) | | 700,000 | 704,651 |
| Series 2021: | | | |
5% 7/1/24 (c) | | 945,000 | 966,035 |
5% 7/1/26 (c) | | 1,000,000 | 1,048,122 |
| Philadelphia Gas Works Rev. Series 15, 5% 8/1/23 | | 780,000 | 787,470 |
TOTAL PENNSYLVANIA | | | 70,946,376 |
| Rhode Island - 0.0% | | | |
| Rhode Island Student Ln. Auth. Student Ln. Rev. Series 2018 A, 5% 12/1/25 (c) | | 875,000 | 909,835 |
| South Carolina - 1.6% | | | |
| Patriots Energy Group Fing. Agcy. Bonds Series 2018 A, 4%, tender 2/1/24 (b) | | 29,755,000 | 29,728,729 |
| South Carolina Ports Auth. Ports Rev.: | | | |
| Series 2015 (AMT), 5% 7/1/45 (Pre-Refunded to 7/1/25 @ 100) (c) | | 2,600,000 | 2,706,376 |
| Series 2015: | | | |
5.25% 7/1/50 (Pre-Refunded to 7/1/25 @ 100) (c) | | 4,525,000 | 4,736,992 |
5.25% 7/1/55 (Pre-Refunded to 7/1/25 @ 100) (c) | | 2,170,000 | 2,271,662 |
| Series 2019 B, 5% 7/1/23 (c) | | 1,000,000 | 1,008,740 |
| Spartanburg County Reg'l. Health Series 2022, 5% 4/15/23 | | 410,000 | 411,667 |
TOTAL SOUTH CAROLINA | | | 40,864,166 |
| Tennessee - 1.4% | | | |
| Metropolitan Gov Nashvle&David Ind. Bonds (Waste Mgmt., Inc. Proj.) Series 2001, 0.58%, tender 8/1/24 (b)(c) | | 900,000 | 843,944 |
| Metropolitan Nashville Arpt. Auth. Rev.: | | | |
| Series 2015 B, 5% 7/1/23 (c) | | 680,000 | 684,849 |
| Series 2022 B, 5% 7/1/26 (c) | | 675,000 | 710,203 |
| Tennergy Corp. Gas Rev. Bonds Series 2019 A, 5%, tender 10/1/24 (b) | | 21,250,000 | 21,559,519 |
| Tennessee Energy Acquisition Corp. Bonds (Gas Rev. Proj.) Series A, 4%, tender 5/1/23 (b) | | 12,325,000 | 12,344,939 |
TOTAL TENNESSEE | | | 36,143,454 |
| Texas - 3.2% | | | |
| Austin Arpt. Sys. Rev.: | | | |
| Series 2019: | | | |
5% 11/15/23 (c) | | 655,000 | 663,992 |
5% 11/15/24 (c) | | 500,000 | 515,741 |
| Series 2022, 5% 11/15/25 (c) | | 1,910,000 | 1,993,757 |
| Crandall Independent School District Series 2021 A, 0% 8/15/24 | | 765,000 | 727,770 |
| Dallas Fort Worth Int'l. Arpt. Rev. Series 2013 E, 5% 11/1/23 (c) | | 10,750,000 | 10,877,070 |
| El Paso Gen. Oblig.: | | | |
| Series 2021 B, 5% 8/15/23 | | 300,000 | 303,791 |
| Series 2021 C, 5% 8/15/23 | | 335,000 | 339,233 |
| Hays Consolidated Independent School District Series 2022: | | | |
| 5% 2/15/25 | | 500,000 | 523,527 |
| 5% 2/15/26 | | 700,000 | 749,033 |
| Houston Convention and Entertainment Facilities Dept. Hotel Occupancy Tax and Spl. Rev. Series 2014, 5% 9/1/26 | | 1,500,000 | 1,540,069 |
| Houston Independent School District Series 2016 A, 5% 2/15/23 | | 725,000 | 726,637 |
| Love Field Arpt. Modernization Rev. Series 2021, 5% 11/1/23 (c) | | 2,330,000 | 2,357,542 |
| Lower Colorado River Auth. Rev.: | | | |
| (LCRA Transmission Svcs. Corp. Proj.): | | | |
Series 2015, 5% 5/15/24 | | 1,080,000 | 1,108,223 |
Series 2018, 5% 5/15/24 | | 2,095,000 | 2,149,747 |
Series 2019, 5% 5/15/23 | | 1,335,000 | 1,343,567 |
Series 2020: | | | |
5% 5/15/23 | | 385,000 | 387,471 |
5% 5/15/25 | | 570,000 | 595,333 |
Series 2021 A, 5% 5/15/23 | | 1,190,000 | 1,197,636 |
| Series 2015 B, 5% 5/15/23 | | 1,000,000 | 1,006,417 |
| Series 2020: | | | |
5% 5/15/23 | | 1,500,000 | 1,509,626 |
5% 5/15/24 | | 760,000 | 779,860 |
| Series 2022, 5% 5/15/24 (Assured Guaranty Muni. Corp. Insured) | | 1,630,000 | 1,672,595 |
| Mission Econ. Dev. Corp. Solid Waste Disp. Rev. Bonds: | | | |
| (Republic Svcs., Inc. Proj.) Series 2020 A, 4.1%, tender 2/1/23 (b)(c) | | 9,200,000 | 9,200,711 |
| (Waste Mgmt., Inc. Proj.): | | | |
Series 2018, 4.035%, tender 7/1/24 (b)(c) | | 6,835,000 | 6,627,857 |
Series 2020 A, 3.5%, tender 3/1/23 (b)(c) | | 3,000,000 | 2,996,416 |
Series 2020 B, 3.5%, tender 3/1/23 (b)(c) | | 3,800,000 | 3,795,460 |
| North Texas Tollway Auth. Rev.: | | | |
| Series 2014: | | | |
5% 1/1/24 | | 630,000 | 642,597 |
5% 1/1/24 (Escrowed to Maturity) | | 310,000 | 316,382 |
| Series 2017 A: | | | |
5% 1/1/24 | | 210,000 | 210,302 |
5% 1/1/24 (Pre-Refunded to 1/1/23 @ 100) | | 1,655,000 | 1,655,000 |
| Series 2021 B, 5% 1/1/26 | | 1,150,000 | 1,217,025 |
| Port Arthur Independent School District Series 2015 A, 5% 2/15/25 | | 600,000 | 628,233 |
| Port of Houston Auth. Series 2021, 5% 10/1/23 | | 440,000 | 446,761 |
| San Antonio Arpt. Sys. Rev. Series 2019 A: | | | |
| 5% 7/1/23 (c) | | 445,000 | 448,065 |
| 5% 7/1/23 (c) | | 400,000 | 402,755 |
| San Antonio Elec. & Gas Sys. Rev.: | | | |
| Bonds Series 2018, SIFMA Municipal Swap Index + 0.870% 4.53%, tender 12/1/25 (b)(e) | | 8,480,000 | 8,480,046 |
| Series 2022, 5% 2/1/26 | | 905,000 | 964,059 |
| Tarrant County Cultural Ed. Facilities Fin. Corp. Hosp. Rev. Bonds (Baylor Scott & White Health Proj.) Series 2022 E, 5%, tender 5/15/26 (b) | | 4,240,000 | 4,476,531 |
| Wylie Independent School District Series 2020 A, 0% 8/15/23 | | 2,985,000 | 2,928,929 |
TOTAL TEXAS | | | 78,505,766 |
| Utah - 0.1% | | | |
| Salt Lake City Arpt. Rev. Series 2021 A: | | | |
| 5% 7/1/24 (c) | | 1,000,000 | 1,024,164 |
| 5% 7/1/25 (c) | | 1,325,000 | 1,375,027 |
| Utah County Hosp. Rev. Bonds Series 2018 B2, 5%, tender 8/1/24 (b) | | 970,000 | 988,641 |
TOTAL UTAH | | | 3,387,832 |
| Vermont - 0.1% | | | |
| Vermont Student Assistant Corp. Ed. Ln. Rev.: | | | |
| Series 2016 A, 5% 6/15/26 (c) | | 1,700,000 | 1,783,065 |
| Series 2017 A, 5% 6/15/23 (c) | | 1,150,000 | 1,157,651 |
TOTAL VERMONT | | | 2,940,716 |
| Virginia - 0.8% | | | |
| Charles City County Econ. Dev. Auth. Solid Waste Disp. Rev. Bonds (Waste Mgmt., Inc. Proj.) Series 2003 A, 3%, tender 5/1/23 (b)(c) | | 9,460,000 | 9,434,456 |
| Sussex County Indl. Dev. Auth. Solid Waste Disp. Rev. Bonds Series 2003 A, 3%, tender 5/1/23 (b)(c) | | 8,000,000 | 7,978,398 |
| Wise County Indl. Dev. Auth. Waste & Sewage Rev. Bonds (Virginia Elec. and Pwr. Co. Proj.) Series 2010 A, 1.2%, tender 5/31/24 (b) | | 1,795,000 | 1,712,674 |
| York County Econ. Dev. Auth. Poll. Cont. Rev. Bonds (Virginia Elec. and Pwr. Co. Proj.) Series 2009 A, 1.9%, tender 6/1/23 (b) | | 1,100,000 | 1,087,681 |
TOTAL VIRGINIA | | | 20,213,209 |
| Washington - 1.0% | | | |
| King County Swr. Rev. Bonds Series 2020 B, 0.875%, tender 1/1/26 (b) | | 2,315,000 | 2,118,425 |
| Port of Seattle Rev.: | | | |
| Series 2018 B, 5% 5/1/24 (c) | | 875,000 | 891,993 |
| Series 2019: | | | |
5% 4/1/24 (c) | | 760,000 | 773,717 |
5% 4/1/25 (c) | | 525,000 | 543,476 |
| Series 2021 C: | | | |
5% 8/1/23 (c) | | 2,640,000 | 2,660,618 |
5% 8/1/24 (c) | | 4,675,000 | 4,785,608 |
| Series 2021: | | | |
5% 9/1/23 (c) | | 2,100,000 | 2,125,785 |
5% 9/1/24 (c) | | 2,220,000 | 2,286,554 |
| Series 2022 B: | | | |
5% 8/1/24 (c) | | 2,670,000 | 2,733,171 |
5% 8/1/25 (c) | | 2,515,000 | 2,617,735 |
5% 8/1/26 (c) | | 1,570,000 | 1,653,656 |
| Port of Seattle Spl. Facility Rev. Series 2013, 5% 6/1/23 (c) | | 845,000 | 849,577 |
TOTAL WASHINGTON | | | 24,040,315 |
| Wisconsin - 0.3% | | | |
| Wisconsin Health & Edl. Facilities Auth. Rev. Series 2022: | | | |
| 5% 10/1/23 | | 1,010,000 | 1,023,581 |
| 5% 10/1/24 | | 4,465,000 | 4,617,210 |
| 5% 10/1/25 | | 920,000 | 970,321 |
| Wisconsin Hsg. & Econ. Dev. Auth. Hsg. Rev. Bonds Series 2021 C, 0.61%, tender 5/1/24 (b) | | 305,000 | 290,337 |
TOTAL WISCONSIN | | | 6,901,449 |
| TOTAL MUNICIPAL BONDS (Cost $1,198,376,499) | | | 1,181,613,250 |
| | | | |
| Municipal Notes - 50.0% |
| | | Principal Amount (a) | Value ($) |
| Alabama - 0.4% | | | |
| Decatur Indl. Dev. Board Exempt Facilities Rev. (Nucor Steel Decatur LLC Proj.) Series 2003 A, 4.15% 1/6/23, VRDN (b)(c) | | 1,760,000 | 1,760,000 |
| Jefferson County Ala Board Ed. Pubs Participating VRDN Series XM 10 90, 2.26% 1/3/23 (Liquidity Facility JPMorgan Chase Bank) (b)(f)(g) | | 5,100,000 | 5,100,000 |
| Mobile Indl. Dev. Board Rev. (Alabama Pwr. Theodore Plant Proj.) Series A, 3.74% 1/3/23, VRDN (b)(c) | | 4,095,000 | 4,095,000 |
TOTAL ALABAMA | | | 10,955,000 |
| Arizona - 2.4% | | | |
| Glendale Indl. dev auth Sr Living Facilities Rev. Participating VRDN Series BC 22 01, 3.44% 2/10/23 (Liquidity Facility Barclays Bank PLC) (b)(f)(g) | | 4,700,000 | 4,700,000 |
| Maricopa County Poll. Cont. Rev.: | | | |
| Series 2009 C, 4% 1/6/23, VRDN (b) | | 30,500,000 | 30,500,000 |
| Series 2009 D, 4% 1/6/23, VRDN (b) | | 23,540,000 | 23,540,000 |
| Phoenix Civic Impt. Board Arpt. Rev. Participating VRDN Series 2018 XM 06 15, 3.85% 1/6/23 (Liquidity Facility Royal Bank of Canada) (b)(c)(f)(g) | | 1,600,000 | 1,600,000 |
TOTAL ARIZONA | | | 60,340,000 |
| Arkansas - 0.1% | | | |
| Blytheville Indl. Dev. Rev. (Nucor Corp. Proj.) Series 1998, 4.15% 1/6/23, VRDN (b)(c) | | 2,600,000 | 2,600,000 |
| California - 7.7% | | | |
| California Cmnty. Choice Fing. Auth. Clean Energy Proj. Rev. Participating VRDN Series XF 30 07, 3.86% 1/6/23 (Liquidity Facility Morgan Stanley Bank, West Valley City Utah) (b)(f)(g) | | 11,900,000 | 11,900,000 |
| California Statewide Cmntys. Dev. Auth. Multi-family Hsg. Rev. Participating VRDN Series Floater MIZ 91 13, 3.91% 2/3/23 (Liquidity Facility Mizuho Cap. Markets LLC) (b)(f)(g) | | 3,300,000 | 3,300,000 |
| Los Angeles Cmnty. Redev. Agcy. Multi-family Hsg. Rev. Participating VRDN: | | | |
| Series 2022 MIZ 90 89, 3.91% 1/6/23 (Liquidity Facility Mizuho Cap. Markets LLC) (b)(c)(f)(g) | | 28,400,000 | 28,400,000 |
| Series 2022 MIZ 90 90, 3.91% 1/6/23 (Liquidity Facility Mizuho Cap. Markets LLC) (b)(c)(f)(g) | | 42,900,000 | 42,900,000 |
| Mizuho Floater / Residual Trust V Participating VRDN Series Floater MIZ 90 97, 3.91% 1/6/23, LOC Mizuho Cap. Markets LLC (b)(f)(g) | | 2,905,000 | 2,905,000 |
| San Diego County Reg'l. Arpt. Auth. Arpt. Rev. Participating VRDN Series XM 10 54, 3.84% 1/6/23 (Liquidity Facility Morgan Stanley Bank, West Valley City Utah) (b)(c)(f)(g) | | 5,375,000 | 5,375,000 |
| San Francisco City & County Arpts. Commission Int'l. Arpt. Rev. Participating VRDN Series 2022 XF 30 51, 3.86% 1/6/23 (Liquidity Facility Morgan Stanley Bank, West Valley City Utah) (b)(c)(f)(g) | | 4,900,000 | 4,900,000 |
| San Francisco City & County Multi-family Hsg. Rev. Participating VRDN: | | | |
| Series MIZ 90 63, 3.91% 2/3/23 (Liquidity Facility Mizuho Cap. Markets LLC) (b)(f)(g)(h) | | 23,330,000 | 23,330,000 |
| Series MIZ 90 95, 3.91% 2/3/23 (Liquidity Facility Mizuho Cap. Markets LLC) (b)(f)(g) | | 27,100,000 | 27,100,000 |
| Series MIZ 91 15, 3.96% 2/3/23 (Liquidity Facility Mizuho Cap. Markets LLC) (b)(f)(g)(h) | | 40,000,000 | 40,000,000 |
TOTAL CALIFORNIA | | | 190,110,000 |
| Colorado - 1.5% | | | |
| Colorado Edl. & Cultural Facilities Auth. Rev. (Mesivta of Greater Los Angeles Proj.) Series 2005, 4.01% 1/6/23, LOC Deutsche Bank AG, VRDN (b) | | 1,735,000 | 1,735,000 |
| Colorado Health Facilities Auth. Rev. Bonds Participating VRDN: | | | |
| Series XM 10 59, 3.91% 1/6/23 (Liquidity Facility JPMorgan Chase Bank) (b)(f)(g) | | 1,620,000 | 1,620,000 |
| Series XM 10 61, 3.91% 1/5/23 (Liquidity Facility JPMorgan Chase Bank) (b)(f)(g) | | 4,180,000 | 4,180,000 |
| Colorado Hsg. & Fin. Auth. Multi-family Hsg. Rev. Participating VRDN Series Floater 2021 MIZ 90 68, 3.76% 2/3/23 (Liquidity Facility Mizuho Cap. Markets LLC) (b)(f)(g)(h) | | 300,000 | 300,000 |
| Denver City & County Arpt. Rev. Participating VRDN: | | | |
| Series Floaters XL 00 90, 3.86% 1/6/23 (Liquidity Facility Morgan Stanley Bank, West Valley City Utah) (b)(c)(f)(g) | | 14,861,500 | 14,861,500 |
| Series Floaters XM 07 15, 3.91% 1/6/23 (Liquidity Facility Morgan Stanley Bank, West Valley City Utah) (b)(c)(f)(g) | | 14,000,000 | 14,000,000 |
TOTAL COLORADO | | | 36,696,500 |
| Florida - 1.8% | | | |
| Greater Orlando Aviation Auth. Arpt. Facilities Rev. Participating VRDN: | | | |
| Series Floaters XF 05 77, 3.85% 1/6/23 (Liquidity Facility Royal Bank of Canada) (b)(c)(f)(g) | | 6,665,000 | 6,665,000 |
| Series XM 10 93, 2.12% 1/3/23 (Liquidity Facility JPMorgan Chase Bank) (b)(c)(f)(g) | | 7,400,000 | 7,400,000 |
| Hillsborough County Aviation Auth. Rev. Participating VRDN Series XL 02 90, 3.96% 1/6/23 (Liquidity Facility Deutsche Bank AG New York Branch) (b)(c)(f)(g) | | 8,390,000 | 8,390,000 |
| Lee Memorial Health Sys. Hosp. Rev. Series 2019 B, 4.21% 1/6/23, VRDN (b) | | 19,270,000 | 19,270,000 |
| Miami Dade County Hsg. Multifamily Hsg. Rev. Participating VRDN: | | | |
| Series Floater MIZ 90 87, 3.74% 2/3/23 (Liquidity Facility Mizuho Cap. Markets LLC) (b)(f)(g)(h) | | 1,900,000 | 1,900,000 |
| Series MIZ 90 72, 3.91% 2/3/23 (Liquidity Facility Mizuho Cap. Markets LLC) (b)(f)(g)(h) | | 800,000 | 800,000 |
TOTAL FLORIDA | | | 44,425,000 |
| Georgia - 1.0% | | | |
| Bartow County Dev. Auth. (Georgia Pwr. Co. Plant Bowen Proj.) Series 2022: | | | |
| 3.8% 1/3/23, VRDN (b)(c) | | 3,250,000 | 3,250,000 |
| 3.9% 1/3/23, VRDN (b)(c) | | 5,220,000 | 5,220,000 |
| Burke County Indl. Dev. Auth. Poll. Cont. Rev. (Georgia Pwr. Co. Plant Vogtle Proj.) Series 2012, 3.8% 1/3/23, VRDN (b)(c) | | 9,440,000 | 9,440,000 |
| Coweta County Dev. Auth. Poll. Cont. Rev. (Georgia Pwr. Co. Plant Yates Proj.) Series 2006, 3.9% 1/3/23, VRDN (b) | | 5,600,000 | 5,600,000 |
| Griffin-Spalding County Hosp. Participating VRDN Series Floaters XL 00 76, 3.83% 1/6/23 (Liquidity Facility JPMorgan Chase Bank) (b)(f)(g) | | 2,300,000 | 2,300,000 |
TOTAL GEORGIA | | | 25,810,000 |
| Hawaii - 0.6% | | | |
| Hawaii Arpts. Sys. Rev. Participating VRDN: | | | |
| Series XG 03 86, 3.84% 1/6/23 (Liquidity Facility Morgan Stanley Bank, West Valley City Utah) (b)(c)(f)(g) | | 11,900,000 | 11,900,000 |
| Series XM 10 55, 3.86% 1/6/23 (Liquidity Facility Morgan Stanley Bank, West Valley City Utah) (b)(c)(f)(g) | | 3,400,000 | 3,400,000 |
TOTAL HAWAII | | | 15,300,000 |
| Illinois - 4.0% | | | |
| Chicago O'Hare Int'l. Arpt. Rev. Participating VRDN: | | | |
| Series XM 10 38, 3.93% 1/6/23 (Liquidity Facility JPMorgan Chase Bank) (b)(c)(f)(g) | | 39,900,000 | 39,900,000 |
| Series XM 10 41, 3.96% 1/6/23 (Liquidity Facility JPMorgan Chase Bank) (b)(c)(f)(g) | | 10,500,000 | 10,500,000 |
| Series XM 10 43, 3.96% 1/6/23 (Liquidity Facility JPMorgan Chase Bank) (b)(c)(f)(g) | | 8,000,000 | 8,000,000 |
| Series XM 10 78, 3.93% 1/6/23 (Liquidity Facility JPMorgan Chase Bank) (b)(c)(f)(g) | | 28,400,000 | 28,400,000 |
| Series XX 12 43, 3.86% 1/6/23 (Liquidity Facility Barclays Bank PLC) (b)(c)(f)(g) | | 7,150,000 | 7,150,000 |
| Deutsche Spears/Lifers Trust Participating VRDN Series 2016 XG 00 93, 3.86% 1/6/23 (Liquidity Facility Deutsche Bank AG New York Branch) (b)(c)(f)(g) | | 4,490,000 | 4,490,000 |
TOTAL ILLINOIS | | | 98,440,000 |
| Indiana - 0.2% | | | |
| Lucky Heights Tc, Lp Participating VRDN Series XF 11 41, 3.96% 1/6/23 (Liquidity Facility Deutsche Bank AG New York Branch) (b)(f)(g) | | 4,300,000 | 4,300,000 |
| Kentucky - 3.2% | | | |
| Kentucky Tpk. Auth. Econ. Dev. Road Rev. Participating VRDN Series XF 24 84, 3.86% 1/6/23 (Liquidity Facility Morgan Stanley Bank, West Valley City Utah) (b)(f)(g) | | 1,780,000 | 1,780,000 |
| Meade County Indl. Bldg. Rev. (Nucor Steel Brandenburg Proj.): | | | |
| Series 2020 A1, 4.28% 1/3/23, VRDN (b)(c) | | 20,640,000 | 20,640,000 |
| Series 2020 B1, 4.28% 1/3/23, VRDN (b)(c) | | 57,920,000 | 57,920,000 |
TOTAL KENTUCKY | | | 80,340,000 |
| Louisiana - 2.4% | | | |
| Galilee Sr. Hsg., Lp Participating VRDN Series XF 11 21, 3.91% 1/6/23 (Liquidity Facility Deutsche Bank AG New York Branch) (b)(f)(g) | | 5,900,000 | 5,900,000 |
| Louisiana Hsg. Corp. Multifamily Hsg. Rev. Participating VRDN Series MIZ 90 53, 3.32% 2/3/23 (Liquidity Facility Mizuho Cap. Markets LLC) (b)(f)(g)(h) | | 1,400,000 | 1,400,000 |
| Saint James Parish Gen. Oblig. (Nucor Steel Louisiana LLC Proj.): | | | |
| Series 2010 A1, 4.12% 1/6/23, VRDN (b) | | 38,000,000 | 38,000,000 |
| Series 2010 B1, 4.1% 1/6/23, VRDN (b) | | 15,000,000 | 15,000,000 |
TOTAL LOUISIANA | | | 60,300,000 |
| Maryland - 0.4% | | | |
| Baltimore County Gen. Oblig. Participating VRDN Series 2022 032, 3.86% 2/10/23 (Liquidity Facility Barclays Bank PLC) (b)(f)(g) | | 3,220,000 | 3,220,000 |
| Integrace Obligated Group Participating VRDN Series 2022 024, 3.86% 2/10/23 (Liquidity Facility Barclays Bank PLC) (b)(f)(g) | | 6,900,000 | 6,900,000 |
TOTAL MARYLAND | | | 10,120,000 |
| Massachusetts - 0.3% | | | |
| Massachusetts Edl. Fing. Auth. Rev. Participating VRDN Series Floaters XF 23 06, 3.86% 1/6/23 (Liquidity Facility Morgan Stanley Bank, West Valley City Utah) (b)(c)(f)(g) | | 7,600,000 | 7,600,000 |
| Michigan - 0.5% | | �� | |
| Great Lakes Wtr. Auth. Wtr. Supply Sys. Rev. Participating VRDN Series XM 10 91, 2.01% 1/3/23 (Liquidity Facility JPMorgan Chase Bank) (b)(f)(g) | | 6,240,000 | 6,240,000 |
| Michigan Bldg. Auth. Rev. Series 2020 III, 3.72% 1/31/24, VRDN (b) | | 3,500,000 | 3,500,000 |
| Michigan Fin. Auth. Rev. RAN Series 2022 A, 5% 7/20/23 | | 2,235,000 | 2,259,224 |
TOTAL MICHIGAN | | | 11,999,224 |
| Minnesota - 0.3% | | | |
| Duluth Minn Hsg. & Redev. Auth. MultiFamily Hsg. Rev. Participating VRDN Series 2021 XF 11 30, 3.69% 1/6/23 (Liquidity Facility Deutsche Bank AG New York Branch) (b)(f)(g) | | 6,375,000 | 6,375,000 |
| Mississippi - 0.7% | | | |
| Mississippi Bus. Fin. Corp. Mississippi Pwr. Co. Proj.) Series 2022, 3.83% 1/3/23, VRDN (b)(c) | | 17,000,000 | 17,000,000 |
| Missouri - 0.5% | | | |
| Kansas City Indl. Dev. Auth. Participating VRDN Series XL 03 3, 3.96% 1/6/23 (Liquidity Facility JPMorgan Chase Bank) (b)(c)(f)(g) | | 9,600,000 | 9,600,000 |
| Kansas City Planned Indl. Expansion Participating VRDN Series Floater MIZ 90 86, 3.69% 2/3/23 (Liquidity Facility Mizuho Cap. Markets LLC) (b)(f)(g)(h) | | 1,500,000 | 1,500,000 |
| Lees Summit Indl. Dev. Auth. Multi-family Hsg. Rev. Participating VRDN Series MIZ 90 55, 3.5% 2/3/23 (Liquidity Facility Mizuho Cap. Markets LLC) (b)(f)(g)(h) | | 500,000 | 500,000 |
TOTAL MISSOURI | | | 11,600,000 |
| Montana - 0.0% | | | |
| Montana Board of Hsg. Participating VRDN Series Floater MIZ 90 62, 3.81% 2/3/23 (Liquidity Facility Mizuho Cap. Markets LLC) (b)(f)(g)(h) | | 1,110,000 | 1,110,000 |
| Nebraska - 0.2% | | | |
| Stanton County Indl. Dev. Rev.: | | | |
| (Nucor Corp. Proj.) Series 1996, 4.15% 1/6/23, VRDN (b)(c) | | 5,600,000 | 5,600,000 |
| Series 1998, 4.15% 1/6/23, VRDN (b)(c) | | 125,000 | 125,000 |
TOTAL NEBRASKA | | | 5,725,000 |
| Nevada - 0.3% | | | |
| Nevada Hsg. Division Participating VRDN Series 2022 MIZ 90 91, 3.91% 2/3/23 (Liquidity Facility Mizuho Cap. Markets LLC) (b)(f)(g)(h) | | 8,600,000 | 8,600,000 |
| New Jersey - 0.5% | | | |
| New Jersey Bldg. Auth. State Bldg. Rev. Participating VRDN Series Floaters XF 05 53, 3.73% 1/6/23 (Liquidity Facility JPMorgan Chase Bank) (b)(f)(g) | | 3,750,000 | 3,750,000 |
| New Jersey Trans. Trust Fund Auth. Participating VRDN: | | | |
| Series XM 09 29, 3.83% 1/6/23 (Liquidity Facility JPMorgan Chase Bank) (b)(f)(g) | | 1,600,000 | 1,600,000 |
| Series XM 10 47, 3.86% 1/6/23 (Liquidity Facility JPMorgan Chase Bank) (b)(f)(g) | | 7,925,000 | 7,925,000 |
TOTAL NEW JERSEY | | | 13,275,000 |
| New Mexico - 0.2% | | | |
| New Mexico St Hosp. Equip. Ln. Co. Participating VRDN Series 2022 034, 3.86% 2/10/23 (Liquidity Facility Barclays Bank PLC) (b)(f)(g) | | 4,400,000 | 4,400,000 |
| New York - 6.1% | | | |
| New York City Gen. Oblig. Series 2012 2, 3.97% 1/9/23, VRDN (b) | | 61,600,000 | 61,600,000 |
| New York Dorm. Auth. Rev. Participating VRDN Series XF 13 28, 3.83% 1/6/23 (Liquidity Facility JPMorgan Chase Bank) (b)(f)(g) | | 5,450,000 | 5,450,000 |
| New York Liberty Dev. Corp. Participating VRDN Series XM 08 44, 3.91% 1/6/23 (Liquidity Facility Deutsche Bank AG New York Branch) (b)(f)(g) | | 8,165,000 | 8,165,000 |
| New York Metropolitan Trans. Auth. Rev. Participating VRDN: | | | |
| Series XF 13 21, 3.84% 1/6/23 (Liquidity Facility JPMorgan Chase Bank) (b)(f)(g) | | 6,900,000 | 6,900,000 |
| Series XF 13 55, 3.84% 1/6/23 (Liquidity Facility JPMorgan Chase Bank) (b)(f)(g) | | 7,500,000 | 7,500,000 |
| Series ZF 02 18, 3.84% 1/6/23 (Liquidity Facility JPMorgan Chase Bank) (b)(f)(g) | | 8,100,000 | 8,100,000 |
| New York Thruway Auth. Gen. Rev. Participating VRDN Series XM 08 31, 3.84% 1/6/23 (Liquidity Facility Morgan Stanley Bank, West Valley City Utah) (b)(f)(g) | | 4,750,000 | 4,750,000 |
| RIB Floater Trust Various States Participating VRDN Series Floater 2022 007, 4.06% 2/10/23 (Liquidity Facility Barclays Bank PLC) (b)(c)(f)(g) | | 43,900,000 | 43,900,000 |
| Rockland County Indl. Dev. Agcy. Participating VRDN Series XF 11 32, 3.86% 1/6/23 (Liquidity Facility Deutsche Bank AG New York Branch) (b)(f)(g) | | 4,700,000 | 4,700,000 |
TOTAL NEW YORK | | | 151,065,000 |
| Ohio - 0.9% | | | |
| Ohio Hosp. Rev.: | | | |
| Series 2013 B, 4.14% 1/6/23, VRDN (b) | | 7,800,000 | 7,800,000 |
| Series 2015 B, 4.14% 1/5/26, VRDN (b) | | 2,875,000 | 2,875,000 |
| Ohio Hsg. Fin. Agcy. Multi-family Hsg. Rev. Participating VRDN Series XF 10 92, 3.59% 1/6/23 (Liquidity Facility Deutsche Bank AG New York Branch) (b)(f)(g) | | 12,200,000 | 12,200,000 |
TOTAL OHIO | | | 22,875,000 |
| Oklahoma - 0.8% | | | |
| Oklahoma Dev. Fin. Auth. Health Sys. Rev. Series 2020 B, 4.21% 1/5/26, VRDN (b) | | 16,000,000 | 16,000,000 |
| Steele Duncan Plaza, LLC Participating VRDN Series MIZ 91 03, 3.91% 2/3/23 (Liquidity Facility Mizuho Cap. Markets LLC) (b)(f)(g)(h) | | 2,600,000 | 2,600,000 |
TOTAL OKLAHOMA | | | 18,600,000 |
| Oregon - 0.5% | | | |
| Oregon St Hsg. & Cmnty. Svcs. Dep Participating VRDN Series 2021 XF 11 23, 3.65% 1/6/23 (Liquidity Facility Deutsche Bank AG New York Branch) (b)(f)(g) | | 13,600,000 | 13,600,000 |
| Pennsylvania - 0.7% | | | |
| Pennsylvania Hsg. Fin. Agcy. Multifamily Hsg. Dev. Rev. Participating VRDN Series XF 10 95, 3.69% 1/6/23 (Liquidity Facility Deutsche Bank AG New York Branch) (b)(f)(g) | | 10,455,000 | 10,455,000 |
| Philadelphia Auth. for Indl. Dev.: | | | |
| Participating VRDN Series MIZ 90 51, 3.35% 2/3/23 (Liquidity Facility Mizuho Cap. Markets LLC) (b)(f)(g)(h) | | 2,430,000 | 2,430,000 |
| Series 2017 B, 4.17% 1/5/26, VRDN (b) | | 5,250,000 | 5,250,000 |
TOTAL PENNSYLVANIA | | | 18,135,000 |
| South Carolina - 0.3% | | | |
| Berkeley County Indl. Dev. Rev. (Nucor Corp. Proj.) Series 1995, 4.15% 1/6/23, VRDN (b)(c) | | 1,200,000 | 1,200,000 |
| Greenville Hosp. Sys. Facilities Rev. Participating VRDN Series XF 01 45, 3.86% 1/6/23 (Liquidity Facility Toronto-Dominion Bank) (b)(f)(g) | | 5,100,000 | 5,100,000 |
TOTAL SOUTH CAROLINA | | | 6,300,000 |
| Tennessee - 0.7% | | | |
| Hope Heights Tower Tc, Lp Participating VRDN Series XF 11 44, 3.96% 1/6/23 (Liquidity Facility Deutsche Bank AG New York Branch) (b)(f)(g) | | 7,880,000 | 7,880,000 |
| Metropolitan Govt. Nashville & Davidson County Health & Edl. Facilities Board Participating VRDN Series XF 10 97, 3.56% 1/6/23 (Liquidity Facility Deutsche Bank AG New York Branch) (b)(f)(g) | | 9,800,000 | 9,800,000 |
TOTAL TENNESSEE | | | 17,680,000 |
| Texas - 8.8% | | | |
| Austin Affordable Pfc, Inc. Multifamily Hsg. Rev. Participating VRDN: | | | |
| Series XF 11 02, 3.72% 1/6/23 (Liquidity Facility Deutsche Bank AG New York Branch) (b)(f)(g) | | 4,645,000 | 4,645,000 |
| Series XF 11 19, 3.75% 1/6/23 (Liquidity Facility Deutsche Bank AG New York Branch) (b)(f)(g) | | 5,200,000 | 5,200,000 |
| Austin Arpt. Sys. Rev. Participating VRDN Series XG 04 27, 3.91% 1/6/23 (Liquidity Facility Morgan Stanley Bank, West Valley City Utah) (b)(c)(f)(g) | | 6,800,000 | 6,800,000 |
| Cap. Area Hsg. Fin. Corp. Multi-family Hsg. Rev. Participating VRDN Series XF 11 31, 3.85% 1/6/23 (Liquidity Facility Deutsche Bank AG New York Branch) (b)(f)(g) | | 10,580,000 | 10,580,000 |
| Ep Machuca Lp Participating VRDN Series MIZ 91 04, 3.91% 2/3/23 (Liquidity Facility Mizuho Cap. Markets LLC) (b)(f)(g)(h) | | 3,660,000 | 3,660,000 |
| Hurst Participating VRDN Series XF 10 94, 3.7% 1/6/23 (Liquidity Facility Deutsche Bank AG New York Branch) (b)(f)(g) | | 3,465,000 | 3,465,000 |
| Jefferson's Landing, LP Participating VRDN Series XG 03 87, 3.96% 1/6/23 (Liquidity Facility Deutsche Bank AG New York Branch) (b)(f)(g) | | 17,200,000 | 17,200,000 |
| North Central Texas Hsg. Fin. Corp. Mu Participating VRDN Series XF 10 99, 3.86% 1/6/23 (Liquidity Facility Deutsche Bank AG New York Branch) (b)(f)(g) | | 2,900,000 | 2,900,000 |
| Port Arthur Navigation District Envir. Facilities Rev. (Motiva Enterprises LLC Proj.): | | | |
| Series 2001 A, 4.2% 1/3/23, VRDN (b) | | 16,200,000 | 16,200,000 |
| Series 2004, 4.51% 1/6/23, VRDN (b)(c) | | 71,385,000 | 71,384,993 |
| Series 2010 C, 4.21% 1/3/23, VRDN (b) | | 2,200,000 | 2,200,000 |
| Series 2010 D: | | | |
4.45% 1/6/23, VRDN (b) | | 33,480,000 | 33,480,000 |
4.46% 1/6/23, VRDN (b) | | 2,475,000 | 2,475,000 |
| Reg Bridge Propco I Llc Participating VRDN Series DBE 80 90, 4.06% 2/28/23 (Liquidity Facility Deutsche Bank AG New York Branch) (b)(f)(g)(h) | | 22,315,000 | 22,315,000 |
| Texas Dept. of Hsg. & Cmnty. Affairs Multi-family Hsg. Rev. Participating VRDN Series XG 03 89, 3.96% 1/6/23 (Liquidity Facility Deutsche Bank AG) (b)(f)(g) | | 7,600,000 | 7,600,000 |
| Texas Private Activity Bond Surface Trans. Corp. Participating VRDN Series XM 07 56, 3.85% 1/6/23 (Liquidity Facility Deutsche Bank AG New York Branch) (b)(c)(f)(g) | | 3,400,000 | 3,400,000 |
| Texas St Technical College Sys. Participating VRDN Series 2022 XF 14 11, 3.86% 1/6/23 (Liquidity Facility Bank of America NA) (b)(f)(g) | | 4,540,000 | 4,540,000 |
TOTAL TEXAS | | | 218,044,993 |
| Utah - 0.8% | | | |
| Roers Salt Lake City Apt. Participating VRDN Series XF 11 38, 3.96% 1/6/23 (Liquidity Facility Deutsche Bank AG New York Branch) (b)(f)(g) | | 5,620,000 | 5,620,000 |
| Salt Lake City Arpt. Rev. Participating VRDN Series 17 XM 0493, 3.86% 1/6/23 (Liquidity Facility Morgan Stanley Bank, West Valley City Utah) (b)(c)(f)(g) | | 6,300,000 | 6,300,000 |
| Utah Hsg. Corp. Multi-family Hsg. Rev. Participating VRDN Series 2021 XF 11 00, 3.78% 1/6/23 (Liquidity Facility Deutsche Bank AG New York Branch) (b)(f)(g) | | 8,300,000 | 8,300,000 |
TOTAL UTAH | | | 20,220,000 |
| Virginia - 0.4% | | | |
| Lynchburg Econ. Dev. Participating VRDN Series XL 00 75, 3.91% 1/6/23 (Liquidity Facility JPMorgan Chase Bank) (b)(f)(g) | | 5,000,000 | 5,000,000 |
| Waters At James Crossing, LP Participating VRDN Series XG 03 90, 3.96% 1/6/23 (Liquidity Facility Deutsche Bank AG New York Branch) (b)(f)(g) | | 4,000,000 | 4,000,000 |
TOTAL VIRGINIA | | | 9,000,000 |
| Washington - 0.4% | | | |
| Washington Econ. Dev. Fin. Auth. Rev. Participating VRDN Series Floaters 005, 3.91% 2/10/23 (Liquidity Facility Barclays Bank PLC) (b)(c)(f)(g) | | 9,255,000 | 9,255,000 |
| West Virginia - 0.3% | | | |
| West Virginia Hosp. Fin. Auth. Hosp. Rev. Series 2018 E, 4.18% 1/5/26, VRDN (b) | | 7,415,000 | 7,415,000 |
| Wisconsin - 0.1% | | | |
| Pub. Fin. Auth. Mulfa Hs Rev. Participating VRDN Series 2022 MIZ 90 92, 3.91% 2/3/23 (Liquidity Facility Mizuho Cap. Markets LLC) (b)(f)(g)(h) | | 3,235,000 | 3,235,000 |
| TOTAL MUNICIPAL NOTES (Cost $1,242,837,851) | | | 1,242,845,717 |
| | | | |
| Money Market Funds - 2.4% |
| | | Shares | Value ($) |
Fidelity Municipal Cash Central Fund 3.72% (i)(j) (Cost $60,404,000) | | 60,391,922 | 60,404,000 |
| | | | |
| TOTAL INVESTMENT IN SECURITIES - 100.0% (Cost $2,501,618,350) | 2,484,862,967 |
NET OTHER ASSETS (LIABILITIES) - 0.0% | 159,146 |
| NET ASSETS - 100.0% | 2,485,022,113 |
| | |
Security Type Abbreviations
| RAN | - | REVENUE ANTICIPATION NOTE |
| VRDN | - | VARIABLE RATE DEMAND NOTE (A debt instrument that is payable upon demand, either daily, weekly or monthly) |
Legend
| (a) | Amount is stated in United States dollars unless otherwise noted. |
| (b) | Coupon rates for floating and adjustable rate securities reflect the rates in effect at period end. |
| (c) | Private activity obligations whose interest is subject to the federal alternative minimum tax for individuals. |
| (d) | Security exempt from registration under Rule 144A of the Securities Act of 1933. These securities may be resold in transactions exempt from registration, normally to qualified institutional buyers. At the end of the period, the value of these securities amounted to $34,144,940 or 1.4% of net assets. |
| (e) | Coupon is indexed to a floating interest rate which may be multiplied by a specified factor and/or subject to caps or floors. |
| (f) | Provides evidence of ownership in one or more underlying municipal bonds. |
| (g) | Coupon rates are determined by re-marketing agents based on current market conditions. |
| (h) | Restricted securities (including private placements) - Investment in securities not registered under the Securities Act of 1933 (excluding 144A issues). At the end of the period, the value of restricted securities (excluding 144A issues) amounted to $113,680,000 or 4.6% of net assets. |
| (i) | Information in this report regarding holdings by state and security types does not reflect the holdings of the Fidelity Municipal Cash Central Fund. |
| (j) | Affiliated fund that is generally available only to investment companies and other accounts managed by Fidelity Investments. The rate quoted is the annualized seven-day yield of the fund at period end. A complete unaudited listing of the fund's holdings as of its most recent quarter end is available upon request. In addition, each Fidelity Central Fund's financial statements, which are not covered by the Fund's Report of Independent Registered Public Accounting Firm, are available on the SEC's website or upon request. |
| Additional information on each restricted holding is as follows: |
| Security | Acquisition Date | Acquisition Cost ($) |
| Colorado Hsg. & Fin. Auth. Multi-family Hsg. Rev. Participating VRDN Series Floater 2021 MIZ 90 68, 3.76% 2/3/23 (Liquidity Facility Mizuho Cap. Markets LLC) | 4/14/21 | 300,000 |
| | | |
| Ep Machuca Lp Participating VRDN Series MIZ 91 04, 3.91% 2/3/23 (Liquidity Facility Mizuho Cap. Markets LLC) | 8/05/22 | 3,660,000 |
| | | |
| Kansas City Planned Indl. Expansion Participating VRDN Series Floater MIZ 90 86, 3.69% 2/3/23 (Liquidity Facility Mizuho Cap. Markets LLC) | 1/27/22 | 1,500,000 |
| | | |
| Lees Summit Indl. Dev. Auth. Multi-family Hsg. Rev. Participating VRDN Series MIZ 90 55, 3.5% 2/3/23 (Liquidity Facility Mizuho Cap. Markets LLC) | 12/29/20 | 500,000 |
| | | |
| Louisiana Hsg. Corp. Multifamily Hsg. Rev. Participating VRDN Series MIZ 90 53, 3.32% 2/3/23 (Liquidity Facility Mizuho Cap. Markets LLC) | 12/17/20 | 1,400,000 |
| | | |
| Miami Dade County Hsg. Multifamily Hsg. Rev. Participating VRDN Series Floater MIZ 90 87, 3.74% 2/3/23 (Liquidity Facility Mizuho Cap. Markets LLC) | 1/27/22 | 1,900,000 |
| | | |
| Miami Dade County Hsg. Multifamily Hsg. Rev. Participating VRDN Series MIZ 90 72, 3.91% 2/3/23 (Liquidity Facility Mizuho Cap. Markets LLC) | 9/02/21 | 800,000 |
| | | |
| Montana Board of Hsg. Participating VRDN Series Floater MIZ 90 62, 3.81% 2/3/23 (Liquidity Facility Mizuho Cap. Markets LLC) | 3/02/21 | 1,110,000 |
| | | |
| Nevada Hsg. Division Participating VRDN Series 2022 MIZ 90 91, 3.91% 2/3/23 (Liquidity Facility Mizuho Cap. Markets LLC) | 2/10/22 | 8,600,000 |
| | | |
| Philadelphia Auth. for Indl. Dev. Participating VRDN Series MIZ 90 51, 3.35% 2/3/23 (Liquidity Facility Mizuho Cap. Markets LLC) | 11/12/20 | 2,430,000 |
| | | |
| Pub. Fin. Auth. Mulfa Hs Rev. Participating VRDN Series 2022 MIZ 90 92, 3.91% 2/3/23 (Liquidity Facility Mizuho Cap. Markets LLC) | 2/24/22 | 3,235,000 |
| | | |
| Reg Bridge Propco I Llc Participating VRDN Series DBE 80 90, 4.06% 2/28/23 (Liquidity Facility Deutsche Bank AG New York Branch) | 9/27/22 | 22,315,000 |
| | | |
| San Francisco City & County Multi-family Hsg. Rev. Participating VRDN Series MIZ 90 63, 3.91% 2/3/23 (Liquidity Facility Mizuho Cap. Markets LLC) | 2/18/21 | 23,330,000 |
| | | |
| San Francisco City & County Multi-family Hsg. Rev. Participating VRDN Series MIZ 91 15, 3.96% 2/3/23 (Liquidity Facility Mizuho Cap. Markets LLC) | 12/01/22 - 12/19/22 | 40,000,000 |
| | | |
| Steele Duncan Plaza, LLC Participating VRDN Series MIZ 91 03, 3.91% 2/3/23 (Liquidity Facility Mizuho Cap. Markets LLC) | 8/11/22 | 2,600,000 |
| | | |
Affiliated Central Funds
Fiscal year to date information regarding the Fund's investments in Fidelity Central Funds, including the ownership percentage, is presented below.
| Affiliate | Value, beginning of period ($) | Purchases ($) | Sales Proceeds ($) | Dividend Income ($) | Realized Gain (loss) ($) | Change in Unrealized appreciation (depreciation) ($) | Value, end of period ($) | % ownership, end of period |
| Fidelity Municipal Cash Central Fund 3.72% | 111,289,220 | 1,140,128,007 | 1,191,013,222 | 1,941,204 | 1,892 | (1,897) | 60,404,000 | 2.4% |
| Total | 111,289,220 | 1,140,128,007 | 1,191,013,222 | 1,941,204 | 1,892 | (1,897) | 60,404,000 | |
| | | | | | | | | |
Amounts in the dividend income column in the above table include any capital gain distributions from underlying funds, which are presented in the corresponding line item in the Statement of Operations, if applicable.
Amounts included in the purchases and sales proceeds columns may include in-kind transactions, if applicable.
Investment Valuation
The following is a summary of the inputs used, as of December 31, 2022, involving the Fund's assets and liabilities carried at fair value. The inputs or methodology used for valuing securities may not be an indication of the risk associated with investing in those securities. For more information on valuation inputs, and their aggregation into the levels used below, please refer to the Investment Valuation section in the accompanying Notes to Financial Statements.
| Valuation Inputs at Reporting Date: |
| Description | Total ($) | Level 1 ($) | Level 2 ($) | Level 3 ($) |
Investments in Securities: | | | | |
|
| Municipal Securities | 2,424,458,967 | - | 2,424,458,967 | - |
|
| Money Market Funds | 60,404,000 | 60,404,000 | - | - |
| Total Investments in Securities: | 2,484,862,967 | 60,404,000 | 2,424,458,967 | - |
| Statement of Assets and Liabilities |
| | | | December 31, 2022 |
| | | | | |
| Assets | | | | |
| Investment in securities, at value - See accompanying schedule: | $ | | | |
Unaffiliated issuers (cost $2,441,214,350) | | 2,424,458,967 | | |
Fidelity Central Funds (cost $60,404,000) | | 60,404,000 | | |
| | | | | |
| | | | | |
| Total Investment in Securities (cost $2,501,618,350) | | | $ | 2,484,862,967 |
| Receivable for investments sold | | | | 43,840,000 |
| Receivable for fund shares sold | | | | 3,493,866 |
| Interest receivable | | | | 16,747,292 |
| Distributions receivable from Fidelity Central Funds | | | | 283,192 |
| Receivable from investment adviser for expense reductions | | | | 205,561 |
| Other receivables | | | | 2,030 |
Total assets | | | | 2,549,434,908 |
| Liabilities | | | | |
| Payable to custodian bank | | $2,262,235 | | |
| Payable for investments purchased | | 48,240,000 | | |
| Payable for fund shares redeemed | | 9,362,559 | | |
| Distributions payable | | 3,772,769 | | |
| Accrued management fee | | 659,119 | | |
| Other affiliated payables | | 116,113 | | |
| Total Liabilities | | | | 64,412,795 |
| Net Assets | | | $ | 2,485,022,113 |
| Net Assets consist of: | | | | |
| Paid in capital | | | $ | 2,503,042,097 |
| Total accumulated earnings (loss) | | | | (18,019,984) |
| Net Assets | | | $ | 2,485,022,113 |
| | | | | |
| Net Asset Value and Maximum Offering Price | | | | |
| Conservative Income Municipal Bond : | | | | |
Net Asset Value , offering price and redemption price per share ($145,195,060 ÷ 14,565,260 shares) | | | $ | 9.97 |
| Institutional Class : | | | | |
Net Asset Value , offering price and redemption price per share ($2,339,827,053 ÷ 234,715,558 shares) | | | $ | 9.97 |
| Statement of Operations |
| | | | Year ended December 31, 2022 |
| Investment Income | | | | |
| Interest | | | $ | 29,475,995 |
| Income from Fidelity Central Funds | | | | 1,939,369 |
| Total Income | | | | 31,415,364 |
| Expenses | | | | |
| Management fee | $ | 7,758,953 | | |
| Transfer agent fees | | 1,368,728 | | |
| Independent trustees' fees and expenses | | 8,335 | | |
| Miscellaneous | | 494 | | |
| Total expenses before reductions | | 9,136,510 | | |
| Expense reductions | | (2,515,758) | | |
| Total expenses after reductions | | | | 6,620,752 |
| Net Investment income (loss) | | | | 24,794,612 |
| Realized and Unrealized Gain (Loss) | | | | |
| Net realized gain (loss) on: | | | | |
| Investment Securities: | | | | |
| Unaffiliated issuers | | (184,310) | | |
| Fidelity Central Funds | | 1,892 | | |
| Capital gain distributions from Fidelity Central Funds | | 1,835 | | |
| Total net realized gain (loss) | | | | (180,583) |
| Change in net unrealized appreciation (depreciation) on: | | | | |
| Investment Securities: | | | | |
| Unaffiliated issuers | | (18,545,390) | | |
| Fidelity Central Funds | | (1,897) | | |
| Total change in net unrealized appreciation (depreciation) | | | | (18,547,287) |
| Net gain (loss) | | | | (18,727,870) |
| Net increase (decrease) in net assets resulting from operations | | | $ | 6,066,742 |
| Statement of Changes in Net Assets |
| |
| | Year ended December 31, 2022 | | Year ended December 31, 2021 |
| Increase (Decrease) in Net Assets | | | | |
| Operations | | | | |
| Net investment income (loss) | $ | 24,794,612 | $ | 7,477,863 |
| Net realized gain (loss) | | (180,583) | | 159,817 |
| Change in net unrealized appreciation (depreciation) | | (18,547,287) | | (4,127,730) |
| Net increase (decrease) in net assets resulting from operations | | 6,066,742 | | 3,509,950 |
| Distributions to shareholders | | (24,762,794) | | (7,476,045) |
| Share transactions - net increase (decrease) | | (257,663,646) | | (674,382,489) |
| Total increase (decrease) in net assets | | (276,359,698) | | (678,348,584) |
| | | | | |
| Net Assets | | | | |
| Beginning of period | | 2,761,381,811 | | 3,439,730,395 |
| End of period | $ | 2,485,022,113 | $ | 2,761,381,811 |
| | | | | |
| | | | | |
Financial Highlights
| Fidelity® Conservative Income Municipal Bond Fund |
| |
| Years ended December 31, | | 2022 | | 2021 | | 2020 | | 2019 | | 2018 |
Selected Per-Share Data | | | | | | | | | | |
| Net asset value, beginning of period | $ | 10.04 | $ | 10.05 | $ | 10.05 | $ | 10.02 | $ | 10.01 |
| Income from Investment Operations | | | | | | | | | | |
Net investment income (loss) A,B | | .086 | | .015 | | .071 | | .147 | | .134 |
| Net realized and unrealized gain (loss) | | (.069) | | (.010) | | .007 | | .032 | | .011 |
| Total from investment operations | | .017 | | .005 | | .078 | | .179 | | .145 |
| Distributions from net investment income | | (.087) | | (.015) | | (.077) | | (.148) | | (.134) |
| Distributions from net realized gain | | - | | - | | (.001) | | (.001) | | (.001) |
| Total distributions | | (.087) | | (.015) | | (.078) | | (.149) | | (.135) |
| Net asset value, end of period | $ | 9.97 | $ | 10.04 | $ | 10.05 | $ | 10.05 | $ | 10.02 |
Total Return C | | .17% | | .05% | | .78% | | 1.79% | | 1.45% |
Ratios to Average Net Assets B,D,E | | | | | | | | | | |
| Expenses before reductions | | .40% | | .40% | | .40% | | .40% | | .40% |
| Expenses net of fee waivers, if any | | .35% | | .35% | | .35% | | .35% | | .35% |
| Expenses net of all reductions | | .35% | | .35% | | .35% | | .35% | | .35% |
| Net investment income (loss) | | .86% | | .15% | | .71% | | 1.46% | | 1.34% |
| Supplemental Data | | | | | | | | | | |
| Net assets, end of period (000 omitted) | $ | 145,195 | $ | 180,805 | $ | 264,227 | $ | 231,598 | $ | 251,811 |
Portfolio turnover rate F | | 56% | | 56% | | 41% | | 63% | | 45% G |
A Calculated based on average shares outstanding during the period.
B Net investment income (loss) is affected by the timing of the declaration of dividends by any underlying mutual funds or exchange-traded funds (ETFs). Net investment income (loss) of any mutual funds or ETFs is not included in the Fund's net investment income (loss) ratio.
C Total returns would have been lower if certain expenses had not been reduced during the applicable periods shown.
D Fees and expenses of any underlying mutual funds or exchange-traded funds (ETFs) are not included in the Fund's expense ratio. The Fund indirectly bears its proportionate share of these expenses. For additional expense information related to investments in Fidelity Central Funds, please refer to the "Investments in Fidelity Central Funds" note found in the Notes to Financial Statements section of the most recent Annual or Semi-Annual report.
E Expense ratios reflect operating expenses of the class. Expenses before reductions do not reflect amounts reimbursed, waived, or reduced through arrangements with the investment adviser, brokerage services, or other offset arrangements, if applicable, and do not represent the amount paid by the class during periods when reimbursements, waivers or reductions occur.
F Amount does not include the portfolio activity of any underlying mutual funds or exchange-traded funds (ETFs).
G Portfolio turnover rate excludes securities received or delivered in-kind.
| Fidelity® Conservative Income Municipal Bond Fund Institutional Class |
| |
| Years ended December 31, | | 2022 | | 2021 | | 2020 | | 2019 | | 2018 |
Selected Per-Share Data | | | | | | | | | | |
| Net asset value, beginning of period | $ | 10.04 | $ | 10.06 | $ | 10.06 | $ | 10.02 | $ | 10.01 |
| Income from Investment Operations | | | | | | | | | | |
Net investment income (loss) A,B | | .096 | | .025 | | .081 | | .157 | | .144 |
| Net realized and unrealized gain (loss) | | (.069) | | (.020) | | .007 | | .042 | | .011 |
| Total from investment operations | | .027 | | .005 | | .088 | | .199 | | .155 |
| Distributions from net investment income | | (.097) | | (.025) | | (.087) | | (.158) | | (.144) |
| Distributions from net realized gain | | - | | - | | (.001) | | (.001) | | (.001) |
| Total distributions | | (.097) | | (.025) | | (.088) | | (.159) | | (.145) |
| Net asset value, end of period | $ | 9.97 | $ | 10.04 | $ | 10.06 | $ | 10.06 | $ | 10.02 |
Total Return C | | .27% | | .05% | | .88% | | 2.00% | | 1.56% |
Ratios to Average Net Assets B,D,E | | | | | | | | | | |
| Expenses before reductions | | .35% | | .35% | | .35% | | .35% | | .35% |
| Expenses net of fee waivers, if any | | .25% | | .25% | | .25% | | .25% | | .25% |
| Expenses net of all reductions | | .25% | | .25% | | .25% | | .25% | | .25% |
| Net investment income (loss) | | .96% | | .25% | | .81% | | 1.56% | | 1.44% |
| Supplemental Data | | | | | | | | | | |
| Net assets, end of period (000 omitted) | $ | 2,339,827 | $ | 2,580,577 | $ | 3,175,503 | $ | 2,108,640 | $ | 1,607,689 |
Portfolio turnover rate F | | 56% | | 56% | | 41% | | 63% | | 45% G |
A Calculated based on average shares outstanding during the period.
B Net investment income (loss) is affected by the timing of the declaration of dividends by any underlying mutual funds or exchange-traded funds (ETFs). Net investment income (loss) of any mutual funds or ETFs is not included in the Fund's net investment income (loss) ratio.
C Total returns would have been lower if certain expenses had not been reduced during the applicable periods shown.
D Fees and expenses of any underlying mutual funds or exchange-traded funds (ETFs) are not included in the Fund's expense ratio. The Fund indirectly bears its proportionate share of these expenses. For additional expense information related to investments in Fidelity Central Funds, please refer to the "Investments in Fidelity Central Funds" note found in the Notes to Financial Statements section of the most recent Annual or Semi-Annual report.
E Expense ratios reflect operating expenses of the class. Expenses before reductions do not reflect amounts reimbursed, waived, or reduced through arrangements with the investment adviser, brokerage services, or other offset arrangements, if applicable, and do not represent the amount paid by the class during periods when reimbursements, waivers or reductions occur.
F Amount does not include the portfolio activity of any underlying mutual funds or exchange-traded funds (ETFs).
G Portfolio turnover rate excludes securities received or delivered in-kind.
For the period ended December 31, 2022
1. Organization.
Fidelity Conservative Income Municipal Bond Fund (the Fund) is a fund of Fidelity Municipal Trust (the Trust) and is authorized to issue an unlimited number of shares. The Trust is registered under the Investment Company Act of 1940, as amended (the 1940 Act), as an open-end management investment company organized as a Massachusetts business trust. The Fund offers Conservative Income Municipal Bond and Institutional Class, each of which has equal rights as to assets and voting privileges. Each class has exclusive voting rights with respect to matters that affect that class.
2. Investments in Fidelity Central Funds.
Funds may invest in Fidelity Central Funds, which are open-end investment companies generally available only to other investment companies and accounts managed by the investment adviser and its affiliates. The Schedule of Investments lists any Fidelity Central Funds held as an investment as of period end, but does not include the underlying holdings of each Fidelity Central Fund. An investing fund indirectly bears its proportionate share of the expenses of the underlying Fidelity Central Funds.
Based on its investment objective, each Fidelity Central Fund may invest or participate in various investment vehicles or strategies that are similar to those of the investing fund. These strategies are consistent with the investment objectives of the investing fund and may involve certain economic risks which may cause a decline in value of each of the Fidelity Central Funds and thus a decline in the value of the investing fund.
| Fidelity Central Fund | Investment Manager | Investment Objective | Investment Practices | Expense Ratio A |
| Fidelity Money Market Central Funds | Fidelity Management & Research Company LLC (FMR) | Each fund seeks to obtain a high level of current income consistent with the preservation of capital and liquidity. | Short-term Investments | Less than .005% |
A Expenses expressed as a percentage of average net assets and are as of each underlying Central Fund's most recent annual or semi-annual shareholder report.
A complete unaudited list of holdings for each Fidelity Central Fund is available upon request or at the Securities and Exchange Commission website at www.sec.gov. In addition, the financial statements of the Fidelity Central Funds which contain the significant accounting policies (including investment valuation policies) of those funds, and are not covered by the Report of Independent Registered Public Accounting Firm, are available on the Securities and Exchange Commission website or upon request.
3. Significant Accounting Policies.
The Fund is an investment company and applies the accounting and reporting guidance of the Financial Accounting Standards Board (FASB) Accounting Standards Codification Topic 946 Financial Services - Investment Companies . The financial statements have been prepared in conformity with accounting principles generally accepted in the United States of America (GAAP), which require management to make certain estimates and assumptions at the date of the financial statements. Actual results could differ from those estimates. Subsequent events, if any, through the date that the financial statements were issued have been evaluated in the preparation of the financial statements. The Fund's Schedule of Investments lists any underlying mutual funds or exchange-traded funds (ETFs) but does not include the underlying holdings of these funds. The following summarizes the significant accounting policies of the Fund:
Investment Valuation. Investments are valued as of 4:00 p.m. Eastern time on the last calendar day of the period. The Board of Trustees (the Board) has designated the Fund's investment adviser as the valuation designee responsible for the fair valuation function and performing fair value determinations as needed. The investment adviser has established a Fair Value Committee (the Committee) to carry out the day-to-day fair valuation responsibilities and has adopted policies and procedures to govern the fair valuation process and the activities of the Committee. In accordance with these fair valuation policies and procedures, which have been approved by the Board, the Fund attempts to obtain prices from one or more third party pricing services or brokers to value its investments. When current market prices, quotations or currency exchange rates are not readily available or reliable, investments will be fair valued in good faith by the Committee, in accordance with the policies and procedures. Factors used in determining fair value vary by investment type and may include market or investment specific events, transaction data, estimated cash flows, and market observations of comparable investments. The frequency that the fair valuation procedures are used cannot be predicted and they may be utilized to a significant extent. The Committee manages the Fund's fair valuation practices and maintains the fair valuation policies and procedures. The Fund's investment adviser reports to the Board information regarding the fair valuation process and related material matters.
The Fund categorizes the inputs to valuation techniques used to value its investments into a disclosure hierarchy consisting of three levels as shown below:
Level 1 - unadjusted quoted prices in active markets for identical investments
Level 2 - other significant observable inputs (including quoted prices for similar investments, interest rates, prepayment speeds, etc.)
Level 3 - unobservable inputs (including the Fund's own assumptions based on the best information available)
Valuation techniques used to value the Fund's investments by major category are as follows:
Debt securities, including restricted securities, are valued based on evaluated prices received from third party pricing services or from brokers who make markets in such securities. Municipal securities are valued by pricing services who utilize matrix pricing which considers yield or price of bonds of comparable quality, coupon, maturity and type or by broker-supplied prices. When independent prices are unavailable or unreliable, debt securities may be valued utilizing pricing methodologies which consider similar factors that would be used by third party pricing services. Debt securities are generally categorized as Level 2 in the hierarchy but may be Level 3 depending on the circumstances.
Investments in open-end mutual funds, including the Fidelity Central Funds, are valued at their closing net asset value (NAV) each business day and are categorized as Level 1 in the hierarchy.
Changes in valuation techniques may result in transfers in or out of an assigned level within the disclosure hierarchy. The aggregate value of investments by input level as of December 31, 2022 is included at the end of the Fund's Schedule of Investments.
Investment Transactions and Income. For financial reporting purposes, the Fund's investment holdings and NAV include trades executed through the end of the last business day of the period. The NAV per share for processing shareholder transactions is calculated as of the close of business of the New York Stock Exchange (NYSE), normally 4:00 p.m. Eastern time and includes trades executed through the end of the prior business day. Gains and losses on securities sold are determined on the basis of identified cost. Income and capital gain distributions from Fidelity Central Funds, if any, are recorded on the ex-dividend date. Interest income is accrued as earned and includes coupon interest and amortization of premium and accretion of discount on debt securities as applicable.
Class Allocations and Expenses. Investment income, realized and unrealized capital gains and losses, common expenses of a fund, and certain fund-level expense reductions, if any, are allocated daily on a pro-rata basis to each class based on the relative net assets of each class to the total net assets of a fund. Each class differs with respect to transfer agent and distribution and service plan fees incurred, as applicable. Certain expense reductions may also differ by class, if applicable. For the reporting period, the allocated portion of income and expenses to each class as a percent of its average net assets may vary due to the timing of recording these transactions in relation to fluctuating net assets of the classes. Expenses directly attributable to a fund are charged to that fund. Expenses attributable to more than one fund are allocated among the respective funds on the basis of relative net assets or other appropriate methods. Expenses included in the accompanying financial statements reflect the expenses of that fund and do not include any expenses associated with any underlying mutual funds or exchange-traded funds. Although not included in a fund's expenses, a fund indirectly bears its proportionate share of these expenses through the net asset value of each underlying mutual fund or exchange-traded fund. Expense estimates are accrued in the period to which they relate and adjustments are made when actual amounts are known.
Income Tax Information and Distributions to Shareholders. Each year, the Fund intends to qualify as a regulated investment company under Subchapter M of the Internal Revenue Code, including distributing substantially all of its taxable income and realized gains. As a result, no provision for U.S. Federal income taxes is required. As of December 31, 2022, the Fund did not have any unrecognized tax benefits in the financial statements; nor is the Fund aware of any tax positions for which it is reasonably possible that the total amounts of unrecognized tax benefits will significantly change in the next twelve months. The Fund files a U.S. federal tax return, in addition to state and local tax returns as required. The Fund's federal income tax returns are subject to examination by the Internal Revenue Service (IRS) for a period of three fiscal years after they are filed. State and local tax returns may be subject to examination for an additional fiscal year depending on the jurisdiction.
Distributions are declared and recorded daily and paid monthly from net investment income. Distributions from realized gains, if any, are declared and recorded on the ex-dividend date. Income and capital gain distributions are declared separately for each class. Income and capital gain distributions are determined in accordance with income tax regulations, which may differ from GAAP.
Capital accounts within the financial statements are adjusted for permanent book-tax differences. These adjustments have no impact on net assets or the results of operations. Capital accounts are not adjusted for temporary book-tax differences which will reverse in a subsequent period.
Book-tax differences are primarily due to market discount, capital loss carryforwards and losses deferred due to wash sales.
The Fund purchases municipal securities whose interest, in the opinion of the issuer, is free from federal income tax. There is no assurance that the IRS will agree with this opinion. In the event the IRS determines that the issuer does not comply with relevant tax requirements, interest payments from a security could become federally taxable, possibly retroactively to the date the security was issued.
As of period end, the cost and unrealized appreciation (depreciation) in securities, and derivatives if applicable, for federal income tax purposes were as follows:
| Gross unrealized appreciation | $898,322 |
| Gross unrealized depreciation | (17,625,980) |
| Net unrealized appreciation (depreciation) | $ (16,727,658) |
| Tax Cost | $2,501,590,625 |
The tax-based components of distributable earnings as of period end were as follows:
| Capital loss carryforward | $(1,291,642) |
| Net unrealized appreciation (depreciation) on securities and other investments | $(16,727,658) |
Capital loss carryforwards are only available to offset future capital gains of the Fund to the extent provided by regulations and may be limited. The capital loss carryforward information presented below, including any applicable limitation, is estimated as of fiscal period end and is subject to adjustment.
| Short-term | $(1,110,648) |
| Long-term | (180,994) |
| Total capital loss carryforward | $(1,291,642) |
The tax character of distributions paid was as follows:
| | December 31, 2022 | December 31, 2021 |
| Tax-exempt Income | $24,762,794 | $7,476,045 |
| Ordinary Income | - | - |
| Total | $24,762,794 | $7,476,045 |
Restricted Securities (including Private Placements). Funds may invest in securities that are subject to legal or contractual restrictions on resale. These securities generally may be resold in transactions exempt from registration or to the public if the securities are registered. Disposal of these securities may involve time-consuming negotiations and expense, and prompt sale at an acceptable price may be difficult. Information regarding restricted securities held at period end is included at the end of the Schedule of Investments, if applicable.
4. Purchases and Sales of Investments.
Purchases and sales of securities, other than short-term securities and in-kind transactions, as applicable, are noted in the table below.
| | Purchases ($) | Sales ($) |
| Fidelity Conservative Income Municipal Bond Fund | 713,719,831 | 979,379,594 |
5. Fees and Other Transactions with Affiliates.
Management Fee. Fidelity Management & Research Company LLC (the investment adviser) and its affiliates provide the Fund with investment management related services for which the Fund pays a monthly management fee that is based on an annual rate of .30% of the Fund's average net assets. Under the management contract, the investment adviser pays all other fund-level expenses, except the compensation of the independent Trustees and certain other expenses such as interest expense.
Transfer Agent Fees. Fidelity Investments Institutional Operations Company LLC (FIIOC), an affiliate of the investment adviser, is the transfer, dividend disbursing and shareholder servicing agent for the Fund. FIIOC receives asset-based fees of .10% and .05% of average net assets for Conservative Income Municipal Bond and Institutional Class, respectively. FIIOC pays for typesetting, printing and mailing of shareholder reports, except proxy statements. For the period, transfer agent fees for each class were as follows:
| | Amount |
| Conservative Income Municipal Bond | $151,139 |
| Institutional Class | 1,217,589 |
| | $1,368,728 |
Interfund Trades. Funds may purchase from or sell securities to other Fidelity Funds under procedures adopted by the Board. The procedures have been designed to ensure these interfund trades are executed in accordance with Rule 17a-7 of the 1940 Act. Any interfund trades are included within the respective purchases and sales amounts shown in the Purchases and Sales of Investments note. Interfund trades during the period are noted in the table below.
| | Purchases ($) | Sales ($) | Realized Gain (Loss) ($) |
| Fidelity Conservative Income Municipal Bond Fund | 97,415,000 | 101,767,143 | (5,581) |
6. Committed Line of Credit.
Certain Funds participate with other funds managed by the investment adviser or an affiliate in a $4.25 billion credit facility (the "line of credit") to be utilized for temporary or emergency purposes to fund shareholder redemptions or for other short-term liquidity purposes. The commitment fees on the pro-rata portion of the line of credit are borne by the investment adviser. During the period, there were no borrowings on this line of credit.
7. Expense Reductions.
The investment adviser contractually agreed to reimburse each class to the extent annual operating expenses exceeded certain levels of average net assets as noted in the table below. This reimbursement will remain in place through April 30, 2024. Some expenses, for example the compensation of the independent Trustees and certain other expenses such as interest expense are excluded from this reimbursement.
The following classes were in reimbursement during the period:
| | Expense Limitations | Reimbursement |
| Conservative Income Municipal Bond | .35% | $75,712 |
| Institutional Class | .25% | 2,436,680 |
| | | $2,512,392 |
In addition, through arrangements with the Fund's custodian, credits realized as a result of certain uninvested cash balances were used to reduce the Fund's expenses. During the period, these credits reduced the Fund's expenses by $3,366.
8. Distributions to Shareholders.
Distributions to shareholders of each class were as follows:
| | Year ended December 31, 2022 | Year ended December 31, 2021 |
| Fidelity Conservative Income Municipal Bond Fund | | |
| Distributions to shareholders | | |
| Conservative Income Municipal Bond | $1,260,065 | $362,605 |
| Institutional Class | 23,502,729 | 7,113,440 |
Total | $24,762,794 | $7,476,045 |
9. Share Transactions.
Share transactions for each class were as follows and may contain in-kind transactions, automatic conversions between classes or exchanges between affiliated funds:
| | Shares | Shares | Dollars | Dollars |
| | Year ended December 31, 2022 | Year ended December 31, 2021 | Year ended December 31, 2022 | Year ended December 31, 2021 |
| Fidelity Conservative Income Municipal Bond Fund | | | | |
| Conservative Income Municipal Bond | | | | |
| Shares sold | 6,431,861 | 8,524,530 | $64,090,475 | $85,739,190 |
| Reinvestment of distributions | 104,367 | 30,330 | 1,039,599 | 304,931 |
| Shares redeemed | (9,979,407) | (16,825,326) | (99,539,380) | (169,146,195) |
| Net increase (decrease) | (3,443,179) | (8,270,466) | $(34,409,306) | $(83,102,074) |
| Institutional Class | | | | |
| Shares sold | 232,738,873 | 175,381,338 | $2,320,419,781 | $1,763,184,354 |
| Reinvestment of distributions | 692,458 | 322,576 | 6,899,221 | 3,243,316 |
| Shares redeemed | (255,738,433) | (234,491,744) | (2,550,573,342) | (2,357,708,085) |
| Net increase (decrease) | (22,307,102) | (58,787,830) | $(223,254,340) | $(591,280,415) |
10. Other.
A fund's organizational documents provide former and current trustees and officers with a limited indemnification against liabilities arising in connection with the performance of their duties to the fund. In the normal course of business, a fund may also enter into contracts that provide general indemnifications. A fund's maximum exposure under these arrangements is unknown as this would be dependent on future claims that may be made against a fund. The risk of material loss from such claims is considered remote.
11. Risk and Uncertainties.
Many factors affect a fund's performance. Developments that disrupt global economies and financial markets, such as pandemics, epidemics, outbreaks of infectious diseases, war, terrorism, and environmental disasters, may significantly affect a fund's investment performance. The effects of these developments to a fund will be impacted by the types of securities in which a fund invests, the financial condition, industry, economic sector, and geographic location of an issuer, and a fund's level of investment in the securities of that issuer.
To the Board of Trustees of Fidelity Municipal Trust and Shareholders of Fidelity Conservative Income Municipal Bond Fund
Opinion on the Financial Statements
We have audited the accompanying statement of assets and liabilities, including the schedule of investments, of Fidelity Conservative Income Municipal Bond Fund (one of the funds constituting Fidelity Municipal Trust, referred to hereafter as the "Fund") as of December 31, 2022, the related statement of operations for the year ended December 31, 2022, the statement of changes in net assets for each of the two years in the period ended December 31, 2022, including the related notes, and the financial highlights for each of the five years in the period ended December 31, 2022 (collectively referred to as the "financial statements"). In our opinion, the financial statements present fairly, in all material respects, the financial position of the Fund as of December 31, 2022, the results of its operations for the year then ended, the changes in its net assets for each of the two years in the period ended December 31, 2022 and the financial highlights for each of the five years in the period ended December 31, 2022 in conformity with accounting principles generally accepted in the United States of America.
Basis for Opinion
These financial statements are the responsibility of the Fund's management. Our responsibility is to express an opinion on the Fund's financial statements based on our audits. We are a public accounting firm registered with the Public Company Accounting Oversight Board (United States) (PCAOB) and are required to be independent with respect to the Fund in accordance with the U.S. federal securities laws and the applicable rules and regulations of the Securities and Exchange Commission and the PCAOB.
We conducted our audits of these financial statements in accordance with the standards of the PCAOB. Those standards require that we plan and perform the audit to obtain reasonable assurance about whether the financial statements are free of material misstatement, whether due to error or fraud.
Our audits included performing procedures to assess the risks of material misstatement of the financial statements, whether due to error or fraud, and performing procedures that respond to those risks. Such procedures included examining, on a test basis, evidence regarding the amounts and disclosures in the financial statements. Our audits also included evaluating the accounting principles used and significant estimates made by management, as well as evaluating the overall presentation of the financial statements. Our procedures included confirmation of securities owned as of December 31, 2022 by correspondence with the custodian and brokers; when replies were not received from brokers, we performed other auditing procedures. We believe that our audits provide a reasonable basis for our opinion.
/s/ PricewaterhouseCoopers LLP
Boston, Massachusetts
February 14, 2023
We have served as the auditor of one or more investment companies in the Fidelity group of funds since 1932.
The Trustees, Members of the Advisory Board (if any), and officers of the trust and fund, as applicable, are listed below. The Board of Trustees governs the fund and is responsible for protecting the interests of shareholders. The Trustees are experienced executives who meet periodically throughout the year to oversee the fund's activities, review contractual arrangements with companies that provide services to the fund, oversee management of the risks associated with such activities and contractual arrangements, and review the fund's performance. Each of the Trustees oversees 295 funds.
The Trustees hold office without limit in time except that (a) any Trustee may resign; (b) any Trustee may be removed by written instrument, signed by at least two-thirds of the number of Trustees prior to such removal; (c) any Trustee who requests to be retired or who has become incapacitated by illness or injury may be retired by written instrument signed by a majority of the other Trustees; and (d) any Trustee may be removed at any special meeting of shareholders by a two-thirds vote of the outstanding voting securities of the trust. Each Trustee who is not an interested person (as defined in the 1940 Act) of the trust and the fund is referred to herein as an Independent Trustee. Each Independent Trustee shall retire not later than the last day of the calendar year in which his or her 75th birthday occurs. The Independent Trustees may waive this mandatory retirement age policy with respect to individual Trustees. Officers and Advisory Board Members hold office without limit in time, except that any officer or Advisory Board Member may resign or may be removed by a vote of a majority of the Trustees at any regular meeting or any special meeting of the Trustees. Except as indicated, each individual has held the office shown or other offices in the same company for the past five years.
The fund's Statement of Additional Information (SAI) includes more information about the Trustees. To request a free copy, call Fidelity at 1-800-544-8544.
Experience, Skills, Attributes, and Qualifications of the Trustees. The Governance and Nominating Committee has adopted a statement of policy that describes the experience, qualifications, attributes, and skills that are necessary and desirable for potential Independent Trustee candidates (Statement of Policy). The Board believes that each Trustee satisfied at the time he or she was initially elected or appointed a Trustee, and continues to satisfy, the standards contemplated by the Statement of Policy. The Governance and Nominating Committee also engages professional search firms to help identify potential Independent Trustee candidates who have the experience, qualifications, attributes, and skills consistent with the Statement of Policy. From time to time, additional criteria based on the composition and skills of the current Independent Trustees, as well as experience or skills that may be appropriate in light of future changes to board composition, business conditions, and regulatory or other developments, have also been considered by the professional search firms and the Governance and Nominating Committee. In addition, the Board takes into account the Trustees' commitment and participation in Board and committee meetings, as well as their leadership of standing and ad hoc committees throughout their tenure.
In determining that a particular Trustee was and continues to be qualified to serve as a Trustee, the Board has considered a variety of criteria, none of which, in isolation, was controlling. The Board believes that, collectively, the Trustees have balanced and diverse experience, qualifications, attributes, and skills, which allow the Board to operate effectively in governing the fund and protecting the interests of shareholders. Information about the specific experience, skills, attributes, and qualifications of each Trustee, which in each case led to the Board's conclusion that the Trustee should serve (or continue to serve) as a trustee of the fund, is provided below.
Board Structure and Oversight Function. Abigail P. Johnson is an interested person and currently serves as Chairman. The Trustees have determined that an interested Chairman is appropriate and benefits shareholders because an interested Chairman has a personal and professional stake in the quality and continuity of services provided to the fund. Independent Trustees exercise their informed business judgment to appoint an individual of their choosing to serve as Chairman, regardless of whether the Trustee happens to be independent or a member of management. The Independent Trustees have determined that they can act independently and effectively without having an Independent Trustee serve as Chairman and that a key structural component for assuring that they are in a position to do so is for the Independent Trustees to constitute a substantial majority for the Board. The Independent Trustees also regularly meet in executive session. Michael E. Kenneally serves as Chairman of the Independent Trustees and as such (i) acts as a liaison between the Independent Trustees and management with respect to matters important to the Independent Trustees and (ii) with management prepares agendas for Board meetings.
Fidelity ® funds are overseen by different Boards of Trustees. The fund's Board oversees Fidelity's investment-grade bond, money market, asset allocation and certain equity funds, and other Boards oversee Fidelity's high income and other equity funds. The asset allocation funds may invest in Fidelity ® funds that are overseen by such other Boards. The use of separate Boards, each with its own committee structure, allows the Trustees of each group of Fidelity ® funds to focus on the unique issues of the funds they oversee, including common research, investment, and operational issues. On occasion, the separate Boards establish joint committees to address issues of overlapping consequences for the Fidelity ® funds overseen by each Board.
The Trustees operate using a system of committees to facilitate the timely and efficient consideration of all matters of importance to the Trustees, the fund, and fund shareholders and to facilitate compliance with legal and regulatory requirements and oversight of the fund's activities and associated risks. The Board, acting through its committees, has charged FMR and its affiliates with (i) identifying events or circumstances the occurrence of which could have demonstrably adverse effects on the fund's business and/or reputation; (ii) implementing processes and controls to lessen the possibility that such events or circumstances occur or to mitigate the effects of such events or circumstances if they do occur; and (iii) creating and maintaining a system designed to evaluate continuously business and market conditions in order to facilitate the identification and implementation processes described in (i) and (ii) above. Because the day-to-day operations and activities of the fund are carried out by or through FMR, its affiliates, and other service providers, the fund's exposure to risks is mitigated but not eliminated by the processes overseen by the Trustees. While each of the Board's committees has responsibility for overseeing different aspects of the fund's activities, oversight is exercised primarily through the Operations and Audit Committees. In addition, an ad hoc Board committee of Independent Trustees has worked with FMR to enhance the Board's oversight of investment and financial risks, legal and regulatory risks, technology risks, and operational risks, including the development of additional risk reporting to the Board. Appropriate personnel, including but not limited to the fund's Chief Compliance Officer (CCO), FMR's internal auditor, the independent accountants, the fund's Treasurer and portfolio management personnel, make periodic reports to the Board's committees, as appropriate, including an annual review of Fidelity's risk management program for the Fidelity ® funds. The responsibilities of each standing committee, including their oversight responsibilities, are described further under "Standing Committees of the Trustees."
Interested Trustees*:
Correspondence intended for a Trustee who is an interested person may be sent to Fidelity Investments, 245 Summer Street, Boston, Massachusetts 02210.
Name, Year of Birth; Principal Occupations and Other Relevant Experience+
Abigail P. Johnson (1961)
Year of Election or Appointment: 2009
Trustee
Chairman of the Board of Trustees
Ms. Johnson also serves as Trustee of other Fidelity ® funds. Ms. Johnson serves as Chairman (2016-present), Chief Executive Officer (2014-present), and Director (2007-present) of FMR LLC (diversified financial services company), President of Fidelity Financial Services (2012-present) and President of Personal, Workplace and Institutional Services (2005-present). Ms. Johnson is Chairman and Director of Fidelity Management & Research Company LLC (investment adviser firm, 2011-present). Previously, Ms. Johnson served as Chairman and Director of FMR Co., Inc. (investment adviser firm, 2011-2019), Vice Chairman (2007-2016) and President (2013-2016) of FMR LLC, President and a Director of Fidelity Management & Research Company (2001-2005), a Trustee of other investment companies advised by Fidelity Management & Research Company, Fidelity Investments Money Management, Inc. (investment adviser firm), and FMR Co., Inc. (2001-2005), Senior Vice President of the Fidelity ® funds (2001-2005), and managed a number of Fidelity ® funds. Ms. Abigail P. Johnson and Mr. Arthur E. Johnson are not related.
Jennifer Toolin McAuliffe (1959)
Year of Election or Appointment: 2016
Trustee
Ms. McAuliffe also serves as Trustee of other Fidelity ® funds and as Trustee of Fidelity Charitable (2020-present). Previously, Ms. McAuliffe served as Co-Head of Fixed Income of Fidelity Investments Limited (now known as FIL Limited (FIL)) (diversified financial services company), Director of Research for FIL's credit and quantitative teams in London, Hong Kong and Tokyo and Director of Research for taxable and municipal bonds at Fidelity Investments Money Management, Inc. Ms. McAuliffe previously served as a member of the Advisory Board of certain Fidelity ® funds (2016). Ms. McAuliffe was previously a lawyer at Ropes & Gray LLP and currently serves as director or trustee of several not-for-profit entities.
* Determined to be an "Interested Trustee" by virtue of, among other things, his or her affiliation with the trust or various entities under common control with FMR.
+ The information includes the Trustee's principal occupation during the last five years and other information relating to the experience, attributes, and skills relevant to the Trustee's qualifications to serve as a Trustee, which led to the conclusion that the Trustee should serve as a Trustee for the fund.
Independent Trustees:
Correspondence intended for an Independent Trustee may be sent to Fidelity Investments, P.O. Box 55235, Boston, Massachusetts 02205-5235.
Name, Year of Birth; Principal Occupations and Other Relevant Experience+
Elizabeth S. Acton (1951)
Year of Election or Appointment: 2013
Trustee
Ms. Acton also serves as Trustee of other Fidelity ® funds. Prior to her retirement, Ms. Acton served as Executive Vice President, Finance (2011-2012), Executive Vice President, Chief Financial Officer (2002-2011) and Treasurer (2004-2005) of Comerica Incorporated (financial services). Prior to joining Comerica, Ms. Acton held a variety of positions at Ford Motor Company (1983-2002), including Vice President and Treasurer (2000-2002) and Executive Vice President and Chief Financial Officer of Ford Motor Credit Company (1998-2000). Ms. Acton currently serves as a member of the Board and Audit and Finance Committees of Beazer Homes USA, Inc. (homebuilding, 2012-present). Ms. Acton previously served as a member of the Advisory Board of certain Fidelity ® funds (2013-2016).
Ann E. Dunwoody (1953)
Year of Election or Appointment: 2018
Trustee
General Dunwoody also serves as Trustee of other Fidelity ® funds. General Dunwoody (United States Army, Retired) was the first woman in U.S. military history to achieve the rank of four-star general and prior to her retirement in 2012 held a variety of positions within the U.S. Army, including Commanding General, U.S. Army Material Command (2008-2012). General Dunwoody currently serves as President of First to Four LLC (leadership and mentoring services, 2012-present), a member of the Board and Nomination and Corporate Governance Committees of Kforce Inc. (professional staffing services, 2016-present) and a member of the Board of Automattic Inc. (software engineering, 2018-present). Previously, General Dunwoody served as a member of the Advisory Board and Nominating and Corporate Governance Committee of L3 Technologies, Inc. (communication, electronic, sensor and aerospace systems, 2013-2019) and a member of the Board and Audit and Sustainability and Corporate Responsibility Committees of Republic Services, Inc. (waste collection, disposal and recycling, 2013-2016). Ms. Dunwoody also serves on several boards for non-profit organizations, including as a member of the Board, Chair of the Nomination and Governance Committee and a member of the Audit Committee of Logistics Management Institute (consulting non-profit, 2012-present), a member of the Council of Trustees for the Association of the United States Army (advocacy non-profit, 2013-present), a member of the Board of Florida Institute of Technology (2015-present) and a member of the Board of ThanksUSA (military family education non-profit, 2014-present). General Dunwoody previously served as a member of the Advisory Board of certain Fidelity ® funds (2018).
John Engler (1948)
Year of Election or Appointment: 2014
Trustee
Mr. Engler also serves as Trustee of other Fidelity ® funds. Previously, Mr. Engler served as Governor of Michigan (1991-2003), President of the Business Roundtable (2011-2017) and interim President of Michigan State University (2018-2019). Mr. Engler currently serves as a member of the Board of Stride, Inc. (formerly K12 Inc.) (technology-based education company, 2012-present). Previously, Mr. Engler served as a member of the Board of Universal Forest Products (manufacturer and distributor of wood and wood-alternative products, 2003-2019) and Trustee of The Munder Funds (2003-2014). Mr. Engler previously served as a member of the Advisory Board of certain Fidelity ® funds (2014-2016).
Robert F. Gartland (1951)
Year of Election or Appointment: 2010
Trustee
Mr. Gartland also serves as Trustee of other Fidelity ® funds. Prior to his retirement, Mr. Gartland held a variety of positions at Morgan Stanley (financial services, 1979-2007), including Managing Director (1987-2007) and Chase Manhattan Bank (1975-1978). Mr. Gartland previously served as Chairman and an investor in Gartland & Mellina Group Corp. (consulting, 2009-2019), as a member of the Board of National Securities Clearing Corporation (1993-1996) and as Chairman of TradeWeb (2003-2004).
Arthur E. Johnson (1947)
Year of Election or Appointment: 2008
Trustee
Mr. Johnson also serves as Trustee of other Fidelity ® funds. Prior to his retirement, Mr. Johnson served as Senior Vice President of Corporate Strategic Development of Lockheed Martin Corporation (defense contractor, 1999-2009). Mr. Johnson currently serves as a member of the Board of Booz Allen Hamilton (management consulting, 2011-present). Mr. Johnson previously served as a member of the Board of Eaton Corporation plc (diversified power management, 2009-2019) and a member of the Board of AGL Resources, Inc. (holding company, 2002-2016). Mr. Johnson previously served as Chairman (2018-2021) and Vice Chairman (2015-2018) of the Independent Trustees of certain Fidelity® funds. Mr. Arthur E. Johnson is not related to Ms. Abigail P. Johnson.
Michael E. Kenneally (1954)
Year of Election or Appointment: 2009
Trustee
Chairman of the Independent Trustees
Mr. Kenneally also serves as Trustee of other Fidelity ® funds and was Vice Chairman (2018-2021) of the Independent Trustees of certain Fidelity ® funds. Prior to retirement in 2005, he was Chairman and Global Chief Executive Officer of Credit Suisse Asset Management, the worldwide fund management and institutional investment business of Credit Suisse Group. Previously, Mr. Kenneally was an Executive Vice President and the Chief Investment Officer for Bank of America. In this role, he was responsible for the investment management, strategy and products delivered to the bank's institutional, high-net-worth and retail clients. Earlier, Mr. Kenneally directed the organization's equity and quantitative research groups. He began his career as a research analyst and then spent more than a dozen years as a portfolio manager for endowments, pension plans and mutual funds. He earned the Chartered Financial Analyst (CFA) designation in 1991.
Mark A. Murray (1954)
Year of Election or Appointment: 2016
Trustee
Mr. Murray also serves as Trustee of other Fidelity ® funds. Previously, Mr. Murray served as Co-Chief Executive Officer (2013-2016), President (2006-2013) and Vice Chairman (2013-2020) of Meijer, Inc. Mr. Murray serves as a member of the Board (2009-present) and Public Policy and Responsibility Committee (2009-present) and Chair of the Nuclear Review Committee (2019-present) of DTE Energy Company (diversified energy company). Mr. Murray previously served as a member of the Board of Spectrum Health (not-for-profit health system, 2015-2019) and as a member of the Board and Audit Committee and Chairman of the Nominating and Corporate Governance Committee of Universal Forest Products, Inc. (manufacturer and distributor of wood and wood-alternative products, 2004-2016). Mr. Murray also serves as a member of the Board of many community and professional organizations. Mr. Murray previously served as a member of the Advisory Board of certain Fidelity ® funds (2016).
+ The information includes the Trustee's principal occupation during the last five years and other information relating to the experience, attributes, and skills relevant to the Trustee's qualifications to serve as a Trustee, which led to the conclusion that the Trustee should serve as a Trustee for the fund.
Advisory Board Members and Officers:
Correspondence intended for a Member of the Advisory Board (if any) may be sent to Fidelity Investments, P.O. Box 55235, Boston, Massachusetts 02205-5235. Correspondence intended for an officer may be sent to Fidelity Investments, 245 Summer Street, Boston, Massachusetts 02210. Officers appear below in alphabetical order.
Name, Year of Birth; Principal Occupation
Laura M. Bishop (1961)
Year of Election or Appointment: 2022
Member of the Advisory Board
Ms. Bishop also serves as a Member of the Advisory Board of other funds. Prior to her retirement, Ms. Bishop held a variety of positions at United Services Automobile Association (2001-2020), including Executive Vice President and Chief Financial Officer (2014-2020) and Senior Vice President and Deputy Chief Financial Officer (2012-2014). Ms. Bishop currently serves as a member of the Audit Committee and Compensation and Personnel Committee (2021-present) of the Board of Directors of Korn Ferry (global organizational consulting).
Robert W. Helm (1957)
Year of Election or Appointment: 2021
Member of the Advisory Board
Mr. Helm also serves as a Member of the Advisory Board of other Fidelity® funds. Mr. Helm was formerly Deputy Chairman (2003-2020), partner (1991-2020) and an associate (1984-1991) of Dechert LLP (formerly Dechert Price & Rhoads). Mr. Helm currently serves on boards and committees of several not-for-profit organizations.
Craig S. Brown (1977)
Year of Election or Appointment: 2019
Assistant Treasurer
Mr. Brown also serves as an officer of other funds. Mr. Brown serves as Assistant Treasurer of FIMM, LLC (2021-present) and is an employee of Fidelity Investments (2013-present). Previously, Mr. Brown served as Assistant Treasurer of certain Fidelity ® funds (2019-2022).
John J. Burke III (1964)
Year of Election or Appointment: 2018
Chief Financial Officer
Mr. Burke also serves as Chief Financial Officer of other funds. Mr. Burke serves as Head of Investment Operations for Fidelity Fund and Investment Operations (2018-present) and is an employee of Fidelity Investments (1998-present). Previously Mr. Burke served as head of Asset Management Investment Operations (2012-2018).
David J. Carter (1973)
Year of Election or Appointment: 2020
Assistant Secretary
Mr. Carter also serves as Assistant Secretary of other funds. Mr. Carter serves as Senior Vice President, Deputy General Counsel (2022-present) and is an employee of Fidelity Investments (2005-present).
Jonathan Davis (1968)
Year of Election or Appointment: 2010
Assistant Treasurer
Mr. Davis also serves as an officer of other funds. Mr. Davis serves as Assistant Treasurer of FIMM, LLC (2021-present), FMR Capital, Inc. (2017-present), FD Funds GP LLC (2021-present), FD Funds Holding LLC (2021-present), and FD Funds Management LLC (2021-present); and is an employee of Fidelity Investments. Previously, Mr. Davis served as Vice President and Associate General Counsel of FMR LLC (diversified financial services company, 2003-2010).
Laura M. Del Prato (1964)
Year of Election or Appointment: 2018
President and Treasurer
Ms. Del Prato also serves as an officer of other funds. Ms. Del Prato serves as Assistant Treasurer of FIMM, LLC (2021-present) and is an employee of Fidelity Investments (2017-present). Previously, Ms. Del Prato served as President and Treasurer of The North Carolina Capital Management Trust: Cash Portfolio and Term Portfolio (2018-2020). Prior to joining Fidelity Investments, Ms. Del Prato served as a Managing Director and Treasurer of the JPMorgan Mutual Funds (2014-2017). Prior to JPMorgan, Ms. Del Prato served as a partner at Cohen Fund Audit Services (accounting firm, 2012-2013) and KPMG LLP (accounting firm, 2004-2012).
Christopher M. Gouveia (1973)
Year of Election or Appointment: 2023
Chief Compliance Officer
Mr. Gouveia also serves as Chief Compliance Officer of other funds. Mr. Gouveia serves as Senior Vice President of Asset Management Compliance for Fidelity Investments and is an employee of Fidelity Investments. Previously, Mr. Gouveia served as Chief Compliance Officer of the North Carolina Capital Management Trust (2016-2019).
Colm A. Hogan (1973)
Year of Election or Appointment: 2016
Assistant Treasurer
Mr. Hogan also serves as an officer of other funds. Mr. Hogan serves as Assistant Treasurer of FIMM, LLC (2021-present) and FMR Capital, Inc. (2017-present) and is an employee of Fidelity Investments (2005-present). Previously, Mr. Hogan served as Deputy Treasurer of certain Fidelity ® funds (2016-2020) and Assistant Treasurer of certain Fidelity ® funds (2016-2018).
Cynthia Lo Bessette (1969)
Year of Election or Appointment: 2019
Secretary and Chief Legal Officer (CLO)
Ms. Lo Bessette also serves as an officer of other funds. Ms. Lo Bessette serves as CLO, Secretary, and Senior Vice President of Fidelity Management & Research Company LLC (investment adviser firm, 2019-present); CLO of Fidelity Management & Research (Hong Kong) Limited, FMR Investment Management (UK) Limited, and Fidelity Management & Research (Japan) Limited (investment adviser firms, 2019-present); Secretary of FD Funds GP LLC (2021-present), FD Funds Holding LLC (2021-present), FD Funds Management LLC (2021-present), and Fidelity Diversifying Solutions LLC (investment adviser firm, 2022-present); and Assistant Secretary of FIMM, LLC (2019-present). She is a Senior Vice President and Deputy General Counsel of FMR LLC (diversified financial services company, 2019-present), and is an employee of Fidelity Investments. Previously, Ms. Lo Bessette served as CLO, Secretary, and Senior Vice President of FMR Co., Inc. (investment adviser firm, 2019); Secretary of Fidelity SelectCo, LLC and Fidelity Investments Money Management, Inc. (investment adviser firms, 2019). Prior to joining Fidelity Investments, Ms. Lo Bessette was Executive Vice President, General Counsel (2016-2019) and Senior Vice President, Deputy General Counsel (2015-2016) of OppenheimerFunds (investment management company) and Deputy Chief Legal Officer (2013-2015) of Jennison Associates LLC (investment adviser firm).
Chris Maher (1972)
Year of Election or Appointment: 2013
Assistant Treasurer
Mr. Maher also serves as an officer of other funds. Mr. Maher serves as Assistant Treasurer of FIMM, LLC (2021-present) and FMR Capital, Inc. (2017-present), and is an employee of Fidelity Investments (2008-present). Previously, Mr. Maher served as Assistant Treasurer of certain funds (2013-2020); Vice President of Asset Management Compliance (2013), Vice President of the Program Management Group of FMR (investment adviser firm, 2010-2013), and Vice President of Valuation Oversight (2008-2010).
Jamie Pagliocco (1964)
Year of Election or Appointment: 2020
Vice President
Mr. Pagliocco also serves as Vice President of other funds. Mr. Pagliocco serves as President of Fixed Income (2020-present), and is an employee of Fidelity Investments (2001-present). Previously, Mr. Pagliocco served as Co-Chief Investment Officer - Bond (2017-2020), Global Head of Bond Trading (2016-2019), and as a portfolio manager.
Brett Segaloff (1972)
Year of Election or Appointment: 2021
Anti-Money Laundering (AML) Officer
Mr. Segaloff also serves as an AML Officer of other funds and other related entities. He is Director, Anti-Money Laundering (2007-present) of FMR LLC (diversified financial services company) and is an employee of Fidelity Investments (1996-present).
Stacie M. Smith (1974)
Year of Election or Appointment: 2013
Assistant Treasurer
Ms. Smith also serves as an officer of other funds. Ms. Smith serves as Assistant Treasurer of FIMM, LLC (2021-present) and FMR Capital, Inc. (2017-present), is an employee of Fidelity Investments (2009-present), and has served in other fund officer roles. Prior to joining Fidelity Investments, Ms. Smith served as Senior Audit Manager of Ernst & Young LLP (accounting firm, 1996-2009). Previously, Ms. Smith served as Assistant Treasurer (2013-2019) and Deputy Treasurer (2013-2016) of certain Fidelity ® funds.
Jim Wegmann (1979)
Year of Election or Appointment: 2021
Deputy Treasurer
Mr. Wegmann also serves as an officer of other funds. Mr. Wegmann serves as Assistant Treasurer of FIMM, LLC (2021-present) and is an employee of Fidelity Investments (2011-present). Previously, Mr. Wegmann served as Assistant Treasurer of certain Fidelity ® funds (2019-2021).
As a shareholder, you incur two types of costs: (1) transaction costs, which may include sales charges (loads) on purchase payments or redemption proceeds, as applicable and (2) ongoing costs, which generally include management fees, distribution and/or service (12b-1) fees and other Fund expenses. This Example is intended to help you understand your ongoing costs (in dollars) of investing in a fund and to compare these costs with the ongoing costs of investing in other mutual funds.
| The Example is based on an investment of $1,000 invested at the beginning of the period and held for the entire period (July 1, 2022 to December 31, 2022). |
Actual Expenses
The first line of the accompanying table provides information about actual account values and actual expenses. You may use the information in this line, together with the amount you invested, to estimate the expenses that you paid over the period. Simply divide your account value by $1,000.00 (for example, an $8,600 account value divided by $1,000.00 = 8.6), then multiply the result by the number in the first line for a class/Fund under the heading entitled "Expenses Paid During Period" to estimate the expenses you paid on your account during this period. If any fund is a shareholder of any underlying mutual funds or exchange-traded funds (ETFs) (the Underlying Funds), such fund indirectly bears its proportional share of the expenses of the Underlying Funds in addition to the direct expenses incurred presented in the table. These fees and expenses are not included in the annualized expense ratio used to calculate the expense estimate in the table below.
Hypothetical Example for Comparison Purposes
The second line of the accompanying table provides information about hypothetical account values and hypothetical expenses based on the actual expense ratio and an assumed rate of return of 5% per year before expenses, which is not the actual return. The hypothetical account values and expenses may not be used to estimate the actual ending account balance or expenses you paid for the period. You may use this information to compare the ongoing costs of investing in the Fund and other funds. To do so, compare this 5% hypothetical example with the 5% hypothetical examples that appear in the shareholder reports of the other funds. If any fund is a shareholder of any Underlying Funds, such fund indirectly bears its proportional share of the expenses of the Underlying Funds in addition to the direct expenses as presented in the table. These fees and expenses are not included in the annualized expense ratio used to calculate the expense estimate in the table below.
Please note that the expenses shown in the table are meant to highlight your ongoing costs only and do not reflect any transaction costs. Therefore, the second line of the table is useful in comparing ongoing costs only, and will not help you determine the relative total costs of owning different funds. In addition, if these transactional costs were included, your costs would have been higher.
| | | | | Annualized Expense Ratio- A | | Beginning Account Value July 1, 2022 | | Ending Account Value December 31, 2022 | | Expenses Paid During Period- C July 1, 2022 to December 31, 2022 |
| Fidelity® Conservative Income Municipal Bond Fund | | | | | | | | | | |
| Fidelity® Conservative Income Municipal Bond Fund | | | | .35% | | | | | | |
| Actual | | | | | | $ 1,000 | | $ 1,007.20 | | $ 1.77 |
Hypothetical- B | | | | | | $ 1,000 | | $ 1,023.44 | | $ 1.79 |
| Institutional Class | | | | .25% | | | | | | |
| Actual | | | | | | $ 1,000 | | $ 1,007.70 | | $ 1.27 |
Hypothetical- B | | | | | | $ 1,000 | | $ 1,023.95 | | $ 1.28 |
| |
A Annualized expense ratio reflects expenses net of applicable fee waivers.
B 5% return per year before expenses
C Expenses are equal to the annualized expense ratio, multiplied by the average account value over the period, multiplied by 184/ 365 (to reflect the one-half year period). The fees and expenses of any Underlying Funds are not included in each annualized expense ratio.
The dividend and capital gains distributions for the fund(s) are available on Fidelity.com or Institutional.Fidelity.com.
During fiscal year ended 2022, 100% of the fund's income dividends were free from federal income tax, and 41.62% of the fund's income dividends was subject to the federal alternative minimum tax.
The fund will notify shareholders in January 2023 of amounts for use in preparing 2022 income tax returns.
Fidelity Conservative Income Municipal Bond Fund
Each year, the Board of Trustees, including the Independent Trustees (together, the Board), votes on the renewal of the management contract with Fidelity Management & Research Company LLC (FMR) and the sub-advisory agreements (together, the Advisory Contracts) for the fund. FMR and the sub-advisers are referred to herein as the Investment Advisers. The Board, assisted by the advice of fund counsel and Independent Trustees' counsel, requests and considers a broad range of information relevant to the renewal of the Advisory Contracts throughout the year.
The Board meets regularly and, at each of its meetings, covers an extensive agenda of topics and materials and considers factors that are relevant to its annual consideration of the renewal of the fund's Advisory Contracts, including the services and support provided to the fund and its shareholders. The Board has established four standing committees (Committees) - Operations, Audit, Fair Valuation, and Governance and Nominating - each composed of and chaired by Independent Trustees with varying backgrounds, to which the Board has assigned specific subject matter responsibilities in order to enhance effective decision-making by the Board. The Operations Committee, of which all the Independent Trustees are members, meets regularly throughout the year and requests, receives and considers, among other matters, information related to the annual consideration of the renewal of the fund's Advisory Contracts before making its recommendation to the Board. The Board also meets as needed to review matters specifically related to the Board's annual consideration of the renewal of the Advisory Contracts. Members of the Board may also meet from time to time with trustees of other Fidelity funds through joint ad hoc committees to discuss certain matters relevant to all of the Fidelity funds.
At its September 2022 meeting, the Board unanimously determined to renew the fund's Advisory Contracts. In reaching its determination, the Board considered all factors it believed relevant, including (i) the nature, extent, and quality of the services provided to the fund and its shareholders (including the investment performance of the fund); (ii) the competitiveness relative to peer funds of the fund's management fee and the total expense ratio of a representative class (the retail class); (iii) the total costs of the services provided by and the profits realized by Fidelity from its relationships with the fund; and (iv) the extent to which, if any, economies of scale exist and are realized as the fund grows, and whether any economies of scale are appropriately shared with fund shareholders.
In considering whether to renew the Advisory Contracts for the fund, the Board reached a determination, with the assistance of fund counsel and Independent Trustees' counsel and through the exercise of its business judgment, that the renewal of the Advisory Contracts was in the best interests of the fund and its shareholders and that the compensation payable under the Advisory Contracts was fair and reasonable. The Board's decision to renew the Advisory Contracts was not based on any single factor, but rather was based on a comprehensive consideration of all the information provided to the Board at its meetings throughout the year. The Board, in reaching its determination to renew the Advisory Contracts, was aware that shareholders of the fund have a broad range of investment choices available to them, including a wide choice among funds offered by Fidelity's competitors, and that the fund's shareholders, who have the opportunity to review and weigh the disclosure provided by the fund in its prospectus and other public disclosures, have chosen to invest in this fund, which is part of the Fidelity family of funds.
Nature, Extent, and Quality of Services Provided . The Board considered Fidelity's staffing as it relates to the fund, including the backgrounds of investment personnel of Fidelity, and also considered the fund's investment objective, strategies, and related investment philosophy. The Independent Trustees also had discussions with senior management of Fidelity's investment operations and investment groups. The Board considered the structure of the investment personnel compensation program and whether this structure provides appropriate incentives to act in the best interests of the fund. Additionally, the Board considered the portfolio managers' investments, if any, in the funds that they manage. The Board also considered the steps Fidelity had taken to ensure the continued provision of high quality services to the Fidelity funds throughout the COVID-19 pandemic, including the expansion of staff in client facing positions to maintain service levels in periods of high volumes and volatility.
Resources Dedicated to Investment Management and Support Services . The Board reviewed the general qualifications and capabilities of Fidelity's investment staff, including its size, education, experience, and resources, as well as Fidelity's approach to recruiting, training, managing, and compensating investment personnel. The Board noted the resources devoted to Fidelity's global investment organization, and that Fidelity's analysts have extensive resources, tools, and capabilities that allow them to conduct quantitative and fundamental analysis, as well as credit analysis of issuers, counterparties, and guarantors. Further, the Board considered that Fidelity's investment professionals have sufficient access to global information and data so as to provide competitive investment results over time, and that those professionals also have access to sophisticated tools that permit them to assess portfolio construction and risk and performance attribution characteristics continuously, as well as to transmit new information and research conclusions rapidly around the world. Additionally, in its deliberations, the Board considered Fidelity's trading, risk management, compliance, cybersecurity, and technology and operations capabilities and resources, which are integral parts of the investment management process.
Shareholder and Administrative Services . The Board considered (i) the nature, extent, quality, and cost of advisory, administrative, and shareholder services performed by the Investment Advisers and their affiliates under the Advisory Contracts and under separate agreements covering transfer agency, and pricing and bookkeeping services for the fund; (ii) the nature and extent of the supervision of third party service providers, principally custodians, subcustodians, and pricing vendors; and (iii) the resources devoted to, and the record of compliance with, the fund's compliance policies and procedures.
The Board noted that the growth of fund assets over time across the complex allows Fidelity to reinvest in the development of services designed to enhance the value and convenience of the Fidelity funds as investment vehicles. These services include 24-hour access to account information and market information over the Internet and through telephone representatives, investor education materials and asset allocation tools. The Board also considered that it reviews customer service metrics such as telephone response times, continuity of services on the website and metrics addressing services at Fidelity Investor Centers.
Investment in a Large Fund Family . The Board considered the benefits to shareholders of investing in a Fidelity fund, including the benefits of investing in a fund that is part of a large family of funds offering a variety of investment disciplines and providing a large variety of mutual fund investor services. The Board noted that Fidelity had taken, or had made recommendations to the Board that resulted in the Fidelity funds taking, a number of actions over the previous year that benefited particular funds, including: (i) continuing to dedicate additional resources to Fidelity's investment research process, which includes meetings with management of issuers of securities in which the funds invest; (ii) continuing efforts to enhance Fidelity's global research capabilities; (iii) launching new funds, ETFs, and share classes with innovative structures, strategies and pricing and making other enhancements to meet investor needs; (iv) broadening eligibility requirements for certain funds and share classes; (v) reducing management fees and total expenses for certain funds and classes; (vi) lowering expenses for certain existing funds and classes by implementing or lowering expense caps; (vii) rationalizing product lines and gaining increased efficiencies from fund mergers and liquidations; (viii) continuing to develop, acquire and implement systems and technology to improve services to the funds and shareholders, strengthen information security, and increase efficiency; and (ix) continuing to implement enhancements to further strengthen Fidelity's product line to increase investors' probability of success in achieving their investment goals, including their retirement income goals.
Investment Performance . The Board considered whether the fund has operated in accordance with its investment objective, as well as its record of compliance with its investment restrictions and its performance history. The Board noted that there were portfolio management changes for the fund in October 2021 and January 2022.
The Board took into account discussions that occur at Board meetings throughout the year with representatives of the Investment Advisers about fund investment performance. In this regard the Board noted that as part of regularly scheduled fund reviews and other reports to the Board on fund performance, the Board considers annualized return information for the fund for different time periods, measured against an appropriate securities market index (benchmark index) and an appropriate peer group of funds with similar objectives (peer group). The Board also receives and considers information about performance attribution. In its evaluation of fund investment performance at meetings throughout the year, the Board gave particular attention to information indicating underperformance of certain Fidelity funds for specific time periods and discussed with the Investment Advisers the reasons for such underperformance.
In addition to reviewing absolute and relative fund performance, the Independent Trustees periodically consider the appropriateness of fund performance metrics in evaluating the results achieved. In general, the Independent Trustees believe that fund performance should be evaluated based on gross performance (before fees and expenses but after transaction costs) compared to appropriate benchmark indices, over appropriate time periods that may include full market cycles, and on net performance (after fees and expenses) compared to appropriate peer groups, as applicable, over the same periods, taking into account relevant factors including the following: general market conditions; expectations for interest rate levels and credit conditions; issuer-specific information including credit quality; the potential for incremental return versus the fund's benchmark index weighed against the risks involved in obtaining that incremental return, including the risk of diminished or negative total returns; and fund cash flows and other factors. The Independent Trustees generally give greater weight to fund performance over longer time periods than over shorter time periods. Depending on the circumstances, the Independent Trustees may be satisfied with a fund's performance notwithstanding that it lags its benchmark index or peer group for certain periods.
The Independent Trustees recognize that shareholders evaluate performance on a net basis over their own holding periods, for which one-, three-, and five-year periods are often used as a proxy. For this reason, the performance information reviewed by the Board also included net cumulative calendar year total return information for the representative class (the retail class) and an appropriate benchmark index and peer group for the most recent one-, three-, and five-year periods.
Based on its review, the Board concluded that the nature, extent, and quality of services provided to the fund under the Advisory Contracts should continue to benefit the shareholders of the fund.
Competitiveness of Management Fee and Total Expense Ratio . The Board considered the fund's management fee and total expense ratio compared to selected groups of competitive funds and classes (referred to as "mapped groups" below) for the purpose of facilitating the Trustees' competitive analysis of management fees and total expenses. Fidelity creates "mapped groups" by combining similar investment objective categories (as classified by Lipper) that have comparable investment mandates. Combining funds with similar investment objective categories aids the Board's comparison of management fees and total expense ratios by broadening the competitive group used for such comparison.
Management Fee . The Board considered two proprietary management fee comparisons for the 12-month periods shown in basis points (BP) in the chart below. The group of Lipper funds used by the Board for management fee comparisons is referred to below as the "Total Mapped Group" and is broader than the Lipper peer group used by the Board for performance comparisons. The Total Mapped Group comparison focuses on a fund's standing in terms of gross management fees before expense reimbursements or caps relative to the total universe of funds with comparable investment mandates, regardless of whether their management fee structures also are comparable. Funds with comparable investment mandates offer exposure to similar types of securities. Funds with comparable management fee structures have similar management fee contractual arrangements (e.g., flat rate charged for advisory services, all-inclusive fee rate, etc.). "TMG %" represents the percentage of funds in the Total Mapped Group that had management fees that were lower than the fund's. For example, a hypothetical TMG % of 20% would mean that 80% of the funds in the Total Mapped Group had higher, and 20% had lower, management fees than the fund. The fund's actual TMG %s and the number of funds in the Total Mapped Group are in the chart below. The "Asset-Sized Peer Group" (ASPG) comparison focuses on a fund's standing relative to a subset of non-Fidelity funds within the Total Mapped Group that are similar in size and management fee structure. For example, if a fund is in the first quartile of the ASPG, the fund's management fee ranks in the least expensive or lowest 25% of funds in the ASPG. The ASPG represents at least 15% of the funds in the Total Mapped Group with comparable asset size and management fee structures, subject to a minimum of 50 funds (or all funds in the Total Mapped Group if fewer than 50). Additional information, such as the ASPG quartile in which the fund's management fee rate ranked, is also included in the chart and was considered by the Board.
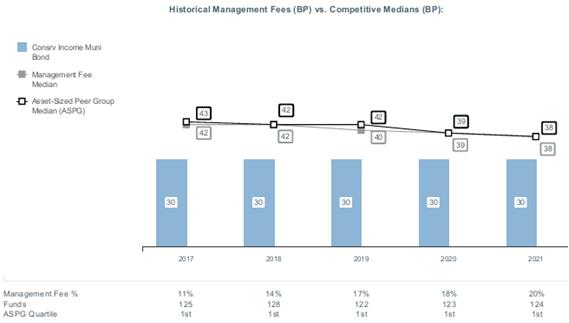
The Board noted that the fund's management fee rate ranked below the median of its Total Mapped Group and below the median of its ASPG for 2021.
Based on its review, the Board concluded that the fund's management fee is fair and reasonable in light of the services that the fund receives and the other factors considered.
Total Expense Ratio . In its review of the total expense ratio of the representative class (the retail class) of the fund, the Board considered the fund's management fee rate as well as other "fund-level" expenses, such as pricing and bookkeeping fees and custodial, legal, and audit fees, paid by FMR under the fund's management contract. The Board also considered other "class-level" expenses, such as transfer agent fees. The Board also noted that Fidelity may agree to waive fees or reimburse expenses from time to time, and the extent to which, if any, it has done so for the fund. The fund's representative class is compared to those funds and classes in the Total Mapped Group (used by the Board for management fee comparisons) that have a similar sales load structure. The Board also considered a total expense ASPG comparison, which focuses on the total expenses of the representative class relative to a subset of non-Fidelity funds within the similar sales load structure group that are similar in size and management fee structure. The total expense ASPG is limited to 15 larger and 15 smaller classes of different funds, where possible. The total expense ASPG comparison excludes performance adjustments and fund-paid 12b-1 fees to eliminate variability in expenses relating to these items.
The Board noted that the total net expense ratio of the retail class ranked below the similar sales load structure group competitive median for 2021 and below the ASPG competitive median for 2021.
The Board further considered that FMR has contractually agreed to reimburse Institutional Class and the retail class of the fund to the extent that total operating expenses, with certain exceptions, as a percentage of their respective average net assets, exceed 0.25% and 0.35% through April 30, 2023.
Fees Charged to Other Fidelity Clients . The Board also considered Fidelity fee structures and other information with respect to clients of Fidelity, such as other funds advised or subadvised by Fidelity, pension plan clients, and other institutional clients with similar mandates. The Board noted that a joint ad hoc committee created by it and the boards of other Fidelity funds periodically reviews and compares Fidelity's institutional investment advisory business with its business of providing services to the Fidelity funds and also noted the most recent findings of the committee. The Board noted that the committee's review included a consideration of the differences in services provided, fees charged, and costs incurred, as well as competition in the markets serving the different categories of clients.
Based on its review of total expense ratios and fees charged to other Fidelity clients, the Board concluded that the total expense ratio of each class of the fund was reasonable in light of the services that the fund and its shareholders receive and the other factors considered.
Costs of the Services and Profitability . The Board considered the revenues earned and the expenses incurred by Fidelity in conducting the business of developing, marketing, distributing, managing, administering and servicing the fund and servicing the fund's shareholders. The Board also considered the level of Fidelity's profits in respect of all the Fidelity funds.
On an annual basis, Fidelity presents to the Board information about the profitability of its relationships with the fund. Fidelity calculates profitability information for each fund, as well as aggregate profitability information for groups of Fidelity funds and all Fidelity funds, using a series of detailed revenue and cost allocation methodologies which originate with the books and records of Fidelity on which Fidelity's audited financial statements are based. The Audit Committee of the Board reviews any significant changes from the prior year's methodologies and the full Board approves such changes.
A public accounting firm has been engaged annually by the Board as part of the Board's assessment of Fidelity's profitability analysis. The engagement includes the review and assessment of the methodologies used by Fidelity in determining the revenues and expenses attributable to Fidelity's mutual fund business, and completion of agreed-upon procedures in respect of the mathematical accuracy of certain fund profitability information and its conformity to established allocation methodologies. After considering the reports issued under the engagement and information provided by Fidelity, the Board concluded that while other allocation methods may also be reasonable, Fidelity's profitability methodologies are reasonable in all material respects.
The Board also reviewed Fidelity's non-fund businesses and potential indirect benefits such businesses may have received as a result of their association with Fidelity's mutual fund business (i.e., fall-out benefits) as well as cases where Fidelity's affiliates may benefit from the funds' business. The Board considered areas where potential indirect benefits to the Fidelity funds from their relationships with Fidelity may exist. The Board's consideration of these matters was informed by the findings of a joint ad hoc committee created by it and the boards of other Fidelity funds to evaluate potential fall-out benefits.
The Board considered the costs of the services provided by and the profits realized by Fidelity in connection with the operation of the fund and was satisfied that the profitability was not excessive.
Economies of Scale . The Board considered whether there have been economies of scale in respect of the management of the Fidelity funds, whether the Fidelity funds (including the fund) have appropriately benefited from any such economies of scale, and whether there is potential for realization of any further economies of scale. The Board considered the extent to which the fund will benefit from economies of scale as assets grow through increased services to the fund, through waivers or reimbursements, or through fee or expense ratio reductions. The Board also noted that a committee (the Economies of Scale Committee) created by it and the boards of other Fidelity funds periodically analyzes whether Fidelity attains economies of scale in respect of the management and servicing of the Fidelity funds, whether the Fidelity funds have appropriately benefited from such economies of scale, and whether there is potential for realization of any further economies of scale.
The Board concluded, taking into account the analysis of the Economies of Scale Committee, that economies of scale, if any, are being appropriately shared between fund shareholders and Fidelity.
Additional Information Requested by the Board . In order to develop fully the factual basis for consideration of the Fidelity funds' advisory contracts, the Board requested and received additional information on certain topics, including: (i) Fidelity's fund profitability methodology, profitability trends for certain funds, the allocation of various costs to different funds, and the impact of certain factors on fund profitability results; (ii) portfolio manager changes that have occurred during the past year and the amount of the investment that each portfolio manager has made in the Fidelity fund(s) that he or she manages; (iii) the extent to which current market conditions have affected retention and recruitment of personnel; (iv) the arrangements with and compensation paid to certain fund sub-advisers on behalf of the Fidelity funds and the treatment of such compensation within Fidelity's fund profitability methodology; (v) the terms of the funds' various management fee structures, including the basic group fee and the terms of Fidelity's voluntary expense limitation arrangements; (vi) Fidelity's transfer agent, pricing and bookkeeping fees, expense and service structures for different funds and classes relative to competitive trends; (vii) the impact on fund profitability of recent industry trends, such as the growth in passively managed funds and the changes in flows for different types of funds; (viii) the types of management fee and total expense comparisons provided, and the challenges and limitations associated with such information; and (ix) explanations regarding the relative total expense ratios and management fees of certain funds and classes, total expense and management fee competitive trends, and methodologies for total expense and management fee competitive comparisons. In addition, the Board considered its discussions with Fidelity regarding Fidelity's efforts to maintain the continuous investment and shareholder services necessary for the funds during the current pandemic and economic circumstances.
Based on its evaluation of all of the conclusions noted above, and after considering all factors it believed relevant, the Board concluded that the advisory fee arrangements are fair and reasonable and that the fund's Advisory Contracts should be renewed.
1.967792.109
CMB-ANN-0323
Fidelity® Minnesota Municipal Income Fund
Annual Report
December 31, 2022
Contents
To view a fund's proxy voting guidelines and proxy voting record for the 12-month period ended June 30, visit http://www.fidelity.com/proxyvotingresults or visit the Securities and Exchange Commission's (SEC) web site at http://www.sec.gov.
You may also call 1-800-544-8544 to request a free copy of the proxy voting guidelines.
Standard & Poor's, S&P and S&P 500 are registered service marks of The McGraw-Hill Companies, Inc. and have been licensed for use by Fidelity Distributors Corporation.
Other third-party marks appearing herein are the property of their respective owners.
All other marks appearing herein are registered or unregistered trademarks or service marks of FMR LLC or an affiliated company. © 2023 FMR LLC. All rights reserved.
This report and the financial statements contained herein are submitted for the general information of the shareholders of the Fund. This report is not authorized for distribution to prospective investors in the Fund unless preceded or accompanied by an effective prospectus.
A fund files its complete schedule of portfolio holdings with the SEC for the first and third quarters of each fiscal year on Form N-PORT. Forms N-PORT are available on the SEC's web site at http://www.sec.gov. A fund's Forms N-PORT may be reviewed and copied at the SEC's Public Reference Room in Washington, DC. Information regarding the operation of the SEC's Public Reference Room may be obtained by calling 1-800-SEC-0330.
For a complete list of a fund's portfolio holdings, view the most recent holdings listing, semiannual report, or annual report on Fidelity's web site at http://www.fidelity.com, http://www.institutional.fidelity.com, or http://www.401k.com, as applicable.
NOT FDIC INSURED •MAY LOSE VALUE •NO BANK GUARANTEE
Neither the Fund nor Fidelity Distributors Corporation is a bank.
Average annual total return reflects the change in the value of an investment, assuming reinvestment of distributions from dividend income and capital gains (the profits earned upon the sale of securities that have grown in value, if any) and assuming a constant rate of performance each year. The hypothetical investment and the average annual total returns do not reflect the deduction of taxes that a shareholder would pay on fund distributions or the redemption of fund shares. During periods of reimbursement by Fidelity, a fund's total return will be greater than it would be had the reimbursement not occurred. How a fund did yesterday is no guarantee of how it will do tomorrow.
| Average Annual Total Returns |
| | | | |
Periods ended December 31, 2022 | Past 1 year | Past 5 years | Past 10 years |
| Fidelity® Minnesota Municipal Income Fund | -7.47% | 1.01% | 1.73% |
| $10,000 Over 10 Years |
| |
Let's say hypothetically that $10,000 was invested in Fidelity® Minnesota Municipal Income Fund on December 31, 2012. The chart shows how the value of your investment would have changed, and also shows how the Bloomberg Municipal Bond Index performed over the same period. |
|
|
Market Recap:
Tax-exempt municipal bonds notably declined in 2022, as a multitude of crosscurrents challenged the global economy and financial markets. The Bloomberg Municipal Bond Index returned -8.53% for the year, its third-worst annual return on record. In late 2021, the Federal Reserve began its pivot to a tighter monetary policy, tapering the large-scale asset purchases it restarted in 2020 amid the COVID-19 pandemic. In early 2022, the Fed, faced with persistent inflationary pressure, began implementing an aggressive series of rate hikes, raising its benchmark interest rate seven times, by a total of 4.25 percentage points, between March and December. This helped push municipal bond yields to their highest level in more than a decade. Muni bond prices, which move inversely to yields, fell sharply. Credit spreads significantly widened, as investors demanded more yield for lower-quality munis as recession risk increased. In November and December, the tax-exempt market staged a rally when comments by Fed Chair Jerome Powell pointed to a slowdown in the pace of rate hikes and inflation data moderated. Favorable supply and demand dynamics also helped amid muted muni bond issuance and increased pockets of demand. Muni tax-backed credit fundamentals remained solid throughout the year and, for the most part, the risk of credit-rating downgrades appeared low. Shorter-duration (lower sensitivity to changes in interest rates) and higher-credit-quality munis performed best for the year.
Comments from Co-Portfolio Managers Elizah McLaughlin, Cormac Cullen and Michael Maka:
For the fiscal year ending December 31, 2022, the fund returned -7.47%, net of fees, lagging the -7.01% result of the state-specific Bloomberg Minnesota Enhanced Modified 2% Tobacco Municipal Bond Index. The past 12 months, we continued to focus on longer-term objectives and sought to generate attractive tax-exempt income and a competitive risk-adjusted return. Versus the state-specific index, the fund's overweight in lower-rated, investment-grade bonds was a key detractor, given that they underperformed as credit spreads widened during the year. Larger-than-index exposure to health care bonds detracted as well, given the segment's lagging results. An overweight to Planned Amortization Class (PAC) housing bonds also crimped the relative result, amid concern that their maturities would lengthen if prepayments slowed too significantly. Differences in the way fund holdings and index components were priced further hindered relative performance. In contrast, duration (interest rate) positioning contributed to performance, relative to the state-specific index. The fund had less sensitivity to interest rates, as measured by its shorter duration, than the index and therefore was hurt less as interest rates rose. A higher-than-average yield on the fund's underlying holdings provided another boost to the relative result.
The views expressed above reflect those of the portfolio manager(s) only through the end of the period as stated on the cover of this report and do not necessarily represent the views of Fidelity or any other person in the Fidelity organization. Any such views are subject to change at any time based upon market or other conditions and Fidelity disclaims any responsibility to update such views. These views may not be relied on as investment advice and, because investment decisions for a Fidelity fund are based on numerous factors, may not be relied on as an indication of trading intent on behalf of any Fidelity fund.
| Revenue Sources (% of Fund's net assets) |
| General Obligations | 39.0% | |
| Health Care | 25.0% | |
| Education | 10.8% | |
| Electric Utilities | 6.8% | |
| Transportation | 6.8% | |
| Housing | 6.3% | |
| Others* (Individually Less Than 5%) | 5.3% | |
| | 100.0% | |
| |
| *Includes net other assets | | |
Quality Diversification (% of Fund's net assets) |
|
| |
| We have used ratings from Moody's Investors Service, Inc. Where Moody's® ratings are not available, we have used S&P® ratings. All ratings are as of the date indicated and do not reflect subsequent changes. |
Showing Percentage of Net Assets
| Municipal Bonds - 98.2% |
| | | Principal Amount (a) | Value ($) |
| Guam - 0.3% | | | |
| Guam Int'l. Arpt. Auth. Rev. Series 2013 C: | | | |
| 6.25% 10/1/34 (b) | | 515,000 | 525,875 |
| 6.25% 10/1/34 (Pre-Refunded to 10/1/23 @ 100) (b) | | 335,000 | 342,074 |
| Guam Pwr. Auth. Rev. Series 2022 A, 5% 10/1/44 | | 1,000,000 | 1,024,941 |
TOTAL GUAM | | | 1,892,890 |
| Minnesota - 96.9% | | | |
| Albany Independent School District #745 (Minnesota School district Cr. Enhancement Prog.) Series 2022 A, 4.125% 2/1/41 | | 1,130,000 | 1,152,021 |
| Anoka-Hennepin Independent School District 11 Series 2014 A: | | | |
| 5% 2/1/25 | | 1,015,000 | 1,036,237 |
| 5% 2/1/26 | | 1,220,000 | 1,245,917 |
| 5% 2/1/27 | | 1,285,000 | 1,311,886 |
| 5% 2/1/28 | | 1,345,000 | 1,372,855 |
| 5% 2/1/29 | | 1,415,000 | 1,443,852 |
| 5% 2/1/34 | | 1,800,000 | 1,834,209 |
| Chaska Elec. Rev. Series 2015 A: | | | |
| 5% 10/1/26 | | 1,000,000 | 1,061,213 |
| 5% 10/1/29 | | 785,000 | 830,489 |
| Chaska Independent School District #112 Gen. Oblig. (Minnesota School District Cr. Enhancement Prog.) Series 2016 A: | | | |
| 5% 2/1/30 | | 1,400,000 | 1,496,912 |
| 5% 2/1/31 | | 3,600,000 | 3,848,103 |
| City of Ramsey Series 2022 A: | | | |
| 5% 12/15/29 | | 670,000 | 769,136 |
| 5% 12/15/30 | | 665,000 | 775,844 |
| 5% 12/15/31 | | 740,000 | 877,245 |
| 5% 12/15/32 | | 775,000 | 929,909 |
| 5% 12/15/33 | | 565,000 | 676,147 |
| 5% 12/15/34 | | 455,000 | 538,652 |
| City of Virginia Series 2020 A: | | | |
| 4% 2/1/37 (Assured Guaranty Muni. Corp. Insured) | | 1,000,000 | 1,008,735 |
| 4% 2/1/39 (Assured Guaranty Muni. Corp. Insured) | | 1,000,000 | 996,501 |
| City of White Bear Lake (YMCA of Greater Twin Cities Proj.) Series 2018: | | | |
| 5% 6/1/25 | | 565,000 | 584,492 |
| 5% 6/1/26 | | 500,000 | 523,841 |
| 5% 6/1/28 | | 1,000,000 | 1,062,457 |
| 5% 6/1/30 | | 625,000 | 673,167 |
| 5% 6/1/31 | | 700,000 | 753,243 |
| 5% 6/1/33 | | 1,400,000 | 1,500,517 |
| Cloquet Independent School District #94 Series 2015 B: | | | |
| 5% 2/1/28 | | 3,030,000 | 3,153,016 |
| 5% 2/1/31 | | 1,245,000 | 1,292,742 |
| Ctr. City Health Care Facilities (Hazelden Betty Ford Foundation Proj.) Series 2014: | | | |
| 5% 11/1/23 | | 775,000 | 784,335 |
| 5% 11/1/25 | | 250,000 | 255,450 |
| 5% 11/1/26 | | 500,000 | 510,456 |
| 5% 11/1/27 | | 420,000 | 428,040 |
| Dawson-Boyd Independent School District Series 2019 A: | | | |
| 4% 2/1/33 | | 1,140,000 | 1,192,637 |
| 4% 2/1/36 | | 1,360,000 | 1,398,069 |
| 4% 2/1/37 | | 1,200,000 | 1,224,774 |
| Dilworth Gen. Oblig. Series 2022 A: | | | |
| 3.5% 2/1/34 | | 455,000 | 460,919 |
| 3.5% 2/1/35 | | 470,000 | 468,242 |
| 3.5% 2/1/36 | | 490,000 | 480,211 |
| 4% 2/1/38 | | 1,030,000 | 1,038,543 |
| 4% 2/1/40 | | 1,115,000 | 1,112,835 |
| 4% 2/1/42 | | 1,205,000 | 1,187,425 |
| Dilworth-Glyndon-Felton ISD No. 2164 Series 2020 A, 4% 2/1/34 | | 1,000,000 | 1,038,084 |
| Duluth Econ. Dev. Auth. Series 2021 A, 4% 7/1/41 | | 930,000 | 741,644 |
| Duluth Econ. Dev. Auth. Health Care Facilities Rev.: | | | |
| Series 2018 A: | | | |
5% 2/15/43 | | 1,500,000 | 1,483,421 |
5% 2/15/48 | | 3,000,000 | 2,915,291 |
5% 2/15/58 | | 3,125,000 | 3,051,926 |
| Series 2021 A: | | | |
4% 6/15/32 | | 535,000 | 519,141 |
4% 6/15/35 | | 550,000 | 517,063 |
| Series 2022 A: | | | |
4% 6/15/37 | | 1,140,000 | 1,037,792 |
4% 6/15/38 | | 400,000 | 359,332 |
4% 6/15/39 | | 250,000 | 222,031 |
5% 6/15/23 | | 300,000 | 301,996 |
5% 6/15/25 | | 565,000 | 576,719 |
5% 6/15/26 | | 360,000 | 370,742 |
5% 6/15/28 | | 935,000 | 974,570 |
5% 6/15/29 | | 775,000 | 810,594 |
5% 6/15/31 | | 1,220,000 | 1,288,114 |
5% 6/15/33 | | 1,170,000 | 1,233,786 |
| Series 2022 B: | | | |
5.25% 6/15/47 | | 2,500,000 | 2,530,725 |
5.25% 6/15/52 | | 1,250,000 | 1,256,967 |
| Duluth Independent School District #709 Ctfs. of Prtn. Series 2019 B: | | | |
| 5% 2/1/24 | | 400,000 | 408,284 |
| 5% 2/1/25 | | 375,000 | 389,687 |
| 5% 2/1/26 | | 395,000 | 418,382 |
| 5% 2/1/27 | | 370,000 | 397,199 |
| Elk River Independent School District #728: | | | |
| Series 2019 A, 3% 2/1/33 | | 2,925,000 | 2,831,460 |
| Series 2020 A, 4% 2/1/31 | | 2,120,000 | 2,205,367 |
| Forest Lake Series 2019 A, 4% 2/1/31 | | 1,790,000 | 1,910,985 |
| Hennepin County Gen. Oblig.: | | | |
| Series 2016 A: | | | |
5% 12/1/39 | | 5,250,000 | 5,601,297 |
5% 12/1/40 | | 7,200,000 | 7,676,320 |
| Series 2016 B, 5% 12/1/31 | | 1,155,000 | 1,253,974 |
| Series 2017 C, 5% 12/1/33 | | 3,075,000 | 3,324,251 |
| Series 2019 B, 5% 12/15/39 | | 3,725,000 | 4,082,038 |
| Series 2020 A, 5% 12/1/31 | | 4,765,000 | 5,564,449 |
| Series 2020 C, 5% 12/15/37 | | 2,500,000 | 2,796,221 |
| Itasca County (Minnesota County Cr. Enhancement Prog.) Series 2020 B, 4% 2/1/30 | | 1,520,000 | 1,621,783 |
| Le Sueur-Henderson ISD No. 2397 (Minnesota School District Cr. Enhancement Prog.) Series 2022 A, 4.5% 2/1/42 | | 2,495,000 | 2,569,720 |
| Maple Grove Health Care Sys. Rev.: | | | |
| Series 2015: | | | |
4% 9/1/35 | | 1,250,000 | 1,175,482 |
5% 9/1/25 | | 215,000 | 223,640 |
5% 9/1/28 | | 695,000 | 717,734 |
5% 9/1/30 | | 1,500,000 | 1,546,659 |
5% 9/1/31 | | 1,300,000 | 1,337,843 |
5% 9/1/32 | | 1,000,000 | 1,025,580 |
| Series 2017: | | | |
5% 5/1/26 | | 1,355,000 | 1,423,333 |
5% 5/1/27 | | 1,400,000 | 1,478,461 |
5% 5/1/28 | | 2,915,000 | 3,065,778 |
5% 5/1/29 | | 1,000,000 | 1,049,487 |
5% 5/1/30 | | 900,000 | 944,276 |
5% 5/1/31 | | 580,000 | 606,956 |
5% 5/1/32 | | 500,000 | 520,425 |
| Maple River Independent School District No. 2135 Series 2020 A, 4% 2/1/45 | | 2,750,000 | 2,746,201 |
| Metropolitan Council Gen. Oblig. Rev. Series 2020 D: | | | |
| 5% 3/1/30 | | 1,295,000 | 1,499,079 |
| 5% 3/1/31 | | 1,355,000 | 1,594,155 |
| Minneapolis & Saint Paul Metropolitan Arpts. Commission Arpt. Rev.: | | | |
| Series 2014 A: | | | |
5% 1/1/26 | | 3,015,000 | 3,082,393 |
5% 1/1/28 | | 4,100,000 | 4,181,031 |
5% 1/1/29 | | 2,150,000 | 2,193,481 |
5% 1/1/30 | | 2,000,000 | 2,040,290 |
5% 1/1/31 | | 6,020,000 | 6,132,056 |
| Series 2016 A: | | | |
5% 1/1/30 | | 4,275,000 | 4,607,092 |
5% 1/1/31 | | 2,375,000 | 2,552,488 |
5% 1/1/32 | | 2,900,000 | 3,112,278 |
| Series 2016 C, 5% 1/1/46 | | 4,770,000 | 4,919,533 |
| Series 2016 D: | | | |
5% 1/1/27 (b) | | 350,000 | 367,987 |
5% 1/1/28 (b) | | 430,000 | 451,175 |
5% 1/1/29 (b) | | 225,000 | 235,626 |
5% 1/1/30 (b) | | 480,000 | 502,525 |
5% 1/1/31 (b) | | 200,000 | 209,343 |
5% 1/1/32 (b) | | 200,000 | 209,046 |
5% 1/1/33 (b) | | 220,000 | 229,632 |
5% 1/1/34 (b) | | 225,000 | 234,398 |
5% 1/1/35 (b) | | 225,000 | 233,411 |
5% 1/1/36 (b) | | 220,000 | 227,318 |
5% 1/1/37 (b) | | 250,000 | 257,081 |
5% 1/1/41 (b) | | 725,000 | 737,269 |
| Series 2022 B: | | | |
4.25% 1/1/42 (b) | | 1,650,000 | 1,555,241 |
5% 1/1/47 (b) | | 1,600,000 | 1,632,024 |
| Minneapolis Health Care Sys. Rev.: | | | |
| Series 2015 A: | | | |
5% 11/15/27 (Assured Guaranty Muni. Corp. Insured) | | 850,000 | 889,341 |
5% 11/15/28 | | 1,380,000 | 1,441,807 |
5% 11/15/29 | | 1,000,000 | 1,044,582 |
5% 11/15/30 | | 1,000,000 | 1,042,475 |
5% 11/15/31 | | 3,665,000 | 3,817,090 |
5% 11/15/32 | | 2,200,000 | 2,285,903 |
| Series 2018 A: | | | |
5% 11/15/34 | | 3,350,000 | 3,562,427 |
5% 11/15/35 | | 2,500,000 | 2,643,527 |
5% 11/15/36 | | 2,500,000 | 2,632,956 |
5% 11/15/49 | | 4,935,000 | 5,033,474 |
| Series 2021: | | | |
4% 11/15/36 | | 5,410,000 | 5,322,966 |
4% 11/15/37 | | 2,550,000 | 2,488,042 |
4% 11/15/38 | | 1,785,000 | 1,727,991 |
4% 11/15/39 | | 1,265,000 | 1,213,000 |
4% 11/15/40 | | 6,000,000 | 5,693,822 |
| Minneapolis Spl. School District: | | | |
| (Minnesota School District Cr. Enhancement Prog.): | | | |
Series 2019 A, 5% 2/1/32 | | 1,125,000 | 1,254,242 |
Series 2019 B, 5% 2/1/32 | | 1,815,000 | 2,023,511 |
| (MN SD Cr. Enhancement Prog.): | | | |
Series 2018 A, 5% 2/1/33 | | 1,000,000 | 1,096,853 |
Series 2018 B, 5% 2/1/33 | | 3,190,000 | 3,498,961 |
| Series 2017 A, 4% 2/1/33 | | 1,415,000 | 1,473,767 |
| Series 2017 B: | | | |
4% 2/1/33 | | 2,595,000 | 2,702,774 |
4% 2/1/34 | | 2,595,000 | 2,699,323 |
| Series 2020 B, 4% 2/1/36 | | 1,745,000 | 1,803,158 |
| Series 2020 C, 4% 2/1/38 | | 1,665,000 | 1,696,946 |
| Series 2021 B: | | | |
5% 2/1/41 | | 1,180,000 | 1,304,269 |
5% 2/1/42 | | 1,235,000 | 1,363,305 |
| Series 2021 C: | | | |
5% 2/1/40 | | 1,585,000 | 1,762,060 |
5% 2/1/41 | | 1,660,000 | 1,834,820 |
5% 2/1/42 | | 1,745,000 | 1,926,290 |
| Series 2022 B: | | | |
5% 2/1/34 | | 850,000 | 988,531 |
5% 2/1/41 | | 1,195,000 | 1,334,130 |
5% 2/1/42 | | 1,255,000 | 1,398,098 |
5% 2/1/43 | | 1,320,000 | 1,465,407 |
| Minneapolis Spl. School District #1 Ctfs. of Prtn. Series 2016 C, 5% 2/1/31 | | 1,915,000 | 2,075,166 |
| Minnesota Armory Bldg. Commission Series 2021 A, 3% 6/1/38 | | 1,900,000 | 1,681,741 |
| Minnesota Ctfs. Prtn. (Minnesota Gen. Oblig. Proj.) Series 2014, 5% 6/1/39 | | 2,445,000 | 2,481,095 |
| Minnesota Gen. Oblig.: | | | |
| Series 2015 A, 5% 8/1/33 | | 1,900,000 | 1,996,321 |
| Series 2017 A, 5% 10/1/33 | | 3,335,000 | 3,682,366 |
| Series 2018 B, 4% 8/1/35 | | 5,270,000 | 5,529,680 |
| Series 2019 A: | | | |
5% 8/1/31 | | 1,000,000 | 1,145,967 |
5% 8/1/35 | | 5,030,000 | 5,638,161 |
| Series 2020 A: | | | |
5% 8/1/35 | | 6,000,000 | 6,824,015 |
5% 8/1/37 | | 6,000,000 | 6,729,245 |
5% 8/1/40 | | 2,500,000 | 2,765,859 |
| Series 2021 A: | | | |
4% 9/1/39 | | 2,645,000 | 2,733,741 |
4% 9/1/41 | | 10,000,000 | 10,241,244 |
| Series 2021 B, 4% 9/1/32 | | 2,000,000 | 2,185,852 |
| Minnesota Higher Ed. Facilities Auth. Rev.: | | | |
| (Univ. of St Thomas) Series 2017 A, 5% 10/1/29 | | 760,000 | 819,641 |
| Series 2016 A, 5% 5/1/46 | | 3,610,000 | 3,238,748 |
| Series 2017 A, 4% 10/1/35 | | 800,000 | 806,475 |
| Series 2017: | | | |
5% 3/1/31 | | 1,000,000 | 1,084,283 |
5% 10/1/31 | | 590,000 | 633,691 |
5% 3/1/34 | | 530,000 | 572,633 |
5% 10/1/34 | | 440,000 | 466,834 |
5% 10/1/35 | | 555,000 | 584,832 |
| Series 2018 A: | | | |
5% 10/1/34 | | 1,155,000 | 1,217,383 |
5% 10/1/35 | | 500,000 | 524,068 |
5% 10/1/45 | | 3,650,000 | 3,720,964 |
| Series 2019: | | | |
3% 12/1/23 | | 100,000 | 99,280 |
4% 12/1/24 | | 100,000 | 100,551 |
4% 12/1/25 | | 180,000 | 181,293 |
4% 12/1/26 | | 190,000 | 191,462 |
4% 12/1/27 | | 195,000 | 196,274 |
4% 12/1/28 | | 240,000 | 241,178 |
4% 12/1/29 | | 285,000 | 285,620 |
4% 12/1/30 | | 200,000 | 200,008 |
4% 12/1/31 | | 450,000 | 447,802 |
4% 12/1/32 | | 690,000 | 682,526 |
4% 12/1/33 | | 750,000 | 735,923 |
4% 12/1/34 | | 225,000 | 218,180 |
4% 12/1/40 | | 4,100,000 | 3,719,953 |
5% 10/1/29 | | 400,000 | 444,052 |
5% 10/1/40 | | 1,000,000 | 1,049,741 |
| Series 2021: | | | |
3% 3/1/40 | | 365,000 | 308,773 |
3% 3/1/43 | | 325,000 | 259,387 |
4% 3/1/24 | | 205,000 | 207,518 |
4% 10/1/24 | | 440,000 | 445,793 |
4% 3/1/25 | | 175,000 | 179,118 |
4% 10/1/25 | | 585,000 | 598,432 |
4% 3/1/26 | | 100,000 | 103,658 |
4% 10/1/26 | | 600,000 | 618,818 |
4% 10/1/28 | | 675,000 | 702,551 |
4% 10/1/29 | | 460,000 | 480,098 |
4% 3/1/30 | | 150,000 | 160,895 |
4% 3/1/31 | | 250,000 | 270,148 |
4% 3/1/32 | | 140,000 | 149,947 |
4% 3/1/33 | | 390,000 | 415,904 |
4% 3/1/34 | | 150,000 | 158,568 |
4% 3/1/35 | | 125,000 | 130,864 |
4% 3/1/36 | | 125,000 | 129,531 |
4% 3/1/37 | | 100,000 | 102,682 |
4% 10/1/46 | | 1,000,000 | 942,179 |
4% 10/1/50 | | 1,000,000 | 931,757 |
| Series 2022 A: | | | |
5% 10/1/47 | | 1,000,000 | 1,042,662 |
5% 10/1/52 | | 1,000,000 | 1,037,328 |
| Series Eight-G, 5% 12/1/31 | | 1,000,000 | 1,051,114 |
| Series Eight-J: | | | |
5% 3/1/26 | | 1,015,000 | 1,060,094 |
5% 3/1/27 | | 500,000 | 521,360 |
| Series Eight-L: | | | |
5% 4/1/28 | | 920,000 | 973,957 |
5% 4/1/29 | | 1,005,000 | 1,065,394 |
5% 4/1/35 | | 500,000 | 524,405 |
| Minnesota Hsg. Fin. Agcy.: | | | |
| (Mtg. Backed Securities Pass Through Prog.) Series 2019 C, 3.15% 6/1/49 | | 793,055 | 757,186 |
| (Mtg.-Backed Securities Pass-Through Prog.) Series H, 2.47% 1/1/50 | | 1,804,091 | 1,653,602 |
| Series 2015 A: | | | |
5% 8/1/29 | | 1,000,000 | 1,029,087 |
5% 8/1/30 | | 1,000,000 | 1,027,843 |
5% 8/1/31 | | 1,000,000 | 1,028,154 |
5% 8/1/32 | | 1,000,000 | 1,027,222 |
5% 8/1/33 | | 1,000,000 | 1,026,601 |
| Series 2016 B, 3.5% 7/1/46 | | 2,720,000 | 2,697,949 |
| Series 2019 B, 4.25% 7/1/49 | | 3,025,000 | 3,049,506 |
| Series 2020 G, 3% 1/1/51 | | 1,285,000 | 1,251,683 |
| Series 2021 D, 3% 1/1/52 | | 1,835,000 | 1,779,182 |
| Series 2021 H, 3% 7/1/52 | | 1,220,000 | 1,179,662 |
| Series 2021, 3% 7/1/51 | | 3,615,000 | 3,511,254 |
| Series 2022 M, 6% 1/1/53 | | 2,500,000 | 2,731,795 |
| Series B: | | | |
3.5% 7/1/50 | | 7,910,000 | 7,822,534 |
4% 8/1/36 | | 2,000,000 | 2,036,402 |
| Series E, 3.5% 7/1/50 | | 4,050,000 | 4,004,885 |
| Series I, 3% 1/1/51 | | 4,480,000 | 4,358,854 |
| Minnesota Muni. Gas Agcy. Rev. Bonds Series 2022 A, 4%, tender 12/1/27 (Liquidity Facility Royal Bank of Canada) (c) | | 7,000,000 | 7,020,161 |
| Minnesota Muni. Pwr. Agcy. Elec. Rev.: | | | |
| Series 2014 A, 5% 10/1/26 | | 830,000 | 860,444 |
| Series 2014: | | | |
5% 10/1/26 | | 630,000 | 653,108 |
5% 10/1/27 | | 750,000 | 777,380 |
5% 10/1/30 | | 1,000,000 | 1,035,643 |
| Series 2016: | | | |
4% 10/1/41 | | 1,000,000 | 983,831 |
5% 10/1/32 | | 1,500,000 | 1,609,513 |
5% 10/1/33 | | 400,000 | 428,910 |
5% 10/1/35 | | 400,000 | 428,763 |
5% 10/1/36 | | 1,000,000 | 1,070,442 |
5% 10/1/47 | | 2,000,000 | 2,091,060 |
| Minnesota Pub. Facilities Auth. Rev. Series 2016 A, 5% 3/1/30 | | 5,150,000 | 5,517,233 |
| Moorhead Edl. Facilities Rev. (The Concordia College Corp. Proj.) Series 2016, 5% 12/1/25 | | 1,925,000 | 1,969,874 |
| Moorhead ISD No. 152 Series 2020 A, 4% 2/1/31 | | 2,015,000 | 2,133,011 |
| Nashwauk Keewatin Independent School District # 319 Gen. Oblig. Series 2022 A: | | | |
| 4% 2/1/35 | | 200,000 | 208,594 |
| 4% 2/1/36 | | 500,000 | 517,641 |
| North St. Paul Maplewood-Oakdale Indpendent School District: | | | |
| (Minnesota School District Cr. Enhancement Prog.) Series 2019 B, 3% 2/1/42 | | 3,090,000 | 2,477,272 |
| (MN SD Cr. Enhancement Prog.) Series 2019 B, 4% 2/1/32 | | 3,120,000 | 3,271,508 |
| Northern Muni. Pwr. Agcy. Elec. Sys. Rev.: | | | |
| Series 2013 A: | | | |
5% 1/1/24 | | 650,000 | 650,902 |
5% 1/1/25 | | 975,000 | 976,293 |
5% 1/1/31 | | 1,740,000 | 1,742,133 |
| Series 2016: | | | |
5% 1/1/28 | | 500,000 | 531,946 |
5% 1/1/29 | | 920,000 | 977,147 |
5% 1/1/30 | | 520,000 | 552,147 |
5% 1/1/31 | | 350,000 | 371,534 |
| Series 2017: | | | |
5% 1/1/29 | | 460,000 | 494,082 |
5% 1/1/31 | | 400,000 | 427,097 |
5% 1/1/33 | | 475,000 | 503,923 |
5% 1/1/35 | | 520,000 | 548,270 |
| Ramsey County Gen. Oblig. Series 2021 A, 5% 2/1/30 | | 590,000 | 678,314 |
| Red Rock Central Independent School District Series 2022 A, 2.375% 2/1/45 | | 1,310,000 | 899,306 |
| Robbinsdale Independent School District 281 (MN SD Cr. Enhancement Prog.) Series 2019 B, 5% 2/1/30 | | 955,000 | 1,054,480 |
| Rochester Elec. Util. Rev. Series 2017 A: | | | |
| 5% 12/1/42 | | 1,100,000 | 1,154,190 |
| 5% 12/1/47 | | 1,000,000 | 1,043,334 |
| Rochester Health Care Facilities Rev.: | | | |
| Series 2016 B: | | | |
5% 11/15/31 | | 3,750,000 | 4,392,260 |
5% 11/15/33 | | 300,000 | 357,912 |
5% 11/15/35 | | 4,000,000 | 4,752,115 |
| Series 2018, 4% 11/15/48 | | 3,400,000 | 3,245,517 |
| Series 2022, 5% 11/15/57 | | 3,500,000 | 3,749,104 |
| Roseville Independent School District Series 2021 A: | | | |
| 5% 4/1/27 | | 850,000 | 899,889 |
| 5% 4/1/28 | | 1,100,000 | 1,177,062 |
| Roseville Independent School District #623: | | | |
| (Minnesota Gen. Oblig.) Series 2018 A, 5% 2/1/31 | | 5,050,000 | 5,494,706 |
| (MN School District Cr. Enhancement Prog.) Series 2018 A, 5% 2/1/29 | | 5,180,000 | 5,629,094 |
| Saint Cloud Health Care Rev.: | | | |
| Series 2016 A: | | | |
5% 5/1/29 | | 1,125,000 | 1,184,399 |
5% 5/1/30 | | 1,000,000 | 1,050,959 |
5% 5/1/31 | | 1,000,000 | 1,048,811 |
5% 5/1/46 | | 5,000,000 | 5,086,944 |
| Series 2019, 5% 5/1/48 | | 6,000,000 | 6,125,977 |
| Saint Paul Gen. Oblig. Series 2021 C, 4% 5/1/31 | | 1,590,000 | 1,729,523 |
| Saint Paul Port Auth. District Series 2021 1: | | | |
| 3% 10/1/26 | | 100,000 | 99,008 |
| 3% 10/1/34 | | 285,000 | 255,889 |
| 4% 10/1/41 | | 500,000 | 467,633 |
| Saint Paul Sales Tax Rev. Series 2014 G: | | | |
| 5% 11/1/26 | | 1,000,000 | 1,038,104 |
| 5% 11/1/28 | | 1,000,000 | 1,036,295 |
| Shakopee Health Care Facilities Rev. Series 2014: | | | |
| 5% 9/1/24 | | 1,000,000 | 1,026,387 |
| 5% 9/1/25 | | 1,345,000 | 1,379,261 |
| 5% 9/1/26 | | 1,575,000 | 1,613,077 |
| 5% 9/1/28 | | 1,000,000 | 1,020,760 |
| 5% 9/1/34 | | 1,065,000 | 1,076,770 |
| Shakopee Sr. Hsg. Rev. Bonds Series 2018, 5.85%, tender 11/1/25 (c)(d) | | 2,900,000 | 2,849,559 |
| Southern Minnesota Muni. Pwr. Agcy. Pwr. Supply Sys. Rev.: | | | |
| (Cap. Appreciation) Series 1994 A, 0% 1/1/26 (Nat'l. Pub. Fin. Guarantee Corp. Insured) | | 3,320,000 | 3,010,301 |
| Series 2015 A: | | | |
5% 1/1/34 | | 1,695,000 | 1,795,285 |
5% 1/1/36 | | 1,000,000 | 1,055,345 |
| Series 2019 A, 5% 1/1/34 | | 1,230,000 | 1,383,232 |
| St Paul Independent School District (Minnesota School District Cr. Enhancement Prog.) Series 2022 E, 4% 2/1/40 | | 1,575,000 | 1,587,245 |
| St. Paul Hsg. & Redev. Auth. Health Care Facilities Rev.: | | | |
| (Fairview Hsp & Hltcare Srv Sys. Proj.) Series 2017 A, 5% 11/15/47 | | 4,395,000 | 4,475,551 |
| Series 2015 A: | | | |
5% 7/1/29 | | 5,000,000 | 5,185,946 |
5% 7/1/30 | | 5,015,000 | 5,201,902 |
| Series 2017 A: | | | |
5% 11/15/28 | | 460,000 | 493,457 |
5% 11/15/30 | | 650,000 | 695,373 |
5% 11/15/31 | | 845,000 | 902,610 |
5% 11/15/33 | | 3,410,000 | 3,609,597 |
5% 11/15/34 | | 665,000 | 700,612 |
| Univ. of Minnesota Gen. Oblig.: | | | |
| Series 2017 A: | | | |
5% 9/1/33 | | 5,025,000 | 5,506,151 |
5% 9/1/37 | | 3,880,000 | 4,186,600 |
| Series 2017 B, 5% 12/1/32 | | 2,000,000 | 2,204,867 |
| Series 2019 A, 5% 4/1/44 | | 5,000,000 | 5,394,486 |
| Series 2020 A: | | | |
5% 11/1/31 | | 1,070,000 | 1,229,305 |
5% 11/1/33 | | 1,015,000 | 1,155,480 |
5% 11/1/45 | | 6,050,000 | 6,554,460 |
| Wayzata Sr Hsg. Rev. Series 2019: | | | |
| 5% 8/1/49 | | 500,000 | 468,584 |
| 5% 8/1/54 | | 1,000,000 | 918,452 |
| West Saint Paul Independent School District #197 (Minnesota School District Cr. Enhancement Prog.) Series 2018 A, 4% 2/1/41 | | 2,400,000 | 2,416,855 |
| Western Minnesota Muni. Pwr. Agcy. Pwr. Supply Rev.: | | | |
| Series 2012 A: | | | |
5% 1/1/27 | | 2,150,000 | 2,150,000 |
5% 1/1/30 | | 1,000,000 | 1,000,000 |
| Series 2015 A, 5% 1/1/31 | | 1,820,000 | 1,934,127 |
| Series 2018 A, 5% 1/1/49 | | 2,000,000 | 2,112,190 |
| White Bear Lake Independent School District #624 Gen. Oblig.: | | | |
| Series 2020 A, 3% 2/1/31 | | 930,000 | 916,014 |
| Series 2022 A, 4% 2/1/32 | | 4,795,000 | 5,135,821 |
| Wright County Ctfs. of Prtn. Series 2019 A: | | | |
| 5% 12/1/30 | | 1,115,000 | 1,265,917 |
| 5% 12/1/31 | | 1,000,000 | 1,132,895 |
TOTAL MINNESOTA | | | 554,841,629 |
| Puerto Rico - 1.0% | | | |
| Puerto Rico Commonwealth Pub. Impt. Gen. Oblig. Series 2021 A1: | | | |
| 0% 7/1/33 | | 1,705,673 | 922,020 |
| 5.625% 7/1/27 | | 190,000 | 193,585 |
| 5.625% 7/1/29 | | 595,000 | 608,812 |
| 5.75% 7/1/31 | | 1,420,000 | 1,468,235 |
| Puerto Rico Hsg. Fin. Auth. Series 2020, 5% 12/1/27 | | 1,225,000 | 1,317,927 |
| Puerto Rico Indl., Tourist, Edl., Med. And Envir. Cont. Facilities Fing. Auth. Series 2021: | | | |
| 4% 7/1/36 | | 105,000 | 96,119 |
| 4% 7/1/41 | | 85,000 | 74,114 |
| 5% 7/1/27 | | 325,000 | 345,804 |
| 5% 7/1/30 | | 140,000 | 153,284 |
| 5% 7/1/32 | | 380,000 | 415,196 |
TOTAL PUERTO RICO | | | 5,595,096 |
| TOTAL MUNICIPAL BONDS (Cost $590,034,280) | | | 562,329,615 |
| | | | |
| TOTAL INVESTMENT IN SECURITIES - 98.2% (Cost $590,034,280) | 562,329,615 |
NET OTHER ASSETS (LIABILITIES) - 1.8% | 10,537,914 |
| NET ASSETS - 100.0% | 572,867,529 |
| | |
Legend
| (a) | Amount is stated in United States dollars unless otherwise noted. |
| (b) | Private activity obligations whose interest is subject to the federal alternative minimum tax for individuals. |
| (c) | Coupon rates for floating and adjustable rate securities reflect the rates in effect at period end. |
| (d) | Security exempt from registration under Rule 144A of the Securities Act of 1933. These securities may be resold in transactions exempt from registration, normally to qualified institutional buyers. At the end of the period, the value of these securities amounted to $2,849,559 or 0.5% of net assets. |
Investment Valuation
The following is a summary of the inputs used, as of December 31, 2022, involving the Fund's assets and liabilities carried at fair value. The inputs or methodology used for valuing securities may not be an indication of the risk associated with investing in those securities. For more information on valuation inputs, and their aggregation into the levels used below, please refer to the Investment Valuation section in the accompanying Notes to Financial Statements.
| Valuation Inputs at Reporting Date: |
| Description | Total ($) | Level 1 ($) | Level 2 ($) | Level 3 ($) |
Investments in Securities: | | | | |
|
| Municipal Securities | 562,329,615 | - | 562,329,615 | - |
| Total Investments in Securities: | 562,329,615 | - | 562,329,615 | - |
| Statement of Assets and Liabilities |
| | | | December 31, 2022 |
| | | | | |
| Assets | | | | |
Investment in securities, at value - See accompanying schedule Unaffiliated issuers (cost $590,034,280): | | | $ | 562,329,615 |
| Cash | | | | 285,730 |
| Receivable for investments sold | | | | 3,564,799 |
| Receivable for fund shares sold | | | | 1,294,459 |
| Interest receivable | | | | 7,383,085 |
| Prepaid expenses | | | | 617 |
| Other receivables | | | | 1,802 |
Total assets | | | | 574,860,107 |
| Liabilities | | | | |
| Payable for fund shares redeemed | | $1,294,844 | | |
| Distributions payable | | 415,214 | | |
| Accrued management fee | | 170,140 | | |
| Other affiliated payables | | 63,797 | | |
| Other payables and accrued expenses | | 48,583 | | |
| Total Liabilities | | | | 1,992,578 |
| Net Assets | | | $ | 572,867,529 |
| Net Assets consist of: | | | | |
| Paid in capital | | | $ | 603,813,576 |
| Total accumulated earnings (loss) | | | | (30,946,047) |
| Net Assets | | | $ | 572,867,529 |
Net Asset Value , offering price and redemption price per share ($572,867,529 ÷ 52,660,948 shares) | | | $ | 10.88 |
| | | | | |
| Statement of Operations |
| | | | Year ended December 31, 2022 |
| Investment Income | | | | |
| Interest | | | $ | 15,736,703 |
| Expenses | | | | |
| Management fee | $ | 2,131,132 | | |
| Transfer agent fees | | 649,744 | | |
| Accounting fees and expenses | | 147,067 | | |
| Custodian fees and expenses | | 7,823 | | |
| Independent trustees' fees and expenses | | 1,991 | | |
| Registration fees | | 95,178 | | |
| Audit | | 52,492 | | |
| Legal | | 11,592 | | |
| Miscellaneous | | 2,782 | | |
| Total expenses before reductions | | 3,099,801 | | |
| Expense reductions | | (18,903) | | |
| Total expenses after reductions | | | | 3,080,898 |
| Net Investment income (loss) | | | | 12,655,805 |
| Realized and Unrealized Gain (Loss) | | | | |
| Net realized gain (loss) on: | | | | |
| Investment Securities: | | | | |
| Unaffiliated issuers | | (3,615,939) | | |
| Total net realized gain (loss) | | | | (3,615,939) |
| Change in net unrealized appreciation (depreciation) on investment securities | | | | (60,238,095) |
| Net gain (loss) | | | | (63,854,034) |
| Net increase (decrease) in net assets resulting from operations | | | $ | (51,198,229) |
| Statement of Changes in Net Assets |
| |
| | Year ended December 31, 2022 | | Year ended December 31, 2021 |
| Increase (Decrease) in Net Assets | | | | |
| Operations | | | | |
| Net investment income (loss) | $ | 12,655,805 | $ | 12,859,823 |
| Net realized gain (loss) | | (3,615,939) | | 2,226,424 |
| Change in net unrealized appreciation (depreciation) | | (60,238,095) | | (10,574,900) |
| Net increase (decrease) in net assets resulting from operations | | (51,198,229) | | 4,511,347 |
| Distributions to shareholders | | (12,925,960) | | (14,402,199) |
| Share transactions | | | | |
| Proceeds from sales of shares | | 282,521,007 | | 123,394,600 |
| Reinvestment of distributions | | 8,361,606 | | 9,630,543 |
| Cost of shares redeemed | | (352,961,319) | | (97,551,678) |
Net increase (decrease) in net assets resulting from share transactions | | (62,078,706) | | 35,473,465 |
| Total increase (decrease) in net assets | | (126,202,895) | | 25,582,613 |
| | | | | |
| Net Assets | | | | |
| Beginning of period | | 699,070,424 | | 673,487,811 |
| End of period | $ | 572,867,529 | $ | 699,070,424 |
| | | | | |
| Other Information | | | | |
| Shares | | | | |
| Sold | | 25,812,038 | | 10,200,980 |
| Issued in reinvestment of distributions | | 756,599 | | 797,769 |
| Redeemed | | (32,118,809) | | (8,073,881) |
| Net increase (decrease) | | (5,550,172) | | 2,924,868 |
| | | | | |
Financial Highlights
| Fidelity® Minnesota Municipal Income Fund |
| |
| Years ended December 31, | | 2022 | | 2021 | | 2020 | | 2019 | | 2018 |
Selected Per-Share Data | | | | | | | | | | |
| Net asset value, beginning of period | $ | 12.01 | $ | 12.18 | $ | 11.91 | $ | 11.41 | $ | 11.64 |
| Income from Investment Operations | | | | | | | | | | |
Net investment income (loss) A,B | | .230 | | .227 | | .251 | | .280 | | .282 |
| Net realized and unrealized gain (loss) | | (1.126) | | (.143) | | .296 | | .525 | | (.211) |
| Total from investment operations | | (.896) | | .084 | | .547 | | .805 | | .071 |
| Distributions from net investment income | | (.229) | | (.222) | | (.251) | | (.280) | | (.282) |
| Distributions from net realized gain | | (.005) | | (.032) | | (.026) | | (.025) | | (.019) |
| Total distributions | | (.234) | | (.254) | | (.277) | | (.305) | | (.301) |
| Net asset value, end of period | $ | 10.88 | $ | 12.01 | $ | 12.18 | $ | 11.91 | $ | 11.41 |
Total Return C | | (7.47)% | | .70% | | 4.65% | | 7.12% | | .65% |
Ratios to Average Net Assets B,D,E | | | | | | | | | | |
| Expenses before reductions | | .51% | | .49% | | .49% | | .49% | | .50% |
| Expenses net of fee waivers, if any | | .50% | | .49% | | .49% | | .49% | | .50% |
| Expenses net of all reductions | | .50% | | .48% | | .49% | | .49% | | .49% |
| Net investment income (loss) | | 2.07% | | 1.88% | | 2.09% | | 2.38% | | 2.48% |
| Supplemental Data | | | | | | | | | | |
| Net assets, end of period (000 omitted) | $ | 572,868 | $ | 699,070 | $ | 673,488 | $ | 593,754 | $ | 523,096 |
Portfolio turnover rate F | | 17% | | 7% | | 9% | | 9% | | 14% |
A Calculated based on average shares outstanding during the period.
B Net investment income (loss) is affected by the timing of the declaration of dividends by any underlying mutual funds or exchange-traded funds (ETFs). Net investment income (loss) of any mutual funds or ETFs is not included in the Fund's net investment income (loss) ratio.
C Total returns would have been lower if certain expenses had not been reduced during the applicable periods shown.
D Fees and expenses of any underlying mutual funds or exchange-traded funds (ETFs) are not included in the Fund's expense ratio. The Fund indirectly bears its proportionate share of these expenses.
E Expense ratios reflect operating expenses of the class. Expenses before reductions do not reflect amounts reimbursed, waived, or reduced through arrangements with the investment adviser, brokerage services, or other offset arrangements, if applicable, and do not represent the amount paid by the class during periods when reimbursements, waivers or reductions occur.
F Amount does not include the portfolio activity of any underlying mutual funds or exchange-traded funds (ETFs).
For the period ended December 31, 2022
1. Organization.
Fidelity Minnesota Municipal Income Fund (the Fund) is a non-diversified fund of Fidelity Municipal Trust (the Trust) and is authorized to issue an unlimited number of shares. Share transactions on the Statement of Changes in Net Assets may contain exchanges between affiliated funds. The Trust is registered under the Investment Company Act of 1940, as amended (the 1940 Act), as an open-end management investment company organized as a Massachusetts business trust. The Fund may be affected by economic and political developments in the state of Minnesota.
2. Significant Accounting Policies.
The Fund is an investment company and applies the accounting and reporting guidance of the Financial Accounting Standards Board (FASB) Accounting Standards Codification Topic 946 Financial Services - Investment Companies . The financial statements have been prepared in conformity with accounting principles generally accepted in the United States of America (GAAP), which require management to make certain estimates and assumptions at the date of the financial statements. Actual results could differ from those estimates. Subsequent events, if any, through the date that the financial statements were issued have been evaluated in the preparation of the financial statements. The Fund's Schedule of Investments lists any underlying mutual funds or exchange-traded funds (ETFs) but does not include the underlying holdings of these funds. The following summarizes the significant accounting policies of the Fund:
Investment Valuation. Investments are valued as of 4:00 p.m. Eastern time on the last calendar day of the period. The Board of Trustees (the Board) has designated the Fund's investment adviser as the valuation designee responsible for the fair valuation function and performing fair value determinations as needed. The investment adviser has established a Fair Value Committee (the Committee) to carry out the day-to-day fair valuation responsibilities and has adopted policies and procedures to govern the fair valuation process and the activities of the Committee. In accordance with these fair valuation policies and procedures, which have been approved by the Board, the Fund attempts to obtain prices from one or more third party pricing services or brokers to value its investments. When current market prices, quotations or currency exchange rates are not readily available or reliable, investments will be fair valued in good faith by the Committee, in accordance with the policies and procedures. Factors used in determining fair value vary by investment type and may include market or investment specific events, transaction data, estimated cash flows, and market observations of comparable investments. The frequency that the fair valuation procedures are used cannot be predicted and they may be utilized to a significant extent. The Committee manages the Fund's fair valuation practices and maintains the fair valuation policies and procedures. The Fund's investment adviser reports to the Board information regarding the fair valuation process and related material matters.
The Fund categorizes the inputs to valuation techniques used to value its investments into a disclosure hierarchy consisting of three levels as shown below:
Level 1 - unadjusted quoted prices in active markets for identical investments
Level 2 - other significant observable inputs (including quoted prices for similar investments, interest rates, prepayment speeds, etc.)
Level 3 - unobservable inputs (including the Fund's own assumptions based on the best information available)
Valuation techniques used to value the Fund's investments by major category are as follows:
Debt securities, including restricted securities, are valued based on evaluated prices received from third party pricing services or from brokers who make markets in such securities. Municipal securities are valued by pricing services who utilize matrix pricing which considers yield or price of bonds of comparable quality, coupon, maturity and type or by broker-supplied prices. When independent prices are unavailable or unreliable, debt securities may be valued utilizing pricing methodologies which consider similar factors that would be used by third party pricing services. Debt securities are generally categorized as Level 2 in the hierarchy but may be Level 3 depending on the circumstances.
Changes in valuation techniques may result in transfers in or out of an assigned level within the disclosure hierarchy. The aggregate value of investments by input level as of December 31, 2022 is included at the end of the Fund's Schedule of Investments.
Investment Transactions and Income. For financial reporting purposes, the Fund's investment holdings and NAV include trades executed through the end of the last business day of the period. The NAV per share for processing shareholder transactions is calculated as of the close of business of the New York Stock Exchange (NYSE), normally 4:00 p.m. Eastern time and includes trades executed through the end of the prior business day. Gains and losses on securities sold are determined on the basis of identified cost. Interest income is accrued as earned and includes coupon interest and amortization of premium and accretion of discount on debt securities as applicable. Debt obligations may be placed on non-accrual status and related interest income may be reduced by ceasing current accruals and writing off interest receivables when the collection of all or a portion of interest has become doubtful based on consistently applied procedures. A debt obligation is removed from non-accrual status when the issuer resumes interest payments or when collectability of interest is reasonably assured.
Expenses. Expenses directly attributable to a fund are charged to that fund. Expenses attributable to more than one fund are allocated among the respective funds on the basis of relative net assets or other appropriate methods. Expenses included in the accompanying financial statements reflect the expenses of that fund and do not include any expenses associated with any underlying mutual funds or exchange-traded funds. Although not included in a fund's expenses, a fund indirectly bears its proportionate share of these expenses through the net asset value of each underlying mutual fund or exchange-traded fund. Expense estimates are accrued in the period to which they relate and adjustments are made when actual amounts are known.
Income Tax Information and Distributions to Shareholders. Each year, the Fund intends to qualify as a regulated investment company under Subchapter M of the Internal Revenue Code, including distributing substantially all of its taxable income and realized gains. As a result, no provision for U.S. Federal income taxes is required. As of December 31, 2022, the Fund did not have any unrecognized tax benefits in the financial statements; nor is the Fund aware of any tax positions for which it is reasonably possible that the total amounts of unrecognized tax benefits will significantly change in the next twelve months. The Fund files a U.S. federal tax return, in addition to state and local tax returns as required. The Fund's federal income tax returns are subject to examination by the Internal Revenue Service (IRS) for a period of three fiscal years after they are filed. State and local tax returns may be subject to examination for an additional fiscal year depending on the jurisdiction.
Distributions are declared and recorded daily and paid monthly from net investment income. Distributions from realized gains, if any, are declared and recorded on the ex-dividend date. Income and capital gain distributions are determined in accordance with income tax regulations, which may differ from GAAP.
Capital accounts within the financial statements are adjusted for permanent book-tax differences. These adjustments have no impact on net assets or the results of operations. Capital accounts are not adjusted for temporary book-tax differences which will reverse in a subsequent period.
Book-tax differences are primarily due to market discount and capital loss carryforwards.
The Fund purchases municipal securities whose interest, in the opinion of the issuer, is free from federal income tax. There is no assurance that the IRS will agree with this opinion. In the event the IRS determines that the issuer does not comply with relevant tax requirements, interest payments from a security could become federally taxable, possibly retroactively to the date the security was issued.
As of period end, the cost and unrealized appreciation (depreciation) in securities, and derivatives if applicable, for federal income tax purposes were as follows:
| Gross unrealized appreciation | $1,249,685 |
| Gross unrealized depreciation | (28,934,764) |
| Net unrealized appreciation (depreciation) | $(27,685,079) |
| Tax Cost | $590,014,694 |
The tax-based components of distributable earnings as of period end were as follows:
| Undistributed tax-exempt income | $354,971 |
| Capital loss carryforward | $(3,615,939) |
| Net unrealized appreciation (depreciation) on securities and other investments | $(27,685,079) |
Capital loss carryforwards are only available to offset future capital gains of the Fund to the extent provided by regulations and may be limited. The capital loss carryforward information presented below, including any applicable limitation, is estimated as of fiscal period end and is subject to adjustment.
Short-term | $(728,872) |
Long-term | (2,887,067) |
| Total capital loss carryforward | $(3,615,939) |
The tax character of distributions paid was as follows:
| | December 31, 2022 | December 31, 2021 |
| Tax-exempt Income | $12,636,975 | $12,553,166 |
| Long-term Capital Gains | 288,985 | 1,849,033 |
| Total | $12,925,960 | $14,402,199 |
Restricted Securities (including Private Placements). Funds may invest in securities that are subject to legal or contractual restrictions on resale. These securities generally may be resold in transactions exempt from registration or to the public if the securities are registered. Disposal of these securities may involve time-consuming negotiations and expense, and prompt sale at an acceptable price may be difficult. Information regarding restricted securities held at period end is included at the end of the Schedule of Investments, if applicable.
3. Purchases and Sales of Investments.
Purchases and sales of securities, other than short-term securities and in-kind transactions, as applicable, are noted in the table below.
| | Purchases ($) | Sales ($) |
| Fidelity Minnesota Municipal Income Fund | 99,999,084 | 147,274,934 |
4. Fees and Other Transactions with Affiliates.
Management Fee. Fidelity Management & Research Company LLC (the investment adviser) and its affiliates provide the Fund with investment management related services for which the Fund pays a monthly management fee. The management fee is the sum of an individual fund fee rate that is based on an annual rate of .25% of the Fund's average net assets and an annualized group fee rate that averaged .10% during the period. The group fee rate is based upon the monthly average net assets of a group of registered investment companies with which the investment adviser has management contracts. The group fee rate decreases as assets under management increase and increases as assets under management decrease. For the reporting period, the total annual management fee rate was .35% of the Fund's average net assets.
Transfer Agent Fees. Fidelity Investments Institutional Operations Company LLC (FIIOC), an affiliate of the investment adviser, is the transfer, dividend disbursing and shareholder servicing agent for the Fund. FIIOC receives account fees and asset-based fees that vary according to account size and type of account. FIIOC pays for typesetting, printing and mailing of shareholder reports, except proxy statements. For the period, transfer agent fees were equivalent to an annual rate of .11% of average net assets.
Accounting Fees. Fidelity Service Company, Inc. (FSC), an affiliate of the investment adviser, maintains the Fund's accounting records. The accounting fee is based on the level of average net assets for each month. For the period, the fees were equivalent to the following annual rates:
| | % of Average Net Assets |
| Fidelity Minnesota Municipal Income Fund | .02 |
Interfund Trades. Funds may purchase from or sell securities to other Fidelity Funds under procedures adopted by the Board. The procedures have been designed to ensure these interfund trades are executed in accordance with Rule 17a-7 of the 1940 Act. Any interfund trades are included within the respective purchases and sales amounts shown in the Purchases and Sales of Investments note. Interfund trades during the period are noted in the table below.
| | Purchases ($) | Sales ($) | Realized Gain (Loss) ($) |
| Fidelity Minnesota Municipal Income Fund | - | 4,910,000 | - |
5. Committed Line of Credit.
Certain Funds participate with other funds managed by the investment adviser or an affiliate in a $4.25 billion credit facility (the "line of credit") to be utilized for temporary or emergency purposes to fund shareholder redemptions or for other short-term liquidity purposes. The participating funds have agreed to pay commitment fees on their pro-rata portion of the line of credit, which are reflected in Miscellaneous expenses on the Statement of Operations, and are listed below. During the period, there were no borrowings on this line of credit.
| | Amount |
| Fidelity Minnesota Municipal Income Fund | $1,090 |
6. Expense Reductions.
Through arrangements with the Fund's custodian, credits realized as a result of certain uninvested cash balances were used to reduce the Fund's expenses by $7,823.
In addition, during the period the investment adviser or an affiliate reimbursed and/or waived a portion of operating expenses in the amount of $11,080.
7. Other.
A fund's organizational documents provide former and current trustees and officers with a limited indemnification against liabilities arising in connection with the performance of their duties to the fund. In the normal course of business, a fund may also enter into contracts that provide general indemnifications. A fund's maximum exposure under these arrangements is unknown as this would be dependent on future claims that may be made against a fund. The risk of material loss from such claims is considered remote.
8. Risk and Uncertainties.
Many factors affect a fund's performance. Developments that disrupt global economies and financial markets, such as pandemics, epidemics, outbreaks of infectious diseases, war, terrorism, and environmental disasters, may significantly affect a fund's investment performance. The effects of these developments to a fund will be impacted by the types of securities in which a fund invests, the financial condition, industry, economic sector, and geographic location of an issuer, and a fund's level of investment in the securities of that issuer.
To the Board of Trustees of Fidelity Municipal Trust and Shareholders of Fidelity Minnesota Municipal Income Fund
Opinion on the Financial Statements
We have audited the accompanying statement of assets and liabilities, including the schedule of investments, of Fidelity Minnesota Municipal Income Fund (one of the funds constituting Fidelity Municipal Trust, referred to hereafter as the "Fund") as of December 31, 2022, the related statement of operations for the year ended December 31, 2022, the statement of changes in net assets for each of the two years in the period ended December 31, 2022, including the related notes, and the financial highlights for each of the five years in the period ended December 31, 2022 (collectively referred to as the "financial statements"). In our opinion, the financial statements present fairly, in all material respects, the financial position of the Fund as of December 31, 2022, the results of its operations for the year then ended, the changes in its net assets for each of the two years in the period ended December 31, 2022 and the financial highlights for each of the five years in the period ended December 31, 2022 in conformity with accounting principles generally accepted in the United States of America.
Basis for Opinion
These financial statements are the responsibility of the Fund's management. Our responsibility is to express an opinion on the Fund's financial statements based on our audits. We are a public accounting firm registered with the Public Company Accounting Oversight Board (United States) (PCAOB) and are required to be independent with respect to the Fund in accordance with the U.S. federal securities laws and the applicable rules and regulations of the Securities and Exchange Commission and the PCAOB.
We conducted our audits of these financial statements in accordance with the standards of the PCAOB. Those standards require that we plan and perform the audit to obtain reasonable assurance about whether the financial statements are free of material misstatement, whether due to error or fraud.
Our audits included performing procedures to assess the risks of material misstatement of the financial statements, whether due to error or fraud, and performing procedures that respond to those risks. Such procedures included examining, on a test basis, evidence regarding the amounts and disclosures in the financial statements. Our audits also included evaluating the accounting principles used and significant estimates made by management, as well as evaluating the overall presentation of the financial statements. Our procedures included confirmation of securities owned as of December 31, 2022 by correspondence with the custodian. We believe that our audits provide a reasonable basis for our opinion.
/s/ PricewaterhouseCoopers LLP
Boston, Massachusetts
February 14, 2023
We have served as the auditor of one or more investment companies in the Fidelity group of funds since 1932.
The Trustees, Members of the Advisory Board (if any), and officers of the trust and fund, as applicable, are listed below. The Board of Trustees governs the fund and is responsible for protecting the interests of shareholders. The Trustees are experienced executives who meet periodically throughout the year to oversee the fund's activities, review contractual arrangements with companies that provide services to the fund, oversee management of the risks associated with such activities and contractual arrangements, and review the fund's performance. Each of the Trustees oversees 295 funds.
The Trustees hold office without limit in time except that (a) any Trustee may resign; (b) any Trustee may be removed by written instrument, signed by at least two-thirds of the number of Trustees prior to such removal; (c) any Trustee who requests to be retired or who has become incapacitated by illness or injury may be retired by written instrument signed by a majority of the other Trustees; and (d) any Trustee may be removed at any special meeting of shareholders by a two-thirds vote of the outstanding voting securities of the trust. Each Trustee who is not an interested person (as defined in the 1940 Act) of the trust and the fund is referred to herein as an Independent Trustee. Each Independent Trustee shall retire not later than the last day of the calendar year in which his or her 75th birthday occurs. The Independent Trustees may waive this mandatory retirement age policy with respect to individual Trustees. Officers and Advisory Board Members hold office without limit in time, except that any officer or Advisory Board Member may resign or may be removed by a vote of a majority of the Trustees at any regular meeting or any special meeting of the Trustees. Except as indicated, each individual has held the office shown or other offices in the same company for the past five years.
The fund's Statement of Additional Information (SAI) includes more information about the Trustees. To request a free copy, call Fidelity at 1-800-544-8544.
Experience, Skills, Attributes, and Qualifications of the Trustees. The Governance and Nominating Committee has adopted a statement of policy that describes the experience, qualifications, attributes, and skills that are necessary and desirable for potential Independent Trustee candidates (Statement of Policy). The Board believes that each Trustee satisfied at the time he or she was initially elected or appointed a Trustee, and continues to satisfy, the standards contemplated by the Statement of Policy. The Governance and Nominating Committee also engages professional search firms to help identify potential Independent Trustee candidates who have the experience, qualifications, attributes, and skills consistent with the Statement of Policy. From time to time, additional criteria based on the composition and skills of the current Independent Trustees, as well as experience or skills that may be appropriate in light of future changes to board composition, business conditions, and regulatory or other developments, have also been considered by the professional search firms and the Governance and Nominating Committee. In addition, the Board takes into account the Trustees' commitment and participation in Board and committee meetings, as well as their leadership of standing and ad hoc committees throughout their tenure.
In determining that a particular Trustee was and continues to be qualified to serve as a Trustee, the Board has considered a variety of criteria, none of which, in isolation, was controlling. The Board believes that, collectively, the Trustees have balanced and diverse experience, qualifications, attributes, and skills, which allow the Board to operate effectively in governing the fund and protecting the interests of shareholders. Information about the specific experience, skills, attributes, and qualifications of each Trustee, which in each case led to the Board's conclusion that the Trustee should serve (or continue to serve) as a trustee of the fund, is provided below.
Board Structure and Oversight Function. Abigail P. Johnson is an interested person and currently serves as Chairman. The Trustees have determined that an interested Chairman is appropriate and benefits shareholders because an interested Chairman has a personal and professional stake in the quality and continuity of services provided to the fund. Independent Trustees exercise their informed business judgment to appoint an individual of their choosing to serve as Chairman, regardless of whether the Trustee happens to be independent or a member of management. The Independent Trustees have determined that they can act independently and effectively without having an Independent Trustee serve as Chairman and that a key structural component for assuring that they are in a position to do so is for the Independent Trustees to constitute a substantial majority for the Board. The Independent Trustees also regularly meet in executive session. Michael E. Kenneally serves as Chairman of the Independent Trustees and as such (i) acts as a liaison between the Independent Trustees and management with respect to matters important to the Independent Trustees and (ii) with management prepares agendas for Board meetings.
Fidelity ® funds are overseen by different Boards of Trustees. The fund's Board oversees Fidelity's investment-grade bond, money market, asset allocation and certain equity funds, and other Boards oversee Fidelity's high income and other equity funds. The asset allocation funds may invest in Fidelity ® funds that are overseen by such other Boards. The use of separate Boards, each with its own committee structure, allows the Trustees of each group of Fidelity ® funds to focus on the unique issues of the funds they oversee, including common research, investment, and operational issues. On occasion, the separate Boards establish joint committees to address issues of overlapping consequences for the Fidelity ® funds overseen by each Board.
The Trustees operate using a system of committees to facilitate the timely and efficient consideration of all matters of importance to the Trustees, the fund, and fund shareholders and to facilitate compliance with legal and regulatory requirements and oversight of the fund's activities and associated risks. The Board, acting through its committees, has charged FMR and its affiliates with (i) identifying events or circumstances the occurrence of which could have demonstrably adverse effects on the fund's business and/or reputation; (ii) implementing processes and controls to lessen the possibility that such events or circumstances occur or to mitigate the effects of such events or circumstances if they do occur; and (iii) creating and maintaining a system designed to evaluate continuously business and market conditions in order to facilitate the identification and implementation processes described in (i) and (ii) above. Because the day-to-day operations and activities of the fund are carried out by or through FMR, its affiliates, and other service providers, the fund's exposure to risks is mitigated but not eliminated by the processes overseen by the Trustees. While each of the Board's committees has responsibility for overseeing different aspects of the fund's activities, oversight is exercised primarily through the Operations and Audit Committees. In addition, an ad hoc Board committee of Independent Trustees has worked with FMR to enhance the Board's oversight of investment and financial risks, legal and regulatory risks, technology risks, and operational risks, including the development of additional risk reporting to the Board. Appropriate personnel, including but not limited to the fund's Chief Compliance Officer (CCO), FMR's internal auditor, the independent accountants, the fund's Treasurer and portfolio management personnel, make periodic reports to the Board's committees, as appropriate, including an annual review of Fidelity's risk management program for the Fidelity ® funds. The responsibilities of each standing committee, including their oversight responsibilities, are described further under "Standing Committees of the Trustees."
Interested Trustees*:
Correspondence intended for a Trustee who is an interested person may be sent to Fidelity Investments, 245 Summer Street, Boston, Massachusetts 02210.
Name, Year of Birth; Principal Occupations and Other Relevant Experience+
Abigail P. Johnson (1961)
Year of Election or Appointment: 2009
Trustee
Chairman of the Board of Trustees
Ms. Johnson also serves as Trustee of other Fidelity ® funds. Ms. Johnson serves as Chairman (2016-present), Chief Executive Officer (2014-present), and Director (2007-present) of FMR LLC (diversified financial services company), President of Fidelity Financial Services (2012-present) and President of Personal, Workplace and Institutional Services (2005-present). Ms. Johnson is Chairman and Director of Fidelity Management & Research Company LLC (investment adviser firm, 2011-present). Previously, Ms. Johnson served as Chairman and Director of FMR Co., Inc. (investment adviser firm, 2011-2019), Vice Chairman (2007-2016) and President (2013-2016) of FMR LLC, President and a Director of Fidelity Management & Research Company (2001-2005), a Trustee of other investment companies advised by Fidelity Management & Research Company, Fidelity Investments Money Management, Inc. (investment adviser firm), and FMR Co., Inc. (2001-2005), Senior Vice President of the Fidelity ® funds (2001-2005), and managed a number of Fidelity ® funds. Ms. Abigail P. Johnson and Mr. Arthur E. Johnson are not related.
Jennifer Toolin McAuliffe (1959)
Year of Election or Appointment: 2016
Trustee
Ms. McAuliffe also serves as Trustee of other Fidelity ® funds and as Trustee of Fidelity Charitable (2020-present). Previously, Ms. McAuliffe served as Co-Head of Fixed Income of Fidelity Investments Limited (now known as FIL Limited (FIL)) (diversified financial services company), Director of Research for FIL's credit and quantitative teams in London, Hong Kong and Tokyo and Director of Research for taxable and municipal bonds at Fidelity Investments Money Management, Inc. Ms. McAuliffe previously served as a member of the Advisory Board of certain Fidelity ® funds (2016). Ms. McAuliffe was previously a lawyer at Ropes & Gray LLP and currently serves as director or trustee of several not-for-profit entities.
* Determined to be an "Interested Trustee" by virtue of, among other things, his or her affiliation with the trust or various entities under common control with FMR.
+ The information includes the Trustee's principal occupation during the last five years and other information relating to the experience, attributes, and skills relevant to the Trustee's qualifications to serve as a Trustee, which led to the conclusion that the Trustee should serve as a Trustee for the fund.
Independent Trustees:
Correspondence intended for an Independent Trustee may be sent to Fidelity Investments, P.O. Box 55235, Boston, Massachusetts 02205-5235.
Name, Year of Birth; Principal Occupations and Other Relevant Experience+
Elizabeth S. Acton (1951)
Year of Election or Appointment: 2013
Trustee
Ms. Acton also serves as Trustee of other Fidelity ® funds. Prior to her retirement, Ms. Acton served as Executive Vice President, Finance (2011-2012), Executive Vice President, Chief Financial Officer (2002-2011) and Treasurer (2004-2005) of Comerica Incorporated (financial services). Prior to joining Comerica, Ms. Acton held a variety of positions at Ford Motor Company (1983-2002), including Vice President and Treasurer (2000-2002) and Executive Vice President and Chief Financial Officer of Ford Motor Credit Company (1998-2000). Ms. Acton currently serves as a member of the Board and Audit and Finance Committees of Beazer Homes USA, Inc. (homebuilding, 2012-present). Ms. Acton previously served as a member of the Advisory Board of certain Fidelity ® funds (2013-2016).
Ann E. Dunwoody (1953)
Year of Election or Appointment: 2018
Trustee
General Dunwoody also serves as Trustee of other Fidelity ® funds. General Dunwoody (United States Army, Retired) was the first woman in U.S. military history to achieve the rank of four-star general and prior to her retirement in 2012 held a variety of positions within the U.S. Army, including Commanding General, U.S. Army Material Command (2008-2012). General Dunwoody currently serves as President of First to Four LLC (leadership and mentoring services, 2012-present), a member of the Board and Nomination and Corporate Governance Committees of Kforce Inc. (professional staffing services, 2016-present) and a member of the Board of Automattic Inc. (software engineering, 2018-present). Previously, General Dunwoody served as a member of the Advisory Board and Nominating and Corporate Governance Committee of L3 Technologies, Inc. (communication, electronic, sensor and aerospace systems, 2013-2019) and a member of the Board and Audit and Sustainability and Corporate Responsibility Committees of Republic Services, Inc. (waste collection, disposal and recycling, 2013-2016). Ms. Dunwoody also serves on several boards for non-profit organizations, including as a member of the Board, Chair of the Nomination and Governance Committee and a member of the Audit Committee of Logistics Management Institute (consulting non-profit, 2012-present), a member of the Council of Trustees for the Association of the United States Army (advocacy non-profit, 2013-present), a member of the Board of Florida Institute of Technology (2015-present) and a member of the Board of ThanksUSA (military family education non-profit, 2014-present). General Dunwoody previously served as a member of the Advisory Board of certain Fidelity ® funds (2018).
John Engler (1948)
Year of Election or Appointment: 2014
Trustee
Mr. Engler also serves as Trustee of other Fidelity ® funds. Previously, Mr. Engler served as Governor of Michigan (1991-2003), President of the Business Roundtable (2011-2017) and interim President of Michigan State University (2018-2019). Mr. Engler currently serves as a member of the Board of Stride, Inc. (formerly K12 Inc.) (technology-based education company, 2012-present). Previously, Mr. Engler served as a member of the Board of Universal Forest Products (manufacturer and distributor of wood and wood-alternative products, 2003-2019) and Trustee of The Munder Funds (2003-2014). Mr. Engler previously served as a member of the Advisory Board of certain Fidelity ® funds (2014-2016).
Robert F. Gartland (1951)
Year of Election or Appointment: 2010
Trustee
Mr. Gartland also serves as Trustee of other Fidelity ® funds. Prior to his retirement, Mr. Gartland held a variety of positions at Morgan Stanley (financial services, 1979-2007), including Managing Director (1987-2007) and Chase Manhattan Bank (1975-1978). Mr. Gartland previously served as Chairman and an investor in Gartland & Mellina Group Corp. (consulting, 2009-2019), as a member of the Board of National Securities Clearing Corporation (1993-1996) and as Chairman of TradeWeb (2003-2004).
Arthur E. Johnson (1947)
Year of Election or Appointment: 2008
Trustee
Mr. Johnson also serves as Trustee of other Fidelity ® funds. Prior to his retirement, Mr. Johnson served as Senior Vice President of Corporate Strategic Development of Lockheed Martin Corporation (defense contractor, 1999-2009). Mr. Johnson currently serves as a member of the Board of Booz Allen Hamilton (management consulting, 2011-present). Mr. Johnson previously served as a member of the Board of Eaton Corporation plc (diversified power management, 2009-2019) and a member of the Board of AGL Resources, Inc. (holding company, 2002-2016). Mr. Johnson previously served as Chairman (2018-2021) and Vice Chairman (2015-2018) of the Independent Trustees of certain Fidelity® funds. Mr. Arthur E. Johnson is not related to Ms. Abigail P. Johnson.
Michael E. Kenneally (1954)
Year of Election or Appointment: 2009
Trustee
Chairman of the Independent Trustees
Mr. Kenneally also serves as Trustee of other Fidelity ® funds and was Vice Chairman (2018-2021) of the Independent Trustees of certain Fidelity ® funds. Prior to retirement in 2005, he was Chairman and Global Chief Executive Officer of Credit Suisse Asset Management, the worldwide fund management and institutional investment business of Credit Suisse Group. Previously, Mr. Kenneally was an Executive Vice President and the Chief Investment Officer for Bank of America. In this role, he was responsible for the investment management, strategy and products delivered to the bank's institutional, high-net-worth and retail clients. Earlier, Mr. Kenneally directed the organization's equity and quantitative research groups. He began his career as a research analyst and then spent more than a dozen years as a portfolio manager for endowments, pension plans and mutual funds. He earned the Chartered Financial Analyst (CFA) designation in 1991.
Mark A. Murray (1954)
Year of Election or Appointment: 2016
Trustee
Mr. Murray also serves as Trustee of other Fidelity ® funds. Previously, Mr. Murray served as Co-Chief Executive Officer (2013-2016), President (2006-2013) and Vice Chairman (2013-2020) of Meijer, Inc. Mr. Murray serves as a member of the Board (2009-present) and Public Policy and Responsibility Committee (2009-present) and Chair of the Nuclear Review Committee (2019-present) of DTE Energy Company (diversified energy company). Mr. Murray previously served as a member of the Board of Spectrum Health (not-for-profit health system, 2015-2019) and as a member of the Board and Audit Committee and Chairman of the Nominating and Corporate Governance Committee of Universal Forest Products, Inc. (manufacturer and distributor of wood and wood-alternative products, 2004-2016). Mr. Murray also serves as a member of the Board of many community and professional organizations. Mr. Murray previously served as a member of the Advisory Board of certain Fidelity ® funds (2016).
+ The information includes the Trustee's principal occupation during the last five years and other information relating to the experience, attributes, and skills relevant to the Trustee's qualifications to serve as a Trustee, which led to the conclusion that the Trustee should serve as a Trustee for the fund.
Advisory Board Members and Officers:
Correspondence intended for a Member of the Advisory Board (if any) may be sent to Fidelity Investments, P.O. Box 55235, Boston, Massachusetts 02205-5235. Correspondence intended for an officer may be sent to Fidelity Investments, 245 Summer Street, Boston, Massachusetts 02210. Officers appear below in alphabetical order.
Name, Year of Birth; Principal Occupation
Laura M. Bishop (1961)
Year of Election or Appointment: 2022
Member of the Advisory Board
Ms. Bishop also serves as a Member of the Advisory Board of other funds. Prior to her retirement, Ms. Bishop held a variety of positions at United Services Automobile Association (2001-2020), including Executive Vice President and Chief Financial Officer (2014-2020) and Senior Vice President and Deputy Chief Financial Officer (2012-2014). Ms. Bishop currently serves as a member of the Audit Committee and Compensation and Personnel Committee (2021-present) of the Board of Directors of Korn Ferry (global organizational consulting).
Robert W. Helm (1957)
Year of Election or Appointment: 2021
Member of the Advisory Board
Mr. Helm also serves as a Member of the Advisory Board of other Fidelity® funds. Mr. Helm was formerly Deputy Chairman (2003-2020), partner (1991-2020) and an associate (1984-1991) of Dechert LLP (formerly Dechert Price & Rhoads). Mr. Helm currently serves on boards and committees of several not-for-profit organizations.
Craig S. Brown (1977)
Year of Election or Appointment: 2019
Assistant Treasurer
Mr. Brown also serves as an officer of other funds. Mr. Brown serves as Assistant Treasurer of FIMM, LLC (2021-present) and is an employee of Fidelity Investments (2013-present). Previously, Mr. Brown served as Assistant Treasurer of certain Fidelity ® funds (2019-2022).
John J. Burke III (1964)
Year of Election or Appointment: 2018
Chief Financial Officer
Mr. Burke also serves as Chief Financial Officer of other funds. Mr. Burke serves as Head of Investment Operations for Fidelity Fund and Investment Operations (2018-present) and is an employee of Fidelity Investments (1998-present). Previously Mr. Burke served as head of Asset Management Investment Operations (2012-2018).
David J. Carter (1973)
Year of Election or Appointment: 2020
Assistant Secretary
Mr. Carter also serves as Assistant Secretary of other funds. Mr. Carter serves as Senior Vice President, Deputy General Counsel (2022-present) and is an employee of Fidelity Investments (2005-present).
Jonathan Davis (1968)
Year of Election or Appointment: 2010
Assistant Treasurer
Mr. Davis also serves as an officer of other funds. Mr. Davis serves as Assistant Treasurer of FIMM, LLC (2021-present), FMR Capital, Inc. (2017-present), FD Funds GP LLC (2021-present), FD Funds Holding LLC (2021-present), and FD Funds Management LLC (2021-present); and is an employee of Fidelity Investments. Previously, Mr. Davis served as Vice President and Associate General Counsel of FMR LLC (diversified financial services company, 2003-2010).
Laura M. Del Prato (1964)
Year of Election or Appointment: 2018
President and Treasurer
Ms. Del Prato also serves as an officer of other funds. Ms. Del Prato serves as Assistant Treasurer of FIMM, LLC (2021-present) and is an employee of Fidelity Investments (2017-present). Previously, Ms. Del Prato served as President and Treasurer of The North Carolina Capital Management Trust: Cash Portfolio and Term Portfolio (2018-2020). Prior to joining Fidelity Investments, Ms. Del Prato served as a Managing Director and Treasurer of the JPMorgan Mutual Funds (2014-2017). Prior to JPMorgan, Ms. Del Prato served as a partner at Cohen Fund Audit Services (accounting firm, 2012-2013) and KPMG LLP (accounting firm, 2004-2012).
Christopher M. Gouveia (1973)
Year of Election or Appointment: 2023
Chief Compliance Officer
Mr. Gouveia also serves as Chief Compliance Officer of other funds. Mr. Gouveia serves as Senior Vice President of Asset Management Compliance for Fidelity Investments and is an employee of Fidelity Investments. Previously, Mr. Gouveia served as Chief Compliance Officer of the North Carolina Capital Management Trust (2016-2019).
Colm A. Hogan (1973)
Year of Election or Appointment: 2016
Assistant Treasurer
Mr. Hogan also serves as an officer of other funds. Mr. Hogan serves as Assistant Treasurer of FIMM, LLC (2021-present) and FMR Capital, Inc. (2017-present) and is an employee of Fidelity Investments (2005-present). Previously, Mr. Hogan served as Deputy Treasurer of certain Fidelity ® funds (2016-2020) and Assistant Treasurer of certain Fidelity ® funds (2016-2018).
Cynthia Lo Bessette (1969)
Year of Election or Appointment: 2019
Secretary and Chief Legal Officer (CLO)
Ms. Lo Bessette also serves as an officer of other funds. Ms. Lo Bessette serves as CLO, Secretary, and Senior Vice President of Fidelity Management & Research Company LLC (investment adviser firm, 2019-present); CLO of Fidelity Management & Research (Hong Kong) Limited, FMR Investment Management (UK) Limited, and Fidelity Management & Research (Japan) Limited (investment adviser firms, 2019-present); Secretary of FD Funds GP LLC (2021-present), FD Funds Holding LLC (2021-present), FD Funds Management LLC (2021-present), and Fidelity Diversifying Solutions LLC (investment adviser firm, 2022-present); and Assistant Secretary of FIMM, LLC (2019-present). She is a Senior Vice President and Deputy General Counsel of FMR LLC (diversified financial services company, 2019-present), and is an employee of Fidelity Investments. Previously, Ms. Lo Bessette served as CLO, Secretary, and Senior Vice President of FMR Co., Inc. (investment adviser firm, 2019); Secretary of Fidelity SelectCo, LLC and Fidelity Investments Money Management, Inc. (investment adviser firms, 2019). Prior to joining Fidelity Investments, Ms. Lo Bessette was Executive Vice President, General Counsel (2016-2019) and Senior Vice President, Deputy General Counsel (2015-2016) of OppenheimerFunds (investment management company) and Deputy Chief Legal Officer (2013-2015) of Jennison Associates LLC (investment adviser firm).
Chris Maher (1972)
Year of Election or Appointment: 2013
Assistant Treasurer
Mr. Maher also serves as an officer of other funds. Mr. Maher serves as Assistant Treasurer of FIMM, LLC (2021-present) and FMR Capital, Inc. (2017-present), and is an employee of Fidelity Investments (2008-present). Previously, Mr. Maher served as Assistant Treasurer of certain funds (2013-2020); Vice President of Asset Management Compliance (2013), Vice President of the Program Management Group of FMR (investment adviser firm, 2010-2013), and Vice President of Valuation Oversight (2008-2010).
Jamie Pagliocco (1964)
Year of Election or Appointment: 2020
Vice President
Mr. Pagliocco also serves as Vice President of other funds. Mr. Pagliocco serves as President of Fixed Income (2020-present), and is an employee of Fidelity Investments (2001-present). Previously, Mr. Pagliocco served as Co-Chief Investment Officer - Bond (2017-2020), Global Head of Bond Trading (2016-2019), and as a portfolio manager.
Brett Segaloff (1972)
Year of Election or Appointment: 2021
Anti-Money Laundering (AML) Officer
Mr. Segaloff also serves as an AML Officer of other funds and other related entities. He is Director, Anti-Money Laundering (2007-present) of FMR LLC (diversified financial services company) and is an employee of Fidelity Investments (1996-present).
Stacie M. Smith (1974)
Year of Election or Appointment: 2013
Assistant Treasurer
Ms. Smith also serves as an officer of other funds. Ms. Smith serves as Assistant Treasurer of FIMM, LLC (2021-present) and FMR Capital, Inc. (2017-present), is an employee of Fidelity Investments (2009-present), and has served in other fund officer roles. Prior to joining Fidelity Investments, Ms. Smith served as Senior Audit Manager of Ernst & Young LLP (accounting firm, 1996-2009). Previously, Ms. Smith served as Assistant Treasurer (2013-2019) and Deputy Treasurer (2013-2016) of certain Fidelity ® funds.
Jim Wegmann (1979)
Year of Election or Appointment: 2021
Deputy Treasurer
Mr. Wegmann also serves as an officer of other funds. Mr. Wegmann serves as Assistant Treasurer of FIMM, LLC (2021-present) and is an employee of Fidelity Investments (2011-present). Previously, Mr. Wegmann served as Assistant Treasurer of certain Fidelity ® funds (2019-2021).
As a shareholder, you incur two types of costs: (1) transaction costs, which may include sales charges (loads) on purchase payments or redemption proceeds, as applicable and (2) ongoing costs, which generally include management fees, distribution and/or service (12b-1) fees and other Fund expenses. This Example is intended to help you understand your ongoing costs (in dollars) of investing in a fund and to compare these costs with the ongoing costs of investing in other mutual funds.
| The Example is based on an investment of $1,000 invested at the beginning of the period and held for the entire period (July 1, 2022 to December 31, 2022). |
Actual Expenses
The first line of the accompanying table provides information about actual account values and actual expenses. You may use the information in this line, together with the amount you invested, to estimate the expenses that you paid over the period. Simply divide your account value by $1,000.00 (for example, an $8,600 account value divided by $1,000.00 = 8.6), then multiply the result by the number in the first line for a class/Fund under the heading entitled "Expenses Paid During Period" to estimate the expenses you paid on your account during this period. If any fund is a shareholder of any underlying mutual funds or exchange-traded funds (ETFs) (the Underlying Funds), such fund indirectly bears its proportional share of the expenses of the Underlying Funds in addition to the direct expenses incurred presented in the table. These fees and expenses are not included in the annualized expense ratio used to calculate the expense estimate in the table below.
Hypothetical Example for Comparison Purposes
The second line of the accompanying table provides information about hypothetical account values and hypothetical expenses based on the actual expense ratio and an assumed rate of return of 5% per year before expenses, which is not the actual return. The hypothetical account values and expenses may not be used to estimate the actual ending account balance or expenses you paid for the period. You may use this information to compare the ongoing costs of investing in the Fund and other funds. To do so, compare this 5% hypothetical example with the 5% hypothetical examples that appear in the shareholder reports of the other funds. If any fund is a shareholder of any Underlying Funds, such fund indirectly bears its proportional share of the expenses of the Underlying Funds in addition to the direct expenses as presented in the table. These fees and expenses are not included in the annualized expense ratio used to calculate the expense estimate in the table below.
Please note that the expenses shown in the table are meant to highlight your ongoing costs only and do not reflect any transaction costs. Therefore, the second line of the table is useful in comparing ongoing costs only, and will not help you determine the relative total costs of owning different funds. In addition, if these transactional costs were included, your costs would have been higher.
| | | | | Annualized Expense Ratio- A | | Beginning Account Value July 1, 2022 | | Ending Account Value December 31, 2022 | | Expenses Paid During Period- C July 1, 2022 to December 31, 2022 |
| | | | | | | | | | |
| Fidelity® Minnesota Municipal Income Fund | | | | .50% | | | | | | |
| Actual | | | | | | $ 1,000 | | $ 1,006.50 | | $ 2.53 |
Hypothetical- B | | | | | | $ 1,000 | | $ 1,022.68 | | $ 2.55 |
| |
A Annualized expense ratio reflects expenses net of applicable fee waivers.
B 5% return per year before expenses
C Expenses are equal to the annualized expense ratio, multiplied by the average account value over the period, multiplied by 184/ 365 (to reflect the one-half year period). The fees and expenses of any Underlying Funds are not included in each annualized expense ratio.
The dividend and capital gains distributions for the fund(s) are available on Fidelity.com or Institutional.Fidelity.com .
During fiscal year ended 2022, 100% of the fund's income dividends was free from federal income tax, and 1.67% of the fund's income dividends was subject to the federal alternative minimum tax.
The fund will notify shareholders in January 2023 of amounts for use in preparing 2022 income tax returns.
Fidelity Minnesota Municipal Income Fund
Each year, the Board of Trustees, including the Independent Trustees (together, the Board), votes on the renewal of the management contract with Fidelity Management & Research Company LLC (FMR) and the sub-advisory agreements (together, the Advisory Contracts) for the fund. FMR and the sub-advisers are referred to herein as the Investment Advisers. The Board, assisted by the advice of fund counsel and Independent Trustees' counsel, requests and considers a broad range of information relevant to the renewal of the Advisory Contracts throughout the year.
The Board meets regularly and, at each of its meetings, covers an extensive agenda of topics and materials and considers factors that are relevant to its annual consideration of the renewal of the fund's Advisory Contracts, including the services and support provided to the fund and its shareholders. The Board has established four standing committees (Committees) - Operations, Audit, Fair Valuation, and Governance and Nominating - each composed of and chaired by Independent Trustees with varying backgrounds, to which the Board has assigned specific subject matter responsibilities in order to enhance effective decision-making by the Board. The Operations Committee, of which all the Independent Trustees are members, meets regularly throughout the year and requests, receives and considers, among other matters, information related to the annual consideration of the renewal of the fund's Advisory Contracts before making its recommendation to the Board. The Board also meets as needed to review matters specifically related to the Board's annual consideration of the renewal of the Advisory Contracts. Members of the Board may also meet from time to time with trustees of other Fidelity funds through joint ad hoc committees to discuss certain matters relevant to all of the Fidelity funds.
At its September 2022 meeting, the Board unanimously determined to renew the fund's Advisory Contracts. In reaching its determination, the Board considered all factors it believed relevant, including (i) the nature, extent, and quality of the services provided to the fund and its shareholders (including the investment performance of the fund); (ii) the competitiveness relative to peer funds of the fund's management fee and the total expense ratio; (iii) the total costs of the services provided by and the profits realized by Fidelity from its relationships with the fund; and (iv) the extent to which, if any, economies of scale exist and are realized as the fund grows, and whether any economies of scale are appropriately shared with fund shareholders.
In considering whether to renew the Advisory Contracts for the fund, the Board reached a determination, with the assistance of fund counsel and Independent Trustees' counsel and through the exercise of its business judgment, that the renewal of the Advisory Contracts was in the best interests of the fund and its shareholders and that the compensation payable under the Advisory Contracts was fair and reasonable. The Board's decision to renew the Advisory Contracts was not based on any single factor, but rather was based on a comprehensive consideration of all the information provided to the Board at its meetings throughout the year. The Board, in reaching its determination to renew the Advisory Contracts, was aware that shareholders of the fund have a broad range of investment choices available to them, including a wide choice among funds offered by Fidelity's competitors, and that the fund's shareholders, who have the opportunity to review and weigh the disclosure provided by the fund in its prospectus and other public disclosures, have chosen to invest in this fund, which is part of the Fidelity family of funds.
Nature, Extent, and Quality of Services Provided. The Board considered Fidelity's staffing as it relates to the fund, including the backgrounds of investment personnel of Fidelity, and also considered the fund's investment objective, strategies, and related investment philosophy. The Independent Trustees also had discussions with senior management of Fidelity's investment operations and investment groups. The Board considered the structure of the investment personnel compensation program and whether this structure provides appropriate incentives to act in the best interests of the fund. Additionally, the Board considered the portfolio managers' investments, if any, in the funds that they manage. The Board also considered the steps Fidelity had taken to ensure the continued provision of high quality services to the Fidelity funds throughout the COVID-19 pandemic, including the expansion of staff in client facing positions to maintain service levels in periods of high volumes and volatility.
Resources Dedicated to Investment Management and Support Services. The Board reviewed the general qualifications and capabilities of Fidelity's investment staff, including its size, education, experience, and resources, as well as Fidelity's approach to recruiting, training, managing, and compensating investment personnel. The Board noted the resources devoted to Fidelity's global investment organization, and that Fidelity's analysts have extensive resources, tools and capabilities that allow them to conduct quantitative and fundamental analysis, as well as credit analysis of issuers, counterparties and guarantors. Further, the Board considered that Fidelity's investment professionals have sufficient access to global information and data so as to provide competitive investment results over time, and that those professionals also have access to sophisticated tools that permit them to assess portfolio construction and risk and performance attribution characteristics continuously, as well as to transmit new information and research conclusions rapidly around the world. Additionally, in its deliberations, the Board considered Fidelity's trading, risk management, compliance, cybersecurity, and technology and operations capabilities and resources, which are integral parts of the investment management process.
Shareholder and Administrative Services . The Board considered (i) the nature, extent, quality, and cost of advisory, administrative, and shareholder services performed by the Investment Advisers and their affiliates under the Advisory Contracts and under separate agreements covering transfer agency and pricing and bookkeeping services for the fund; (ii) the nature and extent of the supervision of third party service providers, principally custodians, subcustodians, and pricing vendors; and (iii) the resources devoted to, and the record of compliance with, the fund's compliance policies and procedures.
The Board noted that the growth of fund assets over time across the complex allows Fidelity to reinvest in the development of services designed to enhance the value and convenience of the Fidelity funds as investment vehicles. These services include 24-hour access to account information and market information over the Internet and through telephone representatives, investor education materials and asset allocation tools. The Board also considered that it reviews customer service metrics such as telephone response times, continuity of services on the website and metrics addressing services at Fidelity Investor Centers.
Investment in a Large Fund Family. The Board considered the benefits to shareholders of investing in a Fidelity fund, including the benefits of investing in a fund that is part of a large family of funds offering a variety of investment disciplines and providing a large variety of mutual fund investor services. The Board noted that Fidelity had taken, or had made recommendations to the Board that resulted in the Fidelity funds taking, a number of actions over the previous year that benefited particular funds, including: (i) continuing to dedicate additional resources to Fidelity's investment research process, which includes meetings with management of issuers of securities in which the funds invest; (ii) continuing efforts to enhance Fidelity's global research capabilities; (iii) launching new funds, ETFs, and share classes with innovative structures, strategies and pricing and making other enhancements to meet investor needs; (iv) broadening eligibility requirements for certain funds and share classes; (v) reducing management fees and total expenses for certain funds and classes; (vi) lowering expenses for certain existing funds and classes by implementing or lowering expense caps; (vii) rationalizing product lines and gaining increased efficiencies from fund mergers and liquidations; (viii) continuing to develop, acquire and implement systems and technology to improve services to the funds and shareholders, strengthen information security, and increase efficiency; and (ix) continuing to implement enhancements to further strengthen Fidelity's product line to increase investors' probability of success in achieving their investment goals, including their retirement income goals.
Investment Performance . The Board considered whether the fund has operated in accordance with its investment objective, as well as its record of compliance with its investment restrictions and its performance history.
The Board took into account discussions that occur at Board meetings throughout the year with representatives of the Investment Advisers about fund investment performance. In this regard the Board noted that as part of regularly scheduled fund reviews and other reports to the Board on fund performance, the Board considers annualized return information for the fund for different time periods, measured against an appropriate securities market index (benchmark index) and an appropriate peer group of funds with similar objectives (peer group). The Board also receives and considers information about performance attribution. In its evaluation of fund investment performance at meetings throughout the year, the Board gave particular attention to information indicating underperformance of certain Fidelity funds for specific time periods and discussed with the Investment Advisers the reasons for such underperformance.
In addition to reviewing absolute and relative fund performance, the Independent Trustees periodically consider the appropriateness of fund performance metrics in evaluating the results achieved. In general, the Independent Trustees believe that fund performance should be evaluated based on gross performance (before fees and expenses but after transaction costs) compared to appropriate benchmark indices, over appropriate time periods that may include full market cycles, and on net performance (after fees and expenses) compared to appropriate peer groups, as applicable, over the same periods, taking into account relevant factors including the following: general market conditions; expectations for interest rate levels and credit conditions; issuer-specific information including credit quality; the potential for incremental return versus the fund's benchmark index weighed against the risks involved in obtaining that incremental return, including the risk of diminished or negative total returns; and fund cash flows and other factors. The Independent Trustees generally give greater weight to fund performance over longer time periods than over shorter time periods. Depending on the circumstances, the Independent Trustees may be satisfied with a fund's performance notwithstanding that it lags its benchmark index or peer group for certain periods.
The Independent Trustees recognize that shareholders evaluate performance on a net basis over their own holding periods, for which one-, three-, and five-year periods are often used as a proxy. For this reason, the performance information reviewed by the Board also included net cumulative calendar year total return information for the fund and an appropriate benchmark index and peer group for the most recent one-, three-, and five-year periods.
Based on its review, the Board concluded that the nature, extent, and quality of services provided to the fund under the Advisory Contracts should continue to benefit the shareholders of the fund.
Competitiveness of Management Fee and Total Expense Ratio. The Board considered the fund's management fee and total expense ratio compared to selected groups of competitive funds and classes (referred to as "mapped groups" below) for the purpose of facilitating the Trustees' competitive analysis of management fees and total expenses. Fidelity creates "mapped groups" by combining similar investment objective categories (as classified by Lipper) that have comparable investment mandates. Combining funds with similar investment objective categories aids the Board's comparison of management fees and total expense ratios by broadening the competitive group used for such comparison.
Management Fee. The Board considered two proprietary management fee comparisons for the 12-month periods shown in basis points (BP) in the chart below. The group of Lipper funds used by the Board for management fee comparisons is referred to below as the "Total Mapped Group" and is broader than the Lipper peer group used by the Board for performance comparisons. The Total Mapped Group comparison focuses on a fund's standing in terms of gross management fees before expense reimbursements or caps relative to the total universe of funds with comparable investment mandates, regardless of whether their management fee structures also are comparable. Funds with comparable investment mandates offer exposure to similar types of securities. Funds with comparable management fee structures have similar management fee contractual arrangements (e.g., flat rate charged for advisory services, all-inclusive fee rate, etc.). "TMG %" represents the percentage of funds in the Total Mapped Group that had management fees that were lower than the fund's. For example, a hypothetical TMG % of 20% would mean that 80% of the funds in the Total Mapped Group had higher, and 20% had lower, management fees than the fund. The fund's actual TMG %s and the number of funds in the Total Mapped Group are in the chart below. The "Asset-Sized Peer Group" (ASPG) comparison focuses on a fund's standing relative to a subset of non-Fidelity funds within the Total Mapped Group that are similar in size and management fee structure. For example, if a fund is in the first quartile of the ASPG, the fund's management fee ranks in the least expensive or lowest 25% of funds in the ASPG. The ASPG represents at least 15% of the funds in the Total Mapped Group with comparable asset size and management fee structures, subject to a minimum of 50 funds (or all funds in the Total Mapped Group if fewer than 50). Additional information, such as the ASPG quartile in which the fund's management fee rate ranked, is also included in the chart and was considered by the Board.

The Board noted that the fund's management fee rate ranked below the median of its Total Mapped Group and below the median of its ASPG for 2021.
Based on its review, the Board concluded that the fund's management fee is fair and reasonable in light of the services that the fund receives and the other factors considered.
Total Expense Ratio . In its review of the fund's total expense ratio, the Board considered the fund's management fee rate as well as other fund expenses, such as transfer agent fees, pricing and bookkeeping fees, and custodial, legal, and audit fees. The Board also noted that Fidelity may agree to waive fees or reimburse expenses from time to time, and the extent to which, if any, it has done so for the fund. The fund is compared to those funds and classes in the Total Mapped Group (used by the Board for management fee comparisons) that have a similar sales load structure. The Board also considered a total expense ASPG comparison, which focuses on the total expenses of the fund relative to a subset of non-Fidelity funds within the similar sales load structure group that are similar in size and management fee structure. The total expense ASPG is limited to 15 larger and 15 smaller classes of different funds, where possible. The total expense ASPG comparison excludes performance adjustments and fund-paid 12b-1 fees to eliminate variability in expenses relating to these items.
The Board noted that the fund's total net expense ratio ranked below the similar sales load structure group competitive median for 2021 and below the ASPG competitive median for 2021.
Fees Charged to Other Fidelity Clients . The Board also considered Fidelity fee structures and other information with respect to clients of Fidelity, such as other funds advised or subadvised by Fidelity, pension plan clients, and other institutional clients with similar mandates. The Board noted that a joint ad hoc committee created by it and the boards of other Fidelity funds periodically reviews and compares Fidelity's institutional investment advisory business with its business of providing services to the Fidelity funds and also noted the most recent findings of the committee. The Board noted that the committee's review included a consideration of the differences in services provided, fees charged, and costs incurred, as well as competition in the markets serving the different categories of clients.
Based on its review of total expense ratios and fees charged to other Fidelity clients, the Board concluded that the fund's total expense ratio was reasonable in light of the services that the fund and its shareholders receive and the other factors considered.
Costs of the Services and Profitability. The Board considered the revenues earned and the expenses incurred by Fidelity in conducting the business of developing, marketing, distributing, managing, administering and servicing the fund and servicing the fund's shareholders. The Board also considered the level of Fidelity's profits in respect of all the Fidelity funds.
On an annual basis, Fidelity presents to the Board information about the profitability of its relationships with the fund. Fidelity calculates profitability information for each fund, as well as aggregate profitability information for groups of Fidelity funds and all Fidelity funds, using a series of detailed revenue and cost allocation methodologies which originate with the books and records of Fidelity on which Fidelity's audited financial statements are based. The Audit Committee of the Board reviews any significant changes from the prior year's methodologies and the full Board approves such changes.
A public accounting firm has been engaged annually by the Board as part of the Board's assessment of Fidelity's profitability analysis. The engagement includes the review and assessment of the methodologies used by Fidelity in determining the revenues and expenses attributable to Fidelity's mutual fund business, and completion of agreed-upon procedures in respect of the mathematical accuracy of certain fund profitability information and its conformity to established allocation methodologies. After considering the reports issued under the engagement and information provided by Fidelity, the Board concluded that while other allocation methods may also be reasonable, Fidelity's profitability methodologies are reasonable in all material respects.
The Board also reviewed Fidelity's non-fund businesses and potential indirect benefits such businesses may have received as a result of their association with Fidelity's mutual fund business (i.e., fall-out benefits) as well as cases where Fidelity's affiliates may benefit from the funds' business. The Board considered areas where potential indirect benefits to the Fidelity funds from their relationships with Fidelity may exist. The Board's consideration of these matters was informed by the findings of a joint ad hoc committee created by it and the boards of other Fidelity funds to evaluate potential fall-out benefits.
The Board considered the costs of the services provided by and the profits realized by Fidelity in connection with the operation of the fund and was satisfied that the profitability was not excessive.
Economies of Scale. The Board considered whether there have been economies of scale in respect of the management of the Fidelity funds, whether the Fidelity funds (including the fund) have appropriately benefited from any such economies of scale, and whether there is potential for realization of any further economies of scale. The Board considered the extent to which the fund will benefit from economies of scale as assets grow through increased services to the fund, through waivers or reimbursements, or through fee or expense ratio reductions. The Board also noted that a committee (the Economies of Scale Committee) created by it and the boards of other Fidelity funds periodically analyzes whether Fidelity attains economies of scale in respect of the management and servicing of the Fidelity funds, whether the Fidelity funds have appropriately benefited from such economies of scale, and whether there is potential for realization of any further economies of scale.
The Board recognized that the fund's management contract incorporates a "group fee" structure, which provides for lower group fee rates as total "group assets" increase, and for higher group fee rates as total "group assets" decrease ("group assets" as defined in the management contract). FMR calculates the group fee rates based on a tiered asset "breakpoint" schedule that varies based on asset class. The Board considered that the group fee is designed to deliver the benefits of economies of scale to fund shareholders when total Fidelity fund assets increase, even if assets of any particular fund are unchanged or have declined, because some portion of Fidelity's costs are attributable to services provided to all Fidelity funds, and all funds benefit if those costs can be allocated among more assets. The Board also considered that Fidelity agreed to impose a temporary fee waiver in the form of additional breakpoints to the current breakpoint schedule. The Board concluded that, given the group fee structure, fund shareholders will benefit from lower management fees as "group assets" increase at the fund complex level, regardless of whether Fidelity achieves any such economies of scale.
The Board concluded, taking into account the analysis of the Economies of Scale Committee, that economies of scale, if any, are being appropriately shared between fund shareholders and Fidelity.
Additional Information Requested by the Board. In order to develop fully the factual basis for consideration of the Fidelity funds' advisory contracts, the Board requested and received additional information on certain topics, including: (i) Fidelity's fund profitability methodology, profitability trends for certain funds, the allocation of various costs to different funds, and the impact of certain factors on fund profitability results; (ii) portfolio manager changes that have occurred during the past year and the amount of the investment that each portfolio manager has made in the Fidelity fund(s) that he or she manages; (iii) the extent to which current market conditions have affected retention and recruitment of personnel; (iv) the arrangements with and compensation paid to certain fund sub-advisers on behalf of the Fidelity funds and the treatment of such compensation within Fidelity's fund profitability methodology; (v) the terms of the funds' various management fee structures, including the basic group fee and the terms of Fidelity's voluntary expense limitation arrangements; (vi) Fidelity's transfer agent, pricing and bookkeeping fees, expense and service structures for different funds and classes relative to competitive trends; (vii) the impact on fund profitability of recent industry trends, such as the growth in passively managed funds and the changes in flows for different types of funds; (viii) the types of management fee and total expense comparisons provided, and the challenges and limitations associated with such information; and (ix) explanations regarding the relative total expense ratios and management fees of certain funds and classes, total expense and management fee competitive trends, and methodologies for total expense and management fee competitive comparisons. In addition, the Board considered its discussions with Fidelity regarding Fidelity's efforts to maintain the continuous investment and shareholder services necessary for the funds during the current pandemic and economic circumstances.
Based on its evaluation of all of the conclusions noted above, and after considering all factors it believed relevant, the Board concluded that the advisory fee arrangements are fair and reasonable and that the fund's Advisory Contracts should be renewed.
1.539899.125
MNF-ANN-0323
Fidelity Flex® Funds
Fidelity Flex® Municipal Income Fund
Annual Report
December 31, 2022
Contents
To view a fund's proxy voting guidelines and proxy voting record for the 12-month period ended June 30, visit http://www.fidelity.com/proxyvotingresults or visit the Securities and Exchange Commission's (SEC) web site at http://www.sec.gov.
You may also call 1-800-544-3455 (for managed account clients) or 1-800-835-5092 (for retirement plan participants) to request a free copy of the proxy voting guidelines.
Standard & Poor's, S&P and S&P 500 are registered service marks of The McGraw-Hill Companies, Inc. and have been licensed for use by Fidelity Distributors Corporation.
Other third-party marks appearing herein are the property of their respective owners.
All other marks appearing herein are registered or unregistered trademarks or service marks of FMR LLC or an affiliated company. © 2023 FMR LLC. All rights reserved.
This report and the financial statements contained herein are submitted for the general information of the shareholders of the Fund. This report is not authorized for distribution to prospective investors in the Fund unless preceded or accompanied by an effective prospectus.
A fund files its complete schedule of portfolio holdings with the SEC for the first and third quarters of each fiscal year on Form N-PORT. Forms N-PORT are available on the SEC's web site at http://www.sec.gov. A fund's Forms N-PORT may be reviewed and copied at the SEC's Public Reference Room in Washington, DC. Information regarding the operation of the SEC's Public Reference Room may be obtained by calling 1-800-SEC-0330.
For a complete list of a fund's portfolio holdings, view the most recent holdings listing, semiannual report, or annual report on Fidelity's web site at http://www.fidelity.com, http://www.institutional.fidelity.com, or http://www.401k.com, as applicable.
NOT FDIC INSURED •MAY LOSE VALUE •NO BANK GUARANTEE
Neither the Fund nor Fidelity Distributors Corporation is a bank.
Average annual total return reflects the change in the value of an investment, assuming reinvestment of distributions from dividend income and capital gains (the profits earned upon the sale of securities that have grown in value, if any) and assuming a constant rate of performance each year. The hypothetical investment and the average annual total returns do not reflect the deduction of taxes that a shareholder would pay on fund distributions or the redemption of fund shares. During periods of reimbursement by Fidelity, a fund's total return will be greater than it would be had the reimbursement not occurred. How a fund did yesterday is no guarantee of how it will do tomorrow.
| Average Annual Total Returns |
| | | | |
Periods ended December 31, 2022 | Past 1 year | Past 5 years | Life of Fund A |
| Fidelity Flex® Municipal Income Fund | -8.63% | 1.13% | 1.24% |
A From October 12, 2017
| $10,000 Over Life of Fund |
| |
Let's say hypothetically that $10,000 was invested in Fidelity Flex® Municipal Income Fund, on October 12, 2017, when the fund started. The chart shows how the value of your investment would have changed, and also shows how the Bloomberg Municipal Bond Index performed over the same period. |
|
|
Market Recap:
Tax-exempt municipal bonds notably declined in 2022, as a multitude of crosscurrents challenged the global economy and financial markets. The Bloomberg Municipal Bond Index returned -8.53% for the year, its third-worst annual return on record. In late 2021, the Federal Reserve began its pivot to a tighter monetary policy, tapering the large-scale asset purchases it restarted in 2020 amid the COVID-19 pandemic. In early 2022, the Fed, faced with persistent inflationary pressure, implemented an aggressive series of rate hikes, raising its benchmark interest rate seven times, by a total of 4.25 percentage points, between March and December. This helped push municipal bond yields to their highest level in more than a decade. Muni bond prices, which move inversely to yields, fell sharply. Credit spreads significantly widened, as investors demanded more yield for lower-quality munis as recession risk increased. In November and December, the tax-exempt market staged a rally when comments by Fed Chair Jerome Powell pointed to a slowdown in the pace of rate hikes and inflation data moderated. Favorable supply and demand dynamics also helped amid muted muni bond issuance and increased pockets of demand. Muni tax-backed credit fundamentals remained solid throughout the year and, for the most part, the risk of credit-rating downgrades appeared low. Shorter-duration (lower sensitivity to changes in interest rates) and higher-credit-quality munis performed best for the year.
Comments from Co-Portfolio Managers Cormac Cullen, Michael Maka and Elizah McLaughlin:
For the fiscal year ending December 31, 2022, the fund returned -8.63%, roughly in line, net of fees, with the -8.53% result of the benchmark, the broad-based Bloomberg Municipal Bond Index. The past 12 months, we continued to focus on longer-term objectives and sought to generate attractive tax-exempt income and a competitive risk-adjusted return. Versus the benchmark, duration (interest rate) positioning contributed to performance. The fund had less sensitivity to interest rates, as measured by its shorter duration, during periods when interest rates rose, and therefore was hurt less. A higher-than-average yield on the fund's underlying holdings provided another boost to the relative result. In contrast, the fund's overweight exposure to the health care and transportation sectors detracted from relative performance, as many of the fund's holdings in these segments were lower-quality investment-grade bonds that produced subpar results as credit spreads widened. Pricing-related factors significantly detracted versus the state-specific index as well. Fund holdings are priced by a third-party pricing service and validated daily by Fidelity Management & Research's fair-value processes. Securities within the index, however, are priced by the index provider. These two approaches employ somewhat different methodologies in estimating the prices of municipal securities, most of which trade infrequently.
The views expressed above reflect those of the portfolio manager(s) only through the end of the period as stated on the cover of this report and do not necessarily represent the views of Fidelity or any other person in the Fidelity organization. Any such views are subject to change at any time based upon market or other conditions and Fidelity disclaims any responsibility to update such views. These views may not be relied on as investment advice and, because investment decisions for a Fidelity fund are based on numerous factors, may not be relied on as an indication of trading intent on behalf of any Fidelity fund.
| Top Five States (% of Fund's net assets) |
| | |
| Illinois | 12.2 |
| Pennsylvania | 8.3 |
| New York | 6.7 |
| Connecticut | 6.2 |
| Georgia | 5.3 |
| | |
| Revenue Sources (% of Fund's net assets) |
| General Obligations | 23.7% | |
| Transportation | 18.7% | |
| Health Care | 13.2% | |
| Education | 9.5% | |
| Housing | 9.3% | |
| Special Tax | 7.7% | |
| Others* (Individually Less Than 5%) | 17.9% | |
| | 100.0% | |
| |
| *Includes net other assets | | |
Quality Diversification (% of Fund's net assets) |
|
| |
| We have used ratings from Moody's Investors Service, Inc. Where Moody's® ratings are not available, we have used S&P® ratings. All ratings are as of the date indicated and do not reflect subsequent changes. |
Showing Percentage of Net Assets
| Municipal Bonds - 96.3% |
| | | Principal Amount (a) | Value ($) |
| Alabama - 0.3% | | | |
| Auburn Univ. Gen. Fee Rev. Series 2018 A, 5% 6/1/43 | | 100,000 | 106,427 |
| Homewood Edl. Bldg. Auth. Rev. Series 2019 A: | | | |
| 4% 12/1/33 | | 110,000 | 111,149 |
| 4% 12/1/41 | | 85,000 | 78,074 |
| 4% 12/1/49 | | 190,000 | 164,529 |
| Jefferson County Gen. Oblig. Series 2018 A, 5% 4/1/26 | | 100,000 | 106,603 |
| Lower Alabama Gas District Bonds (No. 2 Proj.) Series 2020, 4%, tender 12/1/25 (b) | | 1,095,000 | 1,086,342 |
| Montgomery Med. Clinic Facilities Series 2015, 5% 3/1/36 | | 425,000 | 394,318 |
TOTAL ALABAMA | | | 2,047,442 |
| Alaska - 0.2% | | | |
| Alaska Hsg. Fin. Corp. Series 2021 A, 4% 12/1/29 | | 845,000 | 893,393 |
| Alaska Hsg. Fin. Corp. Mtg. Rev. Series 2022 A, 3% 6/1/51 | | 205,000 | 197,775 |
TOTAL ALASKA | | | 1,091,168 |
| Arizona - 2.8% | | | |
| Arizona Health Facilities Auth. Rev. (Scottsdale Lincoln Hospitals Proj.) Series 2014 A, 5% 12/1/39 | | 185,000 | 187,999 |
| Arizona Indl. Dev. Auth. Hosp. Rev. Series 2021 A, 5% 2/1/28 | | 1,000,000 | 1,099,765 |
| Arizona Indl. Dev. Auth. Lease Rev. Series 2020 A, 4% 9/1/46 | | 1,750,000 | 1,652,618 |
| Arizona Indl. Dev. Auth. Rev. (Provident Group-Eastern Michigan Univ. Parking Proj.) Series 2018: | | | |
| 5% 5/1/26 | | 450,000 | 401,978 |
| 5% 5/1/29 | | 290,000 | 246,781 |
| 5% 5/1/33 | | 565,000 | 447,771 |
| Arizona State Lottery Rev. Series 2019, 5% 7/1/23 (Escrowed to Maturity) | | 415,000 | 419,114 |
| Bullhead City Excise Taxes Series 2021 2: | | | |
| 0.95% 7/1/26 | | 250,000 | 227,625 |
| 1.15% 7/1/27 | | 375,000 | 336,308 |
| 1.3% 7/1/28 | | 485,000 | 428,871 |
| 1.5% 7/1/29 | | 600,000 | 527,423 |
| 1.65% 7/1/30 | | 825,000 | 713,416 |
| 1.7% 7/1/31 | | 450,000 | 382,141 |
| Chandler Indl. Dev. Auth. Indl. Dev. Rev.: | | | |
| (Intel Corp. Proj.) Series 2022 2, 5%, tender 9/1/27 (b)(c) | | 1,855,000 | 1,935,830 |
| Bonds (Intel Corp. Proj.): | | | |
Series 2005, 2.4%, tender 8/14/23 (b) | | 65,000 | 64,495 |
Series 2007, 2.7%, tender 8/14/23 (b)(c) | | 600,000 | 596,060 |
Series 2019, 5%, tender 6/3/24 (b)(c) | | 1,980,000 | 2,011,567 |
| Glendale Union School District 205 Series A: | | | |
| 4% 7/1/36 (Assured Guaranty Muni. Corp. Insured) | | 545,000 | 557,657 |
| 4% 7/1/37 (Assured Guaranty Muni. Corp. Insured) | | 1,000,000 | 1,012,734 |
| Glendale Indl. Dev. Auth. (Terraces of Phoenix Proj.) Series 2018 A: | | | |
| 5% 7/1/38 | | 10,000 | 8,726 |
| 5% 7/1/48 | | 10,000 | 8,102 |
| Maricopa County Indl. Dev. Auth.: | | | |
| (Creighton Univ. Proj.) Series 2020, 5% 7/1/47 | | 100,000 | 104,716 |
| Series 2021 A, 4% 9/1/51 | | 775,000 | 690,310 |
| Maricopa County Indl. Dev. Auth. Sr. Living Facilities Series 2016: | | | |
| 5.75% 1/1/36 (d) | | 300,000 | 232,503 |
| 6% 1/1/48 (d) | | 300,000 | 210,852 |
| Maricopa County Rev.: | | | |
| Series 2017 D, 3% 1/1/48 | | 840,000 | 618,952 |
| Series 2019 E, 3% 1/1/49 | | 500,000 | 365,859 |
| Phoenix Civic Impt. Board Arpt. Rev. Series 2019 B, 5% 7/1/35 (c) | | 300,000 | 316,597 |
| Phoenix Civic Impt. Corp. Wtr. Sys. Rev. Series 2021 A, 5% 7/1/45 | | 1,000,000 | 1,084,937 |
| Western Maricopa Ed. Ctr. District Series 2019 B, 5% 7/1/24 | | 190,000 | 195,907 |
TOTAL ARIZONA | | | 17,087,614 |
| California - 4.9% | | | |
| California Edl. Facilities Auth. Rev. Series T1, 5% 3/15/39 | | 65,000 | 76,126 |
| California Gen. Oblig.: | | | |
| Series 2020, 4% 11/1/37 | | 1,000,000 | 1,018,765 |
| Series 2021: | | | |
5% 9/1/32 | | 2,175,000 | 2,563,568 |
5% 10/1/41 | | 5,435,000 | 5,996,970 |
| California Hsg. Fin. Agcy. Series 2021 1, 3.5% 11/20/35 | | 194,881 | 176,265 |
| California Pub. Works Board Lease Rev. (Various Cap. Projs.): | | | |
| Series 2021 B, 4% 5/1/46 | | 1,265,000 | 1,215,859 |
| Series 2022 C, 5% 8/1/32 | | 285,000 | 335,321 |
| California Statewide Cmntys. Dev. Auth. Rev. Series 2015, 5% 2/1/45 | | 105,000 | 77,433 |
| Los Angeles Dept. Arpt. Rev. Series F, 5% 5/15/44 (c) | | 175,000 | 178,937 |
| Los Angeles Dept. of Wtr. & Pwr. Rev.: | | | |
| Series 2021 B, 5% 7/1/51 | | 1,550,000 | 1,657,591 |
| Series B, 5% 7/1/50 | | 1,070,000 | 1,141,462 |
| Los Angeles Hbr. Dept. Rev. Series 2019 A: | | | |
| 5% 8/1/24 (c) | | 310,000 | 319,500 |
| 5% 8/1/25 (c) | | 110,000 | 115,075 |
| Middle Fork Proj. Fin. Auth. Series 2020, 5% 4/1/26 | | 1,000,000 | 1,046,424 |
| Mount Diablo Unified School District Series 2022 B: | | | |
| 4% 8/1/31 | | 225,000 | 244,676 |
| 4% 8/1/34 | | 320,000 | 339,980 |
| Sacramento County Arpt. Sys. Rev. Series 2018 C, 5% 7/1/39 (c) | | 105,000 | 108,322 |
| San Diego County Reg'l. Arpt. Auth. Arpt. Rev. Series 2019 A, 5% 7/1/49 | | 500,000 | 524,063 |
| San Diego County Wtr. Auth. Fing. Agcy. Wtr. Rev. Series 2022 A: | | | |
| 5% 5/1/47 | | 635,000 | 701,461 |
| 5% 5/1/52 | | 1,080,000 | 1,185,866 |
| San Francisco City & County Arpts. Commission Int'l. Arpt. Rev.: | | | |
| Series 2018 G, 5% 5/1/27 (c) | | 560,000 | 591,614 |
| Series 2019 A, 5% 5/1/49 (c) | | 3,000,000 | 3,037,634 |
| Series 2019 B, 5% 5/1/49 | | 45,000 | 47,473 |
| Series 2022 A: | | | |
5% 5/1/26 (c) | | 815,000 | 855,577 |
5% 5/1/27 (c) | | 830,000 | 879,247 |
5% 5/1/28 (c) | | 1,105,000 | 1,179,099 |
5% 5/1/29 (c) | | 740,000 | 795,131 |
| Series 2022 B, 5% 5/1/52 | | 2,240,000 | 2,404,816 |
| Univ. of California Revs.: | | | |
| Series 2018 AZ, 5% 5/15/43 | | 130,000 | 138,552 |
| Series 2023 BM, 5% 5/15/36 (e) | | 180,000 | 209,503 |
| Washington Township Health Care District Rev.: | | | |
| Series 2017 A, 5% 7/1/35 | | 190,000 | 193,878 |
| Series 2017 B: | | | |
5% 7/1/29 | | 115,000 | 119,302 |
5% 7/1/30 | | 230,000 | 238,541 |
TOTAL CALIFORNIA | | | 29,714,031 |
| Colorado - 2.4% | | | |
| Arkansas River Pwr. Auth. Rev. Series 2018 A: | | | |
| 5% 10/1/38 | | 40,000 | 40,058 |
| 5% 10/1/43 | | 50,000 | 48,997 |
| Colorado Health Facilities Auth. Rev. Bonds Series 2016 C, 5%, tender 11/15/26 (b) | | 275,000 | 291,559 |
| Colorado Health Facilities Auth. Rev. Bonds: | | | |
| (Parkview Med. Ctr., Inc. Proj.) Series 2016, 4% 9/1/35 | | 35,000 | 34,043 |
| Bonds Series 2019 B: | | | |
5%, tender 8/1/26 (b) | | 110,000 | 114,864 |
5%, tender 11/19/26 (b) | | 20,000 | 21,562 |
5%, tender 11/19/26 (b) | | 190,000 | 201,259 |
| Series 2019 A: | | | |
5% 11/1/25 | | 435,000 | 457,026 |
5% 11/15/39 | | 190,000 | 204,413 |
| Series 2019 A1, 4% 8/1/44 | | 1,060,000 | 913,792 |
| Series 2019 A2: | | | |
3.25% 8/1/49 | | 600,000 | 424,643 |
4% 8/1/49 | | 1,715,000 | 1,438,400 |
5% 8/1/44 | | 845,000 | 846,498 |
| Series 2020 A: | | | |
4% 9/1/45 | | 775,000 | 675,406 |
4% 9/1/50 | | 210,000 | 171,362 |
| Colorado Hsg. & Fin. Auth.: | | | |
| Series 2019 F, 4.25% 11/1/49 | | 60,000 | 60,533 |
| Series 2019 H, 4.25% 11/1/49 | | 25,000 | 25,237 |
| Colorado Reg'l. Trans. District Ctfs. of Prtn. Series 2020, 5% 6/1/31 | | 105,000 | 117,249 |
| Colorado Reg'l. Trans. District Sales Tax Rev. (Fastracks Proj.) Series 2021 B, 5% 11/1/28 | | 725,000 | 815,739 |
| Denver City & County Arpt. Rev.: | | | |
| Series 2017 A, 5% 11/15/26 (c) | | 50,000 | 52,862 |
| Series 2018 A, 5% 12/1/34 (c) | | 1,125,000 | 1,235,408 |
| Denver City & County Board Wtr. Rev.: | | | |
| Series 2020 A: | | | |
5% 9/15/45 | | 1,190,000 | 1,299,458 |
5% 9/15/46 | | 1,820,000 | 1,983,518 |
| Series 2020 B, 5% 9/15/28 | | 2,000,000 | 2,256,544 |
| Univ. of Colorado Enterprise Sys. Rev. Bonds: | | | |
| Series 2021 C3A, 2%, tender 10/15/25 (b) | | 255,000 | 247,476 |
| Series 2021 C3B, 2%, tender 10/15/26 (b) | | 210,000 | 201,272 |
| Vauxmont Metropolitan District: | | | |
| Series 2019, 5% 12/15/25 (Assured Guaranty Muni. Corp. Insured) | | 40,000 | 42,393 |
| Series 2020, 5% 12/1/30 (Assured Guaranty Muni. Corp. Insured) | | 220,000 | 243,949 |
TOTAL COLORADO | | | 14,465,520 |
| Connecticut - 6.2% | | | |
| Bridgeport Gen. Oblig. Series 2021 A: | | | |
| 5% 8/1/32 | | 300,000 | 340,903 |
| 5% 8/1/33 | | 800,000 | 906,050 |
| 5% 8/1/34 | | 500,000 | 561,075 |
| Connecticut Gen. Oblig.: | | | |
| Series 2016 B: | | | |
5% 5/15/25 | | 220,000 | 231,683 |
5% 5/15/26 | | 125,000 | 134,380 |
| Series 2016 D, 5% 8/15/25 | | 210,000 | 222,392 |
| Series 2018 F: | | | |
5% 9/15/24 | | 100,000 | 103,751 |
5% 9/15/25 | | 100,000 | 106,098 |
| Series 2019 A: | | | |
4% 4/15/37 | | 1,800,000 | 1,807,492 |
5% 4/15/26 | | 115,000 | 123,426 |
| Series 2020 A, 4% 1/15/34 | | 300,000 | 312,331 |
| Series 2021 A: | | | |
3% 1/15/35 | | 1,150,000 | 1,059,267 |
3% 1/15/37 | | 1,910,000 | 1,682,932 |
3% 1/15/39 | | 215,000 | 182,543 |
| Series 2021 B, 5% 6/1/41 | | 1,125,000 | 1,216,163 |
| Series 2021 D, 5% 7/15/24 | | 260,000 | 268,710 |
| Series 2022 B, 4% 1/15/37 | | 2,480,000 | 2,494,387 |
| Series 2022 C: | | | |
4% 6/15/39 | | 300,000 | 293,867 |
4% 6/15/41 | | 250,000 | 238,774 |
5% 6/15/30 | | 400,000 | 457,438 |
5% 6/15/31 | | 500,000 | 577,048 |
5% 6/15/34 | | 350,000 | 400,566 |
5% 6/15/37 | | 250,000 | 277,786 |
5% 6/15/38 | | 300,000 | 331,883 |
5% 6/15/40 | | 500,000 | 547,424 |
5% 6/15/42 | | 500,000 | 543,481 |
| Series 2022 D, 5% 9/15/30 | | 650,000 | 746,059 |
| Series 2022: | | | |
5% 6/15/28 | | 500,000 | 556,168 |
5% 6/15/29 | | 410,000 | 462,617 |
| Connecticut Health & Edl. Facilities Auth. Rev.: | | | |
| Bonds Series 2020 B: | | | |
5%, tender 1/1/25 (b) | | 200,000 | 207,312 |
5%, tender 1/1/27 (b) | | 330,000 | 350,363 |
| Series 2018 K1: | | | |
5% 7/1/26 | | 680,000 | 689,268 |
5% 7/1/28 | | 1,120,000 | 1,140,745 |
| Series 2019 A, 5% 7/1/49 (d) | | 130,000 | 108,263 |
| Series 2019 Q-1: | | | |
5% 11/1/25 | | 90,000 | 95,434 |
5% 11/1/26 | | 95,000 | 102,689 |
| Series 2020 K, 4% 7/1/45 | | 1,000,000 | 915,126 |
| Series 2021 G: | | | |
4% 3/1/46 | | 235,000 | 218,868 |
4% 3/1/51 | | 380,000 | 348,045 |
| Series 2021 S, 4% 6/1/51 | | 240,000 | 209,739 |
| Series 2022 M: | | | |
4% 7/1/39 | | 415,000 | 382,994 |
4% 7/1/52 | | 355,000 | 317,166 |
| Series A, 5% 7/1/26 | | 160,000 | 164,556 |
| Series K1: | | | |
5% 7/1/27 | | 1,100,000 | 1,118,591 |
5% 7/1/30 | | 1,000,000 | 1,015,984 |
5% 7/1/34 | | 725,000 | 729,516 |
5% 7/1/36 | | 450,000 | 446,275 |
5% 7/1/39 | | 490,000 | 473,650 |
| Series K3, 5% 7/1/43 | | 215,000 | 204,214 |
| Series L1: | | | |
4% 7/1/28 | | 750,000 | 754,993 |
4% 7/1/29 | | 750,000 | 754,696 |
4% 7/1/30 | | 1,000,000 | 1,004,076 |
| Series N: | | | |
5% 7/1/25 | | 390,000 | 395,037 |
5% 7/1/26 | | 575,000 | 585,063 |
5% 7/1/27 | | 430,000 | 438,491 |
| Series R, 5% 6/1/36 | | 900,000 | 980,091 |
| Connecticut Hsg. Fin. Auth.: | | | |
| Series 2021 B1, 3% 11/15/49 | | 310,000 | 300,342 |
| Series 2022 A1: | | | |
5% 11/15/26 | | 200,000 | 214,444 |
5% 5/15/27 | | 220,000 | 237,318 |
5% 11/15/27 | | 230,000 | 249,995 |
5% 5/15/28 | | 225,000 | 245,807 |
5% 11/15/28 | | 220,000 | 241,437 |
5% 5/15/29 | | 225,000 | 248,568 |
5% 11/15/29 | | 125,000 | 138,333 |
5% 5/15/30 | | 375,000 | 417,503 |
5% 11/15/30 | | 175,000 | 195,726 |
| Series 2022 A2: | | | |
5% 5/15/23 (c) | | 500,000 | 502,753 |
5% 11/15/23 (c) | | 670,000 | 679,198 |
5% 5/15/24 (c) | | 595,000 | 607,743 |
5% 11/15/24 (c) | | 965,000 | 994,496 |
5% 5/15/25 (c) | | 400,000 | 414,904 |
5% 11/15/25 (c) | | 300,000 | 313,740 |
5% 5/15/26 (c) | | 425,000 | 447,084 |
| Connecticut Spl. Tax Oblig. Trans. Infrastructure Rev. Series 2012 A, 5% 1/1/24 | | 80,000 | 80,000 |
| Univ. of Connecticut Gen. Oblig. Series 2019 A, 5% 11/1/25 | | 140,000 | 148,806 |
TOTAL CONNECTICUT | | | 38,016,136 |
| District Of Columbia - 0.5% | | | |
| Metropolitan Washington Arpts. Auth. Dulles Toll Road Rev.: | | | |
| (Dulles Metrorail and Cap. Impt. Proj.) Series 2019 B, 3% 10/1/50 (Assured Guaranty Muni. Corp. Insured) | | 890,000 | 635,822 |
| (Dulles Metrorail and Cap. Impt. Projs.) Series 2019 A: | | | |
5% 10/1/31 | | 185,000 | 202,240 |
5% 10/1/44 | | 1,000,000 | 1,044,663 |
| Metropolitan Washington DC Arpts. Auth. Sys. Rev.: | | | |
| Series 2017 A, 5% 10/1/26 (c) | | 440,000 | 464,444 |
| Series 2019 A, 5% 10/1/25 (c) | | 70,000 | 73,057 |
| Series 2020 A: | | | |
5% 10/1/26 (c) | | 320,000 | 337,778 |
5% 10/1/27 (c) | | 110,000 | 117,092 |
5% 10/1/28 (c) | | 55,000 | 58,944 |
| Washington Convention & Sports Auth. Series 2018 A: | | | |
| 5% 10/1/23 | | 100,000 | 101,448 |
| 5% 10/1/24 | | 100,000 | 103,616 |
| 5% 10/1/25 | | 100,000 | 106,094 |
TOTAL DISTRICT OF COLUMBIA | | | 3,245,198 |
| Florida - 4.5% | | | |
| Atlantic Beach Health Care Facilities Series A, 5% 11/15/43 | | 255,000 | 242,309 |
| Broward County Arpt. Sys. Rev.: | | | |
| Series 2015 C, 5% 10/1/24 (c) | | 45,000 | 46,233 |
| Series 2017, 5% 10/1/42 (c) | | 1,365,000 | 1,391,955 |
| Series 2019 A, 5% 10/1/49 (c) | | 1,000,000 | 1,013,244 |
| Broward County School Board Ctfs. of Prtn.: | | | |
| Series 2015 A, 5% 7/1/23 | | 50,000 | 50,442 |
| Series 2016, 5% 7/1/26 | | 230,000 | 247,012 |
| Cap. Projs. Fin. Auth. Student Hsg. Rev. (Cap. Projs. Ln. Prog. - Florida Univs.) Series 2020 A, 5% 10/1/30 | | 500,000 | 507,012 |
| Escambia County Health Facilities Auth. Health Facilities Rev. Series 2020 A: | | | |
| 3% 8/15/50 (Assured Guaranty Muni. Corp. Insured) | | 485,000 | 340,807 |
| 4% 8/15/45 | | 110,000 | 95,706 |
| Florida Dev. Fin. Corp. Healthcare Facility Rev. Series 2021, 4% 11/15/38 | | 725,000 | 683,451 |
| Florida Higher Edl. Facilities Fing. Auth. (St. Leo Univ. Proj.) Series 2019, 5% 3/1/24 | | 390,000 | 391,585 |
| Florida Hsg. Fin. Corp. Rev. Series 2019 1, 4% 7/1/50 | | 135,000 | 135,194 |
| Florida Mid-Bay Bridge Auth. Rev. Series 2015 A: | | | |
| 5% 10/1/27 | | 105,000 | 107,336 |
| 5% 10/1/29 | | 80,000 | 81,674 |
| 5% 10/1/30 | | 70,000 | 71,417 |
| Fort Pierce Utils. Auth. Series 2022 A: | | | |
| 5% 10/1/30 (Assured Guaranty Muni. Corp. Insured) | | 175,000 | 198,392 |
| 5% 10/1/34 (Assured Guaranty Muni. Corp. Insured) | | 300,000 | 341,145 |
| 5% 10/1/36 (Assured Guaranty Muni. Corp. Insured) | | 475,000 | 531,110 |
| 5% 10/1/37 (Assured Guaranty Muni. Corp. Insured) | | 425,000 | 471,976 |
| 5% 10/1/39 (Assured Guaranty Muni. Corp. Insured) | | 475,000 | 522,806 |
| 5% 10/1/40 (Assured Guaranty Muni. Corp. Insured) | | 450,000 | 493,383 |
| 5% 10/1/41 (Assured Guaranty Muni. Corp. Insured) | | 400,000 | 438,015 |
| 5% 10/1/42 (Assured Guaranty Muni. Corp. Insured) | | 400,000 | 438,042 |
| Greater Orlando Aviation Auth. Arpt. Facilities Rev.: | | | |
| Series 2017 A, 5% 10/1/31 (c) | | 125,000 | 131,673 |
| Series 2019 A: | | | |
5% 10/1/23 (c) | | 300,000 | 303,614 |
5% 10/1/24 (c) | | 300,000 | 308,732 |
5% 10/1/25 (c) | | 300,000 | 313,103 |
5% 10/1/32 (c) | | 300,000 | 322,184 |
5% 10/1/38 (c) | | 430,000 | 449,243 |
5% 10/1/54 (c) | | 1,620,000 | 1,642,617 |
| Hillsborough County Aviation Auth. Rev. Series 2022 A, 5% 10/1/26 (c) | | 2,750,000 | 2,902,777 |
| Lee Memorial Health Sys. Hosp. Rev. Series 2019 A1, 5% 4/1/44 | | 665,000 | 677,893 |
| Miami-Dade County Aviation Rev.: | | | |
| Series 2015 A: | | | |
5% 10/1/27 (c) | | 620,000 | 640,617 |
5% 10/1/38 (c) | | 80,000 | 81,182 |
| Series 2016 A, 5% 10/1/29 | | 145,000 | 155,601 |
| Series 2017 B, 5% 10/1/40 (c) | | 810,000 | 823,067 |
| Series 2020 A: | | | |
4% 10/1/40 | | 300,000 | 285,112 |
5% 10/1/25 | | 245,000 | 259,464 |
| Miami-Dade County Expressway Auth. Series 2014 A, 5% 7/1/25 | | 395,000 | 405,241 |
| Miami-Dade County School Board Ctfs. of Prtn.: | | | |
| Bonds Series 2014 A, 5%, tender 5/1/24 (b) | | 100,000 | 102,610 |
| Series 2015 A, 5% 5/1/28 | | 290,000 | 301,470 |
| Series 2015 D, 5% 2/1/26 | | 10,000 | 10,628 |
| Miami-Dade County Wtr. & Swr. Rev. Series 2021, 5% 10/1/32 | | 155,000 | 177,876 |
| Orange County Health Facilities Auth. Series 2016 A, 5% 10/1/39 | | 60,000 | 61,671 |
| Orange County Hsg. Fin. Auth. Multi-family Rev. Bonds Series 2021 B, 0.55%, tender 7/1/24 (b) | | 1,600,000 | 1,512,967 |
| Palm Beach County Health Facilities Auth. Hosp. Rev. (Jupiter Med. Ctr. Proj.) Series 2022: | | | |
| 5% 11/1/29 | | 175,000 | 187,158 |
| 5% 11/1/32 | | 200,000 | 214,747 |
| 5% 11/1/34 | | 310,000 | 326,249 |
| 5% 11/1/37 | | 385,000 | 396,997 |
| 5% 11/1/39 | | 400,000 | 409,454 |
| 5% 11/1/41 | | 400,000 | 407,385 |
| Palm Beach County Health Facilities Auth. Rev. Series 2015 C, 5% 5/15/30 | | 495,000 | 478,402 |
| Pinellas County Hsg. Fin. Auth. Bonds Series 2021 B, 0.65%, tender 7/1/24 (b) | | 365,000 | 345,667 |
| South Miami Health Facilities Auth. Hosp. Rev. (Baptist Med. Ctr., FL. Proj.) Series 2017: | | | |
| 5% 8/15/26 | | 100,000 | 106,150 |
| 5% 8/15/42 | | 5,000 | 5,099 |
| Tallahassee Health Facilities Rev.: | | | |
| (Tallahassee Memorial Healthcare, Inc. Proj.) Series 2016 A, 5% 12/1/26 | | 100,000 | 103,926 |
| Series 2015 A, 5% 12/1/40 | | 410,000 | 413,350 |
| Tampa Hosp. Rev.: | | | |
| (H Lee Moffitt Cancer Ctr. Proj.) Series 2016 B, 5% 7/1/29 | | 25,000 | 26,248 |
| (H. Lee Moffitt Cancer Ctr. Proj.) Series 2020 B: | | | |
4% 7/1/39 | | 1,000,000 | 976,828 |
4% 7/1/45 | | 825,000 | 746,391 |
| Tampa Tax Allocation (H. Lee Moffitt Cancer Ctr. Proj.) Series 2020 A: | | | |
| 0% 9/1/34 | | 700,000 | 429,264 |
| 0% 9/1/35 | | 750,000 | 434,916 |
| 0% 9/1/36 | | 800,000 | 439,262 |
| Volusia County Edl. Facilities Auth. Rev. (Embry-Riddle Aeronautical Univ., Inc. Proj.) Series 2020 A: | | | |
| 5% 10/15/44 | | 30,000 | 31,244 |
| 5% 10/15/49 | | 60,000 | 62,063 |
TOTAL FLORIDA | | | 27,250,388 |
| Georgia - 5.3% | | | |
| Atlanta Arpt. Rev.: | | | |
| Series 2014 C, 5% 1/1/29 (c) | | 140,000 | 141,802 |
| Series 2019 B, 5% 7/1/25 (c) | | 60,000 | 62,367 |
| Brookhaven Dev. Auth. Rev. Series 2019 A, 5% 7/1/36 | | 150,000 | 164,282 |
| Burke County Indl. Dev. Auth. Poll. Cont. Rev.: | | | |
| (Georgia Transmission Corp. Proj.) Series 2012, 2.75% 1/1/52 (b) | | 610,000 | 396,924 |
| Bonds (Georgia Pwr. Co. Plant Vogtle Proj.): | | | |
Series 1994: | | | |
2.15%, tender 6/13/24 (b) | | 1,140,000 | 1,112,691 |
2.25%, tender 5/25/23 (b) | | 315,000 | 313,238 |
Series 2013 1st, 2.925%, tender 3/12/24 (b) | | 330,000 | 326,264 |
| DeKalb Private Hosp. Auth. Rev. Series 2019 B, 5% 7/1/27 | | 210,000 | 230,122 |
| Fulton County Dev. Auth. Rev. Series 2019, 4% 6/15/49 | | 40,000 | 37,374 |
| Gainesville & Hall County Hosp. Auth. Rev. Series 2020 A, 3% 2/15/47 | | 1,895,000 | 1,360,433 |
| Georgia Muni. Elec. Auth. Pwr. Rev.: | | | |
| Series 2019 A: | | | |
4% 1/1/49 | | 245,000 | 214,384 |
5% 1/1/23 | | 450,000 | 450,000 |
5% 1/1/26 | | 165,000 | 173,649 |
5% 1/1/30 | | 55,000 | 59,815 |
5% 1/1/34 | | 375,000 | 398,689 |
| Series 2021 A: | | | |
4% 1/1/35 (Assured Guaranty Muni. Corp. Insured) | | 400,000 | 405,169 |
4% 1/1/36 (Assured Guaranty Muni. Corp. Insured) | | 410,000 | 412,531 |
4% 1/1/37 (Assured Guaranty Muni. Corp. Insured) | | 470,000 | 467,439 |
4% 1/1/40 (Assured Guaranty Muni. Corp. Insured) | | 385,000 | 372,727 |
4% 1/1/41 | | 480,000 | 430,364 |
5% 1/1/23 | | 100,000 | 100,000 |
5% 1/1/25 (Assured Guaranty Muni. Corp. Insured) | | 200,000 | 206,998 |
5% 1/1/26 (Assured Guaranty Muni. Corp. Insured) | | 425,000 | 447,899 |
5% 1/1/28 (Assured Guaranty Muni. Corp. Insured) | | 400,000 | 433,691 |
5% 1/1/31 (Assured Guaranty Muni. Corp. Insured) | | 360,000 | 400,798 |
5% 1/1/32 (Assured Guaranty Muni. Corp. Insured) | | 330,000 | 366,539 |
5% 1/1/32 (Assured Guaranty Muni. Corp. Insured) | | 280,000 | 310,079 |
| Georgia Road & Thruway Auth. Rev. Series 2020, 5% 6/1/31 | | 1,000,000 | 1,153,776 |
| Glynn-Brunswick Memorial Hosp. Auth. Rev. (Southeast Georgia Health Sys. Proj.) Series 2017: | | | |
| 4% 8/1/43 | | 5,000 | 4,348 |
| 5% 8/1/39 | | 5,000 | 5,028 |
| 5% 8/1/43 | | 5,000 | 5,031 |
| Hosp. Auth. of Savannah Auth. Rev. Series 2019 A: | | | |
| 4% 7/1/36 | | 195,000 | 195,492 |
| 4% 7/1/43 | | 205,000 | 191,957 |
| Main Street Natural Gas, Inc. Bonds: | | | |
| Series 2018 A, 4%, tender 9/1/23 (b) | | 585,000 | 584,815 |
| Series 2018 C, 4%, tender 12/1/23 (b) | | 500,000 | 499,622 |
| Series 2021 A, 4%, tender 9/1/27 (b) | | 12,000,000 | 11,901,751 |
| Series 2022 E, 4%, tender 12/1/29 (b) | | 3,595,000 | 3,496,601 |
| Monroe County Dev. Auth. Poll. Cont. Rev. (Georgia Pwr. Co. Plant Scherer Proj.) Series 1995, 2.25% 7/1/25 | | 200,000 | 191,839 |
| Private Colleges & Univs. Auth. Rev.: | | | |
| (The Savannah College of Art & Design Projs.) Series 2021: | | | |
4% 4/1/39 | | 1,365,000 | 1,324,243 |
5% 4/1/24 | | 675,000 | 690,908 |
5% 4/1/29 | | 500,000 | 548,814 |
5% 4/1/36 | | 135,000 | 145,799 |
| Series 2020 B: | | | |
5% 9/1/25 | | 180,000 | 191,286 |
5% 9/1/34 | | 1,000,000 | 1,138,189 |
| Series A: | | | |
5% 6/1/23 | | 80,000 | 80,580 |
5% 6/1/24 | | 130,000 | 133,339 |
TOTAL GEORGIA | | | 32,279,686 |
| Hawaii - 1.6% | | | |
| Hawaii Arpts. Sys. Rev.: | | | |
| Series 2018 A: | | | |
5% 7/1/33 (c) | | 350,000 | 370,216 |
5% 7/1/48 (c) | | 2,800,000 | 2,834,516 |
| Series 2022 A, 5% 7/1/42 (c) | | 1,245,000 | 1,292,569 |
| Series 2022 B, 5% 7/1/24 (c) | | 3,350,000 | 3,435,376 |
| Hawaii Gen. Oblig. Series 2020 A, 4% 7/1/36 (c) | | 40,000 | 40,050 |
| Honolulu City & County Gen. Oblig.: | | | |
| (Honolulu Rail Transit Proj.) Series 2020 B, 5% 3/1/29 | | 1,000,000 | 1,131,641 |
| Series 2017 A, 5% 9/1/33 | | 5,000 | 5,472 |
| Series 2022 A, 5% 11/1/23 | | 280,000 | 284,915 |
| Honolulu City and County Wastewtr. Sys. Series 2015 A, 5% 7/1/40 (Pre-Refunded to 7/1/25 @ 100) | | 115,000 | 121,542 |
TOTAL HAWAII | | | 9,516,297 |
| Idaho - 0.1% | | | |
| Idaho Hsg. & Fin. Assoc. Single Family Mtg.: | | | |
| Series 2019 A, 4% 1/1/50 | | 20,000 | 20,037 |
| Series 2021 A, 5% 7/15/31 | | 610,000 | 703,664 |
TOTAL IDAHO | | | 723,701 |
| Illinois - 12.2% | | | |
| Champaign County Cmnty. Unit Series 2019, 4% 6/1/26 | | 15,000 | 15,593 |
| Chicago Board of Ed.: | | | |
| Series 2012 A, 5% 12/1/42 | | 830,000 | 794,640 |
| Series 2018 A: | | | |
5% 12/1/29 | | 350,000 | 357,406 |
5% 12/1/30 | | 160,000 | 163,376 |
5% 12/1/31 | | 150,000 | 152,934 |
| Series 2018 C, 5% 12/1/46 | | 3,250,000 | 3,086,532 |
| Series 2019 A: | | | |
5% 12/1/29 | | 125,000 | 128,251 |
5% 12/1/30 | | 405,000 | 415,030 |
5% 12/1/30 | | 100,000 | 102,476 |
| Series 2022 B: | | | |
4% 12/1/35 | | 600,000 | 549,098 |
4% 12/1/36 | | 1,005,000 | 905,603 |
| Chicago Gen. Oblig.: | | | |
| Series 2015 C, 5% 1/1/27 | | 215,000 | 219,545 |
| Series 2020 A: | | | |
5% 1/1/27 | | 400,000 | 413,934 |
5% 1/1/30 | | 615,000 | 648,202 |
| Series 2021 A, 5% 1/1/32 | | 7,725,000 | 8,179,151 |
| Series 2021 B, 4% 1/1/32 | | 375,000 | 364,261 |
| Series 2023 A: | | | |
5% 1/1/29 (e) | | 1,000,000 | 1,047,500 |
5% 1/1/33 (e) | | 895,000 | 943,974 |
| Chicago Midway Arpt. Rev.: | | | |
| Series 2013 A, 5.5% 1/1/29 (c) | | 200,000 | 200,237 |
| Series 2014 B: | | | |
5% 1/1/26 | | 100,000 | 101,694 |
5% 1/1/28 | | 270,000 | 274,012 |
| Series 2016 A, 4% 1/1/33 (c) | | 305,000 | 299,642 |
| Series 2016 B, 4% 1/1/35 | | 200,000 | 198,722 |
| Chicago O'Hare Int'l. Arpt. Rev.: | | | |
| Series 2012 B, 4% 1/1/29 (c) | | 400,000 | 400,020 |
| Series 2013 A, 5% 1/1/23 (c) | | 70,000 | 70,000 |
| Series 2017 B, 5% 1/1/37 | | 50,000 | 52,181 |
| Series 2018 A, 5% 1/1/48 (c) | | 90,000 | 91,197 |
| Series 2022 C, 5% 1/1/40 (c) | | 1,850,000 | 1,925,330 |
| Chicago O'Hare Int'l. Arpt. Spl. Facilities Rev. Series 2018: | | | |
| 5% 7/1/38 (c) | | 50,000 | 50,240 |
| 5% 7/1/48 (c) | | 600,000 | 587,945 |
| Cook County Cmnty. Consolidated School District No. 59 Series 2020, 5% 3/1/26 | | 615,000 | 659,047 |
| Cook County Gen. Oblig.: | | | |
| Series 2016 A: | | | |
5% 11/15/23 | | 10,000 | 10,136 |
5% 11/15/31 | | 500,000 | 533,099 |
| Series 2021 A: | | | |
5% 11/15/23 | | 35,000 | 35,477 |
5% 11/15/24 | | 50,000 | 51,611 |
5% 11/15/33 | | 425,000 | 472,060 |
| Series 2021 B: | | | |
4% 11/15/25 | | 180,000 | 184,405 |
4% 11/15/26 | | 90,000 | 92,670 |
4% 11/15/27 | | 90,000 | 93,047 |
4% 11/15/28 | | 45,000 | 46,648 |
| DuPage & Cook Counties Cmnty. Unit School District #205 Series 2022, 4% 9/15/42 | | 2,100,000 | 2,041,014 |
| Illinois Fin. Auth.: | | | |
| Bonds Series 2020 B, 5%, tender 11/15/24 (b) | | 400,000 | 408,621 |
| Series 2020 A: | | | |
3% 5/15/50 | | 1,570,000 | 1,063,054 |
3% 5/15/50 (Build America Mutual Assurance Insured) | | 710,000 | 500,773 |
3.25% 8/15/49 | | 285,000 | 220,289 |
4% 5/15/50 | | 1,000,000 | 862,556 |
| Series 2021 A, 4% 8/15/37 | | 2,155,000 | 2,078,191 |
| Series 2022 A: | | | |
5% 10/1/29 | | 350,000 | 359,607 |
5% 10/1/30 | | 230,000 | 236,101 |
5% 10/1/31 | | 215,000 | 219,736 |
| Illinois Fin. Auth. Academic Facilities: | | | |
| (Provident Group UIUC Properties LLC Univ. of Illinois at Urbana-Champaign Proj.) Series 2019 A, 5% 10/1/25 | | 200,000 | 209,807 |
| (Provident Group UIUC Properties LLC Univ. of Illinois at Urbana-Champaign Proj.) Series 2019 A: | | | |
5% 10/1/26 | | 200,000 | 212,921 |
5% 10/1/31 | | 200,000 | 219,643 |
5% 10/1/38 | | 200,000 | 209,548 |
| Illinois Fin. Auth. Health Svcs. Facility Lease Rev. (Provident Group - UIC Surgery Ctr. LLC - Univ. of Illinois Health Svcs. Facility Proj.) Series 2020, 4% 10/1/55 | | 400,000 | 326,774 |
| Illinois Fin. Auth. Rev.: | | | |
| (Bradley Univ. Proj.) Series 2017 C: | | | |
5% 8/1/24 �� | | 45,000 | 45,705 |
5% 8/1/30 | | 615,000 | 638,194 |
| (Depaul Univ., IL Proj.): | | | |
Series 2016 A, 5% 10/1/28 | | 10,000 | 10,624 |
Series 2016, 5% 10/1/29 | | 30,000 | 31,865 |
| (OSF Healthcare Sys.) Series 2018 A: | | | |
4.125% 5/15/47 | | 750,000 | 681,297 |
5% 5/15/43 | | 790,000 | 800,041 |
| (Presence Health Proj.) Series 2016 C, 5% 2/15/36 | | 15,000 | 15,809 |
| Series 2015 A: | | | |
5% 11/15/23 | | 10,000 | 10,154 |
5% 11/15/25 | | 150,000 | 157,583 |
| Series 2015 C: | | | |
4.125% 8/15/37 | | 60,000 | 56,858 |
5% 8/15/26 | | 35,000 | 36,385 |
5% 8/15/44 | | 1,380,000 | 1,327,477 |
| Series 2016 A: | | | |
5% 8/15/24 (Escrowed to Maturity) | | 65,000 | 67,154 |
5% 7/1/31 (Pre-Refunded to 7/1/26 @ 100) | | 30,000 | 32,344 |
5% 7/1/33 (Pre-Refunded to 7/1/26 @ 100) | | 10,000 | 10,781 |
5% 7/1/36 (Pre-Refunded to 7/1/26 @ 100) | | 45,000 | 48,515 |
| Series 2016 B, 5% 8/15/35 | | 250,000 | 261,541 |
| Series 2016 C: | | | |
4% 2/15/41 | | 35,000 | 33,552 |
4% 2/15/41 (Pre-Refunded to 2/15/27 @ 100) | | 5,000 | 5,222 |
5% 2/15/34 | | 50,000 | 53,074 |
| Series 2016: | | | |
5% 12/1/23 | | 155,000 | 157,318 |
5% 5/15/29 | | 10,000 | 10,472 |
5% 12/1/29 | | 620,000 | 648,131 |
5% 12/1/33 | | 485,000 | 502,074 |
5% 12/1/40 | | 85,000 | 84,049 |
5% 12/1/46 | | 2,695,000 | 2,596,685 |
| Series 2017 A, 5% 7/15/42 | | 1,000,000 | 1,038,181 |
| Series 2019: | | | |
4% 9/1/35 | | 60,000 | 54,359 |
5% 9/1/36 | | 295,000 | 296,675 |
5% 9/1/38 | | 100,000 | 99,574 |
| Illinois Gen. Oblig.: | | | |
| Series 2013 A, 5% 4/1/23 | | 525,000 | 526,702 |
| Series 2013, 5% 7/1/23 | | 10,000 | 10,065 |
| Series 2014: | | | |
5% 2/1/25 | | 520,000 | 525,621 |
5% 5/1/28 | | 50,000 | 50,456 |
| Series 2016: | | | |
5% 1/1/26 | | 5,000 | 5,130 |
5% 2/1/26 | | 400,000 | 410,638 |
5% 2/1/27 | | 585,000 | 603,669 |
5% 11/1/29 | | 1,400,000 | 1,427,709 |
| Series 2017 C, 5% 11/1/29 | | 345,000 | 353,438 |
| Series 2017 D, 5% 11/1/27 | | 850,000 | 878,621 |
| Series 2017, 4% 2/1/24 | | 30,000 | 30,078 |
| Series 2018 A: | | | |
5% 10/1/24 | | 25,000 | 25,461 |
5% 10/1/28 | | 1,500,000 | 1,550,509 |
| Series 2018 B: | | | |
5% 5/1/24 | | 1,500,000 | 1,523,161 |
5% 10/1/24 | | 1,050,000 | 1,069,381 |
| Series 2019 B: | | | |
5% 9/1/24 | | 105,000 | 106,883 |
5% 9/1/25 | | 20,000 | 20,483 |
| Series 2020 C, 4% 10/1/37 | | 1,815,000 | 1,632,440 |
| Series 2021 A, 5% 3/1/32 | | 450,000 | 459,951 |
| Series 2022 A, 5% 3/1/32 | | 650,000 | 665,795 |
| Series 2022 B: | | | |
5% 3/1/29 | | 650,000 | 671,864 |
5% 3/1/33 | | 1,700,000 | 1,731,791 |
| Series May 2014, 5% 5/1/39 | | 1,600,000 | 1,587,551 |
| Illinois Hsg. Dev. Auth. Series 2021, 3% 4/1/51 | | 740,000 | 716,538 |
| Illinois Sales Tax Rev. Series 2013, 5% 6/15/24 | | 285,000 | 286,605 |
| Illinois Toll Hwy. Auth. Toll Hwy. Rev.: | | | |
| Series 2019 A, 5% 1/1/44 | | 105,000 | 109,503 |
| Series A, 5% 1/1/40 | | 220,000 | 232,522 |
| Kendall, Kane & Will Counties Cmnty. Unit School District #308: | | | |
| Series 2008, 0% 2/1/25 (Assured Guaranty Muni. Corp. Insured) | | 315,000 | 294,395 |
| Series 2015, 4% 2/1/30 | | 800,000 | 811,464 |
| Metropolitan Pier & Exposition: | | | |
| (McCormick Place Expansion Proj.): | | | |
Series 2002 A, 0% 6/15/36 (Nat'l. Pub. Fin. Guarantee Corp. Insured) | | 2,280,000 | 1,210,791 |
Series 2010 B1: | | | |
0% 6/15/43 (Assured Guaranty Muni. Corp. Insured) | | 610,000 | 226,338 |
0% 6/15/47 (Assured Guaranty Muni. Corp. Insured) | | 155,000 | 46,078 |
| Series 1994 A, 0% 6/15/25 | | 25,000 | 22,882 |
| Series 1994, 0% 6/15/28 (Nat'l. Pub. Fin. Guarantee Corp. Insured) | | 1,200,000 | 972,103 |
| Series 2002 A: | | | |
0% 6/15/32 (Nat'l. Pub. Fin. Guarantee Corp. Insured) | | 30,000 | 20,115 |
0% 6/15/35 (Nat'l. Pub. Fin. Guarantee Corp. Insured) | | 240,000 | 135,128 |
| Series 2002, 0% 12/15/23 | | 205,000 | 197,984 |
| Series 2017 A, 5% 6/15/57 | | 875,000 | 842,979 |
| Series 2020 A: | | | |
4% 6/15/50 | | 1,170,000 | 958,727 |
5% 6/15/50 | | 1,730,000 | 1,685,200 |
| Series 2022 A: | | | |
0% 12/15/35 | | 420,000 | 226,879 |
0% 6/15/40 | | 1,725,000 | 710,927 |
4% 12/15/47 | | 5,000,000 | 4,165,478 |
| Northern Illinois Univ. Revs. Series 2020 B, 4% 4/1/40 (Build America Mutual Assurance Insured) | | 455,000 | 422,387 |
| Univ. of Illinois Board of Trustees Ctfs. of Prtn. (Univ. of Illinois Rev. Proj.) Series 2014 A, 5% 10/1/26 | | 15,000 | 15,444 |
| Univ. of Illinois Rev. Series 2018 A, 5% 4/1/30 | | 100,000 | 109,248 |
TOTAL ILLINOIS | | | 74,184,366 |
| Indiana - 0.8% | | | |
| Indiana Fin. Auth. Envir. Facilities Rev. Bonds (Indianapolis Pwr. & Lt. Co. Proj.): | | | |
| Series 2020 A, 0.75%, tender 4/1/26 (b) | | 50,000 | 43,374 |
| Series 2020 B, 0.95%, tender 4/1/26 (b)(c) | | 100,000 | 87,623 |
| Indiana Fin. Auth. Rev. Series 2016, 5% 9/1/30 | | 50,000 | 52,980 |
| Indiana Fin. Auth. Wastewtr. Util. Rev. Series 2021 2, 5% 10/1/41 | | 1,000,000 | 1,093,810 |
| Indiana Health Facility Fing. Auth. Rev. Bonds Series 2001 A2, 2%, tender 2/1/23 (b) | | 65,000 | 64,938 |
| Indiana Hsg. & Cmnty. Dev. Auth.: | | | |
| Series 2021 B: | | | |
3% 7/1/50 | | 115,000 | 111,705 |
5% 7/1/25 | | 690,000 | 723,121 |
| Series 2021 C1, 3% 1/1/52 | | 1,175,000 | 1,129,996 |
| Series A, 3.75% 1/1/49 | | 335,000 | 333,528 |
| Indianapolis Local Pub. Impt. (Indianapolis Arpt. Auth. Proj.) Series 2014 D: | | | |
| 5% 1/1/28 (c) | | 75,000 | 76,012 |
| 5% 1/1/30 (c) | | 85,000 | 86,046 |
| Saint Joseph County Econ. Dev. Auth. Rev. (St. Mary's College Proj.): | | | |
| Series 2019, 4% 4/1/46 | | 215,000 | 194,521 |
| Series 2020, 5% 4/1/30 | | 105,000 | 114,346 |
| Whiting Envir. Facilities Rev. Bonds (BP Products North America, Inc. Proj.) Series 2019 A, 5%, tender 6/5/26 (b)(c) | | 695,000 | 711,403 |
TOTAL INDIANA | | | 4,823,403 |
| Iowa - 0.6% | | | |
| Iowa Fin. Auth. Rev. Series A: | | | |
| 5% 5/15/43 | | 35,000 | 30,177 |
| 5% 5/15/48 | | 420,000 | 348,049 |
| Iowa Student Ln. Liquidity Corp. Student Ln. Rev. Series 2019 B, 5% 12/1/27 (c) | | 155,000 | 165,671 |
| Tobacco Settlement Auth. Tobacco Settlement Rev.: | | | |
| Series 2021 A2: | | | |
4% 6/1/40 | | 425,000 | 382,842 |
5% 6/1/27 | | 250,000 | 260,980 |
5% 6/1/28 | | 500,000 | 525,324 |
5% 6/1/29 | | 600,000 | 633,932 |
5% 6/1/30 | | 700,000 | 742,455 |
| Series 2021 B1, 4% 6/1/49 | | 305,000 | 299,905 |
TOTAL IOWA | | | 3,389,335 |
| Kentucky - 1.2% | | | |
| Ashland Med. Ctr. Rev. Series 2019: | | | |
| 3% 2/1/40 (Assured Guaranty Muni. Corp. Insured) | | 370,000 | 291,907 |
| 4% 2/1/37 | | 175,000 | 161,148 |
| 5% 2/1/25 | | 280,000 | 287,441 |
| Carroll County Poll. Ctlr Rev. Bonds (Kentucky Utils. Co. Proj.) Series 2016 A, 1.55%, tender 9/1/26 (b) | | 1,000,000 | 909,654 |
| Kentucky Econ. Dev. Fin. Auth. Series 2019 A2, 5% 8/1/30 | | 345,000 | 367,904 |
| Kentucky State Property & Buildings Commission Rev.: | | | |
| (Proj. No. 118) Series 2018, 5% 4/1/25 | | 175,000 | 182,623 |
| (Proj. No. 119) Series 2018: | | | |
5% 5/1/26 | | 80,000 | 85,149 |
5% 5/1/29 | | 85,000 | 93,400 |
5% 5/1/32 | | 20,000 | 21,880 |
5% 5/1/33 | | 15,000 | 16,400 |
5% 5/1/34 | | 20,000 | 21,729 |
5% 5/1/35 | | 10,000 | 10,755 |
5% 5/1/36 | | 10,000 | 10,681 |
5% 5/1/38 | | 1,000,000 | 1,053,411 |
| Series A: | | | |
4% 11/1/35 | | 600,000 | 611,360 |
5% 11/1/29 | | 150,000 | 166,066 |
| Kentucky, Inc. Pub. Energy Bonds Series A, 4%, tender 6/1/26 (b) | | 1,505,000 | 1,489,796 |
| Louisville & Jefferson County: | | | |
| Bonds: | | | |
Series 2020 C, 5%, tender 10/1/26 (b) | | 70,000 | 73,487 |
Series 2020 D, 5%, tender 10/1/29 (b) | | 85,000 | 92,211 |
| Series 2016 A, 5% 10/1/32 | | 70,000 | 72,981 |
| Series 2020 A: | | | |
3% 10/1/43 | | 1,160,000 | 892,643 |
4% 10/1/40 | | 195,000 | 184,318 |
| Louisville Reg'l. Arpt. Auth. Sys. Rev. Series 2014 A, 5% 7/1/24 (c) | | 65,000 | 66,609 |
TOTAL KENTUCKY | | | 7,163,553 |
| Louisiana - 0.4% | | | |
| Louisiana Pub. Facilities Auth. Rev.: | | | |
| (Ochsner Clinic Foundation Proj.): | | | |
Series 2015, 5% 5/15/47 | | 195,000 | 197,265 |
Series 2017, 5% 5/15/27 | | 115,000 | 122,599 |
| (Tulane Univ. of Louisiana Proj.): | | | |
Series 2016 A, 5% 12/15/28 | | 15,000 | 16,013 |
Series 2017 A, 5% 12/15/32 | | 165,000 | 176,727 |
| Series 2018 E, 5% 7/1/38 | | 100,000 | 104,689 |
| New Orleans Aviation Board Rev. (North Term. Proj.) Series 2017 B, 5% 1/1/48 (c) | | 2,000,000 | 1,974,056 |
TOTAL LOUISIANA | | | 2,591,349 |
| Maine - 0.2% | | | |
| Maine Health & Higher Edl. Facilities Auth. Rev.: | | | |
| (Eastern Maine Healthcare Systems Proj.) Series 2013, 5% 7/1/43 (Pre-Refunded to 7/1/23 @ 100) | | 220,000 | 221,912 |
| Series 2013, 5% 7/1/25 (Pre-Refunded to 7/1/23 @ 100) | | 40,000 | 40,348 |
| Series 2014, 5% 7/1/30 (Pre-Refunded to 7/1/24 @ 100) | | 585,000 | 602,842 |
| Series 2016 A: | | | |
4% 7/1/41 | | 85,000 | 75,869 |
4% 7/1/46 | | 85,000 | 73,305 |
5% 7/1/41 | | 25,000 | 25,086 |
5% 7/1/46 | | 155,000 | 153,734 |
| Series 2017 B, 5% 7/1/29 | | 10,000 | 10,696 |
TOTAL MAINE | | | 1,203,792 |
| Maryland - 1.7% | | | |
| Hsg. Opportunities Commission of Montgomery County Series 2021 C, 0.8% 7/1/25 | | 100,000 | 93,528 |
| Maryland Cmnty. Dev. Admin Dept. Hsg. & Cmnty. Dev.: | | | |
| Series 2019 B, 4% 9/1/49 | | 55,000 | 55,093 |
| Series 2019 C, 5% 9/1/28 | | 115,000 | 126,476 |
| Series 2021 C: | | | |
0.375% 7/1/23 | | 100,000 | 98,574 |
0.6% 7/1/24 | | 600,000 | 576,136 |
| Maryland Econ. Dev. Corp. Air Cargo Series 2019: | | | |
| 5% 7/1/23 (c) | | 325,000 | 325,789 |
| 5% 7/1/25 (c) | | 510,000 | 519,719 |
| 5% 7/1/26 (c) | | 230,000 | 235,894 |
| Maryland Gen. Oblig. Series 2022 2C, 4% 3/1/28 | | 1,000,000 | 1,066,992 |
| Maryland Health & Higher Edl. Series 2021 A: | | | |
| 2.5% 7/1/51 | | 1,210,000 | 744,154 |
| 3% 7/1/51 | | 915,000 | 639,996 |
| 4% 6/1/55 | | 190,000 | 156,395 |
| 5% 6/1/29 | | 120,000 | 127,913 |
| Maryland Stadium Auth. Built to Learn Rev. Series 2021, 4% 6/1/46 | | 180,000 | 166,099 |
| Maryland Trans. Auth. Trans. Facility Projs. Rev. Series 2020, 5% 7/1/40 | | 2,000,000 | 2,187,149 |
| Prince Georges County Ctfs. of Prtn. Series 2021: | | | |
| 5% 10/1/25 | | 1,610,000 | 1,706,360 |
| 5% 10/1/26 | | 1,650,000 | 1,783,853 |
TOTAL MARYLAND | | | 10,610,120 |
| Massachusetts - 4.0% | | | |
| Massachusetts Bay Trans. Auth. Sales Tax Rev. Series 2021 A1, 5% 7/1/35 | | 820,000 | 936,649 |
| Massachusetts Commonwealth Trans. Fund Rev.: | | | |
| (Rail Enhancement Prog.) Series 2021 B: | | | |
5% 6/1/26 | | 350,000 | 377,190 |
5% 6/1/27 | | 500,000 | 548,599 |
5% 6/1/41 | | 1,250,000 | 1,336,430 |
| Series 2021 A, 5% 6/1/51 | | 1,860,000 | 1,985,857 |
| Massachusetts Dept. of Trans. Metropolitan Hwy. Sys. Rev. Bonds Series 2019 A, 5%, tender 1/1/23 (b) | | 300,000 | 300,000 |
| Massachusetts Dev. Fin. Agcy. Rev.: | | | |
| (Lawrence Gen. Hosp.) Series 2014 A, 5.25% 7/1/34 | | 40,000 | 36,971 |
| Series 2016 A, 5% 1/1/31 | | 40,000 | 41,538 |
| Series 2016 I: | | | |
5% 7/1/30 | | 195,000 | 203,254 |
5% 7/1/41 | | 140,000 | 141,599 |
| Series 2017 A: | | | |
5% 1/1/36 | | 325,000 | 333,093 |
5% 1/1/37 | | 1,050,000 | 1,069,880 |
| Series 2017, 5% 7/1/36 | | 275,000 | 282,385 |
| Series 2018, 5% 1/1/43 | | 180,000 | 180,804 |
| Series 2019 K: | | | |
5% 7/1/25 | | 125,000 | 130,388 |
5% 7/1/26 | | 165,000 | 174,441 |
5% 7/1/27 | | 195,000 | 208,571 |
| Series 2019: | | | |
5% 7/1/27 | | 440,000 | 464,229 |
5% 9/1/59 | | 510,000 | 522,018 |
| Series 2020 A, 4% 7/1/45 | | 480,000 | 404,743 |
| Series 2021 V, 5% 7/1/55 | | 1,245,000 | 1,407,659 |
| Series 2021: | | | |
4% 7/1/26 | | 240,000 | 233,819 |
4% 7/1/27 | | 255,000 | 246,045 |
4% 7/1/28 | | 325,000 | 310,460 |
4% 7/1/29 | | 340,000 | 321,348 |
4% 7/1/30 | | 355,000 | 331,776 |
4% 7/1/31 | | 370,000 | 341,748 |
| Series M: | | | |
4% 10/1/50 | | 490,000 | 404,678 |
5% 10/1/45 | | 370,000 | 370,223 |
| Massachusetts Edl. Fing. Auth. Rev. Series 2016, 5% 7/1/24 (c) | | 210,000 | 214,674 |
| Massachusetts Gen. Oblig.: | | | |
| Series 2019 A, 5% 1/1/49 | | 2,000,000 | 2,109,245 |
| Series 2019 C, 5% 5/1/49 | | 345,000 | 364,751 |
| Series 2022 C, 5.25% 10/1/47 | | 2,000,000 | 2,221,398 |
| Series E, 5% 11/1/50 | | 1,640,000 | 1,753,611 |
| Massachusetts Hsg. Fin. Auth. Series 2021 223, 3% 6/1/47 | | 700,000 | 678,424 |
| Massachusetts Port Auth. Rev.: | | | |
| Series 2019 A, 5% 7/1/40 (c) | | 500,000 | 518,906 |
| Series 2021 E: | | | |
5% 7/1/41 (c) | | 1,000,000 | 1,042,730 |
5% 7/1/46 (c) | | 290,000 | 298,904 |
5% 7/1/51 (c) | | 1,000,000 | 1,024,498 |
| Massachusetts Port Auth. Spl. Facilities Rev. (Bosfuel Proj.) Series 2019 A, 5% 7/1/49 (c) | | 230,000 | 232,453 |
TOTAL MASSACHUSETTS | | | 24,105,989 |
| Michigan - 1.4% | | | |
| Detroit Downtown Dev. Auth. Tax Series A, 5% 7/1/37 (Assured Guaranty Muni. Corp. Insured) | | 40,000 | 40,541 |
| Flint Hosp. Bldg. Auth. Rev. Series 2020: | | | |
| 4% 7/1/41 | | 140,000 | 116,259 |
| 5% 7/1/25 | | 60,000 | 61,644 |
| 5% 7/1/27 | | 265,000 | 277,913 |
| Grand Rapids Pub. Schools Series 2019, 5% 11/1/26 (Assured Guaranty Muni. Corp. Insured) | | 180,000 | 193,213 |
| Grand Traverse County Hosp. Fin. Auth. Series 2021, 3% 7/1/51 | | 395,000 | 277,816 |
| Great Lakes Wtr. Auth. Sew Disp. Sys. Series 2018 A, 5% 7/1/48 | | 200,000 | 206,661 |
| Great Lakes Wtr. Auth. Wtr. Supply Sys. Rev. Series 2016 D, 5% 7/1/27 | | 100,000 | 106,859 |
| Kalamazoo Hosp. Fin. Auth. Hosp. Facilities Rev. Series 2016, 4% 5/15/36 | | 185,000 | 179,650 |
| Michigan Fin. Auth. Rev.: | | | |
| (Charter County of Wayne Criminal Justice Ctr. Proj.) Series 2018, 5% 11/1/43 | | 50,000 | 52,498 |
| (Henry Ford Health Sys. Proj.) Series 2016, 5% 11/15/25 | | 570,000 | 599,454 |
| Series 2016, 5% 11/15/26 | | 160,000 | 170,892 |
| Series 2019 A: | | | |
3% 12/1/49 | | 555,000 | 401,083 |
5% 11/15/48 | | 55,000 | 55,783 |
| Series 2020 A, 4% 6/1/49 | | 135,000 | 111,872 |
| Series 2020, 5% 6/1/40 | | 1,105,000 | 1,117,902 |
| Series 2021: | | | |
4% 9/1/31 | | 665,000 | 687,332 |
5% 9/1/32 | | 690,000 | 762,125 |
5% 9/1/33 | | 650,000 | 715,485 |
5% 9/1/36 | | 505,000 | 546,314 |
| Michigan Hosp. Fin. Auth. Rev. Series 2008 C, 5% 12/1/32 | | 10,000 | 10,928 |
| Michigan Strategic Fund Ltd. Oblig. Rev. Bonds (Consumer Energy Co. Proj.) Series 2019, 1.8%, tender 10/1/24 (b)(c) | | 175,000 | 169,110 |
| Univ. of Michigan Rev. Series 2020 A, 5% 4/1/50 | | 1,000,000 | 1,087,768 |
| Wayne County Arpt. Auth. Rev.: | | | |
| Series 2017 A, 5% 12/1/29 | | 45,000 | 49,351 |
| Series 2017 B, 5% 12/1/42 (c) | | 150,000 | 153,192 |
| Series 2018 D, 5% 12/1/29 (c) | | 85,000 | 90,752 |
TOTAL MICHIGAN | | | 8,242,397 |
| Minnesota - 0.7% | | | |
| Duluth Econ. Dev. Auth. Health Care Facilities Rev. Series 2018 A: | | | |
| 5% 2/15/48 | | 220,000 | 213,788 |
| 5% 2/15/58 | | 270,000 | 263,686 |
| Maple Grove Health Care Sys. Rev. Series 2015, 5% 9/1/26 | | 60,000 | 62,288 |
| Minneapolis & Saint Paul Metropolitan Arpts. Commission Arpt. Rev. Series 2022 B: | | | |
| 5% 1/1/34 (c) | | 210,000 | 228,030 |
| 5% 1/1/37 (c) | | 520,000 | 550,032 |
| Minnesota Higher Ed. Facilities Auth. Rev. Series 2018 A: | | | |
| 5% 10/1/30 | | 500,000 | 535,242 |
| 5% 10/1/45 | | 30,000 | 30,583 |
| Minnesota Hsg. Fin. Agcy. Series B, 4% 8/1/39 | | 2,050,000 | 2,045,989 |
| Shakopee Sr. Hsg. Rev. Bonds Series 2018, 5.85%, tender 11/1/25 (b)(d) | | 255,000 | 250,565 |
TOTAL MINNESOTA | | | 4,180,203 |
| Mississippi - 0.6% | | | |
| Mississippi Bus. finance Corp. Exempt Facilities Rev. Bonds (Enviva, Inc. Proj.) Series 2022, 7.75%, tender 7/15/32 (b)(c) | | 2,200,000 | 2,212,574 |
| Mississippi Home Corp. Series 2021 B: | | | |
| 3% 6/1/51 | | 320,000 | 310,187 |
| 5% 6/1/25 | | 750,000 | 785,603 |
| Mississippi Hosp. Equip. & Facilities Auth.: | | | |
| Bonds Series II, 5%, tender 3/1/27 (b) | | 80,000 | 83,703 |
| Series I, 5% 10/1/24 | | 70,000 | 72,037 |
TOTAL MISSISSIPPI | | | 3,464,104 |
| Missouri - 0.9% | | | |
| Cape Girardeau County Indl. Dev. Auth.: | | | |
| (Southeast Hosp. Proj.) Series 2017 A, 5% 3/1/36 | | 105,000 | 107,362 |
| Series 2021, 4% 3/1/41 | | 250,000 | 216,680 |
| Kansas City Wtr. Rev. Series 2020 A, 4% 12/1/44 | | 1,200,000 | 1,164,573 |
| Missouri Health & Edl. Facilities Rev.: | | | |
| Series 2017 A, 5% 10/1/42 | | 475,000 | 499,754 |
| Series 2018 A, 5% 11/15/43 | | 1,000,000 | 1,027,954 |
| Missouri Hsg. Dev. Commission Single Family Mtg. Rev.: | | | |
| Series 2019, 4% 5/1/50 | | 20,000 | 20,049 |
| Series 2021 A, 3% 5/1/52 | | 520,000 | 503,915 |
| Saint Louis Arpt. Rev. Series A, 5.25% 7/1/26 (Assured Guaranty Muni. Corp. Insured) | | 570,000 | 612,349 |
| Saint Louis County Indl. Dev. Auth. Sr. Living Facilities Rev. Series 2018 A: | | | |
| 5.125% 9/1/48 | | 25,000 | 21,285 |
| 5.25% 9/1/53 | | 1,240,000 | 1,056,687 |
TOTAL MISSOURI | | | 5,230,608 |
| Montana - 0.1% | | | |
| Montana Board Hsg. Single Family: | | | |
| Series 2017 A, 4% 12/1/47 (c) | | 10,000 | 9,953 |
| Series 2019 B, 4% 6/1/50 | | 10,000 | 10,032 |
| Montana Facility Fin. Auth. Series 2021 A, 3% 6/1/50 | | 575,000 | 395,971 |
| Montana Facility Fin. Auth. Rev. (Benefis Health Sys. Proj.) Series 2016, 5% 2/15/32 | | 30,000 | 31,319 |
TOTAL MONTANA | | | 447,275 |
| Nebraska - 1.0% | | | |
| Central Plains Energy Proj. Gas Supply Bonds Series 2019, 4%, tender 8/1/25 (b) | | 725,000 | 723,109 |
| Douglas County Neb Edl. Facilities Rev. (Creighton Univ. Projs.) Series 2021 A, 3% 7/1/51 | | 260,000 | 177,582 |
| Nebraska Invt. Fin. Auth. Single Family Hsg. Rev.: | | | |
| Series 2019 B, 4% 9/1/49 (c) | | 50,000 | 49,742 |
| Series 2019 E, 3.75% 9/1/49 (c) | | 70,000 | 69,348 |
| Series 2022 B: | | | |
5% 3/1/25 (c) | | 1,090,000 | 1,125,701 |
5% 9/1/25 (c) | | 1,105,000 | 1,150,260 |
5% 3/1/26 (c) | | 1,100,000 | 1,153,880 |
5% 9/1/26 (c) | | 1,140,000 | 1,204,044 |
5% 3/1/30 (c) | | 400,000 | 438,353 |
TOTAL NEBRASKA | | | 6,092,019 |
| Nevada - 0.5% | | | |
| Clark County Arpt. Rev. Series 2014 A2, 5% 7/1/30 | | 115,000 | 118,574 |
| Clark County School District Series 2017 A, 5% 6/15/25 | | 400,000 | 421,255 |
| Nevada Hsg. Division Single Family Mtg. Rev.: | | | |
| Series 2019 A, 4% 4/1/49 | | 340,000 | 340,649 |
| Series 2019 B, 4% 10/1/49 | | 35,000 | 35,069 |
| Series 2021 B, 3% 10/1/51 | | 2,085,000 | 2,003,793 |
| Tahoe-Douglas Visitors Auth. Series 2020, 5% 7/1/45 | | 195,000 | 191,912 |
TOTAL NEVADA | | | 3,111,252 |
| New Hampshire - 0.6% | | | |
| Nat'l. Fin. Auth. Hosp. Rev.: | | | |
| (St. Luke's Univ. Health Network Proj.) Series 2021 B, 5% 8/15/30 | | 1,405,000 | 1,580,986 |
| (St. Lukes Univ. Health Network Proj.) Series 2021 B, 3% 8/15/51 (Assured Guaranty Muni. Corp. Insured) | | 490,000 | 346,034 |
| Nat'l. Finnance Auth. Series 2020 1, 4.125% 1/20/34 | | 225,104 | 218,265 |
| New Hampshire Health & Ed. Facilities Auth. (Dartmouth-Hitchcock Oblgtd Grp Proj.) Series 2018 A: | | | |
| 5% 8/1/23 | | 200,000 | 201,847 |
| 5% 8/1/26 | | 105,000 | 111,139 |
| 5% 8/1/37 | | 100,000 | 105,624 |
| New Hampshire Nat'l. Fin. Auth. Series 2022 2, 4% 10/20/36 | | 1,495,494 | 1,392,304 |
TOTAL NEW HAMPSHIRE | | | 3,956,199 |
| New Jersey - 5.1% | | | |
| New Jersey Econ. Dev. Auth.: | | | |
| Series 2013, 5% 3/1/27 | | 10,000 | 10,027 |
| Series A, 5% 11/1/40 | | 360,000 | 371,188 |
| Series QQQ: | | | |
4% 6/15/46 | | 610,000 | 528,682 |
5% 6/15/27 | | 35,000 | 37,443 |
5% 6/15/28 | | 40,000 | 43,211 |
| New Jersey Econ. Dev. Auth. Lease Rev. Series 2018 A, 5% 6/15/23 | | 1,000,000 | 1,007,142 |
| New Jersey Econ. Dev. Auth. Rev.: | | | |
| (Black Horse EHT Urban Renewal LLC Proj.) Series 2019 A, 5% 10/1/39 (d) | | 100,000 | 74,821 |
| (NJ Transit Corp. Projs.) Series A, 4% 11/1/27 | | 370,000 | 380,262 |
| Series 2013 NN, 5% 3/1/29 (Pre-Refunded to 3/1/23 @ 100) | | 1,000,000 | 1,002,896 |
| Series 2013: | | | |
5% 3/1/23 | | 25,000 | 25,060 |
5% 3/1/24 | | 70,000 | 70,187 |
| Series 2014 PP: | | | |
4% 6/15/30 (Pre-Refunded to 6/15/24 @ 100) | | 70,000 | 71,223 |
5% 6/15/26 | | 280,000 | 287,096 |
| Series 2014 RR, 5% 6/15/32 (Pre-Refunded to 6/15/24 @ 100) | | 60,000 | 61,893 |
| Series 2014 UU, 5% 6/15/30 (Pre-Refunded to 6/15/24 @ 100) | | 70,000 | 72,158 |
| Series 2015 XX, 4.25% 6/15/26 | | 280,000 | 286,314 |
| Series 2018 EEE: | | | |
5% 6/15/28 | | 410,000 | 442,911 |
5% 6/15/43 | | 1,270,000 | 1,294,286 |
| Series LLL: | | | |
4% 6/15/44 | | 315,000 | 277,221 |
5% 6/15/44 | | 180,000 | 183,513 |
| Series MMM, 4% 6/15/35 | | 90,000 | 88,882 |
| Series PP, 5% 6/15/31 (Pre-Refunded to 6/15/24 @ 100) | | 260,000 | 268,204 |
| New Jersey Edl. Facility Series 2016 B, 4% 9/1/26 | | 500,000 | 512,227 |
| New Jersey Gen. Oblig.: | | | |
| Series 2020 A, 5% 6/1/29 | | 205,000 | 231,679 |
| Series 2021, 2% 6/1/23 | | 5,000,000 | 4,968,334 |
| New Jersey Health Care Facilities Fing. Auth. Rev. Series 2016: | | | |
| 4% 7/1/48 | | 100,000 | 83,665 |
| 5% 7/1/41 | | 65,000 | 65,285 |
| New Jersey Higher Ed. Student Assistance Auth. Student Ln. Rev.: | | | |
| Series 2017 1A, 5% 12/1/26 (c) | | 530,000 | 561,461 |
| Series 2018 B: | | | |
5% 12/1/25 (c) | | 500,000 | 522,581 |
5% 12/1/26 (c) | | 485,000 | 513,607 |
5% 12/1/27 (c) | | 850,000 | 910,500 |
| Series 2020: | | | |
5% 12/1/24 (c) | | 100,000 | 102,768 |
5% 12/1/25 (c) | | 235,000 | 244,620 |
5% 12/1/25 (c) | | 60,000 | 62,406 |
5% 12/1/26 (c) | | 205,000 | 216,093 |
5% 12/1/27 (c) | | 145,000 | 154,645 |
5% 12/1/27 (c) | | 40,000 | 42,661 |
| New Jersey Tobacco Settlement Fing. Corp. Series 2018 A, 5.25% 6/1/46 | | 1,915,000 | 1,921,157 |
| New Jersey Tpk. Auth. Tpk. Rev.: | | | |
| Series 2015 E, 5% 1/1/34 | | 190,000 | 197,253 |
| Series D, 5% 1/1/28 | | 170,000 | 182,742 |
| New Jersey Trans. Trust Fund Auth.: | | | |
| (Trans. Prog.) Series 2019 AA, 5.25% 6/15/43 | | 505,000 | 524,612 |
| Series 2010 A, 0% 12/15/27 | | 250,000 | 207,800 |
| Series 2014 AA, 5% 6/15/25 | | 100,000 | 102,510 |
| Series 2016 A, 5% 6/15/27 | | 160,000 | 169,010 |
| Series 2018 A, 5% 12/15/32 | | 100,000 | 107,403 |
| Series 2019 BB, 4% 6/15/50 | | 370,000 | 311,192 |
| Series 2021 A: | | | |
4% 6/15/34 | | 140,000 | 140,452 |
5% 6/15/32 | | 295,000 | 325,154 |
5% 6/15/33 | | 1,000,000 | 1,094,187 |
| Series 2022 A, 4% 6/15/39 | | 720,000 | 665,877 |
| Series 2022 AA: | | | |
5% 6/15/33 | | 250,000 | 275,883 |
5% 6/15/36 | | 1,460,000 | 1,567,668 |
| Series 2022 BB: | | | |
4% 6/15/46 | | 1,385,000 | 1,200,368 |
4% 6/15/50 | | 1,000,000 | 841,060 |
| Series AA: | | | |
4% 6/15/38 | | 185,000 | 173,129 |
4% 6/15/45 | | 1,535,000 | 1,340,448 |
4% 6/15/50 | | 1,980,000 | 1,665,299 |
5% 6/15/40 | | 210,000 | 217,433 |
| Series BB: | | | |
5% 6/15/33 | | 1,000,000 | 1,069,270 |
5% 6/15/50 | | 70,000 | 70,640 |
| Rutgers State Univ. Rev. Series Q, 5% 5/1/23 | | 30,000 | 30,190 |
| South Jersey Trans. Auth. Trans. Sys. Rev. Series 2022 A: | | | |
| 5% 11/1/36 | | 450,000 | 479,072 |
| 5% 11/1/40 | | 150,000 | 152,017 |
TOTAL NEW JERSEY | | | 31,108,978 |
| New Mexico - 0.4% | | | |
| New Mexico Edl. Assistance Foundation Series 2021 1A: | | | |
| 5% 9/1/23 (c) | | 450,000 | 454,143 |
| 5% 9/1/26 (c) | | 1,045,000 | 1,105,553 |
| 5% 9/1/27 (c) | | 350,000 | 374,539 |
| 5% 9/1/29 (c) | | 150,000 | 164,456 |
| New Mexico Mtg. Fin. Auth.: | | | |
| Series 2019 C, 4% 1/1/50 | | 150,000 | 150,298 |
| Series 2019 D, 3.75% 1/1/50 | | 45,000 | 44,805 |
| Santa Fe Retirement Fac. Series 2019 A: | | | |
| 5% 5/15/34 | | 10,000 | 9,380 |
| 5% 5/15/39 | | 5,000 | 4,435 |
| 5% 5/15/44 | | 5,000 | 4,216 |
| 5% 5/15/49 | | 15,000 | 12,259 |
TOTAL NEW MEXICO | | | 2,324,084 |
| New York - 6.7% | | | |
| Buffalo and Erie County Indl. Land Rev. (Catholic Health Sys., Inc. Proj.) Series 2015, 5% 7/1/25 | | 400,000 | 376,195 |
| Long Island Pwr. Auth. Elec. Sys. Rev. Bonds Series 2021 B, 1.5%, tender 9/1/26 (b) | | 500,000 | 464,561 |
| Monroe County Indl. Dev. Corp. (Univ. of Rochester Proj.) Series 2015 B, 4% 7/1/35 | | 5,000 | 5,037 |
| MTA Hudson Rail Yards Trust Oblig. Series 2016 A, 5% 11/15/56 | | 100,000 | 99,119 |
| New York City Edl. Construction Fund Series 2021 B: | | | |
| 5% 4/1/46 | | 675,000 | 714,188 |
| 5% 4/1/52 | | 520,000 | 546,688 |
| New York City Gen. Oblig.: | | | |
| Series 2018 A, 5% 8/1/24 | | 100,000 | 103,502 |
| Series E, 5% 8/1/30 | | 1,025,000 | 1,099,249 |
| New York City Hsg. Dev. Corp. Multifamily Hsg.: | | | |
| Bonds: | | | |
Series 2021 C2, 0.7%, tender 7/1/25 (b) | | 270,000 | 250,058 |
Series 2021 K2, 0.9%, tender 1/1/26 (b) | | 2,075,000 | 1,896,403 |
Series 2021, 0.6%, tender 7/1/25 (b) | | 390,000 | 360,189 |
| Series A 1 B, 5% 5/1/30 | | 490,000 | 541,248 |
| New York City Muni. Wtr. Fin. Auth. Series GG 1, 5% 6/15/48 | | 1,350,000 | 1,427,951 |
| New York City Trust Cultural Resources Rev. Series 2021, 5% 7/1/31 | | 660,000 | 776,746 |
| New York Dorm. Auth. Rev.: | | | |
| Bonds Series 2019 B2, 5%, tender 5/1/24 (b) | | 100,000 | 101,362 |
| Series 2020 A: | | | |
4% 9/1/37 | | 350,000 | 308,934 |
4% 9/1/39 | | 700,000 | 608,479 |
| Series 2022 A: | | | |
5% 7/15/37 | | 110,000 | 113,180 |
5% 7/15/42 | | 310,000 | 315,146 |
| New York Metropolitan Trans. Auth. Rev.: | | | |
| Series 2015 A1, 5% 11/15/29 | | 120,000 | 122,012 |
| Series 2016 A, 5% 11/15/31 | | 100,000 | 102,536 |
| Series 2016 C1, 5% 11/15/33 | | 1,000,000 | 1,024,435 |
| Series 2017 B, 5% 11/15/24 | | 565,000 | 579,858 |
| Series 2017 C1, 5% 11/15/30 | | 325,000 | 336,451 |
| Series 2017 D: | | | |
5% 11/15/25 | | 1,635,000 | 1,695,007 |
5% 11/15/30 | | 2,220,000 | 2,298,221 |
| Series 2020 D: | | | |
4% 11/15/46 | | 2,050,000 | 1,714,440 |
4% 11/15/47 | | 150,000 | 124,544 |
| New York State Dorm. Auth.: | | | |
| Series 2019 D, 3% 2/15/49 | | 1,065,000 | 807,881 |
| Series 2021 A, 4% 3/15/38 | | 1,000,000 | 981,064 |
| Series 2021 E: | | | |
3% 3/15/50 | | 1,060,000 | 797,863 |
4% 3/15/39 | | 1,000,000 | 974,775 |
| New York State Envir. Facilities Corp. Rev. (2010 Master Fing. Prog.) Series 2021 B: | | | |
| 5% 2/15/28 | | 160,000 | 179,062 |
| 5% 8/15/28 | | 235,000 | 265,527 |
| 5% 2/15/29 | | 100,000 | 113,926 |
| 5% 8/15/29 | | 200,000 | 229,895 |
| 5% 2/15/30 | | 340,000 | 393,763 |
| 5% 8/15/30 | | 400,000 | 467,200 |
| New York State Hsg. Fin. Agcy. Rev.: | | | |
| Bonds: | | | |
Series 2021 J2, 1.1%, tender 5/1/27 (b) | | 1,105,000 | 984,643 |
Series 2021 K2, 1%, tender 11/1/26 (b) | | 300,000 | 271,302 |
| Series J, 0.75% 5/1/25 | | 250,000 | 234,515 |
| New York State Mtg. Agcy. Homeowner Mtg.: | | | |
| Series 2021 232, 5% 10/1/25 (c) | | 765,000 | 795,355 |
| Series 2021 239, 3.25% 10/1/51 | | 1,025,000 | 997,746 |
| Series 221, 3.5% 10/1/32 (c) | | 20,000 | 19,583 |
| New York State Urban Dev. Corp.: | | | |
| Series 2020 C, 4% 3/15/39 | | 1,000,000 | 974,775 |
| Series 2020 E: | | | |
4% 3/15/44 | | 1,675,000 | 1,572,741 |
4% 3/15/45 | | 1,350,000 | 1,261,311 |
| New York State Urban Eev Corp. Series 2019 A, 5% 3/15/37 | | 1,105,000 | 1,204,422 |
| New York Trans. Dev. Corp. (Term. 4 John F. Kennedy Int'l. Arpt. Proj.) Series 2022: | | | |
| 5% 12/1/32 (c) | | 380,000 | 406,519 |
| 5% 12/1/33 (c) | | 590,000 | 627,615 |
| 5% 12/1/34 (c) | | 645,000 | 677,473 |
| 5% 12/1/35 (c) | | 325,000 | 338,413 |
| 5% 12/1/36 (c) | | 220,000 | 227,523 |
| 5% 12/1/37 (c) | | 590,000 | 607,102 |
| 5% 12/1/38 (c) | | 1,430,000 | 1,466,001 |
| 5% 12/1/39 (c) | | 1,090,000 | 1,111,631 |
| 5% 12/1/40 (c) | | 925,000 | 938,273 |
| 5% 12/1/41 (c) | | 840,000 | 847,699 |
| 5% 12/1/42 (c) | | 420,000 | 422,890 |
| Niagara Area Dev. Corp. Rev. (Catholic Health Sys., Inc. Proj.) Series 2022, 4.5% 7/1/52 | | 555,000 | 370,231 |
| Oneida County Local Dev. Corp. Rev. (Mohawk Valley Health Sys. Proj.) Series 2019 A, 5% 12/1/29 (Assured Guaranty Muni. Corp. Insured) | | 600,000 | 610,640 |
| Onondaga Civic Dev. Corp. (Le Moyne College Proj.) Series 2015, 5% 7/1/27 | | 295,000 | 302,638 |
| Suffolk County Econ. Dev. Corp. Rev. Series 2021: | | | |
| 5.125% 11/1/41 (d) | | 100,000 | 78,177 |
| 5.375% 11/1/54 (d) | | 100,000 | 75,430 |
TOTAL NEW YORK | | | 40,741,343 |
| New York And New Jersey - 0.1% | | | |
| Port Auth. of New York & New Jersey: | | | |
| Series 194, 5.25% 10/15/55 | | 210,000 | 217,472 |
| Series 2017 202, 5% 10/15/29 (c) | | 500,000 | 531,140 |
TOTAL NEW YORK AND NEW JERSEY | | | 748,612 |
| North Carolina - 0.1% | | | |
| New Hanover County Hosp. Rev. Series 2017: | | | |
| 5% 10/1/27 (Escrowed to Maturity) | | 10,000 | 10,993 |
| 5% 10/1/47 (Pre-Refunded to 10/1/27 @ 100) | | 70,000 | 76,951 |
| North Carolina Med. Care Commission Health Care Facilities Rev.: | | | |
| Bonds Series 2019 C, 2.55%, tender 6/1/26 (b) | | 300,000 | 293,247 |
| Series 2020 A, 3% 7/1/45 | | 365,000 | 273,998 |
| Series 2021 A, 4% 3/1/51 | | 280,000 | 196,431 |
TOTAL NORTH CAROLINA | | | 851,620 |
| North Dakota - 0.2% | | | |
| North Dakota Hsg. Fin. Agcy.: | | | |
| Series 2021 A, 3% 1/1/52 | | 200,000 | 194,112 |
| Series 2021 B, 3% 7/1/52 | | 650,000 | 624,813 |
| Univ. of North Dakota Series 2021 A, 3% 6/1/61 (Assured Guaranty Muni. Corp. Insured) | | 790,000 | 524,859 |
TOTAL NORTH DAKOTA | | | 1,343,784 |
| Ohio - 5.3% | | | |
| Akron Bath Copley Hosp. District Rev.: | | | |
| Series 2016, 5.25% 11/15/46 | | 495,000 | 500,137 |
| Series 2020, 4% 11/15/38 | | 1,500,000 | 1,342,085 |
| Allen County Hosp. Facilities Rev. (Mercy Health) Series 2017 A: | | | |
| 5% 8/1/25 | | 10,000 | 10,502 |
| 5% 8/1/26 | | 390,000 | 416,470 |
| 5% 8/1/27 | | 10,000 | 10,840 |
| 5% 8/1/28 | | 10,000 | 10,952 |
| 5% 8/1/29 | | 10,000 | 10,949 |
| 5% 8/1/30 | | 10,000 | 10,936 |
| American Muni. Pwr., Inc. (Solar Electricity Prepayment Proj.) Series 2019 A, 5% 2/15/44 | | 175,000 | 181,637 |
| Buckeye Tobacco Settlement Fing. Auth.: | | | |
| Series 2020 A2: | | | |
3% 6/1/48 | | 550,000 | 387,122 |
4% 6/1/48 | | 180,000 | 154,027 |
5% 6/1/34 | | 370,000 | 390,351 |
| Series 2020 B2, 5% 6/1/55 | | 1,370,000 | 1,189,161 |
| Cleveland Arpt. Sys. Rev. Series 2016 A, 5% 1/1/25 (Assured Guaranty Muni. Corp. Insured) | | 145,000 | 150,643 |
| Cleveland Wtr. Rev. Series 2020, 5% 1/1/28 | | 800,000 | 886,862 |
| County of Cuyahoga (Ballpark Impt. Proj.) Series 2022 A, 4% 1/1/35 | | 8,000,000 | 8,289,271 |
| Fairfield County Hosp. Facilities Rev. (Fairfield Med. Ctr. Proj.) Series 2013, 4.25% 6/15/24 | | 110,000 | 110,028 |
| Franklin County Convention Facilities Auth. (Greater Columbus Convention Ctr. Hotel Expansion Proj.) Series 2019, 5% 12/1/44 | | 60,000 | 59,310 |
| Franklin County Convention Facilities Authorities (Greater Columbus Convention Ctr. Hotel Expansion Proj.) Series 2019: | | | |
| 5% 12/1/46 | | 200,000 | 214,458 |
| 5% 12/1/51 | | 200,000 | 213,360 |
| Kent State Univ. Revs. Series 2016, 5% 5/1/30 | | 1,495,000 | 1,588,784 |
| Lancaster Port Auth. Gas Rev.: | | | |
| Bonds Series 2019, 5%, tender 2/1/25 (b) | | 255,000 | 259,326 |
| Series 2019, 5% 2/1/25 | | 160,000 | 163,055 |
| Middleburg Heights Hosp. Rev. Series 2021 A, 4% 8/1/41 | | 430,000 | 398,844 |
| Muskingum County Hosp. Facilities (Genesis Healthcare Sys. Obligated Group Proj.) Series 2013, 4% 2/15/23 | | 315,000 | 314,921 |
| Ohio Gen. Oblig.: | | | |
| Series 2021 A: | | | |
5% 3/1/28 | | 110,000 | 122,590 |
5% 3/1/28 | | 140,000 | 156,023 |
5% 3/1/29 | | 160,000 | 181,549 |
5% 3/1/29 | | 210,000 | 238,283 |
5% 3/1/30 | | 190,000 | 219,271 |
5% 3/1/30 | | 290,000 | 334,676 |
| Series 2021 B: | | | |
5% 2/1/28 | | 205,000 | 228,114 |
5% 2/1/29 | | 385,000 | 436,225 |
5% 2/1/30 | | 320,000 | 368,790 |
| Series 2021 C: | | | |
5% 3/15/28 | | 275,000 | 306,693 |
5% 3/15/29 | | 480,000 | 545,011 |
5% 3/15/30 | | 480,000 | 554,303 |
| Ohio Hosp. Facilities Rev. Series 2021 B: | | | |
| 5% 1/1/25 | | 270,000 | 281,252 |
| 5% 1/1/26 | | 320,000 | 340,445 |
| 5% 1/1/27 | | 750,000 | 812,907 |
| Ohio Hosp. Rev. Series 2020 A: | | | |
| 4% 1/15/50 | | 40,000 | 34,844 |
| 5% 1/15/31 | | 300,000 | 325,666 |
| Ohio Hsg. Fin. Agcy. Residential Mtg. Rev.: | | | |
| (Mtg. Backed Securities Prog.) Series 2019 B, 4.5% 3/1/50 | | 15,000 | 15,205 |
| Series 2021 C, 3.25% 3/1/51 | | 4,710,000 | 4,598,754 |
| Ohio Major New State Infrastructure Rev. Series 2021 1A: | | | |
| 5% 12/15/25 | | 800,000 | 853,578 |
| 5% 12/15/28 | | 1,250,000 | 1,405,817 |
| Ohio Spl. Oblig. Series 2020 A: | | | |
| 5% 2/1/23 | | 180,000 | 180,255 |
| 5% 2/1/26 | | 150,000 | 160,338 |
| Ohio Tpk. Commission Tpk. Rev.: | | | |
| (Infrastructure Projs.) Series 2022 A: | | | |
5% 2/15/32 | | 70,000 | 82,473 |
5% 2/15/38 | | 185,000 | 209,655 |
| Series A, 5% 2/15/51 | | 600,000 | 637,460 |
| Scioto County Hosp. Facilities Rev. Series 2019, 5% 2/15/29 | | 100,000 | 104,334 |
| Univ. of Akron Gen. Receipts Series 2019 A, 4% 1/1/27 | | 220,000 | 226,611 |
| Washington County Hosp. Rev. Series 2022: | | | |
| 6% 12/1/28 | | 215,000 | 218,231 |
| 6% 12/1/29 | | 230,000 | 234,101 |
| 6% 12/1/30 | | 245,000 | 249,473 |
| 6% 12/1/31 | | 260,000 | 264,185 |
TOTAL OHIO | | | 32,191,143 |
| Oklahoma - 0.1% | | | |
| Oklahoma City Arpt. Trust Series 33, 5% 7/1/47 (c) | | 200,000 | 202,641 |
| Oklahoma Dev. Fin. Auth. Health Sys. Rev. Series 2015 A, 5% 8/15/24 | | 250,000 | 256,596 |
| Oklahoma Dev. Fin. Auth. Rev. (Oklahoma City Univ. Proj.) Series 2019: | | | |
| 5% 8/1/23 | | 45,000 | 45,135 |
| 5% 8/1/44 | | 125,000 | 121,030 |
TOTAL OKLAHOMA | | | 625,402 |
| Oregon - 0.4% | | | |
| Oregon State Hsg. & Cmnty. Svcs. Dept. Series 2019 A, 4% 7/1/50 | | 1,090,000 | 1,091,357 |
| Port of Portland Arpt. Rev.: | | | |
| Series 2020 27A, 5% 7/1/45 (c) | | 650,000 | 663,454 |
| Series 27 A, 5% 7/1/36 (c) | | 240,000 | 252,617 |
| Salem Hosp. Facility Auth. Rev. (Salem Health Projs.) Series 2019 A, 3% 5/15/49 | | 850,000 | 605,594 |
TOTAL OREGON | | | 2,613,022 |
| Pennsylvania - 8.3% | | | |
| Allegheny County Arpt. Auth. Rev. Series 2021 A: | | | |
| 5% 1/1/51 (c) | | 2,105,000 | 2,126,053 |
| 5% 1/1/56 (c) | | 1,280,000 | 1,288,017 |
| Allegheny County Indl. Dev. Auth. Rev. Series 2021: | | | |
| 3.5% 12/1/31 | | 175,000 | 144,394 |
| 4% 12/1/41 | | 270,000 | 196,182 |
| 4.25% 12/1/50 | | 300,000 | 205,732 |
| Bucks County Indl. Dev. Auth. Hosp. Rev. Series 2021: | | | |
| 5% 7/1/26 | | 475,000 | 488,727 |
| 5% 7/1/27 | | 475,000 | 490,224 |
| 5% 7/1/28 | | 525,000 | 542,436 |
| 5% 7/1/29 | | 550,000 | 567,834 |
| 5% 7/1/36 | | 120,000 | 117,631 |
| 5% 7/1/38 | | 240,000 | 232,972 |
| Centre County Pennsylvania Hosp. Auth. Rev. (Mount Nittany Med. Ctr. Proj.) Series 2018 A, 5% 11/15/25 | | 100,000 | 105,702 |
| Chartiers Valley School District Series 2021 A, 3% 10/15/49 | | 1,155,000 | 853,850 |
| Commonwealth Fing. Auth. Rev. Series 2020 A, 5% 6/1/28 | | 305,000 | 336,455 |
| Delaware County Auth. Rev.: | | | |
| (Cabrini College) Series 2017, 5% 7/1/47 | | 510,000 | 469,218 |
| Series 2017, 5% 7/1/28 | | 445,000 | 448,302 |
| Doylestown Hosp. Auth. Hosp. Rev. Series 2016 A, 5% 7/1/46 | | 20,000 | 16,768 |
| Dubois Hosp. Auth. Hosp. Rev.: | | | |
| (Penn Highlands Healthcare Proj.) Series 2018: | | | |
4% 7/15/37 | | 40,000 | 38,707 |
5% 7/15/36 | | 500,000 | 518,686 |
| Series 2020, 4% 7/15/45 | | 500,000 | 439,341 |
| Geisinger Auth. Health Sys. Rev. Series 2017 A1, 5% 2/15/45 | | 100,000 | 101,894 |
| Lehigh County Gen. Purp. Auth. Rev. (Muhlenberg College Proj.) Series 2017, 5% 2/1/39 | | 60,000 | 61,001 |
| Lehigh County Gen. Purp. Hosp. Rev. Series 2016 A, 4% 7/1/35 | | 5,060,000 | 4,912,984 |
| Monroeville Fin. Auth. UPMC Rev. Series 2012, 5% 2/15/26 | | 95,000 | 100,603 |
| Montgomery County Higher Ed. & Health Auth. Rev.: | | | |
| Series 2016 A, 5% 10/1/40 | | 330,000 | 319,208 |
| Series 2019, 4% 9/1/44 | | 185,000 | 167,972 |
| Series 2020, 5% 4/1/27 | | 300,000 | 312,797 |
| Montgomery County Indl. Dev. Auth. Series 2015 A, 5.25% 1/15/36 (Pre-Refunded to 1/15/25 @ 100) | | 140,000 | 146,404 |
| Northampton County Gen. Purp. Auth. Hosp. Rev.: | | | |
| (St. Luke's Univ. Health Network Proj.) Series 2018 A, 4% 8/15/48 | | 195,000 | 178,091 |
| Series 2016 A, 5% 8/15/46 | | 50,000 | 50,227 |
| Pennsylvania Ctfs. Prtn. Series 2018 A: | | | |
| 5% 7/1/23 | | 250,000 | 252,271 |
| 5% 7/1/24 | | 300,000 | 308,662 |
| 5% 7/1/26 | | 455,000 | 488,028 |
| 5% 7/1/27 | | 500,000 | 543,717 |
| 5% 7/1/34 | | 450,000 | 490,955 |
| Pennsylvania Higher Edl. Facilities Auth. Rev. (Drexel Univ. Proj.): | | | |
| Series 2016, 5% 5/1/35 | | 500,000 | 519,268 |
| Series 2017, 5% 5/1/35 | | 10,000 | 10,495 |
| Pennsylvania Hsg. Fin. Agcy.: | | | |
| Series 2021 134B, 5% 10/1/27 (c) | | 1,160,000 | 1,232,178 |
| Series 2021 137, 3% 10/1/51 | | 895,000 | 853,114 |
| Series 2022 138: | | | |
3% 10/1/52 | | 1,400,000 | 1,331,601 |
5% 4/1/26 | | 1,100,000 | 1,165,622 |
5% 10/1/26 | | 600,000 | 640,949 |
5% 4/1/27 | | 500,000 | 537,306 |
5% 10/1/27 | | 450,000 | 486,155 |
5% 4/1/28 | | 465,000 | 501,269 |
5% 10/1/28 | | 475,000 | 515,216 |
5% 4/1/29 | | 480,000 | 522,336 |
5% 10/1/29 | | 1,000,000 | 1,094,244 |
5% 4/1/30 | | 1,010,000 | 1,111,192 |
5% 10/1/30 | | 695,000 | 768,703 |
| Pennsylvania Tpk. Commission Tpk. Rev.: | | | |
| Series 2015 B, 5% 12/1/45 | | 265,000 | 270,888 |
| Series 2016 A1, 5% 12/1/41 | | 1,215,000 | 1,241,917 |
| Series 2021 A, 4% 12/1/50 | | 1,000,000 | 892,793 |
| Series 2021 B: | | | |
5% 12/1/28 | | 625,000 | 690,577 |
5% 12/1/29 | | 1,000,000 | 1,115,785 |
| Philadelphia Arpt. Rev.: | | | |
| Series 2017 B: | | | |
5% 7/1/35 (c) | | 50,000 | 51,657 |
5% 7/1/47 (c) | | 970,000 | 957,298 |
| Series 2020 C, 5% 7/1/29 (c) | | 595,000 | 638,569 |
| Series 2021: | | | |
5% 7/1/26 (c) | | 2,920,000 | 3,060,516 |
5% 7/1/27 (c) | | 4,020,000 | 4,263,585 |
5% 7/1/28 (c) | | 425,000 | 454,316 |
5% 7/1/34 (c) | | 1,000,000 | 1,069,965 |
5% 7/1/35 (c) | | 1,000,000 | 1,061,552 |
| Philadelphia Auth. for Indl. Dev.: | | | |
| Series 2015 1, 5% 4/1/33 | | 70,000 | 72,264 |
| Series 2017 A, 5% 9/1/42 | | 760,000 | 773,907 |
| Philadelphia Gas Works Rev. Series 2020 A, 5% 8/1/32 (Assured Guaranty Muni. Corp. Insured) | | 1,000,000 | 1,122,986 |
| Philadelphia Gen. Oblig.: | | | |
| Series 2014 A, 5.25% 7/15/27 (Pre-Refunded to 1/15/24 @ 100) | | 275,000 | 281,712 |
| Series 2019 A, 5% 8/1/26 | | 220,000 | 236,712 |
| Philadelphia School District: | | | |
| Series 2018 A, 5% 9/1/25 | | 50,000 | 52,516 |
| Series 2018 B, 5% 9/1/43 | | 50,000 | 52,512 |
| Series 2019 A: | | | |
4% 9/1/35 | | 170,000 | 169,745 |
5% 9/1/23 | | 90,000 | 91,046 |
5% 9/1/34 | | 80,000 | 87,588 |
| Series 2019 B: | | | |
5% 9/1/25 | | 140,000 | 147,045 |
5% 9/1/26 | | 415,000 | 442,143 |
| Series 2019 C, 5% 9/1/33 | | 315,000 | 346,115 |
| Pittsburgh Wtr. & Swr. Auth. Wtr. & Swr. Sys. Rev. Series 2019 A, 5% 9/1/44 (Assured Guaranty Muni. Corp. Insured) | | 70,000 | 74,148 |
| Southcentral Pennsylvania Gen. Auth. Rev.: | | | |
| (Hanover Hosp., Inc. PA Proj.) Series 2015, 5% 12/1/28 | | 45,000 | 46,982 |
| Series 2019 A: | | | |
4% 6/1/44 | | 50,000 | 47,999 |
4% 6/1/49 | | 115,000 | 106,291 |
5% 6/1/25 | | 200,000 | 209,827 |
5% 6/1/44 | | 85,000 | 87,830 |
5% 6/1/49 | | 135,000 | 138,514 |
| State Pub. School Bldg. Auth. Lease Rev. (The School District of Philadelphia Proj.) Series 2016 A, 5% 6/1/32 (Assured Guaranty Muni. Corp. Insured) | | 315,000 | 332,045 |
| Union County Hosp. Auth. Rev. Series 2018 B, 5% 8/1/43 | | 185,000 | 188,646 |
TOTAL PENNSYLVANIA | | | 50,229,684 |
| Puerto Rico - 1.0% | | | |
| Puerto Rico Commonwealth Aqueduct & Swr. Auth.: | | | |
| Series 2021 B: | | | |
5% 7/1/33 (d) | | 250,000 | 241,486 |
5% 7/1/37 (d) | | 960,000 | 906,705 |
| Series 2022 A, 4% 7/1/42 (d) | | 960,000 | 769,417 |
| Puerto Rico Commonwealth Pub. Impt. Gen. Oblig. Series 2021 A1: | | | |
| 0% 7/1/33 | | 2,273,421 | 1,228,922 |
| 4% 7/1/33 | | 1,608,885 | 1,394,999 |
| 4% 7/1/35 | | 575,000 | 483,914 |
| 5.625% 7/1/27 | | 190,000 | 193,585 |
| 5.625% 7/1/29 | | 999,707 | 1,022,913 |
TOTAL PUERTO RICO | | | 6,241,941 |
| Rhode Island - 0.1% | | | |
| Rhode Island Health & Edl. Bldg. Corp. Higher Ed. Facilities Rev. Series 2016, 5% 5/15/39 | | 215,000 | 215,937 |
| Rhode Island Hsg. & Mtg. Fin. Corp. Series 2019 70, 4% 10/1/49 | | 35,000 | 35,055 |
| Rhode Island Student Ln. Auth. Student Ln. Rev. Series A: | | | |
| 4% 12/1/26 (c) | | 35,000 | 35,373 |
| 5% 12/1/23 (c) | | 625,000 | 632,946 |
TOTAL RHODE ISLAND | | | 919,311 |
| South Carolina - 0.9% | | | |
| Charleston County Arpt. District Series 2019, 5% 7/1/48 | | 395,000 | 407,304 |
| South Carolina Hsg. Fin. & Dev. Auth. Mtg. Rev. Series 2019 A, 4% 1/1/50 | | 55,000 | 55,158 |
| South Carolina Jobs-Econ. Dev. Auth. Series 2019 C, 5% 7/1/33 | | 170,000 | 182,306 |
| South Carolina Jobs-Econ. Dev. Auth. Econ. Dev. Rev. Series 2022 A, 4% 4/1/52 | | 1,000,000 | 887,373 |
| South Carolina Ports Auth. Ports Rev.: | | | |
| Series 2015, 5.25% 7/1/55 (Pre-Refunded to 7/1/25 @ 100) (c) | | 255,000 | 266,947 |
| Series 2018, 5% 7/1/43 (c) | | 520,000 | 533,339 |
| South Carolina Pub. Svc. Auth. Rev.: | | | |
| Series 2016 A: | | | |
5% 12/1/26 | | 140,000 | 147,907 |
5% 12/1/29 | | 500,000 | 525,967 |
5% 12/1/33 | | 15,000 | 15,616 |
5% 12/1/38 | | 80,000 | 81,301 |
| Series 2016 B: | | | |
5% 12/1/31 | | 105,000 | 111,036 |
5% 12/1/35 | | 195,000 | 201,420 |
5% 12/1/41 | | 175,000 | 177,898 |
| Series A, 5% 12/1/23 (Escrowed to Maturity) | | 145,000 | 147,652 |
| Series B, 5% 12/1/24 | | 500,000 | 517,114 |
| Spartanburg County Reg'l. Health Series 2017 A: | | | |
| 4% 4/15/43 | | 30,000 | 27,274 |
| 4% 4/15/48 | | 20,000 | 17,627 |
| 5% 4/15/48 | | 1,415,000 | 1,441,017 |
TOTAL SOUTH CAROLINA | | | 5,744,256 |
| South Dakota - 0.1% | | | |
| South Dakota Health & Edl. Facilities Auth. Rev. Series 2020 A, 3% 9/1/45 | | 475,000 | 353,985 |
| Tennessee - 1.4% | | | |
| Chattanooga Health Ed. & Hsg. Facility Board Rev. Series 2019 A1: | | | |
| 4% 8/1/44 | | 575,000 | 495,689 |
| 5% 8/1/25 | | 135,000 | 140,379 |
| Memphis-Shelby County Arpt. Auth. Arpt. Rev. Series 2018: | | | |
| 5% 7/1/26 (c) | | 450,000 | 470,450 |
| 5% 7/1/37 (c) | | 200,000 | 207,264 |
| 5% 7/1/38 (c) | | 1,315,000 | 1,360,310 |
| Metropolitan Nashville Arpt. Auth. Rev.: | | | |
| Series 2015 B, 4% 7/1/25 (c) | | 55,000 | 55,734 |
| Series 2019 B: | | | |
5% 7/1/38 (c) | | 655,000 | 682,862 |
5% 7/1/54 (c) | | 225,000 | 226,336 |
| Nashville and Davidson County Metropolitan Govt. Gen. Oblig. Series 2021 C, 5% 1/1/30 | | 2,400,000 | 2,747,275 |
| Nashville and Davidson County Metropolitan Govt. Health & Edl. Facilities Board Rev. (Lipscomb Univ. Proj.) Series 2019 A, 4% 10/1/49 | | 1,000,000 | 770,675 |
| Tennessee Energy Acquisition Corp. Bonds (Gas Rev. Proj.) Series A, 4%, tender 5/1/23 (b) | | 460,000 | 460,744 |
| Tennessee Hsg. Dev. Agcy. Residential: | | | |
| Series 2021 1, 3% 7/1/51 | | 600,000 | 583,254 |
| Series 2021 3A, 3% 1/1/52 | | 265,000 | 256,289 |
TOTAL TENNESSEE | | | 8,457,261 |
| Texas - 4.3% | | | |
| Austin Cmnty. College District Rev. (Highland Campus Parking Garage Proj.) Series 2018 C: | | | |
| 5% 8/1/25 | | 200,000 | 211,465 |
| 5% 8/1/26 | | 200,000 | 215,547 |
| Central Reg'l. Mobility Auth.: | | | |
| Series 2020 B, 5% 1/1/45 | | 1,000,000 | 1,031,562 |
| Series 2021 B: | | | |
5% 1/1/33 | | 640,000 | 701,875 |
5% 1/1/34 | | 650,000 | 708,906 |
5% 1/1/35 | | 550,000 | 595,207 |
5% 1/1/36 | | 850,000 | 913,171 |
5% 1/1/37 | | 1,100,000 | 1,172,177 |
5% 1/1/38 | | 1,100,000 | 1,166,956 |
| Series 2021 C, 5% 1/1/27 | | 775,000 | 813,681 |
| Dallas Fort Worth Int'l. Arpt. Rev. Series 2014 A, 5.25% 11/1/27 (c) | | 180,000 | 182,367 |
| Denton Independent School District Bonds Series 2014 B: | | | |
| 2%, tender 8/1/24 (b) | | 15,000 | 14,834 |
| 2%, tender 8/1/24 (b) | | 85,000 | 82,869 |
| Fort Bend Independent School District Bonds Series 2021 B, 0.72%, tender 8/1/26 (b) | | 410,000 | 364,556 |
| Garland Elec. Util. Sys. Rev. Series 2021 A: | | | |
| 4% 3/1/35 | | 765,000 | 781,412 |
| 4% 3/1/36 | | 750,000 | 755,485 |
| Harris County Cultural Ed. Facilities Fin. Corp. Rev. Series 2015, 4% 12/1/45 | | 220,000 | 203,794 |
| Harris County Flood Cont. District Series 2021 A: | | | |
| 5% 10/1/25 | | 690,000 | 733,555 |
| 5% 10/1/26 | | 900,000 | 976,352 |
| Houston Arpt. Sys. Rev.: | | | |
| Series 2018 A, 5% 7/1/41 (c) | | 1,000,000 | 1,024,983 |
| Series 2018 C: | | | |
5% 7/1/26 (c) | | 200,000 | 210,431 |
5% 7/1/30 (c) | | 120,000 | 127,525 |
| Series 2018 D, 5% 7/1/39 | | 260,000 | 274,067 |
| Houston City of Higher Ed. Fin. Corp. (Houston Baptist Univ. Proj.) Series 2021: | | | |
| 3.375% 10/1/37 | | 500,000 | 411,745 |
| 4% 10/1/51 | | 1,200,000 | 954,972 |
| Houston Gen. Oblig. Series 2017 A, 5% 3/1/32 | | 25,000 | 26,965 |
| Houston Util. Sys. Rev.: | | | |
| Series 2016 B, 5% 11/15/34 | | 5,000 | 5,318 |
| Series 2020 C, 5% 11/15/45 | | 1,000,000 | 1,068,991 |
| Series 2021 A, 5% 11/15/26 | | 445,000 | 482,551 |
| Love Field Arpt. Modernization Rev.: | | | |
| Series 2015, 5% 11/1/30 (c) | | 320,000 | 330,798 |
| Series 2017, 5% 11/1/31 (c) | | 25,000 | 26,092 |
| Lower Colorado River Auth. Rev. (LCRA Transmission Svcs. Corp. Proj.) Series 2020, 5% 5/15/24 | | 300,000 | 307,840 |
| Midlothian Independent School District Bonds Series 2013 C, 2%, tender 8/1/24 (b) | | 100,000 | 97,612 |
| New Hope Cultural Ed. Facilities Fin. Corp. (Childrens Med. Ctr. of Dallas) Series 2017 A: | | | |
| 5% 8/15/27 | | 10,000 | 10,905 |
| 5% 8/15/47 | | 10,000 | 10,237 |
| North Texas Tollway Auth. Rev.: | | | |
| Series 2019 B, 5% 1/1/25 | | 85,000 | 88,224 |
| Series 2021 B, 4% 1/1/32 | | 2,000,000 | 2,099,242 |
| San Antonio Elec. & Gas Sys. Rev. Series 2017, 5% 2/1/33 | | 5,000 | 5,394 |
| San Antonio Wtr. Sys. Rev.: | | | |
| Series 2018 A, 5% 5/15/33 | | 5,000 | 5,511 |
| Series 2020 A, 5% 5/15/50 | | 475,000 | 502,194 |
| Tarrant County Cultural Ed. Facilities Fin. Corp. Rev.: | | | |
| Series 2017 A, 5% 2/15/24 | | 265,000 | 270,849 |
| Series 2018 A, 5% 7/1/29 | | 305,000 | 333,155 |
| Texas Dept. of Hsg. & Cmnty. Affairs Multi-family Hsg. Rev. Series 2019, 2.95% 7/1/36 | | 123,931 | 110,324 |
| Texas Dept. of Hsg. & Cmnty. Affairs Single Family Mtg. Rev.: | | | |
| Series 2019 A, 4% 3/1/50 | | 100,000 | 100,319 |
| Series A, 3.5% 3/1/51 | | 150,000 | 147,792 |
| Texas Private Activity Bond Surface Trans. Corp. (LBJ Infrastructure Group LLC I-635 Managed Lanes Proj.) Series 2020 A, 4% 6/30/37 | | 1,000,000 | 943,996 |
| Texas Trans. Commission Series 2019 A, 0% 8/1/41 | | 250,000 | 91,390 |
| Texas Trans. Commission Hwy. Impt. Gen. Oblig. Bonds Series 2014 B, 0.65%, tender 4/1/26 (b) | | 2,380,000 | 2,166,170 |
| Univ. of North Texas Univ. Rev. Series 2022 A, 5% 4/15/47 | | 2,000,000 | 2,101,608 |
TOTAL TEXAS | | | 25,962,971 |
| Utah - 0.1% | | | |
| Salt Lake City Arpt. Rev.: | | | |
| Series 2017 A, 5% 7/1/37 (c) | | 385,000 | 396,354 |
| Series 2018 A: | | | |
5% 7/1/33 (c) | | 175,000 | 184,576 |
5.25% 7/1/48 (c) | | 130,000 | 133,032 |
TOTAL UTAH | | | 713,962 |
| Vermont - 0.3% | | | |
| Vermont Hsg. Fin. Agcy. Series 2021 B, 3% 11/1/51 | | 317,000 | 303,406 |
| Vermont Student Assistant Corp. Ed. Ln. Rev.: | | | |
| Series 2019 A, 5% 6/15/25 (c) | | 635,000 | 657,299 |
| Series 2020 A, 5% 6/15/26 (c) | | 620,000 | 650,294 |
TOTAL VERMONT | | | 1,610,999 |
| Virginia - 1.5% | | | |
| Fairfax County Indl. Dev. Auth. Bonds (Inova Health Sys. Proj.) Series 2018 B, 5%, tender 5/15/23 (b) | | 2,000,000 | 2,012,397 |
| Lynchburg Econ. Dev. Series 2021, 3% 1/1/51 | | 425,000 | 293,391 |
| Roanoke Econ. Dev. Auth. Edl. Facilities Series 2018 A: | | | |
| 5% 9/1/23 | | 360,000 | 363,127 |
| 5% 9/1/24 | | 315,000 | 321,828 |
| Salem Econ. Dev. Auth. Series 2020: | | | |
| 4% 4/1/40 | | 120,000 | 107,446 |
| 5% 4/1/25 | | 165,000 | 169,547 |
| 5% 4/1/36 | | 500,000 | 516,930 |
| Virginia College Bldg. Auth. Edl. Facilities Rev.: | | | |
| (21St Century Collage and Equip. Programs) Series 2021 A: | | | |
4% 2/1/34 | | 1,850,000 | 1,942,383 |
4% 2/1/35 | | 1,700,000 | 1,766,950 |
| Series 2019 A, 3% 2/1/36 | | 195,000 | 177,966 |
| Virginia Small Bus. Fing. Auth. (Elizabeth River Crossings OpCo, LLC Proj.) Series 2022, 4% 7/1/34 (c) | | 1,465,000 | 1,428,161 |
| Wise County Indl. Dev. Auth. Waste & Sewage Rev. Bonds (Virginia Elec. and Pwr. Co. Proj.) Series 2010 A, 1.2%, tender 5/31/24 (b) | | 125,000 | 119,267 |
TOTAL VIRGINIA | | | 9,219,393 |
| Washington - 2.7% | | | |
| King County Hsg. Auth. Rev. Series 2021, 4% 12/1/29 | | 230,000 | 238,095 |
| King County Swr. Rev. Series 2017, 5% 7/1/34 | | 10,000 | 10,861 |
| Port of Seattle Rev.: | | | |
| Series 2013, 5% 7/1/24 (c) | | 55,000 | 55,410 |
| Series 2015 B, 5% 3/1/25 | | 70,000 | 72,397 |
| Series 2015 C, 5% 4/1/24 (c) | | 50,000 | 50,902 |
| Series 2018 A, 5% 5/1/31 (c) | | 350,000 | 370,047 |
| Series 2019 A, 4% 4/1/44 (c) | | 100,000 | 88,706 |
| Series 2021 C: | | | |
5% 8/1/24 (c) | | 445,000 | 455,528 |
5% 8/1/25 (c) | | 365,000 | 379,910 |
5% 8/1/26 (c) | | 495,000 | 521,376 |
5% 8/1/27 (c) | | 305,000 | 324,445 |
5% 8/1/28 (c) | | 860,000 | 921,896 |
| Seattle Hsg. Auth. Rev. (Northgate Plaza Proj.) Series 2021, 1% 6/1/26 | | 200,000 | 181,938 |
| Spokane Pub. Facilities District Hotel/Motel Tax & Sales/Use Tax Rev. Series 2017, 5% 12/1/41 | | 295,000 | 306,456 |
| Washington Convention Ctr. Pub. Facilities: | | | |
| Series 2021 B, 3% 7/1/58 (Assured Guaranty Muni. Corp. Insured) | | 1,805,000 | 1,209,394 |
| Series 2021, 4% 7/1/31 | | 2,540,000 | 2,323,205 |
| Washington Gen. Oblig. Series 2021 C, 5% 2/1/44 | | 3,010,000 | 3,261,810 |
| Washington Health Care Facilities Auth. Rev.: | | | |
| (Overlake Hosp. Med. Ctr., WA. Proj.) Series 2017 B: | | | |
5% 7/1/25 | | 5,000 | 5,216 |
5% 7/1/30 | | 5,000 | 5,299 |
5% 7/1/31 | | 10,000 | 10,546 |
5% 7/1/42 | | 100,000 | 100,698 |
| Series 2017, 4% 8/15/42 | | 100,000 | 90,128 |
| Series 2019 A2, 5% 8/1/44 | | 255,000 | 255,452 |
| Series 2020, 5% 9/1/40 | | 735,000 | 764,549 |
| Washington Higher Ed. Facilities Auth. Rev.: | | | |
| (Gonzaga Univ. Proj.) Series 2019 A, 3% 4/1/49 | | 720,000 | 509,451 |
| (Whitworth Univ. Proj.) Series 2016 A, 5% 10/1/25 | | 550,000 | 568,184 |
| Washington Hsg. Fin. Commission Series 2021 2N: | | | |
| 5% 6/1/26 | | 970,000 | 1,035,544 |
| 5% 12/1/27 | | 985,000 | 1,076,049 |
| 5% 12/1/28 | | 500,000 | 553,317 |
| 5% 12/1/29 | | 500,000 | 556,250 |
| Washington Hsg. Fin. Commission Nonprofit Hsg. Rev. (Judson Park Proj.) Series 2018, 5% 7/1/38 (d) | | 100,000 | 88,891 |
TOTAL WASHINGTON | | | 16,391,950 |
| West Virginia - 0.0% | | | |
| West Virginia Hosp. Fin. Auth. Hosp. Rev. Series 2018 A, 5% 1/1/32 | | 50,000 | 52,291 |
| Wisconsin - 1.1% | | | |
| Blue Ridge Healthcare Pub. Fin. Auth. Series 2020 A, 5% 1/1/31 | | 60,000 | 64,845 |
| Pub. Fin. Auth. Edl. Facilities Series 2018 A: | | | |
| 5.25% 10/1/43 | | 160,000 | 156,078 |
| 5.25% 10/1/48 | | 160,000 | 152,560 |
| Pub. Fin. Auth. Hosp. Rev. Series 2019 A, 5% 10/1/44 | | 355,000 | 360,728 |
| Pub. Fin. Auth. Wisconsin Retirement Facility Rev. Series 2018: | | | |
| 5% 10/1/43 (d) | | 15,000 | 12,914 |
| 5% 10/1/48 (d) | | 20,000 | 16,663 |
| 5% 10/1/53 (d) | | 30,000 | 24,484 |
| Roseman Univ. of Health: | | | |
| (Roseman Univ. of Health Sciences Proj.) Series 2020, 5% 4/1/40 (d) | | 100,000 | 94,788 |
| Series 2020, 3% 4/1/25 (d) | | 325,000 | 311,959 |
| Series 2021 A: | | | |
3% 7/1/50 | | 380,000 | 267,339 |
4.5% 6/1/56 (d) | | 1,870,000 | 1,353,715 |
| Series 2021 B, 6.5% 6/1/56 (d) | | 500,000 | 396,181 |
| Wisconsin Gen. Oblig. Series 2021 A, 5% 5/1/32 | | 1,430,000 | 1,597,208 |
| Wisconsin Health & Edl. Facilities: | | | |
| Series 2016 A: | | | |
4% 11/15/46 | | 195,000 | 178,906 |
4% 11/15/46 (Pre-Refunded to 5/15/26 @ 100) | | 80,000 | 82,560 |
| Series 2019 A: | | | |
5% 12/1/28 | | 150,000 | 163,284 |
5% 12/1/29 | | 150,000 | 165,213 |
| Series 2019 B1, 2.825% 11/1/28 | | 50,000 | 44,211 |
| Series 2019 B2, 2.55% 11/1/27 | | 30,000 | 28,145 |
| Series 2019: | | | |
5% 10/1/24 | | 175,000 | 180,966 |
5% 10/1/30 | | 195,000 | 214,535 |
| Wisconsin Hsg. & Econ. Dev. Auth.: | | | |
| Series 2021 A, 3% 3/1/52 | | 195,000 | 188,869 |
| Series 2021 C, 3% 9/1/52 | | 380,000 | 367,452 |
| Wisconsin Hsg. & Econ. Dev. Auth. Hsg. Rev. Bonds Series 2021 C: | | | |
| 0.61%, tender 5/1/24 (b) | | 65,000 | 61,875 |
| 0.81%, tender 5/1/25 (b) | | 225,000 | 212,035 |
TOTAL WISCONSIN | | | 6,697,513 |
| Wyoming - 0.4% | | | |
| Wyoming Cmnty. Dev. Auth. Hsg. Rev. Series 2022 3: | | | |
| 5% 6/1/24 (c) | | 675,000 | 691,866 |
| 5% 12/1/24 (c) | | 695,000 | 718,788 |
| 5% 6/1/25 (c) | | 700,000 | 729,581 |
| 5% 12/1/25 (c) | | 375,000 | 393,954 |
TOTAL WYOMING | | | 2,534,189 |
| TOTAL MUNICIPAL BONDS (Cost $637,312,781) | | | 585,910,839 |
| | | | |
| Money Market Funds - 2.9% |
| | | Shares | Value ($) |
Fidelity Municipal Cash Central Fund 3.72% (f)(g) (Cost $17,796,005) | | 17,792,442 | 17,795,993 |
| | | | |
| TOTAL INVESTMENT IN SECURITIES - 99.2% (Cost $655,108,786) | 603,706,832 |
NET OTHER ASSETS (LIABILITIES) - 0.8% | 4,914,264 |
| NET ASSETS - 100.0% | 608,621,096 |
| | |
Legend
| (a) | Amount is stated in United States dollars unless otherwise noted. |
| (b) | Coupon rates for floating and adjustable rate securities reflect the rates in effect at period end. |
| (c) | Private activity obligations whose interest is subject to the federal alternative minimum tax for individuals. |
| (d) | Security exempt from registration under Rule 144A of the Securities Act of 1933. These securities may be resold in transactions exempt from registration, normally to qualified institutional buyers. At the end of the period, the value of these securities amounted to $5,247,814 or 0.9% of net assets. |
| (e) | Security or a portion of the security purchased on a delayed delivery or when-issued basis. |
| (f) | Information in this report regarding holdings by state and security types does not reflect the holdings of the Fidelity Municipal Cash Central Fund. |
| (g) | Affiliated fund that is generally available only to investment companies and other accounts managed by Fidelity Investments. The rate quoted is the annualized seven-day yield of the fund at period end. A complete unaudited listing of the fund's holdings as of its most recent quarter end is available upon request. In addition, each Fidelity Central Fund's financial statements, which are not covered by the Fund's Report of Independent Registered Public Accounting Firm, are available on the SEC's website or upon request. |
Affiliated Central Funds
Fiscal year to date information regarding the Fund's investments in Fidelity Central Funds, including the ownership percentage, is presented below.
| Affiliate | Value, beginning of period ($) | Purchases ($) | Sales Proceeds ($) | Dividend Income ($) | Realized Gain (loss) ($) | Change in Unrealized appreciation (depreciation) ($) | Value, end of period ($) | % ownership, end of period |
| Fidelity Municipal Cash Central Fund 3.72% | - | 153,638,993 | 135,843,000 | 205,651 | - | - | 17,795,993 | 0.7% |
| Total | - | 153,638,993 | 135,843,000 | 205,651 | - | - | 17,795,993 | |
| | | | | | | | | |
Amounts in the dividend income column in the above table include any capital gain distributions from underlying funds, which are presented in the corresponding line item in the Statement of Operations, if applicable.
Amounts included in the purchases and sales proceeds columns may include in-kind transactions, if applicable.
Investment Valuation
The following is a summary of the inputs used, as of December 31, 2022, involving the Fund's assets and liabilities carried at fair value. The inputs or methodology used for valuing securities may not be an indication of the risk associated with investing in those securities. For more information on valuation inputs, and their aggregation into the levels used below, please refer to the Investment Valuation section in the accompanying Notes to Financial Statements.
| Valuation Inputs at Reporting Date: |
| Description | Total ($) | Level 1 ($) | Level 2 ($) | Level 3 ($) |
Investments in Securities: | | | | |
|
| Municipal Securities | 585,910,839 | - | 585,910,839 | - |
|
| Money Market Funds | 17,795,993 | 17,795,993 | - | - |
| Total Investments in Securities: | 603,706,832 | 17,795,993 | 585,910,839 | - |
| Statement of Assets and Liabilities |
| | | | December 31, 2022 |
| | | | | |
| Assets | | | | |
| Investment in securities, at value - See accompanying schedule: | | | | |
Unaffiliated issuers (cost $637,312,781) | | $585,910,839 | | |
Fidelity Central Funds (cost $17,796,005) | | 17,795,993 | | |
| | | | | |
| Total Investment in Securities (cost $655,108,786) | | | $ | 603,706,832 |
| Cash | | | | 702,751 |
| Receivable for fund shares sold | | | | 613,751 |
| Interest receivable | | | | 7,486,520 |
| Distributions receivable from Fidelity Central Funds | | | | 64,504 |
| Other receivables | | | | 269 |
Total assets | | | | 612,574,627 |
| Liabilities | | | | |
| Payable for investments purchased on a delayed delivery basis | | $2,225,331 | | |
| Payable for fund shares redeemed | | 420,416 | | |
| Distributions payable | | 1,307,784 | | |
| Total Liabilities | | | | 3,953,531 |
| Net Assets | | | $ | 608,621,096 |
| Net Assets consist of: | | | | |
| Paid in capital | | | $ | 666,670,554 |
| Total accumulated earnings (loss) | | | | (58,049,458) |
| Net Assets | | | $ | 608,621,096 |
Net Asset Value , offering price and redemption price per share ($608,621,096 ÷ 64,435,082 shares) | | | $ | 9.45 |
| | | | | |
| Statement of Operations |
| | | | Year ended December 31, 2022 |
| Investment Income | | | | |
| Interest | | | $ | 12,516,451 |
| Income from Fidelity Central Funds | | | | 205,337 |
| Total Income | | | | 12,721,788 |
| Expenses | | | | |
| Independent trustees' fees and expenses | | 1,970 | | |
| Total expenses before reductions | | 1,970 | | |
| Expense reductions | | (1,687) | | |
| Total expenses after reductions | | | | 283 |
| Net Investment income (loss) | | | | 12,721,505 |
| Realized and Unrealized Gain (Loss) | | | | |
| Net realized gain (loss) on: | | | | |
| Investment Securities: | | | | |
| Unaffiliated issuers | | (6,696,733) | | |
| Capital gain distributions from Fidelity Central Funds | | 314 | | |
| Total net realized gain (loss) | | | | (6,696,419) |
| Change in net unrealized appreciation (depreciation) on investment securities | | | | (64,898,138) |
| Net gain (loss) | | | | (71,594,557) |
| Net increase (decrease) in net assets resulting from operations | | | $ | (58,873,052) |
| Statement of Changes in Net Assets |
| |
| | Year ended December 31, 2022 | | Year ended December 31, 2021 |
| Increase (Decrease) in Net Assets | | | | |
| Operations | | | | |
| Net investment income (loss) | $ | 12,721,505 | $ | 8,058,982 |
| Net realized gain (loss) | | (6,696,419) | | 206,929 |
| Change in net unrealized appreciation (depreciation) | | (64,898,138) | | 2,167,623 |
| Net increase (decrease) in net assets resulting from operations | | (58,873,052) | | 10,433,534 |
| Distributions to shareholders | | (12,667,680) | | (8,295,176) |
| Share transactions | | | | |
| Proceeds from sales of shares | | 299,711,432 | | 485,618,087 |
| Reinvestment of distributions | | 13 | | 13 |
| Cost of shares redeemed | | (263,494,616) | | (155,810,090) |
Net increase (decrease) in net assets resulting from share transactions | | 36,216,829 | | 329,808,010 |
| Total increase (decrease) in net assets | | (35,323,903) | | 331,946,368 |
| | | | | |
| Net Assets | | | | |
| Beginning of period | | 643,944,999 | | 311,998,631 |
| End of period | $ | 608,621,096 | $ | 643,944,999 |
| | | | | |
| Other Information | | | | |
| Shares | | | | |
| Sold | | 30,761,210 | | 46,004,101 |
| Issued in reinvestment of distributions | | 1 | | 1 |
| Redeemed | | (27,284,108) | | (14,763,396) |
| Net increase (decrease) | | 3,477,103 | | 31,240,706 |
| | | | | |
Financial Highlights
| Fidelity Flex® Municipal Income Fund |
| |
| Years ended December 31, | | 2022 | | 2021 | | 2020 | | 2019 | | 2018 |
Selected Per-Share Data | | | | | | | | | | |
| Net asset value, beginning of period | $ | 10.56 | $ | 10.50 | $ | 10.35 | $ | 9.85 | $ | 10.04 |
| Income from Investment Operations | | | | | | | | | | |
Net investment income (loss) A,B | | .200 | | .173 | | .232 | | .275 | | .261 |
| Net realized and unrealized gain (loss) | | (1.111) | | .068 | | .153 | | .531 | | (.193) |
| Total from investment operations | | (.911) | | .241 | | .385 | | .806 | | .068 |
| Distributions from net investment income | | (.199) | | (.177) | | (.235) | | (.278) | | (.258) |
| Distributions from net realized gain | | - | | (.004) | | - | | (.028) | | - |
| Total distributions | | (.199) | | (.181) | | (.235) | | (.306) | | (.258) |
| Net asset value, end of period | $ | 9.45 | $ | 10.56 | $ | 10.50 | $ | 10.35 | $ | 9.85 |
Total Return C | | (8.63)% | | 2.31% | | 3.79% | | 8.26% | | .71% |
Ratios to Average Net Assets B,D,E | | | | | | | | | | |
Expenses before reductions F | | -% | | -% | | -% | | -% | | -% |
Expenses net of fee waivers, if any F | | -% | | -% | | -% | | -% | | -% |
Expenses net of all reductions F | | -% | | -% | | -% | | -% | | -% |
| Net investment income (loss) | | 2.07% | | 1.65% | | 2.26% | | 2.70% | | 2.69% |
| Supplemental Data | | | | | | | | | | |
| Net assets, end of period (000 omitted) | $ | 608,621 | $ | 643,945 | $ | 311,999 | $ | 188,914 | $ | 110,680 |
Portfolio turnover rate G | | 16% | | 5% | | 24% | | 18% | | 73% |
A Calculated based on average shares outstanding during the period.
B Net investment income (loss) is affected by the timing of the declaration of dividends by any underlying mutual funds or exchange-traded funds (ETFs). Net investment income (loss) of any mutual funds or ETFs is not included in the Fund's net investment income (loss) ratio.
C Total returns would have been lower if certain expenses had not been reduced during the applicable periods shown.
D Fees and expenses of any underlying mutual funds or exchange-traded funds (ETFs) are not included in the Fund's expense ratio. The Fund indirectly bears its proportionate share of these expenses. For additional expense information related to investments in Fidelity Central Funds, please refer to the "Investments in Fidelity Central Funds" note found in the Notes to Financial Statements section of the most recent Annual or Semi-Annual report.
E Expense ratios reflect operating expenses of the class. Expenses before reductions do not reflect amounts reimbursed, waived, or reduced through arrangements with the investment adviser, brokerage services, or other offset arrangements, if applicable, and do not represent the amount paid by the class during periods when reimbursements, waivers or reductions occur.
F Amount represents less than .005%.
G Amount does not include the portfolio activity of any underlying mutual funds or exchange-traded funds (ETFs).
For the period ended December 31, 2022
1. Organization.
Fidelity Flex Municipal Income Fund (the Fund) is a fund of Fidelity Municipal Trust (the Trust) and is authorized to issue an unlimited number of shares. Share transactions on the Statement of Changes in Net Assets may contain exchanges between affiliated funds. The Trust is registered under the Investment Company Act of 1940, as amended (the 1940 Act), as an open-end management investment company organized as a Massachusetts business trust. The Fund is available only to certain fee-based accounts and advisory programs offered by Fidelity.
2. Investments in Fidelity Central Funds.
Funds may invest in Fidelity Central Funds, which are open-end investment companies generally available only to other investment companies and accounts managed by the investment adviser and its affiliates. The Schedule of Investments lists any Fidelity Central Funds held as an investment as of period end, but does not include the underlying holdings of each Fidelity Central Fund. An investing fund indirectly bears its proportionate share of the expenses of the underlying Fidelity Central Funds.
Based on its investment objective, each Fidelity Central Fund may invest or participate in various investment vehicles or strategies that are similar to those of the investing fund. These strategies are consistent with the investment objectives of the investing fund and may involve certain economic risks which may cause a decline in value of each of the Fidelity Central Funds and thus a decline in the value of the investing fund.
| Fidelity Central Fund | Investment Manager | Investment Objective | Investment Practices | Expense Ratio A |
| Fidelity Money Market Central Funds | Fidelity Management & Research Company LLC (FMR) | Each fund seeks to obtain a high level of current income consistent with the preservation of capital and liquidity. | Short-term Investments | Less than .005% |
A Expenses expressed as a percentage of average net assets and are as of each underlying Central Fund's most recent annual or semi-annual shareholder report.
A complete unaudited list of holdings for each Fidelity Central Fund is available upon request or at the Securities and Exchange Commission website at www.sec.gov. In addition, the financial statements of the Fidelity Central Funds which contain the significant accounting policies (including investment valuation policies) of those funds, and are not covered by the Report of Independent Registered Public Accounting Firm, are available on the Securities and Exchange Commission website or upon request.
3. Significant Accounting Policies.
The Fund is an investment company and applies the accounting and reporting guidance of the Financial Accounting Standards Board (FASB) Accounting Standards Codification Topic 946 Financial Services - Investment Companies . The financial statements have been prepared in conformity with accounting principles generally accepted in the United States of America (GAAP), which require management to make certain estimates and assumptions at the date of the financial statements. Actual results could differ from those estimates. Subsequent events, if any, through the date that the financial statements were issued have been evaluated in the preparation of the financial statements. The Fund's Schedule of Investments lists any underlying mutual funds or exchange-traded funds (ETFs) but does not include the underlying holdings of these funds. The following summarizes the significant accounting policies of the Fund:
Investment Valuation. Investments are valued as of 4:00 p.m. Eastern time on the last calendar day of the period. The Board of Trustees (the Board) has designated the Fund's investment adviser as the valuation designee responsible for the fair valuation function and performing fair value determinations as needed. The investment adviser has established a Fair Value Committee (the Committee) to carry out the day-to-day fair valuation responsibilities and has adopted policies and procedures to govern the fair valuation process and the activities of the Committee. In accordance with these fair valuation policies and procedures, which have been approved by the Board, the Fund attempts to obtain prices from one or more third party pricing services or brokers to value its investments. When current market prices, quotations or currency exchange rates are not readily available or reliable, investments will be fair valued in good faith by the Committee, in accordance with the policies and procedures. Factors used in determining fair value vary by investment type and may include market or investment specific events, transaction data, estimated cash flows, and market observations of comparable investments. The frequency that the fair valuation procedures are used cannot be predicted and they may be utilized to a significant extent. The Committee manages the Fund's fair valuation practices and maintains the fair valuation policies and procedures. The Fund's investment adviser reports to the Board information regarding the fair valuation process and related material matters.
The Fund categorizes the inputs to valuation techniques used to value its investments into a disclosure hierarchy consisting of three levels as shown below:
Level 1 - unadjusted quoted prices in active markets for identical investments
Level 2 - other significant observable inputs (including quoted prices for similar investments, interest rates, prepayment speeds, etc.)
Level 3 - unobservable inputs (including the Fund's own assumptions based on the best information available)
Valuation techniques used to value the Fund's investments by major category are as follows:
Debt securities, including restricted securities, are valued based on evaluated prices received from third party pricing services or from brokers who make markets in such securities. Municipal securities are valued by pricing services who utilize matrix pricing which considers yield or price of bonds of comparable quality, coupon, maturity and type or by broker-supplied prices. When independent prices are unavailable or unreliable, debt securities may be valued utilizing pricing methodologies which consider similar factors that would be used by third party pricing services. Debt securities are generally categorized as Level 2 in the hierarchy but may be Level 3 depending on the circumstances.
Investments in open-end mutual funds, including the Fidelity Central Funds, are valued at their closing net asset value (NAV) each business day and are categorized as Level 1 in the hierarchy.
Changes in valuation techniques may result in transfers in or out of an assigned level within the disclosure hierarchy. The aggregate value of investments by input level as of December 31, 2022 is included at the end of the Fund's Schedule of Investments.
Investment Transactions and Income. For financial reporting purposes, the Fund's investment holdings and NAV include trades executed through the end of the last business day of the period. The NAV per share for processing shareholder transactions is calculated as of the close of business of the New York Stock Exchange (NYSE), normally 4:00 p.m. Eastern time and includes trades executed through the end of the prior business day. Gains and losses on securities sold are determined on the basis of identified cost. Income and capital gain distributions from Fidelity Central Funds, if any, are recorded on the ex-dividend date. Interest income is accrued as earned and includes coupon interest and amortization of premium and accretion of discount on debt securities as applicable. Debt obligations may be placed on non-accrual status and related interest income may be reduced by ceasing current accruals and writing off interest receivables when the collection of all or a portion of interest has become doubtful based on consistently applied procedures. A debt obligation is removed from non-accrual status when the issuer resumes interest payments or when collectability of interest is reasonably assured.
Expenses. Expenses directly attributable to a fund are charged to that fund. Expenses attributable to more than one fund are allocated among the respective funds on the basis of relative net assets or other appropriate methods. Expenses included in the accompanying financial statements reflect the expenses of that fund and do not include any expenses associated with any underlying mutual funds or exchange-traded funds. Although not included in a fund's expenses, a fund indirectly bears its proportionate share of these expenses through the net asset value of each underlying mutual fund or exchange-traded fund. Expense estimates are accrued in the period to which they relate and adjustments are made when actual amounts are known.
Income Tax Information and Distributions to Shareholders. Each year, the Fund intends to qualify as a regulated investment company under Subchapter M of the Internal Revenue Code, including distributing substantially all of its taxable income and realized gains. As a result, no provision for U.S. Federal income taxes is required. As of December 31, 2022, the Fund did not have any unrecognized tax benefits in the financial statements; nor is the Fund aware of any tax positions for which it is reasonably possible that the total amounts of unrecognized tax benefits will significantly change in the next twelve months. The Fund files a U.S. federal tax return, in addition to state and local tax returns as required. The Fund's federal income tax returns are subject to examination by the Internal Revenue Service (IRS) for a period of three fiscal years after they are filed. State and local tax returns may be subject to examination for an additional fiscal year depending on the jurisdiction.
Distributions are declared and recorded daily and paid monthly from net investment income. Distributions from realized gains, if any, are declared and recorded on the ex-dividend date. Income and capital gain distributions are determined in accordance with income tax regulations, which may differ from GAAP.
Capital accounts within the financial statements are adjusted for permanent book-tax differences. These adjustments have no impact on net assets or the results of operations. Capital accounts are not adjusted for temporary book-tax differences which will reverse in a subsequent period.
Book-tax differences are primarily due to market discount, capital loss carryforwards and losses deferred due to excise tax regulations.
The Fund purchases municipal securities whose interest, in the opinion of the issuer, is free from federal income tax. There is no assurance that the IRS will agree with this opinion. In the event the IRS determines that the issuer does not comply with relevant tax requirements, interest payments from a security could become federally taxable, possibly retroactively to the date the security was issued.
As of period end, the cost and unrealized appreciation (depreciation) in securities, and derivatives if applicable, for federal income tax purposes were as follows:
| Gross unrealized appreciation | $ 2,412,281 |
| Gross unrealized depreciation | (53,750,549) |
| Net unrealized appreciation (depreciation) | $(51,338,268) |
| Tax Cost | $655,045,100 |
The tax-based components of distributable earnings as of period end were as follows:
| Capital loss carryforward | $(6,700,516) |
| Net unrealized appreciation (depreciation) on securities and other investments | $(51,338,268) |
| | |
Capital loss carryforwards are only available to offset future capital gains of the Fund to the extent provided by regulations and may be limited. The capital loss carryforward information presented below, including any applicable limitation, is estimated as of fiscal period end and is subject to adjustment.
Short-term | $(2,850,551) |
Long-term | $(3,849,965) |
| Total capital loss carryforward | $(6,700,516) |
The tax character of distributions paid was as follows:
| | December 31, 2022 | December 31, 2021 |
| Tax-exempt Income | $12,667,680 | $8,058,787 |
| Long-term Capital Gains | - | 236,389 |
| Total | $12,667,680 | $8,295,176 |
| | | |
Delayed Delivery Transactions and When-Issued Securities. During the period, certain Funds transacted in securities on a delayed delivery or when-issued basis. Payment and delivery may take place after the customary settlement period for that security. The price of the underlying securities and the date when the securities will be delivered and paid for are fixed at the time the transaction is negotiated. Securities purchased on a delayed delivery or when-issued basis are identified as such in the Schedule of Investments. Compensation for interest forgone in the purchase of a delayed delivery or when-issued debt security may be received. With respect to purchase commitments, each applicable Fund identifies securities as segregated in its records with a value at least equal to the amount of the commitment. Payables and receivables associated with the purchases and sales of delayed delivery securities having the same coupon, settlement date and broker are offset. Delayed delivery or when-issued securities that have been purchased from and sold to different brokers are reflected as both payables and receivables in the Statement of Assets and Liabilities under the caption "Delayed delivery", as applicable. Losses may arise due to changes in the value of the underlying securities or if the counterparty does not perform under the contract's terms, or if the issuer does not issue the securities due to political, economic, or other factors.
Restricted Securities (including Private Placements). Funds may invest in securities that are subject to legal or contractual restrictions on resale. These securities generally may be resold in transactions exempt from registration or to the public if the securities are registered. Disposal of these securities may involve time-consuming negotiations and expense, and prompt sale at an acceptable price may be difficult. Information regarding restricted securities held at period end is included at the end of the Schedule of Investments, if applicable.
4. Purchases and Sales of Investments.
Purchases and sales of securities, other than short-term securities and in-kind transactions, as applicable, are noted in the table below.
| | Purchases ($) | Sales ($) |
| Fidelity Flex Municipal Income Fund | 191,976,293 | 90,953,508 |
5. Fees and Other Transactions with Affiliates.
Management Fee. Fidelity Management & Research Company LLC (the investment adviser) and its affiliates provide the Fund with investment management related services and the Fund does not pay any fees for these services. Under the management contract, the investment adviser or an affiliate pays all other expenses of the Fund, excluding fees and expenses of the independent Trustees, and certain miscellaneous expenses such as proxy and shareholder meeting expenses.
Interfund Trades. Funds may purchase from or sell securities to other Fidelity Funds under procedures adopted by the Board. The procedures have been designed to ensure these interfund trades are executed in accordance with Rule 17a-7 of the 1940 Act. Any interfund trades are included within the respective purchases and sales amounts shown in the Purchases and Sales of Investments note. During the period, there were no interfund trades.
6. Committed Line of Credit.
Certain Funds participate with other funds managed by the investment adviser or an affiliate in a $4.25 billion credit facility (the "line of credit") to be utilized for temporary or emergency purposes to fund shareholder redemptions or for other short-term liquidity purposes. The commitment fees on the pro-rata portion of the line of credit are borne by the investment adviser. During the period, there were no borrowings on this line of credit.
7. Expense Reductions.
Through arrangements with the Fund's custodian, credits realized as a result of certain uninvested cash balances were used to reduce the Fund's expenses by $1,687.
8. Other.
A fund's organizational documents provide former and current trustees and officers with a limited indemnification against liabilities arising in connection with the performance of their duties to the fund. In the normal course of business, a fund may also enter into contracts that provide general indemnifications. A fund's maximum exposure under these arrangements is unknown as this would be dependent on future claims that may be made against a fund. The risk of material loss from such claims is considered remote.
9. Risk and Uncertainties.
Many factors affect a fund's performance. Developments that disrupt global economies and financial markets, such as pandemics, epidemics, outbreaks of infectious diseases, war, terrorism, and environmental disasters, may significantly affect a fund's investment performance. The effects of these developments to a fund will be impacted by the types of securities in which a fund invests, the financial condition, industry, economic sector, and geographic location of an issuer, and a fund's level of investment in the securities of that issuer.
To the Board of Trustees of Fidelity Municipal Trust and Shareholders of Fidelity Flex Municipal Income Fund
Opinion on the Financial Statements
We have audited the accompanying statement of assets and liabilities, including the schedule of investments, of Fidelity Flex Municipal Income Fund (one of the funds constituting Fidelity Municipal Trust, referred to hereafter as the "Fund") as of December 31, 2022, the related statement of operations for the year ended December 31, 2022, the statement of changes in net assets for each of the two years in the period ended December 31, 2022, including the related notes, and the financial highlights for each of the five years in the period ended December 31, 2022 (collectively referred to as the "financial statements"). In our opinion, the financial statements present fairly, in all material respects, the financial position of the Fund as of December 31, 2022, the results of its operations for the year then ended, the changes in its net assets for each of the two years in the period ended December 31, 2022 and the financial highlights for each of the five years in the period ended December 31, 2022 in conformity with accounting principles generally accepted in the United States of America.
Basis for Opinion
These financial statements are the responsibility of the Fund's management. Our responsibility is to express an opinion on the Fund's financial statements based on our audits. We are a public accounting firm registered with the Public Company Accounting Oversight Board (United States) (PCAOB) and are required to be independent with respect to the Fund in accordance with the U.S. federal securities laws and the applicable rules and regulations of the Securities and Exchange Commission and the PCAOB.
We conducted our audits of these financial statements in accordance with the standards of the PCAOB. Those standards require that we plan and perform the audit to obtain reasonable assurance about whether the financial statements are free of material misstatement, whether due to error or fraud.
Our audits included performing procedures to assess the risks of material misstatement of the financial statements, whether due to error or fraud, and performing procedures that respond to those risks. Such procedures included examining, on a test basis, evidence regarding the amounts and disclosures in the financial statements. Our audits also included evaluating the accounting principles used and significant estimates made by management, as well as evaluating the overall presentation of the financial statements. Our procedures included confirmation of securities owned as of December 31, 2022 by correspondence with the custodian and brokers; when replies were not received from brokers, we performed other auditing procedures. We believe that our audits provide a reasonable basis for our opinion.
/s/ PricewaterhouseCoopers LLP
Boston, Massachusetts
February 10, 2023
We have served as the auditor of one or more investment companies in the Fidelity group of funds since 1932.
The Trustees, Members of the Advisory Board (if any), and officers of the trust and fund, as applicable, are listed below. The Board of Trustees governs the fund and is responsible for protecting the interests of shareholders. The Trustees are experienced executives who meet periodically throughout the year to oversee the fund's activities, review contractual arrangements with companies that provide services to the fund, oversee management of the risks associated with such activities and contractual arrangements, and review the fund's performance. Each of the Trustees oversees 295 funds.
The Trustees hold office without limit in time except that (a) any Trustee may resign; (b) any Trustee may be removed by written instrument, signed by at least two-thirds of the number of Trustees prior to such removal; (c) any Trustee who requests to be retired or who has become incapacitated by illness or injury may be retired by written instrument signed by a majority of the other Trustees; and (d) any Trustee may be removed at any special meeting of shareholders by a two-thirds vote of the outstanding voting securities of the trust. Each Trustee who is not an interested person (as defined in the 1940 Act) of the trust and the fund is referred to herein as an Independent Trustee. Each Independent Trustee shall retire not later than the last day of the calendar year in which his or her 75th birthday occurs. The Independent Trustees may waive this mandatory retirement age policy with respect to individual Trustees. Officers and Advisory Board Members hold office without limit in time, except that any officer or Advisory Board Member may resign or may be removed by a vote of a majority of the Trustees at any regular meeting or any special meeting of the Trustees. Except as indicated, each individual has held the office shown or other offices in the same company for the past five years.
The fund's Statement of Additional Information (SAI) includes more information about the Trustees. To request a free copy, call Fidelity at 1-800-544-3455 (for managed account clients) or 1-800-835-5092 (for retirement plan participants).
Experience, Skills, Attributes, and Qualifications of the Trustees. The Governance and Nominating Committee has adopted a statement of policy that describes the experience, qualifications, attributes, and skills that are necessary and desirable for potential Independent Trustee candidates (Statement of Policy). The Board believes that each Trustee satisfied at the time he or she was initially elected or appointed a Trustee, and continues to satisfy, the standards contemplated by the Statement of Policy. The Governance and Nominating Committee also engages professional search firms to help identify potential Independent Trustee candidates who have the experience, qualifications, attributes, and skills consistent with the Statement of Policy. From time to time, additional criteria based on the composition and skills of the current Independent Trustees, as well as experience or skills that may be appropriate in light of future changes to board composition, business conditions, and regulatory or other developments, have also been considered by the professional search firms and the Governance and Nominating Committee. In addition, the Board takes into account the Trustees' commitment and participation in Board and committee meetings, as well as their leadership of standing and ad hoc committees throughout their tenure.
In determining that a particular Trustee was and continues to be qualified to serve as a Trustee, the Board has considered a variety of criteria, none of which, in isolation, was controlling. The Board believes that, collectively, the Trustees have balanced and diverse experience, qualifications, attributes, and skills, which allow the Board to operate effectively in governing the fund and protecting the interests of shareholders. Information about the specific experience, skills, attributes, and qualifications of each Trustee, which in each case led to the Board's conclusion that the Trustee should serve (or continue to serve) as a trustee of the fund, is provided below.
Board Structure and Oversight Function. Abigail P. Johnson is an interested person and currently serves as Chairman. The Trustees have determined that an interested Chairman is appropriate and benefits shareholders because an interested Chairman has a personal and professional stake in the quality and continuity of services provided to the fund. Independent Trustees exercise their informed business judgment to appoint an individual of their choosing to serve as Chairman, regardless of whether the Trustee happens to be independent or a member of management. The Independent Trustees have determined that they can act independently and effectively without having an Independent Trustee serve as Chairman and that a key structural component for assuring that they are in a position to do so is for the Independent Trustees to constitute a substantial majority for the Board. The Independent Trustees also regularly meet in executive session. Michael E. Kenneally serves as Chairman of the Independent Trustees and as such (i) acts as a liaison between the Independent Trustees and management with respect to matters important to the Independent Trustees and (ii) with management prepares agendas for Board meetings.
Fidelity ® funds are overseen by different Boards of Trustees. The fund's Board oversees Fidelity's investment-grade bond, money market, asset allocation and certain equity funds, and other Boards oversee Fidelity's high income and other equity funds. The asset allocation funds may invest in Fidelity ® funds that are overseen by such other Boards. The use of separate Boards, each with its own committee structure, allows the Trustees of each group of Fidelity ® funds to focus on the unique issues of the funds they oversee, including common research, investment, and operational issues. On occasion, the separate Boards establish joint committees to address issues of overlapping consequences for the Fidelity ® funds overseen by each Board.
The Trustees operate using a system of committees to facilitate the timely and efficient consideration of all matters of importance to the Trustees, the fund, and fund shareholders and to facilitate compliance with legal and regulatory requirements and oversight of the fund's activities and associated risks. The Board, acting through its committees, has charged FMR and its affiliates with (i) identifying events or circumstances the occurrence of which could have demonstrably adverse effects on the fund's business and/or reputation; (ii) implementing processes and controls to lessen the possibility that such events or circumstances occur or to mitigate the effects of such events or circumstances if they do occur; and (iii) creating and maintaining a system designed to evaluate continuously business and market conditions in order to facilitate the identification and implementation processes described in (i) and (ii) above. Because the day-to-day operations and activities of the fund are carried out by or through FMR, its affiliates, and other service providers, the fund's exposure to risks is mitigated but not eliminated by the processes overseen by the Trustees. While each of the Board's committees has responsibility for overseeing different aspects of the fund's activities, oversight is exercised primarily through the Operations and Audit Committees. In addition, an ad hoc Board committee of Independent Trustees has worked with FMR to enhance the Board's oversight of investment and financial risks, legal and regulatory risks, technology risks, and operational risks, including the development of additional risk reporting to the Board. Appropriate personnel, including but not limited to the fund's Chief Compliance Officer (CCO), FMR's internal auditor, the independent accountants, the fund's Treasurer and portfolio management personnel, make periodic reports to the Board's committees, as appropriate, including an annual review of Fidelity's risk management program for the Fidelity ® funds. The responsibilities of each standing committee, including their oversight responsibilities, are described further under "Standing Committees of the Trustees."
Interested Trustees*:
Correspondence intended for a Trustee who is an interested person may be sent to Fidelity Investments, 245 Summer Street, Boston, Massachusetts 02210.
Name, Year of Birth; Principal Occupations and Other Relevant Experience+
Abigail P. Johnson (1961)
Year of Election or Appointment: 2009
Trustee
Chairman of the Board of Trustees
Ms. Johnson also serves as Trustee of other Fidelity ® funds. Ms. Johnson serves as Chairman (2016-present), Chief Executive Officer (2014-present), and Director (2007-present) of FMR LLC (diversified financial services company), President of Fidelity Financial Services (2012-present) and President of Personal, Workplace and Institutional Services (2005-present). Ms. Johnson is Chairman and Director of Fidelity Management & Research Company LLC (investment adviser firm, 2011-present). Previously, Ms. Johnson served as Chairman and Director of FMR Co., Inc. (investment adviser firm, 2011-2019), Vice Chairman (2007-2016) and President (2013-2016) of FMR LLC, President and a Director of Fidelity Management & Research Company (2001-2005), a Trustee of other investment companies advised by Fidelity Management & Research Company, Fidelity Investments Money Management, Inc. (investment adviser firm), and FMR Co., Inc. (2001-2005), Senior Vice President of the Fidelity ® funds (2001-2005), and managed a number of Fidelity ® funds. Ms. Abigail P. Johnson and Mr. Arthur E. Johnson are not related.
Jennifer Toolin McAuliffe (1959)
Year of Election or Appointment: 2016
Trustee
Ms. McAuliffe also serves as Trustee of other Fidelity ® funds and as Trustee of Fidelity Charitable (2020-present). Previously, Ms. McAuliffe served as Co-Head of Fixed Income of Fidelity Investments Limited (now known as FIL Limited (FIL)) (diversified financial services company), Director of Research for FIL's credit and quantitative teams in London, Hong Kong and Tokyo and Director of Research for taxable and municipal bonds at Fidelity Investments Money Management, Inc. Ms. McAuliffe previously served as a member of the Advisory Board of certain Fidelity ® funds (2016). Ms. McAuliffe was previously a lawyer at Ropes & Gray LLP and currently serves as director or trustee of several not-for-profit entities.
* Determined to be an "Interested Trustee" by virtue of, among other things, his or her affiliation with the trust or various entities under common control with FMR.
+ The information includes the Trustee's principal occupation during the last five years and other information relating to the experience, attributes, and skills relevant to the Trustee's qualifications to serve as a Trustee, which led to the conclusion that the Trustee should serve as a Trustee for the fund.
Independent Trustees:
Correspondence intended for an Independent Trustee may be sent to Fidelity Investments, P.O. Box 55235, Boston, Massachusetts 02205-5235.
Name, Year of Birth; Principal Occupations and Other Relevant Experience+
Elizabeth S. Acton (1951)
Year of Election or Appointment: 2013
Trustee
Ms. Acton also serves as Trustee of other Fidelity ® funds. Prior to her retirement, Ms. Acton served as Executive Vice President, Finance (2011-2012), Executive Vice President, Chief Financial Officer (2002-2011) and Treasurer (2004-2005) of Comerica Incorporated (financial services). Prior to joining Comerica, Ms. Acton held a variety of positions at Ford Motor Company (1983-2002), including Vice President and Treasurer (2000-2002) and Executive Vice President and Chief Financial Officer of Ford Motor Credit Company (1998-2000). Ms. Acton currently serves as a member of the Board and Audit and Finance Committees of Beazer Homes USA, Inc. (homebuilding, 2012-present). Ms. Acton previously served as a member of the Advisory Board of certain Fidelity ® funds (2013-2016).
Ann E. Dunwoody (1953)
Year of Election or Appointment: 2018
Trustee
General Dunwoody also serves as Trustee of other Fidelity ® funds. General Dunwoody (United States Army, Retired) was the first woman in U.S. military history to achieve the rank of four-star general and prior to her retirement in 2012 held a variety of positions within the U.S. Army, including Commanding General, U.S. Army Material Command (2008-2012). General Dunwoody currently serves as President of First to Four LLC (leadership and mentoring services, 2012-present), a member of the Board and Nomination and Corporate Governance Committees of Kforce Inc. (professional staffing services, 2016-present) and a member of the Board of Automattic Inc. (software engineering, 2018-present). Previously, General Dunwoody served as a member of the Advisory Board and Nominating and Corporate Governance Committee of L3 Technologies, Inc. (communication, electronic, sensor and aerospace systems, 2013-2019) and a member of the Board and Audit and Sustainability and Corporate Responsibility Committees of Republic Services, Inc. (waste collection, disposal and recycling, 2013-2016). Ms. Dunwoody also serves on several boards for non-profit organizations, including as a member of the Board, Chair of the Nomination and Governance Committee and a member of the Audit Committee of Logistics Management Institute (consulting non-profit, 2012-present), a member of the Council of Trustees for the Association of the United States Army (advocacy non-profit, 2013-present), a member of the Board of Florida Institute of Technology (2015-present) and a member of the Board of ThanksUSA (military family education non-profit, 2014-present). General Dunwoody previously served as a member of the Advisory Board of certain Fidelity ® funds (2018).
John Engler (1948)
Year of Election or Appointment: 2014
Trustee
Mr. Engler also serves as Trustee of other Fidelity ® funds. Previously, Mr. Engler served as Governor of Michigan (1991-2003), President of the Business Roundtable (2011-2017) and interim President of Michigan State University (2018-2019). Mr. Engler currently serves as a member of the Board of Stride, Inc. (formerly K12 Inc.) (technology-based education company, 2012-present). Previously, Mr. Engler served as a member of the Board of Universal Forest Products (manufacturer and distributor of wood and wood-alternative products, 2003-2019) and Trustee of The Munder Funds (2003-2014). Mr. Engler previously served as a member of the Advisory Board of certain Fidelity ® funds (2014-2016).
Robert F. Gartland (1951)
Year of Election or Appointment: 2010
Trustee
Mr. Gartland also serves as Trustee of other Fidelity ® funds. Prior to his retirement, Mr. Gartland held a variety of positions at Morgan Stanley (financial services, 1979-2007), including Managing Director (1987-2007) and Chase Manhattan Bank (1975-1978). Mr. Gartland previously served as Chairman and an investor in Gartland & Mellina Group Corp. (consulting, 2009-2019), as a member of the Board of National Securities Clearing Corporation (1993-1996) and as Chairman of TradeWeb (2003-2004).
Arthur E. Johnson (1947)
Year of Election or Appointment: 2008
Trustee
Mr. Johnson also serves as Trustee of other Fidelity ® funds. Prior to his retirement, Mr. Johnson served as Senior Vice President of Corporate Strategic Development of Lockheed Martin Corporation (defense contractor, 1999-2009). Mr. Johnson currently serves as a member of the Board of Booz Allen Hamilton (management consulting, 2011-present). Mr. Johnson previously served as a member of the Board of Eaton Corporation plc (diversified power management, 2009-2019) and a member of the Board of AGL Resources, Inc. (holding company, 2002-2016). Mr. Johnson previously served as Chairman (2018-2021) and Vice Chairman (2015-2018) of the Independent Trustees of certain Fidelity® funds. Mr. Arthur E. Johnson is not related to Ms. Abigail P. Johnson.
Michael E. Kenneally (1954)
Year of Election or Appointment: 2009
Trustee
Chairman of the Independent Trustees
Mr. Kenneally also serves as Trustee of other Fidelity ® funds and was Vice Chairman (2018-2021) of the Independent Trustees of certain Fidelity ® funds. Prior to retirement in 2005, he was Chairman and Global Chief Executive Officer of Credit Suisse Asset Management, the worldwide fund management and institutional investment business of Credit Suisse Group. Previously, Mr. Kenneally was an Executive Vice President and the Chief Investment Officer for Bank of America. In this role, he was responsible for the investment management, strategy and products delivered to the bank's institutional, high-net-worth and retail clients. Earlier, Mr. Kenneally directed the organization's equity and quantitative research groups. He began his career as a research analyst and then spent more than a dozen years as a portfolio manager for endowments, pension plans and mutual funds. He earned the Chartered Financial Analyst (CFA) designation in 1991.
Mark A. Murray (1954)
Year of Election or Appointment: 2016
Trustee
Mr. Murray also serves as Trustee of other Fidelity ® funds. Previously, Mr. Murray served as Co-Chief Executive Officer (2013-2016), President (2006-2013) and Vice Chairman (2013-2020) of Meijer, Inc. Mr. Murray serves as a member of the Board (2009-present) and Public Policy and Responsibility Committee (2009-present) and Chair of the Nuclear Review Committee (2019-present) of DTE Energy Company (diversified energy company). Mr. Murray previously served as a member of the Board of Spectrum Health (not-for-profit health system, 2015-2019) and as a member of the Board and Audit Committee and Chairman of the Nominating and Corporate Governance Committee of Universal Forest Products, Inc. (manufacturer and distributor of wood and wood-alternative products, 2004-2016). Mr. Murray also serves as a member of the Board of many community and professional organizations. Mr. Murray previously served as a member of the Advisory Board of certain Fidelity ® funds (2016).
+ The information includes the Trustee's principal occupation during the last five years and other information relating to the experience, attributes, and skills relevant to the Trustee's qualifications to serve as a Trustee, which led to the conclusion that the Trustee should serve as a Trustee for the fund.
Advisory Board Members and Officers:
Correspondence intended for a Member of the Advisory Board (if any) may be sent to Fidelity Investments, P.O. Box 55235, Boston, Massachusetts 02205-5235. Correspondence intended for an officer may be sent to Fidelity Investments, 245 Summer Street, Boston, Massachusetts 02210. Officers appear below in alphabetical order.
Name, Year of Birth; Principal Occupation
Laura M. Bishop (1961)
Year of Election or Appointment: 2022
Member of the Advisory Board
Ms. Bishop also serves as a Member of the Advisory Board of other funds. Prior to her retirement, Ms. Bishop held a variety of positions at United Services Automobile Association (2001-2020), including Executive Vice President and Chief Financial Officer (2014-2020) and Senior Vice President and Deputy Chief Financial Officer (2012-2014). Ms. Bishop currently serves as a member of the Audit Committee and Compensation and Personnel Committee (2021-present) of the Board of Directors of Korn Ferry (global organizational consulting).
Robert W. Helm (1957)
Year of Election or Appointment: 2021
Member of the Advisory Board
Mr. Helm also serves as a Member of the Advisory Board of other Fidelity® funds. Mr. Helm was formerly Deputy Chairman (2003-2020), partner (1991-2020) and an associate (1984-1991) of Dechert LLP (formerly Dechert Price & Rhoads). Mr. Helm currently serves on boards and committees of several not-for-profit organizations.
Craig S. Brown (1977)
Year of Election or Appointment: 2019
Assistant Treasurer
Mr. Brown also serves as an officer of other funds. Mr. Brown serves as Assistant Treasurer of FIMM, LLC (2021-present) and is an employee of Fidelity Investments (2013-present). Previously, Mr. Brown served as Assistant Treasurer of certain Fidelity ® funds (2019-2022).
John J. Burke III (1964)
Year of Election or Appointment: 2018
Chief Financial Officer
Mr. Burke also serves as Chief Financial Officer of other funds. Mr. Burke serves as Head of Investment Operations for Fidelity Fund and Investment Operations (2018-present) and is an employee of Fidelity Investments (1998-present). Previously Mr. Burke served as head of Asset Management Investment Operations (2012-2018).
David J. Carter (1973)
Year of Election or Appointment: 2020
Assistant Secretary
Mr. Carter also serves as Assistant Secretary of other funds. Mr. Carter serves as Senior Vice President, Deputy General Counsel (2022-present) and is an employee of Fidelity Investments (2005-present).
Jonathan Davis (1968)
Year of Election or Appointment: 2010
Assistant Treasurer
Mr. Davis also serves as an officer of other funds. Mr. Davis serves as Assistant Treasurer of FIMM, LLC (2021-present), FMR Capital, Inc. (2017-present), FD Funds GP LLC (2021-present), FD Funds Holding LLC (2021-present), and FD Funds Management LLC (2021-present); and is an employee of Fidelity Investments. Previously, Mr. Davis served as Vice President and Associate General Counsel of FMR LLC (diversified financial services company, 2003-2010).
Laura M. Del Prato (1964)
Year of Election or Appointment: 2018
President and Treasurer
Ms. Del Prato also serves as an officer of other funds. Ms. Del Prato serves as Assistant Treasurer of FIMM, LLC (2021-present) and is an employee of Fidelity Investments (2017-present). Previously, Ms. Del Prato served as President and Treasurer of The North Carolina Capital Management Trust: Cash Portfolio and Term Portfolio (2018-2020). Prior to joining Fidelity Investments, Ms. Del Prato served as a Managing Director and Treasurer of the JPMorgan Mutual Funds (2014-2017). Prior to JPMorgan, Ms. Del Prato served as a partner at Cohen Fund Audit Services (accounting firm, 2012-2013) and KPMG LLP (accounting firm, 2004-2012).
Christopher M. Gouveia (1973)
Year of Election or Appointment: 2023
Chief Compliance Officer
Mr. Gouveia also serves as Chief Compliance Officer of other funds. Mr. Gouveia serves as Senior Vice President of Asset Management Compliance for Fidelity Investments and is an employee of Fidelity Investments. Previously, Mr. Gouveia served as Chief Compliance Officer of the North Carolina Capital Management Trust (2016-2019).
Colm A. Hogan (1973)
Year of Election or Appointment: 2016
Assistant Treasurer
Mr. Hogan also serves as an officer of other funds. Mr. Hogan serves as Assistant Treasurer of FIMM, LLC (2021-present) and FMR Capital, Inc. (2017-present) and is an employee of Fidelity Investments (2005-present). Previously, Mr. Hogan served as Deputy Treasurer of certain Fidelity ® funds (2016-2020) and Assistant Treasurer of certain Fidelity ® funds (2016-2018).
Cynthia Lo Bessette (1969)
Year of Election or Appointment: 2019
Secretary and Chief Legal Officer (CLO)
Ms. Lo Bessette also serves as an officer of other funds. Ms. Lo Bessette serves as CLO, Secretary, and Senior Vice President of Fidelity Management & Research Company LLC (investment adviser firm, 2019-present); CLO of Fidelity Management & Research (Hong Kong) Limited, FMR Investment Management (UK) Limited, and Fidelity Management & Research (Japan) Limited (investment adviser firms, 2019-present); Secretary of FD Funds GP LLC (2021-present), FD Funds Holding LLC (2021-present), FD Funds Management LLC (2021-present), and Fidelity Diversifying Solutions LLC (investment adviser firm, 2022-present); and Assistant Secretary of FIMM, LLC (2019-present). She is a Senior Vice President and Deputy General Counsel of FMR LLC (diversified financial services company, 2019-present), and is an employee of Fidelity Investments. Previously, Ms. Lo Bessette served as CLO, Secretary, and Senior Vice President of FMR Co., Inc. (investment adviser firm, 2019); Secretary of Fidelity SelectCo, LLC and Fidelity Investments Money Management, Inc. (investment adviser firms, 2019). Prior to joining Fidelity Investments, Ms. Lo Bessette was Executive Vice President, General Counsel (2016-2019) and Senior Vice President, Deputy General Counsel (2015-2016) of OppenheimerFunds (investment management company) and Deputy Chief Legal Officer (2013-2015) of Jennison Associates LLC (investment adviser firm).
Chris Maher (1972)
Year of Election or Appointment: 2013
Assistant Treasurer
Mr. Maher also serves as an officer of other funds. Mr. Maher serves as Assistant Treasurer of FIMM, LLC (2021-present) and FMR Capital, Inc. (2017-present), and is an employee of Fidelity Investments (2008-present). Previously, Mr. Maher served as Assistant Treasurer of certain funds (2013-2020); Vice President of Asset Management Compliance (2013), Vice President of the Program Management Group of FMR (investment adviser firm, 2010-2013), and Vice President of Valuation Oversight (2008-2010).
Jamie Pagliocco (1964)
Year of Election or Appointment: 2020
Vice President
Mr. Pagliocco also serves as Vice President of other funds. Mr. Pagliocco serves as President of Fixed Income (2020-present), and is an employee of Fidelity Investments (2001-present). Previously, Mr. Pagliocco served as Co-Chief Investment Officer - Bond (2017-2020), Global Head of Bond Trading (2016-2019), and as a portfolio manager.
Brett Segaloff (1972)
Year of Election or Appointment: 2021
Anti-Money Laundering (AML) Officer
Mr. Segaloff also serves as an AML Officer of other funds and other related entities. He is Director, Anti-Money Laundering (2007-present) of FMR LLC (diversified financial services company) and is an employee of Fidelity Investments (1996-present).
Stacie M. Smith (1974)
Year of Election or Appointment: 2013
Assistant Treasurer
Ms. Smith also serves as an officer of other funds. Ms. Smith serves as Assistant Treasurer of FIMM, LLC (2021-present) and FMR Capital, Inc. (2017-present), is an employee of Fidelity Investments (2009-present), and has served in other fund officer roles. Prior to joining Fidelity Investments, Ms. Smith served as Senior Audit Manager of Ernst & Young LLP (accounting firm, 1996-2009). Previously, Ms. Smith served as Assistant Treasurer (2013-2019) and Deputy Treasurer (2013-2016) of certain Fidelity ® funds.
Jim Wegmann (1979)
Year of Election or Appointment: 2021
Deputy Treasurer
Mr. Wegmann also serves as an officer of other funds. Mr. Wegmann serves as Assistant Treasurer of FIMM, LLC (2021-present) and is an employee of Fidelity Investments (2011-present). Previously, Mr. Wegmann served as Assistant Treasurer of certain Fidelity ® funds (2019-2021).
As a shareholder, you incur two types of costs: (1) transaction costs, which may include sales charges (loads) on purchase payments or redemption proceeds, as applicable and (2) ongoing costs, which generally include management fees, distribution and/or service (12b-1) fees and other Fund expenses. This Example is intended to help you understand your ongoing costs (in dollars) of investing in a fund and to compare these costs with the ongoing costs of investing in other mutual funds.
| The Example is based on an investment of $1,000 invested at the beginning of the period and held for the entire period (July 1, 2022 to December 31, 2022). |
Actual Expenses
The first line of the accompanying table provides information about actual account values and actual expenses. You may use the information in this line, together with the amount you invested, to estimate the expenses that you paid over the period. Simply divide your account value by $1,000.00 (for example, an $8,600 account value divided by $1,000.00 = 8.6), then multiply the result by the number in the first line for a class/Fund under the heading entitled "Expenses Paid During Period" to estimate the expenses you paid on your account during this period. If any fund is a shareholder of any underlying mutual funds or exchange-traded funds (ETFs) (the Underlying Funds), such fund indirectly bears its proportional share of the expenses of the Underlying Funds in addition to the direct expenses incurred presented in the table. These fees and expenses are not included in the annualized expense ratio used to calculate the expense estimate in the table below.
Hypothetical Example for Comparison Purposes
The second line of the accompanying table provides information about hypothetical account values and hypothetical expenses based on the actual expense ratio and an assumed rate of return of 5% per year before expenses, which is not the actual return. The hypothetical account values and expenses may not be used to estimate the actual ending account balance or expenses you paid for the period. You may use this information to compare the ongoing costs of investing in the Fund and other funds. To do so, compare this 5% hypothetical example with the 5% hypothetical examples that appear in the shareholder reports of the other funds. If any fund is a shareholder of any Underlying Funds, such fund indirectly bears its proportional share of the expenses of the Underlying Funds in addition to the direct expenses as presented in the table. These fees and expenses are not included in the annualized expense ratio used to calculate the expense estimate in the table below.
Please note that the expenses shown in the table are meant to highlight your ongoing costs only and do not reflect any transaction costs. Therefore, the second line of the table is useful in comparing ongoing costs only, and will not help you determine the relative total costs of owning different funds. In addition, if these transactional costs were included, your costs would have been higher.
| | | | | Annualized Expense Ratio- A | | Beginning Account Value July 1, 2022 | | Ending Account Value December 31, 2022 | | Expenses Paid During Period- C July 1, 2022 to December 31, 2022 |
| | | | | | | | | | |
| Fidelity Flex® Municipal Income Fund | | | | -%- D | | | | | | |
| Actual | | | | | | $ 1,000 | | $ 1,005.30 | | $- E |
Hypothetical- B | | | | | | $ 1,000 | | $ 1,025.21 | | $- E |
| |
A Annualized expense ratio reflects expenses net of applicable fee waivers.
B 5% return per year before expenses
C Expenses are equal to the annualized expense ratio, multiplied by the average account value over the period, multiplied by 184/ 365 (to reflect the one-half year period). The fees and expenses of any Underlying Funds are not included in each annualized expense ratio.
D Amount represents less than .005%.
E Amount represents less than $.005.
The dividend and capital gains distributions for the fund(s) are available on Fidelity.com or Institutional.Fidelity.com .
During fiscal year ended 2022, 100% of the fund's income dividends was free from federal income tax, and 17.24% of the fund's income dividends was subject to the federal alternative minimum tax.
The fund will notify shareholders in January 2023 of amounts for use in preparing 2022 income tax returns.
Fidelity Flex Municipal Income Fund
Each year, the Board of Trustees, including the Independent Trustees (together, the Board), votes on the renewal of the management contract with Fidelity Management & Research Company LLC (FMR) and the sub-advisory agreements (together, the Advisory Contracts) for the fund. FMR and the sub-advisers are referred to herein as the Investment Advisers. The Board, assisted by the advice of fund counsel and Independent Trustees' counsel, requests and considers a broad range of information relevant to the renewal of the Advisory Contracts throughout the year.
The Board meets regularly and, at each of its meetings, covers an extensive agenda of topics and materials and considers factors that are relevant to its annual consideration of the renewal of the fund's Advisory Contracts, including the services and support provided to the fund and its shareholders. The Board has established four standing committees (Committees) - Operations, Audit, Fair Valuation, and Governance and Nominating - each composed of and chaired by Independent Trustees with varying backgrounds, to which the Board has assigned specific subject matter responsibilities in order to enhance effective decision-making by the Board. The Operations Committee, of which all the Independent Trustees are members, meets regularly throughout the year and requests, receives and considers, among other matters, information related to the annual consideration of the renewal of the fund's Advisory Contracts before making its recommendation to the Board. The Board also meets as needed to review matters specifically related to the Board's annual consideration of the renewal of the Advisory Contracts. Members of the Board may also meet from time to time with trustees of other Fidelity funds through joint ad hoc committees to discuss certain matters relevant to all of the Fidelity funds.
At its September 2022 meeting, the Board unanimously determined to renew the fund's Advisory Contracts. In considering whether to renew the Advisory Contracts for the fund, the Board considered all factors it believed relevant and reached a determination, with the assistance of fund counsel and Independent Trustees' counsel and through the exercise of its business judgment, that the renewal of the Advisory Contracts was in the best interests of the fund and its shareholders and the fact that no fee is payable under the management contract was fair and reasonable.
Nature, Extent, and Quality of Services Provided . The Board considered Fidelity's staffing as it relates to the fund, including the backgrounds of investment personnel of Fidelity, and also considered the fund's investment objective, strategies, and related investment philosophy. The Independent Trustees also had discussions with senior management of Fidelity's investment operations and investment groups. The Board considered the structure of the investment personnel compensation program and whether this structure provides appropriate incentives to act in the best interests of the fund. Additionally, the Board considered the portfolio managers' investments, if any, in the funds that they manage. The Board also considered the steps Fidelity had taken to ensure the continued provision of high quality services to the Fidelity funds throughout the COVID-19 pandemic, including the expansion of staff in client facing positions to maintain service levels in periods of high volumes and volatility.
Resources Dedicated to Investment Management and Support Services. The Board reviewed the general qualifications and capabilities of Fidelity's investment staff, including its size, education, experience, and resources, as well as Fidelity's approach to recruiting, training, managing, and compensating investment personnel. The Board noted the resources devoted to Fidelity's global investment organization, and that Fidelity's analysts have extensive resources, tools and capabilities that allow them to conduct quantitative and fundamental analysis, as well as credit analysis of issuers, counterparties and guarantors. Further, the Board considered that Fidelity's investment professionals have sufficient access to global information and data so as to provide competitive investment results over time, and that those professionals also have access to sophisticated tools that permit them to assess portfolio construction and risk and performance attribution characteristics continuously, as well as to transmit new information and research conclusions rapidly around the world. Additionally, in its deliberations, the Board considered Fidelity's trading, risk management, compliance, cybersecurity, and technology and operations capabilities and resources, which are integral parts of the investment management process.
Shareholder and Administrative Services. The Board considered (i) the nature, extent, quality, and cost of advisory, administrative, and shareholder services performed by the Investment Advisers and their affiliates under the Advisory Contracts and under separate agreements covering transfer agency and pricing and bookkeeping services for the fund; (ii) the nature and extent of the supervision of third party service providers, principally custodians, subcustodians, and pricing vendors; and (iii) the resources devoted to, and the record of compliance with, the fund's compliance policies and procedures.
The Board noted that the growth of fund assets over time across the complex allows Fidelity to reinvest in the development of services designed to enhance the value and convenience of the Fidelity funds as investment vehicles. These services include 24-hour access to account information and market information over the Internet and through telephone representatives, investor education materials and asset allocation tools. The Board also considered that it reviews customer service metrics such as telephone response times, continuity of services on the website and metrics addressing services at Fidelity Investor Centers.
Investment in a Large Fund Family . The Board considered the benefits to shareholders of investing in a Fidelity fund, including the benefits of investing in a fund that is part of a large family of funds offering a variety of investment disciplines and providing a large variety of mutual fund investor services. The Board noted that Fidelity had taken, or had made recommendations to the Board that resulted in the Fidelity funds taking, a number of actions over the previous year that benefited particular funds, including: (i) continuing to dedicate additional resources to Fidelity's investment research process, which includes meetings with management of issuers of securities in which the funds invest; (ii) continuing efforts to enhance Fidelity's global research capabilities; (iii) launching new funds, ETFs, and share classes with innovative structures, strategies and pricing and making other enhancements to meet investor needs; (iv) broadening eligibility requirements for certain funds and share classes; (v) reducing management fees and total expenses for certain funds and classes; (vi) lowering expenses for certain existing funds and classes by implementing or lowering expense caps; (vii) rationalizing product lines and gaining increased efficiencies from fund mergers and liquidations; (viii) continuing to develop, acquire and implement systems and technology to improve services to the funds and shareholders, strengthen information security, and increase efficiency; and (ix) continuing to implement enhancements to further strengthen Fidelity's product line to increase investors' probability of success in achieving their investment goals, including their retirement income goals.
Investment Performance . The Board considered whether the fund has operated in accordance with its investment objective, as well as its record of compliance with its investment restrictions. The Board reviewed the fund's absolute investment performance, as well as the fund's relative investment performance. The Board did not consider performance to be a material factor in its decision to renew the fund's Advisory Contracts as the fund is not publicly offered as a stand-alone investment product. In this regard, the Board noted that the fund is available exclusively to certain fee-based accounts and advisor programs offered by Fidelity, including certain employer-sponsored plans and discretionary investment programs.
Based on its review, the Board concluded that the nature, extent, and quality of services provided to the fund under the Advisory Contracts should continue to benefit the shareholders of the fund.
Competitiveness of Management Fee and Total Expense Ratio . The Board noted that the fund is available exclusively through certain Fidelity fee-based accounts and advisory programs. The Board considered that the fund does not pay FMR a management fee for investment advisory services, but that FMR is indirectly compensated for its services out of Fidelity fee-based account and advisory program fees. The Board also noted that FMR or an affiliate undertakes to pay all operating expenses of the fund, except Independent Trustee fees and expenses, proxy and shareholder meeting expenses, interest, taxes, and extraordinary expenses (such as litigation expenses). The Board further noted that the fund pays its non-operating expenses, including brokerage commissions and fees and expenses associated with the fund's securities lending program, if applicable.
Based on its review, the Board considered that the fund does not pay a management fee and concluded that the fund's total expense ratio was reasonable in light of the services that the fund and its shareholders receive and the other factors considered.
Costs of the Services and Profitability. The Board considered the level of Fidelity's profits in respect of all the Fidelity funds.
A public accounting firm has been engaged annually by the Board as part of the Board's assessment of Fidelity's profitability analysis. The engagement includes the review and assessment of the methodologies used by Fidelity in determining the revenues and expenses attributable to Fidelity's mutual fund business, and completion of agreed-upon procedures in respect of the mathematical accuracy of certain fund profitability information and its conformity to established allocation methodologies. After considering the reports issued under the engagement and information provided by Fidelity, the Board concluded that while other allocation methods may also be reasonable, Fidelity's profitability methodologies are reasonable in all material respects.
The Board also reviewed Fidelity's non-fund businesses and potential indirect benefits such businesses may have received as a result of their association with Fidelity's mutual fund business (i.e., fall-out benefits) as well as cases where Fidelity's affiliates may benefit from the funds' business. The Board considered areas where potential indirect benefits to the Fidelity funds from their relationships with Fidelity may exist. The Board's consideration of these matters was informed by the findings of a joint ad hoc committee created by it and the boards of other Fidelity funds to evaluate potential fall-out benefits.
The Board concluded that the costs of the services provided by and the profits realized by Fidelity in connection with the operation of the fund were not relevant to the renewal of the Advisory Contracts because the fund pays no advisory fees and FMR or an affiliate bears all expenses of the fund, with limited exceptions.
Economies of Scale . The Board concluded that because the fund pays no advisory fees and FMR or an affiliate bears all expenses of the fund with certain limited exceptions, the realization of economies of scale was not a material factor in the Board's decision to renew the fund's Advisory Contracts.
Additional Information Requested by the Board. In order to develop fully the factual basis for consideration of the Fidelity funds' advisory contracts, the Board requested and received additional information on certain topics, including: (i) Fidelity's fund profitability methodology, profitability trends for certain funds, the allocation of various costs to different funds, and the impact of certain factors on fund profitability results; (ii) portfolio manager changes that have occurred during the past year and the amount of the investment that each portfolio manager has made in the Fidelity fund(s) that he or she manages; (iii) the extent to which current market conditions have affected retention and recruitment of personnel; (iv) the arrangements with and compensation paid to certain fund sub-advisers on behalf of the Fidelity funds and the treatment of such compensation within Fidelity's fund profitability methodology; (v) the terms of the funds' various management fee structures, including the basic group fee and the terms of Fidelity's voluntary expense limitation arrangements; (vi) Fidelity's transfer agent, pricing and bookkeeping fees, expense and service structures for different funds and classes relative to competitive trends; (vii) the impact on fund profitability of recent industry trends, such as the growth in passively managed funds and the changes in flows for different types of funds; (viii) the types of management fee and total expense comparisons provided, and the challenges and limitations associated with such information; and (ix) explanations regarding the relative total expense ratios and management fees of certain funds and classes, total expense and management fee competitive trends, and methodologies for total expense and management fee competitive comparisons. In addition, the Board considered its discussions with Fidelity regarding Fidelity's efforts to maintain the continuous investment and shareholder services necessary for the funds during the current pandemic and economic circumstances.
Based on its evaluation of all of the conclusions noted above, and after considering all factors it believed relevant, the Board concluded that the advisory fee arrangements are fair and reasonable, and that the fund's Advisory Contracts should be renewed.
1.9884856.105
XLI-ANN-0323
Fidelity® Municipal Income Fund
Annual Report
December 31, 2022
Includes Fidelity and Fidelity Advisor share classes
Contents
To view a fund's proxy voting guidelines and proxy voting record for the 12-month period ended June 30, visit http://www.fidelity.com/proxyvotingresults or visit the Securities and Exchange Commission's (SEC) web site at http://www.sec.gov.
You may also call 1-800-544-8544 if you're an individual investing directly with Fidelity, call 1-800-835-5092 if you're a plan sponsor or participant with Fidelity as your recordkeeper or call 1-877-208-0098 on institutional accounts or if you're an advisor or invest through one to request a free copy of the proxy voting guidelines.
Standard & Poor's, S&P and S&P 500 are registered service marks of The McGraw-Hill Companies, Inc. and have been licensed for use by Fidelity Distributors Corporation.
Other third-party marks appearing herein are the property of their respective owners.
All other marks appearing herein are registered or unregistered trademarks or service marks of FMR LLC or an affiliated company. © 2023 FMR LLC. All rights reserved.
This report and the financial statements contained herein are submitted for the general information of the shareholders of the Fund. This report is not authorized for distribution to prospective investors in the Fund unless preceded or accompanied by an effective prospectus.
A fund files its complete schedule of portfolio holdings with the SEC for the first and third quarters of each fiscal year on Form N-PORT. Forms N-PORT are available on the SEC's web site at http://www.sec.gov. A fund's Forms N-PORT may be reviewed and copied at the SEC's Public Reference Room in Washington, DC. Information regarding the operation of the SEC's Public Reference Room may be obtained by calling 1-800-SEC-0330.
For a complete list of a fund's portfolio holdings, view the most recent holdings listing, semiannual report, or annual report on Fidelity's web site at http://www.fidelity.com, http://www.institutional.fidelity.com, or http://www.401k.com, as applicable.
NOT FDIC INSURED •MAY LOSE VALUE •NO BANK GUARANTEE
Neither the Fund nor Fidelity Distributors Corporation is a bank.
Average annual total return reflects the change in the value of an investment, assuming reinvestment of distributions from dividend income and capital gains (the profits earned upon the sale of securities that have grown in value, if any) and assuming a constant rate of performance each year. The hypothetical investment and the average annual total returns do not reflect the deduction of taxes that a shareholder would pay on fund distributions or the redemption of fund shares. During periods of reimbursement by Fidelity, a fund's total return will be greater than it would be had the reimbursement not occurred. How a fund did yesterday is no guarantee of how it will do tomorrow.
| Average Annual Total Returns |
| | | | |
Periods ended December 31, 2022 | Past 1 year | Past 5 years | Past 10 years |
| Class A (incl.4.00% sales charge) | -14.06% | -0.04% | 1.67% |
| Class M (incl.4.00% sales charge) | -14.04% | -0.01% | 1.69% |
Class C (incl. contingent deferred sales charge) | -12.01% | 0.06% | 1.73% |
| Fidelity® Municipal Income Fund | -10.18% | 1.12% | 2.26% |
| Class I | -10.26% | 1.02% | 2.21% |
| Class Z | -10.22% | 1.12% | 2.26% |
Class A shares bear a 0.25% 12b-1 fee. The initial offering of Class A shares took place on March 1, 2018. Returns prior to March 1, 2018, are those of Fidelity® Municipal Income Fund, the original class of the fund, which has no 12b-1 fee. Had Class A's 12b-1 fee been reflected, returns prior to March 1, 2018, would have been lower.
Class M shares bear a 0.25% 12b-1 fee. The initial offering of Class M shares took place on March 1, 2018. Returns prior to March 1, 2018, are those of Fidelity® Municipal Income Fund, the original class of the fund, which has no 12b-1 fee. Had Class M's 12b-1 fee been reflected, returns prior to March 1, 2018, would have been lower.
Class C shares bear a 1.00% 12b-1 fee. The initial offering of Class C shares took place on March 1, 2018. Returns prior to March 1, 2018, are those of Fidelity® Municipal Income Fund, the original class of the fund, which has no 12b-1 fee. Had Class C's 12b-1 fee been reflected, returns prior to March 1, 2018, would have been lower.
The initial offering of Class I shares took place on March 1, 2018. Returns prior to March 1, 2018 are those of Fidelity® Municipal Income Fund, the original class of the fund.
The initial offering of Class Z shares took place on October 2, 2018. Returns between March 1, 2018 and October 2, 2018, are those of Class I. Returns prior to March 1, 2018 are those of Fidelity Municipal Income Fund, the original class of the fund.
Class C shares' contingent deferred sales charges included in the past one year, past five years and past ten years total return figures are 1%, 0% and 0%, respectively.
| $10,000 Over 10 Years |
| |
Let's say hypothetically that $10,000 was invested in Fidelity® Municipal Income Fund, a class of the fund, on December 31, 2012. The chart shows how the value of your investment would have changed, and also shows how the Bloomberg Municipal Bond Index performed over the same period. |
|
|
Market Recap:
Tax-exempt municipal bonds notably declined in 2022, as a multitude of crosscurrents challenged the global economy and financial markets. The Bloomberg Municipal Bond Index returned -8.53% for the year, its third-worst annual return on record. In late 2021, the Federal Reserve began its pivot to a tighter monetary policy, tapering the large-scale asset purchases it restarted in 2020 amid the COVID-19 pandemic. In early 2022, the Fed, faced with persistent inflationary pressure, implemented an aggressive series of rate hikes, raising its benchmark interest rate seven times, by a total of 4.25 percentage points, between March and December. This helped push municipal bond yields to their highest level in more than a decade. Muni bond prices, which move inversely to yields, fell sharply. Credit spreads significantly widened, as investors demanded more yield for lower-quality munis as recession risk increased. In November and December, the tax-exempt market staged a rally when comments by Fed Chair Jerome Powell pointed to a slowdown in the pace of rate hikes and inflation data moderated. Favorable supply and demand dynamics also helped amid muted muni bond issuance and increased pockets of demand. Muni tax-backed credit fundamentals remained solid throughout the year and, for the most part, the risk of credit-rating downgrades appeared low. Shorter-duration (lower sensitivity to changes in interest rates) and higher-credit-quality munis performed best for the year.
Comments from Co-Portfolio Managers Cormac Cullen, Michael Maka and Elizah McLaughlin:
For the fiscal year ending December 31, 2022, the fund's share classes (excluding sales charges, if any) returned roughly -10% to -11%, lagging the -8.53% result of the benchmark, the broad-based Bloomberg Municipal Bond Index. The past 12 months, we continued to focus on longer-term objectives and sought to generate attractive tax-exempt income and a competitive risk-adjusted return. Versus the benchmark, the fund's overweight exposure to the health care and transportation sectors detracted from relative performance, as many of the fund's holdings in these segments were lower-quality investment-grade bonds that produced subpar results as credit spreads widened. Pricing-related factors significantly detracted as well. Fund holdings are priced by a third-party pricing service and validated daily by Fidelity Management & Research's fair-value processes. Securities within the index, however, are priced by the index provider. These two approaches employ somewhat different methodologies in estimating the prices of municipal securities, most of which trade infrequently. In contrast, duration (interest rate) positioning contributed to performance. The fund had less sensitivity to interest rates, as measured by its shorter duration, during periods when interest rates rose and therefore was hurt less. A higher-than-average yield on the fund's underlying holdings provided another boost to the relative result.
The views expressed above reflect those of the portfolio manager(s) only through the end of the period as stated on the cover of this report and do not necessarily represent the views of Fidelity or any other person in the Fidelity organization. Any such views are subject to change at any time based upon market or other conditions and Fidelity disclaims any responsibility to update such views. These views may not be relied on as investment advice and, because investment decisions for a Fidelity fund are based on numerous factors, may not be relied on as an indication of trading intent on behalf of any Fidelity fund.
| Top Five States (% of Fund's net assets) |
| | |
| Illinois | 17.2 |
| Pennsylvania | 8.6 |
| New York | 6.8 |
| Florida | 6.5 |
| New Jersey | 4.8 |
| | |
| Revenue Sources (% of Fund's net assets) |
| Health Care | 25.0% | |
| Transportation | 24.0% | |
| General Obligations | 21.4% | |
| Education | 8.5% | |
| Special Tax | 6.8% | |
| Others* (Individually Less Than 5%) | 14.3% | |
| | 100.0% | |
| |
| *Includes net other assets | | |
Quality Diversification (% of Fund's net assets) |
|
| |
| We have used ratings from Moody's Investors Service, Inc. Where Moody's® ratings are not available, we have used S&P® ratings. All ratings are as of the date indicated and do not reflect subsequent changes. |
Showing Percentage of Net Assets
| Municipal Bonds - 97.0% |
| | | Principal Amount (a) (000s) | Value ($) (000s) |
| Alabama - 0.8% | | | |
| Auburn Univ. Gen. Fee Rev. Series 2018 A, 5% 6/1/43 | | 2,565 | 2,730 |
| Jefferson County Gen. Oblig. Series 2018 A, 5% 4/1/26 | | 2,400 | 2,558 |
| Montgomery Med. Clinic Facilities Series 2015, 5% 3/1/33 | | 4,140 | 4,016 |
| Southeast Energy Auth. Rev. Bonds: | | | |
| (Proj. No. 2) Series 2021 B1: | | | |
4% 6/1/29 | | 1,475 | 1,464 |
4% 6/1/30 | | 1,115 | 1,099 |
4% 6/1/31 | | 975 | 954 |
| Bonds (Proj. No. 2) Series 2021 B1, 4%, tender 12/1/31 (b) | | 23,655 | 22,815 |
TOTAL ALABAMA | | | 35,636 |
| Arizona - 1.8% | | | |
| Arizona Health Facilities Auth. Rev. (Banner Health Sys. Proj.) Series 2007 B, 3 month U.S. LIBOR + 0.810% 3.318%, tender 1/1/37 (b)(c) | | 2,485 | 2,308 |
| Arizona Indl. Dev. Auth. Hosp. Rev. Series 2021 A: | | | |
| 5% 2/1/30 | | 1,300 | 1,469 |
| 5% 2/1/31 | | 1,250 | 1,432 |
| 5% 2/1/32 | | 1,250 | 1,446 |
| Arizona Indl. Dev. Auth. Rev. (Provident Group-Eastern Michigan Univ. Parking Proj.) Series 2018: | | | |
| 5% 5/1/48 | | 910 | 613 |
| 5% 5/1/51 | | 910 | 601 |
| Glendale Gen. Oblig. Series 2017: | | | |
| 5% 7/1/30 | | 2,080 | 2,276 |
| 5% 7/1/31 | | 3,105 | 3,386 |
| Glendale Indl. Dev. Auth. (Terraces of Phoenix Proj.) Series 2018 A: | | | |
| 5% 7/1/38 | | 235 | 205 |
| 5% 7/1/48 | | 295 | 239 |
| Maricopa County Indl. Dev. Auth. (Creighton Univ. Proj.) Series 2020, 5% 7/1/47 | | 2,400 | 2,513 |
| Maricopa County Indl. Dev. Auth. Sr. Living Facilities Series 2016: | | | |
| 5.75% 1/1/36 (d) | | 2,140 | 1,659 |
| 6% 1/1/48 (d) | | 5,260 | 3,697 |
| Maricopa County Rev.: | | | |
| Series 2016 A: | | | |
5% 1/1/32 | | 8,280 | 8,828 |
5% 1/1/33 | | 4,965 | 5,286 |
| Series 2017 D, 3% 1/1/48 | | 5,970 | 4,399 |
| Series 2019 E, 3% 1/1/49 | | 3,535 | 2,587 |
| Phoenix Civic Impt. Board Arpt. Rev.: | | | |
| Series 2017 A: | | | |
5% 7/1/33 (e) | | 910 | 955 |
5% 7/1/36 (e) | | 1,450 | 1,505 |
5% 7/1/37 (e) | | 1,075 | 1,111 |
| Series 2017 B: | | | |
5% 7/1/29 | | 2,070 | 2,263 |
5% 7/1/33 | | 2,900 | 3,149 |
5% 7/1/36 | | 3,310 | 3,518 |
5% 7/1/37 | | 2,070 | 2,187 |
| Phoenix Civic Impt. Corp. Series 2019 A, 5% 7/1/45 | | 6,100 | 6,368 |
| Phoenix IDA Student Hsg. Rev. (Downtown Phoenix Student Hsg. II LLC Arizona State Univ. Proj.) Series 2019 A: | | | |
| 5% 7/1/44 | | 1,000 | 971 |
| 5% 7/1/49 | | 1,125 | 1,071 |
| 5% 7/1/54 | | 1,330 | 1,254 |
| 5% 7/1/59 | | 2,000 | 1,864 |
| Salt Verde Finl. Corp. Sr. Gas Rev. Series 2007, 5.5% 12/1/29 | | 7,370 | 7,892 |
TOTAL ARIZONA | | | 77,052 |
| California - 4.2% | | | |
| ABC Unified School District Series 1997 C, 0% 8/1/28 (Nat'l. Pub. Fin. Guarantee Corp. Insured) | | 3,250 | 2,733 |
| California Gen. Oblig.: | | | |
| Series 2004: | | | |
5.25% 12/1/33 | | 150 | 150 |
5.5% 4/1/28 | | 10 | 10 |
5.5% 4/1/30 | | 5 | 5 |
| Series 2021, 5% 10/1/37 | | 7,740 | 8,743 |
| California Hsg. Fin. Agcy. Series 2021 1, 3.5% 11/20/35 | | 2,007 | 1,816 |
| California Muni. Fin. Auth. Student Hsg. (CHF-Davis I, LLC - West Village Student Hsg. Proj.) Series 2018, 5% 5/15/38 | | 7,200 | 7,313 |
| California Pub. Fin. Auth. Univ. Hsg. Rev.: | | | |
| (Claremont Colleges Proj.) Series 2017 A: | | | |
5% 7/1/27 (d) | | 920 | 891 |
5% 7/1/37 (d) | | 1,525 | 1,475 |
| (NCCD - Claremont Properties LLC - Claremont Colleges Proj.) Series 2017 A, 5% 7/1/47 (d) | | 335 | 324 |
| California Pub. Works Board Lease Rev. (Various Cap. Projs.) Series 2022 C: | | | |
| 5% 8/1/31 | | 1,365 | 1,610 |
| 5% 8/1/34 | | 2,535 | 2,945 |
| California Statewide Cmntys. Dev. Auth. Rev.: | | | |
| Series 2015, 5% 2/1/45 | | 2,695 | 1,987 |
| Series 2018 A, 5% 3/1/42 | | 195 | 199 |
| Eastern Muni. Wtr. District Fing. Auth. Series 2020 A: | | | |
| 4% 7/1/38 | | 1,400 | 1,410 |
| 5% 7/1/36 | | 1,600 | 1,810 |
| 5% 7/1/37 | | 1,000 | 1,121 |
| Folsom Cordova Union School District No. 4 Series A, 0% 10/1/31 (Nat'l. Pub. Fin. Guarantee Corp. Insured) | | 1,520 | 1,118 |
| Kern Cmnty. College District Gen. Oblig. Series 2006: | | | |
| 0% 11/1/28 (Assured Guaranty Muni. Corp. Insured) | | 4,100 | 3,389 |
| 0% 11/1/30 (Assured Guaranty Muni. Corp. Insured) | | 4,140 | 3,171 |
| Long Beach Unified School District Series 2009, 5.5% 8/1/29 | | 155 | 155 |
| Los Angeles Dept. Arpt. Rev.: | | | |
| Series 2020 C, 5% 5/15/45 (e) | | 2,900 | 2,992 |
| Series 2021 D: | | | |
5% 5/15/35 (e) | | 1,610 | 1,733 |
5% 5/15/35 (Pre-Refunded to 11/15/31 @ 100) (e) | | 90 | 105 |
| Los Angeles Hbr. Dept. Rev. Series 2019 A: | | | |
| 5% 8/1/25 (e) | | 3,515 | 3,677 |
| 5% 8/1/26 (e) | | 1,350 | 1,436 |
| Monrovia Unified School District Series B, 0% 8/1/29 (Nat'l. Pub. Fin. Guarantee Corp. Insured) | | 3,745 | 2,979 |
| Mount Diablo Unified School District Series 2022 B: | | | |
| 4% 8/1/29 | | 1,595 | 1,725 |
| 4% 8/1/30 | | 465 | 504 |
| 4% 8/1/32 | | 2,900 | 3,147 |
| Oakland Unified School District Alameda County Series 2015 A, 5% 8/1/29 | | 1,450 | 1,532 |
| Poway Unified School District: | | | |
| (District #2007-1 School Facilities Proj.) Series 2008 A, 0% 8/1/32 | | 4,885 | 3,458 |
| Series 2011, 0% 8/1/46 | | 950 | 297 |
| Series B: | | | |
0% 8/1/37 | | 6,455 | 3,462 |
0% 8/1/39 | | 19,705 | 9,430 |
| Poway Unified School District Pub. Fing. Series 2015 A: | | | |
| 5% 9/1/24 | | 825 | 845 |
| 5% 9/1/26 | | 1,050 | 1,095 |
| 5% 9/1/29 | | 2,185 | 2,269 |
| 5% 9/1/31 | | 985 | 1,017 |
| Sacramento City Fing. Auth. Rev. Series A, 0% 12/1/26 (Nat'l. Pub. Fin. Guarantee Corp. Insured) | | 4,140 | 3,648 |
| San Diego County Reg'l. Arpt. Auth. Arpt. Rev. Series 2021 B: | | | |
| 5% 7/1/46 (e) | | 10,000 | 10,208 |
| 5% 7/1/56 (e) | | 7,000 | 7,046 |
| San Diego Unified School District: | | | |
| Series 2008 C, 0% 7/1/34 | | 2,980 | 1,980 |
| Series 2008 E, 0% 7/1/47 (f) | | 7,205 | 5,162 |
| San Francisco City & County Arpts. Commission Int'l. Arpt. Rev.: | | | |
| Series 2019 A, 5% 5/1/49 (e) | | 1,000 | 1,013 |
| Series 2019 B, 5% 5/1/49 | | 3,765 | 3,972 |
| Series 2022 A: | | �� | |
5% 5/1/26 (e) | | 6,315 | 6,629 |
5% 5/1/27 (e) | | 6,395 | 6,774 |
5% 5/1/28 (e) | | 8,530 | 9,102 |
5% 5/1/29 (e) | | 5,710 | 6,135 |
| Series 2022 B, 5% 5/1/52 | | 17,310 | 18,584 |
| San Marcos Unified School District Series 2010 B, 0% 8/1/47 | | 17,635 | 5,652 |
| San Mateo County Cmnty. College District Series A, 0% 9/1/26 (Nat'l. Pub. Fin. Guarantee Corp. Insured) | | 4,495 | 4,066 |
| Washington Township Health Care District Gen. Oblig. Series 2013 A, 5.5% 8/1/38 | | 3,725 | 3,846 |
TOTAL CALIFORNIA | | | 177,895 |
| Colorado - 2.2% | | | |
| Arkansas River Pwr. Auth. Rev. Series 2018 A: | | | |
| 5% 10/1/38 | | 2,080 | 2,083 |
| 5% 10/1/43 | | 2,600 | 2,548 |
| Colorado Health Facilities Auth. Rev. Bonds: | | | |
| (Parkview Med. Ctr., Inc. Proj.) Series 2016: | | | |
4% 9/1/35 | | 1,365 | 1,328 |
4% 9/1/36 | | 1,075 | 1,025 |
5% 9/1/46 | | 6,045 | 6,101 |
| Series 2019 A1, 4% 8/1/44 | | 4,395 | 3,789 |
| Series 2019 A2: | | | |
3.25% 8/1/49 | | 4,110 | 2,909 |
4% 8/1/49 | | 17,455 | 14,640 |
5% 8/1/37 | | 1,000 | 1,038 |
5% 8/1/44 | | 6,145 | 6,156 |
| Series 2020 A, 4% 9/1/50 | | 1,525 | 1,244 |
| Colorado Hsg. & Fin. Auth. Series 2019 H, 4.25% 11/1/49 | | 1,075 | 1,085 |
| Denver City & County Arpt. Rev.: | | | |
| Series 2017 A: | | | |
5% 11/15/26 (e) | | 2,855 | 3,018 |
5% 11/15/27 (e) | | 2,440 | 2,601 |
| Series 2018 A: | | | |
5% 12/1/34 (e) | | 4,245 | 4,662 |
5% 12/1/36 (e) | | 4,140 | 4,323 |
5% 12/1/37 (e) | | 8,280 | 8,618 |
| Series 2022 A: | | | |
5% 11/15/33 (e) | | 1,185 | 1,301 |
5% 11/15/36 (e) | | 10,000 | 10,721 |
5.5% 11/15/38 (e) | | 12,500 | 13,770 |
TOTAL COLORADO | | | 92,960 |
| Connecticut - 1.8% | | | |
| Connecticut Gen. Oblig.: | | | |
| Series 2015 B, 5% 6/15/32 | | 1,895 | 1,991 |
| Series 2020 A: | | | |
4% 1/15/34 | | 8,385 | 8,730 |
4% 1/15/38 | | 1,000 | 996 |
| Series 2021 A: | | | |
3% 1/15/35 | | 1,000 | 921 |
3% 1/15/39 | | 1,475 | 1,252 |
3% 1/15/40 | | 1,770 | 1,469 |
| Series 2021 B: | | | |
3% 6/1/38 | | 1,850 | 1,598 |
3% 6/1/40 | | 1,740 | 1,441 |
4% 1/15/39 | | 3,305 | 3,238 |
| Series 2022 B, 3% 1/15/40 | | 3,710 | 3,080 |
| Connecticut Health & Edl. Facilities Auth. Rev.: | | | |
| (Sacred Heart Univ., CT. Proj.) Series 2017 I-1: | | | |
5% 7/1/26 | | 415 | 442 |
5% 7/1/27 | | 290 | 313 |
5% 7/1/28 | | 525 | 564 |
5% 7/1/29 | | 330 | 354 |
| Series 2016 K, 4% 7/1/46 | | 7,315 | 6,338 |
| Series 2018 K-3, 5% 7/1/36 | | 895 | 888 |
| Series 2019 A: | | | |
5% 7/1/39 (d) | | 3,930 | 3,497 |
5% 7/1/49 (d) | | 285 | 237 |
| Series 2020 A: | | | |
4% 7/1/37 | | 2,500 | 2,419 |
4% 7/1/38 | | 1,120 | 1,075 |
5% 7/1/32 | | 2,000 | 2,173 |
5% 7/1/34 | | 3,500 | 3,751 |
| Series 2020 K, 5% 7/1/44 (d) | | 1,525 | 1,415 |
| Series 2021 S, 4% 6/1/51 | | 1,675 | 1,464 |
| Series 2022 M: | | | |
4% 7/1/36 | | 4,000 | 3,813 |
4% 7/1/52 | | 2,515 | 2,247 |
| Series G, 5% 7/1/50 (d) | | 1,800 | 1,629 |
| Series K1: | | | |
5% 7/1/27 | | 415 | 422 |
5% 7/1/29 | | 1,060 | 1,079 |
5% 7/1/30 | | 830 | 843 |
5% 7/1/31 | | 1,400 | 1,419 |
5% 7/1/32 | | 1,000 | 1,011 |
5% 7/1/33 | | 2,500 | 2,523 |
5% 7/1/34 | | 620 | 624 |
| Connecticut Hsg. Fin. Auth. Series 2021 B1, 3% 11/15/49 | | 1,820 | 1,763 |
| Hbr. Point Infrastructure Impt. District Series 2017: | | | |
| 5% 4/1/30 (d) | | 3,785 | 3,806 |
| 5% 4/1/39 (d) | | 4,865 | 4,709 |
| New Britain Gen. Oblig. Series 2017 C, 5% 3/1/29 (Assured Guaranty Muni. Corp. Insured) | | 885 | 953 |
TOTAL CONNECTICUT | | | 76,487 |
| District Of Columbia - 1.2% | | | |
| Metropolitan Washington Arpts. Auth. Dulles Toll Road Rev.: | | | |
| (Dulles Metrorail and Cap. Impt. Proj.) Series 2019 B, 3% 10/1/50 (Assured Guaranty Muni. Corp. Insured) | | 6,355 | 4,540 |
| (Dulles Metrorail and Cap. Impt. Projs.): | | | |
Series 2019 A: | | | |
5% 10/1/35 | | 2,115 | 2,280 |
5% 10/1/37 | | 2,125 | 2,261 |
5% 10/1/39 | | 2,000 | 2,106 |
5% 10/1/44 | | 7,000 | 7,313 |
Series 2019 B, 5% 10/1/47 | | 7,150 | 7,254 |
| Metropolitan Washington DC Arpts. Auth. Sys. Rev.: | | | |
| Series 2017 A: | | | |
5% 10/1/31 (e) | | 1,200 | 1,267 |
5% 10/1/32 (e) | | 1,855 | 1,955 |
5% 10/1/33 (e) | | 910 | 957 |
5% 10/1/35 (e) | | 2,070 | 2,158 |
5% 10/1/42 (e) | | 4,140 | 4,225 |
| Series 2020 A: | | | |
5% 10/1/26 (e) | | 9,015 | 9,516 |
5% 10/1/27 (e) | | 3,125 | 3,326 |
5% 10/1/28 (e) | | 1,560 | 1,672 |
TOTAL DISTRICT OF COLUMBIA | | | 50,830 |
| Florida - 6.5% | | | |
| Brevard County School Board Ctfs. of Prtn. Series 2015 C, 5% 7/1/28 | | 1,445 | 1,514 |
| Broward County Arpt. Sys. Rev.: | | | |
| Series 2017: | | | |
5% 10/1/25 (e) | | 205 | 214 |
5% 10/1/26 (e) | | 930 | 982 |
5% 10/1/27 (e) | | 830 | 884 |
5% 10/1/29 (e) | | 2,200 | 2,322 |
5% 10/1/30 (e) | | 610 | 643 |
5% 10/1/32 (e) | | 2,900 | 3,050 |
5% 10/1/33 (e) | | 1,080 | 1,134 |
5% 10/1/34 (e) | | 1,055 | 1,103 |
5% 10/1/35 (e) | | 1,240 | 1,290 |
5% 10/1/36 (e) | | 1,655 | 1,716 |
5% 10/1/37 (e) | | 1,865 | 1,928 |
5% 10/1/42 (e) | | 3,520 | 3,590 |
5% 10/1/47 (e) | | 4,965 | 5,029 |
| Series A: | | | |
5% 10/1/28 (e) | | 2,485 | 2,575 |
5% 10/1/30 (e) | | 2,900 | 2,995 |
5% 10/1/31 (e) | | 2,485 | 2,564 |
5% 10/1/32 (e) | | 2,320 | 2,392 |
| Broward County School Board Ctfs. of Prtn.: | | | |
| (Broward County School District Proj.) Series 2016 A, 5% 7/1/28 | | 555 | 590 |
| Series 2015 A, 5% 7/1/27 | | 830 | 871 |
| Series 2016, 5% 7/1/32 | | 1,820 | 1,930 |
| Cap. Projs. Fin. Auth. Student Hsg. Rev. (Cap. Projs. Ln. Prog. - Florida Univs.) Series 2020 A, 5% 10/1/28 | | 2,000 | 2,037 |
| Duval County School Board Ctfs. of Prtn.: | | | |
| Series 2015 B: | | | |
5% 7/1/28 | | 1,705 | 1,790 |
5% 7/1/32 | | 10,120 | 10,596 |
| Series 2016 A, 5% 7/1/33 | | 1,110 | 1,180 |
| Escambia County Health Facilities Auth. Health Facilities Rev. Series 2020 A, 4% 8/15/45 | | 2,820 | 2,454 |
| Florida Dept. of Trans. Tpk. Rev. Series 2022 B: | | | |
| 4% 7/1/36 | | 4,155 | 4,257 |
| 4% 7/1/37 | | 4,525 | 4,459 |
| 4% 7/1/38 | | 4,710 | 4,662 |
| Florida Mid-Bay Bridge Auth. Rev.: | | | |
| Series 2015 A, 5% 10/1/35 | | 5,300 | 5,362 |
| Series 2015 C: | | | |
5% 10/1/30 | | 2,705 | 2,753 |
5% 10/1/40 | | 1,655 | 1,650 |
| Florida Muni. Pwr. Agcy. Rev.: | | | |
| (Requirements Pwr. Supply Proj.) Series 2016 A: | | | |
5% 10/1/30 | | 1,810 | 1,936 |
5% 10/1/31 | | 1,975 | 2,105 |
| Series 2015 B: | | | |
5% 10/1/28 | | 830 | 876 |
5% 10/1/30 | | 1,490 | 1,571 |
| Greater Orlando Aviation Auth. Arpt. Facilities Rev.: | | | |
| Series 2016 A, 5% 10/1/46 (e) | | 830 | 840 |
| Series 2016: | | | |
5% 10/1/26 (e) | | 1,405 | 1,483 |
5% 10/1/27 (e) | | 830 | 884 |
| Series 2017 A: | | | |
5% 10/1/25 (e) | | 275 | 286 |
5% 10/1/25 (Escrowed to Maturity) (e) | | 555 | 583 |
5% 10/1/27 (e) | | 385 | 407 |
5% 10/1/27 (Escrowed to Maturity) (e) | | 1,270 | 1,378 |
5% 10/1/29 (Pre-Refunded to 10/1/27 @ 100) (e) | | 2,485 | 2,697 |
5% 10/1/30 (Pre-Refunded to 10/1/27 @ 100) (e) | | 2,665 | 2,893 |
5% 10/1/34 (e) | | 4,965 | 5,191 |
5% 10/1/37 (e) | | 5,175 | 5,348 |
| Halifax Hosp. Med. Ctr. Rev. Series 2015, 5% 6/1/24 | | 230 | 235 |
| JEA Wtr. & Swr. Sys. Rev. Series 2021 A: | | | |
| 4% 10/1/37 | | 4,560 | 4,499 |
| 4% 10/1/38 | | 1,090 | 1,074 |
| Miami-Dade County Aviation Rev.: | | | |
| Series 2014 A, 5% 10/1/28 (e) | | 4,140 | 4,236 |
| Series 2015 A: | | | |
5% 10/1/29 (e) | | 1,310 | 1,350 |
5% 10/1/31 (e) | | 1,100 | 1,134 |
5% 10/1/35 (e) | | 4,555 | 4,584 |
| Series 2016 A: | | | |
5% 10/1/29 | | 1,200 | 1,288 |
5% 10/1/31 | | 1,450 | 1,549 |
| Series 2017 B, 5% 10/1/40 (e) | | 10,760 | 10,934 |
| Series 2019 A, 5% 10/1/49 (e) | | 11,860 | 11,922 |
| Miami-Dade County Expressway Auth.: | | | |
| Series 2014 A, 5% 7/1/44 | | 2,265 | 2,284 |
| Series 2014 B, 5% 7/1/28 | | 830 | 850 |
| Series 2016 A: | | | |
5% 7/1/32 | | 3,560 | 3,722 |
5% 7/1/33 | | 3,020 | 3,153 |
| Miami-Dade County School Board Ctfs. of Prtn.: | | | |
| Series 2015 A, 5% 5/1/29 | | 3,375 | 3,504 |
| Series 2016 A, 5% 5/1/30 | | 6,225 | 6,561 |
| Miami-Dade County Wtr. & Swr. Rev.: | | | |
| Series 2017 B, 4% 10/1/35 | | 3,900 | 3,927 |
| Series 2021: | | | |
5% 10/1/31 | | 1,250 | 1,443 |
5% 10/1/32 | | 645 | 740 |
| Orange County Health Facilities Auth. Series 2016 A: | | | |
| 5% 10/1/39 | | 2,200 | 2,261 |
| 5% 10/1/44 | | 1,605 | 1,636 |
| Palm Beach County Arpt. Sys. Rev. Series 2016: | | | |
| 5% 10/1/24 (e) | | 1,140 | 1,172 |
| 5% 10/1/27 (e) | | 830 | 873 |
| 5% 10/1/29 (e) | | 860 | 898 |
| 5% 10/1/30 (e) | | 1,530 | 1,597 |
| 5% 10/1/31 (e) | | 1,075 | 1,121 |
| 5% 10/1/32 (e) | | 1,655 | 1,724 |
| 5% 10/1/33 (e) | | 3,555 | 3,698 |
| 5% 10/1/34 (e) | | 3,730 | 3,866 |
| 5% 10/1/35 (e) | | 3,930 | 4,058 |
| Palm Beach County Health Facilities Auth. Hosp. Rev. Series 2019, 4% 8/15/49 | | 9,880 | 8,709 |
| Palm Beach County School Board Ctfs. of Prtn. Series 2015 D, 5% 8/1/28 | | 3,905 | 4,105 |
| Pinellas County Idr (Drs. Kiran & Pallavi Patel 2017 Foundation for Global Understanding, Inc. Proj.) Series 2019: | | | |
| 5% 7/1/29 | | 400 | 404 |
| 5% 7/1/39 | | 810 | 775 |
| South Florida Wtr. Mgmt. District Ctfs. of Prtn. Series 2015: | | | |
| 5% 10/1/29 | | 4,140 | 4,433 |
| 5% 10/1/32 | | 5,190 | 5,521 |
| South Miami Health Facilities Auth. Hosp. Rev. (Baptist Med. Ctr., FL. Proj.) Series 2017: | | | |
| 4% 8/15/33 | | 2,070 | 2,099 |
| 5% 8/15/26 | | 2,815 | 2,988 |
| 5% 8/15/27 | | 1,865 | 2,005 |
| 5% 8/15/28 | | 1,240 | 1,341 |
| 5% 8/15/30 | | 2,685 | 2,890 |
| 5% 8/15/31 | | 2,590 | 2,783 |
| 5% 8/15/32 | | 1,930 | 2,063 |
| 5% 8/15/34 | | 5,360 | 5,685 |
| 5% 8/15/35 | | 3,555 | 3,745 |
| 5% 8/15/42 | | 5,465 | 5,573 |
| 5% 8/15/47 | | 8,115 | 8,223 |
| Tallahassee Health Facilities Rev.: | | | |
| (Tallahassee Memorial Healthcare, Inc. Proj.) Series 2016 A, 5% 12/1/41 | | 910 | 918 |
| Series 2015 A, 5% 12/1/40 | | 1,820 | 1,835 |
| Volusia County Edl. Facilities Auth. Rev. (Embry-Riddle Aeronautical Univ., Inc. Proj.) Series 2020 A: | | | |
| 5% 10/15/44 | | 905 | 943 |
| 5% 10/15/49 | | 1,705 | 1,764 |
| Volusia County School Board Ctfs. of Prtn. (Florida Master Lease Prog.) Series 2016 A: | | | |
| 5% 8/1/29 (Build America Mutual Assurance Insured) | | 830 | 881 |
| 5% 8/1/32 (Build America Mutual Assurance Insured) | | 4,140 | 4,379 |
TOTAL FLORIDA | | | 274,949 |
| Georgia - 3.5% | | | |
| Atlanta Arpt. Rev. Series 2019 B, 5% 7/1/25 (e) | | 1,870 | 1,944 |
| Burke County Indl. Dev. Auth. Poll. Cont. Rev. (Georgia Transmission Corp. Proj.) Series 2012, 2.75% 1/1/52 (b) | | 4,320 | 2,811 |
| Columbus Med. Ctr. Hosp. Auth. Bonds (Piedmont Healthcare, Inc. Proj.) Series 2019 B, 5%, tender 7/1/29 (b) | | 6,900 | 7,527 |
| Fulton County Dev. Auth. Rev. Series 2019, 4% 6/15/49 | | 1,515 | 1,416 |
| Gainesville & Hall County Hosp. Auth. Rev. Series 2020 A, 3% 2/15/47 | | 13,420 | 9,634 |
| Georgia Gen. Oblig. Series 2022 A: | | | |
| 5% 7/1/33 | | 6,885 | 8,220 |
| 5% 7/1/34 | | 14,350 | 17,019 |
| 5% 7/1/35 | | 24,240 | 28,496 |
| Glynn-Brunswick Memorial Hosp. Auth. Rev. (Southeast Georgia Health Sys. Proj.) Series 2017: | | | |
| 4% 8/1/43 | | 1,860 | 1,617 |
| 5% 8/1/39 | | 1,705 | 1,714 |
| 5% 8/1/43 | | 2,275 | 2,289 |
| Hosp. Auth. of Savannah Auth. Rev. Series 2019 A: | | | |
| 4% 7/1/35 | | 1,400 | 1,411 |
| 4% 7/1/36 | | 4,500 | 4,511 |
| 4% 7/1/43 | | 6,160 | 5,768 |
| Main Street Natural Gas, Inc. Bonds: | | | |
| Series 2021 A, 4%, tender 9/1/27 (b) | | 25,000 | 24,795 |
| Series 2021 C, 4%, tender 12/1/28 (b) | | 23,425 | 22,877 |
| Private Colleges & Univs. Auth. Rev.: | | | |
| (Agnes Scott College) Series 2019 A, 5% 6/1/28 | | 1,000 | 1,080 |
| Series 2019 A, 5% 6/1/29 | | 800 | 874 |
| Series 2020 B: | | | |
5% 9/1/31 | | 2,490 | 2,879 |
5% 9/1/32 | | 1,880 | 2,160 |
TOTAL GEORGIA | | | 149,042 |
| Hawaii - 0.4% | | | |
| Hawaii Arpts. Sys. Rev.: | | | |
| Series 2018 A: | | | |
5% 7/1/29 (e) | | 1,055 | 1,122 |
5% 7/1/30 (e) | | 1,240 | 1,318 |
5% 7/1/31 (e) | | 1,215 | 1,290 |
5% 7/1/32 (e) | | 1,240 | 1,314 |
5% 7/1/33 (e) | | 1,265 | 1,338 |
| Series 2022 A, 5% 7/1/42 (e) | | 9,480 | 9,842 |
| Hawaii Gen. Oblig. Series 2020 A, 4% 7/1/34 (e) | | 750 | 764 |
TOTAL HAWAII | | | 16,988 |
| Idaho - 0.0% | | | |
| Idaho Hsg. & Fin. Assoc. Single Family Mtg. Series 2019 A, 4% 1/1/50 | | 545 | 546 |
| Illinois - 17.2% | | | |
| Chicago Board of Ed.: | | | |
| Series 2012 A, 5% 12/1/42 | | 7,630 | 7,305 |
| Series 2015 C, 5.25% 12/1/39 | | 1,405 | 1,399 |
| Series 2016 B, 6.5% 12/1/46 | | 660 | 696 |
| Series 2017 A, 7% 12/1/46 (d) | | 2,320 | 2,513 |
| Series 2017 C: | | | |
5% 12/1/24 | | 4,770 | 4,858 |
5% 12/1/25 | | 2,725 | 2,788 |
5% 12/1/26 | | 800 | 819 |
5% 12/1/30 | | 2,105 | 2,145 |
5% 12/1/34 | | 1,245 | 1,258 |
| Series 2017 D: | | | |
5% 12/1/23 | | 2,460 | 2,483 |
5% 12/1/24 | | 1,030 | 1,049 |
5% 12/1/31 | | 3,565 | 3,629 |
| Series 2017 H, 5% 12/1/36 | | 95 | 95 |
| Series 2018 A: | | | |
5% 12/1/25 | | 830 | 849 |
5% 12/1/26 | | 830 | 850 |
5% 12/1/28 | | 3,915 | 4,010 |
5% 12/1/30 | | 1,655 | 1,690 |
5% 12/1/32 | | 950 | 967 |
5% 12/1/34 | | 1,140 | 1,151 |
5% 12/1/35 | | 830 | 835 |
| Series 2018 C, 5% 12/1/46 | | 3,250 | 3,087 |
| Series 2019 A: | | | |
4% 12/1/27 | | 5,000 | 4,892 |
5% 12/1/27 | | 1,625 | 1,660 |
5% 12/1/28 | | 2,910 | 2,981 |
5% 12/1/28 | | 2,000 | 2,049 |
5% 12/1/33 | | 1,300 | 1,323 |
| Chicago Gen. Oblig.: | | | |
| Series 2017 A, 6% 1/1/38 | | 1,000 | 1,055 |
| Series 2020 A: | | | |
5% 1/1/27 | | 430 | 445 |
5% 1/1/29 | | 3,175 | 3,326 |
5% 1/1/30 | | 3,555 | 3,747 |
5% 1/1/31 | | 3,760 | 3,962 |
| Series 2021 A, 5% 1/1/32 | | 5,335 | 5,649 |
| Series 2023 A: | | | |
5.25% 1/1/38 (g) | | 11,380 | 11,772 |
5.5% 1/1/39 (g) | | 12,000 | 12,600 |
5.5% 1/1/40 (g) | | 6,750 | 7,064 |
| Chicago Midway Arpt. Rev.: | | | |
| Series 2014 A: | | | |
5% 1/1/28 (e) | | 9,150 | 9,246 |
5% 1/1/33 (e) | | 4,450 | 4,471 |
5% 1/1/34 (e) | | 2,150 | 2,158 |
| Series 2016 A, 5% 1/1/28 (e) | | 1,655 | 1,712 |
| Series 2016 B: | | | |
4% 1/1/35 | | 1,305 | 1,297 |
5% 1/1/36 | | 1,655 | 1,695 |
5% 1/1/37 | | 2,235 | 2,277 |
| Chicago O'Hare Int'l. Arpt. Rev.: | | | |
| Series 2015 A, 5% 1/1/31 (e) | | 5,000 | 5,107 |
| Series 2015 C, 5% 1/1/46 (e) | | 1,985 | 1,985 |
| Series 2016 B, 5% 1/1/34 | | 5,050 | 5,291 |
| Series 2016 C: | | | |
5% 1/1/33 | | 2,255 | 2,369 |
5% 1/1/34 | | 2,610 | 2,735 |
| Series 2016 G: | | | |
5% 1/1/37 (e) | | 1,655 | 1,697 |
5% 1/1/42 (e) | | 1,655 | 1,673 |
5.25% 1/1/29 (e) | | 290 | 306 |
5.25% 1/1/31 (e) | | 330 | 348 |
| Series 2017 A, 5% 1/1/31 | | 2,925 | 3,140 |
| Series 2017 B: | | | |
5% 1/1/35 | | 1,740 | 1,838 |
5% 1/1/37 | | 7,080 | 7,389 |
| Series 2017 C: | | | |
5% 1/1/30 | | 495 | 533 |
5% 1/1/31 | | 495 | 531 |
5% 1/1/32 | | 540 | 578 |
| Series 2017 D: | | | |
5% 1/1/28 (e) | | 2,475 | 2,594 |
5% 1/1/29 (e) | | 2,070 | 2,164 |
5% 1/1/32 (e) | | 2,235 | 2,332 |
5% 1/1/34 (e) | | 3,360 | 3,494 |
5% 1/1/35 (e) | | 2,485 | 2,573 |
5% 1/1/36 (e) | | 3,090 | 3,184 |
5% 1/1/37 (e) | | 1,655 | 1,697 |
| Series 2018 A: | | | |
5% 1/1/48 (e) | | 2,215 | 2,244 |
5% 1/1/53 (e) | | 3,790 | 3,818 |
| Chicago O'Hare Int'l. Arpt. Spl. Facilities Rev. Series 2018: | | | |
| 5% 7/1/38 (e) | | 2,185 | 2,196 |
| 5% 7/1/48 (e) | | 9,030 | 8,849 |
| Chicago Transit Auth. Series 2017, 5% 12/1/46 | | 3,395 | 3,445 |
| Chicago Transit Auth. Cap. Grant Receipts Rev. Series 2017: | | | |
| 5% 6/1/25 | | 255 | 264 |
| 5% 6/1/26 | | 205 | 215 |
| Cook County Gen. Oblig. Series 2016 A: | | | |
| 5% 11/15/26 | | 4,420 | 4,721 |
| 5% 11/15/27 | | 2,320 | 2,478 |
| 5% 11/15/28 | | 3,020 | 3,224 |
| 5% 11/15/29 | | 3,760 | 4,015 |
| 5% 11/15/30 | | 4,140 | 4,419 |
| DuPage & Cook Counties Cmnty. Unit School District #205 Series 2021 A, 2% 1/1/39 | | 4,200 | 2,933 |
| Illinois Fin. Auth.: | | | |
| Series 2020 A: | | | |
3% 5/15/50 | | 10,870 | 7,360 |
3% 5/15/50 (Build America Mutual Assurance Insured) | | 5,040 | 3,555 |
3.25% 8/15/49 | | 2,010 | 1,554 |
| Series 2020, 5% 7/1/36 | | 5,850 | 6,567 |
| Illinois Fin. Auth. Rev.: | | | |
| (Bradley Univ. Proj.) Series 2017 C: | | | |
5% 8/1/29 | | 1,090 | 1,133 |
5% 8/1/30 | | 760 | 789 |
5% 8/1/32 | | 1,015 | 1,048 |
| (Depaul Univ. Proj.) Series 2016 A: | | | |
4% 10/1/34 | | 830 | 833 |
5% 10/1/29 | | 830 | 882 |
5% 10/1/30 | | 830 | 881 |
| (OSF Healthcare Sys.) Series 2018 A: | | | |
4.125% 5/15/47 | | 25,725 | 23,368 |
5% 5/15/43 | | 34,525 | 34,964 |
| (Presence Health Proj.) Series 2016 C: | | | |
3.625% 2/15/32 | | 950 | 954 |
4% 2/15/33 | | 225 | 228 |
5% 2/15/29 | | 5,110 | 5,487 |
5% 2/15/36 | | 1,535 | 1,618 |
| (Rosalind Franklin Univ. Research Bldg. Proj.) Series 2017 C, 5% 8/1/46 | | 830 | 810 |
| (Rush Univ. Med. Ctr. Proj.) Series 2015 A, 5% 11/15/34 | | 415 | 425 |
| Series 2013: | | | |
5% 11/15/28 | | 2,380 | 2,381 |
5% 11/15/29 | | 1,160 | 1,161 |
| Series 2015 A, 5% 11/15/35 | | 1,985 | 2,029 |
| Series 2015 C: | | | |
4.125% 8/15/37 | | 735 | 697 |
5% 8/15/35 | | 6,175 | 6,296 |
5% 8/15/44 | | 30,175 | 29,027 |
| Series 2016 A: | | | |
5% 8/15/25 (Escrowed to Maturity) | | 1,970 | 2,080 |
5% 7/1/28 (Pre-Refunded to 7/1/26 @ 100) | | 1,020 | 1,100 |
5% 2/15/29 | | 4,255 | 4,486 |
5% 2/15/30 | | 4,490 | 4,745 |
5% 7/1/30 (Pre-Refunded to 7/1/26 @ 100) | | 590 | 636 |
5% 2/15/31 | | 3,620 | 3,824 |
5% 7/1/31 (Pre-Refunded to 7/1/26 @ 100) | | 1,040 | 1,121 |
5% 2/15/32 | | 3,520 | 3,714 |
5% 7/1/33 (Pre-Refunded to 7/1/26 @ 100) | | 540 | 582 |
5% 7/1/34 (Pre-Refunded to 7/1/26 @ 100) | | 4,140 | 4,463 |
5% 8/15/35 (Pre-Refunded to 8/15/26 @ 100) | | 420 | 452 |
5% 7/1/36 (Pre-Refunded to 7/1/26 @ 100) | | 2,140 | 2,307 |
5% 8/15/36 (Pre-Refunded to 8/15/26 @ 100) | | 1,685 | 1,815 |
5.25% 8/15/31 (Pre-Refunded to 8/15/26 @ 100) | | 495 | 537 |
| Series 2016 B: | | | |
5% 8/15/31 | | 6,095 | 6,489 |
5% 8/15/32 | | 5,000 | 5,296 |
5% 8/15/34 | | 6,220 | 6,547 |
5% 8/15/36 | | 8,680 | 9,051 |
| Series 2016 C: | | | |
3.75% 2/15/34 | | 1,215 | 1,220 |
4% 2/15/36 | | 5,160 | 5,189 |
4% 2/15/41 | | 20,725 | 19,868 |
4% 2/15/41 (Pre-Refunded to 2/15/27 @ 100) | | 655 | 684 |
5% 2/15/31 | | 12,595 | 13,485 |
5% 2/15/32 | | 3,660 | 3,908 |
5% 2/15/34 | | 2,920 | 3,100 |
| Series 2016 D, 4% 2/15/46 | | 15,500 | 13,935 |
| Series 2016: | | | |
4% 2/15/41 (Pre-Refunded to 2/15/27 @ 100) | | 30 | 31 |
5% 5/15/29 | | 1,040 | 1,089 |
5% 12/1/29 | | 1,420 | 1,484 |
5% 5/15/30 | | 2,200 | 2,296 |
5% 12/1/33 | | 835 | 864 |
5% 12/1/46 | | 11,065 | 10,661 |
| Series 2017 A: | | | |
5% 1/1/36 (Pre-Refunded to 1/1/27 @ 100) | | 1,860 | 2,007 |
5% 8/1/42 | | 730 | 726 |
| Series 2017: | | | |
5% 1/1/29 | | 2,775 | 3,014 |
5% 7/1/34 | | 4,640 | 4,965 |
5% 7/1/35 | | 3,900 | 4,174 |
| Series 2019: | | | |
4% 9/1/37 | | 600 | 528 |
4% 9/1/41 | | 1,000 | 832 |
5% 9/1/36 | | 1,000 | 1,006 |
| Illinois Gen. Oblig.: | | | |
| Series 2014: | | | |
5% 2/1/25 | | 3,005 | 3,037 |
5% 2/1/26 | | 2,270 | 2,292 |
5% 4/1/28 | | 1,895 | 1,911 |
5% 5/1/28 | | 1,780 | 1,796 |
5.25% 2/1/31 | | 360 | 363 |
| Series 2016: | | | |
5% 6/1/26 | | 995 | 1,023 |
5% 2/1/27 | | 5,585 | 5,763 |
| Series 2018 A, 5% 10/1/28 | | 230 | 238 |
| Series 2020, 5.75% 5/1/45 | | 3,865 | 4,014 |
| Series 2021 A: | | | |
5% 3/1/32 | | 2,750 | 2,811 |
5% 3/1/33 | | 1,500 | 1,526 |
5% 3/1/34 | | 2,220 | 2,251 |
5% 3/1/35 | | 5,450 | 5,512 |
5% 3/1/36 | | 4,500 | 4,534 |
5% 3/1/37 | | 5,500 | 5,518 |
5% 3/1/46 | | 7,635 | 7,420 |
| Series 2022 A: | | | |
5% 3/1/29 | | 4,600 | 4,755 |
5% 3/1/32 | | 4,490 | 4,599 |
5% 3/1/33 | | 6,690 | 6,815 |
5% 3/1/34 | | 5,110 | 5,188 |
| Series 2022 B, 5% 10/1/34 | | 16,015 | 16,248 |
| Illinois Hsg. Dev. Auth. Multi-family Hsg. Rev. Series 2019, 2.9% 7/1/35 | | 6,027 | 5,351 |
| Illinois Muni. Elec. Agcy. Pwr. Supply Series 2015 A, 5% 2/1/31 | | 3,370 | 3,507 |
| Illinois Toll Hwy. Auth. Toll Hwy. Rev.: | | | |
| Series 2016 A, 5% 12/1/31 | | 5,825 | 6,157 |
| Series 2019 A, 5% 1/1/44 | | 1,260 | 1,314 |
| Series A: | | | |
5% 1/1/36 | | 1,000 | 1,094 |
5% 1/1/38 | | 350 | 377 |
5% 1/1/40 | | 2,390 | 2,526 |
| Kendall, Kane & Will Counties Cmnty. Unit School District #308 Series 2016: | | | |
| 5% 2/1/34 | | 5,795 | 6,065 |
| 5% 2/1/35 | | 4,140 | 4,327 |
| 5% 2/1/36 | | 7,120 | 7,431 |
| Lake County Cmnty. Consolidated School District #73 Gen. Oblig. Series 2021, 2.25% 1/1/40 | | 1,000 | 733 |
| Metropolitan Pier & Exposition: | | | |
| (McCormick Place Expansion Proj.): | | | |
Series 2002 A, 0% 6/15/36 (Nat'l. Pub. Fin. Guarantee Corp. Insured) | | 2,645 | 1,405 |
Series 2010 B1: | | | |
0% 6/15/43 (Assured Guaranty Muni. Corp. Insured) | | 41,985 | 15,578 |
0% 6/15/45 (Assured Guaranty Muni. Corp. Insured) | | 25,250 | 8,390 |
0% 6/15/47 (Assured Guaranty Muni. Corp. Insured) | | 3,000 | 892 |
Series 2012 B, 0% 12/15/51 | | 10,845 | 2,301 |
| Series 1996 A, 0% 6/15/24 | | 2,535 | 2,405 |
| Series 2002 A, 0% 6/15/35 (Nat'l. Pub. Fin. Guarantee Corp. Insured) | | 1,690 | 952 |
| Series 2002, 0% 12/15/36 (Nat'l. Pub. Fin. Guarantee Corp. Insured) | | 13,280 | 6,854 |
| Series 2017 B: | | | |
5% 12/15/25 | | 830 | 848 |
5% 12/15/26 | | 2,755 | 2,834 |
5% 12/15/27 | | 295 | 305 |
5% 12/15/31 | | 560 | 575 |
5% 12/15/34 | | 330 | 337 |
| Series 2022 A: | | | |
4% 12/15/42 | | 7,330 | 6,378 |
4% 12/15/47 | | 560 | 467 |
4% 6/15/52 | | 2,000 | 1,619 |
| Northern Illinois Univ. Revs. Series 2020 B: | | | |
| 5% 4/1/26 (Build America Mutual Assurance Insured) | | 1,400 | 1,469 |
| 5% 4/1/28 (Build America Mutual Assurance Insured) | | 1,300 | 1,392 |
| 5% 4/1/30 (Build America Mutual Assurance Insured) | | 1,000 | 1,080 |
| 5% 4/1/32 (Build America Mutual Assurance Insured) | | 1,295 | 1,390 |
| Railsplitter Tobacco Settlement Auth. Rev. Series 2017: | | | |
| 5% 6/1/27 | | 4,140 | 4,401 |
| 5% 6/1/28 | | 2,275 | 2,417 |
| Univ. of Illinois Rev.: | | | |
| Series 2013: | | | |
6% 10/1/42 | | 4,555 | 4,643 |
6.25% 10/1/38 | | 4,495 | 4,594 |
| Series 2018 A, 5% 4/1/30 | | 3,425 | 3,742 |
| Will County Cmnty. Unit School District #365-U Series 2007 B, 0% 11/1/26 (Assured Guaranty Muni. Corp. Insured) | | 5,095 | 4,474 |
| Will County Illinois Series 2016: | | | |
| 5% 11/15/32 (Pre-Refunded to 11/15/25 @ 100) | | 1,020 | 1,086 |
| 5% 11/15/33 (Pre-Refunded to 11/15/25 @ 100) | | 1,240 | 1,320 |
| 5% 11/15/34 (Pre-Refunded to 11/15/25 @ 100) | | 1,240 | 1,320 |
TOTAL ILLINOIS | | | 726,558 |
| Indiana - 1.2% | | | |
| Indiana Fin. Auth. Rev.: | | | |
| Series 2015 A, 5.25% 2/1/32 | | 5,845 | 6,128 |
| Series 2016: | | | |
5% 9/1/26 | | 1,075 | 1,153 |
5% 9/1/27 | | 540 | 577 |
5% 9/1/28 | | 2,535 | 2,701 |
5% 9/1/29 | | 1,240 | 1,316 |
5% 9/1/30 | | 1,160 | 1,229 |
| Indiana Fin. Auth. Wastewtr. Util. Rev. (CWA Auth. Proj.) Series 2015 A, 5% 10/1/30 | | 3,990 | 4,113 |
| Indiana Hsg. & Cmnty. Dev. Auth. (Glasswater Creek of Whitestown Proj.) Series 2020, 5.375% 10/1/40 (d) | | 2,045 | 1,660 |
| Indianapolis Local Pub. Impt.: | | | |
| (Indianapolis Arpt. Auth. Proj.) Series 2019 I, 5% 1/1/44 | | 5,100 | 5,302 |
| Series 2016: | | | |
4% 1/1/32 (e) | | 830 | 826 |
4% 1/1/33 (e) | | 830 | 819 |
4% 1/1/34 (e) | | 1,010 | 988 |
4% 1/1/35 (e) | | 2,300 | 2,241 |
5% 1/1/26 (e) | | 875 | 914 |
| Purdue Univ. Rev. Series 2018 DD: | | | |
| 5% 7/1/34 | | 995 | 1,102 |
| 5% 7/1/35 | | 1,960 | 2,159 |
| 5% 7/1/36 | | 2,130 | 2,336 |
| 5% 7/1/37 | | 1,970 | 2,150 |
| 5% 7/1/38 | | 2,345 | 2,552 |
| Saint Joseph County Econ. Dev. Auth. Rev. (St. Mary's College Proj.): | | | |
| Series 2019: | | | |
4% 4/1/38 | | 260 | 247 |
4% 4/1/46 | | 6,035 | 5,460 |
5% 4/1/43 | | 460 | 476 |
| Series 2020: | | | |
4% 4/1/38 | | 1,510 | 1,435 |
5% 4/1/32 | | 1,805 | 1,960 |
TOTAL INDIANA | | | 49,844 |
| Iowa - 0.2% | | | |
| Iowa Fin. Auth. Rev. Series A: | | | |
| 5% 5/15/43 | | 1,145 | 987 |
| 5% 5/15/48 | | 1,885 | 1,562 |
| Iowa Student Ln. Liquidity Corp. Student Ln. Rev. Series 2019 B: | | | |
| 5% 12/1/26 (e) | | 1,850 | 1,954 |
| 5% 12/1/27 (e) | | 1,965 | 2,100 |
| Tobacco Settlement Auth. Tobacco Settlement Rev. Series 2021 B1, 4% 6/1/49 | | 3,820 | 3,756 |
TOTAL IOWA | | | 10,359 |
| Kentucky - 1.2% | | | |
| Ashland Med. Ctr. Rev. Series 2019, 3% 2/1/40 (Assured Guaranty Muni. Corp. Insured) | | 2,545 | 2,008 |
| Kenton County Arpt. Board Arpt. Rev. Series 2016: | | | |
| 5% 1/1/28 | | 1,310 | 1,392 |
| 5% 1/1/31 | | 1,240 | 1,313 |
| 5% 1/1/32 | | 1,240 | 1,310 |
| Kentucky Econ. Dev. Fin. Auth.: | | | |
| Series 2019 A1: | | | |
5% 8/1/35 | | 1,000 | 1,048 |
5% 8/1/44 | | 1,000 | 1,002 |
| Series 2019 A2, 5% 8/1/44 | | 2,995 | 3,000 |
| Kentucky State Property & Buildings Commission Rev. (Proj. No. 119) Series 2018: | | | |
| 5% 5/1/26 | | 830 | 883 |
| 5% 5/1/29 | | 4,510 | 4,956 |
| 5% 5/1/32 | | 1,185 | 1,296 |
| 5% 5/1/33 | | 915 | 1,000 |
| 5% 5/1/34 | | 1,045 | 1,135 |
| 5% 5/1/35 | | 615 | 661 |
| 5% 5/1/36 | | 520 | 555 |
| Kentucky, Inc. Pub. Energy Bonds Series A, 4%, tender 6/1/26 (b) | | 10,000 | 9,899 |
| Louisville & Jefferson County: | | | |
| Bonds: | | | |
Series 2020 C, 5%, tender 10/1/26 (b) | | 1,695 | 1,779 |
Series 2020 D, 5%, tender 10/1/29 (b) | | 2,030 | 2,202 |
| Series 2013 A, 5.5% 10/1/33 | | 2,815 | 2,849 |
| Series 2020 A: | | | |
3% 10/1/43 | | 8,190 | 6,302 |
5% 10/1/37 | | 2,405 | 2,495 |
5% 10/1/38 | | 2,300 | 2,385 |
TOTAL KENTUCKY | | | 49,470 |
| Louisiana - 1.0% | | | |
| Jefferson Parish Consolidated Wtrwks. District No. 2 Series 2022, 5% 2/1/42 (Build America Mutual Assurance Insured) | | 10,390 | 11,181 |
| Louisiana Pub. Facilities Auth. Hosp. Rev. (Franciscan Missionaries of Our Lady Health Sys. Proj.) Series 2017 A, 5% 7/1/47 | | 1,950 | 1,967 |
| Louisiana Pub. Facilities Auth. Rev.: | | | |
| (Tulane Univ. of Louisiana Proj.) Series 2016 A: | | | |
5% 12/15/24 | | 1,240 | 1,287 |
5% 12/15/25 | | 2,585 | 2,722 |
5% 12/15/26 | | 1,045 | 1,118 |
5% 12/15/28 | | 1,655 | 1,767 |
5% 12/15/29 | | 1,175 | 1,253 |
5% 12/15/30 | | 2,320 | 2,473 |
| Series 2018 E: | | | |
5% 7/1/37 | | 1,615 | 1,699 |
5% 7/1/38 | | 1,260 | 1,319 |
| New Orleans Aviation Board Rev.: | | | |
| (North Term. Proj.): | | | |
Series 2015 B: | | | |
5% 1/1/29 (e) | | 4,295 | 4,400 |
5% 1/1/31 (e) | | 2,070 | 2,120 |
Series 2017 B: | | | |
5% 1/1/27 (e) | | 330 | 348 |
5% 1/1/28 (e) | | 205 | 216 |
5% 1/1/32 (e) | | 330 | 345 |
5% 1/1/33 (e) | | 580 | 604 |
5% 1/1/34 (e) | | 180 | 187 |
5% 1/1/35 (e) | | 330 | 341 |
| Series 2017 D2: | | | |
5% 1/1/27 (e) | | 415 | 438 |
5% 1/1/28 (e) | | 595 | 626 |
5% 1/1/31 (e) | | 530 | 555 |
5% 1/1/33 (e) | | 850 | 886 |
5% 1/1/34 (e) | | 1,020 | 1,059 |
5% 1/1/36 (e) | | 775 | 797 |
5% 1/1/37 (e) | | 1,275 | 1,305 |
TOTAL LOUISIANA | | | 41,013 |
| Maine - 1.1% | | | |
| Maine Health & Higher Edl. Facilities Auth. Rev.: | | | |
| Series 2016 A: | | | |
4% 7/1/41 | | 1,935 | 1,727 |
4% 7/1/46 | | 3,180 | 2,742 |
5% 7/1/41 | | 8,620 | 8,650 |
5% 7/1/46 | | 22,975 | 22,787 |
| Series 2017 B: | | | |
4% 7/1/25 | | 375 | 383 |
4% 7/1/31 | | 580 | 591 |
4% 7/1/32 | | 415 | 421 |
4% 7/1/34 | | 835 | 836 |
5% 7/1/26 | | 270 | 286 |
5% 7/1/28 | | 420 | 450 |
5% 7/1/29 | | 330 | 353 |
5% 7/1/33 | | 830 | 881 |
5% 7/1/35 | | 630 | 661 |
| Maine Tpk. Auth. Tpk. Rev. Series 2015: | | | |
| 5% 7/1/32 | | 870 | 912 |
| 5% 7/1/36 | | 2,150 | 2,243 |
| 5% 7/1/38 | | 555 | 578 |
TOTAL MAINE | | | 44,501 |
| Maryland - 1.6% | | | |
| Baltimore Gen. Oblig. Series 2022 A: | | | |
| 5% 10/15/36 | | 1,015 | 1,168 |
| 5% 10/15/38 | | 2,935 | 3,331 |
| 5% 10/15/39 | | 3,085 | 3,483 |
| 5% 10/15/42 | | 3,315 | 3,691 |
| City of Westminster Series 2016: | | | |
| 5% 11/1/27 | | 2,150 | 2,263 |
| 5% 11/1/28 | | 2,275 | 2,392 |
| 5% 11/1/29 | | 2,410 | 2,535 |
| 5% 11/1/30 | | 2,555 | 2,682 |
| Maryland Cmnty. Dev. Admin Dept. Hsg. & Cmnty. Dev. Series 2019 B, 4% 9/1/49 | | 2,010 | 2,013 |
| Maryland Dept. of Trans. Series 2022 A, 5% 12/1/25 | | 1,000 | 1,068 |
| Maryland Econ. Dev. Auth. Rev. (Ports America Chesapeake LLC. Proj.) Series 2017 A: | | | |
| 5% 6/1/30 | | 1,035 | 1,096 |
| 5% 6/1/35 | | 1,655 | 1,725 |
| Maryland Gen. Oblig. Series 2022 A, 5% 6/1/35 | | 10,210 | 11,906 |
| Maryland Health & Higher Edl. Series 2021 A, 3% 7/1/51 | | 6,445 | 4,508 |
| Maryland Health & Higher Edl. Facilities Auth. Rev. Series 2016 A: | | | |
| 4% 7/1/42 | | 1,430 | 1,255 |
| 5% 7/1/35 | | 575 | 590 |
| Maryland Stadium Auth. Built to Learn Rev. Series 2021, 4% 6/1/46 | | 1,280 | 1,181 |
| Maryland Trans. Auth. Trans. Facility Projs. Rev. Series 2021 A, 5% 7/1/51 | | 4,000 | 4,274 |
| Washington Metropolitan Area Transit Auth.: | | | |
| Series 2020 A, 5% 7/15/38 | | 9,900 | 10,821 |
| Series 2021 A: | | | |
5% 7/15/41 | | 1,250 | 1,360 |
5% 7/15/46 | | 2,000 | 2,143 |
TOTAL MARYLAND | | | 65,485 |
| Massachusetts - 4.4% | | | |
| Massachusetts Bay Trans. Auth. Sales Tax Rev. Series 2021 A1: | | | |
| 5% 7/1/32 | | 2,235 | 2,614 |
| 5% 7/1/33 | | 2,500 | 2,910 |
| 5% 7/1/34 | | 1,260 | 1,451 |
| 5% 7/1/35 | | 3,180 | 3,632 |
| Massachusetts Commonwealth Trans. Fund Rev. Series 2021 A, 5% 6/1/51 | | 5,900 | 6,299 |
| Massachusetts Dev. Fin. Agcy. Rev.: | | | |
| (Lesley Univ. Proj.) Series 2016, 5% 7/1/39 | | 1,360 | 1,370 |
| (Partners Healthcare Sys., Inc. Proj.): | | | |
Series 2017 S: | | | |
5% 7/1/30 | | 3,210 | 3,526 |
5% 7/1/34 | | 3,500 | 3,777 |
Series 2017, 4% 7/1/41 | | 8,280 | 7,994 |
| (Univ. of Massachusetts Health Cr., Inc. Proj.) Series 2017 L, 4% 7/1/44 | | 830 | 737 |
| (Wentworth Institute of Technology Proj.) Series 2017: | | | |
5% 10/1/27 | | 830 | 871 |
5% 10/1/28 | | 875 | 917 |
5% 10/1/29 | | 920 | 963 |
5% 10/1/31 | | 1,015 | 1,057 |
5% 10/1/32 | | 1,065 | 1,106 |
| Series 2016 I, 5% 7/1/41 | | 1,925 | 1,947 |
| Series 2016: | | | |
5% 10/1/29 | | 830 | 878 |
5% 10/1/30 | | 1,240 | 1,310 |
5% 7/1/31 | | 1,385 | 1,432 |
5% 10/1/31 | | 1,340 | 1,414 |
5% 10/1/43 | | 8,995 | 9,001 |
| Series 2017: | | | |
5% 7/1/34 | | 1,325 | 1,372 |
5% 7/1/35 | | 1,000 | 1,031 |
| Series 2019, 5% 9/1/59 | | 14,880 | 15,231 |
| Series 2020 A, 4% 7/1/45 | | 12,200 | 10,287 |
| Series 2022, 5% 10/1/37 | | 1,720 | 1,959 |
| Series M: | | | |
4% 10/1/50 | | 12,425 | 10,261 |
5% 10/1/45 | | 9,360 | 9,366 |
| Massachusetts Edl. Fing. Auth. Rev. Series 2019 B: | | | |
| 5% 7/1/27 (e) | | 1,000 | 1,061 |
| 5% 7/1/28 (e) | | 1,915 | 2,041 |
| Massachusetts Gen. Oblig.: | | | �� |
| Series 2019 C, 5% 5/1/49 | | 4,175 | 4,414 |
| Series 2020 D, 5% 7/1/48 | | 5,670 | 6,060 |
| Series 2022 C, 5.25% 10/1/47 | | 30,000 | 33,321 |
| Massachusetts Port Auth. Rev.: | | | |
| Series 2016 A: | | | |
5% 7/1/33 | | 1,740 | 1,861 |
5% 7/1/34 | | 895 | 955 |
5% 7/1/38 | | 1,300 | 1,369 |
| Series 2016 B, 5% 7/1/43 (e) | | 7,110 | 7,233 |
| Series 2021 E: | | | |
5% 7/1/38 (e) | | 2,875 | 3,040 |
5% 7/1/39 (e) | | 4,480 | 4,715 |
5% 7/1/40 (e) | | 2,835 | 2,970 |
5% 7/1/51 (e) | | 10,000 | 10,245 |
TOTAL MASSACHUSETTS | | | 183,998 |
| Michigan - 2.1% | | | |
| Detroit Downtown Dev. Auth. Tax: | | | |
| Series 2018 A, 5% 7/1/32 (Assured Guaranty Muni. Corp. Insured) | | 1,000 | 1,023 |
| Series A, 5% 7/1/34 (Assured Guaranty Muni. Corp. Insured) | | 1,000 | 1,019 |
| Detroit Gen. Oblig. Series 2021 A, 5% 4/1/50 | | 2,600 | 2,431 |
| Flint Hosp. Bldg. Auth. Rev. Series 2020, 5% 7/1/38 | | 1,515 | 1,561 |
| Grand Traverse County Hosp. Fin. Auth. Series 2021, 3% 7/1/51 | | 2,780 | 1,955 |
| Great Lakes Wtr. Auth. Sew Disp. Sys. Series 2018 A: | | | |
| 5% 7/1/43 | | 2,030 | 2,133 |
| 5% 7/1/48 | | 8,725 | 9,016 |
| Kalamazoo Hosp. Fin. Auth. Hosp. Facilities Rev. Series 2016: | | | |
| 5% 5/15/28 | | 1,945 | 2,043 |
| 5% 5/15/28 (Pre-Refunded to 5/15/26 @ 100) | | 10 | 11 |
| Michigan Bldg. Auth. Rev. Series 2015 I: | | | |
| 5% 4/15/30 | | 3,960 | 4,187 |
| 5% 4/15/30 (Pre-Refunded to 10/15/25 @ 100) | | 180 | 191 |
| Michigan Fin. Auth. Rev.: | | | |
| (Charter County of Wayne Criminal Justice Ctr. Proj.) Series 2018, 5% 11/1/43 | | 2,570 | 2,698 |
| Series 2019 A: | | | |
3% 12/1/49 | | 3,935 | 2,844 |
5% 11/15/48 | | 2,105 | 2,135 |
| Series 2020 A, 4% 6/1/49 | | 2,545 | 2,109 |
| Michigan Hosp. Fin. Auth. Rev. Series 2008 C: | | | |
| 5% 12/1/32 | | 1,110 | 1,213 |
| 5% 12/1/32 (Pre-Refunded to 12/1/27 @ 100) | | 130 | 144 |
| Michigan Hsg. Dev. Auth. Single Family Mtg. Rev. Series A, 3.5% 12/1/50 | | 1,855 | 1,832 |
| Oakland Univ. Rev. Series 2019: | | | |
| 5% 3/1/44 | | 8,540 | 8,918 |
| 5% 3/1/50 | | 13,450 | 13,946 |
| Portage Pub. Schools Series 2016: | | | |
| 5% 11/1/30 | | 2,365 | 2,522 |
| 5% 11/1/31 | | 2,090 | 2,220 |
| 5% 11/1/36 | | 205 | 216 |
| Univ. of Michigan Rev. Series 2020 A, 5% 4/1/50 | | 1,165 | 1,267 |
| Wayne County Arpt. Auth. Rev.: | | | |
| Series 2015 G, 5% 12/1/28 (e) | | 4,555 | 4,729 |
| Series 2017 A: | | | |
4% 12/1/33 (Assured Guaranty Muni. Corp. Insured) | | 1,230 | 1,247 |
4% 12/1/34 (Assured Guaranty Muni. Corp. Insured) | | 1,020 | 1,030 |
4% 12/1/35 (Assured Guaranty Muni. Corp. Insured) | | 995 | 999 |
4% 12/1/36 (Assured Guaranty Muni. Corp. Insured) | | 1,035 | 1,031 |
5% 12/1/31 | | 310 | 336 |
5% 12/1/32 | | 315 | 341 |
5% 12/1/34 | | 580 | 624 |
5% 12/1/35 | | 540 | 578 |
5% 12/1/37 | | 355 | 374 |
| Series 2017 B: | | | |
5% 12/1/29 (e) | | 495 | 521 |
5% 12/1/30 (e) | | 580 | 609 |
5% 12/1/31 (e) | | 660 | 692 |
5% 12/1/32 (e) | | 420 | 442 |
5% 12/1/32 (e) | | 540 | 565 |
5% 12/1/34 (e) | | 495 | 518 |
5% 12/1/35 (e) | | 540 | 562 |
5% 12/1/37 (e) | | 705 | 729 |
5% 12/1/42 (e) | | 830 | 848 |
| Series 2018 D, 5% 12/1/29 (e) | | 3,645 | 3,892 |
TOTAL MICHIGAN | | | 88,301 |
| Minnesota - 0.8% | | | |
| Duluth Econ. Dev. Auth. Health Care Facilities Rev. Series 2018 A, 5% 2/15/48 | | 6,000 | 5,831 |
| Maple Grove Health Care Sys. Rev.: | | | |
| Series 2015, 5% 9/1/29 | | 2,345 | 2,418 |
| Series 2017, 5% 5/1/25 | | 660 | 683 |
| Minnesota Higher Ed. Facilities Auth. Rev. Series 2018 A: | | | |
| 5% 10/1/30 | | 615 | 658 |
| 5% 10/1/45 | | 1,370 | 1,397 |
| Minnesota Muni. Gas Agcy. Rev. Bonds Series 2022 A, 4%, tender 12/1/27 (Liquidity Facility Royal Bank of Canada) (b) | | 18,275 | 18,328 |
| Moorhead Edl. Facilities Rev. (The Concordia College Corp. Proj.) Series 2016, 5% 12/1/25 | | 765 | 783 |
| Shakopee Sr. Hsg. Rev. Bonds Series 2018, 5.85%, tender 11/1/25 (b)(d) | | 3,670 | 3,606 |
TOTAL MINNESOTA | | | 33,704 |
| Mississippi - 0.4% | | | |
| Mississippi Bus. finance Corp. Exempt Facilities Rev. Bonds (Enviva, Inc. Proj.) Series 2022, 7.75%, tender 7/15/32 (b)(e) | | 15,100 | 15,186 |
| Missouri - 0.8% | | | |
| Cape Girardeau County Indl. Dev. Auth. (Southeast Hosp. Proj.) Series 2017 A: | | | |
| 5% 3/1/30 | | 580 | 602 |
| 5% 3/1/31 | | 870 | 900 |
| 5% 3/1/36 | | 1,725 | 1,764 |
| Kansas City Wtr. Rev. Series 2020 A, 4% 12/1/42 | | 1,200 | 1,168 |
| Missouri Health & Edl. Facilities Rev.: | | | |
| Series 2015 B: | | | |
3.125% 2/1/27 | | 830 | 827 |
3.25% 2/1/28 | | 830 | 829 |
5% 2/1/29 | | 1,025 | 1,061 |
5% 2/1/31 | | 2,150 | 2,222 |
5% 2/1/33 | | 2,375 | 2,446 |
5% 2/1/36 | | 2,235 | 2,290 |
| Series 2019 A: | | | |
4% 10/1/48 | | 2,850 | 2,666 |
5% 10/1/46 | | 5,575 | 5,943 |
| Missouri Hsg. Dev. Commission Single Family Mtg. Rev. Series 2019, 4% 5/1/50 | | 640 | 642 |
| Saint Louis Arpt. Rev. Series 2019 C: | | | |
| 5% 7/1/33 | | 2,390 | 2,628 |
| 5% 7/1/34 | | 1,750 | 1,915 |
| Saint Louis County Indl. Dev. Auth. Sr. Living Facilities Rev.: | | | |
| Series 2017, 5% 9/1/48 | | 1,000 | 836 |
| Series 2018 A: | | | |
5.125% 9/1/48 | | 3,325 | 2,831 |
5.125% 9/1/49 | | 2,665 | 2,260 |
TOTAL MISSOURI | | | 33,830 |
| Montana - 0.1% | | | |
| Montana Board Hsg. Single Family: | | | |
| Series 2017 B, 4% 12/1/48 (e) | | 395 | 393 |
| Series 2019 B, 4% 6/1/50 | | 355 | 356 |
| Montana Facility Fin. Auth. Series 2021 A, 3% 6/1/50 | | 4,010 | 2,761 |
TOTAL MONTANA | | | 3,510 |
| Nebraska - 0.4% | | | |
| Douglas County Neb Edl. Facilities Rev.: | | | |
| (Creighton Univ. Proj.) Series 2017: | | | |
4% 7/1/34 | | 830 | 841 |
5% 7/1/36 | | 570 | 604 |
| (Creighton Univ. Projs.) Series 2021 A, 3% 7/1/51 | | 1,795 | 1,226 |
| Nebraska Invt. Fin. Auth. Single Family Hsg. Rev.: | | | |
| Series 2019 B, 4% 9/1/49 (e) | | 1,705 | 1,696 |
| Series 2019 E, 3.75% 9/1/49 (e) | | 1,855 | 1,838 |
| Series 2020 A, 3.5% 9/1/50 | | 1,560 | 1,541 |
| Nebraska Pub. Pwr. District Rev. Series 2016 B: | | | |
| 5% 1/1/37 | | 2,050 | 2,140 |
| 5% 1/1/40 | | 935 | 974 |
| Omaha Arpt. Auth. Arpt. Rev. Series 2017 A: | | | |
| 5% 12/15/25 (e) | | 330 | 346 |
| 5% 12/15/26 (e) | | 1,190 | 1,259 |
| 5% 12/15/27 (e) | | 830 | 875 |
| 5% 12/15/30 (e) | | 1,240 | 1,300 |
| 5% 12/15/31 (e) | | 650 | 680 |
| 5% 12/15/33 (e) | | 660 | 689 |
| 5% 12/15/35 (e) | | 1,655 | 1,713 |
| 5% 12/15/36 (e) | | 420 | 433 |
TOTAL NEBRASKA | | | 18,155 |
| Nevada - 0.2% | | | |
| Clark County School District Series 2020 B, 3% 6/15/39 | | 3,710 | 3,006 |
| Nevada Hsg. Division Single Family Mtg. Rev. Series 2019 B, 4% 10/1/49 | | 1,015 | 1,017 |
| Tahoe-Douglas Visitors Auth. Series 2020: | | | |
| 5% 7/1/40 | | 1,000 | 996 |
| 5% 7/1/45 | | 2,605 | 2,564 |
TOTAL NEVADA | | | 7,583 |
| New Hampshire - 1.9% | | | |
| Nat'l. Fin. Auth. Hosp. Rev. (St. Lukes Univ. Health Network Proj.) Series 2021 B, 3% 8/15/51 (Assured Guaranty Muni. Corp. Insured) | | 3,445 | 2,433 |
| Nat'l. Finnance Auth. Series 2020 1, 4.125% 1/20/34 | | 5,881 | 5,703 |
| New Hampshire Health & Ed. Facilities Auth.: | | | |
| (Dartmouth-Hitchcock Oblgtd Grp Proj.) Series 2018 A: | | | |
5% 8/1/28 | | 895 | 967 |
5% 8/1/29 | | 855 | 924 |
5% 8/1/30 | | 850 | 918 |
| (Partners Healthcare Sys., Inc. Proj.): | | | |
Series 2017 5% 7/1/29 | | 3,275 | 3,599 |
Series 2017: | | | |
5% 7/1/30 | | 2,125 | 2,334 |
5% 7/1/31 | | 4,750 | 5,206 |
5% 7/1/32 | | 3,185 | 3,482 |
5% 7/1/33 | | 2,900 | 3,155 |
5% 7/1/34 | | 4,415 | 4,764 |
5% 7/1/35 | | 4,635 | 4,955 |
5% 7/1/36 | | 4,870 | 5,162 |
5% 7/1/37 | | 4,290 | 4,508 |
| Series 2017, 5% 7/1/44 | | 1,590 | 1,538 |
| New Hampshire Health & Ed. Facilities Auth. Rev.: | | | |
| Series 2012: | | | |
4% 7/1/32 | | 2,295 | 2,288 |
5% 7/1/24 | | 830 | 831 |
5% 7/1/25 | | 980 | 981 |
5% 7/1/27 | | 415 | 415 |
| Series 2016: | | | |
4% 10/1/38 | | 2,010 | 1,880 |
5% 10/1/24 | | 1,755 | 1,805 |
5% 10/1/25 | | 1,740 | 1,823 |
5% 10/1/29 | | 5,525 | 5,783 |
5% 10/1/31 | | 4,315 | 4,505 |
5% 10/1/33 | | 3,355 | 3,492 |
5% 10/1/38 | | 6,185 | 6,267 |
TOTAL NEW HAMPSHIRE | | | 79,718 |
| New Jersey - 4.8% | | | |
| Atlantic County Impt. Auth. (Atlantic City Campus Proj.) Series 2016 A: | | | |
| 5% 7/1/28 (Assured Guaranty Muni. Corp. Insured) | | 860 | 916 |
| 5% 7/1/30 (Assured Guaranty Muni. Corp. Insured) | | 2,105 | 2,243 |
| 5% 7/1/32 (Assured Guaranty Muni. Corp. Insured) | | 1,035 | 1,102 |
| 5% 7/1/33 (Assured Guaranty Muni. Corp. Insured) | | 1,075 | 1,143 |
| Lyndhurst Township N J School District Series 2020, 2% 9/1/34 | | 1,000 | 800 |
| New Jersey Econ. Dev. Auth.: | | | |
| (White Horse HMT Urban Renewal LLC Proj.) Series 2020, 5% 1/1/40 (d) | | 1,000 | 745 |
| Series A, 5% 11/1/40 | | 8,915 | 9,192 |
| Series QQQ, 4% 6/15/46 | | 8,255 | 7,155 |
| New Jersey Econ. Dev. Auth. Rev.: | | | |
| (Black Horse EHT Urban Renewal LLC Proj.) Series 2019 A, 5% 10/1/39 (d) | | 910 | 681 |
| Series 2015 XX, 5.25% 6/15/27 | | 14,075 | 14,715 |
| Series LLL, 5% 6/15/44 | | 2,680 | 2,732 |
| New Jersey Edl. Facility Series 2016 A: | | | |
| 5% 7/1/31 | | 1,740 | 1,811 |
| 5% 7/1/32 | | 1,985 | 2,064 |
| New Jersey Gen. Oblig. Series 2020 A, 5% 6/1/29 | | 3,685 | 4,165 |
| New Jersey Health Care Facilities Fing. Auth. Rev.: | | | |
| Series 2016 A: | | | |
5% 7/1/25 (Escrowed to Maturity) | | 1,660 | 1,746 |
5% 7/1/26 (Escrowed to Maturity) | | 915 | 983 |
5% 7/1/26 (Escrowed to Maturity) | | 275 | 295 |
5% 7/1/27 | | 620 | 665 |
5% 7/1/27 (Pre-Refunded to 7/1/26 @ 100) | | 420 | 451 |
5% 7/1/28 | | 300 | 322 |
5% 7/1/29 (Pre-Refunded to 7/1/26 @ 100) | | 580 | 623 |
5% 7/1/29 (Pre-Refunded to 7/1/26 @ 100) | | 415 | 445 |
5% 7/1/30 | | 830 | 888 |
5% 7/1/30 (Pre-Refunded to 7/1/26 @ 100) | | 690 | 740 |
| Series 2016: | | | |
4% 7/1/48 | | 2,400 | 2,008 |
5% 7/1/41 | | 2,865 | 2,878 |
| New Jersey Higher Ed. Student Assistance Auth. Student Ln. Rev.: | | | |
| Series 2017 1A, 5% 12/1/26 (e) | | 830 | 879 |
| Series 2018 B: | | | |
5% 12/1/25 (e) | | 3,495 | 3,653 |
5% 12/1/26 (e) | | 1,035 | 1,096 |
| New Jersey Tpk. Auth. Tpk. Rev. Series 2022 B: | | | |
| 4.25% 1/1/43 | | 1,680 | 1,682 |
| 4.5% 1/1/48 | | 20,000 | 20,259 |
| New Jersey Trans. Trust Fund Auth.: | | | |
| (Trans. Prog.) Series 2019 AA, 5.25% 6/15/43 | | 21,525 | 22,361 |
| Series 2006 C, 0% 12/15/30 (FGIC Insured) | | 1,200 | 878 |
| Series 2008 A, 0% 12/15/38 | | 1,500 | 690 |
| Series 2010 A, 0% 12/15/27 | | 9,485 | 7,884 |
| Series 2014 BB2: | | | |
5% 6/15/32 | | 5,810 | 6,404 |
5% 6/15/33 | | 1,635 | 1,789 |
5% 6/15/34 | | 1,060 | 1,150 |
| Series 2016 A: | | | |
5% 6/15/27 | | 2,250 | 2,377 |
5% 6/15/29 | | 1,865 | 1,966 |
| Series 2019 BB, 4% 6/15/50 | | 2,625 | 2,208 |
| Series 2021 A, 5% 6/15/33 | | 2,980 | 3,261 |
| Series 2022 A: | | | |
4% 6/15/39 | | 5,030 | 4,652 |
4% 6/15/40 | | 5,410 | 4,941 |
4% 6/15/42 | | 7,290 | 6,528 |
| Series 2022 AA: | | | |
5% 6/15/32 | | 8,500 | 9,455 |
5% 6/15/34 | | 7,460 | 8,156 |
5% 6/15/36 | | 2,215 | 2,378 |
5% 6/15/37 | | 4,235 | 4,493 |
| Series A, 5% 12/15/33 | | 680 | 733 |
| Series AA: | | | |
4% 6/15/35 | | 1,500 | 1,481 |
4% 6/15/40 | | 1,680 | 1,534 |
4% 6/15/45 | | 7,950 | 6,942 |
4% 6/15/50 | | 4,865 | 4,092 |
5% 6/15/35 | | 490 | 524 |
5% 6/15/39 | | 3,000 | 3,124 |
| Series BB, 5% 6/15/50 | | 1,885 | 1,902 |
| South Jersey Trans. Auth. Trans. Sys. Rev. Series 2022 A, 4.625% 11/1/47 | | 3,500 | 3,298 |
TOTAL NEW JERSEY | | | 204,278 |
| New Mexico - 0.1% | | | |
| New Mexico Mtg. Fin. Auth. Series 2019 D, 3.75% 1/1/50 | | 1,435 | 1,429 |
| Santa Fe Retirement Fac. Series 2019 A: | | | |
| 5% 5/15/34 | | 275 | 258 |
| 5% 5/15/39 | | 205 | 182 |
| 5% 5/15/44 | | 215 | 181 |
| 5% 5/15/49 | | 425 | 347 |
TOTAL NEW MEXICO | | | 2,397 |
| New York - 6.8% | | | |
| Dorm. Auth. New York Univ. Rev.: | | | |
| (Fordham Univ. Proj.) Series 2017: | | | |
4% 7/1/33 | | 1,035 | 1,063 |
4% 7/1/34 | | 1,035 | 1,059 |
| Series 2017: | | | |
5% 12/1/23 (d) | | 1,200 | 1,210 |
5% 12/1/24 (d) | | 1,100 | 1,117 |
5% 12/1/25 (d) | | 1,200 | 1,226 |
| Hempstead Local Dev. Corp. Rev. (Hofstra Univ. Proj.) Series 2021 A, 3% 7/1/51 | | 3,310 | 2,381 |
| MTA Hudson Rail Yards Trust Oblig. Series 2016 A, 5% 11/15/56 | | 26,320 | 26,088 |
| New York City Edl. Construction Fund Series 2021 B, 5% 4/1/46 | | 5,215 | 5,518 |
| New York City Gen. Oblig. Series 2016 E, 5% 8/1/28 | | 3,645 | 3,917 |
| New York City Muni. Wtr. Fin. Auth.: | | | |
| Series 2022 EE, 5% 6/15/45 | | 11,240 | 12,090 |
| Series GG 1, 5% 6/15/48 | | 3,500 | 3,702 |
| New York City Transitional Fin. Auth. Bldg. Aid Rev. Series 2015 S2, 5% 7/15/35 | | 1,465 | 1,522 |
| New York Dorm. Auth. Rev. Series 2022 A: | | | |
| 5% 7/15/37 | | 785 | 808 |
| 5% 7/15/42 | | 2,210 | 2,247 |
| 5% 7/15/50 | | 5,710 | 5,722 |
| New York Metropolitan Trans. Auth. Rev.: | | | |
| Series 2014 B, 5% 11/15/44 | | 8,280 | 8,015 |
| Series 2015 A1, 5% 11/15/45 | | 6,170 | 5,950 |
| Series 2020 D: | | | |
4% 11/15/46 | | 39,325 | 32,888 |
4% 11/15/47 | | 2,710 | 2,250 |
| New York State Dorm. Auth.: | | | |
| Series 2019 D, 3% 2/15/49 | | 7,555 | 5,731 |
| Series 2021 E: | | | |
3% 3/15/50 | | 3,275 | 2,465 |
4% 3/15/45 | | 13,955 | 13,151 |
| New York State Mtg. Agcy. Homeowner Mtg. Series 221, 3.5% 10/1/32 (e) | | 755 | 739 |
| New York State Urban Dev. Corp.: | | | |
| Series 2020 A, 5% 3/15/42 | | 2,000 | 2,141 |
| Series 2020 C, 5% 3/15/47 | | 15,000 | 15,878 |
| Series 2020 E: | | | |
3% 3/15/50 | | 4,230 | 3,190 |
4% 3/15/44 | | 28,000 | 26,291 |
4% 3/15/45 | | 22,500 | 21,022 |
| New York Trans. Dev. Corp.: | | | |
| (Laguardia Arpt. Term. Redev. Proj.) Series 2016 A, 5% 7/1/41 (e) | | 3,560 | 3,463 |
| (Term. 4 John F. Kennedy Int'l. Arpt. Proj.) Series 2022: | | | |
5% 12/1/32 (e) | | 2,755 | 2,947 |
5% 12/1/33 (e) | | 4,270 | 4,542 |
5% 12/1/34 (e) | | 4,665 | 4,900 |
5% 12/1/35 (e) | | 2,330 | 2,426 |
5% 12/1/36 (e) | | 1,590 | 1,644 |
5% 12/1/37 (e) | | 4,240 | 4,363 |
5% 12/1/38 (e) | | 10,300 | 10,559 |
5% 12/1/39 (e) | | 7,875 | 8,031 |
5% 12/1/40 (e) | | 6,665 | 6,761 |
5% 12/1/41 (e) | | 6,060 | 6,116 |
5% 12/1/42 (e) | | 3,030 | 3,051 |
| New York Urban Dev. Corp. Rev.: | | | |
| (New York State Gen. Oblig. Proj.) Series 2017 A, 5% 3/15/34 | | 5,215 | 5,609 |
| Gen. Oblig. (New York State Gen. Oblig. Proj.) Series 2017 A, 5% 3/15/32 | | 4,470 | 4,835 |
| Oneida County Local Dev. Corp. Rev. (Mohawk Valley Health Sys. Proj.) Series 2019 A: | | | |
| 4% 12/1/33 (Assured Guaranty Muni. Corp. Insured) | | 1,200 | 1,204 |
| 5% 12/1/31 (Assured Guaranty Muni. Corp. Insured) | | 1,500 | 1,662 |
| Onondaga Civic Dev. Corp. (Le Moyne College Proj.) Series 2018, 5% 1/1/43 | | 830 | 830 |
| Suffolk County Econ. Dev. Corp. Rev. Series 2021: | | | |
| 4.625% 11/1/31 (d) | | 750 | 630 |
| 5.375% 11/1/54 (d) | | 1,150 | 867 |
| Triborough Bridge & Tunnel Auth. Revs. Series 2015 A, 5.25% 11/15/45 | | 4,140 | 4,269 |
TOTAL NEW YORK | | | 288,090 |
| New York And New Jersey - 0.1% | | | |
| Port Auth. of New York & New Jersey Series 194, 5.25% 10/15/55 | | 3,915 | 4,054 |
| North Carolina - 0.6% | | | |
| Charlotte Ctfs. of Prtn. (Convention Facility Projs.) Series 2019 A: | | | |
| 5% 6/1/44 | | 4,000 | 4,297 |
| 5% 6/1/46 | | 2,120 | 2,270 |
| Charlotte Int'l. Arpt. Rev.: | | | |
| Series 2017 A: | | | |
5% 7/1/30 | | 1,265 | 1,380 |
5% 7/1/33 | | 1,040 | 1,121 |
5% 7/1/37 | | 2,910 | 3,063 |
| Series 2017 B: | | | |
5% 7/1/25 (e) | | 85 | 88 |
5% 7/1/26 (e) | | 85 | 89 |
5% 7/1/27 (e) | | 160 | 170 |
5% 7/1/28 (e) | | 135 | 143 |
5% 7/1/29 (e) | | 195 | 206 |
5% 7/1/30 (e) | | 210 | 222 |
5% 7/1/31 (e) | | 395 | 416 |
5% 7/1/32 (e) | | 420 | 442 |
5% 7/1/33 (e) | | 440 | 462 |
5% 7/1/34 (e) | | 460 | 481 |
5% 7/1/35 (e) | | 315 | 328 |
5% 7/1/36 (e) | | 255 | 265 |
5% 7/1/37 (e) | | 300 | 310 |
5% 7/1/42 (e) | | 975 | 994 |
| Series 2017 C, 4% 7/1/32 | | 1,190 | 1,217 |
| New Hanover County Hosp. Rev. Series 2017: | | | |
| 5% 10/1/27 (Escrowed to Maturity) | | 275 | 302 |
| 5% 10/1/42 (Pre-Refunded to 10/1/27 @ 100) | | 2,215 | 2,435 |
| 5% 10/1/47 (Pre-Refunded to 10/1/27 @ 100) | | 1,000 | 1,099 |
| North Carolina Med. Care Commission Health Care Facilities Rev.: | | | |
| Series 2020 A, 3% 7/1/45 | | 2,590 | 1,944 |
| Series 2021 A: | | | |
4% 3/1/41 | | 1,050 | 819 |
4% 3/1/51 | | 2,075 | 1,456 |
TOTAL NORTH CAROLINA | | | 26,019 |
| North Dakota - 0.1% | | | |
| Univ. of North Dakota Series 2021 A, 3% 6/1/61 (Assured Guaranty Muni. Corp. Insured) | | 5,480 | 3,641 |
| Ohio - 2.2% | | | |
| Akron Bath Copley Hosp. District Rev. Series 2016, 5.25% 11/15/46 | | 7,285 | 7,361 |
| Allen County Hosp. Facilities Rev. (Mercy Health) Series 2017 A: | | | |
| 5% 8/1/25 | | 2,475 | 2,599 |
| 5% 8/1/26 | | 1,645 | 1,757 |
| 5% 8/1/27 | | 2,060 | 2,233 |
| 5% 8/1/28 | | 2,060 | 2,256 |
| 5% 8/1/29 | | 4,130 | 4,522 |
| 5% 8/1/30 | | 3,520 | 3,850 |
| Buckeye Tobacco Settlement Fing. Auth.: | | | |
| Series 2020 A2: | | | |
3% 6/1/48 | | 3,870 | 2,724 |
4% 6/1/48 | | 1,265 | 1,082 |
5% 6/1/30 | | 2,000 | 2,145 |
5% 6/1/32 | | 1,665 | 1,773 |
5% 6/1/33 | | 2,000 | 2,122 |
5% 6/1/34 | | 420 | 443 |
| Series 2020 B2, 5% 6/1/55 | | 9,515 | 8,259 |
| Columbus City School District Series 2016 A, 5% 12/1/29 | | 1,740 | 1,869 |
| Fairfield County Hosp. Facilities Rev. (Fairfield Med. Ctr. Proj.) Series 2013, 5.25% 6/15/43 | | 3,470 | 3,382 |
| Franklin County Convention Facilities Auth. (Greater Columbus Convention Ctr. Hotel Expansion Proj.) Series 2019, 5% 12/1/44 | | 470 | 465 |
| Franklin County Convention Facilities Authorities (Greater Columbus Convention Ctr. Hotel Expansion Proj.) Series 2019: | | | |
| 5% 12/1/46 | | 4,700 | 5,040 |
| 5% 12/1/51 | | 6,900 | 7,361 |
| Lancaster Port Auth. Gas Rev. Bonds Series 2019, 5%, tender 2/1/25 (b) | | 1,850 | 1,881 |
| Muskingum County Hosp. Facilities (Genesis Healthcare Sys. Obligated Group Proj.) Series 2013, 5% 2/15/33 | | 3,685 | 3,686 |
| Ohio Hosp. Rev. Series 2020 A, 4% 1/15/50 | | 975 | 849 |
| Ohio Hsg. Fin. Agcy. Residential Mtg. Rev. (Mtg. Backed Securities Prog.) Series 2019 B, 4.5% 3/1/50 | | 490 | 497 |
| Ohio Tpk. Commission Tpk. Rev.: | | | |
| (Infrastructure Proj.) Series 2005 A, 0% 2/15/42 | | 2,150 | 900 |
| (Infrastructure Projs.) Series 2022 A: | | | |
5% 2/15/32 | | 4,930 | 5,808 |
5% 2/15/38 | | 1,155 | 1,309 |
5% 2/15/39 | | 240 | 271 |
| Scioto County Hosp. Facilities Rev.: | | | |
| Series 2016: | | | |
5% 2/15/29 | | 1,815 | 1,882 |
5% 2/15/34 | | 370 | 378 |
| Series 2019, 5% 2/15/29 | | 3,525 | 3,678 |
| Univ. of Akron Gen. Receipts Series 2016 A, 5% 1/1/35 | | 3,725 | 3,841 |
| Washington County Hosp. Rev. Series 2022: | | | |
| 6% 12/1/28 | | 1,550 | 1,573 |
| 6% 12/1/29 | | 1,645 | 1,674 |
| 6% 12/1/30 | | 1,750 | 1,782 |
| 6% 12/1/31 | | 1,850 | 1,880 |
TOTAL OHIO | | | 93,132 |
| Oklahoma - 0.2% | | | |
| Oklahoma City Pub. Property Auth. Hotel Tax Rev. Series 2015: | | | |
| 5% 10/1/28 | | 1,050 | 1,109 |
| 5% 10/1/29 | | 1,160 | 1,225 |
| 5% 10/1/36 | | 830 | 874 |
| 5% 10/1/39 | | 1,655 | 1,741 |
| Oklahoma Dev. Fin. Auth. Rev. (Oklahoma City Univ. Proj.) Series 2019, 5% 8/1/44 | | 1,915 | 1,854 |
TOTAL OKLAHOMA | | | 6,803 |
| Oregon - 0.9% | | | |
| Multnomah County School District #1J Portland Series 2020 B, 3% 6/15/36 | | 1,525 | 1,369 |
| Oregon State Hsg. & Cmnty. Svcs. Dept. Series 2019 A, 4% 7/1/50 | | 5,710 | 5,717 |
| Port of Portland Arpt. Rev.: | | | |
| Series 2020 27A, 5% 7/1/45 (e) | | 2,980 | 3,042 |
| Series 2022 28: | | | |
5% 7/1/41 (e) | | 12,420 | 12,865 |
5% 7/1/52 (e) | | 10,500 | 10,655 |
| Salem Hosp. Facility Auth. Rev.: | | | |
| (Salem Health Projs.) Series 2019 A, 3% 5/15/49 | | 5,975 | 4,257 |
| Series 2016 A, 4% 5/15/41 | | 1,680 | 1,616 |
TOTAL OREGON | | | 39,521 |
| Pennsylvania - 8.6% | | | |
| Allegheny County Arpt. Auth. Rev. Series 2021 A: | | | |
| 4% 1/1/38 (e) | | 2,545 | 2,386 |
| 4% 1/1/39 (e) | | 3,075 | 2,872 |
| 4% 1/1/40 (e) | | 10,000 | 9,247 |
| 4% 1/1/41 (e) | | 10,000 | 9,166 |
| 5% 1/1/29 (e) | | 4,185 | 4,471 |
| 5% 1/1/30 (e) | | 4,000 | 4,312 |
| 5% 1/1/31 (e) | | 3,000 | 3,261 |
| 5% 1/1/32 (e) | | 4,000 | 4,323 |
| 5% 1/1/51 (e) | | 20,480 | 20,685 |
| 5% 1/1/56 (e) | | 12,420 | 12,498 |
| Allegheny County Indl. Dev. Auth. Rev. Series 2021: | | | |
| 3.5% 12/1/31 | | 1,300 | 1,073 |
| 4% 12/1/41 | | 2,450 | 1,780 |
| 4.25% 12/1/50 | | 2,730 | 1,872 |
| Bucks County Indl. Dev. Auth. Hosp. Rev. Series 2021: | | | |
| 5% 7/1/32 | | 495 | 501 |
| 5% 7/1/33 | | 1,150 | 1,157 |
| 5% 7/1/40 | | 3,100 | 2,937 |
| Cap. Region Wtr. Wtr. Rev. Series 2018: | | | |
| 5% 7/15/27 | | 830 | 905 |
| 5% 7/15/29 | | 1,290 | 1,423 |
| 5% 7/15/32 | | 830 | 912 |
| Dauphin County Gen. Auth. (Pinnacle Health Sys. Proj.) Series 2016 A: | | | |
| 5% 6/1/28 | | 885 | 930 |
| 5% 6/1/29 | | 970 | 1,016 |
| Delaware County Auth. Rev. (Cabrini College) Series 2017, 5% 7/1/47 | | 3,310 | 3,045 |
| Doylestown Hosp. Auth. Hosp. Rev. Series 2016 A, 5% 7/1/46 | | 1,205 | 1,010 |
| Dubois Hosp. Auth. Hosp. Rev.: | | | |
| (Penn Highlands Healthcare Proj.) Series 2018: | | | |
4% 7/15/33 | | 2,070 | 2,073 |
4% 7/15/35 | | 2,135 | 2,111 |
4% 7/15/37 | | 4,140 | 4,006 |
5% 7/15/25 | | 330 | 342 |
5% 7/15/26 | | 1,035 | 1,088 |
5% 7/15/27 | | 1,745 | 1,849 |
5% 7/15/28 | | 1,285 | 1,369 |
5% 7/15/29 | | 1,385 | 1,470 |
5% 7/15/30 | | 1,815 | 1,922 |
5% 7/15/31 | | 1,240 | 1,310 |
5% 7/15/32 | | 1,305 | 1,376 |
5% 7/15/34 | | 1,405 | 1,473 |
5% 7/15/36 | | 4,150 | 4,305 |
5% 7/15/38 | | 4,990 | 5,086 |
5% 7/15/43 | | 5,795 | 5,906 |
| Series 2020, 4% 7/15/45 | | 2,900 | 2,548 |
| Lancaster County Hosp. Auth. Health Ctr. Rev. Series 2021, 5% 11/1/51 | | 3,595 | 3,628 |
| Lehigh County Gen. Purp. Auth. Rev. (Muhlenberg College Proj.) Series 2017, 5% 2/1/39 | | 2,140 | 2,176 |
| Monroe County Hosp. Auth. Rev. Series 2016: | | | |
| 5% 7/1/26 | | 830 | 877 |
| 5% 7/1/27 | | 830 | 876 |
| 5% 7/1/28 | | 830 | 874 |
| 5% 7/1/34 | | 3,045 | 3,127 |
| 5% 7/1/36 | | 1,655 | 1,687 |
| Montgomery County Higher Ed. & Health Auth. Rev.: | | | |
| Series 2014 A: | | | |
5% 10/1/23 | | 325 | 327 |
5% 10/1/24 | | 965 | 981 |
5% 10/1/25 | | 865 | 872 |
5% 10/1/27 | | 415 | 418 |
| Series 2016 A: | | | |
5% 10/1/28 | | 1,255 | 1,269 |
5% 10/1/29 | | 2,150 | 2,173 |
5% 10/1/31 | | 3,790 | 3,825 |
5% 10/1/36 | | 6,790 | 6,747 |
5% 10/1/40 | | 4,700 | 4,546 |
| Northampton County Gen. Purp. Auth. Hosp. Rev.: | | | |
| (St. Luke's Univ. Health Network Proj.): | | | |
Series 2016 A, 5% 8/15/36 | | 615 | 635 |
Series 2018 A, 4% 8/15/48 | | 10,545 | 9,631 |
| Series 2016 A, 5% 8/15/46 | | 24,835 | 24,948 |
| Pennsylvania Higher Edl. Facilities Auth. Rev.: | | | |
| (Drexel Univ. Proj.): | | | |
Series 2016, 5% 5/1/35 | | 2,880 | 2,991 |
Series 2017: | | | |
5% 5/1/35 | | 1,025 | 1,076 |
5% 5/1/37 | | 1,295 | 1,347 |
5% 5/1/41 | | 5,860 | 6,029 |
| Series 2016: | | | |
5% 5/1/28 | | 415 | 438 |
5% 5/1/32 | | 1,040 | 1,088 |
5% 5/1/33 | | 1,405 | 1,468 |
| Pennsylvania State Univ. Series 2020 A, 4% 9/1/50 | | 2,950 | 2,807 |
| Pennsylvania Tpk. Commission Tpk. Rev. Series 2021 B, 5% 12/1/38 | | 6,680 | 7,298 |
| Philadelphia Arpt. Rev.: | | | |
| Series 2017 A: | | | |
5% 7/1/25 | | 830 | 869 |
5% 7/1/26 | | 830 | 885 |
5% 7/1/27 | | 660 | 715 |
| Series 2017 B: | | | |
5% 7/1/26 (e) | | 2,485 | 2,605 |
5% 7/1/27 (e) | | 2,070 | 2,184 |
5% 7/1/28 (e) | | 2,485 | 2,611 |
5% 7/1/29 (e) | | 1,860 | 1,951 |
5% 7/1/32 (e) | | 2,485 | 2,594 |
5% 7/1/33 (e) | | 1,865 | 1,943 |
5% 7/1/34 (e) | | 3,310 | 3,437 |
5% 7/1/37 (e) | | 3,725 | 3,820 |
| Philadelphia Auth. for Indl. Dev. Series 2017, 5% 11/1/47 | | 5,425 | 5,457 |
| Philadelphia Gas Works Rev. Series 16 A, 4% 8/1/45 (Assured Guaranty Muni. Corp. Insured) | | 2,685 | 2,565 |
| Philadelphia School District: | | | |
| Series 2016 D: | | | |
5% 9/1/26 | | 7,600 | 8,089 |
5% 9/1/27 | | 8,020 | 8,567 |
5% 9/1/28 | | 6,705 | 7,158 |
| Series 2016 F: | | | |
5% 9/1/28 | | 11,600 | 12,355 |
5% 9/1/29 | | 7,540 | 8,020 |
| Series 2018 A: | | | |
5% 9/1/36 | | 1,575 | 1,685 |
5% 9/1/37 | | 910 | 969 |
5% 9/1/38 | | 1,450 | 1,540 |
| Series 2018 B, 5% 9/1/43 | | 2,115 | 2,221 |
| Series 2019 A: | | | |
4% 9/1/35 | | 5,215 | 5,207 |
5% 9/1/33 | | 2,480 | 2,744 |
5% 9/1/34 | | 7,225 | 7,895 |
| Series 2019 C, 5% 9/1/33 | | 2,540 | 2,791 |
| Series F: | | | |
5% 9/1/30 | | 5,625 | 5,963 |
5% 9/1/30 (Pre-Refunded to 9/1/26 @ 100) | | 20 | 22 |
| Philadelphia Wtr. & Wastewtr. Rev. Series 2018 A: | | | |
| 5% 10/1/35 | | 4,190 | 4,578 |
| 5% 10/1/36 | | 6,210 | 6,743 |
| 5% 10/1/48 | | 6,000 | 6,238 |
| Pittsburgh Wtr. & Swr. Auth. Wtr. & Swr. Sys. Rev.: | | | |
| Series 2019 A, 5% 9/1/39 (Assured Guaranty Muni. Corp. Insured) | | 2,315 | 2,493 |
| Series 2019 A, 5% 9/1/44 (Assured Guaranty Muni. Corp. Insured) | | 775 | 821 |
| State Pub. School Bldg. Auth. Lease Rev. (The School District of Philadelphia Proj.) Series 2015 A, 5% 6/1/26 | | 1,055 | 1,096 |
| Union County Hosp. Auth. Rev. Series 2018 B: | | | |
| 5% 8/1/43 | | 4,605 | 4,696 |
| 5% 8/1/48 | | 5,335 | 5,380 |
TOTAL PENNSYLVANIA | | | 363,082 |
| Puerto Rico - 1.1% | | | |
| Puerto Rico Commonwealth Aqueduct & Swr. Auth.: | | | |
| Series 2021 B: | | | |
4% 7/1/42 (d) | | 1,085 | 870 |
5% 7/1/33 (d) | | 1,580 | 1,526 |
5% 7/1/37 (d) | | 6,625 | 6,257 |
| Series 2022 A, 4% 7/1/42 (d) | | 5,545 | 4,444 |
| Puerto Rico Commonwealth Pub. Impt. Gen. Oblig. Series 2021 A1: | | | |
| 0% 7/1/33 | | 16,179 | 8,746 |
| 4% 7/1/33 | | 11,631 | 10,085 |
| 4% 7/1/35 | | 4,213 | 3,546 |
| 5.625% 7/1/27 | | 1,360 | 1,386 |
| 5.625% 7/1/29 | | 3,903 | 3,993 |
| Puerto Rico Sales Tax Fing. Corp. Sales Tax Rev. Series 2018 A1, 0% 7/1/31 | | 9,290 | 6,052 |
TOTAL PUERTO RICO | | | 46,905 |
| Rhode Island - 0.3% | | | |
| Rhode Island Health & Edl. Bldg. Corp. Higher Ed. Facilities Rev.: | | | |
| Series 2016 B: | | | |
5% 9/1/31 | | 655 | 637 |
5% 9/1/36 | | 5,810 | 5,349 |
| Series 2016, 5% 5/15/39 | | 5,215 | 5,238 |
| Rhode Island Hsg. & Mtg. Fin. Corp. Series 2019 70, 4% 10/1/49 | | 1,050 | 1,052 |
| Rhode Island Student Ln. Auth. Student Ln. Rev. Series A: | | | |
| 3.5% 12/1/34 (e) | | 1,200 | 1,166 |
| 5% 12/1/25 (e) | | 1,000 | 1,045 |
TOTAL RHODE ISLAND | | | 14,487 |
| South Carolina - 1.6% | | | |
| Charleston County Arpt. District Series 2019, 5% 7/1/43 | | 2,085 | 2,167 |
| Scago Edl. Facilities Corp. for Colleton School District (School District of Colleton County Proj.) Series 2015: | | | |
| 5% 12/1/25 | | 2,275 | 2,382 |
| 5% 12/1/28 | | 4,690 | 4,908 |
| South Carolina Hsg. Fin. & Dev. Auth. Mtg. Rev. Series 2019 A, 4% 1/1/50 | | 1,780 | 1,785 |
| South Carolina Jobs-Econ. Dev. Auth. Series 2019 C: | | | |
| 5% 7/1/32 | | 1,010 | 1,086 |
| 5% 7/1/33 | | 4,200 | 4,504 |
| South Carolina Ports Auth. Ports Rev. Series 2015, 5.25% 7/1/55 (Pre-Refunded to 7/1/25 @ 100) (e) | | 910 | 953 |
| South Carolina Pub. Svc. Auth. Rev.: | | | |
| Series 2016 A: | | | |
5% 12/1/29 | | 2,485 | 2,614 |
5% 12/1/38 | | 250 | 254 |
| Series 2016 B: | | | |
5% 12/1/31 | | 910 | 962 |
5% 12/1/41 | | 12,515 | 12,722 |
| Spartanburg County Reg'l. Health Series 2017 A: | | | |
| 4% 4/15/43 | | 15,510 | 14,101 |
| 4% 4/15/48 | | 10,815 | 9,532 |
| 5% 4/15/48 | | 10,595 | 10,790 |
TOTAL SOUTH CAROLINA | | | 68,760 |
| South Dakota - 0.1% | | | |
| South Dakota Health & Edl. Facilities Auth. Rev.: | | | |
| (Avera Health Proj.) Series 2017, 5% 7/1/31 | | 540 | 584 |
| Series 2017: | | | |
5% 7/1/26 | | 250 | 266 |
5% 7/1/28 | | 250 | 272 |
5% 7/1/29 | | 470 | 511 |
| Series 2020 A, 3% 9/1/45 | | 3,355 | 2,500 |
TOTAL SOUTH DAKOTA | | | 4,133 |
| Tennessee - 0.5% | | | |
| Chattanooga Health Ed. & Hsg. Facility Board Rev.: | | | |
| Series 2019 A1: | | | |
4% 8/1/44 | | 2,200 | 1,897 |
5% 8/1/31 | | 1,000 | 1,065 |
5% 8/1/33 | | 1,250 | 1,325 |
| Series 2019 A2, 5% 8/1/35 | | 765 | 802 |
| Metropolitan Nashville Arpt. Auth. Rev.: | | | |
| Series 2015 B, 4% 7/1/25 (e) | | 1,755 | 1,778 |
| Series 2019 B, 5% 7/1/54 (e) | | 9,580 | 9,637 |
| Tennessee Hsg. Dev. Agcy. Series 2022 2, 5% 1/1/53 | | 4,750 | 4,951 |
TOTAL TENNESSEE | | | 21,455 |
| Texas - 4.8% | | | |
| Austin Arpt. Sys. Rev.: | | | |
| Series 2014: | | | |
5% 11/15/26 (e) | | 830 | 854 |
5% 11/15/27 (e) | | 1,035 | 1,063 |
5% 11/15/28 (e) | | 1,240 | 1,271 |
5% 11/15/39 (e) | | 2,725 | 2,752 |
| Series 2017 B: | | | |
5% 11/15/28 (e) | | 830 | 871 |
5% 11/15/30 (e) | | 1,275 | 1,333 |
5% 11/15/32 (e) | | 1,005 | 1,048 |
5% 11/15/35 (e) | | 1,035 | 1,069 |
5% 11/15/36 (e) | | 1,385 | 1,427 |
5% 11/15/37 (e) | | 1,165 | 1,197 |
5% 11/15/41 (e) | | 4,725 | 4,811 |
| Central Reg'l. Mobility Auth. Series 2015 A: | | | |
| 5% 1/1/28 | | 1,075 | 1,116 |
| 5% 1/1/31 (Pre-Refunded to 7/1/25 @ 100) | | 395 | 417 |
| 5% 1/1/32 (Pre-Refunded to 7/1/25 @ 100) | | 830 | 877 |
| Collin County Series 2022, 4% 2/15/39 | | 1,800 | 1,732 |
| Dallas Wtrwks. & Swr. Sys. Rev. Series 2020 C: | | | |
| 4% 10/1/35 | | 1,000 | 1,036 |
| 4% 10/1/39 | | 5,000 | 5,074 |
| 4% 10/1/40 | | 2,000 | 2,018 |
| Grand Parkway Trans. Corp.: | | | |
| Series 2018 A, 5% 10/1/38 | | 2,655 | 2,821 |
| Series 2020 C, 4% 10/1/49 | | 3,100 | 2,747 |
| Harris County Cultural Ed. Facilities Fin. Corp. Rev. (Texas Childrens Hosp., Proj.) Series 2015-1 5% 10/1/29 | | 1,115 | 1,174 |
| Harris County Gen. Oblig. Series 2002: | | | |
| 0% 8/15/25 (Nat'l. Pub. Fin. Guarantee Corp. Insured) | | 2,485 | 2,301 |
| 0% 8/15/28 (Nat'l. Pub. Fin. Guarantee Corp. Insured) | | 4,140 | 3,490 |
| Houston Arpt. Sys. Rev.: | | | |
| Series 2018 A, 5% 7/1/41 (e) | | 1,000 | 1,025 |
| Series 2018 C: | | | |
5% 7/1/29 (e) | | 1,655 | 1,760 |
5% 7/1/30 (e) | | 1,765 | 1,876 |
5% 7/1/31 (e) | | 1,240 | 1,316 |
5% 7/1/32 (e) | | 1,450 | 1,536 |
| Houston Gen. Oblig. Series 2017 A: | | | |
| 5% 3/1/31 | | 3,835 | 4,143 |
| 5% 3/1/32 | | 1,635 | 1,764 |
| Houston Util. Sys. Rev. Series 2020 C: | | | |
| 5% 11/15/33 | | 2,000 | 2,270 |
| 5% 11/15/34 | | 2,500 | 2,799 |
| Irving Hosp. Auth. Hosp. Rev. Series 2017 A: | | | |
| 5% 10/15/28 | | 390 | 410 |
| 5% 10/15/30 | | 1,570 | 1,641 |
| 5% 10/15/32 | | 830 | 865 |
| 5% 10/15/36 | | 545 | 561 |
| 5% 10/15/37 | | 930 | 954 |
| 5% 10/15/38 | | 1,325 | 1,356 |
| 5% 10/15/44 | | 1,310 | 1,328 |
| Love Field Arpt. Modernization Rev.: | | | |
| Series 2015: | | | |
5% 11/1/26 (e) | | 830 | 865 |
5% 11/1/27 (e) | | 1,780 | 1,851 |
5% 11/1/28 (e) | | 2,755 | 2,857 |
5% 11/1/29 (e) | | 1,655 | 1,711 |
5% 11/1/32 (e) | | 3,055 | 3,152 |
| Series 2017: | | | |
5% 11/1/24 (e) | | 830 | 854 |
5% 11/1/25 (e) | | 830 | 866 |
5% 11/1/26 (e) | | 830 | 877 |
5% 11/1/27 (e) | | 830 | 874 |
5% 11/1/28 (e) | | 1,450 | 1,522 |
5% 11/1/29 (e) | | 1,035 | 1,082 |
5% 11/1/30 (e) | | 830 | 867 |
5% 11/1/31 (e) | | 1,840 | 1,920 |
5% 11/1/32 (e) | | 2,135 | 2,225 |
5% 11/1/33 (e) | | 830 | 864 |
5% 11/1/34 (e) | | 830 | 860 |
5% 11/1/36 (e) | | 830 | 854 |
| Lower Colorado River Auth. Rev. Series 2015 D: | | | |
| 5% 5/15/28 | | 1,820 | 1,902 |
| 5% 5/15/30 | | 4,140 | 4,326 |
| New Hope Cultural Ed. Facilities Fin. Corp. (Childrens Med. Ctr. of Dallas) Series 2017 A: | | | |
| 5% 8/15/27 | | 625 | 682 |
| 5% 8/15/29 | | 1,655 | 1,795 |
| 5% 8/15/47 | | 1,890 | 1,935 |
| Newark Higher Ed. Fin. Corp. (Abilene Christian Univ. Proj.) Series 2016 A: | | | |
| 5% 4/1/27 | | 595 | 626 |
| 5% 4/1/30 | | 2,825 | 2,970 |
| North Texas Tollway Auth. Rev.: | | | |
| (Sr. Lien Proj.) Series 2017 A: | | | |
5% 1/1/31 | | 830 | 879 |
5% 1/1/33 | | 975 | 1,046 |
5% 1/1/34 | | 1,240 | 1,327 |
5% 1/1/34 | | 2,485 | 2,894 |
5% 1/1/35 | | 1,820 | 1,940 |
5% 1/1/36 | | 4,965 | 5,261 |
5% 1/1/37 | | 6,625 | 6,974 |
| (Sub Lien Proj.) Series 2017 B: | | | |
5% 1/1/30 | | 350 | 368 |
5% 1/1/31 | | 495 | 520 |
| Series 2015 A, 5% 1/1/32 | | 2,775 | 2,864 |
| Series 2016 A, 5% 1/1/36 | | 1,035 | 1,085 |
| Series 2017 A: | | | |
5% 1/1/38 | | 300 | 300 |
5% 1/1/38 (Pre-Refunded to 1/1/23 @ 100) | | 2,390 | 2,390 |
| San Antonio Independent School District Series 2016, 5% 8/15/31 | | 3,590 | 3,873 |
| Southwest Higher Ed. Auth. Rev. (Southern Methodist Univ., TX. Proj.) Series 2017: | | | |
| 5% 10/1/29 | | 375 | 407 |
| 5% 10/1/30 | | 580 | 627 |
| 5% 10/1/31 | | 520 | 560 |
| 5% 10/1/39 | | 1,030 | 1,092 |
| 5% 10/1/40 | | 830 | 878 |
| Tarrant County Cultural Ed. Facilities Fin. Corp. Rev.: | | | |
| Series 2016 A, 4% 2/15/35 | | 4,140 | 4,171 |
| Series 2018 B, 5% 7/1/43 | | 1,500 | 1,536 |
| Texas Dept. of Hsg. & Cmnty. Affairs Multi-family Hsg. Rev. Series 2019, 2.95% 7/1/36 | | 4,390 | 3,908 |
| Texas Dept. of Hsg. & Cmnty. Affairs Single Family Mtg. Rev.: | | | |
| Series 2019 A, 4% 3/1/50 | | 3,680 | 3,692 |
| Series A, 3.5% 3/1/51 | | 3,360 | 3,311 |
| Texas Private Activity Bond Surface Trans. Corp. Series 2013, 6.75% 6/30/43 (e) | | 12,420 | 12,617 |
| Texas State Univ. Sys. Fing. Rev. Series 2017 A: | | | |
| 5% 3/15/29 | | 3,530 | 3,817 |
| 5% 3/15/31 | | 2,690 | 2,895 |
| Texas Wtr. Dev. Board Rev.: | | | |
| Series 2020, 3% 8/1/39 | | 1,165 | 1,010 |
| Series 2021, 2.5% 10/15/39 | | 3,000 | 2,358 |
| Univ. of Houston Univ. Revs. Series 2017 A: | | | |
| 5% 2/15/33 | | 3,310 | 3,503 |
| 5% 2/15/34 | | 4,140 | 4,379 |
| 5% 2/15/36 | | 2,485 | 2,619 |
| Univ. of North Texas Univ. Rev. Series 2017 A, 5% 4/15/32 | | 1,740 | 1,882 |
| Univ. of Texas Board of Regents Sys. Rev. Series 2019 A, 5% 8/15/29 | | 1,850 | 2,119 |
| Univ. of Texas Permanent Univ. Fund Rev. Series 2016 B, 5% 7/1/29 | | 1,685 | 1,822 |
| Waller Independent School District Series 2020, 3% 2/15/39 | | 1,850 | 1,558 |
| Weatherford Independent School District Series 2002, 0% 2/15/33 | | 5,785 | 4,035 |
TOTAL TEXAS | | | 202,957 |
| Utah - 1.4% | | | |
| Salt Lake City Arpt. Rev.: | | | |
| Series 2017 A: | | | |
5% 7/1/25 (e) | | 1,655 | 1,717 |
5% 7/1/27 (e) | | 3,500 | 3,714 |
5% 7/1/29 (e) | | 3,090 | 3,252 |
5% 7/1/30 (e) | | 2,275 | 2,394 |
5% 7/1/31 (e) | | 4,345 | 4,568 |
5% 7/1/33 (e) | | 3,310 | 3,461 |
5% 7/1/35 (e) | | 3,310 | 3,433 |
5% 7/1/36 (e) | | 4,470 | 4,620 |
5% 7/1/37 (e) | | 3,520 | 3,624 |
| Series 2018 A: | | | |
5% 7/1/31 (e) | | 2,000 | 2,123 |
5% 7/1/32 (e) | | 4,310 | 4,567 |
5% 7/1/33 (e) | | 1,420 | 1,498 |
5.25% 7/1/48 (e) | | 5,655 | 5,787 |
| Utah County Hosp. Rev. Series 2020 A: | | | |
| 5% 5/15/43 | | 5,500 | 5,870 |
| 5% 5/15/50 | | 9,000 | 9,301 |
TOTAL UTAH | | | 59,929 |
| Vermont - 0.7% | | | |
| Vermont Edl. & Health Bldg. Fin. Agcy. Rev.: | | | |
| (Champlain College Proj.) Series 2016 A: | | | |
5% 10/15/41 | | 3,810 | 3,683 |
5% 10/15/46 | | 4,720 | 4,439 |
| (Middlebury College Proj.) Series 2020, 5% 11/1/49 | | 18,500 | 19,644 |
| Vermont Student Assistant Corp. Ed. Ln. Rev. Series 2019 A, 5% 6/15/28 (e) | | 1,430 | 1,496 |
TOTAL VERMONT | | | 29,262 |
| Virginia - 0.6% | | | |
| Fredericksburg Econ. Dev. Auth. Rev. Series 2014: | | | |
| 5% 6/15/25 | | 3,860 | 3,972 |
| 5% 6/15/30 | | 1,035 | 1,056 |
| Lynchburg Econ. Dev. Series 2021, 3% 1/1/51 | | 3,000 | 2,071 |
| Stafford County Econ. Dev. Auth. Hosp. Facilities Rev.: | | | |
| (Mary Washington Hosp. Proj.) Series 2016, 3% 6/15/29 | | 525 | 509 |
| Series 2016: | | | |
4% 6/15/37 | | 595 | 568 |
5% 6/15/27 | | 1,240 | 1,309 |
5% 6/15/30 | | 540 | 564 |
5% 6/15/33 | | 350 | 363 |
5% 6/15/34 | | 665 | 687 |
5% 6/15/35 | | 1,820 | 1,872 |
| Virginia Commonwealth Trans. Board Rev. (Virginia Gen. Oblig. Proj.) Series 2017 A, 5% 5/15/32 | | 725 | 800 |
| Virginia Pub. Bldg. Auth. Pub. Facilities Rev. Series 2019 A, 4% 8/1/36 | | 4,505 | 4,636 |
| Winchester Econ. Dev. Auth. Series 2015: | | | |
| 5% 1/1/31 | | 2,070 | 2,175 |
| 5% 1/1/34 | | 1,240 | 1,291 |
| 5% 1/1/35 | | 1,240 | 1,285 |
| 5% 1/1/44 | | 830 | 834 |
TOTAL VIRGINIA | | | 23,992 |
| Washington - 3.1% | | | |
| Port of Seattle Rev.: | | | |
| Series 2016 B: | | | |
5% 10/1/28 (e) | | 2,900 | 3,047 |
5% 10/1/30 (e) | | 1,655 | 1,725 |
| Series 2019 A, 4% 4/1/44 (e) | | 2,525 | 2,240 |
| Washington Convention Ctr. Pub. Facilities: | | | |
| Series 2021 B, 3% 7/1/58 (Assured Guaranty Muni. Corp. Insured) | | 12,930 | 8,663 |
| Series 2021, 4% 7/1/31 | | 17,595 | 16,093 |
| Washington Gen. Oblig.: | | | |
| Series 2020 A, 5% 8/1/33 | | 1,260 | 1,426 |
| Series 2021 A, 5% 8/1/43 | | 2,300 | 2,480 |
| Series 2021 C, 5% 2/1/44 | | 270 | 293 |
| Series 2022 A, 5% 8/1/37 | | 33,745 | 38,062 |
| Series 2022 C, 4% 7/1/35 | | 4,200 | 4,374 |
| Series 2022 D: | | | |
4% 7/1/35 | | 1,800 | 1,875 |
4% 7/1/36 | | 5,735 | 5,929 |
4% 7/1/37 | | 4,000 | 4,105 |
| Series R-2017 A, 5% 8/1/30 | | 1,685 | 1,806 |
| Washington Health Care Facilities Auth. Rev.: | | | |
| (Overlake Hosp. Med. Ctr., WA. Proj.) Series 2017 B: | | | |
5% 7/1/25 | | 675 | 704 |
5% 7/1/27 | | 1,285 | 1,372 |
5% 7/1/28 | | 1,570 | 1,685 |
5% 7/1/29 | | 615 | 655 |
5% 7/1/30 | | 735 | 779 |
5% 7/1/31 | | 1,120 | 1,181 |
5% 7/1/32 | | 1,655 | 1,740 |
5% 7/1/33 | | 2,345 | 2,458 |
5% 7/1/34 | | 540 | 564 |
5% 7/1/42 | | 4,685 | 4,718 |
| Series 2015, 5% 1/1/27 (Pre-Refunded to 7/1/25 @ 100) | | 1,910 | 2,019 |
| Series 2019 A1, 5% 8/1/38 | | 1,000 | 1,034 |
| Series 2019 A2, 5% 8/1/33 | | 2,000 | 2,120 |
| Washington Higher Ed. Facilities Auth. Rev.: | | | |
| (Gonzaga Univ. Proj.) Series 2019 A, 3% 4/1/49 | | 4,975 | 3,520 |
| (Whitworth Univ. Proj.): | | | |
Series 2016 A: | | | |
5% 10/1/27 | | 1,770 | 1,845 |
5% 10/1/28 | | 1,825 | 1,902 |
5% 10/1/35 | | 1,880 | 1,918 |
5% 10/1/36 | | 2,845 | 2,895 |
5% 10/1/40 | | 2,795 | 2,818 |
Series 2019, 4% 10/1/49 | | 3,515 | 2,871 |
| Washington Hsg. Fin. Commission Nonprofit Hsg. Rev. (Judson Park Proj.) Series 2018: | | | |
| 4% 7/1/28 (d) | | 100 | 92 |
| 5% 7/1/33 (d) | | 125 | 116 |
| 5% 7/1/38 (d) | | 100 | 89 |
| 5% 7/1/48 (d) | | 400 | 332 |
TOTAL WASHINGTON | | | 131,545 |
| West Virginia - 0.1% | | | |
| West Virginia Hosp. Fin. Auth. Hosp. Rev. Series 2018 A: | | | |
| 5% 1/1/31 | | 1,355 | 1,420 |
| 5% 1/1/32 | | 1,120 | 1,171 |
TOTAL WEST VIRGINIA | | | 2,591 |
| Wisconsin - 1.3% | | | |
| Blue Ridge Healthcare Pub. Fin. Auth. Series 2020 A: | | | |
| 5% 1/1/35 | | 1,210 | 1,284 |
| 5% 1/1/40 | | 540 | 556 |
| Pub. Fin. Auth. Hosp. Rev.: | | | |
| Series 2019 A, 5% 10/1/44 | | 7,550 | 7,672 |
| Series 2020 A, 3% 6/1/45 | | 4,450 | 3,286 |
| Pub. Fin. Auth. Sr. Living Rev. (Mary's Woods At Marylhurst, Inc. Proj.) Series 2017 A: | | | |
| 5% 5/15/25 (d) | | 700 | 694 |
| 5% 5/15/28 (d) | | 1,095 | 1,056 |
| 5.25% 5/15/37 (d) | | 335 | 307 |
| 5.25% 5/15/42 (d) | | 415 | 367 |
| 5.25% 5/15/47 (d) | | 410 | 351 |
| 5.25% 5/15/52 (d) | | 775 | 651 |
| Pub. Fin. Auth. Wisconsin Retirement Facility Rev. Series 2018: | | | |
| 5% 10/1/43 (d) | | 735 | 633 |
| 5% 10/1/48 (d) | | 930 | 775 |
| 5% 10/1/53 (d) | | 2,330 | 1,902 |
| Roseman Univ. of Health: | | | |
| (Roseman Univ. of Health Sciences Proj.) Series 2020, 5% 4/1/40 (d) | | 750 | 711 |
| Series 2020, 5% 4/1/50 (d) | | 520 | 465 |
| Series 2021 A: | | | |
3% 7/1/50 | | 2,640 | 1,857 |
4.5% 6/1/56 (d) | | 14,095 | 10,204 |
| Series 2021 B, 6.5% 6/1/56 (d) | | 4,700 | 3,724 |
| Wisconsin Health & Edl. Facilities: | | | |
| Series 2014, 4% 5/1/33 | | 2,920 | 2,925 |
| Series 2016 A: | | | |
5% 2/15/28 | | 1,965 | 2,046 |
5% 2/15/29 | | 2,550 | 2,648 |
5% 2/15/30 | | 2,805 | 2,908 |
| Series 2017 A: | | | |
5% 9/1/31 (Pre-Refunded to 9/1/27 @ 100) | | 830 | 907 |
5% 9/1/33 (Pre-Refunded to 9/1/27 @ 100) | | 1,425 | 1,558 |
5% 9/1/35 (Pre-Refunded to 9/1/27 @ 100) | | 1,575 | 1,722 |
| Series 2019 A, 5% 11/1/46 | | 540 | 445 |
| Series 2019 B1, 2.825% 11/1/28 | | 1,435 | 1,269 |
| Series 2019 B2, 2.55% 11/1/27 | | 890 | 835 |
TOTAL WISCONSIN | | | 53,758 |
| TOTAL MUNICIPAL BONDS (Cost $4,322,720) | | | 4,094,391 |
| | | | |
| Money Market Funds - 2.6% |
| | | Shares | Value ($) (000s) |
Fidelity Municipal Cash Central Fund 3.72% (h)(i) (Cost $111,117) | | 111,094,103 | 111,110 |
| | | | |
| TOTAL INVESTMENT IN SECURITIES - 99.6% (Cost $4,433,837) | 4,205,501 |
NET OTHER ASSETS (LIABILITIES) - 0.4% | 17,124 |
| NET ASSETS - 100.0% | 4,222,625 |
| | |
Any values shown as $0 in the Schedule of Investments may reflect amounts less than $500.
Legend
| (a) | Amount is stated in United States dollars unless otherwise noted. |
| (b) | Coupon rates for floating and adjustable rate securities reflect the rates in effect at period end. |
| (c) | Coupon is indexed to a floating interest rate which may be multiplied by a specified factor and/or subject to caps or floors. |
| (d) | Security exempt from registration under Rule 144A of the Securities Act of 1933. These securities may be resold in transactions exempt from registration, normally to qualified institutional buyers. At the end of the period, the value of these securities amounted to $73,160,000 or 1.7% of net assets. |
| (e) | Private activity obligations whose interest is subject to the federal alternative minimum tax for individuals. |
| (f) | Security initially issued in zero coupon form which converts to coupon form at a specified rate and date. The rate shown is the rate at period end. |
| (g) | Security or a portion of the security purchased on a delayed delivery or when-issued basis. |
| (h) | Information in this report regarding holdings by state and security types does not reflect the holdings of the Fidelity Municipal Cash Central Fund. |
| (i) | Affiliated fund that is generally available only to investment companies and other accounts managed by Fidelity Investments. The rate quoted is the annualized seven-day yield of the fund at period end. A complete unaudited listing of the fund's holdings as of its most recent quarter end is available upon request. In addition, each Fidelity Central Fund's financial statements, which are not covered by the Fund's Report of Independent Registered Public Accounting Firm, are available on the SEC's website or upon request. |
Affiliated Central Funds
Fiscal year to date information regarding the Fund's investments in Fidelity Central Funds, including the ownership percentage, is presented below.
| Affiliate (Amounts in thousands) | Value, beginning of period ($) | Purchases ($) | Sales Proceeds ($) | Dividend Income ($) | Realized Gain (loss) ($) | Change in Unrealized appreciation (depreciation) ($) | Value, end of period ($) | % ownership, end of period |
| Fidelity Municipal Cash Central Fund 3.72% | 88,008 | 1,459,368 | 1,436,258 | 1,165 | - | (8) | 111,110 | 4.5% |
| Total | 88,008 | 1,459,368 | 1,436,258 | 1,165 | - | (8) | 111,110 | |
| | | | | | | | | |
Amounts in the dividend income column in the above table include any capital gain distributions from underlying funds, which are presented in the corresponding line item in the Statement of Operations, if applicable.
Amounts included in the purchases and sales proceeds columns may include in-kind transactions, if applicable.
Investment Valuation
The following is a summary of the inputs used, as of December 31, 2022, involving the Fund's assets and liabilities carried at fair value. The inputs or methodology used for valuing securities may not be an indication of the risk associated with investing in those securities. For more information on valuation inputs, and their aggregation into the levels used below, please refer to the Investment Valuation section in the accompanying Notes to Financial Statements.
| Valuation Inputs at Reporting Date: |
Description (Amounts in thousands) | Total ($) | Level 1 ($) | Level 2 ($) | Level 3 ($) |
Investments in Securities: | | | | |
|
| Municipal Securities | 4,094,391 | - | 4,094,391 | - |
|
| Money Market Funds | 111,110 | 111,110 | - | - |
| Total Investments in Securities: | 4,205,501 | 111,110 | 4,094,391 | - |
| Statement of Assets and Liabilities |
| Amounts in thousands (except per-share amounts) | | | | December 31, 2022 |
| | | | | |
| Assets | | | | |
| Investment in securities, at value - See accompanying schedule: | | | | |
Unaffiliated issuers (cost $4,322,720) | | $4,094,391 | | |
Fidelity Central Funds (cost $111,117) | | 111,110 | | |
| | | | | |
| Total Investment in Securities (cost $4,433,837) | | | $ | 4,205,501 |
| Cash | | | | 153 |
| Receivable for investments sold | | | | 8 |
| Receivable for fund shares sold | | | | 7,128 |
| Interest receivable | | | | 56,744 |
| Distributions receivable from Fidelity Central Funds | | | | 249 |
| Prepaid expenses | | | | 4 |
| Other receivables | | | | 2 |
Total assets | | | | 4,269,789 |
| Liabilities | | | | |
| Payable for investments purchased on a delayed delivery basis | | $31,713 | | |
| Payable for fund shares redeemed | | 10,441 | | |
| Distributions payable | | 3,173 | | |
| Accrued management fee | | 1,239 | | |
| Distribution and service plan fees payable | | 92 | | |
| Other affiliated payables | | 435 | | |
| Other payables and accrued expenses | | 71 | | |
| Total Liabilities | | | | 47,164 |
| Net Assets | | | $ | 4,222,625 |
| Net Assets consist of: | | | | |
| Paid in capital | | | $ | 4,481,380 |
| Total accumulated earnings (loss) | | | | (258,755) |
| Net Assets | | | $ | 4,222,625 |
| | | | | |
| Net Asset Value and Maximum Offering Price | | | | |
| Class A : | | | | |
Net Asset Value and redemption price per share ($268,394 ÷ 22,630 shares) (a) | | | $ | 11.86 |
| Maximum offering price per share (100/96.00 of $11.86) | | | $ | 12.35 |
| Class M : | | | | |
Net Asset Value and redemption price per share ($80,023 ÷ 6,741 shares) (a) | | | $ | 11.87 |
| Maximum offering price per share (100/96.00 of $11.87) | | | $ | 12.36 |
| Class C : | | | | |
Net Asset Value and offering price per share ($25,358 ÷ 2,138 shares) (a) | | | $ | 11.86 |
| Fidelity Municipal Income Fund : | | | | |
Net Asset Value , offering price and redemption price per share ($2,780,080 ÷ 234,248 shares) | | | $ | 11.87 |
| Class I : | | | | |
Net Asset Value , offering price and redemption price per share ($834,090 ÷ 70,326 shares) | | | $ | 11.86 |
| Class Z : | | | | |
Net Asset Value , offering price and redemption price per share ($234,680 ÷ 19,781 shares) | | | $ | 11.86 |
(a)Redemption price per share is equal to net asset value less any applicable contingent deferred sales charge. |
| Statement of Operations |
| Amounts in thousands | | | | Year ended December 31, 2022 |
| Investment Income | | | | |
| Interest | | | $ | 135,557 |
| Income from Fidelity Central Funds | | | | 1,164 |
| Total Income | | | | 136,721 |
| Expenses | | | | |
| Management fee | $ | 15,384 | | |
| Transfer agent fees | | 4,636 | | |
| Distribution and service plan fees | | 1,098 | | |
| Accounting fees and expenses | | 635 | | |
| Custodian fees and expenses | | 41 | | |
| Independent trustees' fees and expenses | | 14 | | |
| Registration fees | | 179 | | |
| Audit | | 65 | | |
| Legal | | 4 | | |
| Miscellaneous | | 32 | | |
| Total expenses before reductions | | 22,088 | | |
| Expense reductions | | (83) | | |
| Total expenses after reductions | | | | 22,005 |
| Net Investment income (loss) | | | | 114,716 |
| Realized and Unrealized Gain (Loss) | | | | |
| Net realized gain (loss) on: | | | | |
| Investment Securities: | | | | |
| Unaffiliated issuers | | (30,794) | | |
| Capital gain distributions from Fidelity Central Funds | | 1 | | |
| Total net realized gain (loss) | | | | (30,793) |
| Change in net unrealized appreciation (depreciation) on: | | | | |
| Investment Securities: | | | | |
| Unaffiliated issuers | | (596,221) | | |
| Fidelity Central Funds | | (8) | | |
| Total change in net unrealized appreciation (depreciation) | | | | (596,229) |
| Net gain (loss) | | | | (627,022) |
| Net increase (decrease) in net assets resulting from operations | | | $ | (512,306) |
| Statement of Changes in Net Assets |
| |
| Amount in thousands | | Year ended December 31, 2022 | | Year ended December 31, 2021 |
| Increase (Decrease) in Net Assets | | | | |
| Operations | | | | |
| Net investment income (loss) | $ | 114,716 | $ | 119,881 |
| Net realized gain (loss) | | (30,793) | | 33,989 |
| Change in net unrealized appreciation (depreciation) | | (596,229) | | (13,995) |
| Net increase (decrease) in net assets resulting from operations | | (512,306) | | 139,875 |
| Distributions to shareholders | | (114,383) | | (152,504) |
| Share transactions - net increase (decrease) | | (275,639) | | 123,902 |
| Total increase (decrease) in net assets | | (902,328) | | 111,273 |
| | | | | |
| Net Assets | | | | |
| Beginning of period | | 5,124,953 | | 5,013,680 |
| End of period | $ | 4,222,625 | $ | 5,124,953 |
| | | | | |
| | | | | |
Financial Highlights
| Fidelity Advisor® Municipal Income Fund Class A |
| |
| Years ended December 31, | | 2022 | | 2021 | | 2020 | | 2019 | | 2018 A |
Selected Per-Share Data | | | | | | | | | | |
| Net asset value, beginning of period | $ | 13.56 | $ | 13.59 | $ | 13.39 | $ | 12.75 | $ | 12.73 |
| Income from Investment Operations | | | | | | | | | | |
Net investment income (loss) B,C | | .282 | | .281 | | .305 | | .330 | | .283 |
| Net realized and unrealized gain (loss) | | (1.700) | | .057 | | .257 | | .689 | | .029 |
| Total from investment operations | | (1.418) | | .338 | | .562 | | 1.019 | | .312 |
| Distributions from net investment income | | (.282) | | (.281) | | (.304) | | (.328) | | (.284) |
| Distributions from net realized gain | | - | | (.087) | | (.058) | | (.051) | | (.008) |
| Total distributions | | (.282) | | (.368) | | (.362) | | (.379) | | (.292) |
| Net asset value, end of period | $ | 11.86 | $ | 13.56 | $ | 13.59 | $ | 13.39 | $ | 12.75 |
Total Return D,E | | (10.48)% | | 2.51% | | 4.28% | | 8.06% | | 2.48% |
Ratios to Average Net Assets C,F,G | | | | | | | | | | |
| Expenses before reductions | | .78% | | .78% | | .78% | | .79% | | .78% H |
| Expenses net of fee waivers, if any | | .78% | | .78% | | .78% | | .79% | | .78% H |
| Expenses net of all reductions | | .78% | | .78% | | .78% | | .79% | | .78% H |
| Net investment income (loss) | | 2.31% | | 2.06% | | 2.29% | | 2.49% | | 2.68% H |
| Supplemental Data | | | | | | | | | | |
| Net assets, end of period (in millions) | $ | 268 | $ | 249 | $ | 233 | $ | 241 | $ | 201 |
Portfolio turnover rate I | | 23% | | 13% | | 16% | | 16% | | 14% J,K |
A For the period March 1, 2018 (commencement of sale of shares) through December 31, 2018.
B Calculated based on average shares outstanding during the period.
C Net investment income (loss) is affected by the timing of the declaration of dividends by any underlying mutual funds or exchange-traded funds (ETFs). Net investment income (loss) of any mutual funds or ETFs is not included in the Fund's net investment income (loss) ratio.
D Total returns would have been lower if certain expenses had not been reduced during the applicable periods shown.
E Total returns do not include the effect of the sales charges.
F Fees and expenses of any underlying mutual funds or exchange-traded funds (ETFs) are not included in the Fund's expense ratio. The Fund indirectly bears its proportionate share of these expenses. For additional expense information related to investments in Fidelity Central Funds, please refer to the "Investments in Fidelity Central Funds" note found in the Notes to Financial Statements section of the most recent Annual or Semi-Annual report.
G Expense ratios reflect operating expenses of the class. Expenses before reductions do not reflect amounts reimbursed, waived, or reduced through arrangements with the investment adviser, brokerage services, or other offset arrangements, if applicable, and do not represent the amount paid by the class during periods when reimbursements, waivers or reductions occur.
H Annualized.
I Amount does not include the portfolio activity of any underlying mutual funds or exchange-traded funds (ETFs).
J The portfolio turnover rate does not include the assets acquired in the merger.
K Portfolio turnover rate excludes securities received or delivered in-kind.
| Fidelity Advisor® Municipal Income Fund Class M |
| |
| Years ended December 31, | | 2022 | | 2021 | | 2020 | | 2019 | | 2018 A |
Selected Per-Share Data | | | | | | | | | | |
| Net asset value, beginning of period | $ | 13.57 | $ | 13.60 | $ | 13.40 | $ | 12.76 | $ | 12.73 |
| Income from Investment Operations | | | | | | | | | | |
Net investment income (loss) B,C | | .286 | | .285 | | .308 | | .333 | | .285 |
| Net realized and unrealized gain (loss) | | (1.701) | | .056 | | .258 | | .689 | | .039 |
| Total from investment operations | | (1.415) | | .341 | | .566 | | 1.022 | | .324 |
| Distributions from net investment income | | (.285) | | (.284) | | (.308) | | (.331) | | (.286) |
| Distributions from net realized gain | | - | | (.087) | | (.058) | | (.051) | | (.008) |
| Total distributions | | (.285) | | (.371) | | (.366) | | (.382) | | (.294) |
| Net asset value, end of period | $ | 11.87 | $ | 13.57 | $ | 13.60 | $ | 13.40 | $ | 12.76 |
Total Return D,E | | (10.45)% | | 2.53% | | 4.30% | | 8.08% | | 2.58% |
Ratios to Average Net Assets C,F,G | | | | | | | | | | |
| Expenses before reductions | | .77% | | .76% | | .76% | | .77% | | .77% H |
| Expenses net of fee waivers, if any | | .76% | | .76% | | .76% | | .77% | | .77% H |
| Expenses net of all reductions | | .76% | | .76% | | .76% | | .77% | | .76% H |
| Net investment income (loss) | | 2.33% | | 2.08% | | 2.31% | | 2.51% | | 2.70% H |
| Supplemental Data | | | | | | | | | | |
| Net assets, end of period (in millions) | $ | 80 | $ | 106 | $ | 109 | $ | 120 | $ | 119 |
Portfolio turnover rate I | | 23% | | 13% | | 16% | | 16% | | 14% J,K |
A For the period March 1, 2018 (commencement of sale of shares) through December 31, 2018.
B Calculated based on average shares outstanding during the period.
C Net investment income (loss) is affected by the timing of the declaration of dividends by any underlying mutual funds or exchange-traded funds (ETFs). Net investment income (loss) of any mutual funds or ETFs is not included in the Fund's net investment income (loss) ratio.
D Total returns would have been lower if certain expenses had not been reduced during the applicable periods shown.
E Total returns do not include the effect of the sales charges.
F Fees and expenses of any underlying mutual funds or exchange-traded funds (ETFs) are not included in the Fund's expense ratio. The Fund indirectly bears its proportionate share of these expenses. For additional expense information related to investments in Fidelity Central Funds, please refer to the "Investments in Fidelity Central Funds" note found in the Notes to Financial Statements section of the most recent Annual or Semi-Annual report.
G Expense ratios reflect operating expenses of the class. Expenses before reductions do not reflect amounts reimbursed, waived, or reduced through arrangements with the investment adviser, brokerage services, or other offset arrangements, if applicable, and do not represent the amount paid by the class during periods when reimbursements, waivers or reductions occur.
H Annualized.
I Amount does not include the portfolio activity of any underlying mutual funds or exchange-traded funds (ETFs).
J The portfolio turnover rate does not include the assets acquired in the merger.
K Portfolio turnover rate excludes securities received or delivered in-kind.
| Fidelity Advisor® Municipal Income Fund Class C |
| |
| Years ended December 31, | | 2022 | | 2021 | | 2020 | | 2019 | | 2018 A |
Selected Per-Share Data | | | | | | | | | | |
| Net asset value, beginning of period | $ | 13.56 | $ | 13.59 | $ | 13.39 | $ | 12.75 | $ | 12.73 |
| Income from Investment Operations | | | | | | | | | | |
Net investment income (loss) B,C | | .194 | | .181 | | .206 | | .231 | | .204 |
| Net realized and unrealized gain (loss) | | (1.701) | | .056 | | .257 | | .689 | | .032 |
| Total from investment operations | | (1.507) | | .237 | | .463 | | .920 | | .236 |
| Distributions from net investment income | | (.193) | | (.180) | | (.205) | | (.229) | | (.208) |
| Distributions from net realized gain | | - | | (.087) | | (.058) | | (.051) | | (.008) |
| Total distributions | | (.193) | | (.267) | | (.263) | | (.280) | | (.216) |
| Net asset value, end of period | $ | 11.86 | $ | 13.56 | $ | 13.59 | $ | 13.39 | $ | 12.75 |
Total Return D,E | | (11.13)% | | 1.75% | | 3.51% | | 7.26% | | 1.87% |
Ratios to Average Net Assets C,F,G | | | | | | | | | | |
| Expenses before reductions | | 1.51% | | 1.52% | | 1.53% | | 1.53% | | 1.52% H |
| Expenses net of fee waivers, if any | | 1.51% | | 1.52% | | 1.53% | | 1.53% | | 1.52% H |
| Expenses net of all reductions | | 1.51% | | 1.52% | | 1.53% | | 1.53% | | 1.52% H |
| Net investment income (loss) | | 1.58% | | 1.32% | | 1.54% | | 1.75% | | 1.94% H |
| Supplemental Data | | | | | | | | | | |
| Net assets, end of period (in millions) | $ | 25 | $ | 35 | $ | 52 | $ | 58 | $ | 82 |
Portfolio turnover rate I | | 23% | | 13% | | 16% | | 16% | | 14% J,K |
A For the period March 1, 2018 (commencement of sale of shares) through December 31, 2018.
B Calculated based on average shares outstanding during the period.
C Net investment income (loss) is affected by the timing of the declaration of dividends by any underlying mutual funds or exchange-traded funds (ETFs). Net investment income (loss) of any mutual funds or ETFs is not included in the Fund's net investment income (loss) ratio.
D Total returns would have been lower if certain expenses had not been reduced during the applicable periods shown.
E Total returns do not include the effect of the contingent deferred sales charge.
F Fees and expenses of any underlying mutual funds or exchange-traded funds (ETFs) are not included in the Fund's expense ratio. The Fund indirectly bears its proportionate share of these expenses. For additional expense information related to investments in Fidelity Central Funds, please refer to the "Investments in Fidelity Central Funds" note found in the Notes to Financial Statements section of the most recent Annual or Semi-Annual report.
G Expense ratios reflect operating expenses of the class. Expenses before reductions do not reflect amounts reimbursed, waived, or reduced through arrangements with the investment adviser, brokerage services, or other offset arrangements, if applicable, and do not represent the amount paid by the class during periods when reimbursements, waivers or reductions occur.
H Annualized.
I Amount does not include the portfolio activity of any underlying mutual funds or exchange-traded funds (ETFs).
J The portfolio turnover rate does not include the assets acquired in the merger.
K Portfolio turnover rate excludes securities received or delivered in-kind.
| Fidelity® Municipal Income Fund |
| |
| Years ended December 31, | | 2022 | | 2021 | | 2020 | | 2019 | | 2018 |
Selected Per-Share Data | | | | | | | | | | |
| Net asset value, beginning of period | $ | 13.57 | $ | 13.60 | $ | 13.40 | $ | 12.75 | $ | 13.12 |
| Income from Investment Operations | | | | | | | | | | |
Net investment income (loss) A,B | | .324 | | .327 | | .350 | | .374 | | .382 |
| Net realized and unrealized gain (loss) | | (1.702) | | .057 | | .257 | | .699 | | (.286) |
| Total from investment operations | | (1.378) | | .384 | | .607 | | 1.073 | | .096 |
| Distributions from net investment income | | (.322) | | (.327) | | (.349) | | (.372) | | (.381) |
| Distributions from net realized gain | | - | | (.087) | | (.058) | | (.051) | | (.085) |
| Total distributions | | (.322) | | (.414) | | (.407) | | (.423) | | (.466) |
| Net asset value, end of period | $ | 11.87 | $ | 13.57 | $ | 13.60 | $ | 13.40 | $ | 12.75 |
Total Return C | | (10.18)% | | 2.85% | | 4.63% | | 8.50% | | .80% |
Ratios to Average Net Assets B,D,E | | | | | | | | | | |
| Expenses before reductions | | .46% | | .45% | | .45% | | .45% | | .46% |
| Expenses net of fee waivers, if any | | .46% | | .45% | | .45% | | .45% | | .46% |
| Expenses net of all reductions | | .46% | | .45% | | .45% | | .45% | | .45% |
| Net investment income (loss) | | 2.64% | | 2.39% | | 2.62% | | 2.83% | | 3.00% |
| Supplemental Data | | | | | | | | | | |
| Net assets, end of period (in millions) | $ | 2,780 | $ | 3,787 | $ | 3,805 | $ | 3,955 | $ | 3,817 |
Portfolio turnover rate F | | 23% | | 13% | | 16% | | 16% | | 14% G,H |
A Calculated based on average shares outstanding during the period.
B Net investment income (loss) is affected by the timing of the declaration of dividends by any underlying mutual funds or exchange-traded funds (ETFs). Net investment income (loss) of any mutual funds or ETFs is not included in the Fund's net investment income (loss) ratio.
C Total returns would have been lower if certain expenses had not been reduced during the applicable periods shown.
D Fees and expenses of any underlying mutual funds or exchange-traded funds (ETFs) are not included in the Fund's expense ratio. The Fund indirectly bears its proportionate share of these expenses. For additional expense information related to investments in Fidelity Central Funds, please refer to the "Investments in Fidelity Central Funds" note found in the Notes to Financial Statements section of the most recent Annual or Semi-Annual report.
E Expense ratios reflect operating expenses of the class. Expenses before reductions do not reflect amounts reimbursed, waived, or reduced through arrangements with the investment adviser, brokerage services, or other offset arrangements, if applicable, and do not represent the amount paid by the class during periods when reimbursements, waivers or reductions occur.
F Amount does not include the portfolio activity of any underlying mutual funds or exchange-traded funds (ETFs).
G The portfolio turnover rate does not include the assets acquired in the merger.
H Portfolio turnover rate excludes securities received or delivered in-kind.
| Fidelity Advisor® Municipal Income Fund Class I |
| |
| Years ended December 31, | | 2022 | | 2021 | | 2020 | | 2019 | | 2018 A |
Selected Per-Share Data | | | | | | | | | | |
| Net asset value, beginning of period | $ | 13.56 | $ | 13.59 | $ | 13.39 | $ | 12.75 | $ | 12.73 |
| Income from Investment Operations | | | | | | | | | | |
Net investment income (loss) B,C | | .311 | | .315 | | .339 | | .363 | | .309 |
| Net realized and unrealized gain (loss) | | (1.699) | | .057 | | .257 | | .689 | | .029 |
| Total from investment operations | | (1.388) | | .372 | | .596 | | 1.052 | | .338 |
| Distributions from net investment income | | (.312) | | (.315) | | (.338) | | (.361) | | (.310) |
| Distributions from net realized gain | | - | | (.087) | | (.058) | | (.051) | | (.008) |
| Total distributions | | (.312) | | (.402) | | (.396) | | (.412) | | (.318) |
| Net asset value, end of period | $ | 11.86 | $ | 13.56 | $ | 13.59 | $ | 13.39 | $ | 12.75 |
Total Return D | | (10.26)% | | 2.76% | | 4.54% | | 8.33% | | 2.69% |
Ratios to Average Net Assets C,E,F | | | | | | | | | | |
| Expenses before reductions | | .54% | | .53% | | .53% | | .53% | | .53% G |
| Expenses net of fee waivers, if any | | .54% | | .53% | | .53% | | .53% | | .53% G |
| Expenses net of all reductions | | .54% | | .53% | | .53% | | .53% | | .53% G |
| Net investment income (loss) | | 2.55% | | 2.31% | | 2.54% | | 2.75% | | 2.93% G |
| Supplemental Data | | | | | | | | | | |
| Net assets, end of period (in millions) | $ | 834 | $ | 714 | $ | 619 | $ | 647 | $ | 555 |
Portfolio turnover rate H | | 23% | | 13% | | 16% | | 16% | | 14% I,J |
A For the period March 1, 2018 (commencement of sale of shares) through December 31, 2018.
B Calculated based on average shares outstanding during the period.
C Net investment income (loss) is affected by the timing of the declaration of dividends by any underlying mutual funds or exchange-traded funds (ETFs). Net investment income (loss) of any mutual funds or ETFs is not included in the Fund's net investment income (loss) ratio.
D Total returns would have been lower if certain expenses had not been reduced during the applicable periods shown.
E Fees and expenses of any underlying mutual funds or exchange-traded funds (ETFs) are not included in the Fund's expense ratio. The Fund indirectly bears its proportionate share of these expenses. For additional expense information related to investments in Fidelity Central Funds, please refer to the "Investments in Fidelity Central Funds" note found in the Notes to Financial Statements section of the most recent Annual or Semi-Annual report.
F Expense ratios reflect operating expenses of the class. Expenses before reductions do not reflect amounts reimbursed, waived, or reduced through arrangements with the investment adviser, brokerage services, or other offset arrangements, if applicable, and do not represent the amount paid by the class during periods when reimbursements, waivers or reductions occur.
G Annualized.
H Amount does not include the portfolio activity of any underlying mutual funds or exchange-traded funds (ETFs).
I The portfolio turnover rate does not include the assets acquired in the merger.
J Portfolio turnover rate excludes securities received or delivered in-kind.
| Fidelity Advisor® Municipal Income Fund Class Z |
| |
| Years ended December 31, | | 2022 | | 2021 | | 2020 | | 2019 | | 2018 A |
Selected Per-Share Data | | | | | | | | | | |
| Net asset value, beginning of period | $ | 13.57 | $ | 13.60 | $ | 13.39 | $ | 12.75 | $ | 12.64 |
| Income from Investment Operations | | | | | | | | | | |
Net investment income (loss) B,C | | .327 | | .331 | | .352 | | .378 | | .101 |
| Net realized and unrealized gain (loss) | | (1.710) | | .057 | | .269 | | .689 | | .112 |
| Total from investment operations | | (1.383) | | .388 | | .621 | | 1.067 | | .213 |
| Distributions from net investment income | | (.327) | | (.331) | | (.353) | | (.376) | | (.095) |
| Distributions from net realized gain | | - | | (.087) | | (.058) | | (.051) | | (.008) |
| Total distributions | | (.327) | | (.418) | | (.411) | | (.427) | | (.103) |
| Net asset value, end of period | $ | 11.86 | $ | 13.57 | $ | 13.60 | $ | 13.39 | $ | 12.75 |
Total Return D | | (10.22)% | | 2.88% | | 4.74% | | 8.45% | | 1.69% |
Ratios to Average Net Assets C,E,F | | | | | | | | | | |
| Expenses before reductions | | .42% | | .42% | | .42% | | .42% | | .42% G |
| Expenses net of fee waivers, if any | | .42% | | .42% | | .42% | | .42% | | .42% G |
| Expenses net of all reductions | | .42% | | .42% | | .42% | | .42% | | .42% G |
| Net investment income (loss) | | 2.67% | | 2.42% | | 2.65% | | 2.86% | | 3.08% G |
| Supplemental Data | | | | | | | | | | |
| Net assets, end of period (in millions) | $ | 235 | $ | 235 | $ | 196 | $ | 97 | $ | 21 |
Portfolio turnover rate H | | 23% | | 13% | | 16% | | 16% | | 14% I,J |
A For the period October 2, 2018 (commencement of sale of shares) through December 31, 2018.
B Calculated based on average shares outstanding during the period.
C Net investment income (loss) is affected by the timing of the declaration of dividends by any underlying mutual funds or exchange-traded funds (ETFs). Net investment income (loss) of any mutual funds or ETFs is not included in the Fund's net investment income (loss) ratio.
D Total returns would have been lower if certain expenses had not been reduced during the applicable periods shown.
E Fees and expenses of any underlying mutual funds or exchange-traded funds (ETFs) are not included in the Fund's expense ratio. The Fund indirectly bears its proportionate share of these expenses. For additional expense information related to investments in Fidelity Central Funds, please refer to the "Investments in Fidelity Central Funds" note found in the Notes to Financial Statements section of the most recent Annual or Semi-Annual report.
F Expense ratios reflect operating expenses of the class. Expenses before reductions do not reflect amounts reimbursed, waived, or reduced through arrangements with the investment adviser, brokerage services, or other offset arrangements, if applicable, and do not represent the amount paid by the class during periods when reimbursements, waivers or reductions occur.
G Annualized.
H Amount does not include the portfolio activity of any underlying mutual funds or exchange-traded funds (ETFs).
I The portfolio turnover rate does not include the assets acquired in the merger.
J Portfolio turnover rate excludes securities received or delivered in-kind.
For the period ended December 31, 2022
( Amounts in thousands except percentages)
1. Organization.
Fidelity Municipal Income Fund (the Fund) is a fund of Fidelity Municipal Trust (the Trust) and is authorized to issue an unlimited number of shares. The Trust is registered under the Investment Company Act of 1940, as amended (the 1940 Act), as an open-end management investment company organized as a Massachusetts business trust. The Fund offers Class A, Class M, Class C, Fidelity Municipal Income Fund, Class I and Class Z shares, each of which has equal rights as to assets and voting privileges. Each class has exclusive voting rights with respect to matters that affect that class. Class C shares will automatically convert to Class A shares after a holding period of eight years from the initial date of purchase, with certain exceptions.
2. Investments in Fidelity Central Funds.
Funds may invest in Fidelity Central Funds, which are open-end investment companies generally available only to other investment companies and accounts managed by the investment adviser and its affiliates. The Schedule of Investments lists any Fidelity Central Funds held as an investment as of period end, but does not include the underlying holdings of each Fidelity Central Fund. An investing fund indirectly bears its proportionate share of the expenses of the underlying Fidelity Central Funds.
Based on its investment objective, each Fidelity Central Fund may invest or participate in various investment vehicles or strategies that are similar to those of the investing fund. These strategies are consistent with the investment objectives of the investing fund and may involve certain economic risks which may cause a decline in value of each of the Fidelity Central Funds and thus a decline in the value of the investing fund.
| Fidelity Central Fund | Investment Manager | Investment Objective | Investment Practices | Expense Ratio A |
| Fidelity Money Market Central Funds | Fidelity Management & Research Company LLC (FMR) | Each fund seeks to obtain a high level of current income consistent with the preservation of capital and liquidity. | Short-term Investments | Less than .005% |
A Expenses expressed as a percentage of average net assets and are as of each underlying Central Fund's most recent annual or semi-annual shareholder report.
A complete unaudited list of holdings for each Fidelity Central Fund is available upon request or at the Securities and Exchange Commission website at www.sec.gov. In addition, the financial statements of the Fidelity Central Funds which contain the significant accounting policies (including investment valuation policies) of those funds, and are not covered by the Report of Independent Registered Public Accounting Firm, are available on the Securities and Exchange Commission website or upon request.
3. Significant Accounting Policies.
The Fund is an investment company and applies the accounting and reporting guidance of the Financial Accounting Standards Board (FASB) Accounting Standards Codification Topic 946 Financial Services - Investment Companies . The financial statements have been prepared in conformity with accounting principles generally accepted in the United States of America (GAAP), which require management to make certain estimates and assumptions at the date of the financial statements. Actual results could differ from those estimates. Subsequent events, if any, through the date that the financial statements were issued have been evaluated in the preparation of the financial statements. The Fund's Schedule of Investments lists any underlying mutual funds or exchange-traded funds (ETFs) but does not include the underlying holdings of these funds. The following summarizes the significant accounting policies of the Fund:
Investment Valuation. Investments are valued as of 4:00 p.m. Eastern time on the last calendar day of the period. The Board of Trustees (the Board) has designated the Fund's investment adviser as the valuation designee responsible for the fair valuation function and performing fair value determinations as needed. The investment adviser has established a Fair Value Committee (the Committee) to carry out the day-to-day fair valuation responsibilities and has adopted policies and procedures to govern the fair valuation process and the activities of the Committee. In accordance with these fair valuation policies and procedures, which have been approved by the Board, the Fund attempts to obtain prices from one or more third party pricing services or brokers to value its investments. When current market prices, quotations or currency exchange rates are not readily available or reliable, investments will be fair valued in good faith by the Committee, in accordance with the policies and procedures. Factors used in determining fair value vary by investment type and may include market or investment specific events, transaction data, estimated cash flows, and market observations of comparable investments. The frequency that the fair valuation procedures are used cannot be predicted and they may be utilized to a significant extent. The Committee manages the Fund's fair valuation practices and maintains the fair valuation policies and procedures. The Fund's investment adviser reports to the Board information regarding the fair valuation process and related material matters.
The Fund categorizes the inputs to valuation techniques used to value its investments into a disclosure hierarchy consisting of three levels as shown below:
Level 1 - unadjusted quoted prices in active markets for identical investments
Level 2 - other significant observable inputs (including quoted prices for similar investments, interest rates, prepayment speeds, etc.)
Level 3 - unobservable inputs (including the Fund's own assumptions based on the best information available)
Valuation techniques used to value the Fund's investments by major category are as follows:
Debt securities, including restricted securities, are valued based on evaluated prices received from third party pricing services or from brokers who make markets in such securities. Municipal securities are valued by pricing services who utilize matrix pricing which considers yield or price of bonds of comparable quality, coupon, maturity and type or by broker-supplied prices. When independent prices are unavailable or unreliable, debt securities may be valued utilizing pricing methodologies which consider similar factors that would be used by third party pricing services. Debt securities are generally categorized as Level 2 in the hierarchy but may be Level 3 depending on the circumstances.
Investments in open-end mutual funds, including the Fidelity Central Funds, are valued at their closing net asset value (NAV) each business day and are categorized as Level 1 in the hierarchy.
Changes in valuation techniques may result in transfers in or out of an assigned level within the disclosure hierarchy. The aggregate value of investments by input level as of December 31, 2022 is included at the end of the Fund's Schedule of Investments.
Investment Transactions and Income. For financial reporting purposes, the Fund's investment holdings and NAV include trades executed through the end of the last business day of the period. The NAV per share for processing shareholder transactions is calculated as of the close of business of the New York Stock Exchange (NYSE), normally 4:00 p.m. Eastern time and includes trades executed through the end of the prior business day. Gains and losses on securities sold are determined on the basis of identified cost. Income and capital gain distributions from Fidelity Central Funds, if any, are recorded on the ex-dividend date. Interest income is accrued as earned and includes coupon interest and amortization of premium and accretion of discount on debt securities as applicable. Debt obligations may be placed on non-accrual status and related interest income may be reduced by ceasing current accruals and writing off interest receivables when the collection of all or a portion of interest has become doubtful based on consistently applied procedures. A debt obligation is removed from non-accrual status when the issuer resumes interest payments or when collectability of interest is reasonably assured.
Class Allocations and Expenses. Investment income, realized and unrealized capital gains and losses, common expenses of a fund, and certain fund-level expense reductions, if any, are allocated daily on a pro-rata basis to each class based on the relative net assets of each class to the total net assets of a fund. Each class differs with respect to transfer agent and distribution and service plan fees incurred, as applicable. Certain expense reductions may also differ by class, if applicable. For the reporting period, the allocated portion of income and expenses to each class as a percent of its average net assets may vary due to the timing of recording these transactions in relation to fluctuating net assets of the classes. Expenses directly attributable to a fund are charged to that fund. Expenses attributable to more than one fund are allocated among the respective funds on the basis of relative net assets or other appropriate methods. Expenses included in the accompanying financial statements reflect the expenses of that fund and do not include any expenses associated with any underlying mutual funds or exchange-traded funds. Although not included in a fund's expenses, a fund indirectly bears its proportionate share of these expenses through the net asset value of each underlying mutual fund or exchange-traded fund. Expense estimates are accrued in the period to which they relate and adjustments are made when actual amounts are known.
Income Tax Information and Distributions to Shareholders. Each year, the Fund intends to qualify as a regulated investment company under Subchapter M of the Internal Revenue Code, including distributing substantially all of its taxable income and realized gains. As a result, no provision for U.S. Federal income taxes is required. During the period, the Fund incurred a corporate tax liability on undistributed net investment income which is included in Miscellaneous expense on the Statement of Operations. As of December 31, 2022, the Fund did not have any unrecognized tax benefits in the financial statements; nor is the Fund aware of any tax positions for which it is reasonably possible that the total amounts of unrecognized tax benefits will significantly change in the next twelve months. The Fund files a U.S. federal tax return, in addition to state and local tax returns as required. The Fund's federal income tax returns are subject to examination by the Internal Revenue Service (IRS) for a period of three fiscal years after they are filed. State and local tax returns may be subject to examination for an additional fiscal year depending on the jurisdiction.
Distributions are declared and recorded daily and paid monthly from net investment income. Distributions from realized gains, if any, are declared and recorded on the ex-dividend date. Income and capital gain distributions are declared separately for each class. Income and capital gain distributions are determined in accordance with income tax regulations, which may differ from GAAP.
Capital accounts within the financial statements are adjusted for permanent book-tax differences. These adjustments have no impact on net assets or the results of operations. Capital accounts are not adjusted for temporary book-tax differences which will reverse in a subsequent period.
Book-tax differences are primarily due to market discount and capital loss carryforwards.
The Fund purchases municipal securities whose interest, in the opinion of the issuer, is free from federal income tax. There is no assurance that the IRS will agree with this opinion. In the event the IRS determines that the issuer does not comply with relevant tax requirements, interest payments from a security could become federally taxable, possibly retroactively to the date the security was issued.
As of period end, the cost and unrealized appreciation (depreciation) in securities, and derivatives if applicable, for federal income tax purposes were as follows:
| Gross unrealized appreciation | $32,180 |
| Gross unrealized depreciation | (259,981) |
| Net unrealized appreciation (depreciation) | $(227,801) |
| Tax Cost | $4,433,302 |
The tax-based components of distributable earnings as of period end were as follows:
| Capital loss carryforward | $(30,799) |
| Net unrealized appreciation (depreciation) on securities and other investments | $(227,801) |
Capital loss carryforwards are only available to offset future capital gains of the Fund to the extent provided by regulations and may be limited. The capital loss carryforward information presented below, including any applicable limitation, is estimated as of fiscal period end and is subject to adjustment.
| Short-term | $(15,196) |
| Long-term | (15,603) |
| Total capital loss carryforward | $(30,799) |
The tax character of distributions paid was as follows:
| | December 31, 2022 | December 31, 2021 |
| Tax-exempt Income | $114,383 | $119,772 |
| Long-term Capital Gains | - | 32,732 |
| Total | $114,383 | $152,504 |
Delayed Delivery Transactions and When-Issued Securities. During the period, certain Funds transacted in securities on a delayed delivery or when-issued basis. Payment and delivery may take place after the customary settlement period for that security. The price of the underlying securities and the date when the securities will be delivered and paid for are fixed at the time the transaction is negotiated. Securities purchased on a delayed delivery or when-issued basis are identified as such in the Schedule of Investments. Compensation for interest forgone in the purchase of a delayed delivery or when-issued debt security may be received. With respect to purchase commitments, each applicable Fund identifies securities as segregated in its records with a value at least equal to the amount of the commitment. Payables and receivables associated with the purchases and sales of delayed delivery securities having the same coupon, settlement date and broker are offset. Delayed delivery or when-issued securities that have been purchased from and sold to different brokers are reflected as both payables and receivables in the Statement of Assets and Liabilities under the caption "Delayed delivery", as applicable. Losses may arise due to changes in the value of the underlying securities or if the counterparty does not perform under the contract's terms, or if the issuer does not issue the securities due to political, economic, or other factors.
Restricted Securities (including Private Placements). Funds may invest in securities that are subject to legal or contractual restrictions on resale. These securities generally may be resold in transactions exempt from registration or to the public if the securities are registered. Disposal of these securities may involve time-consuming negotiations and expense, and prompt sale at an acceptable price may be difficult. Information regarding restricted securities held at period end is included at the end of the Schedule of Investments, if applicable.
4. Purchases and Sales of Investments.
Purchases and sales of securities, other than short-term securities and in-kind transactions, as applicable, are noted in the table below.
| | Purchases ($) | Sales ($) |
| Fidelity Municipal Income Fund | 1,021,790 | 1,305,528 |
5. Fees and Other Transactions with Affiliates.
Management Fee. Fidelity Management & Research Company LLC (the investment adviser) and its affiliates provide the Fund with investment management related services for which the Fund pays a monthly management fee. The management fee is the sum of an individual fund fee rate that is based on an annual rate of .25% of the Fund's average net assets and an annualized group fee rate that averaged .10% during the period. The group fee rate is based upon the monthly average net assets of a group of registered investment companies with which the investment adviser has management contracts. The group fee rate decreases as assets under management increase and increases as assets under management decrease. For the reporting period, the total annual management fee rate was .35% of the Fund's average net assets.
Distribution and Service Plan Fees. In accordance with Rule 12b-1 of the 1940 Act, the Fund has adopted separate Distribution and Service Plans for each class of shares. Certain classes pay Fidelity Distributors Company LLC (FDC), an affiliate of the investment adviser, separate Distribution and Service Fees, each of which is based on an annual percentage of each class' average net assets. In addition, FDC may pay financial intermediaries for selling shares of the Fund and providing shareholder support services. For the period, the Distribution and Service Fee rates, total fees and amounts retained by FDC were as follows:
| | Distribution Fee | Service Fee | Total Fees | Retained by FDC |
| Class A | - % | .25% | $596 | $64 |
| Class M | - % | .25% | 224 | 1 |
| Class C | .75% | .25% | 278 | 37 |
| | | | $1,098 | $102 |
Sales Load. FDC may receive a front-end sales charge of up to 4.00% for selling Class A shares and Class M shares, some of which is paid to financial intermediaries for selling shares of the Fund. Depending on the holding period, FDC may receive contingent deferred sales charges levied on Class A, Class M and Class C redemptions. The deferred sales charges are 1.00% for Class C shares, .75% for certain purchases of Class A shares and .25% for certain purchases of Class M shares.
For the period, sales charge amounts retained by FDC were as follows:
| | Retained by FDC |
| Class A | $16 |
| Class M | 2 |
Class C (a)(b) | - |
| | $18 |
(a) When Class C shares are initially sold, FDC pays commissions from its own resources to financial intermediaries through which the sales are made.
(b) Amount represents less than five hundred dollars.
Transfer Agent Fees. Fidelity Investments Institutional Operations Company LLC (FIIOC), an affiliate of the investment adviser, is the transfer, dividend disbursing and shareholder servicing agent for the Fund. FIIOC receives account fees and asset-based fees that vary according to the account size and type of account of the shareholders of the respective classes of the Fund, except for Class Z. FIIOC receives an asset-based fee of Class Z's average net assets. FIIOC pays for typesetting, printing and mailing of shareholder reports, except proxy statements. For the period, transfer agent fees for each class were as follows:
| | Amount | % of Class-Level Average Net Assets |
| Class A | $394 | .16 |
| Class M | 130 | .15 |
| Class C | 40 | .14 |
| Fidelity Municipal Income Fund | 2,751 | .09 |
| Class I | 1,199 | .17 |
| Class Z | 122 | .05 |
| | $4,636 | |
Accounting Fees. Fidelity Service Company, Inc. (FSC), an affiliate of the investment adviser, maintains the Fund's accounting records. The accounting fee is based on the level of average net assets for each month. For the period, the fees were equivalent to the following annual rates:
| | % of Average Net Assets |
| Fidelity Municipal Income Fund | .01 |
Interfund Trades. Funds may purchase from or sell securities to other Fidelity Funds under procedures adopted by the Board. The procedures have been designed to ensure these interfund trades are executed in accordance with Rule 17a-7 of the 1940 Act. Any interfund trades are included within the respective purchases and sales amounts shown in the Purchases and Sales of Investments note. During the period, there were no interfund trades.
6. Committed Line of Credit.
Certain Funds participate with other funds managed by the investment adviser or an affiliate in a $4.25 billion credit facility (the "line of credit") to be utilized for temporary or emergency purposes to fund shareholder redemptions or for other short-term liquidity purposes. The participating funds have agreed to pay commitment fees on their pro-rata portion of the line of credit, which are reflected in Miscellaneous expenses on the Statement of Operations, and are listed below. During the period, there were no borrowings on this line of credit.
| | Amount |
| Fidelity Municipal Income Fund | $8 |
7. Expense Reductions.
Through arrangements with the Fund's custodian, credits realized as a result of certain uninvested cash balances were used to reduce the Fund's expenses. During the period, custodian credits reduced the Fund's expenses by $3.
In addition, during the period the investment adviser or an affiliate reimbursed and/or waived a portion of fund-level operating expenses in the amount of $80.
8. Distributions to Shareholders.
Distributions to shareholders of each class were as follows:
| | Year ended December 31, 2022 | Year ended December 31, 2021 |
| Fidelity Municipal Income Fund | | |
| Distributions to shareholders | | |
| Class A | $5,541 | $6,637 |
| Class M | 2,073 | 2,945 |
| Class C | 435 | 779 |
| Fidelity Municipal Income Fund | 81,658 | 115,474 |
| Class I | 18,130 | 19,903 |
| Class Z | 6,546 | 6,766 |
Total | $114,383 | $152,504 |
9. Share Transactions.
Share transactions for each class were as follows and may contain in-kind transactions, automatic conversions between classes or exchanges between affiliated funds:
| | Shares | Shares | Dollars | Dollars |
| | Year ended December 31, 2022 | Year ended December 31, 2021 | Year ended December 31, 2022 | Year ended December 31, 2021 |
| Fidelity Municipal Income Fund | | | | |
| Class A | | | | |
| Shares sold | 9,594 | 4,233 | $115,427 | $57,833 |
| Reinvestment of distributions | 411 | 436 | 4,981 | 5,947 |
| Shares redeemed | (5,727) | (3,424) | (69,759) | (46,733) |
| Net increase (decrease) | 4,278 | 1,245 | $50,649 | $17,047 |
| Class M | | | | |
| Shares sold | 276 | 479 | $3,355 | $6,563 |
| Reinvestment of distributions | 150 | 189 | 1,825 | 2,578 |
| Shares redeemed | (1,491) | (910) | (18,102) | (12,470) |
| Net increase (decrease) | (1,065) | (242) | $(12,922) | $(3,329) |
| Class C | | | | |
| Shares sold | 511 | 519 | $6,199 | $7,097 |
| Reinvestment of distributions | 34 | 54 | 410 | 733 |
| Shares redeemed | (967) | (1,820) | (11,857) | (24,876) |
| Net increase (decrease) | (422) | (1,247) | $(5,248) | $(17,046) |
| Fidelity Municipal Income Fund | | | | |
| Shares sold | 40,481 | 21,512 | $491,259 | $294,467 |
| Reinvestment of distributions | 4,697 | 5,466 | 57,042 | 74,556 |
| Shares redeemed | (89,945) | (27,724) | (1,101,537) | (378,751) |
| Net increase (decrease) | (44,767) | (746) | $(553,236) | $(9,728) |
| Class I | | | | |
| Shares sold | 56,827 | 16,412 | $682,902 | $224,231 |
| Reinvestment of distributions | 657 | 749 | 7,979 | 10,204 |
| Shares redeemed | (39,781) | (10,070) | (480,093) | (137,392) |
| Net increase (decrease) | 17,703 | 7,091 | $210,788 | $97,043 |
| Class Z | | | | |
| Shares sold | 26,980 | 5,925 | $329,960 | $80,935 |
| Reinvestment of distributions | 414 | 365 | 5,017 | 4,980 |
| Shares redeemed | (24,933) | (3,366) | (300,647) | (46,000) |
| Net increase (decrease) | 2,461 | 2,924 | $34,330 | $39,915 |
10. Other.
A fund's organizational documents provide former and current trustees and officers with a limited indemnification against liabilities arising in connection with the performance of their duties to the fund. In the normal course of business, a fund may also enter into contracts that provide general indemnifications. A fund's maximum exposure under these arrangements is unknown as this would be dependent on future claims that may be made against a fund. The risk of material loss from such claims is considered remote.
11. Risk and Uncertainties.
Many factors affect a fund's performance. Developments that disrupt global economies and financial markets, such as pandemics, epidemics, outbreaks of infectious diseases, war, terrorism, and environmental disasters, may significantly affect a fund's investment performance. The effects of these developments to a fund will be impacted by the types of securities in which a fund invests, the financial condition, industry, economic sector, and geographic location of an issuer, and a fund's level of investment in the securities of that issuer.
To the Board of Trustees of Fidelity Municipal Trust and Shareholders of Fidelity Municipal Income Fund
Opinion on the Financial Statements
We have audited the accompanying statement of assets and liabilities, including the schedule of investments, of Fidelity Municipal Income Fund (one of the funds constituting Fidelity Municipal Trust, referred to hereafter as the "Fund") as of December 31, 2022, the related statement of operations for the year ended December 31, 2022, the statement of changes in net assets for each of the two years in the period ended December 31, 2022, including the related notes, and the financial highlights for each of the periods indicated therein (collectively referred to as the "financial statements"). In our opinion, the financial statements present fairly, in all material respects, the financial position of the Fund as of December 31, 2022, the results of its operations for the year then ended, the changes in its net assets for each of the two years in the period ended December 31, 2022 and the financial highlights for each of the periods indicated therein in conformity with accounting principles generally accepted in the United States of America.
Basis for Opinion
These financial statements are the responsibility of the Fund's management. Our responsibility is to express an opinion on the Fund's financial statements based on our audits. We are a public accounting firm registered with the Public Company Accounting Oversight Board (United States) (PCAOB) and are required to be independent with respect to the Fund in accordance with the U.S. federal securities laws and the applicable rules and regulations of the Securities and Exchange Commission and the PCAOB.
We conducted our audits of these financial statements in accordance with the standards of the PCAOB. Those standards require that we plan and perform the audit to obtain reasonable assurance about whether the financial statements are free of material misstatement, whether due to error or fraud.
Our audits included performing procedures to assess the risks of material misstatement of the financial statements, whether due to error or fraud, and performing procedures that respond to those risks. Such procedures included examining, on a test basis, evidence regarding the amounts and disclosures in the financial statements. Our audits also included evaluating the accounting principles used and significant estimates made by management, as well as evaluating the overall presentation of the financial statements. Our procedures included confirmation of securities owned as of December 31, 2022 by correspondence with the custodian and brokers; when replies were not received from brokers, we performed other auditing procedures. We believe that our audits provide a reasonable basis for our opinion.
/s/ PricewaterhouseCoopers LLP
Boston, Massachusetts
February 10, 2023
We have served as the auditor of one or more investment companies in the Fidelity group of funds since 1932.
The Trustees, Members of the Advisory Board (if any), and officers of the trust and fund, as applicable, are listed below. The Board of Trustees governs the fund and is responsible for protecting the interests of shareholders. The Trustees are experienced executives who meet periodically throughout the year to oversee the fund's activities, review contractual arrangements with companies that provide services to the fund, oversee management of the risks associated with such activities and contractual arrangements, and review the fund's performance. Each of the Trustees oversees 295 funds.
The Trustees hold office without limit in time except that (a) any Trustee may resign; (b) any Trustee may be removed by written instrument, signed by at least two-thirds of the number of Trustees prior to such removal; (c) any Trustee who requests to be retired or who has become incapacitated by illness or injury may be retired by written instrument signed by a majority of the other Trustees; and (d) any Trustee may be removed at any special meeting of shareholders by a two-thirds vote of the outstanding voting securities of the trust. Each Trustee who is not an interested person (as defined in the 1940 Act) of the trust and the fund is referred to herein as an Independent Trustee. Each Independent Trustee shall retire not later than the last day of the calendar year in which his or her 75th birthday occurs. The Independent Trustees may waive this mandatory retirement age policy with respect to individual Trustees. Officers and Advisory Board Members hold office without limit in time, except that any officer or Advisory Board Member may resign or may be removed by a vote of a majority of the Trustees at any regular meeting or any special meeting of the Trustees. Except as indicated, each individual has held the office shown or other offices in the same company for the past five years.
The fund's Statement of Additional Information (SAI) includes more information about the Trustees. To request a free copy, call Fidelity at 1-800-544-8544 if you're an individual investing directly with Fidelity, call 1-800-835-5092 if you're a plan sponsor or participant with Fidelity as your recordkeeper or call 1-877-208-0098 on institutional accounts or if you're an advisor or invest through one.
Experience, Skills, Attributes, and Qualifications of the Trustees. The Governance and Nominating Committee has adopted a statement of policy that describes the experience, qualifications, attributes, and skills that are necessary and desirable for potential Independent Trustee candidates (Statement of Policy). The Board believes that each Trustee satisfied at the time he or she was initially elected or appointed a Trustee, and continues to satisfy, the standards contemplated by the Statement of Policy. The Governance and Nominating Committee also engages professional search firms to help identify potential Independent Trustee candidates who have the experience, qualifications, attributes, and skills consistent with the Statement of Policy. From time to time, additional criteria based on the composition and skills of the current Independent Trustees, as well as experience or skills that may be appropriate in light of future changes to board composition, business conditions, and regulatory or other developments, have also been considered by the professional search firms and the Governance and Nominating Committee. In addition, the Board takes into account the Trustees' commitment and participation in Board and committee meetings, as well as their leadership of standing and ad hoc committees throughout their tenure.
In determining that a particular Trustee was and continues to be qualified to serve as a Trustee, the Board has considered a variety of criteria, none of which, in isolation, was controlling. The Board believes that, collectively, the Trustees have balanced and diverse experience, qualifications, attributes, and skills, which allow the Board to operate effectively in governing the fund and protecting the interests of shareholders. Information about the specific experience, skills, attributes, and qualifications of each Trustee, which in each case led to the Board's conclusion that the Trustee should serve (or continue to serve) as a trustee of the fund, is provided below.
Board Structure and Oversight Function. Abigail P. Johnson is an interested person and currently serves as Chairman. The Trustees have determined that an interested Chairman is appropriate and benefits shareholders because an interested Chairman has a personal and professional stake in the quality and continuity of services provided to the fund. Independent Trustees exercise their informed business judgment to appoint an individual of their choosing to serve as Chairman, regardless of whether the Trustee happens to be independent or a member of management. The Independent Trustees have determined that they can act independently and effectively without having an Independent Trustee serve as Chairman and that a key structural component for assuring that they are in a position to do so is for the Independent Trustees to constitute a substantial majority for the Board. The Independent Trustees also regularly meet in executive session. Michael E. Kenneally serves as Chairman of the Independent Trustees and as such (i) acts as a liaison between the Independent Trustees and management with respect to matters important to the Independent Trustees and (ii) with management prepares agendas for Board meetings.
Fidelity ® funds are overseen by different Boards of Trustees. The fund's Board oversees Fidelity's investment-grade bond, money market, asset allocation and certain equity funds, and other Boards oversee Fidelity's high income and other equity funds. The asset allocation funds may invest in Fidelity ® funds that are overseen by such other Boards. The use of separate Boards, each with its own committee structure, allows the Trustees of each group of Fidelity ® funds to focus on the unique issues of the funds they oversee, including common research, investment, and operational issues. On occasion, the separate Boards establish joint committees to address issues of overlapping consequences for the Fidelity ® funds overseen by each Board.
The Trustees operate using a system of committees to facilitate the timely and efficient consideration of all matters of importance to the Trustees, the fund, and fund shareholders and to facilitate compliance with legal and regulatory requirements and oversight of the fund's activities and associated risks. The Board, acting through its committees, has charged FMR and its affiliates with (i) identifying events or circumstances the occurrence of which could have demonstrably adverse effects on the fund's business and/or reputation; (ii) implementing processes and controls to lessen the possibility that such events or circumstances occur or to mitigate the effects of such events or circumstances if they do occur; and (iii) creating and maintaining a system designed to evaluate continuously business and market conditions in order to facilitate the identification and implementation processes described in (i) and (ii) above. Because the day-to-day operations and activities of the fund are carried out by or through FMR, its affiliates, and other service providers, the fund's exposure to risks is mitigated but not eliminated by the processes overseen by the Trustees. While each of the Board's committees has responsibility for overseeing different aspects of the fund's activities, oversight is exercised primarily through the Operations and Audit Committees. In addition, an ad hoc Board committee of Independent Trustees has worked with FMR to enhance the Board's oversight of investment and financial risks, legal and regulatory risks, technology risks, and operational risks, including the development of additional risk reporting to the Board. Appropriate personnel, including but not limited to the fund's Chief Compliance Officer (CCO), FMR's internal auditor, the independent accountants, the fund's Treasurer and portfolio management personnel, make periodic reports to the Board's committees, as appropriate, including an annual review of Fidelity's risk management program for the Fidelity ® funds. The responsibilities of each standing committee, including their oversight responsibilities, are described further under "Standing Committees of the Trustees."
Interested Trustees*:
Correspondence intended for a Trustee who is an interested person may be sent to Fidelity Investments, 245 Summer Street, Boston, Massachusetts 02210.
Name, Year of Birth; Principal Occupations and Other Relevant Experience+
Abigail P. Johnson (1961)
Year of Election or Appointment: 2009
Trustee
Chairman of the Board of Trustees
Ms. Johnson also serves as Trustee of other Fidelity ® funds. Ms. Johnson serves as Chairman (2016-present), Chief Executive Officer (2014-present), and Director (2007-present) of FMR LLC (diversified financial services company), President of Fidelity Financial Services (2012-present) and President of Personal, Workplace and Institutional Services (2005-present). Ms. Johnson is Chairman and Director of Fidelity Management & Research Company LLC (investment adviser firm, 2011-present). Previously, Ms. Johnson served as Chairman and Director of FMR Co., Inc. (investment adviser firm, 2011-2019), Vice Chairman (2007-2016) and President (2013-2016) of FMR LLC, President and a Director of Fidelity Management & Research Company (2001-2005), a Trustee of other investment companies advised by Fidelity Management & Research Company, Fidelity Investments Money Management, Inc. (investment adviser firm), and FMR Co., Inc. (2001-2005), Senior Vice President of the Fidelity ® funds (2001-2005), and managed a number of Fidelity ® funds. Ms. Abigail P. Johnson and Mr. Arthur E. Johnson are not related.
Jennifer Toolin McAuliffe (1959)
Year of Election or Appointment: 2016
Trustee
Ms. McAuliffe also serves as Trustee of other Fidelity ® funds and as Trustee of Fidelity Charitable (2020-present). Previously, Ms. McAuliffe served as Co-Head of Fixed Income of Fidelity Investments Limited (now known as FIL Limited (FIL)) (diversified financial services company), Director of Research for FIL's credit and quantitative teams in London, Hong Kong and Tokyo and Director of Research for taxable and municipal bonds at Fidelity Investments Money Management, Inc. Ms. McAuliffe previously served as a member of the Advisory Board of certain Fidelity ® funds (2016). Ms. McAuliffe was previously a lawyer at Ropes & Gray LLP and currently serves as director or trustee of several not-for-profit entities.
* Determined to be an "Interested Trustee" by virtue of, among other things, his or her affiliation with the trust or various entities under common control with FMR.
+ The information includes the Trustee's principal occupation during the last five years and other information relating to the experience, attributes, and skills relevant to the Trustee's qualifications to serve as a Trustee, which led to the conclusion that the Trustee should serve as a Trustee for the fund.
Independent Trustees:
Correspondence intended for an Independent Trustee may be sent to Fidelity Investments, P.O. Box 55235, Boston, Massachusetts 02205-5235.
Name, Year of Birth; Principal Occupations and Other Relevant Experience+
Elizabeth S. Acton (1951)
Year of Election or Appointment: 2013
Trustee
Ms. Acton also serves as Trustee of other Fidelity ® funds. Prior to her retirement, Ms. Acton served as Executive Vice President, Finance (2011-2012), Executive Vice President, Chief Financial Officer (2002-2011) and Treasurer (2004-2005) of Comerica Incorporated (financial services). Prior to joining Comerica, Ms. Acton held a variety of positions at Ford Motor Company (1983-2002), including Vice President and Treasurer (2000-2002) and Executive Vice President and Chief Financial Officer of Ford Motor Credit Company (1998-2000). Ms. Acton currently serves as a member of the Board and Audit and Finance Committees of Beazer Homes USA, Inc. (homebuilding, 2012-present). Ms. Acton previously served as a member of the Advisory Board of certain Fidelity ® funds (2013-2016).
Ann E. Dunwoody (1953)
Year of Election or Appointment: 2018
Trustee
General Dunwoody also serves as Trustee of other Fidelity ® funds. General Dunwoody (United States Army, Retired) was the first woman in U.S. military history to achieve the rank of four-star general and prior to her retirement in 2012 held a variety of positions within the U.S. Army, including Commanding General, U.S. Army Material Command (2008-2012). General Dunwoody currently serves as President of First to Four LLC (leadership and mentoring services, 2012-present), a member of the Board and Nomination and Corporate Governance Committees of Kforce Inc. (professional staffing services, 2016-present) and a member of the Board of Automattic Inc. (software engineering, 2018-present). Previously, General Dunwoody served as a member of the Advisory Board and Nominating and Corporate Governance Committee of L3 Technologies, Inc. (communication, electronic, sensor and aerospace systems, 2013-2019) and a member of the Board and Audit and Sustainability and Corporate Responsibility Committees of Republic Services, Inc. (waste collection, disposal and recycling, 2013-2016). Ms. Dunwoody also serves on several boards for non-profit organizations, including as a member of the Board, Chair of the Nomination and Governance Committee and a member of the Audit Committee of Logistics Management Institute (consulting non-profit, 2012-present), a member of the Council of Trustees for the Association of the United States Army (advocacy non-profit, 2013-present), a member of the Board of Florida Institute of Technology (2015-present) and a member of the Board of ThanksUSA (military family education non-profit, 2014-present). General Dunwoody previously served as a member of the Advisory Board of certain Fidelity ® funds (2018).
John Engler (1948)
Year of Election or Appointment: 2014
Trustee
Mr. Engler also serves as Trustee of other Fidelity ® funds. Previously, Mr. Engler served as Governor of Michigan (1991-2003), President of the Business Roundtable (2011-2017) and interim President of Michigan State University (2018-2019). Mr. Engler currently serves as a member of the Board of Stride, Inc. (formerly K12 Inc.) (technology-based education company, 2012-present). Previously, Mr. Engler served as a member of the Board of Universal Forest Products (manufacturer and distributor of wood and wood-alternative products, 2003-2019) and Trustee of The Munder Funds (2003-2014). Mr. Engler previously served as a member of the Advisory Board of certain Fidelity ® funds (2014-2016).
Robert F. Gartland (1951)
Year of Election or Appointment: 2010
Trustee
Mr. Gartland also serves as Trustee of other Fidelity ® funds. Prior to his retirement, Mr. Gartland held a variety of positions at Morgan Stanley (financial services, 1979-2007), including Managing Director (1987-2007) and Chase Manhattan Bank (1975-1978). Mr. Gartland previously served as Chairman and an investor in Gartland & Mellina Group Corp. (consulting, 2009-2019), as a member of the Board of National Securities Clearing Corporation (1993-1996) and as Chairman of TradeWeb (2003-2004).
Arthur E. Johnson (1947)
Year of Election or Appointment: 2008
Trustee
Mr. Johnson also serves as Trustee of other Fidelity ® funds. Prior to his retirement, Mr. Johnson served as Senior Vice President of Corporate Strategic Development of Lockheed Martin Corporation (defense contractor, 1999-2009). Mr. Johnson currently serves as a member of the Board of Booz Allen Hamilton (management consulting, 2011-present). Mr. Johnson previously served as a member of the Board of Eaton Corporation plc (diversified power management, 2009-2019) and a member of the Board of AGL Resources, Inc. (holding company, 2002-2016). Mr. Johnson previously served as Chairman (2018-2021) and Vice Chairman (2015-2018) of the Independent Trustees of certain Fidelity® funds. Mr. Arthur E. Johnson is not related to Ms. Abigail P. Johnson.
Michael E. Kenneally (1954)
Year of Election or Appointment: 2009
Trustee
Chairman of the Independent Trustees
Mr. Kenneally also serves as Trustee of other Fidelity ® funds and was Vice Chairman (2018-2021) of the Independent Trustees of certain Fidelity ® funds. Prior to retirement in 2005, he was Chairman and Global Chief Executive Officer of Credit Suisse Asset Management, the worldwide fund management and institutional investment business of Credit Suisse Group. Previously, Mr. Kenneally was an Executive Vice President and the Chief Investment Officer for Bank of America. In this role, he was responsible for the investment management, strategy and products delivered to the bank's institutional, high-net-worth and retail clients. Earlier, Mr. Kenneally directed the organization's equity and quantitative research groups. He began his career as a research analyst and then spent more than a dozen years as a portfolio manager for endowments, pension plans and mutual funds. He earned the Chartered Financial Analyst (CFA) designation in 1991.
Mark A. Murray (1954)
Year of Election or Appointment: 2016
Trustee
Mr. Murray also serves as Trustee of other Fidelity ® funds. Previously, Mr. Murray served as Co-Chief Executive Officer (2013-2016), President (2006-2013) and Vice Chairman (2013-2020) of Meijer, Inc. Mr. Murray serves as a member of the Board (2009-present) and Public Policy and Responsibility Committee (2009-present) and Chair of the Nuclear Review Committee (2019-present) of DTE Energy Company (diversified energy company). Mr. Murray previously served as a member of the Board of Spectrum Health (not-for-profit health system, 2015-2019) and as a member of the Board and Audit Committee and Chairman of the Nominating and Corporate Governance Committee of Universal Forest Products, Inc. (manufacturer and distributor of wood and wood-alternative products, 2004-2016). Mr. Murray also serves as a member of the Board of many community and professional organizations. Mr. Murray previously served as a member of the Advisory Board of certain Fidelity ® funds (2016).
+ The information includes the Trustee's principal occupation during the last five years and other information relating to the experience, attributes, and skills relevant to the Trustee's qualifications to serve as a Trustee, which led to the conclusion that the Trustee should serve as a Trustee for the fund.
Advisory Board Members and Officers:
Correspondence intended for a Member of the Advisory Board (if any) may be sent to Fidelity Investments, P.O. Box 55235, Boston, Massachusetts 02205-5235. Correspondence intended for an officer may be sent to Fidelity Investments, 245 Summer Street, Boston, Massachusetts 02210. Officers appear below in alphabetical order.
Name, Year of Birth; Principal Occupation
Laura M. Bishop (1961)
Year of Election or Appointment: 2022
Member of the Advisory Board
Ms. Bishop also serves as a Member of the Advisory Board of other funds. Prior to her retirement, Ms. Bishop held a variety of positions at United Services Automobile Association (2001-2020), including Executive Vice President and Chief Financial Officer (2014-2020) and Senior Vice President and Deputy Chief Financial Officer (2012-2014). Ms. Bishop currently serves as a member of the Audit Committee and Compensation and Personnel Committee (2021-present) of the Board of Directors of Korn Ferry (global organizational consulting).
Robert W. Helm (1957)
Year of Election or Appointment: 2021
Member of the Advisory Board
Mr. Helm also serves as a Member of the Advisory Board of other Fidelity® funds. Mr. Helm was formerly Deputy Chairman (2003-2020), partner (1991-2020) and an associate (1984-1991) of Dechert LLP (formerly Dechert Price & Rhoads). Mr. Helm currently serves on boards and committees of several not-for-profit organizations.
Craig S. Brown (1977)
Year of Election or Appointment: 2019
Assistant Treasurer
Mr. Brown also serves as an officer of other funds. Mr. Brown serves as Assistant Treasurer of FIMM, LLC (2021-present) and is an employee of Fidelity Investments (2013-present). Previously, Mr. Brown served as Assistant Treasurer of certain Fidelity ® funds (2019-2022).
John J. Burke III (1964)
Year of Election or Appointment: 2018
Chief Financial Officer
Mr. Burke also serves as Chief Financial Officer of other funds. Mr. Burke serves as Head of Investment Operations for Fidelity Fund and Investment Operations (2018-present) and is an employee of Fidelity Investments (1998-present). Previously Mr. Burke served as head of Asset Management Investment Operations (2012-2018).
David J. Carter (1973)
Year of Election or Appointment: 2020
Assistant Secretary
Mr. Carter also serves as Assistant Secretary of other funds. Mr. Carter serves as Senior Vice President, Deputy General Counsel (2022-present) and is an employee of Fidelity Investments (2005-present).
Jonathan Davis (1968)
Year of Election or Appointment: 2010
Assistant Treasurer
Mr. Davis also serves as an officer of other funds. Mr. Davis serves as Assistant Treasurer of FIMM, LLC (2021-present), FMR Capital, Inc. (2017-present), FD Funds GP LLC (2021-present), FD Funds Holding LLC (2021-present), and FD Funds Management LLC (2021-present); and is an employee of Fidelity Investments. Previously, Mr. Davis served as Vice President and Associate General Counsel of FMR LLC (diversified financial services company, 2003-2010).
Laura M. Del Prato (1964)
Year of Election or Appointment: 2018
President and Treasurer
Ms. Del Prato also serves as an officer of other funds. Ms. Del Prato serves as Assistant Treasurer of FIMM, LLC (2021-present) and is an employee of Fidelity Investments (2017-present). Previously, Ms. Del Prato served as President and Treasurer of The North Carolina Capital Management Trust: Cash Portfolio and Term Portfolio (2018-2020). Prior to joining Fidelity Investments, Ms. Del Prato served as a Managing Director and Treasurer of the JPMorgan Mutual Funds (2014-2017). Prior to JPMorgan, Ms. Del Prato served as a partner at Cohen Fund Audit Services (accounting firm, 2012-2013) and KPMG LLP (accounting firm, 2004-2012).
Christopher M. Gouveia (1973)
Year of Election or Appointment: 2023
Chief Compliance Officer
Mr. Gouveia also serves as Chief Compliance Officer of other funds. Mr. Gouveia serves as Senior Vice President of Asset Management Compliance for Fidelity Investments and is an employee of Fidelity Investments. Previously, Mr. Gouveia served as Chief Compliance Officer of the North Carolina Capital Management Trust (2016-2019).
Colm A. Hogan (1973)
Year of Election or Appointment: 2016
Assistant Treasurer
Mr. Hogan also serves as an officer of other funds. Mr. Hogan serves as Assistant Treasurer of FIMM, LLC (2021-present) and FMR Capital, Inc. (2017-present) and is an employee of Fidelity Investments (2005-present). Previously, Mr. Hogan served as Deputy Treasurer of certain Fidelity ® funds (2016-2020) and Assistant Treasurer of certain Fidelity ® funds (2016-2018).
Cynthia Lo Bessette (1969)
Year of Election or Appointment: 2019
Secretary and Chief Legal Officer (CLO)
Ms. Lo Bessette also serves as an officer of other funds. Ms. Lo Bessette serves as CLO, Secretary, and Senior Vice President of Fidelity Management & Research Company LLC (investment adviser firm, 2019-present); CLO of Fidelity Management & Research (Hong Kong) Limited, FMR Investment Management (UK) Limited, and Fidelity Management & Research (Japan) Limited (investment adviser firms, 2019-present); Secretary of FD Funds GP LLC (2021-present), FD Funds Holding LLC (2021-present), FD Funds Management LLC (2021-present), and Fidelity Diversifying Solutions LLC (investment adviser firm, 2022-present); and Assistant Secretary of FIMM, LLC (2019-present). She is a Senior Vice President and Deputy General Counsel of FMR LLC (diversified financial services company, 2019-present), and is an employee of Fidelity Investments. Previously, Ms. Lo Bessette served as CLO, Secretary, and Senior Vice President of FMR Co., Inc. (investment adviser firm, 2019); Secretary of Fidelity SelectCo, LLC and Fidelity Investments Money Management, Inc. (investment adviser firms, 2019). Prior to joining Fidelity Investments, Ms. Lo Bessette was Executive Vice President, General Counsel (2016-2019) and Senior Vice President, Deputy General Counsel (2015-2016) of OppenheimerFunds (investment management company) and Deputy Chief Legal Officer (2013-2015) of Jennison Associates LLC (investment adviser firm).
Chris Maher (1972)
Year of Election or Appointment: 2013
Assistant Treasurer
Mr. Maher also serves as an officer of other funds. Mr. Maher serves as Assistant Treasurer of FIMM, LLC (2021-present) and FMR Capital, Inc. (2017-present), and is an employee of Fidelity Investments (2008-present). Previously, Mr. Maher served as Assistant Treasurer of certain funds (2013-2020); Vice President of Asset Management Compliance (2013), Vice President of the Program Management Group of FMR (investment adviser firm, 2010-2013), and Vice President of Valuation Oversight (2008-2010).
Jamie Pagliocco (1964)
Year of Election or Appointment: 2020
Vice President
Mr. Pagliocco also serves as Vice President of other funds. Mr. Pagliocco serves as President of Fixed Income (2020-present), and is an employee of Fidelity Investments (2001-present). Previously, Mr. Pagliocco served as Co-Chief Investment Officer - Bond (2017-2020), Global Head of Bond Trading (2016-2019), and as a portfolio manager.
Brett Segaloff (1972)
Year of Election or Appointment: 2021
Anti-Money Laundering (AML) Officer
Mr. Segaloff also serves as an AML Officer of other funds and other related entities. He is Director, Anti-Money Laundering (2007-present) of FMR LLC (diversified financial services company) and is an employee of Fidelity Investments (1996-present).
Stacie M. Smith (1974)
Year of Election or Appointment: 2013
Assistant Treasurer
Ms. Smith also serves as an officer of other funds. Ms. Smith serves as Assistant Treasurer of FIMM, LLC (2021-present) and FMR Capital, Inc. (2017-present), is an employee of Fidelity Investments (2009-present), and has served in other fund officer roles. Prior to joining Fidelity Investments, Ms. Smith served as Senior Audit Manager of Ernst & Young LLP (accounting firm, 1996-2009). Previously, Ms. Smith served as Assistant Treasurer (2013-2019) and Deputy Treasurer (2013-2016) of certain Fidelity ® funds.
Jim Wegmann (1979)
Year of Election or Appointment: 2021
Deputy Treasurer
Mr. Wegmann also serves as an officer of other funds. Mr. Wegmann serves as Assistant Treasurer of FIMM, LLC (2021-present) and is an employee of Fidelity Investments (2011-present). Previously, Mr. Wegmann served as Assistant Treasurer of certain Fidelity ® funds (2019-2021).
As a shareholder, you incur two types of costs: (1) transaction costs, which may include sales charges (loads) on purchase payments or redemption proceeds, as applicable and (2) ongoing costs, which generally include management fees, distribution and/or service (12b-1) fees and other Fund expenses. This Example is intended to help you understand your ongoing costs (in dollars) of investing in a fund and to compare these costs with the ongoing costs of investing in other mutual funds.
| The Example is based on an investment of $1,000 invested at the beginning of the period and held for the entire period (July 1, 2022 to December 31, 2022). |
Actual Expenses
The first line of the accompanying table provides information about actual account values and actual expenses. You may use the information in this line, together with the amount you invested, to estimate the expenses that you paid over the period. Simply divide your account value by $1,000.00 (for example, an $8,600 account value divided by $1,000.00 = 8.6), then multiply the result by the number in the first line for a class/Fund under the heading entitled "Expenses Paid During Period" to estimate the expenses you paid on your account during this period. If any fund is a shareholder of any underlying mutual funds or exchange-traded funds (ETFs) (the Underlying Funds), such fund indirectly bears its proportional share of the expenses of the Underlying Funds in addition to the direct expenses incurred presented in the table. These fees and expenses are not included in the annualized expense ratio used to calculate the expense estimate in the table below.
Hypothetical Example for Comparison Purposes
The second line of the accompanying table provides information about hypothetical account values and hypothetical expenses based on the actual expense ratio and an assumed rate of return of 5% per year before expenses, which is not the actual return. The hypothetical account values and expenses may not be used to estimate the actual ending account balance or expenses you paid for the period. You may use this information to compare the ongoing costs of investing in the Fund and other funds. To do so, compare this 5% hypothetical example with the 5% hypothetical examples that appear in the shareholder reports of the other funds. If any fund is a shareholder of any Underlying Funds, such fund indirectly bears its proportional share of the expenses of the Underlying Funds in addition to the direct expenses as presented in the table. These fees and expenses are not included in the annualized expense ratio used to calculate the expense estimate in the table below.
Please note that the expenses shown in the table are meant to highlight your ongoing costs only and do not reflect any transaction costs. Therefore, the second line of the table is useful in comparing ongoing costs only, and will not help you determine the relative total costs of owning different funds. In addition, if these transactional costs were included, your costs would have been higher.
| | | | | Annualized Expense Ratio- A | | Beginning Account Value July 1, 2022 | | Ending Account Value December 31, 2022 | | Expenses Paid During Period- C July 1, 2022 to December 31, 2022 |
| Fidelity® Municipal Income Fund | | | | | | | | | | |
| Class A | | | | .78% | | | | | | |
| Actual | | | | | | $ 1,000 | | $ 1,000.60 | | $ 3.93 |
Hypothetical- B | | | | | | $ 1,000 | | $ 1,021.27 | | $ 3.97 |
| Class M | | | | .76% | | | | | | |
| Actual | | | | | | $ 1,000 | | $ 1,000.80 | | $ 3.83 |
Hypothetical- B | | | | | | $ 1,000 | | $ 1,021.37 | | $ 3.87 |
| Class C | | | | 1.50% | | | | | | |
| Actual | | | | | | $ 1,000 | | $ 997.00 | | $ 7.55 |
Hypothetical- B | | | | | | $ 1,000 | | $ 1,017.64 | | $ 7.63 |
| Fidelity® Municipal Income Fund | | | | .46% | | | | | | |
| Actual | | | | | | $ 1,000 | | $ 1,002.30 | | $ 2.32 |
Hypothetical- B | | | | | | $ 1,000 | | $ 1,022.89 | | $ 2.35 |
| Class I | | | | .54% | | | | | | |
| Actual | | | | | | $ 1,000 | | $ 1,001.90 | | $ 2.72 |
Hypothetical- B | | | | | | $ 1,000 | | $ 1,022.48 | | $ 2.75 |
| Class Z | | | | .41% | | | | | | |
| Actual | | | | | | $ 1,000 | | $ 1,001.60 | | $ 2.07 |
Hypothetical- B | | | | | | $ 1,000 | | $ 1,023.14 | | $ 2.09 |
| |
A Annualized expense ratio reflects expenses net of applicable fee waivers.
B 5% return per year before expenses
C Expenses are equal to the annualized expense ratio, multiplied by the average account value over the period, multiplied by 184/ 365 (to reflect the one-half year period). The fees and expenses of any Underlying Funds are not included in each annualized expense ratio.
The dividend and capital gains distributions for the fund(s) are available on Fidelity.com or Institutional.Fidelity.com .
During fiscal year ended 2022, 100% of the fund's income dividends was free from federal income tax, and 18.71% of the fund's income dividends was subject to the federal alternative minimum tax.
The fund will notify shareholders in January 2023 of amounts for use in preparing 2022 income tax returns.
Fidelity Municipal Income Fund
Each year, the Board of Trustees, including the Independent Trustees (together, the Board), votes on the renewal of the management contract with Fidelity Management & Research Company LLC (FMR) and the sub-advisory agreements (together, the Advisory Contracts) for the fund. FMR and the sub-advisers are referred to herein as the Investment Advisers. The Board, assisted by the advice of fund counsel and Independent Trustees' counsel, requests and considers a broad range of information relevant to the renewal of the Advisory Contracts throughout the year.
The Board meets regularly and, at each of its meetings, covers an extensive agenda of topics and materials and considers factors that are relevant to its annual consideration of the renewal of the fund's Advisory Contracts, including the services and support provided to the fund and its shareholders. The Board has established four standing committees (Committees) - Operations, Audit, Fair Valuation, and Governance and Nominating - each composed of and chaired by Independent Trustees with varying backgrounds, to which the Board has assigned specific subject matter responsibilities in order to enhance effective decision-making by the Board. The Operations Committee, of which all the Independent Trustees are members, meets regularly throughout the year and requests, receives and considers, among other matters, information related to the annual consideration of the renewal of the fund's Advisory Contracts before making its recommendation to the Board. The Board also meets as needed to review matters specifically related to the Board's annual consideration of the renewal of the Advisory Contracts. Members of the Board may also meet from time to time with trustees of other Fidelity funds through joint ad hoc committees to discuss certain matters relevant to all of the Fidelity funds.
At its September 2022 meeting, the Board unanimously determined to renew the fund's Advisory Contracts. In reaching its determination, the Board considered all factors it believed relevant, including (i) the nature, extent, and quality of the services provided to the fund and its shareholders (including the investment performance of the fund); (ii) the competitiveness relative to peer funds of the fund's management fee and the total expense ratio of a representative class (the retail class); (iii) the total costs of the services provided by and the profits realized by Fidelity from its relationships with the fund; and (iv) the extent to which, if any, economies of scale exist and are realized as the fund grows, and whether any economies of scale are appropriately shared with fund shareholders.
In considering whether to renew the Advisory Contracts for the fund, the Board reached a determination, with the assistance of fund counsel and Independent Trustees' counsel and through the exercise of its business judgment, that the renewal of the Advisory Contracts was in the best interests of the fund and its shareholders and that the compensation payable under the Advisory Contracts was fair and reasonable. The Board's decision to renew the Advisory Contracts was not based on any single factor, but rather was based on a comprehensive consideration of all the information provided to the Board at its meetings throughout the year. The Board, in reaching its determination to renew the Advisory Contracts, was aware that shareholders of the fund have a broad range of investment choices available to them, including a wide choice among funds offered by Fidelity's competitors, and that the fund's shareholders, who have the opportunity to review and weigh the disclosure provided by the fund in its prospectus and other public disclosures, have chosen to invest in this fund, which is part of the Fidelity family of funds.
Nature, Extent, and Quality of Services Provided. The Board considered Fidelity's staffing as it relates to the fund, including the backgrounds of investment personnel of Fidelity, and also considered the fund's investment objective, strategies, and related investment philosophy. The Independent Trustees also had discussions with senior management of Fidelity's investment operations and investment groups. The Board considered the structure of the investment personnel compensation program and whether this structure provides appropriate incentives to act in the best interests of the fund. Additionally, the Board considered the portfolio managers' investments, if any, in the funds that they manage. The Board also considered the steps Fidelity had taken to ensure the continued provision of high quality services to the Fidelity funds throughout the COVID-19 pandemic, including the expansion of staff in client facing positions to maintain service levels in periods of high volumes and volatility.
Resources Dedicated to Investment Management and Support Services . The Board reviewed the general qualifications and capabilities of Fidelity's investment staff, including its size, education, experience, and resources, as well as Fidelity's approach to recruiting, managing, training, and compensating investment personnel. The Board noted the resources devoted to Fidelity's global investment organization, and that Fidelity's analysts have extensive resources, tools and capabilities that allow them to conduct quantitative and fundamental analysis, as well as credit analysis of issuers, counterparties and guarantors. Further, the Board considered that Fidelity's investment professionals have sufficient access to global information and data so as to provide competitive investment results over time, and that those professionals also have access to sophisticated tools that permit them to assess portfolio construction and risk and performance attribution characteristics continuously, as well as to transmit new information and research conclusions rapidly around the world. Additionally, in its deliberations, the Board considered Fidelity's trading, risk management, compliance, cybersecurity, and technology and operations capabilities and resources, which are integral parts of the investment management process.
Shareholder and Administrative Services . The Board considered (i) the nature, extent, quality, and cost of advisory, administrative, and shareholder services performed by the Investment Advisers and their affiliates under the Advisory Contracts and under separate agreements covering transfer agency and pricing and bookkeeping services for the fund; (ii) the nature and extent of the supervision of third party service providers, principally custodians, subcustodians, and pricing vendors; and (iii) the resources devoted to, and the record of compliance with, the fund's compliance policies and procedures.
The Board noted that the growth of fund assets over time across the complex allows Fidelity to reinvest in the development of services designed to enhance the value and convenience of the Fidelity funds as investment vehicles. These services include 24-hour access to account information and market information over the Internet and through telephone representatives, investor education materials and asset allocation tools. The Board also considered that it reviews customer service metrics such as telephone response times, continuity of services on the website and metrics addressing services at Fidelity Investor Centers.
Investment in a Large Fund Family . The Board considered the benefits to shareholders of investing in a Fidelity fund, including the benefits of investing in a fund that is part of a large family of funds offering a variety of investment disciplines and providing a large variety of mutual fund investor services. The Board noted that Fidelity had taken, or had made recommendations to the Board that resulted in the Fidelity funds taking, a number of actions over the previous year that benefited particular funds, including: (i) continuing to dedicate additional resources to Fidelity's investment research process, which includes meetings with management of issuers of securities in which the funds invest; (ii) continuing efforts to enhance Fidelity's global research capabilities; (iii) launching new funds, ETFs, and share classes with innovative structures, strategies and pricing and making other enhancements to meet investor needs; (iv) broadening eligibility requirements for certain funds and share classes; (v) reducing management fees and total expenses for certain funds and classes; (vi) lowering expenses for certain existing funds and classes by implementing or lowering expense caps; (vii) rationalizing product lines and gaining increased efficiencies from fund mergers and liquidations; (viii) continuing to develop, acquire and implement systems and technology to improve services to the funds and shareholders, strengthen information security, and increase efficiency; and (ix) continuing to implement enhancements to further strengthen Fidelity's product line to increase investors' probability of success in achieving their investment goals, including their retirement income goals.
Investment Performance. The Board considered whether the fund has operated in accordance with its investment objective, as well as its record of compliance with its investment restrictions and its performance history.
The Board took into account discussions that occur at Board meetings throughout the year with representatives of the Investment Advisers about fund investment performance. In this regard the Board noted that as part of regularly scheduled fund reviews and other reports to the Board on fund performance, the Board considers annualized return information for the fund for different time periods, measured against an appropriate securities market index (benchmark index) and an appropriate peer group of funds with similar objectives (peer group). The Board also receives and considers information about performance attribution. In its evaluation of fund investment performance at meetings throughout the year, the Board gave particular attention to information indicating underperformance of certain Fidelity funds for specific time periods and discussed with the Investment Advisers the reasons for such underperformance.
In addition to reviewing absolute and relative fund performance, the Independent Trustees periodically consider the appropriateness of fund performance metrics in evaluating the results achieved. In general, the Independent Trustees believe that fund performance should be evaluated based on gross performance (before fees and expenses but after transaction costs) compared to appropriate benchmark indices, over appropriate time periods that may include full market cycles, and on net performance (after fees and expenses) compared to appropriate peer groups, as applicable, over the same periods, taking into account relevant factors including the following: general market conditions; expectations for interest rate levels and credit conditions; issuer-specific information including credit quality; the potential for incremental return versus the fund's benchmark index weighed against the risks involved in obtaining that incremental return, including the risk of diminished or negative total returns; and fund cash flows and other factors. The Independent Trustees generally give greater weight to fund performance over longer time periods than over shorter time periods. Depending on the circumstances, the Independent Trustees may be satisfied with a fund's performance notwithstanding that it lags its benchmark index or peer group for certain periods.
The Independent Trustees recognize that shareholders evaluate performance on a net basis over their own holding periods, for which one-, three-, and five-year periods are often used as a proxy. For this reason, the performance information reviewed by the Board also included net cumulative calendar year total return information for the representative class (the retail class) and an appropriate benchmark index and peer group for the most recent one-, three-, and five-year periods.
Based on its review, the Board concluded that the nature, extent, and quality of services provided to the fund under the Advisory Contracts should continue to benefit the shareholders of the fund.
Competitiveness of Management Fee and Total Expense Ratio . The Board considered the fund's management fee and total expense ratio compared to selected groups of competitive funds and classes (referred to as "mapped groups" below) for the purpose of facilitating the Trustees' competitive analysis of management fees and total expenses. Fidelity creates "mapped groups" by combining similar investment objective categories (as classified by Lipper) that have comparable investment mandates. Combining funds with similar investment objective categories aids the Board's comparison of management fees and total expense ratios by broadening the competitive group used for such comparison.
Management Fee . The Board considered two proprietary management fee comparisons for the 12-month periods shown in basis points (BP) in the chart below. The group of Lipper funds used by the Board for management fee comparisons is referred to below as the "Total Mapped Group" and is broader than the Lipper peer group used by the Board for performance comparisons. The Total Mapped Group comparison focuses on a fund's standing in terms of gross management fees before expense reimbursements or caps relative to the total universe of funds with comparable investment mandates, regardless of whether their management fee structures also are comparable. Funds with comparable investment mandates offer exposure to similar types of securities. Funds with comparable management fee structures have similar management fee contractual arrangements (e.g., flat rate charged for advisory services, all-inclusive fee rate, etc.). "TMG %" represents the percentage of funds in the Total Mapped Group that had management fees that were lower than the fund's. For example, a hypothetical TMG % of 20% would mean that 80% of the funds in the Total Mapped Group had higher, and 20% had lower, management fees than the fund. The fund's actual TMG %s and the number of funds in the Total Mapped Group are in the chart below. The "Asset-Sized Peer Group" (ASPG) comparison focuses on a fund's standing relative to a subset of non-Fidelity funds within the Total Mapped Group that are similar in size and management fee structure. For example, if a fund is in the first quartile of the ASPG, the fund's management fee ranks in the least expensive or lowest 25% of funds in the ASPG. The ASPG represents at least 15% of the funds in the Total Mapped Group with comparable asset size and management fee structures, subject to a minimum of 50 funds (or all funds in the Total Mapped Group if fewer than 50). Additional information, such as the ASPG quartile in which the fund's management fee rate ranked, is also included in the chart and was considered by the Board.
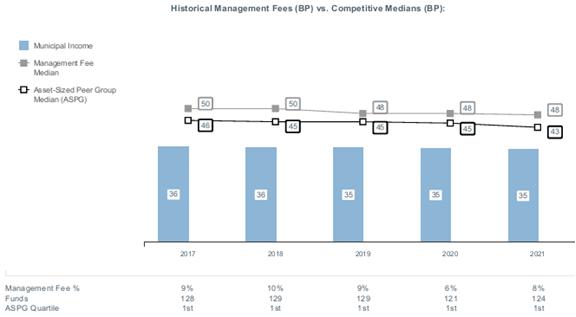
The Board noted that the fund's management fee rate ranked below the median of its Total Mapped Group and below the median of its ASPG for 2021.
Based on its review, the Board concluded that the fund's management fee is fair and reasonable in light of the services that the fund receives and the other factors considered.
Total Expense Ratio . In its review of the total expense ratio of the representative class (the retail class) of the fund, the Board considered the fund's management fee rate as well as other fund or class expenses, as applicable, such as transfer agent fees, pricing and bookkeeping fees, fund-paid 12b-1 fees, and custodial, legal, and audit fees. The Board also noted that Fidelity may agree to waive fees or reimburse expenses from time to time, and the extent to which, if any, it has done so for the fund. The fund's representative class is compared to those funds and classes in the Total Mapped Group (used by the Board for management fee comparisons) that have a similar sales load structure. The Board also considered a total expense ASPG comparison, which focuses on the total expenses of the representative class relative to a subset of non-Fidelity funds within the similar sales load structure group that are similar in size and management fee structure. The total expense ASPG is limited to 15 larger and 15 smaller classes of different funds, where possible. The total expense ASPG comparison excludes performance adjustments and fund-paid 12b-1 fees to eliminate variability in expenses relating to these items.
The Board noted that the total net expense ratio of the retail class ranked below the similar sales load structure group competitive median for 2021 and below the ASPG competitive median for 2021.
The Board further considered that FMR has contractually agreed to reimburse Class Z of the fund to the extent that total operating expenses, with certain exceptions, as a percentage of its average net assets, exceed 0.46% through April 30, 2023.
Fees Charged to Other Fidelity Clients . The Board also considered Fidelity fee structures and other information with respect to clients of Fidelity, such as other funds advised or subadvised by Fidelity, pension plan clients, and other institutional clients with similar mandates. The Board noted that a joint ad hoc committee created by it and the boards of other Fidelity funds periodically reviews and compares Fidelity's institutional investment advisory business with its business of providing services to the Fidelity funds and also noted the most recent findings of the committee. The Board noted that the committee's review included a consideration of the differences in services provided, fees charged, and costs incurred, as well as competition in the markets serving the different categories of clients.
Based on its review of total expense ratios and fees charged to other Fidelity clients, the Board concluded that the total expense ratio of each class of the fund was reasonable in light of the services that the fund and its shareholders receive and the other factors considered.
Costs of the Services and Profitability. The Board considered the revenues earned and the expenses incurred by Fidelity in conducting the business of developing, marketing, distributing, managing, administering and servicing the fund and servicing the fund's shareholders. The Board also considered the level of Fidelity's profits in respect of all the Fidelity funds.
On an annual basis, Fidelity presents to the Board information about the profitability of its relationships with the fund. Fidelity calculates profitability information for each fund, as well as aggregate profitability information for groups of Fidelity funds and all Fidelity funds, using a series of detailed revenue and cost allocation methodologies which originate with the books and records of Fidelity on which Fidelity's audited financial statements are based. The Audit Committee of the Board reviews any significant changes from the prior year's methodologies and the full Board approves such changes.
A public accounting firm has been engaged annually by the Board as part of the Board's assessment of Fidelity's profitability analysis. The engagement includes the review and assessment of the methodologies used by Fidelity in determining the revenues and expenses attributable to Fidelity's mutual fund business, and completion of agreed-upon procedures in respect of the mathematical accuracy of certain fund profitability information and its conformity to established allocation methodologies. After considering the reports issued under the engagement and information provided by Fidelity, the Board concluded that while other allocation methods may also be reasonable, Fidelity's profitability methodologies are reasonable in all material respects.
The Board also reviewed Fidelity's non-fund businesses and potential indirect benefits such businesses may have received as a result of their association with Fidelity's mutual fund business (i.e., fall-out benefits) as well as cases where Fidelity's affiliates may benefit from the funds' business. The Board considered areas where potential indirect benefits to the Fidelity funds from their relationships with Fidelity may exist. The Board's consideration of these matters was informed by the findings of a joint ad hoc committee created by it and the boards of other Fidelity funds to evaluate potential fall-out benefits.
The Board considered the costs of the services provided by and the profits realized by Fidelity in connection with the operation of the fund and was satisfied that the profitability was not excessive.
Economies of Scale . The Board considered whether there have been economies of scale in respect of the management of the Fidelity funds, whether the Fidelity funds (including the fund) have appropriately benefited from any such economies of scale, and whether there is potential for realization of any further economies of scale. The Board considered the extent to which the fund will benefit from economies of scale as assets grow through increased services to the fund, through waivers or reimbursements, or through fee or expense ratio reductions. The Board also noted that a committee (the Economies of Scale Committee) created by it and the boards of other Fidelity funds periodically analyzes whether Fidelity attains economies of scale in respect of the management and servicing of the Fidelity funds, whether the Fidelity funds have appropriately benefited from such economies of scale, and whether there is potential for realization of any further economies of scale.
The Board recognized that the fund's management contract incorporates a "group fee" structure, which provides for lower group fee rates as total "group assets" increase, and for higher group fee rates as total "group assets" decrease ("group assets" as defined in the management contract). FMR calculates the group fee rates based on a tiered asset "breakpoint" schedule that varies based on asset class. The Board considered that the group fee is designed to deliver the benefits of economies of scale to fund shareholders when total Fidelity fund assets increase, even if assets of any particular fund are unchanged or have declined, because some portion of Fidelity's costs are attributable to services provided to all Fidelity funds, and all funds benefit if those costs can be allocated among more assets. The Board also considered that Fidelity agreed to impose a temporary fee waiver in the form of additional breakpoints to the current breakpoint schedule. The Board concluded that, given the group fee structure, fund shareholders will benefit from lower management fees as "group assets" increase at the fund complex level, regardless of whether Fidelity achieves any such economies of scale.
The Board concluded, taking into account the analysis of the Economies of Scale Committee, that economies of scale, if any, are being appropriately shared between fund shareholders and Fidelity.
Additional Information Requested by the Board. In order to develop fully the factual basis for consideration of the Fidelity funds' advisory contracts, the Board requested and received additional information on certain topics, including: (i) Fidelity's fund profitability methodology, profitability trends for certain funds, the allocation of various costs to different funds, and the impact of certain factors on fund profitability results; (ii) portfolio manager changes that have occurred during the past year and the amount of the investment that each portfolio manager has made in the Fidelity fund(s) that he or she manages; (iii) the extent to which current market conditions have affected retention and recruitment of personnel; (iv) the arrangements with and compensation paid to certain fund sub-advisers on behalf of the Fidelity funds and the treatment of such compensation within Fidelity's fund profitability methodology; (v) the terms of the funds' various management fee structures, including the basic group fee and the terms of Fidelity's voluntary expense limitation arrangements; (vi) Fidelity's transfer agent, pricing and bookkeeping fees, expense and service structures for different funds and classes relative to competitive trends; (vii) the impact on fund profitability of recent industry trends, such as the growth in passively managed funds and the changes in flows for different types of funds; (viii) the types of management fee and total expense comparisons provided, and the challenges and limitations associated with such information; and (ix) explanations regarding the relative total expense ratios and management fees of certain funds and classes, total expense and management fee competitive trends, and methodologies for total expense and management fee competitive comparisons. In addition, the Board considered its discussions with Fidelity regarding Fidelity's efforts to maintain the continuous investment and shareholder services necessary for the funds during the current pandemic and economic circumstances.
Based on its evaluation of all of the conclusions noted above, and after considering all factors it believed relevant, the Board concluded that the advisory fee arrangements are fair and reasonable and that the fund's Advisory Contracts should be renewed.
1.539263.125
HIY-ANN-0323
Fidelity® Michigan Municipal Income Fund
Fidelity® Michigan Municipal Money Market Fund
Annual Report
December 31, 2022
Contents
To view a fund's proxy voting guidelines and proxy voting record for the 12-month period ended June 30, visit http://www.fidelity.com/proxyvotingresults or visit the Securities and Exchange Commission's (SEC) web site at http://www.sec.gov.
You may also call 1-800-544-8544 to request a free copy of the proxy voting guidelines.
Standard & Poor's, S&P and S&P 500 are registered service marks of The McGraw-Hill Companies, Inc. and have been licensed for use by Fidelity Distributors Corporation.
Other third-party marks appearing herein are the property of their respective owners.
All other marks appearing herein are registered or unregistered trademarks or service marks of FMR LLC or an affiliated company. © 2023 FMR LLC. All rights reserved.
This report and the financial statements contained herein are submitted for the general information of the shareholders of the Funds. This report is not authorized for distribution to prospective investors in the Funds unless preceded or accompanied by an effective prospectus.
A fund files its complete schedule of portfolio holdings with the SEC for the first and third quarters of each fiscal year on Form N-PORT. Forms N-PORT are available on the SEC's web site at http://www.sec.gov. A fund's Forms N-PORT may be reviewed and copied at the SEC's Public Reference Room in Washington, DC. Information regarding the operation of the SEC's Public Reference Room may be obtained by calling 1-800-SEC-0330.
For a complete list of a fund's portfolio holdings, view the most recent holdings listing, semiannual report, or annual report on Fidelity's web site at http://www.fidelity.com, http://www.institutional.fidelity.com, or http://www.401k.com, as applicable.
NOT FDIC INSURED •MAY LOSE VALUE •NO BANK GUARANTEE
Neither the Funds nor Fidelity Distributors Corporation is a bank.
Average annual total return reflects the change in the value of an investment, assuming reinvestment of distributions from dividend income and capital gains (the profits earned upon the sale of securities that have grown in value, if any) and assuming a constant rate of performance each year. The hypothetical investment and the average annual total returns do not reflect the deduction of taxes that a shareholder would pay on fund distributions or the redemption of fund shares. During periods of reimbursement by Fidelity, a fund's total return will be greater than it would be had the reimbursement not occurred. How a fund did yesterday is no guarantee of how it will do tomorrow.
| Average Annual Total Returns |
| | | | |
Periods ended December 31, 2022 | Past 1 year | Past 5 years | Past 10 years |
| Fidelity® Michigan Municipal Income Fund | -9.18% | 0.94% | 1.97% |
| $10,000 Over 10 Years |
| |
Let's say hypothetically that $10,000 was invested in Fidelity® Michigan Municipal Income Fund on December 31, 2012. The chart shows how the value of your investment would have changed, and also shows how the Bloomberg Municipal Bond Index performed over the same period. |
|
|
Fidelity® Michigan Municipal Income Fund
Market Recap:
Tax-exempt municipal bonds notably declined in 2022, as a multitude of crosscurrents challenged the global economy and financial markets. The Bloomberg Municipal Bond Index returned -8.53% for the year, its third-worst annual return on record. In late 2021, the Federal Reserve began its pivot to a tighter monetary policy, tapering the large-scale asset purchases it restarted in 2020 amid the COVID-19 pandemic. In early 2022, the Fed, faced with persistent inflationary pressure, implemented an aggressive series of rate hikes, raising its benchmark interest rate seven times, by a total of 4.25 percentage points, between March and December. This helped push municipal bond yields to their highest level in more than a decade. Muni bond prices, which move inversely to yields, fell sharply. Credit spreads significantly widened, as investors demanded more yield for lower-quality munis as recession risk increased. In November and December, the tax-exempt market staged a rally when comments by Fed Chair Jerome Powell pointed to a slowdown in the pace of rate hikes and inflation data moderated. Favorable supply and demand dynamics also helped amid muted muni bond issuance and increased pockets of demand. Muni tax-backed credit fundamentals remained solid throughout the year and, for the most part, the risk of credit-rating downgrades appeared low. Shorter-duration (lower sensitivity to changes in interest rates) and higher-credit-quality munis performed best for the year.
Comments from Co-Portfolio Managers Elizah McLaughlin, Cormac Cullen and Michael Maka:
For the fiscal year ending December 31, 2022, the fund returned -9.18%, lagging, net of fees, the -8.72% result of the state-specific Bloomberg Michigan Enhanced Municipal Bond Index, as well as the -8.53% return of the benchmark, the broad-based Bloomberg Municipal Bond Index. The past 12 months, we continued to focus on longer-term objectives and sought to generate attractive tax-exempt income and a competitive risk-adjusted return. Versus the state-specific index, the fund's overweight in lower-rated, investment-grade bonds was a key detractor, given that they underperformed as credit spreads widened. Larger-than-index exposure to bonds issued by airports detracted as well, given the segment's lagging results. Differences in the way fund holdings and index components were priced further hindered relative performance. In contrast, duration (interest rate) positioning contributed to performance, relative to the state-specific index. The fund had less sensitivity to interest rates, as measured by its shorter duration, than the index and therefore was hurt less as interest rates rose. A higher-than-average yield on the fund's underlying holdings provided another boost to the relative result. The fund's underweights in housing and health care bonds, two segments that trailed the index, was an additional positive performance driver. An underweight in bonds from the Oakland Corridor P3 Transportation Project, which underperformed the state index, also added value.
The views expressed above reflect those of the portfolio manager(s) only through the end of the period as stated on the cover of this report and do not necessarily represent the views of Fidelity or any other person in the Fidelity organization. Any such views are subject to change at any time based upon market or other conditions and Fidelity disclaims any responsibility to update such views. These views may not be relied on as investment advice and, because investment decisions for a Fidelity fund are based on numerous factors, may not be relied on as an indication of trading intent on behalf of any Fidelity fund.
Fidelity® Michigan Municipal Income Fund
| Revenue Sources (% of Fund's net assets) |
| General Obligations | 22.6% | |
| Health Care | 21.8% | |
| Education | 13.7% | |
| Transportation | 11.4% | |
| Water & Sewer | 9.3% | |
| Housing | 6.6% | |
| Special Tax | 6.1% | |
| Others* (Individually Less Than 5%) | 8.5% | |
| | 100.0% | |
| |
| *Includes net other assets | | |
Quality Diversification (% of Fund's net assets) |
|
| |
| We have used ratings from Moody's Investors Service, Inc. Where Moody's® ratings are not available, we have used S&P® ratings. All ratings are as of the date indicated and do not reflect subsequent changes. |
Fidelity® Michigan Municipal Income Fund
Showing Percentage of Net Assets
| Municipal Bonds - 96.2% |
| | | Principal Amount (a) | Value ($) |
| Guam - 0.4% | | | |
| Guam Int'l. Arpt. Auth. Rev. Series 2013 C: | | | |
| 6.25% 10/1/34 (b) | | 600,000 | 612,670 |
| 6.25% 10/1/34 (Pre-Refunded to 10/1/23 @ 100) (b) | | 400,000 | 408,447 |
| Guam Pwr. Auth. Rev. Series 2022 A, 5% 10/1/44 | | 1,000,000 | 1,024,941 |
TOTAL GUAM | | | 2,046,058 |
| Michigan - 94.6% | | | |
| Bay City School District Rev. Series 2014: | | | |
| 5% 11/1/27 | | 700,000 | 717,439 |
| 5% 11/1/28 | | 250,000 | 256,196 |
| Bloomfield Hills Schools District Series 2020, 4% 5/1/50 | | 1,500,000 | 1,411,691 |
| Chippewa Valley Schools Series 2016 A: | | | |
| 5% 5/1/32 | | 1,000,000 | 1,047,871 |
| 5% 5/1/33 | | 1,000,000 | 1,046,493 |
| 5% 5/1/34 | | 1,075,000 | 1,122,024 |
| Coopersville Area Pub. Schools Series 2022 I, 4.125% 5/1/52 | | 750,000 | 716,467 |
| Detroit Downtown Dev. Auth. Tax Series A: | | | |
| 5% 7/1/29 (Assured Guaranty Muni. Corp. Insured) | | 1,340,000 | 1,374,151 |
| 5% 7/1/31 (Assured Guaranty Muni. Corp. Insured) | | 1,775,000 | 1,816,849 |
| 5% 7/1/33 (Assured Guaranty Muni. Corp. Insured) | | 2,000,000 | 2,042,178 |
| 5% 7/1/34 (Assured Guaranty Muni. Corp. Insured) | | 1,750,000 | 1,784,096 |
| 5% 7/1/37 (Assured Guaranty Muni. Corp. Insured) | | 2,000,000 | 2,027,057 |
| Detroit Gen. Oblig.: | | | |
| Series 2018, 5% 4/1/23 | | 310,000 | 310,677 |
| Series 2020: | | | |
5.5% 4/1/35 | | 690,000 | 724,557 |
5.5% 4/1/36 | | 435,000 | 454,032 |
5.5% 4/1/37 | | 465,000 | 482,046 |
5.5% 4/1/38 | | 490,000 | 506,223 |
| Series 2021 A: | | | |
5% 4/1/37 | | 1,875,000 | 1,867,040 |
5% 4/1/39 | | 1,210,000 | 1,184,092 |
| Detroit Swr. Disp. Rev.: | | | |
| Series 2001 B, 5.5% 7/1/29 (Assured Guaranty Corp. Insured) (FGIC Insured) | | 25,000 | 27,492 |
| Series 2006, 5% 7/1/36 | | 10,000 | 10,015 |
| Downriver Util. Wastewtr. Auth. Swr. Sys. Rev. Series 2018: | | | |
| 5% 4/1/33 (Assured Guaranty Muni. Corp. Insured) | | 735,000 | 799,803 |
| 5% 4/1/34 (Assured Guaranty Muni. Corp. Insured) | | 520,000 | 563,508 |
| 5% 4/1/35 (Assured Guaranty Muni. Corp. Insured) | | 500,000 | 538,450 |
| Farmington Pub. School District Gen. Oblig. Series 2020, 4% 5/1/40 | | 3,000,000 | 2,943,243 |
| Fitzgerald Pub. School District Series 2019, 5% 5/1/37 | | 1,260,000 | 1,388,019 |
| Flint Hosp. Bldg. Auth. Rev. Series 2020: | | | |
| 4% 7/1/38 | | 1,800,000 | 1,591,561 |
| 4% 7/1/41 | | 1,395,000 | 1,158,433 |
| Fraser Pub. School District Series 2006 B, 5% 5/1/29 | | 1,455,000 | 1,524,211 |
| Gerald R. Ford Int'l. Arpt. Auth. Rev. Series 2021: | | | |
| 5% 1/1/26 (b) | | 225,000 | 238,710 |
| 5% 1/1/27 (b) | | 325,000 | 350,474 |
| 5% 1/1/28 (b) | | 235,000 | 257,065 |
| 5% 1/1/29 (b) | | 525,000 | 578,080 |
| 5% 1/1/30 (b) | | 425,000 | 472,758 |
| 5% 1/1/31 (b) | | 725,000 | 813,696 |
| 5% 1/1/32 (b) | | 725,000 | 820,894 |
| 5% 1/1/33 (b) | | 1,000,000 | 1,124,939 |
| 5% 1/1/34 (b) | | 1,000,000 | 1,120,535 |
| 5% 1/1/35 (b) | | 850,000 | 942,935 |
| 5% 1/1/36 (b) | | 600,000 | 659,284 |
| 5% 1/1/37 (b) | | 700,000 | 761,727 |
| 5% 1/1/38 (b) | | 1,170,000 | 1,267,833 |
| 5% 1/1/39 (b) | | 1,000,000 | 1,078,340 |
| 5% 1/1/40 (b) | | 1,000,000 | 1,072,898 |
| 5% 1/1/41 (b) | | 1,100,000 | 1,174,536 |
| 5% 1/1/46 (b) | | 2,000,000 | 2,109,625 |
| 5% 1/1/51 (b) | | 3,000,000 | 3,144,399 |
| Grand Rapids Pub. Schools: | | | |
| Series 2017, 5% 5/1/29 (Assured Guaranty Muni. Corp. Insured) | | 480,000 | 524,588 |
| Series 2019: | | | |
5% 11/1/39 (Assured Guaranty Muni. Corp. Insured) | | 1,200,000 | 1,285,376 |
5% 11/1/41 (Assured Guaranty Muni. Corp. Insured) | | 1,300,000 | 1,388,292 |
| Grand Rapids San. Swr. Sys. Rev. Series 2018: | | | |
| 5% 1/1/31 | | 475,000 | 524,311 |
| 5% 1/1/33 | | 250,000 | 273,538 |
| 5% 1/1/34 | | 550,000 | 597,699 |
| 5% 1/1/35 | | 400,000 | 430,528 |
| 5% 1/1/38 | | 655,000 | 694,433 |
| Grand Rapids Wtr. Supply Sys. Series 2016: | | | |
| 5% 1/1/31 | | 250,000 | 264,939 |
| 5% 1/1/32 | | 320,000 | 339,027 |
| 5% 1/1/33 | | 550,000 | 582,379 |
| 5% 1/1/34 | | 500,000 | 529,583 |
| 5% 1/1/35 | | 920,000 | 965,003 |
| Grand Traverse County Hosp. Fin. Auth.: | | | |
| Series 2019 A: | | | |
5% 7/1/44 | | 1,110,000 | 1,138,507 |
5% 7/1/49 | | 2,615,000 | 2,659,318 |
| Series 2021, 3% 7/1/51 | | 1,500,000 | 1,054,998 |
| Grand Valley Michigan State Univ. Rev.: | | | |
| Series 2014 B: | | | |
5% 12/1/25 | | 500,000 | 519,376 |
5% 12/1/26 | | 1,900,000 | 1,970,757 |
5% 12/1/28 | | 1,800,000 | 1,863,980 |
| Series 2018: | | | |
5% 12/1/34 | | 1,075,000 | 1,170,652 |
5% 12/1/35 | | 1,225,000 | 1,326,410 |
5% 12/1/37 | | 1,375,000 | 1,478,001 |
5% 12/1/38 | | 875,000 | 937,770 |
5% 12/1/43 | | 1,400,000 | 1,486,744 |
| Grandville Pub. Schools District Series 2020: | | | |
| 4% 5/1/39 (Assured Guaranty Muni. Corp. Insured) | | 1,000,000 | 988,321 |
| 4% 5/1/40 (Assured Guaranty Muni. Corp. Insured) | | 1,300,000 | 1,273,831 |
| Great Lakes Wtr. Auth. Sew Disp. Sys.: | | | |
| Series 2016 B, 5% 7/1/27 | | 15,000 | 15,988 |
| Series 2016 C, 5% 7/1/31 | | 7,000,000 | 7,470,607 |
| Series 2018 A, 5% 7/1/43 | | 10,000,000 | 10,509,783 |
| Series 2018 B: | | | |
5% 7/1/28 | | 1,125,000 | 1,242,081 |
5% 7/1/29 | | 15,000 | 16,720 |
| Great Lakes Wtr. Auth. Wtr. Supply Sys. Rev.: | | | |
| Series 2016 C, 5.25% 7/1/35 | | 2,000,000 | 2,121,991 |
| Series 2020 B: | | | |
5% 7/1/45 | | 1,850,000 | 1,958,993 |
5% 7/1/49 | | 1,300,000 | 1,351,278 |
| Grosse Pointe Pub. School Sys. Series 2019: | | | |
| 5% 5/1/38 | | 1,000,000 | 1,092,166 |
| 5% 5/1/39 | | 1,000,000 | 1,089,369 |
| Hudsonville Pub. Schools Series 2017: | | | |
| 5% 5/1/31 | | 430,000 | 470,053 |
| 5% 5/1/32 | | 1,200,000 | 1,309,776 |
| 5% 5/1/34 | | 1,000,000 | 1,088,576 |
| 5% 5/1/35 | | 1,000,000 | 1,083,700 |
| Kalamazoo Hosp. Fin. Auth. Hosp. Facilities Rev. Series 2016: | | | |
| 4% 5/15/36 | | 1,985,000 | 1,927,600 |
| 4% 5/15/36 (Pre-Refunded to 5/15/26 @ 100) | | 15,000 | 15,577 |
| 5% 5/15/28 | | 775,000 | 814,226 |
| 5% 5/15/28 (Pre-Refunded to 5/15/26 @ 100) | | 5,000 | 5,352 |
| 5% 5/15/30 | | 4,970,000 | 5,193,846 |
| 5% 5/15/30 (Pre-Refunded to 5/15/26 @ 100) | | 30,000 | 32,112 |
| Kentwood Econ. Dev. Corp.: | | | |
| Series 2021, 4% 11/15/45 | | 500,000 | 393,180 |
| Series 2022: | | | |
4% 11/15/31 | | 1,000,000 | 923,636 |
4% 11/15/43 | | 2,250,000 | 1,805,358 |
| Lansing Board of Wtr. & Lt. Util. Rev. Bonds Series 2021 B, 2%, tender 7/1/26 (c) | | 2,000,000 | 1,894,776 |
| Lansing Cmnty. College Series 2019, 5% 5/1/44 | | 3,000,000 | 3,244,821 |
| Lincoln Consolidated School District Series 2016 A: | | | |
| 5% 5/1/29 | | 1,430,000 | 1,522,974 |
| 5% 5/1/31 | | 500,000 | 531,692 |
| 5% 5/1/32 | | 1,000,000 | 1,063,058 |
| Macomb Interceptor Drain Drainage District Series 2017 A: | | | |
| 5% 5/1/33 | | 2,100,000 | 2,272,189 |
| 5% 5/1/34 | | 1,750,000 | 1,889,448 |
| Marquette Board Lt. & Pwr. Elec. Util. Sys. Rev. Series 2016 A: | | | |
| 5% 7/1/29 | | 780,000 | 830,998 |
| 5% 7/1/30 | | 900,000 | 957,922 |
| 5% 7/1/31 | | 780,000 | 828,338 |
| 5% 7/1/32 | | 1,000,000 | 1,059,931 |
| 5% 7/1/33 | | 705,000 | 745,816 |
| Michigan Bldg. Auth. Rev.: | | | |
| (Facilities Prog.) Series I, 3% 10/15/45 | | 6,000,000 | 4,763,533 |
| Series 2021 I, 3% 10/15/51 | | 1,770,000 | 1,328,680 |
| Series 2022 I: | | | |
4% 10/15/52 | | 1,250,000 | 1,162,483 |
5.25% 10/15/57 | | 2,000,000 | 2,162,844 |
| Michigan Fin. Auth. Rev.: | | | |
| (Charter County of Wayne Criminal Justice Ctr. Proj.) Series 2018: | | | |
5% 11/1/30 | | 1,000,000 | 1,113,559 |
5% 11/1/31 | | 750,000 | 832,883 |
5% 11/1/32 | | 1,000,000 | 1,108,331 |
5% 11/1/33 | | 3,250,000 | 3,592,760 |
5% 11/1/35 | | 1,000,000 | 1,095,485 |
5% 11/1/36 | | 1,250,000 | 1,363,774 |
5% 11/1/37 | | 1,500,000 | 1,630,635 |
5% 11/1/38 | | 1,595,000 | 1,727,089 |
| (Detroit Wtr. And Sewerage Dept. Sewage Disp. Sys. Rev. And Rev. Rfdg. Local Proj. Bonds) Series 2014 C3, 5% 7/1/30 (Assured Guaranty Muni. Corp. Insured) | | 6,000,000 | 6,173,242 |
| (Detroit Wtr. And Sewerage Dept. Wtr. Supply Sys. Rev. Rfdg. Local Proj. Bonds) Series 2015, 5% 7/1/30 | | 10,000 | 10,392 |
| (Holland Cmnty. Hosp. Proj.) Series 2013 A: | | | |
5% 1/1/33 (Pre-Refunded to 1/1/23 @ 100) | | 1,250,000 | 1,250,000 |
5% 1/1/40 (Pre-Refunded to 2/20/23 @ 100) | | 3,000,000 | 3,000,000 |
| (Kalamazoo College Proj.) Series 2018: | | | |
4% 12/1/36 | | 790,000 | 769,678 |
4% 12/1/47 | | 2,610,000 | 2,345,643 |
| (Lawrence Technological Univ. Proj.) Series 2017, 5% 2/1/47 | | 3,195,000 | 2,925,702 |
| (Trinity Health Proj.) Series 2017: | | | |
5% 12/1/30 | | 710,000 | 778,458 |
5% 12/1/37 | | 3,270,000 | 3,486,102 |
| Bonds: | | | |
Series 2015 D2, 1.2%, tender 4/13/28 (c) | | 3,000,000 | 2,664,393 |
Series 2016 E1, 4%, tender 8/15/24 (c) | | 1,335,000 | 1,342,730 |
| Series 2014 H1, 5% 10/1/39 | | 4,725,000 | 4,809,476 |
| Series 2015 C: | | | |
5% 7/1/26 | | 570,000 | 592,074 |
5% 7/1/27 | | 1,465,000 | 1,521,023 |
5% 7/1/28 | | 1,500,000 | 1,556,634 |
5% 7/1/35 | | 2,100,000 | 2,159,542 |
| Series 2015 D1: | | | |
5% 7/1/34 | | 1,250,000 | 1,286,941 |
5% 7/1/35 | | 505,000 | 519,318 |
| Series 2015 D2, 5% 7/1/34 | | 1,000,000 | 1,029,793 |
| Series 2016: | | | |
5% 11/15/28 | | 2,655,000 | 2,816,835 |
5% 1/1/29 | | 1,000,000 | 1,046,135 |
5% 11/15/29 | | 2,950,000 | 3,118,026 |
5% 1/1/30 | | 1,000,000 | 1,045,904 |
5% 1/1/31 | | 1,170,000 | 1,223,518 |
5% 1/1/32 | | 1,895,000 | 1,979,520 |
5% 1/1/33 | | 1,915,000 | 1,998,282 |
5% 1/1/34 | | 2,135,000 | 2,224,549 |
5% 11/15/34 | | 1,135,000 | 1,180,022 |
5% 11/15/41 | | 4,710,000 | 4,808,886 |
| Series 2019 A: | | | |
3% 12/1/49 | | 2,000,000 | 1,445,344 |
4% 2/15/44 | | 2,500,000 | 2,327,595 |
4% 12/1/49 | | 8,180,000 | 7,372,034 |
4% 2/15/50 | | 4,000,000 | 3,606,658 |
5% 11/15/48 | | 9,865,000 | 10,005,413 |
| Series 2019 MI1, 5% 12/1/48 | | 2,000,000 | 2,022,093 |
| Series 2020 A: | | | |
4% 6/1/35 | | 2,000,000 | 1,893,022 |
4% 6/1/37 | | 2,000,000 | 1,848,968 |
4% 6/1/40 | | 2,000,000 | 1,800,909 |
4% 6/1/49 | | 4,250,000 | 3,521,882 |
| Series 2020: | | | |
4% 11/1/55 | | 2,500,000 | 2,251,647 |
5% 6/1/40 | | 3,000,000 | 3,035,028 |
| Series 2021, 5% 9/1/38 | | 1,270,000 | 1,350,721 |
| Series 2022: | | | |
4% 2/1/27 | | 185,000 | 179,998 |
4% 2/1/32 | | 285,000 | 268,137 |
4% 2/1/42 | | 745,000 | 615,445 |
4% 4/15/42 | | 2,000,000 | 1,861,901 |
4% 12/1/46 | | 1,725,000 | 1,445,645 |
4% 12/1/51 | | 1,100,000 | 892,755 |
| Michigan Gen. Oblig. Series 2020 A, 4% 5/15/40 | | 500,000 | 503,613 |
| Michigan Hosp. Fin. Auth. Rev.: | | | |
| Series 2010 F, 4% 11/15/47 | | 290,000 | 264,553 |
| Series 2010 F4, 5% 11/15/47 | | 5,050,000 | 5,157,556 |
| Series 2016, 5% 11/15/47 | | 13,000,000 | 13,156,593 |
| Michigan Hsg. Dev. Auth. Rental Hsg. Rev. Series 2020 A1, 0.65% 10/1/24 | | 300,000 | 287,805 |
| Michigan Hsg. Dev. Auth. Single Family Mtg. Rev.: | | | |
| Series 2019 B, 3.75% 6/1/50 | | 2,710,000 | 2,698,415 |
| Series 2020 C, 3% 6/1/51 | | 3,115,000 | 3,027,236 |
| Series 2021 A, 3% 6/1/52 | | 3,315,000 | 3,208,451 |
| Series 2022 A, 5% 6/1/53 | | 2,455,000 | 2,558,640 |
| Series 2022 D, 5.5% 6/1/53 | | 2,500,000 | 2,668,571 |
| Series A: | | | |
3.5% 12/1/50 | | 2,420,000 | 2,390,568 |
4% 12/1/48 | | 1,040,000 | 1,040,971 |
| Series C, 4.25% 6/1/49 | | 2,325,000 | 2,342,048 |
| Michigan State Hsg. Dev. Auth. Series 2021 A, 0.55% 4/1/25 | | 2,750,000 | 2,584,756 |
| Michigan State Univ. Revs. Series 2019 C, 4% 2/15/44 | | 1,500,000 | 1,434,346 |
| Michigan Strategic Fund Ltd. Oblig. Rev.: | | | |
| (I-75 Impt. Proj.): | | | |
Series 2017, 5% 6/30/25 (b) | | 1,100,000 | 1,121,459 |
Series 2018: | | | |
4.25% 12/31/38 (Assured Guaranty Muni. Corp. Insured) (b) | | 840,000 | 791,601 |
5% 12/31/25 (b) | | 1,260,000 | 1,290,542 |
5% 12/31/26 (b) | | 425,000 | 437,909 |
5% 6/30/29 (b) | | 35,000 | 36,282 |
| (The Detroit Edison Co. Exempt Facilities Proj.) Series 2008 ET2, 1.35% 8/1/29 | | 2,000,000 | 1,706,528 |
| (The Detroit Edison Co. Poll. Cont. Bonds Proj.) Series 1995 CC, 1.45% 9/1/30 | | 2,000,000 | 1,670,693 |
| Bonds: | | | |
(Consumer Energy Co. Proj.) Series 2019, 1.8%, tender 10/1/24 (b)(c) | | 6,000,000 | 5,798,071 |
(Graphic Packaging Int'l., LLC Coated Recycled Board Machine Proj.) Series 2021, 4%, tender 10/1/26 (b)(c) | | 5,000,000 | 4,824,367 |
| Series 2020: | | | |
4% 5/15/27 | | 715,000 | 692,139 |
5% 5/15/44 | | 1,500,000 | 1,379,812 |
| Michigan Technological Univ. Series 2021, 4% 10/1/46 | | 2,835,000 | 2,634,830 |
| Michigan Trunk Line Fund Rev. Series 2020 B, 4% 11/15/45 | | 1,500,000 | 1,418,108 |
| Northern Michigan Univ. Revs. Series 2021: | | | |
| 4% 6/1/39 | | 900,000 | 880,858 |
| 4% 6/1/40 | | 500,000 | 483,490 |
| 4% 6/1/41 | | 1,385,000 | 1,326,207 |
| 4% 6/1/46 | | 1,850,000 | 1,705,852 |
| 5% 6/1/32 | | 375,000 | 428,722 |
| 5% 6/1/33 | | 365,000 | 414,835 |
| 5% 6/1/34 | | 375,000 | 425,309 |
| 5% 6/1/35 | | 375,000 | 421,645 |
| 5% 6/1/36 | | 400,000 | 447,095 |
| 5% 6/1/37 | | 675,000 | 748,628 |
| Novi Cmnty. School District Series I: | | | |
| 5% 5/1/43 | | 1,150,000 | 1,238,372 |
| 5% 5/1/44 | | 1,175,000 | 1,262,229 |
| Oakland Univ. Rev.: | | | |
| Series 2013 A: | | | |
5% 3/1/25 | | 995,000 | 997,082 |
5% 3/1/27 | | 815,000 | 816,706 |
| Series 2014: | | | |
5% 3/1/28 | | 335,000 | 341,631 |
5% 3/1/29 | | 525,000 | 535,271 |
| Series 2016: | | | |
5% 3/1/28 | | 1,150,000 | 1,216,236 |
5% 3/1/41 | | 3,475,000 | 3,595,618 |
| Series 2022 B: | | | |
5% 3/1/36 | | 1,135,000 | 1,249,546 |
5% 3/1/37 | | 1,265,000 | 1,376,180 |
| Portage Pub. Schools: | | | |
| Series 2016: | | | |
5% 11/1/32 | | 2,500,000 | 2,649,507 |
5% 11/1/34 | | 1,250,000 | 1,317,467 |
| Series 2019, 4% 11/1/38 | | 2,000,000 | 1,968,047 |
| Series 2021, 4% 11/1/42 | | 1,000,000 | 956,786 |
| Ravenna Pub. Schools Gen. Oblig. Series 2021, 4% 5/1/51 | | 2,140,000 | 1,954,267 |
| Rochester Cmnty. School District Series I, 5% 5/1/31 | | 1,500,000 | 1,597,035 |
| Rockford Pub. Schools Gen. Oblig. Series 2019 I, 5% 5/1/42 | | 3,050,000 | 3,262,599 |
| Saginaw City School District Series 2021, 4% 5/1/47 | | 3,000,000 | 2,730,559 |
| Saginaw Hosp. Fin. Auth. Hosp. Rev. Series 2020 J: | | | |
| 4% 7/1/36 | | 770,000 | 766,384 |
| 4% 7/1/37 | | 820,000 | 807,460 |
| 4% 7/1/39 | | 1,430,000 | 1,390,223 |
| 4% 7/1/40 | | 490,000 | 472,896 |
| Walled Lake Consolidated School District: | | | |
| Series 2020, 5% 5/1/36 | | 1,050,000 | 1,167,205 |
| Series 2022, 5% 5/1/47 | | 1,500,000 | 1,612,794 |
| Warren Consolidated School District: | | | |
| Series 2016: | | | |
5% 5/1/34 | | 5,630,000 | 5,933,871 |
5% 5/1/35 | | 1,250,000 | 1,313,038 |
| Series 2017: | | | |
4% 5/1/24 (Assured Guaranty Muni. Corp. Insured) | | 750,000 | 759,123 |
4% 5/1/25 (Assured Guaranty Muni. Corp. Insured) | | 500,000 | 511,712 |
| Series 2018: | | | |
5% 5/1/32 | | 1,100,000 | 1,214,231 |
5% 5/1/34 | | 1,175,000 | 1,291,041 |
5% 5/1/35 | | 1,200,000 | 1,312,022 |
5% 5/1/36 | | 1,000,000 | 1,087,797 |
5% 5/1/37 | | 1,300,000 | 1,406,966 |
5% 5/1/38 | | 800,000 | 863,487 |
| Wayne County Arpt. Auth. Rev.: | | | |
| Series 2012 B, 5% 12/1/32 (b) | | 1,500,000 | 1,501,039 |
| Series 2014 C: | | | |
5% 12/1/29 (b) | | 720,000 | 736,759 |
5% 12/1/31 (b) | | 860,000 | 879,344 |
5% 12/1/34 (b) | | 1,655,000 | 1,682,984 |
| Series 2015 D, 5% 12/1/40 (Assured Guaranty Muni. Corp. Insured) | | 8,165,000 | 8,394,553 |
| Series 2015 G: | | | |
5% 12/1/35 | | 5,435,000 | 5,669,246 |
5% 12/1/36 | | 5,760,000 | 5,979,544 |
| Series 2017 A: | | | |
5% 12/1/37 | | 545,000 | 573,483 |
5% 12/1/42 | | 1,455,000 | 1,502,125 |
| Series 2017 B, 5% 12/1/47 (b) | | 450,000 | 455,952 |
| Series 2018 B, 5% 12/1/48 (b) | | 5,000,000 | 5,065,503 |
| Series 2018 D: | | | |
5% 12/1/30 (b) | | 4,365,000 | 4,656,647 |
5% 12/1/31 (b) | | 2,825,000 | 3,008,106 |
5% 12/1/32 (b) | | 2,945,000 | 3,129,715 |
| Series 2021 A: | | | |
5% 12/1/36 | | 1,000,000 | 1,105,332 |
5% 12/1/37 | | 1,500,000 | 1,644,243 |
5% 12/1/38 | | 1,250,000 | 1,359,559 |
5% 12/1/39 | | 1,500,000 | 1,623,577 |
| Series 2021 B: | | | |
5% 12/1/35 (b) | | 1,225,000 | 1,309,452 |
5% 12/1/37 (b) | | 1,520,000 | 1,608,219 |
5% 12/1/46 (b) | | 1,280,000 | 1,310,463 |
| Wayne State Univ. Revs. Series 2019 A: | | | |
| 4% 11/15/38 | | 1,000,000 | 987,962 |
| 4% 11/15/39 | | 800,000 | 780,676 |
| Western Michigan Univ. Rev.: | | | |
| Series 2014: | | | |
5% 11/15/25 | | 320,000 | 331,839 |
5% 11/15/26 | | 400,000 | 414,504 |
5% 11/15/28 | | 650,000 | 671,655 |
5% 11/15/29 | | 750,000 | 774,436 |
5% 11/15/30 | | 855,000 | 881,917 |
5% 11/15/31 | | 700,000 | 720,756 |
| Series 2015 A: | | | |
5% 11/15/26 | | 1,000,000 | 1,047,009 |
5% 11/15/28 | | 2,505,000 | 2,610,510 |
| Series 2019 A, 5% 11/15/44 | | 2,000,000 | 2,139,057 |
| Series 2021 A: | | | |
5% 11/15/27 (Assured Guaranty Muni. Corp. Insured) | | 300,000 | 327,214 |
5% 11/15/30 (Assured Guaranty Muni. Corp. Insured) | | 200,000 | 227,398 |
5% 11/15/31 (Assured Guaranty Muni. Corp. Insured) | | 150,000 | 170,686 |
5% 11/15/32 (Assured Guaranty Muni. Corp. Insured) | | 300,000 | 339,285 |
5% 11/15/34 (Assured Guaranty Muni. Corp. Insured) | | 400,000 | 449,855 |
5% 11/15/36 (Assured Guaranty Muni. Corp. Insured) | | 400,000 | 440,621 |
5% 11/15/38 (Assured Guaranty Muni. Corp. Insured) | | 625,000 | 682,538 |
5% 11/15/40 (Assured Guaranty Muni. Corp. Insured) | | 635,000 | 686,975 |
5% 11/15/51 (Assured Guaranty Muni. Corp. Insured) | | 5,000,000 | 5,291,170 |
5% 11/15/53 (Assured Guaranty Muni. Corp. Insured) | | 4,100,000 | 4,333,785 |
| Ypsilanti School District Series A: | | | |
| 5% 5/1/29 | | 1,305,000 | 1,394,977 |
| 5% 5/1/32 | | 2,000,000 | 2,135,272 |
TOTAL MICHIGAN | | | 470,177,437 |
| Puerto Rico - 1.2% | | | |
| Puerto Rico Commonwealth Pub. Impt. Gen. Oblig. Series 2021 A1: | | | |
| 0% 7/1/33 | | 1,643,730 | 888,536 |
| 5.625% 7/1/27 | | 195,000 | 198,679 |
| 5.625% 7/1/29 | | 595,000 | 608,812 |
| 5.75% 7/1/31 | | 1,410,000 | 1,457,895 |
| Puerto Rico Hsg. Fin. Auth. Series 2020, 5% 12/1/27 | | 1,340,000 | 1,441,651 |
| Puerto Rico Indl., Tourist, Edl., Med. And Envir. Cont. Facilities Fing. Auth. Series 2021: | | | |
| 4% 7/1/36 | | 195,000 | 178,506 |
| 5% 7/1/30 | | 485,000 | 531,018 |
| 5% 7/1/32 | | 360,000 | 393,343 |
TOTAL PUERTO RICO | | | 5,698,440 |
| TOTAL MUNICIPAL BONDS (Cost $513,532,955) | | | 477,921,935 |
| | | | |
| Municipal Notes - 3.1% |
| | | Principal Amount (a) | Value ($) |
| Michigan - 3.1% | | | |
| Michigan Fin. Auth. Rev.: | | | |
| (Hosp. Proj.) Series 2016 E2, 3.76% 1/6/23, VRDN (c) | | 2,470,000 | 2,470,000 |
| Series 2016 E3, 3.7% 1/6/23, VRDN (c) | | 4,000,000 | 4,000,000 |
| Michigan Hsg. Dev. Auth. Single Family Mtg. Rev. Series 2014 A, 3.63% 1/6/23 (Liquidity Facility Royal Bank of Canada), VRDN (b)(c) | | 9,200,000 | 9,200,000 |
| | | | |
| TOTAL MUNICIPAL NOTES (Cost $15,670,000) | | | 15,670,000 |
| | | | |
| TOTAL INVESTMENT IN SECURITIES - 99.3% (Cost $529,202,955) | 493,591,935 |
NET OTHER ASSETS (LIABILITIES) - 0.7% | 3,233,950 |
| NET ASSETS - 100.0% | 496,825,885 |
| | |
Security Type Abbreviations
| VRDN | - | VARIABLE RATE DEMAND NOTE (A debt instrument that is payable upon demand, either daily, weekly or monthly) |
Legend
| (a) | Amount is stated in United States dollars unless otherwise noted. |
| (b) | Private activity obligations whose interest is subject to the federal alternative minimum tax for individuals. |
| (c) | Coupon rates for floating and adjustable rate securities reflect the rates in effect at period end. |
Investment Valuation
The following is a summary of the inputs used, as of December 31, 2022, involving the Fund's assets and liabilities carried at fair value. The inputs or methodology used for valuing securities may not be an indication of the risk associated with investing in those securities. For more information on valuation inputs, and their aggregation into the levels used below, please refer to the Investment Valuation section in the accompanying Notes to Financial Statements.
| Valuation Inputs at Reporting Date: |
| Description | Total ($) | Level 1 ($) | Level 2 ($) | Level 3 ($) |
Investments in Securities: | | | | |
|
| Municipal Securities | 493,591,935 | - | 493,591,935 | - |
| Total Investments in Securities: | 493,591,935 | - | 493,591,935 | - |
Fidelity® Michigan Municipal Income Fund
| Statement of Assets and Liabilities |
| | | | December 31, 2022 |
| | | | | |
| Assets | | | | |
Investment in securities, at value - See accompanying schedule Unaffiliated issuers (cost $529,202,955): | | | $ | 493,591,935 |
| Receivable for investments sold | | | | 1,653,416 |
| Receivable for fund shares sold | | | | 1,394,561 |
| Interest receivable | | | | 5,114,306 |
| Prepaid expenses | | | | 586 |
| Other receivables | | | | 1,621 |
Total assets | | | | 501,756,425 |
| Liabilities | | | | |
| Payable to custodian bank | | $3,793,684 | | |
| Payable for fund shares redeemed | | 582,866 | | |
| Distributions payable | | 300,783 | | |
| Accrued management fee | | 150,067 | | |
| Other affiliated payables | | 54,733 | | |
| Other payables and accrued expenses | | 48,407 | | |
| Total Liabilities | | | | 4,930,540 |
| Net Assets | | | $ | 496,825,885 |
| Net Assets consist of: | | | | |
| Paid in capital | | | $ | 536,318,647 |
| Total accumulated earnings (loss) | | | | (39,492,762) |
| Net Assets | | | $ | 496,825,885 |
Net Asset Value , offering price and redemption price per share ($496,825,885 ÷ 44,318,867 shares) | | | $ | 11.21 |
| | | | | |
| Statement of Operations |
| | | | Year ended December 31, 2022 |
| Investment Income | | | | |
| Interest | | | $ | 16,292,756 |
| Expenses | | | | |
| Management fee | $ | 2,070,689 | | |
| Transfer agent fees | | 616,395 | | |
| Accounting fees and expenses | | 144,365 | | |
| Custodian fees and expenses | | 7,412 | | |
| Independent trustees' fees and expenses | | 1,964 | | |
| Registration fees | | 24,197 | | |
| Audit | | 52,492 | | |
| Legal | | 8,430 | | |
| Miscellaneous | | 2,912 | | |
| Total expenses before reductions | | 2,928,856 | | |
| Expense reductions | | (18,486) | | |
| Total expenses after reductions | | | | 2,910,370 |
| Net Investment income (loss) | | | | 13,382,386 |
| Realized and Unrealized Gain (Loss) | | | | |
| Net realized gain (loss) on: | | | | |
| Investment Securities: | | | | |
| Unaffiliated issuers | | (3,890,904) | | |
| Total net realized gain (loss) | | | | (3,890,904) |
| Change in net unrealized appreciation (depreciation) on investment securities | | | | (74,601,773) |
| Net gain (loss) | | | | (78,492,677) |
| Net increase (decrease) in net assets resulting from operations | | | $ | (65,110,291) |
| Statement of Changes in Net Assets |
| |
| | Year ended December 31, 2022 | | Year ended December 31, 2021 |
| Increase (Decrease) in Net Assets | | | | |
| Operations | | | | |
| Net investment income (loss) | $ | 13,382,386 | $ | 15,137,759 |
| Net realized gain (loss) | | (3,890,904) | | 4,360,076 |
| Change in net unrealized appreciation (depreciation) | | (74,601,773) | | (8,677,684) |
| Net increase (decrease) in net assets resulting from operations | | (65,110,291) | | 10,820,151 |
| Distributions to shareholders | | (14,112,830) | | (18,599,520) |
| Share transactions | | | | |
| Proceeds from sales of shares | | 91,927,922 | | 98,407,493 |
| Reinvestment of distributions | | 9,900,392 | | 12,950,242 |
| Cost of shares redeemed | | (257,381,337) | | (88,383,573) |
Net increase (decrease) in net assets resulting from share transactions | | (155,553,023) | | 22,974,162 |
| Total increase (decrease) in net assets | | (234,776,144) | | 15,194,793 |
| | | | | |
| Net Assets | | | | |
| Beginning of period | | 731,602,029 | | 716,407,236 |
| End of period | $ | 496,825,885 | $ | 731,602,029 |
| | | | | |
| Other Information | | | | |
| Shares | | | | |
| Sold | | 7,997,442 | | 7,722,513 |
| Issued in reinvestment of distributions | | 859,107 | | 1,018,827 |
| Redeemed | | (22,425,043) | | (6,946,787) |
| Net increase (decrease) | | (13,568,494) | | 1,794,553 |
| | | | | |
Financial Highlights
| Fidelity® Michigan Municipal Income Fund |
| |
| Years ended December 31, | | 2022 | | 2021 | | 2020 | | 2019 | | 2018 |
Selected Per-Share Data | | | | | | | | | | |
| Net asset value, beginning of period | $ | 12.64 | $ | 12.77 | $ | 12.47 | $ | 11.97 | $ | 12.22 |
| Income from Investment Operations | | | | | | | | | | |
Net investment income (loss) A,B | | .261 | | .265 | | .283 | | .309 | | .319 |
| Net realized and unrealized gain (loss) | | (1.418) | | (.070) | | .347 | | .541 | | (.216) |
| Total from investment operations | | (1.157) | | .195 | | .630 | | .850 | | .103 |
| Distributions from net investment income | | (.260) | | (.265) | | (.284) | | (.310) | | (.318) |
| Distributions from net realized gain | | (.013) | | (.060) | | (.046) | | (.040) | | (.035) |
| Total distributions | | (.273) | | (.325) | | (.330) | | (.350) | | (.353) |
| Net asset value, end of period | $ | 11.21 | $ | 12.64 | $ | 12.77 | $ | 12.47 | $ | 11.97 |
Total Return C | | (9.18)% | | 1.54% | | 5.11% | | 7.16% | | .90% |
Ratios to Average Net Assets B,D,E | | | | | | | | | | |
| Expenses before reductions | | .49% | | .48% | | .48% | | .48% | | .49% |
| Expenses net of fee waivers, if any | | .49% | | .48% | | .48% | | .48% | | .48% |
| Expenses net of all reductions | | .49% | | .48% | | .48% | | .48% | | .48% |
| Net investment income (loss) | | 2.25% | | 2.08% | | 2.25% | | 2.50% | | 2.67% |
| Supplemental Data | | | | | | | | | | |
| Net assets, end of period (000 omitted) | $ | 496,826 | $ | 731,602 | $ | 716,407 | $ | 673,051 | $ | 597,684 |
Portfolio turnover rate F | | 8% | | 13% | | 13% | | 14% | | 22% |
A Calculated based on average shares outstanding during the period.
B Net investment income (loss) is affected by the timing of the declaration of dividends by any underlying mutual funds or exchange-traded funds (ETFs). Net investment income (loss) of any mutual funds or ETFs is not included in the Fund's net investment income (loss) ratio.
C Total returns would have been lower if certain expenses had not been reduced during the applicable periods shown.
D Fees and expenses of any underlying mutual funds or exchange-traded funds (ETFs) are not included in the Fund's expense ratio. The Fund indirectly bears its proportionate share of these expenses.
E Expense ratios reflect operating expenses of the class. Expenses before reductions do not reflect amounts reimbursed, waived, or reduced through arrangements with the investment adviser, brokerage services, or other offset arrangements, if applicable, and do not represent the amount paid by the class during periods when reimbursements, waivers or reductions occur.
F Amount does not include the portfolio activity of any underlying mutual funds or exchange-traded funds (ETFs).
| Current 7-Day Yields |
| | | |
| Fidelity® Michigan Municipal Money Market Fund | 3.18% | |
| | | |
Yield refers to the income paid by the Fund over a given period. Yield for money market funds is usually for seven-day periods, as it is here, though it is expressed as an annual percentage rate. Past performance is no guarantee of future results. Yield will vary and it's possible to lose money investing in the Fund. A portion of the Fund's expenses was reimbursed and/or waived. Absent such reimbursements and/or waivers the yield for the period ending December 31, 2022, the most recent period shown in the table, would have been 3.16% for Fidelity® Michigan Municipal Money Market Fund. | |
| Effective Maturity Diversification (% of Fund's Investments) |
| Days |
| 1 - 7 | 98.8 | |
| 31 - 60 | 1.2 | |
| Effective maturity is determined in accordance with the requirements of Rule 2a-7 under the Investment Company Act of 1940. |
Asset Allocation (% of Fund's net assets) |
|
Percentages shown as 0.0% may reflect amounts less than 0.05%. |
|
Fidelity® Michigan Municipal Money Market Fund
Showing Percentage of Net Assets
| Variable Rate Demand Note - 42.9% |
| | | Principal Amount (a) | Value ($) |
| Alabama - 0.8% | | | |
| Decatur Indl. Dev. Board Exempt Facilities Rev. (Nucor Steel Decatur LLC Proj.) Series 2003 A, 4.15% 1/6/23, VRDN (b)(c) | | 1,100,000 | 1,100,000 |
| West Jefferson Indl. Dev. Series 2008, 3.78% 1/6/23, VRDN (b) | | 200,000 | 200,000 |
TOTAL ALABAMA | | | 1,300,000 |
| Arizona - 0.2% | | | |
| Maricopa County Poll. Cont. Rev. Series 2009 C, 4% 1/6/23, VRDN (b) | | 400,000 | 400,000 |
| Kansas - 0.3% | | | |
| Burlington Envir. Impt. Rev. (Kansas City Pwr. and Lt. Co. Proj.): | | | |
| Series 2007 A, 3.68% 1/6/23, VRDN (b) | | 400,000 | 400,000 |
| Series 2007 B, 3.68% 1/6/23, VRDN (b) | | 100,000 | 100,000 |
TOTAL KANSAS | | | 500,000 |
| Michigan - 40.7% | | | |
| Central Michigan Univ. Rev. Series 2008 A, 3.66% 1/6/23, LOC TD Banknorth, NA, VRDN (b) | | 2,145,000 | 2,145,000 |
| Grand Valley Michigan State Univ. Rev. Series 2008 B, 3.66% 1/6/23, LOC TD Banknorth, NA, VRDN (b) | | 1,945,000 | 1,945,000 |
| Kent Hosp. Fin. Auth. Hosp. Facilities Rev. (Spectrum Health Sys. Proj.) Series 2008 B3, 3.65% 1/6/23 (Liquidity Facility Wells Fargo Bank NA), VRDN (b) | | 400,000 | 400,000 |
| Lakeview School District Calhoun County Series B, 3.66% 1/6/23 (Michigan Gen. Oblig. Guaranteed), LOC TD Banknorth, NA, VRDN (b) | | 1,355,000 | 1,355,000 |
| Michigan Fin. Auth. Rev. (Hosp. Proj.) Series 2016 E2, 3.76% 1/6/23, VRDN (b) | | 300,000 | 300,000 |
| Michigan Hsg. Dev. Auth. Rental Hsg. Rev.: | | | |
| Series 2002 A, 3.8% 1/6/23, LOC Bank of America NA, VRDN (b)(c) | | 4,300,000 | 4,300,000 |
| Series 2008 A, 3.68% 1/6/23, LOC Barclays Bank PLC, VRDN (b)(c) | | 2,895,000 | 2,895,000 |
| Series 2018 C, 3.75% 1/6/23, LOC Bank of America NA, VRDN (b)(c) | | 9,325,000 | 9,325,000 |
| Michigan State Univ. Revs. Series 2000 A: | | | |
| 3.68% 1/6/23 (Liquidity Facility Northern Trust Co.), VRDN (b) | | 3,105,000 | 3,105,000 |
| 3.68% 1/6/23 (Liquidity Facility PNC Bank NA), VRDN (b) | | 3,725,000 | 3,725,000 |
| Michigan Strategic Fund Ltd. Oblig. Rev.: | | | |
| (Henry Ford Museum & Greenfield Village Proj.) Series 2002, 3.75% 1/3/23, LOC Comerica Bank, VRDN (b) | | 1,450,000 | 1,450,000 |
| (The Kroger Co. Recovery Zone Facilities Bond Proj.) Series 2010, 3.7% 1/6/23, LOC Bank of Nova Scotia, VRDN (b) | | 10,660,000 | 10,660,000 |
| Univ. of Michigan Rev. Series 2012 A, 3.55% 1/6/23, VRDN (b) | | 6,000,000 | 6,000,000 |
| FHLMC Livonia Econ. Dev. Corp. (Madonna Univ. Proj.) Series 2009, 3.7% 1/6/23, LOC Fed. Home Ln. Bank Chicago, VRDN (b) | | 17,465,000 | 17,465,000 |
TOTAL MICHIGAN | | | 65,070,000 |
| Nebraska - 0.9% | | | |
| Stanton County Indl. Dev. Rev.: | | | |
| (Nucor Corp. Proj.) Series 1996, 4.15% 1/6/23, VRDN (b)(c) | | 500,000 | 500,000 |
| Series 1998, 4.15% 1/6/23, VRDN (b)(c) | | 1,000,000 | 1,000,000 |
TOTAL NEBRASKA | | | 1,500,000 |
| TOTAL VARIABLE RATE DEMAND NOTE (Cost $68,770,000) | | | 68,770,000 |
| | | | |
| Tender Option Bond - 21.4% |
| | | Principal Amount (a) | Value ($) |
| Colorado - 0.5% | | | |
| Colorado Health Facilities Auth. Rev. Bonds Participating VRDN Series 2022 004, 3.81% 2/10/23 (Liquidity Facility Barclays Bank PLC) (b)(d)(e) | | 800,000 | 800,000 |
| Connecticut - 0.2% | | | |
| Connecticut Gen. Oblig. Participating VRDN Series Floaters 016, 3.81% 2/10/23 (Liquidity Facility Barclays Bank PLC) (b)(d)(e) | | 400,000 | 400,000 |
| Florida - 0.3% | | | |
| Miami-Dade County Aviation Rev. Participating VRDN Series 2022 025, 3.84% 2/10/23 (Liquidity Facility Barclays Bank PLC) (b)(c)(d)(e) | | 100,000 | 100,000 |
| Miami-Dade County Wtr. & Swr. Rev. Participating VRDN Series 2021 XF 11 01, 3.72% 1/6/23 (Liquidity Facility Deutsche Bank AG New York Branch) (b)(d)(e) | | 400,000 | 400,000 |
TOTAL FLORIDA | | | 500,000 |
| Maryland - 0.3% | | | |
| Univ. of Maryland Med. Sys., Participating VRDN Series 2022 031, 3.81% 2/10/23 (Liquidity Facility Barclays Bank PLC) (b)(d)(e) | | 500,000 | 500,000 |
| Michigan - 19.8% | | | |
| Detroit Downtown Dev. Auth. Tax Participating VRDN Series Floaters XX 11 01, 3.7% 1/6/23 (Liquidity Facility Barclays Bank PLC) (b)(d)(e) | | 8,000,000 | 8,000,000 |
| Eastern Michigan Univ. Revs. Participating VRDN Series Floater 046, 3.86% 1/6/23 (Liquidity Facility Barclays Bank PLC) (b)(d)(e) | | 1,600,000 | 1,600,000 |
| Grand Rapids San. Swr. Sys. Rev. Participating VRDN Series Floaters XF 26 12, 3.58% 1/6/23 (Liquidity Facility Citibank NA) (b)(d)(e) | | 4,000,000 | 4,000,000 |
| Mclaren Health Care Corp. Participating VRDN Series XL 02 71, 3.76% 1/6/23 (Liquidity Facility Bank of America NA) (b)(d)(e) | | 1,740,000 | 1,740,000 |
| Michigan Bldg. Auth. Rev. Participating VRDN: | | | |
| Series 2021 XF 11 15, 3.72% 1/6/23 (Liquidity Facility Deutsche Bank AG New York Branch) (b)(d)(e) | | 2,285,000 | 2,285,000 |
| Series Floaters XF 26 09, 3.69% 1/6/23 (Liquidity Facility Citibank NA) (b)(d)(e) | | 800,000 | 800,000 |
| Series Floaters XM 04 65, 3.69% 1/6/23 (Liquidity Facility Morgan Stanley Bank, West Valley City Utah) (b)(d)(e) | | 700,000 | 700,000 |
| Series Floaters XM 07 43, 3.37% 1/6/23 (Liquidity Facility Wells Fargo Bank NA) (b)(d)(e) | | 500,000 | 500,000 |
| Michigan Fin. Auth. Rev. Participating VRDN Series XM 04 72, 3.69% 1/6/23 (Liquidity Facility Citibank NA) (b)(d)(e) | | 1,450,000 | 1,450,000 |
| Michigan Hosp. Fin. Auth. Rev. Participating VRDN Series 2022 ZF 14 01, 3.69% 1/6/23 (Liquidity Facility JPMorgan Chase Bank) (b)(d)(e) | | 1,250,000 | 1,250,000 |
| Michigan Hsg. Dev. Auth. Single Family Mtg. Rev. Participating VRDN Series YZ 11 94, 3.69% 1/6/23 (Liquidity Facility Barclays Bank PLC) (b)(d)(e) | | 1,400,000 | 1,400,000 |
| Trenton Pub. Schools School District Participating VRDN Series Floaters CTFS G 102, 3.69% 1/6/23 (Liquidity Facility Royal Bank of Canada) (b)(d)(e) | | 3,100,000 | 3,100,000 |
| Univ. of Michigan Rev. Participating VRDN: | | | |
| Series 15 XF2199, 3.69% 1/6/23 (Liquidity Facility Morgan Stanley Bank, West Valley City Utah) (b)(d)(e) | | 1,900,500 | 1,900,500 |
| Series 15 XF2205, 3.32% 1/6/23 (Liquidity Facility Toronto-Dominion Bank) (b)(d)(e) | | 2,400,000 | 2,400,000 |
| Series Floaters XF 25 48, 3.57% 1/6/23 (Liquidity Facility Toronto-Dominion Bank) (b)(d)(e) | | 500,000 | 500,000 |
TOTAL MICHIGAN | | | 31,625,500 |
| Missouri - 0.2% | | | |
| Kansas City Indl. Dev. Auth. Participating VRDN Series XG 03 96, 3.85% 1/6/23 (Liquidity Facility Deutsche Bank AG New York Branch) (b)(c)(d)(e) | | 300,000 | 300,000 |
| New York - 0.1% | | | |
| New York City Gen. Oblig. Participating VRDN Series 2020 003, 3.81% 2/10/23 (Liquidity Facility Wells Fargo Bank NA) (b)(d)(e) | | 100,000 | 100,000 |
| TOTAL TENDER OPTION BOND (Cost $34,225,500) | | | 34,225,500 |
| | | | |
| Investment Company - 35.7% |
| | | Shares | Value ($) |
Fidelity Municipal Cash Central Fund 3.72% (f)(g) (Cost $57,148,727) | | 57,137,992 | 57,148,727 |
| | | | |
| TOTAL INVESTMENT IN SECURITIES - 100.0% (Cost $160,144,227) | 160,144,227 |
NET OTHER ASSETS (LIABILITIES) - 0.0% | (74,138) |
| NET ASSETS - 100.0% | 160,070,089 |
| | |
Security Type Abbreviations
| VRDN | - | VARIABLE RATE DEMAND NOTE (A debt instrument that is payable upon demand, either daily, weekly or monthly) |
The date shown for securities represents the date when principal payments must be paid, taking into account any call options exercised by the issuer and any permissible maturity shortening features other than interest rate resets.
Legend
| (a) | Amount is stated in United States dollars unless otherwise noted. |
| (b) | Coupon rates for floating and adjustable rate securities reflect the rates in effect at period end. |
| (c) | Private activity obligations whose interest is subject to the federal alternative minimum tax for individuals. |
| (d) | Provides evidence of ownership in one or more underlying municipal bonds. |
| (e) | Coupon rates are determined by re-marketing agents based on current market conditions. |
| (f) | Information in this report regarding holdings by state and security types does not reflect the holdings of the Fidelity Municipal Cash Central Fund. |
| (g) | Affiliated fund that is generally available only to investment companies and other accounts managed by Fidelity Investments. The rate quoted is the annualized seven-day yield of the fund at period end. A complete unaudited listing of the fund's holdings as of its most recent quarter end is available upon request. In addition, each Fidelity Central Fund's financial statements, which are not covered by the Fund's Report of Independent Registered Public Accounting Firm, are available on the SEC's website or upon request. |
Affiliated Central Funds
Fiscal year to date information regarding the Fund's investments in Fidelity Central Funds, including the ownership percentage, is presented below.
| Affiliate | Value, beginning of period ($) | Purchases ($) | Sales Proceeds ($) | Dividend Income ($) | Realized Gain (loss) ($) | Change in Unrealized appreciation (depreciation) ($) | Value, end of period ($) | % ownership, end of period |
| Fidelity Municipal Cash Central Fund 3.72% | 21,013,810 | 108,406,999 | 72,273,000 | 310,218 | 918 | - | 57,148,727 | 2.3% |
| Total | 21,013,810 | 108,406,999 | 72,273,000 | 310,218 | 918 | - | 57,148,727 | |
| | | | | | | | | |
Amounts in the dividend income column in the above table include any capital gain distributions from underlying funds, which are presented in the corresponding line item in the Statement of Operations, if applicable.
Amounts included in the purchases and sales proceeds columns may include in-kind transactions, if applicable.
Investment Valuation
All investments are categorized as Level 2 under the Fair Value Hierarchy. The inputs or methodology used for valuing securities may not be an indication of the risk associated with investing in these securities. For more information on valuation inputs, refer to the Investment Valuation section in the accompanying Notes to Financial Statements.
Fidelity® Michigan Municipal Money Market Fund
| Statement of Assets and Liabilities |
| | | | December 31, 2022 |
| | | | | |
| Assets | | | | |
| Investment in securities, at value - See accompanying schedule: | | | | |
Unaffiliated issuers (cost $102,995,500) | | $102,995,500 | | |
Fidelity Central Funds (cost $57,148,727) | | 57,148,727 | | |
| | | | | |
| Total Investment in Securities (cost $160,144,227) | | | $ | 160,144,227 |
| Interest receivable | | | | 444,732 |
| Distributions receivable from Fidelity Central Funds | | | | 134,304 |
| Prepaid expenses | | | | 75 |
| Receivable from investment adviser for expense reductions | | | | 5,306 |
Total assets | | | | 160,728,644 |
| Liabilities | | | | |
| Payable to custodian bank | | 388,660 | | |
| Payable for fund shares redeemed | | 103,032 | | |
| Distributions payable | | 37,956 | | |
| Accrued management fee | | 46,823 | | |
| Other affiliated payables | | 23,196 | | |
| Other payables and accrued expenses | | 58,888 | | |
| Total Liabilities | | | | 658,555 |
| Net Assets | | | $ | 160,070,089 |
| Net Assets consist of: | | | | |
| Paid in capital | | | $ | 160,084,130 |
| Total accumulated earnings (loss) | | | | (14,041) |
| Net Assets | | | $ | 160,070,089 |
Net Asset Value , offering price and redemption price per share ($160,070,089 ÷ 159,907,745 shares) | | | $ | 1.00 |
| | | | | |
| Statement of Operations |
| | | | Year ended December 31, 2022 |
| Investment Income | | | | |
| Interest | | | $ | 1,830,550 |
| Income from Fidelity Central Funds | | | | 309,871 |
| Total Income | | | | 2,140,421 |
| Expenses | | | | |
| Management fee | $ | 637,868 | | |
| Transfer agent fees | | 288,329 | | |
| Accounting fees and expenses | | 28,604 | | |
| Custodian fees and expenses | | 2,315 | | |
| Independent trustees' fees and expenses | | 599 | | |
| Registration fees | | 18,050 | | |
| Audit | | 40,131 | | |
| Legal | | 10,667 | | |
| Miscellaneous | | 27,152 | | |
| Total expenses before reductions | | 1,053,715 | | |
| Expense reductions | | (192,036) | | |
| Total expenses after reductions | | | | 861,679 |
| Net Investment income (loss) | | | | 1,278,742 |
| Realized and Unrealized Gain (Loss) | | | | |
| Net realized gain (loss) on: | | | | |
| Investment Securities: | | | | |
| Unaffiliated issuers | | (13,562) | | |
| Fidelity Central Funds | | 918 | | |
| Capital gain distributions from Fidelity Central Funds | | 347 | | |
| Total net realized gain (loss) | | | | (12,297) |
| Net increase in net assets resulting from operations | | | $ | 1,266,445 |
| Statement of Changes in Net Assets |
| |
| | Year ended December 31, 2022 | | Year ended December 31, 2021 |
| Increase (Decrease) in Net Assets | | | | |
| Operations | | | | |
| Net investment income (loss) | $ | 1,278,742 | $ | 21,052 |
| Net realized gain (loss) | | (12,297) | | 23,323 |
Net increase in net assets resulting from operations | | 1,266,445 | | 44,375 |
| Distributions to shareholders | | (1,402,551) | | (105,307) |
| Share transactions | | | | |
| Proceeds from sales of shares | | 12,675,176 | | 25,122,420 |
| Reinvestment of distributions | | 1,248,480 | | 99,870 |
| Cost of shares redeemed | | (55,069,884) | | (38,896,191) |
Net increase (decrease) in net assets and shares resulting from share transactions | | (41,146,228) | | (13,673,901) |
| Total increase (decrease) in net assets | | (41,282,334) | | (13,734,833) |
| | | | | |
| Net Assets | | | | |
| Beginning of period | | 201,352,423 | | 215,087,256 |
| End of period | $ | 160,070,089 | $ | 201,352,423 |
| | | | | |
| Other Information | | | | |
| Shares | | | | |
| Sold | | 12,675,177 | | 25,122,420 |
| Issued in reinvestment of distributions | | 1,248,480 | | 99,870 |
| Redeemed | | (55,069,885) | | (38,896,191) |
| Net increase (decrease) | | (41,146,228) | | (13,673,901) |
| | | | | |
Financial Highlights
| Fidelity® Michigan Municipal Money Market Fund |
| |
| Years ended December 31, | | 2022 | | 2021 | | 2020 | | 2019 | | 2018 |
Selected Per-Share Data | | | | | | | | | | |
| Net asset value, beginning of period | $ | 1.00 | $ | 1.00 | $ | 1.00 | $ | 1.00 | $ | 1.00 |
| Income from Investment Operations | | | | | | | | | | |
Net investment income (loss) A | | .008 | | - B | | .003 | | .010 | | .009 |
| Net realized and unrealized gain (loss) | | - B | | - B | | - B | | - B | | .001 |
| Total from investment operations | | .008 | | - B | | .003 | | .010 | | .010 |
| Distributions from net investment income | | (.008) | | - B | | (.003) | | (.010) | | (.009) |
| Distributions from net realized gain | | (.001) | | - B | | - B | | - B | | (.001) |
| Total distributions | | (.008) C | | - B | | (.003) | | (.010) | | (.010) |
| Net asset value, end of period | $ | 1.00 | $ | 1.00 | $ | 1.00 | $ | 1.00 | $ | 1.00 |
Total Return D | | .83% | | .05% | | .34% | | .98% | | 1.01% |
Ratios to Average Net Assets A,E,F | | | | | | | | | | |
| Expenses before reductions | | .57% | | .55% | | .55% | | .55% | | .55% |
| Expenses net of fee waivers, if any | | .47% | | .09% | | .32% | | .55% | | .55% |
| Expenses net of all reductions | | .47% | | .09% | | .32% | | .55% | | .55% |
| Net investment income (loss) | | .70% | | .01% | | .34% | | .98% | | .90% |
| Supplemental Data | | | | | | | | | | |
| Net assets, end of period (000 omitted) | $ | 160,070 | $ | 201,352 | $ | 215,087 | $ | 253,138 | $ | 310,652 |
A Net investment income (loss) is affected by the timing of the declaration of dividends by any underlying mutual funds or exchange-traded funds (ETFs). Net investment income (loss) of any mutual funds or ETFs is not included in the Fund's net investment income (loss) ratio.
B Amount represents less than $.0005 per share.
C Total distributions per share do not sum due to rounding.
D Total returns would have been lower if certain expenses had not been reduced during the applicable periods shown.
E Fees and expenses of any underlying mutual funds or exchange-traded funds (ETFs) are not included in the Fund's expense ratio. The Fund indirectly bears its proportionate share of these expenses. For additional expense information related to investments in Fidelity Central Funds, please refer to the "Investments in Fidelity Central Funds" note found in the Notes to Financial Statements section of the most recent Annual or Semi-Annual report.
F Expense ratios reflect operating expenses of the class. Expenses before reductions do not reflect amounts reimbursed, waived, or reduced through arrangements with the investment adviser, brokerage services, or other offset arrangements, if applicable, and do not represent the amount paid by the class during periods when reimbursements, waivers or reductions occur.
For the period ended December 31, 2022
1. Organization.
Fidelity Michigan Municipal Income Fund (the Income Fund) is a fund of Fidelity Municipal Trust. Fidelity Michigan Municipal Money Market Fund (the Money Market Fund) is a fund of Fidelity Municipal Trust II. Each Trust is registered under the Investment Company Act of 1940, as amended (the 1940 Act), as an open-end management investment company. Fidelity Municipal Trust and Fidelity Municipal Trust II (the Trusts) are organized as a Massachusetts business trust and a Delaware statutory trust, respectively. The Income Fund is a non-diversified fund. Each Fund is authorized to issue an unlimited number of shares. Shares of the Money Market Fund are only available for purchase by retail shareholders. Share transactions on the Statement of Changes in Net Assets may contain exchanges between affiliated funds. Each Fund may be affected by economic and political developments in the state of Michigan.
2. Investments in Fidelity Central Funds.
Funds may invest in Fidelity Central Funds, which are open-end investment companies generally available only to other investment companies and accounts managed by the investment adviser and its affiliates. The Schedule of Investments lists any Fidelity Central Funds held as an investment as of period end, but does not include the underlying holdings of each Fidelity Central Fund. An investing fund indirectly bears its proportionate share of the expenses of the underlying Fidelity Central Funds.
Based on its investment objective, each Fidelity Central Fund may invest or participate in various investment vehicles or strategies that are similar to those of the investing fund. These strategies are consistent with the investment objectives of the investing fund and may involve certain economic risks which may cause a decline in value of each of the Fidelity Central Funds and thus a decline in the value of the investing fund.
| Fidelity Central Fund | Investment Manager | Investment Objective | Investment Practices | Expense Ratio A |
| Fidelity Money Market Central Funds | Fidelity Management & Research Company LLC (FMR) | Each fund seeks to obtain a high level of current income consistent with the preservation of capital and liquidity. | Short-term Investments | Less than .005% |
A Expenses expressed as a percentage of average net assets and are as of each underlying Central Fund's most recent annual or semi-annual shareholder report.
A complete unaudited list of holdings for each Fidelity Central Fund is available upon request or at the Securities and Exchange Commission website at www.sec.gov. In addition, the financial statements of the Fidelity Central Funds which contain the significant accounting policies (including investment valuation policies) of those funds, and are not covered by the Report of Independent Registered Public Accounting Firm, are available on the Securities and Exchange Commission website or upon request.
3. Significant Accounting Policies.
Each Fund is an investment company and applies the accounting and reporting guidance of the Financial Accounting Standards Board (FASB) Accounting Standards Codification Topic 946 Financial Services - Investment Companies . The financial statements have been prepared in conformity with accounting principles generally accepted in the United States of America (GAAP), which require management to make certain estimates and assumptions at the date of the financial statements. Actual results could differ from those estimates. Subsequent events, if any, through the date that the financial statements were issued have been evaluated in the preparation of the financial statements. Each Fund's Schedule of Investments lists any underlying mutual funds or exchange-traded funds (ETFs) but does not include the underlying holdings of these funds. The following summarizes the significant accounting policies of each Fund:
Investment Valuation. Investments are valued as of 4:00 p.m. Eastern time on the last calendar day of the period. The Board of Trustees (the Board) has designated the Income Fund's investment adviser as the valuation designee responsible for the fair valuation function and performing fair value determinations as needed. The investment adviser has established a Fair Value Committee (the Committee) to carry out the day-to-day fair valuation responsibilities and has adopted policies and procedures to govern the fair valuation process and the activities of the Committee. In accordance with these fair valuation policies and procedures, which have been approved by the Board, the Income Fund attempts to obtain prices from one or more third party pricing services or brokers to value its investments. When current market prices, quotations or currency exchange rates are not readily available or reliable, investments will be fair valued in good faith by the Committee, in accordance with the policies and procedures. Factors used in determining fair value vary by investment type and may include market or investment specific events, transaction data, estimated cash flows, and market observations of comparable investments. The frequency that the fair valuation procedures are used cannot be predicted and they may be utilized to a significant extent. The Committee manages the Income Fund's fair valuation practices and maintains the fair valuation policies and procedures. The Income Fund's investment adviser reports to the Board information regarding the fair valuation process and related material matters.
Each Fund categorizes the inputs to valuation techniques used to value its investments into a disclosure hierarchy consisting of three levels as shown below:
Level 1 - unadjusted quoted prices in active markets for identical investments
Level 2 - other significant observable inputs (including quoted prices for similar investments, interest rates, prepayment speeds, etc.)
Level 3 - unobservable inputs (including the Fund's own assumptions based on the best information available)
Valuation techniques used to value each Fund's investments by major category are as follows:
For the Income Fund, debt securities, including restricted securities, are valued based on evaluated prices received from third party pricing services or from brokers who make markets in such securities. Municipal securities are valued by pricing services who utilize matrix pricing which considers yield or price of bonds of comparable quality, coupon, maturity and type or by broker-supplied prices. When independent prices are unavailable or unreliable, debt securities may be valued utilizing pricing methodologies which consider similar factors that would be used by third party pricing services. Debt securities are generally categorized as Level 2 in the hierarchy but may be Level 3 depending on the circumstances.
For the Money Market Fund, as permitted by compliance with certain conditions under Rule 2a-7 of the 1940 Act, securities are valued at amortized cost, which approximates fair value. The amortized cost of an instrument is determined by valuing it at its original cost and thereafter amortizing any discount or premium from its face value at a constant rate until maturity. Securities held by a money market fund are generally high quality and liquid; however, they are reflected as Level 2 because the inputs used to determine fair value are not quoted prices in an active market.
For the Income Fund, changes in valuation techniques may result in transfers in or out of an assigned level within the disclosure hierarchy. The aggregate value of investments by input level as of December 31, 2022 is included at the end of the Fund's Schedule of Investments.
Investment Transactions and Income. For financial reporting purposes, the Funds' investment holdings and NAV include trades executed through the end of the last business day of the period. The NAV per share for processing shareholder transactions is calculated as of the close of business of the New York Stock Exchange (NYSE), normally 4:00 p.m. Eastern time and includes trades executed through the end of the prior business day for the Income Fund and trades executed through the end of the current business day for the Money Market Fund. Gains and losses on securities sold are determined on the basis of identified cost. Income and capital gain distributions from Fidelity Central Funds, if any, are recorded on the ex-dividend date. Interest income is accrued as earned and includes coupon interest and amortization of premium and accretion of discount on debt securities as applicable.
Expenses. Expenses directly attributable to a fund are charged to that fund. Expenses attributable to more than one fund are allocated among the respective funds on the basis of relative net assets or other appropriate methods. Expenses included in the accompanying financial statements reflect the expenses of that fund and do not include any expenses associated with any underlying mutual funds or exchange-traded funds. Although not included in a fund's expenses, a fund indirectly bears its proportionate share of these expenses through the net asset value of each underlying mutual fund or exchange-traded fund. Expense estimates are accrued in the period to which they relate and adjustments are made when actual amounts are known.
Income Tax Information and Distributions to Shareholders. Each year, each Fund intends to qualify as a regulated investment company under Subchapter M of the Internal Revenue Code, including distributing substantially all of its taxable income and realized gains. As a result, no provision for U.S. Federal income taxes is required. As of December 31, 2022, each Fund did not have any unrecognized tax benefits in the financial statements; nor is each Fund aware of any tax positions for which it is reasonably possible that the total amounts of unrecognized tax benefits will significantly change in the next twelve months. Each Fund files a U.S. federal tax return, in addition to state and local tax returns as required. Each Fund's federal income tax returns are subject to examination by the Internal Revenue Service (IRS) for a period of three fiscal years after they are filed. State and local tax returns may be subject to examination for an additional fiscal year depending on the jurisdiction.
Distributions are declared and recorded daily and paid monthly from net investment income. Distributions from realized gains, if any, are declared and recorded on the ex-dividend date. Income and capital gain distributions are determined in accordance with income tax regulations, which may differ from GAAP.
Capital accounts within the financial statements are adjusted for permanent book-tax differences. These adjustments have no impact on net assets or the results of operations. Capital accounts are not adjusted for temporary book-tax differences which will reverse in a subsequent period.
Book-tax differences are primarily due to the short-term gain distributions from the Fidelity Central Funds, market discount and capital loss carryforwards.
The Funds purchase municipal securities whose interest, in the opinion of the issuer, is free from federal income tax. There is no assurance that the IRS will agree with this opinion. In the event the IRS determines that the issuer does not comply with relevant tax requirements, interest payments from a security could become federally taxable, possibly retroactively to the date the security was issued.
As of period end, the cost and unrealized appreciation (depreciation) in securities, and derivatives if applicable, for federal income tax purposes were as follows for each Fund:
| | Tax cost | Gross unrealized appreciation | Gross unrealized depreciation | Net unrealized appreciation (depreciation) |
Fidelity Michigan Municipal Income Fund | $529,193,793 | $1,228,432 | $(36,830,290) | $(35,601,858) |
Fidelity Michigan Municipal Money Market Fund | 160,144,227 | - | - | - |
The tax-based components of distributable earnings as of period end were as follows for each Fund:
| | Capital loss carryforward | Net unrealized appreciation (depreciation) on securities and other investments |
Fidelity Michigan Municipal Income Fund | $(3,890,904) | $(35,601,858) |
Fidelity Michigan Municipal Money Market Fund | (12,297) | - |
Capital loss carryforwards are only available to offset future capital gains of the Funds to the extent provided by regulations and may be limited. The capital loss carryforward information presented below, including any applicable limitation, is estimated as of fiscal period end and is subject to adjustment.
| | Short-term | Long-term | Total capital loss carryforward |
Fidelity Michigan Municipal Income Fund | $(645,766) | $(3,245,138) | $(3,890,904) |
Fidelity Michigan Municipal Money Market Fund | (12,297) | - | (12,297) |
The tax character of distributions paid was as follows:
| December 31, 2022 | | | | |
| | Tax-Exempt Income | Ordinary Income | Long-term Capital Gains | Total |
Fidelity Michigan Municipal Income Fund | $13,373,131 | $- | $739,699 | $14,112,830 |
Fidelity Michigan Municipal Money Market Fund | 1,278,768 | 123,783 | - | 1,402,551 |
| December 31, 2021 | | | |
| | Tax-Exempt Income | Long-term Capital Gains | Total |
Fidelity Michigan Municipal Income Fund | $15,137,601 | $3,461,919 | $18,599,520 |
Fidelity Michigan Municipal Money Market Fund | 20,999 | 84,308 | 105,307 |
4. Purchases and Sales of Investments.
Purchases and sales of securities, other than short-term securities and in-kind transactions, as applicable, are noted in the table below.
| | Purchases ($) | Sales ($) |
| Fidelity Michigan Municipal Income Fund | 43,409,588 | 196,999,386 |
5. Fees and Other Transactions with Affiliates.
Management Fee. Fidelity Management & Research Company LLC (the investment adviser) and its affiliates provide the Funds with investment management related services for which the Funds pay a monthly management fee. The management fee is the sum of an individual fund fee rate and an annualized group fee rate. The individual fund fee rate is applied to each Fund's average net assets. The group fee rate is based upon the monthly average net assets of a group of registered investment companies with which the investment adviser has management contracts. The group fee rate decreases as assets under management increase and increases as assets under management decrease. For the reporting period, each Fund's annual management fee rate expressed as a percentage of each Fund's average net assets was as follows:
| | Individual Rate | Group Rate | Total |
| Fidelity Michigan Municipal Income Fund | .25% | .10% | .35% |
| Fidelity Michigan Municipal Money Market Fund | .25% | .10% | .35% |
Transfer Agent Fees. Fidelity Investments Institutional Operations Company LLC (FIIOC), an affiliate of the investment adviser, is the transfer, dividend disbursing and shareholder servicing agent for the Funds. FIIOC receives account fees and asset-based fees that vary according to account size and type of account. FIIOC pays for typesetting, printing and mailing of shareholder reports, except proxy statements. For the period, the transfer agent fees were equivalent to the following annual rates expressed as a percentage of average net assets:
| Fidelity Michigan Municipal Income Fund | .10% |
| Fidelity Michigan Municipal Money Market Fund | .16% |
Accounting Fees. Fidelity Service Company, Inc. (FSC), an affiliate of the investment adviser, maintains each Fund's accounting records. The accounting fee is based on the level of average net assets for each month. For the period, the fees were equivalent to the following annual rates:
| | % of Average Net Assets |
| Fidelity Michigan Municipal Income Fund | .02 |
| Fidelity Michigan Municipal Money Market Fund | .02 |
Interfund Trades. Funds may purchase from or sell securities to other Fidelity Funds under procedures adopted by the Board. The procedures have been designed to ensure these interfund trades are executed in accordance with Rule 17a-7 of the 1940 Act. For the Income Fund, any interfund trades are included within the respective purchases and sales amounts shown in the Purchases and Sales of Investments note. Interfund trades during the period are noted in the table below.
| | Purchases ($) | Sales ($) | Realized Gain (Loss) ($) |
| Fidelity Michigan Municipal Income Fund | - | 17,650,000 | - |
| Fidelity Michigan Municipal Money Market Fund | 3,420,000 | 19,555,000 | - |
6. Committed Line of Credit.
Certain Funds participate with other funds managed by the investment adviser or an affiliate in a $4.25 billion credit facility (the "line of credit") to be utilized for temporary or emergency purposes to fund shareholder redemptions or for other short-term liquidity purposes. The participating funds have agreed to pay commitment fees on their pro-rata portion of the line of credit, which are reflected in Miscellaneous expenses on the Statement of Operations, and are listed below. During the period, there were no borrowings on this line of credit.
| | Amount |
| Fidelity Michigan Municipal Income Fund | $1,100 |
7. Expense Reductions.
The investment adviser voluntarily agreed to reimburse expenses of Michigan Municipal Money Market Fund to the extent annual operating expenses exceeded certain levels of average net assets as noted in the table below. Some expenses, for example the compensation of the independent Trustees, and certain miscellaneous expenses such as proxy and shareholder meeting expenses, are excluded from this reimbursement.
Michigan Municipal Money Market Fund was in reimbursement during the period:
| | Expense Limitations | Reimbursement |
| Fidelity Michigan Municipal Money Market Fund | .55% | $18,586 |
Additionally, the investment adviser or its affiliates voluntarily agreed to waive certain fees for the Money Market Fund in order to avoid a negative yield. Such arrangements may be discontinued by the investment adviser at any time. For the period, the amount of the waiver was $170,048.
Through arrangements with each applicable Fund's custodian, credits realized as a result of certain uninvested cash balances were used to reduce each applicable Fund's expenses. All of the applicable expense reductions are noted in the table below.
| | Custodian credits |
Fidelity Michigan Municipal Income Fund | $7,412 |
Fidelity Michigan Municipal Money Market Fund | 73 |
In addition, during the period the investment adviser or an affiliate reimbursed and/or waived a portion of operating expenses as follows:
| | Amount |
| Fidelity Michigan Municipal Income Fund | $11,074 |
| Fidelity Michigan Municipal Money Market Fund | 3,329 |
8. Other.
A fund's organizational documents provide former and current trustees and officers with a limited indemnification against liabilities arising in connection with the performance of their duties to the fund. In the normal course of business, a fund may also enter into contracts that provide general indemnifications. A fund's maximum exposure under these arrangements is unknown as this would be dependent on future claims that may be made against a fund. The risk of material loss from such claims is considered remote.
In July 2022, the Board of Trustees approved a Plan of Liquidation and Dissolution for Fidelity Michigan Municipal Money Market Fund. The Fund distributed all of its net assets to its shareholders on January 13, 2023. The Fund was closed to new accounts on December 1, 2022.
9. Risk and Uncertainties.
Many factors affect a fund's performance. Developments that disrupt global economies and financial markets, such as pandemics, epidemics, outbreaks of infectious diseases, war, terrorism, and environmental disasters, may significantly affect a fund's investment performance. The effects of these developments to a fund will be impacted by the types of securities in which a fund invests, the financial condition, industry, economic sector, and geographic location of an issuer, and a fund's level of investment in the securities of that issuer.
To the Board of Trustees of Fidelity Municipal Trust and Fidelity Municipal Trust II and Shareholders of Fidelity Michigan Municipal Income Fund and Fidelity Michigan Municipal Money Market Fund
Opinions on the Financial Statements
We have audited the accompanying statements of assets and liabilities, including the schedules of investments, of Fidelity Michigan Municipal Income Fund (one of the funds constituting Fidelity Municipal Trust) and Fidelity Michigan Municipal Money Market Fund (one of the funds constituting Fidelity Municipal Trust II) (hereafter collectively referred to as the "Funds") as of December 31, 2022, the related statements of operations for the year ended December 31, 2022, the statements of changes in net assets for each of the two years in the period ended December 31, 2022, including the related notes, and the financial highlights for each of the five years in the period ended December 31, 2022 (collectively referred to as the "financial statements"). In our opinion, the financial statements present fairly, in all material respects, the financial position of each of the Funds as of December 31, 2022, the results of each of their operations for the year then ended, the changes in each of their net assets for each of the two years in the period ended December 31, 2022 and each of the financial highlights for each of the five years in the period ended December 31, 2022 in conformity with accounting principles generally accepted in the United States of America.
Basis for Opinions
These financial statements are the responsibility of the Funds' management. Our responsibility is to express an opinion on the Funds' financial statements based on our audits. We are a public accounting firm registered with the Public Company Accounting Oversight Board (United States) (PCAOB) and are required to be independent with respect to the Funds in accordance with the U.S. federal securities laws and the applicable rules and regulations of the Securities and Exchange Commission and the PCAOB.
We conducted our audits of these financial statements in accordance with the standards of the PCAOB. Those standards require that we plan and perform the audit to obtain reasonable assurance about whether the financial statements are free of material misstatement, whether due to error or fraud.
Our audits included performing procedures to assess the risks of material misstatement of the financial statements, whether due to error or fraud, and performing procedures that respond to those risks. Such procedures included examining, on a test basis, evidence regarding the amounts and disclosures in the financial statements. Our audits also included evaluating the accounting principles used and significant estimates made by management, as well as evaluating the overall presentation of the financial statements. Our procedures included confirmation of securities owned as of December 31, 2022 by correspondence with the custodian. We believe that our audits provide a reasonable basis for our opinions.
/s/ PricewaterhouseCoopers LLP
Boston, Massachusetts
February 10, 2023
We have served as the auditor of one or more investment companies in the Fidelity group of funds since 1932.
The Trustees, Members of the Advisory Board (if any), and officers of the trusts and funds, as applicable, are listed below. The Board of Trustees governs each fund and is responsible for protecting the interests of shareholders. The Trustees are experienced executives who meet periodically throughout the year to oversee each fund's activities, review contractual arrangements with companies that provide services to each fund, oversee management of the risks associated with such activities and contractual arrangements, and review each fund's performance. Each of the Trustees oversees 295 funds.
The Trustees hold office without limit in time except that (a) any Trustee may resign; (b) any Trustee may be removed by written instrument, signed by at least two-thirds of the number of Trustees prior to such removal; (c) any Trustee who requests to be retired or who has become incapacitated by illness or injury may be retired by written instrument signed by a majority of the other Trustees; and (d) any Trustee may be removed at any special meeting of shareholders by a two-thirds vote of the outstanding voting securities of the trust. Each Trustee who is not an interested person (as defined in the 1940 Act) of the trust and the funds is referred to herein as an Independent Trustee. Each Independent Trustee shall retire not later than the last day of the calendar year in which his or her 75th birthday occurs. The Independent Trustees may waive this mandatory retirement age policy with respect to individual Trustees. Officers and Advisory Board Members hold office without limit in time, except that any officer or Advisory Board Member may resign or may be removed by a vote of a majority of the Trustees at any regular meeting or any special meeting of the Trustees. Except as indicated, each individual has held the office shown or other offices in the same company for the past five years.
The funds' Statement of Additional Information (SAI) includes more information about the Trustees. To request a free copy, call Fidelity at 1-800-544-8544.
Experience, Skills, Attributes, and Qualifications of the Trustees. The Governance and Nominating Committee has adopted a statement of policy that describes the experience, qualifications, attributes, and skills that are necessary and desirable for potential Independent Trustee candidates (Statement of Policy). The Board believes that each Trustee satisfied at the time he or she was initially elected or appointed a Trustee, and continues to satisfy, the standards contemplated by the Statement of Policy. The Governance and Nominating Committee also engages professional search firms to help identify potential Independent Trustee candidates who have the experience, qualifications, attributes, and skills consistent with the Statement of Policy. From time to time, additional criteria based on the composition and skills of the current Independent Trustees, as well as experience or skills that may be appropriate in light of future changes to board composition, business conditions, and regulatory or other developments, have also been considered by the professional search firms and the Governance and Nominating Committee. In addition, the Board takes into account the Trustees' commitment and participation in Board and committee meetings, as well as their leadership of standing and ad hoc committees throughout their tenure.
In determining that a particular Trustee was and continues to be qualified to serve as a Trustee, the Board has considered a variety of criteria, none of which, in isolation, was controlling. The Board believes that, collectively, the Trustees have balanced and diverse experience, qualifications, attributes, and skills, which allow the Board to operate effectively in governing each fund and protecting the interests of shareholders. Information about the specific experience, skills, attributes, and qualifications of each Trustee, which in each case led to the Board's conclusion that the Trustee should serve (or continue to serve) as a trustee of the funds, is provided below.
Board Structure and Oversight Function. Abigail P. Johnson is an interested person and currently serves as Chairman. The Trustees have determined that an interested Chairman is appropriate and benefits shareholders because an interested Chairman has a personal and professional stake in the quality and continuity of services provided to the funds. Independent Trustees exercise their informed business judgment to appoint an individual of their choosing to serve as Chairman, regardless of whether the Trustee happens to be independent or a member of management. The Independent Trustees have determined that they can act independently and effectively without having an Independent Trustee serve as Chairman and that a key structural component for assuring that they are in a position to do so is for the Independent Trustees to constitute a substantial majority for the Board. The Independent Trustees also regularly meet in executive session. Michael E. Kenneally serves as Chairman of the Independent Trustees and as such (i) acts as a liaison between the Independent Trustees and management with respect to matters important to the Independent Trustees and (ii) with management prepares agendas for Board meetings.
Fidelity ® funds are overseen by different Boards of Trustees. The funds' Board oversees Fidelity's investment-grade bond, money market, asset allocation and certain equity funds, and other Boards oversee Fidelity's high income and other equity funds. The asset allocation funds may invest in Fidelity ® funds that are overseen by such other Boards. The use of separate Boards, each with its own committee structure, allows the Trustees of each group of Fidelity ® funds to focus on the unique issues of the funds they oversee, including common research, investment, and operational issues. On occasion, the separate Boards establish joint committees to address issues of overlapping consequences for the Fidelity ® funds overseen by each Board.
The Trustees operate using a system of committees to facilitate the timely and efficient consideration of all matters of importance to the Trustees, each fund, and fund shareholders and to facilitate compliance with legal and regulatory requirements and oversight of the funds' activities and associated risks. The Board, acting through its committees, has charged FMR and its affiliates with (i) identifying events or circumstances the occurrence of which could have demonstrably adverse effects on the funds' business and/or reputation; (ii) implementing processes and controls to lessen the possibility that such events or circumstances occur or to mitigate the effects of such events or circumstances if they do occur; and (iii) creating and maintaining a system designed to evaluate continuously business and market conditions in order to facilitate the identification and implementation processes described in (i) and (ii) above. Because the day-to-day operations and activities of the funds are carried out by or through FMR, its affiliates, and other service providers, the funds' exposure to risks is mitigated but not eliminated by the processes overseen by the Trustees. While each of the Board's committees has responsibility for overseeing different aspects of the funds' activities, oversight is exercised primarily through the Operations and Audit Committees. In addition, an ad hoc Board committee of Independent Trustees has worked with FMR to enhance the Board's oversight of investment and financial risks, legal and regulatory risks, technology risks, and operational risks, including the development of additional risk reporting to the Board. The Operations Committee also worked and continues to work with FMR to enhance the stress tests required under SEC regulations for money market funds. Appropriate personnel, including but not limited to the funds' Chief Compliance Officer (CCO), FMR's internal auditor, the independent accountants, the funds' Treasurer and portfolio management personnel, make periodic reports to the Board's committees, as appropriate, including an annual review of Fidelity's risk management program for the Fidelity ® funds. The responsibilities of each standing committee, including their oversight responsibilities, are described further under "Standing Committees of the Trustees."
Interested Trustees*:
Correspondence intended for a Trustee who is an interested person may be sent to Fidelity Investments, 245 Summer Street, Boston, Massachusetts 02210.
Name, Year of Birth; Principal Occupations and Other Relevant Experience+
Abigail P. Johnson (1961)
Year of Election or Appointment: 2009
Trustee
Chairman of the Board of Trustees
Ms. Johnson also serves as Trustee of other Fidelity ® funds. Ms. Johnson serves as Chairman (2016-present), Chief Executive Officer (2014-present), and Director (2007-present) of FMR LLC (diversified financial services company), President of Fidelity Financial Services (2012-present) and President of Personal, Workplace and Institutional Services (2005-present). Ms. Johnson is Chairman and Director of Fidelity Management & Research Company LLC (investment adviser firm, 2011-present). Previously, Ms. Johnson served as Chairman and Director of FMR Co., Inc. (investment adviser firm, 2011-2019), Vice Chairman (2007-2016) and President (2013-2016) of FMR LLC, President and a Director of Fidelity Management & Research Company (2001-2005), a Trustee of other investment companies advised by Fidelity Management & Research Company, Fidelity Investments Money Management, Inc. (investment adviser firm), and FMR Co., Inc. (2001-2005), Senior Vice President of the Fidelity ® funds (2001-2005), and managed a number of Fidelity ® funds. Ms. Abigail P. Johnson and Mr. Arthur E. Johnson are not related.
Jennifer Toolin McAuliffe (1959)
Year of Election or Appointment: 2016
Trustee
Ms. McAuliffe also serves as Trustee of other Fidelity ® funds and as Trustee of Fidelity Charitable (2020-present). Previously, Ms. McAuliffe served as Co-Head of Fixed Income of Fidelity Investments Limited (now known as FIL Limited (FIL)) (diversified financial services company), Director of Research for FIL's credit and quantitative teams in London, Hong Kong and Tokyo and Director of Research for taxable and municipal bonds at Fidelity Investments Money Management, Inc. Ms. McAuliffe previously served as a member of the Advisory Board of certain Fidelity ® funds (2016). Ms. McAuliffe was previously a lawyer at Ropes & Gray LLP and currently serves as director or trustee of several not-for-profit entities.
* Determined to be an "Interested Trustee" by virtue of, among other things, his or her affiliation with the trusts or various entities under common control with FMR.
+ The information includes the Trustee's principal occupation during the last five years and other information relating to the experience, attributes, and skills relevant to the Trustee's qualifications to serve as a Trustee, which led to the conclusion that the Trustee should serve as a Trustee for each fund.
Independent Trustees:
Correspondence intended for an Independent Trustee may be sent to Fidelity Investments, P.O. Box 55235, Boston, Massachusetts 02205-5235.
Name, Year of Birth; Principal Occupations and Other Relevant Experience+
Elizabeth S. Acton (1951)
Year of Election or Appointment: 2013
Trustee
Ms. Acton also serves as Trustee of other Fidelity ® funds. Prior to her retirement, Ms. Acton served as Executive Vice President, Finance (2011-2012), Executive Vice President, Chief Financial Officer (2002-2011) and Treasurer (2004-2005) of Comerica Incorporated (financial services). Prior to joining Comerica, Ms. Acton held a variety of positions at Ford Motor Company (1983-2002), including Vice President and Treasurer (2000-2002) and Executive Vice President and Chief Financial Officer of Ford Motor Credit Company (1998-2000). Ms. Acton currently serves as a member of the Board and Audit and Finance Committees of Beazer Homes USA, Inc. (homebuilding, 2012-present). Ms. Acton previously served as a member of the Advisory Board of certain Fidelity ® funds (2013-2016).
Ann E. Dunwoody (1953)
Year of Election or Appointment: 2018
Trustee
General Dunwoody also serves as Trustee of other Fidelity ® funds. General Dunwoody (United States Army, Retired) was the first woman in U.S. military history to achieve the rank of four-star general and prior to her retirement in 2012 held a variety of positions within the U.S. Army, including Commanding General, U.S. Army Material Command (2008-2012). General Dunwoody currently serves as President of First to Four LLC (leadership and mentoring services, 2012-present), a member of the Board and Nomination and Corporate Governance Committees of Kforce Inc. (professional staffing services, 2016-present) and a member of the Board of Automattic Inc. (software engineering, 2018-present). Previously, General Dunwoody served as a member of the Advisory Board and Nominating and Corporate Governance Committee of L3 Technologies, Inc. (communication, electronic, sensor and aerospace systems, 2013-2019) and a member of the Board and Audit and Sustainability and Corporate Responsibility Committees of Republic Services, Inc. (waste collection, disposal and recycling, 2013-2016). Ms. Dunwoody also serves on several boards for non-profit organizations, including as a member of the Board, Chair of the Nomination and Governance Committee and a member of the Audit Committee of Logistics Management Institute (consulting non-profit, 2012-present), a member of the Council of Trustees for the Association of the United States Army (advocacy non-profit, 2013-present), a member of the Board of Florida Institute of Technology (2015-present) and a member of the Board of ThanksUSA (military family education non-profit, 2014-present). General Dunwoody previously served as a member of the Advisory Board of certain Fidelity ® funds (2018).
John Engler (1948)
Year of Election or Appointment: 2014
Trustee
Mr. Engler also serves as Trustee of other Fidelity ® funds. Previously, Mr. Engler served as Governor of Michigan (1991-2003), President of the Business Roundtable (2011-2017) and interim President of Michigan State University (2018-2019). Mr. Engler currently serves as a member of the Board of Stride, Inc. (formerly K12 Inc.) (technology-based education company, 2012-present). Previously, Mr. Engler served as a member of the Board of Universal Forest Products (manufacturer and distributor of wood and wood-alternative products, 2003-2019) and Trustee of The Munder Funds (2003-2014). Mr. Engler previously served as a member of the Advisory Board of certain Fidelity ® funds (2014-2016).
Robert F. Gartland (1951)
Year of Election or Appointment: 2010
Trustee
Mr. Gartland also serves as Trustee of other Fidelity ® funds. Prior to his retirement, Mr. Gartland held a variety of positions at Morgan Stanley (financial services, 1979-2007), including Managing Director (1987-2007) and Chase Manhattan Bank (1975-1978). Mr. Gartland previously served as Chairman and an investor in Gartland & Mellina Group Corp. (consulting, 2009-2019), as a member of the Board of National Securities Clearing Corporation (1993-1996) and as Chairman of TradeWeb (2003-2004).
Arthur E. Johnson (1947)
Year of Election or Appointment: 2008
Trustee
Mr. Johnson also serves as Trustee of other Fidelity ® funds. Prior to his retirement, Mr. Johnson served as Senior Vice President of Corporate Strategic Development of Lockheed Martin Corporation (defense contractor, 1999-2009). Mr. Johnson currently serves as a member of the Board of Booz Allen Hamilton (management consulting, 2011-present). Mr. Johnson previously served as a member of the Board of Eaton Corporation plc (diversified power management, 2009-2019) and a member of the Board of AGL Resources, Inc. (holding company, 2002-2016). Mr. Johnson previously served as Chairman (2018-2021) and Vice Chairman (2015-2018) of the Independent Trustees of certain Fidelity® funds. Mr. Arthur E. Johnson is not related to Ms. Abigail P. Johnson.
Michael E. Kenneally (1954)
Year of Election or Appointment: 2009
Trustee
Chairman of the Independent Trustees
Mr. Kenneally also serves as Trustee of other Fidelity ® funds and was Vice Chairman (2018-2021) of the Independent Trustees of certain Fidelity ® funds. Prior to retirement in 2005, he was Chairman and Global Chief Executive Officer of Credit Suisse Asset Management, the worldwide fund management and institutional investment business of Credit Suisse Group. Previously, Mr. Kenneally was an Executive Vice President and the Chief Investment Officer for Bank of America. In this role, he was responsible for the investment management, strategy and products delivered to the bank's institutional, high-net-worth and retail clients. Earlier, Mr. Kenneally directed the organization's equity and quantitative research groups. He began his career as a research analyst and then spent more than a dozen years as a portfolio manager for endowments, pension plans and mutual funds. He earned the Chartered Financial Analyst (CFA) designation in 1991.
Mark A. Murray (1954)
Year of Election or Appointment: 2016
Trustee
Mr. Murray also serves as Trustee of other Fidelity ® funds. Previously, Mr. Murray served as Co-Chief Executive Officer (2013-2016), President (2006-2013) and Vice Chairman (2013-2020) of Meijer, Inc. Mr. Murray serves as a member of the Board (2009-present) and Public Policy and Responsibility Committee (2009-present) and Chair of the Nuclear Review Committee (2019-present) of DTE Energy Company (diversified energy company). Mr. Murray previously served as a member of the Board of Spectrum Health (not-for-profit health system, 2015-2019) and as a member of the Board and Audit Committee and Chairman of the Nominating and Corporate Governance Committee of Universal Forest Products, Inc. (manufacturer and distributor of wood and wood-alternative products, 2004-2016). Mr. Murray also serves as a member of the Board of many community and professional organizations. Mr. Murray previously served as a member of the Advisory Board of certain Fidelity ® funds (2016).
+ The information includes the Trustee's principal occupation during the last five years and other information relating to the experience, attributes, and skills relevant to the Trustee's qualifications to serve as a Trustee, which led to the conclusion that the Trustee should serve as a Trustee for each fund.
Advisory Board Members and Officers:
Correspondence intended for a Member of the Advisory Board (if any) may be sent to Fidelity Investments, P.O. Box 55235, Boston, Massachusetts 02205-5235. Correspondence intended for an officer may be sent to Fidelity Investments, 245 Summer Street, Boston, Massachusetts 02210. Officers appear below in alphabetical order.
Name, Year of Birth; Principal Occupation
Laura M. Bishop (1961)
Year of Election or Appointment: 2022
Member of the Advisory Board
Ms. Bishop also serves as a Member of the Advisory Board of other funds. Prior to her retirement, Ms. Bishop held a variety of positions at United Services Automobile Association (2001-2020), including Executive Vice President and Chief Financial Officer (2014-2020) and Senior Vice President and Deputy Chief Financial Officer (2012-2014). Ms. Bishop currently serves as a member of the Audit Committee and Compensation and Personnel Committee (2021-present) of the Board of Directors of Korn Ferry (global organizational consulting).
Robert W. Helm (1957)
Year of Election or Appointment: 2021
Member of the Advisory Board
Mr. Helm also serves as a Member of the Advisory Board of other Fidelity® funds. Mr. Helm was formerly Deputy Chairman (2003-2020), partner (1991-2020) and an associate (1984-1991) of Dechert LLP (formerly Dechert Price & Rhoads). Mr. Helm currently serves on boards and committees of several not-for-profit organizations.
Craig S. Brown (1977)
Year of Election or Appointment: 2019
Assistant Treasurer
Mr. Brown also serves as an officer of other funds. Mr. Brown serves as Assistant Treasurer of FIMM, LLC (2021-present) and is an employee of Fidelity Investments (2013-present). Previously, Mr. Brown served as Assistant Treasurer of certain Fidelity ® funds (2019-2022).
John J. Burke III (1964)
Year of Election or Appointment: 2018
Chief Financial Officer
Mr. Burke also serves as Chief Financial Officer of other funds. Mr. Burke serves as Head of Investment Operations for Fidelity Fund and Investment Operations (2018-present) and is an employee of Fidelity Investments (1998-present). Previously Mr. Burke served as head of Asset Management Investment Operations (2012-2018).
David J. Carter (1973)
Year of Election or Appointment: 2020
Assistant Secretary
Mr. Carter also serves as Assistant Secretary of other funds. Mr. Carter serves as Senior Vice President, Deputy General Counsel (2022-present) and is an employee of Fidelity Investments (2005-present).
Jonathan Davis (1968)
Year of Election or Appointment: 2010
Assistant Treasurer
Mr. Davis also serves as an officer of other funds. Mr. Davis serves as Assistant Treasurer of FIMM, LLC (2021-present), FMR Capital, Inc. (2017-present), FD Funds GP LLC (2021-present), FD Funds Holding LLC (2021-present), and FD Funds Management LLC (2021-present); and is an employee of Fidelity Investments. Previously, Mr. Davis served as Vice President and Associate General Counsel of FMR LLC (diversified financial services company, 2003-2010).
Laura M. Del Prato (1964)
Year of Election or Appointment: 2018
President and Treasurer
Ms. Del Prato also serves as an officer of other funds. Ms. Del Prato serves as Assistant Treasurer of FIMM, LLC (2021-present) and is an employee of Fidelity Investments (2017-present). Previously, Ms. Del Prato served as President and Treasurer of The North Carolina Capital Management Trust: Cash Portfolio and Term Portfolio (2018-2020). Prior to joining Fidelity Investments, Ms. Del Prato served as a Managing Director and Treasurer of the JPMorgan Mutual Funds (2014-2017). Prior to JPMorgan, Ms. Del Prato served as a partner at Cohen Fund Audit Services (accounting firm, 2012-2013) and KPMG LLP (accounting firm, 2004-2012).
Christopher M. Gouveia (1973)
Year of Election or Appointment: 2023
Chief Compliance Officer
Mr. Gouveia also serves as Chief Compliance Officer of other funds. Mr. Gouveia serves as Senior Vice President of Asset Management Compliance for Fidelity Investments and is an employee of Fidelity Investments. Previously, Mr. Gouveia served as Chief Compliance Officer of the North Carolina Capital Management Trust (2016-2019).
Colm A. Hogan (1973)
Year of Election or Appointment: 2016
Assistant Treasurer
Mr. Hogan also serves as an officer of other funds. Mr. Hogan serves as Assistant Treasurer of FIMM, LLC (2021-present) and FMR Capital, Inc. (2017-present) and is an employee of Fidelity Investments (2005-present). Previously, Mr. Hogan served as Deputy Treasurer of certain Fidelity ® funds (2016-2020) and Assistant Treasurer of certain Fidelity ® funds (2016-2018).
Cynthia Lo Bessette (1969)
Year of Election or Appointment: 2019
Secretary and Chief Legal Officer (CLO)
Ms. Lo Bessette also serves as an officer of other funds. Ms. Lo Bessette serves as CLO, Secretary, and Senior Vice President of Fidelity Management & Research Company LLC (investment adviser firm, 2019-present); CLO of Fidelity Management & Research (Hong Kong) Limited, FMR Investment Management (UK) Limited, and Fidelity Management & Research (Japan) Limited (investment adviser firms, 2019-present); Secretary of FD Funds GP LLC (2021-present), FD Funds Holding LLC (2021-present), FD Funds Management LLC (2021-present), and Fidelity Diversifying Solutions LLC (investment adviser firm, 2022-present); and Assistant Secretary of FIMM, LLC (2019-present). She is a Senior Vice President and Deputy General Counsel of FMR LLC (diversified financial services company, 2019-present), and is an employee of Fidelity Investments. Previously, Ms. Lo Bessette served as CLO, Secretary, and Senior Vice President of FMR Co., Inc. (investment adviser firm, 2019); Secretary of Fidelity SelectCo, LLC and Fidelity Investments Money Management, Inc. (investment adviser firms, 2019). Prior to joining Fidelity Investments, Ms. Lo Bessette was Executive Vice President, General Counsel (2016-2019) and Senior Vice President, Deputy General Counsel (2015-2016) of OppenheimerFunds (investment management company) and Deputy Chief Legal Officer (2013-2015) of Jennison Associates LLC (investment adviser firm).
Chris Maher (1972)
Year of Election or Appointment: 2013
Assistant Treasurer
Mr. Maher also serves as an officer of other funds. Mr. Maher serves as Assistant Treasurer of FIMM, LLC (2021-present) and FMR Capital, Inc. (2017-present), and is an employee of Fidelity Investments (2008-present). Previously, Mr. Maher served as Assistant Treasurer of certain funds (2013-2020); Vice President of Asset Management Compliance (2013), Vice President of the Program Management Group of FMR (investment adviser firm, 2010-2013), and Vice President of Valuation Oversight (2008-2010).
Jamie Pagliocco (1964)
Year of Election or Appointment: 2020
Vice President
Mr. Pagliocco also serves as Vice President of other funds. Mr. Pagliocco serves as President of Fixed Income (2020-present), and is an employee of Fidelity Investments (2001-present). Previously, Mr. Pagliocco served as Co-Chief Investment Officer - Bond (2017-2020), Global Head of Bond Trading (2016-2019), and as a portfolio manager.
Brett Segaloff (1972)
Year of Election or Appointment: 2021
Anti-Money Laundering (AML) Officer
Mr. Segaloff also serves as an AML Officer of other funds and other related entities. He is Director, Anti-Money Laundering (2007-present) of FMR LLC (diversified financial services company) and is an employee of Fidelity Investments (1996-present).
Stacie M. Smith (1974)
Year of Election or Appointment: 2013
Assistant Treasurer
Ms. Smith also serves as an officer of other funds. Ms. Smith serves as Assistant Treasurer of FIMM, LLC (2021-present) and FMR Capital, Inc. (2017-present), is an employee of Fidelity Investments (2009-present), and has served in other fund officer roles. Prior to joining Fidelity Investments, Ms. Smith served as Senior Audit Manager of Ernst & Young LLP (accounting firm, 1996-2009). Previously, Ms. Smith served as Assistant Treasurer (2013-2019) and Deputy Treasurer (2013-2016) of certain Fidelity ® funds.
Jim Wegmann (1979)
Year of Election or Appointment: 2021
Deputy Treasurer
Mr. Wegmann also serves as an officer of other funds. Mr. Wegmann serves as Assistant Treasurer of FIMM, LLC (2021-present) and is an employee of Fidelity Investments (2011-present). Previously, Mr. Wegmann served as Assistant Treasurer of certain Fidelity ® funds (2019-2021).
As a shareholder, you incur two types of costs: (1) transaction costs, which may include sales charges (loads) on purchase payments or redemption proceeds, as applicable and (2) ongoing costs, which generally include management fees, distribution and/or service (12b-1) fees and other Fund expenses. This Example is intended to help you understand your ongoing costs (in dollars) of investing in a fund and to compare these costs with the ongoing costs of investing in other mutual funds.
| The Example is based on an investment of $1,000 invested at the beginning of the period and held for the entire period (July 1, 2022 to December 31, 2022). |
Actual Expenses
The first line of the accompanying table provides information about actual account values and actual expenses. You may use the information in this line, together with the amount you invested, to estimate the expenses that you paid over the period. Simply divide your account value by $1,000.00 (for example, an $8,600 account value divided by $1,000.00 = 8.6), then multiply the result by the number in the first line for a class/Fund under the heading entitled "Expenses Paid During Period" to estimate the expenses you paid on your account during this period. If any fund is a shareholder of any underlying mutual funds or exchange-traded funds (ETFs) (the Underlying Funds), such fund indirectly bears its proportional share of the expenses of the Underlying Funds in addition to the direct expenses incurred presented in the table. These fees and expenses are not included in the annualized expense ratio used to calculate the expense estimate in the table below.
Hypothetical Example for Comparison Purposes
The second line of the accompanying table provides information about hypothetical account values and hypothetical expenses based on the actual expense ratio and an assumed rate of return of 5% per year before expenses, which is not the actual return. The hypothetical account values and expenses may not be used to estimate the actual ending account balance or expenses you paid for the period. You may use this information to compare the ongoing costs of investing in the Fund and other funds. To do so, compare this 5% hypothetical example with the 5% hypothetical examples that appear in the shareholder reports of the other funds. If any fund is a shareholder of any Underlying Funds, such fund indirectly bears its proportional share of the expenses of the Underlying Funds in addition to the direct expenses as presented in the table. These fees and expenses are not included in the annualized expense ratio used to calculate the expense estimate in the table below.
Please note that the expenses shown in the table are meant to highlight your ongoing costs only and do not reflect any transaction costs. Therefore, the second line of the table is useful in comparing ongoing costs only, and will not help you determine the relative total costs of owning different funds. In addition, if these transactional costs were included, your costs would have been higher.
| | | | | Annualized Expense Ratio- A | | Beginning Account Value July 1, 2022 | | Ending Account Value December 31, 2022 | | Expenses Paid During Period- C July 1, 2022 to December 31, 2022 |
| | | | | | | | | | |
| Fidelity® Michigan Municipal Income Fund | | | | .48% | | | | | | |
| Actual | | | | | | $ 1,000 | | $ 999.40 | | $ 2.42 |
Hypothetical- B | | | | | | $ 1,000 | | $ 1,022.79 | | $ 2.45 |
| | | | | | | | | | |
| Fidelity® Michigan Municipal Money Market Fund | | | | .58% | | | | | | |
| Actual | | | | | | $ 1,000 | | $ 1,007.90 | | $ 2.94 |
Hypothetical- B | | | | | | $ 1,000 | | $ 1,022.28 | | $ 2.96 |
| |
A Annualized expense ratio reflects expenses net of applicable fee waivers.
B 5% return per year before expenses
C Expenses are equal to the annualized expense ratio, multiplied by the average account value over the period, multiplied by 184/ 365 (to reflect the one-half year period). The fees and expenses of any Underlying Funds are not included in each annualized expense ratio.
The dividend and capital gains distributions for the fund(s) are available on Fidelity.com or Institutional.Fidelity.com.
During fiscal year ended 2022, 100% of each fund's income dividends were free from federal income tax, and 9.80% and 18.30% of Fidelity Michigan Municipal Income Fund and Fidelity Michigan Municipal Money Market Fund's income dividends, respectively, were subject to the federal alternative minimum tax.
The funds will notify shareholders in January 2023 of amounts for use in preparing 2022 income tax returns.
Fidelity Michigan Municipal Income Fund / Fidelity Michigan Municipal Money Market Fund
Each year, the Board of Trustees, including the Independent Trustees (together, the Board), votes on the renewal of the management contract with Fidelity Management & Research Company LLC (FMR) and the sub-advisory agreements (together, the Advisory Contracts) for each fund. FMR and the sub-advisers are referred to herein as the Investment Advisers. The Board, assisted by the advice of fund counsel and Independent Trustees' counsel, requests and considers a broad range of information relevant to the renewal of the Advisory Contracts throughout the year.
The Board meets regularly and, at each of its meetings, covers an extensive agenda of topics and materials and considers factors that are relevant to its annual consideration of the renewal of each fund's Advisory Contracts, including the services and support provided to each fund and its shareholders. The Board has established four standing committees (Committees) - Operations, Audit, Fair Valuation, and Governance and Nominating - each composed of and chaired by Independent Trustees with varying backgrounds, to which the Board has assigned specific subject matter responsibilities in order to enhance effective decision-making by the Board. The Operations Committee, of which all the Independent Trustees are members, meets regularly throughout the year and requests, receives and considers, among other matters, information related to the annual consideration of the renewal of each fund's Advisory Contracts before making its recommendation to the Board. The Board also meets as needed to review matters specifically related to the Board's annual consideration of the renewal of the Advisory Contracts. Members of the Board may also meet from time to time with trustees of other Fidelity funds through joint ad hoc committees to discuss certain matters relevant to all of the Fidelity funds.
At its September 2022 meeting, the Board unanimously determined to renew each fund's Advisory Contracts. In reaching its determination, the Board considered all factors it believed relevant, including (i) the nature, extent, and quality of the services provided to each fund and its shareholders (including the investment performance of each fund); (ii) the competitiveness relative to peer funds of each fund's management fee and total expense ratio; (iii) the total costs of the services provided by and the profits realized by Fidelity from its relationships with each fund; and (iv) the extent to which, if any, economies of scale exist and are realized as each fund grows, and whether any economies of scale are appropriately shared with fund shareholders.
In considering whether to renew the Advisory Contracts for each fund, the Board reached a determination, with the assistance of fund counsel and Independent Trustees' counsel and through the exercise of its business judgment, that the renewal of the Advisory Contracts was in the best interests of each fund and its shareholders and that the compensation payable under the Advisory Contracts was fair and reasonable. The Board's decision to renew the Advisory Contracts was not based on any single factor, but rather was based on a comprehensive consideration of all the information provided to the Board at its meetings throughout the year. The Board, in reaching its determination to renew the Advisory Contracts, was aware that shareholders of each fund have a broad range of investment choices available to them, including a wide choice among funds offered by Fidelity's competitors, and that each fund's shareholders, who have the opportunity to review and weigh the disclosure provided by the fund in its prospectus and other public disclosures, have chosen to invest in that fund, which is part of the Fidelity family of funds.
Nature, Extent, and Quality of Services Provided. The Board considered Fidelity's staffing as it relates to the funds, including the backgrounds of investment personnel of Fidelity, and also considered the funds' investment objectives, strategies, and related investment philosophies. The Independent Trustees also had discussions with senior management of Fidelity's investment operations and investment groups. The Board considered the structure of the investment personnel compensation program and whether this structure provides appropriate incentives to act in the best interests of each fund. Additionally, the Board considered the portfolio managers' investments, if any, in the funds that they manage. The Board also considered the steps Fidelity had taken to ensure the continued provision of high quality services to the Fidelity funds throughout the COVID-19 pandemic, including the expansion of staff in client facing positions to maintain service levels in periods of high volumes and volatility.
Resources Dedicated to Investment Management and Support Services . The Board reviewed the general qualifications and capabilities of Fidelity's investment staff, including its size, education, experience, and resources, as well as Fidelity's approach to recruiting, training, managing, and compensating investment personnel. The Board noted the resources devoted to Fidelity's global investment organization, and that Fidelity's analysts have extensive resources, tools and capabilities that allow them to conduct quantitative and fundamental analysis, as well as credit analysis of issuers, counterparties and guarantors. Further, the Board considered that Fidelity's investment professionals have sufficient access to global information and data so as to provide competitive investment results over time, and that those professionals also have access to sophisticated tools that permit them to assess portfolio construction and risk and performance attribution characteristics continuously, as well as to transmit new information and research conclusions rapidly around the world. Additionally, in its deliberations, the Board considered Fidelity's trading, risk management, compliance, cybersecurity, and technology and operations capabilities and resources, which are integral parts of the investment management process.
Shareholder and Administrative Services . The Board considered (i) the nature, extent, quality, and cost of advisory, administrative, and shareholder services performed by the Investment Advisers and their affiliates under the Advisory Contracts and under separate agreements covering transfer agency and pricing and bookkeeping services for each fund; (ii) the nature and extent of the supervision of third party service providers, principally custodians, subcustodians, and pricing vendors; and (iii) the resources devoted to, and the record of compliance with, each fund's compliance policies and procedures.
The Board noted that the growth of fund assets over time across the complex allows Fidelity to reinvest in the development of services designed to enhance the value and convenience of the Fidelity funds as investment vehicles. These services include 24-hour access to account information and market information over the Internet and through telephone representatives, investor education materials and asset allocation tools. The Board also considered that it reviews customer service metrics such as telephone response times, continuity of services on the website and metrics addressing services at Fidelity Investor Center
Investment in a Large Fund Family . The Board considered the benefits to shareholders of investing in a Fidelity fund, including the benefits of investing in a fund that is part of a large family of funds offering a variety of investment disciplines and providing a large variety of mutual fund investor services. The Board noted that Fidelity had taken, or had made recommendations to the Board that resulted in the Fidelity funds taking, a number of actions over the previous year that benefited particular funds, including: (i) continuing to dedicate additional resources to Fidelity's investment research process, which includes meetings with management of issuers of securities in which the funds invest; (ii) continuing efforts to enhance Fidelity's global research capabilities; (iii) launching new funds, ETFs, and share classes with innovative structures, strategies and pricing and making other enhancements to meet investor needs; (iv) broadening eligibility requirements for certain funds and share classes; (v) reducing management fees and total expenses for certain funds and classes; (vi) lowering expenses for certain existing funds and classes by implementing or lowering expense caps; (vii) rationalizing product lines and gaining increased efficiencies from fund mergers and liquidations; (viii) continuing to develop, acquire and implement systems and technology to improve services to the funds and shareholders, strengthen information security, and increase efficiency; and (ix) continuing to implement enhancements to further strengthen Fidelity's product line to increase investors' probability of success in achieving their investment goals, including their retirement income goals.
Investment Performance (for Fidelity Michigan Municipal Income Fund) . The Board considered whether the fund has operated in accordance with its investment objective, as well as its record of compliance with its investment restrictions and its performance history.
The Board took into account discussions that occur at Board meetings throughout the year with representatives of the Investment Advisers about fund investment performance. In this regard the Board noted that as part of regularly scheduled fund reviews and other reports to the Board on fund performance, the Board considers annualized return information for the fund for different time periods, measured against an appropriate securities market index (benchmark index) and an appropriate peer group of funds with similar objectives (peer group). The Board also receives and considers information about performance attribution. In its evaluation of fund investment performance at meetings throughout the year, the Board gave particular attention to information indicating underperformance of certain Fidelity funds for specific time periods and discussed with the Investment Advisers the reasons for such underperformance.
In addition to reviewing absolute and relative fund performance, the Independent Trustees periodically consider the appropriateness of fund performance metrics in evaluating the results achieved. In general, the Independent Trustees believe that fund performance should be evaluated based on gross performance (before fees and expenses but after transaction costs) compared to appropriate benchmark indices, over appropriate time periods that may include full market cycles, and on net performance (after fees and expenses) compared to appropriate peer groups, as applicable, over the same periods, taking into account relevant factors including the following: general market conditions; expectations for interest rate levels and credit conditions; issuer-specific information including credit quality; the potential for incremental return versus the fund's benchmark index weighed against the risks involved in obtaining that incremental return, including the risk of diminished or negative total returns; and fund cash flows and other factors. The Independent Trustees generally give greater weight to fund performance over longer time periods than over shorter time periods. Depending on the circumstances, the Independent Trustees may be satisfied with a fund's performance notwithstanding that it lags its benchmark index or peer group for certain periods.
The Independent Trustees recognize that shareholders evaluate performance on a net basis over their own holding periods, for which one-, three-, and five-year periods are often used as a proxy. For this reason, the performance information reviewed by the Board also included net cumulative calendar year total return information for the fund and an appropriate benchmark index and peer group for the most recent one-, three-, and five-year periods.
Investment Performance (for Fidelity Michigan Municipal Money Market Fund) . The Board considered whether the fund has operated in accordance with its investment objective, as well as its record of compliance with its investment restrictions and its performance history.
The Board took into account discussions that occur at Board meetings throughout the year with representatives of the Investment Advisers about fund investment performance. In this regard the Board noted that as part of regularly scheduled fund reviews and other reports to the Board on fund performance, the Board considers annualized return information for the fund for different time periods, measured against an appropriate peer group of funds with similar objectives (peer group). The Board also receives and considers information about performance attribution.
In addition to reviewing absolute and relative fund performance, the Independent Trustees periodically consider the appropriateness of fund performance metrics in evaluating the results achieved. In general, the Independent Trustees believe that fund performance should be evaluated based on gross performance (before fees and expenses but after transaction costs) compared to the gross performance of appropriate peer groups, over appropriate time periods that may include full market cycles, taking into account relevant factors including the following: general market conditions; expectations for interest rate levels and credit conditions; issuer-specific information including credit quality; the fund's market value NAV over time and its resilience under various stressed conditions; and fund cash flows and other factors. The Independent Trustees generally give greater weight to fund performance over longer time periods than over shorter time periods.
The Board recognizes that in interest rate environments where many competitors waive fees to maintain a minimum yield, relative money market fund performance on a net basis (after fees and expenses) may not be particularly meaningful due to miniscule performance differences among competitor funds. Depending on the circumstances, the Independent Trustees may be satisfied with a fund's performance notwithstanding that it lags its peer group for certain periods.
The Independent Trustees recognize that shareholders evaluate performance on a net basis over their own holding periods, for which one-, three-, and five-year periods are often used as a proxy. For this reason, the performance information reviewed by the Board also included net cumulative calendar year total return information for the fund and an appropriate peer group for the most recent one-, three-, and five-year periods.
Based on its review, the Board concluded that the nature, extent, and quality of services provided to each fund under the Advisory Contracts should continue to benefit the shareholders of each fund.
Competitiveness of Management Fee and Total Expense Ratio . The Board considered each fund's management fee and total expense ratio compared to selected groups of competitive funds and classes (referred to as "mapped groups" below) for the purpose of facilitating the Trustees' competitive analysis of management fees and total expenses. Fidelity creates "mapped groups" by combining similar investment objective categories (as classified by Lipper) that have comparable investment mandates. Combining funds with similar investment objective categories aids the Board's comparisons of management fees and total expense ratios by broadening the competitive group used for such comparisons.
Management Fee. The Board considered two proprietary management fee comparisons for the 12-month periods shown in basis points (BP) in the charts below. The group of Lipper funds used by the Board for management fee comparisons is referred to below as the "Total Mapped Group" and is broader than the Lipper peer group used by the Board for performance comparisons. For each fund, the Total mapped Group is broader than the Lipper peer group used by the Board for performance comparisons because the Total Mapped Group combines several Lipper investment objective categories while the Lipper peer group does not. The Total Mapped Group comparison focuses on a fund's standing in terms of gross management fees before expense reimbursements or caps relative to the total universe of funds with comparable investment mandates, regardless of whether their management fee structures also are comparable. Funds with comparable investment mandates offer exposure to similar types of securities. Funds with comparable management fee structures have similar management fee contractual arrangements (e.g., flat rate charged for advisory services, all-inclusive fee rate, etc.). "TMG %" represents the percentage of funds in the Total Mapped Group that had management fees that were lower than a fund's. For example, a hypothetical TMG % of 20% would mean that 80% of the funds in the Total Mapped Group had higher, and 20% had lower, management fees than a fund. The funds' actual TMG %s and the number of funds in the Total Mapped Group are in the charts below. The "Asset-Sized Peer Group" (ASPG) comparison focuses on a fund's standing relative to a subset of non-Fidelity funds within the Total Mapped Group that are similar in size and management fee structure. For example, if a fund is in the first quartile of the ASPG, the fund's management fee ranks in the least expensive or lowest 25% of funds in the ASPG. The ASPG represents at least 15% of the funds in the Total Mapped Group with comparable asset size and management fee structures, subject to a minimum of 50 funds (or all funds in the Total Mapped Group if fewer than 50). Additional information, such as the ASPG quartile in which a fund's management fee rate ranked, is also included in the charts and was considered by the Board.
Fidelity Michigan Municipal Income Fund
The Board noted that the fund's management fee rate ranked below the median of its Total Mapped Group and below the median of its ASPG for 2021.
Fidelity Michigan Municipal Money Market Fund
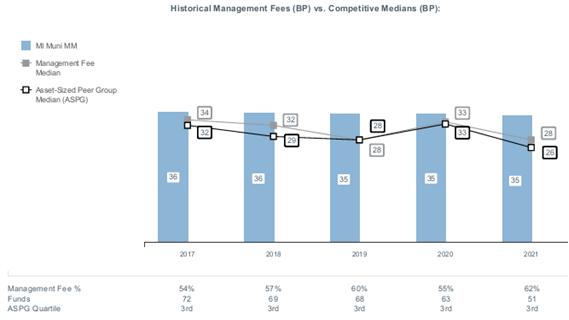
The Board noted that the fund's management fee rate ranked above the median of its Total Mapped Group and above the median of its ASPG for 2021. The Board also noted that the management fee rate was seven BP above the Total Mapped Group median and nine BP above the ASPG median. The Board noted that because there is a relatively small number of state-specific funds in the Lipper objective, Fidelity combines Lipper's separate categories for state-specific funds with all state and national municipal money market funds to create a single mapped group. The Board considered that Fidelity believes the fee charged for the fund is reasonable for overall value of the services provided and also considered that in July 2022 the Board approved and recommended to shareholders for their approval the reorganization of the fund into Fidelity Municipal Money Market Fund. The Board further noted that the proposed reorganization was expected to result in a reduction in the fund's total expense ratio.
Based on its review, the Board concluded that each fund's management fee is fair and reasonable in light of the services that the fund receives and the other factors considered.
Total Expense Ratio . In its review of each fund's total expense ratio, the Board considered the fund's management fee rate as well as other fund expenses, such as transfer agent fees, pricing and bookkeeping fees, and custodial, legal, and audit fees. The Board also noted that Fidelity may agree to waive fees or reimburse expenses from time to time, and the extent to which, if any, it has done so for each fund. Each fund is compared to those funds and classes in the Total Mapped Group (used by the Board for management fee comparisons) that have a similar sales load structure. The Board also considered a total expense ASPG comparison, which focuses on the total expenses of each fund relative to a subset of non-Fidelity funds within the similar sales load structure group that are similar in size and management fee structure. The total expense ASPG is limited to 15 larger and 15 smaller classes of different funds, where possible. The total expense ASPG comparison excludes performance adjustments and fund-paid 12b-1 fees to eliminate variability in expenses relating to these items.
The Board noted that Fidelity Michigan Municipal Income Fund's total net expense ratio ranked below the similar sales load structure group competitive median for 2021 and below the ASPG competitive median for 2021.
The Board noted that Fidelity Michigan Municipal Money Market Fund's total net expense ratio ranked below the similar sales load structure group competitive median for 2021 and below the ASPG competitive median for 2021. The Board considered that Fidelity has been voluntarily waiving part or all of the management fees to maintain a minimum yield for Fidelity Michigan Municipal Money Market Fund.
Fees Charged to Other Fidelity Clients . The Board also considered Fidelity fee structures and other information with respect to clients of Fidelity, such as other funds advised or subadvised by Fidelity, pension plan clients, and other institutional clients with similar mandates. The Board noted that a joint ad hoc committee created by it and the boards of other Fidelity funds periodically reviews and compares Fidelity's institutional investment advisory business with its business of providing services to the Fidelity funds and also noted the most recent findings of the committee. The Board noted that the committee's review included a consideration of the differences in services provided, fees charged, and costs incurred, as well as competition in the markets serving the different categories of clients.
Based on its review of total expense ratios and fees charged to other Fidelity clients, the Board concluded that each fund's total expense ratio was reasonable in light of the services that the fund and its shareholders receive and the other factors considered.
Costs of the Services and Profitability . The Board considered the revenues earned and the expenses incurred by Fidelity in conducting the business of developing, marketing, distributing, managing, administering and servicing each fund and servicing each fund's shareholders. The Board also considered the level of Fidelity's profits in respect of all the Fidelity funds.
On an annual basis, Fidelity presents to the Board information about the profitability of its relationships with each fund. Fidelity calculates profitability information for each fund, as well as aggregate profitability information for groups of Fidelity funds and all Fidelity funds, using a series of detailed revenue and cost allocation methodologies which originate with the books and records of Fidelity on which Fidelity's audited financial statements are based. The Audit Committee of the Board reviews any significant changes from the prior year's methodologies and the full Board approves such changes.
A public accounting firm has been engaged annually by the Board as part of the Board's assessment of Fidelity's profitability analysis. The engagement includes the review and assessment of the methodologies used by Fidelity in determining the revenues and expenses attributable to Fidelity's mutual fund business, and completion of agreed-upon procedures in respect of the mathematical accuracy of certain fund profitability information and its conformity to established allocation methodologies. After considering the reports issued under the engagement and information provided by Fidelity, the Board concluded that while other allocation methods may also be reasonable, Fidelity's profitability methodologies are reasonable in all material respects.
The Board also reviewed Fidelity's non-fund businesses and potential indirect benefits such businesses may have received as a result of their association with Fidelity's mutual fund business (i.e., fall-out benefits) as well as cases where Fidelity's affiliates may benefit from the funds' business. The Board considered areas where potential indirect benefits to the Fidelity funds from their relationships with Fidelity may exist. The Board's consideration of these matters was informed by the findings of a joint ad hoc committee created by it and the boards of other Fidelity funds to evaluate potential fall-out benefits.
The Board considered the costs of the services provided by and the profits realized by Fidelity in connection with the operation of each fund and was satisfied that the profitability was not excessive.
Economies of Scale . The Board considered whether there have been economies of scale in respect of the management of the Fidelity funds, whether the Fidelity funds (including each fund) have appropriately benefited from any such economies of scale, and whether there is potential for realization of any further economies of scale. The Board considered the extent to which each fund will benefit from economies of scale as assets grow through increased services to the fund, through waivers or reimbursements, or through fee or expense ratio reductions. The Board also noted that a committee (the Economies of Scale Committee) created by it and the boards of other Fidelity funds periodically analyzes whether Fidelity attains economies of scale in respect of the management and servicing of the Fidelity funds, whether the Fidelity funds have appropriately benefited from such economies of scale, and whether there is potential for realization of any further economies of scale.
The Board recognized that each fund's management contract incorporates a "group fee" structure, which provides for lower group fee rates as total "group assets" increase, and for higher group fee rates as total "group assets" decrease ("group assets" as defined in the management contract). FMR calculates the group fee rates based on a tiered asset "breakpoint" schedule that varies based on asset class. The Board considered that the group fee is designed to deliver the benefits of economies of scale to fund shareholders when total Fidelity fund assets increase, even if assets of any particular fund are unchanged or have declined, because some portion of Fidelity's costs are attributable to services provided to all Fidelity funds, and all funds benefit if those costs can be allocated among more assets. The Board also considered that Fidelity agreed to impose a temporary fee waiver in the form of additional breakpoints to the current breakpoint schedule. The Board concluded that, given the group fee structure, fund shareholders will benefit from lower management fees as "group assets" increase at the fund complex level, regardless of whether Fidelity achieves any such economies of scale.
The Board concluded, taking into account the analysis of the Economies of Scale Committee, that economies of scale, if any, are being appropriately shared between fund shareholders and Fidelity.
Additional Information Requested by the Board . In order to develop fully the factual basis for consideration of the Fidelity funds' advisory contracts, the Board requested and received additional information on certain topics, including: (i) Fidelity's fund profitability methodology, profitability trends for certain funds, the allocation of various costs to different funds, and the impact of certain factors on fund profitability results; (ii) portfolio manager changes that have occurred during the past year and the amount of the investment that each portfolio manager has made in the Fidelity fund(s) that he or she manages; (iii) the extent to which current market conditions have affected retention and recruitment of personnel; (iv) the arrangements with and compensation paid to certain fund sub-advisers on behalf of the Fidelity funds and the treatment of such compensation within Fidelity's fund profitability methodology; (v) the terms of the funds' various management fee structures, including the basic group fee and the terms of Fidelity's voluntary expense limitation arrangements; (vi) Fidelity's transfer agent, pricing and bookkeeping fees, expense and service structures for different funds and classes relative to competitive trends; (vii) the impact on fund profitability of recent industry trends, such as the growth in passively managed funds and the changes in flows for different types of funds; (viii) the types of management fee and total expense comparisons provided, and the challenges and limitations associated with such information; and (ix) explanations regarding the relative total expense ratios and management fees of certain funds and classes, total expense and management fee competitive trends, and methodologies for total expense and management fee competitive comparisons. In addition, the Board considered its discussions with Fidelity regarding Fidelity's efforts to maintain the continuous investment and shareholder services necessary for the funds during the current pandemic and economic circumstances.
Based on its evaluation of all of the conclusions noted above, and after considering all factors it believed relevant, the Board concluded that the advisory fee arrangements are fair and reasonable and that each fund's Advisory Contracts should be renewed.
1.540080.125
MIR-ANN-0323
Fidelity® Ohio Municipal Income Fund
Fidelity® Ohio Municipal Money Market Fund
Annual Report
December 31, 2022
Contents
To view a fund's proxy voting guidelines and proxy voting record for the 12-month period ended June 30, visit http://www.fidelity.com/proxyvotingresults or visit the Securities and Exchange Commission's (SEC) web site at http://www.sec.gov.
You may also call 1-800-544-8544 to request a free copy of the proxy voting guidelines.
Standard & Poor's, S&P and S&P 500 are registered service marks of The McGraw-Hill Companies, Inc. and have been licensed for use by Fidelity Distributors Corporation.
Other third-party marks appearing herein are the property of their respective owners.
All other marks appearing herein are registered or unregistered trademarks or service marks of FMR LLC or an affiliated company. © 2023 FMR LLC. All rights reserved.
This report and the financial statements contained herein are submitted for the general information of the shareholders of the Funds. This report is not authorized for distribution to prospective investors in the Funds unless preceded or accompanied by an effective prospectus.
A fund files its complete schedule of portfolio holdings with the SEC for the first and third quarters of each fiscal year on Form N-PORT. Forms N-PORT are available on the SEC's web site at http://www.sec.gov. A fund's Forms N-PORT may be reviewed and copied at the SEC's Public Reference Room in Washington, DC. Information regarding the operation of the SEC's Public Reference Room may be obtained by calling 1-800-SEC-0330.
For a complete list of a fund's portfolio holdings, view the most recent holdings listing, semiannual report, or annual report on Fidelity's web site at http://www.fidelity.com, http://www.institutional.fidelity.com, or http://www.401k.com, as applicable.
NOT FDIC INSURED •MAY LOSE VALUE •NO BANK GUARANTEE
Neither the Funds nor Fidelity Distributors Corporation is a bank.
Average annual total return reflects the change in the value of an investment, assuming reinvestment of distributions from dividend income and capital gains (the profits earned upon the sale of securities that have grown in value, if any) and assuming a constant rate of performance each year. The hypothetical investment and the average annual total returns do not reflect the deduction of taxes that a shareholder would pay on fund distributions or the redemption of fund shares. During periods of reimbursement by Fidelity, a fund's total return will be greater than it would be had the reimbursement not occurred. How a fund did yesterday is no guarantee of how it will do tomorrow.
| Average Annual Total Returns |
| | | | |
Periods ended December 31, 2022 | Past 1 year | Past 5 years | Past 10 years |
| Fidelity® Ohio Municipal Income Fund | -8.60% | 0.79% | 2.09% |
| $10,000 Over 10 Years |
| |
Let's say hypothetically that $10,000 was invested in Fidelity® Ohio Municipal Income Fund on December 31, 2012. The chart shows how the value of your investment would have changed, and also shows how the Bloomberg Municipal Bond Index performed over the same period. |
|
|
Fidelity® Ohio Municipal Income Fund
Market Recap:
Tax-exempt municipal bonds notably declined in 2022, as a multitude of crosscurrents challenged the global economy and financial markets. The Bloomberg Municipal Bond Index returned -8.53% for the year, its third-worst annual return on record. In late 2021, the Federal Reserve began its pivot to a tighter monetary policy, tapering the large-scale asset purchases it restarted in 2020 amid the COVID-19 pandemic. In early 2022, the Fed, faced with persistent inflationary pressure, implemented an aggressive series of rate hikes, raising its benchmark interest rate seven times, by a total of 4.25 percentage points, between March and December. This helped push municipal bond yields to their highest level in more than a decade. Muni bond prices, which move inversely to yields, fell sharply. Credit spreads significantly widened, as investors demanded more yield for lower-quality munis as recession risk increased. In November and December, the tax-exempt market staged a rally when comments by Fed Chair Jerome Powell pointed to a slowdown in the pace of rate hikes and inflation data moderated. Favorable supply and demand dynamics also helped amid muted muni bond issuance and increased pockets of demand. Muni tax-backed credit fundamentals remained solid throughout the year and, for the most part, the risk of credit-rating downgrades appeared low. Shorter-duration (lower sensitivity to changes in interest rates) and higher-credit-quality munis performed best for the year.
Comments from Co-Portfolio Managers Cormac Cullen, Michael Maka and Elizah McLaughlin:
For the fiscal year ending December 31, 2022, the fund returned -8.60%, roughly in line, net of fees, with the -8.56% result of the state-specific Bloomberg Ohio Enhanced Municipal Linked Index, as well as the -8.53% return of the benchmark, the broad-based Bloomberg Municipal Bond Index. The past 12 months, we continued to focus on longer-term objectives and sought to generate attractive tax-exempt income and a competitive risk-adjusted return. Versus the state-specific index, duration (interest rate) positioning contributed to performance. The fund had less sensitivity to interest rates, as measured by its shorter duration, than the index and therefore was hurt less as interest rates rose. A higher-than-average yield on the fund's underlying holdings provided another boost to the relative result. The fund's underweight in bonds backed by Promedica Healthcare, a struggling not-for-profit healthcare system that lagged the state index, also contributed. In contrast, the fund's overall overweight exposure to the health care sector detracted from relative performance, as many of the fund's holdings in the sector were lower-quality investment-grade bonds that produced subpar results in an environment that favored higher-quality issues.
The views expressed above reflect those of the portfolio manager(s) only through the end of the period as stated on the cover of this report and do not necessarily represent the views of Fidelity or any other person in the Fidelity organization. Any such views are subject to change at any time based upon market or other conditions and Fidelity disclaims any responsibility to update such views. These views may not be relied on as investment advice and, because investment decisions for a Fidelity fund are based on numerous factors, may not be relied on as an indication of trading intent on behalf of any Fidelity fund.
Fidelity® Ohio Municipal Income Fund
| Revenue Sources (% of Fund's net assets) |
| Health Care | 40.5% | |
| Education | 16.3% | |
| General Obligations | 11.9% | |
| Special Tax | 10.5% | |
| Transportation | 5.2% | |
| Others* (Individually Less Than 5%) | 15.6% | |
| | 100.0% | |
| |
| *Includes net other assets | | |
Quality Diversification (% of Fund's net assets) |
|
| |
| We have used ratings from Moody's Investors Service, Inc. Where Moody's® ratings are not available, we have used S&P® ratings. All ratings are as of the date indicated and do not reflect subsequent changes. |
Fidelity® Ohio Municipal Income Fund
Showing Percentage of Net Assets
| Municipal Bonds - 89.1% |
| | | Principal Amount (a) | Value ($) |
| Guam - 0.2% | | | |
| Guam Int'l. Arpt. Auth. Rev. Series 2013 C: | | | |
| 6.25% 10/1/34 (b) | | 545,000 | 556,509 |
| 6.25% 10/1/34 (Pre-Refunded to 10/1/23 @ 100) (b) | | 355,000 | 362,497 |
| 6.375% 10/1/43 (b) | | 355,000 | 362,818 |
TOTAL GUAM | | | 1,281,824 |
| Ohio - 87.8% | | | |
| Akron Bath Copley Hosp. District Rev.: | | | |
| (Summa Health Sys.) Series 2016, 5% 11/15/25 | | 1,000,000 | 1,041,076 |
| Series 2016: | | | |
5% 11/15/26 | | 535,000 | 564,036 |
5.25% 11/15/32 | | 1,000,000 | 1,049,317 |
5.25% 11/15/34 | | 1,500,000 | 1,557,011 |
5.25% 11/15/41 | | 10,545,000 | 10,713,004 |
5.25% 11/15/46 | | 2,650,000 | 2,677,502 |
| Akron Income Tax Rev. Series 2022: | | | |
| 4% 12/1/24 | | 1,075,000 | 1,100,010 |
| 4% 12/1/25 | | 1,400,000 | 1,450,382 |
| 4% 12/1/26 | | 1,120,000 | 1,173,376 |
| 4% 12/1/27 | | 1,180,000 | 1,246,652 |
| 4% 12/1/28 | | 1,380,000 | 1,468,176 |
| 4% 12/1/29 | | 1,500,000 | 1,605,840 |
| 4% 12/1/30 | | 1,210,000 | 1,285,383 |
| 4% 12/1/31 | | 1,105,000 | 1,165,986 |
| 4% 12/1/32 | | 1,285,000 | 1,351,746 |
| 4% 12/1/33 | | 1,300,000 | 1,359,455 |
| Allen County Hosp. Facilities Rev.: | | | |
| (Mercy Health) Series 2017 A: | | | |
4% 8/1/36 | | 5,000,000 | 5,004,044 |
5% 8/1/42 | | 4,175,000 | 4,362,800 |
| Series 2020 A: | | | |
4% 12/1/40 | | 11,880,000 | 11,126,599 |
5% 12/1/35 | | 750,000 | 816,750 |
| Bowling Green Univ. Gen. Receipts Series 2016 A, 5% 6/1/42 | | 1,000,000 | 1,041,216 |
| Buckeye Tobacco Settlement Fing. Auth.: | | | |
| Series 2020 A2: | | | |
3% 6/1/48 | | 1,500,000 | 1,055,788 |
4% 6/1/37 | | 2,000,000 | 1,899,287 |
4% 6/1/38 | | 1,000,000 | 941,014 |
4% 6/1/39 | | 1,000,000 | 931,314 |
4% 6/1/48 | | 5,750,000 | 4,920,310 |
5% 6/1/27 | | 1,000,000 | 1,048,279 |
5% 6/1/35 | | 2,000,000 | 2,090,521 |
5% 6/1/36 | | 2,000,000 | 2,079,244 |
| Series 2020 B2, 5% 6/1/55 | | 1,500,000 | 1,302,001 |
| Butler County Hosp. Facilities Rev. Series 2016 X, 5% 5/15/32 | | 3,950,000 | 4,565,106 |
| Chillicothe Hosp. Facilities Rev. (Adena Health Sys. Oblig. Group Proj.) Series 2017, 5% 12/1/47 | | 8,535,000 | 8,223,707 |
| Cleveland Arpt. Sys. Rev.: | | | |
| Series 2018 A: | | | |
5% 1/1/43 (Assured Guaranty Muni. Corp. Insured) (b) | | 1,750,000 | 1,788,054 |
5% 1/1/48 (Assured Guaranty Muni. Corp. Insured) (b) | | 3,000,000 | 3,044,222 |
| Series 2019 B: | | | |
5% 1/1/24 (b) | | 1,200,000 | 1,220,456 |
5% 1/1/25 (b) | | 1,125,000 | 1,156,687 |
5% 1/1/26 (b) | | 710,000 | 739,585 |
5% 1/1/27 (b) | | 700,000 | 736,772 |
| Cleveland Gen. Oblig. Series 2012, 5% 12/1/25 | | 25,000 | 25,035 |
| Cleveland Income Tax Rev. Series 2018 A: | | | |
| 5% 10/1/29 | | 600,000 | 664,780 |
| 5% 10/1/30 | | 420,000 | 465,214 |
| 5% 10/1/31 | | 650,000 | 717,271 |
| 5% 10/1/33 | | 600,000 | 659,390 |
| 5% 10/1/36 | | 700,000 | 757,021 |
| 5% 10/1/39 | | 2,040,000 | 2,185,673 |
| 5% 10/1/43 | | 5,000,000 | 5,319,604 |
| Cleveland Ohio Wtr. Poll. Ctl. Rev. Series 2016, 5% 11/15/36 | | 450,000 | 463,527 |
| Cleveland Pub. Library Facilities Series 2019 A: | | | |
| 4% 12/1/33 | | 425,000 | 447,892 |
| 4% 12/1/34 | | 370,000 | 386,693 |
| 4% 12/1/35 | | 620,000 | 644,997 |
| 4% 12/1/36 | | 1,400,000 | 1,439,367 |
| 4% 12/1/37 | | 1,115,000 | 1,135,198 |
| 4% 12/1/38 | | 650,000 | 652,683 |
| Cleveland Pub. Pwr. Sys. Rev.: | | | |
| Series 2018: | | | |
5% 11/15/24 (Assured Guaranty Muni. Corp. Insured) | | 475,000 | 493,100 |
5% 11/15/25 (Assured Guaranty Muni. Corp. Insured) | | 200,000 | 212,027 |
5% 11/15/26 (Assured Guaranty Muni. Corp. Insured) | | 265,000 | 286,148 |
5% 11/15/27 (Assured Guaranty Muni. Corp. Insured) | | 220,000 | 241,735 |
5% 11/15/28 (Assured Guaranty Muni. Corp. Insured) | | 150,000 | 166,203 |
5% 11/15/29 (Assured Guaranty Muni. Corp. Insured) | | 210,000 | 232,603 |
5% 11/15/30 (Assured Guaranty Muni. Corp. Insured) | | 530,000 | 585,495 |
5% 11/15/32 (Assured Guaranty Muni. Corp. Insured) | | 365,000 | 399,915 |
5% 11/15/34 (Assured Guaranty Muni. Corp. Insured) | | 785,000 | 851,561 |
5% 11/15/36 (Assured Guaranty Muni. Corp. Insured) | | 1,000,000 | 1,075,096 |
5% 11/15/38 (Assured Guaranty Muni. Corp. Insured) | | 830,000 | 887,062 |
| Series 2020 A: | | | |
4% 11/15/35 (Assured Guaranty Muni. Corp. Insured) | | 1,000,000 | 1,016,133 |
4% 11/15/36 (Assured Guaranty Muni. Corp. Insured) | | 1,000,000 | 1,005,565 |
4% 11/15/37 (Assured Guaranty Muni. Corp. Insured) | | 1,000,000 | 997,313 |
| Cleveland Wtr. Rev.: | | | |
| Series 2015 Y, 4% 1/1/28 | | 650,000 | 658,770 |
| Series 2020: | | | |
5% 1/1/30 | | 2,000,000 | 2,288,027 |
5% 1/1/31 | | 2,250,000 | 2,573,173 |
5% 1/1/32 | | 1,000,000 | 1,137,539 |
| Cleveland-Cuyahoga County Port Auth. Dev. Lease Rev. (Administrative Headquarters Proj.) Series 2013, 5% 7/1/37 | | 3,000,000 | 3,427,869 |
| Cleveland-Cuyahoga County Port Auth. Rev. (Euclid Avenue Dev. Corp. Proj.) Series 2022 A: | | | |
| 5% 8/1/34 | | 1,865,000 | 2,021,508 |
| 5% 8/1/35 | | 1,910,000 | 2,046,148 |
| 5% 8/1/36 | | 2,065,000 | 2,197,142 |
| 5% 8/1/37 | | 2,170,000 | 2,293,123 |
| County of Cuyahoga (Ballpark Impt. Proj.) Series 2022 A: | | | |
| 4% 1/1/36 | | 3,855,000 | 3,964,432 |
| 4% 1/1/37 | | 3,755,000 | 3,839,789 |
| Cuyahoga County Econ. Dev. Rev.: | | | |
| (The Cleveland Orchestra Proj.) Series 2019: | | | |
5% 1/1/29 | | 325,000 | 355,444 |
5% 1/1/30 | | 250,000 | 275,053 |
5% 1/1/31 | | 525,000 | 577,431 |
5% 1/1/32 | | 500,000 | 548,729 |
5% 1/1/33 | | 400,000 | 438,043 |
5% 1/1/34 | | 300,000 | 328,469 |
5% 1/1/35 | | 500,000 | 543,886 |
5% 1/1/36 | | 440,000 | 475,688 |
5% 1/1/37 | | 400,000 | 429,732 |
5% 1/1/39 | | 1,400,000 | 1,495,340 |
5% 1/1/40 | | 1,620,000 | 1,726,528 |
| Series 2020 D, 5% 12/1/27 | | 2,500,000 | 2,755,109 |
| Cuyahoga County Hosp. Rev. Series 2017: | | | |
| 5% 2/15/26 | | 1,750,000 | 1,835,656 |
| 5% 2/15/27 | | 1,700,000 | 1,793,724 |
| 5% 2/15/28 | | 2,385,000 | 2,501,942 |
| 5% 2/15/30 | | 3,000,000 | 3,136,424 |
| 5% 2/15/31 | | 1,500,000 | 1,565,893 |
| 5% 2/15/32 | | 1,450,000 | 1,510,380 |
| Fairfield County Hosp. Facilities Rev. (Fairfield Med. Ctr. Proj.) Series 2013, 5.25% 6/15/43 | | 5,000,000 | 4,872,662 |
| Franklin County Convention Facilities Auth. (Greater Columbus Convention Ctr. Hotel Expansion Proj.) Series 2019: | | | |
| 5% 12/1/44 | | 2,500,000 | 2,471,232 |
| 5% 12/1/51 | | 6,000,000 | 5,771,417 |
| Franklin County Convention Facilities Auth. Tax & Lease Rev. Series 2014: | | | |
| 5% 12/1/25 | | 1,250,000 | 1,298,675 |
| 5% 12/1/26 | | 3,045,000 | 3,158,397 |
| Franklin County Hosp. Facilities Rev.: | | | |
| (Ohiohealth Corp. Proj.) Series 2015, 5% 5/15/40 | | 3,600,000 | 3,648,155 |
| Bonds (U.S. Health Corp. of Columbus Proj.) Series 2011 B, 5%, tender 5/15/23 (c) | | 2,465,000 | 2,479,741 |
| Series 2016 C: | | | |
4% 11/1/40 | | 3,000,000 | 2,930,398 |
5% 11/1/34 | | 2,155,000 | 2,306,075 |
| Franklin County Ohio Sales Tax R Series 2018, 5% 6/1/48 | | 5,920,000 | 6,296,204 |
| Hamilton County Convention Facilities Auth. Rev. Series 2014, 5% 12/1/27 | | 3,825,000 | 3,848,743 |
| Hamilton County Healthcare Rev. (Life Enriching Cmntys. Proj.) Series 2016: | | | |
| 5% 1/1/31 | | 1,350,000 | 1,339,477 |
| 5% 1/1/36 | | 3,450,000 | 3,341,087 |
| Hamilton County Hosp. Facilities Rev. Series 2014, 5% 2/1/44 | | 775,000 | 768,255 |
| Kent State Univ. Revs.: | | | |
| Series 2016, 5% 5/1/30 | | 1,125,000 | 1,195,574 |
| Series 2020 A: | | | |
5% 5/1/45 | | 1,250,000 | 1,335,225 |
5% 5/1/50 | | 1,700,000 | 1,804,607 |
| Lake County Hosp. Facilities Rev. Series 2015, 5% 8/15/27 (Pre-Refunded to 8/15/25 @ 100) | | 770,000 | 810,987 |
| Lancaster Port Auth. Gas Rev.: | | | |
| Bonds Series 2019, 5%, tender 2/1/25 (c) | | 6,235,000 | 6,340,782 |
| Series 2019, 5% 8/1/24 | | 655,000 | 665,462 |
| Miami County Hosp. Facilities Rev. (Kettering Health Network Obligated Group Proj.) Series 2019: | | | |
| 5% 8/1/45 | | 5,500,000 | 5,628,815 |
| 5% 8/1/49 | | 1,750,000 | 1,779,997 |
| Miami Univ. Series 2022 A: | | | |
| 5% 9/1/25 | | 780,000 | 823,139 |
| 5% 9/1/26 | | 820,000 | 882,164 |
| 5% 9/1/27 | | 575,000 | 629,592 |
| 5% 9/1/28 | | 520,000 | 577,599 |
| 5% 9/1/29 | | 545,000 | 613,082 |
| 5% 9/1/30 | | 500,000 | 570,613 |
| 5% 9/1/31 | | 700,000 | 808,590 |
| 5% 9/1/32 | | 735,000 | 842,446 |
| 5% 9/1/33 | | 780,000 | 889,670 |
| 5% 9/1/34 | | 1,000,000 | 1,130,397 |
| Miamisburg City School District Series 2016: | | | |
| 5% 12/1/28 (Pre-Refunded to 12/1/25 @ 100) | | 500,000 | 533,450 |
| 5% 12/1/29 (Pre-Refunded to 12/1/25 @ 100) | | 300,000 | 320,070 |
| Middleburg Heights Hosp. Rev.: | | | |
| Series 2020 A, 4% 8/1/47 | | 3,000,000 | 2,634,055 |
| Series 2021 A, 4% 8/1/41 | | 3,000,000 | 2,782,634 |
| Milford Exempt Village School District Series 2015, 3.5% 12/1/31 | | 500,000 | 504,210 |
| Montgomery County Hosp. Rev.: | | | |
| (Kettering Health Network Obligated Group Proj.) Series 2021: | | | |
3% 8/1/51 | | 4,880,000 | 3,342,787 |
4% 8/1/37 | | 1,125,000 | 1,112,552 |
4% 8/1/41 | | 850,000 | 821,634 |
4% 8/1/51 | | 2,000,000 | 1,775,380 |
5% 8/1/32 | | 750,000 | 817,438 |
5% 8/1/36 | | 1,225,000 | 1,301,687 |
5% 8/1/38 | | 1,000,000 | 1,053,643 |
5% 8/1/39 | | 1,100,000 | 1,150,036 |
| Series 2021, 4% 8/1/46 | | 1,230,000 | 1,132,823 |
| Ohio Cap. Facilities Lease (Ohio Gen. Oblig. Proj.) Series 2017 A: | | | |
| 5% 10/1/32 | | 1,625,000 | 1,775,773 |
| 5% 10/1/33 | | 1,500,000 | 1,634,314 |
| 5% 10/1/35 | | 1,450,000 | 1,569,157 |
| 5% 10/1/36 | | 1,250,000 | 1,349,859 |
| 5% 10/1/37 | | 1,430,000 | 1,541,626 |
| Ohio Gen. Oblig. Series 2021 A: | | | |
| 5% 3/1/40 | | 1,345,000 | 1,489,008 |
| 5% 3/1/41 | | 2,000,000 | 2,203,313 |
| Ohio Higher Edl. Facility Commission Rev.: | | | |
| (Case Western Reserve Univ. Proj.) Series 2019 B: | | | |
5% 12/1/37 | | 835,000 | 905,307 |
5% 12/1/38 | | 1,100,000 | 1,188,593 |
5% 12/1/39 | | 775,000 | 834,133 |
| (Denison Univ. 2021 Proj.) Series 2021: | | | |
4% 11/1/39 | | 400,000 | 392,473 |
4% 11/1/45 | | 1,900,000 | 1,794,088 |
5% 11/1/30 | | 300,000 | 340,921 |
5% 11/1/33 | | 300,000 | 337,973 |
5% 11/1/35 | | 300,000 | 334,077 |
5% 11/1/41 | | 300,000 | 326,999 |
| (Kenyon College 2015 Proj.) Series 2015, 5% 7/1/41 | | 3,100,000 | 3,169,001 |
| (Kenyon College 2020 Proj.) Series 2020: | | | |
5% 7/1/38 | | 2,500,000 | 2,663,947 |
5% 7/1/39 | | 2,640,000 | 2,801,354 |
| (Kenyon College, Oh. Proj.) Series 2017: | | | |
4% 7/1/36 | | 400,000 | 392,814 |
4% 7/1/37 | | 450,000 | 436,905 |
5% 7/1/28 | | 400,000 | 427,065 |
5% 7/1/29 | | 735,000 | 784,553 |
5% 7/1/30 | | 300,000 | 320,139 |
5% 7/1/31 | | 400,000 | 426,466 |
5% 7/1/33 | | 650,000 | 690,647 |
5% 7/1/35 | | 1,550,000 | 1,633,790 |
5% 7/1/42 | | 1,400,000 | 1,454,067 |
| (Otterbein Univ. 2022 Proj.) Series 2022 A, 4% 12/1/46 | | 1,250,000 | 1,059,724 |
| (The College of Wooster 2018 Proj.) Series 2018: | | | |
5% 9/1/33 | | 1,445,000 | 1,580,716 |
5% 9/1/45 | | 4,255,000 | 4,453,127 |
| (Univ. of Dayton 2018 Proj.) Series A, 5% 12/1/48 | | 1,000,000 | 1,028,448 |
| (Univ. of Dayton 2020 Proj.) Series 2020: | | | |
4% 2/1/36 | | 900,000 | 903,038 |
5% 2/1/34 | | 1,000,000 | 1,092,576 |
5% 2/1/35 | | 800,000 | 867,978 |
| (Univ. of Dayton Proj.) Series 2018 B: | | | |
4% 12/1/33 | | 1,155,000 | 1,174,303 |
5% 12/1/29 | | 1,310,000 | 1,416,532 |
5% 12/1/31 | | 1,130,000 | 1,215,390 |
5% 12/1/35 | | 1,000,000 | 1,061,693 |
5% 12/1/36 | | 1,000,000 | 1,057,807 |
| (Xavier Univ. Proj.) Series 2015 C, 5% 5/1/29 | | 855,000 | 888,041 |
| Bonds (Case Western Reserve Univ. Proj.) Series 2019 C, 1.625%, tender 12/1/26 (c) | | 5,000,000 | 4,692,482 |
| Series 2019, 4% 10/1/49 | | 3,270,000 | 2,866,725 |
| Ohio Hosp. Facilities Rev.: | | | |
| Series 2019 B, 4% 1/1/40 | | 3,000,000 | 2,994,261 |
| Series 2021 B: | | | |
5% 1/1/30 | | 2,500,000 | 2,844,684 |
5% 1/1/31 | | 2,180,000 | 2,518,013 |
5% 1/1/32 | | 1,580,000 | 1,845,213 |
5% 1/1/33 | | 2,410,000 | 2,806,552 |
5% 1/1/34 | | 2,425,000 | 2,796,341 |
5% 1/1/35 | | 230,000 | 262,942 |
5% 1/1/36 | | 540,000 | 612,348 |
5% 1/1/37 | | 250,000 | 279,709 |
5% 1/1/38 | | 855,000 | 949,092 |
5% 1/1/39 | | 925,000 | 1,018,044 |
| Ohio Hosp. Rev.: | | | |
| Series 2013 A, 5% 1/15/28 | | 720,000 | 720,384 |
| Series 2020 A, 4% 1/15/50 | | 1,000,000 | 871,087 |
| Series 2020: | | | |
3% 1/15/45 | | 2,500,000 | 1,856,289 |
4% 11/15/37 | | 1,025,000 | 952,840 |
4% 11/15/39 | | 1,115,000 | 1,017,927 |
4% 11/15/40 | | 1,110,000 | 1,003,535 |
4% 11/15/41 | | 1,175,000 | 1,056,223 |
5% 11/15/33 | | 1,270,000 | 1,351,921 |
5% 11/15/35 | | 1,465,000 | 1,542,275 |
| Series 2021 A, 3% 1/15/46 | | 5,000,000 | 3,660,910 |
| Ohio Hsg. Fin. Agcy. Residential Mtg. Rev.: | | | |
| (Mtg. Backed Securities Prog.): | | | |
Series 2017 B, 4.5% 3/1/47 (b) | | 355,000 | 356,278 |
Series 2019 B, 4.5% 3/1/50 | | 4,600,000 | 4,662,866 |
| (Mtg.-Backed Securities Prog.) Series 2022 A: | | | |
5% 3/1/30 | | 400,000 | 446,405 |
5% 3/1/31 | | 600,000 | 677,628 |
5% 9/1/31 | | 640,000 | 726,199 |
| Series 2021 C, 3.25% 3/1/51 | | 7,850,000 | 7,664,590 |
| Series 2022 B, 5% 3/1/52 | | 3,000,000 | 3,126,575 |
| Ohio Parks & Recreation Cap. Facilities (Parks and Recreation Impt. Fund Proj.) Series 2022 A: | | | |
| 5% 12/1/27 | | 1,325,000 | 1,463,411 |
| 5% 12/1/28 | | 1,325,000 | 1,489,168 |
| 5% 12/1/29 | | 1,500,000 | 1,710,671 |
| 5% 12/1/30 | | 1,600,000 | 1,850,712 |
| 5% 12/1/31 | | 1,000,000 | 1,171,034 |
| Ohio Spl. Oblig.: | | | |
| (Administrative Bldg. Fund Projs.) Series 2020 B, 5% 4/1/39 | | 1,865,000 | 2,036,743 |
| (Ohio Gen. Oblig. Proj.) Series 2017 A: | | | |
5% 4/1/29 | | 2,535,000 | 2,758,849 |
5% 4/1/30 | | 2,250,000 | 2,441,172 |
5% 4/1/31 | | 2,000,000 | 2,164,940 |
5% 4/1/32 | | 1,115,000 | 1,204,179 |
5% 4/1/33 | | 1,850,000 | 1,988,794 |
5% 4/1/34 | | 1,000,000 | 1,072,145 |
| Series 2020 A: | | | |
5% 2/1/29 | | 2,875,000 | 3,235,167 |
5% 2/1/30 | | 1,045,000 | 1,193,458 |
| Series 2021 A: | | | |
5% 4/1/34 | | 1,430,000 | 1,638,524 |
5% 4/1/35 | | 1,660,000 | 1,887,062 |
5% 4/1/37 | | 1,680,000 | 1,875,370 |
5% 4/1/38 | | 1,000,000 | 1,108,120 |
5% 4/1/39 | | 1,000,000 | 1,103,067 |
5% 4/1/40 | | 1,110,000 | 1,218,617 |
5% 4/1/41 | | 750,000 | 819,698 |
| Ohio Tpk. Commission Tpk. Rev.: | | | |
| (Infrastructure Proj.) Series 2005 A, 0% 2/15/43 | | 10,000,000 | 3,952,953 |
| (Infrastructure Projs.): | | | |
Series 2022 A, 5% 2/15/39 | | 5,730,000 | 6,458,629 |
Series A3, 0% 2/15/37 | | 400,000 | 161,039 |
| Series A, 5% 2/15/46 | | 7,500,000 | 8,068,924 |
| Port Auth. Econ. Dev. Rev.: | | | |
| (Univ. of Northwestern Ohio Proj.) Series 2021, 4% 12/1/35 | | 1,300,000 | 1,209,155 |
| Series 2021, 4% 12/1/31 | | 710,000 | 697,160 |
| Ross County Hosp. Facilities Rev. (Adena Health Sys. Obligated Group Proj.) Series 2019, 5% 12/1/49 | | 2,000,000 | 1,915,314 |
| Scioto County Hosp. Facilities Rev. Series 2016: | | | |
| 5% 2/15/28 | | 5,030,000 | 5,248,614 |
| 5% 2/15/30 | | 3,860,000 | 3,989,557 |
| 5% 2/15/32 | | 2,550,000 | 2,616,818 |
| 5% 2/15/33 | | 2,460,000 | 2,514,320 |
| 5% 2/15/34 | | 4,450,000 | 4,540,237 |
| Univ. of Cincinnati Gen. Receipts: | | | |
| Series 2016 A: | | | |
5% 6/1/32 | | 745,000 | 796,340 |
5% 6/1/33 | | 800,000 | 854,057 |
5% 6/1/34 | | 585,000 | 622,963 |
| Series 2016 C, 5% 6/1/41 | | 2,585,000 | 2,707,412 |
| Series 2019 A, 3% 6/1/39 | | 3,000,000 | 2,541,173 |
| Univ. of Toledo Gen. Receipts Series 2018 A: | | | |
| 5% 6/1/26 | | 600,000 | 640,141 |
| 5% 6/1/27 | | 350,000 | 379,767 |
| Village of Bluffton Hosp. Facilities Blanchard Valley Reg Health Ctr. Series 2017: | | | |
| 4% 12/1/32 | | 1,500,000 | 1,514,350 |
| 5% 12/1/29 | | 825,000 | 874,107 |
| 5% 12/1/31 | | 750,000 | 793,182 |
| Washington County Hosp. Rev. Series 2022: | | | |
| 6% 12/1/28 | | 200,000 | 203,006 |
| 6% 12/1/29 | | 215,000 | 218,834 |
| 6% 12/1/30 | | 230,000 | 234,199 |
| 6% 12/1/31 | | 245,000 | 248,944 |
| Wright State Univ. Gen. Receipts Series 2022 A: | | | |
| 5% 5/1/24 (Build America Mutual Assurance Insured) | | 540,000 | 554,447 |
| 5% 5/1/25 (Build America Mutual Assurance Insured) | | 490,000 | 512,970 |
| 5% 5/1/26 (Build America Mutual Assurance Insured) | | 520,000 | 554,660 |
| 5% 5/1/27 (Build America Mutual Assurance Insured) | | 545,000 | 590,073 |
| 5% 5/1/28 (Build America Mutual Assurance Insured) | | 565,000 | 621,853 |
| 5% 5/1/29 (Build America Mutual Assurance Insured) | | 600,000 | 670,160 |
| 5% 5/1/30 (Build America Mutual Assurance Insured) | | 235,000 | 265,269 |
| 5% 5/1/31 (Build America Mutual Assurance Insured) | | 250,000 | 285,740 |
| 5% 5/1/32 (Build America Mutual Assurance Insured) | | 260,000 | 300,376 |
TOTAL OHIO | | | 458,185,375 |
| Puerto Rico - 1.1% | | | |
| Puerto Rico Commonwealth Aqueduct & Swr. Auth. Series 2021 B, 5% 7/1/37 (d) | | 1,455,000 | 1,374,225 |
| Puerto Rico Commonwealth Pub. Impt. Gen. Oblig. Series 2021 A1: | | | |
| 0% 7/1/33 | | 1,634,241 | 883,406 |
| 5.625% 7/1/27 | | 190,000 | 193,585 |
| 5.625% 7/1/29 | | 590,000 | 603,696 |
| 5.75% 7/1/31 | | 1,395,000 | 1,442,386 |
| Puerto Rico Sales Tax Fing. Corp. Sales Tax Rev. Series 2018 A1, 0% 7/1/31 | | 1,515,000 | 986,904 |
TOTAL PUERTO RICO | | | 5,484,202 |
| TOTAL MUNICIPAL BONDS (Cost $493,991,454) | | | 464,951,401 |
| | | | |
| Municipal Notes - 8.0% |
| | | Principal Amount (a) | Value ($) |
| Ohio - 8.0% | | | |
| Franklin County Hosp. Facilities Rev. Series 2022, 3.65% 1/3/23 (Liquidity Facility JPMorgan Chase Bank), VRDN (c) | | 24,000,000 | 23,999,986 |
| Montgomery County Hosp. Rev. Series 2019 C, 3.4% 1/3/23, LOC PNC Bank NA, VRDN (c) | | 2,400,000 | 2,400,000 |
| Ohio Higher Edl. Facility Commission Rev. (Cleveland Clinic Foundation Proj.) Series 2008 B4, 3.37% 1/3/23 (Liquidity Facility Barclays Bank PLC), VRDN (c) | | 15,300,000 | 15,300,000 |
| | | | |
| TOTAL MUNICIPAL NOTES (Cost $41,700,000) | | | 41,699,986 |
| | | | |
| TOTAL INVESTMENT IN SECURITIES - 97.1% (Cost $535,691,454) | 506,651,387 |
NET OTHER ASSETS (LIABILITIES) - 2.9% | 15,078,625 |
| NET ASSETS - 100.0% | 521,730,012 |
| | |
Security Type Abbreviations
| VRDN | - | VARIABLE RATE DEMAND NOTE (A debt instrument that is payable upon demand, either daily, weekly or monthly) |
Legend
| (a) | Amount is stated in United States dollars unless otherwise noted. |
| (b) | Private activity obligations whose interest is subject to the federal alternative minimum tax for individuals. |
| (c) | Coupon rates for floating and adjustable rate securities reflect the rates in effect at period end. |
| (d) | Security exempt from registration under Rule 144A of the Securities Act of 1933. These securities may be resold in transactions exempt from registration, normally to qualified institutional buyers. At the end of the period, the value of these securities amounted to $1,374,225 or 0.3% of net assets. |
Investment Valuation
The following is a summary of the inputs used, as of December 31, 2022, involving the Fund's assets and liabilities carried at fair value. The inputs or methodology used for valuing securities may not be an indication of the risk associated with investing in those securities. For more information on valuation inputs, and their aggregation into the levels used below, please refer to the Investment Valuation section in the accompanying Notes to Financial Statements.
| Valuation Inputs at Reporting Date: |
| Description | Total ($) | Level 1 ($) | Level 2 ($) | Level 3 ($) |
Investments in Securities: | | | | |
|
| Municipal Securities | 506,651,387 | - | 506,651,387 | - |
| Total Investments in Securities: | 506,651,387 | - | 506,651,387 | - |
Fidelity® Ohio Municipal Income Fund
| Statement of Assets and Liabilities |
| | | | December 31, 2022 |
| | | | | |
| Assets | | | | |
Investment in securities, at value - See accompanying schedule Unaffiliated issuers (cost $535,691,454): | | | $ | 506,651,387 |
| Cash | | | | 11,279,283 |
| Receivable for fund shares sold | | | | 468,545 |
| Interest receivable | | | | 5,819,409 |
| Prepaid expenses | | | | 584 |
| Other receivables | | | | 1,639 |
Total assets | | | | 524,220,847 |
| Liabilities | | | | |
| Payable for fund shares redeemed | | $1,856,250 | | |
| Distributions payable | | 376,902 | | |
| Accrued management fee | | 153,431 | | |
| Other affiliated payables | | 55,835 | | |
| Other payables and accrued expenses | | 48,417 | | |
| Total Liabilities | | | | 2,490,835 |
| Net Assets | | | $ | 521,730,012 |
| Net Assets consist of: | | | | |
| Paid in capital | | | $ | 554,311,435 |
| Total accumulated earnings (loss) | | | | (32,581,423) |
| Net Assets | | | $ | 521,730,012 |
Net Asset Value , offering price and redemption price per share ($521,730,012 ÷ 46,832,102 shares) | | | $ | 11.14 |
| | | | | |
| Statement of Operations |
| | | | Year ended December 31, 2022 |
| Investment Income | | | | |
| Interest | | | $ | 15,878,422 |
| Expenses | | | | |
| Management fee | $ | 2,062,336 | | |
| Transfer agent fees | | 618,681 | | |
| Accounting fees and expenses | | 143,988 | | |
| Custodian fees and expenses | | 7,363 | | |
| Independent trustees' fees and expenses | | 1,949 | | |
| Registration fees | | 22,644 | | |
| Audit | | 52,492 | | |
| Legal | | 2,956 | | |
| Miscellaneous | | 2,888 | | |
| Total expenses before reductions | | 2,915,297 | | |
| Expense reductions | | (18,334) | | |
| Total expenses after reductions | | | | 2,896,963 |
| Net Investment income (loss) | | | | 12,981,459 |
| Realized and Unrealized Gain (Loss) | | | | |
| Net realized gain (loss) on: | | | | |
| Investment Securities: | | | | |
| Unaffiliated issuers | | (3,655,544) | | |
| Total net realized gain (loss) | | | | (3,655,544) |
| Change in net unrealized appreciation (depreciation) on investment securities | | | | (69,553,192) |
| Net gain (loss) | | | | (73,208,736) |
| Net increase (decrease) in net assets resulting from operations | | | $ | (60,227,277) |
| Statement of Changes in Net Assets |
| |
| | Year ended December 31, 2022 | | Year ended December 31, 2021 |
| Increase (Decrease) in Net Assets | | | | |
| Operations | | | | |
| Net investment income (loss) | $ | 12,981,459 | $ | 14,475,478 |
| Net realized gain (loss) | | (3,655,544) | | 253,604 |
| Change in net unrealized appreciation (depreciation) | | (69,553,192) | | (3,814,007) |
| Net increase (decrease) in net assets resulting from operations | | (60,227,277) | | 10,915,075 |
| Distributions to shareholders | | (12,952,540) | | (14,819,628) |
| Share transactions | | | | |
| Proceeds from sales of shares | | 191,298,771 | | 107,404,517 |
| Reinvestment of distributions | | 8,354,939 | | 9,334,614 |
| Cost of shares redeemed | | (321,989,652) | | (97,656,138) |
Net increase (decrease) in net assets resulting from share transactions | | (122,335,942) | | 19,082,993 |
| Total increase (decrease) in net assets | | (195,515,759) | | 15,178,440 |
| | | | | |
| Net Assets | | | | |
| Beginning of period | | 717,245,771 | | 702,067,331 |
| End of period | $ | 521,730,012 | $ | 717,245,771 |
| | | | | |
| Other Information | | | | |
| Shares | | | | |
| Sold | | 16,957,245 | | 8,586,036 |
| Issued in reinvestment of distributions | | 736,204 | | 747,188 |
| Redeemed | | (28,417,832) | | (7,810,213) |
| Net increase (decrease) | | (10,724,383) | | 1,523,011 |
| | | | | |
Financial Highlights
| Fidelity® Ohio Municipal Income Fund |
| |
| Years ended December 31, | | 2022 | | 2021 | | 2020 | | 2019 | | 2018 |
Selected Per-Share Data | | | | | | | | | | |
| Net asset value, beginning of period | $ | 12.46 | $ | 12.53 | $ | 12.38 | $ | 11.89 | $ | 12.20 |
| Income from Investment Operations | | | | | | | | | | |
Net investment income (loss) A,B | | .251 | | .253 | | .287 | | .319 | | .321 |
| Net realized and unrealized gain (loss) | | (1.321) | | (.064) | | .235 | | .515 | | (.279) |
| Total from investment operations | | (1.070) | | .189 | | .522 | | .834 | | .042 |
| Distributions from net investment income | | (.250) | | (.253) | | (.287) | | (.319) | | (.321) |
| Distributions from net realized gain | | - | | (.006) | | (.085) | | (.025) | | (.031) |
| Total distributions | | (.250) | | (.259) | | (.372) | | (.344) | | (.352) |
| Net asset value, end of period | $ | 11.14 | $ | 12.46 | $ | 12.53 | $ | 12.38 | $ | 11.89 |
Total Return C | | (8.60)% | | 1.52% | | 4.28% | | 7.08% | | .39% |
Ratios to Average Net Assets B,D,E | | | | | | | | | | |
| Expenses before reductions | | .49% | | .48% | | .48% | | .48% | | .48% |
| Expenses net of fee waivers, if any | | .49% | | .48% | | .48% | | .48% | | .48% |
| Expenses net of all reductions | | .49% | | .48% | | .48% | | .48% | | .48% |
| Net investment income (loss) | | 2.19% | | 2.02% | | 2.31% | | 2.60% | | 2.70% |
| Supplemental Data | | | | | | | | | | |
| Net assets, end of period (000 omitted) | $ | 521,730 | $ | 717,246 | $ | 702,067 | $ | 672,948 | $ | 616,306 |
Portfolio turnover rate F | | 14% | | 6% | | 20% | | 10% | | 11% |
A Calculated based on average shares outstanding during the period.
B Net investment income (loss) is affected by the timing of the declaration of dividends by any underlying mutual funds or exchange-traded funds (ETFs). Net investment income (loss) of any mutual funds or ETFs is not included in the Fund's net investment income (loss) ratio.
C Total returns would have been lower if certain expenses had not been reduced during the applicable periods shown.
D Fees and expenses of any underlying mutual funds or exchange-traded funds (ETFs) are not included in the Fund's expense ratio. The Fund indirectly bears its proportionate share of these expenses.
E Expense ratios reflect operating expenses of the class. Expenses before reductions do not reflect amounts reimbursed, waived, or reduced through arrangements with the investment adviser, brokerage services, or other offset arrangements, if applicable, and do not represent the amount paid by the class during periods when reimbursements, waivers or reductions occur.
F Amount does not include the portfolio activity of any underlying mutual funds or exchange-traded funds (ETFs).
| Current 7-Day Yields |
| | | |
| Fidelity® Ohio Municipal Money Market Fund | 3.13% | |
| | | |
Yield refers to the income paid by the Fund over a given period. Yield for money market funds is usually for seven-day periods, as it is here, though it is expressed as an annual percentage rate. Past performance is no guarantee of future results. Yield will vary and it's possible to lose money investing in the Fund. | |
| Effective Maturity Diversification (% of Fund's Investments) |
| Days |
| 1 - 7 | 91.3 | |
| 31 - 60 | 8.7 | |
| Effective maturity is determined in accordance with the requirements of Rule 2a-7 under the Investment Company Act of 1940. |
Asset Allocation (% of Fund's net assets) |
|
Net Other Assets (Liabilities) - (0.1)%* |
*Net Other Assets (Liabilities) are not available in the pie chart. |
|
Fidelity® Ohio Municipal Money Market Fund
Showing Percentage of Net Assets
| Variable Rate Demand Note - 40.8% |
| | | Principal Amount (a) | Value ($) |
| Alabama - 1.0% | | | |
| Decatur Indl. Dev. Board Exempt Facilities Rev. (Nucor Steel Decatur LLC Proj.) Series 2003 A, 4.15% 1/6/23, VRDN (b)(c) | | 1,260,000 | 1,260,000 |
| West Jefferson Indl. Dev. Series 2008, 3.78% 1/6/23, VRDN (b) | | 200,000 | 200,000 |
TOTAL ALABAMA | | | 1,460,000 |
| Arizona - 0.3% | | | |
| Maricopa County Poll. Cont. Rev. Series 2009 C, 4% 1/6/23, VRDN (b) | | 400,000 | 400,000 |
| Kansas - 0.3% | | | |
| Burlington Envir. Impt. Rev. (Kansas City Pwr. and Lt. Co. Proj.): | | | |
| Series 2007 A, 3.68% 1/6/23, VRDN (b) | | 300,000 | 300,000 |
| Series 2007 B, 3.68% 1/6/23, VRDN (b) | | 100,000 | 100,000 |
TOTAL KANSAS | | | 400,000 |
| Louisiana - 1.0% | | | |
| Saint James Parish Gen. Oblig. (Nucor Steel Louisiana LLC Proj.) Series 2010 B1, 4.1% 1/6/23, VRDN (b) | | 1,500,000 | 1,500,000 |
| Ohio - 37.8% | | | |
| Cuyahoga County Health Care Facilities Rev. (The A.M. McGregor Home Proj.) Series 2014, 3.76% 1/6/23, LOC Northern Trust Co., VRDN (b) | | 11,735,000 | 11,735,000 |
| Franklin County Hosp. Facilities Rev.: | | | |
| Series 2009 B, 3.62% 1/6/23 (Liquidity Facility Barclays Bank PLC), VRDN (b) | | 2,400,000 | 2,400,000 |
| Series 2011 D, 3.6% 1/6/23, VRDN (b) | | 2,775,000 | 2,775,000 |
| Series 2013 B, 3.66% 1/6/23 (Liquidity Facility JPMorgan Chase Bank), VRDN (b) | | 3,000,000 | 3,000,000 |
| Series 2014, 3.66% 1/6/23 (Liquidity Facility JPMorgan Chase Bank), VRDN (b) | | 4,525,000 | 4,525,000 |
| Series 2018 C, 3.6% 1/6/23, VRDN (b) | | 700,000 | 700,000 |
| Hamilton County Healthcare Facilities Rev. (The Children's Home of Cincinnati Proj.) Series 2009, 3.47% 1/6/23, LOC U.S. Bank NA, Cincinnati, VRDN (b) | | 2,245,000 | 2,245,000 |
| Hamilton County Student Hsg. Rev. (Block 3 Proj.) Series 2004, 3.63% 1/6/23, LOC Citizens Bank NA, VRDN (b) | | 12,380,000 | 12,380,000 |
| Ohio Cap. Facilities Lease (Adult Correctional Bldg. Fund Proj.) Series 2019 C, 3.68% 1/6/23, VRDN (b) | | 5,900,000 | 5,900,000 |
| Ohio Higher Edl. Facility Commission Rev. Series 2013 B1, 3.6% 1/6/23, VRDN (b) | | 4,145,000 | 4,145,000 |
| Ohio Hsg. Fin. Agcy. Residential Mtg. Rev. Series 2016 H, 3.64% 1/6/23 (Liquidity Facility Fed. Home Ln. Bank, Cincinnati), VRDN (b)(c) | | 6,500,000 | 6,500,000 |
TOTAL OHIO | | | 56,305,000 |
| West Virginia - 0.4% | | | |
| West Virginia Econ. Dev. Auth. Solid Waste Disp. Facilities Rev.: | | | |
| (Appalachian Pwr. Co. Amos Proj.) Series 2008 B, 3.8% 1/6/23, VRDN (b)(c) | | 100,000 | 100,000 |
| (Appalachian Pwr. Co.- Mountaineer Proj.) Series 2008 A, 3.78% 1/6/23, VRDN (b)(c) | | 500,000 | 500,000 |
TOTAL WEST VIRGINIA | | | 600,000 |
| TOTAL VARIABLE RATE DEMAND NOTE (Cost $60,665,000) | | | 60,665,000 |
| | | | |
| Tender Option Bond - 44.7% |
| | | Principal Amount (a) | Value ($) |
| Colorado - 0.5% | | | |
| Colorado Health Facilities Auth. Rev. Bonds Participating VRDN Series 2022 004, 3.81% 2/10/23 (Liquidity Facility Barclays Bank PLC) (b)(d)(e) | | 700,000 | 700,000 |
| Connecticut - 0.3% | | | |
| Connecticut Gen. Oblig. Participating VRDN Series Floaters 016, 3.81% 2/10/23 (Liquidity Facility Barclays Bank PLC) (b)(d)(e) | | 400,000 | 400,000 |
| Florida - 0.1% | | | |
| Miami-Dade County Aviation Rev. Participating VRDN Series 2022 025, 3.84% 2/10/23 (Liquidity Facility Barclays Bank PLC) (b)(c)(d)(e) | | 100,000 | 100,000 |
| Kentucky - 0.1% | | | |
| CommonSpirit Health Participating VRDN Series MIZ 90 21, 3.76% 1/6/23 (Liquidity Facility Mizuho Cap. Markets LLC) (b)(d)(e) | | 200,000 | 200,000 |
| Maryland - 0.3% | | | |
| Univ. of Maryland Med. Sys., Participating VRDN Series 2022 031, 3.81% 2/10/23 (Liquidity Facility Barclays Bank PLC) (b)(d)(e) | | 500,000 | 500,000 |
| Michigan - 0.3% | | | |
| Eastern Michigan Univ. Revs. Participating VRDN Series Floater 046, 3.86% 1/6/23 (Liquidity Facility Barclays Bank PLC) (b)(d)(e) | | 500,000 | 500,000 |
| Missouri - 0.2% | | | |
| Kansas City Indl. Dev. Auth. Participating VRDN Series XG 03 96, 3.85% 1/6/23 (Liquidity Facility Deutsche Bank AG New York Branch) (b)(c)(d)(e) | | 300,000 | 300,000 |
| Ohio - 42.9% | | | |
| Allen County Hosp. Facilities Rev. Participating VRDN: | | | |
| Series Floaters E 134, 3.69% 1/6/23 (Liquidity Facility Royal Bank of Canada) (b)(d)(e) | | 2,830,000 | 2,830,000 |
| Series Floaters XF 25 16, 3.75% 1/6/23 (Liquidity Facility Toronto-Dominion Bank) (b)(d)(e) | | 3,600,000 | 3,600,000 |
| CommonSpirit Health Participating VRDN Series MIZ 90 20, 3.76% 1/6/23 (Liquidity Facility Mizuho Cap. Markets LLC) (b)(d)(e) | | 2,100,000 | 2,100,000 |
| Cuyahoga County Ctfs. of Prtn. Participating VRDN Series Floaters XG 02 06, 3.76% 1/6/23 (Liquidity Facility Bank of America NA) (b)(d)(e) | | 4,100,000 | 4,100,000 |
| Euclid City School District Participating VRDN Series G-39, 3.69% 1/6/23 (Liquidity Facility Royal Bank of Canada) (b)(d)(e) | | 2,100,000 | 2,100,000 |
| Franklin County Hosp. Facilities Rev. Participating VRDN Series 15 XF0244, 3.71% 1/6/23 (Liquidity Facility Toronto-Dominion Bank) (b)(d)(e) | | 2,670,000 | 2,670,000 |
| Green Local School District Summit Participating VRDN Series 2022 XL 03 31, 3.78% 1/6/23 (Liquidity Facility Bank of America NA) (b)(d)(e) | | 1,600,000 | 1,600,000 |
| Miami County Hosp. Facilities Rev. Participating VRDN Series Floaters XG 02 25, 3.7% 1/6/23 (Liquidity Facility Royal Bank of Canada) (b)(d)(e) | | 6,000,000 | 6,000,000 |
| Middletown Hosp. Facilities Rev. Participating VRDN Series Floaters 003, 3.81% 2/10/23 (Liquidity Facility Barclays Bank PLC) (b)(d)(e) | | 7,900,000 | 7,900,000 |
| Montgomery County Hosp. Rev. Participating VRDN Series Floaters E 132, 3.69% 1/6/23 (Liquidity Facility Royal Bank of Canada) (b)(d)(e) | | 6,800,000 | 6,800,000 |
| Northeast Ohio Reg'l. Swr. District Wastewtr. Rev. Participating VRDN: | | | |
| Series Floaters XF 07 18, 3.69% 1/6/23 (Liquidity Facility JPMorgan Chase Bank) (b)(d)(e) | | 3,750,000 | 3,750,000 |
| Series Floaters ZF 06 70, 3.69% 1/6/23 (Liquidity Facility Bank of America NA) (b)(d)(e) | | 3,100,000 | 3,100,000 |
| Ohio Gen. Oblig. Participating VRDN Series Floaters XF 25 91, 3.69% 1/6/23 (Liquidity Facility Citibank NA) (b)(d)(e) | | 2,000,000 | 2,000,000 |
| Ohio Hosp. Rev. Participating VRDN: | | | |
| Series 002, 3.81% 2/10/23 (Liquidity Facility Barclays Bank PLC) (b)(d)(e) | | 3,300,000 | 3,300,000 |
| Series C18, 3.7% 1/6/23 (Liquidity Facility Royal Bank of Canada) (b)(d)(e) | | 1,800,000 | 1,800,000 |
| Ohio State Univ. Gen. Receipts Participating VRDN Series XL 03 21, 3.7% 1/6/23 (Liquidity Facility Bank of America NA) (b)(d)(e) | | 2,100,000 | 2,100,000 |
| Univ. of Cincinnati Gen. Receipts Participating VRDN Series Floaters XF 24 38, 3.69% 1/6/23 (Liquidity Facility JPMorgan Chase Bank) (b)(d)(e) | | 4,000,000 | 4,000,000 |
| Upper Arlington City School District Participating VRDN Series Floaters XF 25 92, 3.45% 1/6/23 (Liquidity Facility Citibank NA) (b)(d)(e) | | 4,000,000 | 4,000,000 |
TOTAL OHIO | | | 63,750,000 |
| TOTAL TENDER OPTION BOND (Cost $66,450,000) | | | 66,450,000 |
| | | | |
| Investment Company - 14.6% |
| | | Shares | Value ($) |
Fidelity Municipal Cash Central Fund 3.72% (f)(g) (Cost $21,737,049) | | 21,733,176 | 21,737,049 |
| | | | |
| TOTAL INVESTMENT IN SECURITIES - 100.1% (Cost $148,852,049) | 148,852,049 |
NET OTHER ASSETS (LIABILITIES) - (0.1)% | (140,210) |
| NET ASSETS - 100.0% | 148,711,839 |
| | |
Security Type Abbreviations
| VRDN | - | VARIABLE RATE DEMAND NOTE (A debt instrument that is payable upon demand, either daily, weekly or monthly) |
The date shown for securities represents the date when principal payments must be paid, taking into account any call options exercised by the issuer and any permissible maturity shortening features other than interest rate resets.
Legend
| (a) | Amount is stated in United States dollars unless otherwise noted. |
| (b) | Coupon rates for floating and adjustable rate securities reflect the rates in effect at period end. |
| (c) | Private activity obligations whose interest is subject to the federal alternative minimum tax for individuals. |
| (d) | Provides evidence of ownership in one or more underlying municipal bonds. |
| (e) | Coupon rates are determined by re-marketing agents based on current market conditions. |
| (f) | Information in this report regarding holdings by state and security types does not reflect the holdings of the Fidelity Municipal Cash Central Fund. |
| (g) | Affiliated fund that is generally available only to investment companies and other accounts managed by Fidelity Investments. The rate quoted is the annualized seven-day yield of the fund at period end. A complete unaudited listing of the fund's holdings as of its most recent quarter end is available upon request. In addition, each Fidelity Central Fund's financial statements, which are not covered by the Fund's Report of Independent Registered Public Accounting Firm, are available on the SEC's website or upon request. |
Affiliated Central Funds
Fiscal year to date information regarding the Fund's investments in Fidelity Central Funds, including the ownership percentage, is presented below.
| Affiliate | Value, beginning of period ($) | Purchases ($) | Sales Proceeds ($) | Dividend Income ($) | Realized Gain (loss) ($) | Change in Unrealized appreciation (depreciation) ($) | Value, end of period ($) | % ownership, end of period |
| Fidelity Municipal Cash Central Fund 3.72% | 15,525,793 | 95,327,999 | 89,117,000 | 214,315 | 257 | - | 21,737,049 | 0.9% |
| Total | 15,525,793 | 95,327,999 | 89,117,000 | 214,315 | 257 | - | 21,737,049 | |
| | | | | | | | | |
Amounts in the dividend income column in the above table include any capital gain distributions from underlying funds, which are presented in the corresponding line item in the Statement of Operations, if applicable.
Amounts included in the purchases and sales proceeds columns may include in-kind transactions, if applicable.
Investment Valuation
All investments are categorized as Level 2 under the Fair Value Hierarchy. The inputs or methodology used for valuing securities may not be an indication of the risk associated with investing in these securities. For more information on valuation inputs, refer to the Investment Valuation section in the accompanying Notes to Financial Statements.
Fidelity® Ohio Municipal Money Market Fund
| Statement of Assets and Liabilities |
| | | | December 31, 2022 |
| | | | | |
| Assets | | | | |
| Investment in securities, at value - See accompanying schedule: | | | | |
Unaffiliated issuers (cost $127,115,000) | | $127,115,000 | | |
Fidelity Central Funds (cost $21,737,049) | | 21,737,049 | | |
| | | | | |
| Total Investment in Securities (cost $148,852,049) | | | $ | 148,852,049 |
| Interest receivable | | | | 538,838 |
| Distributions receivable from Fidelity Central Funds | | | | 57,389 |
| Prepaid expenses | | | | 71 |
Total assets | | | | 149,448,347 |
| Liabilities | | | | |
| Payable to custodian bank | | 563,119 | | |
| Payable for fund shares redeemed | | 30,274 | | |
| Distributions payable | | 22,840 | | |
| Accrued management fee | | 44,063 | | |
| Other affiliated payables | | 19,299 | | |
| Other payables and accrued expenses | | 56,913 | | |
| Total Liabilities | | | | 736,508 |
| Net Assets | | | $ | 148,711,839 |
| Net Assets consist of: | | | | |
| Paid in capital | | | $ | 148,740,377 |
| Total accumulated earnings (loss) | | | | (28,538) |
| Net Assets | | | $ | 148,711,839 |
Net Asset Value , offering price and redemption price per share ($148,711,839 ÷ 148,558,571 shares) | | | $ | 1.00 |
| | | | | |
| Statement of Operations |
| | | | Year ended December 31, 2022 |
| Investment Income | | | | |
| Interest | | | $ | 1,818,182 |
| Income from Fidelity Central Funds | | | | 214,204 |
| Total Income | | | | 2,032,386 |
| Expenses | | | | |
| Management fee | $ | 603,216 | | |
| Transfer agent fees | | 237,969 | | |
| Accounting fees and expenses | | 27,050 | | |
| Custodian fees and expenses | | 2,165 | | |
| Independent trustees' fees and expenses | | 565 | | |
| Registration fees | | 22,180 | | |
| Audit | | 40,131 | | |
| Legal | | 8,680 | | |
| Miscellaneous | | 25,192 | | |
| Total expenses before reductions | | 967,148 | | |
| Expense reductions | | (157,879) | | |
| Total expenses after reductions | | | | 809,269 |
| Net Investment income (loss) | | | | 1,223,117 |
| Realized and Unrealized Gain (Loss) | | | | |
| Net realized gain (loss) on: | | | | |
| Investment Securities: | | | | |
| Unaffiliated issuers | | (20,776) | | |
| Fidelity Central Funds | | 257 | | |
| Capital gain distributions from Fidelity Central Funds | | 111 | | |
| Total net realized gain (loss) | | | | (20,408) |
| Net increase in net assets resulting from operations | | | $ | 1,202,709 |
| Statement of Changes in Net Assets |
| |
| | Year ended December 31, 2022 | | Year ended December 31, 2021 |
| Increase (Decrease) in Net Assets | | | | |
| Operations | | | | |
| Net investment income (loss) | $ | 1,223,117 | $ | 19,729 |
| Net realized gain (loss) | | (20,408) | | 37,277 |
Net increase in net assets resulting from operations | | 1,202,709 | | 57,006 |
| Distributions to shareholders | | (1,372,278) | | (28,814) |
| Share transactions | | | | |
| Proceeds from sales of shares | | 24,014,270 | | 11,480,697 |
| Reinvestment of distributions | | 1,292,908 | | 27,621 |
| Cost of shares redeemed | | (61,081,966) | | (36,694,265) |
Net increase (decrease) in net assets and shares resulting from share transactions | | (35,774,788) | | (25,185,947) |
| Total increase (decrease) in net assets | | (35,944,357) | | (25,157,755) |
| | | | | |
| Net Assets | | | | |
| Beginning of period | | 184,656,196 | | 209,813,951 |
| End of period | $ | 148,711,839 | $ | 184,656,196 |
| | | | | |
| Other Information | | | | |
| Shares | | | | |
| Sold | | 24,014,270 | | 11,480,697 |
| Issued in reinvestment of distributions | | 1,292,908 | | 27,621 |
| Redeemed | | (61,081,966) | | (36,694,265) |
| Net increase (decrease) | | (35,774,788) | | (25,185,947) |
| | | | | |
Financial Highlights
| Fidelity® Ohio Municipal Money Market Fund |
| |
| Years ended December 31, | | 2022 | | 2021 | | 2020 | | 2019 | | 2018 |
Selected Per-Share Data | | | | | | | | | | |
| Net asset value, beginning of period | $ | 1.00 | $ | 1.00 | $ | 1.00 | $ | 1.00 | $ | 1.00 |
| Income from Investment Operations | | | | | | | | | | |
Net investment income (loss) A | | .007 | | - B | | .003 | | .011 | | .010 |
| Net realized and unrealized gain (loss) | | .001 C | | - B | | - | | .001 | | - B |
| Total from investment operations | | .008 | | - B | | .003 | | .012 | | .010 |
| Distributions from net investment income | | (.008) | | - B | | (.003) | | (.011) | | (.010) |
| Distributions from net realized gain | | (.001) | | - B | | - | | (.001) | | - |
| Total distributions | | (.008) D | | - B | | (.003) | | (.012) | | (.010) |
| Net asset value, end of period | $ | 1.00 | $ | 1.00 | $ | 1.00 | $ | 1.00 | $ | 1.00 |
Total Return E | | .85% | | .02% | | .32% | | 1.16% | | .98% |
Ratios to Average Net Assets A,F,G | | | | | | | | | | |
| Expenses before reductions | | .56% | | .53% | | .53% | | .53% | | .53% |
| Expenses net of fee waivers, if any | | .47% | | .10% | | .38% | | .53% | | .53% |
| Expenses net of all reductions | | .47% | | .10% | | .38% | | .53% | | .53% |
| Net investment income (loss) | | .71% | | .01% | | .33% | | 1.08% | | .96% |
| Supplemental Data | | | | | | | | | | |
| Net assets, end of period (000 omitted) | $ | 148,712 | $ | 184,656 | $ | 209,814 | $ | 239,940 | $ | 298,736 |
A Net investment income (loss) is affected by the timing of the declaration of dividends by any underlying mutual funds or exchange-traded funds (ETFs). Net investment income (loss) of any mutual funds or ETFs is not included in the Fund's net investment income (loss) ratio.
B Amount represents less than $.0005 per share.
C The amount shown for a share outstanding does not correspond with the aggregate net gain (loss) on investments for the period due to the timing of sales and repurchases of shares in relation to fluctuating market values of the investments of the Fund.
D Total distributions per share do not sum due to rounding.
E Total returns would have been lower if certain expenses had not been reduced during the applicable periods shown.
F Fees and expenses of any underlying mutual funds or exchange-traded funds (ETFs) are not included in the Fund's expense ratio. The Fund indirectly bears its proportionate share of these expenses. For additional expense information related to investments in Fidelity Central Funds, please refer to the "Investments in Fidelity Central Funds" note found in the Notes to Financial Statements section of the most recent Annual or Semi-Annual report.
G Expense ratios reflect operating expenses of the class. Expenses before reductions do not reflect amounts reimbursed, waived, or reduced through arrangements with the investment adviser, brokerage services, or other offset arrangements, if applicable, and do not represent the amount paid by the class during periods when reimbursements, waivers or reductions occur.
For the period ended December 31, 2022
1. Organization.
Fidelity Ohio Municipal Income Fund (the Income Fund) is a fund of Fidelity Municipal Trust. Fidelity Ohio Municipal Money Market Fund (the Money Market Fund) is a fund of Fidelity Municipal Trust II. Each Trust is registered under the Investment Company Act of 1940, as amended (the 1940 Act), as an open-end management investment company. Fidelity Municipal Trust and Fidelity Municipal Trust II (the Trusts) are organized as a Massachusetts business trust and a Delaware statutory trust, respectively. Each Fund is authorized to issue an unlimited number of shares. Shares of the Money Market Fund are only available for purchase by retail shareholders. Share transactions on the Statement of Changes in Net Assets may contain exchanges between affiliated funds. Each Fund may be affected by economic and political developments in the state of Ohio.
Effective after the close of business on July 15, 2022, Fidelity Ohio Municipal Money Market Fund was closed to new accounts with certain exceptions.
2. Investments in Fidelity Central Funds.
Funds may invest in Fidelity Central Funds, which are open-end investment companies generally available only to other investment companies and accounts managed by the investment adviser and its affiliates. The Schedule of Investments lists any Fidelity Central Funds held as an investment as of period end, but does not include the underlying holdings of each Fidelity Central Fund. An investing fund indirectly bears its proportionate share of the expenses of the underlying Fidelity Central Funds.
Based on its investment objective, each Fidelity Central Fund may invest or participate in various investment vehicles or strategies that are similar to those of the investing fund. These strategies are consistent with the investment objectives of the investing fund and may involve certain economic risks which may cause a decline in value of each of the Fidelity Central Funds and thus a decline in the value of the investing fund.
| Fidelity Central Fund | Investment Manager | Investment Objective | Investment Practices | Expense Ratio A |
| Fidelity Money Market Central Funds | Fidelity Management & Research Company LLC (FMR) | Each fund seeks to obtain a high level of current income consistent with the preservation of capital and liquidity. | Short-term Investments | Less than .005% |
A Expenses expressed as a percentage of average net assets and are as of each underlying Central Fund's most recent annual or semi-annual shareholder report.
A complete unaudited list of holdings for each Fidelity Central Fund is available upon request or at the Securities and Exchange Commission website at www.sec.gov. In addition, the financial statements of the Fidelity Central Funds which contain the significant accounting policies (including investment valuation policies) of those funds, and are not covered by the Report of Independent Registered Public Accounting Firm, are available on the Securities and Exchange Commission website or upon request.
3. Significant Accounting Policies.
Each Fund is an investment company and applies the accounting and reporting guidance of the Financial Accounting Standards Board (FASB) Accounting Standards Codification Topic 946 Financial Services - Investment Companies . The financial statements have been prepared in conformity with accounting principles generally accepted in the United States of America (GAAP), which require management to make certain estimates and assumptions at the date of the financial statements. Actual results could differ from those estimates. Subsequent events, if any, through the date that the financial statements were issued have been evaluated in the preparation of the financial statements. Each Fund's Schedule of Investments lists any underlying mutual funds or exchange-traded funds (ETFs) but does not include the underlying holdings of these funds. The following summarizes the significant accounting policies of each Fund:
Investment Valuation. Investments are valued as of 4:00 p.m. Eastern time on the last calendar day of the period. The Board of Trustees (the Board) has designated the Income Fund's investment adviser as the valuation designee responsible for the fair valuation function and performing fair value determinations as needed. The investment adviser has established a Fair Value Committee (the Committee) to carry out the day-to-day fair valuation responsibilities and has adopted policies and procedures to govern the fair valuation process and the activities of the Committee. In accordance with these fair valuation policies and procedures, which have been approved by the Board, the Income Fund attempts to obtain prices from one or more third party pricing services or brokers to value its investments. When current market prices, quotations or currency exchange rates are not readily available or reliable, investments will be fair valued in good faith by the Committee, in accordance with the policies and procedures. Factors used in determining fair value vary by investment type and may include market or investment specific events, transaction data, estimated cash flows, and market observations of comparable investments. The frequency that the fair valuation procedures are used cannot be predicted and they may be utilized to a significant extent. The Committee manages the Income Fund's fair valuation practices and maintains the fair valuation policies and procedures. The Income Fund's investment adviser reports to the Board information regarding the fair valuation process and related material matters.
Each Fund categorizes the inputs to valuation techniques used to value its investments into a disclosure hierarchy consisting of three levels as shown below:
Level 1 - unadjusted quoted prices in active markets for identical investments
Level 2 - other significant observable inputs (including quoted prices for similar investments, interest rates, prepayment speeds, etc.)
Level 3 - unobservable inputs (including the Fund's own assumptions based on the best information available)
Valuation techniques used to value each Fund's investments by major category are as follows:
For the Income Fund, debt securities, including restricted securities, are valued based on evaluated prices received from third party pricing services or from brokers who make markets in such securities. Municipal securities are valued by pricing services who utilize matrix pricing which considers yield or price of bonds of comparable quality, coupon, maturity and type or by broker-supplied prices. When independent prices are unavailable or unreliable, debt securities may be valued utilizing pricing methodologies which consider similar factors that would be used by third party pricing services. Debt securities are generally categorized as Level 2 in the hierarchy but may be Level 3 depending on the circumstances.
Investments in open-end mutual funds, including the Fidelity Central Funds, are valued at their closing net asset value (NAV) each business day and are categorized as Level 1 in the hierarchy.
For the Money Market Fund, as permitted by compliance with certain conditions under Rule 2a-7 of the 1940 Act, securities are valued at amortized cost, which approximates fair value. The amortized cost of an instrument is determined by valuing it at its original cost and thereafter amortizing any discount or premium from its face value at a constant rate until maturity. Securities held by a money market fund are generally high quality and liquid; however, they are reflected as Level 2 because the inputs used to determine fair value are not quoted prices in an active market.
For the Income Fund, changes in valuation techniques may result in transfers in or out of an assigned level within the disclosure hierarchy. The aggregate value of investments by input level as of December 31, 2022 is included at the end of the Fund's Schedule of Investments.
Investment Transactions and Income. For financial reporting purposes, the Funds' investment holdings and NAV include trades executed through the end of the last business day of the period. The NAV per share for processing shareholder transactions is calculated as of the close of business of the New York Stock Exchange (NYSE), normally 4:00 p.m. Eastern time and includes trades executed through the end of the prior business day for the Income Fund and trades executed through the end of the current business day for the Money Market Fund. Gains and losses on securities sold are determined on the basis of identified cost. Income and capital gain distributions from Fidelity Central Funds, if any, are recorded on the ex-dividend date. Interest income is accrued as earned and includes coupon interest and amortization of premium and accretion of discount on debt securities as applicable. Debt obligations may be placed on non-accrual status and related interest income may be reduced by ceasing current accruals and writing off interest receivables when the collection of all or a portion of interest has become doubtful based on consistently applied procedures. A debt obligation is removed from non-accrual status when the issuer resumes interest payments or when collectability of interest is reasonably assured.
Expenses. Expenses directly attributable to a fund are charged to that fund. Expenses attributable to more than one fund are allocated among the respective funds on the basis of relative net assets or other appropriate methods. Expenses included in the accompanying financial statements reflect the expenses of that fund and do not include any expenses associated with any underlying mutual funds or exchange-traded funds. Although not included in a fund's expenses, a fund indirectly bears its proportionate share of these expenses through the net asset value of each underlying mutual fund or exchange-traded fund. Expense estimates are accrued in the period to which they relate and adjustments are made when actual amounts are known.
Income Tax Information and Distributions to Shareholders. Each year, each Fund intends to qualify as a regulated investment company under Subchapter M of the Internal Revenue Code, including distributing substantially all of its taxable income and realized gains. As a result, no provision for U.S. Federal income taxes is required. As of December 31, 2022, each Fund did not have any unrecognized tax benefits in the financial statements; nor is each Fund aware of any tax positions for which it is reasonably possible that the total amounts of unrecognized tax benefits will significantly change in the next twelve months. Each Fund files a U.S. federal tax return, in addition to state and local tax returns as required. Each Fund's federal income tax returns are subject to examination by the Internal Revenue Service (IRS) for a period of three fiscal years after they are filed. State and local tax returns may be subject to examination for an additional fiscal year depending on the jurisdiction.
Distributions are declared and recorded daily and paid monthly from net investment income. Distributions from realized gains, if any, are declared and recorded on the ex-dividend date. Income and capital gain distributions are determined in accordance with income tax regulations, which may differ from GAAP.
Capital accounts within the financial statements are adjusted for permanent book-tax differences. These adjustments have no impact on net assets or the results of operations. Capital accounts are not adjusted for temporary book-tax differences which will reverse in a subsequent period.
Book-tax differences are primarily due to market discount and capital loss carryforwards and losses deferred due to excise tax regulations.
The Funds purchase municipal securities whose interest, in the opinion of the issuer, is free from federal income tax. There is no assurance that the IRS will agree with this opinion. In the event the IRS determines that the issuer does not comply with relevant tax requirements, interest payments from a security could become federally taxable, possibly retroactively to the date the security was issued.
As of period end, the cost and unrealized appreciation (depreciation) in securities, and derivatives if applicable, for federal income tax purposes were as follows for each Fund:
| | Tax cost | Gross unrealized appreciation | Gross unrealized depreciation | Net unrealized appreciation (depreciation) |
| Fidelity Ohio Municipal Income Fund. | $535,658,638 | $2,677,616 | $(31,684,867) | $(29,007,251) |
Fidelity Ohio Municipal Money Market Fund | 148,852,049 | - | - | - |
The tax-based components of distributable earnings as of period end were as follows for each Fund:
| | Undistributed tax-exempt income | Capital loss carryforward | Net unrealized appreciation (depreciation) on securities and other investments |
| Fidelity Ohio Municipal Income Fund. | $86,359 | $(3,660,531) | $(29,007,251) |
Fidelity Ohio Municipal Money Market Fund | - | (20,408) | - |
Capital loss carryforwards are only available to offset future capital gains of the Funds to the extent provided by regulations and may be limited. The capital loss carryforward information presented below, including any applicable limitation, is estimated as of fiscal period end and is subject to adjustment.
| | Short-term | Long-term | Total capital loss carryforward |
| Fidelity Ohio Municipal Income Fund. | $(1,493,502) | $(2,167,029) | $ (3,660,531) |
Fidelity Ohio Municipal Money Market Fund | (20,408) | - | (20,408) |
The tax character of distributions paid was as follows:
| December 31, 2022 | | | | | |
| | Tax-Exempt Income | Ordinary Income | Long-term Capital Gains | Tax Return of Capital | Total |
| Fidelity Ohio Municipal Income Fund. | $12,952,540 | $- | $- | $- | $12,952,540 |
Fidelity Ohio Municipal Money Market Fund | 1,231,041 | 141,237 | - | - | 1,372,278 |
| December 31, 2021 | | | |
| | Tax-Exempt Income | Long-term Capital Gains | Total |
| Fidelity Ohio Municipal Income Fund. | $14,473,072 | $346,556 | $14,819,628 |
Fidelity Ohio Municipal Money Market Fund | 19,535 | 9,279 | 28,814 |
Restricted Securities (including Private Placements). Funds may invest in securities that are subject to legal or contractual restrictions on resale. These securities generally may be resold in transactions exempt from registration or to the public if the securities are registered. Disposal of these securities may involve time-consuming negotiations and expense, and prompt sale at an acceptable price may be difficult. Information regarding restricted securities held at period end is included at the end of the Schedule of Investments, if applicable.
4. Purchases and Sales of Investments.
Purchases and sales of securities, other than short-term securities and in-kind transactions, as applicable, are noted in the table below.
| | Purchases ($) | Sales ($) |
| Fidelity Ohio Municipal Income Fund | 83,227,379 | 249,693,983 |
5. Fees and Other Transactions with Affiliates.
Management Fee. Fidelity Management & Research Company LLC (the investment adviser) and its affiliates provide the Funds with investment management related services for which the Funds pay a monthly management fee. The management fee is the sum of an individual fund fee rate and an annualized group fee rate. The individual fund fee rate is applied to each Fund's average net assets. The group fee rate is based upon the monthly average net assets of a group of registered investment companies with which the investment adviser has management contracts. The group fee rate decreases as assets under management increase and increases as assets under management decrease. For the reporting period, each Fund's annual management fee rate expressed as a percentage of each Fund's average net assets was as follows:
| | Individual Rate | Group Rate | Total |
| Fidelity Ohio Municipal Income Fund | .25% | .10% | .35% |
| Fidelity Ohio Municipal Money Market Fund | .25% | .10% | .35% |
During the period, the investment adviser or its affiliates waived a portion of these fees.
Transfer Agent Fees. Fidelity Investments Institutional Operations Company LLC (FIIOC), an affiliate of the investment adviser, is the transfer, dividend disbursing and shareholder servicing agent for the Funds. FIIOC receives account fees and asset-based fees that vary according to account size and type of account. FIIOC pays for typesetting, printing and mailing of shareholder reports, except proxy statements. For the period, the transfer agent fees were equivalent to the following annual rates expressed as a percentage of average net assets:
| Fidelity Ohio Municipal Income Fund | .10% |
| Fidelity Ohio Municipal Money Market Fund | .14% |
During the period, the investment adviser or its affiliates waived a portion of these fees.
Accounting Fees. Fidelity Service Company, Inc. (FSC), an affiliate of the investment adviser, maintains each Fund's accounting records. The accounting fee is based on the level of average net assets for each month. For the period, the fees were equivalent to the following annual rates:
| | % of Average Net Assets |
| Fidelity Ohio Municipal Income Fund | .02 |
| Fidelity Ohio Municipal Money Market Fund | .02 |
Interfund Trades. Funds may purchase from or sell securities to other Fidelity Funds under procedures adopted by the Board. The procedures have been designed to ensure these interfund trades are executed in accordance with Rule 17a-7 of the 1940 Act. For the Income Fund, any interfund trades are included within the respective purchases and sales amounts shown in the Purchases and Sales of Investments note. Interfund trades during the period are noted in the table below.
| | Purchases ($) | Sales ($) | Realized Gain (Loss) ($) |
| Fidelity Ohio Municipal Income Fund | - | - | - |
| Fidelity Ohio Municipal Money Market Fund | 9,380,000 | 3,200,000 | - |
6. Committed Line of Credit.
Certain Funds participate with other funds managed by the investment adviser or an affiliate in a $4.25 billion credit facility (the "line of credit") to be utilized for temporary or emergency purposes to fund shareholder redemptions or for other short-term liquidity purposes. The participating funds have agreed to pay commitment fees on their pro-rata portion of the line of credit, which are reflected in Miscellaneous expenses on the Statement of Operations, and are listed below. During the period, there were no borrowings on this line of credit.
| | Amount |
| Fidelity Ohio Municipal Income Fund | $1,089 |
7. Expense Reductions.
The investment adviser or its affiliates voluntarily agreed to waive certain fees for the Money Market Fund in order to avoid a negative yield. Such arrangements may be discontinued by the investment adviser at any time. For the period, the amount of the waiver was $154,753.
Through arrangements with each applicable Fund's custodian, credits realized as a result of certain uninvested cash balances were used to reduce each applicable Fund's expenses. All of the applicable expense reductions are noted in the table below.
| | Custodian credits |
Fidelity Ohio Municipal Income Fund . | $7,363 |
In addition, during the period the investment adviser or an affiliate reimbursed and/or waived a portion of operating expenses as follows:
| | Amount |
| Fidelity Ohio Municipal Income Fund | $10,971 |
| Fidelity Ohio Municipal Money Market Fund | 3,126 |
8. Other.
A fund's organizational documents provide former and current trustees and officers with a limited indemnification against liabilities arising in connection with the performance of their duties to the fund. In the normal course of business, a fund may also enter into contracts that provide general indemnifications. A fund's maximum exposure under these arrangements is unknown as this would be dependent on future claims that may be made against a fund. The risk of material loss from such claims is considered remote.
In July 2022, the Board of Trustees approved a Plan of Liquidation and Dissolution for Fidelity Ohio Municipal Money Market Fund. The Fund distributed all of its net assets to its shareholders on January 13, 2023. The Fund was closed to new accounts on December 1, 2022.
9. Risk and Uncertainties.
Many factors affect a fund's performance. Developments that disrupt global economies and financial markets, such as pandemics, epidemics, outbreaks of infectious diseases, war, terrorism, and environmental disasters, may significantly affect a fund's investment performance. The effects of these developments to a fund will be impacted by the types of securities in which a fund invests, the financial condition, industry, economic sector, and geographic location of an issuer, and a fund's level of investment in the securities of that issuer.
To the Board of Trustees of Fidelity Municipal Trust and Fidelity Municipal Trust II and Shareholders of Fidelity Ohio Municipal Income Fund and Fidelity Ohio Municipal Money Market Fund
Opinion on the Financial Statements
We have audited the accompanying statements of assets and liabilities, including the schedules of investments, of Fidelity Ohio Municipal Income Fund (one of the funds constituting Fidelity Municipal Trust) and Fidelity Ohio Municipal Money Market Fund (one of the funds constituting Fidelity Municipal Trust II) (hereafter collectively referred to as the "Funds") as of December 31, 2022, the related statements of operations for the year ended December 31, 2022, the statements of changes in net assets for each of the two years in the period ended December 31, 2022, including the related notes, and the financial highlights for each of the five years in the period ended December 31, 2022 (collectively referred to as the "financial statements"). In our opinion, the financial statements present fairly, in all material respects, the financial position of each of the Funds as of December 31, 2022, the results of each of their operations for the year then ended, the changes in each of their net assets for each of the two years in the period ended December 31, 2022 and each of the financial highlights for each of the five years in the period ended December 31, 2022 in conformity with accounting principles generally accepted in the United States of America.
Basis for Opinion
These financial statements are the responsibility of the Funds' management. Our responsibility is to express an opinion on the Funds' financial statements based on our audits. We are a public accounting firm registered with the Public Company Accounting Oversight Board (United States) (PCAOB) and are required to be independent with respect to the Funds in accordance with the U.S. federal securities laws and the applicable rules and regulations of the Securities and Exchange Commission and the PCAOB.
We conducted our audits of these financial statements in accordance with the standards of the PCAOB. Those standards require that we plan and perform the audit to obtain reasonable assurance about whether the financial statements are free of material misstatement, whether due to error or fraud.
Our audits included performing procedures to assess the risks of material misstatement of the financial statements, whether due to error or fraud, and performing procedures that respond to those risks. Such procedures included examining, on a test basis, evidence regarding the amounts and disclosures in the financial statements. Our audits also included evaluating the accounting principles used and significant estimates made by management, as well as evaluating the overall presentation of the financial statements. Our procedures included confirmation of securities owned as of December 31, 2022 by correspondence with the custodian. We believe that our audits provide a reasonable basis for our opinions.
/s/ PricewaterhouseCoopers LLP
Boston, Massachusetts
February 10, 2023
We have served as the auditor of one or more investment companies in the Fidelity group of funds since 1932.
The Trustees, Members of the Advisory Board (if any), and officers of the trusts and funds, as applicable, are listed below. The Board of Trustees governs each fund and is responsible for protecting the interests of shareholders. The Trustees are experienced executives who meet periodically throughout the year to oversee each fund's activities, review contractual arrangements with companies that provide services to each fund, oversee management of the risks associated with such activities and contractual arrangements, and review each fund's performance. Each of the Trustees oversees 295 funds.
The Trustees hold office without limit in time except that (a) any Trustee may resign; (b) any Trustee may be removed by written instrument, signed by at least two-thirds of the number of Trustees prior to such removal; (c) any Trustee who requests to be retired or who has become incapacitated by illness or injury may be retired by written instrument signed by a majority of the other Trustees; and (d) any Trustee may be removed at any special meeting of shareholders by a two-thirds vote of the outstanding voting securities of the trust. Each Trustee who is not an interested person (as defined in the 1940 Act) of the trust and the funds is referred to herein as an Independent Trustee. Each Independent Trustee shall retire not later than the last day of the calendar year in which his or her 75th birthday occurs. The Independent Trustees may waive this mandatory retirement age policy with respect to individual Trustees. Officers and Advisory Board Members hold office without limit in time, except that any officer or Advisory Board Member may resign or may be removed by a vote of a majority of the Trustees at any regular meeting or any special meeting of the Trustees. Except as indicated, each individual has held the office shown or other offices in the same company for the past five years.
The funds' Statement of Additional Information (SAI) includes more information about the Trustees. To request a free copy, call Fidelity at 1-800-544-8544.
Experience, Skills, Attributes, and Qualifications of the Trustees. The Governance and Nominating Committee has adopted a statement of policy that describes the experience, qualifications, attributes, and skills that are necessary and desirable for potential Independent Trustee candidates (Statement of Policy). The Board believes that each Trustee satisfied at the time he or she was initially elected or appointed a Trustee, and continues to satisfy, the standards contemplated by the Statement of Policy. The Governance and Nominating Committee also engages professional search firms to help identify potential Independent Trustee candidates who have the experience, qualifications, attributes, and skills consistent with the Statement of Policy. From time to time, additional criteria based on the composition and skills of the current Independent Trustees, as well as experience or skills that may be appropriate in light of future changes to board composition, business conditions, and regulatory or other developments, have also been considered by the professional search firms and the Governance and Nominating Committee. In addition, the Board takes into account the Trustees' commitment and participation in Board and committee meetings, as well as their leadership of standing and ad hoc committees throughout their tenure.
In determining that a particular Trustee was and continues to be qualified to serve as a Trustee, the Board has considered a variety of criteria, none of which, in isolation, was controlling. The Board believes that, collectively, the Trustees have balanced and diverse experience, qualifications, attributes, and skills, which allow the Board to operate effectively in governing each fund and protecting the interests of shareholders. Information about the specific experience, skills, attributes, and qualifications of each Trustee, which in each case led to the Board's conclusion that the Trustee should serve (or continue to serve) as a trustee of the funds, is provided below.
Board Structure and Oversight Function. Abigail P. Johnson is an interested person and currently serves as Chairman. The Trustees have determined that an interested Chairman is appropriate and benefits shareholders because an interested Chairman has a personal and professional stake in the quality and continuity of services provided to the funds. Independent Trustees exercise their informed business judgment to appoint an individual of their choosing to serve as Chairman, regardless of whether the Trustee happens to be independent or a member of management. The Independent Trustees have determined that they can act independently and effectively without having an Independent Trustee serve as Chairman and that a key structural component for assuring that they are in a position to do so is for the Independent Trustees to constitute a substantial majority for the Board. The Independent Trustees also regularly meet in executive session. Michael E. Kenneally serves as Chairman of the Independent Trustees and as such (i) acts as a liaison between the Independent Trustees and management with respect to matters important to the Independent Trustees and (ii) with management prepares agendas for Board meetings.
Fidelity ® funds are overseen by different Boards of Trustees. The funds' Board oversees Fidelity's investment-grade bond, money market, asset allocation and certain equity funds, and other Boards oversee Fidelity's high income and other equity funds. The asset allocation funds may invest in Fidelity ® funds that are overseen by such other Boards. The use of separate Boards, each with its own committee structure, allows the Trustees of each group of Fidelity ® funds to focus on the unique issues of the funds they oversee, including common research, investment, and operational issues. On occasion, the separate Boards establish joint committees to address issues of overlapping consequences for the Fidelity ® funds overseen by each Board.
The Trustees operate using a system of committees to facilitate the timely and efficient consideration of all matters of importance to the Trustees, each fund, and fund shareholders and to facilitate compliance with legal and regulatory requirements and oversight of the funds' activities and associated risks. The Board, acting through its committees, has charged FMR and its affiliates with (i) identifying events or circumstances the occurrence of which could have demonstrably adverse effects on the funds' business and/or reputation; (ii) implementing processes and controls to lessen the possibility that such events or circumstances occur or to mitigate the effects of such events or circumstances if they do occur; and (iii) creating and maintaining a system designed to evaluate continuously business and market conditions in order to facilitate the identification and implementation processes described in (i) and (ii) above. Because the day-to-day operations and activities of the funds are carried out by or through FMR, its affiliates, and other service providers, the funds' exposure to risks is mitigated but not eliminated by the processes overseen by the Trustees. While each of the Board's committees has responsibility for overseeing different aspects of the funds' activities, oversight is exercised primarily through the Operations and Audit Committees. In addition, an ad hoc Board committee of Independent Trustees has worked with FMR to enhance the Board's oversight of investment and financial risks, legal and regulatory risks, technology risks, and operational risks, including the development of additional risk reporting to the Board. The Operations Committee also worked and continues to work with FMR to enhance the stress tests required under SEC regulations for money market funds. Appropriate personnel, including but not limited to the funds' Chief Compliance Officer (CCO), FMR's internal auditor, the independent accountants, the funds' Treasurer and portfolio management personnel, make periodic reports to the Board's committees, as appropriate, including an annual review of Fidelity's risk management program for the Fidelity ® funds. The responsibilities of each standing committee, including their oversight responsibilities, are described further under "Standing Committees of the Trustees."
Interested Trustees*:
Correspondence intended for a Trustee who is an interested person may be sent to Fidelity Investments, 245 Summer Street, Boston, Massachusetts 02210.
Name, Year of Birth; Principal Occupations and Other Relevant Experience+
Abigail P. Johnson (1961)
Year of Election or Appointment: 2009
Trustee
Chairman of the Board of Trustees
Ms. Johnson also serves as Trustee of other Fidelity ® funds. Ms. Johnson serves as Chairman (2016-present), Chief Executive Officer (2014-present), and Director (2007-present) of FMR LLC (diversified financial services company), President of Fidelity Financial Services (2012-present) and President of Personal, Workplace and Institutional Services (2005-present). Ms. Johnson is Chairman and Director of Fidelity Management & Research Company LLC (investment adviser firm, 2011-present). Previously, Ms. Johnson served as Chairman and Director of FMR Co., Inc. (investment adviser firm, 2011-2019), Vice Chairman (2007-2016) and President (2013-2016) of FMR LLC, President and a Director of Fidelity Management & Research Company (2001-2005), a Trustee of other investment companies advised by Fidelity Management & Research Company, Fidelity Investments Money Management, Inc. (investment adviser firm), and FMR Co., Inc. (2001-2005), Senior Vice President of the Fidelity ® funds (2001-2005), and managed a number of Fidelity ® funds. Ms. Abigail P. Johnson and Mr. Arthur E. Johnson are not related.
Jennifer Toolin McAuliffe (1959)
Year of Election or Appointment: 2016
Trustee
Ms. McAuliffe also serves as Trustee of other Fidelity ® funds and as Trustee of Fidelity Charitable (2020-present). Previously, Ms. McAuliffe served as Co-Head of Fixed Income of Fidelity Investments Limited (now known as FIL Limited (FIL)) (diversified financial services company), Director of Research for FIL's credit and quantitative teams in London, Hong Kong and Tokyo and Director of Research for taxable and municipal bonds at Fidelity Investments Money Management, Inc. Ms. McAuliffe previously served as a member of the Advisory Board of certain Fidelity ® funds (2016). Ms. McAuliffe was previously a lawyer at Ropes & Gray LLP and currently serves as director or trustee of several not-for-profit entities.
* Determined to be an "Interested Trustee" by virtue of, among other things, his or her affiliation with the trusts or various entities under common control with FMR.
+ The information includes the Trustee's principal occupation during the last five years and other information relating to the experience, attributes, and skills relevant to the Trustee's qualifications to serve as a Trustee, which led to the conclusion that the Trustee should serve as a Trustee for each fund.
Independent Trustees:
Correspondence intended for an Independent Trustee may be sent to Fidelity Investments, P.O. Box 55235, Boston, Massachusetts 02205-5235.
Name, Year of Birth; Principal Occupations and Other Relevant Experience+
Elizabeth S. Acton (1951)
Year of Election or Appointment: 2013
Trustee
Ms. Acton also serves as Trustee of other Fidelity ® funds. Prior to her retirement, Ms. Acton served as Executive Vice President, Finance (2011-2012), Executive Vice President, Chief Financial Officer (2002-2011) and Treasurer (2004-2005) of Comerica Incorporated (financial services). Prior to joining Comerica, Ms. Acton held a variety of positions at Ford Motor Company (1983-2002), including Vice President and Treasurer (2000-2002) and Executive Vice President and Chief Financial Officer of Ford Motor Credit Company (1998-2000). Ms. Acton currently serves as a member of the Board and Audit and Finance Committees of Beazer Homes USA, Inc. (homebuilding, 2012-present). Ms. Acton previously served as a member of the Advisory Board of certain Fidelity ® funds (2013-2016).
Ann E. Dunwoody (1953)
Year of Election or Appointment: 2018
Trustee
General Dunwoody also serves as Trustee of other Fidelity ® funds. General Dunwoody (United States Army, Retired) was the first woman in U.S. military history to achieve the rank of four-star general and prior to her retirement in 2012 held a variety of positions within the U.S. Army, including Commanding General, U.S. Army Material Command (2008-2012). General Dunwoody currently serves as President of First to Four LLC (leadership and mentoring services, 2012-present), a member of the Board and Nomination and Corporate Governance Committees of Kforce Inc. (professional staffing services, 2016-present) and a member of the Board of Automattic Inc. (software engineering, 2018-present). Previously, General Dunwoody served as a member of the Advisory Board and Nominating and Corporate Governance Committee of L3 Technologies, Inc. (communication, electronic, sensor and aerospace systems, 2013-2019) and a member of the Board and Audit and Sustainability and Corporate Responsibility Committees of Republic Services, Inc. (waste collection, disposal and recycling, 2013-2016). Ms. Dunwoody also serves on several boards for non-profit organizations, including as a member of the Board, Chair of the Nomination and Governance Committee and a member of the Audit Committee of Logistics Management Institute (consulting non-profit, 2012-present), a member of the Council of Trustees for the Association of the United States Army (advocacy non-profit, 2013-present), a member of the Board of Florida Institute of Technology (2015-present) and a member of the Board of ThanksUSA (military family education non-profit, 2014-present). General Dunwoody previously served as a member of the Advisory Board of certain Fidelity ® funds (2018).
John Engler (1948)
Year of Election or Appointment: 2014
Trustee
Mr. Engler also serves as Trustee of other Fidelity ® funds. Previously, Mr. Engler served as Governor of Michigan (1991-2003), President of the Business Roundtable (2011-2017) and interim President of Michigan State University (2018-2019). Mr. Engler currently serves as a member of the Board of Stride, Inc. (formerly K12 Inc.) (technology-based education company, 2012-present). Previously, Mr. Engler served as a member of the Board of Universal Forest Products (manufacturer and distributor of wood and wood-alternative products, 2003-2019) and Trustee of The Munder Funds (2003-2014). Mr. Engler previously served as a member of the Advisory Board of certain Fidelity ® funds (2014-2016).
Robert F. Gartland (1951)
Year of Election or Appointment: 2010
Trustee
Mr. Gartland also serves as Trustee of other Fidelity ® funds. Prior to his retirement, Mr. Gartland held a variety of positions at Morgan Stanley (financial services, 1979-2007), including Managing Director (1987-2007) and Chase Manhattan Bank (1975-1978). Mr. Gartland previously served as Chairman and an investor in Gartland & Mellina Group Corp. (consulting, 2009-2019), as a member of the Board of National Securities Clearing Corporation (1993-1996) and as Chairman of TradeWeb (2003-2004).
Arthur E. Johnson (1947)
Year of Election or Appointment: 2008
Trustee
Mr. Johnson also serves as Trustee of other Fidelity ® funds. Prior to his retirement, Mr. Johnson served as Senior Vice President of Corporate Strategic Development of Lockheed Martin Corporation (defense contractor, 1999-2009). Mr. Johnson currently serves as a member of the Board of Booz Allen Hamilton (management consulting, 2011-present). Mr. Johnson previously served as a member of the Board of Eaton Corporation plc (diversified power management, 2009-2019) and a member of the Board of AGL Resources, Inc. (holding company, 2002-2016). Mr. Johnson previously served as Chairman (2018-2021) and Vice Chairman (2015-2018) of the Independent Trustees of certain Fidelity® funds. Mr. Arthur E. Johnson is not related to Ms. Abigail P. Johnson.
Michael E. Kenneally (1954)
Year of Election or Appointment: 2009
Trustee
Chairman of the Independent Trustees
Mr. Kenneally also serves as Trustee of other Fidelity ® funds and was Vice Chairman (2018-2021) of the Independent Trustees of certain Fidelity ® funds. Prior to retirement in 2005, he was Chairman and Global Chief Executive Officer of Credit Suisse Asset Management, the worldwide fund management and institutional investment business of Credit Suisse Group. Previously, Mr. Kenneally was an Executive Vice President and the Chief Investment Officer for Bank of America. In this role, he was responsible for the investment management, strategy and products delivered to the bank's institutional, high-net-worth and retail clients. Earlier, Mr. Kenneally directed the organization's equity and quantitative research groups. He began his career as a research analyst and then spent more than a dozen years as a portfolio manager for endowments, pension plans and mutual funds. He earned the Chartered Financial Analyst (CFA) designation in 1991.
Mark A. Murray (1954)
Year of Election or Appointment: 2016
Trustee
Mr. Murray also serves as Trustee of other Fidelity ® funds. Previously, Mr. Murray served as Co-Chief Executive Officer (2013-2016), President (2006-2013) and Vice Chairman (2013-2020) of Meijer, Inc. Mr. Murray serves as a member of the Board (2009-present) and Public Policy and Responsibility Committee (2009-present) and Chair of the Nuclear Review Committee (2019-present) of DTE Energy Company (diversified energy company). Mr. Murray previously served as a member of the Board of Spectrum Health (not-for-profit health system, 2015-2019) and as a member of the Board and Audit Committee and Chairman of the Nominating and Corporate Governance Committee of Universal Forest Products, Inc. (manufacturer and distributor of wood and wood-alternative products, 2004-2016). Mr. Murray also serves as a member of the Board of many community and professional organizations. Mr. Murray previously served as a member of the Advisory Board of certain Fidelity ® funds (2016).
+ The information includes the Trustee's principal occupation during the last five years and other information relating to the experience, attributes, and skills relevant to the Trustee's qualifications to serve as a Trustee, which led to the conclusion that the Trustee should serve as a Trustee for each fund.
Advisory Board Members and Officers:
Correspondence intended for a Member of the Advisory Board (if any) may be sent to Fidelity Investments, P.O. Box 55235, Boston, Massachusetts 02205-5235. Correspondence intended for an officer may be sent to Fidelity Investments, 245 Summer Street, Boston, Massachusetts 02210. Officers appear below in alphabetical order.
Name, Year of Birth; Principal Occupation
Laura M. Bishop (1961)
Year of Election or Appointment: 2022
Member of the Advisory Board
Ms. Bishop also serves as a Member of the Advisory Board of other funds. Prior to her retirement, Ms. Bishop held a variety of positions at United Services Automobile Association (2001-2020), including Executive Vice President and Chief Financial Officer (2014-2020) and Senior Vice President and Deputy Chief Financial Officer (2012-2014). Ms. Bishop currently serves as a member of the Audit Committee and Compensation and Personnel Committee (2021-present) of the Board of Directors of Korn Ferry (global organizational consulting).
Robert W. Helm (1957)
Year of Election or Appointment: 2021
Member of the Advisory Board
Mr. Helm also serves as a Member of the Advisory Board of other Fidelity® funds. Mr. Helm was formerly Deputy Chairman (2003-2020), partner (1991-2020) and an associate (1984-1991) of Dechert LLP (formerly Dechert Price & Rhoads). Mr. Helm currently serves on boards and committees of several not-for-profit organizations.
Craig S. Brown (1977)
Year of Election or Appointment: 2019
Assistant Treasurer
Mr. Brown also serves as an officer of other funds. Mr. Brown serves as Assistant Treasurer of FIMM, LLC (2021-present) and is an employee of Fidelity Investments (2013-present). Previously, Mr. Brown served as Assistant Treasurer of certain Fidelity ® funds (2019-2022).
John J. Burke III (1964)
Year of Election or Appointment: 2018
Chief Financial Officer
Mr. Burke also serves as Chief Financial Officer of other funds. Mr. Burke serves as Head of Investment Operations for Fidelity Fund and Investment Operations (2018-present) and is an employee of Fidelity Investments (1998-present). Previously Mr. Burke served as head of Asset Management Investment Operations (2012-2018).
David J. Carter (1973)
Year of Election or Appointment: 2020
Assistant Secretary
Mr. Carter also serves as Assistant Secretary of other funds. Mr. Carter serves as Senior Vice President, Deputy General Counsel (2022-present) and is an employee of Fidelity Investments (2005-present).
Jonathan Davis (1968)
Year of Election or Appointment: 2010
Assistant Treasurer
Mr. Davis also serves as an officer of other funds. Mr. Davis serves as Assistant Treasurer of FIMM, LLC (2021-present), FMR Capital, Inc. (2017-present), FD Funds GP LLC (2021-present), FD Funds Holding LLC (2021-present), and FD Funds Management LLC (2021-present); and is an employee of Fidelity Investments. Previously, Mr. Davis served as Vice President and Associate General Counsel of FMR LLC (diversified financial services company, 2003-2010).
Laura M. Del Prato (1964)
Year of Election or Appointment: 2018
President and Treasurer
Ms. Del Prato also serves as an officer of other funds. Ms. Del Prato serves as Assistant Treasurer of FIMM, LLC (2021-present) and is an employee of Fidelity Investments (2017-present). Previously, Ms. Del Prato served as President and Treasurer of The North Carolina Capital Management Trust: Cash Portfolio and Term Portfolio (2018-2020). Prior to joining Fidelity Investments, Ms. Del Prato served as a Managing Director and Treasurer of the JPMorgan Mutual Funds (2014-2017). Prior to JPMorgan, Ms. Del Prato served as a partner at Cohen Fund Audit Services (accounting firm, 2012-2013) and KPMG LLP (accounting firm, 2004-2012).
Christopher M. Gouveia (1973)
Year of Election or Appointment: 2023
Chief Compliance Officer
Mr. Gouveia also serves as Chief Compliance Officer of other funds. Mr. Gouveia serves as Senior Vice President of Asset Management Compliance for Fidelity Investments and is an employee of Fidelity Investments. Previously, Mr. Gouveia served as Chief Compliance Officer of the North Carolina Capital Management Trust (2016-2019).
Colm A. Hogan (1973)
Year of Election or Appointment: 2016
Assistant Treasurer
Mr. Hogan also serves as an officer of other funds. Mr. Hogan serves as Assistant Treasurer of FIMM, LLC (2021-present) and FMR Capital, Inc. (2017-present) and is an employee of Fidelity Investments (2005-present). Previously, Mr. Hogan served as Deputy Treasurer of certain Fidelity ® funds (2016-2020) and Assistant Treasurer of certain Fidelity ® funds (2016-2018).
Cynthia Lo Bessette (1969)
Year of Election or Appointment: 2019
Secretary and Chief Legal Officer (CLO)
Ms. Lo Bessette also serves as an officer of other funds. Ms. Lo Bessette serves as CLO, Secretary, and Senior Vice President of Fidelity Management & Research Company LLC (investment adviser firm, 2019-present); CLO of Fidelity Management & Research (Hong Kong) Limited, FMR Investment Management (UK) Limited, and Fidelity Management & Research (Japan) Limited (investment adviser firms, 2019-present); Secretary of FD Funds GP LLC (2021-present), FD Funds Holding LLC (2021-present), FD Funds Management LLC (2021-present), and Fidelity Diversifying Solutions LLC (investment adviser firm, 2022-present); and Assistant Secretary of FIMM, LLC (2019-present). She is a Senior Vice President and Deputy General Counsel of FMR LLC (diversified financial services company, 2019-present), and is an employee of Fidelity Investments. Previously, Ms. Lo Bessette served as CLO, Secretary, and Senior Vice President of FMR Co., Inc. (investment adviser firm, 2019); Secretary of Fidelity SelectCo, LLC and Fidelity Investments Money Management, Inc. (investment adviser firms, 2019). Prior to joining Fidelity Investments, Ms. Lo Bessette was Executive Vice President, General Counsel (2016-2019) and Senior Vice President, Deputy General Counsel (2015-2016) of OppenheimerFunds (investment management company) and Deputy Chief Legal Officer (2013-2015) of Jennison Associates LLC (investment adviser firm).
Chris Maher (1972)
Year of Election or Appointment: 2013
Assistant Treasurer
Mr. Maher also serves as an officer of other funds. Mr. Maher serves as Assistant Treasurer of FIMM, LLC (2021-present) and FMR Capital, Inc. (2017-present), and is an employee of Fidelity Investments (2008-present). Previously, Mr. Maher served as Assistant Treasurer of certain funds (2013-2020); Vice President of Asset Management Compliance (2013), Vice President of the Program Management Group of FMR (investment adviser firm, 2010-2013), and Vice President of Valuation Oversight (2008-2010).
Jamie Pagliocco (1964)
Year of Election or Appointment: 2020
Vice President
Mr. Pagliocco also serves as Vice President of other funds. Mr. Pagliocco serves as President of Fixed Income (2020-present), and is an employee of Fidelity Investments (2001-present). Previously, Mr. Pagliocco served as Co-Chief Investment Officer - Bond (2017-2020), Global Head of Bond Trading (2016-2019), and as a portfolio manager.
Brett Segaloff (1972)
Year of Election or Appointment: 2021
Anti-Money Laundering (AML) Officer
Mr. Segaloff also serves as an AML Officer of other funds and other related entities. He is Director, Anti-Money Laundering (2007-present) of FMR LLC (diversified financial services company) and is an employee of Fidelity Investments (1996-present).
Stacie M. Smith (1974)
Year of Election or Appointment: 2013
Assistant Treasurer
Ms. Smith also serves as an officer of other funds. Ms. Smith serves as Assistant Treasurer of FIMM, LLC (2021-present) and FMR Capital, Inc. (2017-present), is an employee of Fidelity Investments (2009-present), and has served in other fund officer roles. Prior to joining Fidelity Investments, Ms. Smith served as Senior Audit Manager of Ernst & Young LLP (accounting firm, 1996-2009). Previously, Ms. Smith served as Assistant Treasurer (2013-2019) and Deputy Treasurer (2013-2016) of certain Fidelity ® funds.
Jim Wegmann (1979)
Year of Election or Appointment: 2021
Deputy Treasurer
Mr. Wegmann also serves as an officer of other funds. Mr. Wegmann serves as Assistant Treasurer of FIMM, LLC (2021-present) and is an employee of Fidelity Investments (2011-present). Previously, Mr. Wegmann served as Assistant Treasurer of certain Fidelity ® funds (2019-2021).
As a shareholder, you incur two types of costs: (1) transaction costs, which may include sales charges (loads) on purchase payments or redemption proceeds, as applicable and (2) ongoing costs, which generally include management fees, distribution and/or service (12b-1) fees and other Fund expenses. This Example is intended to help you understand your ongoing costs (in dollars) of investing in a fund and to compare these costs with the ongoing costs of investing in other mutual funds.
| The Example is based on an investment of $1,000 invested at the beginning of the period and held for the entire period (July 1, 2022 to December 31, 2022). |
Actual Expenses
The first line of the accompanying table provides information about actual account values and actual expenses. You may use the information in this line, together with the amount you invested, to estimate the expenses that you paid over the period. Simply divide your account value by $1,000.00 (for example, an $8,600 account value divided by $1,000.00 = 8.6), then multiply the result by the number in the first line for a class/Fund under the heading entitled "Expenses Paid During Period" to estimate the expenses you paid on your account during this period. If any fund is a shareholder of any underlying mutual funds or exchange-traded funds (ETFs) (the Underlying Funds), such fund indirectly bears its proportional share of the expenses of the Underlying Funds in addition to the direct expenses incurred presented in the table. These fees and expenses are not included in the annualized expense ratio used to calculate the expense estimate in the table below.
Hypothetical Example for Comparison Purposes
The second line of the accompanying table provides information about hypothetical account values and hypothetical expenses based on the actual expense ratio and an assumed rate of return of 5% per year before expenses, which is not the actual return. The hypothetical account values and expenses may not be used to estimate the actual ending account balance or expenses you paid for the period. You may use this information to compare the ongoing costs of investing in the Fund and other funds. To do so, compare this 5% hypothetical example with the 5% hypothetical examples that appear in the shareholder reports of the other funds. If any fund is a shareholder of any Underlying Funds, such fund indirectly bears its proportional share of the expenses of the Underlying Funds in addition to the direct expenses as presented in the table. These fees and expenses are not included in the annualized expense ratio used to calculate the expense estimate in the table below.
Please note that the expenses shown in the table are meant to highlight your ongoing costs only and do not reflect any transaction costs. Therefore, the second line of the table is useful in comparing ongoing costs only, and will not help you determine the relative total costs of owning different funds. In addition, if these transactional costs were included, your costs would have been higher.
| | | | | Annualized Expense Ratio- A | | Beginning Account Value July 1, 2022 | | Ending Account Value December 31, 2022 | | Expenses Paid During Period- C July 1, 2022 to December 31, 2022 |
| | | | | | | | | | |
| Fidelity® Ohio Municipal Income Fund | | | | .49% | | | | | | |
| Actual | | | | | | $ 1,000 | | $ 1,004.30 | | $ 2.48 |
Hypothetical- B | | | | | | $ 1,000 | | $ 1,022.74 | | $ 2.50 |
| | | | | | | | | | |
| Fidelity® Ohio Municipal Money Market Fund | | | | .57% | | | | | | |
| Actual | | | | | | $ 1,000 | | $ 1,008.00 | | $ 2.88 |
Hypothetical- B | | | | | | $ 1,000 | | $ 1,022.33 | | $ 2.91 |
| |
A Annualized expense ratio reflects expenses net of applicable fee waivers.
B 5% return per year before expenses
C Expenses are equal to the annualized expense ratio, multiplied by the average account value over the period, multiplied by 184/ 365 (to reflect the one-half year period). The fees and expenses of any Underlying Funds are not included in each annualized expense ratio.
The dividend and capital gains distributions for the fund(s) are available on Fidelity.com or Institutional.Fidelity.com.
During fiscal year ended 2022, 100% of each fund's income dividends were free from federal income tax, and 2.18% and 12.16% of Fidelity Ohio Municipal Income Fund and Fidelity Ohio Municipal Money Market Fund's income dividends, respectively, were subject to the federal alternative minimum tax.
The funds will notify shareholders in January 2023 of amounts for use in preparing 2022 income tax returns.
Fidelity Ohio Municipal Income Fund / Fidelity Ohio Municipal Money Market Fund
Each year, the Board of Trustees, including the Independent Trustees (together, the Board), votes on the renewal of the management contract with Fidelity Management & Research Company LLC (FMR) and the sub-advisory agreements (together, the Advisory Contracts) for each fund. FMR and the sub-advisers are referred to herein as the Investment Advisers. The Board, assisted by the advice of fund counsel and Independent Trustees' counsel, requests and considers a broad range of information relevant to the renewal of the Advisory Contracts throughout the year.
The Board meets regularly and, at each of its meetings, covers an extensive agenda of topics and materials and considers factors that are relevant to its annual consideration of the renewal of each fund's Advisory Contracts, including the services and support provided to each fund and its shareholders. The Board has established four standing committees (Committees) - Operations, Audit, Fair Valuation, and Governance and Nominating - each composed of and chaired by Independent Trustees with varying backgrounds, to which the Board has assigned specific subject matter responsibilities in order to enhance effective decision-making by the Board. The Operations Committee, of which all the Independent Trustees are members, meets regularly throughout the year and requests, receives and considers, among other matters, information related to the annual consideration of the renewal of each fund's Advisory Contracts before making its recommendation to the Board. The Board also meets as needed to review matters specifically related to the Board's annual consideration of the renewal of the Advisory Contracts. Members of the Board may also meet from time to time with trustees of other Fidelity funds through joint ad hoc committees to discuss certain matters relevant to all of the Fidelity funds.
At its September 2022 meeting, the Board unanimously determined to renew each fund's Advisory Contracts. In reaching its determination, the Board considered all factors it believed relevant, including (i) the nature, extent, and quality of the services provided to each fund and its shareholders (including the investment performance of each fund); (ii) the competitiveness relative to peer funds of each fund's management fee and total expense ratio; (iii) the total costs of the services provided by and the profits realized by Fidelity from its relationships with each fund; and (iv) the extent to which, if any, economies of scale exist and are realized as each fund grows, and whether any economies of scale are appropriately shared with fund shareholders.
In considering whether to renew the Advisory Contracts for each fund, the Board reached a determination, with the assistance of fund counsel and Independent Trustees' counsel and through the exercise of its business judgment, that the renewal of the Advisory Contracts was in the best interests of each fund and its shareholders and that the compensation payable under the Advisory Contracts was fair and reasonable. The Board's decision to renew the Advisory Contracts was not based on any single factor, but rather was based on a comprehensive consideration of all the information provided to the Board at its meetings throughout the year. The Board, in reaching its determination to renew the Advisory Contracts, was aware that shareholders of each fund have a broad range of investment choices available to them, including a wide choice among funds offered by Fidelity's competitors, and that each fund's shareholders, who have the opportunity to review and weigh the disclosure provided by the fund in its prospectus and other public disclosures, have chosen to invest in that fund, which is part of the Fidelity family of funds.
Nature, Extent, and Quality of Services Provided. The Board considered Fidelity's staffing as it relates to the funds, including the backgrounds of investment personnel of Fidelity, and also considered the funds' investment objectives, strategies, and related investment philosophies. The Independent Trustees also had discussions with senior management of Fidelity's investment operations and investment groups. The Board considered the structure of the investment personnel compensation program and whether this structure provides appropriate incentives to act in the best interests of each fund. Additionally, the Board considered the portfolio managers' investments, if any, in the funds that they manage. The Board also considered the steps Fidelity had taken to ensure the continued provision of high quality services to the Fidelity funds throughout the COVID-19 pandemic, including the expansion of staff in client facing positions to maintain service levels in periods of high volumes and volatility.
Resources Dedicated to Investment Management and Support Services. The Board reviewed the general qualifications and capabilities of Fidelity's investment staff, including its size, education, experience, and resources, as well as Fidelity's approach to recruiting, training, managing, and compensating investment personnel. The Board noted the resources devoted to Fidelity's global investment organization, and that Fidelity's analysts have extensive resources, tools and capabilities that allow them to conduct quantitative and fundamental analysis, as well as credit analysis of issuers, counterparties, and guarantors. Further, the Board considered that Fidelity's investment professionals have sufficient access to global information and data so as to provide competitive investment results over time, and that those professionals also have access to sophisticated tools that permit them to assess portfolio construction and risk and performance attribution characteristics continuously, as well as to transmit new information and research conclusions rapidly around the world. Additionally, in its deliberations, the Board considered Fidelity's trading, risk management, compliance, cybersecurity, and technology and operations capabilities and resources, which are integral parts of the investment management process.
Shareholder and Administrative Services. The Board considered (i) the nature, extent, quality, and cost of advisory, administrative, and shareholder services performed by the Investment Advisers and their affiliates under the Advisory Contracts and under separate agreements covering transfer agency and pricing and bookkeeping services for each fund; (ii) the nature and extent of the supervision of third party service providers, principally custodians, subcustodians, and pricing vendors; and (iii) the resources devoted to, and the record of compliance with, each fund's compliance policies and procedures.
The Board noted that the growth of fund assets over time across the complex allows Fidelity to reinvest in the development of services designed to enhance the value and convenience of the Fidelity funds as investment vehicles. These services include 24-hour access to account information and market information over the Internet and through telephone representatives, investor education materials and asset allocation tools. The Board also considered that it reviews customer service metrics such as telephone response times, continuity of services on the website and metrics addressing services at Fidelity Investor Centers.
Investment in a Large Fund Family . The Board considered the benefits to shareholders of investing in a Fidelity fund, including the benefits of investing in a fund that is part of a large family of funds offering a variety of investment disciplines and providing a large variety of mutual fund investor services. The Board noted that Fidelity had taken, or had made recommendations to the Board that resulted in the Fidelity funds taking, a number of actions over the previous year that benefited particular funds, including: (i) continuing to dedicate additional resources to Fidelity's investment research process, which includes meetings with management of issuers of securities in which the funds invest; (ii) continuing efforts to enhance Fidelity's global research capabilities; (iii) launching new funds, ETFs, and share classes with innovative structures, strategies and pricing and making other enhancements to meet investor needs; (iv) broadening eligibility requirements for certain funds and share classes; (v) reducing management fees and total expenses for certain funds and classes; (vi) lowering expenses for certain existing funds and classes by implementing or lowering expense caps; (vii) rationalizing product lines and gaining increased efficiencies from fund mergers and liquidations; (viii) continuing to develop, acquire and implement systems and technology to improve services to the funds and shareholders, strengthen information security, and increase efficiency; and (ix) continuing to implement enhancements to further strengthen Fidelity's product line to increase investors' probability of success in achieving their investment goals, including their retirement income goals.
Investment Performance (for Fidelity Ohio Municipal Income Fund). The Board considered whether the fund has operated in accordance with its investment objective, as well as its record of compliance with its investment restrictions and its performance history.
The Board took into account discussions that occur at Board meetings throughout the year with representatives of the Investment Advisers about fund investment performance. In this regard the Board noted that as part of regularly scheduled fund reviews and other reports to the Board on fund performance, the Board considers annualized return information for the fund for different time periods, measured against an appropriate securities market index (benchmark index) and an appropriate peer group of funds with similar objectives (peer group). The Board also receives and considers information about performance attribution. In its evaluation of fund investment performance at meetings throughout the year, the Board gave particular attention to information indicating underperformance of certain Fidelity funds for specific time periods and discussed with the Investment Advisers the reasons for such underperformance.
In addition to reviewing absolute and relative fund performance, the Independent Trustees periodically consider the appropriateness of fund performance metrics in evaluating the results achieved. In general, the Independent Trustees believe that fund performance should be evaluated based on gross performance (before fees and expenses but after transaction costs) compared to appropriate benchmark indices, over appropriate time periods that may include full market cycles, and on net performance (after fees and expenses) compared to appropriate peer groups, as applicable, over the same periods, taking into account relevant factors including the following: general market conditions; expectations for interest rate levels and credit conditions; issuer-specific information including credit quality; the potential for incremental return versus the fund's benchmark index weighed against the risks involved in obtaining that incremental return, including the risk of diminished or negative total returns; and fund cash flows and other factors. The Independent Trustees generally give greater weight to fund performance over longer time periods than over shorter time periods. Depending on the circumstances, the Independent Trustees may be satisfied with a fund's performance notwithstanding that it lags its benchmark index or peer group for certain periods.
The Independent Trustees recognize that shareholders evaluate performance on a net basis over their own holding periods, for which one-, three-, and five-year periods are often used as a proxy. For this reason, the performance information reviewed by the Board also included net cumulative calendar year total return information for the fund and an appropriate benchmark index and peer group for the most recent one-, three-, and five-year periods
Investment Performance (for Fidelity Ohio Municipal Money Market Fund) . The Board considered whether the fund has operated in accordance with its investment objective, as well as its record of compliance with its investment restrictions and its performance history.
The Board took into account discussions that occur at Board meetings throughout the year with representatives of the Investment Advisers about fund investment performance. In this regard the Board noted that as part of regularly scheduled fund reviews and other reports to the Board on fund performance, the Board considers annualized return information for the fund for different time periods, measured against an appropriate peer group of funds with similar objectives (peer group). The Board also receives and considers information about performance attribution.
In addition to reviewing absolute and relative fund performance, the Independent Trustees periodically consider the appropriateness of fund performance metrics in evaluating the results achieved. In general, the Independent Trustees believe that fund performance should be evaluated based on gross performance (before fees and expenses but after transaction costs) compared to the gross performance of appropriate peer groups, over appropriate time periods that may include full market cycles, taking into account relevant factors including the following: general market conditions; expectations for interest rate levels and credit conditions; issuer-specific information including credit quality; the fund's market value NAV over time and its resilience under various stressed conditions; and fund cash flows and other factors. The Independent Trustees generally give greater weight to fund performance over longer time periods than over shorter time periods.
The Board recognizes that in interest rate environments where many competitors waive fees to maintain a minimum yield, relative money market fund performance on a net basis (after fees and expenses) may not be particularly meaningful due to miniscule performance differences among competitor funds. Depending on the circumstances, the Independent Trustees may be satisfied with a fund's performance notwithstanding that it lags its peer group for certain periods.
The Independent Trustees recognize that shareholders evaluate performance on a net basis over their own holding periods, for which one-, three-, and five-year periods are often used as a proxy. For this reason, the performance information reviewed by the Board also included net cumulative calendar year total return information for the fund and an appropriate peer group for the most recent one-, three-, and five-year periods.
Based on its review, the Board concluded that the nature, extent, and quality of services provided to each fund under the Advisory Contracts should continue to benefit the shareholders of each fund.
Competitiveness of Management Fee and Total Expense Ratio . The Board considered each fund's management fee and total expense ratio compared to selected groups of competitive funds and classes (referred to as "mapped groups" below) for the purpose of facilitating the Trustees' competitive analysis of management fees and total expenses. Fidelity creates "mapped groups" by combining similar investment objective categories (as classified by Lipper) that have comparable investment mandates. Combining funds with similar investment objective categories aids the Board's comparisons of management fees and total expense ratios by broadening the competitive group used for such comparisons.
Management Fee . The Board considered two proprietary management fee comparisons for the 12-month periods shown in basis points (BP) in the charts below. The group of Lipper funds used by the Board for management fee comparisons is referred to below as the "Total Mapped Group" and is broader than the Lipper peer group used by the Board for performance comparisons. The Total Mapped Group comparison focuses on a fund's standing in terms of gross management fees before expense reimbursements or caps relative to the total universe of funds with comparable investment mandates, regardless of whether their management fee structures also are comparable. Funds with comparable investment mandates offer exposure to similar types of securities. Funds with comparable management fee structures have similar management fee contractual arrangements (e.g., flat rate charged for advisory services, all-inclusive fee rate, etc.). "TMG %" represents the percentage of funds in the Total Mapped Group that had management fees that were lower than a fund's. For example, a hypothetical TMG % of 20% would mean that 80% of the funds in the Total Mapped Group had higher, and 20% had lower, management fees than a fund. The funds' actual TMG %s and the number of funds in the Total Mapped Group are in the charts below. The "Asset-Sized Peer Group" (ASPG) comparison focuses on a fund's standing relative to a subset of non-Fidelity funds within the Total Mapped Group that are similar in size and management fee structure. For example, if a fund is in the first quartile of the ASPG, the fund's management fee ranks in the least expensive or lowest 25% of funds in the ASPG. The ASPG represents at least 15% of the funds in the Total Mapped Group with comparable asset size and management fee structures, subject to a minimum of 50 funds (or all funds in the Total Mapped Group if fewer than 50). Additional information, such as the ASPG quartile in which a fund's management fee rate ranked, is also included in the charts and was considered by the Board.
Fidelity Ohio Municipal Income Fund
The Board noted that the fund's management fee rate ranked below the median of its Total Mapped Group and below the median of its ASPG for 2021.
Fidelity Ohio Municipal Money Market Fund
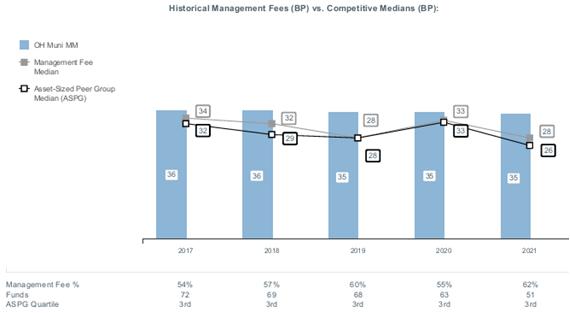
The Board noted that the fund's management fee rate ranked above the median of its Total Mapped Group and above the median of its ASPG for 2021. The Board also noted that the management fee rate was seven BP above the Total Mapped Group median and nine BP above the ASPG median. The Board noted that because there is a relatively small number of state-specific funds in the Lipper objective, Fidelity combines Lipper's separate categories for state-specific funds with all state and national municipal money market funds to create a single mapped group. The Board considered that Fidelity believes the fee charged for the fund is reasonable for overall value of the services provided and also considered that in July 2022 the Board approved and recommended to shareholders for their approval the reorganization of the fund into Fidelity Municipal Money Market Fund. The Board further noted that the proposed reorganization was expected to result in a reduction in the fund's total expense ratio.
Based on its review, the Board concluded that each fund's management fee is fair and reasonable in light of the services that the fund receives and the other factors considered.
Total Expense Ratio . In its review of each fund's total expense ratio, the Board considered the fund's management fee rate as well as other fund expenses, such as transfer agent fees, pricing and bookkeeping fees, and custodial, legal, and audit fees. The Board also noted that Fidelity may agree to waive fees or reimburse expenses from time to time, and the extent to which, if any, it has done so for each fund. Each fund is compared to those funds and classes in the Total Mapped Group (used by the Board for management fee comparisons) that have a similar sales load structure. The Board also considered a total expense ASPG comparison, which focuses on the total expenses of each fund relative to a subset of non-Fidelity funds within the similar sales load structure group that are similar in size and management fee structure. The total expense ASPG is limited to 15 larger and 15 smaller classes of different funds, where possible. The total expense ASPG comparison excludes performance adjustments and fund-paid 12b-1 fees to eliminate variability in expenses relating to these items.
The Board noted that Fidelity Ohio Municipal Income Fund's total net expense ratio ranked below the similar sales load structure group competitive median for 2021 and below the ASPG competitive median for 2021
The Board noted that Fidelity Ohio Municipal Money Market Fund's total net expense ratio ranked below the similar sales load structure group competitive median for 2021 and below the ASPG competitive median for 2021. The Board noted that Fidelity has been voluntarily waiving part or all of the transfer agent fees and/or management fees to maintain a minimum yield for Fidelity Ohio Municipal Money Market Fund. The Board considered that the Fund's total expense ratio was 3 BP above its competitive medians when excluding waivers and reimbursements from both Fidelity and competitor funds.
Fees Charged to Other Fidelity Clients . The Board also considered Fidelity fee structures and other information with respect to clients of Fidelity, such as other funds advised or subadvised by Fidelity, pension plan clients, and other institutional clients with similar mandates. The Board noted that a joint ad hoc committee created by it and the boards of other Fidelity funds periodically reviews and compares Fidelity's institutional investment advisory business with its business of providing services to the Fidelity funds and also noted the most recent findings of the committee. The Board noted that the committee's review included a consideration of the differences in services provided, fees charged, and costs incurred, as well as competition in the markets serving the different categories of clients.
Based on its review of total expense ratios and fees charged to other Fidelity clients, the Board concluded that each fund's total expense ratio was reasonable in light of the services that the fund and its shareholders receive and the other factors considered.
Costs of the Services and Profitability . The Board considered the revenues earned and the expenses incurred by Fidelity in conducting the business of developing, marketing, distributing, managing, administering and servicing each fund and servicing each fund's shareholders. The Board also considered the level of Fidelity's profits in respect of all the Fidelity funds.
On an annual basis, Fidelity presents to the Board information about the profitability of its relationships with each fund. Fidelity calculates profitability information for each fund, as well as aggregate profitability information for groups of Fidelity funds and all Fidelity funds, using a series of detailed revenue and cost allocation methodologies which originate with the books and records of Fidelity on which Fidelity's audited financial statements are based. The Audit Committee of the Board reviews any significant changes from the prior year's methodologies and the full Board approves such changes.
A public accounting firm has been engaged annually by the Board as part of the Board's assessment of Fidelity's profitability analysis. The engagement includes the review and assessment of the methodologies used by Fidelity in determining the revenues and expenses attributable to Fidelity's mutual fund business, and completion of agreed-upon procedures in respect of the mathematical accuracy of certain fund profitability information and its conformity to established allocation methodologies. After considering the reports issued under the engagement and information provided by Fidelity, the Board concluded that while other allocation methods may also be reasonable, Fidelity's profitability methodologies are reasonable in all material respects.
The Board also reviewed Fidelity's non-fund businesses and potential indirect benefits such businesses may have received as a result of their association with Fidelity's mutual fund business (i.e., fall-out benefits) as well as cases where Fidelity's affiliates may benefit from the funds' business. The Board considered areas where potential indirect benefits to the Fidelity funds from their relationships with Fidelity may exist. The Board's consideration of these matters was informed by the findings of a joint ad hoc committee created by it and the boards of other Fidelity funds to evaluate potential fall-out benefits.
The Board considered the costs of the services provided by and the profits realized by Fidelity in connection with the operation of each fund and was satisfied that the profitability was not excessive.
Economies of Scale . The Board considered whether there have been economies of scale in respect of the management of the Fidelity funds, whether the Fidelity funds (including each fund) have appropriately benefited from any such economies of scale, and whether there is potential for realization of any further economies of scale. The Board considered the extent to which each fund will benefit from economies of scale as assets grow through increased services to the fund, through waivers or reimbursements, or through fee or expense ratio reductions. The Board also noted that a committee (the Economies of Scale Committee) created by it and the boards of other Fidelity funds periodically analyzes whether Fidelity attains economies of scale in respect of the management and servicing of the Fidelity funds, whether the Fidelity funds have appropriately benefited from such economies of scale, and whether there is potential for realization of any further economies of scale.
The Board recognized that each fund's management contract incorporates a "group fee" structure, which provides for lower group fee rates as total "group assets" increase, and for higher group fee rates as total "group assets" decrease ("group assets" as defined in the management contract). FMR calculates the group fee rates based on a tiered asset "breakpoint" schedule that varies based on asset class. The Board considered that the group fee is designed to deliver the benefits of economies of scale to fund shareholders when total Fidelity fund assets increase, even if assets of any particular fund are unchanged or have declined, because some portion of Fidelity's costs are attributable to services provided to all Fidelity funds, and all funds benefit if those costs can be allocated among more assets. The Board also considered that Fidelity agreed to impose a temporary fee waiver in the form of additional breakpoints to the current breakpoint schedule. The Board concluded that, given the group fee structure, fund shareholders will benefit from lower management fees as "group assets" increase at the fund complex level, regardless of whether Fidelity achieves any such economies of scale.
The Board concluded, taking into account the analysis of the Economies of Scale Committee, that economies of scale, if any, are being appropriately shared between fund shareholders and Fidelity.
Additional Information Requested by the Board . In order to develop fully the factual basis for consideration of the Fidelity funds' advisory contracts, the Board requested and received additional information on certain topics, including: (i) Fidelity's fund profitability methodology, profitability trends for certain funds, the allocation of various costs to different funds, and the impact of certain factors on fund profitability results; (ii) portfolio manager changes that have occurred during the past year and the amount of the investment that each portfolio manager has made in the Fidelity fund(s) that he or she manages; (iii) the extent to which current market conditions have affected retention and recruitment of personnel; (iv) the arrangements with and compensation paid to certain fund sub-advisers on behalf of the Fidelity funds and the treatment of such compensation within Fidelity's fund profitability methodology; (v) the terms of the funds' various management fee structures, including the basic group fee and the terms of Fidelity's voluntary expense limitation arrangements; (vi) Fidelity's transfer agent, pricing and bookkeeping fees, expense and service structures for different funds and classes relative to competitive trends; (vii) the impact on fund profitability of recent industry trends, such as the growth in passively managed funds and the changes in flows for different types of funds; (viii) the types of management fee and total expense comparisons provided, and the challenges and limitations associated with such information; and (ix) explanations regarding the relative total expense ratios and management fees of certain funds and classes, total expense and management fee competitive trends, and methodologies for total expense and management fee competitive comparisons. In addition, the Board considered its discussions with Fidelity regarding Fidelity's efforts to maintain the continuous investment and shareholder services necessary for the funds during the current pandemic and economic circumstances.
Based on its evaluation of all of the conclusions noted above, and after considering all factors it believed relevant, the Board concluded that the advisory fee arrangements are fair and reasonable and that each fund's Advisory Contracts should be renewed.
1.540019.125
OFF-ANN-0323
Fidelity® Pennsylvania Municipal Income Fund
Fidelity® Pennsylvania Municipal Money Market Fund
Annual Report
December 31, 2022
Contents
To view a fund's proxy voting guidelines and proxy voting record for the 12-month period ended June 30, visit http://www.fidelity.com/proxyvotingresults or visit the Securities and Exchange Commission's (SEC) web site at http://www.sec.gov.
You may also call 1-800-544-8544 to request a free copy of the proxy voting guidelines.
Standard & Poor's, S&P and S&P 500 are registered service marks of The McGraw-Hill Companies, Inc. and have been licensed for use by Fidelity Distributors Corporation.
Other third-party marks appearing herein are the property of their respective owners.
All other marks appearing herein are registered or unregistered trademarks or service marks of FMR LLC or an affiliated company. © 2023 FMR LLC. All rights reserved.
This report and the financial statements contained herein are submitted for the general information of the shareholders of the Funds. This report is not authorized for distribution to prospective investors in the Funds unless preceded or accompanied by an effective prospectus.
A fund files its complete schedule of portfolio holdings with the SEC for the first and third quarters of each fiscal year on Form N-PORT. Forms N-PORT are available on the SEC's web site at http://www.sec.gov. A fund's Forms N-PORT may be reviewed and copied at the SEC's Public Reference Room in Washington, DC. Information regarding the operation of the SEC's Public Reference Room may be obtained by calling 1-800-SEC-0330.
For a complete list of a fund's portfolio holdings, view the most recent holdings listing, semiannual report, or annual report on Fidelity's web site at http://www.fidelity.com, http://www.institutional.fidelity.com, or http://www.401k.com, as applicable.
NOT FDIC INSURED •MAY LOSE VALUE •NO BANK GUARANTEE
Neither the Funds nor Fidelity Distributors Corporation is a bank.
Average annual total return reflects the change in the value of an investment, assuming reinvestment of distributions from dividend income and capital gains (the profits earned upon the sale of securities that have grown in value, if any) and assuming a constant rate of performance each year. The hypothetical investment and the average annual total returns do not reflect the deduction of taxes that a shareholder would pay on fund distributions or the redemption of fund shares. During periods of reimbursement by Fidelity, a fund's total return will be greater than it would be had the reimbursement not occurred. How a fund did yesterday is no guarantee of how it will do tomorrow.
| Average Annual Total Returns |
| | | | |
Periods ended December 31, 2022 | Past 1 year | Past 5 years | Past 10 years |
| Fidelity® Pennsylvania Municipal Income Fund | -9.66% | 0.92% | 2.00% |
| $10,000 Over 10 Years |
| |
Let's say hypothetically that $10,000 was invested in Fidelity® Pennsylvania Municipal Income Fund on December 31, 2012. The chart shows how the value of your investment would have changed, and also shows how the Bloomberg Municipal Bond Index performed over the same period. |
|
|
Fidelity® Pennsylvania Municipal Income Fund
Market Recap:
Tax-exempt municipal bonds notably declined in 2022, as a multitude of crosscurrents challenged the global economy and financial markets. The Bloomberg Municipal Bond Index returned -8.53% for the year, its third-worst annual return on record. In late 2021, the Federal Reserve began its pivot to a tighter monetary policy, tapering the large-scale asset purchases it restarted in 2020 amid the COVID-19 pandemic. In early 2022, the Fed, faced with persistent inflationary pressure, implemented an aggressive series of rate hikes, raising its benchmark interest rate seven times, by a total of 4.25 percentage points, between March and December. This helped push municipal bond yields to their highest level in more than a decade. Muni bond prices, which move inversely to yields, fell sharply. Credit spreads significantly widened, as investors demanded more yield for lower-quality munis as recession risk increased. In November and December, the tax-exempt market staged a rally when comments by Fed Chair Jerome Powell pointed to a slowdown in the pace of rate hikes and inflation data moderated. Favorable supply and demand dynamics also helped amid muted muni bond issuance and increased pockets of demand. Muni tax-backed credit fundamentals remained solid throughout the year and, for the most part, the risk of credit-rating downgrades appeared low. Shorter-duration (lower sensitivity to changes in interest rates) and higher-credit-quality munis performed best for the year.
Comments from Co-Portfolio Managers Cormac Cullen, Michael Maka and Elizah McLaughlin:
For the fiscal year ending December 31, 2022, the fund returned -9.66%, lagging, net of fees, the -8.99% result of the state-specific Bloomberg Pennsylvania Enhanced Municipal Bond Index, as well as the -8.53% return of the benchmark, the broad-based Bloomberg Municipal Bond Index. The past 12 months, we continued to focus on longer-term objectives and sought to generate attractive tax-exempt income and a competitive risk-adjusted return. Versus the state-specific index, the fund's overweight exposure to the health care sector detracted from relative performance, as many of the fund's holdings in the sector were lower-quality investment-grade bonds that produced subpar results as credit spreads widened. Pricing-related factors significantly detracted versus the state-specific index as well. Fund holdings are priced by a third-party pricing service and validated daily by Fidelity Management & Research's fair-value processes. Securities within the index, however, are priced by the index provider. These two approaches employ somewhat different methodologies in estimating the prices of municipal securities, most of which trade infrequently. Duration (interest rate) positioning had no material impact on relative performance this period. Throughout the year, the fund had less sensitivity to interest rates, as measured by its shorter duration, than the index. This contributed to relative performance when market interest rates rose during much of the period but detracted when rates declined in late 2022.
The views expressed above reflect those of the portfolio manager(s) only through the end of the period as stated on the cover of this report and do not necessarily represent the views of Fidelity or any other person in the Fidelity organization. Any such views are subject to change at any time based upon market or other conditions and Fidelity disclaims any responsibility to update such views. These views may not be relied on as investment advice and, because investment decisions for a Fidelity fund are based on numerous factors, may not be relied on as an indication of trading intent on behalf of any Fidelity fund.
Fidelity® Pennsylvania Municipal Income Fund
| Revenue Sources (% of Fund's net assets) |
| Health Care | 28.7% | |
| Transportation | 20.6% | |
| Education | 16.2% | |
| General Obligations | 13.9% | |
| Water & Sewer | 5.4% | |
| Others* (Individually Less Than 5%) | 15.2% | |
| | 100.0% | |
| |
| *Includes net other assets | | |
Quality Diversification (% of Fund's net assets) |
|
| |
| We have used ratings from Moody's Investors Service, Inc. Where Moody's® ratings are not available, we have used S&P® ratings. All ratings are as of the date indicated and do not reflect subsequent changes. |
Fidelity® Pennsylvania Municipal Income Fund
Showing Percentage of Net Assets
| Municipal Bonds - 93.7% |
| | | Principal Amount (a) | Value ($) |
| Guam - 0.2% | | | |
| Guam Int'l. Arpt. Auth. Rev. Series 2013 C: | | | |
| 6.25% 10/1/34 (b) | | 425,000 | 433,975 |
| 6.25% 10/1/34 (Pre-Refunded to 10/1/23 @ 100) (b) | | 275,000 | 280,807 |
TOTAL GUAM | | | 714,782 |
| Pennsylvania - 91.3% | | | |
| Allegheny County Arpt. Auth. Rev. Series 2021 A, 5% 1/1/51 (b) | | 12,000,000 | 12,120,019 |
| Allegheny County Higher Ed. Bldg. Auth. Univ. Rev.: | | | |
| Series 2017, 5% 10/15/47 | | 1,660,000 | 1,551,661 |
| Series 2018: | | | |
5% 3/1/33 | | 1,570,000 | 1,690,475 |
5% 3/1/34 | | 2,250,000 | 2,410,090 |
| Series 2022 A: | | | |
5% 3/1/24 | | 500,000 | 509,782 |
5% 3/1/25 | | 500,000 | 521,146 |
5% 3/1/27 | | 1,740,000 | 1,863,972 |
5% 3/1/31 | | 1,105,000 | 1,235,336 |
5% 3/1/34 | | 645,000 | 719,190 |
| Allegheny County Indl. Dev. Auth. Rev. Series 2021, 4.25% 12/1/50 | | 3,000,000 | 2,057,316 |
| Allegheny County Sanitation Auth. Swr. Rev. Series 2018, 5% 6/1/43 | | 4,785,000 | 5,054,073 |
| Bucks County Indl. Dev. Auth. Hosp. Rev. Series 2021: | | | |
| 5% 7/1/41 | | 2,500,000 | 2,350,445 |
| 5% 7/1/54 | | 4,500,000 | 3,978,702 |
| Butler County Hosp. Auth. Hosp. Rev. (Butler Health Sys. Proj.) Series 2015 A: | | | |
| 5% 7/1/26 | | 500,000 | 516,501 |
| 5% 7/1/27 | | 490,000 | 504,919 |
| 5% 7/1/28 | | 540,000 | 555,081 |
| 5% 7/1/29 | | 710,000 | 728,034 |
| 5% 7/1/30 | | 685,000 | 700,656 |
| 5% 7/1/35 | | 1,885,000 | 1,902,416 |
| 5% 7/1/39 | | 6,675,000 | 6,531,180 |
| Cap. Region Wtr. Wtr. Rev. Series 2018: | | | |
| 5% 7/15/30 | | 1,500,000 | 1,653,686 |
| 5% 7/15/31 | | 1,250,000 | 1,376,473 |
| Centre County Pennsylvania Hosp. Auth. Rev. (Mount Nittany Med. Ctr. Proj.): | | | |
| Series 2016 A: | | | |
4% 11/15/32 | | 350,000 | 353,648 |
4% 11/15/34 | | 250,000 | 250,842 |
4% 11/15/35 | | 200,000 | 200,075 |
5% 11/15/28 | | 840,000 | 876,453 |
5% 11/15/29 | | 1,625,000 | 1,690,677 |
5% 11/15/30 | | 685,000 | 710,682 |
| Series 2016 B: | | | |
4% 11/15/40 | | 600,000 | 578,735 |
4% 11/15/47 | | 3,605,000 | 3,345,678 |
| Series 2018 A: | | | |
5% 11/15/26 | | 1,140,000 | 1,221,039 |
5% 11/15/27 | | 225,000 | 242,136 |
5% 11/15/28 | | 200,000 | 214,268 |
5% 11/15/29 | | 200,000 | 213,276 |
| Chartiers Valley School District Series 2021 A, 3% 10/15/49 | | 4,000,000 | 2,957,056 |
| Chester County Health & Ed. Facilities Auth. Health Sys. Rev. Series 2017 A, 5% 10/1/35 | | 2,125,000 | 2,244,895 |
| Commonwealth Fing. Auth. Rev.: | | | |
| Series 2019 B: | | | |
5% 6/1/28 | | 1,000,000 | 1,103,130 |
5% 6/1/29 | | 1,000,000 | 1,118,308 |
5% 6/1/30 | | 1,000,000 | 1,132,221 |
5% 6/1/31 | | 1,150,000 | 1,322,007 |
| Series 2020 A, 5% 6/1/32 | | 3,500,000 | 3,904,006 |
| Cumberland County Muni. Auth. Rev. (Dickinson College Proj.) Series 2016: | | | |
| 5% 5/1/30 | | 1,000,000 | 1,057,531 |
| 5% 5/1/31 | | 500,000 | 528,118 |
| 5% 5/1/32 | | 750,000 | 790,722 |
| 5% 5/1/33 | | 2,210,000 | 2,329,281 |
| 5% 5/1/34 | | 1,000,000 | 1,053,006 |
| Dallas Area Muni. Auth. Univ. Rev. (Misericordia Univ. Proj.) Series 2019: | | | |
| 5% 5/1/39 | | 1,100,000 | 1,063,454 |
| 5% 5/1/48 | | 4,000,000 | 3,721,738 |
| Dauphin County Gen. Auth. (Pinnacle Health Sys. Proj.) Series 2016 A: | | | |
| 5% 6/1/34 | | 1,275,000 | 1,323,871 |
| 5% 6/1/35 | | 1,000,000 | 1,034,630 |
| 5% 6/1/36 | | 625,000 | 644,722 |
| Delaware County Auth. Rev.: | | | |
| (Cabrini College) Series 2017, 5% 7/1/47 | | 2,000,000 | 1,840,072 |
| Series 2017, 5% 7/1/25 | | 1,000,000 | 1,005,654 |
| Doylestown Hosp. Auth. Hosp. Rev.: | | | |
| Series 2016 A, 5% 7/1/46 | | 3,500,000 | 2,934,472 |
| Series 2019, 4% 7/1/45 | | 1,350,000 | 979,120 |
| Dubois Hosp. Auth. Hosp. Rev.: | | | |
| (Penn Highlands Healthcare Proj.) Series 2018, 5% 7/15/25 | | 200,000 | 207,382 |
| Series 2020: | | | |
4% 7/15/45 | | 1,520,000 | 1,335,595 |
5% 7/15/31 | | 1,030,000 | 1,093,192 |
5% 7/15/34 | | 1,000,000 | 1,052,509 |
5% 7/15/36 | | 1,400,000 | 1,453,450 |
5% 7/15/39 | | 1,160,000 | 1,183,771 |
| Fox Chapel Area School District Series 2013, 5% 8/1/34 | | 1,000,000 | 1,001,396 |
| Geisinger Auth. Health Sys. Rev.: | | | |
| Series 2014 A, 4% 6/1/41 | | 2,000,000 | 1,869,678 |
| Series 2017 A2, 5% 2/15/39 | | 1,880,000 | 1,935,047 |
| Indiana County Hosp. Auth. Series 2014 A, 6% 6/1/39 (Pre-Refunded to 6/1/23 @ 100) | | 1,625,000 | 1,642,312 |
| Lackawanna County Indl. Dev. Auth. Rev. (Univ. of Scranton Proj.) Series 2017: | | | |
| 5% 11/1/24 | | 590,000 | 608,650 |
| 5% 11/1/25 | | 665,000 | 697,018 |
| 5% 11/1/27 | | 1,105,000 | 1,189,053 |
| Lancaster County Hosp. Auth. Health Ctr. Rev. Series 2016: | | | |
| 5% 8/15/31 | | 1,000,000 | 1,076,729 |
| 5% 8/15/33 | | 1,000,000 | 1,068,321 |
| 5% 8/15/34 | | 1,000,000 | 1,063,264 |
| 5% 8/15/36 | | 1,000,000 | 1,054,477 |
| Lehigh County Gen. Purp. Auth. Rev.: | | | |
| (Muhlenberg College Proj.) Series 2017, 5% 2/1/39 | | 4,010,000 | 4,076,876 |
| Series 2021 A, 4% 11/1/51 | | 4,000,000 | 3,281,888 |
| Lehigh County Gen. Purp. Hosp. Rev. Series 2019 A: | | | |
| 4% 7/1/49 | | 5,000,000 | 4,355,861 |
| 5% 7/1/36 | | 2,905,000 | 3,056,832 |
| 5% 7/1/44 | | 5,000,000 | 5,069,840 |
| Monroe County Hosp. Auth. Rev. Series 2016, 5% 7/1/33 | | 3,675,000 | 3,790,759 |
| Montgomery County Higher Ed. & Health Auth. Rev.: | | | |
| Series 2014 A: | | | |
5% 10/1/23 | | 1,305,000 | 1,314,984 |
5% 10/1/24 | | 335,000 | 340,537 |
5% 10/1/25 | | 750,000 | 755,810 |
5% 10/1/26 | | 1,000,000 | 1,007,141 |
5% 10/1/27 | | 1,000,000 | 1,007,035 |
| Series 2016 A, 5% 10/1/40 | | 4,000,000 | 3,869,188 |
| Series 2018 A, 5% 9/1/26 | | 1,500,000 | 1,589,043 |
| Series 2019: | | | |
4% 9/1/34 | | 2,500,000 | 2,479,469 |
4% 9/1/35 | | 1,400,000 | 1,372,461 |
4% 9/1/36 | | 1,200,000 | 1,164,510 |
4% 9/1/37 | | 1,000,000 | 965,325 |
| Montgomery County Indl. Dev. Auth.: | | | |
| Series 2015 A, 5.25% 1/15/36 (Pre-Refunded to 1/15/25 @ 100) | | 2,000,000 | 2,091,489 |
| Series 2017: | | | |
5% 12/1/33 | | 2,150,000 | 2,321,093 |
5% 12/1/35 | | 1,000,000 | 1,070,919 |
5% 12/1/36 | | 2,670,000 | 2,850,599 |
| Northampton County Gen. Purp. Auth. Hosp. Rev. (St. Luke's Univ. Health Network Proj.) Series 2018 A: | | | |
| 4% 8/15/48 | | 4,500,000 | 4,109,787 |
| 5% 8/15/43 | | 2,000,000 | 2,042,264 |
| 5% 8/15/48 | | 2,500,000 | 2,548,574 |
| Northampton County Gen. Purp. College Rev. (Lafayette College Proj.) Series 2017, 5% 11/1/47 | | 2,170,000 | 2,250,343 |
| Pennsylvania Ctfs. Prtn. Series 2018 A: | | | |
| 5% 7/1/28 | | 400,000 | 439,859 |
| 5% 7/1/29 | | 300,000 | 329,216 |
| 5% 7/1/30 | | 375,000 | 412,324 |
| 5% 7/1/31 | | 425,000 | 467,669 |
| Pennsylvania Gen. Oblig.: | | | |
| Series 2020, 2% 5/1/39 | | 500,000 | 353,236 |
| Series 2021: | | | |
2% 5/15/37 | | 1,060,000 | 782,534 |
2% 5/15/38 | | 4,825,000 | 3,478,818 |
| Pennsylvania Higher Edl. Facilities Auth. Rev.: | | | |
| (Drexel Univ. Proj.) Series 2016, 5% 5/1/35 | | 2,000,000 | 2,077,071 |
| Series 2016, 5% 5/1/33 | | 2,200,000 | 2,298,057 |
| Series 2019 A: | | | |
4% 3/1/37 | | 1,150,000 | 1,125,424 |
5% 3/1/36 | | 1,000,000 | 1,068,084 |
5% 3/1/38 | | 1,055,000 | 1,110,321 |
5% 3/1/39 | | 1,000,000 | 1,045,939 |
| Series 2019: | | | |
4% 12/1/44 | | 1,000,000 | 973,272 |
4% 12/1/48 | | 1,000,000 | 959,065 |
| Pennsylvania Hsg. Fin. Agcy.: | | | |
| Series 2019 130A, 4% 10/1/49 | | 1,295,000 | 1,294,282 |
| Series 2019 131, 3.5% 4/1/49 | | 3,390,000 | 3,353,758 |
| Series 2020 13 2A, 3.5% 4/1/51 | | 1,600,000 | 1,585,596 |
| Series 2020 133: | | | |
5% 10/1/23 | | 400,000 | 405,113 |
5% 10/1/24 | | 850,000 | 876,927 |
5% 10/1/27 | | 650,000 | 706,702 |
5% 10/1/28 | | 950,000 | 1,046,061 |
5% 4/1/29 | | 100,000 | 110,000 |
5% 10/1/29 | | 450,000 | 498,119 |
| Series 2021 134B: | | | |
5% 4/1/24 (b) | | 1,255,000 | 1,274,589 |
5% 10/1/24 (b) | | 1,000,000 | 1,023,132 |
5% 10/1/25 (b) | | 370,000 | 384,190 |
5% 4/1/26 (b) | | 995,000 | 1,040,259 |
5% 10/1/26 (b) | | 1,500,000 | 1,577,942 |
| Series 2021 137: | | | |
5% 4/1/24 | | 225,000 | 230,164 |
5% 10/1/24 | | 265,000 | 273,851 |
5% 4/1/25 | | 200,000 | 208,358 |
5% 10/1/25 | | 220,000 | 231,380 |
5% 4/1/26 | | 240,000 | 253,937 |
5% 10/1/26 | | 280,000 | 298,599 |
5% 4/1/27 | | 225,000 | 240,863 |
5% 10/1/27 | | 225,000 | 242,563 |
5% 4/1/28 | | 250,000 | 270,749 |
5% 10/1/28 | | 260,000 | 283,430 |
5% 4/1/29 | | 310,000 | 338,252 |
5% 10/1/29 | | 365,000 | 400,551 |
| Pennsylvania Pub. School Bldg. Auth. School Rev. Series 2014 B2: | | | |
| 5% 12/1/24 | | 630,000 | 654,294 |
| 5% 12/1/25 | | 335,000 | 348,298 |
| 5% 12/1/26 | | 645,000 | 670,482 |
| 5% 12/1/27 | | 360,000 | 373,746 |
| Pennsylvania Tpk. Commission Tpk. Rev.: | | | |
| (Sub Lien Proj.) Series 2017 B-1, 5% 6/1/34 | | 5,000,000 | 5,270,423 |
| Series 2013 A2: | | | |
5% 12/1/28 | | 500,000 | 537,078 |
5% 12/1/38 | | 2,500,000 | 2,610,371 |
| Series 2014 A2, 0% 12/1/40 (c) | | 5,500,000 | 5,368,841 |
| Series 2017 A1: | | | |
5% 12/1/31 | | 2,000,000 | 2,186,454 |
5% 12/1/33 | | 1,500,000 | 1,633,357 |
| Series 2018 A2, 5% 12/1/43 | | 5,000,000 | 5,231,690 |
| Series 2019 A, 5% 12/1/37 | | 5,815,000 | 6,119,241 |
| Series 2020 B, 5% 12/1/50 | | 5,000,000 | 5,238,867 |
| Series 2021 A: | | | |
4% 12/1/44 | | 4,000,000 | 3,731,692 |
4% 12/1/45 | | 4,000,000 | 3,706,528 |
4% 12/1/50 | | 2,000,000 | 1,785,586 |
| Series 2021 B: | | | |
4% 12/1/40 | | 1,000,000 | 969,380 |
4% 12/1/41 | | 1,000,000 | 959,951 |
4% 12/1/42 | | 1,500,000 | 1,432,261 |
5% 12/1/46 | | 2,000,000 | 2,110,868 |
| Philadelphia Arpt. Rev.: | | | |
| Series 2015 A, 5% 6/15/23 (b) | | 200,000 | 201,197 |
| Series 2017 A, 5% 7/1/42 | | 350,000 | 359,035 |
| Series 2017 B: | | | |
5% 7/1/31 (b) | | 1,000,000 | 1,045,376 |
5% 7/1/33 (b) | | 2,250,000 | 2,344,115 |
5% 7/1/37 (b) | | 5,065,000 | 5,193,562 |
5% 7/1/42 (b) | | 4,000,000 | 4,054,390 |
5% 7/1/47 (b) | | 3,035,000 | 2,995,257 |
| Philadelphia Auth. for Indl. Dev.: | | | |
| Series 2016, 5% 4/1/28 | | 275,000 | 287,223 |
| Series 2017, 5% 11/1/47 | | 5,000,000 | 5,029,742 |
| Series 2020 A, 4% 11/1/45 | | 3,825,000 | 3,418,699 |
| Series 2020 C: | | | |
4% 11/1/35 | | 1,750,000 | 1,722,320 |
4% 11/1/36 | | 1,500,000 | 1,462,511 |
4% 11/1/37 | | 1,255,000 | 1,212,461 |
4% 11/1/38 | | 1,000,000 | 949,354 |
| Philadelphia Gas Works Rev.: | | | |
| Series 16 A, 5% 8/1/50 (Assured Guaranty Muni. Corp. Insured) | | 8,835,000 | 9,335,683 |
| Series 2015 13: | | | |
5% 8/1/29 | | 2,000,000 | 2,089,245 |
5% 8/1/30 | | 1,500,000 | 1,563,535 |
5% 8/1/31 | | 1,100,000 | 1,143,279 |
| Series 2016 14: | | | |
5% 10/1/33 | | 1,500,000 | 1,569,363 |
5% 10/1/34 | | 500,000 | 522,943 |
| Philadelphia Gen. Oblig.: | | | |
| Series 2017 A, 5% 8/1/30 | | 1,500,000 | 1,617,533 |
| Series 2019 B: | | | |
5% 2/1/38 | | 3,000,000 | 3,188,064 |
5% 2/1/39 | | 7,600,000 | 8,059,675 |
| Philadelphia Redev. Auth. Rev. Series 2015 A, 5% 4/15/29 | | 3,000,000 | 3,133,757 |
| Philadelphia School District: | | | |
| Series 2018 A: | | | |
5% 9/1/29 | | 1,250,000 | 1,364,799 |
5% 9/1/30 | | 1,000,000 | 1,091,498 |
5% 9/1/33 | | 1,000,000 | 1,085,288 |
| Series 2019 A: | | | |
4% 9/1/37 | | 2,100,000 | 2,046,047 |
4% 9/1/38 | | 2,300,000 | 2,223,019 |
4% 9/1/39 | | 2,000,000 | 1,881,866 |
| Philadelphia Wtr. & Wastewtr. Rev.: | | | |
| Series 2015 B, 5% 7/1/30 | | 3,500,000 | 3,673,164 |
| Series 2020, 5% 10/1/40 | | 3,195,000 | 3,444,183 |
| Pittsburgh & Allegheny County Parking Sys. Series 2017: | | | |
| 5% 12/15/32 | | 500,000 | 538,129 |
| 5% 12/15/33 | | 500,000 | 536,884 |
| Pittsburgh Gen. Oblig. Series 2014, 5% 9/1/23 (Build America Mutual Assurance Insured) | | 575,000 | 582,777 |
| Pittsburgh Wtr. & Swr. Auth. Wtr. & Swr. Sys. Rev.: | | | |
| Series 2019 A, 5% 9/1/44 (Assured Guaranty Muni. Corp. Insured) | | 3,600,000 | 3,813,312 |
| Series 2019 B: | | | |
4% 9/1/34 (Assured Guaranty Muni. Corp. Insured) | | 2,000,000 | 2,047,839 |
4% 9/1/35 (Assured Guaranty Muni. Corp. Insured) | | 400,000 | 404,633 |
| Reading School District Series 2017: | | | |
| 5% 3/1/35 (Assured Guaranty Muni. Corp. Insured) | | 1,000,000 | 1,055,701 |
| 5% 3/1/36 (Assured Guaranty Muni. Corp. Insured) | | 1,050,000 | 1,101,261 |
| Saint Mary Hosp. Auth. Health Sys. Rev. (Trinity Health Proj.) Series 2012 B, 5% 11/15/26 | | 1,000,000 | 1,076,762 |
| Southcentral Pennsylvania Gen. Auth. Rev. Series 2015: | | | |
| 4% 12/1/30 | | 1,040,000 | 1,060,039 |
| 5% 12/1/27 | | 1,480,000 | 1,549,517 |
| 5% 12/1/29 | | 1,000,000 | 1,041,015 |
| Susquehanna Area Reg'l. Arp Auth. Series 2017: | | | |
| 5% 1/1/35 (b) | | 1,000,000 | 1,038,065 |
| 5% 1/1/38 (b) | | 1,125,000 | 1,152,469 |
| Union County Hosp. Auth. Rev. Series 2018 B, 5% 8/1/48 | | 6,000,000 | 6,050,711 |
| West Mifflin Area School District Series 2016: | | | |
| 5% 4/1/24 (Assured Guaranty Muni. Corp. Insured) | | 1,250,000 | 1,278,690 |
| 5% 4/1/26 (Assured Guaranty Muni. Corp. Insured) | | 1,000,000 | 1,064,431 |
| 5% 4/1/28 (Assured Guaranty Muni. Corp. Insured) | | 1,390,000 | 1,490,972 |
| Westmoreland County Indl. Dev. Auth. (Excela Health Proj.) Series 2020 A: | | | |
| 4% 7/1/23 | | 1,125,000 | 1,125,682 |
| 4% 7/1/26 | | 1,000,000 | 1,007,355 |
| 4% 7/1/37 | | 1,400,000 | 1,274,051 |
| 5% 7/1/27 | | 200,000 | 209,746 |
| 5% 7/1/28 | | 1,130,000 | 1,192,956 |
| 5% 7/1/29 | | 500,000 | 530,689 |
| 5% 7/1/30 | | 1,000,000 | 1,069,082 |
TOTAL PENNSYLVANIA | | | 371,741,762 |
| Pennsylvania, New Jersey - 1.2% | | | |
| Delaware River Port Auth. Pennsylvania & New Jersey Rev. Series 2018 A: | | | |
| 5% 1/1/37 | | 1,000,000 | 1,079,805 |
| 5% 1/1/38 | | 1,300,000 | 1,399,550 |
| 5% 1/1/39 | | 1,000,000 | 1,071,726 |
| 5% 1/1/40 | | 1,100,000 | 1,174,655 |
TOTAL PENNSYLVANIA, NEW JERSEY | | | 4,725,736 |
| Puerto Rico - 1.0% | | | |
| Puerto Rico Commonwealth Aqueduct & Swr. Auth. Series 2021 B, 5% 7/1/37 (d) | | 1,155,000 | 1,090,880 |
| Puerto Rico Commonwealth Pub. Impt. Gen. Oblig. Series 2021 A1: | | | |
| 0% 7/1/33 | | 1,225,367 | 662,385 |
| 5.625% 7/1/27 | | 145,000 | 147,736 |
| 5.625% 7/1/29 | | 440,000 | 450,214 |
| 5.75% 7/1/31 | | 1,045,000 | 1,080,497 |
| Puerto Rico Sales Tax Fing. Corp. Sales Tax Rev. Series 2018 A1, 0% 7/1/31 | | 1,155,000 | 752,392 |
TOTAL PUERTO RICO | | | 4,184,104 |
| TOTAL MUNICIPAL BONDS (Cost $406,312,789) | | | 381,366,384 |
| | | | |
| Municipal Notes - 5.2% |
| | | Principal Amount (a) | Value ($) |
| Pennsylvania - 5.2% | | | |
| Delaware County Indl. Dev. Auth. Arpt. Facilities Rev. (United Parcel Svc. Proj.) Series 2015, 3.41% 1/3/23, VRDN (e) | | 17,685,000 | 17,684,999 |
| Southcentral Pennsylvania Gen. Auth. Rev. Series 2019, 3.37% 1/3/23 (Liquidity Facility Bank of America NA), VRDN (e) | | 3,600,000 | 3,600,000 |
| | | | |
| TOTAL MUNICIPAL NOTES (Cost $21,285,005) | | | 21,284,999 |
| | | | |
| TOTAL INVESTMENT IN SECURITIES - 98.9% (Cost $427,597,794) | 402,651,383 |
NET OTHER ASSETS (LIABILITIES) - 1.1% | 4,371,090 |
| NET ASSETS - 100.0% | 407,022,473 |
| | |
Security Type Abbreviations
| VRDN | - | VARIABLE RATE DEMAND NOTE (A debt instrument that is payable upon demand, either daily, weekly or monthly) |
Legend
| (a) | Amount is stated in United States dollars unless otherwise noted. |
| (b) | Private activity obligations whose interest is subject to the federal alternative minimum tax for individuals. |
| (c) | Security initially issued in zero coupon form which converts to coupon form at a specified rate and date. The rate shown is the rate at period end. |
| (d) | Security exempt from registration under Rule 144A of the Securities Act of 1933. These securities may be resold in transactions exempt from registration, normally to qualified institutional buyers. At the end of the period, the value of these securities amounted to $1,090,880 or 0.3% of net assets. |
| (e) | Coupon rates for floating and adjustable rate securities reflect the rates in effect at period end. |
Investment Valuation
The following is a summary of the inputs used, as of December 31, 2022, involving the Fund's assets and liabilities carried at fair value. The inputs or methodology used for valuing securities may not be an indication of the risk associated with investing in those securities. For more information on valuation inputs, and their aggregation into the levels used below, please refer to the Investment Valuation section in the accompanying Notes to Financial Statements.
| Valuation Inputs at Reporting Date: |
| Description | Total ($) | Level 1 ($) | Level 2 ($) | Level 3 ($) |
Investments in Securities: | | | | |
|
| Municipal Securities | 402,651,383 | - | 402,651,383 | - |
| Total Investments in Securities: | 402,651,383 | - | 402,651,383 | - |
Fidelity® Pennsylvania Municipal Income Fund
| Statement of Assets and Liabilities |
| | | | December 31, 2022 |
| | | | | |
| Assets | | | | |
Investment in securities, at value - See accompanying schedule Unaffiliated issuers (cost $427,597,794): | | | $ | 402,651,383 |
| Cash | | | | 3,760,968 |
| Receivable for fund shares sold | | | | 572,132 |
| Interest receivable | | | | 5,339,331 |
| Prepaid expenses | | | | 441 |
| Other receivables | | | | 1,225 |
Total assets | | | | 412,325,480 |
| Liabilities | | | | |
| Payable for fund shares redeemed | | $4,710,201 | | |
| Distributions payable | | 380,107 | | |
| Accrued management fee | | 121,670 | | |
| Other affiliated payables | | 43,019 | | |
| Other payables and accrued expenses | | 48,010 | | |
| Total Liabilities | | | | 5,303,007 |
| Net Assets | | | $ | 407,022,473 |
| Net Assets consist of: | | | | |
| Paid in capital | | | $ | 433,873,081 |
| Total accumulated earnings (loss) | | | | (26,850,608) |
| Net Assets | | | $ | 407,022,473 |
Net Asset Value , offering price and redemption price per share ($407,022,473 ÷ 39,823,506 shares) | | | $ | 10.22 |
| | | | | |
| Statement of Operations |
| | | | Year ended December 31, 2022 |
| Investment Income | | | | |
| Interest | | | $ | 13,166,434 |
| Expenses | | | | |
| Management fee | $ | 1,580,201 | | |
| Transfer agent fees | | 451,310 | | |
| Accounting fees and expenses | | 116,968 | | |
| Custodian fees and expenses | | 5,979 | | |
| Independent trustees' fees and expenses | | 1,490 | | |
| Registration fees | | 25,669 | | |
| Audit | | 52,492 | | |
| Legal | | 7,254 | | |
| Miscellaneous | | 2,223 | | |
| Total expenses before reductions | | 2,243,586 | | |
| Expense reductions | | (14,343) | | |
| Total expenses after reductions | | | | 2,229,243 |
| Net Investment income (loss) | | | | 10,937,191 |
| Realized and Unrealized Gain (Loss) | | | | |
| Net realized gain (loss) on: | | | | |
| Investment Securities: | | | | |
| Unaffiliated issuers | | (2,131,805) | | |
| Total net realized gain (loss) | | | | (2,131,805) |
| Change in net unrealized appreciation (depreciation) on investment securities | | | | (59,341,779) |
| Net gain (loss) | | | | (61,473,584) |
| Net increase (decrease) in net assets resulting from operations | | | $ | (50,536,393) |
| Statement of Changes in Net Assets |
| |
| | Year ended December 31, 2022 | | Year ended December 31, 2021 |
| Increase (Decrease) in Net Assets | | | | |
| Operations | | | | |
| Net investment income (loss) | $ | 10,937,191 | $ | 11,924,047 |
| Net realized gain (loss) | | (2,131,805) | | 417,639 |
| Change in net unrealized appreciation (depreciation) | | (59,341,779) | | 77,355 |
| Net increase (decrease) in net assets resulting from operations | | (50,536,393) | | 12,419,041 |
| Distributions to shareholders | | (10,893,254) | | (12,540,010) |
| Share transactions | | | | |
| Proceeds from sales of shares | | 209,068,548 | | 97,699,349 |
| Reinvestment of distributions | | 6,861,043 | | 7,886,844 |
| Cost of shares redeemed | | (302,424,436) | | (86,105,495) |
Net increase (decrease) in net assets resulting from share transactions | | (86,494,845) | | 19,480,698 |
| Total increase (decrease) in net assets | | (147,924,492) | | 19,359,729 |
| | | | | |
| Net Assets | | | | |
| Beginning of period | | 554,946,965 | | 535,587,236 |
| End of period | $ | 407,022,473 | $ | 554,946,965 |
| | | | | |
| Other Information | | | | |
| Shares | | | | |
| Sold | | 20,229,877 | | 8,417,034 |
| Issued in reinvestment of distributions | | 655,071 | | 679,894 |
| Redeemed | | (28,961,466) | | (7,423,996) |
| Net increase (decrease) | | (8,076,518) | | 1,672,932 |
| | | | | |
Financial Highlights
| Fidelity® Pennsylvania Municipal Income Fund |
| |
| Years ended December 31, | | 2022 | | 2021 | | 2020 | | 2019 | | 2018 |
Selected Per-Share Data | | | | | | | | | | |
| Net asset value, beginning of period | $ | 11.59 | $ | 11.59 | $ | 11.39 | $ | 10.92 | $ | 11.18 |
| Income from Investment Operations | | | | | | | | | | |
Net investment income (loss) A,B | | .255 | | .251 | | .275 | | .310 | | .314 |
| Net realized and unrealized gain (loss) | | (1.372) | | .013 | | .209 | | .523 | | (.226) |
| Total from investment operations | | (1.117) | | .264 | | .484 | | .833 | | .088 |
| Distributions from net investment income | | (.253) | | (.251) | | (.272) | | (.307) | | (.314) |
| Distributions from net realized gain | | - | | (.013) | | (.012) | | (.056) | | (.034) |
| Total distributions | | (.253) | | (.264) | | (.284) | | (.363) | | (.348) |
| Net asset value, end of period | $ | 10.22 | $ | 11.59 | $ | 11.59 | $ | 11.39 | $ | 10.92 |
Total Return C | | (9.66)% | | 2.30% | | 4.32% | | 7.71% | | .84% |
Ratios to Average Net Assets B,D,E | | | | | | | | | | |
| Expenses before reductions | | .49% | | .48% | | .49% | | .48% | | .48% |
| Expenses net of fee waivers, if any | | .49% | | .48% | | .49% | | .48% | | .48% |
| Expenses net of all reductions | | .49% | | .48% | | .48% | | .48% | | .48% |
| Net investment income (loss) | | 2.41% | | 2.16% | | 2.42% | | 2.74% | | 2.88% |
| Supplemental Data | | | | | | | | | | |
| Net assets, end of period (000 omitted) | $ | 407,022 | $ | 554,947 | $ | 535,587 | $ | 516,717 | $ | 452,519 |
Portfolio turnover rate F | | 7% | | 5% | | 17% | | 20% | | 15% |
A Calculated based on average shares outstanding during the period.
B Net investment income (loss) is affected by the timing of the declaration of dividends by any underlying mutual funds or exchange-traded funds (ETFs). Net investment income (loss) of any mutual funds or ETFs is not included in the Fund's net investment income (loss) ratio.
C Total returns would have been lower if certain expenses had not been reduced during the applicable periods shown.
D Fees and expenses of any underlying mutual funds or exchange-traded funds (ETFs) are not included in the Fund's expense ratio. The Fund indirectly bears its proportionate share of these expenses.
E Expense ratios reflect operating expenses of the class. Expenses before reductions do not reflect amounts reimbursed, waived, or reduced through arrangements with the investment adviser, brokerage services, or other offset arrangements, if applicable, and do not represent the amount paid by the class during periods when reimbursements, waivers or reductions occur.
F Amount does not include the portfolio activity of any underlying mutual funds or exchange-traded funds (ETFs).
| Current 7-Day Yields |
| | | |
| Fidelity® Pennsylvania Municipal Money Market Fund | 3.24% | |
| | | |
Yield refers to the income paid by the Fund over a given period. Yield for money market funds is usually for seven-day periods, as it is here, though it is expressed as an annual percentage rate. Past performance is no guarantee of future results. Yield will vary and it's possible to lose money investing in the Fund. | |
| Effective Maturity Diversification (% of Fund's Investments) |
| Days |
| 1 - 7 | 97.6 | |
| 31 - 60 | 2.4 | |
| Effective maturity is determined in accordance with the requirements of Rule 2a-7 under the Investment Company Act of 1940. |
Asset Allocation (% of Fund's net assets) |
|
Percentages shown as 0.0% may reflect amounts less than 0.05%. |
|
Fidelity® Pennsylvania Municipal Money Market Fund
Showing Percentage of Net Assets
| Variable Rate Demand Note - 43.9% |
| | | Principal Amount (a) | Value ($) |
| Alabama - 0.7% | | | |
| Decatur Indl. Dev. Board Exempt Facilities Rev. (Nucor Steel Decatur LLC Proj.) Series 2003 A, 4.15% 1/6/23, VRDN (b)(c) | | 800,000 | 800,000 |
| West Jefferson Indl. Dev. Series 2008, 3.78% 1/6/23, VRDN (b) | | 200,000 | 200,000 |
TOTAL ALABAMA | | | 1,000,000 |
| Arizona - 0.2% | | | |
| Maricopa County Poll. Cont. Rev. Series 2009 B, 3.91% 1/6/23, VRDN (b) | | 300,000 | 300,000 |
| Kansas - 0.7% | | | |
| Burlington Envir. Impt. Rev. (Kansas City Pwr. and Lt. Co. Proj.): | | | |
| Series 2007 A, 3.68% 1/6/23, VRDN (b) | | 100,000 | 100,000 |
| Series 2007 B, 3.68% 1/6/23, VRDN (b) | | 300,000 | 300,000 |
| St. Mary's Kansas Poll. Cont. Rev. Series 1994, 3.46% 1/6/23, VRDN (b) | | 500,000 | 500,000 |
TOTAL KANSAS | | | 900,000 |
| Nebraska - 0.3% | | | |
| Stanton County Indl. Dev. Rev. (Nucor Corp. Proj.) Series 1996, 4.15% 1/6/23, VRDN (b)(c) | | 400,000 | 400,000 |
| Pennsylvania - 40.6% | | | |
| Allegheny County Hosp. Dev. Auth. Rev. Series 2016 A, 3.7% 1/6/23, LOC Truist Bank, VRDN (b) | | 5,000,000 | 5,000,000 |
| Beaver County Indl. Dev. Auth. Series 2018 A, 3.7% 1/6/23, LOC Truist Bank, VRDN (b) | | 1,910,000 | 1,910,000 |
| Chester County Health & Ed. Auth. Rev. Series 2009, 3.73% 1/6/23, LOC Manufacturers & Traders Trust Co., VRDN (b) | | 2,460,000 | 2,460,000 |
| Delaware County Indl. Dev. Auth. Arpt. Facilities Rev. (United Parcel Svc. Proj.) Series 2015, 3.41% 1/3/23, VRDN (b) | | 13,370,000 | 13,370,000 |
| Haverford Township School District Series 2009, 3.66% 1/6/23, LOC TD Banknorth, NA, VRDN (b) | | 2,885,000 | 2,885,000 |
| Lancaster Indl. Dev. Auth. Rev.: | | | |
| (Mennonite Home Proj.) Series 2007, 3.73% 1/6/23, LOC Manufacturers & Traders Trust Co., VRDN (b) | | 4,925,000 | 4,925,000 |
| (Willow Valley Retirement Proj.) Series 2009 B, 3.69% 1/6/23, LOC PNC Bank NA, VRDN (b) | | 2,000,000 | 2,000,000 |
| Lehigh County Gen. Purp. Hosp. Rev. Series 2019 B, 3.7% 1/6/23, LOC Bank of America NA, VRDN (b) | | 500,000 | 500,000 |
| Montgomery County Indl. Dev. Auth. Rev. (Foulkeways at Gwynedd Proj.) Series 2006 B, 3.7% 1/6/23, LOC Citizens Bank NA, VRDN (b) | | 400,000 | 400,000 |
| Pennsylvania Higher Edl. Facilities Auth. Rev. (Univ. of Pennsylvania Health Sys. Proj.) Series 2008 A, 3.64% 1/6/23, LOC Bank of America NA, VRDN (b) | | 200,000 | 200,000 |
| Philadelphia Auth. for Indl. Dev. Rev. (Spl. People in Northeast, Inc. Proj.) Series 2006, 3.75% 1/6/23, LOC Citizens Bank NA, VRDN (b) | | 3,160,000 | 3,160,000 |
| Philadelphia Auth. Indl. Dev. Lease Rev. Series 2007 B2, 3.66% 1/6/23, LOC TD Banknorth, NA, VRDN (b) | | 5,500,000 | 5,500,000 |
| Philadelphia Gas Works Rev. Series 2009 D, 3.66% 1/6/23, LOC TD Banknorth, NA, VRDN (b) | | 600,000 | 600,000 |
| FHLMC Pennsylvania Hsg. Fin. Agcy. Multifamily Hsg. Dev. Rev. (Foxwood Manor Apts. Proj.) Series 2008 O, 3.6% 1/6/23, LOC Freddie Mac, VRDN (b) | | 300,000 | 300,000 |
| FNMA Montgomery County Redev. Auth. Multi-family Hsg. Rev. (Kingswood Apts. Proj.) Series 2001 A, 3.74% 1/6/23, LOC Fannie Mae, VRDN (b) | | 11,975,000 | 11,975,000 |
TOTAL PENNSYLVANIA | | | 55,185,000 |
| South Carolina - 0.1% | | | |
| Berkeley County Indl. Dev. Rev. (Nucor Corp. Proj.) Series 1997, 4.15% 1/6/23, VRDN (b)(c) | | 100,000 | 100,000 |
| West Virginia - 1.3% | | | |
| West Virginia Econ. Dev. Auth. Solid Waste Disp. Facilities Rev.: | | | |
| (Appalachian Pwr. Co. Amos Proj.) Series 2008 B, 3.8% 1/6/23, VRDN (b)(c) | | 500,000 | 500,000 |
| (Appalachian Pwr. Co.- Mountaineer Proj.) Series 2008 A, 3.78% 1/6/23, VRDN (b)(c) | | 1,200,000 | 1,200,000 |
TOTAL WEST VIRGINIA | | | 1,700,000 |
| TOTAL VARIABLE RATE DEMAND NOTE (Cost $59,585,000) | | | 59,585,000 |
| | | | |
| Tender Option Bond - 41.8% |
| | | Principal Amount (a) | Value ($) |
| Colorado - 0.5% | | | |
| Colorado Health Facilities Auth. Rev. Bonds Participating VRDN Series 2022 004, 3.81% 2/10/23 (Liquidity Facility Barclays Bank PLC) (b)(d)(e) | | 700,000 | 700,000 |
| Connecticut - 0.2% | | | |
| Connecticut Gen. Oblig. Participating VRDN Series Floaters 016, 3.81% 2/10/23 (Liquidity Facility Barclays Bank PLC) (b)(d)(e) | | 300,000 | 300,000 |
| Florida - 0.1% | | | |
| Miami-Dade County Aviation Rev. Participating VRDN Series 2022 025, 3.84% 2/10/23 (Liquidity Facility Barclays Bank PLC) (b)(c)(d)(e) | | 100,000 | 100,000 |
| Kentucky - 0.2% | | | |
| CommonSpirit Health Participating VRDN Series MIZ 90 21, 3.76% 1/6/23 (Liquidity Facility Mizuho Cap. Markets LLC) (b)(d)(e) | | 200,000 | 200,000 |
| Maryland - 0.4% | | | |
| Univ. of Maryland Med. Sys., Participating VRDN Series 2022 031, 3.81% 2/10/23 (Liquidity Facility Barclays Bank PLC) (b)(d)(e) | | 500,000 | 500,000 |
| Michigan - 0.4% | | | |
| Eastern Michigan Univ. Revs. Participating VRDN Series Floater 046, 3.86% 1/6/23 (Liquidity Facility Barclays Bank PLC) (b)(d)(e) | | 500,000 | 500,000 |
| Missouri - 0.1% | | | |
| Kansas City Indl. Dev. Auth. Participating VRDN Series XG 03 96, 3.85% 1/6/23 (Liquidity Facility Deutsche Bank AG New York Branch) (b)(c)(d)(e) | | 200,000 | 200,000 |
| Ohio - 0.1% | | | |
| Ohio Hosp. Rev. Participating VRDN Series 002, 3.81% 2/10/23 (Liquidity Facility Barclays Bank PLC) (b)(d)(e) | | 100,000 | 100,000 |
| Pennsylvania - 39.8% | | | |
| Allegheny County Sanitation Auth. Swr. Rev. Participating VRDN Series Floaters XM 00 82, 3.7% 1/6/23 (Liquidity Facility Barclays Bank PLC) (b)(d)(e) | | 3,465,000 | 3,465,000 |
| Central Bradford Progress Auth. Rev. Participating VRDN Series XF 13 46, 3.71% 1/6/23 (Liquidity Facility Bank of America NA) (b)(d)(e) | | 3,845,000 | 3,845,000 |
| Commonwealth Fing. Auth. Tobacco Participating VRDN Series XX 10 80, 3.7% 1/6/23 (Liquidity Facility Barclays Bank PLC) (b)(d)(e) | | 2,700,000 | 2,700,000 |
| Geisinger Auth. Health Sys. Rev. Participating VRDN: | | | |
| Series Floaters XF 05 43, 3.73% 1/6/23 (Liquidity Facility Royal Bank of Canada) (b)(d)(e) | | 2,825,000 | 2,825,000 |
| Series Floaters YX 10 49, 3.38% 1/6/23 (Liquidity Facility Barclays Bank PLC) (b)(d)(e) | | 1,885,000 | 1,885,000 |
| Series XM 08 87, 3.81% 1/6/23 (Liquidity Facility JPMorgan Chase Bank) (b)(d)(e) | | 1,190,000 | 1,190,000 |
| Lancaster County Hosp. Auth. Health Ctr. Rev. Participating VRDN Series 16 ZF0383, 3.71% 1/6/23 (Liquidity Facility Toronto-Dominion Bank) (b)(d)(e) | | 3,750,000 | 3,750,000 |
| Montgomery County Higher Ed. & Health Auth. Rev. Participating VRDN Series XF 28 85, 3.46% 1/6/23 (Liquidity Facility Barclays Bank PLC) (b)(d)(e) | | 2,500,000 | 2,500,000 |
| Pennsylvania Econ. Dev. Participating VRDN Series XM 0048, 3.72% 1/6/23 (Liquidity Facility Deutsche Bank AG New York Branch) (b)(d)(e) | | 299,500 | 299,500 |
| Pennsylvania Gen. Oblig. Participating VRDN Series Floaters ZM 06 50, 3.69% 1/6/23 (Liquidity Facility Bank of America NA) (b)(d)(e) | | 975,000 | 975,000 |
| Pennsylvania Higher Edl. Facilities Auth. Rev. Participating VRDN Series XG 02 63, 3.69% 1/6/23 (Liquidity Facility Bank of America NA) (b)(d)(e) | | 500,000 | 500,000 |
| Pennsylvania State Univ. Participating VRDN Series XM 08 27, 3.69% 1/6/23 (Liquidity Facility JPMorgan Chase Bank) (b)(d)(e) | | 2,700,000 | 2,700,000 |
| Pennsylvania Tpk. Commission Registration Fee Rev. Participating VRDN Series Putters 5025, 3.7% 1/3/23 (Liquidity Facility JPMorgan Chase Bank) (b)(d)(e) | | 3,000,000 | 3,000,000 |
| Pennsylvania Tpk. Commission Tpk. Rev. Participating VRDN: | | | |
| Series BC 22 018, 3.32% 2/10/23 (Liquidity Facility Barclays Bank PLC) (b)(d)(e) | | 1,500,000 | 1,500,000 |
| Series XM 10 08, 3.69% 1/6/23 (Liquidity Facility Royal Bank of Canada) (b)(d)(e) | | 830,000 | 830,000 |
| Philadelphia Arpt. Rev. Participating VRDN Series YX 12 11, 3.71% 1/6/23 (Liquidity Facility Barclays Bank PLC) (b)(c)(d)(e) | | 1,600,000 | 1,600,000 |
| Philadelphia Auth. for Indl. Dev. Participating VRDN: | | | |
| Series XG 02 53, 3.71% 1/6/23 (Liquidity Facility Bank of America NA) (b)(d)(e) | | 1,260,000 | 1,260,000 |
| Series XM 00 05, 3.69% 1/6/23 (Liquidity Facility JPMorgan Chase Bank) (b)(d)(e) | | 4,200,000 | 4,200,000 |
| Philadelphia School District Participating VRDN Series XM 08 60, 3.69% 1/6/23 (Liquidity Facility JPMorgan Chase Bank) (b)(d)(e) | | 1,625,000 | 1,625,000 |
| Philadelphia Wtr. & Wastewtr. Rev. Participating VRDN Series Floaters XF 07 19, 3.7% 1/6/23 (Liquidity Facility Royal Bank of Canada) (b)(d)(e) | | 1,000,000 | 1,000,000 |
| Southcentral Pennsylvania Gen. Auth. Rev. Participating VRDN Series XL 01 04, 3.69% 1/6/23 (Liquidity Facility Morgan Stanley Bank, West Valley City Utah) (b)(d)(e) | | 1,300,000 | 1,300,000 |
| Southeastern Pennsylvania Trans. Auth. Rev. Participating VRDN: | | | |
| Series 2022 XG 04 12, 3.69% 1/6/23 (Liquidity Facility Royal Bank of Canada) (b)(d)(e) | | 1,400,000 | 1,400,000 |
| Series XF 30 41, 3.69% 1/6/23 (Liquidity Facility Morgan Stanley Bank, West Valley City Utah) (b)(d)(e) | | 1,400,000 | 1,400,000 |
| Series XG 04 13, 3.69% 1/6/23 (Liquidity Facility Royal Bank of Canada) (b)(d)(e) | | 1,400,000 | 1,400,000 |
| Series XM 10 57, 3.71% 1/6/23 (Liquidity Facility Bank of America NA) (b)(d)(e) | | 1,400,000 | 1,400,000 |
| Westmoreland County Muni. Auth. Muni. Svc. Rev. Participating VRDN Series XF 10 58, 3.7% 1/6/23 (Liquidity Facility Barclays Bank PLC) (b)(d)(e) | | 3,270,000 | 3,270,000 |
| Wilkes-Barre Area School District Participating VRDN Series Floaters XF 07 77, 3.7% 1/6/23 (Liquidity Facility Bank of America NA) (b)(d)(e) | | 2,285,000 | 2,285,000 |
TOTAL PENNSYLVANIA | | | 54,104,500 |
| TOTAL TENDER OPTION BOND (Cost $56,704,500) | | | 56,704,500 |
| | | | |
| Other Municipal Security - 0.7% |
| | | Principal Amount (a) | Value ($) |
| Pennsylvania - 0.7% | | | |
Philadelphia Wtr. Series 2022 C, 2.45% 1/5/23, LOC The Toronto-Dominion Bank, CP (Cost $1,000,000) | | 1,000,000 | 1,000,000 |
| | | | |
| Investment Company - 13.6% |
| | | Shares | Value ($) |
Fidelity Municipal Cash Central Fund 3.72% (f)(g) (Cost $18,520,875) | | 18,517,547 | 18,520,875 |
| | | | |
| TOTAL INVESTMENT IN SECURITIES - 100.0% (Cost $135,810,375) | 135,810,375 |
NET OTHER ASSETS (LIABILITIES) - 0.0% | 3,742 |
| NET ASSETS - 100.0% | 135,814,117 |
| | |
Security Type Abbreviations
| CP | - | COMMERCIAL PAPER |
| VRDN | - | VARIABLE RATE DEMAND NOTE (A debt instrument that is payable upon demand, either daily, weekly or monthly) |
The date shown for securities represents the date when principal payments must be paid, taking into account any call options exercised by the issuer and any permissible maturity shortening features other than interest rate resets.
Legend
| (a) | Amount is stated in United States dollars unless otherwise noted. |
| (b) | Coupon rates for floating and adjustable rate securities reflect the rates in effect at period end. |
| (c) | Private activity obligations whose interest is subject to the federal alternative minimum tax for individuals. |
| (d) | Provides evidence of ownership in one or more underlying municipal bonds. |
| (e) | Coupon rates are determined by re-marketing agents based on current market conditions. |
| (f) | Information in this report regarding holdings by state and security types does not reflect the holdings of the Fidelity Municipal Cash Central Fund. |
| (g) | Affiliated fund that is generally available only to investment companies and other accounts managed by Fidelity Investments. The rate quoted is the annualized seven-day yield of the fund at period end. A complete unaudited listing of the fund's holdings as of its most recent quarter end is available upon request. In addition, each Fidelity Central Fund's financial statements, which are not covered by the Fund's Report of Independent Registered Public Accounting Firm, are available on the SEC's website or upon request. |
Affiliated Central Funds
Fiscal year to date information regarding the Fund's investments in Fidelity Central Funds, including the ownership percentage, is presented below.
| Affiliate | Value, beginning of period ($) | Purchases ($) | Sales Proceeds ($) | Dividend Income ($) | Realized Gain (loss) ($) | Change in Unrealized appreciation (depreciation) ($) | Value, end of period ($) | % ownership, end of period |
| Fidelity Municipal Cash Central Fund 3.72% | 5,440,706 | 69,055,001 | 55,975,000 | 195,168 | 168 | - | 18,520,875 | 0.7% |
| Total | 5,440,706 | 69,055,001 | 55,975,000 | 195,168 | 168 | - | 18,520,875 | |
| | | | | | | | | |
Amounts in the dividend income column in the above table include any capital gain distributions from underlying funds, which are presented in the corresponding line item in the Statement of Operations, if applicable.
Amounts included in the purchases and sales proceeds columns may include in-kind transactions, if applicable.
Investment Valuation
All investments are categorized as Level 2 under the Fair Value Hierarchy. The inputs or methodology used for valuing securities may not be an indication of the risk associated with investing in these securities. For more information on valuation inputs, refer to the Investment Valuation section in the accompanying Notes to Financial Statements.
Fidelity® Pennsylvania Municipal Money Market Fund
| Statement of Assets and Liabilities |
| | | | December 31, 2022 |
| | | | | |
| Assets | | | | |
| Investment in securities, at value - See accompanying schedule: | | | | |
Unaffiliated issuers (cost $117,289,500) | | $117,289,500 | | |
Fidelity Central Funds (cost $18,520,875) | | 18,520,875 | | |
| | | | | |
| Total Investment in Securities (cost $135,810,375) | | | $ | 135,810,375 |
| Interest receivable | | | | 482,352 |
| Distributions receivable from Fidelity Central Funds | | | | 50,002 |
Total assets | | | | 136,342,729 |
| Liabilities | | | | |
| Payable to custodian bank | | 439,595 | | |
| Payable for fund shares redeemed | | 14,576 | | |
| Distributions payable | | 16,873 | | |
| Accrued management fee | | 57,509 | | |
| Other payables and accrued expenses | | 59 | | |
| Total Liabilities | | | | 528,612 |
| Net Assets | | | $ | 135,814,117 |
| Net Assets consist of: | | | | |
| Paid in capital | | | $ | 135,814,122 |
| Total accumulated earnings (loss) | | | | (5) |
| Net Assets | | | $ | 135,814,117 |
Net Asset Value , offering price and redemption price per share ($135,814,117 ÷ 135,675,010 shares) | | | $ | 1.00 |
| | | | | |
| Statement of Operations |
| | | | Year ended December 31, 2022 |
| Investment Income | | | | |
| Interest | | | $ | 1,589,667 |
| Income from Fidelity Central Funds | | | | 194,994 |
| Total Income | | | | 1,784,661 |
| Expenses | | | | |
| Management fee | $ | 756,855 | | |
| Independent trustees' fees and expenses | | 492 | | |
| Total expenses before reductions | | 757,347 | | |
| Expense reductions | | (112,596) | | |
| Total expenses after reductions | | | | 644,751 |
| Net Investment income (loss) | | | | 1,139,910 |
| Realized and Unrealized Gain (Loss) | | | | |
| Net realized gain (loss) on: | | | | |
| Investment Securities: | | | | |
| Unaffiliated issuers | | 25,673 | | |
| Fidelity Central Funds | | 168 | | |
| Capital gain distributions from Fidelity Central Funds | | 174 | | |
| Total net realized gain (loss) | | | | 26,015 |
| Net increase in net assets resulting from operations | | | $ | 1,165,925 |
| Statement of Changes in Net Assets |
| |
| | Year ended December 31, 2022 | | Year ended December 31, 2021 |
| Increase (Decrease) in Net Assets | | | | |
| Operations | | | | |
| Net investment income (loss) | $ | 1,139,910 | $ | 16,968 |
| Net realized gain (loss) | | 26,015 | | 109,575 |
Net increase in net assets resulting from operations | | 1,165,925 | | 126,543 |
| Distributions to shareholders | | (1,271,917) | | (136,843) |
| Share transactions | | | | |
| Proceeds from sales of shares | | 15,587,716 | | 26,624,972 |
| Reinvestment of distributions | | 1,204,352 | | 129,646 |
| Cost of shares redeemed | | (42,793,994) | | (43,810,109) |
Net increase (decrease) in net assets and shares resulting from share transactions | | (26,001,926) | | (17,055,491) |
| Total increase (decrease) in net assets | | (26,107,918) | | (17,065,791) |
| | | | | |
| Net Assets | | | | |
| Beginning of period | | 161,922,035 | | 178,987,826 |
| End of period | $ | 135,814,117 | $ | 161,922,035 |
| | | | | |
| Other Information | | | | |
| Shares | | | | |
| Sold | | 15,587,716 | | 26,624,972 |
| Issued in reinvestment of distributions | | 1,204,352 | | 129,646 |
| Redeemed | | (42,793,994) | | (43,810,109) |
| Net increase (decrease) | | (26,001,926) | | (17,055,491) |
| | | | | |
Financial Highlights
| Fidelity® Pennsylvania Municipal Money Market Fund |
| |
| Years ended December 31, | | 2022 | | 2021 | | 2020 | | 2019 | | 2018 |
Selected Per-Share Data | | | | | | | | | | |
| Net asset value, beginning of period | $ | 1.00 | $ | 1.00 | $ | 1.00 | $ | 1.00 | $ | 1.00 |
| Income from Investment Operations | | | | | | | | | | |
Net investment income (loss) A | | .008 | | - B | | .003 | | .010 | | .010 |
| Net realized and unrealized gain (loss) | | .001 | | .001 | | - B | | .001 | | - B |
| Total from investment operations | | .009 | | .001 | | .003 | | .011 | | .010 |
| Distributions from net investment income | | (.008) | | - B | | (.003) | | (.010) | | (.010) |
| Distributions from net realized gain | | (.001) | | (.001) | | - B | | - B | | - |
| Total distributions | | (.009) | | (.001) | | (.003) | | (.011) C | | (.010) |
| Net asset value, end of period | $ | 1.00 | $ | 1.00 | $ | 1.00 | $ | 1.00 | $ | 1.00 |
Total Return D | | .89% | | .08% | | .37% | | 1.06% | | .97% |
Ratios to Average Net Assets A,E,F | | | | | | | | | | |
| Expenses before reductions | | .50% | | .50% | | .50% | | .50% | | .50% |
| Expenses net of fee waivers, if any | | .43% | | .10% | | .34% | | .50% | | .50% |
| Expenses net of all reductions | | .43% | | .10% | | .34% | | .50% | | .50% |
| Net investment income (loss) | | .75% | | .01% | | .35% | | 1.03% | | .96% |
| Supplemental Data | | | | | | | | | | |
| Net assets, end of period (000 omitted) | $ | 135,814 | $ | 161,922 | $ | 178,988 | $ | 207,008 | $ | 240,412 |
A Net investment income (loss) is affected by the timing of the declaration of dividends by any underlying mutual funds or exchange-traded funds (ETFs). Net investment income (loss) of any mutual funds or ETFs is not included in the Fund's net investment income (loss) ratio.
B Amount represents less than $.0005 per share.
C Total distributions per share do not sum due to rounding.
D Total returns would have been lower if certain expenses had not been reduced during the applicable periods shown.
E Fees and expenses of any underlying mutual funds or exchange-traded funds (ETFs) are not included in the Fund's expense ratio. The Fund indirectly bears its proportionate share of these expenses. For additional expense information related to investments in Fidelity Central Funds, please refer to the "Investments in Fidelity Central Funds" note found in the Notes to Financial Statements section of the most recent Annual or Semi-Annual report.
F Expense ratios reflect operating expenses of the class. Expenses before reductions do not reflect amounts reimbursed, waived, or reduced through arrangements with the investment adviser, brokerage services, or other offset arrangements, if applicable, and do not represent the amount paid by the class during periods when reimbursements, waivers or reductions occur.
For the period ended December 31, 2022
1. Organization.
Fidelity Pennsylvania Municipal Income Fund (the Income Fund) is a fund of Fidelity Municipal Trust. Fidelity Pennsylvania Municipal Money Market Fund (the Money Market Fund) is a fund of Fidelity Municipal Trust II. Each Trust is registered under the Investment Company Act of 1940, as amended (the 1940 Act), as an open-end management investment company. Fidelity Municipal Trust and Fidelity Municipal Trust II (the Trusts) are organized as a Massachusetts business trust and a Delaware statutory trust, respectively. Each Fund is authorized to issue an unlimited number of shares. Shares of the Money Market Fund are only available for purchase by retail shareholders. Share transactions on the Statement of Changes in Net Assets may contain exchanges between affiliated funds. Each Fund may be affected by economic and political developments in the state of Pennsylvania.
2. Investments in Fidelity Central Funds.
Funds may invest in Fidelity Central Funds, which are open-end investment companies generally available only to other investment companies and accounts managed by the investment adviser and its affiliates. The Schedule of Investments lists any Fidelity Central Funds held as an investment as of period end, but does not include the underlying holdings of each Fidelity Central Fund. An investing fund indirectly bears its proportionate share of the expenses of the underlying Fidelity Central Funds.
Based on its investment objective, each Fidelity Central Fund may invest or participate in various investment vehicles or strategies that are similar to those of the investing fund. These strategies are consistent with the investment objectives of the investing fund and may involve certain economic risks which may cause a decline in value of each of the Fidelity Central Funds and thus a decline in the value of the investing fund.
| Fidelity Central Fund | Investment Manager | Investment Objective | Investment Practices | Expense Ratio A |
| Fidelity Money Market Central Funds | Fidelity Management & Research Company LLC (FMR) | Each fund seeks to obtain a high level of current income consistent with the preservation of capital and liquidity. | Short-term Investments | Less than .005% |
A Expenses expressed as a percentage of average net assets and are as of each underlying Central Fund's most recent annual or semi-annual shareholder report.
A complete unaudited list of holdings for each Fidelity Central Fund is available upon request or at the Securities and Exchange Commission website at www.sec.gov. In addition, the financial statements of the Fidelity Central Funds which contain the significant accounting policies (including investment valuation policies) of those funds, and are not covered by the Report of Independent Registered Public Accounting Firm, are available on the Securities and Exchange Commission website or upon request.
3. Significant Accounting Policies.
Each Fund is an investment company and applies the accounting and reporting guidance of the Financial Accounting Standards Board (FASB) Accounting Standards Codification Topic 946 Financial Services - Investment Companies . The financial statements have been prepared in conformity with accounting principles generally accepted in the United States of America (GAAP), which require management to make certain estimates and assumptions at the date of the financial statements. Actual results could differ from those estimates. Subsequent events, if any, through the date that the financial statements were issued have been evaluated in the preparation of the financial statements. Each Fund's Schedule of Investments lists any underlying mutual funds or exchange-traded funds (ETFs) but does not include the underlying holdings of these funds. The following summarizes the significant accounting policies of each Fund:
Investment Valuation. Investments are valued as of 4:00 p.m. Eastern time on the last calendar day of the period. The Board of Trustees (the Board) has designated the Income Fund's investment adviser as the valuation designee responsible for the fair valuation function and performing fair value determinations as needed. The investment adviser has established a Fair Value Committee (the Committee) to carry out the day-to-day fair valuation responsibilities and has adopted policies and procedures to govern the fair valuation process and the activities of the Committee. In accordance with these fair valuation policies and procedures, which have been approved by the Board, the Income Fund attempts to obtain prices from one or more third party pricing services or brokers to value its investments. When current market prices, quotations or currency exchange rates are not readily available or reliable, investments will be fair valued in good faith by the Committee, in accordance with the policies and procedures. Factors used in determining fair value vary by investment type and may include market or investment specific events, transaction data, estimated cash flows, and market observations of comparable investments. The frequency that the fair valuation procedures are used cannot be predicted and they may be utilized to a significant extent. The Committee manages the Income Fund's fair valuation practices and maintains the fair valuation policies and procedures. The Income Fund's investment adviser reports to the Board information regarding the fair valuation process and related material matters.
Each Fund categorizes the inputs to valuation techniques used to value its investments into a disclosure hierarchy consisting of three levels as shown below:
Level 1 - unadjusted quoted prices in active markets for identical investments
Level 2 - other significant observable inputs (including quoted prices for similar investments, interest rates, prepayment speeds, etc.)
Level 3 - unobservable inputs (including the Fund's own assumptions based on the best information available)
Valuation techniques used to value each Fund's investments by major category are as follows:
For the Income Fund, debt securities, including restricted securities, are valued based on evaluated prices received from third party pricing services or from brokers who make markets in such securities. Municipal securities are valued by pricing services who utilize matrix pricing which considers yield or price of bonds of comparable quality, coupon, maturity and type or by broker-supplied prices. When independent prices are unavailable or unreliable, debt securities may be valued utilizing pricing methodologies which consider similar factors that would be used by third party pricing services. Debt securities are generally categorized as Level 2 in the hierarchy but may be Level 3 depending on the circumstances.
For the Money Market Fund, as permitted by compliance with certain conditions under Rule 2a-7 of the 1940 Act, securities are valued at amortized cost, which approximates fair value. The amortized cost of an instrument is determined by valuing it at its original cost and thereafter amortizing any discount or premium from its face value at a constant rate until maturity. Securities held by a money market fund are generally high quality and liquid; however, they are reflected as Level 2 because the inputs used to determine fair value are not quoted prices in an active market.
For the Income Fund, changes in valuation techniques may result in transfers in or out of an assigned level within the disclosure hierarchy. The aggregate value of investments by input level as of December 31, 2022 is included at the end of the Fund's Schedule of Investments.
Investment Transactions and Income. For financial reporting purposes, the Funds' investment holdings and NAV include trades executed through the end of the last business day of the period. The NAV per share for processing shareholder transactions is calculated as of the close of business of the New York Stock Exchange (NYSE), normally 4:00 p.m. Eastern time and includes trades executed through the end of the prior business day for the Income Fund and trades executed through the end of the current business day for the Money Market Fund. Gains and losses on securities sold are determined on the basis of identified cost. Income and capital gain distributions from Fidelity Central Funds, if any, are recorded on the ex-dividend date. Interest income is accrued as earned and includes coupon interest and amortization of premium and accretion of discount on debt securities as applicable. Debt obligations may be placed on non-accrual status and related interest income may be reduced by ceasing current accruals and writing off interest receivables when the collection of all or a portion of interest has become doubtful based on consistently applied procedures. A debt obligation is removed from non-accrual status when the issuer resumes interest payments or when collectability of interest is reasonably assured.
Expenses. Expenses directly attributable to a fund are charged to that fund. Expenses attributable to more than one fund are allocated among the respective funds on the basis of relative net assets or other appropriate methods. Expenses included in the accompanying financial statements reflect the expenses of that fund and do not include any expenses associated with any underlying mutual funds or exchange-traded funds. Although not included in a fund's expenses, a fund indirectly bears its proportionate share of these expenses through the net asset value of each underlying mutual fund or exchange-traded fund. Expense estimates are accrued in the period to which they relate and adjustments are made when actual amounts are known.
Income Tax Information and Distributions to Shareholders. Each year, each Fund intends to qualify as a regulated investment company under Subchapter M of the Internal Revenue Code, including distributing substantially all of its taxable income and realized gains. As a result, no provision for U.S. Federal income taxes is required. As of December 31, 2022, each Fund did not have any unrecognized tax benefits in the financial statements; nor is each Fund aware of any tax positions for which it is reasonably possible that the total amounts of unrecognized tax benefits will significantly change in the next twelve months. Each Fund files a U.S. federal tax return, in addition to state and local tax returns as required. Each Fund's federal income tax returns are subject to examination by the Internal Revenue Service (IRS) for a period of three fiscal years after they are filed. State and local tax returns may be subject to examination for an additional fiscal year depending on the jurisdiction.
Distributions are declared and recorded daily and paid monthly from net investment income. Distributions from realized gains, if any, are declared and recorded on the ex-dividend date. Income and capital gain distributions are determined in accordance with income tax regulations, which may differ from GAAP.
Capital accounts within the financial statements are adjusted for permanent book-tax differences. These adjustments have no impact on net assets or the results of operations. Capital accounts are not adjusted for temporary book-tax differences which will reverse in a subsequent period.
Book-tax differences are primarily due to market discount and capital loss carryforwards.
The Funds purchase municipal securities whose interest, in the opinion of the issuer, is free from federal income tax. There is no assurance that the IRS will agree with this opinion. In the event the IRS determines that the issuer does not comply with relevant tax requirements, interest payments from a security could become federally taxable, possibly retroactively to the date the security was issued.
As of period end, the cost and unrealized appreciation (depreciation) in securities, and derivatives if applicable, for federal income tax purposes were as follows for each Fund:
| | Tax cost | Gross unrealized appreciation | Gross unrealized depreciation | Net unrealized appreciation (depreciation) |
| Fidelity Pennsylvania Municipal Income Fund | $427,546,411 | $ 1,691,480 | $(26,586,508) | $(24,895,028) |
| Fidelity Pennsylvania Municipal Money Market Fund | 135,810,375 | 299 | (299) | - |
The tax-based components of distributable earnings as of period end were as follows for each Fund:
| | Undistributed tax-exempt income | Capital loss carryforward | Net unrealized appreciation (depreciation) on securities and other investments |
Fidelity Pennsylvania Municipal Income Fund | $176,224 | $(2,131,805) | $(24,895,028) |
Capital loss carryforwards are only available to offset future capital gains of the Funds to the extent provided by regulations and may be limited. The capital loss carryforward information presented below, including any applicable limitation, is estimated as of fiscal period end and is subject to adjustment.
| | Short-term | Long-term | Total capital loss carryforward |
Fidelity Pennsylvania Municipal Income Fund | $(1,841,336) | $(290,469) | $(2,131,805) |
The tax character of distributions paid was as follows:
| December 31, 2022 | | | |
| | Tax-Exempt Income | Long-term Capital Gains | Total |
Fidelity Pennsylvania Municipal Income Fund | $10,893,254 | $- | $10,893,254 |
Fidelity Pennsylvania Municipal Money Market Fund | 1,139,915 | 132,002 | 1,271,917 |
| December 31, 2021 | | | |
| | Tax-Exempt Income | Long-term Capital Gains | Total |
Fidelity Pennsylvania Municipal Income Fund | $11,922,733 | $617,277 | $12,540,010 |
Fidelity Pennsylvania Municipal Money Market Fund | 16,960 | 119,883 | 136,843 |
Restricted Securities (including Private Placements). Funds may invest in securities that are subject to legal or contractual restrictions on resale. These securities generally may be resold in transactions exempt from registration or to the public if the securities are registered. Disposal of these securities may involve time-consuming negotiations and expense, and prompt sale at an acceptable price may be difficult. Information regarding restricted securities held at period end is included at the end of the Schedule of Investments, if applicable.
4. Purchases and Sales of Investments.
Purchases and sales of securities, other than short-term securities and in-kind transactions, as applicable, are noted in the table below.
| | Purchases ($) | Sales ($) |
| Fidelity Pennsylvania Municipal Income Fund | 32,259,411 | 126,666,418 |
5. Fees and Other Transactions with Affiliates.
Management Fee. Fidelity Management & Research Company LLC (the investment adviser) and its affiliates provide the Income Fund with investment management related services for which the Fund pays a monthly management fee. The management fee is the sum of an individual fund fee rate that is based on an annual rate of .25% of the Fund's average net assets and an annualized group fee rate that averaged .10% during the period. The group fee rate is based upon the monthly average net assets of a group of registered investment companies with which the investment adviser has management contracts. The group fee rate decreases as assets under management increase and increases as assets under management decrease. For the reporting period, the total annual management fee rate was .35% of the Fund's average net assets.
Fidelity Management & Research Company LLC (the investment adviser) and its affiliates provide the Money Market Fund with investment management related services for which the Fund pays a monthly management fee that is based on an annual rate of .50% of the Fund's average net assets. Under the management contract, the investment adviser pays all other expenses, except the compensation of the independent Trustees and certain other expenses such as interest expense. The management fee is reduced by an amount equal to the fees and expenses paid by the Fund to the independent Trustees.
Transfer Agent Fees. Fidelity Investments Institutional Operations Company LLC (FIIOC), an affiliate of the investment adviser, is the transfer, dividend disbursing and shareholder servicing agent for the Funds. Under the terms of the management fee contract, the investment adviser pays transfer agent fees on behalf of the Money Market Fund. FIIOC receives account fees and asset-based fees that vary according to account size and type of account. FIIOC pays for typesetting, printing and mailing of shareholder reports, except proxy statements. For the period, the Income Fund's transfer agent fees were equivalent to the following annual rates expressed as a percentage of average net assets:
| Fidelity Pennsylvania Municipal Income Fund | .10% |
Accounting Fees. Fidelity Service Company, Inc. (FSC), an affiliate of the investment adviser, maintains each Fund's accounting records. The accounting fee is based on the level of average net assets for each month. For the period, the fees were equivalent to the following annual rates:
| | % of Average Net Assets |
| Fidelity Pennsylvania Municipal Income Fund | .03 |
Interfund Trades. Funds may purchase from or sell securities to other Fidelity Funds under procedures adopted by the Board. The procedures have been designed to ensure these interfund trades are executed in accordance with Rule 17a-7 of the 1940 Act. For the Income Fund, any interfund trades are included within the respective purchases and sales amounts shown in the Purchases and Sales of Investments note. Interfund trades during the period are noted in the table below.
| | Purchases ($) | Sales ($) | Realized Gain (Loss) ($) |
| Fidelity Pennsylvania Municipal Income Fund | - | - | - |
Fidelity Pennsylvania Municipal Money Market Fund | 8,370,000 | 9,210,000 | - |
6. Committed Line of Credit.
Certain Funds participate with other funds managed by the investment adviser or an affiliate in a $4.25 billion credit facility (the "line of credit") to be utilized for temporary or emergency purposes to fund shareholder redemptions or for other short-term liquidity purposes. The participating funds have agreed to pay commitment fees on their pro-rata portion of the line of credit, which are reflected in Miscellaneous expenses on the Statement of Operations, and are listed below. During the period, there were no borrowings on this line of credit.
| | Amount |
| Fidelity Pennsylvania Municipal Income Fund | $833 |
7. Expense Reductions.
The investment adviser or its affiliates voluntarily agreed to waive certain fees for the Money Market Fund in order to avoid a negative yield. Such arrangements may be discontinued by the investment adviser at any time. For the period, the amount of the waiver was $112,498.
Through arrangements with each applicable Fund's custodian, credits realized as a result of certain uninvested cash balances were used to reduce each applicable Fund's expenses. All of the applicable expense reductions are noted in the table below.
| | Custodian credits |
Fidelity Pennsylvania Municipal Income Fund | $5,979 |
Fidelity Pennsylvania Municipal Money Market Fund | 98 |
In addition, during the period the investment adviser or an affiliate reimbursed and/or waived a portion of operating expenses as follows:
| | Amount |
| Fidelity Pennsylvania Municipal Income Fund | $8,364 |
8. Other.
A fund's organizational documents provide former and current trustees and officers with a limited indemnification against liabilities arising in connection with the performance of their duties to the fund. In the normal course of business, a fund may also enter into contracts that provide general indemnifications. A fund's maximum exposure under these arrangements is unknown as this would be dependent on future claims that may be made against a fund. The risk of material loss from such claims is considered remote.
In July 2022, the Board of Trustees approved a Plan of Liquidation and Dissolution for Fidelity Pennsylvania Municipal Money Market Fund. The Fund distributed all of its net assets to its shareholders on January 13, 2023. The Fund was closed to new accounts on December 1, 2022.
9. Risk and Uncertainties.
Many factors affect a fund's performance. Developments that disrupt global economies and financial markets, such as pandemics, epidemics, outbreaks of infectious diseases, war, terrorism, and environmental disasters, may significantly affect a fund's investment performance. The effects of these developments to a fund will be impacted by the types of securities in which a fund invests, the financial condition, industry, economic sector, and geographic location of an issuer, and a fund's level of investment in the securities of that issuer.
To the Board of Trustees of Fidelity Municipal Trust and Fidelity Municipal Trust II and Shareholders of Fidelity Pennsylvania Municipal Income Fund and Fidelity Pennsylvania Municipal Money Market Fund
Opinions on the Financial Statements
We have audited the accompanying statements of assets and liabilities, including the schedules of investments, of Fidelity Pennsylvania Municipal Income Fund (one of the funds constituting Fidelity Municipal Trust) and Fidelity Pennsylvania Municipal Money Market Fund (one of the funds constituting Fidelity Municipal Trust II) (hereafter collectively referred to as the "Funds") as of December 31, 2022, the related statements of operations for the year ended December 31, 2022, the statements of changes in net assets for each of the two years in the period ended December 31, 2022, including the related notes, and the financial highlights for each of the five years in the period ended December 31, 2022 (collectively referred to as the "financial statements"). In our opinion, the financial statements present fairly, in all material respects, the financial position of each of the Funds as of December 31, 2022, the results of each of their operations for the year then ended, the changes in each of their net assets for each of the two years in the period ended December 31, 2022 and each of the financial highlights for each of the five years in the period ended December 31, 2022 in conformity with accounting principles generally accepted in the United States of America.
Basis for Opinions
These financial statements are the responsibility of the Funds' management. Our responsibility is to express an opinion on the Funds' financial statements based on our audits. We are a public accounting firm registered with the Public Company Accounting Oversight Board (United States) (PCAOB) and are required to be independent with respect to the Funds in accordance with the U.S. federal securities laws and the applicable rules and regulations of the Securities and Exchange Commission and the PCAOB.
We conducted our audits of these financial statements in accordance with the standards of the PCAOB. Those standards require that we plan and perform the audit to obtain reasonable assurance about whether the financial statements are free of material misstatement, whether due to error or fraud.
Our audits included performing procedures to assess the risks of material misstatement of the financial statements, whether due to error or fraud, and performing procedures that respond to those risks. Such procedures included examining, on a test basis, evidence regarding the amounts and disclosures in the financial statements. Our audits also included evaluating the accounting principles used and significant estimates made by management, as well as evaluating the overall presentation of the financial statements. Our procedures included confirmation of securities owned as of December 31, 2022 by correspondence with the custodian. We believe that our audits provide a reasonable basis for our opinions.
/s/ PricewaterhouseCoopers LLP
Boston, Massachusetts
February 10, 2023
We have served as the auditor of one or more investment companies in the Fidelity group of funds since 1932.
The Trustees, Members of the Advisory Board (if any), and officers of the trusts and funds, as applicable, are listed below. The Board of Trustees governs each fund and is responsible for protecting the interests of shareholders. The Trustees are experienced executives who meet periodically throughout the year to oversee each fund's activities, review contractual arrangements with companies that provide services to each fund, oversee management of the risks associated with such activities and contractual arrangements, and review each fund's performance. Each of the Trustees oversees 295 funds.
The Trustees hold office without limit in time except that (a) any Trustee may resign; (b) any Trustee may be removed by written instrument, signed by at least two-thirds of the number of Trustees prior to such removal; (c) any Trustee who requests to be retired or who has become incapacitated by illness or injury may be retired by written instrument signed by a majority of the other Trustees; and (d) any Trustee may be removed at any special meeting of shareholders by a two-thirds vote of the outstanding voting securities of the trust. Each Trustee who is not an interested person (as defined in the 1940 Act) of the trust and the funds is referred to herein as an Independent Trustee. Each Independent Trustee shall retire not later than the last day of the calendar year in which his or her 75th birthday occurs. The Independent Trustees may waive this mandatory retirement age policy with respect to individual Trustees. Officers and Advisory Board Members hold office without limit in time, except that any officer or Advisory Board Member may resign or may be removed by a vote of a majority of the Trustees at any regular meeting or any special meeting of the Trustees. Except as indicated, each individual has held the office shown or other offices in the same company for the past five years.
The funds' Statement of Additional Information (SAI) includes more information about the Trustees. To request a free copy, call Fidelity at 1-800-544-8544.
Experience, Skills, Attributes, and Qualifications of the Trustees. The Governance and Nominating Committee has adopted a statement of policy that describes the experience, qualifications, attributes, and skills that are necessary and desirable for potential Independent Trustee candidates (Statement of Policy). The Board believes that each Trustee satisfied at the time he or she was initially elected or appointed a Trustee, and continues to satisfy, the standards contemplated by the Statement of Policy. The Governance and Nominating Committee also engages professional search firms to help identify potential Independent Trustee candidates who have the experience, qualifications, attributes, and skills consistent with the Statement of Policy. From time to time, additional criteria based on the composition and skills of the current Independent Trustees, as well as experience or skills that may be appropriate in light of future changes to board composition, business conditions, and regulatory or other developments, have also been considered by the professional search firms and the Governance and Nominating Committee. In addition, the Board takes into account the Trustees' commitment and participation in Board and committee meetings, as well as their leadership of standing and ad hoc committees throughout their tenure.
In determining that a particular Trustee was and continues to be qualified to serve as a Trustee, the Board has considered a variety of criteria, none of which, in isolation, was controlling. The Board believes that, collectively, the Trustees have balanced and diverse experience, qualifications, attributes, and skills, which allow the Board to operate effectively in governing each fund and protecting the interests of shareholders. Information about the specific experience, skills, attributes, and qualifications of each Trustee, which in each case led to the Board's conclusion that the Trustee should serve (or continue to serve) as a trustee of the funds, is provided below.
Board Structure and Oversight Function. Abigail P. Johnson is an interested person and currently serves as Chairman. The Trustees have determined that an interested Chairman is appropriate and benefits shareholders because an interested Chairman has a personal and professional stake in the quality and continuity of services provided to the funds. Independent Trustees exercise their informed business judgment to appoint an individual of their choosing to serve as Chairman, regardless of whether the Trustee happens to be independent or a member of management. The Independent Trustees have determined that they can act independently and effectively without having an Independent Trustee serve as Chairman and that a key structural component for assuring that they are in a position to do so is for the Independent Trustees to constitute a substantial majority for the Board. The Independent Trustees also regularly meet in executive session. Michael E. Kenneally serves as Chairman of the Independent Trustees and as such (i) acts as a liaison between the Independent Trustees and management with respect to matters important to the Independent Trustees and (ii) with management prepares agendas for Board meetings.
Fidelity ® funds are overseen by different Boards of Trustees. The funds' Board oversees Fidelity's investment-grade bond, money market, asset allocation and certain equity funds, and other Boards oversee Fidelity's high income and other equity funds. The asset allocation funds may invest in Fidelity ® funds that are overseen by such other Boards. The use of separate Boards, each with its own committee structure, allows the Trustees of each group of Fidelity ® funds to focus on the unique issues of the funds they oversee, including common research, investment, and operational issues. On occasion, the separate Boards establish joint committees to address issues of overlapping consequences for the Fidelity ® funds overseen by each Board.
The Trustees operate using a system of committees to facilitate the timely and efficient consideration of all matters of importance to the Trustees, each fund, and fund shareholders and to facilitate compliance with legal and regulatory requirements and oversight of the funds' activities and associated risks. The Board, acting through its committees, has charged FMR and its affiliates with (i) identifying events or circumstances the occurrence of which could have demonstrably adverse effects on the funds' business and/or reputation; (ii) implementing processes and controls to lessen the possibility that such events or circumstances occur or to mitigate the effects of such events or circumstances if they do occur; and (iii) creating and maintaining a system designed to evaluate continuously business and market conditions in order to facilitate the identification and implementation processes described in (i) and (ii) above. Because the day-to-day operations and activities of the funds are carried out by or through FMR, its affiliates, and other service providers, the funds' exposure to risks is mitigated but not eliminated by the processes overseen by the Trustees. While each of the Board's committees has responsibility for overseeing different aspects of the funds' activities, oversight is exercised primarily through the Operations and Audit Committees. In addition, an ad hoc Board committee of Independent Trustees has worked with FMR to enhance the Board's oversight of investment and financial risks, legal and regulatory risks, technology risks, and operational risks, including the development of additional risk reporting to the Board. The Operations Committee also worked and continues to work with FMR to enhance the stress tests required under SEC regulations for money market funds. Appropriate personnel, including but not limited to the funds' Chief Compliance Officer (CCO), FMR's internal auditor, the independent accountants, the funds' Treasurer and portfolio management personnel, make periodic reports to the Board's committees, as appropriate, including an annual review of Fidelity's risk management program for the Fidelity ® funds. The responsibilities of each standing committee, including their oversight responsibilities, are described further under "Standing Committees of the Trustees."
Interested Trustees*:
Correspondence intended for a Trustee who is an interested person may be sent to Fidelity Investments, 245 Summer Street, Boston, Massachusetts 02210.
Name, Year of Birth; Principal Occupations and Other Relevant Experience+
Abigail P. Johnson (1961)
Year of Election or Appointment: 2009
Trustee
Chairman of the Board of Trustees
Ms. Johnson also serves as Trustee of other Fidelity ® funds. Ms. Johnson serves as Chairman (2016-present), Chief Executive Officer (2014-present), and Director (2007-present) of FMR LLC (diversified financial services company), President of Fidelity Financial Services (2012-present) and President of Personal, Workplace and Institutional Services (2005-present). Ms. Johnson is Chairman and Director of Fidelity Management & Research Company LLC (investment adviser firm, 2011-present). Previously, Ms. Johnson served as Chairman and Director of FMR Co., Inc. (investment adviser firm, 2011-2019), Vice Chairman (2007-2016) and President (2013-2016) of FMR LLC, President and a Director of Fidelity Management & Research Company (2001-2005), a Trustee of other investment companies advised by Fidelity Management & Research Company, Fidelity Investments Money Management, Inc. (investment adviser firm), and FMR Co., Inc. (2001-2005), Senior Vice President of the Fidelity ® funds (2001-2005), and managed a number of Fidelity ® funds. Ms. Abigail P. Johnson and Mr. Arthur E. Johnson are not related.
Jennifer Toolin McAuliffe (1959)
Year of Election or Appointment: 2016
Trustee
Ms. McAuliffe also serves as Trustee of other Fidelity ® funds and as Trustee of Fidelity Charitable (2020-present). Previously, Ms. McAuliffe served as Co-Head of Fixed Income of Fidelity Investments Limited (now known as FIL Limited (FIL)) (diversified financial services company), Director of Research for FIL's credit and quantitative teams in London, Hong Kong and Tokyo and Director of Research for taxable and municipal bonds at Fidelity Investments Money Management, Inc. Ms. McAuliffe previously served as a member of the Advisory Board of certain Fidelity ® funds (2016). Ms. McAuliffe was previously a lawyer at Ropes & Gray LLP and currently serves as director or trustee of several not-for-profit entities.
* Determined to be an "Interested Trustee" by virtue of, among other things, his or her affiliation with the trusts or various entities under common control with FMR.
+ The information includes the Trustee's principal occupation during the last five years and other information relating to the experience, attributes, and skills relevant to the Trustee's qualifications to serve as a Trustee, which led to the conclusion that the Trustee should serve as a Trustee for each fund.
Independent Trustees:
Correspondence intended for an Independent Trustee may be sent to Fidelity Investments, P.O. Box 55235, Boston, Massachusetts 02205-5235.
Name, Year of Birth; Principal Occupations and Other Relevant Experience+
Elizabeth S. Acton (1951)
Year of Election or Appointment: 2013
Trustee
Ms. Acton also serves as Trustee of other Fidelity ® funds. Prior to her retirement, Ms. Acton served as Executive Vice President, Finance (2011-2012), Executive Vice President, Chief Financial Officer (2002-2011) and Treasurer (2004-2005) of Comerica Incorporated (financial services). Prior to joining Comerica, Ms. Acton held a variety of positions at Ford Motor Company (1983-2002), including Vice President and Treasurer (2000-2002) and Executive Vice President and Chief Financial Officer of Ford Motor Credit Company (1998-2000). Ms. Acton currently serves as a member of the Board and Audit and Finance Committees of Beazer Homes USA, Inc. (homebuilding, 2012-present). Ms. Acton previously served as a member of the Advisory Board of certain Fidelity ® funds (2013-2016).
Ann E. Dunwoody (1953)
Year of Election or Appointment: 2018
Trustee
General Dunwoody also serves as Trustee of other Fidelity ® funds. General Dunwoody (United States Army, Retired) was the first woman in U.S. military history to achieve the rank of four-star general and prior to her retirement in 2012 held a variety of positions within the U.S. Army, including Commanding General, U.S. Army Material Command (2008-2012). General Dunwoody currently serves as President of First to Four LLC (leadership and mentoring services, 2012-present), a member of the Board and Nomination and Corporate Governance Committees of Kforce Inc. (professional staffing services, 2016-present) and a member of the Board of Automattic Inc. (software engineering, 2018-present). Previously, General Dunwoody served as a member of the Advisory Board and Nominating and Corporate Governance Committee of L3 Technologies, Inc. (communication, electronic, sensor and aerospace systems, 2013-2019) and a member of the Board and Audit and Sustainability and Corporate Responsibility Committees of Republic Services, Inc. (waste collection, disposal and recycling, 2013-2016). Ms. Dunwoody also serves on several boards for non-profit organizations, including as a member of the Board, Chair of the Nomination and Governance Committee and a member of the Audit Committee of Logistics Management Institute (consulting non-profit, 2012-present), a member of the Council of Trustees for the Association of the United States Army (advocacy non-profit, 2013-present), a member of the Board of Florida Institute of Technology (2015-present) and a member of the Board of ThanksUSA (military family education non-profit, 2014-present). General Dunwoody previously served as a member of the Advisory Board of certain Fidelity ® funds (2018).
John Engler (1948)
Year of Election or Appointment: 2014
Trustee
Mr. Engler also serves as Trustee of other Fidelity ® funds. Previously, Mr. Engler served as Governor of Michigan (1991-2003), President of the Business Roundtable (2011-2017) and interim President of Michigan State University (2018-2019). Mr. Engler currently serves as a member of the Board of Stride, Inc. (formerly K12 Inc.) (technology-based education company, 2012-present). Previously, Mr. Engler served as a member of the Board of Universal Forest Products (manufacturer and distributor of wood and wood-alternative products, 2003-2019) and Trustee of The Munder Funds (2003-2014). Mr. Engler previously served as a member of the Advisory Board of certain Fidelity ® funds (2014-2016).
Robert F. Gartland (1951)
Year of Election or Appointment: 2010
Trustee
Mr. Gartland also serves as Trustee of other Fidelity ® funds. Prior to his retirement, Mr. Gartland held a variety of positions at Morgan Stanley (financial services, 1979-2007), including Managing Director (1987-2007) and Chase Manhattan Bank (1975-1978). Mr. Gartland previously served as Chairman and an investor in Gartland & Mellina Group Corp. (consulting, 2009-2019), as a member of the Board of National Securities Clearing Corporation (1993-1996) and as Chairman of TradeWeb (2003-2004).
Arthur E. Johnson (1947)
Year of Election or Appointment: 2008
Trustee
Mr. Johnson also serves as Trustee of other Fidelity ® funds. Prior to his retirement, Mr. Johnson served as Senior Vice President of Corporate Strategic Development of Lockheed Martin Corporation (defense contractor, 1999-2009). Mr. Johnson currently serves as a member of the Board of Booz Allen Hamilton (management consulting, 2011-present). Mr. Johnson previously served as a member of the Board of Eaton Corporation plc (diversified power management, 2009-2019) and a member of the Board of AGL Resources, Inc. (holding company, 2002-2016). Mr. Johnson previously served as Chairman (2018-2021) and Vice Chairman (2015-2018) of the Independent Trustees of certain Fidelity® funds. Mr. Arthur E. Johnson is not related to Ms. Abigail P. Johnson.
Michael E. Kenneally (1954)
Year of Election or Appointment: 2009
Trustee
Chairman of the Independent Trustees
Mr. Kenneally also serves as Trustee of other Fidelity ® funds and was Vice Chairman (2018-2021) of the Independent Trustees of certain Fidelity ® funds. Prior to retirement in 2005, he was Chairman and Global Chief Executive Officer of Credit Suisse Asset Management, the worldwide fund management and institutional investment business of Credit Suisse Group. Previously, Mr. Kenneally was an Executive Vice President and the Chief Investment Officer for Bank of America. In this role, he was responsible for the investment management, strategy and products delivered to the bank's institutional, high-net-worth and retail clients. Earlier, Mr. Kenneally directed the organization's equity and quantitative research groups. He began his career as a research analyst and then spent more than a dozen years as a portfolio manager for endowments, pension plans and mutual funds. He earned the Chartered Financial Analyst (CFA) designation in 1991.
Mark A. Murray (1954)
Year of Election or Appointment: 2016
Trustee
Mr. Murray also serves as Trustee of other Fidelity ® funds. Previously, Mr. Murray served as Co-Chief Executive Officer (2013-2016), President (2006-2013) and Vice Chairman (2013-2020) of Meijer, Inc. Mr. Murray serves as a member of the Board (2009-present) and Public Policy and Responsibility Committee (2009-present) and Chair of the Nuclear Review Committee (2019-present) of DTE Energy Company (diversified energy company). Mr. Murray previously served as a member of the Board of Spectrum Health (not-for-profit health system, 2015-2019) and as a member of the Board and Audit Committee and Chairman of the Nominating and Corporate Governance Committee of Universal Forest Products, Inc. (manufacturer and distributor of wood and wood-alternative products, 2004-2016). Mr. Murray also serves as a member of the Board of many community and professional organizations. Mr. Murray previously served as a member of the Advisory Board of certain Fidelity ® funds (2016).
+ The information includes the Trustee's principal occupation during the last five years and other information relating to the experience, attributes, and skills relevant to the Trustee's qualifications to serve as a Trustee, which led to the conclusion that the Trustee should serve as a Trustee for each fund.
Advisory Board Members and Officers:
Correspondence intended for a Member of the Advisory Board (if any) may be sent to Fidelity Investments, P.O. Box 55235, Boston, Massachusetts 02205-5235. Correspondence intended for an officer may be sent to Fidelity Investments, 245 Summer Street, Boston, Massachusetts 02210. Officers appear below in alphabetical order.
Name, Year of Birth; Principal Occupation
Laura M. Bishop (1961)
Year of Election or Appointment: 2022
Member of the Advisory Board
Ms. Bishop also serves as a Member of the Advisory Board of other funds. Prior to her retirement, Ms. Bishop held a variety of positions at United Services Automobile Association (2001-2020), including Executive Vice President and Chief Financial Officer (2014-2020) and Senior Vice President and Deputy Chief Financial Officer (2012-2014). Ms. Bishop currently serves as a member of the Audit Committee and Compensation and Personnel Committee (2021-present) of the Board of Directors of Korn Ferry (global organizational consulting).
Robert W. Helm (1957)
Year of Election or Appointment: 2021
Member of the Advisory Board
Mr. Helm also serves as a Member of the Advisory Board of other Fidelity® funds. Mr. Helm was formerly Deputy Chairman (2003-2020), partner (1991-2020) and an associate (1984-1991) of Dechert LLP (formerly Dechert Price & Rhoads). Mr. Helm currently serves on boards and committees of several not-for-profit organizations.
Craig S. Brown (1977)
Year of Election or Appointment: 2019
Assistant Treasurer
Mr. Brown also serves as an officer of other funds. Mr. Brown serves as Assistant Treasurer of FIMM, LLC (2021-present) and is an employee of Fidelity Investments (2013-present). Previously, Mr. Brown served as Assistant Treasurer of certain Fidelity ® funds (2019-2022).
John J. Burke III (1964)
Year of Election or Appointment: 2018
Chief Financial Officer
Mr. Burke also serves as Chief Financial Officer of other funds. Mr. Burke serves as Head of Investment Operations for Fidelity Fund and Investment Operations (2018-present) and is an employee of Fidelity Investments (1998-present). Previously Mr. Burke served as head of Asset Management Investment Operations (2012-2018).
David J. Carter (1973)
Year of Election or Appointment: 2020
Assistant Secretary
Mr. Carter also serves as Assistant Secretary of other funds. Mr. Carter serves as Senior Vice President, Deputy General Counsel (2022-present) and is an employee of Fidelity Investments (2005-present).
Jonathan Davis (1968)
Year of Election or Appointment: 2010
Assistant Treasurer
Mr. Davis also serves as an officer of other funds. Mr. Davis serves as Assistant Treasurer of FIMM, LLC (2021-present), FMR Capital, Inc. (2017-present), FD Funds GP LLC (2021-present), FD Funds Holding LLC (2021-present), and FD Funds Management LLC (2021-present); and is an employee of Fidelity Investments. Previously, Mr. Davis served as Vice President and Associate General Counsel of FMR LLC (diversified financial services company, 2003-2010).
Laura M. Del Prato (1964)
Year of Election or Appointment: 2018
President and Treasurer
Ms. Del Prato also serves as an officer of other funds. Ms. Del Prato serves as Assistant Treasurer of FIMM, LLC (2021-present) and is an employee of Fidelity Investments (2017-present). Previously, Ms. Del Prato served as President and Treasurer of The North Carolina Capital Management Trust: Cash Portfolio and Term Portfolio (2018-2020). Prior to joining Fidelity Investments, Ms. Del Prato served as a Managing Director and Treasurer of the JPMorgan Mutual Funds (2014-2017). Prior to JPMorgan, Ms. Del Prato served as a partner at Cohen Fund Audit Services (accounting firm, 2012-2013) and KPMG LLP (accounting firm, 2004-2012).
Christopher M. Gouveia (1973)
Year of Election or Appointment: 2023
Chief Compliance Officer
Mr. Gouveia also serves as Chief Compliance Officer of other funds. Mr. Gouveia serves as Senior Vice President of Asset Management Compliance for Fidelity Investments and is an employee of Fidelity Investments. Previously, Mr. Gouveia served as Chief Compliance Officer of the North Carolina Capital Management Trust (2016-2019).
Colm A. Hogan (1973)
Year of Election or Appointment: 2016
Assistant Treasurer
Mr. Hogan also serves as an officer of other funds. Mr. Hogan serves as Assistant Treasurer of FIMM, LLC (2021-present) and FMR Capital, Inc. (2017-present) and is an employee of Fidelity Investments (2005-present). Previously, Mr. Hogan served as Deputy Treasurer of certain Fidelity ® funds (2016-2020) and Assistant Treasurer of certain Fidelity ® funds (2016-2018).
Cynthia Lo Bessette (1969)
Year of Election or Appointment: 2019
Secretary and Chief Legal Officer (CLO)
Ms. Lo Bessette also serves as an officer of other funds. Ms. Lo Bessette serves as CLO, Secretary, and Senior Vice President of Fidelity Management & Research Company LLC (investment adviser firm, 2019-present); CLO of Fidelity Management & Research (Hong Kong) Limited, FMR Investment Management (UK) Limited, and Fidelity Management & Research (Japan) Limited (investment adviser firms, 2019-present); Secretary of FD Funds GP LLC (2021-present), FD Funds Holding LLC (2021-present), FD Funds Management LLC (2021-present), and Fidelity Diversifying Solutions LLC (investment adviser firm, 2022-present); and Assistant Secretary of FIMM, LLC (2019-present). She is a Senior Vice President and Deputy General Counsel of FMR LLC (diversified financial services company, 2019-present), and is an employee of Fidelity Investments. Previously, Ms. Lo Bessette served as CLO, Secretary, and Senior Vice President of FMR Co., Inc. (investment adviser firm, 2019); Secretary of Fidelity SelectCo, LLC and Fidelity Investments Money Management, Inc. (investment adviser firms, 2019). Prior to joining Fidelity Investments, Ms. Lo Bessette was Executive Vice President, General Counsel (2016-2019) and Senior Vice President, Deputy General Counsel (2015-2016) of OppenheimerFunds (investment management company) and Deputy Chief Legal Officer (2013-2015) of Jennison Associates LLC (investment adviser firm).
Chris Maher (1972)
Year of Election or Appointment: 2013
Assistant Treasurer
Mr. Maher also serves as an officer of other funds. Mr. Maher serves as Assistant Treasurer of FIMM, LLC (2021-present) and FMR Capital, Inc. (2017-present), and is an employee of Fidelity Investments (2008-present). Previously, Mr. Maher served as Assistant Treasurer of certain funds (2013-2020); Vice President of Asset Management Compliance (2013), Vice President of the Program Management Group of FMR (investment adviser firm, 2010-2013), and Vice President of Valuation Oversight (2008-2010).
Jamie Pagliocco (1964)
Year of Election or Appointment: 2020
Vice President
Mr. Pagliocco also serves as Vice President of other funds. Mr. Pagliocco serves as President of Fixed Income (2020-present), and is an employee of Fidelity Investments (2001-present). Previously, Mr. Pagliocco served as Co-Chief Investment Officer - Bond (2017-2020), Global Head of Bond Trading (2016-2019), and as a portfolio manager.
Brett Segaloff (1972)
Year of Election or Appointment: 2021
Anti-Money Laundering (AML) Officer
Mr. Segaloff also serves as an AML Officer of other funds and other related entities. He is Director, Anti-Money Laundering (2007-present) of FMR LLC (diversified financial services company) and is an employee of Fidelity Investments (1996-present).
Stacie M. Smith (1974)
Year of Election or Appointment: 2013
Assistant Treasurer
Ms. Smith also serves as an officer of other funds. Ms. Smith serves as Assistant Treasurer of FIMM, LLC (2021-present) and FMR Capital, Inc. (2017-present), is an employee of Fidelity Investments (2009-present), and has served in other fund officer roles. Prior to joining Fidelity Investments, Ms. Smith served as Senior Audit Manager of Ernst & Young LLP (accounting firm, 1996-2009). Previously, Ms. Smith served as Assistant Treasurer (2013-2019) and Deputy Treasurer (2013-2016) of certain Fidelity ® funds.
Jim Wegmann (1979)
Year of Election or Appointment: 2021
Deputy Treasurer
Mr. Wegmann also serves as an officer of other funds. Mr. Wegmann serves as Assistant Treasurer of FIMM, LLC (2021-present) and is an employee of Fidelity Investments (2011-present). Previously, Mr. Wegmann served as Assistant Treasurer of certain Fidelity ® funds (2019-2021).
As a shareholder, you incur two types of costs: (1) transaction costs, which may include sales charges (loads) on purchase payments or redemption proceeds, as applicable and (2) ongoing costs, which generally include management fees, distribution and/or service (12b-1) fees and other Fund expenses. This Example is intended to help you understand your ongoing costs (in dollars) of investing in a fund and to compare these costs with the ongoing costs of investing in other mutual funds.
| The Example is based on an investment of $1,000 invested at the beginning of the period and held for the entire period (July 1, 2022 to December 31, 2022). |
Actual Expenses
The first line of the accompanying table provides information about actual account values and actual expenses. You may use the information in this line, together with the amount you invested, to estimate the expenses that you paid over the period. Simply divide your account value by $1,000.00 (for example, an $8,600 account value divided by $1,000.00 = 8.6), then multiply the result by the number in the first line for a class/Fund under the heading entitled "Expenses Paid During Period" to estimate the expenses you paid on your account during this period. If any fund is a shareholder of any underlying mutual funds or exchange-traded funds (ETFs) (the Underlying Funds), such fund indirectly bears its proportional share of the expenses of the Underlying Funds in addition to the direct expenses incurred presented in the table. These fees and expenses are not included in the annualized expense ratio used to calculate the expense estimate in the table below.
Hypothetical Example for Comparison Purposes
The second line of the accompanying table provides information about hypothetical account values and hypothetical expenses based on the actual expense ratio and an assumed rate of return of 5% per year before expenses, which is not the actual return. The hypothetical account values and expenses may not be used to estimate the actual ending account balance or expenses you paid for the period. You may use this information to compare the ongoing costs of investing in the Fund and other funds. To do so, compare this 5% hypothetical example with the 5% hypothetical examples that appear in the shareholder reports of the other funds. If any fund is a shareholder of any Underlying Funds, such fund indirectly bears its proportional share of the expenses of the Underlying Funds in addition to the direct expenses as presented in the table. These fees and expenses are not included in the annualized expense ratio used to calculate the expense estimate in the table below.
Please note that the expenses shown in the table are meant to highlight your ongoing costs only and do not reflect any transaction costs. Therefore, the second line of the table is useful in comparing ongoing costs only, and will not help you determine the relative total costs of owning different funds. In addition, if these transactional costs were included, your costs would have been higher.
| | | | | Annualized Expense Ratio- A | | Beginning Account Value July 1, 2022 | | Ending Account Value December 31, 2022 | | Expenses Paid During Period- C July 1, 2022 to December 31, 2022 |
| | | | | | | | | | |
| Fidelity® Pennsylvania Municipal Income Fund | | | | .48% | | | | | | |
| Actual | | | | | | $ 1,000 | | $ 1,001.10 | | $ 2.42 |
Hypothetical- B | | | | | | $ 1,000 | | $ 1,022.79 | | $ 2.45 |
| | | | | | | | | | |
| Fidelity® Pennsylvania Municipal Money Market Fund | | | | .50% | | | | | | |
| Actual | | | | | | $ 1,000 | | $ 1,008.30 | | $ 2.53 |
Hypothetical- B | | | | | | $ 1,000 | | $ 1,022.68 | | $ 2.55 |
| |
A Annualized expense ratio reflects expenses net of applicable fee waivers.
B 5% return per year before expenses
C Expenses are equal to the annualized expense ratio, multiplied by the average account value over the period, multiplied by 184/ 365 (to reflect the one-half year period). The fees and expenses of any Underlying Funds are not included in each annualized expense ratio.
The dividend and capital gains distributions for the fund(s) are available on Fidelity.com or Institutional.Fidelity.com.
The funds hereby designate as capital gain dividend the amounts noted below for the taxable year ended December 31, 2022, or, if subsequently determined to be different, the net capital gain of such year.
| Fidelity Pennsylvania Municipal Income Fund | $0 |
| Fidelity Pennsylvania Municipal Money Market Fund | $10,142 |
During fiscal year ended 2022, 100% of each fund's income dividends were free from federal income tax, and 8.24% of Fidelity Pennsylvania Municipal Income Fund and 10.05% of Fidelity Pennsylvania Municipal Money Market Fund income dividends were subject to the federal alternative minimum tax.
The funds will notify shareholders in January 2023 of amounts for use in preparing 2022 income tax returns.
Fidelity Pennsylvania Municipal Income Fund / Fidelity Pennsylvania Municipal Money Market Fund
Each year, the Board of Trustees, including the Independent Trustees (together, the Board), votes on the renewal of the management contract with Fidelity Management & Research Company LLC (FMR) and the sub-advisory agreements (together, the Advisory Contracts) for each fund. FMR and the sub-advisers are referred to herein as the Investment Advisers. The Board, assisted by the advice of fund counsel and Independent Trustees' counsel, requests and considers a broad range of information relevant to the renewal of the Advisory Contracts throughout the year.
The Board meets regularly and, at each of its meetings, covers an extensive agenda of topics and materials and considers factors that are relevant to its annual consideration of the renewal of each fund's Advisory Contracts, including the services and support provided to each fund and its shareholders. The Board has established four standing committees (Committees) - Operations, Audit, Fair Valuation, and Governance and Nominating - each composed of and chaired by Independent Trustees with varying backgrounds, to which the Board has assigned specific subject matter responsibilities in order to enhance effective decision-making by the Board. The Operations Committee, of which all the Independent Trustees are members, meets regularly throughout the year and requests, receives and considers, among other matters, information related to the annual consideration of the renewal of each fund's Advisory Contracts before making its recommendation to the Board. The Board also meets as needed to review matters specifically related to the Board's annual consideration of the renewal of the Advisory Contracts. Members of the Board may also meet from time to time with trustees of other Fidelity funds through joint ad hoc committees to discuss certain matters relevant to all of the Fidelity funds.
At its September 2022 meeting, the Board unanimously determined to renew each fund's Advisory Contracts. In reaching its determination, the Board considered all factors it believed relevant, including (i) the nature, extent, and quality of the services provided to each fund and its shareholders (including the investment performance of each fund); (ii) the competitiveness relative to peer funds of each fund's management fee and total expense ratio; (iii) the total costs of the services provided by and the profits realized by Fidelity from its relationships with each fund; and (iv) the extent to which, if any, economies of scale exist and are realized as each fund grows, and whether any economies of scale are appropriately shared with fund shareholders.
In considering whether to renew the Advisory Contracts for each fund, the Board reached a determination, with the assistance of fund counsel and Independent Trustees' counsel and through the exercise of its business judgment, that the renewal of the Advisory Contracts was in the best interests of each fund and its shareholders and that the compensation payable under the Advisory Contracts was fair and reasonable. The Board's decision to renew the Advisory Contracts was not based on any single factor, but rather was based on a comprehensive consideration of all the information provided to the Board at its meetings throughout the year. The Board, in reaching its determination to renew the Advisory Contracts, was aware that shareholders of each fund have a broad range of investment choices available to them, including a wide choice among funds offered by Fidelity's competitors, and that each fund's shareholders, who have the opportunity to review and weigh the disclosure provided by the fund in its prospectus and other public disclosures, have chosen to invest in that fund, which is part of the Fidelity family of funds.
Nature, Extent, and Quality of Services Provided . The Board considered Fidelity's staffing as it relates to the funds, including the backgrounds of investment personnel of Fidelity, and also considered the funds' investment objectives, strategies, and related investment philosophies. The Independent Trustees also had discussions with senior management of Fidelity's investment operations and investment groups. The Board considered the structure of the investment personnel compensation program and whether this structure provides appropriate incentives to act in the best interests of each fund. Additionally, the Board considered the portfolio managers' investments, if any, in the funds that they manage. The Board also considered the steps Fidelity had taken to ensure the continued provision of high quality services to the Fidelity funds during throughout the COVID-19 pandemic, including the expansion of staff in client facing positions to maintain service levels in periods of high volumes and volatility.
Resources Dedicated to Investment Management and Support Services . The Board reviewed the general qualifications and capabilities of Fidelity's investment staff, including its size, education, experience, and resources, as well as Fidelity's approach to recruiting, training, managing, and compensating investment personnel. The Board noted the resources devoted to Fidelity's global investment organization, and that Fidelity's analysts have extensive resources, tools and capabilities that allow them to conduct quantitative and fundamental analysis, as well as credit analysis of issuers, counterparties and guarantors. Further, the Board considered that Fidelity's investment professionals have sufficient access to global information and data so as to provide competitive investment results over time, and that those professionals also have access to sophisticated tools that permit them to assess portfolio construction and risk and performance attribution characteristics continuously, as well as to transmit new information and research conclusions rapidly around the world. Additionally, in its deliberations, the Board considered Fidelity's trading, risk management, compliance, cybersecurity, and technology and operations capabilities and resources, which are integral parts of the investment management process.
Shareholder and Administrative Services . The Board considered (i) the nature, extent, quality, and cost of advisory, administrative, and shareholder services performed by the Investment Advisers and their affiliates under the Advisory Contracts and under separate agreements covering transfer agency and pricing and bookkeeping services for each fund; (ii) the nature and extent of the supervision of third party service providers, principally custodians, subcustodians, and pricing vendors; and (iii) the resources devoted to, and the record of compliance with, each fund's compliance policies and procedures.
The Board noted that the growth of fund assets over time across the complex allows Fidelity to reinvest in the development of services designed to enhance the value and convenience of the Fidelity funds as investment vehicles. These services include 24-hour access to account information and market information over the Internet and through telephone representatives, investor education materials and asset allocation tools. The Board also considered that it reviews customer service metrics such as telephone response times, continuity of services on the website and metrics addressing services at Fidelity Investor Centers.
Investment in a Large Fund Family . The Board considered the benefits to shareholders of investing in a Fidelity fund, including the benefits of investing in a fund that is part of a large family of funds offering a variety of investment disciplines and providing a large variety of mutual fund investor services. The Board noted that Fidelity had taken, or had made recommendations to the Board that resulted in the Fidelity funds taking, a number of actions over the previous year that benefited particular funds, including: (i) continuing to dedicate additional resources to Fidelity's investment research process, which includes meetings with management of issuers of securities in which the funds invest; (ii) continuing efforts to enhance Fidelity's global research capabilities; (iii) launching new funds, ETFs, and share classes with innovative structures, strategies and pricing and making other enhancements to meet investor needs; (iv) broadening eligibility requirements for certain funds and share classes; (v) reducing management fees and total expenses for certain funds and classes; (vi) lowering expenses for certain existing funds and classes by implementing or lowering expense caps; (vii) rationalizing product lines and gaining increased efficiencies from fund mergers and liquidations; (viii) continuing to develop, acquire and implement systems and technology to improve services to the funds and shareholders, strengthen information security, and increase efficiency; and (ix) continuing to implement enhancements to further strengthen Fidelity's product line to increase investors' probability of success in achieving their investment goals, including their retirement income goals.
Investment Performance (for Fidelity Pennsylvania Municipal Income Fund) . The Board considered whether the fund has operated in accordance with its investment objective, as well as its record of compliance with its investment restrictions and its performance history.
The Board took into account discussions that occur at Board meetings throughout the year with representatives of the Investment Advisers about fund investment performance. In this regard the Board noted that as part of regularly scheduled fund reviews and other reports to the Board on fund performance, the Board considers annualized return information for the fund for different time periods, measured against an appropriate securities market index (benchmark index) and an appropriate peer group of funds with similar objectives (peer group). The Board also receives and considers information about performance attribution. In its evaluation of fund investment performance at meetings throughout the year, the Board gave particular attention to information indicating underperformance of certain Fidelity funds for specific time periods and discussed with the Investment Advisers the reasons for such underperformance.
In addition to reviewing absolute and relative fund performance, the Independent Trustees periodically consider the appropriateness of fund performance metrics in evaluating the results achieved. In general, the Independent Trustees believe that fund performance should be evaluated based on gross performance (before fees and expenses but after transaction costs) compared to appropriate benchmark indices, over appropriate time periods that may include full market cycles, and on net performance (after fees and expenses) compared to appropriate peer groups, as applicable, over the same periods, taking into account relevant factors including the following: general market conditions; expectations for interest rate levels and credit conditions; issuer-specific information including credit quality; the potential for incremental return versus the fund's benchmark index weighed against the risks involved in obtaining that incremental return, including the risk of diminished or negative total returns; and fund cash flows and other factors. The Independent Trustees generally give greater weight to fund performance over longer time periods than over shorter time periods. Depending on the circumstances, the Independent Trustees may be satisfied with a fund's performance notwithstanding that it lags its benchmark index or peer group for certain periods.
The Independent Trustees recognize that shareholders evaluate performance on a net basis over their own holding periods, for which one-, three-, and five-year periods are often used as a proxy. For this reason, the performance information reviewed by the Board also included net cumulative calendar year total return information for the fund and an appropriate benchmark index and peer group for the most recent one-, three-, and five-year periods.
Investment Performance (for Fidelity Pennsylvania Municipal Money Market Fund) . The Board considered whether the fund has operated in accordance with its investment objective, as well as its record of compliance with its investment restrictions and its performance history.
The Board took into account discussions that occur at Board meetings throughout the year with representatives of the Investment Advisers about fund investment performance. In this regard the Board noted that as part of regularly scheduled fund reviews and other reports to the Board on fund performance, the Board considers annualized return information for the fund for different time periods, measured against an appropriate peer group of funds with similar objectives (peer group). The Board also receives and considers information about performance attribution.
In addition to reviewing absolute and relative fund performance, the Independent Trustees periodically consider the appropriateness of fund performance metrics in evaluating the results achieved. In general, the Independent Trustees believe that fund performance should be evaluated based on gross performance (before fees and expenses but after transaction costs) compared to the gross performance of appropriate peer groups, over appropriate time periods that may include full market cycles, taking into account relevant factors including the following: general market conditions; expectations for interest rate levels and credit conditions; issuer-specific information including credit quality; the fund's market value NAV over time and its resilience under various stressed conditions; and fund cash flows and other factors. The Independent Trustees generally give greater weight to fund performance over longer time periods than over shorter time periods.
The Board recognizes that in interest rate environments where many competitors waive fees to maintain a minimum yield, relative money market fund performance on a net basis (after fees and expenses) may not be particularly meaningful due to miniscule performance differences among competitor funds. Depending on the circumstances, the Independent Trustees may be satisfied with a fund's performance notwithstanding that it lags its peer group for certain periods.
The Independent Trustees recognize that shareholders evaluate performance on a net basis over their own holding periods, for which one-, three-, and five-year periods are often used as a proxy. For this reason, the performance information reviewed by the Board also included net cumulative calendar year total return information for the fund and an appropriate peer group for the most recent one-, three-, and five-year periods.
Based on its review, the Board concluded that the nature, extent, and quality of services provided to each fund under the Advisory Contracts should continue to benefit the shareholders of each fund.
Competitiveness of Management Fee and Total Expense Ratio. The Board considered each fund's management fee and total expense ratio compared to selected groups of competitive funds and classes (referred to as "mapped groups" below) for the purpose of facilitating the Trustees' competitive analysis of management fees and total expenses. Fidelity creates "mapped groups" by combining similar investment objective categories (as classified by Lipper) that have comparable investment mandates. Combining funds with similar investment objective categories aids the Board's comparisons of management fees and total expense ratios by broadening the competitive group used for such comparisons.
Management Fee . The Board considered two proprietary management fee comparisons for the 12-month periods shown in basis points (BP) in the charts below. The group of Lipper funds used by the Board for management fee comparisons is referred to below as the "Total Mapped Group" and is broader than the Lipper peer group used by the Board for performance comparisons. The Total Mapped Group comparison focuses on a fund's standing in terms of gross management fees before expense reimbursements or caps relative to the total universe of funds with comparable investment mandates, regardless of whether their management fee structures also are comparable. Funds with comparable investment mandates offer exposure to similar types of securities. Funds with comparable management fee structures have similar management fee contractual arrangements (e.g., flat rate charged for advisory services, all-inclusive fee rate, etc.). "TMG %" represents the percentage of funds in the Total Mapped Group that had management fees that were lower than a fund's. For example, a hypothetical TMG % of 20% would mean that 80% of the funds in the Total Mapped Group had higher, and 20% had lower, management fees than a fund. The funds' actual TMG %s and the number of funds in the Total Mapped Group are in the charts below. The "Asset-Sized Peer Group" (ASPG) comparison focuses on a fund's standing relative to a subset of non-Fidelity funds within the Total Mapped Group that are similar in size and management fee structure. For example, if a fund is in the first quartile of the ASPG, the fund's management fee ranks in the least expensive or lowest 25% of funds in the ASPG. The ASPG represents at least 15% of the funds in the Total Mapped Group with comparable asset size and management fee structures, subject to a minimum of 50 funds (or all funds in the Total Mapped Group if fewer than 50). Additional information, such as the ASPG quartile in which a fund's management fee rate ranked, is also included in the charts and was considered by the Board.
Fidelity Pennsylvania Municipal Income Fund
The Board noted that the fund's management fee rate ranked below the median of its Total Mapped Group and below the median of its ASPG for 2021.
Fidelity Pennsylvania Municipal Money Market Fund
The Board noted that the fund's management fee rate ranked above the median of its Total Mapped Group and above the median of its ASPG for 2021. The Board noted that because there is a relatively small number of state-specific funds in the Lipper objective, Fidelity combines Lipper's separate categories for state-specific funds with all state and national municipal money market funds to create a single mapped group. The Board considered that Fidelity believes the fee charged for the fund is reasonable for overall value of the services provided and also considered that in July 2022 the Board approved and recommended to shareholders for their approval the reorganization of the fund into Fidelity Municipal Money Market Fund. The Board further noted that the proposed reorganization was expected to result in a reduction in the fund's total expense ratio.
Based on its review, the Board concluded that each fund's management fee is fair and reasonable in light of the services that the fund receives and the other factors considered.
Total Expense Ratio . In its review of Fidelity Pennsylvania Municipal Income Fund's total expense ratio, the Board considered the fund's management fee rate as well as other fund expenses, such as transfer agent fees, pricing and bookkeeping fees, and custodial, legal, and audit fees. The Board also noted that Fidelity may agree to waive fees or reimburse expenses from time to time, and the extent to which, if any, it has done so for the fund.
In its review of Fidelity Pennsylvania Municipal Money Market Fund's total expense ratio, the Board considered the fund's all-inclusive (subject to certain limited exceptions) fee rate. The Board also considered other expenses, such as transfer agent fees, pricing and bookkeeping fees, and custodial, legal, and audit fees, paid by FMR under the all-inclusive arrangement. The Board also noted that Fidelity may agree to waive fees or reimburse expenses from time to time, and the extent to which, if any, it has done so for the fund.
Each fund is compared to those funds and classes in the Total Mapped Group (used by the Board for management fee comparisons) that have a similar sales load structure. The Board also considered a total expense ASPG comparison, which focuses on the total expenses of each fund relative to a subset of non-Fidelity funds within the similar sales load structure group that are similar in size and management fee structure. The total expense ASPG is limited to 15 larger and 15 smaller classes of different funds, where possible. The total expense ASPG comparison excludes performance adjustments and fund-paid 12b-1 fees to eliminate variability in expenses relating to these items.
The Board noted that each fund's total net expense ratio ranked below the similar sales load structure group competitive median for 2021 and below the ASPG competitive median for 2021.
Fees Charged to Other Fidelity Clients . The Board also considered Fidelity fee structures and other information with respect to clients of Fidelity, such as other funds advised or subadvised by Fidelity, pension plan clients, and other institutional clients with similar mandates. The Board noted that a joint ad hoc committee created by it and the boards of other Fidelity funds periodically reviews and compares Fidelity's institutional investment advisory business with its business of providing services to the Fidelity funds and also noted the most recent findings of the committee. The Board noted that the committee's review included a consideration of the differences in services provided, fees charged, and costs incurred, as well as competition in the markets serving the different categories of clients.
Based on its review of total expense ratios and fees charged to other Fidelity clients, the Board concluded that each fund's total expense ratio was reasonable in light of the services that the fund and its shareholders receive and the other factors considered.
Costs of the Services and Profitability . The Board considered the revenues earned and the expenses incurred by Fidelity in conducting the business of developing, marketing, distributing, managing, administering and servicing each fund and servicing each fund's shareholders. The Board also considered the level of Fidelity's profits in respect of all the Fidelity funds.
On an annual basis, Fidelity presents to the Board information about the profitability of its relationships with each fund. Fidelity calculates profitability information for each fund, as well as aggregate profitability information for groups of Fidelity funds and all Fidelity funds, using a series of detailed revenue and cost allocation methodologies which originate with the books and records of Fidelity on which Fidelity's audited financial statements are based. The Audit Committee of the Board reviews any significant changes from the prior year's methodologies and the full Board approves such changes.
A public accounting firm has been engaged annually by the Board as part of the Board's assessment of Fidelity's profitability analysis. The engagement includes the review and assessment of the methodologies used by Fidelity in determining the revenues and expenses attributable to Fidelity's mutual fund business, and completion of agreed-upon procedures in respect of the mathematical accuracy of certain fund profitability information and its conformity to established allocation methodologies. After considering the reports issued under the engagement and information provided by Fidelity, the Board concluded that while other allocation methods may also be reasonable, Fidelity's profitability methodologies are reasonable in all material respects.
The Board also reviewed Fidelity's non-fund businesses and potential indirect benefits such businesses may have received as a result of their association with Fidelity's mutual fund business (i.e., fall-out benefits) as well as cases where Fidelity's affiliates may benefit from the funds' business. The Board considered areas where potential indirect benefits to the Fidelity funds from their relationships with Fidelity may exist. The Board's consideration of these matters was informed by the findings of a joint ad hoc committee created by it and the boards of other Fidelity funds to evaluate potential fall-out benefits.
The Board considered the costs of the services provided by and the profits realized by Fidelity in connection with the operation of each fund and was satisfied that the profitability was not excessive.
Economies of Scale . The Board considered whether there have been economies of scale in respect of the management of the Fidelity funds, whether the Fidelity funds (including each fund) have appropriately benefited from any such economies of scale, and whether there is potential for realization of any further economies of scale. The Board considered the extent to which each fund will benefit from economies of scale as assets grow through increased services to the fund, through waivers or reimbursements, or through fee or expense ratio reductions. The Board recognized that, due to Fidelity Pennsylvania Municipal Money Market Fund's current contractual arrangements, its expense ratio will not decline if the fund's operating costs decrease as assets grow, or rise as assets decrease. The Board also noted that a committee (the Economies of Scale Committee) created by it and the boards of other Fidelity funds periodically analyzes whether Fidelity attains economies of scale in respect of the management and servicing of the Fidelity funds, whether the Fidelity funds have appropriately benefited from such economies of scale, and whether there is potential for realization of any further economies of scale.
The Board recognized that Fidelity Pennsylvania Municipal Income Fund's management contract incorporates a "group fee" structure, which provides for lower group fee rates as total "group assets" increase, and for higher group fee rates as total "group assets" decrease ("group assets" as defined in the management contract). FMR calculates the group fee rates based on a tiered asset "breakpoint" schedule that varies based on asset class. The Board considered that the group fee is designed to deliver the benefits of economies of scale to fund shareholders when total Fidelity fund assets increase, even if assets of any particular fund are unchanged or have declined, because some portion of Fidelity's costs are attributable to services provided to all Fidelity funds, and all funds benefit if those costs can be allocated among more assets. The Board also considered that Fidelity agreed to impose a temporary fee waiver in the form of additional breakpoints to the current breakpoint schedule. The Board concluded that, given the group fee structure, fund shareholders will benefit from lower management fees as "group assets" increase at the fund complex level, regardless of whether Fidelity achieves any such economies of scale.
The Board concluded, taking into account the analysis of the Economies of Scale Committee, that economies of scale, if any, are being appropriately shared between fund shareholders and Fidelity.
Additional Information Requested by the Board . In order to develop fully the factual basis for consideration of the Fidelity funds' advisory contracts, the Board requested and received additional information on certain topics, including: (i) Fidelity's fund profitability methodology, profitability trends for certain funds, the allocation of various costs to different funds, and the impact of certain factors on fund profitability results; (ii) portfolio manager changes that have occurred during the past year and the amount of the investment that each portfolio manager has made in the Fidelity fund(s) that he or she manages; (iii) the extent to which current market conditions have affected retention and recruitment of personnel; (iv) the arrangements with and compensation paid to certain fund sub-advisers on behalf of the Fidelity funds and the treatment of such compensation within Fidelity's fund profitability methodology; (v) the terms of the funds' various management fee structures, including the basic group fee and the terms of Fidelity's voluntary expense limitation arrangements; (vi) Fidelity's transfer agent, pricing and bookkeeping fees, expense and service structures for different funds and classes relative to competitive trends; (vii) the impact on fund profitability of recent industry trends, such as the growth in passively managed funds and the changes in flows for different types of funds; (viii) the types of management fee and total expense comparisons provided, and the challenges and limitations associated with such information; and (ix) explanations regarding the relative total expense ratios and management fees of certain funds and classes, total expense and management fee competitive trends, and methodologies for total expense and management fee competitive comparisons. In addition, the Board considered its discussions with Fidelity regarding Fidelity's efforts to maintain the continuous investment and shareholder services necessary for the funds during the current pandemic and economic circumstances.
Based on its evaluation of all of the conclusions noted above, and after considering all factors it believed relevant, the Board concluded that the advisory fee arrangements are fair and reasonable and that each fund's Advisory Contracts should be renewed.
1.540037.125
PFR-ANN-0323
Fidelity Flex® Funds
Fidelity Flex® Conservative Income Municipal Bond Fund
Annual Report
December 31, 2022
Contents
To view a fund's proxy voting guidelines and proxy voting record for the 12-month period ended June 30, visit http://www.fidelity.com/proxyvotingresults or visit the Securities and Exchange Commission's (SEC) web site at http://www.sec.gov.
You may also call 1-800-544-3455 (for managed account clients) or 1-800-835-5092 (for retirement plan participants) to request a free copy of the proxy voting guidelines.
Standard & Poor's, S&P and S&P 500 are registered service marks of The McGraw-Hill Companies, Inc. and have been licensed for use by Fidelity Distributors Corporation.
Other third-party marks appearing herein are the property of their respective owners.
All other marks appearing herein are registered or unregistered trademarks or service marks of FMR LLC or an affiliated company. © 2023 FMR LLC. All rights reserved.
This report and the financial statements contained herein are submitted for the general information of the shareholders of the Fund. This report is not authorized for distribution to prospective investors in the Fund unless preceded or accompanied by an effective prospectus.
A fund files its complete schedule of portfolio holdings with the SEC for the first and third quarters of each fiscal year on Form N-PORT. Forms N-PORT are available on the SEC's web site at http://www.sec.gov. A fund's Forms N-PORT may be reviewed and copied at the SEC's Public Reference Room in Washington, DC. Information regarding the operation of the SEC's Public Reference Room may be obtained by calling 1-800-SEC-0330.
For a complete list of a fund's portfolio holdings, view the most recent holdings listing, semiannual report, or annual report on Fidelity's web site at http://www.fidelity.com, http://www.institutional.fidelity.com, or http://www.401k.com, as applicable.
NOT FDIC INSURED •MAY LOSE VALUE •NO BANK GUARANTEE
Neither the Fund nor Fidelity Distributors Corporation is a bank.
Average annual total return reflects the change in the value of an investment, assuming reinvestment of distributions from dividend income and capital gains (the profits earned upon the sale of securities that have grown in value, if any) and assuming a constant rate of performance each year. The hypothetical investment and the average annual total returns do not reflect the deduction of taxes that a shareholder would pay on fund distributions or the redemption of fund shares. During periods of reimbursement by Fidelity, a fund's total return will be greater than it would be had the reimbursement not occurred. How a fund did yesterday is no guarantee of how it will do tomorrow.
| Average Annual Total Returns |
| | | | |
Periods ended December 31, 2022 | Past 1 year | Past 5 years | Life of Fund A |
| Fidelity Flex® Conservative Income Municipal Bond Fund | 0.49% | 1.31% | 1.27% |
A From October 12, 2017
| $10,000 Over Life of Fund |
| |
Let's say hypothetically that $10,000 was invested in Fidelity Flex® Conservative Income Municipal Bond Fund, on October 12, 2017, when the fund started. The chart shows how the value of your investment would have changed, and also shows how the Bloomberg Municipal Bond 1 Year (1-2 Y) Index performed over the same period. |
|
|
Market Recap:
Tax-exempt municipal bonds notably declined in 2022, as a multitude of crosscurrents challenged the global economy and financial markets. The Bloomberg Municipal Bond Index returned -8.53% for the year, its third-worst annual return on record. In late 2021, the Federal Reserve began its pivot to a tighter monetary policy, tapering the large-scale asset purchases it restarted in 2020 amid the COVID-19 pandemic. In early 2022, the Fed, faced with persistent inflationary pressure, began implementing an aggressive series of rate hikes, raising its benchmark interest rate seven times, by a total of 4.25 percentage points, between March and December. This helped push municipal bond yields to their highest level in more than a decade. Muni bond prices, which move inversely to yields, fell sharply. Credit spreads significantly widened, as investors demanded more yield for lower-quality munis as recession risk increased. In November and December, the tax-exempt market staged a rally when comments by Fed Chair Jerome Powell pointed to a slowdown in the pace of rate hikes and inflation data moderated. Favorable supply and demand dynamics also helped amid muted muni bond issuance and increased pockets of demand. Muni tax-backed credit fundamentals remained solid throughout the year and, for the most part, the risk of credit-rating downgrades appeared low. Shorter-duration (lower sensitivity to changes in interest rates) and higher-credit-quality munis performed best for the year.
Comments from Co-Portfolio Managers Elizah McLaughlin, Ryan Brogan and Michael Maka:
For the fiscal year ending December 31, 2022, the fund returned 0.49%, net of fees, outpacing the 0.01% result of the Composite index, an equal-weighted blend of the benchmark, the Bloomberg Municipal Bond 1 Year (1-2Y) Index, and the iMoneyNet All Tax-Free National Retail Money Market Funds Average™. The past 12 months, we continued to focus on longer-term objectives and sought to generate attractive tax-exempt income and a competitive risk-adjusted return. Versus the Composite index, the fund's duration (interest rate) positioning contributed to performance, The fund had less sensitivity to interest rates, as measured by its shorter duration, than the index and therefore was hurt less as interest rates rose. An overweight to variable-rate securities also contributed to relative performance, given that these securities outperformed fixed-rate securities for most of the year amid rising interest rates. In contrast, an overweight in lower-rated, investment-grade bonds was a key detractor because they lagged the Composite index as credit spreads widened. Larger-than-index exposure to industrial development securities and gas pre-pay bonds, two segments that trailed the index, detracted as well. Relative performance also was crimped by the fund's exposure to bonds with a mandatory tender structure, which lagged the index. Differences in the way fund holdings and index components were priced further hindered relative performance.
The views expressed above reflect those of the portfolio manager(s) only through the end of the period as stated on the cover of this report and do not necessarily represent the views of Fidelity or any other person in the Fidelity organization. Any such views are subject to change at any time based upon market or other conditions and Fidelity disclaims any responsibility to update such views. These views may not be relied on as investment advice and, because investment decisions for a Fidelity fund are based on numerous factors, may not be relied on as an indication of trading intent on behalf of any Fidelity fund.
| Top Five States (% of Fund's net assets) |
| | |
| Texas | 11.4 |
| California | 9.6 |
| Illinois | 9.0 |
| Georgia | 6.8 |
| New York | 6.0 |
| | |
| Revenue Sources (% of Fund's net assets) |
| Synthetics | 31.3% | |
| Industrial Development | 13.0% | |
| Health Care | 9.0% | |
| General Obligations | 8.0% | |
| Transportation | 7.5% | |
| Electric Utilities | 6.9% | |
| Resource Recovery | 6.3% | |
| Others* (Individually Less Than 5%) | 18.0% | |
| | 100.0% | |
| |
| *Includes net other assets | | |
Quality Diversification (% of Fund's net assets) |
|
| |
| We have used ratings from Moody's Investors Service, Inc. Where Moody's® ratings are not available, we have used S&P® ratings. All ratings are as of the date indicated and do not reflect subsequent changes. |
| Maturity Diversification (% of Fund's Investments) |
| Days |
| 1 - 7 | 50.6 | |
| 8 - 30 | 4.4 | |
| 31 - 60 | 9.9 | |
| 61 - 90 | 1.0 | |
| 91 - 180 | 6.5 | |
| > 180 | 27.6 | |
| The date shown for securities represents the date when principal payments must be paid, taking into account any call options exercised by the issuer and any permissible maturity shortening features other than interest rate resets. |
Showing Percentage of Net Assets
| Municipal Bonds - 43.6% |
| | | Principal Amount (a) | Value ($) |
| Alabama - 0.7% | | | |
| Black Belt Energy Gas District: | | | |
| Bonds Series 2018 A, 4%, tender 12/1/23 (b) | | 200,000 | 200,185 |
| Series 2021 C1, 4% 12/1/23 | | 100,000 | 99,899 |
| Series 2022 C1: | | | |
5.25% 12/1/24 | | 60,000 | 61,256 |
5.25% 12/1/25 | | 95,000 | 98,079 |
| Series 2022 E: | | | |
5% 6/1/23 | | 15,000 | 15,071 |
5% 6/1/24 | | 85,000 | 86,489 |
5% 6/1/25 | | 90,000 | 92,811 |
5% 6/1/26 | | 125,000 | 130,307 |
| Southeast Alabama Gas Supply District Bonds (Proj. No. 2) Series 2018 A, 4%, tender 6/1/24 (b) | | 270,000 | 269,054 |
TOTAL ALABAMA | | | 1,053,151 |
| Alaska - 0.1% | | | |
| Alaska Int'l. Arpts. Revs. Series 2021 C, 5% 10/1/25 (c) | | 100,000 | 104,181 |
| Arizona - 1.4% | | | |
| Bullhead City Excise Taxes Series 2021 2, 0.6% 7/1/24 | | 275,000 | 261,788 |
| Chandler Indl. Dev. Auth. Indl. Dev. Rev. Bonds (Intel Corp. Proj.): | | | |
| Series 2005, 2.4%, tender 8/14/23 (b) | | 160,000 | 158,758 |
| Series 2019, 5%, tender 6/3/24 (b)(c) | | 1,280,000 | 1,300,407 |
| Maricopa County Rev. Series 2016 A, 5% 1/1/23 | | 100,000 | 100,000 |
| Phoenix Civic Impt. Board Arpt. Rev. Series 2017 D, 5% 7/1/24 | | 225,000 | 231,996 |
TOTAL ARIZONA | | | 2,052,949 |
| California - 2.8% | | | |
| California Health Facilities Fing. Auth. Rev. Series 2016 A, 4% 3/1/23 | | 300,000 | 300,248 |
| California Muni. Fin. Auth. Solid Waste Disp. Rev. Bonds (Republic Svcs., Inc. Proj.): | | | |
| Series 2021 A, 3.875%, tender 4/3/23 (b)(c) | | 400,000 | 399,915 |
| Series 2021 B, 2.35%, tender 1/17/23 (b)(c) | | 1,300,000 | 1,299,256 |
| California Poll. Cont. Fing. Auth. Solid Waste Disp. Rev. Bonds (Republic Svcs., Inc. Proj.): | | | |
| Series 2010 A, 4.1%, tender 2/1/23 (b)(c)(d) | | 300,000 | 300,023 |
| Series 2017 A2, 3.875%, tender 1/17/23 (b)(c)(d) | | 400,000 | 399,988 |
| California Statewide Cmntys. Dev. Auth. Series 2021, 4% 5/15/23 | | 100,000 | 100,247 |
| California Statewide Cmntys. Dev. Auth. Rev. Series 2018 A, 5% 3/1/23 | | 110,000 | 110,288 |
| Long Beach Hbr. Rev. Series 2020 B, 5% 5/15/24 (c) | | 150,000 | 153,515 |
| Los Angeles Dept. Arpt. Rev.: | | | |
| Series 2015, 5% 5/15/23 (c) | | 100,000 | 100,569 |
| Series 2019 E, 4% 5/15/23 | | 125,000 | 125,491 |
| Series 2022 C: | | | |
5% 5/15/24 (c) | | 85,000 | 86,992 |
5% 5/15/26 (c) | | 200,000 | 210,067 |
| Series A, 5% 5/15/23 (c) | | 250,000 | 251,422 |
| Northern California Pwr. Agcy. Rev. Series 2019 A, 5% 8/1/23 | | 100,000 | 101,209 |
| San Francisco City & County Arpts. Commission Int'l. Arpt. Rev. Series 2016 D, 5% 5/1/24 | | 100,000 | 102,899 |
| San Jose Int. Arpt. Rev.: | | | |
| Series 2014 A, 5% 3/1/23 (Escrowed to Maturity) (c) | | 100,000 | 100,310 |
| Series 2017 A, 5% 3/1/23 (Escrowed to Maturity) (c) | | 100,000 | 100,310 |
TOTAL CALIFORNIA | | | 4,242,749 |
| Colorado - 0.4% | | | |
| Colorado Health Facilities Auth. Rev. Series 2014 E, 5% 11/15/24 | | 200,000 | 205,859 |
| Colorado Health Facilities Auth. Rev. Bonds Series 2019 A, 5% 1/1/23 | | 165,000 | 165,000 |
| Denver City & County Arpt. Rev. Series 2022 A, 5% 11/15/25 (c) | | 165,000 | 172,557 |
TOTAL COLORADO | | | 543,416 |
| Connecticut - 1.8% | | | |
| Connecticut Gen. Oblig.: | | | |
| Series 2016 A, 5% 3/15/24 | | 200,000 | 205,126 |
| Series 2020 A, 5% 1/15/23 | | 145,000 | 145,084 |
| Series 2022 A, 3% 1/15/23 | | 340,000 | 339,987 |
| Connecticut Health & Edl. Facilities Auth. Rev. Bonds: | | | |
| Series 2010 A4, 1.1%, tender 2/11/25 (b) | | 510,000 | 482,275 |
| Series 2014 A, 1.1%, tender 2/7/23 (b) | | 300,000 | 299,188 |
| Series 2017 C2, 5%, tender 2/1/23 (b) | | 275,000 | 275,462 |
| Connecticut Hsg. Fin. Auth. Series C, 5% 11/15/23 (c) | | 100,000 | 101,373 |
| Connecticut Muni. Elec. Energy Coop. Pwr. Supply Sys. Rev. Series 2013 A, 5% 1/1/23 | | 115,000 | 115,000 |
| Connecticut Spl. Tax Oblig. Trans. Infrastructure Rev.: | | | |
| Series 2012 A: | | | |
5% 1/1/24 | | 150,000 | 150,000 |
5% 1/1/24 | | 100,000 | 100,000 |
| Series A, 5% 5/1/23 | | 325,000 | 327,148 |
| Hartford Gen. Oblig. Series 2015 C, 5% 7/15/25 (Assured Guaranty Muni. Corp. Insured) | | 105,000 | 110,832 |
TOTAL CONNECTICUT | | | 2,651,475 |
| District Of Columbia - 0.5% | | | |
| Metropolitan Washington DC Arpts. Auth. Sys. Rev.: | | | |
| Series 2014 A: | | | |
5% 10/1/23 (c) | | 100,000 | 101,021 |
5% 10/1/24 (c) | | 110,000 | 112,919 |
| Series 2017 A, 5% 10/1/24 (c) | | 100,000 | 102,654 |
| Series 2020 A, 5% 10/1/24 (c) | | 400,000 | 410,616 |
TOTAL DISTRICT OF COLUMBIA | | | 727,210 |
| Florida - 1.8% | | | |
| Broward County Arpt. Sys. Rev.: | | | |
| Series 2012 P2, 5% 10/1/23 | | 135,000 | 135,190 |
| Series 2017, 5% 10/1/23 (c) | | 125,000 | 126,322 |
| Series 2019 B, 5% 10/1/23 (c) | | 100,000 | 101,058 |
| Citizens Property Ins. Corp. Series 2015 A1, 5% 6/1/25 | | 100,000 | 103,198 |
| Escambia County Poll. Cont. Rev. (Gulf Pwr. Co. Proj.) Series 2003, 2.6% 6/1/23 | | 100,000 | 99,606 |
| Florida Dev. Fin. Corp. Rev. Bonds (Brightline Florida Passenger Rail Expansion Proj.) Series 2021 A, 2.9%, tender 4/4/23 (b)(c) | | 600,000 | 598,288 |
| Hillsborough County Aviation Auth. Rev. Series 2022 A, 5% 10/1/24 (c) | | 200,000 | 206,336 |
| Jacksonville Spl. Rev. Series 2022 A: | | | |
| 5% 10/1/23 | | 15,000 | 15,228 |
| 5% 10/1/24 | | 35,000 | 36,338 |
| 5% 10/1/25 | | 25,000 | 26,483 |
| Lee County Arpt. Rev. Series 2021 A, 5% 10/1/24 (c) | | 55,000 | 56,170 |
| Lee Memorial Health Sys. Hosp. Rev. Series 2019 A1, 5% 4/1/23 | | 165,000 | 165,609 |
| Miami-Dade County Aviation Rev. Series 2016 A, 5% 10/1/23 | | 230,000 | 233,364 |
| Miami-Dade County Health Facilities Auth. Hosp. Rev. (Nicklaus Children Hosp.) Series 2017, 5% 8/1/23 | | 320,000 | 322,955 |
| Miami-Dade County Indl. Dev. Auth. Solid Waste Disp. Rev. Bonds (Waste Mgmt., Inc. Proj.) Series 2018 A, 4.035%, tender 7/1/24 (b)(c) | | 270,000 | 261,817 |
| Miami-Dade County School Board Ctfs. of Prtn. Series 2015 A, 5% 5/1/23 | | 175,000 | 176,083 |
| Orlando & Orange County Expressway Auth. Rev. Series 2013 B, 5% 7/1/23 | | 100,000 | 100,889 |
TOTAL FLORIDA | | | 2,764,934 |
| Georgia - 4.9% | | | |
| Atlanta Arpt. Rev. Series 2019 B, 5% 7/1/24 (c) | | 100,000 | 102,490 |
| Bartow County Dev. Auth. Poll. Cont. Rev. Bonds (Georgia Pwr. Co. Plant Bowen Proj.) Series 2009 1st, 2.75%, tender 3/15/23 (b) | | 1,450,000 | 1,447,151 |
| Burke County Indl. Dev. Auth. Poll. Cont. Rev. Bonds (Georgia Pwr. Co. Plant Vogtle Proj.) Series 2012, 2.875%, tender 8/19/25 (b) | | 210,000 | 207,214 |
| Cobb County Kennestone Hosp. Auth. Rev.: | | | |
| (Wellstar Health Sys., Inc. Proj.) Series 2017 A, 5% 4/1/23 | | 100,000 | 100,369 |
| Series 2012, 5% 4/1/23 | | 100,000 | 100,369 |
| Georgia Muni. Elec. Auth. Pwr. Rev.: | | | |
| Series 2015 A, 5% 1/1/23 | | 245,000 | 245,000 |
| Series 2019 A, 5% 1/1/23 | | 450,000 | 450,000 |
| Series 2020 A: | | | |
5% 1/1/23 | | 100,000 | 100,000 |
5% 1/1/24 | | 145,000 | 147,330 |
| Series 2021 A, 5% 1/1/23 | | 145,000 | 145,000 |
| Series GG, 5% 1/1/23 | | 190,000 | 190,000 |
| Main Street Natural Gas, Inc.: | | | |
| Bonds: | | | |
Series 2018 B, 1 month U.S. LIBOR + 0.750% 3.51%, tender 1/4/23 (b)(e) | | 450,000 | 448,002 |
Series 2018 C, 4%, tender 12/1/23 (b) | | 110,000 | 109,917 |
Series 2018 E, SIFMA Municipal Swap Index + 0.570% 4.23%, tender 1/5/23 (b)(e) | | 930,000 | 926,870 |
Series 2019 B, 4%, tender 12/2/24 (b) | | 265,000 | 265,008 |
| Series 2018 A, 4% 3/1/23 | | 200,000 | 200,037 |
| Series 2022 A, 4% 12/1/25 | | 70,000 | 70,158 |
| Series 2022 B, 5% 6/1/26 | | 1,900,000 | 1,954,868 |
| Paulding County Hosp. Auth. Rev. Series 2022 A, 5% 4/1/25 | | 150,000 | 155,773 |
TOTAL GEORGIA | | | 7,365,556 |
| Guam - 0.2% | | | |
| Guam Pwr. Auth. Rev. Series 2022 A: | | | |
| 5% 10/1/23 | | 85,000 | 85,781 |
| 5% 10/1/24 | | 70,000 | 71,631 |
| 5% 10/1/25 | | 85,000 | 88,170 |
TOTAL GUAM | | | 245,582 |
| Idaho - 0.1% | | | |
| Idaho Hsg. & Fin. Assoc. Single Family Mtg. (Idaho St Garvee Proj.) Series 2017 A, 5% 7/15/23 | | 100,000 | 101,051 |
| Illinois - 4.6% | | | |
| Champaign County Cmnty. Unit Series 2020 A, 0% 1/1/24 | | 380,000 | 367,079 |
| Chicago Metropolitan Wtr. Reclamation District of Greater Chicago Series 2021 C, 5% 12/1/23 | | 130,000 | 132,284 |
| Chicago Midway Arpt. Rev.: | | | |
| Series 2014 B, 5% 1/1/23 | | 100,000 | 100,000 |
| Series 2016 A, 5% 1/1/23 (c) | | 100,000 | 100,000 |
| Chicago O'Hare Int'l. Arpt. Rev.: | | | |
| Series 2015 A, 5% 1/1/24 (c) | | 450,000 | 456,130 |
| Series 2016 C, 5% 1/1/23 | | 175,000 | 175,000 |
| Series 2017 A, 5% 1/1/23 | | 210,000 | 210,000 |
| Series 2022 A, 5% 1/1/25 (c) | | 270,000 | 277,867 |
| Chicago Park District Gen. Oblig. Series 2021 E, 4% 1/1/23 | | 300,000 | 300,000 |
| Cook County Gen. Oblig.: | | | |
| Series 2021 B, 4% 11/15/23 | | 75,000 | 75,391 |
| Series 2022 A: | | | |
5% 11/15/24 | | 350,000 | 361,275 |
5% 11/15/25 | | 255,000 | 268,750 |
| Illinois Dev. Fin. Auth. Solid Waste Disp. Rev. Bonds (Waste Mgmt., Inc. Proj.) Series 2019, 4.4%, tender 11/1/23 (b)(c) | | 500,000 | 501,391 |
| Illinois Fin. Auth. Series 2022 A, 5% 10/1/23 | | 200,000 | 200,730 |
| Illinois Fin. Auth. Rev.: | | | |
| Series 2015 A: | | | |
5% 11/15/23 | | 150,000 | 152,316 |
5% 11/15/24 | | 100,000 | 103,534 |
| Series 2016 C, 5% 2/15/24 | | 105,000 | 107,085 |
| Series 2019, 5% 4/1/23 | | 100,000 | 100,418 |
| Illinois Gen. Oblig.: | | | |
| Series 2013, 5% 7/1/23 | | 100,000 | 100,654 |
| Series 2017 D, 5% 11/1/23 | | 200,000 | 202,075 |
| Series 2021 A, 5% 3/1/23 | | 70,000 | 70,149 |
| Series 2022 A, 5% 3/1/23 | | 60,000 | 60,128 |
| Series 2022 B: | | | |
5% 3/1/24 | | 230,000 | 233,192 |
5% 3/1/25 | | 465,000 | 474,789 |
5% 3/1/26 | | 340,000 | 349,214 |
| Series 2022 D1, 5% 3/1/23 | | 70,000 | 70,149 |
| Illinois Sales Tax Rev. Series 2021 A: | | | |
| 4% 6/15/23 | | 260,000 | 260,608 |
| 4% 6/15/24 | | 135,000 | 135,727 |
| Illinois Toll Hwy. Auth. Toll Hwy. Rev. Series 2018 A, 5% 1/1/23 | | 180,000 | 180,000 |
| Railsplitter Tobacco Settlement Auth. Rev. Series 2017: | | | |
| 5% 6/1/23 | | 370,000 | 372,712 |
| 5% 6/1/24 | | 405,000 | 415,571 |
TOTAL ILLINOIS | | | 6,914,218 |
| Indiana - 1.6% | | | |
| Indiana Dev. Fin. Auth. Envir. Rev. Bonds (Fulcrum Centerpoint, LLC Proj.) Series 2022, 4.5%, tender 11/15/23 (c) | | 1,500,000 | 1,499,052 |
| Indiana Dev. Fin. Auth. Solid Waste Disp. Rev. Bonds (Waste Mgmt., Inc. Proj.) Series 2001, 4%, tender 10/2/23 (b)(c) | | 175,000 | 175,330 |
| Indiana Fin. Auth. Rev. (Butler Univ. Proj.) Series 2019, 4% 2/1/24 | | 200,000 | 201,937 |
| Indiana Muni. Pwr. Agcy. Pwr. Supply Sys. Rev. Series 2017 A, 5% 1/1/23 | | 100,000 | 100,000 |
| Indianapolis Local Pub. Impt. (Indianapolis Arpt. Auth. Proj.) Series 2015 I, 5% 1/1/23 (c) | | 205,000 | 205,000 |
| Whiting Envir. Facilities Rev. Bonds (BP Products North America, Inc. Proj.) Series 2016 A, 5%, tender 3/1/23 (b)(c) | | 200,000 | 200,261 |
TOTAL INDIANA | | | 2,381,580 |
| Kentucky - 0.8% | | | |
| Kenton County Arpt. Board Arpt. Rev. Series 2016, 5% 1/1/23 | | 130,000 | 130,000 |
| Kentucky State Property & Buildings Commission Rev.: | | | |
| Series 2016, 5% 11/1/23 | | 675,000 | 686,238 |
| Series 2018, 5% 5/1/23 | | 65,000 | 65,411 |
| Kentucky, Inc. Pub. Energy Bonds: | | | |
| Series 2018 A, 4%, tender 4/1/24 (b) | | 205,000 | 204,640 |
| Series 2019 A1, 4%, tender 6/1/25 (b) | | 150,000 | 148,616 |
TOTAL KENTUCKY | | | 1,234,905 |
| Louisiana - 0.1% | | | |
| St. John Baptist Parish Rev. Bonds (Marathon Oil Corp.) Series 2017, 2%, tender 4/1/23 (b) | | 100,000 | 99,382 |
| Maine - 0.4% | | | |
| Maine Health & Higher Edl. Facilities Auth. Rev. Series 2021 A, 5% 7/1/23 | | 625,000 | 630,860 |
| Maryland - 0.1% | | | |
| Maryland Dept. of Trans.: | | | |
| Series 2022 A, 5% 12/1/24 | | 25,000 | 26,092 |
| Series 2022 B, 5% 12/1/23 | | 30,000 | 30,584 |
| Maryland Stadium Auth. Built to Learn Rev. Series 2022 A, 5% 6/1/24 | | 120,000 | 123,366 |
TOTAL MARYLAND | | | 180,042 |
| Massachusetts - 2.4% | | | |
| Massachusetts Dept. of Trans. Metropolitan Hwy. Sys. Rev. Bonds Series 2019 A, 5%, tender 1/1/23 (b) | | 250,000 | 250,000 |
| Massachusetts Dev. Fin. Agcy. Rev.: | | | |
| Bonds Series S3, SIFMA Municipal Swap Index + 0.500% 4.16%, tender 1/5/23 (b)(e) | | 200,000 | 199,941 |
| Series 2021 A, 5% 6/1/23 | | 360,000 | 361,877 |
| Massachusetts Edl. Fing. Auth. Rev.: | | | |
| Series 2014 I, 5% 1/1/25 (c) | | 310,000 | 318,431 |
| Series 2015 A, 5% 1/1/24 (c) | | 580,000 | 588,184 |
| Series 2016, 5% 7/1/24 (c) | | 15,000 | 15,334 |
| Series 2017 A, 5% 7/1/25 (c) | | 80,000 | 82,788 |
| Series 2022 B: | | | |
5% 7/1/24 (c) | | 30,000 | 30,646 |
5% 7/1/25 (c) | | 65,000 | 67,360 |
| Massachusetts Gen. Oblig. Series 2021 B, 5% 11/1/23 | | 1,195,000 | 1,215,976 |
| Massachusetts Port Auth. Rev. Series 2019 C, 5% 7/1/23 (c) | | 150,000 | 151,355 |
| Massachusetts Tpk. Auth. Metropolitan Hwy. Sys. Rev.: | | | |
| Series 1997 A, 0% 1/1/24 (Nat'l. Pub. Fin. Guarantee Corp. Insured) | | 115,000 | 111,220 |
| Series 1997 C, 0% 1/1/23 (Nat'l. Pub. Fin. Guarantee Corp. Insured) | | 120,000 | 120,000 |
TOTAL MASSACHUSETTS | | | 3,513,112 |
| Michigan - 0.8% | | | |
| Lapeer Cmnty. Schools Series 2016, 5% 5/1/25 | | 125,000 | 131,581 |
| Michigan Fin. Auth. Rev.: | | | |
| (Detroit Reg'l. Convention Facility Auth. Local Proj.) Series 2014 H1, 5% 10/1/24 | | 105,000 | 106,591 |
| Series 2022: | | | |
5% 4/15/25 | | 160,000 | 167,422 |
5% 4/15/26 | | 265,000 | 282,610 |
| Michigan Gen. Oblig. Series 2016, 5% 3/15/23 | | 100,000 | 100,413 |
| Michigan Hsg. Dev. Auth. Single Family Mtg. Rev. Series 2022 A, 2.5% 6/1/25 | | 70,000 | 68,884 |
| Northern Michigan Univ. Revs. Series 2021, 5% 6/1/23 | | 415,000 | 418,347 |
TOTAL MICHIGAN | | | 1,275,848 |
| Minnesota - 0.8% | | | |
| Minneapolis & Saint Paul Metropolitan Arpts. Commission Arpt. Rev. Series 2022 B, 5% 1/1/23 (c) | | 400,000 | 400,000 |
| Minnesota Hsg. Fin. Agcy. Series 2022 A, 5% 8/1/24 | | 360,000 | 371,875 |
| Saint Cloud Health Care Rev. Series 2014 B, 5% 5/1/23 | | 205,000 | 206,101 |
| Southern Minnesota Muni. Pwr. Agcy. Pwr. Supply Sys. Rev. Series 2015 A, 5% 1/1/23 | | 200,000 | 200,000 |
TOTAL MINNESOTA | | | 1,177,976 |
| Missouri - 0.2% | | | |
| Missouri Health & Edl. Facilities Rev. Series 2014 A, 5% 6/1/23 | | 235,000 | 236,608 |
| Montana - 0.1% | | | |
| Montana Facility Fin. Auth. Rev. Series 2019 A, 5% 1/1/23 | | 100,000 | 100,000 |
| Nebraska - 0.4% | | | |
| Lincoln Arpt. Auth. Series 2021, 5% 7/1/25 (c) | | 550,000 | 570,899 |
| Nevada - 0.4% | | | |
| Nevada Dept. of Bus. & Industry Bonds: | | | |
| (Republic Svcs., Inc. Proj.) Series 2001, 3.75%, tender 6/1/23 (b)(c)(d) | | 200,000 | 199,591 |
| Series 2020 A, 0.85%, tender 1/26/23 (b)(c)(d) | | 400,000 | 399,228 |
TOTAL NEVADA | | | 598,819 |
| New Jersey - 2.7% | | | |
| New Jersey Econ. Dev. Auth. Rev.: | | | |
| (New Jersey Gen. Oblig. Proj.) Series 2017 B, 5% 11/1/24 | | 185,000 | 191,047 |
| Series 2005 N1, 5.5% 9/1/23 | | 400,000 | 405,573 |
| Series 2013, 5% 3/1/25 | | 380,000 | 381,050 |
| Series 2019, 5.25% 9/1/24 (d) | | 320,000 | 330,666 |
| New Jersey Gen. Oblig. Series 2020 A, 5% 6/1/24 | | 140,000 | 144,104 |
| New Jersey Health Care Facilities Fing. Auth. Rev.: | | | |
| Series 2016 A, 5% 7/1/23 | | 240,000 | 242,297 |
| Series 2017 A, 5% 7/1/23 | | 135,000 | 136,173 |
| New Jersey Higher Ed. Student Assistance Auth. Student Ln. Rev.: | | | |
| Series 2016 1A: | | | |
5% 12/1/23 (c) | | 100,000 | 101,361 |
5% 12/1/24 (c) | | 170,000 | 175,086 |
| Series 2017 1A, 5% 12/1/24 (c) | | 350,000 | 360,078 |
| Series 2021 A, 5% 12/1/23 (c) | | 200,000 | 202,722 |
| Series 2022 B, 5% 12/1/25 (c) | | 250,000 | 260,023 |
| New Jersey Hsg. & Mtg. Fin. Agcy. Multi-family Rev. Series 2021 B, 0.5% 11/1/23 | | 90,000 | 87,981 |
| New Jersey Tobacco Settlement Fing. Corp. Series 2018 A: | | | |
| 5% 6/1/23 | | 300,000 | 301,544 |
| 5% 6/1/24 | | 255,000 | 259,284 |
| New Jersey Trans. Trust Fund Auth.: | | | |
| Series 2004 A, 5.75% 6/15/25 (Nat'l. Pub. Fin. Guarantee Corp. Insured) | | 100,000 | 106,174 |
| Series 2006 C, 0% 12/15/24 | | 260,000 | 245,306 |
| Series 2014 AA, 5% 6/15/25 | | 100,000 | 102,510 |
TOTAL NEW JERSEY | | | 4,032,979 |
| New Mexico - 0.2% | | | |
| New Mexico Edl. Assistance Foundation Series 2021 1A, 5% 9/1/23 (c) | | 100,000 | 100,921 |
| New Mexico Muni. Energy Acquisition Auth. Gas Supply Rev. Bonds Series 2019 A, 5%, tender 5/1/25 (b) | | 150,000 | 153,739 |
TOTAL NEW MEXICO | | | 254,660 |
| New York - 0.8% | | | |
| Genesee County Fdg. Corp. (Rochester Reg'l. Health Proj.) Series 2022 A: | | | |
| 5% 12/1/24 | | 175,000 | 179,615 |
| 5% 12/1/25 | | 175,000 | 181,918 |
| New York City Indl. Dev. Agcy. Rev. Series 2021 A, 5% 1/1/26 (Assured Guaranty Muni. Corp. Insured) | | 35,000 | 36,999 |
| New York Metropolitan Trans. Auth. Rev.: | | | |
| Series 2017 B, 5% 11/15/23 | | 390,000 | 395,032 |
| Series 2020 A, 5% 2/1/23 | | 200,000 | 200,146 |
| New York State Dorm. Auth. Series 2017 A: | | | |
| 5% 2/15/23 | | 30,000 | 30,072 |
| 5% 2/15/23 (Escrowed to Maturity) | | 95,000 | 95,213 |
| New York Trans. Dev. Corp. (Term. 4 JFK Int'l. Arpt. Proj.) Series 2020 A, 5% 12/1/25 (c) | | 45,000 | 46,577 |
TOTAL NEW YORK | | | 1,165,572 |
| New York And New Jersey - 0.6% | | | |
| Port Auth. of New York & New Jersey: | | | |
| Series 177, 5% 7/15/23 (c) | | 235,000 | 235,212 |
| Series 178, 5% 12/1/23 (c) | | 135,000 | 136,656 |
| Series 186, 5% 10/15/23 (c) | | 100,000 | 101,038 |
| Series 2017 202, 5% 10/15/23 (c) | | 225,000 | 227,337 |
| Series 2018, 5% 9/15/25 (c) | | 145,000 | 151,033 |
TOTAL NEW YORK AND NEW JERSEY | | | 851,276 |
| North Carolina - 0.2% | | | |
| Charlotte Int'l. Arpt. Rev. Series 2017 B, 5% 7/1/23 (c) | | 130,000 | 131,041 |
| Charlotte-Mecklenburg Hosp. Auth. Health Care Sys. Rev. Bonds Series 2021 B, 5%, tender 12/2/24 (b) | | 115,000 | 119,269 |
TOTAL NORTH CAROLINA | | | 250,310 |
| Ohio - 1.2% | | | |
| American Muni. Pwr., Inc. Rev. Series 2021 A: | | | |
| 5% 2/15/23 | | 200,000 | 200,387 |
| 5% 2/15/24 | | 200,000 | 204,038 |
| Miami Univ. Series 2022 A, 5% 9/1/23 | | 50,000 | 50,653 |
| Ohio Gen. Oblig. Series 2021 A, 5% 3/1/23 | | 100,000 | 100,320 |
| Ohio Higher Ed. Facilities Commission Healthcare Rev. Series 2022: | | | |
| 5% 1/1/23 | | 235,000 | 235,000 |
| 5% 1/1/25 | | 200,000 | 204,088 |
| Ohio Hosp. Facilities Rev. Series 2017 A, 5% 1/1/25 | | 215,000 | 223,960 |
| Ohio Tpk. Commission Tpk. Rev. (Infrastructure Projs.) Series 2022 A, 5% 2/15/25 | | 105,000 | 110,007 |
| Wright State Univ. Gen. Receipts Series 2021 A, 4% 5/1/23 (Build America Mutual Assurance Insured) | | 500,000 | 500,519 |
TOTAL OHIO | | | 1,828,972 |
| Oklahoma - 0.1% | | | |
| Univ. of Oklahoma Gen. Rev. Series 2021 A, 5% 7/1/23 (Assured Guaranty Muni. Corp. Insured) | | 150,000 | 151,355 |
| Oregon - 0.4% | | | |
| Oregon Bus. Dev. Commission Recovery Zone Facility Bonds (Intel Corp. Proj.) Series 232, 2.4%, tender 8/14/23 (b) | | 125,000 | 124,029 |
| Port of Portland Arpt. Rev.: | | | |
| Series 2022, 5% 7/1/25 (c) | | 195,000 | 202,694 |
| Series 26 C, 5% 7/1/24 (c) | | 300,000 | 306,985 |
TOTAL OREGON | | | 633,708 |
| Pennsylvania - 3.6% | | | |
| Allegheny County Higher Ed. Bldg. Auth. Univ. Rev. Series 2021 A, 5% 3/1/23 | | 625,000 | 626,539 |
| Allegheny County Hosp. Dev. Auth. Rev. Series 2019 A, 5% 7/15/23 | | 315,000 | 318,061 |
| Chester County Health & Ed. Facilities Auth. Health Sys. Rev. Series 2020 B, 5% 6/1/23 | | 1,000,000 | 1,008,066 |
| Dauphin County Gen. Auth. (Pinnacle Health Sys. Proj.) Series 2016 A, 5% 6/1/23 | | 100,000 | 100,643 |
| Delaware County Auth. Univ. Rev. Series 2014, 5% 8/1/23 | | 150,000 | 151,728 |
| Pennsylvania Econ. Dev. Fing. Auth. Solid Waste Disp. Rev. Bonds: | | | |
| (Republic Svcs., Inc. Proj.): | | | |
Series 2019 A, 3.875%, tender 1/17/23 (b)(c) | | 100,000 | 99,997 |
Series 2019 B1, 3.875%, tender 1/17/23 (b)(c) | | 100,000 | 99,997 |
| (Republic Svcs., Inc. Proj.): | | | |
Series 2014, 3.8%, tender 1/3/23 (b)(c) | | 1,800,000 | 1,800,000 |
Series 2019 B2, 2.35%, tender 1/17/23 (b)(c) | | 400,000 | 399,771 |
| (Waste Mgmt., Inc. Proj.) Series 2013, 4%, tender 2/1/23 (b)(c) | | 500,000 | 499,978 |
| (Waste Mgmt., Inc. Proj.) Series 2021 A, SIFMA Municipal Swap Index + 0.400% 4.06%, tender 6/3/24 (b)(c)(e) | | 100,000 | 97,197 |
| Pennsylvania Hsg. Fin. Agcy.: | | | |
| Series 2021 135 B: | | | |
5% 4/1/23 (c) | | 10,000 | 10,026 |
5% 4/1/24 (c) | | 10,000 | 10,156 |
5% 4/1/25 (c) | | 15,000 | 15,462 |
| Series 2021 137, 0.4% 4/1/23 | | 40,000 | 39,715 |
| Philadelphia Gas Works Rev. Series 2015 13, 5% 8/1/24 | | 100,000 | 102,846 |
TOTAL PENNSYLVANIA | | | 5,380,182 |
| Pennsylvania, New Jersey - 0.1% | | | |
| Delaware River Port Auth. Pennsylvania & New Jersey Rev. (Port District Proj.) Series 2012, 5% 1/1/24 | | 225,000 | 225,000 |
| Rhode Island - 0.1% | | | |
| Rhode Island Health and Edl. Bldg. Corp. Higher Ed. Facility Rev. Series 2012, 5% 11/1/24 | | 115,000 | 115,166 |
| South Carolina - 0.9% | | | |
| Patriots Energy Group Fing. Agcy. Bonds Series 2018 A, 4%, tender 2/1/24 (b) | | 545,000 | 544,519 |
| South Carolina Pub. Svc. Auth. Rev.: | | | |
| Series 2013, 5% 12/1/25 | | 350,000 | 367,392 |
| Series 2022 A, 5% 12/1/24 | | 315,000 | 325,782 |
| Spartanburg County Reg'l. Health Series 2022, 5% 4/15/23 | | 100,000 | 100,407 |
TOTAL SOUTH CAROLINA | | | 1,338,100 |
| Tennessee - 0.7% | | | |
| Tennergy Corp. Gas Rev. Bonds Series 2019 A, 5%, tender 10/1/24 (b) | | 715,000 | 725,414 |
| Tennessee Energy Acquisition Corp. Bonds (Gas Rev. Proj.) Series A, 4%, tender 5/1/23 (b) | | 300,000 | 300,485 |
TOTAL TENNESSEE | | | 1,025,899 |
| Texas - 1.9% | | | |
| Austin Arpt. Sys. Rev.: | | | |
| Series 2019, 5% 11/15/24 (c) | | 125,000 | 128,935 |
| Series 2022, 5% 11/15/25 (c) | | 105,000 | 109,604 |
| El Paso Gen. Oblig. Series 2021 C, 5% 8/15/23 | | 75,000 | 75,948 |
| Harris County Cultural Ed. Facilities Fin. Corp. Rev. Bonds Series 2019 B, 5%, tender 12/1/24 (b) | | 205,000 | 211,786 |
| Lower Colorado River Auth. Rev. (LCRA Transmission Svcs. Corp. Proj.) Series 2015, 5% 5/15/23 | | 215,000 | 216,380 |
| Mission Econ. Dev. Corp. Solid Waste Disp. Rev. Bonds: | | | |
| (Republic Svcs., Inc. Proj.) Series 2020 A, 4.1%, tender 2/1/23 (b)(c) | | 500,000 | 500,039 |
| (Waste Mgmt., Inc. Proj.) Series 2020 B, 3.5%, tender 3/1/23 (b)(c) | | 400,000 | 399,522 |
| North Texas Tollway Auth. Rev.: | | | |
| Series 2017 B: | | | |
5% 1/1/23 | | 105,000 | 105,000 |
5% 1/1/24 | | 5,000 | 5,007 |
5% 1/1/24 (Pre-Refunded to 1/1/23 @ 100) | | 145,000 | 145,000 |
| Series 2021 B, 5% 1/1/26 | | 65,000 | 68,788 |
| Port of Houston Auth. Series 2021, 5% 10/1/23 | | 105,000 | 106,613 |
| San Antonio Elec. & Gas Sys. Rev.: | | | |
| Bonds Series 2018, SIFMA Municipal Swap Index + 0.870% 4.53%, tender 12/1/25 (b)(e) | | 455,000 | 455,002 |
| Series 2022, 5% 2/1/26 | | 50,000 | 53,263 |
| Tarrant County Cultural Ed. Facilities Fin. Corp. Hosp. Rev. Bonds (Baylor Scott & White Health Proj.) Series 2022 E, 5%, tender 5/15/26 (b) | | 225,000 | 237,552 |
TOTAL TEXAS | | | 2,818,439 |
| Utah - 0.1% | | | |
| Salt Lake City Arpt. Rev. Series 2018 A, 5% 7/1/24 (c) | | 105,000 | 107,537 |
| Utah County Hosp. Rev. Series 2016 A, 5% 5/15/23 | | 110,000 | 110,746 |
TOTAL UTAH | | | 218,283 |
| Virginia - 1.4% | | | |
| Sussex County Indl. Dev. Auth. Solid Waste Disp. Rev. Bonds Series 2003 A, 3%, tender 5/1/23 (b)(c) | | 2,000,000 | 1,994,600 |
| York County Econ. Dev. Auth. Poll. Cont. Rev. Bonds (Virginia Elec. and Pwr. Co. Proj.) Series 2009 A, 1.9%, tender 6/1/23 (b) | | 100,000 | 98,880 |
TOTAL VIRGINIA | | | 2,093,480 |
| Washington - 0.8% | | | |
| King County Swr. Rev. Bonds Series 2020 B, 0.875%, tender 1/1/26 (b) | | 135,000 | 123,537 |
| Port of Seattle Rev.: | | | |
| Series 2015 B, 5% 3/1/24 | | 100,000 | 102,301 |
| Series 2016, 5% 2/1/25 | | 120,000 | 125,118 |
| Series 2021 C: | | | |
5% 8/1/23 (c) | | 100,000 | 100,781 |
5% 8/1/24 (c) | | 205,000 | 209,850 |
| Series 2022 B: | | | |
5% 8/1/24 (c) | | 160,000 | 163,786 |
5% 8/1/25 (c) | | 150,000 | 156,127 |
5% 8/1/26 (c) | | 95,000 | 100,062 |
| Tobacco Settlement Auth. Rev. Series 2018, 5% 6/1/23 | | 155,000 | 156,266 |
TOTAL WASHINGTON | | | 1,237,828 |
| Wisconsin - 0.4% | | | |
| Wisconsin Health & Edl. Facilities: | | | |
| (Agnesian Healthcare Proj.) Series 2017, 5% 7/1/23 | | 100,000 | 100,859 |
| Bonds Series 2018 B, 5%, tender 1/25/23 (b) | | 110,000 | 110,109 |
| Wisconsin Health & Edl. Facilities Auth. Rev. Series 2022, 5% 10/1/25 | | 360,000 | 379,691 |
| Wisconsin Hsg. & Econ. Dev. Auth. Hsg. Rev. Bonds Series 2021 C, 0.61%, tender 5/1/24 (b) | | 15,000 | 14,279 |
TOTAL WISCONSIN | | | 604,938 |
| TOTAL MUNICIPAL BONDS (Cost $65,986,196) | | | 64,992,650 |
| | | | |
| Municipal Notes - 52.1% |
| | | Principal Amount (a) | Value ($) |
| Alabama - 0.3% | | | |
| Birmingham Indl. Dev. Board Solid Waste Rev. (American Cast Iron Pipe Co. Proj.) Series 2000, 3.85% 1/6/23, LOC Bank of America NA, VRDN (b)(c) | | 180,000 | 180,000 |
| Jefferson County Ala Board Ed. Pubs Participating VRDN Series XM 10 90, 2.26% 1/3/23 (Liquidity Facility JPMorgan Chase Bank) (b)(f)(g) | | 300,000 | 300,000 |
TOTAL ALABAMA | | | 480,000 |
| Arizona - 1.6% | | | |
| Arizona St Indl. Dev. Auth. Multi Participating VRDN Series XF 10 91, 3.21% 1/6/23 (Liquidity Facility Deutsche Bank AG New York Branch) (b)(c)(f)(g) | | 100,000 | 100,000 |
| Glendale Indl. dev auth Sr Living Facilities Rev. Participating VRDN Series BC 22 01, 3.44% 2/10/23 (Liquidity Facility Barclays Bank PLC) (b)(f)(g) | | 300,000 | 300,000 |
| Maricopa County Poll. Cont. Rev.: | | | |
| Series 2009 C, 4% 1/6/23, VRDN (b) | | 1,000,000 | 1,000,000 |
| Series 2009 D, 4% 1/6/23, VRDN (b) | | 830,000 | 830,000 |
| Phoenix Civic Impt. Board Arpt. Rev. Participating VRDN Series 2018 XM 06 15, 3.85% 1/6/23 (Liquidity Facility Royal Bank of Canada) (b)(c)(f)(g) | | 100,000 | 100,000 |
TOTAL ARIZONA | | | 2,330,000 |
| California - 6.8% | | | |
| California Cmnty. Choice Fing. Auth. Clean Energy Proj. Rev. Participating VRDN Series XF 30 07, 3.86% 1/6/23 (Liquidity Facility Morgan Stanley Bank, West Valley City Utah) (b)(f)(g) | | 700,000 | 700,000 |
| California Statewide Cmntys. Dev. Auth. Multi-family Hsg. Rev. Participating VRDN Series Floater MIZ 91 13, 3.91% 2/3/23 (Liquidity Facility Mizuho Cap. Markets LLC) (b)(f)(g) | | 200,000 | 200,000 |
| Los Angeles Cmnty. Redev. Agcy. Multi-family Hsg. Rev. Participating VRDN: | | | |
| Series 2022 MIZ 90 89, 3.91% 1/6/23 (Liquidity Facility Mizuho Cap. Markets LLC) (b)(c)(f)(g) | | 1,700,000 | 1,700,000 |
| Series 2022 MIZ 90 90, 3.91% 1/6/23 (Liquidity Facility Mizuho Cap. Markets LLC) (b)(c)(f)(g) | | 2,600,000 | 2,600,000 |
| Mizuho Floater / Residual Trust V Participating VRDN Series Floater MIZ 90 97, 3.91% 1/6/23, LOC Mizuho Cap. Markets LLC (b)(f)(g) | | 200,000 | 200,000 |
| San Diego County Reg'l. Arpt. Auth. Arpt. Rev. Participating VRDN Series XM 10 54, 3.84% 1/6/23 (Liquidity Facility Morgan Stanley Bank, West Valley City Utah) (b)(c)(f)(g) | | 2,300,000 | 2,300,000 |
| San Francisco City & County Arpts. Commission Int'l. Arpt. Rev. Participating VRDN Series 2022 XF 30 51, 3.86% 1/6/23 (Liquidity Facility Morgan Stanley Bank, West Valley City Utah) (b)(c)(f)(g) | | 300,000 | 300,000 |
| San Francisco City & County Multi-family Hsg. Rev. Participating VRDN Series MIZ 91 15, 3.96% 2/3/23 (Liquidity Facility Mizuho Cap. Markets LLC) (b)(f)(g)(h) | | 2,200,000 | 2,200,000 |
TOTAL CALIFORNIA | | | 10,200,000 |
| Colorado - 1.0% | | | |
| Colorado Health Facilities Auth. Rev. Bonds Participating VRDN Series XM 10 61, 3.91% 1/5/23 (Liquidity Facility JPMorgan Chase Bank) (b)(f)(g) | | 300,000 | 300,000 |
| Denver City & County Arpt. Rev. Participating VRDN: | | | |
| Series Floaters XL 00 90, 3.86% 1/6/23 (Liquidity Facility Morgan Stanley Bank, West Valley City Utah) (b)(c)(f)(g) | | 400,000 | 400,000 |
| Series Floaters XM 07 15, 3.91% 1/6/23 (Liquidity Facility Morgan Stanley Bank, West Valley City Utah) (b)(c)(f)(g) | | 800,000 | 800,000 |
TOTAL COLORADO | | | 1,500,000 |
| Florida - 1.7% | | | |
| Greater Orlando Aviation Auth. Arpt. Facilities Rev. Participating VRDN Series XM 10 93, 2.12% 1/3/23 (Liquidity Facility JPMorgan Chase Bank) (b)(c)(f)(g) | | 400,000 | 400,000 |
| Hillsborough County Aviation Auth. Rev. Participating VRDN Series XL 02 90, 3.96% 1/6/23 (Liquidity Facility Deutsche Bank AG New York Branch) (b)(c)(f)(g) | | 500,000 | 500,000 |
| Lee Memorial Health Sys. Hosp. Rev. Series 2019 B, 4.21% 1/6/23, VRDN (b) | | 1,440,000 | 1,440,000 |
| Miami Dade County Hsg. Multifamily Hsg. Rev. Participating VRDN Series Floater MIZ 90 87, 3.74% 2/3/23 (Liquidity Facility Mizuho Cap. Markets LLC) (b)(f)(g)(h) | | 200,000 | 200,000 |
TOTAL FLORIDA | | | 2,540,000 |
| Georgia - 1.9% | | | |
| Appling County Dev. Auth. Poll. Cont. Rev. (Georgia Pwr. Co. Plant Hatch Proj.) Series 1997, 3.9% 1/3/23, VRDN (b) | | 800,000 | 800,000 |
| Bartow County Dev. Auth. (Georgia Pwr. Co. Plant Bowen Proj.) Series 2022: | | | |
| 3.8% 1/3/23, VRDN (b)(c) | | 750,000 | 750,000 |
| 3.9% 1/3/23, VRDN (b)(c) | | 1,280,000 | 1,280,000 |
TOTAL GEORGIA | | | 2,830,000 |
| Hawaii - 1.6% | | | |
| Hawaii Arpts. Sys. Rev. Participating VRDN: | | | |
| Series XG 03 86, 3.84% 1/6/23 (Liquidity Facility Morgan Stanley Bank, West Valley City Utah) (b)(c)(f)(g) | | 100,000 | 100,000 |
| Series XM 10 55, 3.86% 1/6/23 (Liquidity Facility Morgan Stanley Bank, West Valley City Utah) (b)(c)(f)(g) | | 2,300,000 | 2,300,000 |
TOTAL HAWAII | | | 2,400,000 |
| Illinois - 4.4% | | | |
| Chicago O'Hare Int'l. Arpt. Rev. Participating VRDN: | | | |
| Series 2022 XL 03 14, 3.93% 1/6/23 (Liquidity Facility JPMorgan Chase Bank) (b)(c)(f)(g) | | 1,300,000 | 1,300,000 |
| Series XM 10 38, 3.93% 1/6/23 (Liquidity Facility JPMorgan Chase Bank) (b)(c)(f)(g) | | 800,000 | 800,000 |
| Series XM 10 41, 3.96% 1/6/23 (Liquidity Facility JPMorgan Chase Bank) (b)(c)(f)(g) | | 1,400,000 | 1,400,000 |
| Series XM 10 78, 3.93% 1/6/23 (Liquidity Facility JPMorgan Chase Bank) (b)(c)(f)(g) | | 1,600,000 | 1,600,000 |
| Series XX 12 43, 3.86% 1/6/23 (Liquidity Facility Barclays Bank PLC) (b)(c)(f)(g) | | 400,000 | 400,000 |
| Deutsche Spears/Lifers Trust Participating VRDN Series 2016 XG 00 93, 3.86% 1/6/23 (Liquidity Facility Deutsche Bank AG New York Branch) (b)(c)(f)(g) | | 300,000 | 300,000 |
| Village of Oswego Indl. Dev. (Griffith Laboratories Worldwide, Inc.) Series 1995, 3.85% 1/6/23, LOC Wells Fargo Bank NA, VRDN (b)(c) | | 720,000 | 720,000 |
TOTAL ILLINOIS | | | 6,520,000 |
| Indiana - 0.1% | | | |
| Lucky Heights Tc, Lp Participating VRDN Series XF 11 41, 3.96% 1/6/23 (Liquidity Facility Deutsche Bank AG New York Branch) (b)(f)(g) | | 200,000 | 200,000 |
| Kentucky - 0.9% | | | |
| Kentucky Tpk. Auth. Econ. Dev. Road Rev. Participating VRDN Series XF 24 84, 3.86% 1/6/23 (Liquidity Facility Morgan Stanley Bank, West Valley City Utah) (b)(f)(g) | | 100,000 | 100,000 |
| Meade County Indl. Bldg. Rev. (Nucor Steel Brandenburg Proj.) Series 2020 A1, 4.28% 1/3/23, VRDN (b)(c) | | 1,300,000 | 1,300,000 |
TOTAL KENTUCKY | | | 1,400,000 |
| Louisiana - 5.7% | | | |
| Galilee Sr. Hsg., Lp Participating VRDN Series XF 11 21, 3.91% 1/6/23 (Liquidity Facility Deutsche Bank AG New York Branch) (b)(f)(g) | | 300,000 | 300,000 |
| Saint James Parish Gen. Oblig. (Nucor Steel Louisiana LLC Proj.) Series 2010 A1, 4.12% 1/6/23, VRDN (b) | | 8,195,000 | 8,195,000 |
TOTAL LOUISIANA | | | 8,495,000 |
| Maryland - 0.4% | | | |
| Baltimore County Gen. Oblig. Participating VRDN Series 2022 032, 3.86% 2/10/23 (Liquidity Facility Barclays Bank PLC) (b)(f)(g) | | 200,000 | 200,000 |
| Integrace Obligated Group Participating VRDN Series 2022 024, 3.86% 2/10/23 (Liquidity Facility Barclays Bank PLC) (b)(f)(g) | | 400,000 | 400,000 |
TOTAL MARYLAND | | | 600,000 |
| Massachusetts - 0.1% | | | |
| Massachusetts Edl. Fing. Auth. Rev. Participating VRDN Series Floaters XF 23 06, 3.86% 1/6/23 (Liquidity Facility Morgan Stanley Bank, West Valley City Utah) (b)(c)(f)(g) | | 100,000 | 100,000 |
| Michigan - 0.3% | | | |
| Great Lakes Wtr. Auth. Wtr. Supply Sys. Rev. Participating VRDN Series XM 10 91, 2.01% 1/3/23 (Liquidity Facility JPMorgan Chase Bank) (b)(f)(g) | | 400,000 | 400,000 |
| Minnesota - 0.1% | | | |
| Duluth Minn Hsg. & Redev. Auth. MultiFamily Hsg. Rev. Participating VRDN Series 2021 XF 11 30, 3.69% 1/6/23 (Liquidity Facility Deutsche Bank AG New York Branch) (b)(f)(g) | | 100,000 | 100,000 |
| Missouri - 0.3% | | | |
| Kansas City Indl. Dev. Auth. Participating VRDN Series XL 03 3, 3.96% 1/6/23 (Liquidity Facility JPMorgan Chase Bank) (b)(c)(f)(g) | | 500,000 | 500,000 |
| Montana - 0.8% | | | |
| Montana Board of Hsg. Participating VRDN Series Floater MIZ 90 62, 3.81% 2/3/23 (Liquidity Facility Mizuho Cap. Markets LLC) (b)(f)(g)(h) | | 1,110,000 | 1,110,000 |
| Nevada - 0.3% | | | |
| Nevada Hsg. Division Participating VRDN Series 2022 MIZ 90 91, 3.91% 2/3/23 (Liquidity Facility Mizuho Cap. Markets LLC) (b)(f)(g)(h) | | 500,000 | 500,000 |
| New Jersey - 0.3% | | | |
| New Jersey Trans. Trust Fund Auth. Participating VRDN Series XM 10 47, 3.86% 1/6/23 (Liquidity Facility JPMorgan Chase Bank) (b)(f)(g) | | 500,000 | 500,000 |
| New Mexico - 0.1% | | | |
| New Mexico St Hosp. Equip. Ln. Co. Participating VRDN Series 2022 034, 3.86% 2/10/23 (Liquidity Facility Barclays Bank PLC) (b)(f)(g) | | 205,000 | 205,000 |
| New York - 5.2% | | | |
| New York City Gen. Oblig. Series 2012 2, 3.97% 1/9/23, VRDN (b) | | 3,405,000 | 3,405,000 |
| New York Dorm. Auth. Rev. Participating VRDN Series XF 13 28, 3.83% 1/6/23 (Liquidity Facility JPMorgan Chase Bank) (b)(f)(g) | | 300,000 | 300,000 |
| New York Liberty Dev. Corp. Participating VRDN Series XF 12 42, 3.83% 1/6/23 (Liquidity Facility JPMorgan Chase Bank) (b)(f)(g) | | 265,000 | 265,000 |
| New York Metropolitan Trans. Auth. Rev. Participating VRDN: | | | |
| Series XF 13 21, 3.84% 1/6/23 (Liquidity Facility JPMorgan Chase Bank) (b)(f)(g) | | 400,000 | 400,000 |
| Series XF 13 55, 3.84% 1/6/23 (Liquidity Facility JPMorgan Chase Bank) (b)(f)(g) | | 400,000 | 400,000 |
| Series ZF 02 18, 3.84% 1/6/23 (Liquidity Facility JPMorgan Chase Bank) (b)(f)(g) | | 200,000 | 200,000 |
| RIB Floater Trust Various States Participating VRDN Series Floater 2022 007, 4.06% 2/10/23 (Liquidity Facility Barclays Bank PLC) (b)(c)(f)(g) | | 2,600,000 | 2,600,000 |
| Rockland County Indl. Dev. Agcy. Participating VRDN Series XF 11 32, 3.86% 1/6/23 (Liquidity Facility Deutsche Bank AG New York Branch) (b)(f)(g) | | 200,000 | 200,000 |
TOTAL NEW YORK | | | 7,770,000 |
| Ohio - 1.1% | | | |
| Ohio Hosp. Rev.: | | | |
| Series 2013 B, 4.14% 1/6/23, VRDN (b) | | 400,000 | 400,000 |
| Series 2015 B, 4.14% 1/5/26, VRDN (b) | | 900,000 | 900,000 |
| Ohio Hsg. Fin. Agcy. Multi-family Hsg. Rev. Participating VRDN Series XF 10 92, 3.59% 1/6/23 (Liquidity Facility Deutsche Bank AG New York Branch) (b)(f)(g) | | 300,000 | 300,000 |
TOTAL OHIO | | | 1,600,000 |
| Oklahoma - 0.6% | | | |
| Oklahoma Dev. Fin. Auth. Health Sys. Rev. Series 2020 B, 4.21% 1/5/26, VRDN (b) | | 750,000 | 750,000 |
| Steele Duncan Plaza, LLC Participating VRDN Series MIZ 91 03, 3.91% 2/3/23 (Liquidity Facility Mizuho Cap. Markets LLC) (b)(f)(g)(h) | | 145,000 | 145,000 |
TOTAL OKLAHOMA | | | 895,000 |
| Oregon - 2.1% | | | |
| Oregon St Hsg. & Cmnty. Svcs. Dep Participating VRDN Series 2021 XF 11 23, 3.65% 1/6/23 (Liquidity Facility Deutsche Bank AG New York Branch) (b)(f)(g) | | 3,130,000 | 3,130,000 |
| Pennsylvania - 1.2% | | | |
| Pennsylvania Hsg. Fin. Agcy. Multifamily Hsg. Dev. Rev. Participating VRDN Series XF 10 95, 3.69% 1/6/23 (Liquidity Facility Deutsche Bank AG New York Branch) (b)(f)(g) | | 200,000 | 200,000 |
| Philadelphia Auth. for Indl. Dev.: | | | |
| Participating VRDN Series MIZ 90 51, 3.35% 2/3/23 (Liquidity Facility Mizuho Cap. Markets LLC) (b)(f)(g)(h) | | 100,000 | 100,000 |
| Series 2017 B, 4.17% 1/5/26, VRDN (b) | | 1,450,000 | 1,450,000 |
TOTAL PENNSYLVANIA | | | 1,750,000 |
| South Carolina - 1.1% | | | |
| Greenville Hosp. Sys. Facilities Rev. Participating VRDN Series XF 01 45, 3.86% 1/6/23 (Liquidity Facility Toronto-Dominion Bank) (b)(f)(g) | | 200,000 | 200,000 |
| South Carolina Pub. Svc. Auth. Rev. Participating VRDN Series 2021 XF 12 43, 3.82% 1/6/23 (Liquidity Facility JPMorgan Chase Bank) (b)(f)(g) | | 1,495,000 | 1,495,000 |
TOTAL SOUTH CAROLINA | | | 1,695,000 |
| Tennessee - 0.3% | | | |
| Metropolitan Govt. Nashville & Davidson County Health & Edl. Facilities Board Participating VRDN Series XF 10 97, 3.56% 1/6/23 (Liquidity Facility Deutsche Bank AG New York Branch) (b)(f)(g) | | 500,000 | 500,000 |
| Texas - 9.5% | | | |
| Austin Affordable Pfc, Inc. Multifamily Hsg. Rev. Participating VRDN Series XF 11 19, 3.75% 1/6/23 (Liquidity Facility Deutsche Bank AG New York Branch) (b)(f)(g) | | 200,000 | 200,000 |
| Austin Arpt. Sys. Rev. Participating VRDN Series XG 04 27, 3.91% 1/6/23 (Liquidity Facility Morgan Stanley Bank, West Valley City Utah) (b)(c)(f)(g) | | 400,000 | 400,000 |
| Cap. Area Hsg. Fin. Corp. Multi-family Hsg. Rev. Participating VRDN Series XF 11 31, 3.85% 1/6/23 (Liquidity Facility Deutsche Bank AG New York Branch) (b)(f)(g) | | 1,200,000 | 1,200,000 |
| Ep Machuca Lp Participating VRDN Series MIZ 91 04, 3.91% 2/3/23 (Liquidity Facility Mizuho Cap. Markets LLC) (b)(f)(g)(h) | | 200,000 | 200,000 |
| Hurst Participating VRDN Series XF 10 94, 3.7% 1/6/23 (Liquidity Facility Deutsche Bank AG New York Branch) (b)(f)(g) | | 100,000 | 100,000 |
| North Central Texas Hsg. Fin. Corp. Mu Participating VRDN Series XF 10 99, 3.86% 1/6/23 (Liquidity Facility Deutsche Bank AG New York Branch) (b)(f)(g) | | 1,100,000 | 1,100,000 |
| Port Arthur Navigation District Envir. Facilities Rev. (Motiva Enterprises LLC Proj.): | | | |
| Series 2001 A, 4.2% 1/3/23, VRDN (b) | | 800,000 | 800,000 |
| Series 2004, 4.51% 1/6/23, VRDN (b)(c) | | 5,400,000 | 5,400,000 |
| Series 2010 D: | | | |
4.45% 1/6/23, VRDN (b) | | 800,000 | 800,000 |
4.46% 1/6/23, VRDN (b) | | 100,000 | 100,000 |
| Reg Bridge Propco I Llc Participating VRDN Series DBE 80 90, 4.06% 2/28/23 (Liquidity Facility Deutsche Bank AG New York Branch) (b)(f)(g)(h) | | 1,800,000 | 1,800,000 |
| Texas Dept. of Hsg. & Cmnty. Affairs Multi-family Hsg. Rev. Participating VRDN Series XG 03 89, 3.96% 1/6/23 (Liquidity Facility Deutsche Bank AG) (b)(f)(g) | | 400,000 | 400,000 |
| Texas Dept. of Hsg. & Cmnty. Affairs Residential Mtg. Rev. Participating VRDN Series XF 10 98, 3.36% 1/6/23 (Liquidity Facility Deutsche Bank AG New York Branch) (b)(f)(g) | | 1,400,000 | 1,400,000 |
| Texas St Technical College Sys. Participating VRDN Series 2022 XF 14 11, 3.86% 1/6/23 (Liquidity Facility Bank of America NA) (b)(f)(g) | | 200,000 | 200,000 |
TOTAL TEXAS | | | 14,100,000 |
| Utah - 1.6% | | | |
| Roers Salt Lake City Apt. Participating VRDN Series XF 11 38, 3.96% 1/6/23 (Liquidity Facility Deutsche Bank AG New York Branch) (b)(f)(g) | | 100,000 | 100,000 |
| Salt Lake City Arpt. Rev. Participating VRDN Series 17 XM 0493, 3.86% 1/6/23 (Liquidity Facility Morgan Stanley Bank, West Valley City Utah) (b)(c)(f)(g) | | 2,000,000 | 2,000,000 |
| Utah Hsg. Corp. Multi-family Hsg. Rev. Participating VRDN Series 2021 XF 11 00, 3.78% 1/6/23 (Liquidity Facility Deutsche Bank AG New York Branch) (b)(f)(g) | | 300,000 | 300,000 |
TOTAL UTAH | | | 2,400,000 |
| Virginia - 0.3% | | | |
| Lynchburg Econ. Dev. Participating VRDN Series XL 00 75, 3.91% 1/6/23 (Liquidity Facility JPMorgan Chase Bank) (b)(f)(g) | | 300,000 | 300,000 |
| Waters At James Crossing, LP Participating VRDN Series XG 03 90, 3.96% 1/6/23 (Liquidity Facility Deutsche Bank AG New York Branch) (b)(f)(g) | | 200,000 | 200,000 |
TOTAL VIRGINIA | | | 500,000 |
| Washington - 0.1% | | | |
| Washington Econ. Dev. Fin. Auth. Rev. Participating VRDN Series Floaters 005, 3.91% 2/10/23 (Liquidity Facility Barclays Bank PLC) (b)(c)(f)(g) | | 100,000 | 100,000 |
| West Virginia - 0.3% | | | |
| West Virginia Hosp. Fin. Auth. Hosp. Rev. Series 2018 E, 4.18% 1/5/26, VRDN (b) | | 400,000 | 400,000 |
| TOTAL MUNICIPAL NOTES (Cost $77,750,000) | | | 77,750,000 |
| | | | |
| Money Market Funds - 5.7% |
| | | Shares | Value ($) |
Fidelity Municipal Cash Central Fund 3.72% (i)(j) (Cost $8,525,006) | | 8,523,295 | 8,524,997 |
| | | | |
| TOTAL INVESTMENT IN SECURITIES - 101.4% (Cost $152,261,202) | 151,267,647 |
NET OTHER ASSETS (LIABILITIES) - (1.4)% | (2,142,241) |
| NET ASSETS - 100.0% | 149,125,406 |
| | |
Security Type Abbreviations
| VRDN | - | VARIABLE RATE DEMAND NOTE (A debt instrument that is payable upon demand, either daily, weekly or monthly) |
Legend
| (a) | Amount is stated in United States dollars unless otherwise noted. |
| (b) | Coupon rates for floating and adjustable rate securities reflect the rates in effect at period end. |
| (c) | Private activity obligations whose interest is subject to the federal alternative minimum tax for individuals. |
| (d) | Security exempt from registration under Rule 144A of the Securities Act of 1933. These securities may be resold in transactions exempt from registration, normally to qualified institutional buyers. At the end of the period, the value of these securities amounted to $1,629,496 or 1.1% of net assets. |
| (e) | Coupon is indexed to a floating interest rate which may be multiplied by a specified factor and/or subject to caps or floors. |
| (f) | Provides evidence of ownership in one or more underlying municipal bonds. |
| (g) | Coupon rates are determined by re-marketing agents based on current market conditions. |
| (h) | Restricted securities (including private placements) - Investment in securities not registered under the Securities Act of 1933 (excluding 144A issues). At the end of the period, the value of restricted securities (excluding 144A issues) amounted to $6,255,000 or 4.2% of net assets. |
| (i) | Information in this report regarding holdings by state and security types does not reflect the holdings of the Fidelity Municipal Cash Central Fund. |
| (j) | Affiliated fund that is generally available only to investment companies and other accounts managed by Fidelity Investments. The rate quoted is the annualized seven-day yield of the fund at period end. A complete unaudited listing of the fund's holdings as of its most recent quarter end is available upon request. In addition, each Fidelity Central Fund's financial statements, which are not covered by the Fund's Report of Independent Registered Public Accounting Firm, are available on the SEC's website or upon request. |
| Additional information on each restricted holding is as follows: |
| Security | Acquisition Date | Acquisition Cost ($) |
| Ep Machuca Lp Participating VRDN Series MIZ 91 04, 3.91% 2/3/23 (Liquidity Facility Mizuho Cap. Markets LLC) | 8/05/22 | 200,000 |
| | | |
| Miami Dade County Hsg. Multifamily Hsg. Rev. Participating VRDN Series Floater MIZ 90 87, 3.74% 2/3/23 (Liquidity Facility Mizuho Cap. Markets LLC) | 1/27/22 | 200,000 |
| | | |
| Montana Board of Hsg. Participating VRDN Series Floater MIZ 90 62, 3.81% 2/3/23 (Liquidity Facility Mizuho Cap. Markets LLC) | 8/17/22 | 1,110,000 |
| | | |
| Nevada Hsg. Division Participating VRDN Series 2022 MIZ 90 91, 3.91% 2/3/23 (Liquidity Facility Mizuho Cap. Markets LLC) | 2/10/22 | 500,000 |
| | | |
| Philadelphia Auth. for Indl. Dev. Participating VRDN Series MIZ 90 51, 3.35% 2/3/23 (Liquidity Facility Mizuho Cap. Markets LLC) | 11/12/20 | 100,000 |
| | | |
| Reg Bridge Propco I Llc Participating VRDN Series DBE 80 90, 4.06% 2/28/23 (Liquidity Facility Deutsche Bank AG New York Branch) | 9/27/22 | 1,800,000 |
| | | |
| San Francisco City & County Multi-family Hsg. Rev. Participating VRDN Series MIZ 91 15, 3.96% 2/3/23 (Liquidity Facility Mizuho Cap. Markets LLC) | 12/01/22 - 12/19/22 | 2,200,000 |
| | | |
| Steele Duncan Plaza, LLC Participating VRDN Series MIZ 91 03, 3.91% 2/3/23 (Liquidity Facility Mizuho Cap. Markets LLC) | 8/11/22 | 145,000 |
| | | |
Affiliated Central Funds
Fiscal year to date information regarding the Fund's investments in Fidelity Central Funds, including the ownership percentage, is presented below.
| Affiliate | Value, beginning of period ($) | Purchases ($) | Sales Proceeds ($) | Dividend Income ($) | Realized Gain (loss) ($) | Change in Unrealized appreciation (depreciation) ($) | Value, end of period ($) | % ownership, end of period |
| Fidelity Municipal Cash Central Fund 3.72% | 7,907,002 | 63,577,009 | 62,959,000 | 89,847 | - | (14) | 8,524,997 | 0.3% |
| Total | 7,907,002 | 63,577,009 | 62,959,000 | 89,847 | - | (14) | 8,524,997 | |
| | | | | | | | | |
Amounts in the dividend income column in the above table include any capital gain distributions from underlying funds, which are presented in the corresponding line item in the Statement of Operations, if applicable.
Amounts included in the purchases and sales proceeds columns may include in-kind transactions, if applicable.
Investment Valuation
The following is a summary of the inputs used, as of December 31, 2022, involving the Fund's assets and liabilities carried at fair value. The inputs or methodology used for valuing securities may not be an indication of the risk associated with investing in those securities. For more information on valuation inputs, and their aggregation into the levels used below, please refer to the Investment Valuation section in the accompanying Notes to Financial Statements.
| Valuation Inputs at Reporting Date: |
| Description | Total ($) | Level 1 ($) | Level 2 ($) | Level 3 ($) |
Investments in Securities: | | | | |
|
| Municipal Securities | 142,742,650 | - | 142,742,650 | - |
|
| Money Market Funds | 8,524,997 | 8,524,997 | - | - |
| Total Investments in Securities: | 151,267,647 | 8,524,997 | 142,742,650 | - |
| Statement of Assets and Liabilities |
| | | | December 31, 2022 |
| | | | | |
| Assets | | | | |
| Investment in securities, at value - See accompanying schedule: | $ | | | |
Unaffiliated issuers (cost $143,736,196) | | 142,742,650 | | |
Fidelity Central Funds (cost $8,525,006) | | 8,524,997 | | |
| | | | | |
| | | | | |
| Total Investment in Securities (cost $152,261,202) | | | $ | 151,267,647 |
| Receivable for investments sold | | | | 100,513 |
| Receivable for fund shares sold | | | | 144,646 |
| Interest receivable | | | | 1,010,198 |
| Distributions receivable from Fidelity Central Funds | | | | 23,232 |
| Other receivables | | | | 45 |
Total assets | | | | 152,546,281 |
| Liabilities | | | | |
| Payable to custodian bank | | $58,291 | | |
| Payable for investments purchased | | 2,900,000 | | |
| Payable for fund shares redeemed | | 136,880 | | |
| Distributions payable | | 325,452 | | |
| Other payables and accrued expenses | | 252 | | |
| Total Liabilities | | | | 3,420,875 |
| Net Assets | | | $ | 149,125,406 |
| Net Assets consist of: | | | | |
| Paid in capital | | | $ | 150,116,152 |
| Total accumulated earnings (loss) | | | | (990,746) |
| Net Assets | | | $ | 149,125,406 |
Net Asset Value , offering price and redemption price per share ($149,125,406 ÷ 14,971,879 shares) | | | $ | 9.96 |
| | | | | |
| Statement of Operations |
| | | | Year ended December 31, 2022 |
| Investment Income | | | | |
| Interest | | | $ | 1,654,697 |
| Income from Fidelity Central Funds | | | | 89,760 |
| Total Income | | | | 1,744,457 |
| Expenses | | | | |
| Independent trustees' fees and expenses | | 469 | | |
| Tax expense | | 252 | | |
| Total Expenses | | | | 721 |
| Net Investment income (loss) | | | | 1,743,736 |
| Realized and Unrealized Gain (Loss) | | | | |
| Net realized gain (loss) on: | | | | |
| Investment Securities: | | | | |
| Unaffiliated issuers | | 2,844 | | |
| Capital gain distributions from Fidelity Central Funds | | 87 | | |
| Total net realized gain (loss) | | | | 2,931 |
| Change in net unrealized appreciation (depreciation) on: | | | | |
| Investment Securities: | | | | |
| Unaffiliated issuers | | (1,094,823) | | |
| Fidelity Central Funds | | (14) | | |
| Total change in net unrealized appreciation (depreciation) | | | | (1,094,837) |
| Net gain (loss) | | | | (1,091,906) |
| Net increase (decrease) in net assets resulting from operations | | | $ | 651,830 |
| Statement of Changes in Net Assets |
| |
| | Year ended December 31, 2022 | | Year ended December 31, 2021 |
| Increase (Decrease) in Net Assets | | | | |
| Operations | | | | |
| Net investment income (loss) | $ | 1,743,736 | $ | 589,617 |
| Net realized gain (loss) | | 2,931 | | 5,696 |
| Change in net unrealized appreciation (depreciation) | | (1,094,837) | | (178,118) |
| Net increase (decrease) in net assets resulting from operations | | 651,830 | | 417,195 |
| Distributions to shareholders | | (1,742,874) | | (603,242) |
| Share transactions | | | | |
| Proceeds from sales of shares | | 96,062,017 | | 130,607,143 |
| Reinvestment of distributions | | - | | 16,296 |
| Cost of shares redeemed | | (91,447,126) | | (64,903,201) |
Net increase (decrease) in net assets resulting from share transactions | | 4,614,891 | | 65,720,238 |
| Total increase (decrease) in net assets | | 3,523,847 | | 65,534,191 |
| | | | | |
| Net Assets | | | | |
| Beginning of period | | 145,601,559 | | 80,067,368 |
| End of period | $ | 149,125,406 | $ | 145,601,559 |
| | | | | |
| Other Information | | | | |
| Shares | | | | |
| Sold | | 9,635,807 | | 13,003,310 |
| Issued in reinvestment of distributions | | - | | 1,622 |
| Redeemed | | (9,179,850) | | (6,462,435) |
| Net increase (decrease) | | 455,957 | | 6,542,497 |
| | | | | |
Financial Highlights
| Fidelity Flex® Conservative Income Municipal Bond Fund |
| |
| Years ended December 31, | | 2022 | | 2021 | | 2020 | | 2019 | | 2018 |
Selected Per-Share Data | | | | | | | | | | |
| Net asset value, beginning of period | $ | 10.03 | $ | 10.04 | $ | 10.02 | $ | 9.98 | $ | 9.98 |
| Income from Investment Operations | | | | | | | | | | |
Net investment income (loss) A,B | | .118 | | .052 | | .121 | | .192 | | .179 |
| Net realized and unrealized gain (loss) | | (.069) | | (.007) | | .026 | | .044 | | (.004) |
| Total from investment operations | | .049 | | .045 | | .147 | | .236 | | .175 |
| Distributions from net investment income | | (.119) | | (.054) | | (.125) | | (.193) | | (.174) |
| Distributions from net realized gain | | - | | (.001) | | (.002) | | (.003) | | (.001) |
| Total distributions | | (.119) | | (.055) | | (.127) | | (.196) | | (.175) |
| Net asset value, end of period | $ | 9.96 | $ | 10.03 | $ | 10.04 | $ | 10.02 | $ | 9.98 |
Total Return C | | .49% | | .45% | | 1.48% | | 2.39% | | 1.77% |
Ratios to Average Net Assets B,D,E | | | | | | | | | | |
Expenses before reductions F | | -% | | -% | | -% | | -% | | -% |
Expenses net of fee waivers, if any F | | -% | | -% | | -% | | -% | | -% |
Expenses net of all reductions F | | -% | | -% | | -% | | -% | | -% |
| Net investment income (loss) | | 1.19% | | .52% | | 1.21% | | 1.92% | | 1.81% |
| Supplemental Data | | | | | | | | | | |
| Net assets, end of period (000 omitted) | $ | 149,125 | $ | 145,602 | $ | 80,067 | $ | 54,558 | $ | 36,787 |
Portfolio turnover rate G | | 58% | | 44% | | 36% | | 52% | | 11% |
A Calculated based on average shares outstanding during the period.
B Net investment income (loss) is affected by the timing of the declaration of dividends by any underlying mutual funds or exchange-traded funds (ETFs). Net investment income (loss) of any mutual funds or ETFs is not included in the Fund's net investment income (loss) ratio.
C Total returns would have been lower if certain expenses had not been reduced during the applicable periods shown.
D Fees and expenses of any underlying mutual funds or exchange-traded funds (ETFs) are not included in the Fund's expense ratio. The Fund indirectly bears its proportionate share of these expenses. For additional expense information related to investments in Fidelity Central Funds, please refer to the "Investments in Fidelity Central Funds" note found in the Notes to Financial Statements section of the most recent Annual or Semi-Annual report.
E Expense ratios reflect operating expenses of the class. Expenses before reductions do not reflect amounts reimbursed, waived, or reduced through arrangements with the investment adviser, brokerage services, or other offset arrangements, if applicable, and do not represent the amount paid by the class during periods when reimbursements, waivers or reductions occur.
F Amount represents less than .005%.
G Amount does not include the portfolio activity of any underlying mutual funds or exchange-traded funds (ETFs).
For the period ended December 31, 2022
1. Organization.
Fidelity Flex Conservative Income Municipal Bond Fund (the Fund) is a fund of Fidelity Municipal Trust (the Trust) and is authorized to issue an unlimited number of shares. Share transactions on the Statement of Changes in Net Assets may contain exchanges between affiliated funds. The Trust is registered under the Investment Company Act of 1940, as amended (the 1940 Act), as an open-end management investment company organized as a Massachusetts business trust. The Fund is available only to certain fee-based accounts and advisory programs offered by Fidelity.
2. Investments in Fidelity Central Funds.
Funds may invest in Fidelity Central Funds, which are open-end investment companies generally available only to other investment companies and accounts managed by the investment adviser and its affiliates. The Schedule of Investments lists any Fidelity Central Funds held as an investment as of period end, but does not include the underlying holdings of each Fidelity Central Fund. An investing fund indirectly bears its proportionate share of the expenses of the underlying Fidelity Central Funds.
Based on its investment objective, each Fidelity Central Fund may invest or participate in various investment vehicles or strategies that are similar to those of the investing fund. These strategies are consistent with the investment objectives of the investing fund and may involve certain economic risks which may cause a decline in value of each of the Fidelity Central Funds and thus a decline in the value of the investing fund.
| Fidelity Central Fund | Investment Manager | Investment Objective | Investment Practices | Expense Ratio A |
| Fidelity Money Market Central Funds | Fidelity Management & Research Company LLC (FMR) | Each fund seeks to obtain a high level of current income consistent with the preservation of capital and liquidity. | Short-term Investments | Less than .005% |
A Expenses expressed as a percentage of average net assets and are as of each underlying Central Fund's most recent annual or semi-annual shareholder report.
A complete unaudited list of holdings for each Fidelity Central Fund is available upon request or at the Securities and Exchange Commission website at www.sec.gov. In addition, the financial statements of the Fidelity Central Funds which contain the significant accounting policies (including investment valuation policies) of those funds, and are not covered by the Report of Independent Registered Public Accounting Firm, are available on the Securities and Exchange Commission website or upon request.
3. Significant Accounting Policies.
The Fund is an investment company and applies the accounting and reporting guidance of the Financial Accounting Standards Board (FASB) Accounting Standards Codification Topic 946 Financial Services - Investment Companies . The financial statements have been prepared in conformity with accounting principles generally accepted in the United States of America (GAAP), which require management to make certain estimates and assumptions at the date of the financial statements. Actual results could differ from those estimates. Subsequent events, if any, through the date that the financial statements were issued have been evaluated in the preparation of the financial statements. The Fund's Schedule of Investments lists any underlying mutual funds or exchange-traded funds (ETFs) but does not include the underlying holdings of these funds. The following summarizes the significant accounting policies of the Fund:
Investment Valuation. Investments are valued as of 4:00 p.m. Eastern time on the last calendar day of the period. The Board of Trustees (the Board) has designated the Fund's investment adviser as the valuation designee responsible for the fair valuation function and performing fair value determinations as needed. The investment adviser has established a Fair Value Committee (the Committee) to carry out the day-to-day fair valuation responsibilities and has adopted policies and procedures to govern the fair valuation process and the activities of the Committee. In accordance with these fair valuation policies and procedures, which have been approved by the Board, the Fund attempts to obtain prices from one or more third party pricing services or brokers to value its investments. When current market prices, quotations or currency exchange rates are not readily available or reliable, investments will be fair valued in good faith by the Committee, in accordance with the policies and procedures. Factors used in determining fair value vary by investment type and may include market or investment specific events, transaction data, estimated cash flows, and market observations of comparable investments. The frequency that the fair valuation procedures are used cannot be predicted and they may be utilized to a significant extent. The Committee manages the Fund's fair valuation practices and maintains the fair valuation policies and procedures. The Fund's investment adviser reports to the Board information regarding the fair valuation process and related material matters.
The Fund categorizes the inputs to valuation techniques used to value its investments into a disclosure hierarchy consisting of three levels as shown below:
Level 1 - unadjusted quoted prices in active markets for identical investments
Level 2 - other significant observable inputs (including quoted prices for similar investments, interest rates, prepayment speeds, etc.)
Level 3 - unobservable inputs (including the Fund's own assumptions based on the best information available)
Valuation techniques used to value the Fund's investments by major category are as follows:
Debt securities, including restricted securities, are valued based on evaluated prices received from third party pricing services or from brokers who make markets in such securities. Municipal securities are valued by pricing services who utilize matrix pricing which considers yield or price of bonds of comparable quality, coupon, maturity and type or by broker-supplied prices. When independent prices are unavailable or unreliable, debt securities may be valued utilizing pricing methodologies which consider similar factors that would be used by third party pricing services. Debt securities are generally categorized as Level 2 in the hierarchy but may be Level 3 depending on the circumstances.
Investments in open-end mutual funds, including the Fidelity Central Funds, are valued at their closing net asset value (NAV) each business day and are categorized as Level 1 in the hierarchy.
Changes in valuation techniques may result in transfers in or out of an assigned level within the disclosure hierarchy. The aggregate value of investments by input level as of December 31, 2022 is included at the end of the Fund's Schedule of Investments.
Investment Transactions and Income. For financial reporting purposes, the Fund's investment holdings and NAV include trades executed through the end of the last business day of the period. The NAV per share for processing shareholder transactions is calculated as of the close of business of the New York Stock Exchange (NYSE), normally 4:00 p.m. Eastern time and includes trades executed through the end of the prior business day. Gains and losses on securities sold are determined on the basis of identified cost. Income and capital gain distributions from Fidelity Central Funds, if any, are recorded on the ex-dividend date. Interest income is accrued as earned and includes coupon interest and amortization of premium and accretion of discount on debt securities as applicable.
Expenses. Expenses directly attributable to a fund are charged to that fund. Expenses attributable to more than one fund are allocated among the respective funds on the basis of relative net assets or other appropriate methods. Expenses included in the accompanying financial statements reflect the expenses of that fund and do not include any expenses associated with any underlying mutual funds or exchange-traded funds. Although not included in a fund's expenses, a fund indirectly bears its proportionate share of these expenses through the net asset value of each underlying mutual fund or exchange-traded fund. Expense estimates are accrued in the period to which they relate and adjustments are made when actual amounts are known.
Income Tax Information and Distributions to Shareholders. Each year, the Fund intends to qualify as a regulated investment company under Subchapter M of the Internal Revenue Code, including distributing substantially all of its taxable income and realized gains. As a result, no provision for U.S. Federal income taxes is required. During the period, the Fund incurred a corporate tax liability on undistributed short-term capital gain which is included in Tax expense on the Statement of Operations. As of December 31, 2022, the Fund did not have any unrecognized tax benefits in the financial statements; nor is the Fund aware of any tax positions for which it is reasonably possible that the total amounts of unrecognized tax benefits will significantly change in the next twelve months. The Fund files a U.S. federal tax return, in addition to state and local tax returns as required. The Fund's federal income tax returns are subject to examination by the Internal Revenue Service (IRS) for a period of three fiscal years after they are filed. State and local tax returns may be subject to examination for an additional fiscal year depending on the jurisdiction.
Distributions are declared and recorded daily and paid monthly from net investment income. Distributions from realized gains, if any, are declared and recorded on the ex-dividend date. Income and capital gain distributions are determined in accordance with income tax regulations, which may differ from GAAP. In addition, the Fund claimed a portion of the payment made to redeeming shareholders as a distribution for income tax purposes.
Capital accounts within the financial statements are adjusted for permanent book-tax differences. These adjustments have no impact on net assets or the results of operations. Capital accounts are not adjusted for temporary book-tax differences which will reverse in a subsequent period.
Book-tax differences are primarily due to market discount.
The Fund purchases municipal securities whose interest, in the opinion of the issuer, is free from federal income tax. There is no assurance that the IRS will agree with this opinion. In the event the IRS determines that the issuer does not comply with relevant tax requirements, interest payments from a security could become federally taxable, possibly retroactively to the date the security was issued.
As of period end, the cost and unrealized appreciation (depreciation) in securities, and derivatives if applicable, for federal income tax purposes were as follows:
| Gross unrealized appreciation | $7,731 |
| Gross unrealized depreciation | (1,001,104) |
| Net unrealized appreciation (depreciation) | $(993,373) |
| Tax Cost | $152,261,020 |
The tax-based components of distributable earnings as of period end were as follows:
| Undistributed tax-exempt income | $1,239 |
| Undistributed ordinary income | $1,388 |
| Net unrealized appreciation (depreciation) on securities and other investments | $(993,373) |
The tax character of distributions paid was as follows:
| | December 31, 2022 | December 31, 2021 |
| Tax-exempt Income | $1,742,874 | $589,242 |
| Ordinary Income | - | 14,000 |
| Total | $1,742,874 | $603,242 |
Restricted Securities (including Private Placements). Funds may invest in securities that are subject to legal or contractual restrictions on resale. These securities generally may be resold in transactions exempt from registration or to the public if the securities are registered. Disposal of these securities may involve time-consuming negotiations and expense, and prompt sale at an acceptable price may be difficult. Information regarding restricted securities held at period end is included at the end of the Schedule of Investments, if applicable.
4. Purchases and Sales of Investments.
Purchases and sales of securities, other than short-term securities and in-kind transactions, as applicable, are noted in the table below.
| | Purchases ($) | Sales ($) |
| Fidelity Flex Conservative Income Municipal Bond Fund | 40,066,519 | 43,037,596 |
5. Fees and Other Transactions with Affiliates.
Management Fee. Fidelity Management & Research Company LLC (the investment adviser) and its affiliates provide the Fund with investment management related services and the Fund does not pay any fees for these services. Under the management contract, the investment adviser or an affiliate pays all other expenses of the Fund, excluding fees and expenses of the independent Trustees, and certain miscellaneous expenses such as proxy and shareholder meeting expenses.
Interfund Trades. Funds may purchase from or sell securities to other Fidelity Funds under procedures adopted by the Board. The procedures have been designed to ensure these interfund trades are executed in accordance with Rule 17a-7 of the 1940 Act. Any interfund trades are included within the respective purchases and sales amounts shown in the Purchases and Sales of Investments note. Interfund trades during the period are noted in the table below.
| | Purchases ($) | Sales ($) | Realized Gain (Loss) ($) |
| Fidelity Flex Conservative Income Municipal Bond Fund | 5,685,000 | 8,500,000 | - |
6. Committed Line of Credit.
Certain Funds participate with other funds managed by the investment adviser or an affiliate in a $4.25 billion credit facility (the "line of credit") to be utilized for temporary or emergency purposes to fund shareholder redemptions or for other short-term liquidity purposes. The commitment fees on the pro-rata portion of the line of credit are borne by the investment adviser. During the period, there were no borrowings on this line of credit.
7. Other.
A fund's organizational documents provide former and current trustees and officers with a limited indemnification against liabilities arising in connection with the performance of their duties to the fund. In the normal course of business, a fund may also enter into contracts that provide general indemnifications. A fund's maximum exposure under these arrangements is unknown as this would be dependent on future claims that may be made against a fund. The risk of material loss from such claims is considered remote.
8. Risk and Uncertainties.
Many factors affect a fund's performance. Developments that disrupt global economies and financial markets, such as pandemics, epidemics, outbreaks of infectious diseases, war, terrorism, and environmental disasters, may significantly affect a fund's investment performance. The effects of these developments to a fund will be impacted by the types of securities in which a fund invests, the financial condition, industry, economic sector, and geographic location of an issuer, and a fund's level of investment in the securities of that issuer.
To the Board of Trustees of Fidelity Municipal Trust and Shareholders of Fidelity Flex Conservative Income Municipal Bond Fund
Opinion on the Financial Statements
We have audited the accompanying statement of assets and liabilities, including the schedule of investments, of Fidelity Flex Conservative Income Municipal Bond Fund (one of the funds constituting Fidelity Municipal Trust, referred to hereafter as the "Fund") as of December 31, 2022, the related statement of operations for the year ended December 31, 2022, the statement of changes in net assets for each of the two years in the period ended December 31, 2022, including the related notes, and the financial highlights for each of the five years in the period ended December 31, 2022 (collectively referred to as the "financial statements"). In our opinion, the financial statements present fairly, in all material respects, the financial position of the Fund as of December 31, 2022, the results of its operations for the year then ended, the changes in its net assets for each of the two years in the period ended December 31, 2022 and the financial highlights for each of the five years in the period ended December 31, 2022 in conformity with accounting principles generally accepted in the United States of America.
Basis for Opinion
These financial statements are the responsibility of the Fund's management. Our responsibility is to express an opinion on the Fund's financial statements based on our audits. We are a public accounting firm registered with the Public Company Accounting Oversight Board (United States) (PCAOB) and are required to be independent with respect to the Fund in accordance with the U.S. federal securities laws and the applicable rules and regulations of the Securities and Exchange Commission and the PCAOB.
We conducted our audits of these financial statements in accordance with the standards of the PCAOB. Those standards require that we plan and perform the audit to obtain reasonable assurance about whether the financial statements are free of material misstatement, whether due to error or fraud.
Our audits included performing procedures to assess the risks of material misstatement of the financial statements, whether due to error or fraud, and performing procedures that respond to those risks. Such procedures included examining, on a test basis, evidence regarding the amounts and disclosures in the financial statements. Our audits also included evaluating the accounting principles used and significant estimates made by management, as well as evaluating the overall presentation of the financial statements. Our procedures included confirmation of securities owned as of December 31, 2022 by correspondence with the custodian and brokers; when replies were not received from brokers, we performed other auditing procedures. We believe that our audits provide a reasonable basis for our opinion.
/s/ PricewaterhouseCoopers LLP
Boston, Massachusetts
February 14, 2023
We have served as the auditor of one or more investment companies in the Fidelity group of funds since 1932.
The Trustees, Members of the Advisory Board (if any), and officers of the trust and fund, as applicable, are listed below. The Board of Trustees governs the fund and is responsible for protecting the interests of shareholders. The Trustees are experienced executives who meet periodically throughout the year to oversee the fund's activities, review contractual arrangements with companies that provide services to the fund, oversee management of the risks associated with such activities and contractual arrangements, and review the fund's performance. Each of the Trustees oversees 295 funds.
The Trustees hold office without limit in time except that (a) any Trustee may resign; (b) any Trustee may be removed by written instrument, signed by at least two-thirds of the number of Trustees prior to such removal; (c) any Trustee who requests to be retired or who has become incapacitated by illness or injury may be retired by written instrument signed by a majority of the other Trustees; and (d) any Trustee may be removed at any special meeting of shareholders by a two-thirds vote of the outstanding voting securities of the trust. Each Trustee who is not an interested person (as defined in the 1940 Act) of the trust and the fund is referred to herein as an Independent Trustee. Each Independent Trustee shall retire not later than the last day of the calendar year in which his or her 75th birthday occurs. The Independent Trustees may waive this mandatory retirement age policy with respect to individual Trustees. Officers and Advisory Board Members hold office without limit in time, except that any officer or Advisory Board Member may resign or may be removed by a vote of a majority of the Trustees at any regular meeting or any special meeting of the Trustees. Except as indicated, each individual has held the office shown or other offices in the same company for the past five years.
The fund's Statement of Additional Information (SAI) includes more information about the Trustees. To request a free copy, call Fidelity at 1-800-544-3455 (for managed account clients) or 1-800-835-5092 (for retirement plan participants).
Experience, Skills, Attributes, and Qualifications of the Trustees. The Governance and Nominating Committee has adopted a statement of policy that describes the experience, qualifications, attributes, and skills that are necessary and desirable for potential Independent Trustee candidates (Statement of Policy). The Board believes that each Trustee satisfied at the time he or she was initially elected or appointed a Trustee, and continues to satisfy, the standards contemplated by the Statement of Policy. The Governance and Nominating Committee also engages professional search firms to help identify potential Independent Trustee candidates who have the experience, qualifications, attributes, and skills consistent with the Statement of Policy. From time to time, additional criteria based on the composition and skills of the current Independent Trustees, as well as experience or skills that may be appropriate in light of future changes to board composition, business conditions, and regulatory or other developments, have also been considered by the professional search firms and the Governance and Nominating Committee. In addition, the Board takes into account the Trustees' commitment and participation in Board and committee meetings, as well as their leadership of standing and ad hoc committees throughout their tenure.
In determining that a particular Trustee was and continues to be qualified to serve as a Trustee, the Board has considered a variety of criteria, none of which, in isolation, was controlling. The Board believes that, collectively, the Trustees have balanced and diverse experience, qualifications, attributes, and skills, which allow the Board to operate effectively in governing the fund and protecting the interests of shareholders. Information about the specific experience, skills, attributes, and qualifications of each Trustee, which in each case led to the Board's conclusion that the Trustee should serve (or continue to serve) as a trustee of the fund, is provided below.
Board Structure and Oversight Function. Abigail P. Johnson is an interested person and currently serves as Chairman. The Trustees have determined that an interested Chairman is appropriate and benefits shareholders because an interested Chairman has a personal and professional stake in the quality and continuity of services provided to the fund. Independent Trustees exercise their informed business judgment to appoint an individual of their choosing to serve as Chairman, regardless of whether the Trustee happens to be independent or a member of management. The Independent Trustees have determined that they can act independently and effectively without having an Independent Trustee serve as Chairman and that a key structural component for assuring that they are in a position to do so is for the Independent Trustees to constitute a substantial majority for the Board. The Independent Trustees also regularly meet in executive session. Michael E. Kenneally serves as Chairman of the Independent Trustees and as such (i) acts as a liaison between the Independent Trustees and management with respect to matters important to the Independent Trustees and (ii) with management prepares agendas for Board meetings.
Fidelity ® funds are overseen by different Boards of Trustees. The fund's Board oversees Fidelity's investment-grade bond, money market, asset allocation and certain equity funds, and other Boards oversee Fidelity's high income and other equity funds. The asset allocation funds may invest in Fidelity ® funds that are overseen by such other Boards. The use of separate Boards, each with its own committee structure, allows the Trustees of each group of Fidelity ® funds to focus on the unique issues of the funds they oversee, including common research, investment, and operational issues. On occasion, the separate Boards establish joint committees to address issues of overlapping consequences for the Fidelity ® funds overseen by each Board.
The Trustees operate using a system of committees to facilitate the timely and efficient consideration of all matters of importance to the Trustees, the fund, and fund shareholders and to facilitate compliance with legal and regulatory requirements and oversight of the fund's activities and associated risks. The Board, acting through its committees, has charged FMR and its affiliates with (i) identifying events or circumstances the occurrence of which could have demonstrably adverse effects on the fund's business and/or reputation; (ii) implementing processes and controls to lessen the possibility that such events or circumstances occur or to mitigate the effects of such events or circumstances if they do occur; and (iii) creating and maintaining a system designed to evaluate continuously business and market conditions in order to facilitate the identification and implementation processes described in (i) and (ii) above. Because the day-to-day operations and activities of the fund are carried out by or through FMR, its affiliates, and other service providers, the fund's exposure to risks is mitigated but not eliminated by the processes overseen by the Trustees. While each of the Board's committees has responsibility for overseeing different aspects of the fund's activities, oversight is exercised primarily through the Operations and Audit Committees. In addition, an ad hoc Board committee of Independent Trustees has worked with FMR to enhance the Board's oversight of investment and financial risks, legal and regulatory risks, technology risks, and operational risks, including the development of additional risk reporting to the Board. Appropriate personnel, including but not limited to the fund's Chief Compliance Officer (CCO), FMR's internal auditor, the independent accountants, the fund's Treasurer and portfolio management personnel, make periodic reports to the Board's committees, as appropriate, including an annual review of Fidelity's risk management program for the Fidelity ® funds. The responsibilities of each standing committee, including their oversight responsibilities, are described further under "Standing Committees of the Trustees."
Interested Trustees*:
Correspondence intended for a Trustee who is an interested person may be sent to Fidelity Investments, 245 Summer Street, Boston, Massachusetts 02210.
Name, Year of Birth; Principal Occupations and Other Relevant Experience+
Abigail P. Johnson (1961)
Year of Election or Appointment: 2009
Trustee
Chairman of the Board of Trustees
Ms. Johnson also serves as Trustee of other Fidelity ® funds. Ms. Johnson serves as Chairman (2016-present), Chief Executive Officer (2014-present), and Director (2007-present) of FMR LLC (diversified financial services company), President of Fidelity Financial Services (2012-present) and President of Personal, Workplace and Institutional Services (2005-present). Ms. Johnson is Chairman and Director of Fidelity Management & Research Company LLC (investment adviser firm, 2011-present). Previously, Ms. Johnson served as Chairman and Director of FMR Co., Inc. (investment adviser firm, 2011-2019), Vice Chairman (2007-2016) and President (2013-2016) of FMR LLC, President and a Director of Fidelity Management & Research Company (2001-2005), a Trustee of other investment companies advised by Fidelity Management & Research Company, Fidelity Investments Money Management, Inc. (investment adviser firm), and FMR Co., Inc. (2001-2005), Senior Vice President of the Fidelity ® funds (2001-2005), and managed a number of Fidelity ® funds. Ms. Abigail P. Johnson and Mr. Arthur E. Johnson are not related.
Jennifer Toolin McAuliffe (1959)
Year of Election or Appointment: 2016
Trustee
Ms. McAuliffe also serves as Trustee of other Fidelity ® funds and as Trustee of Fidelity Charitable (2020-present). Previously, Ms. McAuliffe served as Co-Head of Fixed Income of Fidelity Investments Limited (now known as FIL Limited (FIL)) (diversified financial services company), Director of Research for FIL's credit and quantitative teams in London, Hong Kong and Tokyo and Director of Research for taxable and municipal bonds at Fidelity Investments Money Management, Inc. Ms. McAuliffe previously served as a member of the Advisory Board of certain Fidelity ® funds (2016). Ms. McAuliffe was previously a lawyer at Ropes & Gray LLP and currently serves as director or trustee of several not-for-profit entities.
* Determined to be an "Interested Trustee" by virtue of, among other things, his or her affiliation with the trust or various entities under common control with FMR.
+ The information includes the Trustee's principal occupation during the last five years and other information relating to the experience, attributes, and skills relevant to the Trustee's qualifications to serve as a Trustee, which led to the conclusion that the Trustee should serve as a Trustee for the fund.
Independent Trustees:
Correspondence intended for an Independent Trustee may be sent to Fidelity Investments, P.O. Box 55235, Boston, Massachusetts 02205-5235.
Name, Year of Birth; Principal Occupations and Other Relevant Experience+
Elizabeth S. Acton (1951)
Year of Election or Appointment: 2013
Trustee
Ms. Acton also serves as Trustee of other Fidelity ® funds. Prior to her retirement, Ms. Acton served as Executive Vice President, Finance (2011-2012), Executive Vice President, Chief Financial Officer (2002-2011) and Treasurer (2004-2005) of Comerica Incorporated (financial services). Prior to joining Comerica, Ms. Acton held a variety of positions at Ford Motor Company (1983-2002), including Vice President and Treasurer (2000-2002) and Executive Vice President and Chief Financial Officer of Ford Motor Credit Company (1998-2000). Ms. Acton currently serves as a member of the Board and Audit and Finance Committees of Beazer Homes USA, Inc. (homebuilding, 2012-present). Ms. Acton previously served as a member of the Advisory Board of certain Fidelity ® funds (2013-2016).
Ann E. Dunwoody (1953)
Year of Election or Appointment: 2018
Trustee
General Dunwoody also serves as Trustee of other Fidelity ® funds. General Dunwoody (United States Army, Retired) was the first woman in U.S. military history to achieve the rank of four-star general and prior to her retirement in 2012 held a variety of positions within the U.S. Army, including Commanding General, U.S. Army Material Command (2008-2012). General Dunwoody currently serves as President of First to Four LLC (leadership and mentoring services, 2012-present), a member of the Board and Nomination and Corporate Governance Committees of Kforce Inc. (professional staffing services, 2016-present) and a member of the Board of Automattic Inc. (software engineering, 2018-present). Previously, General Dunwoody served as a member of the Advisory Board and Nominating and Corporate Governance Committee of L3 Technologies, Inc. (communication, electronic, sensor and aerospace systems, 2013-2019) and a member of the Board and Audit and Sustainability and Corporate Responsibility Committees of Republic Services, Inc. (waste collection, disposal and recycling, 2013-2016). Ms. Dunwoody also serves on several boards for non-profit organizations, including as a member of the Board, Chair of the Nomination and Governance Committee and a member of the Audit Committee of Logistics Management Institute (consulting non-profit, 2012-present), a member of the Council of Trustees for the Association of the United States Army (advocacy non-profit, 2013-present), a member of the Board of Florida Institute of Technology (2015-present) and a member of the Board of ThanksUSA (military family education non-profit, 2014-present). General Dunwoody previously served as a member of the Advisory Board of certain Fidelity ® funds (2018).
John Engler (1948)
Year of Election or Appointment: 2014
Trustee
Mr. Engler also serves as Trustee of other Fidelity ® funds. Previously, Mr. Engler served as Governor of Michigan (1991-2003), President of the Business Roundtable (2011-2017) and interim President of Michigan State University (2018-2019). Mr. Engler currently serves as a member of the Board of Stride, Inc. (formerly K12 Inc.) (technology-based education company, 2012-present). Previously, Mr. Engler served as a member of the Board of Universal Forest Products (manufacturer and distributor of wood and wood-alternative products, 2003-2019) and Trustee of The Munder Funds (2003-2014). Mr. Engler previously served as a member of the Advisory Board of certain Fidelity ® funds (2014-2016).
Robert F. Gartland (1951)
Year of Election or Appointment: 2010
Trustee
Mr. Gartland also serves as Trustee of other Fidelity ® funds. Prior to his retirement, Mr. Gartland held a variety of positions at Morgan Stanley (financial services, 1979-2007), including Managing Director (1987-2007) and Chase Manhattan Bank (1975-1978). Mr. Gartland previously served as Chairman and an investor in Gartland & Mellina Group Corp. (consulting, 2009-2019), as a member of the Board of National Securities Clearing Corporation (1993-1996) and as Chairman of TradeWeb (2003-2004).
Arthur E. Johnson (1947)
Year of Election or Appointment: 2008
Trustee
Mr. Johnson also serves as Trustee of other Fidelity ® funds. Prior to his retirement, Mr. Johnson served as Senior Vice President of Corporate Strategic Development of Lockheed Martin Corporation (defense contractor, 1999-2009). Mr. Johnson currently serves as a member of the Board of Booz Allen Hamilton (management consulting, 2011-present). Mr. Johnson previously served as a member of the Board of Eaton Corporation plc (diversified power management, 2009-2019) and a member of the Board of AGL Resources, Inc. (holding company, 2002-2016). Mr. Johnson previously served as Chairman (2018-2021) and Vice Chairman (2015-2018) of the Independent Trustees of certain Fidelity® funds. Mr. Arthur E. Johnson is not related to Ms. Abigail P. Johnson.
Michael E. Kenneally (1954)
Year of Election or Appointment: 2009
Trustee
Chairman of the Independent Trustees
Mr. Kenneally also serves as Trustee of other Fidelity ® funds and was Vice Chairman (2018-2021) of the Independent Trustees of certain Fidelity ® funds. Prior to retirement in 2005, he was Chairman and Global Chief Executive Officer of Credit Suisse Asset Management, the worldwide fund management and institutional investment business of Credit Suisse Group. Previously, Mr. Kenneally was an Executive Vice President and the Chief Investment Officer for Bank of America. In this role, he was responsible for the investment management, strategy and products delivered to the bank's institutional, high-net-worth and retail clients. Earlier, Mr. Kenneally directed the organization's equity and quantitative research groups. He began his career as a research analyst and then spent more than a dozen years as a portfolio manager for endowments, pension plans and mutual funds. He earned the Chartered Financial Analyst (CFA) designation in 1991.
Mark A. Murray (1954)
Year of Election or Appointment: 2016
Trustee
Mr. Murray also serves as Trustee of other Fidelity ® funds. Previously, Mr. Murray served as Co-Chief Executive Officer (2013-2016), President (2006-2013) and Vice Chairman (2013-2020) of Meijer, Inc. Mr. Murray serves as a member of the Board (2009-present) and Public Policy and Responsibility Committee (2009-present) and Chair of the Nuclear Review Committee (2019-present) of DTE Energy Company (diversified energy company). Mr. Murray previously served as a member of the Board of Spectrum Health (not-for-profit health system, 2015-2019) and as a member of the Board and Audit Committee and Chairman of the Nominating and Corporate Governance Committee of Universal Forest Products, Inc. (manufacturer and distributor of wood and wood-alternative products, 2004-2016). Mr. Murray also serves as a member of the Board of many community and professional organizations. Mr. Murray previously served as a member of the Advisory Board of certain Fidelity ® funds (2016).
+ The information includes the Trustee's principal occupation during the last five years and other information relating to the experience, attributes, and skills relevant to the Trustee's qualifications to serve as a Trustee, which led to the conclusion that the Trustee should serve as a Trustee for the fund.
Advisory Board Members and Officers:
Correspondence intended for a Member of the Advisory Board (if any) may be sent to Fidelity Investments, P.O. Box 55235, Boston, Massachusetts 02205-5235. Correspondence intended for an officer may be sent to Fidelity Investments, 245 Summer Street, Boston, Massachusetts 02210. Officers appear below in alphabetical order.
Name, Year of Birth; Principal Occupation
Laura M. Bishop (1961)
Year of Election or Appointment: 2022
Member of the Advisory Board
Ms. Bishop also serves as a Member of the Advisory Board of other funds. Prior to her retirement, Ms. Bishop held a variety of positions at United Services Automobile Association (2001-2020), including Executive Vice President and Chief Financial Officer (2014-2020) and Senior Vice President and Deputy Chief Financial Officer (2012-2014). Ms. Bishop currently serves as a member of the Audit Committee and Compensation and Personnel Committee (2021-present) of the Board of Directors of Korn Ferry (global organizational consulting).
Robert W. Helm (1957)
Year of Election or Appointment: 2021
Member of the Advisory Board
Mr. Helm also serves as a Member of the Advisory Board of other Fidelity® funds. Mr. Helm was formerly Deputy Chairman (2003-2020), partner (1991-2020) and an associate (1984-1991) of Dechert LLP (formerly Dechert Price & Rhoads). Mr. Helm currently serves on boards and committees of several not-for-profit organizations.
Craig S. Brown (1977)
Year of Election or Appointment: 2019
Assistant Treasurer
Mr. Brown also serves as an officer of other funds. Mr. Brown serves as Assistant Treasurer of FIMM, LLC (2021-present) and is an employee of Fidelity Investments (2013-present). Previously, Mr. Brown served as Assistant Treasurer of certain Fidelity ® funds (2019-2022).
John J. Burke III (1964)
Year of Election or Appointment: 2018
Chief Financial Officer
Mr. Burke also serves as Chief Financial Officer of other funds. Mr. Burke serves as Head of Investment Operations for Fidelity Fund and Investment Operations (2018-present) and is an employee of Fidelity Investments (1998-present). Previously Mr. Burke served as head of Asset Management Investment Operations (2012-2018).
David J. Carter (1973)
Year of Election or Appointment: 2020
Assistant Secretary
Mr. Carter also serves as Assistant Secretary of other funds. Mr. Carter serves as Senior Vice President, Deputy General Counsel (2022-present) and is an employee of Fidelity Investments (2005-present).
Jonathan Davis (1968)
Year of Election or Appointment: 2010
Assistant Treasurer
Mr. Davis also serves as an officer of other funds. Mr. Davis serves as Assistant Treasurer of FIMM, LLC (2021-present), FMR Capital, Inc. (2017-present), FD Funds GP LLC (2021-present), FD Funds Holding LLC (2021-present), and FD Funds Management LLC (2021-present); and is an employee of Fidelity Investments. Previously, Mr. Davis served as Vice President and Associate General Counsel of FMR LLC (diversified financial services company, 2003-2010).
Laura M. Del Prato (1964)
Year of Election or Appointment: 2018
President and Treasurer
Ms. Del Prato also serves as an officer of other funds. Ms. Del Prato serves as Assistant Treasurer of FIMM, LLC (2021-present) and is an employee of Fidelity Investments (2017-present). Previously, Ms. Del Prato served as President and Treasurer of The North Carolina Capital Management Trust: Cash Portfolio and Term Portfolio (2018-2020). Prior to joining Fidelity Investments, Ms. Del Prato served as a Managing Director and Treasurer of the JPMorgan Mutual Funds (2014-2017). Prior to JPMorgan, Ms. Del Prato served as a partner at Cohen Fund Audit Services (accounting firm, 2012-2013) and KPMG LLP (accounting firm, 2004-2012).
Christopher M. Gouveia (1973)
Year of Election or Appointment: 2023
Chief Compliance Officer
Mr. Gouveia also serves as Chief Compliance Officer of other funds. Mr. Gouveia serves as Senior Vice President of Asset Management Compliance for Fidelity Investments and is an employee of Fidelity Investments. Previously, Mr. Gouveia served as Chief Compliance Officer of the North Carolina Capital Management Trust (2016-2019).
Colm A. Hogan (1973)
Year of Election or Appointment: 2016
Assistant Treasurer
Mr. Hogan also serves as an officer of other funds. Mr. Hogan serves as Assistant Treasurer of FIMM, LLC (2021-present) and FMR Capital, Inc. (2017-present) and is an employee of Fidelity Investments (2005-present). Previously, Mr. Hogan served as Deputy Treasurer of certain Fidelity ® funds (2016-2020) and Assistant Treasurer of certain Fidelity ® funds (2016-2018).
Cynthia Lo Bessette (1969)
Year of Election or Appointment: 2019
Secretary and Chief Legal Officer (CLO)
Ms. Lo Bessette also serves as an officer of other funds. Ms. Lo Bessette serves as CLO, Secretary, and Senior Vice President of Fidelity Management & Research Company LLC (investment adviser firm, 2019-present); CLO of Fidelity Management & Research (Hong Kong) Limited, FMR Investment Management (UK) Limited, and Fidelity Management & Research (Japan) Limited (investment adviser firms, 2019-present); Secretary of FD Funds GP LLC (2021-present), FD Funds Holding LLC (2021-present), FD Funds Management LLC (2021-present), and Fidelity Diversifying Solutions LLC (investment adviser firm, 2022-present); and Assistant Secretary of FIMM, LLC (2019-present). She is a Senior Vice President and Deputy General Counsel of FMR LLC (diversified financial services company, 2019-present), and is an employee of Fidelity Investments. Previously, Ms. Lo Bessette served as CLO, Secretary, and Senior Vice President of FMR Co., Inc. (investment adviser firm, 2019); Secretary of Fidelity SelectCo, LLC and Fidelity Investments Money Management, Inc. (investment adviser firms, 2019). Prior to joining Fidelity Investments, Ms. Lo Bessette was Executive Vice President, General Counsel (2016-2019) and Senior Vice President, Deputy General Counsel (2015-2016) of OppenheimerFunds (investment management company) and Deputy Chief Legal Officer (2013-2015) of Jennison Associates LLC (investment adviser firm).
Chris Maher (1972)
Year of Election or Appointment: 2013
Assistant Treasurer
Mr. Maher also serves as an officer of other funds. Mr. Maher serves as Assistant Treasurer of FIMM, LLC (2021-present) and FMR Capital, Inc. (2017-present), and is an employee of Fidelity Investments (2008-present). Previously, Mr. Maher served as Assistant Treasurer of certain funds (2013-2020); Vice President of Asset Management Compliance (2013), Vice President of the Program Management Group of FMR (investment adviser firm, 2010-2013), and Vice President of Valuation Oversight (2008-2010).
Jamie Pagliocco (1964)
Year of Election or Appointment: 2020
Vice President
Mr. Pagliocco also serves as Vice President of other funds. Mr. Pagliocco serves as President of Fixed Income (2020-present), and is an employee of Fidelity Investments (2001-present). Previously, Mr. Pagliocco served as Co-Chief Investment Officer - Bond (2017-2020), Global Head of Bond Trading (2016-2019), and as a portfolio manager.
Brett Segaloff (1972)
Year of Election or Appointment: 2021
Anti-Money Laundering (AML) Officer
Mr. Segaloff also serves as an AML Officer of other funds and other related entities. He is Director, Anti-Money Laundering (2007-present) of FMR LLC (diversified financial services company) and is an employee of Fidelity Investments (1996-present).
Stacie M. Smith (1974)
Year of Election or Appointment: 2013
Assistant Treasurer
Ms. Smith also serves as an officer of other funds. Ms. Smith serves as Assistant Treasurer of FIMM, LLC (2021-present) and FMR Capital, Inc. (2017-present), is an employee of Fidelity Investments (2009-present), and has served in other fund officer roles. Prior to joining Fidelity Investments, Ms. Smith served as Senior Audit Manager of Ernst & Young LLP (accounting firm, 1996-2009). Previously, Ms. Smith served as Assistant Treasurer (2013-2019) and Deputy Treasurer (2013-2016) of certain Fidelity ® funds.
Jim Wegmann (1979)
Year of Election or Appointment: 2021
Deputy Treasurer
Mr. Wegmann also serves as an officer of other funds. Mr. Wegmann serves as Assistant Treasurer of FIMM, LLC (2021-present) and is an employee of Fidelity Investments (2011-present). Previously, Mr. Wegmann served as Assistant Treasurer of certain Fidelity ® funds (2019-2021).
As a shareholder, you incur two types of costs: (1) transaction costs, which may include sales charges (loads) on purchase payments or redemption proceeds, as applicable and (2) ongoing costs, which generally include management fees, distribution and/or service (12b-1) fees and other Fund expenses. This Example is intended to help you understand your ongoing costs (in dollars) of investing in a fund and to compare these costs with the ongoing costs of investing in other mutual funds.
| The Example is based on an investment of $1,000 invested at the beginning of the period and held for the entire period (July 1, 2022 to December 31, 2022). |
Actual Expenses
The first line of the accompanying table provides information about actual account values and actual expenses. You may use the information in this line, together with the amount you invested, to estimate the expenses that you paid over the period. Simply divide your account value by $1,000.00 (for example, an $8,600 account value divided by $1,000.00 = 8.6), then multiply the result by the number in the first line for a class/Fund under the heading entitled "Expenses Paid During Period" to estimate the expenses you paid on your account during this period. If any fund is a shareholder of any underlying mutual funds or exchange-traded funds (ETFs) (the Underlying Funds), such fund indirectly bears its proportional share of the expenses of the Underlying Funds in addition to the direct expenses incurred presented in the table. These fees and expenses are not included in the annualized expense ratio used to calculate the expense estimate in the table below.
Hypothetical Example for Comparison Purposes
The second line of the accompanying table provides information about hypothetical account values and hypothetical expenses based on the actual expense ratio and an assumed rate of return of 5% per year before expenses, which is not the actual return. The hypothetical account values and expenses may not be used to estimate the actual ending account balance or expenses you paid for the period. You may use this information to compare the ongoing costs of investing in the Fund and other funds. To do so, compare this 5% hypothetical example with the 5% hypothetical examples that appear in the shareholder reports of the other funds. If any fund is a shareholder of any Underlying Funds, such fund indirectly bears its proportional share of the expenses of the Underlying Funds in addition to the direct expenses as presented in the table. These fees and expenses are not included in the annualized expense ratio used to calculate the expense estimate in the table below.
Please note that the expenses shown in the table are meant to highlight your ongoing costs only and do not reflect any transaction costs. Therefore, the second line of the table is useful in comparing ongoing costs only, and will not help you determine the relative total costs of owning different funds. In addition, if these transactional costs were included, your costs would have been higher.
| | | | | Annualized Expense Ratio- A | | Beginning Account Value July 1, 2022 | | Ending Account Value December 31, 2022 | | Expenses Paid During Period- C July 1, 2022 to December 31, 2022 |
| | | | | | | | | | |
| Fidelity Flex® Conservative Income Municipal Bond Fund | | | | -%- D | | | | | | |
| Actual | | | | | | $ 1,000 | | $ 1,008.90 | | $- E |
Hypothetical- B | | | | | | $ 1,000 | | $ 1,025.21 | | $- E |
| |
A Annualized expense ratio reflects expenses net of applicable fee waivers.
B 5% return per year before expenses
C Expenses are equal to the annualized expense ratio, multiplied by the average account value over the period, multiplied by 184/ 365 (to reflect the one-half year period). The fees and expenses of any Underlying Funds are not included in each annualized expense ratio.
D Amount represents less than .005%.
E Amount represents less than $.005.
The dividend and capital gains distributions for the fund(s) are available on Fidelity.com or Institutional.Fidelity.com.
During fiscal year ended 2022, 100% of the fund's income dividends were free from federal income tax, and 34.76% of the fund's income dividends was subject to the federal alternative minimum tax.
The fund will notify shareholders in January 2023 of amounts for use in preparing 2022 income tax returns.
Fidelity Flex Conservative Income Municipal Bond Fund
Each year, the Board of Trustees, including the Independent Trustees (together, the Board), votes on the renewal of the management contract with Fidelity Management & Research Company LLC (FMR) and the sub-advisory agreements (together, the Advisory Contracts) for the fund. FMR and the sub-advisers are referred to herein as the Investment Advisers. The Board, assisted by the advice of fund counsel and Independent Trustees' counsel, requests and considers a broad range of information relevant to the renewal of the Advisory Contracts throughout the year.
The Board meets regularly and, at each of its meetings, covers an extensive agenda of topics and materials and considers factors that are relevant to its annual consideration of the renewal of the fund's Advisory Contracts, including the services and support provided to the fund and its shareholders. The Board has established four standing committees (Committees) - Operations, Audit, Fair Valuation, and Governance and Nominating - each composed of and chaired by Independent Trustees with varying backgrounds, to which the Board has assigned specific subject matter responsibilities in order to enhance effective decision-making by the Board. The Operations Committee, of which all the Independent Trustees are members, meets regularly throughout the year and requests, receives and considers, among other matters, information related to the annual consideration of the renewal of the fund's Advisory Contracts before making its recommendation to the Board. The Board also meets as needed to review matters specifically related to the Board's annual consideration of the renewal of the Advisory Contracts. Members of the Board may also meet from time to time with trustees of other Fidelity funds through joint ad hoc committees to discuss certain matters relevant to all of the Fidelity funds.
At its September 2022 meeting, the Board unanimously determined to renew the fund's Advisory Contracts. In considering whether to renew the Advisory Contracts for the fund, the Board considered all factors it believed relevant and reached a determination, with the assistance of fund counsel and Independent Trustees' counsel and through the exercise of its business judgment, that the renewal of the Advisory Contracts was in the best interests of the fund and its shareholders and the fact that no fee is payable under the management contract was fair and reasonable.
Nature, Extent, and Quality of Services Provided . The Board considered Fidelity's staffing as it relates to the fund, including the backgrounds of investment personnel of Fidelity, and also considered the fund's investment objective, strategies, and related investment philosophy. The Independent Trustees also had discussions with senior management of Fidelity's investment operations and investment groups. The Board considered the structure of the investment personnel compensation program and whether this structure provides appropriate incentives to act in the best interests of the fund. Additionally, the Board considered the portfolio managers' investments, if any, in the funds that they manage. The Board also considered the steps Fidelity had taken to ensure the continued provision of high quality services to the Fidelity funds throughout the COVID-19 pandemic, including the expansion of staff in client facing positions to maintain service levels in periods of high volumes and volatility.
Resources Dedicated to Investment Management and Support Services . The Board reviewed the general qualifications and capabilities of Fidelity's investment staff, including its size, education, experience, and resources, as well as Fidelity's approach to recruiting, training, managing, and compensating investment personnel. The Board noted the resources devoted to Fidelity's global investment organization, and that Fidelity's analysts have extensive resources, tools and capabilities that allow them to conduct quantitative and fundamental analysis, as well as credit analysis of issuers, counterparties and guarantors. Further, the Board considered that Fidelity's investment professionals have sufficient access to global information and data so as to provide competitive investment results over time, and that those professionals also have access to sophisticated tools that permit them to assess portfolio construction and risk and performance attribution characteristics continuously, as well as to transmit new information and research conclusions rapidly around the world. Additionally, in its deliberations, the Board considered Fidelity's trading, risk management, compliance, cybersecurity, and technology and operations capabilities and resources, which are integral parts of the investment management process.
Shareholder and Administrative Services . The Board considered (i) the nature, extent, quality, and cost of advisory, administrative, and shareholder services performed by the Investment Advisers and their affiliates under the Advisory Contracts and under separate agreements covering transfer agency and pricing and bookkeeping services for the fund; (ii) the nature and extent of the supervision of third party service providers, principally custodians, subcustodians, and pricing vendors; and (iii) the resources devoted to, and the record of compliance with, the fund's compliance policies and procedures.
The Board noted that the growth of fund assets over time across the complex allows Fidelity to reinvest in the development of services designed to enhance the value and convenience of the Fidelity funds as investment vehicles. These services include 24-hour access to account information and market information over the Internet and through telephone representatives, investor education materials and asset allocation tools. The Board also considered that it reviews customer service metrics such as telephone response times, continuity of services on the website and metrics addressing services at Fidelity Investor Centers.
Investment in a Large Fund Family. The Board considered the benefits to shareholders of investing in a Fidelity fund, including the benefits of investing in a fund that is part of a large family of funds offering a variety of investment disciplines and providing a large variety of mutual fund investor services. The Board noted that Fidelity had taken, or had made recommendations to the Board that resulted in the Fidelity funds taking, a number of actions over the previous year that benefited particular funds, including: (i) continuing to dedicate additional resources to Fidelity's investment research process, which includes meetings with management of issuers of securities in which the funds invest; (ii) continuing efforts to enhance Fidelity's global research capabilities; (iii) launching new funds, ETFs, and share classes with innovative structures, strategies and pricing and making other enhancements to meet investor needs; (iv) broadening eligibility requirements for certain funds and share classes; (v) reducing management fees and total expenses for certain funds and classes; (vi) lowering expenses for certain existing funds and classes by implementing or lowering expense caps; (vii) rationalizing product lines and gaining increased efficiencies from fund mergers and liquidations; (viii) continuing to develop, acquire and implement systems and technology to improve services to the funds and shareholders, strengthen information security, and increase efficiency; and (ix) continuing to implement enhancements to further strengthen Fidelity's product line to increase investors' probability of success in achieving their investment goals, including their retirement income goals.
Investment Performance . The Board considered whether the fund has operated in accordance with its investment objective, as well as its record of compliance with its investment restrictions. The Board reviewed the fund's absolute investment performance, as well as the fund's relative investment performance. The Board did not consider performance to be a material factor in its decision to renew the fund's Advisory Contracts as the fund is not publicly offered as a stand-alone investment product. In this regard, the Board noted that the fund is available exclusively to certain fee-based accounts and advisor programs offered by Fidelity, including certain employer-sponsored plans and discretionary investment programs. The Board noted there was a portfolio management change for the fund in October 2021.
Based on its review, the Board concluded that the nature, extent, and quality of services provided to the fund under the Advisory Contracts should continue to benefit the shareholders of the fund.
Competitiveness of Management Fee and Total Expense Ratio . The Board noted that the fund is available exclusively through certain Fidelity fee-based accounts and advisory programs. The Board considered that the fund does not pay FMR a management fee for investment advisory services, but that FMR is indirectly compensated for its services out of Fidelity fee-based account and advisory program fees. The Board also noted that FMR or an affiliate undertakes to pay all operating expenses of the fund, except Independent Trustee fees and expenses, proxy and shareholder meeting expenses, interest, taxes, and extraordinary expenses (such as litigation expenses). The Board further noted that the fund pays its non-operating expenses, including brokerage commissions and fees and expenses associated with the fund's securities lending program, if applicable.
Based on its review, the Board considered that the fund does not pay a management fee and concluded that the fund's total expense ratio was reasonable in light of the services that the fund and its shareholders receive and the other factors considered.
Costs of the Services and Profitability . The Board considered the level of Fidelity's profits in respect of all the Fidelity funds.
A public accounting firm has been engaged annually by the Board as part of the Board's assessment of Fidelity's profitability analysis. The engagement includes the review and assessment of the methodologies used by Fidelity in determining the revenues and expenses attributable to Fidelity's mutual fund business, and completion of agreed-upon procedures in respect of the mathematical accuracy of certain fund profitability information and its conformity to established allocation methodologies. After considering the reports issued under the engagement and information provided by Fidelity, the Board concluded that while other allocation methods may also be reasonable, Fidelity's profitability methodologies are reasonable in all material respects.
The Board also reviewed Fidelity's non-fund businesses and potential indirect benefits such businesses may have received as a result of their association with Fidelity's mutual fund business (i.e., fall-out benefits) as well as cases where Fidelity's affiliates may benefit from the funds' business. The Board considered areas where potential indirect benefits to the Fidelity funds from their relationships with Fidelity may exist. The Board's consideration of these matters was informed by the findings of a joint ad hoc committee created by it and the boards of other Fidelity funds to evaluate potential fall-out benefits.
The Board concluded that the costs of the services provided by and the profits realized by Fidelity in connection with the operation of the fund were not relevant to the renewal of the Advisory Contracts because the fund pays no advisory fees and FMR or an affiliate bears all expenses of the fund, with limited exceptions.
Economies of Scale . The Board concluded that because the fund pays no advisory fees and FMR or an affiliate bears all expenses of the fund with certain limited exceptions, the realization of economies of scale was not a material factor in the Board's decision to renew the fund's Advisory Contracts.
Additional Information Requested by the Board . In order to develop fully the factual basis for consideration of the Fidelity funds' advisory contracts, the Board requested and received additional information on certain topics, including: (i) Fidelity's fund profitability methodology, profitability trends for certain funds, the allocation of various costs to different funds, and the impact of certain factors on fund profitability results; (ii) portfolio manager changes that have occurred during the past year and the amount of the investment that each portfolio manager has made in the Fidelity fund(s) that he or she manages; (iii) the extent to which current market conditions have affected retention and recruitment of personnel; (iv) the arrangements with and compensation paid to certain fund sub-advisers on behalf of the Fidelity funds and the treatment of such compensation within Fidelity's fund profitability methodology; (v) the terms of the funds' various management fee structures, including the basic group fee and the terms of Fidelity's voluntary expense limitation arrangements; (vi) Fidelity's transfer agent, pricing and bookkeeping fees, expense and service structures for different funds and classes relative to competitive trends; (vii) the impact on fund profitability of recent industry trends, such as the growth in passively managed funds and the changes in flows for different types of funds; (viii) the types of management fee and total expense comparisons provided, and the challenges and limitations associated with such information; and (ix) explanations regarding the relative total expense ratios and management fees of certain funds and classes, total expense and management fee competitive trends, and methodologies for total expense and management fee competitive comparisons. In addition, the Board considered its discussions with Fidelity regarding Fidelity's efforts to maintain the continuous investment and shareholder services necessary for the funds during the current pandemic and economic circumstances.
Based on its evaluation of all of the conclusions noted above, and after considering all factors it believed relevant, the Board concluded that the advisory fee arrangements are fair and reasonable, and that the fund's Advisory Contracts should be renewed.
1.9884863.105
XCB-ANN-0323
Item 2.
Code of Ethics
As of the end of the period, December 31, 2022, Fidelity Municipal Trust (the trust) has adopted a code of ethics, as defined in Item 2 of Form N-CSR, that applies to its President and Treasurer and its Chief Financial Officer. A copy of the code of ethics is filed as an exhibit to this Form N-CSR.
Item 3.
Audit Committee Financial Expert
The Board of Trustees of the trust has determined that Elizabeth S. Acton is an audit committee financial expert, as defined in Item 3 of Form N-CSR. Ms. Acton is independent for purposes of Item 3 of Form N-CSR.
Item 4.
Principal Accountant Fees and Services
Fees and Services
The following table presents fees billed by PricewaterhouseCoopers LLP (“PwC”) in each of the last two fiscal years for services rendered to Fidelity Conservative Income Municipal Bond Fund, Fidelity Flex Conservative Income Municipal Bond Fund, Fidelity Flex Municipal Income Fund, Fidelity Limited Term Municipal Income Fund, Fidelity Michigan Municipal Income Fund, Fidelity Minnesota Municipal Income Fund, Fidelity Municipal Income Fund, Fidelity Ohio Municipal Income Fund and Fidelity Pennsylvania Municipal Income Fund (the “Funds”):
Services Billed by PwC
December 31, 2022 FeesA
| | | | |
| Audit Fees | Audit-Related Fees | Tax Fees | All Other Fees |
Fidelity Conservative Income Municipal Bond Fund | $43,600 | $3,500 | $5,200 | $1,600 |
Fidelity Flex Conservative Income Municipal Bond Fund | $45,300 | $3,700 | $5,200 | $1,600 |
Fidelity Flex Municipal Income Fund | $45,300 | $3,700 | $5,200 | $1,600 |
Fidelity Limited Term Municipal Income Fund | $51,000 | $4,100 | $5,200 | $1,800 |
Fidelity Michigan Municipal Income Fund | $41,500 | $3,400 | $5,200 | $1,500 |
Fidelity Minnesota Municipal Income Fund | $41,500 | $3,400 | $5,200 | $1,500 |
Fidelity Municipal Income Fund | $52,100 | $4,200 | $5,300 | $1,800 |
Fidelity Ohio Municipal Income Fund | $41,500 | $3,400 | $5,200 | $1,500 |
Fidelity Pennsylvania Municipal Income Fund | $41,500 | $3,400 | $5,200 | $1,500 |
| | | | |
| Audit Fees | Audit-Related Fees | Tax Fees | All Other Fees |
Fidelity Conservative Income Municipal Bond Fund | $42,500 | $3,800 | $5,100 | $1,600 |
Fidelity Flex Conservative Income Municipal Bond Fund | $44,100 | $3,900 | $5,100 | $1,700 |
Fidelity Flex Municipal Income Fund | $44,100 | $3,900 | $5,100 | $1,700 |
Fidelity Limited Term Municipal Income Fund | $49,600 | $4,300 | $5,100 | $1,900 |
Fidelity Michigan Municipal Income Fund | $40,400 | $3,600 | $5,100 | $1,600 |
Fidelity Minnesota Municipal Income Fund | $40,400 | $3,600 | $5,100 | $1,600 |
Fidelity Municipal Income Fund | $50,800 | $4,400 | $5,100 | $1,900 |
Fidelity Ohio Municipal Income Fund | $40,400 | $3,600 | $5,100 | $1,600 |
Fidelity Pennsylvania Municipal Income Fund | $40,400 | $3,600 | $5,100 | $1,600 |
A Amounts may reflect rounding.
The following table(s) present(s) fees billed by PwC that were required to be approved by the Audit Committee for services that relate directly to the operations and financial reporting of the Fund(s) and that are rendered on behalf of Fidelity Management & Research Company LLC ("FMR") and entities controlling, controlled by, or under common control with FMR (not including any sub-adviser whose role is primarily portfolio management and is subcontracted with or overseen by another investment adviser) that provide ongoing services to the Fund(s) (“Fund Service Providers”):
Services Billed by PwC
| | |
| December 31, 2022A | December 31, 2021A |
Audit-Related Fees | $7,914,600 | $8,522,600 |
Tax Fees | $1,000 | $354,200 |
All Other Fees | $- | $- |
A Amounts may reflect rounding.
“Audit-Related Fees” represent fees billed for assurance and related services that are reasonably related to the performance of the fund audit or the review of the fund's financial statements and that are not reported under Audit Fees.
“Tax Fees” represent fees billed for tax compliance, tax advice or tax planning that relate directly to the operations and financial reporting of the fund.
“All Other Fees” represent fees billed for services provided to the fund or Fund Service Provider, a significant portion of which are assurance related, that relate directly to the operations and financial reporting of the fund, excluding those services that are reported under Audit Fees, Audit-Related Fees or Tax Fees.
Assurance services must be performed by an independent public accountant.
* * *
The aggregate non-audit fees billed by PwC for services rendered to the Fund(s), FMR (not including any sub-adviser whose role is primarily portfolio management and is subcontracted with or overseen by another investment adviser), and any Fund Service Provider for each of the last two fiscal years of the Fund(s) are as follows:
| | |
Billed By | December 31, 2022A | December 31, 2021A |
PwC | $12,977,100 | $14,215,300 |
A Amounts may reflect rounding.
The trust's Audit Committee has considered non-audit services that were not pre-approved that were provided by PwC to Fund Service Providers to be compatible with maintaining the independence of PwC in its(their) audit of the Fund(s), taking into account representations from PwC, in accordance with Public Company Accounting Oversight Board rules, regarding its independence from the Fund(s) and its(their) related entities and FMR’s review of the appropriateness and permissibility under applicable law of such non-audit services prior to their provision to the Fund(s) Service Providers.
Audit Committee Pre-Approval Policies and Procedures
The trust’s Audit Committee must pre-approve all audit and non-audit services provided by a fund’s independent registered public accounting firm relating to the operations or financial reporting of the fund. Prior to the commencement of any audit or non-audit services to a fund, the Audit Committee reviews the services to determine whether they are appropriate and permissible under applicable law.
The Audit Committee has adopted policies and procedures to, among other purposes, provide a framework for the Committee’s consideration of non-audit services by the audit firms that audit the Fidelity funds. The policies and procedures require that any non-audit service provided by a fund audit firm to a Fidelity fund and any non-audit service provided by a fund auditor to a Fund Service Provider that relates directly to the operations and financial reporting of a Fidelity fund (“Covered Service”) are subject to approval by the Audit Committee before such service is provided.
All Covered Services must be approved in advance of provision of the service either: (i) by formal resolution of the Audit Committee, or (ii) by oral or written approval of the service by the Chair of the Audit Committee (or if the Chair is unavailable, such other member of the Audit Committee as may be designated by the Chair to act in the Chair’s absence). The approval contemplated by (ii) above is permitted where the Treasurer determines that action on such an engagement is necessary before the next meeting of the Audit Committee.
Non-audit services provided by a fund audit firm to a Fund Service Provider that do not relate directly to the operations and financial reporting of a Fidelity fund are reported to the Audit Committee periodically.
Non-Audit Services Approved Pursuant to Rule 2-01(c)(7)(i)(C) and (ii) of Regulation S-X (“De Minimis Exception”)
There were no non-audit services approved or required to be approved by the Audit Committee pursuant to the De Minimis Exception during the Fund’s(s’) last two fiscal years relating to services provided to (i) the Fund(s) or (ii) any Fund Service Provider that relate directly to the operations and financial reporting of the Fund(s).
Item 5.
Audit Committee of Listed Registrants
Not applicable.
Item 6.
Investments
(a)
Not applicable.
(b)
Not applicable.
Item 7.
Disclosure of Proxy Voting Policies and Procedures for Closed-End Management Investment Companies
Not applicable.
Item 8.
Portfolio Managers of Closed-End Management Investment Companies
Not applicable.
Item 9.
Purchase of Equity Securities by Closed-End Management Investment Company and Affiliated Purchasers
Not applicable.
Item 10.
Submission of Matters to a Vote of Security Holders
There were no material changes to the procedures by which shareholders may recommend nominees to the trust’s Board of Trustees.
Item 11.
Controls and Procedures
(a)(i) The President and Treasurer and the Chief Financial Officer have concluded that the trust’s disclosure controls and procedures (as defined in Rule 30a-3(c) under the Investment Company Act) provide reasonable assurances that material information relating to the trust is made known to them by the appropriate persons, based on their evaluation of these controls and procedures as of a date within 90 days of the filing date of this report.
(a)(ii) There was no change in the trust’s internal control over financial reporting (as defined in Rule 30a-3(d) under the Investment Company Act) that occurred during the period covered by this report that has materially affected, or is reasonably likely to materially affect, the trust’s internal control over financial reporting.
Item 12.
Disclosure of Securities Lending Activities for Closed-End Management
Investment Companies
Not applicable.
Item 13.
Exhibits
SIGNATURES
Pursuant to the requirements of the Securities Exchange Act of 1934 and the Investment Company Act of 1940, the registrant has duly caused this report to be signed on its behalf by the undersigned, thereunto duly authorized.
Fidelity Municipal Trust
| |
By: | /s/Laura M. Del Prato |
| Laura M. Del Prato |
| President and Treasurer |
|
|
Date: | February 21, 2023 |
Pursuant to the requirements of the Securities Exchange Act of 1934 and the Investment Company Act of 1940, this report has been signed below by the following persons on behalf of the registrant and in the capacities and on the dates indicated.
| |
By: | /s/Laura M. Del Prato |
| Laura M. Del Prato |
| President and Treasurer |
|
|
Date: | February 21, 2023 |
| |
By: | /s/John J. Burke III |
| John J. Burke III |
| Chief Financial Officer |
|
|
Date: | February 21, 2023 |