UNITED STATES
SECURITIES AND EXCHANGE COMMISSION
Washington, D.C. 20549
FORM N-CSR
CERTIFIED SHAREHOLDER REPORT OF REGISTERED
MANAGEMENT INVESTMENT COMPANIES
Investment Company Act file number 811-02628
Fidelity Municipal Trust
(Exact name of registrant as specified in charter)
245 Summer St., Boston, MA 02210
(Address of principal executive offices) (Zip code)
Margaret Carey, Secretary
245 Summer St.
Boston, Massachusetts 02210
(Name and address of agent for service)
Registrant's telephone number, including area code:
617-563-7000
| |
Date of fiscal year end: | December 31 |
|
|
Date of reporting period: | June 30, 2024 |
Item 1.
Reports to Stockholders
| |
| | SEMI-ANNUAL SHAREHOLDER REPORT | AS OF JUNE 30, 2024 | |
| | Fidelity® Municipal Income Fund Fidelity Advisor® Municipal Income Fund Class I : FROGX |
| | | |
This semi-annual shareholder report contains information about Fidelity® Municipal Income Fund for the period January 1, 2024 to June 30, 2024. You can find additional information about the Fund at fundresearch.fidelity.com/prospectus/sec. You can also request this information by contacting us at 1-877-208-0098 or by sending an e-mail to fidfunddocuments@fidelity.com.
What were your Fund costs for the last six months?(based on hypothetical $10,000 investment)
| | Costs of a $10,000 investment | Costs paid as a percentage of a $10,000 investment | |
| Class I | $ 26 | 0.52% | |
Key Fund Statistics (as of June 30, 2024)
KEY FACTS | | |
| Fund Size | $4,615,397,246 | |
| Number of Holdings | 1,417 | |
| Portfolio Turnover | 11% | |
What did the Fund invest in?
(as of June 30, 2024)
REVENUE SOURCES (% of Fund's net assets) |
| Transportation | 23.8 | |
| General Obligations | 22.0 | |
| Health Care | 20.5 | |
| Education | 9.8 | |
| Special Tax | 9.3 | |
| State G.O. | 6.1 | |
| Others(Individually Less Than 5%) | 8.5 | |
| 100.0 | |
| |
| AAA | 5.6 |
| AA | 29.7 |
| A | 46.3 |
| BBB | 10.2 |
| BB | 2.4 |
| B | 0.4 |
| CCC,CC,C | 0.0 |
| Not Rated | 4.6 |
| Short-Term Investments and Net Other Assets (Liabilities) | 0.8 |
QUALITY DIVERSIFICATION (% of Fund's net assets) |
|
| |
| We have used ratings from Moody's Investors Service, Inc. Where Moody's® ratings are not available, we have used S&P® ratings. All ratings are as of the date indicated and do not reflect subsequent changes. |
TOP STATES (% of Fund's net assets) |
| Illinois | 14.9 |
| New York | 9.0 |
| Pennsylvania | 7.7 |
| New Jersey | 6.5 |
| Florida | 6.3 |
| | |
| Fidelity, the Fidelity Investments Logo and all other Fidelity trademarks or service marks used herein are trademarks or service marks of FMR LLC. Any third-party marks that are used herein are trademarks or service marks of their respective owners. © 2024 FMR LLC. All rights reserved. |
| | For additional information about the Fund; including its prospectus, financial information, holdings and proxy information, scan the QR code or visit fundresearch.fidelity.com/prospectus/sec 1.9915940.100 3071-TSRS-0824 |
| |
| | SEMI-ANNUAL SHAREHOLDER REPORT | AS OF JUNE 30, 2024 | |
| | Fidelity® Michigan Municipal Income Fund Fidelity® Michigan Municipal Income Fund : FMHTX |
| | | |
This semi-annual shareholder report contains information about Fidelity® Michigan Municipal Income Fund for the period January 1, 2024 to June 30, 2024. You can find additional information about the Fund at fundresearch.fidelity.com/prospectus/sec. You can also request this information by contacting us at 1-800-544-8544 or by sending an e-mail to fidfunddocuments@fidelity.com.
What were your Fund costs for the last six months?(based on hypothetical $10,000 investment)
| | Costs of a $10,000 investment | Costs paid as a percentage of a $10,000 investment | |
| Fidelity® Michigan Municipal Income Fund | $ 24 | 0.48% | |
Key Fund Statistics (as of June 30, 2024)
KEY FACTS | | |
| Fund Size | $466,692,866 | |
| Number of Holdings | 285 | |
| Portfolio Turnover | 17% | |
What did the Fund invest in?
(as of June 30, 2024)
REVENUE SOURCES (% of Fund's net assets) |
| Health Care | 22.7 | |
| General Obligations | 22.6 | |
| Transportation | 13.2 | |
| Education | 11.5 | |
| Housing | 9.5 | |
| Electric Utilities | 6.6 | |
| Others(Individually Less Than 5%) | 13.9 | |
| 100.0 | |
| |
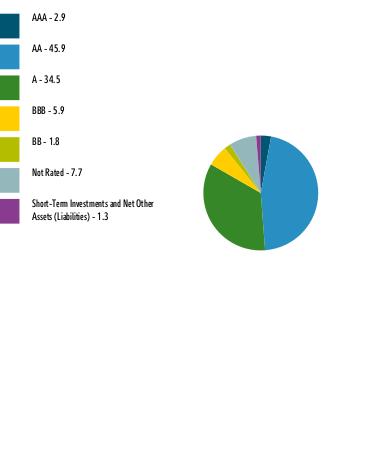
| AAA | 2.9 |
| AA | 45.9 |
| A | 34.5 |
| BBB | 5.9 |
| BB | 1.8 |
| Not Rated | 7.7 |
| Short-Term Investments and Net Other Assets (Liabilities) | 1.3 |
QUALITY DIVERSIFICATION (% of Fund's net assets) |
|
| |
| We have used ratings from Moody's Investors Service, Inc. Where Moody's® ratings are not available, we have used S&P® ratings. All ratings are as of the date indicated and do not reflect subsequent changes. |
| Fidelity, the Fidelity Investments Logo and all other Fidelity trademarks or service marks used herein are trademarks or service marks of FMR LLC. Any third-party marks that are used herein are trademarks or service marks of their respective owners. © 2024 FMR LLC. All rights reserved. |
| | For additional information about the Fund; including its prospectus, financial information, holdings and proxy information, scan the QR code or visit fundresearch.fidelity.com/prospectus/sec 1.9915977.100 81-TSRS-0824 |
| |
| | SEMI-ANNUAL SHAREHOLDER REPORT | AS OF JUNE 30, 2024 | |
| | Fidelity® Limited Term Municipal Income Fund Fidelity Advisor® Limited Term Municipal Income Fund Class A : FASHX |
| | | |
This semi-annual shareholder report contains information about Fidelity® Limited Term Municipal Income Fund for the period January 1, 2024 to June 30, 2024. You can find additional information about the Fund at fundresearch.fidelity.com/prospectus/sec. You can also request this information by contacting us at 1-877-208-0098 or by sending an e-mail to fidfunddocuments@fidelity.com.
What were your Fund costs for the last six months?(based on hypothetical $10,000 investment)
| | Costs of a $10,000 investment | Costs paid as a percentage of a $10,000 investment | |
| Class A | $ 27 | 0.55% | |
Key Fund Statistics (as of June 30, 2024)
KEY FACTS | | |
| Fund Size | $2,594,296,689 | |
| Number of Holdings | 988 | |
| Portfolio Turnover | 19% | |
What did the Fund invest in?
(as of June 30, 2024)
REVENUE SOURCES (% of Fund's net assets) |
| General Obligations | 24.0 | |
| Transportation | 21.7 | |
| Health Care | 16.7 | |
| Housing | 7.5 | |
| State G.O. | 7.3 | |
| Electric Utilities | 7.0 | |
| Others(Individually Less Than 5%) | 15.8 | |
| 100.0 | |
| |
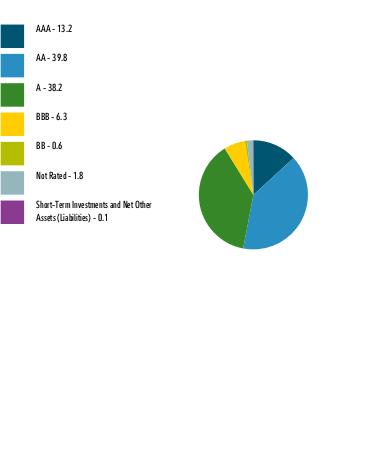
| AAA | 13.2 |
| AA | 39.8 |
| A | 38.2 |
| BBB | 6.3 |
| BB | 0.6 |
| Not Rated | 1.8 |
| Short-Term Investments and Net Other Assets (Liabilities) | 0.1 |
QUALITY DIVERSIFICATION (% of Fund's net assets) |
|
| |
| We have used ratings from Moody's Investors Service, Inc. Where Moody's® ratings are not available, we have used S&P® ratings. All ratings are as of the date indicated and do not reflect subsequent changes. |
TOP STATES (% of Fund's net assets) |
| Texas | 15.5 |
| New York | 11.5 |
| Illinois | 8.8 |
| New Jersey | 4.6 |
| Florida | 4.3 |
| | |
| Fidelity, the Fidelity Investments Logo and all other Fidelity trademarks or service marks used herein are trademarks or service marks of FMR LLC. Any third-party marks that are used herein are trademarks or service marks of their respective owners. © 2024 FMR LLC. All rights reserved. |
| | For additional information about the Fund; including its prospectus, financial information, holdings and proxy information, scan the QR code or visit fundresearch.fidelity.com/prospectus/sec 1.9916011.100 1272-TSRS-0824 |
| |
| | SEMI-ANNUAL SHAREHOLDER REPORT | AS OF JUNE 30, 2024 | |
| | Fidelity® Conservative Income Municipal Bond Fund Fidelity Advisor® Conservative Income Municipal Bond Fund Class Z : FMNHX |
| | | |
This semi-annual shareholder report contains information about Fidelity® Conservative Income Municipal Bond Fund for the period January 1, 2024 to June 30, 2024. You can find additional information about the Fund at fundresearch.fidelity.com/prospectus/sec. You can also request this information by contacting us at 1-877-208-0098 or by sending an e-mail to fidfunddocuments@fidelity.com.
What were your Fund costs for the last six months?(based on hypothetical $10,000 investment)
| | Costs of a $10,000 investment | Costs paid as a percentage of a $10,000 investment | |
| Class Z | $ 10 | 0.20% | |
Key Fund Statistics (as of June 30, 2024)
KEY FACTS | | |
| Fund Size | $1,498,953,331 | |
| Number of Holdings | 540 | |
| Portfolio Turnover | 73% | |
What did the Fund invest in?
(as of June 30, 2024)
REVENUE SOURCES (% of Fund's net assets) |
| Synthetics | 19.2 | |
| General Obligations | 17.4 | |
| Resource Recovery | 12.8 | |
| Industrial Development | 11.6 | |
| Transportation | 10.1 | |
| Health Care | 7.8 | |
| Electric Utilities | 7.8 | |
| Housing | 6.0 | |
| Others(Individually Less Than 5%) | 7.3 | |
| 100.0 | |
| |
| AAA | 14.2 |
| AA | 20.0 |
| A | 42.2 |
| BBB | 16.4 |
| Not Rated | 11.0 |
QUALITY DIVERSIFICATION (% of Fund's net assets) |
|
| Short-Term Investments and Net Other Assets (Liabilities) - (3.8)%* |
| |
| We have used ratings from Moody's Investors Service, Inc. Where Moody's® ratings are not available, we have used S&P® ratings. All ratings are as of the date indicated and do not reflect subsequent changes. |
TOP STATES (% of Fund's net assets) |
| Non-state Specific | 12.9 |
| Texas | 11.3 |
| Florida | 8.0 |
| Pennsylvania | 7.0 |
| North Dakota | 6.2 |
| | |
| Fidelity, the Fidelity Investments Logo and all other Fidelity trademarks or service marks used herein are trademarks or service marks of FMR LLC. Any third-party marks that are used herein are trademarks or service marks of their respective owners. © 2024 FMR LLC. All rights reserved. |
| | For additional information about the Fund; including its prospectus, financial information, holdings and proxy information, scan the QR code or visit fundresearch.fidelity.com/prospectus/sec 1.9916158.100 7367-TSRS-0824 |
| |
| | SEMI-ANNUAL SHAREHOLDER REPORT | AS OF JUNE 30, 2024 | |
| | Fidelity® Limited Term Municipal Income Fund Fidelity® Limited Term Municipal Income Fund : FSTFX |
| | | |
This semi-annual shareholder report contains information about Fidelity® Limited Term Municipal Income Fund for the period January 1, 2024 to June 30, 2024. You can find additional information about the Fund at fundresearch.fidelity.com/prospectus/sec. You can also request this information by contacting us at 1-800-544-8544 or by sending an e-mail to fidfunddocuments@fidelity.com.
What were your Fund costs for the last six months?(based on hypothetical $10,000 investment)
| | Costs of a $10,000 investment | Costs paid as a percentage of a $10,000 investment | |
| Fidelity® Limited Term Municipal Income Fund | $ 15 | 0.30% | |
Key Fund Statistics (as of June 30, 2024)
KEY FACTS | | |
| Fund Size | $2,594,296,689 | |
| Number of Holdings | 988 | |
| Portfolio Turnover | 19% | |
What did the Fund invest in?
(as of June 30, 2024)
REVENUE SOURCES (% of Fund's net assets) |
| General Obligations | 24.0 | |
| Transportation | 21.7 | |
| Health Care | 16.7 | |
| Housing | 7.5 | |
| State G.O. | 7.3 | |
| Electric Utilities | 7.0 | |
| Others(Individually Less Than 5%) | 15.8 | |
| 100.0 | |
| |
| AAA | 13.2 |
| AA | 39.8 |
| A | 38.2 |
| BBB | 6.3 |
| BB | 0.6 |
| Not Rated | 1.8 |
| Short-Term Investments and Net Other Assets (Liabilities) | 0.1 |
QUALITY DIVERSIFICATION (% of Fund's net assets) |
|
| |
| We have used ratings from Moody's Investors Service, Inc. Where Moody's® ratings are not available, we have used S&P® ratings. All ratings are as of the date indicated and do not reflect subsequent changes. |
TOP STATES (% of Fund's net assets) |
| Texas | 15.5 |
| New York | 11.5 |
| Illinois | 8.8 |
| New Jersey | 4.6 |
| Florida | 4.3 |
| | |
| Fidelity, the Fidelity Investments Logo and all other Fidelity trademarks or service marks used herein are trademarks or service marks of FMR LLC. Any third-party marks that are used herein are trademarks or service marks of their respective owners. © 2024 FMR LLC. All rights reserved. |
| | For additional information about the Fund; including its prospectus, financial information, holdings and proxy information, scan the QR code or visit fundresearch.fidelity.com/prospectus/sec 1.9916016.100 404-TSRS-0824 |
| |
| | SEMI-ANNUAL SHAREHOLDER REPORT | AS OF JUNE 30, 2024 | |
| | Fidelity® Conservative Income Municipal Bond Fund Fidelity® Conservative Income Municipal Bond Fund : FMNDX |
| | | |
This semi-annual shareholder report contains information about Fidelity® Conservative Income Municipal Bond Fund for the period January 1, 2024 to June 30, 2024. You can find additional information about the Fund at fundresearch.fidelity.com/prospectus/sec. You can also request this information by contacting us at 1-800-544-8544 or by sending an e-mail to fidfunddocuments@fidelity.com.
What were your Fund costs for the last six months?(based on hypothetical $10,000 investment)
| | Costs of a $10,000 investment | Costs paid as a percentage of a $10,000 investment | |
| Fidelity® Conservative Income Municipal Bond Fund | $ 13 | 0.25% | |
Key Fund Statistics (as of June 30, 2024)
KEY FACTS | | |
| Fund Size | $1,498,953,331 | |
| Number of Holdings | 540 | |
| Portfolio Turnover | 73% | |
What did the Fund invest in?
(as of June 30, 2024)
REVENUE SOURCES (% of Fund's net assets) |
| Synthetics | 19.2 | |
| General Obligations | 17.4 | |
| Resource Recovery | 12.8 | |
| Industrial Development | 11.6 | |
| Transportation | 10.1 | |
| Health Care | 7.8 | |
| Electric Utilities | 7.8 | |
| Housing | 6.0 | |
| Others(Individually Less Than 5%) | 7.3 | |
| 100.0 | |
| |
| AAA | 14.2 |
| AA | 20.0 |
| A | 42.2 |
| BBB | 16.4 |
| Not Rated | 11.0 |
QUALITY DIVERSIFICATION (% of Fund's net assets) |
|
| Short-Term Investments and Net Other Assets (Liabilities) - (3.8)%* |
| |
| We have used ratings from Moody's Investors Service, Inc. Where Moody's® ratings are not available, we have used S&P® ratings. All ratings are as of the date indicated and do not reflect subsequent changes. |
TOP STATES (% of Fund's net assets) |
| Non-state Specific | 12.9 |
| Texas | 11.3 |
| Florida | 8.0 |
| Pennsylvania | 7.0 |
| North Dakota | 6.2 |
| | |
| Fidelity, the Fidelity Investments Logo and all other Fidelity trademarks or service marks used herein are trademarks or service marks of FMR LLC. Any third-party marks that are used herein are trademarks or service marks of their respective owners. © 2024 FMR LLC. All rights reserved. |
| | For additional information about the Fund; including its prospectus, financial information, holdings and proxy information, scan the QR code or visit fundresearch.fidelity.com/prospectus/sec 1.9916155.100 2579-TSRS-0824 |
| |
| | SEMI-ANNUAL SHAREHOLDER REPORT | AS OF JUNE 30, 2024 | |
| | Fidelity Flex® Conservative Income Municipal Bond Fund Fidelity Flex® Conservative Income Municipal Bond Fund : FUEMX |
| | | |
This semi-annual shareholder report contains information about Fidelity Flex® Conservative Income Municipal Bond Fund for the period January 1, 2024 to June 30, 2024. You can find additional information about the Fund at fundresearch.fidelity.com/prospectus/sec. You can also request this information by contacting us at 1-800-544-3455 or by sending an e-mail to fidfunddocuments@fidelity.com.
What were your Fund costs for the last six months?(based on hypothetical $10,000 investment)
| | Costs of a $10,000 investment | Costs paid as a percentage of a $10,000 investment | |
| Fidelity Flex® Conservative Income Municipal Bond Fund | $ 0 A | 0.00%B | |
A Amount represents less than $.50
B Amount represents less than 0.005%
Key Fund Statistics (as of June 30, 2024)
KEY FACTS | | |
| Fund Size | $179,825,903 | |
| Number of Holdings | 366 | |
| Portfolio Turnover | 63% | |
What did the Fund invest in?
(as of June 30, 2024)
REVENUE SOURCES (% of Fund's net assets) |
| Synthetics | 21.1 | |
| General Obligations | 19.3 | |
| Resource Recovery | 11.8 | |
| Industrial Development | 10.8 | |
| Health Care | 9.3 | |
| Electric Utilities | 9.2 | |
| Transportation | 7.6 | |
| Others(Individually Less Than 5%) | 10.9 | |
| 100.0 | |
| |
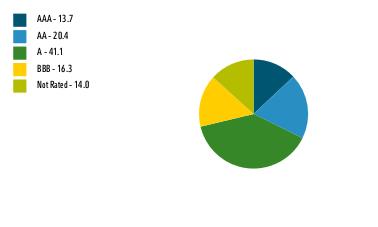
| AAA | 13.7 |
| AA | 20.4 |
| A | 41.1 |
| BBB | 16.3 |
| Not Rated | 14.0 |
QUALITY DIVERSIFICATION (% of Fund's net assets) |
|
| Short-Term Investments and Net Other Assets (Liabilities) - (5.5)%* |
| |
| We have used ratings from Moody's Investors Service, Inc. Where Moody's® ratings are not available, we have used S&P® ratings. All ratings are as of the date indicated and do not reflect subsequent changes. |
TOP STATES (% of Fund's net assets) |
| Texas | 12.7 |
| North Dakota | 10.5 |
| Non-state Specific | 10.5 |
| Pennsylvania | 7.9 |
| Florida | 6.4 |
| | |
| Fidelity, the Fidelity Investments Logo and all other Fidelity trademarks or service marks used herein are trademarks or service marks of FMR LLC. Any third-party marks that are used herein are trademarks or service marks of their respective owners. © 2024 FMR LLC. All rights reserved. |
| | For additional information about the Fund; including its prospectus, financial information, holdings and proxy information, scan the QR code or visit fundresearch.fidelity.com/prospectus/sec 1.9916170.100 3042-TSRS-0824 |
| |
| | SEMI-ANNUAL SHAREHOLDER REPORT | AS OF JUNE 30, 2024 | |
| | Fidelity® Conservative Income Municipal Bond Fund Fidelity Advisor® Conservative Income Municipal Bond Fund Class A : FMNFX |
| | | |
This semi-annual shareholder report contains information about Fidelity® Conservative Income Municipal Bond Fund for the period January 1, 2024 to June 30, 2024. You can find additional information about the Fund at fundresearch.fidelity.com/prospectus/sec. You can also request this information by contacting us at 1-877-208-0098 or by sending an e-mail to fidfunddocuments@fidelity.com.
What were your Fund costs for the last six months?(based on hypothetical $10,000 investment)
| | Costs of a $10,000 investment | Costs paid as a percentage of a $10,000 investment | |
| Class A | $ 21 | 0.43% | |
Key Fund Statistics (as of June 30, 2024)
KEY FACTS | | |
| Fund Size | $1,498,953,331 | |
| Number of Holdings | 540 | |
| Portfolio Turnover | 73% | |
What did the Fund invest in?
(as of June 30, 2024)
REVENUE SOURCES (% of Fund's net assets) |
| Synthetics | 19.2 | |
| General Obligations | 17.4 | |
| Resource Recovery | 12.8 | |
| Industrial Development | 11.6 | |
| Transportation | 10.1 | |
| Health Care | 7.8 | |
| Electric Utilities | 7.8 | |
| Housing | 6.0 | |
| Others(Individually Less Than 5%) | 7.3 | |
| 100.0 | |
| |
| AAA | 14.2 |
| AA | 20.0 |
| A | 42.2 |
| BBB | 16.4 |
| Not Rated | 11.0 |
QUALITY DIVERSIFICATION (% of Fund's net assets) |
|
| Short-Term Investments and Net Other Assets (Liabilities) - (3.8)%* |
| |
| We have used ratings from Moody's Investors Service, Inc. Where Moody's® ratings are not available, we have used S&P® ratings. All ratings are as of the date indicated and do not reflect subsequent changes. |
TOP STATES (% of Fund's net assets) |
| Non-state Specific | 12.9 |
| Texas | 11.3 |
| Florida | 8.0 |
| Pennsylvania | 7.0 |
| North Dakota | 6.2 |
| | |
| Fidelity, the Fidelity Investments Logo and all other Fidelity trademarks or service marks used herein are trademarks or service marks of FMR LLC. Any third-party marks that are used herein are trademarks or service marks of their respective owners. © 2024 FMR LLC. All rights reserved. |
| | For additional information about the Fund; including its prospectus, financial information, holdings and proxy information, scan the QR code or visit fundresearch.fidelity.com/prospectus/sec 1.9916156.100 7365-TSRS-0824 |
| |
| | SEMI-ANNUAL SHAREHOLDER REPORT | AS OF JUNE 30, 2024 | |
| | Fidelity® Minnesota Municipal Income Fund Fidelity® Minnesota Municipal Income Fund : FIMIX |
| | | |
This semi-annual shareholder report contains information about Fidelity® Minnesota Municipal Income Fund for the period January 1, 2024 to June 30, 2024. You can find additional information about the Fund at fundresearch.fidelity.com/prospectus/sec. You can also request this information by contacting us at 1-800-544-8544 or by sending an e-mail to fidfunddocuments@fidelity.com.
What were your Fund costs for the last six months?(based on hypothetical $10,000 investment)
| | Costs of a $10,000 investment | Costs paid as a percentage of a $10,000 investment | |
| Fidelity® Minnesota Municipal Income Fund | $ 24 | 0.49% | |
Key Fund Statistics (as of June 30, 2024)
KEY FACTS | | |
| Fund Size | $539,177,396 | |
| Number of Holdings | 355 | |
| Portfolio Turnover | 32% | |
What did the Fund invest in?
(as of June 30, 2024)
REVENUE SOURCES (% of Fund's net assets) |
| General Obligations | 36.6 | |
| Health Care | 28.2 | |
| Education | 10.8 | |
| Housing | 10.8 | |
| Electric Utilities | 5.4 | |
| Others(Individually Less Than 5%) | 8.2 | |
| 100.0 | |
| |
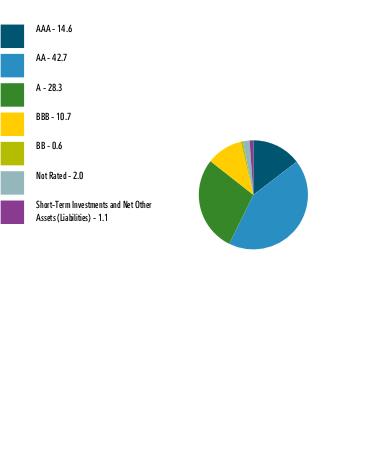
| AAA | 14.6 |
| AA | 42.7 |
| A | 28.3 |
| BBB | 10.7 |
| BB | 0.6 |
| Not Rated | 2.0 |
| Short-Term Investments and Net Other Assets (Liabilities) | 1.1 |
QUALITY DIVERSIFICATION (% of Fund's net assets) |
|
| |
| We have used ratings from Moody's Investors Service, Inc. Where Moody's® ratings are not available, we have used S&P® ratings. All ratings are as of the date indicated and do not reflect subsequent changes. |
| Fidelity, the Fidelity Investments Logo and all other Fidelity trademarks or service marks used herein are trademarks or service marks of FMR LLC. Any third-party marks that are used herein are trademarks or service marks of their respective owners. © 2024 FMR LLC. All rights reserved. |
| | For additional information about the Fund; including its prospectus, financial information, holdings and proxy information, scan the QR code or visit fundresearch.fidelity.com/prospectus/sec 1.9915978.100 82-TSRS-0824 |
| |
| | SEMI-ANNUAL SHAREHOLDER REPORT | AS OF JUNE 30, 2024 | |
| | Fidelity® Municipal Income Fund Fidelity® Municipal Income Fund : FHIGX |
| | | |
This semi-annual shareholder report contains information about Fidelity® Municipal Income Fund for the period January 1, 2024 to June 30, 2024. You can find additional information about the Fund at fundresearch.fidelity.com/prospectus/sec. You can also request this information by contacting us at 1-800-544-8544 or by sending an e-mail to fidfunddocuments@fidelity.com.
What were your Fund costs for the last six months?(based on hypothetical $10,000 investment)
| | Costs of a $10,000 investment | Costs paid as a percentage of a $10,000 investment | |
| Fidelity® Municipal Income Fund | $ 22 | 0.44% | |
Key Fund Statistics (as of June 30, 2024)
KEY FACTS | | |
| Fund Size | $4,615,397,246 | |
| Number of Holdings | 1,417 | |
| Portfolio Turnover | 11% | |
What did the Fund invest in?
(as of June 30, 2024)
REVENUE SOURCES (% of Fund's net assets) |
| Transportation | 23.8 | |
| General Obligations | 22.0 | |
| Health Care | 20.5 | |
| Education | 9.8 | |
| Special Tax | 9.3 | |
| State G.O. | 6.1 | |
| Others(Individually Less Than 5%) | 8.5 | |
| 100.0 | |
| |
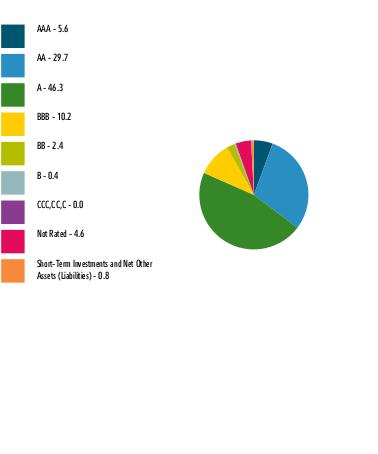
| AAA | 5.6 |
| AA | 29.7 |
| A | 46.3 |
| BBB | 10.2 |
| BB | 2.4 |
| B | 0.4 |
| CCC,CC,C | 0.0 |
| Not Rated | 4.6 |
| Short-Term Investments and Net Other Assets (Liabilities) | 0.8 |
QUALITY DIVERSIFICATION (% of Fund's net assets) |
|
| |
| We have used ratings from Moody's Investors Service, Inc. Where Moody's® ratings are not available, we have used S&P® ratings. All ratings are as of the date indicated and do not reflect subsequent changes. |
TOP STATES (% of Fund's net assets) |
| Illinois | 14.9 |
| New York | 9.0 |
| Pennsylvania | 7.7 |
| New Jersey | 6.5 |
| Florida | 6.3 |
| | |
| Fidelity, the Fidelity Investments Logo and all other Fidelity trademarks or service marks used herein are trademarks or service marks of FMR LLC. Any third-party marks that are used herein are trademarks or service marks of their respective owners. © 2024 FMR LLC. All rights reserved. |
| | For additional information about the Fund; including its prospectus, financial information, holdings and proxy information, scan the QR code or visit fundresearch.fidelity.com/prospectus/sec 1.9915942.100 37-TSRS-0824 |
| |
| | SEMI-ANNUAL SHAREHOLDER REPORT | AS OF JUNE 30, 2024 | |
| | Fidelity Flex® Municipal Income Fund Fidelity Flex® Municipal Income Fund : FUENX |
| | | |
This semi-annual shareholder report contains information about Fidelity Flex® Municipal Income Fund for the period January 1, 2024 to June 30, 2024. You can find additional information about the Fund at fundresearch.fidelity.com/prospectus/sec. You can also request this information by contacting us at 1-800-544-3455 or by sending an e-mail to fidfunddocuments@fidelity.com.
What were your Fund costs for the last six months?(based on hypothetical $10,000 investment)
| | Costs of a $10,000 investment | Costs paid as a percentage of a $10,000 investment | |
| Fidelity Flex® Municipal Income Fund | $ 0 A | 0.00%B | |
A Amount represents less than $.50
B Amount represents less than 0.005%
Key Fund Statistics (as of June 30, 2024)
KEY FACTS | | |
| Fund Size | $779,750,071 | |
| Number of Holdings | 1,152 | |
| Portfolio Turnover | 7% | |
What did the Fund invest in?
(as of June 30, 2024)
REVENUE SOURCES (% of Fund's net assets) |
| General Obligations | 20.6 | |
| Transportation | 20.6 | |
| Health Care | 11.1 | |
| Education | 10.9 | |
| Special Tax | 10.0 | |
| Housing | 8.0 | |
| Others(Individually Less Than 5%) | 18.8 | |
| 100.0 | |
| |
| AAA | 7.6 |
| AA | 34.7 |
| A | 37.7 |
| BBB | 9.7 |
| BB | 0.8 |
| B | 0.2 |
| CCC,CC,C | 0.2 |
| Not Rated | 3.6 |
| Short-Term Investments and Net Other Assets (Liabilities) | 5.5 |
QUALITY DIVERSIFICATION (% of Fund's net assets) |
|
| |
| We have used ratings from Moody's Investors Service, Inc. Where Moody's® ratings are not available, we have used S&P® ratings. All ratings are as of the date indicated and do not reflect subsequent changes. |
TOP STATES (% of Fund's net assets) |
| Illinois | 10.7 |
| New York | 9.9 |
| Pennsylvania | 7.5 |
| California | 6.1 |
| New Jersey | 5.9 |
| | |
| Fidelity, the Fidelity Investments Logo and all other Fidelity trademarks or service marks used herein are trademarks or service marks of FMR LLC. Any third-party marks that are used herein are trademarks or service marks of their respective owners. © 2024 FMR LLC. All rights reserved. |
| | For additional information about the Fund; including its prospectus, financial information, holdings and proxy information, scan the QR code or visit fundresearch.fidelity.com/prospectus/sec 1.9916171.100 3043-TSRS-0824 |
| |
| | SEMI-ANNUAL SHAREHOLDER REPORT | AS OF JUNE 30, 2024 | |
| | Fidelity® Limited Term Municipal Income Fund Fidelity Advisor® Limited Term Municipal Income Fund Class I : FISHX |
| | | |
This semi-annual shareholder report contains information about Fidelity® Limited Term Municipal Income Fund for the period January 1, 2024 to June 30, 2024. You can find additional information about the Fund at fundresearch.fidelity.com/prospectus/sec. You can also request this information by contacting us at 1-877-208-0098 or by sending an e-mail to fidfunddocuments@fidelity.com.
What were your Fund costs for the last six months?(based on hypothetical $10,000 investment)
| | Costs of a $10,000 investment | Costs paid as a percentage of a $10,000 investment | |
| Class I | $ 15 | 0.30% | |
Key Fund Statistics (as of June 30, 2024)
KEY FACTS | | |
| Fund Size | $2,594,296,689 | |
| Number of Holdings | 988 | |
| Portfolio Turnover | 19% | |
What did the Fund invest in?
(as of June 30, 2024)
REVENUE SOURCES (% of Fund's net assets) |
| General Obligations | 24.0 | |
| Transportation | 21.7 | |
| Health Care | 16.7 | |
| Housing | 7.5 | |
| State G.O. | 7.3 | |
| Electric Utilities | 7.0 | |
| Others(Individually Less Than 5%) | 15.8 | |
| 100.0 | |
| |
| AAA | 13.2 |
| AA | 39.8 |
| A | 38.2 |
| BBB | 6.3 |
| BB | 0.6 |
| Not Rated | 1.8 |
| Short-Term Investments and Net Other Assets (Liabilities) | 0.1 |
QUALITY DIVERSIFICATION (% of Fund's net assets) |
|
| |
| We have used ratings from Moody's Investors Service, Inc. Where Moody's® ratings are not available, we have used S&P® ratings. All ratings are as of the date indicated and do not reflect subsequent changes. |
TOP STATES (% of Fund's net assets) |
| Texas | 15.5 |
| New York | 11.5 |
| Illinois | 8.8 |
| New Jersey | 4.6 |
| Florida | 4.3 |
| | |
| Fidelity, the Fidelity Investments Logo and all other Fidelity trademarks or service marks used herein are trademarks or service marks of FMR LLC. Any third-party marks that are used herein are trademarks or service marks of their respective owners. © 2024 FMR LLC. All rights reserved. |
| | For additional information about the Fund; including its prospectus, financial information, holdings and proxy information, scan the QR code or visit fundresearch.fidelity.com/prospectus/sec 1.9916014.100 1276-TSRS-0824 |
| |
| | SEMI-ANNUAL SHAREHOLDER REPORT | AS OF JUNE 30, 2024 | |
| | Fidelity® Municipal Income Fund Fidelity Advisor® Municipal Income Fund Class Z : FIWEX |
| | | |
This semi-annual shareholder report contains information about Fidelity® Municipal Income Fund for the period January 1, 2024 to June 30, 2024. You can find additional information about the Fund at fundresearch.fidelity.com/prospectus/sec. You can also request this information by contacting us at 1-877-208-0098 or by sending an e-mail to fidfunddocuments@fidelity.com.
What were your Fund costs for the last six months?(based on hypothetical $10,000 investment)
| | Costs of a $10,000 investment | Costs paid as a percentage of a $10,000 investment | |
| Class Z | $ 20 | 0.41% | |
Key Fund Statistics (as of June 30, 2024)
KEY FACTS | | |
| Fund Size | $4,615,397,246 | |
| Number of Holdings | 1,417 | |
| Portfolio Turnover | 11% | |
What did the Fund invest in?
(as of June 30, 2024)
REVENUE SOURCES (% of Fund's net assets) |
| Transportation | 23.8 | |
| General Obligations | 22.0 | |
| Health Care | 20.5 | |
| Education | 9.8 | |
| Special Tax | 9.3 | |
| State G.O. | 6.1 | |
| Others(Individually Less Than 5%) | 8.5 | |
| 100.0 | |
| |
| AAA | 5.6 |
| AA | 29.7 |
| A | 46.3 |
| BBB | 10.2 |
| BB | 2.4 |
| B | 0.4 |
| CCC,CC,C | 0.0 |
| Not Rated | 4.6 |
| Short-Term Investments and Net Other Assets (Liabilities) | 0.8 |
QUALITY DIVERSIFICATION (% of Fund's net assets) |
|
| |
| We have used ratings from Moody's Investors Service, Inc. Where Moody's® ratings are not available, we have used S&P® ratings. All ratings are as of the date indicated and do not reflect subsequent changes. |
TOP STATES (% of Fund's net assets) |
| Illinois | 14.9 |
| New York | 9.0 |
| Pennsylvania | 7.7 |
| New Jersey | 6.5 |
| Florida | 6.3 |
| | |
| Fidelity, the Fidelity Investments Logo and all other Fidelity trademarks or service marks used herein are trademarks or service marks of FMR LLC. Any third-party marks that are used herein are trademarks or service marks of their respective owners. © 2024 FMR LLC. All rights reserved. |
| | For additional information about the Fund; including its prospectus, financial information, holdings and proxy information, scan the QR code or visit fundresearch.fidelity.com/prospectus/sec 1.9915941.100 3287-TSRS-0824 |
| |
| | SEMI-ANNUAL SHAREHOLDER REPORT | AS OF JUNE 30, 2024 | |
| | Fidelity® Ohio Municipal Income Fund Fidelity® Ohio Municipal Income Fund : FOHFX |
| | | |
This semi-annual shareholder report contains information about Fidelity® Ohio Municipal Income Fund for the period January 1, 2024 to June 30, 2024. You can find additional information about the Fund at fundresearch.fidelity.com/prospectus/sec. You can also request this information by contacting us at 1-800-544-8544 or by sending an e-mail to fidfunddocuments@fidelity.com.
What were your Fund costs for the last six months?(based on hypothetical $10,000 investment)
| | Costs of a $10,000 investment | Costs paid as a percentage of a $10,000 investment | |
| Fidelity® Ohio Municipal Income Fund | $ 24 | 0.47% | |
Key Fund Statistics (as of June 30, 2024)
KEY FACTS | | |
| Fund Size | $489,392,781 | |
| Number of Holdings | 275 | |
| Portfolio Turnover | 8% | |
What did the Fund invest in?
(as of June 30, 2024)
REVENUE SOURCES (% of Fund's net assets) |
| Health Care | 36.6 | |
| Education | 20.2 | |
| Special Tax | 8.4 | |
| General Obligations | 7.0 | |
| Housing | 5.0 | |
| Others(Individually Less Than 5%) | 22.8 | |
| 100.0 | |
| |
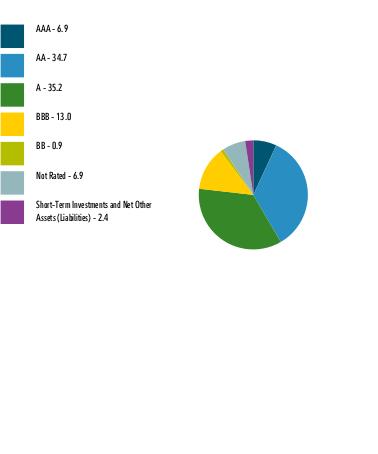
| AAA | 6.9 |
| AA | 34.7 |
| A | 35.2 |
| BBB | 13.0 |
| BB | 0.9 |
| Not Rated | 6.9 |
| Short-Term Investments and Net Other Assets (Liabilities) | 2.4 |
QUALITY DIVERSIFICATION (% of Fund's net assets) |
|
| |
| We have used ratings from Moody's Investors Service, Inc. Where Moody's® ratings are not available, we have used S&P® ratings. All ratings are as of the date indicated and do not reflect subsequent changes. |
| Fidelity, the Fidelity Investments Logo and all other Fidelity trademarks or service marks used herein are trademarks or service marks of FMR LLC. Any third-party marks that are used herein are trademarks or service marks of their respective owners. © 2024 FMR LLC. All rights reserved. |
| | For additional information about the Fund; including its prospectus, financial information, holdings and proxy information, scan the QR code or visit fundresearch.fidelity.com/prospectus/sec 1.9915979.100 88-TSRS-0824 |
| |
| | SEMI-ANNUAL SHAREHOLDER REPORT | AS OF JUNE 30, 2024 | |
| | Fidelity® Municipal Income Fund Fidelity Advisor® Municipal Income Fund Class A : FHUGX |
| | | |
This semi-annual shareholder report contains information about Fidelity® Municipal Income Fund for the period January 1, 2024 to June 30, 2024. You can find additional information about the Fund at fundresearch.fidelity.com/prospectus/sec. You can also request this information by contacting us at 1-877-208-0098 or by sending an e-mail to fidfunddocuments@fidelity.com.
What were your Fund costs for the last six months?(based on hypothetical $10,000 investment)
| | Costs of a $10,000 investment | Costs paid as a percentage of a $10,000 investment | |
| Class A | $ 38 | 0.77% | |
Key Fund Statistics (as of June 30, 2024)
KEY FACTS | | |
| Fund Size | $4,615,397,246 | |
| Number of Holdings | 1,417 | |
| Portfolio Turnover | 11% | |
What did the Fund invest in?
(as of June 30, 2024)
REVENUE SOURCES (% of Fund's net assets) |
| Transportation | 23.8 | |
| General Obligations | 22.0 | |
| Health Care | 20.5 | |
| Education | 9.8 | |
| Special Tax | 9.3 | |
| State G.O. | 6.1 | |
| Others(Individually Less Than 5%) | 8.5 | |
| 100.0 | |
| |
| AAA | 5.6 |
| AA | 29.7 |
| A | 46.3 |
| BBB | 10.2 |
| BB | 2.4 |
| B | 0.4 |
| CCC,CC,C | 0.0 |
| Not Rated | 4.6 |
| Short-Term Investments and Net Other Assets (Liabilities) | 0.8 |
QUALITY DIVERSIFICATION (% of Fund's net assets) |
|
| |
| We have used ratings from Moody's Investors Service, Inc. Where Moody's® ratings are not available, we have used S&P® ratings. All ratings are as of the date indicated and do not reflect subsequent changes. |
TOP STATES (% of Fund's net assets) |
| Illinois | 14.9 |
| New York | 9.0 |
| Pennsylvania | 7.7 |
| New Jersey | 6.5 |
| Florida | 6.3 |
| | |
| Fidelity, the Fidelity Investments Logo and all other Fidelity trademarks or service marks used herein are trademarks or service marks of FMR LLC. Any third-party marks that are used herein are trademarks or service marks of their respective owners. © 2024 FMR LLC. All rights reserved. |
| | For additional information about the Fund; including its prospectus, financial information, holdings and proxy information, scan the QR code or visit fundresearch.fidelity.com/prospectus/sec 1.9915937.100 3068-TSRS-0824 |
| |
| | SEMI-ANNUAL SHAREHOLDER REPORT | AS OF JUNE 30, 2024 | |
| | Fidelity® Limited Term Municipal Income Fund Fidelity Advisor® Limited Term Municipal Income Fund Class Z : FIWAX |
| | | |
This semi-annual shareholder report contains information about Fidelity® Limited Term Municipal Income Fund for the period January 1, 2024 to June 30, 2024. You can find additional information about the Fund at fundresearch.fidelity.com/prospectus/sec. You can also request this information by contacting us at 1-877-208-0098 or by sending an e-mail to fidfunddocuments@fidelity.com.
What were your Fund costs for the last six months?(based on hypothetical $10,000 investment)
| | Costs of a $10,000 investment | Costs paid as a percentage of a $10,000 investment | |
| Class Z | $ 13 | 0.25% | |
Key Fund Statistics (as of June 30, 2024)
KEY FACTS | | |
| Fund Size | $2,594,296,689 | |
| Number of Holdings | 988 | |
| Portfolio Turnover | 19% | |
What did the Fund invest in?
(as of June 30, 2024)
REVENUE SOURCES (% of Fund's net assets) |
| General Obligations | 24.0 | |
| Transportation | 21.7 | |
| Health Care | 16.7 | |
| Housing | 7.5 | |
| State G.O. | 7.3 | |
| Electric Utilities | 7.0 | |
| Others(Individually Less Than 5%) | 15.8 | |
| 100.0 | |
| |
| AAA | 13.2 |
| AA | 39.8 |
| A | 38.2 |
| BBB | 6.3 |
| BB | 0.6 |
| Not Rated | 1.8 |
| Short-Term Investments and Net Other Assets (Liabilities) | 0.1 |
QUALITY DIVERSIFICATION (% of Fund's net assets) |
|
| |
| We have used ratings from Moody's Investors Service, Inc. Where Moody's® ratings are not available, we have used S&P® ratings. All ratings are as of the date indicated and do not reflect subsequent changes. |
TOP STATES (% of Fund's net assets) |
| Texas | 15.5 |
| New York | 11.5 |
| Illinois | 8.8 |
| New Jersey | 4.6 |
| Florida | 4.3 |
| | |
| Fidelity, the Fidelity Investments Logo and all other Fidelity trademarks or service marks used herein are trademarks or service marks of FMR LLC. Any third-party marks that are used herein are trademarks or service marks of their respective owners. © 2024 FMR LLC. All rights reserved. |
| | For additional information about the Fund; including its prospectus, financial information, holdings and proxy information, scan the QR code or visit fundresearch.fidelity.com/prospectus/sec 1.9916015.100 3284-TSRS-0824 |
| |
| | SEMI-ANNUAL SHAREHOLDER REPORT | AS OF JUNE 30, 2024 | |
| | Fidelity® Pennsylvania Municipal Income Fund Fidelity® Pennsylvania Municipal Income Fund : FPXTX |
| | | |
This semi-annual shareholder report contains information about Fidelity® Pennsylvania Municipal Income Fund for the period January 1, 2024 to June 30, 2024. You can find additional information about the Fund at fundresearch.fidelity.com/prospectus/sec. You can also request this information by contacting us at 1-800-544-8544 or by sending an e-mail to fidfunddocuments@fidelity.com.
What were your Fund costs for the last six months?(based on hypothetical $10,000 investment)
| | Costs of a $10,000 investment | Costs paid as a percentage of a $10,000 investment | |
| Fidelity® Pennsylvania Municipal Income Fund | $ 24 | 0.48% | |
Key Fund Statistics (as of June 30, 2024)
KEY FACTS | | |
| Fund Size | $399,407,787 | |
| Number of Holdings | 221 | |
| Portfolio Turnover | 4% | |
What did the Fund invest in?
(as of June 30, 2024)
REVENUE SOURCES (% of Fund's net assets) |
| Health Care | 26.9 | |
| Transportation | 19.3 | |
| Education | 18.9 | |
| General Obligations | 13.4 | |
| Housing | 7.2 | |
| Others(Individually Less Than 5%) | 14.3 | |
| 100.0 | |
| |
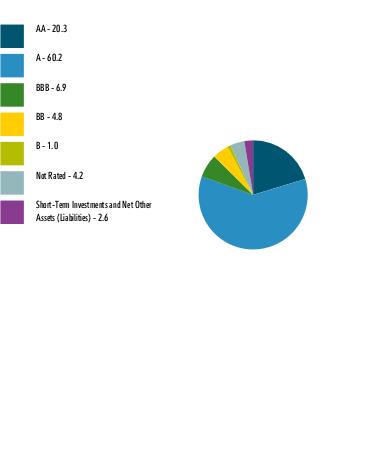
| AA | 20.3 |
| A | 60.2 |
| BBB | 6.9 |
| BB | 4.8 |
| B | 1.0 |
| Not Rated | 4.2 |
| Short-Term Investments and Net Other Assets (Liabilities) | 2.6 |
QUALITY DIVERSIFICATION (% of Fund's net assets) |
|
| |
| We have used ratings from Moody's Investors Service, Inc. Where Moody's® ratings are not available, we have used S&P® ratings. All ratings are as of the date indicated and do not reflect subsequent changes. |
| Fidelity, the Fidelity Investments Logo and all other Fidelity trademarks or service marks used herein are trademarks or service marks of FMR LLC. Any third-party marks that are used herein are trademarks or service marks of their respective owners. © 2024 FMR LLC. All rights reserved. |
| | For additional information about the Fund; including its prospectus, financial information, holdings and proxy information, scan the QR code or visit fundresearch.fidelity.com/prospectus/sec 1.9916010.100 402-TSRS-0824 |
| |
| | SEMI-ANNUAL SHAREHOLDER REPORT | AS OF JUNE 30, 2024 | |
| | Fidelity® Limited Term Municipal Income Fund Fidelity Advisor® Limited Term Municipal Income Fund Class C : FCSHX |
| | | |
This semi-annual shareholder report contains information about Fidelity® Limited Term Municipal Income Fund for the period January 1, 2024 to June 30, 2024. You can find additional information about the Fund at fundresearch.fidelity.com/prospectus/sec. You can also request this information by contacting us at 1-877-208-0098 or by sending an e-mail to fidfunddocuments@fidelity.com.
What were your Fund costs for the last six months?(based on hypothetical $10,000 investment)
| | Costs of a $10,000 investment | Costs paid as a percentage of a $10,000 investment | |
| Class C | $ 64 | 1.29% | |
Key Fund Statistics (as of June 30, 2024)
KEY FACTS | | |
| Fund Size | $2,594,296,689 | |
| Number of Holdings | 988 | |
| Portfolio Turnover | 19% | |
What did the Fund invest in?
(as of June 30, 2024)
REVENUE SOURCES (% of Fund's net assets) |
| General Obligations | 24.0 | |
| Transportation | 21.7 | |
| Health Care | 16.7 | |
| Housing | 7.5 | |
| State G.O. | 7.3 | |
| Electric Utilities | 7.0 | |
| Others(Individually Less Than 5%) | 15.8 | |
| 100.0 | |
| |
| AAA | 13.2 |
| AA | 39.8 |
| A | 38.2 |
| BBB | 6.3 |
| BB | 0.6 |
| Not Rated | 1.8 |
| Short-Term Investments and Net Other Assets (Liabilities) | 0.1 |
QUALITY DIVERSIFICATION (% of Fund's net assets) |
|
| |
| We have used ratings from Moody's Investors Service, Inc. Where Moody's® ratings are not available, we have used S&P® ratings. All ratings are as of the date indicated and do not reflect subsequent changes. |
TOP STATES (% of Fund's net assets) |
| Texas | 15.5 |
| New York | 11.5 |
| Illinois | 8.8 |
| New Jersey | 4.6 |
| Florida | 4.3 |
| | |
| Fidelity, the Fidelity Investments Logo and all other Fidelity trademarks or service marks used herein are trademarks or service marks of FMR LLC. Any third-party marks that are used herein are trademarks or service marks of their respective owners. © 2024 FMR LLC. All rights reserved. |
| | For additional information about the Fund; including its prospectus, financial information, holdings and proxy information, scan the QR code or visit fundresearch.fidelity.com/prospectus/sec 1.9916012.100 1274-TSRS-0824 |
| |
| | SEMI-ANNUAL SHAREHOLDER REPORT | AS OF JUNE 30, 2024 | |
| | Fidelity® Municipal Income Fund Fidelity Advisor® Municipal Income Fund Class M : FLUVX |
| | | |
This semi-annual shareholder report contains information about Fidelity® Municipal Income Fund for the period January 1, 2024 to June 30, 2024. You can find additional information about the Fund at fundresearch.fidelity.com/prospectus/sec. You can also request this information by contacting us at 1-877-208-0098 or by sending an e-mail to fidfunddocuments@fidelity.com.
What were your Fund costs for the last six months?(based on hypothetical $10,000 investment)
| | Costs of a $10,000 investment | Costs paid as a percentage of a $10,000 investment | |
| Class M | $ 37 | 0.75% | |
Key Fund Statistics (as of June 30, 2024)
KEY FACTS | | |
| Fund Size | $4,615,397,246 | |
| Number of Holdings | 1,417 | |
| Portfolio Turnover | 11% | |
What did the Fund invest in?
(as of June 30, 2024)
REVENUE SOURCES (% of Fund's net assets) |
| Transportation | 23.8 | |
| General Obligations | 22.0 | |
| Health Care | 20.5 | |
| Education | 9.8 | |
| Special Tax | 9.3 | |
| State G.O. | 6.1 | |
| Others(Individually Less Than 5%) | 8.5 | |
| 100.0 | |
| |
| AAA | 5.6 |
| AA | 29.7 |
| A | 46.3 |
| BBB | 10.2 |
| BB | 2.4 |
| B | 0.4 |
| CCC,CC,C | 0.0 |
| Not Rated | 4.6 |
| Short-Term Investments and Net Other Assets (Liabilities) | 0.8 |
QUALITY DIVERSIFICATION (% of Fund's net assets) |
|
| |
| We have used ratings from Moody's Investors Service, Inc. Where Moody's® ratings are not available, we have used S&P® ratings. All ratings are as of the date indicated and do not reflect subsequent changes. |
TOP STATES (% of Fund's net assets) |
| Illinois | 14.9 |
| New York | 9.0 |
| Pennsylvania | 7.7 |
| New Jersey | 6.5 |
| Florida | 6.3 |
| | |
| Fidelity, the Fidelity Investments Logo and all other Fidelity trademarks or service marks used herein are trademarks or service marks of FMR LLC. Any third-party marks that are used herein are trademarks or service marks of their respective owners. © 2024 FMR LLC. All rights reserved. |
| | For additional information about the Fund; including its prospectus, financial information, holdings and proxy information, scan the QR code or visit fundresearch.fidelity.com/prospectus/sec 1.9915939.100 3070-TSRS-0824 |
| |
| | SEMI-ANNUAL SHAREHOLDER REPORT | AS OF JUNE 30, 2024 | |
| | Fidelity® Limited Term Municipal Income Fund Fidelity Advisor® Limited Term Municipal Income Fund Class M : FTSHX |
| | | |
This semi-annual shareholder report contains information about Fidelity® Limited Term Municipal Income Fund for the period January 1, 2024 to June 30, 2024. You can find additional information about the Fund at fundresearch.fidelity.com/prospectus/sec. You can also request this information by contacting us at 1-877-208-0098 or by sending an e-mail to fidfunddocuments@fidelity.com.
What were your Fund costs for the last six months?(based on hypothetical $10,000 investment)
| | Costs of a $10,000 investment | Costs paid as a percentage of a $10,000 investment | |
| Class M | $ 27 | 0.55% | |
Key Fund Statistics (as of June 30, 2024)
KEY FACTS | | |
| Fund Size | $2,594,296,689 | |
| Number of Holdings | 988 | |
| Portfolio Turnover | 19% | |
What did the Fund invest in?
(as of June 30, 2024)
REVENUE SOURCES (% of Fund's net assets) |
| General Obligations | 24.0 | |
| Transportation | 21.7 | |
| Health Care | 16.7 | |
| Housing | 7.5 | |
| State G.O. | 7.3 | |
| Electric Utilities | 7.0 | |
| Others(Individually Less Than 5%) | 15.8 | |
| 100.0 | |
| |
| AAA | 13.2 |
| AA | 39.8 |
| A | 38.2 |
| BBB | 6.3 |
| BB | 0.6 |
| Not Rated | 1.8 |
| Short-Term Investments and Net Other Assets (Liabilities) | 0.1 |
QUALITY DIVERSIFICATION (% of Fund's net assets) |
|
| |
| We have used ratings from Moody's Investors Service, Inc. Where Moody's® ratings are not available, we have used S&P® ratings. All ratings are as of the date indicated and do not reflect subsequent changes. |
TOP STATES (% of Fund's net assets) |
| Texas | 15.5 |
| New York | 11.5 |
| Illinois | 8.8 |
| New Jersey | 4.6 |
| Florida | 4.3 |
| | |
| Fidelity, the Fidelity Investments Logo and all other Fidelity trademarks or service marks used herein are trademarks or service marks of FMR LLC. Any third-party marks that are used herein are trademarks or service marks of their respective owners. © 2024 FMR LLC. All rights reserved. |
| | For additional information about the Fund; including its prospectus, financial information, holdings and proxy information, scan the QR code or visit fundresearch.fidelity.com/prospectus/sec 1.9916013.100 1275-TSRS-0824 |
| |
| | SEMI-ANNUAL SHAREHOLDER REPORT | AS OF JUNE 30, 2024 | |
| | Fidelity® Conservative Income Municipal Bond Fund Fidelity Advisor® Conservative Income Municipal Bond Fund Class I : FMNGX |
| | | |
This semi-annual shareholder report contains information about Fidelity® Conservative Income Municipal Bond Fund for the period January 1, 2024 to June 30, 2024. You can find additional information about the Fund at fundresearch.fidelity.com/prospectus/sec. You can also request this information by contacting us at 1-877-208-0098 or by sending an e-mail to fidfunddocuments@fidelity.com.
What were your Fund costs for the last six months?(based on hypothetical $10,000 investment)
| | Costs of a $10,000 investment | Costs paid as a percentage of a $10,000 investment | |
| Class I | $ 13 | 0.25% | |
Key Fund Statistics (as of June 30, 2024)
KEY FACTS | | |
| Fund Size | $1,498,953,331 | |
| Number of Holdings | 540 | |
| Portfolio Turnover | 73% | |
What did the Fund invest in?
(as of June 30, 2024)
REVENUE SOURCES (% of Fund's net assets) |
| Synthetics | 19.2 | |
| General Obligations | 17.4 | |
| Resource Recovery | 12.8 | |
| Industrial Development | 11.6 | |
| Transportation | 10.1 | |
| Health Care | 7.8 | |
| Electric Utilities | 7.8 | |
| Housing | 6.0 | |
| Others(Individually Less Than 5%) | 7.3 | |
| 100.0 | |
| |
| AAA | 14.2 |
| AA | 20.0 |
| A | 42.2 |
| BBB | 16.4 |
| Not Rated | 11.0 |
QUALITY DIVERSIFICATION (% of Fund's net assets) |
|
| Short-Term Investments and Net Other Assets (Liabilities) - (3.8)%* |
| |
| We have used ratings from Moody's Investors Service, Inc. Where Moody's® ratings are not available, we have used S&P® ratings. All ratings are as of the date indicated and do not reflect subsequent changes. |
TOP STATES (% of Fund's net assets) |
| Non-state Specific | 12.9 |
| Texas | 11.3 |
| Florida | 8.0 |
| Pennsylvania | 7.0 |
| North Dakota | 6.2 |
| | |
| Fidelity, the Fidelity Investments Logo and all other Fidelity trademarks or service marks used herein are trademarks or service marks of FMR LLC. Any third-party marks that are used herein are trademarks or service marks of their respective owners. © 2024 FMR LLC. All rights reserved. |
| | For additional information about the Fund; including its prospectus, financial information, holdings and proxy information, scan the QR code or visit fundresearch.fidelity.com/prospectus/sec 1.9916157.100 7366-TSRS-0824 |
| |
| | SEMI-ANNUAL SHAREHOLDER REPORT | AS OF JUNE 30, 2024 | |
| | Fidelity® Municipal Income Fund Fidelity Advisor® Municipal Income Fund Class C : FKISX |
| | | |
This semi-annual shareholder report contains information about Fidelity® Municipal Income Fund for the period January 1, 2024 to June 30, 2024. You can find additional information about the Fund at fundresearch.fidelity.com/prospectus/sec. You can also request this information by contacting us at 1-877-208-0098 or by sending an e-mail to fidfunddocuments@fidelity.com.
What were your Fund costs for the last six months?(based on hypothetical $10,000 investment)
| | Costs of a $10,000 investment | Costs paid as a percentage of a $10,000 investment | |
| Class C | $ 75 | 1.51% | |
Key Fund Statistics (as of June 30, 2024)
KEY FACTS | | |
| Fund Size | $4,615,397,246 | |
| Number of Holdings | 1,417 | |
| Portfolio Turnover | 11% | |
What did the Fund invest in?
(as of June 30, 2024)
REVENUE SOURCES (% of Fund's net assets) |
| Transportation | 23.8 | |
| General Obligations | 22.0 | |
| Health Care | 20.5 | |
| Education | 9.8 | |
| Special Tax | 9.3 | |
| State G.O. | 6.1 | |
| Others(Individually Less Than 5%) | 8.5 | |
| 100.0 | |
| |
| AAA | 5.6 |
| AA | 29.7 |
| A | 46.3 |
| BBB | 10.2 |
| BB | 2.4 |
| B | 0.4 |
| CCC,CC,C | 0.0 |
| Not Rated | 4.6 |
| Short-Term Investments and Net Other Assets (Liabilities) | 0.8 |
QUALITY DIVERSIFICATION (% of Fund's net assets) |
|
| |
| We have used ratings from Moody's Investors Service, Inc. Where Moody's® ratings are not available, we have used S&P® ratings. All ratings are as of the date indicated and do not reflect subsequent changes. |
TOP STATES (% of Fund's net assets) |
| Illinois | 14.9 |
| New York | 9.0 |
| Pennsylvania | 7.7 |
| New Jersey | 6.5 |
| Florida | 6.3 |
| | |
| Fidelity, the Fidelity Investments Logo and all other Fidelity trademarks or service marks used herein are trademarks or service marks of FMR LLC. Any third-party marks that are used herein are trademarks or service marks of their respective owners. © 2024 FMR LLC. All rights reserved. |
| | For additional information about the Fund; including its prospectus, financial information, holdings and proxy information, scan the QR code or visit fundresearch.fidelity.com/prospectus/sec 1.9915938.100 3069-TSRS-0824 |
Item 2.
Code of Ethics
Not applicable.
Item 3.
Audit Committee Financial Expert
Not applicable.
Item 4.
Principal Accountant Fees and Services
Not applicable.
Item 5.
Audit Committee of Listed Registrants
Not applicable.
Item 6.
Investments
(a)
Not applicable.
(b)
Not applicable
Item 7.
Financial Statements and Financial Highlights for Open-End Management Investment Companies
Fidelity® Limited Term Municipal Income Fund
Semi-Annual Report
June 30, 2024
Includes Fidelity and Fidelity Advisor share classes
Contents
To view a fund's proxy voting guidelines and proxy voting record for the 12-month period ended June 30, visit http://www.fidelity.com/proxyvotingresults or visit the Securities and Exchange Commission's (SEC) web site at http://www.sec.gov.
You may also call 1-800-544-8544 if you're an individual investing directly with Fidelity, call 1-800-835-5092 if you're a plan sponsor or participant with Fidelity as your recordkeeper or call 1-877-208-0098 on institutional accounts or if you're an advisor or invest through one to request a free copy of the proxy voting guidelines.
Standard & Poor's, S&P and S&P 500 are registered service marks of The McGraw-Hill Companies, Inc. and have been licensed for use by Fidelity Distributors Corporation.
Other third-party marks appearing herein are the property of their respective owners.
All other marks appearing herein are registered or unregistered trademarks or service marks of FMR LLC or an affiliated company. © 2024 FMR LLC. All rights reserved.
This report and the financial statements contained herein are submitted for the general information of the shareholders of the Fund. This report is not authorized for distribution to prospective investors in the Fund unless preceded or accompanied by an effective prospectus.
A fund files its complete schedule of portfolio holdings with the SEC for the first and third quarters of each fiscal year on Form N-PORT. Forms N-PORT are available on the SEC's web site at http://www.sec.gov. A fund's Forms N-PORT may be reviewed and copied at the SEC's Public Reference Room in Washington, DC. Information regarding the operation of the SEC's Public Reference Room may be obtained by calling 1-800-SEC-0330.
For a complete list of a fund's portfolio holdings, view the most recent holdings listing, semiannual report, or annual report on Fidelity's web site at http://www.fidelity.com, http://www.institutional.fidelity.com, or http://www.401k.com, as applicable.
NOT FDIC INSURED •MAY LOSE VALUE •NO BANK GUARANTEE
Neither the Fund nor Fidelity Distributors Corporation is a bank.
Item 7: Financial Statements and Financial Highlights for Open-End Management Investment Companies (Semi-Annual Report)
Fidelity® Limited Term Municipal Income Fund
Schedule of Investments June 30, 2024 (Unaudited)
Showing Percentage of Net Assets
| Municipal Bonds - 99.9% |
| | | Principal Amount (a) (000s) | Value ($) (000s) |
| Alabama - 2.6% | | | |
| Birmingham Arpt. Auth. Series 2020: | | | |
| 5% 7/1/26 (Build America Mutual Assurance Insured) | | 555 | 573 |
| 5% 7/1/27 (Build America Mutual Assurance Insured) | | 500 | 525 |
| Black Belt Energy Gas District: | | | |
| Bonds: | | | |
(Proj. No. 5) Series A, 4%, tender 10/1/26 (b) | | 4,000 | 4,003 |
Series 2022 E, 5%, tender 6/1/28 (b) | | 4,945 | 5,150 |
Series 2023 D1, 5.5%, tender 2/1/29 (b) | | 4,460 | 4,733 |
| Series 2022 C1: | | | |
5.25% 12/1/26 | | 1,845 | 1,896 |
5.25% 6/1/27 | | 1,290 | 1,334 |
5.25% 12/1/27 | | 1,170 | 1,218 |
5.25% 6/1/28 | | 1,540 | 1,604 |
5.25% 12/1/28 | | 1,275 | 1,333 |
5.25% 6/1/29 | | 1,000 | 1,052 |
| Huntsville Health Care Auth. Bonds Series 2023 A, 5%, tender 6/1/30 (b) | | 8,950 | 9,553 |
| Jefferson County Swr. Rev. Series 2024, 5% 10/1/29 | | 1,195 | 1,283 |
| Mobile County Board of School Commissioners Series 2016 A, 5% 3/1/25 | | 1,225 | 1,236 |
| Mobile Indl. Dev. Board Poll. Cont. Rev. Bonds Series 2009 E, 1%, tender 6/26/25 (b) | | 5,030 | 4,881 |
| Southeast Energy Auth. Coop. Dis Bonds (Proj. No. 6) Series 2023 B, 5%, tender 6/1/30 (b) | | 10,000 | 10,557 |
| Southeast Energy Auth. Rev.: | | | |
| (Proj. No. 2) Series 2021 B1: | | | |
4% 6/1/25 | | 725 | 723 |
4% 6/1/26 | | 1,500 | 1,490 |
4% 6/1/27 | | 2,440 | 2,421 |
4% 6/1/28 | | 3,780 | 3,743 |
| Bonds Series 2022 B1, 5%, tender 8/1/28 (b) | | 6,035 | 6,270 |
| Univ. of Alabama Gen. Rev. Series 2019 C, 5% 7/1/31 | | 2,285 | 2,480 |
TOTAL ALABAMA | | | 68,058 |
| Alaska - 0.1% | | | |
| Alaska Hsg. Fin. Corp. Mtg. Rev. Series 2022 A, 3% 6/1/51 | | 985 | 946 |
| Alaska Int'l. Arpts. Revs. Series 2021 C, 5% 10/1/26 (c) | | 1,510 | 1,554 |
| Alaska Muni. Bond Bank Series 2015 B, 5% 3/1/28 (c) | | 1,390 | 1,401 |
TOTAL ALASKA | | | 3,901 |
| Arizona - 2.1% | | | |
| Arizona Board of Regents Arizona State Univ. Rev.: | | | |
| Series 2016 A, 5% 7/1/26 | | 275 | 280 |
| Series 2021: | | | |
5% 8/1/26 | | 1,100 | 1,141 |
5% 8/1/27 | | 1,500 | 1,583 |
| Arizona Health Facilities Auth. Rev. (Scottsdale Lincoln Hospitals Proj.) Series 2014 A, 5% 12/1/24 | | 1,465 | 1,472 |
| Arizona Indl. Dev. Auth. Hosp. Rev. Series 2021 A: | | | |
| 5% 2/1/25 | | 1,100 | 1,109 |
| 5% 2/1/26 | | 1,200 | 1,230 |
| 5% 2/1/27 | | 1,200 | 1,250 |
| Chandler Indl. Dev. Auth. Indl. Dev. Rev. Bonds (Intel Corp. Proj.) Series 2022 2, 5%, tender 9/1/27 (b)(c) | | 8,765 | 8,998 |
| Glendale Union School District 205 Series A: | | | |
| 5% 7/1/26 (Assured Guaranty Muni. Corp. Insured) | | 200 | 206 |
| 5% 7/1/27 (Assured Guaranty Muni. Corp. Insured) | | 250 | 261 |
| Maricopa County Indl. Dev. Auth. Series 2024 D: | | | |
| 5% 12/1/28 (d) | | 2,100 | 2,221 |
| 5% 12/1/29 (d) | | 4,000 | 4,286 |
| 5% 12/1/30 (d) | | 3,250 | 3,516 |
| Maricopa County Indl. Dev. Auth. Sr. Living Facilities (Christian Care Surprise, Inc. Proj.) Series 2016, 5% 1/1/26 (e) | | 515 | 497 |
| Maricopa County Rev. Bonds: | | | |
| Series 2019 D, 5%, tender 5/15/26 (b) | | 6,765 | 6,930 |
| Series 2023 A2, 5%, tender 5/15/28 (b) | | 4,480 | 4,720 |
| Maricopa County Spl. Health Care District Gen. Oblig. Series 2021 D, 5% 7/1/26 | | 3,000 | 3,100 |
| Maricopa County Unified School District #48 Scottsdale Series D: | | | |
| 4% 7/1/25 | | 800 | 806 |
| 4% 7/1/26 | | 900 | 914 |
| 4% 7/1/27 | | 225 | 231 |
| Phoenix Civic Impt. Board Arpt. Rev. Series 2019 B, 5% 7/1/25 (c) | | 1,500 | 1,521 |
| Phoenix Civic Impt. Corp. Series 2019 B, 5% 7/1/28 | | 1,910 | 2,013 |
| Pima County Unified School District #1 Tucson Series 2024 A: | | | |
| 5% 7/1/28 (Assured Guaranty Muni. Corp. Insured) | | 900 | 962 |
| 5% 7/1/29 (Assured Guaranty Muni. Corp. Insured) | | 600 | 651 |
| Tucson Ctfs. of Prtn. Series 2016, 5% 7/1/27 (Assured Guaranty Muni. Corp. Insured) | | 1,245 | 1,285 |
| Western Maricopa Ed. Ctr. District Series 2019 B, 5% 7/1/26 | | 2,000 | 2,068 |
TOTAL ARIZONA | | | 53,251 |
| California - 4.2% | | | |
| Bay Area Toll Auth. San Francisco Bay Toll Bridge Rev. Bonds: | | | |
| Series 2021 A, 2%, tender 4/1/28 (b) | | 7,365 | 6,833 |
| Series A, 2.95%, tender 4/1/26 (b) | | 4,770 | 4,676 |
| Series B, 2.85%, tender 4/1/25 (b) | | 3,900 | 3,860 |
| California Gen. Oblig.: | | | |
| Series 2017, 5% 8/1/26 | | 1,200 | 1,244 |
| Series 2020: | | | |
4% 11/1/26 | | 700 | 713 |
5% 11/1/28 | | 6,690 | 7,216 |
| Series 2023, 5% 10/1/28 | | 4,000 | 4,308 |
| California Infrastructure and Econ. Dev. Bank Rev.: | | | |
| Bonds (Los Angeles County Museum of Art Proj.) Series 2021 A, 1.2%, tender 6/1/28 (b) | | 780 | 687 |
| Series 2024 A, 3.25% 8/1/29 | | 1,005 | 986 |
| California Pub. Works Board Lease Rev.: | | | |
| (Various Cap. Projs.) Series 2023 B, 5% 12/1/28 | | 5,950 | 6,427 |
| Series 2023 A, 5% 12/1/29 | | 2,000 | 2,197 |
| Castaic Lake Wtr. Agcy. Ctfs. of Prtn. Series 1999, 0% 8/1/28 (AMBAC Insured) | | 1,435 | 1,255 |
| Fresno Arpt. Rev. Series 2023 A: | | | |
| 5% 7/1/26 (Build America Mutual Assurance Insured) (c) | | 1,000 | 1,024 |
| 5% 7/1/27 (Build America Mutual Assurance Insured) (c) | | 1,340 | 1,390 |
| 5% 7/1/28 (Build America Mutual Assurance Insured) (c) | | 2,885 | 3,027 |
| 5% 7/1/29 (Build America Mutual Assurance Insured) (c) | | 3,025 | 3,192 |
| Los Angeles Dept. Arpt. Rev.: | | | |
| Series 2016 A: | | | |
5% 5/15/25 (c) | | 880 | 890 |
5% 5/15/25 (Escrowed to Maturity) (c) | | 120 | 121 |
| Series 2017 B, 5% 5/15/25 (c) | | 2,265 | 2,292 |
| Series 2018 B: | | | |
5% 5/15/25 (c) | | 1,305 | 1,320 |
5% 5/15/26 (c) | | 1,545 | 1,585 |
| Series 2018 C, 5% 5/15/27 (c) | | 1,615 | 1,672 |
| Series 2020 C, 5% 5/15/26 (c) | | 2,645 | 2,714 |
| Los Angeles Unified School District Series 2024 A, 5% 7/1/28 | | 5,000 | 5,373 |
| Los Angeles Unified School District Ctfs. of Prtn. Series 2023 A, 5% 10/1/28 | | 3,450 | 3,715 |
| Port of Oakland Rev.: | | | |
| Series 2017, 5% 5/1/26 (c) | | 1,825 | 1,869 |
| Series 2021: | | | |
5% 5/1/26 (c) | | 5 | 5 |
5% 5/1/27 (c) | | 3,395 | 3,519 |
5% 5/1/27 (c) | | 5 | 5 |
5% 5/1/28 (c) | | 985 | 1,032 |
5% 5/1/28 (c) | | 15 | 16 |
| San Diego County Reg'l. Arpt. Auth. Arpt. Rev. Series 2020 C, 5% 7/1/26 (c) | | 1,000 | 1,022 |
| San Francisco City & County Arpts. Commission Int'l. Arpt. Rev.: | | | |
| Series 2019 A, 5% 1/1/27 (c) | | 2,405 | 2,472 |
| Series 2022 A: | | | |
5% 5/1/26 (c) | | 4,535 | 4,652 |
5% 5/1/27 (c) | | 4,590 | 4,737 |
5% 5/1/28 (c) | | 6,130 | 6,401 |
5% 5/1/29 (c) | | 4,100 | 4,336 |
| Series 2023 A, 5% 5/1/25 (c) | | 1,770 | 1,791 |
| Southern California Pub. Pwr. Auth. Rev. Bonds Series 2020 C, 0.65%, tender 7/1/25 (b) | | 8,000 | 7,700 |
TOTAL CALIFORNIA | | | 108,274 |
| Colorado - 1.8% | | | |
| Colorado Health Facilities Auth. Rev. Bonds Bonds: | | | |
| Series 2019 B: | | | |
5%, tender 8/1/25 (b) | | 2,950 | 2,978 |
5%, tender 8/1/26 (b) | | 2,035 | 2,075 |
5%, tender 11/19/26 (b) | | 615 | 638 |
5%, tender 11/19/26 (b) | | 6,065 | 6,255 |
| Series 2023 A1, 5%, tender 11/15/28 (b) | | 12,265 | 13,020 |
| Series 2024 A1, 5%, tender 11/15/29 (b) | | 2,070 | 2,231 |
| Series 2024 A2, 5%, tender 11/15/31 (b) | | 1,270 | 1,395 |
| Colorado Hsg. & Fin. Auth.: | | | |
| Series 2019 F, 4.25% 11/1/49 | | 895 | 894 |
| Series 2019 H, 4.25% 11/1/49 | | 430 | 430 |
| Colorado Reg'l. Trans. District Ctfs. of Prtn. Series 2020, 5% 6/1/26 | | 1,000 | 1,033 |
| Denver City & County Arpt. Rev.: | | | |
| Series 2018 A, 5% 12/1/29 (c) | | 1,205 | 1,265 |
| Series 2020 B1, 5% 11/15/24 (c) | | 1,500 | 1,507 |
| E-470 Pub. Hwy. Auth. Rev. Series 2020 A, 5% 9/1/26 | | 1,750 | 1,809 |
| Univ. of Colorado Enterprise Sys. Rev. Bonds: | | | |
| Series 2019 C, 2%, tender 10/15/24 (b) | | 9,030 | 8,983 |
| Series 2021 C3A, 2%, tender 10/15/25 (b) | | 1,625 | 1,584 |
| Series 2021 C3B, 2%, tender 10/15/26 (b) | | 1,345 | 1,283 |
TOTAL COLORADO | | | 47,380 |
| Connecticut - 2.3% | | | |
| Connecticut Gen. Oblig.: | | | |
| Series 2019 A, 5% 4/15/30 | | 965 | 1,042 |
| Series 2020 C, 2% 6/1/25 | | 1,000 | 982 |
| Series 2022 E, 5% 11/15/26 | | 6,000 | 6,256 |
| Series C, 4% 6/1/26 | | 1,100 | 1,117 |
| Connecticut Health & Edl. Facilities Auth. Rev.: | | | |
| Bonds: | | | |
Series 2014 B, 1.8%, tender 7/1/24 (b) | | 3,150 | 3,150 |
Series 2017 B2, 3.2%, tender 7/1/26 (b) | | 3,370 | 3,353 |
Series 2017 C2, 2.8%, tender 2/3/26 (b) | | 19,250 | 18,979 |
Series 2024 B, 5%, tender 7/1/29 (b)(d) | | 9,195 | 9,876 |
| Series 2016 A, 2%, tender 7/1/26 (b) | | 1,725 | 1,667 |
| Series 2019 A: | | | |
4% 7/1/24 (e) | | 1,090 | 1,090 |
5% 7/1/25 (e) | | 705 | 698 |
5% 7/1/28 (e) | | 1,315 | 1,273 |
5% 7/1/29 (e) | | 940 | 906 |
| Series 2022 M: | | | |
5% 7/1/24 | | 175 | 175 |
5% 7/1/27 | | 250 | 258 |
5% 7/1/28 | | 300 | 312 |
| Connecticut Spl. Tax Oblig. Trans. Infrastructure Rev. Series A, 5% 9/1/26 | | 1,025 | 1,065 |
| Hartford County Metropolitan District Gen. Oblig. Series 2021 A: | | | |
| 5% 9/1/27 | | 800 | 846 |
| 5% 9/1/28 | | 775 | 834 |
| New Haven Gen. Oblig. Series 2016 A, 5% 8/15/25 (Assured Guaranty Muni. Corp. Insured) | | 980 | 994 |
| Stratford Gen. Oblig. Series 2019, 5% 1/1/26 | | 3,735 | 3,817 |
| Univ. of Connecticut Gen. Oblig. Series 2019 A, 5% 11/1/26 | | 1,000 | 1,038 |
TOTAL CONNECTICUT | | | 59,728 |
| Delaware - 0.1% | | | |
| Delaware Econ. Dev. Auth. Rev. Bonds (Delmarva Pwr. & Lt. Co. Proj.) Series A, 1.05%, tender 7/1/25 (b) | | 1,475 | 1,432 |
| District Of Columbia - 2.5% | | | |
| District of Columbia Income Tax Rev. Series 2022 C, 5% 12/1/27 | | 5,900 | 6,263 |
| District of Columbia Wtr. & Swr. Auth. Pub. Util. Rev. Bonds Series 2019 C, 1.75%, tender 10/1/24 (b) | | 7,540 | 7,485 |
| Metropolitan Washington DC Arpts. Auth. Sys. Rev.: | | | |
| Series 2014 A, 5% 10/1/26 (c) | | 1,140 | 1,144 |
| Series 2017 A, 5% 10/1/26 (c) | | 12,905 | 13,278 |
| Series 2019 A, 5% 10/1/25 (c) | | 1,410 | 1,433 |
| Series 2020 A: | | | |
5% 10/1/24 (c) | | 4,470 | 4,481 |
5% 10/1/25 (c) | | 4,470 | 4,543 |
| Series 2021 A: | | | |
5% 10/1/25 (c) | | 3,000 | 3,049 |
5% 10/1/28 (c) | | 20,500 | 21,476 |
| Washington D.C. Metropolitan Transit Auth. Rev. Series 2018, 5% 7/1/31 | | 1,790 | 1,861 |
TOTAL DISTRICT OF COLUMBIA | | | 65,013 |
| Florida - 4.3% | | | |
| Brevard County Health Facilities Auth. Rev. Series 2023 A: | | | |
| 5% 4/1/26 | | 1,920 | 1,964 |
| 5% 4/1/28 | | 2,115 | 2,219 |
| Broward County Arpt. Sys. Rev.: | | | |
| Series 2012 P-1, 5% 10/1/25 (c) | | 6,645 | 6,650 |
| Series 2015 C, 5% 10/1/24 (c) | | 1,015 | 1,017 |
| Series 2019 A: | | | |
5% 10/1/24 (c) | | 1,300 | 1,303 |
5% 10/1/25 (c) | | 1,500 | 1,521 |
| Series 2019 B: | | | |
5% 10/1/24 (c) | | 750 | 752 |
5% 10/1/25 (c) | | 755 | 766 |
| Cap. Projs. Fin. Auth. Student Hsg. Rev. (Cap. Projs. Ln. Prog. - Florida Univs.) Series 2020 A: | | | |
| 5% 10/1/24 | | 540 | 540 |
| 5% 10/1/26 | | 1,940 | 1,964 |
| Central Florida Expressway Auth. Sr. Lien Rev. Series 2021: | | | |
| 5% 7/1/26 (Assured Guaranty Muni. Corp. Insured) | | 1,485 | 1,535 |
| 5% 7/1/27 (Assured Guaranty Muni. Corp. Insured) | | 8,200 | 8,626 |
| Florida Dev. Fin. Corp. Healthcare Facility Rev. Bonds (Tampa Gen. Hosp. Proj.) Series 2024 B, 5%, tender 10/1/31 (b) | | 3,940 | 4,236 |
| Florida Hsg. Fin. Corp. Multi-family Mtg. Rev. Bonds: | | | |
| Series 2023 C, 5%, tender 12/1/25 (b) | | 1,270 | 1,286 |
| Series 2024 E, 3.8%, tender 6/1/27 (b) | | 2,675 | 2,681 |
| Florida Hsg. Fin. Corp. Rev. Series 2021 1, 3% 1/1/52 | | 4,780 | 4,641 |
| Florida Mid-Bay Bridge Auth. Rev. Series 2015 A: | | | |
| 5% 10/1/24 | | 1,955 | 1,959 |
| 5% 10/1/25 | | 1,710 | 1,732 |
| 5% 10/1/26 | | 1,955 | 1,977 |
| Florida Muni. Pwr. Agcy. Rev. Series 2016 A, 4% 10/1/26 | | 530 | 536 |
| Greater Orlando Aviation Auth. Arpt. Facilities Rev.: | | | |
| Series 2015 A, 5% 10/1/29 (Pre-Refunded to 10/1/25 @ 100) (c) | | 1,070 | 1,084 |
| Series 2016 A, 5% 10/1/25 (Escrowed to Maturity) (c) | | 620 | 630 |
| Series 2016, 5% 10/1/26 (c) | | 1,300 | 1,336 |
| Series 2017 A: | | | |
5% 10/1/25 (c) | | 320 | 325 |
5% 10/1/25 (Escrowed to Maturity) (c) | | 1,675 | 1,701 |
5% 10/1/26 (c) | | 545 | 559 |
5% 10/1/26 (Escrowed to Maturity) (c) | | 2,025 | 2,083 |
5% 10/1/27 (Escrowed to Maturity) (c) | | 580 | 605 |
| Series 2019 A: | | | |
5% 10/1/25 (c) | | 6,700 | 6,829 |
5% 10/1/27 (c) | | 1,940 | 2,012 |
| Highlands County Health Facilities Auth. Rev. Bonds Series 2024 C, 5%, tender 11/15/31 (b) | | 2,675 | 2,935 |
| Hillsborough County School Board Ctfs. of Prtn. (School Board of Hillsbrough County, Florida Master Lease Prog.) Series 2017 B, 5% 7/1/28 | | 2,375 | 2,474 |
| Jacksonville Spl. Rev. Series 2022 A: | | | |
| 5% 10/1/24 | | 785 | 788 |
| 5% 10/1/25 | | 610 | 623 |
| 5% 10/1/26 | | 435 | 452 |
| 5% 10/1/27 | | 345 | 365 |
| 5% 10/1/28 | | 685 | 735 |
| 5% 10/1/29 | | 595 | 649 |
| 5% 10/1/30 | | 560 | 620 |
| 5% 10/1/32 | | 510 | 580 |
| Lee County Arpt. Rev. Series 2021 A: | | | |
| 5% 10/1/24 (c) | | 1,795 | 1,799 |
| 5% 10/1/25 (c) | | 3,325 | 3,372 |
| Lee Memorial Health Sys. Hosp. Rev. Bonds Series 2019 A2, 5%, tender 4/1/26 (b) | | 4,810 | 4,880 |
| Miami-Dade County Aviation Rev.: | | | |
| Series 2012 A, 5% 10/1/24 (c) | | 1,800 | 1,801 |
| Series 2014 A, 5% 10/1/31 (c) | | 1,750 | 1,752 |
| Series 2016 A, 5% 10/1/27 | | 1,275 | 1,311 |
| Miami-Dade County School Board Ctfs. of Prtn. Series 2015 A, 5% 5/1/27 (Assured Guaranty Muni. Corp. Insured) | | 1,880 | 1,902 |
| Orange County Hsg. Fin. Auth. Multi-family Rev. Bonds Series 2021 B, 0.55%, tender 7/1/24 (b) | | 9,950 | 9,950 |
| Palm Beach County Health Facilities Auth. Hosp. Rev.: | | | |
| (Jupiter Med. Ctr. Proj.) Series 2022, 5% 11/1/28 | | 150 | 155 |
| Series 2014, 5% 12/1/24 (Escrowed to Maturity) | | 380 | 382 |
| Palm Beach County Health Facilities Auth. Rev.: | | | |
| Series 2015 C, 5% 5/15/30 | | 2,490 | 2,493 |
| Series 2021 C, 4% 5/15/29 | | 1,440 | 1,386 |
| Pinellas County Hsg. Fin. Auth. Bonds Series 2021 B, 0.65%, tender 7/1/24 (b) | | 2,170 | 2,170 |
| Seminole County School Board Ctfs. of Prtn. Series 2016 C: | | | |
| 5% 7/1/25 | | 980 | 997 |
| 5% 7/1/26 | | 1,115 | 1,152 |
TOTAL FLORIDA | | | 110,792 |
| Georgia - 4.3% | | | |
| Atlanta Arpt. Rev.: | | | |
| Series 2020 A, 5% 7/1/26 (c) | | 3,000 | 3,079 |
| Series 2020 B: | | | |
5% 7/1/27 (c) | | 4,000 | 4,143 |
5% 7/1/29 (c) | | 1,920 | 2,027 |
| Series 2021 C, 5% 7/1/30 (c) | | 1,315 | 1,403 |
| Series 2023 G: | | | |
5% 7/1/28 (c) | | 2,015 | 2,108 |
5% 7/1/29 (c) | | 5,635 | 5,949 |
| Burke County Indl. Dev. Auth. Poll. Cont. Rev.: | | | |
| (Georgia Pwr. Co. Plant Vogtle Proj.) Series 1994, 3.7%, tender 6/13/28 (b) | | 2,265 | 2,283 |
| Bonds: | | | |
(Georgia Pwr. Co. Plant Vogtle Proj.): | | | |
Series 1995 4, 3.8%, tender 5/21/26 (b) | | 3,500 | 3,509 |
Series 2012, 1.7%, tender 8/22/24 (b) | | 3,400 | 3,383 |
(Oglethorpe Pwr. Corp. Vogtle Proj.) Series 2017 E, 3.25%, tender 2/3/25 (b) | | 900 | 892 |
| Columbus Med. Ctr. Hosp. Auth. Bonds (Piedmont Healthcare, Inc. Proj.) Series 2019 A, 5%, tender 7/1/26 (b) | | 4,840 | 4,922 |
| Georgia Gen. Oblig. Series 2016 A, 5% 2/1/27 | | 4,980 | 5,112 |
| Georgia Muni. Elec. Auth. Pwr. Rev. Series 2020 A: | | | |
| 4% 11/1/24 | | 1,420 | 1,421 |
| 5% 1/1/25 | | 1,000 | 1,007 |
| 5% 1/1/26 | | 1,125 | 1,150 |
| 5% 1/1/26 | | 1,000 | 1,022 |
| 5% 1/1/27 | | 760 | 786 |
| Main Street Natural Gas, Inc.: | | | |
| Bonds: | | | |
Series 2021 A, 4%, tender 9/1/27 (b) | | 15,000 | 15,061 |
Series 2021 C, 4%, tender 12/1/28 (b) | | 16,990 | 17,044 |
Series 2023 D, 5%, tender 12/1/30 (b) | | 11,820 | 12,521 |
| Series 2022 A: | | | |
4% 12/1/24 | | 1,100 | 1,097 |
4% 12/1/25 | | 170 | 169 |
4% 12/1/26 | | 1,955 | 1,940 |
| Series 2023 D, 5% 12/1/29 | | 2,750 | 2,879 |
| Series 2024 C: | | | |
5% 12/1/28 | | 1,250 | 1,302 |
5% 12/1/29 | | 2,700 | 2,827 |
5% 12/1/30 | | 3,500 | 3,684 |
| Monroe County Dev. Auth. Poll. Cont. Rev. (Georgia Pwr. Co. Plant Scherer Proj.) Series 1995, 2.25% 7/1/25 | | 6,505 | 6,356 |
| Private Colleges & Univs. Auth. Rev. (The Savannah College of Art & Design Projs.) Series 2021, 5% 4/1/26 | | 1,200 | 1,229 |
TOTAL GEORGIA | | | 110,305 |
| Hawaii - 0.6% | | | |
| Hawaii Arpts. Sys. Rev. Series 2018 A, 5% 7/1/31 (c) | | 1,000 | 1,039 |
| Hawaii Gen. Oblig. Series 2015 EZ, 5% 10/1/26 | | 10,000 | 10,191 |
| Honolulu City & County Gen. Oblig.: | | | |
| Series 2016 C, 5% 10/1/28 | | 1,000 | 1,077 |
| Series 2020 F, 5% 7/1/26 | | 800 | 828 |
| Series 2022 A, 5% 11/1/26 | | 1,985 | 2,066 |
TOTAL HAWAII | | | 15,201 |
| Idaho - 0.0% | | | |
| Idaho Hsg. & Fin. Assoc. Single Family Mtg. Series 2019 A, 4% 1/1/50 | | 220 | 219 |
| Illinois - 8.8% | | | |
| Chicago Board of Ed.: | | | |
| Series 2017 C: | | | |
5% 12/1/26 | | 485 | 496 |
5% 12/1/27 | | 1,830 | 1,886 |
| Series 2019 A, 0% 12/1/26 | | 3,500 | 3,148 |
| Series 2023 A, 5% 12/1/30 | | 5,000 | 5,292 |
| Chicago Gen. Oblig. Series 2020 A, 5% 1/1/30 | | 2,005 | 2,133 |
| Chicago Metropolitan Wtr. Reclamation District of Greater Chicago Series 2007, 5.25% 12/1/32 | | 2,920 | 3,368 |
| Chicago Midway Arpt. Rev. Series 2016 A: | | | |
| 5% 1/1/27 (c) | | 2,810 | 2,838 |
| 5% 1/1/28 (c) | | 500 | 506 |
| Chicago O'Hare Int'l. Arpt. Rev.: | | | |
| Series 2012 B, 4% 1/1/27 (c) | | 1,220 | 1,217 |
| Series 2015 A: | | | |
5% 1/1/26 (c) | | 1,600 | 1,604 |
5% 1/1/27 (c) | | 1,000 | 1,004 |
| Series 2015 C, 5% 1/1/26 (c) | | 1,540 | 1,544 |
| Series 2016 A, 5% 1/1/27 (c) | | 840 | 851 |
| Series 2017 D: | | | |
5% 1/1/26 (c) | | 445 | 453 |
5% 1/1/27 (c) | | 1,595 | 1,637 |
5% 1/1/29 (c) | | 215 | 220 |
| Series 2022 A, 5% 1/1/26 (c) | | 830 | 844 |
| Series 2022 C, 5% 1/1/26 (c) | | 2,300 | 2,340 |
| Chicago Transit Auth. Cap. Grant Receipts Rev. Series 2017, 5% 6/1/25 | | 1,225 | 1,237 |
| Cook County Gen. Oblig.: | | | |
| Series 2021 A: | | | |
5% 11/15/24 | | 425 | 427 |
5% 11/15/25 | | 425 | 434 |
5% 11/15/26 | | 850 | 882 |
5% 11/15/27 | | 1,075 | 1,132 |
| Series 2021 B: | | | |
4% 11/15/25 | | 1,100 | 1,108 |
4% 11/15/26 | | 555 | 563 |
4% 11/15/27 | | 565 | 576 |
4% 11/15/28 | | 285 | 291 |
| Series 2022 A: | | | |
5% 11/15/25 | | 5,585 | 5,700 |
5% 11/15/26 | | 300 | 311 |
5% 11/15/27 | | 325 | 342 |
5% 11/15/28 | | 350 | 374 |
5% 11/15/29 | | 1,315 | 1,428 |
| Cook County Sales Tax Rev.: | | | |
| Series 2022 A: | | | |
5% 11/15/26 | | 635 | 657 |
5% 11/15/27 | | 350 | 368 |
5% 11/15/28 | | 190 | 202 |
5% 11/15/29 | | 140 | 152 |
5% 11/15/30 | | 315 | 345 |
| Series 2022 B: | | | |
5% 11/15/25 | | 815 | 833 |
5% 11/15/26 | | 360 | 373 |
5% 11/15/27 | | 470 | 494 |
5% 11/15/28 | | 290 | 309 |
5% 11/15/29 | | 265 | 288 |
5% 11/15/30 | | 275 | 301 |
| Illinois Fin. Auth.: | | | |
| Bonds Series 2020 B: | | | |
5%, tender 11/15/24 (b) | | 2,125 | 2,126 |
5%, tender 11/15/26 (b) | | 2,830 | 2,893 |
| Series 2015, 5% 5/1/45 (Pre-Refunded to 5/1/25 @ 100) | | 1,190 | 1,203 |
| Series 2021 A, 5% 10/1/31 | | 3,000 | 3,364 |
| Series 2022 A: | | | |
5% 10/1/26 | | 265 | 269 |
5% 10/1/28 | | 330 | 339 |
| Illinois Fin. Auth. Rev.: | | | |
| (Bradley Univ. Proj.) Series 2017 C, 5% 8/1/26 | | 1,650 | 1,691 |
| (Edward-Elmhurst Healthcare) Series 2017 A, 5% 1/1/25 (Escrowed to Maturity) | | 740 | 745 |
| (OSF Healthcare Sys.) Series 2018 A: | | | |
5% 5/15/26 | | 4,300 | 4,370 |
5% 5/15/27 | | 9,260 | 9,506 |
| Series 2008 A3, 5% 11/1/30 | | 2,940 | 3,024 |
| Series 2015 A: | | | |
5% 11/15/24 | | 1,490 | 1,495 |
5% 11/15/25 | | 1,905 | 1,929 |
5% 11/15/26 | | 1,955 | 1,983 |
| Series 2015 B, 5% 11/15/24 | | 1,910 | 1,917 |
| Series 2016 A: | | | |
5.25% 8/15/28 (Pre-Refunded to 8/15/26 @ 100) | | 1,000 | 1,035 |
5.25% 8/15/29 (Pre-Refunded to 8/15/26 @ 100) | | 5,850 | 6,056 |
| Series 2016 C, 5% 2/15/27 | | 1,875 | 1,948 |
| Series 2016: | | | |
5% 5/15/25 | | 490 | 495 |
5% 5/15/26 | | 980 | 997 |
5% 5/15/27 | | 1,225 | 1,253 |
| Series 2019: | | | |
5% 9/1/24 | | 415 | 415 |
5% 9/1/25 | | 900 | 897 |
5% 4/1/26 | | 1,625 | 1,657 |
5% 9/1/26 | | 300 | 299 |
5% 4/1/27 | | 2,135 | 2,204 |
5% 9/1/27 | | 500 | 500 |
5% 4/1/28 | | 1,530 | 1,595 |
5% 4/1/29 | | 2,000 | 2,108 |
| Illinois Gen. Oblig.: | | | |
| Series 2014, 5% 2/1/25 | | 2,275 | 2,277 |
| Series 2016: | | | |
4% 2/1/30 (Assured Guaranty Muni. Corp. Insured) | | 3,760 | 3,798 |
5% 1/1/26 | | 2,970 | 3,031 |
| Series 2017 C, 5% 11/1/29 | | 14,620 | 15,233 |
| Series 2017 D: | | | |
5% 11/1/25 | | 6,635 | 6,758 |
5% 11/1/26 | | 5,890 | 6,080 |
| Series 2018 A, 5% 10/1/26 | | 4,615 | 4,758 |
| Series 2020 B: | | | |
5% 10/1/25 | | 5,105 | 5,192 |
5% 10/1/28 | | 6,500 | 6,875 |
| Series 2022 B: | | | |
5% 3/1/26 | | 6,880 | 7,037 |
5% 3/1/27 | | 6,500 | 6,731 |
| Series 2023 B, 5% 5/1/28 | | 3,000 | 3,157 |
| Series 2023 D, 5% 7/1/28 | | 4,230 | 4,462 |
| Series 2024 B: | | | |
5% 5/1/29 | | 1,000 | 1,065 |
5% 5/1/30 | | 2,000 | 2,153 |
5% 5/1/31 | | 1,500 | 1,633 |
5% 5/1/32 | | 3,000 | 3,294 |
| Illinois Hsg. Dev. Auth. Rev. Series D, 3.75% 4/1/50 | | 450 | 444 |
| Illinois Sales Tax Rev. Series 2021 C, 5% 6/15/25 | | 355 | 359 |
| Illinois Toll Hwy. Auth. Toll Hwy. Rev. Series 2024 A, 5% 1/1/31 | | 790 | 872 |
| Lake, Cook, Kane & McHenry Countries Cmnty. Unit School District #220 Series 2021, 3% 12/1/32 | | 1,250 | 1,167 |
| McHenry County Cmnty. School District #200 Series 2006 B: | | | |
| 0% 1/15/25 | | 4,915 | 4,810 |
| 0% 1/15/26 | | 3,695 | 3,479 |
| Metropolitan Pier & Exposition: | | | |
| Series 1994, 0% 6/15/29 (FGIC Insured) | | 5,020 | 4,109 |
| Series 2002: | | | |
0% 12/15/29 (Assured Guaranty Muni. Corp. Insured) (Nat'l. Pub. Fin. Guarantee Corp. Insured) | | 2,440 | 1,976 |
0% 12/15/29 (Nat'l. Pub. Fin. Guarantee Corp. Insured) | | 3,690 | 2,962 |
| Series 2022 A, 3% 6/15/25 | | 2,330 | 2,303 |
| Series 2023 A, 5% 12/15/28 | | 2,880 | 2,994 |
| Sales Tax Securitization Corp.: | | | |
| Series 2023 C, 5% 1/1/29 | | 5,225 | 5,584 |
| Series 2023 D, 5% 1/1/28 | | 1,735 | 1,827 |
| Schaumburg Village Gen. Oblig. Series 2023, 4% 12/1/31 | | 2,820 | 2,951 |
TOTAL ILLINOIS | | | 228,192 |
| Indiana - 2.1% | | | |
| Indiana Fin. Auth. Envir. Facilities Rev. Bonds (Indianapolis Pwr. & Lt. Co. Proj.): | | | |
| Series 2020 A, 0.75%, tender 4/1/26 (b) | | 600 | 556 |
| Series 2020 B, 0.95%, tender 4/1/26 (b)(c) | | 1,025 | 955 |
| Indiana Fin. Auth. Health Sys. Rev. Bonds: | | | |
| Series 2019 B, 2.25%, tender 7/1/25 (b) | | 6,405 | 6,284 |
| Series 2023 B1, 5%, tender 7/1/28 (b) | | 5,865 | 6,190 |
| Indiana Fin. Auth. Hosp. Rev. Bonds: | | | |
| Series 2011 L, 0.7%, tender 1/1/26 (b) | | 1,105 | 1,053 |
| Series 2011 M, 0.7%, tender 1/1/26 (b) | | 7,795 | 7,430 |
| Indiana Hsg. & Cmnty. Dev. Auth.: | | | |
| Series 2019 B, 3.5% 1/1/49 | | 990 | 975 |
| Series 2021 B, 3% 7/1/50 | | 755 | 732 |
| Series 2021 C1, 3% 1/1/52 | | 3,375 | 3,247 |
| Indianapolis Local Pub. Impt.: | | | |
| (Indianapolis Arpt. Auth. Proj.): | | | |
Series 2016 A1, 5% 1/1/25 (c) | | 2,845 | 2,859 |
Series 2019 D, 5% 1/1/25 (c) | | 1,710 | 1,718 |
| Indianapolis Arpt. Auth. Proj. Series 2019 D, 5% 1/1/26 (c) | | 3,680 | 3,743 |
| Whiting Envir. Facilities Rev. Bonds (BP Products North America, Inc. Proj.): | | | |
| Series 2017, 5%, tender 11/1/24 (b)(c) | | 1,250 | 1,252 |
| Series 2019 A, 5%, tender 6/5/26 (b)(c) | | 15,985 | 16,281 |
TOTAL INDIANA | | | 53,275 |
| Iowa - 0.1% | | | |
| Iowa Student Ln. Liquidity Corp. Student Ln. Rev.: | | | |
| Series 2019 B, 5% 12/1/24 (c) | | 800 | 804 |
| Series 2023 B, 5% 12/1/30 (c) | | 1,770 | 1,849 |
TOTAL IOWA | | | 2,653 |
| Kansas - 0.0% | | | |
| Wyandotte County/Kansas City Unified Govt. Util. Sys. Rev. Series 2016 A, 5% 9/1/25 | | 785 | 798 |
| Kentucky - 3.4% | | | |
| Ashland Med. Ctr. Rev. (Ashland Hosp. Corp. D/B/A King's Daughters Med. Ctr. Proj.) Series 2016 A, 5% 2/1/25 | | 980 | 984 |
| Carroll County Envir. Facilities Rev. Bonds (Kentucky Utils. Co. Proj.) Series 2004 A, 1.75%, tender 9/1/26 (b)(c) | | 9,750 | 9,065 |
| Carroll County Poll. Ctlr Rev. Bonds (Kentucky Utils. Co. Proj.) Series 2016 A, 1.55%, tender 9/1/26 (b) | | 5,750 | 5,355 |
| Kentucky Asset/Liability Commission Gen. Fund Rev. Series 2021 A: | | | |
| 5% 11/1/25 | | 3,000 | 3,067 |
| 5% 11/1/26 | | 1,000 | 1,037 |
| 5% 11/1/27 | | 1,000 | 1,053 |
| Kentucky Hsg. Corp. Single Family Mtg. Rev. Series 2023 A, 6% 7/1/54 | | 12,775 | 13,923 |
| Kentucky, Inc. Pub. Energy: | | | |
| Bonds: | | | |
Series 2019 A1, 4%, tender 6/1/25 (b) | | 10,455 | 10,467 |
Series 2024 A, 5%, tender 7/1/30 (b) | | 4,000 | 4,193 |
Series A, 4%, tender 6/1/26 (b) | | 11,570 | 11,619 |
Series C1, 4%, tender 6/1/25 (b) | | 15,000 | 15,007 |
| Series A: | | | |
4% 12/1/25 | | 825 | 821 |
4% 6/1/26 | | 1,085 | 1,075 |
| Louisville & Jefferson County: | | | |
| Bonds Series 2020 C, 5%, tender 10/1/26 (b) | | 5,985 | 6,118 |
| Series 2023 A: | | | |
5% 10/1/28 | | 2,500 | 2,645 |
5% 10/1/29 | | 1,310 | 1,404 |
5% 10/1/30 | | 1,485 | 1,609 |
| Louisville Reg'l. Arpt. Auth. Sys. Rev. Series 2014 A, 5% 7/1/24 (c) | | 100 | 100 |
TOTAL KENTUCKY | | | 89,542 |
| Louisiana - 0.4% | | | |
| Louisiana Hsg. Corp. Single Fami (Home Ownership Prog.) Series 2023 C, 5.75% 12/1/53 | | 945 | 1,018 |
| New Orleans Aviation Board Rev.: | | | |
| (North Term. Proj.) Series 2017 B: | | | |
5% 1/1/25 (c) | | 195 | 196 |
5% 1/1/26 (c) | | 490 | 498 |
| Series 2017 D2, 5% 1/1/25 (c) | | 1,390 | 1,397 |
| St. John Baptist Parish Rev.: | | | |
| (Marathon Oil Corp.) Series 2017, 2.2% 6/1/37 (b) | | 3,765 | 3,632 |
| Bonds (Marathon Oil Corp.) Series 2017, 4.05%, tender 7/1/26 (b) | | 3,320 | 3,320 |
TOTAL LOUISIANA | | | 10,061 |
| Maine - 0.1% | | | |
| Brunswick Series 2020, 2% 11/1/31 | | 1,015 | 873 |
| City of Portland Arpt. Series 2016, 5% 1/1/29 | | 690 | 700 |
| Maine Health & Higher Edl. Facilities Auth. Rev. Series 2021 A: | | | |
| 5% 7/1/28 | | 555 | 583 |
| 5% 7/1/29 | | 600 | 639 |
| 5% 7/1/30 | | 500 | 539 |
TOTAL MAINE | | | 3,334 |
| Maryland - 1.7% | | | |
| Hsg. Opportunities Commission of Montgomery County Series 2021 C, 0.8% 7/1/25 | | 700 | 672 |
| Maryland Cmnty. Dev. Admin Dept. Hsg. & Cmnty. Dev.: | | | |
| Series 2019 B, 4% 9/1/49 | | 1,125 | 1,118 |
| Series 2019 C, 3.5% 3/1/50 | | 1,100 | 1,082 |
| Series 2021 C, 0.6% 7/1/24 | | 1,095 | 1,095 |
| Series 2023 E, 6.25% 3/1/54 | | 600 | 651 |
| Maryland Dept. of Trans.: | | | |
| Series 2021 B, 5% 8/1/27 (c) | | 1,805 | 1,869 |
| Series 2022 B, 5% 12/1/27 | | 1,295 | 1,376 |
| Series 2022, 5% 12/1/26 | | 1,395 | 1,455 |
| Maryland Gen. Oblig. Series 2022 2D, 3% 8/1/27 | | 1,575 | 1,553 |
| Maryland Health & Higher Edl. Bonds: | | | |
| Series 2020 B2, 5%, tender 7/1/27 (b) | | 2,480 | 2,564 |
| Series 2020, 5%, tender 7/1/25 (b) | | 8,525 | 8,578 |
| Maryland Health & Higher Edl. Facilities Auth. Rev. Series 2015, 5% 7/1/25 | | 1,730 | 1,750 |
| Maryland Trans. Auth. Passenger Facility Charge Rev. Series 2012 B: | | | |
| 2.5% 6/1/26 (c) | | 4,915 | 4,704 |
| 2.625% 6/1/27 (c) | | 4,030 | 3,800 |
| Maryland Trans. Auth. Trans. Facility Projs. Rev. Series 2024 A, 5% 7/1/31 | | 3,770 | 4,234 |
| Montgomery County Gen. Oblig. Series 2022 A, 5% 8/1/26 | | 7,075 | 7,342 |
TOTAL MARYLAND | | | 43,843 |
| Massachusetts - 1.3% | | | |
| Massachusetts Bay Trans. Auth. Sales Tax Rev. Series 2016 A, 0% 7/1/29 | | 1,000 | 845 |
| Massachusetts Dev. Fin. Agcy. Rev.: | | | |
| Bonds Series 2011 N, 0.45%, tender 7/1/25 (b) | | 5,000 | 4,789 |
| Series 2015: | | | |
5% 7/1/25 | | 740 | 750 |
5% 7/1/25 (Escrowed to Maturity) | | 1,915 | 1,942 |
| Series 2016 I: | | | |
5% 7/1/25 | | 1,475 | 1,495 |
5% 7/1/25 | | 1,480 | 1,494 |
5% 7/1/26 | | 980 | 999 |
| Series 2019 A: | | | |
5% 7/1/25 | | 825 | 833 |
5% 7/1/26 | | 2,015 | 2,023 |
| Series 2021: | | | |
4% 7/1/24 | | 225 | 225 |
4% 7/1/25 | | 235 | 233 |
| Massachusetts Edl. Fing. Auth. Rev.: | | | |
| Series 2020 C: | | | |
5% 7/1/25 (c) | | 850 | 862 |
5% 7/1/26 (c) | | 1,900 | 1,938 |
| Series 2021 B, 5% 7/1/26 (c) | | 1,390 | 1,418 |
| Series 2023 B: | | | |
5% 7/1/28 (c) | | 3,675 | 3,779 |
5% 7/1/29 (c) | | 2,650 | 2,748 |
| Massachusetts Health & Edl. Facilities Auth. Rev. Bonds Series I, 0.7%, tender 7/1/25 (b) | | 2,133 | 2,048 |
| Massachusetts Port Auth. Rev.: | | | |
| Series 2017 A, 5% 7/1/25 (c) | | 1,115 | 1,130 |
| Series 2021 E, 5% 7/1/27 (c) | | 500 | 519 |
| South Hadley Gen. Oblig. Series 2014, 2.75% 5/15/29 | | 1,430 | 1,342 |
| Univ. of Massachusetts Bldg. Auth. Rev. Series 2021 1, 5% 11/1/26 | | 2,445 | 2,550 |
TOTAL MASSACHUSETTS | | | 33,962 |
| Michigan - 1.4% | | | |
| Detroit Downtown Dev. Auth. Tax: | | | |
| (Catalyst Dev. Proj.) Series 2024: | | | |
5% 7/1/28 | | 500 | 529 |
5% 7/1/29 | | 1,000 | 1,071 |
5% 7/1/31 | | 1,000 | 1,093 |
| (Catalyst Dev. project) Series 2024, 5% 7/1/30 | | 1,240 | 1,341 |
| Flint Hosp. Bldg. Auth. Rev. Series 2020, 5% 7/1/24 | | 925 | 925 |
| Grand Traverse County Hosp. Fin. Auth. Series 2021: | | | |
| 5% 7/1/26 | | 550 | 565 |
| 5% 7/1/27 | | 900 | 937 |
| 5% 7/1/28 | | 725 | 766 |
| Kalamazoo Hosp. Fin. Auth. Hosp. Facilities Rev. Series 2016: | | | |
| 5% 5/15/25 | | 1,275 | 1,287 |
| 5% 5/15/25 (Escrowed to Maturity) | | 10 | 10 |
| 5% 5/15/26 | | 1,230 | 1,257 |
| 5% 5/15/26 (Escrowed to Maturity) | | 5 | 5 |
| Lansing Board of Wtr. & Lt. Util. Rev.: | | | |
| Bonds Series 2021 B, 2%, tender 7/1/26 (b) | | 2,000 | 1,907 |
| Series 2024 A: | | | |
5% 7/1/30 | | 2,000 | 2,208 |
5% 7/1/31 | | 2,170 | 2,428 |
| Michigan Fin. Auth. Rev.: | | | |
| Bonds Series 2015 D2, 1.2%, tender 4/13/28 (b) | | 635 | 563 |
| Series 2015 A, 5% 8/1/26 (Pre-Refunded to 8/1/24 @ 100) | | 300 | 300 |
| Series 2015 D1, 0.75% 10/15/25 | | 1,000 | 963 |
| Series 2020 A, 5% 6/1/25 | | 2,000 | 2,021 |
| Michigan Hsg. Dev. Auth. Single Family Mtg. Rev.: | | | |
| Series 2021 A, 3% 6/1/52 | | 1,760 | 1,698 |
| Series A, 3.5% 12/1/50 | | 825 | 810 |
| Michigan State Univ. Revs. Series 2024 A: | | | |
| 5% 8/15/27 | | 1,785 | 1,881 |
| 5% 8/15/28 | | 2,125 | 2,278 |
| 5% 8/15/29 | | 1,375 | 1,499 |
| Michigan Strategic Fund Ltd. Oblig. Rev. Bonds (Consumer Energy Co. Proj.) Series 2019, 1.8%, tender 10/1/24 (b)(c) | | 3,140 | 3,118 |
| Novi Cmnty. School District Series I, 4% 5/1/25 | | 600 | 603 |
| Portage Pub. Schools Series 2016: | | | |
| 5% 5/1/25 | | 1,100 | 1,115 |
| 5% 11/1/28 | | 985 | 1,012 |
| Saginaw Hosp. Fin. Auth. Hosp. Rev. Series 2020 J: | | | |
| 5% 7/1/24 | | 765 | 765 |
| 5% 7/1/25 | | 500 | 505 |
| 5% 7/1/26 | | 750 | 765 |
TOTAL MICHIGAN | | | 36,225 |
| Minnesota - 1.5% | | | |
| Duluth Econ. Dev. Auth. Series 2021 A: | | | |
| 3% 7/1/24 | | 200 | 200 |
| 3% 7/1/25 | | 615 | 602 |
| Minneapolis & Saint Paul Metropolitan Arpts. Commission Arpt. Rev. Series 2022 B: | | | |
| 5% 1/1/25 (c) | | 460 | 462 |
| 5% 1/1/26 (c) | | 1,125 | 1,144 |
| 5% 1/1/27 (c) | | 3,800 | 3,901 |
| Minneapolis Health Care Sys. Rev. Bonds Series 2023 A, 5%, tender 11/15/28 (b) | | 11,835 | 12,485 |
| Minnesota Gen. Oblig. Series 2023 A, 5% 8/1/29 | | 7,810 | 8,560 |
| Minnesota Hsg. Fin. Agcy.: | | | |
| Series 2023 E, 6.25% 7/1/54 | | 540 | 586 |
| Series 2023 F, 5.75% 7/1/53 | | 640 | 678 |
| Series 2023, 6% 7/1/53 | | 2,925 | 3,138 |
| Moorhead Edl. Facilities Rev. (The Concordia College Corp. Proj.) Series 2016, 5% 12/1/25 | | 1,555 | 1,555 |
| Shakopee Sr. Hsg. Rev. Bonds Series 2018, 5.85%, tender 11/1/25 (b)(e) | | 2,430 | 2,380 |
| Southern Minnesota Muni. Pwr. Agcy. Pwr. Supply Sys. Rev. Series 2015 A, 5% 1/1/26 | | 2,065 | 2,111 |
TOTAL MINNESOTA | | | 37,802 |
| Mississippi - 0.2% | | | |
| Mississippi Dev. Bank Spl. Oblig. (Magnolia Reg'l. Health Ctr. Proj.) Series 2021: | | | |
| 5% 10/1/25 (e) | | 1,320 | 1,319 |
| 5% 10/1/27 (e) | | 900 | 908 |
| Mississippi Hosp. Equip. & Facilities Auth.: | | | |
| Bonds Series II, 5%, tender 3/1/27 (b) | | 1,130 | 1,166 |
| Series I: | | | |
5% 10/1/25 | | 600 | 609 |
5% 10/1/27 | | 800 | 830 |
TOTAL MISSISSIPPI | | | 4,832 |
| Missouri - 0.7% | | | |
| Cape Girardeau County Indl. Dev. Auth. (Southeast Hosp. Proj.) Series 2017 A: | | | |
| 5% 3/1/25 | | 710 | 712 |
| 5% 3/1/26 | | 980 | 1,003 |
| Kansas City Indl. Dev. Auth. (Kansas City Int'l. Arpt. Term. Modernization Proj.): | | | |
| Series 2020 A: | | | |
5% 3/1/26 (c) | | 1,185 | 1,207 |
5% 3/1/27 (c) | | 4,065 | 4,186 |
| Series 2020 B: | | | |
5% 3/1/26 | | 2,190 | 2,240 |
5% 3/1/27 | | 1,535 | 1,597 |
| Kansas City Planned Indl. Expansion Bonds Series 2023, 5%, tender 7/1/27 (b) | | 2,485 | 2,544 |
| Missouri Hsg. Dev. Commission Single Family Mtg. Rev. Series 2019, 4% 5/1/50 | | 260 | 258 |
| Saint Louis Arpt. Rev. Series A, 5.25% 7/1/26 (Assured Guaranty Muni. Corp. Insured) | | 5,370 | 5,569 |
TOTAL MISSOURI | | | 19,316 |
| Montana - 0.2% | | | |
| Montana Board Hsg. Single Family: | | | |
| Series 2019 B, 4% 6/1/50 | | 155 | 154 |
| Series 2021 B, 3% 12/1/51 | | 2,000 | 1,933 |
| Series 2022 A, 3% 6/1/52 | | 1,565 | 1,509 |
| Series A1, 3.5% 6/1/50 | | 2,225 | 2,185 |
TOTAL MONTANA | | | 5,781 |
| Nebraska - 1.5% | | | |
| Central Plains Energy Proj. Rev. Bonds: | | | |
| (Proj. No. 4) Series 2023 A1, 5%, tender 11/1/29 (b) | | 9,280 | 9,775 |
| Series 2019, 4%, tender 8/1/25 (b) | | 11,940 | 11,952 |
| Douglas County Hosp. Auth. #2 Health Facilities Rev. Bonds Series 2020, 5%, tender 11/15/25 (b) | | 2,200 | 2,225 |
| Lincoln Arpt. Auth. Series 2021: | | | |
| 5% 7/1/26 (c) | | 750 | 765 |
| 5% 7/1/27 (c) | | 1,275 | 1,316 |
| 5% 7/1/28 (c) | | 1,830 | 1,910 |
| 5% 7/1/29 (c) | | 1,000 | 1,056 |
| Nebraska Invt. Fin. Auth. Single Family Hsg. Rev.: | | | |
| Series 2019 B, 4% 9/1/49 (c) | | 705 | 694 |
| Series 2019 E, 3.75% 9/1/49 (c) | | 700 | 690 |
| Nebraska Pub. Pwr. District Rev. Series 2017 B, 5% 1/1/26 | | 1,260 | 1,292 |
| Washington County Wstwtr Sol Bonds (Cargill, Inc. Projs.) Series 2012, 0.9%, tender 9/1/25 (b)(c) | | 7,400 | 7,157 |
TOTAL NEBRASKA | | | 38,832 |
| Nevada - 0.9% | | | |
| Clark County Arpt. Rev.: | | | |
| Series 2014 A2: | | | |
5% 7/1/28 | | 525 | 525 |
5% 7/1/30 | | 750 | 750 |
| Series 2021 B: | | | |
5% 7/1/25 (c) | | 1,795 | 1,819 |
5% 7/1/27 (c) | | 6,000 | 6,206 |
| Clark County McCarran Int'l. Arpt. Passenger Facility Charge Rev. Series 2019 E: | | | |
| 5% 7/1/25 | | 1,275 | 1,297 |
| 5% 7/1/27 | | 2,245 | 2,362 |
| Clark County School District: | | | |
| Series 2017 A, 5% 6/15/26 | | 1,285 | 1,325 |
| Series 2020 B, 5% 6/15/26 | | 5,805 | 5,994 |
| Humboldt County Nev Poll. Cont. Rev. (Sierra Pacific Pwr. Co. Projs.) Series 2016 B, 3.55% 10/1/29 | | 670 | 666 |
| Nevada Gen. Oblig. Series 2015 A, 3% 8/1/29 | | 2,175 | 2,105 |
| Washoe County Gas Facilities Rev. Bonds (Sierra Pacific Pwr. Co. Projs.): | | | |
| Series 2016 C, 4.125%, tender 10/1/29 (b)(c) | | 735 | 736 |
| Series 2016 G, 3.625%, tender 10/1/29 (b) | | 535 | 532 |
TOTAL NEVADA | | | 24,317 |
| New Hampshire - 0.4% | | | |
| Nat'l. Fin. Auth. Hosp. Rev. (St. Luke's Univ. Health Network Proj.) Series 2021 B: | | | |
| 5% 8/15/24 | | 600 | 601 |
| 5% 8/15/28 | | 1,125 | 1,190 |
| Nat'l. Fin. Auth. Solid Bonds (Waste Mgmt., Inc. Proj.): | | | |
| Series 2019 A3, 2.15%, tender 7/1/24 (b)(c) | | 4,455 | 4,455 |
| Series 2019 A4, 2.15%, tender 7/1/24 (b)(c) | | 2,250 | 2,250 |
| New Hampshire Bus. Fin. Auth. Wtr. Facility (Pennichuck Wtr. Works, Inc. Proj.) Series 2014 A, 5% 1/1/25 (Escrowed to Maturity) (c) | | 1,000 | 1,005 |
TOTAL NEW HAMPSHIRE | | | 9,501 |
| New Jersey - 4.6% | | | |
| New Jersey Econ. Dev. Auth. Series 2024 SSS: | | | |
| 5% 6/15/26 | | 2,575 | 2,649 |
| 5% 6/15/27 | | 1,070 | 1,118 |
| New Jersey Econ. Dev. Auth. Rev.: | | | |
| Series 2015 XX, 5% 6/15/26 (Pre-Refunded to 6/15/25 @ 100) | | 975 | 991 |
| Series 2019: | | | |
5.25% 9/1/24 (e) | | 300 | 301 |
5.25% 9/1/26 (e) | | 3,410 | 3,532 |
| New Jersey Edl. Facility Series 2016 B, 4% 9/1/26 | | 320 | 322 |
| New Jersey Gen. Oblig.: | | | |
| Series 2020 A, 4% 6/1/31 | | 12,715 | 13,353 |
| Series 2021, 2% 6/1/29 | | 1,965 | 1,751 |
| New Jersey Health Care Facilities Fing. Auth. Rev.: | | | |
| (Greystone Park Psychiatric Hosp. Proj.) Series 2024: | | | |
5% 9/15/27 | | 1,135 | 1,183 |
5% 9/15/28 | | 1,250 | 1,320 |
| (Marlboro Psychiatric Hosp. Proj.) Series 2024, 5% 9/15/29 | | 1,010 | 1,079 |
| Bonds: | | | |
Series 2019 B2, 5%, tender 7/1/25 (b) | | 3,890 | 3,942 |
Series 2019 B3, 5%, tender 7/1/26 (b) | | 2,750 | 2,820 |
| Series 2016 A, 5% 7/1/24 (Escrowed to Maturity) | | 475 | 475 |
| Series 2016, 5% 7/1/25 | | 275 | 279 |
| New Jersey Higher Ed. Student Assistance Auth. Student Ln. Rev.: | | | |
| Series 2020: | | | |
5% 12/1/24 (c) | | 1,360 | 1,367 |
5% 12/1/25 (c) | | 2,440 | 2,478 |
5% 12/1/26 (c) | | 3,165 | 3,232 |
| Series 2021 A, 5% 12/1/25 (c) | | 130 | 132 |
| Series 2021 B: | | | |
5% 12/1/25 (c) | | 315 | 320 |
5% 12/1/26 (c) | | 1,425 | 1,455 |
| New Jersey Hsg. & Mtg. Fin. Agcy. Rev. Series 2019 D, 4% 4/1/25 (c) | | 1,405 | 1,402 |
| New Jersey Tpk. Auth. Tpk. Rev.: | | | |
| Series 2024, 5% 1/1/28 (d) | | 3,100 | 3,293 |
| Series D, 5% 1/1/28 | | 1,710 | 1,751 |
| New Jersey Trans. Trust Fund Auth.: | | | |
| Series 2006 C: | | | |
0% 12/15/25 | | 6,400 | 6,068 |
0% 12/15/26 (Assured Guaranty Corp. Insured) | | 1,585 | 1,452 |
0% 12/15/27 (Nat'l. Pub. Fin. Guarantee Corp. Insured) | | 1,820 | 1,604 |
0% 12/15/29 (Assured Guaranty Muni. Corp. Insured) | | 1,370 | 1,125 |
0% 12/15/31 (FGIC Insured) | | 5,400 | 4,081 |
| Series 2010 A: | | | |
0% 12/15/25 | | 1,140 | 1,081 |
0% 12/15/27 | | 6,420 | 5,648 |
| Series 2016 A, 5% 6/15/27 | | 3,960 | 4,064 |
| Series 2022 AA: | | | |
5% 6/15/26 | | 9,745 | 10,025 |
5% 6/15/27 | | 8,000 | 8,366 |
5% 6/15/28 | | 10,000 | 10,623 |
| Series A: | | | |
0% 12/15/26 | | 11,265 | 10,293 |
5% 12/15/25 | | 1,680 | 1,715 |
5% 12/15/26 | | 2,600 | 2,698 |
TOTAL NEW JERSEY | | | 119,388 |
| New Mexico - 1.4% | | | |
| New Mexico Edl. Assistance Foundation Series 2021 1A: | | | |
| 5% 9/1/25 (c) | | 6,250 | 6,328 |
| 5% 9/1/28 (c) | | 2,000 | 2,077 |
| New Mexico Hosp. Equip. Ln. Council Rev. Bonds Series 2019 B, 5%, tender 8/1/25 (b) | | 3,135 | 3,175 |
| New Mexico Mtg. Fin. Auth.: | | | |
| Series 2019 C, 4% 1/1/50 | | 2,555 | 2,539 |
| Series 2021 C, 3% 1/1/52 | | 2,805 | 2,705 |
| Series 2021 D, 3% 7/1/52 | | 13,515 | 13,000 |
| Series 2023 C, I 5.75% 3/1/54 | | 1,960 | 2,090 |
| New Mexico Muni. Energy Acquisition Auth. Gas Supply Rev. Series 2019 A: | | | |
| 4% 11/1/24 | | 1,450 | 1,449 |
| 4% 5/1/25 | | 2,790 | 2,785 |
TOTAL NEW MEXICO | | | 36,148 |
| New York - 10.0% | | | |
| East Hampton Union Free School District Series 2017, 2.25% 6/1/28 | | 505 | 463 |
| Long Island Pwr. Auth. Elec. Sys. Rev.: | | | |
| Bonds: | | | |
Series 2019 B, 1.65%, tender 9/1/24 (b) | | 7,255 | 7,218 |
Series 2020 B, 0.85%, tender 9/1/25 (b) | | 19,810 | 19,040 |
Series 2021 B, 1.5%, tender 9/1/26 (b) | | 3,360 | 3,163 |
| Series 2021, 1% 9/1/25 | | 2,805 | 2,690 |
| Monroe County Indl. Dev. Agcy. Bonds (Andrews Terrace Cmnty. Partners, L.P. Proj.) Series 2023 B1, 5%, tender 7/1/27 (b) | | 1,540 | 1,579 |
| Monroe County Indl. Dev. Corp. (Univ. of Rochester Proj.): | | | |
| Series 2017 A, 5% 7/1/25 | | 900 | 915 |
| Series 2020 A: | | | |
5% 7/1/25 | | 750 | 763 |
5% 7/1/26 | | 500 | 519 |
| New York Bridge Auth. Gen. Rev. Series 2021 B, 5% 1/1/27 | | 1,500 | 1,567 |
| New York City Gen. Oblig.: | | | |
| Series 2020 A1, 5% 8/1/27 | | 13,205 | 13,934 |
| Series 2020 C1, 5% 8/1/30 | | 1,000 | 1,105 |
| Series 2022 B1, 5% 8/1/28 | | 11,490 | 12,314 |
| Series A, 5% 8/1/26 | | 1,000 | 1,037 |
| Series A6, 5% 8/1/25 | | 250 | 250 |
| Series F1, 5% 6/1/25 | | 470 | 477 |
| Series I1, 5% 3/1/27 | | 615 | 616 |
| New York City Hsg. Dev. Corp. Bonds: | | | |
| Series 2023 E2, 3.8%, tender 1/3/28 (b) | | 690 | 693 |
| Series 2024 A2, 3.625%, tender 7/1/28 (b) | | 5,210 | 5,206 |
| Series 2024 B2, 3.7%, tender 7/3/28 (b) | | 8,610 | 8,651 |
| New York City Hsg. Dev. Corp. Multifamily Hsg. Bonds: | | | |
| Series 2021 C2, 0.7%, tender 7/1/25 (b) | | 1,360 | 1,308 |
| Series 2021 K2, 0.9%, tender 1/1/26 (b) | | 12,290 | 11,583 |
| Series 2021, 0.6%, tender 7/1/25 (b) | | 2,855 | 2,756 |
| Series 2023 A2, 3.73%, tender 12/29/28 (b) | | 4,675 | 4,683 |
| Series 2023 D, 4.3%, tender 11/1/28 (b) | | 2,355 | 2,400 |
| New York City Indl. Dev. Agcy. Rev. Series 2021 A: | | | |
| 5% 1/1/25 (Assured Guaranty Muni. Corp. Insured) | | 1,000 | 1,007 |
| 5% 1/1/26 (Assured Guaranty Muni. Corp. Insured) | | 1,000 | 1,024 |
| 5% 1/1/27 (Assured Guaranty Muni. Corp. Insured) | | 1,000 | 1,035 |
| New York City Transitional Fin. Auth. Rev.: | | | |
| Series 2017 E1, 5% 2/1/30 | | 2,990 | 3,094 |
| Series E1, 5% 2/1/26 | | 475 | 480 |
| New York Dorm. Auth. Rev.: | | | |
| Series 2015 A: | | | |
5% 7/1/28 | | 370 | 373 |
5% 7/1/28 (Pre-Refunded to 7/1/25 @ 100) | | 30 | 30 |
| Series 2022: | | | |
5% 7/1/26 | | 675 | 685 |
5% 7/1/27 | | 710 | 726 |
5% 7/1/28 | | 750 | 772 |
5% 7/1/29 | | 1,065 | 1,104 |
| New York Dorm. Auth. Sales Tax Rev.: | | | |
| Series 2017 A, 5% 3/15/31 | | 2,745 | 2,851 |
| Series 2023: | | | |
5% 3/15/29 | | 24,985 | 27,149 |
5% 3/15/29 (Escrowed to Maturity) | | 15 | 16 |
| New York Metropolitan Trans. Auth. Dedicated Tax Fund Rev.: | | | |
| Series 2016 A, 5% 11/15/24 | | 525 | 528 |
| Series 2016 B1, 5% 11/15/24 | | 670 | 674 |
| Series 2017 B1, 4% 11/15/25 | | 250 | 253 |
| New York Metropolitan Trans. Auth. Rev.: | | | |
| Series 2015 A1, 5% 11/15/29 | | 765 | 773 |
| Series 2016 D, 5% 11/15/27 | | 1,500 | 1,554 |
| Series 2017 A2: | | | |
5% 11/15/25 | | 2,620 | 2,675 |
5% 11/15/26 | | 5,815 | 6,029 |
| Series 2017 B, 5% 11/15/24 | | 665 | 668 |
| Series 2017 C1, 5% 11/15/28 | | 4,340 | 4,598 |
| New York State Dorm. Auth.: | | | |
| Series 2018 A, 5% 3/15/27 (Escrowed to Maturity) | | 970 | 1,020 |
| Series 2021 A, 5% 3/15/29 | | 1,500 | 1,626 |
| Series 2022 A, 5% 3/15/30 | | 3,820 | 4,205 |
| Series 2023 A: | | | |
5% 3/15/29 | | 5,000 | 5,420 |
5% 3/15/30 | | 7,295 | 8,030 |
| New York State Hsg. Fin. Agcy. Rev.: | | | |
| Bonds: | | | |
Series 2021 D2, 0.65%, tender 11/1/25 (b) | | 2,565 | 2,452 |
Series 2021 J2: | | | |
1%, tender 11/1/26 (b) | | 1,770 | 1,635 |
1.1%, tender 5/1/27 (b) | | 6,610 | 5,968 |
| Series J, 0.75% 5/1/25 | | 1,545 | 1,495 |
| New York State Mtg. Agcy. Homeowner Mtg.: | | | |
| Series 2021 232: | | | |
5% 4/1/25 (c) | | 1,130 | 1,137 |
5% 10/1/26 (c) | | 1,580 | 1,612 |
| Series 221, 3.5% 10/1/32 (c) | | 300 | 293 |
| New York Thruway Auth. Gen. Rev. Series 2014 K, 5% 1/1/32 | | 795 | 800 |
| New York Trans. Dev. Corp.: | | | |
| (Term. 4 JFK Int'l. Arpt. Proj.): | | | |
Series 2020 A: | | | |
5% 12/1/24 (c) | | 1,500 | 1,505 |
5% 12/1/25 (c) | | 2,295 | 2,326 |
5% 12/1/26 (c) | | 1,180 | 1,209 |
Series 2020 C: | | | |
5% 12/1/24 | | 1,000 | 1,004 |
5% 12/1/25 | | 800 | 815 |
5% 12/1/26 | | 1,250 | 1,289 |
5% 12/1/27 | | 1,250 | 1,307 |
5% 12/1/28 | | 1,300 | 1,378 |
| (Term. 4 John F. Kennedy Int'l. Arpt. Proj.) Series 2022: | | | |
5% 12/1/26 (c) | | 13,300 | 13,624 |
5% 12/1/27 (c) | | 12,605 | 13,059 |
5% 12/1/28 (c) | | 600 | 629 |
| New York Urban Dev. Corp. Rev. Series 2015 A, 5% 3/15/26 | | 250 | 255 |
| Niagara Frontier Trans. Auth. Arpt. Rev. Series 2019 A: | | | |
| 5% 4/1/25 (c) | | 625 | 628 |
| 5% 4/1/27 (c) | | 1,350 | 1,381 |
| Suffolk County Gen. Oblig.: | | | |
| Series 2022 A: | | | |
5% 6/15/25 | | 695 | 706 |
5% 6/15/29 | | 965 | 1,051 |
| Series 2022 B: | | | |
5% 10/1/25 | | 800 | 817 |
5% 10/1/26 | | 410 | 426 |
5% 10/1/28 | | 670 | 721 |
| Syracuse Reg'l. Arpt. Auth. Series 2021: | | | |
| 5% 7/1/25 (c) | | 750 | 756 |
| 5% 7/1/26 (c) | | 1,145 | 1,162 |
| 5% 7/1/27 (c) | | 1,515 | 1,549 |
| Triborough Bridge & Tunnel Auth. Bonds: | | | |
| Series 2021 A2: | | | |
2%, tender 5/15/26 (b) | | 7,870 | 7,531 |
2%, tender 5/15/28 (b) | | 2,575 | 2,375 |
| Series 2021 B, 5%, tender 5/15/26 (b) | | 2,470 | 2,528 |
TOTAL NEW YORK | | | 258,752 |
| New York And New Jersey - 1.5% | | | |
| Port Auth. of New York & New Jersey: | | | |
| Series 188, 5% 5/1/25 (c) | | 1,980 | 2,001 |
| Series 193: | | | |
5% 10/15/25 (c) | | 4,015 | 4,085 |
5% 10/15/29 (c) | | 1,350 | 1,366 |
| Series 2015 193, 5% 10/15/27 (c) | | 7,425 | 7,520 |
| Series 2023 242: | | | |
5% 12/1/27 (c) | | 2,700 | 2,817 |
5% 12/1/28 (c) | | 11,915 | 12,572 |
| Series 223: | | | |
5% 7/15/25 (c) | | 1,500 | 1,521 |
5% 7/15/26 (c) | | 2,250 | 2,315 |
5% 7/15/27 (c) | | 3,055 | 3,172 |
5% 7/15/28 (c) | | 2,500 | 2,625 |
TOTAL NEW YORK AND NEW JERSEY | | | 39,994 |
| North Carolina - 1.6% | | | |
| Asheville Spl. Obligations Series 2021, 5% 4/1/25 | | 1,530 | 1,548 |
| Charlotte Int'l. Arpt. Rev.: | | | |
| Series 2019 B, 5% 7/1/27 (c) | | 735 | 760 |
| Series 2021 B: | | | |
5% 7/1/26 (c) | | 5,535 | 5,680 |
5% 7/1/27 (c) | | 4,500 | 4,654 |
5% 7/1/28 (c) | | 1,675 | 1,753 |
5% 7/1/29 (c) | | 865 | 913 |
| Charlotte-Mecklenburg Hosp. Auth. Health Care Sys. Rev. Bonds Series 2021 C, 5%, tender 12/1/28 (b) | | 1,570 | 1,667 |
| New Hanover County Hosp. Rev. Series 2017: | | | |
| 5% 10/1/25 (Escrowed to Maturity) | | 1,115 | 1,136 |
| 5% 10/1/26 (Escrowed to Maturity) | | 1,360 | 1,407 |
| North Carolina Cap. Facilities Fin. Agcy. Edl. Facilities Rev. Series 2021, 5% 5/1/25 | | 260 | 262 |
| North Carolina Grant Anticipation Rev. Series 2021: | | | |
| 5% 3/1/27 | | 2,305 | 2,412 |
| 5% 3/1/28 | | 2,375 | 2,528 |
| North Carolina Hsg. Fin. Agcy. Home Ownership Rev.: | | | |
| Series 2023 52A, 6.25% 1/1/55 | | 1,200 | 1,302 |
| Series 43, 4% 7/1/50 | | 4,245 | 4,219 |
| North Carolina Med. Care Commission Health Care Facilities Rev. Bonds Series 2019 C, 2.55%, tender 6/1/26 (b) | | 7,335 | 7,177 |
| North Carolina Med. Care Commission Hosp. Rev. Bonds Series 2021 B, 5%, tender 2/1/26 (b) | | 1,110 | 1,133 |
| Raleigh Durham Arpt. Auth. Arpt. Rev. Series 2020 A, 5% 5/1/27 (c) | | 355 | 366 |
| Union County Enterprise Systems Rev. Series 2021: | | | |
| 5% 6/1/26 | | 750 | 776 |
| 5% 6/1/27 | | 775 | 817 |
TOTAL NORTH CAROLINA | | | 40,510 |
| North Dakota - 0.2% | | | |
| North Dakota Hsg. Fin. Agcy.: | | | |
| Series 2021 A, 3% 1/1/52 | | 1,305 | 1,265 |
| Series 2021 B, 3% 7/1/52 | | 3,705 | 3,560 |
| Series 2023 F, 6.25% 1/1/54 | | 430 | 467 |
TOTAL NORTH DAKOTA | | | 5,292 |
| Ohio - 2.2% | | | |
| Akron Bath Copley Hosp. District Rev.: | | | |
| Series 2016, 5% 11/15/24 | | 1,955 | 1,960 |
| Series 2020: | | | |
5% 11/15/26 | | 375 | 383 |
5% 11/15/27 | | 185 | 191 |
| American Muni. Pwr., Inc. Rev.: | | | |
| Bonds Series 2021 A2, 1%, tender 8/15/24 (b) | | 2,150 | 2,141 |
| Series 2021 A: | | | |
5% 2/15/26 | | 300 | 307 |
5% 2/15/27 | | 400 | 418 |
| Series 2023 A: | | | |
5% 2/15/28 | | 3,615 | 3,828 |
5% 2/15/29 | | 4,555 | 4,893 |
| Butler County Hosp. Facilities Rev. Series 2017, 5% 11/15/28 | | 1,075 | 1,093 |
| Cleveland Arpt. Sys. Rev. Series 2016 A: | | | |
| 5% 1/1/25 (Assured Guaranty Muni. Corp. Insured) | | 1,225 | 1,233 |
| 5% 1/1/26 (Assured Guaranty Muni. Corp. Insured) | | 490 | 493 |
| Miami County Hosp. Facilities Rev. (Kettering Health Network Obligated Group Proj.) Series 2019: | | | |
| 5% 8/1/27 | | 1,000 | 1,043 |
| 5% 8/1/28 | | 1,000 | 1,057 |
| Miami Univ. Series 2022 A, 5% 9/1/24 | | 125 | 125 |
| Montgomery County Hosp. Rev. (Kettering Health Network Obligated Group Proj.)) Series 2021: | | | |
| 5% 8/1/27 | | 575 | 600 |
| 5% 8/1/28 | | 1,295 | 1,369 |
| Ohio Cap. Facilities Lease (Adult Correctional Bldg. Fund Projs.) Series 2021 A, 5% 10/1/26 | | 1,750 | 1,814 |
| Ohio Higher Edl. Facility Commission Rev. Bonds (Case Western Reserve Univ. Proj.) Series 2019 C, 1.625%, tender 12/1/26 (b) | | 1,345 | 1,266 |
| Ohio Hosp. Rev.: | | | |
| Bonds Series 2019 C, 2.75%, tender 5/1/28 (b) | | 3,920 | 3,783 |
| Series 2024 A, 5% 1/1/32 | | 6,150 | 6,904 |
| Ohio Hsg. Fin. Agcy. Residential Mtg. Rev.: | | | |
| (Mtg. Backed Securities Prog.) Series 2019 B, 4.5% 3/1/50 | | 215 | 216 |
| (Mtg.-Backed Securities Prog.) Series 2023 B, 6% 3/1/55 | | 1,545 | 1,682 |
| Series 2021 C, 3.25% 3/1/51 | | 15,285 | 14,869 |
| Scioto County Hosp. Facilities Rev.: | | | |
| Series 2016: | | | |
5% 2/15/25 | | 2,065 | 2,077 |
5% 2/15/26 | | 1,285 | 1,305 |
| Series 2019, 5% 2/15/29 | | 1,515 | 1,554 |
| Univ. of Akron Gen. Receipts Series 2019 A, 5% 1/1/25 | | 1,100 | 1,109 |
TOTAL OHIO | | | 57,713 |
| Oklahoma - 0.6% | | | |
| Oklahoma County Independent School District #89 Oklahoma City Series 2023 A, 3% 7/1/26 | | 14,520 | 14,347 |
| Oklahoma Hsg. Fin. Agcy. Single Family Mtg. Rev.: | | | |
| (Homeownership Ln. Prog.) Series 2023 C, 6% 3/1/54 | | 285 | 310 |
| (Homeownership Load Prog.) Series 2023 D, 6.5% 9/1/54 | | 310 | 346 |
| Oklahoma Tpk. Auth. Tpk. Rev. Series 2017 D, 5% 1/1/25 | | 775 | 781 |
TOTAL OKLAHOMA | | | 15,784 |
| Oregon - 0.3% | | | |
| Marion & Polk Counties Salem-Keizer School District #24J Series 2020, 0% 6/15/28 | | 2,300 | 1,943 |
| Oregon Facilities Auth. Rev. (Samaritan Health Svcs. Proj.): | | | |
| Series 2020 A: | | | |
5% 10/1/24 | | 200 | 200 |
5% 10/1/25 | | 225 | 227 |
5% 10/1/26 | | 150 | 152 |
| Series A, 5% 10/1/27 | | 150 | 153 |
| Oregon State Hsg. & Cmnty. Svcs. Dept. (Single Family Mtg. Prog.) Series A, 3.5% 1/1/51 | | 2,415 | 2,372 |
| Port of Portland Arpt. Rev.: | | | |
| Series 2020 27 A, 5% 7/1/29 (c) | | 430 | 454 |
| Series 27 A, 5% 7/1/26 (c) | | 1,515 | 1,554 |
TOTAL OREGON | | | 7,055 |
| Pennsylvania - 2.6% | | | |
| Allegheny County Arpt. Auth. Rev. Series 2021 A: | | | |
| 5% 1/1/26 (c) | | 1,750 | 1,778 |
| 5% 1/1/27 (c) | | 2,000 | 2,056 |
| 5% 1/1/28 (c) | | 2,250 | 2,335 |
| Allegheny County Indl. Dev. Auth. Rev. Series 2021, 3.5% 12/1/31 | | 970 | 466 |
| Allegheny County Sanitation Auth. Swr. Rev. Series 2020 A, 4% 6/1/25 | | 200 | 201 |
| Commonwealth Fing. Auth. Rev. Series 2020 A, 5% 6/1/25 | | 1,150 | 1,164 |
| Geisinger Auth. Health Sys. Rev. Bonds: | | | |
| Series 2020 B, 5%, tender 2/15/27 (b) | | 3,420 | 3,519 |
| Series 2020 C, 5%, tender 4/1/30 (b) | | 3,625 | 3,858 |
| Lancaster Muni. Auth. Rev. Series 2023 B, 5% 6/1/29 | | 2,650 | 2,857 |
| Montgomery County Higher Ed. & Health Auth. Rev. Series 2019, 5% 9/1/29 | | 1,000 | 1,059 |
| Pennsylvania Econ. Dev. Fing. Auth. Solid Waste Disp. Rev. Bonds: | | | |
| (Waste Mgmt., Inc. Proj.) Series 2017 A, 0.58%, tender 8/1/24 (b)(c) | | 1,100 | 1,096 |
| Series 2011, 2.15%, tender 7/1/24 (b)(c) | | 1,000 | 1,000 |
| Pennsylvania Gen. Oblig.: | | | |
| Series 2018: | | | |
3.2% 3/1/29 | | 4,065 | 3,987 |
3.35% 3/1/30 | | 6,055 | 5,989 |
| Series 2019: | | | |
5% 7/15/28 | | 1,760 | 1,889 |
5% 7/15/29 | | 1,395 | 1,526 |
| Pennsylvania Higher Edl. Facilities Auth. Rev. Series 2016 C, 5% 8/15/25 | | 2,855 | 2,908 |
| Pennsylvania Hsg. Fin. Agcy.: | | | |
| Series 2020 13 2A, 3.5% 4/1/51 | | 515 | 509 |
| Series 2021 137, 3% 10/1/51 | | 5,305 | 5,071 |
| Pennsylvania Tpk. Commission Tpk. Rev. Series 2021 B: | | | |
| 5% 12/1/25 | | 860 | 880 |
| 5% 12/1/26 | | 1,000 | 1,040 |
| 5% 12/1/27 | | 750 | 793 |
| Philadelphia Arpt. Rev.: | | | |
| Series 2017 A, 5% 7/1/24 | | 490 | 490 |
| Series 2017 B, 5% 7/1/25 (c) | | 1,700 | 1,719 |
| Series 2021: | | | |
5% 7/1/28 (c) | | 3,100 | 3,236 |
5% 7/1/29 (c) | | 1,830 | 1,931 |
| Philadelphia School District: | | | |
| Series 2018 A: | | | |
5% 9/1/25 | | 700 | 711 |
5% 9/1/26 | | 750 | 771 |
| Series 2019 A, 5% 9/1/25 | | 1,200 | 1,219 |
| Reading School District Series 2017: | | | |
| 5% 3/1/25 (Assured Guaranty Muni. Corp. Insured) | | 320 | 323 |
| 5% 3/1/26 (Assured Guaranty Muni. Corp. Insured) | | 260 | 267 |
| 5% 3/1/27 (Assured Guaranty Muni. Corp. Insured) | | 250 | 259 |
| 5% 3/1/28 (Assured Guaranty Muni. Corp. Insured) | | 245 | 254 |
| Southcentral Pennsylvania Gen. Auth. Rev. Series 2023 A, 5% 6/1/29 | | 8,475 | 9,138 |
TOTAL PENNSYLVANIA | | | 66,299 |
| Puerto Rico - 0.7% | | | |
| Puerto Rico Commonwealth Aqueduct & Swr. Auth. Series 2022 A, 5% 7/1/28 (e) | | 7,500 | 7,772 |
| Puerto Rico Commonwealth Pub. Impt. Gen. Oblig.: | | | |
| Series 2021 A1: | | | |
0% 7/1/24 | | 612 | 612 |
5.625% 7/1/29 | | 2,265 | 2,429 |
| Series 2022 A1, 5.375% 7/1/25 | | 6,360 | 6,413 |
TOTAL PUERTO RICO | | | 17,226 |
| Rhode Island - 0.7% | | | |
| Rhode Island Health & Edl. Bldg. Corp. Higher Ed. Facilities Rev. Series 2016, 5% 5/15/25 | | 5,385 | 5,425 |
| Rhode Island Hsg. & Mtg. Fin. Corp. Series 2019 70, 4% 10/1/49 | | 390 | 388 |
| Rhode Island Hsg. & Mtg. Fin. Corp. Rev. Series 72 A, 3.5% 10/1/50 | | 835 | 820 |
| Rhode Island Student Ln. Auth. Student Ln. Rev.: | | | |
| Series 2018 A, 5% 12/1/25 (c) | | 845 | 857 |
| Series 2019 A: | | | |
5% 12/1/24 (c) | | 1,275 | 1,281 |
5% 12/1/25 (c) | | 1,900 | 1,926 |
5% 12/1/26 (c) | | 1,000 | 1,021 |
5% 12/1/28 (c) | | 510 | 533 |
| Series 2021 A, 5% 12/1/27 (c) | | 900 | 929 |
| Series A: | | | |
4% 12/1/26 (c) | | 355 | 352 |
5% 12/1/26 (c) | | 1,200 | 1,225 |
| Tobacco Settlement Fing. Corp. Series 2015 A: | | | |
| 5% 6/1/26 | | 3,425 | 3,456 |
| 5% 6/1/27 | | 980 | 990 |
TOTAL RHODE ISLAND | | | 19,203 |
| South Carolina - 0.8% | | | |
| Scago Edl. Facilities Corp. for Colleton School District (School District of Colleton County Proj.) Series 2015, 5% 12/1/26 | | 1,075 | 1,088 |
| South Carolina Hsg. Fin. & Dev. Auth. Mtg. Rev.: | | | |
| Series 2019 A, 4% 1/1/50 | | 795 | 790 |
| Series 2023 B, 6% 1/1/54 | | 955 | 1,040 |
| South Carolina Ports Auth. Ports Rev.: | | | |
| Series 2015 (AMT), 5% 7/1/45 (Pre-Refunded to 7/1/25 @ 100) (c) | | 2,910 | 2,948 |
| Series 2015: | | | |
5.25% 7/1/50 (Pre-Refunded to 7/1/25 @ 100) (c) | | 4,805 | 4,880 |
5.25% 7/1/55 (Pre-Refunded to 7/1/25 @ 100) (c) | | 2,310 | 2,346 |
| South Carolina Pub. Svc. Auth. Rev.: | | | |
| Series 2015 A, 5% 12/1/25 | | 1,000 | 1,008 |
| Series 2021 A: | | | |
5% 12/1/26 | | 670 | 690 |
5% 12/1/27 | | 750 | 782 |
| Series 2021 B: | | | |
5% 12/1/24 | | 1,400 | 1,406 |
5% 12/1/25 | | 500 | 509 |
5% 12/1/26 | | 500 | 515 |
5% 12/1/27 | | 450 | 469 |
5% 12/1/28 | | 800 | 845 |
| York County School District #4 Series 2020, 1.25% 3/1/31 | | 1,005 | 813 |
TOTAL SOUTH CAROLINA | | | 20,129 |
| South Dakota - 0.0% | | | |
| South Dakota Hsg. Dev. Auth. Series 2023 G, 6.25% 5/1/55 | | 610 | 662 |
| Tennessee - 1.3% | | | |
| Metropolitan Govt. Nashville & Davidson County Elec. Rev.: | | | |
| Series 2024 A: | | | |
5% 5/15/27 | | 1,000 | 1,053 |
5% 5/15/30 | | 3,375 | 3,734 |
5% 5/15/33 | | 2,000 | 2,310 |
| Series 2024 B: | | | |
5% 5/15/27 | | 3,495 | 3,682 |
5% 5/15/32 | | 3,585 | 4,085 |
| Metropolitan Nashville Arpt. Auth. Rev. Series 2019 B: | | | |
| 5% 7/1/26 (c) | | 2,000 | 2,043 |
| 5% 7/1/27 (c) | | 2,435 | 2,518 |
| 5% 7/1/28 (c) | | 3,125 | 3,262 |
| 5% 7/1/29 (c) | | 3,800 | 4,010 |
| 5% 7/1/30 (c) | | 3,000 | 3,199 |
| Shelby County Tenn Health Edl.& H Bonds Series 2024 B, 5%, tender 9/1/29 (b) | | 3,550 | 3,740 |
| Tennessee Hsg. Dev. Agcy. Residential Series 2021 3A, 3% 1/1/52 | | 1,445 | 1,393 |
TOTAL TENNESSEE | | | 35,029 |
| Texas - 15.5% | | | |
| Alvin Independent School District Series 2024: | | | |
| 5% 2/15/30 | | 1,000 | 1,099 |
| 5% 2/15/31 | | 1,000 | 1,115 |
| Austin Arpt. Sys. Rev.: | | | |
| Series 2019 B: | | | |
5% 11/15/24 (c) | | 675 | 677 |
5% 11/15/25 (c) | | 650 | 660 |
| Series 2019, 5% 11/15/24 (c) | | 2,500 | 2,508 |
| Bastrop Independent School District Series 2023, 5% 2/15/30 | | 1,150 | 1,264 |
| Birdville Independent School District Series 2021, 5% 2/15/26 | | 800 | 821 |
| Boerne Independent School District Bonds: | | | |
| Series 2023, 3.125%, tender 2/1/27 (b) | | 1,440 | 1,420 |
| Series 2024, 4%, tender 2/1/28 (b) | | 2,530 | 2,591 |
| Brazos County Gen. Oblig. Series 2020, 1.5% 9/1/32 | | 1,335 | 1,058 |
| Central Reg'l. Mobility Auth.: | | | |
| Series 2016, 5% 1/1/26 | | 2,800 | 2,861 |
| Series 2020 F, 5% 1/1/25 | | 4,455 | 4,462 |
| Series 2021 C, 5% 1/1/27 | | 6,865 | 7,013 |
| City of Denton: | | | |
| Series 2020 A, 5% 2/15/26 | | 1,025 | 1,053 |
| Series 2020, 2% 2/15/31 | | 1,325 | 1,144 |
| Clear Creek Independent School District Bonds Series 2021 B, 0.28%, tender 8/15/24 (b) | | 4,370 | 4,352 |
| Clint Independent School District Series 2015 A, 5% 2/15/26 | | 1,600 | 1,616 |
| Comal County Series 2017, 4% 2/1/26 | | 1,780 | 1,799 |
| Comal Independent School District Series 2020, 1.5% 2/1/31 | | 7,135 | 5,891 |
| Coppell Tex Series 2020: | | | |
| 1% 2/1/31 | | 1,395 | 1,097 |
| 1.125% 2/1/32 | | 1,405 | 1,080 |
| Cypress-Fairbanks Independent School District Bonds: | | | |
| Series 2015 B1, 0.28%, tender 8/15/24 (b) | | 5,800 | 5,776 |
| Series 2015 B2, 0.28%, tender 8/15/24 (b) | | 9,205 | 9,166 |
| Dallas Fort Worth Int'l. Arpt. Rev. Series 2020 A, 5% 11/1/26 | | 2,595 | 2,697 |
| Denton Independent School District: | | | |
| Bonds: | | | |
Series 2014 B: | | | |
2%, tender 8/1/24 (b) | | 265 | 265 |
2%, tender 8/1/24 (b) | | 505 | 504 |
Series 2019: | | | |
2%, tender 8/1/24 (b) | | 395 | 394 |
2%, tender 8/1/24 (b) | | 2,185 | 2,181 |
| Series 2016, 0% 8/15/25 | | 1,610 | 1,549 |
| El Paso Gen. Oblig. Series 2024: | | | |
| 5% 8/15/28 (d) | | 1,665 | 1,775 |
| 5% 8/15/29 (d) | | 1,000 | 1,082 |
| 5% 8/15/30 (d) | | 1,000 | 1,096 |
| 5% 8/15/31 (d) | | 1,250 | 1,388 |
| El Paso Wtr. & Swr. Rev.: | | | |
| Series 2017, 5% 3/1/30 | | 1,750 | 1,817 |
| Series 2020, 3% 3/1/30 | | 1,150 | 1,109 |
| Fort Bend Independent School District Bonds: | | | |
| Series 2020 B, 0.875%, tender 8/1/25 (b) | | 9,400 | 9,103 |
| Series 2021 B, 0.72%, tender 8/1/26 (b) | | 2,970 | 2,743 |
| Fort Worth Gen. Oblig. Series 2020, 5% 3/1/26 | | 3,800 | 3,912 |
| Goose Creek Consolidated Independent School District Bonds Series 2021 B, 0.6%, tender 8/17/26 (b) | | 3,500 | 3,288 |
| Grand Parkway Trans. Corp. Bonds Series 2023, 5%, tender 4/1/28 (b) | | 10,430 | 10,962 |
| Hallsville Independent School District Series 2020, 5% 2/15/30 | | 1,000 | 1,079 |
| Harris County Cultural Ed. Facilities Fin. Corp. Med. Facilities Rev.: | | | |
| Series 2016, 5% 11/15/25 | | 1,500 | 1,528 |
| Series 2024, 5% 5/15/29 | | 2,320 | 2,485 |
| Harris County Cultural Ed. Facilities Fin. Corp. Rev.: | | | |
| Bonds: | | | |
Series 2019 B, 5%, tender 12/1/26 (b) | | 6,545 | 6,782 |
Series 2020 A, 0.9%, tender 5/15/25 (b) | | 4,845 | 4,696 |
Series 2020 C, 5%, tender 12/1/26 (b) | | 7,000 | 7,254 |
Series 2024 C, 5%, tender 7/1/54 | | 10,000 | 10,711 |
| Series 2014 A, 5% 12/1/26 | | 1,085 | 1,091 |
| Harris County Hosp. District Series 2016, 3% 2/15/31 | | 2,650 | 2,512 |
| Hays Consolidated Independent School District Series 2022: | | | |
| 5% 2/15/27 | | 650 | 679 |
| 5% 2/15/28 | | 650 | 691 |
| 5% 2/15/29 | | 1,000 | 1,082 |
| Houston Arpt. Sys. Rev.: | | | |
| Series 2018 A, 5% 7/1/25 (c) | | 1,550 | 1,569 |
| Series 2018 C: | | | |
5% 7/1/26 (c) | | 500 | 511 |
5% 7/1/27 (c) | | 905 | 936 |
| Series 2020 B, 5% 7/1/26 | | 2,250 | 2,325 |
| Houston Gen. Oblig. Series 2017 A, 5% 3/1/27 | | 1,545 | 1,615 |
| Hurst Euless Bedford Independent School District Series 2024: | | | |
| 5% 8/15/29 | | 1,500 | 1,636 |
| 5% 8/15/30 | | 2,000 | 2,215 |
| 5% 8/15/31 | | 4,535 | 5,094 |
| Hutto Independent School District Bonds Series 2015, 2%, tender 8/1/25 (b) | | 1,250 | 1,229 |
| Kilgore Independent School District Series 2020, 5% 2/15/26 | | 1,075 | 1,104 |
| Leander Independent School District Series 2023 A, 0% 2/15/31 | | 5,630 | 4,423 |
| Llano Texas Independent School District Series 2023: | | | |
| 5% 2/15/28 | | 1,150 | 1,222 |
| 5% 2/15/29 | | 500 | 541 |
| 5% 2/15/30 | | 1,500 | 1,648 |
| 5% 2/15/31 | | 750 | 795 |
| Love Field Arpt. Modernization Rev.: | | | |
| Series 2015: | | | |
5% 11/1/26 (c) | | 1,075 | 1,088 |
5% 11/1/30 (c) | | 1,960 | 1,984 |
| Series 2021: | | | |
5% 11/1/24 (c) | | 2,615 | 2,621 |
5% 11/1/25 (c) | | 3,920 | 3,971 |
5% 11/1/26 (c) | | 2,845 | 2,911 |
5% 11/1/27 (c) | | 2,885 | 2,985 |
5% 11/1/28 (c) | | 11,150 | 11,666 |
5% 11/1/29 (c) | | 11,705 | 12,394 |
| Lower Colorado River Auth. Rev.: | | | |
| (LCRA Transmission Svcs. Corp. Proj.): | | | |
Series 2021, 5% 5/15/25 | | 1,315 | 1,333 |
Series 2023, 5% 5/15/26 (Assured Guaranty Muni. Corp. Insured) | | 6,625 | 6,842 |
| Series 2022, 5% 5/15/27 (Assured Guaranty Muni. Corp. Insured) | | 1,385 | 1,451 |
| Lubbock Elec. Lt. & Pwr. Sys. Rev. Series 2021, 5% 4/15/27 | | 1,450 | 1,510 |
| McKinney Independent School District Series 2021, 5% 2/15/27 | | 1,300 | 1,360 |
| Medina Valley Texas Independent School District Series 2023: | | | |
| 5% 2/15/28 (Permanent School Fund of Texas Insured) | | 1,825 | 1,939 |
| 5% 2/15/29 (Permanent School Fund of Texas Insured) | | 1,605 | 1,735 |
| 5% 2/15/30 (Permanent School Fund of Texas Insured) | | 3,065 | 3,368 |
| 5% 2/15/31 (Permanent School Fund of Texas Insured) | | 4,555 | 5,080 |
| Midlothian Independent School District Bonds Series 2013 C: | | | |
| 2%, tender 8/1/24 (b) | | 530 | 529 |
| 2%, tender 8/1/24 (b) | | 1,115 | 1,113 |
| Midway Independent School District Series 2021, 4% 8/1/27 | | 1,425 | 1,457 |
| Mission Econ. Dev. Corp. Solid Waste Disp. Rev. Bonds (Waste Mgmt., Inc. Proj.) Series 2018, 0.370% x SIFMA Municipal Swap Index 4.255%, tender 7/1/24 (b)(c)(f) | | 8,320 | 8,319 |
| New Caney Independent School District Bonds Series 2018, 1.25%, tender 8/15/24 (b) | | 7,200 | 7,176 |
| Newark Higher Ed. Fin. Corp. (Abilene Christian Univ. Proj.) Series 2016 A, 5% 4/1/26 | | 2,425 | 2,472 |
| North East Texas Independent School District Bonds: | | | |
| Series 2019, 2.2%, tender 8/1/24 (b) | | 2,345 | 2,342 |
| Series 2024, 3.75%, tender 8/1/27 (b) | | 3,395 | 3,406 |
| North Texas Tollway Auth. Rev. Series 2021 B, 5% 1/1/29 | | 1,970 | 2,107 |
| Northside Independent School District Bonds: | | | |
| Series 2019, 1.6%, tender 8/1/24 (b) | | 7,660 | 7,646 |
| Series 2020, 0.7%, tender 6/1/25 (b) | | 11,510 | 11,209 |
| Series 2024 B, 3.45%, tender 8/1/27 (b) | | 9,485 | 9,482 |
| Pasadena Independent School District Bonds Series 2015 B, 1.5%, tender 8/15/24 (b) | | 6,615 | 6,591 |
| Pecos Barstow Toyah Independent School District Series 2023, 5% 2/15/30 | | 2,200 | 2,344 |
| Pharr San Juan Alamo Independent School District Series 2016, 5% 2/1/26 | | 1,130 | 1,141 |
| Plano Gen. Oblig. Series 2024: | | | |
| 5% 9/1/27 | | 1,020 | 1,079 |
| 5% 9/1/28 | | 1,070 | 1,150 |
| 5% 9/1/29 | | 1,120 | 1,223 |
| Plano Wtrwks. & Swr. Sys. Rev. Series 2021, 4% 5/1/28 | | 1,110 | 1,142 |
| San Antonio Arpt. Sys. Rev. Series 2019 A: | | | |
| 5% 7/1/25 (c) | | 1,250 | 1,266 |
| 5% 7/1/25 (c) | | 1,350 | 1,367 |
| 5% 7/1/26 (c) | | 1,500 | 1,534 |
| 5% 7/1/26 (c) | | 1,460 | 1,491 |
| San Antonio Elec. & Gas Sys. Rev. Bonds: | | | |
| Series 2015 D, 1.125%, tender 12/1/26 (b) | | 10,810 | 9,841 |
| Series 2022, 2%, tender 12/1/27 (b) | | 3,250 | 3,007 |
| Tarrant County College Series 2022, 5% 8/15/27 | | 3,000 | 3,163 |
| Tarrant County Cultural Ed. Facilities Fin. Corp. Hosp. Rev. Bonds (Baylor Scott & White Health Proj.) Series 2022 E, 5%, tender 5/15/26 (b) | | 4,490 | 4,600 |
| Tarrant County Cultural Ed. Facilities Fin. Corp. Rev. Series 2016 A, 5% 2/15/26 | | 1,465 | 1,503 |
| Texas Dept. of Hsg. & Cmnty. Affairs Residential Mtg. Rev. Series 2023 B, 6% 1/1/54 | | 3,915 | 4,269 |
| Texas Gen. Oblig. Series 2020 B: | | | |
| 3% 8/1/25 (c) | | 4,610 | 4,560 |
| 3% 8/1/26 (c) | | 4,845 | 4,745 |
| 4% 8/1/27 (c) | | 5,085 | 5,109 |
| Texas St Technical College Sys. Series 2022 A: | | | |
| 5% 8/1/30 (Assured Guaranty Muni. Corp. Insured) | | 4,690 | 5,147 |
| 5% 8/1/32 (Assured Guaranty Muni. Corp. Insured) | | 2,000 | 2,252 |
| Texas Trans. Commission Hwy. Impt. Gen. Oblig. Bonds Series 2014 B, 0.65%, tender 4/1/26 (b) | | 16,470 | 15,394 |
| Texas Wtr. Dev. Board Rev.: | | | |
| Series 2016: | | | |
4% 10/15/30 | | 4,600 | 4,635 |
5% 4/15/29 | | 7,500 | 7,721 |
| Series 2022, 5% 8/1/30 | | 1,210 | 1,339 |
| Waco Gen. Oblig. Series 2021 A, 1.5% 2/1/31 | | 3,770 | 3,110 |
| Waxahachie Independent School District Series 2021, 3% 8/15/30 | | 1,905 | 1,840 |
| Wichita Falls Independent School District Series 2021: | | | |
| 4% 2/1/25 | | 600 | 602 |
| 4% 2/1/26 | | 850 | 859 |
| 4% 2/1/27 | | 1,100 | 1,118 |
| 4% 2/1/28 | | 900 | 922 |
TOTAL TEXAS | | | 401,401 |
| Utah - 0.8% | | | |
| Ogden City Utah School District Series 2020, 1.25% 6/15/31 | | 1,730 | 1,372 |
| Salt Lake City Arpt. Rev.: | | | |
| Series 2017 A, 5% 7/1/27 (c) | | 510 | 527 |
| Series 2018 A, 5% 7/1/26 (c) | | 2,550 | 2,605 |
| Series 2021 B: | | | |
5% 7/1/24 | | 250 | 250 |
5% 7/1/25 | | 530 | 538 |
5% 7/1/26 | | 1,150 | 1,187 |
5% 7/1/27 | | 750 | 786 |
| Utah County Hosp. Rev. Bonds Series 2020 B2, 5%, tender 8/1/26 (b) | | 13,205 | 13,561 |
TOTAL UTAH | | | 20,826 |
| Vermont - 0.2% | | | |
| Vermont Hsg. Fin. Agcy. Series 2021 B, 3% 11/1/51 | | 1,715 | 1,641 |
| Vermont Student Assistant Corp. Ed. Ln. Rev.: | | | |
| Series 2017 A: | | | |
5% 6/15/26 (c) | | 1,045 | 1,063 |
5% 6/15/27 (c) | | 560 | 572 |
| Series 2021 A: | | | |
5% 6/15/27 (c) | | 350 | 357 |
5% 6/15/28 (c) | | 425 | 436 |
5% 6/15/29 (c) | | 400 | 414 |
TOTAL VERMONT | | | 4,483 |
| Virginia - 0.8% | | | |
| Arlington County IDA Hosp. Facilities: | | | |
| Bonds Series 2023 A, 5%, tender 7/1/31 (b) | | 1,065 | 1,141 |
| Series 2020, 5% 7/1/25 | | 500 | 507 |
| Fairfax County Redev. & Hsg. Auth. Rev. Bonds (Dominion Square North Proj.) Series 2023, 5%, tender 1/1/28 (b) | | 1,055 | 1,086 |
| Halifax County Indl. Dev. Auth. Bonds (Virgina Elec. and Pwr. Co. Proj.) Series 2010 A, 3.8%, tender 5/28/27 (b) | | 1,975 | 1,980 |
| Loudoun County Gen. Oblig. Series 2016 A, 2.5% 12/1/28 | | 1,345 | 1,262 |
| Louisa Indl. Dev. Auth. Poll. Cont. Rev. Bonds (Virginia Elec. and Pwr. Co. Proj.) Series 2008 B, 0.75%, tender 9/2/25 (b) | | 6,750 | 6,377 |
| Norfolk Arpt. Auth. Series 2021 A: | | | |
| 5% 7/1/27 | | 750 | 783 |
| 5% 7/1/28 | | 1,000 | 1,060 |
| Norfolk Econ. Dev. Auth. Hosp. Facilities Rev. Bonds Series 2018 A, 5%, tender 11/1/28 (b) | | 875 | 929 |
| Stafford County Econ. Dev. Auth. Hosp. Facilities Rev. Series 2016: | | | |
| 5% 6/15/25 | | 980 | 991 |
| 5% 6/15/26 | | 1,680 | 1,719 |
| Wise County Indl. Dev. Auth. Waste & Sewage Rev. Bonds (Virginia Elec. and Pwr. Co. Proj.) Series 2009 A, 0.75%, tender 9/2/25 (b) | | 3,000 | 2,834 |
TOTAL VIRGINIA | | | 20,669 |
| Washington - 2.3% | | | |
| Chelan County Pub. Util. District #1 Columbia River-Rock Island Hydro-Elec. Sys. Rev. Series A, 0% 6/1/28 (Nat'l. Pub. Fin. Guarantee Corp. Insured) | | 1,615 | 1,406 |
| King County Hsg. Auth. Rev.: | | | |
| Series 2019: | | | |
4% 11/1/24 | | 1,075 | 1,076 |
4% 11/1/25 | | 1,260 | 1,269 |
4% 11/1/30 | | 1,575 | 1,589 |
| Series 2021: | | | |
3% 6/1/25 | | 830 | 816 |
4% 12/1/28 | | 375 | 378 |
4% 12/1/30 | | 575 | 579 |
4% 12/1/31 | | 450 | 445 |
| King County Swr. Rev. Bonds Series 2020 B, 0.875%, tender 1/1/26 (b) | | 21,845 | 20,920 |
| King County Wash Hsg. Auth. Afford (Kirkland Heights Proj.): | | | |
| Series 2023 A1, 5% 1/1/28 | | 760 | 773 |
| Series 2023 A2, 5% 1/1/28 | | 380 | 391 |
| Port of Seattle Rev.: | | | |
| Series 2013, 5% 7/1/24 (c) | | 775 | 775 |
| Series 2015 B, 5% 3/1/25 | | 450 | 451 |
| Series 2019, 5% 4/1/25 (c) | | 2,700 | 2,722 |
| Series 2021 C: | | | |
5% 8/1/25 (c) | | 2,660 | 2,694 |
5% 8/1/26 (c) | | 3,655 | 3,744 |
5% 8/1/27 (c) | | 2,260 | 2,343 |
5% 8/1/28 (c) | | 6,320 | 6,612 |
| Seattle Hsg. Auth. Rev.: | | | |
| (Juniper Apts. Proj.) Series 2023, 5% 6/1/27 | | 1,290 | 1,319 |
| (Northgate Plaza Proj.) Series 2021, 1% 6/1/26 | | 1,545 | 1,439 |
| Tacoma Elec. Sys. Rev. Series 2017: | | | |
| 5% 1/1/25 | | 660 | 665 |
| 5% 1/1/26 | | 390 | 401 |
| Washington Health Care Facilities Auth. Rev. (Virginia Mason Med. Ctr. Proj.) Series 2017: | | | |
| 5% 8/15/25 | | 1,450 | 1,461 |
| 5% 8/15/26 | | 2,560 | 2,590 |
| 5% 8/15/27 | | 2,425 | 2,472 |
| Washington Hsg. Fin. Commission Series 2021 2N: | | | |
| 5% 12/1/25 | | 915 | 933 |
| 5% 6/1/27 | | 500 | 520 |
TOTAL WASHINGTON | | | 60,783 |
| West Virginia - 0.2% | | | |
| West Virginia Econ. Dev. Auth. Solid Waste Disp. Facilities Rev. Bonds: | | | |
| (Appalachian Pwr. Co. - Amos Proj.) Series 2015 A, 3.375%, tender 6/15/28 (b) | | 780 | 767 |
| (Appalachian Pwr. Co. Amos Proj.) Series 2011 A, 1%, tender 9/1/25 (b)(c) | | 5,650 | 5,382 |
TOTAL WEST VIRGINIA | | | 6,149 |
| Wisconsin - 2.0% | | | |
| Blue Ridge Healthcare Pub. Fin. Auth. Series 2020 A, 5% 1/1/27 | | 1,085 | 1,113 |
| Madison Gen. Oblig. Series 2020 A, 1.375% 10/1/30 | | 7,065 | 5,826 |
| Milwaukee Gen. Oblig. Series 2018 N4, 5% 4/1/25 | | 7,860 | 7,929 |
| Roseman Univ. of Health Series 2018 A, 5% 12/1/27 | | 760 | 766 |
| Wisconsin Health & Edl. Facilities: | | | |
| Bonds: | | | |
Series 2018 C1, 5%, tender 7/29/26 (b) | | 1,210 | 1,238 |
Series 2020 C, 5%, tender 2/15/27 (b) | | 5,000 | 5,082 |
| Series 2017 A, 5% 4/1/29 | | 1,765 | 1,824 |
| Wisconsin Health & Edl. Facilities Auth. Rev.: | | | |
| Bonds: | | | |
Series 2018 B2, 5%, tender 6/24/26 (b) | | 3,670 | 3,752 |
Series 2018 C3, 5%, tender 6/24/26 (b) | | 2,675 | 2,735 |
Series 2018 C4, 5%, tender 6/22/29 (b) | | 1,125 | 1,206 |
Series 2018, 5%, tender 6/22/29 (b) | | 1,635 | 1,754 |
| Series 2024 A, 5% 2/15/29 | | 13,090 | 13,743 |
| Wisconsin Hsg. & Econ. Dev. Auth.: | | | |
| Series 2021 A, 3% 3/1/52 | | 1,230 | 1,186 |
| Series 2021 C, 3% 9/1/52 | | 1,935 | 1,866 |
| Wisconsin Hsg. & Econ. Dev. Auth. Hsg. Rev. Bonds Series 2021 C, 0.81%, tender 5/1/25 (b) | | 1,335 | 1,287 |
TOTAL WISCONSIN | | | 51,307 |
| Wyoming - 0.0% | | | |
| Laramie County Hosp. Rev. (Cheyenne Reg'l. Med. Ctr. Proj.) Series 2021, 4% 5/1/27 | | 370 | 375 |
| TOTAL MUNICIPAL BONDS (Cost $2,666,940) | | | 2,590,997 |
| | | | |
| Money Market Funds - 0.7% |
| | | Shares | Value ($) (000s) |
Fidelity Municipal Cash Central Fund 4.33% (g)(h) (Cost $19,839) | | 19,835,080 | 19,839 |
| | | | |
| TOTAL INVESTMENT IN SECURITIES - 100.6% (Cost $2,686,779) | 2,610,836 |
NET OTHER ASSETS (LIABILITIES) - (0.6)% | (16,539) |
| NET ASSETS - 100.0% | 2,594,297 |
| | |
Any values shown as $0 in the Schedule of Investments may reflect amounts less than $500.
Legend
| (a) | Amount is stated in United States dollars unless otherwise noted. |
| (b) | Coupon rates for floating and adjustable rate securities reflect the rates in effect at period end. |
| (c) | Private activity obligations whose interest is subject to the federal alternative minimum tax for individuals. |
| (d) | Security or a portion of the security purchased on a delayed delivery or when-issued basis. |
| (e) | Security exempt from registration under Rule 144A of the Securities Act of 1933. These securities may be resold in transactions exempt from registration, normally to qualified institutional buyers. At the end of the period, the value of these securities amounted to $20,676,000 or 0.8% of net assets. |
| (f) | Coupon is indexed to a floating interest rate which may be multiplied by a specified factor and/or subject to caps or floors. |
| (g) | Information in this report regarding holdings by state and security types does not reflect the holdings of the Fidelity Municipal Cash Central Fund. |
| (h) | Affiliated fund that is generally available only to investment companies and other accounts managed by Fidelity Investments. The rate quoted is the annualized seven-day yield of the fund at period end. A complete unaudited listing of the fund's holdings as of its most recent quarter end is available upon request. In addition, each Fidelity Central Fund's financial statements are available on the SEC's website or upon request. |
Affiliated Central Funds
Fiscal year to date information regarding the Fund's investments in Fidelity Central Funds, including the ownership percentage, is presented below.
| Affiliate (Amounts in thousands) | Value, beginning of period ($) | Purchases ($) | Sales Proceeds ($) | Dividend Income ($) | Realized Gain (loss) ($) | Change in Unrealized appreciation (depreciation) ($) | Value, end of period ($) | % ownership, end of period |
| Fidelity Municipal Cash Central Fund 4.33% | 19,565 | 261,881 | 261,605 | 620 | (2) | - | 19,839 | 1.0% |
| Total | 19,565 | 261,881 | 261,605 | 620 | (2) | - | 19,839 | |
| | | | | | | | | |
Amounts in the dividend income column in the above table include any capital gain distributions from underlying funds, which are presented in the corresponding line item in the Statement of Operations, if applicable.
Amounts included in the purchases and sales proceeds columns may include in-kind transactions, if applicable.
Investment Valuation
The following is a summary of the inputs used, as of June 30, 2024, involving the Fund's assets and liabilities carried at fair value. The inputs or methodology used for valuing securities may not be an indication of the risk associated with investing in those securities. For more information on valuation inputs, and their aggregation into the levels used below, please refer to the Investment Valuation section in the accompanying Notes to Financial Statements.
| Valuation Inputs at Reporting Date: |
Description (Amounts in thousands) | Total ($) | Level 1 ($) | Level 2 ($) | Level 3 ($) |
Investments in Securities: | | | | |
|
| Municipal Securities | 2,590,997 | - | 2,590,997 | - |
|
| Money Market Funds | 19,839 | 19,839 | - | - |
| Total Investments in Securities: | 2,610,836 | 19,839 | 2,590,997 | - |
Financial Statements (Unaudited)
| Statement of Assets and Liabilities |
| Amounts in thousands (except per-share amounts) | | | | June 30, 2024 (Unaudited) |
| | | | | |
| Assets | | | | |
| Investment in securities, at value - See accompanying schedule: | | | | |
Unaffiliated issuers (cost $2,666,940) | $ | 2,590,997 | | |
Fidelity Central Funds (cost $19,839) | | 19,839 | | |
| | | | | |
| | | | | |
| Total Investment in Securities (cost $2,686,779) | | | $ | 2,610,836 |
| Cash | | | | 11 |
| Receivable for fund shares sold | | | | 1,114 |
| Interest receivable | | | | 27,959 |
| Distributions receivable from Fidelity Central Funds | | | | 180 |
| Receivable from investment adviser for expense reductions | | | | 28 |
| Other receivables | | | | 1 |
Total assets | | | | 2,640,129 |
| Liabilities | | | | |
| Payable for investments purchased | | | | |
Regular delivery | $ | 13,721 | | |
Delayed delivery | | 28,589 | | |
| Payable for fund shares redeemed | | 1,604 | | |
| Distributions payable | | 1,237 | | |
| Accrued management fee | | 433 | | |
| Distribution and service plan fees payable | | 29 | | |
| Other affiliated payables | | 219 | | |
| Total liabilities | | | | 45,832 |
| Net Assets | | | $ | 2,594,297 |
| Net Assets consist of: | | | | |
| Paid in capital | | | $ | 2,695,408 |
| Total accumulated earnings (loss) | | | | (101,111) |
| Net Assets | | | $ | 2,594,297 |
| | | | | |
| Net Asset Value and Maximum Offering Price | | | | |
| Class A : | | | | |
Net Asset Value and redemption price per share ($116,498 ÷ 11,293 shares)(a) | | | $ | 10.32 |
| Maximum offering price per share (100/97.25 of $10.32) | | | $ | 10.61 |
| Class M : | | | | |
Net Asset Value and redemption price per share ($7,615 ÷ 739 shares)(a) | | | $ | 10.30 |
| Maximum offering price per share (100/97.25 of $10.30) | | | $ | 10.59 |
| Class C : | | | | |
Net Asset Value and offering price per share ($3,475 ÷ 338 shares)(a)(b) | | | $ | 10.30 |
| Limited Term Municipal Income : | | | | |
Net Asset Value, offering price and redemption price per share ($1,691,341 ÷ 164,238 shares) | | | $ | 10.30 |
| Class I : | | | | |
Net Asset Value, offering price and redemption price per share ($296,844 ÷ 28,810 shares) | | | $ | 10.30 |
| Class Z : | | | | |
Net Asset Value, offering price and redemption price per share ($478,524 ÷ 46,448 shares) | | | $ | 10.30 |
(a)Redemption price per share is equal to net asset value less any applicable contingent deferred sales charge. |
(b)Corresponding Net Asset Value does not calculate due to rounding of fractional net assets and/or shares. |
| Statement of Operations |
| Amounts in thousands | | | | Six months ended June 30, 2024 (Unaudited) |
| Investment Income | | | | |
| Interest | | | $ | 28,691 |
| Income from Fidelity Central Funds | | | | 620 |
| Total income | | | | 29,311 |
| Expenses | | | | |
| Management fee | $ | 2,615 | | |
| Transfer agent fees | | 1,330 | | |
| Distribution and service plan fees | | 178 | | |
| Independent trustees' fees and expenses | | 3 | | |
| Total expenses before reductions | | 4,126 | | |
| Expense reductions | | (161) | | |
| Total expenses after reductions | | | | 3,965 |
| Net Investment income (loss) | | | | 25,346 |
| Realized and Unrealized Gain (Loss) | | | | |
| Net realized gain (loss) on: | | | | |
| Investment Securities: | | | | |
| Unaffiliated issuers | | (2,148) | | |
| Fidelity Central Funds | | (2) | | |
| Total net realized gain (loss) | | | | (2,150) |
| Change in net unrealized appreciation (depreciation) on investment securities | | | | (14,695) |
| Net gain (loss) | | | | (16,845) |
| Net increase (decrease) in net assets resulting from operations | | | $ | 8,501 |
| Statement of Changes in Net Assets |
| |
| Amount in thousands | | Six months ended June 30, 2024 (Unaudited) | | Year ended December 31, 2023 |
| Increase (Decrease) in Net Assets | | | | |
| Operations | | | | |
| Net investment income (loss) | $ | 25,346 | $ | 47,987 |
| Net realized gain (loss) | | (2,150) | | (11,359) |
| Change in net unrealized appreciation (depreciation) | | (14,695) | | 66,472 |
| Net increase (decrease) in net assets resulting from operations | | 8,501 | | 103,100 |
| Distributions to shareholders | | (25,107) | | (47,365) |
| | | | | |
| Share transactions - net increase (decrease) | | (42,943) | | (282,666) |
| Total increase (decrease) in net assets | | (59,549) | | (226,931) |
| | | | | |
| Net Assets | | | | |
| Beginning of period | | 2,653,846 | | 2,880,777 |
| End of period | $ | 2,594,297 | $ | 2,653,846 |
| | | | | |
| | | | | |
Financial Highlights
Fidelity Advisor® Limited Term Municipal Income Fund Class A |
| |
| | Six months ended (Unaudited) June 30, 2024 | | Years ended December 31, 2023 | | 2022 | | 2021 | | 2020 | | 2019 |
Selected Per-Share Data | | | | | | | | | | | | |
| Net asset value, beginning of period | $ | 10.38 | $ | 10.16 | $ | 10.79 | $ | 10.89 | $ | 10.72 | $ | 10.49 |
| Income from Investment Operations | | | | | | | | | | | | |
Net investment income (loss) A,B | | .088 | | .150 | | .109 | | .102 | | .141 | | .150 |
| Net realized and unrealized gain (loss) | | (.061) | | .218 | | (.629) | | (.094) | | .183 | | .250 |
| Total from investment operations | | .027 | | .368 | | (.520) | | .008 | | .324 | | .400 |
| Distributions from net investment income | | (.087) | | (.148) | | (.110) | | (.103) | | (.142) | | (.150) |
| Distributions from net realized gain | | - | | - | | - | | (.005) | | (.012) | | (.020) |
| Total distributions | | (.087) | | (.148) | | (.110) | | (.108) | | (.154) | | (.170) |
| Net asset value, end of period | $ | 10.32 | $ | 10.38 | $ | 10.16 | $ | 10.79 | $ | 10.89 | $ | 10.72 |
Total Return C,D,E | | | | 3.66% | | (4.82)% | | .07% | | 3.04% | | 3.83% |
Ratios to Average Net Assets B,F,G | | | | | | | | | | | | |
| Expenses before reductions | | .63% H | | .67% | | .80% | | .80% | | .80% | | .80% |
| Expenses net of fee waivers, if any | | | | .58% | | .66% | | .66% | | .66% | | .78% |
| Expenses net of all reductions | | .55% H | | .58% | | .66% | | .66% | | .66% | | .78% |
| Net investment income (loss) | | 1.70% H | | 1.47% | | 1.06% | | .94% | | 1.31% | | 1.41% |
| Supplemental Data | | | | | | | | | | | | |
| Net assets, end of period (in millions) | $ | 116 | $ | 122 | $ | 156 | $ | 223 | $ | 202 | $ | 180 |
Portfolio turnover rate I | | | | 24% | | 20% | | 20% | | 19% | | 43% |
ACalculated based on average shares outstanding during the period.
BNet investment income (loss) is affected by the timing of the declaration of dividends by any underlying mutual funds or exchange-traded funds (ETFs). Net investment income (loss) of any mutual funds or ETFs is not included in the Fund's net investment income (loss) ratio.
CTotal returns for periods of less than one year are not annualized.
DTotal returns would have been lower if certain expenses had not been reduced during the applicable periods shown.
ETotal returns do not include the effect of the sales charges.
FFees and expenses of any underlying mutual funds or exchange-traded funds (ETFs) are not included in the Fund's expense ratio. The Fund indirectly bears its proportionate share of these expenses. For additional expense information related to investments in Fidelity Central Funds, please refer to the "Investments in Fidelity Central Funds" note found in the Notes to Financial Statements section of the most recent Annual or Semi-Annual report.
GExpense ratios reflect operating expenses of the class. Expenses before reductions do not reflect amounts reimbursed, waived, or reduced through arrangements with the investment adviser, brokerage services, or other offset arrangements, if applicable, and do not represent the amount paid by the class during periods when reimbursements, waivers or reductions occur.
HAnnualized.
IAmount does not include the portfolio activity of any underlying mutual funds or exchange-traded funds (ETFs).
Fidelity Advisor® Limited Term Municipal Income Fund Class M |
| |
| | Six months ended (Unaudited) June 30, 2024 | | Years ended December 31, 2023 | | 2022 | | 2021 | | 2020 | | 2019 |
Selected Per-Share Data | | | | | | | | | | | | |
| Net asset value, beginning of period | $ | 10.36 | $ | 10.14 | $ | 10.77 | $ | 10.87 | $ | 10.70 | $ | 10.47 |
| Income from Investment Operations | | | | | | | | | | | | |
Net investment income (loss) A,B | | .087 | | .150 | | .110 | | .104 | | .142 | | .154 |
| Net realized and unrealized gain (loss) | | (.061) | | .218 | | (.629) | | (.095) | | .182 | | .250 |
| Total from investment operations | | .026 | | .368 | | (.519) | | .009 | | .324 | | .404 |
| Distributions from net investment income | | (.086) | | (.148) | | (.111) | | (.104) | | (.142) | | (.154) |
| Distributions from net realized gain | | - | | - | | - | | (.005) | | (.012) | | (.020) |
| Total distributions | | (.086) | | (.148) | | (.111) | | (.109) | | (.154) | | (.174) |
| Net asset value, end of period | $ | 10.30 | $ | 10.36 | $ | 10.14 | $ | 10.77 | $ | 10.87 | $ | 10.70 |
Total Return C,D,E | | | | 3.67% | | (4.82)% | | .08% | | 3.06% | | 3.88% |
Ratios to Average Net Assets B,F,G | | | | | | | | | | | | |
| Expenses before reductions | | .59% H | | .63% | | .72% | | .72% | | .74% | | .75% |
| Expenses net of fee waivers, if any | | | | .58% | | .65% | | .65% | | .65% | | .74% |
| Expenses net of all reductions | | .55% H | | .58% | | .65% | | .65% | | .65% | | .74% |
| Net investment income (loss) | | 1.70% H | | 1.47% | | 1.07% | | .95% | | 1.32% | | 1.45% |
| Supplemental Data | | | | | | | | | | | | |
| Net assets, end of period (in millions) | $ | 8 | $ | 8 | $ | 9 | $ | 8 | $ | 10 | $ | 12 |
Portfolio turnover rate I | | | | 24% | | 20% | | 20% | | 19% | | 43% |
ACalculated based on average shares outstanding during the period.
BNet investment income (loss) is affected by the timing of the declaration of dividends by any underlying mutual funds or exchange-traded funds (ETFs). Net investment income (loss) of any mutual funds or ETFs is not included in the Fund's net investment income (loss) ratio.
CTotal returns for periods of less than one year are not annualized.
DTotal returns would have been lower if certain expenses had not been reduced during the applicable periods shown.
ETotal returns do not include the effect of the sales charges.
FFees and expenses of any underlying mutual funds or exchange-traded funds (ETFs) are not included in the Fund's expense ratio. The Fund indirectly bears its proportionate share of these expenses. For additional expense information related to investments in Fidelity Central Funds, please refer to the "Investments in Fidelity Central Funds" note found in the Notes to Financial Statements section of the most recent Annual or Semi-Annual report.
GExpense ratios reflect operating expenses of the class. Expenses before reductions do not reflect amounts reimbursed, waived, or reduced through arrangements with the investment adviser, brokerage services, or other offset arrangements, if applicable, and do not represent the amount paid by the class during periods when reimbursements, waivers or reductions occur.
HAnnualized.
IAmount does not include the portfolio activity of any underlying mutual funds or exchange-traded funds (ETFs).
Fidelity Advisor® Limited Term Municipal Income Fund Class C |
| |
| | Six months ended (Unaudited) June 30, 2024 | | Years ended December 31, 2023 | | 2022 | | 2021 | | 2020 | | 2019 |
Selected Per-Share Data | | | | | | | | | | | | |
| Net asset value, beginning of period | $ | 10.36 | $ | 10.14 | $ | 10.77 | $ | 10.87 | $ | 10.70 | $ | 10.47 |
| Income from Investment Operations | | | | | | | | | | | | |
Net investment income (loss) A,B | | .050 | | .076 | | .035 | | .024 | | .064 | | .072 |
| Net realized and unrealized gain (loss) | | (.061) | | .217 | | (.629) | | (.094) | | .182 | | .250 |
| Total from investment operations | | (.011) | | .293 | | (.594) | | (.070) | | .246 | | .322 |
| Distributions from net investment income | | (.049) | | (.073) | | (.036) | | (.025) | | (.064) | | (.072) |
| Distributions from net realized gain | | - | | - | | - | | (.005) | | (.012) | | (.020) |
| Total distributions | | (.049) | | (.073) | | (.036) | | (.030) | | (.076) | | (.092) |
| Net asset value, end of period | $ | 10.30 | $ | 10.36 | $ | 10.14 | $ | 10.77 | $ | 10.87 | $ | 10.70 |
Total Return C,D,E | | | | 2.91% | | (5.51)% | | (.65)% | | 2.31% | | 3.08% |
Ratios to Average Net Assets B,F,G | | | | | | | | | | | | |
| Expenses before reductions | | 1.29% H | | 1.34% | | 1.50% | | 1.51% | | 1.52% | | 1.54% |
| Expenses net of fee waivers, if any | | | | 1.31% | | 1.38% | | 1.38% | | 1.38% | | 1.52% |
| Expenses net of all reductions | | 1.29% H | | 1.31% | | 1.38% | | 1.38% | | 1.38% | | 1.52% |
| Net investment income (loss) | | .97% H | | .74% | | .34% | | .22% | | .59% | | .67% |
| Supplemental Data | | | | | | | | | | | | |
| Net assets, end of period (in millions) | $ | 3 | $ | 5 | $ | 8 | $ | 10 | $ | 15 | $ | 20 |
Portfolio turnover rate I | | | | 24% | | 20% | | 20% | | 19% | | 43% |
ACalculated based on average shares outstanding during the period.
BNet investment income (loss) is affected by the timing of the declaration of dividends by any underlying mutual funds or exchange-traded funds (ETFs). Net investment income (loss) of any mutual funds or ETFs is not included in the Fund's net investment income (loss) ratio.
CTotal returns for periods of less than one year are not annualized.
DTotal returns would have been lower if certain expenses had not been reduced during the applicable periods shown.
ETotal returns do not include the effect of the contingent deferred sales charge.
FFees and expenses of any underlying mutual funds or exchange-traded funds (ETFs) are not included in the Fund's expense ratio. The Fund indirectly bears its proportionate share of these expenses. For additional expense information related to investments in Fidelity Central Funds, please refer to the "Investments in Fidelity Central Funds" note found in the Notes to Financial Statements section of the most recent Annual or Semi-Annual report.
GExpense ratios reflect operating expenses of the class. Expenses before reductions do not reflect amounts reimbursed, waived, or reduced through arrangements with the investment adviser, brokerage services, or other offset arrangements, if applicable, and do not represent the amount paid by the class during periods when reimbursements, waivers or reductions occur.
HAnnualized.
IAmount does not include the portfolio activity of any underlying mutual funds or exchange-traded funds (ETFs).
Fidelity® Limited Term Municipal Income Fund |
| |
| | Six months ended (Unaudited) June 30, 2024 | | Years ended December 31, 2023 | | 2022 | | 2021 | | 2020 | | 2019 |
Selected Per-Share Data | | | | | | | | | | | | |
| Net asset value, beginning of period | $ | 10.36 | $ | 10.15 | $ | 10.77 | $ | 10.87 | $ | 10.70 | $ | 10.47 |
| Income from Investment Operations | | | | | | | | | | | | |
Net investment income (loss) A,B | | .100 | | .177 | | .139 | | .134 | | .172 | | .185 |
| Net realized and unrealized gain (loss) | | (.061) | | .208 | | (.619) | | (.095) | | .182 | | .250 |
| Total from investment operations | | .039 | | .385 | | (.480) | | .039 | | .354 | | .435 |
| Distributions from net investment income | | (.099) | | (.175) | | (.140) | | (.134) | | (.172) | | (.185) |
| Distributions from net realized gain | | - | | - | | - | | (.005) | | (.012) | | (.020) |
| Total distributions | | (.099) | | (.175) | | (.140) | | (.139) | | (.184) | | (.205) |
| Net asset value, end of period | $ | 10.30 | $ | 10.36 | $ | 10.15 | $ | 10.77 | $ | 10.87 | $ | 10.70 |
Total Return C,D | | | | 3.84% | | (4.46)% | | .36% | | 3.34% | | 4.18% |
Ratios to Average Net Assets B,E,F | | | | | | | | | | | | |
| Expenses before reductions | | .30% G | | .34% | | .47% | | .46% | | .46% | | .46% |
| Expenses net of fee waivers, if any | | | | .31% | | .37% | | .37% | | .37% | | .45% |
| Expenses net of all reductions | | .30% G | | .31% | | .37% | | .37% | | .37% | | .45% |
| Net investment income (loss) | | 1.96% G | | 1.74% | | 1.35% | | 1.23% | | 1.60% | | 1.74% |
| Supplemental Data | | | | | | | | | | | | |
| Net assets, end of period (in millions) | $ | 1,691 | $ | 1,873 | $ | 2,006 | $ | 2,565 | $ | 2,420 | $ | 2,245 |
Portfolio turnover rate H | | | | 24% | | 20% | | 20% | | 19% | | 43% |
ACalculated based on average shares outstanding during the period.
BNet investment income (loss) is affected by the timing of the declaration of dividends by any underlying mutual funds or exchange-traded funds (ETFs). Net investment income (loss) of any mutual funds or ETFs is not included in the Fund's net investment income (loss) ratio.
CTotal returns for periods of less than one year are not annualized.
DTotal returns would have been lower if certain expenses had not been reduced during the applicable periods shown.
EFees and expenses of any underlying mutual funds or exchange-traded funds (ETFs) are not included in the Fund's expense ratio. The Fund indirectly bears its proportionate share of these expenses. For additional expense information related to investments in Fidelity Central Funds, please refer to the "Investments in Fidelity Central Funds" note found in the Notes to Financial Statements section of the most recent Annual or Semi-Annual report.
FExpense ratios reflect operating expenses of the class. Expenses before reductions do not reflect amounts reimbursed, waived, or reduced through arrangements with the investment adviser, brokerage services, or other offset arrangements, if applicable, and do not represent the amount paid by the class during periods when reimbursements, waivers or reductions occur.
GAnnualized.
HAmount does not include the portfolio activity of any underlying mutual funds or exchange-traded funds (ETFs).
Fidelity Advisor® Limited Term Municipal Income Fund Class I |
| |
| | Six months ended (Unaudited) June 30, 2024 | | Years ended December 31, 2023 | | 2022 | | 2021 | | 2020 | | 2019 |
Selected Per-Share Data | | | | | | | | | | | | |
| Net asset value, beginning of period | $ | 10.37 | $ | 10.15 | $ | 10.78 | $ | 10.88 | $ | 10.71 | $ | 10.48 |
| Income from Investment Operations | | | | | | | | | | | | |
Net investment income (loss) A,B | | .100 | | .177 | | .139 | | .133 | | .172 | | .178 |
| Net realized and unrealized gain (loss) | | (.071) | | .217 | | (.629) | | (.094) | | .183 | | .250 |
| Total from investment operations | | .029 | | .394 | | (.490) | | .039 | | .355 | | .428 |
| Distributions from net investment income | | (.099) | | (.174) | | (.140) | | (.134) | | (.173) | | (.178) |
| Distributions from net realized gain | | - | | - | | - | | (.005) | | (.012) | | (.020) |
| Total distributions | | (.099) | | (.174) | | (.140) | | (.139) | | (.185) | | (.198) |
| Net asset value, end of period | $ | 10.30 | $ | 10.37 | $ | 10.15 | $ | 10.78 | $ | 10.88 | $ | 10.71 |
Total Return C,D | | | | 3.93% | | (4.55)% | | .36% | | 3.34% | | 4.11% |
Ratios to Average Net Assets B,E,F | | | | | | | | | | | | |
| Expenses before reductions | | .38% G | | .42% | | .55% | | .54% | | .55% | | .54% |
| Expenses net of fee waivers, if any | | | | .32% | | .37% | | .37% | | .37% | | .51% |
| Expenses net of all reductions | | .30% G | | .32% | | .37% | | .37% | | .37% | | .51% |
| Net investment income (loss) | | 1.95% G | | 1.73% | | 1.35% | | 1.23% | | 1.60% | | 1.68% |
| Supplemental Data | | | | | | | | | | | | |
| Net assets, end of period (in millions) | $ | 297 | $ | 294 | $ | 343 | $ | 420 | $ | 335 | $ | 276 |
Portfolio turnover rate H | | | | 24% | | 20% | | 20% | | 19% | | 43% |
ACalculated based on average shares outstanding during the period.
BNet investment income (loss) is affected by the timing of the declaration of dividends by any underlying mutual funds or exchange-traded funds (ETFs). Net investment income (loss) of any mutual funds or ETFs is not included in the Fund's net investment income (loss) ratio.
CTotal returns for periods of less than one year are not annualized.
DTotal returns would have been lower if certain expenses had not been reduced during the applicable periods shown.
EFees and expenses of any underlying mutual funds or exchange-traded funds (ETFs) are not included in the Fund's expense ratio. The Fund indirectly bears its proportionate share of these expenses. For additional expense information related to investments in Fidelity Central Funds, please refer to the "Investments in Fidelity Central Funds" note found in the Notes to Financial Statements section of the most recent Annual or Semi-Annual report.
FExpense ratios reflect operating expenses of the class. Expenses before reductions do not reflect amounts reimbursed, waived, or reduced through arrangements with the investment adviser, brokerage services, or other offset arrangements, if applicable, and do not represent the amount paid by the class during periods when reimbursements, waivers or reductions occur.
GAnnualized.
HAmount does not include the portfolio activity of any underlying mutual funds or exchange-traded funds (ETFs).
Fidelity Advisor® Limited Term Municipal Income Fund Class Z |
| |
| | Six months ended (Unaudited) June 30, 2024 | | Years ended December 31, 2023 | | 2022 | | 2021 | | 2020 | | 2019 |
Selected Per-Share Data | | | | | | | | | | | | |
| Net asset value, beginning of period | $ | 10.37 | $ | 10.15 | $ | 10.77 | $ | 10.87 | $ | 10.71 | $ | 10.48 |
| Income from Investment Operations | | | | | | | | | | | | |
Net investment income (loss) A,B | | .102 | | .181 | | .145 | | .140 | | .178 | | .189 |
| Net realized and unrealized gain (loss) | | (.070) | | .219 | | (.619) | | (.094) | | .173 | | .250 |
| Total from investment operations | | .032 | | .400 | | (.474) | | .046 | | .351 | | .439 |
| Distributions from net investment income | | (.102) | | (.180) | | (.146) | | (.141) | | (.179) | | (.189) |
| Distributions from net realized gain | | - | | - | | - | | (.005) | | (.012) | | (.020) |
| Total distributions | | (.102) | | (.180) | | (.146) | | (.146) | | (.191) | | (.209) |
| Net asset value, end of period | $ | 10.30 | $ | 10.37 | $ | 10.15 | $ | 10.77 | $ | 10.87 | $ | 10.71 |
Total Return C,D | | | | 3.99% | | (4.40)% | | .42% | | 3.31% | | 4.22% |
Ratios to Average Net Assets B,E,F | | | | | | | | | | | | |
| Expenses before reductions | | .25% G | | .30% | | .43% | | .42% | | .43% | | .43% |
| Expenses net of fee waivers, if any | | | | .27% | | .31% | | .31% | | .31% | | .40% |
| Expenses net of all reductions | | .25% G | | .27% | | .31% | | .31% | | .31% | | .40% |
| Net investment income (loss) | | 2.00% G | | 1.78% | | 1.41% | | 1.29% | | 1.66% | | 1.79% |
| Supplemental Data | | | | | | | | | | | | |
| Net assets, end of period (in millions) | $ | 479 | $ | 353 | $ | 358 | $ | 444 | $ | 336 | $ | 214 |
Portfolio turnover rate H | | | | 24% | | 20% | | 20% | | 19% | | 43% |
ACalculated based on average shares outstanding during the period.
BNet investment income (loss) is affected by the timing of the declaration of dividends by any underlying mutual funds or exchange-traded funds (ETFs). Net investment income (loss) of any mutual funds or ETFs is not included in the Fund's net investment income (loss) ratio.
CTotal returns for periods of less than one year are not annualized.
DTotal returns would have been lower if certain expenses had not been reduced during the applicable periods shown.
EFees and expenses of any underlying mutual funds or exchange-traded funds (ETFs) are not included in the Fund's expense ratio. The Fund indirectly bears its proportionate share of these expenses. For additional expense information related to investments in Fidelity Central Funds, please refer to the "Investments in Fidelity Central Funds" note found in the Notes to Financial Statements section of the most recent Annual or Semi-Annual report.
FExpense ratios reflect operating expenses of the class. Expenses before reductions do not reflect amounts reimbursed, waived, or reduced through arrangements with the investment adviser, brokerage services, or other offset arrangements, if applicable, and do not represent the amount paid by the class during periods when reimbursements, waivers or reductions occur.
GAnnualized.
HAmount does not include the portfolio activity of any underlying mutual funds or exchange-traded funds (ETFs).
Notes to Financial Statements
(Unaudited)For the period ended June 30, 2024
(Amounts in thousands except percentages)
1. Organization.
Fidelity Limited Term Municipal Income Fund (the Fund) is a fund of Fidelity Municipal Trust (the Trust) and is authorized to issue an unlimited number of shares. The Trust is registered under the Investment Company Act of 1940, as amended (the 1940 Act), as an open-end management investment company organized as a Massachusetts business trust. The Fund offers Class A,Class M, Class C, Limited Term Municipal Income, Class I and Class Z shares, each of which has equal rights as to assets and voting privileges. Class A, Class M, Class C, Class I and Class Z are Fidelity Advisor classes. Each class has exclusive voting rights with respect to matters that affect that class. Class C shares will automatically convert to Class A shares after a holding period of eight years from the initial date of purchase, with certain exceptions.
2. Investments in Fidelity Central Funds.
Funds may invest in Fidelity Central Funds, which are open-end investment companies generally available only to other investment companies and accounts managed by the investment adviser and its affiliates. The Schedule of Investments lists any Fidelity Central Funds held as an investment as of period end, but does not include the underlying holdings of each Fidelity Central Fund. An investing fund indirectly bears its proportionate share of the expenses of the underlying Fidelity Central Funds.
Based on its investment objective, each Fidelity Central Fund may invest or participate in various investment vehicles or strategies that are similar to those of the investing fund. These strategies are consistent with the investment objectives of the investing fund and may involve certain economic risks which may cause a decline in value of each of the Fidelity Central Funds and thus a decline in the value of the investing fund.
| Fidelity Central Fund | Investment Manager | Investment Objective | Investment Practices | Expense RatioA |
| Fidelity Money Market Central Funds | Fidelity Management & Research Company LLC (FMR) | Each fund seeks to obtain a high level of current income consistent with the preservation of capital and liquidity. | Short-term Investments | Less than .005% |
A Expenses expressed as a percentage of average net assets and are as of each underlying Central Fund's most recent annual or semi-annual shareholder report.
A complete unaudited list of holdings for each Fidelity Central Fund is available upon request or at the Securities and Exchange Commission website at www.sec.gov. In addition, the financial statements of the Fidelity Central Funds which contain the significant accounting policies (including investment valuation policies) of those funds, and are not covered by the Report of Independent Registered Public Accounting Firm, are available on the Securities and Exchange Commission website or upon request.
3. Significant Accounting Policies.
The Fund is an investment company and applies the accounting and reporting guidance of the Financial Accounting Standards Board (FASB) Accounting Standards Codification Topic 946 Financial Services - Investment Companies. The financial statements have been prepared in conformity with accounting principles generally accepted in the United States of America (GAAP), which require management to make certain estimates and assumptions at the date of the financial statements. Actual results could differ from those estimates. Subsequent events, if any, through the date that the financial statements were issued have been evaluated in the preparation of the financial statements. The Fund's Schedule of Investments lists any underlying mutual funds or exchange-traded funds (ETFs) but does not include the underlying holdings of these funds. The following summarizes the significant accounting policies of the Fund:
Investment Valuation. Investments are valued as of 4:00 p.m. Eastern time on the last calendar day of the period. The Board of Trustees (the Board) has designated the Fund's investment adviser as the valuation designee responsible for the fair valuation function and performing fair value determinations as needed. The investment adviser has established a Fair Value Committee (the Committee) to carry out the day-to-day fair valuation responsibilities and has adopted policies and procedures to govern the fair valuation process and the activities of the Committee. In accordance with these fair valuation policies and procedures, which have been approved by the Board, the Fund attempts to obtain prices from one or more third party pricing services or brokers to value its investments. When current market prices, quotations or currency exchange rates are not readily available or reliable, investments will be fair valued in good faith by the Committee, in accordance with the policies and procedures. Factors used in determining fair value vary by investment type and may include market or investment specific events, transaction data, estimated cash flows, and market observations of comparable investments. The frequency that the fair valuation procedures are used cannot be predicted and they may be utilized to a significant extent. The Committee manages the Fund's fair valuation practices and maintains the fair valuation policies and procedures. The Fund's investment adviser reports to the Board information regarding the fair valuation process and related material matters.
The Fund categorizes the inputs to valuation techniques used to value its investments into a disclosure hierarchy consisting of three levels as shown below:
Level 1 - unadjusted quoted prices in active markets for identical investments
Level 2 - other significant observable inputs (including quoted prices for similar investments, interest rates, prepayment speeds, etc.)
Level 3 - unobservable inputs (including the Fund's own assumptions based on the best information available)
Valuation techniques used to value the Fund's investments by major category are as follows:
Debt securities, including restricted securities, are valued based on evaluated prices received from third party pricing services or from brokers who make markets in such securities. Municipal securities are valued by pricing services who utilize matrix pricing which considers yield or price of bonds of comparable quality, coupon, maturity and type or by broker-supplied prices. When independent prices are unavailable or unreliable, debt securities may be valued utilizing pricing methodologies which consider similar factors that would be used by third party pricing services. Debt securities are generally categorized as Level 2 in the hierarchy but may be Level 3 depending on the circumstances.
Investments in open-end mutual funds, including the Fidelity Central Funds, are valued at their closing net asset value (NAV) each business day and are categorized as Level 1 in the hierarchy.
Changes in valuation techniques may result in transfers in or out of an assigned level within the disclosure hierarchy. The aggregate value of investments by input level as of June 30, 2024 is included at the end of the Fund's Schedule of Investments.
Investment Transactions and Income. For financial reporting purposes, the Fund's investment holdings and NAV include trades executed through the end of the last business day of the period. The NAV per share for processing shareholder transactions is calculated as of the close of business of the New York Stock Exchange (NYSE), normally 4:00 p.m. Eastern time and includes trades executed through the end of the prior business day. Gains and losses on securities sold are determined on the basis of identified cost. Income and capital gain distributions from Fidelity Central Funds, if any, are recorded on the ex-dividend date. Interest income is accrued as earned and includes coupon interest and amortization of premium and accretion of discount on debt securities as applicable. Debt obligations may be placed on non-accrual status and related interest income may be reduced by ceasing current accruals and writing off interest receivables when the collection of all or a portion of interest has become doubtful based on consistently applied procedures. A debt obligation is removed from non-accrual status when the issuer resumes interest payments or when collectability of interest is reasonably assured.
Class Allocations and Expenses. Investment income, realized and unrealized capital gains and losses, common expenses of a fund, and certain fund-level expense reductions, if any, are allocated daily on a pro-rata basis to each class based on the relative net assets of each class to the total net assets of a fund. Each class differs with respect to transfer agent and distribution and service plan fees incurred, as applicable. Certain expense reductions may also differ by class, if applicable. For the reporting period, the allocated portion of income and expenses to each class as a percent of its average net assets may vary due to the timing of recording these transactions in relation to fluctuating net assets of the classes. Expenses directly attributable to a fund are charged to that fund. Expenses attributable to more than one fund are allocated among the respective funds on the basis of relative net assets or other appropriate methods. Expenses included in the accompanying financial statements reflect the expenses of that fund and do not include any expenses associated with any underlying mutual funds or exchange-traded funds (ETFs). Although not included in a fund's expenses, a fund indirectly bears its proportionate share of these expenses through the net asset value of each underlying mutual fund or exchange-traded fund (ETF). Expense estimates are accrued in the period to which they relate and adjustments are made when actual amounts are known.
Income Tax Information and Distributions to Shareholders. Each year, the Fund intends to qualify as a regulated investment company under Subchapter M of the Internal Revenue Code, including distributing substantially all of its taxable income and realized gains. As a result, no provision for U.S. Federal income taxes is required. The Fund files a U.S. federal tax return, in addition to state and local tax returns as required. The Fund's federal income tax returns are subject to examination by the Internal Revenue Service (IRS) for a period of three fiscal years after they are filed. State and local tax returns may be subject to examination for an additional fiscal year depending on the jurisdiction.
Distributions are declared and recorded daily and paid monthly from net investment income. Distributions from realized gains, if any, are declared and recorded on the ex-dividend date. Income and capital gain distributions are declared separately for each class. Income and capital gain distributions are determined in accordance with income tax regulations, which may differ from GAAP.
Capital accounts within the financial statements are adjusted for permanent book-tax differences. These adjustments have no impact on net assets or the results of operations. Capital accounts are not adjusted for temporary book-tax differences which will reverse in a subsequent period.
Book-tax differences are primarily due to market discount, capital loss carryforwards and losses deferred due to wash sales.
The Fund purchases municipal securities whose interest, in the opinion of the issuer, is free from federal income tax. There is no assurance that the IRS will agree with this opinion. In the event the IRS determines that the issuer does not comply with relevant tax requirements, interest payments from a security could become federally taxable, possibly retroactively to the date the security was issued.
As of period end, the cost and unrealized appreciation (depreciation) in securities, and derivatives if applicable, for federal income tax purposes were as follows:
| Gross unrealized appreciation | $4,913 |
| Gross unrealized depreciation | (79,940) |
| Net unrealized appreciation (depreciation) | $(75,027) |
| Tax cost | $2,685,863 |
Capital loss carryforwards are only available to offset future capital gains of the Fund to the extent provided by regulations and may be limited. The capital loss carryforward information presented below, including any applicable limitation, is estimated as of prior fiscal period end and is subject to adjustment.
Short-term | $(7,999) |
Long-term | (15,549) |
| Total capital loss carryforward | $(23,548) |
Delayed Delivery Transactions and When-Issued Securities. During the period, certain Funds transacted in securities on a delayed delivery or when-issued basis. Payment and delivery may take place after the customary settlement period for that security. The price of the underlying securities and the date when the securities will be delivered and paid for are fixed at the time the transaction is negotiated. Securities purchased on a delayed delivery or when-issued basis are identified as such in the Schedule of Investments. Compensation for interest forgone in the purchase of a delayed delivery or when-issued debt security may be received. With respect to purchase commitments, each applicable Fund identifies securities as segregated in its records with a value at least equal to the amount of the commitment. Payables and receivables associated with the purchases and sales of delayed delivery securities having the same coupon, settlement date and broker are offset. Delayed delivery or when-issued securities that have been purchased from and sold to different brokers are reflected as both payables and receivables in the Statement of Assets and Liabilities under the caption "Delayed delivery", as applicable. Losses may arise due to changes in the value of the underlying securities or if the counterparty does not perform under the contract's terms, or if the issuer does not issue the securities due to political, economic, or other factors.
Restricted Securities (including Private Placements). Funds may invest in securities that are subject to legal or contractual restrictions on resale. These securities generally may be resold in transactions exempt from registration or to the public if the securities are registered. Disposal of these securities may involve time-consuming negotiations and expense, and prompt sale at an acceptable price may be difficult. Information regarding restricted securities held at period end is included at the end of the Schedule of Investments, if applicable.
4. Purchases and Sales of Investments.
Purchases and sales of securities, other than short-term securities and in-kind transactions, as applicable, are noted in the table below.
| | Purchases ($) | Sales ($) |
| Fidelity Limited Term Municipal Income Fund | 264,611 | 250,062 |
5. Fees and Other Transactions with Affiliates.
Management Fee. Fidelity Management & Research Company LLC (the investment adviser) and its affiliates provide the Fund with investment management related services for which the Fund pays a monthly management fee that is based on an annual rate of .20% of the Fund's average net assets. Under the management contract, the investment adviser pays all other operating expenses, except the compensation of the independent Trustees, transfer agent fees, distribution and service plan fees and certain other expenses such as proxy and shareholder meeting expenses.
Distribution and Service Plan Fees. In accordance with Rule 12b-1 of the 1940 Act, the Fund has adopted separate Distribution and Service Plans for each class of shares. Certain classes pay Fidelity Distributors Company LLC (FDC), an affiliate of the investment adviser, separate Distribution and Service Fees, each of which is based on an annual percentage of each class' average net assets. In addition, FDC may pay financial intermediaries for selling shares of the Fund and providing shareholder support services. For the period, the Distribution and Service Fee rates, total fees and amounts retained by FDC were as follows:
| | Distribution Fee | Service Fee | Total Fees ($) | Retained by FDC ($) |
| Class A | -% | .25% | 148 | 11 |
| Class M | -% | .25% | 10 | -A |
| Class C | .75% | .25% | 20 | 2 |
| | | | 178 | 13 |
A Amount represents less than five hundred dollars.
Sales Load. FDC may receive a front-end sales charge of up to 2.75% for selling Class A shares and Class M shares, some of which is paid to financial intermediaries for selling shares of the Fund. Depending on the holding period, FDC may receive contingent deferred sales charges levied on Class A, Class M and Class C redemptions. The deferred sales charges are 1.00% for Class C shares, .75% or .50% for certain purchases of Class A shares and .25% for certain purchases of Class M shares.
For the period, sales charge amounts retained by FDC were as follows:
| | Retained by FDC ($) |
| Class A | 1 |
| Class M | -A |
| | 1 |
A Amount represents less than five hundred dollars.
Transfer Agent Fees. Fidelity Investments Institutional Operations Company LLC (FIIOC), an affiliate of the investment adviser, is the transfer, dividend disbursing and shareholder servicing agent for the Fund. FIIOC receives account fees and asset-based fees that vary according to the account size and type of account of the shareholders of the respective classes of the Fund, except for Class Z. FIIOC receives an asset-based fee of Class Z's average net assets. FIIOC pays for typesetting, printing and mailing of shareholder reports, except proxy statements. For the period, transfer agent fees for each class were as follows:
| | Amount ($) | % of Class-Level Average Net Assets A |
| Class A | 105 | .18 |
| Class M | 5 | .13 |
| Class C | 2 | .08 |
| Limited Term Municipal Income | 862 | .10 |
| Class I | 257 | .17 |
| Class Z | 99 | .05 |
| | 1,330 | |
A Annualized
Interfund Trades. Funds may purchase from or sell securities to other Fidelity Funds under procedures adopted by the Board. The procedures have been designed to ensure these interfund trades are executed in accordance with Rule 17a-7 of the 1940 Act. Any interfund trades are included within the respective purchases and sales amounts shown in the Purchases and Sales of Investments note. Interfund trades during the period are noted in the table below.
| | Purchases ($) | Sales ($) | Realized Gain (Loss)($) |
| Fidelity Limited Term Municipal Income Fund | - | 6,044 | (74) |
Sub-Advisory Arrangements. Effective March 1, 2024, the Fund's sub-advisory agreements with FMR Investment Management (UK) Limited, Fidelity Management & Research (Hong Kong) Limited, and Fidelity Management & Research (Japan) Limited were amended to provide that the investment adviser pays each sub-adviser monthly fees equal to 110% of the sub-adviser's costs for providing sub-advisory services.
6. Committed Line of Credit.
Certain Funds participate with other funds managed by the investment adviser or an affiliate in a $4.25 billion credit facility (the "line of credit") to be utilized for temporary or emergency purposes to fund shareholder redemptions or for other short-term liquidity purposes. The participating funds have agreed to pay commitment fees on their pro-rata portion of the line of credit, which are reflected in Miscellaneous expenses on the Statement of Operations, and are listed below. During the period, there were no borrowings on this line of credit.
7. Expense Reductions.
The investment adviser contractually agreed to reimburse expenses of each class to the extent annual operating expenses exceeded certain levels of class-level average net assets as noted in the table below. This reimbursement will remain in place through April 30, 2025. Some expenses, for example the compensation of the independent Trustees, and certain other expenses such as interest expense, are excluded from this reimbursement.
The following classes were in reimbursement during the period:
| | Expense Limitations | Reimbursement ($) |
| Class A | .55% | 47 |
| Class M | .55% | 1 |
| Class C | 1.30% | - |
| Limited Term Municipal Income | .30% | - |
| Class I | .30% | 112 |
| | | 160 |
Through arrangements with the Fund's custodian, credits realized as a result of certain uninvested cash balances were used to reduce the Fund's expenses. During the period, custodian credits reduced the Fund's expenses by $1.
8. Distributions to Shareholders.
Distributions to shareholders of each class were as follows:
| | Six months ended June 30, 2024 | Year ended December 31, 2023 |
| Fidelity Limited Term Municipal Income Fund | | |
| Distributions to shareholders | | |
| Class A | $993 | $1,959 |
| Class M | 65 | 120 |
| Class C | 19 | 42 |
| Limited Term Municipal Income | 17,243 | 33,173 |
| Class I | 2,854 | 5,449 |
| Class Z | 3,933 | 6,622 |
Total | $25,107 | $47,365 |
9. Share Transactions.
Share transactions for each class were as follows and may contain in-kind transactions, automatic conversions between classes or exchanges between affiliated funds:
| | Shares | Shares | Dollars | Dollars |
| | Six months ended June 30, 2024 | Year ended December 31, 2023 | Six months ended June 30, 2024 | Year ended December 31, 2023 |
| Fidelity Limited Term Municipal Income Fund | | | | |
| Class A | | | | |
| Shares sold | 1,477 | 2,489 | $15,243 | $25,425 |
| Reinvestment of distributions | 93 | 184 | 957 | 1,879 |
| Shares redeemed | (1,995) | (6,334) | (20,602) | (64,635) |
| Net increase (decrease) | (425) | (3,661) | $(4,402) | $(37,331) |
| Class M | | | | |
| Shares sold | 37 | 132 | $385 | $1,348 |
| Reinvestment of distributions | 6 | 11 | 62 | 112 |
| Shares redeemed | (56) | (263) | (575) | (2,686) |
| Net increase (decrease) | (13) | (120) | $(128) | $(1,226) |
| Class C | | | | |
| Shares sold | 37 | 59 | $379 | $616 |
| Reinvestment of distributions | 2 | 4 | 18 | 39 |
| Shares redeemed | (141) | (405) | (1,455) | (4,125) |
| Net increase (decrease) | (102) | (342) | $(1,058) | $(3,470) |
| Limited Term Municipal Income | | | | |
| Shares sold | 17,212 | 53,880 | $177,399 | $547,805 |
| Reinvestment of distributions | 1,101 | 2,224 | 11,338 | 22,645 |
| Shares redeemed | (34,783) | (73,154) | (358,131) | (743,019) |
| Net increase (decrease) | (16,470) | (17,050) | $(169,394) | $(172,569) |
| Class I | | | | |
| Shares sold | 4,486 | 11,502 | $46,277 | $117,161 |
| Reinvestment of distributions | 259 | 494 | 2,671 | 5,032 |
| Shares redeemed | (4,293) | (17,454) | (44,258) | (177,646) |
| Net increase (decrease) | 452 | (5,458) | $4,690 | $(55,453) |
| Class Z | | | | |
| Shares sold | 17,933 | 17,631 | $184,484 | $179,391 |
| Reinvestment of distributions | 258 | 387 | 2,653 | 3,938 |
| Shares redeemed | (5,798) | (19,252) | (59,788) | (195,945) |
| Net increase (decrease) | 12,393 | (1,234) | $127,349 | $(12,616) |
10. Other.
A fund's organizational documents provide former and current trustees and officers with a limited indemnification against liabilities arising in connection with the performance of their duties to the fund. In the normal course of business, a fund may also enter into contracts that provide general indemnifications. A fund's maximum exposure under these arrangements is unknown as this would be dependent on future claims that may be made against a fund. The risk of material loss from such claims is considered remote.
11. Risk and Uncertainties.
Many factors affect a fund's performance. Developments that disrupt global economies and financial markets, such as pandemics, epidemics, outbreaks of infectious diseases, war, terrorism, and environmental disasters, may significantly affect a fund's investment performance. The effects of these developments to a fund will be impacted by the types of securities in which a fund invests, the financial condition, industry, economic sector, and geographic location of an issuer, and a fund's level of investment in the securities of that issuer. Significant concentrations in security types, issuers, industries, sectors, and geographic locations may magnify the factors that affect a fund's performance.
Item 8: Changes in and Disagreements with Accountants for Open-End Management Investment Companies
Note: This is not applicable for any fund included in this document.
Item 9: Proxy Disclosures for Open-End Management Investment Companies
Note: This is not applicable for any fund included in this document.
Item 10: Remuneration Paid to Directors, Officers, and others of Open-End Management Investment Companies
Note: This information is disclosed as part of the financial statements for each Fund as part of Item 7: Financial Statements and Financial Highlights for Open-End Management Investment companies.
Item 11: Statement Regarding Basis for Approval of Investment Advisory Contract
Board Approval of Investment Advisory Contracts
Fidelity Limited Term Municipal Income Fund
At its January 2024 meeting, the Board of Trustees, including the Independent Trustees (together, the Board), approved amended and restated sub-advisory agreements (the Sub-Advisory Contracts) for the fund, including the fund's sub-advisory agreements with FMR Investment Management (UK) Limited (FMR UK), Fidelity Management & Research (Hong Kong) Limited (FMR H.K.), and Fidelity Management & Research (Japan) Limited (FMR Japan). The Sub-Advisory Contracts will be effective March 1, 2024. The Board will consider the annual renewal of the fund's Sub-Advisory Contracts in September 2024, following its review of additional materials provided by FMR.
The Board considered the Sub-Advisory Contracts, which changed the arrangements for fees paid by FMR to the sub-advisers under the agreements. The Board noted that the agreements with FMR UK, FMR H.K., and FMR Japan were amended to provide that FMR will compensate each sub-adviser at a fee equal to 110% of the sub-adviser's costs incurred in providing services under the agreement. The Board considered that, under the Sub-Advisory Contracts, FMR, and not the fund, will continue to pay the sub-advisory fees to each applicable sub-adviser, and that the management fee paid by the fund under the management contract with FMR will remain unchanged.
The Board considered that the approval of the fund's Sub-Advisory Contracts will not result in any changes in the investment process or strategies employed in the management of the fund's assets or the day-to-day management of the fund or the persons primarily responsible for such management. Further, the Board considered that the Sub-Advisory Contracts would not change the obligations and services of FMR and its affiliates on behalf of the fund, and, in particular, there would be no change in the nature and level of services provided to the fund by FMR and its affiliates.
In connection with its consideration of future renewals of the fund's advisory contracts, the Board will consider: (i) the nature, extent and quality of services provided to the funds, including shareholder and administrative services and investment performance; (ii) the competitiveness of the management fee and total expenses for the fund; (iii) the costs of the services and profitability, including the revenues earned and the expenses incurred in conducting the business of developing, marketing, distributing, managing, administering, and servicing the fund and its shareholders, to the extent applicable; and (iv) whether there have been economies of scale in respect of the Fidelity funds, whether the Fidelity funds (including the fund) have appropriately benefited from any such economies of scale, and whether there is the potential for realization of any further economies.
Based on its evaluation of all of the conclusions noted above, and after considering all factors it believed relevant, the Board concluded that the fund's management fee structure is fair and reasonable, and that the fund's Sub-Advisory Contracts should be approved.
1.701069.126
STM-SANN-0824
Fidelity® Conservative Income Municipal Bond Fund
Semi-Annual Report
June 30, 2024
Includes Fidelity and Fidelity Advisor share classes
Contents
To view a fund's proxy voting guidelines and proxy voting record for the 12-month period ended June 30, visit http://www.fidelity.com/proxyvotingresults or visit the Securities and Exchange Commission's (SEC) web site at http://www.sec.gov.
You may also call 1-800-544-8544 if you're an individual investing directly with Fidelity, call 1-800-835-5092 if you're a plan sponsor or participant with Fidelity as your recordkeeper or call 1-877-208-0098 on institutional accounts or if you're an advisor or invest through one to request a free copy of the proxy voting guidelines.
Standard & Poor's, S&P and S&P 500 are registered service marks of The McGraw-Hill Companies, Inc. and have been licensed for use by Fidelity Distributors Corporation.
Other third-party marks appearing herein are the property of their respective owners.
All other marks appearing herein are registered or unregistered trademarks or service marks of FMR LLC or an affiliated company. © 2024 FMR LLC. All rights reserved.
This report and the financial statements contained herein are submitted for the general information of the shareholders of the Fund. This report is not authorized for distribution to prospective investors in the Fund unless preceded or accompanied by an effective prospectus.
A fund files its complete schedule of portfolio holdings with the SEC for the first and third quarters of each fiscal year on Form N-PORT. Forms N-PORT are available on the SEC's web site at http://www.sec.gov. A fund's Forms N-PORT may be reviewed and copied at the SEC's Public Reference Room in Washington, DC. Information regarding the operation of the SEC's Public Reference Room may be obtained by calling 1-800-SEC-0330.
For a complete list of a fund's portfolio holdings, view the most recent holdings listing, semiannual report, or annual report on Fidelity's web site at http://www.fidelity.com, http://www.institutional.fidelity.com, or http://www.401k.com, as applicable.
NOT FDIC INSURED •MAY LOSE VALUE •NO BANK GUARANTEE
Neither the Fund nor Fidelity Distributors Corporation is a bank.
Item 7: Financial Statements and Financial Highlights for Open-End Management Investment Companies (Semi-Annual Report)
Fidelity® Conservative Income Municipal Bond Fund
Schedule of Investments June 30, 2024 (Unaudited)
Showing Percentage of Net Assets
| Municipal Bonds - 60.9% |
| | | Principal Amount (a) | Value ($) |
| Alabama - 1.2% | | | |
| Black Belt Energy Gas District: | | | |
| Bonds Series 2022 D1, 4%, tender 6/1/27 (b) | | 3,585,000 | 3,606,467 |
| Series 2022 C1: | | | |
5.25% 12/1/24 | | 255,000 | 255,997 |
5.25% 12/1/25 | | 335,000 | 340,081 |
5.25% 6/1/26 | | 780,000 | 796,681 |
| Series 2022 E: | | | |
5% 6/1/25 | | 1,005,000 | 1,012,564 |
5% 6/1/26 | | 1,390,000 | 1,412,871 |
| Series 2023 C: | | | |
5.5% 6/1/26 | | 570,000 | 585,109 |
5.5% 6/1/27 | | 245,000 | 253,935 |
| Jefferson County Swr. Rev. Series 2024: | | | |
| 5% 10/1/24 | | 200,000 | 200,504 |
| 5% 10/1/25 | | 900,000 | 914,495 |
| 5% 10/1/26 | | 545,000 | 561,357 |
| 5% 10/1/27 | | 500,000 | 522,354 |
| Mobile Indl. Dev. Board Poll. Cont. Rev. Bonds (Alabama Pwr. Co. Barry Plant Proj.): | | | |
| Series 2007 C, 3.78%, tender 6/16/26 (b) | | 875,000 | 875,933 |
| Series 2008, 3.65%, tender 1/10/25 (b) | | 6,735,000 | 6,719,386 |
| Southeast Energy Auth. Rev. (Proj. No. 2) Series 2021 B1, 4% 6/1/25 | | 390,000 | 389,014 |
TOTAL ALABAMA | | | 18,446,748 |
| Alaska - 0.1% | | | |
| Alaska Int'l. Arpts. Revs. Series 2021 C, 5% 10/1/25 (c) | | 1,075,000 | 1,092,154 |
| Arizona - 1.7% | | | |
| Arizona Health Facilities Auth. Rev. (Scottsdale Lincoln Hospitals Proj.) Series 2014 A, 5% 12/1/24 | | 635,000 | 637,830 |
| Chandler Indl. Dev. Auth. Indl. Dev. Rev. Bonds (Intel Corp. Proj.) Series 2022 2, 5%, tender 9/1/27 (b)(c) | | 12,550,000 | 12,883,344 |
| Coconino County Poll. Cont. Corp. Rev. Bonds (Navada Pwr. Co. Projs.) Series 2017 A, 4.125%, tender 3/31/26 (b)(c) | | 1,460,000 | 1,450,120 |
| Maricopa County Rev. Bonds: | | | |
| Series 2023 A1, 5%, tender 5/15/26 (b) | | 2,390,000 | 2,448,261 |
| Series C, 5%, tender 10/18/24 (b) | | 600,000 | 602,074 |
| Phoenix Civic Impt. Board Arpt. Rev.: | | | |
| Series 2018, 5% 7/1/24 (c) | | 500,000 | 500,000 |
| Series 2023: | | | |
5% 7/1/24 (c) | | 570,000 | 570,000 |
5% 7/1/26 (c) | | 1,155,000 | 1,185,453 |
| Phoenix Indl. Solid Waste Disp. Rev. Bonds (Republic Svc., Inc. Proj.) Series 2013, 4.05%, tender 8/1/24 (b)(c) | | 4,600,000 | 4,600,735 |
TOTAL ARIZONA | | | 24,877,817 |
| California - 3.9% | | | |
| Anaheim Pub. Fing. Auth. Lease Rev. Series 1997, 0% 9/1/25 (Assured Guaranty Muni. Corp. Insured) | | 6,355,000 | 6,115,572 |
| California Health Facilities Fing. Auth. Rev. Bonds Series 2016 B2, 4%, tender 10/1/24 (b) | | 8,315,000 | 8,311,633 |
| California Muni. Fin. Auth. Solid Waste Disp. Rev. Bonds: | | | |
| (Republic Svcs., Inc. Proj.): | | | |
Series 2021 A, 4%, tender 10/1/24 (b)(c) | | 3,450,000 | 3,450,071 |
Series 2021 B, 4%, tender 7/15/24 (b)(c) | | 9,655,000 | 9,654,705 |
| (Waste Mgmt., Inc. Proj.): | | | |
Series 2009 A, 1.3%, tender 2/3/25 (b)(d) | | 475,000 | 463,641 |
Series 2017 A, 4.25%, tender 12/2/24 (b)(c) | | 8,005,000 | 8,007,831 |
| California Poll. Cont. Fing. Auth. Solid Waste Disp. Rev. Bonds (Republic Svcs. INC. Proj.) Series 2023, 4.125%, tender 8/15/24 (b)(c)(d) | | 6,100,000 | 6,096,368 |
| Los Angeles Dept. Arpt. Rev.: | | | |
| Series 2022 C: | | | |
5% 5/15/25 (c) | | 935,000 | 945,968 |
5% 5/15/26 (c) | | 2,285,000 | 2,344,785 |
| Series 2022 G, 5% 5/15/25 (c) | | 630,000 | 637,390 |
| Series 2023 A: | | | |
5% 5/15/25 (c) | | 295,000 | 298,460 |
5% 5/15/26 (c) | | 510,000 | 523,344 |
| Port of Oakland Rev.: | | | |
| Series 2017, 5% 5/1/26 (c) | | 1,740,000 | 1,782,324 |
| Series 2021, 5% 5/1/26 (c) | | 5,000 | 5,156 |
| San Diego County Reg'l. Arpt. Auth. Arpt. Rev. Series 2019 B, 5% 7/1/24 (c) | | 320,000 | 320,000 |
| San Francisco City & County Arpts. Commission Int'l. Arpt. Rev.: | | | |
| Series 2019 H, 5% 5/1/27 (c) | | 3,810,000 | 3,932,000 |
| Series 2023 A: | | | |
5% 5/1/25 (c) | | 960,000 | 971,122 |
5% 5/1/26 (c) | | 3,760,000 | 3,856,841 |
| San Jose Int. Arpt. Rev. Series 2021 B, 5% 3/1/25 | | 240,000 | 242,788 |
TOTAL CALIFORNIA | | | 57,959,999 |
| Colorado - 1.0% | | | |
| Colorado Health Facilities Auth. Rev. Bonds Series 2022 A: | | | |
| 5% 11/1/24 | | 275,000 | 276,108 |
| 5% 11/1/25 | | 255,000 | 259,958 |
| Colorado Univ. Co. Hosp. Auth. Rev. Bonds Series 2019 C, 5%, tender 11/15/24 (b) | | 445,000 | 445,731 |
| Denver City & County Arpt. Rev.: | | | |
| Series 2017 A, 5% 11/15/24 (c) | | 525,000 | 527,341 |
| Series 2018 A, 5% 12/1/27 (c) | | 2,825,000 | 2,935,823 |
| Series 2022 A: | | | |
5% 11/15/24 (c) | | 635,000 | 637,832 |
5% 11/15/25 (c) | | 1,555,000 | 1,585,543 |
| Series 2022 D: | | | |
5% 11/15/25 (c) | | 2,540,000 | 2,589,889 |
5.25% 11/15/26 (c) | | 3,165,000 | 3,286,489 |
| Maiker Hsg. Partners Colo Multi Bonds Series 2023, 4.5%, tender 5/1/26 (b) | | 2,017,000 | 2,017,841 |
TOTAL COLORADO | | | 14,562,555 |
| Connecticut - 2.4% | | | |
| Connecticut Gen. Oblig.: | | | |
| Series 2013 A, 4.87% 3/1/25 (b) | | 685,000 | 687,015 |
| Series 2016 B, 5% 5/15/25 | | 320,000 | 324,753 |
| Connecticut Health & Edl. Facilities Auth. Rev.: | | | |
| Bonds: | | | |
Series 1999 U2, 1.1%, tender 2/11/25 (b) | | 2,285,000 | 2,240,646 |
Series 2010 A3, 2.95%, tender 7/1/27 (b) | | 2,610,000 | 2,565,822 |
Series 2010 A4, 1.1%, tender 2/11/25 (b) | | 5,750,000 | 5,638,387 |
Series 2014 B, 1.8%, tender 7/1/24 (b) | | 625,000 | 625,000 |
Series 2017 B2, 3.2%, tender 7/1/26 (b) | | 1,850,000 | 1,840,617 |
Series 2017 C2, 2.8%, tender 2/3/26 (b) | | 10,995,000 | 10,840,142 |
| Series 2022 L, 5% 7/1/25 | | 285,000 | 288,952 |
| Series 2024 A: | | | |
5% 7/1/27 (e) | | 2,900,000 | 3,043,125 |
5% 7/1/28 (e) | | 3,800,000 | 4,043,037 |
| Connecticut Spl. Tax Oblig. Trans. Infrastructure Rev.: | | | |
| Series 2015 A, 5% 8/1/26 | | 635,000 | 645,434 |
| Series 2021 A, 5% 5/1/26 | | 805,000 | 831,557 |
| Hartford Gen. Oblig. Series 2015 C, 5% 7/15/25 (Assured Guaranty Muni. Corp. Insured) | | 1,215,000 | 1,237,242 |
| New Haven Gen. Oblig. Series 2023: | | | |
| 5% 8/1/24 | | 380,000 | 380,236 |
| 5% 8/1/25 | | 320,000 | 323,892 |
| 5% 8/1/26 (Build America Mutual Assurance Insured) | | 445,000 | 458,050 |
| 5% 8/1/27 (Build America Mutual Assurance Insured) | | 415,000 | 433,146 |
TOTAL CONNECTICUT | | | 36,447,053 |
| Delaware - 0.0% | | | |
| Delaware Econ. Dev. Auth. Rev. Bonds (Delmarva Pwr. & Lt. Co. Proj.) Series A, 1.05%, tender 7/1/25 (b) | | 370,000 | 359,214 |
| District Of Columbia - 1.6% | | | |
| District of Columbia Hsg. Fin. Agcy. Multi-family Hsg. Rev. Bonds (One Hawaii Avenue Proj.) Series 2024, 3.65%, tender 7/1/27 (b) | | 2,870,000 | 2,864,608 |
| Metropolitan Washington DC Arpts. Auth. Sys. Rev.: | | | |
| Series 2014 A, 5% 10/1/26 (c) | | 605,000 | 607,022 |
| Series 2018 A, 5% 10/1/24 (c) | | 3,605,000 | 3,614,161 |
| Series 2019 A: | | | |
5% 10/1/24 (c) | | 1,905,000 | 1,909,841 |
5% 10/1/26 (c) | | 825,000 | 848,841 |
| Series 2020 A, 5% 10/1/24 (c) | | 4,575,000 | 4,586,626 |
| Series 2022 A, 5% 10/1/24 (c) | | 825,000 | 827,096 |
| Series 2023 A, 5% 10/1/26 (c) | | 1,250,000 | 1,286,123 |
| Series 2024 A: | | | |
5% 10/1/25 (c)(e) | | 2,000,000 | 2,031,940 |
5% 10/1/27 (c)(e) | | 4,445,000 | 4,609,033 |
| Washington Metropolitan Area Transit Auth. Series 2023 A, 5% 7/15/25 | | 635,000 | 646,116 |
TOTAL DISTRICT OF COLUMBIA | | | 23,831,407 |
| Florida - 4.9% | | | |
| Broward County Arpt. Sys. Rev. Series 2017, 5% 10/1/24 (c) | | 320,000 | 320,668 |
| Broward County Fin. Auth. Multi-family Hsg. Rev. Bonds Series 2023, 4.05%, tender 3/1/26 (b) | | 1,191,000 | 1,192,453 |
| Broward County Port Facilities Rev. Series 2022, 5% 9/1/27 (c) | | 1,265,000 | 1,308,048 |
| Broward County School Board Ctfs. of Prtn. Series 2022 A, 5% 7/1/25 | | 1,010,000 | 1,026,295 |
| Citizens Property Ins. Corp. Series 2015 A1, 5% 6/1/25 (Pre-Refunded to 12/1/24 @ 100) | | 2,990,000 | 3,008,278 |
| Duval County School Board Ctfs. of Prtn. Series 2022 A: | | | |
| 5% 7/1/25 (Assured Guaranty Muni. Corp. Insured) | | 1,775,000 | 1,804,513 |
| 5% 7/1/26 (Assured Guaranty Muni. Corp. Insured) | | 3,115,000 | 3,220,256 |
| Escambia County Fla Hsg. Fin. Auth. Bonds Series 2024, 3.8%, tender 6/1/26 (b) | | 4,400,000 | 4,402,937 |
| Florida Hsg. Fin. Corp. Multi-family Mtg. Rev. Bonds: | | | |
| Series 2023 B, 5%, tender 2/1/26 (b) | | 985,000 | 1,001,341 |
| Series 2023 C, 5%, tender 12/1/25 (b) | | 705,000 | 713,625 |
| Series 2024 E, 3.8%, tender 6/1/27 (b) | | 1,530,000 | 1,533,647 |
| Greater Orlando Aviation Auth. Arpt. Facilities Rev. Series 2016 A, 5% 10/1/25 (Escrowed to Maturity) (c) | | 365,000 | 370,601 |
| Hillsborough Co. Sldwst and Resource Receivables Series 2016 A, 5% 9/1/26 (c) | | 1,435,000 | 1,470,190 |
| Hillsborough County Aviation Auth. Rev. Series 2022 A: | | | |
| 5% 10/1/24 (c) | | 2,905,000 | 2,912,528 |
| 5% 10/1/25 (c) | | 1,180,000 | 1,199,553 |
| Jacksonville Spl. Rev. Series 2022 A: | | | |
| 5% 10/1/24 | | 370,000 | 371,294 |
| 5% 10/1/25 | | 290,000 | 296,091 |
| Lee County Arpt. Rev. Series 2021 A, 5% 10/1/24 (c) | | 970,000 | 972,026 |
| Lee County Hsg. Fin. Auth. Multi-family Hsg. Rev. Bonds Series 2023 A, 3.55%, tender 8/1/27 (b) | | 1,588,000 | 1,574,721 |
| Miami Dade County Hsg. Multifamily Hsg. Rev. Bonds: | | | |
| Series 2023 B, 4.05%, tender 9/1/25 (b) | | 695,000 | 695,846 |
| Series 2023: | | | |
3.55%, tender 1/1/26 (b) | | 2,965,000 | 2,928,239 |
5%, tender 9/1/25 (b) | | 2,415,000 | 2,437,503 |
5%, tender 9/1/25 (b) | | 1,330,000 | 1,344,511 |
5%, tender 10/1/25 (b) | | 4,055,000 | 4,115,002 |
| Miami-Dade County Aviation Rev. Series 2012 A, 5% 10/1/24 | | 570,000 | 570,583 |
| Miami-Dade County Indl. Dev. Auth. Solid Waste Disp. Rev. Bonds: | | | |
| Series 2011, 5%, tender 11/1/24 (b)(c) | | 2,380,000 | 2,386,673 |
| Series 2018 B, SIFMA Municipal Swap Index + 0.000% 4.255%, tender 7/5/24 (b)(c)(f) | | 24,600,000 | 24,598,047 |
| Okeechobee County Solid Waste Rev. Bonds (Waste Mgmt., Inc.-Okeechobee Landfill Proj.) Series 2004 A, 0.55%, tender 7/1/24 (b) | | 955,000 | 954,999 |
| Orange County Health Facilities Auth. Bonds Series 2021 C, 5%, tender 11/15/26 (b) | | 1,815,000 | 1,871,467 |
| Orlando Utils. Commission Util. Sys. Rev. Series 2013 A, 5% 10/1/24 | | 320,000 | 321,183 |
| Pasco County Tax Alloc Series 2023 A, 5.25% 9/1/25 (Assured Guaranty Muni. Corp. Insured) | | 160,000 | 162,920 |
| Pasco County School Board Ctfs. of Prtn. Series 2022 A, 5% 8/1/26 (Assured Guaranty Muni. Corp. Insured) | | 665,000 | 686,815 |
| Polk County Hsg. Fin. Auth. Multi-family Hsg. Rev. Bonds Series 2023, 4.15%, tender 6/1/26 (b) | | 1,296,000 | 1,303,029 |
TOTAL FLORIDA | | | 73,075,882 |
| Georgia - 1.3% | | | |
| Atlanta Arpt. Rev. Series 2020 B, 5% 7/1/25 (c) | | 710,000 | 719,356 |
| Burke County Indl. Dev. Auth. Poll. Cont. Rev.: | | | |
| (Georgia Pwr. Co. Plant Vogtle Proj.) Series 1994, 3.7%, tender 6/13/28 (b) | | 1,285,000 | 1,295,201 |
| Bonds (Georgia Pwr. Co. Plant Vogtle Proj.): | | | |
Series 1994 4, 3.8%, tender 5/21/26 (b) | | 1,885,000 | 1,889,796 |
Series 2008 2, 3.375%, tender 3/12/27 (b) | | 730,000 | 724,371 |
Series 2012, 2.875%, tender 8/19/25 (b) | | 2,270,000 | 2,236,884 |
| Fayette County Hosp. Auth. Rev. Bonds (Piedmont Healthcare, Inc. Proj.) Series 2019 A, 5%, tender 7/1/24 (b) | | 725,000 | 725,000 |
| Georgia Muni. Elec. Auth. Pwr. Rev.: | | | |
| Series 2021 A, 5% 1/1/25 (Assured Guaranty Muni. Corp. Insured) | | 125,000 | 125,909 |
| Series 2022 A: | | | |
5% 7/1/24 (Assured Guaranty Muni. Corp. Insured) | | 215,000 | 215,000 |
5% 7/1/25 (Assured Guaranty Muni. Corp. Insured) | | 220,000 | 223,224 |
5% 7/1/26 (Assured Guaranty Muni. Corp. Insured) | | 230,000 | 237,096 |
| Main Street Natural Gas, Inc.: | | | |
| Bonds Series 2019 B, 4%, tender 12/2/24 (b) | | 1,290,000 | 1,290,576 |
| Series 2022 A, 4% 12/1/25 | | 800,000 | 795,476 |
| Series 2023 B: | | | |
5% 9/1/25 | | 220,000 | 221,989 |
5% 9/1/26 | | 430,000 | 437,338 |
| Series 2023 D: | | | |
5% 12/1/24 | | 190,000 | 190,596 |
5% 12/1/25 | | 350,000 | 354,840 |
5% 12/1/26 | | 195,000 | 199,746 |
| Series 2024 A1: | | | |
5% 3/1/25 | | 345,000 | 346,489 |
5% 9/1/25 | | 320,000 | 322,894 |
5% 3/1/26 | | 430,000 | 435,420 |
5% 9/1/26 | | 350,000 | 355,973 |
5% 3/1/27 | | 700,000 | 713,765 |
5% 9/1/27 | | 625,000 | 640,124 |
| Series 2024 C: | | | |
5% 12/1/26 | | 875,000 | 896,297 |
5% 12/1/27 | | 1,000,000 | 1,034,040 |
| Series 2025 B, 5% 9/1/25 | | 325,000 | 327,939 |
| Monroe County Dev. Auth. Poll. Cont. Rev. Bonds (Georgia Pwr. Co. Plant Scherer Proj.) Series 2012, 3.875%, tender 3/6/26 (b) | | 1,725,000 | 1,730,835 |
TOTAL GEORGIA | | | 18,686,174 |
| Guam - 0.1% | | | |
| Guam Pwr. Auth. Rev. Series 2022 A: | | | |
| 5% 10/1/24 | | 785,000 | 786,329 |
| 5% 10/1/25 | | 980,000 | 991,590 |
TOTAL GUAM | | | 1,777,919 |
| Hawaii - 0.2% | | | |
| Honolulu City & County Multi-family housing Rev. Bonds Series 2023, 5%, tender 6/1/26 (b) | | 3,480,000 | 3,549,134 |
| Illinois - 5.0% | | | |
| Chicago Midway Arpt. Rev. Series 2023, 5% 1/1/27 (Build America Mutual Assurance Insured) (c) | | 635,000 | 652,623 |
| Chicago O'Hare Int'l. Arpt. Rev.: | | | |
| Series 2022 A, 5% 1/1/25 (c) | | 695,000 | 698,339 |
| Series 2022 C: | | | |
5% 1/1/25 (c) | | 1,430,000 | 1,436,871 |
5% 1/1/26 (c) | | 760,000 | 773,078 |
| Chicago Wtr. Rev.: | | | |
| Series 2017 2, 5% 11/1/24 | | 635,000 | 637,901 |
| Series 2023 B: | | | |
5% 11/1/24 | | 795,000 | 798,632 |
5% 11/1/25 | | 635,000 | 648,446 |
| Cook County Gen. Oblig.: | | | |
| Series 2021 A, 5% 11/15/24 | | 285,000 | 286,343 |
| Series 2022 A: | | | |
5% 11/15/24 | | 3,775,000 | 3,792,785 |
5% 11/15/25 | | 2,775,000 | 2,832,042 |
| Cook County Sales Tax Rev. Series 2022 A, 5% 11/15/25 | | 430,000 | 439,594 |
| Illinois Dev. Fin. Auth. Solid Waste Disp. Rev. Bonds (Waste Mgmt., Inc. Proj.) Series 2019, 5%, tender 11/1/24 (b)(c) | | 7,940,000 | 7,962,261 |
| Illinois Fin. Auth. Series 2022 A, 5% 10/1/24 | | 100,000 | 99,961 |
| Illinois Gen. Oblig.: | | | |
| Series 2016, 5% 11/1/24 | | 510,000 | 511,973 |
| Series 2017 D: | | | |
5% 11/1/24 | | 16,645,000 | 16,712,778 |
5% 11/1/26 | | 930,000 | 960,043 |
5% 11/1/27 | | 945,000 | 988,394 |
| Series 2019 B, 5% 9/1/25 | | 380,000 | 386,061 |
| Series 2022 A, 5% 3/1/25 | | 1,315,000 | 1,326,052 |
| Series 2022 B: | | | |
5% 3/1/25 | | 10,325,000 | 10,411,773 |
5% 3/1/26 | | 3,850,000 | 3,937,668 |
| Series 2023 C, 5% 5/1/26 | | 2,540,000 | 2,603,748 |
| Series 2023 D, 5% 7/1/25 | | 7,985,000 | 8,093,532 |
| Series 2024 B: | | | |
5% 5/1/26 | | 585,000 | 599,645 |
5% 5/1/27 | | 405,000 | 420,640 |
5% 5/1/28 | | 670,000 | 705,645 |
| Illinois Hsg. Dev. Auth. Multi-family Hsg. Rev. Bonds Series 2023: | | | |
| 4%, tender 6/1/25 (b) | | 1,868,000 | 1,868,006 |
| 5%, tender 2/1/26 (b) | | 893,000 | 904,252 |
| 5%, tender 2/1/26 (b) | | 966,000 | 978,172 |
| Illinois Sales Tax Rev. Series 2021 C, 5% 6/15/25 | | 170,000 | 171,932 |
| McHenry County Conservation District Gen. Oblig. Series 2014, 5% 2/1/25 | | 1,270,000 | 1,280,165 |
| Metropolitan Pier & Exposition Series 2010 B1, 0% 6/15/26 (Assured Guaranty Muni. Corp. Insured) | | 720,000 | 667,459 |
| Railsplitter Tobacco Settlement Auth. Rev. Series 2017, 5% 6/1/26 (Escrowed to Maturity) | | 635,000 | 653,945 |
| Univ. of Illinois Rev. Series 2023, 5% 10/1/27 | | 255,000 | 265,821 |
TOTAL ILLINOIS | | | 75,506,580 |
| Indiana - 1.6% | | | |
| Indiana Fin. Auth. Econ. Dev. Rev. Bonds (Republic Svcs., Inc. Proj.): | | | |
| Series 2012, 4.2%, tender 9/3/24 (b)(c) | | 6,750,000 | 6,752,772 |
| Series B, 3.9%, tender 9/3/24 (b) | | 2,200,000 | 2,200,911 |
| Indianapolis Local Pub. Impt.: | | | |
| (Indianapolis Arpt. Auth. Proj.) Series 2019 D, 5% 1/1/25 (c) | | 3,665,000 | 3,682,610 |
| Indianapolis Arpt. Auth. Proj. Series 2019 D, 5% 1/1/26 (c) | | 3,035,000 | 3,087,226 |
| Series 2016, 5% 1/1/26 (c) | | 1,270,000 | 1,291,854 |
| Series 2022 G2: | | | |
5% 1/1/25 (c) | | 55,000 | 55,264 |
5% 1/1/26 (c) | | 255,000 | 259,388 |
| Indianapolis Local Pub. Impt. Bond Bank (Indianapolis Arpt. Auth. Proj.) Series 2023 I2: | | | |
| 5% 1/1/25 (c) | | 1,090,000 | 1,095,237 |
| 5% 1/1/26 (c) | | 665,000 | 676,443 |
| 5% 1/1/27 (c) | | 1,335,000 | 1,372,051 |
| Whiting Envir. Facilities Rev. Bonds (BP Products North America, Inc. Proj.) Series 2017, 5%, tender 11/1/24 (b)(c) | | 3,725,000 | 3,732,017 |
TOTAL INDIANA | | | 24,205,773 |
| Iowa - 0.1% | | | |
| Iowa Student Ln. Liquidity Corp. Student Ln. Rev.: | | | |
| Series 2015 A, 5% 12/1/24 (c) | | 320,000 | 321,360 |
| Series 2023 B, 5% 12/1/26 (c) | | 380,000 | 386,686 |
TOTAL IOWA | | | 708,046 |
| Kansas - 0.0% | | | |
| Olathe Gen. Oblig. Series 2017 230, 2.5% 10/1/27 | | 720,000 | 678,638 |
| Kentucky - 1.1% | | | |
| Kentucky Asset/Liability Commission Gen. Fund Rev. Series 2021 A, 5% 11/1/24 | | 635,000 | 638,092 |
| Kentucky Econ. Dev. Fin. Auth. Solid Waste Disp. Rev. Bonds (Republic Svcs., Inc. Proj.) Series B, 3.9%, tender 9/3/24 (b) | | 4,200,000 | 4,201,725 |
| Kentucky, Inc. Pub. Energy Bonds Series C1, 4%, tender 6/1/25 (b) | | 3,220,000 | 3,221,399 |
| Trimble County Envirl Facilities Re Bonds Series 2023, 4.7%, tender 6/1/27 (b)(c) | | 8,255,000 | 8,302,460 |
TOTAL KENTUCKY | | | 16,363,676 |
| Louisiana - 0.3% | | | |
| Louisiana Hsg. Corp. Multifamily Hsg. Rev. Bonds: | | | |
| (Loop Commons Proj.) Series 2024 B, 3.75%, tender 2/1/27 (b) | | 2,000,000 | 1,996,386 |
| (Ridge Commons Proj.) Series 2024 B, 3.75%, tender 2/1/27 (b) | | 1,130,000 | 1,128,234 |
| St. John Baptist Parish Rev. Bonds (Marathon Oil Corp.) Series 2017, 4.05%, tender 7/1/26 (b) | | 1,815,000 | 1,815,000 |
TOTAL LOUISIANA | | | 4,939,620 |
| Maryland - 0.5% | | | |
| Maryland Cmnty. Dev. Admin Dept. Hsg. & Cmnty. Dev. Series 2023 D, 3.5% 1/1/26 | | 4,810,000 | 4,762,625 |
| Maryland Dept. of Trans. Series 2022 A, 5% 12/1/24 | | 350,000 | 352,288 |
| Maryland Health & Higher Edl. Bonds Series 2020, 5%, tender 7/1/25 (b) | | 1,750,000 | 1,760,843 |
| Maryland Stadium Auth. Built to Learn Rev. Series 2022 A, 5% 6/1/25 | | 575,000 | 582,959 |
TOTAL MARYLAND | | | 7,458,715 |
| Massachusetts - 0.9% | | | |
| Massachusetts Dev. Fin. Agcy. Rev.: | | | |
| Series 2016 I, 5% 7/1/25 | | 730,000 | 739,979 |
| Series 2021 I, 5% 10/1/24 | | 570,000 | 571,334 |
| Massachusetts Edl. Fing. Auth. Rev.: | | | |
| Series 2014 I, 5% 1/1/25 (c) | | 2,160,000 | 2,171,644 |
| Series 2017 A, 5% 7/1/25 (c) | | 910,000 | 922,788 |
| Series 2018 B, 5% 7/1/25 (c) | | 3,420,000 | 3,468,059 |
| Series 2019 B, 5% 7/1/25 (c) | | 635,000 | 643,923 |
| Series 2020 C, 5% 7/1/24 (c) | | 380,000 | 380,000 |
| Series 2022 B: | | | |
5% 7/1/24 (c) | | 335,000 | 335,000 |
5% 7/1/25 (c) | | 1,780,000 | 1,805,013 |
| Massachusetts School Bldg. Auth. Dedicated Sales Tax Rev. Series 2015 C, 5% 8/15/27 | | 2,925,000 | 2,976,698 |
TOTAL MASSACHUSETTS | | | 14,014,438 |
| Michigan - 1.2% | | | |
| Detroit Downtown Dev. Auth. Tax (Catalyst Dev. Proj.) Series 2024: | | | |
| 5% 7/1/26 | | 400,000 | 411,863 |
| 5% 7/1/27 | | 550,000 | 574,820 |
| Michigan Fin. Auth. Rev.: | | | |
| (Detroit Reg'l. Convention Facility Auth. Local Proj.) Series 2014 H1, 5% 10/1/24 | | 540,000 | 540,506 |
| Bonds Series 2019 C, 3.75%, tender 5/15/26 (b) | | 3,600,000 | 3,589,644 |
| Series 2015 D1, 0.55% 10/15/24 | | 1,080,000 | 1,069,160 |
| Series 2022: | | | |
5% 4/15/25 | | 1,805,000 | 1,826,323 |
5% 4/15/26 | | 3,010,000 | 3,097,128 |
| Michigan Hsg. Dev. Auth. Single Family Mtg. Rev. Series 2022 A, 2.5% 6/1/25 | | 770,000 | 754,564 |
| Oakland Univ. Rev.: | | | |
| Series 2022 A, 5% 3/1/25 | | 125,000 | 126,163 |
| Series 2022 B, 5% 3/1/25 | | 755,000 | 762,022 |
| Southfield Pub. Schools Series 2023: | | | |
| 5% 5/1/25 | | 1,270,000 | 1,286,260 |
| 5% 5/1/26 | | 1,475,000 | 1,519,554 |
| Wayne County Arpt. Auth. Rev.: | | | |
| Series 2015 F, 5% 12/1/26 (c) | | 565,000 | 572,432 |
| Series 2017 E, 4% 12/1/25 (c)(d) | | 1,095,000 | 1,098,339 |
TOTAL MICHIGAN | | | 17,228,778 |
| Minnesota - 0.4% | | | |
| Minneapolis & Saint Paul Metropolitan Arpts. Commission Arpt. Rev. Series 2022 B: | | | |
| 5% 1/1/25 (c) | | 870,000 | 874,180 |
| 5% 1/1/26 (c) | | 575,000 | 584,895 |
| Minnesota Hsg. Fin. Agcy.: | | | |
| Series 2022 A, 5% 8/1/24 | | 580,000 | 580,580 |
| Series 2022 B: | | | |
5% 8/1/24 | | 735,000 | 735,735 |
5% 8/1/25 | | 1,085,000 | 1,102,764 |
5% 8/1/26 | | 1,080,000 | 1,115,136 |
| Series H, 0.7% 7/1/24 (c) | | 125,000 | 125,000 |
| Northern Muni. Pwr. Agcy. Elec. Sys. Rev. Series 2023: | | | |
| 5% 1/1/25 | | 205,000 | 206,377 |
| 5% 1/1/26 | | 240,000 | 245,319 |
| 5% 1/1/27 | | 365,000 | 378,265 |
TOTAL MINNESOTA | | | 5,948,251 |
| Missouri - 0.1% | | | |
| Kansas City Planned Indl. Expansion Bonds Series 2023, 5%, tender 7/1/27 (b) | | 1,528,000 | 1,564,156 |
| Nebraska - 0.2% | | | |
| Central Plains Energy Proj. Rev. Bonds Series 2019, 2.5%, tender 8/1/25 (b) | | 2,230,000 | 2,188,413 |
| Nebraska Pub. Pwr. District Rev. Series 2017 B, 5% 1/1/25 | | 415,000 | 418,187 |
TOTAL NEBRASKA | | | 2,606,600 |
| Nevada - 0.6% | | | |
| Clark County Arpt. Rev. Series 2021 B, 5% 7/1/24 (c) | | 2,365,000 | 2,365,000 |
| Clark County Poll. Cont. Rev. Bonds (Nevada Pwr. Co. Proj.) Series 2017, 3.75%, tender 3/31/26 (b) | | 910,000 | 902,236 |
| Clark County School District: | | | |
| Series 2015 C, 5% 6/15/27 | | 1,145,000 | 1,171,029 |
| Series 2020 A, 3% 6/15/25 | | 320,000 | 317,907 |
| Series 2021 C, 5% 6/15/25 | | 3,095,000 | 3,140,044 |
| Nevada Dept. of Bus. & Industry Bonds (Republic Svcs., Inc. Proj.) Series 2001, 4.15%, tender 12/2/24 (b)(c)(d) | | 1,300,000 | 1,301,018 |
TOTAL NEVADA | | | 9,197,234 |
| New Hampshire - 1.2% | | | |
| Nat'l. Fin. Auth. Solid Bonds (Waste Mgmt., Inc. Proj.) Series 2019 A2, 2.15%, tender 7/1/24 (b)(c) | | 14,500,000 | 14,499,189 |
| New Hampshire Health & Ed. Facilities Auth. Series 2023 B, 5.5% 11/1/26 (c) | | 190,000 | 196,311 |
| New Hampshire St Hsg. Fin.: | | | |
| Series 2023 3: | | | |
3.8% 7/1/26 | | 680,000 | 684,759 |
3.85% 1/1/27 | | 1,080,000 | 1,086,605 |
| Series 2023 4: | | | |
3.625% 4/1/26 | | 365,000 | 366,669 |
3.7% 1/1/27 | | 1,170,000 | 1,173,795 |
TOTAL NEW HAMPSHIRE | | | 18,007,328 |
| New Jersey - 3.4% | | | |
| Harrison Township Series 2023, 5% 11/27/24 | | 2,711,400 | 2,725,099 |
| Millburn Township Board of Ed. Series 2023, 0.05% 8/15/25 | | 730,000 | 696,914 |
| New Jersey Econ. Dev. Auth.: | | | |
| Series 2022 A: | | | |
5% 11/1/24 | | 525,000 | 527,036 |
5% 11/1/25 | | 635,000 | 647,197 |
| Series 2023 RRR: | | | |
5% 3/1/25 | | 4,480,000 | 4,518,352 |
5% 3/1/26 | | 3,445,000 | 3,528,412 |
| Series 2024 SSS, 5% 6/15/26 | | 2,295,000 | 2,360,998 |
| New Jersey Econ. Dev. Auth. Rev. Series 2019: | | | |
| 5.25% 9/1/24 (d) | | 8,060,000 | 8,077,917 |
| 5.25% 9/1/26 (d) | | 1,840,000 | 1,906,049 |
| New Jersey Edl. Facility: | | | |
| Series 2016 A, 5% 7/1/24 | | 3,010,000 | 3,010,000 |
| Series 2016 C, 5% 7/1/24 (Assured Guaranty Muni. Corp. Insured) | | 635,000 | 635,000 |
| New Jersey Gen. Oblig.: | | | |
| Series 2020 A, 5% 6/1/25 | | 2,985,000 | 3,030,102 |
| Series 2021, 2% 6/1/25 | | 1,005,000 | 984,128 |
| New Jersey Health Care Facilities Fing. Auth. Rev.: | | | |
| (Greystone Park Psychiatric Hosp. Proj.) Series 2024: | | | |
5% 9/15/25 | | 395,000 | 402,193 |
5% 9/15/26 | | 2,435,000 | 2,503,424 |
5% 9/15/27 | | 630,000 | 656,492 |
| (Marlboro Psychiatric Hosp. Proj.) Series 2024: | | | |
5% 9/15/25 | | 315,000 | 320,699 |
5% 9/15/26 | | 325,000 | 334,133 |
| New Jersey Higher Ed. Student Assistance Auth. Student Ln. Rev.: | | | |
| Series 2016 1A, 5% 12/1/24 (c) | | 2,795,000 | 2,809,074 |
| Series 2017 1A: | | | |
5% 12/1/24 (c) | | 955,000 | 959,809 |
5% 12/1/25 (c) | | 1,815,000 | 1,843,297 |
| Series 2018 B, 5% 12/1/26 (c) | | 635,000 | 648,369 |
| Series 2019 A, 5% 12/1/24 | | 355,000 | 356,817 |
| Series 2020, 5% 12/1/24 (c) | | 700,000 | 703,525 |
| Series 2021 A, 5% 12/1/24 (c) | | 210,000 | 211,057 |
| Series 2022 A: | | | |
5% 12/1/24 (c) | | 275,000 | 276,385 |
5% 12/1/25 (c) | | 350,000 | 355,457 |
| Series 2022 B: | | | |
5% 12/1/24 (c) | | 1,125,000 | 1,130,665 |
5% 12/1/25 (c) | | 1,670,000 | 1,696,037 |
| New Jersey Tobacco Settlement Fing. Corp. Series 2018 A, 5% 6/1/25 | | 995,000 | 1,005,177 |
| New Jersey Trans. Trust Fund Auth.: | | | |
| Series 2006 C, 0% 12/15/24 | | 100,000 | 98,293 |
| Series 2008 A, 0% 12/15/25 | | 1,555,000 | 1,474,407 |
| Series 2010 A, 0% 12/15/25 | | 665,000 | 630,534 |
| Series 2022 AA, 5% 6/15/25 | | 265,000 | 268,550 |
TOTAL NEW JERSEY | | | 51,331,598 |
| New York - 3.4% | | | |
| East Hampton Union Free School District Series 2017, 2.1% 6/1/27 | | 1,285,000 | 1,197,609 |
| Long Island Pwr. Auth. Elec. Sys. Rev.: | | | |
| Bonds Series 2019 B, 1.65%, tender 9/1/24 (b) | | 1,700,000 | 1,691,233 |
| Series 2021, 1% 9/1/25 | | 1,395,000 | 1,337,902 |
| Monroe County Indl. Dev. Agcy. Bonds (Andrews Terrace Cmnty. Partners, L.P. Proj.) Series 2023 B1, 5%, tender 7/1/27 (b) | | 947,000 | 971,206 |
| New York City Gen. Oblig. Bonds Series 2015 F4, 5%, tender 12/1/25 (g) | | 580,000 | 586,431 |
| New York City Hsg. Dev. Corp. Multifamily Hsg. Bonds Series 2021 K2, 0.9%, tender 1/1/26 (b) | | 795,000 | 749,260 |
| New York City Indl. Dev. Agcy. Rev. Series 2021 A, 5% 1/1/26 (Assured Guaranty Muni. Corp. Insured) | | 380,000 | 389,117 |
| New York City Transitional Fin. Auth. Rev. Series 2015 C, 5% 11/1/27 | | 1,905,000 | 1,929,102 |
| New York Metropolitan Trans. Auth. Rev.: | | | |
| Bonds Series 2019 A1, 5%, tender 11/15/24 (b) | | 14,730,000 | 14,783,850 |
| Series 2015 C1, 5% 11/15/26 | | 1,585,000 | 1,616,263 |
| Series 2017 B, 5% 11/15/26 | | 1,270,000 | 1,316,710 |
| Series 2017 C1, 5% 11/15/25 | | 665,000 | 679,036 |
| New York State Hsg. Fin. Agcy. Rev. Bonds: | | | |
| Series 2023 E2, 3.8%, tender 5/1/27 (b) | | 1,170,000 | 1,172,378 |
| Series 2024 A, 3.375%, tender 11/1/27 (b) | | 8,340,000 | 8,295,754 |
| New York Trans. Dev. Corp.: | | | |
| (Term. 4 JFK Int'l. Arpt. Proj.): | | | |
Series 2020 A, 5% 12/1/25 (c) | | 1,875,000 | 1,900,157 |
Series 2020 C, 5% 12/1/24 | | 635,000 | 637,835 |
| (Term. 4 John F. Kennedy Int'l. Arpt. Proj.) Series 2022, 5% 12/1/26 (c) | | 3,175,000 | 3,252,307 |
| St. Lawrence County Indl. Dev. (St. Lawrence Univ. Proj.) Series 2022: | | | |
| 5% 7/1/25 | | 265,000 | 268,753 |
| 5% 7/1/26 | | 255,000 | 262,220 |
| Syracuse Reg'l. Arpt. Auth. Series 2021, 5% 7/1/24 (c) | | 490,000 | 490,000 |
| Tobacco Settlement Asset Securitization Corp. Series 2017 A, 5% 6/1/25 | | 1,980,000 | 2,002,162 |
| Triborough Bridge & Tunnel Auth. Bonds: | | | |
| Series 2021 A2, 2%, tender 5/15/26 (b) | | 635,000 | 607,675 |
| Series 2024 B3, 5%, tender 11/15/25 (b) | | 4,030,000 | 4,117,970 |
TOTAL NEW YORK | | | 50,254,930 |
| New York And New Jersey - 1.5% | | | |
| Port Auth. of New York & New Jersey: | | | |
| Series 2013, 5% 7/15/25 (c) | | 645,000 | 645,564 |
| Series 2014 186, 5% 10/15/26 (c) | | 3,315,000 | 3,322,810 |
| Series 2016 195, 5% 10/1/25 (c) | | 1,225,000 | 1,245,750 |
| Series 2018, 5% 9/15/25 (c) | | 4,480,000 | 4,553,080 |
| Series 2020 221, 5% 7/15/25 (c) | | 1,265,000 | 1,282,712 |
| Series 2023 242: | | | |
5% 12/1/24 (c) | | 805,000 | 808,854 |
5% 12/1/25 (c) | | 2,680,000 | 2,731,845 |
5% 12/1/26 (c) | | 5,495,000 | 5,664,292 |
| Series 223: | | | |
5% 7/15/24 (c) | | 2,065,000 | 2,065,779 |
5% 7/15/25 (c) | | 325,000 | 329,551 |
TOTAL NEW YORK AND NEW JERSEY | | | 22,650,237 |
| North Carolina - 0.7% | | | |
| Charlotte-Mecklenburg Hosp. Auth. Health Care Sys. Rev. Bonds: | | | |
| Series 2018 C, 3.45%, tender 10/31/25 (b) | | 3,425,000 | 3,417,849 |
| Series 2021 B, 5%, tender 12/2/24 (b) | | 1,605,000 | 1,614,168 |
| Series 2023 D, 3.625%, tender 6/15/27 (b) | | 2,850,000 | 2,820,803 |
| North Carolina Med. Care Commission Hosp. Rev. Bonds Series 2021 B, 5%, tender 2/1/26 (b) | | 2,525,000 | 2,576,492 |
TOTAL NORTH CAROLINA | | | 10,429,312 |
| Ohio - 1.2% | | | |
| American Muni. Pwr., Inc. Rev. Series 2023 A: | | | |
| 5% 2/15/25 | | 555,000 | 559,443 |
| 5% 2/15/26 | | 3,130,000 | 3,203,328 |
| 5% 2/15/27 | | 4,915,000 | 5,133,352 |
| Columbus-Franklin County Fin. Auth. Bonds (Dering Family Homes Proj.) Series 2023, 5%, tender 2/1/27 (b) | | 1,333,000 | 1,358,076 |
| Hamilton County Swr. Sys. Rev. Series 2024 B: | | | |
| 5% 12/1/24 (e) | | 1,680,000 | 1,685,501 |
| 5% 12/1/25 (e) | | 755,000 | 769,388 |
| 5% 12/1/26 (e) | | 755,000 | 784,347 |
| 5% 12/1/27 (e) | | 505,000 | 534,048 |
| Lancaster Port Auth. Gas Rev. Bonds Series 2019, 5%, tender 2/1/25 (b) | | 1,285,000 | 1,292,010 |
| Montgomery County Hosp. Rev. (Kettering Health Network Obligated Group Proj.) Series 2021, 5% 8/1/24 | | 125,000 | 125,088 |
| Northeast Ohio Med. Univ. Series 2022: | | | |
| 5% 12/1/24 (Build America Mutual Assurance Insured) | | 160,000 | 160,812 |
| 5% 12/1/25 (Build America Mutual Assurance Insured) | | 170,000 | 172,697 |
| Ohio Higher Edl. Facility Commission Rev.: | | | |
| (Xavier Univ. 2020 Proj.) Series 2020, 5% 5/1/26 | | 700,000 | 720,668 |
| Bonds (Case Western Reserve Univ. Proj.) Series 2019 C, 1.625%, tender 12/1/26 (b) | | 735,000 | 692,057 |
| Ohio Tpk. Commission Tpk. Rev. (Infrastructure Projs.) Series 2022 A, 5% 2/15/25 | | 1,170,000 | 1,181,472 |
TOTAL OHIO | | | 18,372,287 |
| Oklahoma - 0.8% | | | |
| Oklahoma County Independent School District #89 Oklahoma City Series 2023 A, 3% 7/1/26 | | 7,140,000 | 7,054,806 |
| Oklahoma St Inds. Auth. Edl. Facilities (Oklahoma City Pub. Schools Proj.) Series 2024, 5% 4/1/28 | | 5,125,000 | 5,430,938 |
TOTAL OKLAHOMA | | | 12,485,744 |
| Oregon - 0.3% | | | |
| Port of Portland Arpt. Rev.: | | | |
| Series 2020 26B, 5% 7/1/26 | | 1,015,000 | 1,033,133 |
| Series 2022: | | | |
5% 7/1/24 (c) | | 1,270,000 | 1,270,000 |
5% 7/1/25 (c) | | 1,785,000 | 1,808,523 |
| Series 24B, 5% 7/1/25 (c) | | 635,000 | 643,368 |
TOTAL OREGON | | | 4,755,024 |
| Pennsylvania - 6.2% | | | |
| Allegheny County Arpt. Auth. Rev.: | | | |
| Series 2021 A, 5% 1/1/27 (c) | | 655,000 | 673,178 |
| Series 2023 A, 5% 1/1/27 (Assured Guaranty Muni. Corp. Insured) (c) | | 540,000 | 554,987 |
| Geisinger Auth. Health Sys. Rev. Bonds Series 2020 B, 5%, tender 2/15/27 (b) | | 3,975,000 | 4,089,998 |
| Pennsylvania Econ. Dev. Fing. Auth.: | | | |
| Series 2021 A, 4% 10/15/24 | | 540,000 | 540,508 |
| Series 2022 A: | | | |
5% 2/15/25 | | 100,000 | 100,893 |
5% 2/15/26 | | 125,000 | 128,227 |
| Pennsylvania Econ. Dev. Fing. Auth. Solid Waste Disp. Rev. Bonds: | | | |
| (Republic Svcs., Inc. Proj.): | | | |
Series 2019 A, 4.05%, tender 7/15/24 (b)(c) | | 3,000,000 | 3,000,011 |
Series 2019 B1, 4.05%, tender 7/15/24 (b)(c) | | 5,200,000 | 5,200,020 |
| (Republic Svcs., Inc. Proj.): | | | |
Series 2014, 4%, tender 7/1/24 (b)(c) | | 30,200,000 | 30,199,970 |
Series 2019 B2, 4%, tender 7/15/24 (b)(c) | | 7,795,000 | 7,794,761 |
| (Waste Mgmt., Inc. Proj.): | | | |
Series 2010 B, 3.5%, tender 7/1/24 (b) | | 3,885,000 | 3,884,961 |
Series 2017 A, 0.58%, tender 8/1/24 (b)(c) | | 1,400,000 | 1,395,234 |
Series 2021 A2, 4.6%, tender 10/1/26 (b)(c) | | 15,885,000 | 16,112,804 |
| Series 2011, 2.15%, tender 7/1/24 (b)(c) | | 5,240,000 | 5,240,000 |
| Pennsylvania Gen. Oblig.: | | | |
| Series 2019, 5% 7/15/26 | | 2,000,000 | 2,069,853 |
| Series 2023, 5% 9/1/26 | | 7,990,000 | 8,286,737 |
| Pennsylvania Hsg. Fin. Agcy.: | | | |
| Series 2021 135 B, 5% 4/1/25 (c) | | 240,000 | 241,215 |
| Series 2022 138: | | | |
5% 10/1/24 | | 1,250,000 | 1,254,490 |
5% 10/1/25 | | 700,000 | 711,569 |
| Philadelphia Arpt. Rev. Series 2021: | | | |
| 5% 7/1/24 (c) | | 600,000 | 600,000 |
| 5% 7/1/26 (c) | | 635,000 | 648,665 |
TOTAL PENNSYLVANIA | | | 92,728,081 |
| Rhode Island - 0.0% | | | |
| Rhode Island Student Ln. Auth. Student Ln. Rev. Series 2018 A, 5% 12/1/25 (c) | | 555,000 | 562,581 |
| South Carolina - 0.4% | | | |
| South Carolina Ports Auth. Ports Rev.: | | | |
| Series 2015 (AMT), 5% 7/1/45 (Pre-Refunded to 7/1/25 @ 100) (c) | | 1,650,000 | 1,671,744 |
| Series 2015: | | | |
5.25% 7/1/50 (Pre-Refunded to 7/1/25 @ 100) (c) | | 2,875,000 | 2,919,882 |
5.25% 7/1/55 (Pre-Refunded to 7/1/25 @ 100) (c) | | 1,380,000 | 1,401,543 |
TOTAL SOUTH CAROLINA | | | 5,993,169 |
| South Dakota - 0.3% | | | |
| South Dakota Hsg. Dev. Auth. Bonds Series 2023 J, 3.875%, tender 12/12/24 (b) | | 4,575,000 | 4,574,923 |
| Tennessee - 1.1% | | | |
| Memphis-Shelby County Arpt. Auth. Arpt. Rev. Series 2021 C, 1.875% 7/1/25 (c) | | 790,000 | 763,326 |
| Metropolitan Gov Nashvle&David Ind. Bonds (Waste Mgmt., Inc. Proj.) Series 2001, 0.58%, tender 8/1/24 (b)(c) | | 570,000 | 568,059 |
| Metropolitan Nashville Arpt. Auth. Rev. Series 2022 B: | | | |
| 5% 7/1/26 (c) | | 430,000 | 439,669 |
| 5% 7/1/27 (c) | | 650,000 | 672,278 |
| Tennergy Corp. Gas Rev. Bonds Series 2019 A, 5%, tender 10/1/24 (b) | | 13,500,000 | 13,545,170 |
TOTAL TENNESSEE | | | 15,988,502 |
| Texas - 6.4% | | | |
| Austin Arpt. Sys. Rev.: | | | |
| Series 2019, 5% 11/15/24 (c) | | 875,000 | 877,929 |
| Series 2022, 5% 11/15/25 (c) | | 1,215,000 | 1,233,966 |
| Clear Creek Independent School District Bonds Series 2013 B, 3.6%, tender 8/15/25 (b) | | 930,000 | 930,229 |
| Crandall Independent School District Series 2021 A, 0% 8/15/24 | | 485,000 | 482,682 |
| Cuero Independent School District Series 2017, 5% 8/15/26 | | 1,240,000 | 1,283,929 |
| Dallas Gen. Oblig.: | | | |
| Series 2023 A, 5% 2/15/25 | | 2,365,000 | 2,388,335 |
| Series 2023, 5% 2/15/25 | | 3,505,000 | 3,539,582 |
| Series 2024 A: | | | |
5% 2/15/25 | | 9,495,000 | 9,588,683 |
5% 2/15/26 | | 9,495,000 | 9,763,172 |
| Dallas Hsg. Fin. Corp. Multi-family Hsg. Rev. Bonds Series 2023: | | | |
| 5%, tender 12/1/25 (b) | | 1,493,000 | 1,512,908 |
| 5%, tender 3/1/26 (b) | | 1,861,000 | 1,883,007 |
| 5%, tender 7/1/27 (b) | | 1,982,000 | 2,029,373 |
| El Paso Gen. Oblig. Series 2024, 5% 8/15/25 (e) | | 1,750,000 | 1,780,923 |
| Hays Consolidated Independent School District Series 2022: | | | |
| 5% 2/15/25 | | 320,000 | 323,059 |
| 5% 2/15/26 | | 445,000 | 457,213 |
| Houston Convention and Entertainment Facilities Dept. Hotel Occupancy Tax and Spl. Rev. Series 2014, 5% 9/1/26 | | 955,000 | 956,896 |
| Houston Hsg. Fin. Corp. Multi-family Hsg. Rev. Bonds Series 2023, 5%, tender 8/1/26 (b) | | 1,080,000 | 1,098,423 |
| Houston Independent School District Bonds: | | | |
| Series 2014 A2, 3.5%, tender 6/1/25 (b) | | 5,680,000 | 5,650,019 |
| Series 2023 C, 4%, tender 6/1/25 (b) | | 5,110,000 | 5,105,770 |
| Lower Colorado River Auth. Rev. (LCRA Transmission Svcs. Corp. Proj.) Series 2020, 5% 5/15/25 | | 360,000 | 364,974 |
| Mission Econ. Dev. Corp. Solid Waste Disp. Rev. Bonds: | | | |
| (Republic Svcs., Inc. Proj.): | | | |
Series 2008 A, 4.05%, tender 8/1/24 (b)(c) | | 3,700,000 | 3,700,685 |
Series 2020 A, 4.05%, tender 8/1/24 (b)(c) | | 6,600,000 | 6,601,222 |
| (Waste Mgmt., Inc. Proj.) Series 2018, 0.370% x SIFMA Municipal Swap Index 4.255%, tender 7/1/24 (b)(c)(f) | | 4,340,000 | 4,339,655 |
| (Waste Mgmt., INC. Proj.) Series 2023 A, 4.25%, tender 7/1/27 (b) | | 2,800,000 | 2,799,832 |
| North East Texas Independent School District: | | | |
| Bonds Series 2024, 3.75%, tender 8/1/27 (b) | | 1,950,000 | 1,956,068 |
| Series 2015, 3% 8/1/27 | | 1,095,000 | 1,072,448 |
| North Texas Tollway Auth. Rev. Series 2021 B, 5% 1/1/26 | | 730,000 | 749,023 |
| Northside Independent School District Bonds: | | | |
| Series 2023 B, 3%, tender 8/1/26 (b) | | 6,030,000 | 5,939,206 |
| Series 2024 B, 3.45%, tender 8/1/27 (b) | | 2,150,000 | 2,149,217 |
| Port Arthur Independent School District Series 2015 A, 5% 2/15/25 | | 390,000 | 393,872 |
| Prosper Independent School District Bonds Series 2019 B, 4%, tender 8/15/26 (b) | | 1,050,000 | 1,053,493 |
| San Antonio Elec. & Gas Sys. Rev.: | | | |
| Bonds Series 2018, SIFMA Municipal Swap Index + 0.870% 4.75%, tender 12/1/25 (b)(f) | | 5,390,000 | 5,382,890 |
| Series 2022, 5% 2/1/26 | | 575,000 | 589,849 |
| Tarrant County Cultural Ed. Facilities Fin. Corp. Hosp. Rev. Bonds (Baylor Scott & White Health Proj.) Series 2022 E, 5%, tender 5/15/26 (b) | | 2,695,000 | 2,761,312 |
| Texas Affordable Hsg. Corp. Multi-family Hsg. Rev. Bonds Series 2023, 3.625%, tender 1/1/27 (b) | | 1,365,000 | 1,346,153 |
| Texas Gen. Oblig. Series 2016, 5.5% 8/1/26 (c) | | 645,000 | 670,233 |
| Texas Muni. Gas Acquisition & Supply Corp.: | | | |
| Series 2023 A: | | | |
5.25% 1/1/25 | | 555,000 | 557,721 |
5.25% 1/1/26 | | 635,000 | 644,524 |
5.25% 1/1/27 | | 635,000 | 650,587 |
| Series 2023 B: | | | |
5.25% 1/1/25 | | 385,000 | 386,888 |
5.25% 1/1/26 | | 760,000 | 771,399 |
| Travis County Hsg. Fin. Corp. Bonds Series 2023, 3.75%, tender 8/1/25 (b) | | 310,000 | 308,478 |
TOTAL TEXAS | | | 96,075,827 |
| Utah - 0.3% | | | |
| Salt Lake City Arpt. Rev.: | | | |
| Series 2021 A: | | | |
5% 7/1/24 (c) | | 635,000 | 635,000 |
5% 7/1/25 (c) | | 840,000 | 849,421 |
| Series 2023 A: | | | |
5% 7/1/25 (c) | | 450,000 | 455,047 |
5% 7/1/26 (c) | | 635,000 | 648,665 |
5% 7/1/27 (c) | | 595,000 | 615,393 |
| Utah County Hosp. Rev. Bonds Series 2020 B2, 5%, tender 8/1/26 (b) | | 1,565,000 | 1,607,157 |
TOTAL UTAH | | | 4,810,683 |
| Vermont - 0.1% | | | |
| Vermont Student Assistant Corp. Ed. Ln. Rev. Series 2016 A, 5% 6/15/26 (c) | | 1,080,000 | 1,098,970 |
| Virginia - 0.6% | | | |
| Halifax County Indl. Dev. Auth. Bonds (Virgina Elec. and Pwr. Co. Proj.) Series 2010 A, 3.8%, tender 5/28/27 (b) | | 1,115,000 | 1,118,093 |
| Southampton County Indl. Bonds (PRTA-Virginia One, LLC Proj.) Series 2023, 4.875%, tender 12/12/24 (b)(c) | | 7,940,000 | 7,934,018 |
TOTAL VIRGINIA | | | 9,052,111 |
| Washington - 1.2% | | | |
| King County Swr. Rev. Bonds Series 2020 B, 0.875%, tender 1/1/26 (b) | | 3,430,000 | 3,284,727 |
| Port of Seattle Rev.: | | | |
| Series 2016 B, 5% 10/1/27 (c) | | 635,000 | 647,585 |
| Series 2018 A, 5% 5/1/27 (c) | | 2,610,000 | 2,696,887 |
| Series 2019, 5% 4/1/25 (c) | | 335,000 | 337,697 |
| Series 2021 C, 5% 8/1/24 (c) | | 2,970,000 | 2,972,226 |
| Series 2021, 5% 9/1/24 (c) | | 1,410,000 | 1,412,220 |
| Series 2022 B: | | | |
5% 8/1/24 (c) | | 1,695,000 | 1,696,270 |
5% 8/1/25 (c) | | 1,600,000 | 1,620,346 |
5% 8/1/26 (c) | | 995,000 | 1,019,346 |
| Seattle Hsg. Auth. Rev. (Juniper Apts. Proj.) Series 2023, 5% 6/1/27 | | 765,000 | 782,080 |
| Washington Hsg. Fin. Commission Multi-family Hsg. Rev. Bonds (Ardea At Totem Lake Apts. Proj.) Series 2023, 5%, tender 2/1/27 (b) | | 1,407,000 | 1,431,804 |
TOTAL WASHINGTON | | | 17,901,188 |
| West Virginia - 0.5% | | | |
| West Virginia Econ. Dev. Auth. Solid Waste Disp. Facilities Rev. Bonds (Allegheny Metallurgical Proj.) Series 2023, 4.75%, tender 8/1/24 (b)(c) | | 6,820,000 | 6,825,152 |
| Wisconsin - 0.9% | | | |
| Milwaukee County Arpt. Rev.: | | | |
| Series 2023 A: | | | |
5% 12/1/24 (c) | | 150,000 | 150,575 |
5% 12/1/26 (c) | | 510,000 | 524,191 |
| Series 2023 B, 5% 12/1/24 (c) | | 1,040,000 | 1,043,990 |
| Milwaukee Gen. Oblig. Series 2016, 2% 3/1/27 | | 1,965,000 | 1,836,715 |
| Pub. Fin. Auth. Health Care Sys. Rev. Series 2023 A, 5% 10/1/24 | | 2,825,000 | 2,834,239 |
| Wisconsin Health & Edl. Facilities Auth. Rev.: | | | |
| (Forensic Science and Protective Medicine Collaboration, Inc. Proj.) Series 2024, 5% 8/1/27 (d) | | 3,040,000 | 3,095,701 |
| Series 2022: | | | |
5% 10/1/24 | | 2,835,000 | 2,842,703 |
5% 10/1/25 | | 585,000 | 595,053 |
| Wisconsin Hsg. & Econ. Dev. Auth. Hsg. Rev. Bonds Series 2023 E, 3.875%, tender 5/1/27 (b) | | 1,205,000 | 1,200,632 |
TOTAL WISCONSIN | | | 14,123,799 |
| TOTAL MUNICIPAL BONDS (Cost $915,183,720) | | | 913,108,007 |
| | | | |
| Municipal Notes - 42.9% |
| | | Principal Amount (a) | Value ($) |
| Alabama - 1.7% | | | |
| Black Belt Energy Gas District Participating VRDN: | | | |
| Series XF 30 73, 4.18% 7/5/24 (Liquidity Facility Morgan Stanley Bank, West Valley City Utah) (b)(h)(i) | | 12,515,000 | 12,515,000 |
| Series XM 10 80, 5% 7/5/24 (Liquidity Facility JPMorgan Chase Bank) (b)(h)(i) | | 1,445,000 | 1,445,000 |
| Series ZL 03 96, 4.18% 7/5/24 (Liquidity Facility Morgan Stanley Bank, West Valley City Utah) (b)(h)(i) | | 2,795,000 | 2,795,000 |
| Series ZL 03 97, 4.18% 7/5/24 (Liquidity Facility Morgan Stanley Bank, West Valley City Utah) (b)(h)(i) | | 2,855,000 | 2,855,000 |
| Decatur Indl. Dev. Board Exempt Facilities Rev. (Nucor Steel Decatur LLC Proj.) Series 2003 A, 4.21% 7/5/24, VRDN (b)(c) | | 2,450,000 | 2,450,000 |
| Health Care Auth. for Baptist Health Series 2013 B, 5.3% 7/5/24, VRDN (b) | | 2,923,000 | 2,923,000 |
| Mobile Indl. Dev. Board Rev. (Alabama Pwr. Co. Proj.) Series 2001 B, 4.65% 7/1/24, VRDN (b)(c) | | 400,000 | 400,000 |
TOTAL ALABAMA | | | 25,383,000 |
| Arizona - 1.0% | | | |
| Arizona St Indl. Dev. Auth. Multi Participating VRDN Series XF 31 74, 4.2% 7/5/24 (Liquidity Facility Mizuho Cap. Markets LLC) (b)(h)(i) | | 2,680,000 | 2,680,000 |
| Maricopa County Poll. Cont. Rev. Series 2009 D, 4.05% 7/5/24, VRDN (b) | | 10,350,000 | 10,350,000 |
| Mizuho Floater / Residual Trust V Participating VRDN Series Floater 91 57, 4.2% 8/2/24 (Liquidity Facility Mizuho Cap. Markets LLC) (b)(h)(i) | | 1,905,969 | 1,905,969 |
TOTAL ARIZONA | | | 14,935,969 |
| Arkansas - 0.1% | | | |
| Blytheville Indl. Dev. Rev. (Nucor Corp. Proj.) Series 1998, 4.21% 7/5/24, VRDN (b)(c) | | 1,700,000 | 1,700,000 |
| California - 8.8% | | | |
| California Hsg. Fin. Agcy. Ltd. Obl Participating VRDN Series XF 31 27, 4.2% 7/5/24 (Liquidity Facility Mizuho Cap. Markets LLC) (b)(h)(i) | | 1,755,000 | 1,755,000 |
| California Statewide Cmntys. Dev. Auth. Multi-family Hsg. Rev. Participating VRDN: | | | |
| Series MIZ 91 21, 5.25% 7/1/24 (Liquidity Facility Mizuho Cap. Markets LLC) (b)(c)(h)(i) | | 6,290,000 | 6,290,000 |
| Series MIZ 91 22, 5.25% 7/1/24 (Liquidity Facility Mizuho Cap. Markets LLC) (b)(c)(h)(i) | | 13,170,244 | 13,170,244 |
| Los Angeles Cmnty. Redev. Agcy. Multi-family Hsg. Rev. Participating VRDN: | | | |
| Series 2022 MIZ 90 89, 5.25% 7/1/24 (Liquidity Facility Mizuho Cap. Markets LLC) (b)(c)(h)(i) | | 30,375,000 | 30,375,000 |
| Series 2022 MIZ 90 90, 5.25% 7/1/24 (Liquidity Facility Mizuho Cap. Markets LLC) (b)(c)(h)(i) | | 24,555,000 | 24,555,000 |
| Mizuho Floater / Residual Trust V Participating VRDN: | | | |
| Series Floater MIZ 90 97, 4.2% 7/5/24, LOC Mizuho Cap. Markets LLC (b)(h)(i) | | 1,845,613 | 1,845,613 |
| Series Floater MIZ 91 62, 4.2% 8/2/24 (Liquidity Facility Mizuho Cap. Markets LLC) (b)(h)(i) | | 1,155,000 | 1,155,000 |
| San Francisco City & County Multi-family Hsg. Rev. Participating VRDN: | | | |
| Series MIZ 90 95, 4.2% 8/2/24 (Liquidity Facility Mizuho Cap. Markets LLC) (b)(h)(i)(j) | | 27,100,000 | 27,100,000 |
| Series MIZ 91 15, 4.2% 8/2/24 (Liquidity Facility Mizuho Cap. Markets LLC) (b)(h)(i)(j) | | 25,415,000 | 25,415,000 |
TOTAL CALIFORNIA | | | 131,660,857 |
| Colorado - 0.9% | | | |
| Colorado Edl. & Cultural Facilities Auth. Rev. (Mesivta of Greater Los Angeles Proj.) Series 2005, 4.23% 7/5/24, LOC Deutsche Bank AG, VRDN (b) | | 835,000 | 835,000 |
| Colorado Health Facilities Auth. Rev. Bonds Participating VRDN: | | | |
| Series XM 10 59, 4.03% 7/5/24 (Liquidity Facility JPMorgan Chase Bank) (b)(h)(i) | | 6,495,000 | 6,495,000 |
| Series XM 10 61, 4.03% 7/5/24 (Liquidity Facility JPMorgan Chase Bank) (b)(h)(i) | | 2,655,000 | 2,655,000 |
| Colorado Hsg. & Fin. Auth. Series 2007, 4.13% 7/5/24, LOC U.S. Bank NA, Cincinnati, VRDN (b)(c) | | 4,180,000 | 4,180,000 |
TOTAL COLORADO | | | 14,165,000 |
| Florida - 3.4% | | | |
| Broward County Indl. Dev. Rev. (Florida Pwr. & Lt. Co. Proj.) Series 2015, 4% 7/5/24, VRDN (b)(c) | | 13,600,000 | 13,600,000 |
| Florida Ins. Assistance Interlo Series 2023 A2, 4.67% 7/5/24 (Liquidity Facility Florida Gen. Oblig.), VRDN (b) | | 21,540,000 | 21,540,000 |
| Greater Orlando Aviation Auth. Arpt. Facilities Rev. Participating VRDN Series XM 10 93, 5.15% 7/1/24 (Liquidity Facility JPMorgan Chase Bank) (b)(c)(h)(i) | | 2,180,000 | 2,180,000 |
| Lee Memorial Health Sys. Hosp. Rev. Series 2019 B, 4.47% 7/6/27, VRDN (b) | | 12,245,000 | 12,245,000 |
| Miami Dade County Hsg. Multifamily Hsg. Rev. Participating VRDN Series Floater MIZ 90 87, 4.2% 8/2/24 (Liquidity Facility Mizuho Cap. Markets LLC) (b)(h)(i)(j) | | 1,015,000 | 1,015,000 |
TOTAL FLORIDA | | | 50,580,000 |
| Georgia - 1.6% | | | |
| Bartow County Dev. Auth. (Georgia Pwr. Co. Plant Bowen Proj.) Series 2022, 4.9% 7/1/24, VRDN (b)(c) | | 13,720,000 | 13,720,000 |
| Buford Hsg. Auth. Multifamily Participating VRDN Series XF 31 18, 4.2% 7/5/24 (Liquidity Facility Mizuho Cap. Markets LLC) (b)(h)(i) | | 1,855,143 | 1,855,143 |
| Heard County Dev. Auth. Poll. Cont. Rev. Series 2007, 4.65% 7/1/24, VRDN (b)(c) | | 8,300,000 | 8,300,000 |
TOTAL GEORGIA | | | 23,875,143 |
| Illinois - 0.4% | | | |
| Chicago O'Hare Int'l. Arpt. Rev. Participating VRDN Series XM 10 38, 4.06% 7/5/24 (Liquidity Facility JPMorgan Chase Bank) (b)(c)(h)(i) | | 1,000,000 | 1,000,000 |
| Mizuho Floater / Residual Trust V Participating VRDN Series Floater MIZ 91 67, 4.2% 8/2/24 (Liquidity Facility Mizuho Cap. Markets LLC) (b)(h)(i) | | 5,500,000 | 5,500,000 |
TOTAL ILLINOIS | | | 6,500,000 |
| Indiana - 2.2% | | | |
| Indiana Fin. Auth. Exempt Facilities Rev. Bonds Series MS 00 22, 4.38%, tender 7/25/24 (Liquidity Facility Morgan Stanley Bank, West Valley City Utah) (b)(c)(h)(i) | | 18,300,000 | 18,300,000 |
| Westfield Washington Multi-School Bldg. Corp. BAN Series 2024 A, 5% 12/15/24 | | 14,800,000 | 14,866,122 |
TOTAL INDIANA | | | 33,166,122 |
| Iowa - 0.0% | | | |
| Iowa Fin. Auth. Solid Disp. Waste Rev. (MidAmerican Energy Co. Proj.) Series 2008 A, 4.12% 7/5/24, VRDN (b)(c) | | 520,000 | 520,000 |
| Kentucky - 2.8% | | | |
| Kentucky Higher Ed. Student Ln. Corp. Rev. Series 2023 1A1, 4.22% 7/5/24, LOC Bank of America NA, VRDN (b)(c) | | 6,500,000 | 6,500,000 |
| Meade County Indl. Bldg. Rev. (Nucor Steel Brandenburg Proj.): | | | |
| Series 2020 A1, 5.3% 7/1/24, VRDN (b)(c) | | 13,115,000 | 13,115,000 |
| Series 2020 B1, 5.3% 7/1/24, VRDN (b)(c) | | 22,185,000 | 22,185,000 |
TOTAL KENTUCKY | | | 41,800,000 |
| Louisiana - 1.8% | | | |
| Saint James Parish Gen. Oblig. (Nucor Steel Louisiana LLC Proj.): | | | |
| Series 2010 A1, 4.07% 7/5/24, VRDN (b) | | 25,215,000 | 25,215,000 |
| Series 2010 B1, 4.2% 7/5/24, VRDN (b) | | 1,050,000 | 1,050,000 |
TOTAL LOUISIANA | | | 26,265,000 |
| Maryland - 0.2% | | | |
| Tender Option Bond Trust Receipts Participating VRDN Series XF 32 22, 4.2% 7/5/24 (Liquidity Facility Mizuho Cap. Markets LLC) (b)(h)(i) | | 2,810,000 | 2,810,000 |
| Mississippi - 0.3% | | | |
| Mississippi Bus. Fin. Corp. Rev. (Mississippi Pwr. Co. Proj.) Series 1999, 4.65% 7/1/24, VRDN (b)(c) | | 1,700,000 | 1,700,000 |
| Mississippi Bus. Fin. Corp. Solid Waste Disp. Rev. (Mississippi Pwr. Co. Proj.) Series 1998, 5.1% 7/1/24, VRDN (b)(c) | | 2,500,000 | 2,500,000 |
TOTAL MISSISSIPPI | | | 4,200,000 |
| Missouri - 0.3% | | | |
| Kansas City Indl. Dev. Auth. Participating VRDN Series XM 11 08, 5.1% 7/1/24 (Liquidity Facility JPMorgan Chase Bank) (b)(c)(h)(i) | | 2,190,000 | 2,190,000 |
| Mizuho Floater / Residual Trust V Participating VRDN Series Floater MIZ 91 53, 4.2% 8/2/24 (Liquidity Facility Mizuho Cap. Markets LLC) (b)(h)(i) | | 1,969,501 | 1,969,501 |
TOTAL MISSOURI | | | 4,159,501 |
| Nebraska - 0.2% | | | |
| Stanton County Indl. Dev. Rev.: | | | |
| (Nucor Corp. Proj.) Series 1996, 4.21% 7/5/24, VRDN (b)(c) | | 3,600,000 | 3,600,000 |
| Series 1998, 4.21% 7/5/24, VRDN (b)(c) | | 125,000 | 125,000 |
TOTAL NEBRASKA | | | 3,725,000 |
| New Hampshire - 0.2% | | | |
| Tender Option Bond Trust Receipts Bonds Series MS 00 23, 4.18%, tender 9/5/24 (Liquidity Facility Morgan Stanley Bank, West Valley City Utah) (b)(h)(i)(j) | | 2,600,000 | 2,600,000 |
| New Jersey - 3.0% | | | |
| Clifton Gen. Oblig. BAN Series 2023, 5% 11/26/24 | | 64,000 | 64,313 |
| Elmwood Park BAN Series 2023, 5% 10/9/24 | | 3,175,000 | 3,183,760 |
| Hazlet Township NJ BAN Series 2023, 5% 11/8/24 | | 4,727,000 | 4,746,383 |
| Lacey Township Gen. Oblig. BAN Series 2024, 4.5% 5/7/25 | | 5,100,000 | 5,130,926 |
| Manasquan N J BAN Series 2023, 5% 10/3/24 | | 2,797,450 | 2,805,486 |
| Manchester Township Gen. Oblig. BAN Series 2024 A, 4.5% 5/8/25 | | 2,400,000 | 2,413,007 |
| New Jersey Trans. Trust Fund Auth. Participating VRDN Series XM 09 29, 4.03% 7/5/24 (Liquidity Facility JPMorgan Chase Bank) (b)(h)(i) | | 5,870,000 | 5,870,000 |
| Newark Gen. Oblig. BAN Series 2024 B, 5% 5/13/25 | | 6,800,000 | 6,853,850 |
| Pennsauken Township BAN Series 2024 A, 4.5% 5/28/25 | | 6,300,000 | 6,332,558 |
| Ridgewood Gen. Oblig. BAN Series 2023 B, 5% 10/11/24 | | 7,179,000 | 7,199,398 |
TOTAL NEW JERSEY | | | 44,599,681 |
| New York - 3.0% | | | |
| Liberty Dev. Corp. Rev. Participating VRDN Series MS 1207, 4.23% 7/5/24 (Liquidity Facility Morgan Stanley Bank, West Valley City Utah) (b)(h)(i) | | 1,378,500 | 1,378,500 |
| New York Metropolitan Trans. Auth. Rev. Participating VRDN: | | | |
| Series XF 13 21, 4.2% 7/5/24 (Liquidity Facility JPMorgan Chase Bank) (b)(h)(i) | | 3,025,000 | 3,025,000 |
| Series XF 13 55, 4.2% 7/5/24 (Liquidity Facility JPMorgan Chase Bank) (b)(h)(i) | | 4,445,000 | 4,445,000 |
| Series XF 16 49, 4.2% 7/5/24 (Liquidity Facility JPMorgan Chase Bank) (b)(h)(i) | | 4,480,000 | 4,480,000 |
| New York State Hsg. Fin. Agcy. Rev. Participating VRDN: | | | |
| Series 2022, 4.23% 8/9/24 (Liquidity Facility Barclays Bank PLC) (b)(h)(i) | | 3,500,000 | 3,500,000 |
| Series Floater 2022 007, 4.33% 8/9/24 (Liquidity Facility Barclays Bank PLC) (b)(c)(h)(i) | | 27,890,000 | 27,890,000 |
TOTAL NEW YORK | | | 44,718,500 |
| Ohio - 0.8% | | | |
| Ohio Hosp. Rev.: | | | |
| Series 2013 B, 4.41% 7/6/27, VRDN (b) | | 6,355,000 | 6,355,000 |
| Series 2015 B, 4.41% 7/6/27, VRDN (b) | | 5,005,000 | 5,005,000 |
TOTAL OHIO | | | 11,360,000 |
| Oklahoma - 0.7% | | | |
| Oklahoma Dev. Fin. Auth. Health Sys. Rev. Series 2020 B, 4.52% 7/5/24, VRDN (b) | | 9,275,000 | 9,275,000 |
| Steele Duncan Plaza, LLC Participating VRDN Series MIZ 91 03, 4.2% 8/2/24 (Liquidity Facility Mizuho Cap. Markets LLC) (b)(h)(i)(j) | | 1,642,775 | 1,642,775 |
TOTAL OKLAHOMA | | | 10,917,775 |
| Pennsylvania - 0.8% | | | |
| Montgomery County Higher Ed. & Health Auth. Rev. Series 2018 D, 4.7% 7/5/24, VRDN (b) | | 7,880,000 | 7,880,000 |
| Philadelphia Auth. for Indl. Dev.: | | | |
| Participating VRDN Series MIZ 90 51, 4.2% 8/2/24 (Liquidity Facility Mizuho Cap. Markets LLC) (b)(h)(i)(j) | | 591,548 | 591,548 |
| Series 2017 B, 4.7% 7/5/24, VRDN (b) | | 4,165,000 | 4,165,000 |
TOTAL PENNSYLVANIA | | | 12,636,548 |
| South Carolina - 0.1% | | | |
| Berkeley County Indl. Dev. Rev. (Nucor Corp. Proj.) Series 1995, 4.21% 7/5/24, VRDN (b)(c) | | 800,000 | 800,000 |
| South Carolina Pub. Svc. Auth. Rev. Participating VRDN Series Floaters XM 03 84, 4.18% 7/5/24 (Liquidity Facility JPMorgan Chase Bank) (b)(h)(i) | | 1,000,000 | 1,000,000 |
TOTAL SOUTH CAROLINA | | | 1,800,000 |
| Tennessee - 0.7% | | | |
| Chattanooga Health Ed. & Hsg. Facility Board Rev. (Catholic Health Initiatives Proj.) Series C, 4.25% 7/5/24, VRDN (b) | | 9,115,000 | 9,115,000 |
| Mizuho Floater / Residual Trust V Participating VRDN Series Floater MIZ 91 63, 4.2% 8/2/24 (Liquidity Facility Mizuho Cap. Markets LLC) (b)(h)(i) | | 1,540,658 | 1,540,658 |
TOTAL TENNESSEE | | | 10,655,658 |
| Texas - 6.0% | | | |
| Brazos County Tex Hsg. Fin. Corp. M Participating VRDN Series XF 31 29, 4.2% 7/5/24 (Liquidity Facility Mizuho Cap. Markets LLC) (b)(h)(i) | | 1,588,307 | 1,588,307 |
| Ep Machuca Lp Participating VRDN Series MIZ 91 04, 4.2% 8/2/24 (Liquidity Facility Mizuho Cap. Markets LLC) (b)(h)(i)(j) | | 2,325,282 | 2,325,282 |
| Mizuho Floater / Residual Trust V Participating VRDN Series MIZ 91 24, 4.2% 8/2/24 (Liquidity Facility Mizuho Cap. Markets LLC) (b)(h)(i)(j) | | 13,246,483 | 13,246,483 |
| Port Arthur Navigation District Envir. Facilities Rev. (Motiva Enterprises LLC Proj.): | | | |
| Series 2004, 4.27% 7/5/24, VRDN (b)(c) | | 48,085,000 | 48,084,989 |
| Series 2010 D, 4.25% 7/5/24, VRDN (b) | | 24,975,000 | 24,975,000 |
TOTAL TEXAS | | | 90,220,061 |
| Utah - 0.6% | | | |
| Box Elder County Poll. Cont. Rev. Series 2003, 4.27% 7/5/24, VRDN (b) | | 300,000 | 300,000 |
| Salt Lake City Arpt. Rev. Participating VRDN Series XM 11 07, 5.1% 7/1/24 (Liquidity Facility JPMorgan Chase Bank) (b)(c)(h)(i) | | 8,585,000 | 8,585,000 |
TOTAL UTAH | | | 8,885,000 |
| Virginia - 0.1% | | | |
| Nat'l. Sr. Campuses Participating VRDN Series 2022 028, 4.19% 8/9/24 (Liquidity Facility Barclays Bank PLC) (b)(h)(i) | | 1,100,000 | 1,100,000 |
| West Virginia - 0.3% | | | |
| West Virginia Hosp. Fin. Auth. Hosp. Rev. Series 2018 E, 4.49% 7/6/27, VRDN (b) | | 4,760,000 | 4,760,000 |
| Wyoming - 0.9% | | | |
| Lincoln County Envir. (PacifiCorp Proj.) Series 1995, 4.5% 7/5/24, VRDN (b)(c) | | 8,800,000 | 8,800,000 |
| Lincoln County Poll. Cont. Rev. (PacifiCorp Proj.) Series 1994, 4.45% 7/3/24, VRDN (b) | | 800,000 | 800,000 |
| Sweetwater County Poll. Cont. Rev. (PacifiCorp Proj.) Series 1994, 4.45% 7/3/24, VRDN (b) | | 3,940,000 | 3,940,000 |
TOTAL WYOMING | | | 13,540,000 |
| TOTAL MUNICIPAL NOTES (Cost $643,220,751) | | | 643,238,815 |
| | | | |
| TOTAL INVESTMENT IN SECURITIES - 103.8% (Cost $1,558,404,471) | 1,556,346,822 |
NET OTHER ASSETS (LIABILITIES) - (3.8)% | (57,393,491) |
| NET ASSETS - 100.0% | 1,498,953,331 |
| | |
Security Type Abbreviations
| BAN | - | BOND ANTICIPATION NOTE |
| VRDN | - | VARIABLE RATE DEMAND NOTE (A debt instrument that is payable upon demand, either daily, weekly or monthly) |
Legend
| (a) | Amount is stated in United States dollars unless otherwise noted. |
| (b) | Coupon rates for floating and adjustable rate securities reflect the rates in effect at period end. |
| (c) | Private activity obligations whose interest is subject to the federal alternative minimum tax for individuals. |
| (d) | Security exempt from registration under Rule 144A of the Securities Act of 1933. These securities may be resold in transactions exempt from registration, normally to qualified institutional buyers. At the end of the period, the value of these securities amounted to $22,039,033 or 1.5% of net assets. |
| (e) | Security or a portion of the security purchased on a delayed delivery or when-issued basis. |
| (f) | Coupon is indexed to a floating interest rate which may be multiplied by a specified factor and/or subject to caps or floors. |
| (g) | Security initially issued at one coupon which converts to a higher coupon at a specified date. The rate shown is the rate at period end. |
| (h) | Provides evidence of ownership in one or more underlying municipal bonds. |
| (i) | Coupon rates are determined by re-marketing agents based on current market conditions. |
| (j) | Restricted securities (including private placements) - Investment in securities not registered under the Securities Act of 1933 (excluding 144A issues). At the end of the period, the value of restricted securities (excluding 144A issues) amounted to $73,936,088 or 4.9% of net assets. |
| Additional information on each restricted holding is as follows: |
| Security | Acquisition Date | Acquisition Cost ($) |
| Ep Machuca Lp Participating VRDN Series MIZ 91 04, 4.2% 8/2/24 (Liquidity Facility Mizuho Cap. Markets LLC) | 8/05/22 | 2,325,282 |
| | | |
| Miami Dade County Hsg. Multifamily Hsg. Rev. Participating VRDN Series Floater MIZ 90 87, 4.2% 8/2/24 (Liquidity Facility Mizuho Cap. Markets LLC) | 1/27/22 | 1,015,000 |
| | | |
| Mizuho Floater / Residual Trust V Participating VRDN Series MIZ 91 24, 4.2% 8/2/24 (Liquidity Facility Mizuho Cap. Markets LLC) | 1/27/23 | 13,246,483 |
| | | |
| Philadelphia Auth. for Indl. Dev. Participating VRDN Series MIZ 90 51, 4.2% 8/2/24 (Liquidity Facility Mizuho Cap. Markets LLC) | 11/12/20 | 591,548 |
| | | |
| San Francisco City & County Multi-family Hsg. Rev. Participating VRDN Series MIZ 90 95, 4.2% 8/2/24 (Liquidity Facility Mizuho Cap. Markets LLC) | 4/01/22 | 27,100,000 |
| | | |
| San Francisco City & County Multi-family Hsg. Rev. Participating VRDN Series MIZ 91 15, 4.2% 8/2/24 (Liquidity Facility Mizuho Cap. Markets LLC) | 12/19/22 - 1/30/23 | 25,415,000 |
| | | |
| Steele Duncan Plaza, LLC Participating VRDN Series MIZ 91 03, 4.2% 8/2/24 (Liquidity Facility Mizuho Cap. Markets LLC) | 8/11/22 | 1,642,775 |
| | | |
| Tender Option Bond Trust Receipts Bonds Series MS 00 23, 4.18%, tender 9/5/24 (Liquidity Facility Morgan Stanley Bank, West Valley City Utah) | 4/16/24 | 2,600,000 |
| | | |
Affiliated Central Funds
Fiscal year to date information regarding the Fund's investments in Fidelity Central Funds, including the ownership percentage, is presented below.
| Affiliate | Value, beginning of period ($) | Purchases ($) | Sales Proceeds ($) | Dividend Income ($) | Realized Gain (loss) ($) | Change in Unrealized appreciation (depreciation) ($) | Value, end of period ($) | % ownership, end of period |
| Fidelity Municipal Cash Central Fund 4.33% | 46,002,000 | 211,540,799 | 257,542,778 | 505,295 | (21) | - | - | 0.0% |
| Total | 46,002,000 | 211,540,799 | 257,542,778 | 505,295 | (21) | - | - | |
| | | | | | | | | |
Amounts in the dividend income column in the above table include any capital gain distributions from underlying funds, which are presented in the corresponding line item in the Statement of Operations, if applicable.
Amounts included in the purchases and sales proceeds columns may include in-kind transactions, if applicable.
Investment Valuation
The following is a summary of the inputs used, as of June 30, 2024, involving the Fund's assets and liabilities carried at fair value. The inputs or methodology used for valuing securities may not be an indication of the risk associated with investing in those securities. For more information on valuation inputs, and their aggregation into the levels used below, please refer to the Investment Valuation section in the accompanying Notes to Financial Statements.
| Valuation Inputs at Reporting Date: |
| Description | Total ($) | Level 1 ($) | Level 2 ($) | Level 3 ($) |
Investments in Securities: | | | | |
|
| Municipal Securities | 1,556,346,822 | - | 1,556,346,822 | - |
| | | | | |
| Total Investments in Securities: | 1,556,346,822 | - | 1,556,346,822 | - |
Financial Statements (Unaudited)
| Statement of Assets and Liabilities |
| | | | June 30, 2024 (Unaudited) |
| | | | | |
| Assets | | | | |
Investment in securities, at value - See accompanying schedule Unaffiliated issuers (cost $1,558,404,471): | | | $ | 1,556,346,822 |
| Receivable for investments sold | | | | 17,025,007 |
| Receivable for fund shares sold | | | | 1,660,123 |
| Interest receivable | | | | 13,529,627 |
| Distributions receivable from Fidelity Central Funds | | | | 113,483 |
| Receivable from investment adviser for expense reductions | | | | 67,978 |
| Other receivables | | | | 560 |
Total assets | | | | 1,588,743,600 |
| Liabilities | | | | |
| Payable to custodian bank | $ | 301,877 | | |
| Payable for investments purchased | | | | |
Regular delivery | | 65,645,000 | | |
Delayed delivery | | 19,257,309 | | |
| Payable for fund shares redeemed | | 2,241,773 | | |
| Distributions payable | | 1,973,723 | | |
| Accrued management fee | | 249,812 | | |
| Distribution and service plan fees payable | | 102 | | |
| Other affiliated payables | | 120,673 | | |
| Total liabilities | | | | 89,790,269 |
| Net Assets | | | $ | 1,498,953,331 |
| Net Assets consist of: | | | | |
| Paid in capital | | | $ | 1,502,788,268 |
| Total accumulated earnings (loss) | | | | (3,834,937) |
| Net Assets | | | $ | 1,498,953,331 |
| | | | | |
| Net Asset Value and Maximum Offering Price | | | | |
| Class A : | | | | |
Net Asset Value and redemption price per share ($812,363 ÷ 81,005 shares)(a) | | | $ | 10.03 |
| Maximum offering price per share (100/98.50 of $10.03) | | | $ | 10.18 |
| Fidelity Conservative Income Municipal Bond Fund : | | | | |
Net Asset Value, offering price and redemption price per share ($1,379,127,917 ÷ 137,523,802 shares) | | | $ | 10.03 |
| Class I : | | | | |
Net Asset Value, offering price and redemption price per share ($2,170,067 ÷ 216,385 shares) | | | $ | 10.03 |
| Class Z : | | | | |
Net Asset Value, offering price and redemption price per share ($116,842,984 ÷ 11,651,389 shares) | | | $ | 10.03 |
(a)Redemption price per share is equal to net asset value less any applicable contingent deferred sales charge. |
| Statement of Operations |
| | | | Six months ended June 30, 2024 (Unaudited) |
| Investment Income | | | | |
| Interest | | | $ | 26,637,513 |
| Income from Fidelity Central Funds | | | | 505,295 |
| Total income | | | | 27,142,808 |
| Expenses | | | | |
| Management fee | $ | 1,600,698 | | |
| Transfer agent fees | | 786,979 | | |
| Distribution and service plan fees | | 598 | | |
| Independent trustees' fees and expenses | | 2,450 | | |
| Total expenses before reductions | | 2,390,725 | | |
| Expense reductions | | (395,913) | | |
| Total expenses after reductions | | | | 1,994,812 |
| Net Investment income (loss) | | | | 25,147,996 |
| Realized and Unrealized Gain (Loss) | | | | |
| Net realized gain (loss) on: | | | | |
| Investment Securities: | | | | |
| Unaffiliated issuers | | (192,796) | | |
| Redemptions in-kind | | (761,921) | | |
| Fidelity Central Funds | | (21) | | |
| Total net realized gain (loss) | | | | (954,738) |
| Change in net unrealized appreciation (depreciation) on investment securities | | | | (3,349,757) |
| Net gain (loss) | | | | (4,304,495) |
| Net increase (decrease) in net assets resulting from operations | | | $ | 20,843,501 |
| Statement of Changes in Net Assets |
| |
| | Six months ended June 30, 2024 (Unaudited) | | Year ended December 31, 2023 |
| Increase (Decrease) in Net Assets | | | | |
| Operations | | | | |
| Net investment income (loss) | $ | 25,147,996 | $ | 72,384,290 |
| Net realized gain (loss) | | (954,738) | | 154,029 |
| Change in net unrealized appreciation (depreciation) | | (3,349,757) | | 18,047,491 |
| Net increase (decrease) in net assets resulting from operations | | 20,843,501 | | 90,585,810 |
| Distributions to shareholders | | (25,722,950) | | (71,521,315) |
| | | | | |
| Share transactions - net increase (decrease) | | (1,081,766,996) | | 81,513,168 |
| Total increase (decrease) in net assets | | (1,086,646,445) | | 100,577,663 |
| | | | | |
| Net Assets | | | | |
| Beginning of period | | 2,585,599,776 | | 2,485,022,113 |
| End of period | $ | 1,498,953,331 | $ | 2,585,599,776 |
| | | | | |
| | | | | |
Financial Highlights
Fidelity Advisor® Conservative Income Municipal Bond Fund Class A |
| |
| | Six months ended (Unaudited) June 30, 2024 | | Years ended December 31, 2023 A |
Selected Per-Share Data | | | | |
| Net asset value, beginning of period | $ | 10.04 | $ | 9.97 |
| Income from Investment Operations | | | | |
Net investment income (loss) B,C | | .146 | | .187 |
| Net realized and unrealized gain (loss) | | (.004) | | .060 |
| Total from investment operations | | .142 | | .247 |
| Distributions from net investment income | | (.152) | | (.177) |
| Total distributions | | (.152) | | (.177) |
| Net asset value, end of period | $ | 10.03 | $ | 10.04 |
Total Return D,E,F | | | | 2.50% |
Ratios to Average Net Assets C,G,H | | | | |
| Expenses before reductions | | .43% I | | .42% I |
| Expenses net of fee waivers, if any | | | | .42% I |
| Expenses net of all reductions | | .43% I | | .42% I |
| Net investment income (loss) | | 2.96% I | | 3.11% I |
| Supplemental Data | | | | |
| Net assets, end of period (000 omitted) | $ | 812 | $ | 420 |
Portfolio turnover rate J | | | | 76% |
AFor the period May 25, 2023 (commencement of sale of shares) through December 31, 2023.
BCalculated based on average shares outstanding during the period.
CNet investment income (loss) is affected by the timing of the declaration of dividends by any underlying mutual funds or exchange-traded funds (ETFs). Net investment income (loss) of any mutual funds or ETFs is not included in the Fund's net investment income (loss) ratio.
DTotal returns would have been lower if certain expenses had not been reduced during the applicable periods shown.
ETotal returns do not include the effect of the sales charges.
FTotal returns for periods of less than one year are not annualized.
GFees and expenses of any underlying mutual funds or exchange-traded funds (ETFs) are not included in the Fund's expense ratio. The Fund indirectly bears its proportionate share of these expenses. For additional expense information related to investments in Fidelity Central Funds, please refer to the "Investments in Fidelity Central Funds" note found in the Notes to Financial Statements section of the most recent Annual or Semi-Annual report.
HExpense ratios reflect operating expenses of the class. Expenses before reductions do not reflect amounts reimbursed, waived, or reduced through arrangements with the investment adviser, brokerage services, or other offset arrangements, if applicable, and do not represent the amount paid by the class during periods when reimbursements, waivers or reductions occur.
IAnnualized.
JAmount does not include the portfolio activity of any underlying mutual funds or exchange-traded funds (ETFs).
KPortfolio turnover rate excludes securities received or delivered in-kind.
Fidelity® Conservative Income Municipal Bond Fund |
| |
| | Six months ended (Unaudited) June 30, 2024 | | Years ended December 31, 2023 | | 2022 | | 2021 | | 2020 | | 2019 |
Selected Per-Share Data | | | | | | | | | | | | |
| Net asset value, beginning of period | $ | 10.04 | $ | 9.97 | $ | 10.04 | $ | 10.06 | $ | 10.06 | $ | 10.02 |
| Income from Investment Operations | | | | | | | | | | | | |
Net investment income (loss) A,B | | .158 | | .293 | | .096 | | .025 | | .081 | | .157 |
| Net realized and unrealized gain (loss) | | (.007) | | .066 | | (.069) | | (.020) | | .007 | | .042 |
| Total from investment operations | | .151 | | .359 | | .027 | | .005 | | .088 | | .199 |
| Distributions from net investment income | | (.161) | | (.289) | | (.097) | | (.025) | | (.087) | | (.158) |
| Distributions from net realized gain | | - | | - | | - | | - | | (.001) | | (.001) |
| Total distributions | | (.161) | | (.289) | | (.097) | | (.025) | | (.088) | | (.159) |
| Net asset value, end of period | $ | 10.03 | $ | 10.04 | $ | 9.97 | $ | 10.04 | $ | 10.06 | $ | 10.06 |
Total Return C,D | | | | 3.66% | | .27% | | .05% | | .88% | | 2.00% |
Ratios to Average Net Assets B,E,F | | | | | | | | | | | | |
| Expenses before reductions | | .30% G | | .31% | | .35% | | .35% | | .35% | | .35% |
| Expenses net of fee waivers, if any | | | | .25% | | .25% | | .25% | | .25% | | .25% |
| Expenses net of all reductions | | .25% G | | .25% | | .25% | | .25% | | .25% | | .25% |
| Net investment income (loss) | | 3.13% G | | 2.93% | | .96% | | .25% | | .81% | | 1.56% |
| Supplemental Data | | | | | | | | | | | | |
| Net assets, end of period (000 omitted) | $ | 1,379,128 | $ | 2,541,356 | $ | 2,339,827 | $ | 2,580,577 | $ | 3,175,503 | $ | 2,108,640 |
Portfolio turnover rate H | | | | 76% | | 56% | | 56% | | 41% | | 63% |
ACalculated based on average shares outstanding during the period.
BNet investment income (loss) is affected by the timing of the declaration of dividends by any underlying mutual funds or exchange-traded funds (ETFs). Net investment income (loss) of any mutual funds or ETFs is not included in the Fund's net investment income (loss) ratio.
CTotal returns for periods of less than one year are not annualized.
DTotal returns would have been lower if certain expenses had not been reduced during the applicable periods shown.
EFees and expenses of any underlying mutual funds or exchange-traded funds (ETFs) are not included in the Fund's expense ratio. The Fund indirectly bears its proportionate share of these expenses. For additional expense information related to investments in Fidelity Central Funds, please refer to the "Investments in Fidelity Central Funds" note found in the Notes to Financial Statements section of the most recent Annual or Semi-Annual report.
FExpense ratios reflect operating expenses of the class. Expenses before reductions do not reflect amounts reimbursed, waived, or reduced through arrangements with the investment adviser, brokerage services, or other offset arrangements, if applicable, and do not represent the amount paid by the class during periods when reimbursements, waivers or reductions occur.
GAnnualized.
HAmount does not include the portfolio activity of any underlying mutual funds or exchange-traded funds (ETFs).
IPortfolio turnover rate excludes securities received or delivered in-kind.
Fidelity Advisor® Conservative Income Municipal Bond Fund Class I |
| |
| | Six months ended (Unaudited) June 30, 2024 | | Years ended December 31, 2023 A |
Selected Per-Share Data | | | | |
| Net asset value, beginning of period | $ | 10.04 | $ | 9.97 |
| Income from Investment Operations | | | | |
Net investment income (loss) B,C | | .156 | | .196 |
| Net realized and unrealized gain (loss) | | (.005) | | .062 |
| Total from investment operations | | .151 | | .258 |
| Distributions from net investment income | | (.161) | | (.188) |
| Total distributions | | (.161) | | (.188) |
| Net asset value, end of period | $ | 10.03 | $ | 10.04 |
Total Return D,E | | | | 2.61% |
Ratios to Average Net Assets C,F,G | | | | |
| Expenses before reductions | | .29% H | | .29% H |
| Expenses net of fee waivers, if any | | | | .25% H |
| Expenses net of all reductions | | .25% H | | .25% H |
| Net investment income (loss) | | 3.13% H | | 3.31% H |
| Supplemental Data | | | | |
| Net assets, end of period (000 omitted) | $ | 2,170 | $ | 1,373 |
Portfolio turnover rate I | | | | 76% |
AFor the period May 25, 2023 (commencement of sale of shares) through December 31, 2023.
BCalculated based on average shares outstanding during the period.
CNet investment income (loss) is affected by the timing of the declaration of dividends by any underlying mutual funds or exchange-traded funds (ETFs). Net investment income (loss) of any mutual funds or ETFs is not included in the Fund's net investment income (loss) ratio.
DTotal returns would have been lower if certain expenses had not been reduced during the applicable periods shown.
ETotal returns for periods of less than one year are not annualized.
FFees and expenses of any underlying mutual funds or exchange-traded funds (ETFs) are not included in the Fund's expense ratio. The Fund indirectly bears its proportionate share of these expenses. For additional expense information related to investments in Fidelity Central Funds, please refer to the "Investments in Fidelity Central Funds" note found in the Notes to Financial Statements section of the most recent Annual or Semi-Annual report.
GExpense ratios reflect operating expenses of the class. Expenses before reductions do not reflect amounts reimbursed, waived, or reduced through arrangements with the investment adviser, brokerage services, or other offset arrangements, if applicable, and do not represent the amount paid by the class during periods when reimbursements, waivers or reductions occur.
HAnnualized.
IAmount does not include the portfolio activity of any underlying mutual funds or exchange-traded funds (ETFs).
JPortfolio turnover rate excludes securities received or delivered in-kind.
Fidelity Advisor® Conservative Income Municipal Bond Fund Class Z |
| |
| | Six months ended (Unaudited) June 30, 2024 | | Years ended December 31, 2023 A |
Selected Per-Share Data | | | | |
| Net asset value, beginning of period | $ | 10.04 | $ | 9.97 |
| Income from Investment Operations | | | | |
Net investment income (loss) B,C | | .158 | | .202 |
| Net realized and unrealized gain (loss) | | (.004) | | .059 |
| Total from investment operations | | .154 | | .261 |
| Distributions from net investment income | | (.164) | | (.191) |
| Total distributions | | (.164) | | (.191) |
| Net asset value, end of period | $ | 10.03 | $ | 10.04 |
Total Return D,E | | | | 2.64% |
Ratios to Average Net Assets C,F,G | | | | |
| Expenses before reductions | | .25% H | | .25% H |
| Expenses net of fee waivers, if any | | | | .20% H |
| Expenses net of all reductions | | .20% H | | .20% H |
| Net investment income (loss) | | 3.19% H | | 3.39% H |
| Supplemental Data | | | | |
| Net assets, end of period (000 omitted) | $ | 116,843 | $ | 42,451 |
Portfolio turnover rate I | | | | 76% |
AFor the period May 25, 2023 (commencement of sale of shares) through December 31, 2023.
BCalculated based on average shares outstanding during the period.
CNet investment income (loss) is affected by the timing of the declaration of dividends by any underlying mutual funds or exchange-traded funds (ETFs). Net investment income (loss) of any mutual funds or ETFs is not included in the Fund's net investment income (loss) ratio.
DTotal returns for periods of less than one year are not annualized.
ETotal returns would have been lower if certain expenses had not been reduced during the applicable periods shown.
FFees and expenses of any underlying mutual funds or exchange-traded funds (ETFs) are not included in the Fund's expense ratio. The Fund indirectly bears its proportionate share of these expenses. For additional expense information related to investments in Fidelity Central Funds, please refer to the "Investments in Fidelity Central Funds" note found in the Notes to Financial Statements section of the most recent Annual or Semi-Annual report.
GExpense ratios reflect operating expenses of the class. Expenses before reductions do not reflect amounts reimbursed, waived, or reduced through arrangements with the investment adviser, brokerage services, or other offset arrangements, if applicable, and do not represent the amount paid by the class during periods when reimbursements, waivers or reductions occur.
HAnnualized.
IAmount does not include the portfolio activity of any underlying mutual funds or exchange-traded funds (ETFs).
JPortfolio turnover rate excludes securities received or delivered in-kind.
Notes to Financial Statements
(Unaudited)For the period ended June 30, 2024
1. Organization.
Fidelity Conservative Income Municipal Bond Fund (the Fund) is a fund of Fidelity Municipal Trust (the Trust) and is authorized to issue an unlimited number of shares. The Trust is registered under the Investment Company Act of 1940, as amended (the 1940 Act), as an open-end management investment company organized as a Massachusetts business trust. The Fund offers Class A, Fidelity Conservative Income Municipal Bond Fund (formerly Institutional Class), Class I and Class Z shares, each of which has equal rights as to assets and voting privileges. Class A, Class I and Class Z are Fidelity Advisor classes. Each class has exclusive voting rights with respect to matters that affect that class.
2. Investments in Fidelity Central Funds.
Funds may invest in Fidelity Central Funds, which are open-end investment companies generally available only to other investment companies and accounts managed by the investment adviser and its affiliates. The Schedule of Investments lists any Fidelity Central Funds held as an investment as of period end, but does not include the underlying holdings of each Fidelity Central Fund. An investing fund indirectly bears its proportionate share of the expenses of the underlying Fidelity Central Funds.
Based on its investment objective, each Fidelity Central Fund may invest or participate in various investment vehicles or strategies that are similar to those of the investing fund. These strategies are consistent with the investment objectives of the investing fund and may involve certain economic risks which may cause a decline in value of each of the Fidelity Central Funds and thus a decline in the value of the investing fund.
| Fidelity Central Fund | Investment Manager | Investment Objective | Investment Practices | Expense RatioA |
| Fidelity Money Market Central Funds | Fidelity Management & Research Company LLC (FMR) | Each fund seeks to obtain a high level of current income consistent with the preservation of capital and liquidity. | Short-term Investments | Less than .005% |
A Expenses expressed as a percentage of average net assets and are as of each underlying Central Fund's most recent annual or semi-annual shareholder report.
A complete unaudited list of holdings for each Fidelity Central Fund is available upon request or at the Securities and Exchange Commission website at www.sec.gov. In addition, the financial statements of the Fidelity Central Funds which contain the significant accounting policies (including investment valuation policies) of those funds, and are not covered by the Report of Independent Registered Public Accounting Firm, are available on the Securities and Exchange Commission website or upon request.
3. Significant Accounting Policies.
The Fund is an investment company and applies the accounting and reporting guidance of the Financial Accounting Standards Board (FASB) Accounting Standards Codification Topic 946 Financial Services - Investment Companies. The financial statements have been prepared in conformity with accounting principles generally accepted in the United States of America (GAAP), which require management to make certain estimates and assumptions at the date of the financial statements. Actual results could differ from those estimates. Subsequent events, if any, through the date that the financial statements were issued have been evaluated in the preparation of the financial statements. The Fund's Schedule of Investments lists any underlying mutual funds or exchange-traded funds (ETFs) but does not include the underlying holdings of these funds. The following summarizes the significant accounting policies of the Fund:
Investment Valuation. Investments are valued as of 4:00 p.m. Eastern time on the last calendar day of the period. The Board of Trustees (the Board) has designated the Fund's investment adviser as the valuation designee responsible for the fair valuation function and performing fair value determinations as needed. The investment adviser has established a Fair Value Committee (the Committee) to carry out the day-to-day fair valuation responsibilities and has adopted policies and procedures to govern the fair valuation process and the activities of the Committee. In accordance with these fair valuation policies and procedures, which have been approved by the Board, the Fund attempts to obtain prices from one or more third party pricing services or brokers to value its investments. When current market prices, quotations or currency exchange rates are not readily available or reliable, investments will be fair valued in good faith by the Committee, in accordance with the policies and procedures. Factors used in determining fair value vary by investment type and may include market or investment specific events, transaction data, estimated cash flows, and market observations of comparable investments. The frequency that the fair valuation procedures are used cannot be predicted and they may be utilized to a significant extent. The Committee manages the Fund's fair valuation practices and maintains the fair valuation policies and procedures. The Fund's investment adviser reports to the Board information regarding the fair valuation process and related material matters.
The Fund categorizes the inputs to valuation techniques used to value its investments into a disclosure hierarchy consisting of three levels as shown below:
Level 1 - unadjusted quoted prices in active markets for identical investments
Level 2 - other significant observable inputs (including quoted prices for similar investments, interest rates, prepayment speeds, etc.)
Level 3 - unobservable inputs (including the Fund's own assumptions based on the best information available)
Valuation techniques used to value the Fund's investments by major category are as follows:
Debt securities, including restricted securities, are valued based on evaluated prices received from third party pricing services or from brokers who make markets in such securities. Municipal securities are valued by pricing services who utilize matrix pricing which considers yield or price of bonds of comparable quality, coupon, maturity and type or by broker-supplied prices. When independent prices are unavailable or unreliable, debt securities may be valued utilizing pricing methodologies which consider similar factors that would be used by third party pricing services. Debt securities are generally categorized as Level 2 in the hierarchy but may be Level 3 depending on the circumstances.
Changes in valuation techniques may result in transfers in or out of an assigned level within the disclosure hierarchy. The aggregate value of investments by input level as of June 30, 2024 is included at the end of the Fund's Schedule of Investments.
Investment Transactions and Income. For financial reporting purposes, the Fund's investment holdings and NAV include trades executed through the end of the last business day of the period. The NAV per share for processing shareholder transactions is calculated as of the close of business of the New York Stock Exchange (NYSE), normally 4:00 p.m. Eastern time and includes trades executed through the end of the prior business day. Gains and losses on securities sold are determined on the basis of identified cost. Income and capital gain distributions from Fidelity Central Funds, if any, are recorded on the ex-dividend date. Interest income is accrued as earned and includes coupon interest and amortization of premium and accretion of discount on debt securities as applicable.
Class Allocations and Expenses. Investment income, realized and unrealized capital gains and losses, common expenses of a fund, and certain fund-level expense reductions, if any, are allocated daily on a pro-rata basis to each class based on the relative net assets of each class to the total net assets of a fund. Each class differs with respect to transfer agent and distribution and service plan fees incurred, as applicable. Certain expense reductions may also differ by class, if applicable. For the reporting period, the allocated portion of income and expenses to each class as a percent of its average net assets may vary due to the timing of recording these transactions in relation to fluctuating net assets of the classes. Expenses directly attributable to a fund are charged to that fund. Expenses attributable to more than one fund are allocated among the respective funds on the basis of relative net assets or other appropriate methods. Expenses included in the accompanying financial statements reflect the expenses of that fund and do not include any expenses associated with any underlying mutual funds or exchange-traded funds (ETFs). Although not included in a fund's expenses, a fund indirectly bears its proportionate share of these expenses through the net asset value of each underlying mutual fund or exchange-traded fund (ETF). Expense estimates are accrued in the period to which they relate and adjustments are made when actual amounts are known.
Income Tax Information and Distributions to Shareholders. Each year, the Fund intends to qualify as a regulated investment company under Subchapter M of the Internal Revenue Code, including distributing substantially all of its taxable income and realized gains. As a result, no provision for U.S. Federal income taxes is required. The Fund files a U.S. federal tax return, in addition to state and local tax returns as required. The Fund's federal income tax returns are subject to examination by the Internal Revenue Service (IRS) for a period of three fiscal years after they are filed. State and local tax returns may be subject to examination for an additional fiscal year depending on the jurisdiction.
Distributions are declared and recorded daily and paid monthly from net investment income. Distributions from realized gains, if any, are declared and recorded on the ex-dividend date. Income and capital gain distributions are declared separately for each class. Income and capital gain distributions are determined in accordance with income tax regulations, which may differ from GAAP.
Capital accounts within the financial statements are adjusted for permanent book-tax differences. These adjustments have no impact on net assets or the results of operations. Capital accounts are not adjusted for temporary book-tax differences which will reverse in a subsequent period.
Book-tax differences are primarily due to market discount, capital loss carryforwards, and losses deferred due to wash sales.
The Fund purchases municipal securities whose interest, in the opinion of the issuer, is free from federal income tax. There is no assurance that the IRS will agree with this opinion. In the event the IRS determines that the issuer does not comply with relevant tax requirements, interest payments from a security could become federally taxable, possibly retroactively to the date the security was issued.
As of period end, the cost and unrealized appreciation (depreciation) in securities, and derivatives if applicable, for federal income tax purposes were as follows:
| Gross unrealized appreciation | $1,756,415 |
| Gross unrealized depreciation | (3,599,242) |
| Net unrealized appreciation (depreciation) | $(1,842,827) |
| Tax cost | $1,558,189,649 |
Capital loss carryforwards are only available to offset future capital gains of the Fund to the extent provided by regulations and may be limited. The capital loss carryforward information presented below, including any applicable limitation, is estimated as of prior fiscal period end and is subject to adjustment.
Short-term | $(882,546) |
Long-term | (248,320) |
| Total capital loss carryforward | $(1,130,866) |
Delayed Delivery Transactions and When-Issued Securities. During the period, certain Funds transacted in securities on a delayed delivery or when-issued basis. Payment and delivery may take place after the customary settlement period for that security. The price of the underlying securities and the date when the securities will be delivered and paid for are fixed at the time the transaction is negotiated. Securities purchased on a delayed delivery or when-issued basis are identified as such in the Schedule of Investments. Compensation for interest forgone in the purchase of a delayed delivery or when-issued debt security may be received. With respect to purchase commitments, each applicable Fund identifies securities as segregated in its records with a value at least equal to the amount of the commitment. Payables and receivables associated with the purchases and sales of delayed delivery securities having the same coupon, settlement date and broker are offset. Delayed delivery or when-issued securities that have been purchased from and sold to different brokers are reflected as both payables and receivables in the Statement of Assets and Liabilities under the caption "Delayed delivery", as applicable. Losses may arise due to changes in the value of the underlying securities or if the counterparty does not perform under the contract's terms, or if the issuer does not issue the securities due to political, economic, or other factors.
Restricted Securities (including Private Placements). Funds may invest in securities that are subject to legal or contractual restrictions on resale. These securities generally may be resold in transactions exempt from registration or to the public if the securities are registered. Disposal of these securities may involve time-consuming negotiations and expense, and prompt sale at an acceptable price may be difficult. Information regarding restricted securities held at period end is included at the end of the Schedule of Investments, if applicable.
4. Purchases and Sales of Investments.
Purchases and sales of securities, other than short-term securities and in-kind transactions, as applicable, are noted in the table below.
| | Purchases ($) | Sales ($) |
| Fidelity Conservative Income Municipal Bond Fund | 409,925,664 | 364,873,056 |
5. Fees and Other Transactions with Affiliates.
Management Fee. Fidelity Management & Research Company LLC (the investment adviser) and its affiliates provide the Fund with investment management related services for which the Fund pays a monthly management fee that is based on an annual rate of .20% of the Fund's average net assets. Under the management contract, the investment adviser pays all other fund-level expenses, except the compensation of the independent Trustees and certain other expenses such as interest expense.
Distribution and Service Plan Fees. In accordance with Rule 12b-1 of the 1940 Act, the Fund has adopted separate Distribution and Service Plans for each class of shares. Certain classes pay Fidelity Distributors Company LLC (FDC), an affiliate of the investment adviser, separate Distribution and Service Fees, each of which is based on an annual percentage of each class' average net assets. In addition, FDC may pay financial intermediaries for selling shares of the Fund and providing shareholder support services. For the period, the Distribution and Service Fee rates, total fees and amounts retained by FDC were as follows:
| | Distribution Fee | Service Fee | Total Fees ($) | Retained by FDC ($) |
| Class A | - % | .15% | 598 | 350 |
Sales Load. FDC may receive a front-end sales charge of up to 1.50% for selling Class A shares, some of which is paid to financial intermediaries for selling shares of the Fund. Depending on the holding period, FDC may receive a contingent deferred sales charge levied on Class A redemptions. The deferred sales charges are .75% or .50% for certain purchases of Class A shares.
For the period, sales charge amounts retained by FDC were as follows:
| | Retained by FDC ($) |
| Class A | 69 |
Transfer Agent Fees. Fidelity Investments Institutional Operations Company LLC (FIIOC), an affiliate of the investment adviser, is the transfer, dividend disbursing and shareholder servicing agent for the Fund. FIIOC receives account fees and asset-based fees that vary according to the account size and type of account of the shareholders of the respective classes of the Fund, except for Fidelity Conservative Income Municipal Bond Fund and Class Z. FIIOC receives an asset-based fee of Fidelity Conservative Income Municipal Bond Fund's and Class Z's average net assets. FIIOC pays for typesetting, printing and mailing of shareholder reports, except proxy statements. For the period, transfer agent fees for each class were as follows:
| | Amount ($) | % of Class-Level Average Net AssetsA |
| Class A | 294 | .07 |
| Fidelity Conservative Income Municipal Bond Fund | 772,816 | .10 |
| Class I | 668 | .09 |
| Class Z | 13,201 | .05 |
| | 786,979 | |
A Annualized
Interfund Trades. Funds may purchase from or sell securities to other Fidelity Funds under procedures adopted by the Board. The procedures have been designed to ensure these interfund trades are executed in accordance with Rule 17a-7 of the 1940 Act. Any interfund trades are included within the respective purchases and sales amounts shown in the Purchases and Sales of Investments note. Interfund trades during the period are noted in the table below.
| | Purchases ($) | Sales ($) | Realized Gain (Loss)($) |
| Fidelity Conservative Income Municipal Bond Fund | 4,750,000 | 66,840,000 | - |
Affiliated Redemptions In-Kind. Shares that were redeemed in-kind for investments, including accrued interest and cash, if any, are shown in the table below. The net realized gain or loss on investments delivered through in-kind redemptions is included in the "Net realized gain (loss) on: Redemptions in-kind" line in the accompanying Statement of Operations. The amount of the in-kind redemptions is included in share transactions in the accompanying Statement of Changes in Net Assets. There was no gain or loss for federal income tax purposes.
| | Shares | Total net realized gain or loss ($) | Total Proceeds ($) |
| Fidelity Conservative Income Municipal Bond Fund | 96,728,319 | (761,921) | 969,217,761 |
Sub-Advisory Arrangements. Effective March 1, 2024, each Fund's sub-advisory agreements with Fidelity Management & Research (Hong Kong) Limited and Fidelity Management & Research (Japan) Limited were amended to provide that the investment adviser pays each sub-adviser monthly fees equal to 110% of the sub-adviser's costs for providing sub-advisory services.
6. Committed Line of Credit.
Certain Funds participate with other funds managed by the investment adviser or an affiliate in a $4.25 billion credit facility (the "line of credit") to be utilized for temporary or emergency purposes to fund shareholder redemptions or for other short-term liquidity purposes. The commitment fees on the pro-rata portion of the line of credit are borne by the investment adviser. During the period, there were no borrowings on this line of credit.
7. Expense Reductions.
The investment adviser contractually agreed to reimburse each class to the extent annual operating expenses exceeded certain levels of average net assets as noted in the table below. This reimbursement will remain in place through April 30, 2025. Some expenses, for example the compensation of the independent Trustees, and certain other expenses such as interest expense, are excluded from this reimbursement.
The following classes were in reimbursement during the period:
| | Expense Limitations | Reimbursement ($) |
| Fidelity Conservative Income Municipal Bond Fund | .25% | 382,117 |
| Class I | .25% | 305 |
| Class Z | .20% | 13,333 |
| | | 395,755 |
In addition, through arrangements with the Fund's custodian, credits realized as a result of certain uninvested cash balances were used to reduce the Fund's expenses. During the period, these credits reduced the Fund's expenses by $158.
8. Distributions to Shareholders.
Distributions to shareholders of each class were as follows:
| | Six months ended June 30, 2024 | Year ended December 31, 2023A |
| Fidelity Conservative Income Municipal Bond Fund | | |
| Distributions to shareholders | | |
| Conservative Income Municipal Bond | $ - | $862,973 |
| Class A | 11,955 | 3,791 |
| Fidelity Conservative Income Municipal Bond Fund | 24,819,572 | 70,195,185 |
| Class I | 23,488 | 14,244 |
| Class Z | 867,935 | 445,122 |
Total | $25,722,950 | $71,521,315 |
A Distributions for Class A, Class I and Class Z are for the period May 25, 2023 (commencement of sale of shares) through December 31, 2023.
9.Share Transactions.
Share transactions for each class were as follows and may contain in-kind transactions, automatic conversions between classes or exchanges between affiliated funds:
| | Shares | Shares | Dollars | Dollars |
| | Six months ended June 30, 2024 | Year ended December 31, 2023 A | Six months ended June 30, 2024 | Year ended December 31, 2023 A |
| Fidelity Conservative Income Municipal Bond Fund | | | | |
| Conservative Income Municipal Bond | | | | |
| Shares sold | - | 2,563,002 | $ - | $25,637,442 |
| Reinvestment of distributions | - | 69,620 | - | 695,551 |
| Shares redeemed | - | (17,197,882) | - | (172,014,003) |
| Net increase (decrease) | - | (14,565,260) | $- | $(145,681,010) |
| Class A | | | | |
| Shares sold | 102,713 | 42,367 | $1,030,070 | $423,305 |
| Reinvestment of distributions | 1,193 | 379 | 11,955 | 3,791 |
| Shares redeemed | (64,680) | (967) | (648,078) | (9,698) |
| Net increase (decrease) | 39,226 | 41,779 | $393,947 | $417,398 |
| Fidelity Conservative Income Municipal Bond Fund | | | | |
| Shares sold | 35,216,145 | 155,544,691 | $353,067,518 | $1,554,173,088 |
| Reinvestment of distributions | 1,044,477 | 1,851,005 | 10,468,763 | 18,497,325 |
| Shares redeemed | (151,759,682) | (139,088,392) | (1,520,890,842) | (1,389,471,874) |
| Net increase (decrease) | (115,499,060) | 18,307,304 | $(1,157,354,561) | $183,198,539 |
| Class I | | | | |
| Shares sold | 112,711 | 148,199 | $1,129,450 | $1,481,429 |
| Reinvestment of distributions | 2,327 | 1,419 | 23,322 | 14,191 |
| Shares redeemed | (35,398) | (12,873) | (354,913) | (128,629) |
| Net increase (decrease) | 79,640 | 136,745 | $797,859 | $1,366,991 |
| Class Z | | | | |
| Shares sold | 8,292,481 | 4,521,790 | $83,093,297 | $45,165,531 |
| Reinvestment of distributions | 72,859 | 38,853 | 730,334 | 388,665 |
| Shares redeemed | (940,443) | (334,151) | (9,427,872) | (3,342,946) |
| Net increase (decrease) | 7,424,897 | 4,226,492 | $74,395,759 | $42,211,250 |
A Share transactions for Class A, Class I and Class Z are for the period May 25, 2023 (commencement of sale of shares) through December 31, 2023.
10. Other.
A fund's organizational documents provide former and current trustees and officers with a limited indemnification against liabilities arising in connection with the performance of their duties to the fund. In the normal course of business, a fund may also enter into contracts that provide general indemnifications. A fund's maximum exposure under these arrangements is unknown as this would be dependent on future claims that may be made against a fund. The risk of material loss from such claims is considered remote.
11. Risk and Uncertainties.
Many factors affect a fund's performance. Developments that disrupt global economies and financial markets, such as pandemics, epidemics, outbreaks of infectious diseases, war, terrorism, and environmental disasters, may significantly affect a fund's investment performance. The effects of these developments to a fund will be impacted by the types of securities in which a fund invests, the financial condition, industry, economic sector, and geographic location of an issuer, and a fund's level of investment in the securities of that issuer. Significant concentrations in security types, issuers, industries, sectors, and geographic locations may magnify the factors that affect a fund's performance.
Item 8: Changes in and Disagreements with Accountants for Open-End Management Investment Companies
Note: This is not applicable for any fund included in this document.
Item 9: Proxy Disclosures for Open-End Management Investment Companies
Note: This is not applicable for any fund included in this document.
Item 10: Remuneration Paid to Directors, Officers, and others of Open-End Management Investment Companies
Note: This information is disclosed as part of the financial statements for each Fund as part of Item 7: Financial Statements and Financial Highlights for Open-End Management Investment companies.
Item 11: Statement Regarding Basis for Approval of Investment Advisory Contract
Board Approval of Investment Advisory Contracts
Fidelity Conservative Income Municipal Bond Fund
At its January 2024 meeting, the Board of Trustees, including the Independent Trustees (together, the Board), approved amended and restated sub-advisory agreements (the Sub-Advisory Contracts) for the fund, including the fund's sub-advisory agreements with Fidelity Management & Research (Hong Kong) Limited (FMR H.K.) and Fidelity Management & Research (Japan) Limited (FMR Japan). The Sub-Advisory Contracts will be effective March 1, 2024. The Board will consider the annual renewal of the fund's Sub-Advisory Contracts in September 2024, following its review of additional materials provided by FMR.
The Board considered the Sub-Advisory Contracts, which changed the arrangements for fees paid by FMR to the sub-advisers under the agreements. The Board noted that the agreements with FMR H.K. and FMR Japan were amended to provide that FMR will compensate each sub-adviser at a fee equal to 110% of the sub-adviser's costs incurred in providing services under the agreement. The Board considered that, under the Sub-Advisory Contracts, FMR, and not the fund, will continue to pay the sub-advisory fees to each applicable sub-adviser, and that the management fee paid by the fund under the management contract with FMR will remain unchanged.
The Board considered that the approval of the fund's Sub-Advisory Contracts will not result in any changes in the investment process or strategies employed in the management of the fund's assets or the day-to-day management of the fund or the persons primarily responsible for such management. Further, the Board considered that the Sub-Advisory Contracts would not change the obligations and services of FMR and its affiliates on behalf of the fund, and, in particular, there would be no change in the nature and level of services provided to the fund by FMR and its affiliates.
In connection with its consideration of future renewals of the fund's advisory contracts, the Board will consider: (i) the nature, extent and quality of services provided to the funds, including shareholder and administrative services and investment performance; (ii) the competitiveness of the management fee and total expenses for the fund; (iii) the costs of the services and profitability, including the revenues earned and the expenses incurred in conducting the business of developing, marketing, distributing, managing, administering, and servicing the fund and its shareholders, to the extent applicable; and (iv) whether there have been economies of scale in respect of the Fidelity funds, whether the Fidelity funds (including the fund) have appropriately benefited from any such economies of scale, and whether there is the potential for realization of any further economies.
Based on its evaluation of all of the conclusions noted above, and after considering all factors it believed relevant, the Board concluded that the fund's management fee structure is fair and reasonable, and that the fund's Sub-Advisory Contracts should be approved.
1.967795.110
CMB-SANN-0824
Fidelity® Municipal Income Fund
Semi-Annual Report
June 30, 2024
Includes Fidelity and Fidelity Advisor share classes
Contents
To view a fund's proxy voting guidelines and proxy voting record for the 12-month period ended June 30, visit http://www.fidelity.com/proxyvotingresults or visit the Securities and Exchange Commission's (SEC) web site at http://www.sec.gov.
You may also call 1-800-544-8544 if you're an individual investing directly with Fidelity, call 1-800-835-5092 if you're a plan sponsor or participant with Fidelity as your recordkeeper or call 1-877-208-0098 on institutional accounts or if you're an advisor or invest through one to request a free copy of the proxy voting guidelines.
Standard & Poor's, S&P and S&P 500 are registered service marks of The McGraw-Hill Companies, Inc. and have been licensed for use by Fidelity Distributors Corporation.
Other third-party marks appearing herein are the property of their respective owners.
All other marks appearing herein are registered or unregistered trademarks or service marks of FMR LLC or an affiliated company. © 2024 FMR LLC. All rights reserved.
This report and the financial statements contained herein are submitted for the general information of the shareholders of the Fund. This report is not authorized for distribution to prospective investors in the Fund unless preceded or accompanied by an effective prospectus.
A fund files its complete schedule of portfolio holdings with the SEC for the first and third quarters of each fiscal year on Form N-PORT. Forms N-PORT are available on the SEC's web site at http://www.sec.gov. A fund's Forms N-PORT may be reviewed and copied at the SEC's Public Reference Room in Washington, DC. Information regarding the operation of the SEC's Public Reference Room may be obtained by calling 1-800-SEC-0330.
For a complete list of a fund's portfolio holdings, view the most recent holdings listing, semiannual report, or annual report on Fidelity's web site at http://www.fidelity.com, http://www.institutional.fidelity.com, or http://www.401k.com, as applicable.
NOT FDIC INSURED •MAY LOSE VALUE •NO BANK GUARANTEE
Neither the Fund nor Fidelity Distributors Corporation is a bank.
Item 7: Financial Statements and Financial Highlights for Open-End Management Investment Companies (Semi-Annual Report)
Fidelity® Municipal Income Fund
Schedule of Investments June 30, 2024 (Unaudited)
Showing Percentage of Net Assets
| Municipal Bonds - 99.2% |
| | | Principal Amount (a) (000s) | Value ($) (000s) |
| Alabama - 1.6% | | | |
| Auburn Univ. Gen. Fee Rev. Series 2018 A, 5% 6/1/43 | | 2,565 | 2,672 |
| Black Belt Energy Gas District Bonds: | | | |
| Series 2022 E, 5%, tender 6/1/28 (b) | | 8,020 | 8,353 |
| Series 2024 A, 5.25%, tender 9/1/32 (b) | | 6,900 | 7,498 |
| Homewood Ala Edl. Bldg. Auth. Lea (CHF - Horizons II, L.L.C. Student Hsg. & Proj. at Samford Univ.) Series 2024 A: | | | |
| 5.25% 10/1/39 | | 1,445 | 1,550 |
| 5.5% 10/1/49 | | 1,735 | 1,833 |
| Homewood Edl. Bldg. Auth. Rev. (CHF - Horizons II, L.L.C. Student Hsg. & Proj. at Samford Univ.) Series 2024 C, 5.5% 10/1/49 | | 1,510 | 1,599 |
| Jefferson County Gen. Oblig. Series 2018 A, 5% 4/1/26 | | 2,400 | 2,466 |
| Montgomery Med. Clinic Facilities Series 2015, 5% 3/1/33 | | 4,140 | 3,075 |
| Southeast Energy Auth. Coop. Dis Bonds (Proj. No. 6) Series 2023 B, 5%, tender 6/1/30 (b) | | 17,760 | 18,749 |
| Southeast Energy Auth. Rev.: | | | |
| (Proj. No. 2) Series 2021 B1: | | | |
4% 6/1/29 | | 1,475 | 1,460 |
4% 6/1/30 | | 1,115 | 1,100 |
4% 6/1/31 | | 975 | 956 |
| Bonds (Proj. No. 2) Series 2021 B1, 4%, tender 12/1/31 (b) | | 23,655 | 23,514 |
TOTAL ALABAMA | | | 74,825 |
| Arizona - 1.9% | | | |
| Arizona Health Facilities Auth. Rev. (Banner Health Sys. Proj.) Series 2007 B, S&P Municipal Bond 7 Day High Grade Rate Index + 0.810% 4.52%, tender 1/1/37 (b)(c) | | 2,485 | 2,428 |
| Arizona Indl. Dev. Auth. Hosp. Rev. Series 2021 A: | | | |
| 5% 2/1/30 | | 1,300 | 1,417 |
| 5% 2/1/31 | | 1,250 | 1,377 |
| 5% 2/1/32 | | 1,250 | 1,395 |
| Arizona Indl. Dev. Auth. Rev.: | | | |
| (Provident Group-Eastern Michigan Univ. Parking Proj.) Series 2018: | | | |
5% 5/1/48 | | 910 | 501 |
5% 5/1/51 | | 910 | 501 |
| Series 2019 2, 3.625% 5/20/33 | | 2,705 | 2,540 |
| Chandler Indl. Dev. Auth. Indl. Dev. Rev. Bonds (Intel Corp. Proj.) Series 2022 2, 5%, tender 9/1/27 (b)(d) | | 4,580 | 4,702 |
| Glendale Gen. Oblig. Series 2017: | | | |
| 5% 7/1/30 | | 2,080 | 2,182 |
| 5% 7/1/31 | | 3,105 | 3,253 |
| Glendale Indl. Dev. Auth. (Terraces of Phoenix Proj.) Series 2018 A: | | | |
| 5% 7/1/38 | | 235 | 232 |
| 5% 7/1/48 | | 295 | 270 |
| Maricopa County Indl. Dev. Auth. (Creighton Univ. Proj.) Series 2020, 5% 7/1/47 | | 2,400 | 2,490 |
| Maricopa County Indl. Dev. Auth. Sr. Living Facilities Series 2016: | | | |
| 5.75% 1/1/36 (e) | | 2,140 | 1,820 |
| 6% 1/1/48 (e) | | 5,260 | 3,979 |
| Maricopa County Rev.: | | | |
| Series 2016 A: | | | |
5% 1/1/32 | | 8,280 | 8,520 |
5% 1/1/33 | | 4,965 | 5,108 |
| Series 2017 D, 3% 1/1/48 | | 5,970 | 4,701 |
| Series 2019 E, 3% 1/1/49 | | 3,535 | 2,758 |
| Phoenix Ariz Indl. Dev. Auth. Rev.: | | | |
| (Guam Facilities Foundation, Inc. Projs.) Series 2014, 5.375% 2/1/41 | | 3,825 | 3,505 |
| (Guam Facilities Foundation, Inc. Proj.) Series 2014, 5.125% 2/1/34 | | 2,655 | 2,499 |
| Phoenix Civic Impt. Board Arpt. Rev.: | | | |
| Series 2017 A: | | | |
5% 7/1/33 (d) | | 910 | 934 |
5% 7/1/36 (d) | | 1,450 | 1,486 |
5% 7/1/37 (d) | | 1,075 | 1,100 |
| Series 2017 B: | | | |
5% 7/1/29 | | 2,070 | 2,175 |
5% 7/1/33 | | 2,900 | 3,028 |
5% 7/1/36 | | 3,310 | 3,451 |
5% 7/1/37 | | 2,070 | 2,156 |
| Phoenix Civic Impt. Corp. Series 2019 A, 5% 7/1/45 | | 6,100 | 6,335 |
| Phoenix IDA Student Hsg. Rev. (Downtown Phoenix Student Hsg. II LLC Arizona State Univ. Proj.) Series 2019 A: | | | |
| 5% 7/1/44 | | 1,000 | 1,020 |
| 5% 7/1/49 | | 1,125 | 1,137 |
| 5% 7/1/54 | | 1,330 | 1,339 |
| 5% 7/1/59 | | 2,000 | 2,009 |
| Salt Verde Finl. Corp. Sr. Gas Rev. Series 2007, 5.5% 12/1/29 | | 7,370 | 7,864 |
TOTAL ARIZONA | | | 90,212 |
| California - 4.5% | | | |
| ABC Unified School District Series 1997 C, 0% 8/1/28 (Nat'l. Pub. Fin. Guarantee Corp. Insured) | | 3,250 | 2,835 |
| Alameda Corridor Trans. Auth. Rev. Series 2024 A, 0% 10/1/52 (Assured Guaranty Muni. Corp. Insured) | | 3,145 | 829 |
| California Gen. Oblig. Series 2004: | | | |
| 5.25% 12/1/33 | | 150 | 150 |
| 5.5% 4/1/28 | | 10 | 10 |
| 5.5% 4/1/30 | | 5 | 5 |
| California Hsg. Fin. Agcy.: | | | |
| Series 2021 1, 3.5% 11/20/35 | | 3,019 | 2,885 |
| Series 2023 A1, 4.375% 9/20/36 | | 8,904 | 9,256 |
| California Infrastructure and Econ. Dev. Bank Rev. Bonds (Los Angeles County Museum of Art Proj.) Series 2021 A, 1.2%, tender 6/1/28 (b) | | 1,390 | 1,225 |
| California Muni. Fin. Auth. Student Hsg. (CHF-Davis I, LLC - West Village Student Hsg. Proj.) Series 2018, 5% 5/15/38 | | 7,200 | 7,489 |
| California Pub. Works Board Lease Rev. (Various Cap. Projs.) Series 2022 C: | | | |
| 5% 8/1/31 | | 1,365 | 1,539 |
| 5% 8/1/34 | | 2,535 | 2,857 |
| California Statewide Cmntys. Dev. Auth. Rev.: | | | |
| Series 2015, 5% 2/1/45 (f)(g) | | 2,458 | 1,081 |
| Series 2018 A, 5% 3/1/42 | | 195 | 199 |
| Eastern Muni. Wtr. District Fing. Auth. Series 2020 A: | | | |
| 4% 7/1/38 | | 1,400 | 1,438 |
| 5% 7/1/36 | | 1,600 | 1,793 |
| 5% 7/1/37 | | 1,000 | 1,117 |
| Folsom Cordova Union School District No. 4 Series A, 0% 10/1/31 (Nat'l. Pub. Fin. Guarantee Corp. Insured) | | 1,520 | 1,185 |
| Fresno Arpt. Rev. Series 2023 A: | | | |
| 5% 7/1/30 (Build America Mutual Assurance Insured) (d) | | 2,000 | 2,133 |
| 5% 7/1/31 (Build America Mutual Assurance Insured) (d) | | 1,000 | 1,077 |
| Golden State Tobacco Securitization Corp. Tobacco Settlement Rev. Series 2021 B2, 0% 6/1/66 | | 69,825 | 7,762 |
| Kern Cmnty. College District Gen. Oblig. Series 2006: | | | |
| 0% 11/1/28 (Assured Guaranty Muni. Corp. Insured) | | 4,100 | 3,539 |
| 0% 11/1/30 (Assured Guaranty Muni. Corp. Insured) | | 4,140 | 3,338 |
| Long Beach Unified School District Series 2009, 5.5% 8/1/29 | | 155 | 155 |
| Los Angeles Dept. Arpt. Rev.: | | | |
| Series 2020 C, 5% 5/15/45 (d) | | 2,900 | 3,037 |
| Series 2021 D: | | | |
5% 5/15/35 (d) | | 1,610 | 1,749 |
5% 5/15/35 (Pre-Refunded to 11/15/31 @ 100) (d) | | 90 | 98 |
| Los Angeles Hbr. Dept. Rev. Series 2019 A: | | | |
| 5% 8/1/25 (d) | | 3,515 | 3,571 |
| 5% 8/1/26 (d) | | 1,350 | 1,389 |
| Monrovia Unified School District Series B, 0% 8/1/29 (Nat'l. Pub. Fin. Guarantee Corp. Insured) | | 3,745 | 3,130 |
| Mount Diablo Unified School District Series 2022 B: | | | |
| 4% 8/1/29 | | 1,595 | 1,681 |
| 4% 8/1/30 | | 465 | 492 |
| Poway Unified School District: | | | |
| (District #2007-1 School Facilities Proj.) Series 2008 A, 0% 8/1/32 | | 4,885 | 3,707 |
| Series 2011 B, 0% 8/1/51 | | 1,950 | 558 |
| Series 2011, 0% 8/1/46 | | 950 | 347 |
| Series B: | | | |
0% 8/1/37 | | 6,455 | 4,001 |
0% 8/1/38 | | 6,890 | 4,054 |
0% 8/1/39 | | 19,705 | 11,021 |
| Poway Unified School District Pub. Fing. Series 2015 A: | | | |
| 5% 9/1/24 | | 825 | 826 |
| 5% 9/1/26 | | 1,050 | 1,064 |
| 5% 9/1/29 | | 2,185 | 2,214 |
| 5% 9/1/31 | | 985 | 998 |
| Sacramento City Fing. Auth. Rev. Series A, 0% 12/1/26 (Nat'l. Pub. Fin. Guarantee Corp. Insured) | | 4,140 | 3,792 |
| San Diego County Reg'l. Arpt. Auth. Arpt. Rev. Series 2021 B: | | | |
| 5% 7/1/46 (d) | | 10,000 | 10,446 |
| 5% 7/1/56 (d) | | 7,000 | 7,235 |
| San Diego Unified School District: | | | |
| Series 2008 C, 0% 7/1/34 | | 2,980 | 2,127 |
| Series 2008 E, 0% 7/1/47 (h) | | 7,205 | 5,629 |
| San Francisco City & County Arpts. Commission Int'l. Arpt. Rev.: | | | |
| Series 2019 A, 5% 5/1/49 (d) | | 1,000 | 1,021 |
| Series 2019 B, 5% 5/1/49 | | 3,765 | 3,948 |
| Series 2022 A: | | | |
5% 5/1/26 (d) | | 6,315 | 6,478 |
5% 5/1/27 (d) | | 6,395 | 6,600 |
5% 5/1/28 (d) | | 8,530 | 8,908 |
5% 5/1/29 (d) | | 5,710 | 6,038 |
| Series 2022 B, 5% 5/1/52 | | 17,310 | 18,717 |
| Series 2024 A: | | | |
5.25% 5/1/43 (d) | | 4,940 | 5,419 |
5.25% 5/1/49 (d) | | 4,140 | 4,470 |
| San Marcos Unified School District Series 2010 B, 0% 8/1/47 | | 17,635 | 6,564 |
| San Mateo County Cmnty. College District Series A, 0% 9/1/26 (Nat'l. Pub. Fin. Guarantee Corp. Insured) | | 4,495 | 4,186 |
| Univ. of California Revs. Series 2021 Q, 3% 5/15/51 | | 6,765 | 5,375 |
| Washington Township Health Care District Gen. Oblig. Series 2013 A, 5.5% 8/1/38 | | 3,725 | 3,728 |
TOTAL CALIFORNIA | | | 208,515 |
| Colorado - 2.1% | | | |
| Arkansas River Pwr. Auth. Rev. Series 2018 A: | | | |
| 5% 10/1/38 | | 2,080 | 2,131 |
| 5% 10/1/43 | | 2,600 | 2,644 |
| Colorado Health Facilities Auth. Rev. Bonds: | | | |
| (Parkview Med. Ctr., Inc. Proj.) Series 2016: | | | |
4% 9/1/35 | | 1,365 | 1,369 |
4% 9/1/36 | | 1,075 | 1,077 |
| Series 2019 A1, 4% 8/1/44 | | 4,395 | 4,276 |
| Series 2019 A2: | | | |
3.25% 8/1/49 | | 4,110 | 3,223 |
4% 8/1/49 | | 17,455 | 16,555 |
5% 8/1/37 | | 1,000 | 1,062 |
5% 8/1/44 | | 6,145 | 6,327 |
| Series 2020 A, 4% 9/1/50 | | 1,525 | 1,464 |
| Series 2021 A, 3% 11/15/51 | | 3,735 | 2,841 |
| Colorado Hsg. & Fin. Auth. Series 2019 H, 4.25% 11/1/49 | | 750 | 749 |
| Colorado State Univ. Board of Governors Enterprise Sys. Rev. Series 2024 A, 4% 3/1/47 | | 4,420 | 4,304 |
| Denver City & County Arpt. Rev.: | | | |
| Series 2017 A: | | | |
5% 11/15/26 (d) | | 2,855 | 2,947 |
5% 11/15/27 (d) | | 2,440 | 2,534 |
| Series 2018 A: | | | |
5% 12/1/34 (d) | | 4,245 | 4,699 |
5% 12/1/36 (d) | | 4,140 | 4,303 |
5% 12/1/37 (d) | | 8,280 | 8,585 |
| Series 2022 A: | | | |
5% 11/15/33 (d) | | 1,185 | 1,293 |
5% 11/15/36 (d) | | 10,000 | 10,834 |
5.5% 11/15/38 (d) | | 12,500 | 14,097 |
TOTAL COLORADO | | | 97,314 |
| Connecticut - 1.8% | | | |
| Connecticut Gen. Oblig.: | | | |
| Series 2015 B, 5% 6/15/32 | | 1,895 | 1,918 |
| Series 2020 A: | | | |
4% 1/15/34 | | 8,385 | 8,680 |
4% 1/15/38 | | 1,000 | 1,016 |
| Series 2021 A: | | | |
3% 1/15/35 | | 1,000 | 930 |
3% 1/15/39 | | 1,475 | 1,309 |
3% 1/15/40 | | 1,770 | 1,540 |
| Series 2021 B: | | | |
3% 6/1/38 | | 1,850 | 1,655 |
3% 6/1/40 | | 1,740 | 1,508 |
4% 1/15/39 | | 3,305 | 3,357 |
| Series 2022 B, 3% 1/15/40 | | 3,710 | 3,229 |
| Connecticut Health & Edl. Facilities Auth. Rev.: | | | |
| (Sacred Heart Univ., CT. Proj.) Series 2017 I-1: | | | |
5% 7/1/26 | | 415 | 427 |
5% 7/1/27 | | 290 | 303 |
5% 7/1/28 | | 525 | 545 |
5% 7/1/29 | | 330 | 343 |
| Series 2016 K, 4% 7/1/46 | | 7,315 | 6,529 |
| Series 2018 K-3, 5% 7/1/36 | | 895 | 908 |
| Series 2019 A: | | | |
4% 7/1/35 | | 3,905 | 3,838 |
5% 7/1/39 (e) | | 3,930 | 3,527 |
5% 7/1/49 (e) | | 285 | 238 |
| Series 2020 A: | | | |
4% 7/1/37 | | 2,500 | 2,513 |
4% 7/1/38 | | 1,120 | 1,105 |
5% 7/1/32 | | 2,000 | 2,127 |
5% 7/1/34 | | 3,500 | 3,736 |
| Series 2020 K, 5% 7/1/44 (e) | | 1,525 | 1,449 |
| Series 2021 S, 4% 6/1/51 | | 1,675 | 1,613 |
| Series 2022 M: | | | |
4% 7/1/36 | | 4,000 | 4,017 |
4% 7/1/52 | | 2,515 | 2,389 |
| Series G, 5% 7/1/50 (e) | | 1,800 | 1,654 |
| Series K1: | | | |
5% 7/1/27 | | 415 | 421 |
5% 7/1/29 | | 1,060 | 1,082 |
5% 7/1/30 | | 830 | 847 |
5% 7/1/31 | | 1,400 | 1,428 |
5% 7/1/32 | | 1,000 | 1,019 |
5% 7/1/33 | | 2,500 | 2,545 |
5% 7/1/34 | | 620 | 631 |
| Connecticut Hsg. Fin. Auth. Series 2021 B1, 3% 11/15/49 | | 1,405 | 1,356 |
| Hbr. Point Infrastructure Impt. District Series 2017: | | | |
| 5% 4/1/30 (e) | | 3,085 | 3,104 |
| 5% 4/1/39 (e) | | 4,865 | 4,883 |
| New Britain Gen. Oblig. Series 2017 C, 5% 3/1/29 (Assured Guaranty Muni. Corp. Insured) | | 885 | 922 |
| Steelpointe Hbr. Infrastructure Impt. District (Steelpointe Hbr. Proj.): | | | |
| Series 2021, 4% 4/1/36 (e) | | 1,390 | 1,280 |
| Series 2024, 5.625% 4/1/44 (e) | | 900 | 939 |
TOTAL CONNECTICUT | | | 82,860 |
| District Of Columbia - 1.3% | | | |
| Metropolitan Washington Arpts. Auth. Dulles Toll Road Rev.: | | | |
| (Dulles Metrorail and Cap. Impt. Projs.): | | | |
Series 2019 A: | | | |
5% 10/1/35 | | 2,115 | 2,247 |
5% 10/1/37 | | 2,125 | 2,248 |
5% 10/1/39 | | 2,000 | 2,101 |
5% 10/1/44 | | 7,000 | 7,246 |
Series 2019 B, 3% 10/1/50 (Assured Guaranty Muni. Corp. Insured) | | 6,355 | 4,795 |
| (Dulles Metrorail And Cap. Impt. Projs.) Series 2019 B, 4% 10/1/49 | | 7,815 | 7,343 |
| (Dulles Metrorail and Cap. Impt. Projs.) Series 2019 B, 5% 10/1/47 | | 7,150 | 7,389 |
| (Dulles Metrorail and Cap. Impts. Projs.) Series 2022 A, 3% 10/1/53 (Assured Guaranty Muni. Corp. Insured) | | 3,600 | 2,656 |
| Metropolitan Washington DC Arpts. Auth. Sys. Rev.: | | | |
| Series 2017 A: | | | |
5% 10/1/31 (d) | | 1,200 | 1,242 |
5% 10/1/32 (d) | | 1,855 | 1,920 |
5% 10/1/33 (d) | | 910 | 942 |
5% 10/1/35 (d) | | 2,070 | 2,142 |
5% 10/1/42 (d) | | 4,140 | 4,230 |
| Series 2020 A: | | | |
5% 10/1/26 (d) | | 9,015 | 9,276 |
5% 10/1/27 (d) | | 3,125 | 3,241 |
5% 10/1/28 (d) | | 1,560 | 1,634 |
TOTAL DISTRICT OF COLUMBIA | | | 60,652 |
| Florida - 6.2% | | | |
| Brevard County School Board Ctfs. of Prtn. Series 2015 C, 5% 7/1/28 | | 1,445 | 1,466 |
| Broward County Arpt. Sys. Rev.: | | | |
| Series 2017: | | | |
5% 10/1/25 (d) | | 205 | 208 |
5% 10/1/26 (d) | | 930 | 954 |
5% 10/1/27 (d) | | 830 | 861 |
5% 10/1/29 (d) | | 2,200 | 2,278 |
5% 10/1/30 (d) | | 610 | 632 |
5% 10/1/32 (d) | | 2,900 | 2,992 |
5% 10/1/33 (d) | | 1,080 | 1,114 |
5% 10/1/34 (d) | | 1,055 | 1,089 |
5% 10/1/35 (d) | | 1,240 | 1,279 |
5% 10/1/36 (d) | | 1,655 | 1,704 |
5% 10/1/37 (d) | | 1,865 | 1,918 |
5% 10/1/42 (d) | | 3,520 | 3,580 |
5% 10/1/47 (d) | | 4,965 | 5,013 |
| Series A: | | | |
5% 10/1/28 (d) | | 2,485 | 2,516 |
5% 10/1/30 (d) | | 2,900 | 2,939 |
5% 10/1/31 (d) | | 2,485 | 2,517 |
5% 10/1/32 (d) | | 2,320 | 2,348 |
| Broward County School Board Ctfs. of Prtn.: | | | |
| (Broward County School District Proj.) Series 2016 A, 5% 7/1/28 | | 555 | 569 |
| Series 2015 A, 5% 7/1/27 | | 830 | 842 |
| Series 2016, 5% 7/1/32 | | 1,820 | 1,851 |
| Cap. Projs. Fin. Auth. Student Hsg. Rev. (Cap. Projs. Ln. Prog. - Florida Univs.) Series 2020 A, 5% 10/1/28 | | 2,000 | 2,049 |
| Duval County School Board Ctfs. of Prtn.: | | | |
| Series 2015 B: | | | |
5% 7/1/28 | | 1,705 | 1,731 |
5% 7/1/32 | | 10,120 | 10,260 |
| Series 2016 A, 5% 7/1/33 | | 1,110 | 1,136 |
| Escambia County Health Facilities Auth. Health Facilities Rev. Series 2020 A: | | | |
| 4% 8/15/45 | | 2,820 | 2,545 |
| 4% 8/15/50 | | 1,525 | 1,343 |
| Florida Dept. of Trans. Tpk. Rev.: | | | |
| Series 2020 A, 3% 7/1/35 | | 3,540 | 3,260 |
| Series 2021 C, 3% 7/1/46 | | 1,500 | 1,224 |
| Series 2022 B: | | | |
4% 7/1/36 | | 4,155 | 4,343 |
4% 7/1/37 | | 4,525 | 4,709 |
4% 7/1/38 | | 4,710 | 4,867 |
| Florida Dev. Fin. Corp. Rev. (Brightline Florida Passenger Rail Proj.) Series 2024: | | | |
| 5.25% 7/1/53 (Assured Guaranty Muni. Corp. Insured) (d) | | 11,675 | 12,212 |
| 5.5% 7/1/53 (d) | | 1,250 | 1,302 |
| Florida Higher Edl. Facilities Fing. Auth. (Rollins College Proj.) Series 2020 A, 3% 12/1/48 | | 5,015 | 3,953 |
| Florida Hsg. Fin. Corp. Multi-family Mtg. Rev. Bonds Series 2023 C, 5%, tender 12/1/25 (b) | | 2,050 | 2,075 |
| Florida Mid-Bay Bridge Auth. Rev.: | | | |
| Series 2015 A, 5% 10/1/35 | | 5,300 | 5,372 |
| Series 2015 C: | | | |
5% 10/1/30 | | 2,705 | 2,739 |
5% 10/1/40 | | 1,655 | 1,669 |
| Florida Muni. Pwr. Agcy. Rev.: | | | |
| (Requirements Pwr. Supply Proj.) Series 2016 A: | | | |
5% 10/1/30 | | 1,810 | 1,860 |
5% 10/1/31 | | 1,975 | 2,027 |
| Series 2015 B: | | | |
5% 10/1/28 | | 830 | 843 |
5% 10/1/30 | | 1,490 | 1,512 |
| Greater Orlando Aviation Auth. Arpt. Facilities Rev.: | | | |
| Series 2016 A, 5% 10/1/46 (d) | | 830 | 854 |
| Series 2016: | | | |
5% 10/1/26 (d) | | 1,405 | 1,444 |
5% 10/1/27 (d) | | 830 | 861 |
| Series 2017 A: | | | |
5% 10/1/25 (d) | | 275 | 280 |
5% 10/1/25 (Escrowed to Maturity) (d) | | 555 | 564 |
5% 10/1/27 (d) | | 385 | 399 |
5% 10/1/27 (Escrowed to Maturity) (d) | | 1,270 | 1,325 |
5% 10/1/29 (Pre-Refunded to 10/1/27 @ 100) (d) | | 2,485 | 2,589 |
5% 10/1/30 (Pre-Refunded to 10/1/27 @ 100) (d) | | 2,665 | 2,776 |
5% 10/1/34 (d) | | 4,965 | 5,123 |
5% 10/1/37 (d) | | 5,175 | 5,321 |
| JEA Wtr. & Swr. Sys. Rev. Series 2021 A: | | | |
| 4% 10/1/37 | | 4,560 | 4,676 |
| 4% 10/1/38 | | 1,090 | 1,116 |
| Miami-Dade County Aviation Rev.: | | | |
| Series 2015 A: | | | |
5% 10/1/29 (d) | | 1,310 | 1,321 |
5% 10/1/31 (d) | | 1,100 | 1,109 |
5% 10/1/35 (d) | | 4,555 | 4,560 |
| Series 2016 A: | | | |
5% 10/1/29 | | 1,200 | 1,230 |
5% 10/1/31 | | 1,450 | 1,490 |
| Series 2017 B, 5% 10/1/40 (d) | | 10,760 | 10,946 |
| Series 2019 A, 5% 10/1/49 (d) | | 11,860 | 12,124 |
| Miami-Dade County Expressway Auth.: | | | |
| Series 2014 B, 5% 7/1/28 | | 830 | 831 |
| Series 2016 A: | | | |
5% 7/1/32 | | 3,560 | 3,630 |
5% 7/1/33 | | 3,020 | 3,078 |
| Miami-Dade County School Board Ctfs. of Prtn.: | | | |
| Series 2015 A, 5% 5/1/29 | | 3,375 | 3,409 |
| Series 2016 A, 5% 5/1/30 | | 6,225 | 6,382 |
| Miami-Dade County Wtr. & Swr. Rev.: | | | |
| Series 2017 B, 4% 10/1/35 | | 3,900 | 3,941 |
| Series 2021: | | | |
5% 10/1/31 | | 1,250 | 1,394 |
5% 10/1/32 | | 645 | 717 |
| Orange County Health Facilities Auth. Series 2016 A, 5% 10/1/44 | | 1,605 | 1,624 |
| Palm Beach County Arpt. Sys. Rev. Series 2016: | | | |
| 5% 10/1/24 (d) | | 1,140 | 1,142 |
| 5% 10/1/27 (d) | | 830 | 847 |
| 5% 10/1/29 (d) | | 860 | 880 |
| 5% 10/1/30 (d) | | 1,530 | 1,566 |
| 5% 10/1/31 (d) | | 1,075 | 1,099 |
| 5% 10/1/32 (d) | | 1,655 | 1,690 |
| 5% 10/1/33 (d) | | 3,555 | 3,631 |
| 5% 10/1/34 (d) | | 3,730 | 3,805 |
| 5% 10/1/35 (d) | | 3,930 | 4,004 |
| Palm Beach County Health Facilities Auth. Hosp. Rev. Series 2019, 4% 8/15/49 | | 9,880 | 9,019 |
| Palm Beach County Health Facilities Auth. Rev. Series 2019 B, 5% 5/15/53 | | 5,695 | 5,148 |
| Palm Beach County School Board Ctfs. of Prtn. Series 2015 D, 5% 8/1/28 | | 3,905 | 3,961 |
| Pinellas County Idr (Drs. Kiran & Pallavi Patel 2017 Foundation for Global Understanding, Inc. Proj.) Series 2019: | | | |
| 5% 7/1/29 | | 565 | 577 |
| 5% 7/1/39 | | 810 | 819 |
| South Florida Wtr. Mgmt. District Ctfs. of Prtn. Series 2015, 5% 10/1/29 | | 4,140 | 4,256 |
| South Miami Health Facilities Auth. Hosp. Rev. (Baptist Med. Ctr., FL. Proj.) Series 2017: | | | |
| 4% 8/15/33 | | 2,070 | 2,080 |
| 5% 8/15/26 | | 2,815 | 2,897 |
| 5% 8/15/27 | | 1,865 | 1,950 |
| 5% 8/15/28 | | 1,240 | 1,296 |
| 5% 8/15/30 | | 2,685 | 2,801 |
| 5% 8/15/31 | | 2,590 | 2,699 |
| 5% 8/15/32 | | 1,930 | 2,008 |
| 5% 8/15/34 | | 5,360 | 5,569 |
| 5% 8/15/35 | | 3,555 | 3,686 |
| 5% 8/15/42 | | 5,465 | 5,562 |
| 5% 8/15/47 | | 8,115 | 8,211 |
| Tallahassee Health Facilities Rev.: | | | |
| (Tallahassee Memorial Healthcare, Inc. Proj.) Series 2016 A, 5% 12/1/41 | | 910 | 912 |
| Series 2015 A, 5% 12/1/40 | | 1,820 | 1,823 |
| Volusia County Edl. Facilities Auth. Rev. (Embry-Riddle Aeronautical Univ., Inc. Proj.) Series 2020 A: | | | |
| 5% 10/15/44 | | 905 | 940 |
| 5% 10/15/49 | | 1,705 | 1,762 |
| Volusia County School Board Ctfs. of Prtn. (Florida Master Lease Prog.) Series 2016 A: | | | |
| 5% 8/1/29 (Build America Mutual Assurance Insured) | | 830 | 848 |
| 5% 8/1/32 (Build America Mutual Assurance Insured) | | 4,140 | 4,222 |
TOTAL FLORIDA | | | 288,525 |
| Georgia - 4.3% | | | |
| Atlanta Arpt. Passenger Facilities Charge Rev. Series 2023 E, 5% 7/1/39 (d) | | 3,230 | 3,472 |
| Atlanta Arpt. Rev. Series 2019 B, 5% 7/1/25 (d) | | 1,870 | 1,895 |
| Burke County Indl. Dev. Auth. Poll. Cont. Rev. (Georgia Transmission Corp. Proj.) Series 2012, 2.75% 1/1/52 (b) | | 4,320 | 2,898 |
| Columbus Med. Ctr. Hosp. Auth. Bonds (Piedmont Healthcare, Inc. Proj.) Series 2019 B, 5%, tender 7/1/29 (b) | | 6,900 | 7,286 |
| Fulton County Dev. Auth. Rev. Series 2019, 4% 6/15/49 | | 1,515 | 1,433 |
| Gainesville & Hall County Hosp. Auth. Rev. Series 2020 A, 3% 2/15/47 | | 13,420 | 10,959 |
| Georgia Gen. Oblig. Series 2022 A: | | | |
| 5% 7/1/33 | | 6,885 | 7,896 |
| 5% 7/1/35 | | 24,240 | 27,783 |
| Georgia Hsg. & Fin. Auth. Series 2021 A, 2.25% 12/1/36 | | 2,750 | 2,223 |
| Glynn-Brunswick Memorial Hosp. Auth. Rev. (Southeast Georgia Health Sys. Proj.) Series 2017: | | | |
| 4% 8/1/43 | | 1,860 | 1,664 |
| 5% 8/1/39 | | 1,705 | 1,709 |
| 5% 8/1/43 | | 2,275 | 2,278 |
| Hosp. Auth. of Savannah Auth. Rev. Series 2019 A: | | | |
| 4% 7/1/35 | | 1,400 | 1,402 |
| 4% 7/1/36 | | 4,500 | 4,502 |
| 4% 7/1/43 | | 6,160 | 6,004 |
| Main Street Natural Gas, Inc. Bonds: | | | |
| Series 2021 A, 4%, tender 9/1/27 (b) | | 25,000 | 25,102 |
| Series 2021 C, 4%, tender 12/1/28 (b) | | 23,425 | 23,499 |
| Series 2023 C, 5%, tender 9/1/30 (b) | | 23,910 | 25,385 |
| Series 2023 D, 5%, tender 12/1/30 (b) | | 35,455 | 37,558 |
| Private Colleges & Univs. Auth. Rev.: | | | |
| (Agnes Scott College) Series 2019 A, 5% 6/1/28 | | 1,000 | 1,043 |
| Series 2019 A, 5% 6/1/29 | | 800 | 845 |
TOTAL GEORGIA | | | 196,836 |
| Hawaii - 0.4% | | | |
| Hawaii Arpts. Sys. Rev.: | | | |
| Series 2018 A: | | | |
5% 7/1/29 (d) | | 1,055 | 1,103 |
5% 7/1/30 (d) | | 1,240 | 1,297 |
5% 7/1/31 (d) | | 1,215 | 1,262 |
5% 7/1/32 (d) | | 1,240 | 1,288 |
5% 7/1/33 (d) | | 1,265 | 1,314 |
| Series 2022 A, 5% 7/1/42 (d) | | 9,480 | 10,022 |
| Hawaii Gen. Oblig. Series 2020 A, 4% 7/1/34 (d) | | 750 | 754 |
TOTAL HAWAII | | | 17,040 |
| Idaho - 0.0% | | | |
| Idaho Hsg. & Fin. Assoc. Single Family Mtg. Series 2019 A, 4% 1/1/50 | | 390 | 388 |
| Illinois - 14.9% | | | |
| Chicago Board of Ed.: | | | |
| Series 2012 A, 5% 12/1/42 | | 7,630 | 7,629 |
| Series 2015 C, 5.25% 12/1/39 | | 1,405 | 1,405 |
| Series 2016 B, 6.5% 12/1/46 | | 660 | 686 |
| Series 2017 A, 7% 12/1/46 (e) | | 2,320 | 2,499 |
| Series 2017 C: | | | |
5% 12/1/24 | | 4,770 | 4,787 |
5% 12/1/25 | | 2,725 | 2,760 |
5% 12/1/26 | | 800 | 818 |
5% 12/1/30 | | 2,105 | 2,159 |
5% 12/1/34 | | 1,245 | 1,273 |
| Series 2017 D: | | | |
5% 12/1/24 | | 1,030 | 1,034 |
5% 12/1/31 | | 3,565 | 3,647 |
| Series 2017 H, 5% 12/1/36 | | 95 | 97 |
| Series 2018 A: | | | |
5% 12/1/25 | | 830 | 841 |
5% 12/1/26 | | 830 | 849 |
5% 12/1/28 | | 3,915 | 4,068 |
5% 12/1/30 | | 1,655 | 1,716 |
5% 12/1/32 | | 950 | 982 |
5% 12/1/34 | | 1,140 | 1,176 |
5% 12/1/35 | | 830 | 854 |
| Series 2018 C, 5% 12/1/46 | | 1,850 | 1,855 |
| Series 2019 A: | | | |
4% 12/1/27 | | 5,000 | 4,975 |
5% 12/1/27 | | 1,625 | 1,675 |
5% 12/1/28 | | 2,910 | 3,024 |
5% 12/1/28 | | 2,000 | 2,078 |
5% 12/1/33 | | 1,300 | 1,351 |
| Chicago Gen. Oblig.: | | | |
| Series 2017 A, 6% 1/1/38 | | 1,000 | 1,040 |
| Series 2020 A: | | | |
5% 1/1/27 | | 430 | 442 |
5% 1/1/29 | | 3,175 | 3,349 |
5% 1/1/30 | | 3,555 | 3,782 |
5% 1/1/31 | | 3,760 | 3,992 |
| Series 2021 A, 5% 1/1/32 | | 5,335 | 5,720 |
| Series 2023 A: | | | |
5.25% 1/1/38 | | 11,380 | 12,271 |
5.5% 1/1/39 | | 12,000 | 13,048 |
5.5% 1/1/40 | | 6,750 | 7,303 |
| Chicago Midway Arpt. Rev.: | | | |
| Series 2016 A, 5% 1/1/28 (d) | | 1,655 | 1,673 |
| Series 2016 B: | | | |
4% 1/1/35 | | 1,305 | 1,304 |
5% 1/1/36 | | 1,655 | 1,684 |
5% 1/1/37 | | 2,235 | 2,272 |
| Chicago O'Hare Int'l. Arpt. Rev.: | | | |
| Series 2015 A, 5% 1/1/31 (d) | | 5,000 | 5,017 |
| Series 2015 C, 5% 1/1/46 (d) | | 1,985 | 1,986 |
| Series 2016 B, 5% 1/1/34 | | 5,050 | 5,142 |
| Series 2016 C: | | | |
5% 1/1/33 | | 2,255 | 2,296 |
5% 1/1/34 | | 2,610 | 2,657 |
| Series 2016 G: | | | |
5% 1/1/37 (d) | | 1,655 | 1,687 |
5% 1/1/42 (d) | | 1,655 | 1,669 |
5.25% 1/1/29 (d) | | 290 | 299 |
5.25% 1/1/31 (d) | | 330 | 341 |
| Series 2017 A, 5% 1/1/31 | | 2,925 | 3,033 |
| Series 2017 B: | | | |
5% 1/1/35 | | 1,740 | 1,799 |
5% 1/1/37 | | 7,080 | 7,306 |
| Series 2017 C: | | | |
5% 1/1/30 | | 495 | 513 |
5% 1/1/31 | | 495 | 513 |
5% 1/1/32 | | 540 | 559 |
| Series 2017 D: | | | |
5% 1/1/28 (d) | | 2,475 | 2,539 |
5% 1/1/29 (d) | | 2,070 | 2,121 |
5% 1/1/32 (d) | | 2,235 | 2,285 |
5% 1/1/34 (d) | | 3,360 | 3,436 |
5% 1/1/35 (d) | | 2,485 | 2,538 |
5% 1/1/36 (d) | | 3,090 | 3,153 |
5% 1/1/37 (d) | | 1,655 | 1,687 |
| Series 2018 A: | | | |
5% 1/1/48 (d) | | 2,215 | 2,241 |
5% 1/1/53 (d) | | 3,790 | 3,815 |
| Chicago O'Hare Int'l. Arpt. Spl. Facilities Rev. Series 2018: | | | |
| 5% 7/1/38 (d) | | 2,185 | 2,230 |
| 5% 7/1/48 (d) | | 9,030 | 9,085 |
| Chicago Transit Auth. Cap. Grant Receipts Rev. Series 2017: | | | |
| 5% 6/1/25 | | 255 | 258 |
| 5% 6/1/26 | | 205 | 210 |
| Cook County Gen. Oblig. Series 2016 A: | | | |
| 5% 11/15/27 | | 2,320 | 2,390 |
| 5% 11/15/28 | | 3,020 | 3,113 |
| 5% 11/15/29 | | 3,760 | 3,875 |
| 5% 11/15/30 | | 4,140 | 4,273 |
| DuPage & Cook Counties Cmnty. Unit School District #205 Series 2021 A, 2% 1/1/39 | | 4,475 | 3,313 |
| Illinois Fin. Auth.: | | | |
| Series 2020 A: | | | |
3% 5/15/50 | | 10,870 | 8,467 |
3% 5/15/50 (Build America Mutual Assurance Insured) | | 5,040 | 3,945 |
3.25% 8/15/49 | | 8,905 | 6,915 |
| Series 2020, 5% 7/1/36 | | 5,850 | 6,484 |
| Series 2021 A, 3% 8/15/48 | | 1,340 | 1,020 |
| Series 2022 A, 5% 8/15/47 | | 3,500 | 3,687 |
| Illinois Fin. Auth. Rev.: | | | |
| (Bradley Univ. Proj.) Series 2017 C: | | | |
5% 8/1/29 | | 1,090 | 1,137 |
5% 8/1/30 | | 760 | 793 |
5% 8/1/32 | | 1,015 | 1,059 |
| (Depaul Univ. Proj.) Series 2016 A: | | | |
4% 10/1/34 | | 830 | 833 |
5% 10/1/29 | | 830 | 854 |
5% 10/1/30 | | 830 | 854 |
| (OSF Healthcare Sys.) Series 2018 A: | | | |
4.125% 5/15/47 | | 25,725 | 24,684 |
5% 5/15/43 | | 34,525 | 34,919 |
| (Presence Health Proj.) Series 2016 C: | | | |
3.625% 2/15/32 | | 950 | 919 |
4% 2/15/33 | | 225 | 226 |
5% 2/15/29 | | 5,110 | 5,292 |
5% 2/15/36 | | 1,535 | 1,591 |
| (Rosalind Franklin Univ. Research Bldg. Proj.) Series 2017 C, 5% 8/1/46 | | 830 | 836 |
| (Rush Univ. Med. Ctr. Proj.) Series 2015 A, 5% 11/15/34 | | 415 | 417 |
| Series 2013: | | | |
5% 11/15/28 | | 2,380 | 2,381 |
5% 11/15/29 | | 1,160 | 1,160 |
| Series 2015 A, 5% 11/15/35 | | 1,985 | 1,998 |
| Series 2015 C, 4.125% 8/15/37 | | 735 | 700 |
| Series 2016 A: | | | |
5% 2/15/29 | | 4,255 | 4,348 |
5% 2/15/30 | | 4,490 | 4,589 |
5% 7/1/30 (Pre-Refunded to 7/1/26 @ 100) | | 590 | 610 |
5% 2/15/31 | | 3,620 | 3,700 |
5% 2/15/32 | | 3,520 | 3,598 |
5% 8/15/35 (Pre-Refunded to 8/15/26 @ 100) | | 420 | 433 |
5% 8/15/36 (Pre-Refunded to 8/15/26 @ 100) | | 1,685 | 1,736 |
5.25% 8/15/31 (Pre-Refunded to 8/15/26 @ 100) | | 495 | 512 |
| Series 2016 B: | | | |
5% 8/15/31 | | 6,095 | 6,312 |
5% 8/15/32 | | 5,000 | 5,164 |
5% 8/15/34 | | 6,220 | 6,419 |
5% 8/15/36 | | 8,680 | 8,932 |
| Series 2016 C: | | | |
3.75% 2/15/34 | | 1,215 | 1,177 |
4% 2/15/36 | | 5,160 | 5,124 |
4% 2/15/41 | | 20,725 | 20,243 |
5% 2/15/31 | | 12,595 | 13,047 |
5% 2/15/32 | | 3,660 | 3,791 |
5% 2/15/34 | | 2,920 | 3,027 |
| Series 2016: | | | |
4% 2/15/41 (Pre-Refunded to 2/15/27 @ 100) | | 30 | 30 |
5% 5/15/29 | | 1,040 | 1,061 |
5% 12/1/29 | | 1,420 | 1,449 |
5% 5/15/30 | | 2,200 | 2,242 |
5% 12/1/33 | | 835 | 850 |
| Series 2017 A, 5% 8/1/42 | | 730 | 739 |
| Series 2017: | | | |
5% 1/1/29 | | 2,775 | 2,880 |
5% 7/1/34 | | 4,640 | 4,816 |
5% 7/1/35 | | 3,900 | 4,047 |
| Series 2019: | | | |
4% 9/1/37 | | 600 | 516 |
4% 9/1/41 | | 1,000 | 812 |
5% 9/1/36 | | 1,000 | 975 |
| Illinois Gen. Oblig.: | | | |
| Series 2014: | | | |
5% 2/1/25 | | 3,005 | 3,008 |
5% 2/1/26 | | 2,270 | 2,272 |
5% 4/1/28 | | 1,895 | 1,896 |
5% 5/1/28 | | 1,780 | 1,781 |
5.25% 2/1/31 | | 360 | 360 |
| Series 2016: | | | |
5% 6/1/26 | | 995 | 1,021 |
5% 2/1/27 | | 5,585 | 5,780 |
| Series 2018 A, 5% 10/1/28 | | 230 | 243 |
| Series 2020, 5.75% 5/1/45 | | 3,865 | 4,198 |
| Series 2021 A: | | | |
5% 3/1/32 | | 2,750 | 2,971 |
5% 3/1/33 | | 1,500 | 1,625 |
5% 3/1/34 | | 2,220 | 2,403 |
5% 3/1/35 | | 5,450 | 5,896 |
5% 3/1/36 | | 4,500 | 4,864 |
5% 3/1/37 | | 5,500 | 5,934 |
5% 3/1/46 | | 7,635 | 7,961 |
| Series 2022 A: | | | |
5% 3/1/29 | | 4,600 | 4,890 |
5% 3/1/32 | | 4,490 | 4,920 |
5% 3/1/33 | | 6,690 | 7,329 |
5% 3/1/34 | | 5,110 | 5,594 |
| Series 2022 B, 5% 10/1/34 | | 16,015 | 17,625 |
| Series 2023 B: | | | |
5% 5/1/29 | | 11,295 | 12,029 |
5% 5/1/35 | | 8,085 | 8,858 |
5% 5/1/36 | | 3,550 | 3,885 |
5% 5/1/37 | | 1,770 | 1,933 |
5.25% 5/1/41 | | 4,360 | 4,773 |
5.25% 5/1/43 | | 320 | 347 |
| Series 2024 B: | | | |
5% 5/1/34 | | 1,020 | 1,139 |
5% 5/1/35 | | 3,170 | 3,538 |
5% 5/1/37 | | 3,160 | 3,513 |
5.25% 5/1/43 | | 2,795 | 3,083 |
5.25% 5/1/48 | | 2,000 | 2,163 |
| Illinois Hsg. Dev. Auth. Multi-family Hsg. Rev. Series 2019, 2.9% 7/1/35 | | 5,882 | 5,092 |
| Illinois Hsg. Dev. Auth. Rev. Series 2019 D, 2.7% 10/1/34 | | 760 | 669 |
| Illinois Muni. Elec. Agcy. Pwr. Supply Series 2015 A, 5% 2/1/31 | | 3,370 | 3,408 |
| Illinois Sales Tax Rev. Series 2021 A, 3% 6/15/33 (Build America Mutual Assurance Insured) | | 4,230 | 3,938 |
| Illinois Toll Hwy. Auth. Toll Hwy. Rev.: | | | |
| Series 2019 A, 5% 1/1/44 | | 1,260 | 1,313 |
| Series A: | | | |
5% 1/1/36 | | 1,000 | 1,105 |
5% 1/1/38 | | 350 | 385 |
5% 1/1/40 | | 2,390 | 2,613 |
| Kendall, Kane & Will Counties Cmnty. Unit School District #308 Series 2016: | | | |
| 5% 2/1/34 | | 5,795 | 5,883 |
| 5% 2/1/35 | | 4,140 | 4,199 |
| 5% 2/1/36 | | 7,120 | 7,212 |
| Lake County Cmnty. Consolidated School District #73 Gen. Oblig. Series 2021, 2.25% 1/1/40 | | 1,000 | 746 |
| Metropolitan Pier & Exposition: | | | |
| (McCormick Place Expansion Proj.): | | | |
Series 2002 A, 0% 6/15/36 (Nat'l. Pub. Fin. Guarantee Corp. Insured) | | 2,645 | 1,617 |
Series 2010 B1: | | | |
0% 6/15/43 (Assured Guaranty Muni. Corp. Insured) | | 41,985 | 18,181 |
0% 6/15/44 (Assured Guaranty Muni. Corp. Insured) | | 8,205 | 3,330 |
0% 6/15/45 (Assured Guaranty Muni. Corp. Insured) | | 25,250 | 9,645 |
0% 6/15/46 (Assured Guaranty Muni. Corp. Insured) | | 2,890 | 1,039 |
0% 6/15/47 (Assured Guaranty Muni. Corp. Insured) | | 3,000 | 1,016 |
Series 2012 B, 0% 12/15/51 | | 10,845 | 2,668 |
| Series 2002 A, 0% 6/15/35 (Nat'l. Pub. Fin. Guarantee Corp. Insured) | | 1,690 | 1,082 |
| Series 2002, 0% 12/15/36 (Nat'l. Pub. Fin. Guarantee Corp. Insured) | | 13,280 | 7,934 |
| Series 2017 B: | | | |
5% 12/15/25 | | 830 | 844 |
5% 12/15/26 | | 2,755 | 2,834 |
5% 12/15/27 | | 295 | 307 |
5% 12/15/31 | | 560 | 584 |
5% 12/15/34 | | 330 | 344 |
| Series 2022 A: | | | |
4% 12/15/42 | | 7,330 | 7,223 |
4% 12/15/47 | | 560 | 531 |
4% 6/15/52 | | 2,000 | 1,851 |
| Northern Illinois Univ. Revs. Series 2020 B: | | | |
| 5% 4/1/26 (Build America Mutual Assurance Insured) | | 1,400 | 1,426 |
| 5% 4/1/28 (Build America Mutual Assurance Insured) | | 1,300 | 1,352 |
| 5% 4/1/30 (Build America Mutual Assurance Insured) | | 1,000 | 1,061 |
| 5% 4/1/32 (Build America Mutual Assurance Insured) | | 1,295 | 1,373 |
| Sales Tax Securitization Corp. Series 2023 C, 5% 1/1/32 | | 7,305 | 8,084 |
| Schaumburg Village Gen. Oblig. Series 2023: | | | |
| 4% 12/1/30 | | 2,235 | 2,331 |
| 4% 12/1/31 | | 2,350 | 2,459 |
| Univ. of Illinois Rev. Series 2018 A, 5% 4/1/30 | | 3,425 | 3,627 |
| Will County Cmnty. Unit School District #365-U Series 2007: | | | |
| 0% 11/1/26 | | 745 | 688 |
| 0% 11/1/26 (Assured Guaranty Muni. Corp. Insured) | | 4,350 | 3,978 |
TOTAL ILLINOIS | | | 685,651 |
| Indiana - 1.3% | | | |
| Indiana Fin. Auth. Health Sys. Rev. Series 2016 A, 4% 11/1/51 | | 20,960 | 19,668 |
| Indiana Fin. Auth. Rev. Series 2016: | | | |
| 5% 9/1/26 | | 1,075 | 1,107 |
| 5% 9/1/28 | | 2,535 | 2,606 |
| 5% 9/1/29 | | 1,240 | 1,276 |
| 5% 9/1/30 | | 1,160 | 1,194 |
| Indiana Hsg. & Cmnty. Dev. Auth. (Glasswater Creek of Whitestown Proj.) Series 2020, 5.375% 10/1/40 (e) | | 2,045 | 1,745 |
| Indianapolis Local Pub. Impt.: | | | |
| (Indianapolis Arpt. Auth. Proj.) Series 2019 I, 5% 1/1/44 | | 5,100 | 5,404 |
| Series 2016: | | | |
4% 1/1/32 (d) | | 830 | 826 |
4% 1/1/33 (d) | | 830 | 824 |
4% 1/1/34 (d) | | 1,010 | 1,002 |
4% 1/1/35 (d) | | 2,300 | 2,281 |
5% 1/1/26 (d) | | 875 | 890 |
| Purdue Univ. Rev. Series 2018 DD: | | | |
| 5% 7/1/34 | | 995 | 1,060 |
| 5% 7/1/35 | | 1,960 | 2,084 |
| 5% 7/1/36 | | 2,130 | 2,261 |
| 5% 7/1/37 | | 1,970 | 2,087 |
| 5% 7/1/38 | | 2,345 | 2,476 |
| Saint Joseph County Econ. Dev. Auth. Rev. (St. Mary's College Proj.): | | | |
| Series 2019: | | | |
4% 4/1/38 | | 260 | 253 |
4% 4/1/46 | | 6,035 | 5,558 |
5% 4/1/43 | | 460 | 472 |
| Series 2020: | | | |
4% 4/1/38 | | 1,510 | 1,467 |
5% 4/1/32 | | 1,805 | 1,912 |
TOTAL INDIANA | | | 58,453 |
| Iowa - 0.2% | | | |
| Iowa Fin. Auth. Rev.: | | | |
| Series 2019 A1, 4% 5/15/55 | | 2,000 | 1,506 |
| Series A: | | | |
5% 5/15/43 | | 1,145 | 1,095 |
5% 5/15/48 | | 1,885 | 1,742 |
| Iowa Student Ln. Liquidity Corp. Student Ln. Rev. Series 2019 B: | | | |
| 5% 12/1/26 (d) | | 1,850 | 1,883 |
| 5% 12/1/27 (d) | | 1,965 | 2,010 |
| Tobacco Settlement Auth. Tobacco Settlement Rev. Series 2021 B1, 4% 6/1/49 | | 450 | 446 |
TOTAL IOWA | | | 8,682 |
| Kentucky - 1.5% | | | |
| Ashland Med. Ctr. Rev. Series 2019, 3% 2/1/40 (Assured Guaranty Muni. Corp. Insured) | | 2,545 | 2,167 |
| Kenton County Arpt. Board Arpt. Rev. Series 2016: | | | |
| 5% 1/1/28 | | 1,310 | 1,338 |
| 5% 1/1/31 | | 1,240 | 1,264 |
| 5% 1/1/32 | | 1,240 | 1,264 |
| Kentucky Econ. Dev. Fin. Auth.: | | | |
| Series 2019 A1: | | | |
5% 8/1/35 | | 1,000 | 1,068 |
5% 8/1/44 | | 1,000 | 1,030 |
| Series 2019 A2, 5% 8/1/44 | | 2,995 | 3,084 |
| Kentucky State Property & Buildings Commission Rev. (Proj. No. 119) Series 2018: | | | |
| 5% 5/1/26 | | 830 | 855 |
| 5% 5/1/29 | | 4,510 | 4,751 |
| 5% 5/1/32 | | 1,185 | 1,254 |
| 5% 5/1/33 | | 915 | 968 |
| 5% 5/1/34 | | 1,045 | 1,108 |
| 5% 5/1/35 | | 615 | 649 |
| 5% 5/1/36 | | 520 | 548 |
| Kentucky, Inc. Pub. Energy Bonds: | | | |
| Series 2024 A, 5%, tender 7/1/30 (b) | | 7,030 | 7,369 |
| Series 2024 A1, 5.25%, tender 2/1/32 (b) | | 13,375 | 14,440 |
| Series A, 4%, tender 6/1/26 (b) | | 10,000 | 10,043 |
| Louisville & Jefferson County: | | | |
| Bonds: | | | |
Series 2020 C, 5%, tender 10/1/26 (b) | | 1,695 | 1,733 |
Series 2020 D, 5%, tender 10/1/29 (b) | | 2,030 | 2,162 |
| Series 2020 A: | | | |
3% 10/1/43 | | 8,660 | 6,779 |
5% 10/1/37 | | 2,405 | 2,523 |
5% 10/1/38 | | 2,300 | 2,401 |
TOTAL KENTUCKY | | | 68,798 |
| Louisiana - 0.8% | | | |
| Jefferson Parish Consolidated Wtrwks. District No. 2 Series 2022, 5% 2/1/42 (Build America Mutual Assurance Insured) | | 10,390 | 11,134 |
| Louisiana Hsg. Corp. Single Fami (Home Ownership Prog.) Series 2023 C, 5.75% 12/1/53 | | 1,550 | 1,669 |
| Louisiana Pub. Facilities Auth. Hosp. Rev. (Franciscan Missionaries of Our Lady Health Sys. Proj.) Series 2017 A, 5% 7/1/47 | | 1,950 | 1,966 |
| Louisiana Pub. Facilities Auth. Rev.: | | | |
| (Tulane Univ. of Louisiana Proj.) Series 2016 A: | | | |
5% 12/15/28 | | 1,655 | 1,713 |
5% 12/15/29 | | 1,175 | 1,216 |
5% 12/15/30 | | 2,320 | 2,399 |
| Series 2018 E: | | | |
5% 7/1/37 | | 1,615 | 1,707 |
5% 7/1/38 | | 1,260 | 1,325 |
| New Orleans Aviation Board Rev.: | | | |
| (North Term. Proj.): | | | |
Series 2015 B: | | | |
5% 1/1/29 (d) | | 4,295 | 4,312 |
5% 1/1/31 (d) | | 2,070 | 2,078 |
Series 2017 B: | | | |
5% 1/1/27 (d) | | 330 | 339 |
5% 1/1/28 (d) | | 205 | 210 |
5% 1/1/32 (d) | | 330 | 337 |
5% 1/1/33 (d) | | 580 | 592 |
5% 1/1/34 (d) | | 180 | 184 |
5% 1/1/35 (d) | | 330 | 337 |
| Series 2017 D2: | | | |
5% 1/1/27 (d) | | 415 | 427 |
5% 1/1/28 (d) | | 595 | 609 |
5% 1/1/31 (d) | | 530 | 542 |
5% 1/1/33 (d) | | 850 | 868 |
5% 1/1/34 (d) | | 1,020 | 1,042 |
5% 1/1/36 (d) | | 775 | 791 |
5% 1/1/37 (d) | | 1,275 | 1,300 |
TOTAL LOUISIANA | | | 37,097 |
| Maine - 0.9% | | | |
| Brunswick Series 2020, 2.5% 11/1/39 | | 720 | 574 |
| Maine Health & Higher Edl. Facilities Auth. Rev.: | | | |
| Series 2016 A: | | | |
4% 7/1/41 | | 1,935 | 1,686 |
4% 7/1/46 | | 3,180 | 2,602 |
5% 7/1/41 | | 8,620 | 8,399 |
5% 7/1/46 | | 22,975 | 21,420 |
| Series 2017 B: | | | |
4% 7/1/25 | | 375 | 376 |
4% 7/1/31 | | 580 | 583 |
4% 7/1/32 | | 415 | 417 |
4% 7/1/34 | | 835 | 837 |
5% 7/1/26 | | 270 | 277 |
5% 7/1/28 | | 420 | 436 |
5% 7/1/29 | | 330 | 342 |
5% 7/1/33 | | 830 | 862 |
5% 7/1/35 | | 630 | 655 |
| Maine Tpk. Auth. Tpk. Rev. Series 2015: | | | |
| 5% 7/1/32 | | 870 | 882 |
| 5% 7/1/36 | | 2,150 | 2,173 |
| 5% 7/1/38 | | 555 | 559 |
TOTAL MAINE | | | 43,080 |
| Maryland - 1.5% | | | |
| Anne Arundel County Gen. Oblig.: | | | |
| Series 2012, 3% 10/1/36 | | 3,625 | 3,367 |
| Series 2021, 3% 10/1/37 | | 1,970 | 1,809 |
| Baltimore County Gen. Oblig. Series 2021, 3% 3/1/37 | | 1,285 | 1,188 |
| Baltimore Gen. Oblig. Series 2022 A: | | | |
| 5% 10/15/36 | | 1,015 | 1,152 |
| 5% 10/15/38 | | 2,935 | 3,302 |
| 5% 10/15/39 | | 3,085 | 3,455 |
| 5% 10/15/42 | | 3,315 | 3,669 |
| City of Westminster Series 2016: | | | |
| 5% 11/1/27 | | 2,150 | 2,196 |
| 5% 11/1/28 | | 2,275 | 2,325 |
| 5% 11/1/29 | | 2,410 | 2,466 |
| 5% 11/1/30 | | 2,555 | 2,613 |
| Maryland Cmnty. Dev. Admin Dept. Hsg. & Cmnty. Dev. Series 2019 B, 4% 9/1/49 | | 1,960 | 1,948 |
| Maryland Dept. of Trans. Series 2022 A, 5% 12/1/25 | | 1,000 | 1,025 |
| Maryland Econ. Dev. Auth. Rev. (Ports America Chesapeake LLC. Proj.) Series 2017 A: | | | |
| 5% 6/1/30 | | 1,035 | 1,082 |
| 5% 6/1/35 | | 1,655 | 1,730 |
| Maryland Gen. Oblig. Series 2022 A, 5% 6/1/35 | | 10,210 | 11,674 |
| Maryland Health & Higher Edl. Series 2021 A, 3% 7/1/51 | | 6,445 | 5,094 |
| Maryland Health & Higher Edl. Facilities Auth. Rev. Series 2016 A: | | | |
| 4% 7/1/42 | | 1,430 | 1,312 |
| 5% 7/1/35 | | 575 | 585 |
| Maryland Stadium Auth. Built to Learn Rev. Series 2021: | | | |
| 4% 6/1/46 | | 1,280 | 1,246 |
| 4% 6/1/51 | | 3,000 | 2,878 |
| Washington Metropolitan Area Transit Auth.: | | | |
| Series 2020 A, 5% 7/15/38 | | 9,900 | 10,723 |
| Series 2021 A, 5% 7/15/46 | | 2,000 | 2,144 |
TOTAL MARYLAND | | | 68,983 |
| Massachusetts - 3.8% | | | |
| Massachusetts Bay Trans. Auth. Sales Tax Rev. Series 2021 A1: | | | |
| 5% 7/1/32 | | 2,235 | 2,496 |
| 5% 7/1/33 | | 2,500 | 2,794 |
| 5% 7/1/34 | | 1,260 | 1,410 |
| 5% 7/1/35 | | 3,180 | 3,537 |
| Massachusetts Commonwealth Trans. Fund Rev. Series 2021 A, 5% 6/1/51 | | 5,900 | 6,219 |
| Massachusetts Dev. Fin. Agcy. Rev.: | | | |
| (Lesley Univ. Proj.) Series 2016, 5% 7/1/39 | | 1,360 | 1,375 |
| (Partners Healthcare Sys., Inc. Proj.): | | | |
Series 2017 S: | | | |
5% 7/1/30 | | 3,210 | 3,390 |
5% 7/1/34 | | 3,500 | 3,688 |
Series 2017, 4% 7/1/41 | | 8,280 | 8,130 |
| (Univ. of Massachusetts Health Cr., Inc. Proj.) Series 2017 L, 4% 7/1/44 | | 830 | 744 |
| (Wentworth Institute of Technology Proj.) Series 2017: | | | |
5% 10/1/27 | | 830 | 844 |
5% 10/1/28 | | 875 | 890 |
5% 10/1/29 | | 920 | 937 |
5% 10/1/31 | | 1,015 | 1,033 |
5% 10/1/32 | | 1,065 | 1,083 |
| Series 2016 I, 5% 7/1/41 | | 1,925 | 1,938 |
| Series 2016: | | | |
5% 10/1/29 | | 830 | 853 |
5% 10/1/30 | | 1,240 | 1,273 |
5% 7/1/31 | | 1,385 | 1,413 |
5% 10/1/31 | | 1,340 | 1,376 |
5% 10/1/43 | | 8,995 | 9,007 |
| Series 2017: | | | |
5% 7/1/34 | | 1,325 | 1,354 |
5% 7/1/35 | | 1,000 | 1,021 |
| Series 2019, 5% 9/1/59 | | 5,865 | 6,098 |
| Series 2020 A, 4% 7/1/45 | | 12,200 | 10,791 |
| Series 2022, 5% 10/1/37 | | 1,720 | 1,930 |
| Series M: | | | |
4% 10/1/50 | | 12,425 | 10,465 |
5% 10/1/45 | | 9,360 | 9,396 |
| Massachusetts Edl. Fing. Auth. Rev. Series 2019 B: | | | |
| 5% 7/1/27 (d) | | 1,000 | 1,028 |
| 5% 7/1/28 (d) | | 1,915 | 1,969 |
| Massachusetts Gen. Oblig.: | | | |
| Series 2019 C, 5% 5/1/49 | | 4,175 | 4,370 |
| Series 2020 D, 5% 7/1/48 | | 5,670 | 6,014 |
| Series 2022 C, 5.25% 10/1/47 | | 30,000 | 33,118 |
| Massachusetts Port Auth. Rev.: | | | |
| Series 2016 A: | | | |
5% 7/1/33 | | 1,740 | 1,795 |
5% 7/1/34 | | 895 | 923 |
5% 7/1/38 | | 1,300 | 1,337 |
| Series 2016 B, 5% 7/1/43 (d) | | 7,110 | 7,191 |
| Series 2021 E: | | | |
5% 7/1/38 (d) | | 2,875 | 3,088 |
5% 7/1/39 (d) | | 4,480 | 4,793 |
5% 7/1/40 (d) | | 2,835 | 3,019 |
5% 7/1/51 (d) | | 10,000 | 10,405 |
TOTAL MASSACHUSETTS | | | 174,535 |
| Michigan - 1.8% | | | |
| Detroit Downtown Dev. Auth. Tax Series 2018 A, 5% 7/1/32 (Assured Guaranty Muni. Corp. Insured) | | 1,000 | 1,003 |
| Detroit Gen. Oblig. Series 2021 A, 5% 4/1/50 | | 2,600 | 2,633 |
| Flint Hosp. Bldg. Auth. Rev. Series 2020, 5% 7/1/38 | | 1,515 | 1,504 |
| Grand Traverse County Hosp. Fin. Auth. Series 2021, 3% 7/1/51 | | 2,780 | 2,190 |
| Great Lakes Wtr. Auth. Sew Disp. Sys. Series 2018 A: | | | |
| 5% 7/1/43 | | 2,030 | 2,106 |
| 5% 7/1/48 | | 8,725 | 8,966 |
| Kalamazoo Hosp. Fin. Auth. Hosp. Facilities Rev. Series 2016: | | | |
| 5% 5/15/28 | | 1,945 | 1,988 |
| 5% 5/15/28 (Pre-Refunded to 5/15/26 @ 100) | | 10 | 10 |
| Michigan Bldg. Auth. Rev. Series 2015 I: | | | |
| 5% 4/15/30 | | 3,960 | 4,014 |
| 5% 4/15/30 (Pre-Refunded to 10/15/25 @ 100) | | 180 | 184 |
| Michigan Fin. Auth. Rev.: | | | |
| (Charter County of Wayne Criminal Justice Ctr. Proj.) Series 2018, 5% 11/1/43 | | 2,570 | 2,657 |
| Series 2019 A: | | | |
3% 12/1/49 | | 3,935 | 3,073 |
5% 11/15/48 | | 2,105 | 2,179 |
| Series 2020 A, 4% 6/1/49 | | 2,545 | 2,307 |
| Michigan Hosp. Fin. Auth. Rev. Series 2008 C: | | | |
| 5% 12/1/32 | | 1,110 | 1,160 |
| 5% 12/1/32 (Pre-Refunded to 12/1/27 @ 100) | | 130 | 138 |
| Michigan Hsg. Dev. Auth. Single Family Mtg. Rev. Series A, 3.5% 12/1/50 | | 1,350 | 1,326 |
| Michigan State Hsg. Dev. Auth. Series 2021 A, 2.45% 10/1/46 | | 4,870 | 3,383 |
| Oakland Univ. Rev. Series 2019: | | | |
| 5% 3/1/44 | | 8,540 | 8,849 |
| 5% 3/1/50 | | 13,450 | 13,859 |
| Portage Pub. Schools Series 2016: | | | |
| 5% 11/1/30 | | 2,365 | 2,427 |
| 5% 11/1/31 | | 2,090 | 2,140 |
| 5% 11/1/36 | | 205 | 209 |
| Univ. of Michigan Rev. Series 2020 A, 5% 4/1/50 | | 1,165 | 1,237 |
| Wayne County Arpt. Auth. Rev.: | | | |
| Series 2017 A: | | | |
4% 12/1/33 (Assured Guaranty Muni. Corp. Insured) | | 1,230 | 1,244 |
4% 12/1/34 (Assured Guaranty Muni. Corp. Insured) | | 1,020 | 1,031 |
4% 12/1/35 (Assured Guaranty Muni. Corp. Insured) | | 995 | 1,005 |
4% 12/1/36 (Assured Guaranty Muni. Corp. Insured) | | 1,035 | 1,045 |
5% 12/1/31 | | 310 | 325 |
5% 12/1/32 | | 315 | 330 |
5% 12/1/34 | | 580 | 607 |
5% 12/1/35 | | 540 | 565 |
5% 12/1/37 | | 355 | 370 |
| Series 2017 B: | | | |
5% 12/1/29 (d) | | 495 | 511 |
5% 12/1/30 (d) | | 580 | 597 |
5% 12/1/31 (d) | | 660 | 679 |
5% 12/1/32 (d) | | 420 | 434 |
5% 12/1/32 (d) | | 540 | 555 |
5% 12/1/34 (d) | | 495 | 511 |
5% 12/1/35 (d) | | 540 | 558 |
5% 12/1/37 (d) | | 705 | 726 |
5% 12/1/42 (d) | | 830 | 845 |
| Series 2018 D, 5% 12/1/29 (d) | | 3,645 | 3,815 |
TOTAL MICHIGAN | | | 85,295 |
| Minnesota - 1.1% | | | |
| Duluth Econ. Dev. Auth. Health Care Facilities Rev. Series 2018 A, 5% 2/15/48 | | 6,000 | 6,067 |
| Maple Grove Health Care Sys. Rev.: | | | |
| Series 2015, 5% 9/1/29 | | 2,345 | 2,368 |
| Series 2017, 5% 5/1/25 | | 660 | 664 |
| Minneapolis Multi-family Rev. (Gateway Northeast Proj.) Series 2019, 2.46% 1/1/38 | | 2,559 | 2,032 |
| Minnesota Higher Ed. Facilities Auth. Rev. Series 2018 A: | | | |
| 5% 10/1/30 | | 615 | 636 |
| 5% 10/1/45 | | 1,370 | 1,375 |
| Minnesota Hsg. Fin. Agcy. Series 2023 F, 5.75% 7/1/53 | | 1,035 | 1,097 |
| Minnesota Muni. Gas Agcy. Rev. Bonds Series 2022 A, 4%, tender 12/1/27 (b) | | 18,275 | 18,408 |
| Minnesota Office of Higher Ed. Series 2023: | | | |
| 5% 11/1/30 (d) | | 3,800 | 3,989 |
| 5% 11/1/31 (d) | | 4,200 | 4,425 |
| 5% 11/1/32 (d) | | 4,400 | 4,656 |
| Moorhead Edl. Facilities Rev. (The Concordia College Corp. Proj.) Series 2016, 5% 12/1/25 | | 520 | 520 |
| Shakopee Sr. Hsg. Rev. Bonds Series 2018, 5.85%, tender 11/1/25 (b)(e) | | 3,665 | 3,589 |
TOTAL MINNESOTA | | | 49,826 |
| Mississippi - 0.0% | | | |
| Mississippi Bus. finance Corp. Exempt Facilities Rev. Bonds (Enviva, Inc. Proj.) Series 2022, 7.75%, tender 7/15/32 (b)(d) | | 5,076 | 2,436 |
| Missouri - 0.8% | | | |
| Cape Girardeau County Indl. Dev. Auth. (Southeast Hosp. Proj.) Series 2017 A: | | | |
| 5% 3/1/30 | | 580 | 598 |
| 5% 3/1/31 | | 870 | 895 |
| 5% 3/1/36 | | 1,725 | 1,768 |
| Kansas City Wtr. Rev. Series 2020 A, 4% 12/1/42 | | 1,200 | 1,204 |
| Missouri Health & Edl. Facilities Rev.: | | | |
| Series 2015 B: | | | |
3.125% 2/1/27 | | 830 | 818 |
3.25% 2/1/28 | | 830 | 821 |
5% 2/1/29 | | 1,025 | 1,037 |
5% 2/1/31 | | 2,150 | 2,174 |
5% 2/1/33 | | 2,375 | 2,398 |
5% 2/1/36 | | 2,235 | 2,258 |
| Series 2019 A: | | | |
4% 10/1/48 | | 2,850 | 2,745 |
5% 10/1/46 | | 5,575 | 5,809 |
| Missouri Hsg. Dev. Commission Single Family Mtg. Rev.: | | | |
| (First Place Homeownership Ln. Prog.) Series 2021 C, 3.25% 11/1/52 | | 2,685 | 2,608 |
| Series 2019, 4% 5/1/50 | | 460 | 457 |
| Saint Louis Arpt. Rev. Series 2019 C: | | | |
| 5% 7/1/33 | | 2,390 | 2,567 |
| 5% 7/1/34 | | 1,750 | 1,879 |
| Saint Louis County Indl. Dev. Auth. Sr. Living Facilities Rev.: | | | |
| Series 2017, 5% 9/1/48 | | 1,000 | 966 |
| Series 2018 A: | | | |
5.125% 9/1/48 | | 3,325 | 3,268 |
5.125% 9/1/49 | | 2,665 | 2,604 |
TOTAL MISSOURI | | | 36,874 |
| Montana - 0.1% | | | |
| Montana Board Hsg. Single Family: | | | |
| Series 2017 B, 4% 12/1/48 (d) | | 95 | 95 |
| Series 2019 B, 4% 6/1/50 | | 285 | 283 |
| Montana Facility Fin. Auth. Series 2021 A, 3% 6/1/50 | | 4,010 | 3,191 |
TOTAL MONTANA | | | 3,569 |
| Nebraska - 0.7% | | | |
| Central Plains Energy Proj. Rev. Bonds (Proj. No. 4) Series 2023 A1, 5%, tender 11/1/29 (b) | | 15,135 | 15,943 |
| Douglas County Neb Edl. Facilities Rev.: | | | |
| (Creighton Univ. Proj.) Series 2017: | | | |
4% 7/1/34 | | 830 | 839 |
5% 7/1/36 | | 570 | 593 |
| (Creighton Univ. Projs.) Series 2021 A, 3% 7/1/51 | | 1,795 | 1,344 |
| Nebraska Invt. Fin. Auth. Single Family Hsg. Rev.: | | | |
| Series 2019 B, 4% 9/1/49 (d) | | 1,220 | 1,201 |
| Series 2019 E, 3.75% 9/1/49 (d) | | 1,205 | 1,187 |
| Series 2020 A, 3.5% 9/1/50 | | 1,185 | 1,164 |
| Nebraska Pub. Pwr. District Rev. Series 2016 B: | | | |
| 5% 1/1/37 | | 2,050 | 2,078 |
| 5% 1/1/40 | | 935 | 945 |
| Omaha Arpt. Auth. Arpt. Rev. Series 2017 A: | | | |
| 5% 12/15/25 (d) | | 185 | 189 |
| 5% 12/15/25 (Escrowed to Maturity) (d) | | 145 | 148 |
| 5% 12/15/26 (d) | | 660 | 682 |
| 5% 12/15/26 (Escrowed to Maturity) (d) | | 530 | 547 |
| 5% 12/15/27 (d) | | 455 | 466 |
| 5% 12/15/27 (Pre-Refunded to 12/15/26 @ 100) (d) | | 375 | 387 |
| 5% 12/15/30 (d) | | 685 | 703 |
| 5% 12/15/30 (Pre-Refunded to 12/15/26 @ 100) (d) | | 555 | 573 |
| 5% 12/15/31 (d) | | 360 | 369 |
| 5% 12/15/31 (Pre-Refunded to 12/15/26 @ 100) (d) | | 290 | 300 |
| 5% 12/15/33 (d) | | 365 | 373 |
| 5% 12/15/33 (Pre-Refunded to 12/15/26 @ 100) (d) | | 295 | 305 |
| 5% 12/15/35 (d) | | 910 | 928 |
| 5% 12/15/35 (Pre-Refunded to 12/15/26 @ 100) (d) | | 745 | 770 |
| 5% 12/15/36 (d) | | 230 | 234 |
| 5% 12/15/36 (Pre-Refunded to 12/15/26 @ 100) (d) | | 190 | 196 |
TOTAL NEBRASKA | | | 32,464 |
| Nevada - 0.2% | | | |
| Clark County School District Series 2020 B, 3% 6/15/39 | | 3,710 | 3,202 |
| Nevada Hsg. Division Single Family Mtg. Rev. Series 2019 B, 4% 10/1/49 | | 705 | 701 |
| Tahoe-Douglas Visitors Auth. Series 2020: | | | |
| 5% 7/1/40 | | 1,000 | 1,025 |
| 5% 7/1/45 | | 2,605 | 2,634 |
TOTAL NEVADA | | | 7,562 |
| New Hampshire - 1.9% | | | |
| Nat'l. Fin. Auth. Hosp. Rev. (St. Luke's Univ. Health Network Proj.) Series 2021 B, 3% 8/15/51 (Assured Guaranty Muni. Corp. Insured) | | 3,855 | 3,034 |
| Nat'l. Fin. Auth. Rev. (Presbyterian Sr. Living Proj.) Series 2023 A, 5.25% 7/1/48 | | 1,480 | 1,551 |
| Nat'l. Finnance Auth.: | | | |
| Series 2020 1, 4.125% 1/20/34 | | 5,727 | 5,619 |
| Series 2023 2A, 3.875% 1/20/38 | | 10,488 | 9,878 |
| New Hampshire Health & Ed. Facilities Auth.: | | | |
| (Dartmouth-Hitchcock Oblgtd Grp Proj.) Series 2018 A: | | | |
5% 8/1/28 | | 895 | 940 |
5% 8/1/29 | | 855 | 894 |
5% 8/1/30 | | 850 | 886 |
| (Partners Healthcare Sys., Inc. Proj.): | | | |
Series 2017 5% 7/1/29 | | 3,275 | 3,459 |
Series 2017: | | | |
5% 7/1/30 | | 2,125 | 2,244 |
5% 7/1/31 | | 4,750 | 5,015 |
5% 7/1/32 | | 3,185 | 3,360 |
5% 7/1/33 | | 2,900 | 3,054 |
5% 7/1/34 | | 4,415 | 4,652 |
5% 7/1/35 | | 4,635 | 4,886 |
5% 7/1/36 | | 4,870 | 5,125 |
5% 7/1/37 | | 4,290 | 4,503 |
| Series 2017, 5% 7/1/44 | | 1,590 | 1,478 |
| Series 2023 B, 5% 11/1/43 (d) | | 3,615 | 3,764 |
| New Hampshire Health & Ed. Facilities Auth. Rev.: | | | |
| Series 2012: | | | |
4% 7/1/32 | | 2,295 | 2,219 |
5% 7/1/24 | | 830 | 830 |
5% 7/1/25 | | 980 | 980 |
5% 7/1/27 | | 415 | 415 |
| Series 2016: | | | |
4% 10/1/38 | | 2,010 | 1,906 |
5% 10/1/24 | | 1,755 | 1,759 |
5% 10/1/25 | | 1,740 | 1,766 |
5% 10/1/29 | | 5,525 | 5,633 |
5% 10/1/31 | | 4,315 | 4,397 |
5% 10/1/33 | | 3,355 | 3,415 |
TOTAL NEW HAMPSHIRE | | | 87,662 |
| New Jersey - 6.0% | | | |
| Atlantic County Impt. Auth. (Atlantic City Campus Proj.) Series 2016 A: | | | |
| 5% 7/1/28 (Assured Guaranty Muni. Corp. Insured) | | 860 | 886 |
| 5% 7/1/30 (Assured Guaranty Muni. Corp. Insured) | | 2,105 | 2,165 |
| 5% 7/1/32 (Assured Guaranty Muni. Corp. Insured) | | 1,035 | 1,063 |
| 5% 7/1/33 (Assured Guaranty Muni. Corp. Insured) | | 1,075 | 1,103 |
| Englewood Gen. Oblig. Series 2021, 2% 2/1/31 | | 1,670 | 1,422 |
| Gloucester County Impt. Auth. Rev. (Rowan Univ. Projs.) Series 2024, 5% 7/1/49 (Build America Mutual Assurance Insured) | | 3,185 | 3,422 |
| Lyndhurst Township N J School District Series 2020, 2% 9/1/34 (Assured Guaranty Muni. Corp. Insured) | | 1,000 | 803 |
| New Jersey Econ. Dev. Auth.: | | | |
| (White Horse HMT Urban Renewal LLC Proj.) Series 2020, 5% 1/1/40 (e) | | 1,000 | 684 |
| Series 2015, 5.25% 6/15/27 | | 6,525 | 6,609 |
| Series A, 5% 11/1/40 | | 8,915 | 9,407 |
| Series QQQ, 4% 6/15/46 | | 8,255 | 8,069 |
| New Jersey Econ. Dev. Auth. Rev.: | | | |
| (Black Horse EHT Urban Renewal LLC Proj.) Series 2019 A, 5% 10/1/39 (e) | | 910 | 662 |
| Series LLL, 5% 6/15/44 | | 2,680 | 2,804 |
| New Jersey Edl. Facility Series 2016 A: | | | |
| 5% 7/1/31 | | 1,740 | 1,778 |
| 5% 7/1/32 | | 1,985 | 2,027 |
| New Jersey Gen. Oblig.: | | | |
| Series 2020 A, 5% 6/1/29 | | 3,685 | 3,999 |
| Series 2021: | | | |
2% 6/1/30 | | 3,745 | 3,265 |
2% 6/1/32 | | 3,155 | 2,624 |
2% 6/1/36 | | 1,775 | 1,359 |
| New Jersey Health Care Facilities Fing. Auth. Rev.: | | | |
| Series 2016 A: | | | |
5% 7/1/27 | | 620 | 638 |
5% 7/1/28 | | 300 | 308 |
5% 7/1/29 (Pre-Refunded to 7/1/26 @ 100) | | 580 | 597 |
5% 7/1/30 | | 830 | 852 |
| Series 2016: | | | |
4% 7/1/48 | | 2,400 | 2,154 |
5% 7/1/41 | | 2,865 | 2,873 |
| New Jersey Higher Ed. Student Assistance Auth. Student Ln. Rev.: | | | |
| Series 2017 1A, 5% 12/1/26 (d) | | 830 | 847 |
| Series 2018 B: | | | |
5% 12/1/25 (d) | | 3,495 | 3,549 |
5% 12/1/26 (d) | | 1,035 | 1,057 |
| Series 2023 A: | | | |
5% 12/1/31 (d) | | 2,475 | 2,630 |
5% 12/1/32 (d) | | 2,475 | 2,644 |
5% 12/1/33 (d) | | 2,400 | 2,568 |
| Series 2023 B: | | | |
5% 12/1/30 (d) | | 3,420 | 3,610 |
5% 12/1/31 (d) | | 4,610 | 4,899 |
5% 12/1/32 (d) | | 11,000 | 11,749 |
| New Jersey Tobacco Settlement Fing. Corp. Series 2018 B, 5% 6/1/46 | | 1,485 | 1,499 |
| New Jersey Tpk. Auth. Tpk. Rev.: | | | |
| Series 2022 B: | | | |
4.25% 1/1/43 | | 1,680 | 1,721 |
4.5% 1/1/48 | | 20,000 | 20,496 |
| Series 2024 C: | | | |
5% 1/1/42 (i) | | 4,305 | 4,752 |
5% 1/1/43 (i) | | 4,525 | 4,972 |
5% 1/1/44 (i) | | 6,035 | 6,609 |
5% 1/1/45 (i) | | 5,385 | 5,877 |
| Series 2024: | | | |
4% 1/1/35 (i) | | 2,295 | 2,457 |
5% 1/1/33 (i) | | 4,585 | 5,266 |
5% 1/1/34 (i) | | 2,750 | 3,197 |
| New Jersey Trans. Trust Fund Auth.: | | | |
| (Trans. Prog.) Series 2019 AA, 5.25% 6/15/43 | | 21,525 | 22,482 |
| Series 2006 C: | | | |
0% 12/15/30 (FGIC Insured) | | 1,200 | 942 |
0% 12/15/33 (Assured Guaranty Muni. Corp. Insured) | | 7,625 | 5,359 |
0% 12/15/34 | | 2,220 | 1,501 |
| Series 2008 A, 0% 12/15/38 | | 1,500 | 848 |
| Series 2010 A, 0% 12/15/27 | | 9,485 | 8,344 |
| Series 2014 BB2: | | | |
5% 6/15/32 | | 5,810 | 6,413 |
5% 6/15/33 | | 1,635 | 1,803 |
5% 6/15/34 | | 1,060 | 1,169 |
| Series 2016 A: | | | |
5% 6/15/27 | | 2,250 | 2,309 |
5% 6/15/29 | | 1,865 | 1,913 |
| Series 2019 BB, 4% 6/15/50 | | 2,625 | 2,500 |
| Series 2021 A, 5% 6/15/33 | | 2,980 | 3,283 |
| Series 2022 A: | | | |
4% 6/15/39 | | 5,030 | 5,049 |
4% 6/15/40 | | 5,410 | 5,396 |
4% 6/15/42 | | 7,290 | 7,183 |
| Series 2022 AA: | | | |
5% 6/15/32 | | 8,500 | 9,493 |
5% 6/15/34 | | 7,460 | 8,326 |
5% 6/15/36 | | 2,215 | 2,468 |
5% 6/15/37 | | 4,235 | 4,690 |
| Series A, 5% 12/15/33 | | 680 | 734 |
| Series AA: | | | |
4% 6/15/35 | | 1,500 | 1,522 |
4% 6/15/40 | | 1,680 | 1,664 |
4% 6/15/45 | | 7,950 | 7,692 |
4% 6/15/50 | | 4,865 | 4,632 |
5% 6/15/35 | | 490 | 535 |
5% 6/15/39 | | 3,000 | 3,232 |
| Series BB, 5% 6/15/50 | | 1,885 | 1,930 |
| South Jersey Trans. Auth. Trans. Sys. Rev. Series 2022 A, 4.625% 11/1/47 | | 3,500 | 3,566 |
TOTAL NEW JERSEY | | | 278,950 |
| New Mexico - 0.0% | | | |
| New Mexico Mtg. Fin. Auth. Series 2019 D, 3.75% 1/1/50 | | 1,125 | 1,112 |
| Santa Fe Retirement Fac. Series 2019 A: | | | |
| 5% 5/15/34 | | 275 | 277 |
| 5% 5/15/39 | | 205 | 203 |
| 5% 5/15/44 | | 215 | 205 |
| 5% 5/15/49 | | 425 | 393 |
TOTAL NEW MEXICO | | | 2,190 |
| New York - 8.9% | | | |
| Dorm. Auth. New York Univ. Rev.: | | | |
| (Fordham Univ. Proj.) Series 2017: | | | |
4% 7/1/33 | | 1,035 | 1,047 |
4% 7/1/34 | | 1,035 | 1,047 |
| Series 2017: | | | |
5% 12/1/24 (e) | | 1,100 | 1,098 |
5% 12/1/25 (e) | | 1,200 | 1,196 |
| Hempstead Local Dev. Corp. Rev. (Hofstra Univ. Proj.) Series 2021 A, 3% 7/1/51 | | 3,310 | 2,424 |
| MTA Hudson Rail Yards Trust Oblig. Series 2016 A, 5% 11/15/56 | | 26,320 | 26,319 |
| New York City Edl. Construction Fund Series 2021 B, 5% 4/1/46 | | 5,215 | 5,575 |
| New York City Gen. Oblig. Series 2016 E, 5% 8/1/28 | | 3,645 | 3,764 |
| New York City Hsg. Dev. Corp. Multifamily Hsg.: | | | |
| Series 2019 J, 3.05% 11/1/49 | | 1,925 | 1,490 |
| Series 2021 F1, 2.4% 11/1/46 | | 2,680 | 1,838 |
| New York City Muni. Wtr. Fin. Auth. Wtr. & Swr. Sys. Rev.: | | | |
| Series 2022 EE, 5% 6/15/45 | | 11,240 | 12,209 |
| Series GG 1, 5% 6/15/48 | | 3,500 | 3,711 |
| New York City Transitional Fin. Auth. Series 2024: | | | |
| 5% 11/1/31 | | 8,000 | 9,037 |
| 5% 11/1/33 | | 8,000 | 9,246 |
| New York City Transitional Fin. Auth. Bldg. Aid Rev. Series 2015 S2, 5% 7/15/35 | | 1,465 | 1,488 |
| New York City Transitional Fin. Auth. Rev. Series 2024 A1, 5% 5/1/42 | | 4,870 | 5,376 |
| New York Dorm. Auth. Rev. Series 2022 A: | | | |
| 5% 7/15/37 | | 785 | 818 |
| 5% 7/15/42 | | 2,210 | 2,253 |
| 5% 7/15/50 | | 5,710 | 5,723 |
| New York Dorm. Auth. Sales Tax Rev. Series 2023 A1, 5% 3/15/41 | | 26,245 | 29,341 |
| New York Metropolitan Trans. Auth. Rev.: | | | |
| Series 2015 A1, 5% 11/15/45 | | 6,170 | 6,219 |
| Series 2020 A1: | | | |
4% 11/15/51 | | 3,550 | 3,369 |
4% 11/15/52 | | 3,855 | 3,644 |
| Series 2020 D: | | | |
4% 11/15/46 | | 39,325 | 38,148 |
4% 11/15/47 | | 2,710 | 2,611 |
| Series 2024 A: | | | |
5% 11/15/34 | | 27,955 | 31,401 |
5% 11/15/35 | | 4,000 | 4,490 |
| New York State Dorm. Auth.: | | | |
| Series 2019 D, 3% 2/15/49 | | 7,555 | 5,821 |
| Series 2021 E: | | | |
3% 3/15/50 | | 3,275 | 2,507 |
4% 3/15/45 | | 13,955 | 13,711 |
| Series 2024 A: | | | |
5% 3/15/29 | | 8,000 | 8,672 |
5% 3/15/30 | | 5,235 | 5,762 |
5% 3/15/31 | | 10,470 | 11,694 |
5% 3/15/32 | | 13,090 | 14,815 |
5% 3/15/33 | | 3,410 | 3,907 |
5% 3/15/34 | | 3,055 | 3,542 |
| New York State Mtg. Agcy. Homeowner Mtg. Series 221, 3.5% 10/1/32 (d) | | 545 | 532 |
| New York State Urban Dev. Corp.: | | | |
| Series 2020 A, 5% 3/15/42 | | 2,000 | 2,163 |
| Series 2020 E: | | | |
3% 3/15/50 | | 4,230 | 3,250 |
4% 3/15/44 | | 28,000 | 27,608 |
4% 3/15/45 | | 22,500 | 22,075 |
| New York Trans. Dev. Corp.: | | | |
| (Laguardia Arpt. Term. Redev. Proj.) Series 2016 A, 5% 7/1/41 (d) | | 3,560 | 3,560 |
| (Term. 4 John F. Kennedy Int'l. Arpt. Proj.) Series 2022: | | | |
5% 12/1/32 (d) | | 2,755 | 2,972 |
5% 12/1/33 (d) | | 4,270 | 4,605 |
5% 12/1/34 (d) | | 4,665 | 5,020 |
5% 12/1/35 (d) | | 2,330 | 2,503 |
5% 12/1/36 (d) | | 1,590 | 1,703 |
5% 12/1/37 (d) | | 4,240 | 4,522 |
5% 12/1/38 (d) | | 10,300 | 10,929 |
5% 12/1/39 (d) | | 7,875 | 8,329 |
5% 12/1/40 (d) | | 6,665 | 7,010 |
5% 12/1/41 (d) | | 6,060 | 6,348 |
5% 12/1/42 (d) | | 3,030 | 3,162 |
| New York Urban Dev. Corp. Rev. Gen. Oblig. (New York State Gen. Oblig. Proj.) Series 2017 A, 5% 3/15/32 | | 4,470 | 4,647 |
| Oneida County Local Dev. Corp. Rev. (Mohawk Valley Health Sys. Proj.) Series 2019 A: | | | |
| 4% 12/1/33 (Assured Guaranty Muni. Corp. Insured) | | 1,200 | 1,199 |
| 5% 12/1/31 (Assured Guaranty Muni. Corp. Insured) | | 1,500 | 1,607 |
| Onondaga Civic Dev. Corp. (Le Moyne College Proj.) Series 2018, 5% 1/1/43 | | 830 | 834 |
| Suffolk County Econ. Dev. Corp. Rev. Series 2021: | | | |
| 4.625% 11/1/31 (e) | | 750 | 696 |
| 5.375% 11/1/54 (e) | | 1,150 | 955 |
TOTAL NEW YORK | | | 411,542 |
| New York And New Jersey - 0.6% | | | |
| New Jersey Edl. Facilities Auth. Rev. Series 2024 B, 5.25% 3/1/54 | | 20,395 | 22,757 |
| Port Auth. of New York & New Jersey Series 2023 238: | | | |
| 5% 7/15/38 (d) | | 2,085 | 2,261 |
| 5% 7/15/39 (d) | | 1,275 | 1,379 |
| 5% 7/15/40 (d) | | 1,120 | 1,205 |
TOTAL NEW YORK AND NEW JERSEY | | | 27,602 |
| North Carolina - 0.6% | | | |
| Charlotte Ctfs. of Prtn. (Convention Facility Projs.) Series 2019 A: | | | |
| 5% 6/1/44 | | 4,000 | 4,240 |
| 5% 6/1/46 | | 2,120 | 2,235 |
| Charlotte Int'l. Arpt. Rev.: | | | |
| Series 2017 A: | | | |
5% 7/1/30 | | 1,265 | 1,328 |
5% 7/1/33 | | 1,040 | 1,090 |
5% 7/1/37 | | 2,910 | 3,042 |
| Series 2017 B: | | | |
5% 7/1/25 (d) | | 85 | 86 |
5% 7/1/26 (d) | | 85 | 87 |
5% 7/1/27 (d) | | 160 | 165 |
5% 7/1/28 (d) | | 135 | 139 |
5% 7/1/29 (d) | | 195 | 202 |
5% 7/1/30 (d) | | 210 | 217 |
5% 7/1/31 (d) | | 395 | 408 |
5% 7/1/32 (d) | | 420 | 434 |
5% 7/1/33 (d) | | 440 | 454 |
5% 7/1/34 (d) | | 460 | 475 |
5% 7/1/35 (d) | | 315 | 325 |
5% 7/1/36 (d) | | 255 | 263 |
5% 7/1/37 (d) | | 300 | 309 |
5% 7/1/42 (d) | | 975 | 995 |
| Series 2017 C, 4% 7/1/32 | | 1,190 | 1,204 |
| New Hanover County Hosp. Rev. Series 2017, 5% 10/1/27 (Escrowed to Maturity) | | 275 | 289 |
| North Carolina Grant Anticipation Rev. Series 2021, 2% 3/1/36 | | 5,490 | 4,305 |
| North Carolina Med. Care Commission Health Care Facilities Rev.: | | | |
| Series 2020 A, 3% 7/1/45 | | 3,445 | 2,709 |
| Series 2021 A: | | | |
4% 3/1/41 | | 1,050 | 932 |
4% 3/1/51 | | 2,075 | 1,669 |
| North Carolina State Ed. Assistance Auth. Student Ln. Rev. Series 2023 A, 5% 6/1/43 (d) | | 1,035 | 1,033 |
TOTAL NORTH CAROLINA | | | 28,635 |
| North Dakota - 0.1% | | | |
| Univ. of North Dakota Series 2021 A, 3% 6/1/61 (Assured Guaranty Muni. Corp. Insured) | | 5,480 | 3,817 |
| Ohio - 2.1% | | | |
| Akron Bath Copley Hosp. District Rev. Series 2016, 5.25% 11/15/46 | | 7,285 | 7,376 |
| Allen County Hosp. Facilities Rev. (Mercy Health) Series 2017 A: | | | |
| 5% 8/1/25 | | 2,475 | 2,512 |
| 5% 8/1/26 | | 1,645 | 1,696 |
| 5% 8/1/27 | | 2,060 | 2,158 |
| 5% 8/1/28 | | 2,060 | 2,176 |
| 5% 8/1/29 | | 4,130 | 4,345 |
| 5% 8/1/30 | | 3,520 | 3,706 |
| Bowling Green City School District Series 2024 B, 4% 10/1/44 | | 4,130 | 4,105 |
| Buckeye Tobacco Settlement Fing. Auth. Series 2020 A2: | | | |
| 3% 6/1/48 | | 3,870 | 2,936 |
| 4% 6/1/48 | | 1,265 | 1,166 |
| 5% 6/1/30 | | 2,000 | 2,156 |
| 5% 6/1/32 | | 1,665 | 1,792 |
| 5% 6/1/33 | | 2,000 | 2,150 |
| 5% 6/1/34 | | 420 | 450 |
| Columbus City School District Series 2016 A, 5% 12/1/29 | | 1,740 | 1,794 |
| Fairfield County Hosp. Facilities Rev. (Fairfield Med. Ctr. Proj.) Series 2013, 5.25% 6/15/43 | | 3,470 | 3,129 |
| Franklin County Convention Facilities Auth. (Greater Columbus Convention Ctr. Hotel Expansion Proj.) Series 2019: | | | |
| 5% 12/1/44 | | 470 | 466 |
| 5% 12/1/46 | | 4,700 | 4,906 |
| 5% 12/1/51 | | 6,900 | 7,179 |
| Lancaster Port Auth. Gas Rev. Bonds Series 2019, 5%, tender 2/1/25 (b) | | 1,850 | 1,860 |
| Muskingum County Hosp. Facilities (Genesis Healthcare Sys. Obligated Group Proj.) Series 2013, 5% 2/15/33 | | 3,685 | 3,650 |
| Ohio Hosp. Rev.: | | | |
| Series 2020 A, 4% 1/15/50 | | 975 | 905 |
| Series 2021 A, 4% 1/15/46 | | 5,600 | 5,360 |
| Ohio Hsg. Fin. Agcy. Residential Mtg. Rev.: | | | |
| (Mtg. Backed Securities Prog.) Series 2019 B, 4.5% 3/1/50 | | 370 | 371 |
| (Mtg.-Backed Securities Prog.) Series 2023 B, 6% 3/1/55 | | 2,520 | 2,744 |
| Ohio Tpk. Commission Tpk. Rev.: | | | |
| (Infrastructure Proj.) Series 2005 A, 0% 2/15/42 | | 2,150 | 988 |
| (Infrastructure Projs.) Series 2022 A: | | | |
5% 2/15/32 | | 4,930 | 5,551 |
5% 2/15/38 | | 1,155 | 1,307 |
5% 2/15/39 | | 240 | 271 |
| Scioto County Hosp. Facilities Rev.: | | | |
| Series 2016: | | | |
5% 2/15/29 | | 1,815 | 1,844 |
5% 2/15/34 | | 370 | 374 |
| Series 2019, 5% 2/15/29 | | 2,725 | 2,796 |
| Univ. of Akron Gen. Receipts Series 2016 A, 5% 1/1/35 | | 3,725 | 3,795 |
| Washington County Hosp. Rev. Series 2022: | | | |
| 6% 12/1/28 | | 1,550 | 1,599 |
| 6% 12/1/29 | | 1,645 | 1,710 |
| 6% 12/1/30 | | 1,750 | 1,832 |
| 6% 12/1/31 | | 1,850 | 1,949 |
TOTAL OHIO | | | 95,104 |
| Oklahoma - 0.1% | | | |
| Oklahoma City Pub. Property Auth. Hotel Tax Rev. Series 2015: | | | |
| 5% 10/1/28 | | 1,050 | 1,070 |
| 5% 10/1/29 | | 1,160 | 1,181 |
| 5% 10/1/36 | | 830 | 840 |
| 5% 10/1/39 | | 1,655 | 1,663 |
| Oklahoma Dev. Fin. Auth. Rev. (Oklahoma City Univ. Proj.) Series 2019, 5% 8/1/44 | | 1,915 | 1,901 |
| Oklahoma Hsg. Fin. Agcy. Single Family Mtg. Rev. (Homeownership Ln. Prog.) Series 2023 C, 6% 3/1/54 | | 465 | 506 |
TOTAL OKLAHOMA | | | 7,161 |
| Oregon - 1.1% | | | |
| Lake Oswego Ore Series 2019 A: | | | |
| 2.7% 6/1/37 | | 1,850 | 1,579 |
| 2.75% 6/1/38 | | 1,960 | 1,653 |
| Multnomah County School District #1J Portland Series 2020 B, 3% 6/15/36 | | 1,525 | 1,395 |
| Oregon Health and Science Univ. Spl. Rev. Series 2021 A, 3% 7/1/51 | | 8,100 | 6,100 |
| Oregon State Hsg. & Cmnty. Svcs. Dept.: | | | |
| (Single Family Mtg. Prog.) Series A, 3.5% 1/1/51 | | 1,800 | 1,768 |
| (Single-Family Mtg. Prog.) Series 2019 A, 2.65% 7/1/39 | | 1,065 | 885 |
| Series 2019 A, 4% 7/1/50 | | 4,590 | 4,564 |
| Port of Portland Arpt. Rev.: | | | |
| Series 2020 27A, 5% 7/1/45 (d) | | 2,980 | 3,084 |
| Series 2022 28: | | | |
5% 7/1/41 (d) | | 12,420 | 13,176 |
5% 7/1/52 (d) | | 10,500 | 10,864 |
| Salem Hosp. Facility Auth. Rev.: | | | |
| (Salem Health Projs.) Series 2019 A, 3% 5/15/49 | | 5,975 | 4,674 |
| Series 2016 A, 4% 5/15/41 | | 1,680 | 1,640 |
TOTAL OREGON | | | 51,382 |
| Pennsylvania - 7.7% | | | |
| Allegheny County Arpt. Auth. Rev. Series 2021 A: | | | |
| 4% 1/1/38 (d) | | 2,545 | 2,536 |
| 4% 1/1/39 (d) | | 3,075 | 3,029 |
| 4% 1/1/40 (d) | | 10,000 | 9,829 |
| 4% 1/1/41 (d) | | 10,000 | 9,753 |
| 5% 1/1/29 (d) | | 4,185 | 4,389 |
| 5% 1/1/30 (d) | | 4,000 | 4,243 |
| 5% 1/1/31 (d) | | 3,000 | 3,215 |
| 5% 1/1/32 (d) | | 4,000 | 4,288 |
| 5% 1/1/51 (d) | | 20,480 | 21,094 |
| 5% 1/1/56 (d) | | 12,420 | 12,755 |
| Allegheny County Indl. Dev. Auth. Rev. Series 2021: | | | |
| 3.5% 12/1/31 | | 1,200 | 576 |
| 4% 12/1/41 | | 2,450 | 1,176 |
| 4.25% 12/1/50 | | 2,730 | 1,310 |
| Bucks County Indl. Dev. Auth. Hosp. Rev. Series 2021, 3% 8/15/53 (Assured Guaranty Muni. Corp. Insured) | | 8,240 | 6,472 |
| Cap. Region Wtr. Wtr. Rev. Series 2018: | | | |
| 5% 7/15/27 | | 830 | 871 |
| 5% 7/15/29 | | 1,290 | 1,372 |
| 5% 7/15/32 | | 830 | 881 |
| Dauphin County Gen. Auth. (Pinnacle Health Sys. Proj.) Series 2016 A: | | | |
| 5% 6/1/28 | | 885 | 904 |
| 5% 6/1/29 | | 970 | 990 |
| Delaware County Auth. Rev. (Cabrini College) Series 2017, 5% 7/1/47 | | 3,310 | 3,309 |
| Doylestown Hosp. Auth. Hosp. Rev. Series 2016 A: | | | |
| 5% 7/1/46 | | 980 | 953 |
| 5% 7/1/46 (Pre-Refunded to 7/1/26 @ 100) | | 225 | 232 |
| Dubois Hosp. Auth. Hosp. Rev.: | | | |
| (Penn Highlands Healthcare Proj.) Series 2018: | | | |
4% 7/15/33 | | 2,070 | 2,024 |
4% 7/15/35 | | 2,135 | 2,053 |
4% 7/15/37 | | 4,140 | 4,030 |
5% 7/15/25 | | 330 | 333 |
5% 7/15/26 | | 1,035 | 1,055 |
5% 7/15/27 | | 1,745 | 1,793 |
5% 7/15/28 | | 1,285 | 1,327 |
5% 7/15/29 | | 1,385 | 1,423 |
5% 7/15/30 | | 1,815 | 1,863 |
5% 7/15/31 | | 1,240 | 1,273 |
5% 7/15/32 | | 1,305 | 1,339 |
5% 7/15/34 | | 1,405 | 1,442 |
5% 7/15/36 | | 4,150 | 4,248 |
5% 7/15/38 | | 4,990 | 5,084 |
5% 7/15/43 | | 5,795 | 5,825 |
| Series 2020, 4% 7/15/45 | | 2,900 | 2,690 |
| Lancaster County Hosp. Auth. Health Ctr. Rev. Series 2021, 5% 11/1/51 | | 3,595 | 3,692 |
| Lehigh County Gen. Purp. Auth. Rev. (Muhlenberg College Proj.) Series 2017, 5% 2/1/39 | | 2,140 | 2,181 |
| Monroe County Hosp. Auth. Rev. Series 2016: | | | |
| 5% 7/1/26 | | 830 | 849 |
| 5% 7/1/27 | | 830 | 851 |
| 5% 7/1/28 | | 830 | 849 |
| 5% 7/1/34 | | 3,045 | 3,084 |
| 5% 7/1/36 | | 1,655 | 1,676 |
| Montgomery County Higher Ed. & Health Auth. Rev.: | | | |
| Series 2014 A: | | | |
5% 10/1/24 | | 965 | 964 |
5% 10/1/25 | | 865 | 862 |
5% 10/1/27 | | 415 | 411 |
| Series 2016 A: | | | |
5% 10/1/28 | | 1,255 | 1,222 |
5% 10/1/29 | | 2,150 | 2,088 |
5% 10/1/31 | | 3,790 | 3,651 |
5% 10/1/36 | | 6,790 | 6,490 |
5% 10/1/40 | | 4,700 | 4,377 |
| Northampton County Gen. Purp. Auth. Hosp. Rev. (St. Luke's Univ. Health Network Proj.): | | | |
| Series 2016 A, 5% 8/15/36 | | 615 | 626 |
| Series 2018 A, 4% 8/15/48 | | 10,545 | 9,478 |
| Pennsylvania Econ. Dev. Fing. Auth. Indl. Dev. Rev. (Presbyterian Sr. Living Proj.) Series 2023 B2, 5% 7/1/38 | | 1,625 | 1,730 |
| Pennsylvania Gen. Oblig. Series 2023, 5% 9/1/32 | | 10,000 | 11,401 |
| Pennsylvania Higher Edl. Facilities Auth. Rev.: | | | |
| (Drexel Univ. Proj.): | | | |
Series 2016, 5% 5/1/35 | | 2,880 | 2,917 |
Series 2017: | | | |
5% 5/1/35 | | 1,025 | 1,048 |
5% 5/1/37 | | 1,295 | 1,321 |
5% 5/1/41 | | 5,860 | 5,915 |
| Series 2016: | | | |
5% 5/1/28 | | 415 | 421 |
5% 5/1/32 | | 1,040 | 1,055 |
5% 5/1/33 | | 1,405 | 1,424 |
| Pennsylvania State Univ. Series 2020 A, 4% 9/1/50 | | 2,950 | 2,862 |
| Pennsylvania Tpk. Commission Tpk. Rev. Series 2021 B, 5% 12/1/38 | | 6,680 | 7,372 |
| Philadelphia Arpt. Rev.: | | | |
| Series 2017 A: | | | |
5% 7/1/25 | | 830 | 843 |
5% 7/1/26 | | 830 | 857 |
5% 7/1/27 | | 660 | 692 |
| Series 2017 B: | | | |
5% 7/1/26 (d) | | 2,485 | 2,538 |
5% 7/1/27 (d) | | 2,070 | 2,141 |
5% 7/1/28 (d) | | 2,485 | 2,562 |
5% 7/1/29 (d) | | 1,860 | 1,916 |
5% 7/1/32 (d) | | 2,485 | 2,559 |
5% 7/1/33 (d) | | 1,865 | 1,920 |
5% 7/1/34 (d) | | 3,310 | 3,403 |
5% 7/1/37 (d) | | 3,725 | 3,809 |
| Philadelphia Auth. for Indl. Dev. Series 2017, 5% 11/1/47 | | 5,425 | 5,459 |
| Philadelphia Gas Works Rev. Series 16 A, 4% 8/1/45 (Assured Guaranty Muni. Corp. Insured) | | 2,685 | 2,625 |
| Philadelphia School District: | | | |
| Series 2016 D: | | | |
5% 9/1/26 | | 7,600 | 7,856 |
5% 9/1/27 | | 8,020 | 8,236 |
5% 9/1/28 | | 6,705 | 6,890 |
| Series 2016 F: | | | |
5% 9/1/28 | | 11,600 | 11,920 |
5% 9/1/29 | | 7,540 | 7,737 |
| Series 2018 A: | | | |
5% 9/1/36 | | 1,575 | 1,650 |
5% 9/1/37 | | 910 | 953 |
5% 9/1/38 | | 1,450 | 1,517 |
| Series 2018 B, 5% 9/1/43 | | 2,115 | 2,173 |
| Series 2019 A: | | | |
4% 9/1/35 | | 5,215 | 5,285 |
5% 9/1/33 (Assured Guaranty Muni. Corp. Insured) | | 2,480 | 2,672 |
5% 9/1/34 | | 7,225 | 7,684 |
| Series 2019 C, 5% 9/1/33 | | 2,540 | 2,709 |
| Series F: | | | |
5% 9/1/30 | | 5,625 | 5,758 |
5% 9/1/30 (Pre-Refunded to 9/1/26 @ 100) | | 20 | 21 |
| Philadelphia Wtr. & Wastewtr. Rev.: | | | |
| Series 2018 A: | | | |
5% 10/1/35 | | 4,190 | 4,476 |
5% 10/1/36 | | 6,210 | 6,637 |
5% 10/1/48 | | 6,000 | 6,253 |
| Series 2023 B, 5.5% 9/1/53 (Assured Guaranty Muni. Corp. Insured) | | 4,210 | 4,715 |
| Pittsburgh Wtr. & Swr. Auth. Wtr. & Swr. Sys. Rev.: | | | |
| Series 2019 A, 5% 9/1/39 (Assured Guaranty Muni. Corp. Insured) | | 2,315 | 2,490 |
| Series 2019 A, 5% 9/1/44 (Assured Guaranty Muni. Corp. Insured) | | 775 | 814 |
| State Pub. School Bldg. Auth. Lease Rev. (The School District of Philadelphia Proj.) Series 2015 A, 5% 6/1/26 | | 1,055 | 1,068 |
| Union County Hosp. Auth. Rev. Series 2018 B: | | | |
| 5% 8/1/43 | | 4,605 | 4,733 |
| 5% 8/1/48 | | 5,335 | 5,451 |
TOTAL PENNSYLVANIA | | | 353,818 |
| Puerto Rico - 1.6% | | | |
| Puerto Rico Commonwealth Aqueduct & Swr. Auth.: | | | |
| Series 2020 A, 5% 7/1/35 (e) | | 3,435 | 3,589 |
| Series 2021 B: | | | |
4% 7/1/42 (e) | | 1,085 | 1,016 |
5% 7/1/33 (e) | | 1,580 | 1,667 |
5% 7/1/37 (e) | | 6,625 | 6,911 |
| Series 2022 A, 4% 7/1/42 (e) | | 5,545 | 5,192 |
| Puerto Rico Commonwealth Pub. Impt. Gen. Oblig. Series 2021 A1: | | | |
| 0% 7/1/33 | | 16,679 | 11,129 |
| 4% 7/1/33 | | 11,631 | 11,648 |
| 4% 7/1/35 | | 4,213 | 4,136 |
| 5.625% 7/1/27 | | 1,360 | 1,419 |
| 5.625% 7/1/29 | | 3,903 | 4,186 |
| Puerto Rico Sales Tax Fing. Corp. Sales Tax Rev.: | | | |
| Series 2018 A1: | | | |
0% 7/1/31 | | 9,290 | 7,052 |
4.55% 7/1/40 | | 2,000 | 2,007 |
| Series 2019 A2, 4.329% 7/1/40 | | 12,190 | 12,027 |
TOTAL PUERTO RICO | | | 71,979 |
| Rhode Island - 0.9% | | | |
| Rhode Island Health & Edl. Bldg. Corp. Higher Ed. Facilities Rev.: | | | |
| Series 2016 B: | | | |
5% 9/1/31 | | 655 | 657 |
5% 9/1/36 | | 5,810 | 5,823 |
| Series 2016, 5% 5/15/39 | | 5,215 | 5,271 |
| Rhode Island Health and Edl. Bldg. Corp. Higher Ed. Facility Rev. Series 2024: | | | |
| 5% 6/1/38 | | 1,650 | 1,825 |
| 5% 6/1/43 | | 3,120 | 3,371 |
| 5% 6/1/44 | | 3,170 | 3,417 |
| 5% 6/1/48 | | 7,135 | 7,590 |
| Rhode Island Hsg. & Mtg. Fin. Corp. Series 2019 70, 4% 10/1/49 | | 685 | 681 |
| Rhode Island Student Ln. Auth. Student Ln. Rev.: | | | |
| Series 2021 A, 5% 12/1/28 (d) | | 1,480 | 1,549 |
| Series 2023 A, 5% 12/1/31 (d) | | 4,830 | 5,136 |
| Series 2024 A: | | | |
5% 12/1/30 (d) | | 1,900 | 2,007 |
5% 12/1/31 (d) | | 1,960 | 2,080 |
| Series A: | | | |
3.5% 12/1/34 (d) | | 1,200 | 1,113 |
5% 12/1/25 (d) | | 1,000 | 1,014 |
TOTAL RHODE ISLAND | | | 41,534 |
| South Carolina - 1.3% | | | |
| Charleston County Arpt. District Series 2019, 5% 7/1/43 | | 2,085 | 2,199 |
| Scago Edl. Facilities Corp. for Colleton School District (School District of Colleton County Proj.) Series 2015: | | | |
| 5% 12/1/25 | | 2,275 | 2,301 |
| 5% 12/1/28 | | 4,690 | 4,739 |
| South Carolina Hsg. Fin. & Dev. Auth. Mtg. Rev.: | | | |
| Series 2019 A, 4% 1/1/50 | | 1,375 | 1,366 |
| Series 2023 B, 6% 1/1/54 | | 1,545 | 1,683 |
| South Carolina Jobs-Econ. Dev. Auth. Series 2019 C: | | | |
| 5% 7/1/32 | | 1,010 | 1,065 |
| 5% 7/1/33 | | 4,200 | 4,428 |
| South Carolina Ports Auth. Ports Rev. Series 2015, 5.25% 7/1/55 (Pre-Refunded to 7/1/25 @ 100) (d) | | 910 | 924 |
| South Carolina Pub. Svc. Auth. Rev.: | | | |
| Series 2016 A: | | | |
5% 12/1/29 | | 2,485 | 2,536 |
5% 12/1/38 | | 250 | 253 |
| Series 2016 B, 5% 12/1/31 | | 910 | 932 |
| Spartanburg County Reg'l. Health Series 2017 A: | | | |
| 4% 4/15/43 | | 15,510 | 14,859 |
| 4% 4/15/48 | | 10,815 | 10,010 |
| 5% 4/15/48 | | 10,595 | 10,820 |
TOTAL SOUTH CAROLINA | | | 58,115 |
| South Dakota - 0.1% | | | |
| South Dakota Health & Edl. Facilities Auth. Rev.: | | | |
| (Avera Health Proj.) Series 2017, 5% 7/1/31 | | 540 | 566 |
| Series 2017: | | | |
5% 7/1/26 | | 250 | 257 |
5% 7/1/28 | | 250 | 262 |
5% 7/1/29 | | 470 | 493 |
| Series 2020 A, 3% 9/1/45 | | 3,355 | 2,649 |
TOTAL SOUTH DAKOTA | | | 4,227 |
| Tennessee - 0.5% | | | |
| Chattanooga Health Ed. & Hsg. Facility Board Rev.: | | | |
| Series 2019 A1: | | | |
4% 8/1/44 | | 2,200 | 2,140 |
5% 8/1/31 | | 1,000 | 1,067 |
5% 8/1/33 | | 1,250 | 1,335 |
| Series 2019 A2, 5% 8/1/35 | | 765 | 817 |
| Metropolitan Nashville Arpt. Auth. Rev.: | | | |
| Series 2015 B, 4% 7/1/25 (d) | | 1,755 | 1,757 |
| Series 2019 B, 5% 7/1/54 (d) | | 9,580 | 9,821 |
| Tennessee Hsg. Dev. Agcy.: | | | |
| Series 2015 A, 3.5% 7/1/45 | | 990 | 981 |
| Series 2022 2, 5% 1/1/53 | | 4,625 | 4,735 |
| Tennessee Hsg. Dev. Agcy. Residential: | | | |
| Series 2019 3: | | | |
2.6% 7/1/39 | | 415 | 342 |
2.8% 7/1/44 | | 505 | 398 |
| Series 2019 4, 2.9% 7/1/39 | | 300 | 253 |
TOTAL TENNESSEE | | | 23,646 |
| Texas - 4.7% | | | |
| Austin Arpt. Sys. Rev.: | | | |
| Series 2014: | | | |
5% 11/15/26 (d) | | 830 | 831 |
5% 11/15/27 (d) | | 1,035 | 1,037 |
5% 11/15/28 (d) | | 1,240 | 1,243 |
5% 11/15/39 (d) | | 2,725 | 2,727 |
| Series 2017 B: | | | |
5% 11/15/28 (d) | | 830 | 849 |
5% 11/15/30 (d) | | 1,275 | 1,306 |
5% 11/15/32 (d) | | 1,005 | 1,028 |
5% 11/15/35 (d) | | 1,035 | 1,055 |
5% 11/15/36 (d) | | 1,385 | 1,411 |
5% 11/15/37 (d) | | 1,165 | 1,185 |
5% 11/15/41 (d) | | 4,725 | 4,780 |
| Brazos County Gen. Oblig. Series 2020: | | | |
| 1.75% 9/1/34 | | 1,380 | 1,069 |
| 1.875% 9/1/35 | | 700 | 540 |
| Bryan Tex For Previous Issuess Series 2020, 2.125% 8/15/34 | | 1,150 | 922 |
| Cedar Park Series 2020, 1.625% 2/15/35 | | 1,615 | 1,225 |
| Central Reg'l. Mobility Auth. Series 2015 A: | | | |
| 5% 1/1/28 | | 1,075 | 1,090 |
| 5% 1/1/31 (Pre-Refunded to 7/1/25 @ 100) | | 395 | 402 |
| Collin County Series 2022, 4% 2/15/39 | | 1,800 | 1,829 |
| Coppell Tex Series 2020, 1.375% 2/1/34 | | 1,395 | 1,034 |
| Dallas Wtrwks. & Swr. Sys. Rev. Series 2020 C: | | | |
| 4% 10/1/35 | | 1,000 | 1,030 |
| 4% 10/1/39 | | 5,000 | 5,053 |
| 4% 10/1/40 | | 2,000 | 2,012 |
| Fort Bend Grand Parkway Toll Road Auth. Series 2021, 3% 3/1/46 | | 2,400 | 1,891 |
| Grand Parkway Trans. Corp.: | | | |
| Series 2018 A, 5% 10/1/38 | | 2,655 | 2,792 |
| Series 2020 C, 4% 10/1/49 | | 3,100 | 2,858 |
| Harris County Cultural Ed. Facilities Fin. Corp. Rev. (Texas Childrens Hosp., Proj.) Series 2015-1 5% 10/1/29 | | 1,115 | 1,134 |
| Harris County Gen. Oblig. Series 2002: | | | |
| 0% 8/15/25 (Nat'l. Pub. Fin. Guarantee Corp. Insured) | | 2,485 | 2,387 |
| 0% 8/15/28 (Nat'l. Pub. Fin. Guarantee Corp. Insured) | | 4,140 | 3,575 |
| Houston Arpt. Sys. Rev.: | | | |
| Series 2018 A, 5% 7/1/41 (d) | | 1,000 | 1,028 |
| Series 2018 C: | | | |
5% 7/1/29 (d) | | 1,655 | 1,730 |
5% 7/1/30 (d) | | 1,765 | 1,847 |
5% 7/1/31 (d) | | 1,240 | 1,288 |
5% 7/1/32 (d) | | 1,450 | 1,506 |
| Houston Gen. Oblig. Series 2017 A: | | | |
| 5% 3/1/31 | | 3,835 | 3,980 |
| 5% 3/1/32 | | 1,635 | 1,696 |
| Houston Util. Sys. Rev. Series 2020 C: | | | |
| 5% 11/15/33 | | 2,000 | 2,214 |
| 5% 11/15/34 | | 2,500 | 2,766 |
| Irving Hosp. Auth. Hosp. Rev. Series 2017 A: | | | |
| 5% 10/15/28 | | 390 | 397 |
| 5% 10/15/30 | | 1,570 | 1,599 |
| 5% 10/15/32 | | 830 | 843 |
| 5% 10/15/36 | | 545 | 552 |
| 5% 10/15/37 | | 930 | 939 |
| 5% 10/15/38 | | 1,325 | 1,336 |
| 5% 10/15/44 | | 1,310 | 1,315 |
| Lamar Consolidated Independent School District Series 2021, 3% 2/15/56 | | 2,800 | 2,073 |
| Love Field Arpt. Modernization Rev.: | | | |
| Series 2015: | | | |
5% 11/1/26 (d) | | 830 | 840 |
5% 11/1/27 (d) | | 1,780 | 1,801 |
5% 11/1/28 (d) | | 2,755 | 2,787 |
5% 11/1/29 (d) | | 1,655 | 1,676 |
5% 11/1/32 (d) | | 3,055 | 3,084 |
| Series 2017: | | | |
5% 11/1/24 (d) | | 830 | 832 |
5% 11/1/25 (d) | | 830 | 843 |
5% 11/1/26 (d) | | 830 | 852 |
5% 11/1/27 (d) | | 830 | 848 |
5% 11/1/28 (d) | | 1,450 | 1,483 |
5% 11/1/29 (d) | | 1,035 | 1,058 |
5% 11/1/30 (d) | | 830 | 847 |
5% 11/1/31 (d) | | 1,840 | 1,875 |
5% 11/1/32 (d) | | 2,135 | 2,175 |
5% 11/1/33 (d) | | 830 | 844 |
5% 11/1/34 (d) | | 830 | 844 |
5% 11/1/36 (d) | | 830 | 842 |
| Lower Colorado River Auth. Rev. Series 2015 D, 5% 5/15/28 | | 1,820 | 1,840 |
| Mansfield Tex Series 2020, 2.25% 2/15/35 | | 1,385 | 1,134 |
| New Hope Cultural Ed. Facilities Fin. Corp. (Childrens Med. Ctr. of Dallas) Series 2017 A: | | | |
| 5% 8/15/27 | | 625 | 654 |
| 5% 8/15/29 | | 1,655 | 1,731 |
| 5% 8/15/47 | | 1,890 | 1,923 |
| Newark Higher Ed. Fin. Corp. (Abilene Christian Univ. Proj.) Series 2016 A: | | | |
| 5% 4/1/27 | | 595 | 607 |
| 5% 4/1/30 | | 2,825 | 2,890 |
| North Texas Tollway Auth. Rev.: | | | |
| (Sr. Lien Proj.) Series 2017 A: | | | |
5% 1/1/31 | | 830 | 844 |
5% 1/1/33 | | 975 | 1,012 |
5% 1/1/34 | | 1,240 | 1,288 |
5% 1/1/34 | | 2,485 | 2,852 |
5% 1/1/35 | | 1,820 | 1,891 |
5% 1/1/36 | | 4,965 | 5,154 |
5% 1/1/37 | | 6,625 | 6,870 |
| (Sub Lien Proj.) Series 2017 B: | | | |
5% 1/1/30 | | 350 | 356 |
5% 1/1/31 | | 495 | 503 |
| Series 2015 A, 5% 1/1/32 | | 2,775 | 2,788 |
| Series 2016 A, 5% 1/1/36 | | 1,035 | 1,053 |
| Series 2021 B, 3% 1/1/51 | | 16,575 | 12,614 |
| Prosper Independent School District Series 2021 A, 3% 2/15/39 | | 3,000 | 2,737 |
| Southwest Higher Ed. Auth. Rev. (Southern Methodist Univ., TX. Proj.) Series 2017: | | | |
| 5% 10/1/29 | | 375 | 393 |
| 5% 10/1/30 | | 580 | 607 |
| 5% 10/1/31 | | 520 | 544 |
| 5% 10/1/39 | | 1,030 | 1,066 |
| 5% 10/1/40 | | 830 | 856 |
| Tarrant County Cultural Ed. Facilities Fin. Corp. Rev.: | | | |
| Series 2016 A, 4% 2/15/35 | | 4,140 | 4,157 |
| Series 2018 B, 5% 7/1/43 | | 1,500 | 1,549 |
| Texas Dept. of Hsg. & Cmnty. Affairs Multi-family Hsg. Rev. Series 2019, 2.95% 7/1/36 | | 4,286 | 3,689 |
| Texas Dept. of Hsg. & Cmnty. Affairs Residential Mtg. Rev. Series 2023 B, 6% 1/1/54 | | 6,400 | 6,979 |
| Texas Dept. of Hsg. & Cmnty. Affairs Single Family Mtg. Rev.: | | | |
| Series 2019 A, 4% 3/1/50 | | 2,825 | 2,806 |
| Series A, 3.5% 3/1/51 | | 2,800 | 2,740 |
| Texas Gen. Oblig. Series 2022, 5% 8/1/34 (d) | | 3,185 | 3,482 |
| Texas Muni. Gas Acquisition & Supply Corp. Bonds Series 2023 B, 5.5%, tender 1/1/34 (b) | | 1,980 | 2,211 |
| Texas State Univ. Sys. Fing. Rev. Series 2017 A: | | | |
| 5% 3/15/29 | | 3,530 | 3,687 |
| 5% 3/15/31 | | 2,690 | 2,808 |
| Texas Wtr. Dev. Board Rev.: | | | |
| Series 2020, 3% 8/1/39 | | 1,165 | 1,043 |
| Series 2021, 2.5% 10/15/39 | | 3,000 | 2,320 |
| Univ. of Houston Univ. Revs. Series 2017 A: | | | |
| 5% 2/15/33 | | 3,310 | 3,383 |
| 5% 2/15/34 | | 4,140 | 4,230 |
| 5% 2/15/36 | | 2,485 | 2,532 |
| Univ. of North Texas Univ. Rev. Series 2017 A, 5% 4/15/32 | | 1,740 | 1,814 |
| Univ. of Texas Board of Regents Sys. Rev. Series 2019 A, 5% 8/15/29 | | 1,850 | 2,020 |
| Univ. of Texas Permanent Univ. Fund Rev. Series 2016 B, 5% 7/1/29 | | 1,685 | 1,736 |
| Waco Gen. Oblig. Series 2020: | | | |
| 2% 2/1/34 | | 3,395 | 2,722 |
| 2.375% 2/1/38 | | 1,035 | 796 |
| Waller Independent School District Series 2020, 3% 2/15/39 | | 1,850 | 1,630 |
| Weatherford Independent School District Series 2002, 0% 2/15/33 | | 5,785 | 4,173 |
TOTAL TEXAS | | | 215,649 |
| Utah - 1.4% | | | |
| Salt Lake City Arpt. Rev.: | | | |
| Series 2017 A: | | | |
5% 7/1/25 (d) | | 1,655 | 1,674 |
5% 7/1/27 (d) | | 3,500 | 3,620 |
5% 7/1/29 (d) | | 3,090 | 3,192 |
5% 7/1/30 (d) | | 2,275 | 2,352 |
5% 7/1/31 (d) | | 4,345 | 4,474 |
5% 7/1/33 (d) | | 3,310 | 3,408 |
5% 7/1/35 (d) | | 3,310 | 3,402 |
5% 7/1/36 (d) | | 4,470 | 4,589 |
5% 7/1/37 (d) | | 3,520 | 3,609 |
| Series 2018 A: | | | |
5% 7/1/31 (d) | | 2,000 | 2,078 |
5% 7/1/32 (d) | | 4,310 | 4,477 |
5% 7/1/33 (d) | | 1,420 | 1,475 |
5.25% 7/1/48 (d) | | 5,655 | 5,807 |
| Series 2023 A, 5.25% 7/1/41 (d) | | 2,000 | 2,203 |
| Utah County Hosp. Rev. Series 2020 A: | | | |
| 5% 5/15/43 | | 5,500 | 5,816 |
| 5% 5/15/50 | | 9,000 | 9,373 |
| Weber School District Utah (Utah School District Bond Guaranty Prog.) Series 2019, 2.25% 6/15/34 | | 1,230 | 1,038 |
TOTAL UTAH | | | 62,587 |
| Vermont - 0.6% | | | |
| Vermont Edl. & Health Bldg. Fin. Agcy. Rev.: | | | |
| (Champlain College Proj.) Series 2016 A: | | | |
5% 10/15/41 | | 3,810 | 3,677 |
5% 10/15/46 | | 4,720 | 4,387 |
| (Middlebury College Proj.) Series 2020, 5% 11/1/49 | | 18,500 | 19,328 |
| Vermont Student Assistant Corp. Ed. Ln. Rev. Series 2019 A, 5% 6/15/28 (d) | | 1,430 | 1,467 |
TOTAL VERMONT | | | 28,859 |
| Virginia - 0.4% | | | |
| Fredericksburg Econ. Dev. Auth. Rev. Series 2014, 5% 6/15/30 | | 1,035 | 1,035 |
| Lynchburg Econ. Dev. Series 2021, 3% 1/1/51 | | 3,000 | 2,272 |
| Stafford County Econ. Dev. Auth. Hosp. Facilities Rev.: | | | |
| (Mary Washington Hosp. Proj.) Series 2016, 3% 6/15/29 | | 525 | 502 |
| Series 2016: | | | |
4% 6/15/37 | | 595 | 582 |
5% 6/15/27 | | 1,240 | 1,268 |
5% 6/15/30 | | 540 | 550 |
5% 6/15/33 | | 350 | 357 |
5% 6/15/34 | | 665 | 677 |
5% 6/15/35 | | 1,820 | 1,853 |
| Virginia Commonwealth Trans. Board Rev. (Virginia Gen. Oblig. Proj.) Series 2017 A, 5% 5/15/32 | | 725 | 763 |
| Virginia Pub. Bldg. Auth. Pub. Facilities Rev. Series 2019 A, 4% 8/1/36 | | 4,505 | 4,586 |
| Winchester Econ. Dev. Auth. Series 2015: | | | |
| 5% 1/1/31 | | 2,070 | 2,104 |
| 5% 1/1/34 | | 1,240 | 1,258 |
| 5% 1/1/35 | | 1,240 | 1,257 |
| 5% 1/1/44 | | 830 | 835 |
TOTAL VIRGINIA | | | 19,899 |
| Washington - 2.9% | | | |
| Port of Seattle Rev.: | | | |
| Series 2016 B: | | | |
5% 10/1/28 (d) | | 2,900 | 2,957 |
5% 10/1/30 (d) | | 1,655 | 1,684 |
| Series 2019 A, 4% 4/1/44 (d) | | 2,525 | 2,360 |
| Washington Convention Ctr. Pub. Facilities: | | | |
| Series 2021 B: | | | |
3% 7/1/43 | | 865 | 683 |
3% 7/1/58 (Assured Guaranty Muni. Corp. Insured) | | 12,930 | 9,450 |
| Series 2021, 4% 7/1/31 | | 17,595 | 17,371 |
| Washington Gen. Oblig.: | | | |
| Series 2020 A, 5% 8/1/33 | | 1,260 | 1,372 |
| Series 2021 C, 5% 2/1/44 | | 270 | 290 |
| Series 2022 A, 5% 8/1/37 | | 33,745 | 38,080 |
| Series 2022 C, 4% 7/1/35 | | 4,200 | 4,420 |
| Series 2022 D: | | | |
4% 7/1/35 | | 1,800 | 1,894 |
4% 7/1/36 | | 5,735 | 5,981 |
4% 7/1/37 | | 4,000 | 4,139 |
| Series R-2017 A, 5% 8/1/30 | | 1,685 | 1,739 |
| Washington Health Care Facilities Auth. Rev.: | | | |
| (Overlake Hosp. Med. Ctr., WA. Proj.) Series 2017 B: | | | |
5% 7/1/25 | | 675 | 679 |
5% 7/1/27 | | 1,285 | 1,297 |
5% 7/1/28 | | 1,570 | 1,589 |
5% 7/1/29 | | 615 | 624 |
5% 7/1/30 | | 735 | 746 |
5% 7/1/31 | | 1,120 | 1,137 |
5% 7/1/32 | | 1,655 | 1,679 |
5% 7/1/33 | | 2,345 | 2,377 |
5% 7/1/34 | | 540 | 547 |
5% 7/1/42 | | 4,685 | 4,683 |
| Series 2019 A1, 5% 8/1/38 | | 1,000 | 1,056 |
| Series 2019 A2, 5% 8/1/33 | | 2,000 | 2,136 |
| Washington Higher Ed. Facilities Auth. Rev.: | | | |
| (Gonzaga Univ. Proj.) Series 2019 A, 3% 4/1/49 | | 5,005 | 3,913 |
| (Whitworth Univ. Proj.): | | | |
Series 2016 A: | | | |
5% 10/1/27 | | 1,770 | 1,805 |
5% 10/1/28 | | 1,825 | 1,862 |
5% 10/1/35 | | 1,880 | 1,912 |
5% 10/1/36 | | 2,845 | 2,890 |
5% 10/1/40 | | 2,795 | 2,822 |
Series 2019, 4% 10/1/49 | | 3,515 | 3,010 |
| Washington Hsg. Fin. Commission Nonprofit Hsg. Rev. (Judson Park Proj.) Series 2018: | | | |
| 4% 7/1/28 (e) | | 100 | 98 |
| 5% 7/1/33 (e) | | 125 | 126 |
| 5% 7/1/38 (e) | | 100 | 98 |
| 5% 7/1/48 (e) | | 400 | 361 |
| Washington Hsg. Fin. Commission Nonprofit Rev. (Seattle Academy of Arts and Sciences Proj.) Series 2023, 6.375% 7/1/63 (e) | | 4,125 | 4,538 |
TOTAL WASHINGTON | | | 134,405 |
| West Virginia - 0.2% | | | |
| West Virginia Econ. Dev. Auth. Solid Waste Disp. Facilities Rev. Bonds (Appalachian Pwr. Co. - Amos Proj.) Series 2015 A, 3.375%, tender 6/15/28 (b) | | 1,380 | 1,357 |
| West Virginia Hosp. Fin. Auth. Hosp. Rev. Series 2018 A: | | | |
| 5% 1/1/31 | | 1,355 | 1,357 |
| 5% 1/1/32 | | 1,120 | 1,122 |
| 5% 1/1/43 | | 2,230 | 2,216 |
| West Virginia Hsg. Dev. Fund Series 2018 A, 3.45% 11/1/33 | | 1,250 | 1,208 |
TOTAL WEST VIRGINIA | | | 7,260 |
| Wisconsin - 1.8% | | | |
| Blue Ridge Healthcare Pub. Fin. Auth. Series 2020 A: | | | |
| 5% 1/1/35 | | 1,210 | 1,267 |
| 5% 1/1/40 | | 540 | 555 |
| Howard Suamico Scd Series 2021, 2% 3/1/38 | | 1,780 | 1,319 |
| Kohler Wis School District Series 2021, 2% 3/1/39 | | 1,230 | 884 |
| Pub. Fin. Auth. Hosp. Rev.: | | | |
| (Renown Reg'l. Med. Ctr. Proj.) Series 2020 A: | | | |
4% 6/1/45 | | 2,095 | 1,945 |
5% 6/1/29 | | 820 | 862 |
| Series 2019 A, 5% 10/1/44 | | 7,550 | 7,785 |
| Series 2020 A, 3% 6/1/45 | | 9,350 | 7,371 |
| Pub. Fin. Auth. Sr. Living Rev. (Mary's Woods At Marylhurst, Inc. Proj.) Series 2017 A: | | | |
| 5% 5/15/25 (e) | | 700 | 700 |
| 5% 5/15/28 (e) | | 1,095 | 1,103 |
| 5.25% 5/15/37 (e) | | 415 | 419 |
| 5.25% 5/15/42 (e) | | 415 | 416 |
| 5.25% 5/15/47 (e) | | 410 | 400 |
| 5.25% 5/15/52 (e) | | 775 | 740 |
| Pub. Fin. Auth. Wisconsin Retirement Facility Rev. Series 2018: | | | |
| 5% 10/1/43 (e) | | 945 | 927 |
| 5% 10/1/48 (e) | | 1,055 | 1,002 |
| 5% 10/1/53 (e) | | 2,330 | 2,171 |
| Roseman Univ. of Health: | | | |
| Series 2020: | | | |
5% 4/1/40 (e) | | 720 | 744 |
5% 4/1/40 (Pre-Refunded to 4/1/30 @ 100) (e) | | 30 | 33 |
5% 4/1/50 (e) | | 520 | 526 |
| Series 2021 A: | | | |
3% 7/1/50 | | 2,640 | 1,921 |
4.5% 6/1/56 (e) | | 14,095 | 11,347 |
| Series 2021 B, 6.5% 6/1/56 (e) | | 4,700 | 3,958 |
| Westosha Cent High School District Series 2021: | | | |
| 1.625% 3/1/32 | | 1,010 | 810 |
| 2% 3/1/35 | | 1,000 | 786 |
| 2% 3/1/36 | | 1,005 | 773 |
| Wisconsin Gen. Oblig. Series 2025 1, 5% 5/1/34 (i) | | 2,025 | 2,279 |
| Wisconsin Health & Edl. Facilities: | | | |
| Series 2013 B2, 4% 11/15/43 | | 3,890 | 3,721 |
| Series 2016 A: | | | |
5% 2/15/28 | | 1,965 | 1,988 |
5% 2/15/29 | | 2,550 | 2,579 |
5% 2/15/30 | | 2,805 | 2,837 |
| Series 2016, 4% 12/1/46 | | 4,350 | 4,181 |
| Series 2017 A: | | | |
4% 4/1/39 | | 2,140 | 2,088 |
5% 9/1/31 (Pre-Refunded to 9/1/27 @ 100) | | 830 | 870 |
5% 9/1/33 (Pre-Refunded to 9/1/27 @ 100) | | 1,425 | 1,494 |
5% 9/1/35 (Pre-Refunded to 9/1/27 @ 100) | | 1,575 | 1,651 |
| Series 2019 A, 5% 11/1/46 | | 540 | 474 |
| Series 2019 B1, 2.825% 11/1/28 | | 465 | 431 |
| Wisconsin Health & Edl. Facilities Auth. Rev. Series 2024 A: | | | |
| 4.5% 2/15/54 | | 1,755 | 1,739 |
| 5.5% 2/15/54 | | 1,875 | 1,993 |
| Wisconsin Rapids School District Series 2021: | | | |
| 1.7% 4/1/32 | | 1,600 | 1,296 |
| 2% 4/1/38 | | 2,100 | 1,450 |
TOTAL WISCONSIN | | | 81,835 |
| TOTAL MUNICIPAL BONDS (Cost $4,674,674) | | | 4,578,330 |
| | | | |
| Money Market Funds - 0.5% |
| | | Shares | Value ($) (000s) |
Fidelity Municipal Cash Central Fund 4.33% (j)(k) (Cost $22,624) | | 22,621,282 | 22,626 |
| | | | |
| TOTAL INVESTMENT IN SECURITIES - 99.7% (Cost $4,697,298) | 4,600,956 |
NET OTHER ASSETS (LIABILITIES) - 0.3% | 14,441 |
| NET ASSETS - 100.0% | 4,615,397 |
| | |
Any values shown as $0 in the Schedule of Investments may reflect amounts less than $500.
Legend
| (a) | Amount is stated in United States dollars unless otherwise noted. |
| (b) | Coupon rates for floating and adjustable rate securities reflect the rates in effect at period end. |
| (c) | Coupon is indexed to a floating interest rate which may be multiplied by a specified factor and/or subject to caps or floors. |
| (d) | Private activity obligations whose interest is subject to the federal alternative minimum tax for individuals. |
| (e) | Security exempt from registration under Rule 144A of the Securities Act of 1933. These securities may be resold in transactions exempt from registration, normally to qualified institutional buyers. At the end of the period, the value of these securities amounted to $84,079,000 or 1.8% of net assets. |
| (f) | Non-income producing - Security is in default. |
| (h) | Security initially issued in zero coupon form which converts to coupon form at a specified rate and date. The rate shown is the rate at period end. |
| (i) | Security or a portion of the security purchased on a delayed delivery or when-issued basis. |
| (j) | Information in this report regarding holdings by state and security types does not reflect the holdings of the Fidelity Municipal Cash Central Fund. |
| (k) | Affiliated fund that is generally available only to investment companies and other accounts managed by Fidelity Investments. The rate quoted is the annualized seven-day yield of the fund at period end. A complete unaudited listing of the fund's holdings as of its most recent quarter end is available upon request. In addition, each Fidelity Central Fund's financial statements are available on the SEC's website or upon request. |
Affiliated Central Funds
Fiscal year to date information regarding the Fund's investments in Fidelity Central Funds, including the ownership percentage, is presented below.
| Affiliate (Amounts in thousands) | Value, beginning of period ($) | Purchases ($) | Sales Proceeds ($) | Dividend Income ($) | Realized Gain (loss) ($) | Change in Unrealized appreciation (depreciation) ($) | Value, end of period ($) | % ownership, end of period |
| Fidelity Municipal Cash Central Fund 4.33% | 30,159 | 316,055 | 323,595 | 802 | 6 | 1 | 22,626 | 1.2% |
| Total | 30,159 | 316,055 | 323,595 | 802 | 6 | 1 | 22,626 | |
| | | | | | | | | |
Amounts in the dividend income column in the above table include any capital gain distributions from underlying funds, which are presented in the corresponding line item in the Statement of Operations, if applicable.
Amounts included in the purchases and sales proceeds columns may include in-kind transactions, if applicable.
Investment Valuation
The following is a summary of the inputs used, as of June 30, 2024, involving the Fund's assets and liabilities carried at fair value. The inputs or methodology used for valuing securities may not be an indication of the risk associated with investing in those securities. For more information on valuation inputs, and their aggregation into the levels used below, please refer to the Investment Valuation section in the accompanying Notes to Financial Statements.
| Valuation Inputs at Reporting Date: |
Description (Amounts in thousands) | Total ($) | Level 1 ($) | Level 2 ($) | Level 3 ($) |
Investments in Securities: | | | | |
|
| Municipal Securities | 4,578,330 | - | 4,577,249 | 1,081 |
|
| Money Market Funds | 22,626 | 22,626 | - | - |
| Total Investments in Securities: | 4,600,956 | 22,626 | 4,577,249 | 1,081 |
Financial Statements (Unaudited)
| Statement of Assets and Liabilities |
| Amounts in thousands (except per-share amounts) | | | | June 30, 2024 (Unaudited) |
| | | | | |
| Assets | | | | |
| Investment in securities, at value - See accompanying schedule: | | | | |
Unaffiliated issuers (cost $4,674,674) | $ | 4,578,330 | | |
Fidelity Central Funds (cost $22,624) | | 22,626 | | |
| | | | | |
| | | | | |
| Total Investment in Securities (cost $4,697,298) | | | $ | 4,600,956 |
| Cash | | | | 100 |
| Receivable for fund shares sold | | | | 2,055 |
| Interest receivable | | | | 60,446 |
| Distributions receivable from Fidelity Central Funds | | | | 79 |
Total assets | | | | 4,663,636 |
| Liabilities | | | | |
| Payable for investments purchased | | | | |
Regular delivery | $ | 3,704 | | |
Delayed delivery | | 35,162 | | |
| Payable for fund shares redeemed | | 3,832 | | |
| Distributions payable | | 3,651 | | |
| Accrued management fee | | 1,731 | | |
| Distribution and service plan fees payable | | 92 | | |
| Other payables and accrued expenses | | 67 | | |
| Total liabilities | | | | 48,239 |
| Net Assets | | | $ | 4,615,397 |
| Net Assets consist of: | | | | |
| Paid in capital | | | $ | 4,748,949 |
| Total accumulated earnings (loss) | | | | (133,552) |
| Net Assets | | | $ | 4,615,397 |
| | | | | |
| Net Asset Value and Maximum Offering Price | | | | |
| Class A : | | | | |
Net Asset Value and redemption price per share ($281,850 ÷ 23,102 shares)(a) | | | $ | 12.20 |
| Maximum offering price per share (100/96.00 of $12.20) | | | $ | 12.71 |
| Class M : | | | | |
Net Asset Value and redemption price per share ($72,668 ÷ 5,951 shares)(a) | | | $ | 12.21 |
| Maximum offering price per share (100/96.00 of $12.21) | | | $ | 12.72 |
| Class C : | | | | |
Net Asset Value and offering price per share ($21,799 ÷ 1,787 shares)(a) | | | $ | 12.20 |
| Fidelity Municipal Income Fund : | | | | |
Net Asset Value, offering price and redemption price per share ($2,725,935 ÷ 223,281 shares) | | | $ | 12.21 |
| Class I : | | | | |
Net Asset Value, offering price and redemption price per share ($1,105,063 ÷ 90,574 shares) | | | $ | 12.20 |
| Class Z : | | | | |
Net Asset Value, offering price and redemption price per share ($408,082 ÷ 33,438 shares) | | | $ | 12.20 |
(a)Redemption price per share is equal to net asset value less any applicable contingent deferred sales charge. |
| Statement of Operations |
| Amounts in thousands | | | | Six months ended June 30, 2024 (Unaudited) |
| Investment Income | | | | |
| Interest | | | $ | 78,998 |
| Income from Fidelity Central Funds | | | | 802 |
| Total income | | | | 79,800 |
| Expenses | | | | |
| Management fee | $ | 9,613 | | |
| Transfer agent fees | | 895 | | |
| Distribution and service plan fees | | 558 | | |
| Accounting fees and expenses | | 109 | | |
| Custodian fees and expenses | | 24 | | |
| Independent trustees' fees and expenses | | 6 | | |
| Registration fees | | 122 | | |
| Audit | | 33 | | |
| Legal | | 2 | | |
| Miscellaneous | | 36 | | |
| Total expenses before reductions | | 11,398 | | |
| Expense reductions | | (110) | | |
| Total expenses after reductions | | | | 11,288 |
| Net Investment income (loss) | | | | 68,512 |
| Realized and Unrealized Gain (Loss) | | | | |
| Net realized gain (loss) on: | | | | |
| Investment Securities: | | | | |
| Unaffiliated issuers | | (3,629) | | |
| Fidelity Central Funds | | 6 | | |
| Total net realized gain (loss) | | | | (3,623) |
| Change in net unrealized appreciation (depreciation) on: | | | | |
| Investment Securities: | | | | |
| Unaffiliated issuers | | (50,328) | | |
| Fidelity Central Funds | | 1 | | |
| Total change in net unrealized appreciation (depreciation) | | | | (50,327) |
| Net gain (loss) | | | | (53,950) |
| Net increase (decrease) in net assets resulting from operations | | | $ | 14,562 |
| Statement of Changes in Net Assets |
| |
| Amount in thousands | | Six months ended June 30, 2024 (Unaudited) | | Year ended December 31, 2023 |
| Increase (Decrease) in Net Assets | | | | |
| Operations | | | | |
| Net investment income (loss) | $ | 68,512 | $ | 130,298 |
| Net realized gain (loss) | | (3,623) | | (6,995) |
| Change in net unrealized appreciation (depreciation) | | (50,327) | | 182,321 |
| Net increase (decrease) in net assets resulting from operations | | 14,562 | | 305,624 |
| Distributions to shareholders | | (66,819) | | (128,164) |
| | | | | |
| Share transactions - net increase (decrease) | | (10,275) | | 277,844 |
| Total increase (decrease) in net assets | | (62,532) | | 455,304 |
| | | | | |
| Net Assets | | | | |
| Beginning of period | | 4,677,929 | | 4,222,625 |
| End of period | $ | 4,615,397 | $ | 4,677,929 |
| | | | | |
| | | | | |
Financial Highlights
Fidelity Advisor® Municipal Income Fund Class A |
| |
| | Six months ended (Unaudited) June 30, 2024 | | Years ended December 31, 2023 | | 2022 | | 2021 | | 2020 | | 2019 |
Selected Per-Share Data | | | | | | | | | | | | |
| Net asset value, beginning of period | $ | 12.34 | $ | 11.86 | $ | 13.56 | $ | 13.59 | $ | 13.39 | $ | 12.75 |
| Income from Investment Operations | | | | | | | | | | | | |
Net investment income (loss) A,B | | .163 | | .316 | | .282 | | .281 | | .305 | | .330 |
| Net realized and unrealized gain (loss) | | (.144) | | .474 | | (1.700) | | .057 | | .257 | | .689 |
| Total from investment operations | | .019 | | .790 | | (1.418) | | .338 | | .562 | | 1.019 |
| Distributions from net investment income | | (.159) | | (.310) | | (.282) | | (.281) | | (.304) | | (.328) |
| Distributions from net realized gain | | - | | - | | - | | (.087) | | (.058) | | (.051) |
| Total distributions | | (.159) | | (.310) | | (.282) | | (.368) | | (.362) | | (.379) |
| Net asset value, end of period | $ | 12.20 | $ | 12.34 | $ | 11.86 | $ | 13.56 | $ | 13.59 | $ | 13.39 |
Total Return C,D,E | | | | 6.78% | | (10.48)% | | 2.51% | | 4.28% | | 8.06% |
Ratios to Average Net Assets B,F,G | | | | | | | | | | | | |
| Expenses before reductions | | .78% H | | .79% | | .78% | | .78% | | .78% | | .79% |
| Expenses net of fee waivers, if any | | | | .79% | | .78% | | .78% | | .78% | | .79% |
| Expenses net of all reductions | | .77% H | | .79% | | .78% | | .78% | | .78% | | .79% |
| Net investment income (loss) | | 2.69% H | | 2.64% | | 2.31% | | 2.06% | | 2.29% | | 2.49% |
| Supplemental Data | | | | | | | | | | | | |
| Net assets, end of period (in millions) | $ | 282 | $ | 285 | $ | 268 | $ | 249 | $ | 233 | $ | 241 |
Portfolio turnover rate I | | | | 4% | | 23% | | 13% | | 16% | | 16% |
ACalculated based on average shares outstanding during the period.
BNet investment income (loss) is affected by the timing of the declaration of dividends by any underlying mutual funds or exchange-traded funds (ETFs). Net investment income (loss) of any mutual funds or ETFs is not included in the Fund's net investment income (loss) ratio.
CTotal returns for periods of less than one year are not annualized.
DTotal returns would have been lower if certain expenses had not been reduced during the applicable periods shown.
ETotal returns do not include the effect of the sales charges.
FFees and expenses of any underlying mutual funds or exchange-traded funds (ETFs) are not included in the Fund's expense ratio. The Fund indirectly bears its proportionate share of these expenses. For additional expense information related to investments in Fidelity Central Funds, please refer to the "Investments in Fidelity Central Funds" note found in the Notes to Financial Statements section of the most recent Annual or Semi-Annual report.
GExpense ratios reflect operating expenses of the class. Expenses before reductions do not reflect amounts reimbursed, waived, or reduced through arrangements with the investment adviser, brokerage services, or other offset arrangements, if applicable, and do not represent the amount paid by the class during periods when reimbursements, waivers or reductions occur.
HAnnualized.
IAmount does not include the portfolio activity of any underlying mutual funds or exchange-traded funds (ETFs).
Fidelity Advisor® Municipal Income Fund Class M |
| |
| | Six months ended (Unaudited) June 30, 2024 | | Years ended December 31, 2023 | | 2022 | | 2021 | | 2020 | | 2019 |
Selected Per-Share Data | | | | | | | | | | | | |
| Net asset value, beginning of period | $ | 12.35 | $ | 11.87 | $ | 13.57 | $ | 13.60 | $ | 13.40 | $ | 12.76 |
| Income from Investment Operations | | | | | | | | | | | | |
Net investment income (loss) A,B | | .165 | | .319 | | .286 | | .285 | | .308 | | .333 |
| Net realized and unrealized gain (loss) | | (.145) | | .474 | | (1.701) | | .056 | | .258 | | .689 |
| Total from investment operations | | .020 | | .793 | | (1.415) | | .341 | | .566 | | 1.022 |
| Distributions from net investment income | | (.160) | | (.313) | | (.285) | | (.284) | | (.308) | | (.331) |
| Distributions from net realized gain | | - | | - | | - | | (.087) | | (.058) | | (.051) |
| Total distributions | | (.160) | | (.313) | | (.285) | | (.371) | | (.366) | | (.382) |
| Net asset value, end of period | $ | 12.21 | $ | 12.35 | $ | 11.87 | $ | 13.57 | $ | 13.60 | $ | 13.40 |
Total Return C,D,E | | | | 6.80% | | (10.45)% | | 2.53% | | 4.30% | | 8.08% |
Ratios to Average Net Assets B,F,G | | | | | | | | | | | | |
| Expenses before reductions | | .76% H | | .76% | | .77% | | .76% | | .76% | | .77% |
| Expenses net of fee waivers, if any | | | | .76% | | .76% | | .76% | | .76% | | .77% |
| Expenses net of all reductions | | .75% H | | .76% | | .76% | | .76% | | .76% | | .77% |
| Net investment income (loss) | | 2.71% H | | 2.66% | | 2.33% | | 2.08% | | 2.31% | | 2.51% |
| Supplemental Data | | | | | | | | | | | | |
| Net assets, end of period (in millions) | $ | 73 | $ | 76 | $ | 80 | $ | 106 | $ | 109 | $ | 120 |
Portfolio turnover rate I | | | | 4% | | 23% | | 13% | | 16% | | 16% |
ACalculated based on average shares outstanding during the period.
BNet investment income (loss) is affected by the timing of the declaration of dividends by any underlying mutual funds or exchange-traded funds (ETFs). Net investment income (loss) of any mutual funds or ETFs is not included in the Fund's net investment income (loss) ratio.
CTotal returns for periods of less than one year are not annualized.
DTotal returns would have been lower if certain expenses had not been reduced during the applicable periods shown.
ETotal returns do not include the effect of the sales charges.
FFees and expenses of any underlying mutual funds or exchange-traded funds (ETFs) are not included in the Fund's expense ratio. The Fund indirectly bears its proportionate share of these expenses. For additional expense information related to investments in Fidelity Central Funds, please refer to the "Investments in Fidelity Central Funds" note found in the Notes to Financial Statements section of the most recent Annual or Semi-Annual report.
GExpense ratios reflect operating expenses of the class. Expenses before reductions do not reflect amounts reimbursed, waived, or reduced through arrangements with the investment adviser, brokerage services, or other offset arrangements, if applicable, and do not represent the amount paid by the class during periods when reimbursements, waivers or reductions occur.
HAnnualized.
IAmount does not include the portfolio activity of any underlying mutual funds or exchange-traded funds (ETFs).
Fidelity Advisor® Municipal Income Fund Class C |
| |
| | Six months ended (Unaudited) June 30, 2024 | | Years ended December 31, 2023 | | 2022 | | 2021 | | 2020 | | 2019 |
Selected Per-Share Data | | | | | | | | | | | | |
| Net asset value, beginning of period | $ | 12.34 | $ | 11.86 | $ | 13.56 | $ | 13.59 | $ | 13.39 | $ | 12.75 |
| Income from Investment Operations | | | | | | | | | | | | |
Net investment income (loss) A,B | | .119 | | .230 | | .194 | | .181 | | .206 | | .231 |
| Net realized and unrealized gain (loss) | | (.145) | | .473 | | (1.701) | | .056 | | .257 | | .689 |
| Total from investment operations | | (.026) | | .703 | | (1.507) | | .237 | | .463 | | .920 |
| Distributions from net investment income | | (.114) | | (.223) | | (.193) | | (.180) | | (.205) | | (.229) |
| Distributions from net realized gain | | - | | - | | - | | (.087) | | (.058) | | (.051) |
| Total distributions | | (.114) | | (.223) | | (.193) | | (.267) | | (.263) | | (.280) |
| Net asset value, end of period | $ | 12.20 | $ | 12.34 | $ | 11.86 | $ | 13.56 | $ | 13.59 | $ | 13.39 |
Total Return C,D,E | | | | 6.01% | | (11.13)% | | 1.75% | | 3.51% | | 7.26% |
Ratios to Average Net Assets B,F,G | | | | | | | | | | | | |
| Expenses before reductions | | 1.51% H | | 1.51% | | 1.51% | | 1.52% | | 1.53% | | 1.53% |
| Expenses net of fee waivers, if any | | | | 1.51% | | 1.51% | | 1.52% | | 1.53% | | 1.53% |
| Expenses net of all reductions | | 1.51% H | | 1.51% | | 1.51% | | 1.52% | | 1.53% | | 1.53% |
| Net investment income (loss) | | 1.96% H | | 1.91% | | 1.58% | | 1.32% | | 1.54% | | 1.75% |
| Supplemental Data | | | | | | | | | | | | |
| Net assets, end of period (in millions) | $ | 22 | $ | 23 | $ | 25 | $ | 35 | $ | 52 | $ | 58 |
Portfolio turnover rate I | | | | 4% | | 23% | | 13% | | 16% | | 16% |
ACalculated based on average shares outstanding during the period.
BNet investment income (loss) is affected by the timing of the declaration of dividends by any underlying mutual funds or exchange-traded funds (ETFs). Net investment income (loss) of any mutual funds or ETFs is not included in the Fund's net investment income (loss) ratio.
CTotal returns for periods of less than one year are not annualized.
DTotal returns would have been lower if certain expenses had not been reduced during the applicable periods shown.
ETotal returns do not include the effect of the contingent deferred sales charge.
FFees and expenses of any underlying mutual funds or exchange-traded funds (ETFs) are not included in the Fund's expense ratio. The Fund indirectly bears its proportionate share of these expenses. For additional expense information related to investments in Fidelity Central Funds, please refer to the "Investments in Fidelity Central Funds" note found in the Notes to Financial Statements section of the most recent Annual or Semi-Annual report.
GExpense ratios reflect operating expenses of the class. Expenses before reductions do not reflect amounts reimbursed, waived, or reduced through arrangements with the investment adviser, brokerage services, or other offset arrangements, if applicable, and do not represent the amount paid by the class during periods when reimbursements, waivers or reductions occur.
HAnnualized.
IAmount does not include the portfolio activity of any underlying mutual funds or exchange-traded funds (ETFs).
Fidelity® Municipal Income Fund |
| |
| | Six months ended (Unaudited) June 30, 2024 | | Years ended December 31, 2023 | | 2022 | | 2021 | | 2020 | | 2019 |
Selected Per-Share Data | | | | | | | | | | | | |
| Net asset value, beginning of period | $ | 12.35 | $ | 11.87 | $ | 13.57 | $ | 13.60 | $ | 13.40 | $ | 12.75 |
| Income from Investment Operations | | | | | | | | | | | | |
Net investment income (loss) A,B | | .183 | | .355 | | .324 | | .327 | | .350 | | .374 |
| Net realized and unrealized gain (loss) | | (.144) | | .475 | | (1.702) | | .057 | | .257 | | .699 |
| Total from investment operations | | .039 | | .830 | | (1.378) | | .384 | | .607 | | 1.073 |
| Distributions from net investment income | | (.179) | | (.350) | | (.322) | | (.327) | | (.349) | | (.372) |
| Distributions from net realized gain | | - | | - | | - | | (.087) | | (.058) | | (.051) |
| Total distributions | | (.179) | | (.350) | | (.322) | | (.414) | | (.407) | | (.423) |
| Net asset value, end of period | $ | 12.21 | $ | 12.35 | $ | 11.87 | $ | 13.57 | $ | 13.60 | $ | 13.40 |
Total Return C,D | | | | 7.12% | | (10.18)% | | 2.85% | | 4.63% | | 8.50% |
Ratios to Average Net Assets B,E,F | | | | | | | | | | | | |
| Expenses before reductions | | .45% G | | .46% | | .46% | | .45% | | .45% | | .45% |
| Expenses net of fee waivers, if any | | | | .46% | | .46% | | .45% | | .45% | | .45% |
| Expenses net of all reductions | | .44% G | | .46% | | .46% | | .45% | | .45% | | .45% |
| Net investment income (loss) | | 3.02% G | | 2.97% | | 2.64% | | 2.39% | | 2.62% | | 2.83% |
| Supplemental Data | | | | | | | | | | | | |
| Net assets, end of period (in millions) | $ | 2,726 | $ | 2,783 | $ | 2,780 | $ | 3,787 | $ | 3,805 | $ | 3,955 |
Portfolio turnover rate H | | | | 4% | | 23% | | 13% | | 16% | | 16% |
ACalculated based on average shares outstanding during the period.
BNet investment income (loss) is affected by the timing of the declaration of dividends by any underlying mutual funds or exchange-traded funds (ETFs). Net investment income (loss) of any mutual funds or ETFs is not included in the Fund's net investment income (loss) ratio.
CTotal returns for periods of less than one year are not annualized.
DTotal returns would have been lower if certain expenses had not been reduced during the applicable periods shown.
EFees and expenses of any underlying mutual funds or exchange-traded funds (ETFs) are not included in the Fund's expense ratio. The Fund indirectly bears its proportionate share of these expenses. For additional expense information related to investments in Fidelity Central Funds, please refer to the "Investments in Fidelity Central Funds" note found in the Notes to Financial Statements section of the most recent Annual or Semi-Annual report.
FExpense ratios reflect operating expenses of the class. Expenses before reductions do not reflect amounts reimbursed, waived, or reduced through arrangements with the investment adviser, brokerage services, or other offset arrangements, if applicable, and do not represent the amount paid by the class during periods when reimbursements, waivers or reductions occur.
GAnnualized.
HAmount does not include the portfolio activity of any underlying mutual funds or exchange-traded funds (ETFs).
Fidelity Advisor® Municipal Income Fund Class I |
| |
| | Six months ended (Unaudited) June 30, 2024 | | Years ended December 31, 2023 | | 2022 | | 2021 | | 2020 | | 2019 |
Selected Per-Share Data | | | | | | | | | | | | |
| Net asset value, beginning of period | $ | 12.34 | $ | 11.86 | $ | 13.56 | $ | 13.59 | $ | 13.39 | $ | 12.75 |
| Income from Investment Operations | | | | | | | | | | | | |
Net investment income (loss) A,B | | .179 | | .344 | | .311 | | .315 | | .339 | | .363 |
| Net realized and unrealized gain (loss) | | (.145) | | .475 | | (1.699) | | .057 | | .257 | | .689 |
| Total from investment operations | | .034 | | .819 | | (1.388) | | .372 | | .596 | | 1.052 |
| Distributions from net investment income | | (.174) | | (.339) | | (.312) | | (.315) | | (.338) | | (.361) |
| Distributions from net realized gain | | - | | - | | - | | (.087) | | (.058) | | (.051) |
| Total distributions | | (.174) | | (.339) | | (.312) | | (.402) | | (.396) | | (.412) |
| Net asset value, end of period | $ | 12.20 | $ | 12.34 | $ | 11.86 | $ | 13.56 | $ | 13.59 | $ | 13.39 |
Total Return C,D | | | | 7.04% | | (10.26)% | | 2.76% | | 4.54% | | 8.33% |
Ratios to Average Net Assets B,E,F | | | | | | | | | | | | |
| Expenses before reductions | | .53% G | | .54% | | .54% | | .53% | | .53% | | .53% |
| Expenses net of fee waivers, if any | | | | .54% | | .54% | | .53% | | .53% | | .53% |
| Expenses net of all reductions | | .52% G | | .54% | | .54% | | .53% | | .53% | | .53% |
| Net investment income (loss) | | 2.94% G | | 2.88% | | 2.55% | | 2.31% | | 2.54% | | 2.75% |
| Supplemental Data | | | | | | | | | | | | |
| Net assets, end of period (in millions) | $ | 1,105 | $ | 1,156 | $ | 834 | $ | 714 | $ | 619 | $ | 647 |
Portfolio turnover rate H | | | | 4% | | 23% | | 13% | | 16% | | 16% |
ACalculated based on average shares outstanding during the period.
BNet investment income (loss) is affected by the timing of the declaration of dividends by any underlying mutual funds or exchange-traded funds (ETFs). Net investment income (loss) of any mutual funds or ETFs is not included in the Fund's net investment income (loss) ratio.
CTotal returns for periods of less than one year are not annualized.
DTotal returns would have been lower if certain expenses had not been reduced during the applicable periods shown.
EFees and expenses of any underlying mutual funds or exchange-traded funds (ETFs) are not included in the Fund's expense ratio. The Fund indirectly bears its proportionate share of these expenses. For additional expense information related to investments in Fidelity Central Funds, please refer to the "Investments in Fidelity Central Funds" note found in the Notes to Financial Statements section of the most recent Annual or Semi-Annual report.
FExpense ratios reflect operating expenses of the class. Expenses before reductions do not reflect amounts reimbursed, waived, or reduced through arrangements with the investment adviser, brokerage services, or other offset arrangements, if applicable, and do not represent the amount paid by the class during periods when reimbursements, waivers or reductions occur.
GAnnualized.
HAmount does not include the portfolio activity of any underlying mutual funds or exchange-traded funds (ETFs).
Fidelity Advisor® Municipal Income Fund Class Z |
| |
| | Six months ended (Unaudited) June 30, 2024 | | Years ended December 31, 2023 | | 2022 | | 2021 | | 2020 | | 2019 |
Selected Per-Share Data | | | | | | | | | | | | |
| Net asset value, beginning of period | $ | 12.34 | $ | 11.86 | $ | 13.57 | $ | 13.60 | $ | 13.39 | $ | 12.75 |
| Income from Investment Operations | | | | | | | | | | | | |
Net investment income (loss) A,B | | .185 | | .359 | | .327 | | .331 | | .352 | | .378 |
| Net realized and unrealized gain (loss) | | (.144) | | .476 | | (1.710) | | .057 | | .269 | | .689 |
| Total from investment operations | | .041 | | .835 | | (1.383) | | .388 | | .621 | | 1.067 |
| Distributions from net investment income | | (.181) | | (.355) | | (.327) | | (.331) | | (.353) | | (.376) |
| Distributions from net realized gain | | - | | - | | - | | (.087) | | (.058) | | (.051) |
| Total distributions | | (.181) | | (.355) | | (.327) | | (.418) | | (.411) | | (.427) |
| Net asset value, end of period | $ | 12.20 | $ | 12.34 | $ | 11.86 | $ | 13.57 | $ | 13.60 | $ | 13.39 |
Total Return C,D | | | | 7.17% | | (10.22)% | | 2.88% | | 4.74% | | 8.45% |
Ratios to Average Net Assets B,E,F | | | | | | | | | | | | |
| Expenses before reductions | | .41% G | | .42% | | .42% | | .42% | | .42% | | .42% |
| Expenses net of fee waivers, if any | | | | .42% | | .42% | | .42% | | .42% | | .42% |
| Expenses net of all reductions | | .41% G | | .42% | | .42% | | .42% | | .42% | | .42% |
| Net investment income (loss) | | 3.05% G | | 3.01% | | 2.67% | | 2.42% | | 2.65% | | 2.86% |
| Supplemental Data | | | | | | | | | | | | |
| Net assets, end of period (in millions) | $ | 408 | $ | 355 | $ | 235 | $ | 235 | $ | 196 | $ | 97 |
Portfolio turnover rate H | | | | 4% | | 23% | | 13% | | 16% | | 16% |
ACalculated based on average shares outstanding during the period.
BNet investment income (loss) is affected by the timing of the declaration of dividends by any underlying mutual funds or exchange-traded funds (ETFs). Net investment income (loss) of any mutual funds or ETFs is not included in the Fund's net investment income (loss) ratio.
CTotal returns would have been lower if certain expenses had not been reduced during the applicable periods shown.
DTotal returns for periods of less than one year are not annualized.
EFees and expenses of any underlying mutual funds or exchange-traded funds (ETFs) are not included in the Fund's expense ratio. The Fund indirectly bears its proportionate share of these expenses. For additional expense information related to investments in Fidelity Central Funds, please refer to the "Investments in Fidelity Central Funds" note found in the Notes to Financial Statements section of the most recent Annual or Semi-Annual report.
FExpense ratios reflect operating expenses of the class. Expenses before reductions do not reflect amounts reimbursed, waived, or reduced through arrangements with the investment adviser, brokerage services, or other offset arrangements, if applicable, and do not represent the amount paid by the class during periods when reimbursements, waivers or reductions occur.
GAnnualized.
HAmount does not include the portfolio activity of any underlying mutual funds or exchange-traded funds (ETFs).
Notes to Financial Statements
(Unaudited)For the period ended June 30, 2024
(Amounts in thousands except percentages)
1. Organization.
Fidelity Municipal Income Fund (the Fund) is a fund of Fidelity Municipal Trust (the Trust) and is authorized to issue an unlimited number of shares. The Trust is registered under the Investment Company Act of 1940, as amended (the 1940 Act), as an open-end management investment company organized as a Massachusetts business trust. The Fund offers Class A, Class M, Class C, Fidelity Municipal Income Fund, Class I and Class Z shares, each of which has equal rights as to assets and voting privileges. Class A, Class M, Class C, Class I and Class Z are Fidelity Advisor classes. Each class has exclusive voting rights with respect to matters that affect that class. Class C shares will automatically convert to Class A shares after a holding period of eight years from the initial date of purchase, with certain exceptions.
2. Investments in Fidelity Central Funds.
Funds may invest in Fidelity Central Funds, which are open-end investment companies generally available only to other investment companies and accounts managed by the investment adviser and its affiliates. The Schedule of Investments lists any Fidelity Central Funds held as an investment as of period end, but does not include the underlying holdings of each Fidelity Central Fund. An investing fund indirectly bears its proportionate share of the expenses of the underlying Fidelity Central Funds.
Based on its investment objective, each Fidelity Central Fund may invest or participate in various investment vehicles or strategies that are similar to those of the investing fund. These strategies are consistent with the investment objectives of the investing fund and may involve certain economic risks which may cause a decline in value of each of the Fidelity Central Funds and thus a decline in the value of the investing fund.
| Fidelity Central Fund | Investment Manager | Investment Objective | Investment Practices | Expense RatioA |
| Fidelity Money Market Central Funds | Fidelity Management & Research Company LLC (FMR) | Each fund seeks to obtain a high level of current income consistent with the preservation of capital and liquidity. | Short-term Investments | Less than .005% |
A Expenses expressed as a percentage of average net assets and are as of each underlying Central Fund's most recent annual or semi-annual shareholder report.
A complete unaudited list of holdings for each Fidelity Central Fund is available upon request or at the Securities and Exchange Commission website at www.sec.gov. In addition, the financial statements of the Fidelity Central Funds which contain the significant accounting policies (including investment valuation policies) of those funds, and are not covered by the Report of Independent Registered Public Accounting Firm, are available on the Securities and Exchange Commission website or upon request.
3. Significant Accounting Policies.
The Fund is an investment company and applies the accounting and reporting guidance of the Financial Accounting Standards Board (FASB) Accounting Standards Codification Topic 946 Financial Services - Investment Companies. The financial statements have been prepared in conformity with accounting principles generally accepted in the United States of America (GAAP), which require management to make certain estimates and assumptions at the date of the financial statements. Actual results could differ from those estimates. Subsequent events, if any, through the date that the financial statements were issued have been evaluated in the preparation of the financial statements. The Fund's Schedule of Investments lists any underlying mutual funds or exchange-traded funds (ETFs) but does not include the underlying holdings of these funds. The following summarizes the significant accounting policies of the Fund:
Investment Valuation. Investments are valued as of 4:00 p.m. Eastern time on the last calendar day of the period. The Board of Trustees (the Board) has designated the Fund's investment adviser as the valuation designee responsible for the fair valuation function and performing fair value determinations as needed. The investment adviser has established a Fair Value Committee (the Committee) to carry out the day-to-day fair valuation responsibilities and has adopted policies and procedures to govern the fair valuation process and the activities of the Committee. In accordance with these fair valuation policies and procedures, which have been approved by the Board, the Fund attempts to obtain prices from one or more third party pricing services or brokers to value its investments. When current market prices, quotations or currency exchange rates are not readily available or reliable, investments will be fair valued in good faith by the Committee, in accordance with the policies and procedures. Factors used in determining fair value vary by investment type and may include market or investment specific events, transaction data, estimated cash flows, and market observations of comparable investments. The frequency that the fair valuation procedures are used cannot be predicted and they may be utilized to a significant extent. The Committee manages the Fund's fair valuation practices and maintains the fair valuation policies and procedures. The Fund's investment adviser reports to the Board information regarding the fair valuation process and related material matters.
The Fund categorizes the inputs to valuation techniques used to value its investments into a disclosure hierarchy consisting of three levels as shown below:
Level 1 - unadjusted quoted prices in active markets for identical investments
Level 2 - other significant observable inputs (including quoted prices for similar investments, interest rates, prepayment speeds, etc.)
Level 3 - unobservable inputs (including the Fund's own assumptions based on the best information available)
Valuation techniques used to value the Fund's investments by major category are as follows:
Debt securities, including restricted securities, are valued based on evaluated prices received from third party pricing services or from brokers who make markets in such securities. Municipal securities are valued by pricing services who utilize matrix pricing which considers yield or price of bonds of comparable quality, coupon, maturity and type or by broker-supplied prices. When independent prices are unavailable or unreliable, debt securities may be valued utilizing pricing methodologies which consider similar factors that would be used by third party pricing services. Debt securities are generally categorized as Level 2 in the hierarchy but may be Level 3 depending on the circumstances.
Investments in open-end mutual funds, including the Fidelity Central Funds, are valued at their closing net asset value (NAV) each business day and are categorized as Level 1 in the hierarchy.
Changes in valuation techniques may result in transfers in or out of an assigned level within the disclosure hierarchy. The aggregate value of investments by input level as of June 30, 2024 is included at the end of the Fund's Schedule of Investments.
Investment Transactions and Income. For financial reporting purposes, the Fund's investment holdings and NAV include trades executed through the end of the last business day of the period. The NAV per share for processing shareholder transactions is calculated as of the close of business of the New York Stock Exchange (NYSE), normally 4:00 p.m. Eastern time and includes trades executed through the end of the prior business day. Gains and losses on securities sold are determined on the basis of identified cost. Income and capital gain distributions from Fidelity Central Funds, if any, are recorded on the ex-dividend date. Interest income is accrued as earned and includes coupon interest and amortization of premium and accretion of discount on debt securities as applicable. Debt obligations may be placed on non-accrual status and related interest income may be reduced by ceasing current accruals and writing off interest receivables when the collection of all or a portion of interest has become doubtful based on consistently applied procedures. A debt obligation is removed from non-accrual status when the issuer resumes interest payments or when collectability of interest is reasonably assured.
Class Allocations and Expenses. Investment income, realized and unrealized capital gains and losses, common expenses of a fund, and certain fund-level expense reductions, if any, are allocated daily on a pro-rata basis to each class based on the relative net assets of each class to the total net assets of a fund. Each class differs with respect to transfer agent and distribution and service plan fees incurred, as applicable. Certain expense reductions may also differ by class, if applicable. For the reporting period, the allocated portion of income and expenses to each class as a percent of its average net assets may vary due to the timing of recording these transactions in relation to fluctuating net assets of the classes. Expenses directly attributable to a fund are charged to that fund. Expenses attributable to more than one fund are allocated among the respective funds on the basis of relative net assets or other appropriate methods. Expenses included in the accompanying financial statements reflect the expenses of that fund and do not include any expenses associated with any underlying mutual funds or exchange-traded funds (ETFs). Although not included in a fund's expenses, a fund indirectly bears its proportionate share of these expenses through the net asset value of each underlying mutual fund or exchange-traded fund (ETF). Expense estimates are accrued in the period to which they relate and adjustments are made when actual amounts are known.
Income Tax Information and Distributions to Shareholders. Each year, the Fund intends to qualify as a regulated investment company under Subchapter M of the Internal Revenue Code, including distributing substantially all of its taxable income and realized gains. As a result, no provision for U.S. Federal income taxes is required. During the period, the Fund incurred a corporate tax liability on undistributed net investment income which is included in Miscellaneous expense on the Statement of Operations. The Fund files a U.S. federal tax return, in addition to state and local tax returns as required. The Fund's federal income tax returns are subject to examination by the Internal Revenue Service (IRS) for a period of three fiscal years after they are filed. State and local tax returns may be subject to examination for an additional fiscal year depending on the jurisdiction.
Distributions are declared and recorded daily and paid monthly from net investment income. Distributions from realized gains, if any, are declared and recorded on the ex-dividend date. Income and capital gain distributions are declared separately for each class. Income and capital gain distributions are determined in accordance with income tax regulations, which may differ from GAAP.
Capital accounts within the financial statements are adjusted for permanent book-tax differences. These adjustments have no impact on net assets or the results of operations. Capital accounts are not adjusted for temporary book-tax differences which will reverse in a subsequent period.
Book-tax differences are primarily due to market discount and capital loss carryforwards.
As of period end, the cost and unrealized appreciation (depreciation) in securities, and derivatives if applicable, for federal income tax purposes were as follows:
| Gross unrealized appreciation | $82,966 |
| Gross unrealized depreciation | (175,117) |
| Net unrealized appreciation (depreciation) | $(92,151) |
| Tax cost | $4,693,107 |
Capital loss carryforwards are only available to offset future capital gains of the Fund to the extent provided by regulations and may be limited. The capital loss carryforward information presented below, including any applicable limitation, is estimated as of prior fiscal period end and is subject to adjustment.
Short-term | $(15,066) |
Long-term | (22,727) |
| Total capital loss carryforward | $(37,793) |
Delayed Delivery Transactions and When-Issued Securities. During the period, certain Funds transacted in securities on a delayed delivery or when-issued basis. Payment and delivery may take place after the customary settlement period for that security. The price of the underlying securities and the date when the securities will be delivered and paid for are fixed at the time the transaction is negotiated. Securities purchased on a delayed delivery or when-issued basis are identified as such in the Schedule of Investments. Compensation for interest forgone in the purchase of a delayed delivery or when-issued debt security may be received. With respect to purchase commitments, each applicable Fund identifies securities as segregated in its records with a value at least equal to the amount of the commitment. Payables and receivables associated with the purchases and sales of delayed delivery securities having the same coupon, settlement date and broker are offset. Delayed delivery or when-issued securities that have been purchased from and sold to different brokers are reflected as both payables and receivables in the Statement of Assets and Liabilities under the caption "Delayed delivery", as applicable. Losses may arise due to changes in the value of the underlying securities or if the counterparty does not perform under the contract's terms, or if the issuer does not issue the securities due to political, economic, or other factors.
Restricted Securities (including Private Placements). Funds may invest in securities that are subject to legal or contractual restrictions on resale. These securities generally may be resold in transactions exempt from registration or to the public if the securities are registered. Disposal of these securities may involve time-consuming negotiations and expense, and prompt sale at an acceptable price may be difficult. Information regarding restricted securities held at period end is included at the end of the Schedule of Investments, if applicable.
4. Purchases and Sales of Investments.
Purchases and sales of securities, other than short-term securities and in-kind transactions, as applicable, are noted in the table below.
| | Purchases ($) | Sales ($) |
| Fidelity Municipal Income Fund | 297,240 | 255,169 |
5. Fees and Other Transactions with Affiliates.
Management Fee. Fidelity Management & Research Company LLC (the investment adviser) and its affiliates provide the Fund with investment management related services for which the Fund pays a monthly management fee.
Effective March 1, 2024, the Fund's management contract was amended to incorporate administrative services previously covered under separate services agreements (Transfer Agent and Accounting agreements). The amended contract incorporates a management fee rate that may vary by class. The investment adviser or an affiliate pays certain expenses of managing and operating the Fund out of each class's management fee. Each class of the Fund pays a management fee to the investment adviser. The management fee is calculated and paid to the investment adviser every month. When determining a class's management fee, a mandate rate is calculated based on the monthly average net assets of a group of funds advised by FMR within a designated asset class. A discount rate is subtracted from the mandate rate once the Fund's monthly average net assets reach a certain level. The mandate rate and discount rate may vary by class. The annual management fee rate for a class of shares of the Fund is the lesser of (1) the class's mandate rate reduced by the class's discount rate (if applicable) or (2) the amount set forth in the following table.
| | Maximum Management Fee Rate % |
| Class A | .51 |
| Class M | .49 |
| Class C | .49 |
| Fidelity Municipal Income Fund | .43 |
| Class I | .52 |
| Class Z | .39 |
One-twelfth of the management fee rate for a class is applied to the average net assets of the class for the month, giving a dollar amount which is the management fee for the class for that month. A different management fee rate may be applicable to each class of the Fund. The difference between classes is the result of separate arrangements for class-level services and/or waivers of certain expenses. It is not the result of any difference in advisory or custodial fees or other expenses related to the management of the Fund's assets, which do not vary by class. For the portion of the reporting period on or after March 1, 2024, the total annualized management fee rates were as follows:
| | Total Management Fee Rate % |
| Class A | .50 |
| Class M | .49 |
| Class C | .49 |
| Fidelity Municipal Income Fund | .43 |
| Class I | .50 |
| Class Z | .39 |
Prior to March 1, 2024, the management fee was the sum of an individual fund fee rate that was based on an annual rate of .25% of the Fund's average net assets and an annualized group fee rate that averaged .10% during the period. The group fee rate was based upon the monthly average net assets of a group of registered investment companies with which the investment adviser has management contracts. The group fee rate decreased as assets under management increased and increased as assets under management decreased. For the portion of the reporting period prior to March 1, 2024, the total annualized management fee rate was .35%.
Effective March 1, 2024, the Fund's sub-advisory agreements with FMR Investment Management (UK) Limited, Fidelity Management & Research (Hong Kong) Limited, and Fidelity Management & Research (Japan) Limited were amended to provide that the investment adviser pays each sub-adviser monthly fees equal to 110% of the sub-adviser's costs for providing sub-advisory services.
Distribution and Service Plan Fees. In accordance with Rule 12b-1 of the 1940 Act, the Fund has adopted separate Distribution and Service Plans for each class of shares. Certain classes pay Fidelity Distributors Company LLC (FDC), an affiliate of the investment adviser, separate Distribution and Service Fees, each of which is based on an annual percentage of each class' average net assets. In addition, FDC may pay financial intermediaries for selling shares of the Fund and providing shareholder support services. For the period, the Distribution and Service Fee rates, total fees and amounts retained by FDC were as follows:
| | Distribution Fee | Service Fee | Total Fees ($) | Retained by FDC ($) |
| Class A | - % | .25% | 354 | 14 |
| Class M | - % | .25% | 93 | 1 |
| Class C | .75% | .25% | 111 | 23 |
| | | | 558 | 38 |
Sales Load. FDC may receive a front-end sales charge of up to 4.00% for selling Class A shares and Class M shares, some of which is paid to financial intermediaries for selling shares of the Fund. Depending on the holding period, FDC may receive contingent deferred sales charges levied on Class A, Class M and Class C redemptions. The deferred sales charges are 1.00% for Class C shares, .75% for certain purchases of Class A shares and .25% for certain purchases of Class M shares.
For the period, sales charge amounts retained by FDC were as follows:
| | Retained by FDC ($) |
| Class A | 6 |
| Class M | 1 |
Class C A | - B |
| | 7 |
A When Class C shares are initially sold, FDC pays commissions from its own resources to financial intermediaries through which the sales are made.
B Amount represents less than five hundred dollars.
Transfer Agent Fees. Fidelity Investments Institutional Operations Company LLC (FIIOC), an affiliate of the investment adviser, is the transfer, dividend disbursing and shareholder servicing agent for each class of the Fund. Effective March 1, 2024, the Fund's management contract was amended to incorporate transfer agent services and associated fees previously covered under a separate services agreement. FIIOC pays for typesetting, printing and mailing of shareholder reports, except proxy statements.
During the period January 1, 2024 through February 29, 2024, the transfer agent fees for each class were a fixed annual rate of class-level average net assets as follows:
| | Amount ($) | % of Class-Level Average Net Assets A | |
| Class A | 80 | .1688 | |
| Class M | 18 | .1454 | |
| Class C | 5 | .1461 | |
| Fidelity Municipal Income Fund | 427 | .0926 | |
| Class I | 335 | .1749 | |
| Class Z | 30 | .0500 | |
| | 895 | |
| | | | |
A Annualized.
Accounting Fees. Fidelity Service Company, Inc. (FSC), an affiliate of the investment adviser, maintains the Fund's accounting records. Effective March 1, 2024, the Fund's management contract was amended to incorporate accounting services and associated fees previously covered under a separate services agreement.
During the period January 1, 2024 through February 29, 2024, the accounting fees were a fixed annual rate of average net assets as follows:
| | % of Average Net Assets |
| Fidelity Municipal Income Fund | .0141 |
Interfund Trades. Funds may purchase from or sell securities to other Fidelity Funds under procedures adopted by the Board. The procedures have been designed to ensure these interfund trades are executed in accordance with Rule 17a-7 of the 1940 Act. Any interfund trades are included within the respective purchases and sales amounts shown in the Purchases and Sales of Investments note. During the period, there were no interfund trades.
6. Committed Line of Credit.
Certain Funds participate with other funds managed by the investment adviser or an affiliate in a $4.25 billion credit facility (the "line of credit") to be utilized for temporary or emergency purposes to fund shareholder redemptions or for other short-term liquidity purposes. The participating funds have agreed to pay commitment fees on their pro-rata portion of the line of credit, which are reflected in Miscellaneous expenses on the Statement of Operations, and are listed below. During the period, there were no borrowings on this line of credit.
| | Amount ($) |
| Fidelity Municipal Income Fund | 4 |
7. Expense Reductions.
Through arrangements with the Fund's custodian, credits realized as a result of certain uninvested cash balances were used to reduce the Fund's expenses. During the period, custodian credits reduced the Fund's expenses by an amount of less than five hundred dollars.
In addition, during the period the investment adviser or an affiliate reimbursed and/or waived a portion of fund-level operating expenses in the amount of $110.
8. Distributions to Shareholders.
Distributions to shareholders of each class were as follows:
| | Six months ended June 30, 2024 | Year ended December 31, 2023 |
| Fidelity Municipal Income Fund | | |
| Distributions to shareholders | | |
| Class A | $3,688 | $7,118 |
| Class M | 974 | 2,028 |
| Class C | 208 | 442 |
| Fidelity Municipal Income Fund | 40,228 | 80,821 |
| Class I | 16,023 | 29,017 |
| Class Z | 5,698 | 8,738 |
Total | $66,819 | $128,164 |
9. Share Transactions.
Share transactions for each class were as follows and may contain in-kind transactions, automatic conversions between classes or exchanges between affiliated funds:
| | Shares | Shares | Dollars | Dollars |
| | Six months ended June 30, 2024 | Year ended December 31, 2023 | Six months ended June 30, 2024 | Year ended December 31, 2023 |
| Fidelity Municipal Income Fund | | | | |
| Class A | | | | |
| Shares sold | 1,858 | 3,568 | $22,659 | $42,727 |
| Reinvestment of distributions | 233 | 535 | 2,844 | 6,403 |
| Shares redeemed | (2,123) | (3,599) | (25,925) | (42,868) |
| Net increase (decrease) | (32) | 504 | $(422) | $6,262 |
| Class M | | | | |
| Shares sold | 109 | 162 | $1,322 | $1,943 |
| Reinvestment of distributions | 70 | 150 | 859 | 1,790 |
| Shares redeemed | (390) | (891) | (4,760) | (10,686) |
| Net increase (decrease) | (211) | (579) | $(2,579) | $(6,953) |
| Class C | | | | |
| Shares sold | 169 | 420 | $2,052 | $5,060 |
| Reinvestment of distributions | 15 | 34 | 187 | 411 |
| Shares redeemed | (222) | (767) | (2,710) | (9,192) |
| Net increase (decrease) | (38) | (313) | $(471) | $(3,721) |
| Fidelity Municipal Income Fund | | | | |
| Shares sold | 12,780 | 25,181 | $156,213 | $299,407 |
| Reinvestment of distributions | 2,452 | 4,986 | 29,896 | 59,681 |
| Shares redeemed | (17,390) | (38,976) | (212,420) | (465,366) |
| Net increase (decrease) | (2,158) | (8,809) | $(26,311) | $(106,278) |
| Class I | | | | |
| Shares sold | 13,439 | 54,308 | $164,238 | $648,131 |
| Reinvestment of distributions | 506 | 944 | 6,169 | 11,282 |
| Shares redeemed | (17,059) | (31,890) | (208,279) | (378,696) |
| Net increase (decrease) | (3,114) | 23,362 | $(37,872) | $280,717 |
| Class Z | | | | |
| Shares sold | 7,672 | 16,561 | $93,636 | $198,051 |
| Reinvestment of distributions | 374 | 582 | 4,552 | 6,953 |
| Shares redeemed | (3,348) | (8,184) | (40,808) | (97,187) |
| Net increase (decrease) | 4,698 | 8,959 | $57,380 | $107,817 |
10. Other.
A fund's organizational documents provide former and current trustees and officers with a limited indemnification against liabilities arising in connection with the performance of their duties to the fund. In the normal course of business, a fund may also enter into contracts that provide general indemnifications. A fund's maximum exposure under these arrangements is unknown as this would be dependent on future claims that may be made against a fund. The risk of material loss from such claims is considered remote.
11. Risk and Uncertainties.
Many factors affect a fund's performance. Developments that disrupt global economies and financial markets, such as pandemics, epidemics, outbreaks of infectious diseases, war, terrorism, and environmental disasters, may significantly affect a fund's investment performance. The effects of these developments to a fund will be impacted by the types of securities in which a fund invests, the financial condition, industry, economic sector, and geographic location of an issuer, and a fund's level of investment in the securities of that issuer. Significant concentrations in security types, issuers, industries, sectors, and geographic locations may magnify the factors that affect a fund's performance.
Item 8: Changes in and Disagreements with Accountants for Open-End Management Investment Companies
Note: This is not applicable for any fund included in this document.
Item 9: Proxy Disclosures for Open-End Management Investment Companies
Note: This is not applicable for any fund included in this document.
Item 10: Remuneration Paid to Directors, Officers, and others of Open-End Management Investment Companies
Note: This information is disclosed as part of the financial statements for each Fund as part of Item 7: Financial Statements and Financial Highlights for Open-End Management Investment companies.
Item 11: Statement Regarding Basis for Approval of Investment Advisory Contract
Board Approval of Investment Advisory Contracts
Fidelity Municipal Income Fund
At its January 2024 meeting, the Board of Trustees, including the Independent Trustees (together, the Board), approved an amended and restated management contract with Fidelity Management & Research Company LLC (FMR) (the Management Contract), and amended and restated sub-advisory agreements (the Sub-Advisory Contracts, and together with the Management Contract, the Advisory Contracts) for the fund, including the fund's sub-advisory agreements with FMR Investment Management (UK) Limited (FMR UK), Fidelity Management & Research (Hong Kong) Limited (FMR H.K.), and Fidelity Management & Research (Japan) Limited (FMR Japan). The Advisory Contracts will be effective March 1, 2024. The Board will consider the annual renewal of the fund's Advisory Contracts in September 2024, following its review of additional materials provided by FMR.
Management Contract. The Board approved the Management Contract, which implements a new fee structure combining the management fee, transfer agent fee (TA Fee), and pricing and bookkeeping fee (P&B Fee) of the fund and each class into a single class-level fee based on tiered schedules and subject to a maximum class-level rate (the Unified Fee). In exchange for the Unified Fee, the fund will receive investment advisory, management, administrative, transfer agent, pricing and bookkeeping services under a single agreement - the Management Contract.
In its consideration of the Management Contract over several meetings, the Board received, reviewed and discussed a comprehensive set of analyses regarding the Unified Fee including (i) the legal framework, (ii) design goals for the Unified Fee, (iii) calculation methodology for the Unified Fee and illustrative examples, (iv) annual and cumulative projected impacts under various scenarios, both in the aggregate and at the fund/class level, (v) explanations of schedules, rate levers and maximum rates and (vi) shareholder benefits and projected savings.
The Board considered that the maximum Unified Fee for each class of the fund would be no higher than the sum of (i) the lowest contractual management fee under the fund's existing management contract, which is the individual fund fee, if any, plus the lowest contractual marginal group fee rate and (ii) the TA and P&B Fee rates, which are fixed fee rates since December 1, 2023 (together, the "Unified Fee Cap"). The Board noted that, as a result of this Unified Fee Cap, the Unified Fee would be no greater than the fees previously authorized to be charged for the same services. The Board noted that certain expenses such as third-party expenses, Rule 12b-1 fees, and certain other miscellaneous expenses would be outside the scope of the Unified Fee and the calculation of such fees would not change as a result of the Unified Fee. The Board considered that, under the Management Contract, a different management fee rate will be applicable to each class of the fund. The Board noted that Fidelity has represented that the difference in expenses between classes is based on differences in class-specific expenses and not due to any difference in advisory or third-party custodial fees or other expenses related to the management of the fund's assets.
The Board considered that implementation of the Unified Fee, which includes the Unified Fee Cap, would cause all funds subject to a Unified Fee, including the fund, to experience an immediate reduction on contractual fee rates for services provided under the current management contracts. The Board considered that some funds would not experience lower fees as a result of existing fee caps. The Board further considered that, in addition to the contractual fee savings, the Unified Fee offers funds and their shareholders greater protection from future rate increases for services previously offered under separate agreements that are now covered by the Management Contract because such rate increases would require shareholder, as well as Board, approval.
Sub-Advisory Contracts. In connection with the Unified Fee changes, the Board considered the Sub-Advisory Contracts, which changed the arrangements for fees paid by FMR to the sub-advisers under the agreements. The Board noted that the agreements with FMR UK, FMR H.K., and FMR Japan were amended to provide that FMR will compensate each sub-adviser at a fee equal to 110% of the sub-adviser's costs incurred in providing services under the agreement. The Board considered that, under the Sub-Advisory Contracts, FMR, and not the fund, will continue to pay the sub-advisory fees to each applicable sub-adviser.
The Board considered that the approval of the fund's Advisory Contracts will not result in any changes in the investment process or strategies employed in the management of the fund's assets or the day-to-day management of the fund or the persons primarily responsible for such management. Further, the Board considered that the Management Contract would not change the obligations and services of FMR and its affiliates on behalf of the fund, and, in particular, there would be no change in the nature and level of advisory, management, administration, transfer agent, and pricing and bookkeeping services provided to the fund by FMR and its affiliates.
In connection with its consideration of future renewals of the fund's Advisory Contracts, the Board will consider: (i) the nature, extent and quality of services provided to the funds, including shareholder and administrative services and investment performance; (ii) the competitiveness of the management fee and total expenses for the fund; (iii) the costs of the services and profitability, including the revenues earned and the expenses incurred in conducting the business of developing, marketing, distributing, managing, administering, and servicing the fund and its shareholders, to the extent applicable; and (iv) whether there have been economies of scale in respect of the Fidelity funds, whether the Fidelity funds (including the fund) have appropriately benefited from any such economies of scale, and whether there is the potential for realization of any further economies.
Based on its evaluation of all of the conclusions noted above, and after considering all factors it believed relevant, the Board concluded that the fund's management fee structure is fair and reasonable, and that the fund's Advisory Contracts should be approved.
1.704645.126
HIY-SANN-0824
Fidelity® Michigan Municipal Income Fund
Semi-Annual Report
June 30, 2024
Contents
To view a fund's proxy voting guidelines and proxy voting record for the 12-month period ended June 30, visit http://www.fidelity.com/proxyvotingresults or visit the Securities and Exchange Commission's (SEC) web site at http://www.sec.gov.
You may also call 1-800-544-8544 to request a free copy of the proxy voting guidelines.
Standard & Poor's, S&P and S&P 500 are registered service marks of The McGraw-Hill Companies, Inc. and have been licensed for use by Fidelity Distributors Corporation.
Other third-party marks appearing herein are the property of their respective owners.
All other marks appearing herein are registered or unregistered trademarks or service marks of FMR LLC or an affiliated company. © 2024 FMR LLC. All rights reserved.
This report and the financial statements contained herein are submitted for the general information of the shareholders of the Fund. This report is not authorized for distribution to prospective investors in the Fund unless preceded or accompanied by an effective prospectus.
A fund files its complete schedule of portfolio holdings with the SEC for the first and third quarters of each fiscal year on Form N-PORT. Forms N-PORT are available on the SEC's web site at http://www.sec.gov. A fund's Forms N-PORT may be reviewed and copied at the SEC's Public Reference Room in Washington, DC. Information regarding the operation of the SEC's Public Reference Room may be obtained by calling 1-800-SEC-0330.
For a complete list of a fund's portfolio holdings, view the most recent holdings listing, semiannual report, or annual report on Fidelity's web site at http://www.fidelity.com, http://www.institutional.fidelity.com, or http://www.401k.com, as applicable.
NOT FDIC INSURED •MAY LOSE VALUE •NO BANK GUARANTEE
Neither the Fund nor Fidelity Distributors Corporation is a bank.
Item 7: Financial Statements and Financial Highlights for Open-End Management Investment Companies (Semi-Annual Report)
Fidelity® Michigan Municipal Income Fund
Schedule of Investments June 30, 2024 (Unaudited)
Showing Percentage of Net Assets
| Municipal Bonds - 96.4% |
| | | Principal Amount (a) | Value ($) |
| Guam - 0.2% | | | |
| Guam Pwr. Auth. Rev. Series 2022 A, 5% 10/1/44 | | 1,000,000 | 1,031,294 |
| Michigan - 94.5% | | | |
| Ann Arbor Pub. School District Series 2023, 4% 5/1/40 | | 3,000,000 | 3,069,170 |
| Berkley Mich School District Series 2024 II: | | | |
| 5% 5/1/30 | | 375,000 | 412,928 |
| 5% 5/1/31 | | 450,000 | 503,201 |
| 5% 5/1/32 | | 400,000 | 453,132 |
| 5% 5/1/33 | | 500,000 | 572,872 |
| 5% 5/1/34 | | 300,000 | 347,470 |
| 5% 5/1/35 | | 600,000 | 692,256 |
| 5% 5/1/36 | | 540,000 | 620,188 |
| 5% 5/1/37 | | 1,075,000 | 1,233,200 |
| 5% 5/1/38 | | 575,000 | 658,761 |
| 5% 5/1/39 | | 650,000 | 740,147 |
| 5% 5/1/40 | | 350,000 | 394,461 |
| 5% 5/1/41 | | 775,000 | 865,997 |
| Birmingham Ciy School District Series 2024: | | | |
| 5% 5/1/33 | | 350,000 | 400,719 |
| 5% 5/1/34 | | 425,000 | 486,305 |
| 5% 5/1/35 | | 450,000 | 512,718 |
| 5% 5/1/36 | | 300,000 | 340,384 |
| 5% 5/1/37 | | 280,000 | 317,814 |
| 5% 5/1/38 | | 600,000 | 678,741 |
| Bloomfield Hills Schools District Series 2020, 4% 5/1/50 | | 1,500,000 | 1,464,682 |
| Byron Ctr. Pub. Schools Series 2023 II, 5.25% 5/1/53 | | 3,570,000 | 3,855,045 |
| Chippewa Valley Schools Series 2016 A: | | | |
| 5% 5/1/32 | | 1,000,000 | 1,014,880 |
| 5% 5/1/33 | | 1,000,000 | 1,014,229 |
| 5% 5/1/34 | | 1,075,000 | 1,088,898 |
| Detroit Downtown Dev. Auth. Tax: | | | |
| (Catalyst Dev. Proj.) Series 2024, 5% 7/1/48 | | 1,000,000 | 1,047,373 |
| Series A, 5% 7/1/29 (Assured Guaranty Muni. Corp. Insured) | | 1,340,000 | 1,344,082 |
| Detroit Gen. Oblig.: | | | |
| Series 2020: | | | |
5.5% 4/1/35 | | 1,040,000 | 1,120,886 |
5.5% 4/1/36 | | 435,000 | 468,019 |
5.5% 4/1/37 | | 465,000 | 499,198 |
5.5% 4/1/38 | | 490,000 | 524,135 |
| Series 2021 A: | | | |
5% 4/1/37 | | 1,875,000 | 1,973,286 |
5% 4/1/39 | | 1,210,000 | 1,261,993 |
| Series 2023 C, 6% 5/1/43 | | 1,500,000 | 1,712,405 |
| Detroit Swr. Disp. Rev.: | | | |
| Series 2001 B, 5.5% 7/1/29 (Assured Guaranty Corp. Insured) | | 25,000 | 25,776 |
| Series 2006, 5% 7/1/36 (Nat'l. Pub. Fin. Guarantee Corp. Insured) | | 10,000 | 10,012 |
| Downriver Util. Wastewtr. Auth. Swr. Sys. Rev. Series 2018: | | | |
| 5% 4/1/33 (Assured Guaranty Muni. Corp. Insured) | | 735,000 | 775,830 |
| 5% 4/1/34 (Assured Guaranty Muni. Corp. Insured) | | 520,000 | 546,063 |
| 5% 4/1/35 (Assured Guaranty Muni. Corp. Insured) | | 500,000 | 523,849 |
| Farmington Pub. School District Gen. Oblig. Series 2020, 4% 5/1/40 | | 3,000,000 | 2,997,064 |
| Flint Hosp. Bldg. Auth. Rev. Series 2020: | | | |
| 4% 7/1/38 | | 1,800,000 | 1,677,817 |
| 4% 7/1/41 | | 1,395,000 | 1,257,344 |
| Gerald R. Ford Int'l. Arpt. Auth. Rev. Series 2021: | | | |
| 5% 1/1/26 (b) | | 225,000 | 229,696 |
| 5% 1/1/27 (b) | | 325,000 | 336,688 |
| 5% 1/1/28 (b) | | 235,000 | 247,143 |
| 5% 1/1/29 (b) | | 525,000 | 559,104 |
| 5% 1/1/30 (b) | | 425,000 | 459,170 |
| 5% 1/1/31 (b) | | 725,000 | 792,252 |
| 5% 1/1/32 (b) | | 725,000 | 801,562 |
| 5% 1/1/33 (b) | | 1,000,000 | 1,105,456 |
| 5% 1/1/34 (b) | | 1,000,000 | 1,105,449 |
| 5% 1/1/37 (b) | | 700,000 | 770,152 |
| 5% 1/1/38 (b) | | 1,170,000 | 1,282,075 |
| 5% 1/1/39 (b) | | 1,000,000 | 1,088,585 |
| 5% 1/1/40 (b) | | 1,000,000 | 1,083,054 |
| 5% 1/1/41 (b) | | 1,100,000 | 1,186,969 |
| 5% 1/1/46 (b) | | 2,000,000 | 2,125,064 |
| Grand Rapids Pub. Schools Series 2017, 5% 5/1/29 (Assured Guaranty Muni. Corp. Insured) | | 480,000 | 499,655 |
| Grand Rapids San. Swr. Sys. Rev. Series 2018: | | | |
| 5% 1/1/34 | | 550,000 | 582,355 |
| 5% 1/1/38 | | 655,000 | 687,675 |
| Grand Rapids Wtr. Supply Sys. Series 2016: | | | |
| 5% 1/1/31 | | 250,000 | 255,674 |
| 5% 1/1/32 | | 320,000 | 327,263 |
| 5% 1/1/33 | | 550,000 | 562,483 |
| Grand Traverse County Hosp. Fin. Auth.: | | | |
| Series 2019 A: | | | |
5% 7/1/44 | | 1,110,000 | 1,150,235 |
5% 7/1/49 | | 2,615,000 | 2,662,542 |
| Series 2021, 3% 7/1/51 | | 2,440,000 | 1,921,911 |
| Grand Valley Michigan State Univ. Rev. Series 2018: | | | |
| 5% 12/1/34 | | 1,075,000 | 1,127,911 |
| 5% 12/1/35 | | 1,225,000 | 1,284,257 |
| 5% 12/1/37 | | 1,375,000 | 1,435,021 |
| 5% 12/1/38 | | 875,000 | 910,201 |
| 5% 12/1/43 | | 1,400,000 | 1,435,062 |
| Grandville Pub. Schools District Series 2020: | | | |
| 4% 5/1/39 (Assured Guaranty Muni. Corp. Insured) | | 1,000,000 | 1,002,877 |
| 4% 5/1/40 (Assured Guaranty Muni. Corp. Insured) | | 1,300,000 | 1,304,779 |
| Great Lakes Wtr. Auth. Sew Disp. Sys.: | | | |
| Series 2016 B, 5% 7/1/27 | | 15,000 | 15,500 |
| Series 2018 A, 5% 7/1/43 | | 5,000,000 | 5,187,261 |
| Series 2018 B, 5% 7/1/29 | | 15,000 | 16,330 |
| Great Lakes Wtr. Auth. Wtr. Supply Sys. Rev.: | | | |
| Series 2016 C, 5.25% 7/1/35 | | 2,000,000 | 2,061,591 |
| Series 2024 B, 5% 7/1/36 | | 1,500,000 | 1,725,990 |
| Grosse Pointe Pub. School Sys. Series 2021, 3% 5/1/33 | | 1,000,000 | 925,390 |
| Holland School District Series 2023 II: | | | |
| 4% 11/1/39 | | 1,855,000 | 1,876,279 |
| 4% 11/1/40 | | 1,915,000 | 1,932,319 |
| Kalamazoo County Mich Series 2021: | | | |
| 2% 5/1/38 | | 1,660,000 | 1,228,287 |
| 3% 5/1/30 | | 1,690,000 | 1,627,197 |
| Kalamazoo Hosp. Fin. Auth. Hosp. Facilities Rev. Series 2016: | | | |
| 5% 5/15/28 | | 775,000 | 792,283 |
| 5% 5/15/28 (Pre-Refunded to 5/15/26 @ 100) | | 5,000 | 5,145 |
| 5% 5/15/30 | | 4,970,000 | 5,072,660 |
| 5% 5/15/30 (Pre-Refunded to 5/15/26 @ 100) | | 30,000 | 30,871 |
| Kentwood Econ. Dev. Corp.: | | | |
| Series 2021, 4% 11/15/45 | | 500,000 | 412,960 |
| Series 2022: | | | |
4% 11/15/31 | | 970,000 | 933,917 |
4% 11/15/43 | | 2,250,000 | 1,903,182 |
| Lansing Board of Wtr. & Lt. Util. Rev.: | | | |
| Bonds Series 2021 B, 2%, tender 7/1/26 (c) | | 2,000,000 | 1,907,241 |
| Series 2024 A: | | | |
5% 7/1/25 | | 730,000 | 742,844 |
5% 7/1/26 | | 625,000 | 646,583 |
5% 7/1/27 | | 1,500,000 | 1,580,379 |
| Lansing Mich Series 2023 B, 4% 6/1/40 (Assured Guaranty Muni. Corp. Insured) | | 4,810,000 | 4,826,019 |
| Lincoln Consolidated School District Series 2016 A: | | | |
| 5% 5/1/29 | | 1,430,000 | 1,467,364 |
| 5% 5/1/31 | | 500,000 | 511,812 |
| 5% 5/1/32 | | 1,000,000 | 1,023,446 |
| Macomb Interceptor Drain Drainage District Series 2017 A, 5% 5/1/34 | | 1,750,000 | 1,818,288 |
| Marquette Board Lt. & Pwr. Elec. Util. Sys. Rev. Series 2016 A: | | | |
| 5% 7/1/29 | | 780,000 | 797,442 |
| 5% 7/1/30 | | 900,000 | 919,256 |
| 5% 7/1/31 | | 780,000 | 795,784 |
| 5% 7/1/32 | | 1,000,000 | 1,019,079 |
| 5% 7/1/33 | | 705,000 | 717,501 |
| Michigan Bldg. Auth. Rev.: | | | |
| (Facilities Prog.): | | | |
Series 2024 2, 5.25% 4/15/59 (d) | | 3,000,000 | 3,273,293 |
Series I, 3% 10/15/45 | | 8,670,000 | 6,974,686 |
| Series 2021 I, 3% 10/15/51 | | 1,770,000 | 1,347,727 |
| Michigan Fin. Auth. Act 38 Facss (The Henry Ford Health Detroit South Campus Central Util. Plant Proj.) Series 2024: | | | |
| 5% 2/28/38 | | 1,700,000 | 1,872,912 |
| 5% 2/28/39 | | 1,000,000 | 1,093,478 |
| 5.25% 2/29/40 | | 600,000 | 656,990 |
| Michigan Fin. Auth. Rev.: | | | |
| (Charter County of Wayne Criminal Justice Ctr. Proj.) Series 2018: | | | |
5% 11/1/33 | | 3,250,000 | 3,444,270 |
5% 11/1/35 | | 1,000,000 | 1,058,515 |
5% 11/1/36 | | 1,250,000 | 1,323,653 |
5% 11/1/38 | | 1,595,000 | 1,667,820 |
| (Detroit Wtr. And Sewerage Dept. Wtr. Supply Sys. Rev. Rfdg. Local Proj. Bonds) Series 2015, 5% 7/1/30 | | 10,000 | 10,124 |
| (Kalamazoo College Proj.) Series 2018: | | | |
4% 12/1/36 | | 790,000 | 783,131 |
4% 12/1/47 | | 2,610,000 | 2,380,184 |
| (Lawrence Technological Univ. Proj.) Series 2017, 5% 2/1/47 | | 3,195,000 | 2,973,482 |
| (Trinity Health Proj.) Series 2017: | | | |
5% 12/1/30 | | 710,000 | 746,284 |
5% 12/1/37 | | 3,270,000 | 3,391,109 |
| Bonds: | | | |
Series 2015 D2, 1.2%, tender 4/13/28 (c) | | 4,190,000 | 3,712,353 |
Series 2016 E1, 4%, tender 8/15/24 (c) | | 1,305,000 | 1,304,761 |
| Series 2014 H1, 5% 10/1/39 | | 4,725,000 | 4,730,868 |
| Series 2015 C: | | | |
5% 7/1/26 | | 570,000 | 576,287 |
5% 7/1/27 | | 1,465,000 | 1,480,906 |
5% 7/1/28 | | 1,500,000 | 1,516,139 |
| Series 2015 D1: | | | |
5% 7/1/34 | | 1,250,000 | 1,261,012 |
5% 7/1/35 | | 505,000 | 509,153 |
| Series 2015 D2, 5% 7/1/34 | | 1,000,000 | 1,009,781 |
| Series 2016: | | | |
5% 11/15/28 | | 2,655,000 | 2,727,616 |
5% 1/1/29 | | 1,000,000 | 1,018,286 |
5% 11/15/29 | | 4,950,000 | 5,087,088 |
5% 1/1/30 | | 1,000,000 | 1,018,567 |
5% 1/1/31 | | 1,170,000 | 1,191,952 |
5% 1/1/32 | | 1,895,000 | 1,929,424 |
5% 1/1/33 | | 1,915,000 | 1,949,161 |
5% 1/1/34 | | 2,135,000 | 2,173,712 |
5% 11/15/34 | | 1,135,000 | 1,163,959 |
5% 11/15/41 | | 5,730,000 | 5,825,900 |
| Series 2019 A: | | | |
3% 12/1/49 | | 2,000,000 | 1,561,866 |
4% 2/15/44 | | 4,140,000 | 4,022,248 |
4% 12/1/49 | | 8,180,000 | 7,733,177 |
4% 2/15/50 | | 6,530,000 | 6,080,081 |
5% 11/15/48 | | 11,865,000 | 12,283,852 |
| Series 2020 A: | | | |
4% 6/1/35 | | 2,000,000 | 2,035,087 |
4% 6/1/37 | | 2,000,000 | 2,006,691 |
4% 6/1/40 | | 2,000,000 | 1,967,539 |
4% 6/1/49 | | 4,250,000 | 3,852,224 |
| Series 2020: | | | |
4% 11/1/55 | | 2,500,000 | 2,280,568 |
5% 6/1/40 | | 3,000,000 | 3,126,811 |
| Series 2021: | | | |
3% 9/1/50 | | 2,320,000 | 1,656,308 |
5% 9/1/38 | | 1,270,000 | 1,339,480 |
| Series 2022: | | | |
4% 2/1/27 | | 145,000 | 141,327 |
4% 2/1/32 | | 285,000 | 268,855 |
4% 2/1/42 | | 1,120,000 | 942,991 |
4% 4/15/42 | | 2,000,000 | 1,947,054 |
| Series 2023: | | | |
5% 11/1/32 | | 1,110,000 | 1,109,564 |
5% 11/1/33 | | 1,250,000 | 1,251,212 |
5% 11/1/37 | | 2,000,000 | 1,988,134 |
5.25% 11/1/35 | | 1,400,000 | 1,418,488 |
| Michigan Gen. Oblig. Series 2020 A, 4% 5/15/40 | | 500,000 | 507,251 |
| Michigan Hosp. Fin. Auth. Rev.: | | | |
| Series 2010 F, 4% 11/15/47 | | 290,000 | 272,272 |
| Series 2010 F4, 5% 11/15/47 | | 6,070,000 | 6,319,482 |
| Michigan Hsg. Dev. Auth. Rental Hsg. Rev.: | | | |
| Series 2017 A, 3.75% 10/1/42 | | 2,000,000 | 1,818,789 |
| Series 2018 A, 3.8% 10/1/38 | | 3,965,000 | 3,854,681 |
| Series 2019 A1: | | | |
3.35% 10/1/49 | | 3,000,000 | 2,434,202 |
3.6% 10/1/60 | | 2,500,000 | 2,054,550 |
| Series 2020 A1, 0.65% 10/1/24 | | 225,000 | 223,016 |
| Michigan Hsg. Dev. Auth. Single Family Mtg. Rev.: | | | |
| Series 2019 B, 3.75% 6/1/50 | | 1,900,000 | 1,877,711 |
| Series 2020 C, 3% 6/1/51 | | 2,320,000 | 2,246,115 |
| Series 2021 A, 3% 6/1/52 | | 2,650,000 | 2,556,866 |
| Series 2022 A, 5% 6/1/53 | | 2,110,000 | 2,170,096 |
| Series 2022 D, 5.5% 6/1/53 | | 2,295,000 | 2,401,326 |
| Series 2023 A, 3.8% 12/1/33 | | 1,490,000 | 1,474,089 |
| Series 2023 B, 5.75% 6/1/54 | | 1,955,000 | 2,077,089 |
| Series 2024 A, 6% 6/1/54 | | 2,530,000 | 2,734,412 |
| Series A: | | | |
3.5% 12/1/50 | | 2,560,000 | 2,514,317 |
4% 12/1/48 | | 645,000 | 641,067 |
| Series C, 4.25% 6/1/49 | | 1,525,000 | 1,522,733 |
| Michigan State Hsg. Dev. Auth. Series 2021 A: | | | |
| 0.55% 4/1/25 | | 1,790,000 | 1,740,340 |
| 2.125% 10/1/36 | | 1,775,000 | 1,398,315 |
| 2.45% 10/1/46 | | 2,000,000 | 1,389,234 |
| 2.55% 10/1/51 | | 1,920,000 | 1,240,319 |
| Michigan State Univ. Revs.: | | | |
| Series 2019 C, 4% 2/15/44 | | 1,500,000 | 1,461,964 |
| Series 2024 A, 5.25% 8/15/54 | | 3,000,000 | 3,294,756 |
| Michigan Strategic Fund Ltd. Oblig. Rev.: | | | |
| (I-75 Impt. Proj.): | | | |
Series 2017, 5% 6/30/25 (b) | | 3,150,000 | 3,153,111 |
Series 2018: | | | |
4.25% 12/31/38 (Assured Guaranty Muni. Corp. Insured) (b) | | 5,840,000 | 5,791,326 |
5% 12/31/25 (b) | | 2,200,000 | 2,204,406 |
5% 12/31/26 (b) | | 490,000 | 497,534 |
5% 12/31/28 (b) | | 380,000 | 391,102 |
5% 6/30/29 (b) | | 35,000 | 36,053 |
5% 12/31/30 (b) | | 4,080,000 | 4,208,019 |
5% 6/30/31 (b) | | 470,000 | 485,428 |
5% 12/31/31 (b) | | 3,210,000 | 3,315,256 |
5% 12/31/32 (b) | | 1,785,000 | 1,843,345 |
5% 6/30/33 (b) | | 2,415,000 | 2,493,778 |
5% 12/31/33 (b) | | 2,000,000 | 2,065,364 |
| (The Detroit Edison Co. Exempt Facilities Proj.) Series 2008 ET2, 1.35% 8/1/29 | | 2,000,000 | 1,697,323 |
| (The Detroit Edison Co. Poll. Cont. Bonds Proj.) Series 1995 CC, 1.45% 9/1/30 | | 2,000,000 | 1,651,959 |
| (United Methodist Retirement Cmntys., Inc. Proj.) Series 2019, 5% 11/15/34 | | 500,000 | 494,792 |
| Bonds: | | | |
(Consumer Energy Co. Proj.) Series 2019, 1.8%, tender 10/1/24 (b)(c) | | 6,000,000 | 5,958,135 |
(DTE Elec. Co. Exempt Facilities Proj.) Series 2023 DT, 3.875%, tender 6/3/30 (b)(c) | | 7,000,000 | 7,080,020 |
(Graphic Packaging Int'l., LLC Coated Recycled Board Machine Proj.) Series 2021, 4%, tender 10/1/26 (b)(c) | | 5,000,000 | 5,006,156 |
| Series 2020: | | | |
4% 5/15/27 | | 425,000 | 412,635 |
5% 5/15/44 | | 1,500,000 | 1,349,619 |
| Michigan Technological Univ. Series 2021, 4% 10/1/46 | | 2,835,000 | 2,744,459 |
| Michigan Trunk Line Fund Rev. Series 2020 B, 4% 11/15/45 | | 1,500,000 | 1,467,021 |
| Northern Michigan Univ. Revs. Series 2021: | | | |
| 4% 6/1/39 | | 900,000 | 907,828 |
| 4% 6/1/40 | | 500,000 | 501,625 |
| 4% 6/1/41 | | 1,385,000 | 1,383,973 |
| 4% 6/1/46 | | 1,850,000 | 1,811,763 |
| 5% 6/1/32 | | 375,000 | 415,273 |
| 5% 6/1/33 | | 365,000 | 403,395 |
| 5% 6/1/34 | | 375,000 | 414,981 |
| 5% 6/1/35 | | 375,000 | 414,734 |
| 5% 6/1/36 | | 400,000 | 441,297 |
| Oakland Univ. Rev.: | | | |
| Series 2014: | | | |
5% 3/1/28 | | 335,000 | 335,397 |
5% 3/1/29 | | 525,000 | 525,622 |
| Series 2016: | | | |
5% 3/1/28 | | 1,150,000 | 1,177,350 |
5% 3/1/41 | | 1,475,000 | 1,490,513 |
| Pennfield Schools District Series 2022, 3% 5/1/51 | | 1,160,000 | 865,911 |
| Portage Pub. Schools: | | | |
| Series 2016: | | | |
5% 11/1/32 | | 2,500,000 | 2,556,829 |
5% 11/1/34 | | 1,250,000 | 1,275,742 |
| Series 2019, 4% 11/1/38 | | 2,000,000 | 2,007,650 |
| Series 2021, 4% 11/1/42 | | 1,000,000 | 993,859 |
| Ravenna Pub. Schools Gen. Oblig. Series 2021, 4% 5/1/51 | | 2,140,000 | 2,023,678 |
| Saginaw City School District Series 2021, 4% 5/1/47 | | 3,000,000 | 2,895,853 |
| Saginaw Hosp. Fin. Auth. Hosp. Rev. Series 2020 J: | | | |
| 4% 7/1/36 | | 770,000 | 773,738 |
| 4% 7/1/37 | | 820,000 | 821,579 |
| 4% 7/1/39 | | 1,430,000 | 1,409,338 |
| 4% 7/1/40 | | 490,000 | 478,054 |
| Utica Cmnty. Schools Series 2024, 5% 5/1/39 | | 1,250,000 | 1,413,281 |
| Warren Consolidated School District: | | | |
| Series 2016: | | | |
5% 5/1/34 | | 5,630,000 | 5,761,999 |
5% 5/1/35 | | 1,250,000 | 1,277,523 |
| Series 2017, 4% 5/1/25 (Assured Guaranty Muni. Corp. Insured) | | 500,000 | 502,128 |
| Series 2018, 5% 5/1/32 | | 1,100,000 | 1,156,782 |
| Wayne County Arpt. Auth. Rev.: | | | |
| Series 2014 C: | | | |
5% 12/1/29 (b) | | 720,000 | 721,809 |
5% 12/1/31 (b) | | 860,000 | 862,248 |
| Series 2015 G, 5% 12/1/36 | | 5,760,000 | 5,847,343 |
| Series 2017 A: | | | |
5% 12/1/37 | | 545,000 | 567,563 |
5% 12/1/42 | | 1,455,000 | 1,501,770 |
| Series 2018 D: | | | |
5% 12/1/30 (b) | | 5,865,000 | 6,144,045 |
5% 12/1/31 (b) | | 2,825,000 | 2,944,840 |
5% 12/1/32 (b) | | 2,945,000 | 3,069,642 |
| Series 2021 A, 5% 12/1/38 | | 1,250,000 | 1,375,566 |
| Series 2021 B: | | | |
5% 12/1/35 (b) | | 1,225,000 | 1,323,855 |
5% 12/1/37 (b) | | 1,520,000 | 1,627,954 |
5% 12/1/46 (b) | | 1,280,000 | 1,335,038 |
| Series 2023 B: | | | |
5.25% 12/1/37 (Assured Guaranty Muni. Corp. Insured) (b) | | 1,000,000 | 1,113,184 |
5.25% 12/1/38 (Assured Guaranty Muni. Corp. Insured) (b) | | 900,000 | 996,252 |
5.5% 12/1/39 (Assured Guaranty Muni. Corp. Insured) (b) | | 635,000 | 722,475 |
5.5% 12/1/41 (Assured Guaranty Muni. Corp. Insured) (b) | | 1,685,000 | 1,897,202 |
5.5% 12/1/42 (Assured Guaranty Muni. Corp. Insured) (b) | | 800,000 | 897,141 |
5.5% 12/1/43 (Assured Guaranty Muni. Corp. Insured) (b) | | 675,000 | 753,536 |
| Series 2023 D, 5.25% 12/1/37 (Assured Guaranty Muni. Corp. Insured) (b) | | 900,000 | 1,001,866 |
| Wayne State Univ. Revs.: | | | |
| Series 2019 A: | | | |
4% 11/15/38 | | 1,000,000 | 1,002,792 |
4% 11/15/39 | | 800,000 | 801,144 |
| Series 2023 A: | | | |
4% 11/15/39 (Build America Mutual Assurance Insured) | | 2,000,000 | 2,019,092 |
4% 11/15/40 (Build America Mutual Assurance Insured) | | 1,500,000 | 1,502,610 |
| Western Michigan Univ. Rev.: | | | |
| Series 2014: | | | |
5% 11/15/28 | | 650,000 | 652,987 |
5% 11/15/29 | | 750,000 | 753,335 |
5% 11/15/30 | | 855,000 | 858,612 |
5% 11/15/31 | | 700,000 | 702,697 |
| Series 2015 A, 5% 11/15/28 | | 2,505,000 | 2,533,783 |
| Series 2019 A, 5% 11/15/44 | | 2,000,000 | 2,095,984 |
| Series 2021 A: | | | |
5% 11/15/31 (Assured Guaranty Muni. Corp. Insured) | | 150,000 | 164,475 |
5% 11/15/32 (Assured Guaranty Muni. Corp. Insured) | | 300,000 | 328,597 |
5% 11/15/36 (Assured Guaranty Muni. Corp. Insured) | | 400,000 | 438,330 |
5% 11/15/38 (Assured Guaranty Muni. Corp. Insured) | | 625,000 | 678,730 |
5% 11/15/40 (Assured Guaranty Muni. Corp. Insured) | | 635,000 | 686,533 |
| Ypsilanti School District Series A: | | | |
| 5% 5/1/29 | | 1,305,000 | 1,342,611 |
| 5% 5/1/32 | | 2,000,000 | 2,056,204 |
TOTAL MICHIGAN | | | 440,875,363 |
| Puerto Rico - 1.7% | | | |
| Puerto Rico Commonwealth Pub. Impt. Gen. Oblig. Series 2021 A1: | | | |
| 0% 7/1/33 | | 1,643,730 | 1,096,795 |
| 5.625% 7/1/27 | | 195,000 | 203,449 |
| 5.625% 7/1/29 | | 595,000 | 638,147 |
| 5.75% 7/1/31 | | 1,410,000 | 1,565,719 |
| Puerto Rico Hsg. Fin. Auth. Series 2020, 5% 12/1/27 | | 1,340,000 | 1,394,520 |
| Puerto Rico Indl., Tourist, Edl., Med. And Envir. Cont. Facilities Fing. Auth. Series 2021: | | | |
| 4% 7/1/36 | | 195,000 | 185,545 |
| 5% 7/1/30 | | 845,000 | 886,827 |
| 5% 7/1/32 | | 360,000 | 380,582 |
| Puerto Rico Sales Tax Fing. Corp. Sales Tax Rev. Series 2019 A2, 4.329% 7/1/40 | | 1,780,000 | 1,756,136 |
TOTAL PUERTO RICO | | | 8,107,720 |
| TOTAL MUNICIPAL BONDS (Cost $466,972,557) | | | 450,014,377 |
| | | | |
| Municipal Notes - 2.3% |
| | | Principal Amount (a) | Value ($) |
| Michigan - 2.3% | | | |
| Michigan Fin. Auth. Rev. Series 2016 E3, 4.1% 7/5/24, VRDN (c) | | 5,100,000 | 5,100,000 |
| Michigan Hsg. Dev. Auth. Single Family Mtg. Rev.: | | | |
| (Single Family Mort 12/17/87 Proj.) Series 2009 C, 3.97% 7/5/24 (Liquidity Facility TD Banknorth, NA), VRDN (c) | | 1,335,000 | 1,335,000 |
| Series 2007 F, 4% 7/5/24 (Liquidity Facility TD Banknorth, NA), VRDN (b)(c) | | 4,000,000 | 4,000,000 |
| | | | |
| TOTAL MUNICIPAL NOTES (Cost $10,435,000) | | | 10,435,000 |
| | | | |
| Money Market Funds - 1.2% |
| | | Shares | Value ($) |
Fidelity Municipal Cash Central Fund 4.33% (e)(f) (Cost $5,682,180) | | 5,681,044 | 5,682,180 |
| | | | |
| TOTAL INVESTMENT IN SECURITIES - 99.9% (Cost $483,089,737) | 466,131,557 |
NET OTHER ASSETS (LIABILITIES) - 0.1% | 561,309 |
| NET ASSETS - 100.0% | 466,692,866 |
| | |
Security Type Abbreviations
| VRDN | - | VARIABLE RATE DEMAND NOTE (A debt instrument that is payable upon demand, either daily, weekly or monthly) |
Legend
| (a) | Amount is stated in United States dollars unless otherwise noted. |
| (b) | Private activity obligations whose interest is subject to the federal alternative minimum tax for individuals. |
| (c) | Coupon rates for floating and adjustable rate securities reflect the rates in effect at period end. |
| (d) | Security or a portion of the security purchased on a delayed delivery or when-issued basis. |
| (e) | Information in this report regarding holdings by state and security types does not reflect the holdings of the Fidelity Municipal Cash Central Fund. |
| (f) | Affiliated fund that is generally available only to investment companies and other accounts managed by Fidelity Investments. The rate quoted is the annualized seven-day yield of the fund at period end. A complete unaudited listing of the fund's holdings as of its most recent quarter end is available upon request. In addition, each Fidelity Central Fund's financial statements are available on the SEC's website or upon request. |
Affiliated Central Funds
Fiscal year to date information regarding the Fund's investments in Fidelity Central Funds, including the ownership percentage, is presented below.
| Affiliate | Value, beginning of period ($) | Purchases ($) | Sales Proceeds ($) | Dividend Income ($) | Realized Gain (loss) ($) | Change in Unrealized appreciation (depreciation) ($) | Value, end of period ($) | % ownership, end of period |
| Fidelity Municipal Cash Central Fund 4.33% | 9,622,000 | 53,130,832 | 57,071,154 | 152,345 | 502 | - | 5,682,180 | 0.3% |
| Total | 9,622,000 | 53,130,832 | 57,071,154 | 152,345 | 502 | - | 5,682,180 | |
| | | | | | | | | |
Amounts in the dividend income column in the above table include any capital gain distributions from underlying funds, which are presented in the corresponding line item in the Statement of Operations, if applicable.
Amounts included in the purchases and sales proceeds columns may include in-kind transactions, if applicable.
Investment Valuation
The following is a summary of the inputs used, as of June 30, 2024, involving the Fund's assets and liabilities carried at fair value. The inputs or methodology used for valuing securities may not be an indication of the risk associated with investing in those securities. For more information on valuation inputs, and their aggregation into the levels used below, please refer to the Investment Valuation section in the accompanying Notes to Financial Statements.
| Valuation Inputs at Reporting Date: |
| Description | Total ($) | Level 1 ($) | Level 2 ($) | Level 3 ($) |
Investments in Securities: | | | | |
|
| Municipal Securities | 460,449,377 | - | 460,449,377 | - |
|
| Money Market Funds | 5,682,180 | 5,682,180 | - | - |
| Total Investments in Securities: | 466,131,557 | 5,682,180 | 460,449,377 | - |
Financial Statements (Unaudited)
| Statement of Assets and Liabilities |
| | | | June 30, 2024 (Unaudited) |
| | | | | |
| Assets | | | | |
| Investment in securities, at value - See accompanying schedule: | | | | |
Unaffiliated issuers (cost $477,407,557) | $ | 460,449,377 | | |
Fidelity Central Funds (cost $5,682,180) | | 5,682,180 | | |
| | | | | |
| | | | | |
| Total Investment in Securities (cost $483,089,737) | | | $ | 466,131,557 |
| Cash | | | | 10,324 |
| Receivable for fund shares sold | | | | 130,484 |
| Interest receivable | | | | 4,518,965 |
| Distributions receivable from Fidelity Central Funds | | | | 27,611 |
| Other receivables | | | | 194 |
Total assets | | | | 470,819,135 |
| Liabilities | | | | |
| Payable for investments purchased on a delayed delivery basis | $ | 3,262,500 | | |
| Payable for fund shares redeemed | | 374,820 | | |
| Distributions payable | | 283,948 | | |
| Accrued management fee | | 170,932 | | |
| Other payables and accrued expenses | | 34,069 | | |
| Total liabilities | | | | 4,126,269 |
| Net Assets | | | $ | 466,692,866 |
| Net Assets consist of: | | | | |
| Paid in capital | | | $ | 496,070,363 |
| Total accumulated earnings (loss) | | | | (29,377,497) |
| Net Assets | | | $ | 466,692,866 |
Net Asset Value, offering price and redemption price per share ($466,692,866 ÷ 40,690,209 shares) | | | $ | 11.47 |
| Statement of Operations |
| | | | Six months ended June 30, 2024 (Unaudited) |
| Investment Income | | | | |
| Interest | | | $ | 7,349,773 |
| Income from Fidelity Central Funds | | | | 152,345 |
| Total income | | | | 7,502,118 |
| Expenses | | | | |
| Management fee | $ | 954,581 | | |
| Transfer agent fees | | 78,746 | | |
| Accounting fees and expenses | | 20,195 | | |
| Custodian fees and expenses | | 6,382 | | |
| Independent trustees' fees and expenses | | 628 | | |
| Registration fees | | 19,523 | | |
| Audit | | 26,704 | | |
| Legal | | 10,601 | | |
| Miscellaneous | | 885 | | |
| Total expenses before reductions | | 1,118,245 | | |
| Expense reductions | | (11,172) | | |
| Total expenses after reductions | | | | 1,107,073 |
| Net Investment income (loss) | | | | 6,395,045 |
| Realized and Unrealized Gain (Loss) | | | | |
| Net realized gain (loss) on: | | | | |
| Investment Securities: | | | | |
| Unaffiliated issuers | | (1,434,888) | | |
| Fidelity Central Funds | | 502 | | |
| Total net realized gain (loss) | | | | (1,434,386) |
| Change in net unrealized appreciation (depreciation) on investment securities | | | | (3,493,913) |
| Net gain (loss) | | | | (4,928,299) |
| Net increase (decrease) in net assets resulting from operations | | | $ | 1,466,746 |
| Statement of Changes in Net Assets |
| |
| | Six months ended June 30, 2024 (Unaudited) | | Year ended December 31, 2023 |
| Increase (Decrease) in Net Assets | | | | |
| Operations | | | | |
| Net investment income (loss) | $ | 6,395,045 | $ | 12,190,311 |
| Net realized gain (loss) | | (1,434,386) | | (7,364,134) |
| Change in net unrealized appreciation (depreciation) | | (3,493,913) | | 22,146,753 |
| Net increase (decrease) in net assets resulting from operations | | 1,466,746 | | 26,972,930 |
| Distributions to shareholders | | (6,258,582) | | (12,065,830) |
| | | | | |
| Share transactions | | | | |
| Proceeds from sales of shares | | 31,833,668 | | 67,072,433 |
| Reinvestment of distributions | | 4,574,348 | | 8,716,917 |
| Cost of shares redeemed | | (35,683,638) | | (116,762,011) |
| | | | | |
Net increase (decrease) in net assets resulting from share transactions | | 724,378 | | (40,972,661) |
| Total increase (decrease) in net assets | | (4,067,458) | | (26,065,561) |
| | | | | |
| Net Assets | | | | |
| Beginning of period | | 470,760,324 | | 496,825,885 |
| End of period | $ | 466,692,866 | $ | 470,760,324 |
| | | | | |
| Other Information | | | | |
| Shares | | | | |
| Sold | | 2,774,679 | | 5,949,640 |
| Issued in reinvestment of distributions | | 399,648 | | 775,301 |
| Redeemed | | (3,114,610) | | (10,413,316) |
| Net increase (decrease) | | 59,717 | | (3,688,375) |
| | | | | |
Financial Highlights
Fidelity® Michigan Municipal Income Fund |
| |
| | Six months ended (Unaudited) June 30, 2024 | | Years ended December 31, 2023 | | 2022 | | 2021 | | 2020 | | 2019 |
Selected Per-Share Data | | | | | | | | | | | | |
| Net asset value, beginning of period | $ | 11.59 | $ | 11.21 | $ | 12.64 | $ | 12.77 | $ | 12.47 | $ | 11.97 |
| Income from Investment Operations | | | | | | | | | | | | |
Net investment income (loss) A,B | | .157 | | .283 | | .261 | | .265 | | .283 | | .309 |
| Net realized and unrealized gain (loss) | | (.124) | | .377 | | (1.418) | | (.070) | | .347 | | .541 |
| Total from investment operations | | .033 | | .660 | | (1.157) | | .195 | | .630 | | .850 |
| Distributions from net investment income | | (.153) | | (.280) | | (.260) | | (.265) | | (.284) | | (.310) |
| Distributions from net realized gain | | - | | - | | (.013) | | (.060) | | (.046) | | (.040) |
| Total distributions | | (.153) | | (.280) | | (.273) | | (.325) | | (.330) | | (.350) |
| Net asset value, end of period | $ | 11.47 | $ | 11.59 | $ | 11.21 | $ | 12.64 | $ | 12.77 | $ | 12.47 |
Total Return C,D | | | | 6.00% | | (9.18)% | | 1.54% | | 5.11% | | 7.16% |
Ratios to Average Net Assets B,E,F | | | | | | | | | | | | |
| Expenses before reductions | | .48% G | | .49% | | .49% | | .48% | | .48% | | .48% |
| Expenses net of fee waivers, if any | | | | .49% | | .49% | | .48% | | .48% | | .48% |
| Expenses net of all reductions | | .48% G | | .49% | | .49% | | .48% | | .48% | | .48% |
| Net investment income (loss) | | 2.75% G | | 2.51% | | 2.25% | | 2.08% | | 2.25% | | 2.50% |
| Supplemental Data | | | | | | | | | | | | |
| Net assets, end of period (000 omitted) | $ | 466,693 | $ | 470,760 | $ | 496,826 | $ | 731,602 | $ | 716,407 | $ | 673,051 |
Portfolio turnover rate H | | | | 21% | | 8% | | 13% | | 13% | | 14% |
ACalculated based on average shares outstanding during the period.
BNet investment income (loss) is affected by the timing of the declaration of dividends by any underlying mutual funds or exchange-traded funds (ETFs). Net investment income (loss) of any mutual funds or ETFs is not included in the Fund's net investment income (loss) ratio.
CTotal returns for periods of less than one year are not annualized.
DTotal returns would have been lower if certain expenses had not been reduced during the applicable periods shown.
EFees and expenses of any underlying mutual funds or exchange-traded funds (ETFs) are not included in the Fund's expense ratio. The Fund indirectly bears its proportionate share of these expenses. For additional expense information related to investments in Fidelity Central Funds, please refer to the "Investments in Fidelity Central Funds" note found in the Notes to Financial Statements section of the most recent Annual or Semi-Annual report.
FExpense ratios reflect operating expenses of the class. Expenses before reductions do not reflect amounts reimbursed, waived, or reduced through arrangements with the investment adviser, brokerage services, or other offset arrangements, if applicable, and do not represent the amount paid by the class during periods when reimbursements, waivers or reductions occur.
GAnnualized.
HAmount does not include the portfolio activity of any underlying mutual funds or exchange-traded funds (ETFs).
Notes to Financial Statements
(Unaudited)For the period ended June 30, 2024
1. Organization.
Fidelity Michigan Municipal Income Fund (the Fund) is a non-diversified fund of Fidelity Municipal Trust (the Trust) and is authorized to issue an unlimited number of shares. Share transactions on the Statement of Changes in Net Assets may contain exchanges between affiliated funds. The Trust is registered under the Investment Company Act of 1940, as amended (the 1940 Act), as an open-end management investment company organized as a Massachusetts business trust. The Fund may be affected by economic and political developments in the state of Michigan.
2. Investments in Fidelity Central Funds.
Funds may invest in Fidelity Central Funds, which are open-end investment companies generally available only to other investment companies and accounts managed by the investment adviser and its affiliates. The Schedule of Investments lists any Fidelity Central Funds held as an investment as of period end, but does not include the underlying holdings of each Fidelity Central Fund. An investing fund indirectly bears its proportionate share of the expenses of the underlying Fidelity Central Funds.
Based on its investment objective, each Fidelity Central Fund may invest or participate in various investment vehicles or strategies that are similar to those of the investing fund. These strategies are consistent with the investment objectives of the investing fund and may involve certain economic risks which may cause a decline in value of each of the Fidelity Central Funds and thus a decline in the value of the investing fund.
| Fidelity Central Fund | Investment Manager | Investment Objective | Investment Practices | Expense RatioA |
| Fidelity Money Market Central Funds | Fidelity Management & Research Company LLC (FMR) | Each fund seeks to obtain a high level of current income consistent with the preservation of capital and liquidity. | Short-term Investments | Less than .005% |
A Expenses expressed as a percentage of average net assets and are as of each underlying Central Fund's most recent annual or semi-annual shareholder report.
A complete unaudited list of holdings for each Fidelity Central Fund is available upon request or at the Securities and Exchange Commission website at www.sec.gov. In addition, the financial statements of the Fidelity Central Funds which contain the significant accounting policies (including investment valuation policies) of those funds, and are not covered by the Report of Independent Registered Public Accounting Firm, are available on the Securities and Exchange Commission website or upon request.
3. Significant Accounting Policies.
The Fund is an investment company and applies the accounting and reporting guidance of the Financial Accounting Standards Board (FASB) Accounting Standards Codification Topic 946 Financial Services - Investment Companies. The financial statements have been prepared in conformity with accounting principles generally accepted in the United States of America (GAAP), which require management to make certain estimates and assumptions at the date of the financial statements. Actual results could differ from those estimates. Subsequent events, if any, through the date that the financial statements were issued have been evaluated in the preparation of the financial statements. The Fund's Schedule of Investments lists any underlying mutual funds or exchange-traded funds (ETFs) but does not include the underlying holdings of these funds. The following summarizes the significant accounting policies of the Fund:
Investment Valuation. Investments are valued as of 4:00 p.m. Eastern time on the last calendar day of the period. The Board of Trustees (the Board) has designated the Fund's investment adviser as the valuation designee responsible for the fair valuation function and performing fair value determinations as needed. The investment adviser has established a Fair Value Committee (the Committee) to carry out the day-to-day fair valuation responsibilities and has adopted policies and procedures to govern the fair valuation process and the activities of the Committee. In accordance with these fair valuation policies and procedures, which have been approved by the Board, the Fund attempts to obtain prices from one or more third party pricing services or brokers to value its investments. When current market prices, quotations or currency exchange rates are not readily available or reliable, investments will be fair valued in good faith by the Committee, in accordance with the policies and procedures. Factors used in determining fair value vary by investment type and may include market or investment specific events, transaction data, estimated cash flows, and market observations of comparable investments. The frequency that the fair valuation procedures are used cannot be predicted and they may be utilized to a significant extent. The Committee manages the Fund's fair valuation practices and maintains the fair valuation policies and procedures. The Fund's investment adviser reports to the Board information regarding the fair valuation process and related material matters.
The Fund categorizes the inputs to valuation techniques used to value its investments into a disclosure hierarchy consisting of three levels as shown below:
Level 1 - unadjusted quoted prices in active markets for identical investments
Level 2 - other significant observable inputs (including quoted prices for similar investments, interest rates, prepayment speeds, etc.)
Level 3 - unobservable inputs (including the Fund's own assumptions based on the best information available)
Valuation techniques used to value the Fund's investments by major category are as follows:
Debt securities, including restricted securities, are valued based on evaluated prices received from third party pricing services or from brokers who make markets in such securities. Municipal securities are valued by pricing services who utilize matrix pricing which considers yield or price of bonds of comparable quality, coupon, maturity and type or by broker-supplied prices. When independent prices are unavailable or unreliable, debt securities may be valued utilizing pricing methodologies which consider similar factors that would be used by third party pricing services. Debt securities are generally categorized as Level 2 in the hierarchy but may be Level 3 depending on the circumstances.
Investments in open-end mutual funds, including the Fidelity Central Funds, are valued at their closing net asset value (NAV) each business day and are categorized as Level 1 in the hierarchy.
Changes in valuation techniques may result in transfers in or out of an assigned level within the disclosure hierarchy. The aggregate value of investments by input level as of June 30, 2024 is included at the end of the Fund's Schedule of Investments.
Investment Transactions and Income. For financial reporting purposes, the Fund's investment holdings and NAV include trades executed through the end of the last business day of the period. The NAV per share for processing shareholder transactions is calculated as of the close of business of the New York Stock Exchange (NYSE), normally 4:00 p.m. Eastern time and includes trades executed through the end of the prior business day. Gains and losses on securities sold are determined on the basis of identified cost. Income and capital gain distributions from Fidelity Central Funds, if any, are recorded on the ex-dividend date. Interest income is accrued as earned and includes coupon interest and amortization of premium and accretion of discount on debt securities as applicable. Debt obligations may be placed on non-accrual status and related interest income may be reduced by ceasing current accruals and writing off interest receivables when the collection of all or a portion of interest has become doubtful based on consistently applied procedures. A debt obligation is removed from non-accrual status when the issuer resumes interest payments or when collectability of interest is reasonably assured.
Expenses. Expenses directly attributable to a fund are charged to that fund. Expenses attributable to more than one fund are allocated among the respective funds on the basis of relative net assets or other appropriate methods. Expenses included in the accompanying financial statements reflect the expenses of that fund and do not include any expenses associated with any underlying mutual funds or exchange-traded funds. Although not included in a fund's expenses, a fund indirectly bears its proportionate share of these expenses through the net asset value of each underlying mutual fund or exchange-traded fund. Expense estimates are accrued in the period to which they relate and adjustments are made when actual amounts are known.
Income Tax Information and Distributions to Shareholders. Each year, the Fund intends to qualify as a regulated investment company under Subchapter M of the Internal Revenue Code, including distributing substantially all of its taxable income and realized gains. As a result, no provision for U.S. Federal income taxes is required. The Fund files a U.S. federal tax return, in addition to state and local tax returns as required. The Fund's federal income tax returns are subject to examination by the Internal Revenue Service (IRS) for a period of three fiscal years after they are filed. State and local tax returns may be subject to examination for an additional fiscal year depending on the jurisdiction.
Distributions are declared and recorded daily and paid monthly from net investment income. Distributions from realized gains, if any, are declared and recorded on the ex-dividend date. Income and capital gain distributions are determined in accordance with income tax regulations, which may differ from GAAP.
Capital accounts within the financial statements are adjusted for permanent book-tax differences. These adjustments have no impact on net assets or the results of operations. Capital accounts are not adjusted for temporary book-tax differences which will reverse in a subsequent period.
Book-tax differences are primarily due to market discount, capital loss carryforwards and losses deferred due to wash sales.
The Fund purchases municipal securities whose interest, in the opinion of the issuer, is free from federal income tax. There is no assurance that the IRS will agree with this opinion. In the event the IRS determines that the issuer does not comply with relevant tax requirements, interest payments from a security could become federally taxable, possibly retroactively to the date the security was issued.
As of period end, the cost and unrealized appreciation (depreciation) in securities, and derivatives if applicable, for federal income tax purposes were as follows:
Gross unrealized appreciation | $4,459,371 |
Gross unrealized depreciation | (21,161,615) |
Net unrealized appreciation (depreciation) | $(16,702,244) |
Tax cost | $482,833,801 |
Capital loss carryforwards are only available to offset future capital gains of the Fund to the extent provided by regulations and may be limited. The capital loss carryforward information presented below, including any applicable limitation, is estimated as of prior fiscal period end and is subject to adjustment.
Short-term | $(983,759) |
Long-term | (10,256,717) |
| Total capital loss carryforward | $(11,240,476) |
Delayed Delivery Transactions and When-Issued Securities. During the period, certain Funds transacted in securities on a delayed delivery or when-issued basis. Payment and delivery may take place after the customary settlement period for that security. The price of the underlying securities and the date when the securities will be delivered and paid for are fixed at the time the transaction is negotiated. Securities purchased on a delayed delivery or when-issued basis are identified as such in the Schedule of Investments. Compensation for interest forgone in the purchase of a delayed delivery or when-issued debt security may be received. With respect to purchase commitments, each applicable Fund identifies securities as segregated in its records with a value at least equal to the amount of the commitment. Payables and receivables associated with the purchases and sales of delayed delivery securities having the same coupon, settlement date and broker are offset. Delayed delivery or when-issued securities that have been purchased from and sold to different brokers are reflected as both payables and receivables in the Statement of Assets and Liabilities under the caption "Delayed delivery", as applicable. Losses may arise due to changes in the value of the underlying securities or if the counterparty does not perform under the contract's terms, or if the issuer does not issue the securities due to political, economic, or other factors.
4. Purchases and Sales of Investments.
Purchases and sales of securities, other than short-term securities and in-kind transactions, as applicable, are noted in the table below.
| | Purchases ($) | Sales ($) |
Fidelity Michigan Municipal Income Fund | 48,752,603 | 36,837,195 |
5. Fees and Other Transactions with Affiliates.
Management Fee. Fidelity Management & Research Company LLC (the investment adviser) and its affiliates provide the Fund with investment management related services for which the Fund pays a monthly management fee.
Effective March 1, 2024, the Fund's management contract was amended to incorporate administrative services previously covered under separate services agreements (Transfer Agent and Accounting agreements). Any reference to "class" in this note shall mean "the Fund" as the Fund currently offers only one class of shares. The amended contract incorporates a management fee rate that may vary by class. The investment adviser or an affiliate pays certain expenses of managing and operating the Fund out of each class's management fee. Each class of the Fund pays a management fee to the investment adviser. The management fee is calculated and paid to the investment adviser every month. When determining a class's management fee, a mandate rate is calculated based on the monthly average net assets of a group of funds advised by FMR within a designated asset class. A discount rate is subtracted from the mandate rate once the Fund's monthly average net assets reach a certain level. The mandate rate and discount rate may vary by class. The annual management fee rate for a class of shares of the Fund is the lesser of (1) the class's mandate rate reduced by the class's discount rate (if applicable) or (2) the amount set forth in the following table.
| | Maximum Management Fee Rate % |
| Fidelity Michigan Municipal Income Fund | .44 |
One-twelfth of the management fee rate for a class is applied to the average net assets of the class for the month, giving a dollar amount which is the management fee for the class for that month. A different management fee rate may be applicable to each class of the Fund. The difference between classes is the result of separate arrangements for class-level services and/or waivers of certain expenses. It is not the result of any difference in advisory or custodial fees or other expenses related to the management of the Fund's assets, which do not vary by class. For the portion of the reporting period on or after March 1, 2024, the total annualized management fee rates were as follows:
| | Total Management Fee Rate % |
| Fidelity Michigan Municipal Income Fund | .44 |
Prior to March 1, 2024, the management fee was the sum of an individual fund fee rate that was based on an annual rate of .25% of the Fund's average net assets and an annualized group fee rate that averaged .10% during the period. The group fee rate was based upon the monthly average net assets of a group of registered investment companies with which the investment adviser has management contracts. The group fee rate decreased as assets under management increased and increased as assets under management decreased. For the portion of the reporting period prior to March 1, 2024, the total annualized management fee rate was .35%.
Effective March 1, 2024, the Fund's sub-advisory agreements with FMR Investment Management (UK) Limited, Fidelity Management & Research (Hong Kong) Limited, and Fidelity Management & Research (Japan) Limited were amended to provide that the investment adviser pays each sub-adviser monthly fees equal to 110% of the sub-adviser's costs for providing sub-advisory services.
Transfer Agent Fees. Fidelity Investments Institutional Operations Company LLC (FIIOC), an affiliate of the investment adviser, is the transfer, dividend disbursing and shareholder servicing agent for the Fund. Effective March 1, 2024, each Fund's management contract was amended to incorporate transfer agent services and associated fees previously covered under a separate services agreement. FIIOC pays for typesetting, printing and mailing of shareholder reports, except proxy statements.
During the period January 1, 2024 through February 29, 2024, the transfer agent fees were a fixed annual rate of .1006% of average net assets.
Accounting Fees. Fidelity Service Company, Inc. (FSC), an affiliate of the investment adviser, maintains the Fund's accounting records. Effective March 1, 2024, the Fund's management contract was amended to incorporate accounting services and associated fees previously covered under a separate services agreement.
During the period January 1, 2024 through February 29, 2024, the accounting fees were a fixed annual rate of average net assets as follows:
| | % of Average Net Assets |
Fidelity Michigan Municipal Income Fund | .0258 |
Interfund Trades. Funds may purchase from or sell securities to other Fidelity Funds under procedures adopted by the Board. The procedures have been designed to ensure these interfund trades are executed in accordance with Rule 17a-7 of the 1940 Act. Any interfund trades are included within the respective purchases and sales amounts shown in the Purchases and Sales of Investments note. Interfund trades during the period are noted in the table below.
| | Purchases ($) | Sales ($) | Realized Gain (Loss)($) |
Fidelity Michigan Municipal Income Fund | - | 5,000,000 | - |
6. Committed Line of Credit.
Certain Funds participate with other funds managed by the investment adviser or an affiliate in a $4.25 billion credit facility (the "line of credit") to be utilized for temporary or emergency purposes to fund shareholder redemptions or for other short-term liquidity purposes. The participating funds have agreed to pay commitment fees on their pro-rata portion of the line of credit, which are reflected in Miscellaneous expenses on the Statement of Operations, and are listed below. During the period, there were no borrowings on this line of credit.
| | Amount ($) |
Fidelity Michigan Municipal Income Fund | 435 |
7. Expense Reductions.
Through arrangements with the Fund's custodian, credits realized as a result of certain uninvested cash balances were used to reduce the Fund's expenses by $93.
In addition, during the period the investment adviser or an affiliate reimbursed and/or waived a portion of operating expenses in the amount of $11,079.
8. Other.
A fund's organizational documents provide former and current trustees and officers with a limited indemnification against liabilities arising in connection with the performance of their duties to the fund. In the normal course of business, a fund may also enter into contracts that provide general indemnifications. A fund's maximum exposure under these arrangements is unknown as this would be dependent on future claims that may be made against a fund. The risk of material loss from such claims is considered remote.
9. Risk and Uncertainties.
Many factors affect a fund's performance. Developments that disrupt global economies and financial markets, such as pandemics, epidemics, outbreaks of infectious diseases, war, terrorism, and environmental disasters, may significantly affect a fund's investment performance. The effects of these developments to a fund will be impacted by the types of securities in which a fund invests, the financial condition, industry, economic sector, and geographic location of an issuer, and a fund's level of investment in the securities of that issuer. Significant concentrations in security types, issuers, industries, sectors, and geographic locations may magnify the factors that affect a fund's performance.
Item 8: Changes in and Disagreements with Accountants for Open-End Management Investment Companies
Note: This is not applicable for any fund included in this document.
Item 9: Proxy Disclosures for Open-End Management Investment Companies
Note: This is not applicable for any fund included in this document.
Item 10: Remuneration Paid to Directors, Officers, and others of Open-End Management Investment Companies
Note: This information is disclosed as part of the financial statements for each Fund as part of Item 7: Financial Statements and Financial Highlights for Open-End Management Investment companies.
Item 11: Statement Regarding Basis for Approval of Investment Advisory Contract
Board Approval of Investment Advisory Contracts
Fidelity Michigan Municipal Income Fund
At its January 2024 meeting, the Board of Trustees, including the Independent Trustees (together, the Board), approved an amended and restated management contract with Fidelity Management & Research Company LLC (FMR) (the Management Contract), and amended and restated sub-advisory agreements (the Sub-Advisory Contracts, and together with the Management Contract, the Advisory Contracts) for the fund, including the fund's sub-advisory agreements with FMR Investment Management (UK) Limited (FMR UK), Fidelity Management & Research (Hong Kong) Limited (FMR H.K.), and Fidelity Management & Research (Japan) Limited (FMR Japan). The Advisory Contracts will be effective March 1, 2024. The Board will consider the annual renewal of the fund's Advisory Contracts in September 2024, following its review of additional materials provided by FMR.
Management Contract. The Board approved the Management Contract, which implements a new fee structure combining the management fee, transfer agent fee (TA Fee), and pricing and bookkeeping fee (P&B Fee) of the fund into a single fee based on tiered schedules and subject to a maximum rate (the Unified Fee). In exchange for the Unified Fee, the fund will receive investment advisory, management, administrative, transfer agent, pricing and bookkeeping services under a single agreement - the Management Contract.
In its consideration of the Management Contract over several meetings, the Board received, reviewed and discussed a comprehensive set of analyses regarding the Unified Fee including (i) the legal framework, (ii) design goals for the Unified Fee, (iii) calculation methodology for the Unified Fee and illustrative examples, (iv) annual and cumulative projected impacts under various scenarios, both in the aggregate and at the fund/class level, (v) explanations of schedules, rate levers and maximum rates and (vi) shareholder benefits and projected savings.
The Board considered that the maximum Unified Fee for the fund would be no higher than the sum of (i) the lowest contractual management fee under the fund's existing management contract, which is the individual fund fee, if any, plus the lowest contractual marginal group fee rate and (ii) the TA and P&B Fee rates, which are fixed fee rates since December 1, 2023 (together, the "Unified Fee Cap"). The Board noted that, as a result of this Unified Fee Cap, the Unified Fee would be no greater than the fees previously authorized to be charged for the same services. The Board noted that certain expenses such as third-party expenses and certain other miscellaneous expenses would be outside the scope of the Unified Fee and the calculation of such fees would not change as a result of the Unified Fee.
The Board considered that implementation of the Unified Fee, which includes the Unified Fee Cap, would cause all funds subject to a Unified Fee, including the fund, to experience an immediate reduction on contractual fee rates for services provided under the current management contracts. The Board considered that some funds would not experience lower fees as a result of existing fee caps. The Board further considered that, in addition to the contractual fee savings, the Unified Fee offers funds and their shareholders greater protection from future rate increases for services previously offered under separate agreements that are now covered by the Management Contract because such rate increases would require shareholder, as well as Board, approval.
Sub-Advisory Contracts. In connection with the Unified Fee changes, the Board considered the Sub-Advisory Contracts, which changed the arrangements for fees paid by FMR to the sub-advisers under the agreements. The Board noted that the agreements with FMR UK, FMR H.K., and FMR Japan were amended to provide that FMR will compensate each sub-adviser at a fee equal to 110% of the sub-adviser's costs incurred in providing services under the agreement. The Board considered that, under the Sub-Advisory Contracts, FMR, and not the fund, will continue to pay the sub-advisory fees to each applicable sub-adviser.
The Board considered that the approval of the fund's Advisory Contracts will not result in any changes in the investment process or strategies employed in the management of the fund's assets or the day-to-day management of the fund or the persons primarily responsible for such management. Further, the Board considered that the Management Contract would not change the obligations and services of FMR and its affiliates on behalf of the fund, and, in particular, there would be no change in the nature and level of advisory, management, administration, transfer agent, and pricing and bookkeeping services provided to the fund by FMR and its affiliates.
In connection with its consideration of future renewals of the fund's Advisory Contracts, the Board will consider: (i) the nature, extent and quality of services provided to the funds, including shareholder and administrative services and investment performance; (ii) the competitiveness of the management fee and total expenses for the fund; (iii) the costs of the services and profitability, including the revenues earned and the expenses incurred in conducting the business of developing, marketing, distributing, managing, administering, and servicing the fund and its shareholders, to the extent applicable; and (iv) whether there have been economies of scale in respect of the Fidelity funds, whether the Fidelity funds (including the fund) have appropriately benefited from any such economies of scale, and whether there is the potential for realization of any further economies.
Based on its evaluation of all of the conclusions noted above, and after considering all factors it believed relevant, the Board concluded that the fund's management fee structure is fair and reasonable, and that the fund's Advisory Contracts should be approved.
1.705626.126
MIR-SANN-0824
Fidelity Flex® Funds
Fidelity Flex® Conservative Income Municipal Bond Fund
Semi-Annual Report
June 30, 2024
Contents
To view a fund's proxy voting guidelines and proxy voting record for the 12-month period ended June 30, visit http://www.fidelity.com/proxyvotingresults or visit the Securities and Exchange Commission's (SEC) web site at http://www.sec.gov.
You may also call 1-800-544-3455 (for managed account clients) or 1-800-835-5092 (for retirement plan participants) to request a free copy of the proxy voting guidelines.
Standard & Poor's, S&P and S&P 500 are registered service marks of The McGraw-Hill Companies, Inc. and have been licensed for use by Fidelity Distributors Corporation.
Other third-party marks appearing herein are the property of their respective owners.
All other marks appearing herein are registered or unregistered trademarks or service marks of FMR LLC or an affiliated company. © 2024 FMR LLC. All rights reserved.
This report and the financial statements contained herein are submitted for the general information of the shareholders of the Fund. This report is not authorized for distribution to prospective investors in the Fund unless preceded or accompanied by an effective prospectus.
A fund files its complete schedule of portfolio holdings with the SEC for the first and third quarters of each fiscal year on Form N-PORT. Forms N-PORT are available on the SEC's web site at http://www.sec.gov. A fund's Forms N-PORT may be reviewed and copied at the SEC's Public Reference Room in Washington, DC. Information regarding the operation of the SEC's Public Reference Room may be obtained by calling 1-800-SEC-0330.
For a complete list of a fund's portfolio holdings, view the most recent holdings listing, semiannual report, or annual report on Fidelity's web site at http://www.fidelity.com, http://www.institutional.fidelity.com, or http://www.401k.com, as applicable.
NOT FDIC INSURED •MAY LOSE VALUE •NO BANK GUARANTEE
Neither the Fund nor Fidelity Distributors Corporation is a bank.
Item 7: Financial Statements and Financial Highlights for Open-End Management Investment Companies (Semi-Annual Report)
Fidelity Flex® Conservative Income Municipal Bond Fund
Schedule of Investments June 30, 2024 (Unaudited)
Showing Percentage of Net Assets
| Municipal Bonds - 57.8% |
| | | Principal Amount (a) | Value ($) |
| Alabama - 0.8% | | | |
| Black Belt Energy Gas District: | | | |
| Series 2022 C1: | | | |
5.25% 12/1/24 | | 60,000 | 60,235 |
5.25% 12/1/25 | | 95,000 | 96,441 |
| Series 2022 E: | | | |
5% 6/1/25 | | 90,000 | 90,677 |
5% 6/1/26 | | 125,000 | 127,057 |
| Series 2023 C, 5.5% 6/1/27 | | 80,000 | 82,918 |
| Jefferson County Swr. Rev. Series 2024: | | | |
| 5% 10/1/24 | | 20,000 | 20,050 |
| 5% 10/1/25 | | 90,000 | 91,450 |
| 5% 10/1/26 | | 55,000 | 56,651 |
| 5% 10/1/27 | | 50,000 | 52,235 |
| Mobile Indl. Dev. Board Poll. Cont. Rev. Bonds (Alabama Pwr. Co. Barry Plant Proj.): | | | |
| Series 2007 C, 3.78%, tender 6/16/26 (b) | | 100,000 | 100,107 |
| Series 2008, 3.65%, tender 1/10/25 (b) | | 700,000 | 698,377 |
TOTAL ALABAMA | | | 1,476,198 |
| Alaska - 0.8% | | | |
| Alaska Int'l. Arpts. Revs. Series 2021 C, 5% 10/1/25 (c) | | 1,410,000 | 1,432,500 |
| Arizona - 1.9% | | | |
| Bullhead City Excise Taxes Series 2021 2, 0.6% 7/1/24 | | 275,000 | 275,000 |
| Chandler Indl. Dev. Auth. Indl. Dev. Rev. Bonds (Intel Corp. Proj.) Series 2022 2, 5%, tender 9/1/27 (b)(c) | | 835,000 | 857,179 |
| Maricopa County Indl. Dev. Auth. Series 2024 D: | | | |
| 5% 12/1/25 (d) | | 360,000 | 365,774 |
| 5% 12/1/26 (d) | | 455,000 | 468,574 |
| 5% 12/1/27 (d) | | 365,000 | 381,138 |
| Phoenix Civic Impt. Board Arpt. Rev.: | | | |
| Series 2017 D, 5% 7/1/24 | | 225,000 | 225,000 |
| Series 2023, 5% 7/1/26 (c) | | 185,000 | 189,878 |
| Phoenix Indl. Solid Waste Disp. Rev. Bonds (Republic Svc., Inc. Proj.) Series 2013, 4.05%, tender 8/1/24 (b)(c) | | 600,000 | 600,096 |
TOTAL ARIZONA | | | 3,362,639 |
| California - 2.7% | | | |
| California Health Facilities Fing. Auth. Rev. Bonds Series 2016 B2, 4%, tender 10/1/24 (b) | | 600,000 | 599,757 |
| California Muni. Fin. Auth. Solid Waste Disp. Rev. Bonds: | | | |
| (Republic Svcs., Inc. Proj.): | | | |
Series 2021 A, 4%, tender 10/1/24 (b)(c) | | 400,000 | 400,008 |
Series 2021 B, 4%, tender 7/15/24 (b)(c) | | 1,000,000 | 999,969 |
| (Waste Mgmt., Inc. Proj.) Series 2017 A, 4.25%, tender 12/2/24 (b)(c) | | 800,000 | 800,283 |
| California Poll. Cont. Fing. Auth. Solid Waste Disp. Rev. Bonds: | | | |
| (Republic Svcs. INC. Proj.) Series 2023, 4.125%, tender 8/15/24 (b)(c)(e) | | 700,000 | 699,583 |
| (Republic Svcs., Inc. Proj.) Series 2017 A1, 4.05%, tender 7/15/24 (b)(c)(e) | | 1,000,000 | 1,000,004 |
| Los Angeles Dept. Arpt. Rev.: | | | |
| Series 2022 C, 5% 5/15/26 (c) | | 200,000 | 205,233 |
| Series 2022 G, 5% 5/15/25 (c) | | 65,000 | 65,762 |
| Series 2023 A: | | | |
5% 5/15/25 (c) | | 30,000 | 30,352 |
5% 5/15/26 (c) | | 55,000 | 56,439 |
TOTAL CALIFORNIA | | | 4,857,390 |
| Colorado - 0.7% | | | |
| Colorado Health Facilities Auth. Rev. Series 2014 E, 5% 11/15/24 | | 200,000 | 200,082 |
| Colorado Hsg. & Fin. Auth. Multi-family Hsg. Rev. Bonds (The Reserves at Eagle Point Proj.) Series 2024, 3.5%, tender 11/1/26 (b) | | 400,000 | 399,098 |
| Denver City & County Arpt. Rev.: | | | |
| Series 2018 A, 5% 12/1/27 (c) | | 275,000 | 285,788 |
| Series 2022 A, 5% 11/15/25 (c) | | 165,000 | 168,241 |
| Maiker Hsg. Partners Colo Multi Bonds Series 2023, 4.5%, tender 5/1/26 (b) | | 200,000 | 200,083 |
TOTAL COLORADO | | | 1,253,292 |
| Connecticut - 1.1% | | | |
| Connecticut Health & Edl. Facilities Auth. Rev. Bonds: | | | |
| Series 2010 A3, 2.95%, tender 7/1/27 (b) | | 260,000 | 255,599 |
| Series 2010 A4, 1.1%, tender 2/11/25 (b) | | 510,000 | 500,100 |
| Series 2017 C2, 2.8%, tender 2/3/26 (b) | | 1,100,000 | 1,084,507 |
| Hartford Gen. Oblig. Series 2015 C, 5% 7/15/25 (Assured Guaranty Muni. Corp. Insured) | | 105,000 | 106,922 |
TOTAL CONNECTICUT | | | 1,947,128 |
| District Of Columbia - 1.0% | | | |
| District of Columbia Hsg. Fin. Agcy. Multi-family Hsg. Rev. Bonds (One Hawaii Avenue Proj.) Series 2024, 3.65%, tender 7/1/27 (b) | | 340,000 | 339,361 |
| Metropolitan Washington DC Arpts. Auth. Sys. Rev.: | | | |
| Series 2014 A, 5% 10/1/24 (c) | | 110,000 | 110,280 |
| Series 2017 A, 5% 10/1/24 (c) | | 100,000 | 100,254 |
| Series 2020 A, 5% 10/1/24 (c) | | 400,000 | 401,016 |
| Series 2024 A: | | | |
5% 10/1/26 (c)(d) | | 235,000 | 241,711 |
5% 10/1/27 (c)(d) | | 535,000 | 554,743 |
| Washington Metropolitan Area Transit Auth. Series 2023 A, 5% 7/15/24 | | 100,000 | 100,051 |
TOTAL DISTRICT OF COLUMBIA | | | 1,847,416 |
| Florida - 3.2% | | | |
| Broward County Fin. Auth. Multi-family Hsg. Rev. Bonds Series 2023, 4.05%, tender 3/1/26 (b) | | 125,000 | 125,153 |
| Citizens Property Ins. Corp. Series 2015 A1, 5% 6/1/25 (Pre-Refunded to 12/1/24 @ 100) | | 345,000 | 347,109 |
| Florida Hsg. Fin. Corp. Multi-family Mtg. Rev. Bonds: | | | |
| Series 2023 C, 5%, tender 12/1/25 (b) | | 75,000 | 75,918 |
| Series 2024 E, 3.8%, tender 6/1/27 (b) | | 185,000 | 185,441 |
| Hillsborough County Aviation Auth. Rev. Series 2022 A, 5% 10/1/24 (c) | | 200,000 | 200,518 |
| Jacksonville Spl. Rev. Series 2022 A: | | | |
| 5% 10/1/24 | | 35,000 | 35,122 |
| 5% 10/1/25 | | 25,000 | 25,525 |
| Lee County Arpt. Rev. Series 2021 A, 5% 10/1/24 (c) | | 55,000 | 55,115 |
| Miami Dade County Hsg. Multifamily Hsg. Rev. Bonds Series 2023: | | | |
| 3.55%, tender 1/1/26 (b) | | 290,000 | 286,405 |
| 5%, tender 9/1/25 (b) | | 250,000 | 252,330 |
| 5%, tender 9/1/25 (b) | | 135,000 | 136,473 |
| 5%, tender 10/1/25 (b) | | 420,000 | 426,215 |
| Miami-Dade County Indl. Dev. Auth. Solid Waste Disp. Rev. Bonds: | | | |
| (Waste Mgmt., Inc. Proj.) Series 2018 A, 0.000% x SIFMA Municipal Swap Index 4.255%, tender 7/1/24 (b)(c)(f) | | 270,000 | 269,976 |
| Series 2011, 5%, tender 11/1/24 (b)(c) | | 200,000 | 200,561 |
| Series 2018 B, SIFMA Municipal Swap Index + 0.000% 4.255%, tender 7/5/24 (b)(c)(f) | | 3,000,000 | 2,999,762 |
| Orange County Health Facilities Auth. Bonds Series 2021 C, 5%, tender 11/15/26 (b) | | 190,000 | 195,911 |
TOTAL FLORIDA | | | 5,817,534 |
| Georgia - 2.4% | | | |
| Atlanta Arpt. Rev.: | | | |
| Series 2019 B, 5% 7/1/24 (c) | | 100,000 | 100,000 |
| Series 2020 B, 5% 7/1/25 (c) | | 75,000 | 75,988 |
| Burke County Indl. Dev. Auth. Poll. Cont. Rev.: | | | |
| (Georgia Pwr. Co. Plant Vogtle Proj.) Series 1994, 3.7%, tender 6/13/28 (b) | | 155,000 | 156,231 |
| Bonds (Georgia Pwr. Co. Plant Vogtle Proj.): | | | |
Series 1995 4, 3.8%, tender 5/21/26 (b) | | 200,000 | 200,509 |
Series 2008 2, 3.375%, tender 3/12/27 (b) | | 85,000 | 84,345 |
Series 2012, 2.875%, tender 8/19/25 (b) | | 210,000 | 206,936 |
| Main Street Natural Gas, Inc.: | | | |
| Bonds Series 2019 B, 4%, tender 12/2/24 (b) | | 265,000 | 265,118 |
| Series 2022 A, 4% 12/1/25 | | 70,000 | 69,604 |
| Series 2022 B, 5% 6/1/26 | | 1,900,000 | 1,935,476 |
| Series 2023 B, 5% 3/1/25 | | 390,000 | 391,683 |
| Series 2023 D, 5% 12/1/26 | | 75,000 | 76,825 |
| Series 2024 B, 5% 3/1/26 | | 350,000 | 354,412 |
| Monroe County Dev. Auth. Poll. Cont. Rev. Bonds (Georgia Pwr. Co. Plant Scherer Proj.) Series 2009, 3.875%, tender 3/6/26 (b) | | 170,000 | 170,575 |
| Paulding County Hosp. Auth. Rev. Series 2022 A, 5% 4/1/25 | | 150,000 | 151,583 |
TOTAL GEORGIA | | | 4,239,285 |
| Guam - 0.1% | | | |
| Guam Pwr. Auth. Rev. Series 2022 A: | | | |
| 5% 10/1/24 | | 70,000 | 70,118 |
| 5% 10/1/25 | | 85,000 | 86,005 |
TOTAL GUAM | | | 156,123 |
| Hawaii - 0.2% | | | |
| Honolulu City & County Multi-family housing Rev. Bonds Series 2023, 5%, tender 6/1/26 (b) | | 370,000 | 377,350 |
| Illinois - 3.6% | | | |
| Chicago O'Hare Int'l. Arpt. Rev. Series 2022 A, 5% 1/1/25 (c) | | 270,000 | 271,297 |
| Cook County Gen. Oblig. Series 2022 A: | | | |
| 5% 11/15/24 | | 350,000 | 351,649 |
| 5% 11/15/25 | | 255,000 | 260,242 |
| Illinois Dev. Fin. Auth. Solid Waste Disp. Rev. Bonds (Waste Mgmt., Inc. Proj.) Series 2019, 5%, tender 11/1/24 (b)(c) | | 800,000 | 802,243 |
| Illinois Fin. Auth. Rev. Series 2015 A, 5% 11/15/24 | | 100,000 | 100,390 |
| Illinois Gen. Oblig.: | | | |
| Series 2017 D: | | | |
5% 11/1/24 | | 1,700,000 | 1,706,922 |
5% 11/1/26 | | 85,000 | 87,746 |
| Series 2022 B: | | | |
5% 3/1/25 | | 865,000 | 872,270 |
5% 3/1/26 | | 340,000 | 347,742 |
| Series 2023 C, 5% 5/1/25 | | 1,090,000 | 1,102,326 |
| Series 2024 B: | | | |
5% 5/1/27 | | 125,000 | 129,827 |
5% 5/1/28 | | 85,000 | 89,522 |
| Illinois Hsg. Dev. Auth. Multi-family Hsg. Rev. Bonds Series 2023: | | | |
| 4%, tender 6/1/25 (b) | | 195,000 | 195,001 |
| 5%, tender 2/1/26 (b) | | 90,000 | 91,134 |
| 5%, tender 2/1/26 (b) | | 100,000 | 101,260 |
TOTAL ILLINOIS | | | 6,509,571 |
| Indiana - 0.4% | | | |
| Indianapolis Local Pub. Impt. Bond Bank (Indianapolis Arpt. Auth. Proj.) Series 2023 I2: | | | |
| 5% 1/1/25 (c) | | 105,000 | 105,505 |
| 5% 1/1/26 (c) | | 65,000 | 66,119 |
| 5% 1/1/27 (c) | | 130,000 | 133,608 |
| Whiting Envir. Facilities Rev. Bonds (BP Products North America, Inc. Proj.) Series 2019 A, 5%, tender 6/5/26 (b)(c) | | 370,000 | 376,857 |
TOTAL INDIANA | | | 682,089 |
| Kentucky - 1.4% | | | |
| Kentucky Econ. Dev. Fin. Auth. Solid Waste Disp. Rev. Bonds (Republic Svcs., Inc. Proj.): | | | |
| Series A, 4.2%, tender 9/3/24 (b)(c) | | 800,000 | 800,331 |
| Series B, 3.9%, tender 9/3/24 (b) | | 800,000 | 800,328 |
| Kentucky, Inc. Pub. Energy Bonds Series 2019 A1, 4%, tender 6/1/25 (b) | | 150,000 | 150,172 |
| Trimble County Envirl Facilities Re Bonds Series 2023, 4.7%, tender 6/1/27 (b)(c) | | 800,000 | 804,599 |
TOTAL KENTUCKY | | | 2,555,430 |
| Louisiana - 0.2% | | | |
| Louisiana Hsg. Corp. Multifamily Hsg. Rev. Bonds (Ridge Commons Proj.) Series 2024 B, 3.75%, tender 2/1/27 (b) | | 370,000 | 369,422 |
| Maryland - 0.4% | | | |
| Maryland Cmnty. Dev. Admin Dept. Hsg. & Cmnty. Dev. Series 2023 D, 3.5% 1/1/26 | | 495,000 | 490,125 |
| Maryland Dept. of Trans. Series 2022 A, 5% 12/1/24 | | 25,000 | 25,163 |
| Maryland Health & Higher Edl. Bonds Series 2020, 5%, tender 7/1/25 (b) | | 185,000 | 186,146 |
TOTAL MARYLAND | | | 701,434 |
| Massachusetts - 0.6% | | | |
| Massachusetts Edl. Fing. Auth. Rev.: | | | |
| Series 2014 I, 5% 1/1/25 (c) | | 510,000 | 512,749 |
| Series 2016, 5% 7/1/24 (c) | | 15,000 | 15,000 |
| Series 2017 A, 5% 7/1/25 (c) | | 80,000 | 81,124 |
| Series 2018 B, 5% 7/1/25 (c) | | 110,000 | 111,546 |
| Series 2022 B: | | | |
5% 7/1/24 (c) | | 30,000 | 30,000 |
5% 7/1/25 (c) | | 65,000 | 65,913 |
| Massachusetts School Bldg. Auth. Dedicated Sales Tax Rev. Series 2015 C, 5% 8/15/27 | | 300,000 | 305,302 |
TOTAL MASSACHUSETTS | | | 1,121,634 |
| Michigan - 1.1% | | | |
| Lapeer Cmnty. Schools Series 2016, 5% 5/1/25 | | 125,000 | 126,600 |
| Michigan Fin. Auth. Rev.: | | | |
| (Detroit Reg'l. Convention Facility Auth. Local Proj.) Series 2014 H1, 5% 10/1/24 | | 45,000 | 45,042 |
| Series 2022: | | | |
5% 4/15/25 | | 160,000 | 161,890 |
5% 4/15/26 | | 265,000 | 272,671 |
| Michigan Hsg. Dev. Auth. Single Family Mtg. Rev. Series 2022 A, 2.5% 6/1/25 | | 70,000 | 68,597 |
| Utica Cmnty. Schools Series 2024, 5% 5/1/25 | | 1,195,000 | 1,210,694 |
| Wayne County Arpt. Auth. Rev. Series 2015 F, 5% 12/1/26 (c) | | 55,000 | 55,723 |
TOTAL MICHIGAN | | | 1,941,217 |
| Minnesota - 0.2% | | | |
| Minnesota Hsg. Fin. Agcy. Series 2022 A, 5% 8/1/24 | | 360,000 | 360,360 |
| Missouri - 0.1% | | | |
| Kansas City Planned Indl. Expansion Bonds Series 2023, 5%, tender 7/1/27 (b) | | 150,000 | 153,549 |
| Nebraska - 0.5% | | | |
| Central Plains Energy Proj. Rev. Bonds Series 2019, 2.5%, tender 8/1/25 (b) | | 435,000 | 426,888 |
| Lincoln Arpt. Auth. Series 2021, 5% 7/1/25 (c) | | 550,000 | 555,456 |
TOTAL NEBRASKA | | | 982,344 |
| Nevada - 0.6% | | | |
| Clark County School District: | | | |
| Series 2017 A, 5% 6/15/25 | | 545,000 | 552,932 |
| Series 2021 C, 5% 6/15/25 | | 320,000 | 324,657 |
| Nevada Dept. of Bus. & Industry Bonds (Republic Svcs., Inc. Proj.) Series 2001, 4.15%, tender 12/2/24 (b)(c)(e) | | 200,000 | 200,157 |
TOTAL NEVADA | | | 1,077,746 |
| New Hampshire - 1.0% | | | |
| Nat'l. Fin. Auth. Solid Bonds (Waste Mgmt., Inc. Proj.) Series 2019 A2, 2.15%, tender 7/1/24 (b)(c) | | 1,400,000 | 1,399,922 |
| New Hampshire St Hsg. Fin.: | | | |
| Series 2023 3, 3.8% 7/1/26 | | 170,000 | 171,190 |
| Series 2023 4: | | | |
3.625% 4/1/26 | | 35,000 | 35,160 |
3.7% 1/1/27 | | 115,000 | 115,373 |
TOTAL NEW HAMPSHIRE | | | 1,721,645 |
| New Jersey - 3.0% | | | |
| Camden County Improvment Auth. Mult-Family Hsg. Bonds (Northgate I Apts. Proj.) Series 2024, 5%, tender 3/1/26 (b) | | 550,000 | 559,368 |
| New Jersey Econ. Dev. Auth.: | | | |
| Series 2023 RRR: | | | |
5% 3/1/25 | | 465,000 | 468,981 |
5% 3/1/26 | | 360,000 | 368,716 |
| Series 2024 SSS, 5% 6/15/26 | | 240,000 | 246,902 |
| New Jersey Econ. Dev. Auth. Rev.: | | | |
| (New Jersey Gen. Oblig. Proj.) Series 2017 B, 5% 11/1/24 | | 185,000 | 185,717 |
| Series 2019: | | | |
5.25% 9/1/24 (e) | | 520,000 | 521,156 |
5.25% 9/1/26 (e) | | 180,000 | 186,461 |
| New Jersey Edl. Facility Series 2016 A, 5% 7/1/24 | | 300,000 | 300,000 |
| New Jersey Health Care Facilities Fing. Auth. Rev.: | | | |
| (Greystone Park Psychiatric Hosp. Proj.) Series 2024: | | | |
5% 9/15/24 | | 350,000 | 350,955 |
5% 9/15/27 | | 75,000 | 78,154 |
| (Marlboro Psychiatric Hosp. Proj.) Series 2024, 5% 9/15/26 | | 80,000 | 82,248 |
| New Jersey Higher Ed. Student Assistance Auth. Student Ln. Rev.: | | | |
| Series 2016 1A, 5% 12/1/24 (c) | | 170,000 | 170,856 |
| Series 2017 1A, 5% 12/1/24 (c) | | 350,000 | 351,762 |
| Series 2022 B, 5% 12/1/25 (c) | | 250,000 | 253,898 |
| Series 2024 B: | | | |
5% 12/1/27 (c) | | 415,000 | 427,229 |
5% 12/1/27 (c) | | 150,000 | 154,420 |
| New Jersey Trans. Trust Fund Auth.: | | | |
| Series 2004 A, 5.75% 6/15/25 (Nat'l. Pub. Fin. Guarantee Corp. Insured) | | 100,000 | 102,038 |
| Series 2006 C, 0% 12/15/24 | | 260,000 | 255,746 |
| Series 2008 A, 0% 12/15/25 | | 155,000 | 146,967 |
| Series 2014 AA, 5% 6/15/25 | | 100,000 | 100,067 |
TOTAL NEW JERSEY | | | 5,311,641 |
| New Mexico - 0.2% | | | |
| New Mexico Muni. Energy Acquisition Auth. Gas Supply Rev. Bonds Series 2019 A, 5%, tender 5/1/25 (b) | | 305,000 | 307,884 |
| New York - 4.7% | | | |
| Genesee County Fdg. Corp. (Rochester Reg'l. Health Proj.) Series 2022 A: | | | |
| 5% 12/1/24 | | 175,000 | 175,418 |
| 5% 12/1/25 | | 175,000 | 176,909 |
| Monroe County Indl. Dev. Agcy. Bonds (Andrews Terrace Cmnty. Partners, L.P. Proj.) Series 2023 B1, 5%, tender 7/1/27 (b) | | 90,000 | 92,300 |
| New York City Gen. Oblig. Series 2016 A, 5% 8/1/27 | | 3,665,000 | 3,719,398 |
| New York City Indl. Dev. Agcy. Rev. Series 2021 A, 5% 1/1/26 (Assured Guaranty Muni. Corp. Insured) | | 35,000 | 35,840 |
| New York Metropolitan Trans. Auth. Rev. Bonds Series 2019 A1, 5%, tender 11/15/24 (b) | | 800,000 | 802,925 |
| New York State Hsg. Fin. Agcy. Rev. Bonds: | | | |
| Series 2023 E2, 3.8%, tender 5/1/27 (b) | | 115,000 | 115,234 |
| Series 2024 A, 3.375%, tender 11/1/27 (b) | | 925,000 | 920,093 |
| New York Trans. Dev. Corp.: | | | |
| (Term. 4 JFK Int'l. Arpt. Proj.) Series 2020 A: | | | |
5% 12/1/24 (c) | | 625,000 | 626,887 |
5% 12/1/25 (c) | | 45,000 | 45,604 |
| (Term. 4 John F. Kennedy Int'l. Arpt. Proj.) Series 2022, 5% 12/1/26 (c) | | 330,000 | 338,035 |
| Tobacco Settlement Asset Securitization Corp. Series 2017 A, 5% 6/1/25 | | 205,000 | 207,295 |
| Triborough Bridge & Tunnel Auth. Bonds Series 2024 B3, 5%, tender 11/15/25 (b) | | 500,000 | 510,914 |
| Triborough Bridge & Tunnel Auth. Revs. Series 2023 A, 5% 11/15/24 | | 630,000 | 633,728 |
TOTAL NEW YORK | | | 8,400,580 |
| New York And New Jersey - 0.9% | | | |
| Port Auth. of New York & New Jersey: | | | |
| Series 193, 5% 10/15/25 (c) | | 265,000 | 269,636 |
| Series 2014 186, 5% 10/15/26 (c) | | 340,000 | 340,801 |
| Series 2018, 5% 9/15/25 (c) | | 145,000 | 147,365 |
| Series 2023 242: | | | |
5% 12/1/24 (c) | | 85,000 | 85,407 |
5% 12/1/25 (c) | | 275,000 | 280,320 |
5% 12/1/26 (c) | | 565,000 | 582,407 |
TOTAL NEW YORK AND NEW JERSEY | | | 1,705,936 |
| North Carolina - 0.6% | | | |
| Charlotte Int'l. Arpt. Rev. Series 2023 B, 5% 7/1/27 (c) | | 550,000 | 568,850 |
| Charlotte-Mecklenburg Hosp. Auth. Health Care Sys. Rev. Bonds: | | | |
| Series 2018 C, 3.45%, tender 10/31/25 (b) | | 335,000 | 334,301 |
| Series 2021 B, 5%, tender 12/2/24 (b) | | 115,000 | 115,657 |
TOTAL NORTH CAROLINA | | | 1,018,808 |
| Ohio - 1.1% | | | |
| American Muni. Pwr., Inc. Rev. Series 2023 A: | | | |
| 5% 2/15/25 | | 55,000 | 55,440 |
| 5% 2/15/26 | | 300,000 | 307,028 |
| 5% 2/15/27 | | 475,000 | 496,102 |
| Columbus-Franklin County Fin. Auth. Bonds (Dering Family Homes Proj.) Series 2023, 5%, tender 2/1/27 (b) | | 130,000 | 132,445 |
| Hamilton County Swr. Sys. Rev. Series 2024 B: | | | |
| 5% 12/1/24 (d) | | 210,000 | 210,688 |
| 5% 12/1/25 (d) | | 95,000 | 96,810 |
| 5% 12/1/26 (d) | | 95,000 | 98,693 |
| 5% 12/1/27 (d) | | 60,000 | 63,451 |
| Ohio Higher Ed. Facilities Commission Healthcare Rev. Series 2022, 5% 1/1/25 | | 200,000 | 200,322 |
| Ohio Higher Edl. Facility Commission Rev. Bonds (Case Western Reserve Univ. Proj.) Series 2019 C, 1.625%, tender 12/1/26 (b) | | 70,000 | 65,910 |
| Ohio Hosp. Facilities Rev. Series 2017 A, 5% 1/1/25 | | 215,000 | 216,649 |
| Ohio Tpk. Commission Tpk. Rev. (Infrastructure Projs.) Series 2022 A, 5% 2/15/25 | | 105,000 | 106,030 |
TOTAL OHIO | | | 2,049,568 |
| Oklahoma - 1.0% | | | |
| Oklahoma County Independent School District #89 Oklahoma City Series 2023 A, 3% 7/1/26 | | 700,000 | 691,648 |
| Oklahoma St Inds. Auth. Edl. Facilities (Oklahoma City Pub. Schools Proj.) Series 2024: | | | |
| 5% 4/1/25 | | 500,000 | 505,804 |
| 5% 4/1/26 | | 525,000 | 539,144 |
TOTAL OKLAHOMA | | | 1,736,596 |
| Oregon - 0.3% | | | |
| Port of Portland Arpt. Rev.: | | | |
| Series 2022, 5% 7/1/25 (c) | | 295,000 | 298,887 |
| Series 26 C, 5% 7/1/24 (c) | | 300,000 | 300,000 |
TOTAL OREGON | | | 598,887 |
| Pennsylvania - 6.6% | | | |
| Geisinger Auth. Health Sys. Rev. Bonds Series 2020 B, 5%, tender 2/15/27 (b) | | 410,000 | 421,861 |
| Monroeville Fin. Auth. UPMC Rev. Series 2023 C, 5% 5/15/25 | | 195,000 | 197,556 |
| Pennsylvania Econ. Dev. Fing. Auth.: | | | |
| Series 2023 A2, 5% 5/15/26 | | 500,000 | 515,006 |
| Series 2023 B, 5% 5/15/25 | | 275,000 | 278,605 |
| Pennsylvania Econ. Dev. Fing. Auth. Solid Waste Disp. Rev. Bonds: | | | |
| (Republic Svcs., Inc. Proj.): | | | |
Series 2014, 4%, tender 7/1/24 (b)(c) | | 3,600,000 | 3,599,996 |
Series 2019 B2, 4%, tender 7/15/24 (b)(c) | | 700,000 | 699,979 |
| (Waste Mgmt., Inc. Proj.): | | | |
Series 2010 B, 3.5%, tender 7/1/24 (b) | | 500,000 | 499,995 |
Series 2021 A2, 4.6%, tender 10/1/26 (b)(c) | | 2,000,000 | 2,028,682 |
| Series 2011, 2.15%, tender 7/1/24 (b)(c) | | 600,000 | 600,000 |
| Pennsylvania Gen. Oblig.: | | | |
| Series 2019, 5% 7/15/26 | | 200,000 | 206,985 |
| Series 2023: | | | |
5% 9/1/26 | | 780,000 | 808,968 |
5% 9/1/27 | | 1,820,000 | 1,921,843 |
| Pennsylvania Hsg. Fin. Agcy. Series 2021 135 B, 5% 4/1/25 (c) | | 15,000 | 15,076 |
| Philadelphia Gas Works Rev. Series 2015 13, 5% 8/1/24 | | 100,000 | 100,082 |
TOTAL PENNSYLVANIA | | | 11,894,634 |
| Rhode Island - 0.5% | | | |
| Rhode Island Health and Edl. Bldg. Corp. Higher Ed. Facility Rev.: | | | |
| Series 2012, 5% 11/1/24 | | 115,000 | 115,116 |
| Series 2023: | | | |
5% 11/1/25 | | 500,000 | 510,508 |
5% 11/1/26 | | 350,000 | 362,608 |
TOTAL RHODE ISLAND | | | 988,232 |
| South Carolina - 0.4% | | | |
| South Carolina Pub. Svc. Auth. Rev.: | | | |
| Series 2013, 5% 12/1/25 | | 350,000 | 356,188 |
| Series 2022 A, 5% 12/1/24 | | 315,000 | 316,352 |
TOTAL SOUTH CAROLINA | | | 672,540 |
| South Dakota - 0.3% | | | |
| South Dakota Hsg. Dev. Auth. Bonds Series 2023 J, 3.875%, tender 12/12/24 (b) | | 450,000 | 449,992 |
| Tennessee - 0.4% | | | |
| Memphis-Shelby County Arpt. Auth. Arpt. Rev. Series 2021 C, 1.875% 7/1/25 (c) | | 80,000 | 77,299 |
| Tennergy Corp. Gas Rev. Bonds Series 2019 A, 5%, tender 10/1/24 (b) | | 715,000 | 717,392 |
TOTAL TENNESSEE | | | 794,691 |
| Texas - 7.9% | | | |
| Austin Arpt. Sys. Rev.: | | | |
| Series 2019, 5% 11/15/24 (c) | | 125,000 | 125,418 |
| Series 2022, 5% 11/15/25 (c) | | 105,000 | 106,639 |
| Boerne Independent School District Bonds: | | | |
| Series 2023, 3.125%, tender 2/1/27 (b) | | 800,000 | 789,095 |
| Series 2024, 4%, tender 2/1/28 (b) | | 175,000 | 179,214 |
| Dallas Gen. Oblig.: | | | |
| Series 2023 A, 5% 2/15/25 | | 610,000 | 616,019 |
| Series 2024 A: | | | |
5% 2/15/25 | | 1,000,000 | 1,009,867 |
5% 2/15/26 | | 1,000,000 | 1,028,244 |
5% 2/15/27 | | 1,000,000 | 1,044,995 |
| Dallas Hsg. Fin. Corp. Multi-family Hsg. Rev. Bonds Series 2023, 5%, tender 3/1/26 (b) | | 190,000 | 192,247 |
| Harris County Cultural Ed. Facilities Fin. Corp. Rev. Bonds: | | | |
| Series 2019 B, 5%, tender 12/1/24 (b) | | 205,000 | 206,017 |
| Series 2020 A, 0.9%, tender 5/15/25 (b) | | 155,000 | 150,233 |
| Houston Arpt. Sys. Rev. Series 2021 A, 5% 7/1/25 (c) | | 500,000 | 506,000 |
| Houston Hsg. Fin. Corp. Multi-family Hsg. Rev. Bonds: | | | |
| Series 2023, 5%, tender 8/1/26 (b) | | 110,000 | 111,876 |
| Series 2024, 3.65%, tender 2/1/28 (b) | | 445,000 | 444,500 |
| Houston Independent School District Bonds: | | | |
| Series 2014 A2, 3.5%, tender 6/1/25 (b) | | 585,000 | 581,912 |
| Series 2023 C, 4%, tender 6/1/25 (b) | | 435,000 | 434,640 |
| Magnolia Independent School District Series 2023, 5% 8/15/24 | | 475,000 | 475,782 |
| Mission Econ. Dev. Corp. Solid Waste Disp. Rev. Bonds: | | | |
| (Republic Svcs., Inc. Proj.): | | | |
Series 2008 A, 4.05%, tender 8/1/24 (b)(c) | | 400,000 | 400,074 |
Series 2020 A, 4.05%, tender 8/1/24 (b)(c) | | 800,000 | 800,148 |
| (Waste Mgmt., INC. Proj.) Series 2023 A, 4.25%, tender 7/1/27 (b) | | 300,000 | 299,982 |
| North East Texas Independent School District Bonds Series 2024, 3.75%, tender 8/1/27 (b) | | 235,000 | 235,731 |
| North Texas Tollway Auth. Rev. Series 2021 B, 5% 1/1/26 | | 65,000 | 66,694 |
| Northside Independent School District Bonds: | | | |
| Series 2023 B, 3%, tender 8/1/26 (b) | | 630,000 | 620,514 |
| Series 2024 B, 3.45%, tender 8/1/27 (b) | | 640,000 | 639,767 |
| Prosper Independent School District Bonds Series 2019 B, 4%, tender 8/15/26 (b) | | 110,000 | 110,366 |
| San Antonio Elec. & Gas Sys. Rev.: | | | |
| Bonds Series 2018, SIFMA Municipal Swap Index + 0.870% 4.75%, tender 12/1/25 (b)(f) | | 455,000 | 454,400 |
| Series 2022, 5% 2/1/26 | | 50,000 | 51,291 |
| San Antonio Wtr. Sys. Rev. Bonds Series 2013 F, 1%, tender 11/1/26 (b) | | 1,000,000 | 910,988 |
| Tarrant County Cultural Ed. Facilities Fin. Corp. Hosp. Rev. Bonds (Baylor Scott & White Health Proj.) Series 2022 E, 5%, tender 5/15/26 (b) | | 225,000 | 230,536 |
| Texas A&M Univ. Rev. Series 2016 E, 4% 5/15/27 | | 1,000,000 | 1,010,935 |
| Texas Affordable Hsg. Corp. Multi-family Hsg. Rev. Bonds Series 2023, 3.625%, tender 1/1/27 (b) | | 130,000 | 128,205 |
| Texas Muni. Gas Acquisition & Supply Corp. Series 2023 B, 5.25% 1/1/27 | | 230,000 | 235,646 |
| Travis County Hsg. Fin. Corp. Bonds Series 2023, 3.75%, tender 8/1/25 (b) | | 30,000 | 29,853 |
TOTAL TEXAS | | | 14,227,828 |
| Utah - 0.3% | | | |
| Salt Lake City Arpt. Rev.: | | | |
| Series 2018 A, 5% 7/1/24 (c) | | 105,000 | 105,000 |
| Series 2023 A: | | | |
5% 7/1/25 (c) | | 40,000 | 40,449 |
5% 7/1/27 (c) | | 60,000 | 62,056 |
| Utah County Hosp. Rev. Bonds Series 2020 B2, 5%, tender 8/1/26 (b) | | 160,000 | 164,310 |
| Utah Hsg. Corp. Multi-family Hsg. Rev. Bonds Series 2024, 3.7%, tender 8/1/27 (b) | | 235,000 | 234,637 |
TOTAL UTAH | | | 606,452 |
| Virginia - 0.5% | | | |
| Halifax County Indl. Dev. Auth. Bonds (Virgina Elec. and Pwr. Co. Proj.) Series 2010 A, 3.8%, tender 5/28/27 (b) | | 135,000 | 135,374 |
| Southampton County Indl. Bonds (PRTA-Virginia One, LLC Proj.) Series 2023, 4.875%, tender 12/12/24 (b)(c) | | 800,000 | 799,397 |
TOTAL VIRGINIA | | | 934,771 |
| Washington - 1.0% | | | |
| King County Swr. Rev. Bonds Series 2020 B, 0.875%, tender 1/1/26 (b) | | 325,000 | 311,235 |
| Port of Seattle Rev.: | | | |
| Series 2016, 5% 2/1/25 | | 120,000 | 120,998 |
| Series 2018 A, 5% 5/1/27 (c) | | 250,000 | 258,323 |
| Series 2021 C, 5% 8/1/24 (c) | | 205,000 | 205,154 |
| Series 2022 B: | | | |
5% 8/1/24 (c) | | 160,000 | 160,120 |
5% 8/1/25 (c) | | 150,000 | 151,907 |
5% 8/1/26 (c) | | 95,000 | 97,325 |
| Seattle Hsg. Auth. Rev. (Juniper Apts. Proj.) Series 2023, 5% 6/1/27 | | 80,000 | 81,786 |
| Washington Gen. Oblig. Series 2015 E, 5% 7/1/25 | | 270,000 | 272,132 |
| Washington Hsg. Fin. Commission Multi-family Hsg. Rev. Bonds (Ardea At Totem Lake Apts. Proj.) Series 2023, 5%, tender 2/1/27 (b) | | 135,000 | 137,380 |
TOTAL WASHINGTON | | | 1,796,360 |
| West Virginia - 0.4% | | | |
| West Virginia Econ. Dev. Auth. Solid Waste Disp. Facilities Rev. Bonds (Allegheny Metallurgical Proj.) Series 2023, 4.75%, tender 8/1/24 (b)(c) | | 700,000 | 700,529 |
| Wisconsin - 2.7% | | | |
| Milwaukee County Arpt. Rev.: | | | |
| Series 2023 A, 5% 12/1/24 (c) | | 125,000 | 125,480 |
| Series 2023 B, 5% 12/1/25 (c) | | 800,000 | 812,927 |
| Milwaukee Gen. Oblig. Series 2016, 2% 3/1/27 | | 190,000 | 177,596 |
| Pub. Fin. Auth. Health Care Sys. Rev. Series 2023 A, 5% 10/1/24 | | 280,000 | 280,916 |
| Wisconsin Health & Edl. Facilities Series 2016 A, 4% 11/15/46 (Pre-Refunded to 5/15/26 @ 100) | | 885,000 | 894,781 |
| Wisconsin Health & Edl. Facilities Auth. Rev.: | | | |
| (Forensic Science and Protective Medicine Collaboration, Inc. Proj.) Series 2024, 5% 8/1/27 (e) | | 340,000 | 346,230 |
| Bonds Series 2018 B2, 5%, tender 6/24/26 (b) | | 330,000 | 337,353 |
| Series 2022, 5% 10/1/25 | | 360,000 | 366,186 |
| Series 2024 A: | | | |
5% 2/15/25 | | 400,000 | 402,256 |
5% 2/15/26 | | 400,000 | 406,129 |
5% 2/15/28 | | 525,000 | 545,091 |
| Wisconsin Hsg. & Econ. Dev. Auth. Hsg. Rev. Bonds Series 2023 E, 3.875%, tender 5/1/27 (b) | | 115,000 | 114,583 |
TOTAL WISCONSIN | | | 4,809,528 |
| TOTAL MUNICIPAL BONDS (Cost $104,335,196) | | | 103,948,753 |
| | | | |
| Municipal Notes - 47.7% |
| | | Principal Amount (a) | Value ($) |
| Alabama - 3.3% | | | |
| Black Belt Energy Gas District Participating VRDN: | | | |
| Series XF 30 73, 4.18% 7/5/24 (Liquidity Facility Morgan Stanley Bank, West Valley City Utah) (b)(g)(h) | | 1,000,000 | 1,000,000 |
| Series XM 11 10, 3.91% 7/5/24 (Liquidity Facility Royal Bank of Canada) (b)(g)(h) | | 300,000 | 300,000 |
| Series ZL 03 96, 4.18% 7/5/24 (Liquidity Facility Morgan Stanley Bank, West Valley City Utah) (b)(g)(h) | | 300,000 | 300,000 |
| Health Care Auth. for Baptist Health Series 2013 B, 5.3% 7/5/24, VRDN (b) | | 300,000 | 300,000 |
| Mobile Indl. Dev. Board Rev. (Alabama Pwr. Theodore Plant Proj.) Series A, 4.65% 7/1/24, VRDN (b)(c) | | 1,000,000 | 1,000,000 |
| Southeast Energy Auth. Rev. Participating VRDN: | | | |
| Series XG 04 10, 4.18% 7/5/24 (Liquidity Facility Morgan Stanley Bank, West Valley City Utah) (b)(g)(h) | | 1,600,000 | 1,600,000 |
| Series XM 10 62, 4.18% 7/5/24 (Liquidity Facility Morgan Stanley Bank, West Valley City Utah) (b)(g)(h) | | 500,000 | 500,000 |
| Walker County Econ. & Indl. Dev. Auth. Solid Waste Disp. Rev. (Alabama Pwr. Co. Plant Gorgas Proj.) Series 2007, 4.65% 7/1/24, VRDN (b)(c) | | 700,000 | 700,000 |
| Wilsonville Indl. Dev. Board Poll. Cont. Rev. (Alabama Pwr. Co. Gaston Plant Proj.) Series 2008, 4.65% 7/1/24, VRDN (b)(c) | | 300,000 | 300,000 |
TOTAL ALABAMA | | | 6,000,000 |
| Arizona - 1.5% | | | |
| Arizona St Indl. Dev. Auth. Multi Participating VRDN Series XF 31 74, 4.2% 7/5/24 (Liquidity Facility Mizuho Cap. Markets LLC) (b)(g)(h) | | 800,000 | 800,000 |
| Maricopa County Poll. Cont. Rev.: | | | |
| Series 2009 C, 4.05% 7/5/24, VRDN (b) | | 1,450,000 | 1,450,000 |
| Series 2009 D, 4.05% 7/5/24, VRDN (b) | | 300,000 | 300,000 |
| Mizuho Floater / Residual Trust V Participating VRDN Series Floater 91 57, 4.2% 8/2/24 (Liquidity Facility Mizuho Cap. Markets LLC) (b)(g)(h) | | 200,000 | 200,000 |
TOTAL ARIZONA | | | 2,750,000 |
| California - 7.5% | | | |
| California Cmnty. Choice Fing. Auth. Clean Energy Proj. Rev. Participating VRDN Series XF 30 07, 4.18% 7/5/24 (Liquidity Facility Morgan Stanley Bank, West Valley City Utah) (b)(g)(h) | | 2,005,000 | 2,005,000 |
| California Hsg. Fin. Agcy. Ltd. Obl Participating VRDN Series XF 31 27, 4.2% 7/5/24 (Liquidity Facility Mizuho Cap. Markets LLC) (b)(g)(h) | | 200,000 | 200,000 |
| California Statewide Cmntys. Dev. Auth. Multi-family Hsg. Rev. Participating VRDN: | | | |
| Series Floater MIZ 91 13, 4.2% 8/2/24 (Liquidity Facility Mizuho Cap. Markets LLC) (b)(g)(h)(i) | | 800,000 | 800,000 |
| Series MIZ 91 21, 5.25% 7/1/24 (Liquidity Facility Mizuho Cap. Markets LLC) (b)(c)(g)(h) | | 2,100,000 | 2,100,000 |
| Los Angeles Cmnty. Redev. Agcy. Multi-family Hsg. Rev. Participating VRDN: | | | |
| Series 2022 MIZ 90 89, 5.25% 7/1/24 (Liquidity Facility Mizuho Cap. Markets LLC) (b)(c)(g)(h) | | 3,805,000 | 3,805,000 |
| Series 2022 MIZ 90 90, 5.25% 7/1/24 (Liquidity Facility Mizuho Cap. Markets LLC) (b)(c)(g)(h) | | 2,000,000 | 2,000,000 |
| Mizuho Floater / Residual Trust V Participating VRDN: | | | |
| Series Floater MIZ 90 97, 4.2% 7/5/24, LOC Mizuho Cap. Markets LLC (b)(g)(h) | | 200,000 | 200,000 |
| Series Floater MIZ 91 62, 4.2% 8/2/24 (Liquidity Facility Mizuho Cap. Markets LLC) (b)(g)(h) | | 100,000 | 100,000 |
| San Francisco City & County Multi-family Hsg. Rev. Participating VRDN Series MIZ 91 15, 4.2% 8/2/24 (Liquidity Facility Mizuho Cap. Markets LLC) (b)(g)(h)(i) | | 2,200,000 | 2,200,000 |
TOTAL CALIFORNIA | | | 13,410,000 |
| Colorado - 1.0% | | | |
| Colorado Health Facilities Auth. Rev. Bonds Participating VRDN: | | | |
| Series XM 10 59, 4.03% 7/5/24 (Liquidity Facility JPMorgan Chase Bank) (b)(g)(h) | | 100,000 | 100,000 |
| Series XM 10 61, 4.03% 7/5/24 (Liquidity Facility JPMorgan Chase Bank) (b)(g)(h) | | 500,000 | 500,000 |
| Denver City & County Arpt. Rev. Participating VRDN Series Floaters XM 07 15, 4.18% 7/5/24 (Liquidity Facility Morgan Stanley Bank, West Valley City Utah) (b)(c)(g)(h) | | 1,100,000 | 1,100,000 |
TOTAL COLORADO | | | 1,700,000 |
| Connecticut - 0.3% | | | |
| Colchester Gen. Oblig. BAN Series 2024, 4.5% 10/17/24 | | 500,000 | 500,778 |
| Florida - 3.3% | | | |
| Broward County Indl. Dev. Rev. (Florida Pwr. & Lt. Co. Proj.) Series 2015, 4% 7/5/24, VRDN (b)(c) | | 1,700,000 | 1,700,000 |
| Florida Ins. Assistance Interlo Series 2023 A2, 4.67% 7/5/24 (Liquidity Facility Florida Gen. Oblig.), VRDN (b) | | 2,620,000 | 2,620,000 |
| Lee Memorial Health Sys. Hosp. Rev. Series 2019 B, 4.47% 7/6/27, VRDN (b) | | 1,440,000 | 1,440,000 |
| Miami Dade County Hsg. Multifamily Hsg. Rev. Participating VRDN Series Floater MIZ 90 87, 4.2% 8/2/24 (Liquidity Facility Mizuho Cap. Markets LLC) (b)(g)(h)(i) | | 200,000 | 200,000 |
TOTAL FLORIDA | | | 5,960,000 |
| Georgia - 0.6% | | | |
| Buford Hsg. Auth. Multifamily Participating VRDN Series XF 31 18, 4.2% 7/5/24 (Liquidity Facility Mizuho Cap. Markets LLC) (b)(g)(h) | | 200,000 | 200,000 |
| Heard County Dev. Auth. Poll. Cont. Rev. Series 2007, 4.65% 7/1/24, VRDN (b)(c) | | 900,000 | 900,000 |
TOTAL GEORGIA | | | 1,100,000 |
| Hawaii - 0.1% | | | |
| Hawaii Arpts. Sys. Rev. Participating VRDN Series XG 03 86, 4.18% 7/5/24 (Liquidity Facility Morgan Stanley Bank, West Valley City Utah) (b)(c)(g)(h) | | 200,000 | 200,000 |
| Illinois - 0.4% | | | |
| Chicago O'Hare Int'l. Arpt. Rev. Participating VRDN Series XM 10 38, 4.06% 7/5/24 (Liquidity Facility JPMorgan Chase Bank) (b)(c)(g)(h) | | 100,000 | 100,000 |
| Mizuho Floater / Residual Trust V Participating VRDN Series Floater MIZ 91 67, 4.2% 8/2/24 (Liquidity Facility Mizuho Cap. Markets LLC) (b)(g)(h) | | 700,000 | 700,000 |
TOTAL ILLINOIS | | | 800,000 |
| Indiana - 2.1% | | | |
| Indiana Fin. Auth. Exempt Facilities Rev. Bonds Series MS 00 22, 4.38%, tender 7/25/24 (Liquidity Facility Morgan Stanley Bank, West Valley City Utah) (b)(c)(g)(h) | | 2,000,000 | 2,000,000 |
| Westfield Washington Multi-School Bldg. Corp. BAN Series 2024 A, 5% 12/15/24 | | 1,800,000 | 1,808,042 |
TOTAL INDIANA | | | 3,808,042 |
| Iowa - 1.3% | | | |
| Iowa Fin. Auth. Solid Disp. Waste Rev. (MidAmerican Energy Co. Proj.) Series 2008 A, 4.12% 7/5/24, VRDN (b)(c) | | 800,000 | 800,000 |
| Louisa County Poll. Cont. Rev. Series 1994, 3.95% 7/3/24, VRDN (b) | | 1,520,000 | 1,520,000 |
TOTAL IOWA | | | 2,320,000 |
| Kentucky - 0.7% | | | |
| Kentucky Higher Ed. Student Ln. Corp. Rev. Series 2023 1A1, 4.22% 7/5/24, LOC Bank of America NA, VRDN (b)(c) | | 400,000 | 400,000 |
| Meade County Indl. Bldg. Rev. (Nucor Steel Brandenburg Proj.) Series 2020 A1, 5.3% 7/1/24, VRDN (b)(c) | | 800,000 | 800,000 |
TOTAL KENTUCKY | | | 1,200,000 |
| Louisiana - 4.7% | | | |
| Saint James Parish Gen. Oblig. (Nucor Steel Louisiana LLC Proj.) Series 2010 A1, 4.07% 7/5/24, VRDN (b) | | 8,395,000 | 8,395,001 |
| Maryland - 0.7% | | | |
| Baltimore County Gen. Oblig. Participating VRDN Series 2022 032, 4.23% 8/9/24 (Liquidity Facility Barclays Bank PLC) (b)(g)(h) | | 200,000 | 200,000 |
| Integrace Obligated Group Participating VRDN Series 2022 024, 4.23% 8/9/24 (Liquidity Facility Barclays Bank PLC) (b)(g)(h) | | 400,000 | 400,000 |
| Riderwood Vlg, Inc. Participating VRDN Series 2022 029, 3.86% 8/9/24 (Liquidity Facility Barclays Bank PLC) (b)(g)(h) | | 400,000 | 400,000 |
| Tender Option Bond Trust Receipts Participating VRDN Series XF 32 22, 4.2% 7/5/24 (Liquidity Facility Mizuho Cap. Markets LLC) (b)(g)(h) | | 300,000 | 300,000 |
TOTAL MARYLAND | | | 1,300,000 |
| Mississippi - 0.1% | | | |
| Mississippi Bus. Fin. Corp. Solid Waste Disp. Rev. (Mississippi Pwr. Co. Proj.) Series 1998, 5.1% 7/1/24, VRDN (b)(c) | | 200,000 | 200,000 |
| Missouri - 0.1% | | | |
| Mizuho Floater / Residual Trust V Participating VRDN Series Floater MIZ 91 53, 4.2% 8/2/24 (Liquidity Facility Mizuho Cap. Markets LLC) (b)(g)(h) | | 200,000 | 200,000 |
| New Hampshire - 0.3% | | | |
| Tender Option Bond Trust Receipts Bonds Series MS 00 23, 4.18%, tender 9/5/24 (Liquidity Facility Morgan Stanley Bank, West Valley City Utah) (b)(g)(h)(i) | | 600,000 | 600,000 |
| New Jersey - 4.3% | | | |
| Clifton Gen. Oblig. BAN Series 2023, 5% 11/26/24 | | 1,000,000 | 1,004,898 |
| Hazlet Township NJ BAN Series 2023, 5% 11/8/24 | | 500,000 | 502,050 |
| Jersey City N J Muni. Utils. Auth. BAN Series 2024 B, 5% 5/1/25 | | 600,000 | 604,957 |
| Lacey Township Gen. Oblig. BAN Series 2024, 4.5% 5/7/25 | | 600,000 | 603,638 |
| Manasquan N J BAN Series 2023, 5% 10/3/24 | | 300,000 | 300,862 |
| Manchester Township Gen. Oblig. BAN Series 2024 A, 4.5% 5/8/25 | | 300,000 | 301,626 |
| New Jersey Trans. Trust Fund Auth. Participating VRDN Series XM 09 29, 4.03% 7/5/24 (Liquidity Facility JPMorgan Chase Bank) (b)(g)(h) | | 2,100,000 | 2,100,000 |
| Newark Gen. Oblig. BAN Series 2024 B, 5% 5/13/25 | | 800,000 | 806,335 |
| Pennsauken Township BAN Series 2024 A, 4.5% 5/28/25 | | 800,000 | 804,134 |
| Ridgewood Gen. Oblig. BAN Series 2023 B, 5% 10/11/24 | | 700,000 | 701,989 |
TOTAL NEW JERSEY | | | 7,730,489 |
| New Mexico - 0.1% | | | |
| New Mexico St Hosp. Equip. Ln. Co. Participating VRDN Series 2022 034, 4.23% 8/9/24 (Liquidity Facility Barclays Bank PLC) (b)(g)(h) | | 195,000 | 195,000 |
| New York - 3.1% | | | |
| Liberty Dev. Corp. Rev. Participating VRDN Series MS 1207, 4.23% 7/5/24 (Liquidity Facility Morgan Stanley Bank, West Valley City Utah) (b)(g)(h) | | 100,000 | 100,000 |
| New York Metropolitan Trans. Auth. Rev. Participating VRDN: | | | |
| Series XF 13 21, 4.2% 7/5/24 (Liquidity Facility JPMorgan Chase Bank) (b)(g)(h) | | 225,000 | 225,000 |
| Series XF 13 55, 4.2% 7/5/24 (Liquidity Facility JPMorgan Chase Bank) (b)(g)(h) | | 2,300,000 | 2,300,000 |
| New York State Hsg. Fin. Agcy. Rev. Participating VRDN: | | | |
| Series 2022, 4.23% 8/9/24 (Liquidity Facility Barclays Bank PLC) (b)(g)(h) | | 400,000 | 400,000 |
| Series Floater 2022 007, 4.33% 8/9/24 (Liquidity Facility Barclays Bank PLC) (b)(c)(g)(h) | | 2,600,000 | 2,600,000 |
TOTAL NEW YORK | | | 5,625,000 |
| Ohio - 1.3% | | | |
| Allen County Hosp. Facilities Rev. Series 2012 B, 4.15% 7/5/24 (Liquidity Facility Ohio Gen. Oblig.), VRDN (b) | | 975,000 | 975,000 |
| Ohio Hosp. Rev.: | | | |
| Series 2013 B, 4.41% 7/6/27, VRDN (b) | | 500,000 | 500,000 |
| Series 2015 B, 4.41% 7/6/27, VRDN (b) | | 900,000 | 900,000 |
TOTAL OHIO | | | 2,375,000 |
| Oklahoma - 0.4% | | | |
| Oklahoma Dev. Fin. Auth. Health Sys. Rev. Series 2020 B, 4.52% 7/5/24, VRDN (b) | | 675,000 | 675,000 |
| Steele Duncan Plaza, LLC Participating VRDN Series MIZ 91 03, 4.2% 8/2/24 (Liquidity Facility Mizuho Cap. Markets LLC) (b)(g)(h)(i) | | 114,268 | 114,268 |
TOTAL OKLAHOMA | | | 789,268 |
| Pennsylvania - 1.3% | | | |
| Montgomery County Higher Ed. & Health Auth. Rev. Series 2018 D, 4.7% 7/5/24, VRDN (b) | | 800,000 | 800,000 |
| Philadelphia Auth. for Indl. Dev. Series 2017 B, 4.7% 7/5/24, VRDN (b) | | 1,450,000 | 1,450,000 |
TOTAL PENNSYLVANIA | | | 2,250,000 |
| Tennessee - 0.5% | | | |
| Chattanooga Health Ed. & Hsg. Facility Board Rev. (Catholic Health Initiatives Proj.) Series C, 4.25% 7/5/24, VRDN (b) | | 700,000 | 700,000 |
| Mizuho Floater / Residual Trust V Participating VRDN Series Floater MIZ 91 63, 4.2% 8/2/24 (Liquidity Facility Mizuho Cap. Markets LLC) (b)(g)(h) | | 200,000 | 200,000 |
TOTAL TENNESSEE | | | 900,000 |
| Texas - 5.8% | | | |
| Brazos County Tex Hsg. Fin. Corp. M Participating VRDN Series XF 31 29, 4.2% 7/5/24 (Liquidity Facility Mizuho Cap. Markets LLC) (b)(g)(h) | | 200,000 | 200,000 |
| Ep Machuca Lp Participating VRDN Series MIZ 91 04, 4.2% 8/2/24 (Liquidity Facility Mizuho Cap. Markets LLC) (b)(g)(h)(i) | | 200,000 | 200,000 |
| Mizuho Floater / Residual Trust V Participating VRDN Series MIZ 91 24, 4.2% 8/2/24 (Liquidity Facility Mizuho Cap. Markets LLC) (b)(g)(h)(i) | | 1,300,000 | 1,300,000 |
| Port Arthur Navigation District Envir. Facilities Rev. (Motiva Enterprises LLC Proj.): | | | |
| Series 2004, 4.27% 7/5/24, VRDN (b)(c) | | 5,600,000 | 5,600,000 |
| Series 2010 D: | | | |
4.25% 7/5/24, VRDN (b) | | 400,000 | 400,000 |
4.25% 7/5/24, VRDN (b) | | 2,650,000 | 2,650,000 |
TOTAL TEXAS | | | 10,350,000 |
| Utah - 0.2% | | | |
| Salt Lake City Arpt. Rev. Participating VRDN Series XM 11 07, 5.1% 7/1/24 (Liquidity Facility JPMorgan Chase Bank) (b)(c)(g)(h) | | 300,000 | 300,000 |
| Virginia - 1.3% | | | |
| Lynchburg Econ. Dev. Participating VRDN Series XL 00 75, 4.18% 7/5/24 (Liquidity Facility JPMorgan Chase Bank) (b)(g)(h) | | 2,000,000 | 2,000,000 |
| Nat'l. Sr. Campuses Participating VRDN Series 2022 028, 4.19% 8/9/24 (Liquidity Facility Barclays Bank PLC) (b)(g)(h) | | 400,000 | 400,000 |
TOTAL VIRGINIA | | | 2,400,000 |
| West Virginia - 0.2% | | | |
| West Virginia Hosp. Fin. Auth. Hosp. Rev. Series 2018 E, 4.49% 7/6/27, VRDN (b) | | 350,000 | 350,000 |
| Wyoming - 1.2% | | | |
| Lincoln County Envir. (PacifiCorp Proj.) Series 1995, 4.5% 7/5/24, VRDN (b)(c) | | 900,000 | 900,000 |
| Lincoln County Poll. Cont. Rev. (PacifiCorp Proj.) Series 1994, 4.45% 7/3/24, VRDN (b) | | 100,000 | 100,000 |
| Sweetwater County Env Imp Rev. (Pacificorp Proj.) Series 1995, 5.15% 7/1/24, VRDN (b)(c) | | 700,000 | 700,000 |
| Sweetwater County Poll. Cont. Rev. (PacifiCorp Proj.) Series 1994, 4.45% 7/3/24, VRDN (b) | | 400,000 | 400,000 |
TOTAL WYOMING | | | 2,100,000 |
| TOTAL MUNICIPAL NOTES (Cost $85,806,688) | | | 85,808,578 |
| | | | |
| Money Market Funds - 1.0% |
| | | Shares | Value ($) |
Fidelity Municipal Cash Central Fund 4.33% (j)(k) (Cost $1,836,220) | | 1,835,853 | 1,836,220 |
| | | | |
| TOTAL INVESTMENT IN SECURITIES - 106.5% (Cost $191,978,104) | 191,593,551 |
NET OTHER ASSETS (LIABILITIES) - (6.5)% | (11,767,648) |
| NET ASSETS - 100.0% | 179,825,903 |
| | |
Security Type Abbreviations
| BAN | - | BOND ANTICIPATION NOTE |
| VRDN | - | VARIABLE RATE DEMAND NOTE (A debt instrument that is payable upon demand, either daily, weekly or monthly) |
Legend
| (a) | Amount is stated in United States dollars unless otherwise noted. |
| (b) | Coupon rates for floating and adjustable rate securities reflect the rates in effect at period end. |
| (c) | Private activity obligations whose interest is subject to the federal alternative minimum tax for individuals. |
| (d) | Security or a portion of the security purchased on a delayed delivery or when-issued basis. |
| (e) | Security exempt from registration under Rule 144A of the Securities Act of 1933. These securities may be resold in transactions exempt from registration, normally to qualified institutional buyers. At the end of the period, the value of these securities amounted to $2,953,591 or 1.6% of net assets. |
| (f) | Coupon is indexed to a floating interest rate which may be multiplied by a specified factor and/or subject to caps or floors. |
| (g) | Provides evidence of ownership in one or more underlying municipal bonds. |
| (h) | Coupon rates are determined by re-marketing agents based on current market conditions. |
| (i) | Restricted securities (including private placements) - Investment in securities not registered under the Securities Act of 1933 (excluding 144A issues). At the end of the period, the value of restricted securities (excluding 144A issues) amounted to $5,414,268 or 3.0% of net assets. |
| (j) | Information in this report regarding holdings by state and security types does not reflect the holdings of the Fidelity Municipal Cash Central Fund. |
| (k) | Affiliated fund that is generally available only to investment companies and other accounts managed by Fidelity Investments. The rate quoted is the annualized seven-day yield of the fund at period end. A complete unaudited listing of the fund's holdings as of its most recent quarter end is available upon request. In addition, each Fidelity Central Fund's financial statements are available on the SEC's website or upon request. |
| Additional information on each restricted holding is as follows: |
| Security | Acquisition Date | Acquisition Cost ($) |
| California Statewide Cmntys. Dev. Auth. Multi-family Hsg. Rev. Participating VRDN Series Floater MIZ 91 13, 4.2% 8/2/24 (Liquidity Facility Mizuho Cap. Markets LLC) | 6/22/23 | 800,000 |
| | | |
| Ep Machuca Lp Participating VRDN Series MIZ 91 04, 4.2% 8/2/24 (Liquidity Facility Mizuho Cap. Markets LLC) | 8/05/22 | 200,000 |
| | | |
| Miami Dade County Hsg. Multifamily Hsg. Rev. Participating VRDN Series Floater MIZ 90 87, 4.2% 8/2/24 (Liquidity Facility Mizuho Cap. Markets LLC) | 1/27/22 | 200,000 |
| | | |
| Mizuho Floater / Residual Trust V Participating VRDN Series MIZ 91 24, 4.2% 8/2/24 (Liquidity Facility Mizuho Cap. Markets LLC) | 1/27/23 | 1,300,000 |
| | | |
| San Francisco City & County Multi-family Hsg. Rev. Participating VRDN Series MIZ 91 15, 4.2% 8/2/24 (Liquidity Facility Mizuho Cap. Markets LLC) | 12/19/22 - 1/30/23 | 2,200,000 |
| | | |
| Steele Duncan Plaza, LLC Participating VRDN Series MIZ 91 03, 4.2% 8/2/24 (Liquidity Facility Mizuho Cap. Markets LLC) | 8/11/22 | 114,268 |
| | | |
| Tender Option Bond Trust Receipts Bonds Series MS 00 23, 4.18%, tender 9/5/24 (Liquidity Facility Morgan Stanley Bank, West Valley City Utah) | 4/16/24 | 600,000 |
| | | |
Affiliated Central Funds
Fiscal year to date information regarding the Fund's investments in Fidelity Central Funds, including the ownership percentage, is presented below.
| Affiliate | Value, beginning of period ($) | Purchases ($) | Sales Proceeds ($) | Dividend Income ($) | Realized Gain (loss) ($) | Change in Unrealized appreciation (depreciation) ($) | Value, end of period ($) | % ownership, end of period |
| Fidelity Municipal Cash Central Fund 4.33% | 4,769,000 | 16,347,174 | 19,280,438 | 79,956 | 484 | - | 1,836,220 | 0.1% |
| Total | 4,769,000 | 16,347,174 | 19,280,438 | 79,956 | 484 | - | 1,836,220 | |
| | | | | | | | | |
Amounts in the dividend income column in the above table include any capital gain distributions from underlying funds, which are presented in the corresponding line item in the Statement of Operations, if applicable.
Amounts included in the purchases and sales proceeds columns may include in-kind transactions, if applicable.
Investment Valuation
The following is a summary of the inputs used, as of June 30, 2024, involving the Fund's assets and liabilities carried at fair value. The inputs or methodology used for valuing securities may not be an indication of the risk associated with investing in those securities. For more information on valuation inputs, and their aggregation into the levels used below, please refer to the Investment Valuation section in the accompanying Notes to Financial Statements.
| Valuation Inputs at Reporting Date: |
| Description | Total ($) | Level 1 ($) | Level 2 ($) | Level 3 ($) |
Investments in Securities: | | | | |
|
| Municipal Securities | 189,757,331 | - | 189,757,331 | - |
|
| Money Market Funds | 1,836,220 | 1,836,220 | - | - |
| Total Investments in Securities: | 191,593,551 | 1,836,220 | 189,757,331 | - |
Financial Statements (Unaudited)
| Statement of Assets and Liabilities |
| | | | June 30, 2024 (Unaudited) |
| | | | | |
| Assets | | | | |
| Investment in securities, at value - See accompanying schedule: | | | | |
Unaffiliated issuers (cost $190,141,884) | $ | 189,757,331 | | |
Fidelity Central Funds (cost $1,836,220) | | 1,836,220 | | |
| | | | | |
| | | | | |
| Total Investment in Securities (cost $191,978,104) | | | $ | 191,593,551 |
| Receivable for fund shares sold | | | | 150,813 |
| Interest receivable | | | | 1,521,084 |
| Distributions receivable from Fidelity Central Funds | | | | 13,727 |
| Other receivables | | | | 12 |
Total assets | | | | 193,279,187 |
| Liabilities | | | | |
| Payable to custodian bank | $ | 363,808 | | |
| Payable for investments purchased | | | | |
Regular delivery | | 9,933,208 | | |
Delayed delivery | | 2,482,213 | | |
| Payable for fund shares redeemed | | 161,121 | | |
| Distributions payable | | 512,934 | | |
| Total liabilities | | | | 13,453,284 |
| Net Assets | | | $ | 179,825,903 |
| Net Assets consist of: | | | | |
| Paid in capital | | | $ | 180,182,441 |
| Total accumulated earnings (loss) | | | | (356,538) |
| Net Assets | | | $ | 179,825,903 |
Net Asset Value, offering price and redemption price per share ($179,825,903 ÷ 17,977,397 shares) | | | $ | 10.00 |
| Statement of Operations |
| | | | Six months ended June 30, 2024 (Unaudited) |
| Investment Income | | | | |
| Interest | | | $ | 2,875,778 |
| Income from Fidelity Central Funds | | | | 79,956 |
| Total income | | | | 2,955,734 |
| Expenses | | | | |
| Independent trustees' fees and expenses | $ | 226 | | |
| Proxy | | 1,323 | | |
| Total expenses before reductions | | 1,549 | | |
| Expense reductions | | (12) | | |
| Total expenses after reductions | | | | 1,537 |
| Net Investment income (loss) | | | | 2,954,197 |
| Realized and Unrealized Gain (Loss) | | | | |
| Net realized gain (loss) on: | | | | |
| Investment Securities: | | | | |
| Unaffiliated issuers | | 16,673 | | |
| Fidelity Central Funds | | 484 | | |
| Total net realized gain (loss) | | | | 17,157 |
| Change in net unrealized appreciation (depreciation) on investment securities | | | | (314,976) |
| Net gain (loss) | | | | (297,819) |
| Net increase (decrease) in net assets resulting from operations | | | $ | 2,656,378 |
| Statement of Changes in Net Assets |
| |
| | Six months ended June 30, 2024 (Unaudited) | | Year ended December 31, 2023 |
| Increase (Decrease) in Net Assets | | | | |
| Operations | | | | |
| Net investment income (loss) | $ | 2,954,197 | $ | 5,078,152 |
| Net realized gain (loss) | | 17,157 | | 11,249 |
| Change in net unrealized appreciation (depreciation) | | (314,976) | | 923,978 |
| Net increase (decrease) in net assets resulting from operations | | 2,656,378 | | 6,013,379 |
| Distributions to shareholders | | (2,993,220) | | (5,042,075) |
| | | | | |
| Share transactions | | | | |
| Proceeds from sales of shares | | 57,744,066 | | 82,385,493 |
| Reinvestment of distributions | | 31 | | 54 |
| Cost of shares redeemed | | (40,048,800) | | (70,014,809) |
| | | | | |
Net increase (decrease) in net assets resulting from share transactions | | 17,695,297 | | 12,370,738 |
| Total increase (decrease) in net assets | | 17,358,455 | | 13,342,042 |
| | | | | |
| Net Assets | | | | |
| Beginning of period | | 162,467,448 | | 149,125,406 |
| End of period | $ | 179,825,903 | $ | 162,467,448 |
| | | | | |
| Other Information | | | | |
| Shares | | | | |
| Sold | | 5,772,752 | | 8,257,635 |
| Issued in reinvestment of distributions | | 3 | | 5 |
| Redeemed | | (4,004,118) | | (7,020,759) |
| Net increase (decrease) | | 1,768,637 | | 1,236,881 |
| | | | | |
Financial Highlights
Fidelity Flex® Conservative Income Municipal Bond Fund |
| |
| | Six months ended (Unaudited) June 30, 2024 | | Years ended December 31, 2023 | | 2022 | | 2021 | | 2020 | | 2019 |
Selected Per-Share Data | | | | | | | | | | | | |
| Net asset value, beginning of period | $ | 10.02 | $ | 9.96 | $ | 10.03 | $ | 10.04 | $ | 10.02 | $ | 9.98 |
| Income from Investment Operations | | | | | | | | | | | | |
Net investment income (loss) A,B | | .171 | | .320 | | .118 | | .052 | | .121 | | .192 |
| Net realized and unrealized gain (loss) | | (.018) | | .057 | | (.069) | | (.007) | | .026 | | .044 |
| Total from investment operations | | .153 | | .377 | | .049 | | .045 | | .147 | | .236 |
| Distributions from net investment income | | (.173) | | (.316) | | (.119) | | (.054) | | (.125) | | (.193) |
| Distributions from net realized gain | | - | | (.001) | | - | | (.001) | | (.002) | | (.003) |
| Total distributions | | (.173) | | (.317) | | (.119) | | (.055) | | (.127) | | (.196) |
| Net asset value, end of period | $ | 10.00 | $ | 10.02 | $ | 9.96 | $ | 10.03 | $ | 10.04 | $ | 10.02 |
Total Return C,D | | | | 3.85% | | .49% | | .45% | | 1.48% | | 2.39% |
Ratios to Average Net Assets B,E,F | | | | | | | | | | | | |
| Expenses before reductions | | -% G,H,I | | .02% | | -% H | | -% H | | -% H | | -% H |
Expenses net of fee waivers, if any H | | | | -% | | -% | | -% | | -% | | -% |
Expenses net of all reductions H | | -% G,I | | -% | | -% | | -% | | -% | | -% |
| Net investment income (loss) | | 3.44% G,I | | 3.21% | | 1.19% | | .52% | | 1.21% | | 1.92% |
| Supplemental Data | | | | | | | | | | | | |
| Net assets, end of period (000 omitted) | $ | 179,826 | $ | 162,467 | $ | 149,125 | $ | 145,602 | $ | 80,067 | $ | 54,558 |
Portfolio turnover rate J | | | | 78% | | 58% | | 44% | | 36% | | 52% |
ACalculated based on average shares outstanding during the period.
BNet investment income (loss) is affected by the timing of the declaration of dividends by any underlying mutual funds or exchange-traded funds (ETFs). Net investment income (loss) of any mutual funds or ETFs is not included in the Fund's net investment income (loss) ratio.
CTotal returns for periods of less than one year are not annualized.
DTotal returns would have been lower if certain expenses had not been reduced during the applicable periods shown.
EFees and expenses of any underlying mutual funds or exchange-traded funds (ETFs) are not included in the Fund's expense ratio. The Fund indirectly bears its proportionate share of these expenses. For additional expense information related to investments in Fidelity Central Funds, please refer to the "Investments in Fidelity Central Funds" note found in the Notes to Financial Statements section of the most recent Annual or Semi-Annual report.
FExpense ratios reflect operating expenses of the class. Expenses before reductions do not reflect amounts reimbursed, waived, or reduced through arrangements with the investment adviser, brokerage services, or other offset arrangements, if applicable, and do not represent the amount paid by the class during periods when reimbursements, waivers or reductions occur.
GAnnualized.
HAmount represents less than .005%.
IProxy expenses are not annualized.
JAmount does not include the portfolio activity of any underlying mutual funds or exchange-traded funds (ETFs).
Notes to Financial Statements
(Unaudited)For the period ended June 30, 2024
1. Organization.
Fidelity Flex Conservative Income Municipal Bond Fund (the Fund) is a fund of Fidelity Municipal Trust (the Trust) and is authorized to issue an unlimited number of shares. Share transactions on the Statement of Changes in Net Assets may contain exchanges between affiliated funds. The Trust is registered under the Investment Company Act of 1940, as amended (the 1940 Act), as an open-end management investment company organized as a Massachusetts business trust. The Fund is available only to certain fee-based accounts and advisory programs offered by Fidelity.
2. Investments in Fidelity Central Funds.
Funds may invest in Fidelity Central Funds, which are open-end investment companies generally available only to other investment companies and accounts managed by the investment adviser and its affiliates. The Schedule of Investments lists any Fidelity Central Funds held as an investment as of period end, but does not include the underlying holdings of each Fidelity Central Fund. An investing fund indirectly bears its proportionate share of the expenses of the underlying Fidelity Central Funds.
Based on its investment objective, each Fidelity Central Fund may invest or participate in various investment vehicles or strategies that are similar to those of the investing fund. These strategies are consistent with the investment objectives of the investing fund and may involve certain economic risks which may cause a decline in value of each of the Fidelity Central Funds and thus a decline in the value of the investing fund.
| Fidelity Central Fund | Investment Manager | Investment Objective | Investment Practices | Expense RatioA |
| Fidelity Money Market Central Funds | Fidelity Management & Research Company LLC (FMR) | Each fund seeks to obtain a high level of current income consistent with the preservation of capital and liquidity. | Short-term Investments | Less than .005% |
A Expenses expressed as a percentage of average net assets and are as of each underlying Central Fund's most recent annual or semi-annual shareholder report.
A complete unaudited list of holdings for each Fidelity Central Fund is available upon request or at the Securities and Exchange Commission website at www.sec.gov. In addition, the financial statements of the Fidelity Central Funds which contain the significant accounting policies (including investment valuation policies) of those funds, and are not covered by the Report of Independent Registered Public Accounting Firm, are available on the Securities and Exchange Commission website or upon request.
3. Significant Accounting Policies.
The Fund is an investment company and applies the accounting and reporting guidance of the Financial Accounting Standards Board (FASB) Accounting Standards Codification Topic 946 Financial Services - Investment Companies. The financial statements have been prepared in conformity with accounting principles generally accepted in the United States of America (GAAP), which require management to make certain estimates and assumptions at the date of the financial statements. Actual results could differ from those estimates. Subsequent events, if any, through the date that the financial statements were issued have been evaluated in the preparation of the financial statements. The Fund's Schedule of Investments lists any underlying mutual funds or exchange-traded funds (ETFs) but does not include the underlying holdings of these funds. The following summarizes the significant accounting policies of the Fund:
Investment Valuation. Investments are valued as of 4:00 p.m. Eastern time on the last calendar day of the period. The Board of Trustees (the Board) has designated the Fund's investment adviser as the valuation designee responsible for the fair valuation function and performing fair value determinations as needed. The investment adviser has established a Fair Value Committee (the Committee) to carry out the day-to-day fair valuation responsibilities and has adopted policies and procedures to govern the fair valuation process and the activities of the Committee. In accordance with these fair valuation policies and procedures, which have been approved by the Board, the Fund attempts to obtain prices from one or more third party pricing services or brokers to value its investments. When current market prices, quotations or currency exchange rates are not readily available or reliable, investments will be fair valued in good faith by the Committee, in accordance with the policies and procedures. Factors used in determining fair value vary by investment type and may include market or investment specific events, transaction data, estimated cash flows, and market observations of comparable investments. The frequency that the fair valuation procedures are used cannot be predicted and they may be utilized to a significant extent. The Committee manages the Fund's fair valuation practices and maintains the fair valuation policies and procedures. The Fund's investment adviser reports to the Board information regarding the fair valuation process and related material matters.
The Fund categorizes the inputs to valuation techniques used to value its investments into a disclosure hierarchy consisting of three levels as shown below:
Level 1 - unadjusted quoted prices in active markets for identical investments
Level 2 - other significant observable inputs (including quoted prices for similar investments, interest rates, prepayment speeds, etc.)
Level 3 - unobservable inputs (including the Fund's own assumptions based on the best information available)
Valuation techniques used to value the Fund's investments by major category are as follows:
Debt securities, including restricted securities, are valued based on evaluated prices received from third party pricing services or from brokers who make markets in such securities. Municipal securities are valued by pricing services who utilize matrix pricing which considers yield or price of bonds of comparable quality, coupon, maturity and type or by broker-supplied prices. When independent prices are unavailable or unreliable, debt securities may be valued utilizing pricing methodologies which consider similar factors that would be used by third party pricing services. Debt securities are generally categorized as Level 2 in the hierarchy but may be Level 3 depending on the circumstances.
Investments in open-end mutual funds, including the Fidelity Central Funds, are valued at their closing net asset value (NAV) each business day and are categorized as Level 1 in the hierarchy.
Changes in valuation techniques may result in transfers in or out of an assigned level within the disclosure hierarchy. The aggregate value of investments by input level as of June 30, 2024 is included at the end of the Fund's Schedule of Investments.
Investment Transactions and Income. For financial reporting purposes, the Fund's investment holdings and NAV include trades executed through the end of the last business day of the period. The NAV per share for processing shareholder transactions is calculated as of the close of business of the New York Stock Exchange (NYSE), normally 4:00 p.m. Eastern time and includes trades executed through the end of the prior business day. Gains and losses on securities sold are determined on the basis of identified cost. Income and capital gain distributions from Fidelity Central Funds, if any, are recorded on the ex-dividend date. Interest income is accrued as earned and includes coupon interest and amortization of premium and accretion of discount on debt securities as applicable.
Expenses. Expenses directly attributable to a fund are charged to that fund. Expenses attributable to more than one fund are allocated among the respective funds on the basis of relative net assets or other appropriate methods. Expenses included in the accompanying financial statements reflect the expenses of that fund and do not include any expenses associated with any underlying mutual funds or exchange-traded funds. Although not included in a fund's expenses, a fund indirectly bears its proportionate share of these expenses through the net asset value of each underlying mutual fund or exchange-traded fund. Expense estimates are accrued in the period to which they relate and adjustments are made when actual amounts are known.
Income Tax Information and Distributions to Shareholders. Each year, the Fund intends to qualify as a regulated investment company under Subchapter M of the Internal Revenue Code, including distributing substantially all of its taxable income and realized gains. As a result, no provision for U.S. Federal income taxes is required. The Fund files a U.S. federal tax return, in addition to state and local tax returns as required. The Fund's federal income tax returns are subject to examination by the Internal Revenue Service (IRS) for a period of three fiscal years after they are filed. State and local tax returns may be subject to examination for an additional fiscal year depending on the jurisdiction.
Distributions are declared and recorded daily and paid monthly from net investment income. Distributions from realized gains, if any, are declared and recorded on the ex-dividend date. Income and capital gain distributions are determined in accordance with income tax regulations, which may differ from GAAP.
Capital accounts within the financial statements are adjusted for permanent book-tax differences. These adjustments have no impact on net assets or the results of operations. Capital accounts are not adjusted for temporary book-tax differences which will reverse in a subsequent period.
Book-tax differences are primarily due to market discount.
The Fund purchases municipal securities whose interest, in the opinion of the issuer, is free from federal income tax. There is no assurance that the IRS will agree with this opinion. In the event the IRS determines that the issuer does not comply with relevant tax requirements, interest payments from a security could become federally taxable, possibly retroactively to the date the security was issued.
As of period end, the cost and unrealized appreciation (depreciation) in securities, and derivatives if applicable, for federal income tax purposes were as follows:
| Gross unrealized appreciation | $132,703 |
| Gross unrealized depreciation | (504,008) |
| Net unrealized appreciation (depreciation) | $(371,305) |
| Tax cost | $191,964,856 |
Delayed Delivery Transactions and When-Issued Securities. During the period, certain Funds transacted in securities on a delayed delivery or when-issued basis. Payment and delivery may take place after the customary settlement period for that security. The price of the underlying securities and the date when the securities will be delivered and paid for are fixed at the time the transaction is negotiated. Securities purchased on a delayed delivery or when-issued basis are identified as such in the Schedule of Investments. Compensation for interest forgone in the purchase of a delayed delivery or when-issued debt security may be received. With respect to purchase commitments, each applicable Fund identifies securities as segregated in its records with a value at least equal to the amount of the commitment. Payables and receivables associated with the purchases and sales of delayed delivery securities having the same coupon, settlement date and broker are offset. Delayed delivery or when-issued securities that have been purchased from and sold to different brokers are reflected as both payables and receivables in the Statement of Assets and Liabilities under the caption "Delayed delivery", as applicable. Losses may arise due to changes in the value of the underlying securities or if the counterparty does not perform under the contract's terms, or if the issuer does not issue the securities due to political, economic, or other factors.
Restricted Securities (including Private Placements). Funds may invest in securities that are subject to legal or contractual restrictions on resale. These securities generally may be resold in transactions exempt from registration or to the public if the securities are registered. Disposal of these securities may involve time-consuming negotiations and expense, and prompt sale at an acceptable price may be difficult. Information regarding restricted securities held at period end is included at the end of the Schedule of Investments, if applicable.
4. Purchases and Sales of Investments.
Purchases and sales of securities, other than short-term securities and in-kind transactions, as applicable, are noted in the table below.
| | Purchases ($) | Sales ($) |
| Fidelity Flex Conservative Income Municipal Bond Fund | 48,418,585 | 31,540,135 |
5. Fees and Other Transactions with Affiliates.
Management Fee. Fidelity Management & Research Company LLC (the investment adviser) and its affiliates provide the Fund with investment management related services and the Fund does not pay any fees for these services. Under the management contract, the investment adviser or an affiliate pays all other expenses of the Fund, excluding fees and expenses of the independent Trustees, and certain miscellaneous expenses such as proxy and shareholder meeting expenses.
Interfund Trades. Funds may purchase from or sell securities to other Fidelity Funds under procedures adopted by the Board. The procedures have been designed to ensure these interfund trades are executed in accordance with Rule 17a-7 of the 1940 Act. Any interfund trades are included within the respective purchases and sales amounts shown in the Purchases and Sales of Investments note. Interfund trades during the period are noted in the table below.
| | Purchases ($) | Sales ($) | Realized Gain (Loss)($) |
| Fidelity Flex Conservative Income Municipal Bond Fund | 1,800,000 | 1,700,000 | - |
Sub-Advisory Arrangements. Effective March 1, 2024, the Fund's sub-advisory agreements with FMR Investment Management (UK) Limited, Fidelity Management & Research (Hong Kong) Limited, and Fidelity Management & Research (Japan) Limited were amended to provide that the investment adviser pays each sub-adviser monthly fees equal to 110% of the sub-adviser's costs for providing sub-advisory services.
6. Committed Line of Credit.
Certain Funds participate with other funds managed by the investment adviser or an affiliate in a $4.25 billion credit facility (the "line of credit") to be utilized for temporary or emergency purposes to fund shareholder redemptions or for other short-term liquidity purposes. The commitment fees on the pro-rata portion of the line of credit are borne by the investment adviser. During the period, there were no borrowings on this line of credit.
7. Expense Reductions.
Through arrangements with the Fund's custodian, credits realized as a result of certain uninvested cash balances were used to reduce the Fund's expenses by $12.
8. Other.
A fund's organizational documents provide former and current trustees and officers with a limited indemnification against liabilities arising in connection with the performance of their duties to the fund. In the normal course of business, a fund may also enter into contracts that provide general indemnifications. A fund's maximum exposure under these arrangements is unknown as this would be dependent on future claims that may be made against a fund. The risk of material loss from such claims is considered remote.
9. Risk and Uncertainties.
Many factors affect a fund's performance. Developments that disrupt global economies and financial markets, such as pandemics, epidemics, outbreaks of infectious diseases, war, terrorism, and environmental disasters, may significantly affect a fund's investment performance. The effects of these developments to a fund will be impacted by the types of securities in which a fund invests, the financial condition, industry, economic sector, and geographic location of an issuer, and a fund's level of investment in the securities of that issuer. Significant concentrations in security types, issuers, industries, sectors, and geographic locations may magnify the factors that affect a fund's performance.
Item 8: Changes in and Disagreements with Accountants for Open-End Management Investment Companies
Note: This is not applicable for any fund included in this document.
Item 9: Proxy Disclosures for Open-End Management Investment Companies
Note: This is not applicable for any fund included in this document.
Item 10: Remuneration Paid to Directors, Officers, and others of Open-End Management Investment Companies
Note: This information is disclosed as part of the financial statements for each Fund as part of Item 7: Financial Statements and Financial Highlights for Open-End Management Investment companies.
Item 11: Statement Regarding Basis for Approval of Investment Advisory Contract
Board Approval of Investment Advisory Contracts
Fidelity Flex Conservative Income Municipal Bond Fund
At its January 2024 meeting, the Board of Trustees, including the Independent Trustees (together, the Board), approved amended and restated sub-advisory agreements (the Sub-Advisory Contracts) for the fund, including the fund's sub-advisory agreements with FMR Investment Management (UK) Limited (FMR UK), Fidelity Management & Research (Hong Kong) Limited (FMR H.K.), and Fidelity Management & Research (Japan) Limited (FMR Japan). The Sub-Advisory Contracts will be effective March 1, 2024. The Board will consider the annual renewal of the fund's Sub-Advisory Contracts in September 2024, following its review of additional materials provided by FMR.
The Board considered the Sub-Advisory Contracts, which changed the arrangements for fees paid by FMR to the sub-advisers under the agreements. The Board noted that the agreements with FMR UK, FMR H.K., and FMR Japan were amended to provide that FMR will compensate each sub-adviser at a fee equal to 110% of the sub-adviser's costs incurred in providing services under the agreement. The Board considered that, under the Sub-Advisory Contracts, FMR, and not the fund, will continue to pay the sub-advisory fees to each applicable sub-adviser, and that the management fee paid by the fund under the management contract with FMR will remain unchanged.
The Board considered that the approval of the fund's Sub-Advisory Contracts will not result in any changes in the investment process or strategies employed in the management of the fund's assets or the day-to-day management of the fund or the persons primarily responsible for such management. Further, the Board considered that the Sub-Advisory Contracts would not change the obligations and services of FMR and its affiliates on behalf of the fund, and, in particular, there would be no change in the nature and level of services provided to the fund by FMR and its affiliates.
In connection with its consideration of future renewals of the fund's advisory contracts, the Board will consider: (i) the nature, extent and quality of services provided to the funds, including shareholder and administrative services and investment performance; (ii) the competitiveness of the management fee and total expenses for the fund; (iii) the costs of the services and profitability, including the revenues earned and the expenses incurred in conducting the business of developing, marketing, distributing, managing, administering, and servicing the fund and its shareholders, to the extent applicable; and (iv) whether there have been economies of scale in respect of the Fidelity funds, whether the Fidelity funds (including the fund) have appropriately benefited from any such economies of scale, and whether there is the potential for realization of any further economies.
Based on its evaluation of all of the conclusions noted above, and after considering all factors it believed relevant, the Board concluded that the fund's management fee structure is fair and reasonable, and that the fund's Sub-Advisory Contracts should be approved.
1.9884864.106
XCB-SANN-0824
Fidelity® Minnesota Municipal Income Fund
Semi-Annual Report
June 30, 2024
Contents
To view a fund's proxy voting guidelines and proxy voting record for the 12-month period ended June 30, visit http://www.fidelity.com/proxyvotingresults or visit the Securities and Exchange Commission's (SEC) web site at http://www.sec.gov.
You may also call 1-800-544-8544 to request a free copy of the proxy voting guidelines.
Standard & Poor's, S&P and S&P 500 are registered service marks of The McGraw-Hill Companies, Inc. and have been licensed for use by Fidelity Distributors Corporation.
Other third-party marks appearing herein are the property of their respective owners.
All other marks appearing herein are registered or unregistered trademarks or service marks of FMR LLC or an affiliated company. © 2024 FMR LLC. All rights reserved.
This report and the financial statements contained herein are submitted for the general information of the shareholders of the Fund. This report is not authorized for distribution to prospective investors in the Fund unless preceded or accompanied by an effective prospectus.
A fund files its complete schedule of portfolio holdings with the SEC for the first and third quarters of each fiscal year on Form N-PORT. Forms N-PORT are available on the SEC's web site at http://www.sec.gov. A fund's Forms N-PORT may be reviewed and copied at the SEC's Public Reference Room in Washington, DC. Information regarding the operation of the SEC's Public Reference Room may be obtained by calling 1-800-SEC-0330.
For a complete list of a fund's portfolio holdings, view the most recent holdings listing, semiannual report, or annual report on Fidelity's web site at http://www.fidelity.com, http://www.institutional.fidelity.com, or http://www.401k.com, as applicable.
NOT FDIC INSURED •MAY LOSE VALUE •NO BANK GUARANTEE
Neither the Fund nor Fidelity Distributors Corporation is a bank.
Item 7: Financial Statements and Financial Highlights for Open-End Management Investment Companies (Semi-Annual Report)
Fidelity® Minnesota Municipal Income Fund
Schedule of Investments June 30, 2024 (Unaudited)
Showing Percentage of Net Assets
| Municipal Bonds - 95.3% |
| | | Principal Amount (a) | Value ($) |
| Guam - 0.2% | | | |
| Guam Pwr. Auth. Rev. Series 2022 A, 5% 10/1/44 | | 1,000,000 | 1,031,294 |
| Minnesota - 93.4% | | | |
| Albany Independent School District #745 (Minnesota School district Cr. Enhancement Prog.) Series 2022 A, 4.125% 2/1/41 | | 1,130,000 | 1,153,392 |
| Anoka-Hennepin Independent School District 11 Series 2014 A: | | | |
| 5% 2/1/25 | | 1,015,000 | 1,016,006 |
| 5% 2/1/26 | | 1,220,000 | 1,221,180 |
| 5% 2/1/27 | | 1,285,000 | 1,286,158 |
| 5% 2/1/28 | | 1,345,000 | 1,346,191 |
| 5% 2/1/29 | | 1,415,000 | 1,416,219 |
| 5% 2/1/34 | | 1,800,000 | 1,801,266 |
| Burnsville Series 2017 A, 2.85% 12/20/31 | | 935,000 | 853,021 |
| Chaska Elec. Rev. Series 2015 A: | | | |
| 5% 10/1/26 | | 1,000,000 | 1,018,383 |
| 5% 10/1/29 | | 785,000 | 800,203 |
| City of Ramsey Series 2022 A: | | | |
| 5% 12/15/29 | | 670,000 | 738,705 |
| 5% 12/15/30 | | 665,000 | 745,334 |
| 5% 12/15/31 | | 740,000 | 843,643 |
| 5% 12/15/32 | | 775,000 | 896,261 |
| 5% 12/15/33 | | 565,000 | 655,003 |
| 5% 12/15/34 | | 455,000 | 526,979 |
| City of Virginia Series 2020 A: | | | |
| 4% 2/1/37 (Assured Guaranty Muni. Corp. Insured) | | 1,000,000 | 1,006,873 |
| 4% 2/1/39 (Assured Guaranty Muni. Corp. Insured) | | 1,000,000 | 1,002,047 |
| City of White Bear Lake (YMCA of Greater Twin Cities Proj.) Series 2018: | | | |
| 5% 6/1/25 | | 565,000 | 569,793 |
| 5% 6/1/26 | | 500,000 | 508,843 |
| 5% 6/1/28 | | 1,000,000 | 1,032,265 |
| 5% 6/1/30 | | 625,000 | 659,836 |
| 5% 6/1/31 | | 700,000 | 740,045 |
| 5% 6/1/33 | | 1,400,000 | 1,479,910 |
| Coon Rapids Multi-Family Rev. (Galway Place/Cmnty. Plaza Projs.) Series 2019 A, 2.7% 8/1/35 | | 2,553,592 | 2,179,806 |
| Ctr. City Health Care Facilities (Hazelden Betty Ford Foundation Proj.) Series 2014: | | | |
| 5% 11/1/25 | | 250,000 | 250,995 |
| 5% 11/1/26 | | 500,000 | 501,906 |
| 5% 11/1/27 | | 920,000 | 923,354 |
| Dassel Cokato Mischd # 466 (Minnesota School District Cr. Enhancement Prog.) Series 2023 A: | | | |
| 4% 2/1/41 | | 415,000 | 416,547 |
| 4% 2/1/42 | | 750,000 | 747,665 |
| Dawson-Boyd Independent School District Series 2019 A: | | | |
| 4% 2/1/33 | | 1,140,000 | 1,169,090 |
| 4% 2/1/36 | | 1,360,000 | 1,392,443 |
| 4% 2/1/37 | | 1,200,000 | 1,226,493 |
| Delano Minn Series 2023 A: | | | |
| 4% 2/1/40 | | 1,060,000 | 1,068,634 |
| 4% 2/1/41 | | 1,100,000 | 1,103,206 |
| 5% 2/1/39 | | 1,010,000 | 1,110,010 |
| Dilworth Gen. Oblig. Series 2022 A: | | | |
| 3.5% 2/1/34 | | 455,000 | 451,658 |
| 3.5% 2/1/35 | | 470,000 | 466,034 |
| 3.5% 2/1/36 | | 490,000 | 484,456 |
| 4% 2/1/38 | | 1,030,000 | 1,048,643 |
| 4% 2/1/40 | | 1,115,000 | 1,123,149 |
| 4% 2/1/42 | | 1,205,000 | 1,208,239 |
| Duluth Econ. Dev. Auth. Series 2021 A, 4% 7/1/41 | | 930,000 | 760,200 |
| Duluth Econ. Dev. Auth. Health Care Facilities Rev.: | | | |
| Series 2018 A: | | | |
4.25% 2/15/48 | | 2,030,000 | 1,948,342 |
5% 2/15/43 | | 1,500,000 | 1,522,628 |
| Series 2021 A: | | | |
4% 6/15/32 | | 535,000 | 553,265 |
4% 6/15/35 | | 550,000 | 567,361 |
| Series 2022 A: | | | |
4% 6/15/37 | | 1,140,000 | 1,172,756 |
4% 6/15/38 | | 400,000 | 408,132 |
4% 6/15/39 | | 250,000 | 253,407 |
5% 6/15/25 | | 565,000 | 566,401 |
5% 6/15/26 | | 360,000 | 368,986 |
5% 6/15/28 | | 935,000 | 983,813 |
5% 6/15/29 | | 1,035,000 | 1,104,536 |
5% 6/15/31 | | 1,220,000 | 1,335,847 |
5% 6/15/33 | | 1,170,000 | 1,294,626 |
| Series 2022 B: | | | |
5.25% 6/15/47 | | 2,500,000 | 2,712,599 |
5.25% 6/15/52 | | 1,250,000 | 1,350,218 |
| Duluth Independent School District #709 Ctfs. of Prtn. Series 2021 B, 3% 3/1/32 (Pre-Refunded to 3/1/28 @ 100) | | 540,000 | 536,545 |
| Eden Prairie Independent School District Series 2023 A: | | | |
| 4% 2/1/35 | | 1,050,000 | 1,099,072 |
| 4% 2/1/36 | | 915,000 | 950,281 |
| Elk River Independent School District #728: | | | |
| Series 2019 A, 3% 2/1/33 | | 2,925,000 | 2,744,064 |
| Series 2020 A, 4% 2/1/31 | | 2,120,000 | 2,180,238 |
| Fridley Independent School District #14 (MN School District Cr. Enhancement Prog.) Series 2016 A, 3% 2/1/35 | | 300,000 | 279,420 |
| Hawley Independent School District #150 Series 2023 A, 5% 2/1/39 | | 620,000 | 666,021 |
| Itasca County (Minnesota County Cr. Enhancement Prog.) Series 2020 B, 2% 2/1/35 | | 600,000 | 481,915 |
| Lake Elmo Minn Series 2021 A: | | | |
| 2% 2/1/35 | | 1,185,000 | 939,209 |
| 2% 2/1/36 | | 1,205,000 | 946,564 |
| Lakeville Independent School District #194 (Minnesota School District Cr. Enhancement Prog.) Series 2021 B: | | | |
| 2% 2/1/37 | | 1,515,000 | 1,139,636 |
| 2% 2/1/38 | | 3,075,000 | 2,262,235 |
| 2% 2/1/39 | | 4,180,000 | 2,986,477 |
| 2% 2/1/40 | | 4,285,000 | 2,991,642 |
| 2.125% 2/1/41 | | 3,395,000 | 2,362,532 |
| Le Sueur-Henderson ISD No. 2397 (Minnesota School District Cr. Enhancement Prog.) Series 2022 A, 4.5% 2/1/42 | | 2,495,000 | 2,583,089 |
| Maple Grove Gen. Oblig. Impt. Series 2020 A: | | | |
| 1.5% 2/1/33 | | 715,000 | 563,064 |
| 1.625% 2/1/34 | | 790,000 | 618,588 |
| Maple Grove Health Care Sys. Rev.: | | | |
| Series 2015: | | | |
4% 9/1/35 | | 1,250,000 | 1,182,442 |
5% 9/1/25 | | 215,000 | 217,306 |
5% 9/1/28 | | 695,000 | 701,691 |
5% 9/1/30 | | 1,500,000 | 1,513,418 |
5% 9/1/31 | | 1,300,000 | 1,312,339 |
5% 9/1/32 | | 1,000,000 | 1,008,334 |
| Series 2017: | | | |
5% 5/1/26 | | 1,355,000 | 1,374,693 |
5% 5/1/27 | | 1,400,000 | 1,432,371 |
5% 5/1/28 | | 2,915,000 | 2,979,809 |
5% 5/1/29 | | 1,000,000 | 1,022,477 |
5% 5/1/30 | | 900,000 | 920,521 |
5% 5/1/31 | | 580,000 | 592,955 |
5% 5/1/32 | | 500,000 | 509,831 |
| Metropolitan Council Gen. Oblig. Rev.: | | | |
| Series 2020 B: | | | |
2% 3/1/33 | | 4,250,000 | 3,530,823 |
2.125% 3/1/36 | | 1,000,000 | 803,700 |
| Series 2024 B, 4% 3/1/43 | | 4,210,000 | 4,226,185 |
| Minneapolis & Saint Paul Metropolitan Arpts. Commission Arpt. Rev.: | | | |
| Series 2016 A: | | | |
5% 1/1/30 | | 4,275,000 | 4,452,666 |
5% 1/1/31 | | 2,375,000 | 2,474,173 |
5% 1/1/32 | | 2,900,000 | 3,020,680 |
| Series 2016 D: | | | |
5% 1/1/27 (b) | | 350,000 | 359,293 |
5% 1/1/28 (b) | | 430,000 | 440,228 |
5% 1/1/29 (b) | | 225,000 | 230,519 |
5% 1/1/30 (b) | | 480,000 | 490,560 |
5% 1/1/31 (b) | | 200,000 | 204,487 |
5% 1/1/32 (b) | | 200,000 | 204,506 |
5% 1/1/33 (b) | | 220,000 | 224,946 |
5% 1/1/34 (b) | | 225,000 | 230,058 |
5% 1/1/35 (b) | | 225,000 | 230,035 |
5% 1/1/36 (b) | | 220,000 | 224,781 |
5% 1/1/37 (b) | | 250,000 | 255,171 |
5% 1/1/41 (b) | | 725,000 | 734,687 |
| Series 2022 B: | | | |
4.25% 1/1/42 (b) | | 1,780,000 | 1,780,757 |
5% 1/1/47 (b) | | 1,600,000 | 1,664,752 |
| Series 2023 A, 5% 1/1/35 | | 900,000 | 1,023,338 |
| Minneapolis Gen. Oblig. Series 2019, 3% 12/1/40 | | 395,000 | 339,773 |
| Minneapolis Health Care Sys. Rev.: | | | |
| Bonds Series 2023 B, 5%, tender 11/15/30 (c) | | 11,445,000 | 12,248,846 |
| Series 2015 A: | | | |
5% 11/15/27 (Assured Guaranty Muni. Corp. Insured) | | 850,000 | 859,092 |
5% 11/15/32 | | 2,200,000 | 2,222,078 |
| Series 2018 A: | | | |
5% 11/15/34 | | 3,350,000 | 3,458,777 |
5% 11/15/35 | | 2,500,000 | 2,578,836 |
5% 11/15/36 | | 2,500,000 | 2,574,442 |
5% 11/15/49 | | 4,935,000 | 4,960,003 |
| Series 2021: | | | |
4% 11/15/36 | | 5,410,000 | 5,500,902 |
4% 11/15/37 | | 5,410,000 | 5,462,059 |
4% 11/15/38 | | 1,785,000 | 1,792,436 |
4% 11/15/39 | | 1,265,000 | 1,259,642 |
4% 11/15/40 | | 8,860,000 | 8,724,174 |
| Minneapolis Multi-family Rev. (Gateway Northeast Proj.) Series 2019, 2.46% 1/1/38 | | 6,890,397 | 5,471,343 |
| Minneapolis Spl. School District: | | | |
| (Minnesota School District Cr. Enhancement Prog.) Series 2018 B, 5% 2/1/32 | | 895,000 | 952,615 |
| (MN School District Cr. Enhancement Prog.): | | | |
Series 2018 A, 5% 2/1/33 | | 1,000,000 | 1,055,259 |
Series 2018 B, 5% 2/1/33 | | 3,190,000 | 3,366,276 |
| Series 2017 A, 4% 2/1/33 | | 1,415,000 | 1,445,813 |
| Series 2017 B, 4% 2/1/34 | | 2,595,000 | 2,630,506 |
| Series 2020 B, 4% 2/1/36 | | 1,745,000 | 1,788,134 |
| Series 2020 C, 4% 2/1/38 | | 1,665,000 | 1,688,128 |
| Series 2021 B: | | | |
5% 2/1/41 | | 1,180,000 | 1,281,583 |
5% 2/1/42 | | 1,235,000 | 1,336,660 |
| Series 2021 C: | | | |
5% 2/1/40 | | 1,585,000 | 1,727,074 |
5% 2/1/41 | | 1,660,000 | 1,802,906 |
5% 2/1/42 | | 1,745,000 | 1,888,641 |
| Series 2022 B: | | | |
5% 2/1/34 | | 850,000 | 964,194 |
5% 2/1/41 | | 1,195,000 | 1,311,539 |
5% 2/1/42 | | 1,255,000 | 1,371,995 |
5% 2/1/43 | | 1,320,000 | 1,438,663 |
| Minnesota Agric. & Econ. Dev. Board Rev. Series 2024: | | | |
| 4% 1/1/49 | | 3,000,000 | 2,907,166 |
| 5% 1/1/41 | | 2,300,000 | 2,526,900 |
| Minnesota Armory Bldg. Commission Series 2021 A, 3% 6/1/38 | | 1,925,000 | 1,724,192 |
| Minnesota Gen. Oblig.: | | | |
| Series 2016 D, 2.25% 8/1/29 | | 420,000 | 379,278 |
| Series 2017 D, 3% 10/1/29 | | 5,000,000 | 4,886,442 |
| Series 2018 B, 4% 8/1/35 | | 5,270,000 | 5,402,274 |
| Series 2021 A: | | | |
4% 9/1/39 | | 2,645,000 | 2,732,943 |
4% 9/1/41 | | 10,000,000 | 10,221,272 |
| Series 2021 B, 4% 9/1/32 | | 2,000,000 | 2,101,125 |
| Minnesota Higher Ed. Facilities Auth. Rev.: | | | |
| (Univ. of St Thomas) Series 2017 A, 5% 10/1/29 | | 760,000 | 792,447 |
| Bonds: | | | |
Series 2024 B1, 5%, tender 10/1/27 (c) | | 3,000,000 | 3,106,333 |
Series 2024 B2, 5%, tender 10/1/29 (c) | | 2,900,000 | 3,058,290 |
| Series 2016 A, 5% 5/1/46 | | 3,610,000 | 3,313,219 |
| Series 2017 A, 4% 10/1/35 | | 800,000 | 804,717 |
| Series 2017: | | | |
3% 3/1/33 | | 1,510,000 | 1,405,740 |
3% 3/1/34 | | 430,000 | 397,417 |
5% 3/1/31 | | 1,000,000 | 1,039,277 |
5% 10/1/31 | | 590,000 | 612,332 |
5% 3/1/34 | | 530,000 | 552,431 |
5% 10/1/34 | | 440,000 | 457,449 |
5% 10/1/35 | | 555,000 | 576,722 |
| Series 2018 A: | | | |
5% 10/1/34 | | 1,155,000 | 1,188,427 |
5% 10/1/35 | | 500,000 | 514,093 |
5% 10/1/45 | | 3,650,000 | 3,662,791 |
| Series 2019: | | | |
4% 12/1/24 | | 100,000 | 99,627 |
4% 12/1/25 | | 180,000 | 178,855 |
4% 12/1/26 | | 190,000 | 187,919 |
4% 12/1/27 | | 195,000 | 192,280 |
4% 12/1/28 | | 480,000 | 471,701 |
4% 12/1/29 | | 285,000 | 279,183 |
4% 12/1/30 | | 200,000 | 195,041 |
4% 12/1/31 | | 450,000 | 436,685 |
4% 12/1/32 | | 690,000 | 665,790 |
4% 12/1/33 | | 750,000 | 719,461 |
4% 12/1/34 | | 225,000 | 214,840 |
5% 10/1/29 | | 400,000 | 429,089 |
5% 10/1/40 | | 1,000,000 | 1,048,876 |
| Series 2021: | | | |
3% 3/1/40 | | 365,000 | 317,737 |
3% 3/1/43 | | 430,000 | 355,149 |
4% 10/1/24 | | 440,000 | 439,933 |
4% 3/1/25 | | 175,000 | 175,498 |
4% 10/1/25 | | 585,000 | 586,903 |
4% 3/1/26 | | 100,000 | 100,934 |
4% 10/1/26 | | 600,000 | 604,510 |
4% 10/1/28 | | 675,000 | 684,855 |
4% 10/1/29 | | 460,000 | 468,233 |
4% 3/1/30 | | 150,000 | 155,124 |
4% 3/1/31 | | 250,000 | 260,582 |
4% 3/1/32 | | 140,000 | 145,206 |
4% 3/1/33 | | 390,000 | 403,184 |
4% 3/1/34 | | 150,000 | 154,719 |
4% 3/1/35 | | 125,000 | 129,009 |
4% 3/1/36 | | 125,000 | 128,941 |
4% 3/1/37 | | 100,000 | 102,548 |
4% 10/1/46 | | 2,750,000 | 2,701,141 |
4% 10/1/50 | | 1,000,000 | 976,409 |
| Series 2022 A: | | | |
5% 10/1/47 | | 1,000,000 | 1,045,127 |
5% 10/1/52 | | 1,000,000 | 1,039,495 |
| Series 2023, 5% 3/1/45 | | 5,645,000 | 6,094,389 |
| Series 2024 A, 4.125% 10/1/53 | | 2,500,000 | 2,444,873 |
| Series Eight-G, 5% 12/1/31 | | 1,000,000 | 1,017,835 |
| Series Eight-J, 5% 3/1/27 | | 500,000 | 504,531 |
| Series Eight-L: | | | |
5% 4/1/28 | | 920,000 | 939,657 |
5% 4/1/29 | | 1,005,000 | 1,027,368 |
5% 4/1/35 | | 500,000 | 508,340 |
| Minnesota Hsg. Fin. Agcy.: | | | |
| (Mtg. Backed Securities Pass Through Prog.) Series 2019 C, 3.15% 6/1/49 | | 725,834 | 648,743 |
| (Mtg.-Backed Securities Pass-Through Prog.) Series H, 2.47% 1/1/50 | | 1,557,173 | 1,339,431 |
| Series 2015 A: | | | |
5% 8/1/29 | | 1,000,000 | 1,000,945 |
5% 8/1/30 | | 1,000,000 | 1,000,960 |
5% 8/1/31 | | 1,000,000 | 1,000,848 |
5% 8/1/32 | | 1,000,000 | 1,000,805 |
5% 8/1/33 | | 1,000,000 | 1,000,770 |
| Series 2016 B, 3.5% 7/1/46 | | 1,785,000 | 1,768,239 |
| Series 2019 B, 4.25% 7/1/49 | | 2,305,000 | 2,302,215 |
| Series 2020 B, 2.4% 1/1/35 | | 1,215,000 | 1,012,991 |
| Series 2020 E, 1.95% 1/1/30 | | 1,425,000 | 1,237,981 |
| Series 2020 G, 3% 1/1/51 | | 1,065,000 | 1,034,552 |
| Series 2021 D, 3% 1/1/52 | | 1,565,000 | 1,513,500 |
| Series 2021 G, 2.4% 7/1/33 (b) | | 830,000 | 667,296 |
| Series 2021 H, 3% 7/1/52 | | 1,090,000 | 1,053,194 |
| Series 2021, 3% 7/1/51 | | 3,025,000 | 2,929,727 |
| Series 2022 M, 6% 1/1/53 | | 2,440,000 | 2,586,342 |
| Series 2023 B, 5.75% 7/1/53 | | 3,000,000 | 3,162,182 |
| Series 2023 E, 6.25% 7/1/54 | | 2,000,000 | 2,170,546 |
| Series 2023, 6% 7/1/53 | | 1,000,000 | 1,072,876 |
| Series 2024 A, 6.25% 1/1/54 | | 6,000,000 | 6,532,060 |
| Series B: | | | |
3.5% 7/1/50 | | 6,300,000 | 6,194,112 |
4% 8/1/36 | | 2,000,000 | 2,038,904 |
| Series E, 3.5% 7/1/50 | | 3,180,000 | 3,124,290 |
| Series I, 3% 1/1/51 | | 3,755,000 | 3,643,965 |
| Minnesota Muni. Gas Agcy. Rev. Bonds Series 2022 A, 4%, tender 12/1/27 (c) | | 7,000,000 | 7,050,917 |
| Minnesota Muni. Pwr. Agcy. Elec. Rev.: | | | |
| Series 2014: | | | |
5% 10/1/27 | | 750,000 | 752,633 |
5% 10/1/30 | | 1,000,000 | 1,003,436 |
| Series 2016: | | | |
3% 10/1/34 | | 250,000 | 228,194 |
4% 10/1/41 | | 1,000,000 | 988,701 |
5% 10/1/33 | | 400,000 | 412,876 |
5% 10/1/35 | | 400,000 | 411,390 |
5% 10/1/36 | | 1,000,000 | 1,025,644 |
| Minnesota Office of Higher Ed. Series2023, 5% 11/1/33 (b) | | 3,600,000 | 3,820,964 |
| Moorhead Series 2021 A, 2.125% 2/1/40 | | 365,000 | 259,305 |
| Moorhead Edl. Facilities Rev. (The Concordia College Corp. Proj.) Series 2016, 5% 12/1/25 | | 1,320,000 | 1,320,000 |
| Moorhead ISD No. 152: | | | |
| (MN School District Cr. Enhancement Prog.) Series 2020 A, 2.5% 2/1/37 | | 1,500,000 | 1,248,162 |
| Series 2020 A, 4% 2/1/31 | | 2,015,000 | 2,068,125 |
| Mounds View Independent School District #621 (Minnesota School District Cr. Enhancement Prog.) Series 2018 A: | | | |
| 3.45% 2/1/37 | | 2,000,000 | 1,959,797 |
| 3.55% 2/1/38 | | 2,000,000 | 1,942,799 |
| Nashwauk Keewatin Independent School District # 319 Gen. Oblig. Series 2022 A: | | | |
| 4% 2/1/35 | | 200,000 | 207,972 |
| 4% 2/1/36 | | 1,000,000 | 1,039,869 |
| North St. Paul Maplewood-Oakdale Indpendent School District: | | | |
| (Minnesota School District Cr. Enhancement Prog.) Series 2019 B, 3% 2/1/42 | | 3,090,000 | 2,623,733 |
| (MN School District Cr. Enhancement Prog.) Series 2019 B, 4% 2/1/32 | | 3,120,000 | 3,195,151 |
| Northern Muni. Pwr. Agcy. Elec. Sys. Rev.: | | | |
| Series 2013 A, 5% 1/1/31 | | 1,740,000 | 1,740,000 |
| Series 2016: | | | |
5% 1/1/28 | | 500,000 | 511,515 |
5% 1/1/29 | | 920,000 | 941,729 |
5% 1/1/30 | | 520,000 | 532,205 |
5% 1/1/31 | | 350,000 | 358,163 |
| Series 2017: | | | |
5% 1/1/31 | | 400,000 | 414,561 |
5% 1/1/33 | | 475,000 | 490,651 |
5% 1/1/35 | | 520,000 | 536,769 |
| Series 2023: | | | |
5% 1/1/30 (Assured Guaranty Muni. Corp. Insured) | | 1,050,000 | 1,138,026 |
5% 1/1/31 (Assured Guaranty Muni. Corp. Insured) | | 500,000 | 549,310 |
5% 1/1/32 (Assured Guaranty Muni. Corp. Insured) | | 345,000 | 374,693 |
5% 1/1/33 (Assured Guaranty Muni. Corp. Insured) | | 360,000 | 390,181 |
| Series 2024: | | | |
5% 1/1/30 | | 1,650,000 | 1,781,438 |
5% 1/1/31 | | 2,175,000 | 2,377,526 |
| Northfield Minn Series 2021 A, 2% 2/1/29 | | 250,000 | 233,207 |
| Osseo Independent School District #279 Series 2020 A: | | | |
| 1.75% 2/1/33 | | 3,650,000 | 2,938,388 |
| 1.75% 2/1/34 | | 2,405,000 | 1,897,523 |
| 1.75% 2/1/35 | | 1,790,000 | 1,387,069 |
| 1.875% 2/1/37 | | 3,205,000 | 2,420,282 |
| Red Rock Central Independent School District Series 2022 A, 2.375% 2/1/45 | | 1,310,000 | 903,401 |
| Richfield Independent School District #280 Series 2018 A, 3.5% 2/1/43 | | 260,000 | 240,074 |
| Robbinsdale Independent School District 281 (MN School District Cr. Enhancement Prog.) Series 2016, 3% 2/1/31 | | 300,000 | 298,253 |
| Rochester Elec. Util. Rev. Series 2017 A, 5% 12/1/42 | | 1,100,000 | 1,117,313 |
| Rochester Gen. Oblig. Series 2020 C: | | | |
| 1.5% 2/1/32 | | 990,000 | 800,196 |
| 1.625% 2/1/33 | | 1,205,000 | 964,216 |
| 1.625% 2/1/34 | | 1,255,000 | 985,265 |
| 1.75% 2/1/35 | | 1,215,000 | 949,701 |
| Rochester Health Care Facilities Rev.: | | | |
| Series 2016 B, 5% 11/15/33 | | 1,220,000 | 1,408,764 |
| Series 2018, 4% 11/15/48 | | 3,400,000 | 3,313,900 |
| Series 2022, 4% 11/15/39 | | 2,670,000 | 2,755,086 |
| Rochester Independent School District #535 (Minnesota School District Cr. Enhancement Prog.) Series 2020 A, 3% 2/1/35 | | 1,515,000 | 1,399,801 |
| Roseville Independent School District Series 2021 A: | | | |
| 5% 4/1/27 | | 850,000 | 868,831 |
| 5% 4/1/28 | | 1,100,000 | 1,134,579 |
| Roseville Independent School District #623 (MN School District Cr. Enhancement Prog.) Series 2018 A, 5% 2/1/29 | | 5,180,000 | 5,384,445 |
| Saint Cloud Health Care Rev.: | | | |
| Series 2016 A: | | | |
5% 5/1/29 | | 1,125,000 | 1,155,182 |
5% 5/1/30 | | 1,000,000 | 1,025,282 |
5% 5/1/31 | | 1,000,000 | 1,023,815 |
| Series 2019, 5% 5/1/48 | | 6,000,000 | 6,193,251 |
| Saint Paul Port Auth. District Series 2021 1: | | | |
| 3% 10/1/26 | | 100,000 | 97,024 |
| 3% 10/1/34 | | 295,000 | 265,781 |
| 4% 10/1/41 | | 500,000 | 469,378 |
| Saint Paul Sales Tax Rev. Series 2014 G: | | | |
| 5% 11/1/26 | | 1,000,000 | 1,005,184 |
| 5% 11/1/28 | | 1,000,000 | 1,004,917 |
| Sauk Rapids Minn Independent School District # 47 Series 2020 A, 2.5% 2/1/39 | | 2,925,000 | 2,317,499 |
| Shakopee Health Care Facilities Rev. Series 2014: | | | |
| 5% 9/1/24 | | 1,000,000 | 1,001,283 |
| 5% 9/1/25 | | 1,345,000 | 1,347,090 |
| 5% 9/1/26 | | 1,575,000 | 1,576,255 |
| 5% 9/1/28 | | 1,000,000 | 1,000,332 |
| 5% 9/1/34 | | 1,065,000 | 1,065,487 |
| Shakopee Sr. Hsg. Rev. Bonds Series 2018, 5.85%, tender 11/1/25 (c)(d) | | 2,900,000 | 2,839,997 |
| South Washington County Independent School District #833 (Minnesota School District Cr. Enhancement Prog.) Series 2020 A, 3% 2/1/33 | | 295,000 | 277,758 |
| Southern Minnesota Muni. Pwr. Agcy. Pwr. Supply Sys. Rev.: | | | |
| (Cap. Appreciation) Series 1994 A, 0% 1/1/26 (Nat'l. Pub. Fin. Guarantee Corp. Insured) | | 3,320,000 | 3,121,769 |
| Series 2015 A: | | | |
5% 1/1/34 | | 1,695,000 | 1,733,036 |
5% 1/1/36 | | 1,000,000 | 1,020,823 |
| Series 2019 A, 5% 1/1/34 | | 1,230,000 | 1,350,630 |
| St Paul Independent School District (Minnesota School District Cr. Enhancement Prog.) Series 2022 E, 4% 2/1/40 | | 1,575,000 | 1,607,738 |
| St Paul Minn Independent School District # Series 2024 A, 5% 2/1/29 | | 500,000 | 540,091 |
| St Paul Minn Wtr. Rev.: | | | |
| Series 2021 F, 2% 12/1/41 | | 1,220,000 | 832,991 |
| Series 2023 A, 4% 12/1/47 | | 1,000,000 | 994,603 |
| St. Paul Hsg. & Redev. Auth. Health Care Facilities Rev.: | | | |
| Series 2015 A: | | | |
5% 7/1/29 | | 5,000,000 | 5,039,796 |
5% 7/1/30 | | 5,015,000 | 5,054,249 |
| Series 2017 A: | | | |
3.125% 11/15/32 | | 35,000 | 32,060 |
5% 11/15/28 | | 460,000 | 473,074 |
5% 11/15/30 | | 650,000 | 669,899 |
5% 11/15/31 | | 845,000 | 871,020 |
5% 11/15/33 | | 3,410,000 | 3,514,656 |
5% 11/15/34 | | 665,000 | 685,359 |
| Univ. of Minnesota Gen. Oblig. Series 2020 A: | | | |
| 5% 11/1/33 | | 1,015,000 | 1,124,824 |
| 5% 11/1/45 | | 3,050,000 | 3,288,689 |
| Wadena Minn Rev. (Wadena Cancer Ctr. Proj.) Series 2024 A: | | | |
| 5% 12/1/28 | | 275,000 | 292,147 |
| 5% 12/1/29 | | 285,000 | 306,833 |
| 5% 12/1/30 | | 380,000 | 413,683 |
| 5% 12/1/31 | | 395,000 | 434,679 |
| 5% 12/1/32 | | 365,000 | 405,025 |
| 5% 12/1/33 | | 385,000 | 430,791 |
| 5% 12/1/45 | | 1,900,000 | 2,008,445 |
| Warren / Alvarado / Oslo Minni Series 2023 A: | | | |
| 3.75% 2/1/42 | | 1,030,000 | 999,395 |
| 3.75% 2/1/43 | | 845,000 | 810,551 |
| Watertown Independent School District #111 (Minnesota School District Cr. Enhancement Prog.) Series 2020 A, 0% 2/1/29 | | 1,000,000 | 825,646 |
| Wayzata Sr Hsg. Rev. Series 2019: | | | |
| 5% 8/1/49 | | 500,000 | 501,841 |
| 5% 8/1/54 | | 1,000,000 | 1,002,112 |
| West Saint Paul Independent School District #197 (Minnesota School District Cr. Enhancement Prog.) Series 2018 A: | | | |
| 3.6% 2/1/37 | | 2,000,000 | 1,989,847 |
| 3.65% 2/1/38 | | 2,000,000 | 1,951,398 |
| 4% 2/1/41 | | 2,400,000 | 2,378,990 |
| White Bear Lake Independent School District #624 Gen. Oblig.: | | | |
| Series 2020 A, 3% 2/1/31 | | 1,860,000 | 1,815,486 |
| Series 2022 A, 4% 2/1/32 | | 4,795,000 | 5,018,806 |
| Wright County Series 2018 A: | | | |
| 3.1% 12/1/32 | | 1,790,000 | 1,697,289 |
| 3.15% 12/1/33 | | 1,865,000 | 1,766,754 |
| 3.25% 12/1/34 | | 2,345,000 | 2,230,172 |
| 3.35% 12/1/36 | | 2,440,000 | 2,310,273 |
| Wright County Ctfs. of Prtn. Series 2019 A, 5% 12/1/31 | | 1,000,000 | 1,097,096 |
TOTAL MINNESOTA | | | 503,937,652 |
| Puerto Rico - 1.7% | | | |
| Puerto Rico Commonwealth Pub. Impt. Gen. Oblig. Series 2021 A1: | | | |
| 0% 7/1/33 | | 1,705,673 | 1,138,127 |
| 5.625% 7/1/27 | | 190,000 | 198,232 |
| 5.625% 7/1/29 | | 595,000 | 638,147 |
| 5.75% 7/1/31 | | 1,420,000 | 1,576,823 |
| Puerto Rico Hsg. Fin. Auth. Series 2020, 5% 12/1/27 | | 1,225,000 | 1,274,841 |
| Puerto Rico Indl., Tourist, Edl., Med. And Envir. Cont. Facilities Fing. Auth. Series 2021: | | | |
| 4% 7/1/36 | | 105,000 | 99,909 |
| 4% 7/1/41 | | 85,000 | 78,279 |
| 5% 7/1/27 | | 940,000 | 961,251 |
| 5% 7/1/30 | | 565,000 | 592,967 |
| 5% 7/1/32 | | 380,000 | 401,726 |
| Puerto Rico Sales Tax Fing. Corp. Sales Tax Rev. Series 2019 A2, 4.329% 7/1/40 | | 2,080,000 | 2,052,113 |
TOTAL PUERTO RICO | | | 9,012,415 |
| TOTAL MUNICIPAL BONDS (Cost $527,296,263) | | | 513,981,361 |
| | | | |
| Municipal Notes - 3.6% |
| | | Principal Amount (a) | Value ($) |
| Minnesota - 3.6% | | | |
| Minneapolis Health Care Sys. Rev. (Fairview Health Svcs.) Series 2018 C, 4.5% 7/1/24, LOC Wells Fargo Bank NA, VRDN (c) | | 9,990,000 | 9,990,000 |
| Minnesota Hsg. Fin. Agcy. Series 2016 F, 3.9% 7/5/24 (Liquidity Facility Fed. Home Ln. Bank-Des Moines), VRDN (b)(c) | | 6,400,000 | 6,400,000 |
| Mizuho Floater / Residual Trust V Participating VRDN Series Floater MIZ 91 45, 4.87% 7/1/24 (Liquidity Facility Mizuho Cap. Markets LLC) (c)(e)(f) | | 2,855,000 | 2,855,000 |
| | | | |
| TOTAL MUNICIPAL NOTES (Cost $19,245,000) | | | 19,245,000 |
| | | | |
| TOTAL INVESTMENT IN SECURITIES - 98.9% (Cost $546,541,263) | 533,226,361 |
NET OTHER ASSETS (LIABILITIES) - 1.1% | 5,951,035 |
| NET ASSETS - 100.0% | 539,177,396 |
| | |
Security Type Abbreviations
| VRDN | - | VARIABLE RATE DEMAND NOTE (A debt instrument that is payable upon demand, either daily, weekly or monthly) |
Legend
| (a) | Amount is stated in United States dollars unless otherwise noted. |
| (b) | Private activity obligations whose interest is subject to the federal alternative minimum tax for individuals. |
| (c) | Coupon rates for floating and adjustable rate securities reflect the rates in effect at period end. |
| (d) | Security exempt from registration under Rule 144A of the Securities Act of 1933. These securities may be resold in transactions exempt from registration, normally to qualified institutional buyers. At the end of the period, the value of these securities amounted to $2,839,997 or 0.5% of net assets. |
| (e) | Provides evidence of ownership in one or more underlying municipal bonds. |
| (f) | Coupon rates are determined by re-marketing agents based on current market conditions. |
Investment Valuation
The following is a summary of the inputs used, as of June 30, 2024, involving the Fund's assets and liabilities carried at fair value. The inputs or methodology used for valuing securities may not be an indication of the risk associated with investing in those securities. For more information on valuation inputs, and their aggregation into the levels used below, please refer to the Investment Valuation section in the accompanying Notes to Financial Statements.
| Valuation Inputs at Reporting Date: |
| Description | Total ($) | Level 1 ($) | Level 2 ($) | Level 3 ($) |
Investments in Securities: | | | | |
|
| Municipal Securities | 533,226,361 | - | 533,226,361 | - |
| | | | | |
| Total Investments in Securities: | 533,226,361 | - | 533,226,361 | - |
Financial Statements (Unaudited)
| Statement of Assets and Liabilities |
| | | | June 30, 2024 (Unaudited) |
| | | | | |
| Assets | | | | |
Investment in securities, at value - See accompanying schedule Unaffiliated issuers (cost $546,541,263): | | | $ | 533,226,361 |
| Cash | | | | 140,052 |
| Receivable for fund shares sold | | | | 128,106 |
| Interest receivable | | | | 6,664,275 |
| Other receivables | | | | 4,022 |
Total assets | | | | 540,162,816 |
| Liabilities | | | | |
| Payable for fund shares redeemed | $ | 266,885 | | |
| Distributions payable | | 481,279 | | |
| Accrued management fee | | 202,795 | | |
| Other payables and accrued expenses | | 34,461 | | |
| Total liabilities | | | | 985,420 |
| Net Assets | | | $ | 539,177,396 |
| Net Assets consist of: | | | | |
| Paid in capital | | | $ | 564,680,118 |
| Total accumulated earnings (loss) | | | | (25,502,722) |
| Net Assets | | | $ | 539,177,396 |
Net Asset Value, offering price and redemption price per share ($539,177,396 ÷ 49,015,705 shares) | | | $ | 11.00 |
| Statement of Operations |
| | | | Six months ended June 30, 2024 (Unaudited) |
| Investment Income | | | | |
| Interest | | | $ | 8,894,558 |
| Expenses | | | | |
| Management fee | $ | 1,138,537 | | |
| Transfer agent fees | | 103,679 | | |
| Accounting fees and expenses | | 22,696 | | |
| Custodian fees and expenses | | 6,630 | | |
| Independent trustees' fees and expenses | | 741 | | |
| Registration fees | | 33,710 | | |
| Audit | | 26,706 | | |
| Legal | | 8,525 | | |
| Miscellaneous | | 1,759 | | |
| Total expenses before reductions | | 1,342,983 | | |
| Expense reductions | | (15,789) | | |
| Total expenses after reductions | | | | 1,327,194 |
| Net Investment income (loss) | | | | 7,567,364 |
| Realized and Unrealized Gain (Loss) | | | | |
| Net realized gain (loss) on: | | | | |
| Investment Securities: | | | | |
| Unaffiliated issuers | | (2,918,034) | | |
| Total net realized gain (loss) | | | | (2,918,034) |
| Change in net unrealized appreciation (depreciation) on investment securities | | | | (5,504,234) |
| Net gain (loss) | | | | (8,422,268) |
| Net increase (decrease) in net assets resulting from operations | | | $ | (854,904) |
| Statement of Changes in Net Assets |
| |
| | Six months ended June 30, 2024 (Unaudited) | | Year ended December 31, 2023 |
| Increase (Decrease) in Net Assets | | | | |
| Operations | | | | |
| Net investment income (loss) | $ | 7,567,364 | $ | 13,591,321 |
| Net realized gain (loss) | | (2,918,034) | | (6,678,499) |
| Change in net unrealized appreciation (depreciation) | | (5,504,234) | | 19,893,997 |
| Net increase (decrease) in net assets resulting from operations | | (854,904) | | 26,806,819 |
| Distributions to shareholders | | (7,076,389) | | (13,432,199) |
| | | | | |
| Share transactions | | | | |
| Proceeds from sales of shares | | 35,985,631 | | 153,854,585 |
| Reinvestment of distributions | | 4,167,272 | | 8,080,739 |
| Cost of shares redeemed | | (53,315,648) | | (187,906,039) |
| | | | | |
Net increase (decrease) in net assets resulting from share transactions | | (13,162,745) | | (25,970,715) |
| Total increase (decrease) in net assets | | (21,094,038) | | (12,596,095) |
| | | | | |
| Net Assets | | | | |
| Beginning of period | | 560,271,434 | | 572,867,529 |
| End of period | $ | 539,177,396 | $ | 560,271,434 |
| | | | | |
| Other Information | | | | |
| Shares | | | | |
| Sold | | 3,259,055 | | 14,214,139 |
| Issued in reinvestment of distributions | | 378,459 | | 743,064 |
| Redeemed | | (4,830,088) | | (17,409,872) |
| Net increase (decrease) | | (1,192,574) | | (2,452,669) |
| | | | | |
Financial Highlights
Fidelity® Minnesota Municipal Income Fund |
| |
| | Six months ended (Unaudited) June 30, 2024 | | Years ended December 31, 2023 | | 2022 | | 2021 | | 2020 | | 2019 |
Selected Per-Share Data | | | | | | | | | | | | |
| Net asset value, beginning of period | $ | 11.16 | $ | 10.88 | $ | 12.01 | $ | 12.18 | $ | 11.91 | $ | 11.41 |
| Income from Investment Operations | | | | | | | | | | | | |
Net investment income (loss) A,B | | .152 | | .259 | | .230 | | .227 | | .251 | | .280 |
| Net realized and unrealized gain (loss) | | (.170) | | .277 | | (1.126) | | (.143) | | .296 | | .525 |
| Total from investment operations | | (.018) | | .536 | | (.896) | | .084 | | .547 | | .805 |
| Distributions from net investment income | | (.142) | | (.256) | | (.229) | | (.222) | | (.251) | | (.280) |
| Distributions from net realized gain | | - | | - | | (.005) | | (.032) | | (.026) | | (.025) |
| Total distributions | | (.142) | | (.256) | | (.234) | | (.254) | | (.277) | | (.305) |
| Net asset value, end of period | $ | 11.00 | $ | 11.16 | $ | 10.88 | $ | 12.01 | $ | 12.18 | $ | 11.91 |
Total Return C,D | | | | 5.02% | | (7.47)% | | .70% | | 4.65% | | 7.12% |
Ratios to Average Net Assets B,E,F | | | | | | | | | | | | |
| Expenses before reductions | | .49% G | | .51% | | .51% | | .49% | | .49% | | .49% |
| Expenses net of fee waivers, if any | | | | .50% | | .50% | | .49% | | .49% | | .49% |
| Expenses net of all reductions | | .49% G | | .50% | | .50% | | .48% | | .49% | | .49% |
| Net investment income (loss) | | 2.77% G | | 2.38% | | 2.07% | | 1.88% | | 2.09% | | 2.38% |
| Supplemental Data | | | | | | | | | | | | |
| Net assets, end of period (000 omitted) | $ | 539,177 | $ | 560,271 | $ | 572,868 | $ | 699,070 | $ | 673,488 | $ | 593,754 |
Portfolio turnover rate H | | | | 19% | | 17% | | 7% | | 9% | | 9% |
ACalculated based on average shares outstanding during the period.
BNet investment income (loss) is affected by the timing of the declaration of dividends by any underlying mutual funds or exchange-traded funds (ETFs). Net investment income (loss) of any mutual funds or ETFs is not included in the Fund's net investment income (loss) ratio.
CTotal returns for periods of less than one year are not annualized.
DTotal returns would have been lower if certain expenses had not been reduced during the applicable periods shown.
EFees and expenses of any underlying mutual funds or exchange-traded funds (ETFs) are not included in the Fund's expense ratio. The Fund indirectly bears its proportionate share of these expenses.
FExpense ratios reflect operating expenses of the class. Expenses before reductions do not reflect amounts reimbursed, waived, or reduced through arrangements with the investment adviser, brokerage services, or other offset arrangements, if applicable, and do not represent the amount paid by the class during periods when reimbursements, waivers or reductions occur.
GAnnualized.
HAmount does not include the portfolio activity of any underlying mutual funds or exchange-traded funds (ETFs).
Notes to Financial Statements
(Unaudited)For the period ended June 30, 2024
1. Organization.
Fidelity Minnesota Municipal Income Fund (the Fund) is a non-diversified fund of Fidelity Municipal Trust (the Trust) and is authorized to issue an unlimited number of shares. Share transactions on the Statement of Changes in Net Assets may contain exchanges between affiliated funds. The Trust is registered under the Investment Company Act of 1940, as amended (the 1940 Act), as an open-end management investment company organized as a Massachusetts business trust. The Fund may be affected by economic and political developments in the state of Minnesota.
2. Significant Accounting Policies.
The Fund is an investment company and applies the accounting and reporting guidance of the Financial Accounting Standards Board (FASB) Accounting Standards Codification Topic 946 Financial Services - Investment Companies. The financial statements have been prepared in conformity with accounting principles generally accepted in the United States of America (GAAP), which require management to make certain estimates and assumptions at the date of the financial statements. Actual results could differ from those estimates. Subsequent events, if any, through the date that the financial statements were issued have been evaluated in the preparation of the financial statements. The Fund's Schedule of Investments lists any underlying mutual funds or exchange-traded funds (ETFs) but does not include the underlying holdings of these funds. The following summarizes the significant accounting policies of the Fund:
Investment Valuation. Investments are valued as of 4:00 p.m. Eastern time on the last calendar day of the period. The Board of Trustees (the Board) has designated the Fund's investment adviser as the valuation designee responsible for the fair valuation function and performing fair value determinations as needed. The investment adviser has established a Fair Value Committee (the Committee) to carry out the day-to-day fair valuation responsibilities and has adopted policies and procedures to govern the fair valuation process and the activities of the Committee. In accordance with these fair valuation policies and procedures, which have been approved by the Board, the Fund attempts to obtain prices from one or more third party pricing services or brokers to value its investments. When current market prices, quotations or currency exchange rates are not readily available or reliable, investments will be fair valued in good faith by the Committee, in accordance with the policies and procedures. Factors used in determining fair value vary by investment type and may include market or investment specific events, transaction data, estimated cash flows, and market observations of comparable investments. The frequency that the fair valuation procedures are used cannot be predicted and they may be utilized to a significant extent. The Committee manages the Fund's fair valuation practices and maintains the fair valuation policies and procedures. The Fund's investment adviser reports to the Board information regarding the fair valuation process and related material matters.
The Fund categorizes the inputs to valuation techniques used to value its investments into a disclosure hierarchy consisting of three levels as shown below:
Level 1 - unadjusted quoted prices in active markets for identical investments
Level 2 - other significant observable inputs (including quoted prices for similar investments, interest rates, prepayment speeds, etc.)
Level 3 - unobservable inputs (including the Fund's own assumptions based on the best information available)
Valuation techniques used to value the Fund's investments by major category are as follows:
Debt securities, including restricted securities, are valued based on evaluated prices received from third party pricing services or from brokers who make markets in such securities. Municipal securities are valued by pricing services who utilize matrix pricing which considers yield or price of bonds of comparable quality, coupon, maturity and type or by broker-supplied prices. When independent prices are unavailable or unreliable, debt securities may be valued utilizing pricing methodologies which consider similar factors that would be used by third party pricing services. Debt securities are generally categorized as Level 2 in the hierarchy but may be Level 3 depending on the circumstances.
Changes in valuation techniques may result in transfers in or out of an assigned level within the disclosure hierarchy. The aggregate value of investments by input level as of June 30, 2024 is included at the end of the Fund's Schedule of Investments.
Investment Transactions and Income. For financial reporting purposes, the Fund's investment holdings and NAV include trades executed through the end of the last business day of the period. The NAV per share for processing shareholder transactions is calculated as of the close of business of the New York Stock Exchange (NYSE), normally 4:00 p.m. Eastern time and includes trades executed through the end of the prior business day. Gains and losses on securities sold are determined on the basis of identified cost. Interest income is accrued as earned and includes coupon interest and amortization of premium and accretion of discount on debt securities as applicable. Debt obligations may be placed on non-accrual status and related interest income may be reduced by ceasing current accruals and writing off interest receivables when the collection of all or a portion of interest has become doubtful based on consistently applied procedures. A debt obligation is removed from non-accrual status when the issuer resumes interest payments or when collectability of interest is reasonably assured.
Expenses. Expenses directly attributable to a fund are charged to that fund. Expenses attributable to more than one fund are allocated among the respective funds on the basis of relative net assets or other appropriate methods. Expenses included in the accompanying financial statements reflect the expenses of that fund and do not include any expenses associated with any underlying mutual funds or exchange-traded funds. Although not included in a fund's expenses, a fund indirectly bears its proportionate share of these expenses through the net asset value of each underlying mutual fund or exchange-traded fund. Expense estimates are accrued in the period to which they relate and adjustments are made when actual amounts are known.
Income Tax Information and Distributions to Shareholders. Each year, the Fund intends to qualify as a regulated investment company under Subchapter M of the Internal Revenue Code, including distributing substantially all of its taxable income and realized gains. As a result, no provision for U.S. Federal income taxes is required. The Fund files a U.S. federal tax return, in addition to state and local tax returns as required. The Fund's federal income tax returns are subject to examination by the Internal Revenue Service (IRS) for a period of three fiscal years after they are filed. State and local tax returns may be subject to examination for an additional fiscal year depending on the jurisdiction.
Distributions are declared and recorded daily and paid monthly from net investment income. Distributions from realized gains, if any, are declared and recorded on the ex-dividend date. Income and capital gain distributions are determined in accordance with income tax regulations, which may differ from GAAP.
Capital accounts within the financial statements are adjusted for permanent book-tax differences. These adjustments have no impact on net assets or the results of operations. Capital accounts are not adjusted for temporary book-tax differences which will reverse in a subsequent period.
Book-tax differences are primarily due to market discount and capital loss carryforwards.
The Fund purchases municipal securities whose interest, in the opinion of the issuer, is free from federal income tax. There is no assurance that the IRS will agree with this opinion. In the event the IRS determines that the issuer does not comply with relevant tax requirements, interest payments from a security could become federally taxable, possibly retroactively to the date the security was issued.
As of period end, the cost and unrealized appreciation (depreciation) in securities, and derivatives if applicable, for federal income tax purposes were as follows:
| Gross unrealized appreciation | $3,809,630 |
| Gross unrealized depreciation | (16,466,399) |
Net unrealized appreciation (depreciation) | $(12,656,769) |
Tax cost | $545,883,130 |
Capital loss carryforwards are only available to offset future capital gains of the Fund to the extent provided by regulations and may be limited. The capital loss carryforward information presented below, including any applicable limitation, is estimated as of prior fiscal period end and is subject to adjustment.
Short-term | $(915,024) |
Long-term | (9,379,415) |
| Total capital loss carryforward | $(10,294,439) |
Restricted Securities (including Private Placements). Funds may invest in securities that are subject to legal or contractual restrictions on resale. These securities generally may be resold in transactions exempt from registration or to the public if the securities are registered. Disposal of these securities may involve time-consuming negotiations and expense, and prompt sale at an acceptable price may be difficult. Information regarding restricted securities held at period end is included at the end of the Schedule of Investments, if applicable.
3. Purchases and Sales of Investments.
Purchases and sales of securities, other than short-term securities and in-kind transactions, as applicable, are noted in the table below.
| | Purchases ($) | Sales ($) |
Fidelity Minnesota Municipal Income Fund | 82,340,171 | 89,938,585 |
4. Fees and Other Transactions with Affiliates.
Management Fee. Fidelity Management & Research Company LLC (the investment adviser) and its affiliates provide the Fund with investment management related services for which the Fund pays a monthly management fee.
Effective March 1, 2024, the Fund's management contract was amended to incorporate administrative services previously covered under separate services agreements (Transfer Agent and Accounting agreements). Any reference to "class" in this note shall mean "the Fund" as the Fund currently offers only one class of shares. The amended contract incorporates a management fee rate that may vary by class. The investment adviser or an affiliate pays certain expenses of managing and operating the Fund out of each class's management fee. Each class of the Fund pays a management fee to the investment adviser. The management fee is calculated and paid to the investment adviser every month. When determining a class's management fee, a mandate rate is calculated based on the monthly average net assets of a group of funds advised by FMR within a designated asset class. A discount rate is subtracted from the mandate rate once the Fund's monthly average net assets reach a certain level. The mandate rate and discount rate may vary by class. The annual management fee rate for a class of shares of the Fund is the lesser of (1) the class's mandate rate reduced by the class's discount rate (if applicable) or (2) the amount set forth in the following table.
| | Maximum Management Fee Rate % |
| Fidelity Minnesota Municipal Income Fund | .45 |
One-twelfth of the management fee rate for a class is applied to the average net assets of the class for the month, giving a dollar amount which is the management fee for the class for that month. A different management fee rate may be applicable to each class of the Fund. The difference between classes is the result of separate arrangements for class-level services and/or waivers of certain expenses. It is not the result of any difference in advisory or custodial fees or other expenses related to the management of the Fund's assets, which do not vary by class. For the portion of the reporting period on or after March 1, 2024, the total annualized management fee rates were as follows:
| | Total Management Fee Rate % |
| Fidelity Minnesota Municipal Income Fund | .45 |
| | |
Prior to March 1, 2024, the management fee was the sum of an individual fund fee rate that was based on an annual rate of .25% of the Fund's average net assets and an annualized group fee rate that averaged .10 during the period. The group fee rate was based upon the monthly average net assets of a group of registered investment companies with which the investment adviser has management contracts. The group fee rate decreased as assets under management increased and increased as assets under management decreased. For the portion of the reporting period prior to March 1, 2024, the total annualized management fee rate was .35%.
Effective March 1, 2024, the Fund's sub-advisory agreements with FMR Investment Management (UK) Limited, Fidelity Management & Research (Hong Kong) Limited, and Fidelity Management & Research (Japan) Limited were amended to provide that the investment adviser pays each sub-adviser monthly fees equal to 110% of the sub-adviser's costs for providing sub-advisory services.
Transfer Agent Fees. Fidelity Investments Institutional Operations Company LLC (FIIOC), an affiliate of the investment adviser, is the transfer, dividend disbursing and shareholder servicing agent for the Fund. Effective March 1, 2024, each Fund's management contract was amended to incorporate transfer agent services and associated fees previously covered under a separate services agreement. FIIOC pays for typesetting, printing and mailing of shareholder reports, except proxy statements.
During the period January 1, 2024 through February 29, 2024, the transfer agent fees were a fixed annual rate of .1119% of average net assets.
Accounting Fees. Fidelity Service Company, Inc. (FSC), an affiliate of the investment adviser, maintains the Fund's accounting records. Effective March 1, 2024, the Fund's management contract was amended to incorporate accounting services and associated fees previously covered under a separate services agreement.
During the period January 1, 2024 through February 29, 2024, the accounting fees were a fixed annual rate of average net assets as follows:
| | % of Average Net Assets |
Fidelity Minnesota Municipal Income Fund | .0245 |
Interfund Trades. Funds may purchase from or sell securities to other Fidelity Funds under procedures adopted by the Board. The procedures have been designed to ensure these interfund trades are executed in accordance with Rule 17a-7 of the 1940 Act. Any interfund trades are included within the respective purchases and sales amounts shown in the Purchases and Sales of Investments note. During the period, there were no interfund trades.
5. Committed Line of Credit.
Certain Funds participate with other funds managed by the investment adviser or an affiliate in a $4.25 billion credit facility (the "line of credit") to be utilized for temporary or emergency purposes to fund shareholder redemptions or for other short-term liquidity purposes. The participating funds have agreed to pay commitment fees on their pro-rata portion of the line of credit, which are reflected in Miscellaneous expenses on the Statement of Operations, and are listed below. During the period, there were no borrowings on this line of credit.
| | Amount ($) |
Fidelity Minnesota Municipal Income Fund | 518 |
6. Expense Reductions.
Through arrangements with the Fund's custodian, credits realized as a result of certain uninvested cash balances were used to reduce the Fund's expenses by $2,643.
In addition, during the period the investment adviser or an affiliate reimbursed and/or waived a portion of operating expenses in the amount of $13,146.
7. Other.
A fund's organizational documents provide former and current trustees and officers with a limited indemnification against liabilities arising in connection with the performance of their duties to the fund. In the normal course of business, a fund may also enter into contracts that provide general indemnifications. A fund's maximum exposure under these arrangements is unknown as this would be dependent on future claims that may be made against a fund. The risk of material loss from such claims is considered remote.
8. Risk and Uncertainties.
Many factors affect a fund's performance. Developments that disrupt global economies and financial markets, such as pandemics, epidemics, outbreaks of infectious diseases, war, terrorism, and environmental disasters, may significantly affect a fund's investment performance. The effects of these developments to a fund will be impacted by the types of securities in which a fund invests, the financial condition, industry, economic sector, and geographic location of an issuer, and a fund's level of investment in the securities of that issuer. Significant concentrations in security types, issuers, industries, sectors, and geographic locations may magnify the factors that affect a fund's performance.
Item 8: Changes in and Disagreements with Accountants for Open-End Management Investment Companies
Note: This is not applicable for any fund included in this document.
Item 9: Proxy Disclosures for Open-End Management Investment Companies
Note: This is not applicable for any fund included in this document.
Item 10: Remuneration Paid to Directors, Officers, and others of Open-End Management Investment Companies
Note: This information is disclosed as part of the financial statements for each Fund as part of Item 7: Financial Statements and Financial Highlights for Open-End Management Investment companies.
Item 11: Statement Regarding Basis for Approval of Investment Advisory Contract
Board Approval of Investment Advisory Contracts
Fidelity Minnesota Municipal Income Fund
At its January 2024 meeting, the Board of Trustees, including the Independent Trustees (together, the Board), approved an amended and restated management contract with Fidelity Management & Research Company LLC (FMR) (the Management Contract), and amended and restated sub-advisory agreements (the Sub-Advisory Contracts, and together with the Management Contract, the Advisory Contracts) for the fund, including the fund's sub-advisory agreements with FMR Investment Management (UK) Limited (FMR UK), Fidelity Management & Research (Hong Kong) Limited (FMR H.K.), and Fidelity Management & Research (Japan) Limited (FMR Japan). The Advisory Contracts will be effective March 1, 2024. The Board will consider the annual renewal of the fund's Advisory Contracts in September 2024, following its review of additional materials provided by FMR.
Management Contract. The Board approved the Management Contract, which implements a new fee structure combining the management fee, transfer agent fee (TA Fee), and pricing and bookkeeping fee (P&B Fee) of the fund into a single fee based on tiered schedules and subject to a maximum rate (the Unified Fee). In exchange for the Unified Fee, the fund will receive investment advisory, management, administrative, transfer agent, pricing and bookkeeping services under a single agreement - the Management Contract.
In its consideration of the Management Contract over several meetings, the Board received, reviewed and discussed a comprehensive set of analyses regarding the Unified Fee including (i) the legal framework, (ii) design goals for the Unified Fee, (iii) calculation methodology for the Unified Fee and illustrative examples, (iv) annual and cumulative projected impacts under various scenarios, both in the aggregate and at the fund/class level, (v) explanations of schedules, rate levers and maximum rates and (vi) shareholder benefits and projected savings.
The Board considered that the maximum Unified Fee for the fund would be no higher than the sum of (i) the lowest contractual management fee under the fund's existing management contract, which is the individual fund fee, if any, plus the lowest contractual marginal group fee rate and (ii) the TA and P&B Fee rates, which are fixed fee rates since December 1, 2023 (together, the "Unified Fee Cap"). The Board noted that, as a result of this Unified Fee Cap, the Unified Fee would be no greater than the fees previously authorized to be charged for the same services. The Board noted that certain expenses such as third-party expenses and certain other miscellaneous expenses would be outside the scope of the Unified Fee and the calculation of such fees would not change as a result of the Unified Fee.
The Board considered that implementation of the Unified Fee, which includes the Unified Fee Cap, would cause all funds subject to a Unified Fee, including the fund, to experience an immediate reduction on contractual fee rates for services provided under the current management contracts. The Board considered that some funds would not experience lower fees as a result of existing fee caps. The Board further considered that, in addition to the contractual fee savings, the Unified Fee offers funds and their shareholders greater protection from future rate increases for services previously offered under separate agreements that are now covered by the Management Contract because such rate increases would require shareholder, as well as Board, approval.
Sub-Advisory Contracts. In connection with the Unified Fee changes, the Board considered the Sub-Advisory Contracts, which changed the arrangements for fees paid by FMR to the sub-advisers under the agreements. The Board noted that the agreements with FMR UK, FMR H.K., and FMR Japan were amended to provide that FMR will compensate each sub-adviser at a fee equal to 110% of the sub-adviser's costs incurred in providing services under the agreement. The Board considered that, under the Sub-Advisory Contracts, FMR, and not the fund, will continue to pay the sub-advisory fees to each applicable sub-adviser.
The Board considered that the approval of the fund's Advisory Contracts will not result in any changes in the investment process or strategies employed in the management of the fund's assets or the day-to-day management of the fund or the persons primarily responsible for such management. Further, the Board considered that the Management Contract would not change the obligations and services of FMR and its affiliates on behalf of the fund, and, in particular, there would be no change in the nature and level of advisory, management, administration, transfer agent, and pricing and bookkeeping services provided to the fund by FMR and its affiliates.
In connection with its consideration of future renewals of the fund's Advisory Contracts, the Board will consider: (i) the nature, extent and quality of services provided to the funds, including shareholder and administrative services and investment performance; (ii) the competitiveness of the management fee and total expenses for the fund; (iii) the costs of the services and profitability, including the revenues earned and the expenses incurred in conducting the business of developing, marketing, distributing, managing, administering, and servicing the fund and its shareholders, to the extent applicable; and (iv) whether there have been economies of scale in respect of the Fidelity funds, whether the Fidelity funds (including the fund) have appropriately benefited from any such economies of scale, and whether there is the potential for realization of any further economies.
Based on its evaluation of all of the conclusions noted above, and after considering all factors it believed relevant, the Board concluded that the fund's management fee structure is fair and reasonable, and that the fund's Advisory Contracts should be approved.
1.705580.126
MNF-SANN-0824
Fidelity® Pennsylvania Municipal Income Fund
Semi-Annual Report
June 30, 2024
Contents
To view a fund's proxy voting guidelines and proxy voting record for the 12-month period ended June 30, visit http://www.fidelity.com/proxyvotingresults or visit the Securities and Exchange Commission's (SEC) web site at http://www.sec.gov.
You may also call 1-800-544-8544 to request a free copy of the proxy voting guidelines.
Standard & Poor's, S&P and S&P 500 are registered service marks of The McGraw-Hill Companies, Inc. and have been licensed for use by Fidelity Distributors Corporation.
Other third-party marks appearing herein are the property of their respective owners.
All other marks appearing herein are registered or unregistered trademarks or service marks of FMR LLC or an affiliated company. © 2024 FMR LLC. All rights reserved.
This report and the financial statements contained herein are submitted for the general information of the shareholders of the Fund. This report is not authorized for distribution to prospective investors in the Fund unless preceded or accompanied by an effective prospectus.
A fund files its complete schedule of portfolio holdings with the SEC for the first and third quarters of each fiscal year on Form N-PORT. Forms N-PORT are available on the SEC's web site at http://www.sec.gov. A fund's Forms N-PORT may be reviewed and copied at the SEC's Public Reference Room in Washington, DC. Information regarding the operation of the SEC's Public Reference Room may be obtained by calling 1-800-SEC-0330.
For a complete list of a fund's portfolio holdings, view the most recent holdings listing, semiannual report, or annual report on Fidelity's web site at http://www.fidelity.com, http://www.institutional.fidelity.com, or http://www.401k.com, as applicable.
NOT FDIC INSURED •MAY LOSE VALUE •NO BANK GUARANTEE
Neither the Fund nor Fidelity Distributors Corporation is a bank.
Item 7: Financial Statements and Financial Highlights for Open-End Management Investment Companies (Semi-Annual Report)
Fidelity® Pennsylvania Municipal Income Fund
Schedule of Investments June 30, 2024 (Unaudited)
Showing Percentage of Net Assets
| Municipal Bonds - 97.4% |
| | | Principal Amount (a) | Value ($) |
| Pennsylvania - 95.0% | | | |
| Allegheny County Arpt. Auth. Rev. Series 2021 A, 5% 1/1/51 (b) | | 12,000,000 | 12,359,938 |
| Allegheny County Higher Ed. Bldg. Auth. Univ. Rev.: | | | |
| Series 2017, 5% 10/15/47 | | 1,660,000 | 1,472,005 |
| Series 2018: | | | |
5% 3/1/33 | | 1,570,000 | 1,653,103 |
5% 3/1/34 | | 2,250,000 | 2,371,830 |
| Series 2022 A: | | | |
5% 3/1/27 | | 1,740,000 | 1,803,151 |
5% 3/1/31 | | 1,105,000 | 1,208,566 |
5% 3/1/34 | | 645,000 | 713,096 |
| Allegheny County Indl. Dev. Auth. Rev. Series 2021, 4.25% 12/1/50 | | 3,000,000 | 1,440,000 |
| Butler County Hosp. Auth. Hosp. Rev. (Butler Health Sys. Proj.) Series 2015 A: | | | |
| 5% 7/1/26 | | 500,000 | 497,912 |
| 5% 7/1/27 | | 490,000 | 488,247 |
| 5% 7/1/28 | | 540,000 | 538,241 |
| 5% 7/1/29 | | 710,000 | 709,122 |
| 5% 7/1/30 | | 685,000 | 684,899 |
| 5% 7/1/35 | | 1,885,000 | 1,884,020 |
| 5% 7/1/39 | | 6,675,000 | 6,449,685 |
| Cap. Region Wtr. Wtr. Rev. Series 2018: | | | |
| 5% 7/15/30 | | 1,500,000 | 1,592,321 |
| 5% 7/15/31 | | 1,250,000 | 1,326,406 |
| Centre County Pennsylvania Hosp. Auth. Rev. (Mount Nittany Med. Ctr. Proj.): | | | |
| Series 2016 A: | | | |
4% 11/15/32 | | 350,000 | 350,832 |
4% 11/15/34 | | 250,000 | 250,290 |
4% 11/15/35 | | 200,000 | 200,121 |
5% 11/15/28 | | 840,000 | 853,072 |
5% 11/15/29 | | 1,625,000 | 1,648,875 |
5% 11/15/30 | | 685,000 | 694,254 |
| Series 2016 B: | | | |
4% 11/15/40 | | 600,000 | 587,839 |
4% 11/15/47 | | 3,605,000 | 3,465,983 |
| Series 2018 A: | | | |
5% 11/15/26 | | 1,140,000 | 1,175,522 |
5% 11/15/27 | | 225,000 | 233,495 |
5% 11/15/28 | | 200,000 | 207,440 |
5% 11/15/29 | | 200,000 | 207,024 |
| Chartiers Valley School District Series 2021 A, 3% 10/15/49 | | 4,000,000 | 3,044,769 |
| Chester County Health & Ed. Facilities Auth. Health Sys. Rev. Series 2017 A, 5% 10/1/35 | | 2,125,000 | 2,213,952 |
| Commonwealth Fing. Auth. Rev. Series 2020 A, 5% 6/1/32 | | 3,500,000 | 3,847,741 |
| Commonwealth Fing. Auth. Tobacco Series 2018, 4% 6/1/39 (Assured Guaranty Muni. Corp. Insured) | | 9,555,000 | 9,613,420 |
| Cumberland County Muni. Auth. Rev. (Dickinson College Proj.) Series 2016: | | | |
| 5% 5/1/30 | | 1,000,000 | 1,021,489 |
| 5% 5/1/31 | | 500,000 | 510,566 |
| 5% 5/1/32 | | 750,000 | 765,849 |
| 5% 5/1/33 | | 2,210,000 | 2,256,703 |
| 5% 5/1/34 | | 1,000,000 | 1,020,776 |
| Dallas Area Muni. Auth. Univ. Rev. (Misericordia Univ. Proj.) Series 2019, 5% 5/1/48 | | 4,000,000 | 3,575,604 |
| Dauphin County Gen. Auth. (Pinnacle Health Sys. Proj.) Series 2016 A: | | | |
| 5% 6/1/34 | | 1,275,000 | 1,298,901 |
| 5% 6/1/35 | | 1,000,000 | 1,018,732 |
| 5% 6/1/36 | | 625,000 | 636,445 |
| Delaware County Auth. Rev.: | | | |
| (Cabrini College) Series 2017, 5% 7/1/47 | | 2,000,000 | 1,999,507 |
| Series 2017, 5% 7/1/25 | | 1,000,000 | 999,257 |
| Doylestown Hosp. Auth. Hosp. Rev.: | | | |
| Series 2016 A: | | | |
5% 7/1/46 | | 2,845,000 | 2,767,313 |
5% 7/1/46 (Pre-Refunded to 7/1/26 @ 100) | | 655,000 | 675,464 |
| Series 2019 A, 4% 7/1/45 | | 1,215,000 | 1,028,639 |
| Dubois Hosp. Auth. Hosp. Rev.: | | | |
| (Penn Highlands Healthcare Proj.) Series 2018, 5% 7/15/25 | | 200,000 | 201,864 |
| Series 2020: | | | |
4% 7/15/45 | | 1,520,000 | 1,410,051 |
5% 7/15/31 | | 1,030,000 | 1,060,550 |
5% 7/15/34 | | 1,000,000 | 1,029,212 |
5% 7/15/36 | | 1,400,000 | 1,437,521 |
5% 7/15/39 | | 1,160,000 | 1,181,004 |
| East Lycoming School District Series 2021, 3% 9/15/35 | | 700,000 | 631,398 |
| Geisinger Auth. Health Sys. Rev. Series 2014 A, 4% 6/1/41 | | 2,000,000 | 1,963,854 |
| Haverford Township School District Series 2021 A, 2% 3/15/32 | | 1,035,000 | 880,778 |
| Lackawanna County Indl. Dev. Auth. Rev. (Univ. of Scranton Proj.) Series 2017: | | | |
| 5% 11/1/24 | | 590,000 | 591,827 |
| 5% 11/1/25 | | 665,000 | 675,495 |
| 5% 11/1/27 | | 1,105,000 | 1,148,309 |
| Lancaster County Hosp. Auth. Health Ctr. Rev. Series 2016: | | | |
| 5% 8/15/34 | | 1,000,000 | 1,031,099 |
| 5% 8/15/36 | | 1,000,000 | 1,028,653 |
| Lancaster Muni. Auth. Rev. Series 2023 B, 5% 6/1/29 | | 4,000,000 | 4,313,126 |
| Lehigh County Gen. Purp. Auth. Rev.: | | | |
| (Muhlenberg College Proj.) Series 2017, 5% 2/1/39 | | 4,010,000 | 4,086,888 |
| Series 2021 A, 4% 11/1/51 | | 4,000,000 | 3,394,746 |
| Lehigh County Gen. Purp. Hosp. Rev.: | | | |
| Series 2012 B, 3.25% 7/1/32 | | 340,000 | 323,440 |
| Series 2016 A, 4% 7/1/35 | | 705,000 | 697,860 |
| Series 2019 A: | | | |
4% 7/1/49 | | 5,000,000 | 4,692,586 |
5% 7/1/36 | | 2,905,000 | 3,059,927 |
5% 7/1/44 | | 5,000,000 | 5,144,604 |
| Monroe County Hosp. Auth. Rev. Series 2016, 5% 7/1/33 | | 3,675,000 | 3,724,002 |
| Monroeville Fin. Auth. UPMC Rev. Series 2023 C: | | | |
| 5% 5/15/36 | | 280,000 | 309,406 |
| 5% 5/15/37 | | 330,000 | 361,905 |
| 5% 5/15/38 | | 390,000 | 421,944 |
| 5% 5/15/39 | | 250,000 | 268,821 |
| Montgomery County Higher Ed. & Health Auth. Rev.: | | | |
| Series 2014 A: | | | |
5% 10/1/24 | | 335,000 | 334,492 |
5% 10/1/25 | | 750,000 | 747,533 |
5% 10/1/26 | | 1,000,000 | 993,686 |
5% 10/1/27 | | 1,000,000 | 990,467 |
| Series 2016 A, 5% 10/1/40 | | 4,000,000 | 3,725,268 |
| Series 2018 A, 5% 9/1/26 | | 1,500,000 | 1,535,001 |
| Series 2019: | | | |
4% 9/1/34 | | 2,500,000 | 2,498,921 |
4% 9/1/35 | | 1,400,000 | 1,396,467 |
4% 9/1/36 | | 1,200,000 | 1,195,259 |
4% 9/1/37 | | 1,000,000 | 994,990 |
| Montgomery County Indl. Dev. Auth. Series 2017, 5% 12/1/36 | | 2,670,000 | 2,778,350 |
| Northampton County Gen. Purp. Auth. Hosp. Rev.: | | | |
| (St Luke's Univ. Health Network Proj.) Series 2016 A, 3% 8/15/32 | | 245,000 | 229,226 |
| (St. Luke's Univ. Health Network Proj.) Series 2018 A, 4% 8/15/48 | | 4,500,000 | 4,044,763 |
| Parkland School District Series 2021 C, 3% 2/1/35 | | 665,000 | 635,340 |
| Pennsylvania Ctfs. Prtn. Series 2018 A: | | | |
| 5% 7/1/29 | | 300,000 | 318,089 |
| 5% 7/1/30 | | 375,000 | 396,913 |
| 5% 7/1/31 | | 425,000 | 449,835 |
| Pennsylvania Econ. Dev. Fing. Auth.: | | | |
| Series 2023 A2: | | | |
5% 5/15/36 | | 400,000 | 444,710 |
5% 5/15/37 | | 500,000 | 552,486 |
5% 5/15/38 | | 500,000 | 546,214 |
5% 5/15/39 | | 620,000 | 674,603 |
| Series 2023 B: | | | |
5% 5/15/36 | | 450,000 | 500,299 |
5% 5/15/37 | | 425,000 | 469,613 |
5% 5/15/38 | | 575,000 | 628,146 |
5% 5/15/39 | | 800,000 | 870,456 |
| Pennsylvania Econ. Dev. Fing. Auth. Indl. Dev. Rev. (Presbyterian Sr. Living project) Series 2023 B1, 4.5% 7/1/35 | | 2,910,000 | 3,014,472 |
| Pennsylvania Econ. Dev. Fing. Auth. Solid Waste Disp. Rev. Bonds (Waste Mgmt., Inc. Proj.) Series 2021 A2, 4.6%, tender 10/1/26 (b)(c) | | 10,845,000 | 11,000,526 |
| Pennsylvania Gen. Oblig.: | | | |
| Series 2016, 3% 9/15/35 | | 315,000 | 291,332 |
| Series 2020, 2% 5/1/39 | | 500,000 | 357,584 |
| Series 2021: | | | |
2% 5/15/37 | | 1,060,000 | 810,933 |
2% 5/15/38 | | 4,825,000 | 3,579,590 |
| Pennsylvania Higher Ed. Assistance Agcy. Rev. Series 2023 A: | | | |
| 5% 6/1/29 (b) | | 2,965,000 | 3,071,216 |
| 5% 6/1/30 (b) | | 2,895,000 | 3,011,101 |
| 5% 6/1/31 (b) | | 4,450,000 | 4,731,730 |
| 5% 6/1/32 (b) | | 5,200,000 | 5,547,778 |
| Pennsylvania Higher Edl. Facilities Auth. Rev.: | | | |
| (Drexel Univ. Proj.) Series 2016, 5% 5/1/35 | | 2,000,000 | 2,025,604 |
| Series 2016, 5% 5/1/33 | | 2,200,000 | 2,229,205 |
| Series 2019 A: | | | |
4% 3/1/37 | | 1,150,000 | 1,156,841 |
5% 3/1/36 | | 1,000,000 | 1,063,104 |
5% 3/1/38 | | 1,055,000 | 1,106,538 |
5% 3/1/39 | | 1,000,000 | 1,042,176 |
| Pennsylvania Hsg. Fin. Agcy.: | | | |
| Series 2019 130A, 4% 10/1/49 | | 680,000 | 676,734 |
| Series 2019 131, 3.5% 4/1/49 | | 2,110,000 | 2,084,757 |
| Series 2020 13 2A, 3.5% 4/1/51 | | 970,000 | 957,875 |
| Series 2020 133: | | | |
5% 10/1/24 | | 850,000 | 852,625 |
5% 10/1/27 | | 650,000 | 679,770 |
5% 10/1/28 | | 950,000 | 1,005,774 |
5% 4/1/29 | | 100,000 | 106,560 |
5% 10/1/29 | | 450,000 | 482,847 |
| Series 2021 134B: | | | |
5% 10/1/24 (b) | | 1,000,000 | 1,001,331 |
5% 10/1/25 (b) | | 370,000 | 372,732 |
5% 4/1/26 (b) | | 995,000 | 1,008,341 |
5% 10/1/26 (b) | | 1,500,000 | 1,523,729 |
| Series 2021 135B: | | | |
5% 4/1/29 (b) | | 2,400,000 | 2,484,028 |
5% 10/1/29 (b) | | 2,410,000 | 2,506,034 |
| Series 2021 137: | | | |
2.45% 10/1/41 | | 1,305,000 | 980,418 |
5% 10/1/24 | | 265,000 | 265,952 |
5% 4/1/25 | | 200,000 | 201,824 |
5% 10/1/25 | | 220,000 | 223,636 |
5% 4/1/26 | | 240,000 | 245,622 |
5% 10/1/26 | | 280,000 | 288,616 |
5% 4/1/27 | | 225,000 | 233,602 |
5% 10/1/27 | | 225,000 | 235,305 |
5% 4/1/28 | | 250,000 | 262,829 |
5% 10/1/28 | | 260,000 | 275,265 |
5% 4/1/29 | | 310,000 | 330,335 |
5% 10/1/29 | | 365,000 | 391,643 |
| Series 2022 138A, 2.7% 4/1/33 | | 1,500,000 | 1,340,334 |
| Series 2023 142A: | | | |
4.5% 10/1/38 | | 5,925,000 | 6,038,086 |
5% 10/1/43 | | 2,000,000 | 2,076,576 |
| Pennsylvania Hsg. Fin. Agcy. Single Family Mtg. Rev.: | | | |
| Series 2015 B, 3.8% 10/1/35 | | 1,080,000 | 1,067,045 |
| Series 2016 121, 2.8% 10/1/31 | | 350,000 | 317,972 |
| Series 2017 125B, 3.65% 10/1/42 | | 620,000 | 572,251 |
| Pennsylvania Pub. School Bldg. Auth. School Rev. Series 2014 B2, 5% 12/1/25 | | 335,000 | 337,176 |
| Pennsylvania Tpk. Commission Tpk. Rev.: | | | |
| (Sub Lien Proj.) Series 2017 B-1, 5% 6/1/34 | | 5,000,000 | 5,207,738 |
| Series 2013 A2: | | | |
5% 12/1/28 | | 500,000 | 520,042 |
5% 12/1/38 | | 2,500,000 | 2,645,909 |
| Series 2014 A2, 5.125% 12/1/40 | | 5,500,000 | 5,830,421 |
| Series 2019 A, 5% 12/1/37 | | 5,815,000 | 6,195,653 |
| Series 2020 B, 5% 12/1/50 | | 5,000,000 | 5,298,907 |
| Series 2021 A: | | | |
4% 12/1/44 | | 4,000,000 | 3,920,959 |
4% 12/1/45 | | 4,000,000 | 3,905,970 |
4% 12/1/50 | | 2,000,000 | 1,872,203 |
| Series 2021 B: | | | |
4% 12/1/40 | | 1,000,000 | 984,026 |
4% 12/1/41 | | 1,000,000 | 983,063 |
4% 12/1/42 | | 1,500,000 | 1,476,123 |
5% 12/1/46 | | 2,000,000 | 2,143,198 |
| Series 2024, 5% 12/1/43 | | 4,615,000 | 5,077,635 |
| Philadelphia Arpt. Rev.: | | | |
| Series 2017 A, 5% 7/1/42 | | 350,000 | 359,969 |
| Series 2017 B: | | | |
5% 7/1/31 (b) | | 1,000,000 | 1,029,646 |
5% 7/1/33 (b) | | 2,250,000 | 2,316,412 |
5% 7/1/37 (b) | | 5,065,000 | 5,179,013 |
5% 7/1/47 (b) | | 3,035,000 | 3,062,607 |
| Philadelphia Auth. for Indl. Dev.: | | | |
| Series 2017, 5% 11/1/47 | | 5,000,000 | 5,030,931 |
| Series 2020 A, 4% 11/1/45 | | 3,825,000 | 3,642,026 |
| Series 2020 C: | | | |
4% 11/1/35 | | 1,750,000 | 1,756,611 |
4% 11/1/36 | | 1,500,000 | 1,500,401 |
4% 11/1/37 | | 1,255,000 | 1,245,408 |
4% 11/1/38 | | 1,000,000 | 982,739 |
| Philadelphia Gas Works Rev.: | | | |
| Series 16 A, 5% 8/1/50 (Assured Guaranty Muni. Corp. Insured) | | 8,835,000 | 9,308,317 |
| Series 2015 13, 5% 8/1/31 | | 1,100,000 | 1,112,603 |
| Series 2016 14: | | | |
5% 10/1/33 | | 1,500,000 | 1,537,634 |
5% 10/1/34 | | 500,000 | 511,894 |
| Philadelphia Gen. Oblig.: | | | |
| Series 2017 A, 5% 8/1/30 | | 1,500,000 | 1,563,494 |
| Series 2019 B: | | | |
5% 2/1/38 | | 3,000,000 | 3,174,612 |
5% 2/1/39 | | 7,600,000 | 8,015,899 |
| Philadelphia School District: | | | |
| Series 2018 A: | | | |
5% 9/1/29 | | 1,250,000 | 1,312,287 |
5% 9/1/30 | | 1,000,000 | 1,048,990 |
5% 9/1/33 | | 1,000,000 | 1,046,552 |
| Series 2019 A: | | | |
4% 9/1/37 | | 2,100,000 | 2,118,154 |
4% 9/1/38 | | 2,300,000 | 2,311,384 |
4% 9/1/39 | | 2,000,000 | 2,005,997 |
| Philadelphia Wtr. & Wastewtr. Rev.: | | | |
| Series 2020, 5% 10/1/40 | | 3,195,000 | 3,428,052 |
| Series 2023 B, 5.5% 9/1/53 (Assured Guaranty Muni. Corp. Insured) | | 5,000,000 | 5,599,205 |
| Pittsburgh & Allegheny County Parking Sys. Series 2017: | | | |
| 5% 12/15/32 | | 500,000 | 519,755 |
| 5% 12/15/33 | | 500,000 | 520,076 |
| Pittsburgh Wtr. & Swr. Auth. Wtr. & Swr. Sys. Rev.: | | | |
| Series 2019 A, 5% 9/1/44 (Assured Guaranty Muni. Corp. Insured) | | 3,600,000 | 3,781,566 |
| Series 2019 B: | | | |
4% 9/1/34 (Assured Guaranty Muni. Corp. Insured) | | 2,000,000 | 2,026,297 |
4% 9/1/35 (Assured Guaranty Muni. Corp. Insured) | | 400,000 | 405,135 |
| Reading School District Series 2017, 5% 3/1/35 (Assured Guaranty Muni. Corp. Insured) | | 1,000,000 | 1,036,133 |
| Southcentral Pennsylvania Gen. Auth. Rev. Series 2015: | | | |
| 4% 12/1/30 | | 1,040,000 | 1,044,644 |
| 5% 12/1/27 | | 1,480,000 | 1,504,829 |
| 5% 12/1/29 | | 1,000,000 | 1,017,477 |
| State Pub. School Bldg. Auth. Delaware County Cmnty. College Proj. Series 2023: | | | |
| 5% 10/1/37 (Build America Mutual Assurance Insured) | | 530,000 | 575,000 |
| 5% 10/1/38 (Build America Mutual Assurance Insured) | | 600,000 | 647,570 |
| 5.25% 10/1/44 (Build America Mutual Assurance Insured) | | 1,100,000 | 1,176,842 |
| Susquehanna Area Reg'l. Arp Auth. Series 2017: | | | |
| 5% 1/1/35 (b) | | 1,000,000 | 1,014,422 |
| 5% 1/1/38 (b) | | 1,125,000 | 1,138,137 |
| Union County Hosp. Auth. Rev. Series 2018 B, 5% 8/1/48 | | 6,000,000 | 6,130,432 |
| West Mifflin Area School District Series 2016, 5% 4/1/28 (Assured Guaranty Muni. Corp. Insured) | | 1,390,000 | 1,432,818 |
| Westmoreland County Indl. Dev. Auth. (Excela Health Proj.) Series 2020 A: | | | |
| 4% 7/1/26 | | 1,000,000 | 993,694 |
| 4% 7/1/37 | | 1,400,000 | 1,279,454 |
| 5% 7/1/27 | | 200,000 | 203,675 |
| 5% 7/1/28 | | 1,130,000 | 1,154,577 |
| 5% 7/1/29 | | 500,000 | 512,471 |
| 5% 7/1/30 | | 1,000,000 | 1,025,399 |
TOTAL PENNSYLVANIA | | | 379,254,854 |
| Pennsylvania, New Jersey - 0.9% | | | |
| Delaware River Port Auth. Pennsylvania & New Jersey Rev. Series 2018 A: | | | |
| 5% 1/1/37 | | 1,000,000 | 1,072,072 |
| 5% 1/1/38 | | 1,300,000 | 1,393,182 |
| 5% 1/1/39 | | 1,000,000 | 1,069,808 |
TOTAL PENNSYLVANIA, NEW JERSEY | | | 3,535,062 |
| Puerto Rico - 1.5% | | | |
| Puerto Rico Commonwealth Aqueduct & Swr. Auth. Series 2021 B, 5% 7/1/37 (d) | | 1,155,000 | 1,204,867 |
| Puerto Rico Commonwealth Pub. Impt. Gen. Oblig. Series 2021 A1: | | | |
| 0% 7/1/33 | | 1,225,367 | 817,638 |
| 5.625% 7/1/27 | | 145,000 | 151,282 |
| 5.625% 7/1/29 | | 440,000 | 471,907 |
| 5.75% 7/1/31 | | 1,045,000 | 1,160,408 |
| Puerto Rico Sales Tax Fing. Corp. Sales Tax Rev.: | | | |
| Series 2018 A1, 0% 7/1/31 | | 1,155,000 | 876,735 |
| Series 2019 A2, 4.329% 7/1/40 | | 1,455,000 | 1,435,493 |
TOTAL PUERTO RICO | | | 6,118,330 |
| TOTAL MUNICIPAL BONDS (Cost $401,881,346) | | | 388,908,246 |
| | | | |
| Money Market Funds - 1.1% |
| | | Shares | Value ($) |
Fidelity Municipal Cash Central Fund 4.33% (e)(f) (Cost $4,563,009) | | 4,562,096 | 4,563,009 |
| | | | |
| TOTAL INVESTMENT IN SECURITIES - 98.5% (Cost $406,444,355) | 393,471,255 |
NET OTHER ASSETS (LIABILITIES) - 1.5% | 5,936,532 |
| NET ASSETS - 100.0% | 399,407,787 |
| | |
Legend
| (a) | Amount is stated in United States dollars unless otherwise noted. |
| (b) | Private activity obligations whose interest is subject to the federal alternative minimum tax for individuals. |
| (c) | Coupon rates for floating and adjustable rate securities reflect the rates in effect at period end. |
| (d) | Security exempt from registration under Rule 144A of the Securities Act of 1933. These securities may be resold in transactions exempt from registration, normally to qualified institutional buyers. At the end of the period, the value of these securities amounted to $1,204,867 or 0.3% of net assets. |
| (e) | Information in this report regarding holdings by state and security types does not reflect the holdings of the Fidelity Municipal Cash Central Fund. |
| (f) | Affiliated fund that is generally available only to investment companies and other accounts managed by Fidelity Investments. The rate quoted is the annualized seven-day yield of the fund at period end. A complete unaudited listing of the fund's holdings as of its most recent quarter end is available upon request. In addition, each Fidelity Central Fund's financial statements are available on the SEC's website or upon request. |
Affiliated Central Funds
Fiscal year to date information regarding the Fund's investments in Fidelity Central Funds, including the ownership percentage, is presented below.
| Affiliate | Value, beginning of period ($) | Purchases ($) | Sales Proceeds ($) | Dividend Income ($) | Realized Gain (loss) ($) | Change in Unrealized appreciation (depreciation) ($) | Value, end of period ($) | % ownership, end of period |
| Fidelity Municipal Cash Central Fund 4.33% | 3,849,000 | 23,313,751 | 22,599,509 | 92,901 | (233) | - | 4,563,009 | 0.2% |
| Total | 3,849,000 | 23,313,751 | 22,599,509 | 92,901 | (233) | - | 4,563,009 | |
| | | | | | | | | |
Amounts in the dividend income column in the above table include any capital gain distributions from underlying funds, which are presented in the corresponding line item in the Statement of Operations, if applicable.
Amounts included in the purchases and sales proceeds columns may include in-kind transactions, if applicable.
Investment Valuation
The following is a summary of the inputs used, as of June 30, 2024, involving the Fund's assets and liabilities carried at fair value. The inputs or methodology used for valuing securities may not be an indication of the risk associated with investing in those securities. For more information on valuation inputs, and their aggregation into the levels used below, please refer to the Investment Valuation section in the accompanying Notes to Financial Statements.
| Valuation Inputs at Reporting Date: |
| Description | Total ($) | Level 1 ($) | Level 2 ($) | Level 3 ($) |
Investments in Securities: | | | | |
|
| Municipal Securities | 388,908,246 | - | 388,908,246 | - |
|
| Money Market Funds | 4,563,009 | 4,563,009 | - | - |
| Total Investments in Securities: | 393,471,255 | 4,563,009 | 388,908,246 | - |
Financial Statements (Unaudited)
| Statement of Assets and Liabilities |
| | | | June 30, 2024 (Unaudited) |
| | | | | |
| Assets | | | | |
| Investment in securities, at value - See accompanying schedule: | | | | |
Unaffiliated issuers (cost $401,881,346) | $ | 388,908,246 | | |
Fidelity Central Funds (cost $4,563,009) | | 4,563,009 | | |
| | | | | |
| | | | | |
| Total Investment in Securities (cost $406,444,355) | | | $ | 393,471,255 |
| Cash | | | | 100,000 |
| Receivable for fund shares sold | | | | 1,775,690 |
| Interest receivable | | | | 5,017,476 |
| Distributions receivable from Fidelity Central Funds | | | | 19,356 |
| Other receivables | | | | 145 |
Total assets | | | | 400,383,922 |
| Liabilities | | | | |
| Payable for fund shares redeemed | $ | 387,966 | | |
| Distributions payable | | 408,332 | | |
| Accrued management fee | | 146,324 | | |
| Other payables and accrued expenses | | 33,513 | | |
| Total liabilities | | | | 976,135 |
| Net Assets | | | $ | 399,407,787 |
| Net Assets consist of: | | | | |
| Paid in capital | | | $ | 417,898,917 |
| Total accumulated earnings (loss) | | | | (18,491,130) |
| Net Assets | | | $ | 399,407,787 |
Net Asset Value, offering price and redemption price per share ($399,407,787 ÷ 38,244,150 shares) | | | $ | 10.44 |
| Statement of Operations |
| | | | Six months ended June 30, 2024 (Unaudited) |
| Investment Income | | | | |
| Interest | | | $ | 6,607,579 |
| Income from Fidelity Central Funds | | | | 92,901 |
| Total income | | | | 6,700,480 |
| Expenses | | | | |
| Management fee | $ | 815,558 | | |
| Transfer agent fees | | 65,670 | | |
| Accounting fees and expenses | | 17,268 | | |
| Custodian fees and expenses | | 6,011 | | |
| Independent trustees' fees and expenses | | 537 | | |
| Registration fees | | 24,868 | | |
| Audit | | 26,702 | | |
| Legal | | 10,012 | | |
| Miscellaneous | | 715 | | |
| Total expenses before reductions | | 967,341 | | |
| Expense reductions | | (9,493) | | |
| Total expenses after reductions | | | | 957,848 |
| Net Investment income (loss) | | | | 5,742,632 |
| Realized and Unrealized Gain (Loss) | | | | |
| Net realized gain (loss) on: | | | | |
| Investment Securities: | | | | |
| Unaffiliated issuers | | (44,266) | | |
| Fidelity Central Funds | | (233) | | |
| Total net realized gain (loss) | | | | (44,499) |
| Change in net unrealized appreciation (depreciation) on investment securities | | | | (5,170,990) |
| Net gain (loss) | | | | (5,215,489) |
| Net increase (decrease) in net assets resulting from operations | | | $ | 527,143 |
| Statement of Changes in Net Assets |
| |
| | Six months ended June 30, 2024 (Unaudited) | | Year ended December 31, 2023 |
| Increase (Decrease) in Net Assets | | | | |
| Operations | | | | |
| Net investment income (loss) | $ | 5,742,632 | $ | 11,154,986 |
| Net realized gain (loss) | | (44,499) | | (3,848,915) |
| Change in net unrealized appreciation (depreciation) | | (5,170,990) | | 17,144,301 |
| Net increase (decrease) in net assets resulting from operations | | 527,143 | | 24,450,372 |
| Distributions to shareholders | | (5,626,243) | | (10,991,793) |
| | | | | |
| Share transactions | | | | |
| Proceeds from sales of shares | | 34,629,483 | | 95,418,253 |
| Reinvestment of distributions | | 3,180,015 | | 6,257,235 |
| Cost of shares redeemed | | (38,006,872) | | (117,452,279) |
| | | | | |
Net increase (decrease) in net assets resulting from share transactions | | (197,374) | | (15,776,791) |
| Total increase (decrease) in net assets | | (5,296,474) | | (2,318,212) |
| | | | | |
| Net Assets | | | | |
| Beginning of period | | 404,704,261 | | 407,022,473 |
| End of period | $ | 399,407,787 | $ | 404,704,261 |
| | | | | |
| Other Information | | | | |
| Shares | | | | |
| Sold | | 3,308,294 | | 9,413,921 |
| Issued in reinvestment of distributions | | 304,406 | | 610,459 |
| Redeemed | | (3,628,611) | | (11,587,825) |
| Net increase (decrease) | | (15,911) | | (1,563,445) |
| | | | | |
Financial Highlights
Fidelity® Pennsylvania Municipal Income Fund |
| |
| | Six months ended (Unaudited) June 30, 2024 | | Years ended December 31, 2023 | | 2022 | | 2021 | | 2020 | | 2019 |
Selected Per-Share Data | | | | | | | | | | | | |
| Net asset value, beginning of period | $ | 10.58 | $ | 10.22 | $ | 11.59 | $ | 11.59 | $ | 11.39 | $ | 10.92 |
| Income from Investment Operations | | | | | | | | | | | | |
Net investment income (loss) A,B | | .150 | | .284 | | .255 | | .251 | | .275 | | .310 |
| Net realized and unrealized gain (loss) | | (.143) | | .355 | | (1.372) | | .013 | | .209 | | .523 |
| Total from investment operations | | .007 | | .639 | | (1.117) | | .264 | | .484 | | .833 |
| Distributions from net investment income | | (.147) | | (.279) | | (.253) | | (.251) | | (.272) | | (.307) |
| Distributions from net realized gain | | - | | - | | - | | (.013) | | (.012) | | (.056) |
| Total distributions | | (.147) | | (.279) | | (.253) | | (.264) | | (.284) | | (.363) |
| Net asset value, end of period | $ | 10.44 | $ | 10.58 | $ | 10.22 | $ | 11.59 | $ | 11.59 | $ | 11.39 |
Total Return C,D | | | | 6.38% | | (9.66)% | | 2.30% | | 4.32% | | 7.71% |
Ratios to Average Net Assets B,E,F | | | | | | | | | | | | |
| Expenses before reductions | | .49% G | | .50% | | .49% | | .48% | | .49% | | .48% |
| Expenses net of fee waivers, if any | | | | .49% | | .49% | | .48% | | .49% | | .48% |
| Expenses net of all reductions | | .48% G | | .49% | | .49% | | .48% | | .48% | | .48% |
| Net investment income (loss) | | 2.89% G | | 2.76% | | 2.41% | | 2.16% | | 2.42% | | 2.74% |
| Supplemental Data | | | | | | | | | | | | |
| Net assets, end of period (000 omitted) | $ | 399,408 | $ | 404,704 | $ | 407,022 | $ | 554,947 | $ | 535,587 | $ | 516,717 |
Portfolio turnover rate H | | | | 21% | | 7% | | 5% | | 17% | | 20% |
ACalculated based on average shares outstanding during the period.
BNet investment income (loss) is affected by the timing of the declaration of dividends by any underlying mutual funds or exchange-traded funds (ETFs). Net investment income (loss) of any mutual funds or ETFs is not included in the Fund's net investment income (loss) ratio.
CTotal returns for periods of less than one year are not annualized.
DTotal returns would have been lower if certain expenses had not been reduced during the applicable periods shown.
EFees and expenses of any underlying mutual funds or exchange-traded funds (ETFs) are not included in the Fund's expense ratio. The Fund indirectly bears its proportionate share of these expenses. For additional expense information related to investments in Fidelity Central Funds, please refer to the "Investments in Fidelity Central Funds" note found in the Notes to Financial Statements section of the most recent Annual or Semi-Annual report.
FExpense ratios reflect operating expenses of the class. Expenses before reductions do not reflect amounts reimbursed, waived, or reduced through arrangements with the investment adviser, brokerage services, or other offset arrangements, if applicable, and do not represent the amount paid by the class during periods when reimbursements, waivers or reductions occur.
GAnnualized.
HAmount does not include the portfolio activity of any underlying mutual funds or exchange-traded funds (ETFs).
Notes to Financial Statements
(Unaudited)For the period ended June 30, 2024
1. Organization.
Fidelity Pennsylvania Municipal Income Fund (the Fund) is a fund of Fidelity Municipal Trust (the Trust) and is authorized to issue an unlimited number of shares. Share transactions on the Statement of Changes in Net Assets may contain exchanges between affiliated funds. The Trust is registered under the Investment Company Act of 1940, as amended (the 1940 Act), as an open-end management investment company organized as a Massachusetts business trust. The Fund may be affected by economic and political developments in the state of Pennsylvania.
2. Investments in Fidelity Central Funds.
Funds may invest in Fidelity Central Funds, which are open-end investment companies generally available only to other investment companies and accounts managed by the investment adviser and its affiliates. The Schedule of Investments lists any Fidelity Central Funds held as an investment as of period end, but does not include the underlying holdings of each Fidelity Central Fund. An investing fund indirectly bears its proportionate share of the expenses of the underlying Fidelity Central Funds.
Based on its investment objective, each Fidelity Central Fund may invest or participate in various investment vehicles or strategies that are similar to those of the investing fund. These strategies are consistent with the investment objectives of the investing fund and may involve certain economic risks which may cause a decline in value of each of the Fidelity Central Funds and thus a decline in the value of the investing fund.
| Fidelity Central Fund | Investment Manager | Investment Objective | Investment Practices | Expense RatioA |
| Fidelity Money Market Central Funds | Fidelity Management & Research Company LLC (FMR) | Each fund seeks to obtain a high level of current income consistent with the preservation of capital and liquidity. | Short-term Investments | Less than .005% |
A Expenses expressed as a percentage of average net assets and are as of each underlying Central Fund's most recent annual or semi-annual shareholder report.
A complete unaudited list of holdings for each Fidelity Central Fund is available upon request or at the Securities and Exchange Commission website at www.sec.gov. In addition, the financial statements of the Fidelity Central Funds which contain the significant accounting policies (including investment valuation policies) of those funds, and are not covered by the Report of Independent Registered Public Accounting Firm, are available on the Securities and Exchange Commission website or upon request.
3. Significant Accounting Policies.
The Fund is an investment company and applies the accounting and reporting guidance of the Financial Accounting Standards Board (FASB) Accounting Standards Codification Topic 946 Financial Services - Investment Companies. The financial statements have been prepared in conformity with accounting principles generally accepted in the United States of America (GAAP), which require management to make certain estimates and assumptions at the date of the financial statements. Actual results could differ from those estimates. Subsequent events, if any, through the date that the financial statements were issued have been evaluated in the preparation of the financial statements. The Fund's Schedule of Investments lists any underlying mutual funds or exchange-traded funds (ETFs) but does not include the underlying holdings of these funds. The following summarizes the significant accounting policies of the Fund:
Investment Valuation. Investments are valued as of 4:00 p.m. Eastern time on the last calendar day of the period. The Board of Trustees (the Board) has designated the Fund's investment adviser as the valuation designee responsible for the fair valuation function and performing fair value determinations as needed. The investment adviser has established a Fair Value Committee (the Committee) to carry out the day-to-day fair valuation responsibilities and has adopted policies and procedures to govern the fair valuation process and the activities of the Committee. In accordance with these fair valuation policies and procedures, which have been approved by the Board, the Fund attempts to obtain prices from one or more third party pricing services or brokers to value its investments. When current market prices, quotations or currency exchange rates are not readily available or reliable, investments will be fair valued in good faith by the Committee, in accordance with the policies and procedures. Factors used in determining fair value vary by investment type and may include market or investment specific events, transaction data, estimated cash flows, and market observations of comparable investments. The frequency that the fair valuation procedures are used cannot be predicted and they may be utilized to a significant extent. The Committee manages the Fund's fair valuation practices and maintains the fair valuation policies and procedures. The Fund's investment adviser reports to the Board information regarding the fair valuation process and related material matters.
The Fund categorizes the inputs to valuation techniques used to value its investments into a disclosure hierarchy consisting of three levels as shown below:
Level 1 - unadjusted quoted prices in active markets for identical investments
Level 2 - other significant observable inputs (including quoted prices for similar investments, interest rates, prepayment speeds, etc.)
Level 3 - unobservable inputs (including the Fund's own assumptions based on the best information available)
Valuation techniques used to value the Fund's investments by major category are as follows:
Debt securities, including restricted securities, are valued based on evaluated prices received from third party pricing services or from brokers who make markets in such securities. Municipal securities are valued by pricing services who utilize matrix pricing which considers yield or price of bonds of comparable quality, coupon, maturity and type or by broker-supplied prices. When independent prices are unavailable or unreliable, debt securities may be valued utilizing pricing methodologies which consider similar factors that would be used by third party pricing services. Debt securities are generally categorized as Level 2 in the hierarchy but may be Level 3 depending on the circumstances.
Investments in open-end mutual funds, including the Fidelity Central Funds, are valued at their closing net asset value (NAV) each business day and are categorized as Level 1 in the hierarchy.
Changes in valuation techniques may result in transfers in or out of an assigned level within the disclosure hierarchy. The aggregate value of investments by input level as of June 30, 2024 is included at the end of the Fund's Schedule of Investments.
Investment Transactions and Income. For financial reporting purposes, the Fund's investment holdings and NAV include trades executed through the end of the last business day of the period. The NAV per share for processing shareholder transactions is calculated as of the close of business of the New York Stock Exchange (NYSE), normally 4:00 p.m. Eastern time and includes trades executed through the end of the prior business day. Gains and losses on securities sold are determined on the basis of identified cost. Income and capital gain distributions from Fidelity Central Funds, if any, are recorded on the ex-dividend date. Interest income is accrued as earned and includes coupon interest and amortization of premium and accretion of discount on debt securities as applicable. Debt obligations may be placed on non-accrual status and related interest income may be reduced by ceasing current accruals and writing off interest receivables when the collection of all or a portion of interest has become doubtful based on consistently applied procedures. A debt obligation is removed from non-accrual status when the issuer resumes interest payments or when collectability of interest is reasonably assured.
Expenses. Expenses directly attributable to a fund are charged to that fund. Expenses attributable to more than one fund are allocated among the respective funds on the basis of relative net assets or other appropriate methods. Expenses included in the accompanying financial statements reflect the expenses of that fund and do not include any expenses associated with any underlying mutual funds or exchange-traded funds. Although not included in a fund's expenses, a fund indirectly bears its proportionate share of these expenses through the net asset value of each underlying mutual fund or exchange-traded fund. Expense estimates are accrued in the period to which they relate and adjustments are made when actual amounts are known.
Income Tax Information and Distributions to Shareholders. Each year, the Fund intends to qualify as a regulated investment company under Subchapter M of the Internal Revenue Code, including distributing substantially all of its taxable income and realized gains. As a result, no provision for U.S. Federal income taxes is required. The Fund files a U.S. federal tax return, in addition to state and local tax returns as required. The Fund's federal income tax returns are subject to examination by the Internal Revenue Service (IRS) for a period of three fiscal years after they are filed. State and local tax returns may be subject to examination for an additional fiscal year depending on the jurisdiction.
Distributions are declared and recorded daily and paid monthly from net investment income. Distributions from realized gains, if any, are declared and recorded on the ex-dividend date. Income and capital gain distributions are determined in accordance with income tax regulations, which may differ from GAAP.
Capital accounts within the financial statements are adjusted for permanent book-tax differences. These adjustments have no impact on net assets or the results of operations. Capital accounts are not adjusted for temporary book-tax differences which will reverse in a subsequent period.
Book-tax differences are primarily due to market discount and capital loss carryforwards.
The Fund purchases municipal securities whose interest, in the opinion of the issuer, is free from federal income tax. There is no assurance that the IRS will agree with this opinion. In the event the IRS determines that the issuer does not comply with relevant tax requirements, interest payments from a security could become federally taxable, possibly retroactively to the date the security was issued.
As of period end, the cost and unrealized appreciation (depreciation) in securities, and derivatives if applicable, for federal income tax purposes were as follows:
| Gross unrealized appreciation | $4,661,900 |
| Gross unrealized depreciation | (17,305,686) |
| Net unrealized appreciation (depreciation) | $(12,643,786) |
| Tax cost | $406,115,041 |
Capital loss carryforwards are only available to offset future capital gains of the Fund to the extent provided by regulations and may be limited. The capital loss carryforward information presented below, including any applicable limitation, is estimated as of prior fiscal period end and is subject to adjustment.
Short-term | $(1,946,636) |
Long-term | (4,033,003) |
| Total capital loss carryforward | $(5,979,639) |
Restricted Securities (including Private Placements). Funds may invest in securities that are subject to legal or contractual restrictions on resale. These securities generally may be resold in transactions exempt from registration or to the public if the securities are registered. Disposal of these securities may involve time-consuming negotiations and expense, and prompt sale at an acceptable price may be difficult. Information regarding restricted securities held at period end is included at the end of the Schedule of Investments, if applicable.
4. Purchases and Sales of Investments.
Purchases and sales of securities, other than short-term securities and in-kind transactions, as applicable, are noted in the table below.
| | Purchases ($) | Sales ($) |
| Fidelity Pennsylvania Municipal Income Fund | 8,580,091 | 8,625,198 |
5. Fees and Other Transactions with Affiliates.
Management Fee. Fidelity Management & Research Company LLC (the investment adviser) and its affiliates provide the Fund with investment management related services for which the Fund pays a monthly management fee.
Effective March 1, 2024, the Fund's management contract was amended to incorporate administrative services previously covered under separate services agreements (Transfer Agent and Accounting agreements). Any reference to "class" in this note shall mean "the Fund" as the Fund currently offers only one class of shares. The amended contract incorporates a management fee rate that may vary by class. The investment adviser or an affiliate pays certain expenses of managing and operating the Fund out of each class's management fee. Each class of the Fund pays a management fee to the investment adviser. The management fee is calculated and paid to the investment adviser every month. When determining a class's management fee, a mandate rate is calculated based on the monthly average net assets of a group of funds advised by FMR within a designated asset class. A discount rate is subtracted from the mandate rate once the Fund's monthly average net assets reach a certain level. The mandate rate and discount rate may vary by class. The annual management fee rate for a class of shares of the Fund is the lesser of (1) the class's mandate rate reduced by the class's discount rate (if applicable) or (2) the amount set forth in the following table.
| | Maximum Management Fee Rate % |
| Fidelity Pennsylvania Municipal Income Fund | .44% |
One-twelfth of the management fee rate for a class is applied to the average net assets of the class for the month, giving a dollar amount which is the management fee for the class for that month. A different management fee rate may be applicable to each class of the Fund. The difference between classes is the result of separate arrangements for class-level services and/or waivers of certain expenses. It is not the result of any difference in advisory or custodial fees or other expenses related to the management of the Fund's assets, which do not vary by class. For the portion of the reporting period on or after March 1, 2024, the total annualized management fee rates were as follows:
| | Total Management Fee Rate % |
| Fidelity Pennsylvania Municipal Income Fund | .44% |
| | |
Prior to March 1, 2024, the management fee was the sum of an individual fund fee rate that was based on an annual rate of .25% of the Fund's average net assets and an annualized group fee rate that averaged .10% during the period. The group fee rate was based upon the monthly average net assets of a group of registered investment companies with which the investment adviser has management contracts. The group fee rate decreased as assets under management increased and increased as assets under management decreased. For the portion of the reporting period prior to March 1, 2024, the total annualized management fee rate was .35%.
Effective March 1, 2024, the Fund's sub-advisory agreements with FMR Investment Management (UK) Limited, Fidelity Management & Research (Hong Kong) Limited, and Fidelity Management & Research (Japan) Limited were amended to provide that the investment adviser pays each sub-adviser monthly fees equal to 110% of the sub-adviser's costs for providing sub-advisory services.
Transfer Agent Fees. Fidelity Investments Institutional Operations Company LLC (FIIOC), an affiliate of the investment adviser, is the transfer, dividend disbursing and shareholder servicing agent for the Fund. Effective March 1, 2024, each Fund's management contract was amended to incorporate transfer agent services and associated fees previously covered under a separate services agreement. FIIOC pays for typesetting, printing and mailing of shareholder reports, except proxy statements.
During the period January 1, 2024 through February 29, 2024, the transfer agent fees were a fixed annual rate of average net assets of .0981%.
Accounting Fees. Fidelity Service Company, Inc. (FSC), an affiliate of the investment adviser, maintains the Fund's accounting records. Effective March 1, 2024, the Fund's management contract was amended to incorporate accounting services and associated fees previously covered under a separate services agreement.
During the period January 1, 2024 through February 29, 2024, the accounting fees were a fixed annual rate of average net assets as follows:
| | % of Average Net Assets |
| Fidelity Pennsylvania Municipal Income Fund | .0258% |
Interfund Trades. Funds may purchase from or sell securities to other Fidelity Funds under procedures adopted by the Board. The procedures have been designed to ensure these interfund trades are executed in accordance with Rule 17a-7 of the 1940 Act. Any interfund trades are included within the respective purchases and sales amounts shown in the Purchases and Sales of Investments note. During the period, there were no interfund trades.
6. Committed Line of Credit.
Certain Funds participate with other funds managed by the investment adviser or an affiliate in a $4.25 billion credit facility (the "line of credit") to be utilized for temporary or emergency purposes to fund shareholder redemptions or for other short-term liquidity purposes. The participating funds have agreed to pay commitment fees on their pro-rata portion of the line of credit, which are reflected in Miscellaneous expenses on the Statement of Operations, and are listed below. During the period, there were no borrowings on this line of credit.
| | Amount ($) |
| Fidelity Pennsylvania Municipal Income Fund | 373 |
7. Expense Reductions.
During the period the investment adviser or an affiliate reimbursed and/or waived a portion of operating expenses in the amount of $9,493.
8. Other.
A fund's organizational documents provide former and current trustees and officers with a limited indemnification against liabilities arising in connection with the performance of their duties to the fund. In the normal course of business, a fund may also enter into contracts that provide general indemnifications. A fund's maximum exposure under these arrangements is unknown as this would be dependent on future claims that may be made against a fund. The risk of material loss from such claims is considered remote.
9. Risk and Uncertainties.
Many factors affect a fund's performance. Developments that disrupt global economies and financial markets, such as pandemics, epidemics, outbreaks of infectious diseases, war, terrorism, and environmental disasters, may significantly affect a fund's investment performance. The effects of these developments to a fund will be impacted by the types of securities in which a fund invests, the financial condition, industry, economic sector, and geographic location of an issuer, and a fund's level of investment in the securities of that issuer. Significant concentrations in security types, issuers, industries, sectors, and geographic locations may magnify the factors that affect a fund's performance.
Item 8: Changes in and Disagreements with Accountants for Open-End Management Investment Companies
Note: This is not applicable for any fund included in this document.
Item 9: Proxy Disclosures for Open-End Management Investment Companies
Note: This is not applicable for any fund included in this document.
Item 10: Remuneration Paid to Directors, Officers, and others of Open-End Management Investment Companies
Note: This information is disclosed as part of the financial statements for each Fund as part of Item 7: Financial Statements and Financial Highlights for Open-End Management Investment companies.
Item 11: Statement Regarding Basis for Approval of Investment Advisory Contract
Board Approval of Investment Advisory Contracts
Fidelity Pennsylvania Municipal Income Fund
At its January 2024 meeting, the Board of Trustees, including the Independent Trustees (together, the Board), approved an amended and restated management contract with Fidelity Management & Research Company LLC (FMR) (the Management Contract), and amended and restated sub-advisory agreements (the Sub-Advisory Contracts, and together with the Management Contract, the Advisory Contracts) for the fund, including the fund's sub-advisory agreements with FMR Investment Management (UK) Limited (FMR UK), Fidelity Management & Research (Hong Kong) Limited (FMR H.K.), and Fidelity Management & Research (Japan) Limited (FMR Japan). The Advisory Contracts will be effective March 1, 2024. The Board will consider the annual renewal of the fund's Advisory Contracts in September 2024, following its review of additional materials provided by FMR.
Management Contract. The Board approved the Management Contract, which implements a new fee structure combining the management fee, transfer agent fee (TA Fee), and pricing and bookkeeping fee (P&B Fee) of the fund into a single fee based on tiered schedules and subject to a maximum rate (the Unified Fee). In exchange for the Unified Fee, the fund will receive investment advisory, management, administrative, transfer agent, pricing and bookkeeping services under a single agreement - the Management Contract.
In its consideration of the Management Contract over several meetings, the Board received, reviewed and discussed a comprehensive set of analyses regarding the Unified Fee including (i) the legal framework, (ii) design goals for the Unified Fee, (iii) calculation methodology for the Unified Fee and illustrative examples, (iv) annual and cumulative projected impacts under various scenarios, both in the aggregate and at the fund/class level, (v) explanations of schedules, rate levers and maximum rates and (vi) shareholder benefits and projected savings.
The Board considered that the maximum Unified Fee for the fund would be no higher than the sum of (i) the lowest contractual management fee under the fund's existing management contract, which is the individual fund fee, if any, plus the lowest contractual marginal group fee rate and (ii) the TA and P&B Fee rates, which are fixed fee rates since December 1, 2023 (together, the "Unified Fee Cap"). The Board noted that, as a result of this Unified Fee Cap, the Unified Fee would be no greater than the fees previously authorized to be charged for the same services. The Board noted that certain expenses such as third-party expenses and certain other miscellaneous expenses would be outside the scope of the Unified Fee and the calculation of such fees would not change as a result of the Unified Fee.
The Board considered that implementation of the Unified Fee, which includes the Unified Fee Cap, would cause all funds subject to a Unified Fee, including the fund, to experience an immediate reduction on contractual fee rates for services provided under the current management contracts. The Board considered that some funds would not experience lower fees as a result of existing fee caps. The Board further considered that, in addition to the contractual fee savings, the Unified Fee offers funds and their shareholders greater protection from future rate increases for services previously offered under separate agreements that are now covered by the Management Contract because such rate increases would require shareholder, as well as Board, approval.
Sub-Advisory Contracts. In connection with the Unified Fee changes, the Board considered the Sub-Advisory Contracts, which changed the arrangements for fees paid by FMR to the sub-advisers under the agreements. The Board noted that the agreements with FMR UK, FMR H.K., and FMR Japan were amended to provide that FMR will compensate each sub-adviser at a fee equal to 110% of the sub-adviser's costs incurred in providing services under the agreement. The Board considered that, under the Sub-Advisory Contracts, FMR, and not the fund, will continue to pay the sub-advisory fees to each applicable sub-adviser.
The Board considered that the approval of the fund's Advisory Contracts will not result in any changes in the investment process or strategies employed in the management of the fund's assets or the day-to-day management of the fund or the persons primarily responsible for such management. Further, the Board considered that the Management Contract would not change the obligations and services of FMR and its affiliates on behalf of the fund, and, in particular, there would be no change in the nature and level of advisory, management, administration, transfer agent, and pricing and bookkeeping services provided to the fund by FMR and its affiliates.
In connection with its consideration of future renewals of the fund's Advisory Contracts, the Board will consider: (i) the nature, extent and quality of services provided to the funds, including shareholder and administrative services and investment performance; (ii) the competitiveness of the management fee and total expenses for the fund; (iii) the costs of the services and profitability, including the revenues earned and the expenses incurred in conducting the business of developing, marketing, distributing, managing, administering, and servicing the fund and its shareholders, to the extent applicable; and (iv) whether there have been economies of scale in respect of the Fidelity funds, whether the Fidelity funds (including the fund) have appropriately benefited from any such economies of scale, and whether there is the potential for realization of any further economies.
Based on its evaluation of all of the conclusions noted above, and after considering all factors it believed relevant, the Board concluded that the fund's management fee structure is fair and reasonable, and that the fund's Advisory Contracts should be approved.
1.705577.126
PFR-SANN-0824
Fidelity® Ohio Municipal Income Fund
Semi-Annual Report
June 30, 2024
Contents
To view a fund's proxy voting guidelines and proxy voting record for the 12-month period ended June 30, visit http://www.fidelity.com/proxyvotingresults or visit the Securities and Exchange Commission's (SEC) web site at http://www.sec.gov.
You may also call 1-800-544-8544 to request a free copy of the proxy voting guidelines.
Standard & Poor's, S&P and S&P 500 are registered service marks of The McGraw-Hill Companies, Inc. and have been licensed for use by Fidelity Distributors Corporation.
Other third-party marks appearing herein are the property of their respective owners.
All other marks appearing herein are registered or unregistered trademarks or service marks of FMR LLC or an affiliated company. © 2024 FMR LLC. All rights reserved.
This report and the financial statements contained herein are submitted for the general information of the shareholders of the Fund. This report is not authorized for distribution to prospective investors in the Fund unless preceded or accompanied by an effective prospectus.
A fund files its complete schedule of portfolio holdings with the SEC for the first and third quarters of each fiscal year on Form N-PORT. Forms N-PORT are available on the SEC's web site at http://www.sec.gov. A fund's Forms N-PORT may be reviewed and copied at the SEC's Public Reference Room in Washington, DC. Information regarding the operation of the SEC's Public Reference Room may be obtained by calling 1-800-SEC-0330.
For a complete list of a fund's portfolio holdings, view the most recent holdings listing, semiannual report, or annual report on Fidelity's web site at http://www.fidelity.com, http://www.institutional.fidelity.com, or http://www.401k.com, as applicable.
NOT FDIC INSURED •MAY LOSE VALUE •NO BANK GUARANTEE
Neither the Fund nor Fidelity Distributors Corporation is a bank.
Item 7: Financial Statements and Financial Highlights for Open-End Management Investment Companies (Semi-Annual Report)
Fidelity® Ohio Municipal Income Fund
Schedule of Investments June 30, 2024 (Unaudited)
Showing Percentage of Net Assets
| Municipal Bonds - 93.5% |
| | | Principal Amount (a) | Value ($) |
| Ohio - 91.9% | | | |
| Akron Bath Copley Hosp. District Rev.: | | | |
| (Summa Health Sys.) Series 2016, 5% 11/15/25 | | 1,000,000 | 1,013,054 |
| Series 2016: | | | |
5% 11/15/26 | | 535,000 | 546,771 |
5.25% 11/15/32 | | 1,000,000 | 1,031,735 |
5.25% 11/15/34 | | 1,500,000 | 1,543,370 |
5.25% 11/15/41 | | 10,545,000 | 10,734,713 |
5.25% 11/15/46 | | 2,650,000 | 2,683,015 |
| Series 2020, 3% 11/15/40 | | 5,400,000 | 4,380,669 |
| Akron Income Tax Rev. Series 2022: | | | |
| 4% 12/1/28 | | 1,380,000 | 1,409,719 |
| 4% 12/1/29 | | 1,500,000 | 1,542,504 |
| 4% 12/1/30 | | 1,210,000 | 1,239,015 |
| 4% 12/1/31 | | 1,105,000 | 1,131,230 |
| 4% 12/1/32 | | 1,285,000 | 1,314,715 |
| 4% 12/1/33 | | 1,300,000 | 1,330,057 |
| Allen County Hosp. Facilities Rev.: | | | |
| (Mercy Health) Series 2017 A: | | | |
4% 8/1/36 | | 5,000,000 | 5,035,627 |
5% 8/1/42 | | 4,175,000 | 4,289,243 |
| Series 2020 A: | | | |
4% 12/1/40 | | 11,880,000 | 11,623,386 |
5% 12/1/35 | | 750,000 | 813,909 |
| American Muni. Pwr., Inc. Rev. Series 2023 A: | | | |
| 5% 2/15/28 | | 10,000,000 | 10,589,520 |
| 5% 2/15/39 | | 4,250,000 | 4,696,252 |
| Bath Loc School District Series 2020, 2.125% 12/1/40 (Build America Mutual Assurance Insured) | | 670,000 | 483,313 |
| Bowling Green City School District Series 2024 A, 4% 10/1/44 | | 1,980,000 | 1,980,834 |
| Buckeye Tobacco Settlement Fing. Auth. Series 2020 A2: | | | |
| 3% 6/1/48 | | 1,500,000 | 1,137,807 |
| 4% 6/1/37 | | 5,975,000 | 6,011,838 |
| 4% 6/1/38 | | 1,000,000 | 1,001,310 |
| 4% 6/1/39 | | 1,000,000 | 995,538 |
| 4% 6/1/48 | | 5,750,000 | 5,299,630 |
| 5% 6/1/27 | | 1,000,000 | 1,037,814 |
| 5% 6/1/35 | | 2,000,000 | 2,140,256 |
| 5% 6/1/36 | | 2,000,000 | 2,134,775 |
| Butler County Hosp. Facilities Rev. Series 2017, 4% 11/15/35 | | 2,000,000 | 1,872,386 |
| Chillicothe Hosp. Facilities Rev. (Adena Health Sys. Oblig. Group Proj.) Series 2017, 5% 12/1/47 | | 8,535,000 | 8,629,896 |
| Cleveland Arpt. Sys. Rev.: | | | |
| Series 2018 A: | | | |
5% 1/1/43 (Assured Guaranty Muni. Corp. Insured) (b) | | 1,750,000 | 1,792,370 |
5% 1/1/48 (Assured Guaranty Muni. Corp. Insured) (b) | | 3,000,000 | 3,052,304 |
| Series 2019 B: | | | |
5% 1/1/25 (b) | | 1,125,000 | 1,130,406 |
5% 1/1/26 (b) | | 710,000 | 722,218 |
5% 1/1/27 (b) | | 700,000 | 719,427 |
| Cleveland Gen. Oblig.: | | | |
| Series 2012, 5% 12/1/25 | | 25,000 | 25,032 |
| Series 2021 A: | | | |
3% 12/1/31 | | 270,000 | 256,867 |
3% 12/1/35 | | 370,000 | 339,921 |
3% 12/1/36 | | 430,000 | 389,683 |
| Cleveland Income Tax Rev. Series 2018 A: | | | |
| 5% 10/1/33 | | 600,000 | 633,494 |
| 5% 10/1/36 | | 700,000 | 737,415 |
| 5% 10/1/39 | | 2,040,000 | 2,136,148 |
| 5% 10/1/43 | | 5,000,000 | 5,180,691 |
| Cleveland Ohio Wtr. Poll. Ctl. Rev. Series 2016, 5% 11/15/36 | | 450,000 | 455,702 |
| Cleveland Pub. Library Facilities Series 2019 A: | | | |
| 4% 12/1/33 | | 425,000 | 435,670 |
| 4% 12/1/34 | | 370,000 | 379,234 |
| 4% 12/1/35 | | 620,000 | 632,263 |
| 4% 12/1/36 | | 1,400,000 | 1,415,052 |
| 4% 12/1/37 | | 1,115,000 | 1,122,819 |
| 4% 12/1/38 | | 650,000 | 651,970 |
| Cleveland Pub. Pwr. Sys. Rev.: | | | |
| Series 2018: | | | |
5% 11/15/32 (Assured Guaranty Muni. Corp. Insured) | | 365,000 | 388,277 |
5% 11/15/34 (Assured Guaranty Muni. Corp. Insured) | | 785,000 | 833,919 |
5% 11/15/36 (Assured Guaranty Muni. Corp. Insured) | | 1,000,000 | 1,058,930 |
5% 11/15/38 (Assured Guaranty Muni. Corp. Insured) | | 830,000 | 873,214 |
| Series 2020 A: | | | |
4% 11/15/35 (Assured Guaranty Muni. Corp. Insured) | | 1,000,000 | 1,012,955 |
4% 11/15/36 (Assured Guaranty Muni. Corp. Insured) | | 1,000,000 | 1,009,864 |
4% 11/15/37 (Assured Guaranty Muni. Corp. Insured) | | 1,000,000 | 1,006,694 |
| Cleveland-Cuyahoga County Port Auth. (The Cleveland Museum of Natural History Proj.) Series 2021: | | | |
| 4% 7/1/46 | | 850,000 | 816,465 |
| 4% 7/1/51 | | 1,000,000 | 937,787 |
| Cleveland-Cuyahoga County Port Auth. Dev. Lease Rev. (Administrative Headquarters Proj.) Series 2013, 5% 7/1/37 | | 3,000,000 | 3,365,586 |
| Cleveland-Cuyahoga County Port Auth. Rev. (Euclid Avenue Dev. Corp. Proj.) Series 2022 A: | | | |
| 5% 8/1/34 | | 1,865,000 | 2,027,749 |
| 5% 8/1/35 | | 1,910,000 | 2,074,719 |
| 5% 8/1/36 | | 2,065,000 | 2,236,688 |
| 5% 8/1/37 | | 2,170,000 | 2,342,860 |
| 5.5% 8/1/47 | | 3,000,000 | 3,219,798 |
| Columbus Gen. Oblig. Series 2017 A, 3.25% 4/1/37 | | 265,000 | 253,778 |
| County of Cuyahoga (Ballpark Impt. Proj.) Series 2022 A: | | | |
| 4% 1/1/36 | | 3,855,000 | 3,987,508 |
| 4% 1/1/37 | | 3,755,000 | 3,880,986 |
| Cuyahoga County Econ. Dev. Rev. (The Cleveland Orchestra Proj.) Series 2019: | | | |
| 5% 1/1/29 | | 325,000 | 342,862 |
| 5% 1/1/30 | | 250,000 | 265,824 |
| 5% 1/1/31 | | 525,000 | 557,820 |
| 5% 1/1/32 | | 500,000 | 531,940 |
| 5% 1/1/33 | | 400,000 | 425,611 |
| 5% 1/1/34 | | 300,000 | 319,492 |
| 5% 1/1/35 | | 500,000 | 532,620 |
| 5% 1/1/36 | | 440,000 | 469,077 |
| 5% 1/1/37 | | 400,000 | 427,590 |
| 5% 1/1/39 | | 1,400,000 | 1,486,507 |
| 5% 1/1/40 | | 1,620,000 | 1,710,090 |
| Cuyahoga County Hosp. Rev. Series 2017: | | | |
| 5% 2/15/26 | | 1,750,000 | 1,773,285 |
| 5% 2/15/27 | | 1,700,000 | 1,740,429 |
| 5% 2/15/28 | | 2,385,000 | 2,428,479 |
| 5% 2/15/30 | | 3,000,000 | 3,061,691 |
| 5% 2/15/31 | | 1,500,000 | 1,531,445 |
| 5% 2/15/32 | | 1,450,000 | 1,480,492 |
| 5% 2/15/42 | | 5,135,000 | 5,185,715 |
| Dublin City School District Series 2024: | | | |
| 5% 12/1/27 | | 625,000 | 664,892 |
| 5% 12/1/28 | | 285,000 | 308,171 |
| 5% 12/1/29 | | 250,000 | 275,188 |
| 5% 12/1/30 | | 300,000 | 335,659 |
| 5% 12/1/31 | | 270,000 | 306,673 |
| 5% 12/1/32 | | 300,000 | 345,539 |
| 5% 12/1/33 | | 315,000 | 366,345 |
| 5% 12/1/34 | | 250,000 | 290,684 |
| 5% 12/1/35 | | 525,000 | 609,289 |
| 5% 12/1/36 | | 500,000 | 578,335 |
| 5% 12/1/37 | | 500,000 | 575,646 |
| 5% 12/1/38 | | 300,000 | 342,111 |
| 5% 12/1/39 | | 275,000 | 312,719 |
| 5% 12/1/40 | | 400,000 | 452,085 |
| 5% 12/1/41 | | 500,000 | 560,444 |
| 5% 12/1/42 | | 600,000 | 669,785 |
| 5% 12/1/44 | | 800,000 | 882,487 |
| Fairfield County Hosp. Facilities Rev. (Fairfield Med. Ctr. Proj.) Series 2013, 5.25% 6/15/43 | | 5,000,000 | 4,508,405 |
| Forest Hills Local School District Series 2015, 3.5% 12/1/33 | | 790,000 | 739,822 |
| Franklin County Convention Facilities Auth. (Greater Columbus Convention Ctr. Hotel Expansion Proj.) Series 2019: | | | |
| 5% 12/1/44 | | 2,500,000 | 2,480,952 |
| 5% 12/1/51 | | 6,000,000 | 5,900,122 |
| Franklin County Hosp. Facilities Rev. Series 2016 C, 4% 11/1/40 | | 3,000,000 | 2,955,977 |
| Hamilton County Healthcare Rev.: | | | |
| (Life Enriching Cmntys. Proj.) Series 2016, 5% 1/1/31 | | 1,350,000 | 1,366,130 |
| Series 2023 A, 5.25% 1/1/38 | | 1,755,000 | 1,819,511 |
| Hamilton County Hosp. Facilities Rev. Series 2014, 5% 2/1/44 | | 1,275,000 | 1,274,966 |
| Hamilton County Swr. Sys. Rev. Series 2024 B: | | | |
| 5% 12/1/28 (c) | | 1,750,000 | 1,883,338 |
| 5% 12/1/29 (c) | | 1,900,000 | 2,080,838 |
| 5% 12/1/30 (c) | | 1,250,000 | 1,391,093 |
| 5% 12/1/31 (c) | | 1,250,000 | 1,407,478 |
| 5% 12/1/32 (c) | | 950,000 | 1,084,074 |
| Kent State Univ. Revs.: | | | |
| Series 2016, 5% 5/1/30 | | 1,125,000 | 1,157,577 |
| Series 2020 A: | | | |
5% 5/1/45 | | 1,250,000 | 1,313,173 |
5% 5/1/50 | | 1,700,000 | 1,777,090 |
| Lake County Hosp. Facilities Rev. Series 2015, 5% 8/15/27 (Pre-Refunded to 8/15/25 @ 100) | | 770,000 | 783,936 |
| Lancaster Port Auth. Gas Rev.: | | | |
| Bonds Series 2019, 5%, tender 2/1/25 (d) | | 6,235,000 | 6,269,014 |
| Series 2019, 5% 8/1/24 | | 655,000 | 655,446 |
| Miami County Hosp. Facilities Rev. (Kettering Health Network Obligated Group Proj.) Series 2019: | | | |
| 5% 8/1/45 | | 5,500,000 | 5,593,636 |
| 5% 8/1/49 | | 1,750,000 | 1,771,891 |
| Miami Univ. Series 2022 A: | | | |
| 5% 9/1/29 | | 545,000 | 596,620 |
| 5% 9/1/30 | | 500,000 | 554,342 |
| 5% 9/1/31 | | 700,000 | 787,049 |
| 5% 9/1/32 | | 735,000 | 818,712 |
| 5% 9/1/33 | | 780,000 | 868,383 |
| Middleburg Heights Hosp. Rev.: | | | |
| Series 2020 A: | | | |
4% 8/1/41 | | 905,000 | 866,889 |
4% 8/1/47 | | 3,000,000 | 2,764,014 |
| Series 2021 A, 4% 8/1/41 | | 3,000,000 | 2,887,361 |
| Milford Exempt Village School District Series 2015, 3.5% 12/1/31 | | 500,000 | 493,510 |
| Montgomery County Hosp. Rev.: | | | |
| (Kettering Health Network Obligated Group Proj.) Series 2021: | | | |
3% 8/1/51 | | 4,880,000 | 3,675,914 |
4% 8/1/37 | | 1,125,000 | 1,132,010 |
4% 8/1/41 | | 850,000 | 833,197 |
4% 8/1/51 | | 2,000,000 | 1,817,204 |
5% 8/1/32 | | 750,000 | 820,423 |
5% 8/1/36 | | 1,225,000 | 1,322,242 |
5% 8/1/38 | | 1,000,000 | 1,066,705 |
5% 8/1/39 | | 1,100,000 | 1,171,067 |
| Series 2021, 4% 8/1/46 | | 1,230,000 | 1,193,385 |
| Northeast Ohio Reg'l. Swr. District Wastewtr. Rev.: | | | |
| Series 2016, 3% 11/15/36 | | 250,000 | 225,434 |
| Series 2019, 3% 11/15/34 | | 1,385,000 | 1,285,125 |
| Ohio Cap. Facilities Lease (Ohio Gen. Oblig. Proj.) Series 2017 A: | | | |
| 5% 10/1/35 | | 1,450,000 | 1,508,300 |
| 5% 10/1/36 | | 1,250,000 | 1,297,928 |
| 5% 10/1/37 | | 1,430,000 | 1,479,070 |
| Ohio Higher Edl. Facility Commission Rev.: | | | |
| (Case Western Reserve Univ. Proj.) Series 2019 B: | | | |
5% 12/1/37 | | 835,000 | 897,854 |
5% 12/1/38 | | 1,100,000 | 1,176,932 |
5% 12/1/39 | | 775,000 | 827,632 |
| (Denison Univ. 2021 Proj.) Series 2021: | | | |
5% 11/1/30 | | 300,000 | 330,710 |
5% 11/1/33 | | 300,000 | 330,878 |
5% 11/1/35 | | 300,000 | 331,000 |
5% 11/1/41 | | 300,000 | 324,636 |
| (Kenyon College 2016 Proj.) Series 2016, 4% 7/1/44 | | 1,340,000 | 1,309,273 |
| (Kenyon College 2020 Proj.) Series 2020: | | | |
5% 7/1/38 | | 2,500,000 | 2,696,313 |
5% 7/1/39 | | 2,640,000 | 2,833,371 |
| (Kenyon College, Oh. Proj.) Series 2017: | | | |
4% 7/1/36 | | 400,000 | 402,491 |
4% 7/1/37 | | 450,000 | 452,229 |
5% 7/1/28 | | 400,000 | 415,662 |
5% 7/1/29 | | 735,000 | 763,832 |
5% 7/1/30 | | 300,000 | 311,737 |
5% 7/1/31 | | 400,000 | 415,880 |
5% 7/1/33 | | 650,000 | 675,904 |
5% 7/1/35 | | 1,550,000 | 1,612,285 |
5% 7/1/42 | | 1,400,000 | 1,435,077 |
| (Oberlin College 2023 Proj.): | | | |
Series 2023 A, 5.25% 10/1/53 | | 8,955,000 | 9,778,633 |
Series 2023 B: | | | |
5% 10/1/37 | | 1,270,000 | 1,430,549 |
5% 10/1/38 | | 1,330,000 | 1,489,431 |
| (Otterbein Univ. 2022 Proj.) Series 2022 A, 4% 12/1/46 | | 1,250,000 | 1,087,813 |
| (The College of Wooster 2018 Proj.) Series 2018: | | | |
5% 9/1/33 | | 1,445,000 | 1,539,945 |
5% 9/1/45 | | 4,255,000 | 4,420,038 |
| (Univ. of Dayton 2018 Proj.) Series A, 5% 12/1/48 | | 1,000,000 | 1,028,845 |
| (Univ. of Dayton 2020 Proj.) Series 2020: | | | |
3% 2/1/37 | | 1,335,000 | 1,163,193 |
4% 2/1/36 | | 900,000 | 911,302 |
5% 2/1/34 | | 1,000,000 | 1,075,700 |
5% 2/1/35 | | 800,000 | 861,100 |
| (Univ. of Dayton Proj.) Series 2018 B: | | | |
4% 12/1/33 | | 1,155,000 | 1,167,625 |
5% 12/1/29 | | 1,310,000 | 1,378,431 |
5% 12/1/31 | | 1,130,000 | 1,189,580 |
5% 12/1/35 | | 1,000,000 | 1,051,903 |
5% 12/1/36 | | 1,000,000 | 1,050,802 |
| (Xavier Univ. 2020 Proj.) Series 2020, 5% 5/1/29 | | 250,000 | 269,083 |
| (Xavier Univ. Proj.) Series 2015 C, 5% 5/1/29 | | 855,000 | 864,740 |
| Bonds (Case Western Reserve Univ. Proj.) Series 2019 C, 1.625%, tender 12/1/26 (d) | | 5,000,000 | 4,707,870 |
| Series 2019, 4% 10/1/49 | | 3,270,000 | 3,071,469 |
| Ohio Hosp. Facilities Rev. Series 2021 B: | | | |
| 5% 1/1/32 | | 1,580,000 | 1,773,584 |
| 5% 1/1/35 | | 230,000 | 258,152 |
| 5% 1/1/36 | | 540,000 | 605,822 |
| 5% 1/1/37 | | 250,000 | 279,342 |
| 5% 1/1/38 | | 855,000 | 949,391 |
| 5% 1/1/39 | | 925,000 | 1,020,135 |
| Ohio Hosp. Rev.: | | | |
| Bonds: | | | |
Series 2019 C, 2.75%, tender 5/1/28 (d) | | 5,685,000 | 5,485,767 |
Series 2024 B, 5%, tender 8/15/32 (d) | | 10,000,000 | 11,006,360 |
| Series 2020 A, 4% 1/15/50 | | 1,000,000 | 928,463 |
| Series 2020: | | | |
3% 1/15/45 | | 2,500,000 | 1,970,946 |
4% 11/15/37 | | 1,025,000 | 966,542 |
4% 11/15/39 | | 1,115,000 | 1,037,177 |
4% 11/15/40 | | 1,110,000 | 1,025,403 |
4% 11/15/41 | | 1,175,000 | 1,074,169 |
5% 11/15/33 | | 1,270,000 | 1,312,177 |
5% 11/15/35 | | 1,465,000 | 1,511,547 |
| Series 2021 A, 3% 1/15/46 | | 5,000,000 | 3,860,796 |
| Ohio Hsg. Fin. Agcy. Residential Mtg. Rev.: | | | |
| (Mtg. - Backed Securities Prog.) Series 2021 C, 2.7% 9/1/46 | | 3,900,000 | 2,876,661 |
| (Mtg. Backed Securities Prog.): | | | |
Series 2017 B, 4.5% 3/1/47 (b) | | 260,000 | 258,831 |
Series 2019 B, 4.5% 3/1/50 | | 3,460,000 | 3,471,043 |
| (Mtg.-Backed Secrities Prog.) Series 2023 A, 5.5% 3/1/53 | | 3,950,000 | 4,138,410 |
| (Mtg.-Backed Securities Prog.): | | | |
Series 2020 A, 2.75% 9/1/40 | | 2,335,000 | 1,932,522 |
Series 2022 A: | | | |
2.3% 3/1/33 | | 1,900,000 | 1,613,026 |
5% 3/1/30 | | 400,000 | 426,031 |
5% 3/1/31 | | 600,000 | 646,073 |
5% 9/1/31 | | 640,000 | 692,498 |
| Series 2021 C, 3.25% 3/1/51 | | 6,755,000 | 6,570,989 |
| Series 2022 B, 5% 3/1/52 | | 2,745,000 | 2,814,461 |
| Ohio Spl. Oblig.: | | | |
| (Administrative Bldg. Fund Projs.) Series 2020 B, 5% 4/1/39 | | 1,865,000 | 2,012,923 |
| Series 2021 A: | | | |
5% 4/1/37 | | 1,680,000 | 1,849,493 |
5% 4/1/38 | | 1,000,000 | 1,093,239 |
5% 4/1/39 | | 1,000,000 | 1,088,772 |
5% 4/1/40 | | 1,110,000 | 1,201,497 |
5% 4/1/41 | | 750,000 | 809,185 |
| Ohio Tpk. Commission Tpk. Rev.: | | | |
| (Infrastructure Proj.) Series 2005 A, 0% 2/15/43 | | 10,000,000 | 4,346,912 |
| Series A, 5% 2/15/46 | | 7,500,000 | 7,987,263 |
| Ohio Wtr. Dev. Auth. Wtr. Poll. Cont. Rev. Series 2019 B, 3% 12/1/33 | | 685,000 | 657,898 |
| Port Auth. Econ. Dev. Rev.: | | | |
| (Univ. of Northwestern Ohio Proj.) Series 2021, 4% 12/1/35 | | 1,300,000 | 1,187,562 |
| Series 2021, 4% 12/1/31 | | 710,000 | 664,637 |
| Ross County Hosp. Facilities Rev. (Adena Health Sys. Obligated Group Proj.) Series 2019, 5% 12/1/49 | | 2,000,000 | 2,031,033 |
| Scioto County Hosp. Facilities Rev. Series 2016: | | | |
| 3.5% 2/15/38 | | 315,000 | 287,839 |
| 5% 2/15/28 | | 5,030,000 | 5,123,379 |
| 5% 2/15/30 | | 3,860,000 | 3,918,445 |
| 5% 2/15/32 | | 2,550,000 | 2,580,919 |
| 5% 2/15/33 | | 2,460,000 | 2,486,259 |
| 5% 2/15/34 | | 4,450,000 | 4,500,775 |
| Univ. of Cincinnati Gen. Receipts: | | | |
| Series 2016 A: | | | |
5% 6/1/32 | | 745,000 | 765,483 |
5% 6/1/34 | | 585,000 | 600,755 |
| Series 2019 A, 3% 6/1/39 | | 3,000,000 | 2,568,980 |
| Series 2024 D: | | | |
5% 6/1/28 (c) | | 1,130,000 | 1,199,628 |
5% 6/1/30 (c) | | 590,000 | 642,812 |
5% 6/1/31 (c) | | 620,000 | 684,607 |
5% 6/1/32 (c) | | 500,000 | 558,160 |
5% 6/1/33 (c) | | 995,000 | 1,122,623 |
5% 6/1/35 (c) | | 760,000 | 861,774 |
5% 6/1/38 (c) | | 1,700,000 | 1,904,031 |
5% 6/1/39 (c) | | 1,070,000 | 1,192,104 |
5% 6/1/40 (c) | | 1,120,000 | 1,240,356 |
5% 6/1/41 (c) | | 1,175,000 | 1,295,559 |
| Univ. of Toledo Gen. Receipts Series 2018 A: | | | |
| 5% 6/1/26 | | 600,000 | 616,551 |
| 5% 6/1/27 | | 350,000 | 365,347 |
| Village of Bluffton Hosp. Facilities Blanchard Valley Reg Health Ctr. Series 2017: | | | |
| 4% 12/1/32 | | 1,500,000 | 1,498,835 |
| 5% 12/1/29 | | 825,000 | 851,381 |
| 5% 12/1/31 | | 750,000 | 775,753 |
| Washington County Hosp. Rev. Series 2022: | | | |
| 6% 12/1/28 | | 200,000 | 206,272 |
| 6% 12/1/29 | | 215,000 | 223,559 |
| 6% 12/1/30 | | 230,000 | 240,839 |
| 6% 12/1/31 | | 245,000 | 258,112 |
| West Carrollton Ohio City Schd Series 2020 A, 3% 12/1/44 | | 2,150,000 | 1,737,687 |
| Wright State Univ. Gen. Receipts Series 2022 A: | | | |
| 5% 5/1/25 (Build America Mutual Assurance Insured) | | 490,000 | 495,879 |
| 5% 5/1/26 (Build America Mutual Assurance Insured) | | 520,000 | 534,792 |
| 5% 5/1/27 (Build America Mutual Assurance Insured) | | 545,000 | 567,484 |
| 5% 5/1/28 (Build America Mutual Assurance Insured) | | 565,000 | 597,625 |
| 5% 5/1/29 (Build America Mutual Assurance Insured) | | 600,000 | 644,347 |
| 5% 5/1/30 (Build America Mutual Assurance Insured) | | 235,000 | 256,053 |
| 5% 5/1/31 (Build America Mutual Assurance Insured) | | 250,000 | 275,551 |
| 5% 5/1/32 (Build America Mutual Assurance Insured) | | 260,000 | 288,855 |
TOTAL OHIO | | | 449,524,628 |
| Puerto Rico - 1.6% | | | |
| Puerto Rico Commonwealth Aqueduct & Swr. Auth. Series 2021 B, 5% 7/1/37 (e) | | 1,455,000 | 1,517,819 |
| Puerto Rico Commonwealth Pub. Impt. Gen. Oblig. Series 2021 A1: | | | |
| 0% 7/1/33 | | 1,634,241 | 1,090,463 |
| 5.625% 7/1/27 | | 190,000 | 198,232 |
| 5.625% 7/1/29 | | 590,000 | 632,784 |
| 5.75% 7/1/31 | | 1,395,000 | 1,549,062 |
| Puerto Rico Sales Tax Fing. Corp. Sales Tax Rev.: | | | |
| Series 2018 A1, 0% 7/1/31 | | 1,515,000 | 1,150,003 |
| Series 2019 A2, 4.329% 7/1/40 | | 1,860,000 | 1,835,063 |
TOTAL PUERTO RICO | | | 7,973,426 |
| TOTAL MUNICIPAL BONDS (Cost $469,661,826) | | | 457,498,054 |
| | | | |
| Municipal Notes - 4.1% |
| | | Principal Amount (a) | Value ($) |
| Ohio - 4.1% | | | |
| East Alabama Health Care Auth. Participating VRDN Series BAML 5036, 4.94% 7/1/24 (Liquidity Facility Bank of America NA) (d)(f)(g) | | 1,750,000 | 1,750,000 |
| Franklin County Rev. Participating VRDN Series 2022 D1, 3.4% 7/1/24 (Liquidity Facility Barclays Bank PLC) (d)(f)(g) | | 9,430,000 | 9,430,000 |
| Ohio Higher Edl. Facility Commission Rev. (Cleveland Clinic Foundation Proj.) Series 2008 B4, 4.7% 7/1/24 (Liquidity Facility Barclays Bank PLC), VRDN (d) | | 8,920,000 | 8,920,000 |
| | | | |
| TOTAL MUNICIPAL NOTES (Cost $20,100,000) | | | 20,100,000 |
| | | | |
| Money Market Funds - 5.2% |
| | | Shares | Value ($) |
Fidelity Municipal Cash Central Fund 4.33% (h)(i) (Cost $25,470,303) | | 25,465,164 | 25,470,259 |
| | | | |
| TOTAL INVESTMENT IN SECURITIES - 102.8% (Cost $515,232,129) | 503,068,313 |
NET OTHER ASSETS (LIABILITIES) - (2.8)% | (13,675,532) |
| NET ASSETS - 100.0% | 489,392,781 |
| | |
Security Type Abbreviations
| VRDN | - | VARIABLE RATE DEMAND NOTE (A debt instrument that is payable upon demand, either daily, weekly or monthly) |
Legend
| (a) | Amount is stated in United States dollars unless otherwise noted. |
| (b) | Private activity obligations whose interest is subject to the federal alternative minimum tax for individuals. |
| (c) | Security or a portion of the security purchased on a delayed delivery or when-issued basis. |
| (d) | Coupon rates for floating and adjustable rate securities reflect the rates in effect at period end. |
| (e) | Security exempt from registration under Rule 144A of the Securities Act of 1933. These securities may be resold in transactions exempt from registration, normally to qualified institutional buyers. At the end of the period, the value of these securities amounted to $1,517,819 or 0.3% of net assets. |
| (f) | Provides evidence of ownership in one or more underlying municipal bonds. |
| (g) | Coupon rates are determined by re-marketing agents based on current market conditions. |
| (h) | Information in this report regarding holdings by state and security types does not reflect the holdings of the Fidelity Municipal Cash Central Fund. |
| (i) | Affiliated fund that is generally available only to investment companies and other accounts managed by Fidelity Investments. The rate quoted is the annualized seven-day yield of the fund at period end. A complete unaudited listing of the fund's holdings as of its most recent quarter end is available upon request. In addition, each Fidelity Central Fund's financial statements are available on the SEC's website or upon request. |
Affiliated Central Funds
Fiscal year to date information regarding the Fund's investments in Fidelity Central Funds, including the ownership percentage, is presented below.
| Affiliate | Value, beginning of period ($) | Purchases ($) | Sales Proceeds ($) | Dividend Income ($) | Realized Gain (loss) ($) | Change in Unrealized appreciation (depreciation) ($) | Value, end of period ($) | % ownership, end of period |
| Fidelity Municipal Cash Central Fund 4.33% | 22,416,404 | 39,911,468 | 36,855,529 | 431,786 | (2,040) | (44) | 25,470,259 | 1.3% |
| Total | 22,416,404 | 39,911,468 | 36,855,529 | 431,786 | (2,040) | (44) | 25,470,259 | |
| | | | | | | | | |
Amounts in the dividend income column in the above table include any capital gain distributions from underlying funds, which are presented in the corresponding line item in the Statement of Operations, if applicable.
Amounts included in the purchases and sales proceeds columns may include in-kind transactions, if applicable.
Investment Valuation
The following is a summary of the inputs used, as of June 30, 2024, involving the Fund's assets and liabilities carried at fair value. The inputs or methodology used for valuing securities may not be an indication of the risk associated with investing in those securities. For more information on valuation inputs, and their aggregation into the levels used below, please refer to the Investment Valuation section in the accompanying Notes to Financial Statements.
| Valuation Inputs at Reporting Date: |
| Description | Total ($) | Level 1 ($) | Level 2 ($) | Level 3 ($) |
Investments in Securities: | | | | |
|
| Municipal Securities | 477,598,054 | - | 477,598,054 | - |
|
| Money Market Funds | 25,470,259 | 25,470,259 | - | - |
| Total Investments in Securities: | 503,068,313 | 25,470,259 | 477,598,054 | - |
Financial Statements (Unaudited)
| Statement of Assets and Liabilities |
| | | | June 30, 2024 (Unaudited) |
| | | | | |
| Assets | | | | |
| Investment in securities, at value - See accompanying schedule: | | | | |
Unaffiliated issuers (cost $489,761,826) | $ | 477,598,054 | | |
Fidelity Central Funds (cost $25,470,303) | | 25,470,259 | | |
| | | | | |
| | | | | |
| Total Investment in Securities (cost $515,232,129) | | | $ | 503,068,313 |
| Receivable for investments sold | | | | 7,325 |
| Receivable for fund shares sold | | | | 143,504 |
| Interest receivable | | | | 5,389,190 |
| Distributions receivable from Fidelity Central Funds | | | | 72,679 |
| Other receivables | | | | 232 |
Total assets | | | | 508,681,243 |
| Liabilities | | | | |
| Payable to custodian bank | $ | 103,525 | | |
| Payable for investments purchased on a delayed delivery basis | | 18,397,662 | | |
| Payable for fund shares redeemed | | 147,372 | | |
| Distributions payable | | 426,280 | | |
| Accrued management fee | | 179,495 | | |
| Other payables and accrued expenses | | 34,128 | | |
| Total liabilities | | | | 19,288,462 |
| Net Assets | | | $ | 489,392,781 |
| Net Assets consist of: | | | | |
| Paid in capital | | | $ | 512,933,392 |
| Total accumulated earnings (loss) | | | | (23,540,611) |
| Net Assets | | | $ | 489,392,781 |
Net Asset Value, offering price and redemption price per share ($489,392,781 ÷ 43,126,810 shares) | | | $ | 11.35 |
| Statement of Operations |
| | | | Six months ended June 30, 2024 (Unaudited) |
| Investment Income | | | | |
| Interest | | | $ | 7,728,533 |
| Income from Fidelity Central Funds | | | | 431,786 |
| Total income | | | | 8,160,319 |
| Expenses | | | | |
| Management fee | $ | 1,011,178 | | |
| Transfer agent fees | | 84,761 | | |
| Accounting fees and expenses | | 21,268 | | |
| Custodian fees and expenses | | 6,457 | | |
| Independent trustees' fees and expenses | | 669 | | |
| Registration fees | | 19,460 | | |
| Audit | | 26,705 | | |
| Legal | | 5,465 | | |
| Miscellaneous | | 1,217 | | |
| Total expenses before reductions | | 1,177,180 | | |
| Expense reductions | | (12,165) | | |
| Total expenses after reductions | | | | 1,165,015 |
| Net Investment income (loss) | | | | 6,995,304 |
| Realized and Unrealized Gain (Loss) | | | | |
| Net realized gain (loss) on: | | | | |
| Investment Securities: | | | | |
| Unaffiliated issuers | | (68,561) | | |
| Fidelity Central Funds | | (2,040) | | |
| Total net realized gain (loss) | | | | (70,601) |
| Change in net unrealized appreciation (depreciation) on: | | | | |
| Investment Securities: | | | | |
| Unaffiliated issuers | | (4,707,174) | | |
| Fidelity Central Funds | | (44) | | |
| Total change in net unrealized appreciation (depreciation) | | | | (4,707,218) |
| Net gain (loss) | | | | (4,777,819) |
| Net increase (decrease) in net assets resulting from operations | | | $ | 2,217,485 |
| Statement of Changes in Net Assets |
| |
| | Six months ended June 30, 2024 (Unaudited) | | Year ended December 31, 2023 |
| Increase (Decrease) in Net Assets | | | | |
| Operations | | | | |
| Net investment income (loss) | $ | 6,995,304 | $ | 13,228,791 |
| Net realized gain (loss) | | (70,601) | | (8,159,500) |
| Change in net unrealized appreciation (depreciation) | | (4,707,218) | | 21,583,469 |
| Net increase (decrease) in net assets resulting from operations | | 2,217,485 | | 26,652,760 |
| Distributions to shareholders | | (6,806,363) | | (13,023,068) |
| | | | | |
| Share transactions | | | | |
| Proceeds from sales of shares | | 30,386,705 | | 87,432,066 |
| Reinvestment of distributions | | 4,197,906 | | 8,233,937 |
| Cost of shares redeemed | | (44,658,407) | | (126,970,252) |
| | | | | |
Net increase (decrease) in net assets resulting from share transactions | | (10,073,796) | | (31,304,249) |
| Total increase (decrease) in net assets | | (14,662,674) | | (17,674,557) |
| | | | | |
| Net Assets | | | | |
| Beginning of period | | 504,055,455 | | 521,730,012 |
| End of period | $ | 489,392,781 | $ | 504,055,455 |
| | | | | |
| Other Information | | | | |
| Shares | | | | |
| Sold | | 2,675,313 | | 7,927,835 |
| Issued in reinvestment of distributions | | 370,694 | | 737,902 |
| Redeemed | | (3,936,368) | | (11,480,668) |
| Net increase (decrease) | | (890,361) | | (2,814,931) |
| | | | | |
Financial Highlights
Fidelity® Ohio Municipal Income Fund |
| |
| | Six months ended (Unaudited) June 30, 2024 | | Years ended December 31, 2023 | | 2022 | | 2021 | | 2020 | | 2019 |
Selected Per-Share Data | | | | | | | | | | | | |
| Net asset value, beginning of period | $ | 11.45 | $ | 11.14 | $ | 12.46 | $ | 12.53 | $ | 12.38 | $ | 11.89 |
| Income from Investment Operations | | | | | | | | | | | | |
Net investment income (loss) A,B | | .160 | | .288 | | .251 | | .253 | | .287 | | .319 |
| Net realized and unrealized gain (loss) | | (.104) | | .306 | | (1.321) | | (.064) | | .235 | | .515 |
| Total from investment operations | | .056 | | .594 | | (1.070) | | .189 | | .522 | | .834 |
| Distributions from net investment income | | (.156) | | (.284) | | (.250) | | (.253) | | (.287) | | (.319) |
| Distributions from net realized gain | | - | | - | | - | | (.006) | | (.085) | | (.025) |
| Total distributions | | (.156) | | (.284) | | (.250) | | (.259) | | (.372) | | (.344) |
| Net asset value, end of period | $ | 11.35 | $ | 11.45 | $ | 11.14 | $ | 12.46 | $ | 12.53 | $ | 12.38 |
Total Return C,D | | | | 5.43% | | (8.60)% | | 1.52% | | 4.28% | | 7.08% |
Ratios to Average Net Assets B,E,F | | | | | | | | | | | | |
| Expenses before reductions | | .48% G | | .49% | | .49% | | .48% | | .48% | | .48% |
| Expenses net of fee waivers, if any | | | | .49% | | .49% | | .48% | | .48% | | .48% |
| Expenses net of all reductions | | .47% G | | .49% | | .49% | | .48% | | .48% | | .48% |
| Net investment income (loss) | | 2.84% G | | 2.58% | | 2.19% | | 2.02% | | 2.31% | | 2.60% |
| Supplemental Data | | | | | | | | | | | | |
| Net assets, end of period (000 omitted) | $ | 489,393 | $ | 504,055 | $ | 521,730 | $ | 717,246 | $ | 702,067 | $ | 672,948 |
Portfolio turnover rate H | | | | 21% | | 14% | | 6% | | 20% | | 10% |
ACalculated based on average shares outstanding during the period.
BNet investment income (loss) is affected by the timing of the declaration of dividends by any underlying mutual funds or exchange-traded funds (ETFs). Net investment income (loss) of any mutual funds or ETFs is not included in the Fund's net investment income (loss) ratio.
CTotal returns for periods of less than one year are not annualized.
DTotal returns would have been lower if certain expenses had not been reduced during the applicable periods shown.
EFees and expenses of any underlying mutual funds or exchange-traded funds (ETFs) are not included in the Fund's expense ratio. The Fund indirectly bears its proportionate share of these expenses. For additional expense information related to investments in Fidelity Central Funds, please refer to the "Investments in Fidelity Central Funds" note found in the Notes to Financial Statements section of the most recent Annual or Semi-Annual report.
FExpense ratios reflect operating expenses of the class. Expenses before reductions do not reflect amounts reimbursed, waived, or reduced through arrangements with the investment adviser, brokerage services, or other offset arrangements, if applicable, and do not represent the amount paid by the class during periods when reimbursements, waivers or reductions occur.
GAnnualized.
HAmount does not include the portfolio activity of any underlying mutual funds or exchange-traded funds (ETFs).
Notes to Financial Statements
(Unaudited)For the period ended June 30, 2024
1. Organization.
Fidelity Ohio Municipal Income Fund (the Fund) is a fund of Fidelity Municipal Trust (the Trust) and is authorized to issue an unlimited number of shares. Share transactions on the Statement of Changes in Net Assets may contain exchanges between affiliated funds. The Trust is registered under the Investment Company Act of 1940, as amended (the 1940 Act), as an open-end management investment company organized as a Massachusetts business trust. The Fund may be affected by economic and political developments in the state of Ohio.
2. Investments in Fidelity Central Funds.
Funds may invest in Fidelity Central Funds, which are open-end investment companies generally available only to other investment companies and accounts managed by the investment adviser and its affiliates. The Schedule of Investments lists any Fidelity Central Funds held as an investment as of period end, but does not include the underlying holdings of each Fidelity Central Fund. An investing fund indirectly bears its proportionate share of the expenses of the underlying Fidelity Central Funds.
Based on its investment objective, each Fidelity Central Fund may invest or participate in various investment vehicles or strategies that are similar to those of the investing fund. These strategies are consistent with the investment objectives of the investing fund and may involve certain economic risks which may cause a decline in value of each of the Fidelity Central Funds and thus a decline in the value of the investing fund.
| Fidelity Central Fund | Investment Manager | Investment Objective | Investment Practices | Expense RatioA |
| Fidelity Money Market Central Funds | Fidelity Management & Research Company LLC (FMR) | Each fund seeks to obtain a high level of current income consistent with the preservation of capital and liquidity. | Short-term Investments | Less than .005% |
A Expenses expressed as a percentage of average net assets and are as of each underlying Central Fund's most recent annual or semi-annual shareholder report.
A complete unaudited list of holdings for each Fidelity Central Fund is available upon request or at the Securities and Exchange Commission website at www.sec.gov. In addition, the financial statements of the Fidelity Central Funds which contain the significant accounting policies (including investment valuation policies) of those funds, and are not covered by the Report of Independent Registered Public Accounting Firm, are available on the Securities and Exchange Commission website or upon request.
3. Significant Accounting Policies.
The Fund is an investment company and applies the accounting and reporting guidance of the Financial Accounting Standards Board (FASB) Accounting Standards Codification Topic 946 Financial Services - Investment Companies. The financial statements have been prepared in conformity with accounting principles generally accepted in the United States of America (GAAP), which require management to make certain estimates and assumptions at the date of the financial statements. Actual results could differ from those estimates. Subsequent events, if any, through the date that the financial statements were issued have been evaluated in the preparation of the financial statements. The Fund's Schedule of Investments lists any underlying mutual funds or exchange-traded funds (ETFs) but does not include the underlying holdings of these funds. The following summarizes the significant accounting policies of the Fund:
Investment Valuation. Investments are valued as of 4:00 p.m. Eastern time on the last calendar day of the period. The Board of Trustees (the Board) has designated the Fund's investment adviser as the valuation designee responsible for the fair valuation function and performing fair value determinations as needed. The investment adviser has established a Fair Value Committee (the Committee) to carry out the day-to-day fair valuation responsibilities and has adopted policies and procedures to govern the fair valuation process and the activities of the Committee. In accordance with these fair valuation policies and procedures, which have been approved by the Board, the Fund attempts to obtain prices from one or more third party pricing services or brokers to value its investments. When current market prices, quotations or currency exchange rates are not readily available or reliable, investments will be fair valued in good faith by the Committee, in accordance with the policies and procedures. Factors used in determining fair value vary by investment type and may include market or investment specific events, transaction data, estimated cash flows, and market observations of comparable investments. The frequency that the fair valuation procedures are used cannot be predicted and they may be utilized to a significant extent. The Committee manages the Fund's fair valuation practices and maintains the fair valuation policies and procedures. The Fund's investment adviser reports to the Board information regarding the fair valuation process and related material matters.
The Fund categorizes the inputs to valuation techniques used to value its investments into a disclosure hierarchy consisting of three levels as shown below:
Level 1 - unadjusted quoted prices in active markets for identical investments
Level 2 - other significant observable inputs (including quoted prices for similar investments, interest rates, prepayment speeds, etc.)
Level 3 - unobservable inputs (including the Fund's own assumptions based on the best information available)
Valuation techniques used to value the Fund's investments by major category are as follows:
Debt securities, including restricted securities, are valued based on evaluated prices received from third party pricing services or from brokers who make markets in such securities. Municipal securities are valued by pricing services who utilize matrix pricing which considers yield or price of bonds of comparable quality, coupon, maturity and type or by broker-supplied prices. When independent prices are unavailable or unreliable, debt securities may be valued utilizing pricing methodologies which consider similar factors that would be used by third party pricing services. Debt securities are generally categorized as Level 2 in the hierarchy but may be Level 3 depending on the circumstances.
Investments in open-end mutual funds, including the Fidelity Central Funds, are valued at their closing net asset value (NAV) each business day and are categorized as Level 1 in the hierarchy.
Changes in valuation techniques may result in transfers in or out of an assigned level within the disclosure hierarchy. The aggregate value of investments by input level as of June 30, 2024 is included at the end of the Fund's Schedule of Investments.
Investment Transactions and Income. For financial reporting purposes, the Fund's investment holdings and NAV include trades executed through the end of the last business day of the period. The NAV per share for processing shareholder transactions is calculated as of the close of business of the New York Stock Exchange (NYSE), normally 4:00 p.m. Eastern time and includes trades executed through the end of the prior business day. Gains and losses on securities sold are determined on the basis of identified cost. Income and capital gain distributions from Fidelity Central Funds, if any, are recorded on the ex-dividend date. Interest income is accrued as earned and includes coupon interest and amortization of premium and accretion of discount on debt securities as applicable. Debt obligations may be placed on non-accrual status and related interest income may be reduced by ceasing current accruals and writing off interest receivables when the collection of all or a portion of interest has become doubtful based on consistently applied procedures. A debt obligation is removed from non-accrual status when the issuer resumes interest payments or when collectability of interest is reasonably assured.
Expenses. Expenses directly attributable to a fund are charged to that fund. Expenses attributable to more than one fund are allocated among the respective funds on the basis of relative net assets or other appropriate methods. Expenses included in the accompanying financial statements reflect the expenses of that fund and do not include any expenses associated with any underlying mutual funds or exchange-traded funds. Although not included in a fund's expenses, a fund indirectly bears its proportionate share of these expenses through the net asset value of each underlying mutual fund or exchange-traded fund. Expense estimates are accrued in the period to which they relate and adjustments are made when actual amounts are known.
Income Tax Information and Distributions to Shareholders. Each year, the Fund intends to qualify as a regulated investment company under Subchapter M of the Internal Revenue Code, including distributing substantially all of its taxable income and realized gains. As a result, no provision for U.S. Federal income taxes is required. The Fund files a U.S. federal tax return, in addition to state and local tax returns as required. The Fund's federal income tax returns are subject to examination by the Internal Revenue Service (IRS) for a period of three fiscal years after they are filed. State and local tax returns may be subject to examination for an additional fiscal year depending on the jurisdiction.
Distributions are declared and recorded daily and paid monthly from net investment income. Distributions from realized gains, if any, are declared and recorded on the ex-dividend date. Income and capital gain distributions are determined in accordance with income tax regulations, which may differ from GAAP.
Capital accounts within the financial statements are adjusted for permanent book-tax differences. These adjustments have no impact on net assets or the results of operations. Capital accounts are not adjusted for temporary book-tax differences which will reverse in a subsequent period.
Book-tax differences are primarily due to market discount and capital loss carryforwards.
The Fund purchases municipal securities whose interest, in the opinion of the issuer, is free from federal income tax. There is no assurance that the IRS will agree with this opinion. In the event the IRS determines that the issuer does not comply with relevant tax requirements, interest payments from a security could become federally taxable, possibly retroactively to the date the security was issued.
As of period end, the cost and unrealized appreciation (depreciation) in securities, and derivatives if applicable, for federal income tax purposes were as follows:
| Gross unrealized appreciation | $6,573,030 |
| Gross unrealized depreciation | (18,312,144) |
| Net unrealized appreciation (depreciation) | $(11,739,114) |
| Tax cost | $514,807,427 |
Capital loss carryforwards are only available to offset future capital gains of the Fund to the extent provided by regulations and may be limited. The capital loss carryforward information presented below, including any applicable limitation, is estimated as of prior fiscal period end and is subject to adjustment.
Short-term | $(1,525,935) |
Long-term | (10,294,096) |
| Total capital loss carryforward | $(11,820,031) |
Delayed Delivery Transactions and When-Issued Securities. During the period, certain Funds transacted in securities on a delayed delivery or when-issued basis. Payment and delivery may take place after the customary settlement period for that security. The price of the underlying securities and the date when the securities will be delivered and paid for are fixed at the time the transaction is negotiated. Securities purchased on a delayed delivery or when-issued basis are identified as such in the Schedule of Investments. Compensation for interest forgone in the purchase of a delayed delivery or when-issued debt security may be received. With respect to purchase commitments, each applicable Fund identifies securities as segregated in its records with a value at least equal to the amount of the commitment. Payables and receivables associated with the purchases and sales of delayed delivery securities having the same coupon, settlement date and broker are offset. Delayed delivery or when-issued securities that have been purchased from and sold to different brokers are reflected as both payables and receivables in the Statement of Assets and Liabilities under the caption "Delayed delivery", as applicable. Losses may arise due to changes in the value of the underlying securities or if the counterparty does not perform under the contract's terms, or if the issuer does not issue the securities due to political, economic, or other factors.
Restricted Securities (including Private Placements). Funds may invest in securities that are subject to legal or contractual restrictions on resale. These securities generally may be resold in transactions exempt from registration or to the public if the securities are registered. Disposal of these securities may involve time-consuming negotiations and expense, and prompt sale at an acceptable price may be difficult. Information regarding restricted securities held at period end is included at the end of the Schedule of Investments, if applicable.
4. Purchases and Sales of Investments.
Purchases and sales of securities, other than short-term securities and in-kind transactions, as applicable, are noted in the table below.
| | Purchases ($) | Sales ($) |
| Fidelity Ohio Municipal Income Fund | 51,114,743 | 18,285,916 |
5.Fees and Other Transactions with Affiliates.
Management Fee. Fidelity Management & Research Company LLC (the investment adviser) and its affiliates provide the Fund with investment management related services for which the Fund pays a monthly management fee.
Effective March 1, 2024, the Fund's management contract was amended to incorporate administrative services previously covered under separate services agreements (Transfer Agent and Accounting agreements). Any reference to "class" in this note shall mean "the Fund" as the Fund currently offers only one class of shares. The amended contract incorporates a management fee rate that may vary by class. The investment adviser or an affiliate pays certain expenses of managing and operating the Fund out of each class's management fee. Each class of the Fund pays a management fee to the investment adviser. The management fee is calculated and paid to the investment adviser every month. When determining a class's management fee, a mandate rate is calculated based on the monthly average net assets of a group of funds advised by FMR within a designated asset class. A discount rate is subtracted from the mandate rate once the Fund's monthly average net assets reach a certain level. The mandate rate and discount rate may vary by class. The annual management fee rate for a class of shares of the Fund is the lesser of (1) the class's mandate rate reduced by the class's discount rate (if applicable) or (2) the amount set forth in the following table.
| | Maximum Management Fee Rate % |
| Fidelity Ohio Municipal Income Fund | .44 |
One-twelfth of the management fee rate for a class is applied to the average net assets of the class for the month, giving a dollar amount which is the management fee for the class for that month. A different management fee rate may be applicable to each class of the Fund. The difference between classes is the result of separate arrangements for class-level services and/or waivers of certain expenses. It is not the result of any difference in advisory or custodial fees or other expenses related to the management of the Fund's assets, which do not vary by class. For the portion of the reporting period on or after March 1, 2024, the total annualized management fee rates were as follows:
| | Total Management Fee Rate % |
| Fidelity Ohio Municipal Income Fund | .44 |
Prior to March 1, 2024, the management fee was the sum of an individual fund fee rate that was based on an annual rate of .25% of the Fund's average net assets and an annualized group fee rate that averaged .10% during the period. The group fee rate was based upon the monthly average net assets of a group of registered investment companies with which the investment adviser has management contracts. The group fee rate decreased as assets under management increased and increased as assets under management decreased. For the portion of the reporting period prior to March 1, 2024, the total annualized management fee rate was .35%.
Effective March 1, 2024, the Fund's sub-advisory agreements with FMR Investment Management (UK) Limited, Fidelity Management & Research (Hong Kong) Limited, and Fidelity Management & Research (Japan) Limited were amended to provide that the investment adviser pays each sub-adviser monthly fees equal to 110% of the sub-adviser's costs for providing sub-advisory services.
Transfer Agent Fees. Fidelity Investments Institutional Operations Company LLC (FIIOC), an affiliate of the investment adviser, is the transfer, dividend disbursing and shareholder servicing agent for the Fund. Effective March 1, 2024, each Fund's management contract was amended to incorporate transfer agent services and associated fees previously covered under a separate services agreement. FIIOC pays for typesetting, printing and mailing of shareholder reports, except proxy statements.
During the period January 1, 2024 through February 29, 2024, the transfer agent fees were a fixed annual rate of .1016% of average net assets.
Accounting Fees. Fidelity Service Company, Inc. (FSC), an affiliate of the investment adviser, maintains the Fund's accounting records. Effective March 1, 2024, the Fund's management contract was amended to incorporate accounting services and associated fees previously covered under a separate services agreement.
During the period January 1, 2024 through February 29, 2024, the transfer agent fees were a fixed annual rate of average net assets as follows:
| | % of Average Net Assets |
| Fidelity Ohio Municipal Income Fund | .0255 |
Interfund Trades. Funds may purchase from or sell securities to other Fidelity Funds under procedures adopted by the Board. The procedures have been designed to ensure these interfund trades are executed in accordance with Rule 17a-7 of the 1940 Act. Any interfund trades are included within the respective purchases and sales amounts shown in the Purchases and Sales of Investments note. Interfund trades during the period are noted in the table below.
| | Purchases ($) | Sales ($) | Realized Gain (Loss)($) |
| Fidelity Ohio Municipal Income Fund | - | 11,013,458 | 164,050 |
6. Committed Line of Credit.
Certain Funds participate with other funds managed by the investment adviser or an affiliate in a $4.25 billion credit facility (the "line of credit") to be utilized for temporary or emergency purposes to fund shareholder redemptions or for other short-term liquidity purposes. The participating funds have agreed to pay commitment fees on their pro-rata portion of the line of credit, which are reflected in Miscellaneous expenses on the Statement of Operations, and are listed below. During the period, there were no borrowings on this line of credit.
| | Amount ($) |
| Fidelity Ohio Municipal Income Fund | 467 |
7. Expense Reductions.
Through arrangements with the Fund's custodian, credits realized as a result of certain uninvested cash balances were used to reduce the Fund's expenses by $296.
In addition, during the period the investment adviser or an affiliate reimbursed and/or waived a portion of operating expenses in the amount of $11,869.
8. Other.
A fund's organizational documents provide former and current trustees and officers with a limited indemnification against liabilities arising in connection with the performance of their duties to the fund. In the normal course of business, a fund may also enter into contracts that provide general indemnifications. A fund's maximum exposure under these arrangements is unknown as this would be dependent on future claims that may be made against a fund. The risk of material loss from such claims is considered remote.
9. Risk and Uncertainties.
Many factors affect a fund's performance. Developments that disrupt global economies and financial markets, such as pandemics, epidemics, outbreaks of infectious diseases, war, terrorism, and environmental disasters, may significantly affect a fund's investment performance. The effects of these developments to a fund will be impacted by the types of securities in which a fund invests, the financial condition, industry, economic sector, and geographic location of an issuer, and a fund's level of investment in the securities of that issuer. Significant concentrations in security types, issuers, industries, sectors, and geographic locations may magnify the factors that affect a fund's performance.
Item 8: Changes in and Disagreements with Accountants for Open-End Management Investment Companies
Note: This is not applicable for any fund included in this document.
Item 9: Proxy Disclosures for Open-End Management Investment Companies
Note: This is not applicable for any fund included in this document.
Item 10: Remuneration Paid to Directors, Officers, and others of Open-End Management Investment Companies
Note: This information is disclosed as part of the financial statements for each Fund as part of Item 7: Financial Statements and Financial Highlights for Open-End Management Investment companies.
Item 11: Statement Regarding Basis for Approval of Investment Advisory Contract
Board Approval of Investment Advisory Contracts
Fidelity Ohio Municipal Income Fund
At its January 2024 meeting, the Board of Trustees, including the Independent Trustees (together, the Board), approved an amended and restated management contract with Fidelity Management & Research Company LLC (FMR) (the Management Contract), and amended and restated sub-advisory agreements (the Sub-Advisory Contracts, and together with the Management Contract, the Advisory Contracts) for the fund, including the fund's sub-advisory agreements with FMR Investment Management (UK) Limited (FMR UK), Fidelity Management & Research (Hong Kong) Limited (FMR H.K.), and Fidelity Management & Research (Japan) Limited (FMR Japan). The Advisory Contracts will be effective March 1, 2024. The Board will consider the annual renewal of the fund's Advisory Contracts in September 2024, following its review of additional materials provided by FMR.
Management Contract. The Board approved the Management Contract, which implements a new fee structure combining the management fee, transfer agent fee (TA Fee), and pricing and bookkeeping fee (P&B Fee) of the fund into a single fee based on tiered schedules and subject to a maximum rate (the Unified Fee). In exchange for the Unified Fee, the fund will receive investment advisory, management, administrative, transfer agent, pricing and bookkeeping services under a single agreement - the Management Contract.
In its consideration of the Management Contract over several meetings, the Board received, reviewed and discussed a comprehensive set of analyses regarding the Unified Fee including (i) the legal framework, (ii) design goals for the Unified Fee, (iii) calculation methodology for the Unified Fee and illustrative examples, (iv) annual and cumulative projected impacts under various scenarios, both in the aggregate and at the fund/class level, (v) explanations of schedules, rate levers and maximum rates and (vi) shareholder benefits and projected savings.
The Board considered that the maximum Unified Fee for the fund would be no higher than the sum of (i) the lowest contractual management fee under the fund's existing management contract, which is the individual fund fee, if any, plus the lowest contractual marginal group fee rate and (ii) the TA and P&B Fee rates, which are fixed fee rates since December 1, 2023 (together, the "Unified Fee Cap"). The Board noted that, as a result of this Unified Fee Cap, the Unified Fee would be no greater than the fees previously authorized to be charged for the same services. The Board noted that certain expenses such as third-party expenses and certain other miscellaneous expenses would be outside the scope of the Unified Fee and the calculation of such fees would not change as a result of the Unified Fee.
The Board considered that implementation of the Unified Fee, which includes the Unified Fee Cap, would cause all funds subject to a Unified Fee, including the fund, to experience an immediate reduction on contractual fee rates for services provided under the current management contracts. The Board considered that some funds would not experience lower fees as a result of existing fee caps. The Board further considered that, in addition to the contractual fee savings, the Unified Fee offers funds and their shareholders greater protection from future rate increases for services previously offered under separate agreements that are now covered by the Management Contract because such rate increases would require shareholder, as well as Board, approval.
Sub-Advisory Contracts. In connection with the Unified Fee changes, the Board considered the Sub-Advisory Contracts, which changed the arrangements for fees paid by FMR to the sub-advisers under the agreements. The Board noted that the agreements with FMR UK, FMR H.K., and FMR Japan were amended to provide that FMR will compensate each sub-adviser at a fee equal to 110% of the sub-adviser's costs incurred in providing services under the agreement. The Board considered that, under the Sub-Advisory Contracts, FMR, and not the fund, will continue to pay the sub-advisory fees to each applicable sub-adviser.
The Board considered that the approval of the fund's Advisory Contracts will not result in any changes in the investment process or strategies employed in the management of the fund's assets or the day-to-day management of the fund or the persons primarily responsible for such management. Further, the Board considered that the Management Contract would not change the obligations and services of FMR and its affiliates on behalf of the fund, and, in particular, there would be no change in the nature and level of advisory, management, administration, transfer agent, and pricing and bookkeeping services provided to the fund by FMR and its affiliates.
In connection with its consideration of future renewals of the fund's Advisory Contracts, the Board will consider: (i) the nature, extent and quality of services provided to the funds, including shareholder and administrative services and investment performance; (ii) the competitiveness of the management fee and total expenses for the fund; (iii) the costs of the services and profitability, including the revenues earned and the expenses incurred in conducting the business of developing, marketing, distributing, managing, administering, and servicing the fund and its shareholders, to the extent applicable; and (iv) whether there have been economies of scale in respect of the Fidelity funds, whether the Fidelity funds (including the fund) have appropriately benefited from any such economies of scale, and whether there is the potential for realization of any further economies.
Based on its evaluation of all of the conclusions noted above, and after considering all factors it believed relevant, the Board concluded that the fund's management fee structure is fair and reasonable, and that the fund's Advisory Contracts should be approved.
1.705575.126
OFF-SANN-0824
Fidelity Flex® Funds
Fidelity Flex® Municipal Income Fund
Semi-Annual Report
June 30, 2024
Contents
To view a fund's proxy voting guidelines and proxy voting record for the 12-month period ended June 30, visit http://www.fidelity.com/proxyvotingresults or visit the Securities and Exchange Commission's (SEC) web site at http://www.sec.gov.
You may also call 1-800-544-3455 (for managed account clients) or 1-800-835-5092 (for retirement plan participants) to request a free copy of the proxy voting guidelines.
Standard & Poor's, S&P and S&P 500 are registered service marks of The McGraw-Hill Companies, Inc. and have been licensed for use by Fidelity Distributors Corporation.
Other third-party marks appearing herein are the property of their respective owners.
All other marks appearing herein are registered or unregistered trademarks or service marks of FMR LLC or an affiliated company. © 2024 FMR LLC. All rights reserved.
This report and the financial statements contained herein are submitted for the general information of the shareholders of the Fund. This report is not authorized for distribution to prospective investors in the Fund unless preceded or accompanied by an effective prospectus.
A fund files its complete schedule of portfolio holdings with the SEC for the first and third quarters of each fiscal year on Form N-PORT. Forms N-PORT are available on the SEC's web site at http://www.sec.gov. A fund's Forms N-PORT may be reviewed and copied at the SEC's Public Reference Room in Washington, DC. Information regarding the operation of the SEC's Public Reference Room may be obtained by calling 1-800-SEC-0330.
For a complete list of a fund's portfolio holdings, view the most recent holdings listing, semiannual report, or annual report on Fidelity's web site at http://www.fidelity.com, http://www.institutional.fidelity.com, or http://www.401k.com, as applicable.
NOT FDIC INSURED •MAY LOSE VALUE •NO BANK GUARANTEE
Neither the Fund nor Fidelity Distributors Corporation is a bank.
Item 7: Financial Statements and Financial Highlights for Open-End Management Investment Companies (Semi-Annual Report)
Fidelity Flex® Municipal Income Fund
Schedule of Investments June 30, 2024 (Unaudited)
Showing Percentage of Net Assets
| Municipal Bonds - 94.5% |
| | | Principal Amount (a) | Value ($) |
| Alabama - 0.7% | | | |
| Auburn Univ. Gen. Fee Rev. Series 2018 A, 5% 6/1/43 | | 100,000 | 104,182 |
| Black Belt Energy Gas District Bonds: | | | |
| Series 2022 E, 5%, tender 6/1/28 (b) | | 1,190,000 | 1,239,399 |
| Series 2023 D1, 5.5%, tender 2/1/29 (b) | | 1,085,000 | 1,151,472 |
| Homewood Ala Edl. Bldg. Auth. Lea (CHF - Horizons II, L.L.C. Student Hsg. & Proj. at Samford Univ.) Series 2024 A: | | | |
| 5.25% 10/1/34 | | 265,000 | 289,566 |
| 5.5% 10/1/49 | | 310,000 | 327,500 |
| Homewood Edl. Bldg. Auth. Rev.: | | | |
| (CHF - Horizons II, L.L.C. Student Hsg. & Proj. at Samford Univ.) Series 2024 C, 5.5% 10/1/54 | | 255,000 | 268,217 |
| Series 2019 A: | | | |
4% 12/1/33 | | 110,000 | 108,252 |
4% 12/1/41 | | 85,000 | 78,936 |
4% 12/1/49 | | 190,000 | 168,623 |
| Jefferson County Gen. Oblig. Series 2018 A, 5% 4/1/26 | | 100,000 | 102,738 |
| Lower Alabama Gas District Bonds (No. 2 Proj.) Series 2020, 4%, tender 12/1/25 (b) | | 1,095,000 | 1,095,625 |
| Montgomery Med. Clinic Facilities Series 2015, 5% 3/1/36 | | 425,000 | 314,295 |
TOTAL ALABAMA | | | 5,248,805 |
| Alaska - 0.1% | | | |
| Alaska Hsg. Fin. Corp. Series 2021 A, 4% 12/1/29 | | 845,000 | 867,037 |
| Alaska Hsg. Fin. Corp. Mtg. Rev. Series 2022 A, 3% 6/1/51 | | 165,000 | 158,467 |
TOTAL ALASKA | | | 1,025,504 |
| Arizona - 2.6% | | | |
| Arizona Health Facilities Auth. Rev. (Scottsdale Lincoln Hospitals Proj.) Series 2014 A, 5% 12/1/39 | | 185,000 | 186,093 |
| Arizona Indl. Dev. Auth. Hosp. Rev. Series 2021 A, 5% 2/1/28 | | 1,000,000 | 1,059,512 |
| Arizona Indl. Dev. Auth. Lease Rev. Series 2020 A, 4% 9/1/46 | | 1,750,000 | 1,629,837 |
| Arizona Indl. Dev. Auth. Rev.: | | | |
| (Provident Group-Eastern Michigan Univ. Parking Proj.) Series 2018: | | | |
5% 5/1/26 | | 450,000 | 247,500 |
5% 5/1/29 | | 290,000 | 159,500 |
5% 5/1/33 (c) | | 565,000 | 310,750 |
| Series 2019 2, 3.625% 5/20/33 | | 406,082 | 381,377 |
| Bullhead City Excise Taxes Series 2021 2: | | | |
| 0.95% 7/1/26 | | 250,000 | 232,792 |
| 1.15% 7/1/27 | | 375,000 | 341,123 |
| 1.3% 7/1/28 | | 485,000 | 432,011 |
| 1.5% 7/1/29 | | 600,000 | 532,318 |
| 1.65% 7/1/30 | | 825,000 | 707,645 |
| 1.7% 7/1/31 | | 450,000 | 378,111 |
| Chandler Indl. Dev. Auth. Indl. Dev. Rev. Bonds (Intel Corp. Proj.): | | | |
| Series 2005, 3.8%, tender 6/15/28 (b) | | 2,190,000 | 2,200,273 |
| Series 2007, 4.1%, tender 6/15/28 (b)(d) | | 925,000 | 930,232 |
| Series 2022 2, 5%, tender 9/1/27 (b)(d) | | 3,220,000 | 3,305,527 |
| Glendale Union School District 205 Series A: | | | |
| 4% 7/1/36 (Assured Guaranty Muni. Corp. Insured) | | 545,000 | 558,327 |
| 4% 7/1/37 (Assured Guaranty Muni. Corp. Insured) | | 1,000,000 | 1,019,156 |
| Glendale Indl. Dev. Auth. (Terraces of Phoenix Proj.) Series 2018 A: | | | |
| 5% 7/1/38 | | 10,000 | 9,891 |
| 5% 7/1/48 | | 10,000 | 9,139 |
| Maricopa County Indl. Dev. Auth.: | | | |
| (Creighton Univ. Proj.) Series 2020, 5% 7/1/47 | | 100,000 | 103,735 |
| Series 2021 A, 4% 9/1/51 | | 775,000 | 729,298 |
| Maricopa County Indl. Dev. Auth. Sr. Living Facilities Series 2016: | | | |
| 5.75% 1/1/36 (e) | | 300,000 | 255,076 |
| 6% 1/1/48 (e) | | 300,000 | 226,928 |
| Maricopa County Rev.: | | | |
| Series 2017 D, 3% 1/1/48 | | 840,000 | 661,481 |
| Series 2019 E, 3% 1/1/49 | | 500,000 | 390,068 |
| Phoenix Ariz Indl. Dev. Auth. Rev.: | | | |
| (Guam Facilities Foundation, Inc. Projs.) Series 2014, 5.375% 2/1/41 | | 615,000 | 563,485 |
| (Guam Facilities Foundation, Inc. Proj.) Series 2014, 5.125% 2/1/34 | | 400,000 | 376,550 |
| Phoenix Civic Impt. Board Arpt. Rev. Series 2019 B, 5% 7/1/35 (d) | | 300,000 | 316,177 |
| Phoenix Civic Impt. Corp. Wtr. Sys. Rev. Series 2021 A, 5% 7/1/45 | | 1,000,000 | 1,080,259 |
| Pima County Unified School District #1 Tucson Series 2024 A, 5% 7/1/34 (Assured Guaranty Muni. Corp. Insured) | | 1,000,000 | 1,146,683 |
| Western Maricopa Ed. Ctr. District Series 2019 B, 5% 7/1/24 | | 190,000 | 190,000 |
TOTAL ARIZONA | | | 20,670,854 |
| California - 6.1% | | | |
| Alameda Corridor Trans. Auth. Rev. Series 2024 A, 0% 10/1/52 (Assured Guaranty Muni. Corp. Insured) | | 475,000 | 125,208 |
| Burbank Glendale Pasadena Arpt. Auth. Rev. Series 2024 B, 5% 7/1/35 (d) | | 5,000,000 | 5,527,962 |
| California Edl. Facilities Auth. Rev. Series T1, 5% 3/15/39 | | 65,000 | 78,528 |
| California Gen. Oblig.: | | | |
| Series 2020, 4% 11/1/37 | | 1,000,000 | 1,031,409 |
| Series 2021: | | | |
5% 9/1/32 | | 2,175,000 | 2,458,519 |
5% 10/1/41 | | 5,435,000 | 5,979,060 |
| California Hsg. Fin. Agcy.: | | | |
| Series 2021 1, 3.5% 11/20/35 | | 342,308 | 327,156 |
| Series 2023 A1, 4.375% 9/20/36 | | 1,280,522 | 1,331,093 |
| California Infrastructure and Econ. Dev. Bank Rev. Bonds (Los Angeles County Museum of Art Proj.) Series 2021 A, 1.2%, tender 6/1/28 (b) | | 225,000 | 198,316 |
| California Pub. Works Board Lease Rev. (Various Cap. Projs.): | | | |
| Series 2021 B, 4% 5/1/46 | | 1,265,000 | 1,273,487 |
| Series 2022 C, 5% 8/1/32 | | 285,000 | 321,190 |
| California Statewide Cmntys. Dev. Auth. Rev. Series 2015, 5% 2/1/45 (c)(f) | | 95,764 | 42,136 |
| Fresno Arpt. Rev. Series 2023 A: | | | |
| 5% 7/1/32 (Build America Mutual Assurance Insured) (d) | | 680,000 | 738,565 |
| 5% 7/1/48 (Build America Mutual Assurance Insured) (d) | | 2,000,000 | 2,105,302 |
| 5% 7/1/53 (Build America Mutual Assurance Insured) (d) | | 2,200,000 | 2,299,359 |
| Golden State Tobacco Securitization Corp. Tobacco Settlement Rev. Series 2021 B2, 0% 6/1/66 | | 10,435,000 | 1,160,006 |
| Los Angeles Dept. Arpt. Rev. Series F, 5% 5/15/44 (d) | | 175,000 | 181,259 |
| Los Angeles Dept. of Wtr. & Pwr. Rev.: | | | |
| Series 2021 B, 5% 7/1/51 | | 1,550,000 | 1,662,237 |
| Series B, 5% 7/1/50 | | 1,070,000 | 1,143,171 |
| Los Angeles Hbr. Dept. Rev. Series 2019 A: | | | |
| 5% 8/1/24 (d) | | 310,000 | 310,284 |
| 5% 8/1/25 (d) | | 110,000 | 111,748 |
| Los Angeles Unified School District Ctfs. of Prtn. Series 2023 A, 5% 10/1/35 | | 1,000,000 | 1,151,403 |
| Middle Fork Proj. Fin. Auth. Series 2020, 5% 4/1/26 | | 1,000,000 | 1,014,343 |
| Mount Diablo Unified School District Series 2022 B: | | | |
| 4% 8/1/31 | | 225,000 | 240,060 |
| 4% 8/1/34 | | 320,000 | 340,278 |
| Poway Unified School District Series B, 0% 8/1/38 | | 1,030,000 | 606,080 |
| Sacramento County Arpt. Sys. Rev. Series 2018 C, 5% 7/1/39 (d) | | 105,000 | 108,104 |
| San Diego County Wtr. Auth. Rev. Series 2022 A: | | | |
| 5% 5/1/47 | | 635,000 | 703,979 |
| 5% 5/1/52 | | 1,080,000 | 1,186,277 |
| San Francisco City & County Arpts. Commission Int'l. Arpt. Rev.: | | | |
| Series 2018 G, 5% 5/1/27 (d) | | 560,000 | 577,932 |
| Series 2019 A, 5% 5/1/49 (d) | | 3,000,000 | 3,061,944 |
| Series 2019 B, 5% 5/1/49 | | 45,000 | 47,183 |
| Series 2022 A: | | | |
5% 5/1/26 (d) | | 815,000 | 835,991 |
5% 5/1/27 (d) | | 830,000 | 856,577 |
5% 5/1/28 (d) | | 1,105,000 | 1,153,918 |
5% 5/1/29 (d) | | 740,000 | 782,556 |
| Series 2022 B, 5% 5/1/52 | | 2,240,000 | 2,422,058 |
| Series 2024 A, 5.25% 5/1/43 (d) | | 1,400,000 | 1,535,767 |
| Sanger Unified School District Series 2018 C, 3% 8/1/48 | | 2,265,000 | 1,797,480 |
| Univ. of California Revs.: | | | |
| Series 2018 AZ, 5% 5/15/43 | | 130,000 | 137,209 |
| Series 2023 BM, 5% 5/15/36 | | 180,000 | 208,068 |
| Washington Township Health Care District Rev.: | | | |
| Series 2017 A, 5% 7/1/35 | | 190,000 | 193,675 |
| Series 2017 B: | | | |
5% 7/1/29 | | 115,000 | 117,150 |
5% 7/1/30 | | 230,000 | 234,470 |
TOTAL CALIFORNIA | | | 47,718,497 |
| Colorado - 1.9% | | | |
| Arkansas River Pwr. Auth. Rev. Series 2018 A: | | | |
| 5% 10/1/38 | | 40,000 | 40,978 |
| 5% 10/1/43 | | 50,000 | 50,849 |
| Colorado Health Facilities Auth. Rev. Bonds Series 2016 C, 5%, tender 11/15/26 (b) | | 275,000 | 283,556 |
| Colorado Health Facilities Auth. Rev. Bonds: | | | |
| (Parkview Med. Ctr., Inc. Proj.) Series 2016, 4% 9/1/35 | | 35,000 | 35,098 |
| Bonds: | | | |
Series 2019 B: | | | |
5%, tender 8/1/26 (b) | | 110,000 | 112,138 |
5%, tender 11/19/26 (b) | | 20,000 | 20,753 |
5%, tender 11/19/26 (b) | | 190,000 | 195,943 |
Series 2024 A2, 5%, tender 11/15/31 (b) | | 375,000 | 411,918 |
| Series 2019 A: | | | |
5% 11/1/25 | | 435,000 | 443,058 |
5% 11/15/39 | | 190,000 | 201,619 |
| Series 2019 A1, 4% 8/1/44 | | 1,060,000 | 1,031,204 |
| Series 2019 A2: | | | |
3.25% 8/1/49 | | 600,000 | 470,507 |
4% 8/1/49 | | 1,715,000 | 1,626,620 |
5% 8/1/44 | | 845,000 | 870,076 |
| Series 2020 A: | | | |
4% 9/1/45 | | 775,000 | 752,771 |
4% 9/1/50 | | 210,000 | 201,549 |
| Colorado Hsg. & Fin. Auth.: | | | |
| Series 2019 F, 4.25% 11/1/49 | | 35,000 | 34,960 |
| Series 2019 H, 4.25% 11/1/49 | | 10,000 | 9,991 |
| Colorado Reg'l. Trans. District Ctfs. of Prtn. Series 2020, 5% 6/1/31 | | 105,000 | 113,252 |
| Colorado Reg'l. Trans. District Sales Tax Rev. (Fastracks Proj.) Series 2021 B, 5% 11/1/28 | | 725,000 | 781,650 |
| Denver City & County Arpt. Rev.: | | | |
| Series 2017 A, 5% 11/15/26 (d) | | 50,000 | 51,614 |
| Series 2018 A, 5% 12/1/34 (d) | | 1,125,000 | 1,245,430 |
| Denver City & County Board Wtr. Rev.: | | | |
| Series 2020 A: | | | |
5% 9/15/45 | | 1,190,000 | 1,276,051 |
5% 9/15/46 | | 1,820,000 | 1,944,405 |
| Series 2020 B, 5% 9/15/28 | | 2,000,000 | 2,157,861 |
| Univ. of Colorado Enterprise Sys. Rev. Bonds: | | | |
| Series 2021 C3A, 2%, tender 10/15/25 (b) | | 255,000 | 248,548 |
| Series 2021 C3B, 2%, tender 10/15/26 (b) | | 210,000 | 200,306 |
| Vauxmont Metropolitan District: | | | |
| Series 2019, 5% 12/15/25 (Assured Guaranty Muni. Corp. Insured) | | 40,000 | 40,858 |
| Series 2020, 5% 12/1/30 (Assured Guaranty Muni. Corp. Insured) | | 220,000 | 237,209 |
TOTAL COLORADO | | | 15,090,772 |
| Connecticut - 4.6% | | | |
| Bridgeport Gen. Oblig. Series 2021 A: | | | |
| 5% 8/1/32 | | 300,000 | 332,582 |
| 5% 8/1/33 | | 800,000 | 883,622 |
| 5% 8/1/34 | | 500,000 | 550,663 |
| Connecticut Gen. Oblig.: | | | |
| Series 2016 B, 5% 5/15/26 | | 125,000 | 129,124 |
| Series 2016 D, 5% 8/15/25 | | 210,000 | 214,162 |
| Series 2018 F: | | | |
5% 9/15/24 | | 100,000 | 100,307 |
5% 9/15/25 | | 100,000 | 102,145 |
| Series 2019 A, 5% 4/15/26 | | 115,000 | 118,616 |
| Series 2020 A, 4% 1/15/34 | | 300,000 | 310,571 |
| Series 2021 A: | | | |
3% 1/15/35 | | 1,150,000 | 1,069,419 |
3% 1/15/37 | | 1,910,000 | 1,746,087 |
3% 1/15/39 | | 215,000 | 190,750 |
| Series 2021 D, 5% 7/15/24 | | 260,000 | 260,144 |
| Series 2022 B, 4% 1/15/37 | | 2,480,000 | 2,548,653 |
| Series 2022 C: | | | |
4% 6/15/39 | | 300,000 | 305,265 |
4% 6/15/41 | | 250,000 | 251,490 |
5% 6/15/30 | | 400,000 | 441,567 |
5% 6/15/31 | | 500,000 | 559,819 |
5% 6/15/34 | | 350,000 | 396,107 |
5% 6/15/37 | | 250,000 | 280,549 |
5% 6/15/38 | | 300,000 | 334,857 |
5% 6/15/40 | | 500,000 | 552,664 |
5% 6/15/42 | | 500,000 | 549,288 |
| Series 2022 D, 5% 9/15/30 | | 650,000 | 720,224 |
| Series 2022: | | | |
5% 6/15/28 | | 500,000 | 535,561 |
5% 6/15/29 | | 410,000 | 446,225 |
| Connecticut Health & Edl. Facilities Auth. Rev.: | | | |
| Bonds Series 2020 B: | | | |
5%, tender 1/1/25 (b) | | 200,000 | 200,756 |
5%, tender 1/1/27 (b) | | 330,000 | 338,358 |
| Series 2018 K1: | | | |
5% 7/1/26 | | 680,000 | 686,919 |
5% 7/1/28 | | 1,120,000 | 1,142,724 |
| Series 2019 A, 5% 7/1/49 (e) | | 130,000 | 108,747 |
| Series 2019 Q-1: | | | |
5% 11/1/25 | | 90,000 | 91,998 |
5% 11/1/26 | | 95,000 | 98,567 |
| Series 2020 K, 4% 7/1/45 | | 1,000,000 | 972,832 |
| Series 2021 G: | | | |
4% 3/1/46 | | 235,000 | 235,410 |
4% 3/1/51 | | 380,000 | 379,923 |
| Series 2021 S, 4% 6/1/51 | | 240,000 | 231,070 |
| Series 2022 M: | | | |
4% 7/1/39 | | 415,000 | 406,752 |
4% 7/1/52 | | 355,000 | 337,184 |
| Series 2023 E: | | | |
4% 7/15/42 | | 800,000 | 783,282 |
4% 7/15/43 | | 500,000 | 486,017 |
5% 7/15/33 | | 225,000 | 245,366 |
5% 7/15/34 | | 745,000 | 814,433 |
5% 7/15/36 | | 750,000 | 812,788 |
| Series A, 5% 7/1/26 | | 160,000 | 160,499 |
| Series K1: | | | |
5% 7/1/27 | | 1,100,000 | 1,117,132 |
5% 7/1/30 | | 1,000,000 | 1,020,977 |
5% 7/1/34 | | 725,000 | 737,496 |
5% 7/1/36 | | 450,000 | 456,538 |
5% 7/1/39 | | 490,000 | 492,826 |
| Series K3, 5% 7/1/43 | | 215,000 | 213,069 |
| Series L1: | | | |
4% 7/1/28 | | 750,000 | 753,000 |
4% 7/1/29 | | 750,000 | 754,113 |
4% 7/1/30 | | 1,000,000 | 1,006,791 |
| Series N: | | | |
5% 7/1/25 | | 390,000 | 389,088 |
5% 7/1/26 | | 575,000 | 574,103 |
5% 7/1/27 | | 430,000 | 430,797 |
| Series R, 5% 6/1/36 | | 900,000 | 978,381 |
| Connecticut Hsg. Fin. Auth.: | | | |
| Series 2021 B1, 3% 11/15/49 | | 240,000 | 231,565 |
| Series 2022 A1: | | | |
5% 11/15/26 | | 200,000 | 206,576 |
5% 5/15/27 | | 220,000 | 228,655 |
5% 11/15/27 | | 230,000 | 240,723 |
5% 5/15/28 | | 225,000 | 236,691 |
5% 11/15/28 | | 220,000 | 232,604 |
5% 5/15/29 | | 225,000 | 240,192 |
5% 11/15/29 | | 125,000 | 134,340 |
5% 5/15/30 | | 375,000 | 400,311 |
5% 11/15/30 | | 175,000 | 187,777 |
| Series 2022 A2: | | | |
5% 11/15/24 (d) | | 965,000 | 968,223 |
5% 5/15/25 (d) | | 400,000 | 403,342 |
5% 11/15/25 (d) | | 300,000 | 304,267 |
5% 5/15/26 (d) | | 425,000 | 433,079 |
| Steelpointe Hbr. Infrastructure Impt. District (Steelpointe Hbr. Proj.) Series 2024, 6% 4/1/52 (e) | | 150,000 | 159,226 |
| Univ. of Connecticut Gen. Oblig. Series 2019 A, 5% 11/1/25 | | 140,000 | 143,311 |
TOTAL CONNECTICUT | | | 36,139,279 |
| District Of Columbia - 0.5% | | | |
| Metropolitan Washington Arpts. Auth. Dulles Toll Road Rev.: | | | |
| (Dulles Metrorail and Cap. Impt. Projs.): | | | |
Series 2019 A: | | | |
5% 10/1/31 | | 185,000 | 196,365 |
5% 10/1/44 | | 1,000,000 | 1,035,188 |
Series 2019 B, 3% 10/1/50 (Assured Guaranty Muni. Corp. Insured) | | 890,000 | 671,457 |
| (Dulles Metrorail And Cap. Impt. Projs.) Series 2019 B, 4% 10/1/49 | | 1,160,000 | 1,089,920 |
| Metropolitan Washington DC Arpts. Auth. Sys. Rev.: | | | |
| Series 2017 A, 5% 10/1/26 (d) | | 440,000 | 452,715 |
| Series 2019 A, 5% 10/1/25 (d) | | 70,000 | 71,143 |
| Series 2020 A: | | | |
5% 10/1/26 (d) | | 320,000 | 329,248 |
5% 10/1/27 (d) | | 110,000 | 114,092 |
5% 10/1/28 (d) | | 55,000 | 57,618 |
| Washington Convention & Sports Auth. Series 2018 A: | | | |
| 5% 10/1/24 | | 100,000 | 100,330 |
| 5% 10/1/25 | | 100,000 | 102,001 |
TOTAL DISTRICT OF COLUMBIA | | | 4,220,077 |
| Florida - 4.0% | | | |
| Atlantic Beach Health Care Facilities Series A, 5% 11/15/43 | | 255,000 | 258,682 |
| Broward County Arpt. Sys. Rev.: | | | |
| Series 2015 C, 5% 10/1/24 (d) | | 45,000 | 45,094 |
| Series 2017, 5% 10/1/42 (d) | | 1,365,000 | 1,388,081 |
| Series 2019 A, 5% 10/1/49 (d) | | 1,000,000 | 1,022,225 |
| Cap. Projs. Fin. Auth. Student Hsg. Rev. (Cap. Projs. Ln. Prog. - Florida Univs.) Series 2020 A, 5% 10/1/30 | | 500,000 | 516,072 |
| Escambia County Health Facilities Auth. Health Facilities Rev. Series 2020 A: | | | |
| 3% 8/15/50 (Assured Guaranty Muni. Corp. Insured) | | 485,000 | 361,316 |
| 4% 8/15/45 | | 110,000 | 99,266 |
| Florida Dev. Fin. Corp. Healthcare Facility Rev. Series 2021, 4% 11/15/38 | | 725,000 | 731,721 |
| Florida Dev. Fin. Corp. Rev. (Brightline Florida Passenger Rail Proj.) Series 2024: | | | |
| 5.25% 7/1/53 (Assured Guaranty Muni. Corp. Insured) (d) | | 1,910,000 | 1,997,882 |
| 5.5% 7/1/53 (d) | | 1,000,000 | 1,041,520 |
| Florida Dev. Fin. Corp. Student H (SFP - Tampa I - The Henry Proj.) Series 2024 A1, 5.25% 6/1/54 (e) | | 1,000,000 | 1,020,100 |
| Florida Hsg. Fin. Corp. Multi-family Mtg. Rev. Bonds Series 2023 C, 5%, tender 12/1/25 (b) | | 300,000 | 303,670 |
| Florida Hsg. Fin. Corp. Rev. Series 2019 1, 4% 7/1/50 | | 95,000 | 94,447 |
| Florida Mid-Bay Bridge Auth. Rev. Series 2015 A: | | | |
| 5% 10/1/27 | | 105,000 | 106,287 |
| 5% 10/1/29 | | 80,000 | 81,077 |
| 5% 10/1/30 | | 70,000 | 70,961 |
| Fort Pierce Utils. Auth. Series 2022 A: | | | |
| 5% 10/1/30 (Assured Guaranty Muni. Corp. Insured) | | 175,000 | 191,440 |
| 5% 10/1/34 (Assured Guaranty Muni. Corp. Insured) | | 300,000 | 333,661 |
| 5% 10/1/36 (Assured Guaranty Muni. Corp. Insured) | | 475,000 | 526,044 |
| 5% 10/1/37 (Assured Guaranty Muni. Corp. Insured) | | 425,000 | 469,155 |
| 5% 10/1/39 (Assured Guaranty Muni. Corp. Insured) | | 475,000 | 518,349 |
| 5% 10/1/40 (Assured Guaranty Muni. Corp. Insured) | | 450,000 | 488,664 |
| 5% 10/1/41 (Assured Guaranty Muni. Corp. Insured) | | 400,000 | 434,365 |
| 5% 10/1/42 (Assured Guaranty Muni. Corp. Insured) | | 400,000 | 434,790 |
| Greater Orlando Aviation Auth. Arpt. Facilities Rev.: | | | |
| Series 2017 A, 5% 10/1/31 (d) | | 125,000 | 128,986 |
| Series 2019 A: | | | |
5% 10/1/24 (d) | | 300,000 | 300,943 |
5% 10/1/25 (d) | | 300,000 | 305,783 |
5% 10/1/32 (d) | | 300,000 | 317,044 |
5% 10/1/38 (d) | | 430,000 | 450,321 |
5% 10/1/54 (d) | | 1,620,000 | 1,651,606 |
| Highlands County Health Facilities Auth. Rev. Bonds Series 2024 C, 5%, tender 11/15/31 (b) | | 790,000 | 866,696 |
| Hillsborough County Aviation Auth. Rev. Series 2022 A, 5% 10/1/26 (d) | | 2,750,000 | 2,831,872 |
| Lee Memorial Health Sys. Hosp. Rev. Series 2019 A1, 5% 4/1/44 | | 665,000 | 681,853 |
| Miami-Dade County Aviation Rev.: | | | |
| Series 2015 A: | | | |
5% 10/1/27 (d) | | 620,000 | 625,629 |
5% 10/1/38 (d) | | 80,000 | 80,483 |
| Series 2016 A, 5% 10/1/29 | | 145,000 | 148,640 |
| Series 2017 B, 5% 10/1/40 (d) | | 810,000 | 824,005 |
| Series 2020 A: | | | |
4% 10/1/40 | | 300,000 | 300,138 |
5% 10/1/25 | | 245,000 | 249,813 |
| Miami-Dade County Expressway Auth. Series 2014 A, 5% 7/1/25 | | 395,000 | 395,282 |
| Miami-Dade County School Board Ctfs. of Prtn.: | | | |
| Series 2015 A, 5% 5/1/28 | | 290,000 | 293,004 |
| Series 2015 D, 5% 2/1/26 | | 10,000 | 10,256 |
| Miami-Dade County Wtr. & Swr. Rev. Series 2021, 5% 10/1/32 | | 155,000 | 172,409 |
| Orange County Hsg. Fin. Auth. Multi-family Rev. Bonds Series 2021 B, 0.55%, tender 7/1/24 (b) | | 1,600,000 | 1,600,000 |
| Palm Beach County Health Facilities Auth. Hosp. Rev. (Jupiter Med. Ctr. Proj.) Series 2022: | | | |
| 5% 11/1/29 | | 175,000 | 181,452 |
| 5% 11/1/32 | | 200,000 | 210,784 |
| 5% 11/1/34 | | 310,000 | 326,649 |
| 5% 11/1/37 | | 385,000 | 399,831 |
| 5% 11/1/39 | | 400,000 | 411,235 |
| 5% 11/1/41 | | 400,000 | 408,737 |
| Palm Beach County Health Facilities Auth. Rev. Series 2015 C, 5% 5/15/30 | | 495,000 | 495,640 |
| Pinellas County Hsg. Fin. Auth. Bonds Series 2021 B, 0.65%, tender 7/1/24 (b) | | 365,000 | 365,000 |
| South Miami Health Facilities Auth. Hosp. Rev. (Baptist Med. Ctr., FL. Proj.) Series 2017: | | | |
| 5% 8/15/26 | | 100,000 | 102,918 |
| 5% 8/15/42 | | 5,000 | 5,089 |
| Tallahassee Health Facilities Rev.: | | | |
| (Tallahassee Memorial Healthcare, Inc. Proj.) Series 2016 A, 5% 12/1/26 | | 100,000 | 101,151 |
| Series 2015 A, 5% 12/1/40 | | 410,000 | 410,741 |
| Tampa Hosp. Rev. (H. Lee Moffitt Cancer Ctr. Proj.): | | | |
| Series 2016 B, 5% 7/1/29 | | 25,000 | 25,554 |
| Series 2020 B: | | | |
4% 7/1/39 | | 1,000,000 | 997,743 |
4% 7/1/45 | | 825,000 | 790,347 |
| Tampa Tax Allocation (H. Lee Moffitt Cancer Ctr. Proj.) Series 2020 A: | | | |
| 0% 9/1/34 | | 700,000 | 457,110 |
| 0% 9/1/35 | | 750,000 | 468,804 |
| 0% 9/1/36 | | 800,000 | 476,993 |
| Volusia County Edl. Facilities Auth. Rev. (Embry-Riddle Aeronautical Univ., Inc. Proj.) Series 2020 A: | | | |
| 5% 10/15/44 | | 30,000 | 31,173 |
| 5% 10/15/49 | | 60,000 | 61,991 |
TOTAL FLORIDA | | | 31,498,574 |
| Georgia - 4.5% | | | |
| Atlanta Arpt. Passenger Facilities Charge Rev. Series 2023 E, 5% 7/1/39 (d) | | 520,000 | 558,992 |
| Atlanta Arpt. Rev. Series 2019 B, 5% 7/1/25 (d) | | 60,000 | 60,791 |
| Burke County Indl. Dev. Auth. Poll. Cont. Rev.: | | | |
| (Georgia Transmission Corp. Proj.) Series 2012, 2.75% 1/1/52 (b) | | 610,000 | 409,259 |
| Bonds (Georgia Pwr. Co. Plant Vogtle Proj.) Series 2013 1, 3.375%, tender 3/12/27 (b) | | 360,000 | 357,224 |
| DeKalb Private Hosp. Auth. Rev. Series 2019 B, 5% 7/1/27 | | 210,000 | 220,855 |
| Fulton County Dev. Auth. Rev. Series 2019, 4% 6/15/49 | | 40,000 | 37,837 |
| Gainesville & Hall County Hosp. Auth. Rev. Series 2020 A, 3% 2/15/47 | | 1,895,000 | 1,547,523 |
| Georgia Muni. Elec. Auth. Pwr. Rev.: | | | |
| Series 2019 A: | | | |
4% 1/1/49 | | 245,000 | 227,712 |
5% 1/1/26 | | 165,000 | 168,686 |
5% 1/1/30 | | 55,000 | 58,245 |
5% 1/1/34 | | 375,000 | 397,446 |
| Series 2021 A: | | | |
4% 1/1/35 (Assured Guaranty Muni. Corp. Insured) | | 400,000 | 408,854 |
4% 1/1/36 (Assured Guaranty Muni. Corp. Insured) | | 410,000 | 418,522 |
4% 1/1/37 (Assured Guaranty Muni. Corp. Insured) | | 470,000 | 477,803 |
4% 1/1/40 (Assured Guaranty Muni. Corp. Insured) | | 385,000 | 386,477 |
4% 1/1/41 | | 480,000 | 463,078 |
5% 1/1/25 (Assured Guaranty Muni. Corp. Insured) | | 200,000 | 201,455 |
5% 1/1/26 (Assured Guaranty Muni. Corp. Insured) | | 425,000 | 435,434 |
5% 1/1/28 (Assured Guaranty Muni. Corp. Insured) | | 400,000 | 420,476 |
5% 1/1/31 (Assured Guaranty Muni. Corp. Insured) | | 360,000 | 387,905 |
5% 1/1/32 (Assured Guaranty Muni. Corp. Insured) | | 330,000 | 355,653 |
5% 1/1/32 (Assured Guaranty Muni. Corp. Insured) | | 280,000 | 301,766 |
| Georgia Road & Thruway Auth. Rev. Series 2020, 5% 6/1/31 | | 1,000,000 | 1,106,216 |
| Glynn-Brunswick Memorial Hosp. Auth. Rev. (Southeast Georgia Health Sys. Proj.) Series 2017: | | | |
| 4% 8/1/43 | | 5,000 | 4,472 |
| 5% 8/1/39 | | 5,000 | 5,011 |
| 5% 8/1/43 | | 5,000 | 5,008 |
| Hosp. Auth. of Savannah Auth. Rev. Series 2019 A: | | | |
| 4% 7/1/36 | | 195,000 | 195,101 |
| 4% 7/1/43 | | 205,000 | 199,818 |
| Main Street Natural Gas, Inc.: | | | |
| Bonds: | | | |
Series 2021 A, 4%, tender 9/1/27 (b) | | 12,000,000 | 12,049,015 |
Series 2022 E, 4%, tender 12/1/29 (b) | | 3,595,000 | 3,607,024 |
Series 2023 C, 5%, tender 9/1/30 (b) | | 1,000,000 | 1,061,681 |
Series 2023 D, 5%, tender 12/1/30 (b) | | 3,940,000 | 4,173,711 |
| Series 2024 B: | | | |
5% 9/1/27 | | 425,000 | 435,284 |
5% 9/1/28 | | 550,000 | 567,459 |
| Monroe County Dev. Auth. Poll. Cont. Rev. (Georgia Pwr. Co. Plant Scherer Proj.) Series 1995, 2.25% 7/1/25 | | 200,000 | 195,431 |
| Private Colleges & Univs. Auth. Rev.: | | | |
| (The Savannah College of Art & Design Projs.) Series 2021: | | | |
4% 4/1/39 | | 1,365,000 | 1,368,807 |
5% 4/1/29 | | 500,000 | 532,677 |
5% 4/1/36 | | 135,000 | 146,989 |
| Series 2020 B: | | | |
5% 9/1/25 | | 180,000 | 183,313 |
5% 9/1/34 | | 1,000,000 | 1,103,060 |
TOTAL GEORGIA | | | 35,242,070 |
| Hawaii - 1.2% | | | |
| Hawaii Arpts. Sys. Rev.: | | | |
| Series 2018 A: | | | |
5% 7/1/33 (d) | | 350,000 | 363,514 |
5% 7/1/48 (d) | | 2,800,000 | 2,848,817 |
| Series 2022 A, 5% 7/1/42 (d) | | 1,245,000 | 1,316,129 |
| Series 2022 B, 5% 7/1/24 (d) | | 3,350,000 | 3,350,000 |
| Hawaii Gen. Oblig. Series 2020 A, 4% 7/1/36 (d) | | 40,000 | 40,079 |
| Honolulu City & County Gen. Oblig.: | | | |
| (Honolulu Rail Transit Proj.) Series 2020 B, 5% 3/1/29 | | 1,000,000 | 1,085,594 |
| Series 2017 A, 5% 9/1/33 | | 5,000 | 5,233 |
TOTAL HAWAII | | | 9,009,366 |
| Idaho - 0.1% | | | |
| Idaho Hsg. & Fin. Assoc. Single Family Mtg.: | | | |
| Series 2019 A, 4% 1/1/50 | | 15,000 | 14,908 |
| Series 2021 A, 5% 7/15/31 | | 610,000 | 674,827 |
TOTAL IDAHO | | | 689,735 |
| Illinois - 10.7% | | | |
| Champaign County Cmnty. Unit Series 2019, 4% 6/1/26 | | 15,000 | 15,146 |
| Chicago Board of Ed.: | | | |
| Series 2012 A, 5% 12/1/42 | | 830,000 | 829,932 |
| Series 2018 A: | | | |
5% 12/1/29 | | 350,000 | 362,787 |
5% 12/1/30 | | 160,000 | 165,928 |
5% 12/1/31 | | 150,000 | 155,122 |
| Series 2018 C, 5% 12/1/46 | | 1,850,000 | 1,855,006 |
| Series 2019 A: | | | |
5% 12/1/29 | | 125,000 | 130,833 |
5% 12/1/30 | | 405,000 | 422,063 |
5% 12/1/30 | | 100,000 | 104,213 |
| Series 2022 B: | | | |
4% 12/1/35 | | 600,000 | 589,602 |
4% 12/1/36 | | 1,005,000 | 981,622 |
| Chicago Gen. Oblig.: | | | |
| Series 2015 C, 5% 1/1/27 | | 215,000 | 218,131 |
| Series 2020 A: | | | |
5% 1/1/27 | | 400,000 | 411,535 |
5% 1/1/30 | | 615,000 | 654,200 |
| Series 2021 A, 5% 1/1/32 | | 7,725,000 | 8,282,533 |
| Series 2021 B, 4% 1/1/32 | | 375,000 | 377,461 |
| Series 2023 A: | | | |
5% 1/1/29 | | 1,000,000 | 1,054,711 |
5% 1/1/33 | | 895,000 | 969,245 |
| Chicago Midway Arpt. Rev.: | | | |
| Series 2016 A, 4% 1/1/33 (d) | | 305,000 | 302,928 |
| Series 2016 B, 4% 1/1/35 | | 200,000 | 199,835 |
| Chicago O'Hare Int'l. Arpt. Rev.: | | | |
| Series 2012 B, 4% 1/1/29 (d) | | 400,000 | 397,400 |
| Series 2017 B, 5% 1/1/37 | | 50,000 | 51,598 |
| Series 2018 A, 5% 1/1/48 (d) | | 90,000 | 91,052 |
| Series 2022 C, 5% 1/1/40 (d) | | 1,850,000 | 1,963,841 |
| Series 2023, 5% 1/1/38 (Build America Mutual Assurance Insured) | | 1,000,000 | 1,095,239 |
| Chicago O'Hare Int'l. Arpt. Spl. Facilities Rev. Series 2018: | | | |
| 5% 7/1/38 (d) | | 50,000 | 51,034 |
| 5% 7/1/48 (d) | | 600,000 | 603,673 |
| Cook County Gen. Oblig.: | | | |
| Series 2016 A, 5% 11/15/31 | | 500,000 | 515,928 |
| Series 2021 A: | | | |
5% 11/15/24 | | 50,000 | 50,236 |
5% 11/15/33 | | 425,000 | 464,060 |
| Series 2021 B: | | | |
4% 11/15/25 | | 180,000 | 181,309 |
4% 11/15/26 | | 90,000 | 91,318 |
4% 11/15/27 | | 90,000 | 91,702 |
4% 11/15/28 | | 45,000 | 45,992 |
| DuPage & Cook Counties Cmnty. Unit School District #205 Series 2022, 4% 9/15/42 | | 2,100,000 | 2,026,105 |
| Illinois Fin. Auth.: | | | |
| Bonds Series 2020 B, 5%, tender 11/15/24 (b) | | 400,000 | 400,123 |
| Series 2020 A: | | | |
3% 5/15/50 | | 1,570,000 | 1,222,926 |
3% 5/15/50 (Build America Mutual Assurance Insured) | | 710,000 | 555,811 |
3.25% 8/15/49 | | 285,000 | 221,307 |
4% 5/15/50 | | 1,000,000 | 923,055 |
| Series 2021 A, 4% 8/15/37 | | 2,155,000 | 2,173,687 |
| Series 2022 A: | | | |
5% 10/1/29 | | 350,000 | 361,355 |
5% 10/1/30 | | 230,000 | 238,478 |
5% 10/1/31 | | 215,000 | 223,563 |
| Illinois Fin. Auth. Academic Facilities: | | | |
| (Provident Group UIUC Properties LLC Univ. of Illinois at Urbana-Champaign Proj.) Series 2019 A, 5% 10/1/25 | | 200,000 | 202,995 |
| (Provident Group UIUC Properties LLC Univ. of Illinois at Urbana-Champaign Proj.) Series 2019 A: | | | |
5% 10/1/26 | | 200,000 | 205,466 |
5% 10/1/31 | | 200,000 | 213,207 |
5% 10/1/38 | | 200,000 | 208,647 |
| Illinois Fin. Auth. Health Svcs. Facility Lease Rev. (Provident Group - UIC Surgery Ctr. LLC - Univ. of Illinois Health Svcs. Facility Proj.) Series 2020, 4% 10/1/55 | | 400,000 | 346,349 |
| Illinois Fin. Auth. Rev.: | | | |
| (Bradley Univ. Proj.) Series 2017 C: | | | |
5% 8/1/24 | | 45,000 | 45,043 |
5% 8/1/30 | | 615,000 | 641,884 |
| (Depaul Univ., IL Proj.): | | | |
Series 2016 A, 5% 10/1/28 | | 10,000 | 10,311 |
Series 2016, 5% 10/1/29 | | 30,000 | 30,861 |
| (OSF Healthcare Sys.) Series 2018 A: | | | |
4.125% 5/15/47 | | 750,000 | 719,652 |
5% 5/15/43 | | 790,000 | 799,007 |
| (Presence Health Proj.) Series 2016 C, 5% 2/15/36 | | 15,000 | 15,542 |
| Series 2015 A, 5% 11/15/25 | | 150,000 | 151,900 |
| Series 2015 C: | | | |
4.125% 8/15/37 | | 60,000 | 57,142 |
5% 8/15/26 | | 35,000 | 35,389 |
| Series 2016 A: | | | |
5% 8/15/24 (Escrowed to Maturity) | | 65,000 | 65,080 |
5% 7/1/33 (Pre-Refunded to 7/1/26 @ 100) | | 10,000 | 10,332 |
5% 7/1/36 (Pre-Refunded to 7/1/26 @ 100) | | 45,000 | 46,494 |
| Series 2016 B, 5% 8/15/35 | | 250,000 | 257,594 |
| Series 2016 C: | | | |
4% 2/15/41 | | 35,000 | 34,186 |
5% 2/15/34 | | 50,000 | 51,825 |
| Series 2016: | | | |
5% 5/15/29 | | 10,000 | 10,206 |
5% 12/1/29 | | 620,000 | 632,460 |
5% 12/1/33 | | 485,000 | 493,899 |
| Series 2017 A, 5% 7/15/42 | | 1,000,000 | 1,034,119 |
| Series 2019: | | | |
4% 9/1/35 | | 60,000 | 53,759 |
5% 9/1/36 | | 295,000 | 287,596 |
5% 9/1/38 | | 100,000 | 95,390 |
| Illinois Gen. Oblig.: | | | |
| Series 2014: | | | |
5% 2/1/25 | | 520,000 | 520,491 |
5% 5/1/28 | | 50,000 | 50,035 |
| Series 2016: | | | |
5% 1/1/26 | | 5,000 | 5,103 |
5% 2/1/26 | | 400,000 | 408,652 |
5% 2/1/27 | | 585,000 | 605,412 |
5% 11/1/29 | | 1,400,000 | 1,436,114 |
| Series 2017 C, 5% 11/1/29 | | 345,000 | 359,461 |
| Series 2017 D, 5% 11/1/27 | | 850,000 | 889,032 |
| Series 2018 A: | | | |
5% 10/1/24 | | 25,000 | 25,070 |
5% 10/1/28 | | 1,500,000 | 1,586,575 |
| Series 2018 B, 5% 10/1/24 | | 1,050,000 | 1,052,936 |
| Series 2019 B: | | | |
5% 9/1/24 | | 105,000 | 105,190 |
5% 9/1/25 | | 20,000 | 20,319 |
| Series 2020 C, 4% 10/1/37 | | 1,815,000 | 1,795,123 |
| Series 2021 A, 5% 3/1/32 | | 450,000 | 486,211 |
| Series 2022 A, 5% 3/1/32 | | 650,000 | 712,318 |
| Series 2022 B: | | | |
5% 3/1/29 | | 650,000 | 690,970 |
5% 3/1/33 | | 1,700,000 | 1,862,336 |
| Series 2023 B: | | | |
5% 5/1/35 | | 1,915,000 | 2,098,089 |
5.25% 5/1/41 | | 670,000 | 733,398 |
5.25% 5/1/43 | | 5,000,000 | 5,425,442 |
| Series 2023 D, 5% 7/1/29 | | 1,615,000 | 1,723,045 |
| Series 2024 B: | | | |
5% 5/1/33 | | 685,000 | 758,803 |
5% 5/1/40 | | 520,000 | 569,471 |
5.25% 5/1/44 | | 460,000 | 504,843 |
5.25% 5/1/47 | | 340,000 | 368,829 |
| Series May 2014, 5% 5/1/39 | | 1,700,000 | 1,699,968 |
| Illinois Hsg. Dev. Auth. Series 2021, 3% 4/1/51 | | 580,000 | 559,428 |
| Illinois Hsg. Dev. Auth. Rev. Series 2019 D, 2.7% 10/1/34 | | 115,000 | 101,277 |
| Illinois Toll Hwy. Auth. Toll Hwy. Rev.: | | | |
| Series 2019 A, 5% 1/1/44 | | 105,000 | 109,446 |
| Series A, 5% 1/1/40 | | 220,000 | 240,518 |
| Kendall, Kane & Will Counties Cmnty. Unit School District #308: | | | |
| Series 2008, 0% 2/1/25 (Assured Guaranty Muni. Corp. Insured) | | 315,000 | 307,874 |
| Series 2015, 4% 2/1/30 | | 800,000 | 800,771 |
| Metropolitan Pier & Exposition: | | | |
| (McCormick Place Expansion Proj.): | | | |
Series 2002 A, 0% 6/15/36 (Nat'l. Pub. Fin. Guarantee Corp. Insured) | | 2,280,000 | 1,394,236 |
Series 2010 B1: | | | |
0% 6/15/43 (Assured Guaranty Muni. Corp. Insured) | | 610,000 | 264,159 |
0% 6/15/44 (Assured Guaranty Muni. Corp. Insured) | | 1,680,000 | 681,880 |
0% 6/15/47 (Assured Guaranty Muni. Corp. Insured) | | 155,000 | 52,507 |
| Series 1994 A, 0% 6/15/25 | | 25,000 | 24,068 |
| Series 1994, 0% 6/15/28 (Nat'l. Pub. Fin. Guarantee Corp. Insured) | | 1,200,000 | 1,022,319 |
| Series 2002 A: | | | |
0% 6/15/32 (Nat'l. Pub. Fin. Guarantee Corp. Insured) | | 30,000 | 21,716 |
0% 6/15/35 (Nat'l. Pub. Fin. Guarantee Corp. Insured) | | 240,000 | 153,609 |
| Series 2017 A, 5% 6/15/57 | | 875,000 | 889,504 |
| Series 2020 A: | | | |
4% 6/15/50 | | 1,170,000 | 1,093,483 |
5% 6/15/50 | | 1,730,000 | 1,787,771 |
| Series 2022 A: | | | |
0% 12/15/35 | | 420,000 | 260,746 |
0% 6/15/40 | | 1,725,000 | 836,132 |
4% 12/15/47 | | 5,000,000 | 4,743,152 |
| Northern Illinois Univ. Revs. Series 2020 B, 4% 4/1/40 (Build America Mutual Assurance Insured) | | 455,000 | 438,146 |
| Sales Tax Securitization Corp. Series 2023 C, 5% 1/1/31 | | 1,000,000 | 1,096,782 |
| Schaumburg Village Gen. Oblig. Series 2023, 4% 12/1/30 | | 680,000 | 709,208 |
| Univ. of Illinois Board of Trustees Ctfs. of Prtn. (Univ. of Illinois Rev. Proj.) Series 2014 A, 5% 10/1/26 | | 15,000 | 15,043 |
| Univ. of Illinois Rev. Series 2018 A, 5% 4/1/30 | | 100,000 | 105,888 |
TOTAL ILLINOIS | | | 83,082,859 |
| Indiana - 0.9% | | | |
| Indiana Fin. Auth. Edl. Facilities Rev. (DEPAUW Univ. Proj.) Series 2023 A, 5% 7/1/47 | | 1,055,000 | 1,068,075 |
| Indiana Fin. Auth. Envir. Facilities Rev. Bonds (Indianapolis Pwr. & Lt. Co. Proj.): | | | |
| Series 2020 A, 0.75%, tender 4/1/26 (b) | | 50,000 | 46,358 |
| Series 2020 B, 0.95%, tender 4/1/26 (b)(d) | | 100,000 | 93,215 |
| Indiana Fin. Auth. Health Sys. Rev. Series 2016 A, 4% 11/1/51 | | 1,885,000 | 1,768,811 |
| Indiana Fin. Auth. Rev. Series 2016, 5% 9/1/30 | | 50,000 | 51,473 |
| Indiana Fin. Auth. Wastewtr. Util. Rev. Series 2021 2, 5% 10/1/41 | | 1,000,000 | 1,091,360 |
| Indiana Hsg. & Cmnty. Dev. Auth.: | | | |
| Series 2021 B: | | | |
3% 7/1/50 | | 95,000 | 92,095 |
5% 7/1/25 | | 690,000 | 699,476 |
| Series 2021 C1, 3% 1/1/52 | | 1,065,000 | 1,024,719 |
| Series A, 3.75% 1/1/49 | | 255,000 | 252,165 |
| Saint Joseph County Econ. Dev. Auth. Rev. (St. Mary's College Proj.): | | | |
| Series 2019, 4% 4/1/46 | | 215,000 | 197,992 |
| Series 2020, 5% 4/1/30 | | 105,000 | 110,958 |
| Whiting Envir. Facilities Rev. Bonds (BP Products North America, Inc. Proj.) Series 2019 A, 5%, tender 6/5/26 (b)(d) | | 695,000 | 707,880 |
TOTAL INDIANA | | | 7,204,577 |
| Iowa - 0.5% | | | |
| Iowa Fin. Auth. Rev.: | | | |
| Series 2019 A1, 4% 5/15/55 | | 545,000 | 410,459 |
| Series A: | | | |
5% 5/15/43 | | 35,000 | 33,473 |
5% 5/15/48 | | 420,000 | 388,051 |
| Iowa Student Ln. Liquidity Corp. Student Ln. Rev. Series 2019 B, 5% 12/1/27 (d) | | 155,000 | 158,574 |
| Tobacco Settlement Auth. Tobacco Settlement Rev.: | | | |
| Series 2021 A2: | | | |
4% 6/1/40 | | 425,000 | 411,394 |
5% 6/1/27 | | 250,000 | 258,956 |
5% 6/1/28 | | 500,000 | 524,193 |
5% 6/1/29 | | 600,000 | 635,529 |
5% 6/1/30 | | 700,000 | 748,496 |
| Series 2021 B1, 4% 6/1/49 | | 35,000 | 34,709 |
TOTAL IOWA | | | 3,603,834 |
| Kentucky - 1.3% | | | |
| Ashland Med. Ctr. Rev.: | | | |
| (Ashland Hosp. Corp. D/B/A Kings Daughters Med. Ctr. Proj.) Series 2016 A, 4% 2/1/36 | | 300,000 | 289,711 |
| Series 2019: | | | |
3% 2/1/40 (Assured Guaranty Muni. Corp. Insured) | | 370,000 | 315,038 |
4% 2/1/37 | | 175,000 | 168,705 |
5% 2/1/25 | | 280,000 | 281,003 |
| Carroll County Poll. Ctlr Rev. Bonds (Kentucky Utils. Co. Proj.) Series 2016 A, 1.55%, tender 9/1/26 (b) | | 1,000,000 | 931,275 |
| Kentucky Econ. Dev. Fin. Auth. Series 2019 A2, 5% 8/1/30 | | 345,000 | 367,359 |
| Kentucky State Property & Buildings Commission Rev.: | | | |
| (Proj. No. 118) Series 2018, 5% 4/1/25 | | 175,000 | 177,122 |
| (Proj. No. 119) Series 2018: | | | |
5% 5/1/26 | | 80,000 | 82,451 |
5% 5/1/29 | | 85,000 | 89,549 |
5% 5/1/32 | | 20,000 | 21,159 |
5% 5/1/33 | | 15,000 | 15,873 |
5% 5/1/34 | | 20,000 | 21,209 |
5% 5/1/35 | | 10,000 | 10,547 |
5% 5/1/36 | | 10,000 | 10,544 |
5% 5/1/38 | | 1,000,000 | 1,055,064 |
| Series A: | | | |
4% 11/1/35 | | 600,000 | 603,487 |
5% 11/1/29 | | 150,000 | 159,220 |
| Kentucky, Inc. Pub. Energy: | | | |
| Bonds Series A, 4%, tender 6/1/26 (b) | | 1,505,000 | 1,511,409 |
| Series 2024 A1: | | | |
5% 2/1/30 | | 755,000 | 787,682 |
5% 2/1/31 | | 805,000 | 843,251 |
5% 2/1/32 | | 600,000 | 636,270 |
| Louisville & Jefferson County: | | | |
| Bonds: | | | |
Series 2020 C, 5%, tender 10/1/26 (b) | | 70,000 | 71,550 |
Series 2020 D, 5%, tender 10/1/29 (b) | | 85,000 | 90,545 |
| Series 2016 A, 5% 10/1/32 | | 70,000 | 71,148 |
| Series 2020 A: | | | |
3% 10/1/43 | | 1,230,000 | 962,879 |
4% 10/1/40 | | 195,000 | 188,019 |
| Louisville Reg'l. Arpt. Auth. Sys. Rev. Series 2014 A, 5% 7/1/24 (d) | | 65,000 | 65,000 |
TOTAL KENTUCKY | | | 9,827,069 |
| Louisiana - 0.4% | | | |
| Louisiana Hsg. Corp. Single Fami (Home Ownership Prog.) Series 2023 C, 5.75% 12/1/53 | | 230,000 | 247,651 |
| Louisiana Pub. Facilities Auth. Rev.: | | | |
| (Ochsner Clinic Foundation Proj.): | | | |
Series 2015, 5% 5/15/47 | | 195,000 | 195,867 |
Series 2017, 5% 5/15/27 | | 115,000 | 118,841 |
| (Tulane Univ. of Louisiana Proj.): | | | |
Series 2016 A, 5% 12/15/28 | | 15,000 | 15,530 |
Series 2017 A, 5% 12/15/32 | | 165,000 | 173,557 |
| Series 2018 E, 5% 7/1/38 | | 100,000 | 105,149 |
| New Orleans Aviation Board Rev. (North Term. Proj.) Series 2017 B, 5% 1/1/48 (d) | | 2,000,000 | 2,008,914 |
TOTAL LOUISIANA | | | 2,865,509 |
| Maine - 0.3% | | | |
| Auburn (Edward Little High School Proj.) Series 2021, 2.375% 11/1/40 | | 2,300,000 | 1,690,374 |
| Maine Health & Higher Edl. Facilities Auth. Rev.: | | | |
| Series 2014, 5% 7/1/30 (Pre-Refunded to 7/1/24 @ 100) | | 585,000 | 585,000 |
| Series 2016 A: | | | |
4% 7/1/41 | | 85,000 | 74,053 |
4% 7/1/46 | | 85,000 | 69,554 |
5% 7/1/41 | | 25,000 | 24,359 |
5% 7/1/46 | | 155,000 | 144,511 |
| Series 2017 B, 5% 7/1/29 | | 10,000 | 10,361 |
TOTAL MAINE | | | 2,598,212 |
| Maryland - 1.7% | | | |
| Frederick County Gen. Oblig. Series 2021 A, 1.5% 10/1/33 | | 1,005,000 | 775,078 |
| Hsg. Opportunities Commission of Montgomery County Series 2021 C, 0.8% 7/1/25 | | 100,000 | 96,025 |
| Maryland Cmnty. Dev. Admin Dept. Hsg. & Cmnty. Dev.: | | | |
| Series 2019 B, 4% 9/1/49 | | 55,000 | 54,673 |
| Series 2019 C: | | | |
3.5% 3/1/50 | | 475,000 | 467,296 |
5% 9/1/28 | | 115,000 | 122,063 |
| Series 2021 C, 0.6% 7/1/24 | | 230,000 | 230,000 |
| Maryland Econ. Dev. Corp. Air Cargo Series 2019: | | | |
| 5% 7/1/25 (d) | | 510,000 | 513,703 |
| 5% 7/1/26 (d) | | 230,000 | 233,601 |
| Maryland Gen. Oblig. Series 2022 2C, 4% 3/1/28 | | 1,000,000 | 1,032,495 |
| Maryland Health & Higher Edl. Series 2021 A: | | | |
| 2.5% 7/1/51 | | 1,210,000 | 764,037 |
| 3% 7/1/46 | | 1,265,000 | 1,041,085 |
| 3% 7/1/51 | | 915,000 | 723,189 |
| 4% 6/1/55 | | 190,000 | 164,094 |
| 5% 6/1/29 | | 370,000 | 383,959 |
| 5% 6/1/30 | | 745,000 | 778,526 |
| Maryland Stadium Auth. Built to Learn Rev. Series 2021, 4% 6/1/46 | | 180,000 | 175,164 |
| Maryland Trans. Auth. Trans. Facility Projs. Rev. Series 2020, 5% 7/1/40 | | 2,000,000 | 2,169,651 |
| Prince Georges County Ctfs. of Prtn. Series 2021: | | | |
| 5% 10/1/25 | | 1,610,000 | 1,642,422 |
| 5% 10/1/26 | | 1,650,000 | 1,711,104 |
TOTAL MARYLAND | | | 13,078,165 |
| Massachusetts - 3.4% | | | |
| Massachusetts Bay Trans. Auth. Sales Tax Rev. Series 2021 A1, 5% 7/1/35 | | 820,000 | 912,046 |
| Massachusetts Commonwealth Trans. Fund Rev.: | | | |
| (Rail Enhancement Prog.) Series 2021 B: | | | |
5% 6/1/26 | | 350,000 | 362,698 |
5% 6/1/27 | | 500,000 | 527,285 |
5% 6/1/41 | | 1,250,000 | 1,308,199 |
| Series 2021 A, 5% 6/1/51 | | 1,860,000 | 1,960,675 |
| Massachusetts Dev. Fin. Agcy. Rev.: | | | |
| (Lawrence Gen. Hosp.) Series 2014 A, 5.25% 7/1/34 | | 40,000 | 37,191 |
| Series 2016 A, 5% 1/1/31 | | 40,000 | 41,234 |
| Series 2016 I: | | | |
5% 7/1/30 | | 195,000 | 198,290 |
5% 7/1/41 | | 140,000 | 140,952 |
| Series 2017 A: | | | |
5% 1/1/36 | | 325,000 | 336,410 |
5% 1/1/37 | | 1,050,000 | 1,084,646 |
| Series 2017, 5% 7/1/36 | | 275,000 | 280,301 |
| Series 2018, 5% 1/1/43 | | 180,000 | 182,802 |
| Series 2019 K: | | | |
5% 7/1/25 | | 125,000 | 126,709 |
5% 7/1/26 | | 165,000 | 169,929 |
5% 7/1/27 | | 195,000 | 203,772 |
| Series 2019: | | | |
5% 7/1/27 | | 440,000 | 449,828 |
5% 9/1/59 | | 200,000 | 207,952 |
| Series 2020 A, 4% 7/1/45 | | 480,000 | 424,564 |
| Series 2021 V, 5% 7/1/55 | | 1,245,000 | 1,463,534 |
| Series 2021: | | | |
4% 7/1/26 | | 240,000 | 235,651 |
4% 7/1/27 | | 255,000 | 248,858 |
4% 7/1/28 | | 325,000 | 315,150 |
4% 7/1/29 | | 340,000 | 327,709 |
4% 7/1/30 | | 355,000 | 340,131 |
4% 7/1/31 | | 370,000 | 351,692 |
| Series M: | | | |
4% 10/1/50 | | 490,000 | 412,698 |
5% 10/1/45 | | 370,000 | 371,436 |
| Massachusetts Edl. Fing. Auth. Rev. Series 2016, 5% 7/1/24 (d) | | 210,000 | 210,000 |
| Massachusetts Gen. Oblig.: | | | |
| Series 2019 A, 5% 1/1/49 | | 2,000,000 | 2,089,308 |
| Series 2019 C, 5% 5/1/49 | | 345,000 | 361,116 |
| Series 2022 C, 5.25% 10/1/47 | | 2,000,000 | 2,207,854 |
| Series E, 5% 11/1/50 | | 1,640,000 | 1,734,987 |
| Massachusetts Hsg. Fin. Auth. Series 2021 223, 3% 6/1/47 | | 605,000 | 585,235 |
| Massachusetts Port Auth. Rev.: | | | |
| Series 2019 A, 5% 7/1/40 (d) | | 500,000 | 521,487 |
| Series 2021 E: | | | |
5% 7/1/41 (d) | | 1,000,000 | 1,061,101 |
5% 7/1/46 (d) | | 290,000 | 304,366 |
5% 7/1/51 (d) | | 1,000,000 | 1,040,452 |
| Massachusetts Port Auth. Spl. Facilities Rev. (Bosfuel Proj.) Series 2019 A, 5% 7/1/49 (d) | | 230,000 | 234,910 |
| Massachusetts St Dev. Fin. Agcy. R Series 2024 B, 5% 2/15/34 | | 2,400,000 | 2,829,607 |
TOTAL MASSACHUSETTS | | | 26,202,765 |
| Michigan - 1.2% | | | |
| Flint Hosp. Bldg. Auth. Rev. Series 2020: | | | |
| 4% 7/1/41 | | 140,000 | 126,185 |
| 5% 7/1/25 | | 60,000 | 60,048 |
| 5% 7/1/27 | | 265,000 | 264,780 |
| Grand Rapids Pub. Schools Series 2019, 5% 11/1/26 (Assured Guaranty Muni. Corp. Insured) | | 180,000 | 186,667 |
| Grand Traverse County Hosp. Fin. Auth. Series 2021, 3% 7/1/51 | | 395,000 | 311,129 |
| Great Lakes Wtr. Auth. Sew Disp. Sys. Series 2018 A, 5% 7/1/48 | | 200,000 | 205,529 |
| Great Lakes Wtr. Auth. Wtr. Supply Sys. Rev. Series 2016 D, 5% 7/1/27 | | 100,000 | 102,881 |
| Kalamazoo Hosp. Fin. Auth. Hosp. Facilities Rev. Series 2016, 4% 5/15/36 | | 185,000 | 183,049 |
| Michigan Fin. Auth. Rev.: | | | |
| (Charter County of Wayne Criminal Justice Ctr. Proj.) Series 2018, 5% 11/1/43 | | 50,000 | 51,694 |
| (Henry Ford Health Sys. Proj.) Series 2016, 5% 11/15/25 | | 570,000 | 580,045 |
| Series 2016, 5% 11/15/26 | | 160,000 | 164,618 |
| Series 2019 A: | | | |
3% 12/1/49 | | 555,000 | 433,418 |
5% 11/15/48 | | 55,000 | 56,942 |
| Series 2020 A, 4% 6/1/49 | | 135,000 | 122,365 |
| Series 2020, 5% 6/1/40 | | 1,105,000 | 1,151,709 |
| Series 2021: | | | |
4% 9/1/31 | | 665,000 | 670,243 |
5% 9/1/32 | | 690,000 | 741,586 |
5% 9/1/33 | | 650,000 | 696,050 |
5% 9/1/36 | | 505,000 | 537,872 |
| Michigan Hosp. Fin. Auth. Rev. Series 2008 C, 5% 12/1/32 | | 10,000 | 10,453 |
| Michigan Hsg. Dev. Auth. Single Family Mtg. Rev. Series A, 3.5% 12/1/50 | | 510,000 | 500,899 |
| Michigan State Hsg. Dev. Auth. Series 2021 A, 2.45% 10/1/46 | | 555,000 | 385,512 |
| Michigan Strategic Fund Ltd. Oblig. Rev. Bonds (Consumer Energy Co. Proj.) Series 2019, 1.8%, tender 10/1/24 (b)(d) | | 175,000 | 173,779 |
| Univ. of Michigan Rev. Series 2020 A, 5% 4/1/50 | | 1,000,000 | 1,061,835 |
| Wayne County Arpt. Auth. Rev.: | | | |
| Series 2017 A, 5% 12/1/29 | | 45,000 | 47,128 |
| Series 2017 B, 5% 12/1/42 (d) | | 150,000 | 152,662 |
| Series 2018 D, 5% 12/1/29 (d) | | 85,000 | 88,976 |
TOTAL MICHIGAN | | | 9,068,054 |
| Minnesota - 1.1% | | | |
| Duluth Econ. Dev. Auth. Health Care Facilities Rev. Series 2018 A: | | | |
| 5% 2/15/48 | | 220,000 | 222,464 |
| 5% 2/15/58 | | 270,000 | 271,795 |
| Maple Grove Health Care Sys. Rev. Series 2015, 5% 9/1/26 | | 60,000 | 60,629 |
| Minneapolis & Saint Paul Metropolitan Arpts. Commission Arpt. Rev. Series 2022 B: | | | |
| 5% 1/1/34 (d) | | 210,000 | 227,372 |
| 5% 1/1/37 (d) | | 520,000 | 559,308 |
| Minnesota Higher Ed. Facilities Auth. Rev.: | | | |
| Series 2018 A: | | | |
5% 10/1/30 | | 500,000 | 517,169 |
5% 10/1/45 | | 30,000 | 30,105 |
| Series 2023, 4.25% 10/1/38 | | 300,000 | 290,257 |
| Series 2024 A, 5% 10/1/49 | | 4,000,000 | 4,250,096 |
| Minnesota Hsg. Fin. Agcy.: | | | |
| Series 2023 F, 5.75% 7/1/53 | | 150,000 | 158,934 |
| Series B, 4% 8/1/39 | | 2,050,000 | 2,050,718 |
| Shakopee Sr. Hsg. Rev. Bonds Series 2018, 5.85%, tender 11/1/25 (b)(e) | | 255,000 | 249,724 |
TOTAL MINNESOTA | | | 8,888,571 |
| Mississippi - 0.2% | | | |
| Mississippi Bus. finance Corp. Exempt Facilities Rev. Bonds (Enviva, Inc. Proj.) Series 2022, 7.75%, tender 7/15/32 (b)(d) | | 742,102 | 356,209 |
| Mississippi Home Corp. Series 2021 B: | | | |
| 3% 6/1/51 | | 260,000 | 251,143 |
| 5% 6/1/25 | | 750,000 | 759,393 |
| Mississippi Hosp. Equip. & Facilities Auth.: | | | |
| Bonds Series II, 5%, tender 3/1/27 (b) | | 80,000 | 82,560 |
| Series I, 5% 10/1/24 | | 70,000 | 70,155 |
TOTAL MISSISSIPPI | | | 1,519,460 |
| Missouri - 0.6% | | | |
| Cape Girardeau County Indl. Dev. Auth.: | | | |
| (Southeast Hosp. Proj.) Series 2017 A, 5% 3/1/36 | | 105,000 | 107,615 |
| Series 2021, 4% 3/1/41 | | 250,000 | 242,763 |
| Kansas City Wtr. Rev. Series 2020 A, 4% 12/1/44 | | 1,200,000 | 1,193,597 |
| Missouri Health & Edl. Facilities Rev. Series 2018 A, 5% 11/15/43 | | 1,000,000 | 1,028,427 |
| Missouri Hsg. Dev. Commission Single Family Mtg. Rev.: | | | |
| Series 2019, 4% 5/1/50 | | 10,000 | 9,936 |
| Series 2021 A, 3% 5/1/52 | | 435,000 | 420,071 |
| Saint Louis Arpt. Rev. Series A, 5.25% 7/1/26 (Assured Guaranty Muni. Corp. Insured) | | 570,000 | 591,102 |
| Saint Louis County Indl. Dev. Auth. Sr. Living Facilities Rev. Series 2018 A: | | | |
| 5.125% 9/1/48 | | 25,000 | 24,573 |
| 5.25% 9/1/53 | | 1,240,000 | 1,223,499 |
TOTAL MISSOURI | | | 4,841,583 |
| Montana - 0.1% | | | |
| Montana Board Hsg. Single Family Series 2019 B, 4% 6/1/50 | | 10,000 | 9,935 |
| Montana Facility Fin. Auth. Series 2021 A, 3% 6/1/50 | | 575,000 | 457,609 |
| Montana Facility Fin. Auth. Rev. (Benefis Health Sys. Proj.) Series 2016, 5% 2/15/32 | | 30,000 | 30,655 |
TOTAL MONTANA | | | 498,199 |
| Nebraska - 1.2% | | | |
| Central Plains Energy Proj. Rev. Bonds: | | | |
| (Proj. No. 4) Series 2023 A1, 5%, tender 11/1/29 (b) | | 2,290,000 | 2,412,185 |
| Series 2019, 4%, tender 8/1/25 (b) | | 850,000 | 850,886 |
| Douglas County Neb Edl. Facilities Rev. (Creighton Univ. Projs.) Series 2021 A, 3% 7/1/51 | | 260,000 | 194,710 |
| Nebraska Invt. Fin. Auth. Single Family Hsg. Rev.: | | | |
| Series 2019 B, 4% 9/1/49 (d) | | 35,000 | 34,468 |
| Series 2019 E, 3.75% 9/1/49 (d) | | 50,000 | 49,263 |
| Series 2020 A, 3.5% 9/1/50 | | 625,000 | 613,737 |
| Series 2022 B: | | | |
5% 3/1/25 (d) | | 1,090,000 | 1,096,170 |
5% 9/1/25 (d) | | 1,105,000 | 1,117,575 |
5% 3/1/26 (d) | | 1,100,000 | 1,118,400 |
5% 9/1/26 (d) | | 1,140,000 | 1,165,521 |
5% 3/1/30 (d) | | 400,000 | 416,685 |
TOTAL NEBRASKA | | | 9,069,600 |
| Nevada - 0.3% | | | |
| Clark County Arpt. Rev. Series 2014 A2, 5% 7/1/30 | | 115,000 | 115,000 |
| Nevada Hsg. Division Single Family Mtg. Rev.: | | | |
| Series 2019 A, 4% 4/1/49 | | 235,000 | 233,552 |
| Series 2019 B, 4% 10/1/49 | | 25,000 | 24,845 |
| Series 2021 B, 3% 10/1/51 | | 1,810,000 | 1,739,232 |
| Tahoe-Douglas Visitors Auth. Series 2020, 5% 7/1/45 | | 195,000 | 197,158 |
TOTAL NEVADA | | | 2,309,787 |
| New Hampshire - 0.7% | | | |
| Nat'l. Fin. Auth. Hosp. Rev. (St. Luke's Univ. Health Network Proj.) Series 2021 B: | | | |
| 3% 8/15/51 (Assured Guaranty Muni. Corp. Insured) | | 490,000 | 385,631 |
| 5% 8/15/30 | | 1,405,000 | 1,524,952 |
| Nat'l. Finnance Auth.: | | | |
| Series 2020 1, 4.125% 1/20/34 | | 219,209 | 215,058 |
| Series 2023 2A, 3.875% 1/20/38 | | 1,608,514 | 1,515,019 |
| New Hampshire Health & Ed. Facilities Auth.: | | | |
| (Dartmouth-Hitchcock Oblgtd Grp Proj.) Series 2018 A: | | | |
5% 8/1/26 | | 105,000 | 108,003 |
5% 8/1/37 | | 100,000 | 103,672 |
| Series 2023 B, 5% 11/1/43 (d) | | 550,000 | 572,637 |
| New Hampshire Nat'l. Fin. Auth. Series 2022 2, 4% 10/20/36 | | 1,466,292 | 1,411,981 |
TOTAL NEW HAMPSHIRE | | | 5,836,953 |
| New Jersey - 5.4% | | | |
| Gloucester County Impt. Auth. Rev. (Rowan Univ. Projs.) Series 2024: | | | |
| 5% 7/1/34 (Build America Mutual Assurance Insured) | | 200,000 | 224,182 |
| 5% 7/1/36 (Build America Mutual Assurance Insured) | | 700,000 | 782,459 |
| 5% 7/1/37 (Build America Mutual Assurance Insured) | | 550,000 | 613,423 |
| 5% 7/1/38 (Build America Mutual Assurance Insured) | | 575,000 | 637,994 |
| 5% 7/1/39 (Build America Mutual Assurance Insured) | | 650,000 | 718,728 |
| 5% 7/1/42 (Build America Mutual Assurance Insured) | | 700,000 | 764,206 |
| 5% 7/1/44 (Build America Mutual Assurance Insured) | | 855,000 | 927,194 |
| New Jersey Econ. Dev. Auth.: | | | |
| Series 2018 EEE: | | | |
5% 6/15/43 | | 800,000 | 828,503 |
5% 6/15/43 (Pre-Refunded to 12/15/28 @ 100) | | 470,000 | 508,595 |
| Series 2023 RRR, 5% 3/1/25 | | 1,890,000 | 1,906,180 |
| Series A, 5% 11/1/40 | | 360,000 | 379,856 |
| Series QQQ: | | | |
4% 6/15/46 | | 610,000 | 596,245 |
5% 6/15/27 | | 35,000 | 36,583 |
5% 6/15/28 | | 40,000 | 42,415 |
| New Jersey Econ. Dev. Auth. Rev.: | | | |
| (Black Horse EHT Urban Renewal LLC Proj.) Series 2019 A, 5% 10/1/39 (e) | | 100,000 | 72,715 |
| (NJ Transit Corp. Projs.) Series A, 4% 11/1/27 | | 370,000 | 376,429 |
| Series 2018 EEE, 5% 6/15/28 | | 410,000 | 434,749 |
| Series LLL: | | | |
4% 6/15/44 | | 315,000 | 310,211 |
5% 6/15/44 | | 180,000 | 188,361 |
| Series MMM, 4% 6/15/35 | | 90,000 | 91,727 |
| New Jersey Edl. Facility Series 2016 B, 4% 9/1/26 | | 500,000 | 503,880 |
| New Jersey Gen. Oblig. Series 2020 A, 5% 6/1/29 | | 205,000 | 222,477 |
| New Jersey Health Care Facilities Fing. Auth. Rev.: | | | |
| (Greystone Park Psychiatric Hosp. Proj.) Series 2024, 5% 9/15/32 | | 495,000 | 544,922 |
| (Marlboro Psychiatric Hosp. Proj.) Series 2024, 5% 9/15/32 | | 470,000 | 517,400 |
| Series 2016: | | | |
4% 7/1/48 | | 100,000 | 89,742 |
5% 7/1/41 | | 65,000 | 65,184 |
| New Jersey Higher Ed. Student Assistance Auth. Student Ln. Rev.: | | | |
| Series 2017 1A, 5% 12/1/26 (d) | | 530,000 | 541,158 |
| Series 2018 B: | | | |
5% 12/1/25 (d) | | 500,000 | 507,795 |
5% 12/1/26 (d) | | 485,000 | 495,211 |
5% 12/1/27 (d) | | 850,000 | 875,048 |
| Series 2020: | | | |
5% 12/1/24 (d) | | 100,000 | 100,504 |
5% 12/1/25 (d) | | 235,000 | 238,664 |
5% 12/1/25 (d) | | 60,000 | 60,935 |
5% 12/1/26 (d) | | 205,000 | 209,316 |
5% 12/1/27 (d) | | 145,000 | 149,273 |
5% 12/1/27 (d) | | 40,000 | 41,179 |
| Series 2023 B, 5% 12/1/30 (d) | | 3,780,000 | 3,989,788 |
| Series 2024 B, 5% 12/1/31 (d) | | 1,170,000 | 1,243,284 |
| New Jersey Tobacco Settlement Fing. Corp.: | | | |
| Series 2018 A, 5.25% 6/1/46 | | 1,915,000 | 1,979,864 |
| Series 2018 B, 5% 6/1/46 | | 465,000 | 469,254 |
| New Jersey Tpk. Auth. Tpk. Rev.: | | | |
| Series 2015 E, 5% 1/1/34 | | 190,000 | 191,007 |
| Series 2024 C: | | | |
5% 1/1/42 (g) | | 1,450,000 | 1,600,581 |
5% 1/1/45 (g) | | 1,800,000 | 1,964,538 |
| Series 2024, 5% 1/1/28 (g) | | 840,000 | 892,179 |
| Series D, 5% 1/1/28 | | 170,000 | 174,099 |
| New Jersey Trans. Trust Fund Auth.: | | | |
| (Trans. Prog.) Series 2019 AA, 5.25% 6/15/43 | | 505,000 | 527,457 |
| Series 2006 C, 0% 12/15/33 (Assured Guaranty Muni. Corp. Insured) | | 780,000 | 548,149 |
| Series 2010 A, 0% 12/15/27 | | 250,000 | 219,938 |
| Series 2014 AA, 5% 6/15/25 | | 100,000 | 100,067 |
| Series 2016 A, 5% 6/15/27 | | 160,000 | 164,195 |
| Series 2018 A, 5% 12/15/32 | | 100,000 | 105,741 |
| Series 2019 BB, 4% 6/15/50 | | 370,000 | 352,314 |
| Series 2021 A: | | | |
4% 6/15/34 | | 140,000 | 143,176 |
5% 6/15/32 | | 295,000 | 325,602 |
5% 6/15/33 | | 1,000,000 | 1,101,646 |
| Series 2022 A, 4% 6/15/39 | | 720,000 | 722,751 |
| Series 2022 AA: | | | |
5% 6/15/33 | | 250,000 | 278,976 |
5% 6/15/36 | | 1,460,000 | 1,626,936 |
| Series 2022 BB: | | | |
4% 6/15/46 | | 1,385,000 | 1,349,872 |
4% 6/15/50 | | 1,000,000 | 952,200 |
| Series AA: | | | |
4% 6/15/38 | | 185,000 | 185,779 |
4% 6/15/45 | | 1,535,000 | 1,485,264 |
4% 6/15/50 | | 1,980,000 | 1,885,356 |
5% 6/15/40 | | 210,000 | 225,267 |
| Series BB: | | | |
5% 6/15/33 | | 1,000,000 | 1,056,746 |
5% 6/15/50 | | 70,000 | 71,660 |
| South Jersey Trans. Auth. Trans. Sys. Rev. Series 2022 A: | | | |
| 5% 11/1/36 | | 450,000 | 500,356 |
| 5% 11/1/40 | | 150,000 | 160,196 |
TOTAL NEW JERSEY | | | 42,197,681 |
| New Mexico - 0.2% | | | |
| New Mexico Edl. Assistance Foundation Series 2021 1A: | | | |
| 5% 9/1/26 (d) | | 1,045,000 | 1,066,266 |
| 5% 9/1/27 (d) | | 350,000 | 359,497 |
| 5% 9/1/29 (d) | | 150,000 | 157,101 |
| New Mexico Mtg. Fin. Auth.: | | | |
| Series 2019 C, 4% 1/1/50 | | 120,000 | 119,236 |
| Series 2019 D, 3.75% 1/1/50 | | 35,000 | 34,580 |
| Santa Fe Retirement Fac. Series 2019 A: | | | |
| 5% 5/15/34 | | 10,000 | 10,085 |
| 5% 5/15/39 | | 5,000 | 4,958 |
| 5% 5/15/44 | | 5,000 | 4,775 |
| 5% 5/15/49 | | 15,000 | 13,855 |
TOTAL NEW MEXICO | | | 1,770,353 |
| New York - 9.8% | | | |
| Buffalo and Erie County Indl. Land Rev. (Catholic Health Sys., Inc. Proj.) Series 2015, 5% 7/1/25 | | 400,000 | 395,528 |
| Long Island Pwr. Auth. Elec. Sys. Rev. Bonds Series 2021 B, 1.5%, tender 9/1/26 (b) | | 500,000 | 470,622 |
| Monroe County Indl. Dev. Corp. (Univ. of Rochester Proj.) Series 2015 B, 4% 7/1/35 | | 5,000 | 5,010 |
| MTA Hudson Rail Yards Trust Oblig. Series 2016 A, 5% 11/15/56 | | 100,000 | 99,998 |
| New York City Edl. Construction Fund Series 2021 B: | | | |
| 5% 4/1/46 | | 675,000 | 721,575 |
| 5% 4/1/52 | | 520,000 | 550,244 |
| New York City Gen. Oblig.: | | | |
| Series 2018 A, 5% 8/1/24 | | 100,000 | 100,100 |
| Series 2024 A, 5% 8/1/41 | | 1,135,000 | 1,264,509 |
| Series E, 5% 8/1/30 | | 1,025,000 | 1,056,827 |
| New York City Hsg. Dev. Corp. Bonds: | | | |
| Series 2024 A2, 3.625%, tender 7/1/28 (b) | | 1,485,000 | 1,483,807 |
| Series 2024 B2, 3.7%, tender 7/3/28 (b) | | 2,570,000 | 2,582,212 |
| New York City Hsg. Dev. Corp. Multifamily Hsg.: | | | |
| Bonds: | | | |
Series 2021 C2, 0.7%, tender 7/1/25 (b) | | 165,000 | 158,644 |
Series 2021 K2, 0.9%, tender 1/1/26 (b) | | 2,075,000 | 1,955,615 |
Series 2021, 0.6%, tender 7/1/25 (b) | | 385,000 | 371,696 |
| Series A 1 B, 5% 5/1/30 | | 490,000 | 525,473 |
| New York City Muni. Wtr. Fin. Auth. Wtr. & Swr. Sys. Rev. Series GG 1, 5% 6/15/48 | | 1,350,000 | 1,431,202 |
| New York City Transitional Fin. Auth.: | | | |
| Series 2024 B, 5% 5/1/39 | | 4,750,000 | 5,368,780 |
| Series 2024, 5% 11/1/29 | | 4,000,000 | 4,380,665 |
| New York City Trust Cultural Resources Rev. Series 2021, 5% 7/1/31 | | 660,000 | 739,394 |
| New York Dorm. Auth. Rev.: | | | |
| Series 2020 A: | | | |
4% 9/1/37 | | 350,000 | 339,604 |
4% 9/1/39 | | 700,000 | 667,002 |
4% 7/1/45 | | 1,000,000 | 962,013 |
| Series 2022 A: | | | |
5% 7/15/32 | | 1,250,000 | 1,315,529 |
5% 7/15/37 | | 110,000 | 114,677 |
5% 7/15/42 | | 310,000 | 316,091 |
| New York Dorm. Auth. Sales Tax Rev. Series 2023 A1, 5% 3/15/41 | | 3,915,000 | 4,376,864 |
| New York Metropolitan Trans. Auth. Rev.: | | | |
| Series 2015 A1, 5% 11/15/29 | | 120,000 | 121,225 |
| Series 2016 A, 5% 11/15/31 | | 100,000 | 102,317 |
| Series 2016 C1, 5% 11/15/33 | | 1,000,000 | 1,027,878 |
| Series 2017 B, 5% 11/15/24 | | 565,000 | 567,441 |
| Series 2017 C1, 5% 11/15/30 | | 325,000 | 344,112 |
| Series 2017 D: | | | |
5% 11/15/25 | | 1,635,000 | 1,669,510 |
5% 11/15/30 | | 2,220,000 | 2,350,552 |
| Series 2020 D: | | | |
4% 11/15/46 | | 2,050,000 | 1,988,068 |
4% 11/15/47 | | 150,000 | 144,533 |
| Series 2024 A, 5.25% 11/15/49 | | 5,000,000 | 5,442,489 |
| New York State Dorm. Auth.: | | | |
| Series 2019 D, 3% 2/15/49 | | 1,065,000 | 820,581 |
| Series 2021 A, 4% 3/15/38 | | 1,000,000 | 1,007,419 |
| Series 2021 E: | | | |
3% 3/15/50 | | 1,060,000 | 811,529 |
4% 3/15/39 | | 1,000,000 | 1,002,271 |
| Series 2024 A, 5.25% 3/15/52 | | 3,550,000 | 3,924,551 |
| New York State Envir. Facilities Corp. Rev. (2010 Master Fing. Prog.) Series 2021 B: | | | |
| 5% 2/15/28 | | 160,000 | 171,025 |
| 5% 8/15/28 | | 235,000 | 253,509 |
| 5% 2/15/29 | | 100,000 | 108,957 |
| 5% 8/15/29 | | 200,000 | 219,976 |
| 5% 2/15/30 | | 340,000 | 377,263 |
| 5% 8/15/30 | | 400,000 | 447,668 |
| New York State Hsg. Fin. Agcy. Rev.: | | | |
| Bonds: | | | |
Series 2021 J2, 1.1%, tender 5/1/27 (b) | | 1,105,000 | 997,756 |
Series 2021 K2, 1%, tender 11/1/26 (b) | | 250,000 | 230,899 |
Series 2023 C2, 3.8%, tender 5/1/29 (b) | | 3,120,000 | 3,123,976 |
| Series J, 0.75% 5/1/25 | | 130,000 | 125,767 |
| New York State Mtg. Agcy. Homeowner Mtg.: | | | |
| Series 2021 232, 5% 10/1/25 (d) | | 765,000 | 773,436 |
| Series 2021 239, 3.25% 10/1/51 | | 905,000 | 876,090 |
| Series 221, 3.5% 10/1/32 (d) | | 15,000 | 14,630 |
| New York State Urban Dev. Corp.: | | | |
| Series 2020 C, 4% 3/15/39 | | 1,000,000 | 1,005,784 |
| Series 2020 E: | | | |
4% 3/15/44 | | 1,675,000 | 1,651,529 |
4% 3/15/45 | | 1,350,000 | 1,324,508 |
| New York State Urban Eev Corp. Series 2019 A, 5% 3/15/37 | | 1,105,000 | 1,199,508 |
| New York Trans. Dev. Corp.: | | | |
| (Delta Air Lines, Inc. - Laguardia Arpt. Terminals C&D Redev. Proj.) Series 2020, 5% 10/1/40 (d) | | 1,000,000 | 1,040,412 |
| (Term. 4 John F. Kennedy Int'l. Arpt. Proj.) Series 2022: | | | |
5% 12/1/32 (d) | | 380,000 | 409,873 |
5% 12/1/33 (d) | | 590,000 | 636,354 |
5% 12/1/34 (d) | | 645,000 | 694,093 |
5% 12/1/35 (d) | | 325,000 | 349,145 |
5% 12/1/36 (d) | | 220,000 | 235,633 |
5% 12/1/37 (d) | | 590,000 | 629,278 |
5% 12/1/38 (d) | | 1,430,000 | 1,517,371 |
5% 12/1/39 (d) | | 1,090,000 | 1,152,859 |
5% 12/1/40 (d) | | 925,000 | 972,909 |
5% 12/1/41 (d) | | 840,000 | 879,947 |
5% 12/1/42 (d) | | 420,000 | 438,352 |
| Niagara Area Dev. Corp. Rev. (Catholic Health Sys., Inc. Proj.) Series 2022, 4.5% 7/1/52 | | 555,000 | 423,165 |
| Oneida County Local Dev. Corp. Rev. (Mohawk Valley Health Sys. Proj.) Series 2019 A, 5% 12/1/29 (Assured Guaranty Muni. Corp. Insured) | | 600,000 | 600,256 |
| Onondaga Civic Dev. Corp. (Le Moyne College Proj.) Series 2015, 5% 7/1/27 | | 295,000 | 296,857 |
| Suffolk County Econ. Dev. Corp. Rev. Series 2021: | | | |
| 5.125% 11/1/41 (e) | | 100,000 | 87,609 |
| 5.375% 11/1/54 (e) | | 100,000 | 83,005 |
TOTAL NEW YORK | | | 76,427,556 |
| New York And New Jersey - 0.5% | | | |
| New Jersey Edl. Facilities Auth. Rev. Series 2024 B, 5.25% 3/1/54 | | 3,150,000 | 3,514,788 |
| Port Auth. of New York & New Jersey Series 2017 202, 5% 10/15/29 (d) | | 500,000 | 514,197 |
TOTAL NEW YORK AND NEW JERSEY | | | 4,028,985 |
| North Carolina - 0.6% | | | |
| New Hanover County Hosp. Rev. Series 2017, 5% 10/1/27 (Escrowed to Maturity) | | 10,000 | 10,512 |
| North Carolina Med. Care Commission Health Care Facilities Rev.: | | | |
| Bonds Series 2019 C, 2.55%, tender 6/1/26 (b) | | 300,000 | 293,528 |
| Series 2020 A, 3% 7/1/45 | | 365,000 | 287,070 |
| Series 2021 A, 4% 3/1/51 | | 280,000 | 225,259 |
| North Carolina State Ed. Assistance Auth. Student Ln. Rev. Series 2023 A, 5% 6/1/43 (d) | | 155,000 | 154,726 |
| North Carolina Tpk. Auth. Triangle Expressway Sys. Series 2024 B, 5% 1/1/53 (Assured Guaranty Muni. Corp. Insured) | | 3,340,000 | 3,540,238 |
TOTAL NORTH CAROLINA | | | 4,511,333 |
| North Dakota - 0.2% | | | |
| North Dakota Hsg. Fin. Agcy.: | | | |
| Series 2021 A, 3% 1/1/52 | | 170,000 | 164,746 |
| Series 2021 B, 3% 7/1/52 | | 580,000 | 557,367 |
| Univ. of North Dakota Series 2021 A, 3% 6/1/61 (Assured Guaranty Muni. Corp. Insured) | | 790,000 | 550,217 |
TOTAL NORTH DAKOTA | | | 1,272,330 |
| Ohio - 3.9% | | | |
| Akron Bath Copley Hosp. District Rev.: | | | |
| Series 2016, 5.25% 11/15/46 | | 495,000 | 501,167 |
| Series 2020, 4% 11/15/38 | | 1,500,000 | 1,430,377 |
| Allen County Hosp. Facilities Rev. (Mercy Health) Series 2017 A: | | | |
| 5% 8/1/25 | | 10,000 | 10,148 |
| 5% 8/1/26 | | 390,000 | 402,105 |
| 5% 8/1/27 | | 10,000 | 10,477 |
| 5% 8/1/28 | | 10,000 | 10,563 |
| 5% 8/1/29 | | 10,000 | 10,521 |
| 5% 8/1/30 | | 10,000 | 10,527 |
| American Muni. Pwr., Inc. (Solar Electricity Prepayment Proj.) Series 2019 A, 5% 2/15/44 | | 175,000 | 181,337 |
| American Muni. Pwr., Inc. Rev. Series 2023 A, 5% 2/15/32 | | 500,000 | 556,932 |
| Buckeye Tobacco Settlement Fing. Auth. Series 2020 A2: | | | |
| 3% 6/1/48 | | 550,000 | 417,196 |
| 4% 6/1/48 | | 180,000 | 165,901 |
| 5% 6/1/34 | | 370,000 | 396,759 |
| Cleveland Arpt. Sys. Rev. Series 2016 A, 5% 1/1/25 (Assured Guaranty Muni. Corp. Insured) | | 145,000 | 145,961 |
| Cleveland Wtr. Rev. Series 2020, 5% 1/1/28 | | 800,000 | 851,003 |
| County of Cuyahoga (Ballpark Impt. Proj.) Series 2022 A, 4% 1/1/35 | | 8,000,000 | 8,302,030 |
| Franklin County Convention Facilities Auth. (Greater Columbus Convention Ctr. Hotel Expansion Proj.) Series 2019: | | | |
| 5% 12/1/44 | | 60,000 | 59,543 |
| 5% 12/1/46 | | 200,000 | 208,778 |
| 5% 12/1/51 | | 200,000 | 208,077 |
| Kent State Univ. Revs. Series 2016, 5% 5/1/30 | | 1,495,000 | 1,538,292 |
| Lancaster Port Auth. Gas Rev.: | | | |
| Bonds Series 2019, 5%, tender 2/1/25 (b) | | 255,000 | 256,391 |
| Series 2019, 5% 2/1/25 | | 160,000 | 160,814 |
| Middleburg Heights Hosp. Rev. Series 2021 A, 4% 8/1/41 | | 430,000 | 413,855 |
| Ohio Gen. Oblig.: | | | |
| Series 2021 A: | | | |
5% 3/1/28 | | 110,000 | 117,349 |
5% 3/1/28 | | 140,000 | 149,354 |
5% 3/1/29 | | 160,000 | 173,588 |
5% 3/1/29 | | 210,000 | 227,835 |
5% 3/1/30 | | 190,000 | 209,708 |
5% 3/1/30 | | 290,000 | 320,080 |
| Series 2021 B: | | | |
5% 2/1/28 | | 205,000 | 218,382 |
5% 2/1/29 | | 385,000 | 417,068 |
5% 2/1/30 | | 320,000 | 352,710 |
| Series 2021 C: | | | |
5% 3/15/28 | | 275,000 | 293,572 |
5% 3/15/29 | | 480,000 | 521,135 |
5% 3/15/30 | | 480,000 | 530,127 |
| Ohio Hosp. Facilities Rev. Series 2021 B: | | | |
| 5% 1/1/26 | | 320,000 | 328,234 |
| 5% 1/1/27 | | 750,000 | 781,742 |
| Ohio Hosp. Rev. Series 2020 A: | | | |
| 4% 1/15/50 | | 40,000 | 37,139 |
| 5% 1/15/31 | | 300,000 | 320,333 |
| Ohio Hsg. Fin. Agcy. Residential Mtg. Rev.: | | | |
| (Mtg. Backed Securities Prog.) Series 2019 B, 4.5% 3/1/50 | | 10,000 | 10,032 |
| (Mtg.-Backed Securities Prog.) Series 2023 B, 6% 3/1/55 | | 380,000 | 413,752 |
| Series 2021 C, 3.25% 3/1/51 | | 4,060,000 | 3,949,403 |
| Ohio Major New State Infrastructure Rev. Series 2021 1A: | | | |
| 5% 12/15/25 | | 800,000 | 820,079 |
| 5% 12/15/28 | | 1,250,000 | 1,349,906 |
| Ohio Tpk. Commission Tpk. Rev.: | | | |
| (Infrastructure Projs.) Series 2022 A: | | | |
5% 2/15/32 | | 70,000 | 78,824 |
5% 2/15/38 | | 185,000 | 209,325 |
| Series A, 5% 2/15/51 | | 600,000 | 637,100 |
| Scioto County Hosp. Facilities Rev. Series 2019, 5% 2/15/29 | | 100,000 | 102,595 |
| Univ. of Akron Gen. Receipts Series 2019 A, 4% 1/1/27 | | 220,000 | 222,259 |
| Washington County Hosp. Rev. Series 2022: | | | |
| 6% 12/1/28 | | 215,000 | 221,743 |
| 6% 12/1/29 | | 230,000 | 239,156 |
| 6% 12/1/30 | | 245,000 | 256,546 |
| 6% 12/1/31 | | 260,000 | 273,915 |
TOTAL OHIO | | | 30,031,745 |
| Oklahoma - 0.1% | | | |
| Oklahoma City Arpt. Trust Series 33, 5% 7/1/47 (d) | | 200,000 | 202,736 |
| Oklahoma Dev. Fin. Auth. Health Sys. Rev. Series 2015 A, 5% 8/15/24 | | 250,000 | 250,157 |
| Oklahoma Dev. Fin. Auth. Rev. (Oklahoma City Univ. Proj.) Series 2019, 5% 8/1/44 | | 125,000 | 124,057 |
| Oklahoma Hsg. Fin. Agcy. Single Family Mtg. Rev. (Homeownership Ln. Prog.) Series 2023 C, 6% 3/1/54 | | 70,000 | 76,243 |
TOTAL OKLAHOMA | | | 653,193 |
| Oregon - 0.3% | | | |
| Oregon State Hsg. & Cmnty. Svcs. Dept.: | | | |
| (Single-Family Mtg. Prog.) Series 2019 A, 2.65% 7/1/39 | | 160,000 | 132,927 |
| Series 2019 A, 4% 7/1/50 | | 875,000 | 870,090 |
| Port of Portland Arpt. Rev.: | | | |
| Series 2020 27A, 5% 7/1/45 (d) | | 650,000 | 672,600 |
| Series 27 A, 5% 7/1/36 (d) | | 240,000 | 254,684 |
| Salem Hosp. Facility Auth. Rev. (Salem Health Projs.) Series 2019 A, 3% 5/15/49 | | 850,000 | 664,925 |
TOTAL OREGON | | | 2,595,226 |
| Pennsylvania - 7.5% | | | |
| Allegheny County Arpt. Auth. Rev. Series 2021 A: | | | |
| 5% 1/1/51 (d) | | 2,105,000 | 2,168,140 |
| 5% 1/1/56 (d) | | 1,280,000 | 1,314,547 |
| Allegheny County Indl. Dev. Auth. Rev. Series 2021: | | | |
| 3.5% 12/1/31 | | 170,000 | 81,600 |
| 4% 12/1/41 | | 270,000 | 129,600 |
| 4.25% 12/1/50 | | 300,000 | 144,000 |
| Centre County Pennsylvania Hosp. Auth. Rev. (Mount Nittany Med. Ctr. Proj.) Series 2018 A, 5% 11/15/25 | | 100,000 | 101,897 |
| Chartiers Valley School District Series 2021 A, 3% 10/15/49 | | 1,155,000 | 879,177 |
| Commonwealth Fing. Auth. Rev. Series 2020 A, 5% 6/1/28 | | 305,000 | 323,793 |
| Delaware County Auth. Rev.: | | | |
| (Cabrini College) Series 2017, 5% 7/1/47 | | 510,000 | 509,874 |
| Series 2017, 5% 7/1/28 | | 445,000 | 454,549 |
| Doylestown Hosp. Auth. Hosp. Rev.: | | | |
| Series 2016 A: | | | |
5% 7/1/46 | | 15,000 | 14,590 |
5% 7/1/46 (Pre-Refunded to 7/1/26 @ 100) | | 5,000 | 5,156 |
| Series 2024, 5.375% 7/1/39 (e) | | 2,575,000 | 2,652,310 |
| Dubois Hosp. Auth. Hosp. Rev.: | | | |
| (Penn Highlands Healthcare Proj.) Series 2018: | | | |
4% 7/15/37 | | 40,000 | 38,938 |
5% 7/15/36 | | 500,000 | 511,862 |
| Series 2020, 4% 7/15/45 | | 500,000 | 463,833 |
| Geisinger Auth. Health Sys. Rev. Series 2017 A1, 5% 2/15/45 | | 100,000 | 101,603 |
| Lehigh County Gen. Purp. Auth. Rev. (Muhlenberg College Proj.) Series 2017, 5% 2/1/39 | | 60,000 | 61,150 |
| Lehigh County Gen. Purp. Hosp. Rev. Series 2016 A, 4% 7/1/35 | | 5,060,000 | 5,008,753 |
| Monroeville Fin. Auth. UPMC Rev. Series 2012, 5% 2/15/26 | | 95,000 | 97,452 |
| Montgomery County Higher Ed. & Health Auth. Rev.: | | | |
| Series 2016 A, 5% 10/1/40 | | 330,000 | 307,335 |
| Series 2019, 4% 9/1/44 | | 185,000 | 174,864 |
| Series 2020, 5% 4/1/27 | | 300,000 | 306,843 |
| Northampton County Gen. Purp. Auth. Hosp. Rev. (St. Luke's Univ. Health Network Proj.) Series 2018 A, 4% 8/15/48 | | 195,000 | 175,273 |
| Pennsylvania Ctfs. Prtn. Series 2018 A: | | | |
| 5% 7/1/24 | | 300,000 | 300,000 |
| 5% 7/1/26 | | 455,000 | 469,323 |
| 5% 7/1/27 | | 500,000 | 524,452 |
| 5% 7/1/34 | | 450,000 | 475,181 |
| Pennsylvania Higher Ed. Assistance Agcy. Rev. Series 2024 1A, 5% 6/1/29 (d) | | 410,000 | 429,325 |
| Pennsylvania Higher Edl. Facilities Auth. Rev. (Drexel Univ. Proj.): | | | |
| Series 2016, 5% 5/1/35 | | 500,000 | 506,401 |
| Series 2017, 5% 5/1/35 | | 10,000 | 10,226 |
| Pennsylvania Hsg. Fin. Agcy.: | | | |
| Series 2021 134B, 5% 10/1/27 (d) | | 1,160,000 | 1,186,953 |
| Series 2021 137, 3% 10/1/51 | | 815,000 | 779,047 |
| Series 2022 138: | | | |
3% 10/1/52 | | 1,295,000 | 1,237,316 |
5% 4/1/26 | | 1,100,000 | 1,125,767 |
5% 10/1/26 | | 600,000 | 618,462 |
5% 4/1/27 | | 500,000 | 519,116 |
5% 10/1/27 | | 450,000 | 470,610 |
5% 4/1/28 | | 465,000 | 488,862 |
5% 10/1/28 | | 475,000 | 502,887 |
5% 4/1/29 | | 480,000 | 511,487 |
5% 10/1/29 | | 1,000,000 | 1,072,993 |
5% 4/1/30 | | 1,010,000 | 1,076,708 |
5% 10/1/30 | | 695,000 | 744,817 |
| Pennsylvania Tpk. Commission Tpk. Rev.: | | | |
| Series 2015 B, 5% 12/1/45 | | 265,000 | 268,258 |
| Series 2016 A1, 5% 12/1/41 | | 1,215,000 | 1,232,990 |
| Series 2021 A, 4% 12/1/50 | | 1,000,000 | 936,102 |
| Series 2021 B: | | | |
5% 12/1/28 | | 625,000 | 672,063 |
5% 12/1/29 | | 1,000,000 | 1,092,379 |
| Series 2024, 5% 12/1/44 | | 7,405,000 | 8,119,122 |
| Philadelphia Arpt. Rev.: | | | |
| Series 2017 B: | | | |
5% 7/1/35 (d) | | 50,000 | 51,393 |
5% 7/1/47 (d) | | 970,000 | 978,823 |
| Series 2020 C, 5% 7/1/29 (d) | | 595,000 | 627,826 |
| Series 2021: | | | |
5% 7/1/26 (d) | | 2,920,000 | 2,982,835 |
5% 7/1/27 (d) | | 4,020,000 | 4,157,780 |
5% 7/1/28 (d) | | 425,000 | 443,580 |
5% 7/1/34 (d) | | 1,000,000 | 1,076,705 |
5% 7/1/35 (d) | | 1,000,000 | 1,075,983 |
| Philadelphia Auth. for Indl. Dev.: | | | |
| Series 2015 1, 5% 4/1/33 | | 70,000 | 70,521 |
| Series 2017 A, 5% 9/1/42 | | 760,000 | 769,898 |
| Philadelphia Gas Works Rev. Series 2020 A, 5% 8/1/32 (Assured Guaranty Muni. Corp. Insured) | | 1,000,000 | 1,092,425 |
| Philadelphia Gen. Oblig. Series 2019 A, 5% 8/1/26 | | 220,000 | 227,073 |
| Philadelphia School District: | | | |
| Series 2018 A, 5% 9/1/25 | | 50,000 | 50,807 |
| Series 2018 B, 5% 9/1/43 | | 50,000 | 51,363 |
| Series 2019 A: | | | |
4% 9/1/35 | | 170,000 | 172,276 |
5% 9/1/34 (Assured Guaranty Muni. Corp. Insured) | | 80,000 | 85,311 |
| Series 2019 B, 5% 9/1/26 | | 415,000 | 429,003 |
| Series 2019 C, 5% 9/1/33 | | 315,000 | 335,904 |
| Philadelphia Wtr. & Wastewtr. Rev. Series 2023 B, 5.5% 9/1/53 (Assured Guaranty Muni. Corp. Insured) | | 1,000,000 | 1,119,841 |
| Pittsburgh Wtr. & Swr. Auth. Wtr. & Swr. Sys. Rev. Series 2019 A, 5% 9/1/44 (Assured Guaranty Muni. Corp. Insured) | | 70,000 | 73,530 |
| Southcentral Pennsylvania Gen. Auth. Rev.: | | | |
| (Hanover Hosp., Inc. PA Proj.) Series 2015, 5% 12/1/28 | | 45,000 | 45,772 |
| Series 2019 A: | | | |
4% 6/1/44 | | 50,000 | 47,889 |
4% 6/1/49 | | 115,000 | 108,797 |
5% 6/1/25 | | 200,000 | 202,457 |
5% 6/1/44 | | 85,000 | 87,511 |
5% 6/1/49 | | 135,000 | 138,077 |
| State Pub. School Bldg. Auth. Lease Rev. (The School District of Philadelphia Proj.) Series 2016 A, 5% 6/1/32 (Assured Guaranty Muni. Corp. Insured) | | 315,000 | 323,647 |
| Union County Hosp. Auth. Rev. Series 2018 B, 5% 8/1/43 | | 185,000 | 190,156 |
TOTAL PENNSYLVANIA | | | 58,415,169 |
| Puerto Rico - 1.4% | | | |
| Puerto Rico Commonwealth Aqueduct & Swr. Auth.: | | | |
| Series 2021 A, 5% 7/1/33 (e) | | 900,000 | 949,351 |
| Series 2021 B: | | | |
5% 7/1/33 (e) | | 250,000 | 263,709 |
5% 7/1/37 (e) | | 960,000 | 1,001,448 |
| Series 2022 A, 4% 7/1/42 (e) | | 960,000 | 898,958 |
| Puerto Rico Commonwealth Pub. Impt. Gen. Oblig. Series 2021 A1: | | | |
| 0% 7/1/33 | | 2,273,421 | 1,516,962 |
| 4% 7/1/33 | | 1,608,885 | 1,611,299 |
| 4% 7/1/35 | | 575,000 | 564,456 |
| 5.625% 7/1/27 | | 190,000 | 198,232 |
| 5.625% 7/1/29 | | 999,707 | 1,072,201 |
| Puerto Rico Sales Tax Fing. Corp. Sales Tax Rev. Series 2019 A2, 4.329% 7/1/40 | | 2,920,000 | 2,880,852 |
TOTAL PUERTO RICO | | | 10,957,468 |
| Rhode Island - 0.7% | | | |
| Rhode Island Health & Edl. Bldg. Corp. Higher Ed. Facilities Rev.: | | | |
| Series 2016 B, 5% 9/1/36 | | 500,000 | 501,122 |
| Series 2016, 5% 5/15/39 | | 215,000 | 217,321 |
| Rhode Island Health and Edl. Bldg. Corp. Higher Ed. Facility Rev. Series 2024: | | | |
| 5% 6/1/36 | | 445,000 | 499,959 |
| 5% 6/1/41 | | 555,000 | 604,109 |
| 5% 6/1/45 | | 1,000,000 | 1,075,042 |
| 5% 6/1/48 | | 1,145,000 | 1,218,069 |
| Rhode Island Hsg. & Mtg. Fin. Corp. Series 2019 70, 4% 10/1/49 | | 20,000 | 19,881 |
| Rhode Island Student Ln. Auth. Student Ln. Rev.: | | | |
| Series 2023 A, 5% 12/1/30 (d) | | 730,000 | 770,092 |
| Series 2024 A, 5% 12/1/28 (d) | | 725,000 | 758,630 |
| Series A, 4% 12/1/26 (d) | | 35,000 | 34,685 |
TOTAL RHODE ISLAND | | | 5,698,910 |
| South Carolina - 1.6% | | | |
| Charleston County Arpt. District Series 2019, 5% 7/1/48 | | 395,000 | 411,674 |
| South Carolina Hsg. Fin. & Dev. Auth. Mtg. Rev.: | | | |
| Series 2019 A, 4% 1/1/50 | | 40,000 | 39,741 |
| Series 2023 B, 6% 1/1/54 | | 235,000 | 255,959 |
| South Carolina Jobs-Econ. Series 2024 A, 5.5% 11/1/48 | | 5,000,000 | 5,613,747 |
| South Carolina Jobs-Econ. Dev. Auth.: | | | |
| Series 2019 C, 5% 7/1/33 | | 170,000 | 179,235 |
| Series 2023: | | | |
4% 2/1/42 | | 1,115,000 | 1,113,639 |
5% 2/1/40 | | 835,000 | 906,277 |
| South Carolina Jobs-Econ. Dev. Auth. Econ. Dev. Rev. Series 2022 A, 4% 4/1/52 | | 1,000,000 | 980,052 |
| South Carolina Ports Auth. Ports Rev.: | | | |
| Series 2015, 5.25% 7/1/55 (Pre-Refunded to 7/1/25 @ 100) (d) | | 255,000 | 258,981 |
| Series 2018, 5% 7/1/43 (d) | | 520,000 | 532,911 |
| South Carolina Pub. Svc. Auth. Rev.: | | | |
| Series 2016 A: | | | |
5% 12/1/26 | | 140,000 | 143,132 |
5% 12/1/29 | | 500,000 | 510,308 |
5% 12/1/33 | | 15,000 | 15,218 |
5% 12/1/38 | | 80,000 | 80,862 |
| Series 2016 B: | | | |
5% 12/1/31 | | 105,000 | 107,595 |
5% 12/1/35 | | 195,000 | 198,421 |
| Spartanburg County Reg'l. Health Series 2017 A: | | | |
| 4% 4/15/43 | | 30,000 | 28,742 |
| 4% 4/15/48 | | 20,000 | 18,511 |
| 5% 4/15/48 | | 1,415,000 | 1,445,070 |
TOTAL SOUTH CAROLINA | | | 12,840,075 |
| South Dakota - 0.0% | | | |
| South Dakota Health & Edl. Facilities Auth. Rev. Series 2020 A, 3% 9/1/45 | | 475,000 | 375,004 |
| Tennessee - 1.3% | | | |
| Chattanooga Health Ed. & Hsg. Facility Board Rev. Series 2019 A1: | | | |
| 4% 8/1/44 | | 575,000 | 559,380 |
| 5% 8/1/25 | | 135,000 | 137,116 |
| Memphis-Shelby County Arpt. Auth. Arpt. Rev. Series 2018: | | | |
| 5% 7/1/26 (d) | | 450,000 | 458,728 |
| 5% 7/1/37 (d) | | 200,000 | 206,999 |
| 5% 7/1/38 (d) | | 1,315,000 | 1,356,989 |
| Metropolitan Govt. of Nashville & Davidson County Series 2023: | | | |
| 5% 5/1/38 | | 900,000 | 981,014 |
| 5% 5/1/40 | | 800,000 | 864,171 |
| Metropolitan Nashville Arpt. Auth. Rev.: | | | |
| Series 2015 B, 4% 7/1/25 (d) | | 55,000 | 55,056 |
| Series 2019 B: | | | |
5% 7/1/38 (d) | | 655,000 | 691,928 |
5% 7/1/54 (d) | | 225,000 | 230,666 |
| Nashville and Davidson County Metropolitan Govt. Gen. Oblig. Series 2021 C, 5% 1/1/30 | | 2,400,000 | 2,635,487 |
| Nashville and Davidson County Metropolitan Govt. Health & Edl. Facilities Board Rev. (Lipscomb Univ. Proj.) Series 2019 A, 4% 10/1/49 | | 1,000,000 | 860,210 |
| Tennessee Hsg. Dev. Agcy. Series 2015 A, 3.5% 7/1/45 | | 150,000 | 148,644 |
| Tennessee Hsg. Dev. Agcy. Residential: | | | |
| Series 2019 3: | | | |
2.6% 7/1/39 | | 65,000 | 53,543 |
2.8% 7/1/44 | | 75,000 | 59,052 |
| Series 2019 4, 2.9% 7/1/39 | | 145,000 | 122,148 |
| Series 2021 1, 3% 7/1/51 | | 520,000 | 504,917 |
| Series 2021 3A, 3% 1/1/52 | | 235,000 | 226,576 |
TOTAL TENNESSEE | | | 10,152,624 |
| Texas - 4.5% | | | |
| Austin Cmnty. College District Rev. (Highland Campus Parking Garage Proj.) Series 2018 C: | | | |
| 5% 8/1/25 | | 200,000 | 203,460 |
| 5% 8/1/26 | | 200,000 | 206,933 |
| Birdville Independent School District Series 2020, 2.375% 2/15/35 | | 170,000 | 144,312 |
| Brazos County Gen. Oblig. Series 2020, 2.125% 9/1/40 | | 355,000 | 251,332 |
| Central Reg'l. Mobility Auth.: | | | |
| Series 2020 B, 5% 1/1/45 | | 1,000,000 | 1,048,147 |
| Series 2021 B: | | | |
5% 1/1/33 | | 640,000 | 695,949 |
5% 1/1/34 | | 650,000 | 706,819 |
5% 1/1/35 | | 550,000 | 597,939 |
5% 1/1/36 | | 850,000 | 922,174 |
5% 1/1/37 | | 1,100,000 | 1,190,485 |
5% 1/1/38 | | 1,100,000 | 1,189,557 |
| Series 2021 C, 5% 1/1/27 | | 775,000 | 791,681 |
| Dallas Gen. Oblig. Series 2024 A, 5% 2/15/28 | | 500,000 | 530,743 |
| Denton Independent School District Bonds: | | | |
| Series 2014 B: | | | |
2%, tender 8/1/24 (b) | | 15,000 | 14,979 |
2%, tender 8/1/24 (b) | | 15,000 | 14,979 |
| Series 2019: | | | |
2%, tender 8/1/24 (b) | | 10,000 | 9,984 |
2%, tender 8/1/24 (b) | | 60,000 | 59,901 |
| Fort Bend Independent School District Bonds Series 2021 B, 0.72%, tender 8/1/26 (b) | | 405,000 | 373,987 |
| Garland Elec. Util. Sys. Rev. Series 2021 A: | | | |
| 4% 3/1/35 | | 765,000 | 782,072 |
| 4% 3/1/36 | | 750,000 | 764,855 |
| Grand Parkway Trans. Corp. Bonds Series 2023, 5%, tender 4/1/28 (b) | | 2,545,000 | 2,674,930 |
| Harris County Cultural Ed. Facilities Fin. Corp. Rev. Series 2015, 4% 12/1/45 | | 220,000 | 208,917 |
| Harris County Flood Cont. District Series 2021 A: | | | |
| 5% 10/1/25 | | 690,000 | 705,277 |
| 5% 10/1/26 | | 900,000 | 936,246 |
| Houston Arpt. Sys. Rev.: | | | |
| Series 2018 A, 5% 7/1/41 (d) | | 1,000,000 | 1,028,453 |
| Series 2018 C: | | | |
5% 7/1/26 (d) | | 200,000 | 204,497 |
5% 7/1/30 (d) | | 120,000 | 125,558 |
| Series 2018 D, 5% 7/1/39 | | 260,000 | 271,578 |
| Houston City of Higher Ed. Fin. Corp. (Houston Baptist Univ. Proj.) Series 2021: | | | |
| 3.375% 10/1/37 | | 500,000 | 418,739 |
| 4% 10/1/51 | | 1,200,000 | 948,215 |
| Houston Gen. Oblig. Series 2017 A, 5% 3/1/32 | | 25,000 | 25,938 |
| Houston Hsg. Fin. Corp. Multi-family Hsg. Rev. Bonds Series 2023, 5%, tender 8/1/26 (b) | | 465,000 | 472,932 |
| Houston Util. Sys. Rev.: | | | |
| Series 2020 C, 5% 11/15/45 | | 1,000,000 | 1,070,390 |
| Series 2021 A, 5% 11/15/26 | | 445,000 | 463,373 |
| Love Field Arpt. Modernization Rev.: | | | |
| Series 2015, 5% 11/1/30 (d) | | 320,000 | 323,893 |
| Series 2017, 5% 11/1/31 (d) | | 25,000 | 25,470 |
| Mansfield Tex Series 2020, 2.375% 2/15/36 | | 565,000 | 461,836 |
| Midlothian Independent School District Bonds Series 2013 C: | | | |
| 2%, tender 8/1/24 (b) | | 35,000 | 34,948 |
| 2%, tender 8/1/24 (b) | | 65,000 | 64,893 |
| New Hope Cultural Ed. Facilities Fin. Corp. (Childrens Med. Ctr. of Dallas) Series 2017 A: | | | |
| 5% 8/15/27 | | 10,000 | 10,471 |
| 5% 8/15/47 | | 10,000 | 10,177 |
| North Texas Tollway Auth. Rev.: | | | |
| Series 2019 B, 5% 1/1/25 | | 85,000 | 85,661 |
| Series 2021 B, 4% 1/1/32 | | 2,000,000 | 2,054,771 |
| Northside Independent School District Bonds Series 2024 B, 3.45%, tender 8/1/27 (b) | | 1,610,000 | 1,609,414 |
| Pflugerville Gen. Oblig. Series 2020, 1.875% 8/1/36 | | 1,095,000 | 826,328 |
| San Antonio Elec. & Gas Sys. Rev. Series 2017, 5% 2/1/33 | | 5,000 | 5,205 |
| San Antonio Wtr. Sys. Rev.: | | | |
| Series 2018 A, 5% 5/15/33 | | 5,000 | 5,315 |
| Series 2020 A, 5% 5/15/50 | | 475,000 | 499,456 |
| Southwest Higher Ed. Auth. Rev. (Southern Methodist Univ. Proj.) Series 2016 A, 3% 10/1/32 | | 370,000 | 340,110 |
| Tarrant County Cultural Ed. Facilities Fin. Corp. Rev. Series 2018 A, 5% 7/1/29 | | 305,000 | 322,742 |
| Texas Dept. of Hsg. & Cmnty. Affairs Multi-family Hsg. Rev. Series 2019, 2.95% 7/1/36 | | 120,991 | 104,146 |
| Texas Dept. of Hsg. & Cmnty. Affairs Residential Mtg. Rev. Series 2023 B, 6% 1/1/54 | | 970,000 | 1,057,769 |
| Texas Dept. of Hsg. & Cmnty. Affairs Single Family Mtg. Rev.: | | | |
| Series 2019 A, 4% 3/1/50 | | 65,000 | 64,570 |
| Series A, 3.5% 3/1/51 | | 125,000 | 122,334 |
| Texas Muni. Gas Acquisition & Supply Corp. Bonds Series 2023 B, 5.5%, tender 1/1/34 (b) | | 295,000 | 329,441 |
| Texas Private Activity Bond Surface Trans. Corp. (LBJ Infrastructure Group LLC I-635 Managed Lanes Proj.) Series 2020 A, 4% 6/30/37 | | 1,000,000 | 1,005,490 |
| Texas Trans. Commission Series 2019 A, 0% 8/1/41 | | 250,000 | 111,743 |
| Texas Trans. Commission Hwy. Impt. Gen. Oblig. Bonds Series 2014 B, 0.65%, tender 4/1/26 (b) | | 2,380,000 | 2,224,457 |
| Univ. of North Texas Univ. Rev. Series 2022 A, 5% 4/15/47 | | 2,000,000 | 2,052,395 |
| Univ. of Texas Board of Regents Sys. Rev. Series 2021 A, 2% 8/15/36 | | 700,000 | 543,696 |
| Waco Gen. Oblig. Series 2020, 2.375% 2/1/40 | | 660,000 | 478,772 |
TOTAL TEXAS | | | 34,830,834 |
| Utah - 0.1% | | | |
| Salt Lake City Arpt. Rev.: | | | |
| Series 2017 A, 5% 7/1/37 (d) | | 385,000 | 394,758 |
| Series 2018 A: | | | |
5% 7/1/33 (d) | | 175,000 | 181,757 |
5.25% 7/1/48 (d) | | 130,000 | 133,492 |
| Series 2023 A, 5.25% 7/1/37 (d) | | 310,000 | 348,679 |
TOTAL UTAH | | | 1,058,686 |
| Vermont - 0.2% | | | |
| Vermont Hsg. Fin. Agcy. Series 2021 B, 3% 11/1/51 | | 282,000 | 269,891 |
| Vermont Student Assistant Corp. Ed. Ln. Rev.: | | | |
| Series 2019 A, 5% 6/15/25 (d) | | 635,000 | 639,578 |
| Series 2020 A, 5% 6/15/26 (d) | | 620,000 | 630,890 |
TOTAL VERMONT | | | 1,540,359 |
| Virginia - 0.9% | | | |
| Lynchburg Econ. Dev. Series 2021, 3% 1/1/51 | | 425,000 | 321,829 |
| Roanoke Econ. Dev. Auth. Edl. Facilities Series 2018 A, 5% 9/1/24 | | 315,000 | 315,250 |
| Salem Econ. Dev. Auth. Series 2020: | | | |
| 4% 4/1/40 | | 120,000 | 111,089 |
| 5% 4/1/25 | | 165,000 | 165,717 |
| 5% 4/1/36 | | 500,000 | 518,985 |
| Virginia College Bldg. Auth. Edl. Facilities Rev.: | | | |
| (21St Century Collage and Equip. Programs) Series 2021 A: | | | |
4% 2/1/34 | | 1,850,000 | 1,913,337 |
4% 2/1/35 | | 1,700,000 | 1,754,198 |
| Series 2019 A, 3% 2/1/36 | | 195,000 | 180,256 |
| Virginia Small Bus. Fing. Auth. (Elizabeth River Crossings OpCo, LLC Proj.) Series 2022, 4% 7/1/34 (d) | | 1,465,000 | 1,478,809 |
TOTAL VIRGINIA | | | 6,759,470 |
| Washington - 2.3% | | | |
| King County Hsg. Auth. Rev. Series 2021, 4% 12/1/29 | | 230,000 | 231,884 |
| King County Swr. Rev. Series 2017, 5% 7/1/34 | | 10,000 | 10,448 |
| Port of Seattle Rev.: | | | |
| Series 2013, 5% 7/1/24 (d) | | 55,000 | 55,000 |
| Series 2015 B, 5% 3/1/25 | | 70,000 | 70,165 |
| Series 2018 A, 5% 5/1/31 (d) | | 350,000 | 359,793 |
| Series 2019 A, 4% 4/1/44 (d) | | 100,000 | 93,483 |
| Series 2021 C: | | | |
5% 8/1/24 (d) | | 445,000 | 445,333 |
5% 8/1/25 (d) | | 365,000 | 369,641 |
5% 8/1/26 (d) | | 495,000 | 507,112 |
5% 8/1/27 (d) | | 305,000 | 316,167 |
5% 8/1/28 (d) | | 860,000 | 899,686 |
| Seattle Hsg. Auth. Rev. (Northgate Plaza Proj.) Series 2021, 1% 6/1/26 | | 200,000 | 186,301 |
| Spokane Pub. Facilities District Hotel/Motel Tax & Sales/Use Tax Rev. Series 2017, 5% 12/1/41 | | 295,000 | 298,672 |
| Washington Convention Ctr. Pub. Facilities: | | | |
| Series 2021 B: | | | |
3% 7/1/43 | | 130,000 | 102,651 |
3% 7/1/58 (Assured Guaranty Muni. Corp. Insured) | | 1,805,000 | 1,319,269 |
| Series 2021, 4% 7/1/31 | | 2,540,000 | 2,507,647 |
| Washington Gen. Oblig. Series 2021 C, 5% 2/1/44 | | 3,010,000 | 3,237,677 |
| Washington Health Care Facilities Auth. Rev.: | | | |
| (Overlake Hosp. Med. Ctr., WA. Proj.) Series 2017 B: | | | |
5% 7/1/25 | | 5,000 | 5,027 |
5% 7/1/30 | | 5,000 | 5,075 |
5% 7/1/31 | | 10,000 | 10,153 |
5% 7/1/42 | | 100,000 | 99,954 |
| Series 2017, 4% 8/15/42 | | 100,000 | 87,373 |
| Series 2019 A2, 5% 8/1/44 | | 255,000 | 262,567 |
| Series 2020, 5% 9/1/40 | | 735,000 | 775,485 |
| Washington Higher Ed. Facilities Auth. Rev.: | | | |
| (Gonzaga Univ. Proj.) Series 2019 A, 3% 4/1/49 | | 725,000 | 566,757 |
| (Whitman College Proj.) Series 2024, 4% 1/1/43 | | 315,000 | 305,013 |
| (Whitworth Univ. Proj.) Series 2016 A, 5% 10/1/25 | | 550,000 | 555,679 |
| Washington Hsg. Fin. Commission Series 2021 2N: | | | |
| 5% 6/1/26 | | 970,000 | 995,248 |
| 5% 12/1/27 | | 985,000 | 1,031,558 |
| 5% 12/1/28 | | 500,000 | 528,974 |
| 5% 12/1/29 | | 500,000 | 537,676 |
| Washington Hsg. Fin. Commission Nonprofit Hsg. Rev. (Judson Park Proj.) Series 2018, 5% 7/1/38 (e) | | 100,000 | 97,931 |
| Washington Hsg. Fin. Commission Nonprofit Rev. (Seattle Academy of Arts and Sciences Proj.) Series 2023, 5.125% 7/1/33 (e) | | 740,000 | 794,181 |
TOTAL WASHINGTON | | | 17,669,580 |
| West Virginia - 0.1% | | | |
| West Virginia Hosp. Fin. Auth. Hosp. Rev. Series 2018 A: | | | |
| 5% 1/1/32 | | 50,000 | 50,074 |
| 5% 1/1/43 | | 370,000 | 367,608 |
TOTAL WEST VIRGINIA | | | 417,682 |
| Wisconsin - 1.8% | | | |
| Blue Ridge Healthcare Pub. Fin. Auth. Series 2020 A, 5% 1/1/31 | | 60,000 | 62,794 |
| Howard Suamico Scd Series 2021, 2% 3/1/38 | | 265,000 | 196,295 |
| New Richmond Scd Series 2024: | | | |
| 4% 4/1/43 | | 1,940,000 | 1,879,408 |
| 5% 4/1/34 | | 1,355,000 | 1,511,198 |
| Pub. Fin. Auth. Edl. Facilities Series 2018 A: | | | |
| 5.25% 10/1/43 | | 160,000 | 153,727 |
| 5.25% 10/1/48 | | 160,000 | 149,617 |
| Pub. Fin. Auth. Hosp. Rev.: | | | |
| (Renown Reg'l. Med. Ctr. Proj.) Series 2020 A, 4% 6/1/45 | | 320,000 | 297,037 |
| Series 2019 A, 5% 10/1/44 | | 355,000 | 366,065 |
| Pub. Fin. Auth. Wisconsin Retirement Facility Rev. Series 2018: | | | |
| 5% 10/1/43 (e) | | 45,000 | 44,124 |
| 5% 10/1/48 (e) | | 40,000 | 38,003 |
| 5% 10/1/53 (e) | | 30,000 | 27,952 |
| Roseman Univ. of Health: | | | |
| Series 2020: | | | |
3% 4/1/25 (e) | | 115,000 | 113,826 |
5% 4/1/40 (e) | | 95,000 | 98,154 |
5% 4/1/40 (Pre-Refunded to 4/1/30 @ 100) (e) | | 5,000 | 5,480 |
| Series 2021 A: | | | |
3% 7/1/50 | | 380,000 | 276,466 |
4.5% 6/1/56 (e) | | 1,870,000 | 1,505,474 |
| Series 2021 B, 6.5% 6/1/56 (e) | | 500,000 | 421,020 |
| Wisconsin Gen. Oblig. Series 2021 A, 5% 5/1/32 | | 1,430,000 | 1,522,821 |
| Wisconsin Health & Edl. Facilities: | | | |
| Series 2016 A: | | | |
3.5% 2/15/40 | | 50,000 | 41,261 |
4% 11/15/46 | | 195,000 | 184,506 |
4% 11/15/46 (Pre-Refunded to 5/15/26 @ 100) | | 80,000 | 80,884 |
| Series 2016, 4% 12/1/46 | | 675,000 | 648,763 |
| Series 2019 A: | | | |
5% 12/1/28 | | 150,000 | 157,658 |
5% 12/1/29 | | 150,000 | 159,584 |
| Series 2019 B1, 2.825% 11/1/28 | | 10,000 | 9,272 |
| Series 2019: | | | |
5% 10/1/24 | | 175,000 | 175,475 |
5% 10/1/30 | | 195,000 | 209,248 |
| Wisconsin Health & Edl. Facilities Auth. Rev. Series 2024 A, 5.25% 2/15/54 | | 2,500,000 | 2,665,843 |
| Wisconsin Hsg. & Econ. Dev. Auth.: | | | |
| Series 2021 A, 3% 3/1/52 | | 160,000 | 154,291 |
| Series 2021 C, 3% 9/1/52 | | 335,000 | 323,073 |
| Wisconsin Hsg. & Econ. Dev. Auth. Hsg. Rev. Bonds Series 2021 C, 0.81%, tender 5/1/25 (b) | | 225,000 | 216,952 |
TOTAL WISCONSIN | | | 13,696,271 |
| Wyoming - 0.2% | | | |
| Wyoming Cmnty. Dev. Auth. Hsg. Rev. Series 2022 3: | | | |
| 5% 12/1/24 (d) | | 695,000 | 698,091 |
| 5% 6/1/25 (d) | | 700,000 | 707,378 |
| 5% 12/1/25 (d) | | 375,000 | 381,249 |
TOTAL WYOMING | | | 1,786,718 |
| TOTAL MUNICIPAL BONDS (Cost $764,026,855) | | | 736,735,982 |
| | | | |
| Money Market Funds - 5.5% |
| | | Shares | Value ($) |
Fidelity Municipal Cash Central Fund 4.33% (h)(i) (Cost $43,191,627) | | 43,182,985 | 43,191,613 |
| | | | |
| TOTAL INVESTMENT IN SECURITIES - 100.0% (Cost $807,218,482) | 779,927,595 |
NET OTHER ASSETS (LIABILITIES) - 0.0% | (177,524) |
| NET ASSETS - 100.0% | 779,750,071 |
| | |
Legend
| (a) | Amount is stated in United States dollars unless otherwise noted. |
| (b) | Coupon rates for floating and adjustable rate securities reflect the rates in effect at period end. |
| (d) | Private activity obligations whose interest is subject to the federal alternative minimum tax for individuals. |
| (e) | Security exempt from registration under Rule 144A of the Securities Act of 1933. These securities may be resold in transactions exempt from registration, normally to qualified institutional buyers. At the end of the period, the value of these securities amounted to $11,175,051 or 1.4% of net assets. |
| (f) | Non-income producing - Security is in default. |
| (g) | Security or a portion of the security purchased on a delayed delivery or when-issued basis. |
| (h) | Information in this report regarding holdings by state and security types does not reflect the holdings of the Fidelity Municipal Cash Central Fund. |
| (i) | Affiliated fund that is generally available only to investment companies and other accounts managed by Fidelity Investments. The rate quoted is the annualized seven-day yield of the fund at period end. A complete unaudited listing of the fund's holdings as of its most recent quarter end is available upon request. In addition, each Fidelity Central Fund's financial statements are available on the SEC's website or upon request. |
Affiliated Central Funds
Fiscal year to date information regarding the Fund's investments in Fidelity Central Funds, including the ownership percentage, is presented below.
| Affiliate | Value, beginning of period ($) | Purchases ($) | Sales Proceeds ($) | Dividend Income ($) | Realized Gain (loss) ($) | Change in Unrealized appreciation (depreciation) ($) | Value, end of period ($) | % ownership, end of period |
| Fidelity Municipal Cash Central Fund 4.33% | 27,616,986 | 86,105,787 | 70,530,795 | 710,259 | (350) | (15) | 43,191,613 | 2.3% |
| Total | 27,616,986 | 86,105,787 | 70,530,795 | 710,259 | (350) | (15) | 43,191,613 | |
| | | | | | | | | |
Amounts in the dividend income column in the above table include any capital gain distributions from underlying funds, which are presented in the corresponding line item in the Statement of Operations, if applicable.
Amounts included in the purchases and sales proceeds columns may include in-kind transactions, if applicable.
Investment Valuation
The following is a summary of the inputs used, as of June 30, 2024, involving the Fund's assets and liabilities carried at fair value. The inputs or methodology used for valuing securities may not be an indication of the risk associated with investing in those securities. For more information on valuation inputs, and their aggregation into the levels used below, please refer to the Investment Valuation section in the accompanying Notes to Financial Statements.
| Valuation Inputs at Reporting Date: |
| Description | Total ($) | Level 1 ($) | Level 2 ($) | Level 3 ($) |
Investments in Securities: | | | | |
|
| Municipal Securities | 736,735,982 | - | 736,383,096 | 352,886 |
|
| Money Market Funds | 43,191,613 | 43,191,613 | - | - |
| Total Investments in Securities: | 779,927,595 | 43,191,613 | 736,383,096 | 352,886 |
Financial Statements (Unaudited)
| Statement of Assets and Liabilities |
| | | | June 30, 2024 (Unaudited) |
| | | | | |
| Assets | | | | |
| Investment in securities, at value - See accompanying schedule: | | | | |
Unaffiliated issuers (cost $764,026,855) | $ | 736,735,982 | | |
Fidelity Central Funds (cost $43,191,627) | | 43,191,613 | | |
| | | | | |
| | | | | |
| Total Investment in Securities (cost $807,218,482) | | | $ | 779,927,595 |
| Receivable for fund shares sold | | | | 365,274 |
| Interest receivable | | | | 9,104,466 |
| Distributions receivable from Fidelity Central Funds | | | | 134,769 |
| Other receivables | | | | 107 |
Total assets | | | | 789,532,211 |
| Liabilities | | | | |
| Payable to custodian bank | $ | 278,372 | | |
| Payable for investments purchased | | | | |
Regular delivery | | 2,659,000 | | |
Delayed delivery | | 4,409,507 | | |
| Payable for fund shares redeemed | | 625,870 | | |
| Distributions payable | | 1,809,391 | | |
| Total liabilities | | | | 9,782,140 |
| Net Assets | | | $ | 779,750,071 |
| Net Assets consist of: | | | | |
| Paid in capital | | | $ | 814,923,787 |
| Total accumulated earnings (loss) | | | | (35,173,716) |
| Net Assets | | | $ | 779,750,071 |
Net Asset Value, offering price and redemption price per share ($779,750,071 ÷ 79,642,003 shares) | | | $ | 9.79 |
| Statement of Operations |
| | | | Six months ended June 30, 2024 (Unaudited) |
| Investment Income | | | | |
| Interest | | | $ | 9,972,491 |
| Income from Fidelity Central Funds | | | | 710,259 |
| Total income | | | | 10,682,750 |
| Expenses | | | | |
| Independent trustees' fees and expenses | $ | 970 | | |
| Proxy | | 2,253 | | |
| Total expenses before reductions | | 3,223 | | |
| Expense reductions | | (77) | | |
| Total expenses after reductions | | | | 3,146 |
| Net Investment income (loss) | | | | 10,679,604 |
| Realized and Unrealized Gain (Loss) | | | | |
| Net realized gain (loss) on: | | | | |
| Investment Securities: | | | | |
| Unaffiliated issuers | | (913,978) | | |
| Fidelity Central Funds | | (350) | | |
| Total net realized gain (loss) | | | | (914,328) |
| Change in net unrealized appreciation (depreciation) on: | | | | |
| Investment Securities: | | | | |
| Unaffiliated issuers | | (5,292,335) | | |
| Fidelity Central Funds | | (15) | | |
| Total change in net unrealized appreciation (depreciation) | | | | (5,292,350) |
| Net gain (loss) | | | | (6,206,678) |
| Net increase (decrease) in net assets resulting from operations | | | $ | 4,472,926 |
| Statement of Changes in Net Assets |
| |
| | Six months ended June 30, 2024 (Unaudited) | | Year ended December 31, 2023 |
| Increase (Decrease) in Net Assets | | | | |
| Operations | | | | |
| Net investment income (loss) | $ | 10,679,604 | $ | 17,739,021 |
| Net realized gain (loss) | | (914,328) | | (932,466) |
| Change in net unrealized appreciation (depreciation) | | (5,292,350) | | 29,403,417 |
| Net increase (decrease) in net assets resulting from operations | | 4,472,926 | | 46,209,972 |
| Distributions to shareholders | | (10,426,528) | | (17,380,630) |
| | | | | |
| Share transactions | | | | |
| Proceeds from sales of shares | | 200,564,031 | | 276,425,905 |
| Reinvestment of distributions | | 50 | | 146 |
| Cost of shares redeemed | | (118,587,420) | | (210,149,477) |
| | | | | |
Net increase (decrease) in net assets resulting from share transactions | | 81,976,661 | | 66,276,574 |
| Total increase (decrease) in net assets | | 76,023,059 | | 95,105,916 |
| | | | | |
| Net Assets | | | | |
| Beginning of period | | 703,727,012 | | 608,621,096 |
| End of period | $ | 779,750,071 | $ | 703,727,012 |
| | | | | |
| Other Information | | | | |
| Shares | | | | |
| Sold | | 20,483,587 | | 28,860,862 |
| Issued in reinvestment of distributions | | 5 | | 15 |
| Redeemed | | (12,115,112) | | (22,022,436) |
| Net increase (decrease) | | 8,368,480 | | 6,838,441 |
| | | | | |
Financial Highlights
Fidelity Flex® Municipal Income Fund |
| |
| | Six months ended (Unaudited) June 30, 2024 | | Years ended December 31, 2023 | | 2022 | | 2021 | | 2020 | | 2019 |
Selected Per-Share Data | | | | | | | | | | | | |
| Net asset value, beginning of period | $ | 9.87 | $ | 9.45 | $ | 10.56 | $ | 10.50 | $ | 10.35 | $ | 9.85 |
| Income from Investment Operations | | | | | | | | | | | | |
Net investment income (loss) A,B | | .141 | | .259 | | .200 | | .173 | | .232 | | .275 |
| Net realized and unrealized gain (loss) | | (.083) | | .414 | | (1.111) | | .068 | | .153 | | .531 |
| Total from investment operations | | .058 | | .673 | | (.911) | | .241 | | .385 | | .806 |
| Distributions from net investment income | | (.138) | | (.253) | | (.199) | | (.177) | | (.235) | | (.278) |
| Distributions from net realized gain | | - | | - | | - | | (.004) | | - | | (.028) |
| Total distributions | | (.138) | | (.253) | | (.199) | | (.181) | | (.235) | | (.306) |
| Net asset value, end of period | $ | 9.79 | $ | 9.87 | $ | 9.45 | $ | 10.56 | $ | 10.50 | $ | 10.35 |
Total Return C,D | | | | 7.25% | | (8.63)% | | 2.31% | | 3.79% | | 8.26% |
Ratios to Average Net Assets B,E,F | | | | | | | | | | | | |
| Expenses before reductions | | -% G,H,I | | .01% | | -% H | | -% H | | -% H | | -% H |
Expenses net of fee waivers, if any H | | | | -% | | -% | | -% | | -% | | -% |
Expenses net of all reductions H | | -% G,I | | -% | | -% | | -% | | -% | | -% |
| Net investment income (loss) | | 2.90% G,I | | 2.71% | | 2.07% | | 1.65% | | 2.26% | | 2.70% |
| Supplemental Data | | | | | | | | | | | | |
| Net assets, end of period (000 omitted) | $ | 779,750 | $ | 703,727 | $ | 608,621 | $ | 643,945 | $ | 311,999 | $ | 188,914 |
Portfolio turnover rate J | | | | 5% | | 16% | | 5% | | 24% | | 18% |
ACalculated based on average shares outstanding during the period.
BNet investment income (loss) is affected by the timing of the declaration of dividends by any underlying mutual funds or exchange-traded funds (ETFs). Net investment income (loss) of any mutual funds or ETFs is not included in the Fund's net investment income (loss) ratio.
CTotal returns for periods of less than one year are not annualized.
DTotal returns would have been lower if certain expenses had not been reduced during the applicable periods shown.
EFees and expenses of any underlying mutual funds or exchange-traded funds (ETFs) are not included in the Fund's expense ratio. The Fund indirectly bears its proportionate share of these expenses. For additional expense information related to investments in Fidelity Central Funds, please refer to the "Investments in Fidelity Central Funds" note found in the Notes to Financial Statements section of the most recent Annual or Semi-Annual report.
FExpense ratios reflect operating expenses of the class. Expenses before reductions do not reflect amounts reimbursed, waived, or reduced through arrangements with the investment adviser, brokerage services, or other offset arrangements, if applicable, and do not represent the amount paid by the class during periods when reimbursements, waivers or reductions occur.
GAnnualized.
HAmount represents less than .005%.
IProxy expenses are not annualized.
JAmount does not include the portfolio activity of any underlying mutual funds or exchange-traded funds (ETFs).
Notes to Financial Statements
(Unaudited)For the period ended June 30, 2024
1. Organization.
Fidelity Flex Municipal Income Fund (the Fund) is a fund of Fidelity Municipal Trust (the Trust) and is authorized to issue an unlimited number of shares. Share transactions on the Statement of Changes in Net Assets may contain exchanges between affiliated funds. The Trust is registered under the Investment Company Act of 1940, as amended (the 1940 Act), as an open-end management investment company organized as a Massachusetts business trust. The Fund is available only to certain fee-based accounts and advisory programs offered by Fidelity.
2. Investments in Fidelity Central Funds.
Funds may invest in Fidelity Central Funds, which are open-end investment companies generally available only to other investment companies and accounts managed by the investment adviser and its affiliates. The Schedule of Investments lists any Fidelity Central Funds held as an investment as of period end, but does not include the underlying holdings of each Fidelity Central Fund. An investing fund indirectly bears its proportionate share of the expenses of the underlying Fidelity Central Funds.
Based on its investment objective, each Fidelity Central Fund may invest or participate in various investment vehicles or strategies that are similar to those of the investing fund. These strategies are consistent with the investment objectives of the investing fund and may involve certain economic risks which may cause a decline in value of each of the Fidelity Central Funds and thus a decline in the value of the investing fund.
| Fidelity Central Fund | Investment Manager | Investment Objective | Investment Practices | Expense RatioA |
| Fidelity Money Market Central Funds | Fidelity Management & Research Company LLC (FMR) | Each fund seeks to obtain a high level of current income consistent with the preservation of capital and liquidity. | Short-term Investments | Less than .005% |
A Expenses expressed as a percentage of average net assets and are as of each underlying Central Fund's most recent annual or semi-annual shareholder report.
A complete unaudited list of holdings for each Fidelity Central Fund is available upon request or at the Securities and Exchange Commission website at www.sec.gov. In addition, the financial statements of the Fidelity Central Funds which contain the significant accounting policies (including investment valuation policies) of those funds, and are not covered by the Report of Independent Registered Public Accounting Firm, are available on the Securities and Exchange Commission website or upon request.
3. Significant Accounting Policies.
The Fund is an investment company and applies the accounting and reporting guidance of the Financial Accounting Standards Board (FASB) Accounting Standards Codification Topic 946 Financial Services - Investment Companies. The financial statements have been prepared in conformity with accounting principles generally accepted in the United States of America (GAAP), which require management to make certain estimates and assumptions at the date of the financial statements. Actual results could differ from those estimates. Subsequent events, if any, through the date that the financial statements were issued have been evaluated in the preparation of the financial statements. The Fund's Schedule of Investments lists any underlying mutual funds or exchange-traded funds (ETFs) but does not include the underlying holdings of these funds. The following summarizes the significant accounting policies of the Fund:
Investment Valuation. Investments are valued as of 4:00 p.m. Eastern time on the last calendar day of the period. The Board of Trustees (the Board) has designated the Fund's investment adviser as the valuation designee responsible for the fair valuation function and performing fair value determinations as needed. The investment adviser has established a Fair Value Committee (the Committee) to carry out the day-to-day fair valuation responsibilities and has adopted policies and procedures to govern the fair valuation process and the activities of the Committee. In accordance with these fair valuation policies and procedures, which have been approved by the Board, the Fund attempts to obtain prices from one or more third party pricing services or brokers to value its investments. When current market prices, quotations or currency exchange rates are not readily available or reliable, investments will be fair valued in good faith by the Committee, in accordance with the policies and procedures. Factors used in determining fair value vary by investment type and may include market or investment specific events, transaction data, estimated cash flows, and market observations of comparable investments. The frequency that the fair valuation procedures are used cannot be predicted and they may be utilized to a significant extent. The Committee manages the Fund's fair valuation practices and maintains the fair valuation policies and procedures. The Fund's investment adviser reports to the Board information regarding the fair valuation process and related material matters.
The Fund categorizes the inputs to valuation techniques used to value its investments into a disclosure hierarchy consisting of three levels as shown below:
Level 1 - unadjusted quoted prices in active markets for identical investments
Level 2 - other significant observable inputs (including quoted prices for similar investments, interest rates, prepayment speeds, etc.)
Level 3 - unobservable inputs (including the Fund's own assumptions based on the best information available)
Valuation techniques used to value the Fund's investments by major category are as follows:
Debt securities, including restricted securities, are valued based on evaluated prices received from third party pricing services or from brokers who make markets in such securities. Municipal securities are valued by pricing services who utilize matrix pricing which considers yield or price of bonds of comparable quality, coupon, maturity and type or by broker-supplied prices. When independent prices are unavailable or unreliable, debt securities may be valued utilizing pricing methodologies which consider similar factors that would be used by third party pricing services. Debt securities are generally categorized as Level 2 in the hierarchy but may be Level 3 depending on the circumstances.
Investments in open-end mutual funds, including the Fidelity Central Funds, are valued at their closing net asset value (NAV) each business day and are categorized as Level 1 in the hierarchy.
Changes in valuation techniques may result in transfers in or out of an assigned level within the disclosure hierarchy. The aggregate value of investments by input level as of June 30, 2024 is included at the end of the Fund's Schedule of Investments.
Investment Transactions and Income. For financial reporting purposes, the Fund's investment holdings and NAV include trades executed through the end of the last business day of the period. The NAV per share for processing shareholder transactions is calculated as of the close of business of the New York Stock Exchange (NYSE), normally 4:00 p.m. Eastern time and includes trades executed through the end of the prior business day. Gains and losses on securities sold are determined on the basis of identified cost. Income and capital gain distributions from Fidelity Central Funds, if any, are recorded on the ex-dividend date. Interest income is accrued as earned and includes coupon interest and amortization of premium and accretion of discount on debt securities as applicable. Debt obligations may be placed on non-accrual status and related interest income may be reduced by ceasing current accruals and writing off interest receivables when the collection of all or a portion of interest has become doubtful based on consistently applied procedures. A debt obligation is removed from non-accrual status when the issuer resumes interest payments or when collectability of interest is reasonably assured.
Expenses. Expenses directly attributable to a fund are charged to that fund. Expenses attributable to more than one fund are allocated among the respective funds on the basis of relative net assets or other appropriate methods. Expenses included in the accompanying financial statements reflect the expenses of that fund and do not include any expenses associated with any underlying mutual funds or exchange-traded funds. Although not included in a fund's expenses, a fund indirectly bears its proportionate share of these expenses through the net asset value of each underlying mutual fund or exchange-traded fund. Expense estimates are accrued in the period to which they relate and adjustments are made when actual amounts are known.
Income Tax Information and Distributions to Shareholders. Each year, the Fund intends to qualify as a regulated investment company under Subchapter M of the Internal Revenue Code, including distributing substantially all of its taxable income and realized gains. As a result, no provision for U.S. Federal income taxes is required. The Fund files a U.S. federal tax return, in addition to state and local tax returns as required. The Fund's federal income tax returns are subject to examination by the Internal Revenue Service (IRS) for a period of three fiscal years after they are filed. State and local tax returns may be subject to examination for an additional fiscal year depending on the jurisdiction.
Distributions are declared and recorded daily and paid monthly from net investment income. Distributions from realized gains, if any, are declared and recorded on the ex-dividend date. Income and capital gain distributions are determined in accordance with income tax regulations, which may differ from GAAP.
Capital accounts within the financial statements are adjusted for permanent book-tax differences. These adjustments have no impact on net assets or the results of operations. Capital accounts are not adjusted for temporary book-tax differences which will reverse in a subsequent period.
Book-tax differences are primarily due to market discount and capital loss carryforwards.
The Fund purchases municipal securities whose interest, in the opinion of the issuer, is free from federal income tax. There is no assurance that the IRS will agree with this opinion. In the event the IRS determines that the issuer does not comply with relevant tax requirements, interest payments from a security could become federally taxable, possibly retroactively to the date the security was issued.
As of period end, the cost and unrealized appreciation (depreciation) in securities, and derivatives if applicable, for federal income tax purposes were as follows:
| Gross unrealized appreciation | $10,269,482 |
| Gross unrealized depreciation | (36,926,089) |
| Net unrealized appreciation (depreciation) | $(26,656,607) |
| Tax cost | $806,584,202 |
Capital loss carryforwards are only available to offset future capital gains of the Fund to the extent provided by regulations and may be limited. The capital loss carryforward information presented below, including any applicable limitation, is estimated as of prior fiscal period end and is subject to adjustment.
Short-term | $(2,844,609) |
Long-term | (4,788,347) |
| Total capital loss carryforward | $(7,632,956) |
Delayed Delivery Transactions and When-Issued Securities. During the period, certain Funds transacted in securities on a delayed delivery or when-issued basis. Payment and delivery may take place after the customary settlement period for that security. The price of the underlying securities and the date when the securities will be delivered and paid for are fixed at the time the transaction is negotiated. Securities purchased on a delayed delivery or when-issued basis are identified as such in the Schedule of Investments. Compensation for interest forgone in the purchase of a delayed delivery or when-issued debt security may be received. With respect to purchase commitments, each applicable Fund identifies securities as segregated in its records with a value at least equal to the amount of the commitment. Payables and receivables associated with the purchases and sales of delayed delivery securities having the same coupon, settlement date and broker are offset. Delayed delivery or when-issued securities that have been purchased from and sold to different brokers are reflected as both payables and receivables in the Statement of Assets and Liabilities under the caption "Delayed delivery", as applicable. Losses may arise due to changes in the value of the underlying securities or if the counterparty does not perform under the contract's terms, or if the issuer does not issue the securities due to political, economic, or other factors.
Restricted Securities (including Private Placements). Funds may invest in securities that are subject to legal or contractual restrictions on resale. These securities generally may be resold in transactions exempt from registration or to the public if the securities are registered. Disposal of these securities may involve time-consuming negotiations and expense, and prompt sale at an acceptable price may be difficult. Information regarding restricted securities held at period end is included at the end of the Schedule of Investments, if applicable.
4. Purchases and Sales of Investments.
Purchases and sales of securities, other than short-term securities and in-kind transactions, as applicable, are noted in the table below.
| | Purchases ($) | Sales ($) |
| Fidelity Flex Municipal Income Fund | 99,532,815 | 24,686,780 |
5. Fees and Other Transactions with Affiliates.
Management Fee. Fidelity Management & Research Company LLC (the investment adviser) and its affiliates provide the Fund with investment management related services and the Fund does not pay any fees for these services. Under the management contract, the investment adviser or an affiliate pays all other expenses of the Fund, excluding fees and expenses of the independent Trustees, and certain miscellaneous expenses such as proxy and shareholder meeting expenses.
Interfund Trades. Funds may purchase from or sell securities to other Fidelity Funds under procedures adopted by the Board. The procedures have been designed to ensure these interfund trades are executed in accordance with Rule 17a-7 of the 1940 Act. Any interfund trades are included within the respective purchases and sales amounts shown in the Purchases and Sales of Investments note. Interfund trades during the period are noted in the table below.
| | Purchases ($) | Sales ($) | Realized Gain (Loss) ($) |
| Fidelity Flex Municipal Income Fund | 1,219,875 | - | - |
Sub-Advisory Arrangements. Effective March 1, 2024, the Fund's sub-advisory agreements with FMR Investment Management (UK) Limited, Fidelity Management & Research (Hong Kong) Limited, and Fidelity Management & Research (Japan) Limited were amended to provide that the investment adviser pays each sub-adviser monthly fees equal to 110% of the sub-adviser's costs for providing sub-advisory services.
6. Committed Line of Credit.
Certain Funds participate with other funds managed by the investment adviser or an affiliate in a $4.25 billion credit facility (the "line of credit") to be utilized for temporary or emergency purposes to fund shareholder redemptions or for other short-term liquidity purposes. The commitment fees on the pro-rata portion of the line of credit are borne by the investment adviser. During the period, there were no borrowings on this line of credit.
7. Expense Reductions.
Through arrangements with the Fund's custodian, credits realized as a result of certain uninvested cash balances were used to reduce the Fund's expenses by $77.
8. Other.
A fund's organizational documents provide former and current trustees and officers with a limited indemnification against liabilities arising in connection with the performance of their duties to the fund. In the normal course of business, a fund may also enter into contracts that provide general indemnifications. A fund's maximum exposure under these arrangements is unknown as this would be dependent on future claims that may be made against a fund. The risk of material loss from such claims is considered remote.
9. Risk and Uncertainties.
Many factors affect a fund's performance. Developments that disrupt global economies and financial markets, such as pandemics, epidemics, outbreaks of infectious diseases, war, terrorism, and environmental disasters, may significantly affect a fund's investment performance. The effects of these developments to a fund will be impacted by the types of securities in which a fund invests, the financial condition, industry, economic sector, and geographic location of an issuer, and a fund's level of investment in the securities of that issuer. Significant concentrations in security types, issuers, industries, sectors, and geographic locations may magnify the factors that affect a fund's performance.
Item 8: Changes in and Disagreements with Accountants for Open-End Management Investment Companies
Note: This is not applicable for any fund included in this document.
Item 9: Proxy Disclosures for Open-End Management Investment Companies
Note: This is not applicable for any fund included in this document.
Item 10: Remuneration Paid to Directors, Officers, and others of Open-End Management Investment Companies
Note: This information is disclosed as part of the financial statements for each Fund as part of Item 7: Financial Statements and Financial Highlights for Open-End Management Investment companies.
Item 11: Statement Regarding Basis for Approval of Investment Advisory Contract
Board Approval of Investment Advisory Contracts
Fidelity Flex Municipal Income Fund
At its January 2024 meeting, the Board of Trustees, including the Independent Trustees (together, the Board), approved amended and restated sub-advisory agreements (the Sub-Advisory Contracts) for the fund, including the fund's sub-advisory agreements with FMR Investment Management (UK) Limited (FMR UK), Fidelity Management & Research (Hong Kong) Limited (FMR H.K.), and Fidelity Management & Research (Japan) Limited (FMR Japan). The Sub-Advisory Contracts will be effective March 1, 2024. The Board will consider the annual renewal of the fund's Sub-Advisory Contracts in September 2024, following its review of additional materials provided by FMR.
The Board considered the Sub-Advisory Contracts, which changed the arrangements for fees paid by FMR to the sub-advisers under the agreements. The Board noted that the agreements with FMR UK, FMR H.K., and FMR Japan were amended to provide that FMR will compensate each sub-adviser at a fee equal to 110% of the sub-adviser's costs incurred in providing services under the agreement. The Board considered that, under the Sub-Advisory Contracts, FMR, and not the fund, will continue to pay the sub-advisory fees to each applicable sub-adviser, and that the management fee paid by the fund under the management contract with FMR will remain unchanged.
The Board considered that the approval of the fund's Sub-Advisory Contracts will not result in any changes in the investment process or strategies employed in the management of the fund's assets or the day-to-day management of the fund or the persons primarily responsible for such management. Further, the Board considered that the Sub-Advisory Contracts would not change the obligations and services of FMR and its affiliates on behalf of the fund, and, in particular, there would be no change in the nature and level of services provided to the fund by FMR and its affiliates.
In connection with its consideration of future renewals of the fund's advisory contracts, the Board will consider: (i) the nature, extent and quality of services provided to the funds, including shareholder and administrative services and investment performance; (ii) the competitiveness of the management fee and total expenses for the fund; (iii) the costs of the services and profitability, including the revenues earned and the expenses incurred in conducting the business of developing, marketing, distributing, managing, administering, and servicing the fund and its shareholders, to the extent applicable; and (iv) whether there have been economies of scale in respect of the Fidelity funds, whether the Fidelity funds (including the fund) have appropriately benefited from any such economies of scale, and whether there is the potential for realization of any further economies.
Based on its evaluation of all of the conclusions noted above, and after considering all factors it believed relevant, the Board concluded that the fund's management fee structure is fair and reasonable, and that the fund's Sub-Advisory Contracts should be approved.
1.9884857.106
XLI-SANN-0824
Item 8.
Changes in and Disagreements with Accountants for Open-End Management Investment Companies
See Item 7.
Item 9.
Proxy Disclosures for Open-End Management Investment Companies
See Item 7.
Item 10.
Remuneration Paid to Directors, Officers, and Others of Open-End Management Investment Companies
See Item 7.
Item 11.
Statement Regarding Basis for Approval of Investment Advisory Contract
See Item 7.
Item 12.
Disclosure of Proxy Voting Policies and Procedures for Closed-End Management Investment Companies
Not applicable.
Item 13.
Portfolio Managers of Closed-End Management Investment Companies
Not applicable.
Item 14.
Purchases of Equity Securities by Closed-End Management Investment Company and Affiliated Purchasers
Not applicable.
Item 15.
Submission of Matters to a Vote of Security Holders
There were no material changes to the procedures by which shareholders may recommend nominees to the Fidelity Municipal Trust’s Board of Trustees.
Item 16.
Controls and Procedures
(a)(i) The President and Treasurer and the Chief Financial Officer have concluded that the Fidelity Municipal Trust’s (the “Trust”) disclosure controls and procedures (as defined in Rule 30a-3(c) under the Investment Company Act) provide reasonable assurances that material information relating to the Trust is made known to them by the appropriate persons, based on their evaluation of these controls and procedures as of a date within 90 days of the filing date of this report.
(a)(ii) There was no change in the Trust’s internal control over financial reporting (as defined in Rule 30a-3(d) under the Investment Company Act) that occurred during the period covered by this report that has materially affected, or is reasonably likely to materially affect, the Trust’s internal control over financial reporting.
Item 17.
Disclosure of Securities Lending Activities for Closed-End Management Investment Companies
Not applicable.
Item 18.
Recovery of Erroneously Awarded Compensation
(a)
Not applicable.
(b)
Not applicable.
Item 19.
Exhibits
SIGNATURES
Pursuant to the requirements of the Securities Exchange Act of 1934 and the Investment Company Act of 1940, the registrant has duly caused this report to be signed on its behalf by the undersigned, thereunto duly authorized.
Fidelity Municipal Trust
|
By: | /s/Laura M. Del Prato |
| Laura M. Del Prato |
| President and Treasurer (Principal Executive Officer) |
|
|
Date: | August 22, 2024 |
Pursuant to the requirements of the Securities Exchange Act of 1934 and the Investment Company Act of 1940, this report has been signed below by the following persons on behalf of the registrant and in the capacities and on the dates indicated.
|
By: | /s/Laura M. Del Prato |
| Laura M. Del Prato |
| President and Treasurer (Principal Executive Officer) |
|
|
Date: | August 22, 2024 |
|
By: | /s/John J. Burke III |
| John J. Burke III |
| Chief Financial Officer (Principal Financial Officer) |
|
|
Date: | August 22, 2024 |