UNITED STATES
SECURITIES AND EXCHANGE COMMISSION
Washington, D.C. 20549
FORM N-CSR
CERTIFIED SHAREHOLDER REPORT OF REGISTERED
MANAGEMENT INVESTMENT COMPANIES
Investment Company Act file number 811-02628
Fidelity Municipal Trust
(Exact name of registrant as specified in charter)
245 Summer St., Boston, MA 02210
(Address of principal executive offices) (Zip code)
Cynthia Lo Bessette, Secretary
245 Summer St.
Boston, Massachusetts 02210
(Name and address of agent for service)
Registrant's telephone number, including area code:
617-563-7000
| |
Date of fiscal year end: | December 31 |
|
|
Date of reporting period: | June 30, 2022 |
Item 1.
Reports to Stockholders
Fidelity® Municipal Income Fund
Semi-Annual Report
June 30, 2022
Includes Fidelity and Fidelity Advisor share classes


Contents
To view a fund's proxy voting guidelines and proxy voting record for the 12-month period ended June 30, visit http://www.fidelity.com/proxyvotingresults or visit the Securities and Exchange Commission's (SEC) web site at http://www.sec.gov.
You may also call 1-800-544-8544 if you’re an individual investing directly with Fidelity, call 1-800-835-5092 if you’re a plan sponsor or participant with Fidelity as your recordkeeper or call 1-877-208-0098 on institutional accounts or if you’re an advisor or invest through one to request a free copy of the proxy voting guidelines.
Standard & Poor's, S&P and S&P 500 are registered service marks of The McGraw-Hill Companies, Inc. and have been licensed for use by Fidelity Distributors Corporation.
Other third-party marks appearing herein are the property of their respective owners.
All other marks appearing herein are registered or unregistered trademarks or service marks of FMR LLC or an affiliated company. © 2022 FMR LLC. All rights reserved.
This report and the financial statements contained herein are submitted for the general information of the shareholders of the Fund. This report is not authorized for distribution to prospective investors in the Fund unless preceded or accompanied by an effective prospectus.
A fund files its complete schedule of portfolio holdings with the SEC for the first and third quarters of each fiscal year on Form N-PORT. Forms N-PORT are available on the SEC’s web site at http://www.sec.gov. A fund's Forms N-PORT may be reviewed and copied at the SEC’s Public Reference Room in Washington, DC. Information regarding the operation of the SEC's Public Reference Room may be obtained by calling 1-800-SEC-0330.
For a complete list of a fund's portfolio holdings, view the most recent holdings listing, semiannual report, or annual report on Fidelity's web site at http://www.fidelity.com, http://www.institutional.fidelity.com, or http://www.401k.com, as applicable.
NOT FDIC INSURED •MAY LOSE VALUE •NO BANK GUARANTEE
Neither the Fund nor Fidelity Distributors Corporation is a bank.
Note to Shareholders:
Early in 2020, the outbreak and spread of COVID-19 emerged as a public health emergency that had a major influence on financial markets, primarily based on its impact on the global economy and corporate earnings. On March 11, 2020, the World Health Organization declared the COVID-19 outbreak a pandemic, citing sustained risk of further global spread. The pandemic prompted a number of measures to limit the spread of COVID-19, including travel and border restrictions, quarantines, and restrictions on large gatherings. In turn, these resulted in lower consumer activity, diminished demand for a wide range of products and services, disruption in manufacturing and supply chains, and – given the wide variability in outcomes regarding the outbreak – significant market uncertainty and volatility. To help stem the turmoil, the U.S. government took unprecedented action – in concert with the U.S. Federal Reserve and central banks around the world – to help support consumers, businesses, and the broader economy, and to limit disruption to the financial system.
In general, the overall impact of the pandemic lessened in 2021, amid a resilient economy and widespread distribution of three COVID-19 vaccines granted emergency use authorization from the U.S. Food and Drug Administration (FDA) early in the year. Still, the situation remains dynamic, and the extent and duration of its influence on financial markets and the economy is highly uncertain, due in part to a recent spike in cases based on highly contagious variants of the coronavirus.
Extreme events such as the COVID-19 crisis are exogenous shocks that can have significant adverse effects on mutual funds and their investments. Although multiple asset classes may be affected by market disruption, the duration and impact may not be the same for all types of assets. Fidelity is committed to helping you stay informed amid news about COVID-19 and during increased market volatility, and we continue to take extra steps to be responsive to customer needs. We encourage you to visit us online, where we offer ongoing updates, commentary, and analysis on the markets and our funds.
Investment Summary (Unaudited)
Top Five States as of June 30, 2022
| | % of fund's net assets |
| Illinois | 18.1 |
| Pennsylvania | 8.7 |
| Florida | 7.9 |
| New York | 7.2 |
| California | 5.9 |
Top Five Sectors as of June 30, 2022
| | % of fund's net assets |
| Transportation | 26.9 |
| Health Care | 24.6 |
| General Obligations | 21.3 |
| Education | 8.5 |
| Special Tax | 6.4 |
Quality Diversification (% of fund's net assets)
| As of June 30, 2022 |
| | AAA | 4.3% |
| | AA,A | 75.6% |
| | BBB | 11.9% |
| | BB and Below | 3.7% |
| | Not Rated | 2.9% |
| | Short-Term Investments and Net Other Assets | 1.6% |
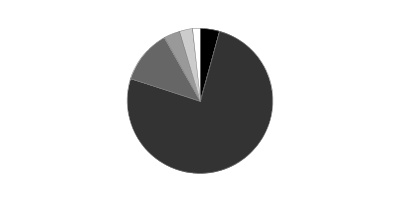
We have used ratings from Moody's Investors Service, Inc. Where Moody's® ratings are not available, we have used S&P® ratings. All ratings are as of the date indicated and do not reflect subsequent changes.
Schedule of Investments June 30, 2022 (Unaudited)
Showing Percentage of Net Assets
| Municipal Bonds - 98.4% | | | |
| | | Principal Amount (000s) | Value (000s) |
| Alabama - 0.9% | | | |
| Auburn Univ. Gen. Fee Rev. Series 2018 A, 5% 6/1/43 | | 2,565 | 2,780 |
| Jefferson County Gen. Oblig. Series 2018 A: | | | |
| 5% 4/1/25 | | $2,550 | $2,743 |
| 5% 4/1/26 | | 2,400 | 2,634 |
| Montgomery Med. Clinic Facilities Series 2015, 5% 3/1/33 | | 4,140 | 4,277 |
| Southeast Energy Auth. Rev. Bonds: | | | |
| (Proj. No. 2) Series 2021 B1: | | | |
| 4% 6/1/29 | | 1,475 | 1,502 |
| 4% 6/1/30 | | 1,115 | 1,130 |
| 4% 6/1/31 | | 975 | 983 |
| Bonds (Proj. No. 2) Series 2021 B1, 4%, tender 12/1/31 (a) | | 23,655 | 23,550 |
|
| TOTAL ALABAMA | | | 39,599 |
|
| Arizona - 1.7% | | | |
| Arizona Health Facilities Auth. Rev. (Banner Health Sys. Proj.) Series 2007 B, 3 month U.S. LIBOR + 0.810% 1.458%, tender 1/1/37 (a)(b) | | 2,485 | 2,337 |
| Arizona Indl. Dev. Auth. Hosp. Rev. Series 2021 A: | | | |
| 5% 2/1/30 | | 1,300 | 1,465 |
| 5% 2/1/31 | | 1,250 | 1,420 |
| 5% 2/1/32 | | 1,250 | 1,424 |
| Arizona Indl. Dev. Auth. Rev. (Provident Group-Eastern Michigan Univ. Parking Proj.) Series 2018: | | | |
| 5% 5/1/48 | | 910 | 734 |
| 5% 5/1/51 | | 910 | 724 |
| Glendale Gen. Oblig. Series 2017: | | | |
| 5% 7/1/30 | | 2,080 | 2,311 |
| 5% 7/1/31 | | 3,105 | 3,444 |
| Glendale Indl. Dev. Auth. (Terraces of Phoenix Proj.) Series 2018 A: | | | |
| 5% 7/1/38 | | 235 | 216 |
| 5% 7/1/48 | | 295 | 255 |
| Maricopa County Indl. Dev. Auth. (Creighton Univ. Proj.) Series 2020, 5% 7/1/47 | | 2,400 | 2,543 |
| Maricopa County Indl. Dev. Auth. Sr. Living Facilities Series 2016: | | | |
| 5.75% 1/1/36 (c) | | 2,140 | 1,703 |
| 6% 1/1/48 (c) | | 5,260 | 3,894 |
| Maricopa County Rev. Series 2016 A: | | | |
| 5% 1/1/32 | | 8,280 | 8,855 |
| 5% 1/1/33 | | 4,965 | 5,285 |
| Phoenix Civic Impt. Board Arpt. Rev.: | | | |
| Series 2017 A: | | | |
| 5% 7/1/33 (d) | | 910 | 967 |
| 5% 7/1/36 (d) | | 1,450 | 1,525 |
| 5% 7/1/37 (d) | | 1,075 | 1,129 |
| Series 2017 B: | | | |
| 5% 7/1/29 | | 2,070 | 2,276 |
| 5% 7/1/33 | | 2,900 | 3,144 |
| 5% 7/1/36 | | 3,310 | 3,560 |
| 5% 7/1/37 | | 2,070 | 2,223 |
| Phoenix Civic Impt. Corp. Series 2019 A, 5% 7/1/45 | | 6,100 | 6,500 |
| Phoenix IDA Student Hsg. Rev. (Downtown Phoenix Student Hsg. II LLC Arizona State Univ. Proj.) Series 2019 A: | | | |
| 5% 7/1/44 | | 1,000 | 1,002 |
| 5% 7/1/49 | | 1,125 | 1,120 |
| 5% 7/1/54 | | 1,330 | 1,313 |
| 5% 7/1/59 | | 2,000 | 1,957 |
| Salt Verde Finl. Corp. Sr. Gas Rev. Series 2007, 5.5% 12/1/29 | | 7,370 | 8,195 |
|
| TOTAL ARIZONA | | | 71,521 |
|
| California - 5.9% | | | |
| ABC Unified School District Series 1997 C, 0% 8/1/28 (Nat'l. Pub. Fin. Guarantee Corp. Insured) | | 3,250 | 2,694 |
| California Gen. Oblig.: | | | |
| Series 2004: | | | |
| 5.25% 12/1/33 | | 150 | 150 |
| 5.5% 4/1/28 | | 10 | 10 |
| 5.5% 4/1/30 | | 5 | 5 |
| Series 2020, 4% 11/1/38 | | 6,500 | 6,541 |
| Series 2021: | | | |
| 5% 10/1/37 | | 7,740 | 8,869 |
| 5% 10/1/41 | | 49,565 | 55,573 |
| California Hsg. Fin. Agcy. Series 2021 1, 3.5% 11/20/35 | | 2,023 | 1,887 |
| California Muni. Fin. Auth. Student Hsg. (CHF-Davis I, LLC - West Village Student Hsg. Proj.) Series 2018, 5% 5/15/38 | | 7,200 | 7,486 |
| California Pub. Fin. Auth. Univ. Hsg. Rev.: | | | |
| (Claremont Colleges Proj.) Series 2017 A: | | | |
| 5% 7/1/27 (c) | | 1,015 | 877 |
| 5% 7/1/37 (c) | | 1,525 | 1,218 |
| (NCCD - Claremont Properties LLC - Claremont Colleges Proj.) Series 2017 A, 5% 7/1/47 (c) | | 335 | 257 |
| California Pub. Works Board Lease Rev.: | | | |
| (Coalinga State Hosp. Proj.) Series 2013 E, 5% 6/1/28 | | 5,110 | 5,245 |
| (Various Cap. Projs.) Series 2022 C: | | | |
| 5% 8/1/31 (e) | | 1,365 | 1,566 |
| 5% 8/1/34 (e) | | 2,535 | 2,875 |
| California Statewide Cmntys. Dev. Auth. Rev.: | | | |
| Series 2015, 5% 2/1/45 | | 2,695 | 2,503 |
| Series 2018 A, 5% 3/1/42 | | 195 | 204 |
| Eastern Muni. Wtr. District Fing. Auth. Series 2020 A: | | | |
| 4% 7/1/38 | | 1,400 | 1,401 |
| 5% 7/1/36 | | 1,600 | 1,810 |
| 5% 7/1/37 | | 1,000 | 1,127 |
| Folsom Cordova Union School District No. 4 Series A, 0% 10/1/31 (Nat'l. Pub. Fin. Guarantee Corp. Insured) | | 1,520 | 1,078 |
| Kern Cmnty. College District Gen. Oblig. Series 2006: | | | |
| 0% 11/1/28 (Assured Guaranty Muni. Corp. Insured) | | 4,100 | 3,338 |
| 0% 11/1/30 (Assured Guaranty Muni. Corp. Insured) | | 4,140 | 3,099 |
| Long Beach Unified School District Series 2009, 5.5% 8/1/29 | | 155 | 155 |
| Los Angeles Dept. Arpt. Rev. Series 2020 C, 5% 5/15/45 (d) | | 2,900 | 3,070 |
| Los Angeles Hbr. Dept. Rev. Series 2019 A: | | | |
| 5% 8/1/25 (d) | | 3,515 | 3,775 |
| 5% 8/1/26 (d) | | 1,350 | 1,470 |
| Monrovia Unified School District Series B, 0% 8/1/29 (Nat'l. Pub. Fin. Guarantee Corp. Insured) | | 3,745 | 2,956 |
| Mount Diablo Unified School District Series 2022 B: | | | |
| 4% 8/1/29 | | 1,595 | 1,719 |
| 4% 8/1/30 | | 465 | 500 |
| 4% 8/1/32 | | 2,900 | 3,090 |
| Oakland Unified School District Alameda County Series 2015 A, 5% 8/1/29 | | 1,450 | 1,545 |
| Poway Unified School District: | | | |
| (District #2007-1 School Facilities Proj.) Series 2008 A, 0% 8/1/32 | | 4,885 | 3,439 |
| Series 2011, 0% 8/1/46 | | 950 | 322 |
| Series B: | | | |
| 0% 8/1/37 | | 6,455 | 3,614 |
| 0% 8/1/39 | | 19,705 | 9,974 |
| Poway Unified School District Pub. Fing. Series 2015 A: | | | |
| 5% 9/1/24 | | 825 | 863 |
| 5% 9/1/26 | | 1,050 | 1,111 |
| 5% 9/1/29 | | 2,185 | 2,278 |
| 5% 9/1/31 | | 985 | 1,019 |
| Sacramento City Fing. Auth. Rev. Series A, 0% 12/1/26 (Nat'l. Pub. Fin. Guarantee Corp. Insured) | | 4,140 | 3,596 |
| San Diego County Reg'l. Arpt. Auth. Arpt. Rev. Series 2021 B: | | | |
| 5% 7/1/46 (d) | | 10,000 | 10,521 |
| 5% 7/1/56 (d) | | 7,000 | 7,272 |
| San Diego Unified School District: | | | |
| Series 2008 C, 0% 7/1/34 | | 2,980 | 1,839 |
| Series 2008 E, 0% 7/1/47 (f) | | 7,205 | 5,156 |
| San Francisco City & County Arpts. Commission Int'l. Arpt. Rev.: | | | |
| Series 2019 A, 5% 5/1/49 (d) | | 1,000 | 1,039 |
| Series 2019 B, 5% 5/1/49 | | 3,765 | 3,969 |
| Series 2022 A: | | | |
| 5% 5/1/26 (d) | | 6,315 | 6,810 |
| 5% 5/1/27 (d) | | 6,395 | 6,964 |
| 5% 5/1/28 (d) | | 8,530 | 9,341 |
| 5% 5/1/29 (d) | | 5,710 | 6,283 |
| Series 2022 B, 5% 5/1/52 | | 17,310 | 18,501 |
| San Marcos Unified School District Series 2010 B, 0% 8/1/47 | | 17,635 | 5,752 |
| San Mateo County Cmnty. College District Series A, 0% 9/1/26 (Nat'l. Pub. Fin. Guarantee Corp. Insured) | | 4,495 | 4,042 |
| Univ. of California Regents Med. Ctr. Pool Rev. Series 2013 J, 5% 5/15/48 | | 2,485 | 2,542 |
| Washington Township Health Care District Gen. Oblig.: | | | |
| Series 2013 A, 5.5% 8/1/38 | | 3,725 | 3,888 |
| Series 2013 B, 5.5% 8/1/38 | | 830 | 866 |
|
| TOTAL CALIFORNIA | | | 249,094 |
|
| Colorado - 1.3% | | | |
| Arkansas River Pwr. Auth. Rev. Series 2018 A: | | | |
| 5% 10/1/38 | | 2,080 | 2,170 |
| 5% 10/1/43 | | 2,600 | 2,667 |
| Colorado Health Facilities Auth.: | | | |
| (Parkview Med. Ctr., Inc. Proj.) Series 2016: | | | |
| 4% 9/1/35 | | 1,365 | 1,312 |
| 4% 9/1/36 | | 1,075 | 1,028 |
| 5% 9/1/46 | | 6,045 | 6,191 |
| Series 2019 A1, 4% 8/1/44 | | 2,395 | 2,204 |
| Series 2019 A2: | | | |
| 4% 8/1/49 | | 6,100 | 5,465 |
| 5% 8/1/37 | | 1,000 | 1,043 |
| 5% 8/1/44 | | 6,145 | 6,277 |
| Colorado Hsg. & Fin. Auth. Series 2019 H, 4.25% 11/1/49 | | 1,200 | 1,227 |
| Denver City & County Arpt. Rev.: | | | |
| Series 2017 A: | | | |
| 5% 11/15/26 (d) | | 2,855 | 3,115 |
| 5% 11/15/27 (d) | | 2,440 | 2,690 |
| Series 2018 A: | | | |
| 5% 12/1/34 (d) | | 4,245 | 4,718 |
| 5% 12/1/36 (d) | | 4,140 | 4,380 |
| 5% 12/1/37 (d) | | 8,280 | 8,726 |
|
| TOTAL COLORADO | | | 53,213 |
|
| Connecticut - 1.7% | | | |
| Connecticut Gen. Oblig.: | | | |
| Series 2015 B, 5% 6/15/32 | | 1,980 | 2,099 |
| Series 2020 A: | | | |
| 4% 1/15/33 | | 10,100 | 10,459 |
| 4% 1/15/34 | | 8,385 | 8,586 |
| 4% 1/15/38 | | 1,000 | 1,001 |
| Series 2021 B, 4% 1/15/39 | | 3,305 | 3,298 |
| Connecticut Health & Edl. Facilities Auth. Rev.: | | | |
| (Sacred Heart Univ., CT. Proj.) Series 2017 I-1: | | | |
| 5% 7/1/26 | | 415 | 448 |
| 5% 7/1/27 | | 290 | 317 |
| 5% 7/1/28 | | 525 | 571 |
| 5% 7/1/29 | | 330 | 357 |
| Series 2016 K, 4% 7/1/46 | | 7,315 | 6,264 |
| Series 2018 K-3, 5% 7/1/36 | | 895 | 912 |
| Series 2019 A: | | | |
| 5% 7/1/39 (c) | | 3,930 | 3,539 |
| 5% 7/1/49 (c) | | 285 | 241 |
| Series 2020 A: | | | |
| 4% 7/1/37 | | 2,500 | 2,462 |
| 4% 7/1/38 | | 1,120 | 1,099 |
| 5% 7/1/32 | | 2,000 | 2,158 |
| 5% 7/1/34 | | 3,500 | 3,755 |
| Series 2020 K, 5% 7/1/44 (c) | | 1,525 | 1,542 |
| Series 2022 M, 4% 7/1/36 | | 4,000 | 3,731 |
| Series G, 5% 7/1/50 (c) | | 1,800 | 1,811 |
| Series K1: | | | |
| 5% 7/1/27 | | 415 | 435 |
| 5% 7/1/29 | | 1,060 | 1,105 |
| 5% 7/1/30 | | 830 | 860 |
| 5% 7/1/31 | | 1,400 | 1,443 |
| 5% 7/1/32 | | 1,000 | 1,028 |
| 5% 7/1/33 | | 2,500 | 2,562 |
| 5% 7/1/34 | | 620 | 634 |
| Hbr. Point Infrastructure Impt. District Series 2017: | | | |
| 5% 4/1/30 (c) | | 3,785 | 3,942 |
| 5% 4/1/39 (c) | | 4,865 | 5,009 |
| New Britain Gen. Oblig. Series 2017 C, 5% 3/1/29 (Assured Guaranty Muni. Corp. Insured) | | 885 | 963 |
|
| TOTAL CONNECTICUT | | | 72,631 |
|
| District Of Columbia - 1.1% | | | |
| Metropolitan Washington Arpts. Auth. Dulles Toll Road Rev. (Dulles Metrorail and Cap. Impt. Projs.): | | | |
| Series 2019 A: | | | |
| 5% 10/1/35 | | 2,115 | 2,324 |
| 5% 10/1/37 | | 2,125 | 2,320 |
| 5% 10/1/39 | | 2,000 | 2,176 |
| 5% 10/1/44 | | 7,000 | 7,543 |
| Series 2019 B, 5% 10/1/47 | | 7,150 | 7,351 |
| Metropolitan Washington DC Arpts. Auth. Sys. Rev.: | | | |
| Series 2017 A: | | | |
| 5% 10/1/31 (d) | | 1,200 | 1,290 |
| 5% 10/1/32 (d) | | 1,855 | 1,985 |
| 5% 10/1/33 (d) | | 910 | 969 |
| 5% 10/1/35 (d) | | 2,070 | 2,188 |
| 5% 10/1/42 (d) | | 4,140 | 4,326 |
| Series 2020 A: | | | |
| 5% 10/1/26 (d) | | 9,015 | 9,818 |
| 5% 10/1/27 (d) | | 3,125 | 3,441 |
| 5% 10/1/28 (d) | | 1,560 | 1,729 |
|
| TOTAL DISTRICT OF COLUMBIA | | | 47,460 |
|
| Florida - 7.9% | | | |
| Brevard County School Board Ctfs. of Prtn. Series 2015 C, 5% 7/1/28 | | 1,445 | 1,533 |
| Broward County Arpt. Sys. Rev.: | | | |
| Series 2017: | | | |
| 5% 10/1/25 (d) | | 205 | 220 |
| 5% 10/1/26 (d) | | 930 | 1,007 |
| 5% 10/1/27 (d) | | 830 | 908 |
| 5% 10/1/29 (d) | | 2,200 | 2,371 |
| 5% 10/1/30 (d) | | 610 | 653 |
| 5% 10/1/32 (d) | | 2,900 | 3,082 |
| 5% 10/1/33 (d) | | 1,080 | 1,142 |
| 5% 10/1/34 (d) | | 1,055 | 1,112 |
| 5% 10/1/35 (d) | | 1,240 | 1,302 |
| 5% 10/1/36 (d) | | 1,655 | 1,735 |
| 5% 10/1/37 (d) | | 1,865 | 1,949 |
| 5% 10/1/42 (d) | | 3,520 | 3,653 |
| 5% 10/1/47 (d) | | 4,965 | 5,124 |
| Series A: | | | |
| 5% 10/1/28 (d) | | 2,485 | 2,619 |
| 5% 10/1/30 (d) | | 2,900 | 3,032 |
| 5% 10/1/31 (d) | | 2,485 | 2,593 |
| 5% 10/1/32 (d) | | 2,320 | 2,414 |
| Broward County School Board Ctfs. of Prtn.: | | | |
| (Broward County School District Proj.) Series 2016 A, 5% 7/1/28 | | 555 | 603 |
| Series 2012 A, 5% 7/1/27 | | 4,715 | 4,715 |
| Series 2015 A, 5% 7/1/27 | | 830 | 889 |
| Series 2016, 5% 7/1/32 | | 1,820 | 1,972 |
| Cap. Projs. Fin. Auth. Student Hsg. Rev. (Cap. Projs. Ln. Prog. - Florida Univs.) Series 2020 A, 5% 10/1/28 | | 2,000 | 2,087 |
| Duval County School Board Ctfs. of Prtn.: | | | |
| Series 2015 B: | | | |
| 5% 7/1/28 | | 1,705 | 1,832 |
| 5% 7/1/32 | | 10,120 | 10,838 |
| Series 2016 A, 5% 7/1/33 | | 1,110 | 1,206 |
| Escambia County Health Facilities Auth. Health Facilities Rev. Series 2020 A, 4% 8/15/45 | | 2,820 | 2,533 |
| Florida Dept. of Trans. Tpk. Rev. Series 2022 B: | | | |
| 4% 7/1/36 | | 4,155 | 4,226 |
| 4% 7/1/37 | | 4,525 | 4,534 |
| 4% 7/1/38 | | 4,710 | 4,703 |
| Florida Mid-Bay Bridge Auth. Rev.: | | | |
| Series 2015 A, 5% 10/1/35 | | 5,300 | 5,455 |
| Series 2015 C: | | | |
| 5% 10/1/30 | | 2,705 | 2,793 |
| 5% 10/1/40 | | 1,655 | 1,686 |
| Florida Muni. Pwr. Agcy. Rev.: | | | |
| (Requirements Pwr. Supply Proj.) Series 2016 A: | | | |
| 5% 10/1/30 | | 1,810 | 1,964 |
| 5% 10/1/31 | | 1,975 | 2,139 |
| Series 2015 B: | | | |
| 5% 10/1/28 | | 830 | 891 |
| 5% 10/1/30 | | 1,490 | 1,591 |
| Greater Orlando Aviation Auth. Arpt. Facilities Rev.: | | | |
| Series 2016 A, 5% 10/1/46 (d) | | 830 | 857 |
| Series 2016: | | | |
| 5% 10/1/26 (d) | | 1,405 | 1,521 |
| 5% 10/1/27 (d) | | 830 | 908 |
| Series 2017 A: | | | |
| 5% 10/1/25 (d) | | 275 | 294 |
| 5% 10/1/25 (Escrowed to Maturity) (d) | | 555 | 599 |
| 5% 10/1/27 (d) | | 385 | 420 |
| 5% 10/1/27 (Escrowed to Maturity) (d) | | 1,270 | 1,416 |
| 5% 10/1/29 (Pre-Refunded to 10/1/27 @ 100) (d) | | 2,485 | 2,776 |
| 5% 10/1/30 (Pre-Refunded to 10/1/27 @ 100) (d) | | 2,665 | 2,977 |
| 5% 10/1/32 (d) | | 5,590 | 5,940 |
| 5% 10/1/34 (d) | | 4,965 | 5,232 |
| 5% 10/1/35 (d) | | 6,565 | 6,896 |
| 5% 10/1/36 (d) | | 6,210 | 6,515 |
| 5% 10/1/37 (d) | | 5,175 | 5,423 |
| Halifax Hosp. Med. Ctr. Rev. Series 2015: | | | |
| 4% 6/1/27 (Pre-Refunded to 6/1/25 @ 100) | | 1,165 | 1,223 |
| 5% 6/1/24 | | 230 | 240 |
| JEA Wtr. & Swr. Sys. Rev. Series 2021 A: | | | |
| 4% 10/1/37 | | 4,560 | 4,593 |
| 4% 10/1/38 | | 1,090 | 1,095 |
| Lake County School Board Ctfs. of Prtn. Series 2014 A: | | | |
| 5% 6/1/27 (Pre-Refunded to 6/1/24 @ 100) | | 830 | 876 |
| 5% 6/1/28 (Pre-Refunded to 6/1/24 @ 100) | | 830 | 876 |
| Miami-Dade County Aviation Rev.: | | | |
| Series 2012 A, 5% 10/1/24 (d) | | 7,490 | 7,541 |
| Series 2014 A: | | | |
| 5% 10/1/28 (d) | | 4,140 | 4,296 |
| 5% 10/1/33 (d) | | 6,940 | 7,174 |
| 5% 10/1/36 (d) | | 13,125 | 13,484 |
| Series 2015 A: | | | |
| 5% 10/1/29 (d) | | 1,310 | 1,365 |
| 5% 10/1/31 (d) | | 1,100 | 1,138 |
| 5% 10/1/35 (d) | | 4,555 | 4,682 |
| Series 2016 A: | | | |
| 5% 10/1/29 | | 1,200 | 1,284 |
| 5% 10/1/31 | | 1,450 | 1,540 |
| Series 2017 B, 5% 10/1/40 (d) | | 10,760 | 11,181 |
| Series 2019 A, 5% 10/1/49 (d) | | 11,860 | 12,302 |
| Miami-Dade County Expressway Auth.: | | | |
| Series 2014 A, 5% 7/1/44 | | 2,900 | 2,997 |
| Series 2014 B: | | | |
| 5% 7/1/26 | | 2,070 | 2,180 |
| 5% 7/1/27 | | 1,450 | 1,526 |
| 5% 7/1/28 | | 830 | 874 |
| Series 2016 A: | | | |
| 5% 7/1/32 | | 3,560 | 3,778 |
| 5% 7/1/33 | | 3,020 | 3,199 |
| Miami-Dade County School Board Ctfs. of Prtn.: | | | |
| Series 2015 A: | | | |
| 5% 5/1/27 (Assured Guaranty Muni. Corp. Insured) | | 645 | 693 |
| 5% 5/1/29 | | 3,375 | 3,570 |
| Series 2016 A, 5% 5/1/30 | | 6,225 | 6,643 |
| Miami-Dade County Wtr. & Swr. Rev.: | | | |
| Series 2017 B, 4% 10/1/35 | | 3,900 | 3,932 |
| Series 2021: | | | |
| 5% 10/1/31 | | 1,250 | 1,435 |
| 5% 10/1/32 | | 645 | 736 |
| Orange County Health Facilities Auth. Series 2016 A: | | | |
| 5% 10/1/39 | | 2,200 | 2,292 |
| 5% 10/1/44 | | 1,605 | 1,663 |
| Palm Beach County Arpt. Sys. Rev. Series 2016: | | | |
| 5% 10/1/24 (d) | | 1,140 | 1,201 |
| 5% 10/1/27 (d) | | 830 | 894 |
| 5% 10/1/29 (d) | | 860 | 915 |
| 5% 10/1/30 (d) | | 1,530 | 1,619 |
| 5% 10/1/31 (d) | | 1,075 | 1,135 |
| 5% 10/1/32 (d) | | 1,655 | 1,742 |
| 5% 10/1/33 (d) | | 3,555 | 3,734 |
| 5% 10/1/34 (d) | | 3,730 | 3,918 |
| 5% 10/1/35 (d) | | 3,930 | 4,123 |
| Palm Beach County School Board Ctfs. of Prtn. Series 2015 D, 5% 8/1/28 | | 3,905 | 4,155 |
| Pinellas County Idr (Drs. Kiran & Pallavi Patel 2017 Foundation for Global Understanding, Inc. Proj.) Series 2019: | | | |
| 5% 7/1/29 | | 400 | 412 |
| 5% 7/1/39 | | 810 | 817 |
| South Florida Wtr. Mgmt. District Ctfs. of Prtn. Series 2015: | | | |
| 5% 10/1/29 | | 4,140 | 4,505 |
| 5% 10/1/32 | | 5,190 | 5,633 |
| South Miami Health Facilities Auth. Hosp. Rev. (Baptist Med. Ctr., FL. Proj.) Series 2017: | | | |
| 4% 8/15/33 | | 2,070 | 2,057 |
| 5% 8/15/26 | | 2,815 | 3,061 |
| 5% 8/15/27 | | 1,865 | 2,054 |
| 5% 8/15/28 | | 1,240 | 1,377 |
| 5% 8/15/30 | | 2,685 | 2,945 |
| 5% 8/15/31 | | 2,590 | 2,819 |
| 5% 8/15/32 | | 1,930 | 2,078 |
| 5% 8/15/34 | | 5,360 | 5,720 |
| 5% 8/15/35 | | 3,555 | 3,780 |
| 5% 8/15/42 | | 5,465 | 5,723 |
| 5% 8/15/47 | | 8,115 | 8,453 |
| Tallahassee Health Facilities Rev.: | | | |
| (Tallahassee Memorial Healthcare, Inc. Proj.) Series 2016 A, 5% 12/1/41 | | 910 | 932 |
| Series 2015 A, 5% 12/1/40 | | 1,820 | 1,859 |
| Tampa Tax Allocation (H. Lee Moffitt Cancer Ctr. Proj.) Series 2012 A, 5% 9/1/25 | | 340 | 342 |
| Volusia County Edl. Facilities Auth. Rev. (Embry-Riddle Aeronautical Univ., Inc. Proj.) Series 2020 A: | | | |
| 5% 10/15/44 | | 905 | 961 |
| 5% 10/15/49 | | 1,705 | 1,801 |
| Volusia County School Board Ctfs. of Prtn.: | | | |
| (Florida Master Lease Prog.) Series 2016 A: | | | |
| 5% 8/1/29 (Build America Mutual Assurance Insured) | | 830 | 900 |
| 5% 8/1/32 (Build America Mutual Assurance Insured) | | 4,140 | 4,475 |
| (Master Lease Prog.) Series 2014 B: | | | |
| 5% 8/1/25 | | 1,470 | 1,555 |
| 5% 8/1/26 | | 280 | 296 |
|
| TOTAL FLORIDA | | | 333,279 |
|
| Georgia - 3.3% | | | |
| Atlanta Arpt. Rev. Series 2019 B, 5% 7/1/25 (d) | | 1,870 | 1,998 |
| Atlanta Wtr. & Wastewtr. Rev. Series 2015, 5% 11/1/27 | | 830 | 887 |
| Columbus Med. Ctr. Hosp. Auth. Bonds (Piedmont Healthcare, Inc. Proj.) Series 2019 B, 5%, tender 7/1/29 (a) | | 6,900 | 7,613 |
| Fulton County Dev. Auth. Rev. Series 2019, 4% 6/15/49 | | 1,515 | 1,473 |
| Georgia Gen. Oblig. Series 2022 A: | | | |
| 5% 7/1/33 (e) | | 6,885 | 8,213 |
| 5% 7/1/34 (e) | | 14,350 | 17,058 |
| 5% 7/1/35 (e) | | 24,240 | 28,744 |
| Glynn-Brunswick Memorial Hosp. Auth. Rev. (Southeast Georgia Health Sys. Proj.) Series 2017: | | | |
| 4% 8/1/43 | | 1,860 | 1,665 |
| 5% 8/1/39 | | 1,705 | 1,738 |
| 5% 8/1/43 | | 2,275 | 2,302 |
| Hosp. Auth. of Savannah Auth. Rev. Series 2019 A: | | | |
| 4% 7/1/35 | | 1,400 | 1,393 |
| 4% 7/1/36 | | 4,500 | 4,441 |
| 4% 7/1/43 | | 6,160 | 5,751 |
| Main Street Natural Gas, Inc. Bonds: | | | |
| Series 2021 A, 4%, tender 9/1/27 (a) | | 25,000 | 25,632 |
| Series 2021 C, 4%, tender 12/1/28 (a) | | 23,425 | 23,451 |
| Private Colleges & Univs. Auth. Rev.: | | | |
| (Agnes Scott College) Series 2019 A, 5% 6/1/28 | | 1,000 | 1,096 |
| Series 2019 A, 5% 6/1/29 | | 800 | 883 |
| Series 2020 B: | | | |
| 5% 9/1/31 | | 2,490 | 2,855 |
| 5% 9/1/32 | | 1,880 | 2,126 |
|
| TOTAL GEORGIA | | | 139,319 |
|
| Hawaii - 0.6% | | | |
| Hawaii Arpts. Sys. Rev.: | | | |
| Series 2015 A, 5% 7/1/41 (d) | | 6,210 | 6,400 |
| Series 2018 A: | | | |
| 5% 7/1/29 (d) | | 1,055 | 1,149 |
| 5% 7/1/30 (d) | | 1,240 | 1,341 |
| 5% 7/1/31 (d) | | 1,215 | 1,308 |
| 5% 7/1/32 (d) | | 1,240 | 1,328 |
| 5% 7/1/33 (d) | | 1,265 | 1,348 |
| Series 2022 A, 5% 7/1/42 (d) | | 9,480 | 10,119 |
| Hawaii Gen. Oblig. Series 2020 A, 4% 7/1/34 (d) | | 750 | 771 |
| State of Hawaii Dept. of Trans. Series 2013: | | | |
| 5.25% 8/1/24 (d) | | 1,655 | 1,702 |
| 5.25% 8/1/25 (d) | | 2,070 | 2,126 |
|
| TOTAL HAWAII | | | 27,592 |
|
| Idaho - 0.0% | | | |
| Idaho Hsg. & Fin. Assoc. Single Family Mtg. Series 2019 A, 4% 1/1/50 | | 605 | 614 |
| Illinois - 18.1% | | | |
| Chicago Board of Ed.: | | | |
| Series 2012 A, 5% 12/1/42 | | 7,630 | 7,630 |
| Series 2015 C, 5.25% 12/1/39 | | 1,405 | 1,433 |
| Series 2016 B, 6.5% 12/1/46 | | 660 | 713 |
| Series 2017 A, 7% 12/1/46 (c) | | 2,320 | 2,580 |
| Series 2017 C: | | | |
| 5% 12/1/24 | | 4,770 | 4,914 |
| 5% 12/1/25 | | 2,725 | 2,828 |
| 5% 12/1/26 | | 800 | 835 |
| 5% 12/1/30 | | 2,105 | 2,173 |
| 5% 12/1/34 | | 1,245 | 1,280 |
| Series 2017 D: | | | |
| 5% 12/1/23 | | 2,460 | 2,512 |
| 5% 12/1/24 | | 1,030 | 1,061 |
| 5% 12/1/31 | | 3,565 | 3,679 |
| Series 2017 H, 5% 12/1/36 | | 95 | 97 |
| Series 2018 A: | | | |
| 5% 12/1/25 | | 830 | 861 |
| 5% 12/1/26 | | 830 | 866 |
| 5% 12/1/28 | | 3,915 | 4,108 |
| 5% 12/1/30 | | 1,655 | 1,716 |
| 5% 12/1/32 | | 950 | 979 |
| 5% 12/1/34 | | 1,140 | 1,170 |
| 5% 12/1/35 | | 830 | 850 |
| Series 2018 C, 5% 12/1/46 | | 3,250 | 3,294 |
| Series 2019 A: | | | |
| 4% 12/1/27 | | 5,000 | 4,961 |
| 5% 12/1/27 | | 1,625 | 1,703 |
| 5% 12/1/28 | | 2,910 | 3,053 |
| 5% 12/1/28 | | 2,000 | 2,098 |
| 5% 12/1/33 | | 1,300 | 1,339 |
| Chicago Gen. Oblig.: | | | |
| Series 2017 A, 6% 1/1/38 | | 1,000 | 1,074 |
| Series 2020 A: | | | |
| 5% 1/1/27 | | 430 | 455 |
| 5% 1/1/29 | | 3,175 | 3,367 |
| 5% 1/1/30 | | 3,125 | 3,298 |
| 5% 1/1/31 | | 3,760 | 3,945 |
| Series 2021 A, 5% 1/1/32 | | 5,335 | 5,584 |
| Chicago Midway Arpt. Rev.: | | | |
| Series 2014 A: | | | |
| 5% 1/1/27 (d) | | 8,550 | 8,794 |
| 5% 1/1/28 (d) | | 15,855 | 16,281 |
| 5% 1/1/33 (d) | | 4,450 | 4,553 |
| 5% 1/1/34 (d) | | 2,150 | 2,195 |
| Series 2016 A, 5% 1/1/28 (d) | | 1,655 | 1,742 |
| Series 2016 B: | | | |
| 4% 1/1/35 | | 1,305 | 1,291 |
| 5% 1/1/36 | | 1,655 | 1,725 |
| 5% 1/1/37 | | 2,235 | 2,327 |
| 5% 1/1/46 | | 5,865 | 5,988 |
| Chicago O'Hare Int'l. Arpt. Rev.: | | | |
| Series 2013 D, 5% 1/1/27 | | 2,650 | 2,684 |
| Series 2015 A: | | | |
| 5% 1/1/31 (d) | | 5,000 | 5,163 |
| 5% 1/1/32 (d) | | 10,100 | 10,414 |
| Series 2015 C, 5% 1/1/46 (d) | | 1,985 | 2,018 |
| Series 2016 B, 5% 1/1/34 | | 5,050 | 5,308 |
| Series 2016 C: | | | |
| 5% 1/1/33 | | 2,255 | 2,375 |
| 5% 1/1/34 | | 2,610 | 2,744 |
| Series 2016 G: | | | |
| 5% 1/1/37 (d) | | 1,655 | 1,720 |
| 5% 1/1/42 (d) | | 1,655 | 1,709 |
| 5.25% 1/1/29 (d) | | 290 | 313 |
| 5.25% 1/1/31 (d) | | 330 | 352 |
| Series 2017 A, 5% 1/1/31 | | 2,925 | 3,147 |
| Series 2017 B: | | | |
| 5% 1/1/35 | | 1,740 | 1,844 |
| 5% 1/1/37 | | 7,080 | 7,461 |
| Series 2017 C: | | | |
| 5% 1/1/30 | | 495 | 535 |
| 5% 1/1/31 | | 495 | 533 |
| 5% 1/1/32 | | 540 | 579 |
| Series 2017 D: | | | |
| 5% 1/1/28 (d) | | 2,475 | 2,661 |
| 5% 1/1/29 (d) | | 2,070 | 2,211 |
| 5% 1/1/32 (d) | | 2,235 | 2,351 |
| 5% 1/1/34 (d) | | 3,360 | 3,506 |
| 5% 1/1/35 (d) | | 2,485 | 2,590 |
| 5% 1/1/36 (d) | | 3,090 | 3,217 |
| 5% 1/1/37 (d) | | 1,655 | 1,720 |
| Series 2018 A: | | | |
| 5% 1/1/48 (d) | | 2,215 | 2,299 |
| 5% 1/1/53 (d) | | 3,790 | 3,924 |
| Chicago O'Hare Int'l. Arpt. Spl. Facilities Rev. Series 2018: | | | |
| 5% 7/1/38 (d) | | 2,185 | 2,252 |
| 5% 7/1/48 (d) | | 9,030 | 9,170 |
| Chicago Transit Auth.: | | | |
| Series 2014, 5.25% 12/1/49 | | 14,900 | 15,332 |
| Series 2017, 5% 12/1/46 | | 3,395 | 3,527 |
| Chicago Transit Auth. Cap. Grant Receipts Rev. Series 2017: | | | |
| 5% 6/1/24 | | 255 | 267 |
| 5% 6/1/25 | | 255 | 272 |
| 5% 6/1/26 | | 205 | 222 |
| Cook County Gen. Oblig. Series 2016 A: | | | |
| 5% 11/15/26 | | 4,420 | 4,834 |
| 5% 11/15/27 | | 2,320 | 2,529 |
| 5% 11/15/28 | | 3,020 | 3,277 |
| 5% 11/15/29 | | 3,760 | 4,067 |
| 5% 11/15/30 | | 4,140 | 4,464 |
| Illinois Fin. Auth. Rev.: | | | |
| (Bradley Univ. Proj.) Series 2017 C: | | | |
| 5% 8/1/29 | | 1,090 | 1,141 |
| 5% 8/1/30 | | 760 | 791 |
| 5% 8/1/32 | | 1,015 | 1,048 |
| (Depaul Univ. Proj.) Series 2016 A: | | | |
| 4% 10/1/34 | | 830 | 826 |
| 5% 10/1/29 | | 830 | 885 |
| 5% 10/1/30 | | 830 | 881 |
| 5% 10/1/35 | | 1,655 | 1,736 |
| (OSF Healthcare Sys.) Series 2018 A: | | | |
| 4.125% 5/15/47 | | 25,725 | 24,221 |
| 5% 5/15/43 | | 34,525 | 35,485 |
| (Presence Health Proj.) Series 2016 C: | | | |
| 3.625% 2/15/32 | | 950 | 931 |
| 4% 2/15/33 | | 225 | 226 |
| 5% 2/15/29 | | 5,110 | 5,601 |
| 5% 2/15/36 | | 1,535 | 1,631 |
| (Rosalind Franklin Univ. Research Bldg. Proj.) Series 2017 C, 5% 8/1/46 | | 830 | 847 |
| (Rush Univ. Med. Ctr. Proj.) Series 2015 A, 5% 11/15/34 | | 415 | 427 |
| Series 2013: | | | |
| 5% 11/15/24 | | 415 | 420 |
| 5% 11/15/27 | | 85 | 86 |
| 5% 11/15/28 | | 2,380 | 2,407 |
| 5% 11/15/29 | | 1,160 | 1,173 |
| Series 2015 A: | | | |
| 5% 11/15/35 | | 1,985 | 2,056 |
| 5% 11/15/45 | | 2,670 | 2,726 |
| Series 2015 B, 5% 11/15/27 | | 2,615 | 2,751 |
| Series 2015 C: | | | |
| 4.125% 8/15/37 | | 735 | 718 |
| 5% 8/15/35 | | 6,175 | 6,370 |
| 5% 8/15/44 | | 30,175 | 30,890 |
| Series 2016 A: | | | |
| 5% 8/15/25 (Escrowed to Maturity) | | 1,970 | 2,131 |
| 5% 7/1/28 (Pre-Refunded to 7/1/26 @ 100) | | 1,020 | 1,118 |
| 5% 2/15/29 | | 4,255 | 4,580 |
| 5% 2/15/30 | | 4,490 | 4,810 |
| 5% 7/1/30 (Pre-Refunded to 7/1/26 @ 100) | | 590 | 646 |
| 5% 2/15/31 | | 3,620 | 3,856 |
| 5% 7/1/31 (Pre-Refunded to 7/1/26 @ 100) | | 1,040 | 1,139 |
| 5% 2/15/32 | | 3,520 | 3,718 |
| 5% 7/1/33 (Pre-Refunded to 7/1/26 @ 100) | | 540 | 592 |
| 5% 7/1/34 (Pre-Refunded to 7/1/26 @ 100) | | 4,140 | 4,536 |
| 5% 8/15/35 (Pre-Refunded to 8/15/26 @ 100) | | 420 | 463 |
| 5% 7/1/36 (Pre-Refunded to 7/1/26 @ 100) | | 2,140 | 2,345 |
| 5% 8/15/36 (Pre-Refunded to 8/15/26 @ 100) | | 1,685 | 1,857 |
| 5.25% 8/15/31 (Pre-Refunded to 8/15/26 @ 100) | | 495 | 550 |
| Series 2016 B: | | | |
| 5% 8/15/31 | | 6,095 | 6,513 |
| 5% 8/15/32 | | 5,000 | 5,309 |
| 5% 8/15/34 | | 6,220 | 6,548 |
| 5% 8/15/36 | | 8,680 | 9,117 |
| Series 2016 C: | | | |
| 3.75% 2/15/34 | | 1,215 | 1,192 |
| 4% 2/15/36 | | 5,160 | 5,168 |
| 4% 2/15/41 | | 20,725 | 20,469 |
| 4% 2/15/41 (Pre-Refunded to 2/15/27 @ 100) | | 655 | 696 |
| 5% 2/15/30 | | 6,425 | 7,002 |
| 5% 2/15/31 | | 12,595 | 13,599 |
| 5% 2/15/32 | | 3,660 | 3,919 |
| 5% 2/15/34 | | 2,920 | 3,113 |
| 5% 2/15/41 | | 5,720 | 6,014 |
| Series 2016 D, 4% 2/15/46 | | 15,500 | 14,455 |
| Series 2016: | | | |
| 4% 2/15/41 (Pre-Refunded to 2/15/27 @ 100) | | 30 | 32 |
| 5% 5/15/29 | | 1,040 | 1,101 |
| 5% 12/1/29 | | 1,420 | 1,515 |
| 5% 5/15/30 | | 2,200 | 2,319 |
| 5% 12/1/33 | | 835 | 883 |
| 5% 12/1/46 | | 11,065 | 11,443 |
| Series 2017 A: | | | |
| 5% 1/1/36 (Pre-Refunded to 1/1/27 @ 100) | | 1,860 | 2,063 |
| 5% 8/1/42 | | 730 | 748 |
| Series 2017: | | | |
| 5% 1/1/29 | | 2,775 | 3,050 |
| 5% 7/1/34 | | 4,640 | 5,013 |
| 5% 7/1/35 | | 3,900 | 4,207 |
| Series 2019: | | | |
| 4% 9/1/37 | | 600 | 553 |
| 4% 9/1/41 | | 1,000 | 894 |
| 5% 9/1/36 | | 1,000 | 1,032 |
| Illinois Gen. Oblig.: | | | |
| Series 2013: | | | |
| 5.5% 7/1/24 | | 830 | 853 |
| 5.5% 7/1/25 | | 4,315 | 4,425 |
| Series 2014: | | | |
| 5% 2/1/25 | | 3,005 | 3,098 |
| 5% 2/1/26 | | 2,270 | 2,342 |
| 5% 4/1/28 | | 1,895 | 1,952 |
| 5% 5/1/28 | | 1,780 | 1,836 |
| 5.25% 2/1/31 | | 360 | 369 |
| Series 2016: | | | |
| 5% 6/1/26 | | 995 | 1,061 |
| 5% 2/1/27 | | 5,585 | 5,996 |
| Series 2018 A, 5% 10/1/28 | | 230 | 249 |
| Series 2020, 5.75% 5/1/45 | | 3,865 | 4,207 |
| Series 2021 A: | | | |
| 5% 3/1/32 | | 2,750 | 2,949 |
| 5% 3/1/33 | | 1,500 | 1,602 |
| 5% 3/1/34 | | 2,220 | 2,359 |
| 5% 3/1/35 | | 5,450 | 5,757 |
| 5% 3/1/36 | | 4,500 | 4,738 |
| 5% 3/1/37 | | 5,500 | 5,775 |
| 5% 3/1/46 | | 7,635 | 7,840 |
| Series 2022 A: | | | |
| 5% 3/1/29 | | 4,600 | 4,987 |
| 5% 3/1/32 | | 4,490 | 4,846 |
| 5% 3/1/33 | | 6,690 | 7,190 |
| 5% 3/1/34 | | 5,110 | 5,461 |
| Illinois Hsg. Dev. Auth. Multi-family Hsg. Rev. Series 2019, 2.9% 7/1/35 | | 6,073 | 5,483 |
| Illinois Muni. Elec. Agcy. Pwr. Supply Series 2015 A, 5% 2/1/31 | | 3,370 | 3,620 |
| Illinois Toll Hwy. Auth. Toll Hwy. Rev.: | | | |
| Series 2016 A: | | | |
| 5% 12/1/31 | | 5,825 | 6,213 |
| 5% 12/1/32 | | 8,525 | 9,065 |
| Series 2019 A, 5% 1/1/44 | | 1,260 | 1,351 |
| Series A: | | | |
| 5% 1/1/36 | | 1,000 | 1,113 |
| 5% 1/1/38 | | 350 | 386 |
| 5% 1/1/40 | | 2,390 | 2,607 |
| Kendall, Kane & Will Counties Cmnty. Unit School District #308 Series 2016: | | | |
| 5% 2/1/34 | | 5,795 | 6,260 |
| 5% 2/1/35 | | 4,140 | 4,470 |
| 5% 2/1/36 | | 7,120 | 7,676 |
| McHenry & Kane Counties Cmnty. Consolidated School District #158 Series 2004, 0% 1/1/24 (Assured Guaranty Muni. Corp. Insured) | | 4,220 | 4,074 |
| Metropolitan Pier & Exposition: | | | |
| (McCormick Place Expansion Proj.): | | | |
| Series 1996 A, 0% 6/15/23 (Nat'l. Pub. Fin. Guarantee Corp. Insured) | | 5,215 | 5,087 |
| Series 2002 A, 0% 6/15/36 (Nat'l. Pub. Fin. Guarantee Corp. Insured) | | 2,645 | 1,427 |
| Series 2010 B1: | | | |
| 0% 6/15/43 (Assured Guaranty Muni. Corp. Insured) | | 41,985 | 15,637 |
| 0% 6/15/45 (Assured Guaranty Muni. Corp. Insured) | | 25,250 | 8,468 |
| 0% 6/15/47 (Assured Guaranty Muni. Corp. Insured) | | 3,000 | 906 |
| Series 2012 B, 0% 12/15/51 | | 10,845 | 2,401 |
| Series A, 0% 12/15/24 (Nat'l. Pub. Fin. Guarantee Corp. Insured) | | 2,560 | 2,371 |
| Series 1996 A, 0% 6/15/24 | | 2,535 | 2,390 |
| Series 1998 A, 5.5% 12/15/23 | | 5 | 5 |
| Series 2002 A, 0% 6/15/35 (Nat'l. Pub. Fin. Guarantee Corp. Insured) | | 1,690 | 964 |
| Series 2002, 0% 12/15/36 (Nat'l. Pub. Fin. Guarantee Corp. Insured) | | 13,280 | 6,965 |
| Series 2017 B: | | | |
| 5% 12/15/25 | | 830 | 872 |
| 5% 12/15/26 | | 2,755 | 2,922 |
| 5% 12/15/27 | | 295 | 315 |
| 5% 12/15/31 | | 560 | 583 |
| 5% 12/15/34 | | 330 | 340 |
| Series 2022 A: | | | |
| 4% 12/15/42 | | 7,330 | 6,554 |
| 4% 12/15/47 | | 560 | 489 |
| 4% 6/15/52 | | 2,000 | 1,722 |
| Northern Illinois Univ. Revs. Series 2020 B: | | | |
| 5% 4/1/26 (Build America Mutual Assurance Insured) | | 1,400 | 1,506 |
| 5% 4/1/28 (Build America Mutual Assurance Insured) | | 1,300 | 1,431 |
| 5% 4/1/30 (Build America Mutual Assurance Insured) | | 1,000 | 1,119 |
| 5% 4/1/32 (Build America Mutual Assurance Insured) | | 1,295 | 1,436 |
| Railsplitter Tobacco Settlement Auth. Rev. Series 2017: | | | |
| 5% 6/1/27 | | 4,140 | 4,451 |
| 5% 6/1/28 | | 2,275 | 2,433 |
| Univ. of Illinois Rev.: | | | |
| Series 2013: | | | |
| 6% 10/1/42 | | 4,555 | 4,725 |
| 6.25% 10/1/38 | | 4,495 | 4,681 |
| Series 2018 A, 5% 4/1/30 | | 3,425 | 3,753 |
| Will County Cmnty. Unit School District #365-U Series 2007 B, 0% 11/1/26 (Assured Guaranty Muni. Corp. Insured) | | 5,095 | 4,511 |
| Will County Illinois Series 2016: | | | |
| 5% 11/15/32 (Pre-Refunded to 11/15/25 @ 100) | | 1,020 | 1,114 |
| 5% 11/15/33 (Pre-Refunded to 11/15/25 @ 100) | | 1,240 | 1,354 |
| 5% 11/15/34 (Pre-Refunded to 11/15/25 @ 100) | | 1,240 | 1,354 |
|
| TOTAL ILLINOIS | | | 768,021 |
|
| Indiana - 1.3% | | | |
| Indiana Fin. Auth. Rev.: | | | |
| Series 2015 A, 5.25% 2/1/32 | | 5,845 | 6,303 |
| Series 2016: | | | |
| 5% 9/1/24 | | 560 | 593 |
| 5% 9/1/26 | | 1,075 | 1,185 |
| 5% 9/1/27 | | 540 | 593 |
| 5% 9/1/28 | | 2,535 | 2,765 |
| 5% 9/1/29 | | 1,240 | 1,346 |
| 5% 9/1/30 | | 1,160 | 1,252 |
| Indiana Fin. Auth. Wastewtr. Util. Rev. (CWA Auth. Proj.): | | | |
| Series 2012 A, 5% 10/1/26 (Pre-Refunded to 10/1/22 @ 100) | | 2,105 | 2,123 |
| Series 2015 A, 5% 10/1/30 | | 3,990 | 4,180 |
| Indiana Hsg. & Cmnty. Dev. Auth. (Glasswater Creek of Whitestown Proj.) Series 2020, 5.375% 10/1/40 (c) | | 2,045 | 1,707 |
| Indianapolis Local Pub. Impt.: | | | |
| (Indianapolis Arpt. Auth. Proj.) Series 2019 I, 5% 1/1/44 | | 5,100 | 5,421 |
| Series 2016: | | | |
| 4% 1/1/32 (d) | | 830 | 832 |
| 4% 1/1/33 (d) | | 830 | 829 |
| 4% 1/1/34 (d) | | 1,010 | 1,003 |
| 4% 1/1/35 (d) | | 2,300 | 2,273 |
| 5% 1/1/26 (d) | | 875 | 938 |
| Purdue Univ. Rev. Series 2018 DD: | | | |
| 5% 7/1/34 | | 995 | 1,108 |
| 5% 7/1/35 | | 1,960 | 2,179 |
| 5% 7/1/36 | | 2,130 | 2,365 |
| 5% 7/1/37 | | 1,970 | 2,184 |
| 5% 7/1/38 | | 2,345 | 2,595 |
| Saint Joseph County Econ. Dev. Auth. Rev. (St. Mary's College Proj.): | | | |
| Series 2019: | | | |
| 4% 4/1/38 | | 260 | 254 |
| 4% 4/1/46 | | 6,035 | 5,599 |
| 5% 4/1/43 | | 460 | 481 |
| Series 2020: | | | |
| 4% 4/1/38 | | 1,510 | 1,474 |
| 5% 4/1/32 | | 1,805 | 1,962 |
|
| TOTAL INDIANA | | | 53,544 |
|
| Iowa - 0.3% | | | |
| Iowa Fin. Auth. Rev. Series A: | | | |
| 5% 5/15/43 | | 1,145 | 1,085 |
| 5% 5/15/48 | | 1,885 | 1,753 |
| Iowa Student Ln. Liquidity Corp. Student Ln. Rev. Series 2019 B: | | | |
| 5% 12/1/26 (d) | | 1,850 | 2,008 |
| 5% 12/1/27 (d) | | 1,965 | 2,152 |
| Tobacco Settlement Auth. Tobacco Settlement Rev. Series 2021 B1, 4% 6/1/49 | | 3,820 | 3,683 |
|
| TOTAL IOWA | | | 10,681 |
|
| Kansas - 0.1% | | | |
| Wyandotte County/Kansas City Unified Govt. Util. Sys. Rev. Series 2016 A, 5% 9/1/40 | | 3,740 | 3,888 |
| Kentucky - 1.2% | | | |
| Kenton County Arpt. Board Arpt. Rev. Series 2016: | | | |
| 5% 1/1/28 | | 1,310 | 1,402 |
| 5% 1/1/31 | | 1,240 | 1,312 |
| 5% 1/1/32 | | 1,240 | 1,308 |
| Kentucky Econ. Dev. Fin. Auth.: | | | |
| Series 2019 A1: | | | |
| 5% 8/1/35 | | 1,000 | 1,050 |
| 5% 8/1/44 | | 1,000 | 1,022 |
| Series 2019 A2, 5% 8/1/44 | | 2,995 | 3,060 |
| Kentucky State Property & Buildings Commission Rev. (Proj. No. 119) Series 2018: | | | |
| 5% 5/1/26 | | 830 | 902 |
| 5% 5/1/29 | | 4,510 | 4,975 |
| 5% 5/1/32 | | 1,185 | 1,305 |
| 5% 5/1/33 | | 915 | 1,002 |
| 5% 5/1/34 | | 1,045 | 1,143 |
| 5% 5/1/35 | | 615 | 665 |
| 5% 5/1/36 | | 520 | 561 |
| Kentucky, Inc. Pub. Energy Bonds Series A, 4%, tender 6/1/26 (a) | | 10,000 | 10,121 |
| Louisville & Jefferson County: | | | |
| Bonds: | | | |
| Series 2020 C, 5%, tender 10/1/26 (a) | | 1,695 | 1,809 |
| Series 2020 D, 5%, tender 10/1/29 (a) | | 2,030 | 2,218 |
| Series 2013 A: | | | |
| 5.5% 10/1/33 | | 2,815 | 2,908 |
| 5.75% 10/1/38 | | 7,255 | 7,505 |
| Series 2020 A: | | | |
| 5% 10/1/37 | | 2,405 | 2,546 |
| 5% 10/1/38 | | 2,300 | 2,430 |
|
| TOTAL KENTUCKY | | | 49,244 |
|
| Louisiana - 1.2% | | | |
| Jefferson Parish Consolidated Wtrwks. District No. 2 Series 2022, 5% 2/1/42 (Build America Mutual Assurance Insured) | | 10,390 | 11,428 |
| Louisiana Pub. Facilities Auth. Hosp. Rev. (Franciscan Missionaries of Our Lady Health Sys. Proj.) Series 2017 A, 5% 7/1/47 | | 1,950 | 2,008 |
| Louisiana Pub. Facilities Auth. Rev.: | | | |
| (Tulane Univ. of Louisiana Proj.) Series 2016 A: | | | |
| 5% 12/15/24 | | 1,240 | 1,311 |
| 5% 12/15/25 | | 2,585 | 2,769 |
| 5% 12/15/26 | | 1,045 | 1,135 |
| 5% 12/15/28 | | 1,655 | 1,780 |
| 5% 12/15/29 | | 1,175 | 1,259 |
| 5% 12/15/30 | | 2,320 | 2,478 |
| Series 2018 E: | | | |
| 5% 7/1/37 | | 1,615 | 1,710 |
| 5% 7/1/38 | | 1,260 | 1,331 |
| New Orleans Aviation Board Rev.: | | | |
| (North Term. Proj.): | | | |
| Series 2015 B: | | | |
| 5% 1/1/27 (d) | | 1,160 | 1,214 |
| 5% 1/1/29 (d) | | 4,295 | 4,467 |
| 5% 1/1/30 (d) | | 5,795 | 6,006 |
| 5% 1/1/31 (d) | | 2,070 | 2,139 |
| Series 2017 B: | | | |
| 5% 1/1/27 (d) | | 330 | 357 |
| 5% 1/1/28 (d) | | 205 | 221 |
| 5% 1/1/32 (d) | | 330 | 348 |
| 5% 1/1/33 (d) | | 580 | 609 |
| 5% 1/1/34 (d) | | 180 | 188 |
| 5% 1/1/35 (d) | | 330 | 344 |
| Series 2017 D2: | | | |
| 5% 1/1/27 (d) | | 415 | 449 |
| 5% 1/1/28 (d) | | 595 | 641 |
| 5% 1/1/31 (d) | | 530 | 561 |
| 5% 1/1/33 (d) | | 850 | 892 |
| 5% 1/1/34 (d) | | 1,020 | 1,067 |
| 5% 1/1/36 (d) | | 775 | 806 |
| 5% 1/1/37 (d) | | 1,275 | 1,323 |
|
| TOTAL LOUISIANA | | | 48,841 |
|
| Maine - 1.1% | | | |
| Maine Health & Higher Edl. Facilities Auth. Rev.: | | | |
| Series 2016 A: | | | |
| 4% 7/1/41 | | 1,935 | 1,752 |
| 4% 7/1/46 | | 3,180 | 2,800 |
| 5% 7/1/41 | | 8,620 | 8,831 |
| 5% 7/1/46 | | 22,975 | 23,419 |
| Series 2017 B: | | | |
| 4% 7/1/25 | | 375 | 390 |
| 4% 7/1/31 | | 580 | 591 |
| 4% 7/1/32 | | 415 | 421 |
| 4% 7/1/34 | | 835 | 832 |
| 5% 7/1/26 | | 270 | 292 |
| 5% 7/1/28 | | 420 | 456 |
| 5% 7/1/29 | | 330 | 356 |
| 5% 7/1/33 | | 830 | 886 |
| 5% 7/1/35 | | 630 | 666 |
| Maine Tpk. Auth. Tpk. Rev. Series 2015: | | | |
| 5% 7/1/32 | | 870 | 934 |
| 5% 7/1/36 | | 2,150 | 2,303 |
| 5% 7/1/38 | | 555 | 594 |
|
| TOTAL MAINE | | | 45,523 |
|
| Maryland - 1.2% | | | |
| City of Westminster Series 2016: | | | |
| 5% 11/1/27 | | 2,150 | 2,299 |
| 5% 11/1/28 | | 2,275 | 2,419 |
| 5% 11/1/29 | | 2,410 | 2,555 |
| 5% 11/1/30 | | 2,555 | 2,695 |
| Harford County Gen. Oblig. Series 2020 A: | | | |
| 5% 10/1/27 | | 2,000 | 2,265 |
| 5% 10/1/29 | | 2,000 | 2,326 |
| Maryland Cmnty. Dev. Admin Dept. Hsg. & Cmnty. Dev. Series 2019 B, 4% 9/1/49 | | 2,345 | 2,379 |
| Maryland Dept. of Trans.: | | | |
| Series 2022 A: | | | |
| 5% 12/1/25 | | 1,000 | 1,094 |
| 5% 12/1/27 | | 1,000 | 1,135 |
| Series 2022 B: | | | |
| 5% 12/1/24 (e) | | 1,160 | 1,222 |
| 5% 12/1/26 (e) | | 1,755 | 1,916 |
| Maryland Econ. Dev. Auth. Rev. (Ports America Chesapeake LLC. Proj.) Series 2017 A: | | | |
| 5% 6/1/30 | | 1,035 | 1,116 |
| 5% 6/1/35 | | 1,655 | 1,756 |
| Maryland Gen. Oblig. Series 2022 A, 5% 6/1/35 | | 10,210 | 12,010 |
| Maryland Health & Higher Edl. Facilities Auth. Rev.: | | | |
| (Medstar Health, Inc. Proj.) Series 2017 A, 5% 5/15/45 | | 2,645 | 2,772 |
| Series 2015, 5% 7/1/24 | | 625 | 654 |
| Series 2016 A: | | | |
| 4% 7/1/42 | | 1,430 | 1,252 |
| 5% 7/1/35 | | 575 | 594 |
| Maryland Trans. Auth. Trans. Facility Projs. Rev. Series 2021 A, 5% 7/1/51 | | 4,000 | 4,425 |
| Washington Metropolitan Area Transit Auth. Series 2021 A: | | | |
| 5% 7/15/41 | | 1,250 | 1,399 |
| 5% 7/15/46 | | 2,000 | 2,210 |
|
| TOTAL MARYLAND | | | 50,493 |
|
| Massachusetts - 3.6% | | | |
| Massachusetts Bay Trans. Auth. Sales Tax Rev. Series 2021 A1: | | | |
| 5% 7/1/32 | | 2,235 | 2,589 |
| 5% 7/1/33 | | 2,500 | 2,863 |
| 5% 7/1/34 | | 1,260 | 1,437 |
| 5% 7/1/35 | | 3,180 | 3,619 |
| Massachusetts Commonwealth Trans. Fund Rev. Series 2021 A, 5% 6/1/51 | | 6,025 | 6,602 |
| Massachusetts Dev. Fin. Agcy. Rev.: | | | |
| (Lesley Univ. Proj.) Series 2016, 5% 7/1/39 | | 1,360 | 1,408 |
| (Partners Healthcare Sys., Inc. Proj.): | | | |
| Series 2017 S: | | | |
| 5% 7/1/30 | | 3,210 | 3,544 |
| 5% 7/1/34 | | 3,500 | 3,751 |
| Series 2017, 4% 7/1/41 | | 8,280 | 8,177 |
| (Univ. of Massachusetts Health Cr., Inc. Proj.) Series 2017 L, 4% 7/1/44 | | 830 | 762 |
| (Wentworth Institute of Technology Proj.) Series 2017: | | | |
| 5% 10/1/27 | | 830 | 875 |
| 5% 10/1/28 | | 875 | 919 |
| 5% 10/1/29 | | 920 | 963 |
| 5% 10/1/31 | | 1,015 | 1,054 |
| 5% 10/1/32 | | 1,065 | 1,104 |
| Series 2016 I, 5% 7/1/41 | | 1,925 | 1,972 |
| Series 2016: | | | |
| 5% 10/1/29 | | 830 | 898 |
| 5% 10/1/30 | | 1,240 | 1,339 |
| 5% 7/1/31 | | 1,385 | 1,445 |
| 5% 10/1/31 | | 1,340 | 1,444 |
| 5% 10/1/43 | | 8,995 | 9,204 |
| Series 2017: | | | |
| 5% 7/1/34 | | 1,325 | 1,375 |
| 5% 7/1/35 | | 1,000 | 1,037 |
| Series 2019, 5% 9/1/59 | | 14,880 | 15,478 |
| Series 2020 A, 4% 7/1/45 | | 12,200 | 10,852 |
| Series BB1, 5% 10/1/46 | | 345 | 366 |
| Series M: | | | |
| 4% 10/1/50 | | 12,425 | 10,957 |
| 5% 10/1/45 | | 9,360 | 9,692 |
| Massachusetts Edl. Fing. Auth. Rev. Series 2019 B: | | | |
| 5% 7/1/27 (d) | | 1,000 | 1,082 |
| 5% 7/1/28 (d) | | 1,915 | 2,084 |
| Massachusetts Gen. Oblig.: | | | |
| Series 2017 A, 5% 4/1/36 | | 1,750 | 1,893 |
| Series 2019 C, 5% 5/1/49 | | 4,175 | 4,538 |
| Series 2020 D, 5% 7/1/48 | | 5,670 | 6,250 |
| Massachusetts Port Auth. Rev.: | | | |
| Series 2016 A: | | | |
| 5% 7/1/33 | | 1,740 | 1,855 |
| 5% 7/1/34 | | 895 | 953 |
| 5% 7/1/38 | | 1,300 | 1,378 |
| Series 2016 B, 5% 7/1/43 (d) | | 7,110 | 7,364 |
| Series 2021 E: | | | |
| 5% 7/1/38 (d) | | 2,875 | 3,129 |
| 5% 7/1/39 (d) | | 4,480 | 4,865 |
| 5% 7/1/40 (d) | | 2,835 | 3,072 |
| 5% 7/1/51 (d) | | 10,000 | 10,589 |
|
| TOTAL MASSACHUSETTS | | | 154,778 |
|
| Michigan - 2.5% | | | |
| Detroit Downtown Dev. Auth. Tax: | | | |
| Series 2018 A, 5% 7/1/32 (Assured Guaranty Muni. Corp. Insured) | | 1,000 | 1,048 |
| Series A, 5% 7/1/34 (Assured Guaranty Muni. Corp. Insured) | | 1,000 | 1,048 |
| Detroit Gen. Oblig. Series 2021 A, 5% 4/1/50 | | 2,600 | 2,634 |
| Flint Hosp. Bldg. Auth. Rev. Series 2020, 5% 7/1/38 | | 1,515 | 1,598 |
| Great Lakes Wtr. Auth. Sew Disp. Sys. Series 2018 A: | | | |
| 5% 7/1/43 | | 2,030 | 2,199 |
| 5% 7/1/48 | | 8,725 | 9,402 |
| Kalamazoo Hosp. Fin. Auth. Hosp. Facilities Rev. Series 2016: | | | |
| 5% 5/15/28 | | 1,945 | 2,070 |
| 5% 5/15/28 (Pre-Refunded to 5/15/26 @ 100) | | 10 | 11 |
| Michigan Bldg. Auth. Rev. Series 2015 I: | | | |
| 5% 4/15/30 | | 3,960 | 4,240 |
| 5% 4/15/30 (Pre-Refunded to 10/15/25 @ 100) | | 180 | 196 |
| Michigan Fin. Auth. Rev.: | | | |
| (Charter County of Wayne Criminal Justice Ctr. Proj.) Series 2018, 5% 11/1/43 | | 2,570 | 2,822 |
| (Trinity Health Proj.) Series 2017, 5% 12/1/42 | | 2,140 | 2,250 |
| Series 2012, 5% 11/15/42 | | 8,595 | 8,667 |
| Series 2016, 5% 11/15/41 | | 1,560 | 1,625 |
| Series 2019 A, 5% 11/15/48 | | 2,105 | 2,175 |
| Series 2020 A, 4% 6/1/49 | | 2,545 | 2,273 |
| Series MI, 5.5% 12/1/27 | | 3,930 | 4,255 |
| Michigan Hosp. Fin. Auth. Rev. Series 2008 C: | | | |
| 5% 12/1/32 | | 1,110 | 1,199 |
| 5% 12/1/32 (Pre-Refunded to 12/1/27 @ 100) | | 130 | 147 |
| Michigan Hsg. Dev. Auth. Single Family Mtg. Rev. Series A, 3.5% 12/1/50 | | 2,010 | 2,007 |
| Oakland Univ. Rev. Series 2019: | | | |
| 5% 3/1/44 | | 8,540 | 8,984 |
| 5% 3/1/50 | | 13,450 | 14,072 |
| Portage Pub. Schools Series 2016: | | | |
| 5% 11/1/30 | | 2,365 | 2,578 |
| 5% 11/1/31 | | 2,090 | 2,278 |
| 5% 11/1/36 | | 205 | 223 |
| Wayne County Arpt. Auth. Rev.: | | | |
| Series 2015 F, 5% 12/1/27 (d) | | 5,790 | 6,147 |
| Series 2015 G, 5% 12/1/28 (d) | | 4,555 | 4,809 |
| Series 2017 A: | | | |
| 4% 12/1/33 (Assured Guaranty Muni. Corp. Insured) | | 1,230 | 1,243 |
| 4% 12/1/34 (Assured Guaranty Muni. Corp. Insured) | | 1,020 | 1,027 |
| 4% 12/1/35 (Assured Guaranty Muni. Corp. Insured) | | 995 | 998 |
| 4% 12/1/36 (Assured Guaranty Muni. Corp. Insured) | | 1,035 | 1,037 |
| 5% 12/1/31 | | 310 | 334 |
| 5% 12/1/32 | | 315 | 338 |
| 5% 12/1/34 | | 580 | 619 |
| 5% 12/1/35 | | 540 | 575 |
| 5% 12/1/37 | | 355 | 375 |
| Series 2017 B: | | | |
| 5% 12/1/29 (d) | | 495 | 534 |
| 5% 12/1/30 (d) | | 580 | 621 |
| 5% 12/1/31 (d) | | 660 | 703 |
| 5% 12/1/32 (d) | | 420 | 447 |
| 5% 12/1/32 (d) | | 540 | 573 |
| 5% 12/1/34 (d) | | 495 | 522 |
| 5% 12/1/35 (d) | | 540 | 568 |
| 5% 12/1/37 (d) | | 705 | 738 |
| 5% 12/1/42 (d) | | 830 | 862 |
| Series 2018 D, 5% 12/1/29 (d) | | 3,645 | 3,979 |
|
| TOTAL MICHIGAN | | | 107,050 |
|
| Minnesota - 0.8% | | | |
| Duluth Econ. Dev. Auth. Health Care Facilities Rev. Series 2018 A, 5% 2/15/48 | | 6,000 | 6,183 |
| Maple Grove Health Care Sys. Rev.: | | | |
| Series 2015, 5% 9/1/29 | | 2,345 | 2,440 |
| Series 2017, 5% 5/1/25 | | 660 | 699 |
| Minnesota Higher Ed. Facilities Auth. Rev. Series 2018 A: | | | |
| 5% 10/1/30 | | 615 | 665 |
| 5% 10/1/45 | | 1,370 | 1,435 |
| Minnesota Muni. Gas Agcy. Rev. Bonds Series 2022 A, 4%, tender 12/1/27 (a) | | 18,275 | 18,731 |
| Moorhead Edl. Facilities Rev. (The Concordia College Corp. Proj.) Series 2016, 5% 12/1/25 | | 990 | 1,029 |
| Shakopee Sr. Hsg. Rev. Bonds Series 2018, 5.85%, tender 11/1/25 (a)(c) | | 3,770 | 3,763 |
|
| TOTAL MINNESOTA | | | 34,945 |
|
| Missouri - 0.8% | | | |
| Cape Girardeau County Indl. Dev. Auth. (Southeast Hosp. Proj.) Series 2017 A: | | | |
| 5% 3/1/30 | | 580 | 611 |
| 5% 3/1/31 | | 620 | 651 |
| 5% 3/1/36 | | 1,240 | 1,286 |
| Kansas City Wtr. Rev. Series 2020 A, 4% 12/1/42 | | 1,200 | 1,189 |
| Missouri Health & Edl. Facilities Rev.: | | | |
| Series 2015 B: | | | |
| 3.125% 2/1/27 | | 830 | 839 |
| 3.25% 2/1/28 | | 830 | 838 |
| 4% 2/1/40 | | 660 | 624 |
| 5% 2/1/29 | | 1,025 | 1,070 |
| 5% 2/1/31 | | 2,150 | 2,231 |
| 5% 2/1/33 | | 2,375 | 2,452 |
| 5% 2/1/36 | | 2,235 | 2,295 |
| Series 2019 A: | | | |
| 4% 10/1/48 | | 2,850 | 2,742 |
| 5% 10/1/46 | | 5,575 | 6,022 |
| Missouri Hsg. Dev. Commission Single Family Mtg. Rev. Series 2019, 4% 5/1/50 | | 695 | 705 |
| Saint Louis Arpt. Rev. Series 2019 C: | | | |
| 5% 7/1/33 | | 2,390 | 2,619 |
| 5% 7/1/34 | | 1,750 | 1,912 |
| Saint Louis County Indl. Dev. Auth. Sr. Living Facilities Rev.: | | | |
| Series 2017, 5% 9/1/48 | | 1,000 | 893 |
| Series 2018 A: | | | |
| 5.125% 9/1/48 | | 3,325 | 3,025 |
| 5.125% 9/1/49 | | 2,665 | 2,417 |
|
| TOTAL MISSOURI | | | 34,421 |
|
| Montana - 0.0% | | | |
| Montana Board Hsg. Single Family: | | | |
| Series 2017 B, 4% 12/1/48 (d) | | 520 | 526 |
| Series 2019 B, 4% 6/1/50 | | 385 | 391 |
|
| TOTAL MONTANA | | | 917 |
|
| Nebraska - 0.4% | | | |
| Douglas County Neb Edl. Facilities Rev. (Creighton Univ. Proj.) Series 2017: | | | |
| 4% 7/1/34 | | 830 | 834 |
| 5% 7/1/36 | | 570 | 609 |
| Nebraska Invt. Fin. Auth. Single Family Hsg. Rev.: | | | |
| Series 2019 B, 4% 9/1/49 (d) | | 1,910 | 1,932 |
| Series 2019 E, 3.75% 9/1/49 (d) | | 2,135 | 2,154 |
| Series 2020 A, 3.5% 9/1/50 | | 1,700 | 1,699 |
| Nebraska Pub. Pwr. District Rev. Series 2016 B: | | | |
| 5% 1/1/37 | | 2,050 | 2,205 |
| 5% 1/1/40 | | 935 | 1,002 |
| Omaha Arpt. Auth. Arpt. Rev. Series 2017 A: | | | |
| 5% 12/15/25 (d) | | 330 | 355 |
| 5% 12/15/26 (d) | | 1,190 | 1,300 |
| 5% 12/15/27 (d) | | 830 | 903 |
| 5% 12/15/30 (d) | | 1,240 | 1,326 |
| 5% 12/15/31 (d) | | 650 | 692 |
| 5% 12/15/33 (d) | | 660 | 697 |
| 5% 12/15/35 (d) | | 1,655 | 1,740 |
| 5% 12/15/36 (d) | | 420 | 441 |
|
| TOTAL NEBRASKA | | | 17,889 |
|
| Nevada - 0.2% | | | |
| Las Vegas Valley Wtr. District Wtr. Impt. Gen. Oblig. Series 2016 B, 5% 6/1/36 | | 3,750 | 4,046 |
| Nevada Hsg. Division Single Family Mtg. Rev. Series 2019 B, 4% 10/1/49 | | 1,130 | 1,146 |
| Tahoe-Douglas Visitors Auth. Series 2020: | | | |
| 5% 7/1/40 | | 1,000 | 1,011 |
| 5% 7/1/45 | | 2,605 | 2,605 |
|
| TOTAL NEVADA | | | 8,808 |
|
| New Hampshire - 1.9% | | | |
| Nat'l. Finnance Auth. Series 2020 1, 4.125% 1/20/34 | | 5,930 | 5,834 |
| New Hampshire Health & Ed. Facilities Auth.: | | | |
| (Concord Hosp.) Series 2017, 5% 10/1/42 | | 2,485 | 2,576 |
| (Dartmouth-Hitchcock Oblgtd Grp Proj.) Series 2018 A: | | | |
| 5% 8/1/28 | | 895 | 975 |
| 5% 8/1/29 | | 855 | 925 |
| 5% 8/1/30 | | 850 | 914 |
| (Partners Healthcare Sys., Inc. Proj.): | | | |
| Series 2017 5% 7/1/29 | | 3,275 | 3,640 |
| Series 2017: | | | |
| 5% 7/1/30 | | 2,125 | 2,346 |
| 5% 7/1/31 | | 4,750 | 5,188 |
| 5% 7/1/32 | | 3,185 | 3,447 |
| 5% 7/1/33 | | 2,900 | 3,121 |
| 5% 7/1/34 | | 4,415 | 4,732 |
| 5% 7/1/35 | | 4,635 | 4,949 |
| 5% 7/1/36 | | 4,870 | 5,181 |
| 5% 7/1/37 | | 4,290 | 4,557 |
| Series 2017, 5% 7/1/44 | | 1,590 | 1,635 |
| New Hampshire Health & Ed. Facilities Auth. Rev.: | | | |
| Series 2012: | | | |
| 4% 7/1/32 | | 2,295 | 2,276 |
| 5% 7/1/24 | | 830 | 831 |
| 5% 7/1/25 | | 980 | 981 |
| 5% 7/1/27 | | 415 | 416 |
| Series 2016: | | | |
| 4% 10/1/38 | | 2,010 | 1,942 |
| 5% 10/1/24 | | 1,755 | 1,846 |
| 5% 10/1/25 | | 1,740 | 1,862 |
| 5% 10/1/29 | | 5,525 | 5,873 |
| 5% 10/1/31 | | 4,315 | 4,544 |
| 5% 10/1/33 | | 3,355 | 3,505 |
| 5% 10/1/38 | | 6,185 | 6,401 |
|
| TOTAL NEW HAMPSHIRE | | | 80,497 |
|
| New Jersey - 4.7% | | | |
| Atlantic County Impt. Auth. (Atlantic City Campus Proj.) Series 2016 A: | | | |
| 5% 7/1/28 (Assured Guaranty Muni. Corp. Insured) | | 860 | 929 |
| 5% 7/1/30 (Assured Guaranty Muni. Corp. Insured) | | 2,105 | 2,261 |
| 5% 7/1/32 (Assured Guaranty Muni. Corp. Insured) | | 1,035 | 1,108 |
| 5% 7/1/33 (Assured Guaranty Muni. Corp. Insured) | | 1,075 | 1,148 |
| New Jersey Econ. Dev. Auth.: | | | |
| (White Horse HMT Urban Renewal LLC Proj.) Series 2020, 5% 1/1/40 (c) | | 1,000 | 801 |
| Series A, 5% 11/1/40 | | 8,915 | 9,365 |
| New Jersey Econ. Dev. Auth. Rev.: | | | |
| (Black Horse EHT Urban Renewal LLC Proj.) Series 2019 A, 5% 10/1/39 (c) | | 910 | 759 |
| Series 2013 NN, 5% 3/1/26 | | 4,125 | 4,197 |
| Series 2013, 5% 3/1/25 | | 1,820 | 1,853 |
| Series 2015 XX, 5.25% 6/15/27 | | 14,075 | 14,833 |
| Series LLL, 5% 6/15/44 | | 2,680 | 2,786 |
| New Jersey Edl. Facility Series 2016 A: | | | |
| 5% 7/1/31 | | 1,740 | 1,847 |
| 5% 7/1/32 | | 1,985 | 2,103 |
| New Jersey Gen. Oblig. Series 2020 A: | | | |
| 4% 6/1/30 | | 22,085 | 23,344 |
| 4% 6/1/31 | | 1,230 | 1,298 |
| 4% 6/1/32 | | 830 | 873 |
| 5% 6/1/29 | | 3,685 | 4,142 |
| New Jersey Health Care Facilities Fing. Auth. Rev.: | | | |
| Series 2016 A: | | | |
| 5% 7/1/22 (Escrowed to Maturity) | | 275 | 275 |
| 5% 7/1/24 (Escrowed to Maturity) | | 1,600 | 1,683 |
| 5% 7/1/25 (Escrowed to Maturity) | | 1,660 | 1,781 |
| 5% 7/1/26 (Escrowed to Maturity) | | 915 | 1,006 |
| 5% 7/1/26 (Escrowed to Maturity) | | 275 | 300 |
| 5% 7/1/27 | | 620 | 679 |
| 5% 7/1/27 (Pre-Refunded to 7/1/26 @ 100) | | 420 | 458 |
| 5% 7/1/28 | | 300 | 326 |
| 5% 7/1/29 (Pre-Refunded to 7/1/26 @ 100) | | 580 | 638 |
| 5% 7/1/29 (Pre-Refunded to 7/1/26 @ 100) | | 415 | 453 |
| 5% 7/1/30 | | 830 | 894 |
| 5% 7/1/30 (Pre-Refunded to 7/1/26 @ 100) | | 690 | 753 |
| Series 2016: | | | |
| 4% 7/1/48 | | 2,400 | 2,138 |
| 5% 7/1/41 | | 2,865 | 2,909 |
| New Jersey Higher Ed. Student Assistance Auth. Student Ln. Rev.: | | | |
| Series 2017 1A, 5% 12/1/26 (d) | | 830 | 899 |
| Series 2018 B: | | | |
| 5% 12/1/25 (d) | | 3,495 | 3,744 |
| 5% 12/1/26 (d) | | 1,035 | 1,119 |
| New Jersey Trans. Trust Fund Auth.: | | | |
| (Trans. Prog.) Series 2019 AA, 5.25% 6/15/43 | | 21,525 | 22,638 |
| Series 2008 A, 0% 12/15/38 | | 1,500 | 694 |
| Series 2010 A, 0% 12/15/27 | | 9,485 | 7,810 |
| Series 2014 BB2: | | | |
| 5% 6/15/32 | | 5,810 | 6,281 |
| 5% 6/15/33 | | 1,635 | 1,759 |
| 5% 6/15/34 | | 1,060 | 1,136 |
| Series 2016 A: | | | |
| 5% 6/15/27 | | 2,250 | 2,437 |
| 5% 6/15/28 | | 9,150 | 9,839 |
| 5% 6/15/29 | | 1,865 | 1,996 |
| Series 2021 A, 5% 6/15/33 | | 2,980 | 3,205 |
| Series 2022 A: | | | |
| 4% 6/15/39 | | 2,030 | 1,985 |
| 4% 6/15/40 | | 2,410 | 2,311 |
| 4% 6/15/42 | | 4,540 | 4,281 |
| Series 2022 AA: | | | |
| 5% 6/15/32 | | 8,500 | 9,304 |
| 5% 6/15/34 | | 7,460 | 8,022 |
| 5% 6/15/36 | | 2,215 | 2,379 |
| 5% 6/15/37 | | 4,235 | 4,538 |
| Series AA: | | | |
| 4% 6/15/35 | | 1,500 | 1,497 |
| 4% 6/15/40 | | 1,680 | 1,611 |
| 4% 6/15/45 | | 6,895 | 6,390 |
| 5% 6/15/35 | | 490 | 524 |
| 5% 6/15/39 | | 3,000 | 3,180 |
| 5% 6/15/45 | | 1,550 | 1,616 |
| Series BB, 5% 6/15/50 | | 1,885 | 1,948 |
|
| TOTAL NEW JERSEY | | | 201,083 |
|
| New Mexico - 0.1% | | | |
| New Mexico Mtg. Fin. Auth. Series 2019 D, 3.75% 1/1/50 | | 1,590 | 1,602 |
| Santa Fe Retirement Fac. Series 2019 A: | | | |
| 5% 5/15/34 | | 275 | 263 |
| 5% 5/15/39 | | 205 | 191 |
| 5% 5/15/44 | | 215 | 194 |
| 5% 5/15/49 | | 425 | 374 |
|
| TOTAL NEW MEXICO | | | 2,624 |
|
| New York - 7.2% | | | |
| Dorm. Auth. New York Univ. Rev.: | | | |
| (Fordham Univ. Proj.) Series 2017: | | | |
| 4% 7/1/33 | | 1,035 | 1,038 |
| 4% 7/1/34 | | 1,035 | 1,034 |
| Series 2017: | | | |
| 5% 12/1/22 (c) | | 1,400 | 1,417 |
| 5% 12/1/23 (c) | | 1,200 | 1,243 |
| 5% 12/1/24 (c) | | 1,100 | 1,159 |
| 5% 12/1/25 (c) | | 1,200 | 1,281 |
| Long Island Pwr. Auth. Elec. Sys. Rev. Series 2012 A, 5% 9/1/42 | | 245 | 246 |
| MTA Hudson Rail Yards Trust Oblig. Series 2016 A, 5% 11/15/56 | | 26,320 | 27,048 |
| New York City Edl. Construction Fund Series 2021 B, 5% 4/1/46 | | 5,215 | 5,642 |
| New York City Gen. Oblig.: | | | |
| Series 2015 C, 5% 8/1/27 | | 580 | 619 |
| Series 2016 C and D, 5% 8/1/28 | | 2,175 | 2,349 |
| Series 2016 E, 5% 8/1/28 | | 3,645 | 3,968 |
| New York City Muni. Wtr. Fin. Auth. Wtr. & Swr. Sys. Rev.: | | | |
| Series 2022 EE, 5% 6/15/45 | | 11,240 | 12,408 |
| Series GG 1, 5% 6/15/48 | | 3,500 | 3,795 |
| New York City Transitional Fin. Auth. Bldg. Aid Rev.: | | | |
| Series 2015 S1, 5% 7/15/43 | | 3,000 | 3,108 |
| Series 2015 S2, 5% 7/15/35 | | 1,465 | 1,546 |
| New York City Transitional Fin. Auth. Rev. Series C1, 5% 5/1/29 | | 3,720 | 4,229 |
| New York Dorm. Auth. Rev. Series 2022 A: | | | |
| 5% 7/15/37 (e) | | 785 | 803 |
| 5% 7/15/42 (e) | | 2,210 | 2,243 |
| 5% 7/15/50 (e) | | 5,710 | 5,743 |
| New York Dorm. Auth. Sales Tax Rev. Series 2016 A, 5% 3/15/34 | | 5,630 | 6,092 |
| New York Metropolitan Trans. Auth. Rev.: | | | |
| Series 2014 B, 5% 11/15/44 | | 8,280 | 8,414 |
| Series 2015 A1, 5% 11/15/45 | | 6,170 | 6,265 |
| Series 2020 D: | | | |
| 4% 11/15/46 | | 39,325 | 35,094 |
| 4% 11/15/47 | | 2,710 | 2,386 |
| New York State Dorm. Auth. Series 2021 E, 4% 3/15/45 | | 13,955 | 13,611 |
| New York State Mtg. Agcy. Homeowner Mtg. Series 221, 3.5% 10/1/32 (d) | | 825 | 823 |
| New York State Urban Dev. Corp.: | | | |
| Series 2020 A, 5% 3/15/42 | | 2,000 | 2,172 |
| Series 2020 C, 5% 3/15/47 | | 15,000 | 16,181 |
| Series 2020 E: | | | |
| 4% 3/15/37 | | 6,970 | 6,942 |
| 4% 3/15/44 | | 28,000 | 27,134 |
| 4% 3/15/45 | | 22,500 | 21,753 |
| New York Trans. Dev. Corp.: | | | |
| (Laguardia Arpt. Term. Redev. Proj.) Series 2016 A, 5% 7/1/41 (d) | | 3,560 | 3,645 |
| (Term. 4 John F. Kennedy Int'l. Arpt. Proj.) Series 2022: | | | |
| 5% 12/1/32 (d) | | 2,755 | 2,903 |
| 5% 12/1/33 (d) | | 4,270 | 4,493 |
| 5% 12/1/34 (d) | | 4,665 | 4,841 |
| 5% 12/1/35 (d) | | 2,330 | 2,440 |
| 5% 12/1/36 (d) | | 1,590 | 1,653 |
| 5% 12/1/37 (d) | | 4,240 | 4,423 |
| 5% 12/1/38 (d) | | 10,300 | 10,732 |
| 5% 12/1/39 (d) | | 7,875 | 8,187 |
| 5% 12/1/40 (d) | | 6,665 | 6,906 |
| 5% 12/1/41 (d) | | 6,060 | 6,266 |
| 5% 12/1/42 (d) | | 3,030 | 3,130 |
| New York Urban Dev. Corp. Rev.: | | | |
| (New York State Gen. Oblig. Proj.) Series 2017 A, 5% 3/15/34 | | 5,215 | 5,657 |
| Gen. Oblig. (New York State Gen. Oblig. Proj.) Series 2017 A, 5% 3/15/32 | | 4,470 | 4,886 |
| Oneida County Local Dev. Corp. Rev. (Mohawk Valley Health Sys. Proj.) Series 2019 A: | | | |
| 4% 12/1/33 (Assured Guaranty Muni. Corp. Insured) | | 1,200 | 1,214 |
| 5% 12/1/31 (Assured Guaranty Muni. Corp. Insured) | | 1,500 | 1,672 |
| Onondaga Civic Dev. Corp. (Le Moyne College Proj.) Series 2018, 5% 1/1/43 | | 830 | 858 |
| Suffolk County Econ. Dev. Corp. Rev. Series 2021: | | | |
| 4.625% 11/1/31 (c) | | 750 | 655 |
| 5.375% 11/1/54 (c) | | 1,150 | 975 |
| Triborough Bridge & Tunnel Auth. Revs. Series 2015 A, 5.25% 11/15/45 | | 4,140 | 4,415 |
|
| TOTAL NEW YORK | | | 307,737 |
|
| New York And New Jersey - 0.1% | | | |
| Port Auth. of New York & New Jersey Series 194, 5.25% 10/15/55 | | 3,915 | 4,111 |
| North Carolina - 0.6% | | | |
| Charlotte Ctfs. of Prtn. (Convention Facility Projs.) Series 2019 A: | | | |
| 5% 6/1/44 | | 4,000 | 4,391 |
| 5% 6/1/46 | | 2,120 | 2,321 |
| Charlotte Int'l. Arpt. Rev.: | | | |
| Series 2017 A: | | | |
| 5% 7/1/30 | | 1,265 | 1,385 |
| 5% 7/1/33 | | 1,040 | 1,127 |
| 5% 7/1/37 | | 2,910 | 3,125 |
| Series 2017 B: | | | |
| 5% 7/1/24 (d) | | 155 | 162 |
| 5% 7/1/25 (d) | | 85 | 91 |
| 5% 7/1/26 (d) | | 85 | 92 |
| 5% 7/1/27 (d) | | 160 | 176 |
| 5% 7/1/28 (d) | | 135 | 147 |
| 5% 7/1/29 (d) | | 195 | 211 |
| 5% 7/1/30 (d) | | 210 | 226 |
| 5% 7/1/31 (d) | | 395 | 424 |
| 5% 7/1/32 (d) | | 420 | 448 |
| 5% 7/1/33 (d) | | 440 | 468 |
| 5% 7/1/34 (d) | | 460 | 487 |
| 5% 7/1/35 (d) | | 315 | 332 |
| 5% 7/1/36 (d) | | 255 | 268 |
| 5% 7/1/37 (d) | | 300 | 315 |
| 5% 7/1/42 (d) | | 975 | 1,017 |
| Series 2017 C, 4% 7/1/32 | | 1,190 | 1,201 |
| New Hanover County Hosp. Rev. Series 2017: | | | |
| 5% 10/1/27 (Escrowed to Maturity) | | 275 | 309 |
| 5% 10/1/42 (Pre-Refunded to 10/1/27 @ 100) | | 2,215 | 2,492 |
| 5% 10/1/47 (Pre-Refunded to 10/1/27 @ 100) | | 1,000 | 1,125 |
| North Carolina Med. Care Commission Health Care Facilities Rev. Series 2021 A: | | | |
| 4% 3/1/41 | | 1,050 | 842 |
| 4% 3/1/51 | | 2,075 | 1,522 |
|
| TOTAL NORTH CAROLINA | | | 24,704 |
|
| Ohio - 2.7% | | | |
| Akron Bath Copley Hosp. District Rev. Series 2016, 5.25% 11/15/46 | | 7,285 | 7,553 |
| Allen County Hosp. Facilities Rev. (Mercy Health) Series 2017 A: | | | |
| 5% 8/1/25 | | 2,475 | 2,641 |
| 5% 8/1/26 | | 1,645 | 1,776 |
| 5% 8/1/27 | | 2,060 | 2,253 |
| 5% 8/1/28 | | 2,060 | 2,249 |
| 5% 8/1/29 | | 4,130 | 4,495 |
| 5% 8/1/30 | | 3,520 | 3,805 |
| Buckeye Tobacco Settlement Fing. Auth.: | | | |
| Series 2020 A2: | | | |
| 5% 6/1/30 | | 2,000 | 2,175 |
| 5% 6/1/32 | | 1,665 | 1,795 |
| 5% 6/1/33 | | 2,000 | 2,151 |
| 5% 6/1/34 | | 420 | 451 |
| Series 2020 B2, 5% 6/1/55 | | 6,150 | 5,791 |
| Columbus City School District Series 2016 A, 5% 12/1/29 | | 1,740 | 1,892 |
| Fairfield County Hosp. Facilities Rev. (Fairfield Med. Ctr. Proj.) Series 2013, 5.25% 6/15/43 | | 3,470 | 3,489 |
| Franklin County Convention Facilities Auth. (Greater Columbus Convention Ctr. Hotel Expansion Proj.) Series 2019, 5% 12/1/44 | | 470 | 474 |
| Franklin County Convention Facilities Authorities (Greater Columbus Convention Ctr. Hotel Expansion Proj.) Series 2019: | | | |
| 5% 12/1/46 | | 4,700 | 5,142 |
| 5% 12/1/51 | | 6,900 | 7,520 |
| Franklin County Hosp. Facilities Rev. (Ohiohealth Corp. Proj.) Series 2015, 5% 5/15/40 | | 5,525 | 5,714 |
| Hamilton County Convention Facilities Auth. Rev. Series 2014: | | | |
| 5% 12/1/25 | | 2,975 | 3,087 |
| 5% 12/1/26 | | 555 | 575 |
| Lancaster Port Auth. Gas Rev. Bonds Series 2019, 5%, tender 2/1/25 (a) | | 1,850 | 1,940 |
| Muskingum County Hosp. Facilities (Genesis Healthcare Sys. Obligated Group Proj.) Series 2013: | | | |
| 5% 2/15/33 | | 3,685 | 3,692 |
| 5% 2/15/44 | | 4,415 | 4,335 |
| 5% 2/15/48 | | 11,260 | 10,910 |
| Ohio Gen. Oblig. Series 2019 A, 5% 3/1/28 | | 4,315 | 4,890 |
| Ohio Hosp. Rev. Series 2020 A, 4% 1/15/50 | | 975 | 909 |
| Ohio Hsg. Fin. Agcy. Residential Mtg. Rev. (Mtg. Backed Securities Prog.) Series 2019 B, 4.5% 3/1/50 | | 545 | 560 |
| Ohio Tpk. Commission Tpk. Rev.: | | | |
| (Infrastructure Proj.): | | | |
| Series 2005 A, 0% 2/15/42 | | 2,150 | 904 |
| Series 2022 A, 5% 2/15/38 (e) | | 1,155 | 1,290 |
| (Infrastructure Projs.) Series 2022 A: | | | |
| 5% 2/15/30 (e) | | 270 | 304 |
| 5% 2/15/32 (e) | | 4,930 | 5,610 |
| 5% 2/15/39 (e) | | 240 | 268 |
| Ohio Wtr. Dev. Auth. Poll. Cont. Facilities Rev. Series 2019 A, 5% 6/1/29 | | 2,615 | 3,007 |
| Scioto County Hosp. Facilities Rev.: | | | |
| Series 2016: | | | |
| 5% 2/15/29 | | 1,815 | 1,908 |
| 5% 2/15/34 | | 370 | 383 |
| Series 2019, 5% 2/15/29 | | 3,525 | 3,733 |
| Univ. of Akron Gen. Receipts Series 2016 A, 5% 1/1/35 | | 3,725 | 3,999 |
| Wood County Hosp. Facilities Rev. (Wood County Hosp. Proj.) Series 2012, 5% 12/1/32 (Pre-Refunded to 12/1/22 @ 100) | | 10 | 10 |
|
| TOTAL OHIO | | | 113,680 |
|
| Oklahoma - 0.2% | | | |
| Oklahoma City Pub. Property Auth. Hotel Tax Rev. Series 2015: | | | |
| 5% 10/1/28 | | 1,050 | 1,138 |
| 5% 10/1/29 | | 1,160 | 1,256 |
| 5% 10/1/36 | | 830 | 892 |
| 5% 10/1/39 | | 1,655 | 1,777 |
| Oklahoma Dev. Fin. Auth. Rev. (Oklahoma City Univ. Proj.) Series 2019, 5% 8/1/44 | | 1,915 | 1,888 |
|
| TOTAL OKLAHOMA | | | 6,951 |
|
| Oregon - 0.9% | | | |
| Oregon State Hsg. & Cmnty. Svcs. Dept. Series 2019 A, 4% 7/1/50 | | 6,325 | 6,412 |
| Port of Portland Arpt. Rev.: | | | |
| Series 2020 27A, 5% 7/1/45 (d) | | 2,980 | 3,157 |
| Series 2022 28: | | | |
| 5% 7/1/41 (d) | | 12,420 | 13,429 |
| 5% 7/1/52 (d) | | 10,500 | 11,162 |
| Salem Hosp. Facility Auth. Rev. Series 2016 A, 4% 5/15/41 | | 2,100 | 2,012 |
|
| TOTAL OREGON | | | 36,172 |
|
| Pennsylvania - 8.7% | | | |
| Allegheny County Arpt. Auth. Rev. Series 2021 A: | | | |
| 4% 1/1/38 (d) | | 2,545 | 2,437 |
| 4% 1/1/39 (d) | | 3,075 | 2,929 |
| 4% 1/1/40 (d) | | 10,000 | 9,505 |
| 4% 1/1/41 (d) | | 10,000 | 9,491 |
| 5% 1/1/29 (d) | | 4,185 | 4,594 |
| 5% 1/1/30 (d) | | 4,000 | 4,403 |
| 5% 1/1/31 (d) | | 3,000 | 3,307 |
| 5% 1/1/32 (d) | | 4,000 | 4,375 |
| 5% 1/1/51 (d) | | 20,480 | 21,318 |
| 5% 1/1/56 (d) | | 12,420 | 12,881 |
| Allegheny County Indl. Dev. Auth. Rev. Series 2021: | | | |
| 3.5% 12/1/31 | | 1,500 | 1,238 |
| 4% 12/1/41 | | 2,450 | 1,842 |
| 4.25% 12/1/50 | | 2,730 | 1,963 |
| Bucks County Indl. Dev. Auth. Hosp. Rev. Series 2021: | | | |
| 5% 7/1/32 | | 495 | 516 |
| 5% 7/1/33 | | 1,150 | 1,189 |
| 5% 7/1/40 | | 3,100 | 3,064 |
| Cap. Region Wtr. Wtr. Rev. Series 2018: | | | |
| 5% 7/15/27 | | 830 | 923 |
| 5% 7/15/29 | | 1,290 | 1,459 |
| 5% 7/15/32 | | 830 | 929 |
| Dauphin County Gen. Auth. (Pinnacle Health Sys. Proj.) Series 2016 A: | | | |
| 5% 6/1/28 | | 885 | 942 |
| 5% 6/1/29 | | 970 | 1,028 |
| Delaware County Auth. Rev. (Cabrini College) Series 2017, 5% 7/1/47 | | 3,310 | 3,170 |
| Doylestown Hosp. Auth. Hosp. Rev. Series 2016 A, 5% 7/1/46 | | 1,205 | 1,124 |
| Dubois Hosp. Auth. Hosp. Rev.: | | | |
| (Penn Highlands Healthcare Proj.) Series 2018: | | | |
| 4% 7/15/33 | | 2,070 | 2,054 |
| 4% 7/15/35 | | 2,135 | 2,097 |
| 4% 7/15/37 | | 4,140 | 4,010 |
| 5% 7/15/25 | | 330 | 350 |
| 5% 7/15/26 | | 1,035 | 1,108 |
| 5% 7/15/27 | | 1,745 | 1,886 |
| 5% 7/15/28 | | 1,285 | 1,386 |
| 5% 7/15/29 | | 1,385 | 1,487 |
| 5% 7/15/30 | | 1,815 | 1,936 |
| 5% 7/15/31 | | 1,240 | 1,318 |
| 5% 7/15/32 | | 1,305 | 1,380 |
| 5% 7/15/34 | | 1,405 | 1,476 |
| 5% 7/15/36 | | 4,150 | 4,349 |
| 5% 7/15/38 | | 4,990 | 5,212 |
| 5% 7/15/43 | | 5,795 | 6,009 |
| Series 2020, 4% 7/15/45 | | 2,900 | 2,621 |
| Lancaster County Hosp. Auth. Health Ctr. Rev. Series 2021, 5% 11/1/51 | | 3,595 | 3,773 |
| Lehigh County Gen. Purp. Auth. Rev. (Muhlenberg College Proj.) Series 2017, 5% 2/1/39 | | 2,140 | 2,257 |
| Monroe County Hosp. Auth. Rev. Series 2016: | | | |
| 5% 7/1/26 | | 830 | 895 |
| 5% 7/1/27 | | 830 | 892 |
| 5% 7/1/28 | | 830 | 886 |
| 5% 7/1/34 | | 3,045 | 3,166 |
| 5% 7/1/36 | | 1,655 | 1,714 |
| Montgomery County Higher Ed. & Health Auth. Rev.: | | | |
| Series 2014 A: | | | |
| 5% 10/1/22 | | 1,140 | 1,148 |
| 5% 10/1/23 | | 325 | 334 |
| 5% 10/1/24 | | 965 | 1,003 |
| 5% 10/1/25 | | 865 | 886 |
| 5% 10/1/27 | | 415 | 422 |
| Series 2016 A: | | | |
| 5% 10/1/28 | | 1,255 | 1,285 |
| 5% 10/1/29 | | 2,150 | 2,193 |
| 5% 10/1/31 | | 3,790 | 3,843 |
| 5% 10/1/36 | | 6,790 | 6,835 |
| 5% 10/1/40 | | 4,700 | 4,710 |
| Northampton County Gen. Purp. Auth. Hosp. Rev.: | | | |
| (St. Luke's Univ. Health Network Proj.): | | | |
| Series 2016 A, 5% 8/15/36 | | 615 | 637 |
| Series 2018 A, 4% 8/15/48 | | 10,545 | 9,411 |
| Series 2016 A, 5% 8/15/46 | | 24,835 | 25,468 |
| Pennsylvania Higher Edl. Facilities Auth. Rev.: | | | |
| (Drexel Univ. Proj.): | | | |
| Series 2016, 5% 5/1/35 | | 2,880 | 2,997 |
| Series 2017: | | | |
| 5% 5/1/35 | | 1,025 | 1,081 |
| 5% 5/1/37 | | 1,295 | 1,362 |
| 5% 5/1/41 | | 5,860 | 6,097 |
| Series 2016: | | | |
| 5% 5/1/28 | | 415 | 440 |
| 5% 5/1/32 | | 1,040 | 1,087 |
| 5% 5/1/33 | | 1,405 | 1,466 |
| Series 2018 A, 5% 2/15/48 | | 1,575 | 1,701 |
| Pennsylvania Tpk. Commission Tpk. Rev. Series 2021 B, 5% 12/1/38 | | 6,680 | 7,403 |
| Philadelphia Arpt. Rev.: | | | |
| Series 2017 A: | | | |
| 5% 7/1/25 | | 830 | 890 |
| 5% 7/1/26 | | 830 | 905 |
| 5% 7/1/27 | | 660 | 729 |
| Series 2017 B: | | | |
| 5% 7/1/26 (d) | | 2,485 | 2,673 |
| 5% 7/1/27 (d) | | 2,070 | 2,253 |
| 5% 7/1/28 (d) | | 2,485 | 2,687 |
| 5% 7/1/29 (d) | | 1,860 | 1,999 |
| 5% 7/1/32 (d) | | 2,485 | 2,627 |
| 5% 7/1/33 (d) | | 1,865 | 1,965 |
| 5% 7/1/34 (d) | | 3,310 | 3,474 |
| 5% 7/1/37 (d) | | 3,725 | 3,881 |
| Philadelphia Auth. for Indl. Dev. Series 2017, 5% 11/1/47 | | 5,425 | 5,598 |
| Philadelphia Gas Works Rev. Series 16 A, 4% 8/1/45 (Assured Guaranty Muni. Corp. Insured) | | 2,685 | 2,486 |
| Philadelphia School District: | | | |
| Series 2016 D: | | | |
| 5% 9/1/26 | | 7,600 | 8,313 |
| 5% 9/1/27 | | 8,020 | 8,806 |
| 5% 9/1/28 | | 6,705 | 7,345 |
| Series 2016 F: | | | |
| 5% 9/1/28 | | 11,600 | 12,708 |
| 5% 9/1/29 | | 7,540 | 8,242 |
| Series 2018 A: | | | |
| 5% 9/1/36 | | 1,575 | 1,687 |
| 5% 9/1/37 | | 910 | 972 |
| 5% 9/1/38 | | 1,450 | 1,544 |
| Series 2018 B, 5% 9/1/43 | | 2,115 | 2,228 |
| Series 2019 A: | | | |
| 4% 9/1/35 | | 5,215 | 5,302 |
| 5% 9/1/33 | | 2,480 | 2,809 |
| 5% 9/1/34 | | 7,225 | 7,799 |
| Series 2019 C, 5% 9/1/33 | | 2,540 | 2,788 |
| Series F: | | | |
| 5% 9/1/30 | | 5,625 | 6,148 |
| 5% 9/1/30 (Pre-Refunded to 9/1/26 @ 100) | | 20 | 22 |
| Philadelphia Wtr. & Wastewtr. Rev. Series 2018 A: | | | |
| 5% 10/1/35 | | 4,190 | 4,622 |
| 5% 10/1/36 | | 6,210 | 6,840 |
| 5% 10/1/48 | | 6,000 | 6,500 |
| Pittsburgh Wtr. & Swr. Auth. Wtr. & Swr. Sys. Rev.: | | | |
| Series 2019 A, 5% 9/1/39 (Assured Guaranty Muni. Corp. Insured) | | 2,315 | 2,578 |
| Series 2019 A, 5% 9/1/44 (Assured Guaranty Muni. Corp. Insured) | | 775 | 856 |
| State Pub. School Bldg. Auth. Lease Rev. (The School District of Philadelphia Proj.) Series 2015 A, 5% 6/1/26 | | 1,055 | 1,132 |
| Union County Hosp. Auth. Rev. Series 2018 B: | | | |
| 5% 8/1/43 | | 4,605 | 4,943 |
| 5% 8/1/48 | | 5,335 | 5,707 |
|
| TOTAL PENNSYLVANIA | | | 370,756 |
|
| Puerto Rico - 0.0% | | | |
| Puerto Rico Commonwealth Pub. Impt. Gen. Oblig. Series 2021 A1, 5.625% 7/1/27 | | 1,360 | 1,447 |
| Rhode Island - 0.4% | | | |
| Rhode Island Health & Edl. Bldg. Corp. Higher Ed. Facilities Rev.: | | | |
| Series 2016 B: | | | |
| 5% 9/1/31 | | 655 | 684 |
| 5% 9/1/36 | | 5,810 | 5,992 |
| Series 2016, 5% 5/15/39 | | 5,215 | 5,359 |
| Rhode Island Health and Edl. Bldg. Corp. Higher Ed. Facility Rev. Series 2022 A, 5% 9/1/33 (e) | | 2,000 | 2,371 |
| Rhode Island Hsg. & Mtg. Fin. Corp. Series 2019 70, 4% 10/1/49 | | 1,185 | 1,202 |
| Rhode Island Student Ln. Auth. Student Ln. Rev. Series A: | | | |
| 3.5% 12/1/34 (d) | | 1,200 | 1,193 |
| 5% 12/1/25 (d) | | 1,000 | 1,078 |
|
| TOTAL RHODE ISLAND | | | 17,879 |
|
| South Carolina - 1.7% | | | |
| Charleston County Arpt. District Series 2019, 5% 7/1/43 | | 2,085 | 2,221 |
| Scago Edl. Facilities Corp. for Colleton School District (School District of Colleton County Proj.) Series 2015: | | | |
| 5% 12/1/25 | | 2,275 | 2,425 |
| 5% 12/1/26 | | 1,160 | 1,233 |
| 5% 12/1/28 | | 4,690 | 4,963 |
| South Carolina Hsg. Fin. & Dev. Auth. Mtg. Rev. Series 2019 A, 4% 1/1/50 | | 1,945 | 1,974 |
| South Carolina Jobs-Econ. Dev. Auth. Series 2019 C: | | | |
| 5% 7/1/32 | | 1,010 | 1,085 |
| 5% 7/1/33 | | 4,200 | 4,498 |
| South Carolina Ports Auth. Ports Rev. Series 2015, 5.25% 7/1/55 (Pre-Refunded to 7/1/25 @ 100) (d) | | 910 | 983 |
| South Carolina Pub. Svc. Auth. Rev.: | | | |
| Series 2016 A: | | | |
| 5% 12/1/29 | | 2,485 | 2,651 |
| 5% 12/1/38 | | 250 | 258 |
| Series 2016 B: | | | |
| 5% 12/1/31 | | 910 | 965 |
| 5% 12/1/41 | | 12,515 | 12,911 |
| Spartanburg County Reg'l. Health Series 2017 A: | | | |
| 4% 4/15/43 | | 15,510 | 14,974 |
| 4% 4/15/48 | | 10,815 | 9,996 |
| 5% 4/15/48 | | 10,595 | 10,948 |
|
| TOTAL SOUTH CAROLINA | | | 72,085 |
|
| South Dakota - 0.0% | | | |
| South Dakota Health & Edl. Facilities Auth. Rev.: | | | |
| (Avera Health Proj.) Series 2017, 5% 7/1/31 | | 540 | 587 |
| Series 2017: | | | |
| 5% 7/1/26 | | 250 | 273 |
| 5% 7/1/28 | | 250 | 277 |
| 5% 7/1/29 | | 470 | 518 |
|
| TOTAL SOUTH DAKOTA | | | 1,655 |
|
| Tennessee - 0.5% | | | |
| Chattanooga Health Ed. & Hsg. Facility Board Rev.: | | | |
| Series 2019 A1: | | | |
| 4% 8/1/44 | | 2,200 | 2,025 |
| 5% 8/1/31 | | 1,000 | 1,063 |
| 5% 8/1/33 | | 1,250 | 1,320 |
| Series 2019 A2, 5% 8/1/35 | | 765 | 803 |
| Greeneville Health & Edl. Facilities Board Series 2018 A, 5% 7/1/25 | | 1,225 | 1,255 |
| Metropolitan Nashville Arpt. Auth. Rev.: | | | |
| Series 2015 B, 4% 7/1/25 (d) | | 1,755 | 1,817 |
| Series 2019 B, 5% 7/1/54 (d) | | 9,580 | 9,951 |
| Tennessee Hsg. Dev. Agcy. Series 2022 2, 5% 1/1/53 | | 4,750 | 5,031 |
|
| TOTAL TENNESSEE | | | 23,265 |
|
| Texas - 5.4% | | | |
| Austin Arpt. Sys. Rev.: | | | |
| Series 2014: | | | |
| 5% 11/15/26 (d) | | 830 | 872 |
| 5% 11/15/27 (d) | | 1,035 | 1,085 |
| 5% 11/15/28 (d) | | 1,240 | 1,296 |
| 5% 11/15/39 (d) | | 9,440 | 9,758 |
| Series 2017 B: | | | |
| 5% 11/15/28 (d) | | 830 | 889 |
| 5% 11/15/30 (d) | | 1,275 | 1,351 |
| 5% 11/15/32 (d) | | 1,005 | 1,059 |
| 5% 11/15/35 (d) | | 1,035 | 1,087 |
| 5% 11/15/36 (d) | | 1,385 | 1,453 |
| 5% 11/15/37 (d) | | 1,165 | 1,221 |
| 5% 11/15/41 (d) | | 4,725 | 4,930 |
| Central Reg'l. Mobility Auth. Series 2015 A: | | | |
| 5% 1/1/28 | | 1,075 | 1,133 |
| 5% 1/1/31 (Pre-Refunded to 7/1/25 @ 100) | | 395 | 427 |
| 5% 1/1/32 (Pre-Refunded to 7/1/25 @ 100) | | 830 | 898 |
| Dallas Wtrwks. & Swr. Sys. Rev. Series 2020 C: | | | |
| 4% 10/1/35 | | 1,000 | 1,040 |
| 4% 10/1/39 | | 5,000 | 5,063 |
| 4% 10/1/40 | | 2,000 | 2,014 |
| Grand Parkway Trans. Corp.: | | | |
| Series 2018 A, 5% 10/1/38 | | 2,655 | 2,876 |
| Series 2020 C, 4% 10/1/49 | | 3,100 | 2,931 |
| Harris County Cultural Ed. Facilities Fin. Corp. Rev. (Texas Childrens Hosp., Proj.) Series 2015-1 5% 10/1/29 | | 1,115 | 1,190 |
| Harris County Gen. Oblig. Series 2002: | | | |
| 0% 8/15/25 (Nat'l. Pub. Fin. Guarantee Corp. Insured) | | 2,485 | 2,301 |
| 0% 8/15/28 (Nat'l. Pub. Fin. Guarantee Corp. Insured) | | 4,140 | 3,468 |
| Houston Arpt. Sys. Rev.: | | | |
| Series 2018 A, 5% 7/1/41 (d) | | 1,000 | 1,044 |
| Series 2018 C: | | | |
| 5% 7/1/29 (d) | | 1,655 | 1,801 |
| 5% 7/1/30 (d) | | 1,765 | 1,908 |
| 5% 7/1/31 (d) | | 1,240 | 1,335 |
| 5% 7/1/32 (d) | | 1,450 | 1,553 |
| Houston Gen. Oblig. Series 2017 A: | | | |
| 5% 3/1/29 | | 3,150 | 3,478 |
| 5% 3/1/31 | | 3,835 | 4,195 |
| 5% 3/1/32 | | 1,635 | 1,783 |
| Houston Util. Sys. Rev. Series 2020 C: | | | |
| 5% 11/15/33 | | 2,000 | 2,255 |
| 5% 11/15/34 | | 2,500 | 2,814 |
| Irving Hosp. Auth. Hosp. Rev. Series 2017 A: | | | |
| 5% 10/15/28 | | 390 | 416 |
| 5% 10/15/30 | | 1,570 | 1,655 |
| 5% 10/15/32 | | 830 | 867 |
| 5% 10/15/36 | | 545 | 564 |
| 5% 10/15/37 | | 930 | 962 |
| 5% 10/15/38 | | 1,325 | 1,369 |
| 5% 10/15/44 | | 1,310 | 1,345 |
| Love Field Arpt. Modernization Rev.: | | | |
| Series 2015: | | | |
| 5% 11/1/26 (d) | | 830 | 887 |
| 5% 11/1/27 (d) | | 1,780 | 1,888 |
| 5% 11/1/28 (d) | | 2,755 | 2,906 |
| 5% 11/1/29 (d) | | 1,655 | 1,738 |
| 5% 11/1/32 (d) | | 3,055 | 3,182 |
| Series 2017: | | | |
| 5% 11/1/24 (d) | | 830 | 876 |
| 5% 11/1/25 (d) | | 830 | 891 |
| 5% 11/1/26 (d) | | 830 | 900 |
| 5% 11/1/27 (d) | | 830 | 895 |
| 5% 11/1/28 (d) | | 1,450 | 1,552 |
| 5% 11/1/29 (d) | | 1,035 | 1,102 |
| 5% 11/1/30 (d) | | 830 | 879 |
| 5% 11/1/31 (d) | | 1,840 | 1,944 |
| 5% 11/1/32 (d) | | 2,135 | 2,248 |
| 5% 11/1/33 (d) | | 830 | 872 |
| 5% 11/1/34 (d) | | 830 | 872 |
| 5% 11/1/36 (d) | | 830 | 871 |
| Lower Colorado River Auth. Rev. Series 2015 D: | | | |
| 5% 5/15/28 | | 1,820 | 1,940 |
| 5% 5/15/30 | | 4,140 | 4,380 |
| New Hope Cultural Ed. Facilities Fin. Corp. (Childrens Med. Ctr. of Dallas) Series 2017 A: | | | |
| 5% 8/15/27 | | 625 | 700 |
| 5% 8/15/29 | | 1,655 | 1,827 |
| 5% 8/15/47 | | 1,890 | 1,978 |
| Newark Higher Ed. Fin. Corp. (Abilene Christian Univ. Proj.) Series 2016 A: | | | |
| 5% 4/1/27 | | 595 | 637 |
| 5% 4/1/30 | | 2,825 | 2,992 |
| North Texas Tollway Auth. Rev.: | | | |
| (Sr. Lien Proj.) Series 2017 A: | | | |
| 5% 1/1/31 | | 830 | 887 |
| 5% 1/1/33 | | 975 | 1,051 |
| 5% 1/1/34 | | 1,240 | 1,334 |
| 5% 1/1/34 | | 2,485 | 2,917 |
| 5% 1/1/35 | | 1,820 | 1,956 |
| 5% 1/1/36 | | 4,965 | 5,329 |
| 5% 1/1/37 | | 6,625 | 7,098 |
| 5% 1/1/38 | | 2,690 | 2,720 |
| (Sub Lien Proj.) Series 2017 B: | | | |
| 5% 1/1/26 | | 740 | 751 |
| 5% 1/1/30 | | 350 | 373 |
| 5% 1/1/31 | | 495 | 527 |
| Series 2015 A, 5% 1/1/32 | | 2,775 | 2,902 |
| Series 2015 B, 5% 1/1/40 | | 8,280 | 8,371 |
| Series 2016 A, 5% 1/1/36 | | 1,035 | 1,096 |
| San Antonio Independent School District Series 2016, 5% 8/15/31 | | 3,590 | 3,930 |
| Southwest Higher Ed. Auth. Rev. (Southern Methodist Univ., TX. Proj.) Series 2017: | | | |
| 5% 10/1/29 | | 375 | 417 |
| 5% 10/1/30 | | 580 | 643 |
| 5% 10/1/31 | | 520 | 574 |
| 5% 10/1/39 | | 1,030 | 1,119 |
| 5% 10/1/40 | | 830 | 900 |
| Tarrant County Cultural Ed. Facilities Fin. Corp. Rev.: | | | |
| Series 2016 A: | | | |
| 4% 2/15/35 | | 4,140 | 4,153 |
| 5% 2/15/25 | | 710 | 760 |
| Series 2018 B, 5% 7/1/43 | | 1,500 | 1,572 |
| Texas Dept. of Hsg. & Cmnty. Affairs Multi-family Hsg. Rev. Series 2019, 2.95% 7/1/36 | | 4,423 | 4,065 |
| Texas Dept. of Hsg. & Cmnty. Affairs Single Family Mtg. Rev.: | | | |
| Series 2019 A, 4% 3/1/50 | | 3,995 | 4,053 |
| Series A, 3.5% 3/1/51 | | 3,550 | 3,533 |
| Texas Private Activity Bond Surface Trans. Corp. Series 2013, 6.75% 6/30/43 (d) | | 12,420 | 12,781 |
| Texas State Univ. Sys. Fing. Rev. Series 2017 A: | | | |
| 5% 3/15/29 | | 3,530 | 3,879 |
| 5% 3/15/31 | | 2,690 | 2,940 |
| Texas Wtr. Dev. Board Rev. Series 2020, 5% 8/1/27 | | 2,400 | 2,704 |
| Univ. of Houston Univ. Revs. Series 2017 A: | | | |
| 5% 2/15/32 | | 5,115 | 5,468 |
| 5% 2/15/33 | | 3,310 | 3,523 |
| 5% 2/15/34 | | 4,140 | 4,401 |
| 5% 2/15/36 | | 2,485 | 2,634 |
| Univ. of North Texas Univ. Rev. Series 2017 A, 5% 4/15/32 | | 1,740 | 1,890 |
| Univ. of Texas Board of Regents Sys. Rev. Series 2019 A, 5% 8/15/29 | | 1,850 | 2,133 |
| Univ. of Texas Permanent Univ. Fund Rev. Series 2016 B, 5% 7/1/29 | | 1,685 | 1,847 |
| Weatherford Independent School District Series 2002, 0% 2/15/33 | | 5,785 | 4,065 |
|
| TOTAL TEXAS | | | 227,939 |
|
| Utah - 1.5% | | | |
| Salt Lake City Arpt. Rev.: | | | |
| Series 2017 A: | | | |
| 5% 7/1/24 (d) | | 1,450 | 1,519 |
| 5% 7/1/25 (d) | | 1,655 | 1,765 |
| 5% 7/1/27 (d) | | 3,500 | 3,818 |
| 5% 7/1/29 (d) | | 3,090 | 3,330 |
| 5% 7/1/30 (d) | | 2,275 | 2,437 |
| 5% 7/1/31 (d) | | 4,345 | 4,630 |
| 5% 7/1/33 (d) | | 3,310 | 3,494 |
| 5% 7/1/35 (d) | | 3,310 | 3,469 |
| 5% 7/1/36 (d) | | 4,470 | 4,680 |
| 5% 7/1/37 (d) | | 3,520 | 3,680 |
| Series 2018 A: | | | |
| 5% 7/1/31 (d) | | 2,000 | 2,155 |
| 5% 7/1/32 (d) | | 4,310 | 4,618 |
| 5% 7/1/33 (d) | | 1,420 | 1,513 |
| 5.25% 7/1/48 (d) | | 5,655 | 5,936 |
| Utah County Hosp. Rev. Series 2020 A: | | | |
| 5% 5/15/43 | | 5,500 | 6,022 |
| 5% 5/15/50 | | 9,000 | 9,743 |
| Utah Gen. Oblig. Series 2020 B, 5% 7/1/28 | | 1,995 | 2,288 |
|
| TOTAL UTAH | | | 65,097 |
|
| Vermont - 0.7% | | | |
| Vermont Edl. & Health Bldg. Fin. Agcy. Rev.: | | | |
| (Champlain College Proj.) Series 2016 A: | | | |
| 5% 10/15/41 | | 3,810 | 3,905 |
| 5% 10/15/46 | | 4,720 | 4,815 |
| (Middlebury College Proj.) Series 2020, 5% 11/1/49 | | 18,500 | 19,928 |
| Vermont Student Assistant Corp. Ed. Ln. Rev. Series 2019 A, 5% 6/15/28 (d) | | 1,430 | 1,516 |
|
| TOTAL VERMONT | | | 30,164 |
|
| Virginia - 0.5% | | | |
| Fredericksburg Econ. Dev. Auth. Rev. Series 2014: | | | |
| 5% 6/15/25 | | 3,860 | 4,028 |
| 5% 6/15/30 | | 1,035 | 1,064 |
| Stafford County Econ. Dev. Auth. Hosp. Facilities Rev.: | | | |
| (Mary Washington Hosp. Proj.) Series 2016, 3% 6/15/29 | | 525 | 508 |
| Series 2016: | | | |
| 4% 6/15/37 | | 595 | 591 |
| 5% 6/15/27 | | 1,240 | 1,325 |
| 5% 6/15/30 | | 540 | 570 |
| 5% 6/15/33 | | 350 | 365 |
| 5% 6/15/34 | | 665 | 691 |
| 5% 6/15/35 | | 1,820 | 1,886 |
| Virginia College Bldg. Auth. Edl. Facilities Rev. Series 2015 A, 5% 1/1/35 (Pre-Refunded to 1/1/25 @ 100) | | 830 | 888 |
| Virginia Commonwealth Trans. Board Rev. (Virginia Gen. Oblig. Proj.) Series 2017 A, 5% 5/15/32 | | 725 | 806 |
| Virginia Pub. Bldg. Auth. Pub. Facilities Rev. Series 2019 A, 4% 8/1/36 | | 4,505 | 4,635 |
| Winchester Econ. Dev. Auth. Series 2015: | | | |
| 5% 1/1/31 | | 2,070 | 2,165 |
| 5% 1/1/34 | | 1,240 | 1,284 |
| 5% 1/1/35 | | 1,240 | 1,281 |
| 5% 1/1/44 | | 830 | 849 |
|
| TOTAL VIRGINIA | | | 22,936 |
|
| Washington - 2.0% | | | |
| Port of Seattle Rev.: | | | |
| Series 2016 B: | | | |
| 5% 10/1/28 (d) | | 2,900 | 3,125 |
| 5% 10/1/30 (d) | | 1,655 | 1,782 |
| Series 2019 A, 4% 4/1/44 (d) | | 2,525 | 2,325 |
| Washington Convention Ctr. Pub. Facilities Series 2021 B, 3% 7/1/58 (Assured Guaranty Muni. Corp. Insured) | | 12,930 | 9,168 |
| Washington Gen. Oblig.: | | | |
| Series 2015 C: | | | |
| 5% 2/1/33 | | 2,790 | 2,950 |
| 5% 2/1/34 | | 3,450 | 3,645 |
| Series 2020 A, 5% 8/1/33 | | 1,260 | 1,422 |
| Series 2021 A, 5% 8/1/43 | | 2,300 | 2,559 |
| Series 2021 C, 5% 2/1/44 | | 270 | 301 |
| Series 2022 C, 4% 7/1/35 | | 4,200 | 4,402 |
| Series 2022 D: | | | |
| 4% 7/1/35 | | 1,800 | 1,886 |
| 4% 7/1/36 | | 5,735 | 5,973 |
| 4% 7/1/37 | | 4,000 | 4,121 |
| Series R-2017 A, 5% 8/1/30 | | 1,685 | 1,840 |
| Washington Health Care Facilities Auth. Rev.: | | | |
| (Overlake Hosp. Med. Ctr., WA. Proj.) Series 2017 B: | | | |
| 5% 7/1/25 | | 675 | 719 |
| 5% 7/1/27 | | 1,285 | 1,398 |
| 5% 7/1/28 | | 1,570 | 1,711 |
| 5% 7/1/29 | | 615 | 668 |
| 5% 7/1/30 | | 735 | 794 |
| 5% 7/1/31 | | 1,120 | 1,206 |
| 5% 7/1/32 | | 1,655 | 1,775 |
| 5% 7/1/33 | | 2,345 | 2,505 |
| 5% 7/1/34 | | 540 | 575 |
| 5% 7/1/42 | | 4,685 | 4,870 |
| Series 2015: | | | |
| 5% 1/1/25 | | 1,655 | 1,765 |
| 5% 1/1/27 (Pre-Refunded to 7/1/25 @ 100) | | 1,910 | 2,058 |
| Series 2019 A1, 5% 8/1/38 | | 1,000 | 1,039 |
| Series 2019 A2, 5% 8/1/33 | | 2,000 | 2,112 |
| Washington Higher Ed. Facilities Auth. Rev. (Whitworth Univ. Proj.): | | | |
| Series 2016 A: | | | |
| 5% 10/1/27 | | 1,770 | 1,897 |
| 5% 10/1/28 | | 1,825 | 1,949 |
| 5% 10/1/35 | | 1,880 | 1,973 |
| 5% 10/1/36 | | 2,845 | 2,982 |
| 5% 10/1/40 | | 2,795 | 2,914 |
| Series 2019, 4% 10/1/49 | | 3,515 | 3,133 |
| Washington Hsg. Fin. Commission Nonprofit Hsg. Rev. (Judson Park Proj.) Series 2018: | | | |
| 4% 7/1/28 (c) | | 100 | 95 |
| 5% 7/1/33 (c) | | 125 | 121 |
| 5% 7/1/38 (c) | | 100 | 94 |
| 5% 7/1/48 (c) | | 400 | 357 |
|
| TOTAL WASHINGTON | | | 84,209 |
|
| West Virginia - 0.1% | | | |
| West Virginia Hosp. Fin. Auth. Hosp. Rev. Series 2018 A: | | | |
| 5% 1/1/31 | | 1,355 | 1,433 |
| 5% 1/1/32 | | 1,120 | 1,177 |
|
| TOTAL WEST VIRGINIA | | | 2,610 |
|
| Wisconsin - 1.3% | | | |
| Blue Ridge Healthcare Pub. Fin. Auth. Series 2020 A: | | | |
| 5% 1/1/35 | | 1,210 | 1,284 |
| 5% 1/1/40 | | 540 | 566 |
| Pub. Fin. Auth. Hosp. Rev. Series 2019 A, 5% 10/1/44 | | 7,550 | 7,870 |
| Pub. Fin. Auth. Sr. Living Rev. (Mary's Woods At Marylhurst, Inc. Proj.) Series 2017 A: | | | |
| 5% 5/15/25 (c) | | 700 | 701 |
| 5% 5/15/28 (c) | | 1,095 | 1,076 |
| 5.25% 5/15/37 (c) | | 335 | 320 |
| 5.25% 5/15/42 (c) | | 415 | 385 |
| 5.25% 5/15/47 (c) | | 410 | 373 |
| 5.25% 5/15/52 (c) | | 775 | 695 |
| Pub. Fin. Auth. Wisconsin Retirement Facility Rev. Series 2018: | | | |
| 5% 10/1/43 (c) | | 735 | 673 |
| 5% 10/1/48 (c) | | 930 | 829 |
| 5% 10/1/53 (c) | | 2,330 | 2,044 |
| Roseman Univ. of Health: | | | |
| (Roseman Univ. of Health Sciences Proj.) Series 2020, 5% 4/1/40 (c) | | 750 | 758 |
| Series 2020, 5% 4/1/50 (c) | | 520 | 519 |
| Series 2021 A, 4.5% 6/1/56 (c) | | 14,095 | 10,513 |
| Series 2021 B, 6.5% 6/1/56 (c) | | 4,700 | 3,754 |
| Wisconsin Health & Edl. Facilities: | | | |
| (Ascension Health Cr. Group Proj.) Series 2016 A, 5% 11/15/36 | | 4,140 | 4,391 |
| Series 2014, 4% 5/1/33 | | 2,920 | 2,866 |
| Series 2016 A: | | | |
| 5% 2/15/28 | | 1,965 | 2,083 |
| 5% 2/15/29 | | 2,550 | 2,693 |
| 5% 2/15/30 | | 2,805 | 2,949 |
| Series 2017 A: | | | |
| 5% 9/1/31 (Pre-Refunded to 9/1/27 @ 100) | | 830 | 926 |
| 5% 9/1/33 (Pre-Refunded to 9/1/27 @ 100) | | 1,425 | 1,590 |
| 5% 9/1/35 (Pre-Refunded to 9/1/27 @ 100) | | 1,575 | 1,758 |
| Series 2019 A: | | | |
| 2.25% 11/1/26 | | 690 | 676 |
| 5% 11/1/46 | | 540 | 503 |
| Series 2019 B1, 2.825% 11/1/28 | | 1,435 | 1,286 |
| Series 2019 B2, 2.55% 11/1/27 | | 920 | 893 |
| Wisconsin Health & Edl. Facilities Auth. Rev. Series 2012, 5% 6/1/27 | | 1,840 | 1,845 |
|
| TOTAL WISCONSIN | | | 56,819 |
|
| TOTAL MUNICIPAL BONDS | | | |
| (Cost $4,370,897) | | | 4,177,785 |
| | | Shares | Value (000s) |
|
| Money Market Funds - 2.4% | | | |
| Fidelity Municipal Cash Central Fund 0.88% (g)(h) | | | |
| (Cost $98,764) | | 98,740,573 | 98,762 |
| TOTAL INVESTMENT IN SECURITIES - 100.8% | | | |
| (Cost $4,469,661) | | | 4,276,547 |
| NET OTHER ASSETS (LIABILITIES) - (0.8)% | | | (31,943) |
| NET ASSETS - 100% | | | $4,244,604 |
Legend
(a) Coupon rates for floating and adjustable rate securities reflect the rates in effect at period end.
(b) Coupon is indexed to a floating interest rate which may be multiplied by a specified factor and/or subject to caps or floors.
(c) Security exempt from registration under Rule 144A of the Securities Act of 1933. These securities may be resold in transactions exempt from registration, normally to qualified institutional buyers. At the end of the period, the value of these securities amounted to $63,680,000 or 1.5% of net assets.
(d) Private activity obligations whose interest is subject to the federal alternative minimum tax for individuals.
(e) Security or a portion of the security purchased on a delayed delivery or when-issued basis.
(f) Security initially issued in zero coupon form which converts to coupon form at a specified rate and date. The rate shown is the rate at period end.
(g) Information in this report regarding holdings by state and security types does not reflect the holdings of the Fidelity Municipal Cash Central Fund.
(h) Affiliated fund that is generally available only to investment companies and other accounts managed by Fidelity Investments. The rate quoted is the annualized seven-day yield of the fund at period end. A complete unaudited listing of the fund's holdings as of its most recent quarter end is available upon request. In addition, each Fidelity Central Fund's financial statements are available on the SEC's website or upon request.
Affiliated Central Funds
Fiscal year to date information regarding the Fund's investments in Fidelity Central Funds, including the ownership percentage, is presented below.
| Fund (Amounts in thousands) | Value, beginning of period | Purchases | Sales Proceeds | Dividend Income | Realized Gain/Loss | Change in Unrealized appreciation (depreciation) | Value, end of period | % ownership, end of period |
| Fidelity Municipal Cash Central Fund 0.88% | $88,008 | $841,299 | $830,541 | $233 | $-- | $(4) | $98,762 | 6.6% |
| Total | $88,008 | $841,299 | $830,541 | $233 | $-- | $(4) | $98,762 | |
Amounts in the income column in the above table include any capital gain distributions from underlying funds, which are presented in the corresponding line-item in the Statement of Operations, if applicable.
Investment Valuation
The following is a summary of the inputs used, as of June 30, 2022, involving the Fund's assets and liabilities carried at fair value. The inputs or methodology used for valuing securities may not be an indication of the risk associated with investing in those securities. For more information on valuation inputs, and their aggregation into the levels used below, please refer to the Investment Valuation section in the accompanying Notes to Financial Statements.
| | Valuation Inputs at Reporting Date: |
| Description | Total | Level 1 | Level 2 | Level 3 |
| (Amounts in thousands) | | | | |
| Investments in Securities: | | | | |
| Municipal Securities | $4,177,785 | $-- | $4,177,785 | $-- |
| Money Market Funds | 98,762 | 98,762 | -- | -- |
| Total Investments in Securities: | $4,276,547 | $98,762 | $4,177,785 | $-- |
Other Information
The distribution of municipal securities by revenue source, as a percentage of total Net Assets, is as follows (Unaudited):
| Transportation | 26.9% |
| Health Care | 24.6% |
| General Obligations | 21.3% |
| Education | 8.5% |
| Special Tax | 6.4% |
| Others* (Individually Less Than 5%) | 12.3% |
| | 100.0% |
* Includes net other assets
See accompanying notes which are an integral part of the financial statements.
Financial Statements
Statement of Assets and Liabilities
| Amounts in thousands (except per-share amounts) | | June 30, 2022 (Unaudited) |
| Assets | | |
Investment in securities, at value — See accompanying schedule:
Unaffiliated issuers (cost $4,370,897) | $4,177,785 | |
| Fidelity Central Funds (cost $98,764) | 98,762 | |
| Total Investment in Securities (cost $4,469,661) | | $4,276,547 |
| Cash | | 108 |
| Receivable for investments sold | | 12 |
| Receivable for fund shares sold | | 2,785 |
| Interest receivable | | 53,933 |
| Distributions receivable from Fidelity Central Funds | | 79 |
| Total assets | | 4,333,464 |
| Liabilities | | |
| Payable for investments purchased on a delayed delivery basis | $80,328 | |
| Payable for fund shares redeemed | 4,042 | |
| Distributions payable | 2,688 | |
| Accrued management fee | 1,245 | |
| Distribution and service plan fees payable | 92 | |
| Other affiliated payables | 422 | |
| Other payables and accrued expenses | 43 | |
| Total liabilities | | 88,860 |
| Net Assets | | $4,244,604 |
| Net Assets consist of: | | |
| Paid in capital | | $4,448,751 |
| Total accumulated earnings (loss) | | (204,147) |
| Net Assets | | $4,244,604 |
| Net Asset Value and Maximum Offering Price | | |
| Class A: | | |
| Net Asset Value and redemption price per share ($243,937 ÷ 20,323 shares)(a) | | $12.00 |
| Maximum offering price per share (100/96.00 of $12.00) | | $12.50 |
| Class M: | | |
| Net Asset Value and redemption price per share ($86,430 ÷ 7,194 shares)(a) | | $12.01 |
| Maximum offering price per share (100/96.00 of $12.01) | | $12.51 |
| Class C: | | |
| Net Asset Value and offering price per share ($27,034 ÷ 2,252 shares)(a) | | $12.00 |
| Fidelity Municipal Income Fund: | | |
| Net Asset Value, offering price and redemption price per share ($3,006,737 ÷ 250,321 shares) | | $12.01 |
| Class I: | | |
| Net Asset Value, offering price and redemption price per share ($634,564 ÷ 52,864 shares) | | $12.00 |
| Class Z: | | |
| Net Asset Value, offering price and redemption price per share ($245,902 ÷ 20,479 shares) | | $12.01 |
(a) Redemption price per share is equal to net asset value less any applicable contingent deferred sales charge.
See accompanying notes which are an integral part of the financial statements.
Statement of Operations
| Amounts in thousands | | Six months ended June 30, 2022 (Unaudited) |
| Investment Income | | |
| Interest | | $67,218 |
| Income from Fidelity Central Funds | | 233 |
| Total income | | 67,451 |
| Expenses | | |
| Management fee | $7,991 | |
| Transfer agent fees | 2,321 | |
| Distribution and service plan fees | 562 | |
| Accounting fees and expenses | 321 | |
| Custodian fees and expenses | 22 | |
| Independent trustees' fees and expenses | 7 | |
| Registration fees | 117 | |
| Audit | 30 | |
| Legal | 2 | |
| Miscellaneous | 11 | |
| Total expenses before reductions | 11,384 | |
| Expense reductions | (40) | |
| Total expenses after reductions | | 11,344 |
| Net investment income (loss) | | 56,107 |
| Realized and Unrealized Gain (Loss) | | |
| Net realized gain (loss) on: | | |
| Investment securities: | | |
| Unaffiliated issuers | (11,122) | |
| Total net realized gain (loss) | | (11,122) |
| Change in net unrealized appreciation (depreciation) on: | | |
| Investment securities: | | |
| Unaffiliated issuers | (561,003) | |
| Fidelity Central Funds | (4) | |
| Total change in net unrealized appreciation (depreciation) | | (561,007) |
| Net gain (loss) | | (572,129) |
| Net increase (decrease) in net assets resulting from operations | | $(516,022) |
See accompanying notes which are an integral part of the financial statements.
Statement of Changes in Net Assets
| Amounts in thousands | Six months ended June 30, 2022 (Unaudited) | Year ended December 31, 2021 |
| Increase (Decrease) in Net Assets | | |
| Operations | | |
| Net investment income (loss) | $56,107 | $119,881 |
| Net realized gain (loss) | (11,122) | 33,989 |
| Change in net unrealized appreciation (depreciation) | (561,007) | (13,995) |
| Net increase (decrease) in net assets resulting from operations | (516,022) | 139,875 |
| Distributions to shareholders | (56,105) | (152,504) |
| Share transactions - net increase (decrease) | (308,222) | 123,902 |
| Total increase (decrease) in net assets | (880,349) | 111,273 |
| Net Assets | | |
| Beginning of period | 5,124,953 | 5,013,680 |
| End of period | $4,244,604 | $5,124,953 |
See accompanying notes which are an integral part of the financial statements.
Financial Highlights
Fidelity Municipal Income Fund Class A
| | Six months ended (Unaudited) June 30, | Years endedDecember 31, | | | |
| | 2022 | 2021 | 2020 | 2019 | 2018 A |
| Selected Per–Share Data | | | | | |
| Net asset value, beginning of period | $13.56 | $13.59 | $13.39 | $12.75 | $12.73 |
| Income from Investment Operations | | | | | |
| Net investment income (loss)B,C | .136 | .281 | .305 | .330 | .283 |
| Net realized and unrealized gain (loss) | (1.560) | .057 | .257 | .689 | .029 |
| Total from investment operations | (1.424) | .338 | .562 | 1.019 | .312 |
| Distributions from net investment income | (.136) | (.281) | (.304) | (.328) | (.284) |
| Distributions from net realized gain | – | (.087) | (.058) | (.051) | (.008) |
| Total distributions | (.136) | (.368) | (.362) | (.379) | (.292) |
| Net asset value, end of period | $12.00 | $13.56 | $13.59 | $13.39 | $12.75 |
| Total ReturnD,E,F | (10.54)% | 2.51% | 4.28% | 8.06% | 2.48% |
| Ratios to Average Net AssetsC,G,H | | | | | |
| Expenses before reductions | .79%I | .78% | .78% | .79% | .78%I |
| Expenses net of fee waivers, if any | .79%I | .78% | .78% | .79% | .78%I |
| Expenses net of all reductions | .79%I | .78% | .78% | .79% | .78%I |
| Net investment income (loss) | 2.17%I | 2.06% | 2.29% | 2.49% | 2.68%I |
| Supplemental Data | | | | | |
| Net assets, end of period (in millions) | $244 | $249 | $233 | $241 | $201 |
| Portfolio turnover rateJ | 24%I | 13% | 16% | 16% | 14%K,L |
A For the period March 1, 2018 (commencement of sale of shares) through December 31, 2018.
B Calculated based on average shares outstanding during the period.
C Net investment income (loss) is affected by the timing of the declaration of dividends by any underlying mutual funds or exchange-traded funds (ETFs). Net investment income (loss) of any such underlying funds is not included in the Fund's net investment income (loss) ratio.
D Total returns for periods of less than one year are not annualized.
E Total returns would have been lower if certain expenses had not been reduced during the applicable periods shown.
F Total returns do not include the effect of the sales charges.
G Fees and expenses of any underlying mutual funds or exchange-traded funds (ETFs) are not included in the Fund's expense ratio. The Fund indirectly bears its proportionate share of these expenses. For additional expense information related to investments in Fidelity Central Funds, please refer to the "Investments in Fidelity Central Funds" note found in the Notes to Financial Statements section of the most recent Annual or Semi-Annual report.
H Expense ratios reflect operating expenses of the class. Expenses before reductions do not reflect amounts reimbursed, waived, or reduced through arrangements with the investment adviser, brokerage services, or other offset arrangements, if applicable, and do not represent the amount paid by the class during periods when reimbursements, waivers or reductions occur.
I Annualized
J Amount does not include the portfolio activity of any underlying mutual funds or exchange-traded funds (ETFs).
K The portfolio turnover rate does not include the assets acquired in the merger.
L Portfolio turnover rate excludes securities received or delivered in-kind.
See accompanying notes which are an integral part of the financial statements.
Fidelity Municipal Income Fund Class M
| | Six months ended (Unaudited) June 30, | Years endedDecember 31, | | | |
| | 2022 | 2021 | 2020 | 2019 | 2018 A |
| Selected Per–Share Data | | | | | |
| Net asset value, beginning of period | $13.57 | $13.60 | $13.40 | $12.76 | $12.73 |
| Income from Investment Operations | | | | | |
| Net investment income (loss)B,C | .137 | .285 | .308 | .333 | .285 |
| Net realized and unrealized gain (loss) | (1.560) | .056 | .258 | .689 | .039 |
| Total from investment operations | (1.423) | .341 | .566 | 1.022 | .324 |
| Distributions from net investment income | (.137) | (.284) | (.308) | (.331) | (.286) |
| Distributions from net realized gain | – | (.087) | (.058) | (.051) | (.008) |
| Total distributions | (.137) | (.371) | (.366) | (.382) | (.294) |
| Net asset value, end of period | $12.01 | $13.57 | $13.60 | $13.40 | $12.76 |
| Total ReturnD,E,F | (10.52)% | 2.53% | 4.30% | 8.08% | 2.58% |
| Ratios to Average Net AssetsC,G,H | | | | | |
| Expenses before reductions | .77%I | .76% | .76% | .77% | .77%I |
| Expenses net of fee waivers, if any | .77%I | .76% | .76% | .77% | .77%I |
| Expenses net of all reductions | .77%I | .76% | .76% | .77% | .76%I |
| Net investment income (loss) | 2.19%I | 2.08% | 2.31% | 2.51% | 2.70%I |
| Supplemental Data | | | | | |
| Net assets, end of period (in millions) | $86 | $106 | $109 | $120 | $119 |
| Portfolio turnover rateJ | 24%I | 13% | 16% | 16% | 14%K,L |
A For the period March 1, 2018 (commencement of sale of shares) through December 31, 2018.
B Calculated based on average shares outstanding during the period.
C Net investment income (loss) is affected by the timing of the declaration of dividends by any underlying mutual funds or exchange-traded funds (ETFs). Net investment income (loss) of any such underlying funds is not included in the Fund's net investment income (loss) ratio.
D Total returns for periods of less than one year are not annualized.
E Total returns would have been lower if certain expenses had not been reduced during the applicable periods shown.
F Total returns do not include the effect of the sales charges.
G Fees and expenses of any underlying mutual funds or exchange-traded funds (ETFs) are not included in the Fund's expense ratio. The Fund indirectly bears its proportionate share of these expenses. For additional expense information related to investments in Fidelity Central Funds, please refer to the "Investments in Fidelity Central Funds" note found in the Notes to Financial Statements section of the most recent Annual or Semi-Annual report.
H Expense ratios reflect operating expenses of the class. Expenses before reductions do not reflect amounts reimbursed, waived, or reduced through arrangements with the investment adviser, brokerage services, or other offset arrangements, if applicable, and do not represent the amount paid by the class during periods when reimbursements, waivers or reductions occur.
I Annualized
J Amount does not include the portfolio activity of any underlying mutual funds or exchange-traded funds (ETFs).
K The portfolio turnover rate does not include the assets acquired in the merger.
L Portfolio turnover rate excludes securities received or delivered in-kind.
See accompanying notes which are an integral part of the financial statements.
Fidelity Municipal Income Fund Class C
| | Six months ended (Unaudited) June 30, | Years endedDecember 31, | | | |
| | 2022 | 2021 | 2020 | 2019 | 2018 A |
| Selected Per–Share Data | | | | | |
| Net asset value, beginning of period | $13.56 | $13.59 | $13.39 | $12.75 | $12.73 |
| Income from Investment Operations | | | | | |
| Net investment income (loss)B,C | .090 | .181 | .206 | .231 | .204 |
| Net realized and unrealized gain (loss) | (1.560) | .056 | .257 | .689 | .032 |
| Total from investment operations | (1.470) | .237 | .463 | .920 | .236 |
| Distributions from net investment income | (.090) | (.180) | (.205) | (.229) | (.208) |
| Distributions from net realized gain | – | (.087) | (.058) | (.051) | (.008) |
| Total distributions | (.090) | (.267) | (.263) | (.280) | (.216) |
| Net asset value, end of period | $12.00 | $13.56 | $13.59 | $13.39 | $12.75 |
| Total ReturnD,E,F | (10.87)% | 1.75% | 3.51% | 7.26% | 1.87% |
| Ratios to Average Net AssetsC,G,H | | | | | |
| Expenses before reductions | 1.53%I | 1.52% | 1.53% | 1.53% | 1.52%I |
| Expenses net of fee waivers, if any | 1.52%I | 1.52% | 1.53% | 1.53% | 1.52%I |
| Expenses net of all reductions | 1.52%I | 1.52% | 1.53% | 1.53% | 1.52%I |
| Net investment income (loss) | 1.43%I | 1.32% | 1.54% | 1.75% | 1.94%I |
| Supplemental Data | | | | | |
| Net assets, end of period (in millions) | $27 | $35 | $52 | $58 | $82 |
| Portfolio turnover rateJ | 24%I | 13% | 16% | 16% | 14%K,L |
A For the period March 1, 2018 (commencement of sale of shares) through December 31, 2018.
B Calculated based on average shares outstanding during the period.
C Net investment income (loss) is affected by the timing of the declaration of dividends by any underlying mutual funds or exchange-traded funds (ETFs). Net investment income (loss) of any such underlying funds is not included in the Fund's net investment income (loss) ratio.
D Total returns for periods of less than one year are not annualized.
E Total returns would have been lower if certain expenses had not been reduced during the applicable periods shown.
F Total returns do not include the effect of the contingent deferred sales charge.
G Fees and expenses of any underlying mutual funds or exchange-traded funds (ETFs) are not included in the Fund's expense ratio. The Fund indirectly bears its proportionate share of these expenses. For additional expense information related to investments in Fidelity Central Funds, please refer to the "Investments in Fidelity Central Funds" note found in the Notes to Financial Statements section of the most recent Annual or Semi-Annual report.
H Expense ratios reflect operating expenses of the class. Expenses before reductions do not reflect amounts reimbursed, waived, or reduced through arrangements with the investment adviser, brokerage services, or other offset arrangements, if applicable, and do not represent the amount paid by the class during periods when reimbursements, waivers or reductions occur.
I Annualized
J Amount does not include the portfolio activity of any underlying mutual funds or exchange-traded funds (ETFs).
K The portfolio turnover rate does not include the assets acquired in the merger.
L Portfolio turnover rate excludes securities received or delivered in-kind.
See accompanying notes which are an integral part of the financial statements.
Fidelity Municipal Income Fund
| | Six months ended (Unaudited) June 30, | Years endedDecember 31, | | | | |
| | 2022 | 2021 | 2020 | 2019 | 2018 | 2017 |
| Selected Per–Share Data | | | | | | |
| Net asset value, beginning of period | $13.57 | $13.60 | $13.40 | $12.75 | $13.12 | $12.86 |
| Income from Investment Operations | | | | | | |
| Net investment income (loss)A,B | .157 | .327 | .350 | .374 | .382 | .399 |
| Net realized and unrealized gain (loss) | (1.560) | .057 | .257 | .699 | (.286) | .444 |
| Total from investment operations | (1.403) | .384 | .607 | 1.073 | .096 | .843 |
| Distributions from net investment income | (.157) | (.327) | (.349) | (.372) | (.381) | (.398) |
| Distributions from net realized gain | – | (.087) | (.058) | (.051) | (.085) | (.185) |
| Total distributions | (.157) | (.414) | (.407) | (.423) | (.466) | (.583) |
| Net asset value, end of period | $12.01 | $13.57 | $13.60 | $13.40 | $12.75 | $13.12 |
| Total ReturnC,D | (10.38)% | 2.85% | 4.63% | 8.50% | .80% | 6.67% |
| Ratios to Average Net AssetsB,E,F | | | | | | |
| Expenses before reductions | .46%G | .45% | .45% | .45% | .46% | .46% |
| Expenses net of fee waivers, if any | .46%G | .45% | .45% | .45% | .46% | .46% |
| Expenses net of all reductions | .46%G | .45% | .45% | .45% | .45% | .46% |
| Net investment income (loss) | 2.50%G | 2.39% | 2.62% | 2.83% | 3.00% | 3.05% |
| Supplemental Data | | | | | | |
| Net assets, end of period (in millions) | $3,007 | $3,787 | $3,805 | $3,955 | $3,817 | $5,617 |
| Portfolio turnover rateH | 24%G | 13% | 16% | 16% | 14%I,J | 37% |
A Calculated based on average shares outstanding during the period.
B Net investment income (loss) is affected by the timing of the declaration of dividends by any underlying mutual funds or exchange-traded funds (ETFs). Net investment income (loss) of any such underlying funds is not included in the Fund's net investment income (loss) ratio.
C Total returns for periods of less than one year are not annualized.
D Total returns would have been lower if certain expenses had not been reduced during the applicable periods shown.
E Fees and expenses of any underlying mutual funds or exchange-traded funds (ETFs) are not included in the Fund's expense ratio. The Fund indirectly bears its proportionate share of these expenses. For additional expense information related to investments in Fidelity Central Funds, please refer to the "Investments in Fidelity Central Funds" note found in the Notes to Financial Statements section of the most recent Annual or Semi-Annual report.
F Expense ratios reflect operating expenses of the class. Expenses before reductions do not reflect amounts reimbursed, waived, or reduced through arrangements with the investment adviser, brokerage services, or other offset arrangements, if applicable, and do not represent the amount paid by the class during periods when reimbursements, waivers or reductions occur.
G Annualized
H Amount does not include the portfolio activity of any underlying mutual funds or exchange-traded funds (ETFs).
I The portfolio turnover rate does not include the assets acquired in the merger.
J Portfolio turnover rate excludes securities received or delivered in-kind.
See accompanying notes which are an integral part of the financial statements.
Fidelity Municipal Income Fund Class I
| | Six months ended (Unaudited) June 30, | Years endedDecember 31, | | | |
| | 2022 | 2021 | 2020 | 2019 | 2018 A |
| Selected Per–Share Data | | | | | |
| Net asset value, beginning of period | $13.56 | $13.59 | $13.39 | $12.75 | $12.73 |
| Income from Investment Operations | | | | | |
| Net investment income (loss)B,C | .151 | .315 | .339 | .363 | .309 |
| Net realized and unrealized gain (loss) | (1.560) | .057 | .257 | .689 | .029 |
| Total from investment operations | (1.409) | .372 | .596 | 1.052 | .338 |
| Distributions from net investment income | (.151) | (.315) | (.338) | (.361) | (.310) |
| Distributions from net realized gain | – | (.087) | (.058) | (.051) | (.008) |
| Total distributions | (.151) | (.402) | (.396) | (.412) | (.318) |
| Net asset value, end of period | $12.00 | $13.56 | $13.59 | $13.39 | $12.75 |
| Total ReturnD,E | (10.43)% | 2.76% | 4.54% | 8.33% | 2.69% |
| Ratios to Average Net AssetsC,F,G | | | | | |
| Expenses before reductions | .54%H | .53% | .53% | .53% | .53%H |
| Expenses net of fee waivers, if any | .54%H | .53% | .53% | .53% | .53%H |
| Expenses net of all reductions | .54%H | .53% | .53% | .53% | .53%H |
| Net investment income (loss) | 2.42%H | 2.31% | 2.54% | 2.75% | 2.93%H |
| Supplemental Data | | | | | |
| Net assets, end of period (in millions) | $635 | $714 | $619 | $647 | $555 |
| Portfolio turnover rateI | 24%H | 13% | 16% | 16% | 14%J,K |
A For the period March 1, 2018 (commencement of sale of shares) through December 31, 2018.
B Calculated based on average shares outstanding during the period.
C Net investment income (loss) is affected by the timing of the declaration of dividends by any underlying mutual funds or exchange-traded funds (ETFs). Net investment income (loss) of any such underlying funds is not included in the Fund's net investment income (loss) ratio.
D Total returns for periods of less than one year are not annualized.
E Total returns would have been lower if certain expenses had not been reduced during the applicable periods shown.
F Fees and expenses of any underlying mutual funds or exchange-traded funds (ETFs) are not included in the Fund's expense ratio. The Fund indirectly bears its proportionate share of these expenses. For additional expense information related to investments in Fidelity Central Funds, please refer to the "Investments in Fidelity Central Funds" note found in the Notes to Financial Statements section of the most recent Annual or Semi-Annual report.
G Expense ratios reflect operating expenses of the class. Expenses before reductions do not reflect amounts reimbursed, waived, or reduced through arrangements with the investment adviser, brokerage services, or other offset arrangements, if applicable, and do not represent the amount paid by the class during periods when reimbursements, waivers or reductions occur.
H Annualized
I Amount does not include the portfolio activity of any underlying mutual funds or exchange-traded funds (ETFs).
J The portfolio turnover rate does not include the assets acquired in the merger.
K Portfolio turnover rate excludes securities received or delivered in-kind.
See accompanying notes which are an integral part of the financial statements.
Fidelity Municipal Income Fund Class Z
| | Six months ended (Unaudited) June 30, | Years endedDecember 31, | | | |
| | 2022 | 2021 | 2020 | 2019 | 2018 A |
| Selected Per–Share Data | | | | | |
| Net asset value, beginning of period | $13.57 | $13.60 | $13.39 | $12.75 | $12.64 |
| Income from Investment Operations | | | | | |
| Net investment income (loss)B,C | .158 | .331 | .352 | .378 | .101 |
| Net realized and unrealized gain (loss) | (1.559) | .057 | .269 | .689 | .112 |
| Total from investment operations | (1.401) | .388 | .621 | 1.067 | .213 |
| Distributions from net investment income | (.159) | (.331) | (.353) | (.376) | (.095) |
| Distributions from net realized gain | – | (.087) | (.058) | (.051) | (.008) |
| Total distributions | (.159) | (.418) | (.411) | (.427) | (.103) |
| Net asset value, end of period | $12.01 | $13.57 | $13.60 | $13.39 | $12.75 |
| Total ReturnD,E | (10.37)% | 2.88% | 4.74% | 8.45% | 1.69% |
| Ratios to Average Net AssetsC,F,G | | | | | |
| Expenses before reductions | .42%H | .42% | .42% | .42% | .42%H |
| Expenses net of fee waivers, if any | .42%H | .42% | .42% | .42% | .42%H |
| Expenses net of all reductions | .42%H | .42% | .42% | .42% | .42%H |
| Net investment income (loss) | 2.54%H | 2.42% | 2.65% | 2.86% | 3.08%H |
| Supplemental Data | | | | | |
| Net assets, end of period (in millions) | $246 | $235 | $196 | $97 | $21 |
| Portfolio turnover rateI | 24%H | 13% | 16% | 16% | 14%J,K |
A For the period October 2, 2018 (commencement of sale of shares) through December 31, 2018.
B Calculated based on average shares outstanding during the period.
C Net investment income (loss) is affected by the timing of the declaration of dividends by any underlying mutual funds or exchange-traded funds (ETFs). Net investment income (loss) of any such underlying funds is not included in the Fund's net investment income (loss) ratio.
D Total returns for periods of less than one year are not annualized.
E Total returns would have been lower if certain expenses had not been reduced during the applicable periods shown.
F Fees and expenses of any underlying mutual funds or exchange-traded funds (ETFs) are not included in the Fund's expense ratio. The Fund indirectly bears its proportionate share of these expenses. For additional expense information related to investments in Fidelity Central Funds, please refer to the "Investments in Fidelity Central Funds" note found in the Notes to Financial Statements section of the most recent Annual or Semi-Annual report.
G Expense ratios reflect operating expenses of the class. Expenses before reductions do not reflect amounts reimbursed, waived, or reduced through arrangements with the investment adviser, brokerage services, or other offset arrangements, if applicable, and do not represent the amount paid by the class during periods when reimbursements, waivers or reductions occur.
H Annualized
I Amount does not include the portfolio activity of any underlying mutual funds or exchange-traded funds (ETFs).
J The portfolio turnover rate does not include the assets acquired in the merger.
K Portfolio turnover rate excludes securities received or delivered in-kind.
See accompanying notes which are an integral part of the financial statements.
Notes to Financial Statements (Unaudited)
For the period ended June 30, 2022
(Amounts in thousands except percentages)
1. Organization.
Fidelity Municipal Income Fund (the Fund) is a fund of Fidelity Municipal Trust (the Trust) and is authorized to issue an unlimited number of shares. The Trust is registered under the Investment Company Act of 1940, as amended (the 1940 Act), as an open-end management investment company organized as a Massachusetts business trust. The Fund offers Class A, Class M, Class C, Fidelity Municipal Income Fund, Class I and Class Z shares, each of which has equal rights as to assets and voting privileges. Each class has exclusive voting rights with respect to matters that affect that class. Class C shares will automatically convert to Class A shares after a holding period of eight years from the initial date of purchase, with certain exceptions.
2. Investments in Fidelity Central Funds.
Funds may invest in Fidelity Central Funds, which are open-end investment companies generally available only to other investment companies and accounts managed by the investment adviser and its affiliates. The Schedule of Investments lists any Fidelity Central Funds held as an investment as of period end, but does not include the underlying holdings of each Fidelity Central Fund. An investing fund indirectly bears its proportionate share of the expenses of the underlying Fidelity Central Funds.
Based on its investment objective, each Fidelity Central Fund may invest or participate in various investment vehicles or strategies that are similar to those of the investing fund. These strategies are consistent with the investment objectives of the investing fund and may involve certain economic risks which may cause a decline in value of each of the Fidelity Central Funds and thus a decline in the value of the investing fund.
| Fidelity Central Fund | Investment Manager | Investment Objective | Investment Practices | Expense Ratio(a) |
| Fidelity Money Market Central Funds | Fidelity Management & Research Company LLC (FMR) | Each fund seeks to obtain a high level of current income consistent with the preservation of capital and liquidity. | Short-term Investments | Less than .005% |
(a) Expenses expressed as a percentage of average net assets and are as of each underlying Central Fund's most recent annual or semi-annual shareholder report.
A complete unaudited list of holdings for each Fidelity Central Fund is available upon request or at the Securities and Exchange Commission website at www.sec.gov. In addition, the financial statements of the Fidelity Central Funds which contain the significant accounting policies (including investment valuation policies) of those funds, and are not covered by the Report of Independent Registered Public Accounting Firm, are available on the Securities and Exchange Commission website or upon request.
3. Significant Accounting Policies.
The Fund is an investment company and applies the accounting and reporting guidance of the Financial Accounting Standards Board (FASB) Accounting Standards Codification Topic 946 Financial Services - Investment Companies. The financial statements have been prepared in conformity with accounting principles generally accepted in the United States of America (GAAP), which require management to make certain estimates and assumptions at the date of the financial statements. Actual results could differ from those estimates. Subsequent events, if any, through the date that the financial statements were issued have been evaluated in the preparation of the financial statements. The Fund's Schedule of Investments lists any underlying mutual funds or exchange-traded funds (ETFs) but does not include the underlying holdings of these funds. The following summarizes the significant accounting policies of the Fund:
Investment Valuation. Investments are valued as of 4:00 p.m. Eastern time on the last calendar day of the period. The Board of Trustees (the Board) has delegated the day to day responsibility for the valuation of the Fund's investments to the Fair Value Committee (the Committee) established by the Fund's investment adviser. In accordance with valuation policies and procedures approved by the Board, the Fund attempts to obtain prices from one or more third party pricing vendors or brokers to value its investments. When current market prices, quotations or currency exchange rates are not readily available or reliable, investments will be fair valued in good faith by the Committee, in accordance with procedures adopted by the Board. Factors used in determining fair value vary by investment type and may include market or investment specific events, changes in interest rates and credit quality. The frequency with which these procedures are used cannot be predicted and they may be utilized to a significant extent. The Committee oversees the Fund's valuation policies and procedures and reports to the Board on the Committee's activities and fair value determinations. The Board monitors the appropriateness of the procedures used in valuing the Fund's investments and ratifies the fair value determinations of the Committee.
The Fund categorizes the inputs to valuation techniques used to value its investments into a disclosure hierarchy consisting of three levels as shown below:
- Level 1 – unadjusted quoted prices in active markets for identical investments
- Level 2 – other significant observable inputs (including quoted prices for similar investments, interest rates, prepayment speeds, etc.)
- Level 3 – unobservable inputs (including the Fund's own assumptions based on the best information available)
Valuation techniques used to value the Fund's investments by major category are as follows:
Debt securities, including restricted securities, are valued based on evaluated prices received from third party pricing vendors or from brokers who make markets in such securities. Municipal securities are valued by pricing vendors who utilize matrix pricing which considers yield or price of bonds of comparable quality, coupon, maturity and type or by broker-supplied prices. When independent prices are unavailable or unreliable, debt securities may be valued utilizing pricing methodologies which consider similar factors that would be used by third party pricing vendors. Debt securities are generally categorized as Level 2 in the hierarchy but may be Level 3 depending on the circumstances.
Investments in open-end mutual funds, including the Fidelity Central Funds, are valued at their closing net asset value (NAV) each business day and are categorized as Level 1 in the hierarchy.
Changes in valuation techniques may result in transfers in or out of an assigned level within the disclosure hierarchy. The aggregate value of investments by input level as of June 30, 2022 is included at the end of the Fund's Schedule of Investments.
Investment Transactions and Income. For financial reporting purposes, the Fund's investment holdings and NAV include trades executed through the end of the last business day of the period. The NAV per share for processing shareholder transactions is calculated as of the close of business of the New York Stock Exchange (NYSE), normally 4:00 p.m. Eastern time and includes trades executed through the end of the prior business day. Gains and losses on securities sold are determined on the basis of identified cost. Income and capital gain distributions from Fidelity Central Funds, if any, are recorded on the ex-dividend date. Interest income is accrued as earned and includes coupon interest and amortization of premium and accretion of discount on debt securities as applicable. Debt obligations may be placed on non-accrual status and related interest income may be reduced by ceasing current accruals and writing off interest receivables when the collection of all or a portion of interest has become doubtful based on consistently applied procedures. A debt obligation is removed from non-accrual status when the issuer resumes interest payments or when collectability of interest is reasonably assured.
Class Allocations and Expenses. Investment income, realized and unrealized capital gains and losses, common expenses of a fund, and certain fund-level expense reductions, if any, are allocated daily on a pro-rata basis to each class based on the relative net assets of each class to the total net assets of a fund. Each class differs with respect to transfer agent and distribution and service plan fees incurred, as applicable. Certain expense reductions may also differ by class, if applicable. For the reporting period, the allocated portion of income and expenses to each class as a percent of its average net assets may vary due to the timing of recording these transactions in relation to fluctuating net assets of the classes. Expenses directly attributable to a fund are charged to that fund. Expenses attributable to more than one fund are allocated among the respective funds on the basis of relative net assets or other appropriate methods. Expenses included in the accompanying financial statements reflect the expenses of that fund and do not include any expenses associated with any underlying mutual funds or exchange-traded funds. Although not included in a fund's expenses, a fund indirectly bears its proportionate share of these expenses through the net asset value of each underlying mutual fund or exchange-traded fund. Expense estimates are accrued in the period to which they relate and adjustments are made when actual amounts are known.
Income Tax Information and Distributions to Shareholders. Each year, the Fund intends to qualify as a regulated investment company under Subchapter M of the Internal Revenue Code, including distributing substantially all of its taxable income and realized gains. As a result, no provision for U.S. Federal income taxes is required. The Fund files a U.S. federal tax return, in addition to state and local tax returns as required. The Fund's federal income tax returns are subject to examination by the Internal Revenue Service (IRS) for a period of three fiscal years after they are filed. State and local tax returns may be subject to examination for an additional fiscal year depending on the jurisdiction.
Distributions are declared and recorded daily and paid monthly from net investment income. Distributions from realized gains, if any, are declared and recorded on the ex-dividend date. Income and capital gain distributions are declared separately for each class. Income and capital gain distributions are determined in accordance with income tax regulations, which may differ from GAAP.
Capital accounts within the financial statements are adjusted for permanent book-tax differences. These adjustments have no impact on net assets or the results of operations. Capital accounts are not adjusted for temporary book-tax differences which will reverse in a subsequent period.
Book-tax differences are primarily due to market discount and losses deferred due to wash sales.
The Fund purchases municipal securities whose interest, in the opinion of the issuer, is free from federal income tax. There is no assurance that the IRS will agree with this opinion. In the event the IRS determines that the issuer does not comply with relevant tax requirements, interest payments from a security could become federally taxable, possibly retroactively to the date the security was issued.
As of period end, the cost and unrealized appreciation (depreciation) in securities, and derivatives if applicable, for federal income tax purposes were as follows:
| Gross unrealized appreciation | $34,343 |
| Gross unrealized depreciation | (227,247) |
| Net unrealized appreciation (depreciation) | $(192,904) |
| Tax cost | $4,469,451 |
Delayed Delivery Transactions and When-Issued Securities. During the period, certain Funds transacted in securities on a delayed delivery or when-issued basis. Payment and delivery may take place after the customary settlement period for that security. The price of the underlying securities and the date when the securities will be delivered and paid for are fixed at the time the transaction is negotiated. Securities purchased on a delayed delivery or when-issued basis are identified as such in the Schedule of Investments. Compensation for interest forgone in the purchase of a delayed delivery or when-issued debt security may be received. With respect to purchase commitments, each applicable Fund identifies securities as segregated in its records with a value at least equal to the amount of the commitment. Payables and receivables associated with the purchases and sales of delayed delivery securities having the same coupon, settlement date and broker are offset. Delayed delivery or when-issued securities that have been purchased from and sold to different brokers are reflected as both payables and receivables in the Statement of Assets and Liabilities under the caption "Delayed delivery", as applicable. Losses may arise due to changes in the value of the underlying securities or if the counterparty does not perform under the contract's terms, or if the issuer does not issue the securities due to political, economic, or other factors.
Restricted Securities (including Private Placements). Funds may invest in securities that are subject to legal or contractual restrictions on resale. These securities generally may be resold in transactions exempt from registration or to the public if the securities are registered. Disposal of these securities may involve time-consuming negotiations and expense, and prompt sale at an acceptable price may be difficult. Information regarding restricted securities held at period end is included at the end of the Schedule of Investments, if applicable.
4. Purchases and Sales of Investments.
Purchases and sales of securities, other than short-term securities and in-kind transactions, as applicable, are noted in the table below.
| | Purchases ($) | Sales ($) |
| Fidelity Municipal Income Fund | 536,552 | 817,258 |
5. Fees and Other Transactions with Affiliates.
Management Fee. Fidelity Management & Research Company LLC (the investment adviser) and its affiliates provide the Fund with investment management related services for which the Fund pays a monthly management fee. The management fee is the sum of an individual fund fee rate that is based on an annual rate of .25% of the Fund's average net assets and an annualized group fee rate that averaged .10% during the period. The group fee rate is based upon the monthly average net assets of a group of registered investment companies with which the investment adviser has management contracts. The group fee rate decreases as assets under management increase and increases as assets under management decrease. For the reporting period, the total annualized management fee rate was .35% of the Fund's average net assets.
Distribution and Service Plan Fees. In accordance with Rule 12b-1 of the 1940 Act, the Fund has adopted separate Distribution and Service Plans for each class of shares. Certain classes pay Fidelity Distributors Company LLC (FDC), an affiliate of the investment adviser, separate Distribution and Service Fees, each of which is based on an annual percentage of each class' average net assets. In addition, FDC may pay financial intermediaries for selling shares of the Fund and providing shareholder support services. For the period, the Distribution and Service Fee rates, total fees and amounts retained by FDC were as follows:
| | Distribution Fee | Service Fee | Total Fees | Retained by FDC |
| Class A | -% | .25% | $292 | $22 |
| Class M | -% | .25% | 120 | 1 |
| Class C | .75% | .25% | 150 | 21 |
| | | | $562 | $44 |
Sales Load. FDC may receive a front-end sales charge of up to 4.00% for selling Class A shares and Class M shares, some of which is paid to financial intermediaries for selling shares of the Fund. Depending on the holding period, FDC may receive contingent deferred sales charges levied on Class A, Class M and Class C redemptions. The deferred sales charges are 1.00% for Class C shares, .75% for certain purchases of Class A shares and .25% for certain purchases of Class M shares.
For the period, sales charge amounts retained by FDC were as follows:
| | Retained by FDC |
| Class A | $11 |
| Class M | 1 |
| Class C(a),(b) | – |
| | $12 |
(a) When Class C shares are initially sold, FDC pays commissions from its own resources to financial intermediaries through which the sales are made.
(b) Amount represents less than five hundred dollars.
Transfer Agent Fees. Fidelity Investments Institutional Operations Company LLC (FIIOC), an affiliate of the investment adviser, is the transfer, dividend disbursing and shareholder servicing agent for the Fund. FIIOC receives account fees and asset-based fees that vary according to the account size and type of account of the shareholders of the respective classes of the Fund, except for Class Z. FIIOC receives an asset-based fee of Class Z's average net assets. FIIOC pays for typesetting, printing and mailing of shareholder reports, except proxy statements. For the period, transfer agent fees for each class were as follows:
| | Amount | % of Class-Level Average Net Assets(a) |
| Class A | $191 | .16 |
| Class M | 70 | .15 |
| Class C | 22 | .15 |
| Fidelity Municipal Income Fund | 1,428 | .09 |
| Class I | 545 | .17 |
| Class Z | 65 | .05 |
| | $2,321 | |
(a) Annualized
Accounting Fees. Fidelity Service Company, Inc. (FSC), an affiliate of the investment adviser, maintains the Fund's accounting records. The accounting fee is based on the level of average net assets for each month. For the period, the fees were equivalent to the following annualized rates:
| | % of Average Net Assets |
| Fidelity Municipal Income Fund | .01 |
Interfund Trades. Funds may purchase from or sell securities to other Fidelity Funds under procedures adopted by the Board. The procedures have been designed to ensure these interfund trades are executed in accordance with Rule 17a-7 of the 1940 Act. Any interfund trades are included within the respective purchases and sales amounts shown in the Purchases and Sales of Investments note. During the period, there were no interfund trades.
6. Committed Line of Credit.
Certain Funds participate with other funds managed by the investment adviser or an affiliate in a $4.25 billion credit facility (the "line of credit") to be utilized for temporary or emergency purposes to fund shareholder redemptions or for other short-term liquidity purposes. The participating funds have agreed to pay commitment fees on their pro-rata portion of the line of credit, which are reflected in Miscellaneous expenses on the Statement of Operations, and are listed below. During the period, there were no borrowings on this line of credit.
| | Amount |
| Fidelity Municipal Income Fund | $4 |
7. Expense Reductions.
Through arrangements with the Fund's custodian, credits realized as a result of certain uninvested cash balances were used to reduce the Fund's expenses. During the period, custodian credits reduced the Fund's expenses by $1.
In addition, during the period the investment adviser or an affiliate reimbursed and/or waived a portion of fund-level operating expenses in the amount of $39.
8. Distributions to Shareholders.
Distributions to shareholders of each class were as follows:
| | Six months ended
June 30, 2022 | Year ended
December 31, 2021 |
| Fidelity Municipal Income Fund | | |
| Distributions to shareholders | | |
| Class A | $2,539 | $6,637 |
| Class M | 1,040 | 2,945 |
| Class C | 213 | 779 |
| Fidelity Municipal Income Fund | 41,182 | 115,474 |
| Class I | 7,828 | 19,903 |
| Class Z | 3,303 | 6,766 |
| Total | $56,105 | $152,504 |
9. Share Transactions.
Share transactions for each class were as follows and may contain in-kind transactions, automatic conversions between classes or exchanges between affiliated funds:
| | Shares | Shares | Dollars | Dollars |
| | Six months ended June 30, 2022 | Year ended December 31, 2021 | Six months ended June 30, 2022 | Year ended December 31, 2021 |
| Fidelity Municipal Income Fund | | | | |
| Class A | | | | |
| Shares sold | 4,880 | 4,233 | $59,252 | $57,833 |
| Reinvestment of distributions | 182 | 436 | 2,269 | 5,947 |
| Shares redeemed | (3,091) | (3,424) | (38,545) | (46,733) |
| Net increase (decrease) | 1,971 | 1,245 | $22,976 | $17,047 |
| Class M | | | | |
| Shares sold | 112 | 479 | $1,426 | $6,563 |
| Reinvestment of distributions | 73 | 189 | 912 | 2,578 |
| Shares redeemed | (797) | (910) | (9,928) | (12,470) |
| Net increase (decrease) | (612) | (242) | $(7,590) | $(3,329) |
| Class C | | | | |
| Shares sold | 195 | 519 | $2,444 | $7,097 |
| Reinvestment of distributions | 16 | 54 | 202 | 733 |
| Shares redeemed | (519) | (1,820) | (6,538) | (24,876) |
| Net increase (decrease) | (308) | (1,247) | $(3,892) | $(17,046) |
| Fidelity Municipal Income Fund | | | | |
| Shares sold | 23,898 | 21,512 | $293,792 | $294,467 |
| Reinvestment of distributions | 2,208 | 5,466 | 27,634 | 74,556 |
| Shares redeemed | (54,800) | (27,724) | (685,783) | (378,751) |
| Net increase (decrease) | (28,694) | (746) | $(364,357) | $(9,728) |
| Class I | | | | |
| Shares sold | 16,744 | 16,412 | $206,570 | $224,231 |
| Reinvestment of distributions | 310 | 749 | 3,874 | 10,204 |
| Shares redeemed | (16,813) | (10,070) | (208,640) | (137,392) |
| Net increase (decrease) | 241 | 7,091 | $1,804 | $97,043 |
| Class Z | | | | |
| Shares sold | 16,682 | 5,925 | $207,547 | $80,935 |
| Reinvestment of distributions | 196 | 365 | 2,445 | 4,980 |
| Shares redeemed | (13,719) | (3,366) | (167,155) | (46,000) |
| Net increase (decrease) | 3,159 | 2,924 | $42,837 | $39,915 |
10. Other.
A fund's organizational documents provide former and current trustees and officers with a limited indemnification against liabilities arising in connection with the performance of their duties to the fund. In the normal course of business, a fund may also enter into contracts that provide general indemnifications. A fund's maximum exposure under these arrangements is unknown as this would be dependent on future claims that may be made against a fund. The risk of material loss from such claims is considered remote.
11. Coronavirus (COVID-19) Pandemic.
An outbreak of COVID-19 first detected in China during December 2019 has since spread globally and was declared a pandemic by the World Health Organization during March 2020. Developments that disrupt global economies and financial markets, such as the COVID-19 pandemic, may magnify factors that affect the Fund's performance.
Shareholder Expense Example
As a shareholder, you incur two types of costs: (1) transaction costs, which may include sales charges (loads) on purchase payments or redemption proceeds, as applicable and (2) ongoing costs, which generally include management fees, distribution and/or service (12b-1) fees and other Fund expenses. This Example is intended to help you understand your ongoing costs (in dollars) of investing in a fund and to compare these costs with the ongoing costs of investing in other mutual funds.
The Example is based on an investment of $1,000 invested at the beginning of the period and held for the entire period (January 1, 2022 to June 30, 2022).
Actual Expenses
The first line of the accompanying table provides information about actual account values and actual expenses. You may use the information in this line, together with the amount you invested, to estimate the expenses that you paid over the period. Simply divide your account value by $1,000.00 (for example, an $8,600 account value divided by $1,000.00 = 8.6), then multiply the result by the number in the first line for a class/Fund under the heading entitled "Expenses Paid During Period" to estimate the expenses you paid on your account during this period. If any fund is a shareholder of any underlying mutual funds or exchange-traded funds (ETFs) (the Underlying Funds), such fund indirectly bears its proportional share of the expenses of the Underlying Funds in addition to the direct expenses incurred presented in the table. These fees and expenses are not included in the annualized expense ratio used to calculate the expense estimate in the table below.
Hypothetical Example for Comparison Purposes
The second line of the accompanying table provides information about hypothetical account values and hypothetical expenses based on the actual expense ratio and an assumed rate of return of 5% per year before expenses, which is not the actual return. The hypothetical account values and expenses may not be used to estimate the actual ending account balance or expenses you paid for the period. You may use this information to compare the ongoing costs of investing in the Fund and other funds. To do so, compare this 5% hypothetical example with the 5% hypothetical examples that appear in the shareholder reports of the other funds. If any fund is a shareholder of any Underlying Funds, such fund indirectly bears its proportional share of the expenses of the Underlying Funds in addition to the direct expenses as presented in the table. These fees and expenses are not included in the annualized expense ratio used to calculate the expense estimate in the table below.
Please note that the expenses shown in the table are meant to highlight your ongoing costs only and do not reflect any transaction costs. Therefore, the second line of the table is useful in comparing ongoing costs only, and will not help you determine the relative total costs of owning different funds. In addition, if these transactional costs were included, your costs would have been higher.
| | Annualized Expense Ratio-A | Beginning
Account Value
January 1, 2022 | Ending
Account Value
June 30, 2022 | Expenses Paid
During Period-B
January 1, 2022
to June 30, 2022 |
| Fidelity Municipal Income Fund | | | | |
| Class A | .79% | | | |
| Actual | | $1,000.00 | $894.60 | $3.71 |
| Hypothetical-C | | $1,000.00 | $1,020.88 | $3.96 |
| Class M | .77% | | | |
| Actual | | $1,000.00 | $894.80 | $3.62 |
| Hypothetical-C | | $1,000.00 | $1,020.98 | $3.86 |
| Class C | 1.52% | | | |
| Actual | | $1,000.00 | $891.30 | $7.13 |
| Hypothetical-C | | $1,000.00 | $1,017.26 | $7.60 |
| Fidelity Municipal Income Fund | .46% | | | |
| Actual | | $1,000.00 | $896.20 | $2.16 |
| Hypothetical-C | | $1,000.00 | $1,022.51 | $2.31 |
| Class I | .54% | | | |
| Actual | | $1,000.00 | $895.70 | $2.54 |
| Hypothetical-C | | $1,000.00 | $1,022.12 | $2.71 |
| Class Z | .42% | | | |
| Actual | | $1,000.00 | $896.30 | $1.97 |
| Hypothetical-C | | $1,000.00 | $1,022.71 | $2.11 |
A Annualized expense ratio reflects expenses net of applicable fee waivers.
B Expenses are equal to the annualized expense ratio, multiplied by the average account value over the period, multiplied by 181/ 365 (to reflect the one-half year period). The fees and expenses of any Underlying Funds are not included in each annualized expense ratio.
C 5% return per year before expenses
Liquidity Risk Management Program
The Securities and Exchange Commission adopted Rule 22e-4 under the Investment Company Act of 1940 (the Liquidity Rule) to promote effective liquidity risk management throughout the open-end investment company industry, thereby reducing the risk that funds will be unable to meet their redemption obligations and mitigating dilution of the interests of fund shareholders.
The Fund has adopted and implemented a liquidity risk management program pursuant to the Liquidity Rule (the Program) effective December 1, 2018. The Program is reasonably designed to assess and manage the Fund’s liquidity risk and to comply with the requirements of the Liquidity Rule. The Fund’s Board of Trustees (the Board) has designated the Fund’s investment adviser as administrator of the Program. The Fidelity advisers have established a Liquidity Risk Management Committee (the LRM Committee) to manage the Program for each of the Fidelity Funds. The LRM Committee monitors the adequacy and effectiveness of implementation of the Program and on a periodic basis assesses each Fund’s liquidity risk based on a variety of factors including (1) the Fund’s investment strategy, (2) portfolio liquidity and cash flow projections during normal and reasonably foreseeable stressed conditions, (3) shareholder redemptions, (4) borrowings and other funding sources and (5) in the case of exchange-traded funds, certain additional factors including the effect of the Fund’s prices and spreads, market participants, and basket compositions on the overall liquidity of the Fund’s portfolio, as applicable.
In accordance with the Program, each of the Fund’s portfolio investments is classified into one of four liquidity categories described below based on a determination of a reasonable expectation for how long it would take to convert the investment to cash (or sell or dispose of the investment) without significantly changing its market value.
- Highly liquid investments – cash or convertible to cash within three business days or less
- Moderately liquid investments – convertible to cash in three to seven calendar days
- Less liquid investments – can be sold or disposed of, but not settled, within seven calendar days
- Illiquid investments – cannot be sold or disposed of within seven calendar days
Liquidity classification determinations take into account a variety of factors including various market, trading and investment-specific considerations, as well as market depth, and generally utilize analysis from a third-party liquidity metrics service.
The Liquidity Rule places a 15% limit on a fund’s illiquid investments and requires funds that do not primarily hold assets that are highly liquid investments to determine and maintain a minimum percentage of the fund’s net assets to be invested in highly liquid investments (highly liquid investment minimum or HLIM). The Program includes provisions reasonably designed to comply with the 15% limit on illiquid investments and for determining, periodically reviewing and complying with the HLIM requirement as applicable.
At a recent meeting of the Fund’s Board of Trustees, the LRM Committee provided a written report to the Board pertaining to the operation, adequacy, and effectiveness of implementation of the Program for the annual period from December 1, 2020 through November 30, 2021. The report concluded that the Program has been implemented and is operating effectively and is reasonably designed to assess and manage the Fund’s liquidity risk.

HIY-SANN-0822
1.704645.124
Fidelity® Michigan Municipal Income Fund
Fidelity® Michigan Municipal Money Market Fund
Semi-Annual Report
June 30, 2022
Contents
To view a fund's proxy voting guidelines and proxy voting record for the 12-month period ended June 30, visit http://www.fidelity.com/proxyvotingresults or visit the Securities and Exchange Commission's (SEC) web site at http://www.sec.gov.
You may also call 1-800-544-8544 to request a free copy of the proxy voting guidelines.
Standard & Poor's, S&P and S&P 500 are registered service marks of The McGraw-Hill Companies, Inc. and have been licensed for use by Fidelity Distributors Corporation.
Other third-party marks appearing herein are the property of their respective owners.
All other marks appearing herein are registered or unregistered trademarks or service marks of FMR LLC or an affiliated company. © 2022 FMR LLC. All rights reserved.
This report and the financial statements contained herein are submitted for the general information of the shareholders of the Funds. This report is not authorized for distribution to prospective investors in the Funds unless preceded or accompanied by an effective prospectus.
A fund files its complete schedule of portfolio holdings with the SEC for the first and third quarters of each fiscal year on Form N-PORT. Forms N-PORT are available on the SEC’s web site at http://www.sec.gov. A fund's Forms N-PORT may be reviewed and copied at the SEC’s Public Reference Room in Washington, DC. Information regarding the operation of the SEC's Public Reference Room may be obtained by calling 1-800-SEC-0330.
For a complete list of a fund's portfolio holdings, view the most recent holdings listing, semiannual report, or annual report on Fidelity's web site at http://www.fidelity.com, http://www.institutional.fidelity.com, or http://www.401k.com, as applicable.
NOT FDIC INSURED •MAY LOSE VALUE •NO BANK GUARANTEE
Neither the Funds nor Fidelity Distributors Corporation is a bank.
Note to Shareholders:
Early in 2020, the outbreak and spread of COVID-19 emerged as a public health emergency that had a major influence on financial markets, primarily based on its impact on the global economy and corporate earnings. On March 11, 2020, the World Health Organization declared the COVID-19 outbreak a pandemic, citing sustained risk of further global spread. The pandemic prompted a number of measures to limit the spread of COVID-19, including travel and border restrictions, quarantines, and restrictions on large gatherings. In turn, these resulted in lower consumer activity, diminished demand for a wide range of products and services, disruption in manufacturing and supply chains, and – given the wide variability in outcomes regarding the outbreak – significant market uncertainty and volatility. To help stem the turmoil, the U.S. government took unprecedented action – in concert with the U.S. Federal Reserve and central banks around the world – to help support consumers, businesses, and the broader economy, and to limit disruption to the financial system.
In general, the overall impact of the pandemic lessened in 2021, amid a resilient economy and widespread distribution of three COVID-19 vaccines granted emergency use authorization from the U.S. Food and Drug Administration (FDA) early in the year. Still, the situation remains dynamic, and the extent and duration of its influence on financial markets and the economy is highly uncertain, due in part to a recent spike in cases based on highly contagious variants of the coronavirus.
Extreme events such as the COVID-19 crisis are exogenous shocks that can have significant adverse effects on mutual funds and their investments. Although multiple asset classes may be affected by market disruption, the duration and impact may not be the same for all types of assets. Fidelity is committed to helping you stay informed amid news about COVID-19 and during increased market volatility, and we continue to take extra steps to be responsive to customer needs. We encourage you to visit us online, where we offer ongoing updates, commentary, and analysis on the markets and our funds.
Fidelity® Michigan Municipal Income Fund
Investment Summary (Unaudited)
Top Five Sectors as of June 30, 2022
| | % of fund's net assets |
| General Obligations | 24.2 |
| Health Care | 23.8 |
| Education | 13.5 |
| Water & Sewer | 10.1 |
| Transportation | 10.0 |
Quality Diversification (% of fund's net assets)
| As of June 30, 2022 |
| | AAA | 3.2% |
| | AA,A | 87.5% |
| | BBB | 3.8% |
| | BB and Below | 1.5% |
| | Not Rated | 2.3% |
| | Short-Term Investments and Net Other Assets | 1.7% |
We have used ratings from Moody's Investors Service, Inc. Where Moody's® ratings are not available, we have used S&P® ratings. All ratings are as of the date indicated and do not reflect subsequent changes.
Fidelity® Michigan Municipal Income Fund
Schedule of Investments June 30, 2022 (Unaudited)
Showing Percentage of Net Assets
| Municipal Bonds - 98.3% | | | |
| | | Principal Amount | Value |
| Guam - 0.4% | | | |
| Guam Int'l. Arpt. Auth. Rev. Series 2013 C: | | | |
| 6.25% 10/1/34 (a) | | $600,000 | $621,084 |
| 6.25% 10/1/34 (Pre-Refunded to 10/1/23 @ 100) (a) | | 400,000 | 420,789 |
| Guam Pwr. Auth. Rev. Series 2022 A, 5% 10/1/44 (b) | | 1,000,000 | 1,020,116 |
|
| TOTAL GUAM | | | 2,061,989 |
|
| Michigan - 96.9% | | | |
| Battle Creek School District Series 2016: | | | |
| 5% 5/1/36 | | 1,500,000 | 1,628,976 |
| 5% 5/1/37 | | 1,175,000 | 1,273,803 |
| Bay City School District Rev. Series 2014: | | | |
| 5% 11/1/26 | | 1,000,000 | 1,052,975 |
| 5% 11/1/27 | | 700,000 | 736,567 |
| 5% 11/1/28 | | 250,000 | 263,014 |
| Bloomfield Hills Schools District Series 2020, 4% 5/1/50 | | 1,500,000 | 1,469,049 |
| Chippewa Valley Schools Series 2016 A: | | | |
| 5% 5/1/32 | | 1,000,000 | 1,063,876 |
| 5% 5/1/33 | | 1,000,000 | 1,062,246 |
| 5% 5/1/34 | | 1,075,000 | 1,140,516 |
| 5% 5/1/35 | | 775,000 | 821,477 |
| Detroit Downtown Dev. Auth. Tax Series A: | | | |
| 5% 7/1/29 (Assured Guaranty Muni. Corp. Insured) | | 1,340,000 | 1,405,280 |
| 5% 7/1/31 (Assured Guaranty Muni. Corp. Insured) | | 1,775,000 | 1,860,766 |
| 5% 7/1/33 (Assured Guaranty Muni. Corp. Insured) | | 2,000,000 | 2,095,843 |
| 5% 7/1/34 (Assured Guaranty Muni. Corp. Insured) | | 1,750,000 | 1,833,515 |
| 5% 7/1/35 (Assured Guaranty Muni. Corp. Insured) | | 2,750,000 | 2,880,145 |
| 5% 7/1/37 (Assured Guaranty Muni. Corp. Insured) | | 2,000,000 | 2,093,857 |
| Detroit Gen. Oblig.: | | | |
| Series 2018, 5% 4/1/23 | | 310,000 | 315,522 |
| Series 2020: | | | |
| 5.5% 4/1/35 | | 690,000 | 751,503 |
| 5.5% 4/1/36 | | 435,000 | 472,988 |
| 5.5% 4/1/37 | | 465,000 | 504,350 |
| 5.5% 4/1/38 | | 490,000 | 530,318 |
| Series 2021 A: | | | |
| 5% 4/1/37 | | 1,875,000 | 1,954,871 |
| 5% 4/1/39 | | 1,210,000 | 1,256,036 |
| Detroit Swr. Disp. Rev.: | | | |
| Series 2001 B, 5.5% 7/1/29 (Assured Guaranty Corp. Insured) (FGIC Insured) | | 25,000 | 27,861 |
| Series 2006, 5% 7/1/36 | | 10,000 | 10,027 |
| Downriver Util. Wastewtr. Auth. Swr. Sys. Rev. Series 2018: | | | |
| 5% 4/1/33 (Assured Guaranty Muni. Corp. Insured) | | 735,000 | 818,867 |
| 5% 4/1/34 (Assured Guaranty Muni. Corp. Insured) | | 520,000 | 578,202 |
| 5% 4/1/35 (Assured Guaranty Muni. Corp. Insured) | | 500,000 | 554,537 |
| Farmington Pub. School District Gen. Oblig.: | | | |
| Series 2015: | | | |
| 5% 5/1/26 (Assured Guaranty Muni. Corp. Insured) | | 1,385,000 | 1,493,802 |
| 5% 5/1/27 (Assured Guaranty Muni. Corp. Insured) | | 1,425,000 | 1,535,318 |
| Series 2020, 4% 5/1/40 | | 3,000,000 | 2,998,505 |
| Fitzgerald Pub. School District Series 2019, 5% 5/1/37 | | 1,260,000 | 1,408,073 |
| Flint Hosp. Bldg. Auth. Rev. Series 2020: | | | |
| 4% 7/1/38 | | 1,800,000 | 1,656,521 |
| 4% 7/1/41 | | 1,395,000 | 1,235,200 |
| Fraser Pub. School District Series 2006 B, 5% 5/1/29 | | 1,455,000 | 1,560,607 |
| Gerald R. Ford Int'l. Arpt. Auth. Rev. Series 2021: | | | |
| 5% 1/1/26 (a) | | 225,000 | 242,636 |
| 5% 1/1/27 (a) | | 325,000 | 356,005 |
| 5% 1/1/28 (a) | | 235,000 | 260,652 |
| 5% 1/1/29 (a) | | 525,000 | 588,024 |
| 5% 1/1/30 (a) | | 425,000 | 479,459 |
| 5% 1/1/31 (a) | | 725,000 | 821,880 |
| 5% 1/1/32 (a) | | 725,000 | 819,507 |
| 5% 1/1/33 (a) | | 1,000,000 | 1,129,944 |
| 5% 1/1/34 (a) | | 1,000,000 | 1,123,528 |
| 5% 1/1/35 (a) | | 850,000 | 951,212 |
| 5% 1/1/36 (a) | | 600,000 | 669,007 |
| 5% 1/1/37 (a) | | 700,000 | 777,797 |
| 5% 1/1/38 (a) | | 1,170,000 | 1,296,649 |
| 5% 1/1/39 (a) | | 1,000,000 | 1,105,895 |
| 5% 1/1/40 (a) | | 1,000,000 | 1,103,312 |
| 5% 1/1/41 (a) | | 1,100,000 | 1,211,216 |
| 5% 1/1/46 (a) | | 2,000,000 | 2,170,555 |
| 5% 1/1/51 (a) | | 3,000,000 | 3,243,116 |
| Grand Rapids Pub. Schools: | | | |
| Series 2017, 5% 5/1/29 (Assured Guaranty Muni. Corp. Insured) | | 480,000 | 529,298 |
| Series 2019: | | | |
| 5% 11/1/39 (Assured Guaranty Muni. Corp. Insured) | | 1,200,000 | 1,323,011 |
| 5% 11/1/41 (Assured Guaranty Muni. Corp. Insured) | | 1,300,000 | 1,420,238 |
| 5% 11/1/42 (Assured Guaranty Muni. Corp. Insured) | | 1,400,000 | 1,522,138 |
| Grand Rapids San. Swr. Sys. Rev.: | | | |
| Series 2018: | | | |
| 5% 1/1/31 | | 475,000 | 529,090 |
| 5% 1/1/33 | | 250,000 | 276,767 |
| 5% 1/1/34 | | 550,000 | 606,999 |
| 5% 1/1/35 | | 400,000 | 440,135 |
| 5% 1/1/38 | | 655,000 | 711,492 |
| Series 2016, 5% 1/1/37 | | 1,250,000 | 1,345,814 |
| Grand Rapids Wtr. Supply Sys. Series 2016: | | | |
| 5% 1/1/31 | | 250,000 | 270,899 |
| 5% 1/1/32 | | 320,000 | 346,639 |
| 5% 1/1/33 | | 550,000 | 595,402 |
| 5% 1/1/34 | | 500,000 | 540,753 |
| 5% 1/1/35 | | 920,000 | 993,707 |
| 5% 1/1/36 | | 385,000 | 415,177 |
| 5% 1/1/46 | | 800,000 | 851,975 |
| Grand Traverse County Hosp. Fin. Auth.: | | | |
| Series 2014 A, 5% 7/1/47 | | 1,400,000 | 1,426,274 |
| Series 2019 A: | | | |
| 5% 7/1/44 | | 1,110,000 | 1,165,659 |
| 5% 7/1/49 | | 2,615,000 | 2,720,201 |
| Grand Valley Michigan State Univ. Rev.: | | | |
| Series 2014 B: | | | |
| 5% 12/1/25 | | 500,000 | 531,883 |
| 5% 12/1/26 | | 1,900,000 | 2,017,481 |
| 5% 12/1/28 | | 1,800,000 | 1,907,391 |
| Series 2018: | | | |
| 5% 12/1/34 | | 1,075,000 | 1,169,939 |
| 5% 12/1/35 | | 1,225,000 | 1,331,134 |
| 5% 12/1/37 | | 1,375,000 | 1,490,221 |
| 5% 12/1/38 | | 875,000 | 946,545 |
| 5% 12/1/43 | | 1,400,000 | 1,505,233 |
| Grandville Pub. Schools District Series 2020: | | | |
| 4% 5/1/39 (Assured Guaranty Muni. Corp. Insured) | | 1,000,000 | 1,005,577 |
| 4% 5/1/40 (Assured Guaranty Muni. Corp. Insured) | | 1,300,000 | 1,303,968 |
| Great Lakes Wtr. Auth. Sew Disp. Sys.: | | | |
| Series 2016 B, 5% 7/1/27 | | 15,000 | 16,328 |
| Series 2016 C, 5% 7/1/31 | | 7,000,000 | 7,502,111 |
| Series 2018 A: | | | |
| 5% 7/1/43 | | 10,000,000 | 10,831,132 |
| 5% 7/1/48 | | 5,000,000 | 5,387,830 |
| Series 2018 B: | | | |
| 5% 7/1/28 | | 1,125,000 | 1,261,278 |
| 5% 7/1/29 | | 15,000 | 17,003 |
| Great Lakes Wtr. Auth. Wtr. Supply Sys. Rev.: | | | |
| Series 2016 C, 5.25% 7/1/35 | | 2,000,000 | 2,151,727 |
| Series 2020 B: | | | |
| 5% 7/1/45 | | 1,850,000 | 2,008,531 |
| 5% 7/1/49 | | 1,300,000 | 1,409,190 |
| Grosse Pointe Pub. School Sys. Series 2019: | | | |
| 5% 5/1/38 | | 1,000,000 | 1,108,810 |
| 5% 5/1/39 | | 1,000,000 | 1,107,014 |
| Hudsonville Pub. Schools Series 2017: | | | |
| 5% 5/1/31 | | 430,000 | 476,396 |
| 5% 5/1/32 | | 1,200,000 | 1,326,792 |
| 5% 5/1/34 | | 1,000,000 | 1,098,901 |
| 5% 5/1/35 | | 1,000,000 | 1,096,498 |
| Ingham, Eaton and Clinton Counties Lansing School District Series II, 5% 5/1/24 | | 355,000 | 373,479 |
| Kalamazoo Hosp. Fin. Auth. Hosp. Facilities Rev. Series 2016: | | | |
| 4% 5/15/36 | | 1,985,000 | 1,980,688 |
| 4% 5/15/36 (Pre-Refunded to 5/15/26 @ 100) | | 15,000 | 15,925 |
| 5% 5/15/28 | | 775,000 | 824,922 |
| 5% 5/15/28 (Pre-Refunded to 5/15/26 @ 100) | | 5,000 | 5,496 |
| 5% 5/15/30 | | 4,970,000 | 5,237,840 |
| 5% 5/15/30 (Pre-Refunded to 5/15/26 @ 100) | | 30,000 | 32,975 |
| Kentwood Econ. Dev. Corp.: | | | |
| Series 2021, 4% 11/15/45 | | 500,000 | 400,877 |
| Series 2022: | | | |
| 4% 11/15/31 | | 1,000,000 | 928,042 |
| 4% 11/15/43 | | 2,250,000 | 1,850,959 |
| Lansing Board of Wtr. & Lt. Util. Rev.: | | | |
| Bonds Series 2021 B, 2%, tender 7/1/26 (c) | | 2,000,000 | 1,895,168 |
| Series 2019 A: | | | |
| 5% 7/1/24 | | 375,000 | 396,568 |
| 5% 7/1/25 | | 375,000 | 405,562 |
| 5% 7/1/44 | | 2,180,000 | 2,382,779 |
| Lansing Cmnty. College Series 2019, 5% 5/1/44 | | 3,000,000 | 3,292,110 |
| Lincoln Consolidated School District Series 2016 A: | | | |
| 5% 5/1/28 | | 2,025,000 | 2,219,994 |
| 5% 5/1/29 | | 1,430,000 | 1,562,220 |
| 5% 5/1/31 | | 500,000 | 543,372 |
| 5% 5/1/32 | | 1,000,000 | 1,086,364 |
| Lowell Area Schools Series I: | | | |
| 5% 5/1/47 | | 1,500,000 | 1,657,600 |
| 5% 5/1/49 | | 1,750,000 | 1,932,313 |
| Macomb Interceptor Drain Drainage District Series 2017 A: | | | |
| 5% 5/1/33 | | 2,100,000 | 2,306,410 |
| 5% 5/1/34 | | 1,750,000 | 1,921,420 |
| Marquette Board Lt. & Pwr. Elec. Util. Sys. Rev. Series 2016 A: | | | |
| 5% 7/1/29 | | 780,000 | 855,821 |
| 5% 7/1/30 | | 900,000 | 987,126 |
| 5% 7/1/31 | | 780,000 | 853,023 |
| 5% 7/1/32 | | 1,000,000 | 1,093,222 |
| 5% 7/1/33 | | 705,000 | 770,722 |
| Michigan Bldg. Auth. Rev.: | | | |
| (Facilities Prog.) Series I, 3% 10/15/45 | | 6,000,000 | 4,989,590 |
| Series I, 5% 4/15/38 | | 3,000,000 | 3,149,393 |
| Michigan Fin. Auth. Rev.: | | | |
| (Charter County of Wayne Criminal Justice Ctr. Proj.) Series 2018: | | | |
| 5% 11/1/30 | | 1,000,000 | 1,133,505 |
| 5% 11/1/31 | | 750,000 | 847,129 |
| 5% 11/1/32 | | 1,000,000 | 1,126,131 |
| 5% 11/1/33 | | 3,250,000 | 3,650,331 |
| 5% 11/1/35 | | 1,000,000 | 1,118,829 |
| 5% 11/1/36 | | 1,250,000 | 1,394,133 |
| 5% 11/1/37 | | 1,500,000 | 1,670,945 |
| 5% 11/1/38 | | 1,595,000 | 1,773,462 |
| (Detroit Wtr. And Sewerage Dept. Sewage Disp. Sys. Rev. And Rev. Rfdg. Local Proj. Bonds): | | | |
| Series 2014 C, 5% 7/1/25 (Assured Guaranty Muni. Corp. Insured) | | 1,850,000 | 1,943,809 |
| Series 2014 C3, 5% 7/1/30 (Assured Guaranty Muni. Corp. Insured) | | 6,000,000 | 6,243,618 |
| (Detroit Wtr. And Sewerage Dept. Wtr. Supply Sys. Rev. Rfdg. Local Proj. Bonds) Series 2015, 5% 7/1/30 | | 10,000 | 10,539 |
| (Holland Cmnty. Hosp. Proj.) Series 2013 A: | | | |
| 5% 1/1/33 | | 1,250,000 | 1,268,766 |
| 5% 1/1/40 | | 3,000,000 | 3,045,038 |
| (Kalamazoo College Proj.) Series 2018: | | | |
| 4% 12/1/36 | | 790,000 | 776,617 |
| 4% 12/1/47 | | 2,610,000 | 2,411,423 |
| (Local Govt. Ln. Prog.) Series 2014 D, 5% 7/1/37 (Assured Guaranty Muni. Corp. Insured) | | 1,000,000 | 1,034,717 |
| (Trinity Health Proj.) Series 2017: | | | |
| 5% 12/1/30 | | 710,000 | 781,665 |
| 5% 12/1/37 | | 3,270,000 | 3,470,435 |
| 5% 12/1/42 | | 2,120,000 | 2,228,573 |
| Bonds: | | | |
| Series 2015 D2, 1.2%, tender 4/13/28 (c) | | 3,000,000 | 2,686,144 |
| Series 2016 E1, 4%, tender 8/15/24 (c) | | 1,355,000 | 1,400,159 |
| Series 2012: | | | |
| 5% 11/15/24 | | 660,000 | 667,439 |
| 5% 11/15/26 | | 800,000 | 808,783 |
| 5% 11/1/42 (Pre-Refunded to 11/1/22 @ 100) | | 2,000,000 | 2,022,980 |
| Series 2013, 5% 8/15/30 (Pre-Refunded to 8/15/23 @ 100) | | 4,105,000 | 4,251,689 |
| Series 2014 H1: | | | |
| 5% 10/1/25 | | 2,250,000 | 2,372,249 |
| 5% 10/1/39 | | 4,725,000 | 4,911,465 |
| Series 2015 C: | | | |
| 5% 7/1/26 | | 570,000 | 606,573 |
| 5% 7/1/27 | | 1,465,000 | 1,555,101 |
| 5% 7/1/28 | | 1,500,000 | 1,586,071 |
| 5% 7/1/35 | | 2,100,000 | 2,194,777 |
| Series 2015 D1: | | | |
| 5% 7/1/34 | | 1,250,000 | 1,309,678 |
| 5% 7/1/35 | | 505,000 | 528,523 |
| Series 2015 D2, 5% 7/1/34 | | 1,000,000 | 1,046,291 |
| Series 2016 A, 5% 11/1/44 | | 4,190,000 | 4,378,792 |
| Series 2016: | | | |
| 5% 11/15/28 | | 2,655,000 | 2,852,192 |
| 5% 1/1/29 | | 1,000,000 | 1,054,799 |
| 5% 11/15/29 | | 2,950,000 | 3,154,453 |
| 5% 1/1/30 | | 1,000,000 | 1,050,150 |
| 5% 1/1/31 | | 1,170,000 | 1,223,619 |
| 5% 1/1/32 | | 1,895,000 | 1,971,628 |
| 5% 1/1/33 | | 1,915,000 | 1,988,961 |
| 5% 1/1/34 | | 2,135,000 | 2,210,800 |
| 5% 11/15/34 | | 1,135,000 | 1,191,091 |
| 5% 11/15/41 | | 11,710,000 | 12,199,869 |
| Series 2019 A: | | | |
| 4% 12/1/49 | | 7,000,000 | 6,511,779 |
| 4% 2/15/50 | | 4,000,000 | 3,742,460 |
| 5% 11/15/48 | | 9,865,000 | 10,193,702 |
| 5% 5/15/54 | | 1,000,000 | 1,026,780 |
| Series 2019 MI1, 5% 12/1/48 | | 2,000,000 | 2,098,044 |
| Series 2020 A: | | | |
| 4% 6/1/35 | | 2,000,000 | 1,973,093 |
| 4% 6/1/37 | | 2,000,000 | 1,954,170 |
| 4% 6/1/40 | | 2,000,000 | 1,934,656 |
| 4% 6/1/49 | | 4,250,000 | 3,796,564 |
| Series 2020: | | | |
| 4% 11/1/55 | | 2,500,000 | 2,298,474 |
| 5% 6/1/40 | | 3,000,000 | 3,160,699 |
| Series 2021, 5% 9/1/38 | | 1,270,000 | 1,370,484 |
| Series 2022: | | | |
| 4% 2/1/27 | | 185,000 | 188,561 |
| 4% 2/1/32 | | 285,000 | 281,711 |
| 4% 2/1/42 | | 745,000 | 669,171 |
| 4% 4/15/42 | | 2,000,000 | 1,976,154 |
| 4% 12/1/46 | | 1,725,000 | 1,526,576 |
| 4% 12/1/51 | | 1,100,000 | 950,151 |
| Michigan Gen. Oblig. Series 2020 A, 4% 5/15/40 | | 500,000 | 501,018 |
| Michigan Hosp. Fin. Auth. Rev.: | | | |
| Series 2010 F, 4% 11/15/47 | | 290,000 | 279,298 |
| Series 2010 F4, 5% 11/15/47 | | 5,050,000 | 5,349,558 |
| Series 2016: | | | |
| 5% 11/15/46 | | 3,500,000 | 3,696,662 |
| 5% 11/15/47 | | 18,000,000 | 18,986,628 |
| Michigan Hsg. Dev. Auth. Rental Hsg. Rev. Series 2020 A1, 0.65% 10/1/24 | | 460,000 | 441,307 |
| Michigan Hsg. Dev. Auth. Single Family Mtg. Rev.: | | | |
| Series 2019 B, 3.75% 6/1/50 | | 3,000,000 | 3,022,496 |
| Series 2020 C, 3% 6/1/51 | | 3,320,000 | 3,255,760 |
| Series 2021 A, 3% 6/1/52 | | 3,430,000 | 3,346,499 |
| Series 2022 A, 5% 6/1/53 | | 2,500,000 | 2,647,859 |
| Series A: | | | |
| 3.5% 12/1/50 | | 2,625,000 | 2,621,384 |
| 4% 12/1/48 | | 1,185,000 | 1,202,818 |
| Series C, 4.25% 6/1/49 | | 2,615,000 | 2,666,972 |
| Michigan State Hsg. Dev. Auth. Series 2021 A, 0.55% 4/1/25 | | 2,750,000 | 2,595,215 |
| Michigan State Univ. Revs.: | | | |
| Series 2019 B, 5% 2/15/48 | | 3,000,000 | 3,201,234 |
| Series 2019 C, 4% 2/15/44 | | 1,500,000 | 1,466,238 |
| Michigan Strategic Fund Ltd. Oblig. Rev.: | | | |
| (I-75 Impt. Proj.): | | | |
| Series 2017, 5% 6/30/25 (a) | | 1,100,000 | 1,144,531 |
| Series 2018: | | | |
| 4.25% 12/31/38 (Assured Guaranty Muni. Corp. Insured) (a) | | 840,000 | 804,349 |
| 5% 12/31/25 (a) | | 1,260,000 | 1,316,769 |
| 5% 12/31/26 (a) | | 425,000 | 446,984 |
| 5% 6/30/29 (a) | | 35,000 | 36,602 |
| (The Detroit Edison Co. Exempt Facilities Proj.) Series 2008 ET2, 1.35% 8/1/29 | | 2,000,000 | 1,698,862 |
| (The Detroit Edison Co. Poll. Cont. Bonds Proj.) Series 1995 CC, 1.45% 9/1/30 | | 2,000,000 | 1,679,915 |
| Bonds: | | | |
| (Consumer Energy Co. Proj.) Series 2019, 1.8%, tender 10/1/24 (a)(c) | | 6,000,000 | 5,803,105 |
| (Graphic Packaging Int'l., LLC Coated Recycled Board Machine Proj.) Series 2021, 4%, tender 10/1/26 (a)(c) | | 5,000,000 | 4,947,895 |
| Series 2020: | | | |
| 4% 5/15/27 | | 715,000 | 695,256 |
| 5% 5/15/44 | | 1,500,000 | 1,416,104 |
| Michigan Technological Univ. Series 2021, 4% 10/1/46 | | 2,835,000 | 2,759,543 |
| Northern Michigan Univ. Revs. Series 2021: | | | |
| 4% 6/1/39 | | 900,000 | 916,988 |
| 4% 6/1/40 | | 500,000 | 506,386 |
| 4% 6/1/41 | | 1,385,000 | 1,394,752 |
| 4% 6/1/46 | | 1,850,000 | 1,809,413 |
| 5% 6/1/32 | | 375,000 | 429,278 |
| 5% 6/1/33 | | 365,000 | 414,939 |
| 5% 6/1/34 | | 375,000 | 425,211 |
| 5% 6/1/35 | | 375,000 | 423,957 |
| 5% 6/1/36 | | 400,000 | 451,718 |
| 5% 6/1/37 | | 675,000 | 759,769 |
| Novi Cmnty. School District Series I: | | | |
| 5% 5/1/43 | | 1,150,000 | 1,251,344 |
| 5% 5/1/44 | | 1,175,000 | 1,276,319 |
| Oakland Macomb Intercepto Series 2020 A, 5% 7/1/29 | | 1,500,000 | 1,715,596 |
| Oakland Univ. Rev.: | | | |
| Series 2013 A: | | | |
| 5% 3/1/25 | | 995,000 | 1,012,504 |
| 5% 3/1/27 | | 815,000 | 829,338 |
| 5% 3/1/38 | | 2,900,000 | 2,951,017 |
| Series 2014: | | | |
| 5% 3/1/28 | | 335,000 | 349,376 |
| 5% 3/1/29 | | 525,000 | 546,484 |
| 5% 3/1/39 | | 3,000,000 | 3,094,595 |
| Series 2016: | | | |
| 5% 3/1/28 | | 1,150,000 | 1,243,029 |
| 5% 3/1/41 | | 3,475,000 | 3,687,555 |
| Series 2022 B: | | | |
| 5% 3/1/36 (b) | | 1,135,000 | 1,219,541 |
| 5% 3/1/37 (b) | | 1,265,000 | 1,355,053 |
| Portage Pub. Schools: | | | |
| Series 2016: | | | |
| 5% 11/1/32 | | 2,500,000 | 2,724,472 |
| 5% 11/1/34 | | 1,250,000 | 1,360,331 |
| 5% 11/1/35 | | 1,300,000 | 1,413,261 |
| 5% 11/1/39 | | 755,000 | 817,057 |
| Series 2019, 4% 11/1/38 | | 2,000,000 | 2,018,756 |
| Series 2021, 4% 11/1/42 | | 1,000,000 | 993,864 |
| Ravenna Pub. Schools Gen. Oblig. Series 2021, 4% 5/1/51 | | 2,140,000 | 2,065,135 |
| Rochester Cmnty. School District Series I, 5% 5/1/31 | | 1,500,000 | 1,638,119 |
| Rockford Pub. Schools Gen. Oblig. Series 2019 I: | | | |
| 5% 5/1/42 | | 3,050,000 | 3,360,743 |
| 5% 5/1/44 | | 3,100,000 | 3,411,761 |
| Roseville Cmnty. Schools: | | | |
| Series 2014, 5% 5/1/24 | | 780,000 | 820,459 |
| Series 2015, 5% 5/1/24 | | 570,000 | 599,566 |
| Royal Oak Hosp. Fin. Auth. Hosp. Rev. Series 2014 D: | | | |
| 5% 9/1/26 (Pre-Refunded to 3/1/24 @ 100) | | 1,000,000 | 1,049,923 |
| 5% 9/1/27 (Pre-Refunded to 3/1/24 @ 100) | | 1,175,000 | 1,233,659 |
| 5% 9/1/28 (Pre-Refunded to 3/1/24 @ 100) | | 1,870,000 | 1,963,355 |
| Saginaw City School District Series 2021, 4% 5/1/47 | | 3,000,000 | 2,929,363 |
| Saginaw Hosp. Fin. Auth. Hosp. Rev. Series 2020 J: | | | |
| 4% 7/1/36 | | 770,000 | 768,085 |
| 4% 7/1/37 | | 820,000 | 816,659 |
| 4% 7/1/39 | | 1,430,000 | 1,416,354 |
| 4% 7/1/40 | | 490,000 | 483,253 |
| Walled Lake Consolidated School District: | | | |
| Series 2020, 5% 5/1/36 | | 1,050,000 | 1,187,648 |
| Series 2022, 5% 5/1/47 | | 1,500,000 | 1,654,275 |
| Warren Consolidated School District: | | | |
| Series 2016: | | | |
| 5% 5/1/34 | | 5,630,000 | 6,146,254 |
| 5% 5/1/35 | | 1,250,000 | 1,362,712 |
| Series 2017: | | | |
| 4% 5/1/24 (Assured Guaranty Muni. Corp. Insured) | | 750,000 | 773,793 |
| 4% 5/1/25 (Assured Guaranty Muni. Corp. Insured) | | 500,000 | 521,319 |
| Series 2018: | | | |
| 5% 5/1/30 | | 550,000 | 607,998 |
| 5% 5/1/32 | | 1,100,000 | 1,208,013 |
| 5% 5/1/34 | | 1,175,000 | 1,281,095 |
| 5% 5/1/35 | | 1,200,000 | 1,302,338 |
| 5% 5/1/36 | | 1,000,000 | 1,081,123 |
| 5% 5/1/37 | | 1,300,000 | 1,402,809 |
| 5% 5/1/38 | | 800,000 | 861,777 |
| Wayne County Arpt. Auth. Rev.: | | | |
| Series 2012 B, 5% 12/1/32 (a) | | 1,500,000 | 1,512,894 |
| Series 2014 C: | | | |
| 5% 12/1/29 (a) | | 720,000 | 751,726 |
| 5% 12/1/31 (a) | | 860,000 | 894,976 |
| 5% 12/1/34 (a) | | 1,655,000 | 1,713,257 |
| Series 2015 D, 5% 12/1/40 (Assured Guaranty Muni. Corp. Insured) | | 8,165,000 | 8,499,045 |
| Series 2015 G: | | | |
| 5% 12/1/35 | | 5,435,000 | 5,682,173 |
| 5% 12/1/36 | | 5,760,000 | 6,016,625 |
| Series 2017 A: | | | |
| 5% 12/1/37 | | 545,000 | 575,129 |
| 5% 12/1/42 | | 1,455,000 | 1,533,138 |
| Series 2017 B, 5% 12/1/47 (a) | | 450,000 | 464,844 |
| Series 2018 B, 5% 12/1/48 (a) | | 5,000,000 | 5,188,078 |
| Series 2018 D: | | | |
| 5% 12/1/30 (a) | | 4,365,000 | 4,733,821 |
| 5% 12/1/31 (a) | | 2,825,000 | 3,051,387 |
| 5% 12/1/32 (a) | | 2,945,000 | 3,162,752 |
| Series 2021 A: | | | |
| 5% 12/1/36 | | 1,000,000 | 1,096,842 |
| 5% 12/1/37 | | 1,500,000 | 1,640,381 |
| 5% 12/1/38 | | 1,250,000 | 1,363,463 |
| 5% 12/1/39 | | 1,500,000 | 1,632,718 |
| Series 2021 B: | | | |
| 5% 12/1/35 (a) | | 1,225,000 | 1,326,303 |
| 5% 12/1/37 (a) | | 1,520,000 | 1,633,623 |
| 5% 12/1/46 (a) | | 1,280,000 | 1,344,086 |
| Wayne State Univ. Revs. Series 2019 A: | | | |
| 4% 11/15/38 | | 1,000,000 | 979,879 |
| 4% 11/15/39 | | 800,000 | 776,696 |
| Western Michigan Univ. Rev.: | | | |
| Series 2014: | | | |
| 5% 11/15/25 | | 320,000 | 339,775 |
| 5% 11/15/26 | | 400,000 | 424,339 |
| 5% 11/15/28 | | 650,000 | 687,090 |
| 5% 11/15/29 | | 750,000 | 792,088 |
| 5% 11/15/30 | | 855,000 | 901,772 |
| 5% 11/15/31 | | 700,000 | 736,648 |
| Series 2015 A: | | | |
| 5% 11/15/26 | | 1,000,000 | 1,071,675 |
| 5% 11/15/28 | | 2,505,000 | 2,669,506 |
| Series 2019 A, 5% 11/15/44 | | 2,000,000 | 2,190,583 |
| Series 2021 A: | | | |
| 5% 11/15/27 (Assured Guaranty Muni. Corp. Insured) | | 300,000 | 336,277 |
| 5% 11/15/30 (Assured Guaranty Muni. Corp. Insured) | | 200,000 | 230,627 |
| 5% 11/15/31 (Assured Guaranty Muni. Corp. Insured) | | 150,000 | 172,737 |
| 5% 11/15/32 (Assured Guaranty Muni. Corp. Insured) | | 300,000 | 344,101 |
| 5% 11/15/34 (Assured Guaranty Muni. Corp. Insured) | | 400,000 | 456,162 |
| 5% 11/15/36 (Assured Guaranty Muni. Corp. Insured) | | 400,000 | 453,643 |
| 5% 11/15/38 (Assured Guaranty Muni. Corp. Insured) | | 625,000 | 705,492 |
| 5% 11/15/40 (Assured Guaranty Muni. Corp. Insured) | | 635,000 | 712,713 |
| 5% 11/15/41 (Assured Guaranty Muni. Corp. Insured) | | 345,000 | 386,486 |
| 5% 11/15/51 (Assured Guaranty Muni. Corp. Insured) | | 5,000,000 | 5,520,145 |
| 5% 11/15/53 (Assured Guaranty Muni. Corp. Insured) | | 4,100,000 | 4,515,885 |
| Ypsilanti School District Series A: | | | |
| 5% 5/1/29 | | 1,305,000 | 1,426,660 |
| 5% 5/1/30 | | 1,550,000 | 1,692,722 |
| 5% 5/1/32 | | 2,000,000 | 2,183,394 |
| Zeeland Pub. Schools Series A, 5% 5/1/27 | | 1,000,000 | 1,071,732 |
|
| TOTAL MICHIGAN | | | 560,461,578 |
|
| Puerto Rico - 1.0% | | | |
| Puerto Rico Commonwealth Pub. Impt. Gen. Oblig. Series 2021 A1: | | | |
| 0% 7/1/33 | | 1,643,730 | 923,258 |
| 5.625% 7/1/27 | | 195,000 | 207,434 |
| 5.625% 7/1/29 | | 595,000 | 638,886 |
| 5.75% 7/1/31 | | 1,410,000 | 1,539,811 |
| Puerto Rico Hsg. Fin. Auth. Series 2020, 5% 12/1/27 | | 1,340,000 | 1,474,442 |
| Puerto Rico Indl., Tourist, Edl., Med. And Envir. Cont. Facilities Fing. Auth. Series 2021: | | | |
| 4% 7/1/36 | | 195,000 | 180,039 |
| 5% 7/1/30 | | 485,000 | 535,469 |
| 5% 7/1/32 | | 360,000 | 395,521 |
|
| TOTAL PUERTO RICO | | | 5,894,860 |
|
| TOTAL MUNICIPAL BONDS | | | |
| (Cost $598,869,999) | | | 568,418,427 |
| TOTAL INVESTMENT IN SECURITIES - 98.3% | | | |
| (Cost $598,869,999) | | | 568,418,427 |
| NET OTHER ASSETS (LIABILITIES) - 1.7% | | | 9,917,358 |
| NET ASSETS - 100% | | | $578,335,785 |
Legend
(a) Private activity obligations whose interest is subject to the federal alternative minimum tax for individuals.
(b) Security or a portion of the security purchased on a delayed delivery or when-issued basis.
(c) Coupon rates for floating and adjustable rate securities reflect the rates in effect at period end.
Investment Valuation
The following is a summary of the inputs used, as of June 30, 2022, involving the Fund's assets and liabilities carried at fair value. The inputs or methodology used for valuing securities may not be an indication of the risk associated with investing in those securities. For more information on valuation inputs, and their aggregation into the levels used below, please refer to the Investment Valuation section in the accompanying Notes to Financial Statements.
| | Valuation Inputs at Reporting Date: |
| Description | Total | Level 1 | Level 2 | Level 3 |
| Investments in Securities: | | | | |
| Municipal Securities | $568,418,427 | $-- | $568,418,427 | $-- |
| Total Investments in Securities: | $568,418,427 | $-- | $568,418,427 | $-- |
Other Information
The distribution of municipal securities by revenue source, as a percentage of total Net Assets, is as follows (Unaudited):
| General Obligations | 24.2% |
| Health Care | 23.8% |
| Education | 13.5% |
| Water & Sewer | 10.1% |
| Transportation | 10.0% |
| Special Tax | 5.9% |
| Others* (Individually Less Than 5%) | 12.5% |
| | 100.0% |
* Includes net other assets
See accompanying notes which are an integral part of the financial statements.
Fidelity® Michigan Municipal Income Fund
Financial Statements
Statement of Assets and Liabilities
| | | June 30, 2022 (Unaudited) |
| Assets | | |
Investment in securities, at value — See accompanying schedule:
Unaffiliated issuers (cost $598,869,999) | | $568,418,427 |
| Cash | | 8,906,800 |
| Receivable for fund shares sold | | 493,275 |
| Interest receivable | | 5,960,158 |
| Other receivables | | 1,420 |
| Total assets | | 583,780,080 |
| Liabilities | | |
| Payable for investments purchased on a delayed delivery basis | $3,739,835 | |
| Payable for fund shares redeemed | 1,129,440 | |
| Distributions payable | 318,708 | |
| Accrued management fee | 169,144 | |
| Other affiliated payables | 63,683 | |
| Other payables and accrued expenses | 23,485 | |
| Total liabilities | | 5,444,295 |
| Net Assets | | $578,335,785 |
| Net Assets consist of: | | |
| Paid in capital | | $609,864,360 |
| Total accumulated earnings (loss) | | (31,528,575) |
| Net Assets | | $578,335,785 |
| Net Asset Value, offering price and redemption price per share ($578,335,785 ÷ 50,934,652 shares) | | $11.35 |
See accompanying notes which are an integral part of the financial statements.
Statement of Operations
| | | Six months ended June 30, 2022 (Unaudited) |
| Investment Income | | |
| Interest | | $8,561,500 |
| Expenses | | |
| Management fee | $1,122,176 | |
| Transfer agent fees | 336,802 | |
| Accounting fees and expenses | 76,152 | |
| Custodian fees and expenses | 4,978 | |
| Independent trustees' fees and expenses | 1,016 | |
| Registration fees | 19,196 | |
| Audit | 24,488 | |
| Legal | 8,250 | |
| Miscellaneous | 1,315 | |
| Total expenses before reductions | 1,594,373 | |
| Expense reductions | (10,607) | |
| Total expenses after reductions | | 1,583,766 |
| Net investment income (loss) | | 6,977,734 |
| Realized and Unrealized Gain (Loss) | | |
| Net realized gain (loss) on: | | |
| Investment securities: | | |
| Unaffiliated issuers | | (1,068,098) |
| Total net realized gain (loss) | | (1,068,098) |
| Change in net unrealized appreciation (depreciation) on investment securities | | (69,442,325) |
| Net gain (loss) | | (70,510,423) |
| Net increase (decrease) in net assets resulting from operations | | $(63,532,689) |
See accompanying notes which are an integral part of the financial statements.
Statement of Changes in Net Assets
| | Six months ended June 30, 2022 (Unaudited) | Year ended December 31, 2021 |
| Increase (Decrease) in Net Assets | | |
| Operations | | |
| Net investment income (loss) | $6,977,734 | $15,137,759 |
| Net realized gain (loss) | (1,068,098) | 4,360,076 |
| Change in net unrealized appreciation (depreciation) | (69,442,325) | (8,677,684) |
| Net increase (decrease) in net assets resulting from operations | (63,532,689) | 10,820,151 |
| Distributions to shareholders | (7,717,256) | (18,599,520) |
| Share transactions | | |
| Proceeds from sales of shares | 50,287,953 | 98,407,493 |
| Reinvestment of distributions | 5,407,418 | 12,950,242 |
| Cost of shares redeemed | (137,711,670) | (88,383,573) |
| Net increase (decrease) in net assets resulting from share transactions | (82,016,299) | 22,974,162 |
| Total increase (decrease) in net assets | (153,266,244) | 15,194,793 |
| Net Assets | | |
| Beginning of period | 731,602,029 | 716,407,236 |
| End of period | $578,335,785 | $731,602,029 |
| Other Information | | |
| Shares | | |
| Sold | 4,294,523 | 7,722,513 |
| Issued in reinvestment of distributions | 456,951 | 1,018,827 |
| Redeemed | (11,704,183) | (6,946,787) |
| Net increase (decrease) | (6,952,709) | 1,794,553 |
See accompanying notes which are an integral part of the financial statements.
Financial Highlights
Fidelity Michigan Municipal Income Fund
| | Six months ended (Unaudited) June 30, | Years endedDecember 31, | | | | |
| | 2022 | 2021 | 2020 | 2019 | 2018 | 2017 |
| Selected Per–Share Data | | | | | | |
| Net asset value, beginning of period | $12.64 | $12.77 | $12.47 | $11.97 | $12.22 | $11.94 |
| Income from Investment Operations | | | | | | |
| Net investment income (loss)A,B | .128 | .265 | .283 | .309 | .319 | .333 |
| Net realized and unrealized gain (loss) | (1.277) | (.070) | .347 | .541 | (.216) | .324 |
| Total from investment operations | (1.149) | .195 | .630 | .850 | .103 | .657 |
| Distributions from net investment income | (.128) | (.265) | (.284) | (.310) | (.318) | (.333) |
| Distributions from net realized gain | (.013) | (.060) | (.046) | (.040) | (.035) | (.044) |
| Total distributions | (.141) | (.325) | (.330) | (.350) | (.353) | (.377) |
| Net asset value, end of period | $11.35 | $12.64 | $12.77 | $12.47 | $11.97 | $12.22 |
| Total ReturnC,D | (9.13)% | 1.54% | 5.11% | 7.16% | .90% | 5.57% |
| Ratios to Average Net AssetsB,E,F | | | | | | |
| Expenses before reductions | .50%G | .48% | .48% | .48% | .49% | .49% |
| Expenses net of fee waivers, if any | .50%G | .48% | .48% | .48% | .48% | .48% |
| Expenses net of all reductions | .49%G | .48% | .48% | .48% | .48% | .48% |
| Net investment income (loss) | 2.18%G | 2.08% | 2.25% | 2.50% | 2.67% | 2.74% |
| Supplemental Data | | | | | | |
| Net assets, end of period (000 omitted) | $578,336 | $731,602 | $716,407 | $673,051 | $597,684 | $680,383 |
| Portfolio turnover rateH | 8%G | 13% | 13% | 14% | 22% | 12% |
A Calculated based on average shares outstanding during the period.
B Net investment income (loss) is affected by the timing of the declaration of dividends by any underlying mutual funds or exchange-traded funds (ETFs). Net investment income (loss) of any such underlying funds is not included in the Fund's net investment income (loss) ratio.
C Total returns for periods of less than one year are not annualized.
D Total returns would have been lower if certain expenses had not been reduced during the applicable periods shown.
E Fees and expenses of any underlying mutual funds or exchange-traded funds (ETFs) are not included in the Fund's expense ratio. The Fund indirectly bears its proportionate share of these expenses.
F Expense ratios reflect operating expenses of the class. Expenses before reductions do not reflect amounts reimbursed, waived, or reduced through arrangements with the investment adviser, brokerage services, or other offset arrangements, if applicable, and do not represent the amount paid by the class during periods when reimbursements, waivers or reductions occur.
G Annualized
H Amount does not include the portfolio activity of any underlying mutual funds or exchange-traded funds (ETFs).
See accompanying notes which are an integral part of the financial statements.
Fidelity® Michigan Municipal Money Market Fund
Investment Summary/Performance (Unaudited)
Effective Maturity Diversification
| Days | % of fund's investments 6/30/22 |
| 1 - 7 | 91.2 |
| 31 - 60 | 2.5 |
| 91 - 180 | 0.4 |
| > 180 | 5.9 |
Effective maturity is determined in accordance with the requirements of Rule 2a-7 under the Investment Company Act of 1940.
Asset Allocation (% of fund's net assets)
| As of June 30, 2022 |
| | Variable Rate Demand Notes (VRDNs) | 36.8% |
| | Tender Option Bond | 39.8% |
| | Other Municipal Security | 9.9% |
| | Investment Companies | 13.5% |
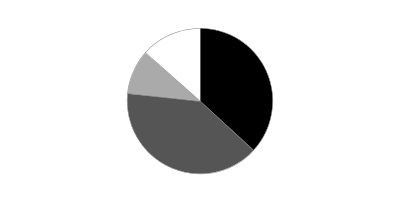
Current 7-Day Yields
| | 6/30/22 |
| Fidelity® Michigan Municipal Money Market Fund | 0.46% |
Yield refers to the income paid by the Fund over a given period. Yield for money market funds is usually for seven-day periods, as it is here, though it is expressed as an annual percentage rate. Past performance is no guarantee of future results. Yield will vary and it's possible to lose money investing in the Fund.
Fidelity® Michigan Municipal Money Market Fund
Schedule of Investments June 30, 2022 (Unaudited)
Showing Percentage of Net Assets
| Variable Rate Demand Note - 36.8% | | | |
| | | Principal Amount | Value |
| Alabama - 0.7% | | | |
| Decatur Indl. Dev. Board Exempt Facilities Rev. (Nucor Steel Decatur LLC Proj.) Series 2003 A, 1.19% 7/7/22, VRDN (a)(b) | | $1,100,000 | $1,100,000 |
| West Jefferson Indl. Dev. Series 2008, 1.1% 7/7/22, VRDN (b) | | 200,000 | 200,000 |
| | | | 1,300,000 |
| Kansas - 0.3% | | | |
| Burlington Envir. Impt. Rev. (Kansas City Pwr. and Lt. Co. Proj.): | | | |
| Series 2007 A, 1.05% 7/7/22, VRDN (b) | | 400,000 | 400,000 |
| Series 2007 B, 1.05% 7/7/22, VRDN (b) | | 100,000 | 100,000 |
| | | | 500,000 |
| Michigan - 35.0% | | | |
| Central Michigan Univ. Rev. Series 2008 A, 0.91% 7/7/22, LOC TD Banknorth, NA, VRDN (b) | | 2,000,000 | 2,000,000 |
| Grand Valley Michigan State Univ. Rev. Series 2008 B, 0.91% 7/7/22, LOC TD Banknorth, NA, VRDN (b) | | 2,150,000 | 2,150,000 |
| Kent Hosp. Fin. Auth. Hosp. Facilities Rev. (Spectrum Health Sys. Proj.) Series 2008 B3, 0.95% 7/7/22 (Liquidity Facility Wells Fargo Bank NA), VRDN (b) | | 400,000 | 400,000 |
| Lakeview School District Calhoun County Series B, 0.91% 7/7/22 (Michigan Gen. Oblig. Guaranteed), LOC TD Banknorth, NA, VRDN (b) | | 2,605,000 | 2,605,000 |
| Michigan Fin. Auth. Rev.: | | | |
| (Hosp. Proj.) Series 2016 E2, 0.96% 7/7/22, VRDN (b) | | 1,970,000 | 1,970,000 |
| Series 2016 E3, 0.85% 7/7/22, VRDN (b) | | 400,000 | 400,000 |
| Michigan Hsg. Dev. Auth. Rental Hsg. Rev.: | | | |
| Series 2002 A, 0.97% 7/7/22, LOC Bank of America NA, VRDN (a)(b) | | 4,500,000 | 4,500,000 |
| Series 2008 A, 0.93% 7/7/22, LOC Barclays Bank PLC, VRDN (a)(b) | | 4,495,000 | 4,495,000 |
| Series 2018 C, 0.98% 7/7/22, LOC Bank of America NA, VRDN (a)(b) | | 10,315,000 | 10,315,000 |
| Michigan State Univ. Revs. Series 2000 A: | | | |
| 0.93% 7/7/22 (Liquidity Facility Northern Trust Co.), VRDN (b) | | 3,005,000 | 3,005,000 |
| 0.93% 7/7/22 (Liquidity Facility PNC Bank NA), VRDN (b) | | 2,125,000 | 2,125,000 |
| Michigan Strategic Fund Ltd. Oblig. Rev.: | | | |
| (Henry Ford Museum & Greenfield Village Proj.) Series 2002, 0.7% 7/1/22, LOC Comerica Bank, VRDN (b) | | 3,240,000 | 3,240,000 |
| (The Kroger Co. Recovery Zone Facilities Bond Proj.) Series 2010, 0.95% 7/7/22, LOC Bank of Nova Scotia, VRDN (b) | | 10,660,000 | 10,660,000 |
| FHLMC Livonia Econ. Dev. Corp. (Madonna Univ. Proj.) Series 2009, 0.93% 7/7/22, LOC Fed. Home Ln. Bank Chicago, VRDN (b) | | 17,465,000 | 17,465,000 |
| | | | 65,330,000 |
| Nebraska - 0.8% | | | |
| Stanton County Indl. Dev. Rev.: | | | |
| (Nucor Corp. Proj.) Series 1996, 1.19% 7/7/22, VRDN (a)(b) | | 500,000 | 500,000 |
| Series 1998, 1.19% 7/7/22, VRDN (a)(b) | | 1,000,000 | 1,000,000 |
| | | | 1,500,000 |
| TOTAL VARIABLE RATE DEMAND NOTE | | | |
| (Cost $68,630,000) | | | 68,630,000 |
|
| Tender Option Bond - 39.8% | | | |
| Colorado - 0.0% | | | |
| Denver City & County Arpt. Rev. Bonds Series G-114, 1.16%, tender 12/1/22 (Liquidity Facility Royal Bank of Canada) (a)(b)(c)(d)(e) | | 100,000 | 100,000 |
| Connecticut - 0.3% | | | |
| Connecticut Gen. Oblig. Participating VRDN Series Floaters 016, 1.03% 8/11/22 (Liquidity Facility Barclays Bank PLC) (b)(c)(e) | | 400,000 | 400,000 |
| Connecticut Spl. Tax Oblig. Trans. Infrastructure Rev. Bonds Series Floaters G 110, 1.09%, tender 10/3/22 (Liquidity Facility Royal Bank of Canada) (b)(c)(d)(e) | | 200,000 | 200,000 |
| | | | 600,000 |
| Florida - 0.4% | | | |
| Greater Orlando Aviation Auth. Arpt. Facilities Rev. Bonds Series Floaters G 25, 1.16%, tender 10/3/22 (Liquidity Facility Royal Bank of Canada) (a)(b)(c)(d)(e) | | 100,000 | 100,000 |
| Miami-Dade County Wtr. & Swr. Rev. Participating VRDN Series 2021 XF 11 01, 0.97% 7/7/22 (Liquidity Facility Deutsche Bank AG New York Branch) (b)(c)(e) | | 700,000 | 700,000 |
| | | | 800,000 |
| Kentucky - 0.0% | | | |
| Kentucky State Property & Buildings Commission Rev. Bonds Series G 116, 1.11%, tender 11/1/22 (Liquidity Facility Royal Bank of Canada) (b)(c)(d)(e) | | 100,000 | 100,000 |
| Maryland - 0.0% | | | |
| Baltimore Proj. Rev. Bonds Series Floaters G 28, 1.11%, tender 1/3/23 (Liquidity Facility Royal Bank of Canada) (b)(c)(d)(e) | | 100,000 | 100,000 |
| Michigan - 38.6% | | | |
| Clarkston Cmnty. Schools Participating VRDN Series Floaters G72, 0.94% 7/7/22 (Liquidity Facility Royal Bank of Canada) (b)(c)(e) | | 2,695,000 | 2,695,000 |
| Detroit Downtown Dev. Auth. Tax Participating VRDN Series Floaters XX 11 01, 0.95% 7/7/22 (Liquidity Facility Barclays Bank PLC) (b)(c)(e) | | 8,000,000 | 8,000,000 |
| Eastern Michigan Univ. Revs. Participating VRDN Series Floaters 009, 0.95% 7/7/22 (Liquidity Facility Barclays Bank PLC) (b)(c)(e) | | 9,300,000 | 9,300,000 |
| Grand Rapids San. Swr. Sys. Rev. Participating VRDN Series Floaters XF 26 12, 0.94% 7/7/22 (Liquidity Facility Citibank NA) (b)(c)(e) | | 4,000,000 | 4,000,000 |
| Grand Traverse County Hosp. Fin. Auth. Participating VRDN Series 2021 XG 03 19, 0.99% 7/7/22 (Liquidity Facility Barclays Bank PLC) (b)(c)(e) | | 2,100,000 | 2,100,000 |
| Mclaren Health Care Corp. Participating VRDN Series XL 02 71, 1.01% 7/7/22 (Liquidity Facility Bank of America NA) (b)(c)(e) | | 1,900,000 | 1,900,000 |
| Michigan Bldg. Auth. Rev. Participating VRDN: | | | |
| Series 2021 XF 11 15, 0.97% 7/7/22 (Liquidity Facility Deutsche Bank AG New York Branch) (b)(c)(e) | | 5,385,000 | 5,385,000 |
| Series Floaters XF 26 09, 0.94% 7/7/22 (Liquidity Facility Citibank NA) (b)(c)(e) | | 800,000 | 800,000 |
| Series Floaters XM 04 65, 0.94% 7/7/22 (Liquidity Facility Morgan Stanley Bank, West Valley City Utah) (b)(c)(e) | | 700,000 | 700,000 |
| Series Floaters XM 07 43, 0.94% 7/7/22 (Liquidity Facility Wells Fargo Bank NA) (b)(c)(e) | | 500,000 | 500,000 |
| Michigan Fin. Auth. Rev. Participating VRDN: | | | |
| Series 15 XF0126, 0.94% 7/7/22 (Liquidity Facility JPMorgan Chase Bank) (b)(c)(e) | | 2,360,000 | 2,360,000 |
| Series Floaters ZF 07 84, 1.01% 7/7/22 (Liquidity Facility JPMorgan Chase Bank) (b)(c)(e) | | 2,000,000 | 2,000,000 |
| Series Floaters ZF 07 90, 1.01% 7/7/22 (Liquidity Facility JPMorgan Chase Bank) (b)(c)(e) | | 2,100,000 | 2,100,000 |
| Series Floaters ZF 07 96, 1.01% 7/7/22 (Liquidity Facility JPMorgan Chase Bank) (b)(c)(e) | | 2,100,000 | 2,100,000 |
| Series Floaters ZF 28 25, 0.99% 7/7/22 (Liquidity Facility Barclays Bank PLC) (b)(c)(e) | | 2,500,000 | 2,500,000 |
| Series XF 28 61, 0.94% 7/7/22 (Liquidity Facility Morgan Stanley Bank, West Valley City Utah) (b)(c)(e) | | 800,000 | 800,000 |
| Series XM 02 23, 0.95% 7/7/22 (Liquidity Facility Toronto-Dominion Bank) (b)(c)(e) | | 4,800,000 | 4,800,000 |
| Series XM 04 72, 0.94% 7/7/22 (Liquidity Facility Citibank NA) (b)(c)(e) | | 1,450,000 | 1,450,000 |
| Michigan Hsg. Dev. Auth. Single Family Mtg. Rev. Participating VRDN Series YZ 11 94, 0.94% 7/7/22 (Liquidity Facility Barclays Bank PLC) (b)(c)(e) | | 1,800,000 | 1,800,000 |
| Michigan State Univ. Revs. Participating VRDN Series Floaters ZF 07 50, 0.96% 7/7/22 (Liquidity Facility Bank of America NA) (b)(c)(e) | | 1,915,000 | 1,915,000 |
| Monroe Mich Pub. Schools Participating VRDN Series XL 01 46, 1.03% 7/7/22 (Liquidity Facility JPMorgan Chase Bank) (b)(c)(e) | | 2,200,000 | 2,200,000 |
| Trenton Pub. Schools School District Participating VRDN Series Floaters CTFS G 102, 0.94% 7/7/22 (Liquidity Facility Royal Bank of Canada) (b)(c)(e) | | 3,100,000 | 3,100,000 |
| Univ. of Michigan Rev. Participating VRDN: | | | |
| Series 15 XF2199, 0.94% 7/7/22 (Liquidity Facility Morgan Stanley Bank, West Valley City Utah) (b)(c)(e) | | 2,589,000 | 2,589,000 |
| Series 15 XF2205, 0.96% 7/7/22 (Liquidity Facility Toronto-Dominion Bank) (b)(c)(e) | | 2,400,000 | 2,400,000 |
| Series Floaters XF 25 48, 0.96% 7/7/22 (Liquidity Facility Toronto-Dominion Bank) (b)(c)(e) | | 500,000 | 500,000 |
| Series Floaters ZF 05 90, 0.96% 7/7/22 (Liquidity Facility Toronto-Dominion Bank) (b)(c)(e) | | 4,100,000 | 4,100,000 |
| | | | 72,094,000 |
| New York - 0.1% | | | |
| New York City Gen. Oblig. Participating VRDN Series 2020 003, 1.06% 8/11/22 (Liquidity Facility Wells Fargo Bank NA) (b)(c)(e) | | 100,000 | 100,000 |
| Ohio - 0.1% | | | |
| Ohio Univ. Gen. Receipts Athens Bonds Series Floaters G 27, 1.11%, tender 12/1/22 (Liquidity Facility Royal Bank of Canada) (b)(c)(d)(e) | | 100,000 | 100,000 |
| South Carolina - 0.1% | | | |
| South Carolina Trans. Infrastructure Bank Rev. Bonds Series Floaters G 109, 1.11%, tender 10/3/22 (Liquidity Facility Royal Bank of Canada) (b)(c)(d)(e) | | 100,000 | 100,000 |
| Tennessee - 0.1% | | | |
| Metropolitan Nashville Arpt. Auth. Rev. Participating VRDN Series 2021 XL 01 89, 0.98% 7/7/22 (Liquidity Facility Deutsche Bank AG New York Branch) (a)(b)(c)(e) | | 100,000 | 100,000 |
| Virginia - 0.1% | | | |
| Suffolk Econ. Dev. Auth. Hosp. Facilities Rev. Participating VRDN Series MIZ 90 25, 1% 7/7/22 (Liquidity Facility Mizuho Cap. Markets LLC) (b)(c)(e) | | 100,000 | 100,000 |
| Virginia Pub. Bldg. Auth. Pub. Facilities Rev. Bonds Series Floaters G 40, 1.11%, tender 2/1/23 (Liquidity Facility Royal Bank of Canada) (b)(c)(d)(e) | | 100,000 | 100,000 |
| | | | 200,000 |
| TOTAL TENDER OPTION BOND | | | |
| (Cost $74,394,000) | | | 74,394,000 |
|
| Other Municipal Security - 9.9% | | | |
| Michigan - 9.9% | | | |
| Detroit Swr. Disp. Rev. Bonds Series 2012 A, 5.25% | | 1,160,000 | 1,160,000 |
| Kent Hosp. Fin. Auth. Hosp. Facilities Rev. Bonds (Spectrum Health Sys. Proj.) Series 2015 A, SIFMA Municipal Swap Index + 0.250% 1.16%, tender 1/24/23 (b)(f) | | 8,915,000 | 8,915,000 |
| Michigan Bldg. Auth. Rev. Series 2022 8, 1.3% 8/25/22, LOC State Street Bank & Trust Co., Boston, LOC U.S. Bank NA, Cincinnati, CP | | 1,900,000 | 1,900,000 |
| Michigan Fin. Auth. Rev. Bonds Series 2014 C2, 5% (a) | | 2,220,000 | 2,220,000 |
| Michigan Hosp. Fin. Auth. Rev. Bonds (Ascension Health Cr. Group Proj.) Series F5, 2.4%, tender 3/15/23 (b) | | 2,000,000 | 2,007,777 |
| Michigan State Univ. Revs. Bonds Series 2019 C, 5% 8/15/22 | | 2,230,000 | 2,239,776 |
| TOTAL OTHER MUNICIPAL SECURITY | | | |
| (Cost $18,442,553) | | | 18,442,553 |
| | | Shares | Value |
|
| Investment Company - 13.5% | | | |
| Fidelity Municipal Cash Central Fund 0.88%(g)(h) | | | |
| (Cost $25,223,727) | | 25,219,375 | 25,223,727 |
| TOTAL INVESTMENT IN SECURITIES - 100.0% | | | |
| (Cost $186,690,280) | | | 186,690,280 |
| NET OTHER ASSETS (LIABILITIES) - 0.0% | | | (26,268) |
| NET ASSETS - 100% | | | $186,664,012 |
Security Type Abbreviations
CP – COMMERCIAL PAPER
VRDN – VARIABLE RATE DEMAND NOTE (A debt instrument that is payable upon demand, either daily, weekly or monthly)
The date shown for securities represents the date when principal payments must be paid, taking into account any call options exercised by the issuer and any permissible maturity shortening features other than interest rate resets.
Legend
(a) Private activity obligations whose interest is subject to the federal alternative minimum tax for individuals.
(b) Coupon rates for floating and adjustable rate securities reflect the rates in effect at period end.
(c) Provides evidence of ownership in one or more underlying municipal bonds.
(d) Restricted securities (including private placements) - Investment in securities not registered under the Securities Act of 1933 (excluding 144A issues). At the end of the period, the value of restricted securities (excluding 144A issues) amounted to $900,000 or 0.5% of net assets.
(e) Coupon rates are determined by re-marketing agents based on current market conditions.
(f) Coupon is indexed to a floating interest rate which may be multiplied by a specified factor and/or subject to caps or floors.
(g) Information in this report regarding holdings by state and security types does not reflect the holdings of the Fidelity Municipal Cash Central Fund.
(h) Affiliated fund that is generally available only to investment companies and other accounts managed by Fidelity Investments. The rate quoted is the annualized seven-day yield of the fund at period end. A complete unaudited listing of the fund's holdings as of its most recent quarter end is available upon request. In addition, each Fidelity Central Fund's financial statements are available on the SEC's website or upon request.
Additional information on each restricted holding is as follows:
| Security | Acquisition Date | Acquisition Cost |
| Baltimore Proj. Rev. Bonds Series Floaters G 28, 1.11%, tender 1/3/23 (Liquidity Facility Royal Bank of Canada) | 7/1/21 | $100,000 |
| Connecticut Spl. Tax Oblig. Trans. Infrastructure Rev. Bonds Series Floaters G 110, 1.09%, tender 10/3/22 (Liquidity Facility Royal Bank of Canada) | 4/1/21 | $200,000 |
| Denver City & County Arpt. Rev. Bonds Series G-114, 1.16%, tender 12/1/22 (Liquidity Facility Royal Bank of Canada) | 6/1/21 | $100,000 |
| Greater Orlando Aviation Auth. Arpt. Facilities Rev. Bonds Series Floaters G 25, 1.16%, tender 10/3/22 (Liquidity Facility Royal Bank of Canada) | 4/1/21 | $100,000 |
| Kentucky State Property & Buildings Commission Rev. Bonds Series G 116, 1.11%, tender 11/1/22 (Liquidity Facility Royal Bank of Canada) | 5/3/21 | $100,000 |
| Ohio Univ. Gen. Receipts Athens Bonds Series Floaters G 27, 1.11%, tender 12/1/22 (Liquidity Facility Royal Bank of Canada) | 6/1/21 | $100,000 |
| South Carolina Trans. Infrastructure Bank Rev. Bonds Series Floaters G 109, 1.11%, tender 10/3/22 (Liquidity Facility Royal Bank of Canada) | 4/1/21 | $100,000 |
| Virginia Pub. Bldg. Auth. Pub. Facilities Rev. Bonds Series Floaters G 40, 1.11%, tender 2/1/23 (Liquidity Facility Royal Bank of Canada) | 2/1/21 | $100,000 |
Affiliated Central Funds
Fiscal year to date information regarding the Fund's investments in Fidelity Central Funds, including the ownership percentage, is presented below.
| Fund | Value, beginning of period | Purchases | Sales Proceeds | Dividend Income | Realized Gain/Loss | Change in Unrealized appreciation (depreciation) | Value, end of period | % ownership, end of period |
| Fidelity Municipal Cash Central Fund 0.88% | $21,013,810 | $48,996,999 | $44,788,000 | $36,402 | $918 | $-- | $25,223,727 | 1.7% |
| Total | $21,013,810 | $48,996,999 | $44,788,000 | $36,402 | $918 | $-- | $25,223,727 | |
Amounts in the income column in the above table include any capital gain distributions from underlying funds, which are presented in the corresponding line-item in the Statement of Operations, if applicable.
Investment Valuation
All investments are categorized as Level 2 under the Fair Value Hierarchy. The inputs or methodology used for valuing securities may not be an indication of the risk associated with investing in those securities. For more information on valuation inputs please refer to the Investment Valuation section in the accompanying Notes to Financial Statements.
| | Valuation Inputs at Reporting Date: |
| Description | Total | Level 1 | Level 2 | Level 3 |
| Investments in Securities: | | | | |
| Variable Rate Demand Note | $68,630,000 | $-- | $68,630,000 | $-- |
| Tender Option Bond | 74,394,000 | -- | 74,394,000 | -- |
| Other Municipal Security | 18,442,553 | -- | 18,442,553 | -- |
| Investment Company | 25,223,727 | 25,223,727 | -- | -- |
| Total Investments in Securities: | $186,690,280 | $25,223,727 | $161,466,553 | $-- |
See accompanying notes which are an integral part of the financial statements.
Fidelity® Michigan Municipal Money Market Fund
Financial Statements
Statement of Assets and Liabilities
| | | June 30, 2022 (Unaudited) |
| Assets | | |
Investment in securities, at value — See accompanying schedule:
Unaffiliated issuers (cost $161,466,553) | $161,466,553 | |
| Fidelity Central Funds (cost $25,223,727) | 25,223,727 | |
| Total Investment in Securities (cost $186,690,280) | | $186,690,280 |
| Receivable for fund shares sold | | 159,356 |
| Interest receivable | | 330,671 |
| Distributions receivable from Fidelity Central Funds | | 16,592 |
| Receivable from investment adviser for expense reductions | | 10 |
| Other receivables | | 15 |
| Total assets | | 187,196,924 |
| Liabilities | | |
| Payable to custodian bank | $401,089 | |
| Payable for fund shares redeemed | 28,261 | |
| Distributions payable | 5,291 | |
| Accrued management fee | 54,571 | |
| Other affiliated payables | 27,061 | |
| Other payables and accrued expenses | 16,639 | |
| Total liabilities | | 532,912 |
| Net Assets | | $186,664,012 |
| Net Assets consist of: | | |
| Paid in capital | | $186,682,978 |
| Total accumulated earnings (loss) | | (18,966) |
| Net Assets | | $186,664,012 |
| Net Asset Value, offering price and redemption price per share ($186,664,012 ÷ 186,382,810 shares) | | $1.00 |
See accompanying notes which are an integral part of the financial statements.
Statement of Operations
| | | Six months ended June 30, 2022 (Unaudited) |
| Investment Income | | |
| Interest | | $417,021 |
| Income from Fidelity Central Funds | | 36,402 |
| Total income | | 453,423 |
| Expenses | | |
| Management fee | $338,988 | |
| Transfer agent fees | 153,793 | |
| Accounting fees and expenses | 15,225 | |
| Custodian fees and expenses | 1,271 | |
| Independent trustees' fees and expenses | 299 | |
| Registration fees | 15,954 | |
| Audit | 17,615 | |
| Legal | 2,301 | |
| Miscellaneous | 213 | |
| Total expenses before reductions | 545,659 | |
| Expense reductions | (184,720) | |
| Total expenses after reductions | | 360,939 |
| Net investment income (loss) | | 92,484 |
| Realized and Unrealized Gain (Loss) | | |
| Net realized gain (loss) on: | | |
| Investment securities: | | |
| Unaffiliated issuers | (18,293) | |
| Fidelity Central Funds | 918 | |
| Total net realized gain (loss) | | (17,375) |
| Net increase in net assets resulting from operations | | $75,109 |
See accompanying notes which are an integral part of the financial statements.
Statement of Changes in Net Assets
| | Six months ended June 30, 2022 (Unaudited) | Year ended December 31, 2021 |
| Increase (Decrease) in Net Assets | | |
| Operations | | |
| Net investment income (loss) | $92,484 | $21,052 |
| Net realized gain (loss) | (17,375) | 23,323 |
| Net increase in net assets resulting from operations | 75,109 | 44,375 |
| Distributions to shareholders | (92,357) | (105,307) |
| Share transactions | | |
| Proceeds from sales of shares | 10,016,495 | 25,122,420 |
| Reinvestment of distributions | 82,605 | 99,870 |
| Cost of shares redeemed | (24,770,263) | (38,896,191) |
| Net increase (decrease) in net assets and shares resulting from share transactions | (14,671,163) | (13,673,901) |
| Total increase (decrease) in net assets | (14,688,411) | (13,734,833) |
| Net Assets | | |
| Beginning of period | 201,352,423 | 215,087,256 |
| End of period | $186,664,012 | $201,352,423 |
| Other Information | | |
| Shares | | |
| Sold | 10,016,495 | 25,122,420 |
| Issued in reinvestment of distributions | 82,605 | 99,870 |
| Redeemed | (24,770,263) | (38,896,191) |
| Net increase (decrease) | (14,671,163) | (13,673,901) |
See accompanying notes which are an integral part of the financial statements.
Financial Highlights
Fidelity Michigan Municipal Money Market Fund
| | Six months ended (Unaudited) June 30, | Years endedDecember 31, | | | | |
| | 2022 | 2021 | 2020 | 2019 | 2018 | 2017 |
| Selected Per–Share Data | | | | | | |
| Net asset value, beginning of period | $1.00 | $1.00 | $1.00 | $1.00 | $1.00 | $1.00 |
| Income from Investment Operations | | | | | | |
| Net investment income (loss)A | –B | –B | .003 | .010 | .009 | .004 |
| Net realized and unrealized gain (loss) | –B | –B | –B | –B | .001 | –B |
| Total from investment operations | –B | –B | .003 | .010 | .010 | .004 |
| Distributions from net investment income | –B | –B | (.003) | (.010) | (.009) | (.004) |
| Distributions from net realized gain | – | –B | –B | –B | (.001) | –B |
| Total distributions | –B | –B | (.003) | (.010) | (.010) | (.004) |
| Net asset value, end of period | $1.00 | $1.00 | $1.00 | $1.00 | $1.00 | $1.00 |
| Total ReturnC,D | .05% | .05% | .34% | .98% | 1.01% | .37% |
| Ratios to Average Net AssetsA,E,F | | | | | | |
| Expenses before reductions | .56%G | .55% | .55% | .55% | .55% | .53% |
| Expenses net of fee waivers, if any | .37%G | .09% | .32% | .55% | .55% | .53% |
| Expenses net of all reductions | .37%G | .09% | .32% | .55% | .55% | .53% |
| Net investment income (loss) | .10%G | .01% | .34% | .98% | .90% | .35% |
| Supplemental Data | | | | | | |
| Net assets, end of period (000 omitted) | $186,664 | $201,352 | $215,087 | $253,138 | $310,652 | $420,820 |
A Net investment income (loss) is affected by the timing of the declaration of dividends by any underlying mutual funds or exchange-traded funds (ETFs). Net investment income (loss) of any such underlying funds is not included in the Fund's net investment income (loss) ratio.
B Amount represents less than $.0005 per share.
C Total returns for periods of less than one year are not annualized.
D Total returns would have been lower if certain expenses had not been reduced during the applicable periods shown.
E Fees and expenses of any underlying mutual funds or exchange-traded funds (ETFs) are not included in the Fund's expense ratio. The Fund indirectly bears its proportionate share of these expenses. For additional expense information related to investments in Fidelity Central Funds, please refer to the "Investments in Fidelity Central Funds" note found in the Notes to Financial Statements section of the most recent Annual or Semi-Annual report.
F Expense ratios reflect operating expenses of the class. Expenses before reductions do not reflect amounts reimbursed, waived, or reduced through arrangements with the investment adviser, brokerage services, or other offset arrangements, if applicable, and do not represent the amount paid by the class during periods when reimbursements, waivers or reductions occur.
G Annualized
See accompanying notes which are an integral part of the financial statements.
Notes to Financial Statements (Unaudited)
For the period ended June 30, 2022
1. Organization.
Fidelity Michigan Municipal Income Fund (the Income Fund) is a fund of Fidelity Municipal Trust. Fidelity Michigan Municipal Money Market Fund (the Money Market Fund) is a fund of Fidelity Municipal Trust II. Each Trust is registered under the Investment Company Act of 1940, as amended (the 1940 Act), as an open-end management investment company. Fidelity Municipal Trust and Fidelity Municipal Trust II (the Trusts) are organized as a Massachusetts business trust and a Delaware statutory trust, respectively. The Income Fund is a non-diversified fund. Each Fund is authorized to issue an unlimited number of shares. Shares of the Money Market Fund are only available for purchase by retail shareholders. Share transactions on the Statement of Changes in Net Assets may contain exchanges between affiliated funds. Each Fund may be affected by economic and political developments in the state of Michigan.
Effective after the close of business on July 15, 2022, Fidelity Michigan Municipal Money Market Fund was closed to new accounts with certain exceptions.
2. Investments in Fidelity Central Funds.
Funds may invest in Fidelity Central Funds, which are open-end investment companies generally available only to other investment companies and accounts managed by the investment adviser and its affiliates. The Schedule of Investments lists any Fidelity Central Funds held as an investment as of period end, but does not include the underlying holdings of each Fidelity Central Fund. An investing fund indirectly bears its proportionate share of the expenses of the underlying Fidelity Central Funds.
Based on its investment objective, each Fidelity Central Fund may invest or participate in various investment vehicles or strategies that are similar to those of the investing fund. These strategies are consistent with the investment objectives of the investing fund and may involve certain economic risks which may cause a decline in value of each of the Fidelity Central Funds and thus a decline in the value of the investing fund.
| Fidelity Central Fund | Investment Manager | Investment Objective | Investment Practices | Expense Ratio(a) |
| Fidelity Money Market Central Funds | Fidelity Management & Research Company LLC (FMR) | Each fund seeks to obtain a high level of current income consistent with the preservation of capital and liquidity. | Short-term Investments | Less than .005% |
(a) Expenses expressed as a percentage of average net assets and are as of each underlying Central Fund's most recent annual or semi-annual shareholder report.
A complete unaudited list of holdings for each Fidelity Central Fund is available upon request or at the Securities and Exchange Commission website at www.sec.gov. In addition, the financial statements of the Fidelity Central Funds which contain the significant accounting policies (including investment valuation policies) of those funds, and are not covered by the Report of Independent Registered Public Accounting Firm, are available on the Securities and Exchange Commission website or upon request.
3. Significant Accounting Policies.
Each Fund is an investment company and applies the accounting and reporting guidance of the Financial Accounting Standards Board (FASB) Accounting Standards Codification Topic 946 Financial Services - Investment Companies. The financial statements have been prepared in conformity with accounting principles generally accepted in the United States of America (GAAP), which require management to make certain estimates and assumptions at the date of the financial statements. Actual results could differ from those estimates. Subsequent events, if any, through the date that the financial statements were issued have been evaluated in the preparation of the financial statements. Each Fund's Schedule of Investments lists any underlying mutual funds or exchange-traded funds (ETFs) but does not include the underlying holdings of these funds. The following summarizes the significant accounting policies of each Fund:
Investment Valuation. Investments are valued as of 4:00 p.m. Eastern time on the last calendar day of the period. The Board of Trustees (the Board) has delegated the day to day responsibility for the valuation of the Income Fund's investments to the Fair Value Committee (the Committee) established by the Income Fund's investment adviser. In accordance with valuation policies and procedures approved by the Board, the Income Fund attempts to obtain prices from one or more third party pricing vendors or brokers to value its investments. When current market prices, quotations or currency exchange rates are not readily available or reliable, investments will be fair valued in good faith by the Committee, in accordance with procedures adopted by the Board. Factors used in determining fair value vary by investment type and may include market or investment specific events, changes in interest rates and credit quality. The frequency with which these procedures are used cannot be predicted and they may be utilized to a significant extent. The Committee oversees the Income Fund's valuation policies and procedures and reports to the Board on the Committee's activities and fair value determinations. The Board monitors the appropriateness of the procedures used in valuing the Income Fund's investments and ratifies the fair value determinations of the Committee.
Each Fund categorizes the inputs to valuation techniques used to value its investments into a disclosure hierarchy consisting of three levels as shown below:
- Level 1 – unadjusted quoted prices in active markets for identical investments
- Level 2 – other significant observable inputs (including quoted prices for similar investments, interest rates, prepayment speeds, etc.)
- Level 3 – unobservable inputs (including the Fund's own assumptions based on the best information available)
Valuation techniques used to value each Fund's investments by major category are as follows:
For the Income Fund, debt securities, including restricted securities, are valued based on evaluated prices received from third party pricing vendors or from brokers who make markets in such securities. Municipal securities are valued by pricing vendors who utilize matrix pricing which considers yield or price of bonds of comparable quality, coupon, maturity and type or by broker-supplied prices. When independent prices are unavailable or unreliable, debt securities may be valued utilizing pricing methodologies which consider similar factors that would be used by third party pricing vendors. Debt securities are generally categorized as Level 2 in the hierarchy but may be Level 3 depending on the circumstances.
For the Money Market Fund, as permitted by compliance with certain conditions under Rule 2a-7 of the 1940 Act, securities are valued at amortized cost, which approximates fair value. The amortized cost of an instrument is determined by valuing it at its original cost and thereafter amortizing any discount or premium from its face value at a constant rate until maturity. Securities held by a money market fund are generally high quality and liquid; however, they are reflected as Level 2 because the inputs used to determine fair value are not quoted prices in an active market.
For the Income Fund, changes in valuation techniques may result in transfers in or out of an assigned level within the disclosure hierarchy. The aggregate value of investments by input level as of June 30, 2022 is included at the end of each Fund's Schedule of Investments.
Investment Transactions and Income. For financial reporting purposes, the Funds' investment holdings and NAV include trades executed through the end of the last business day of the period. The NAV per share for processing shareholder transactions is calculated as of the close of business of the New York Stock Exchange (NYSE), normally 4:00 p.m. Eastern time and includes trades executed through the end of the prior business day for the Income Fund and trades executed through the end of the current business day for the Money Market Fund. Gains and losses on securities sold are determined on the basis of identified cost. Income and capital gain distributions from Fidelity Central Funds, if any, are recorded on the ex-dividend date. Interest income is accrued as earned and includes coupon interest and amortization of premium and accretion of discount on debt securities as applicable. Debt obligations may be placed on non-accrual status and related interest income may be reduced by ceasing current accruals and writing off interest receivables when the collection of all or a portion of interest has become doubtful based on consistently applied procedures. A debt obligation is removed from non-accrual status when the issuer resumes interest payments or when collectability of interest is reasonably assured.
Expenses. Expenses directly attributable to a fund are charged to that fund. Expenses attributable to more than one fund are allocated among the respective funds on the basis of relative net assets or other appropriate methods. Expenses included in the accompanying financial statements reflect the expenses of that fund and do not include any expenses associated with any underlying mutual funds or exchange-traded funds. Although not included in a fund's expenses, a fund indirectly bears its proportionate share of these expenses through the net asset value of each underlying mutual fund or exchange-traded fund. Expense estimates are accrued in the period to which they relate and adjustments are made when actual amounts are known.
Income Tax Information and Distributions to Shareholders. Each year, each Fund intends to qualify as a regulated investment company under Subchapter M of the Internal Revenue Code, including distributing substantially all of its taxable income and realized gains. As a result, no provision for U.S. Federal income taxes is required. Each Fund files a U.S. federal tax return, in addition to state and local tax returns as required. Each Fund's federal income tax returns are subject to examination by the Internal Revenue Service (IRS) for a period of three fiscal years after they are filed. State and local tax returns may be subject to examination for an additional fiscal year depending on the jurisdiction.
Distributions are declared and recorded daily and paid monthly from net investment income. Distributions from realized gains, if any, are declared and recorded on the ex-dividend date. Income and capital gain distributions are determined in accordance with income tax regulations, which may differ from GAAP.
Capital accounts within the financial statements are adjusted for permanent book-tax differences. These adjustments have no impact on net assets or the results of operations. Capital accounts are not adjusted for temporary book-tax differences which will reverse in a subsequent period.
Book-tax differences are primarily due to the short-term gain distributions from the Fidelity Central Funds.
The Funds purchase municipal securities whose interest, in the opinion of the issuer, is free from federal income tax. There is no assurance that the IRS will agree with this opinion. In the event the IRS determines that the issuer does not comply with relevant tax requirements, interest payments from a security could become federally taxable, possibly retroactively to the date the security was issued.
As of period end, the cost and unrealized appreciation (depreciation) in securities, and derivatives if applicable, for federal income tax purposes were as follows for each Fund:
| | Tax cost | Gross unrealized appreciation | Gross unrealized depreciation | Net unrealized appreciation (depreciation) |
| Fidelity Michigan Municipal Income Fund | $598,869,915 | $2,302,889 | $(32,754,377) | $(30,451,488) |
| Fidelity Michigan Municipal Money Market Fund | 186,690,280 | – | – | – |
Delayed Delivery Transactions and When-Issued Securities. During the period, certain Funds transacted in securities on a delayed delivery or when-issued basis. Payment and delivery may take place after the customary settlement period for that security. The price of the underlying securities and the date when the securities will be delivered and paid for are fixed at the time the transaction is negotiated. Securities purchased on a delayed delivery or when-issued basis are identified as such in the Schedule of Investments. Compensation for interest forgone in the purchase of a delayed delivery or when-issued debt security may be received. With respect to purchase commitments, each applicable Fund identifies securities as segregated in its records with a value at least equal to the amount of the commitment. Payables and receivables associated with the purchases and sales of delayed delivery securities having the same coupon, settlement date and broker are offset. Delayed delivery or when-issued securities that have been purchased from and sold to different brokers are reflected as both payables and receivables in the Statement of Assets and Liabilities under the caption "Delayed delivery", as applicable. Losses may arise due to changes in the value of the underlying securities or if the counterparty does not perform under the contract's terms, or if the issuer does not issue the securities due to political, economic, or other factors.
Restricted Securities (including Private Placements). Funds may invest in securities that are subject to legal or contractual restrictions on resale. These securities generally may be resold in transactions exempt from registration or to the public if the securities are registered. Disposal of these securities may involve time-consuming negotiations and expense, and prompt sale at an acceptable price may be difficult. Information regarding restricted securities held at period end is included at the end of the Schedule of Investments, if applicable.
4. Purchases and Sales of Investments.
Purchases and sales of securities, other than short-term securities and in-kind transactions, as applicable, are noted in the table below.
| | Purchases ($) | Sales ($) |
| Fidelity Michigan Municipal Income Fund | 25,397,437 | 100,661,608 |
5. Fees and Other Transactions with Affiliates.
Management Fee. Fidelity Management & Research Company LLC (the investment adviser) and its affiliates provide the Funds with investment management related services for which the Funds pay a monthly management fee. The management fee is the sum of an individual fund fee rate and an annualized group fee rate. The individual fund fee rate is applied to each Fund's average net assets. The group fee rate is based upon the monthly average net assets of a group of registered investment companies with which the investment adviser has management contracts. The group fee rate decreases as assets under management increase and increases as assets under management decrease. For the reporting period, each Fund's annualized management fee rate expressed as a percentage of each Fund's average net assets was as follows:
| | Individual Rate | Group Rate | Total |
| Fidelity Michigan Municipal Income Fund | .25% | .10% | .35% |
| Fidelity Michigan Municipal Money Market Fund | .25% | .10% | .35% |
During the period, the investment advisor or its affiliates waived a portion of these fees for the Money Market Fund.
Transfer Agent Fees. Fidelity Investments Institutional Operations Company LLC (FIIOC), an affiliate of the investment adviser, is the transfer, dividend disbursing and shareholder servicing agent for the Funds. FIIOC receives account fees and asset-based fees that vary according to account size and type of account. FIIOC pays for typesetting, printing and mailing of shareholder reports, except proxy statements. For the period, the transfer agent fees were equivalent to the following annualized rates expressed as a percentage of average net assets:
| Fidelity Michigan Municipal Income Fund | .11% |
| Fidelity Michigan Municipal Money Market Fund | .16% |
During the period, the investment advisor or its affiliates waived a portion of these fees for the Money Market Fund.
Accounting Fees. Fidelity Service Company, Inc. (FSC), an affiliate of the investment adviser, maintains each Fund's accounting records. The accounting fee is based on the level of average net assets for each month. For the period, the fees were equivalent to the following annualized rates:
| | % of Average Net Assets |
| Fidelity Michigan Municipal Income Fund | .02 |
| Fidelity Michigan Municipal Money Market Fund | .02 |
Interfund Trades. Funds may purchase from or sell securities to other Fidelity Funds under procedures adopted by the Board. The procedures have been designed to ensure these interfund trades are executed in accordance with Rule 17a-7 of the 1940 Act. For the Income Fund, any interfund trades are included within the respective purchases and sales amounts shown in the Purchases and Sales of Investments note. Interfund trades during the period are noted in the table below.
| | Purchases ($) | Sales ($) | Realized Gain (Loss) ($) |
| Fidelity Michigan Municipal Income Fund | – | – | – |
| Fidelity Michigan Municipal Money Market Fund | 3,220,000 | 4,900,000 | – |
6. Committed Line of Credit.
Certain Funds participate with other funds managed by the investment adviser or an affiliate in a $4.25 billion credit facility (the "line of credit") to be utilized for temporary or emergency purposes to fund shareholder redemptions or for other short-term liquidity purposes. The participating funds have agreed to pay commitment fees on their pro-rata portion of the line of credit, which are reflected in Miscellaneous expenses on the Statement of Operations, and are listed below. During the period, there were no borrowings on this line of credit.
| | Amount |
| Fidelity Michigan Municipal Income Fund | $588 |
7. Expense Reductions.
The investment adviser voluntarily agreed to reimburse expenses of Michigan Municipal Money Market Fund to the extent annual operating expenses exceeded certain levels of average net assets as noted in the table below. Some expenses, for example the compensation of the independent Trustees, and certain miscellaneous expenses such as proxy and shareholder meeting expenses, are excluded from this reimbursement.
Michigan Municipal Money Market Fund was in reimbursement during the period:
| | Expense Limitations | Reimbursement |
| Fidelity Michigan Municipal Money Market Fund | .55% | $13,007 |
Additionally, the investment adviser or its affiliates voluntarily agreed to waive certain fees for the Money Market Fund in order to avoid a negative yield. Such arrangements may be discontinued by the investment adviser at any time. For the period, the amount of the waiver was $170,048.
Through arrangements with each applicable Fund's custodian, credits realized as a result of certain uninvested cash balances were used to reduce each applicable Fund's expenses. All of the applicable expense reductions are noted in the table below.
| | Custodian credits |
| Fidelity Michigan Municipal Income Fund | $4,978 |
| Fidelity Michigan Municipal Money Market Fund | 60 |
In addition, during the period the investment adviser or an affiliate reimbursed and/or waived a portion of operating expenses as follows:
| | Amount |
| Fidelity Michigan Municipal Income Fund | $5,629 |
| Fidelity Michigan Municipal Money Market Fund | 1,605 |
8. Other.
A fund's organizational documents provide former and current trustees and officers with a limited indemnification against liabilities arising in connection with the performance of their duties to the fund. In the normal course of business, a fund may also enter into contracts that provide general indemnifications. A fund's maximum exposure under these arrangements is unknown as this would be dependent on future claims that may be made against a fund. The risk of material loss from such claims is considered remote.
9. Coronavirus (COVID-19) Pandemic.
An outbreak of COVID-19 first detected in China during December 2019 has since spread globally and was declared a pandemic by the World Health Organization during March 2020. Developments that disrupt global economies and financial markets, such as the COVID-19 pandemic, may magnify factors that affect the Funds' performance.
10. Proposed Reorganization.
The Board of Trustees of Fidelity Michigan Municipal Money Market Fund approved an Agreement and Plan of Reorganization (the Agreement) between Fidelity Michigan Municipal Money Market Fund and Fidelity Municipal Money Market Fund. The Agreement provides for the transfer of all the assets and the assumption of all the liabilities of Fidelity Michigan Municipal Money Market Fund in exchange for shares of Fidelity Municipal Money Market Fund equal in value to the net assets of Fidelity Michigan Municipal Money Market Fund on the day the reorganization is effective.
A meeting of shareholders of Fidelity Michigan Municipal Money Market Fund is expected to be held during the fourth quarter of 2022 to vote on the reorganization. If approved by shareholders, the reorganization is expected to become effective on December 2, 2022. The reorganization is expected to qualify as a tax-free transaction for federal income tax purposes with no gain or loss recognized by the funds or their shareholders.
Shareholder Expense Example
As a shareholder, you incur two types of costs: (1) transaction costs, which may include sales charges (loads) on purchase payments or redemption proceeds, as applicable and (2) ongoing costs, which generally include management fees, distribution and/or service (12b-1) fees and other Fund expenses. This Example is intended to help you understand your ongoing costs (in dollars) of investing in a fund and to compare these costs with the ongoing costs of investing in other mutual funds.
The Example is based on an investment of $1,000 invested at the beginning of the period and held for the entire period (January 1, 2022 to June 30, 2022).
Actual Expenses
The first line of the accompanying table provides information about actual account values and actual expenses. You may use the information in this line, together with the amount you invested, to estimate the expenses that you paid over the period. Simply divide your account value by $1,000.00 (for example, an $8,600 account value divided by $1,000.00 = 8.6), then multiply the result by the number in the first line for a class/Fund under the heading entitled "Expenses Paid During Period" to estimate the expenses you paid on your account during this period. If any fund is a shareholder of any underlying mutual funds or exchange-traded funds (ETFs) (the Underlying Funds), such fund indirectly bears its proportional share of the expenses of the Underlying Funds in addition to the direct expenses incurred presented in the table. These fees and expenses are not included in the annualized expense ratio used to calculate the expense estimate in the table below.
Hypothetical Example for Comparison Purposes
The second line of the accompanying table provides information about hypothetical account values and hypothetical expenses based on the actual expense ratio and an assumed rate of return of 5% per year before expenses, which is not the actual return. The hypothetical account values and expenses may not be used to estimate the actual ending account balance or expenses you paid for the period. You may use this information to compare the ongoing costs of investing in the Fund and other funds. To do so, compare this 5% hypothetical example with the 5% hypothetical examples that appear in the shareholder reports of the other funds. If any fund is a shareholder of any Underlying Funds, such fund indirectly bears its proportional share of the expenses of the Underlying Funds in addition to the direct expenses as presented in the table. These fees and expenses are not included in the annualized expense ratio used to calculate the expense estimate in the table below.
Please note that the expenses shown in the table are meant to highlight your ongoing costs only and do not reflect any transaction costs. Therefore, the second line of the table is useful in comparing ongoing costs only, and will not help you determine the relative total costs of owning different funds. In addition, if these transactional costs were included, your costs would have been higher.
| | Annualized Expense Ratio-A | Beginning
Account Value
January 1, 2022 | Ending
Account Value
June 30, 2022 | Expenses Paid
During Period-B
January 1, 2022
to June 30, 2022 |
| Fidelity Michigan Municipal Income Fund | .50% | | | |
| Actual | | $1,000.00 | $908.70 | $2.37 |
| Hypothetical-C | | $1,000.00 | $1,022.32 | $2.51 |
| Fidelity Michigan Municipal Money Market Fund | .37% | | | |
| Actual | | $1,000.00 | $1,000.50 | $1.84-D |
| Hypothetical-C | | $1,000.00 | $1,022.96 | $1.86-D |
A Annualized expense ratio reflects expenses net of applicable fee waivers.
B Expenses are equal to the annualized expense ratio, multiplied by the average account value over the period, multiplied by 181/ 365 (to reflect the one-half year period). The fees and expenses of any Underlying Funds are not included in each annualized expense ratio.
C 5% return per year before expenses
D If certain fees were not voluntarily waived by the investment adviser or its affiliates during the period, the annualized expense ratio and the expenses paid in the actual and hypothetical examples above would have been as shown in the table below.
| | Annualized Expense Ratio-(a)
| Expenses Paid
|
| Fidelity Michigan Municipal Money Market Fund | .55% | |
| Actual | | $2.73 |
| Hypothetical-(b) | | $2.76 |
| | | |
(a) Annualized expense ratio reflects expenses net of applicable fee waivers.
(b) 5% return per year before expenses
Liquidity Risk Management Program
The Securities and Exchange Commission adopted Rule 22e-4 under the Investment Company Act of 1940 (the Liquidity Rule) to promote effective liquidity risk management throughout the open-end investment company industry, thereby reducing the risk that funds will be unable to meet their redemption obligations and mitigating dilution of the interests of fund shareholders.
The Michigan Municipal Income Fund (the Income Fund) has adopted and implemented a liquidity risk management program pursuant to the Liquidity Rule (the Program) effective December 1, 2018. The Program is reasonably designed to assess and manage the Income Fund’s liquidity risk and to comply with the requirements of the Liquidity Rule. The Income Fund’s Board of Trustees (the Board) has designated the Income Fund’s investment adviser as administrator of the Program. The Fidelity advisers have established a Liquidity Risk Management Committee (the LRM Committee) to manage the Program for each of the Fidelity Funds. The LRM Committee monitors the adequacy and effectiveness of implementation of the Program and on a periodic basis assesses each Fund’s liquidity risk based on a variety of factors including (1) the Fund’s investment strategy, (2) portfolio liquidity and cash flow projections during normal and reasonably foreseeable stressed conditions, (3) shareholder redemptions, (4) borrowings and other funding sources and (5) in the case of exchange-traded funds, certain additional factors including the effect of the Fund’s prices and spreads, market participants, and basket compositions on the overall liquidity of the Fund’s portfolio, as applicable.
In accordance with the Program, each of the Fund’s portfolio investments is classified into one of four liquidity categories described below based on a determination of a reasonable expectation for how long it would take to convert the investment to cash (or sell or dispose of the investment) without significantly changing its market value.
- Highly liquid investments – cash or convertible to cash within three business days or less
- Moderately liquid investments – convertible to cash in three to seven calendar days
- Less liquid investments – can be sold or disposed of, but not settled, within seven calendar days
- Illiquid investments – cannot be sold or disposed of within seven calendar days
Liquidity classification determinations take into account a variety of factors including various market, trading and investment-specific considerations, as well as market depth, and generally utilize analysis from a third-party liquidity metrics service.
The Liquidity Rule places a 15% limit on a fund’s illiquid investments and requires funds that do not primarily hold assets that are highly liquid investments to determine and maintain a minimum percentage of the fund’s net assets to be invested in highly liquid investments (highly liquid investment minimum or HLIM). The Program includes provisions reasonably designed to comply with the 15% limit on illiquid investments and for determining, periodically reviewing and complying with the HLIM requirement as applicable.
At a recent meeting of the Fund’s Board of Trustees, the LRM Committee provided a written report to the Board pertaining to the operation, adequacy, and effectiveness of implementation of the Program for the annual period from December 1, 2020 through November 30, 2021. The report concluded that the Program has been implemented and is operating effectively and is reasonably designed to assess and manage the Fund’s liquidity risk.
MIR-SANN-0822
1.705626.124
Fidelity® Minnesota Municipal Income Fund
Semi-Annual Report
June 30, 2022
Contents
To view a fund's proxy voting guidelines and proxy voting record for the 12-month period ended June 30, visit http://www.fidelity.com/proxyvotingresults or visit the Securities and Exchange Commission's (SEC) web site at http://www.sec.gov.
You may also call 1-800-544-8544 to request a free copy of the proxy voting guidelines.
Standard & Poor's, S&P and S&P 500 are registered service marks of The McGraw-Hill Companies, Inc. and have been licensed for use by Fidelity Distributors Corporation.
Other third-party marks appearing herein are the property of their respective owners.
All other marks appearing herein are registered or unregistered trademarks or service marks of FMR LLC or an affiliated company. © 2022 FMR LLC. All rights reserved.
This report and the financial statements contained herein are submitted for the general information of the shareholders of the Fund. This report is not authorized for distribution to prospective investors in the Fund unless preceded or accompanied by an effective prospectus.
A fund files its complete schedule of portfolio holdings with the SEC for the first and third quarters of each fiscal year on Form N-PORT. Forms N-PORT are available on the SEC’s web site at http://www.sec.gov. A fund's Forms N-PORT may be reviewed and copied at the SEC’s Public Reference Room in Washington, DC. Information regarding the operation of the SEC's Public Reference Room may be obtained by calling 1-800-SEC-0330.
For a complete list of a fund's portfolio holdings, view the most recent holdings listing, semiannual report, or annual report on Fidelity's web site at http://www.fidelity.com, http://www.institutional.fidelity.com, or http://www.401k.com, as applicable.
NOT FDIC INSURED •MAY LOSE VALUE •NO BANK GUARANTEE
Neither the Fund nor Fidelity Distributors Corporation is a bank.
Note to Shareholders:
Early in 2020, the outbreak and spread of COVID-19 emerged as a public health emergency that had a major influence on financial markets, primarily based on its impact on the global economy and corporate earnings. On March 11, 2020, the World Health Organization declared the COVID-19 outbreak a pandemic, citing sustained risk of further global spread. The pandemic prompted a number of measures to limit the spread of COVID-19, including travel and border restrictions, quarantines, and restrictions on large gatherings. In turn, these resulted in lower consumer activity, diminished demand for a wide range of products and services, disruption in manufacturing and supply chains, and – given the wide variability in outcomes regarding the outbreak – significant market uncertainty and volatility. To help stem the turmoil, the U.S. government took unprecedented action – in concert with the U.S. Federal Reserve and central banks around the world – to help support consumers, businesses, and the broader economy, and to limit disruption to the financial system.
In general, the overall impact of the pandemic lessened in 2021, amid a resilient economy and widespread distribution of three COVID-19 vaccines granted emergency use authorization from the U.S. Food and Drug Administration (FDA) early in the year. Still, the situation remains dynamic, and the extent and duration of its influence on financial markets and the economy is highly uncertain, due in part to a recent spike in cases based on highly contagious variants of the coronavirus.
Extreme events such as the COVID-19 crisis are exogenous shocks that can have significant adverse effects on mutual funds and their investments. Although multiple asset classes may be affected by market disruption, the duration and impact may not be the same for all types of assets. Fidelity is committed to helping you stay informed amid news about COVID-19 and during increased market volatility, and we continue to take extra steps to be responsive to customer needs. We encourage you to visit us online, where we offer ongoing updates, commentary, and analysis on the markets and our funds.
Investment Summary (Unaudited)
Top Five Sectors as of June 30, 2022
| | % of fund's net assets |
| General Obligations | 38.4 |
| Health Care | 23.4 |
| Education | 13.5 |
| Electric Utilities | 7.1 |
| Housing | 5.9 |
Quality Diversification (% of fund's net assets)
| As of June 30, 2022 |
| | AAA | 12.9% |
| | AA,A | 73.6% |
| | BBB | 9.1% |
| | BB and Below | 0.6% |
| | Not Rated | 1.4% |
| | Short-Term Investments and Net Other Assets | 2.4% |
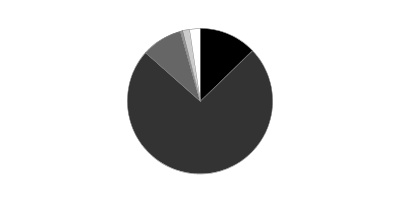
We have used ratings from Moody's Investors Service, Inc. Where Moody's® ratings are not available, we have used S&P® ratings. All ratings are as of the date indicated and do not reflect subsequent changes.
Schedule of Investments June 30, 2022 (Unaudited)
Showing Percentage of Net Assets
| Municipal Bonds - 97.6% | | | |
| | | Principal Amount | Value |
| Guam - 0.3% | | | |
| Guam Int'l. Arpt. Auth. Rev. Series 2013 C: | | | |
| 6.25% 10/1/34 (a) | | $515,000 | $533,097 |
| 6.25% 10/1/34 (Pre-Refunded to 10/1/23 @ 100) (a) | | 335,000 | 352,410 |
| Guam Pwr. Auth. Rev. Series 2022 A, 5% 10/1/44 (b) | | 1,000,000 | 1,020,116 |
|
| TOTAL GUAM | | | 1,905,623 |
|
| Minnesota - 96.3% | | | |
| Anoka-Hennepin Independent School District 11 Series 2014 A: | | | |
| 5% 2/1/24 | | 1,110,000 | 1,159,085 |
| 5% 2/1/25 | | 1,015,000 | 1,061,172 |
| 5% 2/1/26 | | 1,220,000 | 1,276,078 |
| 5% 2/1/27 | | 1,285,000 | 1,343,454 |
| 5% 2/1/28 | | 1,345,000 | 1,405,757 |
| 5% 2/1/29 | | 1,415,000 | 1,478,246 |
| 5% 2/1/34 | | 1,800,000 | 1,875,327 |
| Chaska Elec. Rev. Series 2015 A: | | | |
| 5% 10/1/26 | | 1,000,000 | 1,086,829 |
| 5% 10/1/29 | | 785,000 | 850,087 |
| Chaska Independent School District #112 Gen. Oblig. (Minnesota School District Cr. Enhancement Prog.) Series 2016 A: | | | |
| 5% 2/1/30 | | 1,400,000 | 1,532,281 |
| 5% 2/1/31 | | 3,600,000 | 3,938,855 |
| City of Virginia Series 2020 A: | | | |
| 4% 2/1/37 (Assured Guaranty Muni. Corp. Insured) | | 1,000,000 | 1,016,382 |
| 4% 2/1/39 (Assured Guaranty Muni. Corp. Insured) | | 1,000,000 | 1,012,505 |
| City of White Bear Lake (YMCA of Greater Twin Cities Proj.) Series 2018: | | | |
| 5% 6/1/25 | | 565,000 | 594,304 |
| 5% 6/1/26 | | 500,000 | 531,284 |
| 5% 6/1/28 | | 1,000,000 | 1,076,729 |
| 5% 6/1/30 | | 625,000 | 677,089 |
| 5% 6/1/31 | | 700,000 | 755,577 |
| 5% 6/1/33 | | 1,400,000 | 1,502,606 |
| Cloquet Independent School District #94 Series 2015 B: | | | |
| 5% 2/1/28 | | 3,030,000 | 3,226,647 |
| 5% 2/1/31 | | 1,245,000 | 1,322,594 |
| Ctr. City Health Care Facilities (Hazelden Betty Ford Foundation Proj.) Series 2014: | | | |
| 5% 11/1/23 | | 775,000 | 795,422 |
| 5% 11/1/25 | | 250,000 | 259,131 |
| 5% 11/1/26 | | 500,000 | 517,129 |
| 5% 11/1/27 | | 420,000 | 433,440 |
| Dawson-Boyd Independent School District Series 2019 A: | | | |
| 4% 2/1/33 | | 1,140,000 | 1,192,602 |
| 4% 2/1/36 | | 1,360,000 | 1,405,057 |
| 4% 2/1/37 | | 1,200,000 | 1,218,770 |
| Dilworth Gen. Oblig. Series 2022 A: | | | |
| 3.5% 2/1/34 | | 455,000 | 467,013 |
| 3.5% 2/1/35 | | 470,000 | 480,379 |
| 3.5% 2/1/36 | | 490,000 | 496,838 |
| 4% 2/1/38 | | 1,030,000 | 1,073,220 |
| 4% 2/1/40 | | 1,115,000 | 1,152,697 |
| 4% 2/1/42 | | 1,205,000 | 1,235,946 |
| Dilworth-Glyndon-Felton ISD No. 2164 Series 2020 A, 4% 2/1/34 | | 1,000,000 | 1,027,318 |
| Duluth Econ. Dev. Auth. Series 2021 A, 4% 7/1/41 | | 930,000 | 824,139 |
| Duluth Econ. Dev. Auth. Health Care Facilities Rev.: | | | |
| Series 2018 A: | | | |
| 5% 2/15/43 | | 1,500,000 | 1,553,161 |
| 5% 2/15/48 | | 3,000,000 | 3,091,397 |
| 5% 2/15/58 | | 3,125,000 | 3,197,015 |
| Series 2021 A: | | | |
| 4% 6/15/32 | | 535,000 | 520,731 |
| 4% 6/15/35 | | 550,000 | 522,749 |
| Series 2022 A: | | | |
| 4% 6/15/37 | | 1,140,000 | 1,069,987 |
| 4% 6/15/38 | | 400,000 | 372,765 |
| 4% 6/15/39 | | 250,000 | 231,496 |
| 5% 6/15/23 | | 300,000 | 307,763 |
| 5% 6/15/25 | | 565,000 | 594,432 |
| 5% 6/15/26 | | 360,000 | 382,814 |
| 5% 6/15/28 | | 935,000 | 1,006,872 |
| 5% 6/15/29 | | 775,000 | 837,490 |
| 5% 6/15/31 | | 905,000 | 979,370 |
| 5% 6/15/33 | | 1,170,000 | 1,252,056 |
| Series 2022 B: | | | |
| 5.25% 6/15/47 | | 2,500,000 | 2,576,374 |
| 5.25% 6/15/52 | | 1,250,000 | 1,281,176 |
| Duluth Independent School District #709 Ctfs. of Prtn. Series 2019 B: | | | |
| 5% 2/1/24 | | 400,000 | 418,069 |
| 5% 2/1/25 | | 375,000 | 400,209 |
| 5% 2/1/26 | | 395,000 | 429,769 |
| 5% 2/1/27 | | 370,000 | 408,310 |
| 5% 2/1/28 | | 350,000 | 390,418 |
| Elk River Independent School District #728: | | | |
| Series 2019 A, 3% 2/1/33 | | 2,925,000 | 2,872,198 |
| Series 2020 A, 4% 2/1/31 | | 2,120,000 | 2,248,680 |
| Forest Lake Series 2019 A, 4% 2/1/31 | | 1,790,000 | 1,915,171 |
| Hennepin County Gen. Oblig.: | | | |
| Series 2016 A: | | | |
| 5% 12/1/39 | | 5,250,000 | 5,782,450 |
| 5% 12/1/40 | | 7,200,000 | 7,923,907 |
| Series 2016 B, 5% 12/1/31 | | 1,155,000 | 1,274,674 |
| Series 2017 C, 5% 12/1/33 | | 3,075,000 | 3,389,562 |
| Series 2019 B, 5% 12/15/39 | | 3,725,000 | 4,142,770 |
| Series 2020 A, 5% 12/1/31 | | 4,765,000 | 5,542,101 |
| Series 2020 C, 5% 12/15/37 | | 2,500,000 | 2,808,896 |
| Itasca County (Minnesota County Cr. Enhancement Prog.) Series 2020 B, 4% 2/1/30 | | 1,520,000 | 1,636,724 |
| Maple Grove Health Care Sys. Rev.: | | | |
| Series 2015: | | | |
| 4% 9/1/35 | | 1,250,000 | 1,180,833 |
| 5% 9/1/25 | | 215,000 | 228,732 |
| 5% 9/1/28 | | 695,000 | 725,981 |
| 5% 9/1/30 | | 1,500,000 | 1,556,716 |
| 5% 9/1/31 | | 1,300,000 | 1,344,570 |
| 5% 9/1/32 | | 1,000,000 | 1,029,652 |
| Series 2017: | | | |
| 5% 5/1/26 | | 1,355,000 | 1,455,154 |
| 5% 5/1/27 | | 1,400,000 | 1,510,191 |
| 5% 5/1/28 | | 2,915,000 | 3,113,218 |
| 5% 5/1/29 | | 1,000,000 | 1,061,301 |
| 5% 5/1/30 | | 900,000 | 951,559 |
| 5% 5/1/31 | | 580,000 | 610,014 |
| 5% 5/1/32 | | 500,000 | 522,360 |
| Maple River Independent School District No. 2135 Series 2020 A, 4% 2/1/45 | | 2,750,000 | 2,782,452 |
| Metropolitan Council Gen. Oblig. Rev.: | | | |
| Series 2020 B, 5% 3/1/32 | | 4,500,000 | 5,180,602 |
| Series 2020 D: | | | |
| 5% 3/1/30 | | 1,295,000 | 1,502,985 |
| 5% 3/1/31 | | 1,355,000 | 1,588,117 |
| Series 2021 C, 5% 12/1/29 | | 2,000,000 | 2,316,418 |
| Minneapolis & Saint Paul Hsg. & Redev. Auth. Health Care Sys. Rev. (Allina Health Sys. Proj.) Series 2017 A, 5% 11/15/29 | | 1,040,000 | 1,141,765 |
| Minneapolis & Saint Paul Metropolitan Arpts. Commission Arpt. Rev.: | | | |
| Series 2014 A: | | | |
| 5% 1/1/26 | | 3,015,000 | 3,120,728 |
| 5% 1/1/28 | | 4,100,000 | 4,228,309 |
| 5% 1/1/29 | | 2,150,000 | 2,213,628 |
| 5% 1/1/30 | | 2,000,000 | 2,056,591 |
| 5% 1/1/31 | | 6,020,000 | 6,181,566 |
| Series 2016 A: | | | |
| 5% 1/1/30 | | 4,275,000 | 4,623,819 |
| 5% 1/1/31 | | 2,375,000 | 2,558,549 |
| 5% 1/1/32 | | 2,900,000 | 3,116,338 |
| Series 2016 C, 5% 1/1/46 | | 4,770,000 | 4,945,296 |
| Series 2016 D: | | | |
| 5% 1/1/27 (a) | | 350,000 | 378,773 |
| 5% 1/1/28 (a) | | 430,000 | 462,343 |
| 5% 1/1/29 (a) | | 225,000 | 240,320 |
| 5% 1/1/30 (a) | | 480,000 | 509,842 |
| 5% 1/1/31 (a) | | 200,000 | 211,335 |
| 5% 1/1/32 (a) | | 200,000 | 210,388 |
| 5% 1/1/33 (a) | | 220,000 | 230,456 |
| 5% 1/1/34 (a) | | 225,000 | 234,804 |
| 5% 1/1/35 (a) | | 225,000 | 234,504 |
| 5% 1/1/36 (a) | | 220,000 | 229,040 |
| 5% 1/1/37 (a) | | 250,000 | 259,799 |
| 5% 1/1/41 (a) | | 725,000 | 749,843 |
| Minneapolis Health Care Sys. Rev.: | | | |
| Series 2015 A: | | | |
| 5% 11/15/27 (Assured Guaranty Muni. Corp. Insured) | | 850,000 | 902,807 |
| 5% 11/15/28 | | 1,380,000 | 1,455,694 |
| 5% 11/15/29 | | 1,000,000 | 1,050,359 |
| 5% 11/15/30 | | 1,000,000 | 1,046,103 |
| 5% 11/15/31 | | 3,665,000 | 3,820,520 |
| 5% 11/15/32 | | 2,200,000 | 2,282,442 |
| Series 2018 A: | | | |
| 5% 11/15/34 | | 3,350,000 | 3,549,932 |
| 5% 11/15/35 | | 2,500,000 | 2,633,635 |
| 5% 11/15/36 | | 2,500,000 | 2,629,627 |
| 5% 11/15/49 | | 4,935,000 | 5,102,350 |
| Series 2021: | | | |
| 4% 11/15/36 | | 4,250,000 | 4,261,102 |
| 4% 11/15/40 | | 6,000,000 | 5,938,910 |
| Minneapolis Spl. School District: | | | |
| (Minnesota School District Cr. Enhancement Prog.): | | | |
| Series 2019 A, 5% 2/1/32 | | 1,125,000 | 1,268,507 |
| Series 2019 B, 5% 2/1/32 | | 1,815,000 | 2,046,525 |
| (MN SD Cr. Enhancement Prog.): | | | |
| Series 2018 A, 5% 2/1/33 | | 1,000,000 | 1,107,759 |
| Series 2018 B, 5% 2/1/33 | | 3,190,000 | 3,533,750 |
| Series 2017 A, 4% 2/1/33 | | 1,415,000 | 1,484,680 |
| Series 2017 B: | | | |
| 4% 2/1/33 | | 2,595,000 | 2,722,787 |
| 4% 2/1/34 | | 2,595,000 | 2,683,243 |
| Series 2020 B, 4% 2/1/36 | | 1,745,000 | 1,780,248 |
| Series 2020 C, 4% 2/1/38 | | 1,665,000 | 1,684,509 |
| Series 2021 B: | | | |
| 5% 2/1/41 | | 1,180,000 | 1,338,562 |
| 5% 2/1/42 | | 1,235,000 | 1,397,699 |
| Series 2021 C: | | | |
| 5% 2/1/40 | | 1,585,000 | 1,801,322 |
| 5% 2/1/41 | | 1,660,000 | 1,883,061 |
| 5% 2/1/42 | | 1,745,000 | 1,974,887 |
| Minneapolis Spl. School District #1 Ctfs. of Prtn. Series 2016 C, 5% 2/1/31 | | 1,915,000 | 2,097,488 |
| Minnesota Ctfs. Prtn. (Minnesota Gen. Oblig. Proj.) Series 2014, 5% 6/1/39 | | 2,445,000 | 2,572,547 |
| Minnesota Gen. Oblig.: | | | |
| Series 2015 A, 5% 8/1/33 | | 1,900,000 | 2,050,227 |
| Series 2017 A, 5% 10/1/33 | | 3,335,000 | 3,669,041 |
| Series 2018 B, 4% 8/1/35 | | 5,270,000 | 5,491,849 |
| Series 2019 A: | | | |
| 5% 8/1/31 | | 1,000,000 | 1,139,568 |
| 5% 8/1/35 | | 5,030,000 | 5,673,297 |
| Series 2020 A: | | | |
| 5% 8/1/35 | | 6,000,000 | 6,863,488 |
| 5% 8/1/37 | | 6,000,000 | 6,837,688 |
| 5% 8/1/40 | | 2,500,000 | 2,831,333 |
| Series 2021 A: | | | |
| 4% 9/1/39 | | 2,645,000 | 2,722,973 |
| 4% 9/1/41 | | 10,000,000 | 10,242,326 |
| Minnesota Higher Ed. Facilities Auth. Rev.: | | | |
| (Univ. of St Thomas) Series 2017 A, 5% 10/1/29 | | 760,000 | 823,963 |
| Series 2016 A, 5% 5/1/46 | | 3,610,000 | 3,516,571 |
| Series 2017 A, 4% 10/1/35 | | 800,000 | 783,460 |
| Series 2017: | | | |
| 5% 3/1/31 | | 1,000,000 | 1,091,615 |
| 5% 10/1/31 | | 590,000 | 636,129 |
| 5% 3/1/34 | | 530,000 | 574,827 |
| 5% 10/1/34 | | 440,000 | 468,158 |
| 5% 10/1/35 | | 555,000 | 588,373 |
| Series 2018 A: | | | |
| 5% 10/1/34 | | 1,155,000 | 1,233,536 |
| 5% 10/1/35 | | 500,000 | 532,885 |
| 5% 10/1/45 | | 3,650,000 | 3,823,120 |
| Series 2019: | | | |
| 3% 12/1/23 | | 100,000 | 100,462 |
| 4% 12/1/24 | | 100,000 | 102,254 |
| 4% 12/1/25 | | 180,000 | 184,756 |
| 4% 12/1/26 | | 190,000 | 195,164 |
| 4% 12/1/27 | | 195,000 | 199,988 |
| 4% 12/1/28 | | 240,000 | 245,220 |
| 4% 12/1/29 | | 285,000 | 290,225 |
| 4% 12/1/30 | | 200,000 | 202,107 |
| 4% 12/1/31 | | 450,000 | 452,340 |
| 4% 12/1/32 | | 690,000 | 690,742 |
| 4% 12/1/33 | | 750,000 | 748,023 |
| 4% 12/1/34 | | 225,000 | 223,452 |
| 4% 12/1/40 | | 4,100,000 | 3,970,414 |
| 5% 10/1/29 | | 400,000 | 442,381 |
| 5% 10/1/40 | | 1,000,000 | 1,061,027 |
| Series 2021: | | | |
| 3% 3/1/40 | | 365,000 | 311,031 |
| 3% 3/1/43 | | 325,000 | 263,935 |
| 4% 3/1/24 | | 205,000 | 211,673 |
| 4% 10/1/24 | | 440,000 | 453,997 |
| 4% 3/1/25 | | 175,000 | 182,690 |
| 4% 10/1/25 | | 585,000 | 607,559 |
| 4% 3/1/26 | | 100,000 | 105,558 |
| 4% 10/1/26 | | 600,000 | 627,398 |
| 4% 10/1/27 | | 410,000 | 429,877 |
| 4% 3/1/28 | | 125,000 | 133,724 |
| 4% 10/1/28 | | 675,000 | 704,460 |
| 4% 10/1/29 | | 460,000 | 478,778 |
| 4% 3/1/30 | | 150,000 | 161,183 |
| 4% 3/1/31 | | 125,000 | 134,639 |
| 4% 3/1/32 | | 140,000 | 149,042 |
| 4% 3/1/33 | | 240,000 | 253,544 |
| 4% 3/1/34 | | 150,000 | 156,842 |
| 4% 3/1/35 | | 125,000 | 129,927 |
| 4% 3/1/36 | | 125,000 | 129,202 |
| 4% 3/1/37 | | 100,000 | 102,675 |
| 4% 10/1/46 | | 1,000,000 | 977,863 |
| 4% 10/1/50 | | 1,000,000 | 972,687 |
| Series 2022 A: | | | |
| 5% 10/1/47 | | 1,000,000 | 1,043,229 |
| 5% 10/1/52 | | 1,000,000 | 1,038,969 |
| Series Eight-G, 5% 12/1/31 | | 1,000,000 | 1,068,792 |
| Series Eight-J: | | | |
| 5% 3/1/26 | | 1,015,000 | 1,085,603 |
| 5% 3/1/27 | | 500,000 | 533,712 |
| Series Eight-L: | | | |
| 5% 4/1/28 | | 920,000 | 988,154 |
| 5% 4/1/29 | | 1,005,000 | 1,077,557 |
| 5% 4/1/35 | | 500,000 | 527,643 |
| Minnesota Hsg. Fin. Agcy.: | | | |
| (Mtg. Backed Securities Pass Through Prog.) Series 2019 C, 3.15% 6/1/49 | | 857,962 | 837,710 |
| (Mtg.-Backed Securities Pass-Through Prog.) Series H, 2.47% 1/1/50 | | 1,978,718 | 1,894,159 |
| Series 2015 A: | | | |
| 5% 8/1/29 | | 1,000,000 | 1,055,029 |
| 5% 8/1/30 | | 1,000,000 | 1,053,156 |
| 5% 8/1/31 | | 1,000,000 | 1,051,910 |
| 5% 8/1/32 | | 1,000,000 | 1,050,665 |
| 5% 8/1/33 | | 1,000,000 | 1,049,837 |
| Series 2016 B, 3.5% 7/1/46 | | 3,240,000 | 3,252,564 |
| Series 2019 B, 4.25% 7/1/49 | | 3,390,000 | 3,461,656 |
| Series 2020 G, 3% 1/1/51 | | 1,365,000 | 1,342,109 |
| Series 2021 D, 3% 1/1/52 | | 1,920,000 | 1,874,609 |
| Series 2021 H, 3% 7/1/52 | | 1,245,000 | 1,212,125 |
| Series 2021, 3% 7/1/51 | | 3,810,000 | 3,731,136 |
| Series B: | | | |
| 3.5% 7/1/50 | | 8,745,000 | 8,746,512 |
| 4% 8/1/36 | | 2,000,000 | 1,988,000 |
| Series E, 3.5% 7/1/50 | | 4,415,000 | 4,410,093 |
| Series I, 3% 1/1/51 | | 4,745,000 | 4,650,186 |
| Minnesota Muni. Gas Agcy. Rev. Bonds Series 2022 A, 4%, tender 12/1/27 (c) | | 7,000,000 | 7,174,544 |
| Minnesota Muni. Pwr. Agcy. Elec. Rev.: | | | |
| Series 2014 A, 5% 10/1/26 | | 830,000 | 884,263 |
| Series 2014: | | | |
| 5% 10/1/26 | | 630,000 | 671,187 |
| 5% 10/1/27 | | 750,000 | 798,692 |
| 5% 10/1/30 | | 1,000,000 | 1,064,923 |
| Series 2016: | | | |
| 4% 10/1/41 | | 1,000,000 | 1,015,345 |
| 5% 10/1/32 | | 1,500,000 | 1,660,206 |
| 5% 10/1/33 | | 400,000 | 442,381 |
| 5% 10/1/35 | | 400,000 | 441,021 |
| 5% 10/1/36 | | 1,000,000 | 1,100,857 |
| 5% 10/1/47 | | 2,000,000 | 2,168,975 |
| Minnesota Pub. Facilities Auth. Rev. Series 2016 A: | | | |
| 5% 3/1/29 | | 5,000,000 | 5,431,754 |
| 5% 3/1/30 | | 5,150,000 | 5,577,827 |
| Minnesota State Colleges & Univs. Board of Trustees Rev. Series 2021 A, 5% 10/1/28 | | 5,875,000 | 6,659,737 |
| Minnesota State Gen. Fdg. Rev.: | | | |
| Series 2012 B, 5% 3/1/28 | | 4,275,000 | 4,309,508 |
| Series 2014 A: | | | |
| 5% 6/1/27 | | 5,000,000 | 5,145,792 |
| 5% 6/1/38 | | 5,000,000 | 5,135,276 |
| Moorhead Edl. Facilities Rev. (The Concordia College Corp. Proj.) Series 2016, 5% 12/1/25 | | 2,500,000 | 2,599,197 |
| Moorhead ISD No. 152 Series 2020 A, 4% 2/1/31 | | 2,015,000 | 2,137,306 |
| Nashwauk Keewatin Independent School District # 319 Gen. Oblig. Series 2022 A: | | | |
| 4% 2/1/35 | | 200,000 | 208,009 |
| 4% 2/1/36 | | 500,000 | 513,401 |
| North Branch Independent School District #138 Series 2017 A, 4% 2/1/29 | | 2,015,000 | 2,143,835 |
| North St Paul Maplewood Minn I (MN SD Cr. Enhancement Prog.) Series 2019 B, 4% 2/1/32 | | 3,120,000 | 3,297,740 |
| Northern Muni. Pwr. Agcy. Elec. Sys. Rev.: | | | |
| Series 2013 A: | | | |
| 5% 1/1/24 | | 650,000 | 659,636 |
| 5% 1/1/25 | | 975,000 | 990,934 |
| 5% 1/1/31 | | 1,740,000 | 1,767,149 |
| Series 2016: | | | |
| 5% 1/1/28 | | 500,000 | 544,243 |
| 5% 1/1/29 | | 920,000 | 999,476 |
| 5% 1/1/30 | | 520,000 | 564,739 |
| 5% 1/1/31 | | 350,000 | 379,991 |
| Series 2017: | | | |
| 5% 1/1/29 | | 460,000 | 503,560 |
| 5% 1/1/31 | | 400,000 | 434,931 |
| 5% 1/1/33 | | 475,000 | 514,677 |
| 5% 1/1/35 | | 520,000 | 561,480 |
| Ramsey County Gen. Oblig. Series 2021 A, 5% 2/1/30 | | 590,000 | 684,598 |
| Red Rock Central Independent School District Series 2022 A, 2.375% 2/1/45 | | 1,310,000 | 920,249 |
| Robbinsdale Independent School District 281 (MN SD Cr. Enhancement Prog.) Series 2019 B: | | | |
| 5% 2/1/29 | | 1,010,000 | 1,135,488 |
| 5% 2/1/30 | | 955,000 | 1,071,641 |
| Rochester Elec. Util. Rev. Series 2017 A: | | | |
| 5% 12/1/42 | | 1,100,000 | 1,205,310 |
| 5% 12/1/47 | | 1,000,000 | 1,087,925 |
| Rochester Health Care Facilities Rev.: | | | |
| Series 2016 B: | | | |
| 5% 11/15/31 | | 3,225,000 | 3,754,868 |
| 5% 11/15/35 | | 4,000,000 | 4,735,567 |
| Series 2018, 4% 11/15/48 | | 3,400,000 | 3,307,555 |
| Roseville Independent School District Series 2021 A: | | | |
| 5% 4/1/27 | | 850,000 | 923,871 |
| 5% 4/1/28 | | 1,100,000 | 1,205,180 |
| Roseville Independent School District #623: | | | |
| (Minnesota Gen. Oblig.) Series 2018 A, 5% 2/1/31 | | 5,050,000 | 5,535,784 |
| (MN School District Cr. Enhancement Prog.) Series 2018 A: | | | |
| 5% 2/1/26 | | 2,400,000 | 2,621,584 |
| 5% 2/1/29 | | 5,180,000 | 5,705,365 |
| Saint Cloud Health Care Rev.: | | | |
| Series 2016 A: | | | |
| 5% 5/1/29 | | 1,125,000 | 1,190,502 |
| 5% 5/1/30 | | 1,000,000 | 1,048,032 |
| 5% 5/1/31 | | 1,000,000 | 1,045,389 |
| 5% 5/1/46 | | 5,000,000 | 5,119,145 |
| Series 2019, 5% 5/1/48 | | 6,000,000 | 6,202,405 |
| Saint Paul Gen. Oblig. Series 2021 C, 4% 5/1/31 | | 1,590,000 | 1,732,045 |
| Saint Paul Port Auth. District Series 2021 1: | | | |
| 3% 10/1/26 | | 100,000 | 100,670 |
| 3% 10/1/34 | | 275,000 | 250,045 |
| 4% 10/1/28 | | 500,000 | 528,744 |
| 4% 10/1/41 | | 500,000 | 504,326 |
| Saint Paul Sales Tax Rev. Series 2014 G: | | | |
| 5% 11/1/26 | | 1,000,000 | 1,063,503 |
| 5% 11/1/28 | | 1,000,000 | 1,062,567 |
| Shakopee Health Care Facilities Rev. Series 2014: | | | |
| 5% 9/1/24 | | 1,000,000 | 1,049,167 |
| 5% 9/1/25 | | 1,345,000 | 1,404,496 |
| 5% 9/1/26 | | 1,575,000 | 1,637,827 |
| 5% 9/1/28 | | 1,000,000 | 1,030,960 |
| 5% 9/1/34 | | 1,065,000 | 1,085,113 |
| Shakopee Sr. Hsg. Rev. Bonds Series 2018, 5.85%, tender 11/1/25 (c)(d) | | 3,000,000 | 2,994,350 |
| Southern Minnesota Muni. Pwr. Agcy. Pwr. Supply Sys. Rev.: | | | |
| (Cap. Appreciation) Series 1994 A, 0% 1/1/26 (Nat'l. Pub. Fin. Guarantee Corp. Insured) | | 3,320,000 | 3,024,092 |
| Series 2015 A: | | | |
| 5% 1/1/34 | | 1,695,000 | 1,837,875 |
| 5% 1/1/36 | | 1,000,000 | 1,083,246 |
| 5% 1/1/41 | | 1,045,000 | 1,127,996 |
| Series 2019 A, 5% 1/1/34 | | 1,230,000 | 1,382,359 |
| St. Paul Hsg. & Redev. Auth. Health Care Facilities Rev.: | | | |
| (Fairview Hsp & Hltcare Srv Sys. Proj.) Series 2017 A, 5% 11/15/47 | | 7,395,000 | 7,619,201 |
| Series 2015 A: | | | |
| 5% 7/1/29 | | 5,000,000 | 5,230,273 |
| 5% 7/1/30 | | 5,015,000 | 5,225,869 |
| Series 2017 A: | | | |
| 5% 11/15/28 | | 460,000 | 499,003 |
| 5% 11/15/30 | | 650,000 | 696,211 |
| 5% 11/15/31 | | 845,000 | 900,236 |
| 5% 11/15/33 | | 3,410,000 | 3,598,622 |
| 5% 11/15/34 | | 665,000 | 699,076 |
| Univ. of Minnesota Gen. Oblig.: | | | |
| Series 2016: | | | |
| 5% 4/1/37 | | 2,125,000 | 2,273,301 |
| 5% 4/1/41 | | 6,000,000 | 6,392,473 |
| Series 2017 A: | | | |
| 5% 9/1/33 | | 5,025,000 | 5,486,411 |
| 5% 9/1/37 | | 3,880,000 | 4,204,270 |
| Series 2017 B, 5% 12/1/32 | | 2,000,000 | 2,200,000 |
| Series 2019 A, 5% 4/1/44 | | 5,000,000 | 5,450,072 |
| Series 2020 A: | | | |
| 5% 11/1/31 | | 1,070,000 | 1,226,237 |
| 5% 11/1/33 | | 1,015,000 | 1,154,993 |
| 5% 11/1/45 | | 6,050,000 | 6,691,396 |
| Wayzata Sr Hsg. Rev. Series 2019: | | | |
| 5% 8/1/49 | | 500,000 | 483,426 |
| 5% 8/1/54 | | 1,000,000 | 949,503 |
| West Saint Paul Independent School District #197 (Minnesota School District Cr. Enhancement Prog.) Series 2018 A, 4% 2/1/41 | | 2,400,000 | 2,419,391 |
| Western Minnesota Muni. Pwr. Agcy. Pwr. Supply Rev.: | | | |
| Series 2012 A: | | | |
| 5% 1/1/27 | | 2,150,000 | 2,179,847 |
| 5% 1/1/30 | | 1,000,000 | 1,012,363 |
| Series 2015 A, 5% 1/1/31 | | 1,820,000 | 1,972,776 |
| Series 2018 A, 5% 1/1/49 | | 2,000,000 | 2,192,225 |
| White Bear Lake Independent School District #624 Gen. Oblig. Series 2022 A, 4% 2/1/32 | | 4,795,000 | 5,065,272 |
| Wright County Ctfs. of Prtn. Series 2019 A: | | | |
| 5% 12/1/30 | | 1,115,000 | 1,272,821 |
| 5% 12/1/31 | | 1,000,000 | 1,137,027 |
|
| TOTAL MINNESOTA | | | 582,054,598 |
|
| Puerto Rico - 1.0% | | | |
| Puerto Rico Commonwealth Pub. Impt. Gen. Oblig. Series 2021 A1: | | | |
| 0% 7/1/33 | | 1,705,673 | 958,051 |
| 5.625% 7/1/27 | | 190,000 | 202,115 |
| 5.625% 7/1/29 | | 595,000 | 638,886 |
| 5.75% 7/1/31 | | 1,420,000 | 1,550,732 |
| Puerto Rico Hsg. Fin. Auth. Series 2020, 5% 12/1/27 | | 1,225,000 | 1,347,904 |
| Puerto Rico Indl., Tourist, Edl., Med. And Envir. Cont. Facilities Fing. Auth. Series 2021: | | | |
| 4% 7/1/36 | | 105,000 | 96,944 |
| 4% 7/1/41 | | 85,000 | 76,052 |
| 5% 7/1/27 | | 325,000 | 353,389 |
| 5% 7/1/30 | | 140,000 | 154,568 |
| 5% 7/1/32 | | 380,000 | 417,494 |
|
| TOTAL PUERTO RICO | | | 5,796,135 |
|
| TOTAL MUNICIPAL BONDS | | | |
| (Cost $616,712,367) | | | 589,756,356 |
|
| Municipal Notes - 0.8% | | | |
| Minnesota - 0.8% | | | |
| Minneapolis Health Care Sys. Rev. (Fairview Health Svcs.) Series 2018 C, 0.65% 7/1/22, LOC Wells Fargo Bank NA, VRDN (c) | | | |
| (Cost $4,610,000) | | 4,610,000 | 4,610,000 |
| TOTAL INVESTMENT IN SECURITIES - 98.4% | | | |
| (Cost $621,322,367) | | | 594,366,356 |
| NET OTHER ASSETS (LIABILITIES) - 1.6% | | | 9,720,130 |
| NET ASSETS - 100% | | | $604,086,486 |
Security Type Abbreviations
VRDN – VARIABLE RATE DEMAND NOTE (A debt instrument that is payable upon demand, either daily, weekly or monthly)
Legend
(a) Private activity obligations whose interest is subject to the federal alternative minimum tax for individuals.
(b) Security or a portion of the security purchased on a delayed delivery or when-issued basis.
(c) Coupon rates for floating and adjustable rate securities reflect the rates in effect at period end.
(d) Security exempt from registration under Rule 144A of the Securities Act of 1933. These securities may be resold in transactions exempt from registration, normally to qualified institutional buyers. At the end of the period, the value of these securities amounted to $2,994,350 or 0.5% of net assets.
Investment Valuation
The following is a summary of the inputs used, as of June 30, 2022, involving the Fund's assets and liabilities carried at fair value. The inputs or methodology used for valuing securities may not be an indication of the risk associated with investing in those securities. For more information on valuation inputs, and their aggregation into the levels used below, please refer to the Investment Valuation section in the accompanying Notes to Financial Statements.
| | Valuation Inputs at Reporting Date: |
| Description | Total | Level 1 | Level 2 | Level 3 |
| Investments in Securities: | | | | |
| Municipal Securities | $594,366,356 | $-- | $594,366,356 | $-- |
| Total Investments in Securities: | $594,366,356 | $-- | $594,366,356 | $-- |
Other Information
The distribution of municipal securities by revenue source, as a percentage of total Net Assets, is as follows (Unaudited):
| General Obligations | 38.4% |
| Health Care | 23.4% |
| Education | 13.5% |
| Electric Utilities | 7.1% |
| Housing | 5.9% |
| Transportation | 5.9% |
| Others* (Individually Less Than 5%) | 5.8% |
| | 100.0% |
* Includes net other assets
See accompanying notes which are an integral part of the financial statements.
Financial Statements
Statement of Assets and Liabilities
| | | June 30, 2022 (Unaudited) |
| Assets | | |
Investment in securities, at value — See accompanying schedule:
Unaffiliated issuers (cost $621,322,367) | | $594,366,356 |
| Cash | | 3,001,316 |
| Receivable for fund shares sold | | 5,027,970 |
| Interest receivable | | 7,562,561 |
| Other receivables | | 1,549 |
| Total assets | | 609,959,752 |
| Liabilities | | |
| Payable for investments purchased | | |
| Regular delivery | $3,050,988 | |
| Delayed delivery | 1,070,220 | |
| Payable for fund shares redeemed | 1,139,035 | |
| Distributions payable | 350,839 | |
| Accrued management fee | 174,059 | |
| Other affiliated payables | 64,514 | |
| Other payables and accrued expenses | 23,611 | |
| Total liabilities | | 5,873,266 |
| Net Assets | | $604,086,486 |
| Net Assets consist of: | | |
| Paid in capital | | $632,137,684 |
| Total accumulated earnings (loss) | | (28,051,198) |
| Net Assets | | $604,086,486 |
| Net Asset Value, offering price and redemption price per share ($604,086,486 ÷ 55,250,305 shares) | | $10.93 |
See accompanying notes which are an integral part of the financial statements.
Statement of Operations
| | | Six months ended June 30, 2022 (Unaudited) |
| Investment Income | | |
| Interest | | $7,783,263 |
| Expenses | | |
| Management fee | $1,108,503 | |
| Transfer agent fees | 329,870 | |
| Accounting fees and expenses | 75,536 | |
| Custodian fees and expenses | 5,136 | |
| Independent trustees' fees and expenses | 989 | |
| Registration fees | 50,280 | |
| Audit | 24,488 | |
| Legal | 11,406 | |
| Miscellaneous | 1,238 | |
| Total expenses before reductions | 1,607,446 | |
| Expense reductions | (10,539) | |
| Total expenses after reductions | | 1,596,907 |
| Net investment income (loss) | | 6,186,356 |
| Realized and Unrealized Gain (Loss) | | |
| Net realized gain (loss) on: | | |
| Investment securities: | | |
| Unaffiliated issuers | | (1,452,136) |
| Total net realized gain (loss) | | (1,452,136) |
| Change in net unrealized appreciation (depreciation) on investment securities | | (59,489,441) |
| Net gain (loss) | | (60,941,577) |
| Net increase (decrease) in net assets resulting from operations | | $(54,755,221) |
See accompanying notes which are an integral part of the financial statements.
Statement of Changes in Net Assets
| | Six months ended June 30, 2022 (Unaudited) | Year ended December 31, 2021 |
| Increase (Decrease) in Net Assets | | |
| Operations | | |
| Net investment income (loss) | $6,186,356 | $12,859,823 |
| Net realized gain (loss) | (1,452,136) | 2,226,424 |
| Change in net unrealized appreciation (depreciation) | (59,489,441) | (10,574,900) |
| Net increase (decrease) in net assets resulting from operations | (54,755,221) | 4,511,347 |
| Distributions to shareholders | (6,474,117) | (14,402,199) |
| Share transactions | | |
| Proceeds from sales of shares | 121,892,897 | 123,394,600 |
| Reinvestment of distributions | 4,280,394 | 9,630,543 |
| Cost of shares redeemed | (159,927,891) | (97,551,678) |
| Net increase (decrease) in net assets resulting from share transactions | (33,754,600) | 35,473,465 |
| Total increase (decrease) in net assets | (94,983,938) | 25,582,613 |
| Net Assets | | |
| Beginning of period | 699,070,424 | 673,487,811 |
| End of period | $604,086,486 | $699,070,424 |
| Other Information | | |
| Shares | | |
| Sold | 10,950,579 | 10,200,980 |
| Issued in reinvestment of distributions | 378,986 | 797,769 |
| Redeemed | (14,290,380) | (8,073,881) |
| Net increase (decrease) | (2,960,815) | 2,924,868 |
See accompanying notes which are an integral part of the financial statements.
Financial Highlights
Fidelity Minnesota Municipal Income Fund
| | Six months ended (Unaudited) June 30, | Years endedDecember 31, | | | | |
| | 2022 | 2021 | 2020 | 2019 | 2018 | 2017 |
| Selected Per–Share Data | | | | | | |
| Net asset value, beginning of period | $12.01 | $12.18 | $11.91 | $11.41 | $11.64 | $11.42 |
| Income from Investment Operations | | | | | | |
| Net investment income (loss)A,B | .110 | .227 | .251 | .280 | .282 | .285 |
| Net realized and unrealized gain (loss) | (1.075) | (.143) | .296 | .525 | (.211) | .229 |
| Total from investment operations | (.965) | .084 | .547 | .805 | .071 | .514 |
| Distributions from net investment income | (.110) | (.222) | (.251) | (.280) | (.282) | (.285) |
| Distributions from net realized gain | (.005) | (.032) | (.026) | (.025) | (.019) | (.009) |
| Total distributions | (.115) | (.254) | (.277) | (.305) | (.301) | (.294) |
| Net asset value, end of period | $10.93 | $12.01 | $12.18 | $11.91 | $11.41 | $11.64 |
| Total ReturnC,D | (8.06)% | .70% | 4.65% | 7.12% | .65% | 4.55% |
| Ratios to Average Net AssetsB,E | | | | | | |
| Expenses before reductions | .51%F | .49% | .49% | .49% | .50% | .49% |
| Expenses net of fee waivers, if any | .51%F | .49% | .49% | .49% | .50% | .49% |
| Expenses net of all reductions | .50%F | .48% | .49% | .49% | .49% | .49% |
| Net investment income (loss) | 1.95%F | 1.88% | 2.09% | 2.38% | 2.48% | 2.46% |
| Supplemental Data | | | | | | |
| Net assets, end of period (000 omitted) | $604,086 | $699,070 | $673,488 | $593,754 | $523,096 | $549,919 |
| Portfolio turnover rate | 19%F | 7% | 9% | 9% | 14% | 11% |
A Calculated based on average shares outstanding during the period.
B Net investment income (loss) is affected by the timing of the declaration of dividends by any underlying mutual funds or exchange-traded funds (ETFs). Net investment income (loss) of any such underlying funds is not included in the Fund's net investment income (loss) ratio.
C Total returns for periods of less than one year are not annualized.
D Total returns would have been lower if certain expenses had not been reduced during the applicable periods shown.
E Expense ratios reflect operating expenses of the class. Expenses before reductions do not reflect amounts reimbursed, waived, or reduced through arrangements with the investment adviser, brokerage services, or other offset arrangements, if applicable, and do not represent the amount paid by the class during periods when reimbursements, waivers or reductions occur.
F Annualized
See accompanying notes which are an integral part of the financial statements.
Notes to Financial Statements (Unaudited)
For the period ended June 30, 2022
1. Organization.
Fidelity Minnesota Municipal Income Fund (the Fund) is a non-diversified fund of Fidelity Municipal Trust (the Trust) and is authorized to issue an unlimited number of shares. Share transactions on the Statement of Changes in Net Assets may contain exchanges between affiliated funds. The Trust is registered under the Investment Company Act of 1940, as amended (the 1940 Act), as an open-end management investment company organized as a Massachusetts business trust. The Fund may be affected by economic and political developments in the state of Minnesota.
2. Significant Accounting Policies.
The Fund is an investment company and applies the accounting and reporting guidance of the Financial Accounting Standards Board (FASB) Accounting Standards Codification Topic 946 Financial Services - Investment Companies. The financial statements have been prepared in conformity with accounting principles generally accepted in the United States of America (GAAP), which require management to make certain estimates and assumptions at the date of the financial statements. Actual results could differ from those estimates. Subsequent events, if any, through the date that the financial statements were issued have been evaluated in the preparation of the financial statements. The Fund's Schedule of Investments lists any underlying mutual funds or exchange-traded funds (ETFs) but does not include the underlying holdings of these funds. The following summarizes the significant accounting policies of the Fund:
Investment Valuation. Investments are valued as of 4:00 p.m. Eastern time on the last calendar day of the period. The Board of Trustees (the Board) has delegated the day to day responsibility for the valuation of the Fund's investments to the Fair Value Committee (the Committee) established by the Fund's investment adviser. In accordance with valuation policies and procedures approved by the Board, the Fund attempts to obtain prices from one or more third party pricing vendors or brokers to value its investments. When current market prices, quotations or currency exchange rates are not readily available or reliable, investments will be fair valued in good faith by the Committee, in accordance with procedures adopted by the Board. Factors used in determining fair value vary by investment type and may include market or investment specific events, changes in interest rates and credit quality. The frequency with which these procedures are used cannot be predicted and they may be utilized to a significant extent. The Committee oversees the Fund's valuation policies and procedures and reports to the Board on the Committee's activities and fair value determinations. The Board monitors the appropriateness of the procedures used in valuing the Fund's investments and ratifies the fair value determinations of the Committee.
The Fund categorizes the inputs to valuation techniques used to value its investments into a disclosure hierarchy consisting of three levels as shown below:
- Level 1 – unadjusted quoted prices in active markets for identical investments
- Level 2 – other significant observable inputs (including quoted prices for similar investments, interest rates, prepayment speeds, etc.)
- Level 3 – unobservable inputs (including the Fund's own assumptions based on the best information available)
Valuation techniques used to value the Fund's investments by major category are as follows:
Debt securities, including restricted securities, are valued based on evaluated prices received from third party pricing vendors or from brokers who make markets in such securities. Municipal securities are valued by pricing vendors who utilize matrix pricing which considers yield or price of bonds of comparable quality, coupon, maturity and type or by broker-supplied prices. When independent prices are unavailable or unreliable, debt securities may be valued utilizing pricing methodologies which consider similar factors that would be used by third party pricing vendors. Debt securities are generally categorized as Level 2 in the hierarchy but may be Level 3 depending on the circumstances.
Changes in valuation techniques may result in transfers in or out of an assigned level within the disclosure hierarchy. The aggregate value of investments by input level as of June 30, 2022 is included at the end of the Fund's Schedule of Investments.
Investment Transactions and Income. For financial reporting purposes, the Fund's investment holdings and NAV include trades executed through the end of the last business day of the period. The NAV per share for processing shareholder transactions is calculated as of the close of business of the New York Stock Exchange (NYSE), normally 4:00 p.m. Eastern time and includes trades executed through the end of the prior business day. Gains and losses on securities sold are determined on the basis of identified cost. Interest income is accrued as earned and includes coupon interest and amortization of premium and accretion of discount on debt securities as applicable. Debt obligations may be placed on non-accrual status and related interest income may be reduced by ceasing current accruals and writing off interest receivables when the collection of all or a portion of interest has become doubtful based on consistently applied procedures. A debt obligation is removed from non-accrual status when the issuer resumes interest payments or when collectability of interest is reasonably assured.
Expenses. Expenses directly attributable to a fund are charged to that fund. Expenses attributable to more than one fund are allocated among the respective funds on the basis of relative net assets or other appropriate methods. Expenses included in the accompanying financial statements reflect the expenses of that fund and do not include any expenses associated with any underlying mutual funds or exchange-traded funds. Although not included in a fund's expenses, a fund indirectly bears its proportionate share of these expenses through the net asset value of each underlying mutual fund or exchange-traded fund. Expense estimates are accrued in the period to which they relate and adjustments are made when actual amounts are known.
Income Tax Information and Distributions to Shareholders. Each year, the Fund intends to qualify as a regulated investment company under Subchapter M of the Internal Revenue Code, including distributing substantially all of its taxable income and realized gains. As a result, no provision for U.S. Federal income taxes is required. The Fund files a U.S. federal tax return, in addition to state and local tax returns as required. The Fund's federal income tax returns are subject to examination by the Internal Revenue Service (IRS) for a period of three fiscal years after they are filed. State and local tax returns may be subject to examination for an additional fiscal year depending on the jurisdiction.
Distributions are declared and recorded daily and paid monthly from net investment income. Distributions from realized gains, if any, are declared and recorded on the ex-dividend date. Income and capital gain distributions are determined in accordance with income tax regulations, which may differ from GAAP.
Capital accounts within the financial statements are adjusted for permanent book-tax differences. These adjustments have no impact on net assets or the results of operations. Capital accounts are not adjusted for temporary book-tax differences which will reverse in a subsequent period.
Book-tax differences are primarily due to market discount, and losses deferred due to wash sales and excise tax regulations.
The Fund purchases municipal securities whose interest, in the opinion of the issuer, is free from federal income tax. There is no assurance that the IRS will agree with this opinion. In the event the IRS determines that the issuer does not comply with relevant tax requirements, interest payments from a security could become federally taxable, possibly retroactively to the date the security was issued.
As of period end, the cost and unrealized appreciation (depreciation) in securities, and derivatives if applicable, for federal income tax purposes were as follows:
| Gross unrealized appreciation | $1,824,388 |
| Gross unrealized depreciation | (28,778,888) |
| Net unrealized appreciation (depreciation) | $(26,954,500) |
| Tax cost | $621,320,856 |
Delayed Delivery Transactions and When-Issued Securities. During the period, certain Funds transacted in securities on a delayed delivery or when-issued basis. Payment and delivery may take place after the customary settlement period for that security. The price of the underlying securities and the date when the securities will be delivered and paid for are fixed at the time the transaction is negotiated. Securities purchased on a delayed delivery or when-issued basis are identified as such in the Schedule of Investments. Compensation for interest forgone in the purchase of a delayed delivery or when-issued debt security may be received. With respect to purchase commitments, each applicable Fund identifies securities as segregated in its records with a value at least equal to the amount of the commitment. Payables and receivables associated with the purchases and sales of delayed delivery securities having the same coupon, settlement date and broker are offset. Delayed delivery or when-issued securities that have been purchased from and sold to different brokers are reflected as both payables and receivables in the Statement of Assets and Liabilities under the caption "Delayed delivery", as applicable. Losses may arise due to changes in the value of the underlying securities or if the counterparty does not perform under the contract's terms, or if the issuer does not issue the securities due to political, economic, or other factors.
Restricted Securities (including Private Placements). Funds may invest in securities that are subject to legal or contractual restrictions on resale. These securities generally may be resold in transactions exempt from registration or to the public if the securities are registered. Disposal of these securities may involve time-consuming negotiations and expense, and prompt sale at an acceptable price may be difficult. Information regarding restricted securities held at period end is included at the end of the Schedule of Investments, if applicable.
3. Purchases and Sales of Investments.
Purchases and sales of securities, other than short-term securities and in-kind transactions, as applicable, are noted in the table below.
| | Purchases ($) | Sales ($) |
| Fidelity Minnesota Municipal Income Fund | 59,822,770 | 87,302,129 |
4. Fees and Other Transactions with Affiliates.
Management Fee. Fidelity Management & Research Company LLC (the investment adviser) and its affiliates provide the Fund with investment management related services for which the Fund pays a monthly management fee. The management fee is the sum of an individual fund fee rate that is based on an annual rate of .25% of the Fund's average net assets and an annualized group fee rate that averaged .10% during the period. The group fee rate is based upon the monthly average net assets of a group of registered investment companies with which the investment adviser has management contracts. The group fee rate decreases as assets under management increase and increases as assets under management decrease. For the reporting period, the total annualized management fee rate was .35% of the Fund's average net assets.
Transfer Agent Fees. Fidelity Investments Institutional Operations Company LLC (FIIOC), an affiliate of the investment adviser, is the transfer, dividend disbursing and shareholder servicing agent for the Fund. FIIOC receives account fees and asset-based fees that vary according to account size and type of account. FIIOC pays for typesetting, printing and mailing of shareholder reports, except proxy statements. For the period, transfer agent fees were equivalent to an annualized rate of .10% of average net assets.
Accounting Fees. Fidelity Service Company, Inc. (FSC), an affiliate of the investment adviser, maintains the Fund's accounting records. The accounting fee is based on the level of average net assets for each month. For the period, the fees were equivalent to the following annualized rates:
| | % of Average Net Assets |
| Fidelity Minnesota Municipal Income Fund | .02 |
Interfund Trades. Funds may purchase from or sell securities to other Fidelity Funds under procedures adopted by the Board. The procedures have been designed to ensure these interfund trades are executed in accordance with Rule 17a-7 of the 1940 Act. Any interfund trades are included within the respective purchases and sales amounts shown in the Purchases and Sales of Investments note. During the period, there were no interfund trades.
5. Committed Line of Credit.
Certain Funds participate with other funds managed by the investment adviser or an affiliate in a $4.25 billion credit facility (the "line of credit") to be utilized for temporary or emergency purposes to fund shareholder redemptions or for other short-term liquidity purposes. The participating funds have agreed to pay commitment fees on their pro-rata portion of the line of credit, which are reflected in Miscellaneous expenses on the Statement of Operations, and are listed below. During the period, there were no borrowings on this line of credit.
| | Amount |
| Fidelity Minnesota Municipal Income Fund | $563 |
6. Expense Reductions.
Through arrangements with the Fund's custodian, credits realized as a result of certain uninvested cash balances were used to reduce the Fund's expenses by $5,136.
In addition, during the period the investment adviser or an affiliate reimbursed and/or waived a portion of operating expenses in the amount of $5,403.
7. Other.
A fund's organizational documents provide former and current trustees and officers with a limited indemnification against liabilities arising in connection with the performance of their duties to the fund. In the normal course of business, a fund may also enter into contracts that provide general indemnifications. A fund's maximum exposure under these arrangements is unknown as this would be dependent on future claims that may be made against a fund. The risk of material loss from such claims is considered remote.
8. Coronavirus (COVID-19) Pandemic.
An outbreak of COVID-19 first detected in China during December 2019 has since spread globally and was declared a pandemic by the World Health Organization during March 2020. Developments that disrupt global economies and financial markets, such as the COVID-19 pandemic, may magnify factors that affect the Fund's performance.
Shareholder Expense Example
As a shareholder, you incur two types of costs: (1) transaction costs, which may include sales charges (loads) on purchase payments or redemption proceeds, as applicable and (2) ongoing costs, which generally include management fees, distribution and/or service (12b-1) fees and other Fund expenses. This Example is intended to help you understand your ongoing costs (in dollars) of investing in a fund and to compare these costs with the ongoing costs of investing in other mutual funds.
The Example is based on an investment of $1,000 invested at the beginning of the period and held for the entire period (January 1, 2022 to June 30, 2022).
Actual Expenses
The first line of the accompanying table provides information about actual account values and actual expenses. You may use the information in this line, together with the amount you invested, to estimate the expenses that you paid over the period. Simply divide your account value by $1,000.00 (for example, an $8,600 account value divided by $1,000.00 = 8.6), then multiply the result by the number in the first line for a class/Fund under the heading entitled "Expenses Paid During Period" to estimate the expenses you paid on your account during this period. If any fund is a shareholder of any underlying mutual funds or exchange-traded funds (ETFs) (the Underlying Funds), such fund indirectly bears its proportional share of the expenses of the Underlying Funds in addition to the direct expenses incurred presented in the table. These fees and expenses are not included in the annualized expense ratio used to calculate the expense estimate in the table below.
Hypothetical Example for Comparison Purposes
The second line of the accompanying table provides information about hypothetical account values and hypothetical expenses based on the actual expense ratio and an assumed rate of return of 5% per year before expenses, which is not the actual return. The hypothetical account values and expenses may not be used to estimate the actual ending account balance or expenses you paid for the period. You may use this information to compare the ongoing costs of investing in the Fund and other funds. To do so, compare this 5% hypothetical example with the 5% hypothetical examples that appear in the shareholder reports of the other funds. If any fund is a shareholder of any Underlying Funds, such fund indirectly bears its proportional share of the expenses of the Underlying Funds in addition to the direct expenses as presented in the table. These fees and expenses are not included in the annualized expense ratio used to calculate the expense estimate in the table below.
Please note that the expenses shown in the table are meant to highlight your ongoing costs only and do not reflect any transaction costs. Therefore, the second line of the table is useful in comparing ongoing costs only, and will not help you determine the relative total costs of owning different funds. In addition, if these transactional costs were included, your costs would have been higher.
| | Annualized Expense Ratio-A | Beginning
Account Value
January 1, 2022 | Ending
Account Value
June 30, 2022 | Expenses Paid
During Period-B
January 1, 2022
to June 30, 2022 |
| Fidelity Minnesota Municipal Income Fund | .51% | | | |
| Actual | | $1,000.00 | $919.40 | $2.43 |
| Hypothetical-C | | $1,000.00 | $1,022.27 | $2.56 |
A Annualized expense ratio reflects expenses net of applicable fee waivers.
B Expenses are equal to the annualized expense ratio, multiplied by the average account value over the period, multiplied by 181/ 365 (to reflect the one-half year period). The fees and expenses of any Underlying Funds are not included in each annualized expense ratio.
C 5% return per year before expenses
Liquidity Risk Management Program
The Securities and Exchange Commission adopted Rule 22e-4 under the Investment Company Act of 1940 (the Liquidity Rule) to promote effective liquidity risk management throughout the open-end investment company industry, thereby reducing the risk that funds will be unable to meet their redemption obligations and mitigating dilution of the interests of fund shareholders.
The Minnesota Municipal Income Fund (the Income Fund) has adopted and implemented a liquidity risk management program pursuant to the Liquidity Rule (the Program) effective December 1, 2018. The Program is reasonably designed to assess and manage the Income Fund’s liquidity risk and to comply with the requirements of the Liquidity Rule. The Income Fund’s Board of Trustees (the Board) has designated the Income Fund’s investment adviser as administrator of the Program. The Fidelity advisers have established a Liquidity Risk Management Committee (the LRM Committee) to manage the Program for each of the Fidelity Funds. The LRM Committee monitors the adequacy and effectiveness of implementation of the Program and on a periodic basis assesses each Fund’s liquidity risk based on a variety of factors including (1) the Fund’s investment strategy, (2) portfolio liquidity and cash flow projections during normal and reasonably foreseeable stressed conditions, (3) shareholder redemptions, (4) borrowings and other funding sources and (5) in the case of exchange-traded funds, certain additional factors including the effect of the Fund’s prices and spreads, market participants, and basket compositions on the overall liquidity of the Fund’s portfolio, as applicable.
In accordance with the Program, each of the Fund’s portfolio investments is classified into one of four liquidity categories described below based on a determination of a reasonable expectation for how long it would take to convert the investment to cash (or sell or dispose of the investment) without significantly changing its market value.
- Highly liquid investments – cash or convertible to cash within three business days or less
- Moderately liquid investments – convertible to cash in three to seven calendar days
- Less liquid investments – can be sold or disposed of, but not settled, within seven calendar days
- Illiquid investments – cannot be sold or disposed of within seven calendar days
Liquidity classification determinations take into account a variety of factors including various market, trading and investment-specific considerations, as well as market depth, and generally utilize analysis from a third-party liquidity metrics service.
The Liquidity Rule places a 15% limit on a fund’s illiquid investments and requires funds that do not primarily hold assets that are highly liquid investments to determine and maintain a minimum percentage of the fund’s net assets to be invested in highly liquid investments (highly liquid investment minimum or HLIM). The Program includes provisions reasonably designed to comply with the 15% limit on illiquid investments and for determining, periodically reviewing and complying with the HLIM requirement as applicable.
At a recent meeting of the Fund’s Board of Trustees, the LRM Committee provided a written report to the Board pertaining to the operation, adequacy, and effectiveness of implementation of the Program for the annual period from December 1, 2020 through November 30, 2021. The report concluded that the Program has been implemented and is operating effectively and is reasonably designed to assess and manage the Fund’s liquidity risk.
MNF-SANN-0822
1.705580.124
Fidelity® Ohio Municipal Income Fund
Fidelity® Ohio Municipal Money Market Fund
Semi-Annual Report
June 30, 2022
Contents
To view a fund's proxy voting guidelines and proxy voting record for the 12-month period ended June 30, visit http://www.fidelity.com/proxyvotingresults or visit the Securities and Exchange Commission's (SEC) web site at http://www.sec.gov.
You may also call 1-800-544-8544 to request a free copy of the proxy voting guidelines.
Standard & Poor's, S&P and S&P 500 are registered service marks of The McGraw-Hill Companies, Inc. and have been licensed for use by Fidelity Distributors Corporation.
Other third-party marks appearing herein are the property of their respective owners.
All other marks appearing herein are registered or unregistered trademarks or service marks of FMR LLC or an affiliated company. © 2022 FMR LLC. All rights reserved.
This report and the financial statements contained herein are submitted for the general information of the shareholders of the Funds. This report is not authorized for distribution to prospective investors in the Funds unless preceded or accompanied by an effective prospectus.
A fund files its complete schedule of portfolio holdings with the SEC for the first and third quarters of each fiscal year on Form N-PORT. Forms N-PORT are available on the SEC’s web site at http://www.sec.gov. A fund's Forms N-PORT may be reviewed and copied at the SEC’s Public Reference Room in Washington, DC. Information regarding the operation of the SEC's Public Reference Room may be obtained by calling 1-800-SEC-0330.
For a complete list of a fund's portfolio holdings, view the most recent holdings listing, semiannual report, or annual report on Fidelity's web site at http://www.fidelity.com, http://www.institutional.fidelity.com, or http://www.401k.com, as applicable.
NOT FDIC INSURED •MAY LOSE VALUE •NO BANK GUARANTEE
Neither the Funds nor Fidelity Distributors Corporation is a bank.
Note to Shareholders:
Early in 2020, the outbreak and spread of COVID-19 emerged as a public health emergency that had a major influence on financial markets, primarily based on its impact on the global economy and corporate earnings. On March 11, 2020, the World Health Organization declared the COVID-19 outbreak a pandemic, citing sustained risk of further global spread. The pandemic prompted a number of measures to limit the spread of COVID-19, including travel and border restrictions, quarantines, and restrictions on large gatherings. In turn, these resulted in lower consumer activity, diminished demand for a wide range of products and services, disruption in manufacturing and supply chains, and – given the wide variability in outcomes regarding the outbreak – significant market uncertainty and volatility. To help stem the turmoil, the U.S. government took unprecedented action – in concert with the U.S. Federal Reserve and central banks around the world – to help support consumers, businesses, and the broader economy, and to limit disruption to the financial system.
In general, the overall impact of the pandemic lessened in 2021, amid a resilient economy and widespread distribution of three COVID-19 vaccines granted emergency use authorization from the U.S. Food and Drug Administration (FDA) early in the year. Still, the situation remains dynamic, and the extent and duration of its influence on financial markets and the economy is highly uncertain, due in part to a recent spike in cases based on highly contagious variants of the coronavirus.
Extreme events such as the COVID-19 crisis are exogenous shocks that can have significant adverse effects on mutual funds and their investments. Although multiple asset classes may be affected by market disruption, the duration and impact may not be the same for all types of assets. Fidelity is committed to helping you stay informed amid news about COVID-19 and during increased market volatility, and we continue to take extra steps to be responsive to customer needs. We encourage you to visit us online, where we offer ongoing updates, commentary, and analysis on the markets and our funds.
Fidelity® Ohio Municipal Income Fund
Investment Summary (Unaudited)
Top Five Sectors as of June 30, 2022
| | % of fund's net assets |
| Health Care | 30.9 |
| Education | 20.1 |
| General Obligations | 17.3 |
| Special Tax | 9.8 |
| Transportation | 4.7 |
Quality Diversification (% of fund's net assets)
| As of June 30, 2022 |
| | AAA | 5.4% |
| | AA,A | 76.4% |
| | BBB | 7.3% |
| | BB and Below | 2.2% |
| | Not Rated | 4.9% |
| | Short-Term Investments and Net Other Assets | 3.8% |
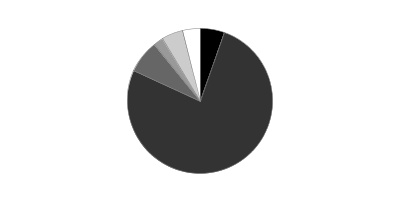
We have used ratings from Moody's Investors Service, Inc. Where Moody's® ratings are not available, we have used S&P® ratings. All ratings are as of the date indicated and do not reflect subsequent changes.
Fidelity® Ohio Municipal Income Fund
Schedule of Investments June 30, 2022 (Unaudited)
Showing Percentage of Net Assets
| Municipal Bonds - 96.2% | | | |
| | | Principal Amount | Value |
| Guam - 0.2% | | | |
| Guam Int'l. Arpt. Auth. Rev. Series 2013 C: | | | |
| 6.25% 10/1/34 (a) | | $545,000 | $564,152 |
| 6.25% 10/1/34 (Pre-Refunded to 10/1/23 @ 100) (a) | | 355,000 | 373,450 |
| 6.375% 10/1/43 (a) | | 355,000 | 367,368 |
|
| TOTAL GUAM | | | 1,304,970 |
|
| Ohio - 95.4% | | | |
| Akron Bath Copley Hosp. District Rev.: | | | |
| (Summa Health Sys.) Series 2016, 5% 11/15/25 | | 1,000,000 | 1,064,113 |
| Series 2016: | | | |
| 5% 11/15/26 | | 535,000 | 576,426 |
| 5.25% 11/15/32 | | 1,000,000 | 1,057,709 |
| 5.25% 11/15/34 | | 1,500,000 | 1,578,596 |
| 5.25% 11/15/41 | | 10,545,000 | 10,992,041 |
| 5.25% 11/15/46 | | 2,650,000 | 2,747,365 |
| Akron Income Tax Rev. Series 2022: | | | |
| 4% 12/1/24 | | 1,075,000 | 1,120,320 |
| 4% 12/1/25 | | 1,400,000 | 1,476,348 |
| 4% 12/1/26 | | 1,120,000 | 1,193,463 |
| 4% 12/1/27 | | 1,180,000 | 1,267,327 |
| 4% 12/1/28 | | 1,380,000 | 1,485,182 |
| 4% 12/1/29 | | 1,500,000 | 1,610,862 |
| 4% 12/1/30 | | 1,210,000 | 1,284,439 |
| 4% 12/1/31 | | 1,105,000 | 1,168,235 |
| 4% 12/1/32 | | 1,285,000 | 1,353,782 |
| 4% 12/1/33 | | 1,300,000 | 1,365,544 |
| Allen County Hosp. Facilities Rev.: | | | |
| (Mercy Health) Series 2017 A: | | | |
| 4% 8/1/36 | | 5,000,000 | 4,975,306 |
| 5% 8/1/42 | | 4,175,000 | 4,360,761 |
| Series 2020 A: | | | |
| 4% 12/1/40 | | 7,000,000 | 6,831,196 |
| 5% 12/1/35 | | 750,000 | 803,586 |
| American Muni. Pwr., Inc. Rev.: | | | |
| (Greenup Hydroelectric Proj.) Series 2016 A, 5% 2/15/41 | | 3,005,000 | 3,175,603 |
| (Prairie State Energy Campus Proj.) Series 2015, 5% 2/15/28 | | 3,995,000 | 4,149,865 |
| Bowling Green Univ. Gen. Receipts Series 2016 A, 5% 6/1/42 | | 1,000,000 | 1,054,814 |
| Buckeye Tobacco Settlement Fing. Auth.: | | | |
| Series 2020 A2: | | | |
| 4% 6/1/37 | | 2,000,000 | 1,957,884 |
| 4% 6/1/38 | | 1,000,000 | 974,410 |
| 4% 6/1/39 | | 1,000,000 | 968,495 |
| 4% 6/1/48 | | 5,750,000 | 5,230,684 |
| 5% 6/1/27 | | 1,000,000 | 1,070,388 |
| 5% 6/1/35 | | 2,000,000 | 2,139,880 |
| 5% 6/1/36 | | 2,000,000 | 2,136,507 |
| Series 2020 B2, 5% 6/1/55 | | 1,500,000 | 1,412,444 |
| Butler County Hosp. Facilities Rev. Series 2016 X, 5% 5/15/32 | | 3,950,000 | 4,556,907 |
| Chillicothe Hosp. Facilities Rev. (Adena Health Sys. Oblig. Group Proj.) Series 2017, 5% 12/1/47 | | 8,535,000 | 8,808,226 |
| Cleveland Arpt. Sys. Rev.: | | | |
| Series 2018 A: | | | |
| 5% 1/1/43 (Assured Guaranty Muni. Corp. Insured) (a) | | 1,750,000 | 1,823,272 |
| 5% 1/1/48 (Assured Guaranty Muni. Corp. Insured) (a) | | 3,000,000 | 3,106,506 |
| Series 2019 B: | | | |
| 5% 1/1/24 (a) | | 1,200,000 | 1,244,683 |
| 5% 1/1/25 (a) | | 1,125,000 | 1,185,159 |
| 5% 1/1/26 (a) | | 710,000 | 758,556 |
| 5% 1/1/27 (a) | | 700,000 | 757,241 |
| Cleveland Gen. Oblig.: | | | |
| Series 2012, 5% 12/1/25 | | 25,000 | 25,331 |
| Series 2015: | | | |
| 5% 12/1/26 | | 1,500,000 | 1,634,750 |
| 5% 12/1/27 | | 2,000,000 | 2,174,182 |
| 5% 12/1/29 | | 1,250,000 | 1,358,436 |
| Cleveland Income Tax Rev. Series 2018 A: | | | |
| 5% 10/1/29 | | 600,000 | 670,540 |
| 5% 10/1/30 | | 420,000 | 467,403 |
| 5% 10/1/31 | | 650,000 | 720,973 |
| 5% 10/1/33 | | 600,000 | 662,036 |
| 5% 10/1/36 | | 700,000 | 768,948 |
| 5% 10/1/39 | | 2,040,000 | 2,230,088 |
| 5% 10/1/43 | | 5,000,000 | 5,432,172 |
| Cleveland Muni. School District: | | | |
| Series 2013, 5% 12/1/24 | | 1,255,000 | 1,272,799 |
| Series 2015 A: | | | |
| 5% 12/1/24 | | 3,725,000 | 3,823,741 |
| 5% 12/1/27 | | 1,750,000 | 1,791,291 |
| Cleveland Ohio Wtr. Poll. Ctl. Rev. Series 2016: | | | |
| 5% 11/15/34 | | 1,190,000 | 1,264,334 |
| 5% 11/15/35 | | 1,245,000 | 1,319,905 |
| 5% 11/15/36 | | 450,000 | 476,041 |
| Cleveland Pub. Library Facilities Series 2019 A: | | | |
| 4% 12/1/33 | | 425,000 | 449,299 |
| 4% 12/1/34 | | 370,000 | 389,099 |
| 4% 12/1/35 | | 620,000 | 646,682 |
| 4% 12/1/36 | | 1,400,000 | 1,448,314 |
| 4% 12/1/37 | | 1,115,000 | 1,143,996 |
| 4% 12/1/38 | | 650,000 | 657,025 |
| Cleveland Pub. Pwr. Sys. Rev.: | | | |
| Series 2018: | | | |
| 5% 11/15/24 (Assured Guaranty Muni. Corp. Insured) | | 475,000 | 505,030 |
| 5% 11/15/25 (Assured Guaranty Muni. Corp. Insured) | | 200,000 | 216,959 |
| 5% 11/15/26 (Assured Guaranty Muni. Corp. Insured) | | 265,000 | 292,577 |
| 5% 11/15/27 (Assured Guaranty Muni. Corp. Insured) | | 220,000 | 246,135 |
| 5% 11/15/28 (Assured Guaranty Muni. Corp. Insured) | | 150,000 | 168,215 |
| 5% 11/15/29 (Assured Guaranty Muni. Corp. Insured) | | 210,000 | 235,646 |
| 5% 11/15/30 (Assured Guaranty Muni. Corp. Insured) | | 530,000 | 591,033 |
| 5% 11/15/32 (Assured Guaranty Muni. Corp. Insured) | | 365,000 | 404,363 |
| 5% 11/15/34 (Assured Guaranty Muni. Corp. Insured) | | 785,000 | 866,134 |
| 5% 11/15/36 (Assured Guaranty Muni. Corp. Insured) | | 1,000,000 | 1,100,189 |
| 5% 11/15/38 (Assured Guaranty Muni. Corp. Insured) | | 830,000 | 910,139 |
| Series 2020 A: | | | |
| 4% 11/15/35 (Assured Guaranty Muni. Corp. Insured) | | 1,000,000 | 1,025,770 |
| 4% 11/15/36 (Assured Guaranty Muni. Corp. Insured) | | 1,000,000 | 1,018,119 |
| 4% 11/15/37 (Assured Guaranty Muni. Corp. Insured) | | 1,000,000 | 1,016,788 |
| Cleveland Wtr. Rev.: | | | |
| Series 2015 Y, 4% 1/1/28 | | 650,000 | 664,754 |
| Series 2020: | | | |
| 5% 1/1/29 | | 1,100,000 | 1,252,938 |
| 5% 1/1/30 | | 2,000,000 | 2,303,925 |
| 5% 1/1/31 | | 2,250,000 | 2,578,956 |
| 5% 1/1/32 | | 1,000,000 | 1,138,106 |
| Cleveland-Cuyahoga County Port Auth. Dev. Lease Rev. (Administrative Headquarters Proj.) Series 2013, 5% 7/1/37 | | 3,000,000 | 3,523,390 |
| Cleveland-Cuyahoga County Port Auth. Rev. (Euclid Avenue Dev. Corp. Proj.) Series 2022 A: | | | |
| 5% 8/1/34 (b) | | 1,865,000 | 2,003,746 |
| 5% 8/1/35 (b) | | 1,910,000 | 2,034,266 |
| 5% 8/1/36 (b) | | 2,065,000 | 2,181,007 |
| 5% 8/1/37 (b) | | 2,170,000 | 2,275,567 |
| Columbus City School District Series 2016 A, 5% 12/1/31 | | 5,000,000 | 5,388,916 |
| Columbus Gen. Oblig. Series 2014 A, 4% 2/15/28 | | 5,000,000 | 5,129,080 |
| County of Cuyahoga (Ballpark Impt. Proj.) Series 2022 A: | | | |
| 4% 1/1/36 | | 3,855,000 | 4,012,477 |
| 4% 1/1/37 | | 3,755,000 | 3,895,631 |
| Cuyahoga County Econ. Dev. Rev.: | | | |
| (The Cleveland Orchestra Proj.) Series 2019: | | | |
| 5% 1/1/29 | | 325,000 | 359,968 |
| 5% 1/1/30 | | 250,000 | 277,295 |
| 5% 1/1/31 | | 525,000 | 579,590 |
| 5% 1/1/32 | | 500,000 | 549,964 |
| 5% 1/1/33 | | 400,000 | 438,543 |
| 5% 1/1/34 | | 300,000 | 328,044 |
| 5% 1/1/35 | | 500,000 | 545,706 |
| 5% 1/1/36 | | 440,000 | 479,438 |
| 5% 1/1/37 | | 400,000 | 435,194 |
| 5% 1/1/39 | | 1,400,000 | 1,516,702 |
| 5% 1/1/40 | | 1,620,000 | 1,752,897 |
| Series 2020 D, 5% 12/1/27 | | 2,500,000 | 2,810,581 |
| Cuyahoga County Hosp. Rev. Series 2017: | | | |
| 5% 2/15/26 | | 1,750,000 | 1,873,983 |
| 5% 2/15/27 | | 1,700,000 | 1,829,597 |
| 5% 2/15/28 | | 2,385,000 | 2,519,765 |
| 5% 2/15/30 | | 3,000,000 | 3,137,551 |
| 5% 2/15/31 | | 1,500,000 | 1,560,642 |
| 5% 2/15/32 | | 1,450,000 | 1,501,837 |
| Fairfield County Hosp. Facilities Rev. (Fairfield Med. Ctr. Proj.) Series 2013, 5.25% 6/15/43 | | 5,000,000 | 5,027,636 |
| Franklin County Convention Facilities Auth. (Greater Columbus Convention Ctr. Hotel Expansion Proj.) Series 2019: | | | |
| 5% 12/1/44 | | 2,500,000 | 2,523,197 |
| 5% 12/1/51 | | 6,000,000 | 6,011,951 |
| Franklin County Convention Facilities Auth. Tax & Lease Rev. Series 2014: | | | |
| 5% 12/1/25 | | 1,250,000 | 1,330,011 |
| 5% 12/1/26 | | 3,045,000 | 3,232,544 |
| Franklin County Hosp. Facilities Rev.: | | | |
| (Ohiohealth Corp. Proj.) Series 2015, 5% 5/15/40 | | 3,600,000 | 3,722,920 |
| Bonds (U.S. Health Corp. of Columbus Proj.) Series 2011 B, 5%, tender 5/15/23 (c) | | 2,580,000 | 2,651,937 |
| Series 2016 C: | | | |
| 4% 11/1/40 | | 3,000,000 | 2,965,664 |
| 5% 11/1/33 | | 2,610,000 | 2,803,071 |
| 5% 11/1/34 | | 2,155,000 | 2,306,236 |
| Franklin County Ohio Sales Tax R Series 2018, 5% 6/1/48 | | 5,920,000 | 6,415,918 |
| Franklin County Rev. (Trinity Health Proj.) Series 2017, 5% 12/1/47 | | 720,000 | 752,576 |
| Hamilton County Convention Facilities Auth. Rev. Series 2014: | | | |
| 5% 12/1/26 | | 1,000,000 | 1,036,804 |
| 5% 12/1/27 | | 3,825,000 | 3,964,157 |
| Hamilton County Healthcare Rev. (Life Enriching Cmntys. Proj.) Series 2016: | | | |
| 5% 1/1/31 | | 1,350,000 | 1,351,274 |
| 5% 1/1/36 | | 3,450,000 | 3,396,807 |
| Hamilton County Hosp. Facilities Rev. Series 2014, 5% 2/1/44 | | 775,000 | 783,506 |
| Kent State Univ. Revs.: | | | |
| Series 2016, 5% 5/1/30 | | 1,125,000 | 1,217,469 |
| Series 2020 A: | | | |
| 5% 5/1/45 | | 1,250,000 | 1,353,367 |
| 5% 5/1/50 | | 1,700,000 | 1,831,460 |
| Lake County Hosp. Facilities Rev. Series 2015, 5% 8/15/27 (Pre-Refunded to 8/15/25 @ 100) | | 770,000 | 831,620 |
| Lakewood City School District Series 2014 C, 5% 12/1/25 | | 1,300,000 | 1,389,524 |
| Lancaster Port Auth. Gas Rev.: | | | |
| Bonds Series 2019, 5%, tender 2/1/25 (c) | | 6,235,000 | 6,539,389 |
| Series 2019, 5% 8/1/24 | | 655,000 | 683,859 |
| Miami County Hosp. Facilities Rev. (Kettering Health Network Obligated Group Proj.) Series 2019: | | | |
| 5% 8/1/45 | | 5,500,000 | 5,748,884 |
| 5% 8/1/49 | | 1,750,000 | 1,823,118 |
| Miami Univ. Series 2022 A: | | | |
| 5% 9/1/25 | | 780,000 | 841,320 |
| 5% 9/1/26 | | 820,000 | 900,364 |
| 5% 9/1/27 | | 575,000 | 641,440 |
| 5% 9/1/28 | | 520,000 | 585,063 |
| 5% 9/1/29 | | 545,000 | 619,892 |
| 5% 9/1/30 | | 500,000 | 573,902 |
| 5% 9/1/31 | | 700,000 | 809,851 |
| 5% 9/1/32 | | 735,000 | 844,356 |
| 5% 9/1/33 | | 780,000 | 892,608 |
| 5% 9/1/34 | | 1,000,000 | 1,141,553 |
| Miamisburg City School District Series 2016: | | | |
| 5% 12/1/28 (Pre-Refunded to 12/1/25 @ 100) | | 500,000 | 546,465 |
| 5% 12/1/29 (Pre-Refunded to 12/1/25 @ 100) | | 300,000 | 327,879 |
| Milford Exempt Village School District Series 2015: | | | |
| 3.5% 12/1/31 | | 500,000 | 503,352 |
| 5% 12/1/28 | | 1,400,000 | 1,497,554 |
| Montgomery County Hosp. Rev. (Kettering Health Network Obligated Group Proj.) Series 2021: | | | |
| 4% 8/1/37 | | 1,125,000 | 1,109,123 |
| 4% 8/1/41 | | 850,000 | 822,912 |
| 4% 8/1/51 | | 2,000,000 | 1,867,326 |
| 5% 8/1/32 | | 750,000 | 816,203 |
| 5% 8/1/36 | | 1,225,000 | 1,319,932 |
| 5% 8/1/38 | | 1,000,000 | 1,072,647 |
| 5% 8/1/39 | | 1,100,000 | 1,177,618 |
| Muskingum County Hosp. Facilities (Genesis Healthcare Sys. Obligated Group Proj.) Series 2013: | | | |
| 5% 2/15/44 | | 4,005,000 | 3,932,828 |
| 5% 2/15/48 | | 3,495,000 | 3,386,509 |
| Ohio Cap. Facilities Lease (Ohio Gen. Oblig. Proj.) Series 2017 A: | | | |
| 5% 10/1/32 | | 1,625,000 | 1,788,645 |
| 5% 10/1/33 | | 1,500,000 | 1,640,374 |
| 5% 10/1/35 | | 1,450,000 | 1,581,293 |
| 5% 10/1/36 | | 1,250,000 | 1,361,291 |
| 5% 10/1/37 | | 1,430,000 | 1,555,156 |
| Ohio Gen. Oblig.: | | | |
| Series 2016 A, 5% 2/1/31 | | 4,255,000 | 4,602,222 |
| Series 2021 A: | | | |
| 5% 3/1/40 | | 1,345,000 | 1,524,476 |
| 5% 3/1/41 | | 2,000,000 | 2,262,258 |
| Ohio Higher Edl. Facility Commission Rev.: | | | |
| (Case Western Reserve Univ. Proj.): | | | |
| Series 2016, 5% 12/1/40 | | 2,000,000 | 2,145,847 |
| Series 2019 B: | | | |
| 5% 12/1/37 | | 835,000 | 921,995 |
| 5% 12/1/38 | | 1,100,000 | 1,212,023 |
| 5% 12/1/39 | | 775,000 | 852,446 |
| (Denison Univ. 2015 Proj.) Series 2015: | | | |
| 5% 11/1/28 | | 1,465,000 | 1,566,771 |
| 5% 11/1/29 | | 1,325,000 | 1,412,934 |
| 5% 11/1/30 | | 2,285,000 | 2,432,145 |
| (Denison Univ. 2021 Proj.) Series 2021: | | | |
| 4% 11/1/39 | | 400,000 | 392,700 |
| 4% 11/1/45 | | 1,900,000 | 1,824,966 |
| 5% 11/1/30 | | 300,000 | 342,487 |
| 5% 11/1/33 | | 300,000 | 338,113 |
| 5% 11/1/35 | | 300,000 | 336,628 |
| 5% 11/1/41 | | 300,000 | 332,561 |
| (Denison Univ., Proj.) Series 2017 B, 5% 11/1/26 | | 1,505,000 | 1,651,427 |
| (Kenyon College 2015 Proj.) Series 2015, 5% 7/1/41 | | 3,100,000 | 3,177,260 |
| (Kenyon College 2020 Proj.) Series 2020: | | | |
| 5% 7/1/38 | | 2,500,000 | 2,665,888 |
| 5% 7/1/39 | | 2,640,000 | 2,810,015 |
| (Kenyon College, Oh. Proj.) Series 2017: | | | |
| 4% 7/1/36 | | 400,000 | 386,118 |
| 4% 7/1/37 | | 450,000 | 426,909 |
| 5% 7/1/28 | | 400,000 | 428,958 |
| 5% 7/1/29 | | 735,000 | 783,083 |
| 5% 7/1/30 | | 300,000 | 318,378 |
| 5% 7/1/31 | | 400,000 | 422,457 |
| 5% 7/1/33 | | 650,000 | 683,189 |
| 5% 7/1/35 | | 1,550,000 | 1,624,573 |
| 5% 7/1/42 | | 1,400,000 | 1,453,882 |
| (Otterbein Univ. 2022 Proj.) Series 2022 A, 4% 12/1/46 | | 1,250,000 | 1,139,742 |
| (The College of Wooster 2018 Proj.) Series 2018: | | | |
| 5% 9/1/33 | | 1,445,000 | 1,584,962 |
| 5% 9/1/45 | | 4,255,000 | 4,576,529 |
| (Univ. of Dayton 2018 Proj.) Series A, 5% 12/1/48 | | 1,000,000 | 1,048,308 |
| (Univ. of Dayton 2020 Proj.) Series 2020: | | | |
| 4% 2/1/36 | | 900,000 | 878,494 |
| 5% 2/1/34 | | 1,000,000 | 1,086,222 |
| 5% 2/1/35 | | 800,000 | 867,238 |
| (Univ. of Dayton Proj.): | | | |
| Series 2013: | | | |
| 5% 12/1/24 | | 585,000 | 593,153 |
| 5% 12/1/25 | | 1,000,000 | 1,013,936 |
| 5% 12/1/26 | | 1,195,000 | 1,211,654 |
| 5% 12/1/27 | | 2,300,000 | 2,332,053 |
| Series 2018 B: | | | |
| 4% 12/1/33 | | 1,155,000 | 1,153,003 |
| 5% 12/1/25 | | 1,065,000 | 1,136,479 |
| 5% 12/1/27 | | 1,000,000 | 1,087,826 |
| 5% 12/1/29 | | 1,310,000 | 1,419,491 |
| 5% 12/1/31 | | 1,130,000 | 1,214,824 |
| 5% 12/1/35 | | 1,000,000 | 1,066,241 |
| 5% 12/1/36 | | 1,000,000 | 1,064,696 |
| (Xavier Univ. Proj.) Series 2015 C: | | | |
| 5% 5/1/26 | | 1,000,000 | 1,057,304 |
| 5% 5/1/28 | | 1,000,000 | 1,051,313 |
| 5% 5/1/29 | | 855,000 | 897,768 |
| 5% 5/1/31 | | 1,005,000 | 1,050,807 |
| Bonds (Case Western Reserve Univ. Proj.) Series 2019 C, 1.625%, tender 12/1/26 (c) | | 5,000,000 | 4,802,124 |
| Series 2019, 4% 10/1/49 | | 3,270,000 | 2,896,235 |
| Ohio Hosp. Facilities Rev.: | | | |
| Series 2017 A, 5% 1/1/32 | | 2,000,000 | 2,205,034 |
| Series 2019 B, 4% 1/1/40 | | 3,000,000 | 2,981,688 |
| Series 2021 B: | | | |
| 5% 1/1/30 | | 2,500,000 | 2,867,150 |
| 5% 1/1/31 | | 2,180,000 | 2,515,099 |
| 5% 1/1/32 | | 1,580,000 | 1,831,841 |
| 5% 1/1/33 | | 2,410,000 | 2,725,253 |
| 5% 1/1/34 | | 2,425,000 | 2,732,917 |
| 5% 1/1/35 | | 230,000 | 258,572 |
| 5% 1/1/36 | | 540,000 | 605,803 |
| 5% 1/1/37 | | 250,000 | 279,489 |
| 5% 1/1/38 | | 855,000 | 951,178 |
| 5% 1/1/39 | | 925,000 | 1,023,734 |
| Ohio Hosp. Rev.: | | | |
| Series 2013 A, 5% 1/15/28 | | 720,000 | 729,704 |
| Series 2016 A, 5% 1/15/41 | | 5,000,000 | 5,188,724 |
| Series 2020 A, 4% 1/15/50 | | 1,000,000 | 932,719 |
| Series 2020: | | | |
| 4% 11/15/37 | | 1,025,000 | 958,430 |
| 4% 11/15/39 | | 1,115,000 | 1,037,406 |
| 4% 11/15/41 | | 1,175,000 | 1,080,850 |
| 5% 11/15/33 | | 1,270,000 | 1,355,038 |
| 5% 11/15/35 | | 1,465,000 | 1,556,630 |
| Ohio Hsg. Fin. Agcy. Residential Mtg. Rev.: | | | |
| (Mtg. Backed Securities Prog.): | | | |
| Series 2017 B, 4.5% 3/1/47 (a) | | 380,000 | 389,009 |
| Series 2019 B, 4.5% 3/1/50 | | 5,095,000 | 5,234,830 |
| (Mtg.-Backed Securities Prog.) Series 2022 A: | | | |
| 5% 3/1/30 | | 400,000 | 451,242 |
| 5% 3/1/31 | | 600,000 | 681,931 |
| 5% 9/1/31 | | 640,000 | 729,992 |
| Series 2021 C, 3.25% 3/1/51 | | 7,990,000 | 7,866,583 |
| Series 2022 B, 5% 3/1/52 | | 3,000,000 | 3,177,368 |
| Ohio Parks & Recreation Cap. Facilities (Parks and Recreation Impt. Fund Proj.) Series 2022 A: | | | |
| 5% 12/1/27 | | 1,325,000 | 1,493,177 |
| 5% 12/1/28 | | 1,325,000 | 1,511,822 |
| 5% 12/1/29 | | 1,500,000 | 1,731,858 |
| 5% 12/1/30 | | 1,600,000 | 1,866,565 |
| 5% 12/1/31 | | 1,000,000 | 1,175,548 |
| Ohio Spl. Oblig.: | | | |
| (Administrative Bldg. Fund Projs.) Series 2020 B, 5% 4/1/39 | | 1,865,000 | 2,074,721 |
| (Ohio Gen. Oblig. Proj.) Series 2017 A: | | | |
| 5% 4/1/29 | | 2,535,000 | 2,812,035 |
| 5% 4/1/30 | | 2,250,000 | 2,481,080 |
| 5% 4/1/31 | | 2,000,000 | 2,196,057 |
| 5% 4/1/32 | | 1,115,000 | 1,218,600 |
| 5% 4/1/33 | | 1,850,000 | 2,009,075 |
| 5% 4/1/34 | | 1,000,000 | 1,084,607 |
| 5% 4/1/35 | | 2,395,000 | 2,594,335 |
| Series 2020 A: | | | |
| 5% 2/1/29 | | 2,875,000 | 3,287,336 |
| 5% 2/1/30 | | 1,045,000 | 1,208,670 |
| Series 2021 A: | | | |
| 5% 4/1/34 | | 1,430,000 | 1,637,722 |
| 5% 4/1/35 | | 1,660,000 | 1,896,887 |
| 5% 4/1/37 | | 1,680,000 | 1,905,239 |
| 5% 4/1/38 | | 1,000,000 | 1,127,244 |
| 5% 4/1/39 | | 1,000,000 | 1,124,997 |
| 5% 4/1/40 | | 1,110,000 | 1,241,548 |
| 5% 4/1/41 | | 750,000 | 837,309 |
| Ohio State Univ. Gen. Receipts Series 2013 A: | | | |
| 5% 6/1/28 | | 2,000,000 | 2,046,464 |
| 5% 6/1/38 | | 3,500,000 | 3,561,070 |
| Ohio Tpk. Commission Tpk. Rev.: | | | |
| (Infrastructure Proj.) Series 2005 A, 0% 2/15/43 | | 10,000,000 | 3,978,734 |
| (Infrastructure Projs.): | | | |
| Series 2022 A, 5% 2/15/39 (b) | | 5,730,000 | 6,386,761 |
| Series A3, 0% 2/15/37 | | 400,000 | 159,876 |
| Series A, 5% 2/15/46 | | 7,500,000 | 8,309,141 |
| Ohio Wtr. Dev. Auth. Rev. (Fresh Wtr. Impt. Proj.) Series 2009 B, 5% 12/1/24 | | 1,025,000 | 1,087,843 |
| Olentangy Local School District Series 2016, 5% 12/1/32 | | 1,275,000 | 1,372,589 |
| Port Auth. Econ. Dev. Rev.: | | | |
| (Univ. of Northwestern Ohio Proj.) Series 2021, 4% 12/1/35 | | 1,300,000 | 1,215,265 |
| Series 2021, 4% 12/1/31 | | 710,000 | 693,752 |
| Reynoldsburg City School District Series 2015, 4% 12/1/30 | | 2,375,000 | 2,465,078 |
| Ross County Hosp. Facilities Rev. (Adena Health Sys. Obligated Group Proj.) Series 2019, 5% 12/1/49 | | 2,000,000 | 2,081,168 |
| Scioto County Hosp. Facilities Rev. Series 2016: | | | |
| 5% 2/15/24 | | 1,000,000 | 1,046,045 |
| 5% 2/15/28 | | 5,030,000 | 5,314,061 |
| 5% 2/15/30 | | 3,860,000 | 4,038,274 |
| 5% 2/15/32 | | 2,550,000 | 2,650,557 |
| 5% 2/15/33 | | 2,460,000 | 2,550,709 |
| 5% 2/15/34 | | 4,450,000 | 4,607,784 |
| Univ. of Akron Gen. Receipts Series 2016 A: | | | |
| 5% 1/1/25 | | 1,025,000 | 1,086,158 |
| 5% 1/1/33 | | 5,000,000 | 5,379,473 |
| Univ. of Cincinnati Gen. Receipts: | | | |
| Series 2012 C, 4% 6/1/28 | | 10,000 | 10,048 |
| Series 2016 A: | | | |
| 5% 6/1/32 | | 745,000 | 797,824 |
| 5% 6/1/33 | | 800,000 | 853,684 |
| 5% 6/1/34 | | 585,000 | 622,264 |
| Series 2016 C, 5% 6/1/41 | | 2,585,000 | 2,726,350 |
| Univ. of Toledo Gen. Receipts Series 2018 A: | | | |
| 5% 6/1/26 | | 600,000 | 647,591 |
| 5% 6/1/27 | | 350,000 | 382,536 |
| Village of Bluffton Hosp. Facilities Blanchard Valley Reg Health Ctr. Series 2017: | | | |
| 4% 12/1/32 | | 1,500,000 | 1,508,468 |
| 5% 12/1/25 | | 1,500,000 | 1,609,239 |
| 5% 12/1/26 | | 1,890,000 | 2,049,656 |
| 5% 12/1/27 | | 1,340,000 | 1,462,550 |
| 5% 12/1/28 | | 1,400,000 | 1,519,356 |
| 5% 12/1/29 | | 825,000 | 889,480 |
| 5% 12/1/30 | | 1,700,000 | 1,821,536 |
| 5% 12/1/31 | | 750,000 | 799,317 |
| Wood County Hosp. Facilities Rev. (Wood County Hosp. Proj.) Series 2012, 5% 12/1/32 (Pre-Refunded to 12/1/22 @ 100) | | 105,000 | 106,528 |
| Wright State Univ. Gen. Receipts: | | | |
| Series 2021 A, 5% 5/1/26 (Build America Mutual Assurance Insured) | | 1,100,000 | 1,199,607 |
| Series 2022 A: | | | |
| 5% 5/1/24 (Build America Mutual Assurance Insured) | | 540,000 | 568,010 |
| 5% 5/1/25 (Build America Mutual Assurance Insured) | | 490,000 | 525,148 |
| 5% 5/1/26 (Build America Mutual Assurance Insured) | | 520,000 | 567,087 |
| 5% 5/1/27 (Build America Mutual Assurance Insured) | | 545,000 | 602,768 |
| 5% 5/1/28 (Build America Mutual Assurance Insured) | | 565,000 | 632,107 |
| 5% 5/1/29 (Build America Mutual Assurance Insured) | | 600,000 | 677,752 |
| 5% 5/1/30 (Build America Mutual Assurance Insured) | | 235,000 | 266,648 |
| 5% 5/1/31 (Build America Mutual Assurance Insured) | | 250,000 | 286,538 |
| 5% 5/1/32 (Build America Mutual Assurance Insured) | | 260,000 | 300,339 |
|
| TOTAL OHIO | | | 550,872,008 |
|
| Puerto Rico - 0.6% | | | |
| Puerto Rico Commonwealth Pub. Impt. Gen. Oblig. Series 2021 A1: | | | |
| 0% 7/1/33 | | 1,634,241 | 917,928 |
| 5.625% 7/1/27 | | 190,000 | 202,115 |
| 5.625% 7/1/29 | | 590,000 | 633,517 |
| 5.75% 7/1/31 | | 1,395,000 | 1,523,430 |
|
| TOTAL PUERTO RICO | | | 3,276,990 |
|
| TOTAL MUNICIPAL BONDS | | | |
| (Cost $582,022,853) | | | 555,453,968 |
| TOTAL INVESTMENT IN SECURITIES - 96.2% | | | |
| (Cost $582,022,853) | | | 555,453,968 |
| NET OTHER ASSETS (LIABILITIES) - 3.8% | | | 21,893,731 |
| NET ASSETS - 100% | | | $577,347,699 |
Legend
(a) Private activity obligations whose interest is subject to the federal alternative minimum tax for individuals.
(b) Security or a portion of the security purchased on a delayed delivery or when-issued basis.
(c) Coupon rates for floating and adjustable rate securities reflect the rates in effect at period end.
Investment Valuation
The following is a summary of the inputs used, as of June 30, 2022, involving the Fund's assets and liabilities carried at fair value. The inputs or methodology used for valuing securities may not be an indication of the risk associated with investing in those securities. For more information on valuation inputs, and their aggregation into the levels used below, please refer to the Investment Valuation section in the accompanying Notes to Financial Statements.
| | Valuation Inputs at Reporting Date: |
| Description | Total | Level 1 | Level 2 | Level 3 |
| Investments in Securities: | | | | |
| Municipal Securities | $555,453,968 | $-- | $555,453,968 | $-- |
| Total Investments in Securities: | $555,453,968 | $-- | $555,453,968 | $-- |
Other Information
The distribution of municipal securities by revenue source, as a percentage of total Net Assets, is as follows (Unaudited):
| Health Care | 30.9% |
| Education | 20.1% |
| General Obligations | 17.3% |
| Special Tax | 9.8% |
| Other * | 5.2% |
| Others (Individually Less Than 5%) | 16.7% |
| | 100.0% |
* Includes net other assets
See accompanying notes which are an integral part of the financial statements.
Fidelity® Ohio Municipal Income Fund
Financial Statements
Statement of Assets and Liabilities
| | | June 30, 2022 (Unaudited) |
| Assets | | |
Investment in securities, at value — See accompanying schedule:
Unaffiliated issuers (cost $582,022,853) | | $555,453,968 |
| Cash | | 31,955,134 |
| Receivable for fund shares sold | | 184,913 |
| Interest receivable | | 6,073,144 |
| Other receivables | | 1,359 |
| Total assets | | 593,668,518 |
| Liabilities | | |
| Payable for investments purchased on a delayed delivery basis | $15,433,022 | |
| Payable for fund shares redeemed | 278,039 | |
| Distributions payable | 355,044 | |
| Accrued management fee | 167,611 | |
| Other affiliated payables | 63,688 | |
| Other payables and accrued expenses | 23,415 | |
| Total liabilities | | 16,320,819 |
| Net Assets | | $577,347,699 |
| Net Assets consist of: | | |
| Paid in capital | | $605,096,528 |
| Total accumulated earnings (loss) | | (27,748,829) |
| Net Assets | | $577,347,699 |
| Net Asset Value, offering price and redemption price per share ($577,347,699 ÷ 51,454,223 shares) | | $11.22 |
See accompanying notes which are an integral part of the financial statements.
Statement of Operations
| | | Six months ended June 30, 2022 (Unaudited) |
| Investment Income | | |
| Interest | | $8,203,339 |
| Expenses | | |
| Management fee | $1,104,206 | |
| Transfer agent fees | 333,277 | |
| Accounting fees and expenses | 75,344 | |
| Custodian fees and expenses | 4,902 | |
| Independent trustees' fees and expenses | 997 | |
| Registration fees | 17,820 | |
| Audit | 24,488 | |
| Legal | 310 | |
| Miscellaneous | 1,295 | |
| Total expenses before reductions | 1,562,639 | |
| Expense reductions | (10,407) | |
| Total expenses after reductions | | 1,552,232 |
| Net investment income (loss) | | 6,651,107 |
| Realized and Unrealized Gain (Loss) | | |
| Net realized gain (loss) on: | | |
| Investment securities: | | |
| Unaffiliated issuers | | (1,266,434) |
| Total net realized gain (loss) | | (1,266,434) |
| Change in net unrealized appreciation (depreciation) on investment securities | | (67,082,010) |
| Net gain (loss) | | (68,348,444) |
| Net increase (decrease) in net assets resulting from operations | | $(61,697,337) |
See accompanying notes which are an integral part of the financial statements.
Statement of Changes in Net Assets
| | Six months ended June 30, 2022 (Unaudited) | Year ended December 31, 2021 |
| Increase (Decrease) in Net Assets | | |
| Operations | | |
| Net investment income (loss) | $6,651,107 | $14,475,478 |
| Net realized gain (loss) | (1,266,434) | 253,604 |
| Change in net unrealized appreciation (depreciation) | (67,082,010) | (3,814,007) |
| Net increase (decrease) in net assets resulting from operations | (61,697,337) | 10,915,075 |
| Distributions to shareholders | (6,649,886) | (14,819,628) |
| Share transactions | | |
| Proceeds from sales of shares | 94,845,439 | 107,404,517 |
| Reinvestment of distributions | 4,288,765 | 9,334,614 |
| Cost of shares redeemed | (170,685,053) | (97,656,138) |
| Net increase (decrease) in net assets resulting from share transactions | (71,550,849) | 19,082,993 |
| Total increase (decrease) in net assets | (139,898,072) | 15,178,440 |
| Net Assets | | |
| Beginning of period | 717,245,771 | 702,067,331 |
| End of period | $577,347,699 | $717,245,771 |
| Other Information | | |
| Shares | | |
| Sold | 8,207,189 | 8,586,036 |
| Issued in reinvestment of distributions | 368,950 | 747,188 |
| Redeemed | (14,678,401) | (7,810,213) |
| Net increase (decrease) | (6,102,262) | 1,523,011 |
See accompanying notes which are an integral part of the financial statements.
Financial Highlights
Fidelity Ohio Municipal Income Fund
| | Six months ended (Unaudited) June 30, | Years endedDecember 31, | | | | |
| | 2022 | 2021 | 2020 | 2019 | 2018 | 2017 |
| Selected Per–Share Data | | | | | | |
| Net asset value, beginning of period | $12.46 | $12.53 | $12.38 | $11.89 | $12.20 | $11.91 |
| Income from Investment Operations | | | | | | |
| Net investment income (loss)A,B | .123 | .253 | .287 | .319 | .321 | .330 |
| Net realized and unrealized gain (loss) | (1.240) | (.064) | .235 | .515 | (.279) | .377 |
| Total from investment operations | (1.117) | .189 | .522 | .834 | .042 | .707 |
| Distributions from net investment income | (.123) | (.253) | (.287) | (.319) | (.321) | (.330) |
| Distributions from net realized gain | – | (.006) | (.085) | (.025) | (.031) | (.087) |
| Total distributions | (.123) | (.259) | (.372) | (.344) | (.352) | (.417) |
| Net asset value, end of period | $11.22 | $12.46 | $12.53 | $12.38 | $11.89 | $12.20 |
| Total ReturnC,D | (9.00)% | 1.52% | 4.28% | 7.08% | .39% | 6.03% |
| Ratios to Average Net AssetsB,E,F | | | | | | |
| Expenses before reductions | .50%G | .48% | .48% | .48% | .48% | .48% |
| Expenses net of fee waivers, if any | .49%G | .48% | .48% | .48% | .48% | .48% |
| Expenses net of all reductions | .49%G | .48% | .48% | .48% | .48% | .48% |
| Net investment income (loss) | 2.11%G | 2.02% | 2.31% | 2.60% | 2.70% | 2.73% |
| Supplemental Data | | | | | | |
| Net assets, end of period (000 omitted) | $577,348 | $717,246 | $702,067 | $672,948 | $616,306 | $677,359 |
| Portfolio turnover rateH | 18%G | 6% | 20% | 10% | 11% | 24% |
A Calculated based on average shares outstanding during the period.
B Net investment income (loss) is affected by the timing of the declaration of dividends by any underlying mutual funds or exchange-traded funds (ETFs). Net investment income (loss) of any such underlying funds is not included in the Fund's net investment income (loss) ratio.
C Total returns for periods of less than one year are not annualized.
D Total returns would have been lower if certain expenses had not been reduced during the applicable periods shown.
E Fees and expenses of any underlying mutual funds or exchange-traded funds (ETFs) are not included in the Fund's expense ratio. The Fund indirectly bears its proportionate share of these expenses.
F Expense ratios reflect operating expenses of the class. Expenses before reductions do not reflect amounts reimbursed, waived, or reduced through arrangements with the investment adviser, brokerage services, or other offset arrangements, if applicable, and do not represent the amount paid by the class during periods when reimbursements, waivers or reductions occur.
G Annualized
H Amount does not include the portfolio activity of any underlying mutual funds or exchange-traded funds (ETFs).
See accompanying notes which are an integral part of the financial statements.
Fidelity® Ohio Municipal Money Market Fund
Investment Summary/Performance (Unaudited)
Effective Maturity Diversification as of June 30, 2022
| Days | % of fund's investments 6/30/22 |
| 1 - 7 | 85.7 |
| 31 - 60 | 9.9 |
| 61 - 90 | 0.3 |
| 91 - 180 | 3.5 |
| > 180 | 0.6 |
Effective maturity is determined in accordance with the requirements of Rule 2a-7 under the Investment Company Act of 1940.
Asset Allocation (% of fund's net assets)
| As of June 30, 2022 |
| | Variable Rate Demand Notes (VRDNs) | 37.3% |
| | Tender Option Bond | 44.3% |
| | Other Municipal Security | 6.2% |
| | Investment Companies | 12.5% |
| | Net Other Assets (Liabilities)* | (0.3)% |
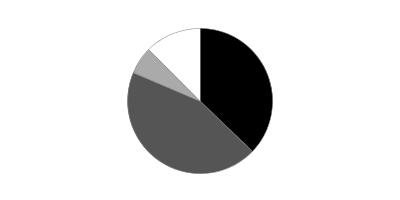
* Net Other Assets (Liabilities) are not included in the pie chart
Current 7-Day Yields
| | 6/30/22 |
| Fidelity® Ohio Municipal Money Market Fund | 0.45% |
Yield refers to the income paid by the Fund over a given period. Yield for money market funds is usually for seven-day periods, as it is here, though it is expressed as an annual percentage rate. Past performance is no guarantee of future results. Yield will vary and it's possible to lose money investing in the Fund.
Fidelity® Ohio Municipal Money Market Fund
Schedule of Investments June 30, 2022 (Unaudited)
Showing Percentage of Net Assets
| Variable Rate Demand Note - 37.3% | | | |
| | | Principal Amount | Value |
| Alabama - 0.8% | | | |
| Decatur Indl. Dev. Board Exempt Facilities Rev. (Nucor Steel Decatur LLC Proj.) Series 2003 A, 1.19% 7/7/22, VRDN (a)(b) | | $1,260,000 | $1,260,000 |
| West Jefferson Indl. Dev. Series 2008, 1.1% 7/7/22, VRDN (b) | | 200,000 | 200,000 |
| | | | 1,460,000 |
| Arkansas - 0.6% | | | |
| Blytheville Indl. Dev. Rev. (Nucor Corp. Proj.) Series 2002, 1.07% 7/7/22, VRDN (a)(b) | | 1,100,000 | 1,100,000 |
| Kansas - 0.6% | | | |
| Burlington Envir. Impt. Rev. (Kansas City Pwr. and Lt. Co. Proj.): | | | |
| Series 2007 A, 1.05% 7/7/22, VRDN (b) | | 300,000 | 300,000 |
| Series 2007 B, 1.05% 7/7/22, VRDN (b) | | 100,000 | 100,000 |
| St. Mary's Kansas Poll. Cont. Rev. (Kansas Gas and Elec. Co. Proj.) Series 1994, 1% 7/7/22, VRDN (b) | | 700,000 | 700,000 |
| | | | 1,100,000 |
| Louisiana - 0.2% | | | |
| Saint James Parish Gen. Oblig. (Nucor Steel Louisiana LLC Proj.) Series 2010 B1, 1.1% 7/7/22, VRDN (b) | | 300,000 | 300,000 |
| Nebraska - 0.4% | | | |
| Stanton County Indl. Dev. Rev. (Nucor Corp. Proj.) Series 1996, 1.19% 7/7/22, VRDN (a)(b) | | 700,000 | 700,000 |
| North Carolina - 0.1% | | | |
| Hertford County Indl. Facilities Poll. Cont. Fing. Auth. (Nucor Corp. Proj.) Series 2000 A, 1.07% 7/7/22, VRDN (a)(b) | | 200,000 | 200,000 |
| Ohio - 33.4% | | | |
| Cuyahoga County Health Care Facilities Rev. (The A.M. McGregor Home Proj.) Series 2014, 0.95% 7/7/22, LOC Northern Trust Co., VRDN (b) | | 11,735,000 | 11,735,000 |
| Franklin County Hosp. Facilities Rev.: | | | |
| Series 2009 B, 0.88% 7/7/22 (Liquidity Facility Barclays Bank PLC), VRDN (b) | | 2,400,000 | 2,400,000 |
| Series 2011 D, 0.85% 7/7/22, VRDN (b) | | 2,900,000 | 2,900,000 |
| Series 2013 B, 0.91% 7/7/22 (Liquidity Facility JPMorgan Chase Bank), VRDN (b) | | 3,000,000 | 3,000,000 |
| Series 2014, 0.91% 7/7/22 (Liquidity Facility JPMorgan Chase Bank), VRDN (b) | | 5,525,000 | 5,525,000 |
| Hamilton County Healthcare Facilities Rev. (The Children's Home of Cincinnati Proj.) Series 2009, 1.03% 7/7/22, LOC U.S. Bank NA, Cincinnati, VRDN (b) | | 2,435,000 | 2,435,000 |
| Hamilton County Hosp. Facilities Rev. Series 2018 Z, 0.89% 7/7/22, VRDN (b) | | 5,200,000 | 5,200,000 |
| Hamilton County Student Hsg. Rev. (Block 3 Proj.) Series 2004, 0.95% 7/7/22, LOC Citizens Bank NA, VRDN (b) | | 12,970,000 | 12,970,000 |
| Ohio Hsg. Fin. Agcy. Residential Mtg. Rev. Series 2016 H, 0.94% 7/7/22 (Liquidity Facility Fed. Home Ln. Bank, Cincinnati), VRDN (a)(b) | | 6,700,000 | 6,700,000 |
| Ohio Spl. Oblig. Series 2016 B, 0.9% 7/7/22, VRDN (b) | | 6,000,000 | 6,000,000 |
| | | | 58,865,000 |
| West Virginia - 1.2% | | | |
| West Virginia Econ. Dev. Auth. Solid Waste Disp. Facilities Rev.: | | | |
| (Appalachian Pwr. Co. Amos Proj.) Series 2008 B, 1.02% 7/7/22, VRDN (a)(b) | | 100,000 | 100,000 |
| (Appalachian Pwr. Co.- Mountaineer Proj.) Series 2008 A, 1% 7/7/22, VRDN (a)(b) | | 2,000,000 | 2,000,000 |
| | | | 2,100,000 |
| TOTAL VARIABLE RATE DEMAND NOTE | | | |
| (Cost $65,825,000) | | | 65,825,000 |
|
| Tender Option Bond - 44.3% | | | |
| Colorado - 0.0% | | | |
| Denver City & County Arpt. Rev. Bonds Series G-114, 1.16%, tender 12/1/22 (Liquidity Facility Royal Bank of Canada) (a)(b)(c)(d)(e) | | 100,000 | 100,000 |
| Connecticut - 0.3% | | | |
| Connecticut Gen. Oblig. Participating VRDN Series Floaters 016, 1.03% 8/11/22 (Liquidity Facility Barclays Bank PLC) (b)(c)(e) | | 400,000 | 400,000 |
| Connecticut Spl. Tax Oblig. Trans. Infrastructure Rev. Bonds Series Floaters G 110, 1.09%, tender 10/3/22 (Liquidity Facility Royal Bank of Canada) (b)(c)(d)(e) | | 200,000 | 200,000 |
| | | | 600,000 |
| Florida - 0.2% | | | |
| Greater Orlando Aviation Auth. Arpt. Facilities Rev. Bonds Series Floaters G 25, 1.16%, tender 10/3/22 (Liquidity Facility Royal Bank of Canada) (a)(b)(c)(d)(e) | | 100,000 | 100,000 |
| Lee County Arpt. Rev. Participating VRDN Series XF 11 26, 0.98% 7/7/22 (Liquidity Facility Deutsche Bank AG New York Branch) (a)(b)(c)(e) | | 100,000 | 100,000 |
| Tampa-Hillsborough County Expressway Auth. Rev. Bonds Series G-113, 1.11%, tender 7/1/22 (Liquidity Facility Royal Bank of Canada) (b)(c)(d)(e) | | 100,000 | 100,000 |
| | | | 300,000 |
| Kentucky - 0.2% | | | |
| CommonSpirit Health Participating VRDN Series MIZ 90 21, 1.01% 7/7/22 (Liquidity Facility Mizuho Cap. Markets LLC) (b)(c)(e) | | 200,000 | 200,000 |
| Kentucky State Property & Buildings Commission Rev. Bonds Series G 116, 1.11%, tender 11/1/22 (Liquidity Facility Royal Bank of Canada) (b)(c)(d)(e) | | 100,000 | 100,000 |
| | | | 300,000 |
| Ohio - 43.2% | | | |
| Allen County Hosp. Facilities Rev. Participating VRDN: | | | |
| Series Floaters E 134, 0.94% 7/7/22 (Liquidity Facility Royal Bank of Canada) (b)(c)(e) | | 2,830,000 | 2,830,000 |
| Series Floaters XF 25 16, 1% 7/7/22 (Liquidity Facility Toronto-Dominion Bank) (b)(c)(e) | | 3,600,000 | 3,600,000 |
| CommonSpirit Health Participating VRDN Series MIZ 90 20, 1.01% 7/7/22 (Liquidity Facility Mizuho Cap. Markets LLC) (b)(c)(e) | | 2,100,000 | 2,100,000 |
| Cuyahoga County Ctfs. of Prtn. Participating VRDN Series Floaters XG 02 06, 1.01% 7/7/22 (Liquidity Facility Bank of America NA) (b)(c)(e) | | 4,100,000 | 4,100,000 |
| Euclid City School District Participating VRDN Series G-39, 0.94% 7/7/22 (Liquidity Facility Royal Bank of Canada) (b)(c)(e) | | 2,100,000 | 2,100,000 |
| Franklin County Hosp. Facilities Rev. Participating VRDN Series 15 XF0244, 0.96% 7/7/22 (Liquidity Facility Toronto-Dominion Bank) (b)(c)(e) | | 2,670,000 | 2,670,000 |
| Miami County Hosp. Facilities Rev. Participating VRDN Series Floaters XG 02 25, 0.95% 7/7/22 (Liquidity Facility Royal Bank of Canada) (b)(c)(e) | | 6,000,000 | 6,000,000 |
| Middletown Hosp. Facilities Rev. Participating VRDN Series Floaters 003, 1.03% 8/11/22 (Liquidity Facility Barclays Bank PLC) (b)(c)(e) | | 7,900,000 | 7,900,000 |
| Montgomery County Hosp. Rev. Participating VRDN: | | | |
| Series Floaters E 132, 0.94% 7/7/22 (Liquidity Facility Royal Bank of Canada) (b)(c)(e) | | 6,800,000 | 6,800,000 |
| Series XX 11 33, 0.95% 7/7/22 (Liquidity Facility Barclays Bank PLC) (b)(c)(e) | | 865,000 | 865,000 |
| Northeast Ohio Reg'l. Swr. District Wastewtr. Rev. Participating VRDN: | | | |
| Series Floaters XF 07 18, 0.94% 7/7/22 (Liquidity Facility JPMorgan Chase Bank) (b)(c)(e) | | 3,750,000 | 3,750,000 |
| Series Floaters ZF 06 70, 0.94% 7/7/22 (Liquidity Facility Bank of America NA) (b)(c)(e) | | 3,100,000 | 3,100,000 |
| Ohio Gen. Oblig. Participating VRDN Series Floaters XF 25 91, 0.94% 7/7/22 (Liquidity Facility Citibank NA) (b)(c)(e) | | 2,000,000 | 2,000,000 |
| Ohio Higher Edl. Facility Commission Rev. Participating VRDN Series XG 00 69, 0.97% 7/7/22 (Liquidity Facility Deutsche Bank AG New York Branch) (b)(c)(e) | | 3,750,000 | 3,750,000 |
| Ohio Hosp. Rev. Participating VRDN: | | | |
| Series 002, 1.03% 8/11/22 (Liquidity Facility Barclays Bank PLC) (b)(c)(e) | | 3,300,000 | 3,300,000 |
| Series 2021 XG 03 39, 0.96% 7/7/22 (Liquidity Facility Bank of America NA) (b)(c)(e) | | 1,250,000 | 1,250,000 |
| Series C18, 0.95% 7/7/22 (Liquidity Facility Royal Bank of Canada) (b)(c)(e) | | 1,800,000 | 1,800,000 |
| Series XF 09 67, 0.96% 7/7/22 (Liquidity Facility Toronto-Dominion Bank) (b)(c)(e) | | 2,100,000 | 2,100,000 |
| Ohio Hsg. Fin. Agcy. Residential Mtg. Rev. Participating VRDN Series Floaters XF 27 83, 0.94% 7/7/22 (Liquidity Facility Morgan Stanley Bank, West Valley City Utah) (b)(c)(e) | | 2,075,000 | 2,075,000 |
| Ohio Univ. Gen. Receipts Athens Bonds Series Floaters G 27, 1.11%, tender 12/1/22 (Liquidity Facility Royal Bank of Canada) (b)(c)(d)(e) | | 2,000,000 | 2,000,000 |
| Univ. of Cincinnati Gen. Receipts Participating VRDN: | | | |
| Series Floaters XF 24 38, 0.94% 7/7/22 (Liquidity Facility JPMorgan Chase Bank) (b)(c)(e) | | 4,000,000 | 4,000,000 |
| Series Floaters ZM 06 46, 0.94% 7/7/22 (Liquidity Facility Wells Fargo Bank NA) (b)(c)(e) | | 4,200,000 | 4,200,000 |
| Upper Arlington City School District Participating VRDN Series Floaters XF 25 92, 0.96% 7/7/22 (Liquidity Facility Citibank NA) (b)(c)(e) | | 4,000,000 | 4,000,000 |
| | | | 76,290,000 |
| South Carolina - 0.0% | | | |
| South Carolina Trans. Infrastructure Bank Rev. Bonds Series Floaters G 109, 1.11%, tender 10/3/22 (Liquidity Facility Royal Bank of Canada) (b)(c)(d)(e) | | 100,000 | 100,000 |
| Tennessee - 0.1% | | | |
| Metropolitan Nashville Arpt. Auth. Rev. Participating VRDN Series 2021 XL 01 89, 0.98% 7/7/22 (Liquidity Facility Deutsche Bank AG New York Branch) (a)(b)(c)(e) | | 100,000 | 100,000 |
| Virginia - 0.3% | | | |
| Suffolk Econ. Dev. Auth. Hosp. Facilities Rev. Participating VRDN Series MIZ 90 25, 1% 7/7/22 (Liquidity Facility Mizuho Cap. Markets LLC) (b)(c)(e) | | 390,000 | 390,000 |
| Virginia Pub. Bldg. Auth. Pub. Facilities Rev. Bonds Series Floaters G 40, 1.11%, tender 2/1/23 (Liquidity Facility Royal Bank of Canada) (b)(c)(d)(e) | | 100,000 | 100,000 |
| | | | 490,000 |
| TOTAL TENDER OPTION BOND | | | |
| (Cost $78,280,000) | | | 78,280,000 |
|
| Other Municipal Security - 6.2% | | | |
| Ohio - 6.2% | | | |
| Allen County Hosp. Facilities Rev. Bonds Series 2017 A, 5% 8/1/22 | | 1,600,000 | 1,605,403 |
| American Muni. Pwr. BAN: | | | |
| (Village of Carey Proj.) Series 2021, 1.25% 11/30/22 (Ohio Gen. Oblig. Guaranteed) | | 1,305,000 | 1,310,215 |
| (Village of Pioneer Proj.) Series 2021, 1.25% 12/1/22 (Ohio Gen. Oblig. Guaranteed) | | 1,315,000 | 1,320,290 |
| Series 2021, 1% 8/11/22 (Ohio Gen. Oblig. Guaranteed) | | 1,220,000 | 1,221,136 |
| County of Cuyahoga Bonds (Ballpark Impt. Proj.) Series 2022 A, 4% 1/1/23 | | 1,000,000 | 1,011,913 |
| Middleburg Heights Hosp. Rev. Bonds Series 2012 A, 5% 8/1/22 (Pre-Refunded to 8/1/22 @ 100) | | 1,500,000 | 1,504,548 |
| Ohio Higher Edl. Facility Commission Rev. Bonds Series 2022 B6, 1.15% tender 8/8/22, CP mode | | 1,500,000 | 1,500,000 |
| Toledo City School District Bonds Series 2022, 2% 12/1/22 | | 1,000,000 | 1,004,929 |
| Union Township Clermont County Gen. Oblig. BAN Series 2021, 0.5% 8/31/22 (Ohio Gen. Oblig. Guaranteed) | | 480,000 | 480,224 |
| TOTAL OTHER MUNICIPAL SECURITY | | | |
| (Cost $10,958,658) | | | 10,958,658 |
| | | Shares | Value |
|
| Investment Company - 12.5% | | | |
| Fidelity Municipal Cash Central Fund 0.88% (f)(g) | | | |
| (Cost $22,059,049) | | 22,055,111 | 22,059,049 |
| TOTAL INVESTMENT IN SECURITIES - 100.3% | | | |
| (Cost $177,122,707) | | | 177,122,707 |
| NET OTHER ASSETS (LIABILITIES) - (0.3)% | | | (596,048) |
| NET ASSETS - 100% | | | $176,526,659 |
Security Type Abbreviations
BAN – BOND ANTICIPATION NOTE
CP – COMMERCIAL PAPER
VRDN – VARIABLE RATE DEMAND NOTE (A debt instrument that is payable upon demand, either daily, weekly or monthly)
The date shown for securities represents the date when principal payments must be paid, taking into account any call options exercised by the issuer and any permissible maturity shortening features other than interest rate resets.
Legend
(a) Private activity obligations whose interest is subject to the federal alternative minimum tax for individuals.
(b) Coupon rates for floating and adjustable rate securities reflect the rates in effect at period end.
(c) Provides evidence of ownership in one or more underlying municipal bonds.
(d) Restricted securities (including private placements) - Investment in securities not registered under the Securities Act of 1933 (excluding 144A issues). At the end of the period, the value of restricted securities (excluding 144A issues) amounted to $2,800,000 or 1.6% of net assets.
(e) Coupon rates are determined by re-marketing agents based on current market conditions.
(f) Information in this report regarding holdings by state and security types does not reflect the holdings of the Fidelity Municipal Cash Central Fund.
(g) Affiliated fund that is generally available only to investment companies and other accounts managed by Fidelity Investments. The rate quoted is the annualized seven-day yield of the fund at period end. A complete unaudited listing of the fund's holdings as of its most recent quarter end is available upon request. In addition, each Fidelity Central Fund's financial statements are available on the SEC's website or upon request.
Additional information on each restricted holding is as follows:
| Security | Acquisition Date | Cost |
| Connecticut Spl. Tax Oblig. Trans. Infrastructure Rev. Bonds Series Floaters G 110, 1.09%, tender 10/3/22 (Liquidity Facility Royal Bank of Canada) | 4/1/21 | $200,000 |
| Denver City & County Arpt. Rev. Bonds Series G-114, 1.16%, tender 12/1/22 (Liquidity Facility Royal Bank of Canada) | 6/1/21 | $100,000 |
| Greater Orlando Aviation Auth. Arpt. Facilities Rev. Bonds Series Floaters G 25, 1.16%, tender 10/3/22 (Liquidity Facility Royal Bank of Canada) | 4/1/21 | $100,000 |
| Kentucky State Property & Buildings Commission Rev. Bonds Series G 116, 1.11%, tender 11/1/22 (Liquidity Facility Royal Bank of Canada) | 5/3/21 | $100,000 |
| Ohio Univ. Gen. Receipts Athens Bonds Series Floaters G 27, 1.11%, tender 12/1/22 (Liquidity Facility Royal Bank of Canada) | 6/1/21 | $2,000,000 |
| South Carolina Trans. Infrastructure Bank Rev. Bonds Series Floaters G 109, 1.11%, tender 10/3/22 (Liquidity Facility Royal Bank of Canada) | 4/1/21 | $100,000 |
| Tampa-Hillsborough County Expressway Auth. Rev. Bonds Series G-113, 1.11%, tender 7/7/22 (Liquidity Facility Royal Bank of Canada) | 7/1/21 | $100,000 |
| Virginia Pub. Bldg. Auth. Pub. Facilities Rev. Bonds Series Floaters G 40, 1.11%, tender 2/1/23 (Liquidity Facility Royal Bank of Canada) | 2/1/21 | $100,000 |
Affiliated Central Funds
Fiscal year to date information regarding the Fund's investments in Fidelity Central Funds, including the ownership percentage, is presented below.
| Fund | Value, beginning of period | Purchases | Sales Proceeds | Dividend Income | Realized Gain/Loss | Change in Unrealized appreciation (depreciation) | Value, end of period | % ownership, end of period |
| Fidelity Municipal Cash Central Fund 0.88% | $15,525,793 | $60,297,999 | $53,765,000 | $36,146 | $257 | $-- | $22,059,049 | 1.5% |
| Total | $15,525,793 | $60,297,999 | $53,765,000 | $36,146 | $257 | $-- | $22,059,049 | |
Amounts in the income column in the above table include any capital gain distributions from underlying funds, which are presented in the corresponding line-item in the Statement of Operations, if applicable.
Investment Valuation
All investments are categorized as Level 2 under the Fair Value Hierarchy. The inputs or methodology used for valuing securities may not be an indication of the risk associated with investing in those securities. For more information on valuation inputs please refer to the Investment Valuation section in the accompanying Notes to Financial Statements.
See accompanying notes which are an integral part of the financial statements.
Fidelity® Ohio Municipal Money Market Fund
Financial Statements
Statement of Assets and Liabilities
| | | June 30, 2022 (Unaudited) |
| Assets | | |
Investment in securities, at value — See accompanying schedule:
Unaffiliated issuers (cost $155,063,658) | $155,063,658 | |
| Fidelity Central Funds (cost $22,059,049) | 22,059,049 | |
| Total Investment in Securities (cost $177,122,707) | | $177,122,707 |
| Receivable for fund shares sold | | 15,651 |
| Interest receivable | | 284,306 |
| Distributions receivable from Fidelity Central Funds | | 12,434 |
| Total assets | | 177,435,098 |
| Liabilities | | |
| Payable to custodian bank | $469,495 | |
| Payable for fund shares redeemed | 345,442 | |
| Distributions payable | 2,360 | |
| Accrued management fee | 51,846 | |
| Other affiliated payables | 22,731 | |
| Other payables and accrued expenses | 16,565 | |
| Total liabilities | | 908,439 |
| Net Assets | | $176,526,659 |
| Net Assets consist of: | | |
| Paid in capital | | $176,542,600 |
| Total accumulated earnings (loss) | | (15,941) |
| Net Assets | | $176,526,659 |
| Net Asset Value, offering price and redemption price per share ($176,526,659 ÷ 176,219,555 shares) | | $1.00 |
See accompanying notes which are an integral part of the financial statements.
Statement of Operations
| | | Six months ended June 30, 2022 (Unaudited) |
| Investment Income | | |
| Interest | | $384,906 |
| Income from Fidelity Central Funds | | 36,146 |
| Total income | | 421,052 |
| Expenses | | |
| Management fee | $315,868 | |
| Transfer agent fees | 125,128 | |
| Accounting fees and expenses | 14,186 | |
| Custodian fees and expenses | 1,210 | |
| Independent trustees' fees and expenses | 276 | |
| Registration fees | 16,821 | |
| Audit | 17,615 | |
| Legal | 82 | |
| Miscellaneous | 197 | |
| Total expenses before reductions | 491,383 | |
| Expense reductions | (156,228) | |
| Total expenses after reductions | | 335,155 |
| Net investment income (loss) | | 85,897 |
| Realized and Unrealized Gain (Loss) | | |
| Net realized gain (loss) on: | | |
| Investment securities: | | |
| Unaffiliated issuers | (16,030) | |
| Fidelity Central Funds | 257 | |
| Total net realized gain (loss) | | (15,773) |
| Net increase in net assets resulting from operations | | $70,124 |
See accompanying notes which are an integral part of the financial statements.
Statement of Changes in Net Assets
| | Six months ended June 30, 2022 (Unaudited) | Year ended December 31, 2021 |
| Increase (Decrease) in Net Assets | | |
| Operations | | |
| Net investment income (loss) | $85,897 | $19,729 |
| Net realized gain (loss) | (15,773) | 37,277 |
| Net increase in net assets resulting from operations | 70,124 | 57,006 |
| Distributions to shareholders | (85,857) | (28,814) |
| Share transactions | | |
| Proceeds from sales of shares | 14,850,494 | 11,480,697 |
| Reinvestment of distributions | 81,579 | 27,621 |
| Cost of shares redeemed | (23,045,877) | (36,694,265) |
| Net increase (decrease) in net assets and shares resulting from share transactions | (8,113,804) | (25,185,947) |
| Total increase (decrease) in net assets | (8,129,537) | (25,157,755) |
| Net Assets | | |
| Beginning of period | 184,656,196 | 209,813,951 |
| End of period | $176,526,659 | $184,656,196 |
| Other Information | | |
| Shares | | |
| Sold | 14,850,494 | 11,480,697 |
| Issued in reinvestment of distributions | 81,579 | 27,621 |
| Redeemed | (23,045,877) | (36,694,265) |
| Net increase (decrease) | (8,113,804) | (25,185,947) |
See accompanying notes which are an integral part of the financial statements.
Financial Highlights
Fidelity Ohio Municipal Money Market Fund
| | Six months ended (Unaudited) June 30, | Years endedDecember 31, | | | | |
| | 2022 | 2021 | 2020 | 2019 | 2018 | 2017 |
| Selected Per–Share Data | | | | | | |
| Net asset value, beginning of period | $1.00 | $1.00 | $1.00 | $1.00 | $1.00 | $1.00 |
| Income from Investment Operations | | | | | | |
| Net investment income (loss)A | –B | –B | .003 | .011 | .010 | .004 |
| Net realized and unrealized gain (loss) | –B | –B | – | .001 | –B | –B |
| Total from investment operations | –B | –B | .003 | .012 | .010 | .004 |
| Distributions from net investment income | –B | –B | (.003) | (.011) | (.010) | (.004) |
| Distributions from net realized gain | – | –B | – | (.001) | – | –B |
| Total distributions | –B | –B | (.003) | (.012) | (.010) | (.004) |
| Net asset value, end of period | $1.00 | $1.00 | $1.00 | $1.00 | $1.00 | $1.00 |
| Total ReturnC,D | .05% | .02% | .32% | 1.16% | .98% | .42% |
| Ratios to Average Net AssetsA,E,F | | | | | | |
| Expenses before reductions | .54%G | .53% | .53% | .53% | .53% | .53% |
| Expenses net of fee waivers, if any | .37%G | .10% | .38% | .53% | .53% | .52% |
| Expenses net of all reductions | .37%G | .10% | .38% | .53% | .53% | .52% |
| Net investment income (loss) | .10%G | .01% | .33% | 1.08% | .96% | .40% |
| Supplemental Data | | | | | | |
| Net assets, end of period (000 omitted) | $176,527 | $184,656 | $209,814 | $239,940 | $298,736 | $419,110 |
A Net investment income (loss) is affected by the timing of the declaration of dividends by any underlying mutual funds or exchange-traded funds (ETFs). Net investment income (loss) of any such underlying funds is not included in the Fund's net investment income (loss) ratio.
B Amount represents less than $.0005 per share.
C Total returns for periods of less than one year are not annualized.
D Total returns would have been lower if certain expenses had not been reduced during the applicable periods shown.
E Fees and expenses of any underlying mutual funds or exchange-traded funds (ETFs) are not included in the Fund's expense ratio. The Fund indirectly bears its proportionate share of these expenses. For additional expense information related to investments in Fidelity Central Funds, please refer to the "Investments in Fidelity Central Funds" note found in the Notes to Financial Statements section of the most recent Annual or Semi-Annual report.
F Expense ratios reflect operating expenses of the class. Expenses before reductions do not reflect amounts reimbursed, waived, or reduced through arrangements with the investment adviser, brokerage services, or other offset arrangements, if applicable, and do not represent the amount paid by the class during periods when reimbursements, waivers or reductions occur.
G Annualized
See accompanying notes which are an integral part of the financial statements.
Notes to Financial Statements (Unaudited)
For the period ended June 30, 2022
1. Organization.
Fidelity Ohio Municipal Income Fund (the Income Fund) is a fund of Fidelity Municipal Trust. Fidelity Ohio Municipal Money Market Fund (the Money Market Fund) is a fund of Fidelity Municipal Trust II. Each Trust is registered under the Investment Company Act of 1940, as amended (the 1940 Act), as an open-end management investment company. Fidelity Municipal Trust and Fidelity Municipal Trust II (the Trusts) are organized as a Massachusetts business trust and a Delaware statutory trust, respectively. Each Fund is authorized to issue an unlimited number of shares. Shares of the Money Market Fund are only available for purchase by retail shareholders. Share transactions on the Statement of Changes in Net Assets may contain exchanges between affiliated funds. Each Fund may be affected by economic and political developments in the state of Ohio.
Effective after the close of business on July 15, 2022, Fidelity Ohio Municipal Money Market Fund was closed to new accounts with certain exceptions.
2. Investments in Fidelity Central Funds.
Funds may invest in Fidelity Central Funds, which are open-end investment companies generally available only to other investment companies and accounts managed by the investment adviser and its affiliates. The Schedule of Investments lists any Fidelity Central Funds held as an investment as of period end, but does not include the underlying holdings of each Fidelity Central Fund. An investing fund indirectly bears its proportionate share of the expenses of the underlying Fidelity Central Funds.
Based on its investment objective, each Fidelity Central Fund may invest or participate in various investment vehicles or strategies that are similar to those of the investing fund. These strategies are consistent with the investment objectives of the investing fund and may involve certain economic risks which may cause a decline in value of each of the Fidelity Central Funds and thus a decline in the value of the investing fund.
| Fidelity Central Fund | Investment Manager | Investment Objective | Investment Practices | Expense Ratio(a) |
| Fidelity Money Market Central Funds | Fidelity Management & Research Company LLC (FMR) | Each fund seeks to obtain a high level of current income consistent with the preservation of capital and liquidity. | Short-term Investments | Less than .005% |
(a) Expenses expressed as a percentage of average net assets and are as of each underlying Central Fund's most recent annual or semi-annual shareholder report.
A complete unaudited list of holdings for each Fidelity Central Fund is available upon request or at the Securities and Exchange Commission website at www.sec.gov. In addition, the financial statements of the Fidelity Central Funds which contain the significant accounting policies (including investment valuation policies) of those funds, and are not covered by the Report of Independent Registered Public Accounting Firm, are available on the Securities and Exchange Commission website or upon request.
3. Significant Accounting Policies.
Each Fund is an investment company and applies the accounting and reporting guidance of the Financial Accounting Standards Board (FASB) Accounting Standards Codification Topic 946 Financial Services - Investment Companies. The financial statements have been prepared in conformity with accounting principles generally accepted in the United States of America (GAAP), which require management to make certain estimates and assumptions at the date of the financial statements. Actual results could differ from those estimates. Subsequent events, if any, through the date that the financial statements were issued have been evaluated in the preparation of the financial statements. Each Fund's Schedule of Investments lists any underlying mutual funds or exchange-traded funds (ETFs) but does not include the underlying holdings of these funds. The following summarizes the significant accounting policies of each Fund:
Investment Valuation. Investments are valued as of 4:00 p.m. Eastern time on the last calendar day of the period. The Board of Trustees (the Board) has delegated the day to day responsibility for the valuation of the Income Fund's investments to the Fair Value Committee (the Committee) established by the Income Fund's investment adviser. In accordance with valuation policies and procedures approved by the Board, the Income Fund attempts to obtain prices from one or more third party pricing vendors or brokers to value its investments. When current market prices, quotations or currency exchange rates are not readily available or reliable, investments will be fair valued in good faith by the Committee, in accordance with procedures adopted by the Board. Factors used in determining fair value vary by investment type and may include market or investment specific events, changes in interest rates and credit quality. The frequency with which these procedures are used cannot be predicted and they may be utilized to a significant extent. The Committee oversees the Income Fund's valuation policies and procedures and reports to the Board on the Committee's activities and fair value determinations. The Board monitors the appropriateness of the procedures used in valuing the Income Fund's investments and ratifies the fair value determinations of the Committee.
Each Fund categorizes the inputs to valuation techniques used to value its investments into a disclosure hierarchy consisting of three levels as shown below:
- Level 1 – unadjusted quoted prices in active markets for identical investments
- Level 2 – other significant observable inputs (including quoted prices for similar investments, interest rates, prepayment speeds, etc.)
- Level 3 – unobservable inputs (including the Fund's own assumptions based on the best information available)
Valuation techniques used to value each Fund's investments by major category are as follows:
For the Income Fund, debt securities, including restricted securities, are valued based on evaluated prices received from third party pricing vendors or from brokers who make markets in such securities. Municipal securities are valued by pricing vendors who utilize matrix pricing which considers yield or price of bonds of comparable quality, coupon, maturity and type or by broker-supplied prices. When independent prices are unavailable or unreliable, debt securities may be valued utilizing pricing methodologies which consider similar factors that would be used by third party pricing vendors. Debt securities are generally categorized as Level 2 in the hierarchy but may be Level 3 depending on the circumstances.
Investments in open-end mutual funds, including the Fidelity Central Funds, are valued at their closing net asset value (NAV) each business day and are categorized as Level 1 in the hierarchy.
For the Money Market Fund, as permitted by compliance with certain conditions under Rule 2a-7 of the 1940 Act, securities are valued at amortized cost, which approximates fair value. The amortized cost of an instrument is determined by valuing it at its original cost and thereafter amortizing any discount or premium from its face value at a constant rate until maturity. Securities held by a money market fund are generally high quality and liquid; however, they are reflected as Level 2 because the inputs used to determine fair value are not quoted prices in an active market.
For the Income Fund, changes in valuation techniques may result in transfers in or out of an assigned level within the disclosure hierarchy. The aggregate value of investments by input level as of June 30, 2022 is included at the end of the Fund's Schedule of Investments.
Investment Transactions and Income. For financial reporting purposes, the Funds' investment holdings and NAV include trades executed through the end of the last business day of the period. The NAV per share for processing shareholder transactions is calculated as of the close of business of the New York Stock Exchange (NYSE), normally 4:00 p.m. Eastern time and includes trades executed through the end of the prior business day for the Income Fund and trades executed through the end of the current business day for the Money Market Fund. Gains and losses on securities sold are determined on the basis of identified cost. Income and capital gain distributions from Fidelity Central Funds, if any, are recorded on the ex-dividend date. Interest income is accrued as earned and includes coupon interest and amortization of premium and accretion of discount on debt securities as applicable. Debt obligations may be placed on non-accrual status and related interest income may be reduced by ceasing current accruals and writing off interest receivables when the collection of all or a portion of interest has become doubtful based on consistently applied procedures. A debt obligation is removed from non-accrual status when the issuer resumes interest payments or when collectability of interest is reasonably assured.
Expenses. Expenses directly attributable to a fund are charged to that fund. Expenses attributable to more than one fund are allocated among the respective funds on the basis of relative net assets or other appropriate methods. Expenses included in the accompanying financial statements reflect the expenses of that fund and do not include any expenses associated with any underlying mutual funds or exchange-traded funds. Although not included in a fund's expenses, a fund indirectly bears its proportionate share of these expenses through the net asset value of each underlying mutual fund or exchange-traded fund. Expense estimates are accrued in the period to which they relate and adjustments are made when actual amounts are known.
Income Tax Information and Distributions to Shareholders. Each year, each Fund intends to qualify as a regulated investment company under Subchapter M of the Internal Revenue Code, including distributing substantially all of its taxable income and realized gains. As a result, no provision for U.S. Federal income taxes is required. Each Fund files a U.S. federal tax return, in addition to state and local tax returns as required. Each Fund's federal income tax returns are subject to examination by the Internal Revenue Service (IRS) for a period of three fiscal years after they are filed. State and local tax returns may be subject to examination for an additional fiscal year depending on the jurisdiction.
Distributions are declared and recorded daily and paid monthly from net investment income. Distributions from realized gains, if any, are declared and recorded on the ex-dividend date. Income and capital gain distributions are determined in accordance with income tax regulations, which may differ from GAAP.
Capital accounts within the financial statements are adjusted for permanent book-tax differences. These adjustments have no impact on net assets or the results of operations. Capital accounts are not adjusted for temporary book-tax differences which will reverse in a subsequent period.
Book-tax differences are primarily due to market discount and capital loss carryforwards.
The Funds purchase municipal securities whose interest, in the opinion of the issuer, is free from federal income tax. There is no assurance that the IRS will agree with this opinion. In the event the IRS determines that the issuer does not comply with relevant tax requirements, interest payments from a security could become federally taxable, possibly retroactively to the date the security was issued.
As of period end, the cost and unrealized appreciation (depreciation) in securities, and derivatives if applicable, for federal income tax purposes were as follows for each Fund:
| | Tax cost | Gross unrealized appreciation | Gross unrealized depreciation | Net unrealized appreciation (depreciation) |
| Fidelity Ohio Municipal Income Fund | $582,017,797 | $2,764,068 | $(29,327,897) | $(26,563,829) |
| Fidelity Ohio Municipal Money Market Fund | 177,122,707 | – | – | – |
Certain of the Funds elected to defer to the next fiscal year capital currency losses recognized during the period November 1, 2021 to December 31, 2021. Loss deferrals were as follows:
| | Capital losses |
| Fidelity Ohio Municipal Income Fund | $(4,987) |
Delayed Delivery Transactions and When-Issued Securities. During the period, certain Funds transacted in securities on a delayed delivery or when-issued basis. Payment and delivery may take place after the customary settlement period for that security. The price of the underlying securities and the date when the securities will be delivered and paid for are fixed at the time the transaction is negotiated. Securities purchased on a delayed delivery or when-issued basis are identified as such in the Schedule of Investments. Compensation for interest forgone in the purchase of a delayed delivery or when-issued debt security may be received. With respect to purchase commitments, each applicable Fund identifies securities as segregated in its records with a value at least equal to the amount of the commitment. Payables and receivables associated with the purchases and sales of delayed delivery securities having the same coupon, settlement date and broker are offset. Delayed delivery or when-issued securities that have been purchased from and sold to different brokers are reflected as both payables and receivables in the Statement of Assets and Liabilities under the caption "Delayed delivery", as applicable. Losses may arise due to changes in the value of the underlying securities or if the counterparty does not perform under the contract's terms, or if the issuer does not issue the securities due to political, economic, or other factors.
Restricted Securities (including Private Placements). Funds may invest in securities that are subject to legal or contractual restrictions on resale. These securities generally may be resold in transactions exempt from registration or to the public if the securities are registered. Disposal of these securities may involve time-consuming negotiations and expense, and prompt sale at an acceptable price may be difficult. Information regarding restricted securities held at period end is included at the end of the Schedule of Investments, if applicable.
4. Purchases and Sales of Investments.
Purchases and sales of securities, other than short-term securities and in-kind transactions, as applicable, are noted in the table below.
| | Purchases ($) | Sales ($) |
| Fidelity Ohio Municipal Income Fund | 55,980,087 | 140,952,686 |
5. Fees and Other Transactions with Affiliates.
Management Fee. Fidelity Management & Research Company LLC (the investment adviser) and its affiliates provide the Funds with investment management related services for which the Funds pay a monthly management fee. The management fee is the sum of an individual fund fee rate and an annualized group fee rate. The individual fund fee rate is applied to each Fund's average net assets. The group fee rate is based upon the monthly average net assets of a group of registered investment companies with which the investment adviser has management contracts. The group fee rate decreases as assets under management increase and increases as assets under management decrease. For the reporting period, each Fund's annualized management fee rate expressed as a percentage of each Fund's average net assets was as follows:
| | Individual Rate | Group Rate | Total |
| Fidelity Ohio Municipal Income Fund | .25% | .10% | .35% |
| Fidelity Ohio Municipal Money Market Fund | .25% | .10% | .35% |
During the period, the investment adviser or its affiliates waived a portion of these fees.
Transfer Agent Fees. Fidelity Investments Institutional Operations Company LLC (FIIOC), an affiliate of the investment adviser, is the transfer, dividend disbursing and shareholder servicing agent for the Funds. FIIOC receives account fees and asset-based fees that vary according to account size and type of account. FIIOC pays for typesetting, printing and mailing of shareholder reports, except proxy statements. For the period, the transfer agent fees were equivalent to the following annualized rates expressed as a percentage of average net assets:
| Fidelity Ohio Municipal Income Fund | .11% |
| Fidelity Ohio Municipal Money Market Fund | .14% |
During the period, the investment adviser or its affiliates waived a portion of these fees.
Accounting Fees. Fidelity Service Company, Inc. (FSC), an affiliate of the investment adviser, maintains each Fund's accounting records. The accounting fee is based on the level of average net assets for each month. For the period, the fees were equivalent to the following annualized rates:
| | % of Average Net Assets |
| Fidelity Ohio Municipal Income Fund | .02 |
| Fidelity Ohio Municipal Money Market Fund | .02 |
Interfund Trades. Funds may purchase from or sell securities to other Fidelity Funds under procedures adopted by the Board. The procedures have been designed to ensure these interfund trades are executed in accordance with Rule 17a-7 of the 1940 Act. For the Income Fund, any interfund trades are included within the respective purchases and sales amounts shown in the Purchases and Sales of Investments note. Interfund trades during the period are noted in the table below.
| | Purchases ($) | Sales ($) | Realized Gain (Loss) ($) |
| Fidelity Ohio Municipal Income Fund | – | – | – |
| Fidelity Ohio Municipal Money Market Fund | 9,380,000 | – | – |
6. Committed Line of Credit.
Certain Funds participate with other funds managed by the investment adviser or an affiliate in a $4.25 billion credit facility (the "line of credit") to be utilized for temporary or emergency purposes to fund shareholder redemptions or for other short-term liquidity purposes. The participating funds have agreed to pay commitment fees on their pro-rata portion of the line of credit, which are reflected in Miscellaneous expenses on the Statement of Operations, and are listed below. During the period, there were no borrowings on this line of credit.
| | Amount |
| Fidelity Ohio Municipal Income Fund | $578 |
7. Expense Reductions.
The investment adviser or its affiliates voluntarily agreed to waive certain fees for the Money Market Fund in order to avoid a negative yield. Such arrangements may be discontinued by the investment adviser at any time. For the period, the amount of the waiver was $154,753.
Through arrangements with each applicable Fund's custodian, credits realized as a result of certain uninvested cash balances were used to reduce each applicable Fund's expenses. All of the applicable expense reductions are noted in the table below.
| | Custodian credits |
| Fidelity Ohio Municipal Income Fund | $4,902 |
In addition, during the period the investment adviser or an affiliate reimbursed and/or waived a portion of operating expenses as follows:
| | Amount |
| Fidelity Ohio Municipal Income Fund | $5,505 |
| Fidelity Ohio Municipal Money Market Fund | 1,475 |
8. Other.
A fund's organizational documents provide former and current trustees and officers with a limited indemnification against liabilities arising in connection with the performance of their duties to the fund. In the normal course of business, a fund may also enter into contracts that provide general indemnifications. A fund's maximum exposure under these arrangements is unknown as this would be dependent on future claims that may be made against a fund. The risk of material loss from such claims is considered remote.
9. Coronavirus (COVID-19) Pandemic.
An outbreak of COVID-19 first detected in China during December 2019 has since spread globally and was declared a pandemic by the World Health Organization during March 2020. Developments that disrupt global economies and financial markets, such as the COVID-19 pandemic, may magnify factors that affect the Funds' performance.
10. Proposed Reorganization.
The Board of Trustees of Fidelity Ohio Municipal Money Market Fund approved an Agreement and Plan of Reorganization (the Agreement) between Fidelity Ohio Municipal Money Market Fund and Fidelity Municipal Money Market Fund. The Agreement provides for the transfer of all the assets and the assumption of all the liabilities of Fidelity Ohio Municipal Money Market Fund in exchange for shares of Fidelity Municipal Money Market Fund equal in value to the net assets of Fidelity Ohio Municipal Money Market Fund on the day the reorganization is effective.
A meeting of shareholders of Fidelity Ohio Municipal Money Market Fund is expected to be held during the fourth quarter of 2022 to vote on the reorganization. If approved by shareholders, the reorganization is expected to become effective on December 2, 2022. The reorganization is expected to qualify as a tax-free transaction for federal income tax purposes with no gain or loss recognized by the funds or their shareholders.
Shareholder Expense Example
As a shareholder, you incur two types of costs: (1) transaction costs, which may include sales charges (loads) on purchase payments or redemption proceeds, as applicable and (2) ongoing costs, which generally include management fees, distribution and/or service (12b-1) fees and other Fund expenses. This Example is intended to help you understand your ongoing costs (in dollars) of investing in a fund and to compare these costs with the ongoing costs of investing in other mutual funds.
The Example is based on an investment of $1,000 invested at the beginning of the period and held for the entire period (January 1, 2022 to June 30, 2022).
Actual Expenses
The first line of the accompanying table provides information about actual account values and actual expenses. You may use the information in this line, together with the amount you invested, to estimate the expenses that you paid over the period. Simply divide your account value by $1,000.00 (for example, an $8,600 account value divided by $1,000.00 = 8.6), then multiply the result by the number in the first line for a class/Fund under the heading entitled "Expenses Paid During Period" to estimate the expenses you paid on your account during this period. If any fund is a shareholder of any underlying mutual funds or exchange-traded funds (ETFs) (the Underlying Funds), such fund indirectly bears its proportional share of the expenses of the Underlying Funds in addition to the direct expenses incurred presented in the table. These fees and expenses are not included in the annualized expense ratio used to calculate the expense estimate in the table below.
Hypothetical Example for Comparison Purposes
The second line of the accompanying table provides information about hypothetical account values and hypothetical expenses based on the actual expense ratio and an assumed rate of return of 5% per year before expenses, which is not the actual return. The hypothetical account values and expenses may not be used to estimate the actual ending account balance or expenses you paid for the period. You may use this information to compare the ongoing costs of investing in the Fund and other funds. To do so, compare this 5% hypothetical example with the 5% hypothetical examples that appear in the shareholder reports of the other funds. If any fund is a shareholder of any Underlying Funds, such fund indirectly bears its proportional share of the expenses of the Underlying Funds in addition to the direct expenses as presented in the table. These fees and expenses are not included in the annualized expense ratio used to calculate the expense estimate in the table below.
Please note that the expenses shown in the table are meant to highlight your ongoing costs only and do not reflect any transaction costs. Therefore, the second line of the table is useful in comparing ongoing costs only, and will not help you determine the relative total costs of owning different funds. In addition, if these transactional costs were included, your costs would have been higher.
| | Annualized Expense Ratio-A | Beginning
Account Value
January 1, 2022 | Ending
Account Value
June 30, 2022 | Expenses Paid
During Period-B
January 1, 2022
to June 30, 2022 |
| Fidelity Ohio Municipal Income Fund | .49% | | | |
| Actual | | $1,000.00 | $910.00 | $2.32 |
| Hypothetical-C | | $1,000.00 | $1,022.36 | $2.46 |
| Fidelity Ohio Municipal Money Market Fund | .37% | | | |
| Actual | | $1,000.00 | $1,000.50 | $1.84-D |
| Hypothetical-C | | $1,000.00 | $1,022.96 | $1.86-D |
A Annualized expense ratio reflects expenses net of applicable fee waivers.
B Expenses are equal to the annualized expense ratio, multiplied by the average account value over the period, multiplied by 181/ 365 (to reflect the one-half year period). The fees and expenses of any Underlying Funds are not included in each annualized expense ratio.
C 5% return per year before expenses
D If certain fees were not voluntarily waived by the investment adviser or its affiliates during the period, the annualized expense ratio and the expenses paid in the actual and hypothetical examples above would have been as shown in table below:
| | Annualized Expense Ratio-(a)
| Expenses Paid
|
| Fidelity Ohio Municipal Money Market Fund | .54% | |
| Actual | | $2.68 |
| Hypothetical-(b) | | $2.71 |
| | | |
(a) Annualized expense ratio reflects expenses net of applicable fee waivers.
(b) 5% return per year before expenses
Liquidity Risk Management Program
The Securities and Exchange Commission adopted Rule 22e-4 under the Investment Company Act of 1940 (the Liquidity Rule) to promote effective liquidity risk management throughout the open-end investment company industry, thereby reducing the risk that funds will be unable to meet their redemption obligations and mitigating dilution of the interests of fund shareholders.
The Ohio Municipal Income Fund (the Income Fund) has adopted and implemented a liquidity risk management program pursuant to the Liquidity Rule (the Program) effective December 1, 2018. The Program is reasonably designed to assess and manage the Income Fund’s liquidity risk and to comply with the requirements of the Liquidity Rule. The Income Fund’s Board of Trustees (the Board) has designated the Income Fund’s investment adviser as administrator of the Program. The Fidelity advisers have established a Liquidity Risk Management Committee (the LRM Committee) to manage the Program for each of the Fidelity Funds. The LRM Committee monitors the adequacy and effectiveness of implementation of the Program and on a periodic basis assesses each Fund’s liquidity risk based on a variety of factors including (1) the Fund’s investment strategy, (2) portfolio liquidity and cash flow projections during normal and reasonably foreseeable stressed conditions, (3) shareholder redemptions, (4) borrowings and other funding sources and (5) in the case of exchange-traded funds, certain additional factors including the effect of the Fund’s prices and spreads, market participants, and basket compositions on the overall liquidity of the Fund’s portfolio, as applicable.
In accordance with the Program, each of the Fund’s portfolio investments is classified into one of four liquidity categories described below based on a determination of a reasonable expectation for how long it would take to convert the investment to cash (or sell or dispose of the investment) without significantly changing its market value.
- Highly liquid investments – cash or convertible to cash within three business days or less
- Moderately liquid investments – convertible to cash in three to seven calendar days
- Less liquid investments – can be sold or disposed of, but not settled, within seven calendar days
- Illiquid investments – cannot be sold or disposed of within seven calendar days
Liquidity classification determinations take into account a variety of factors including various market, trading and investment-specific considerations, as well as market depth, and generally utilize analysis from a third-party liquidity metrics service.
The Liquidity Rule places a 15% limit on a fund’s illiquid investments and requires funds that do not primarily hold assets that are highly liquid investments to determine and maintain a minimum percentage of the fund’s net assets to be invested in highly liquid investments (highly liquid investment minimum or HLIM). The Program includes provisions reasonably designed to comply with the 15% limit on illiquid investments and for determining, periodically reviewing and complying with the HLIM requirement as applicable.
At a recent meeting of the Fund’s Board of Trustees, the LRM Committee provided a written report to the Board pertaining to the operation, adequacy, and effectiveness of implementation of the Program for the annual period from December 1, 2020 through November 30, 2021. The report concluded that the Program has been implemented and is operating effectively and is reasonably designed to assess and manage the Fund’s liquidity risk.
OFF-SANN-0822
1.705575.124
Fidelity® Pennsylvania Municipal Income Fund
Fidelity® Pennsylvania Municipal Money Market Fund
Semi-Annual Report
June 30, 2022
Contents
To view a fund's proxy voting guidelines and proxy voting record for the 12-month period ended June 30, visit http://www.fidelity.com/proxyvotingresults or visit the Securities and Exchange Commission's (SEC) web site at http://www.sec.gov.
You may also call 1-800-544-8544 to request a free copy of the proxy voting guidelines.
Standard & Poor's, S&P and S&P 500 are registered service marks of The McGraw-Hill Companies, Inc. and have been licensed for use by Fidelity Distributors Corporation.
Other third-party marks appearing herein are the property of their respective owners.
All other marks appearing herein are registered or unregistered trademarks or service marks of FMR LLC or an affiliated company. © 2022 FMR LLC. All rights reserved.
This report and the financial statements contained herein are submitted for the general information of the shareholders of the Funds. This report is not authorized for distribution to prospective investors in the Funds unless preceded or accompanied by an effective prospectus.
A fund files its complete schedule of portfolio holdings with the SEC for the first and third quarters of each fiscal year on Form N-PORT. Forms N-PORT are available on the SEC’s web site at http://www.sec.gov. A fund's Forms N-PORT may be reviewed and copied at the SEC’s Public Reference Room in Washington, DC. Information regarding the operation of the SEC's Public Reference Room may be obtained by calling 1-800-SEC-0330.
For a complete list of a fund's portfolio holdings, view the most recent holdings listing, semiannual report, or annual report on Fidelity's web site at http://www.fidelity.com, http://www.institutional.fidelity.com, or http://www.401k.com, as applicable.
NOT FDIC INSURED •MAY LOSE VALUE •NO BANK GUARANTEE
Neither the Funds nor Fidelity Distributors Corporation is a bank.
Note to Shareholders:
Early in 2020, the outbreak and spread of COVID-19 emerged as a public health emergency that had a major influence on financial markets, primarily based on its impact on the global economy and corporate earnings. On March 11, 2020, the World Health Organization declared the COVID-19 outbreak a pandemic, citing sustained risk of further global spread. The pandemic prompted a number of measures to limit the spread of COVID-19, including travel and border restrictions, quarantines, and restrictions on large gatherings. In turn, these resulted in lower consumer activity, diminished demand for a wide range of products and services, disruption in manufacturing and supply chains, and – given the wide variability in outcomes regarding the outbreak – significant market uncertainty and volatility. To help stem the turmoil, the U.S. government took unprecedented action – in concert with the U.S. Federal Reserve and central banks around the world – to help support consumers, businesses, and the broader economy, and to limit disruption to the financial system.
In general, the overall impact of the pandemic lessened in 2021, amid a resilient economy and widespread distribution of three COVID-19 vaccines granted emergency use authorization from the U.S. Food and Drug Administration (FDA) early in the year. Still, the situation remains dynamic, and the extent and duration of its influence on financial markets and the economy is highly uncertain, due in part to a recent spike in cases based on highly contagious variants of the coronavirus.
Extreme events such as the COVID-19 crisis are exogenous shocks that can have significant adverse effects on mutual funds and their investments. Although multiple asset classes may be affected by market disruption, the duration and impact may not be the same for all types of assets. Fidelity is committed to helping you stay informed amid news about COVID-19 and during increased market volatility, and we continue to take extra steps to be responsive to customer needs. We encourage you to visit us online, where we offer ongoing updates, commentary, and analysis on the markets and our funds.
Fidelity® Pennsylvania Municipal Income Fund
Investment Summary (Unaudited)
Top Five Sectors as of June 30, 2022
| | % of fund's net assets |
| Health Care | 25.9 |
| Transportation | 20.8 |
| Education | 18.1 |
| General Obligations | 11.6 |
| Water & Sewer | 7.1 |
Quality Diversification (% of fund's net assets)
| As of June 30, 2022 |
| | AA,A | 77.8% |
| | BBB | 8.2% |
| | BB and Below | 4.9% |
| | Not Rated | 2.7% |
| | Short-Term Investments and Net Other Assets | 6.4% |

We have used ratings from Moody's Investors Service, Inc. Where Moody's® ratings are not available, we have used S&P® ratings. All ratings are as of the date indicated and do not reflect subsequent changes.
Fidelity® Pennsylvania Municipal Income Fund
Schedule of Investments June 30, 2022 (Unaudited)
Showing Percentage of Net Assets
| Municipal Bonds - 93.6% | | | |
| | | Principal Amount | Value |
| Guam - 0.1% | | | |
| Guam Int'l. Arpt. Auth. Rev. Series 2013 C: | | | |
| 6.25% 10/1/34 (a) | | $425,000 | $439,935 |
| 6.25% 10/1/34 (Pre-Refunded to 10/1/23 @ 100) (a) | | 275,000 | 289,292 |
|
| TOTAL GUAM | | | 729,227 |
|
| Pennsylvania - 91.8% | | | |
| Allegheny County Series C: | | | |
| 5% 12/1/28 | | 1,000,000 | 1,066,190 |
| 5% 12/1/30 | | 1,365,000 | 1,455,019 |
| Allegheny County Arpt. Auth. Rev. Series 2021 A, 5% 1/1/51 (a) | | 12,000,000 | 12,490,922 |
| Allegheny County Higher Ed. Bldg. Auth. Univ. Rev.: | | | |
| Series 2017, 5% 10/15/47 | | 1,660,000 | 1,620,629 |
| Series 2018: | | | |
| 5% 3/1/33 | | 1,570,000 | 1,686,781 |
| 5% 3/1/34 | | 2,250,000 | 2,412,508 |
| Series 2022 A: | | | |
| 5% 3/1/24 (b) | | 500,000 | 514,893 |
| 5% 3/1/25 (b) | | 500,000 | 523,979 |
| 5% 3/1/27 (b) | | 1,740,000 | 1,872,015 |
| 5% 3/1/31 (b) | | 1,105,000 | 1,218,481 |
| 5% 3/1/34 (b) | | 645,000 | 709,351 |
| Allegheny County Indl. Dev. Auth. Rev. Series 2021, 4.25% 12/1/50 | | 3,000,000 | 2,157,334 |
| Allegheny County Sanitation Auth. Swr. Rev. Series 2018, 5% 6/1/43 | | 4,785,000 | 5,174,913 |
| Bucks County Indl. Dev. Auth. Hosp. Rev. Series 2021: | | | |
| 5% 7/1/41 | | 2,500,000 | 2,441,508 |
| 5% 7/1/54 | | 4,500,000 | 4,234,216 |
| Butler County Hosp. Auth. Hosp. Rev. (Butler Health Sys. Proj.) Series 2015 A: | | | |
| 5% 7/1/26 | | 500,000 | 527,528 |
| 5% 7/1/27 | | 490,000 | 514,424 |
| 5% 7/1/28 | | 540,000 | 563,114 |
| 5% 7/1/29 | | 710,000 | 737,575 |
| 5% 7/1/30 | | 685,000 | 709,863 |
| 5% 7/1/35 | | 1,885,000 | 1,932,338 |
| 5% 7/1/39 | | 6,675,000 | 6,763,908 |
| Cap. Region Wtr. Wtr. Rev. Series 2018: | | | |
| 5% 7/15/28 | | 1,300,000 | 1,458,139 |
| 5% 7/15/30 | | 1,500,000 | 1,689,072 |
| 5% 7/15/31 | | 1,250,000 | 1,402,468 |
| Centre County Pennsylvania Hosp. Auth. Rev. (Mount Nittany Med. Ctr. Proj.): | | | |
| Series 2016 A: | | | |
| 4% 11/15/32 | | 350,000 | 353,163 |
| 4% 11/15/34 | | 250,000 | 250,852 |
| 4% 11/15/35 | | 200,000 | 200,505 |
| 5% 11/15/28 | | 840,000 | 887,446 |
| 5% 11/15/29 | | 1,625,000 | 1,706,833 |
| 5% 11/15/30 | | 685,000 | 716,581 |
| Series 2016 B: | | | |
| 4% 11/15/40 | | 600,000 | 591,601 |
| 4% 11/15/47 | | 3,605,000 | 3,381,290 |
| Series 2018 A: | | | |
| 5% 11/15/26 | | 1,140,000 | 1,253,184 |
| 5% 11/15/27 | | 225,000 | 250,300 |
| 5% 11/15/28 | | 200,000 | 217,471 |
| 5% 11/15/29 | | 200,000 | 215,550 |
| Chester County Health & Ed. Facilities Auth. Health Sys. Rev. Series 2017 A, 5% 10/1/35 | | 2,125,000 | 2,262,148 |
| Commonwealth Fing. Auth. Rev.: | | | |
| Series 2019 B: | | | |
| 5% 6/1/28 | | 1,000,000 | 1,120,242 |
| 5% 6/1/29 | | 1,000,000 | 1,130,544 |
| 5% 6/1/30 | | 1,000,000 | 1,136,908 |
| 5% 6/1/31 | | 1,150,000 | 1,313,143 |
| Series 2020 A, 5% 6/1/32 | | 3,500,000 | 3,901,912 |
| Cumberland County Muni. Auth. Rev. (Dickinson College Proj.): | | | |
| Series 2012, 5% 11/1/37 | | 1,520,000 | 1,537,465 |
| Series 2016: | | | |
| 5% 5/1/30 | | 1,000,000 | 1,084,466 |
| 5% 5/1/31 | | 500,000 | 540,908 |
| 5% 5/1/32 | | 750,000 | 808,816 |
| 5% 5/1/33 | | 2,210,000 | 2,380,817 |
| 5% 5/1/34 | | 1,000,000 | 1,075,790 |
| Dallas Area Muni. Auth. Univ. Rev. (Misericordia Univ. Proj.) Series 2019: | | | |
| 5% 5/1/39 | | 1,100,000 | 1,087,597 |
| 5% 5/1/48 | | 4,000,000 | 3,821,112 |
| Dauphin County Gen. Auth. (Pinnacle Health Sys. Proj.) Series 2016 A: | | | |
| 5% 6/1/34 | | 1,275,000 | 1,324,582 |
| 5% 6/1/35 | | 1,000,000 | 1,035,936 |
| 5% 6/1/36 | | 625,000 | 646,882 |
| Delaware County Auth. Rev.: | | | |
| (Cabrini College) Series 2017, 5% 7/1/47 | | 2,000,000 | 1,915,118 |
| Series 2017, 5% 7/1/25 | | 1,000,000 | 1,024,249 |
| Delaware County Auth. Univ. Rev. Series 2012, 5% 8/1/22 | | 300,000 | 300,817 |
| Doylestown Hosp. Auth. Hosp. Rev.: | | | |
| Series 2013 A: | | | |
| 5% 7/1/23 | | 1,090,000 | 1,115,794 |
| 5% 7/1/27 | | 2,500,000 | 2,532,070 |
| Series 2016 A, 5% 7/1/46 | | 3,500,000 | 3,266,044 |
| Series 2019, 4% 7/1/45 | | 1,350,000 | 1,057,000 |
| Dubois Hosp. Auth. Hosp. Rev.: | | | |
| (Penn Highlands Healthcare Proj.) Series 2018, 5% 7/15/25 | | 200,000 | 211,830 |
| Series 2020: | | | |
| 5% 7/15/31 | | 1,030,000 | 1,100,164 |
| 5% 7/15/34 | | 1,000,000 | 1,054,751 |
| 5% 7/15/36 | | 1,400,000 | 1,472,420 |
| 5% 7/15/39 | | 1,160,000 | 1,214,085 |
| Fox Chapel Area School District Series 2013, 5% 8/1/34 | | 1,000,000 | 1,018,018 |
| Geisinger Auth. Health Sys. Rev.: | | | |
| Series 2014 A, 4% 6/1/41 | | 2,000,000 | 1,954,427 |
| Series 2017 A2, 5% 2/15/39 | | 1,880,000 | 1,978,722 |
| Indiana County Hosp. Auth. Series 2014 A, 6% 6/1/39 | | 1,625,000 | 1,684,519 |
| Lackawanna County Indl. Dev. Auth. Rev. (Univ. of Scranton Proj.) Series 2017: | | | |
| 5% 11/1/24 | | 590,000 | 622,517 |
| 5% 11/1/25 | | 665,000 | 712,050 |
| 5% 11/1/27 | | 1,105,000 | 1,210,959 |
| Lancaster County Hosp. Auth. Health Ctr. Rev. Series 2016: | | | |
| 5% 8/15/31 | | 1,000,000 | 1,070,303 |
| 5% 8/15/33 | | 1,000,000 | 1,065,658 |
| 5% 8/15/34 | | 1,000,000 | 1,063,554 |
| 5% 8/15/36 | | 1,000,000 | 1,060,575 |
| Lehigh County Gen. Purp. Auth. Rev. (Muhlenberg College Proj.) Series 2017, 5% 2/1/39 | | 4,010,000 | 4,229,333 |
| Lehigh County Gen. Purp. Hosp. Rev. Series 2019 A: | | | |
| 5% 7/1/36 | | 2,905,000 | 3,122,107 |
| 5% 7/1/44 | | 5,000,000 | 5,277,680 |
| Monroe County Hosp. Auth. Rev. Series 2016, 5% 7/1/33 | | 3,675,000 | 3,831,988 |
| Montgomery County Higher Ed. & Health Auth. Rev.: | | | |
| Series 2014 A: | | | |
| 5% 10/1/22 | | 275,000 | 276,853 |
| 5% 10/1/23 | | 1,305,000 | 1,342,736 |
| 5% 10/1/24 | | 335,000 | 348,147 |
| 5% 10/1/25 | | 750,000 | 768,185 |
| 5% 10/1/26 | | 1,000,000 | 1,020,982 |
| 5% 10/1/27 | | 1,000,000 | 1,017,878 |
| Series 2016 A, 5% 10/1/40 | | 4,000,000 | 4,008,924 |
| Series 2018 A, 5% 9/1/26 | | 1,500,000 | 1,626,017 |
| Series 2019: | | | |
| 4% 9/1/34 | | 2,500,000 | 2,505,559 |
| 4% 9/1/35 | | 1,400,000 | 1,400,575 |
| 4% 9/1/36 | | 1,200,000 | 1,197,518 |
| 4% 9/1/37 | | 1,000,000 | 994,733 |
| Montgomery County Indl. Dev. Auth.: | | | |
| Series 2015 A, 5.25% 1/15/36 (Pre-Refunded to 1/15/25 @ 100) | | 2,000,000 | 2,141,936 |
| Series 2017: | | | |
| 5% 12/1/33 | | 2,150,000 | 2,341,796 |
| 5% 12/1/35 | | 1,000,000 | 1,086,349 |
| 5% 12/1/36 | | 2,670,000 | 2,896,964 |
| 5% 12/1/37 | | 1,515,000 | 1,642,402 |
| Northampton County Gen. Purp. Auth. Hosp. Rev. (St. Luke's Univ. Health Network Proj.) Series 2018 A: | | | |
| 4% 8/15/48 | | 4,500,000 | 4,016,206 |
| 5% 8/15/43 | | 2,000,000 | 2,080,788 |
| 5% 8/15/48 | | 2,500,000 | 2,587,524 |
| Northampton County Gen. Purp. College Rev. (Lafayette College Proj.) Series 2017, 5% 11/1/47 | | 2,170,000 | 2,331,224 |
| Pennsylvania Ctfs. Prtn. Series 2018 A: | | | |
| 5% 7/1/28 | | 400,000 | 446,841 |
| 5% 7/1/29 | | 300,000 | 333,039 |
| 5% 7/1/30 | | 375,000 | 415,514 |
| 5% 7/1/31 | | 425,000 | 470,235 |
| Pennsylvania Higher Edl. Facilities Auth. Rev.: | | | |
| (Drexel Univ. Proj.) Series 2016, 5% 5/1/35 | | 2,000,000 | 2,081,388 |
| (Thomas Jefferson Univ. Proj.) Series 2012, 5% 3/1/23 (Pre-Refunded to 9/1/22 @ 100) | | 585,000 | 588,280 |
| Series 2016, 5% 5/1/33 | | 2,200,000 | 2,294,925 |
| Series 2018 A, 5% 2/15/48 | | 4,000,000 | 4,319,892 |
| Series 2019 A: | | | |
| 4% 3/1/37 | | 1,150,000 | 1,121,712 |
| 5% 3/1/36 | | 1,000,000 | 1,076,937 |
| 5% 3/1/38 | | 1,055,000 | 1,131,310 |
| 5% 3/1/39 | | 1,000,000 | 1,070,641 |
| Series 2019: | | | |
| 4% 12/1/44 | | 1,000,000 | 985,601 |
| 4% 12/1/48 | | 1,000,000 | 972,795 |
| Pennsylvania Hsg. Fin. Agcy.: | | | |
| Series 2019 130A, 4% 10/1/49 | | 1,515,000 | 1,535,145 |
| Series 2019 131, 3.5% 4/1/49 | | 3,875,000 | 3,889,615 |
| Series 2020 13 2A, 3.5% 4/1/51 | | 1,775,000 | 1,781,351 |
| Series 2020 133: | | | |
| 5% 10/1/22 | | 350,000 | 352,911 |
| 5% 10/1/23 | | 400,000 | 414,552 |
| 5% 10/1/24 | | 850,000 | 900,191 |
| 5% 10/1/27 | | 650,000 | 724,149 |
| 5% 10/1/28 | | 950,000 | 1,067,018 |
| 5% 4/1/29 | | 100,000 | 111,308 |
| 5% 10/1/29 | | 450,000 | 502,892 |
| Series 2021 134B: | | | |
| 5% 10/1/22 (a) | | 1,175,000 | 1,184,200 |
| 5% 4/1/24 (a) | | 1,255,000 | 1,305,477 |
| 5% 10/1/24 (a) | | 1,000,000 | 1,048,976 |
| 5% 10/1/25 (a) | | 370,000 | 393,174 |
| 5% 4/1/26 (a) | | 995,000 | 1,062,623 |
| 5% 10/1/26 (a) | | 1,500,000 | 1,608,753 |
| Series 2021 137: | | | |
| 5% 4/1/24 | | 225,000 | 236,012 |
| 5% 10/1/24 | | 265,000 | 280,946 |
| 5% 4/1/25 | | 200,000 | 213,997 |
| 5% 10/1/25 | | 220,000 | 237,669 |
| 5% 4/1/26 | | 240,000 | 260,734 |
| 5% 10/1/26 | | 280,000 | 306,703 |
| 5% 4/1/27 | | 225,000 | 247,897 |
| 5% 10/1/27 | | 225,000 | 249,505 |
| 5% 4/1/28 | | 250,000 | 277,925 |
| 5% 10/1/28 | | 260,000 | 290,450 |
| 5% 4/1/29 | | 310,000 | 346,051 |
| 5% 10/1/29 | | 365,000 | 409,155 |
| Pennsylvania Pub. School Bldg. Auth. School Rev. Series 2014 B2: | | | |
| 5% 12/1/24 | | 630,000 | 668,498 |
| 5% 12/1/25 | | 335,000 | 356,849 |
| 5% 12/1/26 | | 645,000 | 685,973 |
| 5% 12/1/27 | | 360,000 | 381,999 |
| Pennsylvania State Univ. Series 2015 A: | | | |
| 5% 9/1/30 | | 1,100,000 | 1,181,271 |
| 5% 9/1/31 | | 1,415,000 | 1,516,431 |
| Pennsylvania Tpk. Commission Tpk. Rev.: | | | |
| (Sub Lien Proj.) Series 2017 B-1, 5% 6/1/34 | | 5,000,000 | 5,343,240 |
| Series 2013 A2: | | | |
| 5% 12/1/28 | | 500,000 | 545,753 |
| 5% 12/1/38 | | 2,500,000 | 2,688,105 |
| Series 2014 A, 5% 12/1/31 | | 865,000 | 908,168 |
| Series 2014 A2, 0% 12/1/40 (c) | | 5,500,000 | 5,415,669 |
| Series 2017 A1: | | | |
| 5% 12/1/30 | | 3,500,000 | 3,871,699 |
| 5% 12/1/31 | | 2,000,000 | 2,200,490 |
| 5% 12/1/33 | | 1,500,000 | 1,634,661 |
| Series 2018 A2, 5% 12/1/43 | | 5,000,000 | 5,334,656 |
| Series 2019 A, 5% 12/1/37 | | 5,815,000 | 6,270,708 |
| Series 2020 B, 5% 12/1/50 | | 5,000,000 | 5,333,500 |
| Series 2021 A: | | | |
| 4% 12/1/44 | | 4,000,000 | 3,766,286 |
| 4% 12/1/45 | | 4,000,000 | 3,743,258 |
| 4% 12/1/50 | | 2,000,000 | 1,821,630 |
| Series 2021 B: | | | |
| 4% 12/1/40 | | 1,000,000 | 970,883 |
| 4% 12/1/41 | | 1,000,000 | 966,481 |
| 4% 12/1/42 | | 1,500,000 | 1,441,570 |
| 5% 12/1/46 | | 2,000,000 | 2,147,711 |
| Philadelphia Arpt. Rev.: | | | |
| Series 2015 A, 5% 6/15/23 (a) | | 200,000 | 205,270 |
| Series 2017 A, 5% 7/1/42 | | 350,000 | 365,555 |
| Series 2017 B: | | | |
| 5% 7/1/31 (a) | | 1,000,000 | 1,062,219 |
| 5% 7/1/33 (a) | | 2,250,000 | 2,370,104 |
| 5% 7/1/37 (a) | | 5,065,000 | 5,276,545 |
| 5% 7/1/42 (a) | | 4,000,000 | 4,135,730 |
| 5% 7/1/47 (a) | | 3,035,000 | 3,121,426 |
| Philadelphia Auth. for Indl. Dev.: | | | |
| Series 2016, 5% 4/1/28 | | 275,000 | 292,362 |
| Series 2017, 5% 11/1/47 | | 5,000,000 | 5,159,770 |
| Series 2020 A, 4% 11/1/45 | | 3,825,000 | 3,478,021 |
| Series 2020 C: | | | |
| 4% 11/1/35 | | 1,750,000 | 1,692,467 |
| 4% 11/1/36 | | 1,500,000 | 1,430,961 |
| 4% 11/1/37 | | 1,255,000 | 1,191,358 |
| 4% 11/1/38 | | 1,000,000 | 942,917 |
| Philadelphia Gas Works Rev.: | | | |
| Series 16 A, 5% 8/1/50 (Assured Guaranty Muni. Corp. Insured) | | 8,835,000 | 9,691,272 |
| Series 2015 13: | | | |
| 5% 8/1/29 | | 2,000,000 | 2,129,950 |
| 5% 8/1/30 | | 1,500,000 | 1,595,185 |
| 5% 8/1/31 | | 1,100,000 | 1,168,135 |
| Series 2016 14: | | | |
| 5% 10/1/33 | | 1,500,000 | 1,617,403 |
| 5% 10/1/34 | | 500,000 | 538,515 |
| Philadelphia Gen. Oblig.: | | | |
| Series 2017 A, 5% 8/1/30 | | 1,500,000 | 1,629,732 |
| Series 2019 B: | | | |
| 5% 2/1/38 | | 3,000,000 | 3,232,806 |
| 5% 2/1/39 | | 2,600,000 | 2,780,455 |
| Philadelphia Redev. Auth. Rev. Series 2015 A, 5% 4/15/29 | | 3,000,000 | 3,207,359 |
| Philadelphia School District: | | | |
| Series 2018 A: | | | |
| 5% 9/1/29 | | 1,250,000 | 1,381,967 |
| 5% 9/1/30 | | 1,000,000 | 1,097,618 |
| 5% 9/1/33 | | 1,000,000 | 1,085,237 |
| Series 2019 A: | | | |
| 4% 9/1/37 | | 2,100,000 | 2,119,917 |
| 4% 9/1/38 | | 2,300,000 | 2,318,359 |
| 4% 9/1/39 | | 2,000,000 | 2,011,261 |
| Philadelphia Wtr. & Wastewtr. Rev.: | | | |
| Series 2015 B, 5% 7/1/30 | | 3,500,000 | 3,740,148 |
| Series 2017 B: | | | |
| 5% 11/1/29 | | 3,000,000 | 3,327,769 |
| 5% 11/1/30 | | 3,700,000 | 4,088,393 |
| Series 2020, 5% 10/1/40 | | 3,195,000 | 3,516,303 |
| Pittsburgh & Allegheny County Parking Sys. Series 2017: | | | |
| 5% 12/15/31 | | 1,000,000 | 1,111,959 |
| 5% 12/15/32 | | 500,000 | 554,787 |
| 5% 12/15/33 | | 500,000 | 553,849 |
| Pittsburgh Gen. Oblig. Series 2014, 5% 9/1/23 (Build America Mutual Assurance Insured) | | 575,000 | 596,317 |
| Pittsburgh School District Series 2015, 5% 9/1/23 (Assured Guaranty Muni. Corp. Insured) | | 1,085,000 | 1,125,479 |
| Pittsburgh Wtr. & Swr. Auth. Wtr. & Swr. Sys. Rev.: | | | |
| Series 2019 A, 5% 9/1/44 (Assured Guaranty Muni. Corp. Insured) | | 3,600,000 | 3,977,744 |
| Series 2019 B: | | | |
| 4% 9/1/34 (Assured Guaranty Muni. Corp. Insured) | | 2,000,000 | 2,075,716 |
| 4% 9/1/35 (Assured Guaranty Muni. Corp. Insured) | | 400,000 | 412,941 |
| Reading School District Series 2017: | | | |
| 5% 3/1/35 (Assured Guaranty Muni. Corp. Insured) | | 1,000,000 | 1,088,144 |
| 5% 3/1/36 (Assured Guaranty Muni. Corp. Insured) | | 1,050,000 | 1,138,906 |
| 5% 3/1/37 (Assured Guaranty Muni. Corp. Insured) | | 1,600,000 | 1,729,597 |
| Saint Mary Hosp. Auth. Health Sys. Rev. (Trinity Health Proj.) Series 2012 B, 5% 11/15/26 | | 1,000,000 | 1,106,247 |
| Southcentral Pennsylvania Gen. Auth. Rev. Series 2015: | | | |
| 4% 12/1/30 | | 1,040,000 | 1,062,073 |
| 5% 12/1/22 | | 30,000 | 30,409 |
| 5% 12/1/27 | | 1,480,000 | 1,572,822 |
| 5% 12/1/29 | | 1,000,000 | 1,050,876 |
| Susquehanna Area Reg'l. Arp Auth. Series 2017: | | | |
| 5% 1/1/35 (a) | | 1,000,000 | 1,029,787 |
| 5% 1/1/38 (a) | | 1,125,000 | 1,152,602 |
| Union County Hosp. Auth. Rev. Series 2018 B, 5% 8/1/48 | | 6,000,000 | 6,418,323 |
| West Mifflin Area School District Series 2016: | | | |
| 5% 4/1/24 (Assured Guaranty Muni. Corp. Insured) | | 1,250,000 | 1,305,712 |
| 5% 4/1/26 (Assured Guaranty Muni. Corp. Insured) | | 1,000,000 | 1,082,677 |
| 5% 4/1/28 (Assured Guaranty Muni. Corp. Insured) | | 1,390,000 | 1,528,426 |
| Westmoreland County Indl. Dev. Auth. (Excela Health Proj.) Series 2020 A: | | | |
| 4% 7/1/22 | | 600,000 | 600,000 |
| 4% 7/1/23 | | 1,125,000 | 1,139,934 |
| 4% 7/1/26 | | 1,000,000 | 1,027,908 |
| 4% 7/1/37 | | 1,400,000 | 1,310,376 |
| 5% 7/1/27 | | 200,000 | 215,076 |
| 5% 7/1/28 | | 1,130,000 | 1,220,255 |
| 5% 7/1/29 | | 500,000 | 543,001 |
| 5% 7/1/30 | | 1,000,000 | 1,090,230 |
|
| TOTAL PENNSYLVANIA | | | 395,509,900 |
|
| Pennsylvania, New Jersey - 1.1% | | | |
| Delaware River Port Auth. Pennsylvania & New Jersey Rev. Series 2018 A: | | | |
| 5% 1/1/37 | | 1,000,000 | 1,075,190 |
| 5% 1/1/38 | | 1,300,000 | 1,395,102 |
| 5% 1/1/39 | | 1,000,000 | 1,066,161 |
| 5% 1/1/40 | | 1,100,000 | 1,164,314 |
|
| TOTAL PENNSYLVANIA, NEW JERSEY | | | 4,700,767 |
|
| Puerto Rico - 0.6% | | | |
| Puerto Rico Commonwealth Pub. Impt. Gen. Oblig. Series 2021 A1: | | | |
| 0% 7/1/33 | | 1,225,367 | 688,270 |
| 5.625% 7/1/27 | | 145,000 | 154,246 |
| 5.625% 7/1/29 | | 440,000 | 472,453 |
| 5.75% 7/1/31 | | 1,045,000 | 1,141,208 |
|
| TOTAL PUERTO RICO | | | 2,456,177 |
|
| TOTAL MUNICIPAL BONDS | | | |
| (Cost $424,005,463) | | | 403,396,071 |
| TOTAL INVESTMENT IN SECURITIES - 93.6% | | | |
| (Cost $424,005,463) | | | 403,396,071 |
| NET OTHER ASSETS (LIABILITIES) - 6.4% | | | 27,434,257 |
| NET ASSETS - 100% | | | $430,830,328 |
Legend
(a) Private activity obligations whose interest is subject to the federal alternative minimum tax for individuals.
(b) Security or a portion of the security purchased on a delayed delivery or when-issued basis.
(c) Security initially issued in zero coupon form which converts to coupon form at a specified rate and date. The rate shown is the rate at period end.
Investment Valuation
The following is a summary of the inputs used, as of June 30, 2022, involving the Fund's assets and liabilities carried at fair value. The inputs or methodology used for valuing securities may not be an indication of the risk associated with investing in those securities. For more information on valuation inputs, and their aggregation into the levels used below, please refer to the Investment Valuation section in the accompanying Notes to Financial Statements.
| | Valuation Inputs at Reporting Date: |
| Description | Total | Level 1 | Level 2 | Level 3 |
| Investments in Securities: | | | | |
| Municipal Securities | $403,396,071 | $-- | $403,396,071 | $-- |
| Total Investments in Securities: | $403,396,071 | $-- | $403,396,071 | $-- |
Other Information
The distribution of municipal securities by revenue source, as a percentage of total Net Assets, is as follows (Unaudited):
| Health Care | 25.9% |
| Transportation | 20.8% |
| Education | 18.1% |
| General Obligations | 11.6% |
| Water & Sewer | 7.1% |
| Housing | 5.2% |
| Others (Individually Less Than 5%) | 4.9% |
| Net Other Assets (Liabilities) | 6.4% |
| | 100.0% |
See accompanying notes which are an integral part of the financial statements.
Fidelity® Pennsylvania Municipal Income Fund
Financial Statements
Statement of Assets and Liabilities
| | | June 30, 2022 (Unaudited) |
| Assets | | |
Investment in securities, at value — See accompanying schedule:
Unaffiliated issuers (cost $424,005,463) | | $403,396,071 |
| Cash | | 28,584,858 |
| Receivable for fund shares sold | | 324,873 |
| Interest receivable | | 5,338,288 |
| Other receivables | | 991 |
| Total assets | | 437,645,081 |
| Liabilities | | |
| Payable for investments purchased | | |
| Regular delivery | $245,231 | |
| Delayed delivery | 5,230,851 | |
| Payable for fund shares redeemed | 864,064 | |
| Distributions payable | 280,332 | |
| Accrued management fee | 125,478 | |
| Other affiliated payables | 45,739 | |
| Other payables and accrued expenses | 23,058 | |
| Total liabilities | | 6,814,753 |
| Net Assets | | $430,830,328 |
| Net Assets consist of: | | |
| Paid in capital | | $452,551,997 |
| Total accumulated earnings (loss) | | (21,721,669) |
| Net Assets | | $430,830,328 |
| Net Asset Value, offering price and redemption price per share ($430,830,328 ÷ 41,668,292 shares) | | $10.34 |
See accompanying notes which are an integral part of the financial statements.
Statement of Operations
| | | Six months ended June 30, 2022 (Unaudited) |
| Investment Income | | |
| Interest | | $6,709,181 |
| Expenses | | |
| Management fee | $842,643 | |
| Transfer agent fees | 241,318 | |
| Accounting fees and expenses | 62,148 | |
| Custodian fees and expenses | 4,174 | |
| Independent trustees' fees and expenses | 765 | |
| Registration fees | 21,925 | |
| Audit | 24,488 | |
| Legal | 7,119 | |
| Miscellaneous | 1,001 | |
| Total expenses before reductions | 1,205,581 | |
| Expense reductions | (8,418) | |
| Total expenses after reductions | | 1,197,163 |
| Net investment income (loss) | | 5,512,018 |
| Realized and Unrealized Gain (Loss) | | |
| Net realized gain (loss) on: | | |
| Investment securities: | | |
| Unaffiliated issuers | | (1,296,571) |
| Total net realized gain (loss) | | (1,296,571) |
| Change in net unrealized appreciation (depreciation) on investment securities | | (55,004,760) |
| Net gain (loss) | | (56,301,331) |
| Net increase (decrease) in net assets resulting from operations | | $(50,789,313) |
See accompanying notes which are an integral part of the financial statements.
Statement of Changes in Net Assets
| | Six months ended June 30, 2022 (Unaudited) | Year ended December 31, 2021 |
| Increase (Decrease) in Net Assets | | |
| Operations | | |
| Net investment income (loss) | $5,512,018 | $11,924,047 |
| Net realized gain (loss) | (1,296,571) | 417,639 |
| Change in net unrealized appreciation (depreciation) | (55,004,760) | 77,355 |
| Net increase (decrease) in net assets resulting from operations | (50,789,313) | 12,419,041 |
| Distributions to shareholders | (5,511,396) | (12,540,010) |
| Share transactions | | |
| Proceeds from sales of shares | 93,396,124 | 97,699,349 |
| Reinvestment of distributions | 3,520,634 | 7,886,844 |
| Cost of shares redeemed | (164,732,686) | (86,105,495) |
| Net increase (decrease) in net assets resulting from share transactions | (67,815,928) | 19,480,698 |
| Total increase (decrease) in net assets | (124,116,637) | 19,359,729 |
| Net Assets | | |
| Beginning of period | 554,946,965 | 535,587,236 |
| End of period | $430,830,328 | $554,946,965 |
| Other Information | | |
| Shares | | |
| Sold | 8,745,755 | 8,417,034 |
| Issued in reinvestment of distributions | 326,493 | 679,894 |
| Redeemed | (15,303,980) | (7,423,996) |
| Net increase (decrease) | (6,231,732) | 1,672,932 |
See accompanying notes which are an integral part of the financial statements.
Financial Highlights
Fidelity Pennsylvania Municipal Income Fund
| | Six months ended (Unaudited) June 30, | Years endedDecember 31, | | | | |
| | 2022 | 2021 | 2020 | 2019 | 2018 | 2017 |
| Selected Per–Share Data | | | | | | |
| Net asset value, beginning of period | $11.59 | $11.59 | $11.39 | $10.92 | $11.18 | $10.97 |
| Income from Investment Operations | | | | | | |
| Net investment income (loss)A,B | .124 | .251 | .275 | .310 | .314 | .328 |
| Net realized and unrealized gain (loss) | (1.250) | .013 | .209 | .523 | (.226) | .257 |
| Total from investment operations | (1.126) | .264 | .484 | .833 | .088 | .585 |
| Distributions from net investment income | (.124) | (.251) | (.272) | (.307) | (.314) | (.328) |
| Distributions from net realized gain | – | (.013) | (.012) | (.056) | (.034) | (.047) |
| Total distributions | (.124) | (.264) | (.284) | (.363) | (.348) | (.375) |
| Net asset value, end of period | $10.34 | $11.59 | $11.59 | $11.39 | $10.92 | $11.18 |
| Total ReturnC,D | (9.76)% | 2.30% | 4.32% | 7.71% | .84% | 5.41% |
| Ratios to Average Net AssetsB,E,F | | | | | | |
| Expenses before reductions | .50%G | .48% | .49% | .48% | .48% | .48% |
| Expenses net of fee waivers, if any | .50%G | .48% | .49% | .48% | .48% | .48% |
| Expenses net of all reductions | .50%G | .48% | .48% | .48% | .48% | .48% |
| Net investment income (loss) | 2.29%G | 2.16% | 2.42% | 2.74% | 2.88% | 2.95% |
| Supplemental Data | | | | | | |
| Net assets, end of period (000 omitted) | $430,830 | $554,947 | $535,587 | $516,717 | $452,519 | $480,405 |
| Portfolio turnover rateH | 4%G | 5% | 17% | 20% | 15% | 12% |
A Calculated based on average shares outstanding during the period.
B Net investment income (loss) is affected by the timing of the declaration of dividends by any underlying mutual funds or exchange-traded funds (ETFs). Net investment income (loss) of any such underlying funds is not included in the Fund's net investment income (loss) ratio.
C Total returns for periods of less than one year are not annualized.
D Total returns would have been lower if certain expenses had not been reduced during the applicable periods shown.
E Fees and expenses of any underlying mutual funds or exchange-traded funds (ETFs) are not included in the Fund's expense ratio. The Fund indirectly bears its proportionate share of these expenses.
F Expense ratios reflect operating expenses of the class. Expenses before reductions do not reflect amounts reimbursed, waived, or reduced through arrangements with the investment adviser, brokerage services, or other offset arrangements, if applicable, and do not represent the amount paid by the class during periods when reimbursements, waivers or reductions occur.
G Annualized
H Amount does not include the portfolio activity of any underlying mutual funds or exchange-traded funds (ETFs).
See accompanying notes which are an integral part of the financial statements.
Fidelity® Pennsylvania Municipal Money Market Fund
Investment Summary/Performance (Unaudited)
Effective Maturity Diversification as of June 30, 2022
| Days | % of fund's investments 6/30/22 |
| 1 - 7 | 92.9 |
| 8 - 30 | 1.1 |
| 31 - 60 | 1.2 |
| 61 - 90 | 2.7 |
| 91 - 180 | 1.4 |
| > 180 | 0.7 |
Effective maturity is determined in accordance with the requirements of Rule 2a-7 under the Investment Company Act of 1940.
Asset Allocation (% of fund's net assets)
| As of June 30, 2022 |
| | Variable Rate Demand Notes (VRDNs) | 35.6% |
| | Tender Option Bond | 46.8% |
| | Other Municipal Security | 8.5% |
| | Investment Companies | 9.1% |
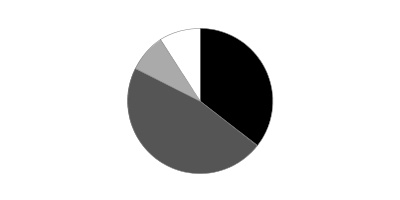
Current 7-Day Yields
| | 6/30/22 |
| Fidelity® Pennsylvania Municipal Money Market Fund | 0.52% |
Yield refers to the income paid by the Fund over a given period. Yield for money market funds is usually for seven-day periods, as it is here, though it is expressed as an annual percentage rate. Past performance is no guarantee of future results. Yield will vary and it's possible to lose money investing in the Fund.
Fidelity® Pennsylvania Municipal Money Market Fund
Schedule of Investments June 30, 2022 (Unaudited)
Showing Percentage of Net Assets
| Variable Rate Demand Note - 35.6% | | | |
| | | Principal Amount | Value |
| Alabama - 0.7% | | | |
| Decatur Indl. Dev. Board Exempt Facilities Rev. (Nucor Steel Decatur LLC Proj.) Series 2003 A, 1.19% 7/7/22, VRDN (a)(b) | | $800,000 | $800,000 |
| West Jefferson Indl. Dev. Series 2008, 1.1% 7/7/22, VRDN (b) | | 200,000 | 200,000 |
| | | | 1,000,000 |
| Kansas - 0.6% | | | |
| Burlington Envir. Impt. Rev. (Kansas City Pwr. and Lt. Co. Proj.): | | | |
| Series 2007 A, 1.05% 7/7/22, VRDN (b) | | 100,000 | 100,000 |
| Series 2007 B, 1.05% 7/7/22, VRDN (b) | | 300,000 | 300,000 |
| St. Mary's Kansas Poll. Cont. Rev. Series 1994, 1% 7/7/22, VRDN (b) | | 500,000 | 500,000 |
| Wamego Kansas Poll. Cont. Rfdg. Rev. (Western Resources, Inc. Proj.) Series 1994, 1% 7/7/22, VRDN (b) | | 100,000 | 100,000 |
| | | | 1,000,000 |
| Nebraska - 0.3% | | | |
| Stanton County Indl. Dev. Rev. (Nucor Corp. Proj.) Series 1996, 1.19% 7/7/22, VRDN (a)(b) | | 400,000 | 400,000 |
| Pennsylvania - 32.8% | | | |
| Allegheny County Hosp. Dev. Auth. Rev. Series 2016 A, 1.01% 7/7/22, LOC Truist Bank, VRDN (b) | | 3,000,000 | 3,000,000 |
| Beaver County Indl. Dev. Auth. Series 2018 A, 1.01% 7/7/22, LOC Truist Bank, VRDN (b)(c) | | 1,810,000 | 1,810,000 |
| Chester County Health & Ed. Auth. Rev. Series 2009, 0.98% 7/7/22, LOC Manufacturers & Traders Trust Co., VRDN (b) | | 2,460,000 | 2,460,000 |
| Delaware County Indl. Dev. Auth. Arpt. Facilities Rev. (United Parcel Svc. Proj.) Series 2015, 0.7% 7/1/22, VRDN (b) | | 4,755,000 | 4,755,000 |
| Delaware Valley Reg'l. Fin. Auth. Local Govt. Rev. Series 2020 D, 0.9% 7/7/22, LOC TD Banknorth, NA, VRDN (b) | | 2,000,000 | 2,000,000 |
| Haverford Township School District Series 2009, 0.89% 7/7/22, LOC TD Banknorth, NA, VRDN (b) | | 2,885,000 | 2,885,000 |
| Lancaster Indl. Dev. Auth. Rev.: | | | |
| (Mennonite Home Proj.) Series 2007, 1.05% 7/7/22, LOC Manufacturers & Traders Trust Co., VRDN (b) | | 4,925,000 | 4,925,000 |
| (Willow Valley Retirement Proj.) Series 2009 B, 0.95% 7/7/22, LOC PNC Bank NA, VRDN (b) | | 1,000,000 | 1,000,000 |
| Lehigh County Gen. Purp. Hosp. Rev. Series 2019 B, 0.9% 7/7/22, LOC Bank of America NA, VRDN (b) | | 900,000 | 900,000 |
| Montgomery County Indl. Dev. Auth. Rev. (Foulkeways at Gwynedd Proj.) Series 2006 B, 1% 7/7/22, LOC Citizens Bank NA, VRDN (b) | | 400,000 | 400,000 |
| Pennsylvania Higher Edl. Facilities Auth. Rev. (Univ. of Pennsylvania Health Sys. Proj.) Series 2008 A, 0.91% 7/7/22, LOC Bank of America NA, VRDN (b) | | 2,000,000 | 2,000,000 |
| Philadelphia Arpt. Rev. Series 2005 C1, 0.98% 7/7/22, LOC Wells Fargo Bank NA, VRDN (a)(b) | | 1,100,000 | 1,100,000 |
| Philadelphia Auth. for Indl. Dev. Rev. (Spl. People in Northeast, Inc. Proj.) Series 2006, 0.98% 7/7/22, LOC Citizens Bank NA, VRDN (b) | | 3,295,000 | 3,295,000 |
| Philadelphia Auth. Indl. Dev. Lease Rev. Series 2007 B2, 0.89% 7/7/22, LOC TD Banknorth, NA, VRDN (b) | | 6,600,000 | 6,600,000 |
| Philadelphia Gas Works Rev. Series 2009 D, 0.96% 7/7/22, LOC TD Banknorth, NA, VRDN (b) | | 200,000 | 200,000 |
| FHLMC Pennsylvania Hsg. Fin. Agcy. Multifamily Hsg. Dev. Rev. (Foxwood Manor Apts. Proj.) Series 2008 O, 0.9% 7/7/22, LOC Freddie Mac, VRDN (b) | | 300,000 | 300,000 |
| FNMA Montgomery County Redev. Auth. Multi-family Hsg. Rev. (Kingswood Apts. Proj.) Series 2001 A, 0.97% 7/7/22, LOC Fannie Mae, VRDN (b) | | 12,375,000 | 12,375,000 |
| | | | 50,005,000 |
| South Carolina - 0.1% | | | |
| Berkeley County Indl. Dev. Rev. (Nucor Corp. Proj.) Series 1997, 1.19% 7/7/22, VRDN (a)(b) | | 100,000 | 100,000 |
| West Virginia - 1.1% | | | |
| West Virginia Econ. Dev. Auth. Solid Waste Disp. Facilities Rev.: | | | |
| (Appalachian Pwr. Co. Amos Proj.) Series 2008 B, 1.02% 7/7/22, VRDN (a)(b) | | 500,000 | 500,000 |
| (Appalachian Pwr. Co.- Mountaineer Proj.) Series 2008 A, 1% 7/7/22, VRDN (a)(b) | | 1,200,000 | 1,200,000 |
| | | | 1,700,000 |
| TOTAL VARIABLE RATE DEMAND NOTE | | | |
| (Cost $54,205,000) | | | 54,205,000 |
|
| Tender Option Bond - 46.8% | | | |
| Colorado - 0.0% | | | |
| Denver City & County Arpt. Rev. Bonds Series G-114, 1.16%, tender 12/1/22 (Liquidity Facility Royal Bank of Canada) (a)(b)(d)(e)(f) | | 100,000 | 100,000 |
| Connecticut - 0.3% | | | |
| Connecticut Gen. Oblig. Participating VRDN Series Floaters 016, 1.03% 8/11/22 (Liquidity Facility Barclays Bank PLC) (b)(d)(f) | | 300,000 | 300,000 |
| Connecticut Spl. Tax Oblig. Trans. Infrastructure Rev. Bonds Series Floaters G 110, 1.09%, tender 10/3/22 (Liquidity Facility Royal Bank of Canada) (b)(d)(e)(f) | | 200,000 | 200,000 |
| | | | 500,000 |
| Florida - 0.0% | | | |
| Greater Orlando Aviation Auth. Arpt. Facilities Rev. Bonds Series Floaters G 25, 1.16%, tender 10/3/22 (Liquidity Facility Royal Bank of Canada) (a)(b)(d)(e)(f) | | 100,000 | 100,000 |
| Kentucky - 0.2% | | | |
| CommonSpirit Health Participating VRDN Series MIZ 90 21, 1.01% 7/7/22 (Liquidity Facility Mizuho Cap. Markets LLC) (b)(d)(f) | | 200,000 | 200,000 |
| Kentucky State Property & Buildings Commission Rev. Bonds Series G 116, 1.11%, tender 11/1/22 (Liquidity Facility Royal Bank of Canada) (b)(d)(e)(f) | | 100,000 | 100,000 |
| | | | 300,000 |
| Mississippi - 0.1% | | | |
| Mississippi Bus. Fin. Corp. Rev. Participating VRDN Series 2021 XF 11 05, 0.98% 7/7/22 (Liquidity Facility Deutsche Bank AG New York Branch) (b)(d)(f) | | 100,000 | 100,000 |
| Ohio - 0.1% | | | |
| Ohio Hosp. Rev. Participating VRDN Series 002, 1.03% 8/11/22 (Liquidity Facility Barclays Bank PLC) (b)(d)(f) | | 100,000 | 100,000 |
| Ohio Univ. Gen. Receipts Athens Bonds Series Floaters G 27, 1.11%, tender 12/1/22 (Liquidity Facility Royal Bank of Canada) (b)(d)(e)(f) | | 100,000 | 100,000 |
| | | | 200,000 |
| Pennsylvania - 45.7% | | | |
| Allegheny County Sanitation Auth. Swr. Rev. Participating VRDN Series Floaters XM 00 82, 0.95% 7/7/22 (Liquidity Facility Barclays Bank PLC) (b)(d)(f) | | 6,665,000 | 6,665,000 |
| Central Bradford Progress Auth. Rev. Participating VRDN: | | | |
| Series 2021 XF 12 59, 0.95% 7/7/22 (Liquidity Facility Bank of America NA)(b)(d)(f) | | 800,000 | 800,000 |
| Series XF 13 46, 0.96% 7/7/22 (Liquidity Facility Bank of America NA) (b)(d)(f) | | 2,165,000 | 2,165,000 |
| Commonwealth Fing. Auth. Tobacco Participating VRDN Series XX 10 80, 0.95% 7/7/22 (Liquidity Facility Barclays Bank PLC) (b)(d)(f) | | 2,700,000 | 2,700,000 |
| Geisinger Auth. Health Sys. Rev. Participating VRDN: | | | |
| Series Floaters XF 05 43, 0.98% 7/7/22 (Liquidity Facility Royal Bank of Canada) (b)(d)(f) | | 3,500,000 | 3,500,000 |
| Series Floaters YX 10 49, 0.99% 7/7/22 (Liquidity Facility Barclays Bank PLC) (b)(d)(f) | | 1,885,000 | 1,885,000 |
| Series XF 09 69, 0.98% 7/7/22 (Liquidity Facility Royal Bank of Canada) (b)(d)(f) | | 1,900,000 | 1,900,000 |
| Series XM 08 87, 1.06% 7/7/22 (Liquidity Facility JPMorgan Chase Bank) (b)(d)(f) | | 1,900,000 | 1,900,000 |
| Lancaster County Hosp. Auth. Health Ctr. Rev. Participating VRDN Series 16 ZF0383, 0.96% 7/7/22 (Liquidity Facility Toronto-Dominion Bank) (b)(d)(f) | | 3,750,000 | 3,750,000 |
| Lehigh County Gen. Purp. Hosp. Rev. Participating VRDN Series ZF 08 33, 0.95% 7/7/22 (Liquidity Facility Bank of America NA) (b)(d)(f) | | 1,680,000 | 1,680,000 |
| Montgomery County Higher Ed. & Health Auth. Rev. Participating VRDN: | | | |
| Series Floaters ZF 07 95, 0.96% 7/7/22 (Liquidity Facility Bank of America NA) (b)(d)(f) | | 2,200,000 | 2,200,000 |
| Series XF 28 85, 0.95% 7/7/22 (Liquidity Facility Barclays Bank PLC) (b)(d)(f) | | 2,500,000 | 2,500,000 |
| Northampton County Gen. Purp. College Rev. Participating VRDN Series Floaters ZM 05 17, 0.94% 7/7/22 (Liquidity Facility Morgan Stanley Bank, West Valley City Utah) (b)(d)(f) | | 7,500,000 | 7,500,000 |
| Pennsylvania Econ. Dev. Participating VRDN Series XM 0048, 0.97% 7/7/22 (Liquidity Facility Deutsche Bank AG New York Branch) (b)(d)(f) | | 299,500 | 299,500 |
| Pennsylvania Gen. Oblig. Participating VRDN Series Floaters ZM 06 50, 0.94% 7/7/22 (Liquidity Facility Bank of America NA) (b)(d)(f) | | 975,000 | 975,000 |
| Pennsylvania State Univ. Participating VRDN Series XM 08 27, 0.94% 7/7/22 (Liquidity Facility JPMorgan Chase Bank) (b)(d)(f) | | 2,900,000 | 2,900,000 |
| Pennsylvania Tpk. Commission Registration Fee Rev. Participating VRDN: | | | |
| Series Putters 5025, 0.68% 7/1/22 (Liquidity Facility JPMorgan Chase Bank) (b)(d)(f) | | 3,000,000 | 3,000,000 |
| Series Putters 5026, 0.68% 7/1/22 (Liquidity Facility JPMorgan Chase Bank) (b)(d)(f) | | 400,000 | 400,000 |
| Pennsylvania Tpk. Commission Tpk. Rev. Participating VRDN: | | | |
| Series XM 10 08, 0.94% 7/7/22 (Liquidity Facility Royal Bank of Canada) (b)(d)(f) | | 1,000,000 | 1,000,000 |
| Series XX 11 34, 0.95% 7/7/22 (Liquidity Facility Barclays Bank PLC) (b)(d)(f) | | 1,300,000 | 1,300,000 |
| Philadelphia Arpt. Rev. Participating VRDN: | | | |
| Series YX 11 44, 0.95% 7/7/22 (Liquidity Facility Barclays Bank PLC) (b)(d)(f) | | 3,000,000 | 3,000,000 |
| Series YX 12 11, 0.98% 7/7/22 (Liquidity Facility Barclays Bank PLC) (a)(b)(d)(f) | | 1,600,000 | 1,600,000 |
| Philadelphia Auth. for Indl. Dev. Participating VRDN: | | | |
| Series XG 02 53, 0.96% 7/7/22 (Liquidity Facility Bank of America NA) (b)(d)(f) | | 2,100,000 | 2,100,000 |
| Series XM 00 05, 0.94% 7/7/22 (Liquidity Facility JPMorgan Chase Bank) (b)(d)(f) | | 4,200,000 | 4,200,000 |
| Philadelphia School District Participating VRDN Series XM 08 60, 0.94% 7/7/22 (Liquidity Facility JPMorgan Chase Bank) (b)(d)(f) | | 1,625,000 | 1,625,000 |
| Philadelphia Wtr. & Wastewtr. Rev. Participating VRDN Series Floaters XF 07 19, 0.95% 7/7/22 (Liquidity Facility Royal Bank of Canada) (b)(d)(f) | | 1,000,000 | 1,000,000 |
| Southcentral Pennsylvania Gen. Auth. Rev. Participating VRDN Series XL 01 04, 0.94% 7/7/22 (Liquidity Facility Morgan Stanley Bank, West Valley City Utah) (b)(d)(f) | | 1,500,000 | 1,500,000 |
| Westmoreland County Muni. Auth. Muni. Svc. Rev. Participating VRDN Series XF 10 58, 0.95% 7/7/22 (Liquidity Facility Barclays Bank PLC) (b)(d)(f) | | 3,270,000 | 3,270,000 |
| Wilkes-Barre Area School District Participating VRDN Series Floaters XF 07 77, 0.95% 7/7/22 (Liquidity Facility Bank of America NA) (b)(d)(f) | | 2,285,000 | 2,285,000 |
| | | | 69,599,500 |
| South Carolina - 0.1% | | | |
| South Carolina Trans. Infrastructure Bank Rev. Bonds Series Floaters G 109, 1.11%, tender 10/3/22 (Liquidity Facility Royal Bank of Canada) (b)(d)(e)(f) | | 100,000 | 100,000 |
| Tennessee - 0.1% | | | |
| Metropolitan Nashville Arpt. Auth. Rev. Participating VRDN Series 2021 XL 01 89, 0.98% 7/7/22 (Liquidity Facility Deutsche Bank AG New York Branch) (a)(b)(d)(f) | | 100,000 | 100,000 |
| Virginia - 0.2% | | | |
| Suffolk Econ. Dev. Auth. Hosp. Facilities Rev. Participating VRDN Series MIZ 90 25, 1% 7/7/22 (Liquidity Facility Mizuho Cap. Markets LLC) (b)(d)(f) | | 290,000 | 290,000 |
| TOTAL TENDER OPTION BOND | | | |
| (Cost $71,389,500) | | | 71,389,500 |
|
| Other Municipal Security - 8.5% | | | |
| Pennsylvania, New Jersey - 0.7% | | | |
| Delaware River Joint Toll Bridge Commission Pennsylvania-New Jersey Bridge Rev. Bonds Series 2012 A, 5% | | 1,020,000 | 1,020,000 |
| Pennsylvania - 7.8% | | | |
| Pennsylvania Gen. Oblig. Bonds: | | | |
| Series 2012, 5% 7/1/22 | | 1,185,000 | 1,185,000 |
| Series 2014, 5% 7/1/22 | | 1,075,000 | 1,075,000 |
| Series 2015 1, 5% 8/15/22 | | 400,000 | 401,711 |
| Series 2016 2, 5% 9/15/22 | | 225,000 | 227,198 |
| Series 2019, 5% 7/15/22 | | 1,600,000 | 1,602,279 |
| Pennsylvania Hsg. Fin. Agcy. Bonds Series 2021 134B, 5% 4/1/23 (a) | | 1,000,000 | 1,018,767 |
| Philadelphia Wtr. & Wastewtr. Rev. Series 2022 B, 1.16% 8/4/22, LOC Royal Bank of Canada, CP | | 1,000,000 | 1,000,000 |
| Pittsburgh Gen. Oblig. Bonds Series 2012 B: | | | |
| 5% 9/1/22 (Pre-Refunded to 9/1/22 @ 100) | | 2,940,000 | 2,957,499 |
| 5% 9/1/22 (Pre-Refunded to 9/1/22 @ 100) | | 1,000,000 | 1,005,852 |
| Univ. of Pittsburgh Commonwealth Sys. of Higher Ed. Bonds Series 2022 B2, 1.67% tender 10/20/22, CP mode | | 1,500,000 | 1,500,000 |
| | | | 11,973,306 |
| TOTAL OTHER MUNICIPAL SECURITY | | | |
| (Cost $12,993,306) | | | 12,993,306 |
| | | Shares | Value |
|
| Investment Company - 9.1% | | | |
| Fidelity Municipal Cash Central Fund 0.88% (g)(h) | | | |
| (Cost $13,879,874) | | 13,877,475 | 13,879,874 |
| TOTAL INVESTMENT IN SECURITIES - 100.0% | | | |
| (Cost $152,467,680) | | | 152,467,680 |
| NET OTHER ASSETS (LIABILITIES) - 0.0% | | | (62,057) |
| NET ASSETS - 100% | | | $152,405,623 |
Security Type Abbreviations
CP – COMMERCIAL PAPER
VRDN – VARIABLE RATE DEMAND NOTE (A debt instrument that is payable upon demand, either daily, weekly or monthly)
The date shown for securities represents the date when principal payments must be paid, taking into account any call options exercised by the issuer and any permissible maturity shortening features other than interest rate resets.
Legend
(a) Private activity obligations whose interest is subject to the federal alternative minimum tax for individuals.
(b) Coupon rates for floating and adjustable rate securities reflect the rates in effect at period end.
(c) Security or a portion of the security purchased on a delayed delivery or when-issued basis.
(d) Provides evidence of ownership in one or more underlying municipal bonds.
(e) Restricted securities (including private placements) - Investment in securities not registered under the Securities Act of 1933 (excluding 144A issues). At the end of the period, the value of restricted securities (excluding 144A issues) amounted to $700,000 or 0.5% of net assets.
(f) Coupon rates are determined by re-marketing agents based on current market conditions.
(g) Information in this report regarding holdings by state and security types does not reflect the holdings of the Fidelity Municipal Cash Central Fund.
(h) Affiliated fund that is generally available only to investment companies and other accounts managed by Fidelity Investments. The rate quoted is the annualized seven-day yield of the fund at period end. A complete unaudited listing of the fund's holdings as of its most recent quarter end is available upon request. In addition, each Fidelity Central Fund's financial statements are available on the SEC's website or upon request.
Additional information on each restricted holding is as follows:
| Security | Acquisition Date | Cost |
| Connecticut Spl. Tax Oblig. Trans. Infrastructure Rev. Bonds Series Floaters G 110, 1.09%, tender 10/3/22 (Liquidity Facility Royal Bank of Canada) | 4/1/21 | $200,000 |
| Denver City & County Arpt. Rev. Bonds Series G-114, 1.16%, tender 12/1/22 (Liquidity Facility Royal Bank of Canada) | 6/1/21 | $100,000 |
| Greater Orlando Aviation Auth. Arpt. Facilities Rev. Bonds Series Floaters G 25, 1.16%, tender 10/3/22 (Liquidity Facility Royal Bank of Canada) | 4/1/21 | $100,000 |
| Kentucky State Property & Buildings Commission Rev. Bonds Series G 116, 1.11%, tender 11/1/22 (Liquidity Facility Royal Bank of Canada) | 5/3/21 | $100,000 |
| Ohio Univ. Gen. Receipts Athens Bonds Series Floaters G 27, 1.11%, tender 12/1/22 (Liquidity Facility Royal Bank of Canada) | 6/1/21 | $100,000 |
| South Carolina Trans. Infrastructure Bank Rev. Bonds Series Floaters G 109, 1.11%, tender 10/3/22 (Liquidity Facility Royal Bank of Canada) | 4/1/21 | $100,000 |
Affiliated Central Funds
Fiscal year to date information regarding the Fund's investments in Fidelity Central Funds, including the ownership percentage, is presented below.
| Fund | Value, beginning of period | Purchases | Sales Proceeds | Dividend Income | Realized Gain/Loss | Change in Unrealized appreciation (depreciation) | Value, end of period | % ownership, end of period |
| Fidelity Municipal Cash Central Fund 0.88% | $5,440,706 | $42,398,000 | $33,959,000 | $30,123 | $168 | $-- | $13,879,874 | 0.9% |
| Total | $5,440,706 | $42,398,000 | $33,959,000 | $30,123 | $168 | $-- | $13,879,874 | |
Amounts in the income column in the above table include any capital gain distributions from underlying funds, which are presented in the corresponding line-item in the Statement of Operations, if applicable.
Investment Valuation
All investments are categorized as Level 2 under the Fair Value Hierarchy. The inputs or methodology used for valuing securities may not be an indication of the risk associated with investing in those securities. For more information on valuation inputs please refer to the Investment Valuation section in the accompanying Notes to Financial Statements.
See accompanying notes which are an integral part of the financial statements.
Fidelity® Pennsylvania Municipal Money Market Fund
Financial Statements
Statement of Assets and Liabilities
| | | June 30, 2022 (Unaudited) |
| Assets | | |
Investment in securities, at value — See accompanying schedule:
Unaffiliated issuers (cost $138,587,806) | $138,587,806 | |
| Fidelity Central Funds (cost $13,879,874) | 13,879,874 | |
| Total Investment in Securities (cost $152,467,680) | | $152,467,680 |
| Cash | | 1,393 |
| Receivable for fund shares sold | | 19,692 |
| Interest receivable | | 353,267 |
| Distributions receivable from Fidelity Central Funds | | 11,227 |
| Other receivables | | 48 |
| Total assets | | 152,853,307 |
| Liabilities | | |
| Payable for investments purchased on a delayed delivery basis | $300,000 | |
| Payable for fund shares redeemed | 80,993 | |
| Distributions payable | 2,239 | |
| Accrued management fee | 64,452 | |
| Total liabilities | | 447,684 |
| Net Assets | | $152,405,623 |
| Net Assets consist of: | | |
| Paid in capital | | $152,378,447 |
| Total accumulated earnings (loss) | | 27,176 |
| Net Assets | | $152,405,623 |
| Net Asset Value, offering price and redemption price per share ($152,405,623 ÷ 152,133,347 shares) | | $1.00 |
See accompanying notes which are an integral part of the financial statements.
Statement of Operations
| | | Six months ended June 30, 2022 (Unaudited) |
| Investment Income | | |
| Interest | | $342,392 |
| Income from Fidelity Central Funds | | 30,123 |
| Total income | | 372,515 |
| Expenses | | |
| Management fee | $394,018 | |
| Independent trustees' fees and expenses | 240 | |
| Total expenses before reductions | 394,258 | |
| Expense reductions | (112,559) | |
| Total expenses after reductions | | 281,699 |
| Net investment income (loss) | | 90,816 |
| Realized and Unrealized Gain (Loss) | | |
| Net realized gain (loss) on: | | |
| Investment securities: | | |
| Unaffiliated issuers | 27,013 | |
| Fidelity Central Funds | 168 | |
| Total net realized gain (loss) | | 27,181 |
| Net increase in net assets resulting from operations | | $117,997 |
See accompanying notes which are an integral part of the financial statements.
Statement of Changes in Net Assets
| | Six months ended June 30, 2022 (Unaudited) | Year ended December 31, 2021 |
| Increase (Decrease) in Net Assets | | |
| Operations | | |
| Net investment income (loss) | $90,816 | $16,968 |
| Net realized gain (loss) | 27,181 | 109,575 |
| Net increase in net assets resulting from operations | 117,997 | 126,543 |
| Distributions to shareholders | (90,820) | (136,843) |
| Share transactions | | |
| Proceeds from sales of shares | 9,967,870 | 26,624,972 |
| Reinvestment of distributions | 86,549 | 129,646 |
| Cost of shares redeemed | (19,598,008) | (43,810,109) |
| Net increase (decrease) in net assets and shares resulting from share transactions | (9,543,589) | (17,055,491) |
| Total increase (decrease) in net assets | (9,516,412) | (17,065,791) |
| Net Assets | | |
| Beginning of period | 161,922,035 | 178,987,826 |
| End of period | $152,405,623 | $161,922,035 |
| Other Information | | |
| Shares | | �� |
| Sold | 9,967,870 | 26,624,972 |
| Issued in reinvestment of distributions | 86,549 | 129,646 |
| Redeemed | (19,598,008) | (43,810,109) |
| Net increase (decrease) | (9,543,589) | (17,055,491) |
See accompanying notes which are an integral part of the financial statements.
Financial Highlights
Fidelity Pennsylvania Municipal Money Market Fund
| | Six months ended (Unaudited) June 30, | Years endedDecember 31, | | | | |
| | 2022 | 2021 | 2020 | 2019 | 2018 | 2017 |
| Selected Per–Share Data | | | | | | |
| Net asset value, beginning of period | $1.00 | $1.00 | $1.00 | $1.00 | $1.00 | $1.00 |
| Income from Investment Operations | | | | | | |
| Net investment income (loss)A | .001 | –B | .003 | .010 | .010 | .004 |
| Net realized and unrealized gain (loss) | –B | .001 | –B | .001 | –B | –B |
| Total from investment operations | .001 | .001 | .003 | .011 | .010 | .004 |
| Distributions from net investment income | (.001) | –B | (.003) | (.010) | (.010) | (.004) |
| Distributions from net realized gain | – | (.001) | –B | –B | – | –B |
| Total distributions | (.001) | (.001) | (.003) | (.011)C | (.010) | (.004) |
| Net asset value, end of period | $1.00 | $1.00 | $1.00 | $1.00 | $1.00 | $1.00 |
| Total ReturnD,E | .06% | .08% | .37% | 1.06% | .97% | .40% |
| Ratios to Average Net AssetsA,F,G | | | | | | |
| Expenses before reductions | .50%H | .50% | .50% | .50% | .50% | .50% |
| Expenses net of fee waivers, if any | .36%H | .10% | .34% | .50% | .50% | .50% |
| Expenses net of all reductions | .36%H | .10% | .34% | .50% | .50% | .50% |
| Net investment income (loss) | .12%H | .01% | .35% | 1.03% | .96% | .38% |
| Supplemental Data | | | | | | |
| Net assets, end of period (000 omitted) | $152,406 | $161,922 | $178,988 | $207,008 | $240,412 | $284,994 |
A Net investment income (loss) is affected by the timing of the declaration of dividends by any underlying mutual funds or exchange-traded funds (ETFs). Net investment income (loss) of any such underlying funds is not included in the Fund's net investment income (loss) ratio.
B Amount represents less than $.0005 per share.
C Total distributions per share do not sum due to rounding.
D Total returns for periods of less than one year are not annualized.
E Total returns would have been lower if certain expenses had not been reduced during the applicable periods shown.
F Fees and expenses of any underlying mutual funds or exchange-traded funds (ETFs) are not included in the Fund's expense ratio. The Fund indirectly bears its proportionate share of these expenses. For additional expense information related to investments in Fidelity Central Funds, please refer to the "Investments in Fidelity Central Funds" note found in the Notes to Financial Statements section of the most recent Annual or Semi-Annual report.
G Expense ratios reflect operating expenses of the class. Expenses before reductions do not reflect amounts reimbursed, waived, or reduced through arrangements with the investment adviser, brokerage services, or other offset arrangements, if applicable, and do not represent the amount paid by the class during periods when reimbursements, waivers or reductions occur.
H Annualized
See accompanying notes which are an integral part of the financial statements.
Notes to Financial Statements (Unaudited)
For the period ended June 30, 2022
1. Organization.
Fidelity Pennsylvania Municipal Income Fund (the Income Fund) is a fund of Fidelity Municipal Trust. Fidelity Pennsylvania Municipal Money Market Fund (the Money Market Fund) is a fund of Fidelity Municipal Trust II. Each Trust is registered under the Investment Company Act of 1940, as amended (the 1940 Act), as an open-end management investment company. Fidelity Municipal Trust and Fidelity Municipal Trust II (the Trusts) are organized as a Massachusetts business trust and a Delaware statutory trust, respectively. Each Fund is authorized to issue an unlimited number of shares. Shares of the Money Market Fund are only available for purchase by retail shareholders. Share transactions on the Statement of Changes in Net Assets may contain exchanges between affiliated funds. Each Fund may be affected by economic and political developments in the state of Pennsylvania.
Effective after the close of business on July 15, 2022, Fidelity Pennsylvania Municipal Money Market Fund was closed to new accounts with certain exceptions.
2. Investments in Fidelity Central Funds.
Funds may invest in Fidelity Central Funds, which are open-end investment companies generally available only to other investment companies and accounts managed by the investment adviser and its affiliates. The Schedule of Investments lists any Fidelity Central Funds held as an investment as of period end, but does not include the underlying holdings of each Fidelity Central Fund. An investing fund indirectly bears its proportionate share of the expenses of the underlying Fidelity Central Funds.
Based on its investment objective, each Fidelity Central Fund may invest or participate in various investment vehicles or strategies that are similar to those of the investing fund. These strategies are consistent with the investment objectives of the investing fund and may involve certain economic risks which may cause a decline in value of each of the Fidelity Central Funds and thus a decline in the value of the investing fund.
| Fidelity Central Fund | Investment Manager | Investment Objective | Investment Practices | Expense Ratio(a) |
| Fidelity Money Market Central Funds | Fidelity Management & Research Company LLC (FMR) | Each fund seeks to obtain a high level of current income consistent with the preservation of capital and liquidity. | Short-term Investments | Less than .005% |
(a) Expenses expressed as a percentage of average net assets and are as of each underlying Central Fund's most recent annual or semi-annual shareholder report.
A complete unaudited list of holdings for each Fidelity Central Fund is available upon request or at the Securities and Exchange Commission website at www.sec.gov. In addition, the financial statements of the Fidelity Central Funds which contain the significant accounting policies (including investment valuation policies) of those funds, and are not covered by the Report of Independent Registered Public Accounting Firm, are available on the Securities and Exchange Commission website or upon request.
3. Significant Accounting Policies.
Each Fund is an investment company and applies the accounting and reporting guidance of the Financial Accounting Standards Board (FASB) Accounting Standards Codification Topic 946 Financial Services - Investment Companies. The financial statements have been prepared in conformity with accounting principles generally accepted in the United States of America (GAAP), which require management to make certain estimates and assumptions at the date of the financial statements. Actual results could differ from those estimates. Subsequent events, if any, through the date that the financial statements were issued have been evaluated in the preparation of the financial statements. Each Fund's Schedule of Investments lists any underlying mutual funds or exchange-traded funds (ETFs) but does not include the underlying holdings of these funds. The following summarizes the significant accounting policies of each Fund:
Investment Valuation. Investments are valued as of 4:00 p.m. Eastern time on the last calendar day of the period. The Board of Trustees (the Board) has delegated the day to day responsibility for the valuation of the Income Fund's investments to the Fair Value Committee (the Committee) established by the Income Fund's investment adviser. In accordance with valuation policies and procedures approved by the Board, the Income Fund attempts to obtain prices from one or more third party pricing vendors or brokers to value its investments. When current market prices, quotations or currency exchange rates are not readily available or reliable, investments will be fair valued in good faith by the Committee, in accordance with procedures adopted by the Board. Factors used in determining fair value vary by investment type and may include market or investment specific events, changes in interest rates and credit quality. The frequency with which these procedures are used cannot be predicted and they may be utilized to a significant extent. The Committee oversees the Income Fund's valuation policies and procedures and reports to the Board on the Committee's activities and fair value determinations. The Board monitors the appropriateness of the procedures used in valuing the Income Fund's investments and ratifies the fair value determinations of the Committee.
Each Fund categorizes the inputs to valuation techniques used to value its investments into a disclosure hierarchy consisting of three levels as shown below:
- Level 1 – unadjusted quoted prices in active markets for identical investments
- Level 2 – other significant observable inputs (including quoted prices for similar investments, interest rates, prepayment speeds, etc.)
- Level 3 – unobservable inputs (including the Fund's own assumptions based on the best information available)
Valuation techniques used to value each Fund's investments by major category are as follows:
For the Income Fund, debt securities, including restricted securities, are valued based on evaluated prices received from third party pricing vendors or from brokers who make markets in such securities. Municipal securities are valued by pricing vendors who utilize matrix pricing which considers yield or price of bonds of comparable quality, coupon, maturity and type or by broker-supplied prices. When independent prices are unavailable or unreliable, debt securities may be valued utilizing pricing methodologies which consider similar factors that would be used by third party pricing vendors. Debt securities are generally categorized as Level 2 in the hierarchy but may be Level 3 depending on the circumstances.
For the Money Market Fund, as permitted by compliance with certain conditions under Rule 2a-7 of the 1940 Act, securities are valued at amortized cost, which approximates fair value. The amortized cost of an instrument is determined by valuing it at its original cost and thereafter amortizing any discount or premium from its face value at a constant rate until maturity. Securities held by a money market fund are generally high quality and liquid; however, they are reflected as Level 2 because the inputs used to determine fair value are not quoted prices in an active market.
For the Income Fund, changes in valuation techniques may result in transfers in or out of an assigned level within the disclosure hierarchy. The aggregate value of investments by input level as of June 30, 2022 is included at the end of the Fund's Schedule of Investments.
Investment Transactions and Income. For financial reporting purposes, the Funds' investment holdings and NAV include trades executed through the end of the last business day of the period. The NAV per share for processing shareholder transactions is calculated as of the close of business of the New York Stock Exchange (NYSE), normally 4:00 p.m. Eastern time and includes trades executed through the end of the prior business day for the Income Fund and trades executed through the end of the current business day for the Money Market Fund. Gains and losses on securities sold are determined on the basis of identified cost. Income and capital gain distributions from Fidelity Central Funds, if any, are recorded on the ex-dividend date. Interest income is accrued as earned and includes coupon interest and amortization of premium and accretion of discount on debt securities as applicable. Debt obligations may be placed on non-accrual status and related interest income may be reduced by ceasing current accruals and writing off interest receivables when the collection of all or a portion of interest has become doubtful based on consistently applied procedures. A debt obligation is removed from non-accrual status when the issuer resumes interest payments or when collectability of interest is reasonably assured.
Expenses. Expenses directly attributable to a fund are charged to that fund. Expenses attributable to more than one fund are allocated among the respective funds on the basis of relative net assets or other appropriate methods. Expenses included in the accompanying financial statements reflect the expenses of that fund and do not include any expenses associated with any underlying mutual funds or exchange-traded funds. Although not included in a fund's expenses, a fund indirectly bears its proportionate share of these expenses through the net asset value of each underlying mutual fund or exchange-traded fund. Expense estimates are accrued in the period to which they relate and adjustments are made when actual amounts are known.
Income Tax Information and Distributions to Shareholders. Each year, each Fund intends to qualify as a regulated investment company under Subchapter M of the Internal Revenue Code, including distributing substantially all of its taxable income and realized gains. As a result, no provision for U.S. Federal income taxes is required. Each Fund files a U.S. federal tax return, in addition to state and local tax returns as required. Each Fund's federal income tax returns are subject to examination by the Internal Revenue Service (IRS) for a period of three fiscal years after they are filed. State and local tax returns may be subject to examination for an additional fiscal year depending on the jurisdiction.
Distributions are declared and recorded daily and paid monthly from net investment income. Distributions from realized gains, if any, are declared and recorded on the ex-dividend date. Income and capital gain distributions are determined in accordance with income tax regulations, which may differ from GAAP.
Capital accounts within the financial statements are adjusted for permanent book-tax differences. These adjustments have no impact on net assets or the results of operations. Capital accounts are not adjusted for temporary book-tax differences which will reverse in a subsequent period.
Book-tax differences are primarily due to market discount and excise tax regulations.
The Funds purchase municipal securities whose interest, in the opinion of the issuer, is free from federal income tax. There is no assurance that the IRS will agree with this opinion. In the event the IRS determines that the issuer does not comply with relevant tax requirements, interest payments from a security could become federally taxable, possibly retroactively to the date the security was issued.
As of period end, the cost and unrealized appreciation (depreciation) in securities, and derivatives if applicable, for federal income tax purposes were as follows for each Fund:
| | Tax cost | Gross unrealized appreciation | Gross unrealized depreciation | Net unrealized appreciation (depreciation) |
| Fidelity Pennsylvania Municipal Income Fund | $423,997,531 | $1,593,306 | $(22,194,766) | $(20,601,460) |
| Fidelity Pennsylvania Municipal Money Market Fund | 152,467,680 | – | – | – |
Delayed Delivery Transactions and When-Issued Securities. During the period, certain Funds transacted in securities on a delayed delivery or when-issued basis. Payment and delivery may take place after the customary settlement period for that security. The price of the underlying securities and the date when the securities will be delivered and paid for are fixed at the time the transaction is negotiated. Securities purchased on a delayed delivery or when-issued basis are identified as such in the Schedule of Investments. Compensation for interest forgone in the purchase of a delayed delivery or when-issued debt security may be received. With respect to purchase commitments, each applicable Fund identifies securities as segregated in its records with a value at least equal to the amount of the commitment. Payables and receivables associated with the purchases and sales of delayed delivery securities having the same coupon, settlement date and broker are offset. Delayed delivery or when-issued securities that have been purchased from and sold to different brokers are reflected as both payables and receivables in the Statement of Assets and Liabilities under the caption "Delayed delivery", as applicable. Losses may arise due to changes in the value of the underlying securities or if the counterparty does not perform under the contract's terms, or if the issuer does not issue the securities due to political, economic, or other factors.
Restricted Securities (including Private Placements). Funds may invest in securities that are subject to legal or contractual restrictions on resale. These securities generally may be resold in transactions exempt from registration or to the public if the securities are registered. Disposal of these securities may involve time-consuming negotiations and expense, and prompt sale at an acceptable price may be difficult. Information regarding restricted securities held at period end is included at the end of the Schedule of Investments, if applicable.
4. Purchases and Sales of Investments.
Purchases and sales of securities, other than short-term securities and in-kind transactions, as applicable, are noted in the table below.
| | Purchases ($) | Sales ($) |
| Fidelity Pennsylvania Municipal Income Fund | 9,218,968 | 89,551,286 |
5. Fees and Other Transactions with Affiliates.
Management Fee. Fidelity Management & Research Company LLC (the investment adviser) and its affiliates provide the Income Fund with investment management related services for which the Fund pays a monthly management fee. The management fee is the sum of an individual fund fee rate that is based on an annual rate of .25% of the Fund's average net assets and an annualized group fee rate that averaged .10% during the period. The group fee rate is based upon the monthly average net assets of a group of registered investment companies with which the investment adviser has management contracts. The group fee rate decreases as assets under management increase and increases as assets under management decrease. For the reporting period, the total annualized management fee rate was .35% of the Fund's average net assets.
Fidelity Management & Research Company LLC (the investment adviser) and its affiliates provide the Money Market Fund with investment management related services for which the Fund pays a monthly management fee that is based on an annual rate of .50% of the Fund's average net assets. Under the management contract, the investment adviser pays all other expenses, except the compensation of the independent Trustees and certain other expenses such as interest expense. The management fee is reduced by an amount equal to the fees and expenses paid by the Fund to the independent Trustees.
During the period, the investment advisor or its affiliates waived a portion of these fees for the Money Market Fund.
Transfer Agent Fees. Fidelity Investments Institutional Operations Company LLC (FIIOC), an affiliate of the investment adviser, is the transfer, dividend disbursing and shareholder servicing agent for the Funds. Under the terms of the management fee contract, the investment adviser pays transfer agent fees on behalf of the Money Market Fund. FIIOC receives account fees and asset-based fees that vary according to account size and type of account. FIIOC pays for typesetting, printing and mailing of shareholder reports, except proxy statements. For the period, the Income Fund's transfer agent fees were equivalent to the following annualized rates expressed as a percentage of average net assets:
| Fidelity Pennsylvania Municipal Income Fund | .10% |
Accounting Fees. Fidelity Service Company, Inc. (FSC), an affiliate of the investment adviser, maintains each Fund's accounting records. The accounting fee is based on the level of average net assets for each month. For the period, the fees were equivalent to the following annualized rates:
| | % of Average Net Assets |
| Fidelity Pennsylvania Municipal Income Fund | .03 |
Interfund Trades. Funds may purchase from or sell securities to other Fidelity Funds under procedures adopted by the Board. The procedures have been designed to ensure these interfund trades are executed in accordance with Rule 17a-7 of the 1940 Act. For the Income Fund, any interfund trades are included within the respective purchases and sales amounts shown in the Purchases and Sales of Investments note. Interfund trades during the period are noted in the table below.
| | Purchases ($) | Sales ($) | Realized Gain (Loss) ($) |
| Fidelity Pennsylvania Municipal Income Fund | – | – | – |
| Fidelity Pennsylvania Municipal Money Market Fund | 4,870,000 | 2,400,000 | – |
6. Committed Line of Credit.
Certain Funds participate with other funds managed by the investment adviser or an affiliate in a $4.25 billion credit facility (the "line of credit") to be utilized for temporary or emergency purposes to fund shareholder redemptions or for other short-term liquidity purposes. The participating funds have agreed to pay commitment fees on their pro-rata portion of the line of credit, which are reflected in Miscellaneous expenses on the Statement of Operations, and are listed below. During the period, there were no borrowings on this line of credit.
| | Amount |
| Fidelity Pennsylvania Municipal Income Fund | $448 |
7. Expense Reductions.
The investment adviser or its affiliates voluntarily agreed to waive certain fees for the Money Market Fund in order to avoid a negative yield. Such arrangements may be discontinued by the investment adviser at any time. For the period, the amount of the waiver was $112,498.
Through arrangements with each applicable Fund's custodian, credits realized as a result of certain uninvested cash balances were used to reduce each applicable Fund's expenses. All of the applicable expense reductions are noted in the table below.
| | Custodian credits |
| Fidelity Pennsylvania Municipal Income Fund | $4,174 |
| Fidelity Pennsylvania Municipal Money Market Fund | 61 |
In addition, during the period the investment adviser or an affiliate reimbursed and/or waived a portion of operating expenses as follows:
| | Amount |
| Fidelity Pennsylvania Municipal Income Fund | $4,244 |
8. Other.
A fund's organizational documents provide former and current trustees and officers with a limited indemnification against liabilities arising in connection with the performance of their duties to the fund. In the normal course of business, a fund may also enter into contracts that provide general indemnifications. A fund's maximum exposure under these arrangements is unknown as this would be dependent on future claims that may be made against a fund. The risk of material loss from such claims is considered remote.
9. Coronavirus (COVID-19) Pandemic.
An outbreak of COVID-19 first detected in China during December 2019 has since spread globally and was declared a pandemic by the World Health Organization during March 2020. Developments that disrupt global economies and financial markets, such as the COVID-19 pandemic, may magnify factors that affect the Funds' performance.
10. Proposed Reorganization.
The Board of Trustees of Fidelity Pennsylvania Municipal Money Market Fund approved an Agreement and Plan of Reorganization (the Agreement) between Fidelity Pennsylvania Municipal Money Market Fund and Fidelity Municipal Money Market Fund. The Agreement provides for the transfer of all the assets and the assumption of all the liabilities of Fidelity Pennsylvania Municipal Money Market Fund in exchange for shares of Fidelity Municipal Money Market Fund equal in value to the net assets of Fidelity Pennsylvania Municipal Money Market Fund on the day the reorganization is effective.
A meeting of shareholders of Fidelity Pennsylvania Municipal Money Market Fund is expected to be held during the fourth quarter of 2022 to vote on the reorganization. If approved by shareholders, the reorganization is expected to become effective on December 2, 2022. The reorganization is expected to qualify as a tax-free transaction for federal income tax purposes with no gain or loss recognized by the funds or their shareholders.
Shareholder Expense Example
As a shareholder, you incur two types of costs: (1) transaction costs, which may include sales charges (loads) on purchase payments or redemption proceeds, as applicable and (2) ongoing costs, which generally include management fees, distribution and/or service (12b-1) fees and other Fund expenses. This Example is intended to help you understand your ongoing costs (in dollars) of investing in a fund and to compare these costs with the ongoing costs of investing in other mutual funds.
The Example is based on an investment of $1,000 invested at the beginning of the period and held for the entire period (January 1, 2022 to June 30, 2022).
Actual Expenses
The first line of the accompanying table provides information about actual account values and actual expenses. You may use the information in this line, together with the amount you invested, to estimate the expenses that you paid over the period. Simply divide your account value by $1,000.00 (for example, an $8,600 account value divided by $1,000.00 = 8.6), then multiply the result by the number in the first line for a class/Fund under the heading entitled "Expenses Paid During Period" to estimate the expenses you paid on your account during this period. If any fund is a shareholder of any underlying mutual funds or exchange-traded funds (ETFs) (the Underlying Funds), such fund indirectly bears its proportional share of the expenses of the Underlying Funds in addition to the direct expenses incurred presented in the table. These fees and expenses are not included in the annualized expense ratio used to calculate the expense estimate in the table below.
Hypothetical Example for Comparison Purposes
The second line of the accompanying table provides information about hypothetical account values and hypothetical expenses based on the actual expense ratio and an assumed rate of return of 5% per year before expenses, which is not the actual return. The hypothetical account values and expenses may not be used to estimate the actual ending account balance or expenses you paid for the period. You may use this information to compare the ongoing costs of investing in the Fund and other funds. To do so, compare this 5% hypothetical example with the 5% hypothetical examples that appear in the shareholder reports of the other funds. If any fund is a shareholder of any Underlying Funds, such fund indirectly bears its proportional share of the expenses of the Underlying Funds in addition to the direct expenses as presented in the table. These fees and expenses are not included in the annualized expense ratio used to calculate the expense estimate in the table below.
Please note that the expenses shown in the table are meant to highlight your ongoing costs only and do not reflect any transaction costs. Therefore, the second line of the table is useful in comparing ongoing costs only, and will not help you determine the relative total costs of owning different funds. In addition, if these transactional costs were included, your costs would have been higher.
| | Annualized Expense Ratio-A | Beginning
Account Value
January 1, 2022 | Ending
Account Value
June 30, 2022 | Expenses Paid
During Period-B
January 1, 2022
to June 30, 2022 |
| Fidelity Pennsylvania Municipal Income Fund | .50% | | | |
| Actual | | $1,000.00 | $902.40 | $2.36 |
| Hypothetical-C | | $1,000.00 | $1,022.32 | $2.51 |
| Fidelity Pennsylvania Municipal Money Market Fund | .36% | | | |
| Actual | | $1,000.00 | $1,000.60 | $1.79** |
| Hypothetical-C | | $1,000.00 | $1,023.01 | $1.81** |
A Annualized expense ratio reflects expenses net of applicable fee waivers.
B Expenses are equal to the annualized expense ratio, multiplied by the average account value over the period, multiplied by 181/ 365 (to reflect the one-half year period). The fees and expenses of any Underlying Funds are not included in each annualized expense ratio.
C 5% return per year before expenses.
** If certain fees were not voluntarily waived by the investment adviser or its affiliates during the period, the annualized expense ratio and the expenses paid in the actual and hypothetical examples above would have been as shown in table below:
| | Annualized Expense Ratio-(a)
| Expenses Paid
|
| Fidelity Pennsylvania Municipal Money Market Fund | .50% | |
| Actual | | $2.48 |
| Hypothetical-(b) | | $2.51 |
| | | |
(a) Annualized expense ratio reflects expenses net of applicable fee waivers.
(b) 5% return per year before expenses
Liquidity Risk Management Program
The Securities and Exchange Commission adopted Rule 22e-4 under the Investment Company Act of 1940 (the Liquidity Rule) to promote effective liquidity risk management throughout the open-end investment company industry, thereby reducing the risk that funds will be unable to meet their redemption obligations and mitigating dilution of the interests of fund shareholders.
The Pennsylvania Municipal Income Fund (the Income Fund) has adopted and implemented a liquidity risk management program pursuant to the Liquidity Rule (the Program) effective December 1, 2018. The Program is reasonably designed to assess and manage the Income Fund’s liquidity risk and to comply with the requirements of the Liquidity Rule. The Income Fund’s Board of Trustees (the Board) has designated the Income Fund’s investment adviser as administrator of the Program. The Fidelity advisers have established a Liquidity Risk Management Committee (the LRM Committee) to manage the Program for each of the Fidelity Funds. The LRM Committee monitors the adequacy and effectiveness of implementation of the Program and on a periodic basis assesses each Fund’s liquidity risk based on a variety of factors including (1) the Fund’s investment strategy, (2) portfolio liquidity and cash flow projections during normal and reasonably foreseeable stressed conditions, (3) shareholder redemptions, (4) borrowings and other funding sources and (5) in the case of exchange-traded funds, certain additional factors including the effect of the Fund’s prices and spreads, market participants, and basket compositions on the overall liquidity of the Fund’s portfolio, as applicable.
In accordance with the Program, each of the Fund’s portfolio investments is classified into one of four liquidity categories described below based on a determination of a reasonable expectation for how long it would take to convert the investment to cash (or sell or dispose of the investment) without significantly changing its market value.
- Highly liquid investments – cash or convertible to cash within three business days or less
- Moderately liquid investments – convertible to cash in three to seven calendar days
- Less liquid investments – can be sold or disposed of, but not settled, within seven calendar days
- Illiquid investments – cannot be sold or disposed of within seven calendar days
Liquidity classification determinations take into account a variety of factors including various market, trading and investment-specific considerations, as well as market depth, and generally utilize analysis from a third-party liquidity metrics service.
The Liquidity Rule places a 15% limit on a fund’s illiquid investments and requires funds that do not primarily hold assets that are highly liquid investments to determine and maintain a minimum percentage of the fund’s net assets to be invested in highly liquid investments (highly liquid investment minimum or HLIM). The Program includes provisions reasonably designed to comply with the 15% limit on illiquid investments and for determining, periodically reviewing and complying with the HLIM requirement as applicable.
At a recent meeting of the Fund’s Board of Trustees, the LRM Committee provided a written report to the Board pertaining to the operation, adequacy, and effectiveness of implementation of the Program for the annual period from December 1, 2020 through November 30, 2021. The report concluded that the Program has been implemented and is operating effectively and is reasonably designed to assess and manage the Fund’s liquidity risk.
PFR-SANN-0822
1.705577.124
Fidelity® Limited Term Municipal Income Fund
Semi-Annual Report
June 30, 2022
Includes Fidelity and Fidelity Advisor share classes
Contents
To view a fund's proxy voting guidelines and proxy voting record for the 12-month period ended June 30, visit http://www.fidelity.com/proxyvotingresults or visit the Securities and Exchange Commission's (SEC) web site at http://www.sec.gov.
You may also call 1-800-544-8544 if you’re an individual investing directly with Fidelity, call 1-800-835-5092 if you’re a plan sponsor or participant with Fidelity as your recordkeeper or call 1-877-208-0098 on institutional accounts or if you’re an advisor or invest through one to request a free copy of the proxy voting guidelines.
Standard & Poor's, S&P and S&P 500 are registered service marks of The McGraw-Hill Companies, Inc. and have been licensed for use by Fidelity Distributors Corporation.
Other third-party marks appearing herein are the property of their respective owners.
All other marks appearing herein are registered or unregistered trademarks or service marks of FMR LLC or an affiliated company. © 2022 FMR LLC. All rights reserved.
This report and the financial statements contained herein are submitted for the general information of the shareholders of the Fund. This report is not authorized for distribution to prospective investors in the Fund unless preceded or accompanied by an effective prospectus.
A fund files its complete schedule of portfolio holdings with the SEC for the first and third quarters of each fiscal year on Form N-PORT. Forms N-PORT are available on the SEC’s web site at http://www.sec.gov. A fund's Forms N-PORT may be reviewed and copied at the SEC’s Public Reference Room in Washington, DC. Information regarding the operation of the SEC's Public Reference Room may be obtained by calling 1-800-SEC-0330.
For a complete list of a fund's portfolio holdings, view the most recent holdings listing, semiannual report, or annual report on Fidelity's web site at http://www.fidelity.com, http://www.institutional.fidelity.com, or http://www.401k.com, as applicable.
NOT FDIC INSURED •MAY LOSE VALUE •NO BANK GUARANTEE
Neither the Fund nor Fidelity Distributors Corporation is a bank.
Note to Shareholders:
Early in 2020, the outbreak and spread of COVID-19 emerged as a public health emergency that had a major influence on financial markets, primarily based on its impact on the global economy and corporate earnings. On March 11, 2020, the World Health Organization declared the COVID-19 outbreak a pandemic, citing sustained risk of further global spread. The pandemic prompted a number of measures to limit the spread of COVID-19, including travel and border restrictions, quarantines, and restrictions on large gatherings. In turn, these resulted in lower consumer activity, diminished demand for a wide range of products and services, disruption in manufacturing and supply chains, and – given the wide variability in outcomes regarding the outbreak – significant market uncertainty and volatility. To help stem the turmoil, the U.S. government took unprecedented action – in concert with the U.S. Federal Reserve and central banks around the world – to help support consumers, businesses, and the broader economy, and to limit disruption to the financial system.
In general, the overall impact of the pandemic lessened in 2021, amid a resilient economy and widespread distribution of three COVID-19 vaccines granted emergency use authorization from the U.S. Food and Drug Administration (FDA) early in the year. Still, the situation remains dynamic, and the extent and duration of its influence on financial markets and the economy is highly uncertain, due in part to a recent spike in cases based on highly contagious variants of the coronavirus.
Extreme events such as the COVID-19 crisis are exogenous shocks that can have significant adverse effects on mutual funds and their investments. Although multiple asset classes may be affected by market disruption, the duration and impact may not be the same for all types of assets. Fidelity is committed to helping you stay informed amid news about COVID-19 and during increased market volatility, and we continue to take extra steps to be responsive to customer needs. We encourage you to visit us online, where we offer ongoing updates, commentary, and analysis on the markets and our funds.
Investment Summary (Unaudited)
Top Five States as of June 30, 2022
| | % of fund's net assets |
| Texas | 11.3 |
| Illinois | 9.7 |
| Florida | 7.3 |
| New York | 7.3 |
| New Jersey | 6.0 |
Top Five Sectors as of June 30, 2022
| | % of fund's net assets |
| Transportation | 25.0 |
| General Obligations | 22.5 |
| Health Care | 13.9 |
| Electric Utilities | 7.3 |
| State G.O | 5.5 |
Quality Diversification (% of fund's net assets)
| As of June 30, 2022 |
| | AAA | 7.1% |
| | AA,A | 74.2% |
| | BBB | 10.2% |
| | BB and Below | 1.0% |
| | Not Rated | 1.9% |
| | Short-Term Investments and Net Other Assets | 5.6% |
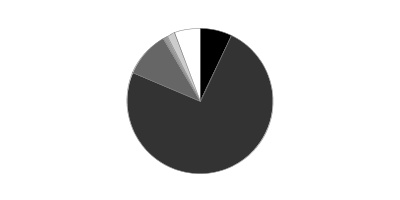
We have used ratings from Moody's Investors Service, Inc. Where Moody's® ratings are not available, we have used S&P® ratings. All ratings are as of the date indicated and do not reflect subsequent changes.
Schedule of Investments June 30, 2022 (Unaudited)
Showing Percentage of Net Assets
| Municipal Bonds - 94.4% | | | |
| | | Principal Amount (000s) | Value (000s) |
| Alabama - 1.0% | | | |
| Birmingham Arpt. Auth. Series 2020: | | | |
| 5% 7/1/26 (Build America Mutual Assurance Insured) | | $555 | $606 |
| 5% 7/1/27 (Build America Mutual Assurance Insured) | | 500 | 554 |
| Black Belt Energy Gas District Bonds (Proj. No. 5) Series A, 4%, tender 10/1/26 (a) | | 4,000 | 4,052 |
| Mobile County Board of School Commissioners: | | | |
| Series 2016 A: | | | |
| 5% 3/1/23 | | 830 | 848 |
| 5% 3/1/24 | | 1,225 | 1,283 |
| 5% 3/1/25 | | 1,225 | 1,315 |
| Series 2016 B, 5% 3/1/24 | | 1,210 | 1,267 |
| Mobile Indl. Dev. Board Poll. Cont. Rev. Bonds Series 2009 E, 1%, tender 6/26/25 (a) | | 5,030 | 4,790 |
| Southeast Energy Auth. Rev. Bonds: | | | |
| (Proj. No. 2) Series 2021 B1: | | | |
| 4% 6/1/24 | | 600 | 611 |
| 4% 6/1/25 | | 725 | 740 |
| 4% 6/1/26 | | 1,500 | 1,535 |
| 4% 6/1/27 | | 2,440 | 2,500 |
| 4% 6/1/28 | | 3,780 | 3,860 |
| Bonds Series 2022 B1, 5%, tender 8/1/28 (a) | | 6,035 | 6,384 |
|
| TOTAL ALABAMA | | | 30,345 |
|
| Alaska - 0.2% | | | |
| Alaska Hsg. Fin. Corp. Mtg. Rev. Series 2022 A, 3% 6/1/51 | | 1,280 | 1,246 |
| Alaska Muni. Bond Bank Series 2015 B, 5% 3/1/28 (b) | | 1,390 | 1,470 |
| Anchorage Gen. Oblig.: | | | |
| Series B, 5% 9/1/22 | | 1,395 | 1,403 |
| Series C, 5% 9/1/22 | | 980 | 986 |
|
| TOTAL ALASKA | | | 5,105 |
|
| Arizona - 3.2% | | | |
| Arizona Board of Regents Arizona State Univ. Rev.: | | | |
| Series 2016 A, 5% 7/1/26 | | 275 | 296 |
| Series 2021: | | | |
| 5% 8/1/26 | | 1,100 | 1,206 |
| 5% 8/1/27 | | 1,500 | 1,672 |
| Arizona Ctfs. of Prtn. Series 2019 A, 5% 10/1/24 (Escrowed to Maturity) | | 2,025 | 2,157 |
| Arizona Health Facilities Auth. Rev. (Scottsdale Lincoln Hospitals Proj.) Series 2014 A: | | | |
| 5% 12/1/22 | | 785 | 796 |
| 5% 12/1/23 | | 980 | 1,023 |
| 5% 12/1/24 | | 1,465 | 1,546 |
| Arizona Indl. Dev. Auth. Hosp. Rev. Series 2021 A: | | | |
| 5% 2/1/24 | | 1,200 | 1,255 |
| 5% 2/1/25 | | 1,100 | 1,169 |
| 5% 2/1/26 | | 1,200 | 1,299 |
| 5% 2/1/27 | | 1,200 | 1,320 |
| Chandler Indl. Dev. Auth. Indl. Dev. Rev. Bonds (Intel Corp. Proj.): | | | |
| Series 2005, 2.4%, tender 8/14/23 (a) | | 1,625 | 1,629 |
| Series 2007, 2.7%, tender 8/14/23 (a)(b) | | 13,435 | 13,515 |
| Series 2019, 5%, tender 6/3/24 (a)(b) | | 24,230 | 25,357 |
| Coconino County Poll. Cont. Corp. Rev. Bonds Series 2017 B, 1.65%, tender 3/31/23 (a) | | 1,505 | 1,498 |
| Glendale Union School District 205 Series A: | | | |
| 5% 7/1/26 (Assured Guaranty Muni. Corp. Insured) | | 200 | 220 |
| 5% 7/1/27 (Assured Guaranty Muni. Corp. Insured) | | 250 | 280 |
| Glendale Gen. Oblig. Series 2015, 5% 7/1/22 (Assured Guaranty Muni. Corp. Insured) | | 980 | 980 |
| Glendale Trans. Excise Tax Rev. Series 2015, 5% 7/1/23 (Assured Guaranty Muni. Corp. Insured) | | 1,365 | 1,409 |
| Maricopa County Indl. Dev. Auth. Sr. Living Facilities (Christian Care Surprise, Inc. Proj.) Series 2016, 5% 1/1/26 (c) | | 985 | 890 |
| Maricopa County Rev.: | | | |
| Bonds Series 2019 D, 5%, tender 5/15/26 (a) | | 5,155 | 5,600 |
| Series 2016 A, 5% 1/1/25 | | 4,725 | 5,042 |
| Maricopa County Spl. Health Care District Gen. Oblig. Series 2021 D: | | | |
| 5% 7/1/25 | | 1,165 | 1,254 |
| 5% 7/1/26 | | 3,000 | 3,282 |
| Maricopa County Unified School District #48 Scottsdale Series D: | | | |
| 4% 7/1/24 | | 1,000 | 1,039 |
| 4% 7/1/25 | | 800 | 844 |
| 4% 7/1/26 | | 900 | 960 |
| 4% 7/1/27 | | 225 | 243 |
| Phoenix Civic Impt. Board Arpt. Rev.: | | | |
| Series 2017 D, 5% 7/1/25 | | 2,110 | 2,264 |
| Series 2019 B: | | | |
| 5% 7/1/24 (b) | | 1,550 | 1,623 |
| 5% 7/1/25 (b) | | 1,500 | 1,602 |
| Phoenix Civic Impt. Corp. Series 2019 B, 5% 7/1/28 | | 1,910 | 2,122 |
| Pima County Ctfs. of Prtn. Series 2014: | | | |
| 5% 12/1/22 | | 2,415 | 2,450 |
| 5% 12/1/23 | | 3,350 | 3,495 |
| Univ. of Arizona Univ. Revs. Series 2013 A, 5% 6/1/25 (Pre-Refunded to 6/1/23 @ 100) | | 1,140 | 1,174 |
| Western Maricopa Ed. Ctr. District Series 2019 B, 5% 7/1/26 | | 2,000 | 2,194 |
|
| TOTAL ARIZONA | | | 94,705 |
|
| California - 3.3% | | | |
| Bay Area Toll Auth. San Francisco Bay Toll Bridge Rev. Bonds: | | | |
| Series 2021 A, 2%, tender 4/1/28 (a) | | 5,000 | 4,704 |
| Series A, 2.95%, tender 4/1/26 (a) | | 5,000 | 4,989 |
| Series B, 2.85%, tender 4/1/25 (a) | | 4,090 | 4,079 |
| California Gen. Oblig.: | | | |
| Series 2017, 5% 8/1/26 | | 1,200 | 1,328 |
| Series 2020, 4% 11/1/26 | | 700 | 749 |
| California Muni. Fin. Auth. Solid Waste Disp. Rev. Bonds (Waste Mgmt., Inc. Proj.) Series 2017 A, 0.7%, tender 12/1/23 (a)(b) | | 4,005 | 3,882 |
| California Pub. Works Board Lease Rev. (Various Cap. Projs.) Series 2022 C: | | | |
| 5% 8/1/23 (d) | | 1,615 | 1,658 |
| 5% 8/1/24 (d) | | 965 | 1,013 |
| Golden State Tobacco Securitization Corp. Tobacco Settlement Rev.: | | | |
| Series 2017 A1, 5% 6/1/24 (Escrowed to Maturity) | | 1,085 | 1,147 |
| Series A, 0% 6/1/24 (Escrowed to Maturity) | | 3,390 | 3,258 |
| Los Angeles County Pub. Works Fing. Auth. Lease Rev. Series 2022 G: | | | |
| 5% 12/1/22 | | 1,245 | 1,263 |
| 5% 12/1/24 | | 1,500 | 1,602 |
| Los Angeles Dept. Arpt. Rev.: | | | |
| Series 2016 A, 5% 5/15/25 (b) | | 1,000 | 1,068 |
| Series 2017 B, 5% 5/15/25 (b) | | 2,265 | 2,419 |
| Series 2018 B: | | | |
| 5% 5/15/25 (b) | | 1,305 | 1,394 |
| 5% 5/15/26 (b) | | 1,545 | 1,678 |
| Series 2018 C, 5% 5/15/27 (b) | | 1,615 | 1,782 |
| Series 2020 C, 5% 5/15/26 (b) | | 2,645 | 2,873 |
| Series A, 5% 5/15/24 (b) | | 1,010 | 1,057 |
| Northern California Energy Auth. Bonds Series 2018, 4%, tender 7/1/24 (a) | | 10,000 | 10,168 |
| Oakland Unified School District Alameda County Series 2013, 5.5% 8/1/23 | | 960 | 982 |
| Palomar Health Rev. Series 2016: | | | |
| 5% 11/1/23 | | 1,955 | 2,018 |
| 5% 11/1/24 | | 1,955 | 2,050 |
| Port of Oakland Rev.: | | | |
| Series 2021 H, 5% 5/1/28 (b) | | 1,000 | 1,097 |
| Series H: | | | |
| 5% 5/1/26 (b) | | 1,830 | 1,978 |
| 5% 5/1/27 (b) | | 3,400 | 3,718 |
| San Diego County Reg'l. Arpt. Auth. Arpt. Rev. Series 2020 C, 5% 7/1/26 (b) | | 1,000 | 1,077 |
| San Francisco City & County Arpts. Commission Int'l. Arpt. Rev.: | | | |
| Series 2019 A: | | | |
| 5% 1/1/24 (b) | | 1,660 | 1,724 |
| 5% 1/1/27 (b) | | 2,405 | 2,608 |
| Series 2022 A: | | | |
| 5% 5/1/26 (b) | | 4,535 | 4,891 |
| 5% 5/1/27 (b) | | 4,590 | 4,998 |
| 5% 5/1/28 (b) | | 6,130 | 6,713 |
| 5% 5/1/29 (b) | | 4,100 | 4,511 |
| San Pablo Redev. Agcy. Series 2014 A, 5% 6/15/24 (Assured Guaranty Muni. Corp. Insured) | | 1,350 | 1,423 |
| Southern California Pub. Pwr. Auth. Rev. Bonds Series 2020 C, 0.65%, tender 7/1/25 (a) | | 8,000 | 7,343 |
|
| TOTAL CALIFORNIA | | | 99,242 |
|
| Colorado - 1.7% | | | |
| Colorado Health Facilities Auth. Bonds: | | | |
| (Valley View Hosp. Assoc. Proj.) Series 2018, 2.8%, tender 5/15/23 (a) | | 1,270 | 1,275 |
| Series 2019 B: | | | |
| 5%, tender 8/1/25 (a) | | 2,950 | 3,083 |
| 5%, tender 8/1/26 (a) | | 2,035 | 2,150 |
| 5%, tender 11/19/26 (a) | | 6,680 | 7,359 |
| Colorado Hsg. & Fin. Auth.: | | | |
| Series 2019 F, 4.25% 11/1/49 | | 1,345 | 1,374 |
| Series 2019 H, 4.25% 11/1/49 | | 680 | 695 |
| Colorado Reg'l. Trans. District Ctfs. of Prtn. Series 2020, 5% 6/1/26 | | 1,000 | 1,072 |
| Colorado Springs Utils. Rev. Series 2020: | | | |
| 5% 11/15/25 | | 1,320 | 1,440 |
| 5% 11/15/25 | | 1,020 | 1,113 |
| Colorado Univ. Co. Hosp. Auth. Rev. Bonds Series 2019 C, 5%, tender 11/15/24 (a) | | 14,230 | 14,908 |
| Denver City & County Arpt. Rev.: | | | |
| Series 2018 A, 5% 12/1/29 (b) | | 1,205 | 1,316 |
| Series 2020 B1, 5% 11/15/24 (b) | | 1,500 | 1,586 |
| E-470 Pub. Hwy. Auth. Rev. Series 2020 A, 5% 9/1/26 | | 1,750 | 1,925 |
| Univ. of Colorado Enterprise Sys. Rev. Bonds: | | | |
| Series 2019 C, 2%, tender 10/15/24 (a) | | 9,030 | 8,908 |
| Series 2021 C3A, 2%, tender 10/15/25 (a) | | 1,625 | 1,587 |
| Series 2021 C3B, 2%, tender 10/15/26 (a) | | 1,345 | 1,297 |
|
| TOTAL COLORADO | | | 51,088 |
|
| Connecticut - 1.8% | | | |
| Connecticut Gen. Oblig.: | | | |
| Series 2016 A, 5% 3/15/26 | | 1,925 | 2,110 |
| Series 2019 A: | | | |
| 5% 4/15/25 | | 4,380 | 4,713 |
| 5% 4/15/26 | | 2,355 | 2,585 |
| 5% 4/15/30 | | 965 | 1,090 |
| Series 2021 D: | | | |
| 5% 7/15/24 | | 1,990 | 2,104 |
| 5% 7/15/25 | | 1,685 | 1,823 |
| Series C, 4% 6/1/26 | | 1,100 | 1,162 |
| Connecticut Health & Edl. Facilities Auth. Rev.: | | | |
| Bonds: | | | |
| Series 2010 A3, 0.25%, tender 2/9/24 (a) | | 4,155 | 4,024 |
| Series 2014 B, 1.8%, tender 7/1/24 (a) | | 3,150 | 3,108 |
| Series 2016 A, 2%, tender 7/1/26 (a) | | 1,725 | 1,672 |
| Series 2018 S: | | | |
| 5% 7/1/23 | | 1,455 | 1,499 |
| 5% 7/1/24 | | 1,000 | 1,048 |
| Series 2019 A: | | | |
| 4% 7/1/23 (c) | | 1,045 | 1,047 |
| 4% 7/1/24 (c) | | 1,090 | 1,071 |
| 5% 7/1/25 (c) | | 705 | 704 |
| 5% 7/1/28 (c) | | 1,315 | 1,289 |
| 5% 7/1/29 (c) | | 940 | 914 |
| Series 2022 M: | | | |
| 5% 7/1/24 | | 175 | 182 |
| 5% 7/1/27 | | 250 | 270 |
| 5% 7/1/28 | | 300 | 325 |
| Connecticut Spl. Tax Oblig. Trans. Infrastructure Rev.: | | | |
| Series 2012 A, 5% 1/1/24 | | 1,650 | 1,675 |
| Series 2021 C: | | | |
| 5% 1/1/24 | | 1,445 | 1,510 |
| 5% 1/1/25 | | 1,280 | 1,369 |
| Series A: | | | |
| 5% 5/1/24 | | 1,000 | 1,053 |
| 5% 9/1/26 | | 1,025 | 1,133 |
| Hartford County Metropolitan District Gen. Oblig. Series 2021 A: | | | |
| 5% 9/1/27 | | 800 | 897 |
| 5% 9/1/28 | | 775 | 877 |
| New Britain Gen. Oblig. Series 2009, 5% 4/1/24 (Escrowed to Maturity) | | 745 | 774 |
| New Haven Gen. Oblig. Series 2016 A, 5% 8/15/25 (Assured Guaranty Muni. Corp. Insured) | | 980 | 1,055 |
| Stratford Gen. Oblig. Series 2019: | | | |
| 5% 1/1/25 | | 3,890 | 4,146 |
| 5% 1/1/26 | | 3,735 | 4,047 |
| Univ. of Connecticut Gen. Oblig. Series 2019 A, 5% 11/1/26 | | 1,000 | 1,106 |
|
| TOTAL CONNECTICUT | | | 52,382 |
|
| Delaware - 0.1% | | | |
| Delaware Econ. Dev. Auth. Rev. Bonds (Delmarva Pwr. & Lt. Co. Proj.) Series A, 1.05%, tender 7/1/25 (a) | | 1,475 | 1,400 |
| District Of Columbia - 2.3% | | | |
| District of Columbia Income Tax Rev. Series 2020 A: | | | |
| 5% 3/1/23 | | 1,075 | 1,100 |
| 5% 3/1/24 | | 715 | 752 |
| District of Columbia Wtr. & Swr. Auth. Pub. Util. Rev. Bonds Series 2019 C, 1.75%, tender 10/1/24 (a) | | 7,540 | 7,471 |
| Metropolitan Washington DC Arpts. Auth. Sys. Rev.: | | | |
| Series 2014 A, 5% 10/1/23 (b) | | 1,035 | 1,070 |
| Series 2017 A, 5% 10/1/26 (b) | | 12,905 | 14,055 |
| Series 2018 A, 5% 10/1/23 (b) | | 3,000 | 3,102 |
| Series 2019 A: | | | |
| 5% 10/1/22 (b) | | 1,815 | 1,830 |
| 5% 10/1/23 (b) | | 465 | 481 |
| 5% 10/1/25 (b) | | 1,410 | 1,513 |
| Series 2020 A: | | | |
| 5% 10/1/23 (b) | | 2,390 | 2,471 |
| 5% 10/1/24 (b) | | 4,470 | 4,714 |
| 5% 10/1/25 (b) | | 4,470 | 4,797 |
| Series 2021 A: | | | |
| 5% 10/1/25 (b) | | 3,000 | 3,220 |
| 5% 10/1/28 (b) | | 20,500 | 22,716 |
|
| TOTAL DISTRICT OF COLUMBIA | | | 69,292 |
|
| Florida - 7.3% | | | |
| Brevard County Health Facilities Auth. Rev. Series 2023 A: | | | |
| 5% 4/1/26 (d) | | 1,920 | 2,011 |
| 5% 4/1/28 (d) | | 2,115 | 2,244 |
| Broward County Arpt. Sys. Rev.: | | | |
| Series 2012 P-1: | | | |
| 5% 10/1/22 (b) | | 600 | 605 |
| 5% 10/1/25 (b) | | 6,645 | 6,689 |
| Series 2015 A, 5% 10/1/22 (b) | | 2,935 | 2,957 |
| Series 2015 C, 5% 10/1/24 (b) | | 1,015 | 1,069 |
| Series 2019 A: | | | |
| 5% 10/1/23 (b) | | 1,200 | 1,240 |
| 5% 10/1/24 (b) | | 1,300 | 1,369 |
| 5% 10/1/25 (b) | | 1,500 | 1,608 |
| Series 2019 B: | | | |
| 5% 10/1/24 (b) | | 750 | 790 |
| 5% 10/1/25 (b) | | 755 | 810 |
| Series C, 5% 10/1/23 (b) | | 3,930 | 4,061 |
| Broward County School Board Ctfs. of Prtn. Series 2015 B, 5% 7/1/24 | | 1,120 | 1,180 |
| Cap. Projs. Fin. Auth. Student Hsg. Rev. (Cap. Projs. Ln. Prog. - Florida Univs.) Series 2020 A: | | | |
| 5% 10/1/24 | | 540 | 556 |
| 5% 10/1/26 | | 1,940 | 2,014 |
| Central Florida Expressway Auth. Sr. Lien Rev. Series 2021: | | | |
| 5% 7/1/26 (Assured Guaranty Muni. Corp. Insured) | | 1,485 | 1,642 |
| 5% 7/1/27 (Assured Guaranty Muni. Corp. Insured) | | 8,200 | 9,243 |
| Florida Hsg. Fin. Corp. Rev. Series 2021 1, 3% 1/1/52 | | 5,980 | 5,856 |
| Florida Keys Aqueduct Auth. Wtr. Rev. Series 2021 B, 5% 9/1/25 | | 2,360 | 2,552 |
| Florida Mid-Bay Bridge Auth. Rev. Series 2015 A: | | | |
| 5% 10/1/22 | | 1,955 | 1,969 |
| 5% 10/1/23 | | 1,240 | 1,280 |
| 5% 10/1/24 | | 1,955 | 2,039 |
| 5% 10/1/25 | | 1,710 | 1,806 |
| 5% 10/1/26 | | 1,955 | 2,058 |
| Florida Muni. Pwr. Agcy. Rev. Series 2016 A, 4% 10/1/26 | | 530 | 560 |
| Greater Orlando Aviation Auth. Arpt. Facilities Rev.: | | | |
| Series 2016, 5% 10/1/26 (b) | | 1,300 | 1,408 |
| Series 2017 A: | | | |
| 5% 10/1/25 (b) | | 320 | 343 |
| 5% 10/1/25 (Escrowed to Maturity) (b) | | 1,675 | 1,808 |
| 5% 10/1/26 (b) | | 545 | 589 |
| 5% 10/1/26 (Escrowed to Maturity) (b) | | 2,025 | 2,224 |
| 5% 10/1/27 (Escrowed to Maturity) (b) | | 580 | 646 |
| Series 2019 A: | | | |
| 5% 10/1/24 (b) | | 12,700 | 13,393 |
| 5% 10/1/25 (b) | | 6,700 | 7,190 |
| 5% 10/1/27 (b) | | 1,940 | 2,136 |
| Halifax Hosp. Med. Ctr. Rev. Series 2015, 5% 6/1/23 | | 1,295 | 1,332 |
| Hillsborough County Aviation Auth. Rev. Series A, 5% 10/1/26 (Pre-Refunded to 10/1/23 @ 100) (b) | | 2,910 | 3,018 |
| Hillsborough County School District Sales Tax Rev. Series 2015 B, 5% 10/1/22 (Assured Guaranty Muni. Corp. Insured) | | 2,025 | 2,042 |
| Indian River County School Board Ctfs. of Prtn. Series 2014, 5% 7/1/22 | | 1,955 | 1,955 |
| Jacksonville Spl. Rev. Series 2022 A: | | | |
| 5% 10/1/23 (d) | | 345 | 359 |
| 5% 10/1/24 (d) | | 785 | 833 |
| 5% 10/1/25 (d) | | 610 | 660 |
| 5% 10/1/26 (d) | | 435 | 478 |
| 5% 10/1/27 (d) | | 345 | 384 |
| 5% 10/1/28 (d) | | 685 | 771 |
| 5% 10/1/29 (d) | | 595 | 677 |
| 5% 10/1/30 (d) | | 560 | 643 |
| 5% 10/1/32 (d) | | 510 | 595 |
| Lee County Arpt. Rev. Series 2021 A: | | | |
| 5% 10/1/23 (b) | | 475 | 491 |
| 5% 10/1/24 (b) | | 1,795 | 1,885 |
| 5% 10/1/25 (b) | | 3,325 | 3,544 |
| Lee Memorial Health Sys. Hosp. Rev. Bonds Series 2019 A2, 5%, tender 4/1/26 (a) | | 4,810 | 5,168 |
| Manatee County Rev. Series 2013, 5% 10/1/22 | | 980 | 989 |
| Manatee County School District Series 2017, 5% 10/1/24 (Assured Guaranty Muni. Corp. Insured) | | 1,270 | 1,346 |
| Miami-Dade County Aviation Rev.: | | | |
| Series 2012 A: | | | |
| 5% 10/1/22 (b) | | 1,465 | 1,476 |
| 5% 10/1/24 (b) | | 1,800 | 1,812 |
| Series 2014 A, 5% 10/1/31 (b) | | 1,750 | 1,813 |
| Series 2016 A, 5% 10/1/27 | | 1,275 | 1,384 |
| Series 2020 A, 5% 10/1/23 | | 3,810 | 3,949 |
| Miami-Dade County Expressway Auth.: | | | |
| (Waste Mgmt., Inc. of Florida Proj.) Series 2013 A: | | | |
| 5% 7/1/22 | | 1,955 | 1,955 |
| 5% 7/1/23 | | 1,955 | 1,960 |
| Series 2014 B: | | | |
| 5% 7/1/22 | | 1,465 | 1,465 |
| 5% 7/1/23 | | 3,180 | 3,272 |
| Miami-Dade County Indl. Dev. Auth. Solid Waste Disp. Rev. Bonds (Waste Mgmt., Inc. of Florida Proj.) Series 2007, 0.32%, tender 11/1/22 (a) | | 1,600 | 1,594 |
| Miami-Dade County School Board Ctfs. of Prtn.: | | | |
| Bonds Series 2014 A, 5%, tender 5/1/24 (a) | | 9,695 | 10,180 |
| Series 2014 D: | | | |
| 5% 11/1/22 | | 2,960 | 2,993 |
| 5% 11/1/23 | | 7,485 | 7,780 |
| Series 2015 A: | | | |
| 5% 5/1/23 | | 6,360 | 6,525 |
| 5% 5/1/27 (Assured Guaranty Muni. Corp. Insured) | | 1,880 | 2,020 |
| Series 2015 B, 5% 5/1/24 | | 29,155 | 30,646 |
| Orange County Hsg. Fin. Auth. Multi-family Rev. Bonds Series 2021 B, 0.55%, tender 7/1/24 (a) | | 9,950 | 9,493 |
| Palm Beach County Health Facilities Auth. Hosp. Rev.: | | | |
| (Jupiter Med. Ctr. Proj.) Series 2022, 5% 11/1/28 (d) | | 150 | 163 |
| Series 2014: | | | |
| 5% 12/1/23 (Escrowed to Maturity) | | 190 | 198 |
| 5% 12/1/24 (Escrowed to Maturity) | | 380 | 406 |
| Palm Beach County Health Facilities Auth. Rev. Series 2015 C: | | | |
| 5% 5/15/24 | | 1,000 | 1,021 |
| 5% 5/15/30 | | 2,490 | 2,508 |
| Palm Beach County School Board Ctfs. of Prtn. Series 2014 B, 5% 8/1/22 | | 980 | 983 |
| Pasco County School District Sales Tax Rev. Series 2013, 5% 10/1/22 | | 980 | 989 |
| Pinellas County Hsg. Fin. Auth. Bonds Series 2021 B, 0.65%, tender 7/1/24 (a) | | 2,170 | 2,074 |
| Seminole County School Board Ctfs. of Prtn. Series 2016 C: | | | |
| 5% 7/1/25 | | 980 | 1,058 |
| 5% 7/1/26 | | 1,115 | 1,225 |
| Tampa Bay Wtr. Reg'l. Wtr. Supply Auth. Util. Sys. Rev. Series 2005, 5.5% 10/1/22 (FGIC Insured) | | 1,340 | 1,354 |
| Village Cmnty. Dev. District No. 13 Series 2019, 2.625% 5/1/24 | | 250 | 244 |
|
| TOTAL FLORIDA | | | 217,655 |
|
| Georgia - 4.8% | | | |
| Atlanta Arpt. Rev.: | | | |
| Series 2014 C, 5% 1/1/29 (b) | | 900 | 926 |
| Series 2020 A, 5% 7/1/26 (b) | | 3,000 | 3,255 |
| Series 2020 B: | | | |
| 5% 7/1/27 (b) | | 4,000 | 4,394 |
| 5% 7/1/29 (b) | | 1,920 | 2,135 |
| Bartow County Dev. Auth. Poll. Cont. Rev. Bonds (Georgia Pwr. Co. Plant Bowen Proj.): | | | |
| Series 2009 1st, 2.75%, tender 3/15/23 (a) | | 21,200 | 21,182 |
| Series 2013, 1.55%, tender 8/19/22 (a) | | 6,770 | 6,763 |
| Burke County Indl. Dev. Auth. Poll. Cont. Rev. Bonds: | | | |
| (Georgia Pwr. Co. Plant Vogtle Proj.): | | | |
| Series 1994, 2.25%, tender 5/25/23 (a) | | 6,480 | 6,440 |
| Series 2012, 1.7%, tender 8/22/24 (a) | | 3,400 | 3,293 |
| Series 2013 1st, 2.925%, tender 3/12/24 (a) | | 9,930 | 9,900 |
| (Oglethorpe Pwr. Corp. Vogtle Proj.) Series 2017 E, 3.25%, tender 2/3/25 (a) | | 900 | 903 |
| Columbus Med. Ctr. Hosp. Auth. Bonds (Piedmont Healthcare, Inc. Proj.) Series 2019 A, 5%, tender 7/1/26 (a) | | 4,840 | 5,204 |
| Georgia Muni. Elec. Auth. Pwr. Rev. Series 2020 A: | | | |
| 4% 11/1/23 | | 920 | 942 |
| 4% 11/1/24 | | 1,420 | 1,466 |
| 5% 1/1/25 | | 1,000 | 1,056 |
| 5% 1/1/26 | | 1,125 | 1,207 |
| 5% 1/1/26 | | 1,000 | 1,073 |
| 5% 1/1/27 | | 760 | 826 |
| Georgia Muni. Gas Auth. Rev. (Gas Portfolio III Proj.) Series 2014 U: | | | |
| 5% 10/1/22 | | 980 | 988 |
| 5% 10/1/23 | | 2,365 | 2,457 |
| Georgia Road & Thruway Auth. Rev. Series 2020: | | | |
| 5% 6/1/24 | | 2,500 | 2,636 |
| 5% 6/1/25 | | 5,000 | 5,382 |
| 5% 6/1/26 | | 2,500 | 2,738 |
| Main Street Natural Gas, Inc.: | | | |
| Bonds: | | | |
| Series 2018 C, 4%, tender 12/1/23 (a) | | 10,210 | 10,416 |
| Series 2021 A, 4%, tender 9/1/27 (a) | | 15,000 | 15,379 |
| Series 2021 C, 4%, tender 12/1/28 (a) | | 16,990 | 17,009 |
| Series 2022 A: | | | |
| 4% 12/1/23 | | 265 | 269 |
| 4% 12/1/24 | | 1,100 | 1,118 |
| 4% 12/1/25 | | 170 | 173 |
| 4% 12/1/26 | | 1,955 | 1,987 |
| Monroe County Dev. Auth. Poll. Cont. Rev. (Georgia Pwr. Co. Plant Scherer Proj.) Series 1995, 2.25% 7/1/25 | | 6,505 | 6,294 |
| Private Colleges & Univs. Auth. Rev.: | | | |
| (Savannah College Art & Design, Inc. Proj.) Series 2014, 5% 4/1/24 (Escrowed to Maturity) | | 1,810 | 1,904 |
| (The Savannah College of Art & Design Projs.) Series 2021, 5% 4/1/26 | | 1,200 | 1,291 |
| Series 2020 B, 5% 9/1/25 | | 2,570 | 2,786 |
|
| TOTAL GEORGIA | | | 143,792 |
|
| Hawaii - 0.5% | | | |
| Hawaii Arpts. Sys. Rev. Series 2022 B, 5% 7/1/24 (b) | | 3,500 | 3,666 |
| Honolulu City & County Gen. Oblig.: | | | |
| Series 2020 F: | | | |
| 5% 7/1/24 | | 1,575 | 1,667 |
| 5% 7/1/25 | | 1,255 | 1,359 |
| 5% 7/1/26 | | 800 | 884 |
| Series 2022 A: | | | |
| 5% 11/1/26 (d) | | 1,985 | 2,195 |
| 5% 11/1/29 (d) | | 2,450 | 2,814 |
| State of Hawaii Dept. of Trans. Series 2013: | | | |
| 5% 8/1/22 (b) | | 2,030 | 2,035 |
| 5% 8/1/23 (b) | | 1,440 | 1,481 |
|
| TOTAL HAWAII | | | 16,101 |
|
| Idaho - 0.0% | | | |
| Idaho Hsg. & Fin. Assoc. Single Family Mtg. Series 2019 A, 4% 1/1/50 | | 340 | 345 |
| Illinois - 9.7% | | | |
| Champaign County Cmnty. Unit Series 2019, 4% 6/1/24 | | 420 | 434 |
| Chicago Board of Ed.: | | | |
| Series 2017 C: | | | |
| 5% 12/1/26 | | 485 | 506 |
| 5% 12/1/27 | | 1,830 | 1,918 |
| Series 2018 C, 5% 12/1/24 | | 13,000 | 13,391 |
| Series 2019 A, 0% 12/1/26 | | 3,500 | 2,948 |
| Chicago Gen. Oblig. Series 2020 A, 5% 1/1/30 | | 1,715 | 1,810 |
| Chicago Metropolitan Wtr. Reclamation District of Greater Chicago Series 2007, 5.25% 12/1/32 | | 2,920 | 3,434 |
| Chicago Midway Arpt. Rev.: | | | |
| Series 2013 B: | | | |
| 5% 1/1/23 | | 5,770 | 5,862 |
| 5% 1/1/25 | | 1,700 | 1,721 |
| Series 2014 A: | | | |
| 5% 1/1/24 (b) | | 10,490 | 10,881 |
| 5% 1/1/26 (b) | | 3,475 | 3,579 |
| Series 2014 B, 5% 1/1/23 | | 2,915 | 2,962 |
| Series 2016 A: | | | |
| 5% 1/1/27 (b) | | 2,810 | 2,969 |
| 5% 1/1/28 (b) | | 500 | 526 |
| Chicago Motor Fuel Tax Rev. Series 2013, 5% 1/1/23 (Escrowed to Maturity) | | 525 | 534 |
| Chicago O'Hare Int'l. Arpt. Rev.: | | | |
| Series 2012 B, 4% 1/1/27 (b) | | 1,220 | 1,221 |
| Series 2013 A, 5% 1/1/23 (b) | | 2,730 | 2,769 |
| Series 2015 A: | | | |
| 5% 1/1/24 (b) | | 1,230 | 1,276 |
| 5% 1/1/26 (b) | | 1,600 | 1,681 |
| 5% 1/1/27 (b) | | 1,000 | 1,047 |
| Series 2015 B, 5% 1/1/24 | | 1,525 | 1,589 |
| Series 2016 A, 5% 1/1/27 (b) | | 840 | 894 |
| Series 2017 D: | | | |
| 5% 1/1/26 (b) | | 445 | 476 |
| 5% 1/1/27 (b) | | 1,595 | 1,726 |
| 5% 1/1/29 (b) | | 215 | 230 |
| Series 2020 B, 5% 1/1/26 | | 1,310 | 1,417 |
| Chicago Transit Auth. Cap. Grant Receipts Rev. Series 2017, 5% 6/1/25 | | 1,225 | 1,306 |
| Chicago Wastewtr. Transmission Rev. Series 2012, 5% 1/1/23 | | 1,175 | 1,181 |
| Cook County Cmnty. Consolidated School District No. 59 Series 2020, 4% 3/1/23 | | 1,315 | 1,335 |
| Cook County Gen. Oblig.: | | | |
| Series 2012 C, 5% 11/15/22 | | 1,260 | 1,276 |
| Series 2014 A, 5% 11/15/22 | | 1,325 | 1,342 |
| Series 2021 A: | | | |
| 5% 11/15/22 | | 1,350 | 1,367 |
| 5% 11/15/23 | | 375 | 391 |
| 5% 11/15/24 | | 425 | 450 |
| 5% 11/15/25 | | 425 | 457 |
| 5% 11/15/26 | | 850 | 930 |
| 5% 11/15/27 | | 1,075 | 1,191 |
| Series 2021 B: | | | |
| 4% 11/15/24 | | 1,475 | 1,528 |
| 4% 11/15/25 | | 1,100 | 1,152 |
| 4% 11/15/26 | | 555 | 585 |
| 4% 11/15/27 | | 565 | 599 |
| 4% 11/15/28 | | 285 | 303 |
| Illinois Dev. Fin. Auth. Solid Waste Disp. Rev. Bonds (Waste Mgmt., Inc. Proj.) Series 2019, 0.4%, tender 11/1/22 (a)(b) | | 4,800 | 4,770 |
| Illinois Fin. Auth.: | | | |
| Bonds Series 2020 B: | | | |
| 5%, tender 11/15/24 (a) | | 2,125 | 2,217 |
| 5%, tender 11/15/26 (a) | | 2,830 | 3,049 |
| Series 2015: | | | |
| 5% 5/1/45 (Pre-Refunded to 5/1/25 @ 100) | | 1,190 | 1,276 |
| 5% 5/1/45 (Pre-Refunded to 5/1/25 @ 100) | | 7,450 | 8,042 |
| Series 2020 A: | | | |
| 5% 8/15/23 | | 1,000 | 1,036 |
| 5% 8/15/24 | | 1,080 | 1,143 |
| Series 2022 A: | | | |
| 5% 10/1/26 (d) | | 265 | 276 |
| 5% 10/1/28 (d) | | 330 | 344 |
| Illinois Fin. Auth. Rev.: | | | |
| (Bradley Univ. Proj.) Series 2017 C, 5% 8/1/26 | | 1,650 | 1,738 |
| (Edward-Elmhurst Healthcare) Series 2017 A, 5% 1/1/25 (Escrowed to Maturity) | | 740 | 790 |
| (OSF Healthcare Sys.) Series 2018 A: | | | |
| 5% 5/15/26 | | 4,300 | 4,628 |
| 5% 5/15/27 | | 9,260 | 10,058 |
| Series 2008 A3, 5% 11/1/30 | | 1,545 | 1,661 |
| Series 2015 A: | | | |
| 5% 11/15/22 | | 490 | 496 |
| 5% 11/15/24 | | 1,490 | 1,571 |
| 5% 11/15/25 | | 1,905 | 2,042 |
| 5% 11/15/26 | | 1,955 | 2,083 |
| Series 2015 B, 5% 11/15/24 | | 1,910 | 2,027 |
| Series 2016 A: | | | |
| 5% 2/15/23 | | 980 | 1,001 |
| 5% 8/15/23 (Escrowed to Maturity) | | 1,465 | 1,516 |
| 5% 8/15/24 (Escrowed to Maturity) | | 2,135 | 2,261 |
| 5.25% 8/15/28 (Pre-Refunded to 8/15/26 @ 100) | | 1,000 | 1,112 |
| 5.25% 8/15/29 (Pre-Refunded to 8/15/26 @ 100) | | 5,850 | 6,505 |
| Series 2016 C: | | | |
| 5% 2/15/23 | | 8,870 | 9,046 |
| 5% 2/15/24 | | 5,220 | 5,460 |
| 5% 2/15/27 | | 1,875 | 2,083 |
| Series 2016: | | | |
| 5% 5/15/25 | | 490 | 521 |
| 5% 5/15/26 | | 980 | 1,055 |
| 5% 5/15/27 | | 1,225 | 1,315 |
| Series 2017: | | | |
| 5% 1/1/23 | | 1,465 | 1,490 |
| 5% 1/1/25 | | 2,260 | 2,416 |
| Series 2019: | | | |
| 5% 9/1/23 | | 400 | 411 |
| 5% 9/1/24 | | 415 | 431 |
| 5% 9/1/25 | | 300 | 315 |
| 5% 4/1/26 | | 1,625 | 1,764 |
| 5% 9/1/26 | | 300 | 318 |
| 5% 4/1/27 | | 2,135 | 2,350 |
| 5% 9/1/27 | | 500 | 532 |
| 5% 4/1/28 | | 1,425 | 1,587 |
| 5% 4/1/29 | | 2,000 | 2,236 |
| Illinois Gen. Oblig.: | | | |
| Series 2012 A, 4% 1/1/23 | | 1,245 | 1,247 |
| Series 2012, 5% 8/1/22 (Assured Guaranty Muni. Corp. Insured) | | 1,105 | 1,108 |
| Series 2013, 5.5% 7/1/25 | | 265 | 272 |
| Series 2014: | | | |
| 5% 4/1/23 | | 2,165 | 2,205 |
| 5% 2/1/25 | | 2,275 | 2,346 |
| Series 2016: | | | |
| 5% 2/1/24 | | 3,100 | 3,208 |
| 5% 1/1/26 | | 2,970 | 3,151 |
| Series 2017 D: | | | |
| 5% 11/1/25 | | 6,635 | 7,025 |
| 5% 11/1/26 | | 4,200 | 4,498 |
| Series 2018 A, 5% 10/1/26 | | 4,615 | 4,938 |
| Series 2020 B: | | | |
| 5% 10/1/25 | | 5,105 | 5,400 |
| 5% 10/1/28 | | 6,500 | 7,030 |
| Series 2020 D, 5% 10/1/24 | | 5,000 | 5,225 |
| Series 2021 B, 5% 3/1/23 | | 2,555 | 2,598 |
| Series 2022 A: | | | |
| 5% 3/1/23 | | 1,205 | 1,225 |
| 5% 3/1/24 | | 4,660 | 4,828 |
| Series 2022 B: | | | |
| 5% 3/1/25 | | 9,385 | 9,862 |
| 5% 3/1/26 | | 6,880 | 7,314 |
| 5% 3/1/27 | | 6,500 | 6,982 |
| Series 2022 D1, 5% 3/1/23 | | 1,375 | 1,398 |
| Illinois Hsg. Dev. Auth. Rev. Series D, 3.75% 4/1/50 | | 685 | 690 |
| Illinois Muni. Elec. Agcy. Pwr. Supply Series 2015 A, 5% 2/1/23 | | 1,180 | 1,201 |
| Illinois Sales Tax Rev.: | | | |
| Series 2013, 5% 6/15/24 | | 2,985 | 3,051 |
| Series 2021 C: | | | |
| 5% 6/15/23 | | 535 | 547 |
| 5% 6/15/24 | | 615 | 639 |
| 5% 6/15/25 | | 355 | 374 |
| McHenry County Cmnty. School District #200 Series 2006 B: | | | |
| 0% 1/15/24 | | 2,540 | 2,441 |
| 0% 1/15/24 (Escrowed to Maturity) | | 2,175 | 2,109 |
| 0% 1/15/25 | | 4,915 | 4,566 |
| 0% 1/15/26 | | 3,695 | 3,314 |
| McHenry County Conservation District Gen. Oblig. Series 2014, 5% 2/1/23 | | 2,175 | 2,215 |
| Metropolitan Pier & Exposition Series 2022 A, 3% 6/15/25 | | 2,330 | 2,296 |
| Northern Illinois Univ. Revs. Series 2020 B, 5% 4/1/24 (Build America Mutual Assurance Insured) | | 1,100 | 1,153 |
| Railsplitter Tobacco Settlement Auth. Rev. Series 2017, 5% 6/1/24 | | 4,365 | 4,566 |
|
| TOTAL ILLINOIS | | | 289,188 |
|
| Indiana - 2.7% | | | |
| Indiana Dev. Fin. Auth. Solid Waste Disp. Rev. Bonds (Waste Mgmt., Inc. Proj.) Series 2001, 0.4%, tender 10/3/22 (a)(b) | | 600 | 597 |
| Indiana Fin. Auth. Envir. Facilities Rev. Bonds (Indianapolis Pwr. & Lt. Co. Proj.): | | | |
| Series 2020 A, 0.75%, tender 4/1/26 (a) | | 600 | 515 |
| Series 2020 B, 0.95%, tender 4/1/26 (a)(b) | | 1,025 | 891 |
| Indiana Fin. Auth. Health Sys. Rev. Bonds Series 2019 B, 2.25%, tender 7/1/25 (a) | | 2,005 | 1,988 |
| Indiana Fin. Auth. Hosp. Rev.: | | | |
| Bonds: | | | |
| Series 2011 L, 0.7%, tender 1/1/26 (a) | | 1,105 | 1,040 |
| Series 2011 M, 0.7%, tender 1/1/26 (a) | | 7,795 | 7,333 |
| Series 2013: | | | |
| 5% 8/15/22 | | 685 | 688 |
| 5% 8/15/23 | | 980 | 1,013 |
| Indiana Fin. Auth. Wastewtr. Util. Rev. (CWA Auth. Proj.): | | | |
| Series 2012 A, 5% 10/1/22 | | 1,590 | 1,604 |
| Series 2014 A, 5% 10/1/22 | | 660 | 666 |
| Series 2015 A: | | | |
| 5% 10/1/24 | | 1,460 | 1,554 |
| 5% 10/1/25 | | 1,590 | 1,687 |
| Indiana Health Facility Fing. Auth. Rev.: | | | |
| Bonds Series 2001 A2, 2%, tender 8/1/22 (a) | | 10 | 10 |
| Series 2005 A1, 4% 11/1/22 | | 755 | 761 |
| Indiana Hsg. & Cmnty. Dev. Auth.: | | | |
| Series 2019 B, 3.5% 1/1/49 | | 1,575 | 1,577 |
| Series 2021 B, 3% 7/1/50 | | 950 | 929 |
| Series 2021 C1, 3% 1/1/52 | | 3,800 | 3,686 |
| Indianapolis Local Pub. Impt. (Indianapolis Arpt. Auth. Proj.): | | | |
| Series 2014 D: | | | |
| 5% 1/1/28 (b) | | 470 | 484 |
| 5% 1/1/30 (b) | | 550 | 565 |
| Series 2016 A1: | | | |
| 5% 1/1/23 (b) | | 1,940 | 1,970 |
| 5% 1/1/24 (b) | | 2,715 | 2,824 |
| 5% 1/1/25 (b) | | 2,845 | 3,011 |
| Series 2019 D, 5% 1/1/25 (b) | | 1,710 | 1,810 |
| Whiting Envir. Facilities Rev. Bonds (BP Products North America, Inc. Proj.): | | | |
| Series 2015, 5%, tender 11/1/22 (a)(b) | | 24,505 | 24,705 |
| Series 2016 A, 5%, tender 3/1/23 (a)(b) | | 1,200 | 1,218 |
| Series 2017, 5%, tender 11/1/24 (a)(b) | | 1,250 | 1,312 |
| Series 2019 A, 5%, tender 6/5/26 (a)(b) | | 15,985 | 17,201 |
|
| TOTAL INDIANA | | | 81,639 |
|
| Iowa - 0.0% | | | |
| Iowa Student Ln. Liquidity Corp. Student Ln. Rev. Series 2019 B, 5% 12/1/24 (b) | | 800 | 844 |
| Kansas - 0.1% | | | |
| Desoto Unified School District # 232 Series 2015 A, 5% 9/1/22 | | 1,525 | 1,534 |
| Wyandotte County/Kansas City Unified Govt. Util. Sys. Rev. Series 2016 A: | | | |
| 5% 9/1/22 | | 490 | 493 |
| 5% 9/1/23 | | 710 | 735 |
| 5% 9/1/25 | | 785 | 847 |
|
| TOTAL KANSAS | | | 3,609 |
|
| Kentucky - 2.9% | | | |
| Ashland Med. Ctr. Rev.: | | | |
| (Ashland Hosp. Corp. D/B/A King's Daughters Med. Ctr. Proj.) Series 2016 A: | | | |
| 5% 2/1/24 | | 1,330 | 1,384 |
| 5% 2/1/25 | | 980 | 1,028 |
| Series 2019, 5% 2/1/23 | | 625 | 636 |
| Carroll County Envir. Facilities Rev. Bonds (Kentucky Utils. Co. Proj.) Series 2004 A, 1.75%, tender 9/1/26 (a)(b) | | 9,750 | 8,835 |
| Carroll County Poll. Ctlr Rev. Bonds (Kentucky Utils. Co. Proj.) Series 2016 A, 1.55%, tender 9/1/26 (a) | | 5,750 | 5,080 |
| Kentucky Asset/Liability Commission Gen. Fund Rev. Series 2021 A: | | | |
| 5% 11/1/24 | | 1,065 | 1,131 |
| 5% 11/1/25 | | 3,000 | 3,229 |
| 5% 11/1/26 | | 1,000 | 1,094 |
| 5% 11/1/27 | | 1,000 | 1,109 |
| Kentucky Econ. Dev. Fin. Auth. Hosp. Rev. Series 2015 A, 5% 6/1/24 | | 1,655 | 1,728 |
| Kentucky State Property & Buildings Commission Rev.: | | | |
| Series 2015, 5% 8/1/24 | | 1,850 | 1,948 |
| Series 2018, 5% 5/1/25 | | 1,605 | 1,714 |
| Series A: | | | |
| 5% 11/1/24 | | 1,250 | 1,322 |
| 5% 11/1/25 | | 1,650 | 1,778 |
| Series B, 5% 8/1/24 | | 2,645 | 2,784 |
| Kentucky, Inc. Pub. Energy: | | | |
| Bonds: | | | |
| Series 2019 A1, 4%, tender 6/1/25 (a) | | 10,455 | 10,594 |
| Series A, 4%, tender 6/1/26 (a) | | 11,570 | 11,709 |
| Series C1, 4%, tender 6/1/25 (a) | | 15,000 | 15,200 |
| Series A: | | | |
| 4% 12/1/23 | | 600 | 609 |
| 4% 12/1/25 | | 825 | 837 |
| 4% 6/1/26 | | 1,085 | 1,101 |
| Louisville & Jefferson County Bonds: | | | |
| Series 2020 B, 5%, tender 10/1/23 (a) | | 2,800 | 2,886 |
| Series 2020 C, 5%, tender 10/1/26 (a) | | 5,985 | 6,387 |
| Louisville Reg'l. Arpt. Auth. Sys. Rev. Series 2014 A, 5% 7/1/24 (b) | | 1,280 | 1,341 |
|
| TOTAL KENTUCKY | | | 85,464 |
|
| Louisiana - 0.6% | | | |
| Louisiana Stadium and Exposition District Series 2013 A, 5% 7/1/22 | | 980 | 980 |
| New Orleans Aviation Board Rev.: | | | |
| (North Term. Proj.) Series 2017 B: | | | |
| 5% 1/1/23 (b) | | 300 | 304 |
| 5% 1/1/24 (b) | | 195 | 202 |
| 5% 1/1/25 (b) | | 195 | 205 |
| 5% 1/1/26 (b) | | 490 | 524 |
| Series 2017 D2: | | | |
| 5% 1/1/23 (b) | | 390 | 396 |
| 5% 1/1/24 (b) | | 735 | 763 |
| 5% 1/1/25 (b) | | 1,390 | 1,464 |
| St. John Baptist Parish Rev.: | | | |
| (Marathon Oil Corp.) Series 2017, 2.2% 6/1/37 (a) | | 3,765 | 3,500 |
| Bonds (Marathon Oil Corp.) Series 2017, 2%, tender 4/1/23 (a) | | 3,555 | 3,513 |
| Tobacco Settlement Fing. Corp. Series 2013 A, 5% 5/15/23 | | 4,400 | 4,496 |
|
| TOTAL LOUISIANA | | | 16,347 |
|
| Maine - 0.1% | | | |
| City of Portland Arpt. Series 2016, 5% 1/1/29 | | 690 | 732 |
| Maine Health & Higher Edl. Facilities Auth. Rev.: | | | |
| Series 2013, 5% 7/1/24 (Pre-Refunded to 7/1/23 @ 100) | | 350 | 361 |
| Series 2021 A: | | | |
| 5% 7/1/28 | | 555 | 612 |
| 5% 7/1/29 | | 600 | 667 |
| 5% 7/1/30 | | 500 | 560 |
|
| TOTAL MAINE | | | 2,932 |
|
| Maryland - 1.2% | | | |
| Baltimore Proj. Rev. Series 2017 D: | | | |
| 5% 7/1/24 | | 3,220 | 3,408 |
| 5% 7/1/25 | | 3,380 | 3,654 |
| Hsg. Opportunities Commission of Montgomery County Series 2021 C, 0.8% 7/1/25 | | 700 | 661 |
| Maryland Cmnty. Dev. Admin Dept. Hsg. & Cmnty. Dev.: | | | |
| Series 2019 B, 4% 9/1/49 | | 1,345 | 1,364 |
| Series 2019 C, 3.5% 3/1/50 | | 1,340 | 1,341 |
| Series 2021 C: | | | |
| 0.375% 7/1/23 | | 640 | 630 |
| 0.5% 1/1/24 | | 1,000 | 975 |
| 0.6% 7/1/24 | | 2,840 | 2,742 |
| Maryland Dept. of Trans.: | | | |
| Series 2021 B, 5% 8/1/27 (b) | | 1,805 | 1,971 |
| Series 2022 A, 5% 12/1/24 | | 740 | 792 |
| Series 2022 B: | | | |
| 5% 12/1/23 (d) | | 845 | 874 |
| 5% 12/1/27 (d) | | 1,295 | 1,434 |
| Series 2022, 5% 12/1/26 | | 1,395 | 1,557 |
| Maryland Health & Higher Edl. Bonds: | | | |
| Series 2020 B2, 5%, tender 7/1/27 (a) | | 2,480 | 2,702 |
| Series 2020, 5%, tender 7/1/25 (a) | | 5,250 | 5,549 |
| Maryland Health & Higher Edl. Facilities Auth. Rev. Series 2015: | | | |
| 5% 7/1/22 | | 1,880 | 1,880 |
| 5% 7/1/23 | | 980 | 1,009 |
| 5% 7/1/24 | | 1,955 | 2,045 |
| 5% 7/1/25 | | 1,730 | 1,836 |
|
| TOTAL MARYLAND | | | 36,424 |
|
| Massachusetts - 1.2% | | | |
| Massachusetts Dept. of Trans. Metropolitan Hwy. Sys. Rev. Bonds Series 2019 A, 5%, tender 1/1/23 (a) | | 5,935 | 6,024 |
| Massachusetts Dev. Fin. Agcy. Rev.: | | | |
| Bonds Series 2011 N, 0.45%, tender 7/1/25 (a) | | 2,500 | 2,304 |
| Caregroup, Inc. Series 2015 H-1, 5% 7/1/25 | | 2,655 | 2,829 |
| Series 2016 I: | | | |
| 5% 7/1/22 | | 585 | 585 |
| 5% 7/1/23 | | 660 | 678 |
| 5% 7/1/24 | | 1,075 | 1,118 |
| 5% 7/1/25 | | 1,480 | 1,561 |
| 5% 7/1/26 | | 980 | 1,045 |
| Series 2019 A: | | | |
| 5% 7/1/23 | | 525 | 540 |
| 5% 7/1/24 | | 1,150 | 1,201 |
| 5% 7/1/25 | | 825 | 875 |
| Series 2021: | | | |
| 4% 7/1/23 | | 215 | 216 |
| 4% 7/1/24 | | 225 | 226 |
| 4% 7/1/25 | | 235 | 235 |
| Massachusetts Edl. Fing. Auth. Rev.: | | | |
| Series 2016 J, 5% 7/1/23 (b) | | 2,175 | 2,232 |
| Series 2016, 5% 7/1/24 (b) | | 2,850 | 2,979 |
| Series 2020 C: | | | |
| 5% 7/1/25 (b) | | 850 | 900 |
| 5% 7/1/26 (b) | | 1,900 | 2,047 |
| Series 2021 B, 5% 7/1/26 (b) | | 1,390 | 1,489 |
| Massachusetts Health & Edl. Facilities Auth. Rev. Bonds Series I, 0.7%, tender 7/1/25 (a) | | 2,515 | 2,399 |
| Massachusetts Port Auth. Rev.: | | | |
| Series 2017 A: | | | |
| 5% 7/1/24 (b) | | 3,005 | 3,150 |
| 5% 7/1/25 (b) | | 1,115 | 1,191 |
| Series 2021 E, 5% 7/1/27 (b) | | 500 | 546 |
|
| TOTAL MASSACHUSETTS | | | 36,370 |
|
| Michigan - 2.3% | | | |
| Detroit Downtown Dev. Auth. Tax Series A, 5% 7/1/24 (Assured Guaranty Muni. Corp. Insured) | | 1,000 | 1,052 |
| Flint Hosp. Bldg. Auth. Rev. Series 2020, 5% 7/1/24 | | 925 | 959 |
| Grand Rapids Pub. Schools Series 2017, 5% 5/1/23 (Assured Guaranty Muni. Corp. Insured) | | 1,275 | 1,310 |
| Grand Traverse County Hosp. Fin. Auth. Series 2021: | | | |
| 5% 7/1/26 | | 550 | 600 |
| 5% 7/1/27 | | 900 | 996 |
| 5% 7/1/28 | | 725 | 809 |
| Kalamazoo Hosp. Fin. Auth. Hosp. Facilities Rev. Series 2016: | | | |
| 5% 5/15/24 | | 635 | 667 |
| 5% 5/15/24 (Escrowed to Maturity) | | 5 | 5 |
| 5% 5/15/25 | | 1,275 | 1,356 |
| 5% 5/15/25 (Escrowed to Maturity) | | 10 | 11 |
| 5% 5/15/26 | | 1,230 | 1,324 |
| 5% 5/15/26 (Escrowed to Maturity) | | 5 | 5 |
| Lansing Board of Wtr. & Lt. Util. Rev. Bonds Series 2021 B, 2%, tender 7/1/26 (a) | | 2,000 | 1,895 |
| Michigan Bldg. Auth. Rev. (Facilities Prog.) Series 2016 I, 5% 4/15/24 | | 1,450 | 1,529 |
| Michigan Fin. Auth. Rev.: | | | |
| (Detroit Wtr. and Sewage Dept. Wtr. Supply Sys. Rev. Rfdg. Local Proj.) Series 2014 D1, 5% 7/1/22 (Assured Guaranty Muni. Corp. Insured) | | 1,920 | 1,920 |
| Bonds: | | | |
| Series 2015 D2, 1.2%, tender 4/13/28 (a) | | 635 | 569 |
| Series 2019 B, 3.5%, tender 11/15/22 (a) | | 2,830 | 2,844 |
| Series 2019 MI2, 5%, tender 2/1/25 (a) | | 4,830 | 5,142 |
| Series 2015 A: | | | |
| 5% 8/1/22 (Escrowed to Maturity) | | 2,630 | 2,637 |
| 5% 8/1/23 | | 3,715 | 3,843 |
| 5% 8/1/26 (Pre-Refunded to 8/1/24 @ 100) | | 300 | 318 |
| Series 2015 D1, 0.75% 10/15/25 | | 1,000 | 946 |
| Series 2015 MI, 5% 12/1/23 | | 1,020 | 1,064 |
| Series 2020 A: | | | |
| 5% 6/1/24 | | 1,000 | 1,038 |
| 5% 6/1/25 | | 2,000 | 2,101 |
| Michigan Gen. Oblig. Series 2016, 5% 3/15/24 | | 6,955 | 7,306 |
| Michigan Hosp. Fin. Auth. Rev. Bonds (Ascension Health Cr. Group Proj.) Series F5, 2.4%, tender 3/15/23 (a) | | 3,535 | 3,546 |
| Michigan Hsg. Dev. Auth. Single Family Mtg. Rev.: | | | |
| Series 2021 A, 3% 6/1/52 | | 2,280 | 2,224 |
| Series A, 3.5% 12/1/50 | | 1,230 | 1,228 |
| Michigan Strategic Fund Ltd. Oblig. Rev. Bonds (Consumer Energy Co. Proj.) Series 2019, 1.8%, tender 10/1/24 (a)(b) | | 3,140 | 3,037 |
| Novi Cmnty. School District Series I: | | | |
| 4% 5/1/24 | | 795 | 822 |
| 4% 5/1/25 | | 600 | 626 |
| Portage Pub. Schools Series 2016: | | | |
| 5% 5/1/23 | | 1,990 | 2,045 |
| 5% 11/1/23 | | 1,335 | 1,391 |
| 5% 5/1/24 | | 1,880 | 1,979 |
| 5% 11/1/24 | | 1,955 | 2,081 |
| 5% 5/1/25 | | 1,100 | 1,184 |
| 5% 11/1/25 | | 1,195 | 1,299 |
| 5% 11/1/28 | | 985 | 1,078 |
| Royal Oak Hosp. Fin. Auth. Hosp. Rev. Series 2014 D, 5% 9/1/23 | | 490 | 508 |
| Saginaw Hosp. Fin. Auth. Hosp. Rev. Series 2020 J: | | | |
| 5% 7/1/24 | | 765 | 804 |
| 5% 7/1/25 | | 500 | 533 |
| 5% 7/1/26 | | 750 | 809 |
|
| TOTAL MICHIGAN | | | 67,440 |
|
| Minnesota - 0.6% | | | |
| Duluth Econ. Dev. Auth. Series 2021 A: | | | |
| 3% 7/1/22 | | 180 | 180 |
| 3% 7/1/24 | | 200 | 198 |
| 3% 7/1/25 | | 615 | 603 |
| Minneapolis & Saint Paul Metropolitan Arpts. Commission Arpt. Rev.: | | | |
| Series 2014 A, 5% 1/1/23 | | 980 | 996 |
| Series 2014 B, 5% 1/1/23 (b) | | 1,480 | 1,503 |
| Moorhead Edl. Facilities Rev. (The Concordia College Corp. Proj.) Series 2016, 5% 12/1/25 | | 2,950 | 3,067 |
| Northern Muni. Pwr. Agcy. Elec. Sys. Rev. Series 2017: | | | |
| 5% 1/1/23 | | 1,115 | 1,133 |
| 5% 1/1/24 | | 1,560 | 1,628 |
| Shakopee Sr. Hsg. Rev. Bonds Series 2018, 5.85%, tender 11/1/25 (a)(c) | | 2,530 | 2,525 |
| Southern Minnesota Muni. Pwr. Agcy. Pwr. Supply Sys. Rev. Series 2015 A, 5% 1/1/26 | | 2,065 | 2,248 |
| Western Minnesota Muni. Pwr. Agcy. Pwr. Supply Rev. Series 2014 A: | | | |
| 5% 1/1/23 | | 1,465 | 1,490 |
| 5% 1/1/24 | | 980 | 1,025 |
|
| TOTAL MINNESOTA | | | 16,596 |
|
| Mississippi - 0.2% | | | |
| Mississippi Dev. Bank Spl. Oblig. (Magnolia Reg'l. Health Ctr. Proj.) Series 2021: | | | |
| 5% 10/1/23 (c) | | 830 | 850 |
| 5% 10/1/25 (c) | | 1,320 | 1,381 |
| 5% 10/1/27 (c) | | 900 | 956 |
| Mississippi Hosp. Equip. & Facilities Auth.: | | | |
| (Forrest County Gen. Hosp. Rfdg. Proj.) Series 2019 B, 5% 1/1/24 | | 400 | 417 |
| Bonds Series II, 5%, tender 3/1/27 (a) | | 1,130 | 1,225 |
| Series I: | | | |
| 5% 10/1/25 | | 600 | 642 |
| 5% 10/1/27 | | 800 | 876 |
|
| TOTAL MISSISSIPPI | | | 6,347 |
|
| Missouri - 0.7% | | | |
| Cape Girardeau County Indl. Dev. Auth. (Southeast Hosp. Proj.) Series 2017 A: | | | |
| 5% 3/1/23 | | 980 | 995 |
| 5% 3/1/24 | | 685 | 707 |
| 5% 3/1/25 | | 710 | 742 |
| 5% 3/1/26 | | 980 | 1,035 |
| Kansas City Indl. Dev. Auth. (Kansas City Int'l. Arpt. Term. Modernization Proj.): | | | |
| Series 2020 A: | | | |
| 5% 3/1/26 (b) | | 1,185 | 1,269 |
| 5% 3/1/27 (b) | | 4,065 | 4,406 |
| Series 2020 B: | | | |
| 5% 3/1/26 | | 2,190 | 2,376 |
| 5% 3/1/27 | | 1,535 | 1,686 |
| Missouri Hsg. Dev. Commission Single Family Mtg. Rev. Series 2019, 4% 5/1/50 | | 395 | 401 |
| Saint Louis Arpt. Rev.: | | | |
| Series 2012, 5% 7/1/32 (b) | | 935 | 935 |
| Series A, 5.25% 7/1/26 (Assured Guaranty Muni. Corp. Insured) | | 5,370 | 5,915 |
|
| TOTAL MISSOURI | | | 20,467 |
|
| Montana - 0.3% | | | |
| Montana Board Hsg. Single Family: | | | |
| Series 2019 B, 4% 6/1/50 | | 215 | 218 |
| Series 2021 B, 3% 12/1/51 | | 2,485 | 2,425 |
| Series 2022 A, 3% 6/1/52 | | 1,735 | 1,687 |
| Series A1, 3.5% 6/1/50 | | 3,310 | 3,308 |
|
| TOTAL MONTANA | | | 7,638 |
|
| Nebraska - 1.0% | | | |
| Central Plains Energy Proj. Gas Supply Bonds Series 2019, 4%, tender 8/1/25 (a) | | 9,765 | 10,031 |
| Douglas County Hosp. Auth. #2 Health Facilities Rev. Bonds Series 2020, 5%, tender 11/15/25 (a) | | 2,200 | 2,368 |
| Lincoln Arpt. Auth. Series 2021: | | | |
| 5% 7/1/24 (b) | | 700 | 739 |
| 5% 7/1/26 (b) | | 750 | 821 |
| 5% 7/1/27 (b) | | 1,275 | 1,416 |
| 5% 7/1/28 (b) | | 1,830 | 2,046 |
| 5% 7/1/29 (b) | | 1,000 | 1,127 |
| Nebraska Invt. Fin. Auth. Single Family Hsg. Rev.: | | | |
| Series 2019 B, 4% 9/1/49 (b) | | 1,100 | 1,113 |
| Series 2019 E, 3.75% 9/1/49 (b) | | 1,230 | 1,241 |
| Nebraska Pub. Pwr. District Rev. Series 2017 B, 5% 1/1/26 | | 1,260 | 1,375 |
| Washington County Wstwtr Sol Bonds (Cargill, Inc. Projs.) Series 2012, 0.9%, tender 9/1/25 (a)(b) | | 7,400 | 6,944 |
|
| TOTAL NEBRASKA | | | 29,221 |
|
| Nevada - 1.2% | | | |
| Clark County Arpt. Rev.: | | | |
| (Sub Lien Proj.) Series 2017 A1, 5% 7/1/22 (b) | | 3,915 | 3,915 |
| Series 2013 A, 5% 7/1/28 (b) | | 1,475 | 1,493 |
| Series 2014 A2: | | | |
| 5% 7/1/28 | | 525 | 549 |
| 5% 7/1/30 | | 750 | 783 |
| Series 2019 D, 5% 7/1/24 | | 1,775 | 1,875 |
| Series 2021 B: | | | |
| 5% 7/1/22 (b) | | 365 | 365 |
| 5% 7/1/23 (b) | | 625 | 642 |
| 5% 7/1/24 (b) | | 985 | 1,032 |
| 5% 7/1/27 (b) | | 6,000 | 6,547 |
| Clark County McCarran Int'l. Arpt. Passenger Facility Charge Rev.: | | | |
| Series 2019 E: | | | |
| 5% 7/1/25 | | 1,275 | 1,377 |
| 5% 7/1/27 | | 2,245 | 2,505 |
| Series B, 5% 7/1/24 (b) | | 2,080 | 2,181 |
| Clark County Poll. Cont. Rev. Bonds Series 2017, 1.65%, tender 3/31/23 (a) | | 835 | 831 |
| Clark County School District: | | | |
| Series 2017 A, 5% 6/15/26 | | 1,285 | 1,411 |
| Series 2020 B, 5% 6/15/26 | | 5,805 | 6,373 |
| Nevada Gen. Oblig. Series 2013 D1, 5% 3/1/24 | | 2,640 | 2,696 |
|
| TOTAL NEVADA | | | 34,575 |
|
| New Hampshire - 0.5% | | | |
| Nat'l. Fin. Auth. Hosp. Rev. (St. Luke's Univ. Health Network Proj.) Series 2021 B: | | | |
| 5% 8/15/24 | | 600 | 633 |
| 5% 8/15/28 | | 1,125 | 1,252 |
| Nat'l. Fin. Auth. Solid Bonds (Waste Mgmt., Inc. Proj.): | | | |
| Series 2019 A3, 2.15%, tender 7/1/24 (a)(b) | | 4,455 | 4,376 |
| Series 2019 A4, 2.15%, tender 7/1/24 (a)(b) | | 2,250 | 2,210 |
| New Hampshire Bus. Fin. Auth. Wtr. Facility (Pennichuck Wtr. Works, Inc. Proj.) Series 2014 A: | | | |
| 5% 1/1/24 (Escrowed to Maturity) (b) | | 1,120 | 1,167 |
| 5% 1/1/25 (Escrowed to Maturity) (b) | | 1,000 | 1,064 |
| New Hampshire Health & Ed. Facilities Auth. Rev. Series 2016: | | | |
| 5% 10/1/22 | | 900 | 907 |
| 5% 10/1/23 | | 2,785 | 2,883 |
|
| TOTAL NEW HAMPSHIRE | | | 14,492 |
|
| New Jersey - 5.8% | | | |
| Camden County Impt. Auth. Health Care Redev. Rev. Series 2014 A, 5% 2/15/23 | | 2,770 | 2,817 |
| Hudson County Impt. Auth. (Hudson County Courthouse Proj.) Series 2020, 4% 10/1/24 | | 1,400 | 1,459 |
| New Jersey Bldg. Auth. State Bldg. Rev. Series 2016 A, 5% 6/15/24 | | 1,720 | 1,798 |
| New Jersey Econ. Dev. Auth. Series 2013, 5% 3/1/27 | | 170 | 173 |
| New Jersey Econ. Dev. Auth. Rev.: | | | |
| (Provident Montclair Proj.) Series 2017: | | | |
| 5% 6/1/23 (Assured Guaranty Muni. Corp. Insured) | | 1,230 | 1,265 |
| 5% 6/1/24 (Assured Guaranty Muni. Corp. Insured) | | 980 | 1,031 |
| Series 2013 NN, 5% 3/1/26 | | 1,925 | 1,959 |
| Series 2013, 5% 3/1/23 | | 13,920 | 14,218 |
| Series 2014 RR, 5% 6/15/32 (Pre-Refunded to 6/15/24 @ 100) | | 375 | 397 |
| Series 2014 UU, 5% 6/15/30 (Pre-Refunded to 6/15/24 @ 100) | | 465 | 491 |
| Series 2015 XX: | | | |
| 4% 6/15/24 | | 550 | 564 |
| 5% 6/15/26 | | 975 | 1,024 |
| Series 2016 BBB, 5% 6/15/23 | | 9,010 | 9,269 |
| New Jersey Edl. Facility: | | | |
| Series 2016 A: | | | |
| 5% 7/1/22 | | 6,160 | 6,160 |
| 5% 7/1/23 | | 3,315 | 3,411 |
| 5% 7/1/24 | | 7,740 | 8,126 |
| Series 2016 B, 4% 9/1/26 | | 320 | 328 |
| New Jersey Gen. Oblig.: | | | |
| Series 2020 A, 5% 6/1/24 | | 10,970 | 11,525 |
| Series 2021, 2% 6/1/23 | | 5,700 | 5,703 |
| New Jersey Health Care Facilities Fing. Auth. Rev.: | | | |
| Bonds: | | | |
| Series 2019 B1, 5%, tender 7/1/24 (a) | | 3,175 | 3,339 |
| Series 2019 B2, 5%, tender 7/1/25 (a) | | 3,890 | 4,143 |
| Series 2019 B3, 5%, tender 7/1/26 (a) | | 2,750 | 2,957 |
| Series 2016 A: | | | |
| 5% 7/1/22 (Escrowed to Maturity) | | 170 | 170 |
| 5% 7/1/23 (Escrowed to Maturity) | | 595 | 612 |
| 5% 7/1/24 | | 1,200 | 1,262 |
| 5% 7/1/24 (Escrowed to Maturity) | | 985 | 1,040 |
| 5% 7/1/24 (Escrowed to Maturity) | | 475 | 500 |
| 5% 7/1/25 (Escrowed to Maturity) | | 515 | 552 |
| 5% 7/1/26 (Escrowed to Maturity) | | 170 | 186 |
| 5% 7/1/27 (Pre-Refunded to 7/1/26 @ 100) | | 255 | 278 |
| Series 2016, 5% 7/1/25 | | 275 | 297 |
| New Jersey Higher Ed. Student Assistance Auth. Student Ln. Rev.: | | | |
| Series 2012 1, 5% 12/1/22 (b) | | 1,090 | 1,101 |
| Series 2015 1A, 5% 12/1/24 (b) | | 6,015 | 6,336 |
| Series 2017 1A: | | | |
| 5% 12/1/22 (b) | | 1,250 | 1,267 |
| 5% 12/1/23 (b) | | 1,930 | 2,001 |
| Series 2019 A, 5% 12/1/24 | | 950 | 1,009 |
| Series 2020: | | | |
| 5% 12/1/22 (b) | | 605 | 613 |
| 5% 12/1/23 (b) | | 1,830 | 1,898 |
| 5% 12/1/24 (b) | | 1,360 | 1,432 |
| 5% 12/1/25 (b) | | 2,440 | 2,614 |
| 5% 12/1/26 (b) | | 3,165 | 3,423 |
| Series 2021 A, 5% 12/1/25 (b) | | 130 | 139 |
| Series 2021 B: | | | |
| 5% 12/1/25 (b) | | 315 | 337 |
| 5% 12/1/26 (b) | | 1,425 | 1,540 |
| New Jersey Hsg. & Mtg. Fin. Agcy. Rev. Series 2019 D: | | | |
| 4% 4/1/23 (b) | | 1,090 | 1,104 |
| 4% 10/1/23 (b) | | 1,150 | 1,172 |
| 4% 4/1/25 (b) | | 1,405 | 1,442 |
| New Jersey Tpk. Auth. Tpk. Rev. Series D, 5% 1/1/28 | | 1,710 | 1,863 |
| New Jersey Trans. Trust Fund Auth.: | | | |
| Series 2006 C, 0% 12/15/27 (Nat'l. Pub. Fin. Guarantee Corp. Insured) | | 1,820 | 1,510 |
| Series 2010 A, 0% 12/15/27 | | 5,520 | 4,545 |
| Series 2016 A, 5% 6/15/27 | | 3,960 | 4,289 |
| Series 2018 A, 5% 6/15/24 | | 5,000 | 5,249 |
| Series 2022 AA: | | | |
| 5% 6/15/23 | | 985 | 1,013 |
| 5% 6/15/25 | | 4,000 | 4,215 |
| 5% 6/15/26 | | 9,745 | 10,402 |
| 5% 6/15/27 | | 8,000 | 8,633 |
| 5% 6/15/28 | | 10,000 | 10,856 |
| Series A: | | | |
| 5% 12/15/24 | | 1,780 | 1,863 |
| 5% 12/15/25 | | 1,680 | 1,782 |
| 5% 12/15/26 | | 2,600 | 2,791 |
| Rutgers State Univ. Rev. Series Q, 5% 5/1/23 | | 540 | 555 |
|
| TOTAL NEW JERSEY | | | 174,048 |
|
| New Mexico - 1.3% | | | |
| New Mexico Edl. Assistance Foundation Series 2021 1A: | | | |
| 5% 9/1/25 (b) | | 6,250 | 6,692 |
| 5% 9/1/28 (b) | | 2,000 | 2,203 |
| New Mexico Hosp. Equip. Ln. Council Rev. Bonds Series 2019 B, 5%, tender 8/1/25 (a) | | 3,135 | 3,374 |
| New Mexico Mtg. Fin. Auth. Series 2019 C, 4% 1/1/50 | | 3,705 | 3,759 |
| New Mexico Muni. Energy Acquisition Auth. Gas Supply Rev.: | | | |
| Bonds Series 2019 A, 5%, tender 5/1/25 (a) | | 15,000 | 15,806 |
| Series 2019 A: | | | |
| 4% 11/1/23 | | 710 | 724 |
| 4% 5/1/24 | | 950 | 973 |
| 4% 11/1/24 | | 1,450 | 1,489 |
| 4% 5/1/25 | | 2,790 | 2,873 |
|
| TOTAL NEW MEXICO | | | 37,893 |
|
| New York - 7.3% | | | |
| Dorm. Auth. New York Univ. Rev. Series 2016 A: | | | |
| 5% 7/1/22 | | 490 | 490 |
| 5% 7/1/24 | | 1,810 | 1,894 |
| Hudson Yards Infrastructure Corp. New York Rev. Series 2017 A, 5% 2/15/25 | | 4,000 | 4,285 |
| Long Island Pwr. Auth. Elec. Sys. Rev. Bonds: | | | |
| Series 2019 B, 1.65%, tender 9/1/24 (a) | | 7,255 | 7,124 |
| Series 2020 B, 0.85%, tender 9/1/25 (a) | | 19,810 | 18,630 |
| Series 2021 B, 1.5%, tender 9/1/26 (a) | | 3,360 | 3,182 |
| Monroe County Indl. Dev. Corp. (Univ. of Rochester Proj.): | | | |
| Series 2017 A, 5% 7/1/25 | | 900 | 965 |
| Series 2020 A: | | | |
| 5% 7/1/25 | | 750 | 804 |
| 5% 7/1/26 | | 500 | 545 |
| New York Bridge Auth. Gen. Rev. Series 2021 B, 5% 1/1/27 | | 1,500 | 1,660 |
| New York City Gen. Oblig.: | | | |
| Bonds Series D, 5%, tender 2/1/24 (a) | | 2,825 | 2,882 |
| Series 2021 A1, 5% 8/1/30 | | 6,825 | 7,817 |
| Series 2021 F1, 5% 3/1/23 | | 555 | 568 |
| Series 2022 B1, 5% 8/1/28 | | 14,555 | 16,534 |
| Series A, 5% 8/1/26 | | 1,000 | 1,107 |
| Series A6, 5% 8/1/25 | | 250 | 261 |
| Series F1, 5% 6/1/25 | | 470 | 508 |
| Series I1, 5% 3/1/27 | | 615 | 643 |
| New York City Health & Hosp. Corp. Rev. Series A: | | | |
| 3% 2/15/24 | | 535 | 543 |
| 5% 2/15/24 | | 750 | 785 |
| New York City Hsg. Dev. Corp. Multifamily Hsg. Bonds: | | | |
| Series 2021 C2, 0.7%, tender 7/1/25 (a) | | 2,210 | 2,061 |
| Series 2021 K2, 0.9%, tender 1/1/26 (a) | | 12,290 | 11,389 |
| Series 2021, 0.6%, tender 7/1/25 (a) | | 2,905 | 2,681 |
| New York City Indl. Dev. Agcy. Rev. Series 2021 A: | | | |
| 5% 1/1/25 (Assured Guaranty Muni. Corp. Insured) | | 1,000 | 1,057 |
| 5% 1/1/26 (Assured Guaranty Muni. Corp. Insured) | | 1,000 | 1,074 |
| 5% 1/1/27 (Assured Guaranty Muni. Corp. Insured) | | 1,000 | 1,088 |
| New York City Muni. Wtr. Fin. Auth. Wtr. & Swr. Sys. Rev. Series 2021 DD, 5% 6/15/25 | | 1,535 | 1,659 |
| New York City Transitional Fin. Auth. Rev. Series E1, 5% 2/1/26 | | 475 | 507 |
| New York Dorm. Auth. Rev.: | | | |
| Bonds Series 2019 B2, 5%, tender 5/1/24 (a) | | 2,005 | 2,072 |
| Series 2015 A: | | | |
| 5% 7/1/28 | | 370 | 388 |
| 5% 7/1/28 (Pre-Refunded to 7/1/25 @ 100) | | 30 | 32 |
| Series 2022: | | | |
| 5% 7/1/26 | | 675 | 713 |
| 5% 7/1/27 | | 710 | 756 |
| 5% 7/1/28 | | 750 | 801 |
| 5% 7/1/29 | | 1,065 | 1,138 |
| New York Envir. Facilities Corp. Clean Wtr. & Drinking Wtr. (NY Muni. Wtr. Fin. Auth. Projs.) Series 2020 A, 5% 6/15/24 | | 1,400 | 1,482 |
| New York Metropolitan Trans. Auth. Dedicated Tax Fund Rev.: | | | |
| Series 2012 A, 5% 11/15/25 | | 1,340 | 1,356 |
| Series 2016 A, 5% 11/15/24 | | 525 | 559 |
| Series 2016 B1: | | | |
| 5% 11/15/24 | | 670 | 713 |
| 5% 11/15/25 | | 1,000 | 1,085 |
| Series 2017 B1, 4% 11/15/25 | | 250 | 263 |
| Series 2017 B2: | | | |
| 5% 11/15/23 | | 1,350 | 1,405 |
| 5% 11/15/25 | | 1,450 | 1,573 |
| New York Metropolitan Trans. Auth. Rev.: | | | |
| Series 2012 B, 5% 11/15/22 | | 1,955 | 1,978 |
| Series 2015 A, 5% 11/15/24 | | 1,000 | 1,052 |
| Series 2015 A1, 5% 11/15/29 | | 765 | 799 |
| Series 2016 A: | | | |
| 5% 11/15/23 | | 2,680 | 2,774 |
| 5% 11/15/23 | | 1,450 | 1,501 |
| Series 2016 D, 5% 11/15/27 | | 1,000 | 1,077 |
| Series 2017 A2: | | | |
| 5% 11/15/25 | | 2,620 | 2,782 |
| 5% 11/15/26 | | 5,815 | 6,227 |
| Series 2017 B: | | | |
| 5% 11/15/23 | | 4,025 | 4,166 |
| 5% 11/15/24 | | 665 | 699 |
| Series 2017 C1, 5% 11/15/28 | | 4,340 | 4,666 |
| New York State Dorm. Auth.: | | | |
| Series 2018 A, 5% 3/15/27 | | 970 | 1,079 |
| Series 2019 D, 5% 2/15/25 | | 1,030 | 1,106 |
| Series 2021 A, 5% 3/15/27 | | 2,975 | 3,309 |
| New York State Hsg. Fin. Agcy. Rev.: | | | |
| Bonds: | | | |
| Series 2021 D2, 0.65%, tender 11/1/25 (a) | | 2,770 | 2,560 |
| Series 2021 J2: | | | |
| 1%, tender 11/1/26 (a) | | 1,770 | 1,616 |
| 1.1%, tender 5/1/27 (a) | | 6,610 | 5,952 |
| Series J, 0.75% 5/1/25 | | 3,030 | 2,865 |
| New York State Mtg. Agcy. Homeowner Mtg.: | | | |
| Series 2021 232: | | | |
| 5% 4/1/25 (b) | | 1,130 | 1,191 |
| 5% 10/1/26 (b) | | 1,580 | 1,698 |
| Series 221, 3.5% 10/1/32 (b) | | 460 | 459 |
| New York Thruway Auth. Gen. Rev. Series 2014 K, 5% 1/1/32 | | 795 | 840 |
| New York Trans. Dev. Corp.: | | | |
| (Term. 4 JFK Int'l. Arpt. Proj.): | | | |
| Series 2020 A: | | | |
| 5% 12/1/22 (b) | | 250 | 253 |
| 5% 12/1/24 (b) | | 1,500 | 1,566 |
| 5% 12/1/25 (b) | | 1,400 | 1,469 |
| 5% 12/1/26 (b) | | 740 | 784 |
| Series 2020 C: | | | |
| 5% 12/1/24 | | 1,000 | 1,053 |
| 5% 12/1/25 | | 800 | 847 |
| 5% 12/1/26 | | 1,250 | 1,336 |
| 5% 12/1/27 | | 1,250 | 1,342 |
| (Term. 4 John F. Kennedy Int'l. Arpt. Proj.) Series 2022: | | | |
| 5% 12/1/26 (b) | | 7,810 | 8,274 |
| 5% 12/1/27 (b) | | 10,415 | 11,033 |
| New York Urban Dev. Corp. Rev. Series 2015 A, 5% 3/15/26 | | 250 | 271 |
| Niagara Frontier Trans. Auth. Arpt. Rev. Series 2019 A: | | | |
| 5% 4/1/25 (b) | | 625 | 659 |
| 5% 4/1/27 (b) | | 1,350 | 1,456 |
| Onondaga County Ind. Dev. Agcy. Swr. Facilities Rev. (Bristol-Meyers Squibb Co. Proj.) Series 1994, 5.75% 3/1/24 (b) | | 6,520 | 6,891 |
| Suffolk County Gen. Oblig.: | | | |
| Series 2022 A: | | | |
| 5% 6/15/24 | | 655 | 690 |
| 5% 6/15/25 | | 695 | 747 |
| 5% 6/15/29 | | 965 | 1,087 |
| Series 2022 B: | | | |
| 5% 10/1/23 (d) | | 650 | 674 |
| 5% 10/1/25 (d) | | 800 | 864 |
| 5% 10/1/26 (d) | | 410 | 450 |
| 5% 10/1/28 (d) | | 670 | 750 |
| Syracuse Reg'l. Arpt. Auth. Series 2021: | | | |
| 5% 7/1/25 (b) | | 750 | 793 |
| 5% 7/1/26 (b) | | 1,145 | 1,227 |
| 5% 7/1/27 (b) | | 1,515 | 1,639 |
| Triborough Bridge & Tunnel Auth. Bonds Series 2021 A2: | | | |
| 2%, tender 5/15/26 (a) | | 7,870 | 7,665 |
| 2%, tender 5/15/28 (a) | | 2,575 | 2,448 |
| Yonkers Gen. Oblig. Series 2017 C, 5% 10/1/22 (Build America Mutual Assurance Insured) | | 2,500 | 2,522 |
|
| TOTAL NEW YORK | | | 216,265 |
|
| New York And New Jersey - 0.7% | | | |
| Port Auth. of New York & New Jersey: | | | |
| Series 178, 5% 12/1/23 (b) | | 1,060 | 1,101 |
| Series 185, 5% 9/1/23 (b) | | 2,870 | 2,963 |
| Series 188, 5% 5/1/25 (b) | | 1,980 | 2,113 |
| Series 193: | | | |
| 5% 10/15/25 (b) | | 3,550 | 3,818 |
| 5% 10/15/29 (b) | | 1,350 | 1,426 |
| Series 223: | | | |
| 5% 7/15/25 (b) | | 1,500 | 1,606 |
| 5% 7/15/26 (b) | | 2,250 | 2,445 |
| 5% 7/15/27 (b) | | 1,785 | 1,965 |
| 5% 7/15/28 (b) | | 2,500 | 2,775 |
|
| TOTAL NEW YORK AND NEW JERSEY | | | 20,212 |
|
| North Carolina - 2.3% | | | |
| Charlotte Int'l. Arpt. Rev.: | | | |
| Series 2019 B, 5% 7/1/27 (b) | | 735 | 807 |
| Series 2021 B: | | | |
| 5% 7/1/26 (b) | | 5,535 | 6,005 |
| 5% 7/1/27 (b) | | 4,500 | 4,943 |
| 5% 7/1/28 (b) | | 1,675 | 1,852 |
| 5% 7/1/29 (b) | | 865 | 962 |
| Charlotte-Mecklenburg Hosp. Auth. Health Care Sys. Rev. Bonds: | | | |
| Series 2021 B, 5%, tender 12/2/24 (a) | | 4,200 | 4,460 |
| Series 2021 C, 5%, tender 12/1/28 (a) | | 1,570 | 1,749 |
| New Hanover County Hosp. Rev. Series 2017: | | | |
| 5% 10/1/25 (Escrowed to Maturity) | | 1,115 | 1,213 |
| 5% 10/1/26 (Escrowed to Maturity) | | 1,360 | 1,508 |
| North Carolina Cap. Facilities Fin. Agcy. Edl. Facilities Rev. Series 2021, 5% 5/1/25 | | 260 | 278 |
| North Carolina Grant Anticipation Rev. Series 2021: | | | |
| 5% 3/1/25 | | 3,000 | 3,221 |
| 5% 3/1/27 | | 2,305 | 2,558 |
| 5% 3/1/28 | | 2,375 | 2,665 |
| North Carolina Hsg. Fin. Agcy. Home Ownership Rev. Series 43, 4% 7/1/50 | | 5,885 | 5,971 |
| North Carolina Med. Care Commission Health Care Facilities Rev. Bonds: | | | |
| Series 2019 B, 2.2%, tender 12/1/22 (a) | | 4,235 | 4,238 |
| Series 2019 C, 2.55%, tender 6/1/26 (a) | | 7,335 | 7,241 |
| North Carolina Med. Care Commission Hosp. Rev. Bonds Series 2021 B, 5%, tender 2/1/26 (a) | | 1,110 | 1,204 |
| North Carolina Muni. Pwr. Agcy. #1 Catawba Elec. Rev. Series 2015 E, 5% 1/1/23 | | 1,465 | 1,490 |
| North Carolina Tpk. Auth. Triangle Expressway Sys. Series 2020 C, 5% 2/1/24 | | 13,610 | 14,169 |
| Raleigh Durham Arpt. Auth. Arpt. Rev. Series 2020 A, 5% 5/1/27 (b) | | 355 | 389 |
| Union County Enterprise Systems Rev. Series 2021: | | | |
| 5% 6/1/25 | | 1,000 | 1,081 |
| 5% 6/1/26 | | 750 | 827 |
| 5% 6/1/27 | | 775 | 871 |
|
| TOTAL NORTH CAROLINA | | | 69,702 |
|
| North Dakota - 0.2% | | | |
| North Dakota Hsg. Fin. Agcy.: | | | |
| Series 2021 A, 3% 1/1/52 | | 1,575 | 1,539 |
| Series 2021 B, 3% 7/1/52 | | 4,210 | 4,081 |
|
| TOTAL NORTH DAKOTA | | | 5,620 |
|
| Ohio - 2.2% | | | |
| Akron Bath Copley Hosp. District Rev.: | | | |
| Series 2016, 5% 11/15/24 | | 1,955 | 2,056 |
| Series 2020: | | | |
| 5% 11/15/26 | | 375 | 404 |
| 5% 11/15/27 | | 185 | 201 |
| Allen County Hosp. Facilities Rev. Series 2020 A, 5% 12/1/23 | | 1,045 | 1,088 |
| American Muni. Pwr., Inc. Rev.: | | | |
| Bonds Series 2021 A2, 1%, tender 8/15/24 (a) | | 2,150 | 2,064 |
| Series 2021 A: | | | |
| 5% 2/15/26 | | 300 | 328 |
| 5% 2/15/27 | | 400 | 445 |
| Cleveland Arpt. Sys. Rev. Series 2016 A: | | | |
| 5% 1/1/24 (Assured Guaranty Muni. Corp. Insured) | | 1,175 | 1,228 |
| 5% 1/1/25 (Assured Guaranty Muni. Corp. Insured) | | 1,225 | 1,302 |
| 5% 1/1/26 (Assured Guaranty Muni. Corp. Insured) | | 490 | 519 |
| Fairfield County Hosp. Facilities Rev. (Fairfield Med. Ctr. Proj.) Series 2013, 5% 6/15/23 | | 1,815 | 1,849 |
| Franklin County Hosp. Facilities Rev. Bonds (U.S. Health Corp. of Columbus Proj.) Series 2011 B, 5%, tender 5/15/23 (a) | | 1,010 | 1,038 |
| Miami County Hosp. Facilities Rev. (Kettering Health Network Obligated Group Proj.) Series 2019: | | | |
| 5% 8/1/27 | | 1,000 | 1,093 |
| 5% 8/1/28 | | 1,000 | 1,099 |
| Miami Univ. Series 2022 A: | | | |
| 5% 9/1/22 | | 390 | 392 |
| 5% 9/1/23 | | 735 | 762 |
| 5% 9/1/24 | | 125 | 132 |
| Montgomery County Hosp. Rev. (Kettering Health Network Obligated Group Proj.)) Series 2021: | | | |
| 5% 8/1/27 | | 575 | 629 |
| 5% 8/1/28 | | 500 | 550 |
| Ohio Cap. Facilities Lease (Adult Correctional Bldg. Fund Projs.) Series 2021 A: | | | |
| 5% 10/1/25 | | 2,000 | 2,174 |
| 5% 10/1/26 | | 1,750 | 1,935 |
| Ohio Hosp. Facilities Rev.: | | | |
| Series 2017 A: | | | |
| 5% 1/1/23 | | 1,955 | 1,987 |
| 5% 1/1/24 | | 1,865 | 1,946 |
| 5% 1/1/25 | | 2,035 | 2,176 |
| Series 2021 B: | | | |
| 5% 1/1/23 | | 450 | 457 |
| 5% 1/1/24 | | 1,725 | 1,800 |
| 5% 1/1/25 | | 1,935 | 2,069 |
| Ohio Hsg. Fin. Agcy. Residential Mtg. Rev.: | | | |
| (Mtg. Backed Securities Prog.) Series 2019 B, 4.5% 3/1/50 | | 305 | 313 |
| Series 2021 C, 3.25% 3/1/51 | | 18,075 | 17,796 |
| Ohio Tpk. Commission Tpk. Rev. (Infrastructure Projs.) Series 2022 A, 5% 2/15/24 (d) | | 2,445 | 2,534 |
| Scioto County Hosp. Facilities Rev.: | | | |
| Series 2016: | | | |
| 5% 2/15/23 | | 2,075 | 2,117 |
| 5% 2/15/24 | | 3,215 | 3,363 |
| 5% 2/15/25 | | 2,065 | 2,187 |
| 5% 2/15/26 | | 1,285 | 1,371 |
| Series 2019, 5% 2/15/29 | | 2,020 | 2,139 |
| Univ. of Akron Gen. Receipts Series 2019 A: | | | |
| 5% 1/1/23 | | 445 | 452 |
| 5% 1/1/24 | | 760 | 793 |
| 5% 1/1/25 | | 1,100 | 1,166 |
|
| TOTAL OHIO | | | 65,954 |
|
| Oklahoma - 0.0% | | | |
| Oklahoma Tpk. Auth. Tpk. Rev. Series 2017 D, 5% 1/1/25 | | 775 | 827 |
| Oregon - 0.5% | | | |
| Oregon Bus. Dev. Commission Recovery Zone Facility Bonds (Intel Corp. Proj.) Series 232, 2.4%, tender 8/14/23 (a) | | 10,405 | 10,433 |
| Oregon Facilities Auth. Rev. (Samaritan Health Svcs. Proj.): | | | |
| Series 2020 A: | | | |
| 5% 10/1/24 | | 200 | 210 |
| 5% 10/1/25 | | 225 | 240 |
| 5% 10/1/26 | | 150 | 162 |
| Series A, 5% 10/1/27 | | 150 | 162 |
| Oregon State Hsg. & Cmnty. Svcs. Dept. (Single Family Mtg. Prog.) Series A, 3.5% 1/1/51 | | 1,570 | 1,569 |
| Port of Portland Arpt. Rev.: | | | |
| Series 2020 27 A, 5% 7/1/29 (b) | | 430 | 473 |
| Series 27 A, 5% 7/1/26 (b) | | 1,515 | 1,632 |
|
| TOTAL OREGON | | | 14,881 |
|
| Pennsylvania - 2.0% | | | |
| Allegheny County Arpt. Auth. Rev. Series 2021 A: | | | |
| 5% 1/1/26 (b) | | 1,750 | 1,870 |
| 5% 1/1/27 (b) | | 2,000 | 2,164 |
| 5% 1/1/28 (b) | | 2,250 | 2,459 |
| Allegheny County Indl. Dev. Auth. Rev. Series 2021, 3.5% 12/1/31 | | 1,075 | 887 |
| Allegheny County Sanitation Auth. Swr. Rev. Series 2020 A: | | | |
| 4% 6/1/25 | | 200 | 210 |
| 5% 6/1/26 | | 1,000 | 1,097 |
| Commonwealth Fing. Auth. Rev. Series 2020 A: | | | |
| 5% 6/1/24 | | 1,475 | 1,551 |
| 5% 6/1/25 | | 1,150 | 1,234 |
| Lehigh County Indl. Dev. Auth. Poll. Cont. Rev. Bonds: | | | |
| (PPL Elec. Utils. Corp. Proj.) Series 2016 A, 1.8%, tender 9/1/22 (a) | | 2,445 | 2,443 |
| Series B, 1.8%, tender 8/15/22 (a) | | 5,280 | 5,277 |
| Montgomery County Higher Ed. & Health Auth. Rev.: | | | |
| Series 2014 A, 5% 10/1/23 | | 190 | 195 |
| Series 2019, 5% 9/1/29 | | 1,000 | 1,102 |
| Pennsylvania Econ. Dev. Fing. Auth. Solid Waste Disp. Rev. Bonds: | | | |
| (Waste Mgmt., Inc. Proj.) Series 2017 A, 0.58%, tender 8/1/24 (a)(b) | | 1,100 | 1,025 |
| Series 2011, 2.15%, tender 7/1/24 (a)(b) | | 1,000 | 975 |
| Pennsylvania Higher Edl. Facilities Auth. Rev.: | | | |
| Series 2014, 5% 12/1/22 | | 835 | 847 |
| Series 2016 C, 5% 8/15/25 | | 2,855 | 3,093 |
| Pennsylvania Hsg. Fin. Agcy.: | | | |
| Series 2020 13 2A, 3.5% 4/1/51 | | 950 | 953 |
| Series 2021 137, 3% 10/1/51 | | 5,900 | 5,682 |
| Pennsylvania Tpk. Commission Tpk. Rev. Series 2021 B: | | | |
| 5% 12/1/25 | | 860 | 928 |
| 5% 12/1/26 | | 1,000 | 1,095 |
| 5% 12/1/27 | | 750 | 833 |
| Philadelphia Arpt. Rev.: | | | |
| Series 2015 A, 5% 6/15/24 (b) | | 600 | 627 |
| Series 2017 A, 5% 7/1/24 | | 490 | 515 |
| Series 2017 B: | | | |
| 5% 7/1/24 (b) | | 4,790 | 5,007 |
| 5% 7/1/25 (b) | | 1,700 | 1,805 |
| Series 2021: | | | |
| 5% 7/1/28 (b) | | 3,100 | 3,398 |
| 5% 7/1/29 (b) | | 1,830 | 2,016 |
| Philadelphia School District: | | | |
| Series 2018 A: | | | |
| 5% 9/1/24 | | 1,000 | 1,057 |
| 5% 9/1/25 | | 700 | 754 |
| 5% 9/1/26 | | 750 | 821 |
| Series 2019 A: | | | |
| 5% 9/1/22 | | 1,250 | 1,257 |
| 5% 9/1/23 | | 315 | 326 |
| 5% 9/1/24 | | 1,050 | 1,109 |
| 5% 9/1/25 | | 1,200 | 1,292 |
| Series 2019 B, 5% 9/1/24 | | 1,000 | 1,057 |
| Reading School District Series 2017: | | | |
| 5% 3/1/25 (Assured Guaranty Muni. Corp. Insured) | | 320 | 341 |
| 5% 3/1/26 (Assured Guaranty Muni. Corp. Insured) | | 260 | 283 |
| 5% 3/1/27 (Assured Guaranty Muni. Corp. Insured) | | 250 | 276 |
| 5% 3/1/28 (Assured Guaranty Muni. Corp. Insured) | | 245 | 272 |
|
| TOTAL PENNSYLVANIA | | | 58,133 |
|
| Puerto Rico - 0.0% | | | |
| Puerto Rico Commonwealth Pub. Impt. Gen. Oblig.: | | | |
| Series 2021 A1, 0% 7/1/24 | | 880 | 805 |
| Series 2022 A1, 5.375% 7/1/25 | | 565 | 587 |
|
| TOTAL PUERTO RICO | | | 1,392 |
|
| Rhode Island - 1.1% | | | |
| Rhode Island Health & Edl. Bldg. Corp. Higher Ed. Facilities Rev. Series 2016: | | | |
| 5% 5/15/23 | | 1,180 | 1,209 |
| 5% 5/15/24 | | 2,300 | 2,406 |
| 5% 5/15/25 | | 5,385 | 5,628 |
| Rhode Island Health & Edl. Bldg. Corp. Pub. Schools Rev. Series 2015, 5% 5/15/25 (Assured Guaranty Muni. Corp. Insured) | | 5,910 | 6,366 |
| Rhode Island Hsg. & Mtg. Fin. Corp. Series 2019 70, 4% 10/1/49 | | 680 | 690 |
| Rhode Island Hsg. & Mtg. Fin. Corp. Rev. Series 72 A, 3.5% 10/1/50 | | 1,335 | 1,335 |
| Rhode Island Student Ln. Auth. Student Ln. Rev.: | | | |
| Series 2018 A, 5% 12/1/25 (b) | | 25 | 27 |
| Series 2019 A: | | | |
| 5% 12/1/23 (b) | | 750 | 779 |
| 5% 12/1/24 (b) | | 1,275 | 1,350 |
| 5% 12/1/25 (b) | | 1,900 | 2,038 |
| 5% 12/1/26 (b) | | 1,000 | 1,087 |
| 5% 12/1/28 (b) | | 510 | 564 |
| Series 2021 A, 5% 12/1/27 (b) | | 900 | 993 |
| Series A: | | | |
| 4% 12/1/26 (b) | | 1,135 | 1,167 |
| 5% 12/1/26 (b) | | 1,200 | 1,312 |
| Tobacco Settlement Fing. Corp. Series 2015 A: | | | |
| 5% 6/1/24 | | 1,885 | 1,938 |
| 5% 6/1/26 | | 3,425 | 3,545 |
| 5% 6/1/27 | | 980 | 1,013 |
|
| TOTAL RHODE ISLAND | | | 33,447 |
|
| South Carolina - 0.9% | | | |
| Richland County School District #2 Gen. Oblig. (South Carolina Gen. Oblig. Proj.) Series 2015 A, 5% 2/1/23 | | 2,565 | 2,617 |
| Scago Edl. Facilities Corp. for Colleton School District (School District of Colleton County Proj.) Series 2015: | | | |
| 5% 12/1/23 | | 4,345 | 4,527 |
| 5% 12/1/26 | | 1,075 | 1,143 |
| South Carolina Hsg. Fin. & Dev. Auth. Mtg. Rev. Series 2019 A, 4% 1/1/50 | | 1,120 | 1,137 |
| South Carolina Pub. Svc. Auth. Rev.: | | | |
| Series 2014 C: | | | |
| 5% 12/1/22 | | 1,075 | 1,090 |
| 5% 12/1/23 | | 4,890 | 5,098 |
| Series 2015 A, 5% 12/1/25 | | 1,000 | 1,059 |
| Series 2015 C, 5% 12/1/22 | | 1,360 | 1,379 |
| Series 2021 A: | | | |
| 5% 12/1/26 | | 670 | 724 |
| 5% 12/1/27 | | 750 | 819 |
| Series 2021 B: | | | |
| 5% 12/1/24 | | 1,400 | 1,476 |
| 5% 12/1/25 | | 500 | 534 |
| 5% 12/1/26 | | 500 | 541 |
| 5% 12/1/27 | | 450 | 492 |
| 5% 12/1/28 | | 800 | 878 |
| Series A, 5% 12/1/23 | | 2,995 | 3,122 |
|
| TOTAL SOUTH CAROLINA | | | 26,636 |
|
| South Dakota - 0.0% | | | |
| South Dakota Health & Edl. Facilities Auth. Rev. Series 2014 B, 5% 11/1/22 | | 365 | 369 |
| Tennessee - 1.2% | | | |
| Metropolitan Nashville Arpt. Auth. Rev. Series 2019 B: | | | |
| 5% 7/1/26 (b) | | 2,000 | 2,151 |
| 5% 7/1/27 (b) | | 2,435 | 2,650 |
| 5% 7/1/28 (b) | | 3,125 | 3,426 |
| 5% 7/1/29 (b) | | 3,800 | 4,186 |
| 5% 7/1/30 (b) | | 3,000 | 3,310 |
| Tennergy Corp. Gas Rev. Bonds Series 2019 A, 5%, tender 10/1/24 (a) | | 11,590 | 12,089 |
| Tennessee Energy Acquisition Corp. Bonds (Gas Rev. Proj.) Series A, 4%, tender 5/1/23 (a) | | 6,040 | 6,114 |
| Tennessee Hsg. Dev. Agcy. Residential Series 2021 3A, 3% 1/1/52 | | 1,735 | 1,689 |
|
| TOTAL TENNESSEE | | | 35,615 |
|
| Texas - 11.3% | | | |
| Aledo Independent School District Series 2015, 0% 2/15/24 | | 1,195 | 1,156 |
| Austin Arpt. Sys. Rev.: | | | |
| Series 2019 B: | | | |
| 5% 11/15/23 (b) | | 620 | 642 |
| 5% 11/15/24 (b) | | 675 | 713 |
| 5% 11/15/25 (b) | | 650 | 698 |
| Series 2019, 5% 11/15/24 (b) | | 2,500 | 2,640 |
| Birdville Independent School District Series 2021, 5% 2/15/26 | | 800 | 876 |
| Central Reg'l. Mobility Auth.: | | | |
| Series 2016: | | | |
| 5% 1/1/23 | | 2,395 | 2,429 |
| 5% 1/1/24 | | 3,295 | 3,418 |
| 5% 1/1/26 | | 2,800 | 3,000 |
| Series 2020 F, 5% 1/1/25 | | 4,455 | 4,646 |
| Series 2021 C, 5% 1/1/27 | | 6,865 | 7,320 |
| City of Denton Series 2020 A, 5% 2/15/26 | | 1,025 | 1,122 |
| Clear Creek Independent School District Bonds Series 2021 B, 0.28%, tender 8/15/24 (a) | | 4,370 | 4,118 |
| Clint Independent School District Series 2015 A, 5% 2/15/26 | | 1,600 | 1,715 |
| Collin County Series 2020, 5% 2/15/26 | | 1,040 | 1,140 |
| Comal County Series 2017, 4% 2/1/26 | | 1,780 | 1,884 |
| Cypress-Fairbanks Independent School District: | | | |
| Bonds: | | | |
| Series 2014 B1, 1.25%, tender 8/15/22 (a) | | 2,420 | 2,420 |
| Series 2015 B1, 0.28%, tender 8/15/24 (a) | | 6,405 | 6,138 |
| Series 2015 B2, 0.28%, tender 8/15/24 (a) | | 10,080 | 9,660 |
| Series 2020 A, 5% 2/15/25 | | 1,330 | 1,426 |
| Dallas Fort Worth Int'l. Arpt. Rev.: | | | |
| Series 2013 A, 5% 11/1/28 (Pre-Refunded to 11/1/22 @ 100) (b) | | 1,000 | 1,011 |
| Series 2014 A, 5.25% 11/1/27 (b) | | 1,175 | 1,211 |
| Series 2014 B, 5% 11/1/29 (Pre-Refunded to 11/1/22 @ 100) (b) | | 1,235 | 1,249 |
| Series 2014 D, 5% 11/1/23 (b) | | 1,905 | 1,971 |
| Series 2020 A, 5% 11/1/26 | | 2,595 | 2,846 |
| Dallas Gen. Oblig. Series 2018, 5% 2/15/25 | | 2,060 | 2,207 |
| Dallas Independent School District Series 2021, 4% 2/15/25 | | 1,835 | 1,923 |
| Denton Independent School District: | | | |
| Bonds Series 2014 B: | | | |
| 2%, tender 8/1/24 (a) | | 265 | 263 |
| 2%, tender 8/1/24 (a) | | 3,085 | 3,048 |
| Series 2016, 0% 8/15/25 | | 1,610 | 1,495 |
| El Paso Independent School District Series 2020: | | | |
| 5% 8/15/23 | | 500 | 518 |
| 5% 8/15/24 | | 650 | 689 |
| Fort Bend Independent School District Bonds: | | | |
| Series 2020 B, 0.875%, tender 8/1/25 (a) | | 9,720 | 9,256 |
| Series 2021 B, 0.72%, tender 8/1/26 (a) | | 3,535 | 3,247 |
| Fort Worth Gen. Oblig.: | | | |
| Series 2015 A, 5% 3/1/23 | | 1,670 | 1,706 |
| Series 2020, 5% 3/1/26 | | 3,800 | 4,164 |
| Fort Worth Independent School District Series 2019 B, 5% 2/15/25 | | 1,805 | 1,939 |
| Goose Creek Consolidated Independent School District Bonds Series 2021 B, 0.6%, tender 8/17/26(a) | | 3,500 | 3,216 |
| Harris County Cultural Ed. Facilities Fin. Corp. Med. Facilities Rev. Series 2016, 5% 11/15/25 | | 1,500 | 1,629 |
| Harris County Cultural Ed. Facilities Fin. Corp. Rev.: | | | |
| Bonds: | | | |
| Series 2019 B, 5%, tender 12/1/26 (a) | | 6,545 | 7,140 |
| Series 2020 A, 0.9%, tender 5/15/25 (a) | | 1,850 | 1,819 |
| Series 2020 C, 5%, tender 12/1/26 (a) | | 7,000 | 7,637 |
| Series 2014 A, 5% 12/1/26 | | 1,085 | 1,144 |
| Houston Arpt. Sys. Rev.: | | | |
| Series 2018 A: | | | |
| 5% 7/1/23 (b) | | 750 | 770 |
| 5% 7/1/25 (b) | | 1,550 | 1,655 |
| Series 2018 C: | | | |
| 5% 7/1/23 (b) | | 1,500 | 1,540 |
| 5% 7/1/26 (b) | | 500 | 540 |
| 5% 7/1/27 (b) | | 905 | 988 |
| Series 2020 B, 5% 7/1/26 | | 2,250 | 2,454 |
| Houston Gen. Oblig. Series 2017 A, 5% 3/1/27 | | 1,545 | 1,722 |
| Houston Independent School District Bonds Series 2014 A, 4%, tender 6/1/23 (a) | | 6,270 | 6,383 |
| Kilgore Independent School District Series 2020, 5% 2/15/26 | | 1,075 | 1,175 |
| Love Field Arpt. Modernization Rev.: | | | |
| Series 2015: | | | |
| 5% 11/1/22 (b) | | 1,000 | 1,010 |
| 5% 11/1/23 (b) | | 2,125 | 2,198 |
| 5% 11/1/26 (b) | | 1,075 | 1,149 |
| 5% 11/1/30 (b) | | 1,960 | 2,051 |
| Series 2021: | | | |
| 5% 11/1/23 (b) | | 895 | 926 |
| 5% 11/1/24 (b) | | 2,615 | 2,750 |
| 5% 11/1/25 (b) | | 3,920 | 4,177 |
| 5% 11/1/26 (b) | | 2,845 | 3,066 |
| 5% 11/1/27 (b) | | 2,885 | 3,128 |
| 5% 11/1/28 (b) | | 11,150 | 12,098 |
| 5% 11/1/29 (b) | | 11,705 | 12,730 |
| Lower Colorado River Auth. Rev.: | | | |
| (Lcra Transmission Svcs. Corp. Proj.) Series 2021, 5% 5/15/25 | | 1,315 | 1,410 |
| Series 2022: | | | |
| 5% 5/15/25 (Assured Guaranty Muni. Corp. Insured) | | 1,670 | 1,791 |
| 5% 5/15/26 (Assured Guaranty Muni. Corp. Insured) | | 1,805 | 1,975 |
| 5% 5/15/27 (Assured Guaranty Muni. Corp. Insured) | | 1,385 | 1,538 |
| Lubbock Elec. Lt. & Pwr. Sys. Rev. Series 2021, 5% 4/15/27 | | 1,450 | 1,607 |
| Mansfield Independent School District Series 2016, 5% 2/15/24 | | 4,185 | 4,395 |
| McKinney Independent School District Series 2021: | | | |
| 5% 2/15/26 | | 1,245 | 1,365 |
| 5% 2/15/27 | | 1,300 | 1,451 |
| Midlothian Independent School District Bonds Series 2013 C, 2%, tender 8/1/24 (a) | | 1,645 | 1,624 |
| Mission Econ. Dev. Corp. Solid Waste Disp. Rev. Bonds (Waste Mgmt., Inc. Proj.) Series 2018, 1.285%, tender 7/1/24 (a)(b) | | 8,320 | 8,017 |
| New Caney Independent School District Bonds Series 2018, 1.25%, tender 8/15/24 (a) | | 4,100 | 4,015 |
| Newark Higher Ed. Fin. Corp. (Abilene Christian Univ. Proj.) Series 2016 A, 5% 4/1/26 | | 2,425 | 2,608 |
| North East Texas Independent School District Bonds Series 2019, 2.2%, tender 8/1/24 (a) | | 2,345 | 2,339 |
| North Harris County Reg'l. Wtr. Auth. Series 2013, 4% 12/15/22 | | 1,545 | 1,563 |
| North Texas Tollway Auth. Rev. Series 2019 B, 5% 1/1/25 | | 1,435 | 1,530 |
| Northside Independent School District Bonds: | | | |
| Series 2019, 1.6%, tender 8/1/24 (a) | | 7,780 | 7,666 |
| Series 2020, 0.7%, tender 6/1/25 (a) | | 9,665 | 9,155 |
| Pasadena Independent School District Bonds Series 2015 B, 1.5%, tender 8/15/24 (a) | | 6,615 | 6,522 |
| Pearland Gen. Oblig. Series 2020, 5% 3/1/24 | | 715 | 750 |
| Pflugerville Independent School District Bonds Series 2019 B, 2.5%, tender 8/15/23 (a) | | 1,480 | 1,492 |
| Pharr San Juan Alamo Independent School District Series 2016, 5% 2/1/26 | | 1,130 | 1,209 |
| Prosper Independent School District Bonds Series 2019 B, 2%, tender 8/15/23 (a) | | 10,000 | 10,008 |
| San Antonio Arpt. Sys. Rev. Series 2019 A: | | | |
| 5% 7/1/22 (b) | | 705 | 705 |
| 5% 7/1/22 (b) | | 690 | 690 |
| 5% 7/1/23 (b) | | 555 | 570 |
| 5% 7/1/23 (b) | | 505 | 519 |
| 5% 7/1/24 (b) | | 1,750 | 1,833 |
| 5% 7/1/24 (b) | | 1,000 | 1,045 |
| 5% 7/1/25 (b) | | 1,250 | 1,335 |
| 5% 7/1/25 (b) | | 1,350 | 1,433 |
| 5% 7/1/26 (b) | | 1,500 | 1,619 |
| 5% 7/1/26 (b) | | 1,460 | 1,570 |
| San Antonio Elec. & Gas Sys. Rev. Bonds: | | | |
| Series 2015 D, 1.125%, tender 12/1/26 (a) | | 10,810 | 9,992 |
| Series 2018, 2.75%, tender 12/1/22 (a) | | 10,100 | 10,121 |
| Series 2022, 2%, tender 12/1/27 (a) | | 3,145 | 2,979 |
| San Antonio Pub. Facilities Corp. and Rfdg. Lease (Convention Ctr. Proj.) Series 2012, 5% 9/15/22 | | 3,365 | 3,388 |
| Tarrant County College Series 2022, 5% 8/15/27 (d) | | 3,000 | 3,368 |
| Tarrant County Cultural Ed. Facilities Fin. Corp. Hosp. Rev. (Scott & White Healthcare Proj.) Series 2013 A, 5% 8/15/23 (Escrowed to Maturity) | | 980 | 1,016 |
| Tarrant County Cultural Ed. Facilities Fin. Corp. Rev.: | | | |
| Series 2016 A, 5% 2/15/26 | | 1,465 | 1,599 |
| Series 2017 A, 5% 2/15/24 | | 1,955 | 2,049 |
| Tarrant Reg'l. Wtr. District (City of Dallas Proj.) Series 2021 A, 4% 9/1/25 | | 2,815 | 2,962 |
| Texas Gen. Oblig. Series 2020 B: | | | |
| 3% 8/1/25 (b) | | 4,610 | 4,677 |
| 3% 8/1/26 (b) | | 4,845 | 4,917 |
| 4% 8/1/27 (b) | | 5,085 | 5,389 |
| Texas Trans. Commission Hwy. Impt. Gen. Oblig. Bonds Series 2014 B, 0.65%, tender 4/1/26 (a) | | 15,910 | 14,671 |
| Wichita Falls Independent School District Series 2021: | | | |
| 4% 2/1/25 | | 600 | 628 |
| 4% 2/1/26 | | 850 | 900 |
| 4% 2/1/27 | | 1,100 | 1,175 |
| 4% 2/1/28 | | 900 | 967 |
|
| TOTAL TEXAS | | | 337,146 |
|
| Utah - 0.6% | | | |
| Salt Lake City Arpt. Rev.: | | | |
| Series 2017 A, 5% 7/1/27 (b) | | 510 | 556 |
| Series 2018 A, 5% 7/1/26 (b) | | 2,550 | 2,747 |
| Series 2021 B: | | | |
| 5% 7/1/24 | | 250 | 263 |
| 5% 7/1/25 | | 530 | 569 |
| 5% 7/1/26 | | 1,150 | 1,254 |
| 5% 7/1/27 | | 750 | 828 |
| Utah County Hosp. Rev. Bonds Series 2020 B2, 5%, tender 8/1/26 (a) | | 10,605 | 11,597 |
|
| TOTAL UTAH | | | 17,814 |
|
| Vermont - 0.1% | | | |
| Vermont Edl. & Health Bldg. Fin. Agcy. Rev. (St. Michael's College Proj.) Series 2012, 5% 10/1/22 | | 300 | 302 |
| Vermont Hsg. Fin. Agcy. Series 2021 B, 3% 11/1/51 | | 1,940 | 1,869 |
| Vermont Student Assistant Corp. Ed. Ln. Rev.: | | | |
| Series 2017 A, 5% 6/15/27 (b) | | 560 | 604 |
| Series 2021 A: | | | |
| 5% 6/15/27 (b) | | 350 | 378 |
| 5% 6/15/28 (b) | | 425 | 450 |
| 5% 6/15/29 (b) | | 400 | 424 |
|
| TOTAL VERMONT | | | 4,027 |
|
| Virginia - 0.7% | | | |
| Arlington County IDA Hosp. Facilities Series 2020, 5% 7/1/25 | | 500 | 533 |
| Fredericksburg Econ. Dev. Auth. Rev. Series 2014, 5% 6/15/24 | | 2,290 | 2,399 |
| Louisa Indl. Dev. Auth. Poll. Cont. Rev. Bonds (Virginia Elec. and Pwr. Co. Proj.) Series 2008 B, 0.75%, tender 9/2/25 (a) | | 6,750 | 6,219 |
| Norfolk Arpt. Auth. Series 2021 A: | | | |
| 5% 7/1/27 | | 750 | 828 |
| 5% 7/1/28 | | 1,000 | 1,114 |
| Stafford County Econ. Dev. Auth. Hosp. Facilities Rev. Series 2016: | | | |
| 5% 6/15/24 | | 1,185 | 1,241 |
| 5% 6/15/25 | | 980 | 1,044 |
| 5% 6/15/26 | | 1,680 | 1,801 |
| Wise County Indl. Dev. Auth. Waste & Sewage Rev. Bonds (Virginia Elec. and Pwr. Co. Proj.): | | | |
| Series 2009 A, 0.75%, tender 9/2/25 (a) | | 3,000 | 2,764 |
| Series 2010 A, 1.2%, tender 5/31/24 (a) | | 1,725 | 1,665 |
| York County Econ. Dev. Auth. Poll. Cont. Rev. Bonds (Virginia Elec. and Pwr. Co. Proj.) Series 2009 A, 1.9%, tender 6/1/23 (a) | | 800 | 794 |
|
| TOTAL VIRGINIA | | | 20,402 |
|
| Washington - 2.5% | | | |
| King County Hsg. Auth. Rev.: | | | |
| Series 2019: | | | |
| 4% 11/1/24 | | 1,075 | 1,115 |
| 4% 11/1/25 | | 1,260 | 1,321 |
| 4% 11/1/30 | | 1,575 | 1,661 |
| Series 2021: | | | |
| 2% 12/1/23 | | 775 | 774 |
| 3% 6/1/25 | | 830 | 836 |
| 4% 12/1/28 | | 375 | 396 |
| 4% 12/1/30 | | 575 | 605 |
| 4% 12/1/31 | | 450 | 471 |
| King County Swr. Rev. Bonds Series 2020 B, 0.875%, tender 1/1/26 (a) | | 18,985 | 17,278 |
| Port of Seattle Rev.: | | | |
| Series 2013, 5% 7/1/24 (b) | | 775 | 794 |
| Series 2015 B, 5% 3/1/25 | | 450 | 476 |
| Series 2016 B: | | | |
| 5% 10/1/22 (b) | | 2,445 | 2,466 |
| 5% 10/1/23 (b) | | 2,965 | 3,075 |
| Series 2019: | | | |
| 5% 4/1/23 (b) | | 1,985 | 2,025 |
| 5% 4/1/24 (b) | | 3,035 | 3,157 |
| 5% 4/1/25 (b) | | 2,700 | 2,856 |
| Series 2021 C: | | | |
| 5% 8/1/24 (b) | | 3,290 | 3,441 |
| 5% 8/1/25 (b) | | 2,660 | 2,828 |
| 5% 8/1/26 (b) | | 3,655 | 3,941 |
| 5% 8/1/27 (b) | | 2,260 | 2,462 |
| 5% 8/1/28 (b) | | 6,320 | 6,937 |
| Seattle Hsg. Auth. Rev. (Northgate Plaza Proj.) Series 2021, 1% 6/1/26 | | 1,545 | 1,456 |
| Tacoma Elec. Sys. Rev. Series 2017: | | | |
| 5% 1/1/25 | | 660 | 706 |
| 5% 1/1/26 | | 390 | 425 |
| Washington Health Care Facilities Auth. Rev.: | | | |
| (Virginia Mason Med. Ctr. Proj.) Series 2017: | | | |
| 5% 8/15/25 | | 1,450 | 1,528 |
| 5% 8/15/26 | | 2,560 | 2,729 |
| 5% 8/15/27 | | 2,425 | 2,611 |
| Bonds Series 2019 B, 5%, tender 8/1/24 (a) | | 4,575 | 4,735 |
| Washington Hsg. Fin. Commission Series 2021 2N: | | | |
| 5% 12/1/25 | | 915 | 996 |
| 5% 6/1/27 | | 500 | 557 |
|
| TOTAL WASHINGTON | | | 74,658 |
|
| West Virginia - 0.2% | | | |
| West Virginia Econ. Dev. Auth. Solid Waste Disp. Facilities Rev. Bonds (Appalachian Pwr. Co. Amos Proj.) Series 2011 A, 1%, tender 9/1/25 (a)(b) | | 5,650 | 5,123 |
| Wisconsin - 2.0% | | | |
| Blue Ridge Healthcare Pub. Fin. Auth. Series 2020 A, 5% 1/1/27 | | 1,085 | 1,173 |
| Milwaukee County Arpt. Rev. Series 2013 A: | | | |
| 5% 12/1/22 (b) | | 1,440 | 1,458 |
| 5.25% 12/1/23 (b) | | 1,505 | 1,568 |
| Milwaukee Gen. Oblig.: | | | |
| Series 2018 N4, 5% 4/1/25 | | 7,860 | 8,430 |
| Series 2020 N4, 5% 4/1/23 | | 10,000 | 10,247 |
| Roseman Univ. of Health Series 2018 A, 5% 12/1/27 | | 1,085 | 1,128 |
| Wisconsin Gen. Oblig. Series 2014 4, 5% 5/1/25 | | 575 | 613 |
| Wisconsin Health & Edl. Facilities: | | | |
| (Hosp. Sisters Svcs., Inc.) Series 2014 A, 5% 11/15/22 | | 3,305 | 3,347 |
| Bonds: | | | |
| Series 2018 B: | | | |
| 5%, tender 1/25/23 (a) | | 8,800 | 8,958 |
| 5%, tender 1/31/24 (a) | | 8,810 | 9,268 |
| Series 2018 C1, 5%, tender 7/29/26 (a) | | 1,210 | 1,313 |
| Series 2020 C, 5%, tender 2/15/27 (a) | | 5,000 | 5,435 |
| Series 2019 A, 2.25% 11/1/26 | | 540 | 529 |
| Wisconsin Hsg. & Econ. Dev. Auth.: | | | |
| Series 2021 A, 3% 3/1/52 | | 1,550 | 1,514 |
| Series 2021 C, 3% 9/1/52 | | 2,225 | 2,166 |
| Wisconsin Hsg. & Econ. Dev. Auth. Hsg. Rev. Bonds Series 2021 C: | | | |
| 0.61%, tender 5/1/24 (a) | | 400 | 384 |
| 0.81%, tender 5/1/25 (a) | | 1,335 | 1,254 |
|
| TOTAL WISCONSIN | | | 58,785 |
|
| Wyoming - 0.0% | | | |
| Laramie County Hosp. Rev. (Cheyenne Reg'l. Med. Ctr. Proj.) Series 2021, 4% 5/1/27 | | 370 | 391 |
| Wyoming Cmnty. Dev. Auth. Hsg. Rev. Series 2020 3, 5% 12/1/22 (b) | | 745 | 755 |
|
| TOTAL WYOMING | | | 1,146 |
|
| TOTAL MUNICIPAL BONDS | | | |
| (Cost $2,914,192) | | | 2,811,140 |
|
| Municipal Notes - 0.2% | | | |
| New Jersey - 0.2% | | | |
| Newark Gen. Oblig. BAN: | | | |
| Series 2021 C, 1.25% 7/25/22 | | 1,400 | $1,400 |
| Series 2021: | | | |
| 1.25% 10/3/22 | | 2,000 | 2,000 |
| 1.25% 10/3/22 | | 2,040 | 2,040 |
| TOTAL MUNICIPAL NOTES | | | |
| (Cost $5,451) | | | 5,440 |
| | | Shares | Value (000s) |
|
| Money Market Funds - 5.9% | | | |
| Fidelity Municipal Cash Central Fund 0.88% (e)(f) | | | |
| (Cost $176,875) | | 176,848,639 | 176,890 |
| TOTAL INVESTMENT IN SECURITIES - 100.5% | | | |
| (Cost $3,096,518) | | | 2,993,470 |
| NET OTHER ASSETS (LIABILITIES) - (0.5)% | | | (14,238) |
| NET ASSETS - 100% | | | $2,979,232 |
Security Type Abbreviations
BAN – BOND ANTICIPATION NOTE
Legend
(a) Coupon rates for floating and adjustable rate securities reflect the rates in effect at period end.
(b) Private activity obligations whose interest is subject to the federal alternative minimum tax for individuals.
(c) Security exempt from registration under Rule 144A of the Securities Act of 1933. These securities may be resold in transactions exempt from registration, normally to qualified institutional buyers. At the end of the period, the value of these securities amounted to $11,627,000 or 0.4% of net assets.
(d) Security or a portion of the security purchased on a delayed delivery or when-issued basis.
(e) Information in this report regarding holdings by state and security types does not reflect the holdings of the Fidelity Municipal Cash Central Fund.
(f) Affiliated fund that is generally available only to investment companies and other accounts managed by Fidelity Investments. The rate quoted is the annualized seven-day yield of the fund at period end. A complete unaudited listing of the fund's holdings as of its most recent quarter end is available upon request. In addition, each Fidelity Central Fund's financial statements are available on the SEC's website or upon request.
Affiliated Central Funds
Fiscal year to date information regarding the Fund's investments in Fidelity Central Funds, including the ownership percentage, is presented below.
| Fund (Amounts in thousands) | Value, beginning of period | Purchases | Sales Proceeds | Dividend Income | Realized Gain/Loss | Change in Unrealized appreciation (depreciation) | Value, end of period | % ownership, end of period |
| Fidelity Municipal Cash Central Fund 0.88% | $23,947 | $746,663 | $593,733 | $204 | $-- | $13 | $176,890 | 11.9% |
| Total | $23,947 | $746,663 | $593,733 | $204 | $-- | $13 | $176,890 | |
Amounts in the income column in the above table include any capital gain distributions from underlying funds, which are presented in the corresponding line-item in the Statement of Operations, if applicable.
Investment Valuation
The following is a summary of the inputs used, as of June 30, 2022, involving the Fund's assets and liabilities carried at fair value. The inputs or methodology used for valuing securities may not be an indication of the risk associated with investing in those securities. For more information on valuation inputs, and their aggregation into the levels used below, please refer to the Investment Valuation section in the accompanying Notes to Financial Statements.
| | Valuation Inputs at Reporting Date: |
| Description | Total | Level 1 | Level 2 | Level 3 |
| (Amounts in thousands) | | | | |
| Investments in Securities: | | | | |
| Municipal Securities | $2,816,580 | $-- | $2,816,580 | $-- |
| Money Market Funds | 176,890 | 176,890 | -- | -- |
| Total Investments in Securities: | $2,993,470 | $176,890 | $2,816,580 | $-- |
Other Information
The distribution of municipal securities by revenue source, as a percentage of total Net Assets, is as follows (Unaudited):
| Transportation | 25.0% |
| General Obligations | 22.5% |
| Health Care | 13.9% |
| Electric Utilities | 7.3% |
| State G.O. | 5.5% |
| Other* | 5.4% |
| Others (Individually Less Than 5%) | 20.4% |
| | 100.0% |
* Includes net other assets
See accompanying notes which are an integral part of the financial statements.
Financial Statements
Statement of Assets and Liabilities
| Amounts in thousands (except per-share amounts) | | June 30, 2022 (Unaudited) |
| Assets | | |
Investment in securities, at value — See accompanying schedule:
Unaffiliated issuers (cost $2,919,643) | $2,816,580 | |
| Fidelity Central Funds (cost $176,875) | 176,890 | |
| Total Investment in Securities (cost $3,096,518) | | $2,993,470 |
| Cash | | 148 |
| Receivable for fund shares sold | | 3,704 |
| Interest receivable | | 30,902 |
| Distributions receivable from Fidelity Central Funds | | 86 |
| Receivable from investment adviser for expense reductions | | 319 |
| Total assets | | 3,028,629 |
| Liabilities | | |
| Payable for investments purchased | | |
| Regular delivery | $7,807 | |
| Delayed delivery | 30,030 | |
| Payable for fund shares redeemed | 9,596 | |
| Distributions payable | 744 | |
| Accrued management fee | 854 | |
| Distribution and service plan fees payable | 46 | |
| Other affiliated payables | 286 | |
| Other payables and accrued expenses | 34 | |
| Total liabilities | | 49,397 |
| Net Assets | | $2,979,232 |
| Net Assets consist of: | | |
| Paid in capital | | $3,093,398 |
| Total accumulated earnings (loss) | | (114,166) |
| Net Assets | | $2,979,232 |
| Net Asset Value and Maximum Offering Price | | |
| Class A: | | |
| Net Asset Value and redemption price per share ($176,769 ÷ 17,267.7 shares)(a) | | $10.24 |
| Maximum offering price per share (100/97.25 of $10.24) | | $10.53 |
| Class M: | | |
| Net Asset Value and redemption price per share ($7,073 ÷ 692.1 shares)(a) | | $10.22 |
| Maximum offering price per share (100/97.25 of $10.22) | | $10.51 |
| Class C: | | |
| Net Asset Value and offering price per share ($8,925 ÷ 873.5 shares)(a) | | $10.22 |
| Limited Term Municipal Income: | | |
| Net Asset Value, offering price and redemption price per share ($2,036,458 ÷ 199,280.9 shares) | | $10.22 |
| Class I: | | |
| Net Asset Value, offering price and redemption price per share ($334,559 ÷ 32,721.8 shares) | | $10.22 |
| Class Z: | | |
| Net Asset Value, offering price and redemption price per share ($415,448 ÷ 40,637.7 shares) | | $10.22 |
(a) Redemption price per share is equal to net asset value less any applicable contingent deferred sales charge.
See accompanying notes which are an integral part of the financial statements.
Statement of Operations
| Amounts in thousands | | Six months ended June 30, 2022 (Unaudited) |
| Investment Income | | |
| Interest | | $26,164 |
| Income from Fidelity Central Funds | | 204 |
| Total income | | 26,368 |
| Expenses | | |
| Management fee | $5,614 | |
| Transfer agent fees | 1,588 | |
| Distribution and service plan fees | 305 | |
| Accounting fees and expenses | 277 | |
| Custodian fees and expenses | 17 | |
| Independent trustees' fees and expenses | 5 | |
| Registration fees | 161 | |
| Audit | 30 | |
| Legal | 2 | |
| Miscellaneous | 4 | |
| Total expenses before reductions | 8,003 | |
| Expense reductions | (1,879) | |
| Total expenses after reductions | | 6,124 |
| Net investment income (loss) | | 20,244 |
| Realized and Unrealized Gain (Loss) | | |
| Net realized gain (loss) on: | | |
| Investment securities: | | |
| Unaffiliated issuers | (11,115) | |
| Total net realized gain (loss) | | (11,115) |
| Change in net unrealized appreciation (depreciation) on: | | |
| Investment securities: | | |
| Unaffiliated issuers | (167,735) | |
| Fidelity Central Funds | 13 | |
| Total change in net unrealized appreciation (depreciation) | | (167,722) |
| Net gain (loss) | | (178,837) |
| Net increase (decrease) in net assets resulting from operations | | $(158,593) |
See accompanying notes which are an integral part of the financial statements.
Statement of Changes in Net Assets
| Amounts in thousands | Six months ended June 30, 2022 (Unaudited) | Year ended December 31, 2021 |
| Increase (Decrease) in Net Assets | | |
| Operations | | |
| Net investment income (loss) | $20,244 | $43,818 |
| Net realized gain (loss) | (11,115) | 1,386 |
| Change in net unrealized appreciation (depreciation) | (167,722) | (34,432) |
| Net increase (decrease) in net assets resulting from operations | (158,593) | 10,772 |
| Distributions to shareholders | (20,249) | (45,557) |
| Share transactions - net increase (decrease) | (511,229) | 384,852 |
| Total increase (decrease) in net assets | (690,071) | 350,067 |
| Net Assets | | |
| Beginning of period | 3,669,303 | 3,319,236 |
| End of period | $2,979,232 | $3,669,303 |
See accompanying notes which are an integral part of the financial statements.
Financial Highlights
Fidelity Limited Term Municipal Income Fund Class A
| | Six months ended (Unaudited) June 30, | Years endedDecember 31, | | | | |
| | 2022 | 2021 | 2020 | 2019 | 2018 | 2017 |
| Selected Per–Share Data | | | | | | |
| Net asset value, beginning of period | $10.79 | $10.89 | $10.72 | $10.49 | $10.53 | $10.45 |
| Income from Investment Operations | | | | | | |
| Net investment income (loss)A,B | .051 | .102 | .141 | .150 | .135 | .122 |
| Net realized and unrealized gain (loss) | (.550) | (.094) | .183 | .250 | (.038) | .086 |
| Total from investment operations | (.499) | .008 | .324 | .400 | .097 | .208 |
| Distributions from net investment income | (.051) | (.103) | (.142) | (.150) | (.135) | (.121) |
| Distributions from net realized gain | – | (.005) | (.012) | (.020) | (.002) | (.007) |
| Total distributions | (.051) | (.108) | (.154) | (.170) | (.137) | (.128) |
| Net asset value, end of period | $10.24 | $10.79 | $10.89 | $10.72 | $10.49 | $10.53 |
| Total ReturnC,D,E | (4.63)% | .07% | 3.04% | 3.83% | .93% | 2.00% |
| Ratios to Average Net AssetsB,F,G | | | | | | |
| Expenses before reductions | .81%H | .80% | .80% | .80% | .81% | .81% |
| Expenses net of fee waivers, if any | .66%H | .66% | .66% | .78% | .81% | .81% |
| Expenses net of all reductions | .66%H | .66% | .66% | .78% | .81% | .81% |
| Net investment income (loss) | .99%H | .94% | 1.31% | 1.41% | 1.28% | 1.15% |
| Supplemental Data | | | | | | |
| Net assets, end of period (in millions) | $177 | $223 | $202 | $180 | $155 | $234 |
| Portfolio turnover rateI | 12%H | 20% | 19% | 43% | 27%J | 33% |
A Calculated based on average shares outstanding during the period.
B Net investment income (loss) is affected by the timing of the declaration of dividends by any underlying mutual funds or exchange-traded funds (ETFs). Net investment income (loss) of any such underlying funds is not included in the Fund's net investment income (loss) ratio.
C Total returns for periods of less than one year are not annualized.
D Total returns would have been lower if certain expenses had not been reduced during the applicable periods shown.
E Total returns do not include the effect of the sales charges.
F Fees and expenses of any underlying mutual funds or exchange-traded funds (ETFs) are not included in the Fund's expense ratio. The Fund indirectly bears its proportionate share of these expenses. For additional expense information related to investments in Fidelity Central Funds, please refer to the "Investments in Fidelity Central Funds" note found in the Notes to Financial Statements section of the most recent Annual or Semi-Annual report.
G Expense ratios reflect operating expenses of the class. Expenses before reductions do not reflect amounts reimbursed, waived, or reduced through arrangements with the investment adviser, brokerage services, or other offset arrangements, if applicable, and do not represent the amount paid by the class during periods when reimbursements, waivers or reductions occur.
H Annualized
I Amount does not include the portfolio activity of any underlying mutual funds or exchange-traded funds (ETFs).
J Portfolio turnover rate excludes securities received or delivered in-kind.
See accompanying notes which are an integral part of the financial statements.
Fidelity Limited Term Municipal Income Fund Class M
| | Six months ended (Unaudited) June 30, | Years endedDecember 31, | | | | |
| | 2022 | 2021 | 2020 | 2019 | 2018 | 2017 |
| Selected Per–Share Data | | | | | | |
| Net asset value, beginning of period | $10.77 | $10.87 | $10.70 | $10.47 | $10.51 | $10.43 |
| Income from Investment Operations | | | | | | |
| Net investment income (loss)A,B | .051 | .104 | .142 | .154 | .139 | .126 |
| Net realized and unrealized gain (loss) | (.550) | (.095) | .182 | .250 | (.038) | .087 |
| Total from investment operations | (.499) | .009 | .324 | .404 | .101 | .213 |
| Distributions from net investment income | (.051) | (.104) | (.142) | (.154) | (.139) | (.126) |
| Distributions from net realized gain | – | (.005) | (.012) | (.020) | (.002) | (.007) |
| Total distributions | (.051) | (.109) | (.154) | (.174) | (.141) | (.133) |
| Net asset value, end of period | $10.22 | $10.77 | $10.87 | $10.70 | $10.47 | $10.51 |
| Total ReturnC,D,E | (4.63)% | .08% | 3.06% | 3.88% | .98% | 2.04% |
| Ratios to Average Net AssetsB,F,G | | | | | | |
| Expenses before reductions | .72%H | .72% | .74% | .75% | .76% | .77% |
| Expenses net of fee waivers, if any | .65%H | .65% | .65% | .74% | .76% | .76% |
| Expenses net of all reductions | .65%H | .65% | .65% | .74% | .76% | .76% |
| Net investment income (loss) | 1.00%H | .95% | 1.32% | 1.45% | 1.33% | 1.19% |
| Supplemental Data | | | | | | |
| Net assets, end of period (in millions) | $7 | $8 | $10 | $12 | $15 | $17 |
| Portfolio turnover rateI | 12%H | 20% | 19% | 43% | 27%J | 33% |
A Calculated based on average shares outstanding during the period.
B Net investment income (loss) is affected by the timing of the declaration of dividends by any underlying mutual funds or exchange-traded funds (ETFs). Net investment income (loss) of any such underlying funds is not included in the Fund's net investment income (loss) ratio.
C Total returns for periods of less than one year are not annualized.
D Total returns would have been lower if certain expenses had not been reduced during the applicable periods shown.
E Total returns do not include the effect of the sales charges.
F Fees and expenses of any underlying mutual funds or exchange-traded funds (ETFs) are not included in the Fund's expense ratio. The Fund indirectly bears its proportionate share of these expenses. For additional expense information related to investments in Fidelity Central Funds, please refer to the "Investments in Fidelity Central Funds" note found in the Notes to Financial Statements section of the most recent Annual or Semi-Annual report.
G Expense ratios reflect operating expenses of the class. Expenses before reductions do not reflect amounts reimbursed, waived, or reduced through arrangements with the investment adviser, brokerage services, or other offset arrangements, if applicable, and do not represent the amount paid by the class during periods when reimbursements, waivers or reductions occur.
H Annualized
I Amount does not include the portfolio activity of any underlying mutual funds or exchange-traded funds (ETFs).
J Portfolio turnover rate excludes securities received or delivered in-kind.
See accompanying notes which are an integral part of the financial statements.
Fidelity Limited Term Municipal Income Fund Class C
| | Six months ended (Unaudited) June 30, | Years endedDecember 31, | | | | |
| | 2022 | 2021 | 2020 | 2019 | 2018 | 2017 |
| Selected Per–Share Data | | | | | | |
| Net asset value, beginning of period | $10.77 | $10.87 | $10.70 | $10.47 | $10.51 | $10.43 |
| Income from Investment Operations | | | | | | |
| Net investment income (loss)A,B | .014 | .024 | .064 | .072 | .057 | .043 |
| Net realized and unrealized gain (loss) | (.550) | (.094) | .182 | .250 | (.038) | .087 |
| Total from investment operations | (.536) | (.070) | .246 | .322 | .019 | .130 |
| Distributions from net investment income | (.014) | (.025) | (.064) | (.072) | (.057) | (.043) |
| Distributions from net realized gain | – | (.005) | (.012) | (.020) | (.002) | (.007) |
| Total distributions | (.014) | (.030) | (.076) | (.092) | (.059) | (.050) |
| Net asset value, end of period | $10.22 | $10.77 | $10.87 | $10.70 | $10.47 | $10.51 |
| Total ReturnC,D,E | (4.98)% | (.65)% | 2.31% | 3.08% | .19% | 1.24% |
| Ratios to Average Net AssetsB,F,G | | | | | | |
| Expenses before reductions | 1.52%H | 1.51% | 1.52% | 1.54% | 1.55% | 1.55% |
| Expenses net of fee waivers, if any | 1.38%H | 1.38% | 1.38% | 1.52% | 1.55% | 1.55% |
| Expenses net of all reductions | 1.38%H | 1.38% | 1.38% | 1.52% | 1.54% | 1.55% |
| Net investment income (loss) | .27%H | .22% | .59% | .67% | .55% | .41% |
| Supplemental Data | | | | | | |
| Net assets, end of period (in millions) | $9 | $10 | $15 | $20 | $32 | $40 |
| Portfolio turnover rateI | 12%H | 20% | 19% | 43% | 27%J | 33% |
A Calculated based on average shares outstanding during the period.
B Net investment income (loss) is affected by the timing of the declaration of dividends by any underlying mutual funds or exchange-traded funds (ETFs). Net investment income (loss) of any such underlying funds is not included in the Fund's net investment income (loss) ratio.
C Total returns for periods of less than one year are not annualized.
D Total returns would have been lower if certain expenses had not been reduced during the applicable periods shown.
E Total returns do not include the effect of the contingent deferred sales charge.
F Fees and expenses of any underlying mutual funds or exchange-traded funds (ETFs) are not included in the Fund's expense ratio. The Fund indirectly bears its proportionate share of these expenses. For additional expense information related to investments in Fidelity Central Funds, please refer to the "Investments in Fidelity Central Funds" note found in the Notes to Financial Statements section of the most recent Annual or Semi-Annual report.
G Expense ratios reflect operating expenses of the class. Expenses before reductions do not reflect amounts reimbursed, waived, or reduced through arrangements with the investment adviser, brokerage services, or other offset arrangements, if applicable, and do not represent the amount paid by the class during periods when reimbursements, waivers or reductions occur.
H Annualized
I Amount does not include the portfolio activity of any underlying mutual funds or exchange-traded funds (ETFs).
J Portfolio turnover rate excludes securities received or delivered in-kind.
See accompanying notes which are an integral part of the financial statements.
Fidelity Limited Term Municipal Income Fund
| | Six months ended (Unaudited) June 30, | Years endedDecember 31, | | | | |
| | 2022 | 2021 | 2020 | 2019 | 2018 | 2017 |
| Selected Per–Share Data | | | | | | |
| Net asset value, beginning of period | $10.77 | $10.87 | $10.70 | $10.47 | $10.51 | $10.43 |
| Income from Investment Operations | | | | | | |
| Net investment income (loss)A,B | .066 | .134 | .172 | .185 | .170 | .157 |
| Net realized and unrealized gain (loss) | (.550) | (.095) | .182 | .250 | (.038) | .087 |
| Total from investment operations | (.484) | .039 | .354 | .435 | .132 | .244 |
| Distributions from net investment income | (.066) | (.134) | (.172) | (.185) | (.170) | (.157) |
| Distributions from net realized gain | – | (.005) | (.012) | (.020) | (.002) | (.007) |
| Total distributions | (.066) | (.139) | (.184) | (.205) | (.172) | (.164) |
| Net asset value, end of period | $10.22 | $10.77 | $10.87 | $10.70 | $10.47 | $10.51 |
| Total ReturnC,D | (4.50)% | .36% | 3.34% | 4.18% | 1.28% | 2.35% |
| Ratios to Average Net AssetsB,E,F | | | | | | |
| Expenses before reductions | .47%G | .46% | .46% | .46% | .46% | .47% |
| Expenses net of fee waivers, if any | .37%G | .37% | .37% | .45% | .46% | .47% |
| Expenses net of all reductions | .37%G | .37% | .37% | .45% | .46% | .47% |
| Net investment income (loss) | 1.28%G | 1.23% | 1.60% | 1.74% | 1.63% | 1.49% |
| Supplemental Data | | | | | | |
| Net assets, end of period (in millions) | $2,036 | $2,565 | $2,420 | $2,245 | $2,393 | $2,740 |
| Portfolio turnover rateH | 12%G | 20% | 19% | 43% | 27%I | 33% |
A Calculated based on average shares outstanding during the period.
B Net investment income (loss) is affected by the timing of the declaration of dividends by any underlying mutual funds or exchange-traded funds (ETFs). Net investment income (loss) of any such underlying funds is not included in the Fund's net investment income (loss) ratio.
C Total returns for periods of less than one year are not annualized.
D Total returns would have been lower if certain expenses had not been reduced during the applicable periods shown.
E Fees and expenses of any underlying mutual funds or exchange-traded funds (ETFs) are not included in the Fund's expense ratio. The Fund indirectly bears its proportionate share of these expenses. For additional expense information related to investments in Fidelity Central Funds, please refer to the "Investments in Fidelity Central Funds" note found in the Notes to Financial Statements section of the most recent Annual or Semi-Annual report.
F Expense ratios reflect operating expenses of the class. Expenses before reductions do not reflect amounts reimbursed, waived, or reduced through arrangements with the investment adviser, brokerage services, or other offset arrangements, if applicable, and do not represent the amount paid by the class during periods when reimbursements, waivers or reductions occur.
G Annualized
H Amount does not include the portfolio activity of any underlying mutual funds or exchange-traded funds (ETFs).
I Portfolio turnover rate excludes securities received or delivered in-kind.
See accompanying notes which are an integral part of the financial statements.
Fidelity Limited Term Municipal Income Fund Class I
| | Six months ended (Unaudited) June 30, | Years endedDecember 31, | | | | |
| | 2022 | 2021 | 2020 | 2019 | 2018 | 2017 |
| Selected Per–Share Data | | | | | | |
| Net asset value, beginning of period | $10.78 | $10.88 | $10.71 | $10.48 | $10.51 | $10.44 |
| Income from Investment Operations | | | | | | |
| Net investment income (loss)A,B | .066 | .133 | .172 | .178 | .162 | .149 |
| Net realized and unrealized gain (loss) | (.560) | (.094) | .183 | .250 | (.028) | .077 |
| Total from investment operations | (.494) | .039 | .355 | .428 | .134 | .226 |
| Distributions from net investment income | (.066) | (.134) | (.173) | (.178) | (.162) | (.149) |
| Distributions from net realized gain | – | (.005) | (.012) | (.020) | (.002) | (.007) |
| Total distributions | (.066) | (.139) | (.185) | (.198) | (.164) | (.156) |
| Net asset value, end of period | $10.22 | $10.78 | $10.88 | $10.71 | $10.48 | $10.51 |
| Total ReturnC,D | (4.59)% | .36% | 3.34% | 4.11% | 1.29% | 2.17% |
| Ratios to Average Net AssetsB,E,F | | | | | | |
| Expenses before reductions | .55%G | .54% | .55% | .54% | .54% | .54% |
| Expenses net of fee waivers, if any | .37%G | .37% | .37% | .51% | .54% | .54% |
| Expenses net of all reductions | .37%G | .37% | .37% | .51% | .54% | .54% |
| Net investment income (loss) | 1.28%G | 1.23% | 1.60% | 1.68% | 1.55% | 1.42% |
| Supplemental Data | | | | | | |
| Net assets, end of period (in millions) | $335 | $420 | $335 | $276 | $269 | $327 |
| Portfolio turnover rateH | 12%G | 20% | 19% | 43% | 27%I | 33% |
A Calculated based on average shares outstanding during the period.
B Net investment income (loss) is affected by the timing of the declaration of dividends by any underlying mutual funds or exchange-traded funds (ETFs). Net investment income (loss) of any such underlying funds is not included in the Fund's net investment income (loss) ratio.
C Total returns for periods of less than one year are not annualized.
D Total returns would have been lower if certain expenses had not been reduced during the applicable periods shown.
E Fees and expenses of any underlying mutual funds or exchange-traded funds (ETFs) are not included in the Fund's expense ratio. The Fund indirectly bears its proportionate share of these expenses. For additional expense information related to investments in Fidelity Central Funds, please refer to the "Investments in Fidelity Central Funds" note found in the Notes to Financial Statements section of the most recent Annual or Semi-Annual report.
F Expense ratios reflect operating expenses of the class. Expenses before reductions do not reflect amounts reimbursed, waived, or reduced through arrangements with the investment adviser, brokerage services, or other offset arrangements, if applicable, and do not represent the amount paid by the class during periods when reimbursements, waivers or reductions occur.
G Annualized
H Amount does not include the portfolio activity of any underlying mutual funds or exchange-traded funds (ETFs).
I Portfolio turnover rate excludes securities received or delivered in-kind.
See accompanying notes which are an integral part of the financial statements.
Fidelity Limited Term Municipal Income Fund Class Z
| | Six months ended (Unaudited) June 30, | Years endedDecember 31, | | | |
| | 2022 | 2021 | 2020 | 2019 | 2018 A |
| Selected Per–Share Data | | | | | |
| Net asset value, beginning of period | $10.77 | $10.87 | $10.71 | $10.48 | $10.41 |
| Income from Investment Operations | | | | | |
| Net investment income (loss)B,C | .069 | .140 | .178 | .189 | .048 |
| Net realized and unrealized gain (loss) | (.550) | (.094) | .173 | .250 | .067 |
| Total from investment operations | (.481) | .046 | .351 | .439 | .115 |
| Distributions from net investment income | (.069) | (.141) | (.179) | (.189) | (.045) |
| Distributions from net realized gain | – | (.005) | (.012) | (.020) | – |
| Total distributions | (.069) | (.146) | (.191) | (.209) | (.045) |
| Net asset value, end of period | $10.22 | $10.77 | $10.87 | $10.71 | $10.48 |
| Total ReturnD,E | (4.47)% | .42% | 3.31% | 4.22% | 1.11% |
| Ratios to Average Net AssetsC,F,G | | | | | |
| Expenses before reductions | .43%H | .42% | .43% | .43% | .43%H |
| Expenses net of fee waivers, if any | .31%H | .31% | .31% | .40% | .43%H |
| Expenses net of all reductions | .31%H | .31% | .31% | .40% | .43%H |
| Net investment income (loss) | 1.34%H | 1.29% | 1.66% | 1.79% | 1.78%H |
| Supplemental Data | | | | | |
| Net assets, end of period (in millions) | $415 | $444 | $336 | $214 | $28 |
| Portfolio turnover rateI | 12%H | 20% | 19% | 43% | 27%J |
A For the period October 2, 2018 (commencement of sale of shares) through December 31, 2018.
B Calculated based on average shares outstanding during the period.
C Net investment income (loss) is affected by the timing of the declaration of dividends by any underlying mutual funds or exchange-traded funds (ETFs). Net investment income (loss) of any such underlying funds is not included in the Fund's net investment income (loss) ratio.
D Total returns for periods of less than one year are not annualized.
E Total returns would have been lower if certain expenses had not been reduced during the applicable periods shown.
F Fees and expenses of any underlying mutual funds or exchange-traded funds (ETFs) are not included in the Fund's expense ratio. The Fund indirectly bears its proportionate share of these expenses. For additional expense information related to investments in Fidelity Central Funds, please refer to the "Investments in Fidelity Central Funds" note found in the Notes to Financial Statements section of the most recent Annual or Semi-Annual report.
G Expense ratios reflect operating expenses of the class. Expenses before reductions do not reflect amounts reimbursed, waived, or reduced through arrangements with the investment adviser, brokerage services, or other offset arrangements, if applicable, and do not represent the amount paid by the class during periods when reimbursements, waivers or reductions occur.
H Annualized
I Amount does not include the portfolio activity of any underlying mutual funds or exchange-traded funds (ETFs).
J Portfolio turnover rate excludes securities received or delivered in-kind.
See accompanying notes which are an integral part of the financial statements.
Notes to Financial Statements (Unaudited)
For the period ended June 30, 2022
(Amounts in thousands except percentages)
1. Organization.
Fidelity Limited Term Municipal Income Fund (the Fund) is a fund of Fidelity Municipal Trust (the Trust) and is authorized to issue an unlimited number of shares. The Trust is registered under the Investment Company Act of 1940, as amended (the 1940 Act), as an open-end management investment company organized as a Massachusetts business trust. The Fund offers Class A, Class M, Class C, Limited Term Municipal Income, Class I and Class Z shares, each of which has equal rights as to assets and voting privileges. Each class has exclusive voting rights with respect to matters that affect that class. Class C shares will automatically convert to Class A shares after a holding period of eight years from the initial date of purchase, with certain exceptions.
2. Investments in Fidelity Central Funds.
Funds may invest in Fidelity Central Funds, which are open-end investment companies generally available only to other investment companies and accounts managed by the investment adviser and its affiliates. The Schedule of Investments lists any Fidelity Central Funds held as an investment as of period end, but does not include the underlying holdings of each Fidelity Central Fund. An investing fund indirectly bears its proportionate share of the expenses of the underlying Fidelity Central Funds.
Based on its investment objective, each Fidelity Central Fund may invest or participate in various investment vehicles or strategies that are similar to those of the investing fund. These strategies are consistent with the investment objectives of the investing fund and may involve certain economic risks which may cause a decline in value of each of the Fidelity Central Funds and thus a decline in the value of the investing fund.
| Fidelity Central Fund | Investment Manager | Investment Objective | Investment Practices | Expense Ratio(a) |
| Fidelity Money Market Central Funds | Fidelity Management & Research Company LLC (FMR) | Each fund seeks to obtain a high level of current income consistent with the preservation of capital and liquidity. | Short-term Investments | Less than .005% |
(a) Expenses expressed as a percentage of average net assets and are as of each underlying Central Fund's most recent annual or semi-annual shareholder report.
A complete unaudited list of holdings for each Fidelity Central Fund is available upon request or at the Securities and Exchange Commission website at www.sec.gov. In addition, the financial statements of the Fidelity Central Funds which contain the significant accounting policies (including investment valuation policies) of those funds, and are not covered by the Report of Independent Registered Public Accounting Firm, are available on the Securities and Exchange Commission website or upon request.
3. Significant Accounting Policies.
The Fund is an investment company and applies the accounting and reporting guidance of the Financial Accounting Standards Board (FASB) Accounting Standards Codification Topic 946 Financial Services - Investment Companies. The financial statements have been prepared in conformity with accounting principles generally accepted in the United States of America (GAAP), which require management to make certain estimates and assumptions at the date of the financial statements. Actual results could differ from those estimates. Subsequent events, if any, through the date that the financial statements were issued have been evaluated in the preparation of the financial statements. The Fund's Schedule of Investments lists any underlying mutual funds or exchange-traded funds (ETFs) but does not include the underlying holdings of these funds. The following summarizes the significant accounting policies of the Fund:
Investment Valuation. Investments are valued as of 4:00 p.m. Eastern time on the last calendar day of the period. The Board of Trustees (the Board) has delegated the day to day responsibility for the valuation of the Fund's investments to the Fair Value Committee (the Committee) established by the Fund's investment adviser. In accordance with valuation policies and procedures approved by the Board, the Fund attempts to obtain prices from one or more third party pricing vendors or brokers to value its investments. When current market prices, quotations or currency exchange rates are not readily available or reliable, investments will be fair valued in good faith by the Committee, in accordance with procedures adopted by the Board. Factors used in determining fair value vary by investment type and may include market or investment specific events, changes in interest rates and credit quality. The frequency with which these procedures are used cannot be predicted and they may be utilized to a significant extent. The Committee oversees the Fund's valuation policies and procedures and reports to the Board on the Committee's activities and fair value determinations. The Board monitors the appropriateness of the procedures used in valuing the Fund's investments and ratifies the fair value determinations of the Committee.
The Fund categorizes the inputs to valuation techniques used to value its investments into a disclosure hierarchy consisting of three levels as shown below:
- Level 1 – unadjusted quoted prices in active markets for identical investments
- Level 2 – other significant observable inputs (including quoted prices for similar investments, interest rates, prepayment speeds, etc.)
- Level 3 – unobservable inputs (including the Fund's own assumptions based on the best information available)
Valuation techniques used to value the Fund's investments by major category are as follows:
Debt securities, including restricted securities, are valued based on evaluated prices received from third party pricing vendors or from brokers who make markets in such securities. Municipal securities are valued by pricing vendors who utilize matrix pricing which considers yield or price of bonds of comparable quality, coupon, maturity and type or by broker-supplied prices. When independent prices are unavailable or unreliable, debt securities may be valued utilizing pricing methodologies which consider similar factors that would be used by third party pricing vendors. Debt securities are generally categorized as Level 2 in the hierarchy but may be Level 3 depending on the circumstances.
Investments in open-end mutual funds, including the Fidelity Central Funds, are valued at their closing net asset value (NAV) each business day and are categorized as Level 1 in the hierarchy.
Changes in valuation techniques may result in transfers in or out of an assigned level within the disclosure hierarchy. The aggregate value of investments by input level as of June 30, 2022 is included at the end of the Fund's Schedule of Investments.
Investment Transactions and Income. For financial reporting purposes, the Fund's investment holdings and NAV include trades executed through the end of the last business day of the period. The NAV per share for processing shareholder transactions is calculated as of the close of business of the New York Stock Exchange (NYSE), normally 4:00 p.m. Eastern time and includes trades executed through the end of the prior business day. Gains and losses on securities sold are determined on the basis of identified cost. Income and capital gain distributions from Fidelity Central Funds, if any, are recorded on the ex-dividend date. Interest income is accrued as earned and includes coupon interest and amortization of premium and accretion of discount on debt securities as applicable. Debt obligations may be placed on non-accrual status and related interest income may be reduced by ceasing current accruals and writing off interest receivables when the collection of all or a portion of interest has become doubtful based on consistently applied procedures. A debt obligation is removed from non-accrual status when the issuer resumes interest payments or when collectability of interest is reasonably assured.
Class Allocations and Expenses. Investment income, realized and unrealized capital gains and losses, common expenses of a fund, and certain fund-level expense reductions, if any, are allocated daily on a pro-rata basis to each class based on the relative net assets of each class to the total net assets of a fund. Each class differs with respect to transfer agent and distribution and service plan fees incurred, as applicable. Certain expense reductions may also differ by class, if applicable. For the reporting period, the allocated portion of income and expenses to each class as a percent of its average net assets may vary due to the timing of recording these transactions in relation to fluctuating net assets of the classes. Expenses directly attributable to a fund are charged to that fund. Expenses attributable to more than one fund are allocated among the respective funds on the basis of relative net assets or other appropriate methods. Expenses included in the accompanying financial statements reflect the expenses of that fund and do not include any expenses associated with any underlying mutual funds or exchange-traded funds. Although not included in a fund's expenses, a fund indirectly bears its proportionate share of these expenses through the net asset value of each underlying mutual fund or exchange-traded fund. Expense estimates are accrued in the period to which they relate and adjustments are made when actual amounts are known.
Income Tax Information and Distributions to Shareholders. Each year, the Fund intends to qualify as a regulated investment company under Subchapter M of the Internal Revenue Code, including distributing substantially all of its taxable income and realized gains. As a result, no provision for U.S. Federal income taxes is required. The Fund files a U.S. federal tax return, in addition to state and local tax returns as required. The Fund's federal income tax returns are subject to examination by the Internal Revenue Service (IRS) for a period of three fiscal years after they are filed. State and local tax returns may be subject to examination for an additional fiscal year depending on the jurisdiction.
Distributions are declared and recorded daily and paid monthly from net investment income. Distributions from realized gains, if any, are declared and recorded on the ex-dividend date. Income and capital gain distributions are declared separately for each class. Income and capital gain distributions are determined in accordance with income tax regulations, which may differ from GAAP.
Capital accounts within the financial statements are adjusted for permanent book-tax differences. These adjustments have no impact on net assets or the results of operations. Capital accounts are not adjusted for temporary book-tax differences which will reverse in a subsequent period.
Book-tax differences are primarily due to market discount.
The Fund purchases municipal securities whose interest, in the opinion of the issuer, is free from federal income tax. There is no assurance that the IRS will agree with this opinion. In the event the IRS determines that the issuer does not comply with relevant tax requirements, interest payments from a security could become federally taxable, possibly retroactively to the date the security was issued.
As of period end, the cost and unrealized appreciation (depreciation) in securities, and derivatives if applicable, for federal income tax purposes were as follows:
| Gross unrealized appreciation | $4,591 |
| Gross unrealized depreciation | (107,605) |
| Net unrealized appreciation (depreciation) | $(103,014) |
| Tax cost | $3,096,484 |
Delayed Delivery Transactions and When-Issued Securities. During the period, certain Funds transacted in securities on a delayed delivery or when-issued basis. Payment and delivery may take place after the customary settlement period for that security. The price of the underlying securities and the date when the securities will be delivered and paid for are fixed at the time the transaction is negotiated. Securities purchased on a delayed delivery or when-issued basis are identified as such in the Schedule of Investments. Compensation for interest forgone in the purchase of a delayed delivery or when-issued debt security may be received. With respect to purchase commitments, each applicable Fund identifies securities as segregated in its records with a value at least equal to the amount of the commitment. Payables and receivables associated with the purchases and sales of delayed delivery securities having the same coupon, settlement date and broker are offset. Delayed delivery or when-issued securities that have been purchased from and sold to different brokers are reflected as both payables and receivables in the Statement of Assets and Liabilities under the caption "Delayed delivery", as applicable. Losses may arise due to changes in the value of the underlying securities or if the counterparty does not perform under the contract's terms, or if the issuer does not issue the securities due to political, economic, or other factors.
Restricted Securities (including Private Placements). Funds may invest in securities that are subject to legal or contractual restrictions on resale. These securities generally may be resold in transactions exempt from registration or to the public if the securities are registered. Disposal of these securities may involve time-consuming negotiations and expense, and prompt sale at an acceptable price may be difficult. Information regarding restricted securities held at period end is included at the end of the Schedule of Investments, if applicable.
4. Purchases and Sales of Investments.
Purchases and sales of securities, other than short-term securities and in-kind transactions, as applicable, are noted in the table below.
| | Purchases ($) | Sales ($) |
| Fidelity Limited Term Municipal Income Fund | 184,306 | 769,499 |
5. Fees and Other Transactions with Affiliates.
Management Fee. Fidelity Management & Research Company LLC (the investment adviser) and its affiliates provide the Fund with investment management related services for which the Fund pays a monthly management fee. The management fee is the sum of an individual fund fee rate that is based on an annual rate of .25% of the Fund's average net assets and an annualized group fee rate that averaged .10% during the period. The group fee rate is based upon the monthly average net assets of a group of registered investment companies with which the investment adviser has management contracts. The group fee rate decreases as assets under management increase and increases as assets under management decrease. For the reporting period, the total annualized management fee rate was .35% of the Fund's average net assets.
Distribution and Service Plan Fees. In accordance with Rule 12b-1 of the 1940 Act, the Fund has adopted separate Distribution and Service Plans for each class of shares. Certain classes pay Fidelity Distributors Company LLC (FDC), an affiliate of the investment adviser, separate Distribution and Service Fees, each of which is based on an annual percentage of each class' average net assets. In addition, FDC may pay financial intermediaries for selling shares of the Fund and providing shareholder support services. For the period, the Distribution and Service Fee rates, total fees and amounts retained by FDC were as follows:
| | Distribution Fee | Service Fee | Total Fees | Retained by FDC |
| Class A | -% | .25% | $248 | $34 |
| Class M | -% | .25% | 9 | –(a) |
| Class C | .75% | .25% | 48 | 9 |
| | | | $305 | $43 |
(a) Amount represents less than five hundred dollars.
Sales Load. FDC may receive a front-end sales charge of up to 2.75% for selling Class A shares and Class M shares, some of which is paid to financial intermediaries for selling shares of the Fund. Depending on the holding period, FDC may receive contingent deferred sales charges levied on Class A, Class M and Class C redemptions. The deferred sales charges are 1.00% for Class C shares, .75% or .50% for certain purchases of Class A shares and .25% for certain purchases of Class M shares.
For the period, sales charge amounts retained by FDC were as follows:
| | Retained by FDC |
| Class A | $4 |
| Class M | 1 |
| Class C(a) | –(b) |
| | $5 |
(a) When Class C shares are initially sold, FDC pays commissions from its own resources to financial intermediaries through which the sales are made.
(b) Amount represents less than five hundred dollars.
Transfer Agent Fees. Fidelity Investments Institutional Operations Company LLC (FIIOC), an affiliate of the investment adviser, is the transfer, dividend disbursing and shareholder servicing agent for the Fund. FIIOC receives account fees and asset-based fees that vary according to the account size and type of account of the shareholders of the respective classes of the Fund, except for Class Z. FIIOC receives an asset-based fee of Class Z's average net assets. FIIOC pays for typesetting, printing and mailing of shareholder reports, except proxy statements. For the period, transfer agent fees for each class were as follows:
| | Amount | % of Class-Level Average Net Assets(a) |
| Class A | $174 | .18 |
| Class M | 3 | .09 |
| Class C | 6 | .13 |
| Limited Term Municipal Income | 972 | .09 |
| Class I | 329 | .17 |
| Class Z | 104 | .05 |
| | $1,588 | |
(a) Annualized
Accounting Fees. Fidelity Service Company, Inc. (FSC), an affiliate of the investment adviser, maintains the Fund's accounting records. The accounting fee is based on the level of average net assets for each month. For the period, the fees were equivalent to the following annualized rates:
| | % of Average Net Assets |
| Fidelity Limited Term Municipal Income Fund | .02 |
Interfund Trades. Funds may purchase from or sell securities to other Fidelity Funds under procedures adopted by the Board. The procedures have been designed to ensure these interfund trades are executed in accordance with Rule 17a-7 of the 1940 Act. Any interfund trades are included within the respective purchases and sales amounts shown in the Purchases and Sales of Investments note. Interfund trades during the period are noted in the table below.
| | Purchases ($) | Sales ($) | Realized Gain (Loss) ($) |
| Fidelity Limited Term Municipal Income Fund | – | 60,706 | 1 |
6. Committed Line of Credit.
Certain Funds participate with other funds managed by the investment adviser or an affiliate in a $4.25 billion credit facility (the "line of credit") to be utilized for temporary or emergency purposes to fund shareholder redemptions or for other short-term liquidity purposes. The participating funds have agreed to pay commitment fees on their pro-rata portion of the line of credit, which are reflected in Miscellaneous expenses on the Statement of Operations, and are listed below. During the period, there were no borrowings on this line of credit.
| | Amount |
| Fidelity Limited Term Municipal Income Fund | $3 |
7. Expense Reductions.
The investment adviser contractually agreed to reimburse expenses of each class to the extent annual operating expenses exceeded certain levels of class-level average net assets as noted in the table below. This reimbursement will remain in place through April 30, 2023. Some expenses, for example the compensation of the independent Trustees and certain other expenses such as interest expense, are excluded from this reimbursement.
The following classes were in reimbursement during the period:
| | Expense Limitations | Reimbursement |
| Class A | .66% | $148 |
| Class M | .65% | 3 |
| Class C | 1.38% | 7 |
| Limited Term Municipal Income | .37% | 1,092 |
| Class I | .37% | 349 |
| Class Z | .31% | 251 |
| | | $1,850 |
Through arrangements with the Fund's custodian, credits realized as a result of certain uninvested cash balances were used to reduce the Fund's expenses. During the period, custodian credits reduced the Fund's expenses by $1.
In addition, during the period the investment adviser or an affiliate reimbursed and/or waived a portion of fund-level operating expenses in the amount of $28.
8. Distributions to Shareholders.
Distributions to shareholders of each class were as follows:
| | Six months ended
June 30, 2022 | Year ended
December 31, 2021 |
| Fidelity Limited Term Municipal Income Fund | | |
| Distributions to shareholders | | |
| Class A | $966 | $2,205 |
| Class M | 37 | 84 |
| Class C | 13 | 33 |
| Limited Term Municipal Income | 14,018 | 33,020 |
| Class I | 2,441 | 5,002 |
| Class Z | 2,774 | 5,213 |
| Total | $20,249 | $45,557 |
9. Share Transactions.
Share transactions for each class were as follows and may contain in-kind transactions, automatic conversions between classes or exchanges between affiliated funds:
| | Shares | Shares | Dollars | Dollars |
| | Six months ended June 30, 2022 | Year ended December 31, 2021 | Six months ended June 30, 2022 | Year ended December 31, 2021 |
| Fidelity Limited Term Municipal Income Fund | | | | |
| Class A | | | | |
| Shares sold | 2,947 | 8,243 | $30,536 | $89,569 |
| Reinvestment of distributions | 89 | 195 | 925 | 2,111 |
| Shares redeemed | (6,444) | (6,349) | (66,768) | (68,892) |
| Net increase (decrease) | (3,408) | 2,089 | $(35,307) | $22,788 |
| Class M | | | | |
| Shares sold | 67 | 115 | $706 | $1,245 |
| Reinvestment of distributions | 3 | 7 | 34 | 78 |
| Shares redeemed | (91) | (295) | (944) | (3,195) |
| Net increase (decrease) | (21) | (173) | $(204) | $(1,872) |
| Class C | | | | |
| Shares sold | 237 | 315 | $2,474 | $3,423 |
| Reinvestment of distributions | 1 | 3 | 11 | 30 |
| Shares redeemed | (255) | (839) | (2,634) | (9,102) |
| Net increase (decrease) | (17) | (521) | $(149) | $(5,649) |
| Limited Term Municipal Income | | | | |
| Shares sold | 50,385 | 90,381 | $520,266 | $980,282 |
| Reinvestment of distributions | 994 | 2,180 | 10,274 | 23,610 |
| Shares redeemed | (90,254) | (77,064) | (936,182) | (834,331) |
| Net increase (decrease) | (38,875) | 15,497 | $(405,642) | $169,561 |
| Class I | | | | |
| Shares sold | 16,953 | 18,053 | $174,678 | $195,847 |
| Reinvestment of distributions | 220 | 428 | 2,274 | 4,637 |
| Shares redeemed | (23,416) | (10,350) | (241,484) | (112,152) |
| Net increase (decrease) | (6,243) | 8,131 | $(64,532) | $88,332 |
| Class Z | | | | |
| Shares sold | 21,218 | 18,531 | $218,173 | $200,944 |
| Reinvestment of distributions | 194 | 356 | 2,009 | 3,852 |
| Shares redeemed | (21,996) | (8,593) | (225,577) | (93,104) |
| Net increase (decrease) | (584) | 10,294 | $(5,395) | $111,692 |
10. Other.
A fund's organizational documents provide former and current trustees and officers with a limited indemnification against liabilities arising in connection with the performance of their duties to the fund. In the normal course of business, a fund may also enter into contracts that provide general indemnifications. A fund's maximum exposure under these arrangements is unknown as this would be dependent on future claims that may be made against a fund. The risk of material loss from such claims is considered remote.
11. Coronavirus (COVID-19) Pandemic.
An outbreak of COVID-19 first detected in China during December 2019 has since spread globally and was declared a pandemic by the World Health Organization during March 2020. Developments that disrupt global economies and financial markets, such as the COVID-19 pandemic, may magnify factors that affect the Fund's performance.
Shareholder Expense Example
As a shareholder, you incur two types of costs: (1) transaction costs, which may include sales charges (loads) on purchase payments or redemption proceeds, as applicable and (2) ongoing costs, which generally include management fees, distribution and/or service (12b-1) fees and other Fund expenses. This Example is intended to help you understand your ongoing costs (in dollars) of investing in a fund and to compare these costs with the ongoing costs of investing in other mutual funds.
The Example is based on an investment of $1,000 invested at the beginning of the period and held for the entire period (January 1, 2022 to June 30, 2022).
Actual Expenses
The first line of the accompanying table provides information about actual account values and actual expenses. You may use the information in this line, together with the amount you invested, to estimate the expenses that you paid over the period. Simply divide your account value by $1,000.00 (for example, an $8,600 account value divided by $1,000.00 = 8.6), then multiply the result by the number in the first line for a class/Fund under the heading entitled "Expenses Paid During Period" to estimate the expenses you paid on your account during this period. If any fund is a shareholder of any underlying mutual funds or exchange-traded funds (ETFs) (the Underlying Funds), such fund indirectly bears its proportional share of the expenses of the Underlying Funds in addition to the direct expenses incurred presented in the table. These fees and expenses are not included in the annualized expense ratio used to calculate the expense estimate in the table below.
Hypothetical Example for Comparison Purposes
The second line of the accompanying table provides information about hypothetical account values and hypothetical expenses based on the actual expense ratio and an assumed rate of return of 5% per year before expenses, which is not the actual return. The hypothetical account values and expenses may not be used to estimate the actual ending account balance or expenses you paid for the period. You may use this information to compare the ongoing costs of investing in the Fund and other funds. To do so, compare this 5% hypothetical example with the 5% hypothetical examples that appear in the shareholder reports of the other funds. If any fund is a shareholder of any Underlying Funds, such fund indirectly bears its proportional share of the expenses of the Underlying Funds in addition to the direct expenses as presented in the table. These fees and expenses are not included in the annualized expense ratio used to calculate the expense estimate in the table below.
Please note that the expenses shown in the table are meant to highlight your ongoing costs only and do not reflect any transaction costs. Therefore, the second line of the table is useful in comparing ongoing costs only, and will not help you determine the relative total costs of owning different funds. In addition, if these transactional costs were included, your costs would have been higher.
| | Annualized Expense Ratio-A | Beginning
Account Value
January 1, 2022 | Ending
Account Value
June 30, 2022 | Expenses Paid
During Period-B
January 1, 2022
to June 30, 2022 |
| Fidelity Limited Term Municipal Income Fund | | | | |
| Class A | .66% | | | |
| Actual | | $1,000.00 | $953.70 | $3.20 |
| Hypothetical-C | | $1,000.00 | $1,021.52 | $3.31 |
| Class M | .65% | | | |
| Actual | | $1,000.00 | $953.70 | $3.15 |
| Hypothetical-C | | $1,000.00 | $1,021.57 | $3.26 |
| Class C | 1.38% | | | |
| Actual | | $1,000.00 | $950.20 | $6.67 |
| Hypothetical-C | | $1,000.00 | $1,017.95 | $6.90 |
| Limited Term Municipal Income | .37% | | | |
| Actual | | $1,000.00 | $955.00 | $1.79 |
| Hypothetical-C | | $1,000.00 | $1,022.96 | $1.86 |
| Class I | .37% | | | |
| Actual | | $1,000.00 | $954.10 | $1.79 |
| Hypothetical-C | | $1,000.00 | $1,022.96 | $1.86 |
| Class Z | .31% | | | |
| Actual | | $1,000.00 | $955.30 | $1.50 |
| Hypothetical-C | | $1,000.00 | $1,023.26 | $1.56 |
A Annualized expense ratio reflects expenses net of applicable fee waivers.
B Expenses are equal to the annualized expense ratio, multiplied by the average account value over the period, multiplied by 181/ 365 (to reflect the one-half year period). The fees and expenses of any Underlying Funds are not included in each annualized expense ratio.
C 5% return per year before expenses
Liquidity Risk Management Program
The Securities and Exchange Commission adopted Rule 22e-4 under the Investment Company Act of 1940 (the Liquidity Rule) to promote effective liquidity risk management throughout the open-end investment company industry, thereby reducing the risk that funds will be unable to meet their redemption obligations and mitigating dilution of the interests of fund shareholders.
The Fund has adopted and implemented a liquidity risk management program pursuant to the Liquidity Rule (the Program) effective December 1, 2018. The Program is reasonably designed to assess and manage the Fund’s liquidity risk and to comply with the requirements of the Liquidity Rule. The Fund’s Board of Trustees (the Board) has designated the Fund’s investment adviser as administrator of the Program. The Fidelity advisers have established a Liquidity Risk Management Committee (the LRM Committee) to manage the Program for each of the Fidelity Funds. The LRM Committee monitors the adequacy and effectiveness of implementation of the Program and on a periodic basis assesses each Fund’s liquidity risk based on a variety of factors including (1) the Fund’s investment strategy, (2) portfolio liquidity and cash flow projections during normal and reasonably foreseeable stressed conditions, (3) shareholder redemptions, (4) borrowings and other funding sources and (5) in the case of exchange-traded funds, certain additional factors including the effect of the Fund’s prices and spreads, market participants, and basket compositions on the overall liquidity of the Fund’s portfolio, as applicable.
In accordance with the Program, each of the Fund’s portfolio investments is classified into one of four liquidity categories described below based on a determination of a reasonable expectation for how long it would take to convert the investment to cash (or sell or dispose of the investment) without significantly changing its market value.
- Highly liquid investments – cash or convertible to cash within three business days or less
- Moderately liquid investments – convertible to cash in three to seven calendar days
- Less liquid investments – can be sold or disposed of, but not settled, within seven calendar days
- Illiquid investments – cannot be sold or disposed of within seven calendar days
Liquidity classification determinations take into account a variety of factors including various market, trading and investment-specific considerations, as well as market depth, and generally utilize analysis from a third-party liquidity metrics service.
The Liquidity Rule places a 15% limit on a fund’s illiquid investments and requires funds that do not primarily hold assets that are highly liquid investments to determine and maintain a minimum percentage of the fund’s net assets to be invested in highly liquid investments (highly liquid investment minimum or HLIM). The Program includes provisions reasonably designed to comply with the 15% limit on illiquid investments and for determining, periodically reviewing and complying with the HLIM requirement as applicable.
At a recent meeting of the Fund’s Board of Trustees, the LRM Committee provided a written report to the Board pertaining to the operation, adequacy, and effectiveness of implementation of the Program for the annual period from December 1, 2020 through November 30, 2021. The report concluded that the Program has been implemented and is operating effectively and is reasonably designed to assess and manage the Fund’s liquidity risk.
STM-SANN-0822
1.701069.124
Fidelity® Conservative Income Municipal Bond Fund
Semi-Annual Report
June 30, 2022
Contents
To view a fund's proxy voting guidelines and proxy voting record for the 12-month period ended June 30, visit http://www.fidelity.com/proxyvotingresults or visit the Securities and Exchange Commission's (SEC) web site at http://www.sec.gov.
You may also call 1-800-544-8544 to request a free copy of the proxy voting guidelines.
Standard & Poor's, S&P and S&P 500 are registered service marks of The McGraw-Hill Companies, Inc. and have been licensed for use by Fidelity Distributors Corporation.
Other third-party marks appearing herein are the property of their respective owners.
All other marks appearing herein are registered or unregistered trademarks or service marks of FMR LLC or an affiliated company. © 2022 FMR LLC. All rights reserved.
This report and the financial statements contained herein are submitted for the general information of the shareholders of the Fund. This report is not authorized for distribution to prospective investors in the Fund unless preceded or accompanied by an effective prospectus.
A fund files its complete schedule of portfolio holdings with the SEC for the first and third quarters of each fiscal year on Form N-PORT. Forms N-PORT are available on the SEC’s web site at http://www.sec.gov. A fund's Forms N-PORT may be reviewed and copied at the SEC’s Public Reference Room in Washington, DC. Information regarding the operation of the SEC's Public Reference Room may be obtained by calling 1-800-SEC-0330.
For a complete list of a fund's portfolio holdings, view the most recent holdings listing, semiannual report, or annual report on Fidelity's web site at http://www.fidelity.com, http://www.institutional.fidelity.com, or http://www.401k.com, as applicable.
NOT FDIC INSURED •MAY LOSE VALUE •NO BANK GUARANTEE
Neither the Fund nor Fidelity Distributors Corporation is a bank.
Note to Shareholders:
Early in 2020, the outbreak and spread of COVID-19 emerged as a public health emergency that had a major influence on financial markets, primarily based on its impact on the global economy and corporate earnings. On March 11, 2020, the World Health Organization declared the COVID-19 outbreak a pandemic, citing sustained risk of further global spread. The pandemic prompted a number of measures to limit the spread of COVID-19, including travel and border restrictions, quarantines, and restrictions on large gatherings. In turn, these resulted in lower consumer activity, diminished demand for a wide range of products and services, disruption in manufacturing and supply chains, and – given the wide variability in outcomes regarding the outbreak – significant market uncertainty and volatility. To help stem the turmoil, the U.S. government took unprecedented action – in concert with the U.S. Federal Reserve and central banks around the world – to help support consumers, businesses, and the broader economy, and to limit disruption to the financial system.
In general, the overall impact of the pandemic lessened in 2021, amid a resilient economy and widespread distribution of three COVID-19 vaccines granted emergency use authorization from the U.S. Food and Drug Administration (FDA) early in the year. Still, the situation remains dynamic, and the extent and duration of its influence on financial markets and the economy is highly uncertain, due in part to a recent spike in cases based on highly contagious variants of the coronavirus.
Extreme events such as the COVID-19 crisis are exogenous shocks that can have significant adverse effects on mutual funds and their investments. Although multiple asset classes may be affected by market disruption, the duration and impact may not be the same for all types of assets. Fidelity is committed to helping you stay informed amid news about COVID-19 and during increased market volatility, and we continue to take extra steps to be responsive to customer needs. We encourage you to visit us online, where we offer ongoing updates, commentary, and analysis on the markets and our funds.
Investment Summary (Unaudited)
Maturity Diversification as of June 30, 2022
| | % of fund's investments |
| 1 - 7 | 44.8 |
| 8 - 30 | 1.9 |
| 31 - 60 | 6.6 |
| 61 - 90 | 4.1 |
| 91 - 180 | 9.3 |
| > 180 | 33.3 |
The date shown for securities represents the date when principal payments must be paid, taking into account any call options exercised by the issuer and any permissible maturity shortening features other than interest rate resets.
Top Five States as of June 30, 2022
| | % of fund's net assets |
| California | 9.7 |
| Texas | 8.0 |
| New York | 7.7 |
| Illinois | 7.7 |
| Other | 7.2 |
Top Five Sectors as of June 30, 2022
| | % of fund's net assets |
| Synthetics | 32.7 |
| Transportation | 11.9 |
| General Obligations | 11.1 |
| Industrial Development | 10.3 |
| Other | 7.2 |
Quality Diversification (% of fund's net assets)
| As of June 30, 2022 |
| | AAA | 3.6% |
| | AA,A | 37.2% |
| | BBB | 6.1% |
| | Not Rated | 0.2% |
| | Short-Term Investments and Net Other Assets | 52.9% |

We have used ratings from Moody's Investors Service, Inc. Where Moody's® ratings are not available, we have used S&P® ratings. All ratings are as of the date indicated and do not reflect subsequent changes.
Schedule of Investments June 30, 2022 (Unaudited)
Showing Percentage of Net Assets
| Municipal Bonds - 46.7% | | | |
| | | Principal Amount | Value |
| Alabama - 0.9% | | | |
| Black Belt Energy Gas District Bonds: | | | |
| Series 2017 A, 4%, tender 7/1/22 (a) | | $12,730,000 | $12,730,000 |
| Series 2018 A, 4%, tender 12/1/23 (a) | | 3,400,000 | 3,459,268 |
| Mobile Indl. Dev. Board Poll. Cont. Rev. Bonds (Alabama Pwr. Co. Barry Plant Proj.) Series 2008, 2.9%, tender 12/12/23 (a) | | 600,000 | 604,696 |
| Southeast Alabama Gas Supply District Bonds (Proj. No. 2) Series 2018 A, 4%, tender 6/1/24 (a) | | 3,890,000 | 3,928,144 |
| Southeast Energy Auth. Rev. Bonds (Proj. No. 2) Series 2021 B1: | | | |
| 4% 6/1/24 | | 510,000 | 519,472 |
| 4% 6/1/25 | | 615,000 | 627,711 |
|
| TOTAL ALABAMA | | | 21,869,291 |
|
| Alaska - 0.1% | | | |
| Alaska Int'l. Arpts. Revs. Series 2021 C, 5% 10/1/25 (b) | | 1,190,000 | 1,275,958 |
| Arizona - 1.2% | | | |
| Arizona Health Facilities Auth. Rev. (Scottsdale Lincoln Hospitals Proj.) Series 2014 A, 5% 12/1/24 | | 1,000,000 | 1,055,097 |
| Chandler Indl. Dev. Auth. Indl. Dev. Rev. Bonds (Intel Corp. Proj.): | | | |
| Series 2007, 2.7%, tender 8/14/23 (a)(b) | | 2,050,000 | 2,062,282 |
| Series 2019, 5%, tender 6/3/24 (a)(b) | | 17,020,000 | 17,811,663 |
| Coconino County Poll. Cont. Corp. Rev. Bonds Series 2017 A, 1.875%, tender 3/31/23 (a)(b) | | 1,450,000 | 1,445,957 |
| Maricopa County Rev. Bonds Series B, 5%, tender 10/18/22 (a) | | 4,020,000 | 4,056,870 |
| Phoenix Civic Impt. Board Arpt. Rev.: | | | |
| Series 2013, 5% 7/1/23 (b) | | 525,000 | 539,922 |
| Series 2017 A, 5% 7/1/23 (b) | | 500,000 | 514,211 |
| Yuma Pledged Rev. Series 2021: | | | |
| 4% 7/1/22 | | 325,000 | 325,000 |
| 4% 7/1/23 | | 325,000 | 332,038 |
| 4% 7/1/24 | | 300,000 | 310,781 |
|
| TOTAL ARIZONA | | | 28,453,821 |
|
| California - 3.2% | | | |
| California Health Facilities Fing. Auth. Rev. Bonds Series 2017 A: | | | |
| 5%, tender 11/1/22 (a) | | 950,000 | 960,232 |
| 5%, tender 11/1/22 (a) | | 13,650,000 | 13,797,015 |
| California Muni. Fin. Auth. Solid Waste Disp. Rev. Bonds: | | | |
| (Republic Svcs., Inc. Proj.): | | | |
| Series 2021 A, 1.875%, tender 10/3/22 (a)(b) | | 10,600,000 | 10,592,842 |
| Series 2021 B, 0.375%, tender 7/15/22 (a)(b) | | 9,950,000 | 9,945,391 |
| (Waste Mgmt., Inc. Proj.) Series 2009 A, 1.3%, tender 2/3/25 (a)(c) | | 750,000 | 713,217 |
| California Poll. Cont. Fing. Auth. Solid Waste Disp. Rev. Bonds (Republic Svcs., Inc. Proj.): | | | |
| Series 2010 A, 2%, tender 8/1/22 (a)(b)(c) | | 6,150,000 | 6,149,335 |
| Series 2017 A1, 2%, tender 7/15/22 (a)(b)(c) | | 14,100,000 | 14,099,774 |
| California Pub. Works Board Lease Rev. (Various Cap. Projs.) Series 2022 C, 5% 8/1/24 (d) | | 1,925,000 | 2,021,357 |
| California Statewide Cmntys. Dev. Auth. Series 2021, 4% 5/15/23 | | 2,500,000 | 2,534,903 |
| Los Angeles Dept. Arpt. Rev.: | | | |
| Series 2017 B, 5% 5/15/23 (b) | | 1,700,000 | 1,742,081 |
| Series 2019 A: | | | |
| 5% 5/15/23 (b) | | 1,865,000 | 1,911,166 |
| 5% 5/15/24 (b) | | 705,000 | 738,078 |
| Series 2020 C, 5% 5/15/24 (b) | | 500,000 | 524,393 |
| Series 2022 C, 5% 5/15/25 (b) | | 1,475,000 | 1,575,231 |
| Series B, 5% 5/15/24 (b) | | 1,065,000 | 1,116,958 |
| San Diego County Reg'l. Arpt. Auth. Arpt. Rev. Series 2019 B: | | | |
| 5% 7/1/23 (b) | | 500,000 | 513,714 |
| 5% 7/1/24 (b) | | 500,000 | 523,663 |
| San Francisco City & County Arpts. Commission Int'l. Arpt. Rev.: | | | |
| Series 2013 A, 5% 5/1/23 (b) | | 1,310,000 | 1,344,950 |
| Series 2017 D, 5% 5/1/24 (b) | | 1,000,000 | 1,046,187 |
| Series 2019 H, 5% 5/1/24 (b) | | 550,000 | 577,922 |
| San Jose Int. Arpt. Rev.: | | | |
| Series 2014 A, 5% 3/1/23 (Escrowed to Maturity) (b) | | 3,500,000 | 3,577,304 |
| Series 2021 B, 5% 3/1/25 | | 375,000 | 399,785 |
| Vernon Elec. Sys. Rev. Series 2021 A: | | | |
| 4% 10/1/22 | | 1,000,000 | 1,004,350 |
| 5% 10/1/23 | | 1,350,000 | 1,387,868 |
|
| TOTAL CALIFORNIA | | | 78,797,716 |
|
| Colorado - 1.0% | | | |
| Colorado Health Facilities Auth. Bonds (Valley View Hosp. Assoc. Proj.) Series 2018, 2.8%, tender 5/15/23 (a) | | 900,000 | 903,287 |
| Colorado Health Facilities Auth. Rev. Bonds Series 2016 C, 5%, tender 11/15/23 (a) | | 595,000 | 618,438 |
| Denver City & County Arpt. Rev.: | | | |
| Series 2012 A: | | | |
| 5% 11/15/22 (b) | | 1,610,000 | 1,628,322 |
| 5% 11/15/23 (b) | | 500,000 | 505,629 |
| 5% 11/15/24 (b) | | 1,600,000 | 1,616,750 |
| Series 2012 B, 5% 11/15/29 (Pre-Refunded to 11/15/22 @ 100) | | 1,000,000 | 1,013,063 |
| Series 2013 A, 5% 11/15/22 (b) | | 800,000 | 809,016 |
| Series 2013 B, 5% 11/15/22 | | 225,000 | 227,857 |
| Series 2016 A, 5% 11/15/23 | | 675,000 | 703,074 |
| Series 2017 A, 5% 11/15/24 (b) | | 825,000 | 872,076 |
| Series 2020 A1, 5% 11/15/22 | | 9,250,000 | 9,367,448 |
| Series 2020 A2, 5% 11/15/22 | | 3,385,000 | 3,427,980 |
| Series 2020 B1, 5% 11/15/22 (b) | | 2,230,000 | 2,255,378 |
| Vauxmont Metropolitan District Series 2020, 5% 12/1/23 (Assured Guaranty Muni. Corp. Insured) | | 195,000 | 202,756 |
|
| TOTAL COLORADO | | | 24,151,074 |
|
| Connecticut - 3.0% | | | |
| Connecticut Gen. Oblig.: | | | |
| Series 2013 A: | | | |
| 1.9% 3/1/25 (a) | | 1,075,000 | 1,092,371 |
| 5% 10/15/22 | | 4,815,000 | 4,864,039 |
| Series 2016 B: | | | |
| 5% 5/15/23 | | 1,470,000 | 1,512,140 |
| 5% 5/15/25 | | 505,000 | 544,394 |
| Series 2016 D, 5% 8/15/23 | | 600,000 | 621,220 |
| Series 2016 E, 5% 10/15/23 | | 1,210,000 | 1,258,315 |
| Series 2018 F, 5% 9/15/22 | | 5,670,000 | 5,710,911 |
| Series 2019 A, 5% 4/15/23 | | 3,985,000 | 4,089,984 |
| Series 2020 B, 5% 1/15/23 | | 1,265,000 | 1,288,499 |
| Series 2021 D, 5% 7/15/24 | | 1,760,000 | 1,860,798 |
| Series 2022 A, 3% 1/15/23 | | 6,705,000 | 6,759,315 |
| Series A: | | | |
| 3% 1/15/23 | | 1,050,000 | 1,058,506 |
| 3% 1/15/24 | | 500,000 | 507,858 |
| 3% 4/15/24 | | 500,000 | 508,421 |
| 4% 1/15/24 | | 465,000 | 479,273 |
| Series C: | | | |
| 4% 6/1/23 | | 400,000 | 408,232 |
| 5% 12/15/23 | | 735,000 | 767,579 |
| Connecticut Health & Edl. Facilities Auth. Rev.: | | | |
| Bonds: | | | |
| Series 2010 A3, 0.25%, tender 2/9/24 (a) | | 11,800,000 | 11,426,588 |
| Series 2010 A4, 1.1%, tender 2/11/25 (a) | | 9,050,000 | 8,686,523 |
| Series 2014 B, 1.8%, tender 7/1/24 (a) | | 980,000 | 966,872 |
| Series 2017 A1, 5%, tender 7/1/22 (a) | | 3,475,000 | 3,475,000 |
| Series 2022 L, 5% 7/1/25 | | 450,000 | 481,278 |
| Series 2022 M, 5% 7/1/23 | | 175,000 | 179,193 |
| Connecticut Higher Ed. Supplemental Ln. Auth. Rev.: | | | |
| (Chesla Ln. Prog.): | | | |
| Series 2017 A, 5% 11/15/23 (b) | | 690,000 | 715,129 |
| Series C, 5% 11/15/22 | | 175,000 | 177,254 |
| (Chesla Loan Prog.): | | | |
| Series B, 5% 11/15/22 (b) | | 125,000 | 126,537 |
| Series C, 5% 11/15/23 | | 225,000 | 234,430 |
| Connecticut Hsg. Fin. Auth.: | | | |
| Series A2: | | | |
| 0.25% 11/15/22 (b) | | 555,000 | 552,656 |
| 0.35% 5/15/23 (b) | | 250,000 | 246,955 |
| 0.4% 11/15/23 (b) | | 300,000 | 293,630 |
| Series C, 5% 5/15/23 (b) | | 445,000 | 456,208 |
| Sseries C, 5% 11/15/22 (b) | | 1,045,000 | 1,058,230 |
| Connecticut Spl. Tax Oblig. Trans. Infrastructure Rev.: | | | |
| Series 2015 A, 5% 8/1/22 | | 725,000 | 726,948 |
| Series 2021 C: | | | |
| 5% 1/1/23 | | 4,925,000 | 5,008,403 |
| 5% 1/1/24 | | 1,340,000 | 1,400,735 |
| Series A: | | | |
| 5% 10/1/22 | | 1,900,000 | 1,916,447 |
| 5% 5/1/23 | | 1,850,000 | 1,899,973 |
|
| TOTAL CONNECTICUT | | | 73,360,844 |
|
| Delaware - 0.1% | | | |
| Delaware Econ. Dev. Auth. Rev. Bonds (Delmarva Pwr. & Lt. Co. Proj.) Series A, 1.05%, tender 7/1/25 (a) | | 580,000 | 550,465 |
| Delaware Trans. Auth. Grant Series 2020, 5% 9/1/24 | | 850,000 | 902,644 |
|
| TOTAL DELAWARE | | | 1,453,109 |
|
| District Of Columbia - 0.5% | | | |
| District of Columbia Gen. Oblig.: | | | |
| Series 2021 D, 4% 2/1/24 | | 325,000 | 335,959 |
| Series 2021 E, 5% 2/1/23 | | 5,000,000 | 5,101,655 |
| District of Columbia Hosp. Rev. Series 2015, 5% 7/15/22 | | 150,000 | 150,147 |
| Metropolitan Washington DC Arpts. Auth. Sys. Rev.: | | | |
| Series 2013 A, 5% 10/1/22 (b) | | 1,000,000 | 1,008,194 |
| Series 2019 A, 5% 10/1/22 (b) | | 220,000 | 221,803 |
| Series 2020 A: | | | |
| 5% 10/1/22 (b) | | 3,625,000 | 3,654,704 |
| 5% 10/1/23 (b) | | 1,910,000 | 1,974,718 |
|
| TOTAL DISTRICT OF COLUMBIA | | | 12,447,180 |
|
| Florida - 2.4% | | | |
| Broward County Arpt. Sys. Rev.: | | | |
| Series 2012 P-1, 5% 10/1/22 (b) | | 625,000 | 629,742 |
| Series 2017, 5% 10/1/24 (b) | | 500,000 | 526,719 |
| Series 2019 A: | | | |
| 5% 10/1/22 (b) | | 1,925,000 | 1,939,605 |
| 5% 10/1/23 (b) | | 1,250,000 | 1,291,577 |
| Series 2019 B, 5% 10/1/22 (b) | | 865,000 | 871,563 |
| Broward County Port Facilities Rev. Series 2011 B, 5% 9/1/22 (b) | | 330,000 | 330,893 |
| Broward County School District Series 2015, 5% 7/1/22 | | 400,000 | 400,000 |
| Escambia County Poll. Cont. Rev. (Gulf Pwr. Co. Proj.) Series 2003, 2.6% 6/1/23 | | 5,150,000 | 5,183,609 |
| Florida Dev. Fin. Corp. Rev. Bonds (Brightline Florida Passenger Rail Expansion Proj.) Series 2021 A: | | | |
| 0.3%, tender 7/1/22 (a)(b) | | 6,025,000 | 6,025,000 |
| 2.9%, tender 4/4/23 (a)(b) | | 11,000,000 | 10,999,956 |
| Greater Orlando Aviation Auth. Arpt. Facilities Rev.: | | | |
| Series 2015 A: | | | |
| 4% 10/1/22 (b) | | 870,000 | 874,646 |
| 4% 10/1/22 (Escrowed to Maturity) (b) | | 200,000 | 201,223 |
| Series 2016 A: | | | |
| 5% 10/1/22 (b) | | 305,000 | 307,351 |
| 5% 10/1/22 (Escrowed to Maturity) (b) | | 465,000 | 468,946 |
| Series 2019 A, 5% 10/1/22 (b) | | 4,430,000 | 4,464,148 |
| Hillsborough County Aviation Auth. Rev.: | | | |
| Series 2013 A, 5.5% 10/1/24 (Pre-Refunded to 10/1/23 @ 100) (b) | | 1,420,000 | 1,481,549 |
| Series 2018 E, 5% 10/1/23 (b) | | 225,000 | 232,905 |
| Series 2022 A: | | | |
| 5% 10/1/24 (b) | | 2,800,000 | 2,952,759 |
| 5% 10/1/25 (b) | | 755,000 | 810,265 |
| Jacksonville Elec. Auth. Elec. Sys. Rev. Series 2013 A, 5% 10/1/22 | | 855,000 | 862,422 |
| Jacksonville Spl. Rev. Series 2022 A: | | | |
| 5% 10/1/23 (d) | | 260,000 | 270,228 |
| 5% 10/1/24 (d) | | 580,000 | 615,208 |
| 5% 10/1/25 (d) | | 455,000 | 492,663 |
| JEA Wtr. & Swr. Sys. Rev. Series A, 5% 10/1/23 | | 895,000 | 929,803 |
| Lee County Arpt. Rev. Series 2021 A: | | | |
| 5% 10/1/23 (b) | | 405,000 | 418,471 |
| 5% 10/1/24 (b) | | 1,530,000 | 1,606,636 |
| Miami-Dade County Aviation Rev.: | | | |
| Series 2012 A: | | | |
| 5% 10/1/22 (b) | | 2,135,000 | 2,151,198 |
| 5% 10/1/24 | | 895,000 | 901,159 |
| Series 2020 A, 5% 10/1/23 | | 1,105,000 | 1,145,200 |
| Miami-Dade County Health Facilities Auth. Hosp. Rev. (Nicklaus Children's Hosp. Proj.) Series 2021 A, 5% 8/1/22 | | 890,000 | 892,463 |
| Miami-Dade County Indl. Dev. Auth. Solid Waste Disp. Rev. Bonds (Waste Mgmt., Inc. of Florida Proj.): | | | |
| Series 2007, 0.32%, tender 11/1/22 (a) | | 1,200,000 | 1,195,818 |
| Series 2018, 0.4%, tender 8/1/23 (a)(b) | | 2,400,000 | 2,351,049 |
| Okeechobee County Solid Waste Rev. Bonds (Waste Mgmt., Inc.-Okeechobee Landfill Proj.) Series 2004 A, 0.55%, tender 7/1/24 (a) | | 1,500,000 | 1,401,456 |
| Orange County Health Facilities Auth. Series B, 5% 10/1/22 | | 2,605,000 | 2,627,487 |
| Orlando & Orange County Expressway Auth. Rev. Series 2012, 5% 7/1/22 | | 755,000 | 755,000 |
| Orlando Utils. Commission Util. Sys. Rev. Series 2013 A, 5% 10/1/24 | | 500,000 | 531,442 |
| Tampa Hosp. Rev. Series 2016 B, 5% 7/1/22 | | 935,000 | 935,000 |
|
| TOTAL FLORIDA | | | 60,075,159 |
|
| Georgia - 4.3% | | | |
| Bartow County Dev. Auth. Poll. Cont. Rev. Bonds (Georgia Pwr. Co. Plant Bowen Proj.): | | | |
| Series 2009 1st, 2.75%, tender 3/15/23 (a) | | 12,025,000 | 12,014,815 |
| Series 2013, 1.55%, tender 8/19/22 (a) | | 3,530,000 | 3,526,251 |
| Burke County Indl. Dev. Auth. Poll. Cont. Rev. Bonds: | | | |
| (Georgia Pwr. Co. Plant Vogtle Proj.): | | | |
| Series 1994, 2.25%, tender 5/25/23 (a) | | 1,300,000 | 1,292,029 |
| Series 2012 1st, 1.55%, tender 8/19/22 (a) | | 900,000 | 899,044 |
| Series 1995, 2.25%, tender 5/25/23 (a) | | 500,000 | 497,585 |
| Georgia Muni. Elec. Auth. Pwr. Rev.: | | | |
| Series 2020 A: | | | |
| 3% 11/1/22 | | 650,000 | 652,467 |
| 4% 11/1/23 | | 895,000 | 916,028 |
| 5% 1/1/23 | | 2,775,000 | 2,816,250 |
| 5% 1/1/23 | | 1,250,000 | 1,268,581 |
| Series 2021 A: | | | |
| 5% 1/1/24 | | 335,000 | 348,474 |
| 5% 1/1/25 (Assured Guaranty Muni. Corp. Insured) | | 200,000 | 211,685 |
| Series 2022 A: | | | |
| 5% 7/1/24 (Assured Guaranty Muni. Corp. Insured) (d) | | 335,000 | 349,650 |
| 5% 7/1/25 (Assured Guaranty Muni. Corp. Insured) (d) | | 350,000 | 371,595 |
| 5% 7/1/26 (Assured Guaranty Muni. Corp. Insured) (d) | | 365,000 | 394,704 |
| Georgia Muni. Gas Auth. Rev. (Gas Portfolio III Proj.) Series S, 5% 10/1/23 | | 2,050,000 | 2,065,492 |
| Griffin-Spalding County Hosp. (WellStar Health Sys., Inc. Proj.) Series 2017 A, 5% 4/1/23 | | 250,000 | 255,977 |
| Main Street Natural Gas, Inc.: | | | |
| Bonds: | | | |
| Series 2018 A, 4%, tender 9/1/23 (a) | | 6,305,000 | 6,415,460 |
| Series 2018 B, 1 month U.S. LIBOR + 0.750% 1.461%, tender 9/1/23 (a)(e) | | 25,095,000 | 24,914,002 |
| Series 2018 C, 4%, tender 12/1/23 (a) | | 2,490,000 | 2,540,237 |
| Series 2018 E, SIFMA Municipal Swap Index + 0.570% 1.48%, tender 12/1/23 (a)(e) | | 40,430,000 | 40,244,265 |
| Series 2019 B, 4%, tender 12/2/24 (a) | | 2,030,000 | 2,087,087 |
| Series 2018 A, 4% 3/1/23 | | 720,000 | 728,672 |
| Series 2022 A, 4% 12/1/25 | | 1,260,000 | 1,281,867 |
| Paulding County Hosp. Auth. Rev. Series 2022 A, 5% 4/1/23 | | 565,000 | 578,467 |
| Private Colleges & Univs. Auth. Rev. (Mercer Univ. Proj.) Series 2021, 5% 10/1/22 | | 300,000 | 302,305 |
|
| TOTAL GEORGIA | | | 106,972,989 |
|
| Guam - 0.2% | | | |
| Guam Pwr. Auth. Rev. Series 2022 A: | | | |
| 5% 10/1/22 (d) | | 905,000 | 910,741 |
| 5% 10/1/23 (d) | | 1,545,000 | 1,589,098 |
| 5% 10/1/24 (d) | | 1,235,000 | 1,288,510 |
| 5% 10/1/25 (d) | | 1,545,000 | 1,630,854 |
|
| TOTAL GUAM | | | 5,419,203 |
|
| Hawaii - 0.0% | | | |
| State of Hawaii Dept. of Trans. Series 2013, 5% 8/1/22 (b) | | 750,000 | 751,688 |
| Illinois - 3.8% | | | |
| Champaign County Cmnty. Unit Series 2020 A, 0% 1/1/23 | | 200,000 | 198,016 |
| Chicago Metropolitan Wtr. Reclamation District of Greater Chicago Series 2021 C: | | | |
| 5% 12/1/22 | | 1,320,000 | 1,338,558 |
| 5% 12/1/23 | | 1,380,000 | 1,438,801 |
| Chicago O'Hare Int'l. Arpt. Rev. Series 2013 A, 5% 1/1/23 (b) | | 4,535,000 | 4,599,738 |
| Chicago Park District Gen. Oblig.: | | | |
| Series 2014 B, 5% 1/1/24 | | 615,000 | 638,726 |
| Series 2021 D: | | | |
| 4% 1/1/23 | | 375,000 | 378,703 |
| 4% 1/1/24 | | 100,000 | 102,403 |
| Series 2021 E, 4% 1/1/24 | | 1,340,000 | 1,372,201 |
| Chicago Transit Auth. Cap. Grant Receipts Rev. Series 2021: | | | |
| 5% 6/1/23 | | 550,000 | 564,730 |
| 5% 6/1/24 | | 625,000 | 655,569 |
| Cook County Gen. Oblig.: | | | |
| Series 2012 C, 5% 11/15/22 | | 1,770,000 | 1,792,539 |
| Series 2021 A: | | | |
| 5% 11/15/22 | | 1,400,000 | 1,417,827 |
| 5% 11/15/23 | | 390,000 | 406,274 |
| 5% 11/15/24 | | 450,000 | 476,316 |
| Series 2021 B: | | | |
| 4% 11/15/22 | | 2,240,000 | 2,260,493 |
| 4% 11/15/23 | | 1,560,000 | 1,604,237 |
| Illinois Dev. Fin. Auth. Solid Waste Disp. Rev. Bonds (Waste Mgmt., Inc. Proj.) Series 2019, 0.4%, tender 11/1/22 (a)(b) | | 3,600,000 | 3,577,348 |
| Illinois Fin. Auth. Series 2022 A, 5% 10/1/24 (d) | | 160,000 | 164,798 |
| Illinois Fin. Auth. Rev.: | | | |
| Bonds Series 2017 B, 5%, tender 12/15/22 (a) | | 1,000,000 | 1,014,282 |
| Series 2019, 5% 9/1/22 | | 225,000 | 226,040 |
| Illinois Gen. Oblig.: | | | |
| Series 2013 A, 5% 4/1/24 | | 1,705,000 | 1,739,670 |
| Series 2013: | | | |
| 5% 7/1/22 | | 490,000 | 490,000 |
| 5% 7/1/23 | | 3,265,000 | 3,342,763 |
| Series 2017 D: | | | |
| 5% 11/1/22 | | 4,400,000 | 4,439,875 |
| 5% 11/1/23 | | 5,300,000 | 5,460,813 |
| Series 2021 A, 5% 3/1/23 | | 230,000 | 233,862 |
| Series 2021 B, 5% 3/1/23 | | 275,000 | 279,618 |
| Series 2021 C, 4% 3/1/23 | | 6,960,000 | 7,031,910 |
| Series 2022 A, 5% 3/1/23 | | 1,060,000 | 1,077,799 |
| Series 2022 B: | | | |
| 5% 3/1/24 | | 4,105,000 | 4,253,315 |
| 5% 3/1/25 | | 8,270,000 | 8,690,087 |
| 5% 3/1/26 | | 6,060,000 | 6,442,279 |
| Series 2022 D1, 5% 3/1/23 | | 1,210,000 | 1,230,318 |
| Illinois Muni. Elec. Agcy. Pwr. Supply Series 2015 A, 5% 2/1/23 | | 280,000 | 284,980 |
| Illinois Reg'l. Trans. Auth. Series 2017 A, 5% 7/1/23 | | 595,000 | 613,691 |
| Illinois Sales Tax Rev.: | | | |
| Series 2021 A: | | | |
| 4% 6/15/23 | | 6,065,000 | 6,147,124 |
| 4% 6/15/24 | | 3,195,000 | 3,263,680 |
| Series 2021 C, 5% 6/15/25 | | 270,000 | 284,541 |
| Illinois Toll Hwy. Auth. Toll Hwy. Rev. Series 2014 A, 5% 12/1/22 | | 3,875,000 | 3,929,480 |
| Kendall, Kane & Will Counties Cmnty. Unit School District #308 Series 2011, 5.5% 2/1/23 | | 1,470,000 | 1,501,671 |
| Metropolitan Pier & Exposition Series 2022 A, 3% 6/15/24 | | 1,870,000 | 1,858,534 |
| Railsplitter Tobacco Settlement Auth. Rev. Series 2017, 5% 6/1/23 | | 6,220,000 | 6,376,375 |
| Univ. of Illinois Board of Trustees Ctfs. of Prtn. Series 2014 C, 5% 3/15/23 | | 630,000 | 643,787 |
| Univ. of Illinois Rev. Series 2013 A, 5% 4/1/25 | | 250,000 | 254,842 |
| Waukegan Gen. Oblig. Series 2018 B, 4% 12/30/22 (Assured Guaranty Muni. Corp. Insured) | | 600,000 | 606,539 |
|
| TOTAL ILLINOIS | | | 94,705,152 |
|
| Indiana - 0.6% | | | |
| Indiana Dev. Fin. Auth. Solid Waste Disp. Rev. Bonds (Waste Mgmt., Inc. Proj.) Series 2001, 0.4%, tender 10/3/22 (a)(b) | | 400,000 | 398,305 |
| Indianapolis Local Pub. Impt.: | | | |
| (Indianapolis Arpt. Auth. Proj.) Series 2015 I, 5% 1/1/23 (b) | | 1,660,000 | 1,685,247 |
| Series 2021 A, 5% 6/1/23 | | 610,000 | 627,898 |
| Purdue Univ. Rev.: | | | |
| Series 2020 EE, 5% 7/1/22 | | 475,000 | 475,000 |
| Series CC, 5% 7/1/22 | | 575,000 | 575,000 |
| Whiting Envir. Facilities Rev. Bonds (BP Products North America, Inc. Proj.): | | | |
| Series 2015, 5%, tender 11/1/22 (a)(b) | | 3,255,000 | 3,281,521 |
| Series 2016 A, 5%, tender 3/1/23 (a)(b) | | 8,700,000 | 8,832,839 |
|
| TOTAL INDIANA | | | 15,875,810 |
|
| Iowa - 0.0% | | | |
| Iowa Fin. Auth. Rev. Series 2018 B, 5% 2/15/23 | | 515,000 | 524,156 |
| Kentucky - 0.9% | | | |
| Kentucky Asset/Liability Commission Agcy. Fund Rev. Series A: | | | |
| 3% 9/1/22 | | 500,000 | 501,235 |
| 5% 9/1/22 | | 3,750,000 | 3,770,846 |
| Kentucky Asset/Liability Commission Gen. Fund Rev. Series 2021 A, 5% 11/1/24 | | 1,000,000 | 1,062,099 |
| Kentucky State Property & Buildings Commission Rev.: | | | |
| Series 2016 B, 5% 11/1/23 | | 1,445,000 | 1,499,020 |
| Series 2017, 5% 4/1/23 | | 1,390,000 | 1,422,715 |
| Series 2018, 5% 5/1/23 | | 3,545,000 | 3,636,633 |
| Series A: | | | |
| 5% 10/1/22 | | 1,025,000 | 1,033,524 |
| 5% 8/1/23 | | 625,000 | 645,411 |
| 5% 11/1/23 | | 1,030,000 | 1,068,506 |
| Series B: | | | |
| 5% 8/1/22 | | 930,000 | 932,402 |
| 5% 11/1/22 | | 1,955,000 | 1,976,695 |
| 5% 8/1/23 | | 4,100,000 | 4,233,894 |
| Kentucky, Inc. Pub. Energy Bonds Series C1, 4%, tender 6/1/25 (a) | | 585,000 | 592,799 |
| Louisville & Jefferson County Bonds Series 2020 B, 5%, tender 10/1/23 (a) | | 1,000,000 | 1,030,893 |
|
| TOTAL KENTUCKY | | | 23,406,672 |
|
| Louisiana - 0.6% | | | |
| Louisiana Gen. Oblig. Series 2020 A, 5% 3/1/23 | | 835,000 | 853,720 |
| St. John Baptist Parish Rev. Bonds (Marathon Oil Corp.) Series 2017, 2%, tender 4/1/23 (a) | | 8,040,000 | 7,944,543 |
| State of Louisiana Grant Anticipation Rev. Series 2021, 5% 9/1/22 | | 4,400,000 | 4,425,857 |
| Tobacco Settlement Fing. Corp. Series 2013 A, 5% 5/15/23 | | 2,700,000 | 2,759,139 |
|
| TOTAL LOUISIANA | | | 15,983,259 |
|
| Maryland - 0.2% | | | |
| Maryland Dept. of Trans.: | | | |
| Series 2022 A, 5% 12/1/24 | | 550,000 | 588,546 |
| Series 2022 B, 5% 12/1/23 (d) | | 635,000 | 656,848 |
| Maryland Gen. Oblig. Series 2 A, 5% 8/1/23 | | 1,130,000 | 1,170,089 |
| Maryland Stadium Auth. Built to Learn Rev. Series 2022 A: | | | |
| 5% 6/1/24 | | 730,000 | 767,662 |
| 5% 6/1/25 | | 905,000 | 971,484 |
|
| TOTAL MARYLAND | | | 4,154,629 |
|
| Massachusetts - 2.7% | | | |
| Massachusetts Dept. of Trans. Metropolitan Hwy. Sys. Rev. Bonds Series 2019 A, 5%, tender 1/1/23 (a) | | 3,200,000 | 3,247,883 |
| Massachusetts Dev. Fin. Agcy. Rev.: | | | |
| Bonds: | | | |
| Series 2019 DD 1, 5%, tender 4/1/24 (a) | | 1,070,000 | 1,107,457 |
| Series 2019 DD 2, 5%, tender 4/1/24 (a) | | 2,295,000 | 2,375,339 |
| Series S3, SIFMA Municipal Swap Index + 0.500% 1.41%, tender 7/7/22 (a)(e) | | 7,400,000 | 7,368,841 |
| Series 2014 M4, 5% 7/1/22 | | 735,000 | 735,000 |
| Series 2018 R, 5% 10/1/22 | | 160,000 | 161,350 |
| Series 2020 A, 5% 10/1/22 | | 905,000 | 913,054 |
| Series 2021 I, 5% 10/1/24 | | 900,000 | 946,686 |
| Massachusetts Edl. Fing. Auth. Rev.: | | | |
| Series 2015 A, 5% 1/1/24 (b) | | 18,160,000 | 18,760,642 |
| Series 2018 B, 5% 7/1/23 (b) | | 450,000 | 462,343 |
| Series 2020 C, 5% 7/1/24 (b) | | 600,000 | 627,800 |
| Series 2022 B: | | | |
| 5% 7/1/24 (b) | | 525,000 | 549,013 |
| 5% 7/1/25 (b) | | 1,125,000 | 1,191,538 |
| Massachusetts Gen. Oblig. Series 2021 B, 5% 11/1/23 | | 24,925,000 | 25,973,385 |
| Massachusetts Port Auth. Rev. Series 2017 A, 5% 7/1/23 (b) | | 2,660,000 | 2,735,603 |
|
| TOTAL MASSACHUSETTS | | | 67,155,934 |
|
| Michigan - 1.4% | | | |
| Detroit Downtown Dev. Auth. Tax Series A, 5% 7/1/22 (Assured Guaranty Muni. Corp. Insured) | | 855,000 | 855,000 |
| Imlay City Cmnty. School District Series 2020 I, 4% 5/1/23 | | 555,000 | 565,527 |
| Michigan Fin. Auth. Rev.: | | | |
| (Detroit Reg'l. Convention Facility Auth. Local Proj.) Series 2014 H1, 5% 10/1/24 | | 1,895,000 | 1,954,966 |
| Bonds Series 2019 B, 3.5%, tender 11/15/22 (a) | | 7,325,000 | 7,362,406 |
| Series 2014 25A, 5% 11/1/22 (b) | | 1,950,000 | 1,971,640 |
| Series 2015 D1: | | | |
| 0.25% 10/15/22 | | 540,000 | 537,474 |
| 0.4% 10/15/23 | | 450,000 | 437,819 |
| 0.55% 10/15/24 | | 700,000 | 672,759 |
| Series 2022: | | | |
| 5% 4/15/25 | | 2,840,000 | 3,048,982 |
| 5% 4/15/26 | | 4,735,000 | 5,183,088 |
| Michigan Gen. Oblig. Series 2016, 5% 3/15/24 | | 500,000 | 525,257 |
| Michigan Hsg. Dev. Auth. Single Family Mtg. Rev. Series 2022 A: | | | |
| 1.95% 12/1/23 | | 975,000 | 973,759 |
| 2.5% 6/1/25 | | 1,215,000 | 1,211,002 |
| Oakland Univ. Rev.: | | | |
| Series 2022 A: | | | |
| 5% 3/1/23 | | 345,000 | 351,957 |
| 5% 3/1/24 | | 175,000 | 182,976 |
| 5% 3/1/25 | | 200,000 | 212,581 |
| Series 2022 B: | | | |
| 5% 3/1/24 (d) | | 350,000 | 359,964 |
| 5% 3/1/25 (d) | | 1,185,000 | 1,239,520 |
| South Lyon Cmnty. Schools Series 2016, 5% 5/1/23 | | 900,000 | 924,012 |
| Walled Lake Consolidated School District Series 2022, 4% 5/1/23 | | 1,670,000 | 1,701,677 |
| Wayne County Arpt. Auth. Rev. Series 2011 A: | | | |
| 4.125% 12/1/22 (Assured Guaranty Muni. Corp. Insured) (b) | | 1,200,000 | 1,201,760 |
| 5% 12/1/22 (b) | | 3,545,000 | 3,552,312 |
|
| TOTAL MICHIGAN | | | 35,026,438 |
|
| Minnesota - 0.1% | | | |
| Minneapolis & Saint Paul Metropolitan Arpts. Commission Arpt. Rev. Series 2016 B, 5% 1/1/23 | | 1,400,000 | 1,423,087 |
| Minnesota Hsg. Fin. Agcy. Series H: | | | |
| 0.6% 7/1/23 (b) | | 225,000 | 222,102 |
| 0.7% 7/1/24 (b) | | 200,000 | 193,721 |
|
| TOTAL MINNESOTA | | | 1,838,910 |
|
| Nebraska - 0.2% | | | |
| Central Plains Energy Proj. Gas Supply Series 2019: | | | |
| 4% 2/1/23 | | 1,060,000 | 1,070,727 |
| 4% 8/1/23 | | 1,170,000 | 1,189,095 |
| Douglas County Neb Edl. Facilities Rev. (Creighton Univ. Projs.) Series 2017, 5% 7/1/23 | | 825,000 | 850,092 |
| Nebraska Pub. Pwr. District Rev.: | | | |
| Bonds Series 2020 A, 0.6%, tender 7/1/23 (a) | | 1,950,000 | 1,919,251 |
| Series 2017 B, 5% 1/1/25 | | 650,000 | 694,630 |
|
| TOTAL NEBRASKA | | | 5,723,795 |
|
| Nevada - 0.7% | | | |
| Clark County Arpt. Rev.: | | | |
| Series 2019 D, 5% 7/1/22 | | 800,000 | 800,000 |
| Series 2021 B, 5% 7/1/24 (b) | | 1,870,000 | 1,958,499 |
| Clark County Poll. Cont. Rev. Bonds Series 2017, 1.65%, tender 3/31/23 (a) | | 1,570,000 | 1,563,051 |
| Clark County School District: | | | |
| Series 2016 D, 5% 6/15/23 | | 2,715,000 | 2,797,397 |
| Series 2016 F, 4% 6/15/24 | | 500,000 | 500,807 |
| Series 2020 A, 3% 6/15/25 (Assured Guaranty Muni. Corp. Insured) | | 500,000 | 511,040 |
| Nevada Dept. of Bus. & Industry Bonds: | | | |
| (Republic Svcs., Inc. Proj.) Series 2001, 2.35%, tender 12/1/22 (a)(b)(c) | | 2,000,000 | 2,001,212 |
| Series 2020 A, 0.85%, tender 1/26/23 (a)(b)(c) | | 7,100,000 | 7,005,332 |
|
| TOTAL NEVADA | | | 17,137,338 |
|
| New Hampshire - 0.0% | | | |
| Nat'l. Fin. Auth. Hosp. Rev. (St. Luke's Univ. Health Network Proj.) Series 2021 B, 5% 8/15/23 | | 405,000 | 419,005 |
| New Jersey - 4.4% | | | |
| Garden State Preservation Trust Open Space & Farmland Preservation Series B, 0% 11/1/22 (Assured Guaranty Muni. Corp. Insured) | | 1,645,000 | 1,635,695 |
| Hudson County Gen. Oblig. Series 2020, 2% 11/15/22 | | 10,000,000 | 10,009,687 |
| New Jersey Econ. Dev. Auth. Rev.: | | | |
| (New Jersey Transit Corp. Projs.) Series 2017 B, 5% 11/1/22 | | 3,655,000 | 3,697,235 |
| Series 2012 II, 5% 3/1/23 | | 1,535,000 | 1,540,877 |
| Series 2013: | | | |
| 5% 3/1/23 | | 1,290,000 | 1,317,637 |
| 5% 3/1/24 | | 15,560,000 | 15,856,930 |
| Series 2014 UU, 5% 6/15/23 | | 675,000 | 694,391 |
| Series 2015 XX: | | | |
| 4% 6/15/24 | | 1,345,000 | 1,379,131 |
| 5% 6/15/23 | | 825,000 | 848,700 |
| 5% 6/15/24 | | 500,000 | 522,586 |
| Series 2016 AAA, 5% 6/15/23 | | 625,000 | 642,955 |
| Series 2018 FFF, 5% 6/15/23 | | 500,000 | 514,364 |
| Series 2019, 5.25% 9/1/24 (c) | | 7,700,000 | 8,040,261 |
| New Jersey Edl. Facility Series 2016 C, 5% 7/1/24 (Assured Guaranty Muni. Corp. Insured) | | 1,000,000 | 1,050,907 |
| New Jersey Gen. Oblig.: | | | |
| Series 2020 A: | | | |
| 4% 6/1/23 | | 11,190,000 | 11,394,871 |
| 5% 6/1/24 | | 1,080,000 | 1,134,683 |
| 5% 6/1/25 | | 500,000 | 534,406 |
| Series 2021, 2% 6/1/25 | | 1,585,000 | 1,549,407 |
| New Jersey Higher Ed. Student Assistance Auth. Student Ln. Rev.: | | | |
| Series 2012 1, 5% 12/1/22 (b) | | 1,385,000 | 1,398,920 |
| Series 2014 A1 1, 5% 12/1/22 (b) | | 1,150,000 | 1,165,366 |
| Series 2016 1A: | | | |
| 5% 12/1/22 (b) | | 3,500,000 | 3,547,053 |
| 5% 12/1/23 (b) | | 3,500,000 | 3,629,307 |
| 5% 12/1/24 (b) | | 4,400,000 | 4,635,055 |
| Series 2017 1A, 5% 12/1/22 (b) | | 300,000 | 304,156 |
| Series 2019 A: | | | |
| 5% 12/1/22 | | 705,000 | 714,622 |
| 5% 12/1/24 | | 555,000 | 589,183 |
| Series 2020: | | | |
| 5% 12/1/22 (b) | | 1,550,000 | 1,570,838 |
| 5% 12/1/22 (b) | | 685,000 | 693,788 |
| 5% 12/1/24 (b) | | 1,100,000 | 1,158,501 |
| Series 2021 A, 5% 12/1/24 (b) | | 330,000 | 347,629 |
| Series 2022 A: | | | |
| 5% 12/1/24 (b) | | 430,000 | 453,074 |
| 5% 12/1/25 (b) | | 550,000 | 589,129 |
| Series 2022 B: | | | |
| 5% 12/1/24 (b) | | 885,000 | 931,009 |
| 5% 12/1/25 (b) | | 2,625,000 | 2,795,912 |
| New Jersey Hsg. & Mtg. Fin. Agcy. Multi-family Rev. Series 2021 B, 0.5% 11/1/23 | | 1,815,000 | 1,775,334 |
| New Jersey Tobacco Settlement Fing. Corp. Series 2018 A: | | | |
| 5% 6/1/23 | | 2,960,000 | 3,022,361 |
| 5% 6/1/24 | | 2,400,000 | 2,486,554 |
| 5% 6/1/25 | | 1,565,000 | 1,642,496 |
| New Jersey Trans. Trust Fund Auth.: | | | |
| Series 2005 B, 5.25% 12/15/22 (AMBAC Insured) | | 410,000 | 416,823 |
| Series 2006 A, 5.5% 12/15/22 (Assured Guaranty Muni. Corp. Insured) | | 1,250,000 | 1,271,787 |
| Series 2006 C, 0% 12/15/24 (AMBAC Insured) | | 160,000 | 148,925 |
| Series 2010 D, 5.25% 12/15/23 | | 820,000 | 855,660 |
| Series 2014 AA, 5% 6/15/23 | | 2,850,000 | 2,931,873 |
| Series 2016 A1, 5% 6/15/24 | | 975,000 | 1,023,593 |
| Series 2016 A2, 5% 6/15/23 | | 1,000,000 | 1,027,585 |
| Series 2018 A: | | | |
| 5% 6/15/23 | | 3,240,000 | 3,329,376 |
| 5% 6/15/24 | | 1,205,000 | 1,265,056 |
| Series 2022 AA, 5% 6/15/24 | | 1,090,000 | 1,139,238 |
| Series A, 5.25% 12/15/23 | | 350,000 | 365,221 |
| Rutgers State Univ. Rev. Series 2018 N, 4% 5/1/23 | | 700,000 | 713,220 |
|
| TOTAL NEW JERSEY | | | 110,303,367 |
|
| New Mexico - 0.1% | | | |
| New Mexico Edl. Assistance Foundation Series 2021 1A, 5% 9/1/23 (b) | | 2,040,000 | 2,106,344 |
| New Mexico Muni. Energy Acquisition Auth. Gas Supply Rev. Series 2019 A, 4% 11/1/22 | | 675,000 | 679,608 |
|
| TOTAL NEW MEXICO | | | 2,785,952 |
|
| New York - 1.6% | | | |
| Albany County Arpt. Auth. Arpt. Rev. Series 2020 B, 5% 12/15/22 (b) | | 1,000,000 | 1,013,296 |
| Dorm. Auth. New York Univ. Rev. Series 2012 B, 5% 7/1/30 (Pre-Refunded to 7/1/22 @ 100) | | 500,000 | 500,000 |
| Long Island Pwr. Auth. Elec. Sys. Rev.: | | | |
| Series 2012 B, 5% 9/1/22 | | 1,390,000 | 1,398,213 |
| Series 2017, 5% 9/1/22 (Escrowed to Maturity) | | 500,000 | 502,915 |
| Nassau County Local Econ. Assistance Corp. Multifamily Hsg. Rev. Bonds (Park Lake Hempstead, L.P. Proj.) Series 2021, 0.3%, tender 11/1/23 (a) | | 7,810,000 | 7,496,047 |
| New York City Gen. Oblig.: | | | |
| Series 1, 5% 8/1/23 | | 5,060,000 | 5,238,965 |
| Series 2013 D, 5% 8/1/23 | | 475,000 | 484,440 |
| Series 2015 B, 5% 8/1/23 | | 430,000 | 445,209 |
| Series 2019 E, 5% 8/1/23 | | 685,000 | 709,227 |
| Series 2021 F1: | | | |
| 3% 3/1/23 | | 300,000 | 302,928 |
| 5% 3/1/23 | | 545,000 | 557,399 |
| Series A, 5% 8/1/23 | | 2,155,000 | 2,231,219 |
| New York City Indl. Dev. Agcy. Rev.: | | | |
| (Queens Baseball Stadium Proj.) Series 2021 A, 5% 1/1/24 (Assured Guaranty Corp. Insured) | | 675,000 | 701,948 |
| Series 2021 A, 5% 1/1/26 (Assured Guaranty Muni. Corp. Insured) | | 600,000 | 644,540 |
| New York Metropolitan Trans. Auth. Dedicated Tax Fund Rev. Series 2016 A, 5% 11/15/22 | | 1,000,000 | 1,012,666 |
| New York Metropolitan Trans. Auth. Rev.: | | | |
| Series 2012 F, 5% 11/15/23 | | 1,875,000 | 1,894,377 |
| Series 2015 A1, 5% 11/15/22 | | 1,910,000 | 1,932,177 |
| Series 2015 F, 5% 11/15/22 | | 1,720,000 | 1,739,971 |
| Series 2016 A2, 5% 11/15/22 | | 455,000 | 460,283 |
| Series 2017 B, 5% 11/15/22 | | 1,000,000 | 1,011,611 |
| Series 2017 C1, 5% 11/15/25 | | 1,045,000 | 1,109,660 |
| Series 2017 D, 5% 11/15/23 | | 790,000 | 817,681 |
| Series 2020 A, 5% 2/1/23 | | 4,765,000 | 4,846,091 |
| New York State Dorm. Auth.: | | | |
| Series 2012 A: | | | |
| 5% 12/15/23 | | 215,000 | 218,343 |
| 5% 12/15/23 (Pre-Refunded to 12/15/22 @ 100) | | 285,000 | 289,495 |
| Series 2018 A, 5% 3/15/23 (Escrowed to Maturity) | | 710,000 | 727,206 |
| New York State Urban Dev. Corp. Series 2020 C, 5% 3/15/23 | | 515,000 | 527,465 |
| Onondaga Civic Dev. Corp. (St. Joseph's Hosp. Health Ctr. Proj.) Series 2012, 5% 7/1/42 (Pre-Refunded to 7/1/22 @ 100) | | 875,000 | 875,000 |
| Syracuse Reg'l. Arpt. Auth. Series 2021, 5% 7/1/24 (b) | | 770,000 | 803,391 |
|
| TOTAL NEW YORK | | | 40,491,763 |
|
| New York And New Jersey - 1.0% | | | |
| Port Auth. of New York & New Jersey: | | | |
| Series 188, 5% 5/1/24 (b) | | 1,990,000 | 2,083,730 |
| Series 189, 5% 5/1/23 | | 280,000 | 287,820 |
| Series 2013: | | | |
| 5% 12/1/22 (b) | | 6,515,000 | 6,598,580 |
| 5% 12/1/22 | | 235,000 | 238,449 |
| Series 2014 185, 5% 9/1/22 (b) | | 600,000 | 603,107 |
| Series 2015 194, 5% 10/15/23 | | 500,000 | 520,612 |
| Series 202, 5% 10/15/22 (b) | | 1,250,000 | 1,261,319 |
| Series 2021 226: | | | |
| 5% 10/15/22 (b) | | 2,875,000 | 2,901,034 |
| 5% 10/15/23 (b) | | 3,450,000 | 3,572,179 |
| Series 207, 5% 9/15/23 (b) | | 870,000 | 899,095 |
| Series 223: | | | |
| 5% 7/15/23 (b) | | 2,750,000 | 2,830,831 |
| 5% 7/15/24 (b) | | 3,250,000 | 3,418,233 |
|
| TOTAL NEW YORK AND NEW JERSEY | | | 25,214,989 |
|
| North Carolina - 0.3% | | | |
| Charlotte-Mecklenburg Hosp. Auth. Health Care Sys. Rev. Bonds Series 2021 B, 5%, tender 12/2/24 (a) | | 2,525,000 | 2,681,259 |
| North Carolina Grant Anticipation Rev. Series 2017, 5% 3/1/23 | | 435,000 | 444,319 |
| North Carolina Med. Care Commission Health Care Facilities Rev. Bonds Series 2019 B, 2.2%, tender 12/1/22 (a) | | 2,860,000 | 2,861,707 |
| North Carolina Med. Care Commission Hosp. Rev. Bonds Series 2021 B, 5%, tender 2/1/26 (a) | | 1,395,000 | 1,513,306 |
|
| TOTAL NORTH CAROLINA | | | 7,500,591 |
|
| Ohio - 0.4% | | | |
| Allen County Hosp. Facilities Rev. Series 2017 A, 5% 8/1/22 | | 865,000 | 867,234 |
| Franklin County Hosp. Facilities Rev. Bonds (U.S. Health Corp. of Columbus Proj.) Series 2011 B, 5%, tender 5/15/23 (a) | | 980,000 | 1,007,325 |
| Miami Univ. Series 2022 A, 5% 9/1/23 | | 915,000 | 948,494 |
| Montgomery County Hosp. Rev. (Kettering Health Network Obligated Group Proj.) Series 2021, 5% 8/1/24 | | 200,000 | 210,009 |
| Ohio Gen. Oblig. Series 2021 A: | | | |
| 5% 3/1/23 | | 510,000 | 521,705 |
| 5% 3/1/23 | | 1,000,000 | 1,022,950 |
| Ohio Higher Edl. Facility Commission Rev.: | | | |
| (Case Western Reserve Univ. Proj.) Series 2016, 5% 12/1/22 | | 1,350,000 | 1,369,368 |
| (Univ. of Dayton 2018 Proj.) Series 2018 A, 5% 12/1/22 | | 460,000 | 466,260 |
| Series A, 5% 12/1/22 | | 520,000 | 527,418 |
| Ohio Hosp. Facilities Rev. Series 2017 A, 5% 1/1/23 | | 830,000 | 843,482 |
| Ohio Tpk. Commission Tpk. Rev. (Infrastructure Projs.) Series 2022 A, 5% 2/15/25 (d) | | 1,840,000 | 1,943,071 |
| Univ. of Cincinnati Gen. Receipts Series 2012 C, 5% 6/1/23 (Pre-Refunded to 12/1/22 @ 100) | | 465,000 | 471,576 |
|
| TOTAL OHIO | | | 10,198,892 |
|
| Oklahoma - 0.1% | | | |
| Oklahoma Dev. Fin. Auth. Health Sys. Rev. Series 2015 A, 5% 8/15/22 | | 450,000 | 451,701 |
| Univ. of Oklahoma Gen. Rev. Series 2021 A, 5% 7/1/23 (Assured Guaranty Muni. Corp. Insured) | | 1,190,000 | 1,226,193 |
|
| TOTAL OKLAHOMA | | | 1,677,894 |
|
| Oregon - 0.9% | | | |
| Gilliam County Solid Waste Disp. Rev. Bonds (Waste Mgmt., Inc. Proj.): | | | |
| Series 2000 A, 3%, tender 5/1/23 (a)(b) | | 8,100,000 | 8,126,317 |
| Series 2003 A, 3%, tender 5/1/23 (a)(b) | | 9,950,000 | 10,016,160 |
| Port of Portland Arpt. Rev.: | | | |
| Series 2022: | | | |
| 5% 7/1/24 (b) | | 2,000,000 | 2,094,651 |
| 5% 7/1/25 (b) | | 1,310,000 | 1,396,770 |
| Series 24B, 5% 7/1/23 (b) | | 1,095,000 | 1,126,449 |
|
| TOTAL OREGON | | | 22,760,347 |
|
| Pennsylvania - 1.5% | | | |
| Bucks Co. Indl. Dev. Auth. Solid Waste Rev. Bonds (Waste Mgmt., Inc. Proj.) Series 2002, 2.75%, tender 12/1/22 (a)(b) | | 3,200,000 | 3,209,135 |
| Coatesville Area School District Series 2017, 5% 8/1/23 (Assured Guaranty Muni. Corp. Insured) | | 890,000 | 919,354 |
| Lehigh County Indl. Dev. Auth. Poll. Cont. Rev. Bonds: | | | |
| (PPL Elec. Utils. Corp. Proj.) Series 2016 A, 1.8%, tender 9/1/22 (a) | | 1,925,000 | 1,923,542 |
| Series B, 1.8%, tender 8/15/22 (a) | | 5,040,000 | 5,037,221 |
| Pennsylvania Econ. Dev. Fing. Auth.: | | | |
| Series 2021 A: | | | |
| 4% 10/15/23 | | 700,000 | 716,199 |
| 4% 10/15/24 | | 850,000 | 873,587 |
| Series 2022 A: | | | |
| 5% 2/15/25 | | 160,000 | 168,886 |
| 5% 2/15/26 | | 200,000 | 214,311 |
| Pennsylvania Econ. Dev. Fing. Auth. Indl. Dev. Rev. Series 2016, 5% 3/15/24 | | 1,250,000 | 1,303,967 |
| Pennsylvania Econ. Dev. Fing. Auth. Solid Waste Disp. Rev. Bonds: | | | |
| (Republic Svcs., Inc. Proj.) Series 2019 B2, 0.3%, tender 7/15/22 (a)(b) | | 3,100,000 | 3,098,501 |
| (Waste Mgmt., Inc. Proj.): | | | |
| Series 2017 A, 0.58%, tender 8/1/24 (a)(b) | | 900,000 | 839,026 |
| Series 2021 A, SIFMA Municipal Swap Index + 0.400% 1.31%, tender 6/3/24 (a)(b)(e) | | 2,845,000 | 2,747,114 |
| Series 2011, 2.15%, tender 7/1/24 (a)(b) | | 850,000 | 828,614 |
| Pennsylvania Gen. Oblig. Series 2016, 5% 2/1/23 | | 975,000 | 994,653 |
| Pennsylvania Hsg. Fin. Agcy.: | | | |
| Series 2021 135 B: | | | |
| 5% 4/1/23 (b) | | 330,000 | 337,521 |
| 5% 4/1/24 (b) | | 230,000 | 240,251 |
| 5% 4/1/25 (b) | | 380,000 | 403,784 |
| Series 2021 137: | | | |
| 0.2% 10/1/22 | | 550,000 | 548,314 |
| 0.4% 4/1/23 | | 285,000 | 281,927 |
| Series 2022 138: | | | |
| 5% 4/1/23 | | 840,000 | 860,398 |
| 5% 10/1/23 | | 1,135,000 | 1,179,135 |
| 5% 4/1/24 | | 1,060,000 | 1,113,741 |
| 5% 10/1/24 | | 1,970,000 | 2,090,767 |
| 5% 10/1/25 | | 1,100,000 | 1,188,344 |
| Pennsylvania Tpk. Commission Tpk. Rev. Series 2012 A, 5% 12/1/23 | | 800,000 | 810,241 |
| Philadelphia Arpt. Rev.: | | | |
| Series 2017 B: | | | |
| 5% 7/1/22 (b) | | 1,500,000 | 1,500,000 |
| 5% 7/1/23 (b) | | 700,000 | 719,200 |
| Series 2020 C, 5% 7/1/22 (b) | | 1,755,000 | 1,755,000 |
| Series 2021, 5% 7/1/24 (b) | | 945,000 | 987,849 |
| Philadelphia Gas Works Rev. Series 15, 5% 8/1/23 | | 780,000 | 804,629 |
|
| TOTAL PENNSYLVANIA | | | 37,695,211 |
|
| South Carolina - 1.1% | | | |
| Patriots Energy Group Fing. Agcy. Bonds Series 2018 A, 4%, tender 2/1/24 (a) | | 24,205,000 | 24,647,985 |
| South Carolina Ports Auth. Ports Rev. Series 2019 B, 5% 7/1/23 (b) | | 1,000,000 | 1,029,717 |
| South Carolina Pub. Svc. Auth. Rev. Series 2015 C, 5% 12/1/22 | | 1,560,000 | 1,581,869 |
| Spartanburg County Reg'l. Health Series 2022, 5% 4/15/23 | | 410,000 | 419,737 |
|
| TOTAL SOUTH CAROLINA | | | 27,679,308 |
|
| Tennessee - 1.0% | | | |
| Greeneville Health & Edl. Facilities Board Series 2018 A, 5% 7/1/22 | | 900,000 | 900,000 |
| Memphis-Shelby County Arpt. Auth. Arpt. Rev. Series 2020 B, 5% 7/1/22 (b) | | 700,000 | 700,000 |
| Metropolitan Gov Nashvle&David Ind. Bonds (Waste Mgmt., Inc. Proj.) Series 2001, 0.58%, tender 8/1/24 (a)(b) | | 900,000 | 839,026 |
| Metropolitan Nashville Arpt. Auth. Rev. Series 2015 B, 5% 7/1/23 (b) | | 680,000 | 699,327 |
| Tennergy Corp. Gas Rev. Bonds Series 2019 A, 5%, tender 10/1/24 (a) | | 21,250,000 | 22,164,987 |
|
| TOTAL TENNESSEE | | | 25,303,340 |
|
| Texas - 3.1% | | | |
| Austin Arpt. Sys. Rev.: | | | |
| Series 2019 B, 5% 11/15/22 (b) | | 1,200,000 | 1,213,218 |
| Series 2019: | | | |
| 5% 11/15/22 (b) | | 3,125,000 | 3,159,422 |
| 5% 11/15/23 (b) | | 655,000 | 678,111 |
| 5% 11/15/24 (b) | | 500,000 | 527,941 |
| Series 2022, 5% 11/15/25 (b) | | 1,910,000 | 2,052,092 |
| Austin Wtr. & Wastewtr. Sys. Rev. Series 2015 A, 5% 11/15/22 | | 500,000 | 506,513 |
| Corpus Christi Util. Sys. Rev. Series 2012, 5% 7/15/22 | | 500,000 | 500,527 |
| Crandall Independent School District Series 2021 A, 0% 8/15/24 | | 765,000 | 726,801 |
| Dallas Fort Worth Int'l. Arpt. Rev.: | | | |
| Series 2013 E, 5% 11/1/23 (b) | | 10,750,000 | 11,120,436 |
| Series 2020 B, 5% 11/1/22 | | 1,035,000 | 1,046,824 |
| El Paso Gen. Oblig.: | | | |
| Series 2021 B: | | | |
| 5% 8/15/22 | | 210,000 | 210,868 |
| 5% 8/15/23 | | 300,000 | 310,644 |
| Series 2021 C: | | | |
| 5% 8/15/22 | | 735,000 | 738,037 |
| 5% 8/15/23 | | 335,000 | 346,886 |
| Harris County Cultural Ed. Facilities Fin. Corp. Rev.: | | | |
| Bonds Series 2019 B, 5%, tender 9/1/22 (a) | | 2,385,000 | 2,419,866 |
| Series 2014 A, 5% 12/1/22 | | 505,000 | 512,058 |
| Houston Arpt. Sys. Rev. Series 2012 A, 5% 7/1/31 (Pre-Refunded to 7/1/22 @ 100) (b) | | 825,000 | 825,000 |
| Houston Independent School District Series 2016 A, 5% 2/15/23 | | 725,000 | 740,304 |
| Love Field Arpt. Modernization Rev. Series 2021: | | | |
| 5% 11/1/22 (b) | | 320,000 | 323,185 |
| 5% 11/1/23 (b) | | 2,330,000 | 2,410,290 |
| Lower Colorado River Auth. Rev.: | | | |
| (LCRA Transmission Svcs. Corp. Proj.): | | | |
| Series 2015, 5% 5/15/24 | | 1,080,000 | 1,135,723 |
| Series 2018, 5% 5/15/24 | | 2,095,000 | 2,203,093 |
| Series 2019, 5% 5/15/23 | | 1,335,000 | 1,370,480 |
| Series 2020: | | | |
| 5% 5/15/23 | | 385,000 | 395,232 |
| 5% 5/15/25 | | 570,000 | 611,182 |
| Series 2021 A, 5% 5/15/23 | | 1,190,000 | 1,221,627 |
| Series 2015 B, 5% 5/15/23 | | 1,000,000 | 1,026,577 |
| Series 2020: | | | |
| 5% 5/15/23 | | 1,500,000 | 1,539,866 |
| 5% 5/15/24 | | 760,000 | 799,213 |
| Series 2022, 5% 5/15/24 (Assured Guaranty Muni. Corp. Insured) | | 1,630,000 | 1,714,101 |
| Mission Econ. Dev. Corp. Solid Waste Disp. Rev. Bonds (Waste Mgmt., Inc. Proj.): | | | |
| Series 2018, 1.285%, tender 7/1/24 (a)(b) | | 6,835,000 | 6,585,984 |
| Series 2020 B, 2.1%, tender 9/1/22 (a)(b) | | 15,100,000 | 15,099,082 |
| North Texas Tollway Auth. Rev.: | | | |
| Series 2014: | | | |
| 5% 1/1/24 | | 630,000 | 657,702 |
| 5% 1/1/24 (Escrowed to Maturity) | | 310,000 | 324,424 |
| Series 2017 A, 5% 1/1/24 | | 1,865,000 | 1,894,024 |
| Series 2021 B, 5% 1/1/26 | | 1,150,000 | 1,248,140 |
| Port Arthur Independent School District Series 2015 A, 5% 2/15/25 | | 600,000 | 643,829 |
| Port of Houston Auth. Series 2021: | | | |
| 5% 10/1/22 | | 1,750,000 | 1,765,617 |
| 5% 10/1/23 | | 440,000 | 457,386 |
| San Antonio Arpt. Sys. Rev. Series 2019 A: | | | |
| 5% 7/1/22 (b) | | 560,000 | 560,000 |
| 5% 7/1/22 (b) | | 545,000 | 545,000 |
| 5% 7/1/23 (b) | | 445,000 | 456,985 |
| 5% 7/1/23 (b) | | 400,000 | 410,773 |
| San Antonio Elec. & Gas Sys. Rev. Series 2022, 5% 2/1/26 | | 905,000 | 985,632 |
| Wylie Independent School District Series 2020 A, 0% 8/15/23 | | 2,985,000 | 2,919,406 |
|
| TOTAL TEXAS | | | 76,940,101 |
|
| Utah - 0.2% | | | |
| Intermountain Pwr. Agcy. Pwr. Supply Rev. Series 2018 A, 5% 7/1/22 (Escrowed to Maturity) | | 625,000 | 625,000 |
| Salt Lake City Arpt. Rev. Series 2021 A: | | | |
| 5% 7/1/24 (b) | | 1,000,000 | 1,047,326 |
| 5% 7/1/25 (b) | | 1,325,000 | 1,412,764 |
| Utah County Hosp. Rev. Bonds Series 2018 B2, 5%, tender 8/1/24 (a) | | 970,000 | 1,013,202 |
|
| TOTAL UTAH | | | 4,098,292 |
|
| Virginia - 0.8% | | | |
| Charles City County Econ. Dev. Auth. Solid Waste Disp. Rev. Bonds (Waste Mgmt., Inc. Proj.) Series 2003 A, 3%, tender 5/1/23 (a)(b) | | 9,460,000 | 9,490,736 |
| Sussex County Indl. Dev. Auth. Solid Waste Disp. Rev. Bonds Series 2003 A, 3%, tender 5/1/23 (a)(b) | | 8,000,000 | 8,025,992 |
| Wise County Indl. Dev. Auth. Waste & Sewage Rev. Bonds (Virginia Elec. and Pwr. Co. Proj.) Series 2010 A, 1.2%, tender 5/31/24 (a) | | 1,795,000 | 1,732,711 |
| York County Econ. Dev. Auth. Poll. Cont. Rev. Bonds (Virginia Elec. and Pwr. Co. Proj.) Series 2009 A, 1.9%, tender 6/1/23 (a) | | 1,100,000 | 1,091,792 |
|
| TOTAL VIRGINIA | | | 20,341,231 |
|
| Washington - 0.6% | | | |
| Port of Seattle Rev.: | | | |
| Series 2016 B, 5% 10/1/22 (b) | | 900,000 | 907,594 |
| Series 2018 B, 5% 5/1/24 (b) | | 875,000 | 911,428 |
| Series 2019: | | | |
| 5% 4/1/24 (b) | | 760,000 | 790,568 |
| 5% 4/1/25 (b) | | 525,000 | 555,290 |
| Series 2021 C: | | | |
| 5% 8/1/23 (b) | | 2,640,000 | 2,713,399 |
| 5% 8/1/24 (b) | | 2,795,000 | 2,923,324 |
| Series 2021: | | | |
| 5% 9/1/23 (b) | | 2,100,000 | 2,170,741 |
| 5% 9/1/24 (b) | | 2,220,000 | 2,340,627 |
| Port of Seattle Spl. Facility Rev. Series 2013, 5% 6/1/23 (b) | | 845,000 | 865,322 |
| Washington Gen. Oblig. Series R 2013 A, 5% 7/1/24 | | 600,000 | 600,000 |
| Washington Health Care Facilities Auth. Rev. Series 2015 B, 4% 8/15/22 | | 525,000 | 526,572 |
|
| TOTAL WASHINGTON | | | 15,304,865 |
|
| West Virginia - 0.7% | | | |
| Mason Co. Poll. Cont. Rev. (Appalachian Pwr. Co. Proj.) Series 2003 L, 2.75% 10/1/22 | | 17,005,000 | 17,018,965 |
| Wisconsin - 0.7% | | | |
| Milwaukee County Arpt. Rev. Series 2016 A, 5% 12/1/22 (b) | | 1,820,000 | 1,843,348 |
| Pub. Fin. Auth. Solid Waste Bonds (Waste Mgmt., Inc. Proj.) Series 2017 A, 2%, tender 8/1/22 (a)(b) | | 7,450,000 | 7,449,688 |
| Wisconsin Health & Edl. Facilities Auth. Rev. Series 2022: | | | |
| 5% 10/1/23 (d) | | 1,010,000 | 1,046,174 |
| 5% 10/1/24 (d) | | 4,465,000 | 4,701,585 |
| 5% 10/1/25 (d) | | 920,000 | 986,073 |
| Wisconsin Hsg. & Econ. Dev. Auth. Hsg. Rev. Bonds Series 2021 C, 0.61%, tender 5/1/24 (a) | | 305,000 | 292,727 |
|
| TOTAL WISCONSIN | | | 16,319,595 |
|
| Wyoming - 0.1% | | | |
| Wyoming Cmnty. Dev. Auth. Hsg. Rev. Series 2020 3, 5% 12/1/22 (b) | | 1,195,000 | 1,210,820 |
| TOTAL MUNICIPAL BONDS | | | |
| (Cost $1,176,187,284) | | | 1,159,824,653 |
|
| Municipal Notes - 46.9% | | | |
| Alabama - 0.1% | | | |
| Decatur Indl. Dev. Board Exempt Facilities Rev. (Nucor Steel Decatur LLC Proj.) Series 2003 A, 1.19% 7/7/22, VRDN (a)(b) | | 1,760,000 | $1,760,000 |
| Arizona - 1.5% | | | |
| Arizona St Indl. Dev. Auth. Multi Participating VRDN: | | | |
| Series Floater MIZ 90 88, 1.16% 8/4/22 (Liquidity Facility Mizuho Cap. Markets LLC) (a)(f)(g)(h) | | 21,000,000 | 21,000,000 |
| Series XF 10 91, 1.16% 7/7/22 (Liquidity Facility Deutsche Bank AG New York Branch) (a)(b)(f)(h) | | 2,000,000 | 2,000,000 |
| Maricopa County Indl. Dev. Auth. Participating VRDN Series 2021 XG 03 09, 1.06% 7/7/22 (Liquidity Facility JPMorgan Chase Bank) (a)(f)(h) | | 1,500,000 | 1,500,000 |
| Phoenix Civic Impt. Board Arpt. Rev. Participating VRDN: | | | |
| Series 2018 XM 06 15, 1.1% 7/7/22 (Liquidity Facility Royal Bank of Canada) (a)(b)(f)(h) | | 1,600,000 | 1,600,000 |
| Series XM 08 23, 1.03% 7/7/22 (Liquidity Facility Morgan Stanley Bank, West Valley City Utah) (a)(f)(h) | | 5,100,000 | 5,100,000 |
| Pima County Indl. Dev. Auth. Multi-family Hsg. Rev. Participating VRDN Series XF 10 96, 1.16% 7/7/22 (Liquidity Facility Deutsche Bank AG New York Branch) (a)(f)(h) | | 5,040,000 | 5,040,000 |
|
| TOTAL ARIZONA | | | 36,240,000 |
|
| Arkansas - 0.2% | | | |
| Blytheville Indl. Dev. Rev. (Nucor Corp. Proj.) Series 1998, 1.19% 7/7/22, VRDN (a)(b) | | 2,600,000 | 2,600,000 |
| Lowell Ark Indl. Dev. Series 2006, 1.05% 7/7/22, LOC JPMorgan Chase Bank, VRDN (a)(b) | | 2,830,000 | 2,830,000 |
|
| TOTAL ARKANSAS | | | 5,430,000 |
|
| California - 6.5% | | | |
| California HFA Rev. Participating VRDN Series Floater MIZ 90 97, 1.16% 7/7/22, LOC Mizuho Cap. Markets LLC (a)(f)(h) | | 2,905,000 | 2,905,000 |
| California Statewide Cmntys. Dev. Auth. Multi-family Hsg. Rev. Participating VRDN Series Floaters XF 10 82, 1.16% 7/7/22 (Liquidity Facility Deutsche Bank AG New York Branch) (a)(f)(h) | | 16,750,000 | 16,750,000 |
| California Statewide Cmntys. Dev. Auth. Rev. Series 2004 I, 0.21% tender 7/13/22, CP mode | | 9,000,000 | 8,997,593 |
| Core/Related Gala Rentals Lp Participating VRDN Series DBE 80 87, 1.31% 8/29/22 (Liquidity Facility Deutsche Bank AG New York Branch) (a)(f)(g)(h) | | 5,780,000 | 5,780,000 |
| Los Angeles Cmnty. Redev. Agcy. Multi-family Hsg. Rev. Participating VRDN: | | | |
| Series 2022 MIZ 90 89, 1.11% 7/7/22 (Liquidity Facility Mizuho Cap. Markets LLC) (a)(b)(f)(h) | | 24,100,000 | 24,100,000 |
| Series 2022 MIZ 90 90, 1.11% 7/7/22 (Liquidity Facility Mizuho Cap. Markets LLC) (a)(b)(f)(h) | | 23,200,000 | 23,200,000 |
| River Islands Pub. Fing. Auth. Participating VRDN Series MIZ 90 26, 1.16% 8/4/22 (Liquidity Facility Mizuho Cap. Markets LLC) (a)(f)(g)(h) | | 9,700,000 | 9,700,000 |
| San Francisco City & County Arpts. Commission Int'l. Arpt. Rev. Participating VRDN Series Floaters XM 06 75, 1.03% 7/7/22 (Liquidity Facility Morgan Stanley Bank, West Valley City Utah) (a)(b)(f)(h) | | 3,400,000 | 3,400,000 |
| San Francisco City & County Multi-family Hsg. Rev. Participating VRDN: | | | |
| Series DBE 8059, 1.31% 8/29/22 (Liquidity Facility Deutsche Bank AG New York Branch) (a)(f)(g)(h) | | 11,800,000 | 11,800,000 |
| Series MIZ 90 63, 1.16% 8/4/22 (Liquidity Facility Mizuho Cap. Markets LLC) (a)(f)(g)(h) | | 23,330,000 | 23,330,000 |
| Series MIZ 90 95, 1.16% 8/4/22 (Liquidity Facility Mizuho Cap. Markets LLC) (a)(f)(h) | | 27,100,000 | 27,100,000 |
| San Jose Int. Arpt. Rev. Participating VRDN Series XF 29 98, 1.03% 7/7/22 (Liquidity Facility Wells Fargo Bank NA) (a)(b)(f)(h) | | 3,400,000 | 3,400,000 |
|
| TOTAL CALIFORNIA | | | 160,462,593 |
|
| Colorado - 1.7% | | | |
| Colorado Edl. & Cultural Facilities Auth. Rev. (Mesivta of Greater Los Angeles Proj.) Series 2005, 1.26% 7/7/22, LOC Deutsche Bank AG, VRDN (a) | | 1,735,000 | 1,735,000 |
| Colorado Hsg. & Fin. Auth. Multi-family Hsg. Rev. Participating VRDN Series Floater 2021 MIZ 90 68, 1.16% 8/4/22 (Liquidity Facility Mizuho Cap. Markets LLC) (a)(f)(g)(h) | | 300,000 | 300,000 |
| Denver City & County Arpt. Rev. Participating VRDN: | | | |
| Series Floaters XL 00 90, 1.03% 7/7/22 (Liquidity Facility Morgan Stanley Bank, West Valley City Utah) (a)(b)(f)(h) | | 14,330,000 | 14,330,000 |
| Series Floaters XM 07 15, 1.06% 7/7/22 (Liquidity Facility Morgan Stanley Bank, West Valley City Utah) (a)(b)(f)(h) | | 21,585,000 | 21,585,000 |
| Series XM 10 20, 1.06% 7/7/22 (Liquidity Facility Morgan Stanley Bank, West Valley City Utah) (a)(b)(f)(h) | | 4,265,000 | 4,265,000 |
|
| TOTAL COLORADO | | | 42,215,000 |
|
| Delaware, New Jersey - 0.4% | | | |
| Delaware River & Bay Auth. Rev. Participating VRDN Series XF 08 18, 1.05% 7/7/22 (Liquidity Facility JPMorgan Chase Bank) (a)(f)(h) | | 11,200,000 | 11,200,000 |
| Florida - 3.5% | | | |
| Alachua County Health Facilities Auth. Health Facilities Rev. Participating VRDN Series XX 12 21, 1.05% 7/7/22 (Liquidity Facility Barclays Bank PLC) (a)(f)(h) | | 2,700,000 | 2,700,000 |
| Broward County Arpt. Sys. Rev. Participating VRDN: | | | |
| Series XL 01 36, 1.04% 7/7/22 (Liquidity Facility JPMorgan Chase Bank) (a)(b)(f)(h) | | 6,330,000 | 6,330,000 |
| Series XM 08 95, 1.04% 7/7/22 (Liquidity Facility JPMorgan Chase Bank) (a)(b)(f)(h) | | 1,800,000 | 1,800,000 |
| Greater Orlando Aviation Auth. Arpt. Facilities Rev. Participating VRDN: | | | |
| Series Floaters XF 05 77, 1.1% 7/7/22 (Liquidity Facility Royal Bank of Canada) (a)(b)(f)(h) | | 6,665,000 | 6,665,000 |
| Series XM 08 91, 1.04% 7/7/22 (Liquidity Facility JPMorgan Chase Bank) (a)(b)(f)(h) | | 8,700,000 | 8,700,000 |
| Hillsborough County Aviation Auth. Rev. Participating VRDN Series XL 02 90, 1.21% 7/7/22 (Liquidity Facility Deutsche Bank AG New York Branch) (a)(b)(f)(h) | | 8,390,000 | 8,390,000 |
| Miami Dade County Hsg. Multifamily Hsg. Rev. Participating VRDN: | | | |
| Series Floater MIZ 90 87, 1.16% 8/4/22 (Liquidity Facility Mizuho Cap. Markets LLC) (a)(f)(g)(h) | | 1,900,000 | 1,900,000 |
| Series MIZ 90 72, 1.16% 8/4/22 (Liquidity Facility Mizuho Cap. Markets LLC) (a)(f)(g)(h) | | 800,000 | 800,000 |
| Miami-Dade County Participating VRDN: | | | |
| Series XF 29 47, 1.01% 7/7/22 (Liquidity Facility Barclays Bank PLC) (a)(b)(f)(h) | | 6,800,000 | 6,800,000 |
| Series XF 29 48, 1.03% 7/7/22 (Liquidity Facility Citibank NA) (a)(f)(h) | | 10,000,000 | 10,000,000 |
| Miami-Dade County Aviation Rev. Participating VRDN Series XM 08 70, 1.04% 7/7/22 (Liquidity Facility JPMorgan Chase Bank) (a)(b)(f)(h) | | 4,465,000 | 4,465,000 |
| Miami-Dade County Health Facilities Auth. Hosp. Rev. Participating VRDN Series 2021 XF 12 61, 1.06% 7/7/22 (Liquidity Facility JPMorgan Chase Bank) (a)(f)(h) | | 2,160,000 | 2,160,000 |
| Orange County Health Facilities Auth. Participating VRDN Series XL 02 77, 1.06% 7/7/22 (Liquidity Facility Bank of America NA) (a)(f)(h) | | 6,355,000 | 6,355,000 |
| Sarasota County Pub. Hosp. District Hosp. Rev. Participating VRDN Series XL 02 75, 1.01% 7/7/22 (Liquidity Facility JPMorgan Chase Bank) (a)(f)(h) | | 7,000,000 | 7,000,000 |
| Tampa Hosp. Rev. Participating VRDN: | | | |
| Series XM 08 85, 1.05% 7/7/22 (Liquidity Facility JPMorgan Chase Bank) (a)(f)(h) | | 7,625,000 | 7,625,000 |
| Series XM 08 86, 1.05% 7/7/22 (Liquidity Facility JPMorgan Chase Bank) (a)(f)(h) | | 6,300,000 | 6,300,000 |
|
| TOTAL FLORIDA | | | 87,990,000 |
|
| Georgia - 0.1% | | | |
| Griffin-Spalding County Hosp. Participating VRDN Series Floaters XL 00 76, 1.08% 7/7/22 (Liquidity Facility JPMorgan Chase Bank) (a)(f)(h) | | 900,000 | 900,000 |
| Gwinnett County Dev. Auth. Indl. Dev. Rev. Series 2007, 1.07% 7/7/22, LOC Truist Bank, VRDN (a)(b) | | 510,000 | 510,000 |
|
| TOTAL GEORGIA | | | 1,410,000 |
|
| Hawaii - 0.7% | | | |
| Hawaii Arpts. Sys. Rev. Participating VRDN: | | | |
| Series XF 07 65, 1.04% 7/7/22 (Liquidity Facility JPMorgan Chase Bank) (a)(b)(f)(h) | | 6,980,000 | 6,980,000 |
| Series XG 03 86, 0% 7/7/22 (Liquidity Facility Morgan Stanley Bank, West Valley City Utah) (a)(b)(f)(h) | | 9,600,000 | 9,600,000 |
|
| TOTAL HAWAII | | | 16,580,000 |
|
| Illinois - 3.9% | | | |
| Chicago O'Hare Int'l. Arpt. Rev. Participating VRDN: | | | |
| Series Floaters XL 00 49, 1.07% 7/7/22 (Liquidity Facility Barclays Bank PLC) (a)(b)(f)(h) | | 14,325,000 | 14,325,000 |
| Series XM 08 79, 1.04% 7/7/22 (Liquidity Facility JPMorgan Chase Bank) (a)(f)(h) | | 4,900,000 | 4,900,000 |
| Series XM 08 84, 1.04% 7/7/22 (Liquidity Facility JPMorgan Chase Bank) (a)(b)(f)(h) | | 4,900,000 | 4,900,000 |
| Series XM 09 17, 1.04% 7/7/22 (Liquidity Facility JPMorgan Chase Bank) (a)(f)(h) | | 7,420,000 | 7,420,000 |
| Series XM 09 18, 1.04% 7/7/22 (Liquidity Facility JPMorgan Chase Bank) (a)(f)(h) | | 4,900,000 | 4,900,000 |
| Chicago Park District Gen. Oblig. Participating VRDN Series 2021 XX 11 68, 1.01% 7/7/22 (Liquidity Facility Barclays Bank PLC) (a)(f)(h) | | 1,000,000 | 1,000,000 |
| Chicago Transit Auth. Participating VRDN: | | | |
| Series XM 09 03, 1.05% 7/7/22 (Liquidity Facility JPMorgan Chase Bank) (a)(f)(h) | | 615,000 | 615,000 |
| Series XM 09 05, 1.05% 7/7/22 (Liquidity Facility JPMorgan Chase Bank) (a)(f)(h) | | 2,700,000 | 2,700,000 |
| Cook County Gen. Oblig. Participating VRDN Series 2015 XF0124, 1.06% 7/7/22 (Liquidity Facility JPMorgan Chase Bank) (a)(f)(h) | | 10,015,000 | 10,015,000 |
| Cook County Sales Tax Rev. Participating VRDN Series 2019 XM 07 28, 1.01% 7/7/22 (Liquidity Facility UBS AG) (a)(f)(h) | | 6,670,000 | 6,670,000 |
| Deutsche Spears/Lifers Trust Participating VRDN Series 2016 XG 00 93, 1.11% 7/7/22 (Liquidity Facility Deutsche Bank AG New York Branch) (a)(b)(f)(h) | | 5,500,000 | 5,500,000 |
| Illinois Gen. Oblig. Participating VRDN Series Floaters XM 01 86, 1.06% 7/7/22 (Liquidity Facility Deutsche Bank AG New York Branch) (a)(f)(h) | | 12,810,000 | 12,810,000 |
| Illinois Hsg. Dev. Auth. Multi-family Hsg. Rev. Participating VRDN Series XF 10 87, 1.16% 7/7/22 (Liquidity Facility Deutsche Bank AG New York Branch) (a)(f)(h) | | 6,535,000 | 6,535,000 |
| Metropolitan Pier & Exposition Participating VRDN: | | | |
| Series 2021 XF 12 23, 1.03% 7/7/22 (Liquidity Facility JPMorgan Chase Bank) (a)(f)(h) | | 1,645,000 | 1,645,000 |
| Series XF 09 65, 1.03% 7/7/22 (Liquidity Facility JPMorgan Chase Bank) (a)(f)(h) | | 12,357,000 | 12,357,000 |
|
| TOTAL ILLINOIS | | | 96,292,000 |
|
| Indiana - 0.2% | | | |
| Lucky Heights Tc, Lp Participating VRDN Series XF 11 41, 1.16% 7/7/22 (Liquidity Facility Deutsche Bank AG New York Branch) (a)(f)(h) | | 4,300,000 | 4,300,000 |
| Kentucky - 3.1% | | | |
| Hopkinsville Indl. Bldg. Rev. Series 2006, 1.07% 7/7/22, LOC Truist Bank, VRDN (a)(b) | | 640,000 | 640,000 |
| Kentucky Econ. Dev. Fin. Auth. Hosp. Rev. Participating VRDN Series XM 09 19, 1.06% 7/7/22 (Liquidity Facility JPMorgan Chase Bank) (a)(f)(h) | | 2,710,000 | 2,710,000 |
| Kentucky Hsg. Corp. Hsg. Rev. Participating VRDN Series XF 10 93, 1.16% 7/7/22 (Liquidity Facility Deutsche Bank AG New York Branch) (a)(f)(h) | | 8,300,000 | 8,300,000 |
| Kentucky Tpk. Auth. Econ. Dev. Road Rev. Participating VRDN Series XF 24 84, 1.03% 7/7/22 (Liquidity Facility Morgan Stanley Bank, West Valley City Utah) (a)(f)(h) | | 800,000 | 800,000 |
| Meade County Indl. Bldg. Rev. (Nucor Steel Brandenburg Proj.): | | | |
| Series 2020 A1, 1.12% 7/1/22, VRDN (a)(b) | | 18,200,000 | 18,200,000 |
| Series 2020 B1, 1.12% 7/1/22, VRDN (a)(b) | | 45,520,000 | 45,520,000 |
|
| TOTAL KENTUCKY | | | 76,170,000 |
|
| Louisiana - 0.8% | | | |
| Louisiana Hsg. Corp. Multifamily Hsg. Rev. Participating VRDN Series MIZ 90 53, 1.16% 8/4/22 (Liquidity Facility Mizuho Cap. Markets LLC) (a)(f)(g)(h) | | 1,400,000 | 1,400,000 |
| Saint James Parish Gen. Oblig. (Nucor Steel Louisiana LLC Proj.) Series 2010 A1, 1.15% 7/7/22, VRDN (a) | | 18,000,000 | 18,000,000 |
|
| TOTAL LOUISIANA | | | 19,400,000 |
|
| Maine - 0.1% | | | |
| Maine Health & Higher Edl. Facilities Auth. Rev. Participating VRDN Series XM 08 98, 1.06% 7/7/22 (Liquidity Facility JPMorgan Chase Bank) (a)(f)(h) | | 1,600,000 | 1,600,000 |
| Massachusetts - 1.0% | | | |
| Massachusetts Dev. Fin. Agcy. Rev. Participating VRDN Series XM 09 99, 1.06% 7/7/22 (Liquidity Facility JPMorgan Chase Bank) (a)(f)(h) | | 6,300,000 | 6,300,000 |
| Massachusetts Edl. Fing. Auth. Rev. Participating VRDN Series Floaters XF 23 06, 1.11% 7/7/22 (Liquidity Facility Morgan Stanley Bank, West Valley City Utah) (a)(b)(f)(h) | | 8,600,000 | 8,600,000 |
| Massachusetts Port Auth. Rev. Participating VRDN Series XM 08 51, 1.01% 7/7/22 (Liquidity Facility JPMorgan Chase Bank) (a)(b)(f)(h) | | 11,050,000 | 11,050,000 |
|
| TOTAL MASSACHUSETTS | | | 25,950,000 |
|
| Michigan - 0.7% | | | |
| Kalamazoo Hosp. Fin. Auth. Hosp. Facilities Rev. Participating VRDN Series XM 08 93, 1.06% 7/7/22 (Liquidity Facility JPMorgan Chase Bank) (a)(f)(h) | | 13,675,000 | 13,675,000 |
| Michigan Bldg. Auth. Rev. Series 2020 III, 1% 8/1/23, VRDN (a) | | 3,500,000 | 3,500,000 |
|
| TOTAL MICHIGAN | | | 17,175,000 |
|
| Minnesota - 0.2% | | | |
| Duluth Minn Hsg. & Redev. Auth. MultiFamily Hsg. Rev. Participating VRDN Series 2021 XF 11 30, 1.16% 7/7/22 (Liquidity Facility Deutsche Bank AG New York Branch) (a)(f)(h) | | 1,600,000 | 1,600,000 |
| Minneapolis Health Care Sys. Rev. Participating VRDN Series XM 08 72, 1.05% 7/7/22 (Liquidity Facility JPMorgan Chase Bank) (a)(f)(h) | | 2,000,000 | 2,000,000 |
| Minnesota Rural Wtr. Fin. Auth. BAN Series 2021 B, 0.3% 8/1/22 | | 1,200,000 | 1,198,315 |
|
| TOTAL MINNESOTA | | | 4,798,315 |
|
| Missouri - 1.1% | | | |
| Kansas City Planned Indl. Expansion Participating VRDN Series Floater MIZ 90 86, 1.16% 8/4/22 (Liquidity Facility Mizuho Cap. Markets LLC) (a)(f)(g)(h) | | 1,500,000 | 1,500,000 |
| Lees Summit Indl. Dev. Auth. Multi-family Hsg. Rev. Participating VRDN Series MIZ 90 55, 1.16% 8/4/22 (Liquidity Facility Mizuho Cap. Markets LLC) (a)(f)(g)(h) | | 500,000 | 500,000 |
| Mercy Health Participating VRDN Series Floaters XL 00 80, 1.06% 7/7/22 (Liquidity Facility JPMorgan Chase Bank) (a)(f)(h) | | 11,295,000 | 11,295,000 |
| Missouri Health & Edl. Facilities Auth. Edl. Facilities Rev. Participating VRDN Series XG 01 76, 1.03% 7/7/22 (Liquidity Facility Royal Bank of Canada) (a)(f)(h) | | 10,895,000 | 10,895,000 |
| Missouri Health & Edl. Facilities Rev. Participating VRDN Series XL 02 58, 1.06% 7/7/22 (Liquidity Facility JPMorgan Chase Bank) (a)(f)(h) | | 3,525,000 | 3,525,000 |
|
| TOTAL MISSOURI | | | 27,715,000 |
|
| Montana - 0.1% | | | |
| Cascade County Indl. Dev. Rev. Series 2007, 1.1% 7/7/22, LOC Wells Fargo Bank NA, VRDN (a)(b) | | 865,000 | 865,000 |
| Montana Board of Hsg. Participating VRDN Series Floater MIZ 90 62, 1.16% 8/4/22 (Liquidity Facility Mizuho Cap. Markets LLC) (a)(f)(g)(h) | | 1,110,000 | 1,110,000 |
|
| TOTAL MONTANA | | | 1,975,000 |
|
| Nebraska - 0.3% | | | |
| Central Plains Energy Proj. Rev. Participating VRDN Series XM 09 64, 1.09% 7/7/22 (Liquidity Facility JPMorgan Chase Bank) (a)(f)(h) | | 1,000,000 | 1,000,000 |
| Stanton County Indl. Dev. Rev.: | | | |
| (Nucor Corp. Proj.) Series 1996, 1.19% 7/7/22, VRDN (a)(b) | | 5,600,000 | 5,600,000 |
| Series 1998, 1.19% 7/7/22, VRDN (a)(b) | | 125,000 | 125,000 |
|
| TOTAL NEBRASKA | | | 6,725,000 |
|
| Nevada - 0.3% | | | |
| Nevada Hsg. Division Participating VRDN Series 2022 MIZ 90 91, 1.16% 8/4/22 (Liquidity Facility Mizuho Cap. Markets LLC) (a)(f)(g)(h) | | 8,600,000 | 8,600,000 |
| New Jersey - 1.2% | | | |
| New Jersey Bldg. Auth. State Bldg. Rev. Participating VRDN Series Floaters XF 05 53, 1.08% 7/7/22 (Liquidity Facility JPMorgan Chase Bank) (a)(f)(h) | | 3,750,000 | 3,750,000 |
| New Jersey Tpk. Auth. Tpk. Rev. Participating VRDN: | | | |
| Series Floaters ZM 05 66, 1.05% 7/7/22 (Liquidity Facility Royal Bank of Canada) (a)(f)(h) | | 3,565,000 | 3,565,000 |
| Series XM 09 12, 1.06% 7/7/22 (Liquidity Facility JPMorgan Chase Bank) (a)(f)(h) | | 1,700,000 | 1,700,000 |
| New Jersey Trans. Trust Fund Auth. Participating VRDN: | | | |
| Series XF 09 75, 1.08% 7/7/22 (Liquidity Facility JPMorgan Chase Bank) (a)(f)(h) | | 2,900,000 | 2,900,000 |
| Series XM 09 29, 1.08% 7/7/22 (Liquidity Facility JPMorgan Chase Bank) (a)(f)(h) | | 1,600,000 | 1,600,000 |
| Newark Gen. Oblig. BAN Series 2021 C, 1.25% 7/25/22 | | 1,100,000 | 1,100,015 |
| Roselle County of Union BAN Series 2021 A, 1.5% 7/20/22 | | 2,000,000 | 2,000,026 |
| Springfield Township Gen. Oblig. BAN Series 2021, 2% 7/29/22 | | 6,300,000 | 6,302,552 |
| West Orange Gen. Oblig. BAN Series 2021, 2% 11/11/22 | | 8,100,000 | 8,109,692 |
|
| TOTAL NEW JERSEY | | | 31,027,285 |
|
| New York - 6.1% | | | |
| Connetquot Central School District BAN Series 2021, 1.25% 7/27/22 | | 800,000 | 799,824 |
| Hempstead Union Free School District BAN Series 2021 A, 1.5% 11/30/22 | | 11,700,000 | 11,694,289 |
| New York Dorm. Auth. Rev. Participating VRDN Series XF 13 28, 1.08% 7/7/22 (Liquidity Facility JPMorgan Chase Bank) (a)(f)(h) | | 5,450,000 | 5,450,000 |
| New York Liberty Dev. Corp. Participating VRDN: | | | |
| Series XF 12 42, 1.03% 7/7/22 (Liquidity Facility JPMorgan Chase Bank) (a)(f)(h) | | 26,115,000 | 26,115,000 |
| Series XM 08 44, 1.16% 7/7/22 (Liquidity Facility Deutsche Bank AG New York Branch) (a)(f)(h) | | 8,165,000 | 8,165,000 |
| New York Metropolitan Trans. Auth. Rev.: | | | |
| BAN Series 2019 D1, 5% 9/1/22 | | 66,505,000 | 66,862,378 |
| Participating VRDN: | | | |
| Series XF 13 21, 1.09% 7/7/22 (Liquidity Facility JPMorgan Chase Bank) (a)(f)(h) | | 6,900,000 | 6,900,000 |
| Series XM 09 35, 1.09% 7/7/22 (Liquidity Facility JPMorgan Chase Bank) (a)(f)(h) | | 1,590,000 | 1,590,000 |
| Series ZF 02 18, 1.09% 7/7/22 (Liquidity Facility JPMorgan Chase Bank) (a)(f)(h) | | 8,100,000 | 8,100,000 |
| New York Thruway Auth. Gen. Rev. Participating VRDN: | | | |
| Series XM 08 30, 1.06% 7/7/22 (Liquidity Facility JPMorgan Chase Bank) (a)(f)(h) | | 4,200,000 | 4,200,000 |
| Series XM 08 31, 1.08% 7/7/22 (Liquidity Facility Morgan Stanley Bank, West Valley City Utah) (a)(f)(h) | | 3,650,000 | 3,650,000 |
| New York Trans. Dev. Corp. Participating VRDN Series XL 01 68, 1.03% 7/7/22 (Liquidity Facility Barclays Bank PLC) (a)(b)(f)(h) | | 700,000 | 700,000 |
| Rockland County Indl. Dev. Agcy. Participating VRDN Series XF 11 32, 1.16% 7/7/22 (Liquidity Facility Deutsche Bank AG New York Branch) (a)(f)(h) | | 2,400,000 | 2,400,000 |
| Triborough Bridge & Tunnel Auth. Revs. Participating VRDN Series RBC 16 ZM 0138, 1.02% 7/7/22 (Liquidity Facility Royal Bank of Canada) (a)(f)(h) | | 5,000,000 | 5,000,000 |
|
| TOTAL NEW YORK | | | 151,626,491 |
|
| North Carolina - 1.2% | | | |
| Hertford County Indl. Facilities Poll. Cont. Fing. Auth. (Nucor Corp. Proj.) Series 2000 A, 1.07% 7/7/22, VRDN (a)(b) | | 29,600,000 | 29,600,000 |
| Ohio - 0.6% | | | |
| Ohio Hsg. Fin. Agcy. Multi-family Hsg. Rev. Participating VRDN Series XF 10 92, 1.16% 7/7/22 (Liquidity Facility Deutsche Bank AG New York Branch) (a)(f)(h) | | 12,200,000 | 12,200,000 |
| Whitehall Spl. Oblig. Nontax Rev. BAN Series 2021 A, 1.5% 12/7/22 | | 3,100,000 | 3,098,728 |
|
| TOTAL OHIO | | | 15,298,728 |
|
| Oklahoma - 0.5% | | | |
| Oklahoma Dev. Fin. Auth. Health Sys. Rev. Series 2020 B, 1.24% 7/7/22, VRDN (a) | | 12,115,000 | 12,115,000 |
| Oregon - 0.4% | | | |
| Oregon Facilities Auth. Rev. Participating VRDN Series XL 02 66, 1.03% 7/7/22 (Liquidity Facility Bank of America NA) (a)(f)(h) | | 3,700,000 | 3,700,000 |
| Oregon St Hsg. & Cmnty. Svcs. Dep Participating VRDN Series 2021 XF 11 23, 1.16% 7/7/22 (Liquidity Facility Deutsche Bank AG New York Branch) (a)(f)(h) | | 5,800,000 | 5,800,000 |
|
| TOTAL OREGON | | | 9,500,000 |
|
| Pennsylvania - 1.0% | | | |
| Chester County Indl. Dev. Auth. Student Hsg. Rev. Participating VRDN Series DBE 80 86, 1.31% 8/29/22 (Liquidity Facility Deutsche Bank AG New York Branch) (a)(f)(g)(h) | | 6,000,000 | 6,000,000 |
| Pennsylvania Hsg. Fin. Agcy. Multifamily Hsg. Dev. Rev. Participating VRDN Series XF 10 95, 1.16% 7/7/22 (Liquidity Facility Deutsche Bank AG New York Branch) (a)(f)(h) | | 10,540,000 | 10,540,000 |
| Philadelphia Auth. for Indl. Dev.: | | | |
| Participating VRDN Series MIZ 90 51, 1.16% 8/4/22 (Liquidity Facility Mizuho Cap. Markets LLC) (a)(f)(g)(h) | | 2,430,000 | 2,430,000 |
| Series 2017 B, 1.21% 7/7/25, VRDN (a) | | 5,250,000 | 5,250,000 |
|
| TOTAL PENNSYLVANIA | | | 24,220,000 |
|
| South Carolina - 0.8% | | | |
| Berkeley County Indl. Dev. Rev. (Nucor Corp. Proj.) Series 1995, 1.19% 7/7/22, VRDN (a)(b) | | 1,200,000 | 1,200,000 |
| Greenville Hosp. Sys. Facilities Rev. Participating VRDN Series XF 01 45, 1.06% 7/7/22 (Liquidity Facility Toronto-Dominion Bank) (a)(f)(h) | | 3,100,000 | 3,100,000 |
| South Carolina Pub. Svc. Auth. Rev. Participating VRDN: | | | |
| Series 2021 XF 12 43, 1.06% 7/7/22 (Liquidity Facility JPMorgan Chase Bank) (a)(f)(h) | | 970,000 | 970,000 |
| Series 2021 XL 01 85, 1.06% 7/7/22 (Liquidity Facility Barclays Bank PLC) (a)(f)(h) | | 1,190,000 | 1,190,000 |
| Series Floaters XM 03 84, 1.05% 7/7/22 (Liquidity Facility JPMorgan Chase Bank) (a)(f)(h) | | 8,800,000 | 8,800,000 |
| Series XL 01 54, 1.06% 7/7/22 (Liquidity Facility Barclays Bank PLC) (a)(f)(h) | | 2,810,000 | 2,810,000 |
| Series YX 11 57, 1.06% 7/7/22 (Liquidity Facility Barclays Bank PLC) (a)(f)(h) | | 1,390,000 | 1,390,000 |
|
| TOTAL SOUTH CAROLINA | | | 19,460,000 |
|
| South Dakota - 0.5% | | | |
| South Dakota Health & Edl. Facilities Auth. Rev. Participating VRDN Series XM 08 97, 1.06% 7/7/22 (Liquidity Facility JPMorgan Chase Bank) (a)(f)(h) | | 13,720,000 | 13,720,000 |
| Tennessee - 0.6% | | | |
| Metropolitan Govt. Nashville & Davidson County Health & Edl. Facilities Board Participating VRDN Series XF 10 97, 1.16% 7/7/22 (Liquidity Facility Deutsche Bank AG New York Branch) (a)(f)(h) | | 9,800,000 | 9,800,000 |
| Metropolitan Nashville Arpt. Auth. Rev. Participating VRDN Series 2022 ZF 29 74, 1.03% 7/7/22 (Liquidity Facility Morgan Stanley Bank, West Valley City Utah) (a)(f)(h) | | 5,000,000 | 5,000,000 |
|
| TOTAL TENNESSEE | | | 14,800,000 |
|
| Texas - 4.9% | | | |
| Austin Affordable Pfc, Inc. Multifamily Hsg. Rev. Participating VRDN: | | | |
| Series XF 11 02, 1.16% 7/7/22 (Liquidity Facility Deutsche Bank AG New York Branch) (a)(f)(h) | | 2,000,000 | 2,000,000 |
| Series XF 11 19, 1.16% 7/7/22 (Liquidity Facility Deutsche Bank AG New York Branch) (a)(f)(h) | | 3,500,000 | 3,500,000 |
| Cap. Area Hsg. Fin. Corp. Multi-family Hsg. Rev. Participating VRDN Series XF 11 31, 1.16% 7/7/22 (Liquidity Facility Deutsche Bank AG New York Branch) (a)(f)(h) | | 7,980,000 | 7,980,000 |
| Hurst Participating VRDN Series XF 10 94, 1.16% 7/7/22 (Liquidity Facility Deutsche Bank AG New York Branch) (a)(f)(h) | | 3,780,000 | 3,780,000 |
| Mission Econ. Dev. Corp. Idr (CMI Proj.) Series 2007, 1.1% 7/7/22, LOC Wells Fargo Bank NA, VRDN (a)(b) | | 445,000 | 445,000 |
| North Central Texas Hsg. Fin. Corp. Mu Participating VRDN Series XF 10 99, 1.16% 7/7/22 (Liquidity Facility Deutsche Bank AG New York Branch) (a)(f)(h) | | 1,100,000 | 1,100,000 |
| North Texas Tollway Auth. Rev. Participating VRDN: | | | |
| Series 2021 XF 12 25, 1.03% 7/7/22 (Liquidity Facility JPMorgan Chase Bank) (a)(f)(h) | | 2,205,000 | 2,205,000 |
| Series XF 12 21, 1.03% 7/7/22 (Liquidity Facility JPMorgan Chase Bank) (a)(f)(h) | | 1,865,000 | 1,865,000 |
| Port Arthur Navigation District Envir. Facilities Rev. (Motiva Enterprises LLC Proj.) Series 2004, 1.07% 7/7/22, VRDN (a)(b) | | 89,185,000 | 89,185,000 |
| Texas Dept. of Hsg. & Cmnty. Affairs Residential Mtg. Rev. Participating VRDN Series XF 10 98, 1.16% 7/7/22 (Liquidity Facility Deutsche Bank AG New York Branch) (a)(f)(h) | | 2,900,000 | 2,900,000 |
| Texas Private Activity Bond Surface Trans. Corp. Participating VRDN Series XM 07 56, 1.1% 7/7/22 (Liquidity Facility Deutsche Bank AG New York Branch) (a)(b)(f)(h) | | 4,100,000 | 4,100,000 |
| Trinity Riv Pub. Facilities Corp. Tex M Participating VRDN Series XF 10 83, 1.16% 7/7/22 (Liquidity Facility Deutsche Bank AG New York Branch) (a)(f)(h) | | 3,300,000 | 3,300,000 |
|
| TOTAL TEXAS | | | 122,360,000 |
|
| Utah - 1.5% | | | |
| Roers Salt Lake City Apt. Participating VRDN Series XF 11 38, 1.16% 7/7/22 (Liquidity Facility Deutsche Bank AG New York Branch) (a)(f)(h) | | 3,200,000 | 3,200,000 |
| Salt Lake City Arpt. Rev. Participating VRDN: | | | |
| Series 17 XM 0493, 1.03% 7/7/22 (Liquidity Facility Morgan Stanley Bank, West Valley City Utah) (a)(b)(f)(h) | | 11,200,000 | 11,200,000 |
| Series Floaters XM 06 99, 1.08% 7/7/22 (Liquidity Facility Cr. Suisse AG) (a)(b)(f)(h) | | 8,300,000 | 8,300,000 |
| Series XM 08 82, 1.04% 7/7/22 (Liquidity Facility JPMorgan Chase Bank) (a)(b)(f)(h) | | 2,700,000 | 2,700,000 |
| Series ZF 29 76, 1.11% 7/7/22 (Liquidity Facility Morgan Stanley Bank, West Valley City Utah) (a)(b)(f)(h) | | 4,600,000 | 4,600,000 |
| Utah Hsg. Corp. Multi-family Hsg. Rev. Participating VRDN Series 2021 XF 11 00, 1.16% 7/7/22 (Liquidity Facility Deutsche Bank AG New York Branch) (a)(f)(h) | | 8,300,000 | 8,300,000 |
|
| TOTAL UTAH | | | 38,300,000 |
|
| Washington - 0.7% | | | |
| Seattle Hsg. Auth. Rev. (Douglas Apts. Proj.) Series 2008, 1.1% 7/7/22, LOC KeyBank NA, VRDN (a) | | 1,000,000 | 1,000,000 |
| Washington Convention Ctr. Pub. Facilities Participating VRDN Series Floaters ZM 06 79, 1.21% 7/7/22 (Liquidity Facility Citibank NA) (a)(f)(h) | | 4,050,000 | 4,050,000 |
| Washington Econ. Dev. Fin. Auth. Rev. Participating VRDN Series Floaters 005, 1.09% 8/11/22 (Liquidity Facility Barclays Bank PLC) (a)(b)(f)(h) | | 9,255,000 | 9,255,000 |
| Washington Health Care Facilities Auth. Rev. Participating VRDN Series XM 08 83, 1.06% 7/7/22 (Liquidity Facility JPMorgan Chase Bank) (a)(f)(h) | | 3,000,000 | 3,000,000 |
|
| TOTAL WASHINGTON | | | 17,305,000 |
|
| West Virginia - 0.2% | | | |
| West Virginia Hosp. Fin. Auth. Hosp. Rev. Series 2018 E, 1.21% 7/7/25, VRDN (a) | | 4,575,000 | 4,575,000 |
| Wisconsin - 0.2% | | | |
| Pub. Fin. Auth. Mulfa Hs Rev. Participating VRDN Series 2022 MIZ 90 92, 1.16% 8/4/22 (Liquidity Facility Mizuho Cap. Markets LLC) (a)(f)(g)(h) | | 3,245,000 | 3,245,000 |
| Pub. Fin. Auth. Hosp. Rev. Participating VRDN Series XM 09 14, 1.06% 7/7/22 (Liquidity Facility JPMorgan Chase Bank) (a)(f)(h) | | 1,560,000 | 1,560,000 |
| Wisconsin Ctr. District Tax Rev. Participating VRDN Series 2021 XF 12 22, 1.05% 7/7/22 (Liquidity Facility JPMorgan Chase Bank) (a)(f)(h) | | 400,000 | 400,000 |
|
| TOTAL WISCONSIN | | | 5,205,000 |
|
| TOTAL MUNICIPAL NOTES | | | |
| (Cost $1,163,331,695) | | | 1,163,100,412 |
| | | Shares | Value |
|
| Money Market Funds - 7.2% | | | |
| Fidelity Municipal Cash Central Fund 0.88% (i)(j) | | | |
| (Cost $180,041,323) | | 180,007,221 | 180,043,212 |
| TOTAL INVESTMENT IN SECURITIES - 100.8% | | | |
| (Cost $2,519,560,302) | | | 2,502,968,277 |
| NET OTHER ASSETS (LIABILITIES) - (0.8)% | | | (20,853,738) |
| NET ASSETS - 100% | | | $2,482,114,539 |
Security Type Abbreviations
BAN – BOND ANTICIPATION NOTE
CP – COMMERCIAL PAPER
VRDN – VARIABLE RATE DEMAND NOTE (A debt instrument that is payable upon demand, either daily, weekly or monthly)
Legend
(a) Coupon rates for floating and adjustable rate securities reflect the rates in effect at period end.
(b) Private activity obligations whose interest is subject to the federal alternative minimum tax for individuals.
(c) Security exempt from registration under Rule 144A of the Securities Act of 1933. These securities may be resold in transactions exempt from registration, normally to qualified institutional buyers. At the end of the period, the value of these securities amounted to $38,009,131 or 1.5% of net assets.
(d) Security or a portion of the security purchased on a delayed delivery or when-issued basis.
(e) Coupon is indexed to a floating interest rate which may be multiplied by a specified factor and/or subject to caps or floors.
(f) Provides evidence of ownership in one or more underlying municipal bonds.
(g) Restricted securities (including private placements) - Investment in securities not registered under the Securities Act of 1933 (excluding 144A issues). At the end of the period, the value of restricted securities (excluding 144A issues) amounted to $99,395,000 or 4.0% of net assets.
(h) Coupon rates are determined by re-marketing agents based on current market conditions.
(i) Information in this report regarding holdings by state and security types does not reflect the holdings of the Fidelity Municipal Cash Central Fund.
(j) Affiliated fund that is generally available only to investment companies and other accounts managed by Fidelity Investments. The rate quoted is the annualized seven-day yield of the fund at period end. A complete unaudited listing of the fund's holdings as of its most recent quarter end is available upon request. In addition, each Fidelity Central Fund's financial statements are available on the SEC's website or upon request.
Additional information on each restricted holding is as follows:
| Security | Acquisition Date | Acquisition Cost |
| Arizona St Indl. Dev. Auth. Multi Participating VRDN Series Floater MIZ 90 88, 1.16% 8/4/22 (Liquidity Facility Mizuho Cap. Markets LLC) | 2/3/22 | $21,000,000 |
| Chester County Indl. Dev. Auth. Student Hsg. Rev. Participating VRDN Series DBE 80 86, 1.31% 8/29/22 (Liquidity Facility Deutsche Bank AG New York Branch) | 4/14/22 | $6,000,000 |
| Colorado Hsg. & Fin. Auth. Multi-family Hsg. Rev. Participating VRDN Series Floater 2021 MIZ 90 68, 1.16% 8/4/22 (Liquidity Facility Mizuho Cap. Markets LLC) | 4/14/21 | $300,000 |
| Core/Related Gala Rentals Lp Participating VRDN Series DBE 80 87, 1.31% 8/29/22 (Liquidity Facility Deutsche Bank AG New York Branch) | 6/2/22 | $5,780,000 |
| Kansas City Planned Indl. Expansion Participating VRDN Series Floater MIZ 90 86, 1.16% 8/4/22 (Liquidity Facility Mizuho Cap. Markets LLC) | 1/27/22 | $1,500,000 |
| Lees Summit Indl. Dev. Auth. Multi-family Hsg. Rev. Participating VRDN Series MIZ 90 55, 1.16% 8/4/22 (Liquidity Facility Mizuho Cap. Markets LLC) | 12/29/20 | $500,000 |
| Louisiana Hsg. Corp. Multifamily Hsg. Rev. Participating VRDN Series MIZ 90 53, 1.16% 8/4/22 (Liquidity Facility Mizuho Cap. Markets LLC) | 12/17/20 | $1,400,000 |
| Miami Dade County Hsg. Multifamily Hsg. Rev. Participating VRDN Series Floater MIZ 90 87, 1.16% 8/4/22 (Liquidity Facility Mizuho Cap. Markets LLC) | 1/27/22 | $1,900,000 |
| Miami Dade County Hsg. Multifamily Hsg. Rev. Participating VRDN Series MIZ 90 72, 1.16% 8/4/22 (Liquidity Facility Mizuho Cap. Markets LLC) | 9/2/21 | $800,000 |
| Montana Board of Hsg. Participating VRDN Series Floater MIZ 90 62, 1.16% 8/4/22 (Liquidity Facility Mizuho Cap. Markets LLC) | 3/2/21 | $1,110,000 |
| Nevada Hsg. Division Participating VRDN Series 2022 MIZ 90 91, 1.16% 8/4/22 (Liquidity Facility Mizuho Cap. Markets LLC) | 2/10/22 | $8,600,000 |
| Philadelphia Auth. for Indl. Dev. Participating VRDN Series MIZ 90 51, 1.16% 8/4/22 (Liquidity Facility Mizuho Cap. Markets LLC) | 11/12/20 | $2,430,000 |
| Pub. Fin. Auth. Mulfa Hs Rev. Participating VRDN Series 2022 MIZ 90 92, 1.16% 8/4/22 (Liquidity Facility Mizuho Cap. Markets LLC) | 2/24/22 | $3,245,000 |
| River Islands Pub. Fing. Auth. Participating VRDN Series MIZ 90 26, 1.16% 8/4/22 (Liquidity Facility Mizuho Cap. Markets LLC) | 8/14/20 | $9,700,000 |
| San Francisco City & County Multi-family Hsg. Rev. Participating VRDN Series DBE 8059, 1.31% 8/29/22 (Liquidity Facility Deutsche Bank AG New York Branch) | 12/10/20 - 4/13/22 | $11,800,000 |
| San Francisco City & County Multi-family Hsg. Rev. Participating VRDN Series MIZ 90 63, 1.16% 8/4/22 (Liquidity Facility Mizuho Cap. Markets LLC) | 2/18/21 | $23,330,000 |
Affiliated Central Funds
Fiscal year to date information regarding the Fund's investments in Fidelity Central Funds, including the ownership percentage, is presented below.
| Fund | Value, beginning of period | Purchases | Sales Proceeds | Dividend Income | Realized Gain/Loss | Change in Unrealized appreciation (depreciation) | Value, end of period | % ownership, end of period |
| Fidelity Municipal Cash Central Fund 0.88% | $111,289,220 | $713,443,000 | $644,689,000 | $429,662 | $-- | $(8) | $180,043,212 | 12.1% |
| Total | $111,289,220 | $713,443,000 | $644,689,000 | $429,662 | $-- | $(8) | $180,043,212 | |
Amounts in the income column in the above table include any capital gain distributions from underlying funds, which are presented in the corresponding line-item in the Statement of Operations, if applicable.
Investment Valuation
The following is a summary of the inputs used, as of June 30, 2022, involving the Fund's assets and liabilities carried at fair value. The inputs or methodology used for valuing securities may not be an indication of the risk associated with investing in those securities. For more information on valuation inputs, and their aggregation into the levels used below, please refer to the Investment Valuation section in the accompanying Notes to Financial Statements.
| | Valuation Inputs at Reporting Date: |
| Description | Total | Level 1 | Level 2 | Level 3 |
| Investments in Securities: | | | | |
| Municipal Securities | $2,322,925,065 | $-- | $2,322,925,065 | $-- |
| Money Market Funds | 180,043,212 | 180,043,212 | -- | -- |
| Total Investments in Securities: | $2,502,968,277 | $180,043,212 | $2,322,925,065 | $-- |
Other Information
The distribution of municipal securities by revenue source, as a percentage of total Net Assets, is as follows (Unaudited):
| Synthetics | 32.7% |
| Transportation | 11.9% |
| General Obligations | 11.1% |
| Industrial Development | 10.3% |
| Other | 7.2% |
| State G.O. | 6.1% |
| Resource Recovery | 5.1% |
| Others* (Individually Less Than 5%) | 15.6% |
| | 100.0% |
* Includes net other assets
See accompanying notes which are an integral part of the financial statements.
Financial Statements
Statement of Assets and Liabilities
| | | June 30, 2022 (Unaudited) |
| Assets | | |
Investment in securities, at value — See accompanying schedule:
Unaffiliated issuers (cost $2,339,518,979) | $2,322,925,065 | |
| Fidelity Central Funds (cost $180,041,323) | 180,043,212 | |
| Total Investment in Securities (cost $2,519,560,302) | | $2,502,968,277 |
| Cash | | 3,497,869 |
| Receivable for fund shares sold | | 7,756,956 |
| Interest receivable | | 12,681,673 |
| Distributions receivable from Fidelity Central Funds | | 129,938 |
| Receivable from investment adviser for expense reductions | | 212,019 |
| Other receivables | | 324 |
| Total assets | | 2,527,247,056 |
| Liabilities | | |
| Payable for investments purchased | | |
| Regular delivery | $15,439,504 | |
| Delayed delivery | 21,177,531 | |
| Payable for fund shares redeemed | 6,856,654 | |
| Distributions payable | 915,086 | |
| Accrued management fee | 632,142 | |
| Other affiliated payables | 111,600 | |
| Total liabilities | | 45,132,517 |
| Net Assets | | $2,482,114,539 |
| Net Assets consist of: | | |
| Paid in capital | | $2,500,059,213 |
| Total accumulated earnings (loss) | | (17,944,674) |
| Net Assets | | $2,482,114,539 |
| Net Asset Value and Maximum Offering Price | | |
| Conservative Income Municipal Bond: | | |
| Net Asset Value, offering price and redemption price per share ($150,220,018 ÷ 15,064,089 shares) | | $9.97 |
| Institutional Class: | | |
| Net Asset Value, offering price and redemption price per share ($2,331,894,521 ÷ 233,838,245 shares) | | $9.97 |
See accompanying notes which are an integral part of the financial statements.
Statement of Operations
| | | Six months ended June 30, 2022 (Unaudited) |
| Investment Income | | |
| Interest | | $8,087,724 |
| Income from Fidelity Central Funds | | 429,662 |
| Total income | | 8,517,386 |
| Expenses | | |
| Management fee | $3,960,287 | |
| Transfer agent fees | 699,959 | |
| Independent trustees' fees and expenses | 4,065 | |
| Miscellaneous | 494 | |
| Total expenses before reductions | 4,664,805 | |
| Expense reductions | (1,307,556) | |
| Total expenses after reductions | | 3,357,249 |
| Net investment income (loss) | | 5,160,137 |
| Realized and Unrealized Gain (Loss) | | |
| Net realized gain (loss) on: | | |
| Investment securities: | | |
| Unaffiliated issuers | (240,287) | |
| Total net realized gain (loss) | | (240,287) |
| Change in net unrealized appreciation (depreciation) on: | | |
| Investment securities: | | |
| Unaffiliated issuers | (18,383,921) | |
| Fidelity Central Funds | (8) | |
| Total change in net unrealized appreciation (depreciation) | | (18,383,929) |
| Net gain (loss) | | (18,624,216) |
| Net increase (decrease) in net assets resulting from operations | | $(13,464,079) |
See accompanying notes which are an integral part of the financial statements.
Statement of Changes in Net Assets
| | Six months ended June 30, 2022 (Unaudited) | Year ended December 31, 2021 |
| Increase (Decrease) in Net Assets | | |
| Operations | | |
| Net investment income (loss) | $5,160,137 | $7,477,863 |
| Net realized gain (loss) | (240,287) | 159,817 |
| Change in net unrealized appreciation (depreciation) | (18,383,929) | (4,127,730) |
| Net increase (decrease) in net assets resulting from operations | (13,464,079) | 3,509,950 |
| Distributions to shareholders | (5,156,662) | (7,476,045) |
| Share transactions - net increase (decrease) | (260,646,531) | (674,382,489) |
| Total increase (decrease) in net assets | (279,267,272) | (678,348,584) |
| Net Assets | | |
| Beginning of period | 2,761,381,811 | 3,439,730,395 |
| End of period | $2,482,114,539 | $2,761,381,811 |
See accompanying notes which are an integral part of the financial statements.
Financial Highlights
Fidelity Conservative Income Municipal Bond Fund
| | Six months ended (Unaudited) June 30, | Years endedDecember 31, | | | | |
| | 2022 | 2021 | 2020 | 2019 | 2018 | 2017 |
| Selected Per–Share Data | | | | | | |
| Net asset value, beginning of period | $10.04 | $10.05 | $10.05 | $10.02 | $10.01 | $10.00 |
| Income from Investment Operations | | | | | | |
| Net investment income (loss)A,B | .015 | .015 | .071 | .147 | .134 | .090 |
| Net realized and unrealized gain (loss) | (.070) | (.010) | .007 | .032 | .011 | .010 |
| Total from investment operations | (.055) | .005 | .078 | .179 | .145 | .100 |
| Distributions from net investment income | (.015) | (.015) | (.077) | (.148) | (.134) | (.088) |
| Distributions from net realized gain | – | – | (.001) | (.001) | (.001) | (.002) |
| Total distributions | (.015) | (.015) | (.078) | (.149) | (.135) | (.090) |
| Net asset value, end of period | $9.97 | $10.04 | $10.05 | $10.05 | $10.02 | $10.01 |
| Total ReturnC,D | (.55)% | .05% | .78% | 1.79% | 1.45% | 1.00% |
| Ratios to Average Net AssetsB,E,F | | | | | | |
| Expenses before reductions | .40%G | .40% | .40% | .40% | .40% | .40% |
| Expenses net of fee waivers, if any | .35%G | .35% | .35% | .35% | .35% | .35% |
| Expenses net of all reductions | .35%G | .35% | .35% | .35% | .35% | .35% |
| Net investment income (loss) | .30%G | .15% | .71% | 1.46% | 1.34% | .90% |
| Supplemental Data | | | | | | |
| Net assets, end of period (000 omitted) | $150,220 | $180,805 | $264,227 | $231,598 | $251,811 | $234,599 |
| Portfolio turnover rateH | 45%G | 56% | 41% | 63% | 45%I | 33% |
A Calculated based on average shares outstanding during the period.
B Net investment income (loss) is affected by the timing of the declaration of dividends by any underlying mutual funds or exchange-traded funds (ETFs). Net investment income (loss) of any such underlying funds is not included in the Fund's net investment income (loss) ratio.
C Total returns for periods of less than one year are not annualized.
D Total returns would have been lower if certain expenses had not been reduced during the applicable periods shown.
E Fees and expenses of any underlying mutual funds or exchange-traded funds (ETFs) are not included in the Fund's expense ratio. The Fund indirectly bears its proportionate share of these expenses. For additional expense information related to investments in Fidelity Central Funds, please refer to the "Investments in Fidelity Central Funds" note found in the Notes to Financial Statements section of the most recent Annual or Semi-Annual report.
F Expense ratios reflect operating expenses of the class. Expenses before reductions do not reflect amounts reimbursed, waived, or reduced through arrangements with the investment adviser, brokerage services, or other offset arrangements, if applicable, and do not represent the amount paid by the class during periods when reimbursements, waivers or reductions occur.
G Annualized
H Amount does not include the portfolio activity of any underlying mutual funds or exchange-traded funds (ETFs).
I Portfolio turnover rate excludes securities received or delivered in-kind.
See accompanying notes which are an integral part of the financial statements.
Fidelity Conservative Income Municipal Bond Fund Institutional Class
| | Six months ended (Unaudited) June 30, | Years endedDecember 31, | | | | |
| | 2022 | 2021 | 2020 | 2019 | 2018 | 2017 |
| Selected Per–Share Data | | | | | | |
| Net asset value, beginning of period | $10.04 | $10.06 | $10.06 | $10.02 | $10.01 | $10.00 |
| Income from Investment Operations | | | | | | |
| Net investment income (loss)A,B | .020 | .025 | .081 | .157 | .144 | .099 |
| Net realized and unrealized gain (loss) | (.070) | (.020) | .007 | .042 | .011 | .011 |
| Total from investment operations | (.050) | .005 | .088 | .199 | .155 | .110 |
| Distributions from net investment income | (.020) | (.025) | (.087) | (.158) | (.144) | (.098) |
| Distributions from net realized gain | – | – | (.001) | (.001) | (.001) | (.002) |
| Total distributions | (.020) | (.025) | (.088) | (.159) | (.145) | (.100) |
| Net asset value, end of period | $9.97 | $10.04 | $10.06 | $10.06 | $10.02 | $10.01 |
| Total ReturnC,D | (.50)% | .05% | .88% | 2.00% | 1.56% | 1.11% |
| Ratios to Average Net AssetsB,E,F | | | | | | |
| Expenses before reductions | .35%G | .35% | .35% | .35% | .35% | .35% |
| Expenses net of fee waivers, if any | .25%G | .25% | .25% | .25% | .25% | .25% |
| Expenses net of all reductions | .25%G | .25% | .25% | .25% | .25% | .25% |
| Net investment income (loss) | .40%G | .25% | .81% | 1.56% | 1.44% | 1.00% |
| Supplemental Data | | | | | | |
| Net assets, end of period (000 omitted) | $2,331,895 | $2,580,577 | $3,175,503 | $2,108,640 | $1,607,689 | $1,689,234 |
| Portfolio turnover rateH | 45%G | 56% | 41% | 63% | 45%I | 33% |
A Calculated based on average shares outstanding during the period.
B Net investment income (loss) is affected by the timing of the declaration of dividends by any underlying mutual funds or exchange-traded funds (ETFs). Net investment income (loss) of any such underlying funds is not included in the Fund's net investment income (loss) ratio.
C Total returns for periods of less than one year are not annualized.
D Total returns would have been lower if certain expenses had not been reduced during the applicable periods shown.
E Fees and expenses of any underlying mutual funds or exchange-traded funds (ETFs) are not included in the Fund's expense ratio. The Fund indirectly bears its proportionate share of these expenses. For additional expense information related to investments in Fidelity Central Funds, please refer to the "Investments in Fidelity Central Funds" note found in the Notes to Financial Statements section of the most recent Annual or Semi-Annual report.
F Expense ratios reflect operating expenses of the class. Expenses before reductions do not reflect amounts reimbursed, waived, or reduced through arrangements with the investment adviser, brokerage services, or other offset arrangements, if applicable, and do not represent the amount paid by the class during periods when reimbursements, waivers or reductions occur.
G Annualized
H Amount does not include the portfolio activity of any underlying mutual funds or exchange-traded funds (ETFs).
I Portfolio turnover rate excludes securities received or delivered in-kind.
See accompanying notes which are an integral part of the financial statements.
Notes to Financial Statements (Unaudited)
For the period ended June 30, 2022
1. Organization.
Fidelity Conservative Income Municipal Bond Fund (the Fund) is a fund of Fidelity Municipal Trust (the Trust) and is authorized to issue an unlimited number of shares. The Trust is registered under the Investment Company Act of 1940, as amended (the 1940 Act), as an open-end management investment company organized as a Massachusetts business trust. The Fund offers Conservative Income Municipal Income Bond and Institutional Class shares, each of which has equal rights as to assets and voting privileges. Each class has exclusive voting rights with respect to matters that affect that class.
2. Investments in Fidelity Central Funds.
Funds may invest in Fidelity Central Funds, which are open-end investment companies generally available only to other investment companies and accounts managed by the investment adviser and its affiliates. The Schedule of Investments lists any Fidelity Central Funds held as an investment as of period end, but does not include the underlying holdings of each Fidelity Central Fund. An investing fund indirectly bears its proportionate share of the expenses of the underlying Fidelity Central Funds.
Based on its investment objective, each Fidelity Central Fund may invest or participate in various investment vehicles or strategies that are similar to those of the investing fund. These strategies are consistent with the investment objectives of the investing fund and may involve certain economic risks which may cause a decline in value of each of the Fidelity Central Funds and thus a decline in the value of the investing fund.
| Fidelity Central Fund | Investment Manager | Investment Objective | Investment Practices | Expense Ratio(a) |
| Fidelity Money Market Central Funds | Fidelity Management & Research Company LLC (FMR) | Each fund seeks to obtain a high level of current income consistent with the preservation of capital and liquidity. | Short-term Investments | Less than .005% |
(a) Expenses expressed as a percentage of average net assets and are as of each underlying Central Fund's most recent annual or semi-annual shareholder report.
A complete unaudited list of holdings for each Fidelity Central Fund is available upon request or at the Securities and Exchange Commission website at www.sec.gov. In addition, the financial statements of the Fidelity Central Funds which contain the significant accounting policies (including investment valuation policies) of those funds, and are not covered by the Report of Independent Registered Public Accounting Firm, are available on the Securities and Exchange Commission website or upon request.
3. Significant Accounting Policies.
The Fund is an investment company and applies the accounting and reporting guidance of the Financial Accounting Standards Board (FASB) Accounting Standards Codification Topic 946 Financial Services - Investment Companies. The financial statements have been prepared in conformity with accounting principles generally accepted in the United States of America (GAAP), which require management to make certain estimates and assumptions at the date of the financial statements. Actual results could differ from those estimates. Subsequent events, if any, through the date that the financial statements were issued have been evaluated in the preparation of the financial statements. The Fund's Schedule of Investments lists any underlying mutual funds or exchange-traded funds (ETFs) but does not include the underlying holdings of these funds. The following summarizes the significant accounting policies of the Fund:
Investment Valuation. Investments are valued as of 4:00 p.m. Eastern time on the last calendar day of the period. The Board of Trustees (the Board) has delegated the day to day responsibility for the valuation of the Fund's investments to the Fair Value Committee (the Committee) established by the Fund's investment adviser. In accordance with valuation policies and procedures approved by the Board, the Fund attempts to obtain prices from one or more third party pricing vendors or brokers to value its investments. When current market prices, quotations or currency exchange rates are not readily available or reliable, investments will be fair valued in good faith by the Committee, in accordance with procedures adopted by the Board. Factors used in determining fair value vary by investment type and may include market or investment specific events, changes in interest rates and credit quality. The frequency with which these procedures are used cannot be predicted and they may be utilized to a significant extent. The Committee oversees the Fund's valuation policies and procedures and reports to the Board on the Committee's activities and fair value determinations. The Board monitors the appropriateness of the procedures used in valuing the Fund's investments and ratifies the fair value determinations of the Committee.
The Fund categorizes the inputs to valuation techniques used to value its investments into a disclosure hierarchy consisting of three levels as shown below:
- Level 1 – unadjusted quoted prices in active markets for identical investments
- Level 2 – other significant observable inputs (including quoted prices for similar investments, interest rates, prepayment speeds, etc.)
- Level 3 – unobservable inputs (including the Fund's own assumptions based on the best information available)
Valuation techniques used to value the Fund's investments by major category are as follows:
Debt securities, including restricted securities, are valued based on evaluated prices received from third party pricing vendors or from brokers who make markets in such securities. Municipal securities are valued by pricing vendors who utilize matrix pricing which considers yield or price of bonds of comparable quality, coupon, maturity and type or by broker-supplied prices. When independent prices are unavailable or unreliable, debt securities may be valued utilizing pricing methodologies which consider similar factors that would be used by third party pricing vendors. Debt securities are generally categorized as Level 2 in the hierarchy but may be Level 3 depending on the circumstances.
Investments in open-end mutual funds, including the Fidelity Central Funds, are valued at their closing net asset value (NAV) each business day and are categorized as Level 1 in the hierarchy.
Changes in valuation techniques may result in transfers in or out of an assigned level within the disclosure hierarchy. The aggregate value of investments by input level as of June 30, 2022 is included at the end of the Fund's Schedule of Investments.
Investment Transactions and Income. For financial reporting purposes, the Fund's investment holdings and NAV include trades executed through the end of the last business day of the period. The NAV per share for processing shareholder transactions is calculated as of the close of business of the New York Stock Exchange (NYSE), normally 4:00 p.m. Eastern time and includes trades executed through the end of the prior business day. Gains and losses on securities sold are determined on the basis of identified cost. Income and capital gain distributions from Fidelity Central Funds, if any, are recorded on the ex-dividend date. Interest income is accrued as earned and includes coupon interest and amortization of premium and accretion of discount on debt securities as applicable.
Class Allocations and Expenses. Investment income, realized and unrealized capital gains and losses, common expenses of a fund, and certain fund-level expense reductions, if any, are allocated daily on a pro-rata basis to each class based on the relative net assets of each class to the total net assets of a fund. Each class differs with respect to transfer agent and distribution and service plan fees incurred, as applicable. Certain expense reductions may also differ by class, if applicable. For the reporting period, the allocated portion of income and expenses to each class as a percent of its average net assets may vary due to the timing of recording these transactions in relation to fluctuating net assets of the classes. Expenses directly attributable to a fund are charged to that fund. Expenses attributable to more than one fund are allocated among the respective funds on the basis of relative net assets or other appropriate methods. Expenses included in the accompanying financial statements reflect the expenses of that fund and do not include any expenses associated with any underlying mutual funds or exchange-traded funds. Although not included in a fund's expenses, a fund indirectly bears its proportionate share of these expenses through the net asset value of each underlying mutual fund or exchange-traded fund. Expense estimates are accrued in the period to which they relate and adjustments are made when actual amounts are known.
Income Tax Information and Distributions to Shareholders. Each year, the Fund intends to qualify as a regulated investment company under Subchapter M of the Internal Revenue Code, including distributing substantially all of its taxable income and realized gains. As a result, no provision for U.S. Federal income taxes is required. The Fund files a U.S. federal tax return, in addition to state and local tax returns as required. The Fund's federal income tax returns are subject to examination by the Internal Revenue Service (IRS) for a period of three fiscal years after they are filed. State and local tax returns may be subject to examination for an additional fiscal year depending on the jurisdiction.
Distributions are declared and recorded daily and paid monthly from net investment income. Distributions from realized gains, if any, are declared and recorded on the ex-dividend date. Income and capital gain distributions are declared separately for each class. Income and capital gain distributions are determined in accordance with income tax regulations, which may differ from GAAP.
Capital accounts within the financial statements are adjusted for permanent book-tax differences. These adjustments have no impact on net assets or the results of operations. Capital accounts are not adjusted for temporary book-tax differences which will reverse in a subsequent period.
Book-tax differences are primarily due to market discount, capital loss carryforwards and losses deferred due to wash sales.
The Fund purchases municipal securities whose interest, in the opinion of the issuer, is free from federal income tax. There is no assurance that the IRS will agree with this opinion. In the event the IRS determines that the issuer does not comply with relevant tax requirements, interest payments from a security could become federally taxable, possibly retroactively to the date the security was issued.
As of period end, the cost and unrealized appreciation (depreciation) in securities, and derivatives if applicable, for federal income tax purposes were as follows:
| Gross unrealized appreciation | $636,659 |
| Gross unrealized depreciation | (17,225,871) |
| Net unrealized appreciation (depreciation) | $(16,589,212) |
| Tax cost | $2,519,557,489 |
Capital loss carryforwards are only available to offset future capital gains of the Fund to the extent provided by regulations and may be limited. The capital loss carryforward information presented below, including any applicable limitation, is estimated as of prior fiscal period end and is subject to adjustment.
| Short-term | $(1,019,072) |
| Long-term | (98,272) |
| Total capital loss carryforward | $(1,117,344) |
Delayed Delivery Transactions and When-Issued Securities. During the period, certain Funds transacted in securities on a delayed delivery or when-issued basis. Payment and delivery may take place after the customary settlement period for that security. The price of the underlying securities and the date when the securities will be delivered and paid for are fixed at the time the transaction is negotiated. Securities purchased on a delayed delivery or when-issued basis are identified as such in the Schedule of Investments. Compensation for interest forgone in the purchase of a delayed delivery or when-issued debt security may be received. With respect to purchase commitments, each applicable Fund identifies securities as segregated in its records with a value at least equal to the amount of the commitment. Payables and receivables associated with the purchases and sales of delayed delivery securities having the same coupon, settlement date and broker are offset. Delayed delivery or when-issued securities that have been purchased from and sold to different brokers are reflected as both payables and receivables in the Statement of Assets and Liabilities under the caption "Delayed delivery", as applicable. Losses may arise due to changes in the value of the underlying securities or if the counterparty does not perform under the contract's terms, or if the issuer does not issue the securities due to political, economic, or other factors.
Restricted Securities (including Private Placements). Funds may invest in securities that are subject to legal or contractual restrictions on resale. These securities generally may be resold in transactions exempt from registration or to the public if the securities are registered. Disposal of these securities may involve time-consuming negotiations and expense, and prompt sale at an acceptable price may be difficult. Information regarding restricted securities held at period end is included at the end of the Schedule of Investments, if applicable.
4. Purchases and Sales of Investments.
Purchases and sales of securities, other than short-term securities and in-kind transactions, as applicable, are noted in the table below.
| | Purchases ($) | Sales ($) |
| Fidelity Conservative Income Municipal Bond Fund | 301,404,571 | 529,728,511 |
5. Fees and Other Transactions with Affiliates.
Management Fee. Fidelity Management & Research Company LLC (the investment adviser) and its affiliates provide the Fund with investment management related services for which the Fund pays a monthly management fee that is based on an annual rate of .30% of the Fund's average net assets. Under the management contract, the investment adviser pays all other fund-level expenses, except the compensation of the independent Trustees and certain other expenses such as interest expense.
Transfer Agent Fees. Fidelity Investments Institutional Operations Company LLC (FIIOC), an affiliate of the investment adviser, is the transfer, dividend disbursing and shareholder servicing agent for the Fund. FIIOC receives asset-based fees of .10% and .05% of average net assets for Conservative Income Municipal Bond and Institutional Class, respectively. FIIOC pays for typesetting, printing and mailing of shareholder reports, except proxy statements. For the period, transfer agent fees for each class were as follows:
| | Amount |
| Conservative Income Municipal Bond | $79,823 |
| Institutional Class | 620,136 |
| | $699,959 |
Interfund Trades. Funds may purchase from or sell securities to other Fidelity Funds under procedures adopted by the Board. The procedures have been designed to ensure these interfund trades are executed in accordance with Rule 17a-7 of the 1940 Act. Any interfund trades are included within the respective purchases and sales amounts shown in the Purchases and Sales of Investments note. Interfund trades during the period are noted in the table below.
| | Purchases ($) | Sales ($) | Realized Gain (Loss) ($) |
| Fidelity Conservative Income Municipal Bond Fund | 46,550,000 | 95,167,143 | (5,581) |
6. Committed Line of Credit.
Certain Funds participate with other funds managed by the investment adviser or an affiliate in a $4.25 billion credit facility (the "line of credit") to be utilized for temporary or emergency purposes to fund shareholder redemptions or for other short-term liquidity purposes. The commitment fees on the pro-rata portion of the line of credit are borne by the investment adviser. During the period, there were no borrowings on this line of credit.
7. Expense Reductions.
The investment adviser contractually agreed to reimburse each class to the extent annual operating expenses exceeded certain levels of average net assets as noted in the table below. This reimbursement will remain in place through April 30, 2023. Some expenses, for example the compensation of the independent Trustees and certain other expenses such as interest expense are excluded from this reimbursement.
The following classes were in reimbursement during the period:
| | Expense Limitations | Reimbursement |
| Conservative Income Municipal Bond | .35% | $42,187 |
| Institutional Class | .25% | 1,265,105 |
| | | $1,307,292 |
In addition, through arrangements with the Fund's custodian, credits realized as a result of certain uninvested cash balances were used to reduce the Fund's expenses. During the period, these credits reduced the Fund's expenses by $264.
8. Distributions to Shareholders.
Distributions to shareholders of each class were as follows:
| | Six months ended
June 30, 2022 | Year ended
December 31, 2021 |
| Fidelity Conservative Income Municipal Bond Fund | | |
| Distributions to shareholders | | |
| Conservative Income Municipal Bond | $231,917 | $362,605 |
| Institutional Class | 4,924,745 | 7,113,440 |
| Total | $5,156,662 | $7,476,045 |
9. Share Transactions.
Share transactions for each class were as follows and may contain in-kind transactions, automatic conversions between classes or exchanges between affiliated funds:
| | Shares | Shares | Dollars | Dollars |
| | Six months ended June 30, 2022 | Year ended December 31, 2021 | Six months ended June 30, 2022 | Year ended December 31, 2021 |
| Fidelity Conservative Income Municipal Bond Fund | | | | |
| Conservative Income Municipal Bond | | | | |
| Shares sold | 2,115,318 | 8,524,530 | $21,101,219 | $85,739,190 |
| Reinvestment of distributions | 18,957 | 30,330 | 189,007 | 304,931 |
| Shares redeemed | (5,078,625) | (16,825,326) | (50,703,049) | (169,146,195) |
| Net increase (decrease) | (2,944,350) | (8,270,466) | $(29,412,823) | $(83,102,074) |
| Institutional Class | | | | |
| Shares sold | 128,214,113 | 175,381,338 | $1,279,792,571 | $1,763,184,354 |
| Reinvestment of distributions | 168,280 | 322,576 | 1,678,228 | 3,243,316 |
| Shares redeemed | (151,566,808) | (234,491,744) | (1,512,704,507) | (2,357,708,085) |
| Net increase (decrease) | (23,184,415) | (58,787,830) | $(231,233,708) | $(591,280,415) |
10. Other.
A fund's organizational documents provide former and current trustees and officers with a limited indemnification against liabilities arising in connection with the performance of their duties to the fund. In the normal course of business, a fund may also enter into contracts that provide general indemnifications. A fund's maximum exposure under these arrangements is unknown as this would be dependent on future claims that may be made against a fund. The risk of material loss from such claims is considered remote.
11. Coronavirus (COVID-19) Pandemic.
An outbreak of COVID-19 first detected in China during December 2019 has since spread globally and was declared a pandemic by the World Health Organization during March 2020. Developments that disrupt global economies and financial markets, such as the COVID-19 pandemic, may magnify factors that affect the Fund's performance.
Shareholder Expense Example
As a shareholder, you incur two types of costs: (1) transaction costs, which may include sales charges (loads) on purchase payments or redemption proceeds, as applicable and (2) ongoing costs, which generally include management fees, distribution and/or service (12b-1) fees and other Fund expenses. This Example is intended to help you understand your ongoing costs (in dollars) of investing in a fund and to compare these costs with the ongoing costs of investing in other mutual funds.
The Example is based on an investment of $1,000 invested at the beginning of the period and held for the entire period (January 1, 2022 to June 30, 2022).
Actual Expenses
The first line of the accompanying table provides information about actual account values and actual expenses. You may use the information in this line, together with the amount you invested, to estimate the expenses that you paid over the period. Simply divide your account value by $1,000.00 (for example, an $8,600 account value divided by $1,000.00 = 8.6), then multiply the result by the number in the first line for a class/Fund under the heading entitled "Expenses Paid During Period" to estimate the expenses you paid on your account during this period. If any fund is a shareholder of any underlying mutual funds or exchange-traded funds (ETFs) (the Underlying Funds), such fund indirectly bears its proportional share of the expenses of the Underlying Funds in addition to the direct expenses incurred presented in the table. These fees and expenses are not included in the annualized expense ratio used to calculate the expense estimate in the table below.
Hypothetical Example for Comparison Purposes
The second line of the accompanying table provides information about hypothetical account values and hypothetical expenses based on the actual expense ratio and an assumed rate of return of 5% per year before expenses, which is not the actual return. The hypothetical account values and expenses may not be used to estimate the actual ending account balance or expenses you paid for the period. You may use this information to compare the ongoing costs of investing in the Fund and other funds. To do so, compare this 5% hypothetical example with the 5% hypothetical examples that appear in the shareholder reports of the other funds. If any fund is a shareholder of any Underlying Funds, such fund indirectly bears its proportional share of the expenses of the Underlying Funds in addition to the direct expenses as presented in the table. These fees and expenses are not included in the annualized expense ratio used to calculate the expense estimate in the table below.
Please note that the expenses shown in the table are meant to highlight your ongoing costs only and do not reflect any transaction costs. Therefore, the second line of the table is useful in comparing ongoing costs only, and will not help you determine the relative total costs of owning different funds. In addition, if these transactional costs were included, your costs would have been higher.
| | Annualized Expense Ratio-A | Beginning
Account Value
January 1, 2022 | Ending
Account Value
June 30, 2022 | Expenses Paid
During Period-B
January 1, 2022
to June 30, 2022 |
| Fidelity Conservative Income Municipal Bond Fund | | | | |
| Conservative Income Municipal Bond | .35% | | | |
| Actual | | $1,000.00 | $994.50 | $1.73 |
| Hypothetical-C | | $1,000.00 | $1,023.06 | $1.76 |
| Institutional Class | .25% | | | |
| Actual | | $1,000.00 | $995.00 | $1.24 |
| Hypothetical-C | | $1,000.00 | $1,023.55 | $1.25 |
A Annualized expense ratio reflects expenses net of applicable fee waivers.
B Expenses are equal to the annualized expense ratio, multiplied by the average account value over the period, multiplied by 181/ 365 (to reflect the one-half year period). The fees and expenses of any Underlying Funds are not included in each annualized expense ratio.
C 5% return per year before expenses
Liquidity Risk Management Program
The Securities and Exchange Commission adopted Rule 22e-4 under the Investment Company Act of 1940 (the Liquidity Rule) to promote effective liquidity risk management throughout the open-end investment company industry, thereby reducing the risk that funds will be unable to meet their redemption obligations and mitigating dilution of the interests of fund shareholders.
The Fund has adopted and implemented a liquidity risk management program pursuant to the Liquidity Rule (the Program) effective December 1, 2018. The Program is reasonably designed to assess and manage the Fund’s liquidity risk and to comply with the requirements of the Liquidity Rule. The Fund’s Board of Trustees (the Board) has designated the Fund’s investment adviser as administrator of the Program. The Fidelity advisers have established a Liquidity Risk Management Committee (the LRM Committee) to manage the Program for each of the Fidelity Funds. The LRM Committee monitors the adequacy and effectiveness of implementation of the Program and on a periodic basis assesses each Fund’s liquidity risk based on a variety of factors including (1) the Fund’s investment strategy, (2) portfolio liquidity and cash flow projections during normal and reasonably foreseeable stressed conditions, (3) shareholder redemptions, (4) borrowings and other funding sources and (5) in the case of exchange-traded funds, certain additional factors including the effect of the Fund’s prices and spreads, market participants, and basket compositions on the overall liquidity of the Fund’s portfolio, as applicable.
In accordance with the Program, each of the Fund’s portfolio investments is classified into one of four liquidity categories described below based on a determination of a reasonable expectation for how long it would take to convert the investment to cash (or sell or dispose of the investment) without significantly changing its market value.
- Highly liquid investments – cash or convertible to cash within three business days or less
- Moderately liquid investments – convertible to cash in three to seven calendar days
- Less liquid investments – can be sold or disposed of, but not settled, within seven calendar days
- Illiquid investments – cannot be sold or disposed of within seven calendar days
Liquidity classification determinations take into account a variety of factors including various market, trading and investment-specific considerations, as well as market depth, and generally utilize analysis from a third-party liquidity metrics service.
The Liquidity Rule places a 15% limit on a fund’s illiquid investments and requires funds that do not primarily hold assets that are highly liquid investments to determine and maintain a minimum percentage of the fund’s net assets to be invested in highly liquid investments (highly liquid investment minimum or HLIM). The Program includes provisions reasonably designed to comply with the 15% limit on illiquid investments and for determining, periodically reviewing and complying with the HLIM requirement as applicable.
At a recent meeting of the Fund’s Board of Trustees, the LRM Committee provided a written report to the Board pertaining to the operation, adequacy, and effectiveness of implementation of the Program for the annual period from December 1, 2020 through November 30, 2021. The report concluded that the Program has been implemented and is operating effectively and is reasonably designed to assess and manage the Fund’s liquidity risk.
CMB-SANN-0822
1.967795.108
Fidelity Flex® Funds
Fidelity Flex® Municipal Income Fund
Semi-Annual Report
June 30, 2022
Contents
To view a fund's proxy voting guidelines and proxy voting record for the 12-month period ended June 30, visit http://www.fidelity.com/proxyvotingresults or visit the Securities and Exchange Commission's (SEC) web site at http://www.sec.gov.
You may also call 1-800-544-3455 (for managed account clients) or 1-800-835-5092 (for retirement plan participants) to request a free copy of the proxy voting guidelines.
Standard & Poor's, S&P and S&P 500 are registered service marks of The McGraw-Hill Companies, Inc. and have been licensed for use by Fidelity Distributors Corporation.
Other third-party marks appearing herein are the property of their respective owners.
All other marks appearing herein are registered or unregistered trademarks or service marks of FMR LLC or an affiliated company. © 2022 FMR LLC. All rights reserved.
This report and the financial statements contained herein are submitted for the general information of the shareholders of the Fund. This report is not authorized for distribution to prospective investors in the Fund unless preceded or accompanied by an effective prospectus.
A fund files its complete schedule of portfolio holdings with the SEC for the first and third quarters of each fiscal year on Form N-PORT. Forms N-PORT are available on the SEC’s web site at http://www.sec.gov. A fund's Forms N-PORT may be reviewed and copied at the SEC’s Public Reference Room in Washington, DC. Information regarding the operation of the SEC's Public Reference Room may be obtained by calling 1-800-SEC-0330.
For a complete list of a fund's portfolio holdings, view the most recent holdings listing, semiannual report, or annual report on Fidelity's web site at http://www.fidelity.com, http://www.institutional.fidelity.com, or http://www.401k.com, as applicable.
NOT FDIC INSURED •MAY LOSE VALUE •NO BANK GUARANTEE
Neither the Fund nor Fidelity Distributors Corporation is a bank.
Note to Shareholders:
Early in 2020, the outbreak and spread of COVID-19 emerged as a public health emergency that had a major influence on financial markets, primarily based on its impact on the global economy and corporate earnings. On March 11, 2020, the World Health Organization declared the COVID-19 outbreak a pandemic, citing sustained risk of further global spread. The pandemic prompted a number of measures to limit the spread of COVID-19, including travel and border restrictions, quarantines, and restrictions on large gatherings. In turn, these resulted in lower consumer activity, diminished demand for a wide range of products and services, disruption in manufacturing and supply chains, and – given the wide variability in outcomes regarding the outbreak – significant market uncertainty and volatility. To help stem the turmoil, the U.S. government took unprecedented action – in concert with the U.S. Federal Reserve and central banks around the world – to help support consumers, businesses, and the broader economy, and to limit disruption to the financial system.
In general, the overall impact of the pandemic lessened in 2021, amid a resilient economy and widespread distribution of three COVID-19 vaccines granted emergency use authorization from the U.S. Food and Drug Administration (FDA) early in the year. Still, the situation remains dynamic, and the extent and duration of its influence on financial markets and the economy is highly uncertain, due in part to a recent spike in cases based on highly contagious variants of the coronavirus.
Extreme events such as the COVID-19 crisis are exogenous shocks that can have significant adverse effects on mutual funds and their investments. Although multiple asset classes may be affected by market disruption, the duration and impact may not be the same for all types of assets. Fidelity is committed to helping you stay informed amid news about COVID-19 and during increased market volatility, and we continue to take extra steps to be responsive to customer needs. We encourage you to visit us online, where we offer ongoing updates, commentary, and analysis on the markets and our funds.
Investment Summary (Unaudited)
Top Five States as of June 30, 2022
| | % of fund's net assets |
| Illinois | 11.6 |
| Pennsylvania | 9.1 |
| California | 7.1 |
| New York | 7.0 |
| Ohio | 6.2 |
Top Five Sectors as of June 30, 2022
| | % of fund's net assets |
| General Obligations | 25.1 |
| Transportation | 20.7 |
| Health Care | 11.6 |
| Education | 10.4 |
| Housing | 9.4 |
Quality Diversification (% of fund's net assets)
| As of June 30, 2022 |
| | AAA | 9.7% |
| | AA,A | 70.8% |
| | BBB | 13.6% |
| | BB and Below | 2.9% |
| | Not Rated | 1.7% |
| | Short-Term Investments and Net Other Assets | 1.3% |
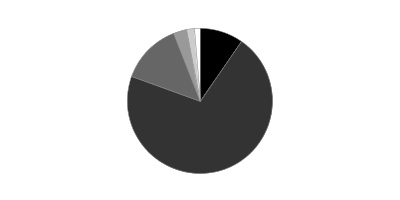
We have used ratings from Moody's Investors Service, Inc. Where Moody's® ratings are not available, we have used S&P® ratings. All ratings are as of the date indicated and do not reflect subsequent changes.
Schedule of Investments June 30, 2022 (Unaudited)
Showing Percentage of Net Assets
| Municipal Bonds - 98.7% | | | |
| | | Principal Amount | Value |
| Alabama - 0.4% | | | |
| Auburn Univ. Gen. Fee Rev. Series 2018 A, 5% 6/1/43 | | 100,000 | 108,371 |
| Homewood Edl. Bldg. Auth. Rev. Series 2019 A: | | | |
| 4% 12/1/33 | | $110,000 | $110,919 |
| 4% 12/1/41 | | 85,000 | 79,886 |
| 4% 12/1/49 | | 190,000 | 171,222 |
| Jefferson County Gen. Oblig. Series 2018 A: | | | |
| 5% 4/1/25 | | 100,000 | 107,550 |
| 5% 4/1/26 | | 100,000 | 109,763 |
| Lower Alabama Gas District Bonds (No. 2 Proj.) Series 2020, 4%, tender 12/1/25 (a) | | 1,095,000 | 1,111,170 |
| Montgomery Med. Clinic Facilities Series 2015, 5% 3/1/36 | | 425,000 | 437,621 |
|
| TOTAL ALABAMA | | | 2,236,502 |
|
| Alaska - 0.2% | | | |
| Alaska Hsg. Fin. Corp. Series 2021 A, 4% 12/1/29 | | 845,000 | 898,750 |
| Alaska Hsg. Fin. Corp. Mtg. Rev. Series 2022 A, 3% 6/1/51 | | 215,000 | 209,225 |
|
| TOTAL ALASKA | | | 1,107,975 |
|
| Arizona - 2.4% | | | |
| Arizona Board of Regents Arizona State Univ. Rev. Series 2012 A, 5% 7/1/32 (Pre-Refunded to 7/1/22 @ 100) | | 10,000 | 10,000 |
| Arizona Health Facilities Auth. Rev. (Scottsdale Lincoln Hospitals Proj.) Series 2014 A, 5% 12/1/39 | | 185,000 | 189,844 |
| Arizona Indl. Dev. Auth. Hosp. Rev. Series 2021 A, 5% 2/1/28 | | 1,000,000 | 1,112,747 |
| Arizona Indl. Dev. Auth. Lease Rev. Series 2020 A, 4% 9/1/46 | | 1,750,000 | 1,645,110 |
| Arizona Indl. Dev. Auth. Rev. (Provident Group-Eastern Michigan Univ. Parking Proj.) Series 2018: | | | |
| 5% 5/1/26 | | 450,000 | 416,732 |
| 5% 5/1/29 | | 290,000 | 265,833 |
| 5% 5/1/33 | | 565,000 | 501,111 |
| Arizona State Lottery Rev. Series 2019, 5% 7/1/23 (Escrowed to Maturity) | | 415,000 | 428,535 |
| Bullhead City Excise Taxes Series 2021 2: | | | |
| 0.95% 7/1/26 | | 250,000 | 227,509 |
| 1.15% 7/1/27 | | 375,000 | 335,858 |
| 1.3% 7/1/28 | | 485,000 | 424,736 |
| 1.5% 7/1/29 | | 600,000 | 519,191 |
| 1.65% 7/1/30 | | 825,000 | 703,355 |
| 1.7% 7/1/31 | | 450,000 | 374,681 |
| Chandler Indl. Dev. Auth. Indl. Dev. Rev. Bonds (Intel Corp. Proj.): | | | |
| Series 2005, 2.4%, tender 8/14/23 (a) | | 65,000 | 65,177 |
| Series 2007, 2.7%, tender 8/14/23 (a)(b) | | 600,000 | 603,595 |
| Series 2019, 5%, tender 6/3/24 (a)(b) | | 1,980,000 | 2,072,097 |
| Glendale Union School District 205 Series A: | | | |
| 4% 7/1/36 (Assured Guaranty Muni. Corp. Insured) | | 545,000 | 561,470 |
| 4% 7/1/37 (Assured Guaranty Muni. Corp. Insured) | | 1,000,000 | 1,019,962 |
| Glendale Indl. Dev. Auth. (Terraces of Phoenix Proj.) Series 2018 A: | | | |
| 5% 7/1/38 | | 10,000 | 9,174 |
| 5% 7/1/48 | | 10,000 | 8,645 |
| Maricopa County Indl. Dev. Auth.: | | | |
| (Creighton Univ. Proj.) Series 2020, 5% 7/1/47 | | 100,000 | 105,961 |
| Series 2021 A, 4% 9/1/51 | | 775,000 | 721,095 |
| Maricopa County Indl. Dev. Auth. Sr. Living Facilities Series 2016: | | | |
| 5.75% 1/1/36 (c) | | 300,000 | 238,808 |
| 6% 1/1/48 (c) | | 300,000 | 222,088 |
| Phoenix Civic Impt. Board Arpt. Rev. Series 2019 B, 5% 7/1/35 (b) | | 300,000 | 318,536 |
| Phoenix Civic Impt. Corp. Wtr. Sys. Rev. Series 2021 A, 5% 7/1/45 | | 1,000,000 | 1,109,233 |
| Western Maricopa Ed. Ctr. District Series 2019 B, 5% 7/1/24 | | 190,000 | 200,508 |
|
| TOTAL ARIZONA | | | 14,411,591 |
|
| California - 7.1% | | | |
| California Edl. Facilities Auth. Rev. Series T1, 5% 3/15/39 | | 65,000 | 76,446 |
| California Gen. Oblig.: | | | |
| Series 2020, 4% 11/1/37 | | 1,000,000 | 1,007,964 |
| Series 2021: | | | |
| 5% 9/1/32 | | 2,175,000 | 2,563,086 |
| 5% 10/1/41 | | 5,435,000 | 6,093,843 |
| California Health Facilities Fing. Auth. Rev. Series 2013 A, 5% 8/15/52 (Pre-Refunded to 8/15/23 @ 100) | | 445,000 | 461,052 |
| California Hsg. Fin. Agcy. Series 2021 1, 3.5% 11/20/35 | | 196,383 | 183,242 |
| California Pub. Works Board Lease Rev.: | | | |
| (Various Cap. Projs.): | | | |
| Series 2021 B, 4% 5/1/46 | | 1,265,000 | 1,233,541 |
| Series 2022 C: | | | |
| 5% 8/1/29 (d) | | 155,000 | 175,008 |
| 5% 8/1/32 (d) | | 285,000 | 325,763 |
| Series 2021 C: | | | |
| 5% 11/1/26 | | 5,000,000 | 5,549,122 |
| 5% 11/1/27 | | 2,380,000 | 2,685,537 |
| 5% 11/1/28 | | 2,500,000 | 2,855,651 |
| California Statewide Cmntys. Dev. Auth. Rev. Series 2015, 5% 2/1/45 | | 105,000 | 97,503 |
| Los Angeles Dept. Arpt. Rev. Series F, 5% 5/15/44 (b) | | 175,000 | 184,343 |
| Los Angeles Dept. of Wtr. & Pwr. Rev.: | | | |
| Series 2021 B, 5% 7/1/51 | | 1,550,000 | 1,696,025 |
| Series B, 5% 7/1/50 | | 1,070,000 | 1,168,145 |
| Los Angeles Hbr. Dept. Rev. Series 2019 A: | | | |
| 5% 8/1/22 (b) | | 155,000 | 155,411 |
| 5% 8/1/24 (b) | | 310,000 | 327,059 |
| 5% 8/1/25 (b) | | 110,000 | 118,122 |
| Middle Fork Proj. Fin. Auth. Series 2020, 5% 4/1/26 | | 1,000,000 | 1,069,789 |
| Mount Diablo Unified School District Series 2022 B: | | | |
| 4% 8/1/31 | | 225,000 | 242,383 |
| 4% 8/1/34 | | 320,000 | 333,583 |
| Sacramento County Arpt. Sys. Rev. Series 2018 C, 5% 7/1/39 (b) | | 105,000 | 109,982 |
| San Diego County Reg'l. Arpt. Auth. Arpt. Rev. Series 2019 A, 5% 7/1/49 | | 500,000 | 524,551 |
| San Diego County Wtr. Auth. Fing. Agcy. Wtr. Rev. Series 2022 A: | | | |
| 5% 5/1/47 | | 635,000 | 722,131 |
| 5% 5/1/52 | | 1,080,000 | 1,222,323 |
| San Francisco City & County Arpts. Commission Int'l. Arpt. Rev.: | | | |
| Series 2018 G, 5% 5/1/27 (b) | | 560,000 | 608,509 |
| Series 2019 A, 5% 5/1/49 (b) | | 3,000,000 | 3,117,026 |
| Series 2019 B, 5% 5/1/49 | | 45,000 | 47,435 |
| Series 2022 A: | | | |
| 5% 5/1/26 (b) | | 815,000 | 878,914 |
| 5% 5/1/27 (b) | | 830,000 | 903,840 |
| 5% 5/1/28 (b) | | 1,105,000 | 1,210,098 |
| 5% 5/1/29 (b) | | 740,000 | 814,232 |
| Series 2022 B, 5% 5/1/52 | | 2,240,000 | 2,394,178 |
| Univ. of California Revs. Series 2018 AZ, 5% 5/15/43 | | 130,000 | 140,162 |
| Washington Township Health Care District Rev.: | | | |
| Series 2017 A, 5% 7/1/35 | | 190,000 | 197,657 |
| Series 2017 B: | | | |
| 5% 7/1/29 | | 115,000 | 122,199 |
| 5% 7/1/30 | | 230,000 | 243,445 |
|
| TOTAL CALIFORNIA | | | 41,859,300 |
|
| Colorado - 2.7% | | | |
| Arkansas River Pwr. Auth. Rev. Series 2018 A: | | | |
| 5% 10/1/38 | | 40,000 | 41,737 |
| 5% 10/1/43 | | 50,000 | 51,284 |
| Colorado Health Facilities Auth.: | | | |
| (Parkview Med. Ctr., Inc. Proj.) Series 2016, 4% 9/1/35 | | 35,000 | 33,647 |
| Bonds Series 2019 B: | | | |
| 5%, tender 8/1/26 (a) | | 110,000 | 116,239 |
| 5%, tender 11/19/26 (a) | | 210,000 | 231,349 |
| Series 2019 A: | | | |
| 5% 11/1/25 | | 435,000 | 466,063 |
| 5% 11/15/39 | | 190,000 | 203,902 |
| Series 2019 A1, 4% 8/1/44 | | 1,060,000 | 975,605 |
| Series 2019 A2: | | | |
| 4% 8/1/49 | | 700,000 | 627,106 |
| 5% 8/1/44 | | 845,000 | 863,203 |
| Colorado Health Facilities Auth. Rev. Bonds Series 2016 C, 5%, tender 11/15/26 (a) | | 275,000 | 302,900 |
| Colorado Hsg. & Fin. Auth.: | | | |
| Series 2019 F, 4.25% 11/1/49 | | 60,000 | 61,310 |
| Series 2019 H, 4.25% 11/1/49 | | 35,000 | 35,774 |
| Colorado Reg'l. Trans. District Ctfs. of Prtn. Series 2020, 5% 6/1/31 | | 105,000 | 115,262 |
| Colorado Reg'l. Trans. District Sales Tax Rev. (Fastracks Proj.) Series 2021 B, 5% 11/1/28 | | 725,000 | 828,594 |
| Colorado Univ. Co. Hosp. Auth. Rev. Series 2012 A, 5% 11/15/42 | | 845,000 | 852,953 |
| Denver City & County Arpt. Rev.: | | | |
| Series 2017 A, 5% 11/15/26 (b) | | 50,000 | 54,554 |
| Series 2018 A, 5% 12/1/34 (b) | | 1,125,000 | 1,250,339 |
| Denver City & County Board Wtr. Rev.: | | | |
| Series 2020 A: | | | |
| 5% 9/15/45 | | 1,190,000 | 1,327,038 |
| 5% 9/15/46 | | 1,820,000 | 2,027,301 |
| Series 2020 B: | | | |
| 5% 9/15/27 | | 2,000,000 | 2,260,126 |
| 5% 9/15/28 | | 2,000,000 | 2,287,951 |
| Univ. of Colorado Enterprise Sys. Rev. Bonds: | | | |
| Series 2021 C3A, 2%, tender 10/15/25 (a) | | 255,000 | 249,034 |
| Series 2021 C3B, 2%, tender 10/15/26 (a) | | 210,000 | 202,435 |
| Vauxmont Metropolitan District: | | | |
| Series 2019, 5% 12/15/25 (Assured Guaranty Muni. Corp. Insured) | | 40,000 | 43,353 |
| Series 2020, 5% 12/1/30 (Assured Guaranty Muni. Corp. Insured) | | 220,000 | 249,569 |
|
| TOTAL COLORADO | | | 15,758,628 |
|
| Connecticut - 5.9% | | | |
| Bridgeport Gen. Oblig. Series 2021 A: | | | |
| 5% 8/1/32 | | 300,000 | 341,608 |
| 5% 8/1/33 | | 800,000 | 906,695 |
| 5% 8/1/34 | | 500,000 | 565,291 |
| Connecticut Gen. Oblig.: | | | |
| Series 2016 B: | | | |
| 5% 5/15/25 | | 220,000 | 237,162 |
| 5% 5/15/26 | | 125,000 | 137,424 |
| Series 2016 D, 5% 8/15/25 | | 210,000 | 227,566 |
| Series 2018 F: | | | |
| 5% 9/15/24 | | 100,000 | 106,223 |
| 5% 9/15/25 | | 100,000 | 108,550 |
| Series 2019 A: | | | |
| 4% 4/15/37 | | 1,800,000 | 1,804,533 |
| 5% 4/15/26 | | 115,000 | 126,232 |
| Series 2020 A, 4% 1/15/34 | | 300,000 | 307,195 |
| Series 2021 B, 5% 6/1/41 | | 1,125,000 | 1,247,199 |
| Series 2021 D: | | | |
| 5% 7/15/24 | | 260,000 | 274,891 |
| 5% 7/15/25 | | 430,000 | 465,163 |
| 5% 7/15/26 | | 425,000 | 468,701 |
| 5% 7/15/27 | | 570,000 | 639,147 |
| 5% 7/15/28 | | 655,000 | 741,666 |
| Series 2022 C: | | | |
| 4% 6/15/39 | | 300,000 | 299,322 |
| 4% 6/15/41 | | 250,000 | 246,554 |
| 5% 6/15/30 | | 400,000 | 458,846 |
| 5% 6/15/31 | | 500,000 | 576,133 |
| 5% 6/15/34 | | 350,000 | 399,229 |
| 5% 6/15/37 | | 250,000 | 281,787 |
| 5% 6/15/38 | | 300,000 | 336,961 |
| 5% 6/15/40 | | 500,000 | 559,000 |
| 5% 6/15/42 | | 500,000 | 556,384 |
| Series 2022 D, 5% 9/15/30 | | 650,000 | 747,348 |
| Series 2022: | | | |
| 5% 6/15/28 | | 500,000 | 565,584 |
| 5% 6/15/29 | | 410,000 | 468,128 |
| Connecticut Health & Edl. Facilities Auth. Rev.: | | | |
| Bonds Series 2020 B: | | | |
| 5%, tender 1/1/25 (a) | | 200,000 | 212,082 |
| 5%, tender 1/1/27 (a) | | 330,000 | 361,336 |
| Series 2018 K1: | | | |
| 5% 7/1/26 | | 680,000 | 708,701 |
| 5% 7/1/28 | | 1,120,000 | 1,172,465 |
| Series 2019 A, 5% 7/1/49 (c) | | 130,000 | 110,093 |
| Series 2019 Q-1: | | | |
| 5% 11/1/25 | | 90,000 | 97,590 |
| 5% 11/1/26 | | 95,000 | 104,898 |
| Series 2020 K, 4% 7/1/45 | | 1,000,000 | 941,309 |
| Series 2021 G: | | | |
| 4% 3/1/46 | | 235,000 | 229,873 |
| 4% 3/1/51 | | 380,000 | 366,971 |
| Series 2022 M, 4% 7/1/39 | | 415,000 | 373,996 |
| Series A, 5% 7/1/26 | | 160,000 | 168,069 |
| Series E, 5% 7/1/42 | | 250,000 | 255,078 |
| Series K1: | | | |
| 5% 7/1/27 | | 1,100,000 | 1,153,011 |
| 5% 7/1/30 | | 1,000,000 | 1,036,302 |
| 5% 7/1/34 | | 725,000 | 741,234 |
| 5% 7/1/36 | | 450,000 | 458,540 |
| 5% 7/1/39 | | 490,000 | 496,104 |
| Series K3, 5% 7/1/43 | | 215,000 | 216,304 |
| Series L1: | | | |
| 4% 7/1/28 | | 750,000 | 759,186 |
| 4% 7/1/29 | | 750,000 | 755,130 |
| 4% 7/1/30 | | 1,000,000 | 998,928 |
| Series N: | | | |
| 5% 7/1/25 | | 390,000 | 405,126 |
| 5% 7/1/26 | | 575,000 | 600,134 |
| 5% 7/1/27 | | 430,000 | 450,921 |
| Series R, 5% 6/1/36 | | 900,000 | 976,239 |
| Connecticut Hsg. Fin. Auth.: | | | |
| Series 2021 B1, 3% 11/15/49 | | 325,000 | 317,580 |
| Series 2022 A1: | | | |
| 5% 11/15/26 | | 200,000 | 219,337 |
| 5% 5/15/27 | | 220,000 | 243,040 |
| 5% 11/15/27 | | 230,000 | 254,894 |
| 5% 5/15/28 | | 225,000 | 250,271 |
| 5% 11/15/28 | | 220,000 | 245,808 |
| 5% 5/15/29 | | 225,000 | 251,583 |
| 5% 11/15/29 | | 125,000 | 139,557 |
| 5% 5/15/30 | | 375,000 | 420,061 |
| 5% 11/15/30 | | 175,000 | 196,415 |
| Series 2022 A2: | | | |
| 5% 5/15/23 (b) | | 500,000 | 513,245 |
| 5% 11/15/23 (b) | | 670,000 | 695,932 |
| 5% 5/15/24 (b) | | 595,000 | 622,917 |
| 5% 11/15/24 (b) | | 965,000 | 1,019,381 |
| 5% 5/15/25 (b) | | 400,000 | 425,472 |
| 5% 11/15/25 (b) | | 300,000 | 321,319 |
| 5% 5/15/26 (b) | | 425,000 | 456,969 |
| Connecticut Spl. Tax Oblig. Trans. Infrastructure Rev. Series 2012 A, 5% 1/1/24 | | 80,000 | 81,202 |
| Univ. of Connecticut Gen. Oblig. Series 2019 A, 5% 11/1/25 | | 140,000 | 152,040 |
|
| TOTAL CONNECTICUT | | | 35,177,165 |
|
| District Of Columbia - 0.5% | | | |
| Metropolitan Washington Arpts. Auth. Dulles Toll Road Rev. (Dulles Metrorail and Cap. Impt. Projs.) Series 2019 A: | | | |
| 5% 10/1/31 | | 185,000 | 206,807 |
| 5% 10/1/44 | | 1,000,000 | 1,077,633 |
| Metropolitan Washington DC Arpts. Auth. Sys. Rev.: | | | |
| Series 2017 A, 5% 10/1/26 (b) | | 440,000 | 479,193 |
| Series 2019 A, 5% 10/1/25 (b) | | 70,000 | 75,124 |
| Series 2020 A: | | | |
| 5% 10/1/26 (b) | | 320,000 | 348,504 |
| 5% 10/1/27 (b) | | 110,000 | 121,134 |
| 5% 10/1/28 (b) | | 55,000 | 60,945 |
| Washington Convention & Sports Auth. Series 2018 A: | | | |
| 5% 10/1/23 | | 100,000 | 103,801 |
| 5% 10/1/24 | | 100,000 | 106,198 |
| 5% 10/1/25 | | 100,000 | 108,422 |
|
| TOTAL DISTRICT OF COLUMBIA | | | 2,687,761 |
|
| Florida - 4.5% | | | |
| Atlantic Beach Health Care Facilities Series A, 5% 11/15/43 | | 255,000 | 261,687 |
| Broward County Arpt. Sys. Rev.: | | | |
| Series 2015 C, 5% 10/1/24 (b) | | 45,000 | 47,405 |
| Series 2017, 5% 10/1/42 (b) | | 1,365,000 | 1,416,560 |
| Series 2019 A, 5% 10/1/49 (b) | | 1,000,000 | 1,041,039 |
| Broward County School Board Ctfs. of Prtn.: | | | |
| Series 2015 A, 5% 7/1/23 | | 50,000 | 51,496 |
| Series 2016, 5% 7/1/26 | | 230,000 | 251,807 |
| Cap. Projs. Fin. Auth. Student Hsg. Rev. (Cap. Projs. Ln. Prog. - Florida Univs.) Series 2020 A, 5% 10/1/30 | | 500,000 | 519,111 |
| Escambia County Health Facilities Auth. Health Facilities Rev. Series 2020 A, 4% 8/15/45 | | 110,000 | 98,800 |
| Florida Higher Edl. Facilities Fing. Auth. (St. Leo Univ. Proj.) Series 2019, 5% 3/1/24 | | 390,000 | 396,418 |
| Florida Hsg. Fin. Corp. Rev. Series 2019 1, 4% 7/1/50 | | 150,000 | 152,141 |
| Florida Keys Aqueduct Auth. Wtr. Rev. Series 2021 B, 5% 9/1/25 | | 325,000 | 351,374 |
| Florida Mid-Bay Bridge Auth. Rev. Series 2015 A: | | | |
| 5% 10/1/27 | | 105,000 | 110,098 |
| 5% 10/1/29 | | 80,000 | 83,243 |
| 5% 10/1/30 | | 70,000 | 72,613 |
| Fort Pierce Utils. Auth. Series 2022 A: | | | |
| 5% 10/1/30 (Assured Guaranty Muni. Corp. Insured) | | 175,000 | 197,739 |
| 5% 10/1/34 (Assured Guaranty Muni. Corp. Insured) | | 300,000 | 338,542 |
| 5% 10/1/36 (Assured Guaranty Muni. Corp. Insured) | | 475,000 | 532,729 |
| 5% 10/1/37 (Assured Guaranty Muni. Corp. Insured) | | 425,000 | 475,306 |
| 5% 10/1/39 (Assured Guaranty Muni. Corp. Insured) | | 475,000 | 527,703 |
| 5% 10/1/40 (Assured Guaranty Muni. Corp. Insured) | | 450,000 | 498,688 |
| 5% 10/1/41 (Assured Guaranty Muni. Corp. Insured) | | 400,000 | 442,336 |
| 5% 10/1/42 (Assured Guaranty Muni. Corp. Insured) | | 400,000 | 441,159 |
| Greater Orlando Aviation Auth. Arpt. Facilities Rev.: | | | |
| Series 2017 A, 5% 10/1/31 (b) | | 125,000 | 133,472 |
| Series 2019 A: | | | |
| 5% 10/1/22 (b) | | 300,000 | 302,313 |
| 5% 10/1/23 (b) | | 300,000 | 310,165 |
| 5% 10/1/24 (b) | | 300,000 | 316,367 |
| 5% 10/1/25 (b) | | 300,000 | 321,960 |
| 5% 10/1/32 (b) | | 300,000 | 327,070 |
| 5% 10/1/38 (b) | | 430,000 | 458,982 |
| 5% 10/1/54 (b) | | 1,620,000 | 1,687,820 |
| Hillsborough County Aviation Auth. Rev. Series 2022 A, 5% 10/1/26 (b) | | 2,750,000 | 2,994,957 |
| Lee Memorial Health Sys. Hosp. Rev. Series 2019 A1, 5% 4/1/44 | | 665,000 | 695,161 |
| Miami-Dade County Aviation Rev.: | | | |
| Series 2015 A: | | | |
| 5% 10/1/27 (b) | | 620,000 | 653,021 |
| 5% 10/1/38 (b) | | 80,000 | 82,157 |
| Series 2016 A, 5% 10/1/29 | | 145,000 | 155,147 |
| Series 2017 B, 5% 10/1/40 (b) | | 810,000 | 841,720 |
| Series 2020 A: | | | |
| 4% 10/1/40 | | 300,000 | 290,199 |
| 5% 10/1/25 | | 245,000 | 263,487 |
| Miami-Dade County Expressway Auth. Series 2014 A, 5% 7/1/25 | | 395,000 | 416,134 |
| Miami-Dade County School Board Ctfs. of Prtn.: | | | |
| Bonds Series 2014 A, 5%, tender 5/1/24 (a) | | 100,000 | 105,003 |
| Series 2015 A, 5% 5/1/28 | | 290,000 | 307,456 |
| Series 2015 D, 5% 2/1/26 | | 10,000 | 10,905 |
| Miami-Dade County Wtr. & Swr. Rev. Series 2021, 5% 10/1/32 | | 155,000 | 176,961 |
| Orange County Health Facilities Auth. Series 2016 A, 5% 10/1/39 | | 60,000 | 62,508 |
| Orange County Hsg. Fin. Auth. Multi-family Rev. Bonds Series 2021 B, 0.55%, tender 7/1/24 (a) | | 1,600,000 | 1,526,513 |
| Palm Beach County Health Facilities Auth. Hosp. Rev. (Jupiter Med. Ctr. Proj.) Series 2022: | | | |
| 5% 11/1/29 (d) | | 175,000 | 189,728 |
| 5% 11/1/32 (d) | | 200,000 | 215,916 |
| 5% 11/1/34 (d) | | 310,000 | 327,423 |
| 5% 11/1/37 (d) | | 385,000 | 401,161 |
| 5% 11/1/39 (d) | | 400,000 | 414,051 |
| 5% 11/1/41 (d) | | 400,000 | 410,840 |
| Palm Beach County Health Facilities Auth. Rev. Series 2015 C, 5% 5/15/30 | | 495,000 | 498,640 |
| Pinellas County Hsg. Fin. Auth. Bonds Series 2021 B, 0.65%, tender 7/1/24 (a) | | 365,000 | 348,936 |
| South Miami Health Facilities Auth. Hosp. Rev. (Baptist Med. Ctr., FL. Proj.) Series 2017: | | | |
| 5% 8/15/26 | | 100,000 | 108,736 |
| 5% 8/15/42 | | 5,000 | 5,236 |
| Tallahassee Health Facilities Rev.: | | | |
| (Tallahassee Memorial Healthcare, Inc. Proj.) Series 2016 A, 5% 12/1/26 | | 100,000 | 106,123 |
| Series 2015 A, 5% 12/1/40 | | 410,000 | 418,879 |
| Tampa Hosp. Rev.: | | | |
| (H Lee Moffitt Cancer Ctr. Proj.) Series 2016 B, 5% 7/1/29 | | 25,000 | 26,512 |
| (H. Lee Moffitt Cancer Ctr. Proj.) Series 2020 B, 4% 7/1/39 | | 1,000,000 | 972,517 |
| Tampa Tax Allocation (H. Lee Moffitt Cancer Ctr. Proj.) Series 2020 A: | | | |
| 0% 9/1/34 | | 700,000 | 419,282 |
| 0% 9/1/35 | | 750,000 | 426,650 |
| 0% 9/1/36 | | 800,000 | 431,668 |
| Volusia County Edl. Facilities Auth. Rev. (Embry-Riddle Aeronautical Univ., Inc. Proj.) Series 2020 A: | | | |
| 5% 10/15/44 | | 30,000 | 31,860 |
| 5% 10/15/49 | | 60,000 | 63,394 |
|
| TOTAL FLORIDA | | | 26,565,024 |
|
| Georgia - 5.2% | | | |
| Atlanta Arpt. Rev.: | | | |
| Series 2014 C, 5% 1/1/29 (b) | | 140,000 | 144,040 |
| Series 2019 B, 5% 7/1/25 (b) | | 60,000 | 64,117 |
| Atlanta Wtr. & Wastewtr. Rev. Series 2018 B, 5% 11/1/47 | | 1,000,000 | 1,069,279 |
| Brookhaven Dev. Auth. Rev. Series 2019 A, 5% 7/1/36 | | 150,000 | 163,228 |
| Burke County Indl. Dev. Auth. Poll. Cont. Rev. Bonds (Georgia Pwr. Co. Plant Vogtle Proj.): | | | |
| Series 1994: | | | |
| 2.15%, tender 6/13/24 (a) | | 1,140,000 | 1,117,660 |
| 2.25%, tender 5/25/23 (a) | | 315,000 | 313,069 |
| Series 2013 1st, 2.925%, tender 3/12/24 (a) | | 330,000 | 328,994 |
| DeKalb Private Hosp. Auth. Rev. Series 2019 B, 5% 7/1/27 | | 210,000 | 234,827 |
| Fulton County Dev. Auth. Rev. Series 2019, 4% 6/15/49 | | 40,000 | 38,890 |
| Georgia Muni. Elec. Auth. Pwr. Rev.: | | | |
| Series 2019 A: | | | |
| 4% 1/1/49 | | 245,000 | 223,821 |
| 5% 1/1/23 | | 450,000 | 456,689 |
| 5% 1/1/26 | | 165,000 | 177,078 |
| 5% 1/1/30 | | 55,000 | 60,282 |
| 5% 1/1/34 | | 375,000 | 399,962 |
| Series 2021 A: | | | |
| 4% 1/1/35 (Assured Guaranty Muni. Corp. Insured) | | 400,000 | 402,228 |
| 4% 1/1/36 (Assured Guaranty Muni. Corp. Insured) | | 410,000 | 412,349 |
| 4% 1/1/37 (Assured Guaranty Muni. Corp. Insured) | | 470,000 | 472,829 |
| 4% 1/1/40 (Assured Guaranty Muni. Corp. Insured) | | 385,000 | 385,517 |
| 4% 1/1/41 | | 480,000 | 451,144 |
| 5% 1/1/23 | | 100,000 | 101,486 |
| 5% 1/1/25 (Assured Guaranty Muni. Corp. Insured) | | 200,000 | 211,685 |
| 5% 1/1/26 (Assured Guaranty Muni. Corp. Insured) | | 425,000 | 455,671 |
| 5% 1/1/28 (Assured Guaranty Muni. Corp. Insured) | | 400,000 | 438,972 |
| 5% 1/1/31 (Assured Guaranty Muni. Corp. Insured) | | 360,000 | 398,538 |
| 5% 1/1/32 (Assured Guaranty Muni. Corp. Insured) | | 330,000 | 361,622 |
| 5% 1/1/32 (Assured Guaranty Muni. Corp. Insured) | | 280,000 | 306,831 |
| Georgia Road & Thruway Auth. Rev. Series 2020, 5% 6/1/31 | | 1,000,000 | 1,140,593 |
| Glynn-Brunswick Memorial Hosp. Auth. Rev. (Southeast Georgia Health Sys. Proj.) Series 2017: | | | |
| 4% 8/1/43 | | 5,000 | 4,475 |
| 5% 8/1/39 | | 5,000 | 5,097 |
| 5% 8/1/43 | | 5,000 | 5,060 |
| Hosp. Auth. of Savannah Auth. Rev. Series 2019 A: | | | |
| 4% 7/1/36 | | 195,000 | 192,461 |
| 4% 7/1/43 | | 205,000 | 191,386 |
| Main Street Natural Gas, Inc. Bonds: | | | |
| Series 2018 A, 4%, tender 9/1/23 (a) | | 585,000 | 595,249 |
| Series 2018 C, 4%, tender 12/1/23 (a) | | 500,000 | 510,088 |
| Series 2021 A, 4%, tender 9/1/27 (a) | | 12,000,000 | 12,303,523 |
| Series 2022 E, 4%, tender 12/1/29 (a) | | 3,595,000 | 3,567,750 |
| Monroe County Dev. Auth. Poll. Cont. Rev. (Georgia Pwr. Co. Plant Scherer Proj.) Series 1995, 2.25% 7/1/25 | | 200,000 | 193,520 |
| Private Colleges & Univs. Auth. Rev.: | | | |
| (The Savannah College of Art & Design Projs.) Series 2021: | | | |
| 4% 4/1/39 | | 245,000 | 237,750 |
| 5% 4/1/24 | | 675,000 | 707,445 |
| 5% 4/1/29 | | 500,000 | 555,255 |
| 5% 4/1/36 | | 135,000 | 148,661 |
| Series 2020 B: | | | |
| 5% 9/1/25 | | 180,000 | 195,122 |
| 5% 9/1/34 | | 1,000,000 | 1,120,393 |
| Series A: | | | |
| 5% 6/1/23 | | 80,000 | 82,216 |
| 5% 6/1/24 | | 130,000 | 135,813 |
|
| TOTAL GEORGIA | | | 31,082,665 |
|
| Hawaii - 1.7% | | | |
| Hawaii Arpts. Sys. Rev.: | | | |
| Series 2018 A: | | | |
| 5% 7/1/33 (b) | | 350,000 | 372,987 |
| 5% 7/1/48 (b) | | 2,800,000 | 2,908,387 |
| Series 2022 A, 5% 7/1/42 (b) | | 1,245,000 | 1,328,910 |
| Series 2022 B, 5% 7/1/24 (b) | | 3,350,000 | 3,508,541 |
| Hawaii Gen. Oblig. Series 2020 A, 4% 7/1/36 (b) | | 40,000 | 40,400 |
| Honolulu City & County Gen. Oblig.: | | | |
| (Honolulu Rail Transit Proj.) Series 2020 B, 5% 3/1/29 | | 1,000,000 | 1,147,883 |
| Series 2017 A, 5% 9/1/33 | | 5,000 | 5,504 |
| Series 2022 A: | | | |
| 5% 11/1/23 (d) | | 280,000 | 290,996 |
| 5% 11/1/27 (d) | | 345,000 | 387,755 |
| Honolulu City and County Wastewtr. Sys. Series 2015 A, 5% 7/1/40 (Pre-Refunded to 7/1/25 @ 100) | | 115,000 | 124,581 |
|
| TOTAL HAWAII | | | 10,115,944 |
|
| Idaho - 0.1% | | | |
| Idaho Hsg. & Fin. Assoc. Single Family Mtg.: | | | |
| Series 2019 A, 4% 1/1/50 | | 20,000 | 20,290 |
| Series 2021 A, 5% 7/15/31 | | 610,000 | 705,462 |
|
| TOTAL IDAHO | | | 725,752 |
|
| Illinois - 11.6% | | | |
| Champaign County Cmnty. Unit Series 2019, 4% 6/1/26 | | 15,000 | 15,822 |
| Chicago Board of Ed.: | | | |
| Series 2012 A, 5% 12/1/42 | | 830,000 | 830,025 |
| Series 2018 A: | | | |
| 5% 12/1/29 | | 350,000 | 364,173 |
| 5% 12/1/30 | | 160,000 | 165,913 |
| 5% 12/1/31 | | 150,000 | 154,998 |
| Series 2018 C, 5% 12/1/46 | | 3,250,000 | 3,294,278 |
| Series 2019 A: | | | |
| 5% 12/1/29 | | 125,000 | 131,275 |
| 5% 12/1/30 | | 405,000 | 421,238 |
| 5% 12/1/30 | | 100,000 | 104,023 |
| Series 2021 B, 5% 12/1/22 | | 500,000 | 504,343 |
| Series 2022 B: | | | |
| 4% 12/1/35 | | 600,000 | 566,006 |
| 4% 12/1/36 | | 1,005,000 | 942,061 |
| Chicago Gen. Oblig.: | | | |
| Series 2015 C, 5% 1/1/27 | | 215,000 | 224,880 |
| Series 2020 A: | | | |
| 5% 1/1/27 | | 400,000 | 423,009 |
| 5% 1/1/30 | | 555,000 | 585,797 |
| Series 2021 A, 5% 1/1/32 | | 7,725,000 | 8,086,168 |
| Series 2021 B, 4% 1/1/32 | | 375,000 | 367,576 |
| Chicago Midway Arpt. Rev.: | | | |
| Series 2013 A: | | | |
| 5.375% 1/1/33 (b) | | 2,000,000 | 2,019,100 |
| 5.5% 1/1/29 (b) | | 200,000 | 202,160 |
| Series 2014 B: | | | |
| 5% 1/1/26 | | 100,000 | 103,373 |
| 5% 1/1/28 | | 270,000 | 278,290 |
| Series 2016 A, 4% 1/1/33 (b) | | 305,000 | 299,937 |
| Series 2016 B: | | | |
| 4% 1/1/35 | | 200,000 | 197,801 |
| 5% 1/1/46 | | 2,000,000 | 2,041,957 |
| Chicago O'Hare Int'l. Arpt. Rev.: | | | |
| Series 2012 B, 4% 1/1/29 (b) | | 400,000 | 400,258 |
| Series 2013 A, 5% 1/1/23 (b) | | 70,000 | 70,999 |
| Series 2017 B, 5% 1/1/37 | | 50,000 | 52,694 |
| Series 2018 A, 5% 1/1/48 (b) | | 90,000 | 93,427 |
| Chicago O'Hare Int'l. Arpt. Spl. Facilities Rev. Series 2018: | | | |
| 5% 7/1/38 (b) | | 50,000 | 51,536 |
| 5% 7/1/48 (b) | | 600,000 | 609,274 |
| Cook County Cmnty. Consolidated School District No. 59 Series 2020, 5% 3/1/26 | | 615,000 | 671,707 |
| Cook County Gen. Oblig.: | | | |
| Series 2016 A: | | | |
| 5% 11/15/23 | | 10,000 | 10,417 |
| 5% 11/15/31 | | 500,000 | 537,659 |
| Series 2021 A: | | | |
| 5% 11/15/22 | | 125,000 | 126,592 |
| 5% 11/15/23 | | 35,000 | 36,461 |
| 5% 11/15/24 | | 50,000 | 52,924 |
| 5% 11/15/33 | | 425,000 | 468,021 |
| Series 2021 B: | | | |
| 4% 11/15/25 | | 180,000 | 188,470 |
| 4% 11/15/26 | | 90,000 | 94,866 |
| 4% 11/15/27 | | 90,000 | 95,430 |
| 4% 11/15/28 | | 45,000 | 47,822 |
| Illinois Fin. Auth.: | | | |
| Bonds Series 2020 B, 5%, tender 11/15/24 (a) | | 400,000 | 417,279 |
| Series 2022 A: | | | |
| 5% 10/1/29 (d) | | 350,000 | 363,074 |
| 5% 10/1/30 (d) | | 230,000 | 237,282 |
| 5% 10/1/31 (d) | | 215,000 | 220,268 |
| Illinois Fin. Auth. Academic Facilities: | | | |
| (Provident Group UIUC Properties LLC Univ. of Illinois at Urbana-Champaign Proj.) Series 2019 A, 5% 10/1/25 | | 200,000 | 215,738 |
| (Provident Group UIUC Properties LLC Univ. of Illinois at Urbana-Champaign Proj.) Series 2019 A: | | | |
| 5% 10/1/26 | | 200,000 | 219,495 |
| 5% 10/1/31 | | 200,000 | 224,753 |
| 5% 10/1/38 | | 200,000 | 220,499 |
| Illinois Fin. Auth. Rev.: | | | |
| (Bradley Univ. Proj.) Series 2017 C: | | | |
| 5% 8/1/22 | | 40,000 | 40,075 |
| 5% 8/1/24 | | 45,000 | 46,569 |
| 5% 8/1/30 | | 615,000 | 640,339 |
| (Depaul Univ., IL Proj.): | | | |
| Series 2016 A, 5% 10/1/28 | | 10,000 | 10,703 |
| Series 2016, 5% 10/1/29 | | 30,000 | 31,977 |
| (OSF Healthcare Sys.) Series 2018 A: | | | |
| 4.125% 5/15/47 | | 750,000 | 706,148 |
| 5% 5/15/43 | | 790,000 | 811,956 |
| (Presence Health Proj.) Series 2016 C, 5% 2/15/36 | | 15,000 | 15,941 |
| Series 2013, 5% 11/15/24 | | 65,000 | 65,787 |
| Series 2015 A: | | | |
| 5% 11/15/23 | | 10,000 | 10,416 |
| 5% 11/15/25 | | 150,000 | 160,809 |
| 5% 10/1/35 | | 715,000 | 761,150 |
| 5% 11/15/45 | | 300,000 | 306,315 |
| Series 2015 C: | | | |
| 4.125% 8/15/37 | | 60,000 | 58,602 |
| 5% 8/15/26 | | 35,000 | 36,991 |
| 5% 8/15/44 | | 1,380,000 | 1,412,687 |
| Series 2016 A: | | | |
| 5% 8/15/24 (Escrowed to Maturity) | | 65,000 | 68,822 |
| 5% 7/1/31 (Pre-Refunded to 7/1/26 @ 100) | | 30,000 | 32,868 |
| 5% 7/1/33 (Pre-Refunded to 7/1/26 @ 100) | | 10,000 | 10,956 |
| 5% 7/1/36 (Pre-Refunded to 7/1/26 @ 100) | | 45,000 | 49,302 |
| Series 2016 B, 5% 8/15/35 | | 250,000 | 262,877 |
| Series 2016 C: | | | |
| 4% 2/15/41 | | 35,000 | 34,568 |
| 4% 2/15/41 (Pre-Refunded to 2/15/27 @ 100) | | 5,000 | 5,315 |
| 5% 2/15/34 | | 50,000 | 53,307 |
| Series 2016: | | | |
| 5% 12/1/23 | | 155,000 | 161,340 |
| 5% 5/15/29 | | 10,000 | 10,590 |
| 5% 12/1/29 | | 620,000 | 661,491 |
| 5% 12/1/33 | | 485,000 | 512,984 |
| 5% 12/1/40 | | 85,000 | 88,639 |
| 5% 12/1/46 | | 2,695,000 | 2,786,991 |
| Series 2017 A, 5% 7/15/42 | | 1,000,000 | 1,051,263 |
| Series 2019: | | | |
| 4% 9/1/35 | | 60,000 | 56,064 |
| 5% 9/1/36 | | 295,000 | 304,305 |
| 5% 9/1/38 | | 100,000 | 102,713 |
| Illinois Gen. Oblig.: | | | |
| Series 2012: | | | |
| 5% 8/1/22 | | 90,000 | 90,194 |
| 5% 8/1/24 | | 70,000 | 70,166 |
| Series 2013 A, 5% 4/1/23 | | 525,000 | 534,770 |
| Series 2013, 5% 7/1/23 | | 10,000 | 10,238 |
| Series 2014: | | | |
| 5% 2/1/25 | | 520,000 | 536,143 |
| 5% 5/1/28 | | 50,000 | 51,569 |
| Series 2016: | | | |
| 5% 1/1/26 | | 5,000 | 5,305 |
| 5% 2/1/26 | | 400,000 | 424,827 |
| 5% 2/1/27 | | 585,000 | 628,055 |
| 5% 11/1/29 | | 1,400,000 | 1,476,354 |
| Series 2017 C, 5% 11/1/29 | | 345,000 | 367,257 |
| Series 2017 D, 5% 11/1/27 | | 850,000 | 916,541 |
| Series 2017, 4% 2/1/24 | | 30,000 | 30,585 |
| Series 2018 A: | | | |
| 5% 10/1/24 | | 25,000 | 26,125 |
| 5% 10/1/28 | | 1,500,000 | 1,622,196 |
| Series 2018 B: | | | |
| 5% 5/1/24 | | 1,500,000 | 1,558,097 |
| 5% 10/1/24 | | 1,050,000 | 1,097,230 |
| Series 2019 B: | | | |
| 5% 9/1/24 | | 105,000 | 109,578 |
| 5% 9/1/25 | | 20,000 | 21,132 |
| Series 2021 A, 5% 3/1/32 | | 450,000 | 482,625 |
| Series 2022 A, 5% 3/1/32 | | 650,000 | 701,604 |
| Series 2022 B: | | | |
| 5% 3/1/29 | | 650,000 | 704,672 |
| 5% 3/1/33 | | 1,700,000 | 1,827,014 |
| Series May 2014, 5% 5/1/39 | | 1,600,000 | 1,617,933 |
| Illinois Hsg. Dev. Auth. Series 2021, 3% 4/1/51 | | 775,000 | 756,749 |
| Illinois Sales Tax Rev. Series 2013, 5% 6/15/24 | | 285,000 | 291,309 |
| Illinois Toll Hwy. Auth. Toll Hwy. Rev.: | | | |
| Series 2014 A, 5% 12/1/22 | | 235,000 | 238,304 |
| Series 2019 A, 5% 1/1/44 | | 105,000 | 112,546 |
| Series A, 5% 1/1/40 | | 220,000 | 239,964 |
| Kendall, Kane & Will Counties Cmnty. Unit School District #308: | | | |
| Series 2008, 0% 2/1/25 (Assured Guaranty Muni. Corp. Insured) | | 315,000 | 294,876 |
| Series 2015, 4% 2/1/30 | | 800,000 | 817,278 |
| Metropolitan Pier & Exposition: | | | |
| (McCormick Place Expansion Proj.): | | | |
| Series 2002 A, 0% 6/15/36 (Nat'l. Pub. Fin. Guarantee Corp. Insured) | | 2,280,000 | 1,230,480 |
| Series 2010 B1: | | | |
| 0% 6/15/43 (Assured Guaranty Muni. Corp. Insured) | | 610,000 | 227,184 |
| 0% 6/15/47 (Assured Guaranty Muni. Corp. Insured) | | 155,000 | 46,804 |
| Series 1994 A, 0% 6/15/25 | | 25,000 | 22,727 |
| Series 1994, 0% 6/15/28 (Nat'l. Pub. Fin. Guarantee Corp. Insured) | | 1,200,000 | 963,681 |
| Series 2002 A: | | | |
| 0% 6/15/32 (Nat'l. Pub. Fin. Guarantee Corp. Insured) | | 30,000 | 19,868 |
| 0% 6/15/35 (Nat'l. Pub. Fin. Guarantee Corp. Insured) | | 240,000 | 136,848 |
| Series 2002, 0% 12/15/23 | | 205,000 | 196,805 |
| Series 2017 A, 5% 6/15/57 | | 875,000 | 880,275 |
| Series 2020 A: | | | |
| 4% 6/15/50 | | 1,170,000 | 1,012,229 |
| 5% 6/15/50 | | 1,730,000 | 1,745,746 |
| Series 2022 A: | | | |
| 0% 12/15/35 | | 420,000 | 229,687 |
| 0% 6/15/40 | | 595,000 | 249,649 |
| 4% 12/15/47 | | 5,000,000 | 4,365,054 |
| Northern Illinois Univ. Revs. Series 2020 B, 4% 4/1/40 (Build America Mutual Assurance Insured) | | 455,000 | 440,959 |
| Univ. of Illinois Board of Trustees Ctfs. of Prtn. (Univ. of Illinois Rev. Proj.) Series 2014 A, 5% 10/1/26 | | 15,000 | 15,795 |
| Univ. of Illinois Rev. Series 2018 A, 5% 4/1/30 | | 100,000 | 109,563 |
|
| TOTAL ILLINOIS | | | 68,976,598 |
|
| Indiana - 0.9% | | | |
| Indiana Fin. Auth. Envir. Facilities Rev. Bonds (Indianapolis Pwr. & Lt. Co. Proj.): | | | |
| Series 2020 A, 0.75%, tender 4/1/26 (a) | | 50,000 | 42,953 |
| Series 2020 B, 0.95%, tender 4/1/26 (a)(b) | | 100,000 | 86,905 |
| Indiana Fin. Auth. Rev. Series 2016: | | | |
| 5% 9/1/24 | | 20,000 | 21,186 |
| 5% 9/1/30 | | 50,000 | 53,985 |
| Indiana Fin. Auth. Wastewtr. Util. Rev. Series 2021 2, 5% 10/1/41 | | 1,000,000 | 1,115,376 |
| Indiana Health Facility Fing. Auth. Rev. Bonds Series 2001 A2, 2%, tender 2/1/23 (a) | | 65,000 | 65,026 |
| Indiana Hsg. & Cmnty. Dev. Auth.: | | | |
| Series 2021 B: | | | |
| 3% 7/1/50 | | 125,000 | 122,277 |
| 5% 7/1/25 | | 690,000 | 740,843 |
| Series 2021 C1, 3% 1/1/52 | | 1,200,000 | 1,163,856 |
| Series A, 3.75% 1/1/49 | | 395,000 | 398,033 |
| Indianapolis Local Pub. Impt. (Indianapolis Arpt. Auth. Proj.) Series 2014 D: | | | |
| 5% 1/1/28 (b) | | 75,000 | 77,292 |
| 5% 1/1/30 (b) | | 85,000 | 87,343 |
| Saint Joseph County Econ. Dev. Auth. Rev. (St. Mary's College Proj.): | | | |
| Series 2019, 4% 4/1/46 | | 215,000 | 199,450 |
| Series 2020, 5% 4/1/30 | | 105,000 | 115,034 |
| Whiting Envir. Facilities Rev. Bonds (BP Products North America, Inc. Proj.) Series 2019 A, 5%, tender 6/5/26 (a)(b) | | 695,000 | 747,852 |
|
| TOTAL INDIANA | | | 5,037,411 |
|
| Iowa - 0.9% | | | |
| Iowa Fin. Auth. Rev. Series A: | | | |
| 5% 5/15/43 | | 35,000 | 33,174 |
| 5% 5/15/48 | | 105,000 | 97,657 |
| Iowa Higher Ed. Ln. Auth. Rev. (Grinnell College Proj.) Series 2017, 5% 12/1/46 | | 2,000,000 | 2,155,223 |
| Iowa Student Ln. Liquidity Corp. Student Ln. Rev. Series 2019 B, 5% 12/1/27 (b) | | 155,000 | 169,740 |
| Tobacco Settlement Auth. Tobacco Settlement Rev.: | | | |
| Series 2021 A2: | | | |
| 4% 6/1/40 | | 425,000 | 384,923 |
| 5% 6/1/27 | | 250,000 | 265,025 |
| 5% 6/1/28 | | 500,000 | 531,727 |
| 5% 6/1/29 | | 600,000 | 639,972 |
| 5% 6/1/30 | | 700,000 | 747,996 |
| Series 2021 B1, 4% 6/1/49 | | 305,000 | 294,025 |
|
| TOTAL IOWA | | | 5,319,462 |
|
| Kentucky - 1.0% | | | |
| Ashland Med. Ctr. Rev. Series 2019: | | | |
| 4% 2/1/37 | | 175,000 | 163,969 |
| 5% 2/1/25 | | 280,000 | 293,736 |
| Carroll County Poll. Ctlr Rev. Bonds (Kentucky Utils. Co. Proj.) Series 2016 A, 1.55%, tender 9/1/26 (a) | | 1,000,000 | 883,417 |
| Kentucky Econ. Dev. Fin. Auth. Series 2019 A2, 5% 8/1/30 | | 345,000 | 368,215 |
| Kentucky State Property & Buildings Commission Rev.: | | | |
| (Proj. No. 118) Series 2018, 5% 4/1/25 | | 175,000 | 187,681 |
| (Proj. No. 119) Series 2018: | | | |
| 5% 5/1/26 | | 80,000 | 86,939 |
| 5% 5/1/29 | | 85,000 | 93,765 |
| 5% 5/1/32 | | 20,000 | 22,020 |
| 5% 5/1/33 | | 15,000 | 16,427 |
| 5% 5/1/34 | | 20,000 | 21,872 |
| 5% 5/1/35 | | 10,000 | 10,809 |
| 5% 5/1/36 | | 10,000 | 10,789 |
| 5% 5/1/38 | | 1,000,000 | 1,075,041 |
| Series A: | | | |
| 4% 11/1/35 | | 600,000 | 624,227 |
| 5% 11/1/29 | | 150,000 | 166,545 |
| Kentucky, Inc. Pub. Energy Bonds Series A, 4%, tender 6/1/26 (a) | | 1,505,000 | 1,523,145 |
| Louisville & Jefferson County: | | | |
| Bonds: | | | |
| Series 2020 C, 5%, tender 10/1/26 (a) | | 70,000 | 74,703 |
| Series 2020 D, 5%, tender 10/1/29 (a) | | 85,000 | 92,863 |
| Series 2016 A, 5% 10/1/32 | | 70,000 | 74,231 |
| Series 2020 A, 4% 10/1/40 | | 195,000 | 183,794 |
| Louisville Reg'l. Arpt. Auth. Sys. Rev. Series 2014 A, 5% 7/1/24 (b) | | 65,000 | 68,076 |
|
| TOTAL KENTUCKY | | | 6,042,264 |
|
| Louisiana - 0.5% | | | |
| Louisiana Pub. Facilities Auth. Rev.: | | | |
| (Ochsner Clinic Foundation Proj.): | | | |
| Series 2015, 5% 5/15/47 | | 195,000 | 198,477 |
| Series 2017, 5% 5/15/27 | | 115,000 | 124,911 |
| (Tulane Univ. of Louisiana Proj.): | | | |
| Series 2016 A, 5% 12/15/28 | | 15,000 | 16,130 |
| Series 2017 A, 5% 12/15/32 | | 165,000 | 177,128 |
| Series 2018 E, 5% 7/1/38 | | 100,000 | 105,662 |
| New Orleans Aviation Board Rev. (North Term. Proj.) Series 2017 B, 5% 1/1/48 (b) | | 2,000,000 | 2,050,785 |
|
| TOTAL LOUISIANA | | | 2,673,093 |
|
| Maine - 0.2% | | | |
| Maine Health & Higher Edl. Facilities Auth. Rev.: | | | |
| (Eastern Maine Healthcare Systems Proj.) Series 2013, 5% 7/1/43 (Pre-Refunded to 7/1/23 @ 100) | | 220,000 | 226,845 |
| (Univ. of New England) Series 2017 A, 4% 7/1/22 | | 20,000 | 20,000 |
| Series 2013, 5% 7/1/25 (Pre-Refunded to 7/1/23 @ 100) | | 40,000 | 41,245 |
| Series 2014, 5% 7/1/30 (Pre-Refunded to 7/1/24 @ 100) | | 585,000 | 618,176 |
| Series 2016 A: | | | |
| 4% 7/1/41 | | 85,000 | 76,968 |
| 4% 7/1/46 | | 85,000 | 74,841 |
| 5% 7/1/41 | | 25,000 | 25,612 |
| 5% 7/1/46 | | 155,000 | 157,997 |
| Series 2017 B, 5% 7/1/29 | | 10,000 | 10,801 |
| Series 2018, 5% 7/1/48 | | 135,000 | 145,321 |
|
| TOTAL MAINE | | | 1,397,806 |
|
| Maryland - 2.3% | | | |
| Anne Arundel County Gen. Oblig. Series 2021, 5% 4/1/27 | | 2,000,000 | 2,246,132 |
| Hsg. Opportunities Commission of Montgomery County Series 2021 C, 0.8% 7/1/25 | | 100,000 | 94,499 |
| Maryland Cmnty. Dev. Admin Dept. Hsg. & Cmnty. Dev.: | | | |
| Series 2019 B, 4% 9/1/49 | | 65,000 | 65,936 |
| Series 2019 C, 5% 9/1/28 | | 115,000 | 129,736 |
| Series 2021 C: | | | |
| 0.375% 7/1/23 | | 100,000 | 98,435 |
| 0.6% 7/1/24 | | 600,000 | 579,209 |
| Maryland Econ. Dev. Corp. Air Cargo Series 2019: | | | |
| 5% 7/1/22 (b) | | 280,000 | 280,000 |
| 5% 7/1/23 (b) | | 325,000 | 330,169 |
| 5% 7/1/25 (b) | | 510,000 | 527,149 |
| 5% 7/1/26 (b) | | 230,000 | 238,846 |
| Maryland Gen. Oblig. Series 2022 2C, 4% 3/1/28 | | 1,000,000 | 1,079,609 |
| Maryland Health & Higher Edl. Series 2021 A: | | | |
| 4% 6/1/55 | | 190,000 | 159,762 |
| 5% 6/1/29 | | 120,000 | 127,920 |
| Maryland Health & Higher Edl. Facilities Auth. Rev. (Medstar Health, Inc. Proj.) Series 2017 A, 5% 5/15/45 | | 150,000 | 157,176 |
| Maryland Trans. Auth. Trans. Facility Projs. Rev. Series 2020, 5% 7/1/40 | | 2,000,000 | 2,225,322 |
| Prince Georges County Ctfs. of Prtn. Series 2021: | | | |
| 5% 10/1/25 | | 1,610,000 | 1,744,539 |
| 5% 10/1/26 | | 1,650,000 | 1,821,312 |
| Washington Metropolitan Area Transit Auth. Series 2021 A, 5% 7/15/26 | | 1,420,000 | 1,568,894 |
|
| TOTAL MARYLAND | | | 13,474,645 |
|
| Massachusetts - 4.0% | | | |
| Massachusetts Bay Trans. Auth. Sales Tax Rev. Series 2021 A1, 5% 7/1/35 | | 820,000 | 933,236 |
| Massachusetts Commonwealth Trans. Fund Rev.: | | | |
| (Rail Enhancement Prog.) Series 2021 B: | | | |
| 5% 6/1/26 | | 350,000 | 386,073 |
| 5% 6/1/27 | | 500,000 | 560,795 |
| 5% 6/1/41 | | 1,250,000 | 1,366,279 |
| Series 2021 A, 5% 6/1/51 | | 1,860,000 | 2,038,150 |
| Massachusetts Dept. of Trans. Metropolitan Hwy. Sys. Rev. Bonds Series 2019 A, 5%, tender 1/1/23 (a) | | 300,000 | 304,489 |
| Massachusetts Dev. Fin. Agcy. Rev.: | | | |
| (Lawrence Gen. Hosp.) Series 2014 A, 5.25% 7/1/34 | | 40,000 | 37,364 |
| Series 2016 A, 5% 1/1/31 | | 40,000 | 41,661 |
| Series 2016 I: | | | |
| 5% 7/1/30 | | 195,000 | 204,057 |
| 5% 7/1/41 | | 140,000 | 143,426 |
| Series 2017 A: | | | |
| 5% 1/1/36 | | 325,000 | 336,483 |
| 5% 1/1/37 | | 1,050,000 | 1,084,739 |
| Series 2017, 5% 7/1/36 | | 275,000 | 284,766 |
| Series 2018, 5% 1/1/43 | | 180,000 | 184,229 |
| Series 2019 K: | | | |
| 5% 7/1/25 | | 125,000 | 133,205 |
| 5% 7/1/26 | | 165,000 | 177,909 |
| 5% 7/1/27 | | 195,000 | 212,127 |
| Series 2019: | | | |
| 5% 7/1/27 | | 440,000 | 470,454 |
| 5% 9/1/59 | | 510,000 | 530,508 |
| Series 2020 A: | | | |
| 4% 7/1/45 | | 480,000 | 426,962 |
| 5% 10/15/28 | | 1,000,000 | 1,145,316 |
| Series 2021 V, 5% 7/1/55 | | 1,245,000 | 1,467,030 |
| Series 2021: | | | |
| 4% 7/1/26 | | 240,000 | 238,427 |
| 4% 7/1/27 | | 255,000 | 251,372 |
| 4% 7/1/28 | | 325,000 | 317,717 |
| 4% 7/1/29 | | 340,000 | 328,910 |
| 4% 7/1/30 | | 355,000 | 339,518 |
| 4% 7/1/31 | | 370,000 | 350,146 |
| Series M: | | | |
| 4% 10/1/50 | | 490,000 | 432,107 |
| 5% 10/1/45 | | 370,000 | 383,142 |
| Massachusetts Edl. Fing. Auth. Rev.: | | | |
| Series 2016 J, 5% 7/1/22 (b) | | 130,000 | 130,000 |
| Series 2016, 5% 7/1/24 (b) | | 210,000 | 219,522 |
| Massachusetts Gen. Oblig.: | | | |
| Series 2019 A, 5% 1/1/49 | | 2,000,000 | 2,168,880 |
| Series 2019 C, 5% 5/1/49 | | 345,000 | 375,005 |
| Series E, 5% 11/1/50 | | 1,640,000 | 1,808,096 |
| Massachusetts Hsg. Fin. Auth. Series 2021 223, 3% 6/1/47 | | 700,000 | 683,874 |
| Massachusetts Port Auth. Rev.: | | | |
| Series 2019 A, 5% 7/1/40 (b) | | 500,000 | 533,707 |
| Series 2021 E: | | | |
| 5% 7/1/41 (b) | | 1,000,000 | 1,081,528 |
| 5% 7/1/46 (b) | | 290,000 | 308,441 |
| 5% 7/1/51 (b) | | 1,000,000 | 1,058,859 |
| Massachusetts Port Auth. Spl. Facilities Rev. (Bosfuel Proj.) Series 2019 A, 5% 7/1/49 (b) | | 230,000 | 239,173 |
|
| TOTAL MASSACHUSETTS | | | 23,717,682 |
|
| Michigan - 1.1% | | | |
| Detroit Downtown Dev. Auth. Tax Series A, 5% 7/1/37 (Assured Guaranty Muni. Corp. Insured) | | 40,000 | 41,877 |
| Flint Hosp. Bldg. Auth. Rev. Series 2020: | | | |
| 4% 7/1/41 | | 140,000 | 123,963 |
| 5% 7/1/25 | | 60,000 | 63,092 |
| 5% 7/1/27 | | 265,000 | 284,597 |
| Grand Rapids Pub. Schools Series 2019, 5% 11/1/26 (Assured Guaranty Muni. Corp. Insured) | | 180,000 | 198,909 |
| Great Lakes Wtr. Auth. Sew Disp. Sys. Series 2018 A, 5% 7/1/48 | | 200,000 | 215,513 |
| Great Lakes Wtr. Auth. Wtr. Supply Sys. Rev. Series 2016 D, 5% 7/1/27 | | 100,000 | 108,694 |
| Kalamazoo Hosp. Fin. Auth. Hosp. Facilities Rev. Series 2016, 4% 5/15/36 | | 185,000 | 184,598 |
| Michigan Fin. Auth. Rev.: | | | |
| (Charter County of Wayne Criminal Justice Ctr. Proj.) Series 2018, 5% 11/1/43 | | 50,000 | 54,897 |
| (Henry Ford Health Sys. Proj.) Series 2016, 5% 11/15/25 | | 570,000 | 611,075 |
| Series 2015 A, 5% 8/1/32 (Pre-Refunded to 8/1/24 @ 100) | | 135,000 | 143,078 |
| Series 2016: | | | |
| 5% 11/15/26 | | 160,000 | 173,409 |
| 5% 11/15/41 | | 30,000 | 31,255 |
| Series 2019 A, 5% 11/15/48 | | 55,000 | 56,833 |
| Series 2020 A, 4% 6/1/49 | | 135,000 | 120,597 |
| Series 2021: | | | |
| 4% 9/1/31 | | 665,000 | 685,337 |
| 5% 9/1/32 | | 690,000 | 761,414 |
| 5% 9/1/33 | | 650,000 | 714,539 |
| 5% 9/1/36 | | 505,000 | 551,511 |
| Michigan Hosp. Fin. Auth. Rev. Series 2008 C, 5% 12/1/32 | | 10,000 | 10,798 |
| Michigan Strategic Fund Ltd. Oblig. Rev. Bonds (Consumer Energy Co. Proj.) Series 2019, 1.8%, tender 10/1/24 (a)(b) | | 175,000 | 169,257 |
| Univ. of Michigan Rev. Series 2020 A, 5% 4/1/50 | | 1,000,000 | 1,104,788 |
| Wayne County Arpt. Auth. Rev.: | | | |
| Series 2017 A, 5% 12/1/29 | | 45,000 | 49,261 |
| Series 2017 B, 5% 12/1/42 (b) | | 150,000 | 155,831 |
| Series 2018 D, 5% 12/1/29 (b) | | 85,000 | 92,797 |
|
| TOTAL MICHIGAN | | | 6,707,920 |
|
| Minnesota - 0.6% | | | |
| Duluth Econ. Dev. Auth. Health Care Facilities Rev. Series 2018 A: | | | |
| 5% 2/15/48 | | 220,000 | 226,702 |
| 5% 2/15/58 | | 270,000 | 276,222 |
| Maple Grove Health Care Sys. Rev. Series 2015, 5% 9/1/26 | | 60,000 | 63,453 |
| Minnesota Higher Ed. Facilities Auth. Rev. Series 2018 A: | | | |
| 5% 10/1/30 | | 500,000 | 540,426 |
| 5% 10/1/45 | | 30,000 | 31,423 |
| Minnesota Hsg. Fin. Agcy. Series B, 4% 8/1/39 | | 2,050,000 | 1,976,493 |
| Shakopee Sr. Hsg. Rev. Bonds Series 2018, 5.85%, tender 11/1/25 (a)(c) | | 255,000 | 254,520 |
|
| TOTAL MINNESOTA | | | 3,369,239 |
|
| Mississippi - 0.2% | | | |
| Mississippi Home Corp. Series 2021 B: | | | |
| 3% 6/1/51 | | 330,000 | 322,504 |
| 5% 6/1/25 | | 750,000 | 806,192 |
| Mississippi Hosp. Equip. & Facilities Auth.: | | | |
| Bonds Series II, 5%, tender 3/1/27 (a) | | 80,000 | 86,724 |
| Series I, 5% 10/1/24 | | 70,000 | 73,992 |
|
| TOTAL MISSISSIPPI | | | 1,289,412 |
|
| Missouri - 0.9% | | | |
| Cape Girardeau County Indl. Dev. Auth. (Southeast Hosp. Proj.) Series 2017 A, 5% 3/1/36 | | 35,000 | 36,298 |
| Kansas City Wtr. Rev. Series 2020 A, 4% 12/1/44 | | 1,200,000 | 1,182,721 |
| Missouri Health & Edl. Facilities Rev.: | | | |
| Series 2017 A, 5% 10/1/42 | | 475,000 | 506,094 |
| Series 2018 A, 5% 11/15/43 | | 1,000,000 | 1,038,928 |
| Missouri Hsg. Dev. Commission Single Family Mtg. Rev.: | | | |
| Series 2019, 4% 5/1/50 | | 20,000 | 20,295 |
| Series 2021 A, 3% 5/1/52 | | 540,000 | 527,721 |
| Saint Louis Arpt. Rev.: | | | |
| Series 2012, 5% 7/1/32 (b) | | 145,000 | 145,000 |
| Series A, 5.25% 7/1/26 (Assured Guaranty Muni. Corp. Insured) | | 570,000 | 627,828 |
| Saint Louis County Indl. Dev. Auth. Sr. Living Facilities Rev. Series 2018 A: | | | |
| 5.125% 9/1/48 | | 25,000 | 22,741 |
| 5.25% 9/1/53 | | 1,240,000 | 1,133,817 |
|
| TOTAL MISSOURI | | | 5,241,443 |
|
| Montana - 0.0% | | | |
| Montana Board Hsg. Single Family: | | | |
| Series 2017 A, 4% 12/1/47 (b) | | 15,000 | 15,191 |
| Series 2019 B, 4% 6/1/50 | | 10,000 | 10,145 |
| Montana Facility Fin. Auth. Rev. (Benefis Health Sys. Proj.) Series 2016, 5% 2/15/32 | | 30,000 | 31,561 |
|
| TOTAL MONTANA | | | 56,897 |
|
| Nebraska - 1.0% | | | |
| Central Plains Energy Proj. Gas Supply Bonds Series 2019, 4%, tender 8/1/25 (a) | | 725,000 | 744,774 |
| Nebraska Invt. Fin. Auth. Single Family Hsg. Rev.: | | | |
| Series 2019 B, 4% 9/1/49 (b) | | 55,000 | 55,644 |
| Series 2019 E, 3.75% 9/1/49 (b) | | 80,000 | 80,715 |
| Series 2022 B: | | | |
| 5% 3/1/25 (b) | | 1,090,000 | 1,149,938 |
| 5% 9/1/25 (b) | | 1,105,000 | 1,174,545 |
| 5% 3/1/26 (b) | | 1,100,000 | 1,177,483 |
| 5% 9/1/26 (b) | | 1,140,000 | 1,228,349 |
| 5% 3/1/30 (b) | | 400,000 | 441,773 |
|
| TOTAL NEBRASKA | | | 6,053,221 |
|
| Nevada - 0.5% | | | |
| Clark County Arpt. Rev. Series 2014 A2, 5% 7/1/30 | | 115,000 | 119,984 |
| Clark County School District Series 2017 A, 5% 6/15/25 | | 400,000 | 430,886 |
| Nevada Hsg. Division Single Family Mtg. Rev.: | | | |
| Series 2019 A, 4% 4/1/49 | | 375,000 | 380,450 |
| Series 2019 B, 4% 10/1/49 | | 40,000 | 40,582 |
| Series 2021 B, 3% 10/1/51 | | 2,095,000 | 2,030,789 |
| Tahoe-Douglas Visitors Auth. Series 2020, 5% 7/1/45 | | 195,000 | 195,015 |
|
| TOTAL NEVADA | | | 3,197,706 |
|
| New Hampshire - 0.4% | | | |
| Nat'l. Fin. Auth. Hosp. Rev. (St. Luke's Univ. Health Network Proj.) Series 2021 B, 5% 8/15/30 | | 1,405,000 | 1,587,113 |
| Nat'l. Finnance Auth. Series 2020 1, 4.125% 1/20/34 | | 226,979 | 223,294 |
| New Hampshire Health & Ed. Facilities Auth. (Dartmouth-Hitchcock Oblgtd Grp Proj.) Series 2018 A: | | | |
| 5% 8/1/23 | | 200,000 | 206,705 |
| 5% 8/1/26 | | 105,000 | 113,347 |
| 5% 8/1/37 | | 100,000 | 104,661 |
|
| TOTAL NEW HAMPSHIRE | | | 2,235,120 |
|
| New Jersey - 4.5% | | | |
| New Jersey Econ. Dev. Auth.: | | | |
| Series 2013, 5% 3/1/27 | | 10,000 | 10,166 |
| Series A, 5% 11/1/40 | | 360,000 | 378,154 |
| Series QQQ: | | | |
| 5% 6/15/27 | | 35,000 | 37,770 |
| 5% 6/15/28 | | 40,000 | 43,425 |
| New Jersey Econ. Dev. Auth. Lease Rev. Series 2018 A, 5% 6/15/23 | | 1,000,000 | 1,028,727 |
| New Jersey Econ. Dev. Auth. Rev.: | | | |
| (Black Horse EHT Urban Renewal LLC Proj.) Series 2019 A, 5% 10/1/39 (c) | | 100,000 | 83,391 |
| (NJ Transit Corp. Projs.) Series A, 4% 11/1/27 | | 370,000 | 378,890 |
| Series 2013 NN, 5% 3/1/29 (Pre-Refunded to 3/1/23 @ 100) | | 1,000,000 | 1,022,552 |
| Series 2013: | | | |
| 5% 3/1/23 | | 25,000 | 25,536 |
| 5% 3/1/24 | | 70,000 | 71,336 |
| Series 2014 PP: | | | |
| 4% 6/15/30 (Pre-Refunded to 6/15/24 @ 100) | | 70,000 | 72,699 |
| 5% 6/15/26 | | 280,000 | 289,271 |
| Series 2014 RR, 5% 6/15/32 (Pre-Refunded to 6/15/24 @ 100) | | 60,000 | 63,476 |
| Series 2014 UU, 5% 6/15/30 (Pre-Refunded to 6/15/24 @ 100) | | 70,000 | 73,986 |
| Series 2015 XX, 4.25% 6/15/26 | | 280,000 | 286,852 |
| Series 2017 DDD, 5% 6/15/30 (Pre-Refunded to 6/15/27 @ 100) | | 1,000,000 | 1,120,523 |
| Series 2018 EEE: | | | |
| 5% 6/15/28 | | 410,000 | 445,111 |
| 5% 6/15/43 | | 1,270,000 | 1,317,963 |
| Series LLL: | | | |
| 4% 6/15/44 | | 315,000 | 293,318 |
| 5% 6/15/44 | | 180,000 | 187,153 |
| Series MMM, 4% 6/15/35 | | 90,000 | 89,830 |
| Series PP, 5% 6/15/31 (Pre-Refunded to 6/15/24 @ 100) | | 260,000 | 275,062 |
| New Jersey Edl. Facility: | | | |
| Series 2016 B, 4% 9/1/26 | | 500,000 | 513,154 |
| Series B, 5% 7/1/30 | | 1,790,000 | 1,986,621 |
| New Jersey Gen. Oblig.: | | | |
| Series 2020 A: | | | |
| 4% 6/1/30 | | 185,000 | 195,547 |
| 4% 6/1/31 | | 70,000 | 73,866 |
| 4% 6/1/32 | | 45,000 | 47,350 |
| 5% 6/1/29 | | 205,000 | 230,397 |
| Series 2021, 2% 6/1/23 | | 5,000,000 | 5,002,249 |
| New Jersey Health Care Facilities Fing. Auth. Rev.: | | | |
| Series 2016 A, 5% 7/1/22 (Escrowed to Maturity) | | 25,000 | 25,000 |
| Series 2016: | | | |
| 4% 7/1/48 | | 100,000 | 89,103 |
| 5% 7/1/41 | | 65,000 | 65,996 |
| New Jersey Higher Ed. Student Assistance Auth. Student Ln. Rev.: | | | |
| Series 2017 1A, 5% 12/1/26 (b) | | 530,000 | 574,087 |
| Series 2018 B: | | | |
| 5% 12/1/25 (b) | | 500,000 | 535,571 |
| 5% 12/1/26 (b) | | 485,000 | 524,511 |
| 5% 12/1/27 (b) | | 850,000 | 937,513 |
| Series 2020: | | | |
| 5% 12/1/24 (b) | | 100,000 | 105,342 |
| 5% 12/1/25 (b) | | 235,000 | 251,719 |
| 5% 12/1/25 (b) | | 60,000 | 64,107 |
| 5% 12/1/26 (b) | | 205,000 | 221,700 |
| 5% 12/1/27 (b) | | 145,000 | 158,261 |
| 5% 12/1/27 (b) | | 40,000 | 43,492 |
| New Jersey Tpk. Auth. Tpk. Rev.: | | | |
| Series 2015 E, 5% 1/1/34 | | 190,000 | 200,068 |
| Series D, 5% 1/1/28 | | 170,000 | 185,242 |
| New Jersey Trans. Trust Fund Auth.: | | | |
| (Trans. Prog.) Series 2019 AA, 5.25% 6/15/43 | | 505,000 | 531,107 |
| Series 2010 A, 0% 12/15/27 | | 250,000 | 205,839 |
| Series 2014 AA, 5% 6/15/25 | | 100,000 | 103,548 |
| Series 2016 A, 5% 6/15/27 | | 160,000 | 173,284 |
| Series 2018 A, 5% 12/15/32 | | 100,000 | 106,647 |
| Series 2021 A, 5% 6/15/33 | | 1,000,000 | 1,075,588 |
| Series 2022 A, 4% 6/15/39 | | 720,000 | 704,105 |
| Series 2022 AA: | | | |
| 5% 6/15/33 | | 250,000 | 270,553 |
| 5% 6/15/36 | | 1,460,000 | 1,567,884 |
| Series AA: | | | |
| 4% 6/15/38 | | 185,000 | 182,097 |
| 4% 6/15/50 | | 400,000 | 364,354 |
| 5% 6/15/40 | | 210,000 | 221,903 |
| 5% 6/15/45 | | 95,000 | 99,065 |
| Series BB: | | | |
| 5% 6/15/33 | | 1,000,000 | 1,062,191 |
| 5% 6/15/50 | | 70,000 | 72,352 |
| Rutgers State Univ. Rev. Series Q, 5% 5/1/23 | | 30,000 | 30,810 |
|
| TOTAL NEW JERSEY | | | 26,397,414 |
|
| New Mexico - 0.4% | | | |
| New Mexico Edl. Assistance Foundation Series 2021 1A: | | | |
| 5% 9/1/23 (b) | | 450,000 | 464,635 |
| 5% 9/1/26 (b) | | 1,045,000 | 1,134,500 |
| 5% 9/1/27 (b) | | 350,000 | 384,235 |
| 5% 9/1/29 (b) | | 150,000 | 166,411 |
| New Mexico Mtg. Fin. Auth.: | | | |
| Series 2019 C, 4% 1/1/50 | | 165,000 | 167,402 |
| Series 2019 D, 3.75% 1/1/50 | | 50,000 | 50,380 |
| Santa Fe Retirement Fac. Series 2019 A: | | | |
| 5% 5/15/34 | | 10,000 | 9,568 |
| 5% 5/15/39 | | 5,000 | 4,649 |
| 5% 5/15/44 | | 5,000 | 4,508 |
| 5% 5/15/49 | | 15,000 | 13,191 |
|
| TOTAL NEW MEXICO | | | 2,399,479 |
|
| New York - 7.0% | | | |
| Buffalo and Erie County Indl. Land Rev. (Catholic Health Sys., Inc. Proj.) Series 2015, 5% 7/1/25 | | 400,000 | 411,968 |
| Long Island Pwr. Auth. Elec. Sys. Rev. Bonds Series 2021 B, 1.5%, tender 9/1/26 (a) | | 500,000 | 473,503 |
| Monroe County Indl. Dev. Corp. (Univ. of Rochester Proj.) Series 2015 B, 4% 7/1/35 | | 5,000 | 5,003 |
| MTA Hudson Rail Yards Trust Oblig. Series 2016 A, 5% 11/15/56 | | 100,000 | 102,768 |
| New York City Edl. Construction Fund Series 2021 B: | | | |
| 5% 4/1/46 | | 675,000 | 730,263 |
| 5% 4/1/52 | | 520,000 | 559,618 |
| New York City Gen. Oblig.: | | | |
| Series 2018 A, 5% 8/1/24 | | 100,000 | 106,088 |
| Series 2021 A1, 5% 8/1/29 | | 1,000,000 | 1,141,995 |
| Series E, 5% 8/1/30 | | 1,025,000 | 1,107,715 |
| New York City Hsg. Dev. Corp. Multifamily Hsg.: | | | |
| Bonds: | | | |
| Series 2021 C2, 0.7%, tender 7/1/25 (a) | | 270,000 | 251,791 |
| Series 2021 K2, 0.9%, tender 1/1/26 (a) | | 2,075,000 | 1,922,940 |
| Series 2021, 0.6%, tender 7/1/25 (a) | | 390,000 | 359,957 |
| Series A 1 B, 5% 5/1/30 | | 490,000 | 540,913 |
| New York City Muni. Wtr. Fin. Auth. Wtr. & Swr. Sys. Rev. Series GG 1, 5% 6/15/48 | | 1,350,000 | 1,463,946 |
| New York City Transitional Fin. Auth. Rev. Series 2016 E1, 5% 2/1/40 | | 2,535,000 | 2,665,684 |
| New York City Trust Cultural Resources Rev. Series 2021, 5% 7/1/31 | | 660,000 | 755,753 |
| New York Dorm. Auth. Rev.: | | | |
| Bonds Series 2019 B2, 5%, tender 5/1/24 (a) | | 100,000 | 103,353 |
| Series 2020 A: | | | |
| 4% 9/1/37 | | 350,000 | 320,909 |
| 4% 9/1/39 | | 700,000 | 635,129 |
| Series 2022 A: | | | |
| 5% 7/15/37 (d) | | 110,000 | 112,475 |
| 5% 7/15/42 (d) | | 310,000 | 314,697 |
| New York Metropolitan Trans. Auth. Rev.: | | | |
| Series 2015 A1, 5% 11/15/29 | | 120,000 | 125,398 |
| Series 2016 A, 5% 11/15/31 | | 100,000 | 104,822 |
| Series 2016 C1, 5% 11/15/33 | | 1,000,000 | 1,047,987 |
| Series 2017 B, 5% 11/15/24 | | 565,000 | 594,248 |
| Series 2017 C1, 5% 11/15/30 | | 325,000 | 344,301 |
| Series 2017 D: | | | |
| 5% 11/15/25 | | 1,635,000 | 1,736,166 |
| 5% 11/15/30 | | 2,220,000 | 2,351,838 |
| Series 2020 D: | | | |
| 4% 11/15/46 | | 2,050,000 | 1,829,428 |
| 4% 11/15/47 | | 150,000 | 132,044 |
| New York State Envir. Facilities Corp. Rev. (2010 Master Fing. Prog.) Series 2021 B: | | | |
| 5% 2/15/28 | | 160,000 | 182,739 |
| 5% 8/15/28 | | 235,000 | 270,247 |
| 5% 2/15/29 | | 100,000 | 115,510 |
| 5% 8/15/29 | | 200,000 | 232,552 |
| 5% 2/15/30 | | 340,000 | 397,215 |
| 5% 8/15/30 | | 400,000 | 469,966 |
| New York State Hsg. Fin. Agcy. Rev.: | | | |
| Bonds: | | | |
| Series 2021 J2, 1.1%, tender 5/1/27 (a) | | 1,105,000 | 994,961 |
| Series 2021 K2, 1%, tender 11/1/26 (a) | | 300,000 | 273,959 |
| Series J, 0.75% 5/1/25 | | 250,000 | 236,401 |
| New York State Mtg. Agcy. Homeowner Mtg.: | | | |
| Series 2021 232, 5% 10/1/25 (b) | | 765,000 | 811,699 |
| Series 2021 239, 3.25% 10/1/51 | | 1,030,000 | 1,005,547 |
| Series 221, 3.5% 10/1/32 (b) | | 25,000 | 24,948 |
| New York State Urban Dev. Corp. Series 2020 E: | | | |
| 4% 3/15/44 | | 1,675,000 | 1,623,204 |
| 4% 3/15/45 | | 1,350,000 | 1,305,165 |
| New York State Urban Eev Corp. Series 2019 A, 5% 3/15/37 | | 1,105,000 | 1,207,615 |
| New York Thruway Auth. Gen. Rev. Series 2016 A, 5% 1/1/46 | | 175,000 | 184,175 |
| New York Trans. Dev. Corp. (Term. 4 John F. Kennedy Int'l. Arpt. Proj.) Series 2022: | | | |
| 5% 12/1/32 (b) | | 380,000 | 400,395 |
| 5% 12/1/33 (b) | | 590,000 | 620,853 |
| 5% 12/1/34 (b) | | 645,000 | 669,314 |
| 5% 12/1/35 (b) | | 325,000 | 340,329 |
| 5% 12/1/36 (b) | | 220,000 | 228,732 |
| 5% 12/1/37 (b) | | 590,000 | 615,447 |
| 5% 12/1/38 (b) | | 1,430,000 | 1,489,971 |
| 5% 12/1/39 (b) | | 1,090,000 | 1,133,154 |
| 5% 12/1/40 (b) | | 925,000 | 958,461 |
| 5% 12/1/41 (b) | | 840,000 | 868,539 |
| 5% 12/1/42 (b) | | 420,000 | 433,817 |
| Niagara Area Dev. Corp. Rev. (Catholic Health Sys., Inc. Proj.) Series 2022, 4.5% 7/1/52 | | 555,000 | 464,025 |
| Oneida County Local Dev. Corp. Rev. (Mohawk Valley Health Sys. Proj.) Series 2019 A, 5% 12/1/29 (Assured Guaranty Muni. Corp. Insured) | | 600,000 | 617,181 |
| Onondaga Civic Dev. Corp. (Le Moyne College Proj.) Series 2015, 5% 7/1/27 | | 295,000 | 311,082 |
| Onondaga County Ind. Dev. Agcy. Swr. Facilities Rev. (Bristol-Meyers Squibb Co. Proj.) Series 1994, 5.75% 3/1/24 (b) | | 220,000 | 232,510 |
| Suffolk County Econ. Dev. Corp. Rev. Series 2021: | | | |
| 5.125% 11/1/41 (c) | | 100,000 | 86,150 |
| 5.375% 11/1/54 (c) | | 100,000 | 84,754 |
|
| TOTAL NEW YORK | | | 41,243,317 |
|
| New York And New Jersey - 0.1% | | | |
| Port Auth. of New York & New Jersey: | | | |
| Series 194, 5.25% 10/15/55 | | 210,000 | 220,539 |
| Series 2017 202, 5% 10/15/29 (b) | | 500,000 | 540,872 |
|
| TOTAL NEW YORK AND NEW JERSEY | | | 761,411 |
|
| North Carolina - 0.1% | | | |
| New Hanover County Hosp. Rev. Series 2017: | | | |
| 5% 10/1/27 (Escrowed to Maturity) | | 10,000 | 11,250 |
| 5% 10/1/47 (Pre-Refunded to 10/1/27 @ 100) | | 70,000 | 78,751 |
| North Carolina Med. Care Commission Health Care Facilities Rev.: | | | |
| Bonds: | | | |
| Series 2019 B, 2.2%, tender 12/1/22 (a) | | 175,000 | 175,104 |
| Series 2019 C, 2.55%, tender 6/1/26 (a) | | 300,000 | 296,153 |
| Series 2021 A, 4% 3/1/51 | | 280,000 | 205,318 |
|
| TOTAL NORTH CAROLINA | | | 766,576 |
|
| North Dakota - 0.1% | | | |
| North Dakota Hsg. Fin. Agcy.: | | | |
| Series 2021 A, 3% 1/1/52 | | 205,000 | 200,358 |
| Series 2021 B, 3% 7/1/52 | | 660,000 | 639,788 |
|
| TOTAL NORTH DAKOTA | | | 840,146 |
|
| Ohio - 6.2% | | | |
| Akron Bath Copley Hosp. District Rev.: | | | |
| Series 2016, 5.25% 11/15/46 | | 495,000 | 513,187 |
| Series 2020, 4% 11/15/38 | | 1,500,000 | 1,447,363 |
| Allen County Hosp. Facilities Rev. (Mercy Health) Series 2017 A: | | | |
| 5% 8/1/25 | | 10,000 | 10,671 |
| 5% 8/1/26 | | 390,000 | 421,005 |
| 5% 8/1/27 | | 10,000 | 10,935 |
| 5% 8/1/28 | | 10,000 | 10,919 |
| 5% 8/1/29 | | 10,000 | 10,883 |
| 5% 8/1/30 | | 10,000 | 10,810 |
| American Muni. Pwr., Inc. (Solar Electricity Prepayment Proj.) Series 2019 A, 5% 2/15/44 | | 175,000 | 187,817 |
| Buckeye Tobacco Settlement Fing. Auth.: | | | |
| Series 2020 A2, 5% 6/1/34 | | 370,000 | 396,872 |
| Series 2020 B2, 5% 6/1/55 | | 900,000 | 847,466 |
| Cleveland Arpt. Sys. Rev. Series 2016 A, 5% 1/1/25 (Assured Guaranty Muni. Corp. Insured) | | 145,000 | 154,121 |
| Cleveland Wtr. Rev. Series 2020: | | | |
| 5% 1/1/26 | | 1,375,000 | 1,499,563 |
| 5% 1/1/28 | | 800,000 | 900,312 |
| County of Cuyahoga (Ballpark Impt. Proj.) Series 2022 A, 4% 1/1/35 | | 8,000,000 | 8,343,291 |
| Fairfield County Hosp. Facilities Rev. (Fairfield Med. Ctr. Proj.) Series 2013, 4.25% 6/15/24 | | 110,000 | 110,858 |
| Franklin County Convention Facilities Auth. (Greater Columbus Convention Ctr. Hotel Expansion Proj.) Series 2019, 5% 12/1/44 | | 60,000 | 60,557 |
| Franklin County Convention Facilities Authorities (Greater Columbus Convention Ctr. Hotel Expansion Proj.) Series 2019: | | | |
| 5% 12/1/46 | | 200,000 | 218,797 |
| 5% 12/1/51 | | 200,000 | 217,962 |
| Kent State Univ. Revs. Series 2016, 5% 5/1/30 | | 1,495,000 | 1,617,881 |
| Lancaster Port Auth. Gas Rev.: | | | |
| Bonds Series 2019, 5%, tender 2/1/25 (a) | | 255,000 | 267,449 |
| Series 2019, 5% 2/1/25 | | 160,000 | 168,214 |
| Muskingum County Hosp. Facilities (Genesis Healthcare Sys. Obligated Group Proj.) Series 2013: | | | |
| 4% 2/15/23 | | 315,000 | 317,604 |
| 5% 2/15/44 | | 100,000 | 98,198 |
| Ohio Gen. Oblig.: | | | |
| Series 2021 A: | | | |
| 5% 3/1/28 | | 110,000 | 124,651 |
| 5% 3/1/28 | | 140,000 | 158,647 |
| 5% 3/1/29 | | 160,000 | 183,135 |
| 5% 3/1/29 | | 210,000 | 240,364 |
| 5% 3/1/30 | | 190,000 | 219,235 |
| 5% 3/1/30 | | 290,000 | 334,622 |
| Series 2021 B: | | | |
| 5% 2/1/28 | | 205,000 | 232,068 |
| 5% 2/1/29 | | 385,000 | 440,217 |
| 5% 2/1/30 | | 320,000 | 368,935 |
| Series 2021 C: | | | |
| 5% 3/15/28 | | 275,000 | 311,772 |
| 5% 3/15/29 | | 480,000 | 549,662 |
| 5% 3/15/30 | | 480,000 | 554,064 |
| Ohio Hosp. Facilities Rev. Series 2021 B: | | | |
| 5% 1/1/24 | | 240,000 | 250,373 |
| 5% 1/1/25 | | 270,000 | 288,674 |
| 5% 1/1/26 | | 320,000 | 349,327 |
| 5% 1/1/27 | | 750,000 | 834,288 |
| Ohio Hosp. Rev. Series 2020 A: | | | |
| 4% 1/15/50 | | 40,000 | 37,309 |
| 5% 1/15/31 | | 300,000 | 328,650 |
| Ohio Hsg. Fin. Agcy. Residential Mtg. Rev.: | | | |
| (Mtg. Backed Securities Prog.) Series 2019 B, 4.5% 3/1/50 | | 15,000 | 15,412 |
| Series 2021 C, 3.25% 3/1/51 | | 4,795,000 | 4,720,935 |
| Ohio Major New State Infrastructure Rev. Series 2021 1A: | | | |
| 5% 12/15/25 | | 800,000 | 873,096 |
| 5% 12/15/26 | | 1,150,000 | 1,276,647 |
| 5% 12/15/27 | | 1,100,000 | 1,240,222 |
| 5% 12/15/28 | | 1,250,000 | 1,426,961 |
| Ohio Spl. Oblig. Series 2020 A: | | | |
| 5% 2/1/23 | | 180,000 | 183,555 |
| 5% 2/1/26 | | 150,000 | 163,849 |
| Ohio Tpk. Commission Tpk. Rev.: | | | |
| (Infrastructure Proj.) Series 2022 A, 5% 2/15/38 (d) | | 185,000 | 206,671 |
| (Infrastructure Projs.) Series 2022 A: | | | |
| 5% 2/15/26 (d) | | 1,090,000 | 1,170,223 |
| 5% 2/15/31 (d) | | 610,000 | 691,374 |
| 5% 2/15/32 (d) | | 70,000 | 79,655 |
| Series A, 5% 2/15/51 | | 600,000 | 661,384 |
| Scioto County Hosp. Facilities Rev. Series 2019, 5% 2/15/29 | | 100,000 | 105,901 |
| Univ. of Akron Gen. Receipts Series 2019 A, 4% 1/1/27 | | 220,000 | 230,803 |
| Wood County Hosp. Facilities Rev. (Wood County Hosp. Proj.) Series 2012: | | | |
| 5% 12/1/32 (Pre-Refunded to 12/1/22 @ 100) | | 10,000 | 10,146 |
| 5% 12/1/32 (Pre-Refunded to 12/1/22 @ 100) | | 5,000 | 5,073 |
|
| TOTAL OHIO | | | 36,710,635 |
|
| Oklahoma - 0.1% | | | |
| Oklahoma City Arpt. Trust Series 33, 5% 7/1/47 (b) | | 200,000 | 207,230 |
| Oklahoma Dev. Fin. Auth. Health Sys. Rev. Series 2015 A, 5% 8/15/24 | | 250,000 | 262,340 |
| Oklahoma Dev. Fin. Auth. Rev. (Oklahoma City Univ. Proj.) Series 2019: | | | |
| 4% 8/1/22 | | 60,000 | 60,055 |
| 5% 8/1/23 | | 45,000 | 45,819 |
| 5% 8/1/44 | | 125,000 | 123,210 |
|
| TOTAL OKLAHOMA | | | 698,654 |
|
| Oregon - 0.4% | | | |
| Oregon State Hsg. & Cmnty. Svcs. Dept. Series 2019 A, 4% 7/1/50 | | 1,205,000 | 1,221,527 |
| Port of Portland Arpt. Rev.: | | | |
| Series 2020 27A, 5% 7/1/45 (b) | | 650,000 | 688,658 |
| Series 27 A, 5% 7/1/36 (b) | | 240,000 | 258,768 |
|
| TOTAL OREGON | | | 2,168,953 |
|
| Pennsylvania - 9.1% | | | |
| Allegheny County Arpt. Auth. Rev. Series 2021 A: | | | |
| 5% 1/1/51 (b) | | 2,105,000 | 2,191,117 |
| 5% 1/1/56 (b) | | 1,280,000 | 1,327,544 |
| Allegheny County Hosp. Dev. Auth. Rev. Series 2019 A, 5% 7/15/22 | | 185,000 | 185,174 |
| Allegheny County Indl. Dev. Auth. Rev. Series 2021: | | | |
| 3.5% 12/1/31 | | 175,000 | 144,448 |
| 4% 12/1/41 | | 270,000 | 202,978 |
| 4.25% 12/1/50 | | 300,000 | 215,733 |
| Bucks County Indl. Dev. Auth. Hosp. Rev. Series 2021: | | | |
| 5% 7/1/26 | | 475,000 | 501,522 |
| 5% 7/1/27 | | 475,000 | 504,299 |
| 5% 7/1/28 | | 525,000 | 557,606 |
| 5% 7/1/29 | | 550,000 | 584,373 |
| 5% 7/1/36 | | 120,000 | 121,968 |
| 5% 7/1/38 | | 240,000 | 241,024 |
| Centre County Pennsylvania Hosp. Auth. Rev. (Mount Nittany Med. Ctr. Proj.): | | | |
| Series 2016 A, 5% 11/15/46 (Pre-Refunded to 11/15/25 @ 100) | | 2,250,000 | 2,453,318 |
| Series 2018 A: | | | |
| 5% 11/15/22 | | 100,000 | 101,229 |
| 5% 11/15/25 | | 100,000 | 108,243 |
| Commonwealth Fing. Auth. Rev. Series 2020 A, 5% 6/1/28 | | 305,000 | 341,674 |
| Delaware County Auth. Rev.: | | | |
| (Cabrini College) Series 2017, 5% 7/1/47 | | 510,000 | 488,355 |
| Series 2017, 5% 7/1/28 | | 445,000 | 453,854 |
| Doylestown Hosp. Auth. Hosp. Rev. Series 2016 A, 5% 7/1/46 | | 20,000 | 18,663 |
| Dubois Hosp. Auth. Hosp. Rev.: | | | |
| (Penn Highlands Healthcare Proj.) Series 2018: | | | |
| 4% 7/15/37 | | 40,000 | 38,740 |
| 5% 7/15/36 | | 500,000 | 523,947 |
| Series 2020, 4% 7/15/45 | | 500,000 | 451,919 |
| Geisinger Auth. Health Sys. Rev. Series 2017 A1, 5% 2/15/45 | | 100,000 | 104,732 |
| Lehigh County Gen. Purp. Auth. Rev. (Muhlenberg College Proj.) Series 2017, 5% 2/1/39 | | 60,000 | 63,282 |
| Lehigh County Gen. Purp. Hosp. Rev. Series 2016 A, 4% 7/1/35 | | 5,060,000 | 5,000,116 |
| Lehigh County Indl. Dev. Auth. Poll. Cont. Rev. Bonds (PPL Elec. Utils. Corp. Proj.) Series 2016 A, 1.8%, tender 9/1/22 (a) | | 95,000 | 94,928 |
| Monroeville Fin. Auth. UPMC Rev. Series 2012, 5% 2/15/26 | | 95,000 | 101,798 |
| Montgomery County Higher Ed. & Health Auth. Rev.: | | | |
| Series 2016 A, 5% 10/1/40 | | 330,000 | 330,736 |
| Series 2019, 4% 9/1/44 | | 185,000 | 175,373 |
| Series 2020, 5% 4/1/27 | | 300,000 | 318,441 |
| Montgomery County Indl. Dev. Auth. Series 2015 A, 5.25% 1/15/36 (Pre-Refunded to 1/15/25 @ 100) | | 140,000 | 149,936 |
| Northampton County Gen. Purp. Auth. Hosp. Rev.: | | | |
| (St. Luke's Univ. Health Network Proj.) Series 2018 A, 4% 8/15/48 | | 195,000 | 174,036 |
| Series 2016 A, 5% 8/15/46 | | 50,000 | 51,275 |
| Pennsylvania Ctfs. Prtn. Series 2018 A: | | | |
| 5% 7/1/23 | | 250,000 | 257,604 |
| 5% 7/1/24 | | 300,000 | 315,991 |
| 5% 7/1/26 | | 455,000 | 497,235 |
| 5% 7/1/27 | | 500,000 | 555,391 |
| 5% 7/1/34 | | 450,000 | 494,183 |
| Pennsylvania Higher Edl. Facilities Auth. Rev.: | | | |
| (Drexel Univ. Proj.): | | | |
| Series 2016, 5% 5/1/35 | | 500,000 | 520,347 |
| Series 2017, 5% 5/1/35 | | 10,000 | 10,546 |
| Series 2018 A, 5% 2/15/48 | | 100,000 | 107,997 |
| Pennsylvania Hsg. Fin. Agcy.: | | | |
| Series 2021 134B, 5% 10/1/27 (b) | | 1,160,000 | 1,253,960 |
| Series 2021 137, 3% 10/1/51 | | 900,000 | 866,778 |
| Series 2022 138: | | | |
| 3% 10/1/52 | | 1,400,000 | 1,334,108 |
| 5% 4/1/26 | | 1,100,000 | 1,197,083 |
| 5% 10/1/26 | | 600,000 | 658,232 |
| 5% 4/1/27 | | 500,000 | 552,054 |
| 5% 10/1/27 | | 450,000 | 500,170 |
| 5% 4/1/28 | | 465,000 | 518,242 |
| 5% 10/1/28 | | 475,000 | 530,629 |
| 5% 4/1/29 | | 480,000 | 538,927 |
| 5% 10/1/29 | | 1,000,000 | 1,124,421 |
| 5% 4/1/30 | | 1,010,000 | 1,136,383 |
| 5% 10/1/30 | | 695,000 | 783,697 |
| Pennsylvania Tpk. Commission Tpk. Rev.: | | | |
| Series 2015 B, 5% 12/1/45 | | 265,000 | 275,586 |
| Series 2016 A1, 5% 12/1/41 | | 1,215,000 | 1,257,380 |
| Series 2021 A, 4% 12/1/50 | | 1,000,000 | 910,815 |
| Series 2021 B: | | | |
| 5% 12/1/28 | | 625,000 | 701,359 |
| 5% 12/1/29 | | 1,000,000 | 1,133,028 |
| Philadelphia Arpt. Rev.: | | | |
| Series 2017 B: | | | |
| 5% 7/1/35 (b) | | 50,000 | 52,290 |
| 5% 7/1/47 (b) | | 970,000 | 997,622 |
| Series 2020 C, 5% 7/1/29 (b) | | 595,000 | 655,439 |
| Series 2021: | | | |
| 5% 7/1/26 (b) | | 2,920,000 | 3,140,473 |
| 5% 7/1/27 (b) | | 4,020,000 | 4,375,029 |
| 5% 7/1/28 (b) | | 425,000 | 465,916 |
| 5% 7/1/34 (b) | | 1,000,000 | 1,082,864 |
| 5% 7/1/35 (b) | | 1,000,000 | 1,076,559 |
| Philadelphia Auth. for Indl. Dev.: | | | |
| Series 2015 1, 5% 4/1/33 | | 70,000 | 73,944 |
| Series 2017 A, 5% 9/1/42 | | 760,000 | 791,359 |
| Philadelphia Gas Works Rev.: | | | |
| Series 14, 5% 10/1/22 | | 375,000 | 378,027 |
| Series 2020 A, 5% 8/1/32 (Assured Guaranty Muni. Corp. Insured) | | 1,000,000 | 1,135,954 |
| Philadelphia Gen. Oblig.: | | | |
| Series 2014 A, 5.25% 7/15/27 (Pre-Refunded to 1/15/24 @ 100) | | 275,000 | 289,156 |
| Series 2019 A, 5% 8/1/26 | | 220,000 | 241,838 |
| Philadelphia School District: | | | |
| Series 2018 A, 5% 9/1/25 | | 50,000 | 53,852 |
| Series 2018 B, 5% 9/1/43 | | 50,000 | 52,669 |
| Series 2019 A: | | | |
| 4% 9/1/35 | | 170,000 | 172,824 |
| 5% 9/1/23 | | 90,000 | 93,084 |
| 5% 9/1/34 | | 80,000 | 89,394 |
| Series 2019 B: | | | |
| 5% 9/1/25 | | 140,000 | 150,785 |
| 5% 9/1/26 | | 415,000 | 454,126 |
| Series 2019 C, 5% 9/1/33 | | 315,000 | 345,704 |
| Pittsburgh Wtr. & Swr. Auth. Wtr. & Swr. Sys. Rev. Series 2019 A, 5% 9/1/44 (Assured Guaranty Muni. Corp. Insured) | | 70,000 | 77,345 |
| Southcentral Pennsylvania Gen. Auth. Rev.: | | | |
| (Hanover Hosp., Inc. PA Proj.) Series 2015, 5% 12/1/28 | | 45,000 | 47,494 |
| Series 2019 A: | | | |
| 4% 6/1/44 | | 50,000 | 49,006 |
| 4% 6/1/49 | | 115,000 | 108,609 |
| 5% 6/1/25 | | 200,000 | 215,277 |
| 5% 6/1/44 | | 85,000 | 89,617 |
| 5% 6/1/49 | | 135,000 | 141,639 |
| State Pub. School Bldg. Auth. Lease Rev. (The School District of Philadelphia Proj.) Series 2016 A, 5% 6/1/32 (Assured Guaranty Muni. Corp. Insured) | | 315,000 | 342,560 |
| Union County Hosp. Auth. Rev. Series 2018 B: | | | |
| 5% 8/1/43 | | 185,000 | 198,575 |
| 5% 8/1/48 | | 310,000 | 331,613 |
|
| TOTAL PENNSYLVANIA | | | 54,125,170 |
|
| Puerto Rico - 0.0% | | | |
| Puerto Rico Commonwealth Pub. Impt. Gen. Oblig. Series 2021 A1, 5.625% 7/1/27 | | 190,000 | 202,115 |
| Rhode Island - 0.2% | | | |
| Rhode Island Health & Edl. Bldg. Corp. Higher Ed. Facilities Rev. Series 2016, 5% 5/15/39 | | 215,000 | 220,919 |
| Rhode Island Hsg. & Mtg. Fin. Corp. Series 2019 70, 4% 10/1/49 | | 40,000 | 40,573 |
| Rhode Island Student Ln. Auth. Student Ln. Rev. Series A: | | | |
| 4% 12/1/26 (b) | | 110,000 | 113,072 |
| 5% 12/1/23 (b) | | 625,000 | 649,415 |
|
| TOTAL RHODE ISLAND | | | 1,023,979 |
|
| South Carolina - 1.0% | | | |
| Charleston County Arpt. District Series 2019, 5% 7/1/48 | | 395,000 | 417,623 |
| South Carolina Hsg. Fin. & Dev. Auth. Mtg. Rev. Series 2019 A, 4% 1/1/50 | | 60,000 | 60,903 |
| South Carolina Jobs-Econ. Dev. Auth. Series 2019 C, 5% 7/1/33 | | 170,000 | 182,043 |
| South Carolina Jobs-Econ. Dev. Auth. Econ. Dev. Rev. Series 2022 A, 4% 4/1/52 | | 1,000,000 | 945,163 |
| South Carolina Ports Auth. Ports Rev.: | | | |
| Series 2015, 5.25% 7/1/55 (Pre-Refunded to 7/1/25 @ 100) (b) | | 255,000 | 275,387 |
| Series 2018, 5% 7/1/43 (b) | | 520,000 | 546,831 |
| South Carolina Pub. Svc. Auth. Rev.: | | | |
| Series 2016 A: | | | |
| 5% 12/1/26 | | 140,000 | 150,131 |
| 5% 12/1/29 | | 500,000 | 533,461 |
| 5% 12/1/33 | | 15,000 | 15,687 |
| 5% 12/1/38 | | 80,000 | 82,511 |
| Series 2016 B: | | | |
| 5% 12/1/31 | | 105,000 | 111,340 |
| 5% 12/1/35 | | 195,000 | 202,488 |
| 5% 12/1/41 | | 175,000 | 180,534 |
| Series A, 5% 12/1/23 | | 145,000 | 151,158 |
| Series B, 5% 12/1/24 | | 500,000 | 527,189 |
| Spartanburg County Reg'l. Health Series 2017 A: | | | |
| 4% 4/15/43 | | 30,000 | 28,963 |
| 4% 4/15/48 | | 20,000 | 18,486 |
| 5% 4/15/48 | | 1,415,000 | 1,462,128 |
|
| TOTAL SOUTH CAROLINA | | | 5,892,026 |
|
| Tennessee - 1.7% | | | |
| Chattanooga Health Ed. & Hsg. Facility Board Rev. Series 2019 A1: | | | |
| 4% 8/1/44 | | 575,000 | 529,220 |
| 5% 8/1/25 | | 135,000 | 142,304 |
| Greeneville Health & Edl. Facilities Board Series 2018 A, 5% 7/1/25 | | 20,000 | 20,485 |
| Memphis-Shelby County Arpt. Auth. Arpt. Rev. Series 2018: | | | |
| 5% 7/1/26 (b) | | 450,000 | 484,680 |
| 5% 7/1/37 (b) | | 200,000 | 210,161 |
| 5% 7/1/38 (b) | | 1,315,000 | 1,379,374 |
| Metropolitan Nashville Arpt. Auth. Rev.: | | | |
| Series 2015 B, 4% 7/1/25 (b) | | 55,000 | 56,945 |
| Series 2019 B: | | | |
| 5% 7/1/38 (b) | | 655,000 | 699,847 |
| 5% 7/1/54 (b) | | 225,000 | 233,713 |
| Nashville and Davidson County Metropolitan Govt. Gen. Oblig. Series 2021 C: | | | |
| 5% 1/1/27 | | 2,210,000 | 2,460,363 |
| 5% 1/1/30 | | 2,400,000 | 2,773,497 |
| Tennessee Energy Acquisition Corp. Bonds (Gas Rev. Proj.) Series A, 4%, tender 5/1/23 (a) | | 460,000 | 465,640 |
| Tennessee Hsg. Dev. Agcy. Residential: | | | |
| Series 2021 1, 3% 7/1/51 | | 620,000 | 607,021 |
| Series 2021 3A, 3% 1/1/52 | | 285,000 | 277,520 |
|
| TOTAL TENNESSEE | | | 10,340,770 |
|
| Texas - 4.7% | | | |
| Austin Cmnty. College District Rev. (Highland Campus Parking Garage Proj.) Series 2018 C: | | | |
| 5% 8/1/25 | | 200,000 | 216,618 |
| 5% 8/1/26 | | 200,000 | 220,507 |
| Austin-Bergstrom Landhost Ente Series 2017, 5% 10/1/22 | | 115,000 | 115,716 |
| Central Reg'l. Mobility Auth.: | | | |
| Series 2020 B, 5% 1/1/45 | | 1,000,000 | 1,053,657 |
| Series 2021 B: | | | |
| 5% 1/1/33 | | 640,000 | 698,324 |
| 5% 1/1/34 | | 650,000 | 707,050 |
| 5% 1/1/35 | | 550,000 | 595,703 |
| 5% 1/1/36 | | 850,000 | 918,232 |
| 5% 1/1/37 | | 1,100,000 | 1,183,725 |
| 5% 1/1/38 | | 1,100,000 | 1,180,105 |
| Series 2021 C, 5% 1/1/27 | | 775,000 | 826,311 |
| Cypress-Fairbanks Independent School District Bonds Series 2017 A2, 1.25%, tender 8/15/22 (a) | | 130,000 | 129,989 |
| Dallas Fort Worth Int'l. Arpt. Rev.: | | | |
| Series 2014 A, 5.25% 11/1/27 (b) | | 180,000 | 185,525 |
| Series 2014 B: | | | |
| 5% 11/1/22 (b) | | 115,000 | 116,145 |
| 5% 11/1/29 (Pre-Refunded to 11/1/22 @ 100) (b) | | 35,000 | 35,396 |
| Denton Independent School District Bonds Series 2014 B: | | | |
| 2%, tender 8/1/24 (a) | | 15,000 | 14,866 |
| 2%, tender 8/1/24 (a) | | 85,000 | 83,967 |
| Fort Bend Independent School District Bonds Series 2021 B, 0.72%, tender 8/1/26 (a) | | 475,000 | 436,274 |
| Garland Elec. Util. Sys. Rev. Series 2021 A: | | | |
| 4% 3/1/35 | | 765,000 | 789,369 |
| 4% 3/1/36 | | 750,000 | 772,390 |
| Harris County Cultural Ed. Facilities Fin. Corp. Rev. Series 2015, 4% 12/1/45 | | 220,000 | 207,561 |
| Harris County Flood Cont. District Series 2021 A: | | | |
| 5% 10/1/25 | | 690,000 | 749,235 |
| 5% 10/1/26 | | 900,000 | 996,124 |
| Houston Arpt. Sys. Rev.: | | | |
| Series 2012 A, 5% 7/1/23 (Pre-Refunded to 7/1/22 @ 100) (b) | | 85,000 | 85,000 |
| Series 2018 A, 5% 7/1/41 (b) | | 1,000,000 | 1,044,378 |
| Series 2018 C: | | | |
| 5% 7/1/26 (b) | | 200,000 | 215,804 |
| 5% 7/1/30 (b) | | 120,000 | 129,745 |
| Series 2018 D, 5% 7/1/39 | | 260,000 | 276,737 |
| Houston City of Higher Ed. Fin. Corp. (Houston Baptist Univ. Proj.) Series 2021: | | | |
| 3.375% 10/1/37 | | 500,000 | 434,082 |
| 4% 10/1/51 | | 1,200,000 | 994,637 |
| Houston Gen. Oblig. Series 2017 A, 5% 3/1/32 | | 25,000 | 27,268 |
| Houston Util. Sys. Rev.: | | | |
| Series 2016 B, 5% 11/15/34 | | 5,000 | 5,383 |
| Series 2020 C, 5% 11/15/45 | | 1,000,000 | 1,100,363 |
| Series 2021 A, 5% 11/15/26 | | 445,000 | 495,206 |
| Love Field Arpt. Modernization Rev.: | | | |
| Series 2015, 5% 11/1/30 (b) | | 320,000 | 334,824 |
| Series 2017, 5% 11/1/31 (b) | | 25,000 | 26,415 |
| Lower Colorado River Auth. Rev. (LCRA Transmission Svcs. Corp. Proj.) Series 2020, 5% 5/15/24 | | 300,000 | 315,479 |
| Midlothian Independent School District Bonds Series 2013 C, 2%, tender 8/1/24 (a) | | 100,000 | 98,705 |
| New Hope Cultural Ed. Facilities Fin. Corp. (Childrens Med. Ctr. of Dallas) Series 2017 A: | | | |
| 5% 8/15/27 | | 10,000 | 11,200 |
| 5% 8/15/47 | | 10,000 | 10,468 |
| North Central Texas Health Facilities Dev. Corp. (Childrens Med. Ctr. of Dallas Proj.) Series 2012, 5% 8/15/32 (Pre-Refunded to 8/15/22 @ 100) | | 100,000 | 100,417 |
| North Texas Tollway Auth. Rev.: | | | |
| Series 2019 B, 5% 1/1/25 | | 85,000 | 90,623 |
| Series 2021 B, 4% 1/1/32 | | 2,000,000 | 2,075,498 |
| San Antonio Elec. & Gas Sys. Rev. Series 2017, 5% 2/1/33 | | 5,000 | 5,402 |
| San Antonio Wtr. Sys. Rev.: | | | |
| Series 2018 A, 5% 5/15/33 | | 5,000 | 5,531 |
| Series 2020 A, 5% 5/15/50 | | 475,000 | 517,609 |
| Tarrant County Cultural Ed. Facilities Fin. Corp. Rev.: | | | |
| Series 2017 A, 5% 2/15/24 | | 265,000 | 277,763 |
| Series 2018 A, 5% 7/1/29 | | 305,000 | 333,810 |
| Texas Dept. of Hsg. & Cmnty. Affairs Multi-family Hsg. Rev. Series 2019, 2.95% 7/1/36 | | 124,869 | 114,742 |
| Texas Dept. of Hsg. & Cmnty. Affairs Single Family Mtg. Rev.: | | | |
| Series 2019 A, 4% 3/1/50 | | 115,000 | 116,663 |
| Series A, 3.5% 3/1/51 | | 160,000 | 159,215 |
| Texas Private Activity Bond Surface Trans. Corp. (LBJ Infrastructure Group LLC I-635 Managed Lanes Proj.) Series 2020 A, 4% 6/30/37 | | 1,000,000 | 934,872 |
| Texas Trans. Commission Series 2019 A, 0% 8/1/41 | | 250,000 | 99,763 |
| Texas Trans. Commission Hwy. Impt. Gen. Oblig. Bonds Series 2014 B, 0.65%, tender 4/1/26 (a) | | 2,380,000 | 2,194,645 |
| Univ. of North Texas Univ. Rev. Series 2022 A, 5% 4/15/47 | | 2,000,000 | 2,143,855 |
| Univ. of Texas Board of Regents Sys. Rev. Series 2020 C, 5% 8/15/28 | | 1,000,000 | 1,141,424 |
|
| TOTAL TEXAS | | | 28,150,315 |
|
| Utah - 0.1% | | | |
| Salt Lake City Arpt. Rev.: | | | |
| Series 2017 A: | | | |
| 5% 7/1/24 (b) | | 10,000 | 10,473 |
| 5% 7/1/37 (b) | | 385,000 | 402,495 |
| Series 2018 A: | | | |
| 5% 7/1/33 (b) | | 175,000 | 186,494 |
| 5.25% 7/1/48 (b) | | 130,000 | 136,454 |
|
| TOTAL UTAH | | | 735,916 |
|
| Vermont - 0.3% | | | |
| Vermont Hsg. Fin. Agcy. Series 2021 B, 3% 11/1/51 | | 320,000 | 308,232 |
| Vermont Student Assistant Corp. Ed. Ln. Rev.: | | | |
| Series 2019 A, 5% 6/15/25 (b) | | 635,000 | 671,748 |
| Series 2020 A, 5% 6/15/26 (b) | | 620,000 | 664,510 |
|
| TOTAL VERMONT | | | 1,644,490 |
|
| Virginia - 1.8% | | | |
| Arlington County Series 2021, 5% 6/15/26 | | 1,600,000 | 1,764,926 |
| Fairfax County Indl. Dev. Auth. Bonds (Inova Health Sys. Proj.) Series 2018 B, 5%, tender 5/15/23 (a) | | 2,000,000 | 2,051,937 |
| Roanoke Econ. Dev. Auth. Edl. Facilities Series 2018 A: | | | |
| 5% 9/1/23 | | 360,000 | 371,080 |
| 5% 9/1/24 | | 315,000 | 328,332 |
| Salem Econ. Dev. Auth. Series 2020: | | | |
| 4% 4/1/40 | | 120,000 | 113,290 |
| 5% 4/1/25 | | 165,000 | 173,272 |
| 5% 4/1/36 | | 500,000 | 532,037 |
| Virginia College Bldg. Auth. Edl. Facilities Rev. (21St Century Collage and Equip. Programs) Series 2021 A: | | | |
| 4% 2/1/34 | | 1,850,000 | 1,924,313 |
| 4% 2/1/35 | | 1,700,000 | 1,752,785 |
| Virginia Small Bus. Fing. Auth. (Elizabeth River Crossings OpCo, LLC Proj.) Series 2022, 4% 7/1/34 (b)(d) | | 1,465,000 | 1,413,726 |
| Wise County Indl. Dev. Auth. Waste & Sewage Rev. Bonds (Virginia Elec. and Pwr. Co. Proj.) Series 2010 A, 1.2%, tender 5/31/24 (a) | | 125,000 | 120,662 |
|
| TOTAL VIRGINIA | | | 10,546,360 |
|
| Washington - 2.6% | | | |
| King County Hsg. Auth. Rev. Series 2021, 4% 12/1/29 | | 230,000 | 243,065 |
| King County Swr. Rev. Series 2017, 5% 7/1/34 | | 10,000 | 10,970 |
| Port of Seattle Rev.: | | | |
| Series 2012 B, 5% 8/1/23 (b) | | 155,000 | 155,290 |
| Series 2013, 5% 7/1/24 (b) | | 55,000 | 56,343 |
| Series 2015 B, 5% 3/1/25 | | 70,000 | 74,061 |
| Series 2015 C, 5% 4/1/24 (b) | | 50,000 | 52,011 |
| Series 2018 A, 5% 5/1/31 (b) | | 350,000 | 378,035 |
| Series 2019 A, 4% 4/1/44 (b) | | 100,000 | 92,089 |
| Series 2021 C: | | | |
| 5% 8/1/24 (b) | | 445,000 | 465,431 |
| 5% 8/1/25 (b) | | 365,000 | 388,051 |
| 5% 8/1/26 (b) | | 495,000 | 533,760 |
| 5% 8/1/27 (b) | | 305,000 | 332,318 |
| 5% 8/1/28 (b) | | 860,000 | 943,956 |
| Seattle Hsg. Auth. Rev. (Northgate Plaza Proj.) Series 2021, 1% 6/1/26 | | 200,000 | 188,478 |
| Spokane Pub. Facilities District Hotel/Motel Tax & Sales/Use Tax Rev. Series 2017, 5% 12/1/41 | | 295,000 | 309,619 |
| Washington Convention Ctr. Pub. Facilities Series 2021 B, 3% 7/1/58 (Assured Guaranty Muni. Corp. Insured) | | 1,805,000 | 1,279,814 |
| Washington Gen. Oblig.: | | | |
| Series 2013 A, 5% 7/1/23 | | 5,000 | 5,000 |
| Series 2015 A1, 5% 8/1/39 | | 1,000,000 | 1,042,827 |
| Series 2021 C, 5% 2/1/44 | | 3,010,000 | 3,361,027 |
| Washington Health Care Facilities Auth. Rev.: | | | |
| (Overlake Hosp. Med. Ctr., WA. Proj.) Series 2017 B: | | | |
| 5% 7/1/25 | | 5,000 | 5,328 |
| 5% 7/1/30 | | 5,000 | 5,404 |
| 5% 7/1/31 | | 10,000 | 10,771 |
| 5% 7/1/42 | | 100,000 | 103,944 |
| Series 2017, 4% 8/15/42 | | 100,000 | 91,098 |
| Series 2019 A2, 5% 8/1/44 | | 255,000 | 260,493 |
| Series 2020, 5% 9/1/40 | | 735,000 | 777,864 |
| Washington Higher Ed. Facilities Auth. Rev. (Whitworth Univ. Proj.) Series 2016 A, 5% 10/1/25 | | 550,000 | 584,099 |
| Washington Hsg. Fin. Commission Series 2021 2N: | | | |
| 5% 6/1/26 | | 970,000 | 1,064,254 |
| 5% 12/1/27 | | 985,000 | 1,104,724 |
| 5% 12/1/28 | | 500,000 | 565,770 |
| 5% 12/1/29 | | 500,000 | 561,217 |
| Washington Hsg. Fin. Commission Nonprofit Hsg. Rev. (Judson Park Proj.) Series 2018, 5% 7/1/38 (c) | | 100,000 | 94,017 |
|
| TOTAL WASHINGTON | | | 15,141,128 |
|
| West Virginia - 0.0% | | | |
| West Virginia Hosp. Fin. Auth. Hosp. Rev. Series 2018 A, 5% 1/1/32 | | 50,000 | 52,534 |
| Wisconsin - 1.1% | | | |
| Blue Ridge Healthcare Pub. Fin. Auth. Series 2020 A, 5% 1/1/31 | | 60,000 | 64,896 |
| Pub. Fin. Auth. Edl. Facilities Series 2018 A: | | | |
| 5.25% 10/1/43 | | 160,000 | 161,495 |
| 5.25% 10/1/48 | | 160,000 | 160,995 |
| Pub. Fin. Auth. Hosp. Rev. Series 2019 A, 5% 10/1/44 | | 355,000 | 370,043 |
| Pub. Fin. Auth. Wisconsin Retirement Facility Rev. Series 2018: | | | |
| 5% 10/1/43 (c) | | 15,000 | 13,732 |
| 5% 10/1/48 (c) | | 20,000 | 17,830 |
| 5% 10/1/53 (c) | | 30,000 | 26,319 |
| Roseman Univ. of Health: | | | |
| (Roseman Univ. of Health Sciences Proj.) Series 2020, 5% 4/1/40 (c) | | 100,000 | 101,079 |
| Series 2020, 3% 4/1/25 (c) | | 325,000 | 319,032 |
| Series 2021 A, 4.5% 6/1/56 (c) | | 1,870,000 | 1,394,776 |
| Series 2021 B, 6.5% 6/1/56 (c) | | 500,000 | 399,360 |
| Wisconsin Gen. Oblig. Series 2021 A, 5% 5/1/32 | | 1,430,000 | 1,594,579 |
| Wisconsin Health & Edl. Facilities: | | | |
| Series 2016 A: | | | |
| 4% 11/15/46 | | 195,000 | 184,933 |
| 4% 11/15/46 (Pre-Refunded to 5/15/26 @ 100) | | 80,000 | 84,177 |
| Series 2019 A: | | | |
| 2.25% 11/1/26 | | 25,000 | 24,483 |
| 5% 11/1/22 | | 230,000 | 230,484 |
| 5% 12/1/28 | | 150,000 | 165,375 |
| 5% 12/1/29 | | 150,000 | 165,549 |
| Series 2019 B1, 2.825% 11/1/28 | | 50,000 | 44,794 |
| Series 2019 B2, 2.55% 11/1/27 | | 30,000 | 29,109 |
| Series 2019: | | | |
| 5% 10/1/24 | | 175,000 | 184,352 |
| 5% 10/1/30 | | 195,000 | 217,469 |
| Wisconsin Hsg. & Econ. Dev. Auth.: | | | |
| Series 2021 A, 3% 3/1/52 | | 205,000 | 200,234 |
| Series 2021 C, 3% 9/1/52 | | 380,000 | 369,966 |
| Wisconsin Hsg. & Econ. Dev. Auth. Hsg. Rev. Bonds Series 2021 C: | | | |
| 0.61%, tender 5/1/24 (a) | | 65,000 | 62,384 |
| 0.81%, tender 5/1/25 (a) | | 225,000 | 211,429 |
|
| TOTAL WISCONSIN | | | 6,798,874 |
|
| Wyoming - 0.4% | | | |
| Wyoming Cmnty. Dev. Auth. Hsg. Rev. Series 2022 3: | | | |
| 5% 6/1/24 (b) | | 675,000 | 707,886 |
| 5% 12/1/24 (b) | | 695,000 | 735,294 |
| 5% 6/1/25 (b) | | 700,000 | 745,939 |
| 5% 12/1/25 (b) | | 375,000 | 402,436 |
|
| TOTAL WYOMING | | | 2,591,555 |
|
| TOTAL MUNICIPAL BONDS | | | |
| (Cost $636,939,701) | | | 585,750,043 |
| | | Shares | Value |
|
| Money Market Funds - 1.5% | | | |
| Fidelity Municipal Cash Central Fund 0.88% (e)(f) | | | |
| (Cost $9,078,000) | | 9,076,185 | 9,078,000 |
| TOTAL INVESTMENT IN SECURITIES - 100.2% | | | |
| (Cost $646,017,701) | | | 594,828,043 |
| NET OTHER ASSETS (LIABILITIES) - (0.2)% | | | (1,469,526) |
| NET ASSETS - 100% | | | $593,358,517 |
Legend
(a) Coupon rates for floating and adjustable rate securities reflect the rates in effect at period end.
(b) Private activity obligations whose interest is subject to the federal alternative minimum tax for individuals.
(c) Security exempt from registration under Rule 144A of the Securities Act of 1933. These securities may be resold in transactions exempt from registration, normally to qualified institutional buyers. At the end of the period, the value of these securities amounted to $3,445,949 or 0.6% of net assets.
(d) Security or a portion of the security purchased on a delayed delivery or when-issued basis.
(e) Information in this report regarding holdings by state and security types does not reflect the holdings of the Fidelity Municipal Cash Central Fund.
(f) Affiliated fund that is generally available only to investment companies and other accounts managed by Fidelity Investments. The rate quoted is the annualized seven-day yield of the fund at period end. A complete unaudited listing of the fund's holdings as of its most recent quarter end is available upon request. In addition, each Fidelity Central Fund's financial statements are available on the SEC's website or upon request.
Affiliated Central Funds
Fiscal year to date information regarding the Fund's investments in Fidelity Central Funds, including the ownership percentage, is presented below.
| Fund | Value, beginning of period | Purchases | Sales Proceeds | Dividend Income | Realized Gain/Loss | Change in Unrealized appreciation (depreciation) | Value, end of period | % ownership, end of period |
| Fidelity Municipal Cash Central Fund 0.88% | $-- | $74,934,000 | $65,856,000 | $43,344 | $-- | $-- | $9,078,000 | 0.6% |
| Total | $-- | $74,934,000 | $65,856,000 | $43,344 | $-- | $-- | $9,078,000 | |
Amounts in the income column in the above table include any capital gain distributions from underlying funds, which are presented in the corresponding line-item in the Statement of Operations, if applicable.
Investment Valuation
The following is a summary of the inputs used, as of June 30, 2022, involving the Fund's assets and liabilities carried at fair value. The inputs or methodology used for valuing securities may not be an indication of the risk associated with investing in those securities. For more information on valuation inputs, and their aggregation into the levels used below, please refer to the Investment Valuation section in the accompanying Notes to Financial Statements.
| | Valuation Inputs at Reporting Date: |
| Description | Total | Level 1 | Level 2 | Level 3 |
| Investments in Securities: | | | | |
| Municipal Securities | $585,750,043 | $-- | $585,750,043 | $-- |
| Money Market Funds | 9,078,000 | 9,078,000 | -- | -- |
| Total Investments in Securities: | $594,828,043 | $9,078,000 | $585,750,043 | $-- |
Other Information
The distribution of municipal securities by revenue source, as a percentage of total Net Assets, is as follows (Unaudited):
| General Obligations | 25.1% |
| Transportation | 20.7% |
| Health Care | 11.6% |
| Education | 10.4% |
| Housing | 9.4% |
| Special Tax | 7.0% |
| Others* (Individually Less Than 5%) | 15.8% |
| | 100.0% |
* Includes net other assets
See accompanying notes which are an integral part of the financial statements.
Financial Statements
Statement of Assets and Liabilities
| | | June 30, 2022 (Unaudited) |
| Assets | | |
Investment in securities, at value — See accompanying schedule:
Unaffiliated issuers (cost $636,939,701) | $585,750,043 | |
| Fidelity Central Funds (cost $9,078,000) | 9,078,000 | |
| Total Investment in Securities (cost $646,017,701) | | $594,828,043 |
| Cash | | 62,508 |
| Receivable for investments sold | | 313,412 |
| Receivable for fund shares sold | | 532,639 |
| Interest receivable | | 7,261,694 |
| Distributions receivable from Fidelity Central Funds | | 13,408 |
| Other receivables | | 45 |
| Total assets | | 603,011,749 |
| Liabilities | | |
| Payable for investments purchased on a delayed delivery basis | $8,275,190 | |
| Payable for fund shares redeemed | 366,011 | |
| Distributions payable | 1,012,031 | |
| Total liabilities | | 9,653,232 |
| Net Assets | | $593,358,517 |
| Net Assets consist of: | | |
| Paid in capital | | $646,925,051 |
| Total accumulated earnings (loss) | | (53,566,534) |
| Net Assets | | $593,358,517 |
| Net Asset Value, offering price and redemption price per share ($593,358,517 ÷ 62,383,848 shares) | | $9.51 |
See accompanying notes which are an integral part of the financial statements.
Statement of Operations
| | | Six months ended June 30, 2022 (Unaudited) |
| Investment Income | | |
| Interest | | 5,679,283 |
| Income from Fidelity Central Funds | | 43,344 |
| Total income | | 5,722,627 |
| Expenses | | |
| Independent trustees' fees and expenses | $955 | |
| Total expenses | | 955 |
| Net investment income (loss) | | 5,721,672 |
| Realized and Unrealized Gain (Loss) | | |
| Net realized gain (loss) on: | | |
| Investment securities: | | |
| Unaffiliated issuers | (2,373,998) | |
| Total net realized gain (loss) | | (2,373,998) |
| Change in net unrealized appreciation (depreciation) on investment securities | | (64,685,842) |
| Net gain (loss) | | (67,059,840) |
| Net increase (decrease) in net assets resulting from operations | | $(61,338,168) |
See accompanying notes which are an integral part of the financial statements.
Statement of Changes in Net Assets
| | Six months ended June 30, 2022 (Unaudited) | Year ended December 31, 2021 |
| Increase (Decrease) in Net Assets | | |
| Operations | | |
| Net investment income (loss) | $5,721,672 | $8,058,982 |
| Net realized gain (loss) | (2,373,998) | 206,929 |
| Change in net unrealized appreciation (depreciation) | (64,685,842) | 2,167,623 |
| Net increase (decrease) in net assets resulting from operations | (61,338,168) | 10,433,534 |
| Distributions to shareholders | (5,719,641) | (8,295,176) |
| Share transactions | | |
| Proceeds from sales of shares | 173,139,475 | 485,618,087 |
| Reinvestment of distributions | 5 | 13 |
| Cost of shares redeemed | (156,668,153) | (155,810,090) |
| Net increase (decrease) in net assets resulting from share transactions | 16,471,327 | 329,808,010 |
| Total increase (decrease) in net assets | (50,586,482) | 331,946,368 |
| Net Assets | | |
| Beginning of period | 643,944,999 | 311,998,631 |
| End of period | $593,358,517 | $643,944,999 |
| Other Information | | |
| Shares | | |
| Sold | 17,345,846 | 46,004,101 |
| Issued in reinvestment of distributions | 1 | 1 |
| Redeemed | (15,919,978) | (14,763,396) |
| Net increase (decrease) | 1,425,869 | 31,240,706 |
See accompanying notes which are an integral part of the financial statements.
Financial Highlights
Fidelity Flex Municipal Income Fund
| | Six months ended (Unaudited) June 30, | Years endedDecember 31, | | | | |
| | 2022 | 2021 | 2020 | 2019 | 2018 | 2017 A |
| Selected Per–Share Data | | | | | | |
| Net asset value, beginning of period | $10.56 | $10.50 | $10.35 | $9.85 | $10.04 | $10.00 |
| Income from Investment Operations | | | | | | |
| Net investment income (loss)B,C | .090 | .173 | .232 | .275 | .261 | .040 |
| Net realized and unrealized gain (loss) | (1.050) | .068 | .153 | .531 | (.193) | .041 |
| Total from investment operations | (.960) | .241 | .385 | .806 | .068 | .081 |
| Distributions from net investment income | (.090) | (.177) | (.235) | (.278) | (.258) | (.040) |
| Distributions from net realized gain | – | (.004) | – | (.028) | – | (.001) |
| Total distributions | (.090) | (.181) | (.235) | (.306) | (.258) | (.041) |
| Net asset value, end of period | $9.51 | $10.56 | $10.50 | $10.35 | $9.85 | $10.04 |
| Total ReturnD | (9.11)% | 2.31% | 3.79% | 8.26% | .71% | .81% |
| Ratios to Average Net AssetsC,E,F | | | | | | |
| Expenses before reductionsG | - %H | -% | -% | -% | -% | - %H |
| Expenses net of fee waivers, if anyG | - %H | -% | -% | -% | -% | - %H |
| Expenses net of all reductionsG | - %H | -% | -% | -% | -% | - %H |
| Net investment income (loss) | 1.84%H | 1.65% | 2.26% | 2.70% | 2.69% | 1.81%H |
| Supplemental Data | | | | | | |
| Net assets, end of period (000 omitted) | $593,359 | $643,945 | $311,999 | $188,914 | $110,680 | $10,128 |
| Portfolio turnover rateI | 11%H | 5% | 24% | 18% | 73% | 35%J |
A For the period October 12, 2017 (commencement of operations) through December 31, 2017.
B Calculated based on average shares outstanding during the period.
C Net investment income (loss) is affected by the timing of the declaration of dividends by any underlying mutual funds or exchange-traded funds (ETFs). Net investment income (loss) of any such underlying funds is not included in the Fund's net investment income (loss) ratio.
D Total returns for periods of less than one year are not annualized.
E Fees and expenses of any underlying mutual funds or exchange-traded funds (ETFs) are not included in the Fund's expense ratio. The Fund indirectly bears its proportionate share of these expenses. For additional expense information related to investments in Fidelity Central Funds, please refer to the "Investments in Fidelity Central Funds" note found in the Notes to Financial Statements section of the most recent Annual or Semi-Annual report.
F Expense ratios reflect operating expenses of the class. Expenses before reductions do not reflect amounts reimbursed, waived, or reduced through arrangements with the investment adviser, brokerage services, or other offset arrangements, if applicable, and do not represent the amount paid by the class during periods when reimbursements, waivers or reductions occur.
G Amount represents less than .005%.
H Annualized
I Amount does not include the portfolio activity of any underlying mutual funds or exchange-traded funds (ETFs).
J Amount not annualized.
See accompanying notes which are an integral part of the financial statements.
Notes to Financial Statements (Unaudited)
For the period ended June 30, 2022
1. Organization.
Fidelity Flex Municipal Income Fund (the Fund) is a fund of Fidelity Municipal Trust (the Trust) and is authorized to issue an unlimited number of shares. Share transactions on the Statement of Changes in Net Assets may contain exchanges between affiliated funds. The Trust is registered under the Investment Company Act of 1940, as amended (the 1940 Act), as an open-end management investment company organized as a Massachusetts business trust. The Fund is available only to certain fee-based accounts and advisory programs offered by Fidelity.
2. Investments in Fidelity Central Funds.
Funds may invest in Fidelity Central Funds, which are open-end investment companies generally available only to other investment companies and accounts managed by the investment adviser and its affiliates. The Schedule of Investments lists any Fidelity Central Funds held as an investment as of period end, but does not include the underlying holdings of each Fidelity Central Fund. An investing fund indirectly bears its proportionate share of the expenses of the underlying Fidelity Central Funds.
Based on its investment objective, each Fidelity Central Fund may invest or participate in various investment vehicles or strategies that are similar to those of the investing fund. These strategies are consistent with the investment objectives of the investing fund and may involve certain economic risks which may cause a decline in value of each of the Fidelity Central Funds and thus a decline in the value of the investing fund.
| Fidelity Central Fund | Investment Manager | Investment Objective | Investment Practices | Expense Ratio(a) |
| Fidelity Money Market Central Funds | Fidelity Management & Research Company LLC (FMR) | Each fund seeks to obtain a high level of current income consistent with the preservation of capital and liquidity. | Short-term Investments | Less than .005% |
(a) Expenses expressed as a percentage of average net assets and are as of each underlying Central Fund's most recent annual or semi-annual shareholder report.
A complete unaudited list of holdings for each Fidelity Central Fund is available upon request or at the Securities and Exchange Commission website at www.sec.gov. In addition, the financial statements of the Fidelity Central Funds which contain the significant accounting policies (including investment valuation policies) of those funds, and are not covered by the Report of Independent Registered Public Accounting Firm, are available on the Securities and Exchange Commission website or upon request.
3. Significant Accounting Policies.
The Fund is an investment company and applies the accounting and reporting guidance of the Financial Accounting Standards Board (FASB) Accounting Standards Codification Topic 946 Financial Services - Investment Companies. The financial statements have been prepared in conformity with accounting principles generally accepted in the United States of America (GAAP), which require management to make certain estimates and assumptions at the date of the financial statements. Actual results could differ from those estimates. Subsequent events, if any, through the date that the financial statements were issued have been evaluated in the preparation of the financial statements. The Fund's Schedule of Investments lists any underlying mutual funds or exchange-traded funds (ETFs) but does not include the underlying holdings of these funds. The following summarizes the significant accounting policies of the Fund:
Investment Valuation. Investments are valued as of 4:00 p.m. Eastern time on the last calendar day of the period. The Board of Trustees (the Board) has delegated the day to day responsibility for the valuation of the Fund's investments to the Fair Value Committee (the Committee) established by the Fund's investment adviser. In accordance with valuation policies and procedures approved by the Board, the Fund attempts to obtain prices from one or more third party pricing vendors or brokers to value its investments. When current market prices, quotations or currency exchange rates are not readily available or reliable, investments will be fair valued in good faith by the Committee, in accordance with procedures adopted by the Board. Factors used in determining fair value vary by investment type and may include market or investment specific events, changes in interest rates and credit quality. The frequency with which these procedures are used cannot be predicted and they may be utilized to a significant extent. The Committee oversees the Fund's valuation policies and procedures and reports to the Board on the Committee's activities and fair value determinations. The Board monitors the appropriateness of the procedures used in valuing the Fund's investments and ratifies the fair value determinations of the Committee.
The Fund categorizes the inputs to valuation techniques used to value its investments into a disclosure hierarchy consisting of three levels as shown below:
- Level 1 – unadjusted quoted prices in active markets for identical investments
- Level 2 – other significant observable inputs (including quoted prices for similar investments, interest rates, prepayment speeds, etc.)
- Level 3 – unobservable inputs (including the Fund's own assumptions based on the best information available)
Valuation techniques used to value the Fund's investments by major category are as follows:
Debt securities, including restricted securities, are valued based on evaluated prices received from third party pricing vendors or from brokers who make markets in such securities. Municipal securities are valued by pricing vendors who utilize matrix pricing which considers yield or price of bonds of comparable quality, coupon, maturity and type or by broker-supplied prices. When independent prices are unavailable or unreliable, debt securities may be valued utilizing pricing methodologies which consider similar factors that would be used by third party pricing vendors. Debt securities are generally categorized as Level 2 in the hierarchy but may be Level 3 depending on the circumstances.
Investments in open-end mutual funds, including the Fidelity Central Funds, are valued at their closing net asset value (NAV) each business day and are categorized as Level 1 in the hierarchy.
Changes in valuation techniques may result in transfers in or out of an assigned level within the disclosure hierarchy. The aggregate value of investments by input level as of June 30, 2022 is included at the end of the Fund's Schedule of Investments.
Investment Transactions and Income. For financial reporting purposes, the Fund's investment holdings and NAV include trades executed through the end of the last business day of the period. The NAV per share for processing shareholder transactions is calculated as of the close of business of the New York Stock Exchange (NYSE), normally 4:00 p.m. Eastern time and includes trades executed through the end of the prior business day. Gains and losses on securities sold are determined on the basis of identified cost. Income and capital gain distributions from Fidelity Central Funds, if any, are recorded on the ex-dividend date. Interest income is accrued as earned and includes coupon interest and amortization of premium and accretion of discount on debt securities as applicable. Debt obligations may be placed on non-accrual status and related interest income may be reduced by ceasing current accruals and writing off interest receivables when the collection of all or a portion of interest has become doubtful based on consistently applied procedures. A debt obligation is removed from non-accrual status when the issuer resumes interest payments or when collectability of interest is reasonably assured.
Expenses. Expenses directly attributable to a fund are charged to that fund. Expenses attributable to more than one fund are allocated among the respective funds on the basis of relative net assets or other appropriate methods. Expenses included in the accompanying financial statements reflect the expenses of that fund and do not include any expenses associated with any underlying mutual funds or exchange-traded funds. Although not included in a fund's expenses, a fund indirectly bears its proportionate share of these expenses through the net asset value of each underlying mutual fund or exchange-traded fund. Expense estimates are accrued in the period to which they relate and adjustments are made when actual amounts are known.
Income Tax Information and Distributions to Shareholders. Each year, the Fund intends to qualify as a regulated investment company under Subchapter M of the Internal Revenue Code, including distributing substantially all of its taxable income and realized gains. As a result, no provision for U.S. Federal income taxes is required. The Fund files a U.S. federal tax return, in addition to state and local tax returns as required. The Fund's federal income tax returns are subject to examination by the Internal Revenue Service (IRS) for a period of three fiscal years after they are filed. State and local tax returns may be subject to examination for an additional fiscal year depending on the jurisdiction.
Distributions are declared and recorded daily and paid monthly from net investment income. Distributions from realized gains, if any, are declared and recorded on the ex-dividend date. Income and capital gain distributions are determined in accordance with income tax regulations, which may differ from GAAP.
Capital accounts within the financial statements are adjusted for permanent book-tax differences. These adjustments have no impact on net assets or the results of operations. Capital accounts are not adjusted for temporary book-tax differences which will reverse in a subsequent period.
Book-tax differences are primarily due to market discount and losses deferred due to excise tax regulations.
The Fund purchases municipal securities whose interest, in the opinion of the issuer, is free from federal income tax. There is no assurance that the IRS will agree with this opinion. In the event the IRS determines that the issuer does not comply with relevant tax requirements, interest payments from a security could become federally taxable, possibly retroactively to the date the security was issued.
As of period end, the cost and unrealized appreciation (depreciation) in securities, and derivatives if applicable, for federal income tax purposes were as follows:
| Gross unrealized appreciation | $1,009,674 |
| Gross unrealized depreciation | (52,194,948) |
| Net unrealized appreciation (depreciation) | $(51,185,274) |
| Tax cost | $646,013,317 |
The Fund elected to defer to its next fiscal year approximately $4,382 of capital losses recognized during the period November 1, 2021 to December 31,2021.
Delayed Delivery Transactions and When-Issued Securities. During the period, certain Funds transacted in securities on a delayed delivery or when-issued basis. Payment and delivery may take place after the customary settlement period for that security. The price of the underlying securities and the date when the securities will be delivered and paid for are fixed at the time the transaction is negotiated. Securities purchased on a delayed delivery or when-issued basis are identified as such in the Schedule of Investments. Compensation for interest forgone in the purchase of a delayed delivery or when-issued debt security may be received. With respect to purchase commitments, each applicable Fund identifies securities as segregated in its records with a value at least equal to the amount of the commitment. Payables and receivables associated with the purchases and sales of delayed delivery securities having the same coupon, settlement date and broker are offset. Delayed delivery or when-issued securities that have been purchased from and sold to different brokers are reflected as both payables and receivables in the Statement of Assets and Liabilities under the caption "Delayed delivery", as applicable. Losses may arise due to changes in the value of the underlying securities or if the counterparty does not perform under the contract's terms, or if the issuer does not issue the securities due to political, economic, or other factors.
Restricted Securities (including Private Placements). Funds may invest in securities that are subject to legal or contractual restrictions on resale. These securities generally may be resold in transactions exempt from registration or to the public if the securities are registered. Disposal of these securities may involve time-consuming negotiations and expense, and prompt sale at an acceptable price may be difficult. Information regarding restricted securities held at period end is included at the end of the Schedule of Investments, if applicable.
4. Purchases and Sales of Investments.
Purchases and sales of securities, other than short-term securities and in-kind transactions, as applicable, are noted in the table below.
| | Purchases ($) | Sales ($) |
| Fidelity Flex Municipal Income Fund | 122,670,168 | 31,924,178 |
5. Fees and Other Transactions with Affiliates.
Management Fee. Fidelity Management & Research Company LLC (the investment adviser) and its affiliates provide the Fund with investment management related services and the Fund does not pay any fees for these services. Under the management contract, the investment adviser or an affiliate pays all other expenses of the Fund, excluding fees and expenses of the independent Trustees, and certain miscellaneous expenses such as proxy and shareholder meeting expenses.
Interfund Trades. Funds may purchase from or sell securities to other Fidelity Funds under procedures adopted by the Board. The procedures have been designed to ensure these interfund trades are executed in accordance with Rule 17a-7 of the 1940 Act. Any interfund trades are included within the respective purchases and sales amounts shown in the Purchases and Sales of Investments note. During the period, there were no interfund trades.
6. Committed Line of Credit.
Certain Funds participate with other funds managed by the investment adviser or an affiliate in a $4.25 billion credit facility (the "line of credit") to be utilized for temporary or emergency purposes to fund shareholder redemptions or for other short-term liquidity purposes. The commitment fees on the pro-rata portion of the line of credit are borne by the investment adviser. During the period, there were no borrowings on this line of credit.
7. Other.
A fund's organizational documents provide former and current trustees and officers with a limited indemnification against liabilities arising in connection with the performance of their duties to the fund. In the normal course of business, a fund may also enter into contracts that provide general indemnifications. A fund's maximum exposure under these arrangements is unknown as this would be dependent on future claims that may be made against a fund. The risk of material loss from such claims is considered remote.
8. Coronavirus (COVID-19) Pandemic.
An outbreak of COVID-19 first detected in China during December 2019 has since spread globally and was declared a pandemic by the World Health Organization during March 2020. Developments that disrupt global economies and financial markets, such as the COVID-19 pandemic, may magnify factors that affect the Fund's performance.
Shareholder Expense Example
As a shareholder, you incur two types of costs: (1) transaction costs, which may include sales charges (loads) on purchase payments or redemption proceeds, as applicable and (2) ongoing costs, which generally include management fees, distribution and/or service (12b-1) fees and other Fund expenses. This Example is intended to help you understand your ongoing costs (in dollars) of investing in a fund and to compare these costs with the ongoing costs of investing in other mutual funds.
The Example is based on an investment of $1,000 invested at the beginning of the period and held for the entire period (January 1, 2022 to June 30, 2022).
Actual Expenses
The first line of the accompanying table provides information about actual account values and actual expenses. You may use the information in this line, together with the amount you invested, to estimate the expenses that you paid over the period. Simply divide your account value by $1,000.00 (for example, an $8,600 account value divided by $1,000.00 = 8.6), then multiply the result by the number in the first line for a class/Fund under the heading entitled "Expenses Paid During Period" to estimate the expenses you paid on your account during this period. If any fund is a shareholder of any underlying mutual funds or exchange-traded funds (ETFs) (the Underlying Funds), such fund indirectly bears its proportional share of the expenses of the Underlying Funds in addition to the direct expenses incurred presented in the table. These fees and expenses are not included in the annualized expense ratio used to calculate the expense estimate in the table below.
Hypothetical Example for Comparison Purposes
The second line of the accompanying table provides information about hypothetical account values and hypothetical expenses based on the actual expense ratio and an assumed rate of return of 5% per year before expenses, which is not the actual return. The hypothetical account values and expenses may not be used to estimate the actual ending account balance or expenses you paid for the period. You may use this information to compare the ongoing costs of investing in the Fund and other funds. To do so, compare this 5% hypothetical example with the 5% hypothetical examples that appear in the shareholder reports of the other funds. If any fund is a shareholder of any Underlying Funds, such fund indirectly bears its proportional share of the expenses of the Underlying Funds in addition to the direct expenses as presented in the table. These fees and expenses are not included in the annualized expense ratio used to calculate the expense estimate in the table below.
Please note that the expenses shown in the table are meant to highlight your ongoing costs only and do not reflect any transaction costs. Therefore, the second line of the table is useful in comparing ongoing costs only, and will not help you determine the relative total costs of owning different funds. In addition, if these transactional costs were included, your costs would have been higher.
| | Annualized Expense Ratio-A | Beginning
Account Value
January 1, 2022 | Ending
Account Value
June 30, 2022 | Expenses Paid
During Period-B
January 1, 2022
to June 30, 2022 |
| Fidelity Flex Municipal Income Fund | - %-C | | | |
| Actual | | $1,000.00 | $908.90 | $--D |
| Hypothetical-E | | $1,000.00 | $1,024.79 | $--D |
A Annualized expense ratio reflects expenses net of applicable fee waivers.
B Expenses are equal to the annualized expense ratio, multiplied by the average account value over the period, multiplied by 181/ 365 (to reflect the one-half year period). The fees and expenses of any Underlying Funds are not included in each annualized expense ratio.
C Amount represents less than .005%.
D Amount represents less than $.005.
E 5% return per year before expenses
Liquidity Risk Management Program
The Securities and Exchange Commission adopted Rule 22e-4 under the Investment Company Act of 1940 (the Liquidity Rule) to promote effective liquidity risk management throughout the open-end investment company industry, thereby reducing the risk that funds will be unable to meet their redemption obligations and mitigating dilution of the interests of fund shareholders.
The Fund has adopted and implemented a liquidity risk management program pursuant to the Liquidity Rule (the Program) effective December 1, 2018. The Program is reasonably designed to assess and manage the Fund’s liquidity risk and to comply with the requirements of the Liquidity Rule. The Fund’s Board of Trustees (the Board) has designated the Fund’s investment adviser as administrator of the Program. The Fidelity advisers have established a Liquidity Risk Management Committee (the LRM Committee) to manage the Program for each of the Fidelity Funds. The LRM Committee monitors the adequacy and effectiveness of implementation of the Program and on a periodic basis assesses each Fund’s liquidity risk based on a variety of factors including (1) the Fund’s investment strategy, (2) portfolio liquidity and cash flow projections during normal and reasonably foreseeable stressed conditions, (3) shareholder redemptions, (4) borrowings and other funding sources and (5) in the case of exchange-traded funds, certain additional factors including the effect of the Fund’s prices and spreads, market participants, and basket compositions on the overall liquidity of the Fund’s portfolio, as applicable.
In accordance with the Program, each of the Fund’s portfolio investments is classified into one of four liquidity categories described below based on a determination of a reasonable expectation for how long it would take to convert the investment to cash (or sell or dispose of the investment) without significantly changing its market value.
- Highly liquid investments – cash or convertible to cash within three business days or less
- Moderately liquid investments – convertible to cash in three to seven calendar days
- Less liquid investments – can be sold or disposed of, but not settled, within seven calendar days
- Illiquid investments – cannot be sold or disposed of within seven calendar days
Liquidity classification determinations take into account a variety of factors including various market, trading and investment-specific considerations, as well as market depth, and generally utilize analysis from a third-party liquidity metrics service.
The Liquidity Rule places a 15% limit on a fund’s illiquid investments and requires funds that do not primarily hold assets that are highly liquid investments to determine and maintain a minimum percentage of the fund’s net assets to be invested in highly liquid investments (highly liquid investment minimum or HLIM). The Program includes provisions reasonably designed to comply with the 15% limit on illiquid investments and for determining, periodically reviewing and complying with the HLIM requirement as applicable.
At a recent meeting of the Fund’s Board of Trustees, the LRM Committee provided a written report to the Board pertaining to the operation, adequacy, and effectiveness of implementation of the Program for the annual period from December 1, 2020 through November 30, 2021. The report concluded that the Program has been implemented and is operating effectively and is reasonably designed to assess and manage the Fund’s liquidity risk.
XLI-SANN-0822
1.9884857.104
Fidelity Flex® Funds
Fidelity Flex® Conservative Income Municipal Bond Fund
Semi-Annual Report
June 30, 2022
Contents
To view a fund's proxy voting guidelines and proxy voting record for the 12-month period ended June 30, visit http://www.fidelity.com/proxyvotingresults or visit the Securities and Exchange Commission's (SEC) web site at http://www.sec.gov.
You may also call 1-800-544-3455 (for managed account clients) or 1-800-835-5092 (for retirement plan participants) to request a free copy of the proxy voting guidelines.
Standard & Poor's, S&P and S&P 500 are registered service marks of The McGraw-Hill Companies, Inc. and have been licensed for use by Fidelity Distributors Corporation.
Other third-party marks appearing herein are the property of their respective owners.
All other marks appearing herein are registered or unregistered trademarks or service marks of FMR LLC or an affiliated company. © 2022 FMR LLC. All rights reserved.
This report and the financial statements contained herein are submitted for the general information of the shareholders of the Fund. This report is not authorized for distribution to prospective investors in the Fund unless preceded or accompanied by an effective prospectus.
A fund files its complete schedule of portfolio holdings with the SEC for the first and third quarters of each fiscal year on Form N-PORT. Forms N-PORT are available on the SEC’s web site at http://www.sec.gov. A fund's Forms N-PORT may be reviewed and copied at the SEC’s Public Reference Room in Washington, DC. Information regarding the operation of the SEC's Public Reference Room may be obtained by calling 1-800-SEC-0330.
For a complete list of a fund's portfolio holdings, view the most recent holdings listing, semiannual report, or annual report on Fidelity's web site at http://www.fidelity.com, http://www.institutional.fidelity.com, or http://www.401k.com, as applicable.
NOT FDIC INSURED •MAY LOSE VALUE •NO BANK GUARANTEE
Neither the Fund nor Fidelity Distributors Corporation is a bank.
Note to Shareholders:
Early in 2020, the outbreak and spread of COVID-19 emerged as a public health emergency that had a major influence on financial markets, primarily based on its impact on the global economy and corporate earnings. On March 11, 2020, the World Health Organization declared the COVID-19 outbreak a pandemic, citing sustained risk of further global spread. The pandemic prompted a number of measures to limit the spread of COVID-19, including travel and border restrictions, quarantines, and restrictions on large gatherings. In turn, these resulted in lower consumer activity, diminished demand for a wide range of products and services, disruption in manufacturing and supply chains, and – given the wide variability in outcomes regarding the outbreak – significant market uncertainty and volatility. To help stem the turmoil, the U.S. government took unprecedented action – in concert with the U.S. Federal Reserve and central banks around the world – to help support consumers, businesses, and the broader economy, and to limit disruption to the financial system.
In general, the overall impact of the pandemic lessened in 2021, amid a resilient economy and widespread distribution of three COVID-19 vaccines granted emergency use authorization from the U.S. Food and Drug Administration (FDA) early in the year. Still, the situation remains dynamic, and the extent and duration of its influence on financial markets and the economy is highly uncertain, due in part to a recent spike in cases based on highly contagious variants of the coronavirus.
Extreme events such as the COVID-19 crisis are exogenous shocks that can have significant adverse effects on mutual funds and their investments. Although multiple asset classes may be affected by market disruption, the duration and impact may not be the same for all types of assets. Fidelity is committed to helping you stay informed amid news about COVID-19 and during increased market volatility, and we continue to take extra steps to be responsive to customer needs. We encourage you to visit us online, where we offer ongoing updates, commentary, and analysis on the markets and our funds.
Investment Summary (Unaudited)
Maturity Diversification as of June 30, 2022
| | % of fund's investments |
| 1 - 7 | 45.7 |
| 8 - 30 | 1.7 |
| 31 - 60 | 4.1 |
| 61 - 90 | 3.8 |
| 91 - 180 | 9.3 |
| > 180 | 35.5 |
The date shown for securities represents the date when principal payments must be paid, taking into account any call options exercised by theissuer and any permissible maturity shortening features other than interest rate resets.
Top Five States as of June 30, 2022
| | % of fund's net assets |
| Illinois | 10.5 |
| Texas | 8.2 |
| New York | 7.9 |
| Louisiana | 7.0 |
| California | 6.3 |
Top Five Sectors as of June 30, 2022
| | % of fund's net assets |
| Synthetics | 28.6 |
| Transportation | 12.7 |
| Industrial Development | 11.9 |
| Health Care | 10.0 |
| Education | 7.6 |
Quality Diversification (% of fund's net assets)
| As of June 30, 2022 |
| | AAA | 2.6% |
| | AA,A | 43.0% |
| | BBB | 6.6% |
| | Not Rated | 0.5% |
| | Short-Term Investments and Net Other Assets | 47.3% |

We have used ratings from Moody's Investors Service, Inc. Where Moody's® ratings are not available, we have used S&P® ratings. All ratings are as of the date indicated and do not reflect subsequent changes.
Schedule of Investments June 30, 2022 (Unaudited)
Showing Percentage of Net Assets
| Municipal Bonds - 52.5% | | | |
| | | Principal Amount | Value |
| Alabama - 0.4% | | | |
| Black Belt Energy Gas District Bonds: | | | |
| Series 2017 A, 4%, tender 7/1/22 (a) | | $250,000 | $250,000 |
| Series 2018 A, 4%, tender 12/1/23 (a) | | 200,000 | 203,486 |
| Southeast Alabama Gas Supply District Bonds (Proj. No. 2) Series 2018 A, 4%, tender 6/1/24 (a) | | 145,000 | 146,422 |
|
| TOTAL ALABAMA | | | 599,908 |
|
| Alaska - 0.0% | | | |
| Alaska Int'l. Arpts. Revs. Series 2021 C, 5% 10/1/25 (b) | | 70,000 | 75,056 |
| Arizona - 1.1% | | | |
| Bullhead City Excise Taxes Series 2021 2, 0.6% 7/1/24 | | 275,000 | 261,893 |
| Chandler Indl. Dev. Auth. Indl. Dev. Rev. Bonds (Intel Corp. Proj.): | | | |
| Series 2005, 2.4%, tender 8/14/23 (a) | | 160,000 | 160,436 |
| Series 2019, 5%, tender 6/3/24 (a)(b) | | 480,000 | 502,327 |
| Maricopa County Rev. Series 2016 A, 5% 1/1/23 | | 100,000 | 101,575 |
| Phoenix Civic Impt. Board Arpt. Rev.: | | | |
| Series 2013, 5% 7/1/22 (b) | | 265,000 | 265,000 |
| Series 2017 D, 5% 7/1/24 | | 225,000 | 236,768 |
|
| TOTAL ARIZONA | | | 1,527,999 |
|
| California - 3.0% | | | |
| California Health Facilities Fing. Auth. Rev.: | | | |
| Series 2013 A, 5% 7/1/22 | | 180,000 | 180,000 |
| Series 2014 A, 5% 10/1/22 | | 150,000 | 151,306 |
| Series 2015, 5% 11/15/22 | | 150,000 | 151,982 |
| Series 2016 A, 4% 3/1/23 | | 300,000 | 304,659 |
| California Muni. Fin. Auth. Solid Waste Disp. Rev. Bonds (Republic Svcs., Inc. Proj.): | | | |
| Series 2021 A, 1.875%, tender 10/3/22 (a)(b) | | 600,000 | 599,595 |
| Series 2021 B, 0.375%, tender 7/15/22 (a)(b) | | 800,000 | 799,629 |
| California Poll. Cont. Fing. Auth. Solid Waste Disp. Rev. Bonds (Republic Svcs., Inc. Proj.): | | | |
| Series 2010 A, 2%, tender 8/1/22 (a)(b)(c) | | 200,000 | 199,978 |
| Series 2017 A1, 2%, tender 7/15/22 (a)(b)(c) | | 400,000 | 399,994 |
| California Statewide Cmntys. Dev. Auth. Series 2021, 4% 5/15/23 | | 100,000 | 101,396 |
| California Statewide Cmntys. Dev. Auth. Rev. Series 2018 A, 5% 3/1/23 | | 110,000 | 112,415 |
| Long Beach Hbr. Rev. Series 2020 B, 5% 5/15/24 (b) | | 150,000 | 157,262 |
| Los Angeles Dept. Arpt. Rev.: | | | |
| Series 2015, 5% 5/15/23 (b) | | 100,000 | 102,562 |
| Series 2019 E, 4% 5/15/23 | | 125,000 | 127,433 |
| Series 2022 C, 5% 5/15/24 (b) | | 85,000 | 88,988 |
| Series A, 5% 5/15/23 (b) | | 250,000 | 256,188 |
| Northern California Pwr. Agcy. Rev. Series 2019 A, 5% 8/1/23 | | 100,000 | 103,537 |
| San Diego County Reg'l. Arpt. Auth. Arpt. Rev. Series 2013 B, 5% 7/1/22 (Escrowed to Maturity) (b) | | 150,000 | 150,000 |
| San Francisco City & County Arpts. Commission Int'l. Arpt. Rev. Series 2016 D, 5% 5/1/24 | | 100,000 | 105,279 |
| San Jose Int. Arpt. Rev.: | | | |
| Series 2014 A, 5% 3/1/23 (Escrowed to Maturity) (b) | | 100,000 | 102,209 |
| Series 2017 A, 5% 3/1/23 (Escrowed to Maturity) (b) | | 100,000 | 102,209 |
|
| TOTAL CALIFORNIA | | | 4,296,621 |
|
| Colorado - 0.5% | | | |
| Colorado Health Facilities Auth. Series 2019 A, 5% 1/1/23 | | 165,000 | 167,794 |
| Colorado Health Facilities Auth. Rev. Series 2014 E, 5% 11/15/24 | | 200,000 | 210,170 |
| Denver City & County Arpt. Rev.: | | | |
| Series 2012 A, 5% 11/15/24 (b) | | 100,000 | 101,047 |
| Series 2012 B, 5% 11/15/22 | | 215,000 | 217,730 |
| Series 2020 B1, 5% 11/15/22 (b) | | 55,000 | 55,626 |
|
| TOTAL COLORADO | | | 752,367 |
|
| Connecticut - 2.6% | | | |
| Connecticut Gen. Oblig.: | | | |
| Series 2012 E, 5% 9/15/22 | | 210,000 | 211,515 |
| Series 2016 A, 5% 3/15/24 | | 200,000 | 209,931 |
| Series 2020 A, 5% 1/15/23 | | 145,000 | 147,694 |
| Series 2022 A, 3% 1/15/23 | | 340,000 | 342,754 |
| Series E: | | | |
| 5% 9/1/22 | | 175,000 | 176,017 |
| 5% 9/15/22 | | 475,000 | 478,427 |
| Connecticut Health & Edl. Facilities Auth. Rev.: | | | |
| Bonds: | | | |
| Series 2010 A4, 1.1%, tender 2/11/25 (a) | | 510,000 | 489,517 |
| Series 2014 A, 1.1%, tender 2/7/23 (a) | | 300,000 | 298,061 |
| Series 2017 A1, 5%, tender 7/1/22 (a) | | 200,000 | 200,000 |
| Series 2017 C2, 5%, tender 2/1/23 (a) | | 275,000 | 279,733 |
| Series 2017 I1, 5% 7/1/22 | | 100,000 | 100,000 |
| Connecticut Hsg. Fin. Auth. Series C, 5% 11/15/23 (b) | | 100,000 | 103,733 |
| Connecticut Muni. Elec. Energy Coop. Pwr. Supply Sys. Rev. Series 2013 A, 5% 1/1/23 | | 115,000 | 116,953 |
| Connecticut Spl. Tax Oblig. Trans. Infrastructure Rev.: | | | |
| Series 2012 A: | | | |
| 5% 1/1/24 | | 150,000 | 152,253 |
| 5% 1/1/24 | | 100,000 | 101,502 |
| Series A, 5% 5/1/23 | | 325,000 | 333,779 |
|
| TOTAL CONNECTICUT | | | 3,741,869 |
|
| District Of Columbia - 0.6% | | | |
| Metropolitan Washington DC Arpts. Auth. Sys. Rev.: | | | |
| Series 2014 A: | | | |
| 5% 10/1/23 (b) | | 100,000 | 103,388 |
| 5% 10/1/24 (b) | | 110,000 | 116,001 |
| Series 2017 A: | | | |
| 5% 10/1/22 (b) | | 355,000 | 357,909 |
| 5% 10/1/24 (b) | | 100,000 | 105,456 |
| Series 2019 A, 5% 10/1/22 (b) | | 5,000 | 5,041 |
| Series 2019 B, 5% 10/1/22 | | 100,000 | 100,868 |
| Series 2020 A, 5% 10/1/22 (b) | | 85,000 | 85,697 |
|
| TOTAL DISTRICT OF COLUMBIA | | | 874,360 |
|
| Florida - 3.5% | | | |
| Broward County Arpt. Sys. Rev.: | | | |
| Series 2012 P2, 5% 10/1/23 | | 135,000 | 136,004 |
| series 2012 Q1, 5% 10/1/22 | | 125,000 | 126,073 |
| Series 2015 C, 5% 10/1/22 (b) | | 275,000 | 277,086 |
| Series 2017, 5% 10/1/23 (b) | | 125,000 | 129,158 |
| Series 2019 B, 5% 10/1/23 (b) | | 100,000 | 103,326 |
| Central Florida Expressway Auth. Sr. Lien Rev. Series 2017, 5% 7/1/22 | | 115,000 | 115,000 |
| Citizens Property Ins. Corp. Series 2015 A1, 5% 6/1/25 | | 100,000 | 106,474 |
| Escambia County Poll. Cont. Rev. (Gulf Pwr. Co. Proj.) Series 2003, 2.6% 6/1/23 | | 100,000 | 100,653 |
| Florida Board of Ed. Lottery Rev. Series 2012 A, 5% 7/1/22 | | 115,000 | 115,000 |
| Florida Dev. Fin. Corp. Rev. Bonds (Brightline Florida Passenger Rail Expansion Proj.) Series 2021 A: | | | |
| 0.3%, tender 7/1/22 (a)(b) | | 300,000 | 300,000 |
| 2.9%, tender 4/4/23 (a)(b) | | 600,000 | 599,998 |
| Florida Mid-Bay Bridge Auth. Rev. Series 2015 A, 5% 10/1/22 | | 180,000 | 181,322 |
| Florida Muni. Pwr. Agcy. Rev. Series 2015 B, 5% 10/1/22 | | 200,000 | 201,741 |
| Greater Orlando Aviation Auth. Arpt. Facilities Rev. Series 2019 A, 5% 10/1/22 (b) | | 105,000 | 105,809 |
| Hillsborough County Aviation Auth. Rev. Series 2022 A, 5% 10/1/24 (b) | | 200,000 | 210,911 |
| Jacksonville Elec. Auth. Elec. Sys. Rev. Series 2013 A, 5% 10/1/22 | | 115,000 | 115,998 |
| Jacksonville Spl. Rev. Series 2022 A: | | | |
| 5% 10/1/23 (d) | | 15,000 | 15,590 |
| 5% 10/1/24 (d) | | 35,000 | 37,125 |
| 5% 10/1/25 (d) | | 25,000 | 27,069 |
| Lee County Arpt. Rev. Series 2021 A, 5% 10/1/24 (b) | | 55,000 | 57,755 |
| Lee Memorial Health Sys. Hosp. Rev. Series 2019 A1, 5% 4/1/23 | | 165,000 | 169,007 |
| Miami-Dade County Aviation Rev. Series 2016 A, 5% 10/1/23 | | 230,000 | 238,368 |
| Miami-Dade County Health Facilities Auth. Hosp. Rev.: | | | |
| (Nicklaus Children Hosp.) Series 2017, 5% 8/1/23 | | 320,000 | 331,005 |
| (Nicklaus Children's Hosp. Proj.) Series 2021 A, 5% 8/1/22 | | 40,000 | 40,111 |
| Miami-Dade County Indl. Dev. Auth. Solid Waste Disp. Rev. Bonds: | | | |
| (Waste Mgmt., Inc. of Florida Proj.) Series 2007, 0.32%, tender 11/1/22 (a) | | 100,000 | 99,652 |
| (Waste Mgmt., Inc. Proj.) Series 2018 A, 1.285%, tender 7/1/24 (a)(b) | | 270,000 | 260,163 |
| Miami-Dade County School Board Ctfs. of Prtn.: | | | |
| Series 2014 D, 5% 11/1/22 | | 100,000 | 101,116 |
| Series 2015 A, 5% 5/1/23 | | 175,000 | 179,553 |
| Orlando & Orange County Expressway Auth. Rev.: | | | |
| Series 2012, 5% 7/1/24 (Pre-Refunded to 7/1/22 @ 100) | | 225,000 | 225,000 |
| Series 2013 B, 5% 7/1/23 | | 100,000 | 103,071 |
| Palm Beach County School Board Ctfs. of Prtn. Series 2012 C, 5% 8/1/23 | | 115,000 | 115,312 |
|
| TOTAL FLORIDA | | | 4,924,450 |
|
| Georgia - 3.8% | | | |
| Atlanta Arpt. Rev. Series 2019 B, 5% 7/1/24 (b) | | 100,000 | 104,832 |
| Bartow County Dev. Auth. Poll. Cont. Rev. Bonds (Georgia Pwr. Co. Plant Bowen Proj.): | | | |
| Series 2009 1st, 2.75%, tender 3/15/23 (a) | | 1,450,000 | 1,448,772 |
| Series 2013, 1.55%, tender 8/19/22 (a) | | 100,000 | 99,894 |
| Cobb County Kennestone Hosp. Auth. Rev.: | | | |
| (Wellstar Health Sys., Inc. Proj.) Series 2017 A, 5% 4/1/23 | | 100,000 | 102,391 |
| Series 2012, 5% 4/1/23 | | 100,000 | 102,391 |
| Georgia Muni. Elec. Auth. Pwr. Rev.: | | | |
| Series 2015 A, 5% 1/1/23 | | 245,000 | 248,642 |
| Series 2019 A, 5% 1/1/23 | | 450,000 | 456,689 |
| Series 2020 A: | | | |
| 5% 1/1/23 | | 100,000 | 101,486 |
| 5% 1/1/24 | | 145,000 | 150,832 |
| Series 2021 A, 5% 1/1/23 | | 145,000 | 147,155 |
| Series GG, 5% 1/1/23 | | 190,000 | 193,161 |
| Main Street Natural Gas, Inc.: | | | |
| Bonds: | | | |
| Series 2018 B, 1 month U.S. LIBOR + 0.750% 1.461%, tender 9/1/23 (a)(e) | | 450,000 | 446,754 |
| Series 2018 C, 4%, tender 12/1/23 (a) | | 110,000 | 112,219 |
| Series 2018 E, SIFMA Municipal Swap Index + 0.570% 1.48%, tender 12/1/23 (a)(e) | | 930,000 | 925,728 |
| Series 2019 B, 4%, tender 12/2/24 (a) | | 265,000 | 272,452 |
| Series 2018 A, 4% 3/1/23 | | 200,000 | 202,409 |
| Series 2022 A, 4% 12/1/25 | | 70,000 | 71,215 |
| Paulding County Hosp. Auth. Rev. Series 2022 A, 5% 4/1/25 | | 150,000 | 159,184 |
|
| TOTAL GEORGIA | | | 5,346,206 |
|
| Guam - 0.2% | | | |
| Guam Pwr. Auth. Rev. Series 2022 A: | | | |
| 5% 10/1/22 (d) | | 50,000 | 50,317 |
| 5% 10/1/23 (d) | | 85,000 | 87,426 |
| 5% 10/1/24 (d) | | 70,000 | 73,033 |
| 5% 10/1/25 (d) | | 85,000 | 89,723 |
|
| TOTAL GUAM | | | 300,499 |
|
| Idaho - 0.1% | | | |
| Idaho Hsg. & Fin. Assoc. Single Family Mtg. (Idaho St Garvee Proj.) Series 2017 A, 5% 7/15/23 | | 100,000 | 103,229 |
| Illinois - 5.2% | | | |
| Champaign County Cmnty. Unit Series 2020 A, 0% 1/1/24 | | 380,000 | 366,103 |
| Chicago Metropolitan Wtr. Reclamation District of Greater Chicago Series 2021 C, 5% 12/1/23 | | 130,000 | 135,539 |
| Chicago Midway Arpt. Rev.: | | | |
| Series 2014 B, 5% 1/1/23 | | 100,000 | 101,600 |
| Series 2016 A, 5% 1/1/23 (b) | | 100,000 | 101,428 |
| Chicago O'Hare Int'l. Arpt. Rev.: | | | |
| Series 2015 A, 5% 1/1/24 (b) | | 450,000 | 466,756 |
| Series 2016 C, 5% 1/1/23 | | 175,000 | 177,782 |
| Series 2017 A, 5% 1/1/23 | | 210,000 | 213,339 |
| Chicago Park District Gen. Oblig. Series 2021 E, 4% 1/1/23 | | 300,000 | 302,963 |
| Cook County Gen. Oblig.: | | | |
| Series 2012 C, 5% 11/15/24 | | 100,000 | 101,083 |
| Series 2021 B: | | | |
| 4% 11/15/22 | | 110,000 | 111,006 |
| 4% 11/15/23 | | 75,000 | 77,127 |
| Illinois Dev. Fin. Auth. Solid Waste Disp. Rev. Bonds (Waste Mgmt., Inc. Proj.) Series 2019, 0.4%, tender 11/1/22 (a)(b) | | 200,000 | 198,742 |
| Illinois Fin. Auth.: | | | |
| Series 2020 A, 5% 8/15/22 | | 100,000 | 100,419 |
| Series 2022 A, 5% 10/1/23 (d) | | 200,000 | 204,230 |
| Illinois Fin. Auth. Rev.: | | | |
| Series 2015 A: | | | |
| 5% 11/15/22 | | 245,000 | 247,842 |
| 5% 11/15/23 | | 150,000 | 156,239 |
| 5% 11/15/24 | | 100,000 | 106,132 |
| Series 2016 A, 5% 10/1/22 | | 200,000 | 201,639 |
| Series 2016 C, 5% 2/15/24 | | 105,000 | 109,835 |
| Series 2017 A, 5% 7/15/22 | | 115,000 | 115,114 |
| Series 2019, 5% 4/1/23 | | 100,000 | 102,466 |
| Illinois Gen. Oblig.: | | | |
| Series 2012: | | | |
| 5% 8/1/22 (Assured Guaranty Muni. Corp. Insured) | | 100,000 | 100,238 |
| 5% 8/1/24 | | 120,000 | 120,285 |
| Series 2013, 5% 7/1/23 | | 100,000 | 102,382 |
| Series 2017 D: | | | |
| 5% 11/1/22 | | 200,000 | 201,813 |
| 5% 11/1/23 | | 200,000 | 206,068 |
| Series 2021 A, 5% 3/1/23 | | 70,000 | 71,175 |
| Series 2022 A, 5% 3/1/23 | | 60,000 | 61,007 |
| Series 2022 B: | | | |
| 5% 3/1/24 | | 230,000 | 238,310 |
| 5% 3/1/25 | | 465,000 | 488,620 |
| 5% 3/1/26 | | 340,000 | 361,448 |
| Series 2022 D1, 5% 3/1/23 | | 70,000 | 71,175 |
| Illinois Sales Tax Rev. Series 2021 A: | | | |
| 4% 6/15/23 | | 260,000 | 263,521 |
| 4% 6/15/24 | | 135,000 | 137,902 |
| Illinois Toll Hwy. Auth. Toll Hwy. Rev.: | | | |
| Series 2014 A, 5% 12/1/22 | | 275,000 | 278,866 |
| Series 2018 A, 5% 1/1/23 | | 180,000 | 183,013 |
| Railsplitter Tobacco Settlement Auth. Rev. Series 2017: | | | |
| 5% 6/1/23 | | 370,000 | 379,302 |
| 5% 6/1/24 | | 405,000 | 423,650 |
|
| TOTAL ILLINOIS | | | 7,386,159 |
|
| Indiana - 0.5% | | | |
| Indiana Fin. Auth. Rev. (Butler Univ. Proj.) Series 2019, 4% 2/1/24 | | 200,000 | 205,800 |
| Indiana Muni. Pwr. Agcy. Pwr. Supply Sys. Rev. Series 2017 A, 5% 1/1/23 | | 100,000 | 101,649 |
| Indianapolis Local Pub. Impt. (Indianapolis Arpt. Auth. Proj.) Series 2015 I, 5% 1/1/23 (b) | | 205,000 | 208,118 |
| Whiting Envir. Facilities Rev. Bonds (BP Products North America, Inc. Proj.) Series 2016 A, 5%, tender 3/1/23 (a)(b) | | 200,000 | 203,054 |
|
| TOTAL INDIANA | | | 718,621 |
|
| Kentucky - 0.8% | | | |
| Kenton County Arpt. Board Arpt. Rev. Series 2016, 5% 1/1/23 | | 130,000 | 132,182 |
| Kentucky State Property & Buildings Commission Rev.: | | | |
| Series 2016, 5% 11/1/23 | | 675,000 | 702,759 |
| Series 2018, 5% 5/1/23 | | 65,000 | 66,680 |
| Kentucky, Inc. Pub. Energy Bonds Series 2019 A1, 4%, tender 6/1/25 (a) | | 150,000 | 152,000 |
| Louisville & Jefferson County Series 2016 A, 5% 10/1/22 | | 140,000 | 141,205 |
|
| TOTAL KENTUCKY | | | 1,194,826 |
|
| Louisiana - 0.2% | | | |
| St. John Baptist Parish Rev. Bonds (Marathon Oil Corp.) Series 2017, 2%, tender 4/1/23 (a) | | 100,000 | 98,813 |
| State of Louisiana Grant Anticipation Rev. Series 2021, 5% 9/1/22 | | 200,000 | 201,175 |
|
| TOTAL LOUISIANA | | | 299,988 |
|
| Maine - 0.6% | | | |
| Maine Health & Higher Edl. Facilities Auth. Rev. Series 2021 A: | | | |
| 5% 7/1/22 | | 210,000 | 210,000 |
| 5% 7/1/23 | | 625,000 | 644,384 |
|
| TOTAL MAINE | | | 854,384 |
|
| Maryland - 0.6% | | | |
| Baltimore Proj. Rev. (Wtr. Projs.) Series 2013 B, 5% 7/1/22 | | 620,000 | 620,000 |
| Maryland Dept. of Trans.: | | | |
| Series 2022 A, 5% 12/1/24 | | 25,000 | 26,752 |
| Series 2022 B, 5% 12/1/23 (d) | | 30,000 | 31,032 |
| Maryland Health & Higher Edl. Facilities Auth. Rev. Series 2012 A, 3.25% 7/1/22 (Escrowed to Maturity) | | 100,000 | 100,000 |
| Maryland Stadium Auth. Built to Learn Rev. Series 2022 A, 5% 6/1/24 | | 120,000 | 126,191 |
|
| TOTAL MARYLAND | | | 903,975 |
|
| Massachusetts - 3.1% | | | |
| Massachusetts Dept. of Trans. Metropolitan Hwy. Sys. Rev. Bonds Series 2019 A, 5%, tender 1/1/23 (a) | | 250,000 | 253,741 |
| Massachusetts Dev. Fin. Agcy. Rev.: | | | |
| (Suffolk Univ. Proj.) Series 2017, 5% 7/1/22 | | 200,000 | 200,000 |
| Bonds Series S3, SIFMA Municipal Swap Index + 0.500% 1.41%, tender 7/7/22 (a)(e) | | 200,000 | 199,158 |
| Series 2015 C, 5% 10/1/22 | | 100,000 | 100,832 |
| Series 2017 S, 5% 7/1/22 | | 100,000 | 100,000 |
| Series 2020 A, 5% 10/1/22 | | 340,000 | 343,026 |
| Series 2021 A, 5% 6/1/23 | | 360,000 | 368,331 |
| Series Q, 5% 7/1/22 | | 105,000 | 105,000 |
| Massachusetts Edl. Fing. Auth. Rev.: | | | |
| Series 2014 I, 5% 1/1/25 (b) | | 310,000 | 326,577 |
| Series 2015 A, 5% 1/1/24 (b) | | 580,000 | 599,184 |
| Series 2016, 5% 7/1/24 (b) | | 15,000 | 15,680 |
| Series 2022 B: | | | |
| 5% 7/1/24 (b) | | 30,000 | 31,372 |
| 5% 7/1/25 (b) | | 65,000 | 68,844 |
| Massachusetts Gen. Oblig. Series 2021 B, 5% 11/1/23 | | 1,195,000 | 1,245,264 |
| Massachusetts Port Auth. Rev. Series 2019 C, 5% 7/1/23 (b) | | 150,000 | 154,263 |
| Massachusetts Tpk. Auth. Metropolitan Hwy. Sys. Rev.: | | | |
| Series 1997 A, 0% 1/1/24 (Nat'l. Pub. Fin. Guarantee Corp. Insured) | | 115,000 | 111,219 |
| Series 1997 C, 0% 1/1/23 (Nat'l. Pub. Fin. Guarantee Corp. Insured) | | 120,000 | 118,942 |
|
| TOTAL MASSACHUSETTS | | | 4,341,433 |
|
| Michigan - 1.7% | | | |
| Lapeer Cmnty. Schools Series 2016, 5% 5/1/25 | | 125,000 | 134,677 |
| Michigan Fin. Auth. Rev.: | | | |
| (Detroit Reg'l. Convention Facility Auth. Local Proj.) Series 2014 H1, 5% 10/1/24 | | 105,000 | 108,323 |
| Bonds Series 2019 B, 3.5%, tender 11/15/22 (a) | | 270,000 | 271,379 |
| Series 2012, 5% 11/1/22 | | 100,000 | 101,149 |
| Series 2014 25A, 5% 11/1/22 (b) | | 100,000 | 101,110 |
| Series 2015 A, 5% 8/1/22 (Escrowed to Maturity) | | 125,000 | 125,339 |
| Series 2022: | | | |
| 5% 4/15/25 | | 160,000 | 171,774 |
| 5% 4/15/26 | | 265,000 | 290,078 |
| Michigan Gen. Oblig. Series 2016, 5% 3/15/23 | | 100,000 | 102,329 |
| Michigan Hsg. Dev. Auth. Single Family Mtg. Rev. Series 2022 A, 2.5% 6/1/25 | | 70,000 | 69,770 |
| Northern Michigan Univ. Revs. Series 2021, 5% 6/1/23 | | 415,000 | 427,253 |
| Royal Oak Hosp. Fin. Auth. Hosp. Rev. Series 2014 D, 3% 9/1/22 | | 125,000 | 125,334 |
| Wayne County Arpt. Auth. Rev.: | | | |
| Series 2011 A, 5% 12/1/22 (b) | | 200,000 | 200,413 |
| Series 2017 C, 5% 12/1/22 | | 125,000 | 126,763 |
|
| TOTAL MICHIGAN | | | 2,355,691 |
|
| Minnesota - 0.3% | | | |
| Saint Cloud Health Care Rev. Series 2014 B, 5% 5/1/23 | | 205,000 | 209,942 |
| Southern Minnesota Muni. Pwr. Agcy. Pwr. Supply Sys. Rev. Series 2015 A, 5% 1/1/23 | | 200,000 | 203,298 |
|
| TOTAL MINNESOTA | | | 413,240 |
|
| Missouri - 0.2% | | | |
| Missouri Health & Edl. Facilities Rev. Series 2014 A, 5% 6/1/23 | | 235,000 | 242,089 |
| Montana - 0.1% | | | |
| Montana Facility Fin. Auth. Rev. Series 2019 A, 5% 1/1/23 | | 100,000 | 101,693 |
| Nebraska - 0.4% | | | |
| Lincoln Arpt. Auth. Series 2021, 5% 7/1/25 (b) | | 550,000 | 592,506 |
| Nevada - 0.3% | | | |
| Nevada Dept. of Bus. & Industry Bonds: | | | |
| (Republic Svcs., Inc. Proj.) Series 2001, 2.35%, tender 12/1/22 (a)(b)(c) | | 100,000 | 100,061 |
| Series 2020 A, 0.85%, tender 1/26/23 (a)(b)(c) | | 400,000 | 394,667 |
|
| TOTAL NEVADA | | | 494,728 |
|
| New Jersey - 4.1% | | | |
| Gloucester County Impt. Auth. Rev. (Rowan Univ. Proj.) Series 2017 A, 5% 11/1/22 (Assured Guaranty Muni. Corp. Insured) | | 1,105,000 | 1,117,479 |
| New Jersey Econ. Dev. Auth. Motor Vehicle Rev. Series 2017 A, 4% 7/1/22 | | 100,000 | 100,000 |
| New Jersey Econ. Dev. Auth. Rev.: | | | |
| (New Jersey Gen. Oblig. Proj.) Series 2017 B, 5% 11/1/24 | | 185,000 | 193,276 |
| Series 2005 N1, 5.5% 9/1/23 (Nat'l. Pub. Fin. Guarantee Corp. Insured) | | 400,000 | 415,512 |
| Series 2019, 5.25% 9/1/24 (c) | | 200,000 | 208,838 |
| New Jersey Gen. Oblig.: | | | |
| Series 2020 A, 5% 6/1/24 | | 140,000 | 147,089 |
| Series O, 5.25% 8/1/22 | | 215,000 | 215,578 |
| New Jersey Health Care Facilities Fing. Auth. Rev.: | | | |
| Series 2016 A: | | | |
| 5% 7/1/22 | | 100,000 | 100,000 |
| 5% 7/1/23 | | 240,000 | 247,443 |
| Series 2017 A, 5% 7/1/23 | | 135,000 | 139,349 |
| New Jersey Higher Ed. Student Assistance Auth. Student Ln. Rev.: | | | |
| Series 2013, 5% 12/1/22 (b) | | 195,000 | 197,622 |
| Series 2015 1A, 5% 12/1/22 (b) | | 100,000 | 101,217 |
| Series 2016 1A: | | | |
| 5% 12/1/22 (b) | | 100,000 | 101,344 |
| 5% 12/1/23 (b) | | 100,000 | 103,694 |
| 5% 12/1/24 (b) | | 170,000 | 179,082 |
| Series 2017 1A, 5% 12/1/24 (b) | | 350,000 | 369,452 |
| Series 2019 A, 5% 12/1/22 | | 15,000 | 15,205 |
| Series 2021 A, 5% 12/1/23 (b) | | 200,000 | 207,389 |
| Series 2022 B, 5% 12/1/25 (b) | | 250,000 | 266,277 |
| New Jersey Hsg. & Mtg. Fin. Agcy. Multi-family Rev. Series 2021 B, 0.5% 11/1/23 | | 90,000 | 88,033 |
| New Jersey Hsg. & Mtg. Fin. Agcy. Rev. Series 2019 D, 4% 10/1/22 (b) | | 100,000 | 100,546 |
| New Jersey Tobacco Settlement Fing. Corp. Series 2018 A: | | | |
| 5% 6/1/23 | | 300,000 | 306,320 |
| 5% 6/1/24 | | 255,000 | 264,196 |
| New Jersey Trans. Trust Fund Auth.: | | | |
| Series 2004 A, 5.75% 6/15/25 (Nat'l. Pub. Fin. Guarantee Corp. Insured) | | 100,000 | 108,473 |
| Series 2006 A, 5.25% 12/15/22 | | 160,000 | 162,663 |
| Series 2006 C, 0% 12/15/24 | | 260,000 | 245,532 |
| Series 2014 AA, 5% 6/15/25 | | 100,000 | 103,548 |
|
| TOTAL NEW JERSEY | | | 5,805,157 |
|
| New Mexico - 0.4% | | | |
| New Mexico Edl. Assistance Foundation Series 2021 1A, 5% 9/1/23 (b) | | 100,000 | 103,252 |
| New Mexico Muni. Energy Acquisition Auth. Gas Supply Rev. Bonds Series 2019 A, 5%, tender 5/1/25 (a) | | 150,000 | 158,061 |
| New Mexico Severance Tax Rev. Series 2016 B, 4% 7/1/22 | | 250,000 | 250,000 |
|
| TOTAL NEW MEXICO | | | 511,313 |
|
| New York - 2.5% | | | |
| Genesee County Fdg. Corp. (Rochester Reg'l. Health Proj.) Series 2022 A: | | | |
| 5% 12/1/24 | | 175,000 | 182,560 |
| 5% 12/1/25 | | 175,000 | 184,304 |
| Monroe County Indl. Dev. Corp. Series 2015 A, 5% 7/1/22 | | 225,000 | 225,000 |
| New York City Gen. Oblig.: | | | |
| Series 2016 A, 5% 8/1/22 | | 110,000 | 110,304 |
| Series 2016, 5% 8/1/22 | | 100,000 | 100,277 |
| New York City Indl. Dev. Agcy. Rev. Series 2021 A, 5% 1/1/26 (Assured Guaranty Muni. Corp. Insured) | | 35,000 | 37,598 |
| New York Dorm. Auth. Rev. Series 2015 A, 4% 7/1/22 | | 100,000 | 100,000 |
| New York Metropolitan Trans. Auth. Rev.: | | | |
| Series 2002 D1, 5% 11/1/22 | | 100,000 | 101,043 |
| Series 2008 B2, 5% 11/15/22 | | 500,000 | 505,805 |
| Series 2012 F, 5% 11/15/22 | | 350,000 | 354,064 |
| Series 2014 A2, 5% 11/15/22 | | 250,000 | 252,903 |
| Series 2015 A1, 5% 11/15/22 | | 100,000 | 101,161 |
| Series 2015 B, 5% 11/15/22 | | 100,000 | 101,161 |
| Series 2015 F, 5% 11/15/22 | | 100,000 | 101,161 |
| Series 2017 B, 5% 11/15/23 | | 390,000 | 403,644 |
| Series 2020 A, 5% 2/1/23 | | 200,000 | 203,404 |
| New York State Dorm. Auth. Series 2017 A: | | | |
| 5% 2/15/23 | | 30,000 | 30,646 |
| 5% 2/15/23 (Escrowed to Maturity) | | 95,000 | 97,003 |
| Syracuse Reg'l. Arpt. Auth. Series 2021, 4% 7/1/22 (b) | | 325,000 | 325,000 |
|
| TOTAL NEW YORK | | | 3,517,038 |
|
| New York And New Jersey - 0.5% | | | |
| Port Auth. of New York & New Jersey: | | | |
| Series 177, 5% 7/15/23 (b) | | 235,000 | 238,565 |
| Series 178, 5% 12/1/23 (b) | | 135,000 | 140,178 |
| Series 186, 5% 10/15/23 (b) | | 100,000 | 103,541 |
| Series 2017 202, 5% 10/15/23 (b) | | 225,000 | 232,968 |
|
| TOTAL NEW YORK AND NEW JERSEY | | | 715,252 |
|
| North Carolina - 0.3% | | | |
| Charlotte Int'l. Arpt. Rev. Series 2017 B: | | | |
| 5% 7/1/22 (b) | | 115,000 | 115,000 |
| 5% 7/1/23 (b) | | 130,000 | 133,695 |
| Charlotte-Mecklenburg Hosp. Auth. Health Care Sys. Rev. Bonds Series 2021 B, 5%, tender 12/2/24 (a) | | 115,000 | 122,117 |
|
| TOTAL NORTH CAROLINA | | | 370,812 |
|
| Ohio - 1.4% | | | |
| American Muni. Pwr., Inc. Rev. Series 2021 A: | | | |
| 5% 2/15/23 | | 200,000 | 203,962 |
| 5% 2/15/24 | | 200,000 | 209,372 |
| Miami Univ. Series 2022 A, 5% 9/1/23 | | 50,000 | 51,830 |
| Ohio Gen. Oblig. Series 2021 A, 5% 3/1/23 | | 100,000 | 102,295 |
| Ohio Higher Ed. Facilities Commission Healthcare Rev. Series 2022: | | | |
| 5% 1/1/23 | | 235,000 | 237,744 |
| 5% 1/1/25 | | 200,000 | 208,294 |
| Ohio Higher Edl. Facility Commission Rev. (Case Western Reserve Univ. Proj.) Series 2016, 5% 12/1/22 | | 100,000 | 101,435 |
| Ohio Hosp. Facilities Rev. Series 2017 A, 5% 1/1/25 | | 215,000 | 229,870 |
| Ohio Tpk. Commission Tpk. Rev. (Infrastructure Projs.) Series 2022 A, 5% 2/15/25 (d) | | 105,000 | 110,882 |
| Wright State Univ. Gen. Receipts Series 2021 A, 4% 5/1/23 (Build America Mutual Assurance Insured) | | 500,000 | 509,153 |
|
| TOTAL OHIO | | | 1,964,837 |
|
| Oklahoma - 0.2% | | | |
| Oklahoma Dev. Fin. Auth. Health Sys. Rev. Series 2015 A, 5% 8/15/22 | | 100,000 | 100,378 |
| Univ. of Oklahoma Gen. Rev. Series 2021 A, 5% 7/1/23 (Assured Guaranty Muni. Corp. Insured) | | 150,000 | 154,562 |
|
| TOTAL OKLAHOMA | | | 254,940 |
|
| Oregon - 0.5% | | | |
| Oregon Bus. Dev. Commission Recovery Zone Facility Bonds (Intel Corp. Proj.) Series 232, 2.4%, tender 8/14/23 (a) | | 125,000 | 125,341 |
| Port of Portland Arpt. Rev.: | | | |
| Series 2022, 5% 7/1/25 (b) | | 195,000 | 207,916 |
| Series 26 C, 5% 7/1/24 (b) | | 300,000 | 314,198 |
|
| TOTAL OREGON | | | 647,455 |
|
| Pennsylvania - 3.9% | | | |
| Allegheny County Higher Ed. Bldg. Auth. Univ. Rev. Series 2021 A, 5% 3/1/23 | | 625,000 | 638,183 |
| Allegheny County Hosp. Dev. Auth. Rev. Series 2019 A, 5% 7/15/23 | | 315,000 | 324,324 |
| Bucks Co. Indl. Dev. Auth. Solid Waste Rev. Bonds (Waste Mgmt., Inc. Proj.) Series 2002, 2.75%, tender 12/1/22 (a)(b) | | 100,000 | 100,285 |
| Chester County Health & Ed. Facilities Auth. Health Sys. Rev. Series 2020 B, 5% 6/1/23 | | 1,000,000 | 1,029,983 |
| Dauphin County Gen. Auth. (Pinnacle Health Sys. Proj.) Series 2016 A, 5% 6/1/23 | | 100,000 | 102,843 |
| Delaware County Auth. Univ. Rev. Series 2014, 5% 8/1/23 | | 150,000 | 155,142 |
| Lehigh County Indl. Dev. Auth. Poll. Cont. Rev. Bonds (PPL Elec. Utils. Corp. Proj.) Series 2016 A, 1.8%, tender 9/1/22 (a) | | 1,030,000 | 1,029,220 |
| Pennsylvania Econ. Dev. Fing. Auth. Solid Waste Disp. Rev. Bonds: | | | |
| (Republic Svcs., Inc. Proj.) Series 2019 A, 2%, tender 7/15/22 (a)(b) | | 400,000 | 399,994 |
| (Republic Svcs., Inc. Proj.) Series 2019 B2, 0.3%, tender 7/15/22 (a)(b) | | 200,000 | 199,903 |
| (Waste Mgmt., Inc. Proj.) Series 2013, 2%, tender 8/1/22 (a)(b) | | 600,000 | 599,975 |
| (Waste Mgmt., Inc. Proj.) Series 2021 A, SIFMA Municipal Swap Index + 0.400% 1.31%, tender 6/3/24 (a)(b)(e) | | 100,000 | 96,559 |
| Pennsylvania Higher Edl. Facilities Auth. Rev. Series 2012 A, 5% 8/15/22 | | 100,000 | 100,418 |
| Pennsylvania Hsg. Fin. Agcy.: | | | |
| Series 2021 135 B: | | | |
| 5% 4/1/23 (b) | | 10,000 | 10,228 |
| 5% 4/1/24 (b) | | 10,000 | 10,446 |
| 5% 4/1/25 (b) | | 15,000 | 15,939 |
| Series 2021 137, 0.4% 4/1/23 | | 40,000 | 39,569 |
| Series 2022 138, 5% 10/1/22 | | 350,000 | 352,987 |
| Philadelphia Gas Works Rev. Series 2015 13: | | | |
| 5% 8/1/22 | | 200,000 | 200,502 |
| 5% 8/1/24 | | 100,000 | 105,420 |
|
| TOTAL PENNSYLVANIA | | | 5,511,920 |
|
| Pennsylvania, New Jersey - 0.2% | | | |
| Delaware River Port Auth. Pennsylvania & New Jersey Rev. (Port District Proj.) Series 2012, 5% 1/1/24 | | 225,000 | 228,568 |
| Rhode Island - 0.2% | | | |
| Rhode Island Health and Edl. Bldg. Corp. Higher Ed. Facility Rev.: | | | |
| Series 2012, 5% 11/1/24 | | 115,000 | 115,997 |
| Series 2015, 5% 11/1/22 | | 210,000 | 212,420 |
|
| TOTAL RHODE ISLAND | | | 328,417 |
|
| South Carolina - 1.3% | | | |
| Charleston County Arpt. District Series 2013 A, 5.25% 7/1/22 (b) | | 320,000 | 320,000 |
| Patriots Energy Group Fing. Agcy. Bonds Series 2018 A, 4%, tender 2/1/24 (a) | | 545,000 | 554,974 |
| South Carolina Pub. Svc. Auth. Rev.: | | | |
| Series 2013, 5% 12/1/25 | | 350,000 | 373,960 |
| Series 2016 C, 5% 12/1/22 | | 100,000 | 101,402 |
| Series 2022 A, 5% 12/1/24 | | 315,000 | 332,129 |
| Spartanburg County Reg'l. Health Series 2022, 5% 4/15/23 | | 100,000 | 102,375 |
|
| TOTAL SOUTH CAROLINA | | | 1,784,840 |
|
| Tennessee - 1.2% | | | |
| Memphis-Shelby County Arpt. Auth. Arpt. Rev. Series 2020 B, 5% 7/1/22 (b) | | 1,000,000 | 1,000,000 |
| Tennergy Corp. Gas Rev. Bonds Series 2019 A, 5%, tender 10/1/24 (a) | | 715,000 | 745,787 |
|
| TOTAL TENNESSEE | | | 1,745,787 |
|
| Texas - 2.5% | | | |
| Austin Arpt. Sys. Rev.: | | | |
| Series 2019, 5% 11/15/24 (b) | | 125,000 | 131,985 |
| Series 2022, 5% 11/15/25 (b) | | 105,000 | 112,811 |
| Dallas Fort Worth Int'l. Arpt. Rev. Series 2014 B, 5% 11/1/22 (b) | | 100,000 | 100,995 |
| El Paso Gen. Oblig. Series 2021 C, 5% 8/15/23 | | 75,000 | 77,661 |
| Harris County Cultural Ed. Facilities Fin. Corp. Rev.: | | | |
| Bonds Series 2019 B, 5%, tender 12/1/24 (a) | | 205,000 | 216,787 |
| Series 2013 A, 5% 12/1/22 | | 300,000 | 304,193 |
| Harris County Gen. Oblig. Series 2012 C, 5% 8/15/24 | | 100,000 | 100,417 |
| Houston Arpt. Sys. Rev. Series 2012 A, 5% 7/1/31 (Pre-Refunded to 7/1/22 @ 100) (b) | | 100,000 | 100,000 |
| Lower Colorado River Auth. Rev. (LCRA Transmission Svcs. Corp. Proj.) Series 2015, 5% 5/15/23 | | 215,000 | 220,714 |
| Mission Econ. Dev. Corp. Solid Waste Disp. Rev. Bonds (Waste Mgmt., Inc. Proj.) Series 2020 B, 2.1%, tender 9/1/22 (a)(b) | | 880,000 | 879,947 |
| North Texas Tollway Auth. Rev.: | | | |
| (Sub Lien) Series 2017 B, 5% 1/1/24 | | 150,000 | 152,334 |
| Series 2017 B, 5% 1/1/23 | | 105,000 | 106,731 |
| Series 2021 B, 5% 1/1/26 | | 65,000 | 70,547 |
| Port of Houston Auth. Series 2021, 5% 10/1/23 | | 105,000 | 109,149 |
| San Antonio Elec. & Gas Sys. Rev. Series 2022, 5% 2/1/26 | | 50,000 | 54,455 |
| Tarrant County Cultural Ed. Facilities Fin. Corp. Hosp. Rev.: | | | |
| Series 2013, 5% 10/1/22 | | 350,000 | 352,928 |
| Series 2014, 5% 12/1/22 | | 220,000 | 223,192 |
| Tarrant County Cultural Ed. Facilities Fin. Corp. Rev. Series 2018 A, 5% 7/1/22 | | 205,000 | 205,000 |
|
| TOTAL TEXAS | | | 3,519,846 |
|
| Utah - 0.2% | | | |
| Salt Lake City Arpt. Rev. Series 2018 A, 5% 7/1/24 (b) | | 105,000 | 109,969 |
| Utah County Hosp. Rev. Series 2016 A, 5% 5/15/23 | | 110,000 | 113,125 |
|
| TOTAL UTAH | | | 223,094 |
|
| Virginia - 1.5% | | | |
| Sussex County Indl. Dev. Auth. Solid Waste Disp. Rev. Bonds Series 2003 A, 3%, tender 5/1/23 (a)(b) | | 2,000,000 | 2,006,498 |
| York County Econ. Dev. Auth. Poll. Cont. Rev. Bonds (Virginia Elec. and Pwr. Co. Proj.) Series 2009 A, 1.9%, tender 6/1/23 (a) | | 100,000 | 99,254 |
|
| TOTAL VIRGINIA | | | 2,105,752 |
|
| Washington - 0.7% | | | |
| King County Hsg. Auth. Rev. Series 2021, 2% 12/1/22 | | 250,000 | 250,364 |
| Port of Seattle Rev.: | | | |
| Series 2015 B, 5% 3/1/24 | | 100,000 | 104,791 |
| Series 2016, 5% 2/1/25 | | 120,000 | 127,819 |
| Series 2021 C: | | | |
| 5% 8/1/23 (b) | | 100,000 | 102,780 |
| 5% 8/1/24 (b) | | 105,000 | 109,821 |
| Tobacco Settlement Auth. Rev. Series 2018, 5% 6/1/23 | | 155,000 | 158,571 |
| Washington Fed. Hwy. Grant Anticipation Rev.: | | | |
| (Sr 520 Corridor Prog.) Series 2012 F, 5% 9/1/24 | | 100,000 | 100,577 |
| Series 2012 F, 5% 9/1/22 | | 100,000 | 100,543 |
|
| TOTAL WASHINGTON | | | 1,055,266 |
|
| West Virginia - 0.1% | | | |
| Mason Co. Poll. Cont. Rev. (Appalachian Pwr. Co. Proj.) Series 2003 L, 2.75% 10/1/22 | | 100,000 | 100,082 |
| Wisconsin - 1.0% | | | |
| Wisconsin Gen. Oblig. Series 1, 5% 11/1/22 | | 175,000 | 177,154 |
| Wisconsin Health & Edl. Facilities: | | | |
| (Agnesian Healthcare Proj.) Series 2017, 5% 7/1/23 | | 100,000 | 103,191 |
| (Hosp. Sisters Svcs., Inc.) Series 2014 A, 5% 11/15/22 | | 485,000 | 491,229 |
| Bonds Series 2018 B, 5%, tender 1/25/23 (a) | | 110,000 | 111,980 |
| Series 2013 B1, 4% 11/15/22 | | 150,000 | 151,312 |
| Wisconsin Health & Edl. Facilities Auth. Rev. Series 2022, 5% 10/1/25 (d) | | 360,000 | 385,854 |
| Wisconsin Hsg. & Econ. Dev. Auth. Hsg. Rev. Bonds Series 2021 C, 0.61%, tender 5/1/24 (a) | | 15,000 | 14,396 |
|
| TOTAL WISCONSIN | | | 1,435,116 |
|
| TOTAL MUNICIPAL BONDS | | | |
| (Cost $75,178,554) | | | 74,267,389 |
|
| Municipal Notes - 44.2% | | | |
| Alabama - 0.1% | | | |
| Birmingham Indl. Dev. Board Solid Waste Rev. (American Cast Iron Pipe Co. Proj.) Series 2000, 1.17% 7/7/22, LOC Bank of America NA, VRDN (a)(b) | | 180,000 | $180,000 |
| Arizona - 1.1% | | | |
| Arizona St Indl. Dev. Auth. Multi Participating VRDN: | | | |
| Series Floater MIZ 90 88, 1.16% 8/4/22 (Liquidity Facility Mizuho Cap. Markets LLC) (a)(f)(g)(h) | | 1,200,000 | 1,200,000 |
| Series XF 10 91, 1.16% 7/7/22 (Liquidity Facility Deutsche Bank AG New York Branch) (a)(b)(f)(h) | | 100,000 | 100,000 |
| Phoenix Civic Impt. Board Arpt. Rev. Participating VRDN: | | | |
| Series 2018 XM 06 15, 1.1% 7/7/22 (Liquidity Facility Royal Bank of Canada) (a)(b)(f)(h) | | 100,000 | 100,000 |
| Series XM 08 23, 1.03% 7/7/22 (Liquidity Facility Morgan Stanley Bank, West Valley City Utah) (a)(f)(h) | | 100,000 | 100,000 |
|
| TOTAL ARIZONA | | | 1,500,000 |
|
| California - 3.3% | | | |
| California HFA Rev. Participating VRDN Series Floater MIZ 90 97, 1.16% 7/7/22, LOC Mizuho Cap. Markets LLC (a)(f)(h) | | 200,000 | 200,000 |
| California Statewide Cmntys. Dev. Auth. Rev. Series 2004 I, 0.21% tender 7/13/22, CP mode | | 500,000 | 499,866 |
| Core/Related Gala Rentals Lp Participating VRDN Series DBE 80 87, 1.31% 8/29/22 (Liquidity Facility Deutsche Bank AG New York Branch) (a)(f)(g)(h) | | 300,000 | 300,000 |
| Los Angeles Cmnty. Redev. Agcy. Multi-family Hsg. Rev. Participating VRDN: | | | |
| Series 2022 MIZ 90 89, 1.11% 7/7/22 (Liquidity Facility Mizuho Cap. Markets LLC) (a)(b)(f)(h) | | 1,400,000 | 1,400,000 |
| Series 2022 MIZ 90 90, 1.11% 7/7/22 (Liquidity Facility Mizuho Cap. Markets LLC) (a)(b)(f)(h) | | 1,500,000 | 1,500,000 |
| River Islands Pub. Fing. Auth. Participating VRDN Series MIZ 90 26, 1.16% 8/4/22 (Liquidity Facility Mizuho Cap. Markets LLC) (a)(f)(g)(h) | | 200,000 | 200,000 |
| San Francisco City & County Multi-family Hsg. Rev. Participating VRDN Series DBE 8059, 1.31% 8/29/22 (Liquidity Facility Deutsche Bank AG New York Branch) (a)(f)(g)(h) | | 400,000 | 400,000 |
| San Jose Int. Arpt. Rev. Participating VRDN Series XF 29 98, 1.03% 7/7/22 (Liquidity Facility Wells Fargo Bank NA) (a)(b)(f)(h) | | 200,000 | 200,000 |
|
| TOTAL CALIFORNIA | | | 4,699,866 |
|
| Colorado - 1.2% | | | |
| Denver City & County Arpt. Rev. Participating VRDN: | | | |
| Series Floaters XL 00 90, 1.03% 7/7/22 (Liquidity Facility Morgan Stanley Bank, West Valley City Utah) (a)(b)(f)(h) | | 1,525,000 | 1,525,000 |
| Series XM 10 20, 1.06% 7/7/22 (Liquidity Facility Morgan Stanley Bank, West Valley City Utah) (a)(b)(f)(h) | | 200,000 | 200,000 |
|
| TOTAL COLORADO | | | 1,725,000 |
|
| Florida - 2.4% | | | |
| Alachua County Health Facilities Auth. Health Facilities Rev. Participating VRDN Series XX 12 21, 1.05% 7/7/22 (Liquidity Facility Barclays Bank PLC) (a)(f)(h) | | 195,000 | 195,000 |
| Greater Orlando Aviation Auth. Arpt. Facilities Rev. Participating VRDN Series XM 08 91, 1.04% 7/7/22 (Liquidity Facility JPMorgan Chase Bank) (a)(b)(f)(h) | | 300,000 | 300,000 |
| Hillsborough County Aviation Auth. Rev. Participating VRDN Series XL 02 90, 1.21% 7/7/22 (Liquidity Facility Deutsche Bank AG New York Branch) (a)(b)(f)(h) | | 500,000 | 500,000 |
| Miami Dade County Hsg. Multifamily Hsg. Rev. Participating VRDN Series Floater MIZ 90 87, 1.16% 8/4/22 (Liquidity Facility Mizuho Cap. Markets LLC) (a)(f)(g)(h) | | 200,000 | 200,000 |
| Miami-Dade County Participating VRDN Series XF 29 47, 1.01% 7/7/22 (Liquidity Facility Barclays Bank PLC) (a)(b)(f)(h) | | 400,000 | 400,000 |
| Miami-Dade County Aviation Rev. Participating VRDN Series XM 08 70, 1.04% 7/7/22 (Liquidity Facility JPMorgan Chase Bank) (a)(b)(f)(h) | | 100,000 | 100,000 |
| Miami-Dade County Health Facilities Auth. Hosp. Rev. Participating VRDN Series 2021 XF 12 61, 1.06% 7/7/22 (Liquidity Facility JPMorgan Chase Bank) (a)(f)(h) | | 140,000 | 140,000 |
| Sarasota County Pub. Hosp. District Hosp. Rev. Participating VRDN Series XL 02 75, 1.01% 7/7/22 (Liquidity Facility JPMorgan Chase Bank) (a)(f)(h) | | 400,000 | 400,000 |
| Tampa Hosp. Rev. Participating VRDN Series XM 08 86, 1.05% 7/7/22 (Liquidity Facility JPMorgan Chase Bank) (a)(f)(h) | | 1,140,000 | 1,140,000 |
|
| TOTAL FLORIDA | | | 3,375,000 |
|
| Hawaii - 0.5% | | | |
| Hawaii Arpts. Sys. Rev. Participating VRDN: | | | |
| Series XF 07 65, 1.04% 7/7/22 (Liquidity Facility JPMorgan Chase Bank) (a)(b)(f)(h) | | 200,000 | 200,000 |
| Series XG 03 86, 0% 7/7/22 (Liquidity Facility Morgan Stanley Bank, West Valley City Utah) (a)(b)(f)(h) | | 500,000 | 500,000 |
|
| TOTAL HAWAII | | | 700,000 |
|
| Illinois - 5.3% | | | |
| Chicago O'Hare Int'l. Arpt. Rev. Participating VRDN: | | | |
| Series XM 08 79, 1.04% 7/7/22 (Liquidity Facility JPMorgan Chase Bank) (a)(f)(h) | | 100,000 | 100,000 |
| Series XM 08 84, 1.04% 7/7/22 (Liquidity Facility JPMorgan Chase Bank) (a)(b)(f)(h) | | 100,000 | 100,000 |
| Series XM 09 17, 1.04% 7/7/22 (Liquidity Facility JPMorgan Chase Bank) (a)(f)(h) | | 1,100,000 | 1,100,000 |
| Chicago Transit Auth. Participating VRDN Series XM 09 05, 1.05% 7/7/22 (Liquidity Facility JPMorgan Chase Bank) (a)(f)(h) | | 3,450,000 | 3,450,000 |
| Cook County Gen. Oblig. Participating VRDN Series 2015 XF0124, 1.06% 7/7/22 (Liquidity Facility JPMorgan Chase Bank) (a)(f)(h) | | 1,365,000 | 1,365,000 |
| Deutsche Spears/Lifers Trust Participating VRDN Series 2016 XG 00 93, 1.11% 7/7/22 (Liquidity Facility Deutsche Bank AG New York Branch) (a)(b)(f)(h) | | 300,000 | 300,000 |
| Illinois Gen. Oblig. Participating VRDN Series Floaters XM 01 86, 1.06% 7/7/22 (Liquidity Facility Deutsche Bank AG New York Branch) (a)(f)(h) | | 520,000 | 520,000 |
| Metropolitan Pier & Exposition Participating VRDN: | | | |
| Series 2021 XF 12 23, 1.03% 7/7/22 (Liquidity Facility JPMorgan Chase Bank) (a)(f)(h) | | 100,000 | 100,000 |
| Series XF 09 65, 1.03% 7/7/22 (Liquidity Facility JPMorgan Chase Bank) (a)(f)(h) | | 300,000 | 300,000 |
| Village of Oswego Indl. Dev. (Griffith Laboratories Worldwide, Inc.) Series 1995, 1.15% 7/7/22, LOC Wells Fargo Bank NA, VRDN (a)(b) | | 120,000 | 120,000 |
|
| TOTAL ILLINOIS | | | 7,455,000 |
|
| Indiana - 0.1% | | | |
| Lucky Heights Tc, Lp Participating VRDN Series XF 11 41, 1.16% 7/7/22 (Liquidity Facility Deutsche Bank AG New York Branch) (a)(f)(h) | | 200,000 | 200,000 |
| Kentucky - 2.1% | | | |
| Kentucky Econ. Dev. Fin. Auth. Hosp. Rev. Participating VRDN Series XM 09 19, 1.06% 7/7/22 (Liquidity Facility JPMorgan Chase Bank) (a)(f)(h) | | 100,000 | 100,000 |
| Meade County Indl. Bldg. Rev. (Nucor Steel Brandenburg Proj.) Series 2020 A1, 1.12% 7/1/22, VRDN (a)(b) | | 2,940,000 | 2,940,000 |
|
| TOTAL KENTUCKY | | | 3,040,000 |
|
| Louisiana - 6.8% | | | |
| Saint James Parish Gen. Oblig. (Nucor Steel Louisiana LLC Proj.): | | | |
| Series 2010 A1, 1.15% 7/7/22, VRDN (a) | | 7,595,000 | 7,594,999 |
| Series 2010 B1, 1.1% 7/7/22, VRDN (a) | | 2,000,000 | 2,000,000 |
|
| TOTAL LOUISIANA | | | 9,594,999 |
|
| Massachusetts - 0.8% | | | |
| Massachusetts Dev. Fin. Agcy. Rev. Participating VRDN Series XM 09 99, 1.06% 7/7/22 (Liquidity Facility JPMorgan Chase Bank) (a)(f)(h) | | 400,000 | 400,000 |
| Massachusetts Edl. Fing. Auth. Rev. Participating VRDN Series Floaters XF 23 06, 1.11% 7/7/22 (Liquidity Facility Morgan Stanley Bank, West Valley City Utah) (a)(b)(f)(h) | | 100,000 | 100,000 |
| Massachusetts Port Auth. Rev. Participating VRDN Series XM 08 51, 1.01% 7/7/22 (Liquidity Facility JPMorgan Chase Bank) (a)(b)(f)(h) | | 600,000 | 600,000 |
|
| TOTAL MASSACHUSETTS | | | 1,100,000 |
|
| Minnesota - 0.2% | | | |
| Duluth Minn Hsg. & Redev. Auth. MultiFamily Hsg. Rev. Participating VRDN Series 2021 XF 11 30, 1.16% 7/7/22 (Liquidity Facility Deutsche Bank AG New York Branch) (a)(f)(h) | | 100,000 | 100,000 |
| Minneapolis Health Care Sys. Rev. Participating VRDN Series XM 08 72, 1.05% 7/7/22 (Liquidity Facility JPMorgan Chase Bank) (a)(f)(h) | | 100,000 | 100,000 |
| Minnesota Rural Wtr. Fin. Auth. BAN Series 2021 B, 0.3% 8/1/22 | | 100,000 | 99,860 |
|
| TOTAL MINNESOTA | | | 299,860 |
|
| Missouri - 0.3% | | | |
| Missouri Health & Edl. Facilities Auth. Edl. Facilities Rev. Participating VRDN Series XG 01 76, 1.03% 7/7/22 (Liquidity Facility Royal Bank of Canada) (a)(f)(h) | | 200,000 | 200,000 |
| Missouri Health & Edl. Facilities Rev. Participating VRDN Series XL 02 58, 1.06% 7/7/22 (Liquidity Facility JPMorgan Chase Bank) (a)(f)(h) | | 200,000 | 200,000 |
|
| TOTAL MISSOURI | | | 400,000 |
|
| Nevada - 0.4% | | | |
| Nevada Hsg. Division Participating VRDN Series 2022 MIZ 90 91, 1.16% 8/4/22 (Liquidity Facility Mizuho Cap. Markets LLC) (a)(f)(g)(h) | | 500,000 | 500,000 |
| New Jersey - 0.4% | | | |
| New Jersey Tpk. Auth. Tpk. Rev. Participating VRDN Series XM 09 12, 1.06% 7/7/22 (Liquidity Facility JPMorgan Chase Bank) (a)(f)(h) | | 120,000 | 120,000 |
| West Orange Gen. Oblig. BAN Series 2021, 2% 11/11/22 | | 400,000 | 400,479 |
|
| TOTAL NEW JERSEY | | | 520,479 |
|
| New York - 5.4% | | | |
| Hempstead Union Free School District BAN Series 2021 A, 1.5% 11/30/22 | | 600,000 | 599,707 |
| New York Dorm. Auth. Rev. Participating VRDN Series XF 13 28, 1.08% 7/7/22 (Liquidity Facility JPMorgan Chase Bank) (a)(f)(h) | | 300,000 | 300,000 |
| New York Liberty Dev. Corp. Participating VRDN Series XF 12 42, 1.03% 7/7/22 (Liquidity Facility JPMorgan Chase Bank) (a)(f)(h) | | 665,000 | 665,000 |
| New York Metropolitan Trans. Auth. Rev.: | | | |
| BAN Series 2019 D1, 5% 9/1/22 | | 2,080,000 | 2,091,177 |
| Participating VRDN: | | | |
| Series XF 13 21, 1.09% 7/7/22 (Liquidity Facility JPMorgan Chase Bank) (a)(f)(h) | | 400,000 | 400,000 |
| Series ZF 02 18, 1.09% 7/7/22 (Liquidity Facility JPMorgan Chase Bank) (a)(f)(h) | | 200,000 | 200,000 |
| New York Pwr. Auth. Participating VRDN Series XF 13 10, 1.03% 7/7/22 (Liquidity Facility Toronto-Dominion Bank) (a)(f)(h) | | 3,000,000 | 3,000,000 |
| New York Thruway Auth. Gen. Rev. Participating VRDN: | | | |
| Series XM 08 30, 1.06% 7/7/22 (Liquidity Facility JPMorgan Chase Bank) (a)(f)(h) | | 100,000 | 100,000 |
| Series XM 08 31, 1.08% 7/7/22 (Liquidity Facility Morgan Stanley Bank, West Valley City Utah) (a)(f)(h) | | 200,000 | 200,000 |
| Rockland County Indl. Dev. Agcy. Participating VRDN Series XF 11 32, 1.16% 7/7/22 (Liquidity Facility Deutsche Bank AG New York Branch) (a)(f)(h) | | 100,000 | 100,000 |
|
| TOTAL NEW YORK | | | 7,655,884 |
|
| Ohio - 0.5% | | | |
| Ohio Hosp. Rev. Series 2015 B, 1.18% 7/7/22, VRDN (a) | | 200,000 | 200,000 |
| Ohio Hsg. Fin. Agcy. Multi-family Hsg. Rev. Participating VRDN Series XF 10 92, 1.16% 7/7/22 (Liquidity Facility Deutsche Bank AG New York Branch) (a)(f)(h) | | 300,000 | 300,000 |
| Whitehall Spl. Oblig. Nontax Rev. BAN Series 2021 A, 1.5% 12/7/22 | | 200,000 | 199,918 |
|
| TOTAL OHIO | | | 699,918 |
|
| Oklahoma - 0.4% | | | |
| Oklahoma Dev. Fin. Auth. Health Sys. Rev. Series 2020 B, 1.24% 7/7/22, VRDN (a) | | 600,000 | 600,000 |
| Oregon - 0.1% | | | |
| Oregon Facilities Auth. Rev. Participating VRDN Series XL 02 66, 1.03% 7/7/22 (Liquidity Facility Bank of America NA) (a)(f)(h) | | 200,000 | 200,000 |
| Pennsylvania - 1.5% | | | |
| Chester County Indl. Dev. Auth. Student Hsg. Rev. Participating VRDN Series DBE 80 86, 1.31% 8/29/22 (Liquidity Facility Deutsche Bank AG New York Branch) (a)(f)(g)(h) | | 300,000 | 300,000 |
| Pennsylvania Hsg. Fin. Agcy. Multifamily Hsg. Dev. Rev. Participating VRDN Series XF 10 95, 1.16% 7/7/22 (Liquidity Facility Deutsche Bank AG New York Branch) (a)(f)(h) | | 200,000 | 200,000 |
| Philadelphia Auth. for Indl. Dev.: | | | |
| Participating VRDN Series MIZ 90 51, 1.16% 8/4/22 (Liquidity Facility Mizuho Cap. Markets LLC)(a)(f)(g)(h) | | 100,000 | 100,000 |
| Series 2017 B, 1.21% 7/7/25, VRDN (a) | | 1,450,000 | 1,450,000 |
|
| TOTAL PENNSYLVANIA | | | 2,050,000 |
|
| South Carolina - 1.1% | | | |
| Greenville Hosp. Sys. Facilities Rev. Participating VRDN Series XF 01 45, 1.06% 7/7/22 (Liquidity Facility Toronto-Dominion Bank) (a)(f)(h) | | 100,000 | 100,000 |
| South Carolina Pub. Svc. Auth. Rev. Participating VRDN Series Floaters XM 03 84, 1.05% 7/7/22 (Liquidity Facility JPMorgan Chase Bank) (a)(f)(h) | | 1,400,000 | 1,400,000 |
|
| TOTAL SOUTH CAROLINA | | | 1,500,000 |
|
| Tennessee - 2.1% | | | |
| Metropolitan Govt. Nashville & Davidson County Health & Edl. Facilities Board Participating VRDN Series XF 10 97, 1.16% 7/7/22 (Liquidity Facility Deutsche Bank AG New York Branch) (a)(f)(h) | | 500,000 | 500,000 |
| Metropolitan Nashville Arpt. Auth. Rev. Participating VRDN Series 2022 ZF 29 74, 1.03% 7/7/22 (Liquidity Facility Morgan Stanley Bank, West Valley City Utah) (a)(f)(h) | | 2,500,000 | 2,500,000 |
|
| TOTAL TENNESSEE | | | 3,000,000 |
|
| Texas - 5.7% | | | |
| Austin Affordable Pfc, Inc. Multifamily Hsg. Rev. Participating VRDN Series XF 11 19, 1.16% 7/7/22 (Liquidity Facility Deutsche Bank AG New York Branch) (a)(f)(h) | | 100,000 | 100,000 |
| Cap. Area Hsg. Fin. Corp. Multi-family Hsg. Rev. Participating VRDN Series XF 11 31, 1.16% 7/7/22 (Liquidity Facility Deutsche Bank AG New York Branch) (a)(f)(h) | | 1,100,000 | 1,100,000 |
| Hurst Participating VRDN Series XF 10 94, 1.16% 7/7/22 (Liquidity Facility Deutsche Bank AG New York Branch) (a)(f)(h) | | 100,000 | 100,000 |
| North Central Texas Hsg. Fin. Corp. Mu Participating VRDN Series XF 10 99, 1.16% 7/7/22 (Liquidity Facility Deutsche Bank AG New York Branch) (a)(f)(h) | | 1,100,000 | 1,100,000 |
| North Texas Tollway Auth. Rev. Participating VRDN: | | | |
| Series XF 12 21, 1.03% 7/7/22 (Liquidity Facility JPMorgan Chase Bank) (a)(f)(h) | | 50,000 | 50,000 |
| Series XF 12 91, 1.03% 7/7/22 (Liquidity Facility JPMorgan Chase Bank) (a)(f)(h) | | 2,500,000 | 2,500,000 |
| Port Arthur Navigation District Envir. Facilities Rev. (Motiva Enterprises LLC Proj.): | | | |
| Series 2004, 1.07% 7/7/22, VRDN (a)(b) | | 2,300,000 | 2,300,000 |
| Series 2010 D, 1.18% 7/7/22, VRDN (a) | | 575,000 | 575,000 |
| Texas Dept. of Hsg. & Cmnty. Affairs Residential Mtg. Rev. Participating VRDN Series XF 10 98, 1.16% 7/7/22 (Liquidity Facility Deutsche Bank AG New York Branch) (a)(f)(h) | | 100,000 | 100,000 |
| Texas Private Activity Bond Surface Trans. Corp. Participating VRDN Series XM 07 56, 1.1% 7/7/22 (Liquidity Facility Deutsche Bank AG New York Branch) (a)(b)(f)(h) | | 100,000 | 100,000 |
| Trinity Riv Pub. Facilities Corp. Tex M Participating VRDN Series XF 10 83, 1.16% 7/7/22 (Liquidity Facility Deutsche Bank AG New York Branch) (a)(f)(h) | | 100,000 | 100,000 |
|
| TOTAL TEXAS | | | 8,125,000 |
|
| Utah - 0.5% | | | |
| Salt Lake City Arpt. Rev. Participating VRDN: | | | |
| Series XM 08 82, 1.04% 7/7/22 (Liquidity Facility JPMorgan Chase Bank) (a)(b)(f)(h) | | 100,000 | 100,000 |
| Series ZF 29 76, 1.11% 7/7/22 (Liquidity Facility Morgan Stanley Bank, West Valley City Utah) (a)(b)(f)(h) | | 300,000 | 300,000 |
| Utah Hsg. Corp. Multi-family Hsg. Rev. Participating VRDN Series 2021 XF 11 00, 1.16% 7/7/22 (Liquidity Facility Deutsche Bank AG New York Branch) (a)(f)(h) | | 300,000 | 300,000 |
|
| TOTAL UTAH | | | 700,000 |
|
| Virginia - 0.1% | | | |
| Virginia Small Bus. Fing. Auth. Series 2004, 1.07% 7/7/22, LOC Truist Bank, VRDN (a)(b) | | 100,000 | 100,000 |
| Washington - 1.7% | | | |
| Washington Convention Ctr. Pub. Facilities Participating VRDN Series Floaters ZM 06 79, 1.21% 7/7/22 (Liquidity Facility Citibank NA) (a)(f)(h) | | 2,350,000 | 2,350,000 |
| Washington Econ. Dev. Fin. Auth. Rev. Participating VRDN Series Floaters 005, 1.09% 8/11/22 (Liquidity Facility Barclays Bank PLC)(a)(b)(f)(h) | | 100,000 | 100,000 |
|
| TOTAL WASHINGTON | | | 2,450,000 |
|
| West Virginia - 0.1% | | | |
| West Virginia Hosp. Fin. Auth. Hosp. Rev. Series 2018 E, 1.21% 7/7/25, VRDN (a) | | 200,000 | 200,000 |
| TOTAL MUNICIPAL NOTES | | | |
| (Cost $62,579,936) | | | 62,571,006 |
| | | Shares | Value |
|
| Money Market Funds - 3.8% | | | |
| Fidelity Municipal Cash Central Fund 0.88% (i)(j) | | | |
| (Cost $5,412,000) | | 5,410,918 | 5,412,000 |
| TOTAL INVESTMENT IN SECURITIES - 100.5% | | | |
| (Cost $143,170,490) | | | 142,250,395 |
| NET OTHER ASSETS (LIABILITIES) - (0.5)% | | | (745,693) |
| NET ASSETS - 100% | | | $141,504,702 |
Security Type Abbreviations
BAN – BOND ANTICIPATION NOTE
CP – COMMERCIAL PAPER
VRDN – VARIABLE RATE DEMAND NOTE (A debt instrument that is payable upon demand, either daily, weekly or monthly)
Legend
(a) Coupon rates for floating and adjustable rate securities reflect the rates in effect at period end.
(b) Private activity obligations whose interest is subject to the federal alternative minimum tax for individuals.
(c) Security exempt from registration under Rule 144A of the Securities Act of 1933. These securities may be resold in transactions exempt from registration, normally to qualified institutional buyers. At the end of the period, the value of these securities amounted to $1,303,538 or 0.9% of net assets.
(d) Security or a portion of the security purchased on a delayed delivery or when-issued basis.
(e) Coupon is indexed to a floating interest rate which may be multiplied by a specified factor and/or subject to caps or floors.
(f) Provides evidence of ownership in one or more underlying municipal bonds.
(g) Restricted securities (including private placements) - Investment in securities not registered under the Securities Act of 1933 (excluding 144A issues). At the end of the period, the value of restricted securities (excluding 144A issues) amounted to $3,200,000 or 2.3% of net assets.
(h) Coupon rates are determined by re-marketing agents based on current market conditions.
(i) Information in this report regarding holdings by state and security types does not reflect the holdings of the Fidelity Municipal Cash Central Fund.
(j) Affiliated fund that is generally available only to investment companies and other accounts managed by Fidelity Investments. The rate quoted is the annualized seven-day yield of the fund at period end. A complete unaudited listing of the fund's holdings as of its most recent quarter end is available upon request. In addition, each Fidelity Central Fund's financial statements are available on the SEC's website or upon request.
Additional information on each restricted holding is as follows:
| Security | Acquisition Date | Acquisition Cost |
| Arizona St Indl. Dev. Auth. Multi Participating VRDN Series Floater MIZ 90 88, 1.16% 8/4/22 (Liquidity Facility Mizuho Cap. Markets LLC) | 2/3/22 | $1,200,000 |
| Chester County Indl. Dev. Auth. Student Hsg. Rev. Participating VRDN Series DBE 80 86, 1.31% 8/29/22 (Liquidity Facility Deutsche Bank AG New York Branch) | 4/14/22 | $300,000 |
| Core/Related Gala Rentals Lp Participating VRDN Series DBE 80 87, 1.31% 8/29/22 (Liquidity Facility Deutsche Bank AG New York Branch) | 6/2/22 | $300,000 |
| Miami Dade County Hsg. Multifamily Hsg. Rev. Participating VRDN Series Floater MIZ 90 87, 1.16% 8/4/22 (Liquidity Facility Mizuho Cap. Markets LLC) | 1/27/22 | $200,000 |
| Nevada Hsg. Division Participating VRDN Series 2022 MIZ 90 91, 1.16% 8/4/22 (Liquidity Facility Mizuho Cap. Markets LLC) | 2/10/22 | $500,000 |
| Philadelphia Auth. for Indl. Dev. Participating VRDN Series MIZ 90 51, 1.16% 8/4/22 (Liquidity Facility Mizuho Cap. Markets LLC) | 11/12/20 | $100,000 |
| River Islands Pub. Fing. Auth. Participating VRDN Series MIZ 90 26, 1.16% 8/4/22 (Liquidity Facility Mizuho Cap. Markets LLC) | 8/14/20 | $200,000 |
| San Francisco City & County Multi-family Hsg. Rev. Participating VRDN Series DBE 8059, 1.31% 8/29/22 (Liquidity Facility Deutsche Bank AG New York Branch) | 12/10/20 - 4/13/22 | $400,000 |
Affiliated Central Funds
Fiscal year to date information regarding the Fund's investments in Fidelity Central Funds, including the ownership percentage, is presented below.
| Fund | Value, beginning of period | Purchases | Sales Proceeds | Dividend Income | Realized Gain/Loss | Change in Unrealized appreciation (depreciation) | Value, end of period | % ownership, end of period |
| Fidelity Municipal Cash Central Fund 0.88% | $7,907,002 | $35,266,003 | $37,761,000 | $17,149 | $-- | $(5) | $5,412,000 | 0.4% |
| Total | $7,907,002 | $35,266,003 | $37,761,000 | $17,149 | $-- | $(5) | $5,412,000 | |
Amounts in the income column in the above table include any capital gain distributions from underlying funds, which are presented in the corresponding line-item in the Statement of Operations, if applicable.
Investment Valuation
The following is a summary of the inputs used, as of June 30, 2022, involving the Fund's assets and liabilities carried at fair value. The inputs or methodology used for valuing securities may not be an indication of the risk associated with investing in those securities. For more information on valuation inputs, and their aggregation into the levels used below, please refer to the Investment Valuation section in the accompanying Notes to Financial Statements.
| | Valuation Inputs at Reporting Date: |
| Description | Total | Level 1 | Level 2 | Level 3 |
| Investments in Securities: | | | | |
| Municipal Securities | $136,838,395 | $-- | $136,838,395 | $-- |
| Money Market Funds | 5,412,000 | 5,412,000 | -- | -- |
| Total Investments in Securities: | $142,250,395 | $5,412,000 | $136,838,395 | $-- |
Other Information
The distribution of municipal securities by revenue source, as a percentage of total Net Assets, is as follows (Unaudited):
| Synthetics | 28.6% |
| Transportation | 12.7% |
| Industrial Development | 11.9% |
| Health Care | 10.0% |
| Education | 7.6% |
| General Obligations | 7.5% |
| Electric Utilities | 5.0% |
| Others* (Individually Less Than 5%) | 16.7% |
| | 100.0% |
* Includes net other assets
See accompanying notes which are an integral part of the financial statements.
Financial Statements
Statement of Assets and Liabilities
| | | June 30, 2022 (Unaudited) |
| Assets | | |
Investment in securities, at value — See accompanying schedule:
Unaffiliated issuers (cost $137,758,490) | $136,838,395 | |
| Fidelity Central Funds (cost $5,412,000) | 5,412,000 | |
| Total Investment in Securities (cost $143,170,490) | | $142,250,395 |
| Cash | | 205,681 |
| Receivable for fund shares sold | | 204,552 |
| Interest receivable | | 962,656 |
| Distributions receivable from Fidelity Central Funds | | 5,253 |
| Total assets | | 143,628,537 |
| Liabilities | | |
| Payable for investments purchased | | |
| Regular delivery | $804,104 | |
| Delayed delivery | 1,118,408 | |
| Payable for fund shares redeemed | 93,318 | |
| Distributions payable | 108,005 | |
| Total liabilities | | 2,123,835 |
| Net Assets | | $141,504,702 |
| Net Assets consist of: | | |
| Paid in capital | | $142,424,829 |
| Total accumulated earnings (loss) | | (920,127) |
| Net Assets | | $141,504,702 |
| Net Asset Value, offering price and redemption price per share ($141,504,702 ÷ 14,201,823 shares) | | $9.96 |
See accompanying notes which are an integral part of the financial statements.
Statement of Operations
| | | Six months ended June 30, 2022 (Unaudited) |
| Investment Income | | |
| Interest | | $434,203 |
| Income from Fidelity Central Funds | | 17,149 |
| Total income | | 451,352 |
| Expenses | | |
| Independent trustees' fees and expenses | $223 | |
| Total expenses | | 223 |
| Net investment income (loss) | | 451,129 |
| Realized and Unrealized Gain (Loss) | | |
| Net realized gain (loss) on: | | |
| Investment securities: | | |
| Unaffiliated issuers | (596) | |
| Total net realized gain (loss) | | (596) |
| Change in net unrealized appreciation (depreciation) on: | | |
| Investment securities: | | |
| Unaffiliated issuers | (1,021,372) | |
| Fidelity Central Funds | (5) | |
| Total change in net unrealized appreciation (depreciation) | | (1,021,377) |
| Net gain (loss) | | (1,021,973) |
| Net increase (decrease) in net assets resulting from operations | | $(570,844) |
See accompanying notes which are an integral part of the financial statements.
Statement of Changes in Net Assets
| | Six months ended June 30, 2022 (Unaudited) | Year ended December 31, 2021 |
| Increase (Decrease) in Net Assets | | |
| Operations | | |
| Net investment income (loss) | $451,129 | $589,617 |
| Net realized gain (loss) | (596) | 5,696 |
| Change in net unrealized appreciation (depreciation) | (1,021,377) | (178,118) |
| Net increase (decrease) in net assets resulting from operations | (570,844) | 417,195 |
| Distributions to shareholders | (450,981) | (603,242) |
| Share transactions | | |
| Proceeds from sales of shares | 54,896,426 | 130,607,143 |
| Reinvestment of distributions | – | 16,296 |
| Cost of shares redeemed | (57,971,458) | (64,903,201) |
| Net increase (decrease) in net assets resulting from share transactions | (3,075,032) | 65,720,238 |
| Total increase (decrease) in net assets | (4,096,857) | 65,534,191 |
| Net Assets | | |
| Beginning of period | 145,601,559 | 80,067,368 |
| End of period | $141,504,702 | $145,601,559 |
| Other Information | | |
| Shares | | |
| Sold | 5,500,764 | 13,003,310 |
| Issued in reinvestment of distributions | – | 1,622 |
| Redeemed | (5,814,863) | (6,462,435) |
| Net increase (decrease) | (314,099) | 6,542,497 |
See accompanying notes which are an integral part of the financial statements.
Financial Highlights
Fidelity Flex Conservative Income Municipal Bond Fund
| | Six months ended (Unaudited) June 30, | Years endedDecember 31, | | | | |
| | 2022 | 2021 | 2020 | 2019 | 2018 | 2017 A |
| Selected Per–Share Data | | | | | | |
| Net asset value, beginning of period | $10.03 | $10.04 | $10.02 | $9.98 | $9.98 | $10.00 |
| Income from Investment Operations | | | | | | |
| Net investment income (loss)B,C | .030 | .052 | .121 | .192 | .179 | .028 |
| Net realized and unrealized gain (loss) | (.069) | (.007) | .026 | .044 | (.004) | (.020) |
| Total from investment operations | (.039) | .045 | .147 | .236 | .175 | .008 |
| Distributions from net investment income | (.031) | (.054) | (.125) | (.193) | (.174) | (.028) |
| Distributions from net realized gain | – | (.001) | (.002) | (.003) | (.001) | – |
| Total distributions | (.031) | (.055) | (.127) | (.196) | (.175) | (.028) |
| Net asset value, end of period | $9.96 | $10.03 | $10.04 | $10.02 | $9.98 | $9.98 |
| Total ReturnD,E | (.39)% | .45% | 1.48% | 2.39% | 1.77% | .08% |
| Ratios to Average Net AssetsC,F,G | | | | | | |
| Expenses before reductionsH | - %I | -% | -% | -% | -% | - %I |
| Expenses net of fee waivers, if anyH | - %I | -% | -% | -% | -% | - %I |
| Expenses net of all reductionsH | - %I | -% | -% | -% | -% | - %I |
| Net investment income (loss) | .61%I | .52% | 1.21% | 1.92% | 1.81% | 1.27%I |
| Supplemental Data | | | | | | |
| Net assets, end of period (000 omitted) | $141,505 | $145,602 | $80,067 | $54,558 | $36,787 | $10,021 |
| Portfolio turnover rateJ | 51%I | 44% | 36% | 52% | 11% | - %K |
A For the period October 12, 2017 (commencement of operations) through December 31, 2017.
B Calculated based on average shares outstanding during the period.
C Net investment income (loss) is affected by the timing of the declaration of dividends by any underlying mutual funds or exchange-traded funds (ETFs). Net investment income (loss) of any such underlying funds is not included in the Fund's net investment income (loss) ratio.
D Total returns for periods of less than one year are not annualized.
E Total returns would have been lower if certain expenses had not been reduced during the applicable periods shown.
F Fees and expenses of any underlying mutual funds or exchange-traded funds (ETFs) are not included in the Fund's expense ratio. The Fund indirectly bears its proportionate share of these expenses. For additional expense information related to investments in Fidelity Central Funds, please refer to the "Investments in Fidelity Central Funds" note found in the Notes to Financial Statements section of the most recent Annual or Semi-Annual report.
G Expense ratios reflect operating expenses of the class. Expenses before reductions do not reflect amounts reimbursed, waived, or reduced through arrangements with the investment adviser, brokerage services, or other offset arrangements, if applicable, and do not represent the amount paid by the class during periods when reimbursements, waivers or reductions occur.
H Amount represents less than .005%.
I Annualized
J Amount does not include the portfolio activity of any underlying mutual funds or exchange-traded funds (ETFs).
K Amount not annualized.
See accompanying notes which are an integral part of the financial statements.
Notes to Financial Statements (Unaudited)
For the period ended June 30, 2022
1. Organization.
Fidelity Flex Conservative Income Municipal Bond Fund (the Fund) is a fund of Fidelity Municipal Trust (the Trust) and is authorized to issue an unlimited number of shares. Share transactions on the Statement of Changes in Net Assets may contain exchanges between affiliated funds. The Trust is registered under the Investment Company Act of 1940, as amended (the 1940 Act), as an open-end management investment company organized as a Massachusetts business trust. The Fund is available only to certain fee-based accounts and advisory programs offered by Fidelity.
2. Investments in Fidelity Central Funds.
Funds may invest in Fidelity Central Funds, which are open-end investment companies generally available only to other investment companies and accounts managed by the investment adviser and its affiliates. The Schedule of Investments lists any Fidelity Central Funds held as an investment as of period end, but does not include the underlying holdings of each Fidelity Central Fund. An investing fund indirectly bears its proportionate share of the expenses of the underlying Fidelity Central Funds.
Based on its investment objective, each Fidelity Central Fund may invest or participate in various investment vehicles or strategies that are similar to those of the investing fund. These strategies are consistent with the investment objectives of the investing fund and may involve certain economic risks which may cause a decline in value of each of the Fidelity Central Funds and thus a decline in the value of the investing fund.
| Fidelity Central Fund | Investment Manager | Investment Objective | Investment Practices | Expense Ratio(a) |
| Fidelity Money Market Central Funds | Fidelity Management & Research Company LLC (FMR) | Each fund seeks to obtain a high level of current income consistent with the preservation of capital and liquidity. | Short-term Investments | Less than .005% |
(a) Expenses expressed as a percentage of average net assets and are as of each underlying Central Fund's most recent annual or semi-annual shareholder report.
A complete unaudited list of holdings for each Fidelity Central Fund is available upon request or at the Securities and Exchange Commission website at www.sec.gov. In addition, the financial statements of the Fidelity Central Funds which contain the significant accounting policies (including investment valuation policies) of those funds, and are not covered by the Report of Independent Registered Public Accounting Firm, are available on the Securities and Exchange Commission website or upon request.
3. Significant Accounting Policies.
The Fund is an investment company and applies the accounting and reporting guidance of the Financial Accounting Standards Board (FASB) Accounting Standards Codification Topic 946 Financial Services - Investment Companies. The financial statements have been prepared in conformity with accounting principles generally accepted in the United States of America (GAAP), which require management to make certain estimates and assumptions at the date of the financial statements. Actual results could differ from those estimates. Subsequent events, if any, through the date that the financial statements were issued have been evaluated in the preparation of the financial statements. The Fund's Schedule of Investments lists any underlying mutual funds or exchange-traded funds (ETFs) but does not include the underlying holdings of these funds. The following summarizes the significant accounting policies of the Fund:
Investment Valuation. Investments are valued as of 4:00 p.m. Eastern time on the last calendar day of the period. The Board of Trustees (the Board) has delegated the day to day responsibility for the valuation of the Fund's investments to the Fair Value Committee (the Committee) established by the Fund's investment adviser. In accordance with valuation policies and procedures approved by the Board, the Fund attempts to obtain prices from one or more third party pricing vendors or brokers to value its investments. When current market prices, quotations or currency exchange rates are not readily available or reliable, investments will be fair valued in good faith by the Committee, in accordance with procedures adopted by the Board. Factors used in determining fair value vary by investment type and may include market or investment specific events, changes in interest rates and credit quality. The frequency with which these procedures are used cannot be predicted and they may be utilized to a significant extent. The Committee oversees the Fund's valuation policies and procedures and reports to the Board on the Committee's activities and fair value determinations. The Board monitors the appropriateness of the procedures used in valuing the Fund's investments and ratifies the fair value determinations of the Committee.
The Fund categorizes the inputs to valuation techniques used to value its investments into a disclosure hierarchy consisting of three levels as shown below:
- Level 1 – unadjusted quoted prices in active markets for identical investments
- Level 2 – other significant observable inputs (including quoted prices for similar investments, interest rates, prepayment speeds, etc.)
- Level 3 – unobservable inputs (including the Fund's own assumptions based on the best information available)
Valuation techniques used to value the Fund's investments by major category are as follows:
Debt securities, including restricted securities, are valued based on evaluated prices received from third party pricing vendors or from brokers who make markets in such securities. Municipal securities are valued by pricing vendors who utilize matrix pricing which considers yield or price of bonds of comparable quality, coupon, maturity and type or by broker-supplied prices. When independent prices are unavailable or unreliable, debt securities may be valued utilizing pricing methodologies which consider similar factors that would be used by third party pricing vendors. Debt securities are generally categorized as Level 2 in the hierarchy but may be Level 3 depending on the circumstances.
Investments in open-end mutual funds, including the Fidelity Central Funds, are valued at their closing net asset value (NAV) each business day and are categorized as Level 1 in the hierarchy.
Changes in valuation techniques may result in transfers in or out of an assigned level within the disclosure hierarchy. The aggregate value of investments by input level as of June 30, 2022 is included at the end of the Fund's Schedule of Investments.
Investment Transactions and Income. For financial reporting purposes, the Fund's investment holdings and NAV include trades executed through the end of the last business day of the period. The NAV per share for processing shareholder transactions is calculated as of the close of business of the New York Stock Exchange (NYSE), normally 4:00 p.m. Eastern time and includes trades executed through the end of the prior business day. Gains and losses on securities sold are determined on the basis of identified cost. Income and capital gain distributions from Fidelity Central Funds, if any, are recorded on the ex-dividend date. Interest income is accrued as earned and includes coupon interest and amortization of premium and accretion of discount on debt securities as applicable.
Expenses. Expenses directly attributable to a fund are charged to that fund. Expenses attributable to more than one fund are allocated among the respective funds on the basis of relative net assets or other appropriate methods. Expenses included in the accompanying financial statements reflect the expenses of that fund and do not include any expenses associated with any underlying mutual funds or exchange-traded funds. Although not included in a fund's expenses, a fund indirectly bears its proportionate share of these expenses through the net asset value of each underlying mutual fund or exchange-traded fund. Expense estimates are accrued in the period to which they relate and adjustments are made when actual amounts are known.
Income Tax Information and Distributions to Shareholders. Each year, the Fund intends to qualify as a regulated investment company under Subchapter M of the Internal Revenue Code, including distributing substantially all of its taxable income and realized gains. As a result, no provision for U.S. Federal income taxes is required. The Fund files a U.S. federal tax return, in addition to state and local tax returns as required. The Fund's federal income tax returns are subject to examination by the Internal Revenue Service (IRS) for a period of three fiscal years after they are filed. State and local tax returns may be subject to examination for an additional fiscal year depending on the jurisdiction.
Distributions are declared and recorded daily and paid monthly from net investment income. Distributions from realized gains, if any, are declared and recorded on the ex-dividend date. Income and capital gain distributions are determined in accordance with income tax regulations, which may differ from GAAP.
Capital accounts within the financial statements are adjusted for permanent book-tax differences. These adjustments have no impact on net assets or the results of operations. Capital accounts are not adjusted for temporary book-tax differences which will reverse in a subsequent period.
Book-tax differences are primarily due to market discount and losses deferred due to excise tax regulations.
The Fund purchases municipal securities whose interest, in the opinion of the issuer, is free from federal income tax. There is no assurance that the IRS will agree with this opinion. In the event the IRS determines that the issuer does not comply with relevant tax requirements, interest payments from a security could become federally taxable, possibly retroactively to the date the security was issued.
As of period end, the cost and unrealized appreciation (depreciation) in securities, and derivatives if applicable, for federal income tax purposes were as follows:
| Gross unrealized appreciation | $34,686 |
| Gross unrealized depreciation | (954,669) |
| Net unrealized appreciation (depreciation) | $(919,983) |
| Tax cost | $143,170,378 |
Delayed Delivery Transactions and When-Issued Securities. During the period, certain Funds transacted in securities on a delayed delivery or when-issued basis. Payment and delivery may take place after the customary settlement period for that security. The price of the underlying securities and the date when the securities will be delivered and paid for are fixed at the time the transaction is negotiated. Securities purchased on a delayed delivery or when-issued basis are identified as such in the Schedule of Investments. Compensation for interest forgone in the purchase of a delayed delivery or when-issued debt security may be received. With respect to purchase commitments, each applicable Fund identifies securities as segregated in its records with a value at least equal to the amount of the commitment. Payables and receivables associated with the purchases and sales of delayed delivery securities having the same coupon, settlement date and broker are offset. Delayed delivery or when-issued securities that have been purchased from and sold to different brokers are reflected as both payables and receivables in the Statement of Assets and Liabilities under the caption "Delayed delivery", as applicable. Losses may arise due to changes in the value of the underlying securities or if the counterparty does not perform under the contract's terms, or if the issuer does not issue the securities due to political, economic, or other factors.
Restricted Securities (including Private Placements). Funds may invest in securities that are subject to legal or contractual restrictions on resale. These securities generally may be resold in transactions exempt from registration or to the public if the securities are registered. Disposal of these securities may involve time-consuming negotiations and expense, and prompt sale at an acceptable price may be difficult. Information regarding restricted securities held at period end is included at the end of the Schedule of Investments, if applicable.
4. Purchases and Sales of Investments.
Purchases and sales of securities, other than short-term securities and in-kind transactions, as applicable, are noted in the table below.
| | Purchases ($) | Sales ($) |
| Fidelity Flex Conservative Income Municipal Bond Fund | 20,554,416 | 18,232,596 |
5. Fees and Other Transactions with Affiliates.
Management Fee. Fidelity Management & Research Company LLC (the investment adviser) and its affiliates provide the Fund with investment management related services and the Fund does not pay any fees for these services. Under the management contract, the investment adviser or an affiliate pays all other expenses of the Fund, excluding fees and expenses of the independent Trustees, and certain miscellaneous expenses such as proxy and shareholder meeting expenses.
Interfund Trades. Funds may purchase from or sell securities to other Fidelity Funds under procedures adopted by the Board. The procedures have been designed to ensure these interfund trades are executed in accordance with Rule 17a-7 of the 1940 Act. Any interfund trades are included within the respective purchases and sales amounts shown in the Purchases and Sales of Investments note. Interfund trades during the period are noted in the table below.
| | Purchases ($) | Sales ($) | Realized Gain (Loss) ($) |
| Fidelity Flex Conservative Income Municipal Bond Fund | 5,085,000 | 4,170,000 | – |
6. Committed Line of Credit.
Certain Funds participate with other funds managed by the investment adviser or an affiliate in a $4.25 billion credit facility (the "line of credit") to be utilized for temporary or emergency purposes to fund shareholder redemptions or for other short-term liquidity purposes. The commitment fees on the pro-rata portion of the line of credit are borne by the investment adviser. During the period, there were no borrowings on this line of credit.
7. Other.
A fund's organizational documents provide former and current trustees and officers with a limited indemnification against liabilities arising in connection with the performance of their duties to the fund. In the normal course of business, a fund may also enter into contracts that provide general indemnifications. A fund's maximum exposure under these arrangements is unknown as this would be dependent on future claims that may be made against a fund. The risk of material loss from such claims is considered remote.
8. Coronavirus (COVID-19) Pandemic.
An outbreak of COVID-19 first detected in China during December 2019 has since spread globally and was declared a pandemic by the World Health Organization during March 2020. Developments that disrupt global economies and financial markets, such as the COVID-19 pandemic, may magnify factors that affect the Fund's performance.
Shareholder Expense Example
As a shareholder, you incur two types of costs: (1) transaction costs, which may include sales charges (loads) on purchase payments or redemption proceeds, as applicable and (2) ongoing costs, which generally include management fees, distribution and/or service (12b-1) fees and other Fund expenses. This Example is intended to help you understand your ongoing costs (in dollars) of investing in a fund and to compare these costs with the ongoing costs of investing in other mutual funds.
The Example is based on an investment of $1,000 invested at the beginning of the period and held for the entire period (January 1, 2022 to June 30, 2022).
Actual Expenses
The first line of the accompanying table provides information about actual account values and actual expenses. You may use the information in this line, together with the amount you invested, to estimate the expenses that you paid over the period. Simply divide your account value by $1,000.00 (for example, an $8,600 account value divided by $1,000.00 = 8.6), then multiply the result by the number in the first line for a class/Fund under the heading entitled "Expenses Paid During Period" to estimate the expenses you paid on your account during this period. If any fund is a shareholder of any underlying mutual funds or exchange-traded funds (ETFs) (the Underlying Funds), such fund indirectly bears its proportional share of the expenses of the Underlying Funds in addition to the direct expenses incurred presented in the table. These fees and expenses are not included in the annualized expense ratio used to calculate the expense estimate in the table below.
Hypothetical Example for Comparison Purposes
The second line of the accompanying table provides information about hypothetical account values and hypothetical expenses based on the actual expense ratio and an assumed rate of return of 5% per year before expenses, which is not the actual return. The hypothetical account values and expenses may not be used to estimate the actual ending account balance or expenses you paid for the period. You may use this information to compare the ongoing costs of investing in the Fund and other funds. To do so, compare this 5% hypothetical example with the 5% hypothetical examples that appear in the shareholder reports of the other funds. If any fund is a shareholder of any Underlying Funds, such fund indirectly bears its proportional share of the expenses of the Underlying Funds in addition to the direct expenses as presented in the table. These fees and expenses are not included in the annualized expense ratio used to calculate the expense estimate in the table below.
Please note that the expenses shown in the table are meant to highlight your ongoing costs only and do not reflect any transaction costs. Therefore, the second line of the table is useful in comparing ongoing costs only, and will not help you determine the relative total costs of owning different funds. In addition, if these transactional costs were included, your costs would have been higher.
| | Annualized Expense Ratio-A | Beginning
Account Value
January 1, 2022 | Ending
Account Value
June 30, 2022 | Expenses Paid
During Period-B
January 1, 2022
to June 30, 2022 |
| Fidelity Flex Conservative Income Municipal Bond Fund | --%C | | | |
| Actual | | $1,000.00 | $996.10 | $--D |
| Hypothetical-E | | $1,000.00 | $1,024.79 | $--D |
A Annualized expense ratio reflects expenses net of applicable fee waivers.
B Expenses are equal to the annualized expense ratio, multiplied by the average account value over the period, multiplied by 181/ 365 (to reflect the one-half year period). The fees and expenses of any Underlying Funds are not included in each annualized expense ratio.
C Amount represents less than .005%.
D Amount represents less than $.005.
E 5% return per year before expenses
Liquidity Risk Management Program
The Securities and Exchange Commission adopted Rule 22e-4 under the Investment Company Act of 1940 (the Liquidity Rule) to promote effective liquidity risk management throughout the open-end investment company industry, thereby reducing the risk that funds will be unable to meet their redemption obligations and mitigating dilution of the interests of fund shareholders.
The Fund has adopted and implemented a liquidity risk management program pursuant to the Liquidity Rule (the Program) effective December 1, 2018. The Program is reasonably designed to assess and manage the Fund’s liquidity risk and to comply with the requirements of the Liquidity Rule. The Fund’s Board of Trustees (the Board) has designated the Fund’s investment adviser as administrator of the Program. The Fidelity advisers have established a Liquidity Risk Management Committee (the LRM Committee) to manage the Program for each of the Fidelity Funds. The LRM Committee monitors the adequacy and effectiveness of implementation of the Program and on a periodic basis assesses each Fund’s liquidity risk based on a variety of factors including (1) the Fund’s investment strategy, (2) portfolio liquidity and cash flow projections during normal and reasonably foreseeable stressed conditions, (3) shareholder redemptions, (4) borrowings and other funding sources and (5) in the case of exchange-traded funds, certain additional factors including the effect of the Fund’s prices and spreads, market participants, and basket compositions on the overall liquidity of the Fund’s portfolio, as applicable.
In accordance with the Program, each of the Fund’s portfolio investments is classified into one of four liquidity categories described below based on a determination of a reasonable expectation for how long it would take to convert the investment to cash (or sell or dispose of the investment) without significantly changing its market value.
- Highly liquid investments – cash or convertible to cash within three business days or less
- Moderately liquid investments – convertible to cash in three to seven calendar days
- Less liquid investments – can be sold or disposed of, but not settled, within seven calendar days
- Illiquid investments – cannot be sold or disposed of within seven calendar days
Liquidity classification determinations take into account a variety of factors including various market, trading and investment-specific considerations, as well as market depth, and generally utilize analysis from a third-party liquidity metrics service.
The Liquidity Rule places a 15% limit on a fund’s illiquid investments and requires funds that do not primarily hold assets that are highly liquid investments to determine and maintain a minimum percentage of the fund’s net assets to be invested in highly liquid investments (highly liquid investment minimum or HLIM). The Program includes provisions reasonably designed to comply with the 15% limit on illiquid investments and for determining, periodically reviewing and complying with the HLIM requirement as applicable.
At a recent meeting of the Fund’s Board of Trustees, the LRM Committee provided a written report to the Board pertaining to the operation, adequacy, and effectiveness of implementation of the Program for the annual period from December 1, 2020 through November 30, 2021. The report concluded that the Program has been implemented and is operating effectively and is reasonably designed to assess and manage the Fund’s liquidity risk.
XCB-SANN-0822
1.9884864.104
Item 2.
Code of Ethics
Not applicable.
Item 3.
Audit Committee Financial Expert
Not applicable.
Item 4.
Principal Accountant Fees and Services
Not applicable.
Item 5.
Audit Committee of Listed Registrants
Not applicable.
Item 6.
Investments
(a)
Not applicable.
(b)
Not applicable
Item 7.
Disclosure of Proxy Voting Policies and Procedures for Closed-End Management Investment Companies
Not applicable.
Item 8.
Portfolio Managers of Closed-End Management Investment Companies
Not applicable.
Item 9.
Purchase of Equity Securities by Closed-End Management Investment Company and Affiliated Purchasers
Not applicable.
Item 10.
Submission of Matters to a Vote of Security Holders
There were no material changes to the procedures by which shareholders may recommend nominees to the Fidelity Municipal Trust’s Board of Trustees.
Item 11.
Controls and Procedures
(a)(i) The President and Treasurer and the Chief Financial Officer have concluded that the Fidelity Municipal Trust’s (the “Trust”) disclosure controls and procedures (as
defined in Rule 30a-3(c) under the Investment Company Act) provide reasonable assurances that material information relating to the Trust is made known to them by the appropriate persons, based on their evaluation of these controls and procedures as of a date within 90 days of the filing date of this report.
(a)(ii) There was no change in the Trust’s internal control over financial reporting (as defined in Rule 30a-3(d) under the Investment Company Act) that occurred during the period covered by this report that has materially affected, or is reasonably likely to materially affect, the Trust’s internal control over financial reporting.
Item 12.
Disclosure of Securities Lending Activities for Closed-End Management
Investment Companies
Not applicable.
Item 13.
Exhibits
SIGNATURES
Pursuant to the requirements of the Securities Exchange Act of 1934 and the Investment Company Act of 1940, the registrant has duly caused this report to be signed on its behalf by the undersigned, thereunto duly authorized.
Fidelity Municipal Trust
| |
By: | /s/Laura M. Del Prato |
| Laura M. Del Prato |
| President and Treasurer |
|
|
Date: | August 19, 2022 |
Pursuant to the requirements of the Securities Exchange Act of 1934 and the Investment Company Act of 1940, this report has been signed below by the following persons on behalf of the registrant and in the capacities and on the dates indicated.
| |
By: | /s/Laura M. Del Prato |
| Laura M. Del Prato |
| President and Treasurer |
|
|
Date: | August 19, 2022 |
| |
By: | /s/John J. Burke III |
| John J. Burke III |
| Chief Financial Officer |
|
|
Date: | August 19, 2022 |