UNITED STATES
SECURITIES AND EXCHANGE COMMISSION
Washington, D.C. 20549
FORM N-CSR
CERTIFIED SHAREHOLDER REPORT OF REGISTERED
MANAGEMENT INVESTMENT COMPANIES
Investment Company Act file number 811-02628
Fidelity Municipal Trust
(Exact name of registrant as specified in charter)
245 Summer St., Boston, MA 02210
(Address of principal executive offices) (Zip code)
William C. Coffey, Secretary
245 Summer St.
Boston, Massachusetts 02210
(Name and address of agent for service)
Registrant's telephone number, including area code:
617-563-7000
| |
Date of fiscal year end: | December 31 |
|
|
Date of reporting period: | June 30, 2019 |
Item 1.
Reports to Stockholders
Fidelity® Municipal Income Fund
Semi-Annual Report June 30, 2019 Includes Fidelity and Fidelity Advisor share classes |
 |
Beginning on January 1, 2021, as permitted by regulations adopted by the Securities and Exchange Commission, paper copies of a fund’s shareholder reports will no longer be sent by mail, unless you specifically request paper copies of the reports from the fund or from your financial intermediary, such as a financial advisor, broker-dealer or bank. Instead, the reports will be made available on a website, and you will be notified by mail each time a report is posted and provided with a website link to access the report.
If you already elected to receive shareholder reports electronically, you will not be affected by this change and you need not take any action. You may elect to receive shareholder reports and other communications from a fund electronically, by contacting your financial intermediary. For Fidelity customers, visit Fidelity's web site or call Fidelity using the contact information listed below.
You may elect to receive all future reports in paper free of charge. If you wish to continue receiving paper copies of your shareholder reports, you may contact your financial intermediary or, if you are a Fidelity customer, visit Fidelity’s website, or call Fidelity at the applicable toll-free number listed below. Your election to receive reports in paper will apply to all funds held with the fund complex/your financial intermediary.
| Account Type | Website | Phone Number |
| Brokerage, Mutual Fund, or Annuity Contracts: | fidelity.com/mailpreferences | 1-800-343-3548 |
| Employer Provided Retirement Accounts: | netbenefits.fidelity.com/preferences (choose 'no' under Required Disclosures to continue to print) | 1-800-343-0860 |
| Advisor Sold Accounts Serviced Through Your Financial Intermediary: | Contact Your Financial Intermediary | Your Financial Intermediary's phone number |
| Advisor Sold Accounts Serviced by Fidelity: | institutional.fidelity.com | 1-877-208-0098 |
Contents
To view a fund's proxy voting guidelines and proxy voting record for the 12-month period ended June 30, visit http://www.fidelity.com/proxyvotingresults or visit the Securities and Exchange Commission's (SEC) web site at http://www.sec.gov.
You may also call 1-800-544-8544 if you’re an individual investing directly with Fidelity, call 1-800-835-5092 if you’re a plan sponsor or participant with Fidelity as your recordkeeper or call 1-877-208-0098 on institutional accounts or if you’re an advisor or invest through one to request a free copy of the proxy voting guidelines.
Standard & Poor's, S&P and S&P 500 are registered service marks of The McGraw-Hill Companies, Inc. and have been licensed for use by Fidelity Distributors Corporation.
Other third-party marks appearing herein are the property of their respective owners.
All other marks appearing herein are registered or unregistered trademarks or service marks of FMR LLC or an affiliated company. © 2019 FMR LLC. All rights reserved.
This report and the financial statements contained herein are submitted for the general information of the shareholders of the Fund. This report is not authorized for distribution to prospective investors in the Fund unless preceded or accompanied by an effective prospectus.
A fund files its complete schedule of portfolio holdings with the SEC for the first and third quarters of each fiscal year on Form N-PORT. Forms N-PORT are available on the SEC’s web site at http://www.sec.gov. A fund's Forms N-PORT may be reviewed and copied at the SEC’s Public Reference Room in Washington, DC. Information regarding the operation of the SEC's Public Reference Room may be obtained by calling 1-800-SEC-0330.
For a complete list of a fund's portfolio holdings, view the most recent holdings listing, semiannual report, or annual report on Fidelity's web site at http://www.fidelity.com, http://www.institutional.fidelity.com, or http://www.401k.com, as applicable.
NOT FDIC INSURED •MAY LOSE VALUE •NO BANK GUARANTEE
Neither the Fund nor Fidelity Distributors Corporation is a bank.
Investment Summary (Unaudited)
Top Five States as of June 30, 2019
| | % of fund's net assets |
| Illinois | 23.7 |
| Florida | 11.3 |
| Texas | 8.4 |
| Pennsylvania | 7.0 |
| New Jersey | 5.8 |
Top Five Sectors as of June 30, 2019
| | % of fund's net assets |
| Transportation | 25.7 |
| Health Care | 25.5 |
| General Obligations | 24.6 |
| Education | 6.2 |
| Electric Utilities | 5.8 |
Quality Diversification (% of fund's net assets)
| As of June 30, 2019 |
| | AAA | 2.2% |
| | AA,A | 70.8% |
| | BBB | 19.3% |
| | BB and Below | 4.0% |
| | Not Rated | 2.6% |
| | Short-Term Investments and Net Other Assets | 1.1% |
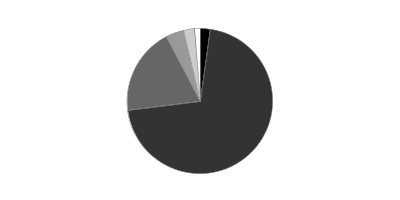
We have used ratings from Moody's Investors Service, Inc. Where Moody's® ratings are not available, we have used S&P® ratings. All ratings are as of the date indicated and do not reflect subsequent changes.
Schedule of Investments June 30, 2019 (Unaudited)
Showing Percentage of Net Assets
| Municipal Bonds - 98.9% | | | |
| | | Principal Amount (000s) | Value (000s) |
| Alabama - 0.3% | | | |
| Auburn Univ. Gen. Fee Rev. Series 2018 A, 5% 6/1/43 | | 2,565 | 3,095 |
| Birmingham Gen. Oblig. Series 2013 A, 5% 3/1/32 | | 2,900 | 3,214 |
| Jefferson County Gen. Oblig. Series 2018 A: | | | |
| 5% 4/1/25 | | $2,550 | $2,999 |
| 5% 4/1/26 | | 2,400 | 2,885 |
| Montgomery Med. Clinic Facilities 5% 3/1/33 | | 4,140 | 4,642 |
|
| TOTAL ALABAMA | | | 16,835 |
|
| Arizona - 2.0% | | | |
| Arizona Ctfs. of Prtn. Series 2010 A: | | | |
| 5.25% 10/1/26 (FSA Insured) | | 2,540 | 2,565 |
| 5.25% 10/1/28 (FSA Insured) | | 8,235 | 8,315 |
| Arizona Health Facilities Auth. Rev. (Banner Health Sys. Proj.) Series 2007 B, 3 month U.S. LIBOR + 0.810% 2.546%, tender 1/1/37 (a)(b) | | 2,485 | 2,439 |
| Arizona Indl. Dev. Auth. Rev. (Provident Group-Eastern Michigan Univ. Parking Proj.) Series 2018: | | | |
| 5% 5/1/48 | | 910 | 1,022 |
| 5% 5/1/51 | | 910 | 1,019 |
| Chandler Indl. Dev. Auth. Indl. Dev. Rev. Bonds (Intel Corp. Proj.) Series 2019, 5%, tender 6/3/24 (a)(c) | | 19,500 | 22,373 |
| Glendale Gen. Oblig. Series 2017: | | | |
| 5% 7/1/30 | | 2,080 | 2,545 |
| 5% 7/1/31 | | 3,105 | 3,778 |
| Glendale Indl. Dev. Auth. (Terraces of Phoenix Proj.) Series 2018 A: | | | |
| 5% 7/1/38 | | 235 | 250 |
| 5% 7/1/48 | | 295 | 310 |
| Maricopa County Indl. Dev. Auth. Sr. Living Facilities Series 2016: | | | |
| 5.75% 1/1/36 (d) | | 740 | 776 |
| 6% 1/1/48 (d) | | 4,540 | 4,743 |
| Maricopa County Rev. Series 2016 A: | | | |
| 5% 1/1/32 | | 8,280 | 9,963 |
| 5% 1/1/33 | | 4,965 | 5,957 |
| Phoenix Civic Impt. Board Arpt. Rev.: | | | |
| Series 2013, 5% 7/1/22 (c) | | 830 | 915 |
| Series 2017 A: | | | |
| 5% 7/1/33 (c) | | 910 | 1,084 |
| 5% 7/1/36 (c) | | 1,450 | 1,712 |
| 5% 7/1/37 (c) | | 1,075 | 1,265 |
| Series 2017 B: | | | |
| 5% 7/1/29 | | 2,070 | 2,566 |
| 5% 7/1/33 | | 2,900 | 3,517 |
| 5% 7/1/36 | | 3,310 | 3,973 |
| 5% 7/1/37 | | 2,070 | 2,477 |
| Phoenix Civic Impt. Corp. Excise Tax Rev. Series 2011 C, 5% 7/1/23 | | 1,655 | 1,774 |
| Pima County Swr. Sys. Rev. Series 2012 A, 5% 7/1/26 | | 830 | 917 |
| Salt Verde Finl. Corp. Sr. Gas Rev. Series 2007: | | | |
| 5.25% 12/1/21 | | 2,900 | 3,135 |
| 5.25% 12/1/22 | | 1,240 | 1,376 |
| 5.5% 12/1/29 | | 7,370 | 9,448 |
| Scottsdale Indl. Dev. Auth. Hosp. Rev. (Scottsdale Healthcare Proj.) Series 2006 C, 5% 9/1/35 (FSA Insured) | | 870 | 903 |
| Tempe Indl. Dev. Auth. Rev. (Mirabella At ASU, Inc. Proj.): | | | |
| Series 2017 A: | | | |
| 6.125% 10/1/47 (d) | | 440 | 498 |
| 6.125% 10/1/52 (d) | | 440 | 496 |
| Series 2017 B, 6% 10/1/37 (d) | | 220 | 251 |
|
| TOTAL ARIZONA | | | 102,362 |
|
| Arkansas - 0.5% | | | |
| Arkansas Dev. Auth. Indl. Dev. Rev. (Big River Steel Proj.) Series 2019, 4.5% 9/1/49 (c)(d) | | 23,950 | 24,860 |
| California - 3.1% | | | |
| ABC Unified School District Series 1997 C, 0% 8/1/28 (Nat'l. Pub. Fin. Guarantee Corp. Insured) | | 3,250 | 2,664 |
| Bay Area Toll Auth. San Francisco Bay Toll Bridge Rev. Bonds Series B, 2.85%, tender 4/1/25 (a) | | 6,840 | 7,270 |
| Cabrillo Unified School District Series A, 0% 8/1/20 (AMBAC Insured) | | 3,540 | 3,487 |
| California Gen. Oblig.: | | | |
| Series 2004, 5.25% 12/1/33 | | 150 | 150 |
| Series 2007, 5.625% 5/1/20 | | 100 | 100 |
| 5.25% 4/1/35 | | 7,080 | 7,831 |
| 5.5% 4/1/28 | | 10 | 10 |
| 5.5% 4/1/30 | | 5 | 5 |
| California Health Facilities Fing. Auth. Rev. (Catholic Healthcare West Proj.) Series 2009 E, 5.625% 7/1/25 | | 7,450 | 7,503 |
| California Muni. Fin. Auth. Student Hsg. (CHF-Davis I, LLC - West Village Student Hsg. Proj.) Series 2018, 5% 5/15/38 | | 7,200 | 8,512 |
| California Pub. Fin. Auth. Univ. H (Claremont Colleges Proj.) Series 2017 A: | | | |
| 5% 7/1/27 (d) | | 750 | 790 |
| 5% 7/1/37 (d) | | 1,525 | 1,586 |
| California Pub. Works Board Lease Rev. (Coalinga State Hosp. Proj.) Series 2013 E: | | | |
| 5% 6/1/26 | | 1,985 | 2,261 |
| 5% 6/1/28 | | 5,110 | 5,790 |
| Folsom Cordova Union School District No. 4 Series A, 0% 10/1/31 (Nat'l. Pub. Fin. Guarantee Corp. Insured) | | 1,520 | 1,099 |
| Golden State Tobacco Securitization Corp. Tobacco Settlement Rev. Series 2017 A1: | | | |
| 5% 6/1/23 | | 3,140 | 3,504 |
| 5% 6/1/24 | | 1,770 | 2,006 |
| Kern Cmnty. College District Gen. Oblig. Series 2006: | | | |
| 0% 11/1/28 (FSA Insured) | | 4,100 | 3,361 |
| 0% 11/1/30 (FSA Insured) | | 4,140 | 3,163 |
| Long Beach Unified School District Series 2009, 5.5% 8/1/29 | | 155 | 156 |
| Los Angeles Cmnty. Redev. Agcy. Lease Rev. (Vermont Manchester Social Svcs. Proj.) Series 2005, 5% 9/1/19 (AMBAC Insured) | | 2,105 | 2,111 |
| Los Angeles Muni. Impt. Corp. Lease Rev. Series 2012 C: | | | |
| 5% 3/1/25 | | 1,205 | 1,326 |
| 5% 3/1/27 | | 1,655 | 1,820 |
| Monrovia Unified School District Series B, 0% 8/1/29 (Nat'l. Pub. Fin. Guarantee Corp. Insured) | | 3,745 | 2,959 |
| Oakland Unified School District Alameda County Series 2015 A, 5% 8/1/29 | | 1,450 | 1,710 |
| Poway Unified School District: | | | |
| (District #2007-1 School Facilities Proj.) Series 2008 A, 0% 8/1/32 | | 4,885 | 3,544 |
| Series 2011, 0% 8/1/46 | | 950 | 376 |
| Series B: | | | |
| 0% 8/1/37 | | 6,455 | 3,905 |
| 0% 8/1/39 | | 19,705 | 11,033 |
| Poway Unified School District Pub. Fing.: | | | |
| 5% 9/1/24 | | 825 | 942 |
| 5% 9/1/26 | | 1,050 | 1,219 |
| 5% 9/1/29 | | 2,185 | 2,507 |
| 5% 9/1/31 | | 985 | 1,121 |
| Sacramento City Fing. Auth. Rev. Series A, 0% 12/1/26 (Nat'l. Pub. Fin. Guarantee Corp. Insured) | | 4,140 | 3,505 |
| San Bernardino County Ctfs. of Prtn. (Arrowhead Proj.) Series 2009 A, 5.25% 8/1/26 | | 3,145 | 3,156 |
| San Diego Unified School District: | | | |
| Series 2008 C, 0% 7/1/34 | | 2,980 | 2,000 |
| Series 2008 E, 0% 7/1/47 (e) | | 7,205 | 5,720 |
| San Francisco City & County Arpts. Commission Int'l. Arpt. Rev. Series 2019 B, 5% 5/1/49 | | 3,765 | 4,579 |
| San Jose Fing. Auth. Lease Rev. (Civic Ctr. Proj.) Series 2013 A: | | | |
| 5% 6/1/27 | | 3,815 | 4,362 |
| 5% 6/1/31 | | 4,790 | 5,455 |
| San Marcos Unified School District Series 2010 B, 0% 8/1/47 | | 17,635 | 7,303 |
| San Mateo County Cmnty. College District Series A, 0% 9/1/26 (Nat'l. Pub. Fin. Guarantee Corp. Insured) | | 4,495 | 3,975 |
| Union Elementary School District Series B, 0% 9/1/22 (Nat'l. Pub. Fin. Guarantee Corp. Insured) | | 1,240 | 1,183 |
| Univ. of California Regents Med. Ctr. Pool Rev. Series 2013 J, 5% 5/15/48 | | 2,485 | 2,759 |
| Washington Township Health Care District Gen. Oblig.: | | | |
| Series 2013 A, 5.5% 8/1/38 | | 3,725 | 4,374 |
| Series 2013 B, 5.5% 8/1/38 | | 830 | 975 |
| Washington Township Health Care District Rev.: | | | |
| Series 2009 A, 5.75% 7/1/24 | | 1,450 | 1,453 |
| Series 2010 A: | | | |
| 5.25% 7/1/30 | | 910 | 943 |
| 5.5% 7/1/38 | | 3,160 | 3,273 |
| West Contra Costa Unified School District Series 2012, 5% 8/1/26 | | 1,655 | 1,839 |
|
| TOTAL CALIFORNIA | | | 152,675 |
|
| Colorado - 1.3% | | | |
| Arkansas River Pwr. Auth. Rev. Series 2018 A: | | | |
| 5% 10/1/38 | | 2,080 | 2,408 |
| 5% 10/1/43 | | 2,600 | 2,985 |
| Colorado Health Facilities Auth. (Parkview Med. Ctr., Inc. Proj.) Series 2016: | | | |
| 4% 9/1/35 | | 1,365 | 1,462 |
| 4% 9/1/36 | | 1,075 | 1,148 |
| 5% 9/1/46 | | 6,045 | 6,853 |
| Colorado Health Facilities Auth. Retirement Hsg. Rev. (Liberty Heights Proj.) Series B, 0% 7/15/20 (Escrowed to Maturity) | | 5,795 | 5,711 |
| Colorado Hsg. & Fin. Auth. Series 2019 H, 4.25% 11/1/49 (f) | | 1,600 | 1,760 |
| Denver City & County Arpt. Rev.: | | | |
| Series 2017 A: | | | |
| 5% 11/15/23 (c) | | 1,885 | 2,154 |
| 5% 11/15/26 (c) | | 2,855 | 3,486 |
| 5% 11/15/27 (c) | | 2,440 | 3,024 |
| Series 2018 A: | | | |
| 5% 12/1/34 (c) | | 4,245 | 5,465 |
| 5% 12/1/36 (c) | | 4,140 | 4,962 |
| 5% 12/1/37 (c) | | 8,280 | 9,890 |
| E-470 Pub. Hwy. Auth. Rev.: | | | |
| Series 2000 B, 0% 9/1/20 (Nat'l. Pub. Fin. Guarantee Corp. Insured) | | 11,240 | 11,036 |
| Series 2010 C: | | | |
| 5.25% 9/1/25 | | 830 | 865 |
| 5.375% 9/1/26 | | 830 | 866 |
|
| TOTAL COLORADO | | | 64,075 |
|
| Connecticut - 1.3% | | | |
| Connecticut Arpt. Auth. Customer Facility Charge Rev. (Ground Trans. Ctr. Proj.) Series 2019 A, 4% 7/1/49 (c) | | 3,500 | 3,735 |
| Connecticut Gen. Oblig.: | | | |
| Series 2014 C, 5% 6/15/25 | | 1,390 | 1,645 |
| Series 2015 B, 5% 6/15/32 | | 1,980 | 2,283 |
| Series 2016 B: | | | |
| 5% 5/15/25 | | 9,080 | 10,726 |
| 5% 5/15/26 | | 5,095 | 6,130 |
| Series 2018 F: | | | |
| 5% 9/15/23 | | 2,150 | 2,449 |
| 5% 9/15/24 | | 2,690 | 3,134 |
| 5% 9/15/25 | | 2,700 | 3,213 |
| Connecticut Health & Edl. Facilities Auth. Rev.: | | | |
| (Sacred Heart Univ., CT. Proj.) Series 2017 I-1: | | | |
| 5% 7/1/26 | | 415 | 500 |
| 5% 7/1/27 | | 290 | 355 |
| 5% 7/1/28 | | 525 | 642 |
| 5% 7/1/29 | | 330 | 401 |
| Series 2016 K, 4% 7/1/46 | | 7,315 | 7,625 |
| Series 2019 A: | | | |
| 5% 7/1/39 (d) | | 3,930 | 4,229 |
| 5% 7/1/49 (d) | | 285 | 302 |
| Series K1: | | | |
| 5% 7/1/27 | | 415 | 496 |
| 5% 7/1/29 | | 1,060 | 1,276 |
| 5% 7/1/30 | | 830 | 991 |
| 5% 7/1/33 | | 1,325 | 1,555 |
| 5% 7/1/34 | | 620 | 724 |
| Eastern Connecticut Resources Recovery Auth. Solid Waste Rev. (Wheelabrator Lisbon Proj.) Series A, 5.5% 1/1/20 (c) | | 660 | 667 |
| Hbr. Point Infra Impt. District Series 2017: | | | |
| 5% 4/1/30 (d) | | 3,785 | 4,347 |
| 5% 4/1/39 (d) | | 4,865 | 5,414 |
| New Britain Gen. Oblig. Series 2017 C, 5% 3/1/29 (FSA Insured) | | 885 | 1,067 |
|
| TOTAL CONNECTICUT | | | 63,906 |
|
| District Of Columbia - 1.2% | | | |
| District of Columbia Gen. Oblig. Series 2019 A, 5% 10/15/44 | | 12,000 | 14,632 |
| District of Columbia Rev. Series B, 4.75% 6/1/32 | | 2,235 | 2,295 |
| Metropolitan Washington Arpts. Auth. Dulles Toll Road Rev. (Dulles Metrorail and Cap. Impt. Projs.) Series 2019 A: | | | |
| 5% 10/1/35 (f) | | 2,115 | 2,584 |
| 5% 10/1/37 (f) | | 2,125 | 2,579 |
| 5% 10/1/39 (f) | | 2,000 | 2,414 |
| 5% 10/1/44 (f) | | 7,000 | 8,387 |
| Metropolitan Washington DC Arpts. Auth. Sys. Rev. Series 2017 A: | | | |
| 5% 10/1/28 (c) | | 5,505 | 6,781 |
| 5% 10/1/29 (c) | | 6,690 | 8,194 |
| 5% 10/1/31 (c) | | 1,200 | 1,452 |
| 5% 10/1/32 (c) | | 1,855 | 2,236 |
| 5% 10/1/33 (c) | | 910 | 1,094 |
| 5% 10/1/35 (c) | | 2,070 | 2,471 |
| 5% 10/1/42 (c) | | 4,140 | 4,855 |
|
| TOTAL DISTRICT OF COLUMBIA | | | 59,974 |
|
| Florida - 11.3% | | | |
| Brevard County School Board Ctfs. of Prtn. Series 2015 C: | | | |
| 5% 7/1/25 | | 1,655 | 1,978 |
| 5% 7/1/26 | | 1,450 | 1,715 |
| 5% 7/1/28 | | 1,445 | 1,699 |
| Broward County Arpt. Sys. Rev.: | | | |
| Series 2012 P-1, 5% 10/1/22 (c) | | 800 | 885 |
| Series 2012 Q1, 5% 10/1/25 | | 4,315 | 4,822 |
| Series 2017: | | | |
| 5% 10/1/25 (c) | | 205 | 244 |
| 5% 10/1/26 (c) | | 830 | 1,005 |
| 5% 10/1/27 (c) | | 830 | 1,023 |
| 5% 10/1/29 (c) | | 2,200 | 2,681 |
| 5% 10/1/30 (c) | | 610 | 738 |
| 5% 10/1/32 (c) | | 2,900 | 3,482 |
| 5% 10/1/33 (c) | | 1,080 | 1,293 |
| 5% 10/1/34 (c) | | 1,055 | 1,258 |
| 5% 10/1/35 (c) | | 1,240 | 1,474 |
| 5% 10/1/36 (c) | | 1,655 | 1,962 |
| 5% 10/1/37 (c) | | 1,865 | 2,204 |
| 5% 10/1/42 (c) | | 3,520 | 4,120 |
| 5% 10/1/47 (c) | | 4,965 | 5,782 |
| Series A: | | | |
| 5% 10/1/23 (c) | | 1,180 | 1,340 |
| 5% 10/1/28 (c) | | 2,485 | 2,928 |
| 5% 10/1/30 (c) | | 2,900 | 3,387 |
| 5% 10/1/31 (c) | | 2,485 | 2,889 |
| 5% 10/1/32 (c) | | 2,320 | 2,686 |
| Broward County School Board Ctfs. of Prtn.: | | | |
| (Broward County School District Proj.) Series 2016 A, 5% 7/1/28 | | 555 | 668 |
| Series 2012 A: | | | |
| 5% 7/1/24 | | 1,795 | 1,977 |
| 5% 7/1/24 (Pre-Refunded to 7/1/22 @ 100) | | 1,845 | 2,041 |
| 5% 7/1/27 | | 4,715 | 5,160 |
| Series 2015 A: | | | |
| 5% 7/1/24 | | 1,855 | 2,171 |
| 5% 7/1/27 | | 830 | 985 |
| Series 2015 B, 5% 7/1/24 | | 2,280 | 2,668 |
| Series 2016, 5% 7/1/32 | | 1,820 | 2,157 |
| Collier County Indl. Dev. Auth. Healthcare Facilities Rev. (NCH Healthcare Sys. Proj.) Series 2011, 6.25% 10/1/39 | | 9,550 | 10,285 |
| Duval County School Board Ctfs. of Prtn.: | | | |
| Series 2015 B: | | | |
| 5% 7/1/28 | | 1,705 | 2,005 |
| 5% 7/1/32 | | 10,120 | 11,806 |
| Series 2016 A, 5% 7/1/33 | | 1,110 | 1,313 |
| Florida Mid-Bay Bridge Auth. Rev.: | | | |
| Series 2015 A, 5% 10/1/35 | | 5,300 | 5,985 |
| Series 2015 C: | | | |
| 5% 10/1/30 | | 2,705 | 3,083 |
| 5% 10/1/40 | | 1,655 | 1,837 |
| Florida Muni. Pwr. Agcy. Rev.: | | | |
| (Requirements Pwr. Supply Proj.) Series 2016 A: | | | |
| 5% 10/1/30 | | 1,810 | 2,190 |
| 5% 10/1/31 | | 1,975 | 2,379 |
| (St. Lucie Proj.) Series 2012 A, 5% 10/1/26 | | 3,065 | 3,383 |
| Series 2015 B: | | | |
| 5% 10/1/28 | | 830 | 985 |
| 5% 10/1/30 | | 1,490 | 1,759 |
| Gainesville Utils. Sys. Rev. Series 2019 A: | | | |
| 5% 10/1/44 | | 7,500 | 9,191 |
| 5% 10/1/47 | | 12,190 | 14,885 |
| Greater Orlando Aviation Auth. Arpt. Facilities Rev.: | | | |
| Series 2016 A, 5% 10/1/46 (c) | | 830 | 960 |
| Series 2016: | | | |
| 5% 10/1/20 (c) | | 165 | 172 |
| 5% 10/1/21 (c) | | 1,280 | 1,377 |
| 5% 10/1/22 (c) | | 830 | 919 |
| 5% 10/1/24 (c) | | 2,485 | 2,893 |
| 5% 10/1/26 (c) | | 1,405 | 1,703 |
| 5% 10/1/27 (c) | | 830 | 1,022 |
| Series 2017 A: | | | |
| 5% 10/1/24 (c) | | 1,925 | 2,241 |
| 5% 10/1/25 (c) | | 830 | 987 |
| 5% 10/1/27 (c) | | 1,655 | 2,037 |
| 5% 10/1/29 (c) | | 2,485 | 3,023 |
| 5% 10/1/30 (c) | | 2,665 | 3,217 |
| 5% 10/1/32 (c) | | 5,590 | 6,688 |
| 5% 10/1/34 (c) | | 4,965 | 5,901 |
| 5% 10/1/35 (c) | | 6,565 | 7,778 |
| 5% 10/1/36 (c) | | 6,210 | 7,335 |
| 5% 10/1/37 (c) | | 5,175 | 6,093 |
| Halifax Hosp. Med. Ctr. Rev.: | | | |
| 4% 6/1/27 | | 1,165 | 1,267 |
| 5% 6/1/24 | | 230 | 262 |
| Highlands County Health Facilities Auth. Rev. Series 2008: | | | |
| 6% 11/15/37 | | 10,740 | 10,920 |
| 6% 11/15/37 (Pre-Refunded to 11/15/19 @ 100) | | 25 | 25 |
| Jacksonville Sales Tax Rev. Series 2012, 5% 10/1/25 | | 830 | 920 |
| Lake County School Board Ctfs. of Prtn. Series 2014 A: | | | |
| 5% 6/1/27 (FSA Insured) | | 830 | 951 |
| 5% 6/1/28 (FSA Insured) | | 830 | 949 |
| 5% 6/1/30 (FSA Insured) | | 1,865 | 2,116 |
| Lee County Arpt. Rev. Series 2011 A, 5.375% 10/1/32 (c) | | 5,225 | 5,590 |
| Miami-Dade County Aviation Rev.: | | | |
| Series 2010, 5.5% 10/1/30 (Pre-Refunded to 10/1/20 @ 100) | | 2,515 | 2,645 |
| Series 2012 A: | | | |
| 5% 10/1/21 (c) | | 1,575 | 1,696 |
| 5% 10/1/22 (c) | | 830 | 920 |
| 5% 10/1/23 (c) | | 6,375 | 7,093 |
| 5% 10/1/24 (c) | | 7,490 | 8,324 |
| 5% 10/1/30 (c) | | 5,810 | 6,379 |
| 5% 10/1/31 (c) | | 3,310 | 3,627 |
| Series 2014 A: | | | |
| 5% 10/1/28 (c) | | 4,140 | 4,794 |
| 5% 10/1/33 (c) | | 6,940 | 7,895 |
| 5% 10/1/36 (c) | | 13,125 | 14,834 |
| Series 2015 A: | | | |
| 5% 10/1/29 (c) | | 1,310 | 1,536 |
| 5% 10/1/31 (c) | | 1,100 | 1,276 |
| 5% 10/1/35 (c) | | 4,555 | 5,160 |
| Series 2016 A: | | | |
| 5% 10/1/29 | | 1,200 | 1,457 |
| 5% 10/1/31 | | 1,450 | 1,740 |
| Series 2017 B, 5% 10/1/40 (c) | | 10,760 | 12,583 |
| Miami-Dade County Cap. Asset Acquisition Series 2012 A, 5% 10/1/26 | | 3,105 | 3,443 |
| Miami-Dade County Expressway Auth.: | | | |
| Series 2014 A, 5% 7/1/44 | | 2,900 | 3,233 |
| Series 2014 B: | | | |
| 5% 7/1/26 | | 2,070 | 2,372 |
| 5% 7/1/27 | | 1,450 | 1,657 |
| 5% 7/1/28 | | 830 | 947 |
| Series 2016 A: | | | |
| 5% 7/1/32 | | 3,560 | 4,210 |
| 5% 7/1/33 | | 3,020 | 3,560 |
| Miami-Dade County School Board Ctfs. of Prtn.: | | | |
| Series 2011 B, 5.625% 5/1/31 | | 5,465 | 5,838 |
| Series 2015 A: | | | |
| 5% 5/1/26 | | 4,555 | 5,368 |
| 5% 5/1/27 (FSA Insured) | | 645 | 762 |
| 5% 5/1/28 | | 9,695 | 11,355 |
| 5% 5/1/29 | | 3,375 | 3,950 |
| Series 2015 B: | | | |
| 5% 5/1/26 | | 7,035 | 8,290 |
| 5% 5/1/27 | | 18,320 | 21,513 |
| Series 2016 A: | | | |
| 5% 5/1/30 | | 6,225 | 7,373 |
| 5% 5/1/32 | | 8,280 | 9,728 |
| Series 2016 B, 5% 8/1/26 | | 8,960 | 10,885 |
| Miami-Dade County Transit Sales Surtax Rev. Series 2012, 5% 7/1/42 | | 1,820 | 1,977 |
| Orange County Health Facilities Auth.: | | | |
| Series 2012 A, 5% 10/1/42 | | 9,975 | 10,604 |
| Series 2016 A: | | | |
| 5% 10/1/39 | | 2,200 | 2,544 |
| 5% 10/1/44 | | 1,605 | 1,842 |
| Orange County School Board Ctfs. of Prtn. Series 2015 C, 5% 8/1/30 | | 8,280 | 9,747 |
| Orlando Utils. Commission Util. Sys. Rev. Series 2012 A, 5% 10/1/25 | | 910 | 1,103 |
| Palm Beach County Arpt. Sys. Rev. Series 2016: | | | |
| 5% 10/1/21 (c) | | 995 | 1,070 |
| 5% 10/1/23 (c) | | 1,095 | 1,244 |
| 5% 10/1/24 (c) | | 1,140 | 1,326 |
| 5% 10/1/27 (c) | | 830 | 999 |
| 5% 10/1/29 (c) | | 860 | 1,027 |
| 5% 10/1/30 (c) | | 1,530 | 1,820 |
| 5% 10/1/31 (c) | | 1,075 | 1,272 |
| 5% 10/1/32 (c) | | 1,655 | 1,951 |
| 5% 10/1/33 (c) | | 3,555 | 4,180 |
| 5% 10/1/34 (c) | | 3,730 | 4,371 |
| 5% 10/1/35 (c) | | 3,930 | 4,593 |
| Palm Beach County Health Facilities Auth. Hosp. Rev. Series 2014: | | | |
| 5% 12/1/22 | | 555 | 616 |
| 5% 12/1/23 | | 1,155 | 1,318 |
| 5% 12/1/24 | | 1,265 | 1,479 |
| 5% 12/1/25 | | 445 | 516 |
| 5% 12/1/31 | | 415 | 470 |
| Palm Beach County School Board Ctfs. of Prtn. Series 2015 D: | | | |
| 5% 8/1/28 | | 3,905 | 4,644 |
| 5% 8/1/29 | | 4,965 | 5,876 |
| 5% 8/1/31 | | 13,725 | 16,140 |
| South Florida Wtr. Mgmt. District Ctfs. of Prtn. Series 2015: | | | |
| 5% 10/1/29 | | 4,140 | 4,971 |
| 5% 10/1/32 | | 5,190 | 6,127 |
| South Lake County Hosp. District (South Lake Hosp., Inc.): | | | |
| Series 2009 A: | | | |
| 6% 4/1/29 | | 1,160 | 1,163 |
| 6.25% 4/1/39 | | 2,730 | 2,738 |
| Series 2010, 5.25% 10/1/34 | | 2,900 | 2,974 |
| South Miami Health Facilities Auth. Hosp. Rev. (Baptist Med. Ctr., FL. Proj.) Series 2017: | | | |
| 4% 8/15/33 | | 2,070 | 2,284 |
| 5% 8/15/26 | | 2,815 | 3,444 |
| 5% 8/15/27 | | 1,865 | 2,327 |
| 5% 8/15/28 | | 1,240 | 1,535 |
| 5% 8/15/30 | | 2,685 | 3,281 |
| 5% 8/15/31 | | 2,590 | 3,143 |
| 5% 8/15/32 | | 1,930 | 2,331 |
| 5% 8/15/34 | | 5,360 | 6,424 |
| 5% 8/15/35 | | 3,555 | 4,242 |
| 5% 8/15/42 | | 5,465 | 6,371 |
| 5% 8/15/47 | | 8,115 | 9,427 |
| Tallahassee Health Facilities Rev.: | | | |
| (Tallahassee Memorial Healthcare, Inc. Proj.) Series 2016 A, 5% 12/1/41 | | 910 | 1,018 |
| Series 2015 A, 5% 12/1/40 | | 1,820 | 2,023 |
| Tampa Tax Allocation (H. Lee Moffitt Cancer Ctr. Proj.) Series 2012 A: | | | |
| 5% 9/1/22 | | 1,905 | 2,108 |
| 5% 9/1/25 | | 340 | 375 |
| Volusia County School Board Ctfs. of Prtn.: | | | |
| (Florida Master Lease Prog.) Series 2016 A: | | | |
| 5% 8/1/29 (Build America Mutual Assurance Insured) | | 830 | 983 |
| 5% 8/1/32 (Build America Mutual Assurance Insured) | | 4,140 | 4,850 |
| (Master Lease Prog.) Series 2014 B: | | | |
| 5% 8/1/25 | | 1,470 | 1,711 |
| 5% 8/1/26 | | 280 | 325 |
|
| TOTAL FLORIDA | | | 563,201 |
|
| Georgia - 1.3% | | | |
| Atlanta Wtr. & Wastewtr. Rev. 5% 11/1/27 | | 830 | 994 |
| Bartow County Dev. Auth. Poll. Cont. Rev. Bonds (Georgia Pwr. Co. Plant Bowen Proj.) Series 1997 1, 2.05%, tender 11/19/21 (a) | | 1,655 | 1,659 |
| Burke County Indl. Dev. Auth. Poll. Cont. Rev. Bonds (Oglethorpe Pwr. Corp. Vogtle Proj.) Series 2013 A, 2.4%, tender 4/1/20 (a) | | 6,290 | 6,324 |
| DeKalb County Wtr. & Swr. Rev. Series 2011 A, 5.25% 10/1/36 | | 2,485 | 2,679 |
| Fulton County Dev. Auth. Rev. Series 2019: | | | |
| 4% 6/15/49 | | 1,515 | 1,658 |
| 5% 6/15/52 | | 5,540 | 6,678 |
| Georgia Muni. Gas Auth. Rev. (Gas Portfolio III Proj.) Series S: | | | |
| 5% 10/1/22 | | 2,835 | 3,149 |
| 5% 10/1/23 | | 3,310 | 3,673 |
| Glynn-Brunswick Memorial Hosp. Auth. Rev. (Southeast Georgia Health Sys. Proj.) Series 2017: | | | |
| 4% 8/1/43 | | 1,860 | 1,918 |
| 5% 8/1/39 | | 1,705 | 1,898 |
| 5% 8/1/43 | | 2,275 | 2,582 |
| Main Street Natural Gas, Inc. Bonds Series 2018 C, 4%, tender 12/1/23 (a) | | 21,230 | 23,194 |
| Main Street Natural Gas, Inc. Georgia Gas Proj. Rev. Series A, 5.25% 9/15/19 | | 1,585 | 1,597 |
| Private Colleges & Univs. Auth. Rev. (The Savannah College of Art and Design Projs.) Series 2014: | | | |
| 5% 4/1/25 | | 2,900 | 3,327 |
| 5% 4/1/30 | | 1,655 | 1,871 |
| 5% 4/1/44 | | 3,160 | 3,473 |
|
| TOTAL GEORGIA | | | 66,674 |
|
| Hawaii - 0.8% | | | |
| Hawaii Arpts. Sys. Rev.: | | | |
| Series 2015 A: | | | |
| 5% 7/1/41 (c) | | 6,210 | 7,044 |
| 5% 7/1/45 (c) | | 16,455 | 18,624 |
| Series 2018 A: | | | |
| 5% 7/1/29 (c) | | 1,055 | 1,307 |
| 5% 7/1/30 (c) | | 1,240 | 1,525 |
| 5% 7/1/31 (c) | | 1,215 | 1,484 |
| 5% 7/1/32 (c) | | 1,240 | 1,509 |
| 5% 7/1/33 (c) | | 1,265 | 1,535 |
| State of Hawaii Dept. of Trans. Series 2013: | | | |
| 5% 8/1/22 (c) | | 1,305 | 1,433 |
| 5.25% 8/1/24 (c) | | 1,655 | 1,886 |
| 5.25% 8/1/25 (c) | | 2,070 | 2,357 |
|
| TOTAL HAWAII | | | 38,704 |
|
| Idaho - 0.0% | | | |
| Idaho Hsg. & Fin. Assoc. Single Family Mtg. Series 2019 A, 4% 1/1/50 | | 790 | 862 |
| Illinois - 23.7% | | | |
| Boone & Winnebago County Cmnty. Unit School District 200: | | | |
| 0% 1/1/21 (Nat'l. Pub. Fin. Guarantee Corp. Insured) | | 1,500 | 1,459 |
| 0% 1/1/22 (Nat'l. Pub. Fin. Guarantee Corp. Insured) | | 1,615 | 1,536 |
| Chicago Board of Ed.: | | | |
| Series 1998 B1, 0% 12/1/21 (Nat'l. Pub. Fin. Guarantee Corp. Insured) | | 1,960 | 1,839 |
| Series 1999 A, 5.25% 12/1/21 (Nat'l. Pub. Fin. Guarantee Corp. Insured) | | 1,975 | 2,105 |
| Series 2010 F, 5% 12/1/20 | | 1,070 | 1,115 |
| Series 2011 A: | | | |
| 5% 12/1/41 | | 4,790 | 4,945 |
| 5.25% 12/1/41 | | 2,965 | 3,078 |
| 5.5% 12/1/39 | | 6,540 | 6,834 |
| Series 2012 A, 5% 12/1/42 | | 7,630 | 7,957 |
| Series 2015 C, 5.25% 12/1/39 | | 1,405 | 1,515 |
| Series 2016 B, 6.5% 12/1/46 | | 660 | 788 |
| Series 2017 A, 7% 12/1/46 (d) | | 2,320 | 2,887 |
| Series 2017 C: | | | |
| 5% 12/1/22 | | 2,175 | 2,325 |
| 5% 12/1/23 | | 1,880 | 2,044 |
| 5% 12/1/24 | | 4,770 | 5,270 |
| 5% 12/1/25 | | 2,725 | 3,054 |
| 5% 12/1/26 | | 800 | 907 |
| 5% 12/1/30 | | 2,105 | 2,376 |
| Series 2017 D: | | | |
| 5% 12/1/23 | | 2,460 | 2,674 |
| 5% 12/1/24 | | 1,030 | 1,138 |
| 5% 12/1/31 | | 2,485 | 2,792 |
| Series 2018 A: | | | |
| 5% 12/1/25 | | 830 | 930 |
| 5% 12/1/26 | | 830 | 941 |
| 5% 12/1/28 | | 3,915 | 4,516 |
| 5% 12/1/30 | | 1,655 | 1,877 |
| 5% 12/1/32 | | 950 | 1,068 |
| 5% 12/1/35 | | 830 | 924 |
| Series 2018 C, 5% 12/1/46 | | 3,250 | 3,553 |
| Chicago Midway Arpt. Rev.: | | | |
| Series 2014 A: | | | |
| 5% 1/1/27 (c) | | 8,550 | 9,687 |
| 5% 1/1/28 (c) | | 15,855 | 17,927 |
| 5% 1/1/33 (c) | | 4,450 | 4,960 |
| 5% 1/1/34 (c) | | 2,150 | 2,392 |
| Series 2016 A, 5% 1/1/28 (c) | | 1,655 | 1,951 |
| Series 2016 B: | | | |
| 4% 1/1/35 | | 1,305 | 1,410 |
| 5% 1/1/36 | | 1,655 | 1,916 |
| 5% 1/1/37 | | 2,235 | 2,581 |
| 5% 1/1/46 | | 5,865 | 6,695 |
| Chicago O'Hare Int'l. Arpt. Rev.: | | | |
| Series 2013 B, 5% 1/1/27 | | 5,195 | 5,799 |
| Series 2013 D, 5% 1/1/27 | | 2,650 | 2,958 |
| Series 2015 A: | | | |
| 5% 1/1/31 (c) | | 5,000 | 5,686 |
| 5% 1/1/32 (c) | | 10,100 | 11,445 |
| Series 2015 C: | | | |
| 5% 1/1/24 (c) | | 1,190 | 1,354 |
| 5% 1/1/46 (c) | | 1,985 | 2,198 |
| Series 2016 B, 5% 1/1/34 | | 5,050 | 5,865 |
| Series 2016 C: | | | |
| 5% 1/1/33 | | 2,255 | 2,626 |
| 5% 1/1/34 | | 2,610 | 3,031 |
| Series 2016 G: | | | |
| 5% 1/1/37 (c) | | 1,655 | 1,912 |
| 5% 1/1/42 (c) | | 1,655 | 1,890 |
| 5.25% 1/1/29 (c) | | 290 | 352 |
| 5.25% 1/1/31 (c) | | 330 | 396 |
| Series 2017 A, 5% 1/1/31 | | 2,925 | 3,503 |
| Series 2017 B: | | | |
| 5% 1/1/35 | | 1,740 | 2,054 |
| 5% 1/1/37 | | 7,080 | 8,308 |
| Series 2017 C: | | | |
| 5% 1/1/30 | | 495 | 596 |
| 5% 1/1/31 | | 495 | 593 |
| 5% 1/1/32 | | 540 | 644 |
| Series 2017 D: | | | |
| 5% 1/1/28 (c) | | 2,475 | 2,969 |
| 5% 1/1/29 (c) | | 2,070 | 2,470 |
| 5% 1/1/32 (c) | | 2,235 | 2,623 |
| 5% 1/1/34 (c) | | 3,360 | 3,918 |
| 5% 1/1/35 (c) | | 2,485 | 2,889 |
| 5% 1/1/36 (c) | | 3,090 | 3,579 |
| 5% 1/1/37 (c) | | 1,655 | 1,912 |
| Chicago O'Hare Int'l. Arpt. Spl. Facilities Rev. Series 2018: | | | |
| 5% 7/1/38 (c) | | 2,185 | 2,529 |
| 5% 7/1/48 (c) | | 9,030 | 10,360 |
| Chicago Transit Auth.: | | | |
| Series 2014, 5.25% 12/1/49 | | 14,900 | 16,616 |
| Series 2017, 5% 12/1/46 | | 3,395 | 3,807 |
| Chicago Transit Auth. Cap. Grant Receipts Rev. Series 2017: | | | |
| 5% 6/1/22 | | 1,670 | 1,819 |
| 5% 6/1/23 | | 1,505 | 1,679 |
| 5% 6/1/24 | | 255 | 291 |
| 5% 6/1/25 | | 255 | 297 |
| 5% 6/1/26 | | 205 | 243 |
| Cook County Forest Preservation District: | | | |
| Series 2012 A, 5% 11/15/22 | | 1,655 | 1,808 |
| Series 2012 C, 5% 12/15/21 | | 830 | 887 |
| Cook County Gen. Oblig.: | | | |
| Series 2010 A: | | | |
| 5.25% 11/15/22 | | 570 | 598 |
| 5.25% 11/15/33 | | 14,925 | 15,552 |
| Series 2010 G, 5% 11/15/25 | | 2,815 | 2,935 |
| Series 2012 C, 5% 11/15/24 | | 9,190 | 10,090 |
| Series 2016 A: | | | |
| 5% 11/15/26 | | 4,420 | 5,163 |
| 5% 11/15/27 | | 2,320 | 2,691 |
| 5% 11/15/28 | | 3,020 | 3,479 |
| 5% 11/15/29 | | 3,760 | 4,305 |
| 5% 11/15/30 | | 4,140 | 4,728 |
| Grundy & Will Counties Cmnty. School Gen. Obligan Series 2017, 5% 2/1/25 | | 745 | 866 |
| Illinois Fin. Auth. Rev.: | | | |
| (Bradley Univ. Proj.) Series 2017 C: | | | |
| 5% 8/1/29 | | 540 | 645 |
| 5% 8/1/30 | | 760 | 902 |
| 5% 8/1/32 | | 1,015 | 1,193 |
| (Depaul Univ. Proj.) Series 2016 A: | | | |
| 4% 10/1/34 | | 830 | 907 |
| 5% 10/1/29 | | 830 | 996 |
| 5% 10/1/30 | | 830 | 990 |
| 5% 10/1/35 | | 1,655 | 1,941 |
| (OSF Healthcare Sys.) Series 2018 A: | | | |
| 4.125% 5/15/47 | | 25,725 | 27,511 |
| 5% 5/15/43 | | 34,525 | 40,252 |
| (Palos Cmnty. Hosp. Proj.) Series 2010 C: | | | |
| 5.375% 5/15/25 | | 25,025 | 25,799 |
| 5.375% 5/15/30 | | 6,020 | 6,186 |
| (Presence Health Proj.) Series 2016 C: | | | |
| 3.625% 2/15/32 | | 950 | 1,002 |
| 4% 2/15/33 | | 225 | 249 |
| 5% 2/15/25 | | 190 | 225 |
| 5% 2/15/26 | | 2,525 | 3,057 |
| 5% 2/15/29 | | 5,110 | 6,256 |
| 5% 2/15/36 | | 1,160 | 1,363 |
| (Rosalind Franklin Univ. Research Bldg. Proj.) Series 2017 C, 5% 8/1/46 | | 830 | 927 |
| (Rush Univ. Med. Ctr. Proj.) Series 2015 A, 5% 11/15/34 | | 415 | 471 |
| Series 2009, 5% 8/15/23 (Pre-Refunded to 8/15/20 @ 100) | | 1,545 | 1,607 |
| Series 2010, 5.25% 5/1/25 | | 5,795 | 5,976 |
| Series 2012 A: | | | |
| 5% 5/15/20 | | 415 | 428 |
| 5% 5/15/22 | | 1,805 | 1,978 |
| 5% 5/15/23 | | 250 | 274 |
| Series 2012: | | | |
| 4% 9/1/32 | | 7,265 | 7,583 |
| 5% 9/1/32 | | 1,575 | 1,720 |
| 5% 9/1/38 | | 21,730 | 23,532 |
| 5% 11/15/43 | | 4,315 | 4,585 |
| Series 2013: | | | |
| 5% 11/15/24 | | 415 | 459 |
| 5% 11/15/27 | | 85 | 93 |
| 5% 11/15/28 | | 2,380 | 2,601 |
| 5% 11/15/29 | | 1,160 | 1,265 |
| 5% 5/15/43 | | 9,775 | 10,336 |
| Series 2014, 5% 8/1/38 | | 11,050 | 12,307 |
| Series 2015 A: | | | |
| 5% 11/15/21 | | 495 | 536 |
| 5% 11/15/35 | | 1,985 | 2,252 |
| 5% 11/15/45 | | 2,670 | 2,965 |
| Series 2015 B, 5% 11/15/27 | | 2,615 | 3,056 |
| Series 2015 C: | | | |
| 4.125% 8/15/37 | | 735 | 761 |
| 5% 8/15/35 | | 6,175 | 6,949 |
| 5% 8/15/44 | | 30,175 | 33,468 |
| Series 2016 A: | | | |
| 5% 8/15/22 | | 830 | 902 |
| 5% 8/15/25 | | 1,970 | 2,278 |
| 5% 8/15/26 | | 2,635 | 3,097 |
| 5% 7/1/28 | | 1,020 | 1,215 |
| 5% 2/15/29 | | 4,255 | 4,998 |
| 5% 2/15/30 | | 4,490 | 5,239 |
| 5% 7/1/30 | | 590 | 695 |
| 5% 2/15/31 | | 3,620 | 4,196 |
| 5% 7/1/31 | | 1,040 | 1,214 |
| 5% 2/15/32 | | 3,520 | 4,059 |
| 5% 7/1/33 | | 540 | 624 |
| 5% 7/1/34 | | 4,140 | 4,767 |
| 5% 8/15/34 | | 535 | 607 |
| 5% 8/15/35 | | 420 | 475 |
| 5% 7/1/36 | | 2,140 | 2,446 |
| 5% 8/15/36 | | 1,685 | 1,903 |
| 5.25% 8/15/27 | | 1,865 | 2,218 |
| 5.25% 8/15/28 | | 2,395 | 2,839 |
| 5.25% 8/15/30 | | 1,840 | 2,162 |
| 5.25% 8/15/31 | | 495 | 578 |
| Series 2016 B: | | | |
| 5% 8/15/31 | | 6,095 | 7,276 |
| 5% 8/15/32 | | 5,000 | 5,931 |
| 5% 8/15/34 | | 6,220 | 7,329 |
| 5% 8/15/36 | | 8,680 | 10,141 |
| Series 2016 C: | | | |
| 3.75% 2/15/34 | | 1,215 | 1,283 |
| 4% 2/15/36 | | 5,160 | 5,648 |
| 5% 2/15/24 | | 555 | 642 |
| 5% 2/15/30 | | 6,425 | 7,791 |
| 5% 2/15/31 | | 12,595 | 15,188 |
| 5% 2/15/32 | | 3,660 | 4,388 |
| 5% 2/15/34 | | 2,920 | 3,466 |
| 5% 2/15/41 | | 8,845 | 10,269 |
| Series 2016: | | | |
| 4% 2/15/41 | | 14,780 | 15,987 |
| 4% 2/15/41 (Pre-Refunded to 2/15/27 @ 100) | | 30 | 35 |
| 5% 5/15/29 | | 1,040 | 1,226 |
| 5% 12/1/29 | | 1,420 | 1,663 |
| 5% 5/15/30 | | 2,200 | 2,575 |
| 5% 12/1/46 | | 3,865 | 4,326 |
| Series 2017 A: | | | |
| 5% 1/1/36 | | 1,860 | 2,130 |
| 5% 8/1/42 | | 730 | 816 |
| Series 2017: | | | |
| 5% 1/1/29 | | 2,775 | 3,410 |
| 5% 7/1/33 | | 5,640 | 6,797 |
| 5% 7/1/34 | | 4,640 | 5,566 |
| 5% 7/1/35 | | 3,900 | 4,664 |
| Series 2018 A: | | | |
| 4.25% 1/1/44 | | 2,465 | 2,612 |
| 5% 1/1/44 | | 14,900 | 16,934 |
| Illinois Gen. Oblig.: | | | |
| Series 2010, 5% 1/1/21 (FSA Insured) | | 2,565 | 2,608 |
| Series 2012 A, 4% 1/1/23 | | 2,090 | 2,165 |
| Series 2012: | | | |
| 5% 8/1/21 | | 1,985 | 2,109 |
| 5% 3/1/23 | | 4,265 | 4,557 |
| 5% 8/1/23 | | 3,810 | 4,212 |
| Series 2013: | | | |
| 5% 1/1/22 | | 2,420 | 2,455 |
| 5.5% 7/1/24 | | 830 | 926 |
| 5.5% 7/1/25 | | 4,315 | 4,792 |
| Series 2014: | | | |
| 5% 2/1/22 | | 880 | 945 |
| 5% 2/1/23 | | 3,665 | 4,008 |
| 5% 2/1/25 | | 3,005 | 3,311 |
| 5% 2/1/26 | | 2,270 | 2,497 |
| 5% 4/1/28 | | 1,895 | 2,081 |
| 5% 5/1/28 | | 1,780 | 1,957 |
| 5.25% 2/1/31 | | 360 | 395 |
| Series 2016: | | | |
| 5% 2/1/23 | | 1,500 | 1,640 |
| 5% 2/1/24 | | 8,285 | 9,224 |
| 5% 6/1/25 | | 7,295 | 8,240 |
| 5% 11/1/25 | | 2,485 | 2,825 |
| 5% 6/1/26 | | 995 | 1,136 |
| 5% 2/1/27 | | 9,975 | 11,450 |
| Series 2017 D: | | | |
| 5% 11/1/22 | | 19,770 | 21,633 |
| 5% 11/1/23 | | 20,695 | 22,997 |
| 5% 11/1/24 | | 28,975 | 32,721 |
| 5% 11/1/25 | | 28,795 | 32,736 |
| 5% 11/1/26 | | 8,690 | 9,977 |
| 5% 11/1/27 | | 2,900 | 3,357 |
| Series 2019 B: | | | |
| 5% 9/1/21 | | 3,990 | 4,249 |
| 5% 9/1/22 | | 3,915 | 4,267 |
| 5% 9/1/23 | | 3,990 | 4,418 |
| 5% 9/1/24 | | 3,990 | 4,492 |
| Illinois Hsg. Dev. Auth. Multi-family Hsg. Rev. Series 2019, 2.9% 7/1/35 | | 6,325 | 6,326 |
| Illinois Muni. Elec. Agcy. Pwr. Supply Series 2015 A: | | | |
| 5% 2/1/25 | | 6,715 | 7,869 |
| 5% 2/1/26 | | 8,585 | 10,156 |
| 5% 2/1/31 | | 3,370 | 3,925 |
| Illinois Toll Hwy. Auth. Toll Hwy. Rev.: | | | |
| Series 2015 A: | | | |
| 5% 1/1/37 | | 3,020 | 3,458 |
| 5% 1/1/40 | | 12,915 | 14,701 |
| Series 2015 B, 5% 1/1/40 | | 7,205 | 8,278 |
| Series 2016 A: | | | |
| 5% 12/1/31 | | 5,825 | 6,794 |
| 5% 12/1/32 | | 8,525 | 9,934 |
| Joliet School District #86 Gen. Oblig. Series 2002, 0% 11/1/19 (FSA Insured) | | 1,655 | 1,646 |
| Kane, McHenry, Cook & DeKalb Counties Unit School District #300: | | | |
| 0% 12/1/21 (AMBAC Insured) | | 2,560 | 2,442 |
| 0% 12/1/21 (Escrowed to Maturity) | | 1,575 | 1,522 |
| 6.5% 1/1/20 (AMBAC Insured) | | 2,600 | 2,665 |
| Kendall, Kane & Will Counties Cmnty. Unit School District #308 Series 2016: | | | |
| 5% 2/1/34 | | 5,795 | 6,644 |
| 5% 2/1/35 | | 4,140 | 4,733 |
| 5% 2/1/36 | | 7,120 | 8,120 |
| Lake County Cmnty. High School District #117, Antioch Series 2000 B, 0% 12/1/20 (Nat'l. Pub. Fin. Guarantee Corp. Insured) | | 1,495 | 1,453 |
| McHenry & Kane Counties Cmnty. Consolidated School District #158 Series 2004, 0% 1/1/24 (FSA Insured) | | 4,220 | 3,813 |
| Metropolitan Pier & Exposition: | | | |
| (McCormick Place Expansion Proj.): | | | |
| Series 1992 A, 0% 6/15/20 (Nat'l. Pub. Fin. Guarantee Corp. Insured) | | 2,990 | 2,934 |
| Series 1996 A, 0% 6/15/23 (Nat'l. Pub. Fin. Guarantee Corp. Insured) | | 5,215 | 4,759 |
| Series 2010 B1: | | | |
| 0% 6/15/43 (FSA Insured) | | 41,985 | 17,611 |
| 0% 6/15/44 (FSA Insured) | | 48,430 | 19,447 |
| 0% 6/15/45 (FSA Insured) | | 25,250 | 9,700 |
| 0% 6/15/47 (FSA Insured) | | 3,000 | 1,056 |
| Series 2012 B, 0% 12/15/51 | | 10,845 | 2,883 |
| Series A: | | | |
| 0% 6/15/22 (Nat'l. Pub. Fin. Guarantee Corp. Insured) | | 1,045 | 980 |
| 0% 12/15/24 (Nat'l. Pub. Fin. Guarantee Corp. Insured) | | 2,560 | 2,235 |
| Series 1996 A, 0% 6/15/24 | | 2,535 | 2,247 |
| Series 2002, 5.5% 6/15/20 | | 220 | 221 |
| Series 2017 B: | | | |
| 5% 12/15/25 | | 830 | 936 |
| 5% 12/15/26 | | 2,755 | 3,138 |
| 5% 12/15/27 | | 295 | 341 |
| 5% 12/15/31 | | 560 | 633 |
| 5% 12/15/34 | | 330 | 369 |
| Series A, 0% 12/15/19 (Nat'l. Pub. Fin. Guarantee Corp. Insured) | | 1,785 | 1,770 |
| Railsplitter Tobacco Settlement Auth. Rev. Series 2017: | | | |
| 5% 6/1/27 | | 4,140 | 4,942 |
| 5% 6/1/28 | | 2,275 | 2,706 |
| Univ. of Illinois Rev.: | | | |
| (Auxiliary Facilities Sys. Proj.): | | | |
| Series 1991, 0% 4/1/20 (Nat'l. Pub. Fin. Guarantee Corp. Insured) | | 6,625 | 6,531 |
| Series 1999 A: | | | |
| 0% 4/1/20 (Nat'l. Pub. Fin. Guarantee Corp. Insured) | | 1,325 | 1,306 |
| 0% 4/1/21 (Nat'l. Pub. Fin. Guarantee Corp. Insured) | | 4,110 | 3,973 |
| Series 2010 A: | | | |
| 5% 4/1/25 | | 5,070 | 5,194 |
| 5.25% 4/1/30 | | 3,475 | 3,559 |
| Series 2013: | | | |
| 6% 10/1/42 | | 4,555 | 5,167 |
| 6.25% 10/1/38 | | 4,495 | 5,158 |
| Series 2018 A, 5% 4/1/30 | | 3,425 | 4,221 |
| Will County Cmnty. Unit School District #365-U: | | | |
| Series 2007 B, 0% 11/1/26 (FSA Insured) | | 5,095 | 4,336 |
| Series 2012, 0% 11/1/25 | | 985 | 857 |
| 0% 11/1/19 (Escrowed to Maturity) | | 1,215 | 1,209 |
| 0% 11/1/19 (FSA Insured) | | 7,790 | 7,752 |
| Will County Illinois Series 2016: | | | |
| 5% 11/15/31 | | 1,340 | 1,575 |
| 5% 11/15/32 | | 1,020 | 1,196 |
| 5% 11/15/33 | | 1,240 | 1,449 |
| 5% 11/15/34 | | 1,240 | 1,443 |
|
| TOTAL ILLINOIS | | | 1,187,180 |
|
| Indiana - 1.4% | | | |
| Crown Point Multi-School Bldg. Corp. 0% 1/15/21 (Nat'l. Pub. Fin. Guarantee Corp. Insured) | | 6,195 | 6,054 |
| Indiana Fin. Auth. Rev.: | | | |
| Series 2012: | | | |
| 5% 3/1/30 | | 3,790 | 4,091 |
| 5% 3/1/41 | | 6,920 | 7,396 |
| Series 2015 A, 5.25% 2/1/32 | | 5,845 | 6,978 |
| Series 2016: | | | |
| 4% 9/1/21 | | 330 | 347 |
| 5% 9/1/22 | | 250 | 277 |
| 5% 9/1/23 | | 375 | 426 |
| 5% 9/1/24 | | 560 | 651 |
| 5% 9/1/26 | | 1,075 | 1,303 |
| 5% 9/1/27 | | 540 | 651 |
| 5% 9/1/28 | | 2,535 | 3,043 |
| 5% 9/1/29 | | 1,240 | 1,479 |
| 5% 9/1/30 | | 1,160 | 1,376 |
| Indiana Fin. Auth. Wastewtr. Util. Rev.: | | | |
| (CWA Auth. Proj.): | | | |
| Series 2012 A: | | | |
| 5% 10/1/24 | | 330 | 369 |
| 5% 10/1/26 | | 2,105 | 2,347 |
| Series 2015 A, 5% 10/1/30 | | 3,990 | 4,615 |
| Series 2011 A, 5.25% 10/1/25 | | 1,450 | 1,571 |
| Indianapolis Local Pub. Impt.: | | | |
| (Courthouse and Jail Proj.) Series 2019 A, 5% 2/1/49 | | 4,655 | 5,592 |
| Series 2016: | | | |
| 4% 1/1/32 (c) | | 830 | 904 |
| 4% 1/1/33 (c) | | 830 | 901 |
| 4% 1/1/34 (c) | | 830 | 898 |
| 4% 1/1/35 (c) | | 2,300 | 2,480 |
| 5% 1/1/26 (c) | | 875 | 1,039 |
| Lake Central Multi-District School Bldg. Corp. Series 2012 B, 5% 1/15/30 | | 1,700 | 1,892 |
| Purdue Univ. Rev. Series 2018 DD: | | | |
| 5% 7/1/34 | | 995 | 1,244 |
| 5% 7/1/35 | | 1,960 | 2,441 |
| 5% 7/1/36 | | 2,130 | 2,644 |
| 5% 7/1/37 | | 1,970 | 2,437 |
| 5% 7/1/38 | | 2,345 | 2,893 |
| Zionsville Cmnty. Schools Bldg. Series 2005, 5% 7/15/20 (FSA Insured) | | 1,610 | 1,656 |
|
| TOTAL INDIANA | | | 69,995 |
|
| Iowa - 0.1% | | | |
| Iowa Fin. Auth. Rev. Series A: | | | |
| 5% 5/15/43 | | 1,145 | 1,259 |
| 5% 5/15/48 | | 2,670 | 2,924 |
|
| TOTAL IOWA | | | 4,183 |
|
| Kansas - 0.6% | | | |
| Kansas Dev. Fin. Agcy. Series 2009: | | | |
| 5.75% 11/15/38 (Pre-Refunded to 11/15/19 @ 100) | | 230 | 234 |
| 5.75% 11/15/38 (Pre-Refunded to 11/15/19 @ 100) | | 10,120 | 10,283 |
| Wyandotte County/Kansas City Unified Govt. Util. Sys. Rev.: | | | |
| Series 2012 A: | | | |
| 5% 9/1/23 | | 1,540 | 1,700 |
| 5% 9/1/25 | | 3,310 | 3,650 |
| 5% 9/1/26 | | 1,615 | 1,781 |
| Series 2016 A: | | | |
| 5% 9/1/40 | | 3,740 | 4,266 |
| 5% 9/1/45 | | 5,630 | 6,407 |
|
| TOTAL KANSAS | | | 28,321 |
|
| Kentucky - 0.8% | | | |
| Kenton County Arpt. Board Arpt. Rev. Series 2016: | | | |
| 5% 1/1/21 | | 540 | 567 |
| 5% 1/1/22 | | 600 | 654 |
| 5% 1/1/23 | | 350 | 394 |
| 5% 1/1/28 | | 1,310 | 1,574 |
| 5% 1/1/31 | | 1,240 | 1,464 |
| 5% 1/1/32 | | 1,240 | 1,456 |
| Kentucky Econ. Dev. Fin. Auth. Rev. Louisville Arena Auth., Inc. Series 2017 A, 5% 12/1/47 (FSA Insured) | | 1,340 | 1,459 |
| Kentucky State Property & Buildings Commission Rev. (Proj. No. 119) Series 2018: | | | |
| 5% 5/1/26 | | 830 | 988 |
| 5% 5/1/27 | | 2,435 | 2,934 |
| 5% 5/1/29 | | 4,510 | 5,490 |
| 5% 5/1/32 | | 1,185 | 1,437 |
| 5% 5/1/33 | | 915 | 1,106 |
| 5% 5/1/34 | | 1,045 | 1,258 |
| 5% 5/1/35 | | 615 | 729 |
| 5% 5/1/36 | | 520 | 614 |
| Louisville & Jefferson County Series 2013 A: | | | |
| 5.5% 10/1/33 | | 2,815 | 3,196 |
| 5.75% 10/1/38 | | 7,255 | 8,270 |
| Louisville/Jefferson County Metropolitan Gov. Series 2012 A: | | | |
| 5% 12/1/28 | | 615 | 669 |
| 5% 12/1/29 | | 3,645 | 3,959 |
| 5% 12/1/30 | | 600 | 649 |
| Pikeville Hosp. Rev. (Pikeville Med. Ctr., Inc. Proj.) Series 2011, 6.5% 3/1/41 | | 2,485 | 2,642 |
|
| TOTAL KENTUCKY | | | 41,509 |
|
| Louisiana - 1.0% | | | |
| Louisiana Pub. Facilities Auth. Hosp. Rev. (Franciscan Missionaries of Our Lady Health Sys. Proj.) Series 2017 A, 5% 7/1/47 | | 1,950 | 2,221 |
| Louisiana Pub. Facilities Auth. Rev.: | | | |
| (Tulane Univ. of Louisiana Proj.) Series 2016 A: | | | |
| 5% 12/15/24 | | 1,240 | 1,456 |
| 5% 12/15/25 | | 2,585 | 3,100 |
| 5% 12/15/26 | | 1,045 | 1,279 |
| 5% 12/15/28 | | 1,655 | 2,001 |
| 5% 12/15/29 | | 1,175 | 1,413 |
| 5% 12/15/30 | | 2,320 | 2,775 |
| Series 2018 E: | | | |
| 5% 7/1/37 | | 1,615 | 1,941 |
| 5% 7/1/38 | | 1,260 | 1,510 |
| New Orleans Aviation Board Rev.: | | | |
| (North Term. Proj.): | | | |
| Series 2015 B: | | | |
| 5% 1/1/27 (c) | | 1,160 | 1,337 |
| 5% 1/1/29 (c) | | 4,295 | 4,918 |
| 5% 1/1/30 (c) | | 5,795 | 6,609 |
| 5% 1/1/31 (c) | | 2,070 | 2,351 |
| 5% 1/1/40 (c) | | 6,860 | 7,634 |
| Series 2017 B: | | | |
| 5% 1/1/27 (c) | | 330 | 396 |
| 5% 1/1/28 (c) | | 205 | 245 |
| 5% 1/1/32 (c) | | 330 | 386 |
| 5% 1/1/33 (c) | | 580 | 677 |
| 5% 1/1/34 (c) | | 180 | 209 |
| 5% 1/1/35 (c) | | 330 | 383 |
| Series 2017 D2: | | | |
| 5% 1/1/27 (c) | | 415 | 498 |
| 5% 1/1/28 (c) | | 595 | 711 |
| 5% 1/1/31 (c) | | 530 | 623 |
| 5% 1/1/33 (c) | | 850 | 992 |
| 5% 1/1/34 (c) | | 1,020 | 1,186 |
| 5% 1/1/36 (c) | | 775 | 897 |
| 5% 1/1/37 (c) | | 1,275 | 1,469 |
|
| TOTAL LOUISIANA | | | 49,217 |
|
| Maine - 1.1% | | | |
| Maine Health & Higher Edl. Facilities Auth. Rev.: | | | |
| (Eastern Maine Healthcare Systems Proj.) Series 2013, 5% 7/1/43 | | 3,745 | 4,006 |
| Series 2013, 5% 7/1/25 | | 1,475 | 1,624 |
| Series 2016 A: | | | |
| 4% 7/1/41 | | 1,935 | 1,990 |
| 4% 7/1/46 | | 3,180 | 3,263 |
| 5% 7/1/41 | | 8,620 | 9,518 |
| 5% 7/1/46 | | 22,975 | 25,343 |
| Series 2017 B: | | | |
| 4% 7/1/25 | | 375 | 420 |
| 4% 7/1/31 | | 580 | 638 |
| 4% 7/1/32 | | 415 | 453 |
| 4% 7/1/34 | | 835 | 906 |
| 5% 7/1/26 | | 270 | 326 |
| 5% 7/1/28 | | 420 | 511 |
| 5% 7/1/29 | | 330 | 399 |
| 5% 7/1/33 | | 830 | 983 |
| 5% 7/1/35 | | 630 | 742 |
| Series 2017 D, 5.75% 7/1/38 | | 135 | 135 |
| Maine Tpk. Auth. Tpk. Rev. Series 2015: | | | |
| 5% 7/1/32 | | 870 | 1,018 |
| 5% 7/1/36 | | 2,150 | 2,491 |
| 5% 7/1/38 | | 555 | 640 |
|
| TOTAL MAINE | | | 55,406 |
|
| Maryland - 0.7% | | | |
| Baltimore Proj. Rev. (Wtr. Projs.) Series 2009 A: | | | |
| 5.375% 7/1/34 (Pre-Refunded to 7/1/19 @ 100) | | 155 | 155 |
| 5.375% 7/1/34 (Pre-Refunded to 7/1/19 @ 100) | | 260 | 260 |
| City of Westminster Series 2016: | | | |
| 5% 11/1/27 | | 2,150 | 2,485 |
| 5% 11/1/28 | | 2,275 | 2,624 |
| 5% 11/1/29 | | 2,410 | 2,760 |
| 5% 11/1/30 | | 2,555 | 2,905 |
| Maryland Econ. Dev. Auth. Rev. (Ports America Chesapeake LLC. Proj.) Series 2017 A: | | | |
| 5% 6/1/30 | | 1,035 | 1,259 |
| 5% 6/1/35 | | 1,655 | 1,965 |
| Maryland Econ. Dev. Corp. (Purple Line Lt. Rail Proj.) Series 2016 D: | | | |
| 5% 3/31/41 (c) | | 1,505 | 1,714 |
| 5% 3/31/46 (c) | | 2,485 | 2,818 |
| Maryland Health & Higher Edl. Facilities Auth. Rev.: | | | |
| (Medstar Health, Inc. Proj.) Series 2017 A, 5% 5/15/45 | | 2,645 | 3,066 |
| (Univ. of Maryland Med. Sys. Proj.) Series 2008 F, 5.25% 7/1/21 | | 830 | 833 |
| Series 2010, 5.625% 7/1/30 (Pre-Refunded to 7/1/20 @ 100) | | 2,785 | 2,904 |
| Series 2015, 5% 7/1/24 | | 625 | 720 |
| Series 2016 A: | | | |
| 4% 7/1/42 | | 1,430 | 1,490 |
| 5% 7/1/35 | | 575 | 657 |
| Maryland St Cmnty. Dev. Admin Dept. Hsg. & Cmnty. Dev. Series 2019 B, 4% 9/1/49 | | 4,420 | 4,830 |
| Rockville Mayor & Council Econ. Dev. (Rfdg.-Ingleside King Farm Proj.) Series 2017: | | | |
| 2.5% 11/1/24 | | 1,455 | 1,455 |
| 3% 11/1/25 | | 1,070 | 1,074 |
| 5% 11/1/30 | | 375 | 418 |
|
| TOTAL MARYLAND | | | 36,392 |
|
| Massachusetts - 1.9% | | | |
| Massachusetts Dev. Fin. Agcy. Rev.: | | | |
| (Lawrence Gen. Hosp. MA. Proj.) Series 2017: | | | |
| 5% 7/1/25 | | 170 | 192 |
| 5% 7/1/29 | | 590 | 675 |
| 5% 7/1/30 | | 630 | 717 |
| 5% 7/1/31 | | 665 | 752 |
| 5% 7/1/32 | | 830 | 934 |
| 5% 7/1/34 | | 830 | 930 |
| 5% 7/1/37 | | 830 | 921 |
| 5% 7/1/42 | | 745 | 819 |
| 5% 7/1/47 | | 1,160 | 1,271 |
| (Lawrence Gen. Hosp.) Series 2017: | | | |
| 5% 7/1/19 | | 230 | 230 |
| 5% 7/1/20 | | 370 | 380 |
| 5% 7/1/21 | | 380 | 400 |
| (Lesley Univ. Proj.) Series 2016, 5% 7/1/39 | | 1,360 | 1,563 |
| (Partners Healthcare Sys., Inc. Proj.): | | | |
| Series 2017 S: | | | |
| 5% 7/1/30 | | 3,210 | 4,001 |
| 5% 7/1/34 | | 3,500 | 4,259 |
| Series 2017, 4% 7/1/41 | | 8,280 | 9,086 |
| (Tufts Med. Ctr. Proj.) Series 2011, 6.75% 1/1/36 (Pre-Refunded to 1/1/21 @ 100) | | 1,310 | 1,414 |
| (Univ. of Massachusetts Health Cr., Inc. Proj.) Series 2017 L, 4% 7/1/44 | | 830 | 868 |
| (Wentworth Institute of Technology Proj.) Series 2017: | | | |
| 5% 10/1/27 | | 830 | 985 |
| 5% 10/1/28 | | 875 | 1,036 |
| 5% 10/1/29 | | 920 | 1,084 |
| 5% 10/1/31 | | 1,015 | 1,181 |
| 5% 10/1/32 | | 1,065 | 1,232 |
| Series 2016: | | | |
| 5% 10/1/29 | | 830 | 1,018 |
| 5% 10/1/30 | | 1,240 | 1,511 |
| 5% 7/1/31 | | 1,385 | 1,616 |
| 5% 10/1/31 | | 1,340 | 1,623 |
| 5% 10/1/43 | | 8,995 | 10,138 |
| Series 2017: | | | |
| 5% 7/1/27 | | 535 | 617 |
| 5% 7/1/34 | | 1,325 | 1,552 |
| 5% 7/1/35 | | 1,000 | 1,167 |
| Series BB1, 5% 10/1/46 | | 345 | 402 |
| Massachusetts Edl. Fing. Auth. Rev.: | | | |
| Series 2017 B, 4.25% 7/1/46 (c) | | 8,280 | 8,775 |
| Series 2019 B: | | | |
| 5% 7/1/27 (c) | | 1,000 | 1,210 |
| 5% 7/1/28 (c) | | 1,915 | 2,348 |
| Massachusetts Gen. Oblig.: | | | |
| Series 2016 B, 5% 7/1/31 | | 2,005 | 2,418 |
| Series 2017 A, 5% 4/1/36 | | 1,750 | 2,103 |
| Series 2017 D, 5% 2/1/33 | | 4,460 | 5,397 |
| Series 2017 F, 5% 11/1/46 | | 2,485 | 2,953 |
| Massachusetts Health & Edl. Facilities Auth. Rev. (Blood Research Institute Proj.) Series A, 6.5% 2/1/22 | | 890 | 894 |
| Massachusetts Port Auth. Rev.: | | | |
| Series 2016 A: | | | |
| 5% 7/1/33 | | 1,740 | 2,084 |
| 5% 7/1/34 | | 895 | 1,069 |
| 5% 7/1/38 | | 1,300 | 1,536 |
| Series 2016 B, 5% 7/1/43 (c) | | 7,110 | 8,185 |
| Series 2017 A, 5% 7/1/25 (c) | | 1,500 | 1,784 |
|
| TOTAL MASSACHUSETTS | | | 95,330 |
|
| Michigan - 2.1% | | | |
| Detroit Downtown Dev. Auth. Tax: | | | |
| Series 2018 A, 5% 7/1/32 (FSA Insured) | | 1,000 | 1,122 |
| Series A, 5% 7/1/34 (FSA Insured) | | 1,000 | 1,117 |
| Detroit School District School Bldg. and Site Impt. Series 2012 A, 5% 5/1/23 | | 3,310 | 3,630 |
| Great Lakes Wtr. Auth. Sew Disp. Sys. Series 2018 A: | | | |
| 5% 7/1/43 | | 2,030 | 2,422 |
| 5% 7/1/48 | | 8,725 | 10,387 |
| Kalamazoo Hosp. Fin. Auth. Hosp. Facilities Rev. Series 2016, 5% 5/15/28 | | 1,955 | 2,325 |
| Lansing Board of Wtr. & Lt. Util. Rev. 5.5% 7/1/41 | | 2,485 | 2,672 |
| Michigan Bldg. Auth. Rev. (Facilities Prog.): | | | |
| Series 2015 I, 5% 4/15/30 | | 4,140 | 4,904 |
| Series 2016 I, 5% 4/15/24 | | 245 | 285 |
| Michigan Fin. Auth. Rev.: | | | |
| (Charter County of Wayne Criminal Justice Ctr. Proj.) Series 2018, 5% 11/1/43 | | 2,570 | 3,068 |
| (Trinity Health Proj.) Series 2017: | | | |
| 5% 12/1/35 | | 1,585 | 1,908 |
| 5% 12/1/42 | | 2,140 | 2,521 |
| Series 2012 A: | | | |
| 5% 6/1/20 (Escrowed to Maturity) | | 1,695 | 1,749 |
| 5% 6/1/21 (Escrowed to Maturity) | | 290 | 309 |
| 5% 6/1/27 (Pre-Refunded to 6/1/22 @ 100) | | 2,900 | 3,200 |
| Series 2012, 5% 11/15/42 | | 8,595 | 9,280 |
| Series 2015 MI, 5% 12/1/24 | | 3,680 | 4,355 |
| Series 2016, 5% 11/15/41 | | 1,560 | 1,803 |
| Series 2019 A, 5% 11/15/48 | | 2,105 | 2,502 |
| Series MI, 5.5% 12/1/27 | | 3,930 | 4,766 |
| Michigan Hosp. Fin. Auth. Rev.: | | | |
| (Trinity Health Proj.) Series 2008 C, 5% 12/1/32 | | 1,240 | 1,512 |
| Series 2012 A, 5% 6/1/26 | | 1,655 | 1,815 |
| Portage Pub. Schools Series 2016: | | | |
| 5% 11/1/30 | | 2,365 | 2,834 |
| 5% 11/1/31 | | 2,090 | 2,488 |
| 5% 11/1/36 | | 205 | 241 |
| Wayne County Arpt. Auth. Rev.: | | | |
| Series 2015 F, 5% 12/1/27 (c) | | 5,790 | 6,887 |
| Series 2015 G, 5% 12/1/28 (c) | | 4,555 | 5,399 |
| Series 2017 A: | | | |
| 4% 12/1/33 (FSA Insured) | | 1,230 | 1,385 |
| 4% 12/1/34 (FSA Insured) | | 1,020 | 1,145 |
| 4% 12/1/35 (FSA Insured) | | 995 | 1,113 |
| 4% 12/1/36 (FSA Insured) | | 1,035 | 1,154 |
| 5% 12/1/31 | | 310 | 380 |
| 5% 12/1/32 | | 315 | 384 |
| 5% 12/1/34 | | 580 | 705 |
| 5% 12/1/35 | | 540 | 654 |
| 5% 12/1/37 | | 355 | 426 |
| Series 2017 B: | | | |
| 5% 12/1/29 (c) | | 495 | 603 |
| 5% 12/1/30 (c) | | 580 | 702 |
| 5% 12/1/31 (c) | | 660 | 795 |
| 5% 12/1/32 (c) | | 420 | 506 |
| 5% 12/1/32 (c) | | 540 | 649 |
| 5% 12/1/34 (c) | | 495 | 593 |
| 5% 12/1/35 (c) | | 540 | 644 |
| 5% 12/1/37 (c) | | 705 | 836 |
| 5% 12/1/42 (c) | | 830 | 974 |
| Series 2018 D, 5% 12/1/29 (c) | | 3,645 | 4,550 |
|
| TOTAL MICHIGAN | | | 103,699 |
|
| Minnesota - 0.3% | | | |
| Duluth Econ. Dev. Auth. Health Care Facilities Rev. Series 2018 A, 5% 2/15/48 | | 6,000 | 6,923 |
| Maple Grove Health Care Sys. Rev.: | | | |
| Series 2015, 5% 9/1/29 | | 2,345 | 2,738 |
| Series 2017: | | | |
| 4% 5/1/21 | | 415 | 433 |
| 5% 5/1/25 | | 660 | 776 |
| Minnesota Higher Ed. Facilities Auth. Rev. Series 2018 A: | | | |
| 5% 10/1/30 | | 615 | 738 |
| 5% 10/1/45 | | 1,370 | 1,573 |
| Moorhead Edl. Facilities Rev. (The Concordia College Corp. Proj.) Series 2016, 5% 12/1/25 | | 990 | 1,111 |
| Saint Paul Hsg. & Redev. Auth. Hosp. Rev. (HealthEast Care Sys. Proj.) Series 2015 A, 5% 11/15/44 (Pre-Refunded to 11/15/25 @ 100) | | 1,255 | 1,516 |
|
| TOTAL MINNESOTA | | | 15,808 |
|
| Missouri - 0.9% | | | |
| Cape Girardeau County Indl. Dev. Auth. (Southeast Hosp. Proj.) Series 2017 A: | | | |
| 5% 3/1/30 | | 580 | 674 |
| 5% 3/1/31 | | 620 | 714 |
| 5% 3/1/36 | | 1,240 | 1,402 |
| Kansas City Spl. Oblig.: | | | |
| 5% 9/1/26 | | 980 | 986 |
| 5% 9/1/27 | | 405 | 407 |
| 5% 9/1/28 | | 830 | 835 |
| 5% 9/1/29 | | 830 | 835 |
| 5% 9/1/30 | | 1,150 | 1,156 |
| Missouri Dev. Fin. Board Infrastructure Facilities Rev. (City of Branson-Branson Landing Proj.) Series 2005 A, 6% 6/1/20 | | 380 | 395 |
| Missouri Health & Edl. Facilities Auth. Edl. Facilities Rev. Series 2015 B: | | | |
| 3.125% 2/1/27 | | 830 | 881 |
| 3.25% 2/1/28 | | 830 | 886 |
| 4% 2/1/40 | | 660 | 697 |
| 5% 2/1/29 | | 1,025 | 1,207 |
| 5% 2/1/31 | | 2,150 | 2,509 |
| 5% 2/1/33 | | 2,375 | 2,750 |
| 5% 2/1/36 | | 2,235 | 2,561 |
| Missouri Health & Edl. Facilities Rev. Series 2019 A: | | | |
| 4% 10/1/48 | | 2,850 | 3,093 |
| 5% 10/1/46 | | 5,575 | 6,688 |
| Missouri Hsg. Dev. Commission Single Family Mtg. Rev. Series 2019, 4% 5/1/50 (f) | | 940 | 1,031 |
| Saint Louis Arpt. Rev. Series 2019 C: | | | |
| 5% 7/1/33 | | 2,390 | 2,982 |
| 5% 7/1/34 | | 1,750 | 2,174 |
| Saint Louis County Indl. Dev. Auth. Sr. Living Facilities Rev.: | | | |
| Series 2017, 5% 9/1/48 | | 1,000 | 1,102 |
| Series 2018 A: | | | |
| 5% 9/1/38 | | 1,395 | 1,555 |
| 5.125% 9/1/48 | | 2,460 | 2,739 |
| 5.125% 9/1/49 | | 2,665 | 2,966 |
|
| TOTAL MISSOURI | | | 43,225 |
|
| Montana - 0.0% | | | |
| Montana Board Hsg. Single Family Series 2019 B, 4% 6/1/50 (f) | | 460 | 510 |
| Nebraska - 0.4% | | | |
| Douglas County Neb Edl. Facilities Rev. (Creighton Univ. Proj.) Series 2017: | | | |
| 4% 7/1/34 | | 830 | 926 |
| 5% 7/1/36 | | 570 | 680 |
| Nebraska Invt. Fin. Auth. Single Family Hsg. Rev. Series 2019 B, 4% 9/1/49 (c) | | 2,665 | 2,869 |
| Nebraska Pub. Pwr. District Rev. Series 2016 B: | | | |
| 5% 1/1/37 | | 2,050 | 2,389 |
| 5% 1/1/40 | | 935 | 1,082 |
| Omaha Arpt. Auth. Arpt. Rev.: | | | |
| Series 2017 A: | | | |
| 5% 12/15/22 (c) | | 620 | 691 |
| 5% 12/15/23 (c) | | 620 | 709 |
| 5% 12/15/25 (c) | | 330 | 393 |
| 5% 12/15/26 (c) | | 1,190 | 1,446 |
| 5% 12/15/27 (c) | | 830 | 1,003 |
| 5% 12/15/30 (c) | | 1,240 | 1,476 |
| 5% 12/15/31 (c) | | 650 | 770 |
| 5% 12/15/33 (c) | | 660 | 778 |
| 5% 12/15/35 (c) | | 1,655 | 1,943 |
| 5% 12/15/36 (c) | | 420 | 492 |
| Series 2017 C, 5% 12/15/21 (c) | | 340 | 368 |
|
| TOTAL NEBRASKA | | | 18,015 |
|
| Nevada - 0.3% | | | |
| Clark County McCarran Int'l. Arpt. Passenger Facility Charge Rev. (Clark County Arpt. Rev. Proj.) Series 2017 B: | | | |
| 5% 7/1/20 (c) | | 1,625 | 1,679 |
| 5% 7/1/22 (c) | | 1,865 | 2,055 |
| 5% 7/1/23 (c) | | 3,310 | 3,744 |
| Las Vegas Valley Wtr. District Wtr. Impt. Gen. Oblig.: | | | |
| Series 2011 C, 5% 6/1/24 | | 4,485 | 4,798 |
| Series 2016 B, 5% 6/1/36 | | 3,750 | 4,427 |
|
| TOTAL NEVADA | | | 16,703 |
|
| New Hampshire - 1.7% | | | |
| New Hampshire Health & Ed. Facilities Auth.: | | | |
| (Concord Hosp.) Series 2017, 5% 10/1/42 | | 2,485 | 2,902 |
| (Dartmouth-Hitchcock Oblgtd Grp Proj.) Series 2018 A: | | | |
| 5% 8/1/28 | | 415 | 512 |
| 5% 8/1/29 | | 705 | 864 |
| 5% 8/1/30 | | 830 | 1,011 |
| (Partners Healthcare Sys., Inc. Proj.): | | | |
| Series 2017 5% 7/1/29 | | 3,275 | 4,105 |
| Series 2017: | | | |
| 5% 7/1/30 | | 2,125 | 2,648 |
| 5% 7/1/31 | | 4,750 | 5,885 |
| 5% 7/1/32 | | 3,185 | 3,919 |
| 5% 7/1/33 | | 2,900 | 3,548 |
| 5% 7/1/34 | | 4,415 | 5,373 |
| 5% 7/1/35 | | 4,635 | 5,614 |
| 5% 7/1/36 | | 4,870 | 5,872 |
| 5% 7/1/37 | | 4,290 | 5,148 |
| Series 2017 B, 4.125% 7/1/24 (d) | | 1,750 | 1,752 |
| Series 2017 C, 3.5% 7/1/22 (d) | | 550 | 551 |
| New Hampshire Health & Ed. Facilities Auth. Rev.: | | | |
| (Covenant Health Sys., Inc. Proj.) Series 2012, 5% 7/1/42 | | 310 | 324 |
| Series 2012: | | | |
| 4% 7/1/32 | | 2,295 | 2,384 |
| 5% 7/1/24 | | 830 | 910 |
| 5% 7/1/25 | | 980 | 1,073 |
| 5% 7/1/27 | | 415 | 453 |
| Series 2016: | | | |
| 3% 10/1/20 | | 465 | 472 |
| 4% 10/1/38 | | 2,010 | 2,141 |
| 5% 10/1/22 | | 885 | 977 |
| 5% 10/1/24 | | 1,755 | 2,035 |
| 5% 10/1/25 | | 1,740 | 2,060 |
| 5% 10/1/29 | | 5,525 | 6,541 |
| 5% 10/1/31 | | 4,315 | 5,048 |
| 5% 10/1/33 | | 3,355 | 3,903 |
| 5% 10/1/38 | | 6,185 | 7,080 |
| New Hampshire Tpk. Sys. Rev. Series 2012 B, 5% 2/1/24 | | 1,470 | 1,600 |
|
| TOTAL NEW HAMPSHIRE | | | 86,705 |
|
| New Jersey - 5.8% | | | |
| Atlantic County Impt. Auth. (Atlantic City Campus Proj.) Series 2016 A: | | | |
| 5% 7/1/28 (FSA Insured) | | 860 | 1,030 |
| 5% 7/1/30 (FSA Insured) | | 2,105 | 2,507 |
| 5% 7/1/32 (FSA Insured) | | 1,035 | 1,220 |
| 5% 7/1/33 (FSA Insured) | | 1,075 | 1,263 |
| New Jersey Econ. Dev. Auth. Rev.: | | | |
| (New Jersey Gen. Oblig. Proj.): | | | |
| Series 2015 XX, 5% 6/15/25 | | 10,905 | 12,572 |
| Series 2017 B, 5% 11/1/23 | | 14,900 | 16,787 |
| Series 2013 NN: | | | |
| 5% 3/1/26 | | 4,125 | 4,511 |
| 5% 3/1/27 | | 51,700 | 56,419 |
| 5% 3/1/29 | | 2,055 | 2,234 |
| Series 2013: | | | |
| 5% 3/1/24 | | 14,900 | 16,446 |
| 5% 3/1/25 | | 1,820 | 1,997 |
| Series 2015 XX, 5.25% 6/15/27 | | 14,075 | 16,194 |
| Series 2016 AAA: | | | |
| 5.5% 6/15/31 | | 1,655 | 1,948 |
| 5.5% 6/15/32 | | 4,140 | 4,859 |
| New Jersey Econ. Dev. Auth. Spl. Facilities Rev. (Port Newark Container Term. LLC. Proj.) Series 2017: | | | |
| 5% 10/1/21 (c) | | 1,240 | 1,320 |
| 5% 10/1/22 (c) | | 780 | 850 |
| 5% 10/1/23 (c) | | 1,240 | 1,378 |
| 5% 10/1/37 (c) | | 4,590 | 5,116 |
| 5% 10/1/47 (c) | | 7,450 | 8,235 |
| New Jersey Edl. Facility Series 2016 A: | | | |
| 5% 7/1/31 | | 1,740 | 2,028 |
| 5% 7/1/32 | | 1,985 | 2,307 |
| New Jersey Health Care Facilities Fing. Auth. Rev.: | | | |
| Series 2016 A: | | | |
| 5% 7/1/20 | | 415 | 428 |
| 5% 7/1/21 | | 275 | 292 |
| 5% 7/1/22 | | 275 | 301 |
| 5% 7/1/23 | | 970 | 1,087 |
| 5% 7/1/24 | | 1,600 | 1,831 |
| 5% 7/1/25 | | 1,660 | 1,935 |
| 5% 7/1/26 | | 915 | 1,085 |
| 5% 7/1/26 | | 275 | 326 |
| 5% 7/1/27 | | 420 | 496 |
| 5% 7/1/27 | | 620 | 755 |
| 5% 7/1/28 | | 300 | 364 |
| 5% 7/1/29 | | 580 | 680 |
| 5% 7/1/29 | | 415 | 487 |
| 5% 7/1/30 | | 690 | 803 |
| 5% 7/1/30 | | 830 | 998 |
| Series 2016: | | | |
| 4% 7/1/48 | | 2,400 | 2,512 |
| 5% 7/1/41 | | 2,865 | 3,220 |
| New Jersey Higher Ed. Student Assistance Auth. Student Ln. Rev.: | | | |
| Series 2017 1A: | | | |
| 5% 12/1/22 (c) | | 1,000 | 1,104 |
| 5% 12/1/23 (c) | | 1,675 | 1,893 |
| 5% 12/1/26 (c) | | 830 | 992 |
| Series 2017 1B, 5% 12/1/21 (c) | | 1,060 | 1,141 |
| Series 2018 B: | | | |
| 5% 12/1/25 (c) | | 3,495 | 4,111 |
| 5% 12/1/26 (c) | | 1,035 | 1,237 |
| Series 2018 C, 4% 12/1/48 (c) | | 1,835 | 1,921 |
| New Jersey Trans. Trust Fund Auth.: | | | |
| (Trans. Prog.) Series 2019 AA: | | | |
| 5% 6/15/46 | | 14,400 | 16,242 |
| 5.25% 6/15/43 | | 29,900 | 34,443 |
| Series 2001 A, 6% 6/15/35 | | 3,230 | 3,458 |
| Series 2005 B, 5.25% 12/15/22 (AMBAC Insured) | | 330 | 367 |
| Series 2010 A, 0% 12/15/27 | | 9,485 | 7,395 |
| Series 2014 AA, 5% 6/15/24 | | 8,280 | 9,423 |
| Series 2016 A: | | | |
| 5% 6/15/27 | | 2,250 | 2,667 |
| 5% 6/15/28 | | 9,150 | 10,780 |
| 5% 6/15/29 | | 1,865 | 2,182 |
| Series 2016 A-2, 5% 6/15/23 | | 4,455 | 4,999 |
| Series 2018 A, 5% 12/15/33 | | 5,205 | 6,075 |
|
| TOTAL NEW JERSEY | | | 289,251 |
|
| New York - 3.6% | | | |
| Dorm. Auth. New York Univ. Rev.: | | | |
| (Fordham Univ. Proj.) Series 2017: | | | |
| 4% 7/1/33 | | 1,035 | 1,153 |
| 4% 7/1/34 | | 1,035 | 1,147 |
| Series 2017: | | | |
| 4% 12/1/20 (d) | | 800 | 823 |
| 4% 12/1/21 (d) | | 900 | 943 |
| 5% 12/1/22 (d) | | 1,400 | 1,537 |
| 5% 12/1/23 (d) | | 1,200 | 1,349 |
| 5% 12/1/24 (d) | | 1,100 | 1,264 |
| 5% 12/1/25 (d) | | 1,200 | 1,407 |
| Hudson Yards Infrastructure Corp. New York Rev. Series 2012 A, 5.75% 2/15/47 | | 5,445 | 5,807 |
| Long Island Pwr. Auth. Elec. Sys. Rev. Series 2012 A, 5% 9/1/42 | | 10,760 | 11,727 |
| MTA Hudson Rail Yards Trust Oblig. Series 2016 A, 5% 11/15/56 | | 26,320 | 28,932 |
| New York City Gen. Oblig.: | | | |
| Series 2003 A, 5.5% 8/1/20 (Nat'l. Pub. Fin. Guarantee Corp. Insured) | | 5 | 5 |
| Series 2012 E, 5% 8/1/24 | | 4,140 | 4,526 |
| Series 2015 C, 5% 8/1/27 | | 580 | 687 |
| Series 2016 C and D, 5% 8/1/28 | | 2,175 | 2,631 |
| Series 2016 E, 5% 8/1/28 | | 3,645 | 4,463 |
| New York City Indl. Dev. Agcy. Rev. (Yankee Stadium Proj.) Series 2006, 5% 3/1/31 | | 3,910 | 3,940 |
| New York City Muni. Wtr. Fin. Auth. Wtr. & Swr. Sys. Rev.: | | | |
| Series 2012 EE, 5.25% 6/15/30 | | 5,960 | 6,617 |
| Series 2013 2, 5% 6/15/47 | | 1,750 | 1,945 |
| New York City Transitional Fin. Auth. Bldg. Aid Rev.: | | | |
| Series 2015 S1, 5% 7/15/43 | | 4,140 | 4,732 |
| Series 2015 S2, 5% 7/15/35 | | 1,465 | 1,715 |
| New York Dorm. Auth. Mental Health Svcs. Facilities Impt. Rev. Series 2012 A, 5% 5/15/23 | | 4,635 | 5,125 |
| New York Dorm. Auth. Revs. Series 2010 A, 5% 7/1/26 | | 3,310 | 3,424 |
| New York Dorm. Auth. Sales Tax Rev. Series 2016 A, 5% 3/15/34 | | 5,630 | 6,782 |
| New York Metropolitan Trans. Auth. Rev.: | | | |
| Series 2012 D, 5% 11/15/25 | | 25,250 | 28,082 |
| Series 2012 F, 5% 11/15/24 | | 10,265 | 11,443 |
| Series 2014 B, 5% 11/15/44 | | 8,280 | 9,197 |
| Series 2015 A1, 5% 11/15/45 | | 6,170 | 7,008 |
| New York Trans. Dev. Corp. (Laguardia Arpt. Term. Redev. Proj.) Series 2016 A, 5% 7/1/41 (c) | | 3,560 | 3,919 |
| New York Urban Dev. Corp. Rev.: | | | |
| (New York State Gen. Oblig. Proj.) Series 2017 A, 5% 3/15/34 | | 5,215 | 6,317 |
| Gen. Oblig. (New York State Gen. Oblig. Proj.) Series 2017 A, 5% 3/15/32 | | 4,470 | 5,455 |
| Onondaga Civic Dev. Corp. (Le Moyne College Proj.) Series 2018, 5% 1/1/43 | | 830 | 957 |
| Rockland County Gen. Oblig. Series 2014 A: | | | |
| 4% 3/1/23 (FSA Insured) | | 930 | 1,016 |
| 4% 3/1/24 (FSA Insured) | | 1,140 | 1,271 |
| Triborough Bridge & Tunnel Auth. Revs. Series 2015 A, 5.25% 11/15/45 | | 4,140 | 4,880 |
|
| TOTAL NEW YORK | | | 182,226 |
|
| North Carolina - 0.7% | | | |
| Charlotte Ctfs. of Prtn. (Convention Facility Projs.) Series 2019 A: | | | |
| 5% 6/1/44 | | 4,000 | 4,885 |
| 5% 6/1/46 | | 2,120 | 2,582 |
| Charlotte Int'l. Arpt. Rev.: | | | |
| Series 2017 A: | | | |
| 5% 7/1/30 | | 1,265 | 1,568 |
| 5% 7/1/33 | | 1,040 | 1,273 |
| 5% 7/1/37 | | 2,910 | 3,515 |
| Series 2017 B: | | | |
| 5% 7/1/20 (c) | | 165 | 171 |
| 5% 7/1/21 (c) | | 175 | 187 |
| 5% 7/1/22 (c) | | 125 | 138 |
| 5% 7/1/23 (c) | | 135 | 153 |
| 5% 7/1/24 (c) | | 155 | 180 |
| 5% 7/1/25 (c) | | 85 | 101 |
| 5% 7/1/26 (c) | | 85 | 103 |
| 5% 7/1/27 (c) | | 160 | 198 |
| 5% 7/1/28 (c) | | 135 | 166 |
| 5% 7/1/29 (c) | | 195 | 238 |
| 5% 7/1/30 (c) | | 210 | 255 |
| 5% 7/1/31 (c) | | 395 | 477 |
| 5% 7/1/32 (c) | | 420 | 505 |
| 5% 7/1/33 (c) | | 440 | 528 |
| 5% 7/1/34 (c) | | 460 | 550 |
| 5% 7/1/35 (c) | | 315 | 375 |
| 5% 7/1/36 (c) | | 255 | 303 |
| 5% 7/1/37 (c) | | 300 | 355 |
| 5% 7/1/42 (c) | | 975 | 1,144 |
| Series 2017 C, 4% 7/1/32 | | 1,190 | 1,359 |
| Nash Health Care Sys. Health Care Facilities Rev.: | | | |
| Series 2012, 5% 11/1/41 | | 4,490 | 4,760 |
| 5% 11/1/30 (FSA Insured) | | 1,055 | 1,057 |
| North Carolina Med. Care Cmnty. Health Series 2012 A, 5% 11/15/26 | | 1,070 | 1,160 |
| North Carolina Med. Care Commission Health Care Facilities Rev. (Rex Healthcare Proj.) Series 2010 A, 5% 7/1/30 | | 7,805 | 8,041 |
| North Carolina Muni. Pwr. Agcy. #1 Catawba Elec. Rev. Series 2009 A, 5% 1/1/30 | | 790 | 792 |
|
| TOTAL NORTH CAROLINA | | | 37,119 |
|
| North Dakota - 0.1% | | | |
| Cass County Health Care Facilities Rev. (Essentia Health Obligated Group Proj.) Series 2008, 5.125% 2/15/37 (Assured Guaranty Corp. Insured) | | 4,430 | 4,518 |
| McLean County Solid Waste Facilities Rev. (Great River Energy Projs.) Series 2010 B, 5.15% 7/1/40 | | 1,905 | 1,958 |
|
| TOTAL NORTH DAKOTA | | | 6,476 |
|
| Ohio - 2.2% | | | |
| Akron Bath Copley Hosp. District Rev. Series 2016, 5.25% 11/15/46 | | 7,285 | 8,397 |
| Allen County Hosp. Facilities Rev.: | | | |
| (Mercy Health) Series 2017 A: | | | |
| 5% 8/1/25 | | 2,475 | 2,936 |
| 5% 8/1/26 | | 1,645 | 1,990 |
| 5% 8/1/27 | | 2,060 | 2,533 |
| 5% 8/1/28 | | 2,060 | 2,556 |
| 5% 8/1/29 | | 4,130 | 5,087 |
| 5% 8/1/30 | | 3,520 | 4,299 |
| Bonds (Mercy Health) Series 2017 B, 5%, tender 5/5/22 (a) | | 3,030 | 3,321 |
| American Muni. Pwr., Inc. Rev.: | | | |
| (Prairie State Energy Campus Proj.) Series 2015, 5% 2/15/28 | | 11,675 | 13,338 |
| Series 2012 B: | | | |
| 5% 2/15/42 | | 1,615 | 1,734 |
| 5% 2/15/42 (Pre-Refunded to 2/15/22 @ 100) | | 460 | 503 |
| Columbus City School District 5% 12/1/29 | | 1,740 | 2,112 |
| Fairfield County Hosp. Facilities Rev. (Fairfield Med. Ctr. Proj.) Series 2013, 5.25% 6/15/43 | | 3,470 | 3,665 |
| Franklin County Hosp. Facilities Rev. (Ohiohealth Corp. Proj.) Series 2015, 5% 5/15/40 | | 5,525 | 6,283 |
| Hamilton County Convention Facilities Auth. Rev. Series 2014: | | | |
| 5% 12/1/25 | | 2,975 | 3,395 |
| 5% 12/1/26 | | 555 | 632 |
| Lake County Hosp. Facilities Rev.: | | | |
| Series 2015: | | | |
| 5% 8/15/29 | | 1,160 | 1,337 |
| 5% 8/15/30 | | 1,245 | 1,426 |
| 5.75% 8/15/38 | | 135 | 135 |
| 6% 8/15/43 | | 660 | 662 |
| Lancaster Port Auth. Gas Rev. Bonds Series 2019, 5%, tender 2/1/25 (a) | | 9,350 | 10,880 |
| Muskingum County Hosp. Facilities (Genesis Healthcare Sys. Obligated Group Proj.) Series 2013: | | | |
| 5% 2/15/33 | | 3,685 | 3,966 |
| 5% 2/15/44 | | 4,415 | 4,707 |
| 5% 2/15/48 | | 11,260 | 11,982 |
| Ohio Hsg. Fin. Agcy. Residential Mtg. Rev. (Mtg. Backed Securities Prog.) Series 2019 B, 4.5% 3/1/50 (f) | | 670 | 751 |
| Ohio Tpk. Commission Tpk. Rev. (Infrastructure Proj.) Series 2005 A, 0% 2/15/42 | | 2,150 | 1,050 |
| Scioto County Hosp. Facilities Rev. Series 2016: | | | |
| 5% 2/15/29 | | 1,815 | 2,130 |
| 5% 2/15/34 | | 370 | 424 |
| Univ. of Akron Gen. Receipts Series 2016 A, 5% 1/1/35 | | 3,725 | 4,358 |
| Wood County Hosp. Facilities Rev. (Wood County Hosp. Assoc. Proj.) Series 2012: | | | |
| 5% 12/1/32 | | 620 | 655 |
| 5% 12/1/42 | | 825 | 862 |
|
| TOTAL OHIO | | | 108,106 |
|
| Oklahoma - 0.3% | | | |
| Canadian Cny Edl. Facilities Auth. (Mustang Pub. Schools Proj.) Series 2017: | | | |
| 5% 9/1/26 | | 2,305 | 2,812 |
| 5% 9/1/28 | | 1,210 | 1,464 |
| Oklahoma City Pub. Property Auth. Hotel Tax Rev. Series 2015: | | | |
| 5% 10/1/28 | | 1,050 | 1,245 |
| 5% 10/1/29 | | 1,160 | 1,371 |
| 5% 10/1/36 | | 830 | 968 |
| 5% 10/1/39 | | 1,655 | 1,927 |
| Oklahoma Dev. Fin. Auth. Health Sys. Rev. (OU Medicine Proj.) Series 2018 B: | | | |
| 5% 8/15/22 | | 415 | 452 |
| 5% 8/15/23 | | 215 | 239 |
| 5% 8/15/33 | | 910 | 1,079 |
| 5% 8/15/38 | | 2,650 | 3,089 |
| Oklahoma Pwr. Auth. Pwr. Supply Sys. Rev. Series 2014 A, 5% 1/1/38 | | 1,070 | 1,235 |
|
| TOTAL OKLAHOMA | | | 15,881 |
|
| Oregon - 0.0% | | | |
| Clackamas County Hosp. Facility Auth. (Willamette View Proj.) Series 2017 B, 3% 11/15/22 | | 660 | 662 |
| Oregon Facilities Auth. Rev. (Legacy Health Sys. Proj.) Series 2009 A, 5% 3/15/30 | | 830 | 848 |
| Oregon State Dept. of Administrative Svcs. Lottery Rev. Series 2011 A, 5.25% 4/1/31 | | 645 | 687 |
|
| TOTAL OREGON | | | 2,197 |
|
| Pennsylvania - 7.0% | | | |
| Allegheny County Hosp. Dev. Auth. Rev. (Univ. of Pittsburgh Med. Ctr. Proj.) Series 2009 A, 5.625% 8/15/39 | | 6,065 | 6,096 |
| Cap. Region Wtr. Wtr. Rev. Series 2018: | | | |
| 5% 7/15/27 | | 830 | 1,020 |
| 5% 7/15/29 | | 1,290 | 1,603 |
| 5% 7/15/32 | | 830 | 1,009 |
| Centre County Pennsylvania Hosp. Auth. Rev. (Mount Nittany Med. Ctr. Proj.): | | | |
| Series 2011, 7% 11/15/46 (Pre-Refunded to 11/15/21 @ 100) | | 2,565 | 2,897 |
| Series 2018 A, 5% 11/15/23 | | 1,075 | 1,220 |
| Dauphin County Gen. Auth. (Pinnacle Health Sys. Proj.) Series 2016 A: | | | |
| 5% 6/1/21 | | 290 | 309 |
| 5% 6/1/23 | | 415 | 467 |
| 5% 6/1/28 | | 885 | 1,061 |
| 5% 6/1/29 | | 970 | 1,157 |
| Delaware County Auth. Rev. (Cabrini College) Series 2017, 5% 7/1/47 | | 3,310 | 3,705 |
| Doylestown Hosp. Auth. Hosp. Rev. Series 2016 A, 5% 7/1/46 | | 1,205 | 1,313 |
| Dubois Hosp. Auth. Hosp. Rev. (Penn Highlands Healthcare Proj.) Series 2018: | | | |
| 4% 7/15/33 | | 2,070 | 2,243 |
| 4% 7/15/35 | | 2,135 | 2,297 |
| 4% 7/15/37 | | 4,140 | 4,409 |
| 5% 7/15/25 | | 330 | 389 |
| 5% 7/15/26 | | 1,035 | 1,242 |
| 5% 7/15/27 | | 1,745 | 2,122 |
| 5% 7/15/28 | | 1,285 | 1,571 |
| 5% 7/15/29 | | 1,385 | 1,686 |
| 5% 7/15/30 | | 1,815 | 2,192 |
| 5% 7/15/31 | | 1,240 | 1,487 |
| 5% 7/15/32 | | 1,305 | 1,557 |
| 5% 7/15/34 | | 1,405 | 1,665 |
| 5% 7/15/36 | | 4,150 | 4,887 |
| 5% 7/15/38 | | 4,990 | 5,796 |
| 5% 7/15/43 | | 5,795 | 6,690 |
| Lehigh County Gen. Purp. Auth. Rev. (Muhlenberg College Proj.) Series 2017, 5% 2/1/39 | | 2,140 | 2,504 |
| Lehigh County Indl. Dev. Auth. Poll. Cont. Rev. Bonds (PPL Elec. Utils. Corp. Proj.) Series 2016 A, 1.8%, tender 9/1/22 (a) | | 4,145 | 4,148 |
| Monroe County Hosp. Auth. Rev. Series 2016: | | | |
| 5% 7/1/26 | | 830 | 986 |
| 5% 7/1/27 | | 830 | 991 |
| 5% 7/1/28 | | 830 | 988 |
| 5% 7/1/34 | | 3,045 | 3,540 |
| 5% 7/1/36 | | 1,655 | 1,914 |
| Montgomery County Higher Ed. & Health Auth. Hosp. Rev. (Abington Memorial Hosp. Proj.): | | | |
| Series 1993 A, 6% 6/1/22 (AMBAC Insured) | | 1,655 | 1,825 |
| Series 2012 A, 5% 6/1/27 (Pre-Refunded to 6/1/22 @ 100) | | 3,400 | 3,751 |
| Montgomery County Higher Ed. & Health Auth. Rev.: | | | |
| Series 2014 A: | | | |
| 5% 10/1/21 | | 1,095 | 1,157 |
| 5% 10/1/22 | | 1,140 | 1,232 |
| 5% 10/1/23 | | 325 | 358 |
| 5% 10/1/24 | | 965 | 1,084 |
| 5% 10/1/25 | | 865 | 971 |
| 5% 10/1/27 | | 415 | 464 |
| Series 2016 A: | | | |
| 5% 10/1/28 | | 1,255 | 1,436 |
| 5% 10/1/29 | | 2,150 | 2,447 |
| 5% 10/1/31 | | 3,790 | 4,262 |
| 5% 10/1/36 | | 6,790 | 7,528 |
| 5% 10/1/40 | | 3,320 | 3,651 |
| Series 2019, 4% 9/1/49 | | 6,560 | 6,959 |
| Northampton County Gen. Purp. Auth. Hosp. Rev.: | | | |
| (St Lukes Hosp. & Health Ntw Proj.) Series 2016 A, 5% 8/15/36 | | 615 | 710 |
| (St. Luke's Univ. Health Network Proj.) Series 2018 A, 4% 8/15/48 | | 10,545 | 11,077 |
| Series 2016 A, 5% 8/15/46 | | 24,835 | 28,291 |
| Pennsylvania Higher Edl. Facilities Auth. Rev.: | | | |
| (Drexel Univ. Proj.): | | | |
| Series 2016, 5% 5/1/35 | | 2,880 | 3,320 |
| Series 2017: | | | |
| 5% 5/1/35 | | 1,025 | 1,211 |
| 5% 5/1/37 | | 1,295 | 1,519 |
| 5% 5/1/41 | | 5,860 | 6,799 |
| Series 2016: | | | |
| 5% 5/1/28 | | 415 | 493 |
| 5% 5/1/32 | | 1,040 | 1,212 |
| 5% 5/1/33 | | 1,405 | 1,632 |
| Series 2018 A, 5% 2/15/48 | | 1,575 | 1,894 |
| Philadelphia Arpt. Rev.: | | | |
| Series 2017 A: | | | |
| 5% 7/1/25 | | 830 | 992 |
| 5% 7/1/26 | | 830 | 1,014 |
| 5% 7/1/27 | | 660 | 820 |
| Series 2017 B: | | | |
| 5% 7/1/22 (c) | | 1,820 | 1,996 |
| 5% 7/1/22 | | 240 | 265 |
| 5% 7/1/23 (c) | | 1,240 | 1,396 |
| 5% 7/1/23 | | 415 | 471 |
| 5% 7/1/25 (c) | | 2,900 | 3,419 |
| 5% 7/1/26 (c) | | 2,485 | 2,987 |
| 5% 7/1/27 (c) | | 2,070 | 2,530 |
| 5% 7/1/28 (c) | | 2,485 | 3,020 |
| 5% 7/1/29 (c) | | 1,865 | 2,252 |
| 5% 7/1/32 (c) | | 2,485 | 2,950 |
| 5% 7/1/33 (c) | | 1,865 | 2,208 |
| 5% 7/1/34 (c) | | 3,310 | 3,904 |
| 5% 7/1/37 (c) | | 3,725 | 4,353 |
| 5% 7/1/42 (c) | | 11,175 | 12,925 |
| 5% 7/1/47 (c) | | 15,730 | 18,108 |
| Philadelphia Gas Works Rev. Series 9, 5.25% 8/1/40 | | 2,305 | 2,390 |
| Philadelphia School District: | | | |
| Series 2016 D: | | | |
| 5% 9/1/25 | | 7,275 | 8,603 |
| 5% 9/1/26 | | 7,600 | 9,107 |
| 5% 9/1/27 | | 8,020 | 9,564 |
| 5% 9/1/28 | | 6,705 | 7,969 |
| Series 2016 F: | | | |
| 5% 9/1/28 | | 11,600 | 13,787 |
| 5% 9/1/29 | | 7,540 | 8,916 |
| Series 2018 A: | | | |
| 5% 9/1/36 | | 1,575 | 1,864 |
| 5% 9/1/37 | | 910 | 1,074 |
| 5% 9/1/38 | | 1,450 | 1,706 |
| Series 2018 B, 5% 9/1/43 | | 2,115 | 2,468 |
| Series F: | | | |
| 5% 9/1/30 | | 5,625 | 6,616 |
| 5% 9/1/30 (Pre-Refunded to 9/1/26 @ 100) | | 20 | 25 |
| Philadelphia Wtr. & Wastewtr. Rev. Series 2018 A: | | | |
| 5% 10/1/35 | | 4,190 | 5,094 |
| 5% 10/1/36 | | 6,210 | 7,524 |
| 5% 10/1/48 | | 6,000 | 7,125 |
| Pittsburgh Wtr. & Swr. Auth. Wtr. & Swr. Sys. Rev.: | | | |
| Series 2019 A, 5% 9/1/39 (FSA Insured) (f) | | 2,315 | 2,806 |
| Series 2019 A, 5% 9/1/44 (FSA Insured) (f) | | 775 | 931 |
| State Pub. School Bldg. Auth. Lease Rev. (Philadelphia School District Proj.) Series 2015 A, 5% 6/1/26 | | 1,055 | 1,235 |
| Union County Hosp. Auth. Rev. Series 2018 B: | | | |
| 5% 8/1/43 | | 4,605 | 5,246 |
| 5% 8/1/48 | | 5,335 | 6,055 |
|
| TOTAL PENNSYLVANIA | | | 348,159 |
|
| Rhode Island - 0.4% | | | |
| Rhode Island Health & Edl. Bldg. Corp. Higher Ed. Facilities Rev.: | | | |
| Series 2016 B: | | | |
| 5% 9/1/31 | | 655 | 742 |
| 5% 9/1/36 | | 5,810 | 6,488 |
| Series 2016, 5% 5/15/39 | | 5,215 | 5,888 |
| Rhode Island Hsg. & Mtg. Fin. Corp. Series 2019 70, 4% 10/1/49 | | 1,680 | 1,837 |
| Rhode Island Student Ln. Auth. Student Ln. Rev. Series A, 3.5% 12/1/34 (c) | | 2,935 | 3,045 |
|
| TOTAL RHODE ISLAND | | | 18,000 |
|
| South Carolina - 3.7% | | | |
| Charleston County Arpt. District Series 2019, 5% 7/1/43 | | 2,085 | 2,537 |
| Scago Edl. Facilities Corp. for Colleton School District (School District of Colleton County Proj.) Series 2015: | | | |
| 5% 12/1/25 | | 2,275 | 2,675 |
| 5% 12/1/26 | | 1,160 | 1,360 |
| 5% 12/1/28 | | 4,690 | 5,480 |
| South Carolina Hsg. Fin. & Dev. Auth. Mtg. Rev. Series 2019 A, 4% 1/1/50 (f) | | 2,525 | 2,787 |
| South Carolina Jobs-Econ. Dev. Auth. Econ. Dev. Rev.: | | | |
| (Bon Secours Health Sys. Proj.) Series 2013, 5% 11/1/28 (Pre-Refunded to 11/1/22 @ 100) | | 2,400 | 2,687 |
| Series 2013, 5% 11/1/27 (Pre-Refunded to 11/1/22 @ 100) | | 7,535 | 8,436 |
| South Carolina Ports Auth. Ports Rev.: | | | |
| Series 2015 (AMT), 5% 7/1/45 (c) | | 4,315 | 4,881 |
| Series 2015, 5.25% 7/1/55 (c) | | 5,280 | 5,987 |
| South Carolina Pub. Svc. Auth. Rev.: | | | |
| Series 2013 E, 5.5% 12/1/53 | | 33,515 | 37,345 |
| Series 2014 A: | | | |
| 5% 12/1/49 | | 11,210 | 12,398 |
| 5.5% 12/1/54 | | 12,985 | 14,633 |
| Series 2014 C, 5% 12/1/46 | | 3,895 | 4,355 |
| Series 2015 A, 5% 12/1/50 | | 5,180 | 5,826 |
| Series 2015 C, 5% 12/1/22 | | 6,985 | 7,771 |
| Series 2015 E, 5.25% 12/1/55 | | 6,195 | 7,099 |
| Series 2016 A: | | | |
| 5% 12/1/29 | | 2,485 | 2,960 |
| 5% 12/1/38 | | 250 | 289 |
| Series 2016 B: | | | |
| 5% 12/1/31 | | 910 | 1,085 |
| 5% 12/1/41 | | 12,515 | 14,520 |
| Spartanburg County Reg'l. Health Series 2017 A: | | | |
| 4% 4/15/43 | | 15,510 | 16,309 |
| 4% 4/15/48 | | 10,815 | 11,315 |
| 5% 4/15/48 | | 10,595 | 12,092 |
|
| TOTAL SOUTH CAROLINA | | | 184,827 |
|
| South Dakota - 0.0% | | | |
| South Dakota Health & Edl. Facilities Auth. Rev.: | | | |
| (Avera Health Proj.) Series 2017, 5% 7/1/31 | | 540 | 647 |
| Series 2017: | | | |
| 5% 7/1/26 | | 250 | 303 |
| 5% 7/1/28 | | 250 | 306 |
| 5% 7/1/29 | | 470 | 572 |
|
| TOTAL SOUTH DAKOTA | | | 1,828 |
|
| Tennessee - 0.2% | | | |
| Greeneville Health & Edl. Facilities Board Series 2018 A: | | | |
| 5% 7/1/23 | | 815 | 917 |
| 5% 7/1/24 | | 1,225 | 1,381 |
| 5% 7/1/25 | | 1,225 | 1,379 |
| Memphis-Shelby County Arpt. Auth. Arpt. Rev. Series 2010 B: | | | |
| 5.75% 7/1/23 (c) | | 4,820 | 5,030 |
| 5.75% 7/1/24 (c) | | 3,310 | 3,451 |
|
| TOTAL TENNESSEE | | | 12,158 |
|
| Texas - 8.4% | | | |
| Argyle Independent School District 5.25% 8/15/40 (FSA Insured) | | 105 | 105 |
| Arlington Spl. Tax Rev. Series 2018 C, 5% 2/15/45 | | 2,565 | 2,679 |
| Austin Arpt. Sys. Rev.: | | | |
| Series 2014: | | | |
| 5% 11/15/26 (c) | | 830 | 968 |
| 5% 11/15/27 (c) | | 1,035 | 1,205 |
| 5% 11/15/28 (c) | | 1,240 | 1,439 |
| 5% 11/15/39 (c) | | 9,440 | 10,673 |
| 5% 11/15/44 (c) | | 23,065 | 25,990 |
| Series 2017 B: | | | |
| 5% 11/15/28 (c) | | 830 | 1,006 |
| 5% 11/15/30 (c) | | 1,275 | 1,525 |
| 5% 11/15/32 (c) | | 1,005 | 1,192 |
| 5% 11/15/35 (c) | | 1,035 | 1,216 |
| 5% 11/15/37 (c) | | 1,165 | 1,362 |
| 5% 11/15/41 (c) | | 4,725 | 5,478 |
| Austin Cmnty. College District Rev. (Convention Ctr. Proj.) Series 2002, 0% 2/1/22 (AMBAC Insured) | | 2,400 | 2,301 |
| Central Reg'l. Mobility Auth.: | | | |
| Series 2015 A: | | | |
| 5% 1/1/28 | | 1,075 | 1,255 |
| 5% 1/1/30 | | 1,365 | 1,585 |
| 5% 1/1/31 | | 395 | 456 |
| 5% 1/1/32 | | 830 | 954 |
| 5% 1/1/45 | | 5,795 | 6,499 |
| Series 2016: | | | |
| 5% 1/1/40 | | 830 | 944 |
| 5% 1/1/46 | | 565 | 638 |
| Coppell Independent School District 0% 8/15/20 | | 1,655 | 1,629 |
| Corpus Christi Util. Sys. Rev. 5% 7/15/24 | | 1,865 | 2,052 |
| Cypress-Fairbanks Independent School District Series 2014 C, 5% 2/15/44 | | 2,365 | 2,656 |
| Dallas Area Rapid Transit Sales Tax Rev. Series 2016 A, 5% 12/1/33 | | 2,150 | 2,540 |
| Dallas Fort Worth Int'l. Arpt. Rev.: | | | |
| Series 2012 D, 5% 11/1/42 (c) | | 2,295 | 2,434 |
| Series 2012 H, 5% 11/1/42 (c) | | 3,095 | 3,282 |
| Dallas Gen. Oblig. Series 2017: | | | |
| 5% 2/15/29 | | 5,445 | 6,705 |
| 5% 2/15/30 | | 1,350 | 1,653 |
| Dallas Independent School District Series 2016 A, 4% 2/15/29 | | 1,190 | 1,330 |
| DeSoto Independent School District 0% 8/15/20 | | 2,760 | 2,714 |
| Grand Parkway Trans. Corp.: | | | |
| Series 2013 B: | | | |
| 5% 4/1/53 | | 1,250 | 1,365 |
| 5.25% 10/1/51 | | 49,755 | 55,764 |
| 5.5% 4/1/53 | | 5,330 | 5,978 |
| Series 2018 A: | | | |
| 5% 10/1/38 | | 2,655 | 3,196 |
| 5% 10/1/43 | | 830 | 988 |
| Harris County Cultural Ed. Facilities Fin. Corp. Med. Facilities Rev. (Baylor College of Medicine Proj.) Series 2012 A, 5% 11/15/37 | | 4,510 | 4,935 |
| Harris County Cultural Ed. Facilities Fin. Corp. Rev. (Texas Childrens Hosp., Proj.) Series 2015-1 5% 10/1/29 | | 1,115 | 1,324 |
| Harris County Gen. Oblig. Series 2002: | | | |
| 0% 8/15/24 (Nat'l. Pub. Fin. Guarantee Corp. Insured) | | 830 | 762 |
| 0% 8/15/25 (Nat'l. Pub. Fin. Guarantee Corp. Insured) | | 2,485 | 2,230 |
| 0% 8/15/28 (Nat'l. Pub. Fin. Guarantee Corp. Insured) | | 4,140 | 3,436 |
| Houston Arpt. Sys. Rev.: | | | |
| Series 2011 A: | | | |
| 5% 7/1/23 (c) | | 2,485 | 2,656 |
| 5% 7/1/24 (c) | | 1,035 | 1,105 |
| 5% 7/1/25 (c) | | 1,240 | 1,321 |
| Series 2012 A: | | | |
| 5% 7/1/21 (c) | | 3,135 | 3,344 |
| 5% 7/1/23 (c) | | 495 | 545 |
| Series 2018 A, 5% 7/1/41 (c) | | 1,000 | 1,182 |
| Series 2018 C: | | | |
| 5% 7/1/29 (c) | | 1,655 | 2,043 |
| 5% 7/1/30 (c) | | 1,765 | 2,164 |
| 5% 7/1/31 (c) | | 1,240 | 1,511 |
| 5% 7/1/32 (c) | | 1,450 | 1,761 |
| Houston Gen. Oblig. Series 2017 A: | | | |
| 5% 3/1/29 | | 3,150 | 3,852 |
| 5% 3/1/30 | | 4,140 | 5,037 |
| 5% 3/1/31 | | 3,835 | 4,643 |
| 5% 3/1/32 | | 1,635 | 1,972 |
| Houston Independent School District Series 2017, 5% 2/15/35 | | 2,815 | 3,381 |
| Houston Util. Sys. Rev. Series 2018 D, 5% 11/15/43 | | 2,445 | 2,956 |
| Irving Hosp. Auth. Hosp. Rev. Series 2017 A: | | | |
| 5% 10/15/28 | | 390 | 461 |
| 5% 10/15/30 | | 1,570 | 1,832 |
| 5% 10/15/32 | | 830 | 955 |
| 5% 10/15/36 | | 545 | 618 |
| 5% 10/15/37 | | 930 | 1,051 |
| 5% 10/15/38 | | 1,325 | 1,494 |
| 5% 10/15/44 | | 1,310 | 1,466 |
| Love Field Arpt. Modernization Rev.: | | | |
| Series 2015: | | | |
| 5% 11/1/26 (c) | | 830 | 985 |
| 5% 11/1/27 (c) | | 1,780 | 2,105 |
| 5% 11/1/28 (c) | | 2,755 | 3,246 |
| 5% 11/1/29 (c) | | 1,655 | 1,940 |
| 5% 11/1/32 (c) | | 3,055 | 3,539 |
| Series 2017: | | | |
| 5% 11/1/22 (c) | | 620 | 688 |
| 5% 11/1/23 (c) | | 910 | 1,036 |
| 5% 11/1/24 (c) | | 830 | 968 |
| 5% 11/1/25 (c) | | 830 | 989 |
| 5% 11/1/26 (c) | | 830 | 1,008 |
| 5% 11/1/27 (c) | | 830 | 1,003 |
| 5% 11/1/28 (c) | | 1,450 | 1,744 |
| 5% 11/1/29 (c) | | 1,035 | 1,238 |
| 5% 11/1/30 (c) | | 830 | 986 |
| 5% 11/1/31 (c) | | 1,840 | 2,176 |
| 5% 11/1/32 (c) | | 2,135 | 2,516 |
| 5% 11/1/33 (c) | | 830 | 975 |
| 5% 11/1/34 (c) | | 830 | 972 |
| 5% 11/1/36 (c) | | 830 | 967 |
| Lower Colorado River Auth. Rev. Series 2015 D: | | | |
| 5% 5/15/28 | | 1,820 | 2,147 |
| 5% 5/15/30 | | 4,140 | 4,844 |
| Midway Independent School District Series 2000, 0% 8/15/19 | | 2,980 | 2,975 |
| New Hope Cultural Ed. Facilities Finc (Childrens Med. Ctr. of Dallas) Series 2017 A: | | | |
| 5% 8/15/27 | | 625 | 777 |
| 5% 8/15/29 | | 1,655 | 2,037 |
| 5% 8/15/47 | | 1,890 | 2,211 |
| Newark Higher Ed. Fin. Corp. (Abilene Christian Univ. Proj.) Series 2016 A: | | | |
| 5% 4/1/27 | | 595 | 699 |
| 5% 4/1/30 | | 2,825 | 3,268 |
| North Texas Tollway Auth. Rev.: | | | |
| (Sr. Lien Proj.) Series 2017 A: | | | |
| 5% 1/1/31 | | 830 | 984 |
| 5% 1/1/33 | | 975 | 1,167 |
| 5% 1/1/34 | | 1,240 | 1,479 |
| 5% 1/1/34 | | 2,485 | 3,272 |
| 5% 1/1/35 | | 1,820 | 2,162 |
| 5% 1/1/36 | | 4,965 | 5,877 |
| 5% 1/1/37 | | 6,625 | 7,814 |
| 5% 1/1/38 | | 2,690 | 2,965 |
| (Sub Lien Proj.) Series 2017 B: | | | |
| 5% 1/1/26 | | 740 | 827 |
| 5% 1/1/30 | | 350 | 413 |
| 5% 1/1/31 | | 495 | 582 |
| Series 2008 I, 6.2% 1/1/42 (Assured Guaranty Corp. Insured) | | 6,870 | 8,389 |
| Series 2009, 6.25% 1/1/39 | | 1,860 | 1,866 |
| Series 2014 A, 5% 1/1/25 | | 4,965 | 5,704 |
| Series 2015 A, 5% 1/1/32 | | 2,775 | 3,206 |
| Series 2015 B, 5% 1/1/40 | | 8,280 | 9,105 |
| Series 2016 A, 5% 1/1/36 | | 1,035 | 1,208 |
| San Antonio Arpt. Sys. Rev.: | | | |
| Series 2007 (AMT), 5.25% 7/1/20 (FSA Insured) (c) | | 2,660 | 2,669 |
| Series 2007 (AMT-SUB LIEN), 5.25% 7/1/20 (FSA Insured) (c) | | 2,295 | 2,303 |
| San Antonio Gen. Oblig. Series 2018, 5% 8/1/37 | | 1,805 | 2,214 |
| San Antonio Independent School District Series 2016, 5% 8/15/31 | | 3,590 | 4,319 |
| Southwest Higher Ed. Auth. Rev. (Southern Methodist Univ., TX. Proj.) Series 2017: | | | |
| 5% 10/1/29 | | 375 | 466 |
| 5% 10/1/30 | | 580 | 715 |
| 5% 10/1/31 | | 520 | 637 |
| 5% 10/1/39 | | 1,030 | 1,230 |
| 5% 10/1/40 | | 830 | 989 |
| Tarrant County Cultural Ed. Facilities Fin. Corp. Hosp. Rev.: | | | |
| (Hendrick Med. Ctr. Proj.) Series 2009 B: | | | |
| 5.25% 9/1/26 (Assured Guaranty Corp. Insured) | | 1,480 | 1,489 |
| 5.25% 9/1/27 (Assured Guaranty Corp. Insured) | | 1,965 | 1,976 |
| 5.25% 9/1/28 (Assured Guaranty Corp. Insured) | | 1,020 | 1,026 |
| (Scott & White Healthcare Proj.) Series 2013 A, 5% 8/15/43 | | 3,310 | 3,656 |
| Tarrant County Cultural Ed. Facilities Fin. Corp. Rev. Series 2016 A: | | | |
| 4% 2/15/35 | | 4,140 | 4,509 |
| 5% 2/15/25 | | 710 | 841 |
| Texas Dept. of Hsg. & Cmnty. Affairs Multi-family Hsg. Rev. Series 2019, 2.95% 7/1/36 | | 4,605 | 4,608 |
| Texas Gen. Oblig. Series 2017 B, 5% 10/1/36 | | 3,190 | 3,868 |
| Texas Private Activity Bond Surface Trans. Corp. Series 2013, 6.75% 6/30/43 (c) | | 12,420 | 14,420 |
| Texas State Univ. Sys. Fing. Rev. Series 2017 A: | | | |
| 5% 3/15/29 | | 3,530 | 4,342 |
| 5% 3/15/31 | | 2,690 | 3,271 |
| Travis County Gen. Oblig. Series 2019 A, 5% 3/1/38 | | 1,850 | 2,282 |
| Univ. of Houston Univ. Revs. Series 2017 A: | | | |
| 5% 2/15/32 | | 5,115 | 6,053 |
| 5% 2/15/33 | | 3,310 | 3,907 |
| 5% 2/15/34 | | 4,140 | 4,873 |
| 5% 2/15/35 | | 4,140 | 4,859 |
| 5% 2/15/36 | | 2,485 | 2,909 |
| Univ. of North Texas Univ. Rev.: | | | |
| Series 2017 A, 5% 4/15/32 | | 1,740 | 2,100 |
| Series 2018 A, 5% 4/15/44 | | 830 | 989 |
| Univ. of Texas Permanent Univ. Fund Rev. Series 2016 B, 5% 7/1/29 | | 1,685 | 2,054 |
| Weatherford Independent School District 0% 2/15/33 | | 5,785 | 4,091 |
|
| TOTAL TEXAS | | | 422,517 |
|
| Utah - 1.9% | | | |
| Salt Lake City Arpt. Rev.: | | | |
| Series 2017 A: | | | |
| 5% 7/1/22 (c) | | 1,655 | 1,818 |
| 5% 7/1/24 (c) | | 1,450 | 1,676 |
| 5% 7/1/25 (c) | | 1,655 | 1,954 |
| 5% 7/1/27 (c) | | 3,500 | 4,292 |
| 5% 7/1/29 (c) | | 3,090 | 3,748 |
| 5% 7/1/30 (c) | | 2,275 | 2,741 |
| 5% 7/1/31 (c) | | 4,345 | 5,206 |
| 5% 7/1/32 (c) | | 4,760 | 5,681 |
| 5% 7/1/33 (c) | | 3,310 | 3,939 |
| 5% 7/1/34 (c) | | 7,830 | 9,286 |
| 5% 7/1/35 (c) | | 3,310 | 3,913 |
| 5% 7/1/36 (c) | | 4,470 | 5,269 |
| 5% 7/1/37 (c) | | 3,520 | 4,136 |
| 5% 7/1/42 (c) | | 20,290 | 23,610 |
| Series 2018 A: | | | |
| 5% 7/1/31 (c) | | 2,000 | 2,437 |
| 5% 7/1/32 (c) | | 4,310 | 5,230 |
| 5% 7/1/33 (c) | | 1,420 | 1,718 |
| 5.25% 7/1/48 (c) | | 5,655 | 6,775 |
| Utah Associated Muni. Pwr. Sys. Rev. (Payson Pwr. Proj.) 5% 9/1/22 | | 2,635 | 2,917 |
|
| TOTAL UTAH | | | 96,346 |
|
| Vermont - 0.2% | | | |
| Vermont Edl. & Health Bldg. Fin. Agcy. Rev. (Champlain College Proj.) Series 2016 A: | | | |
| 5% 10/15/41 | | 3,810 | 4,259 |
| 5% 10/15/46 | | 4,720 | 5,252 |
| Vermont Student Assistant Corp. Ed. Ln. Rev. Series 2019 A, 5% 6/15/28 (c) | | 1,430 | 1,735 |
|
| TOTAL VERMONT | | | 11,246 |
|
| Virginia - 0.6% | | | |
| Fredericksburg Econ. Dev. Auth. Rev. Series 2014: | | | |
| 5% 6/15/25 | | 3,860 | 4,464 |
| 5% 6/15/30 | | 1,035 | 1,183 |
| Stafford County Econ. Dev. Auth. Hosp. Facilities Rev.: | | | |
| (Mary Washington Hosp. Proj.) Series 2016, 3% 6/15/29 | | 525 | 550 |
| Series 2016: | | | |
| 4% 6/15/37 | | 595 | 629 |
| 5% 6/15/27 | | 1,240 | 1,492 |
| 5% 6/15/30 | | 540 | 641 |
| 5% 6/15/33 | | 350 | 410 |
| 5% 6/15/34 | | 665 | 776 |
| 5% 6/15/35 | | 1,820 | 2,117 |
| Virginia College Bldg. Auth. Edl. Facilities Rev. Series 2015 A: | | | |
| 5% 1/1/35 | | 830 | 957 |
| 5% 1/1/40 | | 1,865 | 2,137 |
| Virginia Commonwealth Trans. Board Rev. (Virginia Gen. Oblig. Proj.) Series 2017 A, 5% 5/15/32 | | 725 | 898 |
| Virginia Small Bus. Fing. Auth. (95 Express Lane LLC Proj.) Series 2012: | | | |
| 5% 7/1/34 (c) | | 4,965 | 5,281 |
| 5% 1/1/40 (c) | | 995 | 1,053 |
| Winchester Econ. Dev. Auth. Series 2015: | | | |
| 5% 1/1/31 | | 2,070 | 2,429 |
| 5% 1/1/34 | | 1,240 | 1,433 |
| 5% 1/1/35 | | 1,240 | 1,430 |
| 5% 1/1/44 | | 830 | 939 |
|
| TOTAL VIRGINIA | | | 28,819 |
|
| Washington - 1.5% | | | |
| Clark County School District #37, Vancouver Series 2001 C, 0% 12/1/19 (Nat'l. Pub. Fin. Guarantee Corp. Insured) | | 1,680 | 1,670 |
| Port of Seattle Rev. Series 2016 B: | | | |
| 5% 10/1/28 (c) | | 2,900 | 3,454 |
| 5% 10/1/30 (c) | | 1,655 | 1,946 |
| Port of Seattle Spl. Facility Rev. Series 2013: | | | |
| 5% 6/1/21 (c) | | 1,110 | 1,182 |
| 5% 6/1/22 (c) | | 830 | 910 |
| 5% 6/1/24 (c) | | 1,290 | 1,454 |
| Spokane Pub. Facilities District Hotel/Motel Tax & Sales/Use Tax Rev. Series 2013 B: | | | |
| 5% 12/1/25 | | 4,635 | 5,213 |
| 5% 12/1/27 | | 3,415 | 3,830 |
| Washington Gen. Oblig.: | | | |
| Series 2015 C: | | | |
| 5% 2/1/33 | | 2,790 | 3,241 |
| 5% 2/1/34 | | 3,450 | 3,997 |
| Series R-2017 A, 5% 8/1/30 | | 1,685 | 2,037 |
| Washington Health Care Facilities Auth. Rev.: | | | |
| (Catholic Health Initiatives Proj.) Series 2008 D, 6.375% 10/1/36 | | 6,625 | 6,650 |
| (Overlake Hosp. Med. Ctr., WA. Proj.) Series 2017 B: | | | |
| 5% 7/1/25 | | 675 | 800 |
| 5% 7/1/27 | | 1,285 | 1,587 |
| 5% 7/1/28 | | 1,570 | 1,953 |
| 5% 7/1/29 | | 615 | 758 |
| 5% 7/1/30 | | 735 | 902 |
| 5% 7/1/31 | | 870 | 1,060 |
| 5% 7/1/32 | | 1,655 | 2,005 |
| 5% 7/1/33 | | 2,345 | 2,826 |
| 5% 7/1/34 | | 540 | 647 |
| 5% 7/1/42 | | 4,685 | 5,452 |
| (Providence Health Systems Proj.) Series 2012 A, 5% 10/1/25 | | 4,245 | 4,711 |
| Series 2015: | | | |
| 5% 1/1/25 | | 1,655 | 1,940 |
| 5% 1/1/27 | | 1,910 | 2,238 |
| Washington Higher Ed. Facilities Auth. Rev. (Whitworth Univ. Proj.) Series 2016 A: | | | |
| 5% 10/1/27 | | 1,770 | 2,075 |
| 5% 10/1/28 | | 1,825 | 2,130 |
| 5% 10/1/35 | | 1,880 | 2,136 |
| 5% 10/1/36 | | 2,845 | 3,223 |
| 5% 10/1/40 | | 2,795 | 3,129 |
| Washington Hsg. Fin. Commission Nonprofit Hsg. Rev. (Judson Park Proj.) Series 2018: | | | |
| 4% 7/1/28 (d) | | 100 | 103 |
| 5% 7/1/33 (d) | | 125 | 136 |
| 5% 7/1/38 (d) | | 100 | 108 |
| 5% 7/1/48 (d) | | 400 | 426 |
|
| TOTAL WASHINGTON | | | 75,929 |
|
| West Virginia - 0.3% | | | |
| West Virginia Econ. Dev. Auth. Solid Waste Disp. Facilities Rev. Bonds (Appalachian Pwr. Co. Amos Proj.) Series 2011 A, 1.7%, tender 9/1/20 (a)(c) | | 2,575 | 2,572 |
| West Virginia Hosp. Fin. Auth. Hosp. Rev. Series 2018 A: | | | |
| 5% 1/1/31 | | 1,355 | 1,644 |
| 5% 1/1/32 | | 1,120 | 1,350 |
| West Virginia Univ. Revs. (West Virginia Univ. Projs.) Series 2014 A, 5% 10/1/44 | | 6,290 | 7,110 |
|
| TOTAL WEST VIRGINIA | | | 12,676 |
|
| Wisconsin - 1.7% | | | |
| Pub. Fin. Auth. Hosp. Rev. Series 2019 A, 5% 10/1/44 | | 5,850 | 6,906 |
| Pub. Fin. Auth. Rev. (Denver Great Hall LLC. Proj.) Series 2017: | | | |
| 5% 9/30/37 (c) | | 2,070 | 2,406 |
| 5% 9/30/49 (c) | | 15,085 | 17,154 |
| Pub. Fin. Auth. Sr Liv Rev. (Mary's Woods At Marylhurst, Inc. Proj.): | | | |
| Series 2017 A: | | | |
| 5% 5/15/21 (d) | | 250 | 260 |
| 5% 5/15/25 (d) | | 920 | 1,012 |
| 5% 5/15/28 (d) | | 1,095 | 1,208 |
| 5.25% 5/15/37 (d) | | 335 | 367 |
| 5.25% 5/15/42 (d) | | 415 | 450 |
| 5.25% 5/15/47 (d) | | 410 | 443 |
| 5.25% 5/15/52 (d) | | 775 | 836 |
| Series 2017 B-1 3.95% 11/15/24 (d) | | 300 | 301 |
| Pub. Fin. Auth. Wis Edl. Facilities Series 2016: | | | |
| 5% 1/1/37 | | 5,325 | 5,833 |
| 5% 1/1/42 | | 4,275 | 4,642 |
| Pub. Fin. Auth. Wisconsin Retirement Facility Rev. Series 2018: | | | |
| 5% 10/1/43 (d) | | 735 | 806 |
| 5% 10/1/48 (d) | | 880 | 962 |
| 5% 10/1/53 (d) | | 2,330 | 2,541 |
| Wisconsin Health & Edl. Facilities: | | | |
| (Ascension Health Cr. Group Proj.) Series 2016 A, 5% 11/15/36 | | 4,140 | 4,833 |
| Series 2010: | | | |
| 5.75% 7/1/30 (Pre-Refunded to 7/1/20 @ 100) | | 970 | 1,012 |
| 5.75% 7/1/30 (Pre-Refunded to 7/1/20 @ 100) | | 1,645 | 1,716 |
| Series 2014: | | | |
| 4% 5/1/33 | | 2,920 | 3,043 |
| 5% 5/1/22 | | 660 | 714 |
| Series 2016 A: | | | |
| 5% 2/15/28 | | 1,965 | 2,316 |
| 5% 2/15/29 | | 2,550 | 2,990 |
| 5% 2/15/30 | | 2,805 | 3,269 |
| Series 2016: | | | |
| 4% 2/15/38 (Pre-Refunded to 8/15/25 @ 100) | | 1,000 | 1,140 |
| 5% 2/15/29 (Pre-Refunded to 8/15/25 @ 100) | | 360 | 431 |
| Series 2017 A: | | | |
| 5% 9/1/31 | | 830 | 956 |
| 5% 9/1/33 | | 1,425 | 1,625 |
| 5% 9/1/35 | | 1,575 | 1,777 |
| Wisconsin Health & Edl. Facilities Auth. Rev.: | | | |
| (Agnesian HealthCare, Inc. Proj.): | | | |
| Series 2010, 5.5% 7/1/40 (Pre-Refunded to 7/1/20 @ 100) | | 2,380 | 2,478 |
| Series 2013 B: | | | |
| 5% 7/1/27 (Pre-Refunded to 7/1/23 @ 100) | | 1,000 | 1,138 |
| 5% 7/1/36 (Pre-Refunded to 7/1/23 @ 100) | | 4,905 | 5,583 |
| Series 2012: | | | |
| 4% 10/1/23 | | 2,070 | 2,229 |
| 5% 6/1/27 | | 1,840 | 1,987 |
|
| TOTAL WISCONSIN | | | 85,364 |
|
| Wyoming - 0.2% | | | |
| Campbell County Solid Waste Facilities Rev. (Basin Elec. Pwr. Coop. - Dry Fork Station Facilities Proj.) Series 2009 A, 5.75% 7/15/39 | | 8,525 | 8,539 |
| TOTAL MUNICIPAL BONDS | | | |
| (Cost $4,664,813) | | | 4,953,990 |
| | | Shares | Value (000s) |
|
| Money Market Funds - 0.6% | | | |
| Fidelity Municipal Cash Central Fund 2.00% (g)(h) | | | |
| (Cost $27,626) | | 27,623,607 | 27,626 |
| TOTAL INVESTMENT IN SECURITIES - 99.5% | | | |
| (Cost $4,692,439) | | | 4,981,616 |
| NET OTHER ASSETS (LIABILITIES) - 0.5% | | | 25,333 |
| NET ASSETS - 100% | | | $5,006,949 |
Legend
(a) Coupon rates for floating and adjustable rate securities reflect the rates in effect at period end.
(b) Coupon is indexed to a floating interest rate which may be multiplied by a specified factor and/or subject to caps or floors.
(c) Private activity obligations whose interest is subject to the federal alternative minimum tax for individuals.
(d) Security exempt from registration under Rule 144A of the Securities Act of 1933. These securities may be resold in transactions exempt from registration, normally to qualified institutional buyers. At the end of the period, the value of these securities amounted to $70,764,000 or 1.4% of net assets.
(e) Security initially issued in zero coupon form which converts to coupon form at a specified rate and date. The rate shown is the rate at period end.
(f) Security or a portion of the security purchased on a delayed delivery or when-issued basis.
(g) Information in this report regarding holdings by state and security types does not reflect the holdings of the Fidelity Municipal Cash Central Fund.
(h) Affiliated fund that is available only to investment companies and other accounts managed by Fidelity Investments. The rate quoted is the annualized seven-day yield of the fund at period end. A complete unaudited listing of the fund's holdings as of its most recent quarter end is available upon request. In addition, each Fidelity Central Fund's financial statements are available on the SEC's website or upon request.
Affiliated Central Funds
Information regarding fiscal year to date income earned by the Fund from investments in Fidelity Central Funds is as follows:
| Fund | Income earned |
| | (Amounts in thousands) |
| Fidelity Municipal Cash Central Fund | $456 |
| Total | $456 |
Amounts in the income column in the above table include any capital gain distributions from underlying funds, which are presented in the corresponding line-item in the Statement of Operations, if applicable.
Investment Valuation
The following is a summary of the inputs used, as of June 30, 2019, involving the Fund's assets and liabilities carried at fair value. The inputs or methodology used for valuing securities may not be an indication of the risk associated with investing in those securities. For more information on valuation inputs, and their aggregation into the levels used below, please refer to the Investment Valuation section in the accompanying Notes to Financial Statements.
| | Valuation Inputs at Reporting Date: |
| Description | Total | Level 1 | Level 2 | Level 3 |
| (Amounts in thousands) | | | | |
| Investments in Securities: | | | | |
| Municipal Securities | $4,953,990 | $-- | $4,953,990 | $-- |
| Money Market Funds | 27,626 | 27,626 | -- | -- |
| Total Investments in Securities: | $4,981,616 | $27,626 | $4,953,990 | $-- |
Other Information
The distribution of municipal securities by revenue source, as a percentage of total Net Assets, is as follows (Unaudited):
| Transportation | 25.7% |
| Health Care | 25.5% |
| General Obligations | 24.6% |
| Education | 6.2% |
| Electric Utilities | 5.8% |
| Others* (Individually Less Than 5%) | 12.2% |
| | 100.0% |
* Includes net other assets
See accompanying notes which are an integral part of the financial statements.
Financial Statements
Statement of Assets and Liabilities
| Amounts in thousands (except per-share amounts) | | June 30, 2019 (Unaudited) |
| Assets | | |
Investment in securities, at value — See accompanying schedule:
Unaffiliated issuers (cost $4,664,813) | $4,953,990 | |
| Fidelity Central Funds (cost $27,626) | 27,626 | |
| Total Investment in Securities (cost $4,692,439) | | $4,981,616 |
| Cash | | 83 |
| Receivable for fund shares sold | | 1,911 |
| Interest receivable | | 60,013 |
| Distributions receivable from Fidelity Central Funds | | 55 |
| Other receivables | | 10 |
| Total assets | | 5,043,688 |
| Liabilities | | |
| Payable for investments purchased | | |
| Regular delivery | $862 | |
| Delayed delivery | 26,469 | |
| Payable for fund shares redeemed | 3,032 | |
| Distributions payable | 4,286 | |
| Accrued management fee | 1,471 | |
| Distribution and service plan fees payable | 125 | |
| Other affiliated payables | 450 | |
| Other payables and accrued expenses | 44 | |
| Total liabilities | | 36,739 |
| Net Assets | | $5,006,949 |
| Net Assets consist of: | | |
| Paid in capital | | $4,712,118 |
| Total distributable earnings (loss) | | 294,831 |
| Net Assets | | $5,006,949 |
| Net Asset Value and Maximum Offering Price | | |
| Class A: | | |
| Net Asset Value and redemption price per share ($227,923 ÷ 17,122.3 shares)(a) | | $13.31 |
| Maximum offering price per share (100/96.00 of $13.31) | | $13.86 |
| Class M: | | |
| Net Asset Value and redemption price per share ($120,076 ÷ 9,013.2 shares)(a) | | $13.32 |
| Maximum offering price per share (100/96.00 of $13.32) | | $13.88 |
| Class C: | | |
| Net Asset Value and offering price per share ($62,491 ÷ 4,694.6 shares)(a) | | $13.31 |
| Fidelity Municipal Income Fund: | | |
| Net Asset Value, offering price and redemption price per share ($3,921,600 ÷ 294,421.4 shares) | | $13.32 |
| Class I: | | |
| Net Asset Value, offering price and redemption price per share ($641,721 ÷ 48,209.1 shares) | | $13.31 |
| Class Z: | | |
| Net Asset Value, offering price and redemption price per share ($33,138 ÷ 2,488.7 shares) | | $13.32 |
(a) Redemption price per share is equal to net asset value less any applicable contingent deferred sales charge.
See accompanying notes which are an integral part of the financial statements.
Statement of Operations
| Amounts in thousands | | Six months ended June 30, 2019 (Unaudited) |
| Investment Income | | |
| Interest | | $82,028 |
| Income from Fidelity Central Funds | | 456 |
| Total income | | 82,484 |
| Expenses | | |
| Management fee | $8,663 | |
| Transfer agent fees | 2,336 | |
| Distribution and service plan fees | 773 | |
| Accounting fees and expenses | 327 | |
| Custodian fees and expenses | 16 | |
| Independent trustees' fees and expenses | 9 | |
| Registration fees | 121 | |
| Audit | 55 | |
| Legal | 3 | |
| Miscellaneous | 21 | |
| Total expenses before reductions | 12,324 | |
| Expense reductions | (37) | |
| Total expenses after reductions | | 12,287 |
| Net investment income (loss) | | 70,197 |
| Realized and Unrealized Gain (Loss) | | |
| Net realized gain (loss) on: | | |
| Investment securities: | | |
| Unaffiliated issuers | 6,921 | |
| Total net realized gain (loss) | | 6,921 |
| Change in net unrealized appreciation (depreciation) on investment securities | | 204,993 |
| Net gain (loss) | | 211,914 |
| Net increase (decrease) in net assets resulting from operations | | $282,111 |
See accompanying notes which are an integral part of the financial statements.
Statement of Changes in Net Assets
| Amounts in thousands | Six months ended June 30, 2019 (Unaudited) | Year ended December 31, 2018 |
| Increase (Decrease) in Net Assets | | |
| Operations | | |
| Net investment income (loss) | $70,197 | $173,093 |
| Net realized gain (loss) | 6,921 | 3,018 |
| Change in net unrealized appreciation (depreciation) | 204,993 | (147,650) |
| Net increase (decrease) in net assets resulting from operations | 282,111 | 28,461 |
| Distributions to shareholders | (69,485) | (209,319) |
| Share transactions - net increase (decrease) | 380 | (642,419) |
| Total increase (decrease) in net assets | 213,006 | (823,277) |
| Net Assets | | |
| Beginning of period | 4,793,943 | 5,617,220 |
| End of period | $5,006,949 | $4,793,943 |
See accompanying notes which are an integral part of the financial statements.
Financial Highlights
Fidelity Municipal Income Fund Class A
| | Six months ended (Unaudited) June 30, | Year endedDecember 31, |
| | 2019 | 2018 A |
| Selected Per–Share Data | | |
| Net asset value, beginning of period | $12.75 | $12.73 |
| Income from Investment Operations | | |
| Net investment income (loss)B | .168 | .283 |
| Net realized and unrealized gain (loss) | .558 | .029C |
| Total from investment operations | .726 | .312 |
| Distributions from net investment income | (.166) | (.284) |
| Distributions from net realized gain | – | (.008) |
| Total distributions | (.166) | (.292) |
| Net asset value, end of period | $13.31 | $12.75 |
| Total ReturnD,E,F | 5.73% | 2.48% |
| Ratios to Average Net AssetsG,H | | |
| Expenses before reductions | .80%I | .78%I |
| Expenses net of fee waivers, if any | .80%I | .78%I |
| Expenses net of all reductions | .80%I | .78%I |
| Net investment income (loss) | 2.61%I | 2.68%I |
| Supplemental Data | | |
| Net assets, end of period (in millions) | $228 | $201 |
| Portfolio turnover rateJ | 14%I | 14%K,L |
A For the period March 1, 2018 (commencement of sale of shares) to December 31, 2018.
B Calculated based on average shares outstanding during the period.
C The amount shown for a share outstanding does not correspond with the aggregate net gain (loss) on investments for the period due to the timing of sales and repurchases of shares in relation to fluctuating market values of the investments of the Fund.
D Total returns for periods of less than one year are not annualized.
E Total returns would have been lower if certain expenses had not been reduced during the applicable periods shown.
F Total returns do not include the effect of the sales charges.
G Fees and expenses of any underlying Fidelity Central Funds are not included in the Fund's expense ratio. The Fund indirectly bears its proportionate share of the expenses of any underlying Fidelity Central Funds.
H Expense ratios reflect operating expenses of the class. Expenses before reductions do not reflect amounts reimbursed by the investment adviser or reductions from expense offset arrangements and do not represent the amount paid by the class during periods when reimbursements or reductions occur. Expense ratios before reductions for start-up periods may not be representative of longer-term operating periods. Expenses net of fee waivers reflect expenses after reimbursement by the investment adviser but prior to reductions from expense offset arrangements. Expenses net of all reductions represent the net expenses paid by the class.
I Annualized
J Amount does not include the portfolio activity of any underlying Fidelity Central Funds.
K The portfolio turnover rate does not include the assets acquired in the merger.
L Portfolio turnover rate excludes securities received or delivered in-kind.
See accompanying notes which are an integral part of the financial statements.
Fidelity Municipal Income Fund Class M
| | Six months ended (Unaudited) June 30, | Year endedDecember 31, |
| | 2019 | 2018 A |
| Selected Per–Share Data | | |
| Net asset value, beginning of period | $12.76 | $12.73 |
| Income from Investment Operations | | |
| Net investment income (loss)B | .170 | .285 |
| Net realized and unrealized gain (loss) | .558 | .039C |
| Total from investment operations | .728 | .324 |
| Distributions from net investment income | (.168) | (.286) |
| Distributions from net realized gain | – | (.008) |
| Total distributions | (.168) | (.294) |
| Net asset value, end of period | $13.32 | $12.76 |
| Total ReturnD,E,F | 5.73%�� | 2.58% |
| Ratios to Average Net AssetsG,H | | |
| Expenses before reductions | .78%I | .77%I |
| Expenses net of fee waivers, if any | .78%I | .77%I |
| Expenses net of all reductions | .78%I | .76%I |
| Net investment income (loss) | 2.63%I | 2.70%I |
| Supplemental Data | | |
| Net assets, end of period (in millions) | $120 | $119 |
| Portfolio turnover rateJ | 14%I | 14%K,L |
A For the period March 1, 2018 (commencement of sale of shares) to December 31, 2018.
B Calculated based on average shares outstanding during the period.
C The amount shown for a share outstanding does not correspond with the aggregate net gain (loss) on investments for the period due to the timing of sales and repurchases of shares in relation to fluctuating market values of the investments of the Fund.
D Total returns for periods of less than one year are not annualized.
E Total returns would have been lower if certain expenses had not been reduced during the applicable periods shown.
F Total returns do not include the effect of the sales charges.
G Fees and expenses of any underlying Fidelity Central Funds are not included in the Fund's expense ratio. The Fund indirectly bears its proportionate share of the expenses of any underlying Fidelity Central Funds.
H Expense ratios reflect operating expenses of the class. Expenses before reductions do not reflect amounts reimbursed by the investment adviser or reductions from expense offset arrangements and do not represent the amount paid by the class during periods when reimbursements or reductions occur. Expense ratios before reductions for start-up periods may not be representative of longer-term operating periods. Expenses net of fee waivers reflect expenses after reimbursement by the investment adviser but prior to reductions from expense offset arrangements. Expenses net of all reductions represent the net expenses paid by the class.
I Annualized
J Amount does not include the portfolio activity of any underlying Fidelity Central Funds.
K The portfolio turnover rate does not include the assets acquired in the merger.
L Portfolio turnover rate excludes securities received or delivered in-kind.
See accompanying notes which are an integral part of the financial statements.
Fidelity Municipal Income Fund Class C
| | Six months ended (Unaudited) June 30, | Year endedDecember 31, |
| | 2019 | 2018 A |
| Selected Per–Share Data | | |
| Net asset value, beginning of period | $12.75 | $12.73 |
| Income from Investment Operations | | |
| Net investment income (loss)B | .120 | .204 |
| Net realized and unrealized gain (loss) | .558 | .032C |
| Total from investment operations | .678 | .236 |
| Distributions from net investment income | (.118) | (.208) |
| Distributions from net realized gain | – | (.008) |
| Total distributions | (.118) | (.216) |
| Net asset value, end of period | $13.31 | $12.75 |
| Total ReturnD,E,F | 5.34% | 1.87% |
| Ratios to Average Net AssetsG,H | | |
| Expenses before reductions | 1.55%I | 1.52%I |
| Expenses net of fee waivers, if any | 1.55%I | 1.52%I |
| Expenses net of all reductions | 1.55%I | 1.52%I |
| Net investment income (loss) | 1.85%I | 1.94%I |
| Supplemental Data | | |
| Net assets, end of period (in millions) | $62 | $82 |
| Portfolio turnover rateJ | 14%I | 14%K,L |
A For the period March 1, 2018 (commencement of sale of shares) to December 31, 2018.
B Calculated based on average shares outstanding during the period.
C The amount shown for a share outstanding does not correspond with the aggregate net gain (loss) on investments for the period due to the timing of sales and repurchases of shares in relation to fluctuating market values of the investments of the Fund.
D Total returns for periods of less than one year are not annualized.
E Total returns would have been lower if certain expenses had not been reduced during the applicable periods shown.
F Total returns do not include the effect of the contingent deferred sales charge.
G Fees and expenses of any underlying Fidelity Central Funds are not included in the Fund's expense ratio. The Fund indirectly bears its proportionate share of the expenses of any underlying Fidelity Central Funds.
H Expense ratios reflect operating expenses of the class. Expenses before reductions do not reflect amounts reimbursed by the investment adviser or reductions from expense offset arrangements and do not represent the amount paid by the class during periods when reimbursements or reductions occur. Expense ratios before reductions for start-up periods may not be representative of longer-term operating periods. Expenses net of fee waivers reflect expenses after reimbursement by the investment adviser but prior to reductions from expense offset arrangements. Expenses net of all reductions represent the net expenses paid by the class.
I Annualized
J Amount does not include the portfolio activity of any underlying Fidelity Central Funds.
K The portfolio turnover rate does not include the assets acquired in the merger.
L Portfolio turnover rate excludes securities received or delivered in-kind.
See accompanying notes which are an integral part of the financial statements.
Fidelity Municipal Income Fund
| | Six months ended (Unaudited) June 30, | Years endedDecember 31, | | | | |
| | 2019 | 2018 | 2017 | 2016 | 2015 | 2014 |
| Selected Per–Share Data | | | | | | |
| Net asset value, beginning of period | $12.75 | $13.12 | $12.86 | $13.44 | $13.53 | $12.68 |
| Income from Investment Operations | | | | | | |
| Net investment income (loss)A | .190 | .382 | .399 | .437 | .460 | .475 |
| Net realized and unrealized gain (loss) | .568 | (.286) | .444 | (.428) | (.021) | .851 |
| Total from investment operations | .758 | .096 | .843 | .009 | .439 | 1.326 |
| Distributions from net investment income | (.188) | (.381) | (.398) | (.437) | (.462) | (.476) |
| Distributions from net realized gain | – | (.085) | (.185) | (.152) | (.067) | – |
| Total distributions | (.188) | (.466) | (.583) | (.589) | (.529) | (.476) |
| Redemption fees added to paid in capitalA | – | – | – | –B | –B | –B |
| Net asset value, end of period | $13.32 | $12.75 | $13.12 | $12.86 | $13.44 | $13.53 |
| Total ReturnC,D | 5.98% | .80% | 6.67% | (.01)% | 3.31% | 10.59% |
| Ratios to Average Net AssetsE,F | | | | | | |
| Expenses before reductions | .46%G | .46% | .46% | .46% | .48% | .47% |
| Expenses net of fee waivers, if any | .46%G | .46% | .46% | .46% | .48% | .47% |
| Expenses net of all reductions | .46%G | .45% | .46% | .46% | .48% | .47% |
| Net investment income (loss) | 2.94%G | 3.00% | 3.05% | 3.22% | 3.42% | 3.58% |
| Supplemental Data | | | | | | |
| Net assets, end of period (in millions) | $3,922 | $3,817 | $5,617 | $5,477 | $5,770 | $5,745 |
| Portfolio turnover rateH | 14%G | 14%I,J | 37% | 25% | 14% | 9% |
A Calculated based on average shares outstanding during the period.
B Amount represents less than $.0005 per share.
C Total returns for periods of less than one year are not annualized.
D Total returns would have been lower if certain expenses had not been reduced during the applicable periods shown.
E Fees and expenses of any underlying Fidelity Central Funds are not included in the Fund's expense ratio. The Fund indirectly bears its proportionate share of the expenses of any underlying Fidelity Central Funds.
F Expense ratios reflect operating expenses of the class. Expenses before reductions do not reflect amounts reimbursed by the investment adviser or reductions from expense offset arrangements and do not represent the amount paid by the class during periods when reimbursements or reductions occur. Expenses net of fee waivers reflect expenses after reimbursement by the investment adviser but prior to reductions from expense offset arrangements. Expenses net of all reductions represent the net expenses paid by the class.
G Annualized
H Amount does not include the portfolio activity of any underlying Fidelity Central Funds.
I The portfolio turnover rate does not include the assets acquired in the merger.
J Portfolio turnover rate excludes securities received or delivered in-kind.
See accompanying notes which are an integral part of the financial statements.
Fidelity Municipal Income Fund Class I
| | Six months ended (Unaudited) June 30, | Year endedDecember 31, |
| | 2019 | 2018 A |
| Selected Per–Share Data | | |
| Net asset value, beginning of period | $12.75 | $12.73 |
| Income from Investment Operations | | |
| Net investment income (loss)B | .185 | .309 |
| Net realized and unrealized gain (loss) | .558 | .029C |
| Total from investment operations | .743 | .338 |
| Distributions from net investment income | (.183) | (.310) |
| Distributions from net realized gain | – | (.008) |
| Total distributions | (.183) | (.318) |
| Net asset value, end of period | $13.31 | $12.75 |
| Total ReturnD,E | 5.86% | 2.69% |
| Ratios to Average Net AssetsF,G | | |
| Expenses before reductions | .54%H | .53%H |
| Expenses net of fee waivers, if any | .54%H | .53%H |
| Expenses net of all reductions | .54%H | .53%H |
| Net investment income (loss) | 2.86%H | 2.93%H |
| Supplemental Data | | |
| Net assets, end of period (in millions) | $642 | $555 |
| Portfolio turnover rateI | 14%H | 14%J,K |
A For the period March 1, 2018 (commencement of sale of shares) to December 31, 2018.
B Calculated based on average shares outstanding during the period.
C The amount shown for a share outstanding does not correspond with the aggregate net gain (loss) on investments for the period due to the timing of sales and repurchases of shares in relation to fluctuating market values of the investments of the Fund.
D Total returns for periods of less than one year are not annualized.
E Total returns would have been lower if certain expenses had not been reduced during the applicable periods shown.
F Fees and expenses of any underlying Fidelity Central Funds are not included in the Fund's expense ratio. The Fund indirectly bears its proportionate share of the expenses of any underlying Fidelity Central Funds.
G Expense ratios reflect operating expenses of the class. Expenses before reductions do not reflect amounts reimbursed by the investment adviser or reductions from expense offset arrangements and do not represent the amount paid by the class during periods when reimbursements or reductions occur. Expense ratios before reductions for start-up periods may not be representative of longer-term operating periods. Expenses net of fee waivers reflect expenses after reimbursement by the investment adviser but prior to reductions from expense offset arrangements. Expenses net of all reductions represent the net expenses paid by the class.
H Annualized
I Amount does not include the portfolio activity of any underlying Fidelity Central Funds.
J The portfolio turnover rate does not include the assets acquired in the merger.
K Portfolio turnover rate excludes securities received or delivered in-kind.
See accompanying notes which are an integral part of the financial statements.
Fidelity Municipal Income Fund Class Z
| | Six months ended (Unaudited) June 30, | Year endedDecember 31, |
| | 2019 | 2018 A |
| Selected Per–Share Data | | |
| Net asset value, beginning of period | $12.75 | $12.64 |
| Income from Investment Operations | | |
| Net investment income (loss)B | .192 | .101 |
| Net realized and unrealized gain (loss) | .568 | .112C |
| Total from investment operations | .760 | .213 |
| Distributions from net investment income | (.190) | (.095) |
| Distributions from net realized gain | – | (.008) |
| Total distributions | (.190) | (.103) |
| Net asset value, end of period | $13.32 | $12.75 |
| Total ReturnD,E | 6.00% | 1.69% |
| Ratios to Average Net AssetsF,G | | |
| Expenses before reductions | .43%H | .42%H |
| Expenses net of fee waivers, if any | .43%H | .42%H |
| Expenses net of all reductions | .43%H | .42%H |
| Net investment income (loss) | 2.97%H | 3.08%H |
| Supplemental Data | | |
| Net assets, end of period (in millions) | $33 | $21 |
| Portfolio turnover rateI | 14%H | 14%J,K |
A For the period October 2, 2018 (commencement of sale of shares) to December 31, 2018.
B Calculated based on average shares outstanding during the period.
C The amount shown for a share outstanding does not correspond with the aggregate net gain (loss) on investments for the period due to the timing of sales and repurchases of shares in relation to fluctuating market values of the investments of the Fund.
D Total returns for periods of less than one year are not annualized.
E Total returns would have been lower if certain expenses had not been reduced during the applicable periods shown.
F Fees and expenses of any underlying Fidelity Central Funds are not included in the Fund's expense ratio. The Fund indirectly bears its proportionate share of the expenses of any underlying Fidelity Central Funds.
G Expense ratios reflect operating expenses of the class. Expenses before reductions do not reflect amounts reimbursed by the investment adviser or reductions from expense offset arrangements and do not represent the amount paid by the class during periods when reimbursements or reductions occur. Expense ratios before reductions for start-up periods may not be representative of longer-term operating periods. Expenses net of fee waivers reflect expenses after reimbursement by the investment adviser but prior to reductions from expense offset arrangements. Expenses net of all reductions represent the net expenses paid by the class.
H Annualized
I Amount does not include the portfolio activity of any underlying Fidelity Central Funds.
J The portfolio turnover rate does not include the assets acquired in the merger.
K Portfolio turnover rate excludes securities received or delivered in-kind.
See accompanying notes which are an integral part of the financial statements.
Notes to Financial Statements (Unaudited)
For the period ended June 30, 2019
(Amounts in thousands except percentages)
1. Organization.
Fidelity Municipal Income Fund (the Fund) is a fund of Fidelity Municipal Trust (the Trust) and is authorized to issue an unlimited number of shares. The Trust is registered under the Investment Company Act of 1940, as amended (the 1940 Act), as an open-end management investment company organized as a Massachusetts business trust. The Fund offers Class A, Class M, Class C, Fidelity Municipal Income Fund, Class I and Class Z shares, each of which has equal rights as to assets and voting privileges. Each class has exclusive voting rights with respect to matters that affect that class. Effective March 1, 2019, Class C shares will automatically convert to Class A shares after a holding period of ten years from the initial date of purchase, with certain exceptions.
2. Investments in Fidelity Central Funds.
The Fund invests in Fidelity Central Funds, which are open-end investment companies generally available only to other investment companies and accounts managed by the investment adviser and its affiliates. The Fund's Schedule of Investments lists each of the Fidelity Central Funds held as of period end, if any, as an investment of the Fund, but does not include the underlying holdings of each Fidelity Central Fund. As an Investing Fund, the Fund indirectly bears its proportionate share of the expenses of the underlying Fidelity Central Funds.
The Money Market Central Funds seek preservation of capital and current income and are managed by Fidelity Investments Money Management, Inc. (FIMM), an affiliate of the investment adviser. Annualized expenses of the Money Market Central Funds as of their most recent shareholder report date ranged from less than .005% to .01%.
A complete unaudited list of holdings for each Fidelity Central Fund is available upon request or at the Securities and Exchange Commission (the SEC) website at www.sec.gov. In addition, the financial statements of the Fidelity Central Funds are available on the SEC website or upon request.
3. Significant Accounting Policies.
The Fund is an investment company and applies the accounting and reporting guidance of the Financial Accounting Standards Board (FASB) Accounting Standards Codification Topic 946 Financial Services – Investments Companies. The financial statements have been prepared in conformity with accounting principles generally accepted in the United States of America (GAAP), which require management to make certain estimates and assumptions at the date of the financial statements. Actual results could differ from those estimates. Subsequent events, if any, through the date that the financial statements were issued have been evaluated in the preparation of the financial statements. The following summarizes the significant accounting policies of the Fund:
Investment Valuation. Investments are valued as of 4:00 p.m. Eastern time on the last calendar day of the period. The Board of Trustees (the Board) has delegated the day to day responsibility for the valuation of the Fund's investments to the Fair Value Committee (the Committee) established by the Fund's investment adviser. In accordance with valuation policies and procedures approved by the Board, the Fund attempts to obtain prices from one or more third party pricing vendors or brokers to value its investments. When current market prices, quotations or currency exchange rates are not readily available or reliable, investments will be fair valued in good faith by the Committee, in accordance with procedures adopted by the Board. Factors used in determining fair value vary by investment type and may include market or investment specific events, changes in interest rates and credit quality. The frequency with which these procedures are used cannot be predicted and they may be utilized to a significant extent. The Committee oversees the Fund's valuation policies and procedures and reports to the Board on the Committee's activities and fair value determinations. The Board monitors the appropriateness of the procedures used in valuing the Fund's investments and ratifies the fair value determinations of the Committee.
The Fund categorizes the inputs to valuation techniques used to value its investments into a disclosure hierarchy consisting of three levels as shown below:
- Level 1 – quoted prices in active markets for identical investments
- Level 2 – other significant observable inputs (including quoted prices for similar investments, interest rates, prepayment speeds, etc.)
- Level 3 – unobservable inputs (including the Fund's own assumptions based on the best information available)
Valuation techniques used to value the Fund's investments by major category are as follows:
Debt securities, including restricted securities, are valued based on evaluated prices received from third party pricing vendors or from brokers who make markets in such securities. Municipal securities are valued by pricing vendors who utilize matrix pricing which considers yield or price of bonds of comparable quality, coupon, maturity and type or by broker-supplied prices. When independent prices are unavailable or unreliable, debt securities may be valued utilizing pricing methodologies which consider similar factors that would be used by third party pricing vendors. Debt securities are generally categorized as Level 2 in the hierarchy but may be Level 3 depending on the circumstances.
Investments in open-end mutual funds, including the Fidelity Central Funds, are valued at their closing net asset value (NAV) each business day and are categorized as Level 1 in the hierarchy.
Changes in valuation techniques may result in transfers in or out of an assigned level within the disclosure hierarchy. The aggregate value of investments by input level as of June 30, 2019 is included at the end of the Fund's Schedule of Investments.
Investment Transactions and Income. For financial reporting purposes, the Fund's investment holdings and NAV include trades executed through the end of the last business day of the period. The NAV per share for processing shareholder transactions is calculated as of the close of business of the New York Stock Exchange (NYSE), normally 4:00 p.m. Eastern time and includes trades executed through the end of the prior business day. Gains and losses on securities sold are determined on the basis of identified cost. Income and capital gain distributions from Fidelity Central Funds, if any, are recorded on the ex-dividend date. Interest income is accrued as earned and includes coupon interest and amortization of premium and accretion of discount on debt securities as applicable. Debt obligations may be placed on non-accrual status and related interest income may be reduced by ceasing current accruals and writing off interest receivables when the collection of all or a portion of interest has become doubtful based on consistently applied procedures. A debt obligation is removed from non-accrual status when the issuer resumes interest payments or when collectability of interest is reasonably assured.
Class Allocations and Expenses. Investment income, realized and unrealized capital gains and losses, common expenses of the Fund, and certain fund-level expense reductions, if any, are allocated daily on a pro-rata basis to each class based on the relative net assets of each class to the total net assets of the Fund. Each class differs with respect to transfer agent and distribution and service plan fees incurred. Certain expense reductions may also differ by class. For the reporting period, the allocated portion of income and expenses to each class as a percent of its average net assets may vary due to the timing of recording these transactions in relation to fluctuating net assets of the classes. Expenses directly attributable to a fund are charged to that fund. Expenses attributable to more than one fund are allocated among the respective funds on the basis of relative net assets or other appropriate methods. Expense estimates are accrued in the period to which they relate and adjustments are made when actual amounts are known.
Income Tax Information and Distributions to Shareholders. Each year, the Fund intends to qualify as a regulated investment company under Subchapter M of the Internal Revenue Code, including distributing substantially all of its taxable income and realized gains. As a result, no provision for U.S. Federal income taxes is required. The Fund files a U.S. federal tax return, in addition to state and local tax returns as required. The Fund's federal income tax returns are subject to examination by the Internal Revenue Service (IRS) for a period of three fiscal years after they are filed. State and local tax returns may be subject to examination for an additional fiscal year depending on the jurisdiction.
Distributions are declared and recorded daily and paid monthly from net investment income. Distributions from realized gains, if any, are declared and recorded on the ex-dividend date. Income and capital gain distributions are declared separately for each class. Income and capital gain distributions are determined in accordance with income tax regulations, which may differ from GAAP.
Capital accounts within the financial statements are adjusted for permanent book-tax differences. These adjustments have no impact on net assets or the results of operations. Capital accounts are not adjusted for temporary book-tax differences which will reverse in a subsequent period.
Book-tax differences are primarily due to redemptions in-kind, market discount, deferred trustees compensation, losses deferred due to wash sales and excise tax regulations.
The Fund purchases municipal securities whose interest, in the opinion of the issuer, is free from federal income tax. There is no assurance that the IRS will agree with this opinion. In the event the IRS determines that the issuer does not comply with relevant tax requirements, interest payments from a security could become federally taxable, possibly retroactively to the date the security was issued.
As of period end, the cost and unrealized appreciation (depreciation) in securities, and derivatives if applicable, for federal income tax purposes were as follows:
| Gross unrealized appreciation | $290,495 |
| Gross unrealized depreciation | (288) |
| Net unrealized appreciation (depreciation) | $290,207 |
| Tax cost | $4,691,409 |
The Fund elected to defer to its next fiscal year approximately $2,139 of capital losses recognized during the period November 1, 2018 to December 31, 2018.
Delayed Delivery Transactions and When-Issued Securities. During the period, the Fund transacted in securities on a delayed delivery or when-issued basis. Payment and delivery may take place after the customary settlement period for that security. The price of the underlying securities and the date when the securities will be delivered and paid for are fixed at the time the transaction is negotiated. The securities purchased on a delayed delivery or when-issued basis are identified as such in the Fund's Schedule of Investments. The Fund may receive compensation for interest forgone in the purchase of a delayed delivery or when-issued security. With respect to purchase commitments, the Fund identifies securities as segregated in its records with a value at least equal to the amount of the commitment. Losses may arise due to changes in the value of the underlying securities or if the counterparty does not perform under the contract's terms, or if the issuer does not issue the securities due to political, economic, or other factors.
Restricted Securities. The Fund may invest in securities that are subject to legal or contractual restrictions on resale. These securities generally may be resold in transactions exempt from registration or to the public if the securities are registered. Disposal of these securities may involve time-consuming negotiations and expense, and prompt sale at an acceptable price may be difficult. Information regarding restricted securities is included at the end of the Fund's Schedule of Investments.
4. Purchases and Sales of Investments.
Purchases and sales of securities, other than short-term securities, aggregated $419,095 and $332,929, respectively.
5. Fees and Other Transactions with Affiliates.
Management Fee. Fidelity Management & Research Company (the investment adviser) and its affiliates provide the Fund with investment management related services for which the Fund pays a monthly management fee. The management fee is the sum of an individual fund fee rate that is based on an annual rate of .25% of the Fund's average net assets and an annualized group fee rate that averaged .10% during the period. The group fee rate is based upon the average net assets of all the mutual funds advised by the investment adviser, including any mutual funds previously advised by the investment adviser that are currently advised by Fidelity SelectCo, LLC, an affiliate of the investment adviser. The group fee rate decreases as assets under management increase and increases as assets under management decrease. For the reporting period, the total annualized management fee rate was .35% of the Fund's average net assets.
Distribution and Service Plan Fees. In accordance with Rule 12b-1 of the 1940 Act, the Fund has adopted separate Distribution and Service Plans for each class of shares. Certain classes pay Fidelity Distributors Corporation (FDC), an affiliate of the investment adviser, separate Distribution and Service Fees, each of which is based on an annual percentage of each class' average net assets. In addition, FDC may pay financial intermediaries for selling shares of the Fund and providing shareholder support services. For the period, the Distribution and Service Fee rates, total fees and amounts retained by FDC were as follows:
| | Distribution Fee | Service Fee | Total Fees | Retained by FDC |
| Class A | -% | .25% | $268 | $12 |
| Class M | -% | .25% | 149 | 3 |
| Class C | .75% | .25% | 356 | 22 |
| | | | $773 | $37 |
Sales Load. FDC may receive a front-end sales charge of up to 4.00% for selling Class A shares and Class M shares, some of which is paid to financial intermediaries for selling shares of the Fund. Depending on the holding period, FDC may receive contingent deferred sales charges levied on Class A, Class M and Class C redemptions. The deferred sales charges are 1.00% for Class C shares, .75% for certain purchases of Class A shares and .25% for certain purchases of Class M shares.
For the period, sales charge amounts retained by FDC were as follows:
| | Retained by FDC |
| Class A | $8 |
| Class M | 2 |
| Class C(a) | 2 |
| | $12 |
(a) When Class C shares are initially sold, FDC pays commissions from its own resources to financial intermediaries through which the sales are made.
Transfer Agent Fees. Fidelity Investments Institutional Operations Company, Inc. (FIIOC), an affiliate of the investment adviser, is the transfer, dividend disbursing and shareholder servicing agent for the Fund. FIIOC receives account fees and asset-based fees that vary according to the account size and type of account of the shareholders of the respective classes of the Fund, except for Class Z. FIIOC receives an asset-based fee of Class Z's average net assets. FIIOC pays for typesetting, printing and mailing of shareholder reports, except proxy statements. For the period, transfer agent fees for each class were as follows:
| | Amount | % of Class-Level Average Net Assets(a) |
| Class A | $176 | .17 |
| Class M | 87 | .15 |
| Class C | 57 | .16 |
| Fidelity Municipal Income Fund | 1,529 | .08 |
| Class I | 480 | .16 |
| Class Z | 7 | .05 |
| | $2,336 | |
(a) Annualized
Accounting Fees. Fidelity Service Company, Inc. (FSC), an affiliate of the investment adviser, maintains the Fund's accounting records. The fee is based on the level of average net assets for each month. For the period, the fees were equivalent to an annualized rate of .01%.
Interfund Trades. The Fund may purchase from or sell securities to other Fidelity Funds under procedures adopted by the Board. The procedures have been designed to ensure these interfund trades are executed in accordance with Rule 17a-7 of the 1940 Act. Interfund trades are included within the respective purchases and sales amounts shown in the Purchases and Sales of Investments note.
Prior Fiscal Year Affiliated Redemptions In-Kind. During the prior period, 83,345 shares of the Fund were redeemed in-kind for investments, including accrued interest, and cash with a value of $1,042,642. The Fund had a net realized gain of $939 on investments delivered through in-kind redemptions. The amount of the in-kind redemptions is included in share transactions in the accompanying Statement of Changes in Net Assets as well as the Notes to Financial Statements. The Fund recognized no gain or loss for federal income tax purposes.
6. Committed Line of Credit.
The Fund participates with other funds managed by the investment adviser or an affiliate in a $4.25 billion credit facility (the "line of credit") to be utilized for temporary or emergency purposes to fund shareholder redemptions or for other short-term liquidity purposes. The Fund has agreed to pay commitment fees on its pro-rata portion of the line of credit, which amounted to $7 and is reflected in Miscellaneous expenses on the Statement of Operations. During the period, the Fund did not borrow on this line of credit.
7. Expense Reductions.
The investment adviser voluntarily agreed to reimburse each class to the extent annual operating expenses exceeded certain levels of class-level average net assets as noted in the table below. Some expenses, for example the compensation of the independent Trustees, and certain other expenses such as interest expense, are excluded from this reimbursement.
The following classes were in reimbursement during the period:
| | Expense Limitations | Reimbursement |
| Class C | 1.55% | $–(a) |
(a) Amount represents less than five hundred dollars.
Through arrangements with the Fund's custodian, credits realized as a result of certain uninvested cash balances were used to reduce the Fund's expenses. During the period, these credits reduced the Fund's custody expenses by $9.
In addition, during the period the investment adviser reimbursed and/or waived a portion of fund-level operating expenses in the amount of $12 and a portion of class-level operating expenses as follows:
| | Amount |
| Class A | $1 |
| Class M | –(a) |
| Class C | –(a) |
| Fidelity Municipal Income Fund | 13 |
| Class I | 2 |
| Class Z | –(a) |
| | $16 |
(a) Amount represents less than five hundred dollars.
8. Distributions to Shareholders.
Distributions to shareholders of each class were as follows:
| | Six months ended
June 30, 2019 | Year ended
December 31, 2018(a) |
| Distributions to shareholders | | |
| Class A | $2,742 | $4,817 |
| Class M | 1,538 | 2,830 |
| Class C | 644 | 1,494 |
| Fidelity Municipal Income Fund | 55,717 | 184,722 |
| Class I | 8,457 | 15,359 |
| Class Z | 387 | 97 |
| Total | $69,485 | $209,319 |
(a) Distributions for Class A, Class M, Class C and Class I are for the period March 1, 2018 (commencement of sale of shares) to December 31, 2018. Distributions for Class Z are for the period October 2, 2018 (commencement of sale of shares) to December 31, 2018.
9. Share Transactions.
Share transactions for each class were as follows and may contain automatic conversions between classes or exchanges between affiliated funds:
| | Shares | Shares | Dollars | Dollars |
| | Six months ended June 30, 2019 | Year ended December 31, 2018(a) | Six months ended June 30, 2019 | Year ended December 31, 2018(a) |
| Class A | | | | |
| Shares sold | 2,746 | 1,670 | $35,671 | $21,200 |
| Issued in exchange for the shares of Fidelity Advisor Municipal Income Fund | – | 17,474 | – | 222,273 |
| Reinvestment of distributions | 187 | 338 | 2,449 | 4,287 |
| Shares redeemed | (1,573) | (3,720) | (20,481) | (47,170) |
| Net increase (decrease) | 1,360 | 15,762 | $17,639 | $200,590 |
| Class M | | | | |
| Shares sold | 211 | 170 | $2,732 | $2,172 |
| Issued in exchange for the shares of Fidelity Advisor Municipal Income Fund | – | 10,358 | – | 131,854 |
| Reinvestment of distributions | 104 | 199 | 1,360 | 2,525 |
| Shares redeemed | (595) | (1,434) | (7,745) | (18,218) |
| Net increase (decrease) | (280) | 9,293 | $(3,653) | $118,333 |
| Class C | | | | |
| Shares sold | 339 | 451 | $4,410 | $5,735 |
| Issued in exchange for the shares of Fidelity Advisor Municipal Income Fund | – | 7,653 | – | 97,341 |
| Reinvestment of distributions | 43 | 103 | 567 | 1,311 |
| Shares redeemed | (2,094) | (1,800) | (27,178) | (22,805) |
| Net increase (decrease) | (1,712) | 6,407 | $(22,201) | $81,582 |
| Fidelity Municipal Income Fund | | | | |
| Shares sold | 10,652 | 59,023 | $138,451 | $753,689 |
| Reinvestment of distributions | 2,670 | 9,833 | 34,908 | 125,182 |
| Shares redeemed | (18,227) | (197,790)(b) | (236,720) | (2,496,887)(b) |
| Net increase (decrease) | (4,905) | (128,934) | $(63,361) | $(1,618,016) |
| Class I | | | | |
| Shares sold | 10,374 | 13,956 | $134,356 | $177,050 |
| Issued in exchange for the shares of Fidelity Advisor Municipal Income Fund | – | 50,530 | – | 642,743 |
| Reinvestment of distributions | 318 | 642 | 4,152 | 8,146 |
| Shares redeemed | (6,010) | (21,601) | (77,741) | (273,260) |
| Net increase (decrease) | 4,682 | 43,527 | $60,767 | $554,679 |
| Class Z | | | | |
| Shares sold | 960 | 1,760 | $12,504 | $22,053 |
| Reinvestment of distributions | 28 | 7 | 364 | 95 |
| Shares redeemed | (129) | (137) | (1,679) | (1,735) |
| Net increase (decrease) | 859 | 1,630 | $11,189 | $20,413 |
(a) Share transactions for Class A, Class M, Class C and Class I are for the period March 1, 2018 (commencement of sale of shares) to December 31, 2018. Share transactions for Class Z are for the period October 2, 2018 (commencement of sale of shares) to December 31, 2018.
(b) Amount includes in-kind redemptions (see the Prior Fiscal Year Affiliated Redemptions In-Kind note for additional details).
10. Other.
The Fund's organizational documents provide former and current trustees and officers with a limited indemnification against liabilities arising in connection with the performance of their duties to the Fund. In the normal course of business, the Fund may also enter into contracts that provide general indemnifications. The Fund's maximum exposure under these arrangements is unknown as this would be dependent on future claims that may be made against the Fund. The risk of material loss from such claims is considered remote.
11. Prior Fiscal Year Merger Information.
On March 2, 2018, the Fund acquired all of the assets and assumed all of the liabilities of Fidelity Advisor Municipal Income Fund ("Target Fund") pursuant to an Agreement and Plan of Reorganization approved by the Board of Trustees ("The Board"). The acquisition was accomplished by an exchange of shares of each class of the Fund for corresponding shares then outstanding of the Target Fund at its net asset value on the acquisition date. In addition, the Board approved the creation of additional classes of shares that commenced sale of shares on March 1, 2018. The reorganization provides shareholders of the Target Fund access to a larger portfolio with a similar investment objective. The reorganization qualified as a tax-free reorganization for federal income tax purposes with no gain or loss recognized to the funds or their shareholders. The Target Fund's net assets of $1,094,211, including securities of $1,078,064 and unrealized appreciation of $12,741, was combined with the Fund's net assets of $5,490,715 for total net assets after the acquisition of $6,584,926.
Pro forma results of operations of the combined entity for the entire period ended December 31, 2018, as though the acquisition had occurred as of the beginning of the year (rather than on the actual acquisition date), are as follows:
| Net investment income (loss) | $178,321 |
| Total net realized gain (loss) | 3,763 |
| Total change in net unrealized appreciation (depreciation) | (175,496) |
| Net increase (decrease) in net assets resulting from operations | $6,588 |
Because the combined investment portfolios have been managed as a single portfolio since the acquisition was completed, it is not practicable to separate the amounts of revenue and earnings of the acquired fund that have been included in the Fund's accompanying Statement of Operations since March 2, 2018.
Shareholder Expense Example
As a shareholder of the Fund, you incur two types of costs: (1) transaction costs, including sales charges (loads) on purchase payments or redemption proceeds, and (2) ongoing costs, including management fees, distribution and/or service (12b-1) fees and other Fund expenses. This Example is intended to help you understand your ongoing costs (in dollars) of investing in the Fund and to compare these costs with the ongoing costs of investing in other mutual funds.
The Example is based on an investment of $1,000 invested at the beginning of the period and held for the entire period (January 1, 2019 to June 30, 2019).
Actual Expenses
The first line of the accompanying table for each class of the Fund provides information about actual account values and actual expenses. You may use the information in this line, together with the amount you invested, to estimate the expenses that you paid over the period. Simply divide your account value by $1,000.00 (for example, an $8,600 account value divided by $1,000.00 = 8.6), then multiply the result by the number in the first line for a class of the Fund under the heading entitled "Expenses Paid During Period" to estimate the expenses you paid on your account during this period. In addition, the Fund, as a shareholder in the underlying Fidelity Central Funds, will indirectly bear its pro-rata share of the fees and expenses incurred by the underlying Fidelity Central Funds. These fees and expenses are not included in the Fund's annualized expense ratio used to calculate the expense estimate in the table below.
Hypothetical Example for Comparison Purposes
The second line of the accompanying table for each class of the Fund provides information about hypothetical account values and hypothetical expenses based on a Class' actual expense ratio and an assumed rate of return of 5% per year before expenses, which is not the Class' actual return. The hypothetical account values and expenses may not be used to estimate the actual ending account balance or expenses you paid for the period. You may use this information to compare the ongoing costs of investing in the Fund and other funds. To do so, compare this 5% hypothetical example with the 5% hypothetical examples that appear in the shareholder reports of the other funds. In addition, the Fund, as a shareholder in the underlying Fidelity Central Funds, will indirectly bear its pro-rata share of the fees and expenses incurred by the underlying Fidelity Central Funds. These fees and expenses are not included in the Fund's annualized expense ratio used to calculate the expense estimate in the table below.
Please note that the expenses shown in the table are meant to highlight your ongoing costs only and do not reflect any transaction costs. Therefore, the second line of the table is useful in comparing ongoing costs only, and will not help you determine the relative total costs of owning different funds. In addition, if these transactional costs were included, your costs would have been higher.
| | Annualized Expense Ratio-A | Beginning
Account Value
January 1, 2019 | Ending
Account Value
June 30, 2019 | Expenses Paid
During Period-B
January 1, 2019
to June 30, 2019 |
| Class A | .80% | | | |
| Actual | | $1,000.00 | $1,057.30 | $4.08 |
| Hypothetical-C | | $1,000.00 | $1,020.83 | $4.01 |
| Class M | .78% | | | |
| Actual | | $1,000.00 | $1,057.30 | $3.98 |
| Hypothetical-C | | $1,000.00 | $1,020.93 | $3.91 |
| Class C | 1.55% | | | |
| Actual | | $1,000.00 | $1,053.40 | $7.89 |
| Hypothetical-C | | $1,000.00 | $1,017.11 | $7.75 |
| Fidelity Municipal Income Fund | .46% | | | |
| Actual | | $1,000.00 | $1,059.80 | $2.35 |
| Hypothetical-C | | $1,000.00 | $1,022.51 | $2.31 |
| Class I | .54% | | | |
| Actual | | $1,000.00 | $1,058.60 | $2.76 |
| Hypothetical-C | | $1,000.00 | $1,022.12 | $2.71 |
| Class Z | .43% | | | |
| Actual | | $1,000.00 | $1,060.00 | $2.20 |
| Hypothetical-C | | $1,000.00 | $1,022.66 | $2.16 |
A Annualized expense ratio reflects expenses net of applicable fee waivers.
B Expenses are equal to each Class' annualized expense ratio, multiplied by the average account value over the period, multiplied by 181/365 (to reflect the one-half year period).
C 5% return per year before expenses

HIY-SANN-0819
1.704645.121
Fidelity® Michigan Municipal Income Fund
Fidelity® Michigan Municipal Money Market Fund
Semi-Annual Report June 30, 2019 |
|
Beginning on January 1, 2021, as permitted by regulations adopted by the Securities and Exchange Commission, paper copies of a fund’s shareholder reports will no longer be sent by mail, unless you specifically request paper copies of the reports from the fund or from your financial intermediary, such as a financial advisor, broker-dealer or bank. Instead, the reports will be made available on a website, and you will be notified by mail each time a report is posted and provided with a website link to access the report.
If you already elected to receive shareholder reports electronically, you will not be affected by this change and you need not take any action. You may elect to receive shareholder reports and other communications from a fund electronically, by contacting your financial intermediary. For Fidelity customers, visit Fidelity's web site or call Fidelity using the contact information listed below.
You may elect to receive all future reports in paper free of charge. If you wish to continue receiving paper copies of your shareholder reports, you may contact your financial intermediary or, if you are a Fidelity customer, visit Fidelity’s website, or call Fidelity at the applicable toll-free number listed below. Your election to receive reports in paper will apply to all funds held with the fund complex/your financial intermediary.
| Account Type | Website | Phone Number |
| Brokerage, Mutual Fund, or Annuity Contracts: | fidelity.com/mailpreferences | 1-800-343-3548 |
| Employer Provided Retirement Accounts: | netbenefits.fidelity.com/preferences (choose 'no' under Required Disclosures to continue to print) | 1-800-343-0860 |
| Advisor Sold Accounts Serviced Through Your Financial Intermediary: | Contact Your Financial Intermediary | Your Financial Intermediary's phone number |
| Advisor Sold Accounts Serviced by Fidelity: | institutional.fidelity.com | 1-877-208-0098 |
Contents
To view a fund's proxy voting guidelines and proxy voting record for the 12-month period ended June 30, visit http://www.fidelity.com/proxyvotingresults or visit the Securities and Exchange Commission's (SEC) web site at http://www.sec.gov.
You may also call 1-800-544-8544 to request a free copy of the proxy voting guidelines.
Standard & Poor's, S&P and S&P 500 are registered service marks of The McGraw-Hill Companies, Inc. and have been licensed for use by Fidelity Distributors Corporation.
Other third-party marks appearing herein are the property of their respective owners.
All other marks appearing herein are registered or unregistered trademarks or service marks of FMR LLC or an affiliated company. © 2019 FMR LLC. All rights reserved.
This report and the financial statements contained herein are submitted for the general information of the shareholders of the Fund. This report is not authorized for distribution to prospective investors in the Fund unless preceded or accompanied by an effective prospectus.
A fund files its complete schedule of portfolio holdings with the SEC for the first and third quarters of each fiscal year on Form N-PORT. Forms N-PORT are available on the SEC’s web site at http://www.sec.gov. A fund's Forms N-PORT may be reviewed and copied at the SEC’s Public Reference Room in Washington, DC. Information regarding the operation of the SEC's Public Reference Room may be obtained by calling 1-800-SEC-0330.
For a complete list of a fund's portfolio holdings, view the most recent holdings listing, semiannual report, or annual report on Fidelity's web site at http://www.fidelity.com, http://www.institutional.fidelity.com, or http://www.401k.com, as applicable.
NOT FDIC INSURED •MAY LOSE VALUE •NO BANK GUARANTEE
Neither the Fund nor Fidelity Distributors Corporation is a bank.
Fidelity® Michigan Municipal Income Fund
Investment Summary (Unaudited)
Top Five Sectors as of June 30, 2019
| | % of fund's net assets |
| General Obligations | 31.6 |
| Health Care | 24.0 |
| Transportation | 13.0 |
| Water & Sewer | 10.4 |
| Education | 7.5 |
Quality Diversification (% of fund's net assets)
| As of June 30, 2019 |
| | AAA | 0.3% |
| | AA,A | 94.0% |
| | BBB | 1.2% |
| | BB and Below | 0.5% |
| | Not Rated | 0.6% |
| | Short-Term Investments and Net Other Assets | 3.4% |

We have used ratings from Moody's Investors Service, Inc. Where Moody's® ratings are not available, we have used S&P® ratings. All ratings are as of the date indicated and do not reflect subsequent changes.
Fidelity® Michigan Municipal Income Fund
Schedule of Investments June 30, 2019 (Unaudited)
Showing Percentage of Net Assets
| Municipal Bonds - 96.6% | | | |
| | | Principal Amount | Value |
| Guam - 0.9% | | | |
| Guam Int'l. Arpt. Auth. Rev.: | | | |
| Series 2013 C, 6.25% 10/1/34 (a) | | $1,000,000 | $1,154,980 |
| Series C, 5% 10/1/21 (a) | | 2,920,000 | 3,032,508 |
| Guam Pwr. Auth. Rev. Series 2012 A, 5% 10/1/23 (FSA Insured) | | 1,175,000 | 1,302,711 |
|
| TOTAL GUAM | | | 5,490,199 |
|
| Michigan - 95.7% | | | |
| Battle Creek School District Series 2016: | | | |
| 5% 5/1/36 | | 1,500,000 | 1,750,410 |
| 5% 5/1/37 | | 1,175,000 | 1,366,490 |
| Bay City School District Rev.: | | | |
| 5% 11/1/25 | | 1,000,000 | 1,152,920 |
| 5% 11/1/26 | | 1,000,000 | 1,148,910 |
| 5% 11/1/27 | | 700,000 | 802,487 |
| 5% 11/1/28 | | 250,000 | 286,848 |
| Brandon School District Series 2016 A: | | | |
| 5% 5/1/28 | | 2,515,000 | 2,974,340 |
| 5% 5/1/29 | | 1,250,000 | 1,471,938 |
| 5% 5/1/30 | | 1,250,000 | 1,465,250 |
| 5% 5/1/34 | | 2,475,000 | 2,872,881 |
| Chippewa Valley Schools Series 2016 A: | | | |
| 5% 5/1/32 | | 1,000,000 | 1,182,330 |
| 5% 5/1/33 | | 1,000,000 | 1,178,960 |
| 5% 5/1/34 | | 1,075,000 | 1,262,405 |
| 5% 5/1/35 | | 775,000 | 905,681 |
| Clarkston Cmnty. Schools: | | | |
| Series 2016, 5% 5/1/29 | | 1,500,000 | 1,743,765 |
| 5% 5/1/28 | | 1,745,000 | 2,035,368 |
| Detroit City School District Series 2005 A, 5.25% 5/1/30 (FSA Insured) | | 2,000,000 | 2,567,480 |
| Detroit Downtown Dev. Auth. Tax: | | | |
| Series 1, 5% 7/1/22 (FSA Insured) | | 500,000 | 547,445 |
| Series A: | | | |
| 5% 7/1/29 (FSA Insured) | | 1,340,000 | 1,517,764 |
| 5% 7/1/31 (FSA Insured) | | 1,775,000 | 1,995,011 |
| 5% 7/1/33 (FSA Insured) | | 2,000,000 | 2,239,020 |
| 5% 7/1/34 (FSA Insured) | | 1,750,000 | 1,954,488 |
| 5% 7/1/35 (FSA Insured) | | 2,750,000 | 3,064,903 |
| 5% 7/1/37 (FSA Insured) | | 2,000,000 | 2,219,960 |
| Detroit Gen. Oblig. Series 2018: | | | |
| 5% 4/1/20 | | 750,000 | 763,429 |
| 5% 4/1/21 | | 1,000,000 | 1,038,190 |
| 5% 4/1/22 | | 725,000 | 766,978 |
| 5% 4/1/23 | | 310,000 | 332,946 |
| Detroit School District School Bldg. and Site Impt. Series 2012 A, 5% 5/1/24 | | 5,000,000 | 5,483,800 |
| Detroit Swr. Disp. Rev. Series 2006, 5% 7/1/36 | | 10,000 | 10,025 |
| Detroit Wtr. Supply Sys. Rev. Series 2006 B, 7% 7/1/36 (Pre-Refunded to 7/1/19 @ 100) | | 2,700,000 | 2,700,000 |
| Detroit/Wayne Co. Stadium Auth. Series 2012: | | | |
| 5% 10/1/21 (FSA Insured) | | 2,000,000 | 2,146,300 |
| 5% 10/1/22 (FSA Insured) | | 2,645,000 | 2,912,939 |
| 5% 10/1/26 (FSA Insured) | | 4,850,000 | 5,298,868 |
| Downriver Util. Wastewtr. Auth. Swr. Sys. Rev. Series 2018: | | | |
| 5% 4/1/33 (FSA Insured) | | 735,000 | 873,797 |
| 5% 4/1/34 (FSA Insured) | | 520,000 | 617,292 |
| 5% 4/1/35 (FSA Insured) | | 500,000 | 591,460 |
| Farmington Pub. School District Gen. Oblig.: | | | |
| 5% 5/1/25 (FSA Insured) | | 2,140,000 | 2,550,516 |
| 5% 5/1/26 (FSA Insured) | | 1,385,000 | 1,635,436 |
| 5% 5/1/27 (FSA Insured) | | 1,425,000 | 1,676,612 |
| Forest Hills Pub. Schools: | | | |
| 5% 5/1/20 | | 1,575,000 | 1,623,223 |
| 5% 5/1/21 | | 1,575,000 | 1,680,651 |
| Fraser Pub. School District Series 2006 B, 5% 5/1/29 | | 1,455,000 | 1,698,422 |
| Grand Rapids Pub. Schools: | | | |
| Series 2019: | | | |
| 5% 11/1/39 (FSA Insured) | | 1,200,000 | 1,453,332 |
| 5% 11/1/41 (FSA Insured) | | 1,300,000 | 1,565,720 |
| 5% 11/1/42 (FSA Insured) | | 1,400,000 | 1,683,864 |
| 5% 5/1/29 (FSA Insured) | | 480,000 | 588,562 |
| Grand Rapids San. Swr. Sys. Rev.: | | | |
| Series 2018: | | | |
| 5% 1/1/31 | | 475,000 | 586,473 |
| 5% 1/1/33 | | 250,000 | 305,403 |
| 5% 1/1/34 | | 550,000 | 669,163 |
| 5% 1/1/35 | | 400,000 | 484,932 |
| 5% 1/1/38 | | 655,000 | 787,179 |
| 5% 1/1/43 | | 2,100,000 | 2,498,685 |
| 5% 1/1/48 | | 1,000,000 | 1,183,550 |
| Series 2012, 5% 1/1/37 | | 1,250,000 | 1,386,225 |
| Series 2014: | | | |
| 5% 1/1/27 | | 1,300,000 | 1,502,020 |
| 5% 1/1/29 | | 800,000 | 918,944 |
| 5% 1/1/30 | | 2,000,000 | 2,291,260 |
| Series 2016, 5% 1/1/37 | | 1,250,000 | 1,454,875 |
| Grand Rapids Wtr. Supply Sys.: | | | |
| Series 2016: | | | |
| 5% 1/1/31 | | 250,000 | 298,085 |
| 5% 1/1/32 | | 320,000 | 379,926 |
| 5% 1/1/33 | | 550,000 | 649,528 |
| 5% 1/1/34 | | 500,000 | 589,915 |
| 5% 1/1/35 | | 920,000 | 1,082,371 |
| 5% 1/1/36 | | 385,000 | 451,801 |
| 5% 1/1/46 | | 800,000 | 921,400 |
| Series 2018: | | | |
| 5% 1/1/43 | | 1,325,000 | 1,565,435 |
| 5% 1/1/48 | | 2,500,000 | 2,950,500 |
| Grand Traverse County Hosp. Fin. Auth.: | | | |
| Series 2011 A, 5.375% 7/1/35 | | 2,000,000 | 2,152,920 |
| Series 2014 A, 5% 7/1/47 | | 1,400,000 | 1,537,158 |
| Series 2019 A: | | | |
| 5% 7/1/44 | | 1,110,000 | 1,276,300 |
| 5% 7/1/49 | | 2,615,000 | 3,000,503 |
| Grand Valley Michigan State Univ. Rev.: | | | |
| Series 2014 B: | | | |
| 5% 12/1/25 | | 500,000 | 587,955 |
| 5% 12/1/26 | | 1,900,000 | 2,228,833 |
| 5% 12/1/28 | | 1,800,000 | 2,098,332 |
| Series 2018: | | | |
| 5% 12/1/34 | | 1,075,000 | 1,314,542 |
| 5% 12/1/35 | | 1,225,000 | 1,492,736 |
| 5% 12/1/37 | | 1,375,000 | 1,664,094 |
| 5% 12/1/38 | | 875,000 | 1,056,099 |
| 5% 12/1/43 | | 1,400,000 | 1,675,744 |
| Great Lakes Wtr. Auth. Sew Disp. Sys.: | | | |
| Series 2016 B, 5% 7/1/30 | | 2,000,000 | 2,385,140 |
| Series 2016 C, 5% 7/1/31 | | 7,000,000 | 8,281,490 |
| Series 2018 A: | | | |
| 5% 7/1/43 | | 10,000,000 | 11,931,500 |
| 5% 7/1/48 | | 5,000,000 | 5,952,650 |
| Great Lakes Wtr. Auth. Wtr. Supply Sys. Rev. Series 2016 C, 5.25% 7/1/35 | | 2,000,000 | 2,398,580 |
| Grosse Pointe Pub. School Sys. Series 2019: | | | |
| 5% 5/1/38 | | 1,000,000 | 1,223,840 |
| 5% 5/1/39 | | 1,000,000 | 1,219,510 |
| Hudsonville Pub. Schools: | | | |
| Series 2017: | | | |
| 5% 5/1/31 | | 430,000 | 520,541 |
| 5% 5/1/32 | | 1,200,000 | 1,447,512 |
| 5% 5/1/34 | | 1,000,000 | 1,198,840 |
| 5% 5/1/35 | | 1,000,000 | 1,195,020 |
| 4% 5/1/24 | | 1,220,000 | 1,332,179 |
| 4% 5/1/25 | | 500,000 | 543,505 |
| 5% 5/1/20 | | 1,000,000 | 1,030,111 |
| 5% 5/1/22 | | 600,000 | 659,286 |
| 5.25% 5/1/41 (Pre-Refunded to 5/1/21 @ 100) | | 1,750,000 | 1,875,930 |
| Ingham, Eaton and Clinton Counties Lansing School District: | | | |
| Series II: | | | |
| 4% 5/1/21 | | 375,000 | 392,835 |
| 4% 5/1/22 | | 345,000 | 369,950 |
| 5% 5/1/23 | | 430,000 | 487,319 |
| 5% 5/1/24 | | 355,000 | 412,869 |
| 5% 5/1/22 | | 1,730,000 | 1,902,965 |
| Jackson County Hosp. Fin. Auth. Hosp. Rev. (Allegiance Health Proj.) Series 2010 A, 5% 6/1/37 (Pre-Refunded to 6/1/20 @ 100) | | 2,250,000 | 2,324,318 |
| Kalamazoo Hosp. Fin. Auth. Hosp. Facilities Rev. Series 2016: | | | |
| 4% 5/15/36 | | 2,000,000 | 2,122,960 |
| 5% 5/15/28 | | 780,000 | 927,443 |
| 5% 5/15/30 | | 5,000,000 | 5,852,400 |
| Kent Hosp. Fin. Auth. Hosp. Facilities Rev. (Spectrum Health Sys. Proj.) Series 2011 A, 5.5% 11/15/25 | | 5,000,000 | 5,449,100 |
| Kentwood Pub. Schools Series 2012: | | | |
| 4% 5/1/21 | | 1,000,000 | 1,049,420 |
| 4% 5/1/22 | | 1,000,000 | 1,070,880 |
| L'Anse Creuse Pub. Schools Series 2012, 5% 5/1/23 | | 1,500,000 | 1,593,450 |
| Lake Orion Cmnty. School District 5% 5/1/23 | | 1,915,000 | 2,170,270 |
| Lansing Board of Wtr. & Lt. Util. Rev.: | | | |
| Series 2019 A: | | | |
| 5% 7/1/22 | | 230,000 | 254,884 |
| 5% 7/1/23 | | 340,000 | 387,886 |
| 5% 7/1/24 | | 375,000 | 439,260 |
| 5% 7/1/25 | | 375,000 | 449,659 |
| 5.5% 7/1/41 | | 5,000,000 | 5,376,100 |
| Lansing Cmnty. College: | | | |
| Series 2012: | | | |
| 5% 5/1/25 | | 350,000 | 384,276 |
| 5% 5/1/25 (Pre-Refunded to 5/1/22 @ 100) | | 1,190,000 | 1,311,249 |
| 5% 5/1/23 | | 1,135,000 | 1,244,823 |
| Lenawee Co. Hosp. Fin. Auth. Hosp. Rev. (ProMedica Heathcare Oblig. Group Proj.) Series 2011 B, 6% 11/15/35 (Pre-Refunded to 11/15/21 @ 100) | | 3,030,000 | 3,352,150 |
| Lincoln Consolidated School District Series 2016 A: | | | |
| 5% 5/1/28 | | 2,025,000 | 2,441,867 |
| 5% 5/1/29 | | 1,430,000 | 1,717,745 |
| 5% 5/1/31 | | 500,000 | 593,110 |
| 5% 5/1/32 | | 1,000,000 | 1,180,380 |
| Macomb Interceptor Drain Drainage District Series 2017 A: | | | |
| 5% 5/1/33 | | 2,100,000 | 2,526,132 |
| 5% 5/1/34 | | 1,750,000 | 2,097,970 |
| Marquette Board Lt. & Pwr. Elec. Util. Sys. Rev. Series 2016 A: | | | |
| 5% 7/1/29 | | 780,000 | 925,181 |
| 5% 7/1/30 | | 900,000 | 1,061,739 |
| 5% 7/1/31 | | 780,000 | 914,503 |
| 5% 7/1/32 | | 1,000,000 | 1,169,060 |
| 5% 7/1/33 | | 705,000 | 821,191 |
| Michigan Bldg. Auth. Rev.: | | | |
| (Facilities Prog.) Series 2015 1, 5% 10/15/50 | | 7,250,000 | 8,388,468 |
| Series 2009 I, 5.25% 10/15/25 (Assured Guaranty Corp. Insured) | | 2,000,000 | 2,023,360 |
| 5% 4/15/38 | | 3,000,000 | 3,483,840 |
| Michigan Fin. Auth. Rev.: | | | |
| (Charter County of Wayne Criminal Justice Ctr. Proj.) Series 2018: | | | |
| 5% 11/1/32 | | 1,000,000 | 1,228,570 |
| 5% 11/1/33 | | 2,500,000 | 3,067,925 |
| 5% 11/1/35 | | 1,000,000 | 1,219,020 |
| 5% 11/1/36 | | 1,250,000 | 1,517,400 |
| 5% 11/1/37 | | 1,500,000 | 1,809,120 |
| 5% 11/1/38 | | 1,595,000 | 1,918,514 |
| (Henry Ford Health Sys. Proj.) Series 2016, 5% 11/15/24 | | 2,940,000 | 3,448,473 |
| (Holland Cmnty. Hosp. Proj.) Series 2013 A: | | | |
| 5% 1/1/33 | | 1,250,000 | 1,364,438 |
| 5% 1/1/40 | | 3,000,000 | 3,243,150 |
| (Kalamazoo College Proj.) Series 2018, 4% 12/1/47 | | 2,610,000 | 2,798,494 |
| (Local Govt. Ln. Prog.) Series 2014 D, 5% 7/1/37 (FSA Insured) | | 1,000,000 | 1,125,440 |
| (Mid-Michigan Health Sys. Proj.) Series 2014, 5% 6/1/39 | | 540,000 | 601,425 |
| (Trinity Health Proj.) Series 2017: | | | |
| 5% 12/1/30 | | 710,000 | 874,919 |
| 5% 12/1/42 | | 2,120,000 | 2,497,911 |
| (Trinity Health Proj.) Series 2015, 5% 12/1/33 | | 1,220,000 | 1,329,739 |
| Bonds: | | | |
| Series 2015 D2, 1 month U.S. LIBOR + 0.750% 2.385%, tender 10/15/20 (b)(c) | | 7,920,000 | 7,946,770 |
| Series 2019 MI2, 5%, tender 2/1/25 (b) | | 5,000,000 | 5,850,550 |
| Series 2011, 5% 12/1/39 | | 1,500,000 | 1,610,265 |
| Series 2012 A, 5% 6/1/27 (Pre-Refunded to 6/1/22 @ 100) | | 125,000 | 137,916 |
| Series 2012: | | | |
| 5% 11/15/24 | | 660,000 | 735,643 |
| 5% 11/15/25 | | 1,000,000 | 1,112,870 |
| 5% 11/15/26 | | 800,000 | 888,904 |
| 5% 11/1/42 | | 2,000,000 | 2,174,320 |
| 5% 11/15/42 | | 3,120,000 | 3,368,508 |
| Series 2013: | | | |
| 5% 10/1/25 | | 1,255,000 | 1,400,668 |
| 5% 8/15/30 | | 4,105,000 | 4,599,817 |
| Series 2014 H1: | | | |
| 5% 10/1/22 | | 1,000,000 | 1,075,690 |
| 5% 10/1/25 | | 2,250,000 | 2,610,518 |
| 5% 10/1/39 | | 4,725,000 | 5,368,451 |
| Series 2014: | | | |
| 5% 6/1/25 | | 1,000,000 | 1,154,390 |
| 5% 6/1/26 | | 700,000 | 808,423 |
| 5% 6/1/27 | | 700,000 | 805,637 |
| Series 2015 C: | | | |
| 5% 7/1/26 | | 570,000 | 673,814 |
| 5% 7/1/27 | | 1,215,000 | 1,431,792 |
| 5% 7/1/28 | | 1,500,000 | 1,762,995 |
| 5% 7/1/35 | | 1,000,000 | 1,148,320 |
| Series 2015 D1: | | | |
| 5% 7/1/34 | | 1,250,000 | 1,446,550 |
| 5% 7/1/35 | | 500,000 | 577,490 |
| Series 2015 D2, 5% 7/1/34 | | 1,000,000 | 1,154,810 |
| Series 2016 A, 5% 11/1/44 | | 6,190,000 | 7,019,274 |
| Series 2016: | | | |
| 5% 1/1/29 | | 1,000,000 | 1,182,370 |
| 5% 11/15/29 | | 2,950,000 | 3,534,041 |
| 5% 1/1/30 | | 1,000,000 | 1,177,370 |
| 5% 1/1/31 | | 1,170,000 | 1,370,807 |
| 5% 1/1/32 | | 1,895,000 | 2,207,088 |
| 5% 1/1/33 | | 1,915,000 | 2,221,074 |
| 5% 1/1/34 | | 2,135,000 | 2,468,295 |
| 5% 11/15/41 | | 11,710,000 | 13,534,418 |
| Series 2019 A: | | | |
| 4% 11/15/50 | | 3,000,000 | 3,241,830 |
| 5% 11/15/48 | | 2,000,000 | 2,377,080 |
| Series 2019 MI1, 5% 12/1/48 | | 2,000,000 | 2,369,480 |
| 5% 12/1/27 | | 1,090,000 | 1,142,026 |
| 5% 12/1/27 (Pre-Refunded to 12/1/20 @ 100) | | 10,000 | 10,508 |
| Michigan Hosp. Fin. Auth. Rev.: | | | |
| Bonds Series 2010 F4, 1.95%, tender 4/1/20 (b) | | 5,530,000 | 5,550,016 |
| Series 2016: | | | |
| 5% 11/15/46 | | 3,500,000 | 4,049,360 |
| 5% 11/15/47 | | 18,000,000 | 20,803,663 |
| Michigan Muni. Bond Auth. Rev. Series 2005, 5% 10/1/23 (Pre-Refunded to 10/1/19 @ 100) | | 385,000 | 388,542 |
| Michigan State Univ. Revs. Series 2019 B, 5% 2/15/48 | | 3,000,000 | 3,633,930 |
| Michigan Strategic Fund Ltd. Oblig. Rev.: | | | |
| (Cadillac Place Office Bldg. Proj.) Series 2011, 5.25% 10/15/26 | | 3,585,000 | 3,881,802 |
| (I-75 Impt. Proj.) Series 2018, 4.25% 12/31/38 (FSA Insured) (a) | | 7,000,000 | 7,640,080 |
| Milan Area Schools Series 2019, 5% 5/1/21 | | 950,000 | 1,011,940 |
| Oakland Univ. Rev.: | | | |
| Series 2012: | | | |
| 5% 3/1/24 | | 1,170,000 | 1,273,849 |
| 5% 3/1/25 | | 1,225,000 | 1,331,722 |
| 5% 3/1/26 | | 1,290,000 | 1,399,560 |
| Series 2013 A: | | | |
| 5% 3/1/25 | | 995,000 | 1,111,982 |
| 5% 3/1/26 | | 1,620,000 | 1,806,802 |
| 5% 3/1/27 | | 815,000 | 907,747 |
| 5% 3/1/38 | | 2,900,000 | 3,166,336 |
| Series 2014: | | | |
| 5% 3/1/28 | | 335,000 | 381,853 |
| 5% 3/1/29 | | 525,000 | 594,872 |
| 5% 3/1/39 | | 3,000,000 | 3,333,000 |
| Series 2016: | | | |
| 5% 3/1/28 | | 1,150,000 | 1,373,181 |
| 5% 3/1/41 | | 3,475,000 | 3,986,068 |
| Portage Pub. Schools: | | | |
| Series 2016: | | | |
| 5% 11/1/32 | | 2,500,000 | 2,969,925 |
| 5% 11/1/34 | | 1,250,000 | 1,476,563 |
| 5% 11/1/35 | | 1,300,000 | 1,530,594 |
| 5% 11/1/39 | | 755,000 | 880,700 |
| Series 2019: | | | |
| 3% 5/1/40 | | 2,195,000 | 2,199,895 |
| 4% 11/1/38 | | 2,000,000 | 2,237,060 |
| Rochester Cmnty. School District 5% 5/1/31 | | 1,500,000 | 1,781,430 |
| Rockford Pub. Schools Gen. Oblig. Series 2019 I: | | | |
| 4% 5/1/20 | | 1,840,000 | 1,879,955 |
| 4% 5/1/21 | | 2,145,000 | 2,247,016 |
| 4% 5/1/22 | | 1,575,000 | 1,688,447 |
| 5% 5/1/42 | | 3,050,000 | 3,664,545 |
| 5% 5/1/44 | | 6,100,000 | 7,310,484 |
| 5% 5/1/46 | | 3,120,000 | 3,734,765 |
| Roseville Cmnty. Schools: | | | |
| Series 2014: | | | |
| 5% 5/1/24 | | 780,000 | 905,174 |
| 5% 5/1/25 | | 1,000,000 | 1,189,370 |
| 5% 5/1/26 | | 1,385,000 | 1,641,336 |
| 5% 5/1/24 | | 570,000 | 661,474 |
| 5% 5/1/26 | | 1,715,000 | 2,032,412 |
| 5% 5/1/27 | | 1,795,000 | 2,118,477 |
| 5% 5/1/28 | | 1,885,000 | 2,215,554 |
| Royal Oak Hosp. Fin. Auth. Hosp. Rev. Series 2014 D: | | | |
| 5% 9/1/26 | | 1,000,000 | 1,142,800 |
| 5% 9/1/27 | | 1,175,000 | 1,338,396 |
| 5% 9/1/28 | | 1,870,000 | 2,124,227 |
| Saginaw Hosp. Fin. Auth. Hosp. Rev. (Covenant Med. Ctr., Inc.) Series 2010 H, 5% 7/1/30 | | 5,000,000 | 5,154,400 |
| Saint Clair County Gen. Oblig. 5% 4/1/26 | | 1,495,000 | 1,634,244 |
| South Haven Gen. Oblig. Series 2009, 5.125% 12/1/33 (Pre-Refunded to 12/1/19 @ 100) | | 1,000,000 | 1,015,930 |
| South Lyon Cmnty. Schools Series 2016: | | | |
| 5% 5/1/23 | | 1,575,000 | 1,781,168 |
| 5% 5/1/24 | | 3,200,000 | 3,718,400 |
| 5% 5/1/25 | | 2,355,000 | 2,800,966 |
| Warren Consolidated School District: | | | |
| Series 2016: | | | |
| 5% 5/1/23 | | 810,000 | 911,517 |
| 5% 5/1/34 | | 5,630,000 | 6,543,411 |
| Series 2017: | | | |
| 4% 5/1/23 (FSA Insured) | | 750,000 | 811,883 |
| 4% 5/1/24 (FSA Insured) | | 750,000 | 826,373 |
| 4% 5/1/25 (FSA Insured) | | 500,000 | 558,085 |
| Series 2018: | | | |
| 5% 5/1/30 | | 550,000 | 674,031 |
| 5% 5/1/32 | | 1,100,000 | 1,330,582 |
| 5% 5/1/34 | | 1,175,000 | 1,409,601 |
| 5% 5/1/35 | | 1,200,000 | 1,433,472 |
| 5% 5/1/36 | | 1,000,000 | 1,189,920 |
| 5% 5/1/37 | | 1,300,000 | 1,542,632 |
| 5% 5/1/38 | | 800,000 | 945,984 |
| Wayne County Arpt. Auth. Rev.: | | | |
| Series 2011 A: | | | |
| 5% 12/1/21 (a) | | 5,000,000 | 5,412,000 |
| 5% 12/1/22 (a) | | 5,260,000 | 5,692,109 |
| Series 2012 A, 5% 12/1/23 | | 2,300,000 | 2,580,807 |
| Series 2014 C: | | | |
| 5% 12/1/29 (a) | | 720,000 | 832,889 |
| 5% 12/1/31 (a) | | 860,000 | 986,738 |
| 5% 12/1/34 (a) | | 1,655,000 | 1,884,350 |
| Series 2015 D, 5% 12/1/40 (FSA Insured) | | 8,165,000 | 9,500,222 |
| Series 2015 F: | | | |
| 5% 12/1/25 (a) | | 2,735,000 | 3,273,658 |
| 5% 12/1/27 (a) | | 4,810,000 | 5,720,966 |
| Series 2015 G: | | | |
| 5% 12/1/35 | | 5,435,000 | 6,378,625 |
| 5% 12/1/36 | | 5,760,000 | 6,743,002 |
| Series 2017 A: | | | |
| 5% 12/1/22 | | 640,000 | 717,907 |
| 5% 12/1/37 | | 545,000 | 653,673 |
| 5% 12/1/42 | | 1,455,000 | 1,733,734 |
| Series 2017 B, 5% 12/1/47 (a) | | 450,000 | 525,618 |
| Series 2018 B, 5% 12/1/48 (a) | | 5,000,000 | 5,932,800 |
| Series 2018 D: | | | |
| 5% 12/1/30 (a) | | 4,365,000 | 5,408,235 |
| 5% 12/1/31 (a) | | 2,825,000 | 3,479,016 |
| 5% 12/1/32 (a) | | 2,945,000 | 3,617,020 |
| West Ottawa Pub. School District: | | | |
| Series 2012 A: | | | |
| 5% 5/1/25 | | 2,640,000 | 2,806,426 |
| 5% 5/1/25 (Pre-Refunded to 5/1/21 @ 100) | | 1,670,000 | 1,779,502 |
| 5% 5/1/26 | | 1,225,000 | 1,301,538 |
| 5% 5/1/26 (Pre-Refunded to 5/1/21 @ 100) | | 775,000 | 825,817 |
| Series 2014 1: | | | |
| 5% 5/1/30 | | 725,000 | 827,943 |
| 5% 5/1/32 | | 500,000 | 568,820 |
| 5% 5/1/34 | | 900,000 | 1,022,859 |
| 5% 5/1/35 | | 250,000 | 283,655 |
| Western Michigan Univ. Rev.: | | | |
| Series 2014: | | | |
| 5% 11/15/25 | | 320,000 | 375,165 |
| 5% 11/15/26 | | 400,000 | 468,508 |
| 5% 11/15/28 | | 650,000 | 756,600 |
| 5% 11/15/29 | | 750,000 | 868,253 |
| 5% 11/15/30 | | 855,000 | 992,775 |
| 5% 11/15/31 | | 700,000 | 811,643 |
| Series 2015 A: | | | |
| 5% 11/15/26 | | 1,000,000 | 1,176,340 |
| 5% 11/15/28 | | 2,505,000 | 2,932,278 |
| Woodhaven-Brownstown School District County of Wayne: | | | |
| 5% 5/1/36 | | 2,835,000 | 3,323,896 |
| 5% 5/1/38 | | 5,670,000 | 6,614,225 |
| Ypsilanti School District Series A: | | | |
| 5% 5/1/29 | | 1,305,000 | 1,560,193 |
| 5% 5/1/30 | | 1,550,000 | 1,846,717 |
| 5% 5/1/32 | | 2,000,000 | 2,360,760 |
| Zeeland Pub. Schools: | | | |
| 5% 5/1/27 (FSA Insured) | | 1,000,000 | 1,173,540 |
| 5% 5/1/28 (FSA Insured) | | 500,000 | 585,005 |
| 5% 5/1/29 (FSA Insured) | | 1,000,000 | 1,166,700 |
| 5% 5/1/30 (FSA Insured) | | 1,000,000 | 1,163,190 |
|
| TOTAL MICHIGAN | | | 615,599,478 |
|
| TOTAL MUNICIPAL BONDS | | | |
| (Cost $592,034,957) | | | 621,089,677 |
|
| Municipal Notes - 2.4% | | | |
| Michigan - 2.4% | | | |
| Grand Traverse County Hosp. Fin. Auth. Series 2019 C, 1.97% 7/1/19, LOC PNC Bank NA, VRDN (b) | | 905,000 | $905,000 |
| Michigan Fin. Auth. Rev.: | | | |
| Participating VRDN Series Floaters XF 06 86, 1.95% 7/5/19 (Liquidity Facility Royal Bank of Canada) (b)(d)(e) | | 6,600,000 | 6,600,000 |
| Series 2016 E3, 1.9% 7/5/19, VRDN (b) | | 5,130,000 | 5,130,000 |
| Michigan Hsg. Dev. Auth. Rental Hsg. Rev. Series 2018 C, 1.98% 7/5/19 (Liquidity Facility JPMorgan Chase Bank), VRDN (a)(b) | | 1,200,000 | 1,200,000 |
| Michigan Strategic Fund Ltd. Oblig. Rev.: | | | |
| (Air Products and Chemicals, Inc. Proj.) Series 2007 V1, 2.02% 7/1/19, VRDN (b) | | 770,000 | 770,000 |
| (Henry Ford Museum & Greenfield Village Proj.) Series 2002, 1.95% 7/1/19, LOC Comerica Bank, VRDN (b) | | 1,200,000 | 1,200,000 |
| TOTAL MUNICIPAL NOTES | | | |
| (Cost $15,805,000) | | | 15,805,000 |
| TOTAL INVESTMENT IN SECURITIES - 99.0% | | | |
| (Cost $607,839,957) | | | 636,894,677 |
| NET OTHER ASSETS (LIABILITIES) - 1.0% | | | 6,151,599 |
| NET ASSETS - 100% | | | $643,046,276 |
Security Type Abbreviations
VRDN – VARIABLE RATE DEMAND NOTE (A debt instrument that is payable upon demand, either daily, weekly or monthly)
Legend
(a) Private activity obligations whose interest is subject to the federal alternative minimum tax for individuals.
(b) Coupon rates for floating and adjustable rate securities reflect the rates in effect at period end.
(c) Coupon is indexed to a floating interest rate which may be multiplied by a specified factor and/or subject to caps or floors.
(d) Provides evidence of ownership in one or more underlying municipal bonds.
(e) Coupon rates are determined by re-marketing agents based on current market conditions.
Investment Valuation
All investments are categorized as Level 2 under the Fair Value Hierarchy. The inputs or methodology used for valuing securities may not be an indication of the risk associated with investing in those securities. For more information on valuation inputs please refer to the Investment Valuation section in the accompanying Notes to Financial Statements.
Other Information
The distribution of municipal securities by revenue source, as a percentage of total Net Assets, is as follows (Unaudited):
| General Obligations | 31.6% |
| Health Care | 24.0% |
| Transportation | 13.0% |
| Water & Sewer | 10.4% |
| Education | 7.5% |
| Special Tax | 6.7% |
| Others* (Individually Less Than 5%) | 6.8% |
| | 100.0% |
* Includes net other assets
See accompanying notes which are an integral part of the financial statements.
Fidelity® Michigan Municipal Income Fund
Financial Statements
Statement of Assets and Liabilities
| | | June 30, 2019 (Unaudited) |
| Assets | | |
Investment in securities, at value — See accompanying schedule:
Unaffiliated issuers (cost $607,839,957) | | $636,894,677 |
| Cash | | 463,766 |
| Receivable for fund shares sold | | 252,843 |
| Interest receivable | | 6,297,968 |
| Other receivables | | 1,228 |
| Total assets | | 643,910,482 |
| Liabilities | | |
| Payable for fund shares redeemed | $179,421 | |
| Distributions payable | 409,190 | |
| Accrued management fee | 188,683 | |
| Transfer agent fee payable | 47,204 | |
| Other affiliated payables | 12,609 | |
| Other payables and accrued expenses | 27,099 | |
| Total liabilities | | 864,206 |
| Net Assets | | $643,046,276 |
| Net Assets consist of: | | |
| Paid in capital | | $613,109,067 |
| Total distributable earnings (loss) | | 29,937,209 |
| Net Assets, for 51,797,173 shares outstanding | | $643,046,276 |
| Net Asset Value, offering price and redemption price per share ($643,046,276 ÷ 51,797,173 shares) | | $12.41 |
See accompanying notes which are an integral part of the financial statements.
Statement of Operations
| | | Six months ended June 30, 2019 (Unaudited) |
| Investment Income | | |
| Interest | | $9,489,193 |
| Expenses | | |
| Management fee | $1,097,656 | |
| Transfer agent fees | 276,486 | |
| Accounting fees and expenses | 74,064 | |
| Custodian fees and expenses | 2,517 | |
| Independent trustees' fees and expenses | 1,122 | |
| Registration fees | 18,865 | |
| Audit | 29,383 | |
| Legal | 5,034 | |
| Miscellaneous | 2,439 | |
| Total expenses before reductions | 1,507,566 | |
| Expense reductions | (2,749) | |
| Total expenses after reductions | | 1,504,817 |
| Net investment income (loss) | | 7,984,376 |
| Realized and Unrealized Gain (Loss) | | |
| Net realized gain (loss) on: | | |
| Investment securities: | | |
| Unaffiliated issuers | | 1,603,352 |
| Total net realized gain (loss) | | 1,603,352 |
| Change in net unrealized appreciation (depreciation) on investment securities | | 21,121,756 |
| Net gain (loss) | | 22,725,108 |
| Net increase (decrease) in net assets resulting from operations | | $30,709,484 |
See accompanying notes which are an integral part of the financial statements.
Statement of Changes in Net Assets
| | Six months ended June 30, 2019 (Unaudited) | Year ended December 31, 2018 |
| Increase (Decrease) in Net Assets | | |
| Operations | | |
| Net investment income (loss) | $7,984,376 | $16,997,911 |
| Net realized gain (loss) | 1,603,352 | 904,940 |
| Change in net unrealized appreciation (depreciation) | 21,121,756 | (13,434,751) |
| Net increase (decrease) in net assets resulting from operations | 30,709,484 | 4,468,100 |
| Distributions to shareholders | (7,984,190) | (18,803,882) |
| Share transactions | | |
| Proceeds from sales of shares | 50,446,149 | 78,090,250 |
| Reinvestment of distributions | 5,530,194 | 13,425,197 |
| Cost of shares redeemed | (33,339,359) | (159,878,263) |
| Net increase (decrease) in net assets resulting from share transactions | 22,636,984 | (68,362,816) |
| Total increase (decrease) in net assets | 45,362,278 | (82,698,598) |
| Net Assets | | |
| Beginning of period | 597,683,998 | 680,382,596 |
| End of period | $643,046,276 | $597,683,998 |
| Other Information | | |
| Shares | | |
| Sold | 4,144,208 | 6,528,754 |
| Issued in reinvestment of distributions | 452,346 | 1,125,982 |
| Redeemed | (2,739,998) | (13,403,469) |
| Net increase (decrease) | 1,856,556 | (5,748,733) |
See accompanying notes which are an integral part of the financial statements.
Financial Highlights
Fidelity Michigan Municipal Income Fund
| | Six months ended (Unaudited) June 30, | Years endedDecember 31, | | | | |
| | 2019 | 2018 | 2017 | 2016 | 2015 | 2014 |
| Selected Per–Share Data | | | | | | |
| Net asset value, beginning of period | $11.97 | $12.22 | $11.94 | $12.38 | $12.33 | $11.70 |
| Income from Investment Operations | | | | | | |
| Net investment income (loss)A | .157 | .319 | .333 | .352 | .387 | .422 |
| Net realized and unrealized gain (loss) | .440 | (.216) | .324 | (.364) | .050 | .642 |
| Total from investment operations | .597 | .103 | .657 | (.012) | .437 | 1.064 |
| Distributions from net investment income | (.157) | (.318) | (.333) | (.353) | (.387) | (.421) |
| Distributions from net realized gain | – | (.035) | (.044) | (.075) | – | (.013) |
| Total distributions | (.157) | (.353) | (.377) | (.428) | (.387) | (.434) |
| Redemption fees added to paid in capitalA | – | – | – | –B | –B | –B |
| Net asset value, end of period | $12.41 | $11.97 | $12.22 | $11.94 | $12.38 | $12.33 |
| Total ReturnC,D | 5.01% | .90% | 5.57% | (.16)% | 3.61% | 9.23% |
| Ratios to Average Net AssetsE | | | | | | |
| Expenses before reductions | .49%F | .49% | .49% | .49% | .49% | .48% |
| Expenses net of fee waivers, if any | .49%F | .48% | .48% | .49% | .49% | .48% |
| Expenses net of all reductions | .49%F | .48% | .48% | .48% | .49% | .48% |
| Net investment income (loss) | 2.60%F | 2.67% | 2.74% | 2.83% | 3.15% | 3.49% |
| Supplemental Data | | | | | | |
| Net assets, end of period (000 omitted) | $643,046 | $597,684 | $680,383 | $651,635 | $634,206 | $569,796 |
| Portfolio turnover rate | 15%F | 22% | 12% | 25% | 11% | 12% |
A Calculated based on average shares outstanding during the period.
B Amount represents less than $.0005 per share.
C Total returns for periods of less than one year are not annualized.
D Total returns would have been lower if certain expenses had not been reduced during the applicable periods shown.
E Expense ratios reflect operating expenses of the Fund. Expenses before reductions do not reflect amounts reimbursed by the investment adviser or reductions from expense offset arrangements and do not represent the amount paid by the Fund during periods when reimbursements or reductions occur. Expenses net of fee waivers reflect expenses after reimbursement by the investment adviser but prior to reductions from expense offset arrangements. Expenses net of all reductions represent the net expenses paid by the Fund.
F Annualized
See accompanying notes which are an integral part of the financial statements.
Fidelity® Michigan Municipal Money Market Fund
Investment Summary/Performance (Unaudited)
Effective Maturity Diversification as of June 30, 2019
| Days | % of fund's investments |
| 1 - 7 | 90.0 |
| 8 - 30 | 0.4 |
| 31 - 60 | 2.1 |
| 61 - 90 | 0.4 |
| 91 - 180 | 0.8 |
| >180 | 6.3 |
Effective maturity is determined in accordance with the requirements of Rule 2a-7 under the Investment Company Act of 1940.
Asset Allocation (% of fund's net assets)
| As of June 30, 2019 |
| | Variable Rate Demand Notes (VRDNs) | 47.3% |
| | Tender Option Bond | 38.2% |
| | Other Municipal Security | 12.5% |
| | Investment Companies | 0.5% |
| | Net Other Assets (Liabilities) | 1.5% |

Current 7-Day Yields
| | 6/30/19 |
| Fidelity® Michigan Municipal Money Market Fund | 1.41% |
Yield refers to the income paid by the Fund over a given period. Yield for money market funds is usually for seven-day periods, as it is here, though it is expressed as an annual percentage rate. Past performance is no guarantee of future results. Yield will vary and it's possible to lose money investing in the Fund.
Fidelity® Michigan Municipal Money Market Fund
Schedule of Investments June 30, 2019 (Unaudited)
Showing Percentage of Net Assets
| Variable Rate Demand Note - 47.3% | | | |
| | | Principal Amount | Value |
| Alabama - 0.4% | | | |
| Decatur Indl. Dev. Board Exempt Facilities Rev. (Nucor Steel Decatur LLC Proj.) Series 2003 A, 2.13% 7/5/19, VRDN (a)(b) | | $1,100,000 | $1,100,000 |
| Arkansas - 0.3% | | | |
| Blytheville Indl. Dev. Rev. (Nucor Corp. Proj.) Series 2002, 2.15% 7/5/19, VRDN (a)(b) | | 700,000 | 700,000 |
| Kansas - 0.4% | | | |
| Burlington Envir. Impt. Rev. (Kansas City Pwr. and Lt. Co. Proj.) Series 2007 A, 2.13% 7/5/19, VRDN (b) | | 400,000 | 400,000 |
| St. Mary's Kansas Poll. Cont. Rev. (Kansas Gas and Elec. Co. Proj.) Series 1994, 2.1% 7/5/19, VRDN (b) | | 700,000 | 700,000 |
| | | | 1,100,000 |
| Louisiana - 0.1% | | | |
| Saint James Parish Gen. Oblig. (Nucor Steel Louisiana LLC Proj.): | | | |
| Series 2010 A1, 2.09% 7/5/19, VRDN (b) | | 200,000 | 200,000 |
| Series 2010 B1, 2.05% 7/5/19, VRDN (b) | | 200,000 | 200,000 |
| | | | 400,000 |
| Michigan - 45.7% | | | |
| Central Michigan Univ. Rev. Series 2008 A, 1.9% 7/5/19, LOC TD Banknorth, NA, VRDN (b) | | 1,840,000 | 1,840,000 |
| Grand Traverse County Hosp. Fin. Auth. Series 2011 B, 1.94% 7/5/19, LOC JPMorgan Chase Bank, VRDN (b) | | 13,425,000 | 13,425,000 |
| Grand Valley Michigan State Univ. Rev. Series 2008 B, 1.89% 7/5/19, LOC U.S. Bank NA, Cincinnati, VRDN (b) | | 12,455,000 | 12,455,000 |
| Michigan Bldg. Auth. Rev. Series 2007 1, 1.95% 7/5/19, LOC Citibank NA, VRDN (b) | | 3,515,000 | 3,515,000 |
| Michigan Fin. Auth. Rev.: | | | |
| (Healthcare Equip. Ln. Prog.) Series 2015 C, 2.01% 7/5/19, LOC Fifth Third Bank, Cincinnati, VRDN (b) | | 1,500,000 | 1,500,000 |
| (Hosp. Proj.) Series 2016 E2, 1.94% 7/5/19, VRDN (b) | | 8,000,000 | 8,000,000 |
| Michigan State Univ. Revs. Series 2000 A, 1.93% 7/5/19 (Liquidity Facility Northern Trust Co.), VRDN (b) | | 7,595,000 | 7,595,000 |
| Michigan Strategic Fund Ltd. Oblig. Rev.: | | | |
| (Air Products and Chemicals, Inc. Proj.) Series 2007 V1, 2.02% 7/1/19, VRDN (b) | | 13,770,000 | 13,770,000 |
| (Consumers Energy Co. Proj.) 1.89% 7/5/19, LOC JPMorgan Chase Bank, VRDN (a)(b) | | 18,100,000 | 18,100,000 |
| (Henry Ford Museum & Greenfield Village Proj.) Series 2002, 1.95% 7/1/19, LOC Comerica Bank, VRDN (b) | | 13,710,000 | 13,710,000 |
| (The Kroger Co. Recovery Zone Facilities Bond Proj.) Series 2010, 1.94% 7/5/19, LOC Bank of Tokyo-Mitsubishi UFJ Ltd., VRDN (b) | | 14,700,000 | 14,700,000 |
| FHLMC Livonia Econ. Dev. Corp. (Madonna Univ. Proj.) Series 2009, 1.9% 7/5/19, LOC Fed. Home Ln. Bank Chicago, VRDN (b) | | 19,690,000 | 19,690,000 |
| | | | 128,300,000 |
| Nebraska - 0.2% | | | |
| Stanton County Indl. Dev. Rev.: | | | |
| (Nucor Corp. Proj.) Series 1996, 2.13% 7/5/19, VRDN (a)(b) | | 600,000 | 600,000 |
| Series 1998, 2.13% 7/5/19, VRDN (a)(b) | | 100,000 | 100,000 |
| | | | 700,000 |
| North Carolina - 0.1% | | | |
| Hertford County Indl. Facilities Poll. Cont. Fing. Auth. (Nucor Corp. Proj.) Series 2000 A, 2.15% 7/5/19, VRDN (a)(b) | | 200,000 | 200,000 |
| West Virginia - 0.1% | | | |
| West Virginia Econ. Dev. Auth. Solid Waste Disp. Facilities Rev. (Appalachian Pwr. Co.- Mountaineer Proj.) Series 2008 A, 2.1% 7/5/19, VRDN (a)(b) | | 400,000 | 400,000 |
| TOTAL VARIABLE RATE DEMAND NOTE | | | |
| (Cost $132,900,000) | | | 132,900,000 |
|
| Tender Option Bond - 38.2% | | | |
| Colorado - 0.0% | | | |
| Denver City & County Arpt. Rev. Bonds Series G-114, 2.15%, tender 12/2/19 (Liquidity Facility Royal Bank of Canada) (a)(b)(c)(d)(e)(f) | | 100,000 | 100,000 |
| Connecticut - 0.4% | | | |
| Connecticut Gen. Oblig. Participating VRDN Series Floaters 014, 2.05% 8/9/19 (Liquidity Facility Barclays Bank PLC) (b)(d)(e)(f) | | 850,000 | 850,000 |
| Connecticut Spl. Tax Oblig. Trans. Infrastructure Rev. Bonds Series Floaters G 110, 2.08%, tender 10/1/19 (Liquidity Facility Royal Bank of Canada) (b)(d)(e)(f) | | 100,000 | 100,000 |
| | | | 950,000 |
| Michigan - 36.8% | | | |
| Clarkston Cmnty. Schools Participating VRDN Series Floaters G72, 1.93% 7/5/19 (Liquidity Facility Royal Bank of Canada) (b)(d)(e) | | 2,695,000 | 2,695,000 |
| Detroit Downtown Dev. Auth. Tax Participating VRDN Series Floaters XX 11 01, 1.96% 7/5/19 (Liquidity Facility Barclays Bank PLC) (b)(d)(e) | | 7,100,000 | 7,100,000 |
| Eastern Michigan Univ. Revs. Participating VRDN Series Floaters 009, 1.94% 7/5/19 (Liquidity Facility Barclays Bank PLC) (b)(d)(e) | | 13,800,000 | 13,800,000 |
| Grand Rapids San. Swr. Sys. Rev. Participating VRDN Series Floaters XF 26 12, 1.93% 7/5/19 (Liquidity Facility Citibank NA) (b)(d)(e) | | 4,000,000 | 4,000,000 |
| Michigan Bldg. Auth. Rev. Participating VRDN: | | | |
| Series Floaters XF 26 09, 1.94% 7/5/19 (Liquidity Facility Citibank NA) (b)(d)(e) | | 800,000 | 800,000 |
| Series Floaters XM 04 65, 1.93% 7/5/19 (Liquidity Facility Morgan Stanley Bank, West Valley City Utah) (b)(d)(e) | | 5,800,000 | 5,800,000 |
| Series Floaters ZF 26 40, 1.93% 7/5/19 (Liquidity Facility Morgan Stanley Bank, West Valley City Utah) (b)(d)(e) | | 3,600,000 | 3,600,000 |
| Michigan Fin. Auth. Rev. Participating VRDN: | | | |
| Series 15 XF0126, 1.95% 7/5/19 (Liquidity Facility JPMorgan Chase Bank) (b)(d)(e) | | 5,000,000 | 5,000,000 |
| Series 16 XM0223, 1.93% 7/5/19 (Liquidity Facility Citibank NA) (b)(d)(e) | | 935,000 | 935,000 |
| Series 16 ZM0166, 1.93% 7/5/19 (Liquidity Facility Royal Bank of Canada) (b)(d)(e) | | 8,500,000 | 8,500,000 |
| Series Floaters ZF 07 83, 2% 7/5/19 (Liquidity Facility JPMorgan Chase Bank) (b)(d)(e) | | 2,800,000 | 2,800,000 |
| Series Floaters ZF 07 84, 2% 7/5/19 (Liquidity Facility JPMorgan Chase Bank) (b)(d)(e) | | 2,670,000 | 2,670,000 |
| Series Floaters ZF 28 12, 1.93% 7/5/19 (Liquidity Facility Morgan Stanley Bank, West Valley City Utah) (b)(d)(e) | | 2,900,000 | 2,900,000 |
| Series RBC 2016 XM0132, 1.93% 7/5/19 (Liquidity Facility Royal Bank of Canada) (b)(d)(e) | | 10,065,000 | 10,065,000 |
| Series XM 04 72, 1.93% 7/5/19 (Liquidity Facility Citibank NA) (b)(d)(e) | | 1,750,000 | 1,750,000 |
| Michigan Hosp. Fin. Auth. Rev. Participating VRDN Series Floaters XM 04 08, 1.93% 7/5/19 (Liquidity Facility Morgan Stanley Bank, West Valley City Utah) (b)(d)(e) | | 4,475,000 | 4,475,000 |
| Michigan Hsg. Dev. Auth. Single Family Mtg. Rev. Participating VRDN: | | | |
| Series Floaters 008, 1.93% 7/5/19 (Liquidity Facility Barclays Bank PLC) (b)(d)(e) | | 4,900,000 | 4,900,000 |
| Series Floaters 027, 1.93% 7/5/19 (Liquidity Facility Barclays Bank PLC) (b)(d)(e) | | 900,000 | 900,000 |
| Series Floaters ZF 07 87, 1.93% 7/5/19 (Liquidity Facility Royal Bank of Canada) (b)(d)(e)(g) | | 2,800,000 | 2,800,000 |
| Michigan State Univ. Revs. Participating VRDN Series Floaters ZF 07 50, 1.96% 7/5/19 (Liquidity Facility Bank of America NA) (b)(d)(e)(g) | | 1,915,000 | 1,915,000 |
| Trenton Pub. Schools School District Participating VRDN Series Floaters CTFS G 102, 1.93% 7/5/19 (Liquidity Facility Royal Bank of Canada) (b)(d)(e) | | 3,100,000 | 3,100,000 |
| Univ. of Michigan Rev. Participating VRDN: | | | |
| Series 15 XF2199, 1.93% 7/5/19 (Liquidity Facility Morgan Stanley Bank, West Valley City Utah) (b)(d)(e) | | 3,089,000 | 3,089,000 |
| Series 15 XF2205, 1.93% 7/5/19 (Liquidity Facility Citibank NA) (b)(d)(e) | | 5,300,000 | 5,300,000 |
| Series Floaters ZF 05 90, 1.93% 7/5/19 (Liquidity Facility Toronto-Dominion Bank) (b)(d)(e) | | 4,300,000 | 4,300,000 |
| | | | 103,194,000 |
| Pennsylvania - 0.2% | | | |
| Berks County Muni. Auth. Rev. Participating VRDN Series Floaters 001, 2.05% 8/9/19 (Liquidity Facility Barclays Bank PLC) (b)(d)(e)(f) | | 500,000 | 500,000 |
| Texas - 0.0% | | | |
| Alamo Cmnty. Coll District Rev. Bonds Series G-111, 2.1%, tender 11/1/19 (Liquidity Facility Royal Bank of Canada) (b)(d)(e)(f) | | 100,000 | 100,000 |
| Utah - 0.8% | | | |
| Salt Lake City Arpt. Rev. Participating VRDN Series DBE 8034, 2.15% 7/5/19 (Liquidity Facility Deutsche Bank AG New York Branch) (a)(b)(d)(e) | | 2,300,000 | 2,300,000 |
| Virginia - 0.0% | | | |
| Virginia Pub. Bldg. Auth. Pub. Facilities Rev. Bonds Series Floaters G 40, 2.1%, tender 2/3/20 (Liquidity Facility Royal Bank of Canada) (b)(d)(e)(f) | | 100,000 | 100,000 |
| TOTAL TENDER OPTION BOND | | | |
| (Cost $107,244,000) | | | 107,244,000 |
|
| Other Municipal Security - 12.5% | | | |
| Florida - 0.7% | | | |
| Florida Dev. Fin. Corp. Surface T Bonds (Virgin Trains U.S.A. Passenger Rail Proj.) Series 2019 B, 1.9%, tender 3/17/20 (a)(b) | | 2,000,000 | 2,000,000 |
| Michigan - 10.9% | | | |
| Kent Hosp. Fin. Auth. Hosp. Facilities Rev. Bonds (Spectrum Health Sys. Proj.) Series 2015 A, SIFMA Municipal Swap Index + 0.250% 2.15%, tender 1/24/20 (b)(c) | | 13,915,000 | 13,915,000 |
| Michigan Fin. Auth. Rev. Bonds Series 2012 A, 5% 7/1/19 | | 8,950,000 | 8,950,000 |
| Michigan Hosp. Fin. Auth. Rev. Bonds: | | | |
| Series 2009, 5.625% 11/15/19 (Pre-Refunded to 11/15/19 @ 100) | | 510,000 | 517,578 |
| Series 2010 F4, 1.95%, tender 4/1/20 (b) | | 1,090,000 | 1,090,801 |
| Michigan State Univ. Revs. Bonds: | | | |
| Series 2010 C, 5% 8/15/19 | | 3,300,000 | 3,312,248 |
| Series 2015 A, 4% 8/15/19 | | 1,000,000 | 1,002,469 |
| Michigan Trunk Line Fund Rev. Bonds Series 2009, 5% 11/1/19 | | 690,000 | 696,851 |
| Wayne-Westland Cmnty. Schools Bonds Series 2019: | | | |
| 4% 11/1/19 (Michigan Gen. Oblig. Guaranteed) | | 800,000 | 806,200 |
| 4% 5/1/20 (Michigan Gen. Oblig. Guaranteed) | | 190,000 | 193,575 |
| | | | 30,484,722 |
| New Hampshire - 0.8% | | | |
| New Hampshire Bus. Fin. Auth. Poll. Cont. Rev. Bonds: | | | |
| Series 1990 A, 1.9% tender 7/25/19, CP mode (a) | | 1,200,000 | 1,200,000 |
| Series 1990 A1, 1.99% tender 9/25/19, CP mode (a) | | 1,100,000 | 1,100,000 |
| | | | 2,300,000 |
| New Mexico - 0.1% | | | |
| New Mexico Muni. Energy Acquisition Auth. Gas Supply Rev. Bonds Series 2014 B, 1 month U.S. LIBOR + 0.750% 2.385%, tender 8/1/19 (Liquidity Facility Royal Bank of Canada) (b)(c) | | 400,000 | 400,020 |
| TOTAL OTHER MUNICIPAL SECURITY | | | |
| (Cost $35,184,742) | | | 35,184,742 |
| | | Shares | Value |
|
| Investment Company - 0.5% | | | |
| Fidelity Municipal Cash Central Fund 2.00% (h)(i) | | | |
| (Cost $1,409,418) | | 1,409,418 | 1,409,418 |
| TOTAL INVESTMENT IN SECURITIES - 98.5% | | | |
| (Cost $276,738,160) | | | 276,738,160 |
| NET OTHER ASSETS (LIABILITIES) - 1.5% | | | 4,165,589 |
| NET ASSETS - 100% | | | $280,903,749 |
Security Type Abbreviations
CP – COMMERCIAL PAPER
VRDN – VARIABLE RATE DEMAND NOTE (A debt instrument that is payable upon demand, either daily, weekly or monthly)
The date shown for securities represents the date when principal payments must be paid, taking into account any call options exercised by the issuer and any permissible maturity shortening features other than interest rate resets.
Legend
(a) Private activity obligations whose interest is subject to the federal alternative minimum tax for individuals.
(b) Coupon rates for floating and adjustable rate securities reflect the rates in effect at period end.
(c) Coupon is indexed to a floating interest rate which may be multiplied by a specified factor and/or subject to caps or floors.
(d) Provides evidence of ownership in one or more underlying municipal bonds.
(e) Coupon rates are determined by re-marketing agents based on current market conditions.
(f) Restricted securities - Investment in securities not registered under the Securities Act of 1933 (excluding 144A issues). At the end of the period, the value of restricted securities (excluding 144A issues) amounted to $1,750,000 or 0.6% of net assets.
(g) Security exempt from registration under Rule 144A of the Securities Act of 1933. These securities may be resold in transactions exempt from registration, normally to qualified institutional buyers. At the end of the period, the value of these securities amounted to $4,715,000 or 1.7% of net assets.
(h) Information in this report regarding holdings by state and security types does not reflect the holdings of the Fidelity Municipal Cash Central Fund.
(i) Affiliated fund that is available only to investment companies and other accounts managed by Fidelity Investments. The rate quoted is the annualized seven-day yield of the fund at period end. A complete unaudited listing of the fund's holdings as of its most recent quarter end is available upon request. In addition, each Fidelity Central Fund's financial statements are available on the SEC's website or upon request.
Additional information on each restricted holding is as follows:
| Security | Acquisition Date | Cost |
| Alamo Cmnty. Coll District Rev. Bonds Series G-111, 2.1%, tender 11/1/19 (Liquidity Facility Royal Bank of Canada) | 6/6/19 | $100,000 |
| Berks County Muni. Auth. Rev. Participating VRDN Series Floaters 001, 2.05% 8/9/19 (Liquidity Facility Barclays Bank PLC) | 1/18/18 | $500,000 |
| Connecticut Gen. Oblig. Participating VRDN Series Floaters 014, 2.05% 8/9/19 (Liquidity Facility Barclays Bank PLC) | 6/29/17 | $850,000 |
| Connecticut Spl. Tax Oblig. Trans. Infrastructure Rev. Bonds Series Floaters G 110, 2.08%, tender 10/1/19 (Liquidity Facility Royal Bank of Canada) | 5/16/19 | $100,000 |
| Denver City & County Arpt. Rev. Bonds Series G-114, 2.15%, tender 12/2/19 (Liquidity Facility Royal Bank of Canada) | 6/6/19 | $100,000 |
| Virginia Pub. Bldg. Auth. Pub. Facilities Rev. Bonds Series Floaters G 40, 2.1%, tender 2/3/20 (Liquidity Facility Royal Bank of Canada) | 8/2/18 | $100,000 |
Affiliated Central Funds
Information regarding fiscal year to date income earned by the Fund from investments in Fidelity Central Funds is as follows:
| Fund | Income earned |
| Fidelity Municipal Cash Central Fund | $137,203 |
| Total | $137,203 |
Amounts in the income column in the above table exclude any capital gain distributions from underlying funds, which are presented in the corresponding line-item in the Statement of Operations, if applicable.
Investment Valuation
All investments are categorized as Level 2 under the Fair Value Hierarchy. The inputs or methodology used for valuing securities may not be an indication of the risk associated with investing in those securities. For more information on valuation inputs please refer to the Investment Valuation section in the accompanying Notes to Financial Statements.
See accompanying notes which are an integral part of the financial statements.
Fidelity® Michigan Municipal Money Market Fund
Financial Statements
Statement of Assets and Liabilities
| | | June 30, 2019 (Unaudited) |
| Assets | | |
Investment in securities, at value — See accompanying schedule:
Unaffiliated issuers (cost $275,328,742) | $275,328,742 | |
| Fidelity Central Funds (cost $1,409,418) | 1,409,418 | |
| Total Investment in Securities (cost $276,738,160) | | $276,738,160 |
| Receivable for investments sold | | 3,600,000 |
| Receivable for fund shares sold | | 77,035 |
| Interest receivable | | 889,810 |
| Distributions receivable from Fidelity Central Funds | | 16,322 |
| Other receivables | | 41 |
| Total assets | | 281,321,368 |
| Liabilities | | |
| Payable to custodian bank | $134,910 | |
| Payable for fund shares redeemed | 128,827 | |
| Distributions payable | 10,100 | |
| Accrued management fee | 83,557 | |
| Transfer agent fee payable | 36,922 | |
| Other affiliated payables | 3,669 | |
| Other payables and accrued expenses | 19,634 | |
| Total liabilities | | 417,619 |
| Net Assets | | $280,903,749 |
| Net Assets consist of: | | |
| Paid in capital | | $280,903,931 |
| Total distributable earnings (loss) | | (182) |
| Net Assets, for 280,541,365 shares outstanding | | $280,903,749 |
| Net Asset Value, offering price and redemption price per share ($280,903,749 ÷ 280,541,365 shares) | | $1.00 |
See accompanying notes which are an integral part of the financial statements.
Statement of Operations
| | | Six months ended June 30, 2019 (Unaudited) |
| Investment Income | | |
| Interest | | $2,297,791 |
| Income from Fidelity Central Funds | | 137,203 |
| Total income | | 2,434,994 |
| Expenses | | |
| Management fee | $519,853 | |
| Transfer agent fees | 231,037 | |
| Accounting fees and expenses | 22,879 | |
| Custodian fees and expenses | 1,247 | |
| Independent trustees' fees and expenses | 550 | |
| Registration fees | 18,527 | |
| Audit | 19,132 | |
| Legal | 2,573 | |
| Miscellaneous | 656 | |
| Total expenses before reductions | 816,454 | |
| Expense reductions | (16,085) | |
| Total expenses after reductions | | 800,369 |
| Net investment income (loss) | | 1,634,625 |
| Realized and Unrealized Gain (Loss) | | |
| Net realized gain (loss) on: | | |
| Investment securities: | | |
| Unaffiliated issuers | 1,112 | |
| Fidelity Central Funds | 616 | |
| Total net realized gain (loss) | | 1,728 |
| Net increase in net assets resulting from operations | | $1,636,353 |
See accompanying notes which are an integral part of the financial statements.
Statement of Changes in Net Assets
| | Six months ended June 30, 2019 (Unaudited) | Year ended December 31, 2018 |
| Increase (Decrease) in Net Assets | | |
| Operations | | |
| Net investment income (loss) | $1,634,625 | $3,262,077 |
| Net realized gain (loss) | 1,728 | 15,779 |
| Net increase in net assets resulting from operations | 1,636,353 | 3,277,856 |
| Distributions to shareholders | (1,634,524) | (3,581,532) |
| Share transactions | | |
| Proceeds from sales of shares | 13,619,697 | 35,049,609 |
| Reinvestment of distributions | 1,575,292 | 3,456,334 |
| Cost of shares redeemed | (44,944,641) | (148,370,854) |
| Net increase (decrease) in net assets and shares resulting from share transactions | (29,749,652) | (109,864,911) |
| Total increase (decrease) in net assets | (29,747,823) | (110,168,587) |
| Net Assets | | |
| Beginning of period | 310,651,572 | 420,820,159 |
| End of period | $280,903,749 | $310,651,572 |
| Other Information | | |
| Shares | | |
| Sold | 13,619,697 | 35,049,609 |
| Issued in reinvestment of distributions | 1,575,292 | 3,456,334 |
| Redeemed | (44,944,641) | (148,370,854) |
| Net increase (decrease) | (29,749,652) | (109,864,911) |
See accompanying notes which are an integral part of the financial statements.
Financial Highlights
Fidelity Michigan Municipal Money Market Fund
| | Six months ended (Unaudited) June 30, | Years endedDecember 31, | | | | |
| | 2019 | 2018 | 2017 | 2016 | 2015 | 2014 |
| Selected Per–Share Data | | | | | | |
| Net asset value, beginning of period | $1.00 | $1.00 | $1.00 | $1.00 | $1.00 | $1.00 |
| Income from Investment Operations | | | | | | |
| Net investment income (loss) | .006 | .009 | .004 | .001 | –A | –A |
| Net realized and unrealized gain (loss) | – | .001 | –A | .001 | –A | –A |
| Total from investment operations | .006 | .010 | .004 | .002 | –A | –A |
| Distributions from net investment income | (.006) | (.009) | (.004) | (.001) | –A | –A |
| Distributions from net realized gain | – | (.001) | –A | (.001) | –A | –A |
| Total distributions | (.006) | (.010) | (.004) | (.002) | –A | –A |
| Net asset value, end of period | $1.00 | $1.00 | $1.00 | $1.00 | $1.00 | $1.00 |
| Total ReturnB,C | .56% | 1.01% | .37% | .16% | .01% | .01% |
| Ratios to Average Net AssetsD,E | | | | | | |
| Expenses before reductions | .56%F | .55% | .53% | .52% | .53% | .53% |
| Expenses net of fee waivers, if any | .55%F | .55% | .53% | .35% | .06% | .07% |
| Expenses net of all reductions | .55%F | .55% | .53% | .35% | .06% | .07% |
| Net investment income (loss) | 1.12%F | .90% | .35% | .06% | .01% | .01% |
| Supplemental Data | | | | | | |
| Net assets, end of period (000 omitted) | $280,904 | $310,652 | $420,820 | $574,369 | $993,737 | $1,044,226 |
A Amount represents less than $.0005 per share.
B Total returns for periods of less than one year are not annualized.
C Total returns would have been lower if certain expenses had not been reduced during the applicable periods shown.
D Fees and expenses of any underlying Fidelity Central Funds are not included in the Fund's expense ratio. The Fund indirectly bears its proportionate share of the expenses of any underlying Fidelity Central Funds.
E Expense ratios reflect operating expenses of the Fund. Expenses before reductions do not reflect amounts reimbursed or waived or reductions from expense offset arrangements and do not represent the amount paid by the Fund during periods when reimbursements, waivers or reductions occur. Expenses net of fee waivers reflect expenses after reimbursement and waivers but prior to reductions from expense offset arrangements. Expenses net of all reductions represent the net expenses paid by the Fund.
F Annualized
See accompanying notes which are an integral part of the financial statements.
Notes to Financial Statements (Unaudited)
For the period ended June 30, 2019
1. Organization.
Fidelity Michigan Municipal Income Fund (the Income Fund) is a fund of Fidelity Municipal Trust. Fidelity Michigan Municipal Money Market Fund (the Money Market Fund) is a fund of Fidelity Municipal Trust II. Each Trust is registered under the Investment Company Act of 1940, as amended (the 1940 Act), as an open-end management investment company. Fidelity Municipal Trust and Fidelity Municipal Trust II (the Trusts) are organized as a Massachusetts business trust and a Delaware statutory trust, respectively. The Income Fund is a non-diversified fund. Each Fund is authorized to issue an unlimited number of shares. Shares of the Money Market Fund are only available for purchase by retail shareholders. Share transactions on the Statement of Changes in Net Assets may contain exchanges between affiliated funds. Each Fund may be affected by economic and political developments in the state of Michigan.
2. Investments in Fidelity Central Funds.
The Funds may invest in Fidelity Central Funds, which are open-end investment companies generally available only to other investment companies and accounts managed by the investment adviser and its affiliates. The Funds' Schedules of Investments list each of the Fidelity Central Funds held as of period end, if any, as an investment of each Fund, but does not include the underlying holdings of each Fidelity Central Fund. As an Investing Fund, each Fund indirectly bears its proportionate share of the expenses of the underlying Fidelity Central Funds.
The Money Market Central Funds seek preservation of capital and current income and are managed by Fidelity Investments Money Management, Inc. (FIMM), an affiliate of the investment adviser. Annualized expenses of the Money Market Central Funds as of their most recent shareholder report date ranged from less than .005% to .01%.
A complete unaudited list of holdings for each Fidelity Central Fund is available upon request or at the Securities and Exchange Commission (the SEC) website at www.sec.gov. In addition, the financial statements of the Fidelity Central Funds are available on the SEC website or upon request.
3. Significant Accounting Policies.
Each Fund is an investment company and applies the accounting and reporting guidance of the Financial Accounting Standards Board (FASB) Accounting Standards Codification Topic 946 Financial Services – Investments Companies. The financial statements have been prepared in conformity with accounting principles generally accepted in the United States of America (GAAP), which require management to make certain estimates and assumptions at the date of the financial statements. Actual results could differ from those estimates. Subsequent events, if any, through the date that the financial statements were issued have been evaluated in the preparation of the financial statements. The following summarizes the significant accounting policies of the Funds:
Investment Valuation. Investments are valued as of 4:00 p.m. Eastern time on the last calendar day of the period. The Board of Trustees (the Board) has delegated the day to day responsibility for the valuation of the Income Fund's investments to the Fair Value Committee (the Committee) established by the Income Fund's investment adviser. In accordance with valuation policies and procedures approved by the Board, the Income Fund attempts to obtain prices from one or more third party pricing vendors or brokers to value its investments. When current market prices, quotations or currency exchange rates are not readily available or reliable, investments will be fair valued in good faith by the Committee, in accordance with procedures adopted by the Board. Factors used in determining fair value vary by investment type and may include market or investment specific events, changes in interest rates and credit quality. The frequency with which these procedures are used cannot be predicted and they may be utilized to a significant extent. The Committee oversees the Income Fund's valuation policies and procedures and reports to the Board on the Committee's activities and fair value determinations. The Board monitors the appropriateness of the procedures used in valuing the Income Fund's investments and ratifies the fair value determinations of the Committee.
Each Fund categorizes the inputs to valuation techniques used to value its investments into a disclosure hierarchy consisting of three levels as shown below:
- Level 1 – quoted prices in active markets for identical investments
- Level 2 – other significant observable inputs (including quoted prices for similar investments, interest rates, prepayment speeds, etc.)
- Level 3 – unobservable inputs (including the Fund's own assumptions based on the best information available)
Valuation techniques used to value each Fund's investments by major category are as follows:
For the Income Fund, debt securities, including restricted securities, are valued based on evaluated prices received from third party pricing vendors or from brokers who make markets in such securities. Municipal securities are valued by pricing vendors who utilize matrix pricing which considers yield or price of bonds of comparable quality, coupon, maturity and type or by broker-supplied prices. When independent prices are unavailable or unreliable, debt securities may be valued utilizing pricing methodologies which consider similar factors that would be used by third party pricing vendors. Debt securities are generally categorized as Level 2 in the hierarchy but may be Level 3 depending on the circumstances.
For the Money Market Fund, as permitted by compliance with certain conditions under Rule 2a-7 of the 1940 Act, securities are valued at amortized cost, which approximates fair value. The amortized cost of an instrument is determined by valuing it at its original cost and thereafter amortizing any discount or premium from its face value at a constant rate until maturity. Securities held by a money market fund are generally high quality and liquid; however, they are reflected as Level 2 because the inputs used to determine fair value are not quoted prices in an active market.
For the Income Fund, changes in valuation techniques may result in transfers in or out of an assigned level within the disclosure hierarchy.
Investment Transactions and Income. For financial reporting purposes, the Funds' investment holdings and NAV include trades executed through the end of the last business day of the period. The NAV per share for processing shareholder transactions is calculated as of the close of business of the New York Stock Exchange (NYSE), normally 4:00 p.m. Eastern time and includes trades executed through the end of the prior business day for the Income Fund and trades executed through the end of the current business day for the Money Market Fund. Gains and losses on securities sold are determined on the basis of identified cost. Income and capital gain distributions from Fidelity Central Funds, if any, are recorded on the ex-dividend date. Interest income is accrued as earned and includes coupon interest and amortization of premium and accretion of discount on debt securities as applicable. Debt obligations may be placed on non-accrual status and related interest income may be reduced by ceasing current accruals and writing off interest receivables when the collection of all or a portion of interest has become doubtful based on consistently applied procedures. A debt obligation is removed from non-accrual status when the issuer resumes interest payments or when collectability of interest is reasonably assured.
Expenses. Expenses directly attributable to a fund are charged to that fund. Expenses attributable to more than one fund are allocated among the respective funds on the basis of relative net assets or other appropriate methods. Expense estimates are accrued in the period to which they relate and adjustments are made when actual amounts are known.
Income Tax Information and Distributions to Shareholders. Each year, each Fund intends to qualify as a regulated investment company under Subchapter M of the Internal Revenue Code, including distributing substantially all of its taxable income and realized gains. As a result, no provision for U.S. Federal income taxes is required. Each Fund files a U.S. federal tax return, in addition to state and local tax returns as required. Each Fund's federal income tax returns are subject to examination by the Internal Revenue Service (IRS) for a period of three fiscal years after they are filed. State and local tax returns may be subject to examination for an additional fiscal year depending on the jurisdiction.
Distributions are declared and recorded daily and paid monthly from net investment income. Distributions from realized gains, if any, are declared and recorded on the ex-dividend date. Income and capital gain distributions are determined in accordance with income tax regulations, which may differ from GAAP.
Capital accounts within the financial statements are adjusted for permanent book-tax differences. These adjustments have no impact on net assets or the results of operations. Capital accounts are not adjusted for temporary book-tax differences which will reverse in a subsequent period.
Book-tax differences are primarily due to market discount, deferred trustees compensation, and losses deferred due to excise tax regulations.
The Funds purchase municipal securities whose interest, in the opinion of the issuer, is free from federal income tax. There is no assurance that the IRS will agree with this opinion. In the event the IRS determines that the issuer does not comply with relevant tax requirements, interest payments from a security could become federally taxable, possibly retroactively to the date the security was issued.
As of period end, the cost and unrealized appreciation (depreciation) in securities, and derivatives if applicable, for federal income tax purposes were as follows for each Fund:
| | Tax cost | Gross unrealized appreciation | Gross unrealized depreciation | Net unrealized appreciation (depreciation) |
| Fidelity Michigan Municipal Income Fund | $607,839,804 | $29,075,359 | $(20,486) | $29,054,873 |
| Fidelity Michigan Municipal Money Market Fund | 276,738,160 | – | – | – |
Certain of the Funds elected to defer to the next fiscal year capital losses recognized during the period November 1, 2018 to December 31, 2018. Loss deferrals were as follows:
| | Capital losses |
| Fidelity Michigan Municipal Income Fund | $(753,875) |
Restricted Securities. The Funds may invest in securities that are subject to legal or contractual restrictions on resale. These securities generally may be resold in transactions exempt from registration or to the public if the securities are registered. Disposal of these securities may involve time-consuming negotiations and expense, and prompt sale at an acceptable price may be difficult. Information regarding restricted securities is included at the end of each applicable Fund's Schedule of Investments.
4. Purchases and Sales of Investments.
Purchases and sales of securities, other than short-term securities, for the Income Fund aggregated $77,992,189 and $45,765,667, respectively.
5. Fees and Other Transactions with Affiliates.
Management Fee. Fidelity Management & Research Company (the investment adviser) and its affiliates provide the Funds with investment management related services for which the Funds pay a monthly management fee. The management fee is the sum of an individual fund fee rate and an annualized group fee rate. The individual fund fee rate is applied to each Fund's average net assets. The group fee rate is based upon the average net assets of all the mutual funds advised by the investment adviser, including any mutual funds previously advised by the investment adviser that are currently advised by Fidelity SelectCo, LLC, an affiliate of the investment adviser. The group fee rate decreases as assets under management increase and increases as assets under management decrease. For the reporting period, each Fund's annualized management fee rate expressed as a percentage of each Fund's average net assets was as follows:
| | Individual Rate | Group Rate | Total |
| Fidelity Michigan Municipal Income Fund | .25% | .10% | .36% |
| Fidelity Michigan Municipal Money Market Fund | .25% | .10% | .36% |
Transfer Agent Fees. Fidelity Investments Institutional Operations Company, Inc. (FIIOC), an affiliate of the investment adviser, is the transfer, dividend disbursing and shareholder servicing agent for the Funds. FIIOC receives account fees and asset-based fees that vary according to account size and type of account. FIIOC pays for typesetting, printing and mailing of shareholder reports, except proxy statements. For the period, the transfer agent fees were equivalent to the following annualized rates expressed as a percentage of average net assets:
| Fidelity Michigan Municipal Income Fund | .09% |
| Fidelity Michigan Municipal Money Market Fund | .16% |
Accounting Fees. Fidelity Service Company, Inc. (FSC), an affiliate of the investment adviser, maintains each Fund's accounting records. The fee is based on the level of average net assets for each month. For the period, the fees were equivalent to the following annualized rates:
| | % of Average Net Assets |
| Fidelity Michigan Municipal Income Fund | .02 |
| Fidelity Michigan Municipal Money Market Fund | .02 |
Interfund Trades. The Funds may purchase from or sell securities to other Fidelity Funds under procedures adopted by the Board. The procedures have been designed to ensure these interfund trades are executed in accordance with Rule 17a-7 of the 1940 Act. For the Income Fund, interfund trades are included within the respective purchases and sales amounts shown in the Purchases and Sales of Investments note.
6. Committed Line of Credit.
The Income Fund participates with other funds managed by the investment adviser or an affiliate in a $4.25 billion credit facility (the "line of credit") to be utilized for temporary or emergency purposes to fund shareholder redemptions or for other short-term liquidity purposes. The participating funds have agreed to pay commitment fees on their pro-rata portion of the line of credit, which are reflected in Miscellaneous expenses on the Statement of Operations, and are as follows:
| Fidelity Michigan Municipal Income Fund | $869 |
During the period, the Income Fund did not borrow on this line of credit.
7. Expense Reductions.
The investment adviser voluntarily agreed to reimburse expenses of Fidelity Michigan Municipal Money Market Fund to the extent annual operating expenses exceeded certain levels of average net assets as noted in the table below. Some expenses, for example the compensation of the independent Trustees, and certain miscellaneous expenses such as proxy and shareholder meeting expenses, are excluded from this reimbursement.
Fidelity Michigan Municipal Money Market Fund was in reimbursement during the period:
| | Expense Limitations | Reimbursement |
| Fidelity Michigan Municipal Money Market Fund | .55% | $15,268 |
Through arrangements with each applicable Fund's custodian, credits realized as a result of certain uninvested cash balances were used to reduce each applicable Fund's expenses. All of the applicable expense reductions are noted in the table below.
| | Custody expense reduction |
| Fidelity Michigan Municipal Income Fund | $1,253 |
| Fidelity Michigan Municipal Money Market Fund | 37 |
In addition, during the period the investment adviser reimbursed and/or waived a portion of operating expenses as follows:
| | Amount |
| Fidelity Michigan Municipal Income Fund | $1,496 |
| Fidelity Michigan Municipal Money Market Fund | 780 |
8. Other.
The Funds' organizational documents provide former and current trustees and officers with a limited indemnification against liabilities arising in connection with the performance of their duties to the Funds. In the normal course of business, the Funds may also enter into contracts that provide general indemnifications. The Funds' maximum exposure under these arrangements is unknown as this would be dependent on future claims that may be made against the Funds. The risk of material loss from such claims is considered remote.
Shareholder Expense Example
As a shareholder of a Fund, you incur two types of costs: (1) transaction costs, and (2) ongoing costs, including management fees and other Fund expenses. This Example is intended to help you understand your ongoing costs (in dollars) of investing in the Fund and to compare these costs with the ongoing costs of investing in other mutual funds.
The Example is based on an investment of $1,000 invested at the beginning of the period and held for the entire period (January 1, 2019 to June 30, 2019).
Actual Expenses
The first line of the accompanying table for each fund provides information about actual account values and actual expenses. You may use the information in this line, together with the amount you invested, to estimate the expenses that you paid over the period. Simply divide your account value by $1,000.00 (for example, an $8,600 account value divided by $1,000.00 = 8.6), then multiply the result by the number in the first line for a fund under the heading entitled "Expenses Paid During Period" to estimate the expenses you paid on your account during this period. In addition, each Fund, as a shareholder in the underlying Fidelity Central Funds, will indirectly bear its pro-rata share of the fees and expenses incurred by the underlying Fidelity Central Funds. These fees and expenses are not included in the Fund's annualized expense ratio used to calculate the expense estimate in the table below.
Hypothetical Example for Comparison Purposes
The second line of the accompanying table for each fund provides information about hypothetical account values and hypothetical expenses based on a fund's actual expense ratio and an assumed rate of return of 5% per year before expenses, which is not the Fund's actual return. The hypothetical account values and expenses may not be used to estimate the actual ending account balance or expenses you paid for the period. You may use this information to compare the ongoing costs of investing in the Fund and other funds. To do so, compare this 5% hypothetical example with the 5% hypothetical examples that appear in the shareholder reports of the other funds. In addition, each Fund, as a shareholder in the underlying Fidelity Central Funds, will indirectly bear its pro-rata share of the fees and expenses incurred by the underlying Fidelity Central Funds. These fees and expenses are not included in the Fund's annualized expense ratio used to calculate the expense estimate in the table below.
Please note that the expenses shown in the table are meant to highlight your ongoing costs only and do not reflect any transaction costs. Therefore, the second line of the table is useful in comparing ongoing costs only, and will not help you determine the relative total costs of owning different funds.
| | Annualized Expense Ratio-A | Beginning
Account Value
January 1, 2019 | Ending
Account Value
June 30, 2019 | Expenses Paid
During Period-B
January 1, 2019
to June 30, 2019 |
| Fidelity Michigan Municipal Income Fund | .49% | | | |
| Actual | | $1,000.00 | $1,050.10 | $2.49 |
| Hypothetical-C | | $1,000.00 | $1,022.36 | $2.46 |
| Fidelity Michigan Municipal Money Market Fund | .55% | | | |
| Actual | | $1,000.00 | $1,005.60 | $2.74 |
| Hypothetical-C | | $1,000.00 | $1,022.07 | $2.76 |
A Annualized expense ratio reflects expenses net of applicable fee waivers.
B Expenses are equal to each Fund's annualized expense ratio, multiplied by the average account value over the period, multiplied by 181/ 365 (to reflect the one-half year period).
C 5% return per year before expenses.
MIR-SANN-0819
1.705626.121
Fidelity® Minnesota Municipal Income Fund
Semi-Annual Report June 30, 2019 |
|
Beginning on January 1, 2021, as permitted by regulations adopted by the Securities and Exchange Commission, paper copies of a fund’s shareholder reports will no longer be sent by mail, unless you specifically request paper copies of the reports from the fund or from your financial intermediary, such as a financial advisor, broker-dealer or bank. Instead, the reports will be made available on a website, and you will be notified by mail each time a report is posted and provided with a website link to access the report.
If you already elected to receive shareholder reports electronically, you will not be affected by this change and you need not take any action. You may elect to receive shareholder reports and other communications from a fund electronically, by contacting your financial intermediary. For Fidelity customers, visit Fidelity's web site or call Fidelity using the contact information listed below.
You may elect to receive all future reports in paper free of charge. If you wish to continue receiving paper copies of your shareholder reports, you may contact your financial intermediary or, if you are a Fidelity customer, visit Fidelity’s website, or call Fidelity at the applicable toll-free number listed below. Your election to receive reports in paper will apply to all funds held with the fund complex/your financial intermediary.
| Account Type | Website | Phone Number |
| Brokerage, Mutual Fund, or Annuity Contracts: | fidelity.com/mailpreferences | 1-800-343-3548 |
| Employer Provided Retirement Accounts: | netbenefits.fidelity.com/preferences (choose 'no' under Required Disclosures to continue to print) | 1-800-343-0860 |
| Advisor Sold Accounts Serviced Through Your Financial Intermediary: | Contact Your Financial Intermediary | Your Financial Intermediary's phone number |
| Advisor Sold Accounts Serviced by Fidelity: | institutional.fidelity.com | 1-877-208-0098 |
Contents
To view a fund's proxy voting guidelines and proxy voting record for the 12-month period ended June 30, visit http://www.fidelity.com/proxyvotingresults or visit the Securities and Exchange Commission's (SEC) web site at http://www.sec.gov.
You may also call 1-800-544-8544 to request a free copy of the proxy voting guidelines.
Standard & Poor's, S&P and S&P 500 are registered service marks of The McGraw-Hill Companies, Inc. and have been licensed for use by Fidelity Distributors Corporation.
Other third-party marks appearing herein are the property of their respective owners.
All other marks appearing herein are registered or unregistered trademarks or service marks of FMR LLC or an affiliated company. © 2019 FMR LLC. All rights reserved.
This report and the financial statements contained herein are submitted for the general information of the shareholders of the Fund. This report is not authorized for distribution to prospective investors in the Fund unless preceded or accompanied by an effective prospectus.
A fund files its complete schedule of portfolio holdings with the SEC for the first and third quarters of each fiscal year on Form N-PORT. Forms N-PORT are available on the SEC’s web site at http://www.sec.gov. A fund's Forms N-PORT may be reviewed and copied at the SEC’s Public Reference Room in Washington, DC. Information regarding the operation of the SEC's Public Reference Room may be obtained by calling 1-800-SEC-0330.
For a complete list of a fund's portfolio holdings, view the most recent holdings listing, semiannual report, or annual report on Fidelity's web site at http://www.fidelity.com, http://www.institutional.fidelity.com, or http://www.401k.com, as applicable.
NOT FDIC INSURED •MAY LOSE VALUE •NO BANK GUARANTEE
Neither the Fund nor Fidelity Distributors Corporation is a bank.
Investment Summary (Unaudited)
Top Five Sectors as of June 30, 2019
| | % of fund's net assets |
| General Obligations | 34.9 |
| Health Care | 26.6 |
| Electric Utilities | 15.3 |
| Education | 9.7 |
| Transportation | 7.9 |
Quality Diversification (% of fund's net assets)
| As of June 30, 2019 |
| | AAA | 9.7% |
| | AA,A | 80.9% |
| | BBB | 5.9% |
| | Not Rated | 1.6% |
| | Short-Term Investments and Net Other Assets | 1.9% |
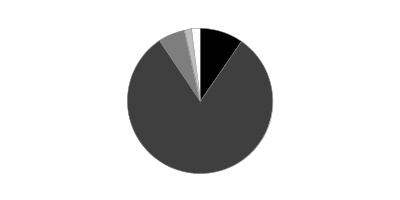
We have used ratings from Moody's Investors Service, Inc. Where Moody's® ratings are not available, we have used S&P® ratings. All ratings are as of the date indicated and do not reflect subsequent changes.
Schedule of Investments June 30, 2019 (Unaudited)
Showing Percentage of Net Assets
| Municipal Bonds - 98.1% | | | |
| | | Principal Amount | Value |
| Guam - 0.4% | | | |
| Guam Int'l. Arpt. Auth. Rev. Series 2013 C, 6.25% 10/1/34 (a) | | 850,000 | 981,733 |
| Guam Pwr. Auth. Rev. Series 2012 A, 5% 10/1/21 (FSA Insured) | | 1,100,000 | 1,181,477 |
|
| TOTAL GUAM | | | 2,163,210 |
|
| Minnesota - 97.7% | | | |
| Anoka-Hennepin Independent School District 11 Series 2014 A: | | | |
| 5% 2/1/23 | | $805,000 | $900,320 |
| 5% 2/1/24 | | 1,110,000 | 1,273,758 |
| 5% 2/1/25 | | 1,015,000 | 1,163,738 |
| 5% 2/1/26 | | 1,220,000 | 1,399,133 |
| 5% 2/1/27 | | 1,285,000 | 1,473,599 |
| 5% 2/1/28 | | 1,345,000 | 1,541,531 |
| 5% 2/1/29 | | 1,415,000 | 1,621,930 |
| 5% 2/1/34 | | 1,800,000 | 2,046,546 |
| Breckenridge Gen. Oblig. (Catholic Health Initiatives Proj.) Series 2004 A, 5% 5/1/30 | | 3,660,000 | 3,701,065 |
| Chaska Elec. Rev. Series 2015 A: | | | |
| 5% 10/1/26 | | 1,000,000 | 1,198,120 |
| 5% 10/1/27 | | 1,665,000 | 1,984,297 |
| 5% 10/1/29 | | 785,000 | 928,404 |
| Chaska Independent School District #112 Gen. Oblig. (Minnesota School District Cr. Enhancement Prog.) Series 2016 A: | | | |
| 5% 2/1/30 | | 1,400,000 | 1,680,098 |
| 5% 2/1/31 | | 3,600,000 | 4,289,184 |
| Cloquet Independent School District #94 Series 2015 B: | | | |
| 5% 2/1/28 | | 3,030,000 | 3,596,792 |
| 5% 2/1/31 | | 1,245,000 | 1,462,576 |
| Ctr. City Health Care Facilities (Hazelden Betty Ford Foundation Proj.) Series 2014: | | | |
| 5% 11/1/23 | | 775,000 | 876,254 |
| 5% 11/1/25 | | 250,000 | 288,040 |
| 5% 11/1/26 | | 500,000 | 573,185 |
| 5% 11/1/27 | | 420,000 | 479,968 |
| Dawson-Boyd Independent School District Series 2019 A: | | | |
| 4% 2/1/33 | | 1,140,000 | 1,295,063 |
| 4% 2/1/36 | | 1,360,000 | 1,527,810 |
| 4% 2/1/37 | | 1,200,000 | 1,343,496 |
| Duluth Econ. Dev. Auth. Health Care Facilities Rev. Series 2018 A: | | | |
| 5% 2/15/43 | | 1,500,000 | 1,736,580 |
| 5% 2/15/48 | | 3,000,000 | 3,461,730 |
| 5% 2/15/58 | | 3,125,000 | 3,551,938 |
| Duluth Gen. Oblig. Series 2016 A: | | | |
| 5% 2/1/30 | | 1,235,000 | 1,480,382 |
| 5% 2/1/31 | | 1,495,000 | 1,782,234 |
| 5% 2/1/32 | | 2,130,000 | 2,528,736 |
| Duluth Independent School District #709 Ctfs. of Prtn. Series 2019 B: | | | |
| 5% 2/1/20 | | 365,000 | 372,117 |
| 5% 2/1/21 | | 300,000 | 315,420 |
| 5% 2/1/22 | | 320,000 | 346,528 |
| 5% 2/1/23 | | 380,000 | 423,027 |
| 5% 2/1/24 | | 400,000 | 456,544 |
| 5% 2/1/25 | | 375,000 | 437,704 |
| 5% 2/1/26 | | 395,000 | 470,465 |
| 5% 2/1/27 | | 370,000 | 448,614 |
| 5% 2/1/28 | | 350,000 | 431,088 |
| Elk River Independent School District #728 Series 2019 A, 3% 2/1/33 | | 2,925,000 | 3,009,474 |
| Hennepin County Gen. Oblig.: | | | |
| Series 2016 A: | | | |
| 5% 12/1/39 | | 5,250,000 | 6,298,163 |
| 5% 12/1/40 | | 7,200,000 | 8,622,360 |
| Series 2016 B, 5% 12/1/31 | | 1,135,000 | 1,389,864 |
| Jordan Ind. School District: | | | |
| Series 2014 A: | | | |
| 5% 2/1/28 | | 960,000 | 1,076,880 |
| 5% 2/1/29 (Pre-Refunded to 2/1/29 @ 100) | | 1,000,000 | 1,122,670 |
| 5% 2/1/30 (Pre-Refunded to 2/1/30 @ 100) | | 1,245,000 | 1,395,882 |
| Series A, 5% 2/1/28 (Pre-Refunded to 2/1/28 @ 100) | | 40,000 | 44,907 |
| Maple Grove Health Care Sys. Rev.: | | | |
| Series 2015: | | | |
| 4% 9/1/35 | | 1,250,000 | 1,333,438 |
| 5% 9/1/25 | | 180,000 | 213,214 |
| 5% 9/1/28 | | 695,000 | 815,027 |
| 5% 9/1/30 | | 1,500,000 | 1,742,940 |
| 5% 9/1/31 | | 1,300,000 | 1,502,683 |
| 5% 9/1/32 | | 1,000,000 | 1,151,770 |
| Series 2017: | | | |
| 5% 5/1/26 | | 1,355,000 | 1,625,011 |
| 5% 5/1/27 | | 1,400,000 | 1,708,238 |
| 5% 5/1/28 | | 2,915,000 | 3,525,897 |
| 5% 5/1/29 | | 1,000,000 | 1,203,560 |
| 5% 5/1/30 | | 850,000 | 1,017,034 |
| 5% 5/1/31 | | 510,000 | 606,028 |
| 5% 5/1/32 | | 500,000 | 591,255 |
| Minneapolis & Saint Paul Hsg. & Redev. Auth. Health Care Sys. Rev.: | | | |
| (Allina Health Sys. Proj.) Series 2017 A: | | | |
| 5% 11/15/27 | | 1,250,000 | 1,544,088 |
| 5% 11/15/28 | | 2,730,000 | 3,360,767 |
| 5% 11/15/29 | | 1,040,000 | 1,272,284 |
| (Children's Health Care Proj.): | | | |
| Series 1995 B, 5% 8/15/25 (FSA Insured) | | 3,000,000 | 3,108,900 |
| Series 2010 A, 5.25% 8/15/25 | | 1,000,000 | 1,039,970 |
| (Children's Hospitals and Clinics Proj.) Series 2004 A1, 5% 8/15/34 (FSA Insured) | | 500,000 | 517,355 |
| Minneapolis & Saint Paul Metropolitan Arpts. Commission Arpt. Rev.: | | | |
| Series 2012 B: | | | |
| 5% 1/1/26 | | 1,250,000 | 1,360,650 |
| 5% 1/1/27 | | 1,500,000 | 1,630,470 |
| Series 2014 A: | | | |
| 5% 1/1/26 | | 3,015,000 | 3,474,999 |
| 5% 1/1/28 | | 4,000,000 | 4,593,360 |
| 5% 1/1/29 | | 2,150,000 | 2,461,879 |
| 5% 1/1/30 | | 2,000,000 | 2,283,600 |
| 5% 1/1/31 | | 6,020,000 | 6,851,242 |
| Series 2016 A: | | | |
| 5% 1/1/30 | | 4,000,000 | 4,891,280 |
| 5% 1/1/31 | | 2,350,000 | 2,855,908 |
| 5% 1/1/32 | | 2,900,000 | 3,507,347 |
| Series 2016 C, 5% 1/1/46 | | 4,770,000 | 5,591,871 |
| Series 2016 D: | | | |
| 5% 1/1/23 (a) | | 670,000 | 745,187 |
| 5% 1/1/27 (a) | | 350,000 | 425,922 |
| 5% 1/1/28 (a) | | 430,000 | 520,786 |
| 5% 1/1/29 (a) | | 225,000 | 271,892 |
| 5% 1/1/30 (a) | | 475,000 | 569,786 |
| 5% 1/1/31 (a) | | 200,000 | 238,434 |
| 5% 1/1/32 (a) | | 200,000 | 237,290 |
| 5% 1/1/33 (a) | | 220,000 | 260,117 |
| 5% 1/1/34 (a) | | 225,000 | 265,066 |
| 5% 1/1/35 (a) | | 225,000 | 264,051 |
| 5% 1/1/36 (a) | | 220,000 | 257,446 |
| 5% 1/1/37 (a) | | 250,000 | 291,703 |
| 5% 1/1/41 (a) | | 725,000 | 838,057 |
| Minneapolis Health Care Sys. Rev.: | | | |
| Series 2015 A: | | | |
| 5% 11/15/27 (FSA Insured) | | 850,000 | 1,010,599 |
| 5% 11/15/28 | | 1,380,000 | 1,633,340 |
| 5% 11/15/29 | | 1,000,000 | 1,176,770 |
| 5% 11/15/30 | | 1,000,000 | 1,171,720 |
| 5% 11/15/31 | | 3,665,000 | 4,275,442 |
| 5% 11/15/32 | | 2,200,000 | 2,558,578 |
| Series 2018 A: | | | |
| 5% 11/15/35 | | 2,500,000 | 3,030,475 |
| 5% 11/15/36 | | 2,500,000 | 3,017,700 |
| Minneapolis Spl. School District: | | | |
| (MN SD Cr. Enhancement Prog.): | | | |
| Series 2017 B, 5% 2/1/29 | | 2,590,000 | 3,276,764 |
| Series 2018 A, 5% 2/1/33 | | 1,000,000 | 1,237,410 |
| Series 2018 B, 5% 2/1/33 | | 3,190,000 | 3,947,338 |
| Series 2017 A, 4% 2/1/33 | | 1,415,000 | 1,608,657 |
| Series 2017 B: | | | |
| 4% 2/1/33 | | 2,595,000 | 2,950,152 |
| 4% 2/1/34 | | 2,595,000 | 2,939,746 |
| Minneapolis Spl. School District #1 Ctfs. of Prtn. Series 2016 C, 5% 2/1/31 | | 1,915,000 | 2,331,953 |
| Minnesota Agric. & Econ. Dev. Board Rev. (Essentia Health Obligated Group Proj.) Series 2008 C1, 5% 2/15/30 (Assured Guaranty Corp. Insured) | | 3,750,000 | 3,819,525 |
| Minnesota Ctfs. Prtn. (Minnesota Gen. Oblig. Proj.) Series 2014, 5% 6/1/39 | | 2,445,000 | 2,791,090 |
| Minnesota Gen. Oblig.: | | | |
| Series 2010 D: | | | |
| 5% 8/1/21 (Pre-Refunded to 8/1/20 @ 100) | | 15,000 | 15,600 |
| 5% 8/1/22 (Pre-Refunded to 8/1/20 @ 100) | | 70,000 | 72,800 |
| 5% 8/1/23 | | 9,855,000 | 10,245,948 |
| 5% 8/1/23 (Pre-Refunded to 8/1/20 @ 100) | | 145,000 | 150,800 |
| Series 2011 B: | | | |
| 5% 10/1/24 | | 2,500,000 | 2,704,250 |
| 5% 10/1/30 | | 3,000,000 | 3,231,210 |
| Series 2013 A, 5% 8/1/25 | | 3,780,000 | 4,327,609 |
| Series 2015 A, 5% 8/1/33 | | 1,900,000 | 2,246,351 |
| Series 2017 A: | | | |
| 5% 10/1/31 | | 5,000,000 | 6,200,200 |
| 5% 10/1/33 | | 3,335,000 | 4,112,589 |
| Minnesota Higher Ed. Facilities Auth. Rev.: | | | |
| (College of St. Scholastica, Inc. Proj.) Series Seven-H, 5.25% 12/1/35 | | 1,000,000 | 1,012,330 |
| (Macalester College, MN Proj.) Series 2017: | | | |
| 5% 3/1/28 | | 400,000 | 492,956 |
| 5% 3/1/30 | | 500,000 | 611,105 |
| (Univ. of St Thomas) Series 2017 A: | | | |
| 5% 10/1/27 | | 500,000 | 626,195 |
| 5% 10/1/28 | | 735,000 | 910,467 |
| 5% 10/1/29 | | 750,000 | 923,085 |
| 5% 10/1/30 | | 655,000 | 800,672 |
| Series 2017 A, 4% 10/1/35 | | 800,000 | 882,888 |
| Series 2017: | | | |
| 5% 3/1/28 | | 2,000,000 | 2,476,120 |
| 5% 3/1/31 | | 1,000,000 | 1,220,190 |
| 5% 10/1/31 | | 590,000 | 706,177 |
| 5% 3/1/34 | | 530,000 | 638,666 |
| 5% 10/1/34 | | 440,000 | 519,354 |
| 5% 10/1/35 | | 555,000 | 652,563 |
| Series 2018 A: | | | |
| 5% 10/1/34 | | 1,140,000 | 1,338,987 |
| 5% 10/1/45 | | 3,650,000 | 4,189,580 |
| Series 2019: | | | |
| 5% 10/1/29 | | 400,000 | 507,028 |
| 5% 10/1/40 | | 1,000,000 | 1,215,240 |
| Series Eight-G, 5% 12/1/31 | | 1,000,000 | 1,177,340 |
| Series Eight-J: | | | |
| 5% 3/1/26 | | 1,015,000 | 1,195,244 |
| 5% 3/1/27 | | 500,000 | 587,015 |
| Series Eight-L: | | | |
| 5% 4/1/28 | | 920,000 | 1,105,536 |
| 5% 4/1/29 | | 1,005,000 | 1,203,970 |
| 5% 4/1/35 | | 500,000 | 584,130 |
| Minnesota Hsg. Fin. Agcy.: | | | |
| (Mtg. Backed Securities Pass Through Prog.) Series 2019 C, 3.15% 6/1/49 | | 2,000,000 | 2,034,500 |
| Series 2015 A: | | | |
| 5% 8/1/29 | | 1,000,000 | 1,164,280 |
| 5% 8/1/30 | | 1,000,000 | 1,159,510 |
| 5% 8/1/31 | | 1,000,000 | 1,154,150 |
| 5% 8/1/32 | | 1,000,000 | 1,153,240 |
| 5% 8/1/33 | | 1,000,000 | 1,151,570 |
| Series 2019 B, 4.25% 7/1/49 | | 5,000,000 | 5,468,650 |
| Minnesota Muni. Pwr. Agcy. Elec. Rev.: | | | |
| Series 2014 A, 5% 10/1/26 | | 830,000 | 970,602 |
| Series 2014: | | | |
| 5% 10/1/26 | | 630,000 | 736,722 |
| 5% 10/1/27 | | 750,000 | 874,298 |
| 5% 10/1/30 | | 1,000,000 | 1,158,200 |
| Series 2016: | | | |
| 4% 10/1/41 | | 1,000,000 | 1,083,300 |
| 5% 10/1/32 | | 1,500,000 | 1,790,490 |
| 5% 10/1/33 | | 400,000 | 476,760 |
| 5% 10/1/35 | | 400,000 | 473,580 |
| 5% 10/1/36 | | 1,000,000 | 1,180,720 |
| 5% 10/1/47 | | 2,000,000 | 2,331,540 |
| Minnesota Pub. Facilities Auth. Rev. Series 2016 A: | | | |
| 5% 3/1/29 | | 5,000,000 | 6,057,500 |
| 5% 3/1/30 | | 5,150,000 | 6,211,467 |
| Minnesota State Colleges & Univs. Board of Trustees Rev. Series 2011 A, 5% 10/1/30 | | 1,495,000 | 1,604,703 |
| Minnesota State Gen. Fdg. Rev.: | | | |
| Series 2012 B: | | | |
| 5% 3/1/27 | | 12,840,000 | 14,021,922 |
| 5% 3/1/28 | | 4,275,000 | 4,667,360 |
| 5% 3/1/29 | | 2,250,000 | 2,452,793 |
| Series 2014 A: | | | |
| 5% 6/1/27 | | 5,000,000 | 5,675,250 |
| 5% 6/1/38 | | 5,000,000 | 5,604,100 |
| Moorhead Edl. Facilities Rev. (The Concordia College Corp. Proj.) Series 2016, 5% 12/1/25 | | 2,500,000 | 2,805,775 |
| Mounds View Independent School District #621 Series 2018 A, 5% 2/1/29 | | 6,840,000 | 8,499,384 |
| North Branch Independent School District #138 Series 2017 A, 4% 2/1/29 | | 2,015,000 | 2,313,925 |
| Northern Muni. Pwr. Agcy. Elec. Sys. Rev.: | | | |
| Series 2013 A: | | | |
| 5% 1/1/23 | | 850,000 | 950,300 |
| 5% 1/1/24 | | 650,000 | 725,290 |
| 5% 1/1/25 | | 975,000 | 1,085,468 |
| 5% 1/1/31 | | 1,740,000 | 1,912,678 |
| Series 2016: | | | |
| 5% 1/1/28 | | 500,000 | 595,385 |
| 5% 1/1/29 | | 620,000 | 734,731 |
| 5% 1/1/30 | | 520,000 | 612,232 |
| 5% 1/1/31 | | 350,000 | 409,609 |
| Series 2017: | | | |
| 5% 1/1/29 | | 460,000 | 557,295 |
| 5% 1/1/31 | | 400,000 | 477,784 |
| 5% 1/1/33 | | 475,000 | 560,187 |
| 5% 1/1/35 | | 520,000 | 609,861 |
| Rochester Elec. Util. Rev.: | | | |
| Series 2013 B: | | | |
| 5% 12/1/26 | | 570,000 | 652,827 |
| 5% 12/1/27 | | 275,000 | 314,584 |
| 5% 12/1/28 | | 275,000 | 313,574 |
| 5% 12/1/43 | | 1,000,000 | 1,126,810 |
| Series 2017 A: | | | |
| 5% 12/1/42 | | 1,100,000 | 1,290,333 |
| 5% 12/1/47 | | 1,000,000 | 1,171,230 |
| Rochester Health Care Facilities Rev.: | | | |
| (Mayo Clinic Proj.) Series 2008 E, 5% 11/15/38 | | 4,000,000 | 4,103,520 |
| (Olmsted Med. Ctr. Proj.) Series 2013: | | | |
| 5% 7/1/21 | | 790,000 | 843,072 |
| 5% 7/1/22 | | 350,000 | 384,829 |
| 5% 7/1/24 | | 300,000 | 338,631 |
| 5% 7/1/27 | | 245,000 | 274,630 |
| 5% 7/1/28 | | 225,000 | 251,474 |
| 5% 7/1/33 | | 1,225,000 | 1,345,344 |
| Bonds (Mayo Foundation Proj.) Series C, 4.5%, tender 11/15/21 (b) | | 1,100,000 | 1,178,914 |
| Series 2016 B, 5% 11/15/35 | | 4,000,000 | 5,471,960 |
| Roseville Independent School District #623: | | | |
| (Minnesota Gen. Oblig.) Series 2018 A, 5% 2/1/31 | | 5,000,000 | 6,026,000 |
| (MN School District Cr. Enhancement Prog.) Series 2018 A: | | | |
| 5% 2/1/26 | | 2,400,000 | 2,894,784 |
| 5% 2/1/29 | | 5,180,000 | 6,312,711 |
| Saint Cloud Health Care Rev.: | | | |
| Series 2014 B, 5% 5/1/22 | | 1,950,000 | 2,135,835 |
| Series 2016 A: | | | |
| 5% 5/1/29 | | 1,000,000 | 1,196,970 |
| 5% 5/1/30 | | 1,000,000 | 1,190,720 |
| 5% 5/1/31 | | 1,000,000 | 1,184,820 |
| 5% 5/1/46 | | 5,000,000 | 5,768,850 |
| Series 2019, 5% 5/1/48 | | 5,000,000 | 5,978,800 |
| 5.125% 5/1/30 | | 310,000 | 319,052 |
| Saint Paul Hsg. & Redev. Auth. Hosp. Rev. (HealthEast Care Sys. Proj.) Series 2015 A: | | | |
| 5% 11/15/27 (Pre-Refunded to 11/15/25 @ 100) | | 2,515,000 | 3,037,592 |
| 5% 11/15/30 (Pre-Refunded to 11/15/25 @ 100) | | 1,585,000 | 1,914,347 |
| Saint Paul Sales Tax Rev. Series 2014 G: | | | |
| 5% 11/1/26 | | 1,000,000 | 1,173,930 |
| 5% 11/1/28 | | 1,000,000 | 1,168,020 |
| Shakopee Health Care Facilities Rev. Series 2014: | | | |
| 5% 9/1/23 | | 1,895,000 | 2,135,400 |
| 5% 9/1/24 | | 1,000,000 | 1,152,160 |
| 5% 9/1/25 | | 1,345,000 | 1,548,324 |
| 5% 9/1/26 | | 1,575,000 | 1,806,998 |
| 5% 9/1/28 | | 1,000,000 | 1,142,410 |
| 5% 9/1/34 | | 1,065,000 | 1,184,142 |
| Southern Minnesota Muni. Pwr. Agcy. Pwr. Supply Sys. Rev.: | | | |
| (Cap. Appreciation) Series 1994 A: | | | |
| 0% 1/1/21 (Nat'l. Pub. Fin. Guarantee Corp. Insured) | | 14,670,000 | 14,317,187 |
| 0% 1/1/26 (Nat'l. Pub. Fin. Guarantee Corp. Insured) | | 3,165,000 | 2,785,706 |
| Series 2015 A: | | | |
| 5% 1/1/28 | | 1,000,000 | 1,199,570 |
| 5% 1/1/34 | | 1,695,000 | 1,982,947 |
| 5% 1/1/36 | | 1,000,000 | 1,163,620 |
| 5% 1/1/41 | | 1,000,000 | 1,152,350 |
| St. Paul Hsg. & Redev. Auth. Health Care Facilities Rev.: | | | |
| (Fairview Hsp & Hltcare Srv Sys. Proj.) 5% 11/15/47 | | 13,350,000 | 15,529,372 |
| Series 2015 A: | | | |
| 5% 7/1/29 | | 5,000,000 | 5,830,400 |
| 5% 7/1/30 | | 5,000,000 | 5,790,650 |
| Series 2017 A: | | | |
| 5% 11/15/30 | | 650,000 | 790,933 |
| 5% 11/15/31 | | 845,000 | 1,023,912 |
| 5% 11/15/33 | | 800,000 | 962,568 |
| 5% 11/15/34 | | 665,000 | 797,288 |
| Univ. of Minnesota Gen. Oblig.: | | | |
| Series 2016: | | | |
| 5% 4/1/37 | | 2,125,000 | 2,511,538 |
| 5% 4/1/41 | | 6,000,000 | 7,037,760 |
| Series 2017 A: | | | |
| 5% 9/1/33 | | 5,025,000 | 6,183,313 |
| 5% 9/1/37 | | 3,880,000 | 4,709,466 |
| Series 2017 B, 5% 12/1/32 | | 2,000,000 | 2,479,760 |
| Series 2019 A, 5% 4/1/44 | | 2,000,000 | 2,459,600 |
| Univ. of Minnesota Spl. Purp. Rev.: | | | |
| (Biomedical Science Research Facilities Fdg. Prog.) Series 2013 C, 5% 8/1/38 | | 5,275,000 | 5,934,955 |
| (State Supported Biomedical Science Research Facilities Fdg. Prog.) Series 2011 B, 5% 8/1/25 | | 2,095,000 | 2,248,354 |
| Virginia Independent School District #706 Series 2019 A, 5% 2/1/31 (c) | | 5,000,000 | 6,179,650 |
| West Saint Paul Independent School District #197 (Minnesota School District Cr. Enhancement Prog.) Series 2018 A, 4% 2/1/41 | | 2,400,000 | 2,615,784 |
| Western Minnesota Muni. Pwr. Agcy. Pwr. Supply Rev.: | | | |
| Series 2012 A: | | | |
| 5% 1/1/26 | | 5,000,000 | 5,580,950 |
| 5% 1/1/27 | | 2,150,000 | 2,398,261 |
| 5% 1/1/30 | | 1,000,000 | 1,112,220 |
| Series 2014 A: | | | |
| 5% 1/1/31 | | 1,750,000 | 1,989,663 |
| 5% 1/1/35 | | 1,595,000 | 1,803,371 |
| 5% 1/1/40 | | 1,500,000 | 1,688,310 |
| 5% 1/1/46 | | 11,270,000 | 12,666,353 |
| Series 2015 A, 5% 1/1/31 | | 1,820,000 | 2,168,839 |
| Series 2018 A, 5% 1/1/49 | | 2,000,000 | 2,407,840 |
| White Bear Lake Minn Rev. (YMCA of Greater Twin Cities Proj.) Series 2018: | | | |
| 5% 6/1/28 | | 1,000,000 | 1,233,780 |
| 5% 6/1/30 | | 500,000 | 608,410 |
| 5% 6/1/31 | | 700,000 | 846,531 |
| 5% 6/1/33 | | 1,000,000 | 1,201,170 |
| Wright County Ctfs. of Prtn. Series 2019 A: | | | |
| 5% 12/1/30 (c) | | 1,000,000 | 1,273,420 |
| 5% 12/1/31 (c) | | 1,000,000 | 1,266,140 |
|
| TOTAL MINNESOTA | | | 547,850,119 |
|
| TOTAL MUNICIPAL BONDS | | | |
| (Cost $524,676,792) | | | 550,013,329 |
|
| Municipal Notes - 2.3% | | | |
| Minnesota - 2.3% | | | |
| Minneapolis & Saint Paul Hsg. & Redev. Auth. Health Care Sys. Rev. (Allina Health Sys. Proj.) Series 2009 B2, 1.95% 7/1/19, LOC JPMorgan Chase Bank, VRDN (b) | | 2,500,000 | $2,500,000 |
| Minneapolis Health Care Sys. Rev. (Fairview Health Svcs.) Series 2018 C, 1.85% 7/1/19, LOC Wells Fargo Bank NA, VRDN (b) | | 2,740,000 | 2,740,000 |
| Rochester Health Care Facilities Rev.: | | | |
| Series A, 1.8% 7/5/19, VRDN (b) | | 2,050,000 | 2,050,000 |
| Series B, 1.8% 7/5/19 (Liquidity Facility Northern Trust Co.), VRDN (b) | | 5,500,000 | 5,500,000 |
| TOTAL MUNICIPAL NOTES | | | |
| (Cost $12,790,000) | | | 12,790,000 |
| TOTAL INVESTMENT IN SECURITIES - 100.4% | | | |
| (Cost $537,466,792) | | | 562,803,329 |
| NET OTHER ASSETS (LIABILITIES) - (0.4)% | | | (2,289,064) |
| NET ASSETS - 100% | | | $560,514,265 |
Security Type Abbreviations
VRDN – VARIABLE RATE DEMAND NOTE (A debt instrument that is payable upon demand, either daily, weekly or monthly)
Legend
(a) Private activity obligations whose interest is subject to the federal alternative minimum tax for individuals.
(b) Coupon rates for floating and adjustable rate securities reflect the rates in effect at period end.
(c) Security or a portion of the security purchased on a delayed delivery or when-issued basis.
Investment Valuation
All investments are categorized as Level 2 under the Fair Value Hierarchy. The inputs or methodology used for valuing securities may not be an indication of the risk associated with investing in those securities. For more information on valuation inputs please refer to the Investment Valuation section in the accompanying Notes to Financial Statements.
Other Information
The distribution of municipal securities by revenue source, as a percentage of total Net Assets, is as follows (Unaudited):
| General Obligations | 34.9% |
| Health Care | 26.6% |
| Electric Utilities | 15.3% |
| Education | 9.7% |
| Transportation | 7.9% |
| Others* (Individually Less Than 5%) | 5.6% |
| | 100.0% |
* Includes net other assets
See accompanying notes which are an integral part of the financial statements.
Financial Statements
Statement of Assets and Liabilities
| | | June 30, 2019 (Unaudited) |
| Assets | | |
Investment in securities, at value — See accompanying schedule:
Unaffiliated issuers (cost $537,466,792) | | $562,803,329 |
| Cash | | 59,440 |
| Receivable for fund shares sold | | 224,358 |
| Interest receivable | | 7,055,458 |
| Other receivables | | 1,467 |
| Total assets | | 570,144,052 |
| Liabilities | | |
| Payable for investments purchased on a delayed delivery basis | $8,750,000 | |
| Payable for fund shares redeemed | 260,018 | |
| Distributions payable | 377,788 | |
| Accrued management fee | 162,107 | |
| Other affiliated payables | 53,239 | |
| Other payables and accrued expenses | 26,635 | |
| Total liabilities | | 9,629,787 |
| Net Assets | | $560,514,265 |
| Net Assets consist of: | | |
| Paid in capital | | $534,897,815 |
| Total distributable earnings (loss) | | 25,616,450 |
| Net Assets, for 47,426,276 shares outstanding | | $560,514,265 |
| Net Asset Value, offering price and redemption price per share ($560,514,265 ÷ 47,426,276 shares) | | $11.82 |
See accompanying notes which are an integral part of the financial statements.
Statement of Operations
| | | Six months ended June 30, 2019 (Unaudited) |
| Investment Income | | |
| Interest | | $7,846,293 |
| Expenses | | |
| Management fee | $951,187 | |
| Transfer agent fees | 247,217 | |
| Accounting fees and expenses | 67,617 | |
| Custodian fees and expenses | 2,055 | |
| Independent trustees' fees and expenses | 978 | |
| Registration fees | 30,556 | |
| Audit | 29,383 | |
| Legal | 8,623 | |
| Miscellaneous | 1,968 | |
| Total expenses before reductions | 1,339,584 | |
| Expense reductions | (2,808) | |
| Total expenses after reductions | | 1,336,776 |
| Net investment income (loss) | | 6,509,517 |
| Realized and Unrealized Gain (Loss) | | |
| Net realized gain (loss) on: | | |
| Investment securities: | | |
| Unaffiliated issuers | | 242,479 |
| Total net realized gain (loss) | | 242,479 |
| Change in net unrealized appreciation (depreciation) on investment securities | | 19,498,298 |
| Net gain (loss) | | 19,740,777 |
| Net increase (decrease) in net assets resulting from operations | | $26,250,294 |
See accompanying notes which are an integral part of the financial statements.
Statement of Changes in Net Assets
| | Six months ended June 30, 2019 (Unaudited) | Year ended December 31, 2018 |
| Increase (Decrease) in Net Assets | | |
| Operations | | |
| Net investment income (loss) | $6,509,517 | $13,460,940 |
| Net realized gain (loss) | 242,479 | 875,406 |
| Change in net unrealized appreciation (depreciation) | 19,498,298 | (11,229,023) |
| Net increase (decrease) in net assets resulting from operations | 26,250,294 | 3,107,323 |
| Distributions to shareholders | (7,242,292) | (14,369,680) |
| Share transactions | | |
| Proceeds from sales of shares | 54,388,307 | 89,718,949 |
| Reinvestment of distributions | 4,788,800 | 9,857,381 |
| Cost of shares redeemed | (40,767,064) | (115,136,318) |
| Net increase (decrease) in net assets resulting from share transactions | 18,410,043 | (15,559,988) |
| Total increase (decrease) in net assets | 37,418,045 | (26,822,345) |
| Net Assets | | |
| Beginning of period | 523,096,220 | 549,918,565 |
| End of period | $560,514,265 | $523,096,220 |
| Other Information | | |
| Shares | | |
| Sold | 4,672,537 | 7,882,945 |
| Issued in reinvestment of distributions | 411,741 | 867,301 |
| Redeemed | (3,511,221) | (10,141,334) |
| Net increase (decrease) | 1,573,057 | (1,391,088) |
See accompanying notes which are an integral part of the financial statements.
Financial Highlights
Fidelity Minnesota Municipal Income Fund
| | Six months ended (Unaudited) June 30, | Years endedDecember 31, | | | | |
| | 2019 | 2018 | 2017 | 2016 | 2015 | 2014 |
| Selected Per–Share Data | | | | | | |
| Net asset value, beginning of period | $11.41 | $11.64 | $11.42 | $11.75 | $11.77 | $11.39 |
| Income from Investment Operations | | | | | | |
| Net investment income (loss)A | .141 | .282 | .285 | .300 | .317 | .329 |
| Net realized and unrealized gain (loss) | .426 | (.211) | .229 | (.286) | .030 | .443 |
| Total from investment operations | .567 | .071 | .514 | .014 | .347 | .772 |
| Distributions from net investment income | (.141) | (.282) | (.285) | (.300) | (.317) | (.329) |
| Distributions from net realized gain | (.016) | (.019) | (.009) | (.044) | (.050) | (.063) |
| Total distributions | (.157) | (.301) | (.294) | (.344) | (.367) | (.392) |
| Redemption fees added to paid in capitalA | – | – | – | –B | –B | –B |
| Net asset value, end of period | $11.82 | $11.41 | $11.64 | $11.42 | $11.75 | $11.77 |
| Total ReturnC,D | 5.00% | .65% | 4.55% | .08% | 3.00% | 6.85% |
| Ratios to Average Net AssetsE | | | | | | |
| Expenses before reductions | .50%F | .50% | .49% | .50% | .50% | .49% |
| Expenses net of fee waivers, if any | .50%F | .50% | .49% | .50% | .49% | .49% |
| Expenses net of all reductions | .50%F | .49% | .49% | .50% | .49% | .49% |
| Net investment income (loss) | 2.44%F | 2.48% | 2.46% | 2.54% | 2.71% | 2.82% |
| Supplemental Data | | | | | | |
| Net assets, end of period (000 omitted) | $560,514 | $523,096 | $549,919 | $521,553 | $505,992 | $506,314 |
| Portfolio turnover rate | 10%F | 14% | 11% | 13% | 13% | 15% |
A Calculated based on average shares outstanding during the period.
B Amount represents less than $.0005 per share.
C Total returns for periods of less than one year are not annualized.
D Total returns would have been lower if certain expenses had not been reduced during the applicable periods shown.
E Expense ratios reflect operating expenses of the Fund. Expenses before reductions do not reflect amounts reimbursed by the investment adviser or reductions from expense offset arrangements and do not represent the amount paid by the Fund during periods when reimbursements or reductions occur. Expenses net of fee waivers reflect expenses after reimbursement by the investment adviser but prior to reductions from expense offset arrangements. Expenses net of all reductions represent the net expenses paid by the Fund.
F Annualized
See accompanying notes which are an integral part of the financial statements.
Notes to Financial Statements (Unaudited)
For the period ended June 30, 2019
1. Organization.
Fidelity Minnesota Municipal Income Fund (the Fund) is a non-diversified fund of Fidelity Municipal Trust (the Trust) and is authorized to issue an unlimited number of shares. Share transactions on the Statement of Changes in Net Assets may contain exchanges between affiliated funds. The Trust is registered under the Investment Company Act of 1940, as amended (the 1940 Act), as an open-end management investment company organized as a Massachusetts business trust. The Fund may be affected by economic and political developments in the state of Minnesota.
2. Significant Accounting Policies.
The Fund is an investment company and applies the accounting and reporting guidance of the Financial Accounting Standards Board (FASB) Accounting Standards Codification Topic 946 Financial Services – Investments Companies. The financial statements have been prepared in conformity with accounting principles generally accepted in the United States of America (GAAP), which require management to make certain estimates and assumptions at the date of the financial statements. Actual results could differ from those estimates. Subsequent events, if any, through the date that the financial statements were issued have been evaluated in the preparation of the financial statements. The following summarizes the significant accounting policies of the Fund:
Investment Valuation. Investments are valued as of 4:00 p.m. Eastern time on the last calendar day of the period. The Board of Trustees (the Board) has delegated the day to day responsibility for the valuation of the Fund's investments to the Fair Value Committee (the Committee) established by the Fund's investment adviser. In accordance with valuation policies and procedures approved by the Board, the Fund attempts to obtain prices from one or more third party pricing vendors or brokers to value its investments. When current market prices, quotations or currency exchange rates are not readily available or reliable, investments will be fair valued in good faith by the Committee, in accordance with procedures adopted by the Board. Factors used in determining fair value vary by investment type and may include market or investment specific events, changes in interest rates and credit quality. The frequency with which these procedures are used cannot be predicted and they may be utilized to a significant extent. The Committee oversees the Fund's valuation policies and procedures and reports to the Board on the Committee's activities and fair value determinations. The Board monitors the appropriateness of the procedures used in valuing the Fund's investments and ratifies the fair value determinations of the Committee.
The Fund categorizes the inputs to valuation techniques used to value its investments into a disclosure hierarchy consisting of three levels as shown below:
- Level 1 – quoted prices in active markets for identical investments
- Level 2 – other significant observable inputs (including quoted prices for similar investments, interest rates, prepayment speeds, etc.)
- Level 3 – unobservable inputs (including the Fund's own assumptions based on the best information available)
Valuation techniques used to value the Fund's investments by major category are as follows:
Debt securities, including restricted securities, are valued based on evaluated prices received from third party pricing vendors or from brokers who make markets in such securities. Municipal securities are valued by pricing vendors who utilize matrix pricing which considers yield or price of bonds of comparable quality, coupon, maturity and type or by broker-supplied prices. When independent prices are unavailable or unreliable, debt securities may be valued utilizing pricing methodologies which consider similar factors that would be used by third party pricing vendors. Debt securities are generally categorized as Level 2 in the hierarchy but may be Level 3 depending on the circumstances.
Changes in valuation techniques may result in transfers in or out of an assigned level within the disclosure hierarchy.
Investment Transactions and Income. For financial reporting purposes, the Fund's investment holdings and NAV include trades executed through the end of the last business day of the period. The NAV per share for processing shareholder transactions is calculated as of the close of business of the New York Stock Exchange (NYSE), normally 4:00 p.m. Eastern time and includes trades executed through the end of the prior business day. Gains and losses on securities sold are determined on the basis of identified cost. Interest income is accrued as earned and includes coupon interest and amortization of premium and accretion of discount on debt securities as applicable.
Expenses. Expenses directly attributable to a fund are charged to that fund. Expenses attributable to more than one fund are allocated among the respective funds on the basis of relative net assets or other appropriate methods. Expense estimates are accrued in the period to which they relate and adjustments are made when actual amounts are known.
Income Tax Information and Distributions to Shareholders. Each year, the Fund intends to qualify as a regulated investment company under Subchapter M of the Internal Revenue Code, including distributing substantially all of its taxable income and realized gains. As a result, no provision for U.S. Federal income taxes is required. The Fund files a U.S. federal tax return, in addition to state and local tax returns as required. The Fund's federal income tax returns are subject to examination by the Internal Revenue Service (IRS) for a period of three fiscal years after they are filed. State and local tax returns may be subject to examination for an additional fiscal year depending on the jurisdiction.
Distributions are declared and recorded daily and paid monthly from net investment income. Distributions from realized gains, if any, are declared and recorded on the ex-dividend date. Income and capital gain distributions are determined in accordance with income tax regulations, which may differ from GAAP.
Capital accounts within the financial statements are adjusted for permanent book-tax differences. These adjustments have no impact on net assets or the results of operations. Capital accounts are not adjusted for temporary book-tax differences which will reverse in a subsequent period.
Book-tax differences are primarily due to market discount and deferred trustees compensation.
The Fund purchases municipal securities whose interest, in the opinion of the issuer, is free from federal income tax. There is no assurance that the IRS will agree with this opinion. In the event the IRS determines that the issuer does not comply with relevant tax requirements, interest payments from a security could become federally taxable, possibly retroactively to the date the security was issued.
As of period end, the cost and unrealized appreciation (depreciation) in securities, and derivatives if applicable, for federal income tax purposes were as follows:
| Gross unrealized appreciation | $25,367,327 |
| Gross unrealized depreciation | (30,790) |
| Net unrealized appreciation (depreciation) | $25,336,537 |
| Tax cost | $537,466,792 |
3. Purchases and Sales of Investments.
Purchases and sales of securities, other than short-term securities, aggregated $45,409,853 and $26,954,744, respectively.
Delayed Delivery Transactions and When-Issued Securities. During the period, the Fund transacted in securities on a delayed delivery or when-issued basis. Payment and delivery may take place after the customary settlement period for that security. The price of the underlying securities and the date when the securities will be delivered and paid for are fixed at the time the transaction is negotiated. The securities purchased on a delayed delivery or when-issued basis are identified as such in the Fund's Schedule of Investments. Losses may arise due to changes in the value of the underlying securities or if the counterparty does not perform under the contract's terms, or if the issuer does not issue the securities due to political, economic, or other factors.
4. Fees and Other Transactions with Affiliates.
Management Fee. Fidelity Management & Research Company (the investment adviser) and its affiliates provide the Fund with investment management related services for which the Fund pays a monthly management fee. The management fee is the sum of an individual fund fee rate that is based on an annual rate of .25% of the Fund's average net assets and an annualized group fee rate that averaged .10% during the period. The group fee rate is based upon the average net assets of all the mutual funds advised by the investment adviser, including any mutual funds previously advised by the investment adviser that are currently advised by Fidelity SelectCo, LLC, an affiliate of the investment adviser. The group fee rate decreases as assets under management increase and increases as assets under management decrease. For the reporting period, the total annualized management fee rate was .35% of the Fund's average net assets.
Transfer Agent Fees. Fidelity Investments Institutional Operations Company, Inc. (FIIOC), an affiliate of the investment adviser, is the transfer, dividend disbursing and shareholder servicing agent for the Fund. FIIOC receives account fees and asset-based fees that vary according to account size and type of account. FIIOC pays for typesetting, printing and mailing of shareholder reports, except proxy statements. For the period, transfer agent fees were equivalent to an annualized rate of .09% of average net assets.
Accounting Fees. Fidelity Service Company, Inc. (FSC), an affiliate of the investment adviser, maintains the Fund's accounting records. The fee is based on the level of average net assets for each month. For the period, the fees were equivalent to an annualized rate of .03%.
Interfund Trades. The Fund may purchase from or sell securities to other Fidelity Funds under procedures adopted by the Board. The procedures have been designed to ensure these interfund trades are executed in accordance with Rule 17a-7 of the 1940 Act. Interfund trades are included within the respective purchases and sales amounts shown in the Purchases and Sales of Investments note.
5. Committed Line of Credit.
The Fund participates with other funds managed by the investment adviser or an affiliate in a $4.25 billion credit facility (the "line of credit") to be utilized for temporary or emergency purposes to fund shareholder redemptions or for other short-term liquidity purposes. The Fund has agreed to pay commitment fees on its pro-rata portion of the line of credit, which amounted to $756 and is reflected in Miscellaneous expenses on the Statement of Operations. During the period, the Fund did not borrow on this line of credit.
6. Expense Reductions.
Through arrangements with the Fund's custodian, credits realized as a result of certain uninvested cash balances were used to reduce the Fund's. During the period, these credits reduced the Fund's custody expenses by $1,489.
In addition, during the period the investment adviser reimbursed and/or waived a portion of operating expenses in the amount of $1,319.
7. Other.
The Fund's organizational documents provide former and current trustees and officers with a limited indemnification against liabilities arising in connection with the performance of their duties to the Fund. In the normal course of business, the Fund may also enter into contracts that provide general indemnifications. The Fund's maximum exposure under these arrangements is unknown as this would be dependent on future claims that may be made against the Fund. The risk of material loss from such claims is considered remote.
Shareholder Expense Example
As a shareholder of the Fund, you incur two types of costs: (1) transaction costs and (2) ongoing costs, including management fees and other Fund expenses. This Example is intended to help you understand your ongoing costs (in dollars) of investing in the Fund and to compare these costs with the ongoing costs of investing in other mutual funds.
The Example is based on an investment of $1,000 invested at the beginning of the period and held for the entire period (January 1, 2019 to June 30, 2019).
Actual Expenses
The first line of the accompanying table provides information about actual account values and actual expenses. You may use the information in this line, together with the amount you invested, to estimate the expenses that you paid over the period. Simply divide your account value by $1,000.00 (for example, an $8,600 account value divided by $1,000.00 = 8.6), then multiply the result by the number in the first line under the heading entitled "Expenses Paid During Period" to estimate the expenses you paid on your account during this period.
Hypothetical Example for Comparison Purposes
The second line of the accompanying table provides information about hypothetical account values and hypothetical expenses based on the Fund's actual expense ratio and an assumed rate of return of 5% per year before expenses, which is not the Fund's actual return. The hypothetical account values and expenses may not be used to estimate the actual ending account balance or expenses you paid for the period. You may use this information to compare the ongoing costs of investing in the Fund and other funds. To do so, compare this 5% hypothetical example with the 5% hypothetical examples that appear in the shareholder reports of the other funds.
Please note that the expenses shown in the table are meant to highlight your ongoing costs only and do not reflect any transaction costs. Therefore, the second line of the table is useful in comparing ongoing costs only, and will not help you determine the relative total costs of owning different funds.
| | Annualized Expense Ratio-A | Beginning
Account Value
January 1, 2019 | Ending
Account Value
June 30, 2019 | Expenses Paid
During Period-B
January 1, 2019
to June 30, 2019 |
| Actual | .50% | $1,000.00 | $1,050.00 | $2.54 |
| Hypothetical-C | | $1,000.00 | $1,022.32 | $2.51 |
A Annualized expense ratio reflects expenses net of applicable fee waivers.
B Expenses are equal to the Fund's annualized expense ratio, multiplied by the average account value over the period, multiplied by 181/365 (to reflect the one-half year period).
C 5% return per year before expenses
MNF-SANN-0819
1.705580.121
Fidelity® Ohio Municipal Income Fund
Fidelity® Ohio Municipal Money Market Fund
Semi-Annual Report June 30, 2019 |
|
Beginning on January 1, 2021, as permitted by regulations adopted by the Securities and Exchange Commission, paper copies of a fund’s shareholder reports will no longer be sent by mail, unless you specifically request paper copies of the reports from the fund or from your financial intermediary, such as a financial advisor, broker-dealer or bank. Instead, the reports will be made available on a website, and you will be notified by mail each time a report is posted and provided with a website link to access the report.
If you already elected to receive shareholder reports electronically, you will not be affected by this change and you need not take any action. You may elect to receive shareholder reports and other communications from a fund electronically, by contacting your financial intermediary. For Fidelity customers, visit Fidelity's web site or call Fidelity using the contact information listed below.
You may elect to receive all future reports in paper free of charge. If you wish to continue receiving paper copies of your shareholder reports, you may contact your financial intermediary or, if you are a Fidelity customer, visit Fidelity’s website, or call Fidelity at the applicable toll-free number listed below. Your election to receive reports in paper will apply to all funds held with the fund complex/your financial intermediary.
| Account Type | Website | Phone Number |
| Brokerage, Mutual Fund, or Annuity Contracts: | fidelity.com/mailpreferences | 1-800-343-3548 |
| Employer Provided Retirement Accounts: | netbenefits.fidelity.com/preferences (choose 'no' under Required Disclosures to continue to print) | 1-800-343-0860 |
| Advisor Sold Accounts Serviced Through Your Financial Intermediary: | Contact Your Financial Intermediary | Your Financial Intermediary's phone number |
| Advisor Sold Accounts Serviced by Fidelity: | institutional.fidelity.com | 1-877-208-0098 |
Contents
To view a fund's proxy voting guidelines and proxy voting record for the 12-month period ended June 30, visit http://www.fidelity.com/proxyvotingresults or visit the Securities and Exchange Commission's (SEC) web site at http://www.sec.gov.
You may also call 1-800-544-8544 to request a free copy of the proxy voting guidelines.
Standard & Poor's, S&P and S&P 500 are registered service marks of The McGraw-Hill Companies, Inc. and have been licensed for use by Fidelity Distributors Corporation.
Other third-party marks appearing herein are the property of their respective owners.
All other marks appearing herein are registered or unregistered trademarks or service marks of FMR LLC or an affiliated company. © 2019 FMR LLC. All rights reserved.
This report and the financial statements contained herein are submitted for the general information of the shareholders of the Fund. This report is not authorized for distribution to prospective investors in the Fund unless preceded or accompanied by an effective prospectus.
A fund files its complete schedule of portfolio holdings with the SEC for the first and third quarters of each fiscal year on Form N-PORT. Forms N-PORT are available on the SEC’s web site at http://www.sec.gov. A fund's Forms N-PORT may be reviewed and copied at the SEC’s Public Reference Room in Washington, DC. Information regarding the operation of the SEC's Public Reference Room may be obtained by calling 1-800-SEC-0330.
For a complete list of a fund's portfolio holdings, view the most recent holdings listing, semiannual report, or annual report on Fidelity's web site at http://www.fidelity.com, http://www.institutional.fidelity.com, or http://www.401k.com, as applicable.
NOT FDIC INSURED •MAY LOSE VALUE •NO BANK GUARANTEE
Neither the Fund nor Fidelity Distributors Corporation is a bank.
Fidelity® Ohio Municipal Income Fund
Investment Summary (Unaudited)
Top Five Sectors as of June 30, 2019
| | % of fund's net assets |
| Health Care | 36.4 |
| Education | 20.3 |
| General Obligations | 18.6 |
| Special Tax | 5.7 |
| Electric Utilities | 4.7 |
Quality Diversification (% of fund's net assets)
| As of June 30, 2019 |
| | AAA | 4.6% |
| | AA,A | 78.6% |
| | BBB | 10.5% |
| | BB and Below | 2.2% |
| | Not Rated | 1.4% |
| | Short-Term Investments and Net Other Assets | 2.7% |
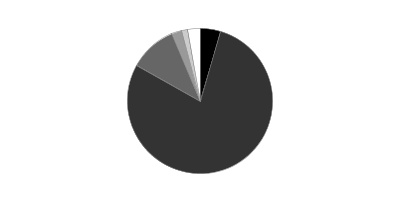
We have used ratings from Moody's Investors Service, Inc. Where Moody's® ratings are not available, we have used S&P® ratings. All ratings are as of the date indicated and do not reflect subsequent changes.
Fidelity® Ohio Municipal Income Fund
Schedule of Investments June 30, 2019 (Unaudited)
Showing Percentage of Net Assets
| Municipal Bonds - 97.3% | | | |
| | | Principal Amount | Value |
| Guam - 0.5% | | | |
| Guam Int'l. Arpt. Auth. Rev. Series 2013 C: | | | |
| 6.25% 10/1/34 (a) | | $900,000 | $1,039,482 |
| 6.375% 10/1/43 (a) | | 735,000 | 851,527 |
| Guam Pwr. Auth. Rev. Series 2012 A, 5% 10/1/23 (FSA Insured) | | 1,000,000 | 1,108,690 |
|
| TOTAL GUAM | | | 2,999,699 |
|
| Ohio - 96.8% | | | |
| Akron Bath Copley Hosp. District Rev.: | | | |
| (Children's Hosp. Med. Ctr. Proj.) Series 2012: | | | |
| 5% 11/15/22 | | 1,000,000 | 1,094,500 |
| 5% 11/15/23 | | 3,245,000 | 3,540,198 |
| Series 2016: | | | |
| 5% 11/15/22 | | 1,020,000 | 1,123,816 |
| 5.25% 11/15/32 | | 1,000,000 | 1,180,360 |
| 5.25% 11/15/34 | | 1,500,000 | 1,759,950 |
| 5.25% 11/15/41 | | 10,295,000 | 11,913,477 |
| 5.25% 11/15/46 | | 1,500,000 | 1,728,930 |
| Allen County Hosp. Facilities Rev. (Mercy Health) Series 2017 A: | | | |
| 4% 8/1/36 | | 5,000,000 | 5,426,200 |
| 5% 8/1/42 | | 4,175,000 | 4,846,549 |
| American Muni. Pwr., Inc. Rev.: | | | |
| (AMP Freemont Energy Ctr. Proj.) Series 2012 B, 5.25% 2/15/26 (Pre-Refunded to 2/15/22 @ 100) | | 1,875,000 | 2,061,525 |
| (Greenup Hydroelectric Proj.) Series 2016 A, 5% 2/15/41 | | 3,005,000 | 3,442,438 |
| (Prairie State Energy Campus Proj.) Series 2015: | | | |
| 5% 2/15/28 | | 3,995,000 | 4,563,968 |
| 5% 2/15/42 | | 3,000,000 | 3,344,220 |
| Bonds: | | | |
| (Combined Hydroelectric Proj.) Series 2018, 2.25%, tender 8/15/21 (b) | | 7,000,000 | 7,067,480 |
| Series 2019 A, 2.3%, tender 2/15/22 (b) | | 6,000,000 | 6,090,540 |
| Beavercreek City School District Series 2015, 5% 12/1/29 | | 1,500,000 | 1,762,530 |
| Bowling Green Univ. Gen. Receipts Series 2016 A, 5% 6/1/42 | | 1,000,000 | 1,139,730 |
| Butler County Hosp. Facilities Rev.: | | | |
| (Kettering Health Network Obligated Group Proj.) Series 2011, 6.375% 4/1/36 | | 5,030,000 | 5,428,980 |
| Series 2016 X: | | | |
| 5% 5/15/31 | | 3,225,000 | 4,208,464 |
| 5% 5/15/32 | | 3,950,000 | 5,205,350 |
| Chillicothe Hosp. Facilities Rev. (Adena Health Sys. Oblig. Group Proj.) Series 2017, 5% 12/1/47 | | 8,535,000 | 9,906,660 |
| Cincinnati City School District Ctfs. of Prtn. (Cincinnati City School District School Impt. Proj.) 5% 12/15/26 | | 4,000,000 | 4,670,680 |
| Cincinnati Gen. Oblig. Series 2015, 5.25% 12/1/29 | | 4,285,000 | 5,145,128 |
| Cleveland Arpt. Sys. Rev. Series 2018 A: | | | |
| 5% 1/1/43 (FSA Insured) (a) | | 1,750,000 | 2,036,860 |
| 5% 1/1/48 (FSA Insured) (a) | | 3,000,000 | 3,475,020 |
| Cleveland Gen. Oblig.: | | | |
| Series 2012, 5% 12/1/25 | | 2,350,000 | 2,629,368 |
| Series 2015: | | | |
| 5% 12/1/26 | | 1,500,000 | 1,808,775 |
| 5% 12/1/27 | | 2,000,000 | 2,397,500 |
| 5% 12/1/29 | | 1,250,000 | 1,486,175 |
| Series C, 5.25% 11/15/23 (Nat'l. Pub. Fin. Guarantee Corp. Insured) | | 1,885,000 | 2,188,278 |
| Cleveland Heights & Univ. Heights County School District Series 2014, 4.5% 12/1/47 | | 3,000,000 | 3,227,580 |
| Cleveland Income Tax Rev. Series 2018 A: | | | |
| 5% 10/1/29 | | 600,000 | 746,718 |
| 5% 10/1/30 | | 420,000 | 521,241 |
| 5% 10/1/31 | | 650,000 | 802,334 |
| 5% 10/1/33 | | 600,000 | 731,490 |
| 5% 10/1/36 | | 700,000 | 843,416 |
| 5% 10/1/39 | | 2,040,000 | 2,437,596 |
| 5% 10/1/43 | | 5,000,000 | 5,923,350 |
| Cleveland Muni. School District: | | | |
| Series 2013, 5% 12/1/24 | | 1,255,000 | 1,401,973 |
| Series 2015 A: | | | |
| 5% 12/1/24 | | 3,725,000 | 4,213,459 |
| 5% 12/1/27 | | 1,750,000 | 1,970,238 |
| Cleveland Ohio Wtr. Poll. Ctl. Rev. Series 2016: | | | |
| 5% 11/15/34 | | 1,190,000 | 1,387,314 |
| 5% 11/15/35 | | 1,245,000 | 1,449,392 |
| 5% 11/15/36 | | 450,000 | 522,284 |
| 5% 11/15/45 | | 2,000,000 | 2,293,100 |
| Cleveland Pub. Pwr. Sys. Rev. Series 2018: | | | |
| 5% 11/15/23 (FSA Insured) | | 360,000 | 411,822 |
| 5% 11/15/24 (FSA Insured) | | 475,000 | 556,083 |
| 5% 11/15/25 (FSA Insured) | | 200,000 | 238,886 |
| 5% 11/15/26 (FSA Insured) | | 265,000 | 322,123 |
| 5% 11/15/27 (FSA Insured) | | 220,000 | 271,729 |
| 5% 11/15/28 (FSA Insured) | | 150,000 | 186,081 |
| 5% 11/15/29 (FSA Insured) | | 210,000 | 258,905 |
| 5% 11/15/30 (FSA Insured) | | 530,000 | 649,229 |
| 5% 11/15/32 (FSA Insured) | | 365,000 | 442,690 |
| 5% 11/15/34 (FSA Insured) | | 785,000 | 945,368 |
| 5% 11/15/36 (FSA Insured) | | 1,000,000 | 1,196,320 |
| 5% 11/15/38 (FSA Insured) | | 830,000 | 986,472 |
| Cleveland State Univ. Gen. Receipts Series 2012: | | | |
| 5% 6/1/24 | | 1,920,000 | 2,077,248 |
| 5% 6/1/25 | | 2,500,000 | 2,702,275 |
| 5% 6/1/26 | | 3,075,000 | 3,319,247 |
| Cleveland Wtr. Rev.: | | | |
| Series 2012 X, 5% 1/1/42 | | 5,465,000 | 5,887,226 |
| Series 2015 Y: | | | |
| 4% 1/1/28 | | 650,000 | 713,921 |
| 4% 1/1/29 | | 1,040,000 | 1,139,195 |
| Cleveland-Cuyahoga County Port Auth. Dev. Lease Rev. (Administrative Headquarters Proj.) Series 2013, 5% 7/1/37 | | 3,000,000 | 3,877,290 |
| Columbus City School District 5% 12/1/31 | | 5,000,000 | 6,001,050 |
| Columbus Gen. Oblig. Series 2014 A, 4% 2/15/28 | | 5,000,000 | 5,526,450 |
| Columbus Metropolitan Library Facility Series 2012 1, 5% 12/1/23 (Pre-Refunded to 12/1/20 @ 100) | | 530,000 | 557,687 |
| Cuyahoga County Econ. Dev. Rev.: | | | |
| (The Cleveland Orchestra Proj.) Series 2019: | | | |
| 5% 1/1/29 | | 325,000 | 409,487 |
| 5% 1/1/30 | | 250,000 | 315,883 |
| 5% 1/1/31 | | 325,000 | 407,758 |
| 5% 1/1/32 | | 500,000 | 621,460 |
| 5% 1/1/33 | | 400,000 | 493,372 |
| 5% 1/1/34 | | 300,000 | 368,619 |
| 5% 1/1/36 | | 440,000 | 536,488 |
| 5% 1/1/37 | | 400,000 | 485,912 |
| 5% 1/1/39 | | 1,400,000 | 1,690,080 |
| 5% 1/1/40 | | 1,620,000 | 1,950,431 |
| Series 2019, (The Cleveland Orchestra Proj.) 5% 1/1/35 | | 500,000 | 611,870 |
| Cuyahoga County Gen. Oblig. Series 2012 A, 4% 12/1/27 | | 1,575,000 | 1,628,865 |
| Cuyahoga County Hosp. Rev. Series 2017: | | | |
| 5% 2/15/26 | | 1,750,000 | 2,014,250 |
| 5% 2/15/27 | | 1,700,000 | 1,983,968 |
| 5% 2/15/28 | | 2,385,000 | 2,773,874 |
| 5% 2/15/30 | | 3,000,000 | 3,454,380 |
| 5% 2/15/31 | | 1,500,000 | 1,717,710 |
| 5% 2/15/32 | | 1,450,000 | 1,653,986 |
| Dayton Gen. Oblig.: | | | |
| 4% 12/1/22 | | 750,000 | 778,140 |
| 4% 12/1/25 | | 1,540,000 | 1,595,794 |
| Fairfield County Hosp. Facilities Rev. (Fairfield Med. Ctr. Proj.) Series 2013, 5.25% 6/15/43 | | 5,000,000 | 5,280,550 |
| Fairview Park Gen. Oblig. Series 2012: | | | |
| 4% 12/1/23 | | 1,395,000 | 1,513,129 |
| 4% 12/1/24 | | 1,490,000 | 1,616,337 |
| Franklin County Convention Facilities Auth. Tax & Lease Rev. Series 2014: | | | |
| 5% 12/1/25 | | 1,250,000 | 1,467,350 |
| 5% 12/1/26 | | 3,045,000 | 3,569,654 |
| 5% 12/1/32 | | 5,920,000 | 6,885,966 |
| Franklin County Hosp. Facilities Rev.: | | | |
| (Ohiohealth Corp. Proj.) Series 2015, 5% 5/15/40 | | 3,600,000 | 4,093,704 |
| Bonds (U.S. Health Corp. of Columbus Proj.) Series 2011 B, 5%, tender 5/15/23 (b) | | 2,635,000 | 2,962,030 |
| Series 2016 C: | | | |
| 4% 11/1/40 | | 3,000,000 | 3,256,800 |
| 5% 11/1/33 | | 2,610,000 | 3,140,744 |
| 5% 11/1/34 | | 2,155,000 | 2,581,000 |
| Franklin County Ohio Sales Tax R Series 2018, 5% 6/1/48 | | 5,920,000 | 7,128,094 |
| Franklin County Rev. (Trinity Health Proj.) Series 2017, 5% 12/1/47 | | 720,000 | 844,531 |
| Greater Cleveland Reg'l. Transit Auth. Series 2012, 5% 12/1/23 | | 660,000 | 716,846 |
| Hamilton City School District Series 2015: | | | |
| 3.5% 12/1/31 | | 1,500,000 | 1,580,445 |
| 5% 12/1/26 | | 1,500,000 | 1,757,595 |
| 5% 12/1/28 | | 1,550,000 | 1,811,129 |
| Hamilton County Convention Facilities Auth. Rev. Series 2014: | | | |
| 5% 12/1/26 | | 1,000,000 | 1,139,350 |
| 5% 12/1/27 | | 3,825,000 | 4,349,293 |
| Hamilton County HealthCare Facilities Rev. (The Christ Hosp. Proj.) Series 2012: | | | |
| 5.25% 6/1/24 | | 3,000,000 | 3,309,930 |
| 5.25% 6/1/27 | | 3,000,000 | 3,296,430 |
| Hamilton County Healthcare Rev. (Life Enriching Cmntys. Proj.) Series 2016: | | | |
| 5% 1/1/31 | | 1,350,000 | 1,516,793 |
| 5% 1/1/36 | | 3,450,000 | 3,833,054 |
| Hamilton County Hosp. Facilities Rev. Series 2014, 5% 2/1/44 | | 775,000 | 853,531 |
| Hamilton County Student Hsg. Rev. (Stratford Heights Proj.) Series 2010, 5% 6/1/30 (FSA Insured) | | 2,500,000 | 2,578,175 |
| Hancock County Hosp. Facilities Rev. (Blanchard Valley Reg'l. Health Ctr. Proj.) Series 2011 A, 6.25% 12/1/34 (Pre-Refunded to 6/1/21 @ 100) | | 4,100,000 | 4,477,446 |
| Kent State Univ. Revs.: | | | |
| Series 2012 A: | | | |
| 5% 5/1/24 | | 1,385,000 | 1,521,852 |
| 5% 5/1/25 | | 1,500,000 | 1,647,330 |
| 5% 5/1/26 | | 2,220,000 | 2,436,117 |
| Series 2016, 5% 5/1/30 | | 1,125,000 | 1,351,496 |
| Lake County Hosp. Facilities Rev. Series 2015: | | | |
| 5% 8/15/27 | | 770,000 | 896,642 |
| 5% 8/15/45 | | 11,000,000 | 12,161,151 |
| Lakewood City School District Series 2014 C, 5% 12/1/25 | | 1,300,000 | 1,539,369 |
| Lancaster City School District Series 2012: | | | |
| 5% 10/1/37 (Pre-Refunded to 10/1/22 @ 100) | | 2,000,000 | 2,236,540 |
| 5% 10/1/49 | | 2,860,000 | 3,123,206 |
| 5% 10/1/49 (Pre-Refunded to 10/1/22 @ 100) | | 140,000 | 156,083 |
| Lancaster Port Auth. Gas Rev.: | | | |
| Bonds Series 2019, 5%, tender 2/1/25 (b) | | 6,105,000 | 7,104,083 |
| Series 2019: | | | |
| 5% 8/1/19 | | 790,000 | 792,276 |
| 5% 8/1/20 | | 650,000 | 674,999 |
| 5% 2/1/21 | | 285,000 | 300,780 |
| 5% 2/1/22 | | 200,000 | 217,692 |
| 5% 2/1/23 | | 100,000 | 111,952 |
| 5% 8/1/24 | | 655,000 | 761,215 |
| Lucas County Hosp. Rev. Series 2011, 5% 11/15/25 (Pre-Refunded to 11/15/21 @ 100) | | 1,780,000 | 1,930,107 |
| Lucas-Plaza Hsg. Dev. Corp. Mtg. Rev. (The Plaza Section 8 Assisted Proj.) Series 1991 A, 0% 6/1/24 (Escrowed to Maturity) | | 9,000,000 | 8,261,460 |
| Miami County Hosp. Facilities Rev. (Kettering Health Network Obligated Group Proj.) Series 2019: | | | |
| 5% 8/1/45 | | 5,500,000 | 6,415,145 |
| 5% 8/1/49 | | 2,200,000 | 2,556,950 |
| Miami Univ. Series 2012, 4% 9/1/28 | | 2,195,000 | 2,345,840 |
| Miamisburg City School District Series 2016: | | | |
| 5% 12/1/28 | | 500,000 | 598,955 |
| 5% 12/1/29 | | 300,000 | 357,681 |
| Middleburg Heights Hosp. Rev.: | | | |
| Series 2011, 5.25% 8/1/41 | | 3,000,000 | 3,192,180 |
| Series 2012 A, 5% 8/1/47 | | 5,725,000 | 6,115,102 |
| Milford Exempt Village School District Series 2015: | | | |
| 3.5% 12/1/31 | | 500,000 | 527,710 |
| 5% 12/1/28 | | 1,400,000 | 1,664,362 |
| Montgomery County Rev. (Catholic Health Initiatives Proj.) Series 2008 D, 6.25% 10/1/33 | | 2,500,000 | 2,517,850 |
| Muskingum County Hosp. Facilities (Genesis Healthcare Sys. Obligated Group Proj.) Series 2013: | | | |
| 5% 2/15/44 | | 4,005,000 | 4,269,610 |
| 5% 2/15/48 | | 3,495,000 | 3,718,960 |
| North Olmsted City School District Series 2015 A: | | | |
| 5% 12/1/26 (Pre-Refunded to 12/1/23 @ 100) | | 665,000 | 770,210 |
| 5% 12/1/27 (Pre-Refunded to 12/1/23 @ 100) | | 220,000 | 254,806 |
| 5% 12/1/28 (Pre-Refunded to 12/1/23 @ 100) | | 365,000 | 422,747 |
| 5% 12/1/29 (Pre-Refunded to 12/1/23 @ 100) | | 500,000 | 579,105 |
| 5% 12/1/30 (Pre-Refunded to 12/1/23 @ 100) | | 750,000 | 868,658 |
| Northeast Ohio Reg'l. Swr. District Wastewtr. Rev. Series 2014, 5% 11/15/44 | | 8,815,000 | 10,061,000 |
| Northwest Local School District Series 2015, 5% 12/1/45 | | 2,980,000 | 3,373,569 |
| Ohio Bldg. Auth. (Adult Correctional Bldg. Fund Proj.) Series 2010 A, 5% 10/1/24 | | 6,030,000 | 6,297,973 |
| Ohio Cap. Facilities Lease (Ohio Gen. Oblig. Proj.) Series 2017 A: | | | |
| 5% 10/1/32 | | 1,625,000 | 1,986,384 |
| 5% 10/1/33 | | 1,500,000 | 1,825,485 |
| 5% 10/1/35 | | 1,450,000 | 1,749,077 |
| 5% 10/1/36 | | 1,250,000 | 1,503,213 |
| 5% 10/1/37 | | 1,430,000 | 1,714,270 |
| Ohio Gen. Oblig. Series 2016 A, 5% 2/1/31 | | 4,255,000 | 5,063,790 |
| Ohio Higher Edl. Facility Commission Rev.: | | | |
| (Case Western Reserve Univ. Proj.): | | | |
| Series 1990 B, 6.5% 10/1/20 | | 875,000 | 907,218 |
| Series 2016, 5% 12/1/40 | | 2,000,000 | 2,345,640 |
| (Denison Univ. 2015 Proj.): | | | |
| 5% 11/1/28 | | 1,465,000 | 1,724,554 |
| 5% 11/1/29 | | 1,325,000 | 1,560,784 |
| 5% 11/1/30 | | 2,285,000 | 2,679,505 |
| (Denison Univ., Proj.) Series 2017 B, 5% 11/1/26 | | 1,505,000 | 1,853,603 |
| (Kenyon College 2010 Proj.) Series 2010, 5.25% 7/1/44 | | 875,000 | 905,678 |
| (Kenyon College 2015 Proj.) 5% 7/1/41 | | 5,100,000 | 5,787,786 |
| (Kenyon College 2016 Proj.) Series 2016, 5% 7/1/42 | | 4,000,000 | 4,607,680 |
| (Kenyon College, Oh. Proj.) Series 2017: | | | |
| 4% 7/1/36 | | 400,000 | 438,148 |
| 4% 7/1/37 | | 450,000 | 491,265 |
| 5% 7/1/28 | | 400,000 | 492,816 |
| 5% 7/1/29 | | 735,000 | 901,264 |
| 5% 7/1/30 | | 300,000 | 364,887 |
| 5% 7/1/31 | | 400,000 | 482,496 |
| 5% 7/1/33 | | 650,000 | 778,850 |
| 5% 7/1/35 | | 700,000 | 833,105 |
| 5% 7/1/42 | | 1,400,000 | 1,640,044 |
| (The College of Wooster 2018 Proj.) Series 2018: | | | |
| 5% 9/1/33 | | 1,445,000 | 1,767,842 |
| 5% 9/1/45 | | 4,255,000 | 5,066,173 |
| (Univ. Hosp. Health Sys. Proj.) Series 2010 A, 5.25% 1/15/23 | | 2,500,000 | 2,548,775 |
| (Univ. of Dayton 2018 Proj.) Series A, 5% 12/1/48 | | 1,000,000 | 1,181,280 |
| (Univ. of Dayton Proj.): | | | |
| Series 2013: | | | |
| 5% 12/1/23 | | 540,000 | 600,755 |
| 5% 12/1/24 | | 585,000 | 650,818 |
| 5% 12/1/25 | | 1,000,000 | 1,112,160 |
| 5% 12/1/26 | | 1,195,000 | 1,330,298 |
| 5% 12/1/27 | | 2,300,000 | 2,557,968 |
| Series 2018 B: | | | |
| 4% 12/1/33 | | 1,155,000 | 1,288,044 |
| 5% 12/1/19 | | 1,000,000 | 1,014,915 |
| 5% 12/1/21 | | 1,000,000 | 1,084,630 |
| 5% 12/1/23 | | 1,000,000 | 1,148,080 |
| 5% 12/1/25 | | 1,065,000 | 1,281,206 |
| 5% 12/1/27 | | 1,000,000 | 1,249,310 |
| 5% 12/1/29 | | 1,310,000 | 1,631,684 |
| 5% 12/1/31 | | 1,130,000 | 1,384,171 |
| 5% 12/1/35 | | 1,000,000 | 1,208,140 |
| 5% 12/1/36 | | 1,000,000 | 1,204,120 |
| (Xavier Univ. Proj.) Series 2015 C: | | | |
| 5% 5/1/26 | | 1,000,000 | 1,160,940 |
| 5% 5/1/28 | | 1,000,000 | 1,152,620 |
| 5% 5/1/29 | | 855,000 | 980,762 |
| 5% 5/1/31 | | 1,005,000 | 1,141,509 |
| Ohio Hosp. Facilities Rev.: | | | |
| Series 2011 A, 5% 1/1/32 | | 3,500,000 | 3,674,160 |
| Series 2017 A, 5% 1/1/32 | | 2,000,000 | 2,454,400 |
| Series 2019 B, 4% 1/1/40 | | 3,000,000 | 3,297,690 |
| Ohio Hosp. Rev.: | | | |
| Series 2013 A, 5% 1/15/27 | | 5,000,000 | 5,550,550 |
| 5% 1/15/41 | | 5,000,000 | 5,704,000 |
| Ohio Hsg. Fin. Agcy. Residential Mtg. Rev.: | | | |
| (Mtg. Backed Securities Prog.) Series 2019 B, 4.5% 3/1/50 (c) | | 6,250,000 | 7,001,000 |
| (Mtg. Backed Securities Programs) Series 2017 B, 4.5% 3/1/47 (a) | | 800,000 | 862,016 |
| Ohio Solid Waste Rev. Bonds (Republic Svcs., Inc. Proj.) 1.5%, tender 9/3/19 (b) | | 9,000,000 | 9,000,851 |
| Ohio Spl. Oblig.: | | | |
| ( Ohio Gen. Oblig. Proj.) Series 2017 A, 5% 4/1/32 | | 1,115,000 | 1,351,057 |
| ( Ohio Gen. Oblig. Proj.P Series 2017 A, 5% 4/1/34 | | 1,000,000 | 1,201,190 |
| (Ohio Gen. Oblig. Proj.) Series 2017 A: | | | |
| 5% 4/1/29 | | 2,535,000 | 3,124,565 |
| 5% 4/1/30 | | 2,250,000 | 2,755,485 |
| 5% 4/1/31 | | 2,000,000 | 2,432,460 |
| 5% 4/1/33 | | 1,850,000 | 2,228,066 |
| 5% 4/1/35 | | 2,395,000 | 2,865,761 |
| Ohio State Univ. Gen. Receipts Series 2013 A: | | | |
| 5% 6/1/28 | | 2,000,000 | 2,252,500 |
| 5% 6/1/38 | | 3,500,000 | 3,899,630 |
| Ohio Tpk. Commission Tpk. Rev. (Infastructure Proj.) Series 2005 A, 0% 2/15/43 | | 10,000,000 | 4,706,000 |
| Ohio Univ. Gen. Receipts Athens Series 2013, 5% 12/1/24 | | 5,075,000 | 5,654,971 |
| Ohio Wtr. Dev. Auth. Rev. (Fresh Wtr. Impt. Proj.) Series 2009 B, 5% 12/1/24 | | 1,025,000 | 1,204,447 |
| Olentangy Local School District 5% 12/1/32 | | 1,275,000 | 1,518,436 |
| Princeton City School District Series 2014, 5% 12/1/39 | | 2,750,000 | 3,154,553 |
| Reynoldsburg City School District 4% 12/1/30 | | 2,375,000 | 2,631,928 |
| Ross County Hosp. Facilities Rev. (Adena Health Sys. Obligated Group Proj.) Series 2019, 5% 12/1/49 | | 5,000,000 | 5,901,800 |
| Scioto County Hosp. Facilities Rev. Series 2016: | | | |
| 5% 2/15/24 | | 970,000 | 1,105,868 |
| 5% 2/15/28 | | 5,030,000 | 5,932,181 |
| 5% 2/15/30 | | 3,860,000 | 4,501,609 |
| 5% 2/15/32 | | 2,550,000 | 2,942,292 |
| 5% 2/15/33 | | 2,460,000 | 2,828,188 |
| 5% 2/15/34 | | 4,450,000 | 5,096,007 |
| South-Western City School District Franklin & Pickway County: | | | |
| (Intercept) Series 2012, 5% 12/1/36 | | 400,000 | 436,456 |
| Series 2012, 5% 12/1/36 (Pre-Refunded to 6/1/22 @ 100) | | 1,600,000 | 1,767,744 |
| Toledo Gen. Oblig. Series 2012 A, 5% 12/1/20 | | 1,635,000 | 1,717,093 |
| Univ. of Akron Gen. Receipts Series 2016 A: | | | |
| 5% 1/1/23 | | 460,000 | 513,783 |
| 5% 1/1/25 | | 1,025,000 | 1,202,417 |
| 5% 1/1/33 | | 5,000,000 | 5,884,000 |
| Univ. of Cincinnati Gen. Receipts: | | | |
| Series 2012 C, 4% 6/1/28 | | 2,000,000 | 2,149,220 |
| Series 2013 A: | | | |
| 5% 6/1/33 | | 4,085,000 | 4,554,693 |
| 5% 6/1/34 | | 5,130,000 | 5,707,535 |
| Series 2016 A: | | | |
| 5% 6/1/32 | | 745,000 | 886,498 |
| 5% 6/1/33 | | 800,000 | 949,616 |
| 5% 6/1/34 | | 585,000 | 690,183 |
| Series 2016 C, 5% 6/1/41 | | 2,585,000 | 3,002,167 |
| Series F: | | | |
| 5% 6/1/32 | | 1,995,000 | 2,089,364 |
| 5% 6/1/32 (Pre-Refunded to 12/1/20 @ 100) | | 5,000 | 5,250 |
| Univ. of Toledo Gen. Receipts: | | | |
| Series 2017 B, 5% 6/1/31 | | 2,470,000 | 3,224,659 |
| Series 2018 A: | | | |
| 5% 6/1/26 | | 600,000 | 728,160 |
| 5% 6/1/27 | | 350,000 | 433,174 |
| Village of Bluffton Hosp. Facilities Blanchard Valley Reg Health Ctr. Series 2017: | | | |
| 4% 12/1/32 | | 1,500,000 | 1,621,080 |
| 5% 12/1/25 | | 1,500,000 | 1,784,400 |
| 5% 12/1/26 | | 1,890,000 | 2,289,149 |
| 5% 12/1/27 | | 1,340,000 | 1,641,232 |
| 5% 12/1/28 | | 1,400,000 | 1,697,570 |
| 5% 12/1/29 | | 825,000 | 994,430 |
| 5% 12/1/30 | | 1,700,000 | 2,036,617 |
| 5% 12/1/31 | | 750,000 | 891,698 |
| Willoughby-Eastlake City School District Series 2016, 5% 12/1/46 | | 4,000,000 | 4,575,800 |
| Wood County Hosp. Facilities Rev.: | | | |
| (Hosp. Proj.) Series 2012, 5% 12/1/27 | | 3,500,000 | 3,746,085 |
| (Wood County Hosp. Assoc. Proj.) Series 2012: | | | |
| 5% 12/1/32 | | 2,000,000 | 2,113,420 |
| 5% 12/1/42 | | 125,000 | 130,593 |
| Wright State Univ. Gen. Receipts Series 2011 A: | | | |
| 5% 5/1/20 | | 1,650,000 | 1,696,066 |
| 5% 5/1/21 | | 1,080,000 | 1,144,454 |
| 5% 5/1/23 | | 2,665,000 | 2,817,705 |
|
| TOTAL OHIO | | | 632,937,141 |
|
| TOTAL MUNICIPAL BONDS | | | |
| (Cost $603,583,799) | | | 635,936,840 |
|
| Municipal Notes - 3.0% | | | |
| Ohio - 3.0% | | | |
| Allen County Hosp. Facilities Rev. (Catholic Healthcare Partners Proj.) Series 2010 C, 1.8% 7/1/19, LOC MUFG Union Bank NA, VRDN (b) | | 12,100,000 | $12,100,000 |
| Montgomery County Hosp. Rev. Series 2016 E, 1.97% 7/1/19, LOC Barclays Bank PLC, VRDN (b) | | 1,500,000 | 1,500,000 |
| Ohio Higher Edl. Facility Commission Rev.: | | | |
| (Cleveland Clinic Foundation Proj.) Series 2008 B4, 1.92% 7/1/19 (Liquidity Facility Barclays Bank PLC), VRDN (b) | | 1,750,000 | 1,750,000 |
| Series 2013 B, 1.85% 7/1/19 (Liquidity Facility Wells Fargo Bank NA), VRDN (b) | | 4,600,000 | 4,600,000 |
| TOTAL MUNICIPAL NOTES | | | |
| (Cost $19,949,998) | | | 19,950,000 |
| TOTAL INVESTMENT IN SECURITIES - 100.3% | | | |
| (Cost $623,533,797) | | | 655,886,840 |
| NET OTHER ASSETS (LIABILITIES) - (0.3)% | | | (2,278,064) |
| NET ASSETS - 100% | | | $653,608,776 |
Security Type Abbreviations
VRDN – VARIABLE RATE DEMAND NOTE (A debt instrument that is payable upon demand, either daily, weekly or monthly)
Legend
(a) Private activity obligations whose interest is subject to the federal alternative minimum tax for individuals.
(b) Coupon rates for floating and adjustable rate securities reflect the rates in effect at period end.
(c) Security or a portion of the security purchased on a delayed delivery or when-issued basis.
Investment Valuation
All investments are categorized as Level 2 under the Fair Value Hierarchy. The inputs or methodology used for valuing securities may not be an indication of the risk associated with investing in those securities. For more information on valuation inputs please refer to the Investment Valuation section in the accompanying Notes to Financial Statements.
Other Information
The distribution of municipal securities by revenue source, as a percentage of total Net Assets, is as follows (Unaudited):
| Health Care | 36.4% |
| Education | 20.3% |
| General Obligations | 18.6% |
| Special Tax | 5.7% |
| Others* (Individually Less Than 5%) | 19.0% |
| | 100.0% |
* Includes net other assets
See accompanying notes which are an integral part of the financial statements.
Fidelity® Ohio Municipal Income Fund
Financial Statements
Statement of Assets and Liabilities
| | | June 30, 2019 (Unaudited) |
| Assets | | |
Investment in securities, at value — See accompanying schedule:
Unaffiliated issuers (cost $623,533,797) | | $655,886,840 |
| Cash | | 256,465 |
| Receivable for fund shares sold | | 147,910 |
| Interest receivable | | 5,711,203 |
| Other receivables | | 1,735 |
| Total assets | | 662,004,153 |
| Liabilities | | |
| Payable for investments purchased on a delayed delivery basis | $7,001,000 | |
| Payable for fund shares redeemed | 616,440 | |
| Distributions payable | 499,257 | |
| Accrued management fee | 192,328 | |
| Other affiliated payables | 59,438 | |
| Other payables and accrued expenses | 26,914 | |
| Total liabilities | | 8,395,377 |
| Net Assets | | $653,608,776 |
| Net Assets consist of: | | |
| Paid in capital | | $620,068,154 |
| Total distributable earnings (loss) | | 33,540,622 |
| Net Assets, for 53,114,210 shares outstanding | | $653,608,776 |
| Net Asset Value, offering price and redemption price per share ($653,608,776 ÷ 53,114,210 shares) | | $12.31 |
See accompanying notes which are an integral part of the financial statements.
Statement of Operations
| | | Six months ended June 30, 2019 (Unaudited) |
| Investment Income | | |
| Interest | | $9,844,199 |
| Expenses | | |
| Management fee | $1,125,288 | |
| Transfer agent fees | 277,038 | |
| Accounting fees and expenses | 75,280 | |
| Custodian fees and expenses | 2,303 | |
| Independent trustees' fees and expenses | 1,153 | |
| Registration fees | 16,450 | |
| Audit | 29,383 | |
| Legal | 2,901 | |
| Miscellaneous | 2,469 | |
| Total expenses before reductions | 1,532,265 | |
| Expense reductions | (3,267) | |
| Total expenses after reductions | | 1,528,998 |
| Net investment income (loss) | | 8,315,201 |
| Realized and Unrealized Gain (Loss) | | |
| Net realized gain (loss) on: | | |
| Investment securities: | | |
| Unaffiliated issuers | | 1,195,529 |
| Total net realized gain (loss) | | 1,195,529 |
| Change in net unrealized appreciation (depreciation) on investment securities | | 20,651,444 |
| Net gain (loss) | | 21,846,973 |
| Net increase (decrease) in net assets resulting from operations | | $30,162,174 |
See accompanying notes which are an integral part of the financial statements.
Statement of Changes in Net Assets
| | Six months ended June 30, 2019 (Unaudited) | Year ended December 31, 2018 |
| Increase (Decrease) in Net Assets | | |
| Operations | | |
| Net investment income (loss) | $8,315,201 | $17,354,397 |
| Net realized gain (loss) | 1,195,529 | 255,765 |
| Change in net unrealized appreciation (depreciation) | 20,651,444 | (16,148,891) |
| Net increase (decrease) in net assets resulting from operations | 30,162,174 | 1,461,271 |
| Distributions to shareholders | (8,472,888) | (19,076,332) |
| Share transactions | | |
| Proceeds from sales of shares | 43,250,654 | 81,600,273 |
| Reinvestment of distributions | 5,469,329 | 12,319,390 |
| Cost of shares redeemed | (33,106,085) | (137,357,769) |
| Net increase (decrease) in net assets resulting from share transactions | 15,613,898 | (43,438,106) |
| Total increase (decrease) in net assets | 37,303,184 | (61,053,167) |
| Net Assets | | |
| Beginning of period | 616,305,592 | 677,358,759 |
| End of period | $653,608,776 | $616,305,592 |
| Other Information | | |
| Shares | | |
| Sold | 3,583,143 | 6,872,638 |
| Issued in reinvestment of distributions | 451,045 | 1,039,123 |
| Redeemed | (2,740,682) | (11,595,747) |
| Net increase (decrease) | 1,293,506 | (3,683,986) |
See accompanying notes which are an integral part of the financial statements.
Financial Highlights
Fidelity Ohio Municipal Income Fund
| | Six months ended (Unaudited) June 30, | Years endedDecember 31, | | | | |
| | 2019 | 2018 | 2017 | 2016 | 2015 | 2014 |
| Selected Per–Share Data | | | | | | |
| Net asset value, beginning of period | $11.89 | $12.20 | $11.91 | $12.29 | $12.26 | $11.48 |
| Income from Investment Operations | | | | | | |
| Net investment income (loss)A | .158 | .321 | .330 | .339 | .363 | .384 |
| Net realized and unrealized gain (loss) | .423 | (.279) | .377 | (.308) | .147 | .780 |
| Total from investment operations | .581 | .042 | .707 | .031 | .510 | 1.164 |
| Distributions from net investment income | (.158) | (.321) | (.330) | (.339) | (.363) | (.384) |
| Distributions from net realized gain | (.003) | (.031) | (.087) | (.072) | (.117) | – |
| Total distributions | (.161) | (.352) | (.417) | (.411) | (.480) | (.384) |
| Redemption fees added to paid in capitalA | – | – | – | –B | –B | –B |
| Net asset value, end of period | $12.31 | $11.89 | $12.20 | $11.91 | $12.29 | $12.26 |
| Total ReturnC,D | 4.92% | .39% | 6.03% | .19% | 4.24% | 10.26% |
| Ratios to Average Net AssetsE | | | | | | |
| Expenses before reductions | .49%F | .48% | .48% | .48% | .48% | .48% |
| Expenses net of fee waivers, if any | .49%F | .48% | .48% | .48% | .48% | .48% |
| Expenses net of all reductions | .49%F | .48% | .48% | .48% | .48% | .48% |
| Net investment income (loss) | 2.64%F | 2.70% | 2.73% | 2.72% | 2.97% | 3.20% |
| Supplemental Data | | | | | | |
| Net assets, end of period (000 omitted) | $653,609 | $616,306 | $677,359 | $657,105 | $636,261 | $598,694 |
| Portfolio turnover rate | 14%F | 11% | 24% | 17% | 17% | 7% |
A Calculated based on average shares outstanding during the period.
B Amount represents less than $.0005 per share.
C Total returns for periods of less than one year are not annualized.
D Total returns would have been lower if certain expenses had not been reduced during the applicable periods shown.
E Expense ratios reflect operating expenses of the Fund. Expenses before reductions do not reflect amounts reimbursed by the investment adviser or reductions from expense offset arrangements and do not represent the amount paid by the Fund during periods when reimbursements or reductions occur. Expenses net of fee waivers reflect expenses after reimbursement by the investment adviser but prior to reductions from expense offset arrangements. Expenses net of all reductions represent the net expenses paid by the Fund.
F Annualized
See accompanying notes which are an integral part of the financial statements.
Fidelity® Ohio Municipal Money Market Fund
Investment Summary/Performance (Unaudited)
Effective Maturity Diversification as of June 30, 2019
| Days | % of fund's investments 6/30/19 |
| 1 - 7 | 70.9 |
| 8 - 30 | 0.8 |
| 31 - 60 | 9.8 |
| 61 - 90 | 3.3 |
| 91 - 180 | 7.2 |
| > 180 | 8.0 |
Effective maturity is determined in accordance with the requirements of Rule 2a-7 under the Investment Company Act of 1940.
Asset Allocation (% of fund's net assets)
| As of June 30, 2019 |
| | Variable Rate Demand Notes (VRDNs) | 41.5% |
| | Tender Option Bond | 32.0% |
| | Other Municipal Security | 22.4% |
| | Investment Companies | 3.8% |
| | Net Other Assets (Liabilities) | 0.3% |

Current 7-Day Yields
| | 6/28/19 |
| Fidelity® Ohio Municipal Money Market Fund | 1.41% |
Yield refers to the income paid by the Fund over a given period. Yield for money market funds is usually for seven-day periods, as it is here, though it is expressed as an annual percentage rate. Past performance is no guarantee of future results. Yield will vary and it's possible to lose money investing in the Fund. A portion of the Fund's expenses was reimbursed and/or waived. Absent such reimbursements and/or waivers the yield for the period ending June 30, 2019, the most recent period shown in the table, would have been 1.24%.
Fidelity® Ohio Municipal Money Market Fund
Schedule of Investments June 30, 2019 (Unaudited)
Showing Percentage of Net Assets
| Variable Rate Demand Note - 41.5% | | | |
| | | Principal Amount | Value |
| Alabama - 0.5% | | | |
| Decatur Indl. Dev. Board Exempt Facilities Rev. (Nucor Steel Decatur LLC Proj.) Series 2003 A, 2.13% 7/5/19, VRDN (a)(b) | | $1,260,000 | $1,260,000 |
| Arkansas - 1.2% | | | |
| Blytheville Indl. Dev. Rev. (Nucor Corp. Proj.): | | | |
| Series 1998, 2.13% 7/5/19, VRDN (a)(b) | | 400,000 | 400,000 |
| Series 2002, 2.15% 7/5/19, VRDN (a)(b) | | 2,700,000 | 2,700,000 |
| | | | 3,100,000 |
| Indiana - 0.4% | | | |
| Indiana Dev. Fin. Auth. Envir. Rev. (PSI Energy Proj.): | | | |
| Series 2003 A, 2.2% 7/5/19, VRDN (a)(b) | | 500,000 | 500,000 |
| Series 2003 B, 2.11% 7/5/19, VRDN (a)(b) | | 400,000 | 400,000 |
| | | | 900,000 |
| Kansas - 0.4% | | | |
| Burlington Envir. Impt. Rev. (Kansas City Pwr. and Lt. Co. Proj.) Series 2007 A, 2.13% 7/5/19, VRDN (b) | | 300,000 | 300,000 |
| St. Mary's Kansas Poll. Cont. Rev. (Kansas Gas and Elec. Co. Proj.) Series 1994, 2.1% 7/5/19, VRDN (b) | | 700,000 | 700,000 |
| | | | 1,000,000 |
| Louisiana - 0.0% | | | |
| Saint James Parish Gen. Oblig. (Nucor Steel Louisiana LLC Proj.) Series 2010 B1, 2.05% 7/5/19, VRDN (b) | | 100,000 | 100,000 |
| Nebraska - 0.3% | | | |
| Stanton County Indl. Dev. Rev. (Nucor Corp. Proj.) Series 1996, 2.13% 7/5/19, VRDN (a)(b) | | 700,000 | 700,000 |
| Ohio - 38.2% | | | |
| Allen County Hosp. Facilities Rev. Series 2012 B, 2.05% 7/5/19, VRDN (b) | | 20,325,000 | 20,325,002 |
| Cuyahoga County Health Care Facilities Rev. (The A.M. McGregor Home Proj.) Series 2014, 1.97% 7/5/19, LOC Northern Trust Co., VRDN (b) | | 12,995,000 | 12,995,000 |
| Hamilton County Student Hsg. Rev. (Block 3 Proj.) Series 2004, 1.95% 7/5/19, LOC RBS Citizens NA, VRDN (b) | | 450,000 | 450,000 |
| Lake County Indl. Dev. Rev. (Norshar Co. Proj.) 2.009% 7/5/19, LOC JPMorgan Chase Bank, VRDN (a)(b) | | 905,000 | 905,000 |
| Montgomery County Hosp. Rev. Series 2016 C, 1.97% 7/1/19, LOC Barclays Bank PLC, VRDN (b) | | 600,000 | 600,000 |
| Ohio Hosp. Rev.: | | | |
| Series 2018 B, 1.89% 7/5/19, LOC PNC Bank NA, VRDN (b) | | 1,720,000 | 1,720,000 |
| Series 2018, 1.95% 7/1/19, LOC PNC Bank NA, VRDN (b) | | 1,070,000 | 1,070,000 |
| Ohio Hsg. Fin. Agcy. Residential Mtg. Rev.: | | | |
| Series 2016 F, 1.9% 7/5/19 (Liquidity Facility Fed. Home Ln. Bank, Cincinnati), VRDN (a)(b) | | 3,000,000 | 3,000,000 |
| Series 2016 G, 1.9% 7/5/19 (Liquidity Facility Fed. Home Ln. Bank, Cincinnati), VRDN (a)(b) | | 13,930,000 | 13,930,000 |
| Series 2016 H, 1.9% 7/5/19 (Liquidity Facility Fed. Home Ln. Bank, Cincinnati), VRDN (a)(b) | | 15,715,000 | 15,715,000 |
| Series 2016 I, 1.9% 7/5/19 (Liquidity Facility Fed. Home Ln. Bank, Cincinnati), VRDN (a)(b) | | 3,450,000 | 3,450,000 |
| Ohio Wtr. Dev. Auth. (Waste Mgmt., Inc. Proj.) Series B, 1.97% 7/5/19, LOC Bank of America NA, VRDN (a)(b) | | 13,000,000 | 13,000,000 |
| FHLMC Ohio Hsg. Fin. Agcy. Multi-family Hsg. Rev. (Wingate at Belle Meadows Proj.) 1.93% 7/5/19, LOC Fed. Home Ln. Bank, Cincinnati, VRDN (a)(b) | | 8,385,000 | 8,385,000 |
| FNMA Franklin County Multi-family Rev. Series 2002, 1.93% 7/5/19, LOC Fannie Mae, VRDN (a)(b) | | 4,850,000 | 4,850,000 |
| | | | 100,395,002 |
| South Carolina - 0.0% | | | |
| Berkeley County Indl. Dev. Rev. Series A, 2.15% 7/5/19, VRDN (a)(b) | | 100,000 | 100,000 |
| West Virginia - 0.5% | | | |
| West Virginia Econ. Dev. Auth. Solid Waste Disp. Facilities Rev. (Appalachian Pwr. Co.- Mountaineer Proj.) Series 2008 A, 2.1% 7/5/19, VRDN (a)(b) | | 1,400,000 | 1,400,000 |
| Wyoming - 0.0% | | | |
| Sweetwater County Poll. Cont. Rev. (PacifiCorp Proj.) Series 1994, 2.05% 7/5/19, VRDN (b) | | 100,000 | 100,000 |
| TOTAL VARIABLE RATE DEMAND NOTE | | | |
| (Cost $109,055,002) | | | 109,055,002 |
|
| Tender Option Bond - 32.0% | | | |
| Colorado - 0.1% | | | |
| Denver City & County Arpt. Rev. Bonds Series G-114, 2.15%, tender 12/2/19 (Liquidity Facility Royal Bank of Canada) (a)(b)(c)(d)(e)(f) | | 100,000 | 100,000 |
| Connecticut - 0.0% | | | |
| Connecticut Spl. Tax Oblig. Trans. Infrastructure Rev. Bonds Series Floaters G 110, 2.08%, tender 10/1/19 (Liquidity Facility Royal Bank of Canada) (b)(c)(d)(f) | | 100,000 | 100,000 |
| Ohio - 31.9% | | | |
| Allen County Hosp. Facilities Rev. Participating VRDN Series Floaters XF 25 16, 2% 7/5/19 (Liquidity Facility Citibank NA) (b)(c)(f) | | 4,340,000 | 4,340,000 |
| Cincinnati Wtr. Sys. Rev. Participating VRDN Series MS 3280, 1.93% 7/5/19 (Liquidity Facility Morgan Stanley Bank, West Valley City Utah) (b)(c)(f) | | 3,750,000 | 3,750,000 |
| Cleveland Wtr. Rev. Participating VRDN Series Floaters E 119, 1.93% 7/5/19 (Liquidity Facility Royal Bank of Canada) (b)(c)(f) | | 3,600,000 | 3,600,000 |
| Cuyahoga County Ctfs. of Prtn. Participating VRDN Series Floaters XG 02 06, 2.02% 7/5/19 (Liquidity Facility Bank of America NA) (b)(c)(f) | | 3,900,000 | 3,900,000 |
| Forest Hills Local School District Participating VRDN Series Floaters G30, 1.93% 7/5/19 (Liquidity Facility Royal Bank of Canada) (b)(c)(f) | | 2,300,000 | 2,300,000 |
| Franklin County Hosp. Facilities Rev. Participating VRDN: | | | |
| Series 15 XF0244, 1.94% 7/5/19 (Liquidity Facility Toronto-Dominion Bank) (b)(c)(f) | | 2,670,000 | 2,670,000 |
| Series 16 XL0004, 1.94% 7/5/19 (Liquidity Facility Barclays Bank PLC) (b)(c)(f) | | 4,480,000 | 4,480,000 |
| Hamilton County HealthCare Facilities Rev. Participating VRDN Series XF 10 50, 2% 7/5/19 (Liquidity Facility Deutsche Bank AG New York Branch) (b)(c)(f) | | 2,700,000 | 2,700,000 |
| Kettering Med. Ctr., Inc., Participating VRDN Series Floaters BAML 50 03, 1.94% 7/5/19 (Liquidity Facility Bank of America NA) (b)(c)(f) | | 2,800,000 | 2,800,000 |
| Lakewood City School District Bonds Series Solar 0067, 2.03%, tender 8/22/19 (Liquidity Facility U.S. Bank NA, Cincinnati) (b)(c)(f) | | 4,185,000 | 4,185,000 |
| Miami County Hosp. Facilities Rev. Participating VRDN Series Floaters XG 02 25, 1.93% 7/5/19 (Liquidity Facility Royal Bank of Canada) (b)(c)(f) | | 3,000,000 | 3,000,000 |
| Middletown Hosp. Facilities Rev. Participating VRDN Series Floaters 00 31 44, 2.05% 8/9/19 (Liquidity Facility Barclays Bank PLC) (b)(c)(d)(f) | | 6,420,000 | 6,420,000 |
| Montgomery County Hosp. Rev. Participating VRDN Series Floaters BAML 50 02, 1.94% 7/5/19 (Liquidity Facility Bank of America NA) (b)(c)(f) | | 2,900,000 | 2,900,000 |
| Northeast Ohio Reg'l. Swr. District Wastewtr. Rev. Participating VRDN: | | | |
| Series Floaters XF 07 18, 1.93% 7/5/19 (Liquidity Facility JPMorgan Chase Bank) (b)(c)(f) | | 3,750,000 | 3,750,000 |
| Series Floaters ZF 06 70, 1.93% 7/5/19 (Liquidity Facility Bank of America NA) (b)(c)(f) | | 2,000,000 | 2,000,000 |
| Ohio Higher Edl. Facility Commission Rev. Participating VRDN: | | | |
| Series 2017, 2.05% 8/9/19 (Liquidity Facility Barclays Bank PLC) (b)(c)(d)(f) | | 3,600,000 | 3,600,000 |
| Series XG 00 69, 2% 7/5/19 (Liquidity Facility Deutsche Bank AG New York Branch) (b)(c)(f) | | 2,500,000 | 2,500,000 |
| Ohio Hsg. Fin. Agcy. Residential Mtg. Rev. Participating VRDN Series Floaters XF 27 83, 1.93% 7/5/19 (Liquidity Facility Morgan Stanley Bank, West Valley City Utah) (b)(c)(f) | | 2,800,000 | 2,800,000 |
| Ohio Univ. Gen. Receipts Athens Bonds Series Floaters G 27, 2.1%, tender 12/2/19 (Liquidity Facility Royal Bank of Canada) (b)(c)(d)(f) | | 3,500,000 | 3,500,000 |
| OhioHealth Corp. Participating VRDN Series Floaters XM 04 51, 1.94% 7/5/19 (Liquidity Facility Barclays Bank PLC) (b)(c)(f) | | 3,000,000 | 3,000,000 |
| the Cleveland Clinic Foundation Participating VRDN Series Floaters XF 05 73, 1.93% 7/5/19 (Liquidity Facility Toronto-Dominion Bank) (b)(c)(f) | | 3,990,000 | 3,990,000 |
| Univ. of Cincinnati Gen. Receipts Participating VRDN: | | | |
| Series Floaters XF 24 38, 1.93% 7/5/19 (Liquidity Facility JPMorgan Chase Bank) (b)(c)(f) | | 4,000,000 | 4,000,000 |
| Series Floaters ZM 06 46, 1.93% 7/5/19 (Liquidity Facility Wells Fargo Bank NA) (b)(c)(f) | | 4,200,000 | 4,200,000 |
| Upper Arlington City School District Participating VRDN Series Floaters XF 25 92, 1.98% 7/5/19 (Liquidity Facility Citibank NA) (b)(c)(f) | | 3,500,000 | 3,500,000 |
| | | | 83,885,000 |
| Texas - 0.0% | | | |
| Alamo Cmnty. Coll District Rev. Bonds Series G-111, 2.1%, tender 11/1/19 (Liquidity Facility Royal Bank of Canada) (b)(c)(d)(f) | | 100,000 | 100,000 |
| TOTAL TENDER OPTION BOND | | | |
| (Cost $84,185,000) | | | 84,185,000 |
|
| Other Municipal Security - 22.4% | | | |
| Florida - 0.6% | | | |
| Florida Dev. Fin. Corp. Surface T Bonds (Virgin Trains U.S.A. Passenger Rail Proj.) Series 2019 B, 1.9%, tender 3/17/20 (a)(b) | | 1,500,000 | 1,500,000 |
| New Hampshire - 0.8% | | | |
| New Hampshire Bus. Fin. Auth. Poll. Cont. Rev. Bonds: | | | |
| Series 1990 A, 1.9% tender 7/25/19, CP mode (a) | | 1,100,000 | 1,100,000 |
| Series 1990 A1, 1.99% tender 9/25/19, CP mode (a) | | 1,000,000 | 1,000,000 |
| | | | 2,100,000 |
| New Mexico - 0.2% | | | |
| New Mexico Muni. Energy Acquisition Auth. Gas Supply Rev. Bonds Series 2014 B, 1 month U.S. LIBOR + 0.750% 2.385%, tender 8/1/19 (Liquidity Facility Royal Bank of Canada) (b)(e) | | 400,000 | 400,020 |
| Ohio - 20.8% | | | |
| Allen County Hosp. Facilities Rev. Bonds: | | | |
| (Mercy Health Proj.) Series 2015 B, SIFMA Municipal Swap Index + 0.750% 2.65%, tender 5/1/20 (b)(e) | | 100,000 | 99,950 |
| Series 2010 B, 5% 9/1/19 | | 2,000,000 | 2,010,170 |
| American Muni. Pwr. BAN: | | | |
| (City of Wapakoneta Proj.) Series 2019, 2.5% 6/25/20 (Ohio Gen. Oblig. Guaranteed) | | 1,000,000 | 1,009,346 |
| Series 2018: | | | |
| 3% 8/15/19 (Ohio Gen. Oblig. Guaranteed) | | 1,400,000 | 1,401,715 |
| 3% 12/5/19 (Ohio Gen. Oblig. Guaranteed) | | 1,000,000 | 1,003,627 |
| Avon Gen. Oblig. BAN: | | | |
| Series 2018, 3% 9/5/19 (Ohio Gen. Oblig. Guaranteed) | | 1,750,000 | 1,753,414 |
| Series 2019, 3% 1/22/20 | | 1,000,000 | 1,004,948 |
| Batavia Ohio Local School District BAN Series 2018, 3% 9/1/19 (Ohio Gen. Oblig. Guaranteed) | | 1,875,000 | 1,877,723 |
| Brooklyn Gen. Oblig. BAN Series 2019, 3% 5/28/20 | | 1,075,000 | 1,086,978 |
| Fairfield County Gen. Oblig. BAN Series 2018, 3% 4/29/20 | | 2,000,000 | 2,019,012 |
| Firelands Ohio Local School District BAN Series 2018, 3% 8/22/19 (Ohio Gen. Oblig. Guaranteed) | | 1,000,000 | 1,001,237 |
| Franklin County Rev. Bonds Series 2013 OH, 1.75%, tender 8/1/19 (b) | | 2,700,000 | 2,700,000 |
| Harrison Ohio BAN Series 2018, 3.5% 10/29/19 (Ohio Gen. Oblig. Guaranteed) | | 1,350,000 | 1,356,084 |
| Highland Heights Gen. Oblig. BAN Series 2019, 3% 6/11/20 | | 785,000 | 794,852 |
| Hudson City Gen. Oblig. BAN Series 2018, 3.5% 12/19/19 | | 2,000,000 | 2,011,544 |
| Indian Valley Loc School District BAN Series 2019, 2.5% 2/11/20 | | 1,000,000 | 1,003,002 |
| Kent Various Purp. Bond BAN Series 2018, 2.875% 8/21/19 | | 1,000,000 | 1,001,336 |
| Lake County Gen. Oblig. BAN Series 2019: | | | |
| 3% 1/16/20 | | 1,000,000 | 1,004,803 |
| 3% 4/2/20 | | 1,265,000 | 1,275,858 |
| Licking County BAN Series 2019, 3% 5/8/20 | | 1,500,000 | 1,515,702 |
| Little Miami Local School District BAN Series 2019, 3% 11/21/19 | | 2,000,000 | 2,008,863 |
| Lorain BAN: | | | |
| Series 2018, 3.5% 7/17/19 (Ohio Gen. Oblig. Guaranteed) | | 1,000,000 | 1,000,587 |
| Series 2019, 3% 6/19/20 (Ohio Gen. Oblig. Guaranteed) | | 540,000 | 546,967 |
| Mason Gen. Oblig. BAN Series 2019, 2.75% 5/14/20 | | 2,000,000 | 2,016,213 |
| Moraine BAN Series 2019, 2.5% 6/25/20 | | 1,000,000 | 1,008,607 |
| Newark Gen. Oblig. BAN Series 2019, 3% 4/2/20 | | 1,125,000 | 1,132,471 |
| Ohio Higher Edl. Facility Commission Rev. Bonds: | | | |
| Series B5, 1.62% tender 8/8/19, CP mode | | 2,700,000 | 2,700,000 |
| Series B6, 1.62% tender 8/8/19, CP mode | | 2,700,000 | 2,700,000 |
| Olmsted Falls BAN Series 2019, 3% 6/11/20 (Ohio Gen. Oblig. Guaranteed) | | 1,365,000 | 1,382,137 |
| Perrysburg Gen. Oblig. BAN Series 2018, 3% 10/24/19 | | 2,085,000 | 2,090,138 |
| Sandusky Gen. Oblig. BAN Series 2019, 3% 10/3/19 | | 3,200,000 | 3,207,508 |
| Seven Hills Gen. Oblig. BAN Series 2019, 3% 4/9/20 | | 1,000,000 | 1,008,807 |
| South-Western City School District Franklin & Pickway County BAN Series 2019, 3% 12/5/19 | | 1,900,000 | 1,909,964 |
| Southwest Local School District BAN Series 2018, 2.625% 11/13/19 (Ohio Gen. Oblig. Guaranteed) | | 1,500,000 | 1,502,576 |
| Uhrichsville Recreational Facilities BAN Series 2019, 3% 6/19/20 (Ohio Gen. Oblig. Guaranteed) | | 1,625,000 | 1,645,551 |
| Union Township Clermont County Gen. Oblig. BAN Series 2018, 3% 9/5/19 (Ohio Gen. Oblig. Guaranteed) | | 1,000,000 | 1,001,951 |
| Worthington Ohio BAN Series 2019, 3% 9/26/19 (Ohio Gen. Oblig. Guaranteed) | | 1,000,000 | 1,002,453 |
| | | | 54,796,094 |
| TOTAL OTHER MUNICIPAL SECURITY | | | |
| (Cost $58,796,114) | | | 58,796,114 |
| | | Shares | Value |
|
| Investment Company - 3.8% | | | |
| Fidelity Municipal Cash Central Fund 2.00% (g)(h) | | | |
| (Cost $10,033,739) | | 10,032,883 | 10,033,739 |
| TOTAL INVESTMENT IN SECURITIES - 99.7% | | | |
| (Cost $262,069,855) | | | 262,069,855 |
| NET OTHER ASSETS (LIABILITIES) - 0.3% | | | 862,231 |
| NET ASSETS - 100% | | | $262,932,086 |
Security Type Abbreviations
BAN – BOND ANTICIPATION NOTE
CP – COMMERCIAL PAPER
VRDN – VARIABLE RATE DEMAND NOTE (A debt instrument that is payable upon demand, either daily, weekly or monthly)
The date shown for securities represents the date when principal payments must be paid, taking into account any call options exercised by the issuer and any permissible maturity shortening features other than interest rate resets.
Legend
(a) Private activity obligations whose interest is subject to the federal alternative minimum tax for individuals.
(b) Coupon rates for floating and adjustable rate securities reflect the rates in effect at period end.
(c) Provides evidence of ownership in one or more underlying municipal bonds.
(d) Restricted securities - Investment in securities not registered under the Securities Act of 1933 (excluding 144A issues). At the end of the period, the value of restricted securities (excluding 144A issues) amounted to $13,820,000 or 5.3% of net assets.
(e) Coupon is indexed to a floating interest rate which may be multiplied by a specified factor and/or subject to caps or floors.
(f) Coupon rates are determined by re-marketing agents based on current market conditions.
(g) Information in this report regarding holdings by state and security types does not reflect the holdings of the Fidelity Municipal Cash Central Fund.
(h) Affiliated fund that is available only to investment companies and other accounts managed by Fidelity Investments. The rate quoted is the annualized seven-day yield of the fund at period end. A complete unaudited listing of the fund's holdings as of its most recent quarter end is available upon request. In addition, each Fidelity Central Fund's financial statements are available on the SEC's website or upon request.
Additional information on each restricted holding is as follows:
| Security | Acquisition Date | Acquisition Cost |
| Alamo Cmnty. Coll District Rev. Bonds Series G-111, 2.1%, tender 11/1/19 (Liquidity Facility Royal Bank of Canada) | 6/6/19 | $100,000 |
| Connecticut Spl. Tax Oblig. Trans. Infrastructure Rev. Bonds Series Floaters G 110, 2.08%, tender 10/1/19 (Liquidity Facility Royal Bank of Canada) | 5/16/19 | $100,000 |
| Denver City & County Arpt. Rev. Bonds Series G-114, 2.15%, tender 12/2/19 (Liquidity Facility Royal Bank of Canada) | 6/6/19 | $100,000 |
| Middletown Hosp. Facilities Rev. Participating VRDN Series Floaters 00 31 44, 2.05% 8/9/19 (Liquidity Facility Barclays Bank PLC) | 9/14/17 - 1/3/18 | $6,420,000 |
| Ohio Higher Edl. Facility Commission Rev. Participating VRDN Series 2017, 2.05% 8/9/19 (Liquidity Facility Barclays Bank PLC) | 1/11/18 - 11/21/18 | $3,600,000 |
| Ohio Univ. Gen. Receipts Athens Bonds Series Floaters G 27, 2.1%, tender 12/2/19 (Liquidity Facility Royal Bank of Canada) | 7/12/18 | $3,500,000 |
Affiliated Central Funds
Information regarding fiscal year to date income earned by the Fund from investments in Fidelity Central Funds is as follows:
| Fund | Income earned |
| Fidelity Municipal Cash Central Fund | $127,941 |
| Total | $127,941 |
Amounts in the income column in the above table exclude any capital gain distributions from underlying funds, which are presented in the corresponding line-item in the Statement of Operations, if applicable.
Investment Valuation
All investments are categorized as Level 2 under the Fair Value Hierarchy. The inputs or methodology used for valuing securities may not be an indication of the risk associated with investing in those securities. For more information on valuation inputs please refer to the Investment Valuation section in the accompanying Notes to Financial Statements.
See accompanying notes which are an integral part of the financial statements.
Fidelity® Ohio Municipal Money Market Fund
Financial Statements
Statement of Assets and Liabilities
| | | June 30, 2019 (Unaudited) |
| Assets | | |
Investment in securities, at value — See accompanying schedule:
Unaffiliated issuers (cost $252,036,116) | $252,036,116 | |
| Fidelity Central Funds (cost $10,033,739) | 10,033,739 | |
| Total Investment in Securities (cost $262,069,855) | | $262,069,855 |
| Cash | | 9,793 |
| Receivable for investments sold | | 458 |
| Receivable for fund shares sold | | 26,028 |
| Interest receivable | | 1,176,545 |
| Distributions receivable from Fidelity Central Funds | | 21,829 |
| Total assets | | 263,304,508 |
| Liabilities | | |
| Payable for fund shares redeemed | $230,437 | |
| Distributions payable | 10,145 | |
| Accrued management fee | 78,229 | |
| Transfer agent fee payable | 30,285 | |
| Other affiliated payables | 3,448 | |
| Other payables and accrued expenses | 19,878 | |
| Total liabilities | | 372,422 |
| Net Assets | | $262,932,086 |
| Net Assets consist of: | | |
| Paid in capital | | $263,195,689 |
| Total distributable earnings (loss) | | (263,603) |
| Net Assets, for 262,645,271 shares outstanding | | $262,932,086 |
| Net Asset Value, offering price and redemption price per share ($262,932,086 ÷ 262,645,271 shares) | | $1.00 |
See accompanying notes which are an integral part of the financial statements.
Statement of Operations
| | | Six months ended June 30, 2019 (Unaudited) |
| Investment Income | | |
| Interest | | $2,290,485 |
| Income from Fidelity Central Funds | | 127,941 |
| Total income | | 2,418,426 |
| Expenses | | |
| Management fee | $492,250 | |
| Transfer agent fees | 190,554 | |
| Accounting fees and expenses | 21,663 | |
| Custodian fees and expenses | 1,589 | |
| Independent trustees' fees and expenses | 525 | |
| Registration fees | 21,078 | |
| Audit | 19,132 | |
| Legal | 1,389 | |
| Miscellaneous | 623 | |
| Total expenses before reductions | 748,803 | |
| Expense reductions | (755) | |
| Total expenses after reductions | | 748,048 |
| Net investment income (loss) | | 1,670,378 |
| Realized and Unrealized Gain (Loss) | | |
| Net realized gain (loss) on: | | |
| Investment securities: | | |
| Unaffiliated issuers | | (588) |
| Total net realized gain (loss) | | (588) |
| Net increase in net assets resulting from operations | | $1,669,790 |
See accompanying notes which are an integral part of the financial statements.
Statement of Changes in Net Assets
| | Six months ended June 30, 2019 (Unaudited) | Year ended December 31, 2018 |
| Increase (Decrease) in Net Assets | | |
| Operations | | |
| Net investment income (loss) | $1,670,378 | $3,363,621 |
| Net realized gain (loss) | (588) | (6,823) |
| Net increase in net assets resulting from operations | 1,669,790 | 3,356,798 |
| Distributions to shareholders | (1,897,845) | (3,363,936) |
| Share transactions | | |
| Proceeds from sales of shares | 16,969,379 | 48,608,768 |
| Reinvestment of distributions | 1,828,716 | 3,258,209 |
| Cost of shares redeemed | (54,374,076) | (172,233,279) |
| Net increase (decrease) in net assets and shares resulting from share transactions | (35,575,981) | (120,366,302) |
| Total increase (decrease) in net assets | (35,804,036) | (120,373,440) |
| Net Assets | | |
| Beginning of period | 298,736,122 | 419,109,562 |
| End of period | $262,932,086 | $298,736,122 |
| Other Information | | |
| Shares | | |
| Sold | 16,969,379 | 48,608,768 |
| Issued in reinvestment of distributions | 1,828,716 | 3,258,209 |
| Redeemed | (54,374,076) | (172,233,279) |
| Net increase (decrease) | (35,575,981) | (120,366,302) |
See accompanying notes which are an integral part of the financial statements.
Financial Highlights
Fidelity Ohio Municipal Money Market Fund
| | Six months ended (Unaudited) June 30, | Years endedDecember 31, | | | | |
| | 2019 | 2018 | 2017 | 2016 | 2015 | 2014 |
| Selected Per–Share Data | | | | | | |
| Net asset value, beginning of period | $1.00 | $1.00 | $1.00 | $1.00 | $1.00 | $1.00 |
| Income from Investment Operations | | | | | | |
| Net investment income (loss) | .006 | .010 | .004 | .001 | –A | –A |
| Net realized and unrealized gain (loss) | .001B | –A | –A | –A | –A | –A |
| Total from investment operations | .007 | .010 | .004 | .001 | –A | –A |
| Distributions from net investment income | (.006) | (.010) | (.004) | (.001) | –A | –A |
| Distributions from net realized gain | (.001) | – | –A | –A | –A | –A |
| Total distributions | (.007) | (.010) | (.004) | (.001) | –A | –A |
| Net asset value, end of period | $1.00 | $1.00 | $1.00 | $1.00 | $1.00 | $1.00 |
| Total ReturnC,D | .68% | .98% | .42% | .09% | .01% | .02% |
| Ratios to Average Net AssetsE,F | | | | | | |
| Expenses before reductions | .54%G | .53% | .53% | .52% | .52% | .51% |
| Expenses net of fee waivers, if any | .54%G | .53% | .52% | .37% | .07% | .08% |
| Expenses net of all reductions | .54%G | .53% | .52% | .36% | .07% | .08% |
| Net investment income (loss) | 1.21%G | .96% | .40% | .07% | .01% | .01% |
| Supplemental Data | | | | | | |
| Net assets, end of period (000 omitted) | $262,932 | $298,736 | $419,110 | $585,637 | $1,250,546 | $1,336,936 |
A Amount represents less than $.0005 per share.
B The amount shown for a share outstanding does not correspond with the aggregate net gain (loss) on investments for the period due to the timing of sales and repurchases of shares in relation to fluctuating market values of the investments of the Fund.
C Total returns for periods of less than one year are not annualized.
D Total returns would have been lower if certain expenses had not been reduced during the applicable periods shown.
E Fees and expenses of any underlying Fidelity Central Funds are not included in the Fund's expense ratio. The Fund indirectly bears its proportionate share of the expenses of any underlying Fidelity Central Funds.
F Expense ratios reflect operating expenses of the Fund. Expenses before reductions do not reflect amounts reimbursed or waived or reductions from expense offset arrangements and do not represent the amount paid by the Fund during periods when reimbursements, waivers or reductions occur. Expenses net of fee waivers reflect expenses after reimbursement and waivers but prior to reductions from expense offset arrangements. Expenses net of all reductions represent the net expenses paid by the Fund.
G Annualized
See accompanying notes which are an integral part of the financial statements.
Notes to Financial Statements (Unaudited)
For the period ended June 30, 2019
1. Organization.
Fidelity Ohio Municipal Income Fund (the Income Fund) is a fund of Fidelity Municipal Trust. Fidelity Ohio Municipal Money Market Fund (the Money Market Fund) is a fund of Fidelity Municipal Trust II. Each Trust is registered under the Investment Company Act of 1940, as amended (the 1940 Act), as an open-end management investment company. Fidelity Municipal Trust and Fidelity Municipal Trust II (the Trusts) are organized as a Massachusetts business trust and a Delaware statutory trust, respectively. Each Fund is authorized to issue an unlimited number of shares. Shares of the Money Market Fund are only available for purchase by retail shareholders. Share transactions on the Statement of Changes in Net Assets may contain exchanges between affiliated funds. Each Fund may be affected by economic and political developments in the state of Ohio.
2. Investments in Fidelity Central Funds.
The Funds may invest in Fidelity Central Funds, which are open-end investment companies generally available only to other investment companies and accounts managed by the investment adviser and its affiliates. The Funds' Schedule of Investments lists each of the Fidelity Central Funds held as of period end, if any, as an investment of each Fund, but does not include the underlying holdings of each Fidelity Central Fund. As an Investing Fund, each Fund indirectly bears its proportionate share of the expenses of the underlying Fidelity Central Funds.
The Money Market Central Funds seek preservation of capital and current income and are managed by Fidelity Investments Money Management, Inc. (FIMM), an affiliate of the investment adviser. Annualized expenses of the Money Market Central Funds as of their most recent shareholder report date ranged from less than .005 to .01%.
A complete unaudited list of holdings for each Fidelity Central Fund is available upon request or at the Securities and Exchange Commission (the SEC) website at www.sec.gov. In addition, the financial statements of the Fidelity Central Funds are available on the SEC website or upon request.
3. Significant Accounting Policies.
Each Fund is an investment company and applies the accounting and reporting guidance of the Financial Accounting Standards Board (FASB) Accounting Standards Codification Topic 946 Financial Services – Investments Companies. The financial statements have been prepared in conformity with accounting principles generally accepted in the United States of America (GAAP), which require management to make certain estimates and assumptions at the date of the financial statements. Actual results could differ from those estimates. Subsequent events, if any, through the date that the financial statements were issued have been evaluated in the preparation of the financial statements. The following summarizes the significant accounting policies of the Funds:
Investment Valuation. Investments are valued as of 4:00 p.m. Eastern time on the last calendar day of the period. The Board of Trustees (the Board) has delegated the day to day responsibility for the valuation of the Income Fund's investments to the Fair Value Committee (the Committee) established by the Income Fund's investment adviser. In accordance with valuation policies and procedures approved by the Board, the Income Fund attempts to obtain prices from one or more third party pricing vendors or brokers to value its investments. When current market prices, quotations or currency exchange rates are not readily available or reliable, investments will be fair valued in good faith by the Committee, in accordance with procedures adopted by the Board. Factors used in determining fair value vary by investment type and may include market or investment specific events, changes in interest rates and credit quality. The frequency with which these procedures are used cannot be predicted and they may be utilized to a significant extent. The Committee oversees the Income Fund's valuation policies and procedures and reports to the Board on the Committee's activities and fair value determinations. The Board monitors the appropriateness of the procedures used in valuing the Income Fund's investments and ratifies the fair value determinations of the Committee.
Each Fund categorizes the inputs to valuation techniques used to value its investments into a disclosure hierarchy consisting of three levels as shown below:
- Level 1 – quoted prices in active markets for identical investments
- Level 2 – other significant observable inputs (including quoted prices for similar investments, interest rates, prepayment speeds, etc.)
- Level 3 – unobservable inputs (including the Fund's own assumptions based on the best information available)
Valuation techniques used to value each Fund's investments by major category are as follows:
For the Income Fund, debt securities, including restricted securities, are valued based on evaluated prices received from third party pricing vendors or from brokers who make markets in such securities. Municipal securities are valued by pricing vendors who utilize matrix pricing which considers yield or price of bonds of comparable quality, coupon, maturity and type or by broker-supplied prices. When independent prices are unavailable or unreliable, debt securities may be valued utilizing pricing methodologies which consider similar factors that would be used by third party pricing vendors. Debt securities are generally categorized as Level 2 in the hierarchy but may be Level 3 depending on the circumstances.
For the Money Market Fund, as permitted by compliance with certain conditions under Rule 2a-7 of the 1940 Act, securities are valued at amortized cost, which approximates fair value. The amortized cost of an instrument is determined by valuing it at its original cost and thereafter amortizing any discount or premium from its face value at a constant rate until maturity. Securities held by a money market fund are generally high quality and liquid; however, they are reflected as Level 2 because the inputs used to determine fair value are not quoted prices in an active market.
For the Income Fund, changes in valuation techniques may result in transfers in or out of an assigned level within the disclosure hierarchy.
Investment Transactions and Income. For financial reporting purposes, the Funds' investment holdings and NAV include trades executed through the end of the last business day of the period. The NAV per share for processing shareholder transactions is calculated as of the close of business of the New York Stock Exchange (NYSE), normally 4:00 p.m. Eastern time and includes trades executed through the end of the prior business day for the Income Fund and trades executed through the end of the current business day for the Money Market Fund. Gains and losses on securities sold are determined on the basis of identified cost. Income and capital gain distributions from Fidelity Central Funds, if any, are recorded on the ex-dividend date. Interest income is accrued as earned and includes coupon interest and amortization of premium and accretion of discount on debt securities as applicable. Debt obligations may be placed on non-accrual status and related interest income may be reduced by ceasing current accruals and writing off interest receivables when the collection of all or a portion of interest has become doubtful based on consistently applied procedures. A debt obligation is removed from non-accrual status when the issuer resumes interest payments or when collectability of interest is reasonably assured.
Expenses. Expenses directly attributable to a fund are charged to that fund. Expenses attributable to more than one fund are allocated among the respective funds on the basis of relative net assets or other appropriate methods. Expense estimates are accrued in the period to which they relate and adjustments are made when actual amounts are known.
Income Tax Information and Distributions to Shareholders. Each year, each Fund intends to qualify as a regulated investment company under Subchapter M of the Internal Revenue Code, including distributing substantially all of its taxable income and realized gains. As a result, no provision for U.S. Federal income taxes is required. Each Fund files a U.S. federal tax return, in addition to state and local tax returns as required. Each Fund's federal income tax returns are subject to examination by the Internal Revenue Service (IRS) for a period of three fiscal years after they are filed. State and local tax returns may be subject to examination for an additional fiscal year depending on the jurisdiction.
Distributions are declared and recorded daily and paid monthly from net investment income. Distributions from realized gains, if any, are declared and recorded on the ex-dividend date. Income and capital gain distributions are determined in accordance with income tax regulations, which may differ from GAAP.
Capital accounts within the financial statements are adjusted for permanent book-tax differences. These adjustments have no impact on net assets or the results of operations. Capital accounts are not adjusted for temporary book-tax differences which will reverse in a subsequent period.
Book-tax differences are primarily due to market discount, deferred trustees compensation, capital loss carryforwards and losses deferred due to future transactions.
The Funds purchase municipal securities whose interest, in the opinion of the issuer, is free from federal income tax. There is no assurance that the IRS will agree with this opinion. In the event the IRS determines that the issuer does not comply with relevant tax requirements, interest payments from a security could become federally taxable, possibly retroactively to the date the security was issued.
As of period end, the cost and unrealized appreciation (depreciation) in securities, and derivatives if applicable, for federal income tax purposes were as follows for each Fund:
| | Tax cost | Gross unrealized appreciation | Gross unrealized depreciation | Net unrealized appreciation (depreciation) |
| Fidelity Ohio Municipal Income Fund | $623,533,777 | $32,354,140 | $(1,077) | $32,353,063 |
| Fidelity Ohio Municipal Money Market Fund | 262,069,855 | – | – | – |
Capital loss carryforwards are only available to offset future capital gains of the Funds to the extent provided by regulations and may be limited. Under the Regulated Investment Company Modernization Act of 2010 (the Act), the Funds are permitted to carry forward capital losses incurred in taxable years beginning after December 22, 2010 for an unlimited period and such capital losses are required to be used prior to any losses that expire. The capital loss carryforward information presented below, including any applicable limitation, is estimated as of prior fiscal period end and is subject to adjustment.
| | No expiration
Short-term |
| Fidelity Ohio Municipal Money Market Fund | $(36,518) |
Delayed Delivery Transactions and When-Issued Securities. During the period, certain Funds transacted in securities on a delayed delivery or when-issued basis. Payment and delivery may take place after the customary settlement period for that security. The price of the underlying securities and the date when the securities will be delivered and paid for are fixed at the time the transaction is negotiated. The securities purchased on a delayed delivery or when-issued basis are identified as such in each applicable Fund's Schedule of Investments. Certain Funds may receive compensation for interest forgone in the purchase of a delayed delivery or when-issued security. With respect to purchase commitments, each applicable Fund identifies securities as segregated in its records with a value at least equal to the amount of the commitment. Losses may arise due to changes in the value of the underlying securities or if the counterparty does not perform under the contract's terms, or if the issuer does not issue the securities due to political, economic, or other factors.
Restricted Securities. The Funds may invest in securities that are subject to legal or contractual restrictions on resale. These securities generally may be resold in transactions exempt from registration or to the public if the securities are registered. Disposal of these securities may involve time-consuming negotiations and expense, and prompt sale at an acceptable price may be difficult. Information regarding restricted securities is included at the end of each applicable Fund's Schedule of Investments.
4. Purchases and Sales of Investments.
Purchases and sales of securities, other than short-term securities, for the Income Fund aggregated $89,789,068 and $39,874,061, respectively.
5. Fees and Other Transactions with Affiliates.
Management Fee. Fidelity Management & Research Company (the investment adviser) and its affiliates provide the Funds with investment management related services for which the Funds pay a monthly management fee. The management fee is the sum of an individual fund fee rate and an annualized group fee rate. The individual fund fee rate is applied to each Fund's average net assets. The group fee rate is based upon the average net assets of all the mutual funds advised by the investment adviser, including any mutual funds previously advised by the investment adviser that are currently advised by Fidelity SelectCo, LLC, an affiliate of the investment adviser. The group fee rate decreases as assets under management increase and increases as assets under management decrease. For the reporting period, each Fund's annualized management fee rate expressed as a percentage of each Fund's average net assets was as follows:
| | Individual Rate | Group Rate | Total |
| Fidelity Ohio Municipal Income Fund | .25% | .10% | .35% |
| Fidelity Ohio Municipal Money Market Fund | .25% | .10% | .35% |
Transfer Agent Fees. Fidelity Investments Institutional Operations Company, Inc. (FIIOC), an affiliate of the investment adviser, is the transfer, dividend disbursing and shareholder servicing agent for the Funds. FIIOC receives account fees and asset-based fees that vary according to account size and type of account. FIIOC pays for typesetting, printing and mailing of shareholder reports, except proxy statements. For the period, the transfer agent fees were equivalent to the following annualized rates expressed as a percentage of average net assets:
| Fidelity Ohio Municipal Income Fund | .09% |
| Fidelity Ohio Municipal Money Market Fund | .14% |
Accounting Fees. Fidelity Service Company, Inc. (FSC), an affiliate of the investment adviser, maintains each Fund's accounting records. The fee is based on the level of average net assets for each month. For the period, the fees were equivalent to the following annualized rates:
| | % of Average Net Assets |
| Fidelity Ohio Municipal Income Fund | .02 |
| Fidelity Ohio Municipal Money Market Fund | .02 |
Interfund Trades. The Funds may purchase from or sell securities to other Fidelity Funds under procedures adopted by the Board. The procedures have been designed to ensure these interfund trades are executed in accordance with Rule 17a-7 of the 1940 Act. For the Income Fund, interfund trades are included within the respective purchases and sales amounts shown in the Purchases and Sales of Investments note.
6. Committed Line of Credit.
The Income Fund participates with other funds managed by the investment adviser or an affiliate in a $4.25 billion credit facility (the "line of credit") to be utilized for temporary or emergency purposes to fund shareholder redemptions or for other short-term liquidity purposes. The participating funds have agreed to pay commitment fees on their pro-rata portion of the line of credit, which are reflected in Miscellaneous expenses on the Statement of Operations, and are as follows:
| Fidelity Ohio Municipal Income Fund | $889 |
During the period, the Income Fund did not borrow on this line of credit.
7. Expense Reductions.
Through arrangements with each applicable Fund's custodian, credits realized as a result of certain uninvested cash balances were used to reduce each applicable Fund's expenses. All of the applicable expense reductions are noted in the table below.
| | | Custody expense reduction | | |
| Fidelity Ohio Municipal Income Fund | | $1,723 | | |
In addition, during the period the investment adviser reimbursed and/or waived a portion of operating expenses as follows:
| | Amount |
| Fidelity Ohio Municipal Income Fund | $1,544 |
| Fidelity Ohio Municipal Money Market Fund | 755 |
8. Other.
The Funds' organizational documents provide former and current trustees and officers with a limited indemnification against liabilities arising in connection with the performance of their duties to the Funds. In the normal course of business, the Funds may also enter into contracts that provide general indemnifications. The Funds' maximum exposure under these arrangements is unknown as this would be dependent on future claims that may be made against the Funds. The risk of material loss from such claims is considered remote.
Shareholder Expense Example
As a shareholder of a Fund, you incur two types of costs: (1) transaction costs and (2) ongoing costs, including management fees and other Fund expenses. This Example is intended to help you understand your ongoing costs (in dollars) of investing in the Funds and to compare these costs with the ongoing costs of investing in other mutual funds.
The Example is based on an investment of $1,000 invested at the beginning of the period and held for the entire period (January 1, 2019 to June 30, 2019).
Actual Expenses
The first line of the accompanying table for each fund provides information about actual account values and actual expenses. You may use the information in this line, together with the amount you invested, to estimate the expenses that you paid over the period. Simply divide your account value by $1,000.00 (for example, an $8,600 account value divided by $1,000.00 = 8.6), then multiply the result by the number in the first line for a fund under the heading entitled "Expenses Paid During Period" to estimate the expenses you paid on your account during this period. In addition, each Fund, as a shareholder in the underlying Fidelity Central Funds, will indirectly bear its pro-rata share of the fees and expenses incurred by the underlying Fidelity Central Funds. These fees and expenses are not included in the Fund's annualized expense ratio used to calculate the expense estimate in the table below.
Hypothetical Example for Comparison Purposes
The second line of the accompanying table for each fund provides information about hypothetical account values and hypothetical expenses based on a fund's actual expense ratio and an assumed rate of return of 5% per year before expenses, which is not the Fund's actual return. The hypothetical account values and expenses may not be used to estimate the actual ending account balance or expenses you paid for the period. You may use this information to compare the ongoing costs of investing in the Fund and other funds. To do so, compare this 5% hypothetical example with the 5% hypothetical examples that appear in the shareholder reports of the other funds. In addition, each Fund, as a shareholder in the underlying Fidelity Central Funds, will indirectly bear its pro-rata share of the fees and expenses incurred by the underlying Fidelity Central Funds. These fees and expenses are not included in the Fund's annualized expense ratio used to calculate the expense estimate in the table below.
Please note that the expenses shown in the table are meant to highlight your ongoing costs only and do not reflect any transaction costs. Therefore, the second line of the table is useful in comparing ongoing costs only, and will not help you determine the relative total costs of owning different funds.
| | Annualized Expense Ratio-A | Beginning
Account Value
January 1, 2019 | Ending
Account Value
June 30, 2019 | Expenses Paid
During Period-B
January 1, 2019
to June 30, 2019 |
| Fidelity Ohio Municipal Income Fund | .49% | | | |
| Actual | | $1,000.00 | $1,049.20 | $2.49 |
| Hypothetical-C | | $1,000.00 | $1,022.36 | $2.46 |
| Fidelity Ohio Municipal Money Market Fund | .54% | | | |
| Actual | | $1,000.00 | $1,006.80 | $2.69 |
| Hypothetical-C | | $1,000.00 | $1,022.12 | $2.71 |
A Annualized expense ratio reflects expenses net of applicable fee waivers.
B Expenses are equal to each Fund's annualized expense ratio, multiplied by the average account value over the period, multiplied by 181/ 365 (to reflect the one-half year period).
C 5% return per year before expenses
OFF-SANN-0819
1.705575.121
Fidelity® Pennsylvania Municipal Income Fund
Fidelity® Pennsylvania Municipal Money Market Fund
Semi-Annual Report June 30, 2019 |
|
Beginning on January 1, 2021, as permitted by regulations adopted by the Securities and Exchange Commission, paper copies of a fund’s shareholder reports will no longer be sent by mail, unless you specifically request paper copies of the reports from the fund or from your financial intermediary, such as a financial advisor, broker-dealer or bank. Instead, the reports will be made available on a website, and you will be notified by mail each time a report is posted and provided with a website link to access the report.
If you already elected to receive shareholder reports electronically, you will not be affected by this change and you need not take any action. You may elect to receive shareholder reports and other communications from a fund electronically, by contacting your financial intermediary. For Fidelity customers, visit Fidelity's web site or call Fidelity using the contact information listed below.
You may elect to receive all future reports in paper free of charge. If you wish to continue receiving paper copies of your shareholder reports, you may contact your financial intermediary or, if you are a Fidelity customer, visit Fidelity’s website, or call Fidelity at the applicable toll-free number listed below. Your election to receive reports in paper will apply to all funds held with the fund complex/your financial intermediary.
| Account Type | Website | Phone Number |
| Brokerage, Mutual Fund, or Annuity Contracts: | fidelity.com/mailpreferences | 1-800-343-3548 |
| Employer Provided Retirement Accounts: | netbenefits.fidelity.com/preferences (choose 'no' under Required Disclosures to continue to print) | 1-800-343-0860 |
| Advisor Sold Accounts Serviced Through Your Financial Intermediary: | Contact Your Financial Intermediary | Your Financial Intermediary's phone number |
| Advisor Sold Accounts Serviced by Fidelity: | institutional.fidelity.com | 1-877-208-0098 |
Contents
To view a fund's proxy voting guidelines and proxy voting record for the 12-month period ended June 30, visit http://www.fidelity.com/proxyvotingresults or visit the Securities and Exchange Commission's (SEC) web site at http://www.sec.gov.
You may also call 1-800-544-8544 to request a free copy of the proxy voting guidelines.
Standard & Poor's, S&P and S&P 500 are registered service marks of The McGraw-Hill Companies, Inc. and have been licensed for use by Fidelity Distributors Corporation.
Other third-party marks appearing herein are the property of their respective owners.
All other marks appearing herein are registered or unregistered trademarks or service marks of FMR LLC or an affiliated company. © 2019 FMR LLC. All rights reserved.
This report and the financial statements contained herein are submitted for the general information of the shareholders of the Fund. This report is not authorized for distribution to prospective investors in the Fund unless preceded or accompanied by an effective prospectus.
A fund files its complete schedule of portfolio holdings with the SEC for the first and third quarters of each fiscal year on Form N-PORT. Forms N-PORT are available on the SEC’s web site at http://www.sec.gov. A fund's Forms N-PORT may be reviewed and copied at the SEC’s Public Reference Room in Washington, DC. Information regarding the operation of the SEC's Public Reference Room may be obtained by calling 1-800-SEC-0330.
For a complete list of a fund's portfolio holdings, view the most recent holdings listing, semiannual report, or annual report on Fidelity's web site at http://www.fidelity.com, http://www.institutional.fidelity.com, or http://www.401k.com, as applicable.
NOT FDIC INSURED •MAY LOSE VALUE •NO BANK GUARANTEE
Neither the Fund nor Fidelity Distributors Corporation is a bank.
Fidelity® Pennsylvania Municipal Income Fund
Investment Summary (Unaudited)
Top Five Sectors as of June 30, 2019
| | % of fund's net assets |
| Health Care | 28.3 |
| General Obligations | 23.7 |
| Education | 16.5 |
| Transportation | 13.5 |
| Water & Sewer | 10.2 |
Quality Diversification (% of fund's net assets)
| As of June 30, 2019 |
| | AAA | 0.1% |
| | AA,A | 86.0% |
| | BBB | 5.8% |
| | BB and Below | 3.2% |
| | Not Rated | 1.4% |
| | Short-Term Investments and Net Other Assets | 3.5% |

We have used ratings from Moody's Investors Service, Inc. Where Moody's® ratings are not available, we have used S&P® ratings. All ratings are as of the date indicated and do not reflect subsequent changes.
Fidelity® Pennsylvania Municipal Income Fund
Schedule of Investments June 30, 2019 (Unaudited)
Showing Percentage of Net Assets
| Municipal Bonds - 96.5% | | | |
| | | Principal Amount | Value |
| Guam - 0.2% | | | |
| Guam Int'l. Arpt. Auth. Rev. Series 2013 C, 6.25% 10/1/34 (a) | | 700,000 | 808,486 |
| Pennsylvania - 94.9% | | | |
| Adams County Indl. Dev. Auth. Rev. (Gettysburg College Proj.) Series 2010, 5% 8/15/24 | | 1,000,000 | 1,037,550 |
| Allegheny County Series C: | | | |
| 5% 12/1/28 | | $1,000,000 | $1,167,430 |
| 5% 12/1/30 | | 1,365,000 | 1,584,137 |
| Allegheny County Arpt. Auth. Rev. Series 2006 B, 5% 1/1/22 (Nat'l. Pub. Fin. Guarantee Corp. Insured) (a) | | 1,650,000 | 1,780,416 |
| Allegheny County Higher Ed. Bldg. Auth. Univ. Rev.: | | | |
| Series 2017, 5% 10/15/47 | | 1,210,000 | 1,323,111 |
| Series 2018: | | | |
| 5% 3/1/33 | | 1,570,000 | 1,906,545 |
| 5% 3/1/34 | | 2,250,000 | 2,722,635 |
| Allegheny County Hosp. Dev. Auth. Rev. Series 2019 A: | | | |
| 4% 7/15/37 | | 1,600,000 | 1,752,576 |
| 4% 7/15/38 | | 1,400,000 | 1,530,200 |
| 4% 7/15/39 | | 1,250,000 | 1,361,275 |
| Allegheny County Sanitation Auth. Swr. Rev.: | | | |
| Series 2018, 5% 6/1/43 | | 4,750,000 | 5,643,523 |
| 5% 12/1/29 (Build America Mutual Assurance Insured) | | 3,905,000 | 4,622,075 |
| Berks County Series 1992, 0% 11/15/19 (Escrowed to Maturity) | | 625,000 | 621,944 |
| Butler County Hosp. Auth. Hosp. Rev. (Butler Health Sys. Proj.) Series 2015 A: | | | |
| 5% 7/1/26 | | 500,000 | 578,735 |
| 5% 7/1/27 | | 490,000 | 565,989 |
| 5% 7/1/28 | | 540,000 | 624,731 |
| 5% 7/1/29 | | 710,000 | 821,406 |
| 5% 7/1/30 | | 685,000 | 788,325 |
| 5% 7/1/35 | | 1,885,000 | 2,133,009 |
| 5% 7/1/39 | | 6,675,000 | 7,478,003 |
| Cap. Region Wtr. Wtr. Rev. Series 2018: | | | |
| 5% 7/15/28 | | 1,300,000 | 1,617,681 |
| 5% 7/15/30 | | 1,500,000 | 1,852,590 |
| 5% 7/15/31 | | 1,250,000 | 1,528,713 |
| Central Bradford Prog. Auth. Rev. Series 2011, 5.375% 12/1/41 | | 2,000,000 | 2,142,560 |
| Centre County Pennsylvania Hosp. Auth. Rev. (Mount Nittany Med. Ctr. Proj.): | | | |
| Series 2011, 7% 11/15/46 (Pre-Refunded to 11/15/21 @ 100) | | 2,000,000 | 2,259,080 |
| Series 2016 A: | | | |
| 4% 11/15/32 | | 350,000 | 377,741 |
| 4% 11/15/34 | | 250,000 | 268,353�� |
| 4% 11/15/35 | | 200,000 | 214,376 |
| 5% 11/15/28 | | 840,000 | 996,425 |
| 5% 11/15/29 | | 1,625,000 | 1,918,638 |
| 5% 11/15/30 | | 685,000 | 804,861 |
| 5% 11/15/46 | | 6,605,000 | 7,450,506 |
| Series 2016 B: | | | |
| 4% 11/15/40 | | 600,000 | 633,582 |
| 4% 11/15/47 | | 3,605,000 | 3,789,396 |
| Series 2018 A: | | | |
| 5% 11/15/26 | | 1,140,000 | 1,373,540 |
| 5% 11/15/27 | | 225,000 | 275,182 |
| 5% 11/15/28 | | 200,000 | 243,726 |
| 5% 11/15/29 | | 200,000 | 242,978 |
| Commonwealth Fing. Auth. Rev.: | | | |
| Series 2013 A2: | | | |
| 5% 6/1/24 | | 800,000 | 876,016 |
| 5% 6/1/25 | | 1,175,000 | 1,284,545 |
| 5% 6/1/26 | | 1,250,000 | 1,364,125 |
| Series 2019 B: | | | |
| 5% 6/1/28 | | 1,000,000 | 1,235,610 |
| 5% 6/1/29 | | 1,000,000 | 1,251,530 |
| 5% 6/1/30 | | 1,000,000 | 1,261,910 |
| 5% 6/1/31 | | 1,150,000 | 1,463,732 |
| Series 2020 A: | | | |
| 5% 6/1/31 (b) | | 3,500,000 | 4,325,755 |
| 5% 6/1/32 (b) | | 3,500,000 | 4,300,485 |
| Cumberland County Muni. Auth. Rev. (Dickinson College Proj.): | | | |
| Series 2012, 5% 11/1/37 | | 1,520,000 | 1,665,282 |
| Series 2016: | | | |
| 5% 5/1/30 | | 1,000,000 | 1,190,020 |
| 5% 5/1/31 | | 500,000 | 590,315 |
| 5% 5/1/32 | | 750,000 | 880,598 |
| 5% 5/1/33 | | 2,210,000 | 2,588,463 |
| 5% 5/1/34 | | 1,000,000 | 1,167,720 |
| Dallas Area Muni. Auth. Univ. Rev. (Misericordia Univ. Proj.) Series 2019: | | | |
| 5% 5/1/39 | | 1,100,000 | 1,238,138 |
| 5% 5/1/48 | | 4,000,000 | 4,439,000 |
| Dauphin County Gen. Auth. (Pinnacle Health Sys. Proj.) Series 2016 A: | | | |
| 5% 6/1/34 | | 1,275,000 | 1,489,991 |
| 5% 6/1/35 | | 1,000,000 | 1,165,310 |
| 5% 6/1/36 | | 500,000 | 581,170 |
| Delaware County Auth. Rev. Series 2017, 5% 7/1/25 | | 1,000,000 | 1,152,590 |
| Delaware County Auth. Univ. Rev. Series 2012: | | | |
| 5% 8/1/21 | | 350,000 | 376,296 |
| 5% 8/1/22 | | 300,000 | 332,739 |
| Doylestown Hosp. Auth. Hosp. Rev.: | | | |
| Series 2013 A: | | | |
| 5% 7/1/23 | | 1,090,000 | 1,194,030 |
| 5% 7/1/27 | | 2,500,000 | 2,712,200 |
| Series 2016 A, 5% 7/1/46 | | 3,500,000 | 3,812,865 |
| Dubois Hosp. Auth. Hosp. Rev. (Penn Highlands Healthcare Proj.) Series 2018, 5% 7/15/25 | | 200,000 | 235,620 |
| Erie County Hosp. Auth. Rev. (Saint Vincent Health Ctr. Proj.) Series 2010 A, 7% 7/1/27 (Pre-Refunded to 7/1/20 @ 100) | | 2,750,000 | 2,901,965 |
| Fox Chapel Area School District Series 2013: | | | |
| 5% 8/1/31 | | 3,080,000 | 3,429,888 |
| 5% 8/1/34 | | 1,000,000 | 1,109,290 |
| Franklin County Indl. Dev. Auth. (The Chambersburg Hosp. Proj.) Series 2010: | | | |
| 5.3% 7/1/30 (Pre-Refunded to 7/1/20 @ 100) | | 1,770,000 | 1,839,030 |
| 5.375% 7/1/42 (Pre-Refunded to 7/1/20 @ 100) | | 2,130,000 | 2,214,646 |
| Geisinger Auth. Health Sys. Rev.: | | | |
| Series 2014 A, 4% 6/1/41 | | 2,000,000 | 2,108,660 |
| Series 2017 A2, 5% 2/15/39 | | 1,880,000 | 2,190,877 |
| Indiana County Hosp. Auth. Series 2014 A: | | | |
| 5% 6/1/20 | | 650,000 | 664,578 |
| 6% 6/1/39 | | 1,625,000 | 1,780,821 |
| Lackawanna County Indl. Dev. Auth. Rev. (Univ. of Scranton Proj.) Series 2017: | | | |
| 5% 11/1/24 | | 590,000 | 685,179 |
| 5% 11/1/25 | | 665,000 | 784,454 |
| 5% 11/1/27 | | 1,105,000 | 1,342,100 |
| Lancaster County Hosp. Auth. Health Ctr. Rev. Series 2016: | | | |
| 5% 8/15/31 | | 1,000,000 | 1,194,310 |
| 5% 8/15/33 | | 1,000,000 | 1,187,800 |
| 5% 8/15/34 | | 1,000,000 | 1,184,000 |
| 5% 8/15/36 | | 1,000,000 | 1,177,510 |
| Lehigh County Gen. Purp. Auth. Rev. (Muhlenberg College Proj.) Series 2017, 5% 2/1/39 | | 4,010,000 | 4,691,540 |
| Lower Paxton Township Series 2014: | | | |
| 5% 4/1/40 | | 3,420,000 | 3,883,889 |
| 5% 4/1/44 | | 1,295,000 | 1,469,566 |
| Luzerne County Indl. Dev. Auth. Wtr. Facilities Rev. (Pennsylvania-American Wtr. Co. Proj.) Series 2009, 5.5% 12/1/39 | | 2,500,000 | 2,540,950 |
| Monroe County Hosp. Auth. Rev. Series 2016, 5% 7/1/33 | | 3,675,000 | 4,285,822 |
| Montgomery County Higher Ed. & Health Auth. Rev.: | | | |
| Series 2014 A: | | | |
| 4% 10/1/19 | | 185,000 | 185,799 |
| 5% 10/1/20 | | 215,000 | 221,843 |
| 5% 10/1/21 | | 245,000 | 258,855 |
| 5% 10/1/22 | | 275,000 | 297,154 |
| 5% 10/1/23 | | 1,305,000 | 1,438,736 |
| 5% 10/1/24 | | 335,000 | 376,165 |
| 5% 10/1/25 | | 750,000 | 841,860 |
| 5% 10/1/26 | | 1,000,000 | 1,120,150 |
| 5% 10/1/27 | | 1,000,000 | 1,117,180 |
| Series 2016 A, 5% 10/1/40 | | 4,000,000 | 4,398,640 |
| Series 2018 A, 5% 9/1/26 | | 1,500,000 | 1,811,805 |
| Series 2019: | | | |
| 4% 9/1/34 | | 2,500,000 | 2,764,525 |
| 4% 9/1/35 | | 1,400,000 | 1,536,906 |
| 4% 9/1/36 | | 1,200,000 | 1,308,096 |
| 4% 9/1/37 | | 1,000,000 | 1,084,000 |
| Montgomery County Indl. Dev. Auth. Series 2017: | | | |
| 5% 12/1/33 | | 2,150,000 | 2,604,639 |
| 5% 12/1/35 | | 1,000,000 | 1,203,710 |
| 5% 12/1/36 | | 2,660,000 | 3,194,314 |
| 5% 12/1/37 | | 1,515,000 | 1,812,834 |
| Montour School District Series 2015 A: | | | |
| 5% 4/1/41 | | 1,000,000 | 1,134,770 |
| 5% 4/1/42 | | 1,000,000 | 1,134,730 |
| Northampton County Gen. Purp. Auth. Hosp. Rev. (St. Luke's Univ. Health Network Proj.) Series 2018 A: | | | |
| 4% 8/15/48 | | 4,500,000 | 4,727,160 |
| 5% 8/15/43 | | 2,000,000 | 2,335,800 |
| 5% 8/15/48 | | 2,500,000 | 2,919,575 |
| Northampton County Gen. Purp. College Rev. (Lafayette College Proj.) Series 2017, 5% 11/1/47 | | 2,170,000 | 2,561,794 |
| Pennsylvania Ctfs. Prtn. Series 2018 A: | | | |
| 5% 7/1/28 | | 400,000 | 492,964 |
| 5% 7/1/29 | | 300,000 | 367,608 |
| 5% 7/1/30 | | 375,000 | 456,551 |
| 5% 7/1/31 | | 425,000 | 514,365 |
| Pennsylvania Econ. Dev. Auth. Governmental Lease (Forum Place Proj.) Series 2012: | | | |
| 5% 3/1/24 | | 1,745,000 | 1,892,644 |
| 5% 3/1/25 | | 3,255,000 | 3,526,630 |
| Pennsylvania Gen. Oblig.: | | | |
| Series 2013, 5% 10/15/27 | | 2,255,000 | 2,579,878 |
| Series 2015 1, 5% 3/15/31 | | 7,000,000 | 8,133,580 |
| Series 2015, 5% 3/15/33 | | 2,880,000 | 3,326,112 |
| Series 2017, 5% 1/1/28 | | 7,000,000 | 8,581,790 |
| Series 2019: | | | |
| 5% 7/15/26 | | 3,000,000 | 3,679,170 |
| 5% 7/15/29 | | 3,000,000 | 3,821,850 |
| Pennsylvania Higher Edl. Facilities Auth. Rev.: | | | |
| (Drexel Univ. Proj.) Series 2016, 5% 5/1/35 | | 2,000,000 | 2,305,680 |
| (Thomas Jefferson Univ. Proj.) Series 2012: | | | |
| 5% 3/1/20 | | 300,000 | 306,945 |
| 5% 3/1/22 | | 275,000 | 299,635 |
| 5% 3/1/23 | | 585,000 | 644,734 |
| First Series 2012: | | | |
| 5% 4/1/21 | | 500,000 | 531,490 |
| 5% 4/1/22 | | 600,000 | 656,904 |
| 5% 4/1/23 | | 800,000 | 874,064 |
| 5% 4/1/24 | | 1,100,000 | 1,200,276 |
| Series 2010 E, 5% 5/15/31 | | 2,500,000 | 2,572,400 |
| Series 2016, 5% 5/1/33 | | 2,200,000 | 2,555,608 |
| Series 2017 A, 5% 8/15/46 | | 3,000,000 | 3,561,240 |
| Series 2018 A, 5% 2/15/48 | | 4,000,000 | 4,811,200 |
| Series 2019 A: | | | |
| 4% 3/1/37 | | 750,000 | 832,403 |
| 5% 3/1/36 | | 1,000,000 | 1,222,680 |
| 5% 3/1/38 | | 1,000,000 | 1,214,320 |
| 5% 3/1/39 | | 1,000,000 | 1,211,010 |
| Series AT-1 5% 6/15/31 | | 5,000,000 | 5,907,550 |
| Pennsylvania Pub. School Bldg. Auth. School Rev. (The School District of Harrisburg Proj.): | | | |
| Series 2014 B2: | | | |
| 5% 12/1/24 (Build America Mutual Assurance Insured) | | 1,250,000 | 1,457,875 |
| 5% 12/1/25 (Build America Mutual Assurance Insured) | | 1,250,000 | 1,446,975 |
| 5% 12/1/26 (Build America Mutual Assurance Insured) | | 1,250,000 | 1,443,638 |
| 5% 12/1/27 (Build America Mutual Assurance Insured) | | 1,010,000 | 1,163,369 |
| Series 2016 A, 5% 12/1/28 (FSA Insured) | | 5,690,000 | 6,849,053 |
| Pennsylvania State Univ.: | | | |
| Series 2015 A: | | | |
| 5% 9/1/30 | | 1,100,000 | 1,306,074 |
| 5% 9/1/31 | | 1,415,000 | 1,672,205 |
| Series 2019 A, 5% 9/1/48 | | 6,390,000 | 7,794,330 |
| Pennsylvania Tpk. Commission Tpk. Rev.: | | | |
| (Sub Lien Proj.) Series 2017 B-1, 5% 6/1/34 | | 5,000,000 | 5,859,600 |
| Series 2013 A2, 5% 12/1/38 | | 2,500,000 | 2,957,625 |
| Series 2014 A, 5% 12/1/31 | | 865,000 | 1,003,469 |
| Series 2014 A2, 0% 12/1/40 (c) | | 5,500,000 | 5,247,220 |
| Series 2017 A1: | | | |
| 5% 12/1/30 | | 3,500,000 | 4,297,755 |
| 5% 12/1/31 | | 2,000,000 | 2,444,080 |
| 5% 12/1/33 | | 1,500,000 | 1,817,505 |
| Series 2018 A2, 5% 12/1/43 | | 5,000,000 | 5,980,150 |
| Philadelphia Arpt. Rev.: | | | |
| Series 2017 A, 5% 7/1/42 | | 350,000 | 413,336 |
| Series 2017 B: | | | |
| 5% 7/1/25 (a) | | 5,500,000 | 6,484,445 |
| 5% 7/1/31 (a) | | 1,000,000 | 1,191,680 |
| 5% 7/1/33 (a) | | 2,250,000 | 2,663,528 |
| 5% 7/1/37 (a) | | 5,065,000 | 5,919,111 |
| 5% 7/1/42 (a) | | 4,000,000 | 4,626,480 |
| 5% 7/1/47 (a) | | 3,035,000 | 3,493,801 |
| Philadelphia Gas Works Rev.: | | | |
| Series 9, 5.25% 8/1/40 | | 5,300,000 | 5,496,418 |
| 5% 8/1/29 | | 2,000,000 | 2,343,020 |
| 5% 8/1/30 | | 1,500,000 | 1,748,895 |
| 5% 8/1/31 | | 1,100,000 | 1,277,078 |
| 5% 10/1/33 | | 1,500,000 | 1,767,990 |
| 5% 10/1/34 | | 500,000 | 587,445 |
| Philadelphia Gen. Oblig. Series 2017 A, 5% 8/1/30 | | 1,500,000 | 1,820,430 |
| Philadelphia Hospitals & Higher Ed. Facilities Auth. Hosp. Rev. (Children's Hosp. of Philadelphia Proj.) Series 2011 D, 5% 7/1/32 | | 2,500,000 | 2,661,550 |
| Philadelphia Redev. Auth. Rev.: | | | |
| Series 2012: | | | |
| 5% 4/15/21 | | 1,000,000 | 1,058,330 |
| 5% 4/15/25 | | 2,230,000 | 2,424,010 |
| Series 2015 A, 5% 4/15/29 | | 3,000,000 | 3,488,160 |
| Philadelphia School District: | | | |
| Series 2010 C, 5% 9/1/21 | | 4,000,000 | 4,156,240 |
| Series 2016 F, 5% 9/1/34 | | 4,000,000 | 4,641,840 |
| Series 2018 A: | | | |
| 5% 9/1/29 | | 1,250,000 | 1,529,888 |
| 5% 9/1/30 | | 1,000,000 | 1,215,710 |
| 5% 9/1/33 | | 1,000,000 | 1,198,710 |
| Philadelphia Wtr. & Wastewtr. Rev.: | | | |
| Series 2010 C, 5% 8/1/40 (Pre-Refunded to 8/1/20 @ 100) | | 4,000,000 | 4,157,800 |
| Series 2011 A, 5% 1/1/41 | | 2,715,000 | 2,828,433 |
| Series 2015 B, 5% 7/1/30 | | 3,500,000 | 4,107,145 |
| Series 2017 B: | | | |
| 5% 11/1/29 | | 3,000,000 | 3,707,220 |
| 5% 11/1/30 | | 3,700,000 | 4,541,047 |
| Pittsburgh & Alleg County Parkin Series 2017: | | | |
| 5% 12/15/31 | | 1,000,000 | 1,187,880 |
| 5% 12/15/32 | | 500,000 | 591,245 |
| 5% 12/15/33 | | 500,000 | 590,145 |
| Pittsburgh & Allegheny County Sports & Exhibition Auth. Series 2012, 5% 2/1/25 (FSA Insured) | | 2,250,000 | 2,471,918 |
| Pittsburgh Gen. Oblig.: | | | |
| Series 2012 A, 5% 9/1/22 | | 2,000,000 | 2,221,880 |
| Series 2014: | | | |
| 5% 9/1/23 (Build America Mutual Assurance Insured) | | 575,000 | 659,646 |
| 5% 9/1/28 (Build America Mutual Assurance Insured) | | 1,300,000 | 1,504,048 |
| 5% 9/1/29 (Build America Mutual Assurance Insured) | | 1,015,000 | 1,172,376 |
| 5% 9/1/31 (Build America Mutual Assurance Insured) | | 1,165,000 | 1,337,839 |
| 5% 9/1/32 (Build America Mutual Assurance Insured) | | 1,000,000 | 1,145,350 |
| Pittsburgh School District: | | | |
| Series 2014 A, 5% 9/1/23 | | 1,000,000 | 1,110,940 |
| Series 2015: | | | |
| 5% 9/1/22 (FSA Insured) | | 885,000 | 985,802 |
| 5% 9/1/23 (FSA Insured) | | 1,085,000 | 1,245,667 |
| Pittsburgh Wtr. & Swr. Auth. Wtr. & Swr. Sys. Rev.: | | | |
| Series 2019 A, 5% 9/1/44 (FSA Insured) (b) | | 3,600,000 | 4,323,636 |
| Series 2019 B: | | | |
| 4% 9/1/34 (FSA Insured) (b) | | 2,000,000 | 2,249,400 |
| 4% 9/1/35 (FSA Insured) (b) | | 400,000 | 448,116 |
| Reading School District Series 2017: | | | |
| 5% 3/1/35 (FSA Insured) | | 1,000,000 | 1,176,430 |
| 5% 3/1/36 (FSA Insured) | | 1,050,000 | 1,231,724 |
| 5% 3/1/37 (FSA Insured) | | 1,600,000 | 1,865,168 |
| Southcentral Pennsylvania Gen. Auth. Rev.: | | | |
| Series 2015: | | | |
| 4% 12/1/30 | | 1,040,000 | 1,126,892 |
| 5% 12/1/20 | | 30,000 | 31,433 |
| 5% 12/1/22 | | 30,000 | 33,312 |
| 5% 12/1/25 | | 1,285,000 | 1,534,637 |
| 5% 12/1/27 | | 1,480,000 | 1,746,563 |
| 5% 12/1/29 | | 1,000,000 | 1,169,820 |
| Series 2019 A, 4% 6/1/49 | | 4,650,000 | 5,063,804 |
| Susquehanna Area Reg'l. Arp Auth. Series 2017: | | | |
| 5% 1/1/35 (a) | | 1,000,000 | 1,136,850 |
| 5% 1/1/38 (a) | | 1,125,000 | 1,272,420 |
| Union County Hosp. Auth. Rev. Series 2018 B, 5% 8/1/48 | | 4,500,000 | 5,107,230 |
| West Mifflin Area School District Series 2016: | | | |
| 5% 4/1/24 (FSA Insured) | | 1,250,000 | 1,414,300 |
| 5% 4/1/26 (FSA Insured) | | 1,000,000 | 1,176,410 |
| 5% 4/1/28 (FSA Insured) | | 1,390,000 | 1,637,059 |
| West Shore Area Auth. Hosp. Rev. Series 2011 B, 5.75% 1/1/41 | | 1,500,000 | 1,645,545 |
| Westmoreland County Indl. Dev. Auth. Rev. (Excela Health Proj.) Series 2010 A: | | | |
| 5% 7/1/19 | | 1,000,000 | 1,000,000 |
| 5% 7/1/25 | | 4,465,000 | 4,607,389 |
| 5.25% 7/1/20 | | 1,000,000 | 1,037,487 |
| Westmoreland County Muni. Auth. Muni. Svc. Rev. Series 2001 A: | | | |
| 0% 8/15/19 (Nat'l. Pub. Fin. Guarantee Corp. Insured) | | 5,000,000 | 4,989,154 |
| 0% 8/15/20 (Nat'l. Pub. Fin. Guarantee Corp. Insured) | | 2,500,000 | 2,448,425 |
| 0% 8/15/22 (Nat'l. Pub. Fin. Guarantee Corp. Insured) | | 6,550,000 | 6,174,620 |
|
| TOTAL PENNSYLVANIA | | | 471,512,017 |
|
| Pennsylvania, New Jersey - 1.4% | | | |
| Delaware River Joint Toll Bridge Commission Pennsylvania-New Jersey Bridge Rev. Series 2012 A: | | | |
| 5% 7/1/22 | | 500,000 | 551,145 |
| 5% 7/1/23 | | 1,000,000 | 1,101,670 |
| Delaware River Port Auth. Pennsylvania & New Jersey Rev. Series 2018 A: | | | |
| 5% 1/1/37 | | 1,000,000 | 1,228,960 |
| 5% 1/1/38 | | 1,300,000 | 1,592,383 |
| 5% 1/1/39 | | 1,000,000 | 1,221,580 |
| 5% 1/1/40 | | 1,100,000 | 1,341,329 |
|
| TOTAL PENNSYLVANIA, NEW JERSEY | | | 7,037,067 |
|
| TOTAL MUNICIPAL BONDS | | | |
| (Cost $456,994,333) | | | 479,357,570 |
|
| Municipal Notes - 5.1% | | | |
| Pennsylvania - 5.1% | | | |
| Allegheny County Higher Ed. Bldg. Auth. Univ. Rev. Series 2008, 1.88% 7/1/19 (Liquidity Facility Bank of New York, New York), VRDN (d) | | 3,600,000 | $3,600,000 |
| Allegheny County Hosp. Dev. Auth. Rev. Participating VRDN Series Floaters E 111, 1.94% 7/1/19 (Liquidity Facility Royal Bank of Canada) (d)(e)(f) | | 5,300,000 | 5,300,000 |
| Geisinger Auth. Health Sys. Rev. (Geisinger Health Sys. Proj.) Series 2005 A, 1.87% 7/1/19 (Liquidity Facility TD Banknorth, NA), VRDN (d) | | 1,300,000 | 1,300,000 |
| Lancaster County Hosp. Auth. Health Ctr. Rev. (Masonic Homes Proj.) Series 2008 D, 1.91% 7/1/19, LOC JPMorgan Chase Bank, VRDN (d) | | 2,370,000 | 2,370,000 |
| Pittsburgh Wtr. & Swr. Auth. Wtr. & Swr. Sys. Rev. Participating VRDN Series Putters 50 20, 1.98% 7/1/19 (Liquidity Facility JPMorgan Chase Bank) (d)(e)(f) | | 950,000 | 950,000 |
| Southcentral Pennsylvania Gen. Auth. Rev. Series 2019 E, 1.92% 7/1/19 (Liquidity Facility U.S. Bank NA, Cincinnati), VRDN (d) | | 12,000,000 | 11,999,988 |
| TOTAL MUNICIPAL NOTES | | | |
| (Cost $25,520,001) | | | 25,519,988 |
| TOTAL INVESTMENT IN SECURITIES - 101.6% | | | |
| (Cost $482,514,334) | | | 504,877,558 |
| NET OTHER ASSETS (LIABILITIES) - (1.6)% | | | (8,045,804) |
| NET ASSETS - 100% | | | $496,831,754 |
Legend
(a) Private activity obligations whose interest is subject to the federal alternative minimum tax for individuals.
(b) Security or a portion of the security purchased on a delayed delivery or when-issued basis.
(c) Security initially issued in zero coupon form which converts to coupon form at a specified rate and date. The rate shown is the rate at period end.
(d) Coupon rates for floating and adjustable rate securities reflect the rates in effect at period end.
(e) Provides evidence of ownership in one or more underlying municipal bonds.
(f) Coupon rates are determined by re-marketing agents based on current market conditions.
Investment Valuation
All investments are categorized as Level 2 under the Fair Value Hierarchy. The inputs or methodology used for valuing securities may not be an indication of the risk associated with investing in those securities. For more information on valuation inputs please refer to the Investment Valuation section in the accompanying Notes to Financial Statements.
Other Information
The distribution of municipal securities by revenue source, as a percentage of total Net Assets, is as follows (Unaudited):
| Health Care | 28.3% |
| General Obligations | 23.7% |
| Education | 16.5% |
| Transportation | 13.5% |
| Water & Sewer | 10.2% |
| Others* (Individually Less Than 5%) | 7.8% |
| | 100.0% |
* Includes net other assets
See accompanying notes which are an integral part of the financial statements.
Fidelity® Pennsylvania Municipal Income Fund
Financial Statements
Statement of Assets and Liabilities
| | | June 30, 2019 (Unaudited) |
| Assets | | |
Investment in securities, at value — See accompanying schedule:
Unaffiliated issuers (cost $482,514,334) | | $504,877,558 |
| Cash | | 153,415 |
| Receivable for investments sold | | |
| Regular delivery | | 10,123,137 |
| Delayed delivery | | 1,537,500 |
| Receivable for fund shares sold | | 275,388 |
| Interest receivable | | 5,403,529 |
| Other receivables | | 1,491 |
| Total assets | | 522,372,018 |
| Liabilities | | |
| Payable for investments purchased | | |
| Regular delivery | $7,481,910 | |
| Delayed delivery | 16,904,981 | |
| Payable for fund shares redeemed | 490,902 | |
| Distributions payable | 448,679 | |
| Accrued management fee | 145,502 | |
| Other affiliated payables | 41,951 | |
| Other payables and accrued expenses | 26,339 | |
| Total liabilities | | 25,540,264 |
| Net Assets | | $496,831,754 |
| Net Assets consist of: | | |
| Paid in capital | | $472,454,464 |
| Total distributable earnings (loss) | | 24,377,290 |
| Net Assets, for 43,802,496 shares outstanding | | $496,831,754 |
| Net Asset Value, offering price and redemption price per share ($496,831,754 ÷ 43,802,496 shares) | | $11.34 |
See accompanying notes which are an integral part of the financial statements.
Statement of Operations
| | | Six months ended June 30, 2019 (Unaudited) |
| Investment Income | | |
| Interest | | $7,887,707 |
| Expenses | | |
| Management fee | $836,159 | |
| Transfer agent fees | 182,907 | |
| Accounting fees and expenses | 61,105 | |
| Custodian fees and expenses | 1,745 | |
| Independent trustees' fees and expenses | 852 | |
| Registration fees | 21,461 | |
| Audit | 29,383 | |
| Legal | 5,480 | |
| Miscellaneous | 1,425 | |
| Total expenses before reductions | 1,140,517 | |
| Expense reductions | (2,632) | |
| Total expenses after reductions | | 1,137,885 |
| Net investment income (loss) | | 6,749,822 |
| Realized and Unrealized Gain (Loss) | | |
| Net realized gain (loss) on: | | |
| Investment securities: | | |
| Unaffiliated issuers | | 2,105,696 |
| Total net realized gain (loss) | | 2,105,696 |
| Change in net unrealized appreciation (depreciation) on investment securities | | 15,876,203 |
| Net gain (loss) | | 17,981,899 |
| Net increase (decrease) in net assets resulting from operations | | $24,731,721 |
See accompanying notes which are an integral part of the financial statements.
Statement of Changes in Net Assets
| | Six months ended June 30, 2019 (Unaudited) | Year ended December 31, 2018 |
| Increase (Decrease) in Net Assets | | |
| Operations | | |
| Net investment income (loss) | $6,749,822 | $13,324,110 |
| Net realized gain (loss) | 2,105,696 | 741,589 |
| Change in net unrealized appreciation (depreciation) | 15,876,203 | (10,508,596) |
| Net increase (decrease) in net assets resulting from operations | 24,731,721 | 3,557,103 |
| Distributions to shareholders | (6,835,926) | (14,772,428) |
| Share transactions | | |
| Proceeds from sales of shares | 49,709,501 | 79,027,190 |
| Reinvestment of distributions | 4,086,468 | 9,313,841 |
| Cost of shares redeemed | (27,378,856) | (105,011,723) |
| Net increase (decrease) in net assets resulting from share transactions | 26,417,113 | (16,670,692) |
| Total increase (decrease) in net assets | 44,312,908 | (27,886,017) |
| Net Assets | | |
| Beginning of period | 452,518,846 | 480,404,863 |
| End of period | $496,831,754 | $452,518,846 |
| Other Information | | |
| Shares | | |
| Sold | 4,467,509 | 7,249,452 |
| Issued in reinvestment of distributions | 366,201 | 854,361 |
| Redeemed | (2,465,284) | (9,646,855) |
| Net increase (decrease) | 2,368,426 | (1,543,042) |
See accompanying notes which are an integral part of the financial statements.
Financial Highlights
Fidelity Pennsylvania Municipal Income Fund
| | Six months ended (Unaudited) June 30, | Years endedDecember 31, | | | | |
| | 2019 | 2018 | 2017 | 2016 | 2015 | 2014 |
| Selected Per–Share Data | | | | | | |
| Net asset value, beginning of period | $10.92 | $11.18 | $10.97 | $11.31 | $11.34 | $10.77 |
| Income from Investment Operations | | | | | | |
| Net investment income (loss)A | .159 | .314 | .328 | .336 | .358 | .373 |
| Net realized and unrealized gain (loss) | .422 | (.226) | .257 | (.291) | .013 | .615 |
| Total from investment operations | .581 | .088 | .585 | .045 | .371 | .988 |
| Distributions from net investment income | (.158) | (.314) | (.328) | (.336) | (.358) | (.373) |
| Distributions from net realized gain | (.003) | (.034) | (.047) | (.049) | (.043) | (.045) |
| Total distributions | (.161) | (.348) | (.375) | (.385) | (.401) | (.418) |
| Redemption fees added to paid in capitalA | – | – | – | –B | –B | –B |
| Net asset value, end of period | $11.34 | $10.92 | $11.18 | $10.97 | $11.31 | $11.34 |
| Total ReturnC,D | 5.36% | .84% | 5.41% | .34% | 3.33% | 9.30% |
| Ratios to Average Net AssetsE | | | | | | |
| Expenses before reductions | .49%F | .48% | .48% | .49% | .49% | .49% |
| Expenses net of fee waivers, if any | .49%F | .48% | .48% | .49% | .49% | .49% |
| Expenses net of all reductions | .49%F | .48% | .48% | .49% | .49% | .49% |
| Net investment income (loss) | 2.88%F | 2.88% | 2.95% | 2.95% | 3.17% | 3.35% |
| Supplemental Data | | | | | | |
| Net assets, end of period (000 omitted) | $496,832 | $452,519 | $480,405 | $452,516 | $468,086 | $452,845 |
| Portfolio turnover rate | 30%F | 15% | 12% | 18% | 17% | 12% |
A Calculated based on average shares outstanding during the period.
B Amount represents less than $.0005 per share.
C Total returns for periods of less than one year are not annualized.
D Total returns would have been lower if certain expenses had not been reduced during the applicable periods shown.
E Expense ratios reflect operating expenses of the Fund. Expenses before reductions do not reflect amounts reimbursed by the investment adviser or reductions from expense offset arrangements and do not represent the amount paid by the Fund during periods when reimbursements or reductions occur. Expenses net of fee waivers reflect expenses after reimbursement by the investment adviser but prior to reductions from expense offset arrangements. Expenses net of all reductions represent the net expenses paid by the Fund.
F Annualized
See accompanying notes which are an integral part of the financial statements.
Fidelity® Pennsylvania Municipal Money Market Fund
Investment Summary/Performance (Unaudited)
Effective Maturity Diversification as of June 30, 2019
| Days | % of fund's investments 6/30/19 |
| 1 - 7 | 89.5 |
| 8 - 30 | 1.4 |
| 31 - 60 | 2.0 |
| 61 - 90 | 0.8 |
| 91 - 180 | 5.0 |
| >180 | 1.3 |
Effective maturity is determined in accordance with the requirements of Rule 2a-7 under the Investment Company Act of 1940.
Asset Allocation (% of fund's net assets)
| As of June 30, 2019 |
| | Variable Rate Demand Notes (VRDNs) | 39.0% |
| | Tender Option Bond | 51.5% |
| | Other Municipal Security | 11.9% |
| | Investment Companies | 0.1% |
| | Net Other Assets (Liabilities)* | (2.5)% |

* Net Other Assets (Liabilities) are not included in the pie chart
Current 7-Day Yields
| | 6/28/19 |
| Fidelity® Pennsylvania Municipal Money Market Fund | 1.41% |
Yield refers to the income paid by the Fund over a given period. Yield for money market funds is usually for seven-day periods, as it is here, though it is expressed as an annual percentage rate. Past performance is no guarantee of future results. Yield will vary and it's possible to lose money investing in the Fund.
Fidelity® Pennsylvania Municipal Money Market Fund
Schedule of Investments June 30, 2019 (Unaudited)
Showing Percentage of Net Assets
| Variable Rate Demand Note - 39.0% | | | |
| | | Principal Amount | Value |
| Alabama - 0.4% | | | |
| Decatur Indl. Dev. Board Exempt Facilities Rev. (Nucor Steel Decatur LLC Proj.) Series 2003 A, 2.13% 7/5/19, VRDN (a)(b) | | $800,000 | $800,000 |
| Arkansas - 0.3% | | | |
| Blytheville Indl. Dev. Rev. (Nucor Corp. Proj.): | | | |
| Series 1998, 2.13% 7/5/19, VRDN (a)(b) | | 200,000 | 200,000 |
| Series 2002, 2.15% 7/5/19, VRDN (a)(b) | | 400,000 | 400,000 |
| | | | 600,000 |
| Delaware - 0.0% | | | |
| Delaware Econ. Dev. Auth. Rev. (Delmarva Pwr. & Lt. Co. Proj.) Series 1999 B, 2.1% 7/5/19, VRDN (a)(b) | | 100,000 | 100,000 |
| Indiana - 0.2% | | | |
| Indiana Dev. Fin. Auth. Envir. Rev. (PSI Energy Proj.) Series 2003 A, 2.2% 7/5/19, VRDN (a)(b) | | 400,000 | 400,000 |
| Kansas - 0.4% | | | |
| Burlington Envir. Impt. Rev. (Kansas City Pwr. and Lt. Co. Proj.): | | | |
| Series 2007 A, 2.13% 7/5/19, VRDN (b) | | 100,000 | 100,000 |
| Series 2007 B, 2.13% 7/5/19, VRDN (b) | | 200,000 | 200,000 |
| St. Mary's Kansas Poll. Cont. Rev. Series 1994, 2.1% 7/5/19, VRDN (b) | | 500,000 | 500,000 |
| | | | 800,000 |
| Louisiana - 0.5% | | | |
| Saint James Parish Gen. Oblig. (Nucor Steel Louisiana LLC Proj.): | | | |
| Series 2010 A1, 2.09% 7/5/19, VRDN (b) | | 900,000 | 900,000 |
| Series 2010 B1, 2.05% 7/5/19, VRDN (b) | | 100,000 | 100,000 |
| | | | 1,000,000 |
| Nebraska - 0.2% | | | |
| Stanton County Indl. Dev. Rev. (Nucor Corp. Proj.) Series 1996, 2.13% 7/5/19, VRDN (a)(b) | | 400,000 | 400,000 |
| North Carolina - 0.0% | | | |
| Hertford County Indl. Facilities Poll. Cont. Fing. Auth. (Nucor Corp. Proj.) Series 2000 A, 2.15% 7/5/19, VRDN (a)(b) | | 100,000 | 100,000 |
| Pennsylvania - 36.2% | | | |
| Allegheny County Hosp. Dev. Auth. Rev. (Children's Institute Pittsburgh Proj.): | | | |
| Series 2005 A, 1.9% 7/5/19, LOC PNC Bank NA, VRDN (b) | | 465,000 | 465,000 |
| Series 2005 B, 1.9% 7/5/19, LOC PNC Bank NA, VRDN (b) | | 2,130,000 | 2,130,000 |
| Allegheny County Indl. Dev. Auth. Rev.: | | | |
| (Union Elec. Steel Co. Proj.) Series 1996 A, 1.94% 7/5/19, LOC PNC Bank NA, VRDN (a)(b) | | 4,120,000 | 4,120,000 |
| Series 2002, 1.95% 7/5/19, LOC RBS Citizens NA, VRDN (b) | | 2,200,000 | 2,200,000 |
| Beaver County Indl. Dev. Auth. Series 2018 A, 1.91% 7/5/19, LOC BMO Harris Bank NA, VRDN (b) | | 2,320,000 | 2,320,000 |
| Bucks County Indl. Dev. Auth. Hosp. Rev. (Grand View Hosp. Proj.) Series 2008 A, 1.9% 7/5/19, LOC PNC Bank NA, VRDN (b) | | 2,200,000 | 2,200,000 |
| Chester County Health & Ed. Auth. Rev. 1.95% 7/5/19, LOC Manufacturers & Traders Trust Co., VRDN (b) | | 3,055,000 | 3,055,000 |
| Delaware County Indl. Dev. Auth. Arpt. Facilities Rev. (United Parcel Svc. Proj.) Series 2015, 1.82% 7/1/19, VRDN (b) | | 10,855,000 | 10,855,000 |
| Lancaster County Hosp. Auth. Health Ctr. Rev. (Masonic Homes Proj.) Series 2008 D, 1.91% 7/1/19, LOC JPMorgan Chase Bank, VRDN (b) | | 630,000 | 630,000 |
| Lancaster Indl. Dev. Auth. Rev.: | | | |
| (Mennonite Home Proj.) 2% 7/5/19, LOC Manufacturers & Traders Trust Co., VRDN (b) | | 2,600,000 | 2,600,000 |
| (Willow Valley Retirement Cmntys. Proj.) Series 2009 C, 1.9% 7/5/19, LOC PNC Bank NA, VRDN (b) | | 1,200,000 | 1,200,000 |
| (Willow Valley Retirement Proj.) Series 2009 B, 1.9% 7/5/19, LOC PNC Bank NA, VRDN (b) | | 7,340,000 | 7,340,000 |
| Lower Merion School District: | | | |
| Series 2009 A, 1.85% 7/5/19, LOC U.S. Bank NA, Cincinnati, VRDN (b) | | 150,000 | 150,000 |
| Series 2009 B, 1.85% 7/5/19, LOC U.S. Bank NA, Cincinnati, VRDN (b) | | 205,000 | 205,000 |
| Pennsylvania Econ. Dev. Fing. Auth. Indl. Dev. Rev. (Leidy's, Inc. Proj.) Series 1995 D7, 1.94% 7/5/19, LOC PNC Bank NA, VRDN (a)(b) | | 300,000 | 300,000 |
| Pennsylvania Higher Edl. Facilities Auth. Rev. (Keystone College Proj.) Series 2001 H5, 1.9% 7/5/19, LOC PNC Bank NA, VRDN (b) | | 3,975,000 | 3,975,000 |
| Philadelphia Arpt. Rev. Series 2005 C1, 1.9% 7/5/19, LOC TD Banknorth, NA, VRDN (a)(b) | | 2,675,000 | 2,675,000 |
| Philadelphia Auth. for Indl. Dev. Rev.: | | | |
| (Spl. People in Northeast, Inc. Proj.) Series 2006, 2.13% 7/5/19, LOC RBS Citizens NA, VRDN (b) | | 1,035,000 | 1,035,000 |
| (The Franklin Institute Proj.) Series 2006, 1.92% 7/5/19, LOC Bank of America NA, VRDN (b) | | 2,545,000 | 2,545,000 |
| Philadelphia Auth. Indl. Dev. Lease Rev.: | | | |
| Series 2007 B2, 1.9% 7/5/19, LOC TD Banknorth, NA, VRDN (b) | | 7,350,000 | 7,350,000 |
| Series 2007 B3, 1.9% 7/5/19, LOC PNC Bank NA, VRDN (b) | | 2,400,000 | 2,400,000 |
| Philadelphia Gas Works Rev. (1998 Gen. Ordinance Proj.) Eighth Series B, 1.9% 7/5/19, LOC TD Banknorth, NA, VRDN (b) | | 1,900,000 | 1,900,000 |
| Ridley School District Series 2009, 1.9% 7/5/19, LOC TD Banknorth, NA, VRDN (b) | | 1,200,000 | 1,200,000 |
| Washington County Hosp. Auth. Rev. (Monongahela Valley Hosp. Proj.) Series 2018 C, 1.95% 7/5/19, LOC RBS Citizens NA, VRDN (b) | | 3,700,000 | 3,700,000 |
| FNMA Montgomery County Redev. Auth. Multi-family Hsg. Rev. (Kingswood Apts. Proj.) Series 2001 A, 1.96% 7/5/19, LOC Fannie Mae, VRDN (b) | | 12,675,000 | 12,674,999 |
| | | | 79,224,999 |
| West Virginia - 0.8% | | | |
| West Virginia Econ. Dev. Auth. Solid Waste Disp. Facilities Rev.: | | | |
| (Appalachian Pwr. Co. - Amos Proj.) Series 2008 B, 2.07% 7/5/19, VRDN (a)(b) | | 500,000 | 500,000 |
| (Appalachian Pwr. Co.- Mountaineer Proj.) Series 2008 A, 2.1% 7/5/19, VRDN (a)(b) | | 1,200,000 | 1,200,000 |
| | | | 1,700,000 |
| TOTAL VARIABLE RATE DEMAND NOTE | | | |
| (Cost $85,124,999) | | | 85,124,999 |
|
| Tender Option Bond - 51.5% | | | |
| Colorado - 0.1% | | | |
| Denver City & County Arpt. Rev. Bonds Series G-114, 2.15%, tender 12/2/19 (Liquidity Facility Royal Bank of Canada) (a)(b)(c)(d)(e)(f) | | 100,000 | 100,000 |
| Connecticut - 0.0% | | | |
| Connecticut Spl. Tax Oblig. Trans. Infrastructure Rev. Bonds Series Floaters G 110, 2.08%, tender 10/1/19 (Liquidity Facility Royal Bank of Canada) (b)(c)(d)(e) | | 100,000 | 100,000 |
| Pennsylvania - 51.4% | | | |
| Allegheny County Participating VRDN Series Floaters XM 06 63, 2% 7/5/19 (Liquidity Facility Morgan Stanley Bank, West Valley City Utah) (b)(c)(d) | | 2,600,000 | 2,600,000 |
| Allegheny County Hosp. Dev. Auth. Rev. Participating VRDN: | | | |
| Series Floaters E 110, 1.94% 7/1/19 (Liquidity Facility Royal Bank of Canada) (b)(c)(d) | | 3,850,000 | 3,850,000 |
| Series Floaters E 111, 1.94% 7/1/19 (Liquidity Facility Royal Bank of Canada) (b)(c)(d) | | 1,510,000 | 1,510,000 |
| Allegheny County Sanitation Auth. Swr. Rev. Participating VRDN Series Floaters XM 00 82, 1.93% 7/5/19 (Liquidity Facility Barclays Bank PLC) (b)(c)(d) | | 1,165,000 | 1,165,000 |
| Berks County Muni. Auth. Rev. Participating VRDN Series Floaters 001, 2.05% 8/9/19 (Liquidity Facility Barclays Bank PLC) (b)(c)(d)(e) | | 1,750,000 | 1,750,000 |
| Delaware Valley Reg'l. Fin. Auth. Local Govt. Rev. Participating VRDN Series Floaters XG 02 01, 1.94% 7/5/19 (Liquidity Facility Barclays Bank PLC) (b)(c)(d) | | 3,000,000 | 3,000,000 |
| Geisinger Auth. Health Sys. Rev. Participating VRDN: | | | |
| Series Floaters XF 05 43, 1.93% 7/5/19 (Liquidity Facility Royal Bank of Canada) (b)(c)(d) | | 4,000,000 | 4,000,000 |
| Series Floaters XF 06 02, 1.93% 7/5/19 (Liquidity Facility Toronto-Dominion Bank) (b)(c)(d) | | 4,695,000 | 4,695,000 |
| Series Floaters XM 06 13, 1.93% 7/5/19 (Liquidity Facility JPMorgan Chase Bank) (b)(c)(d) | | 1,700,000 | 1,700,000 |
| Lancaster County Hosp. Auth. Health Ctr. Rev. Participating VRDN Series 16 ZF0383, 1.94% 7/5/19 (Liquidity Facility Toronto-Dominion Bank) (b)(c)(d) | | 3,750,000 | 3,750,000 |
| Lehigh County Gen. Purp. Hosp. Rev. Participating VRDN Series Floaters 2019 003, 2.05% 8/9/19 (Liquidity Facility Barclays Bank PLC) (b)(c)(d)(e) | | 1,000,000 | 1,000,000 |
| Northampton County Gen. Purp. College Rev. Participating VRDN: | | | |
| Series Floaters XL 00 48, 1.93% 7/5/19 (Liquidity Facility Morgan Stanley Bank, West Valley City Utah) (b)(c)(d) | | 3,400,000 | 3,400,000 |
| Series Floaters ZM 05 17, 1.93% 7/5/19 (Liquidity Facility Morgan Stanley Bank, West Valley City Utah) (b)(c)(d) | | 7,500,000 | 7,500,000 |
| Pennsylvania Econ. Dev. Participating VRDN Series XM 0048, 2% 7/5/19 (Liquidity Facility Deutsche Bank AG New York Branch) (b)(c)(d) | | 2,653,500 | 2,653,500 |
| Pennsylvania Econ. Dev. Fing. Auth. Rev. Participating VRDN Series Floaters 16 YX1028, 2% 7/5/19 (Liquidity Facility Barclays Bank PLC) (b)(c)(d) | | 6,405,000 | 6,405,000 |
| Pennsylvania Gen. Oblig. Participating VRDN: | | | |
| Series Floaters XF 24 54, 1.93% 7/5/19 (Liquidity Facility Barclays Bank PLC) (b)(c)(d) | | 5,200,000 | 5,200,000 |
| Series Floaters XG 01 80, 1.92% 7/5/19 (Liquidity Facility Bank of America NA) (b)(c)(d) | | 5,600,000 | 5,600,000 |
| Series Floaters ZF 06 71, 1.92% 7/5/19 (Liquidity Facility Bank of America NA) (b)(c)(d) | | 3,330,000 | 3,330,000 |
| Series Floaters ZM 06 50, 1.92% 7/5/19 (Liquidity Facility Bank of America NA) (b)(c)(d) | | 7,000,000 | 7,000,000 |
| Pennsylvania Higher Edl. Facilities Auth. Rev.: | | | |
| Bonds Series 2016 E75, 2.07%, tender 9/3/19 (Liquidity Facility Royal Bank of Canada) (b)(c)(d)(e) | | 100,000 | 100,000 |
| Participating VRDN: | | | |
| Series Floaters XF 25 53, 1.9% 7/5/19 (Liquidity Facility Citibank NA) (b)(c)(d) | | 2,740,000 | 2,740,000 |
| Series MS 3252, 1.93% 7/5/19 (Liquidity Facility Morgan Stanley Bank, West Valley City Utah) (b)(c)(d) | | 5,840,000 | 5,840,000 |
| Pennsylvania Intergovernmental Coop. Auth. Spl. Tax Rev. Participating VRDN Series Putters 15 XM0010, 1.93% 7/5/19 (Liquidity Facility JPMorgan Chase Bank) (b)(c)(d) | | 5,035,000 | 5,035,000 |
| Pennsylvania Tpk. Commission Tpk. Rev.: | | | |
| Bonds Series Floaters G 43, 2.1%, tender 12/2/19 (Liquidity Facility Royal Bank of Canada) (b)(c)(d)(e) | | 2,500,000 | 2,500,000 |
| Participating VRDN: | | | |
| Series DBE 8032, 2.15% 7/5/19 (Liquidity Facility Deutsche Bank AG New York Branch) (b)(c)(d) | | 1,480,000 | 1,480,000 |
| Series Floaters E 101, 1.93% 7/5/19 (Liquidity Facility Royal Bank of Canada) (b)(c)(d) | | 6,200,000 | 6,200,000 |
| Philadelphia Auth. For Indl. Dev. Participating VRDN Series Putters 14 XM0005, 1.93% 7/5/19 (Liquidity Facility JPMorgan Chase Bank) (b)(c)(d)(g) | | 5,325,000 | 5,325,000 |
| Philadelphia Hospitals & Higher Ed. Facilities Auth. Hosp. Rev. Participating VRDN Series 15 F0114, 1.93% 7/5/19 (Liquidity Facility JPMorgan Chase Bank) (b)(c)(d) | | 5,330,000 | 5,330,000 |
| Philadelphia Wtr. & Wastewtr. Rev. Participating VRDN Series 2017, 1.93% 7/5/19 (Liquidity Facility Barclays Bank PLC) (b)(c)(d) | | 3,160,000 | 3,160,000 |
| Pittsburgh Wtr. & Swr. Auth. Wtr. & Swr. Sys. Rev. Participating VRDN Series Putters 50 20, 1.98% 7/1/19 (Liquidity Facility JPMorgan Chase Bank) (b)(c)(d) | | 2,200,000 | 2,200,000 |
| Wilkes Barre Asd Participating VRDN Series Floaters XF 07 77, 1.94% 7/5/19 (Liquidity Facility Bank of America NA) (b)(c)(d) | | 2,285,000 | 2,285,000 |
| | | | 112,303,500 |
| Texas - 0.0% | | | |
| Alamo Cmnty. Coll District Rev. Bonds Series G-111, 2.1%, tender 11/1/19 (Liquidity Facility Royal Bank of Canada) (b)(c)(d)(e) | | 100,000 | 100,000 |
| TOTAL TENDER OPTION BOND | | | |
| (Cost $112,603,500) | | | 112,603,500 |
|
| Other Municipal Security - 11.9% | | | |
| Florida - 1.1% | | | |
| Florida Dev. Fin. Corp. Surface T Bonds (Virgin Trains U.S.A. Passenger Rail Proj.) Series 2019 B, 1.9%, tender 3/17/20 (a)(b) | | 2,500,000 | 2,500,000 |
| Kentucky - 0.1% | | | |
| Jefferson County Poll. Cont. Rev. Bonds Series A, 1.7% tender 7/9/19, CP mode | | 100,000 | 100,000 |
| New Hampshire - 0.8% | | | |
| New Hampshire Bus. Fin. Auth. Poll. Cont. Rev. Bonds: | | | |
| Series 1990 A, 1.9% tender 7/25/19, CP mode (a) | | 900,000 | 900,000 |
| Series 1990 A1, 1.99% tender 9/25/19, CP mode (a) | | 800,000 | 800,000 |
| | | | 1,700,000 |
| New Mexico - 0.1% | | | |
| New Mexico Muni. Energy Acquisition Auth. Gas Supply Rev. Bonds Series 2014 B, 1 month U.S. LIBOR + 0.750% 2.385%, tender 8/1/19 (Liquidity Facility Royal Bank of Canada) (b)(f) | | 300,000 | 300,017 |
| Pennsylvania - 9.8% | | | |
| Butler County Hosp. Auth. Hosp. Rev. Bonds (Butler Memorial Hosp., Proj.) Series 2009 B, 7.25% 7/1/19 (Pre-Refunded to 7/1/19 @ 100) | | 1,500,000 | 1,500,000 |
| Commonwealth Fing. Auth. Tobacco Bonds Series 2018, 5% 6/1/20 | | 475,000 | 489,962 |
| Pennsylvania Econ. Dev. Fin. Auth. Unemployment Compensation Rev. Bonds Series 2012 A, 5% 7/1/19 | | 1,310,000 | 1,310,000 |
| Pennsylvania Econ. Dev. Fing. Auth. Health Sys. Rev. Bonds Series 2009 A, 6.25% 10/15/19 (Pre-Refunded to 10/15/19 @ 100) | | 2,495,000 | 2,528,496 |
| Pennsylvania Gen. Oblig. Bonds: | | | |
| Series 2004, 5.375% 7/1/19 | | 2,175,000 | 2,175,000 |
| Series 2009, 5% 7/1/19 | | 2,820,000 | 2,820,000 |
| Series 2015, 5% 8/15/19 | | 1,780,000 | 1,787,345 |
| Series 2016, 5% 9/15/19 | | 150,000 | 150,893 |
| Pennsylvania Higher Edl. Facilities Auth. Rev. Bonds (The Trustees of the Univ. of Pennsylvania Proj.) Series 2009 A, 5% 9/1/19 (Escrowed to Maturity) | | 660,000 | 663,796 |
| Philadelphia Arpt. Rev. Series B2, 1.65% 7/24/19, LOC PNC Bank NA, CP (a) | | 2,200,000 | 2,200,000 |
| Philadelphia Wtr. & Wastewtr. Rev. Bonds Series 2017 A, 5% 10/1/19 | | 2,400,000 | 2,420,614 |
| Saint Mary Hosp. Auth. Health Sys. Rev. Bonds: | | | |
| Series 2010 B: | | | |
| 5% 11/15/19 | | 1,545,000 | 1,561,550 |
| 5% 11/15/19 (Escrowed to Maturity) | | 315,000 | 318,374 |
| Series 2012 B, 5% 11/15/19 | | 1,100,000 | 1,112,956 |
| St. Mary Hosp. Auth. Bucks County Bonds Series 2019 PA, 5% 12/1/19 | | 360,000 | 364,599 |
| | | | 21,403,585 |
| TOTAL OTHER MUNICIPAL SECURITY | | | |
| (Cost $26,003,602) | | | 26,003,602 |
| | | Shares | Value |
|
| Investment Company - 0.1% | | | |
| Fidelity Municipal Cash Central Fund 2.00% (h)(i) | | | |
| (Cost $197,000) | | 196,980 | 197,000 |
| TOTAL INVESTMENT IN SECURITIES - 102.5% | | | |
| (Cost $223,929,101) | | | 223,929,101 |
| NET OTHER ASSETS (LIABILITIES) - (2.5)% | | | (5,409,441) |
| NET ASSETS - 100% | | | $218,519,660 |
Security Type Abbreviations
CP – COMMERCIAL PAPER
VRDN – VARIABLE RATE DEMAND NOTE (A debt instrument that is payable upon demand, either daily, weekly or monthly)
The date shown for securities represents the date when principal payments must be paid, taking into account any call options exercised by the issuer and any permissible maturity shortening features other than interest rate resets.
Legend
(a) Private activity obligations whose interest is subject to the federal alternative minimum tax for individuals.
(b) Coupon rates for floating and adjustable rate securities reflect the rates in effect at period end.
(c) Provides evidence of ownership in one or more underlying municipal bonds.
(d) Coupon rates are determined by re-marketing agents based on current market conditions.
(e) Restricted securities - Investment in securities not registered under the Securities Act of 1933 (excluding 144A issues). At the end of the period, the value of restricted securities (excluding 144A issues) amounted to $5,650,000 or 2.6% of net assets.
(f) Coupon is indexed to a floating interest rate which may be multiplied by a specified factor and/or subject to caps or floors.
(g) Security exempt from registration under Rule 144A of the Securities Act of 1933. These securities may be resold in transactions exempt from registration, normally to qualified institutional buyers. At the end of the period, the value of these securities amounted to $5,325,000 or 2.4% of net assets.
(h) Information in this report regarding holdings by state and security types does not reflect the holdings of the Fidelity Municipal Cash Central Fund.
(i) Affiliated fund that is available only to investment companies and other accounts managed by Fidelity Investments. The rate quoted is the annualized seven-day yield of the fund at period end. A complete unaudited listing of the fund's holdings as of its most recent quarter end is available upon request. In addition, each Fidelity Central Fund's financial statements are available on the SEC's website or upon request.
Additional information on each restricted holding is as follows:
| Security | Acquisition Date | Cost |
| Alamo Cmnty. Coll District Rev. Bonds Series G-111, 2.1%, tender 11/1/19 (Liquidity Facility Royal Bank of Canada) | 6/6/19 | $100,000 |
| Berks County Muni. Auth. Rev. Participating VRDN Series Floaters 001, 2.05% 8/9/19 (Liquidity Facility Barclays Bank PLC) | 1/18/18 - 7/6/18 | $1,750,000 |
| Connecticut Spl. Tax Oblig. Trans. Infrastructure Rev. Bonds Series Floaters G 110, 2.08%, tender 10/1/19 (Liquidity Facility Royal Bank of Canada) | 5/16/19 | $100,000 |
| Denver City & County Arpt. Rev. Bonds Series G-114, 2.15%, tender 12/2/19 (Liquidity Facility Royal Bank of Canada) | 6/6/19 | $100,000 |
| Lehigh County Gen. Purp. Hosp. Rev. Participating VRDN Series Floaters 2019 003, 2.05% 8/9/19 (Liquidity Facility Barclays Bank PLC) | 1/17/19 | $1,000,000 |
| Pennsylvania Higher Edl. Facilities Auth. Rev. Bonds Series 2016 E75, 2.07%, tender 9/3/19 (Liquidity Facility Royal Bank of Canada) | 4/23/19 | $100,000 |
| Pennsylvania Tpk. Commission Tpk. Rev. Bonds Series Floaters G 43, 2.1%, tender 12/2/19 (Liquidity Facility Royal Bank of Canada) | 8/2/18 | $2,500,000 |
Affiliated Central Funds
Information regarding fiscal year to date income earned by the Fund from investments in Fidelity Central Funds is as follows:
| Fund | Income earned |
| Fidelity Municipal Cash Central Fund | $90,638 |
| Total | $90,638 |
Amounts in the income column in the above table exclude any capital gain distributions from underlying funds, which are presented in the corresponding line-item in the Statement of Operations, if applicable.
Investment Valuation
All investments are categorized as Level 2 under the Fair Value Hierarchy. The inputs or methodology used for valuing securities may not be an indication of the risk associated with investing in those securities. For more information on valuation inputs please refer to the Investment Valuation section in the accompanying Notes to Financial Statements.
See accompanying notes which are an integral part of the financial statements.
Fidelity® Pennsylvania Municipal Money Market Fund
Financial Statements
Statement of Assets and Liabilities
| | | June 30, 2019 (Unaudited) |
| Assets | | |
Investment in securities, at value — See accompanying schedule:
Unaffiliated issuers (cost $223,732,101) | $223,732,101 | |
| Fidelity Central Funds (cost $197,000) | 197,000 | |
| Total Investment in Securities (cost $223,929,101) | | $223,929,101 |
| Cash | | 10,718 |
| Receivable for fund shares sold | | 146,599 |
| Interest receivable | | 958,800 |
| Distributions receivable from Fidelity Central Funds | | 3,224 |
| Other receivables | | 33 |
| Total assets | | 225,048,475 |
| Liabilities | | |
| Payable for investments purchased | $6,300,000 | |
| Payable for fund shares redeemed | 126,611 | |
| Distributions payable | 11,444 | |
| Accrued management fee | 90,760 | |
| Total liabilities | | 6,528,815 |
| Net Assets | | $218,519,660 |
| Net Assets consist of: | | |
| Paid in capital | | $218,454,011 |
| Total distributable earnings (loss) | | 65,649 |
| Net Assets, for 218,201,112 shares outstanding | | $218,519,660 |
| Net Asset Value, offering price and redemption price per share ($218,519,660 ÷ 218,201,112 shares) | | $1.00 |
See accompanying notes which are an integral part of the financial statements.
Statement of Operations
| | | Six months ended June 30, 2019 (Unaudited) |
| Investment Income | | |
| Interest | | $1,764,991 |
| Income from Fidelity Central Funds | | 90,638 |
| Total income | | 1,855,629 |
| Expenses | | |
| Management fee | $558,182 | |
| Independent trustees' fees and expenses | 420 | |
| Total expenses before reductions | 558,602 | |
| Expense reductions | (28) | |
| Total expenses after reductions | | 558,574 |
| Net investment income (loss) | | 1,297,055 |
| Realized and Unrealized Gain (Loss) | | |
| Net realized gain (loss) on: | | |
| Investment securities: | | |
| Unaffiliated issuers | 69,184 | |
| Fidelity Central Funds | 710 | |
| Total net realized gain (loss) | | 69,894 |
| Net increase in net assets resulting from operations | | $1,366,949 |
See accompanying notes which are an integral part of the financial statements.
Statement of Changes in Net Assets
| | Six months ended June 30, 2019 (Unaudited) | Year ended December 31, 2018 |
| Increase (Decrease) in Net Assets | | |
| Operations | | |
| Net investment income (loss) | $1,297,055 | $2,481,867 |
| Net realized gain (loss) | 69,894 | (7,807) |
| Net increase in net assets resulting from operations | 1,366,949 | 2,474,060 |
| Distributions to shareholders | (1,296,755) | (2,482,188) |
| Share transactions | | |
| Proceeds from sales of shares | 21,271,227 | 39,484,580 |
| Reinvestment of distributions | 1,224,063 | 2,343,361 |
| Cost of shares redeemed | (44,458,131) | (86,401,616) |
| Net increase (decrease) in net assets and shares resulting from share transactions | (21,962,841) | (44,573,675) |
| Total increase (decrease) in net assets | (21,892,647) | (44,581,803) |
| Net Assets | | |
| Beginning of period | 240,412,307 | 284,994,110 |
| End of period | $218,519,660 | $240,412,307 |
| Other Information | | |
| Shares | | |
| Sold | 21,271,227 | 39,484,580 |
| Issued in reinvestment of distributions | 1,224,063 | 2,343,361 |
| Redeemed | (44,458,131) | (86,401,616) |
| Net increase (decrease) | (21,962,841) | (44,573,675) |
See accompanying notes which are an integral part of the financial statements.
Financial Highlights
Fidelity Pennsylvania Municipal Money Market Fund
| | Six months ended (Unaudited) June 30, | Years endedDecember 31, | | | | |
| | 2019 | 2018 | 2017 | 2016 | 2015 | 2014 |
| Selected Per–Share Data | | | | | | |
| Net asset value, beginning of period | $1.00 | $1.00 | $1.00 | $1.00 | $1.00 | $1.00 |
| Income from Investment Operations | | | | | | |
| Net investment income (loss) | .006 | .010 | .004 | .001 | –A | –A |
| Net realized and unrealized gain (loss) | – | – | – | – | – | – |
| Total from investment operations | .006 | .010 | .004 | .001 | –A | –A |
| Distributions from net investment income | (.006) | (.010) | (.004) | (.001) | –A | –A |
| Distributions from net realized gain | – | – | –A | –A | –A | – |
| Total distributions | (.006) | (.010) | (.004) | (.001) | –A | –A |
| Net asset value, end of period | $1.00 | $1.00 | $1.00 | $1.00 | $1.00 | $1.00 |
| Total ReturnB,C | .58% | .97% | .40% | .09% | .01% | .01% |
| Ratios to Average Net AssetsD,E | | | | | | |
| Expenses before reductions | .50%F | .50% | .50% | .50% | .50% | .50% |
| Expenses net of fee waivers, if any | .50%F | .50% | .50% | .35% | .06% | .07% |
| Expenses net of all reductions | .50%F | .50% | .50% | .35% | .06% | .07% |
| Net investment income (loss) | 1.17%F | .96% | .38% | .07% | .01% | .01%A |
| Supplemental Data | | | | | | |
| Net assets, end of period (000 omitted) | $218,520 | $240,412 | $284,994 | $405,526 | $731,701 | $760,467 |
A Amount represents less than $.0005 per share.
B Total returns for periods of less than one year are not annualized.
C Total returns would have been lower if certain expenses had not been reduced during the applicable periods shown.
D Fees and expenses of any underlying Fidelity Central Funds are not included in the Fund's expense ratio. The Fund indirectly bears its proportionate share of the expenses of any underlying Fidelity Central Funds.
E Expense ratios reflect operating expenses of the Fund. Expenses before reductions do not reflect amounts reimbursed or waived or reductions from expense offset arrangements and do not represent the amount paid by the Fund during periods when reimbursements, waivers or reductions occur. Expenses net of fee waivers reflect expenses after reimbursement and waivers but prior to reductions from expense offset arrangements. Expenses net of all reductions represent the net expenses paid by the Fund.
F Annualized
See accompanying notes which are an integral part of the financial statements.
Notes to Financial Statements (Unaudited)
For the period ended June 30, 2019
1. Organization.
Fidelity Pennsylvania Municipal Income Fund (the Income Fund) is a fund of Fidelity Municipal Trust. Fidelity Pennsylvania Municipal Money Market Fund (the Money Market Fund) is a fund of Fidelity Municipal Trust II. Each Trust is registered under the Investment Company Act of 1940, as amended (the 1940 Act), as an open-end management investment company. Fidelity Municipal Trust and Fidelity Municipal Trust II (the Trusts) are organized as a Massachusetts business trust and a Delaware statutory trust, respectively. Each Fund is authorized to issue an unlimited number of shares. Shares of the Money Market Fund are only available for purchase by retail shareholders. Share transactions on the Statement of Changes in Net Assets may contain exchanges between affiliated funds. Each Fund may be affected by economic and political developments in the state of Pennsylvania.
2. Investments in Fidelity Central Funds.
The Funds may invest in Fidelity Central Funds, which are open-end investment companies generally available only to other investment companies and accounts managed by the investment adviser and its affiliates. The Funds' Schedules of Investments list each of the Fidelity Central Funds held as of period end, if any, as an investment of each Fund, but do not include the underlying holdings of each Fidelity Central Fund. As an Investing Fund, each Fund indirectly bears its proportionate share of the expenses of the underlying Fidelity Central Funds.
The Money Market Central Funds seek preservation of capital and current income and are managed by Fidelity Investments Money Management, Inc. (FIMM), an affiliate of the investment adviser. Annualized expenses of the Money Market Central Funds as of their most recent shareholder report date ranged from less than .005% to .01%.
A complete unaudited list of holdings for each Fidelity Central Fund is available upon request or at the Securities and Exchange Commission (the SEC) website at www.sec.gov. In addition, the financial statements of the Fidelity Central Funds are available on the SEC website or upon request.
3. Significant Accounting Policies.
Each Fund is an investment company and applies the accounting and reporting guidance of the Financial Accounting Standards Board (FASB) Accounting Standards Codification Topic 946 Financial Services – Investments Companies. The financial statements have been prepared in conformity with accounting principles generally accepted in the United States of America (GAAP), which require management to make certain estimates and assumptions at the date of the financial statements. Actual results could differ from those estimates. Subsequent events, if any, through the date that the financial statements were issued have been evaluated in the preparation of the financial statements. The following summarizes the significant accounting policies of the Funds:
Investment Valuation. Investments are valued as of 4:00 p.m. Eastern time on the last calendar day of the period. The Board of Trustees (the Board) has delegated the day to day responsibility for the valuation of the Income Fund's investments to the Fair Value Committee (the Committee) established by the Income Fund's investment adviser. In accordance with valuation policies and procedures approved by the Board, the Income Fund attempts to obtain prices from one or more third party pricing vendors or brokers to value its investments. When current market prices, quotations or currency exchange rates are not readily available or reliable, investments will be fair valued in good faith by the Committee, in accordance with procedures adopted by the Board. Factors used in determining fair value vary by investment type and may include market or investment specific events, changes in interest rates and credit quality. The frequency with which these procedures are used cannot be predicted and they may be utilized to a significant extent. The Committee oversees the Income Fund's valuation policies and procedures and reports to the Board on the Committee's activities and fair value determinations. The Board monitors the appropriateness of the procedures used in valuing the Income Fund's investments and ratifies the fair value determinations of the Committee.
Each Fund categorizes the inputs to valuation techniques used to value its investments into a disclosure hierarchy consisting of three levels as shown below:
- Level 1 – quoted prices in active markets for identical investments
- Level 2 – other significant observable inputs (including quoted prices for similar investments, interest rates, prepayment speeds, etc.)
- Level 3 – unobservable inputs (including the Fund's own assumptions based on the best information available)
Valuation techniques used to value each Fund's investments by major category are as follows:
For the Income Fund, debt securities, including restricted securities, are valued based on evaluated prices received from third party pricing vendors or from brokers who make markets in such securities. Municipal securities are valued by pricing vendors who utilize matrix pricing which considers yield or price of bonds of comparable quality, coupon, maturity and type or by broker-supplied prices. When independent prices are unavailable or unreliable, debt securities may be valued utilizing pricing methodologies which consider similar factors that would be used by third party pricing vendors. Debt securities are generally categorized as Level 2 in the hierarchy but may be Level 3 depending on the circumstances.
For the Money Market Fund, as permitted by compliance with certain conditions under Rule 2a-7 of the 1940 Act, securities are valued at amortized cost, which approximates fair value. The amortized cost of an instrument is determined by valuing it at its original cost and thereafter amortizing any discount or premium from its face value at a constant rate until maturity. Securities held by a money market fund are generally high quality and liquid; however, they are reflected as Level 2 because the inputs used to determine fair value are not quoted prices in an active market.
For the Income Fund, changes in valuation techniques may result in transfers in or out of an assigned level within the disclosure hierarchy.
Investment Transactions and Income. For financial reporting purposes, the Funds' investment holdings and net asset value (NAV) include trades executed through the end of the last business day of the period. The NAV per share for processing shareholder transactions is calculated as of the close of business of the New York Stock Exchange (NYSE), normally 4:00 p.m. Eastern time and includes trades executed through the end of the prior business day for the Income Fund and trades executed through the end of the current business day for the Money Market Fund. Gains and losses on securities sold are determined on the basis of identified cost. Income and capital gain distributions from Fidelity Central Funds, if any, are recorded on the ex-dividend date. Interest income is accrued as earned and includes coupon interest and amortization of premium and accretion of discount on debt securities as applicable. Debt obligations may be placed on non-accrual status and related interest income may be reduced by ceasing current accruals and writing off interest receivables when the collection of all or a portion of interest has become doubtful based on consistently applied procedures. A debt obligation is removed from non-accrual status when the issuer resumes interest payments or when collectability of interest is reasonably assured.
Expenses. Expenses directly attributable to a fund are charged to that fund. Expenses attributable to more than one fund are allocated among the respective funds on the basis of relative net assets or other appropriate methods. Expense estimates are accrued in the period to which they relate and adjustments are made when actual amounts are known.
Income Tax Information and Distributions to Shareholders. Each year, each Fund intends to qualify as a regulated investment company under Subchapter M of the Internal Revenue Code, including distributing substantially all of its taxable income and realized gains. As a result, no provision for U.S. Federal income taxes is required. Each Fund files a U.S. federal tax return, in addition to state and local tax returns as required. Each Fund's federal income tax returns are subject to examination by the Internal Revenue Service (IRS) for a period of three fiscal years after they are filed. State and local tax returns may be subject to examination for an additional fiscal year depending on the jurisdiction.
Distributions are declared and recorded daily and paid monthly from net investment income. Distributions from realized gains, if any, are declared and recorded on the ex-dividend date. Income and capital gain distributions are determined in accordance with income tax regulations, which may differ from GAAP.
Capital accounts within the financial statements are adjusted for permanent book-tax differences. These adjustments have no impact on net assets or the results of operations. Capital accounts are not adjusted for temporary book-tax differences which will reverse in a subsequent period.
Book-tax differences are primarily due to market discount and deferred trustees compensation and losses deferred due to wash sales.
The Funds purchase municipal securities whose interest, in the opinion of the issuer, is free from federal income tax. There is no assurance that the IRS will agree with this opinion. In the event the IRS determines that the issuer does not comply with relevant tax requirements, interest payments from a security could become federally taxable, possibly retroactively to the date the security was issued.
As of period end, the cost and unrealized appreciation (depreciation) in securities, and derivatives if applicable, for federal income tax purposes were as follows for each Fund:
| | Tax cost | Gross unrealized appreciation | Gross unrealized depreciation | Net unrealized appreciation (depreciation) |
| Fidelity Pennsylvania Municipal Income Fund | $481,510,815 | $23,408,034 | $(41,291) | $23,366,743 |
| Fidelity Pennsylvania Municipal Money Market Fund | 223,929,101 | – | – | – |
Capital loss carryforwards are only available to offset future capital gains of the Funds to the extent provided by regulations and may be limited. Under the Regulated Investment Company Modernization Act of 2010 (the Act), the Funds are permitted to carry forward capital losses incurred in taxable years beginning after December 22, 2010 for an unlimited period and such capital losses are required to be used prior to any losses that expire. The capital loss carryforward information presented below, including any applicable limitation, is estimated as of prior fiscal period end and is subject to adjustment.
| | No expiration |
| | Short-term |
| Fidelity Pennsylvania Municipal Money Market Fund | $(7,675) |
Delayed Delivery Transactions and When-Issued Securities. During the period, certain Funds transacted in securities on a delayed delivery or when-issued basis. Payment and delivery may take place after the customary settlement period for that security. The price of the underlying securities and the date when the securities will be delivered and paid for are fixed at the time the transaction is negotiated. The securities purchased on a delayed delivery or when-issued basis are identified as such in each applicable Fund's Schedule of Investments. Certain Funds may receive compensation for interest forgone in the purchase of a delayed delivery or when-issued security. With respect to purchase commitments, each applicable Fund identifies securities as segregated in its records with a value at least equal to the amount of the commitment. Losses may arise due to changes in the value of the underlying securities or if the counterparty does not perform under the contract's terms, or if the issuer does not issue the securities due to political, economic, or other factors.
Restricted Securities. The Funds may invest in securities that are subject to legal or contractual restrictions on resale. These securities generally may be resold in transactions exempt from registration or to the public if the securities are registered. Disposal of these securities may involve time-consuming negotiations and expense, and prompt sale at an acceptable price may be difficult. Information regarding restricted securities is included at the end of each applicable Fund's Schedule of Investments.
4. Purchases and Sales of Investments.
Purchases and sales of securities, other than short-term securities, for the Income Fund aggregated $85,425,870 and $68,631,713, respectively.
5. Fees and Other Transactions with Affiliates.
Management Fee. Fidelity Management & Research Company (the investment adviser) and its affiliates provide the Income Fund with investment management related services for which the Fund pays a monthly management fee. The management fee is the sum of an individual fund fee rate that is based on an annual rate of.25% of the Fund's average net assets and an annualized group fee rate that averaged .11% during the period. The group fee rate is based upon the average net assets of all the mutual funds advised by the investment adviser, including any mutual funds previously advised by the investment adviser that are currently advised by Fidelity SelectCo, LLC, an affiliate of the investment adviser. The group fee rate decreases as assets under management increase and increases as assets under management decrease. For the reporting period, the total annualized management fee rate was.36% of the Fund's average net assets.
Fidelity Management & Research Company (the investment adviser) and its affiliates provide the Money Market Fund with investment management related services for which the Fund pays a monthly management fee that is based on an annual rate of .50% of the Fund's average net assets. Under the management contract, the investment adviser pays all other expenses, except the compensation of the independent Trustees and certain other expenses such as interest expense. The management fee is reduced by an amount equal to the fees and expenses paid by the Fund to the independent Trustees.
Transfer Agent Fees. Fidelity Investments Institutional Operations Company, Inc. (FIIOC), an affiliate of the investment adviser, is the transfer, dividend disbursing and shareholder servicing agent for the Funds. Under the terms of the management fee contract, the investment adviser pays transfer agent fees on behalf of the Money Market Fund. FIIOC receives account fees and asset-based fees that vary according to account size and type of account. FIIOC pays for typesetting, printing and mailing of shareholder reports, except proxy statements. For the period, the Income Fund's transfer agent fees were equivalent to the following annualized rates expressed as a percentage of average net assets:
| Fidelity Pennsylvania Municipal Income Fund | .08% |
Accounting Fees. Fidelity Service Company, Inc. (FSC), an affiliate of the investment adviser, maintains each Fund's accounting records. The fee is based on the level of average net assets for each month. For the period, the fees were equivalent to the following annualized rates:
| | % of Average Net Assets |
| Fidelity Pennsylvania Municipal Income Fund | .03 |
Interfund Trades. The Funds may purchase from or sell securities to other Fidelity Funds under procedures adopted by the Board. The procedures have been designed to ensure these interfund trades are executed in accordance with Rule 17a-7 of the 1940 Act. For the Income Fund, interfund trades are included within the respective purchases and sales amounts shown in the Purchases and Sales of Investments note.
6. Committed Line of Credit.
The Income Fund participates with other funds managed by the investment adviser or an affiliate in a $4.25 billion credit facility (the "line of credit") to be utilized for temporary or emergency purposes to fund shareholder redemptions or for other short-term liquidity purposes. The participating funds have agreed to pay commitment fees on their pro-rata portion of the line of credit, which are reflected in Miscellaneous expenses on the Statement of Operations, and are as follows:
| Fidelity Pennsylvania Municipal Income Fund | $652 |
During the period, the Income Fund did not borrow on this line of credit.
7. Expense Reductions.
Through arrangements with the Income Fund's custodian, credits realized as a result of certain uninvested cash balances were used to reduce fund expenses. These expense reductions are noted in the table below.
| | | Custody expense reduction | | |
| Fidelity Pennsylvania Municipal Income Fund | | $1,500 | | |
In addition, through an arrangement with Money Market Fund's custodian, $28 of credits realized as a result of certain uninvested cash balances were used to reduce the Fund's management fee.
In addition, during the period the investment adviser reimbursed and/or waived a portion of operating expenses as follows:
| | Amount |
| Fidelity Pennsylvania Municipal Income Fund | $1,132 |
8. Other.
The Funds' organizational documents provide former and current trustees and officers with a limited indemnification against liabilities arising in connection with the performance of their duties to the Funds. In the normal course of business, the Funds may also enter into contracts that provide general indemnifications. The Funds' maximum exposure under these arrangements is unknown as this would be dependent on future claims that may be made against the Funds. The risk of material loss from such claims is considered remote.
Shareholder Expense Example
As a shareholder of a Fund, you incur two types of costs: (1) transaction costs and (2) ongoing costs, including management fees and other Fund expenses. This Example is intended to help you understand your ongoing costs (in dollars) of investing in the Funds and to compare these costs with the ongoing costs of investing in other mutual funds.
The Example is based on an investment of $1,000 invested at the beginning of the period and held for the entire period (January 1, 2019 to June 30, 2019).
Actual Expenses
The first line of the accompanying table for each fund provides information about actual account values and actual expenses. You may use the information in this line, together with the amount you invested, to estimate the expenses that you paid over the period. Simply divide your account value by $1,000.00 (for example, an $8,600 account value divided by $1,000.00 = 8.6), then multiply the result by the number in the first line for a fund under the heading entitled "Expenses Paid During Period" to estimate the expenses you paid on your account during this period. In addition, each Fund, as a shareholder in the underlying Fidelity Central Funds, will indirectly bear its pro-rata share of the fees and expenses incurred by the underlying Fidelity Central Funds. These fees and expenses are not included in the Fund's annualized expense ratio used to calculate the expense estimate in the table below.
Hypothetical Example for Comparison Purposes
The second line of the accompanying table for each fund provides information about hypothetical account values and hypothetical expenses based on a fund's actual expense ratio and an assumed rate of return of 5% per year before expenses, which is not the Fund's actual return. The hypothetical account values and expenses may not be used to estimate the actual ending account balance or expenses you paid for the period. You may use this information to compare the ongoing costs of investing in the Fund and other funds. To do so, compare this 5% hypothetical example with the 5% hypothetical examples that appear in the shareholder reports of the other funds. In addition, each Fund, as a shareholder in the underlying Fidelity Central Funds, will indirectly bear its pro-rata share of the fees and expenses incurred by the underlying Fidelity Central Funds. These fees and expenses are not included in the Fund's annualized expense ratio used to calculate the expense estimate in the table below.
Please note that the expenses shown in the table are meant to highlight your ongoing costs only and do not reflect any transaction costs. Therefore, the second line of the table is useful in comparing ongoing costs only, and will not help you determine the relative total costs of owning different funds.
| | Annualized Expense Ratio-A | Beginning
Account Value
January 1, 2019 | Ending
Account Value
June 30, 2019 | Expenses Paid
During Period-B
January 1, 2019
to June 30, 2019 |
| Fidelity Pennsylvania Municipal Income Fund | .49% | | | |
| Actual | | $1,000.00 | $1,053.60 | $2.49 |
| Hypothetical-C | | $1,000.00 | $1,022.36 | $2.46 |
| Fidelity Pennsylvania Municipal Money Market Fund | .50% | | | |
| Actual | | $1,000.00 | $1,005.80 | $2.49 |
| Hypothetical-C | | $1,000.00 | $1,022.32 | $2.51 |
A Annualized expense ratio reflects expenses net of applicable fee waivers.
B Expenses are equal to each Fund's annualized expense ratio, multiplied by the average account value over the period, multiplied by 181/ 365 (to reflect the one-half year period).
C 5% return per year before expenses
PFR-SANN-0819
1.705577.121
Fidelity® Limited Term Municipal Income Fund
Semi-Annual Report June 30, 2019 Includes Fidelity and Fidelity Advisor share classes |
|
Beginning on January 1, 2021, as permitted by regulations adopted by the Securities and Exchange Commission, paper copies of a fund’s shareholder reports will no longer be sent by mail, unless you specifically request paper copies of the reports from the fund or from your financial intermediary, such as a financial advisor, broker-dealer or bank. Instead, the reports will be made available on a website, and you will be notified by mail each time a report is posted and provided with a website link to access the report.
If you already elected to receive shareholder reports electronically, you will not be affected by this change and you need not take any action. You may elect to receive shareholder reports and other communications from a fund electronically, by contacting your financial intermediary. For Fidelity customers, visit Fidelity's web site or call Fidelity using the contact information listed below.
You may elect to receive all future reports in paper free of charge. If you wish to continue receiving paper copies of your shareholder reports, you may contact your financial intermediary or, if you are a Fidelity customer, visit Fidelity’s website, or call Fidelity at the applicable toll-free number listed below. Your election to receive reports in paper will apply to all funds held with the fund complex/your financial intermediary.
| Account Type | Website | Phone Number |
| Brokerage, Mutual Fund, or Annuity Contracts: | fidelity.com/mailpreferences | 1-800-343-3548 |
| Employer Provided Retirement Accounts: | netbenefits.fidelity.com/preferences (choose 'no' under Required Disclosures to continue to print) | 1-800-343-0860 |
| Advisor Sold Accounts Serviced Through Your Financial Intermediary: | Contact Your Financial Intermediary | Your Financial Intermediary's phone number |
| Advisor Sold Accounts Serviced by Fidelity: | institutional.fidelity.com | 1-877-208-0098 |
Contents
To view a fund's proxy voting guidelines and proxy voting record for the 12-month period ended June 30, visit http://www.fidelity.com/proxyvotingresults or visit the Securities and Exchange Commission's (SEC) web site at http://www.sec.gov.
You may also call 1-800-544-8544 if you’re an individual investing directly with Fidelity, call 1-800-835-5092 if you’re a plan sponsor or participant with Fidelity as your recordkeeper or call 1-877-208-0098 on institutional accounts or if you’re an advisor or invest through one to request a free copy of the proxy voting guidelines.
Standard & Poor's, S&P and S&P 500 are registered service marks of The McGraw-Hill Companies, Inc. and have been licensed for use by Fidelity Distributors Corporation.
Other third-party marks appearing herein are the property of their respective owners.
All other marks appearing herein are registered or unregistered trademarks or service marks of FMR LLC or an affiliated company. © 2019 FMR LLC. All rights reserved.
This report and the financial statements contained herein are submitted for the general information of the shareholders of the Fund. This report is not authorized for distribution to prospective investors in the Fund unless preceded or accompanied by an effective prospectus.
A fund files its complete schedule of portfolio holdings with the SEC for the first and third quarters of each fiscal year on Form N-PORT. Forms N-PORT are available on the SEC’s web site at http://www.sec.gov. A fund's Forms N-PORT may be reviewed and copied at the SEC’s Public Reference Room in Washington, DC. Information regarding the operation of the SEC's Public Reference Room may be obtained by calling 1-800-SEC-0330.
For a complete list of a fund's portfolio holdings, view the most recent holdings listing, semiannual report, or annual report on Fidelity's web site at http://www.fidelity.com, http://www.institutional.fidelity.com, or http://www.401k.com, as applicable.
NOT FDIC INSURED •MAY LOSE VALUE •NO BANK GUARANTEE
Neither the Fund nor Fidelity Distributors Corporation is a bank.
Investment Summary (Unaudited)
Top Five States as of June 30, 2019
| | % of fund's net assets |
| Illinois | 13.9 |
| Texas | 11.7 |
| Florida | 8.4 |
| New Jersey | 6.6 |
| Connecticut | 4.7 |
Top Five Sectors as of June 30, 2019
| | % of fund's net assets |
| General Obligations | 33.1 |
| Health Care | 15.2 |
| Transportation | 14.1 |
| Electric Utilities | 9.2 |
| Industrial Development | 5.0 |
Quality Diversification (% of fund's net assets)
| As of June 30, 2019 |
| | AAA | 5.1% |
| | AA,A | 49.4% |
| | BBB | 18.4% |
| | BB and Below | 1.0% |
| | Not Rated | 22.8% |
| | Short-Term Investments and Net Other Assets | 3.3% |
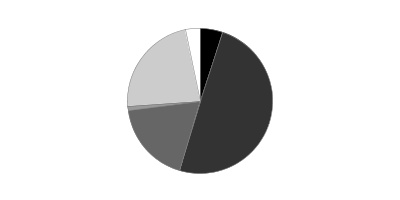
We have used ratings from Moody's Investors Service, Inc. Where Moody's® ratings are not available, we have used S&P® ratings. All ratings are as of the date indicated and do not reflect subsequent changes.
Schedule of Investments June 30, 2019 (Unaudited)
Showing Percentage of Net Assets
| Municipal Bonds - 96.4% | | | |
| | | Principal Amount (000s) | Value (000s) |
| Alabama - 0.8% | | | |
| Jefferson County Gen. Oblig. Series 2018 B, 5% 4/1/21 | | 2,630 | 2,791 |
| Mobile County Board of School Commissioners: | | | |
| Series 2016 A: | | $ | $ |
| 5% 3/1/22 | | 585 | 635 |
| 5% 3/1/23 | | 830 | 924 |
| 5% 3/1/24 | | 1,225 | 1,396 |
| 5% 3/1/25 | | 1,225 | 1,424 |
| Series 2016 B: | | | |
| 5% 3/1/22 | | 1,330 | 1,444 |
| 5% 3/1/24 | | 1,210 | 1,379 |
| Mobile Indl. Dev. Board Poll. Cont. Rev. Bonds Series 2009 E, 1.85%, tender 3/24/20 (a) | | 4,810 | 4,817 |
| Montgomery Med. Clinic Facilities Series 2015: | | | |
| 5% 3/1/20 | | 2,825 | 2,879 |
| 5% 3/1/21 | | 490 | 513 |
| 5% 3/1/22 | | 3,145 | 3,386 |
| 5% 3/1/25 | | 1,465 | 1,679 |
|
| TOTAL ALABAMA | | | 23,267 |
|
| Alaska - 0.6% | | | |
| Anchorage Gen. Oblig.: | | | |
| Series A, 5% 9/1/20 | | 1,065 | 1,111 |
| Series B: | | | |
| 5% 9/1/20 | | 1,955 | 2,039 |
| 5% 9/1/22 | | 1,395 | 1,554 |
| Series C: | | | |
| 5% 9/1/20 | | 1,230 | 1,283 |
| 5% 9/1/22 | | 980 | 1,092 |
| Series D, 5% 9/1/20 | | 1,955 | 2,039 |
| Valdez Marine Term. Rev. (BP Pipelines (Alaska), Inc. Proj.) Series 2003 B, 5% 1/1/21 | | 6,300 | 6,626 |
|
| TOTAL ALASKA | | | 15,744 |
|
| Arizona - 4.1% | | | |
| Arizona Ctfs. of Prtn. Series 2019 A: | | | |
| 5% 10/1/20 (b) | | 1,590 | 1,661 |
| 5% 10/1/21 (b) | | 1,395 | 1,507 |
| 5% 10/1/22 (b) | | 1,485 | 1,653 |
| 5% 10/1/23 (b) | | 1,950 | 2,237 |
| 5% 10/1/24 (b) | | 2,025 | 2,387 |
| Arizona Health Facilities Auth. Rev. (Scottsdale Lincoln Hospitals Proj.) Series 2014 A: | | | |
| 5% 12/1/19 | | 600 | 609 |
| 5% 12/1/20 | | 800 | 840 |
| 5% 12/1/21 | | 1,080 | 1,168 |
| 5% 12/1/22 | | 785 | 874 |
| 5% 12/1/23 | | 980 | 1,120 |
| 5% 12/1/24 | | 1,465 | 1,716 |
| Arizona State Lottery Rev. Series 2019: | | | |
| 5% 7/1/21 (b) | | 2,560 | 2,718 |
| 5% 7/1/22 (b) | | 2,045 | 2,240 |
| Chandler Indl. Dev. Auth. Indl. Dev. Rev. Bonds (Intel Corp. Proj.): | | | |
| Series 2005, 2.4%, tender 8/14/23 (a) | | 1,625 | 1,671 |
| Series 2007, 2.7%, tender 8/14/23 (a)(c) | | 13,345 | 13,792 |
| Series 2019, 5%, tender 6/3/24 (a)(c) | | 14,460 | 16,591 |
| Glendale Gen. Oblig.: | | | |
| Series 2015, 5% 7/1/22 (FSA Insured) | | 980 | 1,084 |
| Series 2017: | | | |
| 5% 7/1/21 | | 2,900 | 3,110 |
| 5% 7/1/22 | | 3,320 | 3,673 |
| Glendale Trans. Excise Tax Rev.: | | | |
| 5% 7/1/21 (FSA Insured) | | 735 | 788 |
| 5% 7/1/22 (FSA Insured) | | 1,145 | 1,269 |
| 5% 7/1/23 (FSA Insured) | | 1,365 | 1,556 |
| Maricopa County Rev.: | | | |
| Bonds Series 2019 D, 5%, tender 5/15/26 (a) | | 4,985 | 6,033 |
| Series 2016 A: | | | |
| 5% 1/1/25 | | 4,675 | 5,519 |
| 5% 1/1/26 | | 10,485 | 12,659 |
| Phoenix Indl. Solid Waste Disp. Rev. Bonds (Republic Svc., Inc. Proj.) Series 2013, 1.9%, tender 8/1/19 (a)(c) | | 16,000 | 16,005 |
| Pima County Ctfs. of Prtn. Series 2014: | | | |
| 5% 12/1/21 | | 2,160 | 2,346 |
| 5% 12/1/22 | | 2,415 | 2,706 |
| 5% 12/1/23 | | 3,350 | 3,863 |
| Tempe Indl. Dev. Auth. Rev. (Mirabella At Asu, Inc. Proj.) Series 2017 B, 4% 10/1/23 (d) | | 3,915 | 3,958 |
|
| TOTAL ARIZONA | | | 117,353 |
|
| California - 2.4% | | | |
| Alameda Corridor Trans. Auth. Rev. Series 2004, 0% 10/1/19 | | 260 | 259 |
| Bay Area Toll Auth. San Francisco Bay Toll Bridge Rev. Bonds: | | | |
| Series A, 2.95%, tender 4/1/26 (a) | | 5,075 | 5,457 |
| Series B, 2.85%, tender 4/1/25 (a) | | 4,150 | 4,411 |
| Series C, 2.1%, tender 4/1/22 (a) | | 3,875 | 3,926 |
| California Muni. Fin. Auth. Rev. (LINXS APM Proj.) Series 2018 A: | | | |
| 5% 12/31/23 (c) | | 860 | 978 |
| 5% 6/30/24 (c) | | 665 | 765 |
| 5% 12/31/24 (c) | | 800 | 931 |
| 5% 6/30/25 (c) | | 1,000 | 1,175 |
| 5% 12/31/25 (c) | | 1,760 | 2,089 |
| 5% 6/30/26 (c) | | 1,360 | 1,630 |
| 5% 12/31/26 (c) | | 2,570 | 3,106 |
| 5% 6/30/27 (c) | | 1,910 | 2,326 |
| 5% 12/31/27 (c) | | 3,000 | 3,682 |
| California Poll. Cont. Fing. Auth. Solid Waste Disp. Rev. Bonds (Republic Svcs., Inc. Proj.) Series 2010 A, 1.9%, tender 8/1/19 (a)(c)(d) | | 7,700 | 7,702 |
| Golden State Tobacco Securitization Corp. Tobacco Settlement Rev.: | | | |
| Series 2017 A1: | | | |
| 5% 6/1/21 | | 1,205 | 1,281 |
| 5% 6/1/22 | | 1,685 | 1,839 |
| 5% 6/1/23 | | 1,925 | 2,148 |
| 5% 6/1/24 | | 1,085 | 1,230 |
| Series A, 0% 6/1/24 (AMBAC Insured) | | 3,390 | 3,125 |
| Northern California Energy Auth. Bonds Series 2018, 4%, tender 7/1/24 (a) | | 10,000 | 10,924 |
| Oakland Unified School District Alameda County Series 2013, 5.5% 8/1/23 | | 980 | 1,115 |
| Palomar Health Rev. Series 2016: | | | |
| 5% 11/1/23 | | 1,955 | 2,193 |
| 5% 11/1/24 | | 1,955 | 2,243 |
| Port of Oakland Rev. Series 2012 P, 5% 5/1/21 (c) | | 2,445 | 2,603 |
| San Pablo Redev. Agcy. Series 2014 A, 5% 6/15/24 (FSA Insured) | | 1,350 | 1,580 |
|
| TOTAL CALIFORNIA | | | 68,718 |
|
| Colorado - 1.3% | | | |
| Colorado Health Facilities Auth. Bonds (Valley View Hosp. Assoc. Proj.) Series 2018, 2.8%, tender 5/15/23 (a) | | 1,385 | 1,432 |
| Colorado Health Facilities Auth. Retirement Hsg. Rev. (Liberty Heights Proj.) 0% 7/15/22 (Escrowed to Maturity) | | 1,840 | 1,759 |
| Colorado Health Facilities Auth. Rev. Bonds Series 2008 D3, 5%, tender 11/12/21 (a) | | 5,170 | 5,557 |
| Colorado Hsg. & Fin. Auth.: | | | |
| Series 2019 F, 4.25% 11/1/49 | | 1,825 | 2,010 |
| Series 2019 H, 4.25% 11/1/49 (b) | | 910 | 1,001 |
| Colorado Reg'l. Trans. District Ctfs. of Prtn.: | | | |
| Series 2013 A, 5% 6/1/23 | | 4,400 | 4,993 |
| Series 2014 A, 5% 6/1/23 | | 3,775 | 4,284 |
| Denver City & County Arpt. Rev. Series 2017 A, 5% 11/15/19 (c) | | 2,520 | 2,553 |
| E-470 Pub. Hwy. Auth. Rev.: | | | |
| Series 2000 B: | | | |
| 0% 9/1/19 (Nat'l. Pub. Fin. Guarantee Corp. Insured) | | 8,140 | 8,119 |
| 0% 9/1/20 (Nat'l. Pub. Fin. Guarantee Corp. Insured) | | 2,775 | 2,725 |
| Series 2015 A: | | | |
| 5% 9/1/19 | | 980 | 985 |
| 5% 9/1/20 | | 980 | 1,018 |
|
| TOTAL COLORADO | | | 36,436 |
|
| Connecticut - 4.7% | | | |
| Connecticut Gen. Oblig.: | | | |
| Series 2012 C, 5% 6/1/21 | | 22,910 | 24,453 |
| Series 2014 H, 5% 11/15/21 | | 6,255 | 6,773 |
| Series 2016 A, 5% 3/15/26 | | 1,925 | 2,308 |
| Series 2019 A: | | | |
| 5% 4/15/23 | | 1,550 | 1,746 |
| 5% 4/15/25 | | 4,380 | 5,164 |
| 5% 4/15/26 | | 2,355 | 2,828 |
| 5% 4/15/30 | | 965 | 1,200 |
| Connecticut Health& Edl. Facilities Auth. Rev.: | | | |
| Bonds: | | | |
| Series 2010 A, 1.8%, tender 2/9/21 (a) | | 16,680 | 16,775 |
| Series 2015 A, 2.05%, tender 7/21/21 (a) | | 16,315 | 16,554 |
| Series U1, 2%, tender 2/8/22 (a) | | 11,050 | 11,226 |
| Series X2, 1.8%, tender 2/9/21 (a) | | 12,000 | 12,068 |
| Series 2018 S: | | | |
| 5% 7/1/23 | | 1,455 | 1,646 |
| 5% 7/1/24 | | 1,000 | 1,159 |
| Connecticut Health and Edl. Facilities Auth. Rev.: | | | |
| Bonds Series 2014 B, 1.8%, tender 7/1/24 (a)(b) | | 3,150 | 3,172 |
| Series 2019 A: | | | |
| 4% 7/1/23 (d) | | 1,045 | 1,092 |
| 4% 7/1/24 (d) | | 1,090 | 1,149 |
| 5% 7/1/28 (d) | | 1,315 | 1,467 |
| 5% 7/1/29 (d) | | 940 | 1,053 |
| Series 2019 Q-1: | | | |
| 5% 11/1/21 | | 1,000 | 1,079 |
| 5% 11/1/23 | | 1,870 | 2,130 |
| Connecticut Hsg. Fin. Auth. Series 2013 B2, 4% 11/15/32 | | 3,175 | 3,267 |
| Connecticut Spl. Tax Oblig. Trans. Infrastructure Rev. Series 2012 A, 5% 1/1/24 | | 1,650 | 1,842 |
| New Haven Gen. Oblig. Series 2016 A, 5% 8/15/25 (FSA Insured) | | 980 | 1,144 |
| Stratford Gen. Oblig. Series 2019: | | | |
| 5% 1/1/25 | | 3,890 | 4,550 |
| 5% 1/1/26 | | 3,735 | 4,461 |
| Univ. of Connecticut Gen. Oblig.: | | | |
| Series 2013 A, 5% 2/15/22 | | 1,000 | 1,091 |
| Series 2016 A, 5% 3/15/22 | | 775 | 847 |
| Series 2019 A: | | | |
| 5% 11/1/26 | | 1,000 | 1,214 |
| 5% 11/1/26 | | 1,065 | 1,293 |
|
| TOTAL CONNECTICUT | | | 134,751 |
|
| Delaware, New Jersey - 0.2% | | | |
| Delaware River & Bay Auth. Rev. Series 2014 C: | | | |
| 5% 1/1/20 | | 2,445 | 2,488 |
| 5% 1/1/21 | | 1,955 | 2,060 |
|
| TOTAL DELAWARE, NEW JERSEY | | | 4,548 |
|
| District Of Columbia - 1.0% | | | |
| Metropolitan Washington DC Arpts. Auth. Sys. Rev.: | | | |
| Series 2011 C: | | | |
| 5% 10/1/23 (c) | | 1,305 | 1,406 |
| 5% 10/1/24 (c) | | 1,175 | 1,266 |
| Series 2012 A, 5% 10/1/22 (c) | | 6,185 | 6,863 |
| Series 2014 A, 5% 10/1/23 (c) | | 435 | 496 |
| Series 2017 A, 5% 10/1/26 (c) | | 6,555 | 7,989 |
| Series 2018 A, 5% 10/1/21 (c) | | 3,595 | 3,873 |
| Series 2019 A: | | | |
| 5% 10/1/22 (b)(c) | | 320 | 355 |
| 5% 10/1/23 (b)(c) | | 465 | 530 |
| 5% 10/1/25 (b)(c) | | 1,410 | 1,685 |
| Washington Convention & Sports Auth. Series 2018 A, 5% 10/1/21 | | 5,000 | 5,395 |
|
| TOTAL DISTRICT OF COLUMBIA | | | 29,858 |
|
| Florida - 8.3% | | | |
| Brevard County School Board Ctfs. of Prtn.: | | | |
| Series 2014, 5% 7/1/21 | | 980 | 1,049 |
| Series 2015 C: | | | |
| 5% 7/1/21 | | 635 | 680 |
| 5% 7/1/22 | | 3,645 | 4,021 |
| 5% 7/1/23 | | 2,935 | 3,334 |
| Broward County Arpt. Sys. Rev.: | | | |
| Series 2012 Q1, 5% 10/1/21 | | 980 | 1,059 |
| Series 2015 C, 5% 10/1/24 (c) | | 1,010 | 1,175 |
| Series A: | | | |
| 5% 10/1/22 (c) | | 2,935 | 3,248 |
| 5% 10/1/23 (c) | | 3,930 | 4,462 |
| Broward County School Board Ctfs. of Prtn.: | | | |
| (Broward County School District Proj.) Series 2017 C, 5% 7/1/22 | | 3,180 | 3,517 |
| Series 2015 A: | | | |
| 5% 7/1/20 | | 3,915 | 4,057 |
| 5% 7/1/21 | | 4,400 | 4,716 |
| 5% 7/1/22 | | 3,425 | 3,787 |
| 5% 7/1/23 | | 2,690 | 3,063 |
| 5% 7/1/24 | | 1,290 | 1,510 |
| Series 2015 B: | | | |
| 5% 7/1/20 | | 2,935 | 3,041 |
| 5% 7/1/21 | | 6,120 | 6,559 |
| 5% 7/1/22 | | 4,490 | 4,965 |
| 5% 7/1/23 | | 2,690 | 3,062 |
| 5% 7/1/24 | | 1,120 | 1,311 |
| Citizens Property Ins. Corp. (Citizens Pla Proj.) Series 2012 A-1, 5% 6/1/20 | | 5,155 | 5,323 |
| Florida Dev. Fin. Corp. Healthcare Facility Rev. (Univ. Health Proj.) Series 2013 A, 5% 2/1/20 | | 1,980 | 2,008 |
| Florida Mid-Bay Bridge Auth. Rev. Series 2015 A: | | | |
| 5% 10/1/21 | | 1,010 | 1,084 |
| 5% 10/1/22 | | 1,955 | 2,150 |
| 5% 10/1/23 | | 1,240 | 1,396 |
| 5% 10/1/24 | | 1,955 | 2,246 |
| 5% 10/1/25 | | 1,710 | 2,005 |
| 5% 10/1/26 | | 1,955 | 2,280 |
| Greater Orlando Aviation Auth. Arpt. Facilities Rev. Series 2017 A: | | | |
| 5% 10/1/25 (c) | | 980 | 1,165 |
| 5% 10/1/26 (c) | | 1,955 | 2,369 |
| Halifax Hosp. Med. Ctr. Rev. Series 2015, 5% 6/1/23 | | 1,295 | 1,443 |
| Hillsborough County School District Sales Tax Rev. Series 2015 B, 5% 10/1/22 (FSA Insured) | | 1,975 | 2,198 |
| Indian River County School Board Ctfs. of Prtn. Series 2014: | | | |
| 5% 7/1/20 | | 915 | 948 |
| 5% 7/1/22 | | 1,955 | 2,157 |
| 5% 7/1/23 | | 1,955 | 2,218 |
| Lee Memorial Health Sys. Hosp. Rev.: | | | |
| Bonds Series 2019 A2, 5%, tender 4/1/26 (a) | | 4,810 | 5,670 |
| Series 2019 A1, 5% 4/1/29 | | 2,500 | 3,150 |
| Manatee County Rev. Series 2013: | | | |
| 5% 10/1/21 | | 1,955 | 2,111 |
| 5% 10/1/22 | | 980 | 1,091 |
| Manatee County School District Series 2017, 5% 10/1/24 (FSA Insured) | | 1,270 | 1,496 |
| Miami-Dade County Aviation Rev. Series 2017 B, 5% 10/1/20 (c) | | 2,075 | 2,165 |
| Miami-Dade County Expressway Auth.: | | | |
| (Waste Mgmt., Inc. of Florida Proj.): | | | |
| 5% 7/1/20 | | 980 | 1,015 |
| 5% 7/1/21 | | 1,955 | 2,085 |
| 5% 7/1/22 | | 1,955 | 2,148 |
| 5% 7/1/23 | | 1,955 | 2,152 |
| Series 2014 A, 5% 7/1/24 | | 610 | 707 |
| Series 2014 B: | | | |
| 5% 7/1/22 | | 1,465 | 1,609 |
| 5% 7/1/23 | | 3,180 | 3,591 |
| Miami-Dade County School Board Ctfs. of Prtn.: | | | |
| Bonds Series 2014 A, 5%, tender 5/1/24 (a) | | 8,010 | 9,199 |
| Series 2014 D: | | | |
| 5% 11/1/20 | | 4,770 | 4,997 |
| 5% 11/1/21 | | 6,140 | 6,635 |
| 5% 11/1/22 | | 2,850 | 3,172 |
| 5% 11/1/23 | | 7,485 | 8,553 |
| Series 2015 A: | | | |
| 5% 5/1/20 | | 2,050 | 2,111 |
| 5% 5/1/21 | | 3,915 | 4,171 |
| 5% 5/1/22 | | 3,640 | 3,990 |
| 5% 5/1/23 | | 6,360 | 7,172 |
| Series 2015 B, 5% 5/1/24 | | 28,915 | 33,438 |
| Series 2016 A, 5% 8/1/27 | | 5,440 | 6,557 |
| Palm Beach County Health Facilities Auth. Hosp. Rev. Series 2014: | | | |
| 4% 12/1/19 | | 980 | 989 |
| 5% 12/1/20 | | 1,395 | 1,460 |
| 5% 12/1/21 | | 1,465 | 1,581 |
| 5% 12/1/23 | | 190 | 217 |
| 5% 12/1/24 | | 380 | 444 |
| Palm Beach County School Board Ctfs. of Prtn. Series 2014 B: | | | |
| 4% 8/1/21 | | 3,950 | 4,166 |
| 5% 8/1/21 | | 5,185 | 5,575 |
| 5% 8/1/22 | | 980 | 1,087 |
| Pasco County School District Sales Tax Rev. Series 2013: | | | |
| 5% 10/1/20 | | 980 | 1,024 |
| 5% 10/1/21 | | 980 | 1,057 |
| 5% 10/1/22 | | 980 | 1,087 |
| Pasco County Solid Waste Disp. & Resource Recovery Sys. Rev. Series 2011, 5% 10/1/19 (c) | | 1,980 | 1,998 |
| Seminole County School Board Ctfs. of Prtn. Series 2016 C: | | | |
| 5% 7/1/25 | | 980 | 1,170 |
| 5% 7/1/26 | | 1,115 | 1,362 |
| Tallahassee Health Facilities Rev. (Tallahassee Memorial Healthcare, Inc. Proj.) Series 2016 A, 5% 12/1/21 | | 1,135 | 1,221 |
| Tampa Bay Wtr. Reg'l. Wtr. Supply Auth. Util. Sys. Rev. Series 2005, 5.5% 10/1/22 (FGIC Insured) | | 1,340 | 1,516 |
| Tampa Tax Allocation (H. Lee Moffitt Cancer Ctr. Proj.) Series 2012 A, 5% 9/1/20 | | 1,760 | 1,830 |
|
| TOTAL FLORIDA | | | 236,375 |
|
| Georgia - 3.4% | | | |
| Atlanta Arpt. Rev. 5% 1/1/22 | | 980 | 1,069 |
| Bartow County Dev. Auth. Poll. Cont. Rev. Bonds (Georgia Pwr. Co. Plant Bowen Proj.) Series 2009 1st, 2.75%, tender 3/15/23 (a) | | 21,200 | 21,743 |
| Burke County Indl. Dev. Auth. Poll. Cont. Rev. Bonds: | | | |
| (Georgia Pwr. Co. Plant Vogtle Proj.): | | | |
| Series 1994, 2.25%, tender 5/25/23 (a) | | 6,480 | 6,537 |
| Series 2013 1st, 2.925%, tender 3/12/24 (a) | | 9,930 | 10,287 |
| (Oglethorpe Pwr. Corp. Vogtle Proj.): | | | |
| Series 2013 A, 2.4%, tender 4/1/20 (a) | | 9,780 | 9,833 |
| Series 2017 E, 3.25%, tender 2/3/25 (a) | | 900 | 932 |
| Georgia Muni. Elec. Auth. Pwr. Rev. Series GG: | | | |
| 5% 1/1/20 | | 660 | 671 |
| 5% 1/1/21 | | 1,635 | 1,720 |
| Georgia Muni. Gas Auth. Rev. (Gas Portfolio III Proj.): | | | |
| Series 2014 U: | | | |
| 5% 10/1/19 | | 1,465 | 1,478 |
| 5% 10/1/22 | | 980 | 1,088 |
| 5% 10/1/23 | | 2,365 | 2,697 |
| Series R, 5% 10/1/21 | | 4,890 | 5,268 |
| Main Street Natural Gas, Inc. Bonds Series 2018 C, 4%, tender 12/1/23 (a) | | 13,910 | 15,197 |
| Monroe County Dev. Auth. Poll. Cont. Rev.: | | | |
| (Georgia Pwr. Co. Plant Scherer Proj.) Series 1995, 2.25% 7/1/25 | | 4,005 | 4,042 |
| Bonds: | | | |
| (Georgia Pwr. Co. Plant Scherer Proj.) Series 2009, 2.35%, tender 12/11/20 (a) | | 4,610 | 4,655 |
| (Gulf Pwr. Co. Plant Scherer Proj.) Series 2002 1, 2%, tender 6/25/20 (a) | | 6,000 | 6,020 |
| Private Colleges & Univs. Auth. Rev. (The Savannah College of Arts and Design Projs.) Series 2014, 5% 4/1/21 | | 3,260 | 3,460 |
|
| TOTAL GEORGIA | | | 96,697 |
|
| Hawaii - 0.4% | | | |
| Hawaii Arpts. Sys. Rev. Series 2011, 5% 7/1/19 (c) | | 3,915 | 3,915 |
| State of Hawaii Dept. of Trans. Series 2013: | | | |
| 5% 8/1/19 (c) | | 1,370 | 1,374 |
| 5% 8/1/20 (c) | | 2,985 | 3,093 |
| 5% 8/1/21 (c) | | 540 | 576 |
| 5% 8/1/22 (c) | | 2,030 | 2,229 |
| 5% 8/1/23 (c) | | 1,440 | 1,618 |
|
| TOTAL HAWAII | | | 12,805 |
|
| Idaho - 0.0% | | | |
| Idaho Hsg. & Fin. Assoc. Single Family Mtg. Series 2019 A, 4% 1/1/50 | | 450 | 491 |
| Illinois - 13.7% | | | |
| Chicago Board of Ed.: | | | |
| Series 1998 B1, 0% 12/1/21 (Nat'l. Pub. Fin. Guarantee Corp. Insured) | | 9,780 | 9,178 |
| Series 2010 F, 5% 12/1/20 | | 745 | 776 |
| Series 2017 C: | | | |
| 5% 12/1/26 | | 485 | 550 |
| 5% 12/1/27 | | 2,830 | 3,243 |
| Series 2018 C, 5% 12/1/24 | | 13,000 | 14,362 |
| Chicago Gen. Oblig. (City Colleges Proj.) Series 1999, 0% 1/1/20 (Nat'l. Pub. Fin. Guarantee Corp. Insured) | | 14,435 | 14,279 |
| Chicago Metropolitan Wtr. Reclamation District of Greater Chicago Series 2007, 5.25% 12/1/32 | | 2,920 | 3,780 |
| Chicago Midway Arpt. Rev.: | | | |
| Series 2014 B: | | | |
| 5% 1/1/20 | | 610 | 621 |
| 5% 1/1/21 | | 390 | 411 |
| 5% 1/1/23 | | 2,445 | 2,734 |
| 5% 1/1/22 | | 4,890 | 5,313 |
| 5% 1/1/23 | | 5,770 | 6,451 |
| Chicago Motor Fuel Tax Rev. Series 2013: | | | |
| 5% 1/1/20 | | 295 | 299 |
| 5% 1/1/21 | | 390 | 403 |
| 5% 1/1/22 | | 295 | 311 |
| 5% 1/1/23 | | 525 | 561 |
| Chicago O'Hare Int'l. Arpt. Rev.: | | | |
| Series 2012 A, 5% 1/1/21 | | 1,370 | 1,442 |
| Series 2012 B, 5% 1/1/21 (c) | | 4,505 | 4,736 |
| Series 2013 B, 5% 1/1/22 | | 3,915 | 4,257 |
| Series 2013 D, 5% 1/1/22 | | 3,150 | 3,425 |
| Series 2017 D, 5% 1/1/27 (c) | | 1,470 | 1,774 |
| Chicago Transit Auth. Cap. Grant Receipts Rev. Series 2017: | | | |
| 5% 6/1/20 | | 2,430 | 2,500 |
| 5% 6/1/21 | | 2,305 | 2,442 |
| 5% 6/1/25 | | 1,225 | 1,426 |
| Chicago Wastewtr. Transmission Rev. Series 2012, 5% 1/1/23 | | 1,175 | 1,265 |
| Cook County Gen. Oblig.: | | | |
| Series 2009 C, 5% 11/15/21 | | 8,390 | 8,494 |
| Series 2010 A, 5.25% 11/15/22 | | 4,850 | 5,085 |
| Series 2011 A, 5.25% 11/15/22 | | 980 | 1,058 |
| Series 2012 C: | | | |
| 5% 11/15/19 | | 3,130 | 3,170 |
| 5% 11/15/20 | | 7,055 | 7,376 |
| 5% 11/15/21 | | 5,465 | 5,871 |
| 5% 11/15/22 | | 1,260 | 1,388 |
| Series 2014 A: | | | |
| 5% 11/15/20 | | 980 | 1,025 |
| 5% 11/15/21 | | 490 | 526 |
| 5% 11/15/22 | | 1,325 | 1,460 |
| Granite City Solid Waste Disp. Rev. Bonds (Waste Mgmt., Inc. Proj.) Series 2002, 2.2%, tender 5/1/20 (a)(c) | | 14,250 | 14,298 |
| Illinois Edl. Facilities Auth. Rev. Bonds (Univ. of Chicago Proj.) Series B2, 1.55%, tender 2/13/20 (a) | | 9,780 | 9,780 |
| Illinois Fin. Auth. Rev.: | | | |
| (Bradley Univ. Proj.) Series 2017 C, 5% 8/1/26 | | 1,650 | 1,956 |
| (OSF Healthcare Sys.) Series 2018 A: | | | |
| 5% 5/15/26 | | 4,300 | 5,137 |
| 5% 5/15/27 | | 9,260 | 11,261 |
| (Southern Illinois Healthcare Enterprises, Inc. Proj.) Series 2005, 5.25% 3/1/30 (Pre-Refunded to 3/1/20 @ 100) | | 4,650 | 4,769 |
| Bonds: | | | |
| (Ascension Health Cr. Group Proj.) Series 2012 E2, 1.75%, tender 4/1/21 (a) | | 3,000 | 3,012 |
| Series 2017 B, 5%, tender 12/15/22 (a) | | 4,325 | 4,829 |
| Series E, 2.25%, tender 4/29/22 (a) | | 22,430 | 22,778 |
| Series 2011 IL, 5% 12/1/22 (Pre-Refunded to 12/1/21 @ 100) | | 1,110 | 1,204 |
| Series 2012 A, 5% 5/15/23 | | 1,270 | 1,391 |
| Series 2012: | | | |
| 5% 9/1/20 | | 1,440 | 1,499 |
| 5% 9/1/21 | | 2,000 | 2,152 |
| 5% 9/1/22 | | 3,455 | 3,831 |
| Series 2015 A: | | | |
| 5% 11/15/22 | | 490 | 546 |
| 5% 11/15/24 | | 1,490 | 1,739 |
| 5% 11/15/25 | | 1,905 | 2,265 |
| 5% 11/15/26 | | 1,955 | 2,307 |
| Series 2015 B: | | | |
| 5% 11/15/20 | | 1,615 | 1,694 |
| 5% 11/15/24 | | 1,910 | 2,240 |
| Series 2016 A: | | | |
| 5% 8/15/20 | | 490 | 506 |
| 5% 2/15/21 | | 735 | 775 |
| 5% 8/15/21 | | 685 | 726 |
| 5% 2/15/23 | | 980 | 1,097 |
| 5% 8/15/23 | | 1,465 | 1,629 |
| 5% 8/15/24 | | 2,135 | 2,424 |
| Series 2016 C: | | | |
| 5% 2/15/20 | | 4,970 | 5,070 |
| 5% 2/15/22 | | 3,335 | 3,644 |
| 5% 2/15/23 | | 4,470 | 5,030 |
| 5% 2/15/24 | | 5,220 | 6,039 |
| Series 2016: | | | |
| 5% 7/1/22 | | 2,895 | 3,202 |
| 5% 5/15/25 | | 490 | 577 |
| 5% 5/15/26 | | 980 | 1,171 |
| 5% 5/15/27 | | 1,225 | 1,454 |
| Series 2017: | | | |
| 5% 1/1/23 | | 1,465 | 1,645 |
| 5% 1/1/25 | | 2,260 | 2,671 |
| Series 2019: | | | |
| 5% 4/1/26 | | 1,625 | 1,957 |
| 5% 4/1/27 | | 2,135 | 2,617 |
| 5% 4/1/28 | | 1,425 | 1,774 |
| 5% 4/1/29 | | 2,000 | 2,518 |
| Illinois Gen. Oblig.: | | | |
| Series 2010, 5% 1/1/21 (FSA Insured) | | 1,565 | 1,591 |
| Series 2012 A, 4% 1/1/23 | | 1,245 | 1,290 |
| Series 2012: | | | |
| 5% 8/1/21 | | 2,360 | 2,507 |
| 5% 8/1/22 | | 5,675 | 6,172 |
| Series 2013: | | | |
| 5% 7/1/21 | | 6,360 | 6,742 |
| 5% 7/1/22 | | 10,995 | 11,934 |
| Series 2014: | | | |
| 5% 2/1/22 | | 2,935 | 3,152 |
| 5% 4/1/23 | | 2,165 | 2,376 |
| 5% 2/1/25 | | 2,275 | 2,507 |
| Series 2016: | | | |
| 5% 1/1/26 | | 2,900 | 3,292 |
| 5% 2/1/26 | | 15,525 | 17,647 |
| Series 2017 D: | | | |
| 5% 11/1/23 | | 3,860 | 4,289 |
| 5% 11/1/25 | | 6,635 | 7,543 |
| Series 2018 A, 5% 10/1/26 | | 4,615 | 5,293 |
| Series 2019 B, 5% 9/1/20 | | 3,740 | 3,882 |
| Illinois Muni. Elec. Agcy. Pwr. Supply Series 2015 A, 5% 2/1/23 | | 1,180 | 1,315 |
| Illinois Reg'l. Trans. Auth. Series 2017 A: | | | |
| 5% 7/1/20 | | 1,320 | 1,366 |
| 5% 7/1/21 | | 1,320 | 1,412 |
| McHenry County Cmnty. School District #200 Series 2006 B: | | | |
| 0% 1/15/24 | | 4,715 | 4,285 |
| 0% 1/15/25 | | 4,915 | 4,356 |
| 0% 1/15/26 | | 3,695 | 3,185 |
| McHenry County Conservation District Gen. Oblig. Series 2014: | | | |
| 5% 2/1/20 | | 2,225 | 2,272 |
| 5% 2/1/23 | | 2,175 | 2,436 |
| Railsplitter Tobacco Settlement Auth. Rev.: | | | |
| Series 2010, 5.5% 6/1/23 (Pre-Refunded to 6/1/21 @ 100) | | 11,285 | 12,165 |
| Series 2017, 5% 6/1/22 | | 9,780 | 10,698 |
|
| TOTAL ILLINOIS | | | 390,913 |
|
| Indiana - 3.5% | | | |
| Indiana Fin. Auth. Econ. Dev. Rev. Bonds (Republic Svcs., Inc. Proj.) Series A, 1.6%, tender 9/3/19 (a)(c) | | 14,650 | 14,651 |
| Indiana Fin. Auth. Health Sys. Rev. Bonds Series 2019 B, 2.25%, tender 7/1/25 (a)(b) | | 2,005 | 2,061 |
| Indiana Fin. Auth. Hosp. Rev.: | | | |
| Bonds Series 2015 B, 1.65%, tender 7/2/22 (a)(b) | | 3,345 | 3,351 |
| Series 2013: | | | |
| 5% 8/15/22 | | 685 | 758 |
| 5% 8/15/23 | | 980 | 1,114 |
| Indiana Fin. Auth. Rev. Series 2012: | | | |
| 5% 3/1/20 | | 635 | 650 |
| 5% 3/1/21 | | 1,200 | 1,265 |
| Indiana Fin. Auth. Wastewtr. Util. Rev. (CWA Auth. Proj.): | | | |
| Series 2012 A: | | | |
| 5% 10/1/20 | | 805 | 840 |
| 5% 10/1/22 | | 1,565 | 1,742 |
| Series 2014 A: | | | |
| 5% 10/1/20 | | 365 | 381 |
| 5% 10/1/21 | | 370 | 399 |
| 5% 10/1/22 | | 660 | 735 |
| Series 2015 A: | | | |
| 5% 10/1/24 | | 1,460 | 1,716 |
| 5% 10/1/25 | | 1,590 | 1,861 |
| Indiana Health Facility Fing. Auth. Rev. Bonds Series 2001 A2, 2%, tender 2/1/23 (a) | | 1,440 | 1,460 |
| Indiana Muni. Pwr. Agcy. Pwr. Supply Sys. Rev. Series 2011 A, 5% 1/1/20 | | 1,225 | 1,247 |
| Indianapolis Local Pub. Impt. (Indianapolis Arpt. Auth. Proj.) Series 2016 A1: | | | |
| 5% 1/1/21 (c) | | 2,690 | 2,827 |
| 5% 1/1/23 (c) | | 1,940 | 2,152 |
| 5% 1/1/24 (c) | | 2,715 | 3,087 |
| 5% 1/1/25 (c) | | 2,845 | 3,308 |
| Lake Central Multi-District School Bldg. Corp. Series 2012 B: | | | |
| 4% 1/15/20 | | 1,315 | 1,333 |
| 4% 1/15/21 | | 1,225 | 1,272 |
| 5% 7/15/20 | | 1,145 | 1,187 |
| 5% 7/15/21 | | 980 | 1,049 |
| Whiting Envir. Facilities Rev.: | | | |
| (BP Products North America, Inc. Proj.) Series 2009, 5.25% 1/1/21 | | 4,160 | 4,391 |
| Bonds: | | | |
| (BA Products North America, Inc. Proj.) Series 2019 A, 5%, tender 6/5/26 (a)(c) | | 13,670 | 16,237 |
| (BP Products North America, Inc. Proj.): | | | |
| Series 2008, 1.85%, tender 10/1/19 (a) | | 1,470 | 1,471 |
| Series 2015, 5%, tender 11/1/22 (a)(c) | | 22,305 | 24,597 |
| Series 2016 A, 5%, tender 3/1/23 (a)(c) | | 1,200 | 1,333 |
|
| TOTAL INDIANA | | | 98,475 |
|
| Kansas - 0.1% | | | |
| Desoto Usd # 232 Series 2015 A, 5% 9/1/22 | | 1,525 | 1,696 |
| Wyandotte County/Kansas City Unified Govt. Util. Sys. Rev. Series 2016 A: | | | |
| 5% 9/1/22 | | 490 | 543 |
| 5% 9/1/23 | | 710 | 807 |
| 5% 9/1/25 | | 785 | 934 |
|
| TOTAL KANSAS | | | 3,980 |
|
| Kentucky - 1.9% | | | |
| Ashland Med. Ctr. Rev.: | | | |
| (Ashland Hosp. Corp. D/B/A King's Daughters Med. Ctr. Proj.) Series 2016 A, 5% 2/1/24 | | 1,330 | 1,484 |
| (Ashland Hosp. Corp. D/B/A Kings Daughters Med. Ctr. Proj.) Series 2016 A, 5% 2/1/25 | | 980 | 1,115 |
| Kentucky Econ. Dev. Fin. Auth. Bonds Series 2009 B, 2.7%, tender 11/10/21 (a) | | 10,200 | 10,423 |
| Kentucky Econ. Dev. Fin. Auth. Hosp. Rev. Series 2015 A: | | | |
| 5% 6/1/20 | | 1,380 | 1,415 |
| 5% 6/1/22 | | 1,525 | 1,642 |
| 5% 6/1/24 | | 1,655 | 1,854 |
| Kentucky State Property & Buildings Commission Rev. (Kentucky St Proj.) Series D, 5% 5/1/21 | | 980 | 1,044 |
| Kentucky, Inc. Pub. Energy Bonds: | | | |
| Series 2019 A1, 4%, tender 6/1/25 (a) | | 10,455 | 11,529 |
| Series C1, 4%, tender 6/1/25 (a) | | 15,000 | 16,528 |
| Louisville Reg'l. Arpt. Auth. Sys. Rev. Series 2014 A, 5% 7/1/24 (c) | | 1,280 | 1,473 |
| Louisville/Jefferson County Metropolitan Gov. Series 2012 A: | | | |
| 5% 12/1/28 | | 505 | 549 |
| 5% 12/1/29 | | 2,140 | 2,325 |
| Univ. Louisville Revs. Series 2016 C, 3% 9/1/21 | | 2,315 | 2,387 |
|
| TOTAL KENTUCKY | | | 53,768 |
|
| Louisiana - 1.9% | | | |
| Louisiana Citizens Property Ins. Corp. Assessment Rev. Series 2015, 5% 6/1/21 (FSA Insured) | | 4,890 | 5,221 |
| Louisiana Gen. Oblig.: | | | |
| Series 2012 A, 5% 8/1/22 | | 1,480 | 1,640 |
| Series 2012 C, 5% 7/15/21 | | 3,305 | 3,545 |
| Series 2014 D1, 5% 12/1/22 | | 1,275 | 1,427 |
| Series 2016 B: | | | |
| 5% 8/1/22 | | 14,185 | 15,724 |
| 5% 8/1/23 | | 6,115 | 6,977 |
| Series 2016 D, 5% 9/1/22 | | 6,220 | 6,910 |
| Louisiana Stadium and Exposition District Series 2013 A: | | | |
| 5% 7/1/21 | | 1,465 | 1,567 |
| 5% 7/1/22 | | 980 | 1,081 |
| New Orleans Aviation Board Rev.: | | | |
| (North Term. Proj.) Series 2017 B: | | | |
| 5% 1/1/23 (c) | | 300 | 332 |
| 5% 1/1/24 (c) | | 195 | 221 |
| 5% 1/1/25 (c) | | 195 | 225 |
| 5% 1/1/26 (c) | | 490 | 578 |
| Series 2017 D2: | | | |
| 5% 1/1/23 (c) | | 390 | 432 |
| 5% 1/1/24 (c) | | 735 | 832 |
| 5% 1/1/25 (c) | | 490 | 566 |
| New Orleans Gen. Oblig. Series 2012, 5% 12/1/20 | | 2,740 | 2,874 |
| Tobacco Settlement Fing. Corp. Series 2013 A, 5% 5/15/23 | | 4,400 | 4,908 |
|
| TOTAL LOUISIANA | | | 55,060 |
|
| Maine - 0.2% | | | |
| Maine Tpk. Auth. Tpk. Rev. Series 2015: | | | |
| 5% 7/1/21 | | 2,350 | 2,520 |
| 5% 7/1/22 | | 1,810 | 2,005 |
|
| TOTAL MAINE | | | 4,525 |
|
| Maryland - 0.9% | | | |
| Baltimore Proj. Rev. Series 2017 D: | | | |
| 5% 7/1/24 | | 3,220 | 3,775 |
| 5% 7/1/25 | | 3,380 | 4,057 |
| Maryland Econ. Dev. Auth. Rev. (Ports America Chesapeake LLC. Proj.) Series 2017 A: | | | |
| 4% 6/1/20 | | 2,960 | 3,025 |
| 5% 6/1/21 | | 1,640 | 1,743 |
| 5% 6/1/22 | | 1,750 | 1,909 |
| Maryland Health & Higher Edl. Facilities Auth. Rev. Series 2015: | | | |
| 5% 7/1/19 | | 390 | 390 |
| 5% 7/1/22 | | 880 | 966 |
| 5% 7/1/23 | | 980 | 1,103 |
| 5% 7/1/24 | | 1,955 | 2,252 |
| 5% 7/1/25 | | 1,730 | 2,032 |
| Maryland St Cmnty. Dev. Admin Dept. Hsg. & Cmnty. Dev. Series 2019 B, 4% 9/1/49 | | 2,540 | 2,776 |
| Rockville Mayor & Council Econ. Dev. (Rfdg.-Ingleside King Farm Proj.) Series 2017: | | | |
| 2.5% 11/1/24 | | 850 | 850 |
| 3% 11/1/25 | | 625 | 627 |
|
| TOTAL MARYLAND | | | 25,505 |
|
| Massachusetts - 2.2% | | | |
| Massachusetts Dept. of Trans. Metropolitan Hwy. Sys. Rev. Bonds Series 2019 A, 5%, tender 1/1/23 (a) | | 3,000 | 3,355 |
| Massachusetts Dev. Fin. Agcy. Rev.: | | | |
| Series 2012, 5% 7/1/31 (Pre-Refunded to 7/1/21 @ 100) | | 1,035 | 1,110 |
| Series 2016 I: | | | |
| 5% 7/1/21 | | 490 | 522 |
| 5% 7/1/22 | | 585 | 641 |
| 5% 7/1/23 | | 660 | 742 |
| 5% 7/1/24 | | 1,075 | 1,238 |
| 5% 7/1/25 | | 980 | 1,153 |
| 5% 7/1/26 | | 980 | 1,176 |
| Series 2019 A: | | | |
| 5% 7/1/23 | | 525 | 589 |
| 5% 7/1/24 | | 1,150 | 1,319 |
| 5% 7/1/25 | | 825 | 963 |
| 5% 7/1/26 | | 1,510 | 1,797 |
| 5% 7/1/27 | | 1,300 | 1,569 |
| 5% 7/1/28 | | 2,135 | 2,616 |
| Massachusetts Edl. Fing. Auth. Rev.: | | | |
| Series 2013, 5% 7/1/19 (c) | | 4,620 | 4,620 |
| Series 2016 J, 5% 7/1/23 (c) | | 2,175 | 2,442 |
| Massachusetts Gen. Oblig. Bonds Series 2014 D1, 1.05%, tender 7/1/20 (a) | | 31,300 | 31,183 |
| Massachusetts Port Auth. Rev. Series 2017 A: | | | |
| 5% 7/1/24 (c) | | 3,005 | 3,493 |
| 5% 7/1/25 (c) | | 1,115 | 1,326 |
|
| TOTAL MASSACHUSETTS | | | 61,854 |
|
| Michigan - 3.8% | | | |
| Clarkston Cmnty. Schools 5% 5/1/22 | | 1,635 | 1,798 |
| Detroit Downtown Dev. Auth. Tax Series A, 5% 7/1/24 (FSA Insured) | | 1,000 | 1,150 |
| Detroit Swr. Disp. Rev. Series 2006 D, 3 month U.S. LIBOR + 0.600% 2.336% 7/1/32 (a)(e) | | 3,980 | 3,971 |
| Grand Blanc Cmnty. Schools Series 2013: | | | |
| 5% 5/1/20 | | 2,575 | 2,653 |
| 5% 5/1/21 | | 2,105 | 2,244 |
| 5% 5/1/22 | | 1,810 | 1,989 |
| Grand Rapids Pub. Schools 5% 5/1/23 (FSA Insured) | | 1,275 | 1,442 |
| Kalamazoo Hosp. Fin. Auth. Hosp. Facilities Rev. Series 2016: | | | |
| 5% 5/15/22 | | 980 | 1,069 |
| 5% 5/15/24 | | 540 | 620 |
| 5% 5/15/25 | | 635 | 746 |
| 5% 5/15/26 | | 610 | 732 |
| Michigan Bldg. Auth. Rev. (Facilities Prog.) Series 2016 I: | | | |
| 5% 4/15/22 | | 980 | 1,078 |
| 5% 4/15/24 | | 1,450 | 1,689 |
| Michigan Fin. Auth. Rev.: | | | |
| Bonds: | | | |
| Series 2019 MI2, 5%, tender 2/1/25 (a) | | 4,830 | 5,652 |
| 1.1%, tender 8/15/19 (a) | | 4,155 | 4,153 |
| Series 2015 A: | | | |
| 5% 8/1/22 | | 2,350 | 2,600 |
| 5% 8/1/23 | | 3,715 | 4,229 |
| Michigan Gen. Oblig. Series 2016: | | | |
| 5% 3/15/20 | | 3,255 | 3,338 |
| 5% 3/15/21 | | 980 | 1,040 |
| 5% 3/15/22 | | 2,280 | 2,498 |
| 5% 3/15/23 | | 3,915 | 4,417 |
| 5% 3/15/24 | | 6,760 | 7,838 |
| Michigan Hosp. Fin. Auth. Rev. Bonds: | | | |
| (Ascension Health Cr. Group Proj.) Series F5, 2.4%, tender 3/15/23 (a) | | 3,535 | 3,610 |
| Series 2005 A4, 1.625%, tender 11/1/19 (a) | | 6,615 | 6,619 |
| Series 2010 F4, 1.95%, tender 4/1/20 (a) | | 6,400 | 6,423 |
| Michigan Strategic Fund Ltd. Oblig. Rev. Bonds Series CC, 1.45%, tender 9/1/21 (a) | | 7,040 | 7,012 |
| Portage Pub. Schools Series 2016: | | | |
| 5% 5/1/23 | | 1,990 | 2,245 |
| 5% 11/1/23 | | 1,335 | 1,526 |
| 5% 5/1/24 | | 1,880 | 2,181 |
| 5% 11/1/24 | | 1,955 | 2,296 |
| 5% 5/1/25 | | 1,100 | 1,308 |
| 5% 11/1/25 | | 1,195 | 1,437 |
| 5% 5/1/26 | | 1,665 | 2,029 |
| 5% 11/1/26 | | 1,155 | 1,405 |
| 5% 11/1/28 | | 985 | 1,192 |
| Royal Oak Hosp. Fin. Auth. Hosp. Rev. Series 2014 D: | | | |
| 5% 9/1/21 | | 1,465 | 1,575 |
| 5% 9/1/23 | | 490 | 559 |
| Spring Lake Pub. Schools: | | | |
| 5% 5/1/20 | | 3,550 | 3,657 |
| 5% 11/1/20 | | 1,705 | 1,787 |
| 5% 5/1/21 | | 4,020 | 4,285 |
|
| TOTAL MICHIGAN | | | 108,092 |
|
| Minnesota - 0.7% | | | |
| Minneapolis & Saint Paul Metropolitan Arpts. Commission Arpt. Rev.: | | | |
| Series 2014 A: | | | |
| 5% 1/1/22 | | 980 | 1,067 |
| 5% 1/1/23 | | 980 | 1,100 |
| Series 2014 B: | | | |
| 5% 1/1/21 (c) | | 2,240 | 2,353 |
| 5% 1/1/22 (c) | | 1,955 | 2,116 |
| 5% 1/1/23 (c) | | 980 | 1,090 |
| Moorhead Edl. Facilities Rev. (The Concordia College Corp. Proj.) Series 2016, 5% 12/1/25 | | 2,950 | 3,311 |
| Northern Muni. Pwr. Agcy. Elec. Sys. Rev. Series 2017: | | | |
| 5% 1/1/22 | | 1,160 | 1,259 |
| 5% 1/1/23 | | 1,115 | 1,247 |
| 5% 1/1/24 | | 1,560 | 1,791 |
| Western Minnesota Muni. Pwr. Agcy. Pwr. Supply Rev. Series 2014 A: | | | |
| 5% 1/1/22 | | 980 | 1,068 |
| 5% 1/1/23 | | 1,465 | 1,645 |
| 5% 1/1/24 | | 980 | 1,133 |
|
| TOTAL MINNESOTA | | | 19,180 |
|
| Missouri - 0.7% | | | |
| Cape Girardeau County Indl. Dev. Auth. (Southeast Hosp. Proj.) Series 2017 A: | | | |
| 5% 3/1/20 | | 320 | 326 |
| 5% 3/1/21 | | 390 | 408 |
| 5% 3/1/22 | | 585 | 628 |
| 5% 3/1/23 | | 980 | 1,075 |
| 5% 3/1/24 | | 685 | 767 |
| 5% 3/1/25 | | 710 | 811 |
| 5% 3/1/26 | | 980 | 1,137 |
| Missouri Hsg. Dev. Commission Single Family Mtg. Rev. Series 2019, 4% 5/1/50 (b) | | 535 | 587 |
| Saint Louis Arpt. Rev.: | | | |
| Series 2019 C: | | | |
| 5% 7/1/28 | | 3,250 | 4,091 |
| 5% 7/1/29 | | 3,000 | 3,830 |
| Series A, 5.25% 7/1/26 (FSA Insured) | | 5,270 | 6,541 |
|
| TOTAL MISSOURI | | | 20,201 |
|
| Montana - 0.0% | | | |
| Montana Board Hsg. Single Family Series 2019 B, 4% 6/1/50 (b) | | 260 | 288 |
| Nebraska - 0.1% | | | |
| Nebraska Invt. Fin. Auth. Single Family Hsg. Rev. Series 2019 B, 4% 9/1/49 (c) | | 1,555 | 1,674 |
| Nevada - 2.3% | | | |
| Clark County Arpt. Rev.: | | | |
| (Sub Lien Proj.) Series 2017 A-1, 5% 7/1/22 (c) | | 3,915 | 4,313 |
| Series 2017 C, 5% 7/1/21 (c) | | 7,785 | 8,322 |
| Clark County School District: | | | |
| Series 2016 A: | | | |
| 5% 6/15/21 | | 1,470 | 1,572 |
| 5% 6/15/23 | | 1,285 | 1,456 |
| Series 2016 D, 5% 6/15/23 | | 10,000 | 11,328 |
| Series 2017 A: | | | |
| 5% 6/15/22 | | 2,800 | 3,087 |
| 5% 6/15/26 | | 1,285 | 1,559 |
| Series 2017 C: | | | |
| 5% 6/15/21 | | 9,030 | 9,659 |
| 5% 6/15/23 | | 4,550 | 5,154 |
| Series A, 5% 6/15/27 | | 8,220 | 10,133 |
| Nevada Dept. of Bus. & Industry Bonds (Republic Svcs., Inc. Proj.) Series 2001, 1.875%, tender 12/2/19 (a)(c)(d) | | 2,100 | 2,100 |
| Nevada Gen. Oblig. Series 2013 D1, 5% 3/1/24 | | 2,640 | 2,983 |
| Washoe County Gas & Wtr. Facilities Bonds (Sierra Pacific Pwr. Co. Proj.) Series 2016 B, 3%, tender 6/1/22 (a) | | 5,185 | 5,399 |
|
| TOTAL NEVADA | | | 67,065 |
|
| New Hampshire - 0.8% | | | |
| Nat'l. Fin. Auth. Solid Bonds (Waste Mgmt., Inc. Proj.): | | | |
| Series 2019 A3, 2.15%, tender 7/1/24 (a)(c) | | 2,355 | 2,370 |
| Series 2019 A4, 2.15%, tender 7/1/24 (a)(c) | | 2,250 | 2,265 |
| New Hampshire Health & Ed. Facilities Auth.: | | | |
| Series 2017 B, 4.125% 7/1/24 (d) | | 1,010 | 1,011 |
| Series 2017 C, 3.5% 7/1/22 (d) | | 335 | 335 |
| New Hampshire Health & Ed. Facilities Auth. Rev.: | | | |
| (Dartmouth-Hitchcock Obligated Group Proj.) Series 2010, 5% 8/1/40 (Pre-Refunded to 8/1/20 @ 100) | | 6,000 | 6,230 |
| (Southern NH Med. Ctr. Proj.) Series 2016, 3% 10/1/21 | | 1,375 | 1,413 |
| Series 2012: | | | |
| 4% 7/1/20 | | 2,645 | 2,704 |
| 4% 7/1/21 | | 1,485 | 1,551 |
| Series 2016: | | | |
| 5% 10/1/21 | | 1,225 | 1,314 |
| 5% 10/1/22 | | 900 | 994 |
| 5% 10/1/23 | | 2,785 | 3,155 |
|
| TOTAL NEW HAMPSHIRE | | | 23,342 |
|
| New Jersey - 6.6% | | | |
| Camden County Impt. Auth. Health Care Redev. Rev. Series 2014 A: | | | |
| 5% 2/15/20 | | 3,030 | 3,091 |
| 5% 2/15/21 | | 2,445 | 2,572 |
| 5% 2/15/22 | | 2,445 | 2,651 |
| 5% 2/15/23 | | 2,770 | 3,082 |
| New Jersey Econ. Dev. Auth. Rev.: | | | |
| (Provident Montclair Proj.) Series 2017: | | | |
| 4% 6/1/22 (FSA Insured) | | 980 | 1,043 |
| 5% 6/1/23 (FSA Insured) | | 1,230 | 1,381 |
| 5% 6/1/24 (FSA Insured) | | 980 | 1,128 |
| Series 2011 EE: | | | |
| 5% 9/1/20 | | 1,320 | 1,369 |
| 5% 9/1/20 (Escrowed to Maturity) | | 3,570 | 3,717 |
| Series 2012 II: | | | |
| 5% 3/1/21 | | 6,650 | 6,978 |
| 5% 3/1/22 | | 6,155 | 6,651 |
| Series 2013, 5% 3/1/23 | | 20,920 | 23,136 |
| Series 2016 BBB, 5% 6/15/23 | | 9,010 | 10,034 |
| New Jersey Econ. Dev. Auth. Spl. Facilities Rev. (Port Newark Container Term. LLC. Proj.) Series 2017 5% 10/1/26 (c) | | 2,130 | 2,467 |
| New Jersey Edl. Facility: | | | |
| Series 2014: | | | |
| 5% 6/15/20 | | 10,760 | 11,090 |
| 5% 6/15/21 | | 10,760 | 11,428 |
| Series 2016 A: | | | |
| 5% 7/1/21 | | 2,150 | 2,274 |
| 5% 7/1/22 | | 6,160 | 6,686 |
| 5% 7/1/23 | | 3,315 | 3,683 |
| 5% 7/1/24 | | 7,740 | 8,802 |
| New Jersey Health Care Facilities Fing. Auth. Rev. Series 2016 A: | | | |
| 5% 7/1/19 | | 1,465 | 1,465 |
| 5% 7/1/21 | | 170 | 181 |
| 5% 7/1/22 | | 170 | 186 |
| 5% 7/1/23 | | 595 | 667 |
| 5% 7/1/24 | | 1,200 | 1,401 |
| 5% 7/1/24 | | 985 | 1,127 |
| 5% 7/1/24 | | 475 | 544 |
| 5% 7/1/25 | | 515 | 600 |
| 5% 7/1/26 | | 170 | 201 |
| 5% 7/1/27 | | 255 | 301 |
| New Jersey Higher Ed. Student Assistance Auth. Student Ln. Rev.: | | | |
| Series 2013, 5% 12/1/19 (c) | | 3,765 | 3,816 |
| Series 2017 1A: | | | |
| 5% 12/1/22 (c) | | 1,250 | 1,381 |
| 5% 12/1/23 (c) | | 1,930 | 2,181 |
| Series 2017 1B, 5% 12/1/21 (c) | | 1,285 | 1,383 |
| Series 2019 A: | | | |
| 5% 12/1/23 | | 720 | 825 |
| 5% 12/1/24 | | 420 | 493 |
| New Jersey Hsg. & Mtg. Fin. Agcy. Rev. Series 2019 D: | | | |
| 4% 4/1/20 (c) | | 1,015 | 1,032 |
| 4% 10/1/21 (c) | | 2,120 | 2,215 |
| 4% 4/1/22 (c) | | 1,655 | 1,741 |
| 4% 4/1/23 (c) | | 1,090 | 1,163 |
| 4% 10/1/23 (c) | | 1,150 | 1,236 |
| 4% 4/1/25 (c) | | 1,405 | 1,534 |
| New Jersey Tpk. Auth. Tpk. Rev.: | | | |
| Bonds Series 2017 C5, 1 month U.S. LIBOR + 0.460% 2.168%, tender 1/1/21 (a)(e) | | 10,485 | 10,498 |
| Series 2017 C1, 1 month U.S. LIBOR + 0.340% 2.048% 1/1/21 (a)(e) | | 1,170 | 1,171 |
| New Jersey Trans. Trust Fund Auth.: | | | |
| Series 2010 A, 0% 12/15/27 | | 5,520 | 4,304 |
| Series 2013 A, 5% 6/15/20 | | 17,605 | 18,148 |
| Series 2016 A, 5% 6/15/27 | | 3,960 | 4,693 |
| Series 2018 A, 5% 6/15/24 | | 5,000 | 5,752 |
| New Jersey Transit Corp. Ctfs. of Prtn. Series 2014 A, 5% 9/15/21 | | 4,795 | 5,133 |
|
| TOTAL NEW JERSEY | | | 188,635 |
|
| New Mexico - 1.7% | | | |
| Farmington Poll. Cont. Rev. Bonds (Southern California Edison Co. Four Corners Proj.): | | | |
| Series 2005 B, 1.875%, tender 4/1/20 (a) | | 10,785 | 10,758 |
| Series 2011, 1.875%, tender 4/1/20 (a) | | 6,155 | 6,140 |
| New Mexico Mtg. Fin. Auth. Series 2019 C, 4% 7/1/50 | | 4,965 | 5,420 |
| New Mexico Muni. Energy Acquisition Auth. Gas Supply Rev.: | | | |
| Bonds Series 2019 A, 5%, tender 5/1/25 (Liquidity Facility Royal Bank of Canada) (a)(b) | | 15,000 | 17,502 |
| Series 2019 A: | | | |
| 4% 5/1/21 (Liquidity Facility Royal Bank of Canada) (b) | | 505 | 527 |
| 4% 11/1/21 (Liquidity Facility Royal Bank of Canada) (b) | | 625 | 659 |
| 4% 5/1/22 (Liquidity Facility Royal Bank of Canada) (b) | | 960 | 1,023 |
| 4% 11/1/23 (Liquidity Facility Royal Bank of Canada) (b) | | 710 | 779 |
| 4% 5/1/24 (Liquidity Facility Royal Bank of Canada) (b) | | 950 | 1,050 |
| 4% 11/1/24 (Liquidity Facility Royal Bank of Canada) (b) | | 1,450 | 1,615 |
| 4% 5/1/25 (Liquidity Facility Royal Bank of Canada) (b) | | 2,790 | 3,122 |
|
| TOTAL NEW MEXICO | | | 48,595 |
|
| New York - 1.9% | | | |
| Dorm. Auth. New York Univ. Rev. Series 2016 A: | | | |
| 5% 7/1/22 | | 490 | 540 |
| 5% 7/1/24 | | 1,810 | 2,104 |
| Dutchess County Local Dev. Corp. Rev. (Health Quest Systems, Inc. Proj.) Series 2010 A, 5% 7/1/19 (Assured Guaranty Corp. Insured) (FSA Insured) | | 625 | 625 |
| New York Metropolitan Trans. Auth. Rev.: | | | |
| Bonds Series 2018 A, 5%, tender 11/15/20 (a) | | 20,000 | 20,917 |
| Series 2008 B2: | | | |
| 5% 11/15/20 | | 5,380 | 5,649 |
| 5% 11/15/21 | | 3,915 | 4,244 |
| Series 2012 B, 5% 11/15/22 | | 1,955 | 2,187 |
| Series 2012 E, 5% 11/15/21 | | 2,380 | 2,580 |
| Series 2014 C, 5% 11/15/21 | | 2,740 | 2,970 |
| Series 2016 B, 5% 11/15/21 | | 2,150 | 2,331 |
| Niagara Frontier Trans. Auth. Arpt. Rev. Series 2019 A: | | | |
| 5% 4/1/25 (c) | | 625 | 726 |
| 5% 4/1/27 (c) | | 1,350 | 1,625 |
| Onondaga County Ind. Dev. Agcy. Swr. Facilities Rev. (Bristol-Meyers Squibb Co. Proj.) 5.75% 3/1/24 (c) | | 5,335 | 6,179 |
| Yonkers Gen. Oblig. Series 2017 C, 5% 10/1/22 (Build America Mutual Assurance Insured) | | 2,490 | 2,779 |
|
| TOTAL NEW YORK | | | 55,456 |
|
| North Carolina - 1.2% | | | |
| North Carolina Cap. Facilities Fin. Agcy. Rev. Bonds (Republic Svcs., Inc. Proj.): | | | |
| Series 2010 B, 1.6%, tender 9/3/19 (a)(c) | | 5,000 | 5,000 |
| Series 2013, 1.75%, tender 9/16/19 (a)(c) | | 2,250 | 2,250 |
| North Carolina Grant Anticipation Rev. Series 2017: | | | |
| 5% 3/1/22 | | 3,580 | 3,924 |
| 5% 3/1/23 | | 3,580 | 4,046 |
| North Carolina Med. Care Commission Health Care Facilities Rev. Bonds: | | | |
| Series 2019 B, 2.2%, tender 12/1/22 (a) | | 4,235 | 4,281 |
| Series 2019 C, 2.55%, tender 6/1/26 (a) | | 7,335 | 7,493 |
| North Carolina Muni. Pwr. Agcy. #1 Catawba Elec. Rev. Series 2015 E: | | | |
| 5% 1/1/22 | | 4,890 | 5,332 |
| 5% 1/1/23 | | 1,465 | 1,647 |
|
| TOTAL NORTH CAROLINA | | | 33,973 |
|
| Ohio - 3.6% | | | |
| Akron Bath Copley Hosp. District Rev. Series 2016, 5% 11/15/24 | | 1,955 | 2,253 |
| Allen County Hosp. Facilities Rev. Bonds (Mercy Health) Series 2017 B, 5%, tender 5/5/22 (a) | | 5,280 | 5,787 |
| American Muni. Pwr., Inc. Rev. Bonds: | | | |
| (Combined Hydroelectric Proj.) Series 2018, 2.25%, tender 8/15/21 (a) | | 2,500 | 2,524 |
| Series 2019 A, 2.3%, tender 2/15/22 (a) | | 5,500 | 5,583 |
| Series B, 5%, tender 8/15/20 (a) | | 38,935 | 39,799 |
| Cleveland Arpt. Sys. Rev.: | | | |
| Series 2016 A, 5% 1/1/26 (FSA Insured) | | 490 | 574 |
| 5% 1/1/20 (FSA Insured) | | 415 | 422 |
| 5% 1/1/22 (FSA Insured) | | 1,295 | 1,407 |
| 5% 1/1/24 (FSA Insured) | | 1,175 | 1,348 |
| 5% 1/1/25 (FSA Insured) | | 1,225 | 1,438 |
| Fairfield County Hosp. Facilities Rev. (Fairfield Med. Ctr. Proj.) Series 2013: | | | |
| 5% 6/15/22 | | 2,100 | 2,274 |
| 5% 6/15/23 | | 1,815 | 2,004 |
| Franklin County Hosp. Facilities Rev. Series 2016 C, 5% 11/1/23 | | 2,800 | 3,216 |
| Hamilton County Convention Facilities Auth. Rev. Series 2014: | | | |
| 5% 12/1/19 | | 1,870 | 1,898 |
| 5% 12/1/20 | | 2,155 | 2,263 |
| 5% 12/1/21 | | 2,000 | 2,164 |
| Hamilton County HealthCare Facilities Rev. Series 2012, 5% 6/1/21 | | 1,200 | 1,277 |
| Miami County Hosp. Facilities Rev. (Kettering Health Network Obligated Group Proj.) Series 2019: | | | |
| 5% 8/1/27 | | 500 | 616 |
| 5% 8/1/28 | | 1,000 | 1,251 |
| Ohio Hosp. Facilities Rev. Series 2017 A: | | | |
| 4% 1/1/20 | | 2,365 | 2,396 |
| 5% 1/1/21 | | 2,640 | 2,782 |
| 5% 1/1/22 | | 1,665 | 1,813 |
| 5% 1/1/23 | | 1,955 | 2,194 |
| 5% 1/1/24 | | 1,690 | 1,952 |
| 5% 1/1/25 | | 2,035 | 2,411 |
| Ohio Hsg. Fin. Agcy. Residential Mtg. Rev. (Mtg. Backed Securities Prog.) Series 2019 B, 4.5% 3/1/50 (b) | | 380 | 426 |
| Scioto County Hosp. Facilities Rev. Series 2016: | | | |
| 5% 2/15/21 | | 1,295 | 1,363 |
| 5% 2/15/22 | | 1,075 | 1,166 |
| 5% 2/15/23 | | 2,075 | 2,312 |
| 5% 2/15/24 | | 1,605 | 1,830 |
| 5% 2/15/25 | | 1,675 | 1,953 |
| 5% 2/15/26 | | 1,225 | 1,455 |
|
| TOTAL OHIO | | | 102,151 |
|
| Oklahoma - 0.2% | | | |
| Oklahoma Dev. Fin. Auth. Health Sys. Rev. (OU Medicine Proj.) Series 2018 B: | | | |
| 5% 8/15/24 | | 500 | 569 |
| 5% 8/15/25 | | 500 | 580 |
| 5% 8/15/26 | | 800 | 944 |
| Oklahoma Dev. Fin. Auth. Rev.: | | | |
| (Saint John Health Sys. Proj.) Series 2012, 5% 2/15/23 (Pre-Refunded to 2/15/22 @ 100) | | 2,545 | 2,782 |
| Series 2004 A, 2.375% 12/1/21 (a) | | 1,320 | 1,337 |
|
| TOTAL OKLAHOMA | | | 6,212 |
|
| Oregon - 1.3% | | | |
| Clackamas County Hosp. Facility Auth. (Willamette View Proj.) Series 2017 B, 3% 11/15/22 | | 390 | 391 |
| Gilliam County Solid Waste Disp. Rev. Bonds (Waste Mgmt., Inc. Proj.): | | | |
| Series 2000 A, 2.4%, tender 5/2/22 (a)(c) | | 2,500 | 2,534 |
| Series 2003 A, 2.4%, tender 5/2/22 (a)(c) | | 2,275 | 2,307 |
| Oregon Bus. Dev. Commission Bonds Series 250, 5%, tender 3/1/22 (a)(c) | | 8,165 | 8,861 |
| Oregon Bus. Dev. Commn Recovery Zone Facility Bonds (Intel Corp. Proj.) Series 232, 2.4%, tender 8/14/23 (a) | | 21,105 | 21,689 |
|
| TOTAL OREGON | | | 35,782 |
|
| Pennsylvania - 1.8% | | | |
| Commonwealth Fing. Auth. Rev. Series 2020 A: | | | |
| 5% 6/1/24 (b) | | 1,475 | 1,661 |
| 5% 6/1/25 (b) | | 1,150 | 1,325 |
| Lehigh County Indl. Dev. Auth. Poll. Cont. Rev. Bonds: | | | |
| (PPL Elec. Utils. Corp. Proj.) Series 2016 A, 1.8%, tender 9/1/22 (a) | | 2,445 | 2,447 |
| Series B, 1.8%, tender 8/15/22 (a) | | 5,245 | 5,277 |
| Montgomery County Higher Ed. & Health Auth. Rev.: | | | |
| Series 2014 A: | | | |
| 4% 10/1/19 | | 645 | 648 |
| 5% 10/1/20 | | 1,230 | 1,269 |
| 5% 10/1/23 | | 190 | 209 |
| Series 2019, 5% 9/1/29 | | 1,000 | 1,254 |
| Pennsylvania Econ. Dev. Auth. Governmental Lease (Forum Place Proj.) Series 2012, 5% 3/1/20 | | 2,095 | 2,141 |
| Pennsylvania Econ. Dev. Fing. Auth. Solid Waste Disp. Rev. Bonds: | | | |
| (Republic Svcs., Inc. Proj.) Series 2019 A, 1.95%, tender 7/15/19 (a)(c) | | 2,700 | 2,700 |
| (Waste Mgmt., Inc. Proj.) Series 2013, 1.95%, tender 8/1/19 (a)(c) | | 5,000 | 5,002 |
| (Waste Mgmt., Inc. Proj.): | | | |
| Series 2009, 2.8%, tender 12/1/21 (a) | | 1,700 | 1,738 |
| Series 2017 A, 1.7%, tender 8/3/20 (a)(c) | | 3,220 | 3,218 |
| Pennsylvania Gen. Oblig.: | | | |
| Series 2011, 5% 7/1/21 | | 1,860 | 1,996 |
| Series 2017, 5% 1/1/27 | | 3,955 | 4,875 |
| Pennsylvania Higher Edl. Facilities Auth. Rev. Series 2014: | | | |
| 5% 12/1/21 | | 270 | 294 |
| 5% 12/1/22 | | 835 | 935 |
| Pennsylvania Indl. Dev. Auth. Rev. Series 2012, 5% 7/1/21 | | 1,140 | 1,220 |
| Pennsylvania Pub. School Bldg. Auth. School Rev. (The School District of Harrisburg Proj.) Series 2016 A, 5% 12/1/21 (FSA Insured) | | 4,890 | 5,270 |
| Philadelphia Arpt. Rev.: | | | |
| Series 2017 A, 5% 7/1/24 | | 490 | 572 |
| Series 2017 B, 5% 7/1/24 (c) | | 2,445 | 2,821 |
| Philadelphia Gas Works Rev. Series 15, 5% 8/1/21 | | 1,225 | 1,313 |
| Philadelphia School District Series 2018 A: | | | |
| 5% 9/1/24 | | 1,000 | 1,157 |
| 5% 9/1/25 | | 700 | 828 |
| 5% 9/1/26 | | 750 | 899 |
| Reading School District Series 2017: | | | |
| 5% 3/1/25 (FSA Insured) | | 320 | 373 |
| 5% 3/1/26 (FSA Insured) | | 260 | 309 |
| 5% 3/1/27 (FSA Insured) | | 250 | 303 |
| 5% 3/1/28 (FSA Insured) | | 245 | 296 |
|
| TOTAL PENNSYLVANIA | | | 52,350 |
|
| Rhode Island - 1.1% | | | |
| Rhode Island Health& Edl. Bldg. Corp. Higher Ed. Facilities Rev. Series 2016: | | | |
| 5% 5/15/20 | | 645 | 663 |
| 5% 5/15/21 | | 1,475 | 1,561 |
| 5% 5/15/22 | | 1,955 | 2,124 |
| 5% 5/15/23 | | 1,180 | 1,313 |
| 5% 5/15/24 | | 2,300 | 2,615 |
| 5% 5/15/25 | | 5,385 | 6,247 |
| Rhode Island Health & Edl. Bldg. Corp. Pub. Schools Rev. Series 2015, 5% 5/15/25 (FSA Insured) | | 5,910 | 6,977 |
| Rhode Island Hsg. & Mtg. Fin. Corp. Series 2019 70, 4% 10/1/49 | | 960 | 1,050 |
| Rhode Island Student Ln. Auth. Student Ln. Rev. Series 2019 A: | | | |
| 5% 12/1/23 (c) | | 750 | 847 |
| 5% 12/1/24 (c) | | 1,000 | 1,151 |
| 5% 12/1/25 (c) | | 1,250 | 1,464 |
| 5% 12/1/26 (c) | | 1,000 | 1,190 |
| 5% 12/1/28 (c) | | 510 | 621 |
| Tobacco Setlement Fing. Corp. Series 2015 A: | | | |
| 5% 6/1/26 | | 3,425 | 3,896 |
| 5% 6/1/27 | | 980 | 1,110 |
|
| TOTAL RHODE ISLAND | | | 32,829 |
|
| South Carolina - 0.9% | | | |
| Lancaster County School District ( South Carolina Gen. Oblig. Proj.) Series 2017, 5% 3/1/22 | | 2,020 | 2,217 |
| Lexington County Health Svcs. District, Inc. Hosp. Rev. Series 2011, 5% 11/1/19 | | 1,165 | 1,178 |
| Richland County School District #2 Gen. Oblig. (South Carolina Gen. Oblig. Proj.) Series 2015 A, 5% 2/1/23 | | 2,565 | 2,894 |
| Scago Edl. Facilities Corp. for Colleton School District (School District of Colleton County Proj.) Series 2015: | | | |
| 5% 12/1/23 | | 4,345 | 4,950 |
| 5% 12/1/26 | | 1,075 | 1,260 |
| South Carolina Hsg. Fin. & Dev. Auth. Mtg. Rev. Series 2019 A, 4% 1/1/50 (b) | | 1,445 | 1,595 |
| South Carolina Jobs-Econ. Dev. Auth. Econ. Dev. Rev. (Bon Secours Health Sys. Proj.) Series 2013, 5% 11/1/28 (Pre-Refunded to 11/1/22 @ 100) | | 1,465 | 1,640 |
| South Carolina Pub. Svc. Auth. Rev.: | | | |
| Series 2012 B, 5% 12/1/20 | | 980 | 1,025 |
| Series 2014 C: | | | |
| 5% 12/1/22 | | 1,075 | 1,196 |
| 5% 12/1/23 | | 4,890 | 5,578 |
| Series A, 5% 12/1/23 | | 2,995 | 3,416 |
|
| TOTAL SOUTH CAROLINA | | | 26,949 |
|
| South Dakota - 0.1% | | | |
| South Dakota Health & Edl. Facilities Auth. Rev. Series 2014 B: | | | |
| 4% 11/1/19 | | 390 | 393 |
| 4% 11/1/20 | | 610 | 630 |
| 4% 11/1/21 | | 490 | 519 |
| 5% 11/1/22 | | 365 | 407 |
|
| TOTAL SOUTH DAKOTA | | | 1,949 |
|
| Tennessee - 0.9% | | | |
| Greeneville Health & Edl. Facilities Board Series 2018 A, 5% 7/1/21 | | 650 | 692 |
| Knox County Health Edl. & Hsg. Facilities Board Rev. Series 2016: | | | |
| 5% 9/1/25 | | 1,635 | 1,886 |
| 5% 9/1/26 | | 1,795 | 2,104 |
| Tennergy Corp. Gas Rev. Bonds Series 2019 A, 5%, tender 10/1/24 (a) | | 11,590 | 13,389 |
| Tennessee Energy Acquisition Corp. Bonds (Gas Rev. Proj.) Series A, 4%, tender 5/1/23 (a) | | 6,040 | 6,475 |
|
| TOTAL TENNESSEE | | | 24,546 |
|
| Texas - 11.3% | | | |
| Aledo Independent School District Series 2015, 0% 2/15/24 | | 1,195 | 1,105 |
| Central Reg'l. Mobility Auth. Series 2016: | | | |
| 5% 1/1/21 | | 490 | 514 |
| 5% 1/1/22 | | 1,465 | 1,580 |
| 5% 1/1/23 | | 2,395 | 2,653 |
| 5% 1/1/24 | | 3,295 | 3,736 |
| 5% 1/1/26 | | 2,800 | 3,316 |
| Cypress-Fairbanks Independent School District Bonds: | | | |
| Series 2014 B2, 1.4%, tender 8/17/20 (a) | | 3,220 | 3,219 |
| Series 2014 B3, 1.4%, tender 8/17/20 (a) | | 3,485 | 3,484 |
| Series 2015 B2, 2.125%, tender 8/16/21 (a) | | 16,000 | 16,169 |
| Dallas County Gen. Oblig. Series 2016 5% 8/15/22 | | 3,445 | 3,828 |
| Dallas Fort Worth Int'l. Arpt. Rev.: | | | |
| Series 2013 F: | | | |
| 5% 11/1/20 | | 1,465 | 1,536 |
| 5% 11/1/21 | | 2,935 | 3,181 |
| 5% 11/1/22 | | 4,890 | 5,468 |
| Series 2014 D, 5% 11/1/23 (c) | | 1,905 | 2,168 |
| Dallas Independent School District Bonds: | | | |
| Series 2016 B4, 5%, tender 2/15/20 (a) | | 6,845 | 6,995 |
| Series 2016 B5, 5%, tender 2/15/21 (a) | | 7,825 | 8,259 |
| Series 2016, 5%, tender 2/15/22 (a) | | 150 | 164 |
| Series 2019, 5%, tender 2/15/22 (a) | | 7,765 | 8,454 |
| Denton Independent School District Series 2016, 0% 8/15/25 | | 1,610 | 1,452 |
| Fort Bend Independent School District Bonds: | | | |
| Series 2019 A, 1.95%, tender 8/1/22 (a) | | 9,990 | 10,113 |
| Series C, 1.35%, tender 8/1/20 (a) | | 1,735 | 1,734 |
| Series D, 1.5%, tender 8/1/21 (a) | | 3,130 | 3,121 |
| Fort Worth Gen. Oblig. Series 2015 A, 5% 3/1/23 | | 1,670 | 1,883 |
| Fort Worth Independent School District Series 2015, 5% 2/15/22 | | 1,580 | 1,730 |
| Gregg County Health Facilities Dev. Series 2012 C, 5% 7/1/42 (Pre-Refunded to 7/1/22 @ 100) | | 6,135 | 6,777 |
| Gulf Coast Waste Disp. Auth. Solid Waste Disp. Rev. Bonds (Waste Mgmt. of Texas, Inc. Denton County Proj.) Series 2003 B, 2.15%, tender 5/1/20 (a)(c) | | 2,000 | 2,006 |
| Harris County Cultural Ed. Facilities Fin. Corp. Rev. Series 2014 A, 5% 12/1/26 | | 1,085 | 1,264 |
| Houston Arpt. Sys. Rev.: | | | |
| Series 2012 A, 5% 7/1/23 (c) | | 3,720 | 4,096 |
| Series 2018 A: | | | |
| 5% 7/1/23 (c) | | 750 | 844 |
| 5% 7/1/25 (c) | | 1,550 | 1,826 |
| Houston Gen. Oblig. Series 2013 A, 5% 3/1/22 | | 5,520 | 6,043 |
| Houston Independent School District: | | | |
| Bonds: | | | |
| Series 2012, 2.4%, tender 6/1/21 (a) | | 12,235 | 12,437 |
| Series 2013 B, 2.4%, tender 6/1/21 (a) | | 5,880 | 5,977 |
| Series 2017, 3% 2/15/22 | | 13,810 | 14,419 |
| Leander Independent School District Series 2013 A, 0% 8/15/21 | | 1,870 | 1,813 |
| Lewisville Independent School District Series 1996, 0% 8/15/21 | | 2,110 | 2,040 |
| Lower Colorado River Auth. Rev. Series 2010 B, 5% 5/15/21 | | 2,965 | 3,058 |
| Mansfield Independent School District Series 2016, 5% 2/15/24 | | 4,185 | 4,858 |
| Mission Econ. Dev. Corp. Solid Waste Disp. Rev. Bonds (Republic Svcs., Inc. Proj.) Series 2008 A, 1.9%, tender 8/1/19 (a)(c) | | 2,800 | 2,801 |
| Newark Higher Ed. Fin. Corp. (Abilene Christian Univ. Proj.) Series 2016 A, 5% 4/1/26 | | 2,425 | 2,861 |
| North East Texas Independent School District Bonds: | | | |
| Series 2013 B, 1.42%, tender 8/1/21 (a) | | 2,705 | 2,691 |
| Series 2019, 2.2%, tender 8/1/24 (a) | | 1,845 | 1,893 |
| North Harris County Reg'l. Wtr. Auth. Series 2013, 4% 12/15/22 | | 1,545 | 1,677 |
| North Texas Tollway Auth. Rev.: | | | |
| Series 2011 A, 5.5% 9/1/41 (Pre-Refunded to 9/1/21 @ 100) | | 16,800 | 18,278 |
| Series 2011 D, 5% 9/1/28 (Pre-Refunded to 9/1/21 @ 100) | | 4,100 | 4,417 |
| Northside Independent School District Bonds 2%, tender 6/1/21 (a) | | 11,865 | 11,972 |
| Plano Independent School District Series 2016 A, 5% 2/15/22 | | 7,270 | 7,964 |
| Sam Rayburn Muni. Pwr. Agcy. Series 2012, 5% 10/1/20 | | 980 | 1,017 |
| San Antonio Elec. & Gas Sys. Rev. Bonds: | | | |
| Series 2015 B, 2%, tender 12/1/21 (a) | | 3,965 | 3,991 |
| Series 2018, 2.75%, tender 12/1/22 (a) | | 10,100 | 10,433 |
| San Antonio Pub. Facilities Corp. and Rfdg. Lease (Convention Ctr. Proj.) Series 2012: | | | |
| 5% 9/15/21 | | 980 | 1,055 |
| 5% 9/15/22 | | 3,365 | 3,733 |
| San Antonio Wtr. Sys. Rev. Bonds Series 2013 F, 2%, tender 11/1/21 (a) | | 7,420 | 7,477 |
| Southwest Higher Ed. Auth. Rev. (Southern Methodist Univ. Proj.) Series 2016 A: | | | |
| 5% 10/1/20 | | 3,405 | 3,559 |
| 5% 10/1/21 | | 2,935 | 3,170 |
| Tarrant County Cultural Ed. Facilities Fin. Corp. Hosp. Rev.: | | | |
| (Scott & White Healthcare Proj.) Series 2013 A: | | | |
| 5% 8/15/21 | | 735 | 789 |
| 5% 8/15/23 | | 980 | 1,113 |
| Series 2013: | | | |
| 5% 9/1/19 | | 640 | 644 |
| 5% 9/1/20 | | 895 | 932 |
| Tarrant County Cultural Ed. Facilities Fin. Corp. Retirement Facility Rev. (Mrc Crestview Proj.) Series 2010, 8.125% 11/15/44 (Pre-Refunded to 11/15/20 @ 100) | | 2,875 | 3,135 |
| Tarrant County Cultural Ed. Facilities Fin. Corp. Rev.: | | | |
| Series 2016 A, 5% 2/15/26 | | 1,465 | 1,774 |
| Series 2017 A, 5% 2/15/24 | | 1,955 | 2,259 |
| Texas Gen. Oblig.: | | | |
| Bonds: | | | |
| Series 2019 C2, 1.85%, tender 8/1/22 (a) | | 1,510 | 1,514 |
| Series 2019 E2, 2.25%, tender 8/1/22 (a) | | 6,805 | 6,861 |
| Series 2013 B, 5.25% 8/1/21 (c) | | 8,805 | 9,491 |
| Series 2018, 4% 8/1/21 (c) | | 2,340 | 2,462 |
| Texas Trans. Commission Central Texas Tpk. Sys. Rev. Bonds Series 2015 A, 5%, tender 4/1/20 (a) | | 17,160 | 17,589 |
| Texas Wtr. Dev. Board Rev. Series 2018 B: | | | |
| 5% 4/15/22 | | 5,500 | 6,054 |
| 5% 10/15/22 | | 3,170 | 3,544 |
| 5% 4/15/23 | | 4,000 | 4,537 |
| Tomball Independent School District Bonds Series 2014 B2, 2.125%, tender 8/15/21 (a) | | 4,920 | 4,975 |
| Trinity River Auth. Reg'l. Wastewtr. Sys. Rev. Series 2016, 5% 8/1/23 | | 1,550 | 1,771 |
|
| TOTAL TEXAS | | | 321,753 |
|
| Utah - 0.5% | | | |
| Intermountain Pwr. Agcy. Pwr. Supply Rev. Series 2018 A, 5% 7/1/21 | | 12,655 | 13,562 |
| Virginia - 0.5% | | | |
| Chesapeake Trans. Sys. Toll Road Rev. Series 2012 A: | | | |
| 4% 7/15/20 | | 590 | 604 |
| 5% 7/15/21 | | 390 | 416 |
| Fredericksburg Econ. Dev. Auth. Rev. Series 2014, 5% 6/15/24 | | 2,290 | 2,657 |
| Gloucester County Indl. Dev. Auth. Bonds Series 2003 A, 2.4%, tender 5/2/22 (a)(c) | | 1,500 | 1,521 |
| Louisa Indl. Dev. Auth. Poll. Cont. Rev. Bonds Series 2008 B, 2.15%, tender 9/1/20 (a) | | 2,605 | 2,624 |
| Stafford County Econ. Dev. Auth. Hosp. Facilities Rev. Series 2016: | | | |
| 5% 6/15/24 | | 1,185 | 1,375 |
| 5% 6/15/25 | | 980 | 1,161 |
| 5% 6/15/26 | | 1,680 | 2,032 |
| Sussex County Indl. Dev. Auth. Solid Waste Disp. Rev. Bonds Series 2003 A, 2.4%, tender 5/2/22 (a)(c) | | 945 | 958 |
| Wise County Indl. Dev. Auth. Waste & Sewage Rev. Bonds Series 2009 A, 2.15%, tender 9/1/20 (a) | | 600 | 604 |
|
| TOTAL VIRGINIA | | | 13,952 |
|
| Washington - 1.0% | | | |
| Grant County Pub. Util. District #2 Series 2012 A, 5% 1/1/21 | | 1,825 | 1,923 |
| Port of Seattle Rev. Series 2016 B: | | | |
| 5% 10/1/20 (c) | | 2,870 | 2,996 |
| 5% 10/1/21 (c) | | 2,720 | 2,930 |
| 5% 10/1/22 (c) | | 2,445 | 2,713 |
| 5% 10/1/23 (c) | | 2,965 | 3,377 |
| Tacoma Elec. Sys. Rev.: | | | |
| Series 2013 A: | | | |
| 4% 1/1/21 | | 195 | 203 |
| 5% 1/1/21 | | 1,730 | 1,825 |
| Series 2017: | | | |
| 5% 1/1/22 | | 785 | 856 |
| 5% 1/1/25 | | 660 | 783 |
| 5% 1/1/26 | | 390 | 474 |
| Tobacco Settlement Auth. Rev. Series 2013, 5% 6/1/22 | | 2,165 | 2,345 |
| Washington Health Care Facilities Auth. Rev.: | | | |
| (Providence Health Systems Proj.) Series 2012 A, 5% 10/1/24 | | 795 | 884 |
| (Virginia Mason Med. Ctr. Proj.) Series 2017: | | | |
| 5% 8/15/25 | | 980 | 1,131 |
| 5% 8/15/26 | | 1,955 | 2,293 |
| 5% 8/15/27 | | 2,125 | 2,525 |
|
| TOTAL WASHINGTON | | | 27,258 |
|
| West Virginia - 0.2% | | | |
| West Virginia Econ. Dev. Auth. Solid Waste Disp. Facilities Rev. Bonds (Appalachian Pwr. Co. Amos Proj.) Series 2011 A, 1.7%, tender 9/1/20 (a)(c) | | 6,610 | 6,602 |
| Wisconsin - 1.6% | | | |
| Milwaukee County Arpt. Rev. Series 2013 A: | | | |
| 5% 12/1/20 (c) | | 1,300 | 1,361 |
| 5% 12/1/22 (c) | | 1,440 | 1,594 |
| 5.25% 12/1/23 (c) | | 1,505 | 1,723 |
| Pub. Fin. Auth. Sr Liv Rev. (Mary's Woods At Marylhurst, Inc. Proj.): | | | |
| Series 2017 A, 5% 5/15/23 (d) | | 365 | 392 |
| Series 2017 B-1 3.95% 11/15/24 (d) | | 175 | 176 |
| Pub. Fin. Auth. Solid Waste Bonds (Waste Mgmt., Inc. Proj.) Series 2017 A-2, 1.95%, tender 8/1/19 (a)(c) | | 6,200 | 6,202 |
| Wisconsin Health & Edl. Facilities: | | | |
| (Hosp. Sisters Svcs., Inc.) Series 2014 A, 5% 11/15/22 | | 3,305 | 3,679 |
| Bonds Series 2018 B: | | | |
| 5%, tender 1/25/23 (a) | | 8,500 | 9,534 |
| 5%, tender 1/31/24 (a) | | 8,810 | 10,097 |
| Series 2014: | | | |
| 5% 5/1/20 | | 400 | 410 |
| 5% 5/1/21 | | 625 | 659 |
| Wisconsin Health & Edl. Facilities Auth. Rev. Series 2012, 5% 10/1/21 | | 1,370 | 1,478 |
| Wisconsin St Gen. Fund Annual Appropriation Series 2019 A, 5% 5/1/22 | | 8,100 | 8,931 |
|
| TOTAL WISCONSIN | | | 46,236 |
|
| TOTAL MUNICIPAL BONDS | | | |
| (Cost $2,700,256) | | | 2,749,755 |
|
| Municipal Notes - 4.5% | | | |
| California - 0.7% | | | |
| San Francisco City & County Arpts. Commission Int'l. Arpt. Rev. Participating VRDN: | | | |
| Series Floaters XM 06 75, 2.15% 7/5/19 (Liquidity Facility Morgan Stanley Bank, West Valley City Utah) (a)(c)(f)(g) | | 1,500 | $1,500 |
| Series Floaters ZF 26 76, 2.1% 7/5/19 (Liquidity Facility Morgan Stanley Bank, West Valley City Utah) (a)(c)(f)(g) | | 6,000 | 6,000 |
| Wilshire Vermont Station Apts Participating VRDN Series Spears DBE 80 16, 2.25% 7/5/19 (Liquidity Facility Deutsche Bank AG New York Branch) (a)(c)(f)(g) | | 12,600 | 12,600 |
|
| TOTAL CALIFORNIA | | | 20,100 |
|
| Colorado - 0.5% | | | |
| Denver City & County Arpt. Rev. Participating VRDN: | | | |
| Series DBE 8027, 2.15% 7/5/19 (Liquidity Facility Deutsche Bank AG New York Branch) (a)(c)(f)(g) | | 5,200 | 5,200 |
| Series Floaters XL 00 90, 2.15% 7/5/19 (Liquidity Facility Morgan Stanley Bank, West Valley City Utah) (a)(c)(f)(g) | | 5,000 | 5,000 |
| Series Floaters XM 07 15, 2.2% 7/5/19 (Liquidity Facility Morgan Stanley Bank, West Valley City Utah) (a)(c)(f)(g) | | 4,590 | 4,590 |
|
| TOTAL COLORADO | | | 14,790 |
|
| Florida - 0.1% | | | |
| Greater Orlando Aviation Auth. Arpt. Facilities Rev. Participating VRDN Series Floaters XF 05 77, 2.1% 7/5/19 (Liquidity Facility Royal Bank of Canada) (a)(c)(f)(g) | | 3,300 | 3,300 |
| Illinois - 0.2% | | | |
| Chicago Board of Ed. Participating VRDN Series Floaters XG 01 08, 2.08% 7/5/19 (a)(f)(g) | | 1,500 | 1,500 |
| Illinois Gen. Oblig. Participating VRDN Series Floaters XM 01 86, 2.15% 7/5/19 (Liquidity Facility Deutsche Bank AG New York Branch) (a)(f)(g) | | 3,200 | 3,200 |
|
| TOTAL ILLINOIS | | | 4,700 |
|
| Indiana - 0.5% | | | |
| Indiana Dev. Fin. Auth. Envir. Rev. (PSI Energy Proj.) Series 2003 B, 2.11% 7/5/19, VRDN (a)(c) | | 14,250 | 14,250 |
| Louisiana - 0.2% | | | |
| Saint James Parish Gen. Oblig. (Nucor Steel Louisiana LLC Proj.) Series 2010 A1, 2.09% 7/5/19, VRDN (a) | | 6,700 | 6,700 |
| Minnesota - 0.6% | | | |
| Shakopee Minn Sr Hsg. Rev. Participating VRDN: | | | |
| Series Floaters 001, 2.2% 8/9/19 (Liquidity Facility Barclays Bank PLC) (a)(f)(g)(h) | | 10,000 | 10,000 |
| Series Floaters YX 11 03, 2.08% 7/5/19 (Liquidity Facility Barclays Bank PLC) (a)(f)(g) | | 7,745 | 7,745 |
|
| TOTAL MINNESOTA | | | 17,745 |
|
| Missouri - 0.2% | | | |
| Kansas City Indl. Dev. Auth. Multi-family Hsg. Rev. Participating VRDN Series Floaters XF 10 84, 2.3% 7/5/19 (Liquidity Facility Deutsche Bank AG New York Branch) (a)(f)(g) | | 6,200 | 6,200 |
| New York - 0.8% | | | |
| Build NYC Resource Corp. Rev. Participating VRDN Series Floaters XF 10 80, 2.3% 7/5/19 (Liquidity Facility Deutsche Bank AG New York Branch) (a)(f)(g) | | 14,000 | 14,000 |
| New York Metropolitan Trans. Auth. Rev. BAN: | | | |
| Series 2018 B, 5% 5/15/20 | | 3,500 | 3,608 |
| Series 2018 C, 5% 9/1/21 | | 3,435 | 3,692 |
|
| TOTAL NEW YORK | | | 21,300 |
|
| North Carolina - 0.1% | | | |
| Hertford County Indl. Facilities Poll. Cont. Fing. Auth. Series 2000 B, 2.15% 7/5/19, VRDN (a)(c) | | 2,300 | 2,300 |
| South Carolina - 0.1% | | | |
| South Carolina Pub. Svc. Auth. Rev. Participating VRDN Series Floaters XM 02 91, 2.15% 7/5/19 (Liquidity Facility Royal Bank of Canada) (a)(f)(g) | | 2,790 | 2,790 |
| Texas - 0.4% | | | |
| Garland Wtr. & Swr. Rev. Series 2019, 2.3% 7/12/19, LOC Sumitomo Mitsui Banking Corp., CP | | 2,500 | 2,500 |
| North Texas Tollway Auth. Rev. Participating VRDN Series XM0085, 2.1% 7/5/19 (Liquidity Facility Barclays Bank PLC) (a)(f)(g) | | 5,400 | 5,400 |
| Port Arthur Navigation District Envir. Facilities Rev. (Motiva Enterprises LLC Proj.): | | | |
| Series 2001 A, 2.07% 7/1/19, VRDN (a) | | 1,825 | 1,825 |
| Series 2010 B, 2.07% 7/1/19, VRDN (a) | | 1,000 | 1,000 |
|
| TOTAL TEXAS | | | 10,725 |
|
| Wisconsin - 0.1% | | | |
| Deforest Area School District BAN Series 2019, 3% 12/18/19 | | 3,400 | 3,406 |
| TOTAL MUNICIPAL NOTES | | | |
| (Cost $128,218) | | | 128,306 |
| | | Shares | Value (000s) |
|
| Money Market Funds - 0.1% | | | |
| Fidelity Municipal Cash Central Fund 2.00%(i)(j) | | | |
| (Cost $3,905) | | 3,904,610 | 3,905 |
| TOTAL INVESTMENT IN SECURITIES - 101.0% | | | |
| (Cost $2,832,379) | | | 2,881,966 |
| NET OTHER ASSETS (LIABILITIES) - (1.0)% | | | (29,098) |
| NET ASSETS - 100% | | | $2,852,868 |
Security Type Abbreviations
BAN – BOND ANTICIPATION NOTE
CP – COMMERCIAL PAPER
VRDN – VARIABLE RATE DEMAND NOTE (A debt instrument that is payable upon demand, either daily, weekly or monthly)
Legend
(a) Coupon rates for floating and adjustable rate securities reflect the rates in effect at period end.
(b) Security or a portion of the security purchased on a delayed delivery or when-issued basis.
(c) Private activity obligations whose interest is subject to the federal alternative minimum tax for individuals.
(d) Security exempt from registration under Rule 144A of the Securities Act of 1933. These securities may be resold in transactions exempt from registration, normally to qualified institutional buyers. At the end of the period, the value of these securities amounted to $20,435,000 or 0.7% of net assets.
(e) Coupon is indexed to a floating interest rate which may be multiplied by a specified factor and/or subject to caps or floors.
(f) Provides evidence of ownership in one or more underlying municipal bonds.
(g) Coupon rates are determined by re-marketing agents based on current market conditions.
(h) Restricted securities - Investment in securities not registered under the Securities Act of 1933 (excluding 144A issues). At the end of the period, the value of restricted securities (excluding 144A issues) amounted to $10,000,000 or 0.4% of net assets.
(i) Affiliated fund that is available only to investment companies and other accounts managed by Fidelity Investments. The rate quoted is the annualized seven-day yield of the fund at period end. A complete unaudited listing of the fund's holdings as of its most recent quarter end is available upon request. In addition, each Fidelity Central Fund's financial statements are available on the SEC's website or upon request.
(j) Information in this report regarding holdings by state and security types does not reflect the holdings of the Fidelity Municipal Cash Central Fund.
Additional information on each restricted holding is as follows:
| Security | Acquisition Date | Acquisition Cost (000s) |
| Shakopee Minn Sr Hsg. Rev. Participating VRDN Series Floaters 001, 2.2% 8/9/19 (Liquidity Facility Barclays Bank PLC) | 1/10/19 | $10,000 |
Affiliated Central Funds
Information regarding fiscal year to date income earned by the Fund from investments in Fidelity Central Funds is as follows:
| Fund | Income earned |
| | (Amounts in thousands) |
| Fidelity Municipal Cash Central Fund | $339 |
| Total | $339 |
Amounts in the income column in the above table include any capital gain distributions from underlying funds, which are presented in the corresponding line-item in the Statement of Operations, if applicable.
Investment Valuation
The following is a summary of the inputs used, as of June 30, 2019, involving the Fund's assets and liabilities carried at fair value. The inputs or methodology used for valuing securities may not be an indication of the risk associated with investing in those securities. For more information on valuation inputs, and their aggregation into the levels used below, please refer to the Investment Valuation section in the accompanying Notes to Financial Statements.
| | Valuation Inputs at Reporting Date: |
| Description | Total | Level 1 | Level 2 | Level 3 |
| (Amounts in thousands) | | | | |
| Investments in Securities: | | | | |
| Municipal Securities | $2,878,061 | $-- | $2,878,061 | $-- |
| Money Market Funds | 3,905 | 3,905 | -- | -- |
| Total Investments in Securities: | $2,881,966 | $3,905 | $2,878,061 | $-- |
Other Information
The distribution of municipal securities by revenue source, as a percentage of total Net Assets, is as follows (Unaudited):
| General Obligations | 33.1% |
| Health Care | 15.2% |
| Transportation | 14.1% |
| Electric Utilities | 9.2% |
| Industrial Development | 5.0% |
| Others* (Individually Less Than 5%) | 23.4% |
| | 100.0% |
* Includes net other assets
See accompanying notes which are an integral part of the financial statements.
Financial Statements
Statement of Assets and Liabilities
| Amounts in thousands (except per-share amounts) | | June 30, 2019 (Unaudited) |
| Assets | | |
Investment in securities, at value — See accompanying schedule:
Unaffiliated issuers (cost $2,828,474) | $2,878,061 | |
| Fidelity Central Funds (cost $3,905) | 3,905 | |
| Total Investment in Securities (cost $2,832,379) | | $2,881,966 |
| Cash | | 49 |
| Receivable for investments sold | | 6,795 |
| Receivable for fund shares sold | | 2,161 |
| Interest receivable | | 29,373 |
| Distributions receivable from Fidelity Central Funds | | 45 |
| Other receivables | | 3 |
| Total assets | | 2,920,392 |
| Liabilities | | |
| Payable for investments purchased | | |
| Regular delivery | $5,096 | |
| Delayed delivery | 58,181 | |
| Payable for fund shares redeemed | 2,135 | |
| Distributions payable | 907 | |
| Accrued management fee | 840 | |
| Distribution and service plan fees payable | 56 | |
| Other affiliated payables | 268 | |
| Other payables and accrued expenses | 41 | |
| Total liabilities | | 67,524 |
| Net Assets | | $2,852,868 |
| Net Assets consist of: | | |
| Paid in capital | | $2,802,557 |
| Total distributable earnings (loss) | | 50,311 |
| Net Assets | | $2,852,868 |
| Net Asset Value and Maximum Offering Price | | |
| Class A: | | |
| Net Asset Value and redemption price per share ($157,429 ÷ 14,719.6 shares)(a) | | $10.70 |
| Maximum offering price per share (100/97.25 of $10.70) | | $11.00 |
| Class M: | | |
| Net Asset Value and redemption price per share ($14,339 ÷ 1,343.2 shares)(a) | | $10.68 |
| Maximum offering price per share (100/97.25 of $10.68) | | $10.98 |
| Class C: | | |
| Net Asset Value and offering price per share ($24,068 ÷ 2,255.1 shares)(a) | | $10.67 |
| Limited Term Municipal Income: | | |
| Net Asset Value, offering price and redemption price per share ($2,201,313÷ 206,188.1 shares) | | $10.68 |
| Class I: | | |
| Net Asset Value, offering price and redemption price per share ($270,102 ÷ 25,286.1 shares) | | $10.68 |
| Class Z: | | |
| Net Asset Value, offering price and redemption price per share ($185,617 ÷ 17,378.4 shares) | | $10.68 |
(a) Redemption price per share is equal to net asset value less any applicable contingent deferred sales charge.
See accompanying notes which are an integral part of the financial statements.
Statement of Operations
| Amounts in thousands | | Six months ended June 30, 2019 (Unaudited) |
| Investment Income | | |
| Interest | | $31,477 |
| Income from Fidelity Central Funds | | 339 |
| Total income | | 31,816 |
| Expenses | | |
| Management fee | $5,067 | |
| Transfer agent fees | 1,353 | |
| Distribution and service plan fees | 352 | |
| Accounting fees and expenses | 249 | |
| Custodian fees and expenses | 11 | |
| Independent trustees' fees and expenses | 5 | |
| Registration fees | 125 | |
| Audit | 46 | |
| Legal | 2 | |
| Miscellaneous | 11 | |
| Total expenses before reductions | 7,221 | |
| Expense reductions | (26) | |
| Total expenses after reductions | | 7,195 |
| Net investment income (loss) | | 24,621 |
| Realized and Unrealized Gain (Loss) | | |
| Net realized gain (loss) on: | | |
| Investment securities: | | |
| Unaffiliated issuers | 1,812 | |
| Total net realized gain (loss) | | 1,812 |
| Change in net unrealized appreciation (depreciation) on: | | |
| Investment securities: | | |
| Unaffiliated issuers | 53,490 | |
| Fidelity Central Funds | 6 | |
| Total change in net unrealized appreciation (depreciation) | | 53,496 |
| Net gain (loss) | | 55,308 |
| Net increase (decrease) in net assets resulting from operations | | $79,929 |
See accompanying notes which are an integral part of the financial statements.
Statement of Changes in Net Assets
| Amounts in thousands | Six months ended June 30, 2019 (Unaudited) | Year ended December 31, 2018 |
| Increase (Decrease) in Net Assets | | |
| Operations | | |
| Net investment income (loss) | $24,621 | $47,961 |
| Net realized gain (loss) | 1,812 | (881) |
| Change in net unrealized appreciation (depreciation) | 53,496 | (12,220) |
| Net increase (decrease) in net assets resulting from operations | 79,929 | 34,860 |
| Distributions to shareholders | (24,569) | (48,484) |
| Share transactions - net increase (decrease) | (94,316) | (451,938) |
| Total increase (decrease) in net assets | (38,956) | (465,562) |
| Net Assets | | |
| Beginning of period | 2,891,824 | 3,357,386 |
| End of period | $2,852,868 | $2,891,824 |
See accompanying notes which are an integral part of the financial statements.
Financial Highlights
Fidelity Limited Term Municipal Income Fund Class A
| | Six months ended (Unaudited) June 30, | Years endedDecember 31, | | | | |
| | 2019 | 2018 | 2017 | 2016 | 2015 | 2014 |
| Selected Per–Share Data | | | | | | |
| Net asset value, beginning of period | $10.49 | $10.53 | $10.45 | $10.64 | $10.71 | $10.68 |
| Income from Investment Operations | | | | | | |
| Net investment income (loss)A | .075 | .135 | .122 | .118 | .129 | .153 |
| Net realized and unrealized gain (loss) | .210 | (.038) | .086 | (.188) | (.048) | .046 |
| Total from investment operations | .285 | .097 | .208 | (.070) | .081 | .199 |
| Distributions from net investment income | (.075) | (.135) | (.121) | (.118) | (.130) | (.153) |
| Distributions from net realized gain | – | (.002) | (.007) | (.002) | (.021) | (.016) |
| Total distributions | (.075) | (.137) | (.128) | (.120) | (.151) | (.169) |
| Redemption fees added to paid in capitalA | – | – | – | –B | –B | –B |
| Net asset value, end of period | $10.70 | $10.49 | $10.53 | $10.45 | $10.64 | $10.71 |
| Total ReturnC,D,E | 2.72% | .93% | 2.00% | (.68)% | .76% | 1.87% |
| Ratios to Average Net AssetsF,G | | | | | | |
| Expenses before reductions | .82%H | .81% | .81% | .80% | .81% | .79% |
| Expenses net of fee waivers, if any | .81%H | .81% | .81% | .80% | .81% | .79% |
| Expenses net of all reductions | .81%H | .81% | .81% | .80% | .81% | .79% |
| Net investment income (loss) | 1.43%H | 1.28% | 1.15% | 1.10% | 1.21% | 1.42% |
| Supplemental Data | | | | | | |
| Net assets, end of period (in millions) | $157 | $155 | $234 | $317 | $377 | $397 |
| Portfolio turnover rateI | 48%H | 27%J | 33% | 31% | 30% | 21% |
A Calculated based on average shares outstanding during the period.
B Amount represents less than $.0005 per share.
C Total returns for periods of less than one year are not annualized.
D Total returns would have been lower if certain expenses had not been reduced during the applicable periods shown.
E Total returns do not include the effect of the sales charges.
F Fees and expenses of any underlying Fidelity Central Funds are not included in the Fund's expense ratio. The Fund indirectly bears its proportionate share of the expenses of any underlying Fidelity Central Funds.
G Expense ratios reflect operating expenses of the class. Expenses before reductions do not reflect amounts reimbursed by the investment adviser or reductions from expense offset arrangements and do not represent the amount paid by the class during periods when reimbursements or reductions occur. Expenses net of fee waivers reflect expenses after reimbursement by the investment adviser but prior to reductions from expense offset arrangements. Expenses net of all reductions represent the net expenses paid by the class.
H Annualized
I Amount does not include the portfolio activity of any underlying Fidelity Central Funds.
J Portfolio turnover rate excludes securities received or delivered in-kind.
See accompanying notes which are an integral part of the financial statements.
Fidelity Limited Term Municipal Income Fund Class M
| | Six months ended (Unaudited) June 30, | Years endedDecember 31, | | | | |
| | 2019 | 2018 | 2017 | 2016 | 2015 | 2014 |
| Selected Per–Share Data | | | | | | |
| Net asset value, beginning of period | $10.47 | $10.51 | $10.43 | $10.62 | $10.69 | $10.66 |
| Income from Investment Operations | | | | | | |
| Net investment income (loss)A | .077 | .139 | .126 | .121 | .134 | .157 |
| Net realized and unrealized gain (loss) | .210 | (.038) | .087 | (.188) | (.049) | .046 |
| Total from investment operations | .287 | .101 | .213 | (.067) | .085 | .203 |
| Distributions from net investment income | (.077) | (.139) | (.126) | (.121) | (.134) | (.157) |
| Distributions from net realized gain | – | (.002) | (.007) | (.002) | (.021) | (.016) |
| Total distributions | (.077) | (.141) | (.133) | (.123) | (.155) | (.173) |
| Redemption fees added to paid in capitalA | – | – | – | –B | –B | –B |
| Net asset value, end of period | $10.68 | $10.47 | $10.51 | $10.43 | $10.62 | $10.69 |
| Total ReturnC,D,E | 2.75% | .98% | 2.04% | (.65)% | .80% | 1.91% |
| Ratios to Average Net AssetsF,G | | | | | | |
| Expenses before reductions | .78%H | .76% | .77% | .77% | .77% | .76% |
| Expenses net of fee waivers, if any | .77%H | .76% | .76% | .77% | .77% | .76% |
| Expenses net of all reductions | .77%H | .76% | .76% | .77% | .77% | .75% |
| Net investment income (loss) | 1.47%H | 1.33% | 1.19% | 1.14% | 1.25% | 1.46% |
| Supplemental Data | | | | | | |
| Net assets, end of period (in millions) | $14 | $15 | $17 | $20 | $22 | $25 |
| Portfolio turnover rateI | 48%H | 27%J | 33% | 31% | 30% | 21% |
A Calculated based on average shares outstanding during the period.
B Amount represents less than $.0005 per share.
C Total returns for periods of less than one year are not annualized.
D Total returns would have been lower if certain expenses had not been reduced during the applicable periods shown.
E Total returns do not include the effect of the sales charges.
F Fees and expenses of any underlying Fidelity Central Funds are not included in the Fund's expense ratio. The Fund indirectly bears its proportionate share of the expenses of any underlying Fidelity Central Funds.
G Expense ratios reflect operating expenses of the class. Expenses before reductions do not reflect amounts reimbursed by the investment adviser or reductions from expense offset arrangements and do not represent the amount paid by the class during periods when reimbursements or reductions occur. Expenses net of fee waivers reflect expenses after reimbursement by the investment adviser but prior to reductions from expense offset arrangements. Expenses net of all reductions represent the net expenses paid by the class.
H Annualized
I Amount does not include the portfolio activity of any underlying Fidelity Central Funds.
J Portfolio turnover rate excludes securities received or delivered in-kind.
See accompanying notes which are an integral part of the financial statements.
Fidelity Limited Term Municipal Income Fund Class C
| | Six months ended (Unaudited) June 30, | Years endedDecember 31, | | | | |
| | 2019 | 2018 | 2017 | 2016 | 2015 | 2014 |
| Selected Per–Share Data | | | | | | |
| Net asset value, beginning of period | $10.47 | $10.51 | $10.43 | $10.62 | $10.69 | $10.66 |
| Income from Investment Operations | | | | | | |
| Net investment income (loss)A | .036 | .057 | .043 | .038 | .050 | .072 |
| Net realized and unrealized gain (loss) | .200 | (.038) | .087 | (.188) | (.049) | .046 |
| Total from investment operations | .236 | .019 | .130 | (.150) | .001 | .118 |
| Distributions from net investment income | (.036) | (.057) | (.043) | (.038) | (.050) | (.072) |
| Distributions from net realized gain | – | (.002) | (.007) | (.002) | (.021) | (.016) |
| Total distributions | (.036) | (.059) | (.050) | (.040) | (.071) | (.088) |
| Redemption fees added to paid in capitalA | – | – | – | –B | –B | –B |
| Net asset value, end of period | $10.67 | $10.47 | $10.51 | $10.43 | $10.62 | $10.69 |
| Total ReturnC,D,E | 2.26% | .19% | 1.24% | (1.42)% | .01% | 1.11% |
| Ratios to Average Net AssetsF,G | | | | | | |
| Expenses before reductions | 1.56%H | 1.55% | 1.55% | 1.55% | 1.55% | 1.54% |
| Expenses net of fee waivers, if any | 1.56%H | 1.55% | 1.55% | 1.55% | 1.55% | 1.54% |
| Expenses net of all reductions | 1.56%H | 1.54% | 1.55% | 1.55% | 1.55% | 1.54% |
| Net investment income (loss) | .69%H | .55% | .41% | .35% | .47% | .67% |
| Supplemental Data | | | | | | |
| Net assets, end of period (in millions) | $24 | $32 | $40 | $53 | $63 | $65 |
| Portfolio turnover rateI | 48%H | 27%J | 33% | 31% | 30% | 21% |
A Calculated based on average shares outstanding during the period.
B Amount represents less than $.0005 per share.
C Total returns for periods of less than one year are not annualized.
D Total returns would have been lower if certain expenses had not been reduced during the applicable periods shown.
E Total returns do not include the effect of the contingent deferred sales charge.
F Fees and expenses of any underlying Fidelity Central Funds are not included in the Fund's expense ratio. The Fund indirectly bears its proportionate share of the expenses of any underlying Fidelity Central Funds.
G Expense ratios reflect operating expenses of the class. Expenses before reductions do not reflect amounts reimbursed by the investment adviser or reductions from expense offset arrangements and do not represent the amount paid by the class during periods when reimbursements or reductions occur. Expenses net of fee waivers reflect expenses after reimbursement by the investment adviser but prior to reductions from expense offset arrangements. Expenses net of all reductions represent the net expenses paid by the class.
H Annualized
I Amount does not include the portfolio activity of any underlying Fidelity Central Funds.
J Portfolio turnover rate excludes securities received or delivered in-kind.
See accompanying notes which are an integral part of the financial statements.
Fidelity Limited Term Municipal Income Fund
| | Six months ended (Unaudited) June 30, | Years endedDecember 31, | | | | |
| | 2019 | 2018 | 2017 | 2016 | 2015 | 2014 |
| Selected Per–Share Data | | | | | | |
| Net asset value, beginning of period | $10.47 | $10.51 | $10.43 | $10.63 | $10.69 | $10.66 |
| Income from Investment Operations | | | | | | |
| Net investment income (loss)A | .093 | .170 | .157 | .152 | .164 | .186 |
| Net realized and unrealized gain (loss) | .210 | (.038) | .087 | (.198) | (.039) | .046 |
| Total from investment operations | .303 | .132 | .244 | (.046) | .125 | .232 |
| Distributions from net investment income | (.093) | (.170) | (.157) | (.152) | (.164) | (.186) |
| Distributions from net realized gain | – | (.002) | (.007) | (.002) | (.021) | (.016) |
| Total distributions | (.093) | (.172) | (.164) | (.154) | (.185) | (.202) |
| Redemption fees added to paid in capitalA | – | – | – | –B | –B | –B |
| Net asset value, end of period | $10.68 | $10.47 | $10.51 | $10.43 | $10.63 | $10.69 |
| Total ReturnC,D | 2.90% | 1.28% | 2.35% | (.45)% | 1.18% | 2.19% |
| Ratios to Average Net AssetsE,F | | | | | | |
| Expenses before reductions | .47%G | .46% | .47% | .48% | .48% | .48% |
| Expenses net of fee waivers, if any | .47%G | .46% | .47% | .48% | .48% | .48% |
| Expenses net of all reductions | .47%G | .46% | .47% | .48% | .48% | .48% |
| Net investment income (loss) | 1.77%G | 1.63% | 1.49% | 1.43% | 1.54% | 1.73% |
| Supplemental Data | | | | | | |
| Net assets, end of period (in millions) | $2,201 | $2,393 | $2,740 | $2,779 | $3,058 | $3,225 |
| Portfolio turnover rateH | 48%G | 27%I | 33% | 31% | 30% | 21% |
A Calculated based on average shares outstanding during the period.
B Amount represents less than $.0005 per share.
C Total returns for periods of less than one year are not annualized.
D Total returns would have been lower if certain expenses had not been reduced during the applicable periods shown.
E Fees and expenses of any underlying Fidelity Central Funds are not included in the Fund's expense ratio. The Fund indirectly bears its proportionate share of the expenses of any underlying Fidelity Central Funds.
F Expense ratios reflect operating expenses of the class. Expenses before reductions do not reflect amounts reimbursed by the investment adviser or reductions from expense offset arrangements and do not represent the amount paid by the class during periods when reimbursements or reductions occur. Expenses net of fee waivers reflect expenses after reimbursement by the investment adviser but prior to reductions from expense offset arrangements. Expenses net of all reductions represent the net expenses paid by the class.
G Annualized
H Amount does not include the portfolio activity of any underlying Fidelity Central Funds.
I Portfolio turnover rate excludes securities received or delivered in-kind.
See accompanying notes which are an integral part of the financial statements.
Fidelity Limited Term Municipal Income Fund Class I
| | Six months ended (Unaudited) June 30, | Years endedDecember 31, | | | | |
| | 2019 | 2018 | 2017 | 2016 | 2015 | 2014 |
| Selected Per–Share Data | | | | | | |
| Net asset value, beginning of period | $10.48 | $10.51 | $10.44 | $10.63 | $10.70 | $10.67 |
| Income from Investment Operations | | | | | | |
| Net investment income (loss)A | .089 | .162 | .149 | .145 | .156 | .179 |
| Net realized and unrealized gain (loss) | .200 | (.028) | .077 | (.188) | (.048) | .046 |
| Total from investment operations | .289 | .134 | .226 | (.043) | .108 | .225 |
| Distributions from net investment income | (.089) | (.162) | (.149) | (.145) | (.157) | (.179) |
| Distributions from net realized gain | – | (.002) | (.007) | (.002) | (.021) | (.016) |
| Total distributions | (.089) | (.164) | (.156) | (.147) | (.178) | (.195) |
| Redemption fees added to paid in capitalA | – | – | – | –B | –B | –B |
| Net asset value, end of period | $10.68 | $10.48 | $10.51 | $10.44 | $10.63 | $10.70 |
| Total ReturnC,D | 2.76% | 1.29% | 2.17% | (.42)% | 1.02% | 2.12% |
| Ratios to Average Net AssetsE,F | | | | | | |
| Expenses before reductions | .55%G | .54% | .54% | .55% | .55% | .55% |
| Expenses net of fee waivers, if any | .55%G | .54% | .54% | .55% | .55% | .55% |
| Expenses net of all reductions | .55%G | .54% | .54% | .54% | .55% | .54% |
| Net investment income (loss) | 1.70%G | 1.55% | 1.42% | 1.36% | 1.47% | 1.67% |
| Supplemental Data | | | | | | |
| Net assets, end of period (in millions) | $270 | $269 | $327 | $297 | $276 | $263 |
| Portfolio turnover rateH | 48%G | 27%I | 33% | 31% | 30% | 21% |
A Calculated based on average shares outstanding during the period.
B Amount represents less than $.0005 per share.
C Total returns for periods of less than one year are not annualized.
D Total returns would have been lower if certain expenses had not been reduced during the applicable periods shown.
E Fees and expenses of any underlying Fidelity Central Funds are not included in the Fund's expense ratio. The Fund indirectly bears its proportionate share of the expenses of any underlying Fidelity Central Funds.
F Expense ratios reflect operating expenses of the class. Expenses before reductions do not reflect amounts reimbursed by the investment adviser or reductions from expense offset arrangements and do not represent the amount paid by the class during periods when reimbursements or reductions occur. Expenses net of fee waivers reflect expenses after reimbursement by the investment adviser but prior to reductions from expense offset arrangements. Expenses net of all reductions represent the net expenses paid by the class.
G Annualized
H Amount does not include the portfolio activity of any underlying Fidelity Central Funds.
I Portfolio turnover rate excludes securities received or delivered in-kind.
See accompanying notes which are an integral part of the financial statements.
Fidelity Limited Term Municipal Income Fund Class Z
| | Six months ended (Unaudited) June 30, | Years endedDecember 31, |
| | 2019 | 2018 A |
| Selected Per–Share Data | | |
| Net asset value, beginning of period | $10.48 | $10.41 |
| Income from Investment Operations | | |
| Net investment income (loss)B | .093 | .048 |
| Net realized and unrealized gain (loss) | .202 | .067 |
| Total from investment operations | .295 | .115 |
| Distributions from net investment income | (.095) | (.045) |
| Distributions from net realized gain | – | – |
| Total distributions | (.095) | (.045) |
| Net asset value, end of period | $10.68 | $10.48 |
| Total ReturnC,D | 2.82% | 1.11% |
| Ratios to Average Net AssetsE,F | | |
| Expenses before reductions | .44%G | .43%G |
| Expenses net of fee waivers, if any | .44%G | .43%G |
| Expenses net of all reductions | .44%G | .43%G |
| Net investment income (loss) | 1.81%G | 1.78%G |
| Supplemental Data | | |
| Net assets, end of period (in millions) | $186 | $28 |
| Portfolio turnover rateH | 48%G | 27%I |
A For the period October 2, 2018 (commencement of sale of shares) to December 31, 2018.
B Calculated based on average shares outstanding during the period.
C Total returns for periods of less than one year are not annualized.
D Total returns would have been lower if certain expenses had not been reduced during the applicable periods shown.
E Fees and expenses of any underlying Fidelity Central Funds are not included in the Fund's expense ratio. The Fund indirectly bears its proportionate share of the expenses of any underlying Fidelity Central Funds.
F Expense ratios reflect operating expenses of the class. Expenses before reductions do not reflect amounts reimbursed by the investment adviser or reductions from expense offset arrangements and do not represent the amount paid by the class during periods when reimbursements or reductions occur. Expense ratios before reductions for start-up periods may not be representative of longer-term operating periods. Expenses net of fee waivers reflect expenses after reimbursement by the investment adviser but prior to reductions from expense offset arrangements. Expenses net of all reductions represent the net expenses paid by the class.
G Annualized
H Amount does not include the portfolio activity of any underlying Fidelity Central Funds.
I Portfolio turnover rate excludes securities received or delivered in-kind.
See accompanying notes which are an integral part of the financial statements.
Notes to Financial Statements (Unaudited)
For the period ended June 30, 2019
(Amounts in thousands except percentages)
1. Organization.
Fidelity Limited Term Municipal Income Fund (the Fund) is a fund of Fidelity Municipal Trust (the Trust) and is authorized to issue an unlimited number of shares. The Trust is registered under the Investment Company Act of 1940, as amended (the 1940 Act), as an open-end management investment company organized as a Massachusetts business trust. The Fund offers Class A, Class M, Class C, Limited Term Municipal Income, Class I and Class Z shares, each of which has equal rights as to assets and voting privileges. Each class has exclusive voting rights with respect to matters that affect that class. Effective March 1, 2019, Class C shares will automatically convert to Class A shares after a holding period of ten years from the initial date of purchase, with certain exceptions.
2. Investments in Fidelity Central Funds.
The Fund invests in Fidelity Central Funds, which are open-end investment companies generally available only to other investment companies and accounts managed by the investment adviser and its affiliates. The Fund's Schedule of Investments lists each of the Fidelity Central Funds held as of period end, if any, as an investment of the Fund, but does not include the underlying holdings of each Fidelity Central Fund. As an Investing Fund, the Fund indirectly bears its proportionate share of the expenses of the underlying Fidelity Central Funds.
The Money Market Central Funds seek preservation of capital and current income and are managed by Fidelity Investments Money Management, Inc. (FIMM), an affiliate of the investment adviser. Annualized expenses of the Money Market Central Funds as of their most recent shareholder report date ranged from less than .005% to .01%.
A complete unaudited list of holdings for each Fidelity Central Fund is available upon request or at the Securities and Exchange Commission (the SEC) website at www.sec.gov. In addition, the financial statements of the Fidelity Central Funds are available on the SEC website or upon request.
3. Significant Accounting Policies.
The Fund is an investment company and applies the accounting and reporting guidance of the Financial Accounting Standards Board (FASB) Accounting Standards Codification Topic 946 Financial Services – Investments Companies. The financial statements have been prepared in conformity with accounting principles generally accepted in the United States of America (GAAP), which require management to make certain estimates and assumptions at the date of the financial statements. Actual results could differ from those estimates. Subsequent events, if any, through the date that the financial statements were issued have been evaluated in the preparation of the financial statements. The following summarizes the significant accounting policies of the Fund:
Investment Valuation. Investments are valued as of 4:00 p.m. Eastern time on the last calendar day of the period. The Board of Trustees (the Board) has delegated the day to day responsibility for the valuation of the Fund's investments to the Fair Value Committee (the Committee) established by the Fund's investment adviser. In accordance with valuation policies and procedures approved by the Board, the Fund attempts to obtain prices from one or more third party pricing vendors or brokers to value its investments. When current market prices, quotations or currency exchange rates are not readily available or reliable, investments will be fair valued in good faith by the Committee, in accordance with procedures adopted by the Board. Factors used in determining fair value vary by investment type and may include market or investment specific events, changes in interest rates and credit quality. The frequency with which these procedures are used cannot be predicted and they may be utilized to a significant extent. The Committee oversees the Fund's valuation policies and procedures and reports to the Board on the Committee's activities and fair value determinations. The Board monitors the appropriateness of the procedures used in valuing the Fund's investments and ratifies the fair value determinations of the Committee.
The Fund categorizes the inputs to valuation techniques used to value its investments into a disclosure hierarchy consisting of three levels as shown below:
- Level 1 – quoted prices in active markets for identical investments
- Level 2 – other significant observable inputs (including quoted prices for similar investments, interest rates, prepayment speeds, etc.)
- Level 3 – unobservable inputs (including the Fund's own assumptions based on the best information available)
Valuation techniques used to value the Fund's investments by major category are as follows:
Debt securities, including restricted securities, are valued based on evaluated prices received from third party pricing vendors or from brokers who make markets in such securities. Municipal securities are valued by pricing vendors who utilize matrix pricing which considers yield or price of bonds of comparable quality, coupon, maturity and type or by broker-supplied prices. When independent prices are unavailable or unreliable, debt securities may be valued utilizing pricing methodologies which consider similar factors that would be used by third party pricing vendors. Debt securities are generally categorized as Level 2 in the hierarchy but may be Level 3 depending on the circumstances.
Investments in open-end mutual funds, including the Fidelity Central Funds, are valued at their closing net asset value (NAV) each business day and are categorized as Level 1 in the hierarchy.
Changes in valuation techniques may result in transfers in or out of an assigned level within the disclosure hierarchy. The aggregate value of investments by input level as of June 30, 2019 is included at the end of the Fund's Schedule of Investments.
Investment Transactions and Income. For financial reporting purposes, the Fund's investment holdings and NAV include trades executed through the end of the last business day of the period. The NAV per share for processing shareholder transactions is calculated as of the close of business of the New York Stock Exchange (NYSE), normally 4:00 p.m. Eastern time and includes trades executed through the end of the prior business day. Gains and losses on securities sold are determined on the basis of identified cost. Income and capital gain distributions from Fidelity Central Funds, if any, are recorded on the ex-dividend date. Interest income is accrued as earned and includes coupon interest and amortization of premium and accretion of discount on debt securities as applicable. Debt obligations may be placed on non-accrual status and related interest income may be reduced by ceasing current accruals and writing off interest receivables when the collection of all or a portion of interest has become doubtful based on consistently applied procedures. A debt obligation is removed from non-accrual status when the issuer resumes interest payments or when collectability of interest is reasonably assured.
Class Allocations and Expenses. Investment income, realized and unrealized capital gains and losses, common expenses of the Fund, and certain fund-level expense reductions, if any, are allocated daily on a pro-rata basis to each class based on the relative net assets of each class to the total net assets of the Fund. Each class differs with respect to transfer agent and distribution and service plan fees incurred. Certain expense reductions may also differ by class. For the reporting period, the allocated portion of income and expenses to each class as a percent of its average net assets may vary due to the timing of recording these transactions in relation to fluctuating net assets of the classes. Expenses directly attributable to a fund are charged to that fund. Expenses attributable to more than one fund are allocated among the respective funds on the basis of relative net assets or other appropriate methods. Expense estimates are accrued in the period to which they relate and adjustments are made when actual amounts are known.
Income Tax Information and Distributions to Shareholders. Each year, the Fund intends to qualify as a regulated investment company under Subchapter M of the Internal Revenue Code, including distributing substantially all of its taxable income and realized gains. As a result, no provision for U.S. Federal income taxes is required. The Fund files a U.S. federal tax return, in addition to state and local tax returns as required. The Fund's federal income tax returns are subject to examination by the Internal Revenue Service (IRS) for a period of three fiscal years after they are filed. State and local tax returns may be subject to examination for an additional fiscal year depending on the jurisdiction.
Distributions are declared and recorded daily and paid monthly from net investment income. Distributions from realized gains, if any, are declared and recorded on the ex-dividend date. Income and capital gain distributions are declared separately for each class. Income and capital gain distributions are determined in accordance with income tax regulations, which may differ from GAAP.
Capital accounts within the financial statements are adjusted for permanent book-tax differences. These adjustments have no impact on net assets or the results of operations. Capital accounts are not adjusted for temporary book-tax differences which will reverse in a subsequent period.
Book-tax differences are primarily due to market discount, redemptions in kind, deferred trustees compensation and losses deferred due to wash sales.
The Fund purchases municipal securities whose interest, in the opinion of the issuer, is free from federal income tax. There is no assurance that the IRS will agree with this opinion. In the event the IRS determines that the issuer does not comply with relevant tax requirements, interest payments from a security could become federally taxable, possibly retroactively to the date the security was issued.
As of period end, the cost and unrealized appreciation (depreciation) in securities, and derivatives if applicable, for federal income tax purposes were as follows:
| Gross unrealized appreciation | $50,523 |
| Gross unrealized depreciation | (915) |
| Net unrealized appreciation (depreciation) | $49,608 |
| Tax cost | $2,832,358 |
Capital loss carryforwards are only available to offset future capital gains of the Fund to the extent provided by regulations and may be limited. Under the Regulated Investment Company Modernization Act of 2010 (the Act), the Fund is permitted to carry forward capital losses incurred in taxable years beginning after December 22, 2010 for an unlimited period and such capital losses are required to be used prior to any losses that expire. The capital loss carryforward information presented below, including any applicable limitation, is estimated as of prior fiscal period end and is subject to adjustment.
| No expiration | |
| Short-term | $(1,020) |
| Long-term | (91) |
| Total capital loss carryforward | $(1,111) |
Delayed Delivery Transactions and When-Issued Securities. During the period, the Fund transacted in securities on a delayed delivery or when-issued basis. Payment and delivery may take place after the customary settlement period for that security. The price of the underlying securities and the date when the securities will be delivered and paid for are fixed at the time the transaction is negotiated. The securities purchased on a delayed delivery or when-issued basis are identified as such in the Fund's Schedule of Investments. The Fund may receive compensation for interest forgone in the purchase of a delayed delivery or when-issued security. With respect to purchase commitments, the Fund identifies securities as segregated in its records with a value at least equal to the amount of the commitment. Losses may arise due to changes in the value of the underlying securities or if the counterparty does not perform under the contract's terms, or if the issuer does not issue the securities due to political, economic, or other factors.
Restricted Securities. The Fund may invest in securities that are subject to legal or contractual restrictions on resale. These securities generally may be resold in transactions exempt from registration or to the public if the securities are registered. Disposal of these securities may involve time-consuming negotiations and expense, and prompt sale at an acceptable price may be difficult. Information regarding restricted securities is included at the end of the Fund's Schedule of Investments.
4. Purchases and Sales of Investments.
Purchases and sales of securities, other than short-term securities, aggregated $650,602 and $662,096, respectively.
5. Fees and Other Transactions with Affiliates.
Management Fee. Fidelity Management & Research Company (the investment adviser) and its affiliates provide the Fund with investment management related services for which the Fund pays a monthly management fee. The management fee is the sum of an individual fund fee rate that is based on an annual rate of .25% of the Fund's average net assets and an annualized group fee rate that averaged .10% during the period. The group fee rate is based upon the average net assets of all the mutual funds advised by the investment adviser, including any mutual funds previously advised by the investment adviser that are currently advised by Fidelity SelectCo, LLC, an affiliate of the investment adviser. The group fee rate decreases as assets under management increase and increases as assets under management decrease. For the reporting period, the total annualized management fee rate was .35% of the Fund's average net assets.
Distribution and Service Plan Fees. In accordance with Rule 12b-1 of the 1940 Act, the Fund has adopted separate Distribution and Service Plans for each class of shares. Certain classes pay Fidelity Distributors Corporation (FDC), an affiliate of the investment adviser, separate Distribution and Service Fees, each of which is based on an annual percentage of each class' average net assets. In addition, FDC may pay financial intermediaries for selling shares of the Fund and providing shareholder support services. For the period, the Distribution and Service Fee rates, total fees and amounts retained by FDC were as follows:
| | Distribution Fee | Service Fee | Total Fees | Retained by FDC |
| Class A | -% | .25% | $195 | $14 |
| Class M | -% | .25% | 18 | –(a) |
| Class C | .75% | .25% | 139 | 10 |
| | | | $352 | $24 |
(a) In the amount of less than five hundred dollars.
Sales Load. FDC may receive a front-end sales charge of up to 2.75% for selling Class A shares and Class M shares, some of which is paid to financial intermediaries for selling shares of the Fund. Depending on the holding period, FDC may receive contingent deferred sales charges levied on Class A, Class M and Class C redemptions. The deferred sales charges are 1.00% for Class C shares, .75% or .50% for certain purchases of Class A shares and .25% for certain purchases of Class M shares.
For the period, sales charge amounts retained by FDC were as follows:
| | Retained by FDC |
| Class A | $6 |
| Class M | –(a) |
| Class C(b) | 1 |
| | $7 |
(a) In the amount of less than five hundred dollars.
(b) When Class C shares are initially sold, FDC pays commissions from its own resources to financial intermediaries through which the sales are made.
Transfer Agent Fees. Fidelity Investments Institutional Operations Company, Inc. (FIIOC), an affiliate of the investment adviser, is the transfer, dividend disbursing and shareholder servicing agent for the Fund. FIIOC receives account fees and asset-based fees that vary according to the account size and type of account of the shareholders of the respective classes of the Fund, except for Class Z. FIIOC receives an asset-based fee of Class Z's average net assets. FIIOC pays for typesetting, printing and mailing of shareholder reports, except proxy statements. For the period, transfer agent fees for each class were as follows:
| | Amount | % of Class-Level Average Net Assets(a) |
| Class A | $136 | .18 |
| Class M | 10 | .14 |
| Class C | 22 | .16 |
| Limited Term Municipal Income | 946 | .08 |
| Class I | 221 | .16 |
| Class Z | 18 | .05 |
| | $1,353 | |
(a) Annualized
Accounting Fees. Fidelity Service Company, Inc. (FSC), an affiliate of the investment adviser, maintains the Fund's accounting records. The fee is based on the level of average net assets for each month. For the period, the fees were equivalent to an annualized rate of .02%.
Interfund Trades. The Fund may purchase from or sell securities to other Fidelity Funds under procedures adopted by the Board. The procedures have been designed to ensure these interfund trades are executed in accordance with Rule 17a-7 of the 1940 Act. Interfund trades are included within the respective purchases and sales amounts shown in the Purchases and Sales of Investments note.
Prior Fiscal Year Affiliated Redemptions In-Kind. During the prior period, 6,984 shares of the Fund were redeemed in-kind for investments, including accrued interest, and cash with a value of $73,334. The Fund had a net realized gain of $220 on investments delivered through in-kind redemptions. The amount of the in-kind redemptions is included in share transactions in the accompanying Statement of Changes in Net Assets as well as the Notes to Financial Statements. The Fund recognized no gain or loss for federal income tax purposes.
6. Committed Line of Credit.
The Fund participates with other funds managed by the investment adviser or an affiliate in a $4.25 billion credit facility (the "line of credit") to be utilized for temporary or emergency purposes to fund shareholder redemptions or for other short-term liquidity purposes. The Fund has agreed to pay commitment fees on its pro-rata portion of the line of credit, which amounted to $4 and is reflected in Miscellaneous expenses on the Statement of Operations. During the period, the Fund did not borrow on this line of credit.
7. Expense Reductions.
Through arrangements with the Fund's custodian, credits realized as a result of certain uninvested cash balances were used to reduce the Fund's expenses. During the period, these credits reduced the Fund's custody expenses by $3. During the period, credits reduced each class' transfer agent expense in the amount of less than five hundred dollars.
In addition, during the period the investment adviser reimbursed and/or waived a portion of fund-level operating expenses in the amount of $7 and a portion of class-level operating expenses as follows:
| | Amount |
| Class A | $1 |
| Class M | –(a) |
| Class C | –(a) |
| Limited Term Municipal Income | 13 |
| Class I | 2 |
| Class Z | –(a) |
| | $16 |
(a) In the amount of less than five hundred dollars.
8. Distributions to Shareholders.
Distributions to shareholders of each class were as follows:
| | Six months ended
June 30, 2019 | Year ended
December 31, 2018(a) |
| Distributions to shareholders | | |
| Class A | $1,106 | $2,440 |
| Class M | 106 | 211 |
| Class C | 95 | 196 |
| Limited Term Municipal Income | 20,307 | 40,730 |
| Class I | 2,312 | 4,853 |
| Class Z | 643 | 54 |
| Total | $24,569 | $48,484 |
(a) Distributions for Class Z are for the period October 2, 2018 (commencement of sale of shares) to December 31, 2018.
9. Share Transactions.
Share transactions for each class were as follows and may contain automatic conversions between classes or exchanges between affiliated funds:
| | Shares | Shares | Dollars | Dollars |
| | Six months ended June 30, 2019 | Year ended December 31, 2018(a) | Six months ended June 30, 2019 | Year ended December 31, 2018(a) |
| Class A | | | | |
| Shares sold | 2,599 | 3,881 | $27,542 | $40,594 |
| Reinvestment of distributions | 100 | 221 | 1,057 | 2,313 |
| Shares redeemed | (2,748) | (11,559) | (29,121) | (120,913) |
| Net increase (decrease) | (49) | (7,457) | $(522) | $(78,006) |
| Class M | | | | |
| Shares sold | 42 | 566 | $455 | $5,917 |
| Reinvestment of distributions | 10 | 19 | 102 | 202 |
| Shares redeemed | (151) | (765) | (1,596) | (7,999) |
| Net increase (decrease) | (99) | (180) | $(1,039) | $(1,880) |
| Class C | | | | |
| Shares sold | 159 | 439 | $1,682 | $4,574 |
| Reinvestment of distributions | 8 | 17 | 82 | 173 |
| Shares redeemed | (979) | (1,196) | (10,343) | (12,485) |
| Net increase (decrease) | (812) | (740) | $(8,579) | $(7,738) |
| Limited Term Municipal Income | | | | |
| Shares sold | 20,539 | 67,006 | $217,094 | $700,289 |
| Reinvestment of distributions | 1,428 | 2,921 | 15,128 | 30,494 |
| Shares redeemed | (44,335) | (102,066)(b) | (469,025) | (1,066,085)(b) |
| Net increase (decrease) | (22,368) | (32,139) | $(236,803) | $(335,302) |
| Class I | | | | |
| Shares sold | 4,705 | 11,071 | $49,711 | $115,733 |
| Reinvestment of distributions | 189 | 403 | 2,000 | 4,212 |
| Shares redeemed | (5,268) | (16,897) | (55,778) | (176,288) |
| Net increase (decrease) | (374) | (5,423) | $(4,067) | $(56,343) |
| Class Z | | | | |
| Shares sold | 15,857 | 2,844 | $168,391 | $29,574 |
| Reinvestment of distributions | 45 | 5 | 481 | 51 |
| Shares redeemed | (1,153) | (220) | (12,178) | (2,294) |
| Net increase (decrease) | 14,749 | 2,629 | $156,694 | $27,331 |
(a) Share transactions for Class Z are for the period October 2, 2018 (commencement of sale of shares) to December 31, 2018.
(b) Amount includes in-kind redemptions (see the Prior Fiscal Year Affiliated Redemptions In-Kind note for additional details).
10. Other.
The Fund's organizational documents provide former and current trustees and officers with a limited indemnification against liabilities arising in connection with the performance of their duties to the Fund. In the normal course of business, the Fund may also enter into contracts that provide general indemnifications. The Fund's maximum exposure under these arrangements is unknown as this would be dependent on future claims that may be made against the Fund. The risk of material loss from such claims is considered remote.
Shareholder Expense Example
As a shareholder of the Fund, you incur two types of costs: (1) transaction costs, including sales charges (loads) on purchase payments or redemption proceeds, and (2) ongoing costs, including management fees, distribution and/or service (12b-1) fees and other Fund expenses. This Example is intended to help you understand your ongoing costs (in dollars) of investing in the Fund and to compare these costs with the ongoing costs of investing in other mutual funds.
The Example is based on an investment of $1,000 invested at the beginning of the period and held for the entire period (January 1, 2019 to June 30, 2019).
Actual Expenses
The first line of the accompanying table for each class of the Fund provides information about actual account values and actual expenses. You may use the information in this line, together with the amount you invested, to estimate the expenses that you paid over the period. Simply divide your account value by $1,000.00 (for example, an $8,600 account value divided by $1,000.00 = 8.6), then multiply the result by the number in the first line for a class of the Fund under the heading entitled "Expenses Paid During Period" to estimate the expenses you paid on your account during this period. In addition, the Fund, as a shareholder in the underlying Fidelity Central Funds, will indirectly bear its pro-rata share of the fees and expenses incurred by the underlying Fidelity Central Funds. These fees and expenses are not included in the Fund's annualized expense ratio used to calculate the expense estimate in the table below.
Hypothetical Example for Comparison Purposes
The second line of the accompanying table for each class of the Fund provides information about hypothetical account values and hypothetical expenses based on a Class' actual expense ratio and an assumed rate of return of 5% per year before expenses, which is not the Class' actual return. The hypothetical account values and expenses may not be used to estimate the actual ending account balance or expenses you paid for the period. You may use this information to compare the ongoing costs of investing in the Fund and other funds. To do so, compare this 5% hypothetical example with the 5% hypothetical examples that appear in the shareholder reports of the other funds. In addition, the Fund, as a shareholder in the underlying Fidelity Central Funds, will indirectly bear its pro-rata share of the fees and expenses incurred by the underlying Fidelity Central Funds. These fees and expenses are not included in the Fund's annualized expense ratio used to calculate the expense estimate in the table below.
Please note that the expenses shown in the table are meant to highlight your ongoing costs only and do not reflect any transaction costs. Therefore, the second line of the table is useful in comparing ongoing costs only, and will not help you determine the relative total costs of owning different funds. In addition, if these transactional costs were included, your costs would have been higher.
| | Annualized Expense Ratio-A | Beginning
Account Value
January 1, 2019 | Ending
Account Value
June 30, 2019 | Expenses Paid
During Period-B
January 1, 2019
to June 30, 2019 |
| Class A | .81% | | | |
| Actual | | $1,000.00 | $1,027.20 | $4.07 |
| Hypothetical-C | | $1,000.00 | $1,020.78 | $4.06 |
| Class M | .77% | | | |
| Actual | | $1,000.00 | $1,027.50 | $3.87 |
| Hypothetical-C | | $1,000.00 | $1,020.98 | $3.86 |
| Class C | 1.56% | | | |
| Actual | | $1,000.00 | $1,022.60 | $7.82 |
| Hypothetical-C | | $1,000.00 | $1,017.06 | $7.80 |
| Limited Term Municipal Income | .47% | | | |
| Actual | | $1,000.00 | $1,029.00 | $2.36 |
| Hypothetical-C | | $1,000.00 | $1,022.46 | $2.36 |
| Class I | .55% | | | |
| Actual | | $1,000.00 | $1,027.60 | $2.77 |
| Hypothetical-C | | $1,000.00 | $1,022.07 | $2.76 |
| Class Z | .44% | | | |
| Actual | | $1,000.00 | $1,028.20 | $2.21 |
| Hypothetical-C | | $1,000.00 | $1,022.61 | $2.21 |
A Annualized expense ratio reflects expenses net of applicable fee waivers.
B Expenses are equal to each Class' annualized expense ratio, multiplied by the average account value over the period, multiplied by 181/365 (to reflect the one-half year period).
C 5% return per year before expenses
STM-SANN-0819
1.701069.121
Fidelity® Conservative Income Municipal Bond Fund
Semi-Annual Report June 30, 2019 |
|
Beginning on January 1, 2021, as permitted by regulations adopted by the Securities and Exchange Commission, paper copies of a fund’s shareholder reports will no longer be sent by mail, unless you specifically request paper copies of the reports from the fund or from your financial intermediary, such as a financial advisor, broker-dealer or bank. Instead, the reports will be made available on a website, and you will be notified by mail each time a report is posted and provided with a website link to access the report.
If you already elected to receive shareholder reports electronically, you will not be affected by this change and you need not take any action. You may elect to receive shareholder reports and other communications from a fund electronically, by contacting your financial intermediary. For Fidelity customers, visit Fidelity's web site or call Fidelity using the contact information listed below.
You may elect to receive all future reports in paper free of charge. If you wish to continue receiving paper copies of your shareholder reports, you may contact your financial intermediary or, if you are a Fidelity customer, visit Fidelity’s website, or call Fidelity at the applicable toll-free number listed below. Your election to receive reports in paper will apply to all funds held with the fund complex/your financial intermediary.
| Account Type | Website | Phone Number |
| Brokerage, Mutual Fund, or Annuity Contracts: | fidelity.com/mailpreferences | 1-800-343-3548 |
| Employer Provided Retirement Accounts: | netbenefits.fidelity.com/preferences (choose 'no' under Required Disclosures to continue to print) | 1-800-343-0860 |
| Advisor Sold Accounts Serviced Through Your Financial Intermediary: | Contact Your Financial Intermediary | Your Financial Intermediary's phone number |
| Advisor Sold Accounts Serviced by Fidelity: | institutional.fidelity.com | 1-877-208-0098 |
Contents
To view a fund's proxy voting guidelines and proxy voting record for the 12-month period ended June 30, visit http://www.fidelity.com/proxyvotingresults or visit the Securities and Exchange Commission's (SEC) web site at http://www.sec.gov.
You may also call 1-800-544-8544 to request a free copy of the proxy voting guidelines.
Standard & Poor's, S&P and S&P 500 are registered service marks of The McGraw-Hill Companies, Inc. and have been licensed for use by Fidelity Distributors Corporation.
Other third-party marks appearing herein are the property of their respective owners.
All other marks appearing herein are registered or unregistered trademarks or service marks of FMR LLC or an affiliated company. © 2019 FMR LLC. All rights reserved.
This report and the financial statements contained herein are submitted for the general information of the shareholders of the Fund. This report is not authorized for distribution to prospective investors in the Fund unless preceded or accompanied by an effective prospectus.
A fund files its complete schedule of portfolio holdings with the SEC for the first and third quarters of each fiscal year on Form N-PORT. Forms N-PORT are available on the SEC’s web site at http://www.sec.gov. A fund's Forms N-PORT may be reviewed and copied at the SEC’s Public Reference Room in Washington, DC. Information regarding the operation of the SEC's Public Reference Room may be obtained by calling 1-800-SEC-0330.
For a complete list of a fund's portfolio holdings, view the most recent holdings listing, semiannual report, or annual report on Fidelity's web site at http://www.fidelity.com, http://www.institutional.fidelity.com, or http://www.401k.com, as applicable.
NOT FDIC INSURED •MAY LOSE VALUE •NO BANK GUARANTEE
Neither the Fund nor Fidelity Distributors Corporation is a bank.
Investment Summary (Unaudited)
Maturity Diversification as of June 30, 2019
| | % of fund's investments |
| 1 - 7 | 40.2 |
| 8 - 30 | 2.5 |
| 31 - 60 | 2.1 |
| 61 - 90 | 1.5 |
| 91 - 180 | 8.1 |
| > 180 | 45.6 |
The date shown for securities represents the date when principal payments must be paid, taking into account any call options exercised by the issuer and any permissible maturity shortening features other than interest rate resets.
Top Five States as of June 30, 2019
| | % of fund's net assets |
| Texas | 9.8 |
| New Jersey | 9.0 |
| New York | 8.5 |
| Florida | 6.3 |
| Illinois | 5.8 |
Top Five Sectors as of June 30, 2019
| | % of fund's net assets |
| General Obligations | 18.5 |
| Synthetics | 17.2 |
| Health Care | 14.8 |
| Industrial Development | 14.2 |
| Transportation | 12.4 |
Quality Diversification (% of fund's net assets)
| As of June 30, 2019 |
| | AAA | 2.1% |
| | AA,A | 41.5% |
| | BBB | 4.0% |
| | Not Rated | 0.5% |
| | Short-Term Investments and Net Other Assets | 51.9% |

We have used ratings from Moody's Investors Service, Inc. Where Moody's® ratings are not available, we have used S&P® ratings. All ratings are as of the date indicated and do not reflect subsequent changes.
Schedule of Investments June 30, 2019 (Unaudited)
Showing Percentage of Net Assets
| Municipal Bonds - 47.9% | | | |
| | | Principal Amount | Value |
| Alabama - 0.8% | | | |
| Alabama 21st Century Auth. Tobacco Settlement Rev. Series 2012 A, 5% 6/1/21 | | 950,000 | 1,006,554 |
| Mobile Indl. Dev. Board Poll. Cont. Rev. Bonds Series 2009 E, 1.85%, tender 3/24/20 (a) | | 15,770,000 | 15,791,436 |
|
| TOTAL ALABAMA | | | 16,797,990 |
|
| Alaska - 0.4% | | | |
| North Slope Borough Gen. Oblig. Series 2017 A, 5% 6/30/21 (Pre-Refunded to 6/30/20 @ 100) | | 440,000 | 456,258 |
| Valdez Marine Term. Rev. (BP Pipelines (Alaska), Inc. Proj.): | | | |
| Series 2003 B, 5% 1/1/21 | | $4,500,000 | $4,733,010 |
| Series 2003 C, 5% 1/1/21 | | 2,225,000 | 2,340,211 |
|
| TOTAL ALASKA | | | 7,529,479 |
|
| Arizona - 1.5% | | | |
| Arizona Board of Regents Ctfs. of Prtn. Series 2015 A, 5% 6/1/22 | | 100,000 | 110,284 |
| Arizona Ctfs. of Prtn. Series 2019 A: | | | |
| 5% 10/1/20 (b) | | 1,050,000 | 1,097,019 |
| 5% 10/1/21 (b) | | 920,000 | 993,885 |
| 5% 10/1/22 (b) | | 980,000 | 1,091,112 |
| Arizona Health Facilities Auth. Rev.: | | | |
| (Banner Health Sys. Proj.) Series 2015 A, 5% 1/1/20 | | 2,000,000 | 2,035,249 |
| Bonds Series 2013 A1, 3.75%, tender 7/4/19 (a) | | 2,500,000 | 2,503,737 |
| Arizona State Lottery Rev. Series 2019: | | | |
| 5% 7/1/21 (b) | | 1,575,000 | 1,672,335 |
| 5% 7/1/22 (b) | | 1,265,000 | 1,385,820 |
| Coconino County Poll. Cont. Corp. Rev. Bonds (Nevada Pwr. Co. Projs.): | | | |
| Series 2017 A, 1.8%, tender 5/21/20 (a)(c) | | 6,915,000 | 6,927,077 |
| Series 2017 B, 1.6%, tender 5/21/20 (a) | | 820,000 | 820,715 |
| Maricopa County Rev.: | | | |
| Bonds Series 2019 B, SIFMA Municipal Swap Index + 0.380% 2.28%, tender 10/18/22 (a)(d) | | 8,500,000 | 8,500,000 |
| Series 2016 A, 5% 1/1/20 | | 2,360,000 | 2,401,594 |
|
| TOTAL ARIZONA | | | 29,538,827 |
|
| Arkansas - 0.2% | | | |
| Little Rock School District Series 2017, 3% 2/1/21 | | 3,255,000 | 3,334,031 |
| California - 0.9% | | | |
| California Infrastructure and Econ. Dev. Bank Rev. Bonds: | | | |
| Series 2018 A, 1 month U.S. LIBOR + 0.380% 2.053%, tender 8/1/21 (a)(d) | | 13,270,000 | 13,269,867 |
| Series 2018 C, 1 month U.S. LIBOR + 0.380% 2.061%, tender 8/1/21 (a)(d) | | 5,800,000 | 5,799,942 |
|
| TOTAL CALIFORNIA | | | 19,069,809 |
|
| Colorado - 1.2% | | | |
| Colorado Health Facilities Auth. Bonds (Valley View Hosp. Assoc. Proj.) Series 2018, 2.8%, tender 5/15/23 (a) | | 980,000 | 1,012,908 |
| Colorado Reg'l. Trans. District Ctfs. of Prtn. Series 2013 A, 5% 6/1/20 | | 185,000 | 191,179 |
| Colorado Univ. Co. Hosp. Auth. Rev. Bonds: | | | |
| Series 2017C-1, 4%, tender 3/1/20 (a) | | 8,600,000 | 8,633,293 |
| Series 2017C-2, 5%, tender 3/1/22 (a) | | 2,675,000 | 2,873,699 |
| Denver City & County Arpt. Rev.: | | | |
| Series 2012 A, 5% 11/15/22 (c) | | 1,000,000 | 1,113,570 |
| Series 2017 A, 5% 11/15/19 (c) | | 1,060,000 | 1,073,712 |
| E-470 Pub. Hwy. Auth. Rev.: | | | |
| Series 2000 B: | | | |
| 0% 9/1/19 (Nat'l. Pub. Fin. Guarantee Corp. Insured) | | 3,480,000 | 3,471,126 |
| 0% 9/1/20 (Nat'l. Pub. Fin. Guarantee Corp. Insured) | | 2,000,000 | 1,963,680 |
| Series 2015 A: | | | |
| 2.35% 9/1/20 | | 300,000 | 302,403 |
| 5% 9/1/20 | | 845,000 | 877,473 |
| Series B, 0% 9/1/20 (Nat'l. Pub. Fin. Guarantee Corp. Insured) | | 1,995,000 | 1,958,771 |
|
| TOTAL COLORADO | | | 23,471,814 |
|
| Connecticut - 4.4% | | | |
| Connecticut Gen. Oblig.: | | | |
| Series 2011 D, 5% 11/1/19 | | 1,880,000 | 1,902,637 |
| Series 2012 A, SIFMA Municipal Swap Index + 1.250% 3.15% 4/15/20 (a)(d) | | 9,665,000 | 9,738,318 |
| Series 2012 C, 5% 6/1/20 | | 1,940,000 | 2,004,437 |
| Series 2012 D, SIFMA Municipal Swap Index + 0.920% 2.82% 9/15/19 (a)(d) | | 1,870,000 | 1,872,473 |
| Series 2013 A: | | | |
| SIFMA Municipal Swap Index + 0.650% 2.55% 3/1/20 (a)(d) | | 220,000 | 220,543 |
| 5% 10/15/19 | | 1,040,000 | 1,050,837 |
| Series 2013 D: | | | |
| SIFMA Municipal Swap Index + 0.880% 2.78% 8/15/19 (a)(d) | | 745,000 | 745,579 |
| 5% 8/15/20 | | 560,000 | 582,753 |
| Series 2014 C, 5% 6/15/20 | | 1,155,000 | 1,194,992 |
| Series 2014 E, 5% 9/1/19 | | 1,245,000 | 1,252,427 |
| Series 2015 C, SIFMA Municipal Swap Index + 0.900% 2.8% 6/15/21 (a)(d) | | 4,900,000 | 4,936,799 |
| Series 2015 E, 5% 8/1/19 | | 570,000 | 571,671 |
| Series 2015 F, 5% 11/15/20 | | 530,000 | 556,299 |
| Series 2016 B: | | | |
| 5% 5/15/20 | | 1,495,000 | 1,542,249 |
| 5% 5/15/21 | | 5,345,000 | 5,699,748 |
| 5% 5/15/23 | | 750,000 | 846,690 |
| Series 2016 E: | | | |
| 4% 10/15/19 | | 2,565,000 | 2,584,437 |
| 5% 10/15/20 | | 3,460,000 | 3,621,340 |
| 5% 10/15/21 | | 475,000 | 513,010 |
| Series 2016 G: | | | |
| 5% 11/1/19 | | 1,620,000 | 1,639,507 |
| 5% 11/1/21 | | 2,550,000 | 2,757,927 |
| Series 2017 A, 5% 4/15/20 | | 7,935,000 | 8,161,824 |
| Series 2017 B, 5% 4/15/20 | | 300,000 | 308,576 |
| Series 2018 A, 5% 4/15/20 | | 1,315,000 | 1,352,590 |
| Series 2018 B: | | | |
| 5% 4/15/21 | | 3,285,000 | 3,493,433 |
| 5% 4/15/22 | | 1,315,000 | 1,440,293 |
| 5% 4/15/23 | | 1,000,000 | 1,126,320 |
| Series 2018 F, 5% 9/15/22 | | 570,000 | 632,079 |
| Series A, 5% 2/15/21 | | 4,425,000 | 4,436,859 |
| Series D, SIFMA Municipal Swap Index + 1.020% 2.92% 8/15/20 (a)(d) | | 1,935,000 | 1,950,093 |
| Connecticut Health & Edl. Facilities Auth. Rev.: | | | |
| Bonds (Yale New Haven Hosp. Proj.) Series B, 1 month U.S. LIBOR + 0.550% 2.185%, tender 7/1/19 (a)(d) | | 13,500,000 | 13,500,000 |
| Series 2016 CT, 3% 12/1/19 | | 445,000 | 447,960 |
| Series A, 5% 7/1/20 | | 1,400,000 | 1,451,583 |
| Connecticut Spl. Tax Oblig. Trans. Infrastructure Rev.: | | | |
| Series 2011 A, 5% 12/1/19 | | 250,000 | 253,823 |
| Series 2014 A, 5% 9/1/20 | | 420,000 | 437,485 |
| Series 2016 A, 5% 9/1/21 | | 1,300,000 | 1,398,878 |
| Naugatuck Ctfs. of Prtn. (Naugatuck Incineration Facilities Proj.) Series 2014 A, 5% 6/15/20 (c) | | 920,000 | 951,053 |
| New Britain Gen. Oblig. Series 2017 A: | | | |
| 5% 3/1/20 (FSA Insured) | | 185,000 | 189,345 |
| 5% 3/1/21 (FSA Insured) | | 255,000 | 269,563 |
| Stratford Gen. Oblig. Series 2017, 4% 7/1/19 (FSA Insured) | | 480,000 | 480,000 |
|
| TOTAL CONNECTICUT | | | 88,116,430 |
|
| District Of Columbia - 0.2% | | | |
| Metropolitan Washington DC Arpts. Auth. Sys. Rev.: | | | |
| Series 2010 B, 5% 10/1/19 (c) | | 1,495,000 | 1,508,157 |
| Series 2011 C, 5% 10/1/22 (c) | | 840,000 | 905,318 |
| Series 2015 B, 2.75% 10/1/19 (c) | | 2,000,000 | 2,006,554 |
| Series 2019 A: | | | |
| 5% 10/1/21 (b)(c) | | 380,000 | 409,340 |
| 5% 10/1/22 (b)(c) | | 220,000 | 244,108 |
|
| TOTAL DISTRICT OF COLUMBIA | | | 5,073,477 |
|
| Florida - 3.1% | | | |
| Broward County Arpt. Sys. Rev.: | | | |
| Series 2012 P1, 4% 10/1/19 (c) | | 1,690,000 | 1,701,020 |
| Series 2013 A, 5% 10/1/20 (c) | | 700,000 | 730,142 |
| Broward County Port Facilities Rev. Series 2011 B: | | | |
| 5% 9/1/21 (c) | | 645,000 | 691,479 |
| 5% 9/1/22 (c) | | 1,000,000 | 1,070,510 |
| Citizens Property Ins. Corp. Series 2012 A1, 5% 6/1/21 | | 7,885,000 | 8,419,130 |
| Florida Muni. Pwr. Agcy. Rev. Series 2015 B, 5% 10/1/19 | | 900,000 | 907,988 |
| Greater Orlando Aviation Auth. Arpt. Facilities Rev.: | | | |
| Series 2016 A, 5% 10/1/20 (c) | | 700,000 | 730,058 |
| Series 2016, 5% 10/1/20 (c) | | 150,000 | 156,441 |
| Hillsborough County Aviation Auth. Rev. Series 2013 A, 5% 10/1/20 (c) | | 1,465,000 | 1,528,273 |
| Jacksonville Elec. Auth. Elec. Sys. Rev.: | | | |
| Series 2010 B, 5% 10/1/20 | | 635,000 | 660,978 |
| Series 2013 A, 5% 10/1/20 | | 4,400,000 | 4,580,004 |
| Series 2013 C, 5% 10/1/19 | | 770,000 | 776,273 |
| Series 2013 D, 5% 10/1/20 | | 660,000 | 687,001 |
| Series 2017 3A, 5% 10/1/19 | | 1,500,000 | 1,512,258 |
| Lakeland Hosp. Sys. Rev. Series 2016, 5% 11/15/19 | | 195,000 | 197,566 |
| Miami-Dade County Aviation Rev.: | | | |
| Series 2012 A: | | | |
| 5% 10/1/20 (c) | | 1,175,000 | 1,226,195 |
| 5% 10/1/21 (c) | | 710,000 | 764,720 |
| Series 2014, 5% 10/1/21 (c) | | 770,000 | 829,344 |
| Series 2015 A: | | | |
| 5% 10/1/19 (c) | | 5,780,000 | 5,832,759 |
| 5% 10/1/21 (c) | | 740,000 | 797,202 |
| Series 2017 B, 5% 10/1/19 (c) | | 3,905,000 | 3,940,644 |
| Series A1, 5% 10/1/21 | | 200,000 | 209,424 |
| Miami-Dade County Expressway Auth.: | | | |
| (Waste Mgmt., Inc. of Florida Proj.) 5% 7/1/21 | | 1,505,000 | 1,605,022 |
| Series 2014 B, 5% 7/1/21 | | 685,000 | 730,525 |
| Miami-Dade County Indl. Dev. Auth. Solid Waste Disp. Rev. Bonds (Waste Mgmt. of Florida Proj.) Series 2018, 2.85%, tender 8/2/21 (a)(c) | | 1,560,000 | 1,592,698 |
| Miami-Dade County School Board Ctfs. of Prtn.: | | | |
| (Miami-Dade County School District) Series 2012 B-2, 4% 4/1/20 | | 400,000 | 407,787 |
| Series 2014 D, 5% 11/1/20 | | 485,000 | 508,125 |
| Series 2015 A: | | | |
| 5% 5/1/20 | | 2,270,000 | 2,337,777 |
| 5% 5/1/21 | | 885,000 | 942,861 |
| Series 2016 C, 5% 2/1/20 | | 1,360,000 | 1,388,435 |
| Orange County Health Facilities Auth. Series B: | | | |
| 4% 10/1/19 (b) | | 3,675,000 | 3,698,604 |
| 5% 10/1/20 (b) | | 3,340,000 | 3,489,866 |
| 5% 10/1/21 (b) | | 2,670,000 | 2,880,449 |
| 5% 10/1/22 (b) | | 2,605,000 | 2,893,061 |
| Tampa Solid Waste Sys. Rev.: | | | |
| Series 2010, 5% 10/1/19 (FSA Insured) (c) | | 745,000 | 751,369 |
| Series 2013, 5% 10/1/20 (c) | | 690,000 | 719,187 |
| Tampa Tax Allocation (H. Lee Moffitt Cancer Ctr. Proj.) Series 2016 A: | | | |
| 5% 9/1/19 | | 375,000 | 377,149 |
| 5% 9/1/20 | | 435,000 | 452,391 |
|
| TOTAL FLORIDA | | | 62,724,715 |
|
| Georgia - 1.5% | | | |
| Clarke County Hosp. Auth. Series 2016: | | | |
| 5% 7/1/19 | | 855,000 | 855,000 |
| 5% 7/1/20 | | 560,000 | 579,952 |
| Cobb County Kennestone Hosp. Auth. Rev. (Wellstar Health Sys., Inc. Proj.) Series 2017 A: | | | |
| 5% 4/1/20 | | 130,000 | 133,434 |
| 5% 4/1/21 | | 300,000 | 317,232 |
| Fulton County Dev. Auth. Hosp. R (Wellstar Health Sys., Inc. Proj.) Series 2017 A: | | | |
| 5% 4/1/20 | | 110,000 | 112,906 |
| 5% 4/1/21 | | 245,000 | 259,073 |
| Fulton County Dev. Auth. (Piedmont Healthcare, Inc. Proj.) Series 2016, 5% 7/1/20 | | 370,000 | 383,182 |
| Georgia Muni. Elec. Auth. Pwr. Rev.: | | | |
| Series 2008 A, 5.25% 1/1/21 | | 400,000 | 421,944 |
| Series 2009 B, 5% 1/1/20 | | 11,110,000 | 11,301,902 |
| Series 2011 A: | | | |
| 5% 1/1/20 | | 1,230,000 | 1,251,246 |
| 5% 1/1/21 | | 7,860,000 | 8,262,196 |
| Series 2015 A: | | | |
| 5% 1/1/20 | | 1,040,000 | 1,057,807 |
| 5% 1/1/21 | | 745,000 | 783,122 |
| Series 2016 A: | | | |
| 4% 1/1/21 | | 820,000 | 849,864 |
| 5% 1/1/20 | | 1,360,000 | 1,383,286 |
| Series C, 5% 1/1/22 | | 730,000 | 789,751 |
| Series GG: | | | |
| 5% 1/1/20 | | 355,000 | 361,168 |
| 5% 1/1/21 | | 635,000 | 667,976 |
| Griffin-Spalding County Hosp. (Wellstar Health Sys., Inc. Proj.) Series 2017 A: | | | |
| 3% 4/1/20 | | 110,000 | 111,278 |
| 3% 4/1/21 | | 100,000 | 102,314 |
| Lagrange-Troup County Hosp. Rev. (Wellstar Health Sys., Inc. Proj.) Series 2017 A: | | | |
| 5% 4/1/20 | | 95,000 | 97,510 |
| 5% 4/1/21 | | 240,000 | 253,786 |
|
| TOTAL GEORGIA | | | 30,335,929 |
|
| Hawaii - 0.1% | | | |
| Hawaii Arpts. Sys. Rev. Series 2011, 5% 7/1/19 (c) | | 690,000 | 690,000 |
| State of Hawaii Dept. of Trans. Series 2013, 5% 8/1/22 (c) | | 750,000 | 823,493 |
|
| TOTAL HAWAII | | | 1,513,493 |
|
| Idaho - 0.1% | | | |
| Idaho Hsg. & Fin. Assoc. Single Family Mtg. (Idaho St Garvee Proj.) Series 2017 A: | | | |
| 5% 7/15/20 | | 445,000 | 461,560 |
| 5% 7/15/21 | | 660,000 | 706,563 |
|
| TOTAL IDAHO | | | 1,168,123 |
|
| Illinois - 3.4% | | | |
| Champaign County Ill Cmnty. Unit Series 2017, 5% 1/1/21 | | 745,000 | 784,716 |
| Chicago Metropolitan Wtr. Reclamation District of Greater Chicago Series 2014 D, 5% 12/1/19 | | 1,620,000 | 1,643,619 |
| Chicago O'Hare Int'l. Arpt. Rev.: | | | |
| Series 2012 B, 4% 1/1/20 (c) | | 6,365,000 | 6,444,166 |
| Series 2015 B, 5% 1/1/21 | | 1,400,000 | 1,473,990 |
| Series 2018 A, 5% 1/1/20 (c) | | 800,000 | 813,899 |
| Chicago Park District Gen. Oblig. Series 2013 D, 5% 1/1/20 | | 645,000 | 655,009 |
| Chicago Transit Auth. Cap. Grant Receipts Rev. Series 2017: | | | |
| 5% 6/1/20 | | 2,280,000 | 2,345,802 |
| 5% 6/1/21 | | 975,000 | 1,032,857 |
| Cook County Gen. Oblig.: | | | |
| Series 2014 A, 3% 11/15/19 | | 965,000 | 970,226 |
| Series 2018, 5% 11/15/19 | | 1,115,000 | 1,129,214 |
| Illinois Fin. Auth. Rev.: | | | |
| (Hosp. Sisters Svcs., Inc. Proj.) Series 2012 C, 5% 8/15/20 | | 2,005,000 | 2,082,814 |
| (Rush Univ. Med. Ctr. Proj.) Series 2015 A, 5% 11/15/19 | | 1,415,000 | 1,433,781 |
| Bonds: | | | |
| (Advocate Health Care Network Proj.): | | | |
| Series 2008 A1, 5%, tender 1/15/20 (a) | | 1,300,000 | 1,324,479 |
| Series 2008 A2, 5%, tender 2/12/20 (a) | | 2,035,000 | 2,078,638 |
| (Ascension Health Cr. Group Proj.) Series 2012 E2, 1.75%, tender 4/1/21 (a) | | 2,100,000 | 2,108,631 |
| Series 2016 A: | | | |
| 5% 7/1/19 | | 445,000 | 445,000 |
| 5% 8/15/19 | | 370,000 | 371,279 |
| Series 2016 D, 5% 2/15/20 | | 1,475,000 | 1,507,521 |
| Series 2016, 5% 11/15/19 | | 260,000 | 263,315 |
| Illinois Gen. Oblig.: | | | |
| Series 2012, 5% 8/1/22 (FSA Insured) | | 1,000,000 | 1,091,070 |
| Series 2013 A, 5% 4/1/20 | | 780,000 | 799,011 |
| Series 2014, 4% 2/1/20 | | 600,000 | 607,932 |
| Series 2016, 5% 2/1/20 | | 375,000 | 382,114 |
| Series 2017 B, 5% 11/1/19 | | 9,725,000 | 9,830,030 |
| Series 2017 D, 5% 11/1/20 | | 400,000 | 417,284 |
| Series B, 5.25% 1/1/20 | | 710,000 | 722,427 |
| Illinois Muni. Elec. Agcy. Pwr. Supply: | | | |
| Series 2007 C, 5.25% 2/1/20 | | 430,000 | 439,458 |
| Series 2015 A, 5% 2/1/21 | | 1,165,000 | 1,226,943 |
| Series C, 5.25% 2/1/21 | | 1,000,000 | 1,056,240 |
| Illinois Reg'l. Trans. Auth.: | | | |
| Series 2000, 6.25% 7/1/20 (Nat'l. Pub. Fin. Guarantee Corp. Insured) | | 4,285,000 | 4,486,150 |
| Series 2010A, 5% 7/1/20 | | 1,305,000 | 1,327,607 |
| Series 2017 A: | | | |
| 5% 7/1/20 | | 520,000 | 538,211 |
| 5% 7/1/21 | | 520,000 | 556,150 |
| Illinois Toll Hwy. Auth. Toll Hwy. Rev. Series 2014 A: | | | |
| 5% 12/1/20 | | 5,300,000 | 5,563,092 |
| 5% 12/1/22 | | 3,230,000 | 3,607,135 |
| Railsplitter Tobacco Settlement Auth. Rev. Series 2010, 5.25% 6/1/20 | | 3,535,000 | 3,650,233 |
| Univ. of Illinois Board of Trustees Ctfs. of Prtn.: | | | |
| Series 2014 C, 5% 3/15/23 | | 520,000 | 582,140 |
| Series 2016 A, 4% 8/15/19 | | 500,000 | 501,483 |
| Univ. of Illinois Rev.: | | | |
| Series 2005 A, 5.5% 4/1/21 (Nat'l. Pub. Fin. Guarantee Corp. Insured) | | 1,300,000 | 1,389,544 |
| Series 2018 A, 5% 4/1/21 | | 830,000 | 880,041 |
|
| TOTAL ILLINOIS | | | 68,563,251 |
|
| Indiana - 1.8% | | | |
| Indiana Fin. Auth. (Citizens Energy Group Wtr. Proj.) Series 2014 A, 5% 10/1/19 | | 340,000 | 343,026 |
| Indiana Fin. Auth. Hosp. Rev. Bonds: | | | |
| Series 2011 H, 1.65%, tender 7/1/22 (a)(b) | | 1,555,000 | 1,557,597 |
| Series 2011 I, 1.65%, tender 7/1/22 (a)(b) | | 5,000,000 | 5,008,350 |
| Series 2011 L: | | | |
| SIFMA Municipal Swap Index + 0.280% 2.45%, tender 5/4/21 (a)(b)(d) | | 6,600,000 | 6,601,848 |
| 2.45%, tender 5/4/21 (a)(b) | | 6,900,000 | 6,901,932 |
| Series 2015 B, 1.65%, tender 7/2/22 (a)(b) | | 2,360,000 | 2,363,941 |
| Indiana Fin. Auth. Rev. Series 2016: | | | |
| 3% 9/1/19 | | 185,000 | 185,412 |
| 4% 9/1/20 | | 370,000 | 380,105 |
| Indianapolis Local Pub. Impt.: | | | |
| (Indianapolis Arpt. Auth. Proj.) Series 2016 A1, 5% 1/1/21 (c) | | 1,600,000 | 1,681,376 |
| Series 2016, 5% 1/1/20 (c) | | 2,135,000 | 2,171,342 |
| Whiting Envir. Facilities Rev.: | | | |
| (BP Products North America, Inc. Proj.) Series 2009, 5.25% 1/1/21 | | 3,870,000 | 4,084,669 |
| Bonds (BP Products North America, Inc. Proj.): | | | |
| Series 2008, 1.85%, tender 10/1/19 (a) | | 2,000,000 | 2,001,542 |
| Series 2015, 5%, tender 11/1/22 (a)(c) | | 1,100,000 | 1,213,047 |
| Series 2016 A, 5%, tender 3/1/23 (a)(c) | | 800,000 | 888,520 |
|
| TOTAL INDIANA | | | 35,382,707 |
|
| Kansas - 0.1% | | | |
| Kansas Dev. Fin. Agcy. Series 2009, 5.25% 11/15/21 | | 1,270,000 | 1,288,021 |
| Kentucky - 2.5% | | | |
| Ashland Med. Ctr. Rev. (Ashland Hosp. Corp. D/B/A King's Daughters Med. Ctr. Proj.) Series 2016 A, 4% 2/1/20 | | 595,000 | 601,136 |
| Carroll County Poll. Ctlr Rev. Bonds (Kentucky Utils. Co. Proj.) Series 2016 A, 1.05%, tender 9/1/19 (a) | | 12,000,000 | 11,982,222 |
| Kenton County Arpt. Board Arpt. Rev. Series 2016, 5% 1/1/20 | | 160,000 | 162,764 |
| Kentucky Bond Dev. Corp. (Lexington Ctr. Corp. Proj.) Series 2018 A, 5% 9/1/19 | | 855,000 | 859,843 |
| Kentucky State Property & Buildings Commission Rev.: | | | |
| (Kentucky St Proj.) Series D: | | | |
| 5% 5/1/20 | | 3,645,000 | 3,753,831 |
| 5% 5/1/21 | | 1,580,000 | 1,683,300 |
| (Kentucky St Proj.): | | | |
| Series 2005 5% 8/1/21 (Nat'l. Pub. Fin. Guarantee Corp. Insured) | | 835,000 | 896,481 |
| Series 2005, 5% 8/1/20 (Nat'l. Pub. Fin. Guarantee Corp. Insured) | | 1,050,000 | 1,090,730 |
| Series 2010, 5% 8/1/20 | | 2,720,000 | 2,825,509 |
| (Proj. No. 117) Series B, 3% 5/1/20 | | 1,570,000 | 1,591,045 |
| (Proj. No. 98) Series 2010, 4% 8/1/19 | | 675,000 | 676,438 |
| Series 2015 B, 5% 8/1/19 | | 1,925,000 | 1,930,642 |
| Series 2016 B, 5% 11/1/19 | | 2,110,000 | 2,135,407 |
| Series 2016: | | | |
| 3% 4/1/21 | | 775,000 | 797,545 |
| 3% 4/1/22 | | 895,000 | 925,985 |
| Series 2017, 5% 4/1/22 | | 900,000 | 985,104 |
| Series 2018, 5% 5/1/21 | | 2,000,000 | 2,130,760 |
| Series A: | | | |
| 5% 8/1/19 | | 950,000 | 952,784 |
| 5% 10/1/22 | | 940,000 | 1,042,460 |
| Series B: | | | |
| 5% 8/1/21 | | 950,000 | 1,019,949 |
| 5% 11/1/21 | | 900,000 | 973,386 |
| 5% 11/1/22 | | 645,000 | 717,008 |
| Kentucky, Inc. Pub. Energy Series 2018 B, 4% 7/1/21 | | 2,200,000 | 2,296,932 |
| Louisville & Jefferson County (Norton Healthcare, Inc. Proj.) Series 2016 A, 5% 10/1/19 | | 1,415,000 | 1,426,883 |
| Trimble County Poll. Cont. Rev. Bonds (Louisville Gas and Elec. Co. Proj.): | | | |
| Series 2001 A, 2.3%, tender 9/1/21 (a) | | 1,150,000 | 1,166,445 |
| Series 2001 B, 2.55%, tender 5/3/21 (a) | | 5,580,000 | 5,684,625 |
|
| TOTAL KENTUCKY | | | 50,309,214 |
|
| Louisiana - 0.8% | | | |
| Louisiana Citizens Property Ins. Corp. Assessment Rev. Series 2015: | | | |
| 5% 6/1/20 | | 4,750,000 | 4,905,124 |
| 5% 6/1/21 (FSA Insured) | | 1,600,000 | 1,708,384 |
| Louisiana Pub. Facilities Auth. Rev.: | | | |
| (Ochsner Clinic Foundation Proj.) Series 2015, 5% 5/15/21 | | 520,000 | 551,335 |
| (Tulane Univ. of Louisiana Proj.) Series 2016 A, 5% 12/15/19 | | 745,000 | 756,817 |
| Series 2009 A, 5.25% 7/1/20 (Escrowed to Maturity) | | 2,530,000 | 2,622,276 |
| New Orleans Aviation Board Rev.: | | | |
| (North Term. Proj.) Series 2017 B, 5% 1/1/22 (c) | | 520,000 | 561,101 |
| Series 2017 D1, 5% 1/1/20 | | 745,000 | 758,280 |
| Series 2017 D2: | | | |
| 5% 1/1/20 (c) | | 150,000 | 152,523 |
| 5% 1/1/21 (c) | | 370,000 | 387,804 |
| 5% 1/1/22 (c) | | 655,000 | 706,771 |
| Tobacco Settlement Fing. Corp. Series 2013 A: | | | |
| 5% 5/15/20 | | 1,635,000 | 1,681,193 |
| 5% 5/15/21 | | 930,000 | 984,805 |
|
| TOTAL LOUISIANA | | | 15,776,413 |
|
| Maine - 0.0% | | | |
| Maine Health & Higher Edl. Facilities Auth. Rev. Series 2017 B, 4% 7/1/21 | | 250,000 | 262,150 |
| Massachusetts - 1.2% | | | |
| Massachusetts Dept. of Trans. Metropolitan Hwy. Sys. Rev. Series 2010 B, 5% 1/1/20 | | 370,000 | 376,782 |
| Massachusetts Dev. Fin. Agcy. Rev.: | | | |
| (Lesley Univ. Proj.) Series 2016, 5% 7/1/20 | | 765,000 | 792,411 |
| Series 2012 G, 5% 10/1/19 | | 600,000 | 605,416 |
| Series 2016 I, 5% 7/1/21 | | 790,000 | 843,720 |
| Massachusetts Edl. Fing. Auth. Rev.: | | | |
| Series 2015 A, 5% 1/1/22 (c) | | 1,400,000 | 1,511,370 |
| Series 2016 J, 5% 7/1/21 (c) | | 2,840,000 | 3,024,685 |
| Series 2017 A: | | | |
| 3% 7/1/19 (c) | | 185,000 | 185,000 |
| 4% 7/1/20 (c) | | 280,000 | 286,566 |
| Massachusetts Gen. Oblig.: | | | |
| Bonds Series 2014 D1, 1.05%, tender 7/1/20 (a) | | 3,720,000 | 3,706,052 |
| Series 2017 B, SIFMA Municipal Swap Index + 0.600% 2.5% 2/1/20 (a)(d) | | 13,020,000 | 13,025,282 |
| Massachusetts Health & Edl. Facilities Auth. Rev. (Partners Healthcare Sys., Inc. Proj.) Series 2010, 5% 7/1/21 | | 420,000 | 421,130 |
|
| TOTAL MASSACHUSETTS | | | 24,778,414 |
|
| Michigan - 4.0% | | | |
| Clarkston Cmnty. Schools Series 2016 I, 4% 5/1/20 | | 255,000 | 260,580 |
| Detroit Downtown Dev. Auth. Tax: | | | |
| Series 1, 5% 7/1/21 (FSA Insured) | | 1,185,000 | 1,260,852 |
| Series A, 5% 7/1/22 (FSA Insured) | | 650,000 | 711,679 |
| Ferris State Univ. Rev. Series 2016: | | | |
| 5% 10/1/19 | | 285,000 | 287,537 |
| 5% 10/1/20 | | 400,000 | 417,888 |
| Grand Haven Area Pub. Schools Series 2013, 3% 5/1/20 | | 370,000 | 375,175 |
| Grand Valley Michigan State Univ. Rev. Series 2011, 5% 2/1/20 | | 975,000 | 995,385 |
| Huron Valley School District Series 2011, 5% 5/1/21 | | 1,475,000 | 1,571,716 |
| Kent Hosp. Fin. Auth. Hosp. Facilities Rev. (Spectrum Health Sys. Proj.) Series 2011 A, 5% 11/15/20 | | 470,000 | 492,668 |
| Lapeer Cmnty. Schools Series 2016, 4% 5/1/20 | | 905,000 | 923,818 |
| Michigan Fin. Auth. Rev.: | | | |
| (Mclaren Health Care Corp. Proj.) 5% 5/15/21 | | 370,000 | 394,346 |
| Bonds: | | | |
| Series 2016 MI2, SIFMA Municipal Swap Index + 0.480% 2.38%, tender 2/1/22 (a)(d) | | 45,050,000 | 45,117,125 |
| 1.1%, tender 8/15/19 (a) | | 975,000 | 974,574 |
| Series 2016: | | | |
| 3% 1/1/20 | | 110,000 | 110,754 |
| 5% 11/15/19 | | 495,000 | 501,236 |
| Michigan Gen. Oblig. Series 2016, 5% 3/15/20 | | 815,000 | 835,721 |
| Michigan Hosp. Fin. Auth. Rev. Bonds Series 2010 F4, 1.95%, tender 4/1/20 (a) | | 3,930,000 | 3,944,225 |
| Michigan Strategic Fund Exempt Facilities Rev. Bonds (Waste Mgmt., Inc. Proj.) 2.85%, tender 8/2/21 (a)(c) | | 10,500,000 | 10,716,195 |
| Milan Area Schools Series 2019, 5% 5/1/22 | | 675,000 | 740,313 |
| Mount Clemens Cmnty. School District Series 2017 A, 5% 5/1/20 | | 630,000 | 649,289 |
| Portage Pub. Schools Series 2016, 5% 5/1/20 | | 500,000 | 515,224 |
| Royal Oak City School District Series 2018, 4% 5/1/20 | | 300,000 | 306,716 |
| South Lyon Cmnty. Schools Series 2016, 5% 5/1/23 | | 625,000 | 706,813 |
| Wayne County Arpt. Auth. Rev.: | | | |
| Series 2011 A: | | | |
| 4.125% 12/1/22 (FSA Insured) (c) | | 1,100,000 | 1,167,386 |
| 5% 12/1/19 (c) | | 2,890,000 | 2,930,924 |
| Series 2017 A: | | | |
| 5% 12/1/19 | | 930,000 | 944,066 |
| 5% 12/1/20 | | 445,000 | 467,860 |
| Series 2017 B: | | | |
| 5% 12/1/19 (c) | | 845,000 | 856,930 |
| 5% 12/1/20 (c) | | 535,000 | 560,632 |
| Zeeland Pub. Schools Series 2015, 5% 5/1/21 | | 1,285,000 | 1,366,610 |
|
| TOTAL MICHIGAN | | | 81,104,237 |
|
| Missouri - 0.0% | | | |
| Kansas City Santn Swr. Sys. R Series 2018 B, 5% 1/1/20 | | 300,000 | 305,544 |
| Missouri Health & Edl. Facilities Rev. Series 2016, 5% 5/15/20 | | 590,000 | 607,709 |
|
| TOTAL MISSOURI | | | 913,253 |
|
| Montana - 0.1% | | | |
| Montana Facility Fin. Auth. Rev. Series 2016, 5% 2/15/20 | | 1,290,000 | 1,318,037 |
| Nevada - 1.6% | | | |
| Clark County Arpt. Rev.: | | | |
| (Sub Lien Proj.) Series 2017 A-1, 5% 7/1/20 (c) | | 2,445,000 | 2,525,928 |
| Series 2013 A, 5% 7/1/20 (c) | | 1,520,000 | 1,569,544 |
| Series 2017 C, 5% 7/1/21 (c) | | 19,730,000 | 21,091,765 |
| Clark County Poll. Cont. Rev. Bonds (Nevada Pwr. Co. Projs.) Series 2017, 1.6%, tender 5/21/20 (a) | | 3,080,000 | 3,082,685 |
| Clark County School District: | | | |
| Series 2015 D, 5% 6/15/20 | | 440,000 | 455,064 |
| Series 2016 A: | | | |
| 5% 6/15/21 | | 625,000 | 668,563 |
| 5% 6/15/23 | | 1,395,000 | 1,580,200 |
| Series 2017 C, 5% 6/15/22 | | 600,000 | 661,590 |
|
| TOTAL NEVADA | | | 31,635,339 |
|
| New Hampshire - 0.1% | | | |
| New Hampshire Health & Ed. Facilities Auth. Rev.: | | | |
| (Southern NH Med. Ctr. Proj.) Series 2016: | | | |
| 3% 10/1/19 | | 460,000 | 461,561 |
| 3% 10/1/21 | | 570,000 | 585,772 |
| Series 2016, 3% 10/1/20 | | 820,000 | 832,784 |
|
| TOTAL NEW HAMPSHIRE | | | 1,880,117 |
|
| New Jersey - 5.5% | | | |
| Garden State Preservation Trust Open Space & Farmland Preservation: | | | |
| Series 2007 A3, 0% 11/1/22 (FSA Insured) | | 935,000 | 885,866 |
| Series 2012 A, 5% 11/1/19 | | 6,735,000 | 6,810,221 |
| Jersey City Gen. Oblig. Series 2015, 4% 2/15/20 (FSA Insured) | | 391,000 | 397,561 |
| New Jersey Econ. Dev. Auth. Rev.: | | | |
| (New Jersey Gen. Oblig. Proj.): | | | |
| Series 2011 EE, 4.5% 9/1/20 | | 170,000 | 175,379 |
| Series 2017 B, 5% 11/1/19 | | 2,480,000 | 2,507,948 |
| New Jersey Gen. Oblig. Series 2013 NN, 5% 3/1/21 | | 290,000 | 304,306 |
| Series 2013, 5% 3/1/20 | | 3,030,000 | 3,094,848 |
| Series 2017 DDD, 5% 6/15/20 | | 370,000 | 381,345 |
| Series PP, 5% 6/15/20 | | 150,000 | 154,599 |
| New Jersey Edl. Facility ( William Paterson College Proj.) Series 2017 B, 5% 7/1/20 | | 357,000 | 369,719 |
| New Jersey Gen. Oblig.: | | | |
| Series 2005 L, 5.25% 7/15/19 | | 445,000 | 445,641 |
| Series 2016 T, 5% 6/1/20 | | 510,000 | 527,414 |
| New Jersey Health Care Facilities Fing. Auth. Rev.: | | | |
| Series 2016 A, 5% 7/1/19 | | 300,000 | 300,000 |
| Series 2016, 5% 7/1/20 | | 1,500,000 | 1,553,746 |
| New Jersey Higher Ed. Student Assistance Auth. Student Ln. Rev.: | | | |
| Series 2011 1, 5% 12/1/20 (c) | | 6,345,000 | 6,635,982 |
| Series 2011-1, 5.5% 12/1/21 (c) | | 6,345,000 | 6,903,233 |
| Series 2013: | | | |
| 4% 12/1/20 (c) | | 1,905,000 | 1,965,865 |
| 5% 12/1/19 (c) | | 500,000 | 506,829 |
| Series 2014 1A: | | | |
| 5% 12/1/20 (c) | | 6,000,000 | 6,275,160 |
| 5% 12/1/21 (c) | | 4,500,000 | 4,842,990 |
| Series 2016 1A, 5% 12/1/21 (c) | | 2,000,000 | 2,152,440 |
| Series 2017 1A, 5% 12/1/22 (c) | | 300,000 | 331,332 |
| Series 2017 1B: | | | |
| 5% 12/1/19 (c) | | 1,970,000 | 1,996,907 |
| 5% 12/1/20 (c) | | 4,125,000 | 4,314,173 |
| 5% 12/1/21 (c) | | 340,000 | 365,915 |
| Series 2018 B: | | | |
| 5% 12/1/20 (c) | | 2,275,000 | 2,379,332 |
| 5% 12/1/21 (c) | | 1,290,000 | 1,388,324 |
| Series 2019 A, 5% 12/1/22 | | 705,000 | 787,316 |
| New Jersey Hsg. & Mtg. Fin. Agcy. Rev. Series 2019 D: | | | |
| 4% 10/1/20 (c) | | 1,295,000 | 1,330,742 |
| 4% 4/1/21 (c) | | 1,405,000 | 1,455,580 |
| New Jersey Tobacco Settlement Fing. Corp. Series 2018 A: | | | |
| 5% 6/1/20 | | 2,430,000 | 2,501,703 |
| 5% 6/1/21 | | 5,190,000 | 5,504,670 |
| 5% 6/1/22 | | 805,000 | 877,305 |
| New Jersey Tpk. Auth. Tpk. Rev. Series 2017 C1, 1 month U.S. LIBOR + 0.340% 2.048% 1/1/21 (a)(d) | | 485,000 | 485,228 |
| New Jersey Trans. Trust Fund Auth.: | | | |
| Series 1999 A, 5.75% 6/15/20 | | 105,000 | 108,981 |
| Series 2013 A, 5% 6/15/20 | | 695,000 | 716,445 |
| Series 2016 A, 5% 6/15/20 | | 13,185,000 | 13,603,278 |
| Series 2018 A: | | | |
| 4% 6/15/20 | | 575,000 | 587,828 |
| 5% 6/15/21 | | 7,330,000 | 7,786,806 |
| 5% 6/15/22 | | 12,065,000 | 13,186,080 |
| Series AA, 5% 6/15/20 | | 125,000 | 128,857 |
| New Jersey Transit Corp. Ctfs. of Prtn. Series 2014 A: | | | |
| 5% 9/15/19 | | 3,860,000 | 3,887,457 |
| 5% 9/15/20 | | 605,000 | 629,248 |
|
| TOTAL NEW JERSEY | | | 111,544,599 |
|
| New Mexico - 0.2% | | | |
| Farmington Poll. Cont. Rev. Bonds (Southern California Edison Co. Four Corners Proj.): | | | |
| Series 2005 A, 1.875%, tender 4/1/20 (a) | | 1,490,000 | 1,486,272 |
| Series 2005 B, 1.875%, tender 4/1/20 (a) | | 1,300,000 | 1,296,747 |
| New Mexico Muni. Energy Acquisition Auth. Gas Supply Rev. Series 2019 A: | | | |
| 4% 5/1/21 (Liquidity Facility Royal Bank of Canada) (b) | | 795,000 | 829,121 |
| 4% 11/1/22 (Liquidity Facility Royal Bank of Canada) (b) | | 675,000 | 726,820 |
|
| TOTAL NEW MEXICO | | | 4,338,960 |
|
| New York - 0.2% | | | |
| New York Metropolitan Trans. Auth. Rev.: | | | |
| Bonds Series 2015 C, 4%, tender 11/15/20 (a) | | 1,000,000 | 1,026,510 |
| Series 2012 F, 5% 11/15/21 | | 1,500,000 | 1,626,135 |
| Series 2018 B, 5% 5/15/20 | | 900,000 | 927,896 |
| Niagara Frontier Trans. Auth. Arpt. Rev. Series 2019 A, 5% 4/1/22 (c) | | 800,000 | 869,096 |
|
| TOTAL NEW YORK | | | 4,449,637 |
|
| North Carolina - 0.2% | | | |
| North Carolina Med. Care Commission Health Care Facilities Rev. Bonds Series 2019 B, 2.2%, tender 12/1/22 (a) | | 2,860,000 | 2,891,002 |
| North Carolina Muni. Pwr. Agcy. #1 Catawba Elec. Rev.: | | | |
| Series 2010 A, 5% 1/1/20 | | 330,000 | 335,916 |
| Series C, 5% 1/1/21 | | 355,000 | 355,962 |
|
| TOTAL NORTH CAROLINA | | | 3,582,880 |
|
| Ohio - 1.3% | | | |
| Allen County Hosp. Facilities Rev.: | | | |
| Bonds (Mercy Health Proj.) Series 2015 B, SIFMA Municipal Swap Index + 0.750% 2.65%, tender 7/5/19 (a)(d) | | 11,660,000 | 11,667,228 |
| Series 2017 A: | | | |
| 5% 8/1/20 | | 710,000 | 736,760 |
| 5% 8/1/22 | | 700,000 | 772,149 |
| Cleveland Ctfs. of Prtn. Series 2010 A, 5% 11/15/19 | | 1,665,000 | 1,685,914 |
| Cleveland Pub. Pwr. Sys. Rev. Series 2016 A, 5% 11/15/19 | | 1,405,000 | 1,423,491 |
| Franklin County Hosp. Facilities Rev. Bonds (Ohio Health Corp.) Series 2018 B, SIFMA Municipal Swap Index + 0.430% 2.33%, tender 11/15/21 (a)(d) | | 7,100,000 | 7,118,531 |
| Hamilton County HealthCare Facilities Rev. (Christ Hosp., OH. Proj.) Series 2012, 5% 6/1/20 | | 645,000 | 664,987 |
| Ohio Higher Edl. Facility Commission Rev.: | | | |
| (Kenyon College, Oh. Proj.) Series 2017, 4% 7/1/19 | | 150,000 | 150,000 |
| (Kenyon College, Oh. Proj.) Series 2017, 4% 7/1/20 | | 150,000 | 153,849 |
| (Univ. of Dayton 2018 Proj.) Series 2018 A, 5% 12/1/22 | | 260,000 | 290,449 |
| Ross County Hosp. Facilities Rev. (Adena Health Sys. Obligated Group Proj.) Series 2019, 5% 12/1/20 | | 755,000 | 792,259 |
| Scioto County Hosp. Facilities Rev. Series 2016, 5% 2/15/20 | | 1,615,000 | 1,648,075 |
|
| TOTAL OHIO | | | 27,103,692 |
|
| Oklahoma - 0.0% | | | |
| Oklahoma County Fin. Auth. Edl. Facilities (Midwest City- Del City School Dis Proj.) Series 2018: | | | |
| 5% 10/1/19 | | 345,000 | 348,045 |
| 5% 10/1/21 | | 510,000 | 549,188 |
|
| TOTAL OKLAHOMA | | | 897,233 |
|
| Oregon - 0.3% | | | |
| Oregon Bus. Dev. Commission Bonds Series 250, 5%, tender 3/1/22 (a)(c) | | 5,535,000 | 6,006,637 |
| Oregon Facilities Auth. Rev. Series 2011 C, 5% 10/1/20 | | 310,000 | 323,742 |
|
| TOTAL OREGON | | | 6,330,379 |
|
| Pennsylvania - 3.4% | | | |
| Adams County Indl. Dev. Auth. Rev. Series 2010, 5% 8/15/20 | | 1,310,000 | 1,362,177 |
| Allegheny County Arpt. Auth. Rev.: | | | |
| Series 2001, 5% 1/1/21 (Nat'l. Pub. Fin. Guarantee Corp. Insured) (c) | | 3,200,000 | 3,363,744 |
| Series 2006 B: | | | |
| 5% 1/1/21 (Nat'l. Pub. Fin. Guarantee Corp. Insured) (c) | | 800,000 | 840,936 |
| 5% 1/1/22 (Nat'l. Pub. Fin. Guarantee Corp. Insured) (c) | | 625,000 | 674,400 |
| Doylestown Hosp. Auth. Hosp. Rev. Series 2016 B, 5% 7/1/20 | | 430,000 | 441,080 |
| Lehigh County Indl. Dev. Auth. Poll. Cont. Rev. Bonds (PPL Elec. Utils. Corp. Proj.) Series 2016 A, 1.8%, tender 9/1/22 (a) | | 1,325,000 | 1,326,113 |
| Luzerne County Series 2015 B, 5% 5/15/20 (FSA Insured) | | 1,150,000 | 1,182,794 |
| Lycoming County Auth. College Rev. Series 2016, 4% 10/1/19 | | 745,000 | 749,429 |
| Pennsylvania Ctfs. Prtn. Series 2018 A, 5% 7/1/21 | | 350,000 | 372,904 |
| Pennsylvania Gen. Oblig.: | | | |
| Series 2010 A, 5% 5/1/20 | | 575,000 | 592,654 |
| Series 2016: | | | |
| 5% 1/15/21 | | 420,000 | 443,688 |
| 5% 1/15/22 | | 3,110,000 | 3,396,804 |
| Pennsylvania Tpk. Commission Tpk. Rev.: | | | |
| Series 2018 A1: | | | |
| SIFMA Municipal Swap Index + 0.350% 2.25% 12/1/20 (a)(d) | | 5,100,000 | 5,097,297 |
| SIFMA Municipal Swap Index + 0.430% 2.33% 12/1/21 (a)(d) | | 10,010,000 | 10,013,003 |
| Series 2018 B, SIFMA Municipal Swap Index + 0.500% 2.4% 12/1/21 (a)(d) | | 6,410,000 | 6,417,692 |
| Philadelphia Arpt. Rev.: | | | |
| Series 2010 D, 5% 6/15/21 (c) | | 1,425,000 | 1,471,583 |
| Series 2011 A, 5% 6/15/21 (c) | | 510,000 | 543,915 |
| Series 2015 A, 5% 6/15/21 (c) | | 865,000 | 922,523 |
| Series 2017 B, 5% 7/1/19 (c) | | 1,000,000 | 1,000,000 |
| Philadelphia Gas Works Rev.: | | | |
| Series 2015 13: | | | |
| 5% 8/1/19 | | 1,955,000 | 1,960,585 |
| 5% 8/1/20 | | 1,835,000 | 1,905,170 |
| 5% 8/1/21 | | 1,770,000 | 1,897,670 |
| Series 2016 14: | | | |
| 5% 10/1/19 | | 3,715,000 | 3,747,601 |
| 5% 10/1/20 | | 1,345,000 | 1,404,288 |
| Series 2017 15, 4% 8/1/20 | | 370,000 | 380,197 |
| Pittsburgh & Alleg County Parkin Series 2017, 4% 12/15/19 | | 245,000 | 247,874 |
| Reading School District Series 2017, 5% 3/1/21 (FSA Insured) | | 150,000 | 158,033 |
| Saint Mary Hosp. Auth. Health Sys. Rev. Series 2010 B: | | | |
| 5% 11/15/19 | | 500,000 | 506,636 |
| 5% 11/15/19 (Escrowed to Maturity) | | 100,000 | 101,339 |
| Univ. of Pittsburgh Commonwealth Sys. of Higher Ed. Series 2018, SIFMA Municipal Swap Index + 0.240% 2.14% 9/15/21 (a)(d) | | 15,700,000 | 15,672,525 |
|
| TOTAL PENNSYLVANIA | | | 68,194,654 |
|
| Rhode Island - 0.3% | | | |
| Rhode Island Student Ln. Auth. Student Ln. Rev. Series A, 5% 12/1/21 (c) | | 500,000 | 537,615 |
| Tobacco Setlement Fing. Corp. Series 2015 A: | | | |
| 5% 6/1/20 | | 3,500,000 | 3,602,629 |
| 5% 6/1/21 | | 1,465,000 | 1,551,933 |
|
| TOTAL RHODE ISLAND | | | 5,692,177 |
|
| South Carolina - 0.5% | | | |
| Lexington County Health Svcs. District, Inc. Hosp. Rev. Series 2011, 5% 11/1/19 | | 1,300,000 | 1,314,825 |
| Piedmont Muni. Pwr. Agcy. Elec. Rev. Series A4: | | | |
| 5% 1/1/20 (Escrowed to Maturity) | | 2,530,000 | 2,576,244 |
| 5% 1/1/20 (Escrowed to Maturity) | | 2,605,000 | 2,652,615 |
| South Carolina Jobs-Econ. Dev. Auth. (Anmed Health Proj.) Series 2016, 5% 2/1/20 | | 560,000 | 571,247 |
| South Carolina Pub. Svc. Auth. Rev.: | | | |
| Series 2010 B, 4% 1/1/20 (Escrowed to Maturity) | | 225,000 | 228,001 |
| Series 2012 D, 4% 12/1/19 (Escrowed to Maturity) | | 195,000 | 197,164 |
| Series 2012, 5% 12/1/19 | | 1,095,000 | 1,109,956 |
| Series 2015 C, 5% 12/1/21 | | 850,000 | 919,403 |
|
| TOTAL SOUTH CAROLINA | | | 9,569,455 |
|
| Tennessee - 0.5% | | | |
| Greeneville Health & Edl. Facilities Board Series 2018 A, 5% 7/1/22 | | 900,000 | 987,336 |
| Jackson Hosp. Rev. Series 2018 A, 5% 4/1/21 | | 500,000 | 528,895 |
| Memphis-Shelby County Arpt. Auth. Arpt. Rev.: | | | |
| Series 2010 B, 5.5% 7/1/19 (c) | | 1,950,000 | 1,950,000 |
| Series 2011 C, 5% 7/1/19 (c) | | 1,210,000 | 1,210,000 |
| Nashville and Davidson County Metropolitan Govt. Health & Edl. Facilities Board Rev. Bonds Series 2001 B, 1.55%, tender 11/3/20 (a) | | 5,375,000 | 5,381,343 |
|
| TOTAL TENNESSEE | | | 10,057,574 |
|
| Texas - 1.2% | | | |
| Austin-Bergstrom Landhost Ente Series 2017: | | | |
| 5% 10/1/19 | | 395,000 | 398,228 |
| 5% 10/1/20 | | 675,000 | 702,695 |
| 5% 10/1/21 | | 810,000 | 868,887 |
| Corpus Christi Util. Sys. Rev. Series 2015, 4% 7/15/19 | | 900,000 | 900,846 |
| Dallas County Util. and Reclamation District Series 2016: | | | |
| 5% 2/15/20 | | 980,000 | 1,001,545 |
| 5% 2/15/22 | | 1,035,000 | 1,128,171 |
| Dallas Fort Worth Int'l. Arpt. Rev. Series 2012 F, 5% 11/1/20 (c) | | 600,000 | 627,954 |
| Harris County Cultural Ed. Facilities Fin. Corp. Med. Facilities Rev. (Baylor College of Medicine Proj.) Series 2016, 5% 11/15/19 | | 1,350,000 | 1,367,413 |
| Harris County Cultural Ed. Facilities Fin. Corp. Rev.: | | | |
| Bonds: | | | |
| Series 2014 B, 2.48%, tender 7/5/19 (a) | | 3,820,000 | 3,820,041 |
| Series 2015 3, 1 month U.S. LIBOR + 0.850% 2.484%, tender 7/5/19 (a)(d) | | 1,935,000 | 1,940,069 |
| Series 2013 B, SIFMA Municipal Swap Index + 0.900% 2.8% 6/1/22 (a)(d) | | 900,000 | 906,300 |
| Series 2015, 5% 10/1/20 | | 600,000 | 627,210 |
| Houston Arpt. Sys. Rev.: | | | |
| (Houston TX Arpt. Sys. Rev. Subord Proj.) Series 2011 A, 5% 7/1/21 (c) | | 1,325,000 | 1,413,205 |
| Series 2011 A: | | | |
| 5% 7/1/19 (c) | | 805,000 | 805,000 |
| 5% 7/1/22 (c) | | 1,300,000 | 1,389,583 |
| Series 2018 A, 5% 7/1/21 (c) | | 525,000 | 559,949 |
| Irving Hosp. Auth. Hosp. Rev. Series 2017 A: | | | |
| 5% 10/15/20 | | 370,000 | 385,122 |
| 5% 10/15/21 | | 185,000 | 198,244 |
| Love Field Arpt. Modernization Rev. Series 2015, 5% 11/1/19 (c) | | 745,000 | 753,721 |
| Lower Colorado River Auth. Rev.: | | | |
| (LCRA Transmission Svcs. Corp. Proj.) Series 2010, 5% 5/15/22 | | 1,100,000 | 1,134,573 |
| Series 2010: | | | |
| 5% 5/15/20 | | 240,000 | 247,564 |
| 5% 5/15/21 | | 1,255,000 | 1,294,558 |
| Series 2015 A, 5% 5/15/21 | | 925,000 | 987,280 |
| Royse City Independent School District Series 2014, 0% 2/15/20 | | 415,000 | 411,454 |
|
| TOTAL TEXAS | | | 23,869,612 |
|
| Virginia - 1.1% | | | |
| Halifax County Indl. Dev. Auth. Bonds 2.15%, tender 9/1/20 (a) | | 2,720,000 | 2,739,366 |
| Louisa Indl. Dev. Auth. Poll. Cont. Rev. Bonds Series 2008 B, 2.15%, tender 9/1/20 (a) | | 4,170,000 | 4,199,690 |
| Lynchburg Econ. Dev. (Centra Health Proj.) Series A, 5% 1/1/20 | | 370,000 | 376,410 |
| Wise County Indl. Dev. Auth. Waste & Sewage Rev. Bonds: | | | |
| (Virginia Elec. and Pwr. Co. Proj.) Series 2010 A, 1.875%, tender 6/1/20 (a) | | 10,840,000 | 10,873,757 |
| Series 2009 A, 2.15%, tender 9/1/20 (a) | | 3,335,000 | 3,358,745 |
|
| TOTAL VIRGINIA | | | 21,547,968 |
|
| Washington - 0.6% | | | |
| Port of Seattle Gen. Oblig. Series 2011, 5.25% 12/1/21 (c) | | 700,000 | 749,399 |
| Port of Seattle Rev.: | | | |
| Series 2010 C, 5% 2/1/20 (c) | | 2,080,000 | 2,123,243 |
| Series 2015 B, 5% 3/1/20 | | 685,000 | 702,011 |
| Series 2015 C, 5% 4/1/21 (c) | | 1,565,000 | 1,662,155 |
| Tobacco Settlement Auth. Rev. Series 2013, 5% 6/1/20 | | 3,405,000 | 3,499,814 |
| Washington Health Care Facilities Auth. Rev.: | | | |
| (MultiCare Health Sys. Proj.) Series 2010 A, 5.25% 8/15/19 | | 950,000 | 954,318 |
| (Providence Health Systems Proj.) Series 2011 B, 5% 10/1/19 | | 790,000 | 796,972 |
| Bonds Series 2012 B, 5%, tender 10/1/21 (a) | | 350,000 | 376,975 |
| Series 2012 A, 5% 10/1/19 | | 575,000 | 580,075 |
|
| TOTAL WASHINGTON | | | 11,444,962 |
|
| West Virginia - 1.2% | | | |
| Harrison County Commission Solid Waste Disp. Rev. Bonds (Monongahela Pwr. Co. Proj.) Series 2018 A, 3%, tender 10/15/21 (a)(c) | | 16,300,000 | 16,374,817 |
| Mason Co. Poll. Cont. Rev. (Appalachian Pwr. Co. Proj.) Series 2003 L, 2.75% 10/1/22 | | 4,455,000 | 4,556,663 |
| West Virginia Econ. Dev. Auth. Solid Waste Disp. Facilities Rev. Bonds (Appalachian Pwr. Co. Amos Proj.) Series 2011 A, 1.7%, tender 9/1/20 (a)(c) | | 2,820,000 | 2,816,729 |
|
| TOTAL WEST VIRGINIA | | | 23,748,209 |
|
| Wisconsin - 1.4% | | | |
| Milwaukee County Arpt. Rev. Series 2016 A, 5% 12/1/19 (c) | | 1,810,000 | 1,835,858 |
| Wisconsin Health & Edl. Facilities: | | | |
| (Agnesian Healthcare Proj.) Series 2017: | | | |
| 4% 7/1/19 | | 300,000 | 300,000 |
| 5% 7/1/21 | | 300,000 | 319,482 |
| Bonds: | | | |
| (Ascension Health Cr. Group Proj.) Series 2013 B: | | | |
| 5%, tender 6/1/20 (a) | | 4,455,000 | 4,597,595 |
| 5%, tender 6/1/21 (a) | | 4,145,000 | 4,416,829 |
| Series 2018 B, 5%, tender 1/26/22 (a) | | 4,660,000 | 5,076,231 |
| Series 2018 C, SIFMA Municipal Swap Index + 0.450% 2.35%, tender 7/27/22 (a)(d) | | 9,960,000 | 9,943,964 |
| Wisconsin Health & Edl. Facilities Auth. Series 2014 A, 5% 12/1/21 | | 700,000 | 758,373 |
|
| TOTAL WISCONSIN | | | 27,248,332 |
|
| TOTAL MUNICIPAL BONDS | | | |
| (Cost $957,378,654) | | | 961,505,593 |
|
| Municipal Notes - 50.6% | | | |
| Alabama - 0.1% | | | |
| Decatur Indl. Dev. Board Exempt Facilities Rev. (Nucor Steel Decatur LLC Proj.) Series 2003 A, 2.13% 7/5/19, VRDN (a)(c) | | 2,803,000 | $2,803,000 |
| California - 3.1% | | | |
| California Health Facilities Fing. Auth. Participating VRDN Series Floaters XG 00 49, 2% 7/5/19 (Liquidity Facility Deutsche Bank AG New York Branch) (a)(e)(f) | | 3,400,000 | 3,400,000 |
| El Centro Reg'l. Med. Cen Participating VRDN Series Floaters XF 10 72, 2.15% 7/5/19 (Liquidity Facility Deutsche Bank AG New York Branch) (a)(e)(f) | | 11,580,000 | 11,580,000 |
| San Francisco Calif. City & Cnty. Arpts. Commn. Int'l. Arpt. Rev. Participating VRDN Series 15 ZF 01 64, 2.15% 7/5/19 (Liquidity Facility JPMorgan Chase Bank) (a)(c)(e)(f) | | 4,960,000 | 4,960,000 |
| San Francisco City & County Arpts. Commission Int'l. Arpt. Rev. Participating VRDN: | | | |
| Series Floaters XM 06 75, 2.15% 7/5/19 (Liquidity Facility Morgan Stanley Bank, West Valley City Utah) (a)(c)(e)(f) | | 1,000,000 | 1,000,000 |
| Series Floaters ZM 06 41, 2.15% 7/5/19 (Liquidity Facility JPMorgan Chase Bank) (a)(c)(e)(f) | | 8,225,000 | 8,225,000 |
| Series Floaters ZM 06 44, 2.15% 7/5/19 (Liquidity Facility JPMorgan Chase Bank) (a)(c)(e)(f) | | 11,235,000 | 11,235,000 |
| Series XF 10 32, 2% 7/5/19 (Liquidity Facility Deutsche Bank AG New York Branch) (a)(e)(f) | | 600,000 | 600,000 |
| San Jose Int. Arpt. Rev. Participating VRDN Series 2017, 2.25% 7/5/19 (Liquidity Facility Citibank NA) (a)(c)(e)(f) | | 20,000,000 | 20,000,000 |
| Shafter Indl. Dev. Auth. Indl. Dev. Rev. 2.31% 7/5/19, LOC Deutsche Bank AG New York Branch, VRDN (a)(c) | | 800,000 | 800,000 |
|
| TOTAL CALIFORNIA | | | 61,800,000 |
|
| Colorado - 1.3% | | | |
| Colorado Edl. & Cultural Facilities Auth. Rev. (Mesivta of Greater Los Angeles Proj.) Series 2005, 2.25% 7/5/19, LOC Deutsche Bank AG, VRDN (a) | | 2,265,000 | 2,265,000 |
| Colorado Hsg. & Fin. Auth. Econ. Dev. (Pacific Instruments Proj.) Series 2000, 2.1% 7/5/19, LOC Wells Fargo Bank NA, VRDN (a)(c) | | 685,000 | 685,000 |
| Colorado Springs Spl. Oblig. Series 2007, 2.1% 7/5/19, LOC Wells Fargo Bank NA, VRDN (a)(c) | | 1,190,000 | 1,190,000 |
| Denver City & County Arpt. Rev. Participating VRDN: | | | |
| Series DBE 8027, 2.15% 7/5/19 (Liquidity Facility Deutsche Bank AG New York Branch) (a)(c)(e)(f) | | 3,500,000 | 3,500,000 |
| Series Floaters XL 00 90, 2.15% 7/5/19 (Liquidity Facility Morgan Stanley Bank, West Valley City Utah) (a)(c)(e)(f) | | 3,300,000 | 3,300,000 |
| Series Floaters XM 07 15, 2.2% 7/5/19 (Liquidity Facility Morgan Stanley Bank, West Valley City Utah) (a)(c)(e)(f) | | 15,395,000 | 15,395,000 |
|
| TOTAL COLORADO | | | 26,335,000 |
|
| Connecticut - 0.2% | | | |
| New Britain Gen. Oblig. BAN Series 2018, 5% 12/19/19 | | 4,100,000 | 4,165,100 |
| Delaware - 0.1% | | | |
| Delaware Econ. Dev. Auth. Rev. (Delmarva Pwr. & Lt. Co. Proj.) Series 1994, 2.1% 7/1/19, VRDN (a)(c) | | 2,200,000 | 2,200,000 |
| District Of Columbia - 0.4% | | | |
| District of Columbia Rev. Participating VRDN Series Floaters XF 10 78, 2.3% 7/5/19 (Liquidity Facility Deutsche Bank AG New York Branch) (a)(e)(f) | | 8,650,000 | 8,650,000 |
| Florida - 3.2% | | | |
| Aqua One Cmnty. Dev. District Fla Participating VRDN Series Floaters XF 10 76, 2.25% 7/5/19 (Liquidity Facility Deutsche Bank AG New York Branch) (a)(e)(f) | | 8,955,000 | 8,955,000 |
| Avenir Cmnty. Dev. District Participating VRDN Series Floaters XF 10 74, 2.25% 7/5/19 (Liquidity Facility Deutsche Bank AG New York Branch) (a)(e)(f) | | 855,000 | 855,000 |
| Broward County Arpt. Sys. Rev. Participating VRDN Series Floaters XL 00 88, 2.25% 7/5/19 (Liquidity Facility Citibank NA) (a)(c)(e)(f) | | 15,730,000 | 15,730,000 |
| Collier County Indl. Dev. Auth. Rev. (Var March Proj.) Series 2004, 2.05% 7/5/19, LOC Wells Fargo Bank NA, VRDN (a)(c) | | 220,000 | 220,000 |
| Gainesville Utils. Sys. Rev. Series 2019 C, 2.03% 7/1/19, LOC Bank of America NA, VRDN (a) | | 3,500,000 | 3,500,000 |
| Greater Orlando Aviation Auth. Arpt. Facilities Rev. Participating VRDN Series Floaters XF 05 77, 2.1% 7/5/19 (Liquidity Facility Royal Bank of Canada) (a)(c)(e)(f) | | 2,200,000 | 2,200,000 |
| Lee County Indl. Dev. Auth. Rev. (Florida Pwr. & Lt. Co. Proj.): | | | |
| Series 2016 A, 1.99% 7/1/19, VRDN (a)(c) | | 9,100,000 | 9,100,000 |
| 2% 7/1/19, VRDN (a)(c) | | 16,070,000 | 16,070,000 |
| Lee Memorial Health Sys. Hosp. Rev. Series 2019 B, 2.14% 7/4/22, VRDN (a) | | 7,100,000 | 7,100,000 |
| Miami-Dade County Aviation Rev. Participating VRDN Series XG 00 65 2% 7/5/19 (Liquidity Facility Deutsche Bank AG New York Branch) (a)(e)(f) | | 500,000 | 500,000 |
|
| TOTAL FLORIDA | | | 64,230,000 |
|
| Georgia - 1.3% | | | |
| Burke County Indl. Dev. Auth. Poll. Cont. Rev. (Georgia Pwr. Co. Plant Vogtle Proj.) Series 2012, 2.1% 7/1/19, VRDN (a)(c) | | 24,910,000 | 24,910,000 |
| Gordon County Dev. Auth. Series 2006, 2.07% 7/5/19, LOC Branch Banking & Trust Co., VRDN (a)(c) | | 670,000 | 670,000 |
| Monroe County Dev. Auth. Rev. (Florida Pwr. & Lt. Co. Proj.) Series 2017, 2% 7/1/19, VRDN (a)(c) | | 880,000 | 880,000 |
|
| TOTAL GEORGIA | | | 26,460,000 |
|
| Idaho - 0.1% | | | |
| Idaho Health Facilities Auth. Rev. Participating VRDN Series 16 XG 00 66, 2.13% 7/5/19 (Liquidity Facility Deutsche Bank AG New York Branch) (a)(e)(f) | | 1,500,000 | 1,500,000 |
| Illinois - 2.4% | | | |
| Chicago O'Hare Int'l. Arpt. Rev. Participating VRDN Series Floaters XL 00 49, 2.15% 7/5/19 (Liquidity Facility Citibank NA) (a)(c)(e)(f) | | 14,325,000 | 14,325,000 |
| Chicago Park District Gen. Oblig. Participating VRDN Series ROC II R 11935, 2.25% 7/5/19 (Liquidity Facility Citibank NA) (a)(e)(f) | | 6,975,000 | 6,975,000 |
| Chicago Transit Auth. Rev. Bonds Participating VRDN Series XM 00 53, 2.1% 7/5/19 (Liquidity Facility Citibank NA) (a)(e)(f) | | 12,205,000 | 12,205,000 |
| Cook County Gen. Oblig. Participating VRDN Series 2015 XF0124, 2.13% 7/5/19 (Liquidity Facility JPMorgan Chase Bank) (a)(e)(f) | | 3,720,000 | 3,720,000 |
| Illinois Gen. Oblig. Participating VRDN Series Floaters XM 01 86, 2.15% 7/5/19 (Liquidity Facility Deutsche Bank AG New York Branch) (a)(e)(f) | | 8,730,000 | 8,730,000 |
| Village of Oswego Indl. Dev. (Griffith Laboratories Worldwide, Inc.) Series 1995, 2.1% 7/5/19, LOC Wells Fargo Bank NA, VRDN (a)(c) | | 1,310,000 | 1,310,000 |
| Village of Woodridge, DuPage, Will & Cook Counties (Home Run Inn Frozen Foods Corp. Proj.) Series 2005, 1.05% 6/27/19, LOC JPMorgan Chase Bank, VRDN (a)(c) | | 1,305,000 | 1,305,000 |
|
| TOTAL ILLINOIS | | | 48,570,000 |
|
| Indiana - 0.1% | | | |
| Indiana Dev. Fin. Auth. Envir. Rev. (PSI Energy Proj.) Series 2003 A, 2.2% 7/5/19, VRDN (a)(c) | | 830,000 | 830,000 |
| Jeffersonville Ind. Econ. Dev. Rev. Series 2003, 2.21% 7/5/19, LOC PNC Bank NA, VRDN (a)(c) | | 1,115,000 | 1,115,000 |
|
| TOTAL INDIANA | | | 1,945,000 |
|
| Kansas - 0.1% | | | |
| Wamego Kansas Poll. Cont. Rfdg. Rev. (Kansas Gas & Elec. Co. Proj.) Series 1994, 2.1% 7/5/19, VRDN (a) | | 1,000,000 | 1,000,000 |
| Kentucky - 0.1% | | | |
| Hopkinsville Indl. Bldg. Rev. Series 2006, 2.07% 7/5/19, LOC Branch Banking & Trust Co., VRDN (a)(c) | | 1,330,000 | 1,330,000 |
| Louisiana - 4.4% | | | |
| New Orleans Aviation Board Rev. Participating VRDN: | | | |
| Series Floater ZF 24 97, 2.15% 7/5/19 (Liquidity Facility Citibank NA) (a)(c)(e)(f) | | 7,500,000 | 7,500,000 |
| Series Floaters XL 00 46, 2.15% 7/5/19 (Liquidity Facility Citibank NA) (a)(c)(e)(f) | | 13,340,000 | 13,340,000 |
| Series Floaters ZM 05 58, 2.15% 7/5/19 (Liquidity Facility Citibank NA) (a)(c)(e)(f) | | 7,500,000 | 7,500,000 |
| Saint James Parish Gen. Oblig. (Nucor Steel Louisiana LLC Proj.): | | | |
| Series 2010 A1, 2.09% 7/5/19, VRDN (a) | | 24,300,000 | 24,300,000 |
| Series 2010 B1, 2.05% 7/5/19, VRDN (a) | | 35,335,000 | 35,335,000 |
|
| TOTAL LOUISIANA | | | 87,975,000 |
|
| Maine - 0.0% | | | |
| Auburn Rev. Oblig. Secs Series 2001, 2.24% 7/5/19, LOC TD Banknorth, NA, VRDN (a)(c) | | 210,000 | 210,000 |
| Massachusetts - 1.1% | | | |
| Massachusetts Edl. Fing. Auth. Rev. Participating VRDN Series Floaters XF 23 06, 2.15% 7/5/19 (Liquidity Facility Morgan Stanley Bank, West Valley City Utah) (a)(c)(e)(f) | | 16,330,000 | 16,330,000 |
| Nahant BAN: | | | |
| Series 2019 A, 2.5% 6/26/20 | | 900,000 | 908,157 |
| Series 2019 B, 2.5% 7/9/20 (b) | | 2,700,000 | 2,726,743 |
| Truro Massachusetts BAN Series 2019, 2.5% 6/19/20 | | 2,581,000 | 2,605,422 |
|
| TOTAL MASSACHUSETTS | | | 22,570,322 |
|
| Michigan - 0.1% | | | |
| Michigan Strategic Fund Ltd. Oblig. Rev. Series 2005, 2.21% 7/5/19, LOC PNC Bank NA, VRDN (a)(c) | | 830,000 | 830,000 |
| Minnesota - 0.5% | | | |
| Shakopee Minn Sr Hsg. Rev. Participating VRDN Series Floaters 001, 2.2% 8/9/19 (Liquidity Facility Barclays Bank PLC) (a)(e)(f)(g) | | 9,700,000 | 9,700,000 |
| Mississippi - 0.6% | | | |
| Mississippi Bus. Fin. Corp. Solid Waste Disp. Rev. (Gulf Pwr. Co. Proj.) Series 2012, 1.98% 7/1/19, VRDN (a)(c) | | 10,855,000 | 10,855,000 |
| Missouri - 0.2% | | | |
| Kansas City Indl. Dev. Auth. Multi-family Hsg. Rev. Participating VRDN Series Floaters XF 10 84, 2.3% 7/5/19 (Liquidity Facility Deutsche Bank AG New York Branch) (a)(e)(f) | | 4,385,000 | 4,385,000 |
| Nebraska - 0.1% | | | |
| Stanton County Indl. Dev. Rev. Series 1998, 2.13% 7/5/19, VRDN (a)(c) | | 900,000 | 900,000 |
| Nevada - 0.8% | | | |
| Clark County Arpt. Rev. Participating VRDN Series ROC II R 11823, 2.1% 7/5/19 (Liquidity Facility Citibank NA) (a)(e)(f) | | 16,250,000 | 16,250,000 |
| Sparks Econ. Dev. Rev. (RIX Industries Proj.) Series 2002, 2.1% 7/5/19, LOC Wells Fargo Bank NA, VRDN (a)(c) | | 235,000 | 235,000 |
|
| TOTAL NEVADA | | | 16,485,000 |
|
| New Jersey - 3.5% | | | |
| Belmar Gen. Oblig. BAN Series 2019, 3.25% 2/7/20 | | 13,097,000 | 13,219,888 |
| Borough of Riverdale BAN Series 2018, 3% 9/13/19 | | 4,050,000 | 4,060,861 |
| Chester Township Gen. Oblig. BAN Series 2018, 3% 10/11/19 | | 5,580,000 | 5,602,375 |
| Delran Township BAN Series 2018, 3% 10/25/19 | | 8,900,000 | 8,938,444 |
| East Brunswick Township Gen. Oblig. BAN Series 2019, 3.5% 1/10/20 | | 3,100,000 | 3,134,415 |
| Flemington BAN 3.5% 1/15/20 | | 4,603,000 | 4,649,470 |
| Millburn Township Gen. Oblig. BAN Series 2019, 2.25% 6/12/20 | | 2,788,000 | 2,808,634 |
| Millstone Township Gen. Oblig. BAN Series 2018, 3% 9/10/19 | | 5,128,000 | 5,141,375 |
| Roselle County of Union BAN Series 2018, 3.5% 12/6/19 | | 4,800,000 | 4,841,201 |
| South River Borough Gen. Oblig. BAN Series 2018, 3.5% 12/10/19 | | 9,407,250 | 9,492,178 |
| Vineland Gen. Oblig. BAN Series 2018, 3.5% 11/14/19 | | 8,200,000 | 8,258,524 |
|
| TOTAL NEW JERSEY | | | 70,147,365 |
|
| New York - 8.3% | | | |
| Binghamton Gen. Oblig. BAN Series 2018, 3.5% 11/15/19 | | 700,000 | 705,296 |
| Geneva Hsg. Auth. Rev. Series 2000, 2.4% 7/5/19, VRDN (a)(c) | | 1,165,000 | 1,165,000 |
| Gloversville School District BAN Series 2018, 3% 10/18/19 | | 23,145,000 | 23,236,728 |
| New York Liberty Dev. Corp. Participating VRDN Series Floaters XF 10 27, 2% 7/5/19 (Liquidity Facility Deutsche Bank AG New York Branch) (a)(e)(f) | | 900,000 | 900,000 |
| New York Metropolitan Trans. Auth. Rev. BAN: | | | |
| Series 2018 B, 5% 5/15/21 | | 700,000 | 745,458 |
| Series 2018 C, 5% 9/1/21 | | 360,000 | 386,935 |
| Series 2019 A, 4% 2/3/20 | | 55,575,000 | 56,415,611 |
| North Rose-Wolcott Central School District Wayne County BAN Series 2018, 3.5% 7/26/19 | | 16,000,000 | 16,019,579 |
| Onondaga County Indl. Dev. Agcy. Indl. Dev. Rev. (Var G A Braun, Inc. Proj.) Series 2007, 2.2% 7/5/19, LOC Manufacturers & Traders Trust Co., VRDN (a)(c) | | 5,540,000 | 5,540,000 |
| Penn Yan NY Central School District BAN Series 2018, 3% 7/19/19 | | 8,400,000 | 8,404,721 |
| Putnam County Indl. Dev. Agcy. Rev. Series 2006 A, 2.3% 7/5/19, LOC RBS Citizens NA, VRDN (a) | | 4,035,000 | 4,035,000 |
| Queensbury Union Free School District BAN Series 2018, 3% 7/12/19 | | 4,900,000 | 4,901,575 |
| Sidney Cent School District BAN Series 2018, 3% 7/10/19 | | 4,798,077 | 4,799,388 |
| South Glens Falls Central School District BAN: | | | |
| Series 2018 A, 3% 7/26/19 | | 12,500,000 | 12,511,433 |
| Series 2018 B, 3% 7/26/19 | | 1,099,950 | 1,100,956 |
| Troy Rensselaer County BAN Series B, 3% 8/2/19 | | 12,440,695 | 12,454,917 |
| Ulster County Indl. Dev. Agcy. I (Selux Corp. Proj.) Series A: | | | |
| 2.28% 7/5/19, LOC Manufacturers & Traders Trust Co., VRDN (a)(c) | | 270,000 | 270,000 |
| 2.28% 7/5/19, LOC Manufacturers & Traders Trust Co., VRDN (a)(c) | | 205,000 | 205,000 |
| Watertown Enlarged City School District BAN Series 2019, 2.25% 6/30/20 (b) | | 12,357,147 | 12,445,984 |
|
| TOTAL NEW YORK | | | 166,243,581 |
|
| Ohio - 0.9% | | | |
| Akron Income Tax Rev. BAN Series 2018, 3.5% 12/10/19 | | 5,350,000 | 5,397,113 |
| East Clinton Local School District BAN Series 2019: | | | |
| 2.8% 12/3/19 | | 2,200,000 | 2,211,040 |
| 3% 12/17/19 | | 2,200,000 | 2,213,065 |
| Englewood BAN Series 2019, 3% 1/22/20 | | 1,600,000 | 1,611,053 |
| Forest Park Gen. Oblig. BAN Series 2019, 2.5% 5/27/20 | | 1,300,000 | 1,309,998 |
| Hamilton County HealthCare Facilities Rev. Participating VRDN Series XF 10 50, 2% 7/5/19 (Liquidity Facility Deutsche Bank AG New York Branch) (a)(e)(f) | | 3,600,000 | 3,600,000 |
| Ohio Indl. Dev. Rev. Series 2000, 2.1% 7/5/19, LOC JPMorgan Chase Bank, VRDN (a)(c) | | 1,800,000 | 1,800,000 |
| Summit County Indl. Dev. Rev. Series 2001, 2.21% 7/5/19, LOC Huntington Nat'l. Bank, VRDN (a)(c) | | 720,000 | 720,000 |
|
| TOTAL OHIO | | | 18,862,269 |
|
| Oregon - 0.3% | | | |
| Port Portland Spl. Oblig. Rev. (Horizon Air Ind. Proj.) Series 1997, 2.09% 7/1/19, LOC Bank of America NA, VRDN (a)(c) | | 6,840,000 | 6,840,000 |
| Pennsylvania - 1.6% | | | |
| Berks County Indl. Dev. Auth. Rev. (KTB Real Estate Partnership Proj.) 2.1% 7/5/19, LOC Manufacturers & Traders Trust Co., VRDN (a)(c) | | 300,000 | 300,000 |
| Montgomery County Higher Ed.& Health Auth. Rev. Series 2018 D, 2.13% 7/4/22, VRDN (a) | | 13,080,000 | 13,080,000 |
| Pennsylvania Econ. Dev. Participating VRDN Series XM 0048, 2% 7/5/19 (Liquidity Facility Deutsche Bank AG New York Branch) (a)(e)(f) | | 3,351,000 | 3,351,000 |
| Pennsylvania Higher Edl. Facilities Auth. Rev. Series 2015 B, 2.13% 7/4/22, VRDN (a) | | 7,360,000 | 7,360,000 |
| Philadelphia Auth. For Indl. Series 2017 B, 2.13% 7/4/22, VRDN (a) | | 7,955,000 | 7,955,000 |
|
| TOTAL PENNSYLVANIA | | | 32,046,000 |
|
| Rhode Island - 0.1% | | | |
| Rhode Island Health & Edl. Bldg. Corp. Higher Ed. Facilities Rev. Series 2005 A, 2.15% 7/1/19, LOC RBS Citizens NA, VRDN (a) | | 2,410,000 | 2,410,000 |
| South Carolina - 2.2% | | | |
| Berkeley County Indl. Dev. Rev. (Nucor Corp. Proj.): | | | |
| Series 1995, 2.13% 7/5/19, VRDN (a)(c) | | 11,700,000 | 11,700,000 |
| Series 1997, 2.13% 7/5/19, VRDN (a)(c) | | 3,800,000 | 3,800,000 |
| South Carolina Jobs-Econ. Dev. Auth. Series 2018 C, 2.12% 7/4/22, VRDN (a) | | 7,675,000 | 7,675,000 |
| South Carolina Jobs-Econ. Dev. Auth. Econ. Dev. Rev. Series 2001, 2.05% 7/5/19, LOC Wells Fargo Bank NA, VRDN (a)(c) | | 1,800,000 | 1,800,000 |
| South Carolina Pub. Svc. Auth. Rev. Participating VRDN: | | | |
| Series Floaters XG 02 09, 2.3% 7/5/19 (Liquidity Facility Toronto-Dominion Bank) (a)(e)(f) | | 4,625,000 | 4,625,000 |
| Series Floaters XM 02 91, 2.15% 7/5/19 (Liquidity Facility Royal Bank of Canada) (a)(e)(f) | | 2,500,000 | 2,500,000 |
| Series Floaters XM 03 84, 2.15% 7/5/19 (Liquidity Facility JPMorgan Chase Bank) (a)(e)(f) | | 10,000,000 | 10,000,000 |
| South Carolina St. Pub. Svc. Auth. Rev. Participating VRDN Series XG 0046, 2.3% 7/5/19 (Liquidity Facility Toronto-Dominion Bank) (a)(e)(f) | | 2,165,000 | 2,165,000 |
|
| TOTAL SOUTH CAROLINA | | | 44,265,000 |
|
| Tennessee - 0.1% | | | |
| Memphis-Shelby County Indl. Dev. Board Facilities Rev. Series 2007, 2.13% 7/5/19, VRDN (a)(c) | | 2,230,000 | 2,230,000 |
| Texas - 8.6% | | | |
| Dallas Fort Worth Int'l. Arpt. Rev. Participating VRDN Series Floaters XF 10 61, 2.1% 7/5/19 (Liquidity Facility Deutsche Bank AG New York Branch) (a)(c)(e)(f) | | 8,370,000 | 8,370,000 |
| Garland Wtr. & Swr. Rev. Series 2019, 2.3% 7/12/19, LOC Sumitomo Mitsui Banking Corp., CP | | 1,600,000 | 1,599,958 |
| Gulf Coast Waste Disp. Auth. Envir. Facilities Rev.: | | | |
| (Exxon Mobil Corp. Proj.) Series 2003, 2.03% 7/1/19, VRDN (a)(c) | | 3,240,000 | 3,240,000 |
| (Exxon Mobil Proj.) Series 2002, 2.03% 7/1/19, VRDN (a)(c) | | 2,300,000 | 2,300,000 |
| North Texas Tollway Auth. Rev. Participating VRDN Series XM0085, 2.1% 7/5/19 (Liquidity Facility Barclays Bank PLC) (a)(e)(f) | | 3,600,000 | 3,600,000 |
| Port Arthur Navigation District Envir. Facilities Rev. (Motiva Enterprises LLC Proj.): | | | |
| Series 2001 A, 2.07% 7/1/19, VRDN (a) | | 4,375,000 | 4,375,000 |
| Series 2004, 2.12% 7/5/19, VRDN (a)(c) | | 63,985,000 | 63,985,000 |
| Series 2010 B, 2.07% 7/1/19, VRDN (a) | | 2,335,000 | 2,335,000 |
| Series 2010 C, 2.06% 7/1/19, VRDN (a) | | 23,290,000 | 23,290,000 |
| Series 2010 D: | | | |
| 2.05% 7/5/19, VRDN (a) | | 33,665,000 | 33,665,000 |
| 2.05% 7/5/19, VRDN (a) | | 12,400,000 | 12,400,000 |
| San Antonio Arpt. Sys. Rev. 1.99% 7/5/19, LOC Bank of America NA, VRDN (a)(c) | | 800,000 | 800,000 |
| Texas Gen. Oblig.: | | | |
| Series 2004 B, 2.05% 7/5/19 (Liquidity Facility State Street Bank & Trust Co., Boston), VRDN (a)(c) | | 7,940,000 | 7,940,000 |
| Series 2006 A, 2.05% 7/5/19 (Liquidity Facility State Street Bank & Trust Co., Boston), VRDN (a)(c) | | 5,060,000 | 5,060,000 |
|
| TOTAL TEXAS | | | 172,959,958 |
|
| Utah - 1.7% | | | |
| Salt Lake City Arpt. Rev. Participating VRDN: | | | |
| Series 17 XM 0493, 2.15% 7/5/19 (Liquidity Facility Morgan Stanley Bank, West Valley City Utah) (a)(c)(e)(f) | | 20,500,000 | 20,500,000 |
| Series Floaters XM 06 99, 2.2% 7/5/19 (Liquidity Facility Cr. Suisse AG) (a)(c)(e)(f) | | 6,400,000 | 6,400,000 |
| Series Floaters ZM 05 51, 2.15% 7/5/19 (Liquidity Facility Citibank NA) (a)(c)(e)(f) | | 7,500,000 | 7,500,000 |
|
| TOTAL UTAH | | | 34,400,000 |
|
| Washington - 1.1% | | | |
| Kitsap County Indl. Dev. Corpre (Cara Land Co., L.L.C. Proj.) Series 2006, 2.1% 7/5/19, LOC Wells Fargo Bank NA, VRDN (a)(c) | | 700,000 | 700,000 |
| Seattle Hsg. Auth. Rev. (Douglas Apts. Proj.) 2.05% 7/5/19, LOC KeyBank NA, VRDN (a) | | 715,000 | 715,000 |
| Washington Econ. Dev. Fin. Auth. Rev. Participating VRDN Series Floaters 005, 2.25% 8/9/19 (Liquidity Facility Barclays Bank PLC) (a)(c)(e)(f)(g) | | 9,915,000 | 9,915,000 |
| Washington Health Care Facilities Auth. Rev. Participating VRDN: | | | |
| Series Floaters XF 00 42, 2.13% 7/5/19 (Liquidity Facility JPMorgan Chase Bank) (a)(e)(f) | | 8,705,000 | 8,705,000 |
| Series Floaters XG 00 51, 2.05% 7/5/19 (Liquidity Facility Deutsche Bank AG New York Branch) (a)(e)(f) | | 2,275,000 | 2,275,000 |
|
| TOTAL WASHINGTON | | | 22,310,000 |
|
| West Virginia - 1.1% | | | |
| West Virginia Hosp. Fin. Auth. Hosp. Rev. Series 2018 E, 2.12% 7/4/22, VRDN (a) | | 22,190,000 | 22,190,000 |
| Wisconsin - 0.8% | | | |
| Brodhead Indl. Dev. Series 2000, 2.15% 7/5/19, LOC JPMorgan Chase Bank, VRDN (a)(c) | | 4,400,000 | 4,400,000 |
| Deforest Area School District BAN Series 2019, 3% 12/18/19 | | 2,200,000 | 2,203,904 |
| Milton School District BAN Series 2019, 5% 8/19/19 | | 2,100,000 | 2,109,921 |
| Wisconsin Health & Edl. Facilities Participating VRDN Series 2017 ZF 2412, 2.15% 7/5/19 (Liquidity Facility Citibank NA) (a)(e)(f) | | 7,500,000 | 7,500,000 |
|
| TOTAL WISCONSIN | | | 16,213,825 |
|
| TOTAL MUNICIPAL NOTES | | | |
| (Cost $1,015,544,753) | | | 1,016,016,420 |
| | | Shares | Value |
|
| Money Market Funds - 4.0% | | | |
| Fidelity Municipal Cash Central Fund 2.00% (h)(i) | | | |
| (Cost $79,305,010) | | 79,297,070 | 79,304,984 |
| TOTAL INVESTMENT IN SECURITIES - 102.5% | | | |
| (Cost $2,052,228,417) | | | 2,056,826,997 |
| NET OTHER ASSETS (LIABILITIES) - (2.5)% | | | (49,559,333) |
| NET ASSETS - 100% | | | $2,007,267,664 |
Security Type Abbreviations
BAN – BOND ANTICIPATION NOTE
CP – COMMERCIAL PAPER
VRDN – VARIABLE RATE DEMAND NOTE (A debt instrument that is payable upon demand, either daily, weekly or monthly)
Legend
(a) Coupon rates for floating and adjustable rate securities reflect the rates in effect at period end.
(b) Security or a portion of the security purchased on a delayed delivery or when-issued basis.
(c) Private activity obligations whose interest is subject to the federal alternative minimum tax for individuals.
(d) Coupon is indexed to a floating interest rate which may be multiplied by a specified factor and/or subject to caps or floors.
(e) Provides evidence of ownership in one or more underlying municipal bonds.
(f) Coupon rates are determined by re-marketing agents based on current market conditions.
(g) Restricted securities - Investment in securities not registered under the Securities Act of 1933 (excluding 144A issues). At the end of the period, the value of restricted securities (excluding 144A issues) amounted to $19,615,000 or 1.0% of net assets.
(h) Information in this report regarding holdings by state and security types does not reflect the holdings of the Fidelity Municipal Cash Central Fund.
(i) Affiliated fund that is available only to investment companies and other accounts managed by Fidelity Investments. The rate quoted is the annualized seven-day yield of the fund at period end. A complete unaudited listing of the fund's holdings as of its most recent quarter end is available upon request. In addition, each Fidelity Central Fund's financial statements are available on the SEC's website or upon request.
Additional information on each restricted holding is as follows:
| Security | Acquisition Date | Acquisition Cost |
| Shakopee Minn Sr Hsg. Rev. Participating VRDN Series Floaters 001, 2.2% 8/9/19 (Liquidity Facility Barclays Bank PLC) | 1/10/19 | $9,700,000 |
| Washington Econ. Dev. Fin. Auth. Rev. Participating VRDN Series Floaters 005, 2.25% 8/9/19 (Liquidity Facility Barclays Bank PLC) | 3/1/18 - 1/18/19 | $9,915,000 |
Affiliated Central Funds
Information regarding fiscal year to date income earned by the Fund from investments in Fidelity Central Funds is as follows:
| Fund | Income earned |
| Fidelity Municipal Cash Central Fund | $363,876 |
| Total | $363,876 |
Amounts in the income column in the above table include any capital gain distributions from underlying funds, which are presented in the corresponding line-item in the Statement of Operations, if applicable.
Investment Valuation
The following is a summary of the inputs used, as of June 30, 2019, involving the Fund's assets and liabilities carried at fair value. The inputs or methodology used for valuing securities may not be an indication of the risk associated with investing in those securities. For more information on valuation inputs, and their aggregation into the levels used below, please refer to the Investment Valuation section in the accompanying Notes to Financial Statements.
| | Valuation Inputs at Reporting Date: |
| Description | Total | Level 1 | Level 2 | Level 3 |
| Investments in Securities: | | | | |
| Municipal Securities | $1,977,522,013 | $-- | $1,977,522,013 | $-- |
| Money Market Funds | 79,304,984 | 79,304,984 | -- | -- |
| Total Investments in Securities: | $2,056,826,997 | $79,304,984 | $1,977,522,013 | $-- |
Other Information
The distribution of municipal securities by revenue source, as a percentage of total Net Assets, is as follows (Unaudited):
| General Obligations | 18.5% |
| Synthetics | 17.2% |
| Health Care | 14.8% |
| Industrial Development | 14.2% |
| Transportation | 12.4% |
| Electric Utilities | 11.7% |
| Others* (Individually Less Than 5%) | 11.2% |
| | 100.0% |
* Includes net other assets
See accompanying notes which are an integral part of the financial statements.
Financial Statements
Statement of Assets and Liabilities
| | | June 30, 2019 (Unaudited) |
| Assets | | |
Investment in securities, at value — See accompanying schedule:
Unaffiliated issuers (cost $1,972,923,407) | $1,977,522,013 | |
| Fidelity Central Funds (cost $79,305,010) | 79,304,984 | |
| Total Investment in Securities (cost $2,052,228,417) | | $2,056,826,997 |
| Receivable for investments sold | | 20,496,931 |
| Receivable for fund shares sold | | 2,635,278 |
| Interest receivable | | 15,397,599 |
| Distributions receivable from Fidelity Central Funds | | 98,431 |
| Receivable from investment adviser for expense reductions | | 162,539 |
| Other receivables | | 516 |
| Total assets | | 2,095,618,291 |
| Liabilities | | |
| Payable to custodian bank | $19,618,843 | |
| Payable for investments purchased | | |
| Regular delivery | 2,750,602 | |
| Delayed delivery | 58,725,899 | |
| Payable for fund shares redeemed | 5,509,319 | |
| Distributions payable | 1,152,025 | |
| Accrued management fee | 499,711 | |
| Other affiliated payables | 94,228 | |
| Total liabilities | | 88,350,627 |
| Net Assets | | $2,007,267,664 |
| Net Assets consist of: | | |
| Paid in capital | | $2,002,951,250 |
| Total distributable earnings (loss) | | 4,316,414 |
| Net Assets | | $2,007,267,664 |
| Net Asset Value and Maximum Offering Price | | |
| Conservative Income Municipal Bond: | | |
| Net Asset Value, offering price and redemption price per share ($260,230,659 ÷ 25,891,795 shares) | | $10.05 |
| Institutional Class: | | |
| Net Asset Value, offering price and redemption price per share ($1,747,037,005 ÷ 173,813,843 shares) | | $10.05 |
See accompanying notes which are an integral part of the financial statements.
Statement of Operations
| | | Six months ended June 30, 2019 (Unaudited) |
| Investment Income | | |
| Interest | | $18,346,005 |
| Income from Fidelity Central Funds | | 363,876 |
| Total income | | 18,709,881 |
| Expenses | | |
| Management fee | $2,894,967 | |
| Transfer agent fees | 548,225 | |
| Independent trustees' fees and expenses | 3,449 | |
| Commitment fees | 2,626 | |
| Total expenses before reductions | 3,449,267 | |
| Expense reductions | (923,105) | |
| Total expenses after reductions | | 2,526,162 |
| Net investment income (loss) | | 16,183,719 |
| Realized and Unrealized Gain (Loss) | | |
| Net realized gain (loss) on: | | |
| Investment securities: | | |
| Unaffiliated issuers | 132,908 | |
| Total net realized gain (loss) | | 132,908 |
| Change in net unrealized appreciation (depreciation) on: | | |
| Investment securities: | | |
| Unaffiliated issuers | 6,481,143 | |
| Fidelity Central Funds | (26) | |
| Total change in net unrealized appreciation (depreciation) | | 6,481,117 |
| Net gain (loss) | | 6,614,025 |
| Net increase (decrease) in net assets resulting from operations | | $22,797,744 |
See accompanying notes which are an integral part of the financial statements.
Statement of Changes in Net Assets
| | Six months ended June 30, 2019 (Unaudited) | Year ended December 31, 2018 |
| Increase (Decrease) in Net Assets | | |
| Operations | | |
| Net investment income (loss) | $16,183,719 | $24,613,757 |
| Net realized gain (loss) | 132,908 | (1,081,256) |
| Change in net unrealized appreciation (depreciation) | 6,481,117 | 2,603,795 |
| Net increase (decrease) in net assets resulting from operations | 22,797,744 | 26,136,296 |
| Distributions to shareholders | (16,170,215) | (24,774,551) |
| Share transactions - net increase (decrease) | 141,139,882 | (65,694,840) |
| Total increase (decrease) in net assets | 147,767,411 | (64,333,095) |
| Net Assets | | |
| Beginning of period | 1,859,500,253 | 1,923,833,348 |
| End of period | $2,007,267,664 | $1,859,500,253 |
See accompanying notes which are an integral part of the financial statements.
Financial Highlights
Fidelity Conservative Income Municipal Bond Fund
| | Six months ended (Unaudited) June 30, | Years endedDecember 31, | | | | |
| | 2019 | 2018 | 2017 | 2016 | 2015 | 2014 |
| Selected Per–Share Data | | | | | | |
| Net asset value, beginning of period | $10.02 | $10.01 | $10.00 | $10.04 | $10.04 | $10.02 |
| Income from Investment Operations | | | | | | |
| Net investment income (loss)A | .080 | .134 | .090 | .062 | .032 | .015 |
| Net realized and unrealized gain (loss) | .030 | .011 | .010 | (.041) | –B | .021 |
| Total from investment operations | .110 | .145 | .100 | .021 | .032 | .036 |
| Distributions from net investment income | (.080) | (.134) | (.088) | (.059) | (.031) | (.015) |
| Distributions from net realized gain | – | (.001) | (.002) | (.002) | (.001) | (.001) |
| Total distributions | (.080) | (.135) | (.090) | (.061) | (.032) | (.016) |
| Net asset value, end of period | $10.05 | $10.02 | $10.01 | $10.00 | $10.04 | $10.04 |
| Total ReturnC,D | 1.10% | 1.45% | 1.00% | .21% | .32% | .36% |
| Ratios to Average Net AssetsE,F | | | | | | |
| Expenses before reductions | .40%G | .40% | .40% | .40% | .40% | .40% |
| Expenses net of fee waivers, if any | .35%G | .35% | .35% | .35% | .39% | .40% |
| Expenses net of all reductions | .35%G | .35% | .35% | .35% | .39% | .40% |
| Net investment income (loss) | 1.61%G | 1.34% | .90% | .62% | .32% | .15% |
| Supplemental Data | | | | | | |
| Net assets, end of period (000 omitted) | $260,231 | $251,811 | $234,599 | $164,586 | $73,914 | $45,107 |
| Portfolio turnover rateH | 65%G | 45%I | 33% | 36% | 32% | 51% |
A Calculated based on average shares outstanding during the period.
B Amount represents less than $.0005 per share.
C Total returns for periods of less than one year are not annualized.
D Total returns would have been lower if certain expenses had not been reduced during the applicable periods shown.
E Fees and expenses of any underlying Fidelity Central Funds are not included in the Fund's expense ratio. The Fund indirectly bears its proportionate share of the expenses of any underlying Fidelity Central Funds.
F Expense ratios reflect operating expenses of the class. Expenses before reductions do not reflect amounts reimbursed by the investment adviser or reductions from expense offset arrangements and do not represent the amount paid by the class during periods when reimbursements or reductions occur. Expenses net of fee waivers reflect expenses after reimbursement by the investment adviser but prior to reductions from expense offset arrangements. Expenses net of all reductions represent the net expenses paid by the class.
G Annualized
H Amount does not include the portfolio activity of any underlying Fidelity Central Funds.
I Portfolio turnover rate excludes securities received or delivered in-kind.
See accompanying notes which are an integral part of the financial statements.
Fidelity Conservative Income Municipal Bond Fund Institutional Class
| | Six months ended (Unaudited) June 30, | Years endedDecember 31, | | | | |
| | 2019 | 2018 | 2017 | 2016 | 2015 | 2014 |
| Selected Per–Share Data | | | | | | |
| Net asset value, beginning of period | $10.02 | $10.01 | $10.00 | $10.04 | $10.04 | $10.02 |
| Income from Investment Operations | | | | | | |
| Net investment income (loss)A | .085 | .144 | .099 | .071 | .042 | .025 |
| Net realized and unrealized gain (loss) | .030 | .011 | .011 | (.040) | –B | .021 |
| Total from investment operations | .115 | .155 | .110 | .031 | .042 | .046 |
| Distributions from net investment income | (.085) | (.144) | (.098) | (.069) | (.041) | (.025) |
| Distributions from net realized gain | – | (.001) | (.002) | (.002) | (.001) | (.001) |
| Total distributions | (.085) | (.145) | (.100) | (.071) | (.042) | (.026) |
| Net asset value, end of period | $10.05 | $10.02 | $10.01 | $10.00 | $10.04 | $10.04 |
| Total ReturnC,D | 1.15% | 1.56% | 1.11% | .31% | .42% | .46% |
| Ratios to Average Net AssetsE,F | | | | | | |
| Expenses before reductions | .35%G | .35% | .35% | .35% | .35% | .35% |
| Expenses net of fee waivers, if any | .25%G | .25% | .25% | .25% | .29% | .30% |
| Expenses net of all reductions | .25%G | .25% | .25% | .25% | .29% | .30% |
| Net investment income (loss) | 1.71%G | 1.44% | 1.00% | .72% | .42% | .25% |
| Supplemental Data | | | | | | |
| Net assets, end of period (000 omitted) | $1,747,037 | $1,607,689 | $1,689,234 | $844,145 | $290,823 | $143,491 |
| Portfolio turnover rateH | 65%G | 45%I | 33% | 36% | 32% | 51% |
A Calculated based on average shares outstanding during the period.
B Amount represents less than $.0005 per share.
C Total returns for periods of less than one year are not annualized.
D Total returns would have been lower if certain expenses had not been reduced during the applicable periods shown.
E Fees and expenses of any underlying Fidelity Central Funds are not included in the Fund's expense ratio. The Fund indirectly bears its proportionate share of the expenses of any underlying Fidelity Central Funds.
F Expense ratios reflect operating expenses of the class. Expenses before reductions do not reflect amounts reimbursed by the investment adviser or reductions from expense offset arrangements and do not represent the amount paid by the class during periods when reimbursements or reductions occur. Expenses net of fee waivers reflect expenses after reimbursement by the investment adviser but prior to reductions from expense offset arrangements. Expenses net of all reductions represent the net expenses paid by the class.
G Annualized
H Amount does not include the portfolio activity of any underlying Fidelity Central Funds.
I Portfolio turnover rate excludes securities received or delivered in-kind.
See accompanying notes which are an integral part of the financial statements.
Notes to Financial Statements (Unaudited)
For the period ended June 30, 2019
1. Organization.
Fidelity Conservative Income Municipal Bond Fund (the Fund) is a fund of Fidelity Municipal Trust (the Trust) and is authorized to issue an unlimited number of shares. The Trust is registered under the Investment Company Act of 1940, as amended (the 1940 Act), as an open-end management investment company organized as a Massachusetts business trust. The Fund offers Conservative Income Municipal Bond and Institutional Class shares, each of which has equal rights as to assets and voting privileges. Each class has exclusive voting rights with respect to matters that affect that class.
2. Investments in Fidelity Central Funds.
The Fund invests in Fidelity Central Funds, which are open-end investment companies generally available only to other investment companies and accounts managed by the investment adviser and its affiliates. The Fund's Schedule of Investments lists each of the Fidelity Central Funds held as of period end, if any, as an investment of the Fund, but does not include the underlying holdings of each Fidelity Central Fund. As an Investing Fund, the Fund indirectly bears its proportionate share of the expenses of the underlying Fidelity Central Funds.
The Money Market Central Funds seek preservation of capital and current income and are managed by Fidelity Investments Money Management, Inc. (FIMM), an affiliate of the investment adviser. Annualized expenses of the Money Market Central Funds as of their most recent shareholder report date ranged from less than .005% to .01%.
A complete unaudited list of holdings for each Fidelity Central Fund is available upon request or at the Securities and Exchange Commission (the SEC) website at www.sec.gov. In addition, the financial statements of the Fidelity Central Funds are available on the SEC website or upon request.
3. Significant Accounting Policies.
The Fund is an investment company and applies the accounting and reporting guidance of the Financial Accounting Standards Board (FASB) Accounting Standards Codification Topic 946 Financial Services – Investments Companies. The financial statements have been prepared in conformity with accounting principles generally accepted in the United States of America (GAAP), which require management to make certain estimates and assumptions at the date of the financial statements. Actual results could differ from those estimates. Subsequent events, if any, through the date that the financial statements were issued have been evaluated in the preparation of the financial statements. The following summarizes the significant accounting policies of the Fund:
Investment Valuation. Investments are valued as of 4:00 p.m. Eastern time on the last calendar day of the period. The Board of Trustees (the Board) has delegated the day to day responsibility for the valuation of the Fund's investments to the Fair Value Committee (the Committee) established by the Fund's investment adviser. In accordance with valuation policies and procedures approved by the Board, the Fund attempts to obtain prices from one or more third party pricing vendors or brokers to value its investments. When current market prices, quotations or currency exchange rates are not readily available or reliable, investments will be fair valued in good faith by the Committee, in accordance with procedures adopted by the Board. Factors used in determining fair value vary by investment type and may include market or investment specific events, changes in interest rates and credit quality. The frequency with which these procedures are used cannot be predicted and they may be utilized to a significant extent. The Committee oversees the Fund's valuation policies and procedures and reports to the Board on the Committee's activities and fair value determinations. The Board monitors the appropriateness of the procedures used in valuing the Fund's investments and ratifies the fair value determinations of the Committee.
The Fund categorizes the inputs to valuation techniques used to value its investments into a disclosure hierarchy consisting of three levels as shown below:
- Level 1 – quoted prices in active markets for identical investments
- Level 2 – other significant observable inputs (including quoted prices for similar investments, interest rates, prepayment speeds, etc.)
- Level 3 – unobservable inputs (including the Fund's own assumptions based on the best information available)
Valuation techniques used to value the Fund's investments by major category are as follows:
Debt securities, including restricted securities, are valued based on evaluated prices received from third party pricing vendors or from brokers who make markets in such securities. Municipal securities are valued by pricing vendors who utilize matrix pricing which considers yield or price of bonds of comparable quality, coupon, maturity and type or by broker-supplied prices. When independent prices are unavailable or unreliable, debt securities may be valued utilizing pricing methodologies which consider similar factors that would be used by third party pricing vendors. Debt securities are generally categorized as Level 2 in the hierarchy but may be Level 3 depending on the circumstances.
Investments in open-end mutual funds, including the Fidelity Central Funds, are valued at their closing net asset value (NAV) each business day and are categorized as Level 1 in the hierarchy.
Changes in valuation techniques may result in transfers in or out of an assigned level within the disclosure hierarchy. The aggregate value of investments by input level as of June 30, 2019 is included at the end of the Fund's Schedule of Investments.
Investment Transactions and Income. For financial reporting purposes, the Fund's investment holdings and NAV include trades executed through the end of the last business day of the period. The NAV per share for processing shareholder transactions is calculated as of the close of business of the New York Stock Exchange (NYSE), normally 4:00 p.m. Eastern time and includes trades executed through the end of the prior business day. Gains and losses on securities sold are determined on the basis of identified cost. Income and capital gain distributions from Fidelity Central Funds, if any, are recorded on the ex-dividend date. Interest income is accrued as earned and includes coupon interest and amortization of premium and accretion of discount on debt securities as applicable.
Class Allocations and Expenses. Investment income, realized and unrealized capital gains and losses, common expenses of the Fund, and certain fund-level expense reductions, if any, are allocated daily on a pro-rata basis to each class based on the relative net assets of each class to the total net assets of the Fund. Each class differs with respect to transfer agent fees incurred. Certain expense reductions may also differ by class. For the reporting period, the allocated portion of income and expenses to each class as a percent of its average net assets may vary due to the timing of recording these transactions in relation to fluctuating net assets of the classes. Expenses directly attributable to a fund are charged to that fund. Expenses attributable to more than one fund are allocated among the respective funds on the basis of relative net assets or other appropriate methods. Expense estimates are accrued in the period to which they relate and adjustments are made when actual amounts are known.
Income Tax Information and Distributions to Shareholders. Each year, the Fund intends to qualify as a regulated investment company under Subchapter M of the Internal Revenue Code, including distributing substantially all of its taxable income and realized gains. As a result, no provision for U.S. Federal income taxes is required. The Fund files a U.S. federal tax return, in addition to state and local tax returns as required. The Fund's federal income tax returns are subject to examination by the Internal Revenue Service (IRS) for a period of three fiscal years after they are filed. State and local tax returns may be subject to examination for an additional fiscal year depending on the jurisdiction.
Distributions are declared and recorded daily and paid monthly from net investment income. Distributions from realized gains, if any, are declared and recorded on the ex-dividend date. Income and capital gain distributions are declared separately for each class. Income and capital gain distributions are determined in accordance with income tax regulations, which may differ from GAAP.
Capital accounts within the financial statements are adjusted for permanent book-tax differences. These adjustments have no impact on net assets or the results of operations. Capital accounts are not adjusted for temporary book-tax differences which will reverse in a subsequent period.
Book-tax differences are primarily due to market discount, redemptions in kind, capital loss carryforwards, and losses deferred due to wash sales and excise tax regulations.
The Fund purchases municipal securities whose interest, in the opinion of the issuer, is free from federal income tax. There is no assurance that the IRS will agree with this opinion. In the event the IRS determines that the issuer does not comply with relevant tax requirements, interest payments from a security could become federally taxable, possibly retroactively to the date the security was issued.
As of period end, the cost and unrealized appreciation (depreciation) in securities, and derivatives if applicable, for federal income tax purposes were as follows:
| Gross unrealized appreciation | $4,864,555 |
| Gross unrealized depreciation | (253,378) |
| Net unrealized appreciation (depreciation) | $4,611,177 |
| Tax cost | $2,052,215,820 |
Capital loss carryforwards are only available to offset future capital gains of the Fund to the extent provided by regulations and may be limited. Under the Regulated Investment Company Modernization Act of 2010 (the Act), the Fund is permitted to carry forward capital losses incurred in taxable years beginning after December 22, 2010 for an unlimited period and such capital losses are required to be used prior to any losses that expire. The capital loss carryforward information presented below, including any applicable limitation, is estimated as of prior fiscal period end and is subject to adjustment.
| No expiration | |
| Short-term | $(225,881) |
| Long-term | (217,501) |
| Total capital loss carryforward | $(443,382) |
Delayed Delivery Transactions and When-Issued Securities. During the period, the Fund transacted in securities on a delayed delivery or when-issued basis. Payment and delivery may take place after the customary settlement period for that security. The price of the underlying securities and the date when the securities will be delivered and paid for are fixed at the time the transaction is negotiated. The securities purchased on a delayed delivery or when-issued basis are identified as such in the Fund's Schedule of Investments. The Fund may receive compensation for interest forgone in the purchase of a delayed delivery or when-issued security. With respect to purchase commitments, the Fund identifies securities as segregated in its records with a value at least equal to the amount of the commitment. Losses may arise due to changes in the value of the underlying securities or if the counterparty does not perform under the contract's terms, or if the issuer does not issue the securities due to political, economic, or other factors.
Restricted Securities. The Fund may invest in securities that are subject to legal or contractual restrictions on resale. These securities generally may be resold in transactions exempt from registration or to the public if the securities are registered. Disposal of these securities may involve time-consuming negotiations and expense, and prompt sale at an acceptable price may be difficult. Information regarding restricted securities is included at the end of the Fund's Schedule of Investments.
4. Purchases and Sales of Investments.
Purchases and sales of securities, other than short-term securities, aggregated $345,758,218 and $354,422,574, respectively.
5. Fees and Other Transactions with Affiliates.
Management Fee. Fidelity Management & Research Company (the investment adviser) and its affiliates provide the Fund with investment management related services for which the Fund pays a monthly management fee that is based on an annual rate of .30% of the Fund's average net assets. Under the management contract, the investment adviser pays all other fund-level expenses, except the compensation of the independent Trustees and certain other expenses such as interest expense, including commitment fees.
Transfer Agent Fees. Fidelity Investments Institutional Operations Company, Inc. (FIIOC), an affiliate of the investment adviser, is the transfer, dividend disbursing and shareholder servicing agent for the Fund. FIIOC receives asset-based fees of .10% and .05% of average net assets for Conservative Income Municipal Bond and Institutional Class, respectively. FIIOC pays for typesetting, printing and mailing of shareholder reports, except proxy statements. For the period, transfer agent fees for each class were as follows:
| | Amount |
| Conservative Income Municipal Bond | $131,460 |
| Institutional Class | 416,765 |
| | $548,225 |
Interfund Trades. The Fund may purchase from or sell securities to other Fidelity Funds under procedures adopted by the Board. The procedures have been designed to ensure these interfund trades are executed in accordance with Rule 17a-7 of the 1940 Act. Interfund trades are included within the respective purchases and sales amounts shown in the Purchases and Sales of Investments note.
Prior Fiscal Year Affiliated Redemptions In-Kind. During the prior period, 55,039,919 shares of the Fund were redeemed in-kind for investments, including accrued interest, with a value of $551,499,983. The Fund had a net realized loss of $(778,563) on investments delivered through in-kind redemptions. The amount of the in-kind redemptions is included in share transactions in the accompanying Statement of Changes in Net Assets as well as the Notes to Financial Statements. The Fund recognized no gain or loss for federal income tax purposes.
6. Committed Line of Credit.
The Fund participates with other funds managed by the investment adviser or an affiliate in a $4.25 billion credit facility (the "line of credit") to be utilized for temporary or emergency purposes to fund shareholder redemptions or for other short-term liquidity purposes. The Fund has agreed to pay commitment fees on its pro-rata portion of the line of credit, which amounted to $2,626 and is reflected in Commitment fees on the Statement of Operations. During the period, the Fund did not borrow on this line of credit.
7. Expense Reductions.
The investment adviser contractually agreed to reimburse each class to the extent annual operating expenses exceeded certain levels of class-level average net assets as noted in the table below. This reimbursement will remain in place through April 30, 2020. Some expenses, for example the compensation of the independent Trustees, and certain other expenses such as interest expense, are excluded from this reimbursement.
The following classes were in reimbursement during the period:
| | Expense Limitations | Reimbursement |
| Conservative Income Municipal Bond | .35% | $69,887 |
| Institutional Class | .25% | 852,657 |
| | | $922,544 |
In addition, through arrangements with the Fund's custodian, credits realized as a result of certain uninvested cash balances were used to reduce the Fund's expenses. During the period, these credits reduced the Fund's custody expenses by $561.
8. Distributions to Shareholders.
Distributions to shareholders of each class were as follows:
| | Six months ended
June 30, 2019 | Year ended
December 31, 2018 |
| Distributions to shareholders | | |
| Conservative Income Municipal Bond | $2,090,973 | $3,247,996 |
| Institutional Class | 14,079,242 | 21,526,555 |
| Total | $16,170,215 | $24,774,551 |
9. Share Transactions.
Share transactions for each class were as follows and may contain automatic conversions between classes or exchanges between affiliated funds:
| | Shares | Shares | Dollars | Dollars |
| | Six months ended June 30, 2019 | Year ended December 31, 2018 | Six months ended June 30, 2019 | Year ended December 31, 2018 |
| Conservative Income Municipal Bond | | | | |
| Shares sold | 8,910,635 | 17,356,623 | $89,394,989 | $173,753,090 |
| Reinvestment of distributions | 173,261 | 261,161 | 1,738,983 | 2,614,969 |
| Shares redeemed | (8,332,669) | (15,912,352) | (83,616,719) | (159,258,683) |
| Net increase (decrease) | 751,227 | 1,705,432 | $7,517,253 | $17,109,376 |
| Institutional Class | | | | |
| Shares sold | 66,251,512 | 194,198,866 | $664,874,665 | $1,944,266,168 |
| Reinvestment of distributions | 840,815 | 1,414,041 | 8,440,323 | 14,158,673 |
| Shares redeemed | (53,781,739) | (203,850,365)(a) | (539,692,359) | (2,041,229,057)(a) |
| Net increase (decrease) | 13,310,588 | (8,237,458) | $133,622,629 | $(82,804,216) |
(a) Amount includes in-kind redemptions (see the Prior Year Affiliated Redemptions In-Kind note for additional details).
10. Other.
The Fund's organizational documents provide former and current trustees and officers with a limited indemnification against liabilities arising in connection with the performance of their duties to the Fund. In the normal course of business, the Fund may also enter into contracts that provide general indemnifications. The Fund's maximum exposure under these arrangements is unknown as this would be dependent on future claims that may be made against the Fund. The risk of material loss from such claims is considered remote.
Shareholder Expense Example
As a shareholder of the Fund, you incur two types of costs: (1) transaction costs and (2) ongoing costs, including management fees and other Fund expenses. This Example is intended to help you understand your ongoing costs (in dollars) of investing in the Fund and to compare these costs with the ongoing costs of investing in other mutual funds.
The Example is based on an investment of $1,000 invested at the beginning of the period and held for the entire period (January 1, 2019 to June 30, 2019).
Actual Expenses
The first line of the accompanying table for each class of the Fund provides information about actual account values and actual expenses. You may use the information in this line, together with the amount you invested, to estimate the expenses that you paid over the period. Simply divide your account value by $1,000.00 (for example, an $8,600 account value divided by $1,000.00 = 8.6), then multiply the result by the number in the first line for a class of the Fund under the heading entitled "Expenses Paid During Period" to estimate the expenses you paid on your account during this period. In addition, the Fund, as a shareholder in the underlying Fidelity Central Funds, will indirectly bear its pro-rata share of the fees and expenses incurred by the underlying Fidelity Central Funds. These fees and expenses are not included in the Fund's annualized expense ratio used to calculate the expense estimate in the table below.
Hypothetical Example for Comparison Purposes
The second line of the accompanying table for each class of the Fund provides information about hypothetical account values and hypothetical expenses based on a Class' actual expense ratio and an assumed rate of return of 5% per year before expenses, which is not the Class' actual return. The hypothetical account values and expenses may not be used to estimate the actual ending account balance or expenses you paid for the period. You may use this information to compare the ongoing costs of investing in the Fund and other funds. To do so, compare this 5% hypothetical example with the 5% hypothetical examples that appear in the shareholder reports of the other funds. In addition, the Fund, as a shareholder in the underlying Fidelity Central Funds, will indirectly bear its pro-rata share of the fees and expenses incurred by the underlying Fidelity Central Funds. These fees and expenses are not included in the Fund's annualized expense ratio used to calculate the expense estimate in the table below.
Please note that the expenses shown in the table are meant to highlight your ongoing costs only and do not reflect any transaction costs. Therefore, the second line of the table is useful in comparing ongoing costs only, and will not help you determine the relative total costs of owning different funds.
| | Annualized Expense Ratio-A | Beginning
Account Value
January 1, 2019 | Ending
Account Value
June 30, 2019 | Expenses Paid
During Period-B
January 1, 2019
to June 30, 2019 |
| Conservative Income Municipal Bond | .35% | | | |
| Actual | | $1,000.00 | $1,011.00 | $1.75 |
| Hypothetical-C | | $1,000.00 | $1,023.06 | $1.76 |
| Institutional Class | .25% | | | |
| Actual | | $1,000.00 | $1,011.50 | $1.25 |
| Hypothetical-C | | $1,000.00 | $1,023.55 | $1.25 |
A Annualized expense ratio reflects expenses net of applicable fee waivers.
B Expenses are equal to each Class' annualized expense ratio, multiplied by the average account value over the period, multiplied by 181/365 (to reflect the one-half year period).
C 5% return per year before expenses
CMB-SANN-0819
1.967795.105
Fidelity Flex℠ Funds Fidelity Flex℠ Municipal Income Fund
Semi-Annual Report June 30, 2019 |
|
Beginning on January 1, 2021, as permitted by regulations adopted by the Securities and Exchange Commission, paper copies of a fund’s shareholder reports will no longer be sent by mail, unless you specifically request paper copies of the reports from the fund or from your financial intermediary, such as a financial advisor, broker-dealer or bank. Instead, the reports will be made available on a website, and you will be notified by mail each time a report is posted and provided with a website link to access the report.
If you already elected to receive shareholder reports electronically, you will not be affected by this change and you need not take any action. You may elect to receive shareholder reports and other communications from a fund electronically, by contacting your financial intermediary. For Fidelity customers, visit Fidelity's web site or call Fidelity using the contact information listed below.
You may elect to receive all future reports in paper free of charge. If you wish to continue receiving paper copies of your shareholder reports, you may contact your financial intermediary or, if you are a Fidelity customer, visit Fidelity’s website, or call Fidelity at the applicable toll-free number listed below. Your election to receive reports in paper will apply to all funds held with the fund complex/your financial intermediary.
| Account Type | Website | Phone Number |
| Brokerage, Mutual Fund, or Annuity Contracts: | fidelity.com/mailpreferences | 1-800-343-3548 |
| Employer Provided Retirement Accounts: | netbenefits.fidelity.com/preferences (choose 'no' under Required Disclosures to continue to print) | 1-800-343-0860 |
| Advisor Sold Accounts Serviced Through Your Financial Intermediary: | Contact Your Financial Intermediary | Your Financial Intermediary's phone number |
| Advisor Sold Accounts Serviced by Fidelity: | institutional.fidelity.com | 1-877-208-0098 |
Contents
To view a fund's proxy voting guidelines and proxy voting record for the 12-month period ended June 30, visit http://www.fidelity.com/proxyvotingresults or visit the Securities and Exchange Commission's (SEC) web site at http://www.sec.gov.
You may also call 1-800-544-3455 (for managed account clients) or 1-800-835-5092 (for retirement plan participants) to request a free copy of the proxy voting guidelines.
Standard & Poor's, S&P and S&P 500 are registered service marks of The McGraw-Hill Companies, Inc. and have been licensed for use by Fidelity Distributors Corporation.
Other third-party marks appearing herein are the property of their respective owners.
All other marks appearing herein are registered or unregistered trademarks or service marks of FMR LLC or an affiliated company. © 2019 FMR LLC. All rights reserved.
This report and the financial statements contained herein are submitted for the general information of the shareholders of the Fund. This report is not authorized for distribution to prospective investors in the Fund unless preceded or accompanied by an effective prospectus.
A fund files its complete schedule of portfolio holdings with the SEC for the first and third quarters of each fiscal year on Form N-PORT. Forms N-PORT are available on the SEC’s web site at http://www.sec.gov. A fund's Forms N-PORT may be reviewed and copied at the SEC’s Public Reference Room in Washington, DC. Information regarding the operation of the SEC's Public Reference Room may be obtained by calling 1-800-SEC-0330.
For a complete list of a fund's portfolio holdings, view the most recent holdings listing, semiannual report, or annual report on Fidelity's web site at http://www.fidelity.com, http://www.institutional.fidelity.com, or http://www.401k.com, as applicable.
NOT FDIC INSURED •MAY LOSE VALUE •NO BANK GUARANTEE
Neither the Fund nor Fidelity Distributors Corporation is a bank.
Investment Summary (Unaudited)
Top Five States as of June 30, 2019
| | % of fund's net assets |
| Illinois | 19.8 |
| Texas | 7.8 |
| Pennsylvania | 7.2 |
| Ohio | 6.4 |
| New Jersey | 6.4 |
Top Five Sectors as of June 30, 2019
| | % of fund's net assets |
| Health Care | 27.4 |
| General Obligations | 18.3 |
| Education | 15.0 |
| Transportation | 15.0 |
| Electric Utilities | 7.0 |
Quality Diversification (% of fund's net assets)
| As of June 30, 2019 |
| | AAA | 3.9% |
| | AA,A | 65.9% |
| | BBB | 19.0% |
| | BB and Below | 2.2% |
| | Not Rated | 3.4% |
| | Short-Term Investments and Net Other Assets | 5.6% |
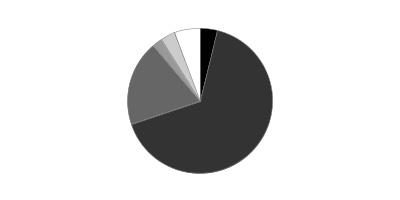
We have used ratings from Moody's Investors Service, Inc. Where Moody's® ratings are not available, we have used S&P® ratings. All ratings are as of the date indicated and do not reflect subsequent changes.
Schedule of Investments June 30, 2019 (Unaudited)
Showing Percentage of Net Assets
| Municipal Bonds - 94.3% | | | |
| | | Principal Amount | Value |
| Alabama - 0.9% | | | |
| Auburn Univ. Gen. Fee Rev. Series 2018 A, 5% 6/1/43 | | 100,000 | 120,664 |
| Jefferson County Gen. Oblig. Series 2018 A: | | | |
| 5% 4/1/25 | | $100,000 | $117,621 |
| 5% 4/1/26 | | 100,000 | 120,214 |
| Mobile Indl. Dev. Board Poll. Cont. Rev. Bonds Series 2009 E, 1.85%, tender 3/24/20 (a) | | 900,000 | 901,223 |
|
| TOTAL ALABAMA | | | 1,259,722 |
|
| Alaska - 0.0% | | | |
| Alaska Int'l. Arpts. Revs. Series 2010 A, 5% 10/1/23 (b) | | 30,000 | 31,253 |
| Arizona - 2.8% | | | |
| Arizona Board of Regents Arizona State Univ. Rev. Series 2012 A, 5% 7/1/32 (Pre-Refunded to 7/1/22 @ 100) | | 10,000 | 11,062 |
| Arizona Ctfs. of Prtn. Series 2019 A, 5% 10/1/24 (c) | | 80,000 | 94,305 |
| Arizona Health Facilities Auth. Rev. (Banner Health Sys. Proj.) Series 2015 A, 5% 1/1/21 | | 25,000 | 26,318 |
| Arizona Indl. Dev. Auth. Rev. (Provident Group-Eastern Michigan Univ. Parking Proj.) Series 2018: | | | |
| 5% 5/1/26 | | 450,000 | 515,435 |
| 5% 5/1/29 | | 290,000 | 338,856 |
| 5% 5/1/33 | | 565,000 | 652,163 |
| Arizona State Lottery Rev. Series 2019, 5% 7/1/23 (c) | | 415,000 | 468,539 |
| Chandler Indl. Dev. Auth. Indl. Dev. Rev. Bonds (Intel Corp. Proj.): | | | |
| Series 2005, 2.4%, tender 8/14/23 (a) | | 65,000 | 66,852 |
| Series 2007, 2.7%, tender 8/14/23 (a)(b) | | 600,000 | 620,106 |
| Series 2019, 5%, tender 6/3/24 (a)(b) | | 650,000 | 745,778 |
| Glendale Indl. Dev. Auth. (Terraces of Phoenix Proj.) Series 2018 A: | | | |
| 5% 7/1/38 | | 10,000 | 10,644 |
| 5% 7/1/48 | | 10,000 | 10,497 |
| Maricopa County Indl. Dev. Auth. Sr. Living Facilities Series 2016, 6% 1/1/48 (d) | | 200,000 | 208,946 |
| Tempe Indl. Dev. Auth. Rev. (Mirabella At ASU, Inc. Proj.) Series 2017 A, 6.125% 10/1/52 (d) | | 190,000 | 214,128 |
| Univ. of Arizona Univ. Revs. Series 2015 A, 5% 6/1/22 | | 10,000 | 11,056 |
|
| TOTAL ARIZONA | | | 3,994,685 |
|
| Arkansas - 0.5% | | | |
| Arkansas Dev. Auth. Indl. Dev. Rev. (Big River Steel Proj.) Series 2019, 4.5% 9/1/49 (b)(d) | | 665,000 | 690,257 |
| California - 1.8% | | | |
| California Edl. Facilities Auth. Rev. Series T1, 5% 3/15/39 | | 65,000 | 91,324 |
| California Muni. Fin. Auth. Rev. (LINXS APM Proj.) Series 2018 A, 5% 12/31/47 (b) | | 500,000 | 582,150 |
| San Francisco City & County Arpts. Commission Int'l. Arpt. Rev.: | | | |
| Series 2019 A, 5% 5/1/49 (b) | | 1,000,000 | 1,193,960 |
| Series 2019 B, 5% 5/1/49 | | 45,000 | 54,724 |
| Washington Township Health Care District Rev.: | | | |
| Series 2017 A, 5% 7/1/35 | | 190,000 | 221,166 |
| Series 2017 B: | | | |
| 5% 7/1/29 | | 115,000 | 137,717 |
| 5% 7/1/30 | | 230,000 | 272,847 |
|
| TOTAL CALIFORNIA | | | 2,553,888 |
|
| Colorado - 1.7% | | | |
| Arkansas River Pwr. Auth. Rev. Series 2018 A: | | | |
| 5% 10/1/38 | | 40,000 | 46,317 |
| 5% 10/1/43 | | 50,000 | 57,396 |
| Colorado Health Facilities Auth. (Parkview Med. Ctr., Inc. Proj.) Series 2016, 4% 9/1/35 | | 35,000 | 37,491 |
| Colorado Health Facilities Auth. Retirement Hsg. Rev. (Liberty Heights Proj.) 0% 7/15/22 (Escrowed to Maturity) | | 380,000 | 363,253 |
| Colorado Health Facilities Auth. Rev. Bonds Series 2016 C, 5%, tender 11/15/26 (a) | | 275,000 | 335,550 |
| Colorado Hsg. & Fin. Auth.: | | | |
| Series 2019 F, 4.25% 11/1/49 | | 85,000 | 93,618 |
| Series 2019 H, 4.25% 11/1/49 (c) | | 45,000 | 49,500 |
| Denver City & County Arpt. Rev.: | | | |
| Series 2017 A: | | | |
| 5% 11/15/23 (b) | | 25,000 | 28,565 |
| 5% 11/15/26 (b) | | 50,000 | 61,048 |
| Series 2018 A, 5% 12/1/34 (b) | | 1,125,000 | 1,448,190 |
|
| TOTAL COLORADO | | | 2,520,928 |
|
| Connecticut - 3.4% | | | |
| Connecticut Arpt. Auth. Customer Facility Charge Rev. (Ground Trans. Ctr. Proj.) Series 2019 A, 4% 7/1/49 (b) | | 90,000 | 96,047 |
| Connecticut Gen. Oblig.: | | | |
| Series 2014 H, 5% 11/15/21 | | 295,000 | 319,447 |
| Series 2016 B: | | | |
| 5% 5/15/25 | | 220,000 | 259,871 |
| 5% 5/15/26 | | 125,000 | 150,386 |
| Series 2018 F: | | | |
| 5% 9/15/24 | | 100,000 | 116,500 |
| 5% 9/15/25 | | 100,000 | 119,004 |
| Series 2019 A, 5% 4/15/26 | | 115,000 | 138,114 |
| Connecticut Health & Edl. Facilities Auth. Rev.: | | | |
| Series 2012 J, 4% 7/1/19 | | 100,000 | 100,000 |
| Series 2019 A: | | | |
| 4% 7/1/20 (d) | | 220,000 | 222,578 |
| 5% 7/1/49 (d) | | 130,000 | 137,777 |
| Series 2019 Q-1: | | | |
| 5% 11/1/25 | | 90,000 | 107,229 |
| 5% 11/1/26 | | 95,000 | 115,612 |
| Series A, 5% 7/1/26 | | 105,000 | 111,849 |
| Series F, 5% 7/1/21 (Escrowed to Maturity) | | 2,215,000 | 2,366,528 |
| Series K3, 5% 7/1/43 | | 215,000 | 245,218 |
| Connecticut Spl. Tax Oblig. Trans. Infrastructure Rev. Series 2012 A, 5% 1/1/24 | | 80,000 | 89,295 |
| Univ. of Connecticut Gen. Oblig.: | | | |
| Series 2016 A, 5% 3/15/22 | | 85,000 | 92,935 |
| Series 2019 A, 5% 11/1/25 | | 140,000 | 166,708 |
|
| TOTAL CONNECTICUT | | | 4,955,098 |
|
| District Of Columbia - 1.5% | | | |
| Metropolitan Washington Arpts. Auth. Dulles Toll Road Rev. (Dulles Metrorail and Cap. Impt. Projs.) Series 2019 A: | | | |
| 5% 10/1/31 (c) | | 185,000 | 229,805 |
| 5% 10/1/44 (c) | | 1,000,000 | 1,198,120 |
| Metropolitan Washington DC Arpts. Auth. Sys. Rev.: | | | |
| Series 2011 C: | | | |
| 5% 10/1/22 (b) | | 60,000 | 64,666 |
| 5% 10/1/23 (b) | | 65,000 | 70,054 |
| 5% 10/1/24 (b) | | 60,000 | 64,666 |
| 5% 10/1/25 (b) | | 80,000 | 86,221 |
| Series 2019 A, 5% 10/1/25 (b)(c) | | 70,000 | 83,654 |
| Washington Convention & Sports Auth. Series 2018 A: | | | |
| 5% 10/1/23 | | 100,000 | 114,507 |
| 5% 10/1/24 | | 100,000 | 117,558 |
| 5% 10/1/25 | | 100,000 | 120,369 |
|
| TOTAL DISTRICT OF COLUMBIA | | | 2,149,620 |
|
| Florida - 4.4% | | | |
| Atlantic Beach Health Care Facilities Series A, 5% 11/15/43 | | 255,000 | 287,747 |
| Broward County Arpt. Sys. Rev.: | | | |
| Series 2012 Q1, 5% 10/1/21 | | 250,000 | 270,135 |
| Series 2015 C, 5% 10/1/24 (b) | | 45,000 | 52,333 |
| Series 2017, 5% 10/1/42 (b) | | 1,365,000 | 1,597,541 |
| Broward County School Board Ctfs. of Prtn. Series 2015 A, 5% 7/1/23 | | 50,000 | 56,938 |
| Florida Higher Edl. Facilities Fing. Auth. (St. Leo Univ. Proj.) Series 2019, 5% 3/1/24 | | 390,000 | 437,588 |
| Greater Orlando Aviation Auth. Arpt. Facilities Rev. Series 2017 A, 5% 10/1/31 (b) | | 125,000 | 150,029 |
| Jacksonville Elec. Auth. Elec. Sys. Rev. Series 2013 D, 5% 10/1/20 | | 1,480,000 | 1,540,547 |
| Lee County Arpt. Rev. Series 2011 A, 5.375% 10/1/32 (b) | | 25,000 | 26,749 |
| Lee Memorial Health Sys. Hosp. Rev. Series 2019 A1, 5% 4/1/44 | | 665,000 | 789,754 |
| Miami-Dade County Aviation Rev.: | | | |
| Series 2015 A, 5% 10/1/27 (b) | | 200,000 | 236,794 |
| Series 2017 B, 5% 10/1/40 (b) | | 105,000 | 122,794 |
| Miami-Dade County Expressway Auth. Series 2014 A, 5% 7/1/25 | | 395,000 | 453,839 |
| Miami-Dade County School Board Ctfs. of Prtn.: | | | |
| Bonds Series 2014 A, 5%, tender 5/1/24 (a) | | 100,000 | 114,841 |
| Series 2015 D, 5% 2/1/26 | | 10,000 | 12,020 |
| South Miami Health Facilities Auth. Hosp. Rev. (Baptist Med. Ctr., FL. Proj.) Series 2017: | | | |
| 5% 8/15/26 | | 100,000 | 122,327 |
| 5% 8/15/42 | | 5,000 | 5,829 |
| Tampa Hosp. Rev. (H Lee Moffitt Cancer Ctr. Proj.) Series 2016 B, 5% 7/1/29 | | 25,000 | 29,546 |
|
| TOTAL FLORIDA | | | 6,307,351 |
|
| Georgia - 3.2% | | | |
| Burke County Indl. Dev. Auth. Poll. Cont. Rev. Bonds (Georgia Pwr. Co. Plant Vogtle Proj.): | | | |
| Series 1994: | | | |
| 2.15%, tender 6/13/24 (a) | | 1,140,000 | 1,141,436 |
| 2.25%, tender 5/25/23 (a) | | 315,000 | 317,766 |
| Series 2013 1st, 2.925%, tender 3/12/24 (a) | | 330,000 | 341,864 |
| Fulton County Dev. Auth. Rev. Series 2019: | | | |
| 4% 6/15/49 | | 40,000 | 43,786 |
| 5% 6/15/52 | | 145,000 | 174,798 |
| Georgia Muni. Elec. Auth. Pwr. Rev.: | | | |
| Series 2018 A, 5% 1/1/22 | | 375,000 | 405,788 |
| Series HH, 5% 1/1/22 | | 425,000 | 460,330 |
| Glynn-Brunswick Memorial Hosp. Auth. Rev. (Southeast Georgia Health Sys. Proj.) Series 2017: | | | |
| 4% 8/1/43 | | 5,000 | 5,155 |
| 5% 8/1/39 | | 5,000 | 5,567 |
| 5% 8/1/43 | | 5,000 | 5,674 |
| Main Street Natural Gas, Inc. Bonds: | | | |
| Series 2018 C, 4%, tender 12/1/23 (a) | | 500,000 | 546,265 |
| Series 2019 B, 4%, tender 12/2/24 (a) | | 505,000 | 560,202 |
| Monroe County Dev. Auth. Poll. Cont. Rev. (Georgia Pwr. Co. Plant Scherer Proj.) Series 1995, 2.25% 7/1/25 | | 200,000 | 201,844 |
| Private Colleges & Univs. Auth. Rev. Series A: | | | |
| 4% 6/1/20 | | 15,000 | 15,347 |
| 4% 6/1/21 | | 120,000 | 125,684 |
| 5% 6/1/22 | | 80,000 | 87,914 |
| 5% 6/1/23 | | 80,000 | 90,327 |
| 5% 6/1/24 | | 130,000 | 150,461 |
|
| TOTAL GEORGIA | | | 4,680,208 |
|
| Hawaii - 0.1% | | | |
| Hawaii Arpts. Sys. Rev. Series 2018 A, 5% 7/1/33 (b) | | 125,000 | 151,668 |
| Honolulu City & County Gen. Oblig. Series 2017 A, 5% 9/1/33 | | 5,000 | 6,115 |
|
| TOTAL HAWAII | | | 157,783 |
|
| Idaho - 0.0% | | | |
| Idaho Hsg. & Fin. Assoc. Single Family Mtg. Series 2019 A, 4% 1/1/50 | | 25,000 | 27,293 |
| Illinois - 19.4% | | | |
| Chicago Board of Ed.: | | | |
| Series 1998 B1, 0% 12/1/21 (Nat'l. Pub. Fin. Guarantee Corp. Insured) | | 45,000 | 42,229 |
| Series 2011 A, 5% 12/1/41 | | 50,000 | 51,620 |
| Series 2012 A, 5% 12/1/42 | | 500,000 | 521,445 |
| Series 2018 A: | | | |
| 5% 12/1/29 | | 350,000 | 399,529 |
| 5% 12/1/31 | | 150,000 | 169,221 |
| Series 2018 C, 5% 12/1/46 | | 200,000 | 218,674 |
| Chicago Midway Arpt. Rev.: | | | |
| Series 2014 B, 5% 1/1/26 | | 100,000 | 114,647 |
| Series 2016 B: | | | |
| 4% 1/1/35 | | 200,000 | 216,122 |
| 5% 1/1/46 | | 2,000,000 | 2,282,880 |
| Chicago O'Hare Int'l. Arpt. Rev.: | | | |
| Series 2013 A, 5% 1/1/23 (b) | | 70,000 | 77,729 |
| Series 2017 B, 5% 1/1/37 | | 50,000 | 58,676 |
| Chicago O'Hare Int'l. Arpt. Spl. Facilities Rev. Series 2018: | | | |
| 5% 7/1/38 (b) | | 50,000 | 57,866 |
| 5% 7/1/48 (b) | | 400,000 | 458,924 |
| Cook County Gen. Oblig.: | | | |
| Series 2009 C, 5% 11/15/21 | | 100,000 | 101,237 |
| Series 2011 A, 5.25% 11/15/23 | | 50,000 | 53,777 |
| Series 2016 A: | | | |
| 5% 11/15/23 | | 10,000 | 11,262 |
| 5% 11/15/31 | | 500,000 | 569,560 |
| Illinois Fin. Auth. Academic Facilities: | | | |
| (Provident Group UIUC Properties LLC Univ. of Illinois at Urbana-Champaign Proj.) Series 2019 A, 5% 10/1/25 | | 100,000 | 117,954 |
| (Provident Group UIUC Properties LLC Univ. of Illinois at Urbana-Champaign Proj.) Series 2019 A, 5% 10/1/26 | | 200,000 | 240,748 |
| Illinois Fin. Auth. Rev.: | | | |
| (Bradley Univ. Proj.) Series 2017 C, 5% 8/1/30 | | 615,000 | 729,796 |
| (Depaul Univ., IL Proj.): | | | |
| Series 2016 A, 5% 10/1/28 | | 10,000 | 12,049 |
| Series 2016, 5% 10/1/29 | | 30,000 | 35,985 |
| (OSF Healthcare Sys.) Series 2018 A: | | | |
| 4.125% 5/15/47 | | 750,000 | 802,058 |
| 5% 5/15/43 | | 790,000 | 921,045 |
| (Presence Health Proj.) Series 2016 C, 5% 2/15/36 | | 15,000 | 17,630 |
| Bonds Series E, 2.25%, tender 4/29/22 (a) | | 3,695,000 | 3,752,309 |
| Series 2011 IL: | | | |
| 4% 12/1/20 | | 100,000 | 103,655 |
| 5% 12/1/22 (Pre-Refunded to 12/1/21 @ 100) | | 5,000 | 5,423 |
| Series 2012 A, 5% 5/15/41 | | 695,000 | 739,709 |
| Series 2013: | | | |
| 4% 5/15/33 | | 90,000 | 92,655 |
| 5% 11/15/24 | | 65,000 | 71,840 |
| Series 2014, 5% 8/1/38 | | 10,000 | 11,138 |
| Series 2015 A: | | | |
| 5% 11/15/20 | | 760,000 | 796,016 |
| 5% 11/15/23 | | 10,000 | 11,403 |
| 5% 11/15/25 | | 150,000 | 178,368 |
| 5% 11/15/45 | | 300,000 | 333,135 |
| Series 2015 C: | | | |
| 4.125% 8/15/37 | | 60,000 | 62,145 |
| 5% 8/15/26 | | 35,000 | 40,578 |
| Series 2016 A: | | | |
| 5% 8/15/24 | | 65,000 | 73,797 |
| 5% 7/1/31 | | 30,000 | 35,026 |
| 5% 7/1/33 | | 10,000 | 11,565 |
| 5% 7/1/36 | | 45,000 | 51,442 |
| Series 2016 B, 5% 8/15/35 | | 250,000 | 293,100 |
| Series 2016 C, 5% 2/15/34 | | 50,000 | 59,353 |
| Series 2016: | | | |
| 4% 2/15/41 | | 40,000 | 43,266 |
| 5% 12/1/23 | | 155,000 | 175,823 |
| 5% 5/15/29 | | 10,000 | 11,788 |
| 5% 12/1/29 | | 620,000 | 725,952 |
| 5% 12/1/33 | | 485,000 | 555,010 |
| 5% 12/1/40 | | 85,000 | 95,611 |
| 5% 12/1/46 | | 95,000 | 106,327 |
| Series 2017 A, 5% 7/15/42 | | 1,000,000 | 1,170,070 |
| Series 2018 A: | | | |
| 4.25% 1/1/44 | | 55,000 | 58,276 |
| 5% 1/1/38 | | 225,000 | 258,269 |
| 5% 1/1/44 | | 340,000 | 386,420 |
| Illinois Gen. Oblig.: | | | |
| Serie 2014, 5% 4/1/24 | | 100,000 | 111,609 |
| Series 2013, 5% 7/1/23 | | 10,000 | 11,035 |
| Series 2016: | | | |
| 5% 2/1/21 | | 30,000 | 31,436 |
| 5% 2/1/26 | | 400,000 | 454,664 |
| 5% 2/1/27 | | 1,000,000 | 1,147,910 |
| 5% 11/1/29 | | 1,400,000 | 1,581,650 |
| Series 2017 D: | | | |
| 5% 11/1/21 | | 900,000 | 962,658 |
| 5% 11/1/24 | | 730,000 | 824,374 |
| 5% 11/1/27 | | 250,000 | 289,395 |
| Series 2017, 4% 2/1/24 | | 15,000 | 15,846 |
| Series 2019 B: | | | |
| 5% 9/1/21 | | 105,000 | 111,803 |
| 5% 9/1/22 | | 100,000 | 108,982 |
| 5% 9/1/23 | | 105,000 | 116,273 |
| 5% 9/1/24 | | 105,000 | 118,222 |
| Illinois Toll Hwy. Auth. Toll Hwy. Rev.: | | | |
| Series 2014 A, 5% 12/1/22 | | 235,000 | 262,439 |
| Series 2014 C, 5% 1/1/38 | | 85,000 | 96,156 |
| Series 2019 A, 5% 1/1/44 (c) | | 1,000,000 | 1,194,530 |
| Kane, Cook & DuPage Counties School District #46 Elgin Series 2003 B, 0% 1/1/22 (Escrowed to Maturity) | | 100,000 | 96,241 |
| Kendall, Kane & Will Counties Cmnty. Unit School District #308: | | | |
| Series 2008, 0% 2/1/25 (FSA Insured) | | 315,000 | 278,892 |
| Series 2011, 5.5% 2/1/22 | | 100,000 | 109,334 |
| Metropolitan Pier & Exposition: | | | |
| (McCormick Place Expansion Proj.) Series 2010 B1: | | | |
| 0% 6/15/43 (FSA Insured) | | 610,000 | 255,871 |
| 0% 6/15/47 (FSA Insured) | | 155,000 | 54,562 |
| Series 1994 A, 0% 6/15/25 | | 25,000 | 21,484 |
| Series 1994, 0% 6/15/28 (Nat'l. Pub. Fin. Guarantee Corp. Insured) | | 1,200,000 | 935,448 |
| Series 2012 B, 5% 6/15/23 | | 10,000 | 10,721 |
| Railsplitter Tobacco Settlement Auth. Rev. Series 2010, 5.5% 6/1/23 (Pre-Refunded to 6/1/21 @ 100) | | 105,000 | 113,184 |
| Univ. of Illinois Board of Trustees Ctfs. of Prtn. (Univ. of Illinois Rev. Proj.) Series 2014 A, 5% 10/1/26 | | 15,000 | 17,395 |
| Univ. of Illinois Rev. Series 2018 A, 5% 4/1/30 | | 100,000 | 123,231 |
|
| TOTAL ILLINOIS | | | 28,047,477 |
|
| Indiana - 1.5% | | | |
| Indiana Fin. Auth. Rev.: | | | |
| Series 2012, 5% 3/1/23 | | 35,000 | 38,116 |
| Series 2016: | | | |
| 5% 9/1/24 | | 20,000 | 23,268 |
| 5% 9/1/30 | | 50,000 | 59,314 |
| Indiana Health Facility Fing. Auth. Rev. Bonds Series 2001 A2, 2%, tender 2/1/23 (a) | | 65,000 | 65,913 |
| Indianapolis Local Pub. Impt. (Courthouse and Jail Proj.) Series 2019 A, 5% 2/1/49 | | 1,000,000 | 1,201,300 |
| Whiting Envir. Facilities Rev. Bonds (BA Products North America, Inc. Proj.) Series 2019 A, 5%, tender 6/5/26 (a)(b) | | 690,000 | 819,561 |
|
| TOTAL INDIANA | | | 2,207,472 |
|
| Iowa - 0.1% | | | |
| Iowa Fin. Auth. Rev. Series A: | | | |
| 5% 5/15/43 | | 25,000 | 27,488 |
| 5% 5/15/48 | | 55,000 | 60,242 |
|
| TOTAL IOWA | | | 87,730 |
|
| Kentucky - 1.9% | | | |
| Ashland Med. Ctr. Rev. (King's Daugthers Med. Ctr. Proj.) Series 2010 B, 4.5% 2/1/25 | | 25,000 | 25,299 |
| Kentucky Econ. Dev. Fin. Auth. Bonds Series 2009 B, 2.7%, tender 11/10/21 (a) | | 100,000 | 102,182 |
| Kentucky State Property & Buildings Commission Rev.: | | | |
| (Proj. No. 118) Series 2018, 5% 4/1/25 | | 175,000 | 205,837 |
| (Proj. No. 119) Series 2018: | | | |
| 5% 5/1/26 | | 60,000 | 71,448 |
| 5% 5/1/29 | | 85,000 | 103,471 |
| 5% 5/1/32 | | 20,000 | 24,246 |
| 5% 5/1/33 | | 15,000 | 18,129 |
| 5% 5/1/34 | | 20,000 | 24,081 |
| 5% 5/1/35 | | 10,000 | 11,850 |
| 5% 5/1/36 | | 10,000 | 11,813 |
| 5% 5/1/38 | | 1,000,000 | 1,171,320 |
| Louisville & Jefferson County Series 2016 A, 5% 10/1/32 | | 70,000 | 81,914 |
| Louisville Reg'l. Arpt. Auth. Sys. Rev. Series 2014 A, 5% 7/1/24 (b) | | 65,000 | 74,816 |
| Louisville/Jefferson County Metropolitan Gov.: | | | |
| Series 2012 A: | | | |
| 5% 12/1/28 | | 25,000 | 27,189 |
| 5% 12/1/29 | | 95,000 | 103,193 |
| Series 2012, 5% 12/1/35 | | 125,000 | 133,716 |
| Pikeville Hosp. Rev. Series 2011: | | | |
| 6% 3/1/20 | | 25,000 | 25,659 |
| 6% 3/1/22 | | 240,000 | 255,000 |
| 6% 3/1/22 (Pre-Refunded to 3/1/21 @ 100) | | 75,000 | 80,705 |
| Trimble County Poll. Cont. Rev. Bonds (Louisville Gas and Elec. Co. Proj.) Series 2001 B, 2.55%, tender 5/3/21 (a) | | 200,000 | 203,750 |
|
| TOTAL KENTUCKY | | | 2,755,618 |
|
| Louisiana - 0.1% | | | |
| Louisiana Pub. Facilities Auth. Rev. (Tulane Univ. of Louisiana Proj.): | | | |
| Series 2016 A, 5% 12/15/28 | | 15,000 | 18,136 |
| Series 2017 A, 5% 12/15/32 | | 165,000 | 199,709 |
|
| TOTAL LOUISIANA | | | 217,845 |
|
| Maine - 0.8% | | | |
| Maine Health & Higher Edl. Facilities Auth. Rev.: | | | |
| (Eastern Maine Healthcare Systems Proj.) Series 2013, 5% 7/1/43 | | 65,000 | 69,532 |
| (Univ. of New England) Series 2017 A, 4% 7/1/22 | | 20,000 | 21,431 |
| Series 2013, 5% 7/1/25 | | 40,000 | 44,030 |
| Series 2014, 5% 7/1/30 | | 585,000 | 667,064 |
| Series 2016 A: | | | |
| 4% 7/1/41 | | 25,000 | 25,707 |
| 4% 7/1/46 | | 5,000 | 5,130 |
| 5% 7/1/46 | | 125,000 | 137,884 |
| Series 2017 B, 5% 7/1/29 | | 10,000 | 12,089 |
| Series 2018, 5% 7/1/48 | | 135,000 | 162,159 |
|
| TOTAL MAINE | | | 1,145,026 |
|
| Maryland - 0.2% | | | |
| Maryland Health & Higher Edl. Facilities Auth. Rev. (Medstar Health, Inc. Proj.) Series 2017 A, 5% 5/15/45 | | 150,000 | 173,852 |
| Maryland St Cmnty. Dev. Admin Dept. Hsg. & Cmnty. Dev. Series 2019 B, 4% 9/1/49 | | 125,000 | 136,596 |
|
| TOTAL MARYLAND | | | 310,448 |
|
| Massachusetts - 2.8% | | | |
| Massachusetts Dept. of Trans. Metropolitan Hwy. Sys. Rev. Bonds Series 2019 A, 5%, tender 1/1/23 (a) | | 300,000 | 335,511 |
| Massachusetts Dev. Fin. Agcy. Rev.: | | | |
| (Lawrence Gen. Hosp. MA. Proj.) Series 2017, 5% 7/1/47 | | 100,000 | 109,574 |
| (Lawrence Gen. Hosp.): | | | |
| Series 2014 A, 5.25% 7/1/34 | | 40,000 | 44,171 |
| Series 2017: | | | |
| 5% 7/1/19 | | 100,000 | 100,000 |
| 5% 7/1/20 | | 100,000 | 102,647 |
| 5% 7/1/21 | | 100,000 | 105,170 |
| Series 2016 A, 5% 1/1/31 | | 40,000 | 46,962 |
| Series 2016 I: | | | |
| 5% 7/1/30 | | 195,000 | 228,665 |
| 5% 7/1/41 | | 140,000 | 158,782 |
| Series 2017 A, 5% 1/1/37 | | 1,050,000 | 1,227,744 |
| Series 2019, 5% 7/1/27 | | 440,000 | 533,359 |
| Massachusetts Health & Edl. Facilities Auth. Rev. (Winchester Hosp. Proj.) Series 2010 H, 5.25% 7/1/38 | | 510,000 | 527,672 |
| Massachusetts Port Auth. Rev. Series 2019 A, 5% 7/1/40 (b) | | 500,000 | 603,640 |
|
| TOTAL MASSACHUSETTS | | | 4,123,897 |
|
| Michigan - 1.5% | | | |
| Detroit Downtown Dev. Auth. Tax Series A, 5% 7/1/37 (FSA Insured) | | 40,000 | 44,399 |
| Grand Rapids Pub. Schools Series 2019, 5% 11/1/26 (FSA Insured) | | 180,000 | 221,414 |
| Great Lakes Wtr. Auth. Sew Disp. Sys. Series 2018 A, 5% 7/1/48 | | 200,000 | 238,106 |
| Great Lakes Wtr. Auth. Wtr. Supply Sys. Rev. Series 2016 D, 5% 7/1/27 | | 100,000 | 120,924 |
| Michigan Fin. Auth. Rev.: | | | |
| (Charter County of Wayne Criminal Justice Ctr. Proj.) Series 2018, 5% 11/1/43 | | 50,000 | 59,683 |
| (Henry Ford Health Sys. Proj.) Series 2016, 5% 11/15/25 | | 570,000 | 683,105 |
| Series 2016: | | | |
| 5% 11/15/26 | | 160,000 | 195,229 |
| 5% 11/15/41 | | 30,000 | 34,674 |
| Series 2019 A: | | | |
| 4% 11/15/50 | | 95,000 | 102,658 |
| 5% 11/15/48 | | 55,000 | 65,370 |
| Michigan Hosp. Fin. Auth. Rev. (Trinity Health Proj.) Series 2008 C, 5% 12/1/32 | | 10,000 | 12,190 |
| Wayne County Arpt. Auth. Rev.: | | | |
| Series 2011 A, 5% 12/1/19 (b) | | 100,000 | 101,416 |
| Series 2017 A, 5% 12/1/29 | | 45,000 | 55,993 |
| Series 2017 B, 5% 12/1/42 (b) | | 150,000 | 175,998 |
| Series 2018 D, 5% 12/1/29 (b) | | 85,000 | 106,111 |
|
| TOTAL MICHIGAN | | | 2,217,270 |
|
| Minnesota - 1.2% | | | |
| Duluth Econ. Dev. Auth. Health Care Facilities Rev. Series 2018 A: | | | |
| 5% 2/15/48 | | 220,000 | 253,860 |
| 5% 2/15/58 | | 270,000 | 306,887 |
| Maple Grove Health Care Sys. Rev. ( North Memorial Med. Ctr., Proj.) Series 2015, 4% 9/1/21 | | 25,000 | 26,049 |
| Minnesota Higher Ed. Facilities Auth. Rev. Series 2018 A: | | | |
| 5% 10/1/30 | | 500,000 | 599,680 |
| 5% 10/1/45 | | 30,000 | 34,435 |
| White Bear Lake Minn Rev. (YMCA of Greater Twin Cities Proj.) Series 2018, 5% 6/1/22 | | 490,000 | 536,413 |
|
| TOTAL MINNESOTA | | | 1,757,324 |
|
| Missouri - 1.8% | | | |
| Missouri Health & Edl. Facilities Rev.: | | | |
| Series 2017 A, 5% 10/1/42 | | 475,000 | 554,762 |
| Series 2018 A, 5% 11/15/43 | | 1,000,000 | 1,171,320 |
| Missouri Hsg. Dev. Commission Single Family Mtg. Rev. Series 2019, 4% 5/1/50 (c) | | 25,000 | 27,424 |
| Saint Louis Arpt. Rev. Series A, 5.25% 7/1/26 (FSA Insured) | | 570,000 | 707,450 |
| Saint Louis County Indl. Dev. Auth. Sr. Living Facilities Rev. Series 2018 A: | | | |
| 5% 9/1/38 | | 30,000 | 33,432 |
| 5.125% 9/1/48 | | 55,000 | 61,246 |
|
| TOTAL MISSOURI | | | 2,555,634 |
|
| Montana - 0.0% | | | |
| Montana Board Hsg. Single Family Series 2019 B, 4% 6/1/50 (c) | | 15,000 | 16,628 |
| Montana Facility Fin. Auth. Rev. (Benefis Health Sys. Proj.) Series 2016, 5% 2/15/32 | | 30,000 | 35,114 |
|
| TOTAL MONTANA | | | 51,742 |
|
| Nebraska - 0.1% | | | |
| Nebraska Invt. Fin. Auth. Single Family Hsg. Rev. Series 2019 B, 4% 9/1/49 (b) | | 70,000 | 75,371 |
| Nevada - 0.7% | | | |
| Clark County School District Series 2017 A, 5% 6/15/25 | | 400,000 | 474,612 |
| Nevada Hsg. Division Single Family Mtg. Rev. Series 2019 A, 4% 4/1/49 | | 490,000 | 535,746 |
|
| TOTAL NEVADA | | | 1,010,358 |
|
| New Hampshire - 0.8% | | | |
| New Hampshire Health & Ed. Facilities Auth. (Dartmouth-Hitchcock Oblgtd Grp Proj.) Series 2018 A: | | | |
| 5% 8/1/23 | | 200,000 | 226,336 |
| 5% 8/1/26 | | 105,000 | 126,860 |
| 5% 8/1/37 | | 100,000 | 118,692 |
| New Hampshire Health & Ed. Facilities Auth. Rev.: | | | |
| (Covenant Health Sys., Inc. Proj.) Series 2012, 5% 7/1/42 | | 560,000 | 584,724 |
| (Southern NH Med. Ctr. Proj.) Series 2016, 3% 10/1/21 | | 50,000 | 51,384 |
| Series 2016, 5% 10/1/22 | | 85,000 | 93,837 |
|
| TOTAL NEW HAMPSHIRE | | | 1,201,833 |
|
| New Jersey - 6.4% | | | |
| New Jersey Econ. Dev. Auth. Rev.: | | | |
| (New Jersey Gen. Oblig. Proj.) Series 2017 B, 5% 11/1/23 | | 25,000 | 28,166 |
| Series 2013 NN, 5% 3/1/29 | | 1,000,000 | 1,087,100 |
| Series 2013: | | | |
| 5% 3/1/23 | | 25,000 | 27,648 |
| 5% 3/1/24 | | 70,000 | 77,264 |
| Series 2014 PP, 5% 6/15/26 | | 280,000 | 313,628 |
| Series 2015 XX, 5% 6/15/23 | | 200,000 | 222,724 |
| Series 2017 DDD, 5% 6/15/30 | | 1,000,000 | 1,160,520 |
| New Jersey Health Care Facilities Fing. Auth. Rev. Series 2016: | | | |
| 4% 7/1/48 | | 100,000 | 104,658 |
| 5% 7/1/41 | | 65,000 | 73,063 |
| New Jersey Higher Ed. Student Assistance Auth. Student Ln. Rev.: | | | |
| Series 2011-1, 5.5% 12/1/21 (b) | | 80,000 | 87,038 |
| Series 2017 1A, 5% 12/1/26 (b) | | 280,000 | 334,648 |
| Series 2018 B: | | | |
| 5% 12/1/25 (b) | | 500,000 | 588,185 |
| 5% 12/1/26 (b) | | 315,000 | 376,479 |
| 5% 12/1/27 (b) | | 850,000 | 1,029,393 |
| Series 2018 C, 4% 12/1/48 (b) | | 35,000 | 36,635 |
| Series 2019 A, 5% 12/1/20 | | 1,200,000 | 1,260,912 |
| New Jersey Trans. Trust Fund Auth.: | | | |
| (Trans. Prog.) Series 2019 AA: | | | |
| 5% 6/15/46 | | 300,000 | 338,379 |
| 5.25% 6/15/43 | | 700,000 | 806,365 |
| Series 2003 B, 5.25% 12/15/19 | | 250,000 | 254,143 |
| Series 2009 A, 0% 12/15/36 | | 160,000 | 86,574 |
| Series 2010 A, 0% 12/15/27 | | 250,000 | 194,918 |
| Series 2014 AA, 5% 6/15/25 | | 100,000 | 112,856 |
| Series 2016 A, 5% 6/15/27 | | 160,000 | 189,629 |
| Series 2018 A: | | | |
| 5% 12/15/32 | | 100,000 | 117,227 |
| 5% 12/15/33 | | 165,000 | 192,586 |
| 5% 12/15/35 | | 100,000 | 115,511 |
|
| TOTAL NEW JERSEY | | | 9,216,249 |
|
| New Mexico - 0.2% | | | |
| New Mexico Mtg. Fin. Auth. Series 2019 C, 4% 7/1/50 | | 225,000 | 245,624 |
| New York - 1.8% | | | |
| Buffalo and Erie County Indl. Land Rev. (Catholic Health Sys., Inc. Proj.) Series 2015, 5% 7/1/25 | | 400,000 | 475,092 |
| Monroe County Indl. Dev. Corp. (Univ. of Rochester Proj.) Series 2015 B, 4% 7/1/35 | | 5,000 | 5,443 |
| MTA Hudson Rail Yards Trust Oblig. Series 2016 A, 5% 11/15/56 | | 100,000 | 109,924 |
| New York City Gen. Oblig. Series 2018 A, 5% 8/1/24 | | 100,000 | 117,872 |
| New York City Transitional Fin. Auth. Rev. Series 2016 E, 5% 2/1/37 | | 1,000,000 | 1,176,260 |
| New York Dorm. Auth. Personal Income Tax Rev. (New York State Pit Proj.) Series 2012 D, 5% 2/15/22 (Escrowed to Maturity) | | 10,000 | 10,971 |
| New York Metropolitan Trans. Auth. Rev. Series 2016 A, 5% 11/15/31 | | 100,000 | 118,710 |
| Onondaga Civic Dev. Corp. (Le Moyne College Proj.) Series 2015, 5% 7/1/27 | | 295,000 | 343,268 |
| Onondaga County Ind. Dev. Agcy. Swr. Facilities Rev. (Bristol-Meyers Squibb Co. Proj.) 5.75% 3/1/24 (b) | | 220,000 | 254,800 |
|
| TOTAL NEW YORK | | | 2,612,340 |
|
| North Carolina - 0.5% | | | |
| Charlotte Ctfs. of Prtn. (Convention Facility Projs.) Series 2019 A, 5% 6/1/40 | | 160,000 | 196,566 |
| North Carolina Med. Care Commission Health Care Facilities Rev. Bonds: | | | |
| Series 2019 B, 2.2%, tender 12/1/22 (a) | | 175,000 | 176,897 |
| Series 2019 C, 2.55%, tender 6/1/26 (a) | | 300,000 | 306,450 |
|
| TOTAL NORTH CAROLINA | | | 679,913 |
|
| Ohio - 6.4% | | | |
| Akron Bath Copley Hosp. District Rev. Series 2016, 5.25% 11/15/46 | | 425,000 | 489,864 |
| Allen County Hosp. Facilities Rev.: | | | |
| (Mercy Health) Series 2017 A: | | | |
| 5% 8/1/25 | | 10,000 | 11,862 |
| 5% 8/1/26 | | 290,000 | 350,804 |
| 5% 8/1/27 | | 10,000 | 12,297 |
| 5% 8/1/28 | | 10,000 | 12,408 |
| 5% 8/1/29 | | 10,000 | 12,318 |
| 5% 8/1/30 | | 10,000 | 12,213 |
| Bonds (Mercy Health) Series 2017 B, 5%, tender 5/5/22 (a) | | 10,000 | 10,960 |
| American Muni. Pwr., Inc. (Solar Electricity Prepayment Proj.) Series 2019 A, 5% 2/15/44 | | 175,000 | 206,668 |
| American Muni. Pwr., Inc. Rev.: | | | |
| Bonds (Combined Hydroelectric Proj.) Series 2018, 2.25%, tender 8/15/21 (a) | | 500,000 | 504,820 |
| Series 2017 A, 5% 2/15/21 | | 30,000 | 31,738 |
| Cleveland Arpt. Sys. Rev. 5% 1/1/25 (FSA Insured) | | 145,000 | 170,265 |
| Cleveland State Univ. Gen. Receipts Series 2012, 5% 6/1/37 | | 510,000 | 546,368 |
| Columbus Gen. Oblig. Series 2016 2, 5% 7/1/25 | | 485,000 | 584,648 |
| Fairfield County Hosp. Facilities Rev. (Fairfield Med. Ctr. Proj.) Series 2013, 4.25% 6/15/24 | | 110,000 | 116,041 |
| Hamilton County HealthCare Facilities Rev. (The Christ Hosp. Proj.) Series 2012, 5.25% 6/1/24 | | 2,900,000 | 3,199,599 |
| Lancaster Port Auth. Gas Rev.: | | | |
| Bonds Series 2019, 5%, tender 2/1/25 (a) | | 255,000 | 296,731 |
| Series 2019, 5% 2/1/25 | | 160,000 | 187,312 |
| Lucas County Hosp. Rev. Series 2011, 5% 11/15/23 (Pre-Refunded to 11/15/21 @ 100) | | 20,000 | 21,687 |
| Muskingum County Hosp. Facilities (Genesis Healthcare Sys. Obligated Group Proj.) Series 2013: | | | |
| 4% 2/15/23 | | 315,000 | 333,418 |
| 5% 2/15/44 | | 100,000 | 106,607 |
| Ohio Hsg. Fin. Agcy. Residential Mtg. Rev. (Mtg. Backed Securities Prog.) Series 2019 B, 4.5% 3/1/50 (c) | | 20,000 | 22,403 |
| Steubenville Hosp. Rev. (Trinity Health Proj.) Series 2010, 4.125% 10/1/21 (Pre-Refunded to 2/1/20 @ 100) | | 15,000 | 15,235 |
| Univ. of Toledo Gen. Receipts Series 2018 A: | | | |
| 5% 6/1/20 | | 645,000 | 665,765 |
| 5% 6/1/21 | | 865,000 | 922,574 |
| 5% 6/1/22 | | 330,000 | 362,746 |
| Wood County Hosp. Facilities Rev. (Wood County Hosp. Assoc. Proj.) Series 2012, 5% 12/1/32 | | 15,000 | 15,851 |
|
| TOTAL OHIO | | | 9,223,202 |
|
| Oklahoma - 0.7% | | | |
| Oklahoma City Arpt. Trust Series 33, 5% 7/1/47 (b) | | 200,000 | 233,380 |
| Oklahoma Dev. Fin. Auth. Health Sys. Rev. (OU Medicine Proj.) Series 2018 B: | | | |
| 5% 8/15/23 | | 200,000 | 222,764 |
| 5.5% 8/15/57 | | 515,000 | 609,806 |
|
| TOTAL OKLAHOMA | | | 1,065,950 |
|
| Oregon - 0.6% | | | |
| Oregon Bus. Dev. Commn Recovery Zone Facility Bonds (Intel Corp. Proj.) Series 232, 2.4%, tender 8/14/23 (a) | | 830,000 | 852,974 |
| Pennsylvania - 7.2% | | | |
| Allegheny County Hosp. Dev. Auth. Rev. Series 2019 A, 5% 7/15/22 | | 185,000 | 204,388 |
| Centre County Pennsylvania Hosp. Auth. Rev. (Mount Nittany Med. Ctr. Proj.): | | | |
| Series 2016 A, 5% 11/15/46 | | 2,250,000 | 2,538,023 |
| Series 2018 A: | | | |
| 5% 11/15/22 | | 100,000 | 111,008 |
| 5% 11/15/25 | | 100,000 | 118,450 |
| Commonwealth Fing. Auth. Rev. Series 2020 A, 5% 6/1/28 (c) | | 305,000 | 371,911 |
| Doylestown Hosp. Auth. Hosp. Rev. Series 2016 A, 5% 7/1/46 | | 20,000 | 21,788 |
| Dubois Hosp. Auth. Hosp. Rev. (Penn Highlands Healthcare Proj.) Series 2018: | | | |
| 4% 7/15/37 | | 40,000 | 42,595 |
| 5% 7/15/36 | | 500,000 | 588,825 |
| Lehigh County Gen. Purp. Auth. Rev. (Muhlenberg College Proj.) Series 2017, 5% 2/1/39 | | 60,000 | 70,198 |
| Lehigh County Indl. Dev. Auth. Poll. Cont. Rev. Bonds (PPL Elec. Utils. Corp. Proj.) Series 2016 A, 1.8%, tender 9/1/22 (a) | | 95,000 | 95,080 |
| Montgomery County Higher Ed. & Health Auth. Rev. Series 2019: | | | |
| 4% 9/1/44 | | 185,000 | 197,537 |
| 4% 9/1/49 | | 190,000 | 201,556 |
| Northampton County Gen. Purp. Auth. Hosp. Rev.: | | | |
| (St. Luke's Univ. Health Network Proj.) Series 2018 A, 4% 8/15/48 | | 195,000 | 204,844 |
| Series 2016 A, 5% 8/15/46 | | 50,000 | 56,957 |
| Pennsylvania Ctfs. Prtn. Series 2018 A: | | | |
| 5% 7/1/23 | | 250,000 | 281,778 |
| 5% 7/1/24 | | 300,000 | 346,860 |
| 5% 7/1/25 | | 300,000 | 353,883 |
| 5% 7/1/26 | | 455,000 | 548,521 |
| 5% 7/1/27 | | 500,000 | 611,855 |
| 5% 7/1/34 | | 450,000 | 539,127 |
| Pennsylvania Higher Edl. Facilities Auth. Rev.: | | | |
| (Drexel Univ. Proj.): | | | |
| Series 2016, 5% 5/1/35 | | 500,000 | 576,420 |
| Series 2017, 5% 5/1/35 | | 10,000 | 11,814 |
| Series 2018 A, 5% 2/15/48 | | 100,000 | 120,280 |
| Philadelphia Gas Works Rev. Series 2015 13, 5% 8/1/21 | | 100,000 | 107,213 |
| Philadelphia Gen. Oblig.: | | | |
| Series 2014 A, 5.25% 7/15/27 | | 275,000 | 314,914 |
| Series 2019 A, 5% 8/1/26 | | 220,000 | 268,413 |
| Philadelphia School District: | | | |
| Series 2018 A, 5% 9/1/25 | | 50,000 | 59,130 |
| Series 2018 B, 5% 9/1/43 | | 50,000 | 58,341 |
| Pittsburgh Wtr. & Swr. Auth. Wtr. & Swr. Sys. Rev. Series 2019 A, 5% 9/1/44 (FSA Insured) (c) | | 70,000 | 84,071 |
| Southcentral Pennsylvania Gen. Auth. Rev.: | | | |
| (Hanover Hosp., Inc. PA Proj.) Series 2015, 5% 12/1/28 | | 45,000 | 52,890 |
| Series 2019 A: | | | |
| 4% 6/1/44 | | 50,000 | 54,800 |
| 4% 6/1/49 | | 115,000 | 125,234 |
| 5% 6/1/25 | | 200,000 | 237,842 |
| 5% 6/1/44 | | 85,000 | 102,233 |
| 5% 6/1/49 | | 135,000 | 161,360 |
| Union County Hosp. Auth. Rev. Series 2018 B: | | | |
| 5% 8/1/43 | | 185,000 | 210,745 |
| 5% 8/1/48 | | 310,000 | 351,831 |
|
| TOTAL PENNSYLVANIA | | | 10,402,715 |
|
| Rhode Island - 0.6% | | | |
| Rhode Island Health & Edl. Bldg. Corp. Higher Ed. Facilities Rev. Series 2016: | | | |
| 5% 5/15/21 | | 25,000 | 26,457 |
| 5% 5/15/39 | | 50,000 | 56,455 |
| Rhode Island Hsg. & Mtg. Fin. Corp. Series 2019 70, 4% 10/1/49 | | 50,000 | 54,682 |
| Rhode Island Student Ln. Auth. Student Ln. Rev. Series A, 5% 12/1/23 (b) | | 625,000 | 705,563 |
|
| TOTAL RHODE ISLAND | | | 843,157 |
|
| South Carolina - 2.9% | | | |
| Charleston County Arpt. District Series 2019, 5% 7/1/48 | | 395,000 | 477,974 |
| South Carolina Hsg. Fin. & Dev. Auth. Mtg. Rev. Series 2019 A, 4% 1/1/50 (c) | | 70,000 | 77,258 |
| South Carolina Jobs-Econ. Dev. Auth. Econ. Dev. Rev. (Bon Secours Health Sys. Proj.) Series 2013, 5% 11/1/28 (Pre-Refunded to 11/1/22 @ 100) | | 180,000 | 201,512 |
| South Carolina Pub. Svc. Auth. Rev.: | | | |
| Series 2010 B, 5% 1/1/21 (Pre-Refunded to 7/1/20 @ 100) | | 5,000 | 5,183 |
| Series 2014 A: | | | |
| 5% 12/1/49 | | 440,000 | 486,627 |
| 5.5% 12/1/54 | | 140,000 | 157,763 |
| Series 2014 C, 5% 12/1/46 | | 20,000 | 22,364 |
| Series 2015 A, 5% 12/1/50 | | 75,000 | 84,355 |
| Series 2015 E, 5.25% 12/1/55 | | 25,000 | 28,647 |
| Series 2016 A: | | | |
| 5% 12/1/26 | | 140,000 | 168,808 |
| 5% 12/1/29 | | 500,000 | 595,655 |
| 5% 12/1/33 | | 15,000 | 17,568 |
| 5% 12/1/38 | | 75,000 | 86,699 |
| Series 2016 B: | | | |
| 5% 12/1/31 | | 105,000 | 125,197 |
| 5% 12/1/35 | | 120,000 | 141,046 |
| 5% 12/1/41 | | 175,000 | 203,042 |
| Series A, 5% 12/1/23 | | 145,000 | 165,406 |
| Series B, 5% 12/1/24 | | 480,000 | 561,178 |
| Spartanburg County Reg'l. Health Series 2017 A: | | | |
| 4% 4/15/43 | | 30,000 | 31,546 |
| 4% 4/15/48 | | 20,000 | 20,925 |
| 5% 4/15/48 | | 415,000 | 473,635 |
|
| TOTAL SOUTH CAROLINA | | | 4,132,388 |
|
| Tennessee - 2.2% | | | |
| Greeneville Health & Edl. Facilities Board Series 2018 A: | | | |
| 5% 7/1/20 | | 700,000 | 724,018 |
| 5% 7/1/23 | | 15,000 | 16,876 |
| 5% 7/1/24 | | 20,000 | 22,551 |
| 5% 7/1/25 | | 20,000 | 22,509 |
| Memphis-Shelby County Arpt. Auth. Arpt. Rev. Series 2018: | | | |
| 5% 7/1/26 (b) | | 450,000 | 540,531 |
| 5% 7/1/38 (b) | | 1,000,000 | 1,185,920 |
| Tennessee Energy Acquisition Corp. Bonds: | | | |
| (Gas Rev. Proj.) Series A, 4%, tender 5/1/23 (a) | | 460,000 | 493,102 |
| Series 2018, 4%, tender 11/1/49 | | 180,000 | 198,346 |
|
| TOTAL TENNESSEE | | | 3,203,853 |
|
| Texas - 7.8% | | | |
| Arlington Spl. Tax Rev. Series 2018 C, 5% 2/15/45 | | 50,000 | 52,220 |
| Austin Cmnty. College District Rev. (Highland Campus Parking Garage Proj.) Series 2018 C: | | | |
| 5% 8/1/25 | | 200,000 | 239,274 |
| 5% 8/1/26 | | 200,000 | 244,760 |
| Austin-Bergstrom Landhost Ente Series 2017, 5% 10/1/22 | | 115,000 | 126,765 |
| Dallas Fort Worth Int'l. Arpt. Rev. Series 2014 B, 5% 11/1/22 (b) | | 115,000 | 127,720 |
| Dallas Independent School District Series 2016 A, 4% 2/15/29 | | 500,000 | 558,995 |
| Fort Bend Independent School District Bonds Series 2019 A, 1.95%, tender 8/1/22 (a) | | 400,000 | 404,916 |
| Grand Parkway Trans. Corp.: | | | |
| Series 2013 B, 5.25% 10/1/51 | | 30,000 | 33,623 |
| Series 2018 A, 5% 10/1/43 | | 450,000 | 535,815 |
| Houston Arpt. Sys. Rev.: | | | |
| Series 2012 A, 5% 7/1/23 (b) | | 85,000 | 93,589 |
| Series 2018 A, 5% 7/1/41 (b) | | 1,000,000 | 1,181,760 |
| Series 2018 C, 5% 7/1/30 (b) | | 120,000 | 147,143 |
| Houston Gen. Oblig. Series 2017 A: | | | |
| 5% 3/1/25 | | 500,000 | 592,945 |
| 5% 3/1/32 | | 25,000 | 30,150 |
| Houston Util. Sys. Rev. Series 2016 B, 5% 11/15/34 | | 5,000 | 5,964 |
| Love Field Arpt. Modernization Rev. Series 2017, 5% 11/1/31 (b) | | 25,000 | 29,562 |
| Lower Colorado River Auth. Rev. (LCRA Transmission Svcs. Corp. Proj.): | | | |
| Series 2011 B, 5% 5/15/22 | | 300,000 | 319,941 |
| Series 2019, 5% 5/15/38 | | 215,000 | 255,915 |
| New Hope Cultural Ed. Facilities Finc (Childrens Med. Ctr. of Dallas) Series 2017 A: | | | |
| 5% 8/15/27 | | 10,000 | 12,433 |
| 5% 8/15/47 | | 10,000 | 11,696 |
| North Central Texas Health Facilities Dev. Corp. (Childrens Med. Ctr. of Dallas Proj.) Series 2012, 5% 8/15/32 (Pre-Refunded to 8/15/22 @ 100) | | 100,000 | 111,209 |
| Prosper Independent School District Series 2019, 5% 2/15/44 | | 100,000 | 122,050 |
| San Antonio Elec. & Gas Sys. Rev. Series 2017, 5% 2/1/33 | | 5,000 | 6,039 |
| San Antonio Gen. Oblig. Series 2018, 5% 8/1/37 | | 40,000 | 49,064 |
| San Antonio Wtr. Sys. Rev. Series 2018 A, 5% 5/15/33 | | 5,000 | 6,177 |
| Tarrant County Cultural Ed. Facilities Fin. Corp. Hosp. Rev. (Scott & White Healthcare Proj.) Series 2013 A, 5% 8/15/21 | | 60,000 | 64,420 |
| Tarrant County Cultural Ed. Facilities Fin. Corp. Rev.: | | | |
| Series 2016 A, 5% 2/15/47 | | 2,335,000 | 2,701,058 |
| Series 2017 A, 5% 2/15/24 | | 265,000 | 306,189 |
| Texas Dept. of Hsg. & Cmnty. Affairs Multi-family Hsg. Rev. Series 2019, 2.95% 7/1/36 | | 130,000 | 130,099 |
| Texas Gen. Oblig.: | | | |
| Bonds: | | | |
| Series 2019 C2, 1.85%, tender 8/1/22 (a) | | 75,000 | 75,183 |
| Series 2019 E2, 2.25%, tender 8/1/22 (a) | | 330,000 | 332,709 |
| Series 2017 B, 5% 10/1/36 | | 100,000 | 121,262 |
| Texas Pub. Fin. Auth. Lease Rev. Series 2019, 5% 2/1/28 | | 200,000 | 252,258 |
| Texas Trans. Commission Series 2019 A, 0% 8/1/41 | | 250,000 | 97,250 |
| Univ. of Houston Univ. Revs. Series 2017 A, 5% 2/15/30 | | 690,000 | 823,391 |
| Univ. of North Texas Univ. Rev. Series 2018 A, 5% 4/15/44 | | 450,000 | 536,333 |
| Waco Gen. Oblig. Series 2015, 5% 2/1/25 | | 500,000 | 577,095 |
|
| TOTAL TEXAS | | | 11,316,972 |
|
| Utah - 0.3% | | | |
| Salt Lake City Arpt. Rev.: | | | |
| Series 2017 A, 5% 7/1/24 (b) | | 10,000 | 11,557 |
| Series 2018 A: | | | |
| 5% 7/1/33 (b) | | 175,000 | 211,703 |
| 5.25% 7/1/48 (b) | | 130,000 | 155,745 |
|
| TOTAL UTAH | | | 379,005 |
|
| Vermont - 0.5% | | | |
| Vermont Student Assistant Corp. Ed. Ln. Rev. Series 2019 A, 5% 6/15/25 (b) | | 635,000 | 737,051 |
| Virginia - 1.3% | | | |
| Roanoke Econ. Dev. Auth. Edl. Facilities Series 2018 A: | | | |
| 5% 9/1/23 | | 360,000 | 404,438 |
| 5% 9/1/24 | | 315,000 | 361,425 |
| 5% 9/1/27 | | 875,000 | 1,054,830 |
| Winchester Econ. Dev. Auth. (Valley Health Proj.) Series 2015, 5% 1/1/22 | | 50,000 | 54,311 |
|
| TOTAL VIRGINIA | | | 1,875,004 |
|
| Washington - 0.7% | | | |
| King County Swr. Rev. Series 2017, 5% 7/1/34 | | 10,000 | 12,135 |
| Port of Seattle Rev. Series 2015 C, 5% 4/1/24 (b) | | 50,000 | 57,648 |
| Washington Gen. Oblig. Series 2013 A, 5% 7/1/23 | | 5,000 | 5,546 |
| Washington Health Care Facilities Auth. Rev.: | | | |
| (Catholic Health Initiatives Proj.) Series 2008 D, 6.375% 10/1/36 | | 5,000 | 5,019 |
| (Overlake Hosp. Med. Ctr., WA. Proj.) Series 2017 B: | | | |
| 5% 7/1/25 | | 5,000 | 5,929 |
| 5% 7/1/30 | | 5,000 | 6,139 |
| 5% 7/1/31 | | 10,000 | 12,180 |
| 5% 7/1/42 | | 100,000 | 116,366 |
| Washington Higher Ed. Facilities Auth. Rev. (Whitworth Univ. Proj.) Series 2016 A, 5% 10/1/25 | | 550,000 | 640,299 |
| Washington Hsg. Fin. Commission Nonprofit Hsg. Rev. (Judson Park Proj.) Series 2018, 5% 7/1/38 (d) | | 100,000 | 107,865 |
|
| TOTAL WASHINGTON | | | 969,126 |
|
| West Virginia - 0.0% | | | |
| West Virginia Hosp. Fin. Auth. Hosp. Rev. Series 2018 A, 5% 1/1/32 | | 50,000 | 60,274 |
| Wisconsin - 1.0% | | | |
| Pub. Fin. Auth. Hosp. Rev. Series 2019 A, 5% 10/1/44 | | 155,000 | 182,990 |
| Pub. Fin. Auth. Rev.: | | | |
| (Denver Great Hall LLC. Proj.) Series 2017: | | | |
| 5% 9/30/37 (b) | | 250,000 | 290,520 |
| 5% 9/30/49 (b) | | 235,000 | 267,226 |
| (Denver Int. Arpt. Great Hall Proj.) Series 2017, 5% 9/30/24 (b) | | 260,000 | 297,684 |
| Pub. Fin. Auth. Wis Edl. Facilities Series 2018 A: | | | |
| 5.25% 10/1/43 | | 160,000 | 182,450 |
| 5.25% 10/1/48 | | 160,000 | 181,746 |
| Pub. Fin. Auth. Wisconsin Retirement Facility Rev. Series 2018: | | | |
| 5% 10/1/43 (d) | | 15,000 | 16,445 |
| 5% 10/1/48 (d) | | 15,000 | 16,400 |
| 5% 10/1/53 (d) | | 30,000 | 32,713 |
|
| TOTAL WISCONSIN | | | 1,468,174 |
|
| TOTAL MUNICIPAL BONDS | | | |
| (Cost $130,910,656) | | | 136,377,102 |
|
| Municipal Notes - 0.7% | | | |
| Illinois - 0.4% | | | |
| Chicago Board of Ed. TAN Series 2018 G, 2% 10/1/19 | | 600,000 | $600,077 |
| Wisconsin - 0.3% | | | |
| Deforest Area School District BAN Series 2019, 3% 12/18/19 | | 200,000 | 200,355 |
| Milton School District BAN Series 2019, 5% 8/19/19 | | 200,000 | 200,945 |
|
| TOTAL WISCONSIN | | | 401,300 |
|
| TOTAL MUNICIPAL NOTES | | | |
| (Cost $1,001,295) | | | 1,001,377 |
| | | Shares | Value |
|
| Money Market Funds - 5.7% | | | |
| Fidelity Municipal Cash Central Fund 2.00% (e)(f) | | | |
| (Cost $8,249,999) | | 8,249,175 | 8,249,971 |
| TOTAL INVESTMENT IN SECURITIES - 100.7% | | | |
| (Cost $140,161,950) | | | 145,628,450 |
| NET OTHER ASSETS (LIABILITIES) - (0.7)% | | | (1,027,747) |
| NET ASSETS - 100% | | | $144,600,703 |
Security Type Abbreviations
BAN – BOND ANTICIPATION NOTE
TAN – TAX ANTICIPATION NOTE
Legend
(a) Coupon rates for floating and adjustable rate securities reflect the rates in effect at period end.
(b) Private activity obligations whose interest is subject to the federal alternative minimum tax for individuals.
(c) Security or a portion of the security purchased on a delayed delivery or when-issued basis.
(d) Security exempt from registration under Rule 144A of the Securities Act of 1933. These securities may be resold in transactions exempt from registration, normally to qualified institutional buyers. At the end of the period, the value of these securities amounted to $1,647,109 or 1.1% of net assets.
(e) Information in this report regarding holdings by state and security types does not reflect the holdings of the Fidelity Municipal Cash Central Fund.
(f) Affiliated fund that is available only to investment companies and other accounts managed by Fidelity Investments. The rate quoted is the annualized seven-day yield of the fund at period end. A complete unaudited listing of the fund's holdings as of its most recent quarter end is available upon request. In addition, each Fidelity Central Fund's financial statements are available on the SEC's website or upon request.
Affiliated Central Funds
Information regarding fiscal year to date income earned by the Fund from investments in Fidelity Central Funds is as follows:
| Fund | Income earned |
| Fidelity Municipal Cash Central Fund | $101,556 |
| Total | $101,556 |
Amounts in the income column in the above table include any capital gain distributions from underlying funds, which are presented in the corresponding line-item in the Statement of Operations, if applicable.
Investment Valuation
The following is a summary of the inputs used, as of June 30, 2019, involving the Fund's assets and liabilities carried at fair value. The inputs or methodology used for valuing securities may not be an indication of the risk associated with investing in those securities. For more information on valuation inputs, and their aggregation into the levels used below, please refer to the Investment Valuation section in the accompanying Notes to Financial Statements.
| | Valuation Inputs at Reporting Date: |
| Description | Total | Level 1 | Level 2 | Level 3 |
| Investments in Securities: | | | | |
| Municipal Securities | $137,378,479 | $-- | $137,378,479 | $-- |
| Money Market Funds | 8,249,971 | 8,249,971 | -- | -- |
| Total Investments in Securities: | $145,628,450 | $8,249,971 | $137,378,479 | $-- |
Other Information
The distribution of municipal securities by revenue source, as a percentage of total Net Assets, is as follows (Unaudited):
| Health Care | 27.4% |
| General Obligations | 18.3% |
| Education | 15.0% |
| Transportation | 15.0% |
| Electric Utilities | 7.0% |
| Money Market Funds | 5.7% |
| Others* (Individually Less Than 5%) | 11.6% |
| | 100.0% |
* Includes net other assets
See accompanying notes which are an integral part of the financial statements.
Financial Statements
Statement of Assets and Liabilities
| | | June 30, 2019 (Unaudited) |
| Assets | | |
Investment in securities, at value — See accompanying schedule:
Unaffiliated issuers (cost $131,911,951) | $137,378,479 | |
| Fidelity Central Funds (cost $8,249,999) | 8,249,971 | |
| Total Investment in Securities (cost $140,161,950) | | $145,628,450 |
| Cash | | 60,759 |
| Receivable for investments sold | | 1,214,050 |
| Receivable for fund shares sold | | 600,074 |
| Interest receivable | | 1,399,557 |
| Distributions receivable from Fidelity Central Funds | | 16,143 |
| Other receivables | | 663 |
| Total assets | | 148,919,696 |
| Liabilities | | |
| Payable for investments purchased | | |
| Regular delivery | $27,282 | |
| Delayed delivery | 3,883,329 | |
| Payable for fund shares redeemed | 80,529 | |
| Distributions payable | 327,853 | |
| Total liabilities | | 4,318,993 |
| Net Assets | | $144,600,703 |
| Net Assets consist of: | | |
| Paid in capital | | $139,000,120 |
| Total distributable earnings (loss) | | 5,600,583 |
| Net Assets, for 14,076,671 shares outstanding | | $144,600,703 |
| Net Asset Value, offering price and redemption price per share ($144,600,703 ÷ 14,076,671 shares) | | $10.27 |
See accompanying notes which are an integral part of the financial statements.
Statement of Operations
| | | Six months ended June 30, 2019 (Unaudited) |
| Investment Income | | |
| Interest | | $1,714,739 |
| Income from Fidelity Central Funds | | 101,556 |
| Total income | | 1,816,295 |
| Expenses | | |
| Independent trustees' fees and expenses | $224 | |
| Commitment fees | 165 | |
| Total expenses | | 389 |
| Net investment income (loss) | | 1,815,906 |
| Realized and Unrealized Gain (Loss) | | |
| Net realized gain (loss) on: | | |
| Investment securities: | | |
| Unaffiliated issuers | 418,751 | |
| Total net realized gain (loss) | | 418,751 |
| Change in net unrealized appreciation (depreciation) on: | | |
| Investment securities: | | |
| Unaffiliated issuers | 4,971,329 | |
| Fidelity Central Funds | (10) | |
| Total change in net unrealized appreciation (depreciation) | | 4,971,319 |
| Net gain (loss) | | 5,390,070 |
| Net increase (decrease) in net assets resulting from operations | | $7,205,976 |
See accompanying notes which are an integral part of the financial statements.
Statement of Changes in Net Assets
| | Six months ended June 30, 2019 (Unaudited) | Year ended December 31, 2018 |
| Increase (Decrease) in Net Assets | | |
| Operations | | |
| Net investment income (loss) | $1,815,906 | $2,096,924 |
| Net realized gain (loss) | 418,751 | (282,724) |
| Change in net unrealized appreciation (depreciation) | 4,971,319 | 454,804 |
| Net increase (decrease) in net assets resulting from operations | 7,205,976 | 2,269,004 |
| Distributions to shareholders | (1,815,327) | (2,096,254) |
| Share transactions | | |
| Proceeds from sales of shares | 51,852,661 | 146,892,882 |
| Reinvestment of distributions | 89 | 71,016 |
| Cost of shares redeemed | (23,322,406) | (46,585,236) |
| Net increase (decrease) in net assets resulting from share transactions | 28,530,344 | 100,378,662 |
| Total increase (decrease) in net assets | 33,920,993 | 100,551,412 |
| Net Assets | | |
| Beginning of period | 110,679,710 | 10,128,298 |
| End of period | $144,600,703 | $110,679,710 |
| Other Information | | |
| Shares | | |
| Sold | 5,162,627 | 14,973,498 |
| Issued in reinvestment of distributions | 9 | 7,225 |
| Redeemed | (2,319,947) | (4,755,849) |
| Net increase (decrease) | 2,842,689 | 10,224,874 |
See accompanying notes which are an integral part of the financial statements.
Financial Highlights
Fidelity Flex Municipal Income Fund
| | Six months ended (Unaudited) June 30, | Years endedDecember 31, | |
| | 2019 | 2018 | 2017 A |
| Selected Per–Share Data | | | |
| Net asset value, beginning of period | $9.85 | $10.04 | $10.00 |
| Income from Investment Operations | | | |
| Net investment income (loss)B | .143 | .261 | .040 |
| Net realized and unrealized gain (loss) | .420 | (.193)C | .041 |
| Total from investment operations | .563 | .068 | .081 |
| Distributions from net investment income | (.143) | (.258) | (.040) |
| Distributions from net realized gain | – | – | (.001) |
| Total distributions | (.143) | (.258) | (.041) |
| Net asset value, end of period | $10.27 | $9.85 | $10.04 |
| Total ReturnD | 5.75% | .71% | .81% |
| Ratios to Average Net AssetsE,F | | | |
| Expenses before reductionsG | - %H | -% | - %H |
| Expenses net of fee waivers, if anyG | - %H | -% | - %H |
| Expenses net of all reductionsG | - %H | -% | - %H |
| Net investment income (loss) | 2.87%H | 2.69% | 1.81%H |
| Supplemental Data | | | |
| Net assets, end of period (000 omitted) | $144,601 | $110,680 | $10,128 |
| Portfolio turnover rateI | 30%H | 73% | 35%J |
A For the period October 12, 2017 (commencement of operations) to December 31, 2017.
B Calculated based on average shares outstanding during the period.
C The amount shown for a share outstanding does not correspond with the aggregate net gain (loss) on investments for the period due to the timing of sales and repurchases of shares in relation to fluctuating market values of the investments of the Fund.
D Total returns for periods of less than one year are not annualized.
E Fees and expenses of any underlying Fidelity Central Funds are not included in the Fund's expense ratio. The Fund indirectly bears its proportionate share of the expenses of any underlying Fidelity Central Funds.
F Expense ratios reflect operating expenses of the Fund. Expenses before reductions do not reflect amounts reimbursed by the investment adviser or reductions from expense offset arrangements and do not represent the amount paid by the Fund during periods when reimbursements or reductions occur. Expenses net of fee waivers reflect expenses after reimbursement by the investment adviser but prior to reductions from expense offset arrangements. Expenses net of all reductions represent the net expenses paid by the Fund.
G Amount represents less than .005%.
H Annualized
I Amount does not include the portfolio activity of any underlying Fidelity Central Funds.
J Amount not annualized.
See accompanying notes which are an integral part of the financial statements.
Notes to Financial Statements (Unaudited)
For the period ended June 30, 2019
1. Organization.
Fidelity Flex Municipal Income Fund (the Fund) is a fund of Fidelity Municipal Trust (the Trust) and is authorized to issue an unlimited number of shares. Share transactions on the Statement of Changes in Net Assets may contain exchanges between affiliated funds. The Trust is registered under the Investment Company Act of 1940, as amended (the 1940 Act), as an open-end management investment company organized as a Massachusetts business trust. The Fund is available only to certain fee-based accounts offered by Fidelity.
2. Investments in Fidelity Central Funds.
The Fund invests in Fidelity Central Funds, which are open-end investment companies generally available only to other investment companies and accounts managed by the investment adviser and its affiliates. The Fund's Schedule of Investments lists each of the Fidelity Central Funds held as of period end, if any, as an investment of the Fund, but does not include the underlying holdings of each Fidelity Central Fund. As an Investing Fund, the Fund indirectly bears its proportionate share of the expenses of the underlying Fidelity Central Funds.
The Money Market Central Funds seek preservation of capital and current income and are managed by Fidelity Investments Money Management, Inc. (FIMM), an affiliate of the investment adviser. Annualized expenses of the Money Market Central Funds as of their most recent shareholder report date ranged from less than .005% to .01%.
A complete unaudited list of holdings for each Fidelity Central Fund is available upon request or at the Securities and Exchange Commission (the SEC) website at www.sec.gov. In addition, the financial statements of the Fidelity Central Funds are available on the SEC website or upon request.
3. Significant Accounting Policies.
The Fund is an investment company and applies the accounting and reporting guidance of the Financial Accounting Standards Board (FASB) Accounting Standards Codification Topic 946 Financial Services – Investments Companies. The financial statements have been prepared in conformity with accounting principles generally accepted in the United States of America (GAAP), which require management to make certain estimates and assumptions at the date of the financial statements. Actual results could differ from those estimates. Subsequent events, if any, through the date that the financial statements were issued have been evaluated in the preparation of the financial statements. The following summarizes the significant accounting policies of the Fund:
Investment Valuation. Investments are valued as of 4:00 p.m. Eastern time on the last calendar day of the period. The Board of Trustees (the Board) has delegated the day to day responsibility for the valuation of the Fund's investments to the Fair Value Committee (the Committee) established by the Fund's investment adviser. In accordance with valuation policies and procedures approved by the Board, the Fund attempts to obtain prices from one or more third party pricing vendors or brokers to value its investments. When current market prices, quotations or currency exchange rates are not readily available or reliable, investments will be fair valued in good faith by the Committee, in accordance with procedures adopted by the Board. Factors used in determining fair value vary by investment type and may include market or investment specific events, changes in interest rates and credit quality. The frequency with which these procedures are used cannot be predicted and they may be utilized to a significant extent. The Committee oversees the Fund's valuation policies and procedures and reports to the Board on the Committee's activities and fair value determinations. The Board monitors the appropriateness of the procedures used in valuing the Fund's investments and ratifies the fair value determinations of the Committee.
The Fund categorizes the inputs to valuation techniques used to value its investments into a disclosure hierarchy consisting of three levels as shown below:
- Level 1 – quoted prices in active markets for identical investments
- Level 2 – other significant observable inputs (including quoted prices for similar investments, interest rates, prepayment speeds, etc.)
- Level 3 – unobservable inputs (including the Fund's own assumptions based on the best information available)
Valuation techniques used to value the Fund's investments by major category are as follows:
Debt securities, including restricted securities, are valued based on evaluated prices received from third party pricing vendors or from brokers who make markets in such securities. Municipal securities are valued by pricing vendors who utilize matrix pricing which considers yield or price of bonds of comparable quality, coupon, maturity and type or by broker-supplied prices. When independent prices are unavailable or unreliable, debt securities may be valued utilizing pricing methodologies which consider similar factors that would be used by third party pricing vendors. Debt securities are generally categorized as Level 2 in the hierarchy but may be Level 3 depending on the circumstances.
Investments in open-end mutual funds, including the Fidelity Central Funds, are valued at their closing net asset value (NAV) each business day and are categorized as Level 1 in the hierarchy.
Changes in valuation techniques may result in transfers in or out of an assigned level within the disclosure hierarchy. The aggregate value of investments by input level as of June 30, 2019 is included at the end of the Fund's Schedule of Investments.
Investment Transactions and Income. For financial reporting purposes, the Fund's investment holdings and NAV include trades executed through the end of the last business day of the period. The NAV per share for processing shareholder transactions is calculated as of the close of business of the New York Stock Exchange (NYSE), normally 4:00 p.m. Eastern time and includes trades executed through the end of the prior business day. Gains and losses on securities sold are determined on the basis of identified cost. Income and capital gain distributions from Fidelity Central Funds, if any, are recorded on the ex-dividend date. Interest income is accrued as earned and includes coupon interest and amortization of premium and accretion of discount on debt securities as applicable. Debt obligations may be placed on non-accrual status and related interest income may be reduced by ceasing current accruals and writing off interest receivables when the collection of all or a portion of interest has become doubtful based on consistently applied procedures. A debt obligation is removed from non-accrual status when the issuer resumes interest payments or when collectability of interest is reasonably assured.
Expenses. Expenses directly attributable to a fund are charged to that fund. Expenses attributable to more than one fund are allocated among the respective funds on the basis of relative net assets or other appropriate methods. Expense estimates are accrued in the period to which they relate and adjustments are made when actual amounts are known.
Income Tax Information and Distributions to Shareholders. Each year, the Fund intends to qualify as a regulated investment company under Subchapter M of the Internal Revenue Code, including distributing substantially all of its taxable income and realized gains. As a result, no provision for U.S. Federal income taxes is required. The Fund files a U.S. federal tax return, in addition to state and local tax returns as required. The Fund's federal income tax returns are subject to examination by the Internal Revenue Service (IRS) for a period of three fiscal years after they are filed. State and local tax returns may be subject to examination for an additional fiscal year depending on the jurisdiction.
Distributions are declared and recorded daily and paid monthly from net investment income. Distributions from realized gains, if any, are declared and recorded on the ex-dividend date. Income and capital gain distributions are determined in accordance with income tax regulations, which may differ from GAAP.
Capital accounts within the financial statements are adjusted for permanent book-tax differences. These adjustments have no impact on net assets or the results of operations. Capital accounts are not adjusted for temporary book-tax differences which will reverse in a subsequent period.
Book-tax differences are primarily due market discount and capital loss carryforwards.
The Fund purchases municipal securities whose interest, in the opinion of the issuer, is free from federal income tax. There is no assurance that the IRS will agree with this opinion. In the event the IRS determines that the issuer does not comply with relevant tax requirements, interest payments from a security could become federally taxable, possibly retroactively to the date the security was issued.
As of period end, the cost and unrealized appreciation (depreciation) in securities, and derivatives if applicable, for federal income tax purposes were as follows:
| Gross unrealized appreciation | $5,467,416 |
| Gross unrealized depreciation | (12) |
| Net unrealized appreciation (depreciation) | $5,467,404 |
| Tax cost | $140,161,046 |
Capital loss carryforwards are only available to offset future capital gains of the Fund to the extent provided by regulations and may be limited. Under the Regulated Investment Company Modernization Act of 2010 (the Act), the Fund is permitted to carry forward capital losses incurred in taxable years beginning after December 22, 2010 for an unlimited period and such capital losses are required to be used prior to any losses that expire. The capital loss carryforward information presented below, including any applicable limitation, is estimated as of prior fiscal period end and is subject to adjustment.
| No expiration | |
| Short-term | $(270,486) |
| Long-term | (14,582) |
| Total capital loss carryforward | $(285,068) |
Delayed Delivery Transactions and When-Issued Securities. During the period, the Fund transacted in securities on a delayed delivery or when-issued basis. Payment and delivery may take place after the customary settlement period for that security. The price of the underlying securities and the date when the securities will be delivered and paid for are fixed at the time the transaction is negotiated. The securities purchased on a delayed delivery or when-issued basis are identified as such in the Fund's Schedule of Investments. The Fund may receive compensation for interest forgone in the purchase of a delayed delivery or when-issued security. With respect to purchase commitments, the Fund identifies securities as segregated in its records with a value at least equal to the amount of the commitment. Losses may arise due to changes in the value of the underlying securities or if the counterparty does not perform under the contract's terms, or if the issuer does not issue the securities due to political, economic, or other factors.
Restricted Securities. The Fund may invest in securities that are subject to legal or contractual restrictions on resale. These securities generally may be resold in transactions exempt from registration or to the public if the securities are registered. Disposal of these securities may involve time-consuming negotiations and expense, and prompt sale at an acceptable price may be difficult. Information regarding restricted securities is included at the end of the Fund's Schedule of Investments.
4. Purchases and Sales of Investments.
Purchases and sales of securities, other than short-term securities, aggregated $47,038,132 and $17,086,035, respectively.
5. Fees and Other Transactions with Affiliates.
Management Fee. Fidelity Management & Research Company (the investment adviser) and its affiliates provide the Fund with investment management related services and the Fund does not pay any fees for these services. Under the management contract, the investment adviser or an affiliate pays all other expenses of the Fund, excluding fees and expenses of the independent Trustees, and certain miscellaneous expenses such as proxy and shareholder meeting expenses.
Interfund Trades. The Fund may purchase from or sell securities to other Fidelity Funds under procedures adopted by the Board. The procedures have been designed to ensure these interfund trades are executed in accordance with Rule 17a-7 of the 1940 Act. Interfund trades are included within the respective purchases and sales amounts shown in the Purchases and Sales of Investments note.
6. Committed Line of Credit.
The Fund participates with other funds managed by the investment adviser or an affiliate in a $4.25 billion credit facility (the "line of credit") to be utilized for temporary or emergency purposes to fund shareholder redemptions or for other short-term liquidity purposes. The Fund has agreed to pay commitment fees on its pro-rata portion of the line of credit, which amounted to $165 and is reflected in Commitment fees on the Statement of Operations. During the period, the Fund did not borrow on this line of credit.
7. Other.
The Fund's organizational documents provide former and current trustees and officers with a limited indemnification against liabilities arising in connection with the performance of their duties to the Fund. In the normal course of business, the Fund may also enter into contracts that provide general indemnifications. The Fund's maximum exposure under these arrangements is unknown as this would be dependent on future claims that may be made against the Fund. The risk of material loss from such claims is considered remote.
Shareholder Expense Example
As a shareholder of the Fund, you incur two types of costs: (1) transaction costs and (2) ongoing costs, including other Fund expenses. This Example is intended to help you understand your ongoing costs (in dollars) of investing in the Fund and to compare these costs with the ongoing costs of investing in other mutual funds.
The Example is based on an investment of $1,000 invested at the beginning of the period and held for the entire period (January 1, 2019 to June 30, 2019).
Actual Expenses
The first line of the accompanying table provides information about actual account values and actual expenses. You may use the information in this line, together with the amount you invested, to estimate the expenses that you paid over the period. Simply divide your account value by $1,000.00 (for example, an $8,600 account value divided by $1,000.00 = 8.6), then multiply the result by the number in the first line under the heading entitled "Expenses Paid During Period" to estimate the expenses you paid on your account during this period. In addition, the Fund, as a shareholder in the underlying Fidelity Central Funds, will indirectly bear its pro-rata share of the fees and expenses incurred by the underlying Fidelity Central Funds. These fees and expenses are not included in the Fund's annualized expense ratio used to calculate the expense estimate in the table below.
Hypothetical Example for Comparison Purposes
The second line of the accompanying table provides information about hypothetical account values and hypothetical expenses based on the Fund's actual expense ratio and an assumed rate of return of 5% per year before expenses, which is not the Fund's actual return. The hypothetical account values and expenses may not be used to estimate the actual ending account balance or expenses you paid for the period. You may use this information to compare the ongoing costs of investing in the Fund and other funds. To do so, compare this 5% hypothetical example with the 5% hypothetical examples that appear in the shareholder reports of the other funds. In addition, the Fund, as a shareholder in the underlying Fidelity Central Funds, will indirectly bear its pro-rata share of the fees and expenses incurred by the underlying Fidelity Central Funds. These fees and expenses are not included in the Fund's annualized expense ratio used to calculate the expense estimate in the table below.
Please note that the expenses shown in the table are meant to highlight your ongoing costs only and do not reflect any transaction costs. Therefore, the second line of the table is useful in comparing ongoing costs only, and will not help you determine the relative total costs of owning different funds.
| | Annualized Expense Ratio-A | Beginning
Account Value
January 1, 2019 | Ending
Account Value
June 30, 2019 | Expenses Paid
During Period-B
January 1, 2019
to June 30, 2019 |
| Actual | - %-C | $1,000.00 | $1,057.50 | $--D |
| Hypothetical-E | | $1,000.00 | $1,024.79 | $--D |
A Annualized expense ratio reflects expenses net of applicable fee waivers.
B Expenses are equal to the Fund's annualized expense ratio, multiplied by the average account value over the period, multiplied by 181/365 (to reflect the one-half year period).
C Amount represents less than .005%.
D Amount represents less than $.005.
E 5% return per year before expenses
XLI-SANN-0819
1.9884857.101
Fidelity Flex℠ Funds Fidelity Flex℠ Conservative Income Municipal Bond Fund
Semi-Annual Report June 30, 2019 |
|
Beginning on January 1, 2021, as permitted by regulations adopted by the Securities and Exchange Commission, paper copies of a fund’s shareholder reports will no longer be sent by mail, unless you specifically request paper copies of the reports from the fund or from your financial intermediary, such as a financial advisor, broker-dealer or bank. Instead, the reports will be made available on a website, and you will be notified by mail each time a report is posted and provided with a website link to access the report.
If you already elected to receive shareholder reports electronically, you will not be affected by this change and you need not take any action. You may elect to receive shareholder reports and other communications from a fund electronically, by contacting your financial intermediary. For Fidelity customers, visit Fidelity's web site or call Fidelity using the contact information listed below.
You may elect to receive all future reports in paper free of charge. If you wish to continue receiving paper copies of your shareholder reports, you may contact your financial intermediary or, if you are a Fidelity customer, visit Fidelity’s website, or call Fidelity at the applicable toll-free number listed below. Your election to receive reports in paper will apply to all funds held with the fund complex/your financial intermediary.
| Account Type | Website | Phone Number |
| Brokerage, Mutual Fund, or Annuity Contracts: | fidelity.com/mailpreferences | 1-800-343-3548 |
| Employer Provided Retirement Accounts: | netbenefits.fidelity.com/preferences (choose 'no' under Required Disclosures to continue to print) | 1-800-343-0860 |
| Advisor Sold Accounts Serviced Through Your Financial Intermediary: | Contact Your Financial Intermediary | Your Financial Intermediary's phone number |
| Advisor Sold Accounts Serviced by Fidelity: | institutional.fidelity.com | 1-877-208-0098 |
Contents
To view a fund's proxy voting guidelines and proxy voting record for the 12-month period ended June 30, visit http://www.fidelity.com/proxyvotingresults or visit the Securities and Exchange Commission's (SEC) web site at http://www.sec.gov.
You may also call 1-800-544-3455 (for managed account clients) or 1-800-835-5092 (for retirement plan participants) to request a free copy of the proxy voting guidelines.
Standard & Poor's, S&P and S&P 500 are registered service marks of The McGraw-Hill Companies, Inc. and have been licensed for use by Fidelity Distributors Corporation.
Other third-party marks appearing herein are the property of their respective owners.
All other marks appearing herein are registered or unregistered trademarks or service marks of FMR LLC or an affiliated company. © 2019 FMR LLC. All rights reserved.
This report and the financial statements contained herein are submitted for the general information of the shareholders of the Fund. This report is not authorized for distribution to prospective investors in the Fund unless preceded or accompanied by an effective prospectus.
A fund files its complete schedule of portfolio holdings with the SEC for the first and third quarters of each fiscal year on Form N-PORT. Forms N-PORT are available on the SEC’s web site at http://www.sec.gov. A fund's Forms N-PORT may be reviewed and copied at the SEC’s Public Reference Room in Washington, DC. Information regarding the operation of the SEC's Public Reference Room may be obtained by calling 1-800-SEC-0330.
For a complete list of a fund's portfolio holdings, view the most recent holdings listing, semiannual report, or annual report on Fidelity's web site at http://www.fidelity.com, http://www.institutional.fidelity.com, or http://www.401k.com, as applicable.
NOT FDIC INSURED •MAY LOSE VALUE •NO BANK GUARANTEE
Neither the Fund nor Fidelity Distributors Corporation is a bank.
Investment Summary (Unaudited)
Maturity Diversification as of June 30, 2019
| | % of fund's investments |
| 1 - 7 | 23.9 |
| 8 - 30 | 1.1 |
| 31 - 60 | 4.8 |
| 61 - 90 | 1.0 |
| 91 - 180 | 14.1 |
| > 180 | 55.1 |
The date shown for securities represents the date when principal payments must be paid, taking into account any call options exercised by the issuer and any permissible maturity shortening features other than interest rate resets.
Top Five States as of June 30, 2019
| | % of fund's net assets |
| Illinois | 15.4 |
| New Jersey | 11.3 |
| Florida | 9.1 |
| Michigan | 6.3 |
| New York | 5.7 |
Top Five Sectors as of June 30, 2019
| | % of fund's net assets |
| General Obligations | 21.1 |
| Health Care | 16.6 |
| Transportation | 14.7 |
| Electric Utilities | 13.4 |
| Synthetics | 10.1 |
Quality Diversification (% of fund's net assets)
| As of June 30, 2019 |
| | AAA | 3.3% |
| | AA,A | 56.4% |
| | BBB | 5.1% |
| | BB and Below | 1.4% |
| | Not Rated | 1.8% |
| | Short-Term Investments and Net Other Assets | 32.0% |
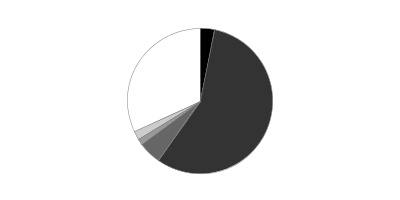
We have used ratings from Moody's Investors Service, Inc. Where Moody's® ratings are not available, we have used S&P® ratings. All ratings are as of the date indicated and do not reflect subsequent changes.
Schedule of Investments June 30, 2019 (Unaudited)
Showing Percentage of Net Assets
| Municipal Bonds - 68.0% | | | |
| | | Principal Amount | Value |
| Alabama - 1.0% | | | |
| Mobile Indl. Dev. Board Poll. Cont. Rev. Bonds Series 2009 E, 1.85%, tender 3/24/20 (a) | | 450,000 | 450,612 |
| Arizona - 1.2% | | | |
| Arizona Health Facilities Auth. Rev. (Banner Health Sys. Proj.) Series 2015 A, 5% 1/1/20 | | 100,000 | 101,762 |
| Arizona State Lottery Rev. Series 2019, 5% 7/1/20 (b) | | 100,000 | 102,655 |
| Coconino County Poll. Cont. Corp. Rev. Bonds (Nevada Pwr. Co. Projs.) Series 2017 A, 1.8%, tender 5/21/20 (a)(c) | | 50,000 | 50,087 |
| Maricopa County Rev. Bonds Series 2019 B, SIFMA Municipal Swap Index + 0.380% 2.28%, tender 10/18/22 (a)(d) | | 200,000 | 200,000 |
| Univ. Med. Ctr. Corp. Hosp. Rev. Series 2009, 6.5% 7/1/39 (Pre-Refunded to 7/1/19 @ 100) | | 60,000 | 60,000 |
|
| TOTAL ARIZONA | | | 514,504 |
|
| California - 0.6% | | | |
| California Infrastructure and Econ. Dev. Bank Rev. Bonds Series 2018 C, 1 month U.S. LIBOR + 0.380% 2.061%, tender 8/1/21 (a)(d) | | 245,000 | 244,998 |
| Colorado - 1.4% | | | |
| Colorado Univ. Co. Hosp. Auth. Rev. Bonds Series 2017C-1, 4%, tender 3/1/20 (a) | | 280,000 | 281,084 |
| E-470 Pub. Hwy. Auth. Rev.: | | | |
| Series 2015 A: | | $ | $ |
| 5% 9/1/19 | | 265,000 | 266,457 |
| 5% 9/1/20 | | 50,000 | 51,922 |
| Series B, 0% 9/1/20 (Nat'l. Pub. Fin. Guarantee Corp. Insured) | | 45,000 | 44,183 |
|
| TOTAL COLORADO | | | 643,646 |
|
| Connecticut - 4.1% | | | |
| Connecticut Gen. Oblig.: | | | |
| Series 2011, 5% 5/15/22 | | 200,000 | 212,568 |
| Series 2012 A, SIFMA Municipal Swap Index + 1.250% 3.15% 4/15/20 (a)(d) | | 100,000 | 100,759 |
| Series 2014 F, 5% 11/15/20 | | 225,000 | 236,165 |
| Series 2015 C, SIFMA Municipal Swap Index + 0.900% 2.8% 6/15/21 (a)(d) | | 100,000 | 100,751 |
| Series 2016 B, 4% 5/15/20 | | 200,000 | 204,598 |
| Series A, 5% 2/15/21 | | 75,000 | 75,201 |
| Connecticut Health & Edl. Facilities Auth. Rev. Bonds (Yale New Haven Hosp. Proj.) Series B, 1 month U.S. LIBOR + 0.550% 2.185%, tender 7/1/19 (a)(d) | | 200,000 | 200,000 |
| Connecticut Spl. Tax Oblig. Trans. Infrastructure Rev.: | | | |
| Series 2011 A, 5% 12/1/19 | | 225,000 | 228,441 |
| Series 2015 B, 5% 8/1/20 | | 245,000 | 254,477 |
| Series 2016 A, 5% 9/1/21 | | 220,000 | 236,733 |
|
| TOTAL CONNECTICUT | | | 1,849,693 |
|
| District Of Columbia - 0.6% | | | |
| Metropolitan Washington DC Arpts. Auth. Sys. Rev.: | | | |
| Series 2011 C, 5% 10/1/22 (c) | | 20,000 | 21,555 |
| Series 2017 A, 5% 10/1/22 (c) | | 215,000 | 238,579 |
| Series 2019 A: | | | |
| 5% 10/1/21 (b)(c) | | 10,000 | 10,772 |
| 5% 10/1/22 (b)(c) | | 5,000 | 5,548 |
|
| TOTAL DISTRICT OF COLUMBIA | | | 276,454 |
|
| Florida - 6.8% | | | |
| Broward County Port Facilities Rev. Series 2009 A, 5% 9/1/20 | | 150,000 | 150,885 |
| Florida Mid-Bay Bridge Auth. Rev. Series 2015 A, 5% 10/1/22 | | 180,000 | 197,995 |
| Greater Orlando Aviation Auth. Arpt. Facilities Rev. Series 2011 C, 5% 10/1/19 | | 200,000 | 201,805 |
| Jacksonville Elec. Auth. Elec. Sys. Rev.: | | | |
| Series 2012 A, 5% 10/1/20 | | 200,000 | 208,182 |
| Series 2013 A: | | | |
| 3.5% 10/1/19 | | 200,000 | 200,899 |
| 5% 10/1/20 | | 200,000 | 208,182 |
| Series 2013 C, 5% 10/1/19 | | 225,000 | 226,833 |
| Series 2013 D, 5% 10/1/21 | | 200,000 | 214,676 |
| Series 2014 A, 5% 10/1/19 | | 375,000 | 378,055 |
| Jea Bulk Pwr. Supply Sys. Rev. Series 2014 A, 3.5% 10/1/19 | | 400,000 | 402,047 |
| Miami-Dade County Indl. Dev. Auth. Solid Waste Disp. Rev. Bonds (Waste Mgmt. of Florida Proj.) Series 2018, 2.85%, tender 8/2/21 (a)(c) | | 150,000 | 153,144 |
| Orange County Health Facilities Auth.: | | | |
| Series 2009, 5.25% 10/1/19 | | 240,000 | 242,326 |
| Series B, 5% 10/1/22 (b) | | 100,000 | 111,058 |
| Pasco County School District Sales Tax Rev. Series 2013, 5% 10/1/19 | | 135,000 | 136,202 |
|
| TOTAL FLORIDA | | | 3,032,289 |
|
| Georgia - 3.4% | | | |
| Georgia Muni. Elec. Auth. Pwr. Rev.: | | | |
| (Combined Cycle Proj.) Series 2012 A, 5% 11/1/20 | | 75,000 | 78,494 |
| (Gen. Resolution Proj.) Series 2008 A, 5.25% 1/1/21 | | 225,000 | 237,344 |
| (Gen. Resolution Projs.) Series 2009 B, 5% 1/1/20 | | 290,000 | 294,965 |
| (Proj. One) Series 2008 A, 5.25% 1/1/20 | | 75,000 | 76,377 |
| Series 2009 B, 5% 1/1/20 | | 320,000 | 325,527 |
| Series 2011 A, 5% 1/1/21 | | 220,000 | 231,257 |
| Series 2016 A, 5% 1/1/20 | | 160,000 | 162,740 |
| Monroe County Dev. Auth. Poll. Cont. Rev. Bonds (Gulf Pwr. Co. Plant Scherer Proj.) Series 2002 1, 2%, tender 6/25/20 (a) | | 100,000 | 100,329 |
|
| TOTAL GEORGIA | | | 1,507,033 |
|
| Illinois - 14.5% | | | |
| Chicago Metropolitan Wtr. Reclamation District of Greater Chicago: | | | |
| Series 2011 B, 5% 12/1/19 | | 165,000 | 167,406 |
| Series 2014 D, 5% 12/1/19 | | 50,000 | 50,729 |
| Chicago O'Hare Int'l. Arpt. Rev.: | | | |
| Series 2012 A, 5% 1/1/20 (c) | | 220,000 | 223,822 |
| Series 2012 B, 4% 1/1/20 (c) | | 135,000 | 136,679 |
| Series 2013 D, 5% 1/1/22 | | 215,000 | 233,757 |
| Chicago Park District Gen. Oblig.: | | | |
| Series 2013, 5% 1/1/20 | | 615,000 | 624,544 |
| Series 2018 E, 5% 11/15/19 | | 170,000 | 172,129 |
| Cook County Gen. Oblig.: | | | |
| Series 2009 C, 5% 11/15/21 | | 200,000 | 202,474 |
| Series 2009 D, 5% 11/15/19 | | 205,000 | 207,613 |
| Series 2011 A, 5% 11/15/19 | | 475,000 | 481,055 |
| Series 2012 C, 5% 11/15/21 | | 150,000 | 161,154 |
| Illinois Edl. Facilities Auth. Rev. Bonds (Univ. of Chicago Proj.) Series B2, 1.55%, tender 2/13/20 (a) | | 250,000 | 249,999 |
| Illinois Fin. Auth. Rev.: | | | |
| Bonds (Advocate Health Care Network Proj.) Series 2008 A2, 5%, tender 2/12/20 (a) | | 345,000 | 352,398 |
| Series 2009, 5% 8/15/20 | | 100,000 | 103,903 |
| Series 2011 IL, 4% 12/1/20 | | 150,000 | 155,483 |
| Series 2012 C, 5% 8/15/21 | | 100,000 | 107,236 |
| Series 2015 A, 5% 11/15/20 | | 110,000 | 115,381 |
| Illinois Gen. Oblig.: | | | |
| Series 2010, 5% 1/1/21 (FSA Insured) | | 165,000 | 167,792 |
| Series 2017 B, 5% 11/1/19 | | 250,000 | 252,700 |
| Series 2018 B, 5% 10/1/20 | | 240,000 | 249,727 |
| Illinois Muni. Elec. Agcy. Pwr. Supply Series 2015 A, 5% 2/1/21 | | 170,000 | 179,039 |
| Illinois Reg'l. Trans. Auth. Series 2016 A, 5% 6/1/21 | | 200,000 | 213,352 |
| Illinois Toll Hwy. Auth. Toll Hwy. Rev. Series 2014 A: | | | |
| 5% 12/1/20 | | 100,000 | 104,964 |
| 5% 12/1/22 | | 275,000 | 307,109 |
| Railsplitter Tobacco Settlement Auth. Rev.: | | | |
| Series 2010: | | | |
| 5.25% 6/1/20 | | 200,000 | 206,520 |
| 5.375% 6/1/21 | | 375,000 | 401,093 |
| Series 2017: | | | |
| 5% 6/1/22 | | 135,000 | 147,667 |
| 5% 6/1/23 | | 240,000 | 269,429 |
| Univ. of Illinois Rev. Series 1991, 0% 4/1/21 | | 230,000 | 222,355 |
|
| TOTAL ILLINOIS | | | 6,467,509 |
|
| Indiana - 1.7% | | | |
| Indiana Fin. Auth. Hosp. Rev. Bonds: | | | |
| Series 2011 H, 1.65%, tender 7/1/22 (a)(b) | | 145,000 | 145,242 |
| Series 2011 L: | | | |
| SIFMA Municipal Swap Index + 0.280% 2.45%, tender 5/4/21 (a)(b)(d) | | 100,000 | 100,028 |
| 2.45%, tender 5/4/21 (a)(b) | | 100,000 | 100,028 |
| Series 2015 B, 1.65%, tender 7/2/22 (a)(b) | | 50,000 | 50,084 |
| Indiana Fin. Auth. Rev. (Butler Univ. Proj.) Series 2019, 3% 2/1/21 (b) | | 140,000 | 143,296 |
| Indianapolis Local Pub. Impt. (Indianapolis Arpt. Auth. Proj.) Series 2015 I, 5% 1/1/23 (c) | | 205,000 | 227,415 |
|
| TOTAL INDIANA | | | 766,093 |
|
| Iowa - 0.3% | | | |
| Iowa Fin. Auth. Health Facilities Rev. Series 2016, 5% 8/15/19 | | 115,000 | 115,462 |
| Kansas - 0.5% | | | |
| Kansas Dev. Fin. Agcy. Series 2009, 5.5% 11/15/22 | | 200,000 | 203,060 |
| Kentucky - 3.3% | | | |
| Kentucky State Property & Buildings Commission Rev.: | | | |
| (Kentucky St Proj.) Series 2010, 5% 8/1/20 | | 650,000 | 675,214 |
| (Proj. No. 83) Series 2004, 5% 10/1/19 (AMBAC Insured) | | 200,000 | 201,800 |
| Series 2015, 5% 8/1/19 | | 225,000 | 225,659 |
| Kentucky, Inc. Pub. Energy Series 2018 B, 4% 7/1/21 | | 100,000 | 104,406 |
| Trimble County Poll. Cont. Rev. Bonds (Louisville Gas and Elec. Co. Proj.) Series 2001 B, 2.55%, tender 5/3/21 (a) | | 250,000 | 254,688 |
|
| TOTAL KENTUCKY | | | 1,461,767 |
|
| Massachusetts - 0.2% | | | |
| Massachusetts Edl. Fing. Auth. Rev. Series 2010 A, 5.5% 1/1/22 | | 100,000 | 102,079 |
| Michigan - 6.3% | | | |
| Detroit Downtown Dev. Auth. Tax Series 1, 5% 7/1/19 (FSA Insured) | | 130,000 | 130,000 |
| Grand Traverse County Hosp. Fin. Auth. Series 2011 A, 5% 7/1/20 | | 115,000 | 118,946 |
| Michigan Fin. Auth. Rev.: | | | |
| (Henry Ford Health Sys. Proj.) Series 2016, 5% 11/15/20 | | 200,000 | 209,088 |
| Bonds Series 2016 MI2, SIFMA Municipal Swap Index + 0.480% 2.38%, tender 2/1/22 (a)(d) | | 200,000 | 200,298 |
| Series 2010 A, 5% 12/1/19 | | 160,000 | 162,380 |
| Series 2015 A: | | | |
| 4% 8/1/19 | | 900,000 | 901,792 |
| 5% 5/15/20 | | 125,000 | 128,851 |
| 5% 8/1/22 | | 125,000 | 138,281 |
| Michigan Hosp. Fin. Auth. Rev. Bonds (Ascension Health Cr. Group Proj.) Series F5, 1.9%, tender 4/1/21 (a) | | 180,000 | 181,204 |
| Milan Area Schools Series 2019, 5% 5/1/21 | | 170,000 | 181,084 |
| Wayne County Arpt. Auth. Rev.: | | | |
| (Detroit Metropolitan Wayne County Arpt.) Series 2015 G, 5% 12/1/19 | | 200,000 | 203,025 |
| Series 2011 A, 5% 12/1/19 (c) | | 260,000 | 263,682 |
|
| TOTAL MICHIGAN | | | 2,818,631 |
|
| Nevada - 0.9% | | | |
| Clark County Arpt. Rev.: | | | |
| (Sub Lien Proj.) Series 2017 A-1, 5% 7/1/20 (c) | | 200,000 | 206,620 |
| Series 2017 C, 5% 7/1/21 (c) | | 200,000 | 213,804 |
|
| TOTAL NEVADA | | | 420,424 |
|
| New Jersey - 9.0% | | | |
| New Jersey Econ. Dev. Auth. Rev.: | | | |
| Series 2013, 5% 3/1/20 | | 10,000 | 10,214 |
| Series 2015 XX, 5% 6/15/20 | | 245,000 | 252,512 |
| New Jersey Edl. Facilities Auth. Rev. Series 2012 A, 5% 7/1/19 | | 50,000 | 50,000 |
| New Jersey Edl. Facility Series 2015 G, 4% 7/1/20 | | 175,000 | 179,508 |
| New Jersey Health Care Facilities Fing. Auth. Rev. Series 2016 A, 4% 7/1/19 | | 200,000 | 200,000 |
| New Jersey Higher Ed. Student Assistance Auth. Student Ln. Rev.: | | | |
| Series 2011 1, 5% 12/1/20 (c) | | 135,000 | 141,191 |
| Series 2012 1A, 4% 12/1/19 (c) | | 210,000 | 212,006 |
| Series 2013, 4% 12/1/20 (c) | | 40,000 | 41,278 |
| Series 2015 1A, 5% 12/1/21 (c) | | 600,000 | 645,732 |
| Series 2018 B, 5% 12/1/20 (c) | | 100,000 | 104,586 |
| Series 2019 A, 5% 12/1/22 | | 15,000 | 16,751 |
| New Jersey Hsg. & Mtg. Fin. Agcy. Rev. Series 2019 D, 4% 10/1/22 (c) | | 100,000 | 106,013 |
| New Jersey Tobacco Settlement Fing. Corp. Series 2018 A: | | | |
| 5% 6/1/21 | | 100,000 | 106,063 |
| 5% 6/1/23 | | 175,000 | 195,375 |
| New Jersey Trans. Trust Fund Auth.: | | | |
| Series 2003 B. 5.25% 12/15/19 | | 90,000 | 91,492 |
| Series 2014 AA, 5% 6/15/20 | | 200,000 | 206,171 |
| Series 2016 A, 5% 6/15/20 | | 180,000 | 185,710 |
| Series 2018 A: | | | |
| 5% 6/15/21 | | 175,000 | 185,906 |
| 5% 6/15/22 | | 210,000 | 229,513 |
| New Jersey Transit Corp. Ctfs. of Prtn. Series 2014 A: | | | |
| 5% 9/15/20 | | 250,000 | 260,020 |
| 5% 9/15/21 | | 570,000 | 610,128 |
|
| TOTAL NEW JERSEY | | | 4,030,169 |
|
| New York - 1.1% | | | |
| New York Metropolitan Trans. Auth. Rev.: | | | |
| Series 2018 A, 4% 8/15/19 | | 300,000 | 300,869 |
| Series 2018 C, 5% 9/1/20 | | 175,000 | 182,163 |
|
| TOTAL NEW YORK | | | 483,032 |
|
| Ohio - 0.2% | | | |
| Franklin County Hosp. Facilities Rev. Bonds (Ohio Health Corp.) Series 2018 B, SIFMA Municipal Swap Index + 0.430% 2.33%, tender 11/15/21 (a)(d) | | 100,000 | 100,261 |
| Pennsylvania - 4.0% | | | |
| Allegheny County Arpt. Auth. Rev. Series 2001, 5% 1/1/21 (Nat'l. Pub. Fin. Guarantee Corp. Insured) (c) | | 100,000 | 105,117 |
| Dauphin County Gen. Auth. (Pinnacle Health Sys. Proj.) Series 2016 A, 5% 6/1/20 | | 100,000 | 103,099 |
| Lehigh County Indl. Dev. Auth. Poll. Cont. Rev. Bonds (PPL Elec. Utils. Corp. Proj.) Series 2016 A, 1.8%, tender 9/1/22 (a) | | 30,000 | 30,025 |
| Pennsylvania Gen. Oblig.: | | | |
| Series 2011, 5% 11/15/20 | | 60,000 | 63,019 |
| Series 2016, 5% 1/15/22 | | 225,000 | 245,750 |
| Pennsylvania Higher Edl. Facilities Auth. Rev.: | | | |
| (Thomas Jefferson Univ. Proj.) Series 2012, 5% 3/1/20 | | 50,000 | 51,157 |
| First Series 2012, 5% 4/1/21 | | 125,000 | 132,873 |
| Pennsylvania Tpk. Commission Tpk. Rev.: | | | |
| Series 2018 A1: | | | |
| SIFMA Municipal Swap Index + 0.350% 2.25% 12/1/20 (a)(d) | | 100,000 | 99,947 |
| SIFMA Municipal Swap Index + 0.430% 2.33% 12/1/21 (a)(d) | | 200,000 | 200,060 |
| Series 2018 B, SIFMA Municipal Swap Index + 0.500% 2.4% 12/1/21 (a)(d) | | 130,000 | 130,156 |
| Pittsburgh Wtr. & Swr. Auth. Wtr. & Swr. Sys. Rev. Series 2019 A, 5% 9/1/22 (b) | | 300,000 | 332,889 |
| Univ. of Pittsburgh Commonwealth Sys. of Higher Ed. Series 2018, SIFMA Municipal Swap Index + 0.240% 2.14% 9/15/21 (a)(d) | | 300,000 | 299,475 |
|
| TOTAL PENNSYLVANIA | | | 1,793,567 |
|
| Rhode Island - 0.5% | | | |
| Rhode Island Health and Edl. Bldg. Corp. Higher Ed. Facility Rev. Series 2015, 5% 11/1/21 | | 200,000 | 216,068 |
| South Carolina - 0.6% | | | |
| South Carolina Pub. Svc. Auth. Rev. Series 2012, 5% 12/1/19 | | 275,000 | 278,756 |
| Tennessee - 0.2% | | | |
| Jackson Hosp. Rev. Series 2018 A, 5% 4/1/20 | | 100,000 | 102,490 |
| Texas - 1.6% | | | |
| Bridgeport Independent School District Series 2010, 4% 8/15/20 | | 340,000 | 341,108 |
| Lower Colorado River Auth. Rev. Series 2012 B, 5% 5/15/21 | | 245,000 | 261,496 |
| North Central Texas Health Facilities Dev. Corp. (Children's Med. Ctr. of Dallas Proj.) Series 2012, 5% 8/15/20 | | 100,000 | 103,960 |
|
| TOTAL TEXAS | | | 706,564 |
|
| Virginia - 0.7% | | | |
| Louisa Indl. Dev. Auth. Poll. Cont. Rev. Bonds Series 2008 B, 2.15%, tender 9/1/20 (a) | | 250,000 | 251,780 |
| Wise County Indl. Dev. Auth. Waste & Sewage Rev. Bonds: | | | |
| (Virginia Elec. and Pwr. Co. Proj.) Series 2010 A, 1.875%, tender 6/1/20 (a) | | 25,000 | 25,078 |
| Series 2009 A, 2.15%, tender 9/1/20 (a) | | 50,000 | 50,356 |
|
| TOTAL VIRGINIA | | | 327,214 |
|
| Washington - 0.4% | | | |
| Port of Seattle Rev.: | | | |
| Series 2010 C, 5% 2/1/20 (c) | | 45,000 | 45,936 |
| Series C, 5% 2/1/21 (c) | | 105,000 | 110,904 |
|
| TOTAL WASHINGTON | | | 156,840 |
|
| West Virginia - 0.9% | | | |
| Harrison County Commission Solid Waste Disp. Rev. Bonds (Monongahela Pwr. Co. Proj.) Series 2018 A, 3%, tender 10/15/21 (a)(c) | | 300,000 | 301,377 |
| Mason Co. Poll. Cont. Rev. (Appalachian Pwr. Co. Proj.) Series 2003 L, 2.75% 10/1/22 | | 100,000 | 102,282 |
|
| TOTAL WEST VIRGINIA | | | 403,659 |
|
| Wisconsin - 2.0% | | | |
| Wisconsin Health & Edl. Facilities: | | | |
| Bonds: | | | |
| Series 2018 B, 5%, tender 1/26/22 (a) | | 100,000 | 108,932 |
| Series 2018 C, SIFMA Municipal Swap Index + 0.450% 2.35%, tender 7/27/22 (a)(d) | | 155,000 | 154,750 |
| Series 2017 A, 5% 4/1/20 | | 150,000 | 153,917 |
| Wisconsin Health & Edl. Facilities Auth. (Unitypoint Health Proj.) Series 2014 A, 5% 12/1/19 | | 200,000 | 202,790 |
| Wisconsin Health & Edl. Facilities Auth. Rev. Series 2009 A, 5.5% 12/15/20 | | 250,000 | 254,595 |
|
| TOTAL WISCONSIN | | | 874,984 |
|
| TOTAL MUNICIPAL BONDS | | | |
| (Cost $30,189,235) | | | 30,347,858 |
|
| Municipal Notes - 30.2% | | | |
| Alabama - 0.4% | | | |
| Birmingham Indl. Dev. Board Solid Waste Rev. (American Cast Iron Pipe Co. Proj.) Series 2000, 2.1% 7/5/19, LOC Bank of America NA, VRDN (a)(c) | | 180,000 | $180,000 |
| California - 0.7% | | | |
| California Health Facilities Fing. Auth. Rev. Participating VRDN Series Floaters XG 00 48, 2% 7/5/19 (Liquidity Facility Deutsche Bank AG New York Branch) (a)(e)(f) | | 100,000 | 100,000 |
| El Centro Reg'l. Med. Cen Participating VRDN Series Floaters XF 10 72, 2.15% 7/5/19 (Liquidity Facility Deutsche Bank AG New York Branch) (a)(e)(f) | | 200,000 | 200,000 |
|
| TOTAL CALIFORNIA | | | 300,000 |
|
| Colorado - 3.1% | | | |
| Colorado Hsg. & Fin. Auth. Econ. Dev. (Pacific Instruments Proj.) Series 2000, 2.1% 7/5/19, LOC Wells Fargo Bank NA, VRDN (a)(c) | | 165,000 | 165,000 |
| Denver City & County Arpt. Rev. Participating VRDN: | | | |
| Series DBE 8027, 2.15% 7/5/19 (Liquidity Facility Deutsche Bank AG New York Branch) (a)(c)(e)(f) | | 100,000 | 100,000 |
| Series Floaters XL 00 90, 2.15% 7/5/19 (Liquidity Facility Morgan Stanley Bank, West Valley City Utah) (a)(c)(e)(f) | | 1,100,000 | 1,100,000 |
|
| TOTAL COLORADO | | | 1,365,000 |
|
| Connecticut - 0.2% | | | |
| New Britain Gen. Oblig. BAN Series 2018, 5% 12/19/19 | | 100,000 | 101,588 |
| District Of Columbia - 0.4% | | | |
| District of Columbia Rev. Participating VRDN Series Floaters XF 10 78, 2.3% 7/5/19 (Liquidity Facility Deutsche Bank AG New York Branch) (a)(e)(f) | | 185,000 | 185,000 |
| Florida - 2.3% | | | |
| Aqua One Cmnty. Dev. District Fla Participating VRDN Series Floaters XF 10 76, 2.25% 7/5/19 (Liquidity Facility Deutsche Bank AG New York Branch) (a)(e)(f) | | 200,000 | 200,000 |
| Avenir Cmnty. Dev. District Participating VRDN Series Floaters XF 10 74, 2.25% 7/5/19 (Liquidity Facility Deutsche Bank AG New York Branch) (a)(e)(f) | | 120,000 | 120,000 |
| Broward County Arpt. Sys. Rev. Participating VRDN Series Floaters XL 00 88, 2.25% 7/5/19 (Liquidity Facility Citibank NA) (a)(c)(e)(f) | | 200,000 | 200,000 |
| Lee Memorial Health Sys. Hosp. Rev. Series 2019 B, 2.14% 7/4/22, VRDN (a) | | 200,000 | 200,000 |
| Pinellas County Health Facilities Auth. Rev. (Suncoast Hospice Proj.) Series 2004, 2% 7/5/19, LOC Wells Fargo Bank NA, VRDN (a) | | 325,000 | 325,000 |
|
| TOTAL FLORIDA | | | 1,045,000 |
|
| Illinois - 0.9% | | | |
| Illinois Gen. Oblig. Participating VRDN Series Floaters XM 01 86, 2.15% 7/5/19 (Liquidity Facility Deutsche Bank AG New York Branch) (a)(e)(f) | | 400,000 | 400,000 |
| Kentucky - 0.3% | | | |
| Glasgow Indl. Bldg. Rev. (Felker Brothers Corp. Proj.) 2.27% 7/3/19, LOC JPMorgan Chase Bank, VRDN (a)(c) | | 140,000 | 140,000 |
| Louisiana - 2.0% | | | |
| Saint James Parish Gen. Oblig. (Nucor Steel Louisiana LLC Proj.): | | | |
| Series 2010 A1, 2.09% 7/5/19, VRDN (a) | | 400,000 | 400,000 |
| Series 2010 B1, 2.05% 7/5/19, VRDN (a) | | 500,000 | 500,000 |
|
| TOTAL LOUISIANA | | | 900,000 |
|
| Massachusetts - 0.9% | | | |
| Massachusetts Edl. Fing. Auth. Rev. Participating VRDN Series Floaters XF 23 06, 2.15% 7/5/19 (Liquidity Facility Morgan Stanley Bank, West Valley City Utah) (a)(c)(e)(f) | | 180,000 | 180,000 |
| Nahant BAN Series 2019 B, 2.5% 7/9/20 (b) | | 100,000 | 100,990 |
| Truro Massachusetts BAN Series 2019, 2.5% 6/19/20 | | 100,000 | 100,946 |
|
| TOTAL MASSACHUSETTS | | | 381,936 |
|
| Minnesota - 0.5% | | | |
| Shakopee Minn Sr Hsg. Rev. Participating VRDN Series Floaters 001, 2.2% 8/9/19 (Liquidity Facility Barclays Bank PLC) (a)(e)(f)(g) | | 200,000 | 200,000 |
| Mississippi - 0.5% | | | |
| Mississippi Bus. Fin. Corp. Solid Waste Disp. Rev. (Gulf Pwr. Co. Proj.) Series 2012, 1.98% 7/1/19, VRDN (a)(c) | | 200,000 | 200,000 |
| Missouri - 0.4% | | | |
| Kansas City Indl. Dev. Auth. Multi-family Hsg. Rev. Participating VRDN Series Floaters XF 10 84, 2.3% 7/5/19 (Liquidity Facility Deutsche Bank AG New York Branch) (a)(e)(f) | | 100,000 | 100,000 |
| St Louis Pkg Commn Fin. Corp. (Var-Cupples Garage Proj.) Series A, 2.06% 7/5/19, LOC Bank of America NA, VRDN (a) | | 100,000 | 100,000 |
|
| TOTAL MISSOURI | | | 200,000 |
|
| Nebraska - 0.4% | | | |
| Stanton County Indl. Dev. Rev. (Nucor Corp. Proj.) Series 1996, 2.13% 7/5/19, VRDN (a)(c) | | 200,000 | 200,000 |
| Nevada - 2.2% | | | |
| Clark County Arpt. Rev. Participating VRDN Series ROC II R 11823, 2.1% 7/5/19 (Liquidity Facility Citibank NA) (a)(e)(f) | | 1,000,000 | 1,000,000 |
| New Jersey - 2.3% | | | |
| Borough of Riverdale BAN Series 2018, 3% 9/13/19 | | 100,000 | 100,268 |
| Chester Township Gen. Oblig. BAN Series 2018, 3% 10/11/19 | | 100,000 | 100,401 |
| Delran Township BAN Series 2018, 3% 10/25/19 | | 200,000 | 200,864 |
| East Brunswick Township Gen. Oblig. BAN Series 2019, 3.5% 1/10/20 | | 100,000 | 101,110 |
| Flemington BAN 3.5% 1/15/20 | | 100,000 | 101,010 |
| Millstone Township Gen. Oblig. BAN Series 2018, 3% 9/10/19 | | 100,000 | 100,261 |
| Roselle County of Union BAN Series 2018, 3.5% 12/6/19 | | 100,000 | 100,858 |
| Vineland Gen. Oblig. BAN Series 2018, 3.5% 11/14/19 | | 200,000 | 201,427 |
|
| TOTAL NEW JERSEY | | | 1,006,199 |
|
| New York - 4.6% | | | |
| Geneva Hsg. Auth. Rev. Series 2000, 2.4% 7/5/19, VRDN (a)(c) | | 100,000 | 100,000 |
| Gloversville School District BAN Series 2018, 3% 10/18/19 | | 500,000 | 501,982 |
| New York Metropolitan Trans. Auth. Rev. BAN Series 2018 B, 5% 5/15/21 | | 615,000 | 654,938 |
| Penn Yan NY Central School District BAN Series 2018, 3% 7/19/19 | | 200,000 | 200,112 |
| Queensbury Union Free School District BAN Series 2018, 3% 7/12/19 | | 200,000 | 200,064 |
| Sidney Cent School District BAN Series 2018, 3% 7/10/19 | | 100,000 | 100,027 |
| Troy Rensselaer County BAN Series B, 3% 8/2/19 | | 300,000 | 300,343 |
|
| TOTAL NEW YORK | | | 2,057,466 |
|
| Ohio - 0.7% | | | |
| East Clinton Local School District BAN Series 2019, 2.8% 12/3/19 | | 100,000 | 100,502 |
| Englewood BAN Series 2019, 3% 1/22/20 | | 100,000 | 100,691 |
| Forest Park Gen. Oblig. BAN Series 2019, 2.5% 5/27/20 | | 100,000 | 100,769 |
|
| TOTAL OHIO | | | 301,962 |
|
| Pennsylvania - 1.4% | | | |
| Montgomery County Higher Ed. & Health Auth. Rev. Series 2018 D, 2.13% 7/4/22, VRDN (a) | | 160,000 | 160,000 |
| Pennsylvania Econ. Dev. Participating VRDN Series XM 0048, 2% 7/5/19 (Liquidity Facility Deutsche Bank AG New York Branch) (a)(e)(f) | | 200,000 | 200,000 |
| Pennsylvania Higher Edl. Facilities Auth. Rev. Series 2015 B, 2.13% 7/4/22, VRDN (a) | | 150,000 | 150,000 |
| Philadelphia Auth. For Indl. Series 2017 B, 2.13% 7/4/22, VRDN (a) | | 100,000 | 100,000 |
|
| TOTAL PENNSYLVANIA | | | 610,000 |
|
| South Carolina - 0.7% | | | |
| South Carolina Jobs-Econ. Dev. Auth. Series 2018 C, 2.12% 7/4/22, VRDN (a) | | 300,000 | 300,000 |
| Texas - 3.8% | | | |
| Mission Econ. Dev. Corp. Idr (CMI Proj.) Series 2007, 2.05% 7/5/19, LOC Wells Fargo Bank NA, VRDN (a)(c) | | 320,000 | 320,000 |
| North Texas Tollway Auth. Rev. Participating VRDN Series XM0085, 2.1% 7/5/19 (Liquidity Facility Barclays Bank PLC) (a)(e)(f) | | 100,000 | 100,000 |
| Port Arthur Navigation District Envir. Facilities Rev. (Motiva Enterprises LLC Proj.): | | | |
| Series 2001 A, 2.07% 7/1/19, VRDN (a) | | 165,000 | 165,000 |
| Series 2004, 2.12% 7/5/19, VRDN (a)(c) | | 1,000,000 | 1,000,000 |
| Series 2010 C, 2.06% 7/1/19, VRDN (a) | | 100,000 | 100,000 |
|
| TOTAL TEXAS | | | 1,685,000 |
|
| Virginia - 1.1% | | | |
| Henrico County Econ. Dev. Auth. Indl. Dev. Rev. Series 2001, 2.1% 7/5/19, LOC Wells Fargo Bank NA, VRDN (a)(c) | | 355,000 | 355,000 |
| Prince William County Indl. Dev. Auth. Sewage Disp. Facilities Rev. (Dale Svc. Corp. Proj.) Series 2001, 1.95% 7/5/19, LOC Wells Fargo Bank NA, VRDN (a)(c) | | 150,000 | 150,000 |
|
| TOTAL VIRGINIA | | | 505,000 |
|
| Washington - 0.2% | | | |
| Washington Econ. Dev. Fin. Auth. Rev. Participating VRDN Series Floaters 005, 2.25% 8/9/19 (Liquidity Facility Barclays Bank PLC) (a)(c)(e)(f)(g) | | 100,000 | 100,000 |
| Wisconsin - 0.2% | | | |
| Deforest Area School District BAN Series 2019, 3% 12/18/19 | | 100,000 | 100,177 |
| TOTAL MUNICIPAL NOTES | | | |
| (Cost $13,454,923) | | | 13,464,328 |
| | | Shares | Value |
|
| Money Market Funds - 3.3% | | | |
| Fidelity Municipal Cash Central Fund 2.00% (h)(i) | | | |
| (Cost $1,466,995) | | 1,466,853 | 1,466,999 |
| TOTAL INVESTMENT IN SECURITIES - 101.5% | | | |
| (Cost $45,111,153) | | | 45,279,185 |
| NET OTHER ASSETS (LIABILITIES) - (1.5)% | | | (682,211) |
| NET ASSETS - 100% | | | $44,596,974 |
Security Type Abbreviations
BAN – BOND ANTICIPATION NOTE
VRDN – VARIABLE RATE DEMAND NOTE (A debt instrument that is payable upon demand, either daily, weekly or monthly)
Legend
(a) Coupon rates for floating and adjustable rate securities reflect the rates in effect at period end.
(b) Security or a portion of the security purchased on a delayed delivery or when-issued basis.
(c) Private activity obligations whose interest is subject to the federal alternative minimum tax for individuals.
(d) Coupon is indexed to a floating interest rate which may be multiplied by a specified factor and/or subject to caps or floors.
(e) Provides evidence of ownership in one or more underlying municipal bonds.
(f) Coupon rates are determined by re-marketing agents based on current market conditions.
(g) Restricted securities - Investment in securities not registered under the Securities Act of 1933 (excluding 144A issues). At the end of the period, the value of restricted securities (excluding 144A issues) amounted to $300,000 or 0.7% of net assets.
(h) Information in this report regarding holdings by state and security types does not reflect the holdings of the Fidelity Municipal Cash Central Fund.
(i) Affiliated fund that is available only to investment companies and other accounts managed by Fidelity Investments. The rate quoted is the annualized seven-day yield of the fund at period end. A complete unaudited listing of the fund's holdings as of its most recent quarter end is available upon request. In addition, each Fidelity Central Fund's financial statements are available on the SEC's website or upon request.
Additional information on each restricted holding is as follows:
| Security | Acquisition Date | Acquisition Cost |
| Shakopee Minn Sr Hsg. Rev. Participating VRDN Series Floaters 001, 2.2% 8/9/19 (Liquidity Facility Barclays Bank PLC) | 1/10/19 | $200,000 |
| Washington Econ. Dev. Fin. Auth. Rev. Participating VRDN Series Floaters 005, 2.25% 8/9/19 (Liquidity Facility Barclays Bank PLC) | 1/18/19 | $100,000 |
Affiliated Central Funds
Information regarding fiscal year to date income earned by the Fund from investments in Fidelity Central Funds is as follows:
| Fund | Income earned |
| Fidelity Municipal Cash Central Fund | $14,730 |
| Total | $14,730 |
Amounts in the income column in the above table include any capital gain distributions from underlying funds, which are presented in the corresponding line-item in the Statement of Operations, if applicable.
Investment Valuation
The following is a summary of the inputs used, as of June 30, 2019, involving the Fund's assets and liabilities carried at fair value. The inputs or methodology used for valuing securities may not be an indication of the risk associated with investing in those securities. For more information on valuation inputs, and their aggregation into the levels used below, please refer to the Investment Valuation section in the accompanying Notes to Financial Statements.
| | Valuation Inputs at Reporting Date: |
| Description | Total | Level 1 | Level 2 | Level 3 |
| Investments in Securities: | | | | |
| Municipal Securities | $43,812,186 | $-- | $43,812,186 | $-- |
| Money Market Funds | 1,466,999 | 1,466,999 | -- | -- |
| Total Investments in Securities: | $45,279,185 | $1,466,999 | $43,812,186 | $-- |
Other Information
The distribution of municipal securities by revenue source, as a percentage of total Net Assets, is as follows (Unaudited):
| General Obligations | 21.1% |
| Health Care | 16.6% |
| Transportation | 14.7% |
| Electric Utilities | 13.4% |
| Synthetics | 10.1% |
| Industrial Development | 7.9% |
| Education | 6.2% |
| Others* (Individually Less Than 5%) | 10.0% |
| | 100.0% |
* Includes net other assets
See accompanying notes which are an integral part of the financial statements.
Financial Statements
Statement of Assets and Liabilities
| | | June 30, 2019 (Unaudited) |
| Assets | | |
Investment in securities, at value — See accompanying schedule:
Unaffiliated issuers (cost $43,644,158) | $43,812,186 | |
| Fidelity Central Funds (cost $1,466,995) | 1,466,999 | |
| Total Investment in Securities (cost $45,111,153) | | $45,279,185 |
| Receivable for investments sold | | 532,000 |
| Receivable for fund shares sold | | 353,971 |
| Interest receivable | | 407,345 |
| Distributions receivable from Fidelity Central Funds | | 1,141 |
| Other receivables | | 10 |
| Total assets | | 46,573,652 |
| Liabilities | | |
| Payable to custodian bank | $401,266 | |
| Payable for investments purchased | | |
| Regular delivery | 291,830 | |
| Delayed delivery | 1,197,940 | |
| Payable for fund shares redeemed | 29,835 | |
| Distributions payable | 55,807 | |
| Total liabilities | | 1,976,678 |
| Net Assets | | $44,596,974 |
| Net Assets consist of: | | |
| Paid in capital | | $44,425,337 |
| Total distributable earnings (loss) | | 171,637 |
| Net Assets, for 4,450,251 shares outstanding | | $44,596,974 |
| Net Asset Value, offering price and redemption price per share ($44,596,974 ÷ 4,450,251 shares) | | $10.02 |
See accompanying notes which are an integral part of the financial statements.
Statement of Operations
| | | Six months ended June 30, 2019 (Unaudited) |
| Investment Income | | |
| Interest | | $398,882 |
| Income from Fidelity Central Funds | | 14,730 |
| Total income | | 413,612 |
| Expenses | | |
| Independent trustees' fees and expenses | $72 | |
| Commitment fees | 54 | |
| Total expenses before reductions | 126 | |
| Expense reductions | (10) | |
| Total expenses after reductions | | 116 |
| Net investment income (loss) | | 413,496 |
| Realized and Unrealized Gain (Loss) | | |
| Net realized gain (loss) on: | | |
| Investment securities: | | |
| Unaffiliated issuers | 3,152 | |
| Total net realized gain (loss) | | 3,152 |
| Change in net unrealized appreciation (depreciation) on: | | |
| Investment securities: | | |
| Unaffiliated issuers | 153,654 | |
| Fidelity Central Funds | 4 | |
| Total change in net unrealized appreciation (depreciation) | | 153,658 |
| Net gain (loss) | | 156,810 |
| Net increase (decrease) in net assets resulting from operations | | $570,306 |
See accompanying notes which are an integral part of the financial statements.
Statement of Changes in Net Assets
| | Six months ended June 30, 2019 (Unaudited) | Year ended December 31, 2018 |
| Increase (Decrease) in Net Assets | | |
| Operations | | |
| Net investment income (loss) | $413,496 | $498,546 |
| Net realized gain (loss) | 3,152 | 1,219 |
| Change in net unrealized appreciation (depreciation) | 153,658 | 31,816 |
| Net increase (decrease) in net assets resulting from operations | 570,306 | 531,581 |
| Distributions to shareholders | (413,256) | (502,074) |
| Share transactions | | |
| Proceeds from sales of shares | 15,658,495 | 37,244,080 |
| Reinvestment of distributions | 104,921 | 176,879 |
| Cost of shares redeemed | (8,110,730) | (10,683,799) |
| Net increase (decrease) in net assets resulting from share transactions | 7,652,686 | 26,737,160 |
| Total increase (decrease) in net assets | 7,809,736 | 26,766,667 |
| Net Assets | | |
| Beginning of period | 36,787,238 | 10,020,571 |
| End of period | $44,596,974 | $36,787,238 |
| Other Information | | |
| Shares | | |
| Sold | 1,565,400 | 3,734,777 |
| Issued in reinvestment of distributions | 10,487 | 17,730 |
| Redeemed | (810,842) | (1,071,115) |
| Net increase (decrease) | 765,045 | 2,681,392 |
See accompanying notes which are an integral part of the financial statements.
Financial Highlights
Fidelity Flex Conservative Income Municipal Bond Fund
| | Six months ended (Unaudited) June 30, | Years endedDecember 31, | |
| | 2019 | 2018 | 2017 A |
| Selected Per–Share Data | | | |
| Net asset value, beginning of period | $9.98 | $9.98 | $10.00 |
| Income from Investment Operations | | | |
| Net investment income (loss)B | .102 | .179 | .028 |
| Net realized and unrealized gain (loss) | .040 | (.004)C | (.020) |
| Total from investment operations | .142 | .175 | .008 |
| Distributions from net investment income | (.102) | (.174) | (.028) |
| Distributions from net realized gain | – | (.001) | – |
| Total distributions | (.102) | (.175) | (.028) |
| Net asset value, end of period | $10.02 | $9.98 | $9.98 |
| Total ReturnD,E | 1.43% | 1.77% | .08% |
| Ratios to Average Net AssetsF,G | | | |
| Expenses before reductionsH | - %I | -% | - %I |
| Expenses net of fee waivers, if anyH | - %I | -% | - %I |
| Expenses net of all reductionsH | - %I | -% | - %I |
| Net investment income (loss) | 2.06%I | 1.81% | 1.27%I |
| Supplemental Data | | | |
| Net assets, end of period (000 omitted) | $44,597 | $36,787 | $10,021 |
| Portfolio turnover rateJ | 39%I | 11% | - %K |
A For the period October 12, 2017 (commencement of operations) to December 31, 2017.
B Calculated based on average shares outstanding during the period.
C The amount shown for a share outstanding does not correspond with the aggregate net gain (loss) on investments for the period due to the timing of sales and repurchases of shares in relation to fluctuating market values of the investments of the Fund.
D Total returns for periods of less than one year are not annualized.
E Total returns would have been lower if certain expenses had not been reduced during the applicable periods shown.
F Fees and expenses of any underlying Fidelity Central Funds are not included in the Fund's expense ratio. The Fund indirectly bears its proportionate share of the expenses of any underlying Fidelity Central Funds.
G Expense ratios reflect operating expenses of the Fund. Expenses before reductions do not reflect amounts reimbursed by the investment adviser or reductions from expense offset arrangements and do not represent the amount paid by the Fund during periods when reimbursements or reductions occur. Expenses net of fee waivers reflect expenses after reimbursement by the investment adviser but prior to reductions from expense offset arrangements. Expenses net of all reductions represent the net expenses paid by the Fund.
H Amount represents less than .005%.
I Annualized
J Amount does not include the portfolio activity of any underlying Fidelity Central Funds.
K Amount not annualized.
See accompanying notes which are an integral part of the financial statements.
Notes to Financial Statements (Unaudited)
For the period ended June 30, 2019
1. Organization.
Fidelity Flex Conservative Income Municipal Bond Fund (the Fund) is a fund of Fidelity Municipal Trust (the Trust) and is authorized to issue an unlimited number of shares. Share transactions on the Statement of Changes in Net Assets may contain exchanges between affiliated funds. The Trust is registered under the Investment Company Act of 1940, as amended (the 1940 Act), as an open-end management investment company organized as a Massachusetts business trust. The Fund is available only to certain fee-based accounts offered by Fidelity.
2. Investments in Fidelity Central Funds.
The Fund invests in Fidelity Central Funds, which are open-end investment companies generally available only to other investment companies and accounts managed by the investment adviser and its affiliates. The Fund's Schedule of Investments lists each of the Fidelity Central Funds held as of period end, if any, as an investment of the Fund, but does not include the underlying holdings of each Fidelity Central Fund. As an Investing Fund, the Fund indirectly bears its proportionate share of the expenses of the underlying Fidelity Central Funds.
The Money Market Central Funds seek preservation of capital and current income and are managed by Fidelity Investments Money Management, Inc. (FIMM), an affiliate of the investment adviser. Annualized expenses of the Money Market Central Funds as of their most recent shareholder report date ranged from less than .005% to .01%.
A complete unaudited list of holdings for each Fidelity Central Fund is available upon request or at the Securities and Exchange Commission (the SEC) website at www.sec.gov. In addition, the financial statements of the Fidelity Central Funds are available on the SEC website or upon request.
3. Significant Accounting Policies.
The Fund is an investment company and applies the accounting and reporting guidance of the Financial Accounting Standards Board (FASB) Accounting Standards Codification Topic 946 Financial Services – Investments Companies. The financial statements have been prepared in conformity with accounting principles generally accepted in the United States of America (GAAP), which require management to make certain estimates and assumptions at the date of the financial statements. Actual results could differ from those estimates. Subsequent events, if any, through the date that the financial statements were issued have been evaluated in the preparation of the financial statements. The following summarizes the significant accounting policies of the Fund:
Investment Valuation. Investments are valued as of 4:00 p.m. Eastern time on the last calendar day of the period. The Board of Trustees (the Board) has delegated the day to day responsibility for the valuation of the Fund's investments to the Fair Value Committee (the Committee) established by the Fund's investment adviser. In accordance with valuation policies and procedures approved by the Board, the Fund attempts to obtain prices from one or more third party pricing vendors or brokers to value its investments. When current market prices, quotations or currency exchange rates are not readily available or reliable, investments will be fair valued in good faith by the Committee, in accordance with procedures adopted by the Board. Factors used in determining fair value vary by investment type and may include market or investment specific events, changes in interest rates and credit quality. The frequency with which these procedures are used cannot be predicted and they may be utilized to a significant extent. The Committee oversees the Fund's valuation policies and procedures and reports to the Board on the Committee's activities and fair value determinations. The Board monitors the appropriateness of the procedures used in valuing the Fund's investments and ratifies the fair value determinations of the Committee.
The Fund categorizes the inputs to valuation techniques used to value its investments into a disclosure hierarchy consisting of three levels as shown below:
- Level 1 – quoted prices in active markets for identical investments
- Level 2 – other significant observable inputs (including quoted prices for similar investments, interest rates, prepayment speeds, etc.)
- Level 3 – unobservable inputs (including the Fund's own assumptions based on the best information available)
Valuation techniques used to value the Fund's investments by major category are as follows:
Debt securities, including restricted securities, are valued based on evaluated prices received from third party pricing vendors or from brokers who make markets in such securities. Municipal securities are valued by pricing vendors who utilize matrix pricing which considers yield or price of bonds of comparable quality, coupon, maturity and type or by broker-supplied prices. When independent prices are unavailable or unreliable, debt securities may be valued utilizing pricing methodologies which consider similar factors that would be used by third party pricing vendors. Debt securities are generally categorized as Level 2 in the hierarchy but may be Level 3 depending on the circumstances.
Investments in open-end mutual funds, including the Fidelity Central Funds, are valued at their closing net asset value (NAV) each business day and are categorized as Level 1 in the hierarchy.
Changes in valuation techniques may result in transfers in or out of an assigned level within the disclosure hierarchy. The aggregate value of investments by input level as of June 30, 2019 is included at the end of the Fund's Schedule of Investments.
Investment Transactions and Income. For financial reporting purposes, the Fund's investment holdings and NAV include trades executed through the end of the last business day of the period. The NAV per share for processing shareholder transactions is calculated as of the close of business of the New York Stock Exchange (NYSE), normally 4:00 p.m. Eastern time and includes trades executed through the end of the prior business day. Gains and losses on securities sold are determined on the basis of identified cost. Income and capital gain distributions from Fidelity Central Funds, if any, are recorded on the ex-dividend date. Interest income is accrued as earned and includes coupon interest and amortization of premium and accretion of discount on debt securities as applicable. Debt obligations may be placed on non-accrual status and related interest income may be reduced by ceasing current accruals and writing off interest receivables when the collection of all or a portion of interest has become doubtful based on consistently applied procedures. A debt obligation is removed from non-accrual status when the issuer resumes interest payments or when collectability of interest is reasonably assured.
Expenses. Expenses directly attributable to a fund are charged to that fund. Expenses attributable to more than one fund are allocated among the respective funds on the basis of relative net assets or other appropriate methods. Expense estimates are accrued in the period to which they relate and adjustments are made when actual amounts are known.
Income Tax Information and Distributions to Shareholders. Each year, the Fund intends to qualify as a regulated investment company under Subchapter M of the Internal Revenue Code, including distributing substantially all of its taxable income and realized gains. As a result, no provision for U.S. Federal income taxes is required. The Fund files a U.S. federal tax return, in addition to state and local tax returns as required. The Fund's federal income tax returns are subject to examination by the Internal Revenue Service (IRS) for a period of three fiscal years after they are filed. State and local tax returns may be subject to examination for an additional fiscal year depending on the jurisdiction.
Distributions are declared and recorded daily and paid monthly from net investment income. Distributions from realized gains, if any, are declared and recorded on the ex-dividend date. Income and capital gain distributions are determined in accordance with income tax regulations, which may differ from GAAP.
Capital accounts within the financial statements are adjusted for permanent book-tax differences. These adjustments have no impact on net assets or the results of operations. Capital accounts are not adjusted for temporary book-tax differences which will reverse in a subsequent period.
Book-tax differences are primarily due to market discount.
The Fund purchases municipal securities whose interest, in the opinion of the issuer, is free from federal income tax. There is no assurance that the IRS will agree with this opinion. In the event the IRS determines that the issuer does not comply with relevant tax requirements, interest payments from a security could become federally taxable, possibly retroactively to the date the security was issued.
As of period end, the cost and unrealized appreciation (depreciation) in securities, and derivatives if applicable, for federal income tax purposes were as follows:
| Gross unrealized appreciation | $171,769 |
| Gross unrealized depreciation | (3,500) |
| Net unrealized appreciation (depreciation) | $168,269 |
| Tax cost | $45,110,916 |
Delayed Delivery Transactions and When-Issued Securities. During the period, the Fund transacted in securities on a delayed delivery or when-issued basis. Payment and delivery may take place after the customary settlement period for that security. The price of the underlying securities and the date when the securities will be delivered and paid for are fixed at the time the transaction is negotiated. The securities purchased on a delayed delivery or when-issued basis are identified as such in the Fund's Schedule of Investments. The Fund may receive compensation for interest forgone in the purchase of a delayed delivery or when-issued security. With respect to purchase commitments, the Fund identifies securities as segregated in its records with a value at least equal to the amount of the commitment. Losses may arise due to changes in the value of the underlying securities or if the counterparty does not perform under the contract's terms, or if the issuer does not issue the securities due to political, economic, or other factors.
Restricted Securities. The Fund may invest in securities that are subject to legal or contractual restrictions on resale. These securities generally may be resold in transactions exempt from registration or to the public if the securities are registered. Disposal of these securities may involve time-consuming negotiations and expense, and prompt sale at an acceptable price may be difficult. Information regarding restricted securities is included at the end of the Fund's Schedule of Investments.
4. Purchases and Sales of Investments.
Purchases and sales of securities, other than short-term securities, aggregated $9,359,562 and $4,956,264, respectively.
5. Fees and Other Transactions with Affiliates.
Management Fee. Fidelity Management & Research Company (the investment adviser) and its affiliates provide the Fund with investment management related services and the Fund does not pay any fees for these services. Under the management contract, the investment adviser or an affiliate pays all other expenses of the Fund, excluding fees and expenses of the independent Trustees, and certain miscellaneous expenses such as proxy and shareholder meeting expenses.
Interfund Trades. The Fund may purchase from or sell securities to other Fidelity Funds under procedures adopted by the Board. The procedures have been designed to ensure these interfund trades are executed in accordance with Rule 17a-7 of the 1940 Act. Interfund trades are included within the respective purchases and sales amounts shown in the Purchases and Sales of Investments note.
6. Committed Line of Credit.
The Fund participates with other funds managed by the investment adviser or an affiliate in a $4.25 billion credit facility (the "line of credit") to be utilized for temporary or emergency purposes to fund shareholder redemptions or for other short-term liquidity purposes. The Fund has agreed to pay commitment fees on its pro-rata portion of the line of credit, which amounted to $54 and is reflected in Commitment fees on the Statement of Operations. During the period, the Fund did not borrow on this line of credit.
7. Expense Reductions.
Through arrangements with the Fund's custodian, credits realized as a result of certain uninvested cash balances were used to reduce the Fund's expenses. During the period, these credits reduced the Fund's custody expenses by $10.
8. Other.
The Fund's organizational documents provide former and current trustees and officers with a limited indemnification against liabilities arising in connection with the performance of their duties to the Fund. In the normal course of business, the Fund may also enter into contracts that provide general indemnifications. The Fund's maximum exposure under these arrangements is unknown as this would be dependent on future claims that may be made against the Fund. The risk of material loss from such claims is considered remote.
At the end of the period, the investment adviser or its affiliates were the owners of record of approximately 23% of the total outstanding shares of the Fund.
Shareholder Expense Example
As a shareholder of the Fund, you incur two types of costs: (1) transaction costs and (2) ongoing costs, including other Fund expenses. This Example is intended to help you understand your ongoing costs (in dollars) of investing in the Fund and to compare these costs with the ongoing costs of investing in other mutual funds.
The Example is based on an investment of $1,000 invested at the beginning of the period and held for the entire period (January 1, 2019 to June 30, 2019).
Actual Expenses
The first line of the accompanying table provides information about actual account values and actual expenses. You may use the information in this line, together with the amount you invested, to estimate the expenses that you paid over the period. Simply divide your account value by $1,000.00 (for example, an $8,600 account value divided by $1,000.00 = 8.6), then multiply the result by the number in the first line under the heading entitled "Expenses Paid During Period" to estimate the expenses you paid on your account during this period. In addition, the Fund, as a shareholder in the underlying Fidelity Central Funds, will indirectly bear its pro-rata share of the fees and expenses incurred by the underlying Fidelity Central Funds. These fees and expenses are not included in the Fund's annualized expense ratio used to calculate the expense estimate in the table below.
Hypothetical Example for Comparison Purposes
The second line of the accompanying table provides information about hypothetical account values and hypothetical expenses based on the Fund's actual expense ratio and an assumed rate of return of 5% per year before expenses, which is not the Fund's actual return. The hypothetical account values and expenses may not be used to estimate the actual ending account balance or expenses you paid for the period. You may use this information to compare the ongoing costs of investing in the Fund and other funds. To do so, compare this 5% hypothetical example with the 5% hypothetical examples that appear in the shareholder reports of the other funds. In addition, the Fund, as a shareholder in the underlying Fidelity Central Funds, will indirectly bear its pro-rata share of the fees and expenses incurred by the underlying Fidelity Central Funds. These fees and expenses are not included in the Fund's annualized expense ratio used to calculate the expense estimate in the table below.
Please note that the expenses shown in the table are meant to highlight your ongoing costs only and do not reflect any transaction costs. Therefore, the second line of the table is useful in comparing ongoing costs only, and will not help you determine the relative total costs of owning different funds.
| | Annualized Expense Ratio-A | Beginning
Account Value
January 1, 2019 | Ending
Account Value
June 30, 2019 | Expenses Paid
During Period-B
January 1, 2019
to June 30, 2019 |
| Actual | - %-C | $1,000.00 | $1,014.30 | $--D |
| Hypothetical-E | | $1,000.00 | $1,024.79 | $--D |
A Annualized expense ratio reflects expenses net of applicable fee waivers.
B Expenses are equal to the Fund's annualized expense ratio, multiplied by the average account value over the period, multiplied by 181/365 (to reflect the one-half year period).
C Amount represents less than .005%.
D Amount represents less than $.005.
E 5% return per year before expenses
XCB-SANN-0819
1.9884864.101
Item 2.
Code of Ethics
Not applicable.
Item 3.
Audit Committee Financial Expert
Not applicable.
Item 4.
Principal Accountant Fees and Services
Not applicable.
Item 5.
Audit Committee of Listed Registrants
Not applicable.
Item 6.
Investments
(a)
Not applicable.
(b)
Not applicable
Item 7.
Disclosure of Proxy Voting Policies and Procedures for Closed-End Management Investment Companies
Not applicable.
Item 8.
Portfolio Managers of Closed-End Management Investment Companies
Not applicable.
Item 9.
Purchase of Equity Securities by Closed-End Management Investment Company and Affiliated Purchasers
Not applicable.
Item 10.
Submission of Matters to a Vote of Security Holders
There were no material changes to the procedures by which shareholders may recommend nominees to the Fidelity Municipal Trust’s Board of Trustees.
Item 11.
Controls and Procedures
(a)(i) The President and Treasurer and the Chief Financial Officer have concluded that the Fidelity Municipal Trust’s (the “Trust”) disclosure controls and procedures (as
defined in Rule 30a-3(c) under the Investment Company Act) provide reasonable assurances that material information relating to the Trust is made known to them by the appropriate persons, based on their evaluation of these controls and procedures as of a date within 90 days of the filing date of this report.
(a)(ii) There was no change in the Trust’s internal control over financial reporting (as defined in Rule 30a-3(d) under the Investment Company Act) that occurred during the period covered by this report that has materially affected, or is reasonably likely to materially affect, the Trust’s internal control over financial reporting.
Item 12.
Disclosure of Securities Lending Activities for Closed-End Management
Investment Companies
Not applicable.
Item 13.
Exhibits
| | |
(a) | (1) | Not applicable. |
(a) | (2) | Certification pursuant to Rule 30a-2(a) under the Investment Company Act of 1940 (17 CFR 270.30a-2(a)) is filed and attached hereto as Exhibit 99.CERT. |
(a) | (3) | Not applicable. |
(b) |
| Certification pursuant to Rule 30a-2(b) under the Investment Company Act of 1940 (17 CFR 270.30a-2(b)) is furnished and attached hereto as Exhibit 99.906CERT. |
SIGNATURES
Pursuant to the requirements of the Securities Exchange Act of 1934 and the Investment Company Act of 1940, the registrant has duly caused this report to be signed on its behalf by the undersigned, thereunto duly authorized.
Fidelity Municipal Trust
| |
By: | /s/Laura M. Del Prato |
| Laura M. Del Prato |
| President and Treasurer |
|
|
Date: | August 26, 2019 |
Pursuant to the requirements of the Securities Exchange Act of 1934 and the Investment Company Act of 1940, this report has been signed below by the following persons on behalf of the registrant and in the capacities and on the dates indicated.
| |
By: | /s/Laura M. Del Prato |
| Laura M. Del Prato |
| President and Treasurer |
|
|
Date: | August 26, 2019 |
| |
By: | /s/John J. Burke III |
| John J. Burke III |
| Chief Financial Officer |
|
|
Date: | August 26, 2019 |