UNITED STATES
SECURITIES AND EXCHANGE COMMISSION
Washington, D.C. 20549
FORM N-CSR
CERTIFIED SHAREHOLDER REPORT OF REGISTERED
MANAGEMENT INVESTMENT COMPANIES
Investment Company Act file number 811-02628
Fidelity Municipal Trust
(Exact name of registrant as specified in charter)
245 Summer St., Boston, Massachusetts 02210
(Address of principal executive offices) (Zip code)
Marc Bryant, Secretary
245 Summer St.
Boston, Massachusetts 02210
(Name and address of agent for service)
Registrant's telephone number, including area code:
617-563-7000
| |
Date of fiscal year end: | December 31 |
| |
Date of reporting period: | December 31, 2016 |
Item 1.
Reports to Stockholders
Fidelity® Conservative Income Municipal Bond Fund Fidelity® Conservative Income Municipal Bond Fund and
Institutional Class
Annual Report December 31, 2016 |
 |
Contents
To view a fund's proxy voting guidelines and proxy voting record for the 12-month period ended June 30, visit http://www.fidelity.com/proxyvotingresults or visit the Securities and Exchange Commission's (SEC) web site at http://www.sec.gov.
You may also call 1-800-544-8544 to request a free copy of the proxy voting guidelines.
Standard & Poor's, S&P and S&P 500 are registered service marks of The McGraw-Hill Companies, Inc. and have been licensed for use by Fidelity Distributors Corporation.
Other third-party marks appearing herein are the property of their respective owners.
All other marks appearing herein are registered or unregistered trademarks or service marks of FMR LLC or an affiliated company. © 2017 FMR LLC. All rights reserved.
This report and the financial statements contained herein are submitted for the general information of the shareholders of the Fund. This report is not authorized for distribution to prospective investors in the Fund unless preceded or accompanied by an effective prospectus.
A fund files its complete schedule of portfolio holdings with the SEC for the first and third quarters of each fiscal year on Form N-Q. Forms N-Q are available on the SEC’s web site at http://www.sec.gov. A fund's Forms N-Q may be reviewed and copied at the SEC’s Public Reference Room in Washington, DC. Information regarding the operation of the SEC's Public Reference Room may be obtained by calling 1-800-SEC-0330.
For a complete list of a fund's portfolio holdings, view the most recent holdings listing, semiannual report, or annual report on Fidelity's web site at http://www.fidelity.com, http://www.institutional.fidelity.com, or http://www.401k.com, as applicable.
NOT FDIC INSURED •MAY LOSE VALUE •NO BANK GUARANTEE
Neither the Fund nor Fidelity Distributors Corporation is a bank.
Performance: The Bottom Line
Average annual total return reflects the change in the value of an investment, assuming reinvestment of distributions from dividend income and capital gains (the profits earned upon the sale of securities that have grown in value, if any) and assuming a constant rate of performance each year. The hypothetical investment and the average annual total returns do not reflect the deduction of taxes that a shareholder would pay on fund distributions or the redemption of fund shares. During periods of reimbursement by Fidelity, a fund’s total return will be greater than it would be had the reimbursement not occurred. How a fund did yesterday is no guarantee of how it will do tomorrow.
Average Annual Total Returns
| For the periods ended December 31, 2016 | Past 1 year | Life of fundA |
| Fidelity® Conservative Income Municipal Bond Fund | 0.21% | 0.35% |
| Institutional Class | 0.31% | 0.44% |
A From October 15, 2013
$10,000 Over Life of Fund
Let's say hypothetically that $10,000 was invested in Fidelity® Conservative Income Municipal Bond Fund, a class of the fund, on October 15, 2013, when the fund started.
The chart shows how the value of your investment would have changed, and also shows how the Bloomberg Barclays Municipal Bond 1 Year (1-2 Y) Index performed over the same period.
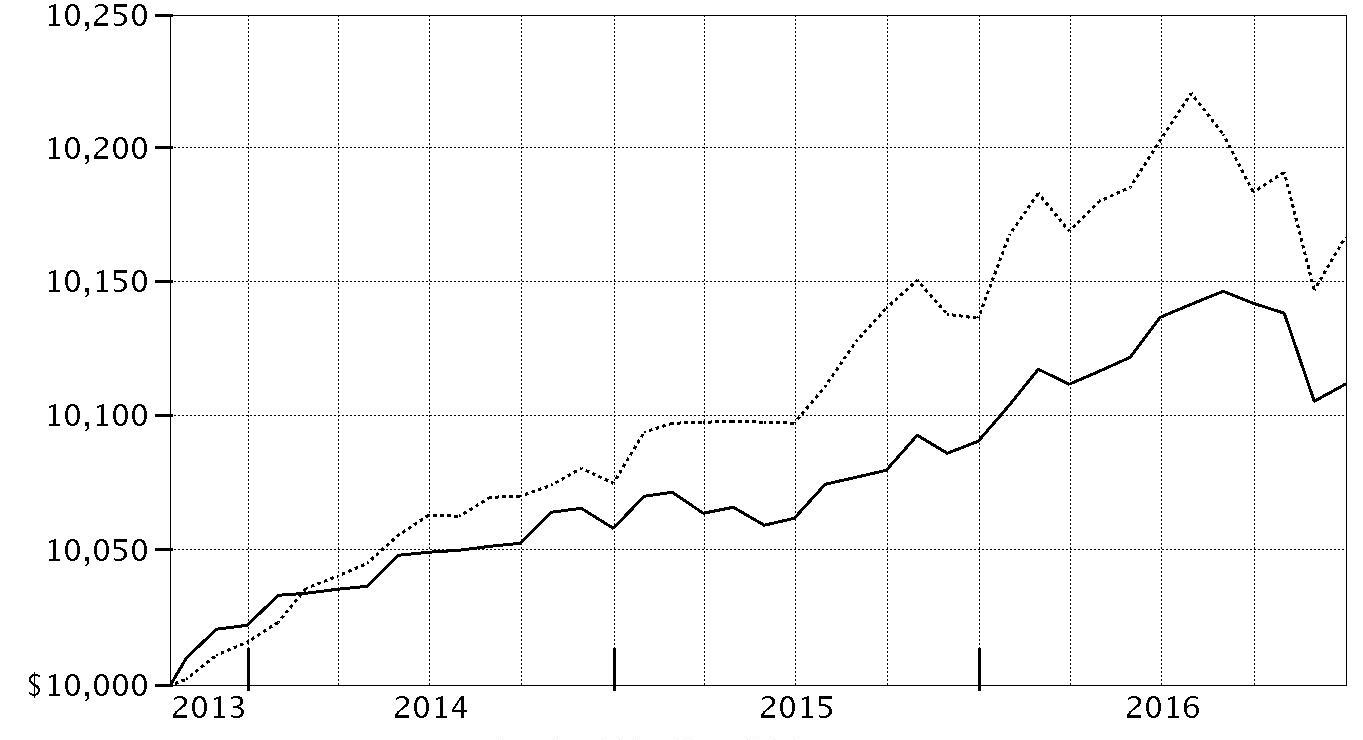
| Period Ending Values |
| $10,111 | Fidelity® Conservative Income Municipal Bond Fund |
| $10,166 | Bloomberg Barclays Municipal Bond 1 Year (1-2 Y) Index |
Effective August 24, 2016, all Barclays benchmark indices were co-branded as the Bloomberg Barclays Indices for a period of five years.
Management's Discussion of Fund Performance
Market Recap: For the 12 months ending December 31, 2016, tax-exempt bonds eked out only a 0.25% return, according to the Bloomberg Barclays Municipal Bond Index. For much of the period, fairly strong demand and a stable credit environment for state and local governments drove moderate muni returns. But a downward trend began in September and steepened through November – the worst month for the muni market since 2008 – as investors became concerned about U.S. President-elect Donald Trump’s expansionary fiscal policy ambitions, inflation and the potential for tax reform to impair tax-exempt bond valuations. Further, some theorized that changes to or repeal of the Affordable Care Act by the incoming administration and a Republican-controlled Congress may affect the prices of muni bonds issued by hospitals. Muni bonds also were hurt by market anticipation of a quarter-point increase in policy interest rates, which happened in December. At year-end, concerns about unfunded pension liabilities generally are compartmentalized to certain issuers. Looking ahead, we think the U.S. Federal Reserve is likely to raise policy interest rates further in 2017, perhaps in multiple stages.
Comments from Portfolio Manager Doug McGinley: For the year, the fund’s share classes posted returns ranging from 0.21% to 0.31%, nearly in line, net of fees, with the 0.35% return of the benchmark Fidelity Conservative Income Municipal Bond Composite Index, an equal-weighted blend of the Bloomberg Barclays
® Municipal Bond 1 Year (1-2 Y) Index and the iMoneyNet All Tax-Free National Retail Money Market Funds Average. This period, I sought value among municipal bonds with maturities of two to four years, which are not in the Composite. Overall, sector selection contributed versus the benchmark this period, driven by bottom-up research. Overweightings in certain health care, airport and industrial-revenue bonds particularly boosted the fund's relative performance. Conversely, our yield-curve strategy detracted overall. Initially, performance was boosted by our decision to hold bonds with maturities of two to four years, as income-seeking investors looked to longer-term securities for higher yields through the early fall. However, these securities were among the worst performers in the fund’s investment universe during the final months of the period.
The views expressed above reflect those of the portfolio manager(s) only through the end of the period as stated on the cover of this report and do not necessarily represent the views of Fidelity or any other person in the Fidelity organization. Any such views are subject to change at any time based upon market or other conditions and Fidelity disclaims any responsibility to update such views. These views may not be relied on as investment advice and, because investment decisions for a Fidelity fund are based on numerous factors, may not be relied on as an indication of trading intent on behalf of any Fidelity fund.
Investment Summary (Unaudited)
Effective Maturity Diversification as of December 31, 2016
| | % of fund's investments | % of fund's investments 6 months ago |
| 1 - 7 | 49.5 | 46.0 |
| 8 - 30 | 0.3 | 0.4 |
| 31 - 60 | 3.5 | 2.0 |
| 61 - 90 | 0.6 | 1.0 |
| 91 - 180 | 5.3 | 5.1 |
| > 180 | 40.8 | 45.5 |
The date shown for securities represents the date when principal payments must be paid, taking into account any call options exercised by the issuer and any permissible maturity shortening features other than interest rate resets.
Top Five States as of December 31, 2016
| | % of fund's net assets | % of fund's net assets 6 months ago |
| Illinois | 16.9 | 18.4 |
| Texas | 13.5 | 14.9 |
| Louisiana | 9.9 | 4.9 |
| New Jersey | 6.6 | 6.2 |
| Pennsylvania | 5.8 | 3.9 |
Top Five Sectors as of December 31, 2016
| | % of fund's net assets | % of fund's net assets 6 months ago |
| General Obligations | 22.5 | 22.3 |
| Synthetics | 20.6 | 13.3 |
| Industrial Development | 20.5 | 21.5 |
| Health Care | 13.3 | 13.9 |
| Electric Utilities | 11.8 | 12.3 |
Quality Diversification (% of fund's net assets)
| As of December 31, 2016 |
| | AAA | 0.2% |
| | AA,A | 47.2% |
| | BBB | 4.2% |
| | BB and Below | 0.4% |
| | Not Rated | 0.5% |
| | Short-Term Investments and Net Other Assets | 47.5% |

| As of June 30, 2016 |
| | AAA | 0.4% |
| | AA,A | 53.6% |
| | BBB | 3.7% |
| | BB and Below | 0.7% |
| | Not Rated | 0.3% |
| | Short-Term Investments and Net Other Assets | 41.3% |

We have used ratings from Moody's Investors Service, Inc. Where Moody's® ratings are not available, we have used S&P® ratings. All ratings are as of the date indicated and do not reflect subsequent changes.
Investments December 31, 2016
Showing Percentage of Net Assets
| Municipal Bonds - 52.5% | | | |
| | | Principal Amount | Value |
| Alabama - 0.8% | | | |
| Mobile County Board of School Commissioners: | | | |
| Series 2016 A: | | $ | $ |
| 2% 3/1/18 | | 500,000 | 504,170 |
| 3% 3/1/19 | | 550,000 | 567,545 |
| Series 2016 B, 5% 3/1/19 | | 900,000 | 966,753 |
| Mobile Indl. Dev. Board Poll. Cont. Rev. Bonds: | | | |
| (Alabama Pwr. Co. Barry Plant Proj.) Series 2008, 1.625%, tender 10/2/18 (a) | | 3,000,000 | 2,999,220 |
| Series 2009 E, 1.65%, tender 3/20/17 (a) | | 2,455,000 | 2,457,332 |
| Montgomery Med. Clinic Facilities Series 2015, 5% 3/1/18 | | 1,000,000 | 1,035,120 |
|
| TOTAL ALABAMA | | | 8,530,140 |
|
| Arizona - 0.7% | | | |
| Arizona Board of Regents Arizona State Univ. Rev.: | | | |
| Series 2011, 3% 8/1/17 | | 125,000 | 126,365 |
| Series 2016 A, 5% 7/1/19 | | 500,000 | 542,850 |
| Arizona Ctfs. of Prtn.: | | | |
| Series 2008 A, 4% 9/1/17 (FSA Insured) | | 145,000 | 147,727 |
| Series 2010 A: | | | |
| 5% 10/1/17 (FSA Insured) | | 150,000 | 154,257 |
| 5% 10/1/18 (FSA Insured) | | 140,000 | 148,476 |
| Series 2013 A, 3% 10/1/17 | | 100,000 | 101,371 |
| Arizona Health Facilities Auth. Rev. (Scottsdale Lincoln Hospitals Proj.) Series 2014 A, 5% 12/1/17 | | 725,000 | 749,730 |
| Arizona School Facilities Board Ctfs. of Prtn.: | | | |
| Series 2013 A2, 5% 9/1/17 | | 275,000 | 282,183 |
| Series 2015 A, 5% 9/1/19 | | 600,000 | 652,818 |
| Arizona School Facilities Board Rev. 5% 7/1/17 | | 185,000 | 188,656 |
| Glendale Gen. Oblig. Series 2015, 4% 7/1/18 (FSA Insured) | | 370,000 | 384,349 |
| Maricopa County Indl. Dev. Auth. Rev. Series 2016 A, 5% 1/1/20 | | 3,025,000 | 3,306,355 |
|
| TOTAL ARIZONA | | | 6,785,137 |
|
| California - 0.3% | | | |
| California Health Facilities Fing. Auth. Rev.: | | | |
| Series 2011 A, 5% 3/1/17 | | 350,000 | 352,254 |
| 4% 3/1/17 | | 500,000 | 502,345 |
| California Statewide Cmntys. Dev. Auth. Poll. Cont. Rev. Bonds Series 2006 A, 1.375%, tender 4/2/18 (a) | | 2,440,000 | 2,439,244 |
|
| TOTAL CALIFORNIA | | | 3,293,843 |
|
| Colorado - 0.1% | | | |
| Colorado Health Facilities Auth. Rev.: | | | |
| Series 2011 A: | | | |
| 5% 2/1/17 | | 225,000 | 225,641 |
| 5% 2/1/18 | | 95,000 | 98,792 |
| Series 2011, 4% 2/1/17 | | 350,000 | 350,746 |
| 5.125% 10/1/17 | | 50,000 | 51,446 |
| Colorado Reg'l. Trans. District Ctfs. of Prtn. Series 2013 A, 5% 6/1/20 | | 250,000 | 275,435 |
| Denver City & County Arpt. Rev.: | | | |
| Series 2011 A, 4% 11/15/17 (b) | | 50,000 | 51,195 |
| Series 2012 A, 4% 11/15/17 (b) | | 100,000 | 102,390 |
|
| TOTAL COLORADO | | | 1,155,645 |
|
| Connecticut - 4.2% | | | |
| Connecticut Gen. Oblig.: | | | |
| Bonds Series 2012 D, 1.37%, tender 1/5/17 (a) | | 3,850,000 | 3,851,425 |
| Series 2012 D: | | | |
| 1.24% 9/15/17 (a) | | 2,000,000 | 2,000,740 |
| 1.49% 9/15/18 (a) | | 1,945,000 | 1,947,256 |
| 1.64% 9/15/19 (a) | | 2,365,000 | 2,373,703 |
| Series 2013 A: | | | |
| 1.27% 3/1/19 (a) | | 275,000 | 273,980 |
| 5% 10/15/19 | | 1,300,000 | 1,408,498 |
| Series 2013 D: | | | |
| 1.6% 8/15/18 (a) | | 3,000,000 | 3,008,790 |
| 1.6% 8/15/19 (a) | | 1,000,000 | 1,002,650 |
| Series 2014 C, 5% 6/15/17 | | 185,000 | 188,239 |
| Series 2014 H, 5% 11/15/18 | | 150,000 | 159,198 |
| Series 2015 C, 1.47% 6/15/18 (a) | | 795,000 | 795,501 |
| Series 2016 B: | | | |
| 5% 5/15/19 | | 2,000,000 | 2,146,780 |
| 5% 5/15/20 | | 1,000,000 | 1,094,630 |
| Series 2016 E: | | | |
| 4% 10/15/19 | | 3,450,000 | 3,645,063 |
| 5% 10/15/20 | | 4,000,000 | 4,412,920 |
| Series 2016 G: | | | |
| 5% 11/1/18 | | 2,000,000 | 2,120,120 |
| 5% 11/1/19 | | 2,000,000 | 2,168,380 |
| Connecticut Health & Edl. Facilities Auth. Rev.: | | | |
| Bonds: | | | |
| (Ascension Health Cr. Group Proj.) Series 1998 B, 1.55%, tender 2/1/17 (a) | | 1,660,000 | 1,661,162 |
| (Yale New Haven Hosp. Proj.) Series B, 0.963%, tender 7/1/19 (a) | | 3,000,000 | 2,968,620 |
| Series 2010 A2, 1.2%, tender 2/1/19 (a) | | 475,000 | 470,184 |
| Series A: | | | |
| 4% 7/1/17 | | 200,000 | 202,860 |
| 5% 7/1/20 | | 1,155,000 | 1,272,025 |
| Series N: | | | |
| 4% 7/1/17 | | 190,000 | 192,717 |
| 5% 7/1/17 | | 395,000 | 402,469 |
| New Britain Gen. Oblig. Series 2016 A: | | | |
| 5% 3/1/17 | | 1,000,000 | 1,006,000 |
| 5% 3/1/18 | | 1,000,000 | 1,041,930 |
| Stratford Gen. Oblig. Series 2017, 4% 7/1/19 (FSA Insured) (c) | | 475,000 | 500,441 |
|
| TOTAL CONNECTICUT | | | 42,316,281 |
|
| District Of Columbia - 0.1% | | | |
| District of Columbia Hosp. Rev. Series 2015, 5% 7/15/17 | | 385,000 | 392,858 |
| District of Columbia Univ. Rev. Bonds (Georgetown Univ. Proj.) Series 2001 B, 4.7%, tender 4/1/18 (a) | | 325,000 | 337,262 |
| Metropolitan Washington DC Arpts. Auth. Sys. Rev.: | | | |
| Series 2011 C, 4% 10/1/17 (b) | | 250,000 | 255,075 |
| Series 2012 A, 5% 10/1/18 (b) | | 200,000 | 211,646 |
|
| TOTAL DISTRICT OF COLUMBIA | | | 1,196,841 |
|
| Florida - 2.3% | | | |
| Broward County Port Facilities Rev. Series 2011 B, 5% 9/1/18 (b) | | 250,000 | 264,463 |
| Broward County School Board Ctfs. of Prtn.: | | | |
| Series 2012 A, 5% 7/1/17 | | 500,000 | 509,950 |
| 5% 7/1/19 | | 600,000 | 647,592 |
| Citizens Property Ins. Corp.: | | | |
| Series 2009 A1, 6% 6/1/17 | | 260,000 | 265,330 |
| Series 2011 A1: | | | |
| 5% 6/1/18 | | 935,000 | 980,338 |
| 5% 6/1/19 | | 45,000 | 48,452 |
| Series 2015 A1, 5% 6/1/18 | | 675,000 | 696,161 |
| Series 2015 A2, 1.57% 6/1/18 (a) | | 1,000,000 | 1,000,510 |
| Escambia County Poll. Cont. Rev. Bonds (Gulf Pwr. Co. Proj.) Series 2003, 1.15%, tender 6/21/18 (a) | | 3,500,000 | 3,478,335 |
| Florida Mid-Bay Bridge Auth. Rev. Series 2015 C: | | | |
| 5% 10/1/17 | | 250,000 | 254,965 |
| 5% 10/1/18 | | 275,000 | 286,952 |
| Florida Muni. Pwr. Agcy. Rev. (All-Requirements Pwr. Supply Proj.) Series 2015 B, 5% 10/1/17 | | 565,000 | 581,035 |
| Greater Orlando Aviation Auth. Arpt. Facilities Rev.: | | | |
| Series 2008 A, 5.25% 10/1/17 (FSA Insured) (b) | | 250,000 | 257,648 |
| Series 2010 B, 4.25% 10/1/18 (b) | | 165,000 | 172,814 |
| 6% 10/1/17 (b) | | 60,000 | 62,165 |
| Halifax Hosp. Med. Ctr. Rev. Series 2016: | | | |
| 4% 6/1/18 | | 500,000 | 517,955 |
| 5% 6/1/19 | | 250,000 | 268,195 |
| Lake County School Board Ctfs. of Prtn. Series 2014 A: | | | |
| 4% 6/1/18 (FSA Insured) | | 95,000 | 98,411 |
| 5% 6/1/17 (FSA Insured) | | 140,000 | 142,236 |
| Lakeland Hosp. Sys. Rev. Series 2016: | | | |
| 3% 11/15/17 | | 315,000 | 319,977 |
| 4% 11/15/18 | | 500,000 | 523,415 |
| 5% 11/15/19 | | 265,000 | 286,454 |
| Lee County Arpt. Rev. Series 2010 A, 5% 10/1/17 (FSA Insured) (b) | | 240,000 | 246,720 |
| Miami-Dade County Aviation Rev.: | | | |
| Series 2008 E, 5.375% 10/1/17 (Nat'l. Pub. Fin. Guarantee Corp. Insured) (b) | | 115,000 | 118,624 |
| Series 2010 B: | | | |
| 5% 10/1/17 | | 285,000 | 293,088 |
| 5% 10/1/18 | | 465,000 | 492,988 |
| Series 2012 B, 4% 10/1/17 | | 685,000 | 699,412 |
| Miami-Dade County Expressway Auth.: | | | |
| Series 2013 A, 5% 7/1/17 | | 100,000 | 101,981 |
| Series 2014 B: | | | |
| 5% 7/1/17 | | 585,000 | 596,589 |
| 5% 7/1/18 | | 590,000 | 622,627 |
| Miami-Dade County School Board Ctfs. of Prtn.: | | | |
| Series 2008 A, 5% 8/1/18 (AMBAC Insured) | | 365,000 | 385,418 |
| Series 2008 B: | | | |
| 5% 5/1/17 | | 620,000 | 628,010 |
| 5% 5/1/18 (Assured Guaranty Corp. Insured) | | 300,000 | 314,337 |
| Series 2014 D, 5% 11/1/19 | | 645,000 | 698,193 |
| Series 2015 A, 5% 5/1/20 | | 1,500,000 | 1,641,375 |
| Series A, 5% 5/1/17 (Nat'l. Pub. Fin. Guarantee Corp. Insured) | | 250,000 | 253,230 |
| Series B, 5% 5/1/17 (Nat'l. Pub. Fin. Guarantee Corp. Insured) | | 700,000 | 709,044 |
| Reedy Creek Impt. District Utils. Rev. Series 2013 1, 5% 10/1/17 | | 570,000 | 586,177 |
| Tampa Health Sys. Rev. (Baycare Health Sys. Proj.) Series 2010, 5% 11/15/17 | | 95,000 | 98,258 |
| Tampa Solid Waste Sys. Rev. Series 2010, 5% 10/1/19 (FSA Insured) (b) | | 1,000,000 | 1,081,210 |
| Tampa Tax Allocation (H. Lee Moffitt Cancer Ctr. Proj.): | | | |
| Series 2012 A, 4% 9/1/17 | | 475,000 | 483,498 |
| Series 2016 A: | | | |
| 5% 9/1/18 | | 350,000 | 370,129 |
| 5% 9/1/19 | | 425,000 | 459,183 |
| 5% 9/1/20 | | 535,000 | 588,907 |
|
| TOTAL FLORIDA | | | 23,132,351 |
|
| Georgia - 2.1% | | | |
| Atlanta Arpt. Rev.: | | | |
| Series 2012 C, 5% 1/1/17 (b) | | 100,000 | 100,000 |
| Series 2014 C, 5% 1/1/18 (b) | | 350,000 | 362,366 |
| Bartow County Dev. Auth. Poll. Cont. Rev. Bonds (Georgia Pwr. Co. Plant Bowen Proj.) Series 1997, 2.375%, tender 8/10/17 (a) | | 665,000 | 668,126 |
| Burke County Indl. Dev. Auth. Poll. Cont. Rev. Bonds: | | | |
| (Georgia Pwr. Co. Plant Vogtle Proj.): | | | |
| Series 1994, 1.8%, tender 4/3/18 (a) | | 12,750,000 | 12,776,520 |
| Series 2012, 1.75%, tender 6/1/17 (a) | | 250,000 | 250,390 |
| 1.375%, tender 4/4/17 (a) | | 1,905,000 | 1,905,191 |
| Clarke County Hosp. Auth. Series 2016: | | | |
| 5% 7/1/18 | | 900,000 | 948,123 |
| 5% 7/1/19 | | 1,150,000 | 1,242,092 |
| 5% 7/1/20 | | 750,000 | 827,595 |
| Fulton County Dev. Auth. (Piedmont Healthcare, Inc. Proj.) Series 2016, 5% 7/1/20 | | 500,000 | 551,730 |
| Georgia Muni. Elec. Auth. Pwr. Rev.: | | | |
| (Combined Cycle Proj.) Series 2012 A, 5% 11/1/17 | | 535,000 | 552,698 |
| (Proj. One) Series 2008 A, 5.25% 1/1/18 | | 150,000 | 156,090 |
| (Unrefunded Balance Proj.) Series 2008, 5.75% 1/1/19 | | 45,000 | 47,909 |
| Series B: | | | |
| 5% 1/1/17 | | 150,000 | 150,000 |
| 6.25% 1/1/17 | | 445,000 | 445,000 |
| 4.25% 1/1/18 | | 100,000 | 103,080 |
| 5% 11/1/17 | | 180,000 | 185,954 |
| 6.25% 1/1/17 | | 115,000 | 115,000 |
|
| TOTAL GEORGIA | | | 21,387,864 |
|
| Hawaii - 0.0% | | | |
| Hawaii Arpts. Sys. Rev. Series 2010 B, 5% 7/1/18 (b) | | 155,000 | 163,523 |
| Illinois - 6.6% | | | |
| Chicago O'Hare Int'l. Arpt. Rev.: | | | |
| Series 2005 B, 5.25% 1/1/18 (Nat'l. Pub. Fin. Guarantee Corp. Insured) | | 340,000 | 353,257 |
| Series 2008 B, 5% 1/1/19 (FSA Insured) | | 1,000,000 | 1,000,000 |
| Series 2010 A, 5% 1/1/17 | | 295,000 | 295,000 |
| Series 2011 B: | | | |
| 4% 1/1/17 | | 100,000 | 100,000 |
| 5% 1/1/17 (b) | | 340,000 | 340,000 |
| 5% 1/1/17 | | 410,000 | 410,000 |
| 5% 1/1/18 (b) | | 60,000 | 62,132 |
| Series 2013 A, 5% 1/1/17 (b) | | 375,000 | 375,000 |
| Series 2016 A, 3% 1/1/17 (b) | | 600,000 | 600,000 |
| Series B, 5% 1/1/18 (FSA Insured) | | 180,000 | 180,000 |
| Chicago Park District Gen. Oblig.: | | | |
| Series 2008 G, 5% 1/1/17 | | 620,000 | 620,000 |
| Series 2008 H, 5% 1/1/17 | | 450,000 | 450,000 |
| Series 2011 B, 4% 1/1/17 | | 830,000 | 830,000 |
| Series 2011 D: | | | |
| 4% 1/1/18 | | 375,000 | 382,305 |
| 5% 1/1/17 | | 365,000 | 365,000 |
| Series 2013 B, 4% 1/1/17 | | 600,000 | 600,000 |
| Series 2014 D, 4% 1/1/18 | | 500,000 | 509,740 |
| 5% 1/1/17 | | 125,000 | 125,000 |
| 5% 1/1/17 | | 300,000 | 300,000 |
| Chicago Wastewtr. Transmission Rev.: | | | |
| Series 2006 A, 4% 1/1/17 | | 100,000 | 100,000 |
| Series 2006 B, 5% 1/1/18 (Nat'l. Pub. Fin. Guarantee Corp. Insured) | | 145,000 | 145,344 |
| Series 2008 C, 4% 1/1/17 | | 1,600,000 | 1,600,000 |
| Series 2010 A, 3% 1/1/18 | | 60,000 | 60,526 |
| 5.5% 1/1/17 | | 375,000 | 375,000 |
| Chicago Wtr. Rev. 5% 11/1/17 (FSA Insured) | | 330,000 | 339,672 |
| Cook County Gen. Oblig.: | | | |
| Series 2009 A, 5% 11/15/17 | | 1,225,000 | 1,260,991 |
| Series 2014 A: | | | |
| 5% 11/15/17 | | 450,000 | 463,221 |
| 5% 11/15/18 | | 200,000 | 211,016 |
| Series B, 5% 11/15/17 (Nat'l. Pub. Fin. Guarantee Corp. Insured) | | 710,000 | 730,860 |
| Illinois Edl. Facilities Auth. Rev. Bonds (Univ. of Chicago Proj.) Series B1, 1.1%, tender 2/15/18 (a) | | 2,290,000 | 2,278,184 |
| Illinois Fin. Auth. Rev.: | | | |
| Bonds Series E, 5%, tender 5/1/17 (a) | | 1,420,000 | 1,438,432 |
| Series 2008 A, 4.375% 7/1/17 | | 250,000 | 253,845 |
| Series 2008 B, 5.5% 8/15/19 | | 250,000 | 264,700 |
| Series 2008 D, 5.5% 11/1/18 | | 280,000 | 294,916 |
| Series 2010 A, 5.5% 5/1/17 (Escrowed to Maturity) | | 100,000 | 101,472 |
| Series 2010, 5% 2/15/17 | | 100,000 | 100,430 |
| Series 2011 A, 5% 8/15/18 | | 2,500,000 | 2,637,075 |
| Series 2011 A1, 4% 4/1/17 | | 190,000 | 191,359 |
| Series 2012 A: | | | |
| 5% 5/15/17 | | 105,000 | 106,443 |
| 5% 5/15/18 | | 1,310,000 | 1,371,701 |
| Series 2015 A: | | | |
| 4% 11/15/17 | | 240,000 | 245,527 |
| 5% 11/15/17 | | 125,000 | 128,946 |
| 5% 11/15/18 | | 250,000 | 265,568 |
| Series 2016 A: | | | |
| 5% 8/15/18 | | 500,000 | 522,600 |
| 5% 7/1/19 | | 600,000 | 646,068 |
| 5% 8/15/19 | | 500,000 | 531,525 |
| Series 2016 D, 5% 2/15/20 | | 1,980,000 | 2,161,388 |
| Series 2016: | | | |
| 3% 11/15/17 | | 200,000 | 203,090 |
| 4% 11/15/18 | | 375,000 | 392,209 |
| 5% 11/15/19 | | 320,000 | 348,330 |
| 5% 8/15/17 | | 225,000 | 230,258 |
| Illinois Gen. Oblig.: | | | |
| Series 2004 A, 5% 3/1/17 | | 75,000 | 75,164 |
| Series 2006: | | | |
| 5% 1/1/17 | | 200,000 | 200,000 |
| 5% 1/1/17 | | 100,000 | 100,000 |
| Series 2007 A, 5% 6/1/18 (FSA Insured) | | 435,000 | 440,198 |
| Series 2007 B: | | | |
| 5% 1/1/17 | | 300,000 | 300,000 |
| 5.25% 1/1/18 | | 940,000 | 965,277 |
| Series 2007, 5% 6/1/17 (FSA Insured) | | 250,000 | 252,925 |
| Series 2008, 4.5% 4/1/18 | | 375,000 | 376,946 |
| Series 2010: | | | |
| 5% 1/1/17 | | 675,000 | 675,000 |
| 5% 1/1/17 (FSA Insured) | | 850,000 | 850,000 |
| 5% 1/1/18 | | 750,000 | 768,345 |
| Series 2012 A, 4% 1/1/17 | | 500,000 | 500,000 |
| Series 2012, 5% 3/1/17 | | 500,000 | 502,600 |
| Series 2014: | | | |
| 3% 2/1/17 | | 5,450,000 | 5,456,268 |
| 4% 2/1/17 | | 550,000 | 551,029 |
| 4% 2/1/18 | | 810,000 | 822,766 |
| 5% 5/1/17 | | 7,675,000 | 7,752,057 |
| Series 2016, 5% 2/1/18 | | 6,000,000 | 6,157,620 |
| 3% 1/1/18 | | 500,000 | 502,525 |
| 5% 8/1/17 | | 2,070,000 | 2,106,204 |
| Illinois Muni. Elec. Agcy. Pwr. Supply: | | | |
| Series 2007 A, 5.25% 2/1/17 (Nat'l. Pub. Fin. Guarantee Corp. Insured) | | 4,150,000 | 4,162,367 |
| Series 2007 C: | | | |
| 5.25% 2/1/17 | | 400,000 | 401,192 |
| 5.25% 2/1/20 | | 250,000 | 275,190 |
| Illinois Sales Tax Rev. Series 2013, 5% 6/15/17 | | 75,000 | 76,232 |
| Metropolitan Pier & Exposition: | | | |
| (McCormick Place Expansion Proj.) Series 1996 A, 0% 12/15/17 (Nat'l. Pub. Fin. Guarantee Corp. Insured) | | 75,000 | 73,097 |
| 0% 6/15/17 (Escrowed to Maturity) | | 10,000 | 9,954 |
| 0% 6/15/17 (Nat'l. Pub. Fin. Guarantee Corp. Insured) | | 45,000 | 44,600 |
| 0% 6/15/18 (Nat'l. Pub. Fin. Guarantee Corp. Insured) | | 105,000 | 101,154 |
| Quincy Hosp. Rev. Series 2007, 5% 11/15/18 | | 1,000,000 | 1,030,430 |
| Railsplitter Tobacco Settlement Auth. Rev. Series 2010, 5% 6/1/17 | | 1,095,000 | 1,109,837 |
| Univ. of Illinois Board of Trustees Ctfs. of Prtn. Series 2014 A, 5% 10/1/18 | | 500,000 | 530,450 |
| Univ. of Illinois Rev.: | | | |
| Series 2000, 0% 4/1/17 | | 640,000 | 637,395 |
| Series A, 0% 4/1/18 | | 800,000 | 780,136 |
| Will County Illinois Series 2016, 4% 11/15/18 | | 405,000 | 424,120 |
|
| TOTAL ILLINOIS | | | 66,909,208 |
|
| Indiana - 0.6% | | | |
| Indiana Fin. Auth. Health Sys. Rev. Series 2008 C, 5.5% 11/1/17 | | 125,000 | 129,383 |
| Indiana Fin. Auth. Hosp. Rev. Series 2011 N, 5% 3/1/17 | | 325,000 | 327,077 |
| Indiana Fin. Auth. Rev. Series 2016: | | | |
| 3% 9/1/18 | | 150,000 | 153,293 |
| 3% 9/1/19 | | 250,000 | 256,430 |
| 4% 9/1/20 | | 500,000 | 530,350 |
| Indiana Fin. Auth. Wastewtr. Util. Rev. (CWA Auth. Proj.) Series 2012 A, 5% 10/1/18 | | 875,000 | 929,688 |
| Indiana Health Facility Fing. Auth. Rev. Bonds Series 2001: | | | |
| 1.6%, tender 2/1/17 (a) | | 35,000 | 35,018 |
| 1.6%, tender 2/1/17 (a) | | 160,000 | 160,118 |
| Indianapolis Gas Util. Sys. Rev. 3.5% 6/1/17 (Nat'l. Pub. Fin. Guarantee Corp. Insured) | | 300,000 | 302,928 |
| Indianapolis Local Pub. Impt. Series 2016, 5% 1/1/20 (b) | | 2,685,000 | 2,924,905 |
| Indianapolis Thermal Energy Sys. Series 2010 B, 5% 10/1/17 | | 655,000 | 673,294 |
|
| TOTAL INDIANA | | | 6,422,484 |
|
| Kansas - 0.3% | | | |
| Johnson County Unified School District # 233 Series 2016 A: | | | |
| 2% 9/1/18 | | 1,250,000 | 1,264,688 |
| 5% 9/1/20 | | 1,250,000 | 1,393,225 |
| Wyandotte County/Kansas City Unified Govt. Util. Sys. Rev. Series 2012 A, 4% 9/1/17 | | 225,000 | 229,293 |
|
| TOTAL KANSAS | | | 2,887,206 |
|
| Kentucky - 1.9% | | | |
| Ashland Med. Ctr. Rev. (Ashland Hosp. Corp. D/B/A King's Daughters Med. Ctr. Proj.) Series 2016 A: | | | |
| 4% 2/1/18 | | 325,000 | 331,510 |
| 4% 2/1/20 | | 800,000 | 831,168 |
| Carroll County Poll. Ctlr Rev. Bonds (Kentucky Utils. Co. Proj.) Series 2016 A, 1.05%, tender 9/1/19 (a) | | 8,000,000 | 7,853,200 |
| Kenton County Arpt. Board Arpt. Rev. Series 2016, 5% 1/1/20 | | 215,000 | 234,604 |
| Kentucky Econ. Dev. Fin. Auth. Hosp. Rev. (Baptist Healthcare Sys. Proj.) Series A, 5% 8/15/17 | | 550,000 | 562,749 |
| Kentucky State Property & Buildings Commission Rev.: | | | |
| (#82 Proj.) 5.25% 10/1/17 (FSA Insured) | | 725,000 | 747,178 |
| Series 2016 B, 5% 11/1/19 | | 2,000,000 | 2,170,680 |
| Louisville & Jefferson County Series 2016 A, 5% 10/1/18 | | 1,100,000 | 1,161,523 |
| Louisville/Jefferson County Metropolitan Govt. Poll. Cont. Rev. Bonds (Louisville Gas and Elec. Co. Proj.): | | | |
| Series 2001 B, 1.35%, tender 5/1/18 (a)(b) | | 500,000 | 498,045 |
| Series 2003 A, 1.65%, tender 4/3/17 (a) | | 4,405,000 | 4,408,172 |
| Series 2007 B, 1.15%, tender 6/1/17 (a) | | 100,000 | 99,911 |
|
| TOTAL KENTUCKY | | | 18,898,740 |
|
| Louisiana - 1.9% | | | |
| Louisiana Citizens Property Ins. Corp. Assessment Rev. Series 2015: | | | |
| 5% 6/1/17 | | 3,100,000 | 3,147,864 |
| 5% 6/1/18 | | 1,500,000 | 1,573,380 |
| Louisiana Gen. Oblig. Series 2016 A: | | | |
| 4% 9/1/19 | | 1,500,000 | 1,589,985 |
| 5% 9/1/20 | | 2,185,000 | 2,424,695 |
| Louisiana Loc Govt. Envirl Facilities Bonds Series 2013, 1.144%, tender 8/1/18 (a) | | 5,475,000 | 5,450,417 |
| Louisiana Pub. Facilities Auth. Rev.: | | | |
| (Tulane Univ. of Louisiana Proj.) Series 2016 A, 5% 12/15/19 | | 1,000,000 | 1,088,050 |
| Series 2009 A, 5% 7/1/17 | | 1,690,000 | 1,722,127 |
| Series 2015, 5% 7/1/18 | | 2,100,000 | 2,211,972 |
|
| TOTAL LOUISIANA | | | 19,208,490 |
|
| Massachusetts - 4.4% | | | |
| Massachusetts Dept. of Trans. Metropolitan Hwy. Sys. Rev. Series 2010 B, 5% 1/1/20 | | 500,000 | 548,655 |
| Massachusetts Dev. Fin. Agcy. Rev.: | | | |
| (Lesley Univ. Proj.) Series 2016, 5% 7/1/20 | | 1,025,000 | 1,132,871 |
| Bonds: | | | |
| Series 2011 K5, 5%, tender 1/18/18 (a) | | 1,950,000 | 2,022,560 |
| 1.27%, tender 1/5/17 (a) | | 7,485,000 | 7,485,749 |
| Series 2012 L, 5% 7/1/17 | | 165,000 | 168,236 |
| Series 2013 F, 4% 7/1/18 | | 555,000 | 576,190 |
| Massachusetts Dev. Fin. Agcy. Solid Waste Disp. Rev. Bonds (Waste Mgmt., Inc. Proj.) Series 2002, 1.6%, tender 5/1/17 (a)(b) | | 150,000 | 150,110 |
| Massachusetts Gen. Oblig.: | | | |
| Bonds Series 2014 D1, 1.05%, tender 7/1/20 (a) | | 5,000,000 | 4,930,250 |
| Series 1998 C, 0% 8/1/18 (Nat'l. Pub. Fin. Guarantee Corp. Insured) | | 180,000 | 176,067 |
| Series 2007 A, 1.054% 11/1/18 (a) | | 725,000 | 724,435 |
| Series 2012 D, 1.15% 1/1/18 (a) | | 5,000,000 | 5,002,650 |
| Series 2017 A, 0% 2/1/19 (a)(c) | | 5,000,000 | 4,999,000 |
| Series 2017 B, 0% 2/1/20 (a)(c) | | 16,000,000 | 15,995,200 |
| Massachusetts Health & Edl. Facilities Auth. Rev.: | | | |
| (Partners HealthCare Sys., Inc. Proj.) Series 2007 G, 5% 7/1/18 | | 100,000 | 101,896 |
| Bonds Series 2007 G6, 1.6%, tender 1/5/17 (a) | | 300,000 | 300,924 |
| Series 2008 E2, 5% 7/1/17 | | 120,000 | 122,281 |
|
| TOTAL MASSACHUSETTS | | | 44,437,074 |
|
| Michigan - 3.8% | | | |
| Battle Creek School District Series 2016, 5% 5/1/18 | | 1,000,000 | 1,045,090 |
| Chippewa Valley Schools Series 2016, 5% 5/1/19 | | 1,730,000 | 1,861,463 |
| Clarkston Cmnty. Schools Series 2016 I, 4% 5/1/20 | | 345,000 | 369,247 |
| Ferris State Univ. Rev. Series 2016: | | | |
| 5% 10/1/19 | | 385,000 | 418,849 |
| 5% 10/1/20 | | 540,000 | 599,303 |
| Grand Rapids Pub. Schools Series 2016, 5% 5/1/19 (FSA Insured) | | 2,000,000 | 2,150,560 |
| Ingham, Eaton and Clinton Counties Lansing School District Series 2016 I, 5% 5/1/19 | | 765,000 | 823,132 |
| Lake Orion Cmnty. School District 5% 5/1/19 | | 900,000 | 968,391 |
| Lapeer Cmnty. Schools Series 2016: | | | |
| 4% 5/1/19 | | 535,000 | 563,521 |
| 4% 5/1/20 | | 1,215,000 | 1,295,530 |
| Lenawee Co. Hosp. Fin. Auth. Hosp. Rev. Series 2011 E, 3% 11/15/17 | | 240,000 | 243,998 |
| Lincoln Consolidated School District Series 2016 A, 5% 5/1/19 | | 1,000,000 | 1,071,730 |
| Michigan Fin. Auth. Rev.: | | | |
| Bonds Series 2015 D1, 1.118%, tender 10/15/18 (a) | | 1,905,000 | 1,893,418 |
| Series 2010 A, 5% 12/1/18 | | 325,000 | 347,493 |
| Series 2012, 4% 11/15/17 | | 410,000 | 420,016 |
| Series 2014, 4% 6/1/18 | | 300,000 | 310,944 |
| Series 2015 A, 5% 5/15/19 | | 250,000 | 268,948 |
| Series 2016: | | | |
| 2% 1/1/18 | | 125,000 | 125,858 |
| 3% 1/1/19 | | 100,000 | 102,373 |
| 3% 1/1/20 | | 150,000 | 154,242 |
| 5% 11/15/18 | | 760,000 | 808,769 |
| 5% 11/15/19 | | 500,000 | 539,760 |
| Michigan Gen. Oblig. Series 2016: | | | |
| 3% 3/15/20 | | 5,000,000 | 5,183,800 |
| 5% 3/15/20 | | 1,025,000 | 1,126,014 |
| Michigan Hosp. Fin. Auth. Rev.: | | | |
| Bonds: | | | |
| (Ascension Health Cr. Group Proj.) 1.5%, tender 3/15/17 (a) | | 750,000 | 750,900 |
| Series 2010 F1, 2%, tender 5/30/18 (a) | | 1,290,000 | 1,303,584 |
| Series 2010 F4, 1.95%, tender 4/1/20 (a) | | 700,000 | 698,684 |
| Series 2012 A, 5% 6/1/17 | | 125,000 | 126,966 |
| Oakland Univ. Rev.: | | | |
| Series 2012: | | | |
| 4% 3/1/17 | | 405,000 | 406,904 |
| 4% 3/1/18 | | 130,000 | 134,011 |
| Series 2013 A, 4% 3/1/18 | | 400,000 | 412,340 |
| Portage Pub. Schools Series 2016: | | | |
| 5% 5/1/19 | | 525,000 | 564,769 |
| 5% 11/1/19 | | 740,000 | 805,497 |
| 5% 5/1/20 | | 675,000 | 741,130 |
| Rochester Cmnty. School District 5% 5/1/19 (Nat'l. Pub. Fin. Guarantee Corp. Insured) | | 270,000 | 286,743 |
| Roseville Cmnty. Schools Series 2014, 5% 5/1/18 | | 410,000 | 428,487 |
| Royal Oak Hosp. Fin. Auth. Hosp. Rev. Series 2014 D: | | | |
| 5% 9/1/17 | | 1,775,000 | 1,818,647 |
| 5% 9/1/18 | | 465,000 | 491,821 |
| Warren Consolidated School District Series 2016: | | | |
| 4% 5/1/18 | | 550,000 | 568,882 |
| 4% 5/1/19 | | 1,000,000 | 1,048,860 |
| Wayne-Westland Cmnty. Schools Series 2014, 5% 5/1/18 | | 1,130,000 | 1,184,003 |
| Western Michigan Univ. Rev.: | | | |
| Series 2011, 5% 11/15/17 | | 500,000 | 516,835 |
| Series 2014, 5% 11/15/17 | | 200,000 | 206,734 |
| Ypsilanti School District Series A: | | | |
| 4% 5/1/18 | | 350,000 | 361,641 |
| 4% 5/1/19 | | 1,845,000 | 1,933,855 |
| Zeeland Pub. Schools: | | | |
| 4% 5/1/18 | | 360,000 | 372,020 |
| 4% 5/1/18 (FSA Insured) | | 290,000 | 299,683 |
|
| TOTAL MICHIGAN | | | 38,155,445 |
|
| Minnesota - 0.4% | | | |
| Minneapolis & Saint Paul Metropolitan Arpts. Commission Arpt. Rev. Series 2014 B, 5% 1/1/18 (b) | | 600,000 | 620,538 |
| Northern Muni. Pwr. Agcy. Elec. Sys. Rev.: | | | |
| Series 2008 A, 5% 1/1/19 (Assured Guaranty Corp. Insured) | | 150,000 | 155,058 |
| Series A, 5% 1/1/18 (Assured Guaranty Corp. Insured) | | 330,000 | 342,124 |
| Shakopee Health Care Facilities Rev. Series 2014, 5% 9/1/17 | | 500,000 | 512,160 |
| Southern Minnesota Muni. Pwr. Agcy. Pwr. Supply Sys. Rev.: | | | |
| Series 2002 A, 5.25% 1/1/17 | | 1,280,000 | 1,280,000 |
| 0% 1/1/18 (AMBAC Insured) | | 520,000 | 513,230 |
| Western Minnesota Muni. Pwr. Agcy. Pwr. Supply Rev. Series 2006 A, 5% 1/1/17 (FSA Insured) | | 185,000 | 185,000 |
|
| TOTAL MINNESOTA | | | 3,608,110 |
|
| Mississippi - 0.3% | | | |
| Mississippi Gen. Oblig. (Cap. Impts. Proj.) Series 2012 D, 1.25% 9/1/17 (a) | | 3,110,000 | 3,111,742 |
| Missouri - 0.1% | | | |
| Missouri Health & Edl. Facilities Rev. Series 2016, 5% 5/15/20 | | 750,000 | 818,168 |
| Montana - 0.3% | | | |
| Montana Facility Fin. Auth. Rev. Series 2016: | | | |
| 5% 2/15/19 | | 905,000 | 963,354 |
| 5% 2/15/20 | | 1,735,000 | 1,881,902 |
|
| TOTAL MONTANA | | | 2,845,256 |
|
| Nebraska - 0.1% | | | |
| Nebraska Pub. Pwr. District Rev.: | | | |
| Series 2010 C, 5% 1/1/17 | | 145,000 | 145,000 |
| Series 2014, 4% 1/1/17 | | 125,000 | 125,000 |
| Omaha Pub. Pwr. District Elec. Rev. Series 2007 A, 4% 2/1/18 (Pre-Refunded to 2/1/17 @ 100) | | 190,000 | 190,433 |
|
| TOTAL NEBRASKA | | | 460,433 |
|
| Nevada - 0.7% | | | |
| Clark County Arpt. Rev.: | | | |
| Series 2014 B, 5% 7/1/18 | | 1,310,000 | 1,380,046 |
| 5% 7/1/17 (AMBAC Insured) (b) | | 140,000 | 142,593 |
| Clark County School District: | | | |
| Series 2007 A, 4.5% 6/15/19 | | 360,000 | 376,240 |
| Series 2007 B, 5% 6/15/19 | | 350,000 | 363,328 |
| Series 2007 C, 5% 6/15/18 | | 350,000 | 363,024 |
| Series 2008 A: | | | |
| 5% 6/15/17 | | 495,000 | 503,776 |
| 5% 6/15/19 | | 110,000 | 115,577 |
| Series 2014 A, 5.5% 6/15/17 | | 1,585,000 | 1,616,605 |
| Series 2014 B, 5.5% 6/15/17 | | 175,000 | 178,490 |
| Las Vegas Valley Wtr. District Wtr. Impt. Gen. Oblig.: | | | |
| Series 2010 B, 4% 3/1/17 | | 55,000 | 55,274 |
| Series 2012 B, 5% 6/1/18 | | 70,000 | 73,695 |
| Nevada Lease Rev. Ctfs. Prtn. (Bldg. 1 Proj.) Series 2013, 5% 4/1/17 | | 350,000 | 353,325 |
| Washoe County Gas Facilities Rev. Bonds (Seirra Pacific Pwr. Co. Projs.) Series 2016 A, 1.5%, tender 6/3/19 (a)(b) | | 1,400,000 | 1,373,862 |
|
| TOTAL NEVADA | | | 6,895,835 |
|
| New Hampshire - 0.2% | | | |
| New Hampshire Health & Ed. Facilities Auth. Rev. Series 2016: | | | |
| 3% 10/1/18 | | 1,120,000 | 1,147,160 |
| 3% 10/1/20 | | 1,000,000 | 1,010,930 |
|
| TOTAL NEW HAMPSHIRE | | | 2,158,090 |
|
| New Jersey - 4.8% | | | |
| Middlesex County Gen. Oblig. Series 2007, 4% 6/1/17 | | 195,000 | 197,416 |
| New Brunswick Hsg. Auth. Rev. (Rutgers Univ. Easton Avenue Proj.) Series 2011, 5% 7/1/17 | | 330,000 | 336,405 |
| New Jersey Bldg. Auth. State Bldg. Rev. Series 2007 B, 5% 6/15/17 | | 100,000 | 101,400 |
| New Jersey Econ. Dev. Auth. Rev.: | | | |
| (N.J. Transit Corp. Ligit Rail Transit Sys. Proj.) Series 2008 A, 5% 5/1/17 | | 500,000 | 505,200 |
| Series 2008: | | | |
| 5% 3/1/17 | | 460,000 | 462,489 |
| 5% 5/1/18 | | 250,000 | 258,700 |
| Series 2011 EE: | | | |
| 5% 9/1/18 | | 45,000 | 47,021 |
| 5% 9/1/18 (Escrowed to Maturity) | | 140,000 | 148,478 |
| Series 2012 H, 1.62% 2/1/17 (a) | | 1,000,000 | 1,000,020 |
| Series 2012, 5% 6/15/17 | | 500,000 | 506,595 |
| Series 2015 XX, 5% 6/15/19 | | 1,000,000 | 1,047,990 |
| 5% 12/15/17 (Escrowed to Maturity) | | 95,000 | 98,525 |
| New Jersey Edl. Facilities Auth. Rev.: | | | |
| Series 2010 H, 5% 7/1/18 | | 125,000 | 131,550 |
| Series 2011 C, 3% 7/1/18 | | 100,000 | 102,290 |
| Series 2012 B, 5% 7/1/18 | | 265,000 | 278,886 |
| Series 2013 A, 5% 7/1/17 | | 80,000 | 81,513 |
| New Jersey Edl. Facility: | | | |
| Series 2008: | | | |
| 5% 7/1/17 (Escrowed to Maturity) | | 670,000 | 683,172 |
| 5% 7/1/17 (FSA Insured) | | 1,190,000 | 1,212,503 |
| Series 2015 B, 5% 7/1/19 | | 190,000 | 204,349 |
| New Jersey Gen. Oblig.: | | | |
| Series 2001 H, 5.25% 7/1/17 | | 305,000 | 311,063 |
| Series 2014, 5% 6/1/19 | | 625,000 | 670,181 |
| New Jersey Health Care Facilities Fing. Auth. Rev.: | | | |
| (Virtua Health Proj.) Series A, 5.25% 7/1/17 (Assured Guaranty Corp. Insured) | | 175,000 | 178,609 |
| Series 2008: | | | |
| 5% 7/1/18 | | 3,915,000 | 4,127,898 |
| 5% 7/1/18 | | 180,000 | 189,788 |
| Series 2010: | | | |
| 5% 1/1/19 | | 140,000 | 149,197 |
| 5% 1/1/19 | | 220,000 | 235,347 |
| Series 2011: | | | |
| 4% 7/1/17 | | 575,000 | 582,906 |
| 5% 7/1/17 | | 150,000 | 152,927 |
| Series 2013 A, 5% 7/1/18 | | 100,000 | 105,240 |
| Series 2016 A, 5% 7/1/19 | | 250,000 | 269,005 |
| Series 2016: | | | |
| 5% 7/1/19 | | 1,000,000 | 1,075,260 |
| 5% 7/1/20 | | 2,000,000 | 2,192,720 |
| 4% 7/1/17 | | 330,000 | 334,442 |
| 4% 7/1/19 (Escrowed to Maturity) | | 245,000 | 259,538 |
| New Jersey Tpk. Auth. Tpk. Rev.: | | | |
| Bonds 1.4%, tender 1/5/17 (a) | | 5,220,000 | 5,226,682 |
| Series 2013 C, 1.27% 1/1/18 (a) | | 8,000,000 | 8,010,160 |
| New Jersey Trans. Trust Fund Auth.: | | | |
| Series 2003 B1, 5% 12/15/17 | | 330,000 | 339,181 |
| Series 2010 D, 5% 12/15/17 | | 790,000 | 811,978 |
| Series 2011 B, 5% 6/15/18 | | 130,000 | 134,901 |
| Series 2012 AA, 4% 6/15/18 | | 980,000 | 1,003,099 |
| Series 2015 AA, 3% 6/15/17 | | 600,000 | 603,114 |
| Series 2016 A, 5% 6/15/20 | | 8,000,000 | 8,546,800 |
| 5% 6/15/17 | | 375,000 | 380,250 |
| 5% 6/15/17 | | 1,380,000 | 1,399,320 |
| New Jersey Transit Corp. Ctfs. of Prtn. Series 2014 A: | | | |
| 5% 9/15/17 | | 1,000,000 | 1,023,360 |
| 5% 9/15/19 | | 2,000,000 | 2,104,300 |
| Rutgers State Univ. Rev. Series 2009 F, 4% 5/1/17 | | 225,000 | 227,185 |
|
| TOTAL NEW JERSEY | | | 48,048,953 |
|
| New York - 0.7% | | | |
| Long Island Pwr. Auth. Elec. Sys. Rev.: | | | |
| Series 2000 A, 0% 6/1/19 (FSA Insured) | | 450,000 | 430,191 |
| Series 2016 B, 5% 9/1/20 | | 1,395,000 | 1,544,377 |
| New York City Gen. Oblig. Series 2015 F, 1.37% 2/15/19 (a) | | 1,000,000 | 1,001,620 |
| New York Metropolitan Trans. Auth. Rev. Series 2002 G1, 1.243% 11/1/17 (a) | | 1,665,000 | 1,667,131 |
| New York Thruway Auth. Gen. Rev. Series 2007 H, 4% 1/1/18 (Nat'l. Pub. Fin. Guarantee Corp. Insured) | | 65,000 | 66,829 |
| New York Trans. Dev. Corp. (Term. One Group Assoc. L.P. Proj.) Series 2015, 5% 1/1/18 (b) | | 2,000,000 | 2,074,480 |
|
| TOTAL NEW YORK | | | 6,784,628 |
|
| North Carolina - 1.2% | | | |
| Charlotte-Mecklenburg Hosp. Auth. Health Care Sys. Rev.: | | | |
| Series 2007 A: | | | |
| 5% 1/15/18 | | 420,000 | 420,487 |
| 5% 1/15/19 | | 125,000 | 125,145 |
| Series 2009 A, 4% 1/15/17 | | 150,000 | 150,132 |
| Series 2011 A, 3% 1/15/17 | | 100,000 | 100,060 |
| Series 2012 A, 5% 1/15/17 | | 100,000 | 100,115 |
| 5% 1/15/17 | | 350,000 | 350,403 |
| North Carolina Eastern Muni. Pwr. Agcy. Pwr. Sys. Rev.: | | | |
| Series 1991 A, 6.5% 1/1/18 (Escrowed to Maturity) | | 50,000 | 52,577 |
| Series 2009 A, 5% 1/1/18 (Escrowed to Maturity) | | 125,000 | 129,819 |
| North Carolina Med. Care Cmnty. Health Series 2017: | | | |
| 5% 10/1/18 (c) | | 745,000 | 778,339 |
| 5% 10/1/19 (c) | | 985,000 | 1,042,997 |
| North Carolina Muni. Pwr. Agcy. #1 Catawba Elec. Rev.: | | | |
| Series 2010 A, 5% 1/1/20 | | 340,000 | 371,729 |
| Series 2012 A: | | | |
| 5% 1/1/18 | | 6,990,000 | 7,251,007 |
| 5% 1/1/19 | | 655,000 | 699,887 |
| Raleigh Durham Arpt. Auth. Arpt. Rev. Series 2007, 5% 5/1/18 (Nat'l. Pub. Fin. Guarantee Corp. Insured) (b) | | 190,000 | 192,379 |
| Univ. of North Carolina at Chapel Hill Rev. Bonds Series 2012 B, 1.163%, tender 1/3/17 (a) | | 550,000 | 550,501 |
|
| TOTAL NORTH CAROLINA | | | 12,315,577 |
|
| Ohio - 0.8% | | | |
| Cleveland Ctfs. of Prtn. (Cleveland Stadium Proj.) Series 2010 A, 5% 11/15/17 | | 260,000 | 268,138 |
| Cleveland Pub. Pwr. Sys. Rev. Series 2016 A, 5% 11/15/19 | | 1,890,000 | 2,029,917 |
| Cleveland State Univ. Gen. Receipts Series 2012, 4% 6/1/17 | | 150,000 | 151,791 |
| Franklin County Hosp. Facilities Rev. Bonds (U.S. Health Corp. of Columbus Proj.) Series 2011 B, 5%, tender 7/12/17 (a) | | 1,075,000 | 1,097,102 |
| Hamilton County HealthCare Facilities Rev.: | | | |
| (Christ Hosp. Proj.) Series 2012, 5% 6/1/18 | | 425,000 | 446,458 |
| 5% 6/1/17 | | 65,000 | 65,958 |
| Kent State Univ. Revs. Series 2009 B: | | | |
| 5% 5/1/17 (Assured Guaranty Corp. Insured) | | 60,000 | 60,785 |
| 5% 5/1/18 (Assured Guaranty Corp. Insured) | | 310,000 | 325,444 |
| Ohio Higher Edl. Facility Commission Rev.: | | | |
| (Univ. of Dayton 2009 Proj.) 5% 12/1/17 | | 330,000 | 341,349 |
| Series 2010 A, 5% 1/15/18 | | 360,000 | 373,968 |
| Ohio Hosp. Rev.: | | | |
| Series 2012 A, 5% 1/15/17 | | 430,000 | 430,482 |
| Series 2013 A, 5% 1/15/17 | | 715,000 | 715,801 |
| Scioto County Hosp. Facilities Rev. Series 2016, 5% 2/15/20 | | 1,180,000 | 1,281,397 |
| Univ. of Akron Gen. Receipts Series 2010 A, 5% 1/1/19 (FSA Insured) | | 480,000 | 512,798 |
|
| TOTAL OHIO | | | 8,101,388 |
|
| Oregon - 0.4% | | | |
| Oregon Facilities Auth. Rev.: | | | |
| (Legacy Health Proj.): | | | |
| Series 2011 A, 5.25% 5/1/19 | | 100,000 | 108,000 |
| Series 2012 A, 5% 5/1/17 | | 490,000 | 496,248 |
| Series 2011 C, 5% 10/1/20 | | 420,000 | 467,410 |
| Port of Portland Arpt. Rev.: | | | |
| Series 2010, 5% 7/1/17 (b) | | 1,865,000 | 1,899,167 |
| Series 2012 B, 5% 7/1/17 (b) | | 690,000 | 702,296 |
| 5% 7/1/18 (b) | | 165,000 | 173,572 |
|
| TOTAL OREGON | | | 3,846,693 |
|
| Pennsylvania - 4.9% | | | |
| Allegheny County Arpt. Auth. Rev.: | | | |
| Series 2007 B, 5% 1/1/18 (FSA Insured) | | 1,150,000 | 1,191,205 |
| Series 2010 A, 5% 1/1/17 (FSA Insured) (b) | | 465,000 | 465,000 |
| Series B, 5% 1/1/19 (FSA Insured) | | 290,000 | 299,898 |
| 5% 1/1/17 (Nat'l. Pub. Fin. Guarantee Corp. Insured) (b) | | 1,245,000 | 1,245,000 |
| 5% 1/1/18 (Nat'l. Pub. Fin. Guarantee Corp. Insured) (b) | | 255,000 | 263,754 |
| Allegheny County Hosp. Dev. Auth. Rev.: | | | |
| Series 2008 A, 5% 9/1/17 | | 280,000 | 287,165 |
| Series 2010 A, 5% 5/15/18 | | 1,865,000 | 1,958,287 |
| Bucks Co. Indl. Dev. Auth. Solid Waste Rev. Bonds 1.375%, tender 2/1/17 (a) | | 350,000 | 350,102 |
| Doylestown Hosp. Auth. Hosp. Rev. Series 2016 B, 5% 7/1/20 | | 580,000 | 625,739 |
| Lehigh County Indl. Dev. Auth. Poll. Cont. Rev. Bonds 0.9%, tender 9/1/17 (a) | | 2,030,000 | 2,022,347 |
| Lycoming County Auth. College Rev. Series 2016: | | | |
| 4% 10/1/18 | | 500,000 | 521,545 |
| 4% 10/1/19 | | 1,000,000 | 1,052,750 |
| Monroeville Fin. Auth. UPMC Rev.: | | | |
| Series 2012, 4% 2/15/18 | | 160,000 | 164,928 |
| Series 2014 B, 3% 2/1/19 | | 195,000 | 200,380 |
| Montgomery County Indl. Dev. 4% 10/1/17 | | 500,000 | 510,635 |
| Montgomery County Higher Ed. & Health Auth. Hosp. Rev.: | | | |
| (Abington Memorial Hosp. Proj.) Series 2009 A, 5% 6/1/17 | | 75,000 | 76,198 |
| Series 2009 A, 5% 6/1/18 | | 1,735,000 | 1,819,876 |
| Pennsylvania Econ. Dev. Fin. Auth. Unemployment Compensation Rev. Series 2012 A, 4% 1/1/17 | | 150,000 | 150,000 |
| Pennsylvania Econ. Dev. Fing. Auth. Indl. Dev. Rev.: | | | |
| Series 2014 A: | | | |
| 4% 2/1/18 | | 515,000 | 530,311 |
| 4% 2/1/19 | | 175,000 | 183,379 |
| Series 2016, 4% 3/15/19 | | 3,115,000 | 3,271,373 |
| Pennsylvania Gen. Oblig.: | | | |
| Series 2006, 4% 9/1/17 | | 300,000 | 300,345 |
| Series 2007 A, 5% 11/1/17 | | 315,000 | 325,156 |
| Series 2008: | | | |
| 5% 5/15/17 | | 1,020,000 | 1,034,953 |
| 5% 2/15/18 (Escrowed to Maturity) | | 165,000 | 172,103 |
| Series 2009 1, 5% 3/15/18 | | 120,000 | 125,185 |
| Series 2011, 5% 7/1/18 | | 225,000 | 236,790 |
| Series 2012, 5% 6/1/18 | | 335,000 | 351,676 |
| Series 2014, 5% 7/1/18 | | 410,000 | 431,484 |
| Series 2015, 5% 3/15/18 | | 1,430,000 | 1,491,790 |
| Series 2016: | | | |
| 5% 9/15/18 | | 4,000,000 | 4,236,040 |
| 5% 1/15/19 | | 325,000 | 346,824 |
| 5% 9/15/19 | | 8,075,000 | 8,751,443 |
| 5% 9/15/20 | | 385,000 | 425,490 |
| 4% 9/1/19 | | 250,000 | 250,288 |
| Pennsylvania Higher Edl. Facilities Auth. Rev.: | | | |
| Series 2010 1, 5% 4/1/18 | | 255,000 | 266,942 |
| Series 2010 E: | | | |
| 5% 5/15/18 | | 450,000 | 472,509 |
| 5% 5/15/19 | | 760,000 | 817,973 |
| Series 2012, 4% 4/1/18 | | 200,000 | 206,914 |
| Philadelphia Arpt. Rev.: | | | |
| Series 2007 B, 5% 6/15/17 (FSA Insured) (b) | | 2,325,000 | 2,365,502 |
| Series 2010 C, 5% 6/15/18 (b) | | 445,000 | 466,841 |
| Series 2011 A, 5% 6/15/18 (b) | | 1,350,000 | 1,416,258 |
| Series 2015 A, 5% 6/15/19 (b) | | 1,195,000 | 1,287,529 |
| Philadelphia Gas Works Rev. 5% 10/1/19 | | 4,040,000 | 4,343,404 |
| Philadelphia School District: | | | |
| Series 2016 D: | | | |
| 5% 9/1/17 | | 190,000 | 194,180 |
| 5% 9/1/18 | | 750,000 | 784,058 |
| Series 2016 F, 5% 9/1/19 | | 1,000,000 | 1,059,840 |
| State Pub. School Bldg. Auth. Lease Rev. (The School District of Philadelphia Proj.) Series 2016 A, 5% 6/1/19 | | 375,000 | 395,936 |
|
| TOTAL PENNSYLVANIA | | | 49,747,325 |
|
| Rhode Island - 0.1% | | | |
| Rhode Island Comm Corp. Rev. Series 2016 A, 5% 6/15/19 | | 985,000 | 1,058,570 |
| South Carolina - 0.3% | | | |
| Scago Edl. Facilities Corp. for Colleton School District (School District of Colleton County Proj.) Series 2015, 5% 12/1/18 | | 1,575,000 | 1,677,848 |
| South Carolina Jobs-Econ. Dev. Auth. (Anmed Health Proj.) Series 2016, 5% 2/1/20 | | 750,000 | 822,825 |
| South Carolina Pub. Svc. Auth. Rev.: | | | |
| Series 2006 C, 5% 1/1/18 (FSA Insured) | | 125,000 | 125,000 |
| Series 2007 A, 5% 1/1/18 (Pre-Refunded to 1/1/17 @ 100) | | 270,000 | 270,000 |
| Series 2015 A, 5% 1/1/19 (FSA Insured) | | 325,000 | 325,000 |
|
| TOTAL SOUTH CAROLINA | | | 3,220,673 |
|
| Tennessee - 0.6% | | | |
| Knox County Health Edl. & Hsg. Facilities Series 2016 A, 3% 1/1/19 | | 500,000 | 510,095 |
| Memphis-Shelby County Arpt. Auth. Arpt. Rev.: | | | |
| Series 2010 B, 5.5% 7/1/19 (b) | | 2,500,000 | 2,712,675 |
| Series 2011 A1, 5% 7/1/17 (b) | | 30,000 | 30,564 |
| Series 2011 C, 5% 7/1/19 (b) | | 280,000 | 300,437 |
| Nashville and Davidson County Metropolitan Govt. Health & Edl. Facilities Board Rev. Bonds Series 2001 B, 1.55%, tender 11/3/20 (a) | | 3,000,000 | 2,938,500 |
|
| TOTAL TENNESSEE | | | 6,492,271 |
|
| Texas - 4.3% | | | |
| Alief Independent School District Series 2016, 3% 2/15/17 | | 400,000 | 400,988 |
| Austin Independent School District Series 2016 A, 4% 8/1/17 | | 475,000 | 483,384 |
| Brownsville Util. Sys. Rev.: | | | |
| Series 2013 A, 3% 9/1/17 | | 500,000 | 505,655 |
| Series 2015: | | | |
| 5% 9/1/17 | | 495,000 | 507,038 |
| 5% 9/1/18 | | 1,075,000 | 1,136,275 |
| Corpus Christi Util. Sys. Rev. Bonds Series 2015 B, 2%, tender 7/15/17 (a) | | 5,165,000 | 5,167,376 |
| Dallas County Util. and Reclamation District Series 2016: | | | |
| 5% 2/15/19 | | 1,375,000 | 1,471,044 |
| 5% 2/15/20 | | 1,320,000 | 1,445,123 |
| Dallas Fort Worth Int'l. Arpt. Rev.: | | | |
| Series 2013 E, 5% 11/1/17 (b) | | 165,000 | 170,264 |
| Series 2014 A, 3% 11/1/17 (b) | | 185,000 | 187,882 |
| Harris County Cultural Ed. Facilities Fin. Corp. Rev.: | | | |
| Bonds Series 2014 B, 1.3%, tender 12/1/19 (a) | | 3,000,000 | 2,982,600 |
| Series 2013 A: | | | |
| 4% 12/1/18 | | 420,000 | 440,051 |
| 5% 12/1/17 | | 400,000 | 413,644 |
| Houston Arpt. Sys. Rev.: | | | |
| Series 2007 B, 5% 7/1/20 (FGIC Insured) | | 5,500,000 | 5,602,355 |
| Series 2011 A: | | | |
| 5% 7/1/18 (b) | | 100,000 | 105,286 |
| 5% 7/1/19 (b) | | 715,000 | 769,540 |
| Series 2012 A, 5% 7/1/18 (b) | | 145,000 | 152,665 |
| 5% 7/1/17 (Nat'l. Pub. Fin. Guarantee Corp. Insured) | | 600,000 | 611,556 |
| Houston Cmnty. College Sys. Rev. Series 2011, 5% 2/15/18 | | 80,000 | 83,454 |
| Houston Util. Sys. Rev. Bonds 1.47%, tender 1/5/17 (a) | | 775,000 | 774,241 |
| Lower Colorado River Auth. Rev.: | | | |
| (LCRA Transmission Corp. Proj.) Series 2011 A, 5% 5/15/19 | | 250,000 | 269,673 |
| (LCRA Transmission Svcs. Corp. Proj.) Series 2016, 5% 5/15/18 | | 925,000 | 971,916 |
| Series 2008: | | | |
| 5% 5/15/18 | | 470,000 | 493,838 |
| 5.5% 5/15/19 | | 160,000 | 168,565 |
| Series 2010 4% 5/15/18 | | 250,000 | 259,315 |
| Series 2010 A, 5% 5/15/20 | | 3,130,000 | 3,434,768 |
| Series 2010: | | | |
| 5% 5/15/17 | | 500,000 | 507,200 |
| 5% 5/15/20 | | 200,000 | 219,474 |
| Series 2011 A 5% 5/15/17 | | 165,000 | 167,376 |
| Series 2012 B, 5% 5/15/17 | | 100,000 | 101,440 |
| Series 2014, 5% 5/15/18 | | 280,000 | 294,202 |
| Series 2015 D: | | | |
| 4% 5/15/17 | | 180,000 | 181,946 |
| 5% 5/15/17 | | 635,000 | 644,144 |
| Series 2015, 4% 5/15/17 | | 375,000 | 379,054 |
| 5% 5/15/19 | | 595,000 | 641,107 |
| San Antonio Elec. & Gas Sys. Rev. Series 2006 B, 5% 2/1/18 | | 100,000 | 100,309 |
| San Antonio Gen. Oblig. Series 2016, 5% 2/1/18 | | 405,000 | 422,010 |
| Southwest Higher Ed. Auth. Rev. (Southern Methodist Univ. Proj.) Series 2009, 5% 10/1/17 | | 60,000 | 61,753 |
| Tarrant County Cultural Ed. Facilities Fin. Corp. Rev.: | | | |
| Series 2007 A: | | | |
| 5% 2/15/20 | | 2,235,000 | 2,245,303 |
| 5% 2/15/21 | | 3,740,000 | 3,757,241 |
| 5% 2/15/23 | | 500,000 | 502,305 |
| 5% 2/15/26 | | 4,000,000 | 4,018,440 |
| 5.75% 7/1/18 | | 335,000 | 348,708 |
|
| TOTAL TEXAS | | | 43,600,508 |
|
| Virginia - 1.0% | | | |
| Fairfax County Indl. Dev. Auth. (Inova Health Sys. Proj.) Series 2009 C, 5% 5/15/18 | | 495,000 | 520,379 |
| Louisa Indl. Dev. Auth. Poll. Cont. Rev. Bonds Series 2008 A, 1.75%, tender 5/16/19 (a) | | 1,600,000 | 1,592,624 |
| Wise County Indl. Dev. Auth. Waste & Sewage Rev. Bonds (Virginia Elec. and Pwr. Co. Proj.) Series 2010 A, 1.875%, tender 6/1/20 (a) | | 8,125,000 | 7,986,225 |
|
| TOTAL VIRGINIA | | | 10,099,228 |
|
| Washington - 0.3% | | | |
| Chelan County Pub. Util. District #1 Rev. Series 2011 B, 5% 7/1/18 (b) | | 175,000 | 184,438 |
| Port of Seattle Rev.: | | | |
| Series 2010 C: | | | |
| 5% 2/1/17 (b) | | 185,000 | 185,549 |
| 5% 2/1/18 (b) | | 875,000 | 910,306 |
| Series 2012 A, 4% 8/1/17 | | 125,000 | 127,184 |
| Series 2012 B, 4% 8/1/17 (b) | | 115,000 | 116,976 |
| Washington Ctfs. of Prtn. Series 2013 D, 4% 7/1/17 | | 240,000 | 243,586 |
| Washington Gen. Oblig.: | | | |
| Series 2000 S5, 0% 1/1/17 | | 200,000 | 200,000 |
| Series 2004 C, 0% 6/1/18 | | 210,000 | 205,951 |
| Washington Health Care Facilities Auth. Rev. Series 2014, 5% 3/1/18 | | 275,000 | 286,822 |
| Washington Pub. Pwr. Supply Sys. Nuclear Proj. #3 Rev. Series 1993 C, 0% 7/1/18 | | 475,000 | 464,137 |
|
| TOTAL WASHINGTON | | | 2,924,949 |
|
| West Virginia - 0.3% | | | |
| West Virginia Econ. Dev. Auth. Poll. Cont. Rev. (Appalacian Pwr. Co. - Amos Proj.) Series 2008 D, 3.25% 5/1/19 | | 250,000 | 255,923 |
| West Virginia Econ. Dev. Auth. Solid Waste Disp. Facilities Rev. Bonds: | | | |
| (Appalachian Pwr. Co. Amos Proj.) Series 2011 A, 1.7%, tender 9/1/20 (a)(b) | | 2,515,000 | 2,428,836 |
| 1.9%, tender 4/1/19 (a) | | 530,000 | 527,801 |
|
| TOTAL WEST VIRGINIA | | | 3,212,560 |
|
| Wisconsin - 0.6% | | | |
| Milwaukee County Arpt. Rev. Series 2016 A: | | | |
| 5% 12/1/18 (b) | | 700,000 | 744,345 |
| 5% 12/1/19 (b) | | 2,435,000 | 2,644,483 |
| Wisconsin Health & Edl. Facilities: | | | |
| Bonds Series 2013 B: | | | |
| 4%, tender 3/1/18 (a) | | 1,020,000 | 1,052,426 |
| 4%, tender 5/30/19 (a) | | 655,000 | 689,676 |
| Series 2013 A, 5% 11/15/18 | | 160,000 | 170,726 |
| Wisconsin Health & Edl. Facilities Auth. Rev.: | | | |
| (Aurora Health Care, Inc. Proj.) Series 2010 A, 5% 4/15/17 | | 55,000 | 55,608 |
| Series 2012 B, 5% 8/15/18 | | 525,000 | 555,518 |
|
| TOTAL WISCONSIN | | | 5,912,782 |
|
| TOTAL MUNICIPAL BONDS | | | |
| (Cost $533,636,741) | | | 530,144,011 |
|
| Municipal Notes - 49.6% | | | |
| Alabama - 0.3% | | | |
| Decatur Indl. Dev. Board Exempt Facilities Rev. (Nucor Steel Decatur LLC Proj.) Series 2003 A, 1% 1/6/17, VRDN (a)(b) | | 2,903,000 | $2,903,000 |
| Mobile County Board of School Commissioners TAN Series 2016 A, 2% 3/1/17 | | 350,000 | 350,567 |
|
| TOTAL ALABAMA | | | 3,253,567 |
|
| California - 3.8% | | | |
| California Gen. Oblig. Participating VRDN Series Floaters XF 10 38, 0.93% 1/6/17 (Liquidity Facility Deutsche Bank AG New York Branch) (a)(d) | | 11,700,000 | 11,700,000 |
| California St Enterprise Dev. Auth. (Var Evapco Proj.) Series 2008, 1.02% 1/6/17, LOC Manufacturers & Traders Trust Co., VRDN (a)(b) | | 4,270,000 | 4,270,000 |
| California Statewide Cmntys. Dev. Auth. Participating VRDN Series ZF 01 99, 0.92% 1/6/17 (Liquidity Facility JPMorgan Chase Bank) (a)(d) | | 2,695,000 | 2,695,000 |
| San Francisco Calif. City & Cnty. Arpts. Commn. Int'l. Arpt. Rev. Participating VRDN Series 15 ZF 01 64, 1.02% 1/6/17 (Liquidity Facility JPMorgan Chase Bank) (a)(b)(d) | | 6,665,000 | 6,665,000 |
| San Francisco City & County Arpt. Commission Participating VRDN Series Floaters 16 ZF0516, 1.02% 1/6/17 (Liquidity Facility JPMorgan Chase Bank) (a)(b)(d) | | 12,500,000 | 12,500,000 |
| Shafter Indl. Dev. Auth. Indl. Dev. Rev. 1.18% 1/6/17, LOC Deutsche Bank AG, VRDN (a)(b) | | 800,000 | 800,000 |
|
| TOTAL CALIFORNIA | | | 38,630,000 |
|
| Colorado - 0.4% | | | |
| Colorado Edl. & Cultural Facilities Auth. Rev. (Mesivta of Greater Los Angeles Proj.) Series 2005, 1.07% 1/6/17, LOC Deutsche Bank AG, VRDN (a) | | 3,670,000 | 3,670,000 |
| Connecticut - 0.2% | | | |
| New London BAN Series 2016, 2% 3/23/17 | | 500,000 | 500,835 |
| Stratford Gen. Oblig. BAN Series 2017, 2.5% 1/3/18 (c) | | 1,200,000 | 1,213,380 |
|
| TOTAL CONNECTICUT | | | 1,714,215 |
|
| Delaware - 1.8% | | | |
| Delaware Econ. Dev. Auth. Rev. (Delmarva Pwr. & Lt. Co. Proj.) Series 1994, 0.96% 1/3/17, VRDN (a)(b) | | 18,600,000 | 18,600,000 |
| Florida - 1.0% | | | |
| Hillsborough County Indl. Dev. Auth. Rev. (Var-Independent Day School Proj.) Series 2000, 0.9% 1/6/17, LOC Bank of America NA, VRDN (a) | | 1,000,000 | 1,000,000 |
| Miami Dade Cnty. Aviation Rev. Participating VRDN Series Floaters XL 00 35, 1% 1/6/17 (Liquidity Facility JPMorgan Chase Bank) (a)(b)(d) | | 3,975,000 | 3,975,000 |
| Miami-Dade County Transit Sales Surtax Rev. Participating VRDN Series Floaters ZF 20 83, 0.92% 1/6/17 (Liquidity Facility Morgan Stanley Bank, West Valley City Utah) (a)(d) | | 5,000,000 | 5,000,000 |
|
| TOTAL FLORIDA | | | 9,975,000 |
|
| Idaho - 0.2% | | | |
| Idaho Health Facilities Auth. Rev. Participating VRDN Series 16 XG 00 66, 1.04% 1/6/17 (Liquidity Facility Deutsche Bank AG New York Branch) (a)(d) | | 1,500,000 | 1,500,000 |
| Illinois - 10.3% | | | |
| Centegra Health Sys. Participating VRDN Series Floaters XF 23 39, 0.97% 1/6/17 (Liquidity Facility Barclays Bank PLC) (a)(d) | | 17,050,000 | 17,050,000 |
| Chicago O'Hare Int'l. Arpt. Rev. Participating VRDN Series Floaters YX 10 35, 1% 1/6/17 (Liquidity Facility Barclays Bank PLC) (a)(d) | | 10,180,000 | 10,180,000 |
| Chicago Park District Gen. Oblig. Participating VRDN Series ROC II R 11935, 1.22% 1/6/17 (Liquidity Facility Citibank NA) (a)(d) | | 9,375,000 | 9,375,000 |
| Chicago Tran Auth. Participating VRDN Series Floaters XM 04 50, 0.99% 1/6/17 (Liquidity Facility Deutsche Bank AG New York Branch) (a)(d) | | 1,500,000 | 1,500,000 |
| Chicago Transit Auth. Rev. Bonds Participating VRDN Series XM 00 53, 0.97% 1/6/17 (Liquidity Facility Citibank NA) (a)(d) | | 12,205,000 | 12,205,000 |
| Cook County Gen. Oblig. Participating VRDN: | | | |
| Series 2015 XF0124, 1.04% 1/6/17 (Liquidity Facility JPMorgan Chase Bank) (a)(d) | | 5,000,000 | 5,000,000 |
| Series XX 10 11, 0.92% 1/6/17 (Liquidity Facility Barclays Bank PLC) (a)(d) | | 6,660,000 | 6,660,000 |
| Illinois Dev. Fin. Auth. Indl. Dev. Rev. (R. A. Zweig, Inc. Proj.) 0.96% 1/6/17, LOC JPMorgan Chase Bank, VRDN (a)(b) | | 650,000 | 650,000 |
| Illinois Dev. Fin. Auth. Ltd. Oblg. Rev. (Var Decatur Mental Health Ctr. Proj.) Series 1997, 1% 1/6/17, LOC PNC Bank NA, VRDN (a)(b) | | 265,000 | 265,000 |
| Illinois Dev. Fin. Auth. Rev. (Var-Cook Communications Proj.) Series 2002, 0.9% 1/5/17, LOC Bank of America NA, VRDN (a) | | 4,500,000 | 4,500,000 |
| Illinois Fin. Auth. Rev. Participating VRDN: | | | |
| Series XF 01 04, 1.02% 1/6/17 (Liquidity Facility JPMorgan Chase Bank) (a)(d) | | 5,000,000 | 5,000,000 |
| Series XF 23 38, 1.03% 1/6/17 (Liquidity Facility Barclays Bank PLC) (a)(d) | | 18,075,000 | 18,075,000 |
| Illinois Gen. Oblig. Participating VRDN Series 15 XF 1006, 1.03% 1/6/17 (Liquidity Facility Deutsche Bank AG) (a)(d) | | 8,900,000 | 8,900,000 |
| Metropolitan Wtr. Reclamation District of Greater Chicago Participating VRDN Series Floaters XM 03 78, 0.92% 1/6/17 (Liquidity Facility JPMorgan Chase Bank) (a)(d) | | 5,000,000 | 5,000,000 |
|
| TOTAL ILLINOIS | | | 104,360,000 |
|
| Indiana - 0.2% | | | |
| Allen County Econ. Dev. Rev. (DeBrand, Inc. Proj.) 0.97% 1/5/17, LOC JPMorgan Chase Bank, VRDN (a)(b) | | 300,000 | 300,000 |
| Indiana Dev. Fin. Auth. Envir. Rev. (PSI Energy Proj.) Series 2003 A, 0.9% 1/6/17, VRDN (a)(b) | | 1,800,000 | 1,800,000 |
| Indiana Fin. Auth. Rev. RAN Series 2016, 2% 9/1/17 | | 195,000 | 195,823 |
|
| TOTAL INDIANA | | | 2,295,823 |
|
| Kentucky - 0.1% | | | |
| Bardstown Indl. Rev. (JAV Invt. LLC Proj.) Series 2001, 0.97% 1/6/17, LOC JPMorgan Chase Bank, VRDN (a)(b) | | 200,000 | 200,000 |
| Kentucky Pub. Trans. BAN Series 2013 A, 5% 7/1/17 | | 300,000 | 304,680 |
| Lexington-Fayette Urban County K Series 1998, 1% 1/6/17, LOC PNC Bank NA, VRDN (a) | | 330,000 | 330,000 |
|
| TOTAL KENTUCKY | | | 834,680 |
|
| Louisiana - 8.0% | | | |
| Saint James Parish Gen. Oblig. (Nucor Steel Louisiana LLC Proj.): | | | |
| Series 2010 A1, 0.95% 1/6/17, VRDN (a) | | 31,605,000 | 31,605,000 |
| Series 2010 B1, 0.94% 1/6/17, VRDN (a) | | 48,710,000 | 48,709,970 |
|
| TOTAL LOUISIANA | | | 80,314,970 |
|
| Maine - 0.1% | | | |
| Auburn Rev. Oblig. Secs Series 2001, 0.96% 1/6/17, LOC TD Banknorth, NA, VRDN (a)(b) | | 850,000 | 850,000 |
| Maryland - 0.3% | | | |
| Maryland Health & Higher Edl. Facilities Auth. Rev. Series 1995, 1% 1/6/17 (Liquidity Facility Manufacturers & Traders Trust Co.), VRDN (a) | | 2,920,000 | 2,920,000 |
| Massachusetts - 0.7% | | | |
| Massachusetts Dev. Fin. Agcy. Rev. Participating VRDN Series Floaters XF 23 65, 0.92% 1/6/17 (Liquidity Facility Morgan Stanley Bank, West Valley City Utah) (a)(d) | | 6,665,000 | 6,665,000 |
| Michigan - 0.1% | | | |
| Lowell Mich Ltd. Oblig. Indl. Dev. (Litehouse, Inc. Proj.) Series 2003, 1.09% 1/6/17, LOC Fifth Third Bank, Cincinnati, VRDN (a)(b) | | 870,000 | 870,000 |
| Mississippi - 0.1% | | | |
| Mississippi Bus. Fin. Corp. Rev. (Utils. Optimization LLC Proj.) Series 2002 A, 0.89% 1/6/17, LOC Cap. One Bank, VRDN (a)(b) | | 900,000 | 900,000 |
| Nevada - 2.2% | | | |
| Clark County Arpt. Rev. Participating VRDN Series ROC II R 11823, 1.02% 1/6/17 (Liquidity Facility Citibank NA) (a)(d) | | 21,840,000 | 21,840,000 |
| Sparks Econ. Dev. Rev. (RIX Industries Proj.) Series 2002, 0.89% 1/6/17, LOC Wells Fargo Bank NA, VRDN (a)(b) | | 565,000 | 565,000 |
|
| TOTAL NEVADA | | | 22,405,000 |
|
| New Hampshire - 1.1% | | | |
| New Hampshire Bus. Fin. Auth. Rev. Series 2008, 0.87% 1/3/17, LOC RBS Citizens NA, VRDN (a) | | 11,110,000 | 11,110,000 |
| New Jersey - 1.8% | | | |
| Clark Township Gen. Oblig. BAN Series 2016, 2% 3/17/17 | | 3,000,000 | 3,004,920 |
| Hackensack City Tax Appeal Nts BAN Series 2016, 2% 11/6/17 | | 1,800,000 | 1,809,216 |
| New Brunswick Gen. Oblig. BAN Series 2016, 3% 6/6/17 | | 1,100,000 | 1,107,414 |
| New Jersey Health Care Facilities Fing. Auth. Rev. Participating VRDN Series 16 XG 00 47, 1.11% 1/6/17 (Liquidity Facility Deutsche Bank AG New York Branch) (a)(d) | | 8,753,627 | 8,753,627 |
| Plainfield Gen. Oblig. BAN Series 2016, 1.5% 8/30/17 | | 3,951,000 | 3,955,741 |
|
| TOTAL NEW JERSEY | | | 18,630,918 |
|
| New York - 3.5% | | | |
| Albany Gen. Oblig. BAN Series 2016, 2% 6/30/17 | | 1,846,812 | 1,853,368 |
| Binghamton Gen. Oblig. BAN Series 2016, 2.5% 11/17/17 | | 900,000 | 909,279 |
| Eastport-South Manor Central School District TAN Series 2016, 1.5% 6/23/17 | | 10,250,000 | 10,264,145 |
| Nassau County Indl. Dev. Agcy. Indl. Dev. Rev. (Rubies Costume Co. Proj.) Series 1999, 1% 1/6/17, LOC Bank of America NA, VRDN (a) | | 570,000 | 570,000 |
| New York St Twy Auth. Participating VRDN Series Floaters ZF 04 82, 0.87% 1/6/17 (Liquidity Facility JPMorgan Chase Bank) (a)(d) | | 5,550,000 | 5,550,000 |
| Onondaga County Indl. Dev. Agcy. Indl. Dev. Rev. (Var G A Braun, Inc. Proj.) Series 2007, 1.02% 1/6/17, LOC Manufacturers & Traders Trust Co., VRDN (a)(b) | | 6,575,000 | 6,575,000 |
| Rensselaer County Indl. Dev. Auth. Civic Facilities Rev. (Rensselaer Polytechnic Institute Proj.) Series 1997 A, 1.13% 1/6/17, VRDN (a) | | 5,715,000 | 5,715,000 |
| Sachem Central School District of Holbrook TAN Series 2016, 1.5% 6/29/17 | | 1,700,000 | 1,701,428 |
| Syracuse Gen. Oblig. RAN Series 2016 B, 2% 6/30/17 | | 1,400,000 | 1,404,970 |
| Ulster County Indl. Dev. Agcy. I (Selux Corp. Proj.) Series A: | | | |
| 1.1% 1/6/17, LOC Manufacturers & Traders Trust Co., VRDN (a)(b) | | 440,000 | 440,000 |
| 1.1% 1/6/17, LOC Manufacturers & Traders Trust Co., VRDN (a)(b) | | 305,000 | 305,000 |
|
| TOTAL NEW YORK | | | 35,288,190 |
|
| North Carolina - 0.4% | | | |
| Hertford County Indl. Facilities Poll. Cont. Fing. Auth. Series 2000 B, 1% 1/6/17, VRDN (a)(b) | | 4,400,000 | 4,400,000 |
| Ohio - 0.5% | | | |
| Belmont County BAN Series 2016, 1.375% 8/31/17 | | 400,000 | 399,944 |
| Marietta BAN 1.5% 5/12/17 | | 3,475,000 | 3,476,946 |
| St Bernard-Elmwood Pl School District BAN Series 2016, 2.75% 5/3/17 | | 1,100,000 | 1,103,564 |
|
| TOTAL OHIO | | | 4,980,454 |
|
| Oklahoma - 0.2% | | | |
| Broken Arrow Eda Indl. dev Series 1989, 0.97% 1/6/17, LOC JPMorgan Chase Bank, VRDN (a)(b) | | 2,500,000 | 2,500,000 |
| Pennsylvania - 0.9% | | | |
| Berks County Indl. Dev. Auth. Rev. (KTB Real Estate Partnership Proj.) 0.89% 1/6/17, LOC Manufacturers & Traders Trust Co., VRDN (a)(b) | | 600,000 | 600,000 |
| Montgomery County Indl. Dev. Auth. Rev. (Var-FXD-Big Little Assoc. Proj.) Series 1999, 0.89% 1/6/17, LOC Wells Fargo Bank NA, VRDN (a) | | 300,000 | 300,000 |
| Northampton County Indl. Dev. Auth. Rev. Series 1998, 0.94% 1/6/17, LOC Wells Fargo Bank NA, VRDN (a) | | 450,000 | 450,000 |
| Pennsylvania Tpk. Commission Tpk. Rev. Participating VRDN Series ROC II R 11995, 0.92% 1/6/17 (Liquidity Facility Citibank NA) (a)(d) | | 7,330,000 | 7,330,000 |
|
| TOTAL PENNSYLVANIA | | | 8,680,000 |
|
| South Carolina - 0.5% | | | |
| Berkeley County Indl. Dev. Rev. (Nucor Corp. Proj.) Series 1995, 1% 1/6/17, VRDN (a)(b) | | 2,800,000 | 2,800,000 |
| South Carolina Jobs-Econ. Dev. Auth. Econ. Dev. Rev. (Var-Dorris PPTYS LLC Proj.) Series 2006, 0.93% 1/6/17, LOC TD Banknorth, NA, VRDN (a)(b) | | 2,295,000 | 2,295,000 |
|
| TOTAL SOUTH CAROLINA | | | 5,095,000 |
|
| Tennessee - 0.5% | | | |
| Vanderbilt Hosp. Participating VRDN 0.95% 1/6/17 (Liquidity Facility Deutsche Bank AG New York Branch) (a)(d) | | 5,100,000 | 5,100,000 |
| Texas - 9.2% | | | |
| Port Arthur Navigation District Envir. Facilities Rev. (Motiva Enterprises LLC Proj.): | | | |
| Series 2001 A, 0.85% 1/3/17, VRDN (a) | | 11,140,000 | 11,140,000 |
| Series 2004, 0.92% 1/6/17, VRDN (a)(b) | | 10,230,000 | 10,230,000 |
| Series 2009 A, 0.85% 1/3/17, VRDN (a) | | 21,850,000 | 21,850,000 |
| Series 2009 B, 0.85% 1/3/17, VRDN (a) | | 2,200,000 | 2,200,000 |
| Series 2009 C, 0.85% 1/3/17, VRDN (a) | | 23,705,000 | 23,705,000 |
| Series 2010 B, 0.85% 1/3/17, VRDN (a) | | 5,300,000 | 5,300,000 |
| Series 2010 C, 0.85% 1/3/17, VRDN (a) | | 5,000,000 | 5,000,000 |
| Series 2010 D: | | | |
| 0.85% 1/3/17, VRDN (a) | | 5,550,000 | 5,550,000 |
| 0.85% 1/3/17, VRDN (a) | | 7,280,000 | 7,280,000 |
| Splendora Higher Ed. Facilities Corp. Rev. (Fellowship Christian Academy Proj.) 0.9% 1/1/17, LOC Bank of America NA, VRDN (a) | | 400,000 | 400,000 |
|
| TOTAL TEXAS | | | 92,655,000 |
|
| Virginia - 0.7% | | | |
| Suffolk Econ. Dev. Auth. Hosp. Facilities Rev. Bonds Series EGL 13 0014, 1%, tender 2/23/17 (Liquidity Facility Citibank NA) (a)(d)(e) | | 7,225,000 | 7,225,000 |
| Washington - 0.4% | | | |
| Seattle Hsg. Auth. Rev. (Douglas Apts. Proj.) 0.84% 1/6/17, LOC KeyBank NA, VRDN (a) | | 770,000 | 770,000 |
| Washington Health Care Facilities Auth. Rev. Participating VRDN Series Floaters XG 00 51, 0.94% 1/6/17 (Liquidity Facility Deutsche Bank AG New York Branch) (a)(d) | | 3,375,000 | 3,375,000 |
|
| TOTAL WASHINGTON | | | 4,145,000 |
|
| Wisconsin - 0.1% | | | |
| Baraboo Indl. Dev. Rev. (Teel Plastics, Inc. Proj.) Series 2007, 1.3% 1/6/17, LOC BMO Harris Bank NA, VRDN (a)(b) | | 280,000 | 280,000 |
| River Falls Indl. Dev. Rev. 1.08% 1/6/17, LOC U.S. Bank NA, Cincinnati, VRDN (a)(b) | | 360,000 | 360,000 |
|
| TOTAL WISCONSIN | | | 640,000 |
|
| TOTAL MUNICIPAL NOTES | | | |
| (Cost $500,270,878) | | | 500,207,817 |
| TOTAL INVESTMENT PORTFOLIO - 102.1% | | | |
| (Cost $1,033,907,619) | | | 1,030,351,828 |
| NET OTHER ASSETS (LIABILITIES) - (2.1)% | | | (21,620,566) |
| NET ASSETS - 100% | | | $1,008,731,262 |
Security Type Abbreviations
BAN – BOND ANTICIPATION NOTE
RAN – REVENUE ANTICIPATION NOTE
TAN – TAX ANTICIPATION NOTE
VRDN – VARIABLE RATE DEMAND NOTE (A debt instrument that is payable upon demand, either daily, weekly or monthly)
Legend
(a) Coupon rates for floating and adjustable rate securities reflect the rates in effect at period end.
(b) Private activity obligations whose interest is subject to the federal alternative minimum tax for individuals.
(c) Security or a portion of the security purchased on a delayed delivery or when-issued basis.
(d) Provides evidence of ownership in one or more underlying municipal bonds.
(e) Restricted securities - Investment in securities not registered under the Securities Act of 1933 (excluding 144A issues). At the end of the period, the value of restricted securities (excluding 144A issues) amounted to $7,225,000 or 0.7% of net assets.
Additional information on each restricted holding is as follows:
| Security | Acquisition Date | Acquisition Cost |
| Suffolk Econ. Dev. Auth. Hosp. Facilities Rev. Bonds Series EGL 13 0014, 1%, tender 2/23/17 (Liquidity Facility Citibank NA) | 9/8/16 - 12/22/16 | $7,225,000 |
Affiliated Central Funds
Information regarding fiscal year to date income earned by the Fund from investments in Fidelity Central Funds is as follows:
| Fund | Income earned |
| Fidelity Municipal Cash Central Fund | $4,074 |
| Total | $4,074 |
Investment Valuation
All investments are categorized as Level 2 under the Fair Value Hierarchy. The inputs or methodology used for valuing securities may not be an indication of the risk associated with investing in those securities. For more information on valuation inputs please refer to the Investment Valuation section in the accompanying Notes to Financial Statements.
Other Information
The distribution of municipal securities by revenue source, as a percentage of total Net Assets, is as follows (Unaudited):
| General Obligations | 22.5% |
| Synthetics | 20.6% |
| Industrial Development | 20.5% |
| Health Care | 13.3% |
| Electric Utilities | 11.8% |
| Transportation | 7.7% |
| Others* (Individually Less Than 5%) | 3.6% |
| | 100.0% |
* Includes net other assets
See accompanying notes which are an integral part of the financial statements.
Financial Statements
Statement of Assets and Liabilities
| | | December 31, 2016 |
| Assets | | |
Investment in securities, at value — See accompanying schedule:
Unaffiliated issuers (cost $1,033,907,619) | | $1,030,351,828 |
| Receivable for fund shares sold | | 1,567,301 |
| Interest receivable | | 5,888,075 |
| Distributions receivable from Fidelity Central Funds | | 31 |
| Receivable from investment adviser for expense reductions | | 69,204 |
| Total assets | | 1,037,876,439 |
| Liabilities | | |
| Payable to custodian bank | $2,985,006 | |
| Payable for investments purchased | | |
| Regular delivery | 337,159 | |
| Delayed delivery | 24,554,441 | |
| Payable for fund shares redeemed | 787,309 | |
| Distributions payable | 195,345 | |
| Accrued management fee | 239,351 | |
| Other affiliated payables | 46,566 | |
| Total liabilities | | 29,145,177 |
| Net Assets | | $1,008,731,262 |
| Net Assets consist of: | | |
| Paid in capital | | $1,012,274,603 |
| Undistributed net investment income | | 12,665 |
| Accumulated undistributed net realized gain (loss) on investments | | (215) |
| Net unrealized appreciation (depreciation) on investments | | (3,555,791) |
| Net Assets | | $1,008,731,262 |
| Conservative Income Municipal Bond: | | |
| Net Asset Value, offering price and redemption price per share ($164,586,142 ÷ 16,452,607 shares) | | $10.00 |
| Institutional Class: | | |
| Net Asset Value, offering price and redemption price per share ($844,145,120 ÷ 84,381,282 shares) | | $10.00 |
See accompanying notes which are an integral part of the financial statements.
Statement of Operations
| | | Year ended December 31, 2016 |
| Investment Income | | |
| Interest | | $5,779,557 |
| Income from Fidelity Central Funds | | 4,074 |
| Total income | | 5,783,631 |
| Expenses | | |
| Management fee | $1,792,950 | |
| Transfer agent fees | 355,284 | |
| Independent trustees' fees and expenses | 2,428 | |
| Miscellaneous | 1,247 | |
| Total expenses before reductions | 2,151,909 | |
| Expense reductions | (542,350) | 1,609,559 |
| Net investment income (loss) | | 4,174,072 |
| Realized and Unrealized Gain (Loss) | | |
| Net realized gain (loss) on: | | |
| Investment securities: | | |
| Unaffiliated issuers | | 131,010 |
| Total net realized gain (loss) | | 131,010 |
| Change in net unrealized appreciation (depreciation) on investment securities | | (3,621,050) |
| Net gain (loss) | | (3,490,040) |
| Net increase (decrease) in net assets resulting from operations | | $684,032 |
See accompanying notes which are an integral part of the financial statements.
Statement of Changes in Net Assets
| | Year ended December 31, 2016 | Year ended December 31, 2015 |
| Increase (Decrease) in Net Assets | | |
| Operations | | |
| Net investment income (loss) | $4,174,072 | $1,045,098 |
| Net realized gain (loss) | 131,010 | 28,825 |
| Change in net unrealized appreciation (depreciation) | (3,621,050) | (55,919) |
| Net increase (decrease) in net assets resulting from operations | 684,032 | 1,018,004 |
| Distributions to shareholders from net investment income | (4,160,006) | (1,037,794) |
| Distributions to shareholders from net realized gain | (182,699) | (35,775) |
| Total distributions | (4,342,705) | (1,073,569) |
| Share transactions - net increase (decrease) | 647,653,266 | 176,194,534 |
| Total increase (decrease) in net assets | 643,994,593 | 176,138,969 |
| Net Assets | | |
| Beginning of period | 364,736,669 | 188,597,700 |
| End of period | $1,008,731,262 | $364,736,669 |
| Other Information | | |
| Undistributed net investment income end of period | $12,665 | $7,173 |
See accompanying notes which are an integral part of the financial statements.
Financial Highlights — Fidelity Conservative Income Municipal Bond Fund
| Years ended December 31, | 2016 | 2015 | 2014 | 2013 A |
| Selected Per–Share Data | | | | |
| Net asset value, beginning of period | $10.04 | $10.04 | $10.02 | $10.00 |
| Income from Investment Operations | | | | |
| Net investment income (loss)B | .062 | .032 | .015 | .002 |
| Net realized and unrealized gain (loss) | (.041) | –C | .021 | .020 |
| Total from investment operations | .021 | .032 | .036 | .022 |
| Distributions from net investment income | (.059) | (.031) | (.015) | (.002) |
| Distributions from net realized gain | (.002) | (.001) | (.001) | – |
| Total distributions | (.061) | (.032) | (.016) | (.002) |
| Net asset value, end of period | $10.00 | $10.04 | $10.04 | $10.02 |
| Total ReturnD,E | .21% | .32% | .36% | .22% |
| Ratios to Average Net AssetsF,G | | | | |
| Expenses before reductions | .40% | .40% | .40% | .40%H |
| Expenses net of fee waivers, if any | .35% | .39% | .40% | .40%H |
| Expenses net of all reductions | .35% | .39% | .40% | .40%H |
| Net investment income (loss) | .62% | .32% | .15% | .11%H |
| Supplemental Data | | | | |
| Net assets, end of period (000 omitted) | $164,586 | $73,914 | $45,107 | $22,205 |
| Portfolio turnover rateI | 36% | 32% | 51% | - %J,K |
A For the period October 15, 2013 (commencement of operations) to December 31, 2013.
B Calculated based on average shares outstanding during the period.
C Amount represents less than $.0005 per share.
D Total returns for periods of less than one year are not annualized.
E Total returns would have been lower if certain expenses had not been reduced during the applicable periods shown.
F Fees and expenses of any underlying Fidelity Central Funds are not included in the Fund's expense ratio. The Fund indirectly bears its proportionate share of the expenses of any underlying Fidelity Central Funds.
G Expense ratios reflect operating expenses of the class. Expenses before reductions do not reflect amounts reimbursed by the investment adviser or reductions from expense offset arrangements and do not represent the amount paid by the class during periods when reimbursements or reductions occur. Expense ratios before reductions for start-up periods may not be representative of longer-term operating periods. Expenses net of fee waivers reflect expenses after reimbursement by the investment adviser but prior to reductions from expense offset arrangements. Expenses net of all reductions represent the net expenses paid by the class.
H Annualized
I Amount does not include the portfolio activity of any underlying Fidelity Central Funds.
J Amount represents less than .005%.
K Amount not annualized.
See accompanying notes which are an integral part of the financial statements.
Financial Highlights — Fidelity Conservative Income Municipal Bond Fund Institutional Class
| Years ended December 31, | 2016 | 2015 | 2014 | 2013 A |
| Selected Per–Share Data | | | | |
| Net asset value, beginning of period | $10.04 | $10.04 | $10.02 | $10.00 |
| Income from Investment Operations | | | | |
| Net investment income (loss)B | .071 | .042 | .025 | .004 |
| Net realized and unrealized gain (loss) | (.040) | –C | .021 | .020 |
| Total from investment operations | .031 | .042 | .046 | .024 |
| Distributions from net investment income | (.069) | (.041) | (.025) | (.004) |
| Distributions from net realized gain | (.002) | (.001) | (.001) | – |
| Total distributions | (.071) | (.042) | (.026) | (.004) |
| Net asset value, end of period | $10.00 | $10.04 | $10.04 | $10.02 |
| Total ReturnD,E | .31% | .42% | .46% | .24% |
| Ratios to Average Net AssetsF,G | | | | |
| Expenses before reductions | .35% | .35% | .35% | .35%H |
| Expenses net of fee waivers, if any | .25% | .29% | .30% | .30%H |
| Expenses net of all reductions | .25% | .29% | .30% | .30%H |
| Net investment income (loss) | .72% | .42% | .25% | .22%H |
| Supplemental Data | | | | |
| Net assets, end of period (000 omitted) | $844,145 | $290,823 | $143,491 | $27,963 |
| Portfolio turnover rateI | 36% | 32% | 51% | - %J,K |
A For the period October 15, 2013 (commencement of operations) to December 31, 2013.
B Calculated based on average shares outstanding during the period.
C Amount represents less than $.0005 per share.
D Total returns for periods of less than one year are not annualized.
E Total returns would have been lower if certain expenses had not been reduced during the applicable periods shown.
F Fees and expenses of any underlying Fidelity Central Funds are not included in the Fund's expense ratio. The Fund indirectly bears its proportionate share of the expenses of any underlying Fidelity Central Funds.
G Expense ratios reflect operating expenses of the class. Expenses before reductions do not reflect amounts reimbursed by the investment adviser or reductions from expense offset arrangements and do not represent the amount paid by the class during periods when reimbursements or reductions occur. Expense ratios before reductions for start-up periods may not be representative of longer-term operating periods. Expenses net of fee waivers reflect expenses after reimbursement by the investment adviser but prior to reductions from expense offset arrangements. Expenses net of all reductions represent the net expenses paid by the class.
H Annualized
I Amount does not include the portfolio activity of any underlying Fidelity Central Funds.
J Amount represents less than .005%.
K Amount not annualized.
See accompanying notes which are an integral part of the financial statements.
Notes to Financial Statements
For the period ended December 31, 2016
1. Organization.
Fidelity Conservative Income Municipal Bond Fund (the Fund) is a fund of Fidelity Municipal Trust (the Trust) and is authorized to issue an unlimited number of shares. The Trust is registered under the Investment Company Act of 1940, as amended (the 1940 Act), as an open-end management investment company organized as a Massachusetts business trust. The Fund offers Conservative Income Municipal Bond and Institutional Class shares, each of which has equal rights as to assets and voting privileges. Each class has exclusive voting rights with respect to matters that affect that class.
2. Investments in Fidelity Central Funds.
The Fund invests in Fidelity Central Funds, which are open-end investment companies generally available only to other investment companies and accounts managed by the investment adviser and its affiliates. The Fund's Schedule of Investments lists each of the Fidelity Central Funds held as of period end, if any, as an investment of the Fund, but does not include the underlying holdings of each Fidelity Central Fund. As an Investing Fund, the Fund indirectly bears its proportionate share of the expenses of the underlying Fidelity Central Funds.
The Money Market Central Funds seek preservation of capital and current income and are managed by Fidelity Investments Money Management, Inc. (FIMM), an affiliate of the investment adviser. Annualized expenses of the Money Market Central Funds as of their most recent shareholder report date are less than .005%.
A complete unaudited list of holdings for each Fidelity Central Fund is available upon request or at the Securities and Exchange Commission (the SEC) website at www.sec.gov. In addition, the financial statements of the Fidelity Central Funds, which are not covered by the Fund's Report of Independent Registered Public Accounting Firm, are available on the SEC website or upon request.
3. Significant Accounting Policies.
The financial statements have been prepared in conformity with accounting principles generally accepted in the United States of America (GAAP), which require management to make certain estimates and assumptions at the date of the financial statements. Actual results could differ from those estimates. Subsequent events, if any, through the date that the financial statements were issued have been evaluated in the preparation of the financial statements. The following summarizes the significant accounting policies of the Fund:
Investment Valuation. Investments are valued as of 4:00 p.m. Eastern time on the last calendar day of the period. The Board of Trustees (the Board) has delegated the day to day responsibility for the valuation of the Fund's investments to the Fair Value Committee (the Committee) established by the Fund's investment adviser. In accordance with valuation policies and procedures approved by the Board, the Fund attempts to obtain prices from one or more third party pricing vendors or brokers to value its investments. When current market prices, quotations or currency exchange rates are not readily available or reliable, investments will be fair valued in good faith by the Committee, in accordance with procedures adopted by the Board. Factors used in determining fair value vary by investment type and may include market or investment specific events, changes in interest rates and credit quality. The frequency with which these procedures are used cannot be predicted and they may be utilized to a significant extent. The Committee oversees the Fund's valuation policies and procedures and reports to the Board on the Committee's activities and fair value determinations. The Board monitors the appropriateness of the procedures used in valuing the Fund's investments and ratifies the fair value determinations of the Committee.
The Fund categorizes the inputs to valuation techniques used to value its investments into a disclosure hierarchy consisting of three levels as shown below:
- Level 1 – quoted prices in active markets for identical investments
- Level 2 – other significant observable inputs (including quoted prices for similar investments, interest rates, prepayment speeds, etc.)
- Level 3 – unobservable inputs (including the Fund's own assumptions based on the best information available)
Valuation techniques used to value the Fund's investments by major category are as follows:
Debt securities, including restricted securities, are valued based on evaluated prices received from third party pricing vendors or from brokers who make markets in such securities. Municipal securities are valued by pricing vendors who utilize matrix pricing which considers yield or price of bonds of comparable quality, coupon, maturity and type or by broker-supplied prices. When independent prices are unavailable or unreliable, debt securities may be valued utilizing pricing methodologies which consider similar factors that would be used by third party pricing vendors. Debt securities are generally categorized as Level 2 in the hierarchy but may be Level 3 depending on the circumstances.
Changes in valuation techniques may result in transfers in or out of an assigned level within the disclosure hierarchy.
Investment Transactions and Income. For financial reporting purposes, the Fund's investment holdings and NAV include trades executed through the end of the last business day of the period. The NAV per share for processing shareholder transactions is calculated as of the close of business of the New York Stock Exchange (NYSE), normally 4:00 p.m. Eastern time and includes trades executed through the end of the prior business day. Gains and losses on securities sold are determined on the basis of identified cost. Income and capital gain distributions from Fidelity Central Funds, if any, are recorded on the ex-dividend date. Interest income is accrued as earned and includes coupon interest and amortization of premium and accretion of discount on debt securities as applicable. Debt obligations may be placed on non-accrual status and related interest income may be reduced by ceasing current accruals and writing off interest receivables when the collection of all or a portion of interest has become doubtful based on consistently applied procedures. A debt obligation is removed from non-accrual status when the issuer resumes interest payments or when collectability of interest is reasonably assured.
Class Allocations and Expenses. Investment income, realized and unrealized capital gains and losses, common expenses of the Fund, and certain fund-level expense reductions, if any, are allocated daily on a pro-rata basis to each class based on the relative net assets of each class to the total net assets of the Fund. Each class differs with respect to transfer agent fees incurred. Certain expense reductions may also differ by class. For the reporting period, the allocated portion of income and expenses to each class as a percent of its average net assets may vary due to the timing of recording these transactions in relation to fluctuating net assets of the classes. Expenses directly attributable to a fund are charged to that fund. Expenses attributable to more than one fund are allocated among the respective funds on the basis of relative net assets or other appropriate methods. Expense estimates are accrued in the period to which they relate and adjustments are made when actual amounts are known.
Income Tax Information and Distributions to Shareholders. Each year, the Fund intends to qualify as a regulated investment company under Subchapter M of the Internal Revenue Code, including distributing substantially all of its taxable income and realized gains. As a result, no provision for U.S. Federal income taxes is required. As of December 31, 2016, the Fund did not have any unrecognized tax benefits in the financial statements; nor is the Fund aware of any tax positions for which it is reasonably possible that the total amounts of unrecognized tax benefits will significantly change in the next twelve months. The Fund files a U.S. federal tax return, in addition to state and local tax returns as required. The Fund's federal income tax returns are subject to examination by the Internal Revenue Service (IRS) for a period of three fiscal years after they are filed. State and local tax returns may be subject to examination for an additional fiscal year depending on the jurisdiction.
Dividends are declared and recorded daily and paid monthly from net investment income. Distributions from realized gains, if any, are declared and recorded on the ex-dividend date. Income dividends and capital gain distributions are declared separately for each class. Income and capital gain distributions are determined in accordance with income tax regulations, which may differ from GAAP.
Capital accounts within the financial statements are adjusted for permanent book-tax differences. These adjustments have no impact on net assets or the results of operations. Capital accounts are not adjusted for temporary book-tax differences which will reverse in a subsequent period.
Book-tax differences are primarily due to market discount and losses deferred due to wash sales.
The Fund purchases municipal securities whose interest, in the opinion of the issuer, is free from federal income tax. There is no assurance that the IRS will agree with this opinion. In the event the IRS determines that the issuer does not comply with relevant tax requirements, interest payments from a security could become federally taxable, possibly retroactively to the date the security was issued.
The federal tax cost of investment securities and unrealized appreciation (depreciation) as of period end were as follows:
| Gross unrealized appreciation | $134,767 |
| Gross unrealized depreciation | (3,678,108) |
| Net unrealized appreciation (depreciation) on securities | $(3,543,341) |
The tax-based components of distributable earnings as of period end were as follows:
| Net unrealized appreciation (depreciation) on securities and other investments | $(3,543,341) |
The tax character of distributions paid was as follows:
| | December 31, 2016 | December 31, 2015 |
| Tax-exempt Income | $4,160,007 | $1,037,794 |
| Ordinary Income | 91,349 | 35,775 |
| Long-Term Capital Gains | 91,349 | – |
| Total | $4,342,705 | $ 1,073,569 |
Delayed Delivery Transactions and When-Issued Securities. During the period, the Fund transacted in securities on a delayed delivery or when-issued basis. Payment and delivery may take place after the customary settlement period for that security. The price of the underlying securities and the date when the securities will be delivered and paid for are fixed at the time the transaction is negotiated. The securities purchased on a delayed delivery or when-issued basis are identified as such in the Fund's Schedule of Investments. The Fund may receive compensation for interest forgone in the purchase of a delayed delivery or when-issued security. With respect to purchase commitments, the Fund identifies securities as segregated in its records with a value at least equal to the amount of the commitment. Losses may arise due to changes in the value of the underlying securities or if the counterparty does not perform under the contract's terms, or if the issuer does not issue the securities due to political, economic, or other factors.
Restricted Securities. The Fund may invest in securities that are subject to legal or contractual restrictions on resale. These securities generally may be resold in transactions exempt from registration or to the public if the securities are registered. Disposal of these securities may involve time-consuming negotiations and expense, and prompt sale at an acceptable price may be difficult. Information regarding restricted securities is included at the end of the Fund's Schedule of Investments.
4. Purchases and Sales of Investments.
Purchases and sales of securities, other than short-term securities, aggregated $433,049,684 and $110,233,803, respectively.
5. Fees and Other Transactions with Affiliates.
Management Fee. Fidelity Management & Research Company (the investment adviser) and its affiliates provide the Fund with investment management related services for which the Fund pays a monthly management fee that is based on an annual rate of .30% of the Fund's average net assets. Under the management contract, the investment adviser pays all other fund-level expenses, except the compensation of the independent Trustees and certain other expenses such as interest expense, including commitment fees.
Transfer Agent Fees. Fidelity Investments Institutional Operations Company, Inc. (FIIOC), an affiliate of the investment adviser, is the transfer, dividend disbursing and shareholder servicing agent for the Fund. FIIOC receives asset-based fees of .10% and .05% of average net assets for Conservative Income Municipal Bond and Institutional Class, respectively. FIIOC pays for typesetting, printing and mailing of shareholder reports, except proxy statements. For the period, transfer agent fees for each class were as follows:
| | Amount |
| Conservative Income Municipal Bond | $112,918 |
| Institutional Class | 242,366 |
| | $355,284 |
Interfund Trades. The Fund may purchase from or sell securities to other Fidelity Funds under procedures adopted by the Board. The procedures have been designed to ensure these interfund trades are executed in accordance with Rule 17a-7 of the 1940 Act. Interfund trades are included within the respective purchases and sales amounts shown in the Purchases and Sales of Investments note.
6. Committed Line of Credit.
The Fund participates with other funds managed by the investment adviser or an affiliate in a $4.25 billion credit facility (the "line of credit") to be utilized for temporary or emergency purposes to fund shareholder redemptions or for other short-term liquidity purposes. The Fund has agreed to pay commitment fees on its pro-rata portion of the line of credit, which amounted to $1,247 and is reflected in Miscellaneous expenses on the Statement of Operations. During the period, the Fund did not borrow on this line of credit.
7. Expense Reductions.
The investment adviser contractually agreed to reimburse each class to the extent annual operating expenses exceeded certain levels of average net assets as noted in the table below. This reimbursement will remain in place through February 28, 2018. Some expenses, for example interest expense, including commitment fees, are excluded from this reimbursement.
The following classes were in reimbursement during the period:
| | Expense
Limitations | Reimbursement |
| Conservative Income Municipal Bond | .35% | $56,640 |
| Institutional Class | .25% | 485,430 |
| | | $542,070 |
In addition, through arrangements with the Fund's custodian, credits realized as a result of certain uninvested cash balances were used to reduce the Fund's expenses. During the period, these credits reduced the Fund's custody expenses by $280.
8. Distributions to Shareholders.
Distributions to shareholders of each class were as follows:
| | Year ended
December 31, 2016 | Year ended December 31, 2015 |
| From net investment income | | |
| Conservative Income Municipal Bond | $692,647 | $167,696 |
| Institutional Class | 3,467,359 | 870,098 |
| Total | $4,160,006 | $1,037,794 |
| From net realized gain | | |
| Conservative Income Municipal Bond | $31,575 | $7,215 |
| Institutional Class | 151,124 | 28,560 |
| Total | $182,699 | $35,775 |
9. Share Transactions.
Share transactions for each class were as follows and may contain automatic conversions between classes or exchanges between affiliated funds:
| | Shares | Shares | Dollars | Dollars |
| | Year ended
December 31, 2016 | Year ended December 31, 2015 | Year ended
December 31, 2016 | Year ended December 31, 2015 |
| Conservative Income Municipal Bond | | | | |
| Shares sold | 17,659,660 | 5,228,688 | $177,328,065 | $52,487,644 |
| Reinvestment of distributions | 55,220 | 12,669 | 554,207 | 127,195 |
| Shares redeemed | (8,627,040) | (2,370,994) | (86,547,233) | (23,803,845) |
| Net increase (decrease) | 9,087,840 | 2,870,363 | $91,335,039 | $28,810,994 |
| Institutional Class | | | | |
| Shares sold | 92,920,987 | 26,484,896 | $932,815,363 | $265,900,155 |
| Reinvestment of distributions | 262,905 | 67,293 | 2,638,502 | 675,635 |
| Shares redeemed | (37,779,698) | (11,871,797) | (379,135,638) | (119,192,250) |
| Net increase (decrease) | 55,404,194 | 14,680,392 | $556,318,227 | $147,383,540 |
10. Other.
The Fund's organizational documents provide former and current trustees and officers with a limited indemnification against liabilities arising in connection with the performance of their duties to the Fund. In the normal course of business, the Fund may also enter into contracts that provide general indemnifications. The Fund's maximum exposure under these arrangements is unknown as this would be dependent on future claims that may be made against the Fund. The risk of material loss from such claims is considered remote.
Report of Independent Registered Public Accounting Firm
To the Trustees of Fidelity Municipal Trust and Shareholders of Fidelity Conservative Income Municipal Bond Fund:
In our opinion, the accompanying statement of assets and liabilities, including the schedule of investments, and the related statements of operations and of changes in net assets and the financial highlights present fairly, in all material respects, the financial position of Fidelity Conservative Income Municipal Bond Fund (a fund of Fidelity Municipal Trust) as of December 31, 2016, the results of its operations for the year then ended, the changes in its net assets for each of the two years in the period then ended and the financial highlights for each of the periods indicated, in conformity with accounting principles generally accepted in the United States of America. These financial statements and financial highlights (hereafter referred to as “financial statements”) are the responsibility of the Fidelity Conservative Income Municipal Bond Fund’s management. Our responsibility is to express an opinion on these financial statements based on our audits. We conducted our audits of these financial statements in accordance with the standards of the Public Company Accounting Oversight Board (United States). Those standards require that we plan and perform the audit to obtain reasonable assurance about whether the financial statements are free of material misstatement. An audit includes examining, on a test basis, evidence supporting the amounts and disclosures in the financial statements, assessing the accounting principles used and significant estimates made by management, and evaluating the overall financial statement presentation. We believe that our audits, which included confirmation of securities as of December 31, 2016 by correspondence with the custodian and brokers, provide a reasonable basis for our opinion.
PricewaterhouseCoopers LLP
Boston, Massachusetts
February 17, 2017
Trustees and Officers
The Trustees, Members of the Advisory Board (if any), and officers of the trust and fund, as applicable, are listed below. The Board of Trustees governs the fund and is responsible for protecting the interests of shareholders. The Trustees are experienced executives who meet periodically throughout the year to oversee the fund's activities, review contractual arrangements with companies that provide services to the fund, oversee management of the risks associated with such activities and contractual arrangements, and review the fund's performance. Each of the Trustees oversees 243 funds.
The Trustees hold office without limit in time except that (a) any Trustee may resign; (b) any Trustee may be removed by written instrument, signed by at least two-thirds of the number of Trustees prior to such removal; (c) any Trustee who requests to be retired or who has become incapacitated by illness or injury may be retired by written instrument signed by a majority of the other Trustees; and (d) any Trustee may be removed at any special meeting of shareholders by a two-thirds vote of the outstanding voting securities of the trust. Each Trustee who is not an interested person (as defined in the 1940 Act) of the trust and the fund is referred to herein as an Independent Trustee. Each Independent Trustee shall retire not later than the last day of the calendar year in which his or her 75th birthday occurs. The Independent Trustees may waive this mandatory retirement age policy with respect to individual Trustees. Officers and Advisory Board Members hold office without limit in time, except that any officer or Advisory Board Member may resign or may be removed by a vote of a majority of the Trustees at any regular meeting or any special meeting of the Trustees. Except as indicated, each individual has held the office shown or other offices in the same company for the past five years.
The fund’s Statement of Additional Information (SAI) includes more information about the Trustees. To request a free copy, call Fidelity at 1-800-544-8544.
Experience, Skills, Attributes, and Qualifications of the Trustees. The Governance and Nominating Committee has adopted a statement of policy that describes the experience, qualifications, attributes, and skills that are necessary and desirable for potential Independent Trustee candidates (Statement of Policy). The Board believes that each Trustee satisfied at the time he or she was initially elected or appointed a Trustee, and continues to satisfy, the standards contemplated by the Statement of Policy. The Governance and Nominating Committee also engages professional search firms to help identify potential Independent Trustee candidates who have the experience, qualifications, attributes, and skills consistent with the Statement of Policy. From time to time, additional criteria based on the composition and skills of the current Independent Trustees, as well as experience or skills that may be appropriate in light of future changes to board composition, business conditions, and regulatory or other developments, have also been considered by the professional search firms and the Governance and Nominating Committee. In addition, the Board takes into account the Trustees' commitment and participation in Board and committee meetings, as well as their leadership of standing and ad hoc committees throughout their tenure.
In determining that a particular Trustee was and continues to be qualified to serve as a Trustee, the Board has considered a variety of criteria, none of which, in isolation, was controlling. The Board believes that, collectively, the Trustees have balanced and diverse experience, qualifications, attributes, and skills, which allow the Board to operate effectively in governing the fund and protecting the interests of shareholders. Information about the specific experience, skills, attributes, and qualifications of each Trustee, which in each case led to the Board's conclusion that the Trustee should serve (or continue to serve) as a trustee of the fund, is provided below.
Board Structure and Oversight Function. Abigail P. Johnson is an interested person and currently serves as Chairman. The Trustees have determined that an interested Chairman is appropriate and benefits shareholders because an interested Chairman has a personal and professional stake in the quality and continuity of services provided to the fund. Independent Trustees exercise their informed business judgment to appoint an individual of their choosing to serve as Chairman, regardless of whether the Trustee happens to be independent or a member of management. The Independent Trustees have determined that they can act independently and effectively without having an Independent Trustee serve as Chairman and that a key structural component for assuring that they are in a position to do so is for the Independent Trustees to constitute a substantial majority for the Board. The Independent Trustees also regularly meet in executive session. Marie L. Knowles serves as Chairman of the Independent Trustees and as such (i) acts as a liaison between the Independent Trustees and management with respect to matters important to the Independent Trustees and (ii) with management prepares agendas for Board meetings.
Fidelity® funds are overseen by different Boards of Trustees. The fund's Board oversees Fidelity's investment-grade bond, money market, asset allocation and certain equity funds, and other Boards oversee Fidelity's high income, sector and other equity funds. The asset allocation funds may invest in Fidelity® funds that are overseen by such other Boards. The use of separate Boards, each with its own committee structure, allows the Trustees of each group of Fidelity® funds to focus on the unique issues of the funds they oversee, including common research, investment, and operational issues. On occasion, the separate Boards establish joint committees to address issues of overlapping consequences for the Fidelity® funds overseen by each Board.
The Trustees operate using a system of committees to facilitate the timely and efficient consideration of all matters of importance to the Trustees, the fund, and fund shareholders and to facilitate compliance with legal and regulatory requirements and oversight of the fund's activities and associated risks. The Board, acting through its committees, has charged FMR and its affiliates with (i) identifying events or circumstances the occurrence of which could have demonstrably adverse effects on the fund's business and/or reputation; (ii) implementing processes and controls to lessen the possibility that such events or circumstances occur or to mitigate the effects of such events or circumstances if they do occur; and (iii) creating and maintaining a system designed to evaluate continuously business and market conditions in order to facilitate the identification and implementation processes described in (i) and (ii) above. Because the day-to-day operations and activities of the fund are carried out by or through FMR, its affiliates, and other service providers, the fund's exposure to risks is mitigated but not eliminated by the processes overseen by the Trustees. While each of the Board's committees has responsibility for overseeing different aspects of the fund's activities, oversight is exercised primarily through the Operations and Audit Committees. In addition, an ad hoc Board committee of Independent Trustees has worked with FMR to enhance the Board's oversight of investment and financial risks, legal and regulatory risks, technology risks, and operational risks, including the development of additional risk reporting to the Board. Appropriate personnel, including but not limited to the fund's Chief Compliance Officer (CCO), FMR's internal auditor, the independent accountants, the fund's Treasurer and portfolio management personnel, make periodic reports to the Board's committees, as appropriate, including an annual review of Fidelity's risk management program for the Fidelity® funds. The responsibilities of each standing committee, including their oversight responsibilities, are described further under "Standing Committees of the Trustees."
Interested Trustees*:
Correspondence intended for a Trustee who is an interested person may be sent to Fidelity Investments, 245 Summer Street, Boston, Massachusetts 02210.
Name, Year of Birth; Principal Occupations and Other Relevant Experience+
Abigail P. Johnson (1961)
Year of Election or Appointment: 2009
Trustee
Chairman of the Board of Trustees
Ms. Johnson also serves as Trustee of other Fidelity® funds. Ms. Johnson serves as Chairman (2016-present), Chief Executive Officer (2014-present), and Director (2007-present) of FMR LLC (diversified financial services company), President of Fidelity Financial Services (2012-present) and President of Personal, Workplace and Institutional Services (2005-present). Ms. Johnson is Chairman and Director of FMR Co., Inc. (investment adviser firm, 2011-present) and Chairman and Director of FMR (investment adviser firm, 2011-present). Previously, Ms. Johnson served as Vice Chairman (2007-2016) and President (2013-2016) of FMR LLC, President and a Director of FMR (2001-2005), a Trustee of other investment companies advised by FMR, Fidelity Investments Money Management, Inc. (investment adviser firm), and FMR Co., Inc. (2001-2005), Senior Vice President of the Fidelity® funds (2001-2005), and managed a number of Fidelity® funds. Ms. Abigail P. Johnson and Mr. Arthur E. Johnson are not related.
Jennifer Toolin McAuliffe (1959)
Year of Election or Appointment: 2016
Trustee
Ms. McAuliffe also serves as Trustee of other Fidelity® funds. Ms. McAuliffe previously served as a Member of the Advisory Board of certain Fidelity® funds (2016) and as Co-Head of Fixed Income of Fidelity Investments Limited (now known as FIL Limited (FIL)) (diversified financial services company). Earlier roles at FIL included Director of Research for FIL’s credit and quantitative teams in London, Hong Kong and Tokyo. Ms. McAuliffe also was the Director of Research for taxable and municipal bonds at Fidelity Investments Money Management, Inc. Ms. McAuliffe is also a director or trustee of several not-for-profit entities.
* Determined to be an “Interested Trustee” by virtue of, among other things, his or her affiliation with the trust or various entities under common control with FMR.
+ The information includes the Trustee's principal occupation during the last five years and other information relating to the experience, attributes, and skills relevant to the Trustee's qualifications to serve as a Trustee, which led to the conclusion that the Trustee should serve as a Trustee for the fund.
Independent Trustees:
Correspondence intended for an Independent Trustee may be sent to Fidelity Investments, P.O. Box 55235, Boston, Massachusetts 02205-5235.
Name, Year of Birth; Principal Occupations and Other Relevant Experience+
Elizabeth S. Acton (1951)
Year of Election or Appointment: 2013
Trustee
Ms. Acton also serves as Trustee of other Fidelity® funds. Prior to her retirement in April 2012, Ms. Acton was Executive Vice President, Finance (2011-2012), Executive Vice President, Chief Financial Officer (2002-2011), and Treasurer (2004-2005) of Comerica Incorporated (financial services). Prior to joining Comerica, Ms. Acton held a variety of positions at Ford Motor Company (1983-2002), including Vice President and Treasurer (2000-2002) and Executive Vice President and Chief Financial Officer of Ford Motor Credit Company (1998-2000). Ms. Acton currently serves as a member of the Board of Directors and Audit and Finance Committees of Beazer Homes USA, Inc. (homebuilding, 2012-present). Previously, Ms. Acton served as a Member of the Advisory Board of certain Fidelity® funds (2013-2016).
John Engler (1948)
Year of Election or Appointment: 2014
Trustee
Mr. Engler also serves as Trustee of other Fidelity® funds. He serves as president of the Business Roundtable (2011-present), and on the board of directors for Universal Forest Products (manufacturer and distributor of wood and wood-alternative products, 2003-present) and K12 Inc. (technology-based education company, 2012-present). Previously, Mr. Engler served as a Member of the Advisory Board of certain Fidelity® funds (2014-2016), a trustee of The Munder Funds (2003-2014), president and CEO of the National Association of Manufacturers (2004-2011), member of the Board of Trustees of the Annie E. Casey Foundation (2004-2015), and as governor of Michigan (1991-2003). He is a past chairman of the National Governors Association.
Albert R. Gamper, Jr. (1942)
Year of Election or Appointment: 2006
Trustee
Mr. Gamper also serves as Trustee of other Fidelity® funds. Prior to his retirement in December 2004, Mr. Gamper served as Chairman of the Board of CIT Group Inc. (commercial finance). During his tenure with CIT Group Inc. Mr. Gamper served in numerous senior management positions, including Chairman (1987-1989; 1999-2001; 2002-2004), Chief Executive Officer (1987-2004), and President (2002-2003). Mr. Gamper currently serves as a member of the Board of Directors of Public Service Enterprise Group (utilities, 2000-present), and Member of the Board of Trustees of Barnabas Health Care System (1997-present). Previously, Mr. Gamper served as Chairman (2012-2015) and Vice Chairman (2011-2012) of the Independent Trustees of certain Fidelity® funds and as Chairman of the Board of Governors, Rutgers University (2004-2007).
Robert F. Gartland (1951)
Year of Election or Appointment: 2010
Trustee
Mr. Gartland also serves as Trustee of other Fidelity® funds. Mr. Gartland is Chairman and an investor in Gartland & Mellina Group Corp. (consulting, 2009-present). Previously, Mr. Gartland served as a partner and investor of Vietnam Partners LLC (investments and consulting, 2008-2011). Prior to his retirement, Mr. Gartland held a variety of positions at Morgan Stanley (financial services, 1979-2007) including Managing Director (1987-2007).
Arthur E. Johnson (1947)
Year of Election or Appointment: 2008
Trustee
Vice Chairman of the Independent Trustees
Mr. Johnson also serves as Trustee of other Fidelity® funds. Mr. Johnson serves as a member of the Board of Directors of Eaton Corporation plc (diversified power management, 2009-present) and Booz Allen Hamilton (management consulting, 2011-present). Prior to his retirement, Mr. Johnson served as Senior Vice President of Corporate Strategic Development of Lockheed Martin Corporation (defense contractor, 1999-2009). He previously served on the Board of Directors of IKON Office Solutions, Inc. (1999-2008), AGL Resources, Inc. (holding company, 2002-2016), and Delta Airlines (2005-2007). Mr. Arthur E. Johnson is not related to Ms. Abigail P. Johnson.
Michael E. Kenneally (1954)
Year of Election or Appointment: 2009
Trustee
Mr. Kenneally also serves as Trustee of other Fidelity® funds. Prior to his retirement, Mr. Kenneally served as Chairman and Global Chief Executive Officer of Credit Suisse Asset Management. Before joining Credit Suisse, he was an Executive Vice President and Chief Investment Officer for Bank of America Corporation. Earlier roles at Bank of America included Director of Research, Senior Portfolio Manager and Research Analyst, and Mr. Kenneally was awarded the Chartered Financial Analyst (CFA) designation in 1991.
Marie L. Knowles (1946)
Year of Election or Appointment: 2001
Trustee
Chairman of the Independent Trustees
Ms. Knowles also serves as Trustee of other Fidelity® funds. Prior to Ms. Knowles' retirement in June 2000, she served as Executive Vice President and Chief Financial Officer of Atlantic Richfield Company (ARCO) (diversified energy, 1996-2000). From 1993 to 1996, she was a Senior Vice President of ARCO and President of ARCO Transportation Company (pipeline and tanker operations). Ms. Knowles currently serves as a Director and Chairman of the Audit Committee of McKesson Corporation (healthcare service, since 2002). Ms. Knowles is a member of the Board of the Santa Catalina Island Company (real estate, 2009-present). Ms. Knowles is a Member of the Investment Company Institute Board of Governors and a Member of the Governing Council of the Independent Directors Council (2014-present). She also serves as a member of the Advisory Board for the School of Engineering of the University of Southern California. Previously, Ms. Knowles served as a Director of Phelps Dodge Corporation (copper mining and manufacturing, 1994-2007), URS Corporation (engineering and construction, 2000-2003) and America West (airline, 1999-2002). Ms. Knowles previously served as Vice Chairman of the Independent Trustees of certain Fidelity® funds (2012-2015).
Mark A. Murray (1954)
Year of Election or Appointment: 2016
Trustee
Mr. Murray also serves as Trustee of other Fidelity® funds. Mr. Murray is Vice Chairman (2013-present) of Meijer, Inc. (regional retail chain). Previously, Mr. Murray served as a Member of the Advisory Board of certain Fidelity® funds (2016) and as Co-Chief Executive Officer (2013-2016) and President (2006-2013) of Meijer, Inc. Mr. Murray serves as a member of the Board of Directors and Nuclear Review and Public Policy and Responsibility Committees of DTE Energy Company (diversified energy company, 2009-present). Mr. Murray also serves as a member of the Board of Directors of Spectrum Health (not-for-profit health system, 2015-present). Mr. Murray previously served as President of Grand Valley State University (2001-2006), Treasurer for the State of Michigan (1999-2001), Vice President of Finance and Administration for Michigan State University (1998-1999), and a member of the Board of Directors and Audit Committee and Chairman of the Nominating and Corporate Governance Committee of Universal Forest Products, Inc. (manufacturer and distributor of wood and wood-alternative products, 2004-2016). Mr. Murray is also a director or trustee of many community and professional organizations.
+ The information includes the Trustee's principal occupation during the last five years and other information relating to the experience, attributes, and skills relevant to the Trustee's qualifications to serve as a Trustee, which led to the conclusion that the Trustee should serve as a Trustee for the fund.
Advisory Board Members and Officers:
Correspondence intended for an officer may be sent to Fidelity Investments, 245 Summer Street, Boston, Massachusetts 02210. Officers appear below in alphabetical order.
Name, Year of Birth; Principal Occupation
Marc R. Bryant (1966)
Year of Election or Appointment: 2015
Secretary and Chief Legal Officer (CLO)
Mr. Bryant also serves as Secretary and CLO of other funds. Mr. Bryant serves as CLO, Secretary, and Senior Vice President of Fidelity Management & Research Company (investment adviser firm, 2015-present) and FMR Co., Inc. (investment adviser firm, 2015-present); Secretary of Fidelity SelectCo, LLC (investment adviser firm, 2015-present) and Fidelity Investments Money Management, Inc. (investment adviser firm, 2015-present); and CLO of Fidelity Management & Research (Hong Kong) Limited and FMR Investment Management (UK) Limited (investment adviser firms, 2015-present) and Fidelity Management & Research (Japan) Limited (investment adviser firm, 2016-present). He is Senior Vice President and Deputy General Counsel of FMR LLC (diversified financial services company). Previously, Mr. Bryant served as Secretary and CLO of Fidelity Rutland Square Trust II (2010-2014) and Assistant Secretary of Fidelity's Fixed Income and Asset Allocation Funds (2013-2015). Prior to joining Fidelity Investments, Mr. Bryant served as a Senior Vice President and the Head of Global Retail Legal for AllianceBernstein L.P. (2006-2010), and as the General Counsel for ProFund Advisors LLC (2001-2006).
Jeffrey S. Christian (1961)
Year of Election or Appointment: 2016
Assistant Treasurer
Mr. Christian also serves as Assistant Treasurer of other funds. Mr. Christian is an employee of Fidelity Investments (2003-present).
Jonathan Davis (1968)
Year of Election or Appointment: 2010
Assistant Treasurer
Mr. Davis also serves as Assistant Treasurer of other funds, and is an employee of Fidelity Investments. Previously, Mr. Davis served as Vice President and Associate General Counsel of FMR LLC (diversified financial services company, 2003-2010).
Adrien E. Deberghes (1967)
Year of Election or Appointment: 2010
Assistant Treasurer
Mr. Deberghes also serves as an officer of other funds. He serves as Executive Vice President of Fidelity Investments Money Management, Inc. (FIMM) (investment adviser firm, 2016-present) and is an employee of Fidelity Investments (2008-present). Prior to joining Fidelity Investments, Mr. Deberghes was Senior Vice President of Mutual Fund Administration at State Street Corporation (2007-2008), Senior Director of Mutual Fund Administration at Investors Bank & Trust (2005-2007), and Director of Finance for Dunkin' Brands (2000-2005). Previously, Mr. Deberghes served in other fund officer roles.
Stephanie J. Dorsey (1969)
Year of Election or Appointment: 2013
President and Treasurer
Ms. Dorsey also serves as an officer of other funds. She is an employee of Fidelity Investments (2008-present) and has served in other fund officer roles. Prior to joining Fidelity Investments, Ms. Dorsey served as Treasurer (2004-2008) of the JPMorgan Mutual Funds and Vice President (2004-2008) of JPMorgan Chase Bank.
Howard J. Galligan III (1966)
Year of Election or Appointment: 2014
Chief Financial Officer
Mr. Galligan also serves as Chief Financial Officer of other funds. Mr. Galligan serves as President of Fidelity Pricing and Cash Management Services (FPCMS) (2014-present) and as a Director of Strategic Advisers, Inc. (investment adviser firm, 2008-present). Previously, Mr. Galligan served as Chief Administrative Officer of Asset Management (2011-2014) and Chief Operating Officer and Senior Vice President of Investment Support for Strategic Advisers, Inc. (2003-2011).
Scott C. Goebel (1968)
Year of Election or Appointment: 2015
Vice President
Mr. Goebel serves as Vice President of other funds and is an employee of Fidelity Investments (2001-present). Previously, Mr. Goebel served as Senior Vice President of Fidelity Management & Research Company (FMR) (investment adviser firm, 2016), Secretary of Fidelity SelectCo, LLC (investment adviser firm, 2013-2015), Fidelity Investments Money Management, Inc. (FIMM) (investment adviser firm, 2010-2015), and Fidelity Research and Analysis Company (FRAC) (investment adviser firm, 2010-2015); General Counsel, Secretary, and Senior Vice President of FMR (investment adviser firm, 2008-2015) and FMR Co., Inc. (investment adviser firm, 2008-2015); Assistant Secretary of Fidelity Management & Research (Japan) Limited (investment adviser firm, 2008-2015) and Fidelity Management & Research (U.K.) Inc. (investment adviser firm, 2008-2015); Chief Legal Officer (CLO) of Fidelity Management & Research (Hong Kong) Limited (investment adviser firm, 2008-2015); Secretary and CLO of certain Fidelity® funds (2008-2015); Assistant Secretary of FIMM (2008-2010), FRAC (2008-2010), and certain funds (2007-2008); and as Vice President and Secretary of Fidelity Distributors Corporation (FDC) (2005-2007).
Colm A. Hogan (1973)
Year of Election or Appointment: 2016
Assistant Treasurer
Mr. Hogan also serves as an officer of other funds. Mr. Hogan is an employee of Fidelity Investments (2005-present).
Chris Maher (1972)
Year of Election or Appointment: 2013
Assistant Treasurer
Mr. Maher serves as Assistant Treasurer of other funds. Mr. Maher is Vice President of Valuation Oversight and is an employee of Fidelity Investments. Previously, Mr. Maher served as Vice President of Asset Management Compliance (2013), Vice President of the Program Management Group of FMR (investment adviser firm, 2010-2013), and Vice President of Valuation Oversight (2008-2010).
John B. McGinty, Jr. (1962)
Year of Election or Appointment: 2016
Chief Compliance Officer
Mr. McGinty also serves as Chief Compliance Officer of other funds. Mr. McGinty is Senior Vice President of Asset Management Compliance for Fidelity Investments and is an employee of Fidelity Investments (2016-present). Mr. McGinty previously served as Vice President, Senior Attorney at Eaton Vance Management (investment management firm, 2015-2016), and prior to Eaton Vance as global CCO for all firm operations and registered investment companies at GMO LLC (investment management firm, 2009-2015). Before joining GMO LLC, Mr. McGinty served as Senior Vice President, Deputy General Counsel for Fidelity Investments (2007-2009).
John F. Papandrea (1972)
Year of Election or Appointment: 2016
Anti-Money Laundering (AML) Officer
Mr. Papandrea also serves as AML Officer of other funds. Mr. Papandrea is Vice President of FMR LLC (diversified financial services company, 2008-present) and is an employee of Fidelity Investments (2005-present).
Jason P. Pogorelec (1975)
Year of Election or Appointment: 2015
Assistant Secretary
Mr. Pogorelec also serves as Assistant Secretary of other funds. Mr. Pogorelec serves as Vice President, Associate General Counsel (2010-present) and is an employee of Fidelity Investments (2006-present).
Nancy D. Prior (1967)
Year of Election or Appointment: 2014
Vice President
Ms. Prior also serves as Vice President of other funds. Ms. Prior serves as a Director of FMR Investment Management (UK) Limited (investment adviser firm, 2015-present), President (2016-present) and Director (2014-present) of Fidelity Investments Money Management, Inc. (FIMM) (investment adviser firm), President, Fixed Income (2014-present), Vice Chairman of FIAM LLC (investment adviser firm, 2014-present), and is an employee of Fidelity Investments (2002-present). Previously, Ms. Prior served as Vice President of Fidelity's Money Market Funds (2012-2014), President, Money Market and Short Duration Bond Group of Fidelity Management & Research (FMR) (investment adviser firm, 2013-2014), President, Money Market Group of FMR (2011-2013), Managing Director of Research (2009-2011), Senior Vice President and Deputy General Counsel (2007-2009), and Assistant Secretary of certain Fidelity® funds (2008-2009).
Stacie M. Smith (1974)
Year of Election or Appointment: 2013
Assistant Treasurer
Ms. Smith also serves as an officer of other funds. She is an employee of Fidelity Investments (2009-present) and has served in other fund officer roles. Prior to joining Fidelity Investments, Ms. Smith served as Senior Audit Manager of Ernst & Young LLP (accounting firm, 1996-2009). Previously, Ms. Smith served as Deputy Treasurer of certain Fidelity® funds (2013-2016).
Marc L. Spector (1972)
Year of Election or Appointment: 2016
Deputy Treasurer
Mr. Spector also serves as an officer of other funds. Mr. Spector is an employee of Fidelity Investments (2016-present). Prior to joining Fidelity Investments, Mr. Spector served as Director at the Siegfried Group (accounting firm, 2013-2016), and prior to Siegfried Group as audit senior manager at Deloitte & Touche (accounting firm, 2005-2013).
Renee Stagnone (1975)
Year of Election or Appointment: 2016
Assistant Treasurer
Ms. Stagnone also serves as an officer of other funds. Ms. Stagnone is an employee of Fidelity Investments (1997-present). Previously, Ms. Stagnone served as Deputy Treasurer of certain Fidelity® funds (2013-2016).
Christine J. Thompson (1958)
Year of Election or Appointment: 2015
Vice President of Fidelity's Bond Funds
Ms. Thompson also serves as Vice President of other funds. Ms. Thompson also serves as Chief Investment Officer of FMR's Bond Group (2010-present) and is an employee of Fidelity Investments (1985-present). Previously, Ms. Thompson served as Vice President of Fidelity's Bond Funds (2010-2012).
Shareholder Expense Example
As a shareholder of the Fund, you incur two types of costs: (1) transaction costs and (2) ongoing costs, including management fees and other Fund expenses. This Example is intended to help you understand your ongoing costs (in dollars) of investing in the Fund and to compare these costs with the ongoing costs of investing in other mutual funds.
The Example is based on an investment of $1,000 invested at the beginning of the period and held for the entire period (July 1, 2016 to December 31, 2016).
Actual Expenses
The first line of the accompanying table for each class of the Fund provides information about actual account values and actual expenses. You may use the information in this line, together with the amount you invested, to estimate the expenses that you paid over the period. Simply divide your account value by $1,000.00 (for example, an $8,600 account value divided by $1,000.00 = 8.6), then multiply the result by the number in the first line for a class of the Fund under the heading entitled "Expenses Paid During Period" to estimate the expenses you paid on your account during this period. A small balance maintenance fee of $12.00 that is charged once a year may apply for certain accounts with a value of less than $2,000. This fee is not included in the table below. If it was, the estimate of expenses you paid during the period would be higher, and your ending account value lower, by this amount. In addition, the Fund, as a shareholder in the underlying Fidelity Central Funds, will indirectly bear its pro-rata share of the fees and expenses incurred by the underlying Fidelity Central Funds. These fees and expenses are not included in the Fund's annualized expense ratio used to calculate the expense estimate in the table below.
Hypothetical Example for Comparison Purposes
The second line of the accompanying table for each class of the Fund provides information about hypothetical account values and hypothetical expenses based on a Class' actual expense ratio and an assumed rate of return of 5% per year before expenses, which is not the Class' actual return. The hypothetical account values and expenses may not be used to estimate the actual ending account balance or expenses you paid for the period. You may use this information to compare the ongoing costs of investing in the Fund and other funds. To do so, compare this 5% hypothetical example with the 5% hypothetical examples that appear in the shareholder reports of the other funds. A small balance maintenance fee of $12.00 that is charged once a year may apply for certain accounts with a value of less than $2,000. This fee is not included in the table below. If it was, the estimate of expenses you paid during the period would be higher, and your ending account value lower, by this amount. In addition, the Fund, as a shareholder in the underlying Fidelity Central Funds, will indirectly bear its pro-rata share of the fees and expenses incurred by the underlying Fidelity Central Funds. These fees and expenses are not included in the Fund's annualized expense ratio used to calculate the expense estimate in the table below.
Please note that the expenses shown in the table are meant to highlight your ongoing costs only and do not reflect any transaction costs. Therefore, the second line of the table is useful in comparing ongoing costs only, and will not help you determine the relative total costs of owning different funds.
| | Annualized Expense Ratio-A | Beginning
Account Value
July 1, 2016 | Ending
Account Value
December 31, 2016 | Expenses Paid
During Period-B
July 1, 2016
to December 31, 2016 |
| Conservative Income Municipal Bond | .35% | | | |
| Actual | | $1,000.00 | $997.50 | $1.76 |
| Hypothetical-C | | $1,000.00 | $1,023.38 | $1.78 |
| Institutional Class | .25% | | | |
| Actual | | $1,000.00 | $998.00 | $1.26 |
| Hypothetical-C | | $1,000.00 | $1,023.88 | $1.27 |
A Annualized expense ratio reflects expenses net of applicable fee waivers.
B Expenses are equal to each Class' annualized expense ratio, multiplied by the average account value over the period, multiplied by 184/366 (to reflect the one-half year period).
C 5% return per year before expenses
Distributions (Unaudited)
The fund hereby designates as a capital gain dividend with respect to the taxable year ended December 31, 2016, $35,526, or, if subsequently determined to be different, the net capital gain of such year.
During fiscal year ended 2016, 100% of the fund's income dividends was free from federal income tax, and 14.33% of the fund's income dividends was subject to the federal alternative minimum tax.
The fund will notify shareholders in January 2017 of amounts for use in preparing 2016 income tax returns.
Board Approval of Investment Advisory Contracts and Management Fees
Fidelity Conservative Income Municipal Bond Fund
Each year, the Board of Trustees, including the Independent Trustees (together, the Board), votes on the renewal of the management contract with Fidelity Management & Research Company (FMR) and the sub-advisory agreements (together, the Advisory Contracts) for the fund. The Board, assisted by the advice of fund counsel and Independent Trustees' counsel, requests and considers a broad range of information relevant to the renewal of the Advisory Contracts throughout the year.
The Board meets regularly and, at each of its meetings, covers an extensive agenda of topics and materials and considers factors that are relevant to its annual consideration of the renewal of the fund's Advisory Contracts, including the services and support provided to the fund and its shareholders. The Board has established four standing committees (Committees) — Operations, Audit, Fair Valuation, and Governance and Nominating — each composed of and chaired by Independent Trustees with varying backgrounds, to which the Board has assigned specific subject matter responsibilities in order to enhance effective decision-making by the Board. The Operations Committee, of which all of the Independent Trustees are members, meets regularly throughout the year and considers, among other matters, information specifically related to the annual consideration of the renewal of the fund's Advisory Contracts. The Board, acting directly and through its Committees, requests and receives information concerning the annual consideration of the renewal of the fund's Advisory Contracts. The Board also meets as needed to consider matters specifically related to the Board's annual consideration of the renewal of the Advisory Contracts. Members of the Board may also meet with trustees of other Fidelity funds through ad hoc joint committees to discuss certain matters relevant to all of the Fidelity funds.
At its September 2016 meeting, the Board unanimously determined to renew the fund's Advisory Contracts. In reaching its determination, the Board considered all factors it believed relevant, including (i) the nature, extent, and quality of the services to be provided to the fund and its shareholders (including the investment performance of the fund); (ii) the competitiveness of the fund's management fee and total expense ratio relative to peer funds; (iii) the total costs of the services to be provided by and the profits to be realized by Fidelity from its relationships with the fund; and (iv) the extent to which, if any, economies of scale exist and would be realized as the fund grows, and whether any economies of scale are appropriately shared with fund shareholders.
In considering whether to renew the Advisory Contracts for the fund, the Board reached a determination, with the assistance of fund counsel and Independent Trustees' counsel and through the exercise of its business judgment, that the renewal of the Advisory Contracts was in the best interests of the fund and its shareholders and that the compensation payable under the Advisory Contracts was fair and reasonable. The Board's decision to renew the Advisory Contracts was not based on any single factor, but rather was based on a comprehensive consideration of all the information provided to the Board at its meetings throughout the year. The Board, in reaching its determination to renew the Advisory Contracts, was aware that shareholders of the fund have a broad range of investment choices available to them, including a wide choice among funds offered by Fidelity's competitors, and that the fund's shareholders, who have the opportunity to review and weigh the disclosure provided by the fund in its prospectus and other public disclosures, have chosen to invest in this fund, which is part of the Fidelity family of funds.
Nature, Extent, and Quality of Services Provided. The Board considered Fidelity's staffing as it relates to the fund, including the backgrounds of investment personnel of Fidelity, and also considered the fund's investment objective, strategies, and related investment philosophy. The Independent Trustees also had discussions with senior management of Fidelity's investment operations and investment groups. The Board considered the structure of the investment personnel compensation program and whether this structure provides appropriate incentives to act in the best interests of the fund. Additionally, the Board considered the portfolio managers' investments, if any, in the funds that they manage.
Resources Dedicated to Investment Management and Support Services. The Board reviewed the general qualifications and capabilities of Fidelity's investment staff, including its size, education, experience, and resources, as well as Fidelity's approach to recruiting, managing, and compensating investment personnel. The Board noted that Fidelity has continued to increase the resources devoted to non-U.S. offices, including expansion of Fidelity's global investment organization. The Board also noted that Fidelity's analysts have extensive resources, tools and capabilities that allow them to conduct sophisticated quantitative and fundamental analysis, as well as credit analysis of issuers, counterparties and guarantors. Further, the Board considered that Fidelity's investment professionals have sufficient access to global information and data so as to provide competitive investment results over time, and that those professionals also have access to sophisticated tools that permit them to assess portfolio construction and risk and performance attribution characteristics continuously, as well as to transmit new information and research conclusions rapidly around the world. Additionally, in its deliberations, the Board considered Fidelity's trading, risk management, compliance, and technology and operations capabilities and resources, which are integral parts of the investment management process.
Shareholder and Administrative Services. The Board considered (i) the nature, extent, quality, and cost of advisory, administrative, and shareholder services performed by FMR, the sub-advisers (together with FMR, the Investment Advisers), and their affiliates under the Advisory Contracts and under separate agreements covering transfer agency and pricing and bookkeeping services for the fund; (ii) the nature and extent of the supervision of third party service providers, principally custodians, subcustodians, and pricing vendors; and (iii) the resources devoted to, and the record of compliance with, the fund's compliance policies and procedures.
The Board noted that the growth of fund assets over time across the complex allows Fidelity to reinvest in the development of services designed to enhance the value or convenience of the Fidelity funds as investment vehicles. These services include 24-hour access to account information and market information through telephone representatives and over the Internet, investor education materials and asset allocation tools, and the expanded availability of Fidelity Investor Centers.
Investment in a Large Fund Family. The Board considered the benefits to shareholders of investing in a Fidelity fund, including the benefits of investing in a fund that is part of a large family of funds offering a variety of investment disciplines and providing a large variety of mutual fund investor services. The Board noted that Fidelity had taken, or had made recommendations that resulted in the Fidelity funds taking, a number of actions over the previous year that benefited particular funds, including: (i) continuing to dedicate additional resources to investment research and to the support of the senior management team that oversees asset management; (ii) continuing efforts to enhance Fidelity's global research capabilities; (iii) launching new funds and making other enhancements to meet client needs; (iv) broadening eligibility requirements for certain lower-priced share classes of, and streamlining the fee structure for, certain existing equity index funds; (v) lowering expense caps for certain existing funds and classes to reduce expenses paid by shareholders; (vi) eliminating redemption fees for certain variable insurance product funds and classes; (vii) continuing to launch dedicated lower cost underlying funds to meet portfolio construction needs related to expanding underlying fund options for Fidelity funds of funds, specifically for the Freedom Fund product lines; (viii) launching a lower cost share class for use by the Freedom Index Fund product line; (ix) rationalizing product lines and gaining increased efficiencies through fund mergers and share class consolidations; (x) continuing to develop, acquire and implement systems and technology to improve services to the funds and shareholders, strengthen information security, and increase efficiency; (xi) implementing investment enhancements to further strengthen Fidelity's target date product line to increase investors' probability of success in achieving their goals; (xii) accelerating the conversion of all remaining Class B shares to Class A shares, which have a lower expense structure; and (xiii) implementing changes to Fidelity's money market fund product line in response to recent regulatory reforms.
Investment Performance. The Board considered whether the fund has operated in accordance with its investment objective, as well as its record of compliance with its investment restrictions and its performance history.
The Board took into account discussions with representatives of the Investment Advisers about fund investment performance that occur at Board meetings throughout the year. In this regard the Board noted that as part of regularly scheduled fund reviews and other reports to the Board on fund performance, the Board considers annualized return information for the fund for different time periods, measured against a securities market index ("benchmark index") and a peer group of funds with similar objectives ("peer group"), if any. In its evaluation of fund investment performance at meetings throughout the year, the Board gave particular attention to information indicating underperformance of certain Fidelity funds for specific time periods and discussed with the Investment Advisers the reasons for such underperformance.
In addition to reviewing absolute and relative fund performance, the Independent Trustees periodically consider the appropriateness of fund performance metrics in evaluating the results achieved. In general, the Independent Trustees believe that fund performance should be evaluated based on gross performance (before fees and expenses but after transaction costs) compared to appropriate benchmark indices, over appropriate time periods that may include full market cycles, and on net performance (after fees and expenses) compared to peer groups, as applicable, over the same periods, taking into account relevant factors including the following: general market conditions; expectations for interest rate levels and credit conditions; issuer-specific information including credit quality; the potential for incremental return versus the fund's benchmark index weighed against the risks involved in obtaining that incremental return, including the risk of diminished or negative total returns; and fund cash flows and other factors. Depending on the circumstances, the Independent Trustees may be satisfied with a fund's performance notwithstanding that it lags its benchmark index or peer group for certain periods.
The Independent Trustees recognize that shareholders evaluate performance on a net basis over their own holding periods, for which one-, three-, and five-year periods are often used as a proxy. For this reason, the performance information reviewed by the Board also included net cumulative calendar year total return information for the fund and an appropriate benchmark index and peer group for the most recent one-year period.
Based on its review, the Board concluded that the nature, extent, and quality of services provided to the fund under the Advisory Contracts should continue to benefit the shareholders of the fund.
Competitiveness of Management Fee and Total Expense Ratio. The Board considered the fund's management fee and total expense ratio compared to "mapped groups" of competitive funds and classes created for the purpose of facilitating the Trustees' competitive analysis of management fees and total expenses. Fidelity creates "mapped groups" by combining similar Lipper investment objective categories that have comparable investment mandates. Combining Lipper investment objective categories aids the Board's management fee and total expense ratio comparisons by broadening the competitive group used for comparison.
Management Fee. The Board considered two proprietary management fee comparisons for the 12-month (or shorter) periods shown in basis points (BP) in the chart below. The group of Lipper funds used by the Board for management fee comparisons is referred to below as the "Total Mapped Group" and, for the reasons explained above, is broader than the Lipper peer group used by the Board for performance comparisons. The Total Mapped Group comparison focuses on a fund's standing in terms of gross management fees before expense reimbursements or caps relative to the total universe of funds with comparable investment mandates, regardless of whether their management fee structures also are comparable. Funds with comparable investment mandates offer exposure to similar types of securities. Funds with comparable management fee structures have similar management fee contractual arrangements (
e.g., flat rate charged for advisory services, all-inclusive fee rate,
etc.). "TMG %" represents the percentage of funds in the Total Mapped Group that had management fees that were lower than the fund's. For example, a hypothetical TMG % of 20% would mean that 80% of the funds in the Total Mapped Group had higher, and 20% had lower, management fees than the fund. The fund's actual TMG %s and the number of funds in the Total Mapped Group are in the chart below. The "Asset-Size Peer Group" (ASPG) comparison focuses on a fund's standing relative to a subset of non-Fidelity funds within the Total Mapped Group that are similar in size and management fee structure. For example, if a fund is in the first quartile of the ASPG, the fund's management fee ranks in the least expensive or lowest 25% of funds in the ASPG. The ASPG represents at least 15% of the funds in the Total Mapped Group with comparable asset size and management fee structures, subject to a minimum of 50 funds (or all funds in the Total Mapped Group if fewer than 50). Additional information, such as the ASPG quartile in which the fund's management fee rate ranked, is also included in the chart and considered by the Board. Because the vast majority of competitor funds' management fees do not cover non-management expenses, for a more meaningful comparison of management fees, the fund is compared on the basis of a hypothetical "net management fee," which is derived by subtracting payments made by FMR for "fund-level" non-management expenses (including pricing and bookkeeping fees and fees paid to non-affiliated custodians) from the fund's management fee. In this regard, the Board considered that net management fees can vary from year to year because of differences in "fund-level" non-management expenses. The Board noted, however, that FMR does not pay transfer agent fees or other "class-level" expenses under the fund's management contract.
Fidelity Conservative Income Municipal Bond Fund
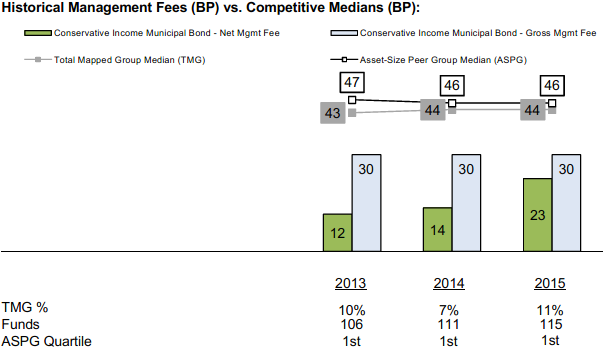
The Board noted that the fund's hypothetical net management fee rate ranked below the median of its Total Mapped Group and below the median of its ASPG for 2015.
The Board noted that, in 2014, the ad hoc Committee on Group Fee was formed by it and the boards of other Fidelity funds to conduct an in-depth review of the "group fee" component of the management fee of funds with such management fee structures. The Committee's focus included the mechanics of the group fee, the competitive landscape of group fee structures, Fidelity funds with no group fee component (such as the fund) and investment products not included in group fee assets. The Board also considered that, for funds subject to the group fee, FMR agreed to voluntarily waive fees over a specified period of time in amounts designed to account for assets converted from certain funds to certain collective investment trusts.
Based on its review, the Board concluded that the fund's management fee is fair and reasonable in light of the services that the fund receives and the other factors considered.
Total Expense Ratio. In its review of each class's total expense ratio, the Board considered the fund's hypothetical net management fee rate as well as the fund's gross management fee. The Board also considered other "fund-level" expenses, such as pricing and bookkeeping fees and custodial, legal, and audit fees. The Board also considered other "class-level" expenses, such as transfer agent fees. The Board also noted that Fidelity may agree to waive fees and expenses from time to time, and the extent to which, if any, it has done so for the fund. As part of its review, the Board also considered the current and historical total expense ratios of each class of the fund compared to competitive fund median expenses. Each class of the fund is compared to those funds and classes in the Total Mapped Group (used by the Board for management fee comparisons) that have a similar sales load structure.
The Board noted that the total expense ratio of each class ranked below the competitive median for 2015.
The Board further considered that FMR has contractually agreed to reimburse Institutional Class and the retail class of the fund to the extent that total operating expenses (excluding interest, certain taxes, certain securities lending costs, brokerage commissions, extraordinary expenses, and acquired fund fees and expenses, if any), as a percentage of their respective average net assets, exceed 0.25% and 0.35% through February 28, 2017.
Fees Charged to Other Fidelity Clients. The Board also considered Fidelity fee structures and other information with respect to clients of Fidelity, such as other funds advised or subadvised by Fidelity, pension plan clients, and other institutional clients with similar mandates. The Board noted that an ad hoc joint committee created by it and the boards of other Fidelity funds periodically (most recently in 2013) reviews and compares Fidelity's institutional investment advisory business with its business of providing services to the Fidelity funds, including the differences in services provided, fees charged, and costs incurred, as well as competition in their respective marketplaces.
Based on its review of total expense ratios and fees charged to other Fidelity clients, the Board concluded that the total expense ratio of each class of the fund was reasonable in light of the services that the fund and its shareholders receive and the other factors considered.
Costs of the Services and Profitability. The Board considered the revenues earned and the expenses incurred by Fidelity in conducting the business of developing, marketing, distributing, managing, administering and servicing the fund and servicing the fund's shareholders. The Board also considered the level of Fidelity's profits in respect of all the Fidelity funds.
On an annual basis, Fidelity presents to the Board information about the profitability of its relationships with the fund. Fidelity calculates profitability information for each fund, as well as aggregate profitability information for groups of Fidelity funds and all Fidelity funds, using a series of detailed revenue and cost allocation methodologies which originate with the books and records of Fidelity on which Fidelity's audited financial statements are based. The Audit Committee of the Board reviews any significant changes from the prior year's methodologies.
PricewaterhouseCoopers LLP (PwC), independent registered public accounting firm and auditor to Fidelity and certain Fidelity funds, has been engaged annually by the Board as part of the Board's assessment of Fidelity's profitability analysis. PwC's engagement includes the review and assessment of the methodologies used by Fidelity in determining the revenues and expenses attributable to Fidelity's mutual fund business, and completion of agreed-upon procedures in respect of the mathematical accuracy of the fund profitability information and its conformity to established allocation methodologies. After considering PwC's reports issued under the engagement and information provided by Fidelity, the Board concluded that while other allocation methods may also be reasonable, Fidelity's profitability methodologies are reasonable in all material respects.
The Board also reviewed Fidelity's non-fund businesses and fall-out benefits related to the mutual fund business as well as cases where Fidelity's affiliates may benefit from or be related to the fund's business.
The Board considered the costs of the services provided by and the profits realized by Fidelity in connection with the operation of the fund and was satisfied that the profitability was not excessive.
Economies of Scale. The Board considered whether there have been economies of scale in respect of the management of the Fidelity funds, whether the Fidelity funds (including the fund) have appropriately benefited from any such economies of scale, and whether there is potential for realization of any further economies of scale. The Board considered the extent to which the fund will benefit from economies of scale as assets grow through increased services to the fund, through waivers or reimbursements, or through fee or expense ratio reductions. The Board also noted that a committee (the Economies of Scale Committee) created by it and the boards of other Fidelity funds periodically (most recently in 2013) analyzes whether Fidelity attains economies of scale in respect of the management and servicing of the Fidelity funds, whether the Fidelity funds have appropriately benefited from such economies of scale, and whether there is potential for realization of any further economies of scale.
The Board concluded, taking into account the analysis of the Economies of Scale Committee, that economies of scale, if any, are being appropriately shared between fund shareholders and Fidelity.
Additional Information Requested by the Board. In order to develop fully the factual basis for consideration of the Fidelity funds' advisory contracts, the Board requested and received additional information on certain topics, including: (i) Fidelity's fund profitability methodology, profitability trends for certain funds, and the impact of certain factors on fund profitability results; (ii) portfolio manager changes that have occurred during the past year and the amount of the investment that each portfolio manager has made in the Fidelity fund(s) that he or she manages; (iii) Fidelity's compensation structure for portfolio managers, research analysts, and other key personnel, including its effects on fund profitability, the rationale for the compensation structure, and the extent to which current market conditions have affected retention and recruitment; (iv) the arrangements with and compensation paid to certain fund sub-advisers on behalf of the Fidelity funds; (v) Fidelity's voluntary waiver of its fees to maintain minimum yields for certain money market funds and classes as well as contractual waivers in place for certain funds; (vi) the methodology with respect to competitive fund data and peer group classifications; (vii) Fidelity's transfer agent fee, expense, and service structures for different funds and classes relative to competitive trends, and the impact of the increased use of omnibus accounts; (viii) Fidelity's long-term expectations for its offerings in the workplace investing channel; (ix) new developments in the retail and institutional marketplaces; (x) the approach to considering "fall-out" benefits; and (xi) the impact of money market reform on Fidelity's money market funds, including with respect to costs and profitability. In addition, the Board considered its discussions with Fidelity throughout the year regarding enhanced information security initiatives and the funds' fair valuation policies.
Based on its evaluation of all of the conclusions noted above, and after considering all factors it believed relevant, the Board concluded that the advisory fee structures are fair and reasonable, and that the fund's Advisory Contracts should be renewed.

Corporate Headquarters
245 Summer St.
Boston, MA 02210
www.fidelity.com
CMB-ANN-0217
1.967792.103
Fidelity Advisor® Limited Term Municipal Income Fund - Class A, Class T, Class C and Class I
Annual Report December 31, 2016 Class A, Class T, Class C and Class I are classes of Fidelity® Limited Term Municipal Income Fund |
|
Contents
To view a fund's proxy voting guidelines and proxy voting record for the 12-month period ended June 30, visit http://www.fidelity.com/proxyvotingresults or visit the Securities and Exchange Commission's (SEC) web site at http://www.sec.gov.
You may also call 1-877-208-0098 to request a free copy of the proxy voting guidelines.
Standard & Poor's, S&P and S&P 500 are registered service marks of The McGraw-Hill Companies, Inc. and have been licensed for use by Fidelity Distributors Corporation.
Other third-party marks appearing herein are the property of their respective owners.
All other marks appearing herein are registered or unregistered trademarks or service marks of FMR LLC or an affiliated company. © 2017 FMR LLC. All rights reserved.
This report and the financial statements contained herein are submitted for the general information of the shareholders of the Fund. This report is not authorized for distribution to prospective investors in the Fund unless preceded or accompanied by an effective prospectus.
A fund files its complete schedule of portfolio holdings with the SEC for the first and third quarters of each fiscal year on Form N-Q. Forms N-Q are available on the SEC’s web site at http://www.sec.gov. A fund's Forms N-Q may be reviewed and copied at the SEC’s Public Reference Room in Washington, DC. Information regarding the operation of the SEC's Public Reference Room may be obtained by calling 1-800-SEC-0330.
For a complete list of a fund's portfolio holdings, view the most recent holdings listing, semiannual report, or annual report on Fidelity's web site at http://www.fidelity.com, http://www.institutional.fidelity.com, or http://www.401k.com, as applicable.
NOT FDIC INSURED •MAY LOSE VALUE •NO BANK GUARANTEE
Neither the Fund nor Fidelity Distributors Corporation is a bank.
Performance: The Bottom Line
Average annual total return reflects the change in the value of an investment, assuming reinvestment of distributions from dividend income and capital gains (the profits earned upon the sale of securities that have grown in value, if any) and assuming a constant rate of performance each year. The hypothetical investment and the average annual total returns do not reflect the deduction of taxes that a shareholder would pay on fund distributions or the redemption of fund shares. During periods of reimbursement by Fidelity, a fund’s total return will be greater than it would be had the reimbursement not occurred. How a fund did yesterday is no guarantee of how it will do tomorrow.
Average Annual Total Returns
| For the periods ended December 31, 2016 | Past 1 year | Past 5 years | Past 10 years |
| Class A (incl. 2.75% sales charge) | (3.41)% | 0.17% | 1.92% |
| Class T (incl. 2.75% sales charge) | (3.38)% | 0.20% | 1.94% |
| Class C (incl. contingent deferred sales charge) | (2.40)% | (0.02)% | 1.44% |
| Class I | (0.42)% | 1.00% | 2.45% |
Class C shares' contingent deferred sales charges included in the past one year, past five years and past ten years total return figures are 1%, 0% and 0%, respectively.
$10,000 Over 10 Years
Let's say hypothetically that $10,000 was invested in Fidelity Advisor® Limited Term Municipal Income Fund - Class A on December 31, 2006, and the current 2.75% sales charge was paid.
The chart shows how the value of your investment would have changed, and also shows how the Bloomberg Barclays Municipal Bond Index performed over the same period.
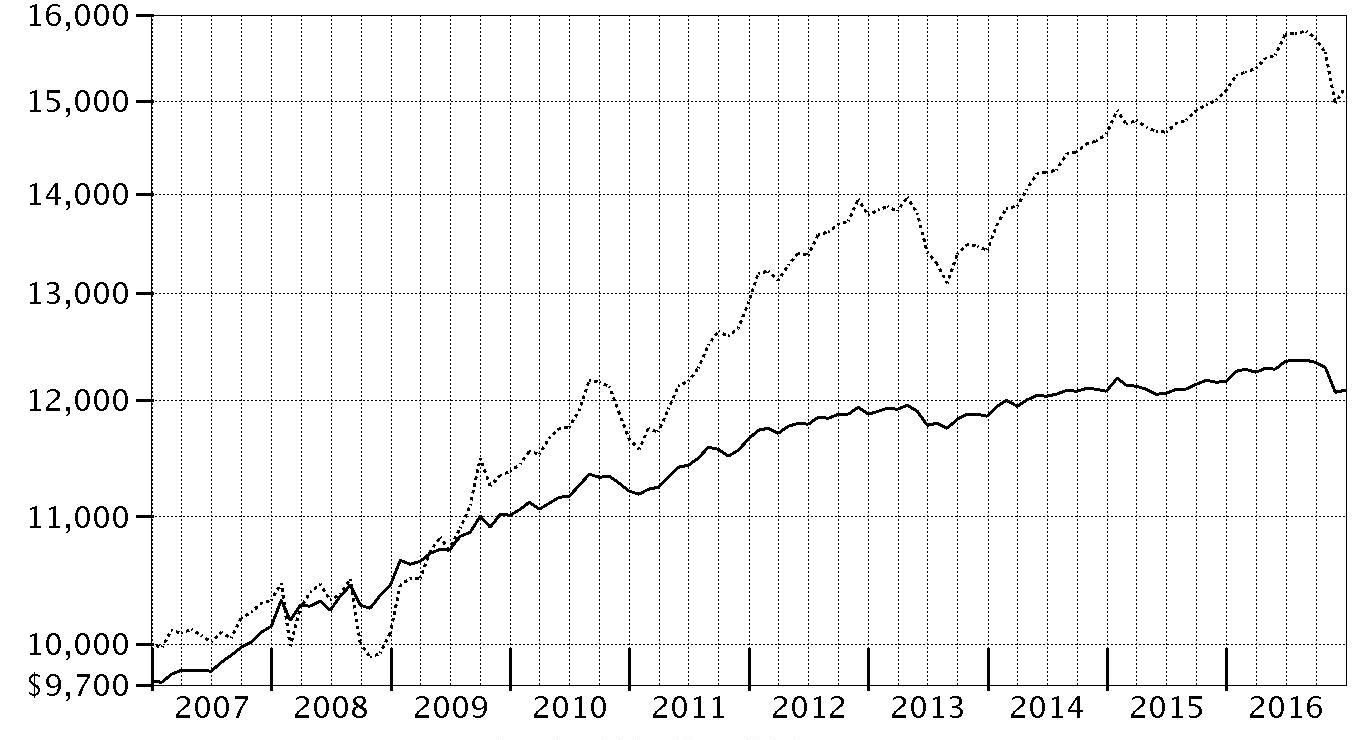
| Period Ending Values |
| $12,091 | Fidelity Advisor® Limited Term Municipal Income Fund - Class A |
| $15,158 | Bloomberg Barclays Municipal Bond Index |
Effective August 24, 2016, all Barclays benchmark indices were co-branded as the Bloomberg Barclays Indices for a period of five years.
Management's Discussion of Fund Performance
Market Recap: For the 12 months ending December 31, 2016, tax-exempt bonds eked out only a 0.25% return, according to the Bloomberg Barclays Municipal Bond Index. For much of the period, fairly strong demand and a stable credit environment for state and local governments drove moderate muni returns. But a downward trend began in September and steepened through November – the worst month for the muni market since 2008 – as investors became concerned about U.S. President-elect Donald Trump’s expansionary fiscal policy ambitions, inflation and the potential for tax reform to impair tax-exempt bond valuations. Further, some theorized that changes to or repeal of the Affordable Care Act by the incoming administration and a Republican-controlled Congress may affect the prices of muni bonds issued by hospitals. Muni bonds also were hurt by market anticipation of a quarter-point increase in policy interest rates, which happened in December. At year-end, concerns about unfunded pension liabilities generally are compartmentalized to certain issuers. Looking ahead, we think the U.S. Federal Reserve is likely to raise policy interest rates further in 2017, perhaps in multiple stages.
Comments from Co-Portfolio Manager Mark Sommer: For the year, the fund’s share classes (excluding sales charges, if applicable) posted modestly negative returns, slightly lagging, net of fees, the 0.00% return the Bloomberg Barclays 1-6 Year Municipal Bond Index. The portfolio managers continued to focus on longer-term investment principles by seeking to generate attractive tax-exempt income and competitive risk-adjusted returns over time. The fund’s yield curve positioning hurt performance versus the Bloomberg Barclays 1-6 year index. Specifically, overweighting bonds in the five- to seven-year range was detrimental. Overweighting Illinois state-backed bonds also hurt, as the state continued to struggle to balance its budget and was hit with downgrades to its credit rating. In addition, an overweighting in bonds issued by Chicago and related entities detracted. These securities were hurt by worries about the unfunded pension challenges of Chicago and its Public School system. In contrast, the fund benefited from security selection in the healthcare sector. We have focused on hospital systems that have less reliance on federal insurance programs, stronger balance sheets and significant market share or essentiality that gives them negotiating leverage with commercial insurers. These types of credits have held their value better under the threat of further healthcare reform.
The views expressed above reflect those of the portfolio manager(s) only through the end of the period as stated on the cover of this report and do not necessarily represent the views of Fidelity or any other person in the Fidelity organization. Any such views are subject to change at any time based upon market or other conditions and Fidelity disclaims any responsibility to update such views. These views may not be relied on as investment advice and, because investment decisions for a Fidelity fund are based on numerous factors, may not be relied on as an indication of trading intent on behalf of any Fidelity fund.
Note to Shareholders: On May 2, 2016, Cormac Cullen succeeded Jamie Pagliocco as Co-Manager of the fund, joining Co-Managers Kevin Ramundo and Mark Sommer.
Investment Summary (Unaudited)
Top Five States as of December 31, 2016
| | % of fund's net assets | % of fund's net assets 6 months ago |
| New York | 12.3 | 13.5 |
| Florida | 11.1 | 11.2 |
| Illinois | 10.2 | 8.6 |
| Texas | 9.6 | 10.3 |
| New Jersey | 6.4 | 5.5 |
Top Five Sectors as of December 31, 2016
| | % of fund's net assets | % of fund's net assets 6 months ago |
| General Obligations | 42.4 | 42.4 |
| Transportation | 11.5 | 11.8 |
| Health Care | 10.5 | 7.5 |
| Special Tax | 9.7 | 10.0 |
| Electric Utilities | 9.4 | 9.1 |
Quality Diversification (% of fund's net assets)
| As of December 31, 2016 |
| | AAA | 8.2% |
| | AA,A | 72.4% |
| | BBB | 10.5% |
| | BB and Below | 0.5% |
| | Not Rated | 1.9% |
| | Short-Term Investments and Net Other Assets | 6.5% |

| As of June 30, 2016 |
| | AAA | 9.3% |
| | AA,A | 71.1% |
| | BBB | 8.5% |
| | BB and Below | 0.9% |
| | Not Rated | 2.0% |
| | Short-Term Investments and Net Other Assets | 8.2% |

We have used ratings from Moody's Investors Service, Inc. Where Moody's® ratings are not available, we have used S&P® ratings. All ratings are as of the date indicated and do not reflect subsequent changes.
Investments December 31, 2016
Showing Percentage of Net Assets
| Municipal Bonds - 93.5% | | | |
| | | Principal Amount (000s) | Value (000s) |
| Alabama - 0.4% | | | |
| Mobile County Board of School Commissioners: | | | |
| Series 2016 A: | | $ | $ |
| 5% 3/1/22 | | 600 | 681 |
| 5% 3/1/23 | | 850 | 977 |
| 5% 3/1/24 | | 1,250 | 1,454 |
| 5% 3/1/25 | | 1,250 | 1,464 |
| Series 2016 B: | | | |
| 5% 3/1/22 | | 1,000 | 1,135 |
| 5% 3/1/24 | | 1,000 | 1,164 |
| 5% 3/1/25 | | 1,500 | 1,757 |
| Montgomery Med. Clinic Facilities: | | | |
| 5% 3/1/20 | | 2,890 | 3,108 |
| 5% 3/1/25 | | 1,500 | 1,680 |
|
| TOTAL ALABAMA | | | 13,420 |
|
| Alaska - 0.7% | | | |
| Anchorage Gen. Oblig.: | | | |
| Series A: | | | |
| 5% 9/1/20 | | 1,090 | 1,210 |
| 5% 9/1/22 | | 1,200 | 1,379 |
| Series B: | | | |
| 5% 9/1/18 | | 3,685 | 3,904 |
| 5% 9/1/20 | | 2,000 | 2,220 |
| 5% 9/1/22 | | 1,425 | 1,638 |
| Series C: | | | |
| 5% 9/1/18 | | 1,000 | 1,059 |
| 5% 9/1/19 | | 2,150 | 2,337 |
| 5% 9/1/20 | | 1,260 | 1,399 |
| 5% 9/1/22 | | 1,000 | 1,149 |
| Series D: | | | |
| 5% 9/1/19 | | 3,895 | 4,234 |
| 5% 9/1/20 | | 2,000 | 2,220 |
|
| TOTAL ALASKA | | | 22,749 |
|
| Arizona - 3.3% | | | |
| Arizona Health Facilities Auth. Rev. (Scottsdale Lincoln Hospitals Proj.) Series 2014 A: | | | |
| 5% 12/1/18 | | 500 | 533 |
| 5% 12/1/19 | | 615 | 670 |
| 5% 12/1/20 | | 820 | 912 |
| 5% 12/1/21 | | 1,105 | 1,250 |
| 5% 12/1/22 | | 800 | 920 |
| 5% 12/1/23 | | 1,000 | 1,164 |
| 5% 12/1/24 | | 1,500 | 1,766 |
| Arizona State Trans. Board Series 2016: | | | |
| 5% 7/1/24 | | 5,000 | 5,920 |
| 5% 7/1/25 | | 5,000 | 5,980 |
| Arizona Wtr. Infrastructure Fin. Auth. Rev. Series 2009 A: | | | |
| 5% 10/1/18 | | 1,000 | 1,065 |
| 5% 10/1/20 (Pre-Refunded to 10/1/19 @ 100) | | 5,180 | 5,663 |
| Glendale Gen. Oblig. Series 2015: | | | |
| 4% 7/1/19 (FSA Insured) | | 600 | 636 |
| 5% 7/1/22 (FSA Insured) | | 1,000 | 1,148 |
| Glendale Trans. Excise Tax Rev.: | | | |
| 5% 7/1/21 (FSA Insured) | | 750 | 849 |
| 5% 7/1/22 (FSA Insured) | | 1,170 | 1,344 |
| 5% 7/1/23 (FSA Insured) | | 1,395 | 1,624 |
| Maricopa County Indl. Dev. Auth. Rev. Series 2016 A: | | | |
| 5% 1/1/25 | | 4,780 | 5,595 |
| 5% 1/1/26 | | 10,720 | 12,592 |
| Maricopa County Mesa Unified School District # 4 Series 2016, 4% 7/1/18 | | 1,325 | 1,380 |
| Maricopa County School District #28 Kyrene Elementary Series 2010 B: | | | |
| 4% 7/1/19 | | 900 | 956 |
| 4% 7/1/20 | | 1,360 | 1,469 |
| Phoenix Indl. Solid Waste Disp. Rev. Bonds (Republic Svc., Inc. Proj.) Series 2013, 0.9%, tender 2/1/17 (a)(b) | | 40,200 | 40,194 |
| Pima County Ctfs. of Prtn. Series 2014: | | | |
| 5% 12/1/21 | | 2,210 | 2,483 |
| 5% 12/1/22 | | 2,470 | 2,808 |
| 5% 12/1/23 | | 3,425 | 3,934 |
| Pima County Swr. Sys. Rev.: | | | |
| Series 2011 B, 5% 7/1/19 | | 3,225 | 3,498 |
| Series 2012 A: | | | |
| 5% 7/1/18 | | 825 | 871 |
| 5% 7/1/19 | | 1,550 | 1,681 |
| Univ. Med. Ctr. Corp. Hosp. Rev. Series 2011: | | | |
| 5% 7/1/17 (Escrowed to Maturity) | | 3,315 | 3,379 |
| 5% 7/1/18 (Escrowed to Maturity) | | 3,365 | 3,543 |
|
| TOTAL ARIZONA | | | 115,827 |
|
| California - 4.9% | | | |
| Alameda Corridor Trans. Auth. Rev.: | | | |
| Series 2004: | | | |
| 0% 10/1/19 | | 3,335 | 3,196 |
| 0% 10/1/19 | | 265 | 246 |
| Series 2013 A, 5% 10/1/22 | | 2,190 | 2,525 |
| Bay Area Toll Auth. San Francisco Bay Toll Bridge Rev. Bonds 1.5%, tender 4/2/18 (a) | | 5,200 | 5,206 |
| California Gen. Oblig. Bonds 3%, tender 12/1/19 (a) | | 15,600 | 15,990 |
| California Health Facilities Fing. Auth. Rev. Bonds (Children's Hosp. of Orange County Proj.) Series 2012 A, 2.52%, tender 1/5/17 (a) | | 4,000 | 4,002 |
| California Pub. Works Board Lease Rev.: | | | |
| (Dept. of Corrections & Rehab. Proj.) Series 2011 C, 5% 10/1/18 | | 1,750 | 1,860 |
| (Riverside Campus Proj.) Series 2012 H, 5% 4/1/22 | | 1,000 | 1,143 |
| (Univ. Proj.) Series 2011 B: | | | |
| 5% 10/1/18 (Escrowed to Maturity) | | 2,740 | 2,921 |
| 5% 10/1/19 (Escrowed to Maturity) | | 1,490 | 1,631 |
| (Various Cap. Projs.): | | | |
| Series 2011 A: | | | |
| 5% 10/1/18 | | 6,475 | 6,883 |
| 5% 10/1/19 | | 5,000 | 5,449 |
| 5% 10/1/20 | | 2,525 | 2,814 |
| Series 2012 A, 5% 4/1/21 | | 1,000 | 1,125 |
| Series 2012 G, 5% 11/1/22 | | 1,250 | 1,443 |
| (Various Judicial Council Projects) Series 2011 D, 5% 12/1/19 | | 4,100 | 4,486 |
| Series 2009 J, 5% 11/1/17 | | 2,300 | 2,373 |
| Series 2010 A, 5% 3/1/17 | | 5,405 | 5,441 |
| California Statewide Cmntys. Dev. Auth. Rev. Bonds: | | | |
| Series 2002 C, 5%, tender 5/1/17 (a) | | 4,000 | 4,052 |
| Series 2009 E2, 5%, tender 5/1/17 (a) | | 2,050 | 2,077 |
| Golden State Tobacco Securitization Corp. Tobacco Settlement Rev. Series 2013 A, 4% 6/1/21 | | 3,500 | 3,786 |
| Los Angeles County Pub. Works Fing. Auth. Lease Rev. Series 2010 A, 5% 8/1/17 | | 5,000 | 5,114 |
| Los Angeles Muni. Impt. Corp. Lease Rev. Series 2012 C, 4.625% 3/1/18 | | 1,500 | 1,561 |
| Los Angeles Unified School District Ctfs. of Prtn. (Multiple Properties Proj.) Series 2010 A, 5% 12/1/17 | | 9,790 | 10,143 |
| Metropolitan Wtr. District of Southern California Wtr. Rev. Bonds: | | | |
| Series 2009 A2, 0.88%, tender 1/5/17 (a) | | 13,000 | 13,000 |
| Series 2011 A3, 0.88%, tender 1/5/17 (a) | | 1,900 | 1,900 |
| Series 2016, 0.84%, tender 1/5/17 (a) | | 7,300 | 7,301 |
| Monterey County Pub. Impt. Corp. Ctfs. of Prtn. (Refing. Proj.) Series 2009, 5% 8/1/17 (FSA Insured) | | 2,130 | 2,178 |
| Northern California Pwr. Agcy. Rev. (Hydroelectric #1 Proj.) Series 2010 A, 5% 7/1/18 | | 2,000 | 2,110 |
| Northern California Transmission Agcy. Rev. (Ref. Calif Ore Proj.) Series 2009 A, 3.5% 5/1/17 | | 2,500 | 2,521 |
| Oakland Unified School District Alameda County Series 2013, 5.5% 8/1/23 | | 1,000 | 1,169 |
| Palomar Health Rev. Series 2016: | | | |
| 5% 11/1/23 | | 2,000 | 2,201 |
| 5% 11/1/24 | | 2,000 | 2,217 |
| Port of Oakland Rev. Series 2012 P, 5% 5/1/21 (b) | | 2,500 | 2,782 |
| Rancho Cucamonga Redev. Agcy. (Rancho Redev. Proj.): | | | |
| 5% 9/1/23 (FSA Insured) | | 1,350 | 1,566 |
| 5% 9/1/24 (FSA Insured) | | 2,300 | 2,697 |
| Riverside County Asset Leasing Rev. (Riverside Cap. Proj.) Series 2012 A: | | | |
| 4% 6/1/17 | | 1,750 | 1,771 |
| 5% 6/1/17 | | 3,700 | 3,760 |
| 5% 6/1/18 | | 6,470 | 6,806 |
| San Bernardino County Ctfs. of Prtn. (Arrowhead Proj.) Series 2009 A, 5% 8/1/18 | | 8,000 | 8,457 |
| San Pablo Calif Redev. Agcy. Series 2014 A, 5% 6/15/24 (FSA Insured) | | 1,380 | 1,617 |
| State Ctr. Cmnty. College District Series 2007 A, 5% 8/1/26 (Pre-Refunded to 8/1/17 @ 100) | | 9,480 | 9,700 |
| Stockton Unified School District Gen. Oblig. 5% 7/1/18 (FSA Insured) | | 1,035 | 1,091 |
|
| TOTAL CALIFORNIA | | | 170,311 |
|
| Colorado - 0.5% | | | |
| Colorado Health Facilities Auth. Rev. Bonds Series 2008 D3, 5%, tender 11/12/21 (a) | | 5,285 | 5,839 |
| Colorado Reg'l. Trans. District Ctfs. of Prtn.: | | | |
| Series 2013 A, 5% 6/1/23 | | 4,500 | 5,188 |
| Series 2014 A, 5% 6/1/23 | | 3,860 | 4,450 |
| E-470 Pub. Hwy. Auth. Rev. Series 2015 A: | | | |
| 5% 9/1/19 | | 1,000 | 1,070 |
| 5% 9/1/20 | | 1,000 | 1,090 |
| Univ. of Colorado Enterprise Sys. Rev. Series 2009 A, 5% 6/1/17 | | 500 | 508 |
|
| TOTAL COLORADO | | | 18,145 |
|
| Connecticut - 2.6% | | | |
| Connecticut Gen. Oblig.: | | | |
| Series 2009 B, 5% 3/1/18 | | 3,470 | 3,609 |
| Series 2012 C, 5% 6/1/21 | | 23,420 | 26,044 |
| Series 2013 A, 1.06% 3/1/17 (a) | | 1,400 | 1,400 |
| Series 2015 E, 5% 8/1/17 | | 26,395 | 26,983 |
| Series 2016 A: | | | |
| 4% 3/15/18 | | 13,900 | 14,311 |
| 5% 3/15/26 | | 1,970 | 2,300 |
| Connecticut Health & Edl. Facilities Auth. Rev. Bonds (Ascension Health Cr. Group Proj.) Series 1998 B, 1.55%, tender 2/1/17 (a) | | 2,560 | 2,562 |
| Connecticut Hsg. Fin. Auth. Series 2013 B2, 4% 11/15/32 | | 6,125 | 6,411 |
| Connecticut Spl. Tax Oblig. Trans. Infrastructure Rev. Series 2011 A, 5% 12/1/18 | | 5,575 | 5,946 |
| New Haven Gen. Oblig. Series 2016 A: | | | |
| 5% 8/15/23 (FSA Insured) | | 900 | 1,001 |
| 5% 8/15/25 (FSA Insured) | | 1,000 | 1,123 |
|
| TOTAL CONNECTICUT | | | 91,690 |
|
| Delaware, New Jersey - 0.1% | | | |
| Delaware River & Bay Auth. Rev. Series 2014 C: | | | |
| 5% 1/1/20 | | 2,500 | 2,726 |
| 5% 1/1/21 | | 2,000 | 2,222 |
|
| TOTAL DELAWARE, NEW JERSEY | | | 4,948 |
|
| District Of Columbia - 0.5% | | | |
| District of Columbia Univ. Rev. Bonds (Georgetown Univ. Proj.) Series 2001 B, 4.7%, tender 4/1/18 (a) | | 8,500 | 8,821 |
| Metropolitan Washington DC Arpts. Auth. Sys. Rev.: | | | |
| Series 2012 A, 5% 10/1/22 (b) | | 6,325 | 7,176 |
| Series 2014 A, 5% 10/1/23 (b) | | 445 | 511 |
|
| TOTAL DISTRICT OF COLUMBIA | | | 16,508 |
|
| Florida - 11.1% | | | |
| Brevard County School Board Ctfs. of Prtn.: | | | |
| Series 2014, 5% 7/1/21 | | 1,000 | 1,123 |
| Series 2015 C: | | | |
| 5% 7/1/21 | | 650 | 730 |
| 5% 7/1/22 | | 3,725 | 4,243 |
| 5% 7/1/23 | | 3,000 | 3,452 |
| Broward County Arpt. Sys. Rev.: | | | |
| Series 2012 Q1, 5% 10/1/21 | | 1,000 | 1,126 |
| Series A: | | | |
| 5% 10/1/22 (b) | | 3,000 | 3,371 |
| 5% 10/1/23 (b) | | 4,020 | 4,583 |
| Broward County School Board Ctfs. of Prtn.: | | | |
| Series 2012 A, 5% 7/1/19 | | 7,000 | 7,555 |
| Series 2015 A: | | | |
| 5% 7/1/19 | | 2,000 | 2,159 |
| 5% 7/1/20 | | 4,000 | 4,405 |
| 5% 7/1/21 | | 4,500 | 5,046 |
| 5% 7/1/22 | | 3,500 | 3,987 |
| 5% 7/1/23 | | 2,750 | 3,170 |
| 5% 7/1/24 | | 1,320 | 1,535 |
| Series 2015 B: | | | |
| 5% 7/1/19 | | 2,000 | 2,159 |
| 5% 7/1/20 | | 3,000 | 3,304 |
| 5% 7/1/21 | | 6,235 | 6,991 |
| 5% 7/1/22 | | 1,275 | 1,452 |
| 5% 7/1/23 | | 2,750 | 3,170 |
| 5% 7/1/24 | | 1,145 | 1,332 |
| Series A, 5.25% 7/1/17 (AMBAC Insured) | | 7,015 | 7,163 |
| Citizens Property Ins. Corp.: | | | |
| Series 2009 A1, 6% 6/1/17 | | 1,275 | 1,301 |
| Series 2010 A1, 5.25% 6/1/17 | | 4,125 | 4,197 |
| Series 2012 A1, 5% 6/1/17 | | 18,095 | 18,393 |
| Clearwater Wtr. and Swr. Rev. Series 2011: | | | |
| 5% 12/1/17 | | 1,685 | 1,744 |
| 5% 12/1/18 | | 685 | 732 |
| 5% 12/1/19 | | 1,820 | 1,988 |
| 5% 12/1/20 | | 1,000 | 1,115 |
| Collier County Indl. Dev. Auth. Healthcare Facilities Rev. (NCH Healthcare Sys. Proj.) Series 2011, 5% 10/1/17 | | 1,455 | 1,496 |
| Florida Board of Ed. Lottery Rev. Series 2011 A, 5% 7/1/20 | | 8,600 | 9,536 |
| Florida Board of Ed. Pub. Ed. Cap. Outlay Series 2009 C, 5% 6/1/20 | | 3,625 | 3,954 |
| Florida Dept. of Envir. Protection Rev. Series 2012 A, 5% 7/1/19 | | 15,800 | 17,106 |
| Florida Dev. Fin. Corp. Healthcare Facility Rev. (Univ. Health Proj.) Series 2013 A: | | | |
| 5% 2/1/17 | | 700 | 701 |
| 5% 2/1/18 | | 1,790 | 1,838 |
| 5% 2/1/19 | | 1,450 | 1,517 |
| 5% 2/1/20 | | 2,025 | 2,148 |
| Florida Gen. Oblig. Series 2015 A, 4% 7/1/17 | | 17,295 | 17,559 |
| Florida Mid-Bay Bridge Auth. Rev. Series 2015 A: | | | |
| 5% 10/1/21 | | 1,030 | 1,134 |
| 5% 10/1/22 | | 2,000 | 2,209 |
| 5% 10/1/23 | | 1,270 | 1,410 |
| 5% 10/1/24 | | 2,000 | 2,206 |
| 5% 10/1/25 | | 1,750 | 1,954 |
| 5% 10/1/26 | | 2,000 | 2,215 |
| Florida Muni. Pwr. Agcy. Rev. (Stanton II Proj.) Series 2012 A, 5% 10/1/18 | | 2,850 | 3,024 |
| Greater Orlando Aviation Auth. Arpt. Facilities Rev. Series 2011 C: | | | |
| 5% 10/1/19 | | 1,705 | 1,856 |
| 5% 10/1/20 | | 1,000 | 1,111 |
| Halifax Hosp. Med. Ctr. Rev. 5% 6/1/23 | | 1,325 | 1,508 |
| Hillsborough County School Board Ctfs. of Prtn. Series 2015 A, 4% 7/1/17 | | 1,500 | 1,523 |
| Hillsborough County School District Sales Tax Rev. Series 2015 B, 5% 10/1/22 (FSA Insured) | | 2,020 | 2,333 |
| Indian River County School Board Ctfs. of Prtn. Series 2014: | | | |
| 5% 7/1/20 | | 935 | 1,031 |
| 5% 7/1/22 | | 2,000 | 2,278 |
| 5% 7/1/23 | | 2,000 | 2,307 |
| Indian River County Wtr. & Swr. Rev. 5% 9/1/17 | | 1,000 | 1,026 |
| JEA Wtr. & Swr. Sys. Rev. Series 2010 D, 5% 10/1/21 | | 1,945 | 2,131 |
| Manatee County Rev. Series 2013: | | | |
| 5% 10/1/19 | | 1,250 | 1,363 |
| 5% 10/1/20 | | 2,000 | 2,228 |
| 5% 10/1/21 | | 2,000 | 2,270 |
| 5% 10/1/22 | | 1,000 | 1,156 |
| Miami-Dade County Expressway Auth.: | | | |
| (Waste Mgmt., Inc. of Florida Proj.): | | | |
| Series 2013, 5% 7/1/19 | | 2,000 | 2,162 |
| 5% 7/1/20 | | 1,000 | 1,105 |
| 5% 7/1/21 | | 2,000 | 2,250 |
| 5% 7/1/22 | | 2,000 | 2,283 |
| 5% 7/1/23 | | 2,000 | 2,290 |
| Series 2014 A, 5% 7/1/24 | | 625 | 730 |
| Series 2014 B: | | | |
| 5% 7/1/22 | | 1,500 | 1,718 |
| 5% 7/1/23 | | 3,250 | 3,772 |
| Miami-Dade County Gen. Oblig. (Parks Prog.) Series 2015 A, 5% 11/1/22 | | 3,880 | 4,494 |
| Miami-Dade County School Board Ctfs. of Prtn.: | | | |
| Series 2014 D: | | | |
| 5% 11/1/20 | | 4,875 | 5,373 |
| 5% 11/1/21 | | 6,275 | 7,014 |
| 5% 11/1/22 | | 2,915 | 3,304 |
| 5% 11/1/23 | | 7,650 | 8,765 |
| Series 2015 A: | | | |
| 5% 5/1/19 | | 1,000 | 1,072 |
| 5% 5/1/20 | | 2,095 | 2,292 |
| 5% 5/1/21 | | 4,000 | 4,451 |
| 5% 5/1/22 | | 3,720 | 4,191 |
| 5% 5/1/23 | | 6,500 | 7,404 |
| Series 2015 B, 5% 5/1/24 | | 29,560 | 33,985 |
| Series 2016 A, 5% 8/1/27 | | 5,560 | 6,474 |
| Miami-Dade County School District Series 2015, 5% 3/15/17 | | 3,225 | 3,251 |
| Miami-Dade County Transit Sales Surtax Rev. Series 2012, 5% 7/1/19 | | 1,250 | 1,351 |
| Orange County Health Facilities Auth. Series 2009, 5.25% 10/1/19 | | 1,245 | 1,361 |
| Orange County School Board Ctfs. of Prtn. Series 2015 C, 5% 8/1/18 | | 1,500 | 1,587 |
| Orlando & Orange County Expressway Auth. Rev. Series 2012, 5% 7/1/19 | | 1,000 | 1,081 |
| Orlando Utils. Commission Util. Sys. Rev.: | | | |
| Series 2009 C, 5% 10/1/17 | | 1,500 | 1,544 |
| Series 2010 C, 5% 10/1/17 | | 1,895 | 1,951 |
| Series 2011 B: | | | |
| 5% 10/1/18 | | 2,250 | 2,393 |
| 5% 10/1/19 | | 2,325 | 2,539 |
| Palm Beach County Health Facilities Auth. Hosp. Rev. Series 2014: | | | |
| 4% 12/1/19 | | 1,000 | 1,043 |
| 5% 12/1/20 | | 880 | 952 |
| 5% 12/1/21 | | 1,100 | 1,204 |
| Palm Beach County School Board Ctfs. of Prtn.: | | | |
| Series 2014 B: | | | |
| 4% 8/1/19 | | 4,000 | 4,241 |
| 4% 8/1/21 | | 4,040 | 4,397 |
| 5% 8/1/17 | | 1,170 | 1,197 |
| 5% 8/1/19 | | 3,000 | 3,256 |
| 5% 8/1/21 | | 5,300 | 5,999 |
| Series 2015 B: | | | |
| 5% 8/1/19 | | 2,735 | 2,968 |
| 5% 8/1/20 | | 1,750 | 1,944 |
| Pasco County School District Sales Tax Rev. Series 2013: | | | |
| 5% 10/1/18 | | 1,250 | 1,326 |
| 5% 10/1/19 | | 1,100 | 1,197 |
| 5% 10/1/20 | | 1,000 | 1,112 |
| 5% 10/1/21 | | 1,000 | 1,131 |
| 5% 10/1/22 | | 1,000 | 1,154 |
| Pasco County Solid Waste Disp. & Resource Recovery Sys. Rev.: | | | |
| Series 2011: | | | |
| 5% 10/1/17 (b) | | 4,465 | 4,590 |
| 5% 10/1/19 (b) | | 2,025 | 2,193 |
| 5% 10/1/18 (b) | | 2,745 | 2,908 |
| Seminole County School Board Ctfs. of Prtn. Series 2016 C: | | | |
| 5% 7/1/25 | | 1,000 | 1,174 |
| 5% 7/1/26 | | 1,140 | 1,343 |
| Tallahassee Health Facilities Rev. (Tallahassee Memorial Healthcare, Inc. Proj.) Series 2016 A, 5% 12/1/21 | | 1,000 | 1,102 |
| Tampa Bay Wtr. Reg'l. Wtr. Supply Auth. Util. Sys. Rev.: | | | |
| Series 2011 B: | | | |
| 5% 10/1/18 (Escrowed to Maturity) | | 2,440 | 2,595 |
| 5% 10/1/18 (Escrowed to Maturity) | | 2,260 | 2,405 |
| Series 2011, 5% 10/1/19 | | 5,590 | 6,116 |
| Tampa Health Sys. Rev. (Baycare Health Sys. Proj.) Series 2010, 5% 11/15/17 | | 1,605 | 1,660 |
| Tampa Solid Waste Sys. Rev. Series 2010, 5% 10/1/17 (FSA Insured) (b) | | 5,000 | 5,140 |
| Tampa Tax Allocation (H. Lee Moffitt Cancer Ctr. Proj.) Series 2012 A, 5% 9/1/20 | | 1,800 | 1,981 |
| Titusville Wtr. & Swr. Rev. Series 2010, 5% 10/1/17 (Assured Guaranty Corp. Insured) | | 1,135 | 1,168 |
| Volusia County School Board Ctfs. of Prtn. (Master Lease Prog.) Series 2014 B: | | | |
| 5% 8/1/18 | | 500 | 529 |
| 5% 8/1/19 | | 310 | 335 |
|
| TOTAL FLORIDA | | | 386,201 |
|
| Georgia - 2.7% | | | |
| Atlanta Arpt. Rev.: | | | |
| 5% 1/1/22 | | 1,000 | 1,141 |
| 5% 1/1/23 | | 1,000 | 1,158 |
| 5% 1/1/24 | | 1,150 | 1,351 |
| Bartow County Dev. Auth. Poll. Cont. Rev. Bonds (Georgia Pwr. Co. Plant Bowen Proj.) Series 1997, 2.375%, tender 8/10/17 (a) | | 2,100 | 2,110 |
| Burke County Indl. Dev. Auth. Poll. Cont. Rev. Bonds: | | | |
| (Georgia Pwr. Co. Plant Vogtle Proj.) Series 2012, 1.75%, tender 6/1/17 (a) | | 1,000 | 1,002 |
| (Oglethorpe Pwr. Corp. Vogtle Proj.) Series 2013 A, 2.4%, tender 4/1/20 (a) | | 12,500 | 12,539 |
| 2.2%, tender 4/2/19 (a) | | 9,700 | 9,740 |
| Fulton County Wtr. & Swr. Rev. Series 2011: | | | |
| 5% 1/1/19 | | 4,000 | 4,286 |
| 5% 1/1/20 | | 4,000 | 4,394 |
| Georgia Muni. Elec. Auth. Pwr. Rev.: | | | |
| (Combined Cycle Proj.) Series A, 5% 11/1/18 | | 2,000 | 2,134 |
| (Prerefunded Proj.) Series 2008 D: | | | |
| 5.75% 1/1/19 (Pre-Refunded to 7/1/18 @ 100) | | 11,020 | 11,766 |
| 5.75% 1/1/20 (Pre-Refunded to 7/1/18 @ 100) | | 2,630 | 2,808 |
| (Proj. One) Series 2008 A, 5.25% 1/1/17 (Berkshire Hathaway Assurance Corp. Insured) | | 7,925 | 7,925 |
| (Unrefunded Balance Proj.) Series 2008: | | | |
| 5.75% 1/1/19 | | 3,870 | 4,120 |
| 5.75% 1/1/20 | | 925 | 985 |
| Series B, 5% 1/1/17 | | 2,750 | 2,750 |
| Series GG: | | | |
| 5% 1/1/20 | | 675 | 739 |
| 5% 1/1/21 | | 1,670 | 1,873 |
| Georgia Muni. Gas Auth. Rev. (Gas Portfolio III Proj.): | | | |
| Series 2014 U: | | | |
| 5% 10/1/19 | | 1,500 | 1,634 |
| 5% 10/1/22 | | 1,000 | 1,150 |
| 5% 10/1/23 | | 2,420 | 2,821 |
| Series R, 5% 10/1/21 | | 5,000 | 5,660 |
| Monroe County Dev. Auth. Poll. Cont. Rev. Bonds (Georgia Pwr. Co. Plant Scherer Proj.) Series 2009, 2.35%, tender 12/11/20 (a) | | 4,715 | 4,710 |
| Private Colleges & Univs. Auth. Rev. (The Savannah College of Arts and Design Projs.) Series 2014, 5% 4/1/21 | | 3,335 | 3,630 |
| Richmond County Hosp. Auth. (Univ. Health Svcs., Inc. Proj.) Series 2009, 5% 1/1/18 (Escrowed to Maturity) | | 1,530 | 1,589 |
|
| TOTAL GEORGIA | | | 94,015 |
|
| Hawaii - 0.5% | | | |
| Hawaii Arpts. Sys. Rev. Series 2011, 5% 7/1/19 (b) | | 4,000 | 4,309 |
| State of Hawaii Dept. of Trans. Series 2013: | | | |
| 5% 8/1/17 (b) | | 2,300 | 2,350 |
| 5% 8/1/19 (b) | | 1,400 | 1,507 |
| 5% 8/1/20 (b) | | 3,050 | 3,352 |
| 5% 8/1/21 (b) | | 550 | 611 |
| 5% 8/1/22 (b) | | 2,075 | 2,334 |
| 5% 8/1/23 (b) | | 1,435 | 1,634 |
|
| TOTAL HAWAII | | | 16,097 |
|
| Illinois - 10.2% | | | |
| Chicago Board of Ed.: | | | |
| Series 1998 B1, 0% 12/1/21 (Nat'l. Pub. Fin. Guarantee Corp. Insured) | | 10,000 | 8,085 |
| Series 2008 C: | | | |
| 5.25% 12/1/23 | | 7,665 | 6,494 |
| 5.25% 12/1/24 | | 955 | 794 |
| Series 2009 D: | | | |
| 5% 12/1/17 (Assured Guaranty Corp. Insured) | | 4,115 | 4,212 |
| 5% 12/1/18 (Assured Guaranty Corp. Insured) | | 2,335 | 2,426 |
| Series 2010 F, 5% 12/1/20 | | 760 | 676 |
| Chicago Gen. Oblig.: | | | |
| (City Colleges Proj.) Series 1999: | | | |
| 0% 1/1/17 (Nat'l. Pub. Fin. Guarantee Corp. Insured) | | 7,200 | 7,200 |
| 0% 1/1/18 (Nat'l. Pub. Fin. Guarantee Corp. Insured) | | 3,000 | 2,918 |
| 0% 1/1/19 (Nat'l. Pub. Fin. Guarantee Corp. Insured) | | 9,805 | 9,214 |
| 0% 1/1/20 (Nat'l. Pub. Fin. Guarantee Corp. Insured) | | 14,755 | 13,301 |
| 4.5% 1/1/20 | | 1,150 | 1,148 |
| 5% 1/1/23 | | 2,920 | 2,921 |
| Chicago Metropolitan Wtr. Reclamation District of Greater Chicago: | | | |
| Series 2014 C, 5% 12/1/17 | | 3,975 | 4,108 |
| Series 2014 D, 5% 12/1/17 | | 3,425 | 3,540 |
| Chicago Midway Arpt. Rev.: | | | |
| Series 2014 B: | | | |
| 5% 1/1/20 | | 625 | 681 |
| 5% 1/1/21 | | 400 | 443 |
| 5% 1/1/23 | | 2,500 | 2,841 |
| 5% 1/1/22 | | 5,000 | 5,623 |
| 5% 1/1/23 | | 5,900 | 6,705 |
| Chicago Motor Fuel Tax Rev. Series 2013: | | | |
| 5% 1/1/19 | | 250 | 257 |
| 5% 1/1/20 | | 300 | 311 |
| 5% 1/1/21 | | 400 | 418 |
| 5% 1/1/22 | | 300 | 313 |
| 5% 1/1/23 | | 535 | 556 |
| Chicago O'Hare Int'l. Arpt. Rev.: | | | |
| Series 2010 D, 5.25% 1/1/17 (b) | | 1,000 | 1,000 |
| Series 2011 B, 5% 1/1/18 | | 6,500 | 6,738 |
| Series 2012 A, 5% 1/1/21 | | 1,400 | 1,549 |
| Series 2012 B: | | | |
| 4% 1/1/17 (b) | | 4,100 | 4,100 |
| 5% 1/1/21 (b) | | 4,605 | 5,008 |
| Series 2013 B, 5% 1/1/22 | | 4,000 | 4,482 |
| Series 2013 D, 5% 1/1/22 | | 3,220 | 3,608 |
| Chicago Park District Gen. Oblig. Series 2014 D, 4% 1/1/17 | | 1,050 | 1,050 |
| Chicago Wastewtr. Transmission Rev. Series 2012: | | | |
| 5% 1/1/19 | | 1,310 | 1,376 |
| 5% 1/1/23 | | 1,200 | 1,311 |
| Cook County Gen. Oblig.: | | | |
| Series 2009 C, 5% 11/15/21 | | 8,575 | 9,148 |
| Series 2010 A, 5.25% 11/15/22 | | 4,960 | 5,409 |
| Series 2011 A, 5.25% 11/15/22 | | 1,000 | 1,103 |
| Series 2012 C: | | | |
| 5% 11/15/19 | | 3,200 | 3,440 |
| 5% 11/15/20 | | 7,210 | 7,817 |
| 5% 11/15/21 | | 4,985 | 5,449 |
| 5% 11/15/22 | | 1,290 | 1,423 |
| Series 2014 A: | | | |
| 5% 11/15/20 | | 1,000 | 1,084 |
| 5% 11/15/21 | | 500 | 547 |
| 5% 11/15/22 | | 1,000 | 1,103 |
| Illinois Edl. Facilities Auth. Rev. Bonds: | | | |
| (Univ. of Chicago Proj.) Series B2, 1.55%, tender 2/13/20 (a) | | 10,000 | 9,859 |
| Series 2001 B3, 0.5%, tender 3/7/17 (a) | | 6,000 | 5,992 |
| Illinois Fin. Auth. Rev.: | | | |
| (Palos Cmnty. Hosp. Proj.) Series 2010 C, 5% 5/15/17 | | 3,520 | 3,568 |
| (Provena Health Proj.) Series 2010 A, 5.75% 5/1/19 (Escrowed to Maturity) | | 2,650 | 2,908 |
| Bonds Series E, 2.25%, tender 4/29/22 (a) | | 22,930 | 22,511 |
| Series 2008 D, 6.25% 11/1/28 (Pre-Refunded to 11/1/18 @ 100) | | 2,065 | 2,250 |
| Series 2012 A, 5% 5/15/23 | | 1,300 | 1,454 |
| Series 2012: | | | |
| 5% 9/1/18 | | 1,160 | 1,212 |
| 5% 9/1/19 | | 1,115 | 1,186 |
| 5% 9/1/20 | | 1,470 | 1,598 |
| 5% 9/1/21 | | 2,045 | 2,256 |
| 5% 9/1/22 | | 3,530 | 3,916 |
| Series 2015 A: | | | |
| 5% 11/15/24 | | 1,525 | 1,772 |
| 5% 11/15/25 | | 1,950 | 2,276 |
| 5% 11/15/26 | | 2,000 | 2,263 |
| Series 2016 A: | | | |
| 5% 8/15/20 | | 500 | 538 |
| 5% 2/15/21 | | 750 | 827 |
| 5% 8/15/21 | | 700 | 760 |
| 5% 2/15/23 | | 1,000 | 1,131 |
| 5% 8/15/23 | | 1,500 | 1,647 |
| 5% 8/15/24 | | 2,185 | 2,402 |
| Series 2016 C: | | | |
| 5% 2/15/20 | | 5,080 | 5,369 |
| 5% 2/15/22 | | 1,885 | 2,021 |
| 5% 2/15/23 | | 4,500 | 4,845 |
| 5% 2/15/24 | | 5,000 | 5,377 |
| Series 2016: | | | |
| 5% 5/15/25 | | 500 | 581 |
| 5% 5/15/26 | | 1,000 | 1,170 |
| 5% 5/15/27 | | 1,250 | 1,404 |
| 5% 11/15/20 | | 1,650 | 1,838 |
| 5% 11/15/22 | | 500 | 576 |
| 5% 11/15/24 | | 1,955 | 2,299 |
| Illinois Gen. Oblig.: | | | |
| Series 2005, 5% 4/1/17 (AMBAC Insured) | | 8,050 | 8,068 |
| Series 2006, 5% 1/1/17 | | 700 | 700 |
| Series 2010, 5% 1/1/21 (FSA Insured) | | 1,600 | 1,695 |
| Series 2012: | | | |
| 5% 3/1/19 | | 5,500 | 5,678 |
| 5% 8/1/19 | | 2,660 | 2,755 |
| 5% 8/1/20 | | 6,900 | 7,162 |
| 5% 8/1/21 | | 2,415 | 2,508 |
| 5% 8/1/22 | | 5,800 | 5,999 |
| Series 2013: | | | |
| 5% 7/1/21 | | 6,500 | 6,751 |
| 5% 7/1/22 | | 9,920 | 10,261 |
| Series 2014: | | | |
| 5% 4/1/18 | | 10,000 | 10,297 |
| 5% 2/1/22 | | 3,000 | 3,104 |
| 5% 2/1/25 | | 2,200 | 2,249 |
| Series 2016, 5% 2/1/26 | | 10,000 | 10,123 |
| Illinois Health Facilities Auth. Rev. Series 2003 A, 5% 5/15/17 (FSA Insured) | | 2,150 | 2,181 |
| Illinois Sales Tax Rev. Series 2009 B, 4.5% 6/15/17 | | 6,075 | 6,161 |
| McHenry County Cmnty. School District #200 Series 2006 B: | | | |
| 0% 1/15/24 | | 4,820 | 3,902 |
| 0% 1/15/25 | | 5,025 | 3,910 |
| 0% 1/15/26 | | 3,775 | 2,824 |
| McHenry County Conservation District Gen. Oblig.: | | | |
| Series 2014: | | | |
| 5% 2/1/19 | | 2,285 | 2,447 |
| 5% 2/1/20 | | 2,275 | 2,496 |
| Series 2014. 5% 2/1/23 | | 2,225 | 2,568 |
|
| TOTAL ILLINOIS | | | 353,575 |
|
| Indiana - 2.5% | | | |
| Indiana Fin. Auth. Hosp. Rev. Series 2013: | | | |
| 5% 8/15/22 | | 700 | 803 |
| 5% 8/15/23 | | 1,000 | 1,159 |
| Indiana Fin. Auth. Rev.: | | | |
| Series 2010 A, 5% 2/1/17 | | 2,800 | 2,809 |
| Series 2012: | | | |
| 5% 3/1/20 | | 650 | 699 |
| 5% 3/1/21 | | 1,225 | 1,339 |
| Indiana Fin. Auth. Wastewtr. Util. Rev. (CWA Auth. Proj.): | | | |
| Series 2012 A: | | | |
| 5% 10/1/20 | | 825 | 911 |
| 5% 10/1/22 | | 1,600 | 1,822 |
| Series 2014 A: | | | |
| 5% 10/1/20 | | 375 | 415 |
| 5% 10/1/21 | | 380 | 427 |
| 5% 10/1/22 | | 675 | 769 |
| Series 2015 A: | | | |
| 5% 10/1/24 | | 1,495 | 1,743 |
| 5% 10/1/25 | | 1,625 | 1,941 |
| Indiana Health Facility Fing. Auth. Rev. Bonds Series 2001: | | | |
| 1.6%, tender 2/1/17 (a) | | 50 | 50 |
| 1.6%, tender 2/1/17 (a) | | 9,850 | 9,857 |
| Indiana Muni. Pwr. Agcy. Pwr. Supply Sys. Rev. Series 2011 A: | | | |
| 5% 1/1/19 | | 1,470 | 1,575 |
| 5% 1/1/20 | | 1,250 | 1,369 |
| Indianapolis Local Pub. Impt. Series 2016: | | | |
| 5% 1/1/21 (b) | | 2,750 | 3,051 |
| 5% 1/1/23 (b) | | 1,830 | 2,088 |
| 5% 1/1/24 (b) | | 2,775 | 3,192 |
| 5% 1/1/25 (b) | | 2,910 | 3,374 |
| Indianapolis Thermal Energy Sys. Series 2010 B, 5% 10/1/17 | | 5,000 | 5,140 |
| Lake Central Multi-District School Bldg. Corp. Series 2012 B: | | | |
| 4% 1/15/19 | | 1,000 | 1,050 |
| 4% 1/15/20 | | 1,345 | 1,433 |
| 4% 1/15/21 | | 1,250 | 1,350 |
| 5% 7/15/19 | | 1,680 | 1,818 |
| 5% 7/15/20 | | 1,170 | 1,294 |
| 5% 7/15/21 | | 1,000 | 1,128 |
| Purdue Univ. Rev.: | | | |
| (Student Facilities Sys. Proj.) Series 2009 B, 4% 7/1/17 (Escrowed to Maturity) | | 500 | 508 |
| Series Z-1: | | | |
| 5% 7/1/17 | | 1,000 | 1,020 |
| 5% 7/1/18 | | 1,500 | 1,583 |
| Rockport Poll. Cont. Rev. Bonds (Indiana Michigan Pwr. Co. Proj. Series 2009 B, 1.75%, tender 6/1/18 (a) | | 8,500 | 8,474 |
| Whiting Envir. Facilities Rev. Bonds (BP Products North America, Inc. Proj.) Series 2015, 5%, tender 11/1/22 (a)(b) | | 20,745 | 23,169 |
|
| TOTAL INDIANA | | | 87,360 |
|
| Kansas - 0.3% | | | |
| Johnson County Unified School District # 233 Series 2016 B, 5% 9/1/23 | | 1,460 | 1,708 |
| Wichita Hosp. Facilities Rev. Series 2011 IV A: | | | |
| 5% 11/15/18 (Escrowed to Maturity) | | 2,250 | 2,400 |
| 5% 11/15/20 (Escrowed to Maturity) | | 2,745 | 3,069 |
| Wyandotte County/Kansas City Unified Govt. Util. Sys. Rev. Series 2016 A: | | | |
| 5% 9/1/22 | | 500 | 572 |
| 5% 9/1/23 | | 725 | 835 |
| 5% 9/1/25 | | 800 | 938 |
|
| TOTAL KANSAS | | | 9,522 |
|
| Kentucky - 1.2% | | | |
| Ashland Med. Ctr. Rev. (Ashland Hosp. Corp. D/B/A Kings Daughters Med. Ctr. Proj.) Series 2016 A: | | | |
| 5% 2/1/22 | | 1,120 | 1,218 |
| 5% 2/1/24 | | 1,360 | 1,499 |
| 5% 2/1/25 | | 1,000 | 1,108 |
| 5% 2/1/27 | | 1,230 | 1,346 |
| Kentucky Econ. Dev. Fin. Auth. Bonds Series 2009 B, 2.7%, tender 11/10/21 (a) | | 9,000 | 9,008 |
| Kentucky Econ. Dev. Fin. Auth. Hosp. Rev. Series 2015 A: | | | |
| 5% 6/1/20 | | 1,410 | 1,514 |
| 5% 6/1/22 | | 1,560 | 1,702 |
| 5% 6/1/24 | | 1,690 | 1,870 |
| Kentucky State Property & Buildings Commission Rev.: | | | |
| (#82 Proj.) 5.25% 10/1/17 (FSA Insured) | | 2,450 | 2,525 |
| Series 2016, 3% 11/1/17 | | 1,630 | 1,655 |
| Louisville/Jefferson County Metropolitan Govt. Poll. Cont. Rev. Bonds (Louisville Gas and Elec. Co. Proj.): | | | |
| Series 2003 A, 1.65%, tender 4/3/17 (a) | | 6,000 | 6,004 |
| Series 2007 B: | | | |
| 1.15%, tender 6/1/17 (a) | | 2,600 | 2,598 |
| 1.6%, tender 6/1/17 (a) | | 8,050 | 8,057 |
|
| TOTAL KENTUCKY | | | 40,104 |
|
| Louisiana - 2.7% | | | |
| Louisiana Citizens Property Ins. Corp. Assessment Rev. Series 2015: | | | |
| 5% 6/1/19 | | 9,350 | 10,060 |
| 5% 6/1/21 (FSA Insured) | | 5,000 | 5,614 |
| Louisiana Gas & Fuel Tax Rev. Bonds Series 2013 B, 0.902%, tender 1/3/17 (a) | | 25,000 | 24,965 |
| Louisiana Gen. Oblig.: | | | |
| Series 2012 A, 5% 8/1/22 | | 1,515 | 1,737 |
| Series 2014 D1, 5% 12/1/22 | | 1,305 | 1,505 |
| Series 2015, 5% 5/1/18 | | 1,075 | 1,127 |
| Series 2016 B: | | | |
| 5% 8/1/22 | | 14,095 | 16,162 |
| 5% 8/1/23 | | 6,250 | 7,270 |
| Series 2016 D: | | | |
| 5% 9/1/22 | | 6,360 | 7,302 |
| 5% 9/1/24 | | 7,030 | 8,280 |
| Louisiana Stadium and Exposition District Series 2013 A: | | | |
| 5% 7/1/21 | | 1,500 | 1,685 |
| 5% 7/1/22 | | 1,000 | 1,138 |
| New Orleans Gen. Oblig. Series 2012, 5% 12/1/20 | | 2,800 | 3,110 |
| Tobacco Settlement Fing. Corp. Series 2013 A, 5% 5/15/23 | | 4,500 | 5,065 |
|
| TOTAL LOUISIANA | | | 95,020 |
|
| Maine - 0.2% | | | |
| Maine Tpk. Auth. Tpk. Rev. Series 2015: | | | |
| 5% 7/1/21 | | 2,400 | 2,705 |
| 5% 7/1/22 | | 1,850 | 2,119 |
| 5% 7/1/24 | | 2,350 | 2,759 |
|
| TOTAL MAINE | | | 7,583 |
|
| Maryland - 1.6% | | | |
| Maryland Gen. Oblig. Series 2008 2, 5% 7/15/22 (Pre-Refunded to 7/15/18 @ 100) | | 5,500 | 5,820 |
| Maryland Health & Higher Edl. Facilities Auth. Rev.: | | | |
| Bonds: | | | |
| Series 2012 D, 1.243%, tender 1/3/17 (a) | | 13,940 | 13,960 |
| Series 2013 A: | | | |
| 0.993%, tender 5/15/18 (a) | | 4,515 | 4,516 |
| 1.013%, tender 5/15/18 (a) | | 7,100 | 7,103 |
| Series 2015: | | | |
| 5% 7/1/19 | | 400 | 427 |
| 5% 7/1/22 | | 900 | 1,000 |
| 5% 7/1/23 | | 1,000 | 1,120 |
| 5% 7/1/24 | | 2,000 | 2,248 |
| 5% 7/1/25 | | 1,770 | 1,998 |
| Montgomery County Gen. Oblig. Series 2011 A, 5% 7/1/20 | | 16,000 | 17,367 |
|
| TOTAL MARYLAND | | | 55,559 |
|
| Massachusetts - 2.0% | | | |
| Massachusetts Bay Trans. Auth. Sales Tax Rev. Series 2006 B, 5.25% 7/1/18 | | 2,300 | 2,440 |
| Massachusetts Dev. Fin. Agcy. Rev.: | | | |
| (Boston College Proj.) Series Q2, 5% 7/1/17 | | 1,370 | 1,397 |
| Series 2016 I: | | | |
| 5% 7/1/21 | | 500 | 556 |
| 5% 7/1/22 | | 600 | 671 |
| 5% 7/1/23 | | 675 | 765 |
| 5% 7/1/24 | | 550 | 630 |
| 5% 7/1/25 | | 500 | 578 |
| 5% 7/1/26 | | 1,000 | 1,162 |
| Massachusetts Edl. Fing. Auth. Rev. Series 2013, 5% 7/1/19 (b) | | 4,725 | 5,001 |
| Massachusetts Gen. Oblig.: | | | |
| Bonds Series 2014 D1, 1.05%, tender 7/1/20 (a) | | 32,000 | 31,554 |
| Series 2004 B, 5.25% 8/1/20 | | 12,700 | 14,237 |
| Series 2007 C, 5% 8/1/19 (Pre-Refunded to 8/1/17 @ 100) | | 2,000 | 2,046 |
| Massachusetts Health & Edl. Facilities Auth. Rev. Bonds Series 2007 G6, 1.6%, tender 1/5/17 (a) | | 2,900 | 2,909 |
| Medford Gen. Oblig. Series 2011 B, 4% 3/1/19 | | 3,570 | 3,761 |
|
| TOTAL MASSACHUSETTS | | | 67,707 |
|
| Michigan - 3.3% | | | |
| Detroit Swr. Disp. Rev. Series 2006 D, 1.167% 7/1/32 (a) | | 4,070 | 3,553 |
| Grand Blanc Cmnty. Schools Series 2013: | | | |
| 5% 5/1/19 | | 1,225 | 1,318 |
| 5% 5/1/20 | | 2,635 | 2,894 |
| 5% 5/1/21 | | 2,150 | 2,405 |
| 5% 5/1/22 | | 1,850 | 2,096 |
| Grand Rapids Pub. Schools Series 2016: | | | |
| 4% 5/1/17 (FSA Insured) | | 500 | 505 |
| 4% 5/1/18 (FSA Insured) | | 1,950 | 2,015 |
| Kalamazoo Hosp. Fin. Auth. Hosp. Facilities Rev. Series 2016: | | | |
| 5% 5/15/22 | | 1,000 | 1,135 |
| 5% 5/15/24 | | 550 | 637 |
| 5% 5/15/25 | | 650 | 759 |
| 5% 5/15/26 | | 625 | 732 |
| Kent Hosp. Fin. Auth. Hosp. Facilities Rev. (Spectrum Health Sys. Proj.) Series 2011 A: | | | |
| 5% 11/15/18 | | 1,250 | 1,334 |
| 5% 11/15/19 | | 1,000 | 1,087 |
| Michigan Bldg. Auth. Rev. (Facilities Prog.) Series 2016 I: | | | |
| 5% 4/15/22 | | 1,000 | 1,138 |
| 5% 4/15/23 | | 1,350 | 1,550 |
| 5% 4/15/24 | | 1,480 | 1,716 |
| Michigan Fin. Auth. Rev.: | | | |
| Bonds 1.1%, tender 8/15/19 (a) | | 4,250 | 4,174 |
| Series 2012 A: | | | |
| 5% 6/1/17 (Escrowed to Maturity) | | 1,410 | 1,433 |
| 5% 6/1/18 (Escrowed to Maturity) | | 2,430 | 2,557 |
| Series 2015 A: | | | |
| 5% 8/1/22 | | 2,400 | 2,696 |
| 5% 8/1/23 | | 3,800 | 4,313 |
| Michigan Gen. Oblig. Series 2016: | | | |
| 5% 3/15/20 | | 3,330 | 3,658 |
| 5% 3/15/21 | | 1,000 | 1,119 |
| 5% 3/15/22 | | 2,330 | 2,640 |
| 5% 3/15/23 | | 4,000 | 4,585 |
| Michigan Hosp. Fin. Auth. Rev.: | | | |
| (McLaren Health Care Corp. Proj.) Series 2008 A, 5.75% 5/15/38 (Pre-Refunded to 5/15/18 @ 100) | | 1,190 | 1,264 |
| Bonds: | | | |
| Series 1999: | | | |
| 0.95%, tender 2/1/18 (a) | | 130 | 130 |
| 0.95%, tender 2/1/18 (a) | | 3,865 | 3,854 |
| Series 2005 A4, 1.625%, tender 11/1/19 (a) | | 8,025 | 7,960 |
| Series 2010 F3, 1.4%, tender 6/29/18 (a) | | 1,900 | 1,904 |
| Series 2010 F4, 1.95%, tender 4/1/20 (a) | | 6,545 | 6,533 |
| Michigan Strategic Fund Ltd. Oblig. Rev. Bonds Series CC, 1.45%, tender 9/1/21 (a) | | 7,195 | 6,961 |
| Portage Pub. Schools Series 2016: | | | |
| 5% 5/1/23 | | 2,035 | 2,332 |
| 5% 11/1/23 | | 1,365 | 1,571 |
| 5% 5/1/24 | | 1,920 | 2,223 |
| 5% 11/1/24 | | 2,000 | 2,327 |
| 5% 5/1/25 | | 1,125 | 1,314 |
| 5% 11/1/25 | | 1,220 | 1,430 |
| 5% 5/1/26 | | 1,700 | 1,997 |
| 5% 11/1/26 | | 1,180 | 1,382 |
| 5% 11/1/28 | | 1,005 | 1,166 |
| Royal Oak Hosp. Fin. Auth. Hosp. Rev. Series 2014 D: | | | |
| 5% 9/1/21 | | 1,500 | 1,665 |
| 5% 9/1/23 | | 500 | 568 |
| Spring Lake Pub. Schools: | | | |
| Series 2014, 5% 5/1/19 | | 2,300 | 2,475 |
| 5% 11/1/19 | | 2,775 | 3,021 |
| 5% 5/1/20 | | 3,630 | 3,987 |
| 5% 11/1/20 | | 1,745 | 1,935 |
| 5% 5/1/21 | | 4,110 | 4,591 |
|
| TOTAL MICHIGAN | | | 114,639 |
|
| Minnesota - 0.4% | | | |
| Minneapolis & Saint Paul Metropolitan Arpts. Commission Arpt. Rev.: | | | |
| Series 2014 A: | | | |
| 5% 1/1/22 | | 1,000 | 1,138 |
| 5% 1/1/23 | | 1,000 | 1,156 |
| Series 2014 B: | | | |
| 5% 1/1/21 (b) | | 2,290 | 2,512 |
| 5% 1/1/22 (b) | | 2,000 | 2,213 |
| 5% 1/1/23 (b) | | 1,000 | 1,116 |
| Western Minnesota Muni. Pwr. Agcy. Pwr. Supply Rev. Series 2014 A: | | | |
| 5% 1/1/22 | | 1,000 | 1,141 |
| 5% 1/1/23 | | 1,500 | 1,742 |
| 5% 1/1/24 | | 1,000 | 1,176 |
|
| TOTAL MINNESOTA | | | 12,194 |
|
| Mississippi - 0.1% | | | |
| Mississippi Gen. Oblig. (Cap. Impts. Proj.) Series 2012 D, 1.25% 9/1/17 (a) | | 2,860 | 2,862 |
| Missouri - 0.0% | | | |
| Saint Louis Arpt. Rev. Series 2013, 5% 7/1/18 | | 765 | 805 |
| Nebraska - 0.0% | | | |
| Nebraska Pub. Pwr. District Rev. Series 2012 C, 5% 1/1/22 (Pre-Refunded to 1/1/18 @ 100) | | 1,100 | 1,143 |
| Nevada - 1.2% | | | |
| Humboldt County Nev Poll. Cont. Rev. Bonds (Seirra Pacific Pwr. Co. Projs.) Series 2016 A, 1.25%, tender 6/3/19 (a) | | 2,000 | 1,962 |
| Las Vegas Valley Wtr. District Wtr. Impt. Gen. Oblig.: | | | |
| Series 2016 B, 3% 6/1/18 | | 1,020 | 1,046 |
| Series 2016, 3% 6/1/17 | | 2,195 | 2,214 |
| Nevada Gen. Oblig.: | | | |
| Series 2010 C, 5% 6/1/19 | | 12,140 | 13,134 |
| Series 2012 B, 5% 8/1/20 | | 2,230 | 2,480 |
| Series 2013 D1: | | | |
| 5% 3/1/23 | | 4,500 | 5,236 |
| 5% 3/1/24 | | 2,700 | 3,133 |
| Washoe County Gas & Wtr. Facilities Bonds (Seirra Pacific Pwr. Co. Projs.) Series 2016 B, 3%, tender 6/1/22 (a) | | 5,300 | 5,422 |
| Washoe County Gas Facilities Rev. Bonds (Seirra Pacific Pwr. Co. Projs.) Series 2016 A, 1.5%, tender 6/3/19 (a)(b) | | 6,125 | 6,011 |
|
| TOTAL NEVADA | | | 40,638 |
|
| New Hampshire - 0.4% | | | |
| New Hampshire Health & Ed. Facilities Auth. Rev.: | | | |
| Series 2012: | | | |
| 4% 7/1/20 | | 2,705 | 2,837 |
| 4% 7/1/21 | | 1,520 | 1,603 |
| Series 2016: | | | |
| 5% 10/1/21 | | 1,250 | 1,368 |
| 5% 10/1/23 | | 1,675 | 1,850 |
| New Hampshire Tpk. Sys. Rev. Series 2012 B: | | | |
| 5% 2/1/17 | | 3,000 | 3,009 |
| 5% 2/1/18 | | 2,500 | 2,603 |
|
| TOTAL NEW HAMPSHIRE | | | 13,270 |
|
| New Jersey - 5.9% | | | |
| Camden County Impt. Auth. Health Care Redev. Rev. Series 2014 A: | | | |
| 5% 2/15/20 | | 3,000 | 3,243 |
| 5% 2/15/21 | | 2,500 | 2,746 |
| 5% 2/15/22 | | 2,500 | 2,774 |
| 5% 2/15/23 | | 2,750 | 3,078 |
| New Jersey Econ. Dev. Auth. Rev.: | | | |
| Series 2005 K, 5.5% 12/15/19 | | 8,030 | 8,601 |
| Series 2011 EE: | | | |
| 5% 9/1/20 | | 1,350 | 1,432 |
| 5% 9/1/20 (Escrowed to Maturity) | | 3,650 | 4,070 |
| Series 2012 II: | | | |
| 5% 3/1/21 | | 6,800 | 7,210 |
| 5% 3/1/22 | | 6,290 | 6,634 |
| Series 2013 NN, 5% 3/1/19 (Escrowed to Maturity) | | 8,165 | 8,783 |
| Series 2013, 5% 3/1/23 | | 6,000 | 6,284 |
| Series 2014 PP, 5% 6/15/19 | | 17,000 | 17,816 |
| New Jersey Edl. Facility: | | | |
| Series 2014: | | | |
| 5% 6/15/20 | | 11,000 | 11,652 |
| 5% 6/15/21 | | 11,000 | 11,664 |
| Series 2016 A: | | | |
| 4% 7/1/18 | | 3,585 | 3,698 |
| 5% 7/1/21 | | 2,200 | 2,405 |
| 5% 7/1/22 | | 6,300 | 6,943 |
| 5% 7/1/23 | | 3,390 | 3,772 |
| 5% 7/1/24 | | 7,915 | 8,835 |
| New Jersey Gen. Oblig. Series O, 5% 8/1/17 | | 6,940 | 7,091 |
| New Jersey Health Care Facilities Fing. Auth. Rev. Series 2016 A: | | | |
| 5% 7/1/19 (c) | | 1,500 | 1,577 |
| 5% 7/1/24 | | 1,225 | 1,410 |
| 5% 7/1/24 | | 1,005 | 1,130 |
| New Jersey Higher Ed. Student Assistance Auth. Student Ln. Rev. Series 2013: | | | |
| 5% 12/1/18 (b) | | 6,000 | 6,309 |
| 5% 12/1/19 (b) | | 3,850 | 4,104 |
| New Jersey Tpk. Auth. Tpk. Rev.: | | | |
| Series 2013 A, 5% 1/1/24 | | 4,345 | 4,930 |
| Series 2013 C, 1.2% 1/1/17 (a) | | 16,000 | 16,000 |
| New Jersey Trans. Trust Fund Auth.: | | | |
| Series 2003 B, 5.25% 12/15/19 | | 3,870 | 4,111 |
| Series 2012 AA, 5% 6/15/19 | | 1,500 | 1,573 |
| Series 2013 A: | | | |
| 5% 12/15/19 | | 6,455 | 6,812 |
| 5% 6/15/20 | | 18,000 | 18,988 |
| Series 2016 A, 5% 6/15/27 | | 4,050 | 4,386 |
| New Jersey Transit Corp. Ctfs. of Prtn. Series 2014 A, 5% 9/15/21 | | 4,900 | 5,313 |
|
| TOTAL NEW JERSEY | | | 205,374 |
|
| New Mexico - 0.6% | | | |
| Farmington Poll. Cont. Rev. Bonds (Southern California Edison Co. Four Corners Proj.): | | | |
| Series 2005 B, 1.875%, tender 4/1/20 (a) | | 11,000 | 10,902 |
| Series 2011, 1.875%, tender 4/1/20 (a) | | 6,290 | 6,234 |
| Rio Rancho Wtr. & Wastewtr. Sys. Rev. Series 2009, 5% 5/15/17 (FSA Insured) | | 4,480 | 4,544 |
|
| TOTAL NEW MEXICO | | | 21,680 |
|
| New York - 9.2% | | | |
| Dorm. Auth. New York Univ. Rev. Series 2016 A: | | | |
| 5% 7/1/22 | | 500 | 566 |
| 5% 7/1/24 | | 1,850 | 2,131 |
| Dutchess County Local Dev. Corp. Rev. (Health Quest Systems, Inc. Proj.) Series 2010 A: | | | |
| 5% 7/1/18 (Assured Guaranty Corp. Insured) (FSA Insured) | | 1,100 | 1,157 |
| 5% 7/1/19 (Assured Guaranty Corp. Insured) (FSA Insured) | | 640 | 690 |
| Long Island Pwr. Auth. Elec. Sys. Rev. Series 2016 B: | | | |
| 5% 9/1/25 | | 2,800 | 3,289 |
| 5% 9/1/26 | | 1,245 | 1,471 |
| Metropolitan Trans. Auth. Svc. Contract Rev. Series 2002 A, 5.5% 7/1/17 | | 5,000 | 5,112 |
| New York City Gen. Oblig.: | | | |
| Series 2008 C, 5.25% 8/1/17 | | 2,280 | 2,337 |
| Series 2010 F, 5% 8/1/17 | | 8,365 | 8,561 |
| Series 2011 B, 5% 8/1/17 | | 1,000 | 1,023 |
| Series 2012 C, 4% 8/1/17 | | 2,740 | 2,789 |
| Series 2015 C, 5% 8/1/25 | | 1,700 | 2,008 |
| Series 2015 F1, 3% 6/1/17 | | 14,370 | 14,495 |
| New York City Transitional Fin. Auth. Bldg. Aid Rev. Series 2015 S2, 3% 7/15/17 | | 9,565 | 9,669 |
| New York City Transitional Fin. Auth. Rev.: | | | |
| Series 2003 B, 5% 2/1/20 | | 3,000 | 3,305 |
| Series 2010 B: | | | |
| 5% 11/1/17 | | 11,740 | 12,125 |
| 5% 11/1/17 (Escrowed to Maturity) | | 18,260 | 18,866 |
| 5% 11/1/20 | | 5,950 | 6,497 |
| Series 2010 D: | | | |
| 5% 11/1/17 | | 8,015 | 8,278 |
| 5% 11/1/17 (Escrowed to Maturity) | | 2,100 | 2,168 |
| Series 2012 A: | | | |
| 5% 11/1/17 | | 6,180 | 6,383 |
| 5% 11/1/17 (Escrowed to Maturity) | | 820 | 847 |
| 5% 11/1/20 | | 4,500 | 5,040 |
| New York Dorm. Auth. Mental Health Svcs. Facilities Impt. Rev.: | | | |
| (State Univ. Proj.) Series 2012 A, 5% 5/15/20 | | 4,000 | 4,427 |
| Series 2012 A, 4% 5/15/20 | | 8,000 | 8,593 |
| New York Dorm. Auth. Personal Income Tax Rev. Series 2012 A, 5% 12/15/20 | | 8,500 | 9,555 |
| New York Dorm. Auth. Revs. Series 2008 D, 5.25% 8/15/17 (FSA Insured) | | 7,000 | 7,182 |
| New York Dorm. Auth. Sales Tax Rev. Series 2015 A, 5% 3/15/17 | | 90,000 | 90,725 |
| New York Metropolitan Trans. Auth. Rev.: | | | |
| Series 2003 B, 5.25% 11/15/19 (Nat'l. Pub. Fin. Guarantee Corp. Insured) | | 5,200 | 5,716 |
| Series 2008 B2: | | | |
| 5% 11/15/19 | | 6,185 | 6,756 |
| 5% 11/15/20 | | 5,500 | 6,130 |
| 5% 11/15/21 | | 4,000 | 4,531 |
| Series 2012 B, 5% 11/15/22 | | 2,000 | 2,298 |
| Series 2012 D, 5% 11/15/18 | | 2,515 | 2,684 |
| Series 2012 E: | | | |
| 4% 11/15/19 | | 4,000 | 4,258 |
| 5% 11/15/21 | | 2,435 | 2,758 |
| Series 2012 F, 5% 11/15/19 | | 5,000 | 5,462 |
| New York Thruway Auth. Gen. Rev. Series 2013 A, 5% 5/1/19 | | 20,400 | 21,979 |
| New York Thruway Auth. Second Gen. Hwy. & Bridge Trust Fund: | | | |
| Series 2010 A, 5% 4/1/17 | | 1,000 | 1,010 |
| Series 2011 A1: | | | |
| 5% 4/1/17 | | 1,500 | 1,515 |
| 5% 4/1/18 | | 3,500 | 3,669 |
| New York Trans. Dev. Corp. (Term. One Group Assoc. L.P. Proj.) Series 2015, 5% 1/1/17 (b) | | 8,890 | 8,890 |
| Tobacco Settlement Fing. Corp. Series 2013 B, 5% 6/1/21 | | 65 | 65 |
| Triborough Bridge & Tunnel Auth. Revs. Series Y, 5.5% 1/1/17 (Escrowed to Maturity) | | 760 | 760 |
|
| TOTAL NEW YORK | | | 317,770 |
|
| North Carolina - 0.7% | | | |
| Dare County Ctfs. of Prtn. Series 2012 B: | | | |
| 4% 6/1/17 | | 1,000 | 1,012 |
| 4% 6/1/18 | | 1,280 | 1,330 |
| 4% 6/1/20 | | 1,000 | 1,073 |
| 5% 6/1/19 | | 1,305 | 1,411 |
| Mecklenburg County Pub. Facilities Corp. Series 2009, 5% 3/1/18 | | 1,500 | 1,568 |
| North Carolina Cap. Facilities Fin. Agcy. Rev. Bonds (Republic Svcs., Inc. Proj.) Series 2013, 1.25%, tender 3/15/17 (a)(b) | | 2,200 | 2,200 |
| North Carolina Med. Care Commission Hosp. Rev. (North Carolina Baptist Hosp. Proj.) Series 2010: | | | |
| 5% 6/1/17 | | 3,220 | 3,271 |
| 5% 6/1/18 | | 3,820 | 4,016 |
| North Carolina Muni. Pwr. Agcy. #1 Catawba Elec. Rev. Series 2015 E: | | | |
| 5% 1/1/22 | | 5,000 | 5,683 |
| 5% 1/1/23 | | 1,500 | 1,734 |
|
| TOTAL NORTH CAROLINA | | | 23,298 |
|
| Ohio - 2.7% | | | |
| Akron Bath Copley Hosp. District Rev. Series 2016, 5% 11/15/24 | | 2,000 | 2,232 |
| American Muni. Pwr., Inc. Rev. Bonds Series B, 5%, tender 8/15/20 (a) | | 35,000 | 37,930 |
| Buckeye Tobacco Settlement Fing. Auth. Series 2007 A1, 5% 6/1/17 | | 3,500 | 3,554 |
| Cincinnati City School District 5.25% 12/1/18 (Nat'l. Pub. Fin. Guarantee Corp. Insured) | | 3,555 | 3,823 |
| Cleveland Arpt. Sys. Rev.: | | | |
| 5% 1/1/20 (FSA Insured) | | 425 | 462 |
| 5% 1/1/22 (FSA Insured) | | 1,325 | 1,493 |
| 5% 1/1/24 (FSA Insured) | | 1,200 | 1,385 |
| 5% 1/1/25 (FSA Insured) | | 1,250 | 1,451 |
| 5% 1/1/26 (FSA Insured) | | 500 | 576 |
| Columbus Gen. Oblig. Series 2013 1, 5% 7/1/17 | | 2,075 | 2,117 |
| Fairfield County Hosp. Facilities Rev. (Fairfield Med. Ctr. Proj.) Series 2013: | | | |
| 5% 6/15/22 | | 2,145 | 2,356 |
| 5% 6/15/23 | | 1,855 | 2,061 |
| Franklin County Hosp. Facilities Rev. Series 2016 C, 5% 11/1/23 | | 2,860 | 3,327 |
| Hamilton County Convention Facilities Auth. Rev. Series 2014: | | | |
| 5% 12/1/19 | | 1,910 | 2,056 |
| 5% 12/1/20 | | 2,205 | 2,413 |
| 5% 12/1/21 | | 2,045 | 2,268 |
| Hamilton County Student Hsg. Rev. (Stratford Heights Proj.) Series 2010, 5% 6/1/17 (FSA Insured) | | 1,160 | 1,179 |
| Ohio Gen. Oblig.: | | | |
| (Higher Ed. Proj.) Series 2010 A, 5% 8/1/17 | | 3,290 | 3,367 |
| Series 2011 A, 5% 8/1/17 | | 3,070 | 3,142 |
| Series 2012 C, 5% 9/15/21 | | 4,350 | 4,955 |
| Ohio Higher Edl. Facility Commission Rev. (Univ. Hosp. Health Sys. Proj.) Series 2010 A, 5% 1/15/17 | | 1,000 | 1,001 |
| Scioto County Hosp. Facilities Rev. Series 2016: | | | |
| 5% 2/15/21 | | 650 | 719 |
| 5% 2/15/22 | | 1,100 | 1,235 |
| 5% 2/15/23 | | 2,120 | 2,410 |
| 5% 2/15/24 | | 1,640 | 1,887 |
| 5% 2/15/25 | | 1,710 | 1,981 |
| 5% 2/15/26 | | 1,250 | 1,457 |
|
| TOTAL OHIO | | | 92,837 |
|
| Oklahoma - 0.4% | | | |
| Oklahoma City Pub. Property Auth. Hotel Tax Rev. Series 2015, 5% 10/1/17 | | 450 | 463 |
| Oklahoma Dev. Fin. Auth. Rev.: | | | |
| (Saint John Health Sys. Proj.) Series 2012, 5% 2/15/23 | | 2,600 | 2,911 |
| Series 2004 A, 2.375% 12/1/21 | | 1,350 | 1,384 |
| Series 2012, 5% 2/15/21 | | 1,600 | 1,784 |
| Tulsa County Independent School Disctrict #9 Series 2015, 2% 4/1/17 | | 3,000 | 3,008 |
| Tulsa County Indl. Auth. Edl. Facilities Lease Rev. (Jenks Pub. Schools Proj.) Series 2009, 5.5% 9/1/18 | | 5,215 | 5,567 |
|
| TOTAL OKLAHOMA | | | 15,117 |
|
| Pennsylvania - 5.0% | | | |
| Franklin County Indl. Dev. Auth. (The Chambersburg Hosp. Proj.) Series 2010, 5% 7/1/17 | | 1,255 | 1,279 |
| Lehigh County Indl. Dev. Auth. Poll. Cont. Rev. Bonds 0.9%, tender 8/15/17 (a) | | 10,255 | 10,221 |
| Montgomery County Higher Ed. & Health Auth. Hosp. Rev. (Abington Memorial Hosp. Proj.) Series 2009 A, 5% 6/1/17 | | 2,200 | 2,235 |
| Montgomery County Higher Ed. & Health Auth. Rev. Series 2014 A: | | | |
| 4% 10/1/18 | | 1,000 | 1,032 |
| 4% 10/1/19 | | 660 | 688 |
| 5% 10/1/20 | | 1,260 | 1,368 |
| Mount Lebanon School District Series 2015, 4% 2/15/18 | | 865 | 893 |
| Pennsylvania Econ. Dev. Auth. Governmental Lease (Forum Place Proj.) Series 2012: | | | |
| 5% 3/1/18 | | 2,455 | 2,558 |
| 5% 3/1/19 | | 2,310 | 2,453 |
| 5% 3/1/20 | | 2,140 | 2,318 |
| Pennsylvania Econ. Dev. Fin. Auth. Unemployment Compensation Rev. Series 2012 B: | | | |
| 5% 1/1/22 | | 5,000 | 5,097 |
| 5% 7/1/22 | | 3,795 | 3,827 |
| Pennsylvania Econ. Dev. Fing. Auth. Solid Waste Disp. Rev. Bonds (Waste Mgmt., Inc. Proj.) Series 2013, 0.85%, tender 2/1/17 (a)(b) | | 18,500 | 18,498 |
| Pennsylvania Gen. Oblig.: | | | |
| Series 2011, 5% 7/1/21 | | 1,900 | 2,129 |
| Series 2012, 5% 6/1/18 | | 3,410 | 3,580 |
| Series 2016: | | | |
| 5% 2/1/21 | | 8,825 | 9,819 |
| 5% 2/1/22 | | 9,265 | 10,470 |
| 5% 2/1/23 | | 9,075 | 10,368 |
| 5% 2/1/24 | | 10,215 | 11,754 |
| 5% 6/1/17 | | 9,000 | 9,148 |
| 5% 8/15/17 | | 18,000 | 18,440 |
| Pennsylvania Higher Edl. Facilities Auth. Rev. Series 2014: | | | |
| 5% 12/1/19 | | 340 | 372 |
| 5% 12/1/21 | | 275 | 313 |
| 5% 12/1/22 | | 855 | 989 |
| Pennsylvania Pub. School Bldg. Auth. School Rev. (The School District of Harrisburg Proj.) Series 2016 A, 5% 12/1/21 (FSA Insured) | | 5,000 | 5,547 |
| Pennsylvania Tpk. Commission Tpk. Rev. Series 2013 A, 1.32% 12/1/17 (a) | | 6,400 | 6,399 |
| Philadelphia Gen. Oblig. Series 2011: | | | |
| 5.25% 8/1/17 | | 6,165 | 6,307 |
| 5.25% 8/1/18 | | 5,515 | 5,840 |
| Philadelphia Muni. Auth. Rev. Series 2013 A: | | | |
| 5% 11/15/17 | | 6,635 | 6,853 |
| 5% 11/15/18 | | 3,430 | 3,650 |
| Philadelphia School District Series 2016 D, 5% 9/1/17 | | 1,000 | 1,022 |
| Southeastern Pennsylvania Trans. Auth. Rev. Series 2011: | | | |
| 5% 6/1/18 | | 1,000 | 1,049 |
| 5% 6/1/19 | | 200 | 215 |
| State Pub. School Bldg. Auth. Lease Rev. (Philadelphia School District Proj.) Series 2012: | | | |
| 5% 4/1/19 | | 1,305 | 1,374 |
| 5% 4/1/20 | | 1,250 | 1,333 |
| 5% 4/1/21 | | 1,000 | 1,075 |
| Unionville-Chadds Ford School District Gen. Oblig. Series 2009, 5% 6/1/20 | | 1,190 | 1,289 |
|
| TOTAL PENNSYLVANIA | | | 171,802 |
|
| Rhode Island - 0.9% | | | |
| Rhode Island & Providence Plantations Series 2015 A, 4% 8/1/17 | | 5,000 | 5,086 |
| Rhode Island Health & Edl. Bldg. Corp. Higher Ed. Facilities Rev.: | | | |
| Series 2013 A: | | | |
| 5% 5/15/18 | | 1,000 | 1,043 |
| 5% 5/15/19 | | 1,500 | 1,602 |
| Series 2016: | | | |
| 5% 5/15/20 | | 660 | 710 |
| 5% 5/15/22 | | 2,000 | 2,190 |
| 5% 5/15/23 | | 1,205 | 1,327 |
| 5% 5/15/24 | | 2,350 | 2,596 |
| 5% 5/15/25 | | 5,505 | 6,086 |
| Rhode Island Health & Edl. Bldg. Corp. Pub. Schools Rev. Series 2015, 5% 5/15/25 (FSA Insured) | | 6,040 | 7,000 |
| Tobacco Setlement Fing. Corp. Series 2015 A: | | | |
| 5% 6/1/26 | | 3,500 | 3,794 |
| 5% 6/1/27 | | 1,000 | 1,073 |
|
| TOTAL RHODE ISLAND | | | 32,507 |
|
| South Carolina - 1.5% | | | |
| Lexington County Health Svcs. District, Inc. Hosp. Rev. Series 2011, 5% 11/1/19 | | 1,190 | 1,293 |
| Scago Edl. Facilities Corp. for Colleton School District (School District of Colleton County Proj.) Series 2015: | | | |
| 5% 12/1/23 | | 4,440 | 5,067 |
| 5% 12/1/26 | | 1,100 | 1,244 |
| South Carolina Pub. Svc. Auth. Rev.: | | | |
| Series 2012 B: | | | |
| 5% 12/1/17 | | 2,000 | 2,071 |
| 5% 12/1/20 | | 1,000 | 1,116 |
| Series 2012 C, 5% 12/1/17 | | 10,535 | 10,910 |
| Series 2014 C: | | | |
| 5% 12/1/22 | | 1,100 | 1,269 |
| 5% 12/1/23 | | 5,000 | 5,830 |
| Series 2015 C, 5% 12/1/18 | | 15,000 | 16,029 |
| South Carolina Trans. Infrastructure Bank Rev. Series 2012 B, 5% 10/1/17 | | 8,000 | 8,232 |
|
| TOTAL SOUTH CAROLINA | | | 53,061 |
|
| South Dakota - 0.2% | | | |
| South Dakota Health & Edl. Facilities Auth. Rev.: | | | |
| (Reg'l. Health Proj.) Series 2010, 5% 9/1/17 | | 490 | 502 |
| Series 2011: | | | |
| 5% 9/1/17 | | 1,100 | 1,127 |
| 5% 9/1/18 | | 1,200 | 1,269 |
| 5% 9/1/19 | | 1,255 | 1,353 |
| Series 2014 B: | | | |
| 4% 11/1/19 | | 400 | 425 |
| 4% 11/1/20 | | 625 | 671 |
| 4% 11/1/21 | | 500 | 542 |
| 5% 11/1/22 | | 375 | 430 |
|
| TOTAL SOUTH DAKOTA | | | 6,319 |
|
| Tennessee - 0.1% | | | |
| Knox County Health Edl. & Hsg. Facilities Board Rev. Series 2016: | | | |
| 5% 9/1/25 | | 1,670 | 1,885 |
| 5% 9/1/26 | | 1,835 | 2,064 |
| Metropolitan Nashville Arpt. Auth. Rev. Series 2010 A, 5% 7/1/17 | | 1,100 | 1,121 |
|
| TOTAL TENNESSEE | | | 5,070 |
|
| Texas - 9.6% | | | |
| Allen Independent School District Series 2013, 4% 2/15/18 | | 1,290 | 1,331 |
| Austin Elec. Util. Sys. Rev. 0% 5/15/18 (Nat'l. Pub. Fin. Guarantee Corp. Insured) | | 4,500 | 4,419 |
| Austin Independent School District Series 2004, 5% 8/1/17 | | 1,450 | 1,484 |
| Bastrop Independent School District Series 2007, 5.25% 2/15/37 (Pre-Refunded to 2/15/17 @ 100) | | 2,705 | 2,718 |
| Brownsville Util. Sys. Rev. Series 2015, 5% 9/1/17 | | 2,135 | 2,187 |
| Carroll Independent School District Series 2009 C, 5.25% 2/15/19 | | 1,000 | 1,080 |
| Central Reg'l. Mobility Auth. Series 2016: | | | |
| 5% 1/1/21 | | 500 | 547 |
| 5% 1/1/22 | | 1,500 | 1,661 |
| 5% 1/1/23 | | 2,450 | 2,730 |
| 5% 1/1/24 | | 3,370 | 3,779 |
| 5% 1/1/26 | | 2,865 | 3,234 |
| Cypress-Fairbanks Independent School District Bonds Series 2014 B3, 1.05%, tender 8/15/17 (a) | | 2,025 | 2,022 |
| Dallas County Gen. Oblig. Series 2016: | | | |
| 5% 8/15/22 | | 3,520 | 4,072 |
| 5% 8/15/23 | | 3,000 | 3,518 |
| Dallas Fort Worth Int'l. Arpt. Rev.: | | | |
| Series 2013 F: | | | |
| 5% 11/1/19 | | 2,000 | 2,180 |
| 5% 11/1/20 | | 1,500 | 1,671 |
| 5% 11/1/21 | | 3,000 | 3,384 |
| 5% 11/1/22 | | 5,000 | 5,717 |
| Series 2014 D, 5% 11/1/23 (b) | | 1,950 | 2,202 |
| Dallas Independent School District Bonds: | | | |
| Series 2016 B1, 3%, tender 2/15/17 (a) | | 1,985 | 1,990 |
| Series 2016 B2, 4%, tender 2/15/18 (a) | | 3,970 | 4,082 |
| Series 2016 B3, 5%, tender 2/15/19 (a) | | 6,000 | 6,420 |
| Series 2016 B4, 5%, tender 2/15/20 (a) | | 7,000 | 7,632 |
| Series 2016 B5, 5%, tender 2/15/21 (a) | | 8,000 | 8,946 |
| Series 2016 B6, 5%, tender 2/15/22 (a) | | 10,000 | 11,383 |
| Dallas Wtrwks. & Swr. Sys. Rev. Series 2011, 5% 10/1/18 | | 1,600 | 1,703 |
| Dickinson Independent School District Bonds Series 2013, 1.05%, tender 8/1/17 (a) | | 5,150 | 5,143 |
| El Paso Gen. Oblig. Series 2014, 5% 8/15/18 | | 2,695 | 2,856 |
| Harris County Gen. Oblig. Series 2015 A, 4% 10/1/17 | | 2,500 | 2,557 |
| Houston Arpt. Sys. Rev.: | | | |
| Series 2011 A, 5% 7/1/17 (b) | | 7,380 | 7,517 |
| Series 2012 A, 5% 7/1/23 (b) | | 2,000 | 2,226 |
| Kermit Independent School District Series 2007, 5.25% 2/15/32 (Pre-Refunded to 2/15/17 @ 100) | | 1,300 | 1,306 |
| Lewisville Independent School District Series 2009, 5% 8/15/17 | | 1,170 | 1,199 |
| Lower Colorado River Auth. Rev.: | | | |
| (LCRA Transmission Svcs. Corp. Proj.) Series 2010, 5% 5/15/18 | | 3,140 | 3,299 |
| Series 2010, 5% 5/15/17 | | 3,005 | 3,048 |
| Lubbock Health Facilities Dev. Corp. Rev. (St. Joseph Health Sys. Proj.) Series 2008 B: | | | |
| 5% 7/1/17 | | 2,800 | 2,854 |
| 5% 7/1/18 | | 3,030 | 3,196 |
| Mansfield Independent School District Series 2009, 4% 2/15/17 | | 1,840 | 1,847 |
| Newark Higher Ed. Fin. Corp. (Abilene Christian Univ. Proj.) Series 2016 A, 5% 4/1/26 | | 2,480 | 2,882 |
| North East Texas Independent School District: | | | |
| Bonds Series 2013 B, 1.42%, tender 8/1/21 (a) | | 3,505 | 3,381 |
| Series 2007 A, 5% 8/1/24 (Pre-Refunded to 8/1/17 @ 100) | | 10,000 | 10,232 |
| North Harris County Reg'l. Wtr. Auth. Series 2013, 4% 12/15/22 | | 1,580 | 1,732 |
| North Texas Tollway Auth. Rev.: | | | |
| Bonds Series 2012 C, 1.95%, tender 1/1/19 (a) | | 8,500 | 8,487 |
| Series 2016 A, 5% 1/1/26 | | 13,000 | 14,928 |
| 5.75% 1/1/38 (Pre-Refunded to 1/1/18 @ 100) | | 7,830 | 8,185 |
| Northside Independent School District Bonds: | | | |
| Series 2011 A, 2%, tender 6/1/19 (a) | | 6,225 | 6,245 |
| 1.2%, tender 8/1/17 (a) | | 28,155 | 28,139 |
| 2%, tender 6/1/21 (a) | | 10,000 | 9,975 |
| Plano Independent School District 5% 2/15/18 | | 2,500 | 2,608 |
| Port Houston Auth. Harris County Series 2015 B, 5% 10/1/17 (b) | | 2,000 | 2,058 |
| Round Rock Independent School District Series 2015, 5% 8/1/17 | | 5,000 | 5,117 |
| Sam Rayburn Muni. Pwr. Agcy. Series 2012, 5% 10/1/20 | | 1,000 | 1,088 |
| San Antonio Pub. Facilities Corp. and Rfdg. Lease (Convention Ctr. Proj.) Series 2012: | | | |
| 5% 9/15/20 | | 1,000 | 1,106 |
| 5% 9/15/21 | | 1,000 | 1,126 |
| 5% 9/15/22 | | 3,440 | 3,925 |
| San Antonio Wtr. Sys. Rev. Series 2012: | | | |
| 4% 5/15/19 | | 1,500 | 1,589 |
| 5% 5/15/20 | | 6,000 | 6,646 |
| Southwest Higher Ed. Auth. Rev. (Southern Methodist Univ. Proj.) Series 2016 A: | | | |
| 5% 10/1/20 | | 3,480 | 3,878 |
| 5% 10/1/21 | | 3,000 | 3,406 |
| Tarrant County Cultural Ed. Facilities Fin. Corp. Hosp. Rev.: | | | |
| (Scott & White Healthcare Proj.) Series 2013 A: | | | |
| 5% 8/15/21 | | 750 | 851 |
| 5% 8/15/23 | | 1,000 | 1,169 |
| Series 2013: | | | |
| 4% 9/1/18 | | 400 | 417 |
| 5% 9/1/19 | | 655 | 706 |
| 5% 9/1/20 | | 915 | 1,006 |
| 5.75% 11/15/24 (Pre-Refunded to 11/15/18 @ 100) | | 2,385 | 2,576 |
| Tarrant County Cultural Ed. Facilities Fin. Corp. Rev.: | | | |
| Series 2016 A, 5% 2/15/26 | | 1,500 | 1,788 |
| Series 2017 A, 5% 2/15/24 | | 2,000 | 2,341 |
| 5.75% 7/1/18 | | 1,830 | 1,905 |
| Texas Pub. Fin. Auth. Rev. Series 2014 B, 4% 7/1/17 | | 2,100 | 2,104 |
| Texas Trans. Commission Central Texas Tpk. Sys. Rev. Bonds Series 2015 A, 5%, tender 4/1/20 (a) | | 12,885 | 14,057 |
| Texas Trans. Commission State Hwy. Fund Rev. Series 2015, 3% 10/1/17 | | 34,000 | 34,507 |
| Tomball Independent School District 5% 2/15/17 (Assured Guaranty Corp. Insured) | | 1,105 | 1,110 |
| Trinity River Auth. Reg'l. Wastewtr. Sys. Rev. Series 2016, 5% 8/1/23 | | 1,585 | 1,852 |
| Univ. of Texas Board of Regents Sys. Rev. Series 2010 B, 5% 8/15/21 | | 1,800 | 2,049 |
| Univ. of Texas Permanent Univ. Fund Rev.: | | | |
| Series 2015 B, 4% 7/1/17 | | 5,625 | 5,711 |
| Series 2015, 5% 7/1/17 | | 1,985 | 2,025 |
|
| TOTAL TEXAS | | | 332,047 |
|
| Utah - 0.0% | | | |
| Utah Associated Muni. Pwr. Sys. Rev. (Payson Pwr. Proj.) 5% 9/1/17 | | 1,090 | 1,118 |
| Virginia - 1.0% | | | |
| Chesapeake Trans. Sys. Toll Road Rev. Series 2012 A: | | | |
| 4% 7/15/20 | | 605 | 641 |
| 5% 7/15/21 | | 400 | 444 |
| Fairfax County Gen. Oblig.: | | | |
| 5% 10/1/20 | | 6,710 | 7,527 |
| 5% 10/1/21 | | 3,000 | 3,436 |
| Fredericksburg Econ. Dev. Auth. Rev. Series 2014, 5% 6/15/24 | | 2,340 | 2,697 |
| Stafford County Econ. Dev. Auth. Hosp. Facilities Rev. Series 2016: | | | |
| 5% 6/15/24 | | 650 | 749 |
| 5% 6/15/25 | | 1,000 | 1,155 |
| 5% 6/15/26 | | 1,715 | 1,988 |
| Virginia College Bldg. Auth. Edl. Facilities Rev. (21st Century College and Equip. Progs.) Series 2015 D, 5% 2/1/17 | | 12,830 | 12,869 |
| York County Econ. Dev. Auth. Poll. Cont. Rev. Bonds (Virginia Elec. and Pwr. Co. Proj.) Series 2009 A, 1.875%, tender 5/16/19 (a) | | 2,500 | 2,500�� |
|
| TOTAL VIRGINIA | | | 34,006 |
|
| Washington - 1.4% | | | |
| Grant County Pub. Util. District #2 Series 2012 A: | | | |
| 5% 1/1/20 | | 1,375 | 1,503 |
| 5% 1/1/21 | | 1,865 | 2,083 |
| King County Highline School District # 401 Series 2009, 5% 12/1/17 | | 2,950 | 3,056 |
| Port of Seattle Rev.: | | | |
| Series 2010 C, 5% 2/1/17 (b) | | 2,500 | 2,507 |
| Series 2015 B, 5% 3/1/17 | | 5,000 | 5,032 |
| Series 2016 B: | | | |
| 5% 10/1/20 (b) | | 2,935 | 3,251 |
| 5% 10/1/21 (b) | | 2,780 | 3,122 |
| 5% 10/1/22 (b) | | 2,500 | 2,844 |
| 5% 10/1/23 (b) | | 3,030 | 3,483 |
| Seattle Muni. Lt. & Pwr. Rev. Series 2010 B, 5% 2/1/17 | | 2,000 | 2,006 |
| Tacoma Elec. Sys. Rev. Series 2013 A: | | | |
| 4% 1/1/20 | | 5,000 | 5,329 |
| 4% 1/1/21 | | 2,000 | 2,159 |
| 5% 1/1/20 | | 3,000 | 3,285 |
| 5% 1/1/21 | | 1,770 | 1,978 |
| Washington Gen. Oblig. Series 2012 AR, 5% 7/1/18 | | 5,000 | 5,283 |
|
| TOTAL WASHINGTON | | | 46,921 |
|
| West Virginia - 0.4% | | | |
| West Virginia Econ. Dev. Auth. Solid Waste Disp. Facilities Rev. Bonds: | | | |
| (Appalachian Pwr. Co. Amos Proj.) Series 2011 A, 1.7%, tender 9/1/20 (a)(b) | | 6,760 | 6,528 |
| 1.9%, tender 4/1/19 (a) | | 6,285 | 6,259 |
|
| TOTAL WEST VIRGINIA | | | 12,787 |
|
| Wisconsin - 0.5% | | | |
| Madison Gen. Oblig. Series 2014 A, 5% 10/1/21 | | 3,215 | 3,660 |
| Milwaukee County Arpt. Rev. Series 2013 A: | | | |
| 5% 12/1/20 (b) | | 1,330 | 1,471 |
| 5% 12/1/22 (b) | | 1,470 | 1,672 |
| 5.25% 12/1/23 (b) | | 1,540 | 1,767 |
| Wisconsin Health & Edl. Facilities: | | | |
| Bonds Series 2013 B, 4%, tender 3/1/18 (a) | | 2,090 | 2,156 |
| Series 2014: | | | |
| 4% 5/1/18 | | 375 | 384 |
| 4% 5/1/19 | | 285 | 295 |
| 5% 5/1/20 | | 410 | 441 |
| 5% 5/1/21 | | 640 | 697 |
| Wisconsin Health & Edl. Facilities Auth. Rev.: | | | |
| (Aurora Health Care, Inc. Proj.) Series 2010 A, 5% 4/15/17 | | 1,500 | 1,517 |
| (Thedacare, Inc. Proj.) Series 2010, 5% 12/15/17 | | 1,540 | 1,595 |
| Series 2012, 5% 10/1/21 | | 1,400 | 1,584 |
|
| TOTAL WISCONSIN | | | 17,239 |
|
| TOTAL MUNICIPAL BONDS | | | |
| (Cost $3,256,982) | | | 3,240,845 |
|
| Municipal Notes - 4.1% | | | |
| Connecticut - 0.3% | | | |
| New Britain Gen. Oblig. BAN 2% 3/23/17 | | 5,000 | $5,015 |
| New Haven Gen. Oblig. TAN Series 2016, 2.5% 5/18/17 | | 2,600 | 2,611 |
| New London BAN Series 2016, 2% 3/23/17 | | 4,800 | 4,808 |
|
| TOTAL CONNECTICUT | | | 12,434 |
|
| Kentucky - 0.1% | | | |
| Kentucky Pub. Trans. BAN Series 2013 A, 5% 7/1/17 | | 2,165 | 2,199 |
| New Jersey - 0.5% | | | |
| Hackensack City Tax Appeal Nts BAN Series 2016, 2% 11/6/17 | | 8,900 | 8,946 |
| New Brunswick Gen. Oblig. BAN Series 2016, 3% 6/6/17 | | 7,723 | 7,775 |
|
| TOTAL NEW JERSEY | | | 16,721 |
|
| New York - 3.1% | | | |
| Albany Gen. Oblig. BAN Series 2016, 2% 6/30/17 | | 14,600 | 14,652 |
| Binghamton Gen. Oblig. BAN Series 2016, 2.5% 11/17/17 | | 4,250 | 4,294 |
| Rockland County Gen. Oblig. TAN Series 2016, 2% 3/16/17 | | 3,500 | 3,506 |
| Sachem Central School District of Holbrook TAN Series 2016, 1.5% 6/29/17 | | 10,400 | 10,409 |
| Suffolk County Gen. Oblig. TAN Series 2017, 2% 7/26/17 | | 66,600 | 66,860 |
| Syracuse Gen. Oblig. RAN Series 2016 B, 2% 6/30/17 | | 6,800 | 6,824 |
|
| TOTAL NEW YORK | | | 106,545 |
|
| Ohio - 0.1% | | | |
| Belmont County BAN Series 2016, 1.375% 8/31/17 | | 2,300 | 2,300 |
| TOTAL MUNICIPAL NOTES | | | |
| (Cost $140,353) | | | 140,199 |
| | | Shares | Value (000s) |
|
| Money Market Funds - 0.7% | | | |
| Fidelity Municipal Cash Central Fund, 0.79% (d)(e) | | | |
| (Cost $25,102) | | 25,099,490 | 25,099 |
| TOTAL INVESTMENT PORTFOLIO - 98.3% | | | |
| (Cost $3,422,437) | | | 3,406,143 |
| NET OTHER ASSETS (LIABILITIES) - 1.7% | | | 58,857 |
| NET ASSETS - 100% | | | $3,465,000 |
Security Type Abbreviations
BAN – BOND ANTICIPATION NOTE
TAN – TAX ANTICIPATION NOTE
VRDN – VARIABLE RATE DEMAND NOTE (A debt instrument that is payable upon demand, either daily, weekly or monthly)
Legend
(a) Coupon rates for floating and adjustable rate securities reflect the rates in effect at period end.
(b) Private activity obligations whose interest is subject to the federal alternative minimum tax for individuals.
(c) Security or a portion of the security purchased on a delayed delivery or when-issued basis.
(d) Information in this report regarding holdings by state and security types does not reflect the holdings of the Fidelity Municipal Cash Central Fund.
(e) Affiliated fund that is available only to investment companies and other accounts managed by Fidelity Investments. The rate quoted is the annualized seven-day yield of the fund at period end. A complete unaudited listing of the fund's holdings as of its most recent quarter end is available upon request. In addition, each Fidelity Central Fund's financial statements, which are not covered by the Fund's Report of Independent Registered Public Accounting Firm, are available on the SEC's website or upon request.
Affiliated Central Funds
Information regarding fiscal year to date income earned by the Fund from investments in Fidelity Central Funds is as follows:
| Fund | Income earned |
| | (Amounts in thousands) |
| Fidelity Municipal Cash Central Fund | $663 |
| Total | $663 |
Investment Valuation
The following is a summary of the inputs used, as of December 31, 2016, involving the Fund's assets and liabilities carried at fair value. The inputs or methodology used for valuing securities may not be an indication of the risk associated with investing in those securities. For more information on valuation inputs, and their aggregation into the levels used below, please refer to the Investment Valuation section in the accompanying Notes to Financial Statements.
| | Valuation Inputs at Reporting Date: |
| Description | Total | Level 1 | Level 2 | Level 3 |
| (Amounts in thousands) | | | | |
| Investments in Securities: | | | | |
| Municipal Securities | $3,381,044 | $-- | $3,381,044 | $-- |
| Money Market Funds | 25,099 | 25,099 | -- | -- |
| Total Investments in Securities: | $3,406,143 | $25,099 | $3,381,044 | $-- |
Other Information
The distribution of municipal securities by revenue source, as a percentage of total Net Assets, is as follows (Unaudited):
| General Obligations | 42.4% |
| Transportation | 11.5% |
| Health Care | 10.5% |
| Special Tax | 9.7% |
| Electric Utilities | 9.4% |
| Others* (Individually Less Than 5%) | 16.5% |
| | 100.0% |
* Includes net other assets
See accompanying notes which are an integral part of the financial statements.
Financial Statements
Statement of Assets and Liabilities
| Amounts in thousands (except per-share amounts) | | December 31, 2016 |
| Assets | | |
Investment in securities, at value — See accompanying schedule:
Unaffiliated issuers (cost $3,397,335) | $3,381,044 | |
| Fidelity Central Funds (cost $25,102) | 25,099 | |
| Total Investments (cost $3,422,437) | | $3,406,143 |
| Cash | | 37,783 |
| Receivable for fund shares sold | | 13,699 |
| Interest receivable | | 38,452 |
| Distributions receivable from Fidelity Central Funds | | 19 |
| Prepaid expenses | | 7 |
| Other receivables | | 10 |
| Total assets | | 3,496,113 |
| Liabilities | | |
| Payable for investments purchased on a delayed delivery basis | $1,606 | |
| Payable for fund shares redeemed | 26,784 | |
| Distributions payable | 1,081 | |
| Accrued management fee | 1,088 | |
| Distribution and service plan fees payable | 119 | |
| Other affiliated payables | 381 | |
| Other payables and accrued expenses | 54 | |
| Total liabilities | | 31,113 |
| Net Assets | | $3,465,000 |
| Net Assets consist of: | | |
| Paid in capital | | $3,481,762 |
| Distributions in excess of net investment income | | (47) |
| Accumulated undistributed net realized gain (loss) on investments | | (421) |
| Net unrealized appreciation (depreciation) on investments | | (16,294) |
| Net Assets | | $3,465,000 |
| Calculation of Maximum Offering Price | | |
| Class A: | | |
| Net Asset Value and redemption price per share ($316,679 ÷ 30,303 shares) | | $10.45 |
| Maximum offering price per share (100/97.25 of $10.45) | | $10.75 |
| Class T: | | |
| Net Asset Value and redemption price per share ($19,706 ÷ 1,889 shares) | | $10.43 |
| Maximum offering price per share (100/97.25 of $10.43) | | $10.72 |
| Class C: | | |
| Net Asset Value and offering price per share ($52,842 ÷ 5,066 shares)(a) | | $10.43 |
| Limited Term Municipal Income: | | |
| Net Asset Value, offering price and redemption price per share ($2,779,251 ÷ 266,416 shares) | | $10.43 |
| Class I: | | |
| Net Asset Value, offering price and redemption price per share ($296,522 ÷ 28,409 shares) | | $10.44 |
(a) Redemption price per share is equal to net asset value less any applicable contingent deferred sales charge.
See accompanying notes which are an integral part of the financial statements.
Statement of Operations
| Amounts in thousands | | Year ended December 31, 2016 |
| Investment Income | | |
| Interest | | $74,144 |
| Income from Fidelity Central Funds | | 663 |
| Total income | | 74,807 |
| Expenses | | |
| Management fee | $14,159 | |
| Transfer agent fees | 4,155 | |
| Distribution and service plan fees | 1,586 | |
| Accounting fees and expenses | 615 | |
| Custodian fees and expenses | 28 | |
| Independent trustees' fees and expenses | 18 | |
| Registration fees | 214 | |
| Audit | 56 | |
| Legal | 11 | |
| Miscellaneous | 29 | |
| Total expenses before reductions | 20,871 | |
| Expense reductions | (44) | 20,827 |
| Net investment income (loss) | | 53,980 |
| Realized and Unrealized Gain (Loss) | | |
| Net realized gain (loss) on: | | |
| Investment securities: | | |
| Unaffiliated issuers | 312 | |
| Total net realized gain (loss) | | 312 |
| Change in net unrealized appreciation (depreciation) on investment securities | | (72,267) |
| Net gain (loss) | | (71,955) |
| Net increase (decrease) in net assets resulting from operations | | $(17,975) |
See accompanying notes which are an integral part of the financial statements.
Statement of Changes in Net Assets
| Amounts in thousands | Year ended December 31, 2016 | Year ended December 31, 2015 |
| Increase (Decrease) in Net Assets | | |
| Operations | | |
| Net investment income (loss) | $53,980 | $57,962 |
| Net realized gain (loss) | 312 | 7,031 |
| Change in net unrealized appreciation (depreciation) | (72,267) | (25,919) |
| Net increase (decrease) in net assets resulting from operations | (17,975) | 39,074 |
| Distributions to shareholders from net investment income | (53,929) | (58,133) |
| Distributions to shareholders from net realized gain | (727) | (7,563) |
| Total distributions | (54,656) | (65,696) |
| Share transactions - net increase (decrease) | (259,868) | (152,171) |
| Redemption fees | 58 | 42 |
| Total increase (decrease) in net assets | (332,441) | (178,751) |
| Net Assets | | |
| Beginning of period | 3,797,441 | 3,976,192 |
| End of period | $3,465,000 | $3,797,441 |
| Other Information | | |
| Distributions in excess of net investment income end of period | $(47) | $(90) |
See accompanying notes which are an integral part of the financial statements.
Financial Highlights — Fidelity Limited Term Municipal Income Fund Class A
| Years ended December 31, | 2016 | 2015 | 2014 | 2013 | 2012 |
| Selected Per–Share Data | | | | | |
| Net asset value, beginning of period | $10.64 | $10.71 | $10.68 | $10.86 | $10.83 |
| Income from Investment Operations | | | | | |
| Net investment income (loss)A | .118 | .129 | .153 | .158 | .164 |
| Net realized and unrealized gain (loss) | (.188) | (.048) | .046 | (.170) | .034 |
| Total from investment operations | (.070) | .081 | .199 | (.012) | .198 |
| Distributions from net investment income | (.118) | (.130) | (.153) | (.158) | (.156) |
| Distributions from net realized gain | (.002) | (.021) | (.016) | (.010) | (.012) |
| Total distributions | (.120) | (.151) | (.169) | (.168) | (.168) |
| Redemption fees added to paid in capitalA,B | – | – | – | – | – |
| Net asset value, end of period | $10.45 | $10.64 | $10.71 | $10.68 | $10.86 |
| Total ReturnC,D | (.68)% | .76% | 1.87% | (.11)% | 1.84% |
| Ratios to Average Net AssetsE,F | | | | | |
| Expenses before reductions | .80% | .81% | .79% | .78% | .79% |
| Expenses net of fee waivers, if any | .80% | .81% | .79% | .78% | .79% |
| Expenses net of all reductions | .80% | .81% | .79% | .78% | .78% |
| Net investment income (loss) | 1.10% | 1.21% | 1.42% | 1.47% | 1.51% |
| Supplemental Data | | | | | |
| Net assets, end of period (in millions) | $317 | $377 | $397 | $318 | $394 |
| Portfolio turnover rateG | 31% | 30% | 21% | 20% | 21% |
A Calculated based on average shares outstanding during the period.
B Amount represents less than $.0005 per share.
C Total returns would have been lower if certain expenses had not been reduced during the applicable periods shown.
D Total returns do not include the effect of the sales charges.
E Fees and expenses of any underlying Fidelity Central Funds are not included in the Fund's expense ratio. The Fund indirectly bears its proportionate share of the expenses of any underlying Fidelity Central Funds.
F Expense ratios reflect operating expenses of the class. Expenses before reductions do not reflect amounts reimbursed by the investment adviser or reductions from expense offset arrangements and do not represent the amount paid by the class during periods when reimbursements or reductions occur. Expenses net of fee waivers reflect expenses after reimbursement by the investment adviser but prior to reductions from expense offset arrangements. Expenses net of all reductions represent the net expenses paid by the class.
G Amount does not include the portfolio activity of any underlying Fidelity Central Funds.
See accompanying notes which are an integral part of the financial statements.
Financial Highlights — Fidelity Limited Term Municipal Income Fund Class T
| Years ended December 31, | 2016 | 2015 | 2014 | 2013 | 2012 |
| Selected Per–Share Data | | | | | |
| Net asset value, beginning of period | $10.62 | $10.69 | $10.66 | $10.85 | $10.81 |
| Income from Investment Operations | | | | | |
| Net investment income (loss)A | .121 | .134 | .157 | .162 | .166 |
| Net realized and unrealized gain (loss) | (.188) | (.049) | .046 | (.180) | .044 |
| Total from investment operations | (.067) | .085 | .203 | (.018) | .210 |
| Distributions from net investment income | (.121) | (.134) | (.157) | (.162) | (.158) |
| Distributions from net realized gain | (.002) | (.021) | (.016) | (.010) | (.012) |
| Total distributions | (.123) | (.155) | (.173) | (.172) | (.170) |
| Redemption fees added to paid in capitalA,B | – | – | – | – | – |
| Net asset value, end of period | $10.43 | $10.62 | $10.69 | $10.66 | $10.85 |
| Total ReturnC,D | (.65)% | .80% | 1.91% | (.17)% | 1.95% |
| Ratios to Average Net AssetsE,F | | | | | |
| Expenses before reductions | .77% | .77% | .76% | .75% | .77% |
| Expenses net of fee waivers, if any | .77% | .77% | .76% | .75% | .77% |
| Expenses net of all reductions | .77% | .77% | .75% | .75% | .76% |
| Net investment income (loss) | 1.14% | 1.25% | 1.46% | 1.50% | 1.52% |
| Supplemental Data | | | | | |
| Net assets, end of period (in millions) | $20 | $22 | $25 | $24 | $25 |
| Portfolio turnover rateG | 31% | 30% | 21% | 20% | 21% |
A Calculated based on average shares outstanding during the period.
B Amount represents less than $.0005 per share.
C Total returns would have been lower if certain expenses had not been reduced during the applicable periods shown.
D Total returns do not include the effect of the sales charges.
E Fees and expenses of any underlying Fidelity Central Funds are not included in the Fund's expense ratio. The Fund indirectly bears its proportionate share of the expenses of any underlying Fidelity Central Funds.
F Expense ratios reflect operating expenses of the class. Expenses before reductions do not reflect amounts reimbursed by the investment adviser or reductions from expense offset arrangements and do not represent the amount paid by the class during periods when reimbursements or reductions occur. Expenses net of fee waivers reflect expenses after reimbursement by the investment adviser but prior to reductions from expense offset arrangements. Expenses net of all reductions represent the net expenses paid by the class.
G Amount does not include the portfolio activity of any underlying Fidelity Central Funds.
See accompanying notes which are an integral part of the financial statements.
Financial Highlights — Fidelity Limited Term Municipal Income Fund Class C
| Years ended December 31, | 2016 | 2015 | 2014 | 2013 | 2012 |
| Selected Per–Share Data | | | | | |
| Net asset value, beginning of period | $10.62 | $10.69 | $10.66 | $10.84 | $10.81 |
| Income from Investment Operations | | | | | |
| Net investment income (loss)A | .038 | .050 | .072 | .077 | .082 |
| Net realized and unrealized gain (loss) | (.188) | (.049) | .046 | (.169) | .035 |
| Total from investment operations | (.150) | .001 | .118 | (.092) | .117 |
| Distributions from net investment income | (.038) | (.050) | (.072) | (.078) | (.075) |
| Distributions from net realized gain | (.002) | (.021) | (.016) | (.010) | (.012) |
| Total distributions | (.040) | (.071) | (.088) | (.088) | (.087) |
| Redemption fees added to paid in capitalA,B | – | – | – | – | – |
| Net asset value, end of period | $10.43 | $10.62 | $10.69 | $10.66 | $10.84 |
| Total ReturnC,D | (1.42)% | .01% | 1.11% | (.86)% | 1.08% |
| Ratios to Average Net AssetsE,F | | | | | |
| Expenses before reductions | 1.55% | 1.55% | 1.54% | 1.54% | 1.53% |
| Expenses net of fee waivers, if any | 1.55% | 1.55% | 1.54% | 1.54% | 1.53% |
| Expenses net of all reductions | 1.55% | 1.55% | 1.54% | 1.53% | 1.53% |
| Net investment income (loss) | .35% | .47% | .67% | .72% | .76% |
| Supplemental Data | | | | | |
| Net assets, end of period (in millions) | $53 | $63 | $65 | $71 | $92 |
| Portfolio turnover rateG | 31% | 30% | 21% | 20% | 21% |
A Calculated based on average shares outstanding during the period.
B Amount represents less than $.0005 per share.
C Total returns would have been lower if certain expenses had not been reduced during the applicable periods shown.
D Total returns do not include the effect of the contingent deferred sales charge.
E Fees and expenses of any underlying Fidelity Central Funds are not included in the Fund's expense ratio. The Fund indirectly bears its proportionate share of the expenses of any underlying Fidelity Central Funds.
F Expense ratios reflect operating expenses of the class. Expenses before reductions do not reflect amounts reimbursed by the investment adviser or reductions from expense offset arrangements and do not represent the amount paid by the class during periods when reimbursements or reductions occur. Expenses net of fee waivers reflect expenses after reimbursement by the investment adviser but prior to reductions from expense offset arrangements. Expenses net of all reductions represent the net expenses paid by the class.
G Amount does not include the portfolio activity of any underlying Fidelity Central Funds.
See accompanying notes which are an integral part of the financial statements.
Financial Highlights — Fidelity Limited Term Municipal Income Fund
| Years ended December 31, | 2016 | 2015 | 2014 | 2013 | 2012 |
| Selected Per–Share Data | | | | | |
| Net asset value, beginning of period | $10.63 | $10.69 | $10.66 | $10.85 | $10.81 |
| Income from Investment Operations | | | | | |
| Net investment income (loss)A | .152 | .164 | .186 | .191 | .197 |
| Net realized and unrealized gain (loss) | (.198) | (.039) | .046 | (.180) | .045 |
| Total from investment operations | (.046) | .125 | .232 | .011 | .242 |
| Distributions from net investment income | (.152) | (.164) | (.186) | (.191) | (.190) |
| Distributions from net realized gain | (.002) | (.021) | (.016) | (.010) | (.012) |
| Total distributions | (.154) | (.185) | (.202) | (.201) | (.202) |
| Redemption fees added to paid in capitalA,B | – | – | – | – | – |
| Net asset value, end of period | $10.43 | $10.63 | $10.69 | $10.66 | $10.85 |
| Total ReturnC | (.45)% | 1.18% | 2.19% | .10% | 2.25% |
| Ratios to Average Net AssetsD,E | | | | | |
| Expenses before reductions | .48% | .48% | .48% | .48% | .48% |
| Expenses net of fee waivers, if any | .48% | .48% | .48% | .48% | .48% |
| Expenses net of all reductions | .48% | .48% | .48% | .48% | .47% |
| Net investment income (loss) | 1.43% | 1.54% | 1.73% | 1.78% | 1.81% |
| Supplemental Data | | | | | |
| Net assets, end of period (in millions) | $2,779 | $3,058 | $3,225 | $3,168 | $3,624 |
| Portfolio turnover rateF | 31% | 30% | 21% | 20% | 21% |
A Calculated based on average shares outstanding during the period.
B Amount represents less than $.0005 per share.
C Total returns would have been lower if certain expenses had not been reduced during the applicable periods shown.
D Fees and expenses of any underlying Fidelity Central Funds are not included in the Fund's expense ratio. The Fund indirectly bears its proportionate share of the expenses of any underlying Fidelity Central Funds.
E Expense ratios reflect operating expenses of the class. Expenses before reductions do not reflect amounts reimbursed by the investment adviser or reductions from expense offset arrangements and do not represent the amount paid by the class during periods when reimbursements or reductions occur. Expenses net of fee waivers reflect expenses after reimbursement by the investment adviser but prior to reductions from expense offset arrangements. Expenses net of all reductions represent the net expenses paid by the class.
F Amount does not include the portfolio activity of any underlying Fidelity Central Funds.
See accompanying notes which are an integral part of the financial statements.
Financial Highlights — Fidelity Limited Term Municipal Income Fund Class I
| Years ended December 31, | 2016 | 2015 | 2014 | 2013 | 2012 |
| Selected Per–Share Data | | | | | |
| Net asset value, beginning of period | $10.63 | $10.70 | $10.67 | $10.85 | $10.81 |
| Income from Investment Operations | | | | | |
| Net investment income (loss)A | .145 | .156 | .179 | .184 | .191 |
| Net realized and unrealized gain (loss) | (.188) | (.048) | .046 | (.169) | .045 |
| Total from investment operations | (.043) | .108 | .225 | .015 | .236 |
| Distributions from net investment income | (.145) | (.157) | (.179) | (.185) | (.184) |
| Distributions from net realized gain | (.002) | (.021) | (.016) | (.010) | (.012) |
| Total distributions | (.147) | (.178) | (.195) | (.195) | (.196) |
| Redemption fees added to paid in capitalA,B | – | – | – | – | – |
| Net asset value, end of period | $10.44 | $10.63 | $10.70 | $10.67 | $10.85 |
| Total ReturnC | (.42)% | 1.02% | 2.12% | .14% | 2.19% |
| Ratios to Average Net AssetsD,E | | | | | |
| Expenses before reductions | .55% | .55% | .55% | .54% | .54% |
| Expenses net of fee waivers, if any | .55% | .55% | .55% | .54% | .54% |
| Expenses net of all reductions | .54% | .55% | .54% | .54% | .53% |
| Net investment income (loss) | 1.36% | 1.47% | 1.67% | 1.71% | 1.76% |
| Supplemental Data | | | | | |
| Net assets, end of period (in millions) | $297 | $276 | $263 | $207 | $206 |
| Portfolio turnover rateF | 31% | 30% | 21% | 20% | 21% |
A Calculated based on average shares outstanding during the period.
B Amount represents less than $.0005 per share.
C Total returns would have been lower if certain expenses had not been reduced during the applicable periods shown.
D Fees and expenses of any underlying Fidelity Central Funds are not included in the Fund's expense ratio. The Fund indirectly bears its proportionate share of the expenses of any underlying Fidelity Central Funds.
E Expense ratios reflect operating expenses of the class. Expenses before reductions do not reflect amounts reimbursed by the investment adviser or reductions from expense offset arrangements and do not represent the amount paid by the class during periods when reimbursements or reductions occur. Expenses net of fee waivers reflect expenses after reimbursement by the investment adviser but prior to reductions from expense offset arrangements. Expenses net of all reductions represent the net expenses paid by the class.
F Amount does not include the portfolio activity of any underlying Fidelity Central Funds.
See accompanying notes which are an integral part of the financial statements.
Notes to Financial Statements
For the period ended December 31, 2016
(Amounts in thousands except percentages)
1. Organization.
Fidelity Limited Term Municipal Income Fund (the Fund) is a fund of Fidelity Municipal Trust (the Trust) and is authorized to issue an unlimited number of shares. The Trust is registered under the Investment Company Act of 1940, as amended (the 1940 Act), as an open-end management investment company organized as a Massachusetts business trust. The Fund offers Class A, Class T, Class C, Limited Term Municipal Income and Class I shares, each of which has equal rights as to assets and voting privileges. Each class has exclusive voting rights with respect to matters that affect that class.
After the close of business on June 24, 2016, all outstanding Class B shares were converted to Class A shares. All current fiscal period dollar and share amounts for Class B presented in the Notes to Financial Statements are for the period January 1, 2016 through June 24, 2016.
2. Investments in Fidelity Central Funds.
The Fund invests in Fidelity Central Funds, which are open-end investment companies generally available only to other investment companies and accounts managed by the investment adviser and its affiliates. The Fund's Schedule of Investments lists each of the Fidelity Central Funds held as of period end, if any, as an investment of the Fund, but does not include the underlying holdings of each Fidelity Central Fund. As an Investing Fund, the Fund indirectly bears its proportionate share of the expenses of the underlying Fidelity Central Funds.
The Money Market Central Funds seek preservation of capital and current income and are managed by Fidelity Investments Money Management, Inc. (FIMM), an affiliate of the investment adviser. Annualized expenses of the Money Market Central Funds as of their most recent shareholder report date are less than .005%.
A complete unaudited list of holdings for each Fidelity Central Fund is available upon request or at the Securities and Exchange Commission (the SEC) website at www.sec.gov. In addition, the financial statements of the Fidelity Central Funds, which are not covered by the Fund's Report of Independent Registered Public Accounting Firm, are available on the SEC website or upon request.
3. Significant Accounting Policies.
The financial statements have been prepared in conformity with accounting principles generally accepted in the United States of America (GAAP), which require management to make certain estimates and assumptions at the date of the financial statements. Actual results could differ from those estimates. Subsequent events, if any, through the date that the financial statements were issued have been evaluated in the preparation of the financial statements. The following summarizes the significant accounting policies of the Fund:
Investment Valuation. Investments are valued as of 4:00 p.m. Eastern time on the last calendar day of the period. The Board of Trustees (the Board) has delegated the day to day responsibility for the valuation of the Fund's investments to the Fair Value Committee (the Committee) established by the Fund's investment adviser. In accordance with valuation policies and procedures approved by the Board, the Fund attempts to obtain prices from one or more third party pricing vendors or brokers to value its investments. When current market prices, quotations or currency exchange rates are not readily available or reliable, investments will be fair valued in good faith by the Committee, in accordance with procedures adopted by the Board. Factors used in determining fair value vary by investment type and may include market or investment specific events, changes in interest rates and credit quality. The frequency with which these procedures are used cannot be predicted and they may be utilized to a significant extent. The Committee oversees the Fund's valuation policies and procedures and reports to the Board on the Committee's activities and fair value determinations. The Board monitors the appropriateness of the procedures used in valuing the Fund's investments and ratifies the fair value determinations of the Committee.
The Fund categorizes the inputs to valuation techniques used to value its investments into a disclosure hierarchy consisting of three levels as shown below:
- Level 1 – quoted prices in active markets for identical investments
- Level 2 – other significant observable inputs (including quoted prices for similar investments, interest rates, prepayment speeds, etc.)
- Level 3 – unobservable inputs (including the Fund's own assumptions based on the best information available)
Valuation techniques used to value the Fund's investments by major category are as follows:
Debt securities, including restricted securities, are valued based on evaluated prices received from third party pricing vendors or from brokers who make markets in such securities. Municipal securities are valued by pricing vendors who utilize matrix pricing which considers yield or price of bonds of comparable quality, coupon, maturity and type or by broker-supplied prices. When independent prices are unavailable or unreliable, debt securities may be valued utilizing pricing methodologies which consider similar factors that would be used by third party pricing vendors. Debt securities are generally categorized as Level 2 in the hierarchy but may be Level 3 depending on the circumstances.
Investments in open-end mutual funds, including the Fidelity Central Funds, are valued at their closing net asset value (NAV) each business day and are categorized as Level 1 in the hierarchy.
Changes in valuation techniques may result in transfers in or out of an assigned level within the disclosure hierarchy. The aggregate value of investments by input level as of December 31, 2016 is included at the end of the Fund's Schedule of Investments.
Investment Transactions and Income. For financial reporting purposes, the Fund's investment holdings and NAV include trades executed through the end of the last business day of the period. The NAV per share for processing shareholder transactions is calculated as of the close of business of the New York Stock Exchange (NYSE), normally 4:00 p.m. Eastern time and includes trades executed through the end of the prior business day. Gains and losses on securities sold are determined on the basis of identified cost. Income and capital gain distributions from Fidelity Central Funds, if any, are recorded on the ex-dividend date. Interest income is accrued as earned and includes coupon interest and amortization of premium and accretion of discount on debt securities as applicable. Debt obligations may be placed on non-accrual status and related interest income may be reduced by ceasing current accruals and writing off interest receivables when the collection of all or a portion of interest has become doubtful based on consistently applied procedures. A debt obligation is removed from non-accrual status when the issuer resumes interest payments or when collectability of interest is reasonably assured.
Class Allocations and Expenses. Investment income, realized and unrealized capital gains and losses, common expenses of the Fund, and certain fund-level expense reductions, if any, are allocated daily on a pro-rata basis to each class based on the relative net assets of each class to the total net assets of the Fund. Each class differs with respect to transfer agent and distribution and service plan fees incurred. Certain expense reductions may also differ by class. For the reporting period, the allocated portion of income and expenses to each class as a percent of its average net assets may vary due to the timing of recording these transactions in relation to fluctuating net assets of the classes. Expenses directly attributable to a fund are charged to that fund. Expenses attributable to more than one fund are allocated among the respective funds on the basis of relative net assets or other appropriate methods. Expense estimates are accrued in the period to which they relate and adjustments are made when actual amounts are known.
Income Tax Information and Distributions to Shareholders. Each year, the Fund intends to qualify as a regulated investment company under Subchapter M of the Internal Revenue Code, including distributing substantially all of its taxable income and realized gains. As a result, no provision for U.S. Federal income taxes is required. As of December 31, 2016, the Fund did not have any unrecognized tax benefits in the financial statements; nor is the Fund aware of any tax positions for which it is reasonably possible that the total amounts of unrecognized tax benefits will significantly change in the next twelve months. The Fund files a U.S. federal tax return, in addition to state and local tax returns as required. The Fund's federal income tax returns are subject to examination by the Internal Revenue Service (IRS) for a period of three fiscal years after they are filed. State and local tax returns may be subject to examination for an additional fiscal year depending on the jurisdiction.
Dividends are declared and recorded daily and paid monthly from net investment income. Distributions from realized gains, if any, are declared and recorded on the ex-dividend date. Income dividends and capital gain distributions are declared separately for each class. Income and capital gain distributions are determined in accordance with income tax regulations, which may differ from GAAP.
Capital accounts within the financial statements are adjusted for permanent book-tax differences. These adjustments have no impact on net assets or the results of operations. Capital accounts are not adjusted for temporary book-tax differences which will reverse in a subsequent period.
Book-tax differences are primarily due to market discount, deferred trustees compensation and losses deferred due to wash sales and excise tax regulations.
The Fund purchases municipal securities whose interest, in the opinion of the issuer, is free from federal income tax. There is no assurance that the IRS will agree with this opinion. In the event the IRS determines that the issuer does not comply with relevant tax requirements, interest payments from a security could become federally taxable, possibly retroactively to the date the security was issued.
The federal tax cost of investment securities and unrealized appreciation (depreciation) as of period end were as follows:
| Gross unrealized appreciation | $21,251 |
| Gross unrealized depreciation | (37,479) |
| Net unrealized appreciation (depreciation) on securities | $(16,228) |
| Tax Cost | $3,422,371 |
The tax-based components of distributable earnings as of period end were as follows:
| Net unrealized appreciation (depreciation) on securities and other investments | $(16,228) |
The Fund intends to elect to defer to its next fiscal year $421 of capital losses recognized during the period November 1, 2016 to December 31, 2016.
The tax character of distributions paid was as follows:
| | December 31, 2016 | December 31, 2015 |
| Tax-exempt Income | $53,929 | $58,133 |
| Long-term Capital Gains | 727 | 7,563 |
| Total | $54,656 | $ 65,696 |
Short-Term Trading (Redemption) Fees. Shares held by investors in the Fund less than 30 days may have been subject to a redemption fee equal to .50% of the NAV of shares redeemed. All redemption fees, which reduce the proceeds of the shareholder redemption, are retained by the Fund and accounted for as an addition to paid in capital. In November 2016, the Board of Trustees approved the elimination of these redemption fees effective December 12, 2016.
Delayed Delivery Transactions and When-Issued Securities. During the period, the Fund transacted in securities on a delayed delivery or when-issued basis. Payment and delivery may take place after the customary settlement period for that security. The price of the underlying securities and the date when the securities will be delivered and paid for are fixed at the time the transaction is negotiated. The securities purchased on a delayed delivery or when-issued basis are identified as such in the Fund's Schedule of Investments. The Fund may receive compensation for interest forgone in the purchase of a delayed delivery or when-issued security. With respect to purchase commitments, the Fund identifies securities as segregated in its records with a value at least equal to the amount of the commitment. Losses may arise due to changes in the value of the underlying securities or if the counterparty does not perform under the contract's terms, or if the issuer does not issue the securities due to political, economic, or other factors.
4. Purchases and Sales of Investments.
Purchases and sales of securities, other than short-term securities, aggregated $1,136,782 and $1,271,826, respectively.
5. Fees and Other Transactions with Affiliates.
Management Fee. Fidelity Management & Research Company (the investment adviser) and its affiliates provide the Fund with investment management related services for which the Fund pays a monthly management fee. The management fee is the sum of an individual fund fee rate that is based on an annual rate of .25% of the Fund's average net assets and an annualized group fee rate that averaged .11% during the period. The group fee rate is based upon the average net assets of all the mutual funds advised by the investment adviser, including any mutual funds previously advised by the investment adviser that are currently advised by Fidelity SelectCo, LLC, an affiliate of the investment adviser. The group fee rate decreases as assets under management increase and increases as assets under management decrease. For the reporting period, the total annual management fee rate was .36% of the Fund's average net assets.
Distribution and Service Plan Fees. In accordance with Rule 12b-1 of the 1940 Act, the Fund has adopted separate Distribution and Service Plans for each class of shares. Certain classes pay Fidelity Distributors Corporation (FDC), an affiliate of the investment adviser, separate Distribution and Service Fees, each of which is based on an annual percentage of each class' average net assets. In addition, FDC may pay financial intermediaries for selling shares of the Fund and providing shareholder support services. For the period, the Distribution and Service Fee rates, total fees and amounts retained by FDC were as follows:
| | Distribution
Fee | Service
Fee | Total Fees | Retained
by FDC |
| Class A | -% | .25% | $919 | $93 |
| Class T | -% | .25% | 54 | 1 |
| Class B | .65% | .25% | 1 | 1 |
| Class C | .75% | .25% | 612 | 65 |
| | | | $1,586 | $160 |
Sales Load. FDC may receive a front-end sales charge of up to 2.75% for selling Class A shares and Class T shares, some of which is paid to financial intermediaries for selling shares of the Fund. Depending on the holding period, FDC may receive contingent deferred sales charges levied on Class A, Class T, Class B, and Class C redemptions. The deferred sales charges range from 3.00% to 1.00% for Class B shares, 1.00% for Class C shares, .75% or .50% for certain purchases of Class A shares and .25% for certain purchases of Class T shares.
For the period, sales charge amounts retained by FDC were as follows:
| | Retained
by FDC |
| Class A | $14 |
| Class T | 3 |
| Class B(a) | –(b) |
| Class C(a) | 12 |
| | $29 |
(a) When Class B and Class C shares are initially sold, FDC pays commissions from its own resources to financial intermediaries through which the sales are made.
(b) In the amount of less than five hundred dollars.
Transfer Agent Fees. Fidelity Investments Institutional Operations Company, Inc. (FIIOC), an affiliate of the investment adviser, is the transfer, dividend disbursing and shareholder servicing agent for the Fund. FIIOC receives account fees and asset-based fees that vary according to the account size and type of account of the shareholders of the respective classes of the Fund. FIIOC pays for typesetting, printing and mailing of shareholder reports, except proxy statements. For the period, transfer agent fees for each class were as follows:
| | Amount | % of
Class-Level Average
Net Assets |
| Class A | $620 | .17 |
| Class T | 29 | .13 |
| Class B | –(a) | .11 |
| Class C | 101 | .16 |
| Limited Term Municipal Income | 2,927 | .09 |
| Class I | 478 | .16 |
| | $4,155 | |
(a) In the amount of less than five hundred dollars.
Accounting Fees. Fidelity Service Company, Inc. (FSC), an affiliate of the investment adviser, maintains the Fund's accounting records. The fee is based on the level of average net assets for each month.
Interfund Trades. The Fund may purchase from or sell securities to other Fidelity Funds under procedures adopted by the Board. The procedures have been designed to ensure these interfund trades are executed in accordance with Rule 17a-7 of the 1940 Act. Interfund trades are included within the respective purchases and sales amounts shown in the Purchases and Sales of Investments note.
6. Committed Line of Credit.
The Fund participates with other funds managed by the investment adviser or an affiliate in a $4.25 billion credit facility (the "line of credit") to be utilized for temporary or emergency purposes to fund shareholder redemptions or for other short-term liquidity purposes. The Fund has agreed to pay commitment fees on its pro-rata portion of the line of credit, which amounted to $10 and is reflected in Miscellaneous expenses on the Statement of Operations. During the period, the Fund did not borrow on this line of credit.
7. Expense Reductions.
Through arrangements with the Fund's custodian, credits realized as a result of certain uninvested cash balances were used to reduce the Fund's expenses. During the period, these credits reduced the Fund's custody expenses fee by $28.
In addition, during the period the investment adviser reimbursed and/or waived a portion of the fund-level operating expenses in the amount of $16.
8. Distributions to Shareholders.
Distributions to shareholders of each class were as follows:
| | Year ended
December 31, 2016 | Year ended December 31, 2015 |
| From net investment income | | |
| Class A | $4,046 | $4,860 |
| Class T | 246 | 289 |
| Class B | 1 | 2 |
| Class C | 217 | 303 |
| Limited Term Municipal Income | 45,375 | 48,674 |
| Class I | 4,044 | 4,005 |
| Total | $53,929 | $58,133 |
| From net realized gain | | |
| Class A | $65 | $751 |
| Class T | 4 | 45 |
| Class B | – | 1 |
| Class C | 11 | 125 |
| Limited Term Municipal Income | 588 | 6,100 |
| Class I | 59 | 541 |
| Total | $727 | $7,563 |
9. Share Transactions.
Share transactions for each class were as follows and may contain automatic conversions between classes or exchanges between affiliated funds:
| | Shares | Shares | Dollars | Dollars |
| | Year ended December 31, 2016 | Year ended December 31, 2015 | Year ended December 31, 2016 | Year ended December 31, 2015 |
| Class A | | | | |
| Shares sold | 13,917 | 16,831 | $148,531 | $179,831 |
| Reinvestment of distributions | 351 | 483 | 3,741 | 5,154 |
| Shares redeemed | (19,410) | (18,951) | (206,381) | (202,084) |
| Net increase (decrease) | (5,142) | (1,637) | $(54,109) | $(17,099) |
| Class T | | �� | | |
| Shares sold | 682 | 791 | $7,226 | $8,447 |
| Reinvestment of distributions | 22 | 30 | 235 | 316 |
| Shares redeemed | (874) | (1,080) | (9,260) | (11,510) |
| Net increase (decrease) | (170) | (259) | $(1,799) | $(2,747) |
| Class B | | | | |
| Shares sold | 3 | 3 | $28 | $17 |
| Reinvestment of distributions | –(a) | –(a) | 1 | 3 |
| Shares redeemed | (30) | (14) | (317) | (144) |
| Net increase (decrease) | (27) | (11) | $(288) | $(124) |
| Class C | | | | |
| Shares sold | 961 | 1,149 | $10,252 | $12,246 |
| Reinvestment of distributions | 18 | 34 | 188 | 359 |
| Shares redeemed | (1,887) | (1,330) | (20,039) | (14,162) |
| Net increase (decrease) | (908) | (147) | $(9,599) | $(1,557) |
| Limited Term Municipal Income | | | | |
| Shares sold | 91,180 | 66,529 | $970,470 | $709,164 |
| Reinvestment of distributions | 3,156 | 3,861 | 33,582 | 41,135 |
| Shares redeemed | (115,740) | (84,109) | (1,224,234) | (895,882) |
| Net increase (decrease) | (21,404) | (13,719) | $(220,182) | $(145,583) |
| Class I | | | | |
| Shares sold | 15,767 | 13,372 | $167,805 | $142,602 |
| Reinvestment of distributions | 311 | 335 | 3,311 | 3,575 |
| Shares redeemed | (13,673) | (12,317) | (145,007) | (131,238) |
| Net increase (decrease) | 2,405 | 1,390 | $26,109 | $14,939 |
(a) In the amount of less than five hundred dollars.
10. Other.
The Fund's organizational documents provide former and current trustees and officers with a limited indemnification against liabilities arising in connection with the performance of their duties to the Fund. In the normal course of business, the Fund may also enter into contracts that provide general indemnifications. The Fund's maximum exposure under these arrangements is unknown as this would be dependent on future claims that may be made against the Fund. The risk of material loss from such claims is considered remote.
Report of Independent Registered Public Accounting Firm
To the Trustees of Fidelity Municipal Trust and Shareholders of Fidelity Limited Term Municipal Income Fund:
In our opinion, the accompanying statement of assets and liabilities, including the schedule of investments, and the related statements of operations and of changes in net assets and the financial highlights present fairly, in all material respects, the financial position of Fidelity Limited Term Municipal Income Fund (a fund of Fidelity Municipal Trust) as of December 31, 2016, the results of its operations for the year then ended, the changes in its net assets for each of the two years in the period then ended and the financial highlights for each of the five years in the period then ended, in conformity with accounting principles generally accepted in the United States of America. These financial statements and financial highlights (hereafter referred to as “financial statements”) are the responsibility of the Fidelity Limited Term Municipal Income Fund’s management. Our responsibility is to express an opinion on these financial statements based on our audits. We conducted our audits of these financial statements in accordance with the standards of the Public Company Accounting Oversight Board (United States). Those standards require that we plan and perform the audit to obtain reasonable assurance about whether the financial statements are free of material misstatement. An audit includes examining, on a test basis, evidence supporting the amounts and disclosures in the financial statements, assessing the accounting principles used and significant estimates made by management, and evaluating the overall financial statement presentation. We believe that our audits, which included confirmation of securities as of December 31, 2016 by correspondence with the custodian and brokers, provide a reasonable basis for our opinion.
PricewaterhouseCoopers LLP
Boston, Massachusetts
February 17, 2017
Trustees and Officers
The Trustees, Members of the Advisory Board (if any), and officers of the trust and fund, as applicable, are listed below. The Board of Trustees governs the fund and is responsible for protecting the interests of shareholders. The Trustees are experienced executives who meet periodically throughout the year to oversee the fund's activities, review contractual arrangements with companies that provide services to the fund, oversee management of the risks associated with such activities and contractual arrangements, and review the fund's performance. Each of the Trustees oversees 243 funds.
The Trustees hold office without limit in time except that (a) any Trustee may resign; (b) any Trustee may be removed by written instrument, signed by at least two-thirds of the number of Trustees prior to such removal; (c) any Trustee who requests to be retired or who has become incapacitated by illness or injury may be retired by written instrument signed by a majority of the other Trustees; and (d) any Trustee may be removed at any special meeting of shareholders by a two-thirds vote of the outstanding voting securities of the trust. Each Trustee who is not an interested person (as defined in the 1940 Act) of the trust and the fund is referred to herein as an Independent Trustee. Each Independent Trustee shall retire not later than the last day of the calendar year in which his or her 75th birthday occurs. The Independent Trustees may waive this mandatory retirement age policy with respect to individual Trustees. Officers and Advisory Board Members hold office without limit in time, except that any officer or Advisory Board Member may resign or may be removed by a vote of a majority of the Trustees at any regular meeting or any special meeting of the Trustees. Except as indicated, each individual has held the office shown or other offices in the same company for the past five years.
The fund’s Statement of Additional Information (SAI) includes more information about the Trustees. To request a free copy, call Fidelity at 1-877-208-0098.
Experience, Skills, Attributes, and Qualifications of the Trustees. The Governance and Nominating Committee has adopted a statement of policy that describes the experience, qualifications, attributes, and skills that are necessary and desirable for potential Independent Trustee candidates (Statement of Policy). The Board believes that each Trustee satisfied at the time he or she was initially elected or appointed a Trustee, and continues to satisfy, the standards contemplated by the Statement of Policy. The Governance and Nominating Committee also engages professional search firms to help identify potential Independent Trustee candidates who have the experience, qualifications, attributes, and skills consistent with the Statement of Policy. From time to time, additional criteria based on the composition and skills of the current Independent Trustees, as well as experience or skills that may be appropriate in light of future changes to board composition, business conditions, and regulatory or other developments, have also been considered by the professional search firms and the Governance and Nominating Committee. In addition, the Board takes into account the Trustees' commitment and participation in Board and committee meetings, as well as their leadership of standing and ad hoc committees throughout their tenure.
In determining that a particular Trustee was and continues to be qualified to serve as a Trustee, the Board has considered a variety of criteria, none of which, in isolation, was controlling. The Board believes that, collectively, the Trustees have balanced and diverse experience, qualifications, attributes, and skills, which allow the Board to operate effectively in governing the fund and protecting the interests of shareholders. Information about the specific experience, skills, attributes, and qualifications of each Trustee, which in each case led to the Board's conclusion that the Trustee should serve (or continue to serve) as a trustee of the fund, is provided below.
Board Structure and Oversight Function. Abigail P. Johnson is an interested person and currently serves as Chairman. The Trustees have determined that an interested Chairman is appropriate and benefits shareholders because an interested Chairman has a personal and professional stake in the quality and continuity of services provided to the fund. Independent Trustees exercise their informed business judgment to appoint an individual of their choosing to serve as Chairman, regardless of whether the Trustee happens to be independent or a member of management. The Independent Trustees have determined that they can act independently and effectively without having an Independent Trustee serve as Chairman and that a key structural component for assuring that they are in a position to do so is for the Independent Trustees to constitute a substantial majority for the Board. The Independent Trustees also regularly meet in executive session. Marie L. Knowles serves as Chairman of the Independent Trustees and as such (i) acts as a liaison between the Independent Trustees and management with respect to matters important to the Independent Trustees and (ii) with management prepares agendas for Board meetings.
Fidelity® funds are overseen by different Boards of Trustees. The fund's Board oversees Fidelity's investment-grade bond, money market, asset allocation and certain equity funds, and other Boards oversee Fidelity's high income, sector and other equity funds. The asset allocation funds may invest in Fidelity® funds that are overseen by such other Boards. The use of separate Boards, each with its own committee structure, allows the Trustees of each group of Fidelity® funds to focus on the unique issues of the funds they oversee, including common research, investment, and operational issues. On occasion, the separate Boards establish joint committees to address issues of overlapping consequences for the Fidelity® funds overseen by each Board.
The Trustees operate using a system of committees to facilitate the timely and efficient consideration of all matters of importance to the Trustees, the fund, and fund shareholders and to facilitate compliance with legal and regulatory requirements and oversight of the fund's activities and associated risks. The Board, acting through its committees, has charged FMR and its affiliates with (i) identifying events or circumstances the occurrence of which could have demonstrably adverse effects on the fund's business and/or reputation; (ii) implementing processes and controls to lessen the possibility that such events or circumstances occur or to mitigate the effects of such events or circumstances if they do occur; and (iii) creating and maintaining a system designed to evaluate continuously business and market conditions in order to facilitate the identification and implementation processes described in (i) and (ii) above. Because the day-to-day operations and activities of the fund are carried out by or through FMR, its affiliates, and other service providers, the fund's exposure to risks is mitigated but not eliminated by the processes overseen by the Trustees. While each of the Board's committees has responsibility for overseeing different aspects of the fund's activities, oversight is exercised primarily through the Operations and Audit Committees. In addition, an ad hoc Board committee of Independent Trustees has worked with FMR to enhance the Board's oversight of investment and financial risks, legal and regulatory risks, technology risks, and operational risks, including the development of additional risk reporting to the Board. Appropriate personnel, including but not limited to the fund's Chief Compliance Officer (CCO), FMR's internal auditor, the independent accountants, the fund's Treasurer and portfolio management personnel, make periodic reports to the Board's committees, as appropriate, including an annual review of Fidelity's risk management program for the Fidelity® funds. The responsibilities of each standing committee, including their oversight responsibilities, are described further under "Standing Committees of the Trustees."
Interested Trustees*:
Correspondence intended for a Trustee who is an interested person may be sent to Fidelity Investments, 245 Summer Street, Boston, Massachusetts 02210.
Name, Year of Birth; Principal Occupations and Other Relevant Experience+
Abigail P. Johnson (1961)
Year of Election or Appointment: 2009
Trustee
Chairman of the Board of Trustees
Ms. Johnson also serves as Trustee of other Fidelity® funds. Ms. Johnson serves as Chairman (2016-present), Chief Executive Officer (2014-present), and Director (2007-present) of FMR LLC (diversified financial services company), President of Fidelity Financial Services (2012-present) and President of Personal, Workplace and Institutional Services (2005-present). Ms. Johnson is Chairman and Director of FMR Co., Inc. (investment adviser firm, 2011-present) and Chairman and Director of FMR (investment adviser firm, 2011-present). Previously, Ms. Johnson served as Vice Chairman (2007-2016) and President (2013-2016) of FMR LLC, President and a Director of FMR (2001-2005), a Trustee of other investment companies advised by FMR, Fidelity Investments Money Management, Inc. (investment adviser firm), and FMR Co., Inc. (2001-2005), Senior Vice President of the Fidelity® funds (2001-2005), and managed a number of Fidelity® funds. Ms. Abigail P. Johnson and Mr. Arthur E. Johnson are not related.
Jennifer Toolin McAuliffe (1959)
Year of Election or Appointment: 2016
Trustee
Ms. McAuliffe also serves as Trustee of other Fidelity® funds. Ms. McAuliffe previously served as a Member of the Advisory Board of certain Fidelity® funds (2016) and as Co-Head of Fixed Income of Fidelity Investments Limited (now known as FIL Limited (FIL)) (diversified financial services company). Earlier roles at FIL included Director of Research for FIL’s credit and quantitative teams in London, Hong Kong and Tokyo. Ms. McAuliffe also was the Director of Research for taxable and municipal bonds at Fidelity Investments Money Management, Inc. Ms. McAuliffe is also a director or trustee of several not-for-profit entities.
* Determined to be an “Interested Trustee” by virtue of, among other things, his or her affiliation with the trust or various entities under common control with FMR.
+ The information includes the Trustee's principal occupation during the last five years and other information relating to the experience, attributes, and skills relevant to the Trustee's qualifications to serve as a Trustee, which led to the conclusion that the Trustee should serve as a Trustee for the fund.
Independent Trustees:
Correspondence intended for an Independent Trustee may be sent to Fidelity Investments, P.O. Box 55235, Boston, Massachusetts 02205-5235.
Name, Year of Birth; Principal Occupations and Other Relevant Experience+
Elizabeth S. Acton (1951)
Year of Election or Appointment: 2013
Trustee
Ms. Acton also serves as Trustee of other Fidelity® funds. Prior to her retirement in April 2012, Ms. Acton was Executive Vice President, Finance (2011-2012), Executive Vice President, Chief Financial Officer (2002-2011), and Treasurer (2004-2005) of Comerica Incorporated (financial services). Prior to joining Comerica, Ms. Acton held a variety of positions at Ford Motor Company (1983-2002), including Vice President and Treasurer (2000-2002) and Executive Vice President and Chief Financial Officer of Ford Motor Credit Company (1998-2000). Ms. Acton currently serves as a member of the Board of Directors and Audit and Finance Committees of Beazer Homes USA, Inc. (homebuilding, 2012-present). Previously, Ms. Acton served as a Member of the Advisory Board of certain Fidelity® funds (2013-2016).
John Engler (1948)
Year of Election or Appointment: 2014
Trustee
Mr. Engler also serves as Trustee of other Fidelity® funds. He serves as president of the Business Roundtable (2011-present), and on the board of directors for Universal Forest Products (manufacturer and distributor of wood and wood-alternative products, 2003-present) and K12 Inc. (technology-based education company, 2012-present). Previously, Mr. Engler served as a Member of the Advisory Board of certain Fidelity® funds (2014-2016), a trustee of The Munder Funds (2003-2014), president and CEO of the National Association of Manufacturers (2004-2011), member of the Board of Trustees of the Annie E. Casey Foundation (2004-2015), and as governor of Michigan (1991-2003). He is a past chairman of the National Governors Association.
Albert R. Gamper, Jr. (1942)
Year of Election or Appointment: 2006
Trustee
Mr. Gamper also serves as Trustee of other Fidelity® funds. Prior to his retirement in December 2004, Mr. Gamper served as Chairman of the Board of CIT Group Inc. (commercial finance). During his tenure with CIT Group Inc. Mr. Gamper served in numerous senior management positions, including Chairman (1987-1989; 1999-2001; 2002-2004), Chief Executive Officer (1987-2004), and President (2002-2003). Mr. Gamper currently serves as a member of the Board of Directors of Public Service Enterprise Group (utilities, 2000-present), and Member of the Board of Trustees of Barnabas Health Care System (1997-present). Previously, Mr. Gamper served as Chairman (2012-2015) and Vice Chairman (2011-2012) of the Independent Trustees of certain Fidelity® funds and as Chairman of the Board of Governors, Rutgers University (2004-2007).
Robert F. Gartland (1951)
Year of Election or Appointment: 2010
Trustee
Mr. Gartland also serves as Trustee of other Fidelity® funds. Mr. Gartland is Chairman and an investor in Gartland & Mellina Group Corp. (consulting, 2009-present). Previously, Mr. Gartland served as a partner and investor of Vietnam Partners LLC (investments and consulting, 2008-2011). Prior to his retirement, Mr. Gartland held a variety of positions at Morgan Stanley (financial services, 1979-2007) including Managing Director (1987-2007).
Arthur E. Johnson (1947)
Year of Election or Appointment: 2008
Trustee
Vice Chairman of the Independent Trustees
Mr. Johnson also serves as Trustee of other Fidelity® funds. Mr. Johnson serves as a member of the Board of Directors of Eaton Corporation plc (diversified power management, 2009-present) and Booz Allen Hamilton (management consulting, 2011-present). Prior to his retirement, Mr. Johnson served as Senior Vice President of Corporate Strategic Development of Lockheed Martin Corporation (defense contractor, 1999-2009). He previously served on the Board of Directors of IKON Office Solutions, Inc. (1999-2008), AGL Resources, Inc. (holding company, 2002-2016), and Delta Airlines (2005-2007). Mr. Arthur E. Johnson is not related to Ms. Abigail P. Johnson.
Michael E. Kenneally (1954)
Year of Election or Appointment: 2009
Trustee
Mr. Kenneally also serves as Trustee of other Fidelity® funds. Prior to his retirement, Mr. Kenneally served as Chairman and Global Chief Executive Officer of Credit Suisse Asset Management. Before joining Credit Suisse, he was an Executive Vice President and Chief Investment Officer for Bank of America Corporation. Earlier roles at Bank of America included Director of Research, Senior Portfolio Manager and Research Analyst, and Mr. Kenneally was awarded the Chartered Financial Analyst (CFA) designation in 1991.
Marie L. Knowles (1946)
Year of Election or Appointment: 2001
Trustee
Chairman of the Independent Trustees
Ms. Knowles also serves as Trustee of other Fidelity® funds. Prior to Ms. Knowles' retirement in June 2000, she served as Executive Vice President and Chief Financial Officer of Atlantic Richfield Company (ARCO) (diversified energy, 1996-2000). From 1993 to 1996, she was a Senior Vice President of ARCO and President of ARCO Transportation Company (pipeline and tanker operations). Ms. Knowles currently serves as a Director and Chairman of the Audit Committee of McKesson Corporation (healthcare service, since 2002). Ms. Knowles is a member of the Board of the Santa Catalina Island Company (real estate, 2009-present). Ms. Knowles is a Member of the Investment Company Institute Board of Governors and a Member of the Governing Council of the Independent Directors Council (2014-present). She also serves as a member of the Advisory Board for the School of Engineering of the University of Southern California. Previously, Ms. Knowles served as a Director of Phelps Dodge Corporation (copper mining and manufacturing, 1994-2007), URS Corporation (engineering and construction, 2000-2003) and America West (airline, 1999-2002). Ms. Knowles previously served as Vice Chairman of the Independent Trustees of certain Fidelity® funds (2012-2015).
Mark A. Murray (1954)
Year of Election or Appointment: 2016
Trustee
Mr. Murray also serves as Trustee of other Fidelity® funds. Mr. Murray is Vice Chairman (2013-present) of Meijer, Inc. (regional retail chain). Previously, Mr. Murray served as a Member of the Advisory Board of certain Fidelity® funds (2016) and as Co-Chief Executive Officer (2013-2016) and President (2006-2013) of Meijer, Inc. Mr. Murray serves as a member of the Board of Directors and Nuclear Review and Public Policy and Responsibility Committees of DTE Energy Company (diversified energy company, 2009-present). Mr. Murray also serves as a member of the Board of Directors of Spectrum Health (not-for-profit health system, 2015-present). Mr. Murray previously served as President of Grand Valley State University (2001-2006), Treasurer for the State of Michigan (1999-2001), Vice President of Finance and Administration for Michigan State University (1998-1999), and a member of the Board of Directors and Audit Committee and Chairman of the Nominating and Corporate Governance Committee of Universal Forest Products, Inc. (manufacturer and distributor of wood and wood-alternative products, 2004-2016). Mr. Murray is also a director or trustee of many community and professional organizations.
+ The information includes the Trustee's principal occupation during the last five years and other information relating to the experience, attributes, and skills relevant to the Trustee's qualifications to serve as a Trustee, which led to the conclusion that the Trustee should serve as a Trustee for the fund.
Advisory Board Members and Officers:
Correspondence intended for an officer may be sent to Fidelity Investments, 245 Summer Street, Boston, Massachusetts 02210. Officers appear below in alphabetical order.
Name, Year of Birth; Principal Occupation
Marc R. Bryant (1966)
Year of Election or Appointment: 2015
Secretary and Chief Legal Officer (CLO)
Mr. Bryant also serves as Secretary and CLO of other funds. Mr. Bryant serves as CLO, Secretary, and Senior Vice President of Fidelity Management & Research Company (investment adviser firm, 2015-present) and FMR Co., Inc. (investment adviser firm, 2015-present); Secretary of Fidelity SelectCo, LLC (investment adviser firm, 2015-present) and Fidelity Investments Money Management, Inc. (investment adviser firm, 2015-present); and CLO of Fidelity Management & Research (Hong Kong) Limited and FMR Investment Management (UK) Limited (investment adviser firms, 2015-present) and Fidelity Management & Research (Japan) Limited (investment adviser firm, 2016-present). He is Senior Vice President and Deputy General Counsel of FMR LLC (diversified financial services company). Previously, Mr. Bryant served as Secretary and CLO of Fidelity Rutland Square Trust II (2010-2014) and Assistant Secretary of Fidelity's Fixed Income and Asset Allocation Funds (2013-2015). Prior to joining Fidelity Investments, Mr. Bryant served as a Senior Vice President and the Head of Global Retail Legal for AllianceBernstein L.P. (2006-2010), and as the General Counsel for ProFund Advisors LLC (2001-2006).
Jeffrey S. Christian (1961)
Year of Election or Appointment: 2016
Assistant Treasurer
Mr. Christian also serves as Assistant Treasurer of other funds. Mr. Christian is an employee of Fidelity Investments (2003-present).
Jonathan Davis (1968)
Year of Election or Appointment: 2010
Assistant Treasurer
Mr. Davis also serves as Assistant Treasurer of other funds, and is an employee of Fidelity Investments. Previously, Mr. Davis served as Vice President and Associate General Counsel of FMR LLC (diversified financial services company, 2003-2010).
Adrien E. Deberghes (1967)
Year of Election or Appointment: 2010
Assistant Treasurer
Mr. Deberghes also serves as an officer of other funds. He serves as Executive Vice President of Fidelity Investments Money Management, Inc. (FIMM) (investment adviser firm, 2016-present) and is an employee of Fidelity Investments (2008-present). Prior to joining Fidelity Investments, Mr. Deberghes was Senior Vice President of Mutual Fund Administration at State Street Corporation (2007-2008), Senior Director of Mutual Fund Administration at Investors Bank & Trust (2005-2007), and Director of Finance for Dunkin' Brands (2000-2005). Previously, Mr. Deberghes served in other fund officer roles.
Stephanie J. Dorsey (1969)
Year of Election or Appointment: 2013
President and Treasurer
Ms. Dorsey also serves as an officer of other funds. She is an employee of Fidelity Investments (2008-present) and has served in other fund officer roles. Prior to joining Fidelity Investments, Ms. Dorsey served as Treasurer (2004-2008) of the JPMorgan Mutual Funds and Vice President (2004-2008) of JPMorgan Chase Bank.
Howard J. Galligan III (1966)
Year of Election or Appointment: 2014
Chief Financial Officer
Mr. Galligan also serves as Chief Financial Officer of other funds. Mr. Galligan serves as President of Fidelity Pricing and Cash Management Services (FPCMS) (2014-present) and as a Director of Strategic Advisers, Inc. (investment adviser firm, 2008-present). Previously, Mr. Galligan served as Chief Administrative Officer of Asset Management (2011-2014) and Chief Operating Officer and Senior Vice President of Investment Support for Strategic Advisers, Inc. (2003-2011).
Scott C. Goebel (1968)
Year of Election or Appointment: 2015
Vice President
Mr. Goebel serves as Vice President of other funds and is an employee of Fidelity Investments (2001-present). Previously, Mr. Goebel served as Senior Vice President of Fidelity Management & Research Company (FMR) (investment adviser firm, 2016), Secretary of Fidelity SelectCo, LLC (investment adviser firm, 2013-2015), Fidelity Investments Money Management, Inc. (FIMM) (investment adviser firm, 2010-2015), and Fidelity Research and Analysis Company (FRAC) (investment adviser firm, 2010-2015); General Counsel, Secretary, and Senior Vice President of FMR (investment adviser firm, 2008-2015) and FMR Co., Inc. (investment adviser firm, 2008-2015); Assistant Secretary of Fidelity Management & Research (Japan) Limited (investment adviser firm, 2008-2015) and Fidelity Management & Research (U.K.) Inc. (investment adviser firm, 2008-2015); Chief Legal Officer (CLO) of Fidelity Management & Research (Hong Kong) Limited (investment adviser firm, 2008-2015); Secretary and CLO of certain Fidelity® funds (2008-2015); Assistant Secretary of FIMM (2008-2010), FRAC (2008-2010), and certain funds (2007-2008); and as Vice President and Secretary of Fidelity Distributors Corporation (FDC) (2005-2007).
Colm A. Hogan (1973)
Year of Election or Appointment: 2016
Assistant Treasurer
Mr. Hogan also serves as an officer of other funds. Mr. Hogan is an employee of Fidelity Investments (2005-present).
Chris Maher (1972)
Year of Election or Appointment: 2013
Assistant Treasurer
Mr. Maher serves as Assistant Treasurer of other funds. Mr. Maher is Vice President of Valuation Oversight and is an employee of Fidelity Investments. Previously, Mr. Maher served as Vice President of Asset Management Compliance (2013), Vice President of the Program Management Group of FMR (investment adviser firm, 2010-2013), and Vice President of Valuation Oversight (2008-2010).
John B. McGinty, Jr. (1962)
Year of Election or Appointment: 2016
Chief Compliance Officer
Mr. McGinty also serves as Chief Compliance Officer of other funds. Mr. McGinty is Senior Vice President of Asset Management Compliance for Fidelity Investments and is an employee of Fidelity Investments (2016-present). Mr. McGinty previously served as Vice President, Senior Attorney at Eaton Vance Management (investment management firm, 2015-2016), and prior to Eaton Vance as global CCO for all firm operations and registered investment companies at GMO LLC (investment management firm, 2009-2015). Before joining GMO LLC, Mr. McGinty served as Senior Vice President, Deputy General Counsel for Fidelity Investments (2007-2009).
John F. Papandrea (1972)
Year of Election or Appointment: 2016
Anti-Money Laundering (AML) Officer
Mr. Papandrea also serves as AML Officer of other funds. Mr. Papandrea is Vice President of FMR LLC (diversified financial services company, 2008-present) and is an employee of Fidelity Investments (2005-present).
Jason P. Pogorelec (1975)
Year of Election or Appointment: 2015
Assistant Secretary
Mr. Pogorelec also serves as Assistant Secretary of other funds. Mr. Pogorelec serves as Vice President, Associate General Counsel (2010-present) and is an employee of Fidelity Investments (2006-present).
Nancy D. Prior (1967)
Year of Election or Appointment: 2014
Vice President
Ms. Prior also serves as Vice President of other funds. Ms. Prior serves as a Director of FMR Investment Management (UK) Limited (investment adviser firm, 2015-present), President (2016-present) and Director (2014-present) of Fidelity Investments Money Management, Inc. (FIMM) (investment adviser firm), President, Fixed Income (2014-present), Vice Chairman of FIAM LLC (investment adviser firm, 2014-present), and is an employee of Fidelity Investments (2002-present). Previously, Ms. Prior served as Vice President of Fidelity's Money Market Funds (2012-2014), President, Money Market and Short Duration Bond Group of Fidelity Management & Research (FMR) (investment adviser firm, 2013-2014), President, Money Market Group of FMR (2011-2013), Managing Director of Research (2009-2011), Senior Vice President and Deputy General Counsel (2007-2009), and Assistant Secretary of certain Fidelity® funds (2008-2009).
Stacie M. Smith (1974)
Year of Election or Appointment: 2013
Assistant Treasurer
Ms. Smith also serves as an officer of other funds. She is an employee of Fidelity Investments (2009-present) and has served in other fund officer roles. Prior to joining Fidelity Investments, Ms. Smith served as Senior Audit Manager of Ernst & Young LLP (accounting firm, 1996-2009). Previously, Ms. Smith served as Deputy Treasurer of certain Fidelity® funds (2013-2016).
Marc L. Spector (1972)
Year of Election or Appointment: 2016
Deputy Treasurer
Mr. Spector also serves as an officer of other funds. Mr. Spector is an employee of Fidelity Investments (2016-present). Prior to joining Fidelity Investments, Mr. Spector served as Director at the Siegfried Group (accounting firm, 2013-2016), and prior to Siegfried Group as audit senior manager at Deloitte & Touche (accounting firm, 2005-2013).
Renee Stagnone (1975)
Year of Election or Appointment: 2016
Assistant Treasurer
Ms. Stagnone also serves as an officer of other funds. Ms. Stagnone is an employee of Fidelity Investments (1997-present). Previously, Ms. Stagnone served as Deputy Treasurer of certain Fidelity® funds (2013-2016).
Christine J. Thompson (1958)
Year of Election or Appointment: 2015
Vice President of Fidelity's Bond Funds
Ms. Thompson also serves as Vice President of other funds. Ms. Thompson also serves as Chief Investment Officer of FMR's Bond Group (2010-present) and is an employee of Fidelity Investments (1985-present). Previously, Ms. Thompson served as Vice President of Fidelity's Bond Funds (2010-2012).
Shareholder Expense Example
As a shareholder of the Fund, you incur two types of costs: (1) transaction costs, including sales charges (loads) on purchase payments or redemption proceeds, redemption fees and (2) ongoing costs, including management fees, distribution and/or service (12b-1) fees and other Fund expenses. This Example is intended to help you understand your ongoing costs (in dollars) of investing in the Fund and to compare these costs with the ongoing costs of investing in other mutual funds.
The Example is based on an investment of $1,000 invested at the beginning of the period and held for the entire period (July 1, 2016 to December 31, 2016).
Actual Expenses
The first line of the accompanying table for each class of the Fund provides information about actual account values and actual expenses. You may use the information in this line, together with the amount you invested, to estimate the expenses that you paid over the period. Simply divide your account value by $1,000.00 (for example, an $8,600 account value divided by $1,000.00 = 8.6), then multiply the result by the number in the first line for a class of the Fund under the heading entitled "Expenses Paid During Period" to estimate the expenses you paid on your account during this period. A small balance maintenance fee of $12.00 that is charged once a year may apply for certain accounts with a value of less than $2,000. This fee is not included in the table below. If it was, the estimate of expenses you paid during the period would be higher, and your ending account value lower, by this amount. In addition, the Fund, as a shareholder in the underlying Fidelity Central Funds, will indirectly bear its pro-rata share of the fees and expenses incurred by the underlying Fidelity Central Funds. These fees and expenses are not included in the Fund's annualized expense ratio used to calculate the expense estimate in the table below.
Hypothetical Example for Comparison Purposes
The second line of the accompanying table for each class of the Fund provides information about hypothetical account values and hypothetical expenses based on a Class' actual expense ratio and an assumed rate of return of 5% per year before expenses, which is not the Class' actual return. The hypothetical account values and expenses may not be used to estimate the actual ending account balance or expenses you paid for the period. You may use this information to compare the ongoing costs of investing in the Fund and other funds. To do so, compare this 5% hypothetical example with the 5% hypothetical examples that appear in the shareholder reports of the other funds. A small balance maintenance fee of $12.00 that is charged once a year may apply for certain accounts with a value of less than $2,000. This fee is not included in the table below. If it was, the estimate of expenses you paid during the period would be higher, and your ending account value lower, by this amount. In addition, the Fund, as a shareholder in the underlying Fidelity Central Funds, will indirectly bear its pro-rata share of the fees and expenses incurred by the underlying Fidelity Central Funds. These fees and expenses are not included in the Fund's annualized expense ratio used to calculate the expense estimate in the table below.
Please note that the expenses shown in the table are meant to highlight your ongoing costs only and do not reflect any transaction costs. Therefore, the second line of the table is useful in comparing ongoing costs only, and will not help you determine the relative total costs of owning different funds. In addition, if these transactional costs were included, your costs would have been higher.
| | Annualized Expense Ratio-A | Beginning
Account Value
July 1, 2016 | Ending
Account Value
December 31, 2016 | Expenses Paid
During Period-B
July 1, 2016
to December 31, 2016 |
| Class A | .80% | | | |
| Actual | | $1,000.00 | $978.60 | $3.98 |
| Hypothetical-C | | $1,000.00 | $1,021.11 | $4.06 |
| Class T | .76% | | | |
| Actual | | $1,000.00 | $978.70 | $3.78 |
| Hypothetical-C | | $1,000.00 | $1,021.32 | $3.86 |
| Class C | 1.54% | | | |
| Actual | | $1,000.00 | $974.90 | $7.64 |
| Hypothetical-C | | $1,000.00 | $1,017.39 | $7.81 |
| Limited Term Municipal Income | .47% | | | |
| Actual | | $1,000.00 | $980.10 | $2.34 |
| Hypothetical-C | | $1,000.00 | $1,022.77 | $2.39 |
| Class I | .54% | | | |
| Actual | | $1,000.00 | $980.70 | $2.69 |
| Hypothetical-C | | $1,000.00 | $1,022.42 | $2.75 |
A Annualized expense ratio reflects expenses net of applicable fee waivers.
B Expenses are equal to each Class' annualized expense ratio, multiplied by the average account value over the period, multiplied by 184/366 (to reflect the one-half year period).
C 5% return per year before expenses
Distributions (Unaudited)
The fund hereby designates as a capital gain dividend with respect to the taxable year ended December 31, 2016, $726,749 or, if subsequently determined to be different, the net capital gain of such year.
During fiscal year ended 2016, 100% of the fund's income dividends were free from federal income tax, and 6.96% of the fund's income dividends was subject to the federal alternative minimum tax.
The fund will notify shareholders in January 2017 of amounts for use in preparing 2016 income tax returns.
Board Approval of Investment Advisory Contracts and Management Fees
Fidelity Limited Term Municipal Income Fund
Each year, the Board of Trustees, including the Independent Trustees (together, the Board), votes on the renewal of the management contract with Fidelity Management & Research Company (FMR) and the sub-advisory agreements (together, the Advisory Contracts) for the fund. The Board, assisted by the advice of fund counsel and Independent Trustees' counsel, requests and considers a broad range of information relevant to the renewal of the Advisory Contracts throughout the year.
The Board meets regularly and, at each of its meetings, covers an extensive agenda of topics and materials and considers factors that are relevant to its annual consideration of the renewal of the fund's Advisory Contracts, including the services and support provided to the fund and its shareholders. The Board has established four standing committees (Committees) — Operations, Audit, Fair Valuation, and Governance and Nominating — each composed of and chaired by Independent Trustees with varying backgrounds, to which the Board has assigned specific subject matter responsibilities in order to enhance effective decision-making by the Board. The Operations Committee, of which all of the Independent Trustees are members, meets regularly throughout the year and considers, among other matters, information specifically related to the annual consideration of the renewal of the fund's Advisory Contracts. The Board, acting directly and through its Committees, requests and receives information concerning the annual consideration of the renewal of the fund's Advisory Contracts. The Board also meets as needed to consider matters specifically related to the Board's annual consideration of the renewal of the Advisory Contracts. Members of the Board may also meet with trustees of other Fidelity funds through ad hoc joint committees to discuss certain matters relevant to all of the Fidelity funds.
At its September 2016 meeting, the Board unanimously determined to renew the fund's Advisory Contracts. In reaching its determination, the Board considered all factors it believed relevant, including (i) the nature, extent, and quality of the services to be provided to the fund and its shareholders (including the investment performance of the fund); (ii) the competitiveness of the fund's management fee and total expense ratio relative to peer funds; (iii) the total costs of the services to be provided by and the profits to be realized by Fidelity from its relationships with the fund; and (iv) the extent to which, if any, economies of scale exist and would be realized as the fund grows, and whether any economies of scale are appropriately shared with fund shareholders.
In considering whether to renew the Advisory Contracts for the fund, the Board reached a determination, with the assistance of fund counsel and Independent Trustees' counsel and through the exercise of its business judgment, that the renewal of the Advisory Contracts was in the best interests of the fund and its shareholders and that the compensation payable under the Advisory Contracts was fair and reasonable. The Board's decision to renew the Advisory Contracts was not based on any single factor, but rather was based on a comprehensive consideration of all the information provided to the Board at its meetings throughout the year. The Board, in reaching its determination to renew the Advisory Contracts, was aware that shareholders of the fund have a broad range of investment choices available to them, including a wide choice among funds offered by Fidelity's competitors, and that the fund's shareholders, who have the opportunity to review and weigh the disclosure provided by the fund in its prospectus and other public disclosures, have chosen to invest in this fund, which is part of the Fidelity family of funds.
Nature, Extent, and Quality of Services Provided. The Board considered Fidelity's staffing as it relates to the fund, including the backgrounds of investment personnel of Fidelity, and also considered the fund's investment objective, strategies, and related investment philosophy. The Independent Trustees also had discussions with senior management of Fidelity's investment operations and investment groups. The Board considered the structure of the investment personnel compensation program and whether this structure provides appropriate incentives to act in the best interests of the fund. Additionally, the Board considered the portfolio managers' investments, if any, in the funds that they manage.
Resources Dedicated to Investment Management and Support Services. The Board reviewed the general qualifications and capabilities of Fidelity's investment staff, including its size, education, experience, and resources, as well as Fidelity's approach to recruiting, managing, and compensating investment personnel. The Board noted that Fidelity has continued to increase the resources devoted to non-U.S. offices, including expansion of Fidelity's global investment organization. The Board also noted that Fidelity's analysts have extensive resources, tools and capabilities that allow them to conduct sophisticated quantitative and fundamental analysis, as well as credit analysis of issuers, counterparties and guarantors. Further, the Board considered that Fidelity's investment professionals have sufficient access to global information and data so as to provide competitive investment results over time, and that those professionals also have access to sophisticated tools that permit them to assess portfolio construction and risk and performance attribution characteristics continuously, as well as to transmit new information and research conclusions rapidly around the world. Additionally, in its deliberations, the Board considered Fidelity's trading, risk management, compliance, and technology and operations capabilities and resources, which are integral parts of the investment management process.
Shareholder and Administrative Services. The Board considered (i) the nature, extent, quality, and cost of advisory, administrative, and shareholder services performed by FMR, the sub-advisers (together with FMR, the Investment Advisers), and their affiliates under the Advisory Contracts and under separate agreements covering transfer agency and pricing and bookkeeping services for the fund; (ii) the nature and extent of the supervision of third party service providers, principally custodians, subcustodians, and pricing vendors; and (iii) the resources devoted to, and the record of compliance with, the fund's compliance policies and procedures.
The Board noted that the growth of fund assets over time across the complex allows Fidelity to reinvest in the development of services designed to enhance the value or convenience of the Fidelity funds as investment vehicles. These services include 24-hour access to account information and market information through telephone representatives and over the Internet, investor education materials and asset allocation tools, and the expanded availability of Fidelity Investor Centers.
Investment in a Large Fund Family. The Board considered the benefits to shareholders of investing in a Fidelity fund, including the benefits of investing in a fund that is part of a large family of funds offering a variety of investment disciplines and providing a large variety of mutual fund investor services. The Board noted that Fidelity had taken, or had made recommendations that resulted in the Fidelity funds taking, a number of actions over the previous year that benefited particular funds, including: (i) continuing to dedicate additional resources to investment research and to the support of the senior management team that oversees asset management; (ii) continuing efforts to enhance Fidelity's global research capabilities; (iii) launching new funds and making other enhancements to meet client needs; (iv) broadening eligibility requirements for certain lower-priced share classes of, and streamlining the fee structure for, certain existing equity index funds; (v) lowering expense caps for certain existing funds and classes to reduce expenses paid by shareholders; (vi) eliminating redemption fees for certain variable insurance product funds and classes; (vii) continuing to launch dedicated lower cost underlying funds to meet portfolio construction needs related to expanding underlying fund options for Fidelity funds of funds, specifically for the Freedom Fund product lines; (viii) launching a lower cost share class for use by the Freedom Index Fund product line; (ix) rationalizing product lines and gaining increased efficiencies through fund mergers and share class consolidations; (x) continuing to develop, acquire and implement systems and technology to improve services to the funds and shareholders, strengthen information security, and increase efficiency; (xi) implementing investment enhancements to further strengthen Fidelity's target date product line to increase investors' probability of success in achieving their goals; (xii) accelerating the conversion of all remaining Class B shares to Class A shares, which have a lower expense structure; and (xiii) implementing changes to Fidelity's money market fund product line in response to recent regulatory reforms.
Investment Performance. The Board considered whether the fund has operated in accordance with its investment objective, as well as its record of compliance with its investment restrictions and its performance history. The Board noted that there was a portfolio management change for the fund in May 2016.
The Board took into account discussions with representatives of the Investment Advisers about fund investment performance that occur at Board meetings throughout the year. In this regard the Board noted that as part of regularly scheduled fund reviews and other reports to the Board on fund performance, the Board considers annualized return information for the fund for different time periods, measured against a securities market index ("benchmark index") and a peer group of funds with similar objectives ("peer group"), if any. In its evaluation of fund investment performance at meetings throughout the year, the Board gave particular attention to information indicating underperformance of certain Fidelity funds for specific time periods and discussed with the Investment Advisers the reasons for such underperformance.
In addition to reviewing absolute and relative fund performance, the Independent Trustees periodically consider the appropriateness of fund performance metrics in evaluating the results achieved. In general, the Independent Trustees believe that fund performance should be evaluated based on gross performance (before fees and expenses but after transaction costs) compared to appropriate benchmark indices, over appropriate time periods that may include full market cycles, and on net performance (after fees and expenses) compared to peer groups, as applicable, over the same periods, taking into account relevant factors including the following: general market conditions; expectations for interest rate levels and credit conditions; issuer-specific information including credit quality; the potential for incremental return versus the fund's benchmark index weighed against the risks involved in obtaining that incremental return, including the risk of diminished or negative total returns; and fund cash flows and other factors. Depending on the circumstances, the Independent Trustees may be satisfied with a fund's performance notwithstanding that it lags its benchmark index or peer group for certain periods.
The Independent Trustees recognize that shareholders evaluate performance on a net basis over their own holding periods, for which one-, three-, and five-year periods are often used as a proxy. For this reason, the performance information reviewed by the Board also included net cumulative calendar year total return information for the fund and an appropriate benchmark index and peer group for the most recent one-, three-, and five-year periods.
Based on its review, the Board concluded that the nature, extent, and quality of services provided to the fund under the Advisory Contracts should continue to benefit the shareholders of the fund.
Competitiveness of Management Fee and Total Expense Ratio. The Board considered the fund's management fee and total expense ratio compared to "mapped groups" of competitive funds and classes created for the purpose of facilitating the Trustees' competitive analysis of management fees and total expenses. Fidelity creates "mapped groups" by combining similar Lipper investment objective categories that have comparable investment mandates. Combining Lipper investment objective categories aids the Board's management fee and total expense ratio comparisons by broadening the competitive group used for comparison.
Management Fee. The Board considered two proprietary management fee comparisons for the 12-month periods shown in basis points (BP) in the chart below. The group of Lipper funds used by the Board for management fee comparisons is referred to below as the "Total Mapped Group" and, for the reasons explained above, is broader than the Lipper peer group used by the Board for performance comparisons. The Total Mapped Group comparison focuses on a fund's standing in terms of gross management fees before expense reimbursements or caps relative to the total universe of funds with comparable investment mandates, regardless of whether their management fee structures also are comparable. Funds with comparable investment mandates offer exposure to similar types of securities. Funds with comparable management fee structures have similar management fee contractual arrangements (
e.g., flat rate charged for advisory services, all-inclusive fee rate,
etc.). "TMG %" represents the percentage of funds in the Total Mapped Group that had management fees that were lower than the fund's. For example, a hypothetical TMG % of 20% would mean that 80% of the funds in the Total Mapped Group had higher, and 20% had lower, management fees than the fund. The fund's actual TMG %s and the number of funds in the Total Mapped Group are in the chart below. The "Asset-Size Peer Group" (ASPG) comparison focuses on a fund's standing relative to a subset of non-Fidelity funds within the Total Mapped Group that are similar in size and management fee structure. For example, if a fund is in the first quartile of the ASPG, the fund's management fee ranks in the least expensive or lowest 25% of funds in the ASPG. The ASPG represents at least 15% of the funds in the Total Mapped Group with comparable asset size and management fee structures, subject to a minimum of 50 funds (or all funds in the Total Mapped Group if fewer than 50). Additional information, such as the ASPG quartile in which the fund's management fee rate ranked, is also included in the chart and considered by the Board.
Fidelity Limited Term Municipal Income Fund
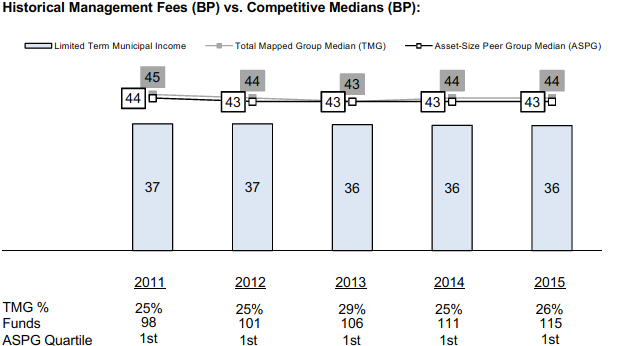
The Board noted that the fund's management fee rate ranked below the median of its Total Mapped Group and below the median of its ASPG for 2015.
The Board noted that, in 2014, the ad hoc Committee on Group Fee was formed by it and the boards of other Fidelity funds to conduct an in-depth review of the "group fee" component of the management fee of funds with such management fee structures. The Committee's focus included the mechanics of the group fee, the competitive landscape of group fee structures, Fidelity funds with no group fee component and investment products not included in group fee assets. The Board also considered that, for funds subject to the group fee, FMR agreed to voluntarily waive fees over a specified period of time in amounts designed to account for assets converted from certain funds to certain collective investment trusts.
Based on its review, the Board concluded that the fund's management fee is fair and reasonable in light of the services that the fund receives and the other factors considered.
Total Expense Ratio. In its review of each class's total expense ratio, the Board considered the fund's management fee rate as well as other fund or class expenses, as applicable, such as transfer agent fees, pricing and bookkeeping fees, fund-paid 12b-1 fees, and custodial, legal, and audit fees. The Board also noted that Fidelity may agree to waive fees and expenses from time to time, and the extent to which, if any, it has done so for the fund. As part of its review, the Board also considered the current and historical total expense ratios of each class of the fund compared to competitive fund median expenses. Each class of the fund is compared to those funds and classes in the Total Mapped Group (used by the Board for management fee comparisons) that have a similar sales load structure.
The Board noted that the total expense ratio of the retail class ranked below the competitive median for 2015 and the total expense ratio of each of Class A, Class T, Class C, and Class I ranked above the competitive median for 2015. The Board considered that, in general, various factors can affect total expense ratios. The Board considered that each of Class A, Class T, and Class I is above the competitive median primarily due to transfer agent fees. The Board noted that the total expense ratio of Class C was above the competitive median primarily because of its 12b-1 fees. The Board noted that the fund offers multiple classes, each of which has a different sales load and 12b-1 fee structure, and that the multiple structures are intended to offer a range of pricing options for the intermediary market. The Board also noted that the total expense ratios of the classes vary primarily by the level of their 12b-1 fees, although differences in transfer agent fees may also cause expenses to vary from class to class.
Fees Charged to Other Fidelity Clients. The Board also considered Fidelity fee structures and other information with respect to clients of Fidelity, such as other funds advised or subadvised by Fidelity, pension plan clients, and other institutional clients with similar mandates. The Board noted that an ad hoc joint committee created by it and the boards of other Fidelity funds periodically (most recently in 2013) reviews and compares Fidelity's institutional investment advisory business with its business of providing services to the Fidelity funds, including the differences in services provided, fees charged, and costs incurred, as well as competition in their respective marketplaces.
Based on its review of total expense ratios and fees charged to other Fidelity clients, the Board concluded that, although some classes were above the median of the universe presented for comparison, the total expense ratio of each class of the fund was reasonable in light of the services that the fund and its shareholders receive and the other factors considered.
Costs of the Services and Profitability. The Board considered the revenues earned and the expenses incurred by Fidelity in conducting the business of developing, marketing, distributing, managing, administering and servicing the fund and servicing the fund's shareholders. The Board also considered the level of Fidelity's profits in respect of all the Fidelity funds.
On an annual basis, Fidelity presents to the Board information about the profitability of its relationships with the fund. Fidelity calculates profitability information for each fund, as well as aggregate profitability information for groups of Fidelity funds and all Fidelity funds, using a series of detailed revenue and cost allocation methodologies which originate with the books and records of Fidelity on which Fidelity's audited financial statements are based. The Audit Committee of the Board reviews any significant changes from the prior year's methodologies.
PricewaterhouseCoopers LLP (PwC), independent registered public accounting firm and auditor to Fidelity and certain Fidelity funds, has been engaged annually by the Board as part of the Board's assessment of Fidelity's profitability analysis. PwC's engagement includes the review and assessment of the methodologies used by Fidelity in determining the revenues and expenses attributable to Fidelity's mutual fund business, and completion of agreed-upon procedures in respect of the mathematical accuracy of the fund profitability information and its conformity to established allocation methodologies. After considering PwC's reports issued under the engagement and information provided by Fidelity, the Board concluded that while other allocation methods may also be reasonable, Fidelity's profitability methodologies are reasonable in all material respects.
The Board also reviewed Fidelity's non-fund businesses and fall-out benefits related to the mutual fund business as well as cases where Fidelity's affiliates may benefit from or be related to the fund's business.
The Board considered the costs of the services provided by and the profits realized by Fidelity in connection with the operation of the fund and was satisfied that the profitability was not excessive.
Economies of Scale. The Board considered whether there have been economies of scale in respect of the management of the Fidelity funds, whether the Fidelity funds (including the fund) have appropriately benefited from any such economies of scale, and whether there is potential for realization of any further economies of scale. The Board considered the extent to which the fund will benefit from economies of scale as assets grow through increased services to the fund, through waivers or reimbursements, or through fee or expense ratio reductions. The Board also noted that a committee (the Economies of Scale Committee) created by it and the boards of other Fidelity funds periodically (most recently in 2013) analyzes whether Fidelity attains economies of scale in respect of the management and servicing of the Fidelity funds, whether the Fidelity funds have appropriately benefited from such economies of scale, and whether there is potential for realization of any further economies of scale.
The Board recognized that the fund's management contract incorporates a "group fee" structure, which provides for lower group fee rates as total group assets increase, and for higher group fee rates as total group assets decrease (with "group assets" defined to include fund assets under FMR's management plus the assets of sector funds previously under FMR's management). FMR calculates the group fee rates based on a tiered asset "breakpoint" schedule that varies based on asset class. The Board considered that the group fee is designed to deliver the benefits of economies of scale to fund shareholders when total Fidelity fund assets increase, even if assets of any particular fund are unchanged or have declined, because some portion of Fidelity's costs are attributable to services provided to all Fidelity funds, and all funds benefit if those costs can be allocated among more assets. The Board concluded that, given the group fee structure, fund shareholders will benefit from lower management fees as group assets increase at the fund complex level, regardless of whether Fidelity achieves any such economies of scale.
The Board concluded, taking into account the analysis of the Economies of Scale Committee, that economies of scale, if any, are being appropriately shared between fund shareholders and Fidelity.
Additional Information Requested by the Board. In order to develop fully the factual basis for consideration of the Fidelity funds' advisory contracts, the Board requested and received additional information on certain topics, including: (i) Fidelity's fund profitability methodology, profitability trends for certain funds, and the impact of certain factors on fund profitability results; (ii) portfolio manager changes that have occurred during the past year and the amount of the investment that each portfolio manager has made in the Fidelity fund(s) that he or she manages; (iii) Fidelity's compensation structure for portfolio managers, research analysts, and other key personnel, including its effects on fund profitability, the rationale for the compensation structure, and the extent to which current market conditions have affected retention and recruitment; (iv) the arrangements with and compensation paid to certain fund sub-advisers on behalf of the Fidelity funds; (v) Fidelity's voluntary waiver of its fees to maintain minimum yields for certain money market funds and classes as well as contractual waivers in place for certain funds; (vi) the methodology with respect to competitive fund data and peer group classifications; (vii) Fidelity's transfer agent fee, expense, and service structures for different funds and classes relative to competitive trends, and the impact of the increased use of omnibus accounts; (viii) Fidelity's long-term expectations for its offerings in the workplace investing channel; (ix) new developments in the retail and institutional marketplaces; (x) the approach to considering "fall-out" benefits; and (xi) the impact of money market reform on Fidelity's money market funds, including with respect to costs and profitability. In addition, the Board considered its discussions with Fidelity throughout the year regarding enhanced information security initiatives and the funds' fair valuation policies.
Based on its evaluation of all of the conclusions noted above, and after considering all factors it believed relevant, the Board concluded that the advisory fee structures are fair and reasonable, and that the fund's Advisory Contracts should be renewed.
ASTM-ANN-0217
1.796592.113
Fidelity® Limited Term Municipal Income Fund
Annual Report December 31, 2016 |
|
Contents
To view a fund's proxy voting guidelines and proxy voting record for the 12-month period ended June 30, visit http://www.fidelity.com/proxyvotingresults or visit the Securities and Exchange Commission's (SEC) web site at http://www.sec.gov.
You may also call 1-800-544-8544 to request a free copy of the proxy voting guidelines.
Standard & Poor's, S&P and S&P 500 are registered service marks of The McGraw-Hill Companies, Inc. and have been licensed for use by Fidelity Distributors Corporation.
Other third-party marks appearing herein are the property of their respective owners.
All other marks appearing herein are registered or unregistered trademarks or service marks of FMR LLC or an affiliated company. © 2017 FMR LLC. All rights reserved.
This report and the financial statements contained herein are submitted for the general information of the shareholders of the Fund. This report is not authorized for distribution to prospective investors in the Fund unless preceded or accompanied by an effective prospectus.
A fund files its complete schedule of portfolio holdings with the SEC for the first and third quarters of each fiscal year on Form N-Q. Forms N-Q are available on the SEC’s web site at http://www.sec.gov. A fund's Forms N-Q may be reviewed and copied at the SEC’s Public Reference Room in Washington, DC. Information regarding the operation of the SEC's Public Reference Room may be obtained by calling 1-800-SEC-0330.
For a complete list of a fund's portfolio holdings, view the most recent holdings listing, semiannual report, or annual report on Fidelity's web site at http://www.fidelity.com, http://www.institutional.fidelity.com, or http://www.401k.com, as applicable.
NOT FDIC INSURED •MAY LOSE VALUE •NO BANK GUARANTEE
Neither the Fund nor Fidelity Distributors Corporation is a bank.
Performance: The Bottom Line
Average annual total return reflects the change in the value of an investment, assuming reinvestment of distributions from dividend income and capital gains (the profits earned upon the sale of securities that have grown in value, if any) and assuming a constant rate of performance each year. The hypothetical investment and the average annual total returns do not reflect the deduction of taxes that a shareholder would pay on fund distributions or the redemption of fund shares. During periods of reimbursement by Fidelity, a fund’s total return will be greater than it would be had the reimbursement not occurred. How a fund did yesterday is no guarantee of how it will do tomorrow.
Average Annual Total Returns
| For the periods ended December 31, 2016 | Past 1 year | Past 5 years | Past 10 years |
| Fidelity® Limited Term Municipal Income Fund | (0.45)% | 1.05% | 2.50% |
$10,000 Over 10 Years
Let's say hypothetically that $10,000 was invested in Fidelity® Limited Term Municipal Income Fund, a class of the fund, on December 31, 2006.
The chart shows how the value of your investment would have changed, and also shows how the Bloomberg Barclays Municipal Bond Index performed over the same period.
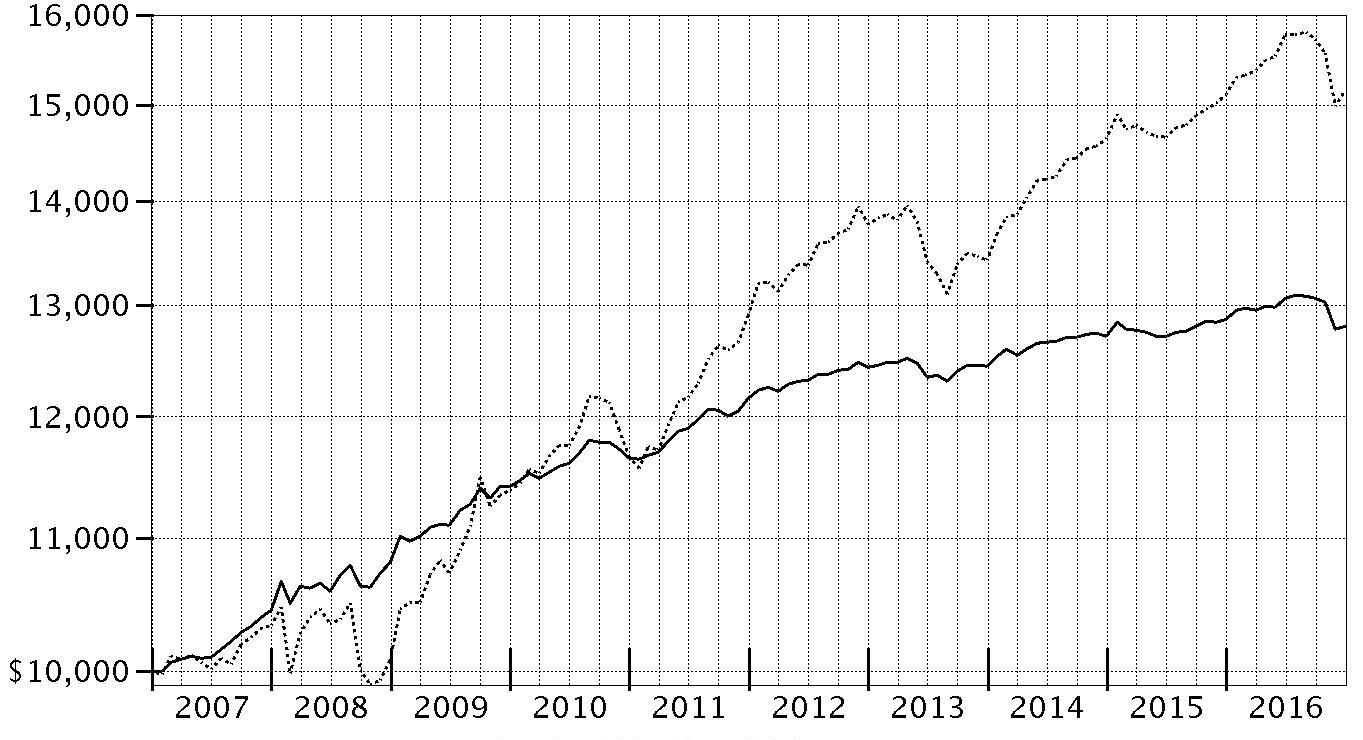
| Period Ending Values |
| $12,805 | Fidelity® Limited Term Municipal Income Fund |
| $15,158 | Bloomberg Barclays Municipal Bond Index |
Effective August 24, 2016, all Barclays benchmark indices were co-branded as the Bloomberg Barclays Indices for a period of five years.
Management's Discussion of Fund Performance
Market Recap: For the 12 months ending December 31, 2016, tax-exempt bonds eked out only a 0.25% return, according to the Bloomberg Barclays Municipal Bond Index. For much of the period, fairly strong demand and a stable credit environment for state and local governments drove moderate muni returns. But a downward trend began in September and steepened through November – the worst month for the muni market since 2008 – as investors became concerned about U.S. President-elect Donald Trump’s expansionary fiscal policy ambitions, inflation and the potential for tax reform to impair tax-exempt bond valuations. Further, some theorized that changes to or repeal of the Affordable Care Act by the incoming administration and a Republican-controlled Congress may affect the prices of muni bonds issued by hospitals. Muni bonds also were hurt by market anticipation of a quarter-point increase in policy interest rates, which happened in December. At year-end, concerns about unfunded pension liabilities generally are compartmentalized to certain issuers. Looking ahead, we think the U.S. Federal Reserve is likely to raise policy interest rates further in 2017, perhaps in multiple stages.
Comments from Co-Portfolio Manager Mark Sommer: For the year, the fund’s share classes (excluding sales charges, if applicable) posted modestly negative returns, slightly lagging, net of fees, the 0.00% return the Bloomberg Barclays 1-6 Year Municipal Bond Index. The portfolio managers continued to focus on longer-term investment principles by seeking to generate attractive tax-exempt income and competitive risk-adjusted returns over time. The fund’s yield curve positioning hurt performance versus the Bloomberg Barclays 1-6 year index. Specifically, overweighting bonds in the five- to seven-year range was detrimental. Overweighting Illinois state-backed bonds also hurt, as the state continued to struggle to balance its budget and was hit with downgrades to its credit rating. In addition, an overweighting in bonds issued by Chicago and related entities detracted. These securities were hurt by worries about the unfunded pension challenges of Chicago and its Public School system. In contrast, the fund benefited from security selection in the healthcare sector. We have focused on hospital systems that have less reliance on federal insurance programs, stronger balance sheets and significant market share or essentiality that gives them negotiating leverage with commercial insurers. These types of credits have held their value better under the threat of further healthcare reform.
The views expressed above reflect those of the portfolio manager(s) only through the end of the period as stated on the cover of this report and do not necessarily represent the views of Fidelity or any other person in the Fidelity organization. Any such views are subject to change at any time based upon market or other conditions and Fidelity disclaims any responsibility to update such views. These views may not be relied on as investment advice and, because investment decisions for a Fidelity fund are based on numerous factors, may not be relied on as an indication of trading intent on behalf of any Fidelity fund.
Note to Shareholders: On May 2, 2016, Cormac Cullen succeeded Jamie Pagliocco as Co-Manager of the fund, joining Co-Managers Kevin Ramundo and Mark Sommer.
Investment Summary (Unaudited)
Top Five States as of December 31, 2016
| | % of fund's net assets | % of fund's net assets 6 months ago |
| New York | 12.3 | 13.5 |
| Florida | 11.1 | 11.2 |
| Illinois | 10.2 | 8.6 |
| Texas | 9.6 | 10.3 |
| New Jersey | 6.4 | 5.5 |
Top Five Sectors as of December 31, 2016
| | % of fund's net assets | % of fund's net assets 6 months ago |
| General Obligations | 42.4 | 42.4 |
| Transportation | 11.5 | 11.8 |
| Health Care | 10.5 | 7.5 |
| Special Tax | 9.7 | 10.0 |
| Electric Utilities | 9.4 | 9.1 |
Quality Diversification (% of fund's net assets)
| As of December 31, 2016 |
| | AAA | 8.2% |
| | AA,A | 72.4% |
| | BBB | 10.5% |
| | BB and Below | 0.5% |
| | Not Rated | 1.9% |
| | Short-Term Investments and Net Other Assets | 6.5% |

| As of June 30, 2016 |
| | AAA | 9.3% |
| | AA,A | 71.1% |
| | BBB | 8.5% |
| | BB and Below | 0.9% |
| | Not Rated | 2.0% |
| | Short-Term Investments and Net Other Assets | 8.2% |

We have used ratings from Moody's Investors Service, Inc. Where Moody's® ratings are not available, we have used S&P® ratings. All ratings are as of the date indicated and do not reflect subsequent changes.
Investments December 31, 2016
Showing Percentage of Net Assets
| Municipal Bonds - 93.5% | | | |
| | | Principal Amount (000s) | Value (000s) |
| Alabama - 0.4% | | | |
| Mobile County Board of School Commissioners: | | | |
| Series 2016 A: | | $ | $ |
| 5% 3/1/22 | | 600 | 681 |
| 5% 3/1/23 | | 850 | 977 |
| 5% 3/1/24 | | 1,250 | 1,454 |
| 5% 3/1/25 | | 1,250 | 1,464 |
| Series 2016 B: | | | |
| 5% 3/1/22 | | 1,000 | 1,135 |
| 5% 3/1/24 | | 1,000 | 1,164 |
| 5% 3/1/25 | | 1,500 | 1,757 |
| Montgomery Med. Clinic Facilities: | | | |
| 5% 3/1/20 | | 2,890 | 3,108 |
| 5% 3/1/25 | | 1,500 | 1,680 |
|
| TOTAL ALABAMA | | | 13,420 |
|
| Alaska - 0.7% | | | |
| Anchorage Gen. Oblig.: | | | |
| Series A: | | | |
| 5% 9/1/20 | | 1,090 | 1,210 |
| 5% 9/1/22 | | 1,200 | 1,379 |
| Series B: | | | |
| 5% 9/1/18 | | 3,685 | 3,904 |
| 5% 9/1/20 | | 2,000 | 2,220 |
| 5% 9/1/22 | | 1,425 | 1,638 |
| Series C: | | | |
| 5% 9/1/18 | | 1,000 | 1,059 |
| 5% 9/1/19 | | 2,150 | 2,337 |
| 5% 9/1/20 | | 1,260 | 1,399 |
| 5% 9/1/22 | | 1,000 | 1,149 |
| Series D: | | | |
| 5% 9/1/19 | | 3,895 | 4,234 |
| 5% 9/1/20 | | 2,000 | 2,220 |
|
| TOTAL ALASKA | | | 22,749 |
|
| Arizona - 3.3% | | | |
| Arizona Health Facilities Auth. Rev. (Scottsdale Lincoln Hospitals Proj.) Series 2014 A: | | | |
| 5% 12/1/18 | | 500 | 533 |
| 5% 12/1/19 | | 615 | 670 |
| 5% 12/1/20 | | 820 | 912 |
| 5% 12/1/21 | | 1,105 | 1,250 |
| 5% 12/1/22 | | 800 | 920 |
| 5% 12/1/23 | | 1,000 | 1,164 |
| 5% 12/1/24 | | 1,500 | 1,766 |
| Arizona State Trans. Board Series 2016: | | | |
| 5% 7/1/24 | | 5,000 | 5,920 |
| 5% 7/1/25 | | 5,000 | 5,980 |
| Arizona Wtr. Infrastructure Fin. Auth. Rev. Series 2009 A: | | | |
| 5% 10/1/18 | | 1,000 | 1,065 |
| 5% 10/1/20 (Pre-Refunded to 10/1/19 @ 100) | | 5,180 | 5,663 |
| Glendale Gen. Oblig. Series 2015: | | | |
| 4% 7/1/19 (FSA Insured) | | 600 | 636 |
| 5% 7/1/22 (FSA Insured) | | 1,000 | 1,148 |
| Glendale Trans. Excise Tax Rev.: | | | |
| 5% 7/1/21 (FSA Insured) | | 750 | 849 |
| 5% 7/1/22 (FSA Insured) | | 1,170 | 1,344 |
| 5% 7/1/23 (FSA Insured) | | 1,395 | 1,624 |
| Maricopa County Indl. Dev. Auth. Rev. Series 2016 A: | | | |
| 5% 1/1/25 | | 4,780 | 5,595 |
| 5% 1/1/26 | | 10,720 | 12,592 |
| Maricopa County Mesa Unified School District # 4 Series 2016, 4% 7/1/18 | | 1,325 | 1,380 |
| Maricopa County School District #28 Kyrene Elementary Series 2010 B: | | | |
| 4% 7/1/19 | | 900 | 956 |
| 4% 7/1/20 | | 1,360 | 1,469 |
| Phoenix Indl. Solid Waste Disp. Rev. Bonds (Republic Svc., Inc. Proj.) Series 2013, 0.9%, tender 2/1/17 (a)(b) | | 40,200 | 40,194 |
| Pima County Ctfs. of Prtn. Series 2014: | | | |
| 5% 12/1/21 | | 2,210 | 2,483 |
| 5% 12/1/22 | | 2,470 | 2,808 |
| 5% 12/1/23 | | 3,425 | 3,934 |
| Pima County Swr. Sys. Rev.: | | | |
| Series 2011 B, 5% 7/1/19 | | 3,225 | 3,498 |
| Series 2012 A: | | | |
| 5% 7/1/18 | | 825 | 871 |
| 5% 7/1/19 | | 1,550 | 1,681 |
| Univ. Med. Ctr. Corp. Hosp. Rev. Series 2011: | | | |
| 5% 7/1/17 (Escrowed to Maturity) | | 3,315 | 3,379 |
| 5% 7/1/18 (Escrowed to Maturity) | | 3,365 | 3,543 |
|
| TOTAL ARIZONA | | | 115,827 |
|
| California - 4.9% | | | |
| Alameda Corridor Trans. Auth. Rev.: | | | |
| Series 2004: | | | |
| 0% 10/1/19 | | 3,335 | 3,196 |
| 0% 10/1/19 | | 265 | 246 |
| Series 2013 A, 5% 10/1/22 | | 2,190 | 2,525 |
| Bay Area Toll Auth. San Francisco Bay Toll Bridge Rev. Bonds 1.5%, tender 4/2/18 (a) | | 5,200 | 5,206 |
| California Gen. Oblig. Bonds 3%, tender 12/1/19 (a) | | 15,600 | 15,990 |
| California Health Facilities Fing. Auth. Rev. Bonds (Children's Hosp. of Orange County Proj.) Series 2012 A, 2.52%, tender 1/5/17 (a) | | 4,000 | 4,002 |
| California Pub. Works Board Lease Rev.: | | | |
| (Dept. of Corrections & Rehab. Proj.) Series 2011 C, 5% 10/1/18 | | 1,750 | 1,860 |
| (Riverside Campus Proj.) Series 2012 H, 5% 4/1/22 | | 1,000 | 1,143 |
| (Univ. Proj.) Series 2011 B: | | | |
| 5% 10/1/18 (Escrowed to Maturity) | | 2,740 | 2,921 |
| 5% 10/1/19 (Escrowed to Maturity) | | 1,490 | 1,631 |
| (Various Cap. Projs.): | | | |
| Series 2011 A: | | | |
| 5% 10/1/18 | | 6,475 | 6,883 |
| 5% 10/1/19 | | 5,000 | 5,449 |
| 5% 10/1/20 | | 2,525 | 2,814 |
| Series 2012 A, 5% 4/1/21 | | 1,000 | 1,125 |
| Series 2012 G, 5% 11/1/22 | | 1,250 | 1,443 |
| (Various Judicial Council Projects) Series 2011 D, 5% 12/1/19 | | 4,100 | 4,486 |
| Series 2009 J, 5% 11/1/17 | | 2,300 | 2,373 |
| Series 2010 A, 5% 3/1/17 | | 5,405 | 5,441 |
| California Statewide Cmntys. Dev. Auth. Rev. Bonds: | | | |
| Series 2002 C, 5%, tender 5/1/17 (a) | | 4,000 | 4,052 |
| Series 2009 E2, 5%, tender 5/1/17 (a) | | 2,050 | 2,077 |
| Golden State Tobacco Securitization Corp. Tobacco Settlement Rev. Series 2013 A, 4% 6/1/21 | | 3,500 | 3,786 |
| Los Angeles County Pub. Works Fing. Auth. Lease Rev. Series 2010 A, 5% 8/1/17 | | 5,000 | 5,114 |
| Los Angeles Muni. Impt. Corp. Lease Rev. Series 2012 C, 4.625% 3/1/18 | | 1,500 | 1,561 |
| Los Angeles Unified School District Ctfs. of Prtn. (Multiple Properties Proj.) Series 2010 A, 5% 12/1/17 | | 9,790 | 10,143 |
| Metropolitan Wtr. District of Southern California Wtr. Rev. Bonds: | | | |
| Series 2009 A2, 0.88%, tender 1/5/17 (a) | | 13,000 | 13,000 |
| Series 2011 A3, 0.88%, tender 1/5/17 (a) | | 1,900 | 1,900 |
| Series 2016, 0.84%, tender 1/5/17 (a) | | 7,300 | 7,301 |
| Monterey County Pub. Impt. Corp. Ctfs. of Prtn. (Refing. Proj.) Series 2009, 5% 8/1/17 (FSA Insured) | | 2,130 | 2,178 |
| Northern California Pwr. Agcy. Rev. (Hydroelectric #1 Proj.) Series 2010 A, 5% 7/1/18 | | 2,000 | 2,110 |
| Northern California Transmission Agcy. Rev. (Ref. Calif Ore Proj.) Series 2009 A, 3.5% 5/1/17 | | 2,500 | 2,521 |
| Oakland Unified School District Alameda County Series 2013, 5.5% 8/1/23 | | 1,000 | 1,169 |
| Palomar Health Rev. Series 2016: | | | |
| 5% 11/1/23 | | 2,000 | 2,201 |
| 5% 11/1/24 | | 2,000 | 2,217 |
| Port of Oakland Rev. Series 2012 P, 5% 5/1/21 (b) | | 2,500 | 2,782 |
| Rancho Cucamonga Redev. Agcy. (Rancho Redev. Proj.): | | | |
| 5% 9/1/23 (FSA Insured) | | 1,350 | 1,566 |
| 5% 9/1/24 (FSA Insured) | | 2,300 | 2,697 |
| Riverside County Asset Leasing Rev. (Riverside Cap. Proj.) Series 2012 A: | | | |
| 4% 6/1/17 | | 1,750 | 1,771 |
| 5% 6/1/17 | | 3,700 | 3,760 |
| 5% 6/1/18 | | 6,470 | 6,806 |
| San Bernardino County Ctfs. of Prtn. (Arrowhead Proj.) Series 2009 A, 5% 8/1/18 | | 8,000 | 8,457 |
| San Pablo Calif Redev. Agcy. Series 2014 A, 5% 6/15/24 (FSA Insured) | | 1,380 | 1,617 |
| State Ctr. Cmnty. College District Series 2007 A, 5% 8/1/26 (Pre-Refunded to 8/1/17 @ 100) | | 9,480 | 9,700 |
| Stockton Unified School District Gen. Oblig. 5% 7/1/18 (FSA Insured) | | 1,035 | 1,091 |
|
| TOTAL CALIFORNIA | | | 170,311 |
|
| Colorado - 0.5% | | | |
| Colorado Health Facilities Auth. Rev. Bonds Series 2008 D3, 5%, tender 11/12/21 (a) | | 5,285 | 5,839 |
| Colorado Reg'l. Trans. District Ctfs. of Prtn.: | | | |
| Series 2013 A, 5% 6/1/23 | | 4,500 | 5,188 |
| Series 2014 A, 5% 6/1/23 | | 3,860 | 4,450 |
| E-470 Pub. Hwy. Auth. Rev. Series 2015 A: | | | |
| 5% 9/1/19 | | 1,000 | 1,070 |
| 5% 9/1/20 | | 1,000 | 1,090 |
| Univ. of Colorado Enterprise Sys. Rev. Series 2009 A, 5% 6/1/17 | | 500 | 508 |
|
| TOTAL COLORADO | | | 18,145 |
|
| Connecticut - 2.6% | | | |
| Connecticut Gen. Oblig.: | | | |
| Series 2009 B, 5% 3/1/18 | | 3,470 | 3,609 |
| Series 2012 C, 5% 6/1/21 | | 23,420 | 26,044 |
| Series 2013 A, 1.06% 3/1/17 (a) | | 1,400 | 1,400 |
| Series 2015 E, 5% 8/1/17 | | 26,395 | 26,983 |
| Series 2016 A: | | | |
| 4% 3/15/18 | | 13,900 | 14,311 |
| 5% 3/15/26 | | 1,970 | 2,300 |
| Connecticut Health & Edl. Facilities Auth. Rev. Bonds (Ascension Health Cr. Group Proj.) Series 1998 B, 1.55%, tender 2/1/17 (a) | | 2,560 | 2,562 |
| Connecticut Hsg. Fin. Auth. Series 2013 B2, 4% 11/15/32 | | 6,125 | 6,411 |
| Connecticut Spl. Tax Oblig. Trans. Infrastructure Rev. Series 2011 A, 5% 12/1/18 | | 5,575 | 5,946 |
| New Haven Gen. Oblig. Series 2016 A: | | | |
| 5% 8/15/23 (FSA Insured) | | 900 | 1,001 |
| 5% 8/15/25 (FSA Insured) | | 1,000 | 1,123 |
|
| TOTAL CONNECTICUT | | | 91,690 |
|
| Delaware, New Jersey - 0.1% | | | |
| Delaware River & Bay Auth. Rev. Series 2014 C: | | | |
| 5% 1/1/20 | | 2,500 | 2,726 |
| 5% 1/1/21 | | 2,000 | 2,222 |
|
| TOTAL DELAWARE, NEW JERSEY | | | 4,948 |
|
| District Of Columbia - 0.5% | | | |
| District of Columbia Univ. Rev. Bonds (Georgetown Univ. Proj.) Series 2001 B, 4.7%, tender 4/1/18 (a) | | 8,500 | 8,821 |
| Metropolitan Washington DC Arpts. Auth. Sys. Rev.: | | | |
| Series 2012 A, 5% 10/1/22 (b) | | 6,325 | 7,176 |
| Series 2014 A, 5% 10/1/23 (b) | | 445 | 511 |
|
| TOTAL DISTRICT OF COLUMBIA | | | 16,508 |
|
| Florida - 11.1% | | | |
| Brevard County School Board Ctfs. of Prtn.: | | | |
| Series 2014, 5% 7/1/21 | | 1,000 | 1,123 |
| Series 2015 C: | | | |
| 5% 7/1/21 | | 650 | 730 |
| 5% 7/1/22 | | 3,725 | 4,243 |
| 5% 7/1/23 | | 3,000 | 3,452 |
| Broward County Arpt. Sys. Rev.: | | | |
| Series 2012 Q1, 5% 10/1/21 | | 1,000 | 1,126 |
| Series A: | | | |
| 5% 10/1/22 (b) | | 3,000 | 3,371 |
| 5% 10/1/23 (b) | | 4,020 | 4,583 |
| Broward County School Board Ctfs. of Prtn.: | | | |
| Series 2012 A, 5% 7/1/19 | | 7,000 | 7,555 |
| Series 2015 A: | | | |
| 5% 7/1/19 | | 2,000 | 2,159 |
| 5% 7/1/20 | | 4,000 | 4,405 |
| 5% 7/1/21 | | 4,500 | 5,046 |
| 5% 7/1/22 | | 3,500 | 3,987 |
| 5% 7/1/23 | | 2,750 | 3,170 |
| 5% 7/1/24 | | 1,320 | 1,535 |
| Series 2015 B: | | | |
| 5% 7/1/19 | | 2,000 | 2,159 |
| 5% 7/1/20 | | 3,000 | 3,304 |
| 5% 7/1/21 | | 6,235 | 6,991 |
| 5% 7/1/22 | | 1,275 | 1,452 |
| 5% 7/1/23 | | 2,750 | 3,170 |
| 5% 7/1/24 | | 1,145 | 1,332 |
| Series A, 5.25% 7/1/17 (AMBAC Insured) | | 7,015 | 7,163 |
| Citizens Property Ins. Corp.: | | | |
| Series 2009 A1, 6% 6/1/17 | | 1,275 | 1,301 |
| Series 2010 A1, 5.25% 6/1/17 | | 4,125 | 4,197 |
| Series 2012 A1, 5% 6/1/17 | | 18,095 | 18,393 |
| Clearwater Wtr. and Swr. Rev. Series 2011: | | | |
| 5% 12/1/17 | | 1,685 | 1,744 |
| 5% 12/1/18 | | 685 | 732 |
| 5% 12/1/19 | | 1,820 | 1,988 |
| 5% 12/1/20 | | 1,000 | 1,115 |
| Collier County Indl. Dev. Auth. Healthcare Facilities Rev. (NCH Healthcare Sys. Proj.) Series 2011, 5% 10/1/17 | | 1,455 | 1,496 |
| Florida Board of Ed. Lottery Rev. Series 2011 A, 5% 7/1/20 | | 8,600 | 9,536 |
| Florida Board of Ed. Pub. Ed. Cap. Outlay Series 2009 C, 5% 6/1/20 | | 3,625 | 3,954 |
| Florida Dept. of Envir. Protection Rev. Series 2012 A, 5% 7/1/19 | | 15,800 | 17,106 |
| Florida Dev. Fin. Corp. Healthcare Facility Rev. (Univ. Health Proj.) Series 2013 A: | | | |
| 5% 2/1/17 | | 700 | 701 |
| 5% 2/1/18 | | 1,790 | 1,838 |
| 5% 2/1/19 | | 1,450 | 1,517 |
| 5% 2/1/20 | | 2,025 | 2,148 |
| Florida Gen. Oblig. Series 2015 A, 4% 7/1/17 | | 17,295 | 17,559 |
| Florida Mid-Bay Bridge Auth. Rev. Series 2015 A: | | | |
| 5% 10/1/21 | | 1,030 | 1,134 |
| 5% 10/1/22 | | 2,000 | 2,209 |
| 5% 10/1/23 | | 1,270 | 1,410 |
| 5% 10/1/24 | | 2,000 | 2,206 |
| 5% 10/1/25 | | 1,750 | 1,954 |
| 5% 10/1/26 | | 2,000 | 2,215 |
| Florida Muni. Pwr. Agcy. Rev. (Stanton II Proj.) Series 2012 A, 5% 10/1/18 | | 2,850 | 3,024 |
| Greater Orlando Aviation Auth. Arpt. Facilities Rev. Series 2011 C: | | | |
| 5% 10/1/19 | | 1,705 | 1,856 |
| 5% 10/1/20 | | 1,000 | 1,111 |
| Halifax Hosp. Med. Ctr. Rev. 5% 6/1/23 | | 1,325 | 1,508 |
| Hillsborough County School Board Ctfs. of Prtn. Series 2015 A, 4% 7/1/17 | | 1,500 | 1,523 |
| Hillsborough County School District Sales Tax Rev. Series 2015 B, 5% 10/1/22 (FSA Insured) | | 2,020 | 2,333 |
| Indian River County School Board Ctfs. of Prtn. Series 2014: | | | |
| 5% 7/1/20 | | 935 | 1,031 |
| 5% 7/1/22 | | 2,000 | 2,278 |
| 5% 7/1/23 | | 2,000 | 2,307 |
| Indian River County Wtr. & Swr. Rev. 5% 9/1/17 | | 1,000 | 1,026 |
| JEA Wtr. & Swr. Sys. Rev. Series 2010 D, 5% 10/1/21 | | 1,945 | 2,131 |
| Manatee County Rev. Series 2013: | | | |
| 5% 10/1/19 | | 1,250 | 1,363 |
| 5% 10/1/20 | | 2,000 | 2,228 |
| 5% 10/1/21 | | 2,000 | 2,270 |
| 5% 10/1/22 | | 1,000 | 1,156 |
| Miami-Dade County Expressway Auth.: | | | |
| (Waste Mgmt., Inc. of Florida Proj.): | | | |
| Series 2013, 5% 7/1/19 | | 2,000 | 2,162 |
| 5% 7/1/20 | | 1,000 | 1,105 |
| 5% 7/1/21 | | 2,000 | 2,250 |
| 5% 7/1/22 | | 2,000 | 2,283 |
| 5% 7/1/23 | | 2,000 | 2,290 |
| Series 2014 A, 5% 7/1/24 | | 625 | 730 |
| Series 2014 B: | | | |
| 5% 7/1/22 | | 1,500 | 1,718 |
| 5% 7/1/23 | | 3,250 | 3,772 |
| Miami-Dade County Gen. Oblig. (Parks Prog.) Series 2015 A, 5% 11/1/22 | | 3,880 | 4,494 |
| Miami-Dade County School Board Ctfs. of Prtn.: | | | |
| Series 2014 D: | | | |
| 5% 11/1/20 | | 4,875 | 5,373 |
| 5% 11/1/21 | | 6,275 | 7,014 |
| 5% 11/1/22 | | 2,915 | 3,304 |
| 5% 11/1/23 | | 7,650 | 8,765 |
| Series 2015 A: | | | |
| 5% 5/1/19 | | 1,000 | 1,072 |
| 5% 5/1/20 | | 2,095 | 2,292 |
| 5% 5/1/21 | | 4,000 | 4,451 |
| 5% 5/1/22 | | 3,720 | 4,191 |
| 5% 5/1/23 | | 6,500 | 7,404 |
| Series 2015 B, 5% 5/1/24 | | 29,560 | 33,985 |
| Series 2016 A, 5% 8/1/27 | | 5,560 | 6,474 |
| Miami-Dade County School District Series 2015, 5% 3/15/17 | | 3,225 | 3,251 |
| Miami-Dade County Transit Sales Surtax Rev. Series 2012, 5% 7/1/19 | | 1,250 | 1,351 |
| Orange County Health Facilities Auth. Series 2009, 5.25% 10/1/19 | | 1,245 | 1,361 |
| Orange County School Board Ctfs. of Prtn. Series 2015 C, 5% 8/1/18 | | 1,500 | 1,587 |
| Orlando & Orange County Expressway Auth. Rev. Series 2012, 5% 7/1/19 | | 1,000 | 1,081 |
| Orlando Utils. Commission Util. Sys. Rev.: | | | |
| Series 2009 C, 5% 10/1/17 | | 1,500 | 1,544 |
| Series 2010 C, 5% 10/1/17 | | 1,895 | 1,951 |
| Series 2011 B: | | | |
| 5% 10/1/18 | | 2,250 | 2,393 |
| 5% 10/1/19 | | 2,325 | 2,539 |
| Palm Beach County Health Facilities Auth. Hosp. Rev. Series 2014: | | | |
| 4% 12/1/19 | | 1,000 | 1,043 |
| 5% 12/1/20 | | 880 | 952 |
| 5% 12/1/21 | | 1,100 | 1,204 |
| Palm Beach County School Board Ctfs. of Prtn.: | | | |
| Series 2014 B: | | | |
| 4% 8/1/19 | | 4,000 | 4,241 |
| 4% 8/1/21 | | 4,040 | 4,397 |
| 5% 8/1/17 | | 1,170 | 1,197 |
| 5% 8/1/19 | | 3,000 | 3,256 |
| 5% 8/1/21 | | 5,300 | 5,999 |
| Series 2015 B: | | | |
| 5% 8/1/19 | | 2,735 | 2,968 |
| 5% 8/1/20 | | 1,750 | 1,944 |
| Pasco County School District Sales Tax Rev. Series 2013: | | | |
| 5% 10/1/18 | | 1,250 | 1,326 |
| 5% 10/1/19 | | 1,100 | 1,197 |
| 5% 10/1/20 | | 1,000 | 1,112 |
| 5% 10/1/21 | | 1,000 | 1,131 |
| 5% 10/1/22 | | 1,000 | 1,154 |
| Pasco County Solid Waste Disp. & Resource Recovery Sys. Rev.: | | | |
| Series 2011: | | | |
| 5% 10/1/17 (b) | | 4,465 | 4,590 |
| 5% 10/1/19 (b) | | 2,025 | 2,193 |
| 5% 10/1/18 (b) | | 2,745 | 2,908 |
| Seminole County School Board Ctfs. of Prtn. Series 2016 C: | | | |
| 5% 7/1/25 | | 1,000 | 1,174 |
| 5% 7/1/26 | | 1,140 | 1,343 |
| Tallahassee Health Facilities Rev. (Tallahassee Memorial Healthcare, Inc. Proj.) Series 2016 A, 5% 12/1/21 | | 1,000 | 1,102 |
| Tampa Bay Wtr. Reg'l. Wtr. Supply Auth. Util. Sys. Rev.: | | | |
| Series 2011 B: | | | |
| 5% 10/1/18 (Escrowed to Maturity) | | 2,440 | 2,595 |
| 5% 10/1/18 (Escrowed to Maturity) | | 2,260 | 2,405 |
| Series 2011, 5% 10/1/19 | | 5,590 | 6,116 |
| Tampa Health Sys. Rev. (Baycare Health Sys. Proj.) Series 2010, 5% 11/15/17 | | 1,605 | 1,660 |
| Tampa Solid Waste Sys. Rev. Series 2010, 5% 10/1/17 (FSA Insured) (b) | | 5,000 | 5,140 |
| Tampa Tax Allocation (H. Lee Moffitt Cancer Ctr. Proj.) Series 2012 A, 5% 9/1/20 | | 1,800 | 1,981 |
| Titusville Wtr. & Swr. Rev. Series 2010, 5% 10/1/17 (Assured Guaranty Corp. Insured) | | 1,135 | 1,168 |
| Volusia County School Board Ctfs. of Prtn. (Master Lease Prog.) Series 2014 B: | | | |
| 5% 8/1/18 | | 500 | 529 |
| 5% 8/1/19 | | 310 | 335 |
|
| TOTAL FLORIDA | | | 386,201 |
|
| Georgia - 2.7% | | | |
| Atlanta Arpt. Rev.: | | | |
| 5% 1/1/22 | | 1,000 | 1,141 |
| 5% 1/1/23 | | 1,000 | 1,158 |
| 5% 1/1/24 | | 1,150 | 1,351 |
| Bartow County Dev. Auth. Poll. Cont. Rev. Bonds (Georgia Pwr. Co. Plant Bowen Proj.) Series 1997, 2.375%, tender 8/10/17 (a) | | 2,100 | 2,110 |
| Burke County Indl. Dev. Auth. Poll. Cont. Rev. Bonds: | | | |
| (Georgia Pwr. Co. Plant Vogtle Proj.) Series 2012, 1.75%, tender 6/1/17 (a) | | 1,000 | 1,002 |
| (Oglethorpe Pwr. Corp. Vogtle Proj.) Series 2013 A, 2.4%, tender 4/1/20 (a) | | 12,500 | 12,539 |
| 2.2%, tender 4/2/19 (a) | | 9,700 | 9,740 |
| Fulton County Wtr. & Swr. Rev. Series 2011: | | | |
| 5% 1/1/19 | | 4,000 | 4,286 |
| 5% 1/1/20 | | 4,000 | 4,394 |
| Georgia Muni. Elec. Auth. Pwr. Rev.: | | | |
| (Combined Cycle Proj.) Series A, 5% 11/1/18 | | 2,000 | 2,134 |
| (Prerefunded Proj.) Series 2008 D: | | | |
| 5.75% 1/1/19 (Pre-Refunded to 7/1/18 @ 100) | | 11,020 | 11,766 |
| 5.75% 1/1/20 (Pre-Refunded to 7/1/18 @ 100) | | 2,630 | 2,808 |
| (Proj. One) Series 2008 A, 5.25% 1/1/17 (Berkshire Hathaway Assurance Corp. Insured) | | 7,925 | 7,925 |
| (Unrefunded Balance Proj.) Series 2008: | | | |
| 5.75% 1/1/19 | | 3,870 | 4,120 |
| 5.75% 1/1/20 | | 925 | 985 |
| Series B, 5% 1/1/17 | | 2,750 | 2,750 |
| Series GG: | | | |
| 5% 1/1/20 | | 675 | 739 |
| 5% 1/1/21 | | 1,670 | 1,873 |
| Georgia Muni. Gas Auth. Rev. (Gas Portfolio III Proj.): | | | |
| Series 2014 U: | | | |
| 5% 10/1/19 | | 1,500 | 1,634 |
| 5% 10/1/22 | | 1,000 | 1,150 |
| 5% 10/1/23 | | 2,420 | 2,821 |
| Series R, 5% 10/1/21 | | 5,000 | 5,660 |
| Monroe County Dev. Auth. Poll. Cont. Rev. Bonds (Georgia Pwr. Co. Plant Scherer Proj.) Series 2009, 2.35%, tender 12/11/20 (a) | | 4,715 | 4,710 |
| Private Colleges & Univs. Auth. Rev. (The Savannah College of Arts and Design Projs.) Series 2014, 5% 4/1/21 | | 3,335 | 3,630 |
| Richmond County Hosp. Auth. (Univ. Health Svcs., Inc. Proj.) Series 2009, 5% 1/1/18 (Escrowed to Maturity) | | 1,530 | 1,589 |
|
| TOTAL GEORGIA | | | 94,015 |
|
| Hawaii - 0.5% | | | |
| Hawaii Arpts. Sys. Rev. Series 2011, 5% 7/1/19 (b) | | 4,000 | 4,309 |
| State of Hawaii Dept. of Trans. Series 2013: | | | |
| 5% 8/1/17 (b) | | 2,300 | 2,350 |
| 5% 8/1/19 (b) | | 1,400 | 1,507 |
| 5% 8/1/20 (b) | | 3,050 | 3,352 |
| 5% 8/1/21 (b) | | 550 | 611 |
| 5% 8/1/22 (b) | | 2,075 | 2,334 |
| 5% 8/1/23 (b) | | 1,435 | 1,634 |
|
| TOTAL HAWAII | | | 16,097 |
|
| Illinois - 10.2% | | | |
| Chicago Board of Ed.: | | | |
| Series 1998 B1, 0% 12/1/21 (Nat'l. Pub. Fin. Guarantee Corp. Insured) | | 10,000 | 8,085 |
| Series 2008 C: | | | |
| 5.25% 12/1/23 | | 7,665 | 6,494 |
| 5.25% 12/1/24 | | 955 | 794 |
| Series 2009 D: | | | |
| 5% 12/1/17 (Assured Guaranty Corp. Insured) | | 4,115 | 4,212 |
| 5% 12/1/18 (Assured Guaranty Corp. Insured) | | 2,335 | 2,426 |
| Series 2010 F, 5% 12/1/20 | | 760 | 676 |
| Chicago Gen. Oblig.: | | | |
| (City Colleges Proj.) Series 1999: | | | |
| 0% 1/1/17 (Nat'l. Pub. Fin. Guarantee Corp. Insured) | | 7,200 | 7,200 |
| 0% 1/1/18 (Nat'l. Pub. Fin. Guarantee Corp. Insured) | | 3,000 | 2,918 |
| 0% 1/1/19 (Nat'l. Pub. Fin. Guarantee Corp. Insured) | | 9,805 | 9,214 |
| 0% 1/1/20 (Nat'l. Pub. Fin. Guarantee Corp. Insured) | | 14,755 | 13,301 |
| 4.5% 1/1/20 | | 1,150 | 1,148 |
| 5% 1/1/23 | | 2,920 | 2,921 |
| Chicago Metropolitan Wtr. Reclamation District of Greater Chicago: | | | |
| Series 2014 C, 5% 12/1/17 | | 3,975 | 4,108 |
| Series 2014 D, 5% 12/1/17 | | 3,425 | 3,540 |
| Chicago Midway Arpt. Rev.: | | | |
| Series 2014 B: | | | |
| 5% 1/1/20 | | 625 | 681 |
| 5% 1/1/21 | | 400 | 443 |
| 5% 1/1/23 | | 2,500 | 2,841 |
| 5% 1/1/22 | | 5,000 | 5,623 |
| 5% 1/1/23 | | 5,900 | 6,705 |
| Chicago Motor Fuel Tax Rev. Series 2013: | | | |
| 5% 1/1/19 | | 250 | 257 |
| 5% 1/1/20 | | 300 | 311 |
| 5% 1/1/21 | | 400 | 418 |
| 5% 1/1/22 | | 300 | 313 |
| 5% 1/1/23 | | 535 | 556 |
| Chicago O'Hare Int'l. Arpt. Rev.: | | | |
| Series 2010 D, 5.25% 1/1/17 (b) | | 1,000 | 1,000 |
| Series 2011 B, 5% 1/1/18 | | 6,500 | 6,738 |
| Series 2012 A, 5% 1/1/21 | | 1,400 | 1,549 |
| Series 2012 B: | | | |
| 4% 1/1/17 (b) | | 4,100 | 4,100 |
| 5% 1/1/21 (b) | | 4,605 | 5,008 |
| Series 2013 B, 5% 1/1/22 | | 4,000 | 4,482 |
| Series 2013 D, 5% 1/1/22 | | 3,220 | 3,608 |
| Chicago Park District Gen. Oblig. Series 2014 D, 4% 1/1/17 | | 1,050 | 1,050 |
| Chicago Wastewtr. Transmission Rev. Series 2012: | | | |
| 5% 1/1/19 | | 1,310 | 1,376 |
| 5% 1/1/23 | | 1,200 | 1,311 |
| Cook County Gen. Oblig.: | | | |
| Series 2009 C, 5% 11/15/21 | | 8,575 | 9,148 |
| Series 2010 A, 5.25% 11/15/22 | | 4,960 | 5,409 |
| Series 2011 A, 5.25% 11/15/22 | | 1,000 | 1,103 |
| Series 2012 C: | | | |
| 5% 11/15/19 | | 3,200 | 3,440 |
| 5% 11/15/20 | | 7,210 | 7,817 |
| 5% 11/15/21 | | 4,985 | 5,449 |
| 5% 11/15/22 | | 1,290 | 1,423 |
| Series 2014 A: | | | |
| 5% 11/15/20 | | 1,000 | 1,084 |
| 5% 11/15/21 | | 500 | 547 |
| 5% 11/15/22 | | 1,000 | 1,103 |
| Illinois Edl. Facilities Auth. Rev. Bonds: | | | |
| (Univ. of Chicago Proj.) Series B2, 1.55%, tender 2/13/20 (a) | | 10,000 | 9,859 |
| Series 2001 B3, 0.5%, tender 3/7/17 (a) | | 6,000 | 5,992 |
| Illinois Fin. Auth. Rev.: | | | |
| (Palos Cmnty. Hosp. Proj.) Series 2010 C, 5% 5/15/17 | | 3,520 | 3,568 |
| (Provena Health Proj.) Series 2010 A, 5.75% 5/1/19 (Escrowed to Maturity) | | 2,650 | 2,908 |
| Bonds Series E, 2.25%, tender 4/29/22 (a) | | 22,930 | 22,511 |
| Series 2008 D, 6.25% 11/1/28 (Pre-Refunded to 11/1/18 @ 100) | | 2,065 | 2,250 |
| Series 2012 A, 5% 5/15/23 | | 1,300 | 1,454 |
| Series 2012: | | | |
| 5% 9/1/18 | | 1,160 | 1,212 |
| 5% 9/1/19 | | 1,115 | 1,186 |
| 5% 9/1/20 | | 1,470 | 1,598 |
| 5% 9/1/21 | | 2,045 | 2,256 |
| 5% 9/1/22 | | 3,530 | 3,916 |
| Series 2015 A: | | | |
| 5% 11/15/24 | | 1,525 | 1,772 |
| 5% 11/15/25 | | 1,950 | 2,276 |
| 5% 11/15/26 | | 2,000 | 2,263 |
| Series 2016 A: | | | |
| 5% 8/15/20 | | 500 | 538 |
| 5% 2/15/21 | | 750 | 827 |
| 5% 8/15/21 | | 700 | 760 |
| 5% 2/15/23 | | 1,000 | 1,131 |
| 5% 8/15/23 | | 1,500 | 1,647 |
| 5% 8/15/24 | | 2,185 | 2,402 |
| Series 2016 C: | | | |
| 5% 2/15/20 | | 5,080 | 5,369 |
| 5% 2/15/22 | | 1,885 | 2,021 |
| 5% 2/15/23 | | 4,500 | 4,845 |
| 5% 2/15/24 | | 5,000 | 5,377 |
| Series 2016: | | | |
| 5% 5/15/25 | | 500 | 581 |
| 5% 5/15/26 | | 1,000 | 1,170 |
| 5% 5/15/27 | | 1,250 | 1,404 |
| 5% 11/15/20 | | 1,650 | 1,838 |
| 5% 11/15/22 | | 500 | 576 |
| 5% 11/15/24 | | 1,955 | 2,299 |
| Illinois Gen. Oblig.: | | | |
| Series 2005, 5% 4/1/17 (AMBAC Insured) | | 8,050 | 8,068 |
| Series 2006, 5% 1/1/17 | | 700 | 700 |
| Series 2010, 5% 1/1/21 (FSA Insured) | | 1,600 | 1,695 |
| Series 2012: | | | |
| 5% 3/1/19 | | 5,500 | 5,678 |
| 5% 8/1/19 | | 2,660 | 2,755 |
| 5% 8/1/20 | | 6,900 | 7,162 |
| 5% 8/1/21 | | 2,415 | 2,508 |
| 5% 8/1/22 | | 5,800 | 5,999 |
| Series 2013: | | | |
| 5% 7/1/21 | | 6,500 | 6,751 |
| 5% 7/1/22 | | 9,920 | 10,261 |
| Series 2014: | | | |
| 5% 4/1/18 | | 10,000 | 10,297 |
| 5% 2/1/22 | | 3,000 | 3,104 |
| 5% 2/1/25 | | 2,200 | 2,249 |
| Series 2016, 5% 2/1/26 | | 10,000 | 10,123 |
| Illinois Health Facilities Auth. Rev. Series 2003 A, 5% 5/15/17 (FSA Insured) | | 2,150 | 2,181 |
| Illinois Sales Tax Rev. Series 2009 B, 4.5% 6/15/17 | | 6,075 | 6,161 |
| McHenry County Cmnty. School District #200 Series 2006 B: | | | |
| 0% 1/15/24 | | 4,820 | 3,902 |
| 0% 1/15/25 | | 5,025 | 3,910 |
| 0% 1/15/26 | | 3,775 | 2,824 |
| McHenry County Conservation District Gen. Oblig.: | | | |
| Series 2014: | | | |
| 5% 2/1/19 | | 2,285 | 2,447 |
| 5% 2/1/20 | | 2,275 | 2,496 |
| Series 2014. 5% 2/1/23 | | 2,225 | 2,568 |
|
| TOTAL ILLINOIS | | | 353,575 |
|
| Indiana - 2.5% | | | |
| Indiana Fin. Auth. Hosp. Rev. Series 2013: | | | |
| 5% 8/15/22 | | 700 | 803 |
| 5% 8/15/23 | | 1,000 | 1,159 |
| Indiana Fin. Auth. Rev.: | | | |
| Series 2010 A, 5% 2/1/17 | | 2,800 | 2,809 |
| Series 2012: | | | |
| 5% 3/1/20 | | 650 | 699 |
| 5% 3/1/21 | | 1,225 | 1,339 |
| Indiana Fin. Auth. Wastewtr. Util. Rev. (CWA Auth. Proj.): | | | |
| Series 2012 A: | | | |
| 5% 10/1/20 | | 825 | 911 |
| 5% 10/1/22 | | 1,600 | 1,822 |
| Series 2014 A: | | | |
| 5% 10/1/20 | | 375 | 415 |
| 5% 10/1/21 | | 380 | 427 |
| 5% 10/1/22 | | 675 | 769 |
| Series 2015 A: | | | |
| 5% 10/1/24 | | 1,495 | 1,743 |
| 5% 10/1/25 | | 1,625 | 1,941 |
| Indiana Health Facility Fing. Auth. Rev. Bonds Series 2001: | | | |
| 1.6%, tender 2/1/17 (a) | | 50 | 50 |
| 1.6%, tender 2/1/17 (a) | | 9,850 | 9,857 |
| Indiana Muni. Pwr. Agcy. Pwr. Supply Sys. Rev. Series 2011 A: | | | |
| 5% 1/1/19 | | 1,470 | 1,575 |
| 5% 1/1/20 | | 1,250 | 1,369 |
| Indianapolis Local Pub. Impt. Series 2016: | | | |
| 5% 1/1/21 (b) | | 2,750 | 3,051 |
| 5% 1/1/23 (b) | | 1,830 | 2,088 |
| 5% 1/1/24 (b) | | 2,775 | 3,192 |
| 5% 1/1/25 (b) | | 2,910 | 3,374 |
| Indianapolis Thermal Energy Sys. Series 2010 B, 5% 10/1/17 | | 5,000 | 5,140 |
| Lake Central Multi-District School Bldg. Corp. Series 2012 B: | | | |
| 4% 1/15/19 | | 1,000 | 1,050 |
| 4% 1/15/20 | | 1,345 | 1,433 |
| 4% 1/15/21 | | 1,250 | 1,350 |
| 5% 7/15/19 | | 1,680 | 1,818 |
| 5% 7/15/20 | | 1,170 | 1,294 |
| 5% 7/15/21 | | 1,000 | 1,128 |
| Purdue Univ. Rev.: | | | |
| (Student Facilities Sys. Proj.) Series 2009 B, 4% 7/1/17 (Escrowed to Maturity) | | 500 | 508 |
| Series Z-1: | | | |
| 5% 7/1/17 | | 1,000 | 1,020 |
| 5% 7/1/18 | | 1,500 | 1,583 |
| Rockport Poll. Cont. Rev. Bonds (Indiana Michigan Pwr. Co. Proj. Series 2009 B, 1.75%, tender 6/1/18 (a) | | 8,500 | 8,474 |
| Whiting Envir. Facilities Rev. Bonds (BP Products North America, Inc. Proj.) Series 2015, 5%, tender 11/1/22 (a)(b) | | 20,745 | 23,169 |
|
| TOTAL INDIANA | | | 87,360 |
|
| Kansas - 0.3% | | | |
| Johnson County Unified School District # 233 Series 2016 B, 5% 9/1/23 | | 1,460 | 1,708 |
| Wichita Hosp. Facilities Rev. Series 2011 IV A: | | | |
| 5% 11/15/18 (Escrowed to Maturity) | | 2,250 | 2,400 |
| 5% 11/15/20 (Escrowed to Maturity) | | 2,745 | 3,069 |
| Wyandotte County/Kansas City Unified Govt. Util. Sys. Rev. Series 2016 A: | | | |
| 5% 9/1/22 | | 500 | 572 |
| 5% 9/1/23 | | 725 | 835 |
| 5% 9/1/25 | | 800 | 938 |
|
| TOTAL KANSAS | | | 9,522 |
|
| Kentucky - 1.2% | | | |
| Ashland Med. Ctr. Rev. (Ashland Hosp. Corp. D/B/A Kings Daughters Med. Ctr. Proj.) Series 2016 A: | | | |
| 5% 2/1/22 | | 1,120 | 1,218 |
| 5% 2/1/24 | | 1,360 | 1,499 |
| 5% 2/1/25 | | 1,000 | 1,108 |
| 5% 2/1/27 | | 1,230 | 1,346 |
| Kentucky Econ. Dev. Fin. Auth. Bonds Series 2009 B, 2.7%, tender 11/10/21 (a) | | 9,000 | 9,008 |
| Kentucky Econ. Dev. Fin. Auth. Hosp. Rev. Series 2015 A: | | | |
| 5% 6/1/20 | | 1,410 | 1,514 |
| 5% 6/1/22 | | 1,560 | 1,702 |
| 5% 6/1/24 | | 1,690 | 1,870 |
| Kentucky State Property & Buildings Commission Rev.: | | | |
| (#82 Proj.) 5.25% 10/1/17 (FSA Insured) | | 2,450 | 2,525 |
| Series 2016, 3% 11/1/17 | | 1,630 | 1,655 |
| Louisville/Jefferson County Metropolitan Govt. Poll. Cont. Rev. Bonds (Louisville Gas and Elec. Co. Proj.): | | | |
| Series 2003 A, 1.65%, tender 4/3/17 (a) | | 6,000 | 6,004 |
| Series 2007 B: | | | |
| 1.15%, tender 6/1/17 (a) | | 2,600 | 2,598 |
| 1.6%, tender 6/1/17 (a) | | 8,050 | 8,057 |
|
| TOTAL KENTUCKY | | | 40,104 |
|
| Louisiana - 2.7% | | | |
| Louisiana Citizens Property Ins. Corp. Assessment Rev. Series 2015: | | | |
| 5% 6/1/19 | | 9,350 | 10,060 |
| 5% 6/1/21 (FSA Insured) | | 5,000 | 5,614 |
| Louisiana Gas & Fuel Tax Rev. Bonds Series 2013 B, 0.902%, tender 1/3/17 (a) | | 25,000 | 24,965 |
| Louisiana Gen. Oblig.: | | | |
| Series 2012 A, 5% 8/1/22 | | 1,515 | 1,737 |
| Series 2014 D1, 5% 12/1/22 | | 1,305 | 1,505 |
| Series 2015, 5% 5/1/18 | | 1,075 | 1,127 |
| Series 2016 B: | | | |
| 5% 8/1/22 | | 14,095 | 16,162 |
| 5% 8/1/23 | | 6,250 | 7,270 |
| Series 2016 D: | | | |
| 5% 9/1/22 | | 6,360 | 7,302 |
| 5% 9/1/24 | | 7,030 | 8,280 |
| Louisiana Stadium and Exposition District Series 2013 A: | | | |
| 5% 7/1/21 | | 1,500 | 1,685 |
| 5% 7/1/22 | | 1,000 | 1,138 |
| New Orleans Gen. Oblig. Series 2012, 5% 12/1/20 | | 2,800 | 3,110 |
| Tobacco Settlement Fing. Corp. Series 2013 A, 5% 5/15/23 | | 4,500 | 5,065 |
|
| TOTAL LOUISIANA | | | 95,020 |
|
| Maine - 0.2% | | | |
| Maine Tpk. Auth. Tpk. Rev. Series 2015: | | | |
| 5% 7/1/21 | | 2,400 | 2,705 |
| 5% 7/1/22 | | 1,850 | 2,119 |
| 5% 7/1/24 | | 2,350 | 2,759 |
|
| TOTAL MAINE | | | 7,583 |
|
| Maryland - 1.6% | | | |
| Maryland Gen. Oblig. Series 2008 2, 5% 7/15/22 (Pre-Refunded to 7/15/18 @ 100) | | 5,500 | 5,820 |
| Maryland Health & Higher Edl. Facilities Auth. Rev.: | | | |
| Bonds: | | | |
| Series 2012 D, 1.243%, tender 1/3/17 (a) | | 13,940 | 13,960 |
| Series 2013 A: | | | |
| 0.993%, tender 5/15/18 (a) | | 4,515 | 4,516 |
| 1.013%, tender 5/15/18 (a) | | 7,100 | 7,103 |
| Series 2015: | | | |
| 5% 7/1/19 | | 400 | 427 |
| 5% 7/1/22 | | 900 | 1,000 |
| 5% 7/1/23 | | 1,000 | 1,120 |
| 5% 7/1/24 | | 2,000 | 2,248 |
| 5% 7/1/25 | | 1,770 | 1,998 |
| Montgomery County Gen. Oblig. Series 2011 A, 5% 7/1/20 | | 16,000 | 17,367 |
|
| TOTAL MARYLAND | | | 55,559 |
|
| Massachusetts - 2.0% | | | |
| Massachusetts Bay Trans. Auth. Sales Tax Rev. Series 2006 B, 5.25% 7/1/18 | | 2,300 | 2,440 |
| Massachusetts Dev. Fin. Agcy. Rev.: | | | |
| (Boston College Proj.) Series Q2, 5% 7/1/17 | | 1,370 | 1,397 |
| Series 2016 I: | | | |
| 5% 7/1/21 | | 500 | 556 |
| 5% 7/1/22 | | 600 | 671 |
| 5% 7/1/23 | | 675 | 765 |
| 5% 7/1/24 | | 550 | 630 |
| 5% 7/1/25 | | 500 | 578 |
| 5% 7/1/26 | | 1,000 | 1,162 |
| Massachusetts Edl. Fing. Auth. Rev. Series 2013, 5% 7/1/19 (b) | | 4,725 | 5,001 |
| Massachusetts Gen. Oblig.: | | | |
| Bonds Series 2014 D1, 1.05%, tender 7/1/20 (a) | | 32,000 | 31,554 |
| Series 2004 B, 5.25% 8/1/20 | | 12,700 | 14,237 |
| Series 2007 C, 5% 8/1/19 (Pre-Refunded to 8/1/17 @ 100) | | 2,000 | 2,046 |
| Massachusetts Health & Edl. Facilities Auth. Rev. Bonds Series 2007 G6, 1.6%, tender 1/5/17 (a) | | 2,900 | 2,909 |
| Medford Gen. Oblig. Series 2011 B, 4% 3/1/19 | | 3,570 | 3,761 |
|
| TOTAL MASSACHUSETTS | | | 67,707 |
|
| Michigan - 3.3% | | | |
| Detroit Swr. Disp. Rev. Series 2006 D, 1.167% 7/1/32 (a) | | 4,070 | 3,553 |
| Grand Blanc Cmnty. Schools Series 2013: | | | |
| 5% 5/1/19 | | 1,225 | 1,318 |
| 5% 5/1/20 | | 2,635 | 2,894 |
| 5% 5/1/21 | | 2,150 | 2,405 |
| 5% 5/1/22 | | 1,850 | 2,096 |
| Grand Rapids Pub. Schools Series 2016: | | | |
| 4% 5/1/17 (FSA Insured) | | 500 | 505 |
| 4% 5/1/18 (FSA Insured) | | 1,950 | 2,015 |
| Kalamazoo Hosp. Fin. Auth. Hosp. Facilities Rev. Series 2016: | | | |
| 5% 5/15/22 | | 1,000 | 1,135 |
| 5% 5/15/24 | | 550 | 637 |
| 5% 5/15/25 | | 650 | 759 |
| 5% 5/15/26 | | 625 | 732 |
| Kent Hosp. Fin. Auth. Hosp. Facilities Rev. (Spectrum Health Sys. Proj.) Series 2011 A: | | | |
| 5% 11/15/18 | | 1,250 | 1,334 |
| 5% 11/15/19 | | 1,000 | 1,087 |
| Michigan Bldg. Auth. Rev. (Facilities Prog.) Series 2016 I: | | | |
| 5% 4/15/22 | | 1,000 | 1,138 |
| 5% 4/15/23 | | 1,350 | 1,550 |
| 5% 4/15/24 | | 1,480 | 1,716 |
| Michigan Fin. Auth. Rev.: | | | |
| Bonds 1.1%, tender 8/15/19 (a) | | 4,250 | 4,174 |
| Series 2012 A: | | | |
| 5% 6/1/17 (Escrowed to Maturity) | | 1,410 | 1,433 |
| 5% 6/1/18 (Escrowed to Maturity) | | 2,430 | 2,557 |
| Series 2015 A: | | | |
| 5% 8/1/22 | | 2,400 | 2,696 |
| 5% 8/1/23 | | 3,800 | 4,313 |
| Michigan Gen. Oblig. Series 2016: | | | |
| 5% 3/15/20 | | 3,330 | 3,658 |
| 5% 3/15/21 | | 1,000 | 1,119 |
| 5% 3/15/22 | | 2,330 | 2,640 |
| 5% 3/15/23 | | 4,000 | 4,585 |
| Michigan Hosp. Fin. Auth. Rev.: | | | |
| (McLaren Health Care Corp. Proj.) Series 2008 A, 5.75% 5/15/38 (Pre-Refunded to 5/15/18 @ 100) | | 1,190 | 1,264 |
| Bonds: | | | |
| Series 1999: | | | |
| 0.95%, tender 2/1/18 (a) | | 130 | 130 |
| 0.95%, tender 2/1/18 (a) | | 3,865 | 3,854 |
| Series 2005 A4, 1.625%, tender 11/1/19 (a) | | 8,025 | 7,960 |
| Series 2010 F3, 1.4%, tender 6/29/18 (a) | | 1,900 | 1,904 |
| Series 2010 F4, 1.95%, tender 4/1/20 (a) | | 6,545 | 6,533 |
| Michigan Strategic Fund Ltd. Oblig. Rev. Bonds Series CC, 1.45%, tender 9/1/21 (a) | | 7,195 | 6,961 |
| Portage Pub. Schools Series 2016: | | | |
| 5% 5/1/23 | | 2,035 | 2,332 |
| 5% 11/1/23 | | 1,365 | 1,571 |
| 5% 5/1/24 | | 1,920 | 2,223 |
| 5% 11/1/24 | | 2,000 | 2,327 |
| 5% 5/1/25 | | 1,125 | 1,314 |
| 5% 11/1/25 | | 1,220 | 1,430 |
| 5% 5/1/26 | | 1,700 | 1,997 |
| 5% 11/1/26 | | 1,180 | 1,382 |
| 5% 11/1/28 | | 1,005 | 1,166 |
| Royal Oak Hosp. Fin. Auth. Hosp. Rev. Series 2014 D: | | | |
| 5% 9/1/21 | | 1,500 | 1,665 |
| 5% 9/1/23 | | 500 | 568 |
| Spring Lake Pub. Schools: | | | |
| Series 2014, 5% 5/1/19 | | 2,300 | 2,475 |
| 5% 11/1/19 | | 2,775 | 3,021 |
| 5% 5/1/20 | | 3,630 | 3,987 |
| 5% 11/1/20 | | 1,745 | 1,935 |
| 5% 5/1/21 | | 4,110 | 4,591 |
|
| TOTAL MICHIGAN | | | 114,639 |
|
| Minnesota - 0.4% | | | |
| Minneapolis & Saint Paul Metropolitan Arpts. Commission Arpt. Rev.: | | | |
| Series 2014 A: | | | |
| 5% 1/1/22 | | 1,000 | 1,138 |
| 5% 1/1/23 | | 1,000 | 1,156 |
| Series 2014 B: | | | |
| 5% 1/1/21 (b) | | 2,290 | 2,512 |
| 5% 1/1/22 (b) | | 2,000 | 2,213 |
| 5% 1/1/23 (b) | | 1,000 | 1,116 |
| Western Minnesota Muni. Pwr. Agcy. Pwr. Supply Rev. Series 2014 A: | | | |
| 5% 1/1/22 | | 1,000 | 1,141 |
| 5% 1/1/23 | | 1,500 | 1,742 |
| 5% 1/1/24 | | 1,000 | 1,176 |
|
| TOTAL MINNESOTA | | | 12,194 |
|
| Mississippi - 0.1% | | | |
| Mississippi Gen. Oblig. (Cap. Impts. Proj.) Series 2012 D, 1.25% 9/1/17 (a) | | 2,860 | 2,862 |
| Missouri - 0.0% | | | |
| Saint Louis Arpt. Rev. Series 2013, 5% 7/1/18 | | 765 | 805 |
| Nebraska - 0.0% | | | |
| Nebraska Pub. Pwr. District Rev. Series 2012 C, 5% 1/1/22 (Pre-Refunded to 1/1/18 @ 100) | | 1,100 | 1,143 |
| Nevada - 1.2% | | | |
| Humboldt County Nev Poll. Cont. Rev. Bonds (Seirra Pacific Pwr. Co. Projs.) Series 2016 A, 1.25%, tender 6/3/19 (a) | | 2,000 | 1,962 |
| Las Vegas Valley Wtr. District Wtr. Impt. Gen. Oblig.: | | | |
| Series 2016 B, 3% 6/1/18 | | 1,020 | 1,046 |
| Series 2016, 3% 6/1/17 | | 2,195 | 2,214 |
| Nevada Gen. Oblig.: | | | |
| Series 2010 C, 5% 6/1/19 | | 12,140 | 13,134 |
| Series 2012 B, 5% 8/1/20 | | 2,230 | 2,480 |
| Series 2013 D1: | | | |
| 5% 3/1/23 | | 4,500 | 5,236 |
| 5% 3/1/24 | | 2,700 | 3,133 |
| Washoe County Gas & Wtr. Facilities Bonds (Seirra Pacific Pwr. Co. Projs.) Series 2016 B, 3%, tender 6/1/22 (a) | | 5,300 | 5,422 |
| Washoe County Gas Facilities Rev. Bonds (Seirra Pacific Pwr. Co. Projs.) Series 2016 A, 1.5%, tender 6/3/19 (a)(b) | | 6,125 | 6,011 |
|
| TOTAL NEVADA | | | 40,638 |
|
| New Hampshire - 0.4% | | | |
| New Hampshire Health & Ed. Facilities Auth. Rev.: | | | |
| Series 2012: | | | |
| 4% 7/1/20 | | 2,705 | 2,837 |
| 4% 7/1/21 | | 1,520 | 1,603 |
| Series 2016: | | | |
| 5% 10/1/21 | | 1,250 | 1,368 |
| 5% 10/1/23 | | 1,675 | 1,850 |
| New Hampshire Tpk. Sys. Rev. Series 2012 B: | | | |
| 5% 2/1/17 | | 3,000 | 3,009 |
| 5% 2/1/18 | | 2,500 | 2,603 |
|
| TOTAL NEW HAMPSHIRE | | | 13,270 |
|
| New Jersey - 5.9% | | | |
| Camden County Impt. Auth. Health Care Redev. Rev. Series 2014 A: | | | |
| 5% 2/15/20 | | 3,000 | 3,243 |
| 5% 2/15/21 | | 2,500 | 2,746 |
| 5% 2/15/22 | | 2,500 | 2,774 |
| 5% 2/15/23 | | 2,750 | 3,078 |
| New Jersey Econ. Dev. Auth. Rev.: | | | |
| Series 2005 K, 5.5% 12/15/19 | | 8,030 | 8,601 |
| Series 2011 EE: | | | |
| 5% 9/1/20 | | 1,350 | 1,432 |
| 5% 9/1/20 (Escrowed to Maturity) | | 3,650 | 4,070 |
| Series 2012 II: | | | |
| 5% 3/1/21 | | 6,800 | 7,210 |
| 5% 3/1/22 | | 6,290 | 6,634 |
| Series 2013 NN, 5% 3/1/19 (Escrowed to Maturity) | | 8,165 | 8,783 |
| Series 2013, 5% 3/1/23 | | 6,000 | 6,284 |
| Series 2014 PP, 5% 6/15/19 | | 17,000 | 17,816 |
| New Jersey Edl. Facility: | | | |
| Series 2014: | | | |
| 5% 6/15/20 | | 11,000 | 11,652 |
| 5% 6/15/21 | | 11,000 | 11,664 |
| Series 2016 A: | | | |
| 4% 7/1/18 | | 3,585 | 3,698 |
| 5% 7/1/21 | | 2,200 | 2,405 |
| 5% 7/1/22 | | 6,300 | 6,943 |
| 5% 7/1/23 | | 3,390 | 3,772 |
| 5% 7/1/24 | | 7,915 | 8,835 |
| New Jersey Gen. Oblig. Series O, 5% 8/1/17 | | 6,940 | 7,091 |
| New Jersey Health Care Facilities Fing. Auth. Rev. Series 2016 A: | | | |
| 5% 7/1/19 (c) | | 1,500 | 1,577 |
| 5% 7/1/24 | | 1,225 | 1,410 |
| 5% 7/1/24 | | 1,005 | 1,130 |
| New Jersey Higher Ed. Student Assistance Auth. Student Ln. Rev. Series 2013: | | | |
| 5% 12/1/18 (b) | | 6,000 | 6,309 |
| 5% 12/1/19 (b) | | 3,850 | 4,104 |
| New Jersey Tpk. Auth. Tpk. Rev.: | | | |
| Series 2013 A, 5% 1/1/24 | | 4,345 | 4,930 |
| Series 2013 C, 1.2% 1/1/17 (a) | | 16,000 | 16,000 |
| New Jersey Trans. Trust Fund Auth.: | | | |
| Series 2003 B, 5.25% 12/15/19 | | 3,870 | 4,111 |
| Series 2012 AA, 5% 6/15/19 | | 1,500 | 1,573 |
| Series 2013 A: | | | |
| 5% 12/15/19 | | 6,455 | 6,812 |
| 5% 6/15/20 | | 18,000 | 18,988 |
| Series 2016 A, 5% 6/15/27 | | 4,050 | 4,386 |
| New Jersey Transit Corp. Ctfs. of Prtn. Series 2014 A, 5% 9/15/21 | | 4,900 | 5,313 |
|
| TOTAL NEW JERSEY | | | 205,374 |
|
| New Mexico - 0.6% | | | |
| Farmington Poll. Cont. Rev. Bonds (Southern California Edison Co. Four Corners Proj.): | | | |
| Series 2005 B, 1.875%, tender 4/1/20 (a) | | 11,000 | 10,902 |
| Series 2011, 1.875%, tender 4/1/20 (a) | | 6,290 | 6,234 |
| Rio Rancho Wtr. & Wastewtr. Sys. Rev. Series 2009, 5% 5/15/17 (FSA Insured) | | 4,480 | 4,544 |
|
| TOTAL NEW MEXICO | | | 21,680 |
|
| New York - 9.2% | | | |
| Dorm. Auth. New York Univ. Rev. Series 2016 A: | | | |
| 5% 7/1/22 | | 500 | 566 |
| 5% 7/1/24 | | 1,850 | 2,131 |
| Dutchess County Local Dev. Corp. Rev. (Health Quest Systems, Inc. Proj.) Series 2010 A: | | | |
| 5% 7/1/18 (Assured Guaranty Corp. Insured) (FSA Insured) | | 1,100 | 1,157 |
| 5% 7/1/19 (Assured Guaranty Corp. Insured) (FSA Insured) | | 640 | 690 |
| Long Island Pwr. Auth. Elec. Sys. Rev. Series 2016 B: | | | |
| 5% 9/1/25 | | 2,800 | 3,289 |
| 5% 9/1/26 | | 1,245 | 1,471 |
| Metropolitan Trans. Auth. Svc. Contract Rev. Series 2002 A, 5.5% 7/1/17 | | 5,000 | 5,112 |
| New York City Gen. Oblig.: | | | |
| Series 2008 C, 5.25% 8/1/17 | | 2,280 | 2,337 |
| Series 2010 F, 5% 8/1/17 | | 8,365 | 8,561 |
| Series 2011 B, 5% 8/1/17 | | 1,000 | 1,023 |
| Series 2012 C, 4% 8/1/17 | | 2,740 | 2,789 |
| Series 2015 C, 5% 8/1/25 | | 1,700 | 2,008 |
| Series 2015 F1, 3% 6/1/17 | | 14,370 | 14,495 |
| New York City Transitional Fin. Auth. Bldg. Aid Rev. Series 2015 S2, 3% 7/15/17 | | 9,565 | 9,669 |
| New York City Transitional Fin. Auth. Rev.: | | | |
| Series 2003 B, 5% 2/1/20 | | 3,000 | 3,305 |
| Series 2010 B: | | | |
| 5% 11/1/17 | | 11,740 | 12,125 |
| 5% 11/1/17 (Escrowed to Maturity) | | 18,260 | 18,866 |
| 5% 11/1/20 | | 5,950 | 6,497 |
| Series 2010 D: | | | |
| 5% 11/1/17 | | 8,015 | 8,278 |
| 5% 11/1/17 (Escrowed to Maturity) | | 2,100 | 2,168 |
| Series 2012 A: | | | |
| 5% 11/1/17 | | 6,180 | 6,383 |
| 5% 11/1/17 (Escrowed to Maturity) | | 820 | 847 |
| 5% 11/1/20 | | 4,500 | 5,040 |
| New York Dorm. Auth. Mental Health Svcs. Facilities Impt. Rev.: | | | |
| (State Univ. Proj.) Series 2012 A, 5% 5/15/20 | | 4,000 | 4,427 |
| Series 2012 A, 4% 5/15/20 | | 8,000 | 8,593 |
| New York Dorm. Auth. Personal Income Tax Rev. Series 2012 A, 5% 12/15/20 | | 8,500 | 9,555 |
| New York Dorm. Auth. Revs. Series 2008 D, 5.25% 8/15/17 (FSA Insured) | | 7,000 | 7,182 |
| New York Dorm. Auth. Sales Tax Rev. Series 2015 A, 5% 3/15/17 | | 90,000 | 90,725 |
| New York Metropolitan Trans. Auth. Rev.: | | | |
| Series 2003 B, 5.25% 11/15/19 (Nat'l. Pub. Fin. Guarantee Corp. Insured) | | 5,200 | 5,716 |
| Series 2008 B2: | | | |
| 5% 11/15/19 | | 6,185 | 6,756 |
| 5% 11/15/20 | | 5,500 | 6,130 |
| 5% 11/15/21 | | 4,000 | 4,531 |
| Series 2012 B, 5% 11/15/22 | | 2,000 | 2,298 |
| Series 2012 D, 5% 11/15/18 | | 2,515 | 2,684 |
| Series 2012 E: | | | |
| 4% 11/15/19 | | 4,000 | 4,258 |
| 5% 11/15/21 | | 2,435 | 2,758 |
| Series 2012 F, 5% 11/15/19 | | 5,000 | 5,462 |
| New York Thruway Auth. Gen. Rev. Series 2013 A, 5% 5/1/19 | | 20,400 | 21,979 |
| New York Thruway Auth. Second Gen. Hwy. & Bridge Trust Fund: | | | |
| Series 2010 A, 5% 4/1/17 | | 1,000 | 1,010 |
| Series 2011 A1: | | | |
| 5% 4/1/17 | | 1,500 | 1,515 |
| 5% 4/1/18 | | 3,500 | 3,669 |
| New York Trans. Dev. Corp. (Term. One Group Assoc. L.P. Proj.) Series 2015, 5% 1/1/17 (b) | | 8,890 | 8,890 |
| Tobacco Settlement Fing. Corp. Series 2013 B, 5% 6/1/21 | | 65 | 65 |
| Triborough Bridge & Tunnel Auth. Revs. Series Y, 5.5% 1/1/17 (Escrowed to Maturity) | | 760 | 760 |
|
| TOTAL NEW YORK | | | 317,770 |
|
| North Carolina - 0.7% | | | |
| Dare County Ctfs. of Prtn. Series 2012 B: | | | |
| 4% 6/1/17 | | 1,000 | 1,012 |
| 4% 6/1/18 | | 1,280 | 1,330 |
| 4% 6/1/20 | | 1,000 | 1,073 |
| 5% 6/1/19 | | 1,305 | 1,411 |
| Mecklenburg County Pub. Facilities Corp. Series 2009, 5% 3/1/18 | | 1,500 | 1,568 |
| North Carolina Cap. Facilities Fin. Agcy. Rev. Bonds (Republic Svcs., Inc. Proj.) Series 2013, 1.25%, tender 3/15/17 (a)(b) | | 2,200 | 2,200 |
| North Carolina Med. Care Commission Hosp. Rev. (North Carolina Baptist Hosp. Proj.) Series 2010: | | | |
| 5% 6/1/17 | | 3,220 | 3,271 |
| 5% 6/1/18 | | 3,820 | 4,016 |
| North Carolina Muni. Pwr. Agcy. #1 Catawba Elec. Rev. Series 2015 E: | | | |
| 5% 1/1/22 | | 5,000 | 5,683 |
| 5% 1/1/23 | | 1,500 | 1,734 |
|
| TOTAL NORTH CAROLINA | | | 23,298 |
|
| Ohio - 2.7% | | | |
| Akron Bath Copley Hosp. District Rev. Series 2016, 5% 11/15/24 | | 2,000 | 2,232 |
| American Muni. Pwr., Inc. Rev. Bonds Series B, 5%, tender 8/15/20 (a) | | 35,000 | 37,930 |
| Buckeye Tobacco Settlement Fing. Auth. Series 2007 A1, 5% 6/1/17 | | 3,500 | 3,554 |
| Cincinnati City School District 5.25% 12/1/18 (Nat'l. Pub. Fin. Guarantee Corp. Insured) | | 3,555 | 3,823 |
| Cleveland Arpt. Sys. Rev.: | | | |
| 5% 1/1/20 (FSA Insured) | | 425 | 462 |
| 5% 1/1/22 (FSA Insured) | | 1,325 | 1,493 |
| 5% 1/1/24 (FSA Insured) | | 1,200 | 1,385 |
| 5% 1/1/25 (FSA Insured) | | 1,250 | 1,451 |
| 5% 1/1/26 (FSA Insured) | | 500 | 576 |
| Columbus Gen. Oblig. Series 2013 1, 5% 7/1/17 | | 2,075 | 2,117 |
| Fairfield County Hosp. Facilities Rev. (Fairfield Med. Ctr. Proj.) Series 2013: | | | |
| 5% 6/15/22 | | 2,145 | 2,356 |
| 5% 6/15/23 | | 1,855 | 2,061 |
| Franklin County Hosp. Facilities Rev. Series 2016 C, 5% 11/1/23 | | 2,860 | 3,327 |
| Hamilton County Convention Facilities Auth. Rev. Series 2014: | | | |
| 5% 12/1/19 | | 1,910 | 2,056 |
| 5% 12/1/20 | | 2,205 | 2,413 |
| 5% 12/1/21 | | 2,045 | 2,268 |
| Hamilton County Student Hsg. Rev. (Stratford Heights Proj.) Series 2010, 5% 6/1/17 (FSA Insured) | | 1,160 | 1,179 |
| Ohio Gen. Oblig.: | | | |
| (Higher Ed. Proj.) Series 2010 A, 5% 8/1/17 | | 3,290 | 3,367 |
| Series 2011 A, 5% 8/1/17 | | 3,070 | 3,142 |
| Series 2012 C, 5% 9/15/21 | | 4,350 | 4,955 |
| Ohio Higher Edl. Facility Commission Rev. (Univ. Hosp. Health Sys. Proj.) Series 2010 A, 5% 1/15/17 | | 1,000 | 1,001 |
| Scioto County Hosp. Facilities Rev. Series 2016: | | | |
| 5% 2/15/21 | | 650 | 719 |
| 5% 2/15/22 | | 1,100 | 1,235 |
| 5% 2/15/23 | | 2,120 | 2,410 |
| 5% 2/15/24 | | 1,640 | 1,887 |
| 5% 2/15/25 | | 1,710 | 1,981 |
| 5% 2/15/26 | | 1,250 | 1,457 |
|
| TOTAL OHIO | | | 92,837 |
|
| Oklahoma - 0.4% | | | |
| Oklahoma City Pub. Property Auth. Hotel Tax Rev. Series 2015, 5% 10/1/17 | | 450 | 463 |
| Oklahoma Dev. Fin. Auth. Rev.: | | | |
| (Saint John Health Sys. Proj.) Series 2012, 5% 2/15/23 | | 2,600 | 2,911 |
| Series 2004 A, 2.375% 12/1/21 | | 1,350 | 1,384 |
| Series 2012, 5% 2/15/21 | | 1,600 | 1,784 |
| Tulsa County Independent School Disctrict #9 Series 2015, 2% 4/1/17 | | 3,000 | 3,008 |
| Tulsa County Indl. Auth. Edl. Facilities Lease Rev. (Jenks Pub. Schools Proj.) Series 2009, 5.5% 9/1/18 | | 5,215 | 5,567 |
|
| TOTAL OKLAHOMA | | | 15,117 |
|
| Pennsylvania - 5.0% | | | |
| Franklin County Indl. Dev. Auth. (The Chambersburg Hosp. Proj.) Series 2010, 5% 7/1/17 | | 1,255 | 1,279 |
| Lehigh County Indl. Dev. Auth. Poll. Cont. Rev. Bonds 0.9%, tender 8/15/17 (a) | | 10,255 | 10,221 |
| Montgomery County Higher Ed. & Health Auth. Hosp. Rev. (Abington Memorial Hosp. Proj.) Series 2009 A, 5% 6/1/17 | | 2,200 | 2,235 |
| Montgomery County Higher Ed. & Health Auth. Rev. Series 2014 A: | | | |
| 4% 10/1/18 | | 1,000 | 1,032 |
| 4% 10/1/19 | | 660 | 688 |
| 5% 10/1/20 | | 1,260 | 1,368 |
| Mount Lebanon School District Series 2015, 4% 2/15/18 | | 865 | 893 |
| Pennsylvania Econ. Dev. Auth. Governmental Lease (Forum Place Proj.) Series 2012: | | | |
| 5% 3/1/18 | | 2,455 | 2,558 |
| 5% 3/1/19 | | 2,310 | 2,453 |
| 5% 3/1/20 | | 2,140 | 2,318 |
| Pennsylvania Econ. Dev. Fin. Auth. Unemployment Compensation Rev. Series 2012 B: | | | |
| 5% 1/1/22 | | 5,000 | 5,097 |
| 5% 7/1/22 | | 3,795 | 3,827 |
| Pennsylvania Econ. Dev. Fing. Auth. Solid Waste Disp. Rev. Bonds (Waste Mgmt., Inc. Proj.) Series 2013, 0.85%, tender 2/1/17 (a)(b) | | 18,500 | 18,498 |
| Pennsylvania Gen. Oblig.: | | | |
| Series 2011, 5% 7/1/21 | | 1,900 | 2,129 |
| Series 2012, 5% 6/1/18 | | 3,410 | 3,580 |
| Series 2016: | | | |
| 5% 2/1/21 | | 8,825 | 9,819 |
| 5% 2/1/22 | | 9,265 | 10,470 |
| 5% 2/1/23 | | 9,075 | 10,368 |
| 5% 2/1/24 | | 10,215 | 11,754 |
| 5% 6/1/17 | | 9,000 | 9,148 |
| 5% 8/15/17 | | 18,000 | 18,440 |
| Pennsylvania Higher Edl. Facilities Auth. Rev. Series 2014: | | | |
| 5% 12/1/19 | | 340 | 372 |
| 5% 12/1/21 | | 275 | 313 |
| 5% 12/1/22 | | 855 | 989 |
| Pennsylvania Pub. School Bldg. Auth. School Rev. (The School District of Harrisburg Proj.) Series 2016 A, 5% 12/1/21 (FSA Insured) | | 5,000 | 5,547 |
| Pennsylvania Tpk. Commission Tpk. Rev. Series 2013 A, 1.32% 12/1/17 (a) | | 6,400 | 6,399 |
| Philadelphia Gen. Oblig. Series 2011: | | | |
| 5.25% 8/1/17 | | 6,165 | 6,307 |
| 5.25% 8/1/18 | | 5,515 | 5,840 |
| Philadelphia Muni. Auth. Rev. Series 2013 A: | | | |
| 5% 11/15/17 | | 6,635 | 6,853 |
| 5% 11/15/18 | | 3,430 | 3,650 |
| Philadelphia School District Series 2016 D, 5% 9/1/17 | | 1,000 | 1,022 |
| Southeastern Pennsylvania Trans. Auth. Rev. Series 2011: | | | |
| 5% 6/1/18 | | 1,000 | 1,049 |
| 5% 6/1/19 | | 200 | 215 |
| State Pub. School Bldg. Auth. Lease Rev. (Philadelphia School District Proj.) Series 2012: | | | |
| 5% 4/1/19 | | 1,305 | 1,374 |
| 5% 4/1/20 | | 1,250 | 1,333 |
| 5% 4/1/21 | | 1,000 | 1,075 |
| Unionville-Chadds Ford School District Gen. Oblig. Series 2009, 5% 6/1/20 | | 1,190 | 1,289 |
|
| TOTAL PENNSYLVANIA | | | 171,802 |
|
| Rhode Island - 0.9% | | | |
| Rhode Island & Providence Plantations Series 2015 A, 4% 8/1/17 | | 5,000 | 5,086 |
| Rhode Island Health & Edl. Bldg. Corp. Higher Ed. Facilities Rev.: | | | |
| Series 2013 A: | | | |
| 5% 5/15/18 | | 1,000 | 1,043 |
| 5% 5/15/19 | | 1,500 | 1,602 |
| Series 2016: | | | |
| 5% 5/15/20 | | 660 | 710 |
| 5% 5/15/22 | | 2,000 | 2,190 |
| 5% 5/15/23 | | 1,205 | 1,327 |
| 5% 5/15/24 | | 2,350 | 2,596 |
| 5% 5/15/25 | | 5,505 | 6,086 |
| Rhode Island Health & Edl. Bldg. Corp. Pub. Schools Rev. Series 2015, 5% 5/15/25 (FSA Insured) | | 6,040 | 7,000 |
| Tobacco Setlement Fing. Corp. Series 2015 A: | | | |
| 5% 6/1/26 | | 3,500 | 3,794 |
| 5% 6/1/27 | | 1,000 | 1,073 |
|
| TOTAL RHODE ISLAND | | | 32,507 |
|
| South Carolina - 1.5% | | | |
| Lexington County Health Svcs. District, Inc. Hosp. Rev. Series 2011, 5% 11/1/19 | | 1,190 | 1,293 |
| Scago Edl. Facilities Corp. for Colleton School District (School District of Colleton County Proj.) Series 2015: | | | |
| 5% 12/1/23 | | 4,440 | 5,067 |
| 5% 12/1/26 | | 1,100 | 1,244 |
| South Carolina Pub. Svc. Auth. Rev.: | | | |
| Series 2012 B: | | | |
| 5% 12/1/17 | | 2,000 | 2,071 |
| 5% 12/1/20 | | 1,000 | 1,116 |
| Series 2012 C, 5% 12/1/17 | | 10,535 | 10,910 |
| Series 2014 C: | | | |
| 5% 12/1/22 | | 1,100 | 1,269 |
| 5% 12/1/23 | | 5,000 | 5,830 |
| Series 2015 C, 5% 12/1/18 | | 15,000 | 16,029 |
| South Carolina Trans. Infrastructure Bank Rev. Series 2012 B, 5% 10/1/17 | | 8,000 | 8,232 |
|
| TOTAL SOUTH CAROLINA | | | 53,061 |
|
| South Dakota - 0.2% | | | |
| South Dakota Health & Edl. Facilities Auth. Rev.: | | | |
| (Reg'l. Health Proj.) Series 2010, 5% 9/1/17 | | 490 | 502 |
| Series 2011: | | | |
| 5% 9/1/17 | | 1,100 | 1,127 |
| 5% 9/1/18 | | 1,200 | 1,269 |
| 5% 9/1/19 | | 1,255 | 1,353 |
| Series 2014 B: | | | |
| 4% 11/1/19 | | 400 | 425 |
| 4% 11/1/20 | | 625 | 671 |
| 4% 11/1/21 | | 500 | 542 |
| 5% 11/1/22 | | 375 | 430 |
|
| TOTAL SOUTH DAKOTA | | | 6,319 |
|
| Tennessee - 0.1% | | | |
| Knox County Health Edl. & Hsg. Facilities Board Rev. Series 2016: | | | |
| 5% 9/1/25 | | 1,670 | 1,885 |
| 5% 9/1/26 | | 1,835 | 2,064 |
| Metropolitan Nashville Arpt. Auth. Rev. Series 2010 A, 5% 7/1/17 | | 1,100 | 1,121 |
|
| TOTAL TENNESSEE | | | 5,070 |
|
| Texas - 9.6% | | | |
| Allen Independent School District Series 2013, 4% 2/15/18 | | 1,290 | 1,331 |
| Austin Elec. Util. Sys. Rev. 0% 5/15/18 (Nat'l. Pub. Fin. Guarantee Corp. Insured) | | 4,500 | 4,419 |
| Austin Independent School District Series 2004, 5% 8/1/17 | | 1,450 | 1,484 |
| Bastrop Independent School District Series 2007, 5.25% 2/15/37 (Pre-Refunded to 2/15/17 @ 100) | | 2,705 | 2,718 |
| Brownsville Util. Sys. Rev. Series 2015, 5% 9/1/17 | | 2,135 | 2,187 |
| Carroll Independent School District Series 2009 C, 5.25% 2/15/19 | | 1,000 | 1,080 |
| Central Reg'l. Mobility Auth. Series 2016: | | | |
| 5% 1/1/21 | | 500 | 547 |
| 5% 1/1/22 | | 1,500 | 1,661 |
| 5% 1/1/23 | | 2,450 | 2,730 |
| 5% 1/1/24 | | 3,370 | 3,779 |
| 5% 1/1/26 | | 2,865 | 3,234 |
| Cypress-Fairbanks Independent School District Bonds Series 2014 B3, 1.05%, tender 8/15/17 (a) | | 2,025 | 2,022 |
| Dallas County Gen. Oblig. Series 2016: | | | |
| 5% 8/15/22 | | 3,520 | 4,072 |
| 5% 8/15/23 | | 3,000 | 3,518 |
| Dallas Fort Worth Int'l. Arpt. Rev.: | | | |
| Series 2013 F: | | | |
| 5% 11/1/19 | | 2,000 | 2,180 |
| 5% 11/1/20 | | 1,500 | 1,671 |
| 5% 11/1/21 | | 3,000 | 3,384 |
| 5% 11/1/22 | | 5,000 | 5,717 |
| Series 2014 D, 5% 11/1/23 (b) | | 1,950 | 2,202 |
| Dallas Independent School District Bonds: | | | |
| Series 2016 B1, 3%, tender 2/15/17 (a) | | 1,985 | 1,990 |
| Series 2016 B2, 4%, tender 2/15/18 (a) | | 3,970 | 4,082 |
| Series 2016 B3, 5%, tender 2/15/19 (a) | | 6,000 | 6,420 |
| Series 2016 B4, 5%, tender 2/15/20 (a) | | 7,000 | 7,632 |
| Series 2016 B5, 5%, tender 2/15/21 (a) | | 8,000 | 8,946 |
| Series 2016 B6, 5%, tender 2/15/22 (a) | | 10,000 | 11,383 |
| Dallas Wtrwks. & Swr. Sys. Rev. Series 2011, 5% 10/1/18 | | 1,600 | 1,703 |
| Dickinson Independent School District Bonds Series 2013, 1.05%, tender 8/1/17 (a) | | 5,150 | 5,143 |
| El Paso Gen. Oblig. Series 2014, 5% 8/15/18 | | 2,695 | 2,856 |
| Harris County Gen. Oblig. Series 2015 A, 4% 10/1/17 | | 2,500 | 2,557 |
| Houston Arpt. Sys. Rev.: | | | |
| Series 2011 A, 5% 7/1/17 (b) | | 7,380 | 7,517 |
| Series 2012 A, 5% 7/1/23 (b) | | 2,000 | 2,226 |
| Kermit Independent School District Series 2007, 5.25% 2/15/32 (Pre-Refunded to 2/15/17 @ 100) | | 1,300 | 1,306 |
| Lewisville Independent School District Series 2009, 5% 8/15/17 | | 1,170 | 1,199 |
| Lower Colorado River Auth. Rev.: | | | |
| (LCRA Transmission Svcs. Corp. Proj.) Series 2010, 5% 5/15/18 | | 3,140 | 3,299 |
| Series 2010, 5% 5/15/17 | | 3,005 | 3,048 |
| Lubbock Health Facilities Dev. Corp. Rev. (St. Joseph Health Sys. Proj.) Series 2008 B: | | | |
| 5% 7/1/17 | | 2,800 | 2,854 |
| 5% 7/1/18 | | 3,030 | 3,196 |
| Mansfield Independent School District Series 2009, 4% 2/15/17 | | 1,840 | 1,847 |
| Newark Higher Ed. Fin. Corp. (Abilene Christian Univ. Proj.) Series 2016 A, 5% 4/1/26 | | 2,480 | 2,882 |
| North East Texas Independent School District: | | | |
| Bonds Series 2013 B, 1.42%, tender 8/1/21 (a) | | 3,505 | 3,381 |
| Series 2007 A, 5% 8/1/24 (Pre-Refunded to 8/1/17 @ 100) | | 10,000 | 10,232 |
| North Harris County Reg'l. Wtr. Auth. Series 2013, 4% 12/15/22 | | 1,580 | 1,732 |
| North Texas Tollway Auth. Rev.: | | | |
| Bonds Series 2012 C, 1.95%, tender 1/1/19 (a) | | 8,500 | 8,487 |
| Series 2016 A, 5% 1/1/26 | | 13,000 | 14,928 |
| 5.75% 1/1/38 (Pre-Refunded to 1/1/18 @ 100) | | 7,830 | 8,185 |
| Northside Independent School District Bonds: | | | |
| Series 2011 A, 2%, tender 6/1/19 (a) | | 6,225 | 6,245 |
| 1.2%, tender 8/1/17 (a) | | 28,155 | 28,139 |
| 2%, tender 6/1/21 (a) | | 10,000 | 9,975 |
| Plano Independent School District 5% 2/15/18 | | 2,500 | 2,608 |
| Port Houston Auth. Harris County Series 2015 B, 5% 10/1/17 (b) | | 2,000 | 2,058 |
| Round Rock Independent School District Series 2015, 5% 8/1/17 | | 5,000 | 5,117 |
| Sam Rayburn Muni. Pwr. Agcy. Series 2012, 5% 10/1/20 | | 1,000 | 1,088 |
| San Antonio Pub. Facilities Corp. and Rfdg. Lease (Convention Ctr. Proj.) Series 2012: | | | |
| 5% 9/15/20 | | 1,000 | 1,106 |
| 5% 9/15/21 | | 1,000 | 1,126 |
| 5% 9/15/22 | | 3,440 | 3,925 |
| San Antonio Wtr. Sys. Rev. Series 2012: | | | |
| 4% 5/15/19 | | 1,500 | 1,589 |
| 5% 5/15/20 | | 6,000 | 6,646 |
| Southwest Higher Ed. Auth. Rev. (Southern Methodist Univ. Proj.) Series 2016 A: | | | |
| 5% 10/1/20 | | 3,480 | 3,878 |
| 5% 10/1/21 | | 3,000 | 3,406 |
| Tarrant County Cultural Ed. Facilities Fin. Corp. Hosp. Rev.: | | | |
| (Scott & White Healthcare Proj.) Series 2013 A: | | | |
| 5% 8/15/21 | | 750 | 851 |
| 5% 8/15/23 | | 1,000 | 1,169 |
| Series 2013: | | | |
| 4% 9/1/18 | | 400 | 417 |
| 5% 9/1/19 | | 655 | 706 |
| 5% 9/1/20 | | 915 | 1,006 |
| 5.75% 11/15/24 (Pre-Refunded to 11/15/18 @ 100) | | 2,385 | 2,576 |
| Tarrant County Cultural Ed. Facilities Fin. Corp. Rev.: | | | |
| Series 2016 A, 5% 2/15/26 | | 1,500 | 1,788 |
| Series 2017 A, 5% 2/15/24 | | 2,000 | 2,341 |
| 5.75% 7/1/18 | | 1,830 | 1,905 |
| Texas Pub. Fin. Auth. Rev. Series 2014 B, 4% 7/1/17 | | 2,100 | 2,104 |
| Texas Trans. Commission Central Texas Tpk. Sys. Rev. Bonds Series 2015 A, 5%, tender 4/1/20 (a) | | 12,885 | 14,057 |
| Texas Trans. Commission State Hwy. Fund Rev. Series 2015, 3% 10/1/17 | | 34,000 | 34,507 |
| Tomball Independent School District 5% 2/15/17 (Assured Guaranty Corp. Insured) | | 1,105 | 1,110 |
| Trinity River Auth. Reg'l. Wastewtr. Sys. Rev. Series 2016, 5% 8/1/23 | | 1,585 | 1,852 |
| Univ. of Texas Board of Regents Sys. Rev. Series 2010 B, 5% 8/15/21 | | 1,800 | 2,049 |
| Univ. of Texas Permanent Univ. Fund Rev.: | | | |
| Series 2015 B, 4% 7/1/17 | | 5,625 | 5,711 |
| Series 2015, 5% 7/1/17 | | 1,985 | 2,025 |
|
| TOTAL TEXAS | | | 332,047 |
|
| Utah - 0.0% | | | |
| Utah Associated Muni. Pwr. Sys. Rev. (Payson Pwr. Proj.) 5% 9/1/17 | | 1,090 | 1,118 |
| Virginia - 1.0% | | | |
| Chesapeake Trans. Sys. Toll Road Rev. Series 2012 A: | | | |
| 4% 7/15/20 | | 605 | 641 |
| 5% 7/15/21 | | 400 | 444 |
| Fairfax County Gen. Oblig.: | | | |
| 5% 10/1/20 | | 6,710 | 7,527 |
| 5% 10/1/21 | | 3,000 | 3,436 |
| Fredericksburg Econ. Dev. Auth. Rev. Series 2014, 5% 6/15/24 | | 2,340 | 2,697 |
| Stafford County Econ. Dev. Auth. Hosp. Facilities Rev. Series 2016: | | | |
| 5% 6/15/24 | | 650 | 749 |
| 5% 6/15/25 | | 1,000 | 1,155 |
| 5% 6/15/26 | | 1,715 | 1,988 |
| Virginia College Bldg. Auth. Edl. Facilities Rev. (21st Century College and Equip. Progs.) Series 2015 D, 5% 2/1/17 | | 12,830 | 12,869 |
| York County Econ. Dev. Auth. Poll. Cont. Rev. Bonds (Virginia Elec. and Pwr. Co. Proj.) Series 2009 A, 1.875%, tender 5/16/19 (a) | | 2,500 | 2,500 |
|
| TOTAL VIRGINIA | | | 34,006 |
|
| Washington - 1.4% | | | |
| Grant County Pub. Util. District #2 Series 2012 A: | | | |
| 5% 1/1/20 | | 1,375 | 1,503 |
| 5% 1/1/21 | | 1,865 | 2,083 |
| King County Highline School District # 401 Series 2009, 5% 12/1/17 | | 2,950 | 3,056 |
| Port of Seattle Rev.: | | | |
| Series 2010 C, 5% 2/1/17 (b) | | 2,500 | 2,507 |
| Series 2015 B, 5% 3/1/17 | | 5,000 | 5,032 |
| Series 2016 B: | | | |
| 5% 10/1/20 (b) | | 2,935 | 3,251 |
| 5% 10/1/21 (b) | | 2,780 | 3,122 |
| 5% 10/1/22 (b) | | 2,500 | 2,844 |
| 5% 10/1/23 (b) | | 3,030 | 3,483 |
| Seattle Muni. Lt. & Pwr. Rev. Series 2010 B, 5% 2/1/17 | | 2,000 | 2,006 |
| Tacoma Elec. Sys. Rev. Series 2013 A: | | | |
| 4% 1/1/20 | | 5,000 | 5,329 |
| 4% 1/1/21 | | 2,000 | 2,159 |
| 5% 1/1/20 | | 3,000 | 3,285 |
| 5% 1/1/21 | | 1,770 | 1,978 |
| Washington Gen. Oblig. Series 2012 AR, 5% 7/1/18 | | 5,000 | 5,283 |
|
| TOTAL WASHINGTON | | | 46,921 |
|
| West Virginia - 0.4% | | | |
| West Virginia Econ. Dev. Auth. Solid Waste Disp. Facilities Rev. Bonds: | | | |
| (Appalachian Pwr. Co. Amos Proj.) Series 2011 A, 1.7%, tender 9/1/20 (a)(b) | | 6,760 | 6,528 |
| 1.9%, tender 4/1/19 (a) | | 6,285 | 6,259 |
|
| TOTAL WEST VIRGINIA | | | 12,787 |
|
| Wisconsin - 0.5% | | | |
| Madison Gen. Oblig. Series 2014 A, 5% 10/1/21 | | 3,215 | 3,660 |
| Milwaukee County Arpt. Rev. Series 2013 A: | | | |
| 5% 12/1/20 (b) | | 1,330 | 1,471 |
| 5% 12/1/22 (b) | | 1,470 | 1,672 |
| 5.25% 12/1/23 (b) | | 1,540 | 1,767 |
| Wisconsin Health & Edl. Facilities: | | | |
| Bonds Series 2013 B, 4%, tender 3/1/18 (a) | | 2,090 | 2,156 |
| Series 2014: | | | |
| 4% 5/1/18 | | 375 | 384 |
| 4% 5/1/19 | | 285 | 295 |
| 5% 5/1/20 | | 410 | 441 |
| 5% 5/1/21 | | 640 | 697 |
| Wisconsin Health & Edl. Facilities Auth. Rev.: | | | |
| (Aurora Health Care, Inc. Proj.) Series 2010 A, 5% 4/15/17 | | 1,500 | 1,517 |
| (Thedacare, Inc. Proj.) Series 2010, 5% 12/15/17 | | 1,540 | 1,595 |
| Series 2012, 5% 10/1/21 | | 1,400 | 1,584 |
|
| TOTAL WISCONSIN | | | 17,239 |
|
| TOTAL MUNICIPAL BONDS | | | |
| (Cost $3,256,982) | | | 3,240,845 |
|
| Municipal Notes - 4.1% | | | |
| Connecticut - 0.3% | | | |
| New Britain Gen. Oblig. BAN 2% 3/23/17 | | 5,000 | $5,015 |
| New Haven Gen. Oblig. TAN Series 2016, 2.5% 5/18/17 | | 2,600 | 2,611 |
| New London BAN Series 2016, 2% 3/23/17 | | 4,800 | 4,808 |
|
| TOTAL CONNECTICUT | | | 12,434 |
|
| Kentucky - 0.1% | | | |
| Kentucky Pub. Trans. BAN Series 2013 A, 5% 7/1/17 | | 2,165 | 2,199 |
| New Jersey - 0.5% | | | |
| Hackensack City Tax Appeal Nts BAN Series 2016, 2% 11/6/17 | | 8,900 | 8,946 |
| New Brunswick Gen. Oblig. BAN Series 2016, 3% 6/6/17 | | 7,723 | 7,775 |
|
| TOTAL NEW JERSEY | | | 16,721 |
|
| New York - 3.1% | | | |
| Albany Gen. Oblig. BAN Series 2016, 2% 6/30/17 | | 14,600 | 14,652 |
| Binghamton Gen. Oblig. BAN Series 2016, 2.5% 11/17/17 | | 4,250 | 4,294 |
| Rockland County Gen. Oblig. TAN Series 2016, 2% 3/16/17 | | 3,500 | 3,506 |
| Sachem Central School District of Holbrook TAN Series 2016, 1.5% 6/29/17 | | 10,400 | 10,409 |
| Suffolk County Gen. Oblig. TAN Series 2017, 2% 7/26/17 | | 66,600 | 66,860 |
| Syracuse Gen. Oblig. RAN Series 2016 B, 2% 6/30/17 | | 6,800 | 6,824 |
|
| TOTAL NEW YORK | | | 106,545 |
|
| Ohio - 0.1% | | | |
| Belmont County BAN Series 2016, 1.375% 8/31/17 | | 2,300 | 2,300 |
| TOTAL MUNICIPAL NOTES | | | |
| (Cost $140,353) | | | 140,199 |
| | | Shares | Value (000s) |
|
| Money Market Funds - 0.7% | | | |
| Fidelity Municipal Cash Central Fund, 0.79% (d)(e) | | | |
| (Cost $25,102) | | 25,099,490 | 25,099 |
| TOTAL INVESTMENT PORTFOLIO - 98.3% | | | |
| (Cost $3,422,437) | | | 3,406,143 |
| NET OTHER ASSETS (LIABILITIES) - 1.7% | | | 58,857 |
| NET ASSETS - 100% | | | $3,465,000 |
Security Type Abbreviations
BAN – BOND ANTICIPATION NOTE
TAN – TAX ANTICIPATION NOTE
VRDN – VARIABLE RATE DEMAND NOTE (A debt instrument that is payable upon demand, either daily, weekly or monthly)
Legend
(a) Coupon rates for floating and adjustable rate securities reflect the rates in effect at period end.
(b) Private activity obligations whose interest is subject to the federal alternative minimum tax for individuals.
(c) Security or a portion of the security purchased on a delayed delivery or when-issued basis.
(d) Information in this report regarding holdings by state and security types does not reflect the holdings of the Fidelity Municipal Cash Central Fund.
(e) Affiliated fund that is available only to investment companies and other accounts managed by Fidelity Investments. The rate quoted is the annualized seven-day yield of the fund at period end. A complete unaudited listing of the fund's holdings as of its most recent quarter end is available upon request. In addition, each Fidelity Central Fund's financial statements, which are not covered by the Fund's Report of Independent Registered Public Accounting Firm, are available on the SEC's website or upon request.
Affiliated Central Funds
Information regarding fiscal year to date income earned by the Fund from investments in Fidelity Central Funds is as follows:
| Fund | Income earned |
| | (Amounts in thousands) |
| Fidelity Municipal Cash Central Fund | $663 |
| Total | $663 |
Investment Valuation
The following is a summary of the inputs used, as of December 31, 2016, involving the Fund's assets and liabilities carried at fair value. The inputs or methodology used for valuing securities may not be an indication of the risk associated with investing in those securities. For more information on valuation inputs, and their aggregation into the levels used below, please refer to the Investment Valuation section in the accompanying Notes to Financial Statements.
| | Valuation Inputs at Reporting Date: |
| Description | Total | Level 1 | Level 2 | Level 3 |
| (Amounts in thousands) | | | | |
| Investments in Securities: | | | | |
| Municipal Securities | $3,381,044 | $-- | $3,381,044 | $-- |
| Money Market Funds | 25,099 | 25,099 | -- | -- |
| Total Investments in Securities: | $3,406,143 | $25,099 | $3,381,044 | $-- |
Other Information
The distribution of municipal securities by revenue source, as a percentage of total Net Assets, is as follows (Unaudited):
| General Obligations | 42.4% |
| Transportation | 11.5% |
| Health Care | 10.5% |
| Special Tax | 9.7% |
| Electric Utilities | 9.4% |
| Others* (Individually Less Than 5%) | 16.5% |
| | 100.0% |
* Includes net other assets
See accompanying notes which are an integral part of the financial statements.
Financial Statements
Statement of Assets and Liabilities
| Amounts in thousands (except per-share amounts) | | December 31, 2016 |
| Assets | | |
Investment in securities, at value — See accompanying schedule:
Unaffiliated issuers (cost $3,397,335) | $3,381,044 | |
| Fidelity Central Funds (cost $25,102) | 25,099 | |
| Total Investments (cost $3,422,437) | | $3,406,143 |
| Cash | | 37,783 |
| Receivable for fund shares sold | | 13,699 |
| Interest receivable | | 38,452 |
| Distributions receivable from Fidelity Central Funds | | 19 |
| Prepaid expenses | | 7 |
| Other receivables | | 10 |
| Total assets | | 3,496,113 |
| Liabilities | | |
| Payable for investments purchased on a delayed delivery basis | $1,606 | |
| Payable for fund shares redeemed | 26,784 | |
| Distributions payable | 1,081 | |
| Accrued management fee | 1,088 | |
| Distribution and service plan fees payable | 119 | |
| Other affiliated payables | 381 | |
| Other payables and accrued expenses | 54 | |
| Total liabilities | | 31,113 |
| Net Assets | | $3,465,000 |
| Net Assets consist of: | | |
| Paid in capital | | $3,481,762 |
| Distributions in excess of net investment income | | (47) |
| Accumulated undistributed net realized gain (loss) on investments | | (421) |
| Net unrealized appreciation (depreciation) on investments | | (16,294) |
| Net Assets | | $3,465,000 |
| Calculation of Maximum Offering Price | | |
| Class A: | | |
| Net Asset Value and redemption price per share ($316,679 ÷ 30,303 shares) | | $10.45 |
| Maximum offering price per share (100/97.25 of $10.45) | | $10.75 |
| Class T: | | |
| Net Asset Value and redemption price per share ($19,706 ÷ 1,889 shares) | | $10.43 |
| Maximum offering price per share (100/97.25 of $10.43) | | $10.72 |
| Class C: | | |
| Net Asset Value and offering price per share ($52,842 ÷ 5,066 shares)(a) | | $10.43 |
| Limited Term Municipal Income: | | |
| Net Asset Value, offering price and redemption price per share ($2,779,251 ÷ 266,416 shares) | | $10.43 |
| Class I: | | |
| Net Asset Value, offering price and redemption price per share ($296,522 ÷ 28,409 shares) | | $10.44 |
(a) Redemption price per share is equal to net asset value less any applicable contingent deferred sales charge.
See accompanying notes which are an integral part of the financial statements.
Statement of Operations
| Amounts in thousands | | Year ended December 31, 2016 |
| Investment Income | | |
| Interest | | $74,144 |
| Income from Fidelity Central Funds | | 663 |
| Total income | | 74,807 |
| Expenses | | |
| Management fee | $14,159 | |
| Transfer agent fees | 4,155 | |
| Distribution and service plan fees | 1,586 | |
| Accounting fees and expenses | 615 | |
| Custodian fees and expenses | 28 | |
| Independent trustees' fees and expenses | 18 | |
| Registration fees | 214 | |
| Audit | 56 | |
| Legal | 11 | |
| Miscellaneous | 29 | |
| Total expenses before reductions | 20,871 | |
| Expense reductions | (44) | 20,827 |
| Net investment income (loss) | | 53,980 |
| Realized and Unrealized Gain (Loss) | | |
| Net realized gain (loss) on: | | |
| Investment securities: | | |
| Unaffiliated issuers | 312 | |
| Total net realized gain (loss) | | 312 |
| Change in net unrealized appreciation (depreciation) on investment securities | | (72,267) |
| Net gain (loss) | | (71,955) |
| Net increase (decrease) in net assets resulting from operations | | $(17,975) |
See accompanying notes which are an integral part of the financial statements.
Statement of Changes in Net Assets
| Amounts in thousands | Year ended December 31, 2016 | Year ended December 31, 2015 |
| Increase (Decrease) in Net Assets | | |
| Operations | | |
| Net investment income (loss) | $53,980 | $57,962 |
| Net realized gain (loss) | 312 | 7,031 |
| Change in net unrealized appreciation (depreciation) | (72,267) | (25,919) |
| Net increase (decrease) in net assets resulting from operations | (17,975) | 39,074 |
| Distributions to shareholders from net investment income | (53,929) | (58,133) |
| Distributions to shareholders from net realized gain | (727) | (7,563) |
| Total distributions | (54,656) | (65,696) |
| Share transactions - net increase (decrease) | (259,868) | (152,171) |
| Redemption fees | 58 | 42 |
| Total increase (decrease) in net assets | (332,441) | (178,751) |
| Net Assets | | |
| Beginning of period | 3,797,441 | 3,976,192 |
| End of period | $3,465,000 | $3,797,441 |
| Other Information | | |
| Distributions in excess of net investment income end of period | $(47) | $(90) |
See accompanying notes which are an integral part of the financial statements.
Financial Highlights — Fidelity Limited Term Municipal Income Fund Class A
| Years ended December 31, | 2016 | 2015 | 2014 | 2013 | 2012 |
| Selected Per–Share Data | | | | | |
| Net asset value, beginning of period | $10.64 | $10.71 | $10.68 | $10.86 | $10.83 |
| Income from Investment Operations | | | | | |
| Net investment income (loss)A | .118 | .129 | .153 | .158 | .164 |
| Net realized and unrealized gain (loss) | (.188) | (.048) | .046 | (.170) | .034 |
| Total from investment operations | (.070) | .081 | .199 | (.012) | .198 |
| Distributions from net investment income | (.118) | (.130) | (.153) | (.158) | (.156) |
| Distributions from net realized gain | (.002) | (.021) | (.016) | (.010) | (.012) |
| Total distributions | (.120) | (.151) | (.169) | (.168) | (.168) |
| Redemption fees added to paid in capitalA,B | – | – | – | – | – |
| Net asset value, end of period | $10.45 | $10.64 | $10.71 | $10.68 | $10.86 |
| Total ReturnC,D | (.68)% | .76% | 1.87% | (.11)% | 1.84% |
| Ratios to Average Net AssetsE,F | | | | | |
| Expenses before reductions | .80% | .81% | .79% | .78% | .79% |
| Expenses net of fee waivers, if any | .80% | .81% | .79% | .78% | .79% |
| Expenses net of all reductions | .80% | .81% | .79% | .78% | .78% |
| Net investment income (loss) | 1.10% | 1.21% | 1.42% | 1.47% | 1.51% |
| Supplemental Data | | | | | |
| Net assets, end of period (in millions) | $317 | $377 | $397 | $318 | $394 |
| Portfolio turnover rateG | 31% | 30% | 21% | 20% | 21% |
A Calculated based on average shares outstanding during the period.
B Amount represents less than $.0005 per share.
C Total returns would have been lower if certain expenses had not been reduced during the applicable periods shown.
D Total returns do not include the effect of the sales charges.
E Fees and expenses of any underlying Fidelity Central Funds are not included in the Fund's expense ratio. The Fund indirectly bears its proportionate share of the expenses of any underlying Fidelity Central Funds.
F Expense ratios reflect operating expenses of the class. Expenses before reductions do not reflect amounts reimbursed by the investment adviser or reductions from expense offset arrangements and do not represent the amount paid by the class during periods when reimbursements or reductions occur. Expenses net of fee waivers reflect expenses after reimbursement by the investment adviser but prior to reductions from expense offset arrangements. Expenses net of all reductions represent the net expenses paid by the class.
G Amount does not include the portfolio activity of any underlying Fidelity Central Funds.
See accompanying notes which are an integral part of the financial statements.
Financial Highlights — Fidelity Limited Term Municipal Income Fund Class T
| Years ended December 31, | 2016 | 2015 | 2014 | 2013 | 2012 |
| Selected Per–Share Data | | | | | |
| Net asset value, beginning of period | $10.62 | $10.69 | $10.66 | $10.85 | $10.81 |
| Income from Investment Operations | | | | | |
| Net investment income (loss)A | .121 | .134 | .157 | .162 | .166 |
| Net realized and unrealized gain (loss) | (.188) | (.049) | .046 | (.180) | .044 |
| Total from investment operations | (.067) | .085 | .203 | (.018) | .210 |
| Distributions from net investment income | (.121) | (.134) | (.157) | (.162) | (.158) |
| Distributions from net realized gain | (.002) | (.021) | (.016) | (.010) | (.012) |
| Total distributions | (.123) | (.155) | (.173) | (.172) | (.170) |
| Redemption fees added to paid in capitalA,B | – | – | – | – | – |
| Net asset value, end of period | $10.43 | $10.62 | $10.69 | $10.66 | $10.85 |
| Total ReturnC,D | (.65)% | .80% | 1.91% | (.17)% | 1.95% |
| Ratios to Average Net AssetsE,F | | | | | |
| Expenses before reductions | .77% | .77% | .76% | .75% | .77% |
| Expenses net of fee waivers, if any | .77% | .77% | .76% | .75% | .77% |
| Expenses net of all reductions | .77% | .77% | .75% | .75% | .76% |
| Net investment income (loss) | 1.14% | 1.25% | 1.46% | 1.50% | 1.52% |
| Supplemental Data | | | | | |
| Net assets, end of period (in millions) | $20 | $22 | $25 | $24 | $25 |
| Portfolio turnover rateG | 31% | 30% | 21% | 20% | 21% |
A Calculated based on average shares outstanding during the period.
B Amount represents less than $.0005 per share.
C Total returns would have been lower if certain expenses had not been reduced during the applicable periods shown.
D Total returns do not include the effect of the sales charges.
E Fees and expenses of any underlying Fidelity Central Funds are not included in the Fund's expense ratio. The Fund indirectly bears its proportionate share of the expenses of any underlying Fidelity Central Funds.
F Expense ratios reflect operating expenses of the class. Expenses before reductions do not reflect amounts reimbursed by the investment adviser or reductions from expense offset arrangements and do not represent the amount paid by the class during periods when reimbursements or reductions occur. Expenses net of fee waivers reflect expenses after reimbursement by the investment adviser but prior to reductions from expense offset arrangements. Expenses net of all reductions represent the net expenses paid by the class.
G Amount does not include the portfolio activity of any underlying Fidelity Central Funds.
See accompanying notes which are an integral part of the financial statements.
Financial Highlights — Fidelity Limited Term Municipal Income Fund Class C
| Years ended December 31, | 2016 | 2015 | 2014 | 2013 | 2012 |
| Selected Per–Share Data | | | | | |
| Net asset value, beginning of period | $10.62 | $10.69 | $10.66 | $10.84 | $10.81 |
| Income from Investment Operations | | | | | |
| Net investment income (loss)A | .038 | .050 | .072 | .077 | .082 |
| Net realized and unrealized gain (loss) | (.188) | (.049) | .046 | (.169) | .035 |
| Total from investment operations | (.150) | .001 | .118 | (.092) | .117 |
| Distributions from net investment income | (.038) | (.050) | (.072) | (.078) | (.075) |
| Distributions from net realized gain | (.002) | (.021) | (.016) | (.010) | (.012) |
| Total distributions | (.040) | (.071) | (.088) | (.088) | (.087) |
| Redemption fees added to paid in capitalA,B | – | – | – | – | – |
| Net asset value, end of period | $10.43 | $10.62 | $10.69 | $10.66 | $10.84 |
| Total ReturnC,D | (1.42)% | .01% | 1.11% | (.86)% | 1.08% |
| Ratios to Average Net AssetsE,F | | | | | |
| Expenses before reductions | 1.55% | 1.55% | 1.54% | 1.54% | 1.53% |
| Expenses net of fee waivers, if any | 1.55% | 1.55% | 1.54% | 1.54% | 1.53% |
| Expenses net of all reductions | 1.55% | 1.55% | 1.54% | 1.53% | 1.53% |
| Net investment income (loss) | .35% | .47% | .67% | .72% | .76% |
| Supplemental Data | | | | | |
| Net assets, end of period (in millions) | $53 | $63 | $65 | $71 | $92 |
| Portfolio turnover rateG | 31% | 30% | 21% | 20% | 21% |
A Calculated based on average shares outstanding during the period.
B Amount represents less than $.0005 per share.
C Total returns would have been lower if certain expenses had not been reduced during the applicable periods shown.
D Total returns do not include the effect of the contingent deferred sales charge.
E Fees and expenses of any underlying Fidelity Central Funds are not included in the Fund's expense ratio. The Fund indirectly bears its proportionate share of the expenses of any underlying Fidelity Central Funds.
F Expense ratios reflect operating expenses of the class. Expenses before reductions do not reflect amounts reimbursed by the investment adviser or reductions from expense offset arrangements and do not represent the amount paid by the class during periods when reimbursements or reductions occur. Expenses net of fee waivers reflect expenses after reimbursement by the investment adviser but prior to reductions from expense offset arrangements. Expenses net of all reductions represent the net expenses paid by the class.
G Amount does not include the portfolio activity of any underlying Fidelity Central Funds.
See accompanying notes which are an integral part of the financial statements.
Financial Highlights — Fidelity Limited Term Municipal Income Fund
| Years ended December 31, | 2016 | 2015 | 2014 | 2013 | 2012 |
| Selected Per–Share Data | | | | | |
| Net asset value, beginning of period | $10.63 | $10.69 | $10.66 | $10.85 | $10.81 |
| Income from Investment Operations | | | | | |
| Net investment income (loss)A | .152 | .164 | .186 | .191 | .197 |
| Net realized and unrealized gain (loss) | (.198) | (.039) | .046 | (.180) | .045 |
| Total from investment operations | (.046) | .125 | .232 | .011 | .242 |
| Distributions from net investment income | (.152) | (.164) | (.186) | (.191) | (.190) |
| Distributions from net realized gain | (.002) | (.021) | (.016) | (.010) | (.012) |
| Total distributions | (.154) | (.185) | (.202) | (.201) | (.202) |
| Redemption fees added to paid in capitalA,B | – | – | – | – | – |
| Net asset value, end of period | $10.43 | $10.63 | $10.69 | $10.66 | $10.85 |
| Total ReturnC | (.45)% | 1.18% | 2.19% | .10% | 2.25% |
| Ratios to Average Net AssetsD,E | | | | | |
| Expenses before reductions | .48% | .48% | .48% | .48% | .48% |
| Expenses net of fee waivers, if any | .48% | .48% | .48% | .48% | .48% |
| Expenses net of all reductions | .48% | .48% | .48% | .48% | .47% |
| Net investment income (loss) | 1.43% | 1.54% | 1.73% | 1.78% | 1.81% |
| Supplemental Data | | | | | |
| Net assets, end of period (in millions) | $2,779 | $3,058 | $3,225 | $3,168 | $3,624 |
| Portfolio turnover rateF | 31% | 30% | 21% | 20% | 21% |
A Calculated based on average shares outstanding during the period.
B Amount represents less than $.0005 per share.
C Total returns would have been lower if certain expenses had not been reduced during the applicable periods shown.
D Fees and expenses of any underlying Fidelity Central Funds are not included in the Fund's expense ratio. The Fund indirectly bears its proportionate share of the expenses of any underlying Fidelity Central Funds.
E Expense ratios reflect operating expenses of the class. Expenses before reductions do not reflect amounts reimbursed by the investment adviser or reductions from expense offset arrangements and do not represent the amount paid by the class during periods when reimbursements or reductions occur. Expenses net of fee waivers reflect expenses after reimbursement by the investment adviser but prior to reductions from expense offset arrangements. Expenses net of all reductions represent the net expenses paid by the class.
F Amount does not include the portfolio activity of any underlying Fidelity Central Funds.
See accompanying notes which are an integral part of the financial statements.
Financial Highlights — Fidelity Limited Term Municipal Income Fund Class I
| Years ended December 31, | 2016 | 2015 | 2014 | 2013 | 2012 |
| Selected Per–Share Data | | | | | |
| Net asset value, beginning of period | $10.63 | $10.70 | $10.67 | $10.85 | $10.81 |
| Income from Investment Operations | | | | | |
| Net investment income (loss)A | .145 | .156 | .179 | .184 | .191 |
| Net realized and unrealized gain (loss) | (.188) | (.048) | .046 | (.169) | .045 |
| Total from investment operations | (.043) | .108 | .225 | .015 | .236 |
| Distributions from net investment income | (.145) | (.157) | (.179) | (.185) | (.184) |
| Distributions from net realized gain | (.002) | (.021) | (.016) | (.010) | (.012) |
| Total distributions | (.147) | (.178) | (.195) | (.195) | (.196) |
| Redemption fees added to paid in capitalA,B | – | – | – | – | – |
| Net asset value, end of period | $10.44 | $10.63 | $10.70 | $10.67 | $10.85 |
| Total ReturnC | (.42)% | 1.02% | 2.12% | .14% | 2.19% |
| Ratios to Average Net AssetsD,E | | | | | |
| Expenses before reductions | .55% | .55% | .55% | .54% | .54% |
| Expenses net of fee waivers, if any | .55% | .55% | .55% | .54% | .54% |
| Expenses net of all reductions | .54% | .55% | .54% | .54% | .53% |
| Net investment income (loss) | 1.36% | 1.47% | 1.67% | 1.71% | 1.76% |
| Supplemental Data | | | | | |
| Net assets, end of period (in millions) | $297 | $276 | $263 | $207 | $206 |
| Portfolio turnover rateF | 31% | 30% | 21% | 20% | 21% |
A Calculated based on average shares outstanding during the period.
B Amount represents less than $.0005 per share.
C Total returns would have been lower if certain expenses had not been reduced during the applicable periods shown.
D Fees and expenses of any underlying Fidelity Central Funds are not included in the Fund's expense ratio. The Fund indirectly bears its proportionate share of the expenses of any underlying Fidelity Central Funds.
E Expense ratios reflect operating expenses of the class. Expenses before reductions do not reflect amounts reimbursed by the investment adviser or reductions from expense offset arrangements and do not represent the amount paid by the class during periods when reimbursements or reductions occur. Expenses net of fee waivers reflect expenses after reimbursement by the investment adviser but prior to reductions from expense offset arrangements. Expenses net of all reductions represent the net expenses paid by the class.
F Amount does not include the portfolio activity of any underlying Fidelity Central Funds.
See accompanying notes which are an integral part of the financial statements.
Notes to Financial Statements
For the period ended December 31, 2016
(Amounts in thousands except percentages)
1. Organization.
Fidelity Limited Term Municipal Income Fund (the Fund) is a fund of Fidelity Municipal Trust (the Trust) and is authorized to issue an unlimited number of shares. The Trust is registered under the Investment Company Act of 1940, as amended (the 1940 Act), as an open-end management investment company organized as a Massachusetts business trust. The Fund offers Class A, Class T, Class C, Limited Term Municipal Income and Class I shares, each of which has equal rights as to assets and voting privileges. Each class has exclusive voting rights with respect to matters that affect that class.
After the close of business on June 24, 2016, all outstanding Class B shares were converted to Class A shares. All current fiscal period dollar and share amounts for Class B presented in the Notes to Financial Statements are for the period January 1, 2016 through June 24, 2016.
2. Investments in Fidelity Central Funds.
The Fund invests in Fidelity Central Funds, which are open-end investment companies generally available only to other investment companies and accounts managed by the investment adviser and its affiliates. The Fund's Schedule of Investments lists each of the Fidelity Central Funds held as of period end, if any, as an investment of the Fund, but does not include the underlying holdings of each Fidelity Central Fund. As an Investing Fund, the Fund indirectly bears its proportionate share of the expenses of the underlying Fidelity Central Funds.
The Money Market Central Funds seek preservation of capital and current income and are managed by Fidelity Investments Money Management, Inc. (FIMM), an affiliate of the investment adviser. Annualized expenses of the Money Market Central Funds as of their most recent shareholder report date are less than .005%.
A complete unaudited list of holdings for each Fidelity Central Fund is available upon request or at the Securities and Exchange Commission (the SEC) website at www.sec.gov. In addition, the financial statements of the Fidelity Central Funds, which are not covered by the Fund's Report of Independent Registered Public Accounting Firm, are available on the SEC website or upon request.
3. Significant Accounting Policies.
The financial statements have been prepared in conformity with accounting principles generally accepted in the United States of America (GAAP), which require management to make certain estimates and assumptions at the date of the financial statements. Actual results could differ from those estimates. Subsequent events, if any, through the date that the financial statements were issued have been evaluated in the preparation of the financial statements. The following summarizes the significant accounting policies of the Fund:
Investment Valuation. Investments are valued as of 4:00 p.m. Eastern time on the last calendar day of the period. The Board of Trustees (the Board) has delegated the day to day responsibility for the valuation of the Fund's investments to the Fair Value Committee (the Committee) established by the Fund's investment adviser. In accordance with valuation policies and procedures approved by the Board, the Fund attempts to obtain prices from one or more third party pricing vendors or brokers to value its investments. When current market prices, quotations or currency exchange rates are not readily available or reliable, investments will be fair valued in good faith by the Committee, in accordance with procedures adopted by the Board. Factors used in determining fair value vary by investment type and may include market or investment specific events, changes in interest rates and credit quality. The frequency with which these procedures are used cannot be predicted and they may be utilized to a significant extent. The Committee oversees the Fund's valuation policies and procedures and reports to the Board on the Committee's activities and fair value determinations. The Board monitors the appropriateness of the procedures used in valuing the Fund's investments and ratifies the fair value determinations of the Committee.
The Fund categorizes the inputs to valuation techniques used to value its investments into a disclosure hierarchy consisting of three levels as shown below:
- Level 1 – quoted prices in active markets for identical investments
- Level 2 – other significant observable inputs (including quoted prices for similar investments, interest rates, prepayment speeds, etc.)
- Level 3 – unobservable inputs (including the Fund's own assumptions based on the best information available)
Valuation techniques used to value the Fund's investments by major category are as follows:
Debt securities, including restricted securities, are valued based on evaluated prices received from third party pricing vendors or from brokers who make markets in such securities. Municipal securities are valued by pricing vendors who utilize matrix pricing which considers yield or price of bonds of comparable quality, coupon, maturity and type or by broker-supplied prices. When independent prices are unavailable or unreliable, debt securities may be valued utilizing pricing methodologies which consider similar factors that would be used by third party pricing vendors. Debt securities are generally categorized as Level 2 in the hierarchy but may be Level 3 depending on the circumstances.
Investments in open-end mutual funds, including the Fidelity Central Funds, are valued at their closing net asset value (NAV) each business day and are categorized as Level 1 in the hierarchy.
Changes in valuation techniques may result in transfers in or out of an assigned level within the disclosure hierarchy. The aggregate value of investments by input level as of December 31, 2016 is included at the end of the Fund's Schedule of Investments.
Investment Transactions and Income. For financial reporting purposes, the Fund's investment holdings and NAV include trades executed through the end of the last business day of the period. The NAV per share for processing shareholder transactions is calculated as of the close of business of the New York Stock Exchange (NYSE), normally 4:00 p.m. Eastern time and includes trades executed through the end of the prior business day. Gains and losses on securities sold are determined on the basis of identified cost. Income and capital gain distributions from Fidelity Central Funds, if any, are recorded on the ex-dividend date. Interest income is accrued as earned and includes coupon interest and amortization of premium and accretion of discount on debt securities as applicable. Debt obligations may be placed on non-accrual status and related interest income may be reduced by ceasing current accruals and writing off interest receivables when the collection of all or a portion of interest has become doubtful based on consistently applied procedures. A debt obligation is removed from non-accrual status when the issuer resumes interest payments or when collectability of interest is reasonably assured.
Class Allocations and Expenses. Investment income, realized and unrealized capital gains and losses, common expenses of the Fund, and certain fund-level expense reductions, if any, are allocated daily on a pro-rata basis to each class based on the relative net assets of each class to the total net assets of the Fund. Each class differs with respect to transfer agent and distribution and service plan fees incurred. Certain expense reductions may also differ by class. For the reporting period, the allocated portion of income and expenses to each class as a percent of its average net assets may vary due to the timing of recording these transactions in relation to fluctuating net assets of the classes. Expenses directly attributable to a fund are charged to that fund. Expenses attributable to more than one fund are allocated among the respective funds on the basis of relative net assets or other appropriate methods. Expense estimates are accrued in the period to which they relate and adjustments are made when actual amounts are known.
Income Tax Information and Distributions to Shareholders. Each year, the Fund intends to qualify as a regulated investment company under Subchapter M of the Internal Revenue Code, including distributing substantially all of its taxable income and realized gains. As a result, no provision for U.S. Federal income taxes is required. As of December 31, 2016, the Fund did not have any unrecognized tax benefits in the financial statements; nor is the Fund aware of any tax positions for which it is reasonably possible that the total amounts of unrecognized tax benefits will significantly change in the next twelve months. The Fund files a U.S. federal tax return, in addition to state and local tax returns as required. The Fund's federal income tax returns are subject to examination by the Internal Revenue Service (IRS) for a period of three fiscal years after they are filed. State and local tax returns may be subject to examination for an additional fiscal year depending on the jurisdiction.
Dividends are declared and recorded daily and paid monthly from net investment income. Distributions from realized gains, if any, are declared and recorded on the ex-dividend date. Income dividends and capital gain distributions are declared separately for each class. Income and capital gain distributions are determined in accordance with income tax regulations, which may differ from GAAP.
Capital accounts within the financial statements are adjusted for permanent book-tax differences. These adjustments have no impact on net assets or the results of operations. Capital accounts are not adjusted for temporary book-tax differences which will reverse in a subsequent period.
Book-tax differences are primarily due to market discount, deferred trustees compensation and losses deferred due to wash sales and excise tax regulations.
The Fund purchases municipal securities whose interest, in the opinion of the issuer, is free from federal income tax. There is no assurance that the IRS will agree with this opinion. In the event the IRS determines that the issuer does not comply with relevant tax requirements, interest payments from a security could become federally taxable, possibly retroactively to the date the security was issued.
The federal tax cost of investment securities and unrealized appreciation (depreciation) as of period end were as follows:
| Gross unrealized appreciation | $21,251 |
| Gross unrealized depreciation | (37,479) |
| Net unrealized appreciation (depreciation) on securities | $(16,228) |
| Tax Cost | $3,422,371 |
The tax-based components of distributable earnings as of period end were as follows:
| Net unrealized appreciation (depreciation) on securities and other investments | $(16,228) |
The Fund intends to elect to defer to its next fiscal year $421 of capital losses recognized during the period November 1, 2016 to December 31, 2016.
The tax character of distributions paid was as follows:
| | December 31, 2016 | December 31, 2015 |
| Tax-exempt Income | $53,929 | $58,133 |
| Long-term Capital Gains | 727 | 7,563 |
| Total | $54,656 | $ 65,696 |
Short-Term Trading (Redemption) Fees. Shares held by investors in the Fund less than 30 days may have been subject to a redemption fee equal to .50% of the NAV of shares redeemed. All redemption fees, which reduce the proceeds of the shareholder redemption, are retained by the Fund and accounted for as an addition to paid in capital. In November 2016, the Board of Trustees approved the elimination of these redemption fees effective December 12, 2016.
Delayed Delivery Transactions and When-Issued Securities. During the period, the Fund transacted in securities on a delayed delivery or when-issued basis. Payment and delivery may take place after the customary settlement period for that security. The price of the underlying securities and the date when the securities will be delivered and paid for are fixed at the time the transaction is negotiated. The securities purchased on a delayed delivery or when-issued basis are identified as such in the Fund's Schedule of Investments. The Fund may receive compensation for interest forgone in the purchase of a delayed delivery or when-issued security. With respect to purchase commitments, the Fund identifies securities as segregated in its records with a value at least equal to the amount of the commitment. Losses may arise due to changes in the value of the underlying securities or if the counterparty does not perform under the contract's terms, or if the issuer does not issue the securities due to political, economic, or other factors.
4. Purchases and Sales of Investments.
Purchases and sales of securities, other than short-term securities, aggregated $1,136,782 and $1,271,826, respectively.
5. Fees and Other Transactions with Affiliates.
Management Fee. Fidelity Management & Research Company (the investment adviser) and its affiliates provide the Fund with investment management related services for which the Fund pays a monthly management fee. The management fee is the sum of an individual fund fee rate that is based on an annual rate of .25% of the Fund's average net assets and an annualized group fee rate that averaged .11% during the period. The group fee rate is based upon the average net assets of all the mutual funds advised by the investment adviser, including any mutual funds previously advised by the investment adviser that are currently advised by Fidelity SelectCo, LLC, an affiliate of the investment adviser. The group fee rate decreases as assets under management increase and increases as assets under management decrease. For the reporting period, the total annual management fee rate was .36% of the Fund's average net assets.
Distribution and Service Plan Fees. In accordance with Rule 12b-1 of the 1940 Act, the Fund has adopted separate Distribution and Service Plans for each class of shares. Certain classes pay Fidelity Distributors Corporation (FDC), an affiliate of the investment adviser, separate Distribution and Service Fees, each of which is based on an annual percentage of each class' average net assets. In addition, FDC may pay financial intermediaries for selling shares of the Fund and providing shareholder support services. For the period, the Distribution and Service Fee rates, total fees and amounts retained by FDC were as follows:
| | Distribution
Fee | Service
Fee | Total Fees | Retained
by FDC |
| Class A | -% | .25% | $919 | $93 |
| Class T | -% | .25% | 54 | 1 |
| Class B | .65% | .25% | 1 | 1 |
| Class C | .75% | .25% | 612 | 65 |
| | | | $1,586 | $160 |
Sales Load. FDC may receive a front-end sales charge of up to 2.75% for selling Class A shares and Class T shares, some of which is paid to financial intermediaries for selling shares of the Fund. Depending on the holding period, FDC may receive contingent deferred sales charges levied on Class A, Class T, Class B, and Class C redemptions. The deferred sales charges range from 3.00% to 1.00% for Class B shares, 1.00% for Class C shares, .75% or .50% for certain purchases of Class A shares and .25% for certain purchases of Class T shares.
For the period, sales charge amounts retained by FDC were as follows:
| | Retained
by FDC |
| Class A | $14 |
| Class T | 3 |
| Class B(a) | –(b) |
| Class C(a) | 12 |
| | $29 |
(a) When Class B and Class C shares are initially sold, FDC pays commissions from its own resources to financial intermediaries through which the sales are made.
(b) In the amount of less than five hundred dollars.
Transfer Agent Fees. Fidelity Investments Institutional Operations Company, Inc. (FIIOC), an affiliate of the investment adviser, is the transfer, dividend disbursing and shareholder servicing agent for the Fund. FIIOC receives account fees and asset-based fees that vary according to the account size and type of account of the shareholders of the respective classes of the Fund. FIIOC pays for typesetting, printing and mailing of shareholder reports, except proxy statements. For the period, transfer agent fees for each class were as follows:
| | Amount | % of
Class-Level Average
Net Assets |
| Class A | $620 | .17 |
| Class T | 29 | .13 |
| Class B | –(a) | .11 |
| Class C | 101 | .16 |
| Limited Term Municipal Income | 2,927 | .09 |
| Class I | 478 | .16 |
| | $4,155 | |
(a) In the amount of less than five hundred dollars.
Accounting Fees. Fidelity Service Company, Inc. (FSC), an affiliate of the investment adviser, maintains the Fund's accounting records. The fee is based on the level of average net assets for each month.
Interfund Trades. The Fund may purchase from or sell securities to other Fidelity Funds under procedures adopted by the Board. The procedures have been designed to ensure these interfund trades are executed in accordance with Rule 17a-7 of the 1940 Act. Interfund trades are included within the respective purchases and sales amounts shown in the Purchases and Sales of Investments note.
6. Committed Line of Credit.
The Fund participates with other funds managed by the investment adviser or an affiliate in a $4.25 billion credit facility (the "line of credit") to be utilized for temporary or emergency purposes to fund shareholder redemptions or for other short-term liquidity purposes. The Fund has agreed to pay commitment fees on its pro-rata portion of the line of credit, which amounted to $10 and is reflected in Miscellaneous expenses on the Statement of Operations. During the period, the Fund did not borrow on this line of credit.
7. Expense Reductions.
Through arrangements with the Fund's custodian, credits realized as a result of certain uninvested cash balances were used to reduce the Fund's expenses. During the period, these credits reduced the Fund's custody expenses fee by $28.
In addition, during the period the investment adviser reimbursed and/or waived a portion of the fund-level operating expenses in the amount of $16.
8. Distributions to Shareholders.
Distributions to shareholders of each class were as follows:
| | Year ended
December 31, 2016 | Year ended December 31, 2015 |
| From net investment income | | |
| Class A | $4,046 | $4,860 |
| Class T | 246 | 289 |
| Class B | 1 | 2 |
| Class C | 217 | 303 |
| Limited Term Municipal Income | 45,375 | 48,674 |
| Class I | 4,044 | 4,005 |
| Total | $53,929 | $58,133 |
| From net realized gain | | |
| Class A | $65 | $751 |
| Class T | 4 | 45 |
| Class B | – | 1 |
| Class C | 11 | 125 |
| Limited Term Municipal Income | 588 | 6,100 |
| Class I | 59 | 541 |
| Total | $727 | $7,563 |
9. Share Transactions.
Share transactions for each class were as follows and may contain automatic conversions between classes or exchanges between affiliated funds:
| | Shares | Shares | Dollars | Dollars |
| | Year ended December 31, 2016 | Year ended December 31, 2015 | Year ended December 31, 2016 | Year ended December 31, 2015 |
| Class A | | | | |
| Shares sold | 13,917 | 16,831 | $148,531 | $179,831 |
| Reinvestment of distributions | 351 | 483 | 3,741 | 5,154 |
| Shares redeemed | (19,410) | (18,951) | (206,381) | (202,084) |
| Net increase (decrease) | (5,142) | (1,637) | $(54,109) | $(17,099) |
| Class T | | | | |
| Shares sold | 682 | 791 | $7,226 | $8,447 |
| Reinvestment of distributions | 22 | 30 | 235 | 316 |
| Shares redeemed | (874) | (1,080) | (9,260) | (11,510) |
| Net increase (decrease) | (170) | (259) | $(1,799) | $(2,747) |
| Class B | | | | |
| Shares sold | 3 | 3 | $28 | $17 |
| Reinvestment of distributions | –(a) | –(a) | 1 | 3 |
| Shares redeemed | (30) | (14) | (317) | (144) |
| Net increase (decrease) | (27) | (11) | $(288) | $(124) |
| Class C | | | | |
| Shares sold | 961 | 1,149 | $10,252 | $12,246 |
| Reinvestment of distributions | 18 | 34 | 188 | 359 |
| Shares redeemed | (1,887) | (1,330) | (20,039) | (14,162) |
| Net increase (decrease) | (908) | (147) | $(9,599) | $(1,557) |
| Limited Term Municipal Income | | | | |
| Shares sold | 91,180 | 66,529 | $970,470 | $709,164 |
| Reinvestment of distributions | 3,156 | 3,861 | 33,582 | 41,135 |
| Shares redeemed | (115,740) | (84,109) | (1,224,234) | (895,882) |
| Net increase (decrease) | (21,404) | (13,719) | $(220,182) | $(145,583) |
| Class I | | | | |
| Shares sold | 15,767 | 13,372 | $167,805 | $142,602 |
| Reinvestment of distributions | 311 | 335 | 3,311 | 3,575 |
| Shares redeemed | (13,673) | (12,317) | (145,007) | (131,238) |
| Net increase (decrease) | 2,405 | 1,390 | $26,109 | $14,939 |
(a) In the amount of less than five hundred dollars.
10. Other.
The Fund's organizational documents provide former and current trustees and officers with a limited indemnification against liabilities arising in connection with the performance of their duties to the Fund. In the normal course of business, the Fund may also enter into contracts that provide general indemnifications. The Fund's maximum exposure under these arrangements is unknown as this would be dependent on future claims that may be made against the Fund. The risk of material loss from such claims is considered remote.
Report of Independent Registered Public Accounting Firm
To the Trustees of Fidelity Municipal Trust and Shareholders of Fidelity Limited Term Municipal Income Fund:
In our opinion, the accompanying statement of assets and liabilities, including the schedule of investments, and the related statements of operations and of changes in net assets and the financial highlights present fairly, in all material respects, the financial position of Fidelity Limited Term Municipal Income Fund (a fund of Fidelity Municipal Trust) as of December 31, 2016, the results of its operations for the year then ended, the changes in its net assets for each of the two years in the period then ended and the financial highlights for each of the five years in the period then ended, in conformity with accounting principles generally accepted in the United States of America. These financial statements and financial highlights (hereafter referred to as “financial statements”) are the responsibility of the Fidelity Limited Term Municipal Income Fund’s management. Our responsibility is to express an opinion on these financial statements based on our audits. We conducted our audits of these financial statements in accordance with the standards of the Public Company Accounting Oversight Board (United States). Those standards require that we plan and perform the audit to obtain reasonable assurance about whether the financial statements are free of material misstatement. An audit includes examining, on a test basis, evidence supporting the amounts and disclosures in the financial statements, assessing the accounting principles used and significant estimates made by management, and evaluating the overall financial statement presentation. We believe that our audits, which included confirmation of securities as of December 31, 2016 by correspondence with the custodian and brokers, provide a reasonable basis for our opinion.
PricewaterhouseCoopers LLP
Boston, Massachusetts
February 17, 2017
Trustees and Officers
The Trustees, Members of the Advisory Board (if any), and officers of the trust and fund, as applicable, are listed below. The Board of Trustees governs the fund and is responsible for protecting the interests of shareholders. The Trustees are experienced executives who meet periodically throughout the year to oversee the fund's activities, review contractual arrangements with companies that provide services to the fund, oversee management of the risks associated with such activities and contractual arrangements, and review the fund's performance. Each of the Trustees oversees 243 funds.
The Trustees hold office without limit in time except that (a) any Trustee may resign; (b) any Trustee may be removed by written instrument, signed by at least two-thirds of the number of Trustees prior to such removal; (c) any Trustee who requests to be retired or who has become incapacitated by illness or injury may be retired by written instrument signed by a majority of the other Trustees; and (d) any Trustee may be removed at any special meeting of shareholders by a two-thirds vote of the outstanding voting securities of the trust. Each Trustee who is not an interested person (as defined in the 1940 Act) of the trust and the fund is referred to herein as an Independent Trustee. Each Independent Trustee shall retire not later than the last day of the calendar year in which his or her 75th birthday occurs. The Independent Trustees may waive this mandatory retirement age policy with respect to individual Trustees. Officers and Advisory Board Members hold office without limit in time, except that any officer or Advisory Board Member may resign or may be removed by a vote of a majority of the Trustees at any regular meeting or any special meeting of the Trustees. Except as indicated, each individual has held the office shown or other offices in the same company for the past five years.
The fund’s Statement of Additional Information (SAI) includes more information about the Trustees. To request a free copy, call Fidelity at 1-800-544-8544.
Experience, Skills, Attributes, and Qualifications of the Trustees. The Governance and Nominating Committee has adopted a statement of policy that describes the experience, qualifications, attributes, and skills that are necessary and desirable for potential Independent Trustee candidates (Statement of Policy). The Board believes that each Trustee satisfied at the time he or she was initially elected or appointed a Trustee, and continues to satisfy, the standards contemplated by the Statement of Policy. The Governance and Nominating Committee also engages professional search firms to help identify potential Independent Trustee candidates who have the experience, qualifications, attributes, and skills consistent with the Statement of Policy. From time to time, additional criteria based on the composition and skills of the current Independent Trustees, as well as experience or skills that may be appropriate in light of future changes to board composition, business conditions, and regulatory or other developments, have also been considered by the professional search firms and the Governance and Nominating Committee. In addition, the Board takes into account the Trustees' commitment and participation in Board and committee meetings, as well as their leadership of standing and ad hoc committees throughout their tenure.
In determining that a particular Trustee was and continues to be qualified to serve as a Trustee, the Board has considered a variety of criteria, none of which, in isolation, was controlling. The Board believes that, collectively, the Trustees have balanced and diverse experience, qualifications, attributes, and skills, which allow the Board to operate effectively in governing the fund and protecting the interests of shareholders. Information about the specific experience, skills, attributes, and qualifications of each Trustee, which in each case led to the Board's conclusion that the Trustee should serve (or continue to serve) as a trustee of the fund, is provided below.
Board Structure and Oversight Function. Abigail P. Johnson is an interested person and currently serves as Chairman. The Trustees have determined that an interested Chairman is appropriate and benefits shareholders because an interested Chairman has a personal and professional stake in the quality and continuity of services provided to the fund. Independent Trustees exercise their informed business judgment to appoint an individual of their choosing to serve as Chairman, regardless of whether the Trustee happens to be independent or a member of management. The Independent Trustees have determined that they can act independently and effectively without having an Independent Trustee serve as Chairman and that a key structural component for assuring that they are in a position to do so is for the Independent Trustees to constitute a substantial majority for the Board. The Independent Trustees also regularly meet in executive session. Marie L. Knowles serves as Chairman of the Independent Trustees and as such (i) acts as a liaison between the Independent Trustees and management with respect to matters important to the Independent Trustees and (ii) with management prepares agendas for Board meetings.
Fidelity® funds are overseen by different Boards of Trustees. The fund's Board oversees Fidelity's investment-grade bond, money market, asset allocation and certain equity funds, and other Boards oversee Fidelity's high income, sector and other equity funds. The asset allocation funds may invest in Fidelity® funds that are overseen by such other Boards. The use of separate Boards, each with its own committee structure, allows the Trustees of each group of Fidelity® funds to focus on the unique issues of the funds they oversee, including common research, investment, and operational issues. On occasion, the separate Boards establish joint committees to address issues of overlapping consequences for the Fidelity® funds overseen by each Board.
The Trustees operate using a system of committees to facilitate the timely and efficient consideration of all matters of importance to the Trustees, the fund, and fund shareholders and to facilitate compliance with legal and regulatory requirements and oversight of the fund's activities and associated risks. The Board, acting through its committees, has charged FMR and its affiliates with (i) identifying events or circumstances the occurrence of which could have demonstrably adverse effects on the fund's business and/or reputation; (ii) implementing processes and controls to lessen the possibility that such events or circumstances occur or to mitigate the effects of such events or circumstances if they do occur; and (iii) creating and maintaining a system designed to evaluate continuously business and market conditions in order to facilitate the identification and implementation processes described in (i) and (ii) above. Because the day-to-day operations and activities of the fund are carried out by or through FMR, its affiliates, and other service providers, the fund's exposure to risks is mitigated but not eliminated by the processes overseen by the Trustees. While each of the Board's committees has responsibility for overseeing different aspects of the fund's activities, oversight is exercised primarily through the Operations and Audit Committees. In addition, an ad hoc Board committee of Independent Trustees has worked with FMR to enhance the Board's oversight of investment and financial risks, legal and regulatory risks, technology risks, and operational risks, including the development of additional risk reporting to the Board. Appropriate personnel, including but not limited to the fund's Chief Compliance Officer (CCO), FMR's internal auditor, the independent accountants, the fund's Treasurer and portfolio management personnel, make periodic reports to the Board's committees, as appropriate, including an annual review of Fidelity's risk management program for the Fidelity® funds. The responsibilities of each standing committee, including their oversight responsibilities, are described further under "Standing Committees of the Trustees."
Interested Trustees*:
Correspondence intended for a Trustee who is an interested person may be sent to Fidelity Investments, 245 Summer Street, Boston, Massachusetts 02210.
Name, Year of Birth; Principal Occupations and Other Relevant Experience+
Abigail P. Johnson (1961)
Year of Election or Appointment: 2009
Trustee
Chairman of the Board of Trustees
Ms. Johnson also serves as Trustee of other Fidelity® funds. Ms. Johnson serves as Chairman (2016-present), Chief Executive Officer (2014-present), and Director (2007-present) of FMR LLC (diversified financial services company), President of Fidelity Financial Services (2012-present) and President of Personal, Workplace and Institutional Services (2005-present). Ms. Johnson is Chairman and Director of FMR Co., Inc. (investment adviser firm, 2011-present) and Chairman and Director of FMR (investment adviser firm, 2011-present). Previously, Ms. Johnson served as Vice Chairman (2007-2016) and President (2013-2016) of FMR LLC, President and a Director of FMR (2001-2005), a Trustee of other investment companies advised by FMR, Fidelity Investments Money Management, Inc. (investment adviser firm), and FMR Co., Inc. (2001-2005), Senior Vice President of the Fidelity® funds (2001-2005), and managed a number of Fidelity® funds. Ms. Abigail P. Johnson and Mr. Arthur E. Johnson are not related.
Jennifer Toolin McAuliffe (1959)
Year of Election or Appointment: 2016
Trustee
Ms. McAuliffe also serves as Trustee of other Fidelity® funds. Ms. McAuliffe previously served as a Member of the Advisory Board of certain Fidelity® funds (2016) and as Co-Head of Fixed Income of Fidelity Investments Limited (now known as FIL Limited (FIL)) (diversified financial services company). Earlier roles at FIL included Director of Research for FIL’s credit and quantitative teams in London, Hong Kong and Tokyo. Ms. McAuliffe also was the Director of Research for taxable and municipal bonds at Fidelity Investments Money Management, Inc. Ms. McAuliffe is also a director or trustee of several not-for-profit entities.
* Determined to be an “Interested Trustee” by virtue of, among other things, his or her affiliation with the trust or various entities under common control with FMR.
+ The information includes the Trustee's principal occupation during the last five years and other information relating to the experience, attributes, and skills relevant to the Trustee's qualifications to serve as a Trustee, which led to the conclusion that the Trustee should serve as a Trustee for the fund.
Independent Trustees:
Correspondence intended for an Independent Trustee may be sent to Fidelity Investments, P.O. Box 55235, Boston, Massachusetts 02205-5235.
Name, Year of Birth; Principal Occupations and Other Relevant Experience+
Elizabeth S. Acton (1951)
Year of Election or Appointment: 2013
Trustee
Ms. Acton also serves as Trustee of other Fidelity® funds. Prior to her retirement in April 2012, Ms. Acton was Executive Vice President, Finance (2011-2012), Executive Vice President, Chief Financial Officer (2002-2011), and Treasurer (2004-2005) of Comerica Incorporated (financial services). Prior to joining Comerica, Ms. Acton held a variety of positions at Ford Motor Company (1983-2002), including Vice President and Treasurer (2000-2002) and Executive Vice President and Chief Financial Officer of Ford Motor Credit Company (1998-2000). Ms. Acton currently serves as a member of the Board of Directors and Audit and Finance Committees of Beazer Homes USA, Inc. (homebuilding, 2012-present). Previously, Ms. Acton served as a Member of the Advisory Board of certain Fidelity® funds (2013-2016).
John Engler (1948)
Year of Election or Appointment: 2014
Trustee
Mr. Engler also serves as Trustee of other Fidelity® funds. He serves as president of the Business Roundtable (2011-present), and on the board of directors for Universal Forest Products (manufacturer and distributor of wood and wood-alternative products, 2003-present) and K12 Inc. (technology-based education company, 2012-present). Previously, Mr. Engler served as a Member of the Advisory Board of certain Fidelity® funds (2014-2016), a trustee of The Munder Funds (2003-2014), president and CEO of the National Association of Manufacturers (2004-2011), member of the Board of Trustees of the Annie E. Casey Foundation (2004-2015), and as governor of Michigan (1991-2003). He is a past chairman of the National Governors Association.
Albert R. Gamper, Jr. (1942)
Year of Election or Appointment: 2006
Trustee
Mr. Gamper also serves as Trustee of other Fidelity® funds. Prior to his retirement in December 2004, Mr. Gamper served as Chairman of the Board of CIT Group Inc. (commercial finance). During his tenure with CIT Group Inc. Mr. Gamper served in numerous senior management positions, including Chairman (1987-1989; 1999-2001; 2002-2004), Chief Executive Officer (1987-2004), and President (2002-2003). Mr. Gamper currently serves as a member of the Board of Directors of Public Service Enterprise Group (utilities, 2000-present), and Member of the Board of Trustees of Barnabas Health Care System (1997-present). Previously, Mr. Gamper served as Chairman (2012-2015) and Vice Chairman (2011-2012) of the Independent Trustees of certain Fidelity® funds and as Chairman of the Board of Governors, Rutgers University (2004-2007).
Robert F. Gartland (1951)
Year of Election or Appointment: 2010
Trustee
Mr. Gartland also serves as Trustee of other Fidelity® funds. Mr. Gartland is Chairman and an investor in Gartland & Mellina Group Corp. (consulting, 2009-present). Previously, Mr. Gartland served as a partner and investor of Vietnam Partners LLC (investments and consulting, 2008-2011). Prior to his retirement, Mr. Gartland held a variety of positions at Morgan Stanley (financial services, 1979-2007) including Managing Director (1987-2007).
Arthur E. Johnson (1947)
Year of Election or Appointment: 2008
Trustee
Vice Chairman of the Independent Trustees
Mr. Johnson also serves as Trustee of other Fidelity® funds. Mr. Johnson serves as a member of the Board of Directors of Eaton Corporation plc (diversified power management, 2009-present) and Booz Allen Hamilton (management consulting, 2011-present). Prior to his retirement, Mr. Johnson served as Senior Vice President of Corporate Strategic Development of Lockheed Martin Corporation (defense contractor, 1999-2009). He previously served on the Board of Directors of IKON Office Solutions, Inc. (1999-2008), AGL Resources, Inc. (holding company, 2002-2016), and Delta Airlines (2005-2007). Mr. Arthur E. Johnson is not related to Ms. Abigail P. Johnson.
Michael E. Kenneally (1954)
Year of Election or Appointment: 2009
Trustee
Mr. Kenneally also serves as Trustee of other Fidelity® funds. Prior to his retirement, Mr. Kenneally served as Chairman and Global Chief Executive Officer of Credit Suisse Asset Management. Before joining Credit Suisse, he was an Executive Vice President and Chief Investment Officer for Bank of America Corporation. Earlier roles at Bank of America included Director of Research, Senior Portfolio Manager and Research Analyst, and Mr. Kenneally was awarded the Chartered Financial Analyst (CFA) designation in 1991.
Marie L. Knowles (1946)
Year of Election or Appointment: 2001
Trustee
Chairman of the Independent Trustees
Ms. Knowles also serves as Trustee of other Fidelity® funds. Prior to Ms. Knowles' retirement in June 2000, she served as Executive Vice President and Chief Financial Officer of Atlantic Richfield Company (ARCO) (diversified energy, 1996-2000). From 1993 to 1996, she was a Senior Vice President of ARCO and President of ARCO Transportation Company (pipeline and tanker operations). Ms. Knowles currently serves as a Director and Chairman of the Audit Committee of McKesson Corporation (healthcare service, since 2002). Ms. Knowles is a member of the Board of the Santa Catalina Island Company (real estate, 2009-present). Ms. Knowles is a Member of the Investment Company Institute Board of Governors and a Member of the Governing Council of the Independent Directors Council (2014-present). She also serves as a member of the Advisory Board for the School of Engineering of the University of Southern California. Previously, Ms. Knowles served as a Director of Phelps Dodge Corporation (copper mining and manufacturing, 1994-2007), URS Corporation (engineering and construction, 2000-2003) and America West (airline, 1999-2002). Ms. Knowles previously served as Vice Chairman of the Independent Trustees of certain Fidelity® funds (2012-2015).
Mark A. Murray (1954)
Year of Election or Appointment: 2016
Trustee
Mr. Murray also serves as Trustee of other Fidelity® funds. Mr. Murray is Vice Chairman (2013-present) of Meijer, Inc. (regional retail chain). Previously, Mr. Murray served as a Member of the Advisory Board of certain Fidelity® funds (2016) and as Co-Chief Executive Officer (2013-2016) and President (2006-2013) of Meijer, Inc. Mr. Murray serves as a member of the Board of Directors and Nuclear Review and Public Policy and Responsibility Committees of DTE Energy Company (diversified energy company, 2009-present). Mr. Murray also serves as a member of the Board of Directors of Spectrum Health (not-for-profit health system, 2015-present). Mr. Murray previously served as President of Grand Valley State University (2001-2006), Treasurer for the State of Michigan (1999-2001), Vice President of Finance and Administration for Michigan State University (1998-1999), and a member of the Board of Directors and Audit Committee and Chairman of the Nominating and Corporate Governance Committee of Universal Forest Products, Inc. (manufacturer and distributor of wood and wood-alternative products, 2004-2016). Mr. Murray is also a director or trustee of many community and professional organizations.
+ The information includes the Trustee's principal occupation during the last five years and other information relating to the experience, attributes, and skills relevant to the Trustee's qualifications to serve as a Trustee, which led to the conclusion that the Trustee should serve as a Trustee for the fund.
Advisory Board Members and Officers:
Correspondence intended for an officer may be sent to Fidelity Investments, 245 Summer Street, Boston, Massachusetts 02210. Officers appear below in alphabetical order.
Name, Year of Birth; Principal Occupation
Marc R. Bryant (1966)
Year of Election or Appointment: 2015
Secretary and Chief Legal Officer (CLO)
Mr. Bryant also serves as Secretary and CLO of other funds. Mr. Bryant serves as CLO, Secretary, and Senior Vice President of Fidelity Management & Research Company (investment adviser firm, 2015-present) and FMR Co., Inc. (investment adviser firm, 2015-present); Secretary of Fidelity SelectCo, LLC (investment adviser firm, 2015-present) and Fidelity Investments Money Management, Inc. (investment adviser firm, 2015-present); and CLO of Fidelity Management & Research (Hong Kong) Limited and FMR Investment Management (UK) Limited (investment adviser firms, 2015-present) and Fidelity Management & Research (Japan) Limited (investment adviser firm, 2016-present). He is Senior Vice President and Deputy General Counsel of FMR LLC (diversified financial services company). Previously, Mr. Bryant served as Secretary and CLO of Fidelity Rutland Square Trust II (2010-2014) and Assistant Secretary of Fidelity's Fixed Income and Asset Allocation Funds (2013-2015). Prior to joining Fidelity Investments, Mr. Bryant served as a Senior Vice President and the Head of Global Retail Legal for AllianceBernstein L.P. (2006-2010), and as the General Counsel for ProFund Advisors LLC (2001-2006).
Jeffrey S. Christian (1961)
Year of Election or Appointment: 2016
Assistant Treasurer
Mr. Christian also serves as Assistant Treasurer of other funds. Mr. Christian is an employee of Fidelity Investments (2003-present).
Jonathan Davis (1968)
Year of Election or Appointment: 2010
Assistant Treasurer
Mr. Davis also serves as Assistant Treasurer of other funds, and is an employee of Fidelity Investments. Previously, Mr. Davis served as Vice President and Associate General Counsel of FMR LLC (diversified financial services company, 2003-2010).
Adrien E. Deberghes (1967)
Year of Election or Appointment: 2010
Assistant Treasurer
Mr. Deberghes also serves as an officer of other funds. He serves as Executive Vice President of Fidelity Investments Money Management, Inc. (FIMM) (investment adviser firm, 2016-present) and is an employee of Fidelity Investments (2008-present). Prior to joining Fidelity Investments, Mr. Deberghes was Senior Vice President of Mutual Fund Administration at State Street Corporation (2007-2008), Senior Director of Mutual Fund Administration at Investors Bank & Trust (2005-2007), and Director of Finance for Dunkin' Brands (2000-2005). Previously, Mr. Deberghes served in other fund officer roles.
Stephanie J. Dorsey (1969)
Year of Election or Appointment: 2013
President and Treasurer
Ms. Dorsey also serves as an officer of other funds. She is an employee of Fidelity Investments (2008-present) and has served in other fund officer roles. Prior to joining Fidelity Investments, Ms. Dorsey served as Treasurer (2004-2008) of the JPMorgan Mutual Funds and Vice President (2004-2008) of JPMorgan Chase Bank.
Howard J. Galligan III (1966)
Year of Election or Appointment: 2014
Chief Financial Officer
Mr. Galligan also serves as Chief Financial Officer of other funds. Mr. Galligan serves as President of Fidelity Pricing and Cash Management Services (FPCMS) (2014-present) and as a Director of Strategic Advisers, Inc. (investment adviser firm, 2008-present). Previously, Mr. Galligan served as Chief Administrative Officer of Asset Management (2011-2014) and Chief Operating Officer and Senior Vice President of Investment Support for Strategic Advisers, Inc. (2003-2011).
Scott C. Goebel (1968)
Year of Election or Appointment: 2015
Vice President
Mr. Goebel serves as Vice President of other funds and is an employee of Fidelity Investments (2001-present). Previously, Mr. Goebel served as Senior Vice President of Fidelity Management & Research Company (FMR) (investment adviser firm, 2016), Secretary of Fidelity SelectCo, LLC (investment adviser firm, 2013-2015), Fidelity Investments Money Management, Inc. (FIMM) (investment adviser firm, 2010-2015), and Fidelity Research and Analysis Company (FRAC) (investment adviser firm, 2010-2015); General Counsel, Secretary, and Senior Vice President of FMR (investment adviser firm, 2008-2015) and FMR Co., Inc. (investment adviser firm, 2008-2015); Assistant Secretary of Fidelity Management & Research (Japan) Limited (investment adviser firm, 2008-2015) and Fidelity Management & Research (U.K.) Inc. (investment adviser firm, 2008-2015); Chief Legal Officer (CLO) of Fidelity Management & Research (Hong Kong) Limited (investment adviser firm, 2008-2015); Secretary and CLO of certain Fidelity® funds (2008-2015); Assistant Secretary of FIMM (2008-2010), FRAC (2008-2010), and certain funds (2007-2008); and as Vice President and Secretary of Fidelity Distributors Corporation (FDC) (2005-2007).
Colm A. Hogan (1973)
Year of Election or Appointment: 2016
Assistant Treasurer
Mr. Hogan also serves as an officer of other funds. Mr. Hogan is an employee of Fidelity Investments (2005-present).
Chris Maher (1972)
Year of Election or Appointment: 2013
Assistant Treasurer
Mr. Maher serves as Assistant Treasurer of other funds. Mr. Maher is Vice President of Valuation Oversight and is an employee of Fidelity Investments. Previously, Mr. Maher served as Vice President of Asset Management Compliance (2013), Vice President of the Program Management Group of FMR (investment adviser firm, 2010-2013), and Vice President of Valuation Oversight (2008-2010).
John B. McGinty, Jr. (1962)
Year of Election or Appointment: 2016
Chief Compliance Officer
Mr. McGinty also serves as Chief Compliance Officer of other funds. Mr. McGinty is Senior Vice President of Asset Management Compliance for Fidelity Investments and is an employee of Fidelity Investments (2016-present). Mr. McGinty previously served as Vice President, Senior Attorney at Eaton Vance Management (investment management firm, 2015-2016), and prior to Eaton Vance as global CCO for all firm operations and registered investment companies at GMO LLC (investment management firm, 2009-2015). Before joining GMO LLC, Mr. McGinty served as Senior Vice President, Deputy General Counsel for Fidelity Investments (2007-2009).
John F. Papandrea (1972)
Year of Election or Appointment: 2016
Anti-Money Laundering (AML) Officer
Mr. Papandrea also serves as AML Officer of other funds. Mr. Papandrea is Vice President of FMR LLC (diversified financial services company, 2008-present) and is an employee of Fidelity Investments (2005-present).
Jason P. Pogorelec (1975)
Year of Election or Appointment: 2015
Assistant Secretary
Mr. Pogorelec also serves as Assistant Secretary of other funds. Mr. Pogorelec serves as Vice President, Associate General Counsel (2010-present) and is an employee of Fidelity Investments (2006-present).
Nancy D. Prior (1967)
Year of Election or Appointment: 2014
Vice President
Ms. Prior also serves as Vice President of other funds. Ms. Prior serves as a Director of FMR Investment Management (UK) Limited (investment adviser firm, 2015-present), President (2016-present) and Director (2014-present) of Fidelity Investments Money Management, Inc. (FIMM) (investment adviser firm), President, Fixed Income (2014-present), Vice Chairman of FIAM LLC (investment adviser firm, 2014-present), and is an employee of Fidelity Investments (2002-present). Previously, Ms. Prior served as Vice President of Fidelity's Money Market Funds (2012-2014), President, Money Market and Short Duration Bond Group of Fidelity Management & Research (FMR) (investment adviser firm, 2013-2014), President, Money Market Group of FMR (2011-2013), Managing Director of Research (2009-2011), Senior Vice President and Deputy General Counsel (2007-2009), and Assistant Secretary of certain Fidelity® funds (2008-2009).
Stacie M. Smith (1974)
Year of Election or Appointment: 2013
Assistant Treasurer
Ms. Smith also serves as an officer of other funds. She is an employee of Fidelity Investments (2009-present) and has served in other fund officer roles. Prior to joining Fidelity Investments, Ms. Smith served as Senior Audit Manager of Ernst & Young LLP (accounting firm, 1996-2009). Previously, Ms. Smith served as Deputy Treasurer of certain Fidelity® funds (2013-2016).
Marc L. Spector (1972)
Year of Election or Appointment: 2016
Deputy Treasurer
Mr. Spector also serves as an officer of other funds. Mr. Spector is an employee of Fidelity Investments (2016-present). Prior to joining Fidelity Investments, Mr. Spector served as Director at the Siegfried Group (accounting firm, 2013-2016), and prior to Siegfried Group as audit senior manager at Deloitte & Touche (accounting firm, 2005-2013).
Renee Stagnone (1975)
Year of Election or Appointment: 2016
Assistant Treasurer
Ms. Stagnone also serves as an officer of other funds. Ms. Stagnone is an employee of Fidelity Investments (1997-present). Previously, Ms. Stagnone served as Deputy Treasurer of certain Fidelity® funds (2013-2016).
Christine J. Thompson (1958)
Year of Election or Appointment: 2015
Vice President of Fidelity's Bond Funds
Ms. Thompson also serves as Vice President of other funds. Ms. Thompson also serves as Chief Investment Officer of FMR's Bond Group (2010-present) and is an employee of Fidelity Investments (1985-present). Previously, Ms. Thompson served as Vice President of Fidelity's Bond Funds (2010-2012).
Shareholder Expense Example
As a shareholder of the Fund, you incur two types of costs: (1) transaction costs, including sales charges (loads) on purchase payments or redemption proceeds, redemption fees and (2) ongoing costs, including management fees, distribution and/or service (12b-1) fees and other Fund expenses. This Example is intended to help you understand your ongoing costs (in dollars) of investing in the Fund and to compare these costs with the ongoing costs of investing in other mutual funds.
The Example is based on an investment of $1,000 invested at the beginning of the period and held for the entire period (July 1, 2016 to December 31, 2016).
Actual Expenses
The first line of the accompanying table for each class of the Fund provides information about actual account values and actual expenses. You may use the information in this line, together with the amount you invested, to estimate the expenses that you paid over the period. Simply divide your account value by $1,000.00 (for example, an $8,600 account value divided by $1,000.00 = 8.6), then multiply the result by the number in the first line for a class of the Fund under the heading entitled "Expenses Paid During Period" to estimate the expenses you paid on your account during this period. A small balance maintenance fee of $12.00 that is charged once a year may apply for certain accounts with a value of less than $2,000. This fee is not included in the table below. If it was, the estimate of expenses you paid during the period would be higher, and your ending account value lower, by this amount. In addition, the Fund, as a shareholder in the underlying Fidelity Central Funds, will indirectly bear its pro-rata share of the fees and expenses incurred by the underlying Fidelity Central Funds. These fees and expenses are not included in the Fund's annualized expense ratio used to calculate the expense estimate in the table below.
Hypothetical Example for Comparison Purposes
The second line of the accompanying table for each class of the Fund provides information about hypothetical account values and hypothetical expenses based on a Class' actual expense ratio and an assumed rate of return of 5% per year before expenses, which is not the Class' actual return. The hypothetical account values and expenses may not be used to estimate the actual ending account balance or expenses you paid for the period. You may use this information to compare the ongoing costs of investing in the Fund and other funds. To do so, compare this 5% hypothetical example with the 5% hypothetical examples that appear in the shareholder reports of the other funds. A small balance maintenance fee of $12.00 that is charged once a year may apply for certain accounts with a value of less than $2,000. This fee is not included in the table below. If it was, the estimate of expenses you paid during the period would be higher, and your ending account value lower, by this amount. In addition, the Fund, as a shareholder in the underlying Fidelity Central Funds, will indirectly bear its pro-rata share of the fees and expenses incurred by the underlying Fidelity Central Funds. These fees and expenses are not included in the Fund's annualized expense ratio used to calculate the expense estimate in the table below.
Please note that the expenses shown in the table are meant to highlight your ongoing costs only and do not reflect any transaction costs. Therefore, the second line of the table is useful in comparing ongoing costs only, and will not help you determine the relative total costs of owning different funds. In addition, if these transactional costs were included, your costs would have been higher.
| | Annualized Expense Ratio-A | Beginning
Account Value
July 1, 2016 | Ending
Account Value
December 31, 2016 | Expenses Paid
During Period-B
July 1, 2016
to December 31, 2016 |
| Class A | .80% | | | |
| Actual | | $1,000.00 | $978.60 | $3.98 |
| Hypothetical-C | | $1,000.00 | $1,021.11 | $4.06 |
| Class T | .76% | | | |
| Actual | | $1,000.00 | $978.70 | $3.78 |
| Hypothetical-C | | $1,000.00 | $1,021.32 | $3.86 |
| Class C | 1.54% | | | |
| Actual | | $1,000.00 | $974.90 | $7.64 |
| Hypothetical-C | | $1,000.00 | $1,017.39 | $7.81 |
| Limited Term Municipal Income | .47% | | | |
| Actual | | $1,000.00 | $980.10 | $2.34 |
| Hypothetical-C | | $1,000.00 | $1,022.77 | $2.39 |
| Class I | .54% | | | |
| Actual | | $1,000.00 | $980.70 | $2.69 |
| Hypothetical-C | | $1,000.00 | $1,022.42 | $2.75 |
A Annualized expense ratio reflects expenses net of applicable fee waivers.
B Expenses are equal to each Class' annualized expense ratio, multiplied by the average account value over the period, multiplied by 184/366 (to reflect the one-half year period).
C 5% return per year before expenses
Distributions (Unaudited)
The fund hereby designates as a capital gain dividend with respect to the taxable year ended December 31, 2016, $726,749 or, if subsequently determined to be different, the net capital gain of such year.
During fiscal year ended 2016, 100% of the fund's income dividends were free from federal income tax, and 6.96% of the fund's income dividends was subject to the federal alternative minimum tax.
The fund will notify shareholders in January 2017 of amounts for use in preparing 2016 income tax returns.
Board Approval of Investment Advisory Contracts and Management Fees
Fidelity Limited Term Municipal Income Fund
Each year, the Board of Trustees, including the Independent Trustees (together, the Board), votes on the renewal of the management contract with Fidelity Management & Research Company (FMR) and the sub-advisory agreements (together, the Advisory Contracts) for the fund. The Board, assisted by the advice of fund counsel and Independent Trustees' counsel, requests and considers a broad range of information relevant to the renewal of the Advisory Contracts throughout the year.
The Board meets regularly and, at each of its meetings, covers an extensive agenda of topics and materials and considers factors that are relevant to its annual consideration of the renewal of the fund's Advisory Contracts, including the services and support provided to the fund and its shareholders. The Board has established four standing committees (Committees) — Operations, Audit, Fair Valuation, and Governance and Nominating — each composed of and chaired by Independent Trustees with varying backgrounds, to which the Board has assigned specific subject matter responsibilities in order to enhance effective decision-making by the Board. The Operations Committee, of which all of the Independent Trustees are members, meets regularly throughout the year and considers, among other matters, information specifically related to the annual consideration of the renewal of the fund's Advisory Contracts. The Board, acting directly and through its Committees, requests and receives information concerning the annual consideration of the renewal of the fund's Advisory Contracts. The Board also meets as needed to consider matters specifically related to the Board's annual consideration of the renewal of the Advisory Contracts. Members of the Board may also meet with trustees of other Fidelity funds through ad hoc joint committees to discuss certain matters relevant to all of the Fidelity funds.
At its September 2016 meeting, the Board unanimously determined to renew the fund's Advisory Contracts. In reaching its determination, the Board considered all factors it believed relevant, including (i) the nature, extent, and quality of the services to be provided to the fund and its shareholders (including the investment performance of the fund); (ii) the competitiveness of the fund's management fee and total expense ratio relative to peer funds; (iii) the total costs of the services to be provided by and the profits to be realized by Fidelity from its relationships with the fund; and (iv) the extent to which, if any, economies of scale exist and would be realized as the fund grows, and whether any economies of scale are appropriately shared with fund shareholders.
In considering whether to renew the Advisory Contracts for the fund, the Board reached a determination, with the assistance of fund counsel and Independent Trustees' counsel and through the exercise of its business judgment, that the renewal of the Advisory Contracts was in the best interests of the fund and its shareholders and that the compensation payable under the Advisory Contracts was fair and reasonable. The Board's decision to renew the Advisory Contracts was not based on any single factor, but rather was based on a comprehensive consideration of all the information provided to the Board at its meetings throughout the year. The Board, in reaching its determination to renew the Advisory Contracts, was aware that shareholders of the fund have a broad range of investment choices available to them, including a wide choice among funds offered by Fidelity's competitors, and that the fund's shareholders, who have the opportunity to review and weigh the disclosure provided by the fund in its prospectus and other public disclosures, have chosen to invest in this fund, which is part of the Fidelity family of funds.
Nature, Extent, and Quality of Services Provided. The Board considered Fidelity's staffing as it relates to the fund, including the backgrounds of investment personnel of Fidelity, and also considered the fund's investment objective, strategies, and related investment philosophy. The Independent Trustees also had discussions with senior management of Fidelity's investment operations and investment groups. The Board considered the structure of the investment personnel compensation program and whether this structure provides appropriate incentives to act in the best interests of the fund. Additionally, the Board considered the portfolio managers' investments, if any, in the funds that they manage.
Resources Dedicated to Investment Management and Support Services. The Board reviewed the general qualifications and capabilities of Fidelity's investment staff, including its size, education, experience, and resources, as well as Fidelity's approach to recruiting, managing, and compensating investment personnel. The Board noted that Fidelity has continued to increase the resources devoted to non-U.S. offices, including expansion of Fidelity's global investment organization. The Board also noted that Fidelity's analysts have extensive resources, tools and capabilities that allow them to conduct sophisticated quantitative and fundamental analysis, as well as credit analysis of issuers, counterparties and guarantors. Further, the Board considered that Fidelity's investment professionals have sufficient access to global information and data so as to provide competitive investment results over time, and that those professionals also have access to sophisticated tools that permit them to assess portfolio construction and risk and performance attribution characteristics continuously, as well as to transmit new information and research conclusions rapidly around the world. Additionally, in its deliberations, the Board considered Fidelity's trading, risk management, compliance, and technology and operations capabilities and resources, which are integral parts of the investment management process.
Shareholder and Administrative Services. The Board considered (i) the nature, extent, quality, and cost of advisory, administrative, and shareholder services performed by FMR, the sub-advisers (together with FMR, the Investment Advisers), and their affiliates under the Advisory Contracts and under separate agreements covering transfer agency and pricing and bookkeeping services for the fund; (ii) the nature and extent of the supervision of third party service providers, principally custodians, subcustodians, and pricing vendors; and (iii) the resources devoted to, and the record of compliance with, the fund's compliance policies and procedures.
The Board noted that the growth of fund assets over time across the complex allows Fidelity to reinvest in the development of services designed to enhance the value or convenience of the Fidelity funds as investment vehicles. These services include 24-hour access to account information and market information through telephone representatives and over the Internet, investor education materials and asset allocation tools, and the expanded availability of Fidelity Investor Centers.
Investment in a Large Fund Family. The Board considered the benefits to shareholders of investing in a Fidelity fund, including the benefits of investing in a fund that is part of a large family of funds offering a variety of investment disciplines and providing a large variety of mutual fund investor services. The Board noted that Fidelity had taken, or had made recommendations that resulted in the Fidelity funds taking, a number of actions over the previous year that benefited particular funds, including: (i) continuing to dedicate additional resources to investment research and to the support of the senior management team that oversees asset management; (ii) continuing efforts to enhance Fidelity's global research capabilities; (iii) launching new funds and making other enhancements to meet client needs; (iv) broadening eligibility requirements for certain lower-priced share classes of, and streamlining the fee structure for, certain existing equity index funds; (v) lowering expense caps for certain existing funds and classes to reduce expenses paid by shareholders; (vi) eliminating redemption fees for certain variable insurance product funds and classes; (vii) continuing to launch dedicated lower cost underlying funds to meet portfolio construction needs related to expanding underlying fund options for Fidelity funds of funds, specifically for the Freedom Fund product lines; (viii) launching a lower cost share class for use by the Freedom Index Fund product line; (ix) rationalizing product lines and gaining increased efficiencies through fund mergers and share class consolidations; (x) continuing to develop, acquire and implement systems and technology to improve services to the funds and shareholders, strengthen information security, and increase efficiency; (xi) implementing investment enhancements to further strengthen Fidelity's target date product line to increase investors' probability of success in achieving their goals; (xii) accelerating the conversion of all remaining Class B shares to Class A shares, which have a lower expense structure; and (xiii) implementing changes to Fidelity's money market fund product line in response to recent regulatory reforms.
Investment Performance. The Board considered whether the fund has operated in accordance with its investment objective, as well as its record of compliance with its investment restrictions and its performance history. The Board noted that there was a portfolio management change for the fund in May 2016.
The Board took into account discussions with representatives of the Investment Advisers about fund investment performance that occur at Board meetings throughout the year. In this regard the Board noted that as part of regularly scheduled fund reviews and other reports to the Board on fund performance, the Board considers annualized return information for the fund for different time periods, measured against a securities market index ("benchmark index") and a peer group of funds with similar objectives ("peer group"), if any. In its evaluation of fund investment performance at meetings throughout the year, the Board gave particular attention to information indicating underperformance of certain Fidelity funds for specific time periods and discussed with the Investment Advisers the reasons for such underperformance.
In addition to reviewing absolute and relative fund performance, the Independent Trustees periodically consider the appropriateness of fund performance metrics in evaluating the results achieved. In general, the Independent Trustees believe that fund performance should be evaluated based on gross performance (before fees and expenses but after transaction costs) compared to appropriate benchmark indices, over appropriate time periods that may include full market cycles, and on net performance (after fees and expenses) compared to peer groups, as applicable, over the same periods, taking into account relevant factors including the following: general market conditions; expectations for interest rate levels and credit conditions; issuer-specific information including credit quality; the potential for incremental return versus the fund's benchmark index weighed against the risks involved in obtaining that incremental return, including the risk of diminished or negative total returns; and fund cash flows and other factors. Depending on the circumstances, the Independent Trustees may be satisfied with a fund's performance notwithstanding that it lags its benchmark index or peer group for certain periods.
The Independent Trustees recognize that shareholders evaluate performance on a net basis over their own holding periods, for which one-, three-, and five-year periods are often used as a proxy. For this reason, the performance information reviewed by the Board also included net cumulative calendar year total return information for the fund and an appropriate benchmark index and peer group for the most recent one-, three-, and five-year periods.
Based on its review, the Board concluded that the nature, extent, and quality of services provided to the fund under the Advisory Contracts should continue to benefit the shareholders of the fund.
Competitiveness of Management Fee and Total Expense Ratio. The Board considered the fund's management fee and total expense ratio compared to "mapped groups" of competitive funds and classes created for the purpose of facilitating the Trustees' competitive analysis of management fees and total expenses. Fidelity creates "mapped groups" by combining similar Lipper investment objective categories that have comparable investment mandates. Combining Lipper investment objective categories aids the Board's management fee and total expense ratio comparisons by broadening the competitive group used for comparison.
Management Fee. The Board considered two proprietary management fee comparisons for the 12-month periods shown in basis points (BP) in the chart below. The group of Lipper funds used by the Board for management fee comparisons is referred to below as the "Total Mapped Group" and, for the reasons explained above, is broader than the Lipper peer group used by the Board for performance comparisons. The Total Mapped Group comparison focuses on a fund's standing in terms of gross management fees before expense reimbursements or caps relative to the total universe of funds with comparable investment mandates, regardless of whether their management fee structures also are comparable. Funds with comparable investment mandates offer exposure to similar types of securities. Funds with comparable management fee structures have similar management fee contractual arrangements (
e.g., flat rate charged for advisory services, all-inclusive fee rate,
etc.). "TMG %" represents the percentage of funds in the Total Mapped Group that had management fees that were lower than the fund's. For example, a hypothetical TMG % of 20% would mean that 80% of the funds in the Total Mapped Group had higher, and 20% had lower, management fees than the fund. The fund's actual TMG %s and the number of funds in the Total Mapped Group are in the chart below. The "Asset-Size Peer Group" (ASPG) comparison focuses on a fund's standing relative to a subset of non-Fidelity funds within the Total Mapped Group that are similar in size and management fee structure. For example, if a fund is in the first quartile of the ASPG, the fund's management fee ranks in the least expensive or lowest 25% of funds in the ASPG. The ASPG represents at least 15% of the funds in the Total Mapped Group with comparable asset size and management fee structures, subject to a minimum of 50 funds (or all funds in the Total Mapped Group if fewer than 50). Additional information, such as the ASPG quartile in which the fund's management fee rate ranked, is also included in the chart and considered by the Board.
Fidelity Limited Term Municipal Income Fund
The Board noted that the fund's management fee rate ranked below the median of its Total Mapped Group and below the median of its ASPG for 2015.
The Board noted that, in 2014, the ad hoc Committee on Group Fee was formed by it and the boards of other Fidelity funds to conduct an in-depth review of the "group fee" component of the management fee of funds with such management fee structures. The Committee's focus included the mechanics of the group fee, the competitive landscape of group fee structures, Fidelity funds with no group fee component and investment products not included in group fee assets. The Board also considered that, for funds subject to the group fee, FMR agreed to voluntarily waive fees over a specified period of time in amounts designed to account for assets converted from certain funds to certain collective investment trusts.
Based on its review, the Board concluded that the fund's management fee is fair and reasonable in light of the services that the fund receives and the other factors considered.
Total Expense Ratio. In its review of each class's total expense ratio, the Board considered the fund's management fee rate as well as other fund or class expenses, as applicable, such as transfer agent fees, pricing and bookkeeping fees, fund-paid 12b-1 fees, and custodial, legal, and audit fees. The Board also noted that Fidelity may agree to waive fees and expenses from time to time, and the extent to which, if any, it has done so for the fund. As part of its review, the Board also considered the current and historical total expense ratios of each class of the fund compared to competitive fund median expenses. Each class of the fund is compared to those funds and classes in the Total Mapped Group (used by the Board for management fee comparisons) that have a similar sales load structure.
The Board noted that the total expense ratio of the retail class ranked below the competitive median for 2015 and the total expense ratio of each of Class A, Class T, Class C, and Class I ranked above the competitive median for 2015. The Board considered that, in general, various factors can affect total expense ratios. The Board considered that each of Class A, Class T, and Class I is above the competitive median primarily due to transfer agent fees. The Board noted that the total expense ratio of Class C was above the competitive median primarily because of its 12b-1 fees. The Board noted that the fund offers multiple classes, each of which has a different sales load and 12b-1 fee structure, and that the multiple structures are intended to offer a range of pricing options for the intermediary market. The Board also noted that the total expense ratios of the classes vary primarily by the level of their 12b-1 fees, although differences in transfer agent fees may also cause expenses to vary from class to class.
Fees Charged to Other Fidelity Clients. The Board also considered Fidelity fee structures and other information with respect to clients of Fidelity, such as other funds advised or subadvised by Fidelity, pension plan clients, and other institutional clients with similar mandates. The Board noted that an ad hoc joint committee created by it and the boards of other Fidelity funds periodically (most recently in 2013) reviews and compares Fidelity's institutional investment advisory business with its business of providing services to the Fidelity funds, including the differences in services provided, fees charged, and costs incurred, as well as competition in their respective marketplaces.
Based on its review of total expense ratios and fees charged to other Fidelity clients, the Board concluded that, although some classes were above the median of the universe presented for comparison, the total expense ratio of each class of the fund was reasonable in light of the services that the fund and its shareholders receive and the other factors considered.
Costs of the Services and Profitability. The Board considered the revenues earned and the expenses incurred by Fidelity in conducting the business of developing, marketing, distributing, managing, administering and servicing the fund and servicing the fund's shareholders. The Board also considered the level of Fidelity's profits in respect of all the Fidelity funds.
On an annual basis, Fidelity presents to the Board information about the profitability of its relationships with the fund. Fidelity calculates profitability information for each fund, as well as aggregate profitability information for groups of Fidelity funds and all Fidelity funds, using a series of detailed revenue and cost allocation methodologies which originate with the books and records of Fidelity on which Fidelity's audited financial statements are based. The Audit Committee of the Board reviews any significant changes from the prior year's methodologies.
PricewaterhouseCoopers LLP (PwC), independent registered public accounting firm and auditor to Fidelity and certain Fidelity funds, has been engaged annually by the Board as part of the Board's assessment of Fidelity's profitability analysis. PwC's engagement includes the review and assessment of the methodologies used by Fidelity in determining the revenues and expenses attributable to Fidelity's mutual fund business, and completion of agreed-upon procedures in respect of the mathematical accuracy of the fund profitability information and its conformity to established allocation methodologies. After considering PwC's reports issued under the engagement and information provided by Fidelity, the Board concluded that while other allocation methods may also be reasonable, Fidelity's profitability methodologies are reasonable in all material respects.
The Board also reviewed Fidelity's non-fund businesses and fall-out benefits related to the mutual fund business as well as cases where Fidelity's affiliates may benefit from or be related to the fund's business.
The Board considered the costs of the services provided by and the profits realized by Fidelity in connection with the operation of the fund and was satisfied that the profitability was not excessive.
Economies of Scale. The Board considered whether there have been economies of scale in respect of the management of the Fidelity funds, whether the Fidelity funds (including the fund) have appropriately benefited from any such economies of scale, and whether there is potential for realization of any further economies of scale. The Board considered the extent to which the fund will benefit from economies of scale as assets grow through increased services to the fund, through waivers or reimbursements, or through fee or expense ratio reductions. The Board also noted that a committee (the Economies of Scale Committee) created by it and the boards of other Fidelity funds periodically (most recently in 2013) analyzes whether Fidelity attains economies of scale in respect of the management and servicing of the Fidelity funds, whether the Fidelity funds have appropriately benefited from such economies of scale, and whether there is potential for realization of any further economies of scale.
The Board recognized that the fund's management contract incorporates a "group fee" structure, which provides for lower group fee rates as total group assets increase, and for higher group fee rates as total group assets decrease (with "group assets" defined to include fund assets under FMR's management plus the assets of sector funds previously under FMR's management). FMR calculates the group fee rates based on a tiered asset "breakpoint" schedule that varies based on asset class. The Board considered that the group fee is designed to deliver the benefits of economies of scale to fund shareholders when total Fidelity fund assets increase, even if assets of any particular fund are unchanged or have declined, because some portion of Fidelity's costs are attributable to services provided to all Fidelity funds, and all funds benefit if those costs can be allocated among more assets. The Board concluded that, given the group fee structure, fund shareholders will benefit from lower management fees as group assets increase at the fund complex level, regardless of whether Fidelity achieves any such economies of scale.
The Board concluded, taking into account the analysis of the Economies of Scale Committee, that economies of scale, if any, are being appropriately shared between fund shareholders and Fidelity.
Additional Information Requested by the Board. In order to develop fully the factual basis for consideration of the Fidelity funds' advisory contracts, the Board requested and received additional information on certain topics, including: (i) Fidelity's fund profitability methodology, profitability trends for certain funds, and the impact of certain factors on fund profitability results; (ii) portfolio manager changes that have occurred during the past year and the amount of the investment that each portfolio manager has made in the Fidelity fund(s) that he or she manages; (iii) Fidelity's compensation structure for portfolio managers, research analysts, and other key personnel, including its effects on fund profitability, the rationale for the compensation structure, and the extent to which current market conditions have affected retention and recruitment; (iv) the arrangements with and compensation paid to certain fund sub-advisers on behalf of the Fidelity funds; (v) Fidelity's voluntary waiver of its fees to maintain minimum yields for certain money market funds and classes as well as contractual waivers in place for certain funds; (vi) the methodology with respect to competitive fund data and peer group classifications; (vii) Fidelity's transfer agent fee, expense, and service structures for different funds and classes relative to competitive trends, and the impact of the increased use of omnibus accounts; (viii) Fidelity's long-term expectations for its offerings in the workplace investing channel; (ix) new developments in the retail and institutional marketplaces; (x) the approach to considering "fall-out" benefits; and (xi) the impact of money market reform on Fidelity's money market funds, including with respect to costs and profitability. In addition, the Board considered its discussions with Fidelity throughout the year regarding enhanced information security initiatives and the funds' fair valuation policies.
Based on its evaluation of all of the conclusions noted above, and after considering all factors it believed relevant, the Board concluded that the advisory fee structures are fair and reasonable, and that the fund's Advisory Contracts should be renewed.
Corporate Headquarters
245 Summer St.
Boston, MA 02210
www.fidelity.com
STM-ANN-0217
1.536709.120
Fidelity® Michigan Municipal Income Fund
Fidelity® Michigan Municipal Money Market Fund
Annual Report December 31, 2016 |
|
Contents
To view a fund's proxy voting guidelines and proxy voting record for the 12-month period ended June 30, visit http://www.fidelity.com/proxyvotingresults or visit the Securities and Exchange Commission's (SEC) web site at http://www.sec.gov.
You may also call 1-800-544-8544 to request a free copy of the proxy voting guidelines.
Standard & Poor's, S&P and S&P 500 are registered service marks of The McGraw-Hill Companies, Inc. and have been licensed for use by Fidelity Distributors Corporation.
Other third-party marks appearing herein are the property of their respective owners.
All other marks appearing herein are registered or unregistered trademarks or service marks of FMR LLC or an affiliated company. © 2017 FMR LLC. All rights reserved.
This report and the financial statements contained herein are submitted for the general information of the shareholders of the Fund. This report is not authorized for distribution to prospective investors in the Fund unless preceded or accompanied by an effective prospectus.
A fund files its complete schedule of portfolio holdings with the SEC for the first and third quarters of each fiscal year on Form N-Q. Forms N-Q are available on the SEC’s web site at http://www.sec.gov. A fund's Forms N-Q may be reviewed and copied at the SEC’s Public Reference Room in Washington, DC. Information regarding the operation of the SEC's Public Reference Room may be obtained by calling 1-800-SEC-0330.
For a complete list of a fund's portfolio holdings, view the most recent holdings listing, semiannual report, or annual report on Fidelity's web site at http://www.fidelity.com, http://www.institutional.fidelity.com, or http://www.401k.com, as applicable.
NOT FDIC INSURED •MAY LOSE VALUE •NO BANK GUARANTEE
Neither the Fund nor Fidelity Distributors Corporation is a bank.
Fidelity® Michigan Municipal Income Fund
Performance: The Bottom Line
Average annual total return reflects the change in the value of an investment, assuming reinvestment of distributions from dividend income and capital gains (the profits earned upon the sale of securities that have grown in value, if any) and assuming a constant rate of performance each year. The hypothetical investment and the average annual total returns do not reflect the deduction of taxes that a shareholder would pay on fund distributions or the redemption of fund shares. During periods of reimbursement by Fidelity, a fund’s total return will be greater than it would be had the reimbursement not occurred. How a fund did yesterday is no guarantee of how it will do tomorrow.
Average Annual Total Returns
| For the periods ended December 31, 2016 | Past 1 year | Past 5 years | Past 10 years |
| Fidelity® Michigan Municipal Income Fund | (0.16)% | 3.13% | 3.98% |
$10,000 Over 10 Years
Let's say hypothetically that $10,000 was invested in Fidelity® Michigan Municipal Income Fund on December 31, 2006.
The chart shows how the value of your investment would have changed, and also shows how the Bloomberg Barclays Municipal Bond Index performed over the same period.
| Period Ending Values |
| $14,771 | Fidelity® Michigan Municipal Income Fund |
| $15,158 | Bloomberg Barclays Municipal Bond Index |
Effective August 24, 2016, all Barclays benchmark indices were co-branded as the Bloomberg Barclays Indices for a period of five years.
Fidelity® Michigan Municipal Income Fund
Management's Discussion of Fund Performance
Market Recap: For the 12 months ending December 31, 2016, tax-exempt bonds eked out only a 0.25% return, according to the Bloomberg Barclays Municipal Bond Index. For much of the period, fairly strong demand and a stable credit environment for state and local governments drove moderate muni returns. But a downward trend began in September and steepened through November – the worst month for the muni market since 2008 – as investors became concerned about U.S. President-elect Donald Trump’s expansionary fiscal policy ambitions, inflation and the potential for tax reform to impair tax-exempt bond valuations. Further, some theorized that changes to or repeal of the Affordable Care Act by the incoming administration and a Republican-controlled Congress may affect the prices of muni bonds issued by hospitals. Muni bonds also were hurt by market anticipation of a quarter-point increase in policy interest rates, which happened in December. At year-end, concerns about unfunded pension liabilities generally are compartmentalized to certain issuers. Looking ahead, we think the U.S. Federal Reserve is likely to raise policy interest rates further in 2017, perhaps in multiple stages.
Comments from Co-Portfolio Manager Cormac Cullen: For the year, the fund returned -0.16%, modestly lagging, net of fees, the 0.24% gain of the Bloomberg Barclays Michigan Enhanced Municipal Bond Index. The portfolio managers continued to focus on long-term objectives by seeking to generate attractive tax-exempt income and competitive risk-adjusted returns over time. The manner in which the fund’s investments were spread across bonds with various maturities – known as yield curve positioning – was the main drag on our result versus the state index. The fund was bulleted, meaning it was more heavily concentrated in bonds in the intermediate-maturity range, reflecting what we viewed as attractive valuations. However, bonds in the intermediate-maturity range underperformed shorter- and longer-term alternatives. In contrast, relative performance was helped by our overweighting in lower-rated investment-grade bonds, particularly those in the health care sector. These securities – rated A and BBB – attracted heavy demand from yield-seeking investors throughout much of the year. Coupled with the comparatively high level of income they generated, they outperformed high-quality securities, in which the fund had an underweighting for the year overall.
The views expressed above reflect those of the portfolio manager(s) only through the end of the period as stated on the cover of this report and do not necessarily represent the views of Fidelity or any other person in the Fidelity organization. Any such views are subject to change at any time based upon market or other conditions and Fidelity disclaims any responsibility to update such views. These views may not be relied on as investment advice and, because investment decisions for a Fidelity fund are based on numerous factors, may not be relied on as an indication of trading intent on behalf of any Fidelity fund.
Note to Shareholders: On May 2, 2016, Cormac Cullen, Kevin Ramundo and Mark Sommer became Co-Managers of the fund, succeeding Portfolio Manager Jamie Pagliocco.
Fidelity® Michigan Municipal Income Fund
Investment Summary (Unaudited)
Top Five Sectors as of December 31, 2016
| | % of fund's net assets | % of fund's net assets 6 months ago |
| General Obligations | 33.7 | 34.4 |
| Health Care | 22.1 | 18.3 |
| Escrowed/Pre-Refunded | 11.6 | 12.0 |
| Education | 7.8 | 11.8 |
| Transportation | 7.8 | 7.2 |
Quality Diversification (% of fund's net assets)
| As of December 31, 2016 |
| | AAA | 4.0% |
| | AA,A | 85.0% |
| | BBB | 2.5% |
| | Not Rated | 5.9% |
| | Short-Term Investments and Net Other Assets | 2.6% |

| As of June 30, 2016 |
| | AAA | 4.0% |
| | AA,A | 80.9% |
| | BBB | 1.3% |
| | BB and Below | 0.4% |
| | Not Rated | 5.3% |
| | Short-Term Investments and Net Other Assets | 8.1% |

We have used ratings from Moody's Investors Service, Inc. Where Moody's® ratings are not available, we have used S&P® ratings. All ratings are as of the date indicated and do not reflect subsequent changes.
Fidelity® Michigan Municipal Income Fund
Investments December 31, 2016
Showing Percentage of Net Assets
| Municipal Bonds - 97.4% | | | |
| | | Principal Amount | Value |
| Guam - 0.8% | | | |
| Guam Gov't. Ltd. Oblig. Rev. Series 2016 A: | | | |
| 5% 12/1/35 | | $555,000 | $591,591 |
| 5% 12/1/46 | | 2,000,000 | 2,118,500 |
| Guam Int'l. Arpt. Auth. Rev. Series 2013 C, 6.25% 10/1/34 (a) | | 1,000,000 | 1,139,600 |
| Guam Pwr. Auth. Rev. Series 2012 A, 5% 10/1/23 (FSA Insured) | | 1,175,000 | 1,322,792 |
|
| TOTAL GUAM | | | 5,172,483 |
|
| Michigan - 96.6% | | | |
| Ann Arbor Econ. Dev. Corp. Ltd. Oblig. Rev. (Glacier Hills, Inc. Proj.) 8.375% 1/15/19 (Escrowed to Maturity) | | 1,053,000 | 1,125,341 |
| Battle Creek School District Series 2016: | | | |
| 5% 5/1/35 | | 2,240,000 | 2,508,979 |
| 5% 5/1/36 | | 1,500,000 | 1,670,010 |
| 5% 5/1/37 | | 1,175,000 | 1,305,214 |
| Bay City School District Rev.: | | | |
| 5% 11/1/25 | | 1,000,000 | 1,148,260 |
| 5% 11/1/26 | | 1,000,000 | 1,139,020 |
| 5% 11/1/27 | | 700,000 | 795,830 |
| 5% 11/1/28 | | 250,000 | 284,048 |
| Brandon School District Series 2016 A: | | | |
| 5% 5/1/28 | | 2,515,000 | 2,898,915 |
| 5% 5/1/29 | | 1,250,000 | 1,433,850 |
| 5% 5/1/30 | | 1,250,000 | 1,424,950 |
| Charter Township of Commerce Gen. Oblig. Series 2009 B, 5.125% 12/1/38 (Pre-Refunded to 12/1/18 @ 100) | | 970,000 | 1,039,792 |
| Chelsea School District Series 2008, 5% 5/1/18 (Nat'l. Pub. Fin. Guarantee Corp. Insured) | | 1,675,000 | 1,755,048 |
| Chippewa Valley Schools: | | | |
| Series 2016 A: | | | |
| 5% 5/1/32 | | 1,000,000 | 1,134,070 |
| 5% 5/1/33 | | 1,000,000 | 1,129,160 |
| 5% 5/1/34 | | 1,075,000 | 1,208,590 |
| 5% 5/1/35 | | 775,000 | 867,543 |
| Series 2016: | | | |
| 5% 5/1/25 | | 1,420,000 | 1,660,775 |
| 5% 5/1/27 | | 555,000 | 650,571 |
| Clarkston Cmnty. Schools: | | | |
| Series 2016, 5% 5/1/29 | | 1,500,000 | 1,717,050 |
| 5% 5/1/28 | | 1,735,000 | 1,995,701 |
| Detroit City School District Series 2005 A, 5.25% 5/1/30 (FSA Insured) | | 5,000,000 | 5,919,200 |
| Detroit School District Series 2012 A, 5% 5/1/24 | | 5,000,000 | 5,535,000 |
| Detroit Swr. Disp. Rev.: | | | |
| Series 1998, 5.5% 7/1/17 (Nat'l. Pub. Fin. Guarantee Corp. Insured) | | 3,050,000 | 3,106,944 |
| Series 2001 E, 5.75% 7/1/31 (Pre-Refunded to 7/1/18 @ 100) | | 1,400,000 | 1,492,638 |
| Series 2006, 5% 7/1/36 | | 10,000 | 10,028 |
| Detroit Wtr. Supply Sys. Rev. Series 2006 B, 7% 7/1/36 (Pre-Refunded to 7/1/19 @ 100) | | 2,700,000 | 3,064,284 |
| Detroit/Wayne Co. Stadium Auth. Series 2012: | | | |
| 5% 10/1/21 (FSA Insured) | | 2,000,000 | 2,177,220 |
| 5% 10/1/22 (FSA Insured) | | 2,645,000 | 2,929,232 |
| 5% 10/1/26 (FSA Insured) | | 4,850,000 | 5,243,384 |
| Dexter Cmnty. Schools (School Bldg. and Site Proj.) Series 1998, 5.1% 5/1/18 (Nat'l. Pub. Fin. Guarantee Corp. Insured) | | 1,000,000 | 1,029,390 |
| Farmington Pub. School District Gen. Oblig.: | | | |
| 5% 5/1/25 (FSA Insured) | | 2,140,000 | 2,497,637 |
| 5% 5/1/26 (FSA Insured) | | 1,385,000 | 1,604,176 |
| 5% 5/1/27 (FSA Insured) | | 1,425,000 | 1,641,386 |
| Ferris State Univ. Rev. Series 2016, 5% 10/1/41 | | 2,000,000 | 2,228,200 |
| Forest Hills Pub. Schools: | | | |
| 5% 5/1/18 | | 1,650,000 | 1,729,514 |
| 5% 5/1/19 | | 1,375,000 | 1,480,793 |
| 5% 5/1/20 | | 1,575,000 | 1,736,249 |
| 5% 5/1/21 | | 1,575,000 | 1,771,056 |
| Fraser Pub. School District Series 2006 B, 5% 5/1/29 | | 1,455,000 | 1,669,001 |
| Genesee County Gen. Oblig. Series 2005: | | | |
| 5% 5/1/17 (Nat'l. Pub. Fin. Guarantee Corp. Insured) | | 1,355,000 | 1,372,330 |
| 5% 5/1/18 (Nat'l. Pub. Fin. Guarantee Corp. Insured) | | 1,505,000 | 1,523,948 |
| Grand Blanc Cmnty. Schools Series 2013, 4% 5/1/24 | | 4,925,000 | 5,268,026 |
| Grand Rapids Cmnty. College Series 2008, 5% 5/1/19 (FSA Insured) | | 1,315,000 | 1,378,909 |
| Grand Rapids San. Swr. Sys. Rev.: | | | |
| Series 2012, 5% 1/1/37 | | 1,250,000 | 1,377,463 |
| Series 2014: | | | |
| 5% 1/1/27 | | 1,300,000 | 1,502,709 |
| 5% 1/1/29 | | 800,000 | 917,024 |
| 5% 1/1/30 | | 2,000,000 | 2,277,540 |
| Series 2016, 5% 1/1/37 | | 1,250,000 | 1,409,975 |
| Grand Rapids Wtr. Supply Sys. Series 2016: | | | |
| 5% 1/1/31 | | 250,000 | 289,565 |
| 5% 1/1/32 | | 320,000 | 369,008 |
| 5% 1/1/33 | | 550,000 | 630,504 |
| 5% 1/1/34 | | 500,000 | 570,660 |
| 5% 1/1/35 | | 920,000 | 1,043,860 |
| 5% 1/1/36 | | 385,000 | 435,870 |
| 5% 1/1/41 | | 2,190,000 | 2,457,618 |
| 5% 1/1/46 | | 800,000 | 894,480 |
| Grand Traverse County Hosp.: | | | |
| Series 2011 A, 5.375% 7/1/35 | | 2,000,000 | 2,172,700 |
| Series 2014 A, 5% 7/1/47 | | 1,400,000 | 1,486,100 |
| Grand Valley Michigan State Univ. Rev.: | | | |
| Series 2007, 5% 12/1/19 (AMBAC Insured) | | 500,000 | 516,595 |
| Series 2008, 5% 12/1/33 (Pre-Refunded to 6/1/18 @ 100) | | 5,000,000 | 5,265,400 |
| Series 2014 B: | | | |
| 5% 12/1/25 | | 500,000 | 576,745 |
| 5% 12/1/26 | | 1,900,000 | 2,190,187 |
| 5% 12/1/28 | | 1,800,000 | 2,059,830 |
| Great Lakes Wtr. Auth. Sew Disp. Sys. Series 2016 C, 5% 7/1/31 | | 7,000,000 | 7,758,030 |
| Harper Creek Cmnty. School District (School Bldg. & Site Proj.) Series 2008: | | | |
| 4.75% 5/1/27 (FSA Insured) | | 500,000 | 519,510 |
| 5.25% 5/1/21 (FSA Insured) | | 2,000,000 | 2,097,240 |
| 5.25% 5/1/24 (FSA Insured) | | 2,100,000 | 2,201,262 |
| Hudsonville Pub. Schools: | | | |
| 4% 5/1/24 | | 1,220,000 | 1,314,513 |
| 4% 5/1/25 | | 500,000 | 537,530 |
| 5% 5/1/20 | | 1,000,000 | 1,098,300 |
| 5% 5/1/22 | | 600,000 | 679,734 |
| 5.25% 5/1/41 | | 1,750,000 | 1,908,428 |
| Ingham, Eaton and Clinton Counties Lansing School District 5% 5/1/22 | | 1,730,000 | 1,959,900 |
| Jackson County Hosp. Fin. Auth. Hosp. Rev. (Allegiance Health Proj.) Series 2010 A, 5% 6/1/37 (Pre-Refunded to 6/1/20 @ 100) | | 2,250,000 | 2,494,643 |
| Kalamazoo Hosp. Fin. Auth. Hosp. Facilities Rev. Series 2016: | | | |
| 5% 5/15/28 | | 750,000 | 842,295 |
| 5% 5/15/29 | | 2,500,000 | 2,792,800 |
| 5% 5/15/30 | | 3,375,000 | 3,739,028 |
| Kalamazoo Pub. Schools 5% 5/1/17 (FSA Insured) | | 1,595,000 | 1,599,291 |
| Kent County Gen. Oblig. Series 2015: | | | |
| 5% 1/1/28 | | 4,655,000 | 5,500,395 |
| 5% 1/1/29 | | 4,390,000 | 5,173,352 |
| Kent Hosp. Fin. Auth. Hosp. Facilities Rev. (Spectrum Health Sys. Proj.) Series 2011 A, 5.5% 11/15/25 | | 5,000,000 | 5,751,600 |
| Kentwood Pub. Schools Series 2012: | | | |
| 4% 5/1/21 | | 1,000,000 | 1,073,800 |
| 4% 5/1/22 | | 1,000,000 | 1,076,870 |
| L'Anse Creuse Pub. Schools Series 2012: | | | |
| 5% 5/1/22 | | 1,500,000 | 1,674,195 |
| 5% 5/1/23 | | 1,500,000 | 1,670,910 |
| Lake Orion Cmnty. School District: | | | |
| 5% 5/1/23 | | 1,915,000 | 2,202,959 |
| 5% 5/1/25 | | 3,275,000 | 3,835,615 |
| Lansing Board of Wtr. & Lt. Util. Rev. 5.5% 7/1/41 | | 5,000,000 | 5,617,350 |
| Lansing Cmnty. College: | | | |
| 5% 5/1/23 | | 1,135,000 | 1,291,312 |
| 5% 5/1/25 | | 1,540,000 | 1,742,171 |
| Lapeer Cmnty. Schools Series 2007: | | | |
| 5% 5/1/19 (Pre-Refunded to 5/1/18 @ 100) | | 1,350,000 | 1,417,797 |
| 5% 5/1/20 (Pre-Refunded to 5/1/18 @ 100) | | 1,425,000 | 1,496,564 |
| 5% 5/1/22 (Pre-Refunded to 5/1/18 @ 100) | | 1,395,000 | 1,465,057 |
| Lenawee Co. Hosp. Fin. Auth. Hosp. Rev. (ProMedica Heathcare Oblig. Group Proj.) Series 2011 B, 6% 11/15/35 | | 3,030,000 | 3,507,983 |
| Lincoln Consolidated School District Series 2016 A: | | | |
| 5% 5/1/28 | | 2,025,000 | 2,309,695 |
| 5% 5/1/29 | | 1,430,000 | 1,622,421 |
| 5% 5/1/31 | | 500,000 | 560,885 |
| 5% 5/1/32 | | 1,000,000 | 1,118,390 |
| Marquette Board Lt. & Pwr. Elec. Util. Sys. Rev. Series 2016 A: | | | |
| 5% 7/1/29 | | 780,000 | 895,495 |
| 5% 7/1/30 | | 900,000 | 1,026,927 |
| 5% 7/1/31 | | 780,000 | 885,908 |
| 5% 7/1/32 | | 1,000,000 | 1,130,570 |
| 5% 7/1/33 | | 705,000 | 793,393 |
| Michigan Bldg. Auth. Rev.: | | | |
| (Facilities Prog.) Series 2015 1, 5% 10/15/50 | | 7,250,000 | 7,899,455 |
| Series 2009 I, 5.25% 10/15/25 (Assured Guaranty Corp. Insured) | | 2,000,000 | 2,192,940 |
| Series 2016: | | | |
| 6% 10/15/38 | | 165,000 | 178,124 |
| 6% 10/15/38 (Pre-Refunded to 10/15/18 @ 100) | | 1,805,000 | 1,953,570 |
| Series IA: | | | |
| 5.375% 10/15/41 | | 3,000,000 | 3,373,080 |
| 5.5% 10/15/45 | | 10,000,000 | 11,237,200 |
| 5% 4/15/33 | | 5,000,000 | 5,586,400 |
| 5% 4/15/38 | | 3,000,000 | 3,301,680 |
| 6% 10/15/38 (Pre-Refunded to 10/15/18 @ 100) | | 3,030,000 | 3,279,399 |
| Michigan Fin. Auth. Rev.: | | | |
| (Holland Cmnty. Hosp. Proj.) Series 2013 A: | | | |
| 5% 1/1/33 | | 1,250,000 | 1,376,025 |
| 5% 1/1/40 | | 3,000,000 | 3,269,970 |
| (Local Govt. Ln. Prog.) Series 2014 D, 5% 7/1/37 (FSA Insured) | | 1,000,000 | 1,085,030 |
| Series 2012 A: | | | |
| 4.125% 6/1/32 (Pre-Refunded to 6/1/22 @ 100) | | 3,000,000 | 3,321,810 |
| 5% 6/1/27 (Pre-Refunded to 6/1/22 @ 100) | | 125,000 | 143,983 |
| 5% 6/1/39 (Pre-Refunded to 6/1/22 @ 100) | | 12,790,000 | 14,732,289 |
| Series 2012 B, 5% 7/1/22 | | 1,700,000 | 1,715,895 |
| Series 2012: | | | |
| 5% 11/15/24 | | 660,000 | 754,446 |
| 5% 11/15/25 | | 1,000,000 | 1,137,240 |
| 5% 11/1/26 | | 6,425,000 | 7,190,282 |
| 5% 11/15/26 | | 800,000 | 905,592 |
| 5% 11/15/36 | | 6,200,000 | 6,809,274 |
| 5% 11/1/42 | | 2,000,000 | 2,159,960 |
| 5% 11/15/42 | | 4,500,000 | 4,911,975 |
| Series 2013: | | | |
| 5% 10/1/25 | | 1,255,000 | 1,447,831 |
| 5% 8/15/30 | | 4,105,000 | 4,508,645 |
| Series 2014 H1: | | | |
| 5% 10/1/22 | | 1,000,000 | 1,118,150 |
| 5% 10/1/25 | | 2,250,000 | 2,578,703 |
| 5% 10/1/39 | | 8,600,000 | 9,321,798 |
| Series 2014: | | | |
| 5% 6/1/25 | | 1,000,000 | 1,156,330 |
| 5% 6/1/26 | | 700,000 | 804,860 |
| 5% 6/1/27 | | 700,000 | 801,332 |
| Series 2015 C: | | | |
| 5% 7/1/26 | | 570,000 | 636,314 |
| 5% 7/1/27 | | 1,215,000 | 1,347,848 |
| 5% 7/1/28 | | 1,500,000 | 1,657,050 |
| 5% 7/1/35 | | 1,000,000 | 1,071,380 |
| Series 2015 D1: | | | |
| 5% 7/1/34 | | 1,250,000 | 1,370,313 |
| 5% 7/1/35 | | 500,000 | 545,840 |
| Series 2015: | | | |
| 5% 11/15/26 | | 2,250,000 | 2,603,925 |
| 5% 11/15/27 | | 3,500,000 | 4,028,080 |
| 5% 11/15/28 | | 1,835,000 | 2,101,626 |
| Series 2016 A, 5% 11/1/44 | | 6,190,000 | 6,617,481 |
| Series 2016: | | | |
| 5% 1/1/29 | | 1,000,000 | 1,142,160 |
| 5% 1/1/30 | | 1,000,000 | 1,133,790 |
| 5% 1/1/31 | | 1,100,000 | 1,241,691 |
| 5% 1/1/32 | | 1,895,000 | 2,125,015 |
| 5% 1/1/33 | | 1,915,000 | 2,138,021 |
| 5% 1/1/34 | | 1,385,000 | 1,539,524 |
| 5% 11/15/41 | | 5,700,000 | 6,083,781 |
| 5.25% 12/1/41 | | 4,000,000 | 4,605,200 |
| 5% 12/1/27 | | 1,090,000 | 1,209,769 |
| 5% 12/1/27 (Pre-Refunded to 12/1/20 @ 100) | | 10,000 | 11,230 |
| Michigan Hosp. Fin. Auth. Rev.: | | | |
| (Henry Ford Health Sys. Proj.) Series 2009, 5.25% 11/15/24 (Pre-Refunded to 11/15/19 @ 100) | | 3,000,000 | 3,302,310 |
| (McLaren Health Care Corp. Proj.): | | | |
| Series 2008 A, 5.75% 5/15/38 (Pre-Refunded to 5/15/18 @ 100) | | 6,890,000 | 7,315,733 |
| Series 2012 A, 5% 6/1/24 | | 2,765,000 | 3,134,846 |
| (MidMichigan Obligated Group Proj.) Series 2009 A, 6.125% 6/1/39 (Pre-Refunded to 6/1/19 @ 100) | | 3,740,000 | 4,148,071 |
| (Oakwood Hosp. Proj.) Series 2007, 5% 7/15/17 | | 1,000,000 | 1,019,980 |
| (Sparrow Hosp. Obligated Group Proj.) Series 2007, 5% 11/15/17 | | 535,000 | 552,639 |
| Bonds: | | | |
| Series 2010 F3, 1.4%, tender 6/29/18 (b) | | 6,200,000 | 6,213,640 |
| Series 2010 F4, 1.95%, tender 4/1/20 (b) | | 5,500,000 | 5,489,660 |
| Series 2008 A1, 6.5% 12/1/33 (Pre-Refunded to 12/1/18 @ 100) | | 3,965,000 | 4,348,614 |
| Series 2016: | | | |
| 5% 11/15/46 | | 3,500,000 | 3,900,470 |
| 5% 11/15/47 | | 18,000,000 | 20,043,881 |
| 5% 11/15/18 | | 500,000 | 516,355 |
| 5% 11/15/18 (Pre-Refunded to 11/15/17 @ 100) | | 1,225,000 | 1,266,675 |
| 5% 11/15/19 | | 290,000 | 298,926 |
| 5% 11/15/19 (Pre-Refunded to 11/15/17 @ 100) | | 710,000 | 734,154 |
| 5% 11/15/20 | | 575,000 | 592,699 |
| 5% 11/15/20 (Pre-Refunded to 11/15/17 @ 100) | | 1,425,000 | 1,473,479 |
| 5% 11/15/31 | | 1,450,000 | 1,490,832 |
| 5% 11/15/31 (Pre-Refunded to 11/15/17 @ 100) | | 3,550,000 | 3,670,771 |
| 6.5% 12/1/33 (Pre-Refunded to 12/1/18 @ 100) | | 870,000 | 954,173 |
| 6.5% 12/1/33 (Pre-Refunded to 12/1/18 @ 100) | | 165,000 | 179,556 |
| Michigan Muni. Bond Auth. Rev. Series 2005, 5% 10/1/23 (Pre-Refunded to 10/1/19 @ 100) | | 385,000 | 420,366 |
| Michigan State Univ. Revs. Series 2013 A, 5% 8/15/41 | | 1,125,000 | 1,239,131 |
| Michigan Strategic Fund Ltd. Oblig. Rev. (Cadillac Place Office Bldg. Proj.) Series 2011, 5.25% 10/15/26 | | 3,585,000 | 4,015,953 |
| Michigan Trunk Line Fund Rev. Series 2011, 5% 11/15/36 | | 2,000,000 | 2,180,560 |
| Northview Pub. Schools District Series 2008, 5% 5/1/21 (FSA Insured) | | 1,070,000 | 1,118,246 |
| Oakland Univ. Rev.: | | | |
| Series 2012: | | | |
| 5% 3/1/24 | | 1,170,000 | 1,309,429 |
| 5% 3/1/25 | | 1,225,000 | 1,370,346 |
| 5% 3/1/26 | | 1,290,000 | 1,442,401 |
| 5% 3/1/37 | | 4,000,000 | 4,284,520 |
| Series 2013 A: | | | |
| 5% 3/1/25 | | 995,000 | 1,123,345 |
| 5% 3/1/26 | | 1,620,000 | 1,824,088 |
| 5% 3/1/27 | | 815,000 | 917,177 |
| 5% 3/1/38 | | 2,900,000 | 3,120,574 |
| Series 2014: | | | |
| 5% 3/1/28 | | 335,000 | 378,764 |
| 5% 3/1/29 | | 525,000 | 589,990 |
| 5% 3/1/39 | | 3,000,000 | 3,252,900 |
| Series 2016: | | | |
| 5% 3/1/41 | | 3,000,000 | 3,327,450 |
| 5% 3/1/47 | | 5,000,000 | 5,508,850 |
| Olivet Cmnty. School District (School Bldg. & Site Proj.) Series 2008: | | | |
| 5.25% 5/1/23 (FSA Insured) | | 1,010,000 | 1,061,561 |
| 5.25% 5/1/27 (FSA Insured) | | 1,135,000 | 1,186,972 |
| Plainwell Cmnty. School District (School Bldg. & Site Proj.) Series 2008: | | | |
| 5% 5/1/23 (Assured Guaranty Corp. Insured) | | 1,885,000 | 1,968,732 |
| 5% 5/1/28 (Assured Guaranty Corp. Insured) | | 1,000,000 | 1,042,670 |
| Portage Pub. Schools Series 2016: | | | |
| 5% 11/1/32 | | 2,500,000 | 2,847,150 |
| 5% 11/1/34 | | 1,250,000 | 1,412,850 |
| 5% 11/1/35 | | 1,300,000 | 1,462,708 |
| 5% 11/1/39 | | 755,000 | 843,109 |
| Ravenna Pub. Schools Gen. Oblig. (2008 School Bldg. and Site Proj.) Series 2008: | | | |
| 5% 5/1/31 (FSA Insured) | | 2,080,000 | 2,159,851 |
| 5% 5/1/38 (FSA Insured) | | 1,000,000 | 1,034,400 |
| Rochester Cmnty. School District: | | | |
| 4% 5/1/19 | | 1,375,000 | 1,448,618 |
| 5% 5/1/19 (Nat'l. Pub. Fin. Guarantee Corp. Insured) | | 1,475,000 | 1,566,465 |
| 5% 5/1/29 | | 1,625,000 | 1,886,089 |
| 5% 5/1/30 | | 1,700,000 | 1,959,692 |
| 5% 5/1/31 | | 1,500,000 | 1,721,295 |
| Roseville Cmnty. Schools: | | | |
| Series 2014: | | | |
| 5% 5/1/24 | | 780,000 | 902,928 |
| 5% 5/1/25 | | 1,000,000 | 1,167,930 |
| 5% 5/1/26 | | 1,385,000 | 1,599,744 |
| 5% 5/1/24 | | 570,000 | 659,832 |
| 5% 5/1/25 | | 1,640,000 | 1,915,405 |
| 5% 5/1/26 | | 1,715,000 | 1,980,911 |
| 5% 5/1/27 | | 1,795,000 | 2,061,863 |
| 5% 5/1/28 | | 1,885,000 | 2,150,314 |
| Royal Oak Hosp. Fin. Auth. Hosp. Rev.: | | | |
| (William Beaumont Hosp. Proj.) Series 2009 V: | | | |
| 8% 9/1/29 (Pre-Refunded to 9/1/18 @ 100) | | 1,945,000 | 2,158,036 |
| 8.25% 9/1/39 (Pre-Refunded to 9/1/18 @ 100) | | 3,425,000 | 3,814,114 |
| Series 2014 D: | | | |
| 5% 9/1/26 | | 1,000,000 | 1,125,150 |
| 5% 9/1/27 | | 1,175,000 | 1,313,239 |
| 5% 9/1/28 | | 1,870,000 | 2,078,617 |
| Saginaw Hosp. Fin. Auth. Hosp. Rev. (Covenant Med. Ctr., Inc.) Series 2010 H, 5% 7/1/30 | | 5,000,000 | 5,394,300 |
| Saint Clair County Gen. Oblig. 5% 4/1/26 | | 1,495,000 | 1,683,654 |
| South Haven Gen. Oblig. Series 2009, 5.125% 12/1/33 (Assured Guaranty Corp. Insured) | | 1,000,000 | 1,091,910 |
| South Lyon Cmnty. Schools Series 2016: | | | |
| 5% 5/1/23 | | 1,575,000 | 1,805,864 |
| 5% 5/1/24 | | 3,200,000 | 3,704,320 |
| 5% 5/1/25 | | 2,355,000 | 2,744,753 |
| Univ. of Michigan Rev. Series 2015, 5% 4/1/46 | | 5,000,000 | 5,749,200 |
| Warren Consolidated School District Series 2016: | | | |
| 5% 5/1/23 | | 810,000 | 920,103 |
| 5% 5/1/33 | | 5,410,000 | 6,036,803 |
| 5% 5/1/34 | | 5,630,000 | 6,253,917 |
| Wayne County Arpt. Auth. Rev.: | | | |
| (Detroit Metropolitan Wayne County Arpt. Proj.) Series 2012 A: | | | |
| 5% 12/1/24 | | 2,875,000 | 3,192,199 |
| 5% 12/1/25 | | 5,120,000 | 5,690,778 |
| Series 2011 A, 5% 12/1/21 (a) | | 5,000,000 | 5,476,800 |
| Series 2012 A: | | | |
| 5% 12/1/22 | | 2,220,000 | 2,500,830 |
| 5% 12/1/23 | | 2,300,000 | 2,555,093 |
| Series 2014 C: | | | |
| 5% 12/1/29 (a) | | 720,000 | 789,314 |
| 5% 12/1/31 (a) | | 860,000 | 933,539 |
| 5% 12/1/34 (a) | | 1,655,000 | 1,775,434 |
| Series 2015 D, 5% 12/1/40 (FSA Insured) | | 8,165,000 | 8,944,349 |
| Series 2015 F, 5% 12/1/27 (a) | | 4,810,000 | 5,361,707 |
| Series 2015 G: | | | |
| 5% 12/1/35 | | 5,435,000 | 6,001,436 |
| 5% 12/1/36 | | 5,760,000 | 6,346,483 |
| West Ottawa Pub. School District: | | | |
| Series 2012 A: | | | |
| 5% 5/1/25 | | 4,310,000 | 4,767,334 |
| 5% 5/1/26 | | 2,000,000 | 2,207,880 |
| Series 2014 1: | | | |
| 5% 5/1/30 | | 725,000 | 817,119 |
| 5% 5/1/32 | | 500,000 | 559,700 |
| 5% 5/1/34 | | 900,000 | 999,378 |
| 5% 5/1/35 | | 250,000 | 276,405 |
| Western Michigan Univ. Rev.: | | | |
| Series 2014: | | | |
| 5% 11/15/17 | | 45,000 | 46,515 |
| 5% 11/15/25 | | 320,000 | 371,315 |
| 5% 11/15/26 | | 400,000 | 461,388 |
| 5% 11/15/28 | | 650,000 | 745,804 |
| 5% 11/15/29 | | 750,000 | 849,833 |
| 5% 11/15/30 | | 855,000 | 963,081 |
| 5% 11/15/31 | | 700,000 | 783,839 |
| Series 2015 A: | | | |
| 5% 11/15/26 | | 1,000,000 | 1,158,110 |
| 5% 11/15/28 | | 2,505,000 | 2,859,057 |
| Woodhaven-Brownstown School District County of Wayne: | | | |
| 5% 5/1/36 | | 2,835,000 | 3,163,463 |
| 5% 5/1/38 | | 5,670,000 | 6,303,112 |
| Ypsilanti School District Series A: | | | |
| 5% 5/1/29 | | 1,305,000 | 1,469,456 |
| 5% 5/1/30 | | 1,550,000 | 1,730,885 |
| 5% 5/1/32 | | 1,750,000 | 1,936,638 |
| Zeeland Pub. Schools: | | | |
| 5% 5/1/27 (FSA Insured) | | 1,000,000 | 1,136,030 |
| 5% 5/1/28 (FSA Insured) | | 500,000 | 565,280 |
| 5% 5/1/29 (FSA Insured) | | 1,000,000 | 1,124,340 |
| 5% 5/1/30 (FSA Insured) | | 1,000,000 | 1,118,160 |
|
| TOTAL MICHIGAN | | | 629,561,226 |
|
| TOTAL MUNICIPAL BONDS | | | |
| (Cost $627,179,174) | | | 634,733,709 |
|
| Municipal Notes - 1.1% | | | |
| Michigan - 1.1% | | | |
| JPMorgan Chase Participating VRDN Series Putters 5010, 0.77% 1/3/17 (Liquidity Facility JPMorgan Chase Bank) (b)(c) | | 1,000,000 | $1,000,000 |
| Karegnondi Wtr. Auth. Participating VRDN Series Putters 5009, 0.77% 1/3/17 (Liquidity Facility JPMorgan Chase Bank) (b)(c) | | 5,000,000 | 5,000,000 |
| Michigan Strategic Fund Ltd. Oblig. Rev. (Henry Ford Museum & Greenfield Village Proj.) Series 2002, 0.79% 1/3/17, LOC Comerica Bank, VRDN (b) | | 1,400,000 | 1,400,000 |
|
| TOTAL MICHIGAN | | | 7,400,000 |
|
| TOTAL MUNICIPAL NOTES | | | |
| (Cost $7,400,000) | | | 7,400,000 |
| TOTAL INVESTMENT PORTFOLIO - 98.5% | | | |
| (Cost $634,579,174) | | | 642,133,709 |
| NET OTHER ASSETS (LIABILITIES) - 1.5% | | | 9,501,218 |
| NET ASSETS - 100% | | | $651,634,927 |
Security Type Abbreviations
VRDN – VARIABLE RATE DEMAND NOTE (A debt instrument that is payable upon demand, either daily, weekly or monthly)
Legend
(a) Private activity obligations whose interest is subject to the federal alternative minimum tax for individuals.
(b) Coupon rates for floating and adjustable rate securities reflect the rates in effect at period end.
(c) Provides evidence of ownership in one or more underlying municipal bonds.
Investment Valuation
All investments are categorized as Level 2 under the Fair Value Hierarchy. The inputs or methodology used for valuing securities may not be an indication of the risk associated with investing in those securities. For more information on valuation inputs please refer to the Investment Valuation section in the accompanying Notes to Financial Statements.
Other Information
The distribution of municipal securities by revenue source, as a percentage of total Net Assets, is as follows (Unaudited):
| General Obligations | 33.7% |
| Health Care | 22.1% |
| Escrowed/Pre-Refunded | 11.6% |
| Education | 7.8% |
| Transportation | 7.8% |
| Water & Sewer | 5.4% |
| Others* (Individually Less Than 5%) | 11.6% |
| | 100.0% |
* Includes net other assets
See accompanying notes which are an integral part of the financial statements.
Fidelity® Michigan Municipal Income Fund
Financial Statements
Statement of Assets and Liabilities
| | | December 31, 2016 |
| Assets | | |
Investment in securities, at value — See accompanying schedule:
Unaffiliated issuers (cost $634,579,174) | | $642,133,709 |
| Cash | | 5,111,427 |
| Receivable for fund shares sold | | 281,108 |
| Interest receivable | | 5,992,827 |
| Prepaid expenses | | 1,325 |
| Other receivables | | 1,889 |
| Total assets | | 653,522,285 |
| Liabilities | | |
| Payable for fund shares redeemed | $1,038,154 | |
| Distributions payable | 538,095 | |
| Accrued management fee | 198,695 | |
| Other affiliated payables | 65,369 | |
| Other payables and accrued expenses | 47,045 | |
| Total liabilities | | 1,887,358 |
| Net Assets | | $651,634,927 |
| Net Assets consist of: | | |
| Paid in capital | | $644,557,109 |
| Undistributed net investment income | | 185,571 |
| Accumulated undistributed net realized gain (loss) on investments | | (662,288) |
| Net unrealized appreciation (depreciation) on investments | | 7,554,535 |
| Net Assets, for 54,563,679 shares outstanding | | $651,634,927 |
| Net Asset Value, offering price and redemption price per share ($651,634,927 ÷ 54,563,679 shares) | | $11.94 |
See accompanying notes which are an integral part of the financial statements.
Statement of Operations
| | | Year ended December 31, 2016 |
| Investment Income | | |
| Interest | | $23,002,828 |
| Expenses | | |
| Management fee | $2,499,491 | |
| Transfer agent fees | 608,334 | |
| Accounting fees and expenses | 159,733 | |
| Custodian fees and expenses | 5,543 | |
| Independent trustees' fees and expenses | 3,099 | |
| Registration fees | 28,856 | |
| Audit | 57,146 | |
| Legal | 5,258 | |
| Miscellaneous | 3,413 | |
| Total expenses before reductions | 3,370,873 | |
| Expense reductions | (8,067) | 3,362,806 |
| Net investment income (loss) | | 19,640,022 |
| Realized and Unrealized Gain (Loss) | | |
| Net realized gain (loss) on: | | |
| Investment securities: | | |
| Unaffiliated issuers | | 4,276,556 |
| Total net realized gain (loss) | | 4,276,556 |
| Change in net unrealized appreciation (depreciation) on investment securities | | (26,972,213) |
| Net gain (loss) | | (22,695,657) |
| Net increase (decrease) in net assets resulting from operations | | $(3,055,635) |
See accompanying notes which are an integral part of the financial statements.
Statement of Changes in Net Assets
| | Year ended December 31, 2016 | Year ended December 31, 2015 |
| Increase (Decrease) in Net Assets | | |
| Operations | | |
| Net investment income (loss) | $19,640,022 | $18,652,068 |
| Net realized gain (loss) | 4,276,556 | 196,475 |
| Change in net unrealized appreciation (depreciation) | (26,972,213) | 2,430,258 |
| Net increase (decrease) in net assets resulting from operations | (3,055,635) | 21,278,801 |
| Distributions to shareholders from net investment income | (19,608,060) | (18,621,343) |
| Distributions to shareholders from net realized gain | (4,300,072) | – |
| Total distributions | (23,908,132) | (18,621,343) |
| Share transactions | | |
| Proceeds from sales of shares | 161,615,926 | 107,376,253 |
| Reinvestment of distributions | 15,953,121 | 12,034,426 |
| Cost of shares redeemed | (133,182,519) | (57,660,123) |
| Net increase (decrease) in net assets resulting from share transactions | 44,386,528 | 61,750,556 |
| Redemption fees | 6,546 | 1,745 |
| Total increase (decrease) in net assets | 17,429,307 | 64,409,759 |
| Net Assets | | |
| Beginning of period | 634,205,620 | 569,795,861 |
| End of period | $651,634,927 | $634,205,620 |
| Other Information | | |
| Undistributed net investment income end of period | $185,571 | $170,177 |
| Shares | | |
| Sold | 12,945,542 | 8,719,799 |
| Issued in reinvestment of distributions | 1,293,440 | 977,711 |
| Redeemed | (10,893,149) | (4,695,016) |
| Net increase (decrease) | 3,345,833 | 5,002,494 |
See accompanying notes which are an integral part of the financial statements.
Financial Highlights — Fidelity Michigan Municipal Income Fund
| Years ended December 31, | 2016 | 2015 | 2014 | 2013 | 2012 |
| Selected Per–Share Data | | | | | |
| Net asset value, beginning of period | $12.38 | $12.33 | $11.70 | $12.54 | $12.24 |
| Income from Investment Operations | | | | | |
| Net investment income (loss)A | .352 | .387 | .422 | .437 | .445 |
| Net realized and unrealized gain (loss) | (.364) | .050 | .642 | (.777) | .303 |
| Total from investment operations | (.012) | .437 | 1.064 | (.340) | .748 |
| Distributions from net investment income | (.353) | (.387) | (.421) | (.436) | (.444) |
| Distributions from net realized gain | (.075) | – | (.013) | (.064) | (.004) |
| Total distributions | (.428) | (.387) | (.434) | (.500) | (.448) |
| Redemption fees added to paid in capitalA,B | – | – | – | – | – |
| Net asset value, end of period | $11.94 | $12.38 | $12.33 | $11.70 | $12.54 |
| Total ReturnC | (.16)% | 3.61% | 9.23% | (2.75)% | 6.19% |
| Ratios to Average Net AssetsD | | | | | |
| Expenses before reductions | .49% | .49% | .48% | .48% | .49% |
| Expenses net of fee waivers, if any | .49% | .49% | .48% | .48% | .49% |
| Expenses net of all reductions | .48% | .49% | .48% | .48% | .48% |
| Net investment income (loss) | 2.83% | 3.15% | 3.49% | 3.59% | 3.57% |
| Supplemental Data | | | | | |
| Net assets, end of period (000 omitted) | $651,635 | $634,206 | $569,796 | $528,289 | $693,682 |
| Portfolio turnover rate | 25% | 11% | 12% | 8% | 10% |
A Calculated based on average shares outstanding during the period.
B Amount represents less than $.0005 per share.
C Total returns would have been lower if certain expenses had not been reduced during the applicable periods shown.
D Expense ratios reflect operating expenses of the Fund. Expenses before reductions do not reflect amounts reimbursed by the investment adviser or reductions from expense offset arrangements and do not represent the amount paid by the Fund during periods when reimbursements or reductions occur. Expenses net of fee waivers reflect expenses after reimbursement by the investment adviser but prior to reductions from expense offset arrangements. Expenses net of all reductions represent the net expenses paid by the Fund.
See accompanying notes which are an integral part of the financial statements.
Fidelity® Michigan Municipal Money Market Fund
Investment Summary/Performance (Unaudited)
Effective Maturity Diversification
| Days | % of fund's investments 12/31/16 | % of fund's investments 6/30/16 | % of fund's investments 12/31/15 |
| 1 - 7 | 76.5 | 78.5 | 76.0 |
| 8 - 30 | 0.6 | 1.6 | 5.6 |
| 31 - 60 | 5.8 | 1.0 | 4.4 |
| 61 - 90 | 2.4 | 4.1 | 1.9 |
| 91 - 180 | 2.4 | 4.0 | 1.5 |
| > 180 | 12.3 | 10.8 | 10.6 |
Effective maturity is determined in accordance with the requirements of Rule 2a-7 under the Investment Company Act of 1940.
Asset Allocation (% of fund's net assets)
| As of December 31, 2016 |
| | Variable Rate Demand Notes (VRDNs) | 49.5% |
| | Tender Option Bond | 15.6% |
| | Other Municipal Security | 24.3% |
| | Investment Companies | 9.4% |
| | Net Other Assets (Liabilities) | 1.2% |

| As of June 30, 2016 |
| | Variable Rate Demand Notes (VRDNs) | 61.8% |
| | Tender Option Bond | 7.5% |
| | Other Municipal Security | 24.3% |
| | Investment Companies | 6.6% |
| | Net Other Assets (Liabilities)* | (0.2)% |

* Short-Term Investments and Net Other Assets (Liabilities) are not included in the pie chart
Current And Historical 7-Day Yields
| | 12/31/16 | 9/30/16 | 6/30/16 | 3/31/16 | 12/31/15 |
| Fidelity® Michigan Municipal Money Market Fund | 0.26% | 0.31% | 0.01% | 0.01% | 0.01% |
Yield refers to the income paid by the Fund over a given period. Yields for money market funds are usually for seven-day periods, as they are here, though they are expressed as annual percentage rates. Past performance is no guarantee of future results. Yield will vary and it's possible to lose money investing in the Fund.
Fidelity® Michigan Municipal Money Market Fund
Investments December 31, 2016
Showing Percentage of Net Assets
| Variable Rate Demand Note - 49.5% | | | |
| | | Principal Amount | Value |
| Alabama - 0.1% | | | |
| Decatur Indl. Dev. Board Exempt Facilities Rev. (Nucor Steel Decatur LLC Proj.) Series 2003 A, 1% 1/6/17, VRDN (a)(b) | | $600,000 | $600,000 |
| Arkansas - 0.5% | | | |
| Blytheville Indl. Dev. Rev. (Nucor Corp. Proj.) Series 2002, 1% 1/6/17, VRDN (a)(b) | | 200,000 | 200,000 |
| Osceola Solid Waste Disp. Rev. (Plum Point Energy Associates, LLC Proj.) Series 2006, 0.93% 1/6/17, LOC Royal Bank of Scotland PLC, VRDN (a)(b) | | 2,600,000 | 2,600,000 |
| | | | 2,800,000 |
| Delaware - 0.1% | | | |
| Delaware Econ. Dev. Auth. Rev. (Delmarva Pwr. & Lt. Co. Proj.): | | | |
| Series 1988, 0.96% 1/3/17, VRDN (a)(b) | | 300,000 | 300,000 |
| Series 1993 C, 0.95% 1/6/17, VRDN (b) | | 200,000 | 200,000 |
| Series 1994, 0.96% 1/3/17, VRDN (a)(b) | | 200,000 | 200,000 |
| | | | 700,000 |
| Georgia - 0.4% | | | |
| Bartow County Dev. Auth. Poll. Cont. Rev. (Georgia Pwr. Co. Plant Bowen Proj.) First Series 2009, 0.77% 1/6/17, VRDN (b)(c) | | 2,300,000 | 2,300,000 |
| Iowa - 0.1% | | | |
| Iowa Fin. Auth. Solid Disp. Waste Rev. (MidAmerican Energy Proj.) Series 2008 A, 0.8% 1/6/17, VRDN (a)(b) | | 500,000 | 500,000 |
| Kentucky - 0.3% | | | |
| Trimble County Poll. Cont. Rev. (Louisville Gas and Elec. Co. Proj.) Series 2016 A, 0.83% 1/6/17, VRDN (a)(b) | | 1,400,000 | 1,400,000 |
| Michigan - 47.3% | | | |
| Central Michigan Univ. Rev. Series 2008 A, 0.71% 1/6/17, LOC JPMorgan Chase Bank, VRDN (b) | | 13,640,000 | 13,640,000 |
| Grand Traverse County Hosp. Series 2011 B, 0.74% 1/6/17, LOC JPMorgan Chase Bank, VRDN (b) | | 19,825,000 | 19,825,000 |
| Grand Valley Michigan State Univ. Rev. Series 2008 B: | | | |
| 0.71% 1/6/17, LOC U.S. Bank NA, Cincinnati, VRDN (b) | | 1,955,000 | 1,955,000 |
| 0.71% 1/6/17, LOC U.S. Bank NA, Cincinnati, VRDN (b)(c) | | 25,940,000 | 25,940,000 |
| Kent Hosp. Fin. Auth. Hosp. Facilities Rev.: | | | |
| (Metropolitan Hosp. Proj.) Series 2012, 0.74% 1/6/17, LOC Bank of America NA, VRDN (b) | | 6,230,000 | 6,230,000 |
| (Spectrum Health Sys. Proj.) Series 2008 C, 0.74% 1/6/17, LOC Bank of New York, New York, VRDN (b)(c) | | 100,000 | 100,000 |
| Livonia Econ. Dev. Corp. (Madonna Univ. Proj.) Series 2009, 0.74% 1/6/17, LOC Fed. Home Ln. Bank Chicago, VRDN (b) | | 21,665,000 | 21,665,000 |
| Michigan Bldg. Auth. Rev.: | | | |
| Series 2007 1, 0.73% 1/6/17, LOC Citibank NA, VRDN (b) | | 15,370,000 | 15,370,000 |
| Series 2011 B, 0.73% 1/6/17, LOC Citibank NA, VRDN (b) | | 6,895,000 | 6,895,000 |
| Michigan Fin. Auth. Rev.: | | | |
| (Healthcare Equip. Ln. Prog.) Series 2015 C, 0.81% 1/6/17, LOC Fifth Third Bank, Cincinnati, VRDN (b) | | 1,500,000 | 1,500,000 |
| (Hosp. Proj.) Series 2016 E2, 0.72% 1/6/17, VRDN (b)(c) | | 8,600,000 | 8,600,000 |
| Series 22 A, 0.73% 1/6/17, LOC State Street Bank & Trust Co., Boston, VRDN (a)(b)(c) | | 51,880,000 | 51,880,000 |
| Michigan Hosp. Fin. Auth. Rev. (Trinity Health Sys. Proj.) Series 2005 E, 0.72% 1/6/17, VRDN (b) | | 2,855,000 | 2,855,000 |
| Michigan Hsg. Dev. Auth. Ltd.: | | | |
| (Sand Creek Apts., Phase I Proj.) Series 2007 A, 0.76% 1/6/17, LOC Citibank NA, VRDN (a)(b) | | 3,555,000 | 3,555,000 |
| (Sand Creek II Apts. Proj.) Series 2007 A, 0.76% 1/6/17, LOC Citibank NA, VRDN (a)(b) | | 5,285,000 | 5,285,000 |
| (Teal Run I Apts. Proj.) Series 2007 A, 0.76% 1/6/17, LOC Citibank NA, VRDN (a)(b) | | 6,110,000 | 6,110,000 |
| Michigan Hsg. Dev. Auth. Multi-family Hsg. Rev. (Hunt Club Apts. Proj.) 0.75% 1/6/17, LOC Fannie Mae, VRDN (a)(b) | | 5,765,000 | 5,765,000 |
| Michigan Hsg. Dev. Ltd. Oblig. Rev. (JAS Non-Profit Hsg. Corp. VI Proj.) Series 2000, 0.73% 1/6/17, LOC JPMorgan Chase Bank, VRDN (b) | | 9,200,000 | 9,200,000 |
| Michigan State Univ. Revs. Series 2000 A, 0.72% 1/6/17 (Liquidity Facility Northern Trust Co.), VRDN (b)(c) | | 20,285,000 | 20,285,000 |
| Michigan Strategic Fund Indl. Dev. Rev. (Lapeer Industries, Inc. Proj.) Series 2007, 0.9% 1/6/17, LOC Bank of America NA, VRDN (a)(b) | | 1,860,000 | 1,860,000 |
| Michigan Strategic Fund Ltd. Oblig. Rev.: | | | |
| (Consumers Energy Co. Proj.): | | | |
| 0.74% 1/6/17, LOC JPMorgan Chase Bank, VRDN (b) | | 17,800,000 | 17,800,000 |
| 0.77% 1/6/17, LOC JPMorgan Chase Bank, VRDN (a)(b) | | 1,900,000 | 1,900,000 |
| (Henry Ford Museum & Greenfield Village Proj.) Series 2002, 0.79% 1/3/17, LOC Comerica Bank, VRDN (b) | | 2,300,000 | 2,300,000 |
| (The Kroger Co. Recovery Zone Facilities Bond Proj.) Series 2010, 0.78% 1/6/17, LOC Bank of Tokyo-Mitsubishi UFJ Ltd., VRDN (b) | | 19,000,000 | 19,000,000 |
| Oakland County Econ. Dev. Corp. Ltd. Oblig. Rev. (Osmic, Inc. Proj.) Series 2001 A, 0.79% 1/6/17, LOC JPMorgan Chase Bank, VRDN (a)(b) | | 2,300,000 | 2,300,000 |
| | | | 271,815,000 |
| Nebraska - 0.1% | | | |
| Stanton County Indl. Dev. Rev. (Nucor Corp. Proj.) Series 1996, 1% 1/6/17, VRDN (a)(b) | | 600,000 | 600,000 |
| Texas - 0.2% | | | |
| Port Arthur Navigation District Envir. Facilities Rev. (Motiva Enterprises LLC Proj.): | | | |
| Series 2004, 0.92% 1/6/17, VRDN (a)(b) | | 400,000 | 400,000 |
| Series 2010 D, 0.85% 1/3/17, VRDN (b) | | 725,000 | 725,000 |
| | | | 1,125,000 |
| Virginia - 0.3% | | | |
| Newport News Indl. Dev. Auth. (CNU Warwick LLC Student Apts. Proj.) 0.83% 1/6/17, LOC Bank of America NA, VRDN (b) | | 1,555,000 | 1,555,000 |
| West Virginia - 0.1% | | | |
| West Virginia Econ. Dev. Auth. Solid Waste Disp. Facilities Rev. (Appalachian Pwr. Co. - Amos Proj.) Series 2008 B, 1% 1/6/17, VRDN (a)(b) | | 800,000 | 800,000 |
| TOTAL VARIABLE RATE DEMAND NOTE | | | |
| (Cost $284,195,000) | | | 284,195,000 |
|
| Tender Option Bond - 15.6% | | | |
| California - 0.2% | | | |
| California Health Facilities Fing. Auth. Participating VRDN Series 16 XG 00 49, 0.87% 1/6/17 (Liquidity Facility Deutsche Bank AG New York Branch) (b)(d) | | 1,100,000 | 1,100,000 |
| Colorado - 0.0% | | | |
| Colorado Health Facilities Auth. Rev. Participating VRDN Series Floaters XF 22 41, 0.92% 1/6/17 (Liquidity Facility Citibank NA) (b)(d) | | 200,000 | 200,000 |
| Michigan - 15.2% | | | |
| JPMorgan Chase Participating VRDN: | | | |
| Series Putters 5009, 0.77% 1/3/17 (Liquidity Facility JPMorgan Chase Bank) (b)(d) | | 10,000,000 | 10,000,000 |
| Series Putters 5010, 0.77% 1/3/17 (Liquidity Facility JPMorgan Chase Bank) (b)(d) | | 2,000,000 | 2,000,000 |
| Michigan Bldg. Auth. Rev. Participating VRDN: | | | |
| Series Floaters XM 03 92, 0.75% 1/6/17 (Liquidity Facility Morgan Stanley Bank, West Valley City Utah) (b)(d) | | 3,600,000 | 3,600,000 |
| Series Floaters XM 04 65, 0.75% 1/6/17 (Liquidity Facility Morgan Stanley Bank, West Valley City Utah) (b)(d) | | 5,800,000 | 5,800,000 |
| Michigan Fin. Auth. Rev. Participating VRDN: | | | |
| Series 15 XF0126, 0.75% 1/6/17 (Liquidity Facility JPMorgan Chase Bank) (b)(d) | | 10,000,000 | 10,000,000 |
| Series 16 XM0223, 0.76% 1/6/17 (Liquidity Facility Citibank NA) (b)(d) | | 7,010,000 | 7,010,000 |
| Series 16 ZM0166, 0.75% 1/6/17 (Liquidity Facility Royal Bank of Canada) (b)(d) | | 8,500,000 | 8,500,000 |
| Series RBC 2016 XM0132, 0.75% 1/6/17 (Liquidity Facility Royal Bank of Canada) (b)(d) | | 13,165,000 | 13,165,000 |
| Series RBC 2016 ZM0131, 0.75% 1/6/17 (Liquidity Facility Royal Bank of Canada) (b)(d) | | 3,335,000 | 3,335,000 |
| Michigan Hosp. Fin. Auth. Rev. Participating VRDN Series Floaters XM 04 08, 0.75% 1/6/17 (Liquidity Facility Morgan Stanley Bank, West Valley City Utah) (b)(d) | | 4,475,000 | 4,475,000 |
| Michigan State Univ. Revs. Bonds Series WF 11 33 C, 0.92%, tender 3/9/17 (Liquidity Facility Wells Fargo Bank NA) (b)(d)(e) | | 7,610,000 | 7,610,000 |
| Univ. of Michigan Rev. Participating VRDN: | | | |
| Series 15 XF2199, 0.75% 1/6/17 (Liquidity Facility Morgan Stanley Bank, West Valley City Utah) (b)(d) | | 6,190,000 | 6,190,000 |
| Series 15 XF2205, 0.76% 1/6/17 (Liquidity Facility Citibank NA) (b)(d) | | 5,300,000 | 5,300,000 |
| | | | 86,985,000 |
| Nebraska - 0.1% | | | |
| Omaha Pub. Pwr. District Elec. Rev. Participating VRDN Series 16 XF1053, 0.9% 1/6/17 (Liquidity Facility Deutsche Bank AG New York Branch) (b)(d) | | 300,000 | 300,000 |
| New Jersey - 0.0% | | | |
| New Jersey St. Trans. Trust Fund Auth. Participating VRDN Series Floaters 16 XF1059, 0.91% 1/6/17 (Liquidity Facility Deutsche Bank AG New York Branch) (b)(d) | | 200,000 | 200,000 |
| South Carolina - 0.1% | | | |
| South Carolina St. Pub. Svc. Auth. Rev. Participating VRDN Series XG 0046, 0.81% 1/6/17 (Liquidity Facility Toronto-Dominion Bank) (b)(d) | | 700,000 | 700,000 |
| TOTAL TENDER OPTION BOND | | | |
| (Cost $89,485,000) | | | 89,485,000 |
|
| Other Municipal Security - 24.3% | | | |
| Georgia - 1.3% | | | |
| Main Street Natural Gas, Inc. Georgia Gas Proj. Rev. Bonds: | | | |
| Series 2010 A1, 0.83%, tender 4/3/17 (Liquidity Facility Royal Bank of Canada) (b) | | 2,500,000 | 2,500,000 |
| Series 2010 A2, 0.83%, tender 4/3/17 (Liquidity Facility Royal Bank of Canada) (b) | | 4,960,000 | 4,960,000 |
| | | | 7,460,000 |
| Kentucky - 0.0% | | | |
| Jefferson County Poll. Cont. Rev. Bonds Series 01A, 0.85% tender 1/23/17, CP mode | | 300,000 | 300,000 |
| Massachusetts - 0.3% | | | |
| Massachusetts Indl. Fin. Agcy. Poll. Cont. Rev. Bonds (New England Pwr. Co. Proj.): | | | |
| Series 1992: | | | |
| 0.9% tender 1/25/17, CP mode | | 100,000 | 100,000 |
| 0.9% tender 2/2/17, CP mode | | 400,000 | 400,000 |
| Series 1993 A, 0.9% tender 1/25/17, CP mode | | 800,000 | 800,000 |
| Series 93B, 0.8% tender 1/4/17, CP mode | | 500,000 | 500,000 |
| | | | 1,800,000 |
| Michigan - 21.9% | | | |
| Ingham, Eaton and Clinton Counties Lansing School District Bonds Series 2016 I, 3% 5/1/17 | | 3,000,000 | 3,021,976 |
| Kent Hosp. Fin. Auth. Hosp. Facilities Rev. Bonds (Spectrum Health Sys. Proj.) Series 2015 A, 0.97%, tender 7/28/17 (b) | | 27,915,000 | 27,915,000 |
| Michigan Bldg. Auth. Rev. Series 7, 0.77% 2/23/17, LOC State Street Bank & Trust Co., Boston, LOC U.S. Bank NA, Cincinnati, CP | | 5,800,000 | 5,800,000 |
| Michigan Fin. Auth. Rev. Bonds: | | | |
| Series 2010 A, 4% 12/1/17 | | 500,000 | 513,156 |
| Series 2012 A, 5% 7/1/17 | | 9,230,000 | 9,418,226 |
| Series 2013 M1, 0.75%, tender 3/1/17 (b) | | 9,000,000 | 9,000,000 |
| Michigan Gen. Oblig. Bonds (Envir. Prog.): | | | |
| Series 2008 A, 5% 5/1/17 | | 5,700,000 | 5,777,838 |
| Series 2012, 5% 11/1/17 | | 5,700,000 | 5,894,124 |
| Michigan Hosp. Fin. Auth. Rev. Bonds: | | | |
| (Ascension Health Cr. Group Proj.) 1.5%, tender 3/15/17 (b) | | 5,800,000 | 5,807,202 |
| Series 2010 F2, 1.5%, tender 3/1/17 (b) | | 8,960,000 | 8,969,370 |
| Michigan Trunk Line Fund Rev. Bonds: | | | |
| Series 2005, 5.25% 11/1/17 | | 8,050,000 | 8,333,821 |
| Series 2014, 5% 11/15/17 | | 3,830,000 | 3,964,482 |
| Series A, 5.5% 11/1/17 | | 1,320,000 | 1,369,968 |
| Rochester Cmnty. School District Bonds 4% 5/1/17 (Michigan Gen. Oblig. Guaranteed) | | 4,560,000 | 4,609,589 |
| Univ. of Michigan Rev.: | | | |
| Series K1: | | | |
| 0.6% 1/4/17, CP | | 6,000,000 | 6,000,000 |
| 0.72% 2/2/17, CP | | 6,800,000 | 6,800,000 |
| Series K2: | | | |
| 0.75% 7/17/17, CP | | 6,500,000 | 6,500,000 |
| 0.75% 9/1/17, CP | | 5,900,000 | 5,900,000 |
| | | | 125,594,752 |
| New Hampshire - 0.6% | | | |
| New Hampshire Bus. Fin. Auth. Poll. Cont. Rev. Bonds: | | | |
| (New England Pwr. Co. Proj.) Series 90B, 0.85% tender 1/19/17, CP mode | | 600,000 | 600,000 |
| Series 1990 A: | | | |
| 0.95% tender 1/24/17, CP mode (a) | | 1,100,000 | 1,100,000 |
| 0.95% tender 2/2/17, CP mode (a) | | 400,000 | 400,000 |
| Series A1: | | | |
| 0.95% tender 1/30/17, CP mode (a) | | 100,000 | 100,000 |
| 0.97% tender 1/31/17, CP mode (a) | | 1,000,000 | 1,000,000 |
| | | | 3,200,000 |
| Virginia - 0.1% | | | |
| Halifax County Indl. Dev. Auth. Poll. Cont. Rev. Bonds Series 2016, 0.98% tender 1/25/17, CP mode (a) | | 600,000 | 600,000 |
| West Virginia - 0.1% | | | |
| Grant County Cmnty. Solid Waste Disp. Rev. Bonds Series 96, 0.96% tender 2/2/17, CP mode (a) | | 500,000 | 500,000 |
| TOTAL OTHER MUNICIPAL SECURITY | | | |
| (Cost $139,454,752) | | | 139,454,752 |
| | | Shares | Value |
|
| Investment Company - 9.4% | | | |
| Fidelity Municipal Cash Central Fund, 0.79% (f)(g) | | | |
| (Cost $54,132,480) | | 54,132,480 | 54,132,480 |
| TOTAL INVESTMENT PORTFOLIO - 98.8% | | | |
| (Cost $567,267,232) | | | 567,267,232 |
| NET OTHER ASSETS (LIABILITIES) - 1.2% | | | 7,101,628 |
| NET ASSETS - 100% | | | $574,368,860 |
Security Type Abbreviations
VRDN – VARIABLE RATE DEMAND NOTE (A debt instrument that is payable upon demand, either daily, weekly or monthly)
CP – COMMERCIAL PAPER
The date shown for securities represents the date when principal payments must be paid, taking into account any call options exercised by the issuer and any permissible maturity shortening features other than interest rate resets.
Legend
(a) Private activity obligations whose interest is subject to the federal alternative minimum tax for individuals.
(b) Coupon rates for floating and adjustable rate securities reflect the rates in effect at period end.
(c) A portion of the security sold on a delayed delivery basis.
(d) Provides evidence of ownership in one or more underlying municipal bonds.
(e) Restricted securities - Investment in securities not registered under the Securities Act of 1933 (excluding 144A issues). At the end of the period, the value of restricted securities (excluding 144A issues) amounted to $7,610,000 or 1.3% of net assets.
(f) Information in this report regarding holdings by state and security types does not reflect the holdings of the Fidelity Municipal Cash Central Fund.
(g) Affiliated fund that is available only to investment companies and other accounts managed by Fidelity Investments. The rate quoted is the annualized seven-day yield of the fund at period end. A complete unaudited listing of the fund's holdings as of its most recent quarter end is available upon request. In addition, each Fidelity Central Fund's financial statements, which are not covered by the Fund's Report of Independent Registered Public Accounting Firm, are available on the SEC's website or upon request.
Additional information on each restricted holding is as follows:
| Security | Acquisition Date | Cost |
| Michigan State Univ. Revs. Bonds Series WF 11 33 C, 0.92%, tender 3/9/17 (Liquidity Facility Wells Fargo Bank NA) | 9/24/14 | $7,610,000 |
Affiliated Central Funds
Information regarding fiscal year to date income earned by the Fund from investments in Fidelity Central Funds is as follows:
| Fund | Income earned |
| Fidelity Municipal Cash Central Fund | $301,936 |
| Total | $301,936 |
Investment Valuation
All investments are categorized as Level 2 under the Fair Value Hierarchy. The inputs or methodology used for valuing securities may not be an indication of the risk associated with investing in those securities. For more information on valuation inputs please refer to the Investment Valuation section in the accompanying Notes to Financial Statements.
See accompanying notes which are an integral part of the financial statements.
Fidelity® Michigan Municipal Money Market Fund
Financial Statements
Statement of Assets and Liabilities
| | | December 31, 2016 |
| Assets | | |
Investment in securities, at value — See accompanying schedule:
Unaffiliated issuers (cost $513,134,752) | $513,134,752 | |
| Fidelity Central Funds (cost $54,132,480) | 54,132,480 | |
| Total Investments (cost $567,267,232) | | $567,267,232 |
| Cash | | 39,588 |
| Receivable for securities sold on a delayed delivery basis | | 6,000,000 |
| Receivable for fund shares sold | | 912,927 |
| Interest receivable | | 927,367 |
| Distributions receivable from Fidelity Central Funds | | 31,130 |
| Prepaid expenses | | 1,400 |
| Receivable from investment adviser for expense reductions | | 1,068 |
| Other receivables | | 4,754 |
| Total assets | | 575,185,466 |
| Liabilities | | |
| Payable for fund shares redeemed | $533,368 | |
| Distributions payable | 2,615 | |
| Accrued management fee | 173,799 | |
| Transfer agent fee payable | 64,849 | |
| Other affiliated payables | 7,163 | |
| Other payables and accrued expenses | 34,812 | |
| Total liabilities | | 816,606 |
| Net Assets | | $574,368,860 |
| Net Assets consist of: | | |
| Paid in capital | | $574,370,970 |
| Distributions in excess of net investment income | | (2,110) |
| Net Assets, for 573,704,552 shares outstanding | | $574,368,860 |
| Net Asset Value, offering price and redemption price per share ($574,368,860 ÷ 573,704,552 shares) | | $1.00 |
See accompanying notes which are an integral part of the financial statements.
Statement of Operations
| | | Year ended December 31, 2016 |
| Investment Income | | |
| Interest | | $2,880,683 |
| Income from Fidelity Central Funds | | 301,936 |
| Total income | | 3,182,619 |
| Expenses | | |
| Management fee | $2,753,423 | |
| Transfer agent fees | 1,030,866 | |
| Accounting fees and expenses | 98,595 | |
| Custodian fees and expenses | 5,644 | |
| Independent trustees' fees and expenses | 3,607 | |
| Registration fees | 28,341 | |
| Audit | 39,497 | |
| Legal | 5,961 | |
| Miscellaneous | 22,442 | |
| Total expenses before reductions | 3,988,376 | |
| Expense reductions | (1,292,034) | 2,696,342 |
| Net investment income (loss) | | 486,277 |
| Realized and Unrealized Gain (Loss) | | |
| Net realized gain (loss) on: | | |
| Investment securities: | | |
| Unaffiliated issuers | (8,256) | |
| Fidelity Central Funds | 480 | |
| Capital gain distributions from Fidelity Central Funds | 21,736 | |
| Total net realized gain (loss) | | 13,960 |
| Net increase in net assets resulting from operations | | $500,237 |
See accompanying notes which are an integral part of the financial statements.
Statement of Changes in Net Assets
| | Year ended December 31, 2016 | Year ended December 31, 2015 |
| Increase (Decrease) in Net Assets | | |
| Operations | | |
| Net investment income (loss) | $486,277 | $100,228 |
| Net realized gain (loss) | 13,960 | 3,904 |
| Net increase in net assets resulting from operations | 500,237 | 104,132 |
| Distributions to shareholders from net investment income | (486,526) | (100,222) |
| Distributions to shareholders from net realized gain | (490,312) | – |
| Total distributions | (976,838) | (100,222) |
| Share transactions at net asset value of $1.00 per share | | |
| Proceeds from sales of shares | 621,774,730 | 2,126,419,383 |
| Reinvestment of distributions | 948,313 | 95,842 |
| Cost of shares redeemed | (1,041,614,524) | (2,177,007,905) |
| Net increase (decrease) in net assets and shares resulting from share transactions | (418,891,481) | (50,492,680) |
| Total increase (decrease) in net assets | (419,368,082) | (50,488,770) |
| Net Assets | | |
| Beginning of period | 993,736,942 | 1,044,225,712 |
| End of period | $574,368,860 | $993,736,942 |
| Other Information | | |
| Distributions in excess of net investment income end of period | $(2,110) | $(1,861) |
See accompanying notes which are an integral part of the financial statements.
Financial Highlights — Fidelity Michigan Municipal Money Market Fund
| Years ended December 31, | 2016 | 2015 | 2014 | 2013 | 2012 |
| Selected Per–Share Data | | | | | |
| Net asset value, beginning of period | $1.00 | $1.00 | $1.00 | $1.00 | $1.00 |
| Income from Investment Operations | | | | | |
| Net investment income (loss) | .001 | –A | –A | –A | –A |
| Net realized and unrealized gain (loss) | .001 | –A | –A | –A | –A |
| Total from investment operationsA | .002 | –A | –A | –A | –A |
| Distributions from net investment income | (.001) | –A | –A | –A | –A |
| Distributions from net realized gain | (.001) | – | – | –A | – |
| Total distributions | (.002) | –A | –A | –A | –A |
| Net asset value, end of period | $1.00 | $1.00 | $1.00 | $1.00 | $1.00 |
| Total ReturnB | .16% | .01% | .01% | .02% | .01% |
| Ratios to Average Net AssetsC,D | | | | | |
| Expenses before reductions | .52% | .53% | .53% | .54% | .55% |
| Expenses net of fee waivers, if any | .35% | .06% | .07% | .11% | .19% |
| Expenses net of all reductions | .35% | .06% | .07% | .11% | .19% |
| Net investment income (loss) | .06% | .01% | .01% | .01% | .01% |
| Supplemental Data | | | | | |
| Net assets, end of period (000 omitted) | $574,369 | $993,737 | $1,044,226 | $1,077,691 | $985,600 |
A Amount represents less than $.0005 per share.
B Total returns would have been lower if certain expenses had not been reduced during the applicable periods shown.
C Fees and expenses of any underlying Fidelity Central Funds are not included in the Fund's expense ratio. The Fund indirectly bears its proportionate share of the expenses of any underlying Fidelity Central Funds.
D Expense ratios reflect operating expenses of the Fund. Expenses before reductions do not reflect amounts reimbursed or waived or reductions from expense offset arrangements and do not represent the amount paid by the Fund during periods when reimbursements, waivers or reductions occur. Expenses net of fee waivers reflect expenses after reimbursement and waivers but prior to reductions from expense offset arrangements. Expenses net of all reductions represent the net expenses paid by the Fund.
See accompanying notes which are an integral part of the financial statements.
Notes to Financial Statements
For the period ended December 31, 2016
1. Organization.
Fidelity Michigan Municipal Income Fund (the Income Fund) is a fund of Fidelity Municipal Trust. Fidelity Michigan Municipal Money Market Fund (the Money Market Fund) is a fund of Fidelity Municipal Trust II. Each Trust is registered under the Investment Company Act of 1940, as amended (the 1940 Act), as an open-end management investment company. Fidelity Municipal Trust and Fidelity Municipal Trust II (the Trusts) are organized as a Massachusetts business trust and a Delaware statutory trust, respectively. The Income Fund is a non-diversified fund. Each Fund is authorized to issue an unlimited number of shares. Share transactions on the Statement of Changes in Net Assets may contain exchanges between affiliated funds. Effective January 1, 2016 shares of the Money Market Fund are only available for purchase by retail shareholders. Each Fund may be affected by economic and political developments in the state of Michigan.
2. Investments in Fidelity Central Funds.
The Funds may invest in Fidelity Central Funds, which are open-end investment companies generally available only to other investment companies and accounts managed by the investment adviser and its affiliates. The Funds' Schedules of Investments list each of the Fidelity Central Funds held as of period end, if any, as an investment of each Fund, but does not include the underlying holdings of each Fidelity Central Fund. As an Investing Fund, each Fund indirectly bears its proportionate share of the expenses of the underlying Fidelity Central Funds.
The Money Market Central Funds seek preservation of capital and current income and are managed by Fidelity Investments Money Management, Inc. (FIMM), an affiliate of the investment adviser. Annualized expenses of the Money Market Central Funds as of their most recent shareholder report date are less than .005%.
A complete unaudited list of holdings for each Fidelity Central Fund is available upon request or at the Securities and Exchange Commission (the SEC) website at www.sec.gov. In addition, the financial statements of the Fidelity Central Funds, which are not covered by the Funds' Report of Independent Registered Public Accounting Firm, are available on the SEC website or upon request.
3. Significant Accounting Policies.
The financial statements have been prepared in conformity with accounting principles generally accepted in the United States of America (GAAP), which require management to make certain estimates and assumptions at the date of the financial statements. Actual results could differ from those estimates. Subsequent events, if any, through the date that the financial statements were issued have been evaluated in the preparation of the financial statements. The following summarizes the significant accounting policies of the Funds:
Investment Valuation. Investments are valued as of 4:00 p.m. Eastern time on the last calendar day of the period. The Board of Trustees (the Board) has delegated the day to day responsibility for the valuation of the Income Fund's investments to the Fair Value Committee (the Committee) established by the Income Fund's investment adviser. In accordance with valuation policies and procedures approved by the Board, the Income attempts to obtain prices from one or more third party pricing vendors or brokers to value its investments. When current market prices, quotations or currency exchange rates are not readily available or reliable, investments will be fair valued in good faith by the Committee, in accordance with procedures adopted by the Board. Factors used in determining fair value vary by investment type and may include market or investment specific events, changes in interest rates and credit quality. The frequency with which these procedures are used cannot be predicted and they may be utilized to a significant extent. The Committee oversees the Income Fund's valuation policies and procedures and reports to the Board on the Committee's activities and fair value determinations. The Board monitors the appropriateness of the procedures used in valuing the Income Fund's investments and ratifies the fair value determinations of the Committee.
Each Fund categorizes the inputs to valuation techniques used to value its investments into a disclosure hierarchy consisting of three levels as shown below:
- Level 1 – quoted prices in active markets for identical investments
- Level 2 – other significant observable inputs (including quoted prices for similar investments, interest rates, prepayment speeds, etc.)
- Level 3 – unobservable inputs (including the Fund's own assumptions based on the best information available)
Valuation techniques used to value each Fund's investments by major category are as follows:
For the Income Fund, debt securities, including restricted securities, are valued based on evaluated prices received from third party pricing vendors or from brokers who make markets in such securities. Municipal securities are valued by pricing vendors who utilize matrix pricing which considers yield or price of bonds of comparable quality, coupon, maturity and type or by broker-supplied prices. When independent prices are unavailable or unreliable, debt securities may be valued utilizing pricing methodologies which consider similar factors that would be used by third party pricing vendors. Debt securities are generally categorized as Level 2 in the hierarchy but may be Level 3 depending on the circumstances.
For the Money Market Fund, as permitted by compliance with certain conditions under Rule 2a-7 of the 1940 Act, securities are valued at amortized cost, which approximates fair value. The amortized cost of an instrument is determined by valuing it at its original cost and thereafter amortizing any discount or premium from its face value at a constant rate until maturity. Securities held by a money market fund are generally high quality and liquid; however, they are reflected as Level 2 because the inputs used to determine fair value are not quoted prices in an active market.
For the Income Fund, changes in valuation techniques may result in transfers in or out of an assigned level within the disclosure hierarchy.
Investment Transactions and Income. For financial reporting purposes, the Funds' investment holdings and net asset value (NAV) include trades executed through the end of the last business day of the period. The NAV per share for processing shareholder transactions is calculated as of the close of business of the New York Stock Exchange (NYSE), normally 4:00 p.m. Eastern time and includes trades executed through the end of the prior business day for the Income Fund and trades executed through the end of the current business day for the Money Market Fund. Gains and losses on securities sold are determined on the basis of identified cost. Income and capital gain distributions from Fidelity Central Funds, if any, are recorded on the ex-dividend date. Interest income is accrued as earned and includes coupon interest and amortization of premium and accretion of discount on debt securities as applicable. Debt obligations may be placed on non-accrual status and related interest income may be reduced by ceasing current accruals and writing off interest receivables when the collection of all or a portion of interest has become doubtful based on consistently applied procedures. A debt obligation is removed from non-accrual status when the issuer resumes interest payments or when collectability of interest is reasonably assured.
Expenses. Expenses directly attributable to a fund are charged to that fund. Expenses attributable to more than one fund are allocated among the respective funds on the basis of relative net assets or other appropriate methods. Expense estimates are accrued in the period to which they relate and adjustments are made when actual amounts are known.
Income Tax Information and Distributions to Shareholders. Each year, each Fund intends to qualify as a regulated investment company under Subchapter M of the Internal Revenue Code, including distributing substantially all of its taxable income and realized gains. As a result, no provision for U.S. Federal income taxes is required. During the period, the Money Market Fund incurred a corporate tax liability on undistributed long-term capital gain which is included as Miscellaneous expense on the Statement of Operations. As of December 31, 2016, each Fund did not have any unrecognized tax benefits in the financial statements; nor is each Fund aware of any tax positions for which it is reasonably possible that the total amounts of unrecognized tax benefits will significantly change in the next twelve months. Each Fund files a U.S. federal tax return, in addition to state and local tax returns as required. Each Fund's federal income tax returns are subject to examination by the Internal Revenue Service (IRS) for a period of three fiscal years after they are filed. State and local tax returns may be subject to examination for an additional fiscal year depending on the jurisdiction.
Dividends are declared and recorded daily and paid monthly from net investment income. Distributions from realized gains, if any, are declared and recorded on the ex-dividend date. Income and capital gain distributions are determined in accordance with income tax regulations, which may differ from GAAP. In addition, the Income Fund claimed a portion of the payment made to redeeming shareholders as a distribution for income tax purposes.
Capital accounts within the financial statements are adjusted for permanent book-tax differences. These adjustments have no impact on net assets or the results of operations. Capital accounts are not adjusted for temporary book-tax differences which will reverse in a subsequent period.
Book-tax differences are primarily due to market discount, deferred trustees compensation, capital loss carryforwards and losses deferred due to excise tax regulations.
The Funds purchase municipal securities whose interest, in the opinion of the issuer, is free from federal income tax. There is no assurance that the IRS will agree with this opinion. In the event the IRS determines that the issuer does not comply with relevant tax requirements, interest payments from a security could become federally taxable, possibly retroactively to the date the security was issued.
The federal tax cost of investment securities and unrealized appreciation (depreciation) as of period end were as follows for each Fund:
| | Tax cost | Gross unrealized appreciation | Gross unrealized depreciation | Net unrealized appreciation (depreciation) on securities |
| Fidelity Michigan Municipal Income Fund | $634,505,151 | $17,386,255 | $(9,757,697) | $7,628,558 |
| Fidelity Michigan Municipal Money Market Fund | 567,267,232 | – | – | – |
The tax-based components of distributable earnings as of period end were as follows for each Fund:
| | Undistributed tax-exempt income | Undistributed ordinary income | Net unrealized appreciation (depreciation) on securities and other investments |
| Fidelity Michigan Municipal Income Fund | $22,870 | $89,346 | $7,628,558 |
| Fidelity Michigan Municipal Money Market Fund | - | - | - |
Certain of the Funds intend to elect to defer to the next fiscal year capital losses recognized during the period November 1, 2016 to December 31, 2016. Loss deferrals were as follows:
| | Capital losses |
| Fidelity Michigan Municipal Income Fund | $(662,288) |
The tax character of distributions paid was as follows:
| December 31, 2016 | | | | |
| | Tax-Exempt Income | Ordinary Income | Long-term Capital Gains | Total |
| Fidelity Michigan Municipal Income Fund | $19,608,060 | $114,669 | $4,185,403 | $23,908,132 |
| Fidelity Michigan Municipal Money Market Fund | 486,526 | 471,693 | 18,619 | 976,838 |
| December 31, 2015 | | |
| | Tax-Exempt Income | Total |
| Fidelity Michigan Municipal Income Fund | $18,621,343 | $18,621,343 |
| Fidelity Michigan Municipal Money Market Fund | 100,222 | 100,222 |
Short-Term Trading (Redemption) Fees. Shares held by investors in the Income Fund less than 30 days may be subject to a redemption fee equal to .50% of the NAV of shares redeemed. All redemption fees, which reduce the proceeds of the shareholder redemption, are retained by the Fund and accounted for as an addition to paid in capital. In November 2016, the Board of Trustees approved the elimination of these redemption fees effective December 12, 2016.
Delayed Delivery Transactions and When-Issued Securities. During the period, certain Funds transacted in securities on a delayed delivery or when-issued basis. Payment and delivery may take place after the customary settlement period for that security. The price of the underlying securities and the date when the securities will be delivered and paid for are fixed at the time the transaction is negotiated. Certain Funds may receive compensation for interest forgone in the purchase of a delayed delivery or when-issued security. With respect to purchase commitments, each applicable Fund identifies securities as segregated in its records with a value at least equal to the amount of the commitment. Losses may arise due to changes in the value of the underlying securities or if the counterparty does not perform under the contract's terms, or if the issuer does not issue the securities due to political, economic, or other factors.
Restricted Securities. The Funds may invest in securities that are subject to legal or contractual restrictions on resale. These securities generally may be resold in transactions exempt from registration or to the public if the securities are registered. Disposal of these securities may involve time-consuming negotiations and expense, and prompt sale at an acceptable price may be difficult. Information regarding restricted securities is included at the end of each applicable Fund's Schedule of Investments.
4. Purchases and Sales of Investments.
Purchases and sales of securities, other than short-term securities, for the Income Fund aggregated $210,987,092 and $166,833,187, respectively.
5. Fees and Other Transactions with Affiliates.
Management Fee. Fidelity Management & Research Company (the investment adviser) and its affiliates provide the Funds with investment management related services for which the Funds pay a monthly management fee. The management fee is the sum of an individual fund fee rate and an annualized group fee rate. The individual fund fee rate is applied to each Fund's average net assets. The group fee rate is based upon the average net assets of all the mutual funds advised by the investment adviser, including any mutual funds previously advised by the investment adviser that are currently advised by Fidelity SelectCo, LLC, an affiliate of the investment adviser. The group fee rate decreases as assets under management increase and increases as assets under management decrease. For the reporting period, each Fund's annual management fee rate expressed as a percentage of each Fund's average net assets was as follows:
| | Individual Rate | Group Rate | Total |
| Fidelity Michigan Municipal Income Fund | .25% | .11% | .36% |
| Fidelity Michigan Municipal Money Market Fund | .25% | .11% | .36% |
Transfer Agent Fees. Fidelity Investments Institutional Operations Company, Inc. (FIIOC), an affiliate of the investment adviser, is the transfer, dividend disbursing and shareholder servicing agent for the Funds. FIIOC receives account fees and asset-based fees that vary according to account size and type of account. FIIOC pays for typesetting, printing and mailing of shareholder reports, except proxy statements. For the period, the transfer agent fees were equivalent to the following annual rates expressed as a percentage of average net assets:
| Fidelity Michigan Municipal Income Fund | .09% |
| Fidelity Michigan Municipal Money Market Fund | .13% |
Accounting Fees. Fidelity Service Company, Inc. (FSC), an affiliate of the investment adviser, maintains each Fund's accounting records. The fee is based on the level of average net assets for each month.
Interfund Trades. The Fund may purchase from or sell securities to other Fidelity Funds under procedures adopted by the Board. The procedures have been designed to ensure these interfund trades are executed in accordance with Rule 17a-7 of the 1940 Act. For the Income Fund, interfund trades are included within the respective purchases and sales amounts shown in the Purchases and Sales of Investments note.
6. Committed Line of Credit.
The Income Fund participates with other funds managed by the investment adviser or an affiliate in a $4.25 billion credit facility (the "line of credit") to be utilized for temporary or emergency purposes to fund shareholder redemptions or for other short-term liquidity purposes. The participating funds have agreed to pay commitment fees on their pro-rata portion of the line of credit, which are reflected in Miscellaneous expenses on the Statement of Operations, and are as follows:
| Fidelity Michigan Municipal Income Fund | $1,750 |
During the period, the Income Fund did not borrow on this line of credit.
7. Expense Reductions.
The investment adviser or its affiliates voluntarily agreed to waive certain fees for the Money Market Fund in order to maintain a minimum annualized yield of .01%. Such arrangements may be discontinued by the investment adviser at any time. For the period, the amount of the waiver was $1,283,111.
In addition, through arrangements with each applicable Fund's custodian, credits realized as a result of certain uninvested cash balances were used to reduce each applicable Fund's expenses. All of the applicable expense reductions are noted in the table below.
| | Custody
expense
reduction |
| Fidelity Michigan Municipal Income Fund | $5,543 |
| Fidelity Michigan Municipal Money Market Fund | 3,830 |
In addition, during the period the investment adviser reimbursed and/or waived a portion of operating expenses as follows:
| | Amount |
| Fidelity Michigan Municipal Income Fund | $2,524 |
| Fidelity Michigan Municipal Money Market Fund | 5,093 |
8. Other.
The Funds' organizational documents provide former and current trustees and officers with a limited indemnification against liabilities arising in connection with the performance of their duties to the Funds. In the normal course of business, the Funds may also enter into contracts that provide general indemnifications. The Funds' maximum exposure under these arrangements is unknown as this would be dependent on future claims that may be made against the Funds. The risk of material loss from such claims is considered remote.
Report of Independent Registered Public Accounting Firm
To the Trustees of Fidelity Municipal Trust and Fidelity Municipal Trust II and the Shareholders of Fidelity Michigan Municipal Income Fund and Fidelity Michigan Municipal Money Market Fund:
In our opinion, the accompanying statements of assets and liabilities, including the schedules of investments, and the related statements of operations and of changes in net assets and the financial highlights present fairly, in all material respects, the financial position of Fidelity Michigan Municipal Income Fund (a fund of Fidelity Municipal Trust) and Fidelity Michigan Municipal Money Market Fund (a fund of Fidelity Municipal Trust II) (the "Funds") as of December 31, 2016, the results of each of their operations for the year then ended, the changes in each of their net assets for each of the two years in the period then ended and the financial highlights for each of the five years in the period then ended, in conformity with accounting principles generally accepted in the United States of America. These financial statements and financial highlights (hereafter referred to as “financial statements”) are the responsibility of the Funds' management. Our responsibility is to express an opinion on these financial statements based on our audits. We conducted our audits of these financial statements in accordance with the standards of the Public Company Accounting Oversight Board (United States). Those standards require that we plan and perform the audit to obtain reasonable assurance about whether the financial statements are free of material misstatement. An audit includes examining, on a test basis, evidence supporting the amounts and disclosures in the financial statements, assessing the accounting principles used and significant estimates made by management, and evaluating the overall financial statement presentation. We believe that our audits, which included confirmation of securities as of December 31, 2016 by correspondence with the custodian and brokers, provide a reasonable basis for our opinion.
PricewaterhouseCoopers LLP
Boston, Massachusetts
February 16, 2017
Trustees and Officers
The Trustees, Members of the Advisory Board (if any), and officers of the trusts and funds, as applicable, are listed below. The Board of Trustees governs each fund and is responsible for protecting the interests of shareholders. The Trustees are experienced executives who meet periodically throughout the year to oversee each fund's activities, review contractual arrangements with companies that provide services to each fund, oversee management of the risks associated with such activities and contractual arrangements, and review each fund's performance. Each of the Trustees oversees 243 funds.
The Trustees hold office without limit in time except that (a) any Trustee may resign; (b) any Trustee may be removed by written instrument, signed by at least two-thirds of the number of Trustees prior to such removal; (c) any Trustee who requests to be retired or who has become incapacitated by illness or injury may be retired by written instrument signed by a majority of the other Trustees; and (d) any Trustee may be removed at any special meeting of shareholders by a two-thirds vote of the outstanding voting securities of the trust. Each Trustee who is not an interested person (as defined in the 1940 Act) of the trust and the funds is referred to herein as an Independent Trustee. Each Independent Trustee shall retire not later than the last day of the calendar year in which his or her 75th birthday occurs. The Independent Trustees may waive this mandatory retirement age policy with respect to individual Trustees. Officers and Advisory Board Members hold office without limit in time, except that any officer or Advisory Board Member may resign or may be removed by a vote of a majority of the Trustees at any regular meeting or any special meeting of the Trustees. Except as indicated, each individual has held the office shown or other offices in the same company for the past five years.
Each fund’s Statement of Additional Information (SAI) includes more information about the Trustees. To request a free copy, call Fidelity at 1-800-544-8544.
Experience, Skills, Attributes, and Qualifications of the Trustees. The Governance and Nominating Committee has adopted a statement of policy that describes the experience, qualifications, attributes, and skills that are necessary and desirable for potential Independent Trustee candidates (Statement of Policy). The Board believes that each Trustee satisfied at the time he or she was initially elected or appointed a Trustee, and continues to satisfy, the standards contemplated by the Statement of Policy. The Governance and Nominating Committee also engages professional search firms to help identify potential Independent Trustee candidates who have the experience, qualifications, attributes, and skills consistent with the Statement of Policy. From time to time, additional criteria based on the composition and skills of the current Independent Trustees, as well as experience or skills that may be appropriate in light of future changes to board composition, business conditions, and regulatory or other developments, have also been considered by the professional search firms and the Governance and Nominating Committee. In addition, the Board takes into account the Trustees' commitment and participation in Board and committee meetings, as well as their leadership of standing and ad hoc committees throughout their tenure.
In determining that a particular Trustee was and continues to be qualified to serve as a Trustee, the Board has considered a variety of criteria, none of which, in isolation, was controlling. The Board believes that, collectively, the Trustees have balanced and diverse experience, qualifications, attributes, and skills, which allow the Board to operate effectively in governing each fund and protecting the interests of shareholders. Information about the specific experience, skills, attributes, and qualifications of each Trustee, which in each case led to the Board's conclusion that the Trustee should serve (or continue to serve) as a trustee of the funds, is provided below.
Board Structure and Oversight Function. Abigail P. Johnson is an interested person and currently serves as Chairman. The Trustees have determined that an interested Chairman is appropriate and benefits shareholders because an interested Chairman has a personal and professional stake in the quality and continuity of services provided to the funds. Independent Trustees exercise their informed business judgment to appoint an individual of their choosing to serve as Chairman, regardless of whether the Trustee happens to be independent or a member of management. The Independent Trustees have determined that they can act independently and effectively without having an Independent Trustee serve as Chairman and that a key structural component for assuring that they are in a position to do so is for the Independent Trustees to constitute a substantial majority for the Board. The Independent Trustees also regularly meet in executive session. Marie L. Knowles serves as Chairman of the Independent Trustees and as such (i) acts as a liaison between the Independent Trustees and management with respect to matters important to the Independent Trustees and (ii) with management prepares agendas for Board meetings.
Fidelity® funds are overseen by different Boards of Trustees. The funds' Board oversees Fidelity's investment-grade bond, money market, asset allocation and certain equity funds, and other Boards oversee Fidelity's high income, sector and other equity funds. The asset allocation funds may invest in Fidelity® funds that are overseen by such other Boards. The use of separate Boards, each with its own committee structure, allows the Trustees of each group of Fidelity® funds to focus on the unique issues of the funds they oversee, including common research, investment, and operational issues. On occasion, the separate Boards establish joint committees to address issues of overlapping consequences for the Fidelity® funds overseen by each Board.
The Trustees operate using a system of committees to facilitate the timely and efficient consideration of all matters of importance to the Trustees, each fund, and fund shareholders and to facilitate compliance with legal and regulatory requirements and oversight of the funds' activities and associated risks. The Board, acting through its committees, has charged FMR and its affiliates with (i) identifying events or circumstances the occurrence of which could have demonstrably adverse effects on the funds' business and/or reputation; (ii) implementing processes and controls to lessen the possibility that such events or circumstances occur or to mitigate the effects of such events or circumstances if they do occur; and (iii) creating and maintaining a system designed to evaluate continuously business and market conditions in order to facilitate the identification and implementation processes described in (i) and (ii) above. Because the day-to-day operations and activities of the funds are carried out by or through FMR, its affiliates, and other service providers, the funds' exposure to risks is mitigated but not eliminated by the processes overseen by the Trustees. While each of the Board's committees has responsibility for overseeing different aspects of the funds' activities, oversight is exercised primarily through the Operations and Audit Committees. In addition, an ad hoc Board committee of Independent Trustees has worked with FMR to enhance the Board's oversight of investment and financial risks, legal and regulatory risks, technology risks, and operational risks, including the development of additional risk reporting to the Board. The Operations Committee also worked and continues to work with FMR to enhance the stress tests required under SEC regulations for money market funds. Appropriate personnel, including but not limited to the funds' Chief Compliance Officer (CCO), FMR's internal auditor, the independent accountants, the funds' Treasurer and portfolio management personnel, make periodic reports to the Board's committees, as appropriate, including an annual review of Fidelity's risk management program for the Fidelity® funds. The responsibilities of each standing committee, including their oversight responsibilities, are described further under "Standing Committees of the Trustees."
Interested Trustees*:
Correspondence intended for a Trustee who is an interested person may be sent to Fidelity Investments, 245 Summer Street, Boston, Massachusetts 02210.
Name, Year of Birth; Principal Occupations and Other Relevant Experience+
Abigail P. Johnson (1961)
Year of Election or Appointment: 2009
Trustee
Chairman of the Board of Trustees
Ms. Johnson also serves as Trustee of other Fidelity® funds. Ms. Johnson serves as Chairman (2016-present), Chief Executive Officer (2014-present), and Director (2007-present) of FMR LLC (diversified financial services company), President of Fidelity Financial Services (2012-present) and President of Personal, Workplace and Institutional Services (2005-present). Ms. Johnson is Chairman and Director of FMR Co., Inc. (investment adviser firm, 2011-present) and Chairman and Director of FMR (investment adviser firm, 2011-present). Previously, Ms. Johnson served as Vice Chairman (2007-2016) and President (2013-2016) of FMR LLC, President and a Director of FMR (2001-2005), a Trustee of other investment companies advised by FMR, Fidelity Investments Money Management, Inc. (investment adviser firm), and FMR Co., Inc. (2001-2005), Senior Vice President of the Fidelity® funds (2001-2005), and managed a number of Fidelity® funds. Ms. Abigail P. Johnson and Mr. Arthur E. Johnson are not related.
Jennifer Toolin McAuliffe (1959)
Year of Election or Appointment: 2016
Trustee
Ms. McAuliffe also serves as Trustee of other Fidelity® funds. Ms. McAuliffe previously served as a Member of the Advisory Board of certain Fidelity® funds (2016) and as Co-Head of Fixed Income of Fidelity Investments Limited (now known as FIL Limited (FIL)) (diversified financial services company). Earlier roles at FIL included Director of Research for FIL’s credit and quantitative teams in London, Hong Kong and Tokyo. Ms. McAuliffe also was the Director of Research for taxable and municipal bonds at Fidelity Investments Money Management, Inc. Ms. McAuliffe is also a director or trustee of several not-for-profit entities.
* Determined to be an “Interested Trustee” by virtue of, among other things, his or her affiliation with the trusts or various entities under common control with FMR.
+ The information includes the Trustee's principal occupation during the last five years and other information relating to the experience, attributes, and skills relevant to the Trustee's qualifications to serve as a Trustee, which led to the conclusion that the Trustee should serve as a Trustee for each fund.
Independent Trustees:
Correspondence intended for an Independent Trustee may be sent to Fidelity Investments, P.O. Box 55235, Boston, Massachusetts 02205-5235.
Name, Year of Birth; Principal Occupations and Other Relevant Experience+
Elizabeth S. Acton (1951)
Year of Election or Appointment: 2013
Trustee
Ms. Acton also serves as Trustee of other Fidelity® funds. Prior to her retirement in April 2012, Ms. Acton was Executive Vice President, Finance (2011-2012), Executive Vice President, Chief Financial Officer (2002-2011), and Treasurer (2004-2005) of Comerica Incorporated (financial services). Prior to joining Comerica, Ms. Acton held a variety of positions at Ford Motor Company (1983-2002), including Vice President and Treasurer (2000-2002) and Executive Vice President and Chief Financial Officer of Ford Motor Credit Company (1998-2000). Ms. Acton currently serves as a member of the Board of Directors and Audit and Finance Committees of Beazer Homes USA, Inc. (homebuilding, 2012-present). Previously, Ms. Acton served as a Member of the Advisory Board of certain Fidelity® funds (2013-2016).
John Engler (1948)
Year of Election or Appointment: 2014
Trustee
Mr. Engler also serves as Trustee of other Fidelity® funds. He serves as president of the Business Roundtable (2011-present), and on the board of directors for Universal Forest Products (manufacturer and distributor of wood and wood-alternative products, 2003-present) and K12 Inc. (technology-based education company, 2012-present). Previously, Mr. Engler served as a Member of the Advisory Board of certain Fidelity® funds (2014-2016), a trustee of The Munder Funds (2003-2014), president and CEO of the National Association of Manufacturers (2004-2011), member of the Board of Trustees of the Annie E. Casey Foundation (2004-2015), and as governor of Michigan (1991-2003). He is a past chairman of the National Governors Association.
Albert R. Gamper, Jr. (1942)
Year of Election or Appointment: 2006
Trustee
Mr. Gamper also serves as Trustee of other Fidelity® funds. Prior to his retirement in December 2004, Mr. Gamper served as Chairman of the Board of CIT Group Inc. (commercial finance). During his tenure with CIT Group Inc. Mr. Gamper served in numerous senior management positions, including Chairman (1987-1989; 1999-2001; 2002-2004), Chief Executive Officer (1987-2004), and President (2002-2003). Mr. Gamper currently serves as a member of the Board of Directors of Public Service Enterprise Group (utilities, 2000-present), and Member of the Board of Trustees of Barnabas Health Care System (1997-present). Previously, Mr. Gamper served as Chairman (2012-2015) and Vice Chairman (2011-2012) of the Independent Trustees of certain Fidelity® funds and as Chairman of the Board of Governors, Rutgers University (2004-2007).
Robert F. Gartland (1951)
Year of Election or Appointment: 2010
Trustee
Mr. Gartland also serves as Trustee of other Fidelity® funds. Mr. Gartland is Chairman and an investor in Gartland & Mellina Group Corp. (consulting, 2009-present). Previously, Mr. Gartland served as a partner and investor of Vietnam Partners LLC (investments and consulting, 2008-2011). Prior to his retirement, Mr. Gartland held a variety of positions at Morgan Stanley (financial services, 1979-2007) including Managing Director (1987-2007).
Arthur E. Johnson (1947)
Year of Election or Appointment: 2008
Trustee
Vice Chairman of the Independent Trustees
Mr. Johnson also serves as Trustee of other Fidelity® funds. Mr. Johnson serves as a member of the Board of Directors of Eaton Corporation plc (diversified power management, 2009-present) and Booz Allen Hamilton (management consulting, 2011-present). Prior to his retirement, Mr. Johnson served as Senior Vice President of Corporate Strategic Development of Lockheed Martin Corporation (defense contractor, 1999-2009). He previously served on the Board of Directors of IKON Office Solutions, Inc. (1999-2008), AGL Resources, Inc. (holding company, 2002-2016), and Delta Airlines (2005-2007). Mr. Arthur E. Johnson is not related to Ms. Abigail P. Johnson.
Michael E. Kenneally (1954)
Year of Election or Appointment: 2009
Trustee
Mr. Kenneally also serves as Trustee of other Fidelity® funds. Prior to his retirement, Mr. Kenneally served as Chairman and Global Chief Executive Officer of Credit Suisse Asset Management. Before joining Credit Suisse, he was an Executive Vice President and Chief Investment Officer for Bank of America Corporation. Earlier roles at Bank of America included Director of Research, Senior Portfolio Manager and Research Analyst, and Mr. Kenneally was awarded the Chartered Financial Analyst (CFA) designation in 1991.
Marie L. Knowles (1946)
Year of Election or Appointment: 2001
Trustee
Chairman of the Independent Trustees
Ms. Knowles also serves as Trustee of other Fidelity® funds. Prior to Ms. Knowles' retirement in June 2000, she served as Executive Vice President and Chief Financial Officer of Atlantic Richfield Company (ARCO) (diversified energy, 1996-2000). From 1993 to 1996, she was a Senior Vice President of ARCO and President of ARCO Transportation Company (pipeline and tanker operations). Ms. Knowles currently serves as a Director and Chairman of the Audit Committee of McKesson Corporation (healthcare service, since 2002). Ms. Knowles is a member of the Board of the Santa Catalina Island Company (real estate, 2009-present). Ms. Knowles is a Member of the Investment Company Institute Board of Governors and a Member of the Governing Council of the Independent Directors Council (2014-present). She also serves as a member of the Advisory Board for the School of Engineering of the University of Southern California. Previously, Ms. Knowles served as a Director of Phelps Dodge Corporation (copper mining and manufacturing, 1994-2007), URS Corporation (engineering and construction, 2000-2003) and America West (airline, 1999-2002). Ms. Knowles previously served as Vice Chairman of the Independent Trustees of certain Fidelity® funds (2012-2015).
Mark A. Murray (1954)
Year of Election or Appointment: 2016
Trustee
Mr. Murray also serves as Trustee of other Fidelity® funds. Mr. Murray is Vice Chairman (2013-present) of Meijer, Inc. (regional retail chain). Previously, Mr. Murray served as a Member of the Advisory Board of certain Fidelity® funds (2016) and as Co-Chief Executive Officer (2013-2016) and President (2006-2013) of Meijer, Inc. Mr. Murray serves as a member of the Board of Directors and Nuclear Review and Public Policy and Responsibility Committees of DTE Energy Company (diversified energy company, 2009-present). Mr. Murray also serves as a member of the Board of Directors of Spectrum Health (not-for-profit health system, 2015-present). Mr. Murray previously served as President of Grand Valley State University (2001-2006), Treasurer for the State of Michigan (1999-2001), Vice President of Finance and Administration for Michigan State University (1998-1999), and a member of the Board of Directors and Audit Committee and Chairman of the Nominating and Corporate Governance Committee of Universal Forest Products, Inc. (manufacturer and distributor of wood and wood-alternative products, 2004-2016). Mr. Murray is also a director or trustee of many community and professional organizations.
+ The information includes the Trustee's principal occupation during the last five years and other information relating to the experience, attributes, and skills relevant to the Trustee's qualifications to serve as a Trustee, which led to the conclusion that the Trustee should serve as a Trustee for each fund.
Advisory Board Members and Officers:
Correspondence intended for an officer may be sent to Fidelity Investments, 245 Summer Street, Boston, Massachusetts 02210. Officers appear below in alphabetical order.
Name, Year of Birth; Principal Occupation
Marc R. Bryant (1966)
Year of Election or Appointment: 2015
Secretary and Chief Legal Officer (CLO)
Mr. Bryant also serves as Secretary and CLO of other funds. Mr. Bryant serves as CLO, Secretary, and Senior Vice President of Fidelity Management & Research Company (investment adviser firm, 2015-present) and FMR Co., Inc. (investment adviser firm, 2015-present); Secretary of Fidelity SelectCo, LLC (investment adviser firm, 2015-present) and Fidelity Investments Money Management, Inc. (investment adviser firm, 2015-present); and CLO of Fidelity Management & Research (Hong Kong) Limited and FMR Investment Management (UK) Limited (investment adviser firms, 2015-present) and Fidelity Management & Research (Japan) Limited (investment adviser firm, 2016-present). He is Senior Vice President and Deputy General Counsel of FMR LLC (diversified financial services company). Previously, Mr. Bryant served as Secretary and CLO of Fidelity Rutland Square Trust II (2010-2014) and Assistant Secretary of Fidelity's Fixed Income and Asset Allocation Funds (2013-2015). Prior to joining Fidelity Investments, Mr. Bryant served as a Senior Vice President and the Head of Global Retail Legal for AllianceBernstein L.P. (2006-2010), and as the General Counsel for ProFund Advisors LLC (2001-2006).
Jeffrey S. Christian (1961)
Year of Election or Appointment: 2016
Assistant Treasurer
Mr. Christian also serves as Assistant Treasurer of other funds. Mr. Christian is an employee of Fidelity Investments (2003-present).
Jonathan Davis (1968)
Year of Election or Appointment: 2010
Assistant Treasurer
Mr. Davis also serves as Assistant Treasurer of other funds, and is an employee of Fidelity Investments. Previously, Mr. Davis served as Vice President and Associate General Counsel of FMR LLC (diversified financial services company, 2003-2010).
Adrien E. Deberghes (1967)
Year of Election or Appointment: 2010
Assistant Treasurer
Mr. Deberghes also serves as an officer of other funds. He serves as Executive Vice President of Fidelity Investments Money Management, Inc. (FIMM) (investment adviser firm, 2016-present) and is an employee of Fidelity Investments (2008-present). Prior to joining Fidelity Investments, Mr. Deberghes was Senior Vice President of Mutual Fund Administration at State Street Corporation (2007-2008), Senior Director of Mutual Fund Administration at Investors Bank & Trust (2005-2007), and Director of Finance for Dunkin' Brands (2000-2005). Previously, Mr. Deberghes served in other fund officer roles.
Stephanie J. Dorsey (1969)
Year of Election or Appointment: 2013
President and Treasurer
Ms. Dorsey also serves as an officer of other funds. She is an employee of Fidelity Investments (2008-present) and has served in other fund officer roles. Prior to joining Fidelity Investments, Ms. Dorsey served as Treasurer (2004-2008) of the JPMorgan Mutual Funds and Vice President (2004-2008) of JPMorgan Chase Bank.
Howard J. Galligan III (1966)
Year of Election or Appointment: 2014
Chief Financial Officer
Mr. Galligan also serves as Chief Financial Officer of other funds. Mr. Galligan serves as President of Fidelity Pricing and Cash Management Services (FPCMS) (2014-present) and as a Director of Strategic Advisers, Inc. (investment adviser firm, 2008-present). Previously, Mr. Galligan served as Chief Administrative Officer of Asset Management (2011-2014) and Chief Operating Officer and Senior Vice President of Investment Support for Strategic Advisers, Inc. (2003-2011).
Scott C. Goebel (1968)
Year of Election or Appointment: 2015
Vice President
Mr. Goebel serves as Vice President of other funds and is an employee of Fidelity Investments (2001-present). Previously, Mr. Goebel served as Senior Vice President of Fidelity Management & Research Company (FMR) (investment adviser firm, 2016), Secretary of Fidelity SelectCo, LLC (investment adviser firm, 2013-2015), Fidelity Investments Money Management, Inc. (FIMM) (investment adviser firm, 2010-2015), and Fidelity Research and Analysis Company (FRAC) (investment adviser firm, 2010-2015); General Counsel, Secretary, and Senior Vice President of FMR (investment adviser firm, 2008-2015) and FMR Co., Inc. (investment adviser firm, 2008-2015); Assistant Secretary of Fidelity Management & Research (Japan) Limited (investment adviser firm, 2008-2015) and Fidelity Management & Research (U.K.) Inc. (investment adviser firm, 2008-2015); Chief Legal Officer (CLO) of Fidelity Management & Research (Hong Kong) Limited (investment adviser firm, 2008-2015); Secretary and CLO of certain Fidelity® funds (2008-2015); Assistant Secretary of FIMM (2008-2010), FRAC (2008-2010), and certain funds (2007-2008); and as Vice President and Secretary of Fidelity Distributors Corporation (FDC) (2005-2007).
Colm A. Hogan (1973)
Year of Election or Appointment: 2016
Assistant Treasurer
Mr. Hogan also serves as an officer of other funds. Mr. Hogan is an employee of Fidelity Investments (2005-present).
Timothy Huyck (1964)
Year of Election or Appointment: 2015
Vice President of Fidelity's Money Market Funds
Mr. Huyck also serves as Vice President of other funds. Mr. Huyck serves as Chief Investment Officer of Fidelity's Money Market Funds (2015-present) and is an employee of Fidelity Investments (1990-present).
Chris Maher (1972)
Year of Election or Appointment: 2013
Assistant Treasurer
Mr. Maher serves as Assistant Treasurer of other funds. Mr. Maher is Vice President of Valuation Oversight and is an employee of Fidelity Investments. Previously, Mr. Maher served as Vice President of Asset Management Compliance (2013), Vice President of the Program Management Group of FMR (investment adviser firm, 2010-2013), and Vice President of Valuation Oversight (2008-2010).
John B. McGinty, Jr. (1962)
Year of Election or Appointment: 2016
Chief Compliance Officer
Mr. McGinty also serves as Chief Compliance Officer of other funds. Mr. McGinty is Senior Vice President of Asset Management Compliance for Fidelity Investments and is an employee of Fidelity Investments (2016-present). Mr. McGinty previously served as Vice President, Senior Attorney at Eaton Vance Management (investment management firm, 2015-2016), and prior to Eaton Vance as global CCO for all firm operations and registered investment companies at GMO LLC (investment management firm, 2009-2015). Before joining GMO LLC, Mr. McGinty served as Senior Vice President, Deputy General Counsel for Fidelity Investments (2007-2009).
John F. Papandrea (1972)
Year of Election or Appointment: 2016
Anti-Money Laundering (AML) Officer
Mr. Papandrea also serves as AML Officer of other funds. Mr. Papandrea is Vice President of FMR LLC (diversified financial services company, 2008-present) and is an employee of Fidelity Investments (2005-present).
Jason P. Pogorelec (1975)
Year of Election or Appointment: 2015
Assistant Secretary
Mr. Pogorelec also serves as Assistant Secretary of other funds. Mr. Pogorelec serves as Vice President, Associate General Counsel (2010-present) and is an employee of Fidelity Investments (2006-present).
Nancy D. Prior (1967)
Year of Election or Appointment: 2014
Vice President
Ms. Prior also serves as Vice President of other funds. Ms. Prior serves as a Director of FMR Investment Management (UK) Limited (investment adviser firm, 2015-present), President (2016-present) and Director (2014-present) of Fidelity Investments Money Management, Inc. (FIMM) (investment adviser firm), President, Fixed Income (2014-present), Vice Chairman of FIAM LLC (investment adviser firm, 2014-present), and is an employee of Fidelity Investments (2002-present). Previously, Ms. Prior served as Vice President of Fidelity's Money Market Funds (2012-2014), President, Money Market and Short Duration Bond Group of Fidelity Management & Research (FMR) (investment adviser firm, 2013-2014), President, Money Market Group of FMR (2011-2013), Managing Director of Research (2009-2011), Senior Vice President and Deputy General Counsel (2007-2009), and Assistant Secretary of certain Fidelity® funds (2008-2009).
Stacie M. Smith (1974)
Year of Election or Appointment: 2013
Assistant Treasurer
Ms. Smith also serves as an officer of other funds. She is an employee of Fidelity Investments (2009-present) and has served in other fund officer roles. Prior to joining Fidelity Investments, Ms. Smith served as Senior Audit Manager of Ernst & Young LLP (accounting firm, 1996-2009). Previously, Ms. Smith served as Deputy Treasurer of certain Fidelity® funds (2013-2016).
Marc L. Spector (1972)
Year of Election or Appointment: 2016
Deputy Treasurer
Mr. Spector also serves as an officer of other funds. Mr. Spector is an employee of Fidelity Investments (2016-present). Prior to joining Fidelity Investments, Mr. Spector served as Director at the Siegfried Group (accounting firm, 2013-2016), and prior to Siegfried Group as audit senior manager at Deloitte & Touche (accounting firm, 2005-2013).
Renee Stagnone (1975)
Year of Election or Appointment: 2016
Assistant Treasurer
Ms. Stagnone also serves as an officer of other funds. Ms. Stagnone is an employee of Fidelity Investments (1997-present). Previously, Ms. Stagnone served as Deputy Treasurer of certain Fidelity® funds (2013-2016).
Christine J. Thompson (1958)
Year of Election or Appointment: 2015
Vice President of Fidelity's Bond Funds
Ms. Thompson also serves as Vice President of other funds. Ms. Thompson also serves as Chief Investment Officer of FMR's Bond Group (2010-present) and is an employee of Fidelity Investments (1985-present). Previously, Ms. Thompson served as Vice President of Fidelity's Bond Funds (2010-2012).
Shareholder Expense Example
As a shareholder of a Fund, you incur two types of costs: (1) transaction costs, including redemption fees and (2) ongoing costs, including management fees and other Fund expenses. This Example is intended to help you understand your ongoing costs (in dollars) of investing in the Funds and to compare these costs with the ongoing costs of investing in other mutual funds.
The Example is based on an investment of $1,000 invested at the beginning of the period and held for the entire period (July 1, 2016 to December 31, 2016).
Actual Expenses
The first line of the accompanying table for each fund provides information about actual account values and actual expenses. You may use the information in this line, together with the amount you invested, to estimate the expenses that you paid over the period. Simply divide your account value by $1,000.00 (for example, an $8,600 account value divided by $1,000.00 = 8.6), then multiply the result by the number in the first line for a fund under the heading entitled "Expenses Paid During Period" to estimate the expenses you paid on your account during this period. A small balance maintenance fee of $12.00 that is charged once a year may apply for certain accounts with a value of less than $2,000. This fee is not included in the table below. If it was, the estimate of expenses you paid during the period would be higher, and your ending account value lower, by this amount. In addition, each Fund, as a shareholder in the underlying Fidelity Central Funds, will indirectly bear its pro-rata share of the fees and expenses incurred by the underlying Fidelity Central Funds. These fees and expenses are not included in the Fund's annualized expense ratio used to calculate the expense estimate in the table below.
Hypothetical Example for Comparison Purposes
The second line of the accompanying table for each fund provides information about hypothetical account values and hypothetical expenses based on a fund's actual expense ratio and an assumed rate of return of 5% per year before expenses, which is not the Fund's actual return. The hypothetical account values and expenses may not be used to estimate the actual ending account balance or expenses you paid for the period. You may use this information to compare the ongoing costs of investing in the Fund and other funds. To do so, compare this 5% hypothetical example with the 5% hypothetical examples that appear in the shareholder reports of the other funds. A small balance maintenance fee of $12.00 that is charged once a year may apply for certain accounts with a value of less than $2,000. This fee is not included in the table below. If it was, the estimate of expenses you paid during the period would be higher, and your ending account value lower, by this amount. In addition, each Fund, as a shareholder in the underlying Fidelity Central Funds, will indirectly bear its pro-rata share of the fees and expenses incurred by the underlying Fidelity Central Funds. These fees and expenses are not included in the Fund's annualized expense ratio used to calculate the expense estimate in the table below.
Please note that the expenses shown in the table are meant to highlight your ongoing costs only and do not reflect any transaction costs. Therefore, the second line of the table is useful in comparing ongoing costs only, and will not help you determine the relative total costs of owning different funds. In addition, if these transactional costs were included, your costs would have been higher.
| | Annualized Expense Ratio-A | Beginning
Account Value
July 1, 2016 | Ending
Account Value
December 31, 2016 | Expenses Paid
During Period-B
July 1, 2016
to December 31, 2016 |
| Fidelity Michigan Municipal Income Fund | .48% | | | |
| Actual | | $1,000.00 | $958.40 | $2.36 |
| Hypothetical-C | | $1,000.00 | $1,022.72 | $2.44 |
| Fidelity Michigan Municipal Money Market Fund | .50% | | | |
| Actual | | $1,000.00 | $1,001.50 | $2.52 |
| Hypothetical-C | | $1,000.00 | $1,022.62 | $2.54 |
A Annualized expense ratio reflects expenses net of applicable fee waivers.
B Expenses are equal to each Fund's annualized expense ratio, multiplied by the average account value over the period, multiplied by 184/366 (to reflect the one-half year period).
C 5% return per year before expenses
Distributions (Unaudited)
The funds hereby designate as capital gain dividend the amounts noted below for the taxable year ended December 31, 2016, or, if subsequently determined to be different, the net capital gain of such year.
| Fidelity Michigan Municipal Income Fund | $4,132,371 |
| Fidelity Michigan Municipal Money Market Fund | $13,960 |
|
During fiscal year ended 2016, 100% of Fidelity Michigan Municipal Income Fund and Fidelity Michigan Municipal Money Market Fund's income dividends were free from federal income tax, and 2.48% of Fidelity Michigan Municipal Income Fund and 17.73% of Fidelity Michigan Municipal Money Market Fund's income dividends were subject to the federal alternative minimum tax.
The funds will notify shareholders in January 2017 of amounts for use in preparing 2016 income tax returns.
Board Approval of Investment Advisory Contracts and Management Fees
Fidelity Michigan Municipal Income Fund / Fidelity Michigan Municipal Money Market Fund
Each year, the Board of Trustees, including the Independent Trustees (together, the Board), votes on the renewal of the management contract with Fidelity Management & Research Company (FMR) and the sub-advisory agreements (together, the Advisory Contracts) for each fund. The Board, assisted by the advice of fund counsel and Independent Trustees' counsel, requests and considers a broad range of information relevant to the renewal of the Advisory Contracts throughout the year.
The Board meets regularly and, at each of its meetings, covers an extensive agenda of topics and materials and considers factors that are relevant to its annual consideration of the renewal of each fund's Advisory Contracts, including the services and support provided to each fund and its shareholders. The Board has established four standing committees (Committees) — Operations, Audit, Fair Valuation, and Governance and Nominating — each composed of and chaired by Independent Trustees with varying backgrounds, to which the Board has assigned specific subject matter responsibilities in order to enhance effective decision-making by the Board. The Operations Committee, of which all of the Independent Trustees are members, meets regularly throughout the year and considers, among other matters, information specifically related to the annual consideration of the renewal of each fund's Advisory Contracts. The Board, acting directly and through its Committees, requests and receives information concerning the annual consideration of the renewal of each fund's Advisory Contracts. The Board also meets as needed to consider matters specifically related to the Board's annual consideration of the renewal of the Advisory Contracts. Members of the Board may also meet with trustees of other Fidelity funds through ad hoc joint committees to discuss certain matters relevant to all of the Fidelity funds.
At its September 2016 meeting, the Board unanimously determined to renew each fund's Advisory Contracts. In reaching its determination, the Board considered all factors it believed relevant, including (i) the nature, extent, and quality of the services to be provided to each fund and its shareholders (including the investment performance of each fund); (ii) the competitiveness of each fund's management fee and total expense ratio relative to peer funds; (iii) the total costs of the services to be provided by and the profits to be realized by Fidelity from its relationships with each fund; and (iv) the extent to which, if any, economies of scale exist and would be realized as each fund grows, and whether any economies of scale are appropriately shared with fund shareholders.
In considering whether to renew the Advisory Contracts for each fund, the Board reached a determination, with the assistance of fund counsel and Independent Trustees' counsel and through the exercise of its business judgment, that the renewal of the Advisory Contracts was in the best interests of each fund and its shareholders and that the compensation payable under the Advisory Contracts was fair and reasonable. The Board's decision to renew the Advisory Contracts was not based on any single factor, but rather was based on a comprehensive consideration of all the information provided to the Board at its meetings throughout the year. The Board, in reaching its determination to renew the Advisory Contracts, was aware that shareholders of each fund have a broad range of investment choices available to them, including a wide choice among funds offered by Fidelity's competitors, and that each fund's shareholders, who have the opportunity to review and weigh the disclosure provided by the fund in its prospectus and other public disclosures, have chosen to invest in that fund, which is part of the Fidelity family of funds.
Nature, Extent, and Quality of Services Provided. The Board considered Fidelity's staffing as it relates to the funds, including the backgrounds of investment personnel of Fidelity, and also considered the funds' investment objectives, strategies, and related investment philosophies. The Independent Trustees also had discussions with senior management of Fidelity's investment operations and investment groups. The Board considered the structure of the investment personnel compensation program and whether this structure provides appropriate incentives to act in the best interests of each fund. Additionally, the Board considered the portfolio managers' investments, if any, in the funds that they manage.
Resources Dedicated to Investment Management and Support Services. The Board reviewed the general qualifications and capabilities of Fidelity's investment staff, including its size, education, experience, and resources, as well as Fidelity's approach to recruiting, managing, and compensating investment personnel. The Board noted that Fidelity has continued to increase the resources devoted to non-U.S. offices, including expansion of Fidelity's global investment organization. The Board also noted that Fidelity's analysts have extensive resources, tools and capabilities that allow them to conduct sophisticated quantitative and fundamental analysis, as well as credit analysis of issuers, counterparties and guarantors. Further, the Board considered that Fidelity's investment professionals have sufficient access to global information and data so as to provide competitive investment results over time, and that those professionals also have access to sophisticated tools that permit them to assess portfolio construction and risk and performance attribution characteristics continuously, as well as to transmit new information and research conclusions rapidly around the world. Additionally, in its deliberations, the Board considered Fidelity's trading, risk management, compliance, and technology and operations capabilities and resources, which are integral parts of the investment management process.
Shareholder and Administrative Services. The Board considered (i) the nature, extent, quality, and cost of advisory, administrative, and shareholder services performed by FMR, the sub-advisers (together with FMR, the Investment Advisers), and their affiliates under the Advisory Contracts and under separate agreements covering transfer agency and pricing and bookkeeping services for each fund; (ii) the nature and extent of the supervision of third party service providers, principally custodians, subcustodians, and pricing vendors; and (iii) the resources devoted to, and the record of compliance with, each fund's compliance policies and procedures.
The Board noted that the growth of fund assets over time across the complex allows Fidelity to reinvest in the development of services designed to enhance the value or convenience of the Fidelity funds as investment vehicles. These services include 24-hour access to account information and market information through telephone representatives and over the Internet, investor education materials and asset allocation tools, and the expanded availability of Fidelity Investor Centers.
Investment in a Large Fund Family. The Board considered the benefits to shareholders of investing in a Fidelity fund, including the benefits of investing in a fund that is part of a large family of funds offering a variety of investment disciplines and providing a large variety of mutual fund investor services. The Board noted that Fidelity had taken, or had made recommendations that resulted in the Fidelity funds taking, a number of actions over the previous year that benefited particular funds, including: (i) continuing to dedicate additional resources to investment research and to the support of the senior management team that oversees asset management; (ii) continuing efforts to enhance Fidelity's global research capabilities; (iii) launching new funds and making other enhancements to meet client needs; (iv) broadening eligibility requirements for certain lower-priced share classes of, and streamlining the fee structure for, certain existing equity index funds; (v) lowering expense caps for certain existing funds and classes to reduce expenses paid by shareholders; (vi) eliminating redemption fees for certain variable insurance product funds and classes; (vii) continuing to launch dedicated lower cost underlying funds to meet portfolio construction needs related to expanding underlying fund options for Fidelity funds of funds, specifically for the Freedom Fund product lines; (viii) launching a lower cost share class for use by the Freedom Index Fund product line; (ix) rationalizing product lines and gaining increased efficiencies through fund mergers and share class consolidations; (x) continuing to develop, acquire and implement systems and technology to improve services to the funds and shareholders, strengthen information security, and increase efficiency; (xi) implementing investment enhancements to further strengthen Fidelity's target date product line to increase investors' probability of success in achieving their goals; (xii) accelerating the conversion of all remaining Class B shares to Class A shares, which have a lower expense structure; and (xiii) implementing changes to Fidelity's money market fund product line in response to recent regulatory reforms.
Investment Performance (for Fidelity Michigan Municipal Income Fund). The Board considered whether the fund has operated in accordance with its investment objective, as well as its record of compliance with its investment restrictions and its performance history. The Board noted that there was a portfolio management change for the fund in May 2016.
The Board took into account discussions with representatives of the Investment Advisers about fund investment performance that occur at Board meetings throughout the year. In this regard the Board noted that as part of regularly scheduled fund reviews and other reports to the Board on fund performance, the Board considers annualized return information for the fund for different time periods, measured against a securities market index ("benchmark index") and a peer group of funds with similar objectives ("peer group"), if any. In its evaluation of fund investment performance at meetings throughout the year, the Board gave particular attention to information indicating underperformance of certain Fidelity funds for specific time periods and discussed with the Investment Advisers the reasons for such underperformance.
In addition to reviewing absolute and relative fund performance, the Independent Trustees periodically consider the appropriateness of fund performance metrics in evaluating the results achieved. In general, the Independent Trustees believe that fund performance should be evaluated based on gross performance (before fees and expenses but after transaction costs) compared to appropriate benchmark indices, over appropriate time periods that may include full market cycles, and on net performance (after fees and expenses) compared to peer groups, as applicable, over the same periods, taking into account relevant factors including the following: general market conditions; expectations for interest rate levels and credit conditions; issuer-specific information including credit quality; the potential for incremental return versus the fund's benchmark index weighed against the risks involved in obtaining that incremental return, including the risk of diminished or negative total returns; and fund cash flows and other factors. Depending on the circumstances, the Independent Trustees may be satisfied with a fund's performance notwithstanding that it lags its benchmark index or peer group for certain periods.
The Independent Trustees recognize that shareholders evaluate performance on a net basis over their own holding periods, for which one-, three-, and five-year periods are often used as a proxy. For this reason, the performance information reviewed by the Board also included net cumulative calendar year total return information for the fund and an appropriate benchmark index and peer group for the most recent one-, three-, and five-year periods.
Investment Performance (for Fidelity Michigan Municipal Money Market Fund). The Board considered whether the fund has operated in accordance with its investment objective, as well as its record of compliance with its investment restrictions and its performance history.
The Board took into account discussions with representatives of the Investment Advisers about fund investment performance that occur at Board meetings throughout the year. In this regard the Board noted that as part of regularly scheduled fund reviews and other reports to the Board on fund performance, the Board considers annualized return information for the fund for different time periods, measured against a peer group of funds with similar objectives ("peer group").
In addition to reviewing absolute and relative fund performance, the Independent Trustees periodically consider the appropriateness of fund performance metrics in evaluating the results achieved. In general, the Independent Trustees believe that fund performance should be evaluated based on gross performance (before fees and expenses but after transaction costs) compared to the gross performance of appropriate peer groups, over appropriate time periods that may include full market cycles, taking into account relevant factors including the following: general market conditions; expectations for interest rate levels and credit conditions; issuer-specific information including credit quality; the fund’s market value NAV over time and its resilience under various stressed conditions; and fund cash flows and other factors.
The Board recognizes that in interest rate environments where many competitors waive fees to maintain a minimum yield, relative money market fund performance on a net basis (after fees and expenses) may not be particularly meaningful due to miniscule performance differences among competitor funds. Depending on the circumstances, the Independent Trustees may be satisfied with a fund's performance notwithstanding that it lags its peer group for certain periods.
The Independent Trustees recognize that shareholders evaluate performance on a net basis over their own holding periods, for which one-, three-, and five-year periods are often used as a proxy. For this reason, the performance information reviewed by the Board also included net cumulative calendar year total return information for the fund and an appropriate peer group for the most recent one-, three-, and five-year periods.
Based on its review, the Board concluded that the nature, extent, and quality of services provided to each fund under the Advisory Contracts should continue to benefit the shareholders of each fund.
Competitiveness of Management Fee and Total Expense Ratio. The Board considered each fund's management fee and total expense ratio compared to "mapped groups" of competitive funds and classes created for the purpose of facilitating the Trustees' competitive analysis of management fees and total expenses. Fidelity creates "mapped groups" by combining similar Lipper investment objective categories that have comparable investment mandates. Combining Lipper investment objective categories aids the Board's management fee and total expense ratio comparisons by broadening the competitive group used for comparison.
Management Fee. The Board considered two proprietary management fee comparisons for the 12-month periods shown in basis points (BP) in the charts below. The group of Lipper funds used by the Board for management fee comparisons is referred to below as the "Total Mapped Group" and, for the reasons explained above, is broader than the Lipper peer group used by the Board for performance comparisons. The Total Mapped Group comparison focuses on a fund's standing in terms of gross management fees before expense reimbursements or caps relative to the total universe of funds with comparable investment mandates, regardless of whether their management fee structures also are comparable. Funds with comparable investment mandates offer exposure to similar types of securities. Funds with comparable management fee structures have similar management fee contractual arrangements (
e.g., flat rate charged for advisory services, all-inclusive fee rate,
etc.). "TMG %" represents the percentage of funds in the Total Mapped Group that had management fees that were lower than a fund's. For example, a hypothetical TMG % of 20% would mean that 80% of the funds in the Total Mapped Group had higher, and 20% had lower, management fees than a fund. The funds' actual TMG %s and the number of funds in the Total Mapped Group are in the charts below. The "Asset-Size Peer Group" (ASPG) comparison focuses on a fund's standing relative to a subset of non-Fidelity funds within the Total Mapped Group that are similar in size and management fee structure. For example, if a fund is in the first quartile of the ASPG, the fund's management fee ranks in the least expensive or lowest 25% of funds in the ASPG. The ASPG represents at least 15% of the funds in the Total Mapped Group with comparable asset size and management fee structures, subject to a minimum of 50 funds (or all funds in the Total Mapped Group if fewer than 50). Additional information, such as the ASPG quartile in which a fund's management fee rate ranked, is also included in the charts and considered by the Board.
Fidelity Michigan Municipal Income Fund

The Board noted that the fund's management fee rate ranked below the median of its Total Mapped Group and below the median of its ASPG for 2015.
Fidelity Michigan Municipal Money Market Fund
The Board noted that the fund's management fee rate ranked equal to the median of its Total Mapped Group and above the median of its ASPG for 2015. The Board noted that there is a relatively small number of state-specific funds in the Lipper objective.
The Board noted that, in 2014, the ad hoc Committee on Group Fee was formed by it and the boards of other Fidelity funds to conduct an in-depth review of the "group fee" component of the management fee of funds with such management fee structures. The Committee's focus included the mechanics of the group fee, the competitive landscape of group fee structures, Fidelity funds with no group fee component and investment products not included in group fee assets. The Board also considered that, for funds subject to the group fee, FMR agreed to voluntarily waive fees over a specified period of time in amounts designed to account for assets converted from certain funds to certain collective investment trusts.
Based on its review, the Board concluded that each fund's management fee is fair and reasonable in light of the services that the fund receives and the other factors considered.
Total Expense Ratio. In its review of each fund's total expense ratio, the Board considered the fund's management fee rate as well as other fund expenses, such as transfer agent fees, pricing and bookkeeping fees, and custodial, legal, and audit fees. The Board also noted that Fidelity may agree to waive fees and expenses from time to time, and the extent to which, if any, it has done so for the funds. As part of its review, the Board also considered the current and historical total expense ratios of each fund compared to competitive fund median expenses. Each fund is compared to those funds and classes in the Total Mapped Group (used by the Board for management fee comparisons) that have a similar sales load structure.
The Board noted that each fund's total expense ratio ranked below the competitive median for 2015. The Board considered that Fidelity has been voluntarily waiving part or all of the transfer agent fees and/or management fees to maintain a minimum yield for Fidelity Michigan Municipal Money Market Fund.
Fees Charged to Other Fidelity Clients. The Board also considered Fidelity fee structures and other information with respect to clients of Fidelity, such as other funds advised or subadvised by Fidelity, pension plan clients, and other institutional clients with similar mandates. The Board noted that an ad hoc joint committee created by it and the boards of other Fidelity funds periodically (most recently in 2013) reviews and compares Fidelity's institutional investment advisory business with its business of providing services to the Fidelity funds, including the differences in services provided, fees charged, and costs incurred, as well as competition in their respective marketplaces.
Based on its review of total expense ratios and fees charged to other Fidelity clients, the Board concluded that each fund's total expense ratio was reasonable in light of the services that the fund and its shareholders receive and the other factors considered.
Costs of the Services and Profitability. The Board considered the revenues earned and the expenses incurred by Fidelity in conducting the business of developing, marketing, distributing, managing, administering and servicing each fund and servicing each fund's shareholders. The Board also considered the level of Fidelity's profits in respect of all the Fidelity funds.
On an annual basis, Fidelity presents to the Board information about the profitability of its relationships with each fund. Fidelity calculates profitability information for each fund, as well as aggregate profitability information for groups of Fidelity funds and all Fidelity funds, using a series of detailed revenue and cost allocation methodologies which originate with the books and records of Fidelity on which Fidelity's audited financial statements are based. The Audit Committee of the Board reviews any significant changes from the prior year's methodologies.
PricewaterhouseCoopers LLP (PwC), independent registered public accounting firm and auditor to Fidelity and certain Fidelity funds, has been engaged annually by the Board as part of the Board's assessment of Fidelity's profitability analysis. PwC's engagement includes the review and assessment of the methodologies used by Fidelity in determining the revenues and expenses attributable to Fidelity's mutual fund business, and completion of agreed-upon procedures in respect of the mathematical accuracy of the fund profitability information and its conformity to established allocation methodologies. After considering PwC's reports issued under the engagement and information provided by Fidelity, the Board concluded that while other allocation methods may also be reasonable, Fidelity's profitability methodologies are reasonable in all material respects.
The Board also reviewed Fidelity's non-fund businesses and fall-out benefits related to the mutual fund business as well as cases where Fidelity's affiliates may benefit from or be related to the funds' business.
The Board considered the costs of the services provided by and the profits realized by Fidelity in connection with the operation of each fund and was satisfied that the profitability was not excessive.
Economies of Scale. The Board considered whether there have been economies of scale in respect of the management of the Fidelity funds, whether the Fidelity funds (including each fund) have appropriately benefited from any such economies of scale, and whether there is potential for realization of any further economies of scale. The Board considered the extent to which each fund will benefit from economies of scale as assets grow through increased services to the fund, through waivers or reimbursements, or through fee or expense ratio reductions. The Board also noted that a committee (the Economies of Scale Committee) created by it and the boards of other Fidelity funds periodically (most recently in 2013) analyzes whether Fidelity attains economies of scale in respect of the management and servicing of the Fidelity funds, whether the Fidelity funds have appropriately benefited from such economies of scale, and whether there is potential for realization of any further economies of scale.
The Board recognized that each fund's management contract incorporates a "group fee" structure, which provides for lower group fee rates as total group assets increase, and for higher group fee rates as total group assets decrease (with "group assets" defined to include fund assets under FMR's management plus the assets of sector funds previously under FMR's management). FMR calculates the group fee rates based on a tiered asset "breakpoint" schedule that varies based on asset class. The Board considered that the group fee is designed to deliver the benefits of economies of scale to fund shareholders when total Fidelity fund assets increase, even if assets of any particular fund are unchanged or have declined, because some portion of Fidelity's costs are attributable to services provided to all Fidelity funds, and all funds benefit if those costs can be allocated among more assets. The Board concluded that, given the group fee structure, fund shareholders will benefit from lower management fees as group assets increase at the fund complex level, regardless of whether Fidelity achieves any such economies of scale.
The Board concluded, taking into account the analysis of the Economies of Scale Committee, that economies of scale, if any, are being appropriately shared between fund shareholders and Fidelity.
Additional Information Requested by the Board. In order to develop fully the factual basis for consideration of the Fidelity funds' advisory contracts, the Board requested and received additional information on certain topics, including: (i) Fidelity's fund profitability methodology, profitability trends for certain funds, and the impact of certain factors on fund profitability results; (ii) portfolio manager changes that have occurred during the past year and the amount of the investment that each portfolio manager has made in the Fidelity fund(s) that he or she manages; (iii) Fidelity's compensation structure for portfolio managers, research analysts, and other key personnel, including its effects on fund profitability, the rationale for the compensation structure, and the extent to which current market conditions have affected retention and recruitment; (iv) the arrangements with and compensation paid to certain fund sub-advisers on behalf of the Fidelity funds; (v) Fidelity's voluntary waiver of its fees to maintain minimum yields for certain money market funds and classes as well as contractual waivers in place for certain funds; (vi) the methodology with respect to competitive fund data and peer group classifications; (vii) Fidelity's transfer agent fee, expense, and service structures for different funds and classes relative to competitive trends, and the impact of the increased use of omnibus accounts; (viii) Fidelity's long-term expectations for its offerings in the workplace investing channel; (ix) new developments in the retail and institutional marketplaces; (x) the approach to considering "fall-out" benefits; and (xi) the impact of money market reform on Fidelity's money market funds, including with respect to costs and profitability. In addition, the Board considered its discussions with Fidelity throughout the year regarding enhanced information security initiatives and the funds' fair valuation policies.
Based on its evaluation of all of the conclusions noted above, and after considering all factors it believed relevant, the Board concluded that the advisory fee structures are fair and reasonable, and that each fund's Advisory Contracts should be renewed.
Proxy Voting Results
A special meeting of Fidelity® Michigan Municipal Money Market Fund's shareholders was held on February 12, 2016. The results of votes taken among shareholders on the proposal before them are reported below. Each vote reported represents one dollar of net asset value held on the record date for the meeting.
PROPOSAL 1
| To elect a Board of Trustees. |
| | # of
Votes | % of
Votes |
| Elizabeth S. Acton | | |
| Affirmative | 990,112,248.51 | 94.973 |
| Withheld | 52,412,467.62 | 5.027 |
| TOTAL | 1,042,524,716.13 | 100.000 |
| John Engler | | |
| Affirmative | 979,840,026.26 | 93.988 |
| Withheld | 62,684,689.87 | 6.012 |
| TOTAL | 1,042,524,716.13 | 100.000 |
| Albert R. Gamper, Jr. | | |
| Affirmative | 988,200,285.84 | 94.790 |
| Withheld | 54,324,430.29 | 5.210 |
| TOTAL | 1,042,524,716.13 | 100.000 |
| Robert F. Gartland | | |
| Affirmative | 990,287,516.81 | 94.990 |
| Withheld | 52,237,199.32 | 5.010 |
| TOTAL | 1,042,524,716.13 | 100.000 |
| Abigail P. Johnson | | |
| Affirmative | 986,818,518.63 | 94.657 |
| Withheld | 55,706,197.50 | 5.343 |
| TOTAL | 1,042,524,716.13 | 100.000 |
| Arthur E. Johnson | | |
| Affirmative | 988,490,870.48 | 94.818 |
| Withheld | 54,033,845.65 | 5.182�� |
| TOTAL | 1,042,524,716.13 | 100.000 |
| Michael E. Kenneally | | |
| Affirmative | 990,615,595.60 | 95.021 |
| Withheld | 51,909,120.53 | 4.979 |
| TOTAL | 1,042,524,716.13 | 100.000 |
| James H. Keyes | | |
| Affirmative | 989,121,754.10 | 94.878 |
| Withheld | 53,402,962.03 | 5.122 |
| TOTAL | 1,042,524,716.13 | 100.000 |
| Marie L. Knowles | | |
| Affirmative | 987,633,370.10 | 94.735 |
| Withheld | 54,891,346.03 | 5.265 |
| TOTAL | 1,042,524,716.13 | 100.000 |
| Geoffrey A. von Kuhn | | |
| Affirmative | 987,164,185.38 | 94.690 |
| Withheld | 55,360,530.75 | 5.310 |
| TOTAL | 1,042,524,716.13 | 100.000 |
| Proposal 1 reflects trust wide proposal and voting results. |
Corporate Headquarters
245 Summer St.
Boston, MA 02210
www.fidelity.com
MIR-ANN-0217
1.540080.119
Fidelity® Minnesota Municipal Income Fund
Annual Report December 31, 2016 |
|
Contents
To view a fund's proxy voting guidelines and proxy voting record for the 12-month period ended June 30, visit http://www.fidelity.com/proxyvotingresults or visit the Securities and Exchange Commission's (SEC) web site at http://www.sec.gov.
You may also call 1-800-544-8544 to request a free copy of the proxy voting guidelines.
Standard & Poor's, S&P and S&P 500 are registered service marks of The McGraw-Hill Companies, Inc. and have been licensed for use by Fidelity Distributors Corporation.
Other third-party marks appearing herein are the property of their respective owners.
All other marks appearing herein are registered or unregistered trademarks or service marks of FMR LLC or an affiliated company. © 2017 FMR LLC. All rights reserved.
This report and the financial statements contained herein are submitted for the general information of the shareholders of the Fund. This report is not authorized for distribution to prospective investors in the Fund unless preceded or accompanied by an effective prospectus.
A fund files its complete schedule of portfolio holdings with the SEC for the first and third quarters of each fiscal year on Form N-Q. Forms N-Q are available on the SEC’s web site at http://www.sec.gov. A fund's Forms N-Q may be reviewed and copied at the SEC’s Public Reference Room in Washington, DC. Information regarding the operation of the SEC's Public Reference Room may be obtained by calling 1-800-SEC-0330.
For a complete list of a fund's portfolio holdings, view the most recent holdings listing, semiannual report, or annual report on Fidelity's web site at http://www.fidelity.com, http://www.institutional.fidelity.com, or http://www.401k.com, as applicable.
NOT FDIC INSURED •MAY LOSE VALUE •NO BANK GUARANTEE
Neither the Fund nor Fidelity Distributors Corporation is a bank.
Performance: The Bottom Line
Average annual total return reflects the change in the value of an investment, assuming reinvestment of distributions from dividend income and capital gains (the profits earned upon the sale of securities that have grown in value, if any) and assuming a constant rate of performance each year. The hypothetical investment and the average annual total returns do not reflect the deduction of taxes that a shareholder would pay on fund distributions or the redemption of fund shares. During periods of reimbursement by Fidelity, a fund’s total return will be greater than it would be had the reimbursement not occurred. How a fund did yesterday is no guarantee of how it will do tomorrow.
Average Annual Total Returns
| For the periods ended December 31, 2016 | Past 1 year | Past 5 years | Past 10 years |
| Fidelity® Minnesota Municipal Income Fund | 0.08% | 2.54% | 3.66% |
$10,000 Over 10 Years
Let's say hypothetically that $10,000 was invested in Fidelity® Minnesota Municipal Income Fund on December 31, 2006.
The chart shows how the value of your investment would have changed, and also shows how the Bloomberg Barclays Municipal Bond Index performed over the same period.
| Period Ending Values |
| $14,321 | Fidelity® Minnesota Municipal Income Fund |
| $15,158 | Bloomberg Barclays Municipal Bond Index |
Effective August 24, 2016, all Barclays benchmark indices were co-branded as the Bloomberg Barclays Indices for a period of five years.
Management's Discussion of Fund Performance
Market Recap: For the 12 months ending December 31, 2016, tax-exempt bonds eked out only a 0.25% return, according to the Bloomberg Barclays Municipal Bond Index. For much of the period, fairly strong demand and a stable credit environment for state and local governments drove moderate muni returns. But a downward trend began in September and steepened through November – the worst month for the muni market since 2008 – as investors became concerned about U.S. President-elect Donald Trump’s expansionary fiscal policy ambitions, inflation and the potential for tax reform to impair tax-exempt bond valuations. Further, some theorized that changes to or repeal of the Affordable Care Act by the incoming administration and a Republican-controlled Congress may affect the prices of muni bonds issued by hospitals. Muni bonds also were hurt by market anticipation of a quarter-point increase in policy interest rates, which happened in December. At year-end, concerns about unfunded pension liabilities generally are compartmentalized to certain issuers. Looking ahead, we think the U.S. Federal Reserve is likely to raise policy interest rates further in 2017, perhaps in multiple stages.
Comments from Co-Portfolio Manager Kevin Ramundo: For the year, the fund gained 0.08%, outpacing, net of fees, the -0.27% return of the Bloomberg Barclays Minnesota Enhanced Modified 2% Tobacco Municipal Bond Index. The portfolio managers continued to focus on long-term objectives by seeking to generate attractive tax-exempt income and competitive risk-adjusted returns over time. The fund’s performance versus the state index was boosted by our overweighting in lower-rated investment-grade bonds, particularly those in the health care sector. These securities – rated A and BBB – attracted heavy demand from yield-seeking investors throughout much of the period. Coupled with the comparatively high level of income they generated, they outperformed high-quality securities, in which the fund had an underweighting for the period overall. The fund’s yield curve positioning was the predominant relative detractor. The front end of the yield curve – bonds 10 years and shorter – lagged the past 12 months. This was due to fear of rising interest rates and the surprising results of the U.S. national election. The fund was bulleted, meaning it was overweighted the 10-year part of the curve. This positioning reflected a lack of longer-term alternatives in the Minnesota market.
The views expressed above reflect those of the portfolio manager(s) only through the end of the period as stated on the cover of this report and do not necessarily represent the views of Fidelity or any other person in the Fidelity organization. Any such views are subject to change at any time based upon market or other conditions and Fidelity disclaims any responsibility to update such views. These views may not be relied on as investment advice and, because investment decisions for a Fidelity fund are based on numerous factors, may not be relied on as an indication of trading intent on behalf of any Fidelity fund.
Note to Shareholders: On May 2, 2016, Cormac Cullen and Mark Sommer joined Kevin Ramundo as Co-Managers of the fund.
Investment Summary (Unaudited)
Top Five Sectors as of December 31, 2016
| | % of fund's net assets | % of fund's net assets 6 months ago |
| General Obligations | 34.8 | 35.3 |
| Health Care | 21.7 | 22.2 |
| Electric Utilities | 17.5 | 16.5 |
| Education | 9.6 | 9.0 |
| Transportation | 9.0 | 7.5 |
Quality Diversification (% of fund's net assets)
| As of December 31, 2016 |
| | AAA | 6.0% |
| | AA,A | 83.5% |
| | BBB | 6.7% |
| | Not Rated | 2.1% |
| | Short-Term Investments and Net Other Assets | 1.7% |

| As of June 30, 2016 |
| | AAA | 5.1% |
| | AA,A | 84.0% |
| | BBB | 7.0% |
| | BB and Below | 0.2% |
| | Not Rated | 3.0% |
| | Short-Term Investments and Net Other Assets | 0.7% |

We have used ratings from Moody's Investors Service, Inc. Where Moody's® ratings are not available, we have used S&P® ratings. All ratings are as of the date indicated and do not reflect subsequent changes.
Investments December 31, 2016
Showing Percentage of Net Assets
| Municipal Bonds - 98.3% | | | |
| | | Principal Amount | Value |
| Guam - 0.7% | | | |
| Guam Gov't. Ltd. Oblig. Rev. Series 2016 A, 5% 12/1/29 | | 800,000 | 875,912 |
| Guam Int'l. Arpt. Auth. Rev. Series 2013 C: | | | |
| 5% 10/1/17 (a) | | $800,000 | $817,328 |
| 6.25% 10/1/34 (a) | | 850,000 | 968,660 |
| Guam Pwr. Auth. Rev. Series 2012 A, 5% 10/1/21 (FSA Insured) | | 1,100,000 | 1,227,743 |
|
| TOTAL GUAM | | | 3,889,643 |
|
| Minnesota - 97.6% | | | |
| Anoka-Hennepin Independent School District 11 Series 2014 A: | | | |
| 5% 2/1/23 | | 805,000 | 926,032 |
| 5% 2/1/24 | | 1,110,000 | 1,288,843 |
| 5% 2/1/25 | | 1,015,000 | 1,176,395 |
| 5% 2/1/26 | | 1,220,000 | 1,404,610 |
| 5% 2/1/27 | | 1,285,000 | 1,466,982 |
| 5% 2/1/28 | | 1,345,000 | 1,529,938 |
| 5% 2/1/29 | | 1,415,000 | 1,596,983 |
| 5% 2/1/34 | | 1,800,000 | 1,990,368 |
| Breckenridge Gen. Oblig. (Catholic Health Initiatives Proj.) Series 2004 A, 5% 5/1/30 | | 4,365,000 | 4,375,476 |
| Burnsville-Eagan-Savage Independent School District #191 Gen. Oblig. (Minnesota School District Cr. Enhancement Prog.) Series 2007 A, 5% 2/1/17 (FSA Insured) | | 525,000 | 526,591 |
| Chaska Elec. Rev.: | | | |
| Series 2015 A: | | | |
| 5% 10/1/27 | | 1,665,000 | 1,947,134 |
| 5% 10/1/29 | | 785,000 | 909,446 |
| 5% 10/1/26 | | 1,000,000 | 1,175,380 |
| Chaska Independent School District #112 Gen. Oblig.: | | | |
| (Cr. Enhancement Prog.) Series 2012 A: | | | |
| 5% 2/1/19 | | 4,090,000 | 4,398,386 |
| 5% 2/1/22 | | 4,975,000 | 5,701,748 |
| (Minnesota School District Cr. Enhancement Prog.) Series 2016 A: | | | |
| 5% 2/1/30 | | 1,400,000 | 1,647,674 |
| 5% 2/1/31 | | 3,600,000 | 4,217,976 |
| (School Bldg. Proj.) Series 2007 A, 5% 2/1/17 (Nat'l. Pub. Fin. Guarantee Corp. Insured) | | 750,000 | 752,273 |
| Cloquet Independent School District #94 Series 2015 B: | | | |
| 5% 2/1/28 | | 3,030,000 | 3,544,343 |
| 5% 2/1/31 | | 1,245,000 | 1,432,908 |
| Ctr. City Health Care Facilities (Hazelden Betty Ford Foundation Proj.) Series 2014: | | | |
| 5% 11/1/23 | | 775,000 | 892,134 |
| 5% 11/1/25 | | 250,000 | 287,250 |
| 5% 11/1/26 | | 500,000 | 572,995 |
| 5% 11/1/27 | | 400,000 | 455,692 |
| Duluth Gen. Oblig. Series 2016 A: | | | |
| 5% 2/1/28 | | 1,660,000 | 1,980,098 |
| 5% 2/1/30 | | 1,235,000 | 1,453,484 |
| 5% 2/1/31 | | 1,495,000 | 1,745,128 |
| 5% 2/1/32 | | 2,130,000 | 2,475,294 |
| Duluth Independent School District #709 Ctfs. of Prtn. Series 2009 B: | | | |
| 4% 3/1/17 | | 1,495,000 | 1,498,752 |
| 4% 3/1/18 | | 1,235,000 | 1,255,513 |
| 5% 3/1/30 | | 2,535,000 | 2,589,883 |
| Hennepin County Gen. Oblig.: | | | |
| Series 2016 A: | | | |
| 5% 12/1/39 | | 5,250,000 | 6,104,753 |
| 5% 12/1/40 | | 7,200,000 | 8,365,608 |
| Series 2016 B, 5% 12/1/31 | | 1,135,000 | 1,356,177 |
| Hennepin County Sales Tax Rev. (Ballpark Proj.) Series 2007 A, 5% 12/15/24 | | 1,000,000 | 1,036,730 |
| Jordan Ind. School District Series 2014 A: | | | |
| 5% 2/1/28 | | 1,000,000 | 1,147,300 |
| 5% 2/1/29 | | 1,000,000 | 1,143,650 |
| 5% 2/1/30 | | 1,245,000 | 1,420,831 |
| Lakeville Independent School District #194 Series 2012 D, 5% 2/1/20 | | 1,570,000 | 1,727,895 |
| Maple Grove Health Care Facilities Series 2015: | | | |
| 4% 9/1/35 | | 1,250,000 | 1,227,350 |
| 5% 9/1/28 | | 695,000 | 776,642 |
| 5% 9/1/30 | | 1,500,000 | 1,661,970 |
| 5% 9/1/31 | | 1,300,000 | 1,432,223 |
| 5% 9/1/32 | | 1,000,000 | 1,096,260 |
| Maple Grove Health Care Sys. Rev. (Maple Grove Hosp. Corp. Proj.) Series 2007: | | | |
| 5.25% 5/1/24 | | 1,500,000 | 1,515,525 |
| 5.25% 5/1/25 | | 2,000,000 | 2,020,240 |
| 5.25% 5/1/28 | | 3,720,000 | 3,755,340 |
| Minneapolis & Saint Paul Hsg. & Redev. Auth. Health Care Sys. Rev.: | | | |
| (Children's Health Care Proj.): | | | |
| Series 1995 B, 5% 8/15/25 (FSA Insured) | | 3,000,000 | 3,295,470 |
| Series 2010 A, 5.25% 8/15/25 | | 1,000,000 | 1,112,660 |
| (Children's Hospitals and Clinics Proj.) Series 2004 A1, 5% 8/15/34 (FSA Insured) | | 500,000 | 542,170 |
| Minneapolis & Saint Paul Metropolitan Arpts. Commission Arpt. Rev.: | | | |
| Series 2007 B, 5% 1/1/18 (Nat'l. Pub. Fin. Guarantee Corp. Insured) | | 2,000,000 | 2,000,000 |
| Series 2010 D, 5% 1/1/17 (a) | | 4,155,000 | 4,155,000 |
| Series 2012 B: | | | |
| 5% 1/1/26 | | 1,250,000 | 1,395,088 |
| 5% 1/1/27 | | 1,500,000 | 1,673,370 |
| Series 2014 A: | | | |
| 5% 1/1/26 | | 3,015,000 | 3,485,129 |
| 5% 1/1/28 | | 4,000,000 | 4,576,880 |
| 5% 1/1/29 | | 2,150,000 | 2,449,818 |
| 5% 1/1/30 | | 2,000,000 | 2,263,960 |
| 5% 1/1/31 | | 6,020,000 | 6,790,199 |
| Series 2016 A: | | | |
| 5% 1/1/30 | | 4,000,000 | 4,746,840 |
| 5% 1/1/31 | | 2,350,000 | 2,775,303 |
| 5% 1/1/32 | | 2,900,000 | 3,405,615 |
| Series 2016 D: | | | |
| 5% 1/1/23 (a) | | 670,000 | 748,008 |
| 5% 1/1/27 (a) | | 175,000 | 202,074 |
| 5% 1/1/28 (a) | | 215,000 | 246,478 |
| 5% 1/1/29 (a) | | 225,000 | 256,295 |
| 5% 1/1/30 (a) | | 225,000 | 254,459 |
| 5% 1/1/31 (a) | | 200,000 | 225,106 |
| 5% 1/1/32 (a) | | 200,000 | 223,852 |
| 5% 1/1/33 (a) | | 220,000 | 245,062 |
| 5% 1/1/34 (a) | | 225,000 | 249,440 |
| 5% 1/1/35 (a) | | 225,000 | 249,041 |
| 5% 1/1/36 (a) | | 220,000 | 242,735 |
| 5% 1/1/37 (a) | | 250,000 | 274,960 |
| 5% 1/1/41 (a) | | 725,000 | 794,223 |
| Minneapolis Health Care Sys. Rev.: | | | |
| Series 2015 A: | | | |
| 5% 11/15/27 (FSA Insured) | | 850,000 | 984,258 |
| 5% 11/15/28 | | 1,000,000 | 1,153,730 |
| 5% 11/15/29 | | 1,000,000 | 1,147,030 |
| 5% 11/15/30 | | 1,000,000 | 1,142,860 |
| 5% 11/15/31 | | 3,665,000 | 4,170,367 |
| 5% 11/15/32 | | 2,200,000 | 2,494,272 |
| 6.5% 11/15/38 | | 2,960,000 | 3,199,790 |
| 6.5% 11/15/38 (Pre-Refunded to 11/15/18 @ 100) | | 540,000 | 591,246 |
| Minnesota 911 Rev.: | | | |
| (Pub. Safety Radio Communications Sys. Proj.) Series 2009, 5% 6/1/21 (Pre-Refunded to 6/1/19 @ 100) | | 2,220,000 | 2,406,169 |
| 5% 6/1/21 (Pre-Refunded to 6/1/19 @ 100) | | 2,000,000 | 2,167,720 |
| Minnesota Agric. & Econ. Dev. Board Rev. (Essentia Health Obligated Group Proj.) Series 2008 C1: | | | |
| 5% 2/15/17 (Assured Guaranty Corp. Insured) | | 1,975,000 | 1,983,730 |
| 5% 2/15/30 (Assured Guaranty Corp. Insured) | | 3,750,000 | 4,044,038 |
| 5.25% 2/15/23 (Assured Guaranty Corp. Insured) | | 1,660,000 | 1,816,638 |
| 5.5% 2/15/25 (Assured Guaranty Corp. Insured) | | 2,500,000 | 2,753,050 |
| Minnesota Gen. Oblig.: | | | |
| Series 2010 A, 5% 8/1/27 | | 5,000,000 | 5,563,950 |
| Series 2010 D: | | | |
| 5% 8/1/21 | | 1,000,000 | 1,114,260 |
| 5% 8/1/22 | | 5,000,000 | 5,567,650 |
| 5% 8/1/23 | | 10,000,000 | 11,127,900 |
| Series 2011 B: | | | |
| 5% 10/1/24 | | 2,500,000 | 2,848,350 |
| 5% 10/1/30 | | 3,000,000 | 3,393,270 |
| Series 2013 A, 5% 8/1/25 | | 3,780,000 | 4,485,310 |
| Series 2013 D, 5% 10/1/23 | | 1,100,000 | 1,303,236 |
| Series 2015 A, 5% 8/1/33 | | 1,900,000 | 2,229,213 |
| 5% 8/1/22 (Pre-Refunded to 8/1/17 @ 100) | | 55,000 | 56,245 |
| 5% 8/1/24 | | 4,780,000 | 5,529,791 |
| 5% 8/1/24 (Pre-Refunded to 8/1/22 @ 100) | | 220,000 | 254,133 |
| Minnesota Higher Ed. Facilities Auth. Rev.: | | | |
| (College of St. Scholastica, Inc. Proj.) Series Seven-H, 5.25% 12/1/35 | | 1,000,000 | 1,065,580 |
| (Gustovus Adolphus College Proj.) Series Seven-B: | | | |
| 5% 10/1/22 | | 2,250,000 | 2,433,353 |
| 5% 10/1/23 | | 1,000,000 | 1,081,210 |
| (Hamline Univ. Proj.) Series Seven-E: | | | |
| 5% 10/1/17 | | 1,565,000 | 1,596,770 |
| 5% 10/1/19 | | 1,000,000 | 1,056,760 |
| (Univ. of St. Thomas Proj.) Series Seven-A, 5% 10/1/39 | | 1,650,000 | 1,765,731 |
| Series 2015 8J, 5% 3/1/24 | | 1,000,000 | 1,173,570 |
| Series 8 L: | | | |
| 5% 4/1/28 | | 920,000 | 1,078,820 |
| 5% 4/1/29 | | 1,000,000 | 1,161,170 |
| 5% 4/1/35 | | 500,000 | 563,795 |
| Series Eight J, 5% 3/1/26 | | 1,015,000 | 1,188,068 |
| Series G8, 5% 12/1/31 | | 1,000,000 | 1,147,680 |
| Series Seven-Q: | | | |
| 5% 10/1/17 | | 495,000 | 507,524 |
| 5% 10/1/18 | | 400,000 | 421,524 |
| 5% 10/1/19 | | 780,000 | 839,444 |
| 5% 10/1/20 | | 1,140,000 | 1,247,057 |
| 5% 3/1/21 | | 940,000 | 945,574 |
| 5% 3/1/22 | | 1,030,000 | 1,036,098 |
| 5% 3/1/27 | | 500,000 | 582,070 |
| Minnesota Hsg. Fin. Agcy. Series 2015 A: | | | |
| 5% 8/1/29 | | 1,000,000 | 1,141,100 |
| 5% 8/1/30 | | 1,000,000 | 1,136,010 |
| 5% 8/1/31 | | 1,000,000 | 1,131,660 |
| 5% 8/1/32 | | 1,000,000 | 1,127,340 |
| 5% 8/1/33 | | 1,000,000 | 1,123,030 |
| Minnesota Muni. Pwr. Agcy. Elec. Rev.: | | | |
| Series 2007, 5.25% 10/1/22 | | 1,000,000 | 1,029,010 |
| Series 2014 A: | | | |
| 5% 10/1/25 | | 200,000 | 234,056 |
| 5% 10/1/26 | | 830,000 | 968,162 |
| Series 2014: | | | |
| 5% 10/1/26 | | 630,000 | 734,870 |
| 5% 10/1/27 | | 750,000 | 873,128 |
| 5% 10/1/30 | | 1,000,000 | 1,148,330 |
| Series 2016: | | | |
| 4% 10/1/41 | | 1,000,000 | 1,013,660 |
| 5% 10/1/32 | | 1,500,000 | 1,718,910 |
| 5% 10/1/33 | | 400,000 | 456,224 |
| 5% 10/1/35 | | 400,000 | 451,956 |
| 5% 10/1/36 | | 500,000 | 563,620 |
| 5% 10/1/47 | | 2,000,000 | 2,228,200 |
| Minnesota Pub. Facilities Auth. Rev.: | | | |
| Series 2016 A, 5% 3/1/29 | | 5,000,000 | 5,958,450 |
| 5% 3/1/30 | | 5,150,000 | 6,091,214 |
| Minnesota State Colleges & Univs. Board of Trustees Rev.: | | | |
| Series 2009 A: | | | |
| 4% 10/1/18 | | 1,490,000 | 1,559,196 |
| 4% 10/1/19 | | 1,550,000 | 1,654,005 |
| 4% 10/1/20 | | 1,580,000 | 1,681,626 |
| Series 2011 A, 5% 10/1/30 | | 1,495,000 | 1,673,055 |
| Series 2013 A: | | | |
| 4% 10/1/18 | | 2,210,000 | 2,312,632 |
| 4% 10/1/19 | | 2,300,000 | 2,454,330 |
| 4% 10/1/20 | | 2,385,000 | 2,579,234 |
| Minnesota State Gen. Fdg. Rev.: | | | |
| Series 2012 B: | | | |
| 5% 3/1/27 | | 12,840,000 | 14,502,637 |
| 5% 3/1/28 | | 4,275,000 | 4,817,498 |
| 5% 3/1/29 | | 2,250,000 | 2,530,868 |
| 5% 6/1/27 | | 5,000,000 | 5,764,300 |
| 5% 6/1/38 | | 5,000,000 | 5,554,100 |
| Northern Muni. Pwr. Agcy. Elec. Sys. Rev.: | | | |
| Series 2010 A1: | | | |
| 5% 1/1/19 | | 3,010,000 | 3,220,580 |
| 5% 1/1/20 | | 2,100,000 | 2,299,185 |
| Series 2013 A: | | | |
| 5% 1/1/23 | | 850,000 | 977,203 |
| 5% 1/1/24 | | 650,000 | 746,876 |
| 5% 1/1/25 | | 975,000 | 1,114,454 |
| 5% 1/1/31 | | 1,740,000 | 1,923,431 |
| Series 2016: | | | |
| 5% 1/1/28 | | 500,000 | 583,850 |
| 5% 1/1/29 | | 620,000 | 720,242 |
| 5% 1/1/30 | | 520,000 | 599,196 |
| 5% 1/1/31 | | 350,000 | 401,527 |
| Series A, 5% 1/1/18 (Assured Guaranty Corp. Insured) | | 3,180,000 | 3,296,833 |
| Ramsey County Gen. Oblig. Series 2012 B: | | | |
| 5% 2/1/20 | | 1,635,000 | 1,804,092 |
| 5% 2/1/21 | | 1,350,000 | 1,523,975 |
| Rochester Elec. Util. Rev.: | | | |
| Series 2007 C, 5% 12/1/30 | | 705,000 | 707,037 |
| Series 2013 B: | | | |
| 5% 12/1/26 | | 570,000 | 659,462 |
| 5% 12/1/27 | | 275,000 | 317,031 |
| 5% 12/1/28 | | 275,000 | 315,906 |
| 5% 12/1/43 | | 1,000,000 | 1,114,640 |
| Rochester Health Care Facilities Rev.: | | | |
| (Mayo Clinic Proj.) Series 2008 E, 5% 11/15/38 | | 4,000,000 | 4,354,200 |
| (Olmsted Med. Ctr. Proj.) Series 2013: | | | |
| 5% 7/1/17 | | 650,000 | 661,486 |
| 5% 7/1/18 | | 685,000 | 718,510 |
| 5% 7/1/21 | | 790,000 | 880,834 |
| 5% 7/1/22 | | 350,000 | 396,729 |
| 5% 7/1/24 | | 300,000 | 343,893 |
| 5% 7/1/27 | | 245,000 | 276,779 |
| 5% 7/1/28 | | 225,000 | 253,474 |
| 5% 7/1/33 | | 1,225,000 | 1,354,029 |
| Bonds: | | | |
| (Mayo Clinic Proj.): | | | |
| Series 2011, 4%, tender 11/15/18 (b) | | 2,475,000 | 2,589,741 |
| Series B, 4%, tender 11/15/18 (b) | | 3,000,000 | 3,139,080 |
| (Mayo Foundation Proj.) Series C, 4.5%, tender 11/15/21 (b) | | 1,100,000 | 1,219,218 |
| Series 2016 B, 5% 11/15/35 | | 2,000,000 | 2,442,780 |
| Saint Cloud Health Care Rev.: | | | |
| Series 2014 B, 5% 5/1/22 | | 1,950,000 | 2,231,190 |
| Series 2016 A: | | | |
| 5% 5/1/29 | | 1,000,000 | 1,156,270 |
| 5% 5/1/30 | | 1,000,000 | 1,146,660 |
| 5% 5/1/31 | | 1,000,000 | 1,139,730 |
| 5% 5/1/46 | | 5,000,000 | 5,495,900 |
| 5.125% 5/1/30 | | 310,000 | 338,784 |
| 5.125% 5/1/30 (Pre-Refunded to 5/1/20 @ 100) | | 4,695,000 | 5,215,394 |
| Saint Paul Hsg. & Redev. Auth. Hosp. Rev. (HealthEast Care Sys. Proj.) Series 2015 A: | | | |
| 5% 11/15/27 | | 2,515,000 | 2,796,127 |
| 5% 11/15/29 | | 1,750,000 | 1,924,633 |
| 5% 11/15/30 | | 1,585,000 | 1,736,891 |
| Saint Paul Port Auth. Series 2007-2, 5% 3/1/37 | | 1,500,000 | 1,509,615 |
| Saint Paul Port Auth. Lease Rev. Series 2013, 5% 12/1/21 | | 4,900,000 | 5,593,399 |
| Saint Paul Sales Tax Rev. Series 2014 G: | | | |
| 5% 11/1/26 | | 1,000,000 | 1,161,170 |
| 5% 11/1/28 | | 1,000,000 | 1,149,000 |
| Sartell Independent School District 748: | | | |
| Series 2016 A, 5% 2/1/27 | | 1,825,000 | 2,143,499 |
| Series 2016 B, 5% 2/1/26 | | 1,500,000 | 1,772,550 |
| Shakopee Health Care Facilities Rev. Series 2014: | | | |
| 5% 9/1/23 | | 1,895,000 | 2,139,114 |
| 5% 9/1/24 | | 1,000,000 | 1,141,000 |
| 5% 9/1/25 | | 1,345,000 | 1,528,714 |
| 5% 9/1/26 | | 575,000 | 649,342 |
| 5% 9/1/28 | | 1,000,000 | 1,119,160 |
| 5% 9/1/34 | | 1,040,000 | 1,138,082 |
| Shakopee Independent School District #720: | | | |
| Series 2012, 5% 2/1/21 | | 1,000,000 | 1,124,260 |
| Series 2013 A, 5% 2/1/19 | | 2,940,000 | 3,156,649 |
| Southern Minnesota Muni. Pwr. Agcy. Pwr. Supply Sys. Rev.: | | | |
| (Cap. Appreciation) Series 1994 A: | | | |
| 0% 1/1/19 (Nat'l. Pub. Fin. Guarantee Corp. Insured) | | 6,210,000 | 6,009,169 |
| 0% 1/1/21 (Nat'l. Pub. Fin. Guarantee Corp. Insured) | | 14,670,000 | 13,454,591 |
| 0% 1/1/26 (Nat'l. Pub. Fin. Guarantee Corp. Insured) | | 3,165,000 | 2,447,621 |
| Series 2009 A, 5.5% 1/1/24 (Pre-Refunded to 1/1/19 @ 100) | | 500,000 | 540,790 |
| Series 2015 A: | | | |
| 5% 1/1/28 | | 1,000,000 | 1,169,430 |
| 5% 1/1/34 | | 1,695,000 | 1,921,774 |
| 5% 1/1/36 | | 1,000,000 | 1,126,330 |
| 5% 1/1/41 | | 1,000,000 | 1,118,920 |
| 0% 1/1/18 (AMBAC Insured) | | 125,000 | 123,373 |
| St. Louis Park Health Care Facilities Rev. (Park Nicollet Health Svcs. Proj.) Series 2008 C, 5.5% 7/1/17 (Escrowed to Maturity) | | 535,000 | 546,684 |
| St. Paul Hsg. & Redev. Auth. Health Care Facilities Rev.: | | | |
| (Allina Health Sys. Proj.): | | | |
| Series 2007 A, 5% 11/15/22 (Nat'l. Pub. Fin. Guarantee Corp. Insured) | | 2,100,000 | 2,160,585 |
| Series 2009 A1, 5.25% 11/15/29 | | 3,000,000 | 3,272,370 |
| Series 2009 A2, 5.5% 11/15/24 | | 2,000,000 | 2,208,360 |
| Series 2015 A: | | | |
| 5% 7/1/29 | | 5,000,000 | 5,768,800 |
| 5% 7/1/30 | | 5,000,000 | 5,736,450 |
| Univ. of Minnesota Gen. Oblig.: | | | |
| Series 2009 A: | | | |
| 5% 4/1/23 | | 200,000 | 215,258 |
| 5.125% 4/1/34 | | 1,000,000 | 1,072,160 |
| 5.25% 4/1/29 | | 1,000,000 | 1,080,620 |
| Series 2009 C, 5% 12/1/21 | | 1,000,000 | 1,082,380 |
| Series 2011 D: | | | |
| 5% 12/1/23 | | 1,180,000 | 1,344,610 |
| 5% 12/1/26 | | 1,020,000 | 1,160,750 |
| 5% 12/1/36 | | 2,085,000 | 2,332,364 |
| Series 2016: | | | |
| 5% 4/1/37 | | 2,125,000 | 2,448,956 |
| 5% 4/1/41 | | 6,000,000 | 6,883,500 |
| Univ. of Minnesota Spl. Purp. Rev.: | | | |
| (Biomedical Science Research Facilities Fdg. Prog.) Series 2013 C, 5% 8/1/38 | | 5,275,000 | 5,866,697 |
| (State Supported Biomedical Science Research Facilities Fdg. Prog.) Series 2011 B, 5% 8/1/25 | | 2,095,000 | 2,366,323 |
| Virginia Hsg. & Redev. Auth. Health Care Facility Lease Rev. Series 2005, 5.25% 10/1/25 | | 440,000 | 441,285 |
| West Saint Paul Independent School District #197 Series 2012 A, 4% 2/1/24 | | 3,530,000 | 3,863,514 |
| Western Minnesota Muni. Pwr. Agcy. Pwr. Supply Rev.: | | | |
| Series 2012 A: | | | |
| 5% 1/1/26 | | 5,000,000 | 5,742,200 |
| 5% 1/1/27 | | 2,150,000 | 2,462,675 |
| 5% 1/1/30 | | 1,000,000 | 1,136,460 |
| Series 2014 A: | | | |
| 5% 1/1/31 | | 1,750,000 | 1,985,708 |
| 5% 1/1/35 | | 1,595,000 | 1,775,634 |
| 5% 1/1/40 | | 1,500,000 | 1,654,065 |
| 5% 1/1/46 | | 11,270,000 | 12,375,925 |
| Series 2015 A, 5% 1/1/31 | | 1,820,000 | 2,103,374 |
|
| TOTAL MINNESOTA | | | 508,978,964 |
|
| TOTAL MUNICIPAL BONDS | | | |
| (Cost $505,564,621) | | | 512,868,607 |
| TOTAL INVESTMENT PORTFOLIO - 98.3% | | | |
| (Cost $505,564,621) | | | 512,868,607 |
| NET OTHER ASSETS (LIABILITIES) - 1.7% | | | 8,684,697 |
| NET ASSETS - 100% | | | $521,553,304 |
Legend
(a) Private activity obligations whose interest is subject to the federal alternative minimum tax for individuals.
(b) Coupon rates for floating and adjustable rate securities reflect the rates in effect at period end.
Investment Valuation
All investments are categorized as Level 2 under the Fair Value Hierarchy. The inputs or methodology used for valuing securities may not be an indication of the risk associated with investing in those securities. For more information on valuation inputs please refer to the Investment Valuation section in the accompanying Notes to Financial Statements.
Other Information
The distribution of municipal securities by revenue source, as a percentage of total Net Assets, is as follows (Unaudited):
| General Obligations | 34.8% |
| Health Care | 21.7% |
| Electric Utilities | 17.5% |
| Education | 9.6% |
| Transportation | 9.0% |
| Others* (Individually Less Than 5%) | 7.4% |
| | 100.0% |
* Includes net other assets
See accompanying notes which are an integral part of the financial statements.
Financial Statements
Statement of Assets and Liabilities
| | | December 31, 2016 |
| Assets | | |
Investment in securities, at value — See accompanying schedule:
Unaffiliated issuers (cost $505,564,621) | | $512,868,607 |
| Cash | | 2,933,090 |
| Receivable for fund shares sold | | 605,627 |
| Interest receivable | | 7,068,011 |
| Prepaid expenses | | 1,008 |
| Other receivables | | 1,364 |
| Total assets | | 523,477,707 |
| Liabilities | | |
| Payable for fund shares redeemed | $1,342,829 | |
| Distributions payable | 325,298 | |
| Accrued management fee | 157,550 | |
| Other affiliated payables | 52,212 | |
| Other payables and accrued expenses | 46,514 | |
| Total liabilities | | 1,924,403 |
| Net Assets | | $521,553,304 |
| Net Assets consist of: | | |
| Paid in capital | | $513,925,631 |
| Undistributed net investment income | | 95,702 |
| Accumulated undistributed net realized gain (loss) on investments | | 227,985 |
| Net unrealized appreciation (depreciation) on investments | | 7,303,986 |
| Net Assets, for 45,687,445 shares outstanding | | $521,553,304 |
| Net Asset Value, offering price and redemption price per share ($521,553,304 ÷ 45,687,445 shares) | | $11.42 |
See accompanying notes which are an integral part of the financial statements.
Statement of Operations
| | | Year ended December 31, 2016 |
| Investment Income | | |
| Interest | | $16,160,655 |
| Expenses | | |
| Management fee | $1,919,868 | |
| Transfer agent fees | 476,000 | |
| Accounting fees and expenses | 134,632 | |
| Custodian fees and expenses | 4,180 | |
| Independent trustees' fees and expenses | 2,387 | |
| Registration fees | 41,504 | |
| Audit | 57,146 | |
| Legal | 7,565 | |
| Miscellaneous | 3,133 | |
| Total expenses before reductions | 2,646,415 | |
| Expense reductions | (6,249) | 2,640,166 |
| Net investment income (loss) | | 13,520,489 |
| Realized and Unrealized Gain (Loss) | | |
| Net realized gain (loss) on: | | |
| Investment securities: | | |
| Unaffiliated issuers | | 2,345,972 |
| Total net realized gain (loss) | | 2,345,972 |
| Change in net unrealized appreciation (depreciation) on investment securities | | (16,307,166) |
| Net gain (loss) | | (13,961,194) |
| Net increase (decrease) in net assets resulting from operations | | $(440,705) |
See accompanying notes which are an integral part of the financial statements.
Statement of Changes in Net Assets
| | Year ended December 31, 2016 | Year ended December 31, 2015 |
| Increase (Decrease) in Net Assets | | |
| Operations | | |
| Net investment income (loss) | $13,520,489 | $13,712,614 |
| Net realized gain (loss) | 2,345,972 | 2,126,037 |
| Change in net unrealized appreciation (depreciation) | (16,307,166) | (1,178,690) |
| Net increase (decrease) in net assets resulting from operations | (440,705) | 14,659,961 |
| Distributions to shareholders from net investment income | (13,519,571) | (13,710,535) |
| Distributions to shareholders from net realized gain | (2,044,957) | (2,144,688) |
| Total distributions | (15,564,528) | (15,855,223) |
| Share transactions | | |
| Proceeds from sales of shares | 94,086,383 | 51,680,463 |
| Reinvestment of distributions | 11,158,760 | 11,302,436 |
| Cost of shares redeemed | (73,683,383) | (62,113,437) |
| Net increase (decrease) in net assets resulting from share transactions | 31,561,760 | 869,462 |
| Redemption fees | 5,025 | 3,516 |
| Total increase (decrease) in net assets | 15,561,552 | (322,284) |
| Net Assets | | |
| Beginning of period | 505,991,752 | 506,314,036 |
| End of period | $521,553,304 | $505,991,752 |
| Other Information | | |
| Undistributed net investment income end of period | $95,702 | $113,630 |
| Shares | | |
| Sold | 7,993,155 | 4,399,563 |
| Issued in reinvestment of distributions | 948,955 | 962,635 |
| Redeemed | (6,334,257) | (5,296,254) |
| Net increase (decrease) | 2,607,853 | 65,944 |
See accompanying notes which are an integral part of the financial statements.
Financial Highlights — Fidelity Minnesota Municipal Income Fund
| Years ended December 31, | 2016 | 2015 | 2014 | 2013 | 2012 |
| Selected Per–Share Data | | | | | |
| Net asset value, beginning of period | $11.75 | $11.77 | $11.39 | $11.99 | $11.80 |
| Income from Investment Operations | | | | | |
| Net investment income (loss)A | .300 | .317 | .329 | .333 | .371 |
| Net realized and unrealized gain (loss) | (.286) | .030 | .443 | (.559) | .204 |
| Total from investment operations | .014 | .347 | .772 | (.226) | .575 |
| Distributions from net investment income | (.300) | (.317) | (.329) | (.333) | (.370) |
| Distributions from net realized gain | (.044) | (.050) | (.063) | (.041) | (.015) |
| Total distributions | (.344) | (.367) | (.392) | (.374) | (.385) |
| Redemption fees added to paid in capitalA,B | – | – | – | – | – |
| Net asset value, end of period | $11.42 | $11.75 | $11.77 | $11.39 | $11.99 |
| Total ReturnC | .08% | 3.00% | 6.85% | (1.91)% | 4.91% |
| Ratios to Average Net AssetsD | | | | | |
| Expenses before reductions | .50% | .50% | .49% | .50% | .49% |
| Expenses net of fee waivers, if any | .50% | .49% | .49% | .50% | .49% |
| Expenses net of all reductions | .50% | .49% | .49% | .49% | .49% |
| Net investment income (loss) | 2.54% | 2.71% | 2.82% | 2.85% | 3.09% |
| Supplemental Data | | | | | |
| Net assets, end of period (000 omitted) | $521,553 | $505,992 | $506,314 | $481,013 | $558,353 |
| Portfolio turnover rate | 13% | 13% | 15% | 14% | 15% |
A Calculated based on average shares outstanding during the period.
B Amount represents less than $.0005 per share.
C Total returns would have been lower if certain expenses had not been reduced during the applicable periods shown.
D Expense ratios reflect operating expenses of the Fund. Expenses before reductions do not reflect amounts reimbursed by the investment adviser or reductions from expense offset arrangements and do not represent the amount paid by the Fund during periods when reimbursements or reductions occur. Expenses net of fee waivers reflect expenses after reimbursement by the investment adviser but prior to reductions from expense offset arrangements. Expenses net of all reductions represent the net expenses paid by the Fund.
See accompanying notes which are an integral part of the financial statements.
Notes to Financial Statements
For the period ended December 31, 2016
1. Organization.
Fidelity Minnesota Municipal Income Fund (the Fund) is a non-diversified fund of Fidelity Municipal Trust (the Trust) and is authorized to issue an unlimited number of shares. Share transactions on the Statement of Changes in Net Assets may contain exchanges between affiliated funds. The Trust is registered under the Investment Company Act of 1940, as amended (the 1940 Act), as an open-end management investment company organized as a Massachusetts business trust. The Fund may be affected by economic and political developments in the state of Minnesota.
2. Significant Accounting Policies.
The financial statements have been prepared in conformity with accounting principles generally accepted in the United States of America (GAAP), which require management to make certain estimates and assumptions at the date of the financial statements. Actual results could differ from those estimates. Subsequent events, if any, through the date that the financial statements were issued have been evaluated in the preparation of the financial statements. The following summarizes the significant accounting policies of the Fund:
Investment Valuation. Investments are valued as of 4:00 p.m. Eastern time on the last calendar day of the period. The Board of Trustees (the Board) has delegated the day to day responsibility for the valuation of the Fund's investments to the Fair Value Committee (the Committee) established by the Fund's investment adviser. In accordance with valuation policies and procedures approved by the Board, the Fund attempts to obtain prices from one or more third party pricing vendors or brokers to value its investments. When current market prices, quotations or currency exchange rates are not readily available or reliable, investments will be fair valued in good faith by the Committee, in accordance with procedures adopted by the Board. Factors used in determining fair value vary by investment type and may include market or investment specific events, changes in interest rates and credit quality. The frequency with which these procedures are used cannot be predicted and they may be utilized to a significant extent. The Committee oversees the Fund's valuation policies and procedures and reports to the Board on the Committee's activities and fair value determinations. The Board monitors the appropriateness of the procedures used in valuing the Fund's investments and ratifies the fair value determinations of the Committee.
The Fund categorizes the inputs to valuation techniques used to value its investments into a disclosure hierarchy consisting of three levels as shown below:
- Level 1 – quoted prices in active markets for identical investments
- Level 2 – other significant observable inputs (including quoted prices for similar investments, interest rates, prepayment speeds, etc.)
- Level 3 – unobservable inputs (including the Fund's own assumptions based on the best information available)
Valuation techniques used to value the Fund's investments by major category are as follows:
Debt securities, including restricted securities, are valued based on evaluated prices received from third party pricing vendors or from brokers who make markets in such securities. Municipal securities are valued by pricing vendors who utilize matrix pricing which considers yield or price of bonds of comparable quality, coupon, maturity and type or by broker-supplied prices. When independent prices are unavailable or unreliable, debt securities may be valued utilizing pricing methodologies which consider similar factors that would be used by third party pricing vendors. Debt securities are generally categorized as Level 2 in the hierarchy but may be Level 3 depending on the circumstances.
Changes in valuation techniques may result in transfers in or out of an assigned level within the disclosure hierarchy.
Investment Transactions and Income. For financial reporting purposes, the Fund's investment holdings and net asset value (NAV) include trades executed through the end of the last business day of the period. The NAV per share for processing shareholder transactions is calculated as of the close of business of the New York Stock Exchange (NYSE), normally 4:00 p.m. Eastern time and includes trades executed through the end of the prior business day. Gains and losses on securities sold are determined on the basis of identified cost. Interest income is accrued as earned and includes coupon interest and amortization of premium and accretion of discount on debt securities as applicable. Debt obligations may be placed on non-accrual status and related interest income may be reduced by ceasing current accruals and writing off interest receivables when the collection of all or a portion of interest has become doubtful based on consistently applied procedures. A debt obligation is removed from non-accrual status when the issuer resumes interest payments or when collectability of interest is reasonably assured.
Expenses. Expenses directly attributable to a fund are charged to that fund. Expenses attributable to more than one fund are allocated among the respective funds on the basis of relative net assets or other appropriate methods. Expense estimates are accrued in the period to which they relate and adjustments are made when actual amounts are known.
Income Tax Information and Distributions to Shareholders. Each year, the Fund intends to qualify as a regulated investment company under Subchapter M of the Internal Revenue Code, including distributing substantially all of its taxable income and realized gains. As a result, no provision for U.S. Federal income taxes is required. As of December 31, 2016, the Fund did not have any unrecognized tax benefits in the financial statements; nor is the Fund aware of any tax positions for which it is reasonably possible that the total amounts of unrecognized tax benefits will significantly change in the next twelve months. The Fund files a U.S. federal tax return, in addition to state and local tax returns as required. The Fund's federal income tax returns are subject to examination by the Internal Revenue Service (IRS) for a period of three fiscal years after they are filed. State and local tax returns may be subject to examination for an additional fiscal year depending on the jurisdiction.
Dividends are declared and recorded daily and paid monthly from net investment income. Distributions from realized gains, if any, are declared and recorded on the ex-dividend date. Income and capital gain distributions are determined in accordance with income tax regulations, which may differ from GAAP. In addition, the Fund claimed a portion of the payment made to redeeming shareholders as a distribution for income tax purposes.
Capital accounts within the financial statements are adjusted for permanent book-tax differences. These adjustments have no impact on net assets or the results of operations. Capital accounts are not adjusted for temporary book-tax differences which will reverse in a subsequent period.
Book-tax differences are primarily due to market discount, deferred trustees compensation and losses deferred due to futures contracts.
The Fund purchases municipal securities whose interest, in the opinion of the issuer, is free from federal income tax. There is no assurance that the IRS will agree with this opinion. In the event the IRS determines that the issuer does not comply with relevant tax requirements, interest payments from a security could become federally taxable, possibly retroactively to the date the security was issued.
The federal tax cost of investment securities and unrealized appreciation (depreciation) as of period end were as follows:
| Gross unrealized appreciation | $12,660,000 |
| Gross unrealized depreciation | (5,356,014) |
| Net unrealized appreciation (depreciation) on securities | $7,303,986 |
| Tax Cost | $505,564,621 |
The tax-based components of distributable earnings as of period end were as follows:
| Undistributed tax-exempt income | $96,084 |
| Undistributed long-term capital gain | $227,985 |
| Net unrealized appreciation (depreciation) on securities and other investments | $7,303,986 |
The tax character of distributions paid was as follows:
| | December 31, 2016 | December 31, 2015 |
| Tax-exempt Income | $13,519,571 | $13,710,535 |
| Long-term Capital Gains | 2,044,957 | 2,144,688 |
| Total | $15,564,528 | $ 15,855,223 |
Short-Term Trading (Redemption) Fees. Shares held by investors in the Fund less than 30 days may have been subject to a redemption fee equal to .50% of the NAV of shares redeemed. All redemption fees, which reduce the proceeds of the shareholder redemption, are retained by the Fund and accounted for as an addition to paid in capital. In November 2016, the Board of Trustees approved the elimination of these redemption fees effective December 12, 2016.
3. Purchases and Sales of Investments.
Purchases and sales of securities, other than short-term securities, aggregated $103,638,562 and $69,931,428, respectively.
4. Fees and Other Transactions with Affiliates.
Management Fee. Fidelity Management & Research Company (the investment adviser) and its affiliates provide the Fund with investment management related services for which the Fund pays a monthly management fee. The management fee is the sum of an individual fund fee rate that is based on an annual rate of .25% of the Fund's average net assets and an annualized group fee rate that averaged .11% during the period. The group fee rate is based upon the average net assets of all the mutual funds advised by the investment adviser, including any mutual funds previously advised by the investment adviser that are currently advised by Fidelity SelectCo, LLC, an affiliate of the investment adviser. The group fee rate decreases as assets under management increase and increases as assets under management decrease. For the reporting period, the total annual management fee rate was .36% of the Fund's average net assets.
Transfer Agent Fees. Fidelity Investments Institutional Operations Company, Inc. (FIIOC), an affiliate of the investment adviser, is the transfer, dividend disbursing and shareholder servicing agent for the Fund. FIIOC receives account fees and asset-based fees that vary according to account size and type of account. FIIOC pays for typesetting, printing and mailing of shareholder reports, except proxy statements. For the period, transfer agent fees were equivalent to an annual rate of .09% of average net assets.
Accounting Fees. Fidelity Service Company, Inc. (FSC), an affiliate of the investment adviser, maintains the Fund's accounting records. The fee is based on the level of average net assets for each month.
Interfund Trades. The Fund may purchase from or sell securities to other Fidelity Funds under procedures adopted by the Board. The procedures have been designed to ensure these interfund trades are executed in accordance with Rule 17a-7 of the 1940 Act. Interfund trades are included within the respective purchases and sales amounts shown in the Purchases and Sales of Investments note.
5. Committed Line of Credit.
The Fund participates with other funds managed by the investment adviser or an affiliate in a $4.25 billion credit facility (the "line of credit") to be utilized for temporary or emergency purposes to fund shareholder redemptions or for other short-term liquidity purposes. The Fund has agreed to pay commitment fees on its pro-rata portion of the line of credit, which amounted to $1,355 and is reflected in Miscellaneous expenses on the Statement of Operations. During the period, the Fund did not borrow on this line of credit.
6. Expense Reductions.
Through arrangements with the Fund's custodian, credits realized as a result of certain uninvested cash balances were used to reduce the Fund's expenses. During the period, these credits reduced the Fund's custody expenses by $4,180.
In addition, during the period the investment adviser reimbursed and/or waived a portion of operating expenses in the amount of $2,069.
7. Other.
The Fund's organizational documents provide former and current trustees and officers with a limited indemnification against liabilities arising in connection with the performance of their duties to the Fund. In the normal course of business, the Fund may also enter into contracts that provide general indemnifications. The Fund's maximum exposure under these arrangements is unknown as this would be dependent on future claims that may be made against the Fund. The risk of material loss from such claims is considered remote.
Report of Independent Registered Public Accounting Firm
To the Trustees of Fidelity Municipal Trust and Shareholders of Fidelity Minnesota Municipal Income Fund:
In our opinion, the accompanying statement of assets and liabilities, including the schedule of investments, and the related statements of operations and of changes in net assets and the financial highlights present fairly, in all material respects, the financial position of Fidelity Minnesota Municipal Income Fund (a fund of Fidelity Municipal Trust) as of December 31, 2016, the results of its operations for the year then ended, the changes in its net assets for each of the two years in the period then ended and the financial highlights for each of the five years in the period then ended, in conformity with accounting principles generally accepted in the United States of America. These financial statements and financial highlights (hereafter referred to as “financial statements”) are the responsibility of the Fidelity Minnesota Municipal Income Fund’s management. Our responsibility is to express an opinion on these financial statements based on our audits. We conducted our audits of these financial statements in accordance with the standards of the Public Company Accounting Oversight Board (United States). Those standards require that we plan and perform the audit to obtain reasonable assurance about whether the financial statements are free of material misstatement. An audit includes examining, on a test basis, evidence supporting the amounts and disclosures in the financial statements, assessing the accounting principles used and significant estimates made by management, and evaluating the overall financial statement presentation. We believe that our audits, which included confirmation of securities as of December 31, 2016 by correspondence with the custodian and brokers, provide a reasonable basis for our opinion.
PricewaterhouseCoopers LLP
Boston, Massachusetts
February 14, 2017
Trustees and Officers
The Trustees, Members of the Advisory Board (if any), and officers of the trust and fund, as applicable, are listed below. The Board of Trustees governs the fund and is responsible for protecting the interests of shareholders. The Trustees are experienced executives who meet periodically throughout the year to oversee the fund's activities, review contractual arrangements with companies that provide services to the fund, oversee management of the risks associated with such activities and contractual arrangements, and review the fund's performance. Each of the Trustees oversees 243 funds.
The Trustees hold office without limit in time except that (a) any Trustee may resign; (b) any Trustee may be removed by written instrument, signed by at least two-thirds of the number of Trustees prior to such removal; (c) any Trustee who requests to be retired or who has become incapacitated by illness or injury may be retired by written instrument signed by a majority of the other Trustees; and (d) any Trustee may be removed at any special meeting of shareholders by a two-thirds vote of the outstanding voting securities of the trust. Each Trustee who is not an interested person (as defined in the 1940 Act) of the trust and the fund is referred to herein as an Independent Trustee. Each Independent Trustee shall retire not later than the last day of the calendar year in which his or her 75th birthday occurs. The Independent Trustees may waive this mandatory retirement age policy with respect to individual Trustees. Officers and Advisory Board Members hold office without limit in time, except that any officer or Advisory Board Member may resign or may be removed by a vote of a majority of the Trustees at any regular meeting or any special meeting of the Trustees. Except as indicated, each individual has held the office shown or other offices in the same company for the past five years.
The fund’s Statement of Additional Information (SAI) includes more information about the Trustees. To request a free copy, call Fidelity at 1-800-544-8544.
Experience, Skills, Attributes, and Qualifications of the Trustees. The Governance and Nominating Committee has adopted a statement of policy that describes the experience, qualifications, attributes, and skills that are necessary and desirable for potential Independent Trustee candidates (Statement of Policy). The Board believes that each Trustee satisfied at the time he or she was initially elected or appointed a Trustee, and continues to satisfy, the standards contemplated by the Statement of Policy. The Governance and Nominating Committee also engages professional search firms to help identify potential Independent Trustee candidates who have the experience, qualifications, attributes, and skills consistent with the Statement of Policy. From time to time, additional criteria based on the composition and skills of the current Independent Trustees, as well as experience or skills that may be appropriate in light of future changes to board composition, business conditions, and regulatory or other developments, have also been considered by the professional search firms and the Governance and Nominating Committee. In addition, the Board takes into account the Trustees' commitment and participation in Board and committee meetings, as well as their leadership of standing and ad hoc committees throughout their tenure.
In determining that a particular Trustee was and continues to be qualified to serve as a Trustee, the Board has considered a variety of criteria, none of which, in isolation, was controlling. The Board believes that, collectively, the Trustees have balanced and diverse experience, qualifications, attributes, and skills, which allow the Board to operate effectively in governing the fund and protecting the interests of shareholders. Information about the specific experience, skills, attributes, and qualifications of each Trustee, which in each case led to the Board's conclusion that the Trustee should serve (or continue to serve) as a trustee of the fund, is provided below.
Board Structure and Oversight Function. Abigail P. Johnson is an interested person and currently serves as Chairman. The Trustees have determined that an interested Chairman is appropriate and benefits shareholders because an interested Chairman has a personal and professional stake in the quality and continuity of services provided to the fund. Independent Trustees exercise their informed business judgment to appoint an individual of their choosing to serve as Chairman, regardless of whether the Trustee happens to be independent or a member of management. The Independent Trustees have determined that they can act independently and effectively without having an Independent Trustee serve as Chairman and that a key structural component for assuring that they are in a position to do so is for the Independent Trustees to constitute a substantial majority for the Board. The Independent Trustees also regularly meet in executive session. Marie L. Knowles serves as Chairman of the Independent Trustees and as such (i) acts as a liaison between the Independent Trustees and management with respect to matters important to the Independent Trustees and (ii) with management prepares agendas for Board meetings.
Fidelity® funds are overseen by different Boards of Trustees. The fund's Board oversees Fidelity's investment-grade bond, money market, asset allocation and certain equity funds, and other Boards oversee Fidelity's high income, sector and other equity funds. The asset allocation funds may invest in Fidelity® funds that are overseen by such other Boards. The use of separate Boards, each with its own committee structure, allows the Trustees of each group of Fidelity® funds to focus on the unique issues of the funds they oversee, including common research, investment, and operational issues. On occasion, the separate Boards establish joint committees to address issues of overlapping consequences for the Fidelity® funds overseen by each Board.
The Trustees operate using a system of committees to facilitate the timely and efficient consideration of all matters of importance to the Trustees, the fund, and fund shareholders and to facilitate compliance with legal and regulatory requirements and oversight of the fund's activities and associated risks. The Board, acting through its committees, has charged FMR and its affiliates with (i) identifying events or circumstances the occurrence of which could have demonstrably adverse effects on the fund's business and/or reputation; (ii) implementing processes and controls to lessen the possibility that such events or circumstances occur or to mitigate the effects of such events or circumstances if they do occur; and (iii) creating and maintaining a system designed to evaluate continuously business and market conditions in order to facilitate the identification and implementation processes described in (i) and (ii) above. Because the day-to-day operations and activities of the fund are carried out by or through FMR, its affiliates, and other service providers, the fund's exposure to risks is mitigated but not eliminated by the processes overseen by the Trustees. While each of the Board's committees has responsibility for overseeing different aspects of the fund's activities, oversight is exercised primarily through the Operations and Audit Committees. In addition, an ad hoc Board committee of Independent Trustees has worked with FMR to enhance the Board's oversight of investment and financial risks, legal and regulatory risks, technology risks, and operational risks, including the development of additional risk reporting to the Board. Appropriate personnel, including but not limited to the fund's Chief Compliance Officer (CCO), FMR's internal auditor, the independent accountants, the fund's Treasurer and portfolio management personnel, make periodic reports to the Board's committees, as appropriate, including an annual review of Fidelity's risk management program for the Fidelity® funds. The responsibilities of each standing committee, including their oversight responsibilities, are described further under "Standing Committees of the Trustees."
Interested Trustees*:
Correspondence intended for a Trustee who is an interested person may be sent to Fidelity Investments, 245 Summer Street, Boston, Massachusetts 02210.
Name, Year of Birth; Principal Occupations and Other Relevant Experience+
Abigail P. Johnson (1961)
Year of Election or Appointment: 2009
Trustee
Chairman of the Board of Trustees
Ms. Johnson also serves as Trustee of other Fidelity® funds. Ms. Johnson serves as Chairman (2016-present), Chief Executive Officer (2014-present), and Director (2007-present) of FMR LLC (diversified financial services company), President of Fidelity Financial Services (2012-present) and President of Personal, Workplace and Institutional Services (2005-present). Ms. Johnson is Chairman and Director of FMR Co., Inc. (investment adviser firm, 2011-present) and Chairman and Director of FMR (investment adviser firm, 2011-present). Previously, Ms. Johnson served as Vice Chairman (2007-2016) and President (2013-2016) of FMR LLC, President and a Director of FMR (2001-2005), a Trustee of other investment companies advised by FMR, Fidelity Investments Money Management, Inc. (investment adviser firm), and FMR Co., Inc. (2001-2005), Senior Vice President of the Fidelity® funds (2001-2005), and managed a number of Fidelity® funds. Ms. Abigail P. Johnson and Mr. Arthur E. Johnson are not related.
Jennifer Toolin McAuliffe (1959)
Year of Election or Appointment: 2016
Trustee
Ms. McAuliffe also serves as Trustee of other Fidelity® funds. Ms. McAuliffe previously served as a Member of the Advisory Board of certain Fidelity® funds (2016) and as Co-Head of Fixed Income of Fidelity Investments Limited (now known as FIL Limited (FIL)) (diversified financial services company). Earlier roles at FIL included Director of Research for FIL’s credit and quantitative teams in London, Hong Kong and Tokyo. Ms. McAuliffe also was the Director of Research for taxable and municipal bonds at Fidelity Investments Money Management, Inc. Ms. McAuliffe is also a director or trustee of several not-for-profit entities.
* Determined to be an “Interested Trustee” by virtue of, among other things, his or her affiliation with the trust or various entities under common control with FMR.
+ The information includes the Trustee's principal occupation during the last five years and other information relating to the experience, attributes, and skills relevant to the Trustee's qualifications to serve as a Trustee, which led to the conclusion that the Trustee should serve as a Trustee for the fund.
Independent Trustees:
Correspondence intended for an Independent Trustee may be sent to Fidelity Investments, P.O. Box 55235, Boston, Massachusetts 02205-5235.
Name, Year of Birth; Principal Occupations and Other Relevant Experience+
Elizabeth S. Acton (1951)
Year of Election or Appointment: 2013
Trustee
Ms. Acton also serves as Trustee of other Fidelity® funds. Prior to her retirement in April 2012, Ms. Acton was Executive Vice President, Finance (2011-2012), Executive Vice President, Chief Financial Officer (2002-2011), and Treasurer (2004-2005) of Comerica Incorporated (financial services). Prior to joining Comerica, Ms. Acton held a variety of positions at Ford Motor Company (1983-2002), including Vice President and Treasurer (2000-2002) and Executive Vice President and Chief Financial Officer of Ford Motor Credit Company (1998-2000). Ms. Acton currently serves as a member of the Board of Directors and Audit and Finance Committees of Beazer Homes USA, Inc. (homebuilding, 2012-present). Previously, Ms. Acton served as a Member of the Advisory Board of certain Fidelity® funds (2013-2016).
John Engler (1948)
Year of Election or Appointment: 2014
Trustee
Mr. Engler also serves as Trustee of other Fidelity® funds. He serves as president of the Business Roundtable (2011-present), and on the board of directors for Universal Forest Products (manufacturer and distributor of wood and wood-alternative products, 2003-present) and K12 Inc. (technology-based education company, 2012-present). Previously, Mr. Engler served as a Member of the Advisory Board of certain Fidelity® funds (2014-2016), a trustee of The Munder Funds (2003-2014), president and CEO of the National Association of Manufacturers (2004-2011), member of the Board of Trustees of the Annie E. Casey Foundation (2004-2015), and as governor of Michigan (1991-2003). He is a past chairman of the National Governors Association.
Albert R. Gamper, Jr. (1942)
Year of Election or Appointment: 2006
Trustee
Mr. Gamper also serves as Trustee of other Fidelity® funds. Prior to his retirement in December 2004, Mr. Gamper served as Chairman of the Board of CIT Group Inc. (commercial finance). During his tenure with CIT Group Inc. Mr. Gamper served in numerous senior management positions, including Chairman (1987-1989; 1999-2001; 2002-2004), Chief Executive Officer (1987-2004), and President (2002-2003). Mr. Gamper currently serves as a member of the Board of Directors of Public Service Enterprise Group (utilities, 2000-present), and Member of the Board of Trustees of Barnabas Health Care System (1997-present). Previously, Mr. Gamper served as Chairman (2012-2015) and Vice Chairman (2011-2012) of the Independent Trustees of certain Fidelity® funds and as Chairman of the Board of Governors, Rutgers University (2004-2007).
Robert F. Gartland (1951)
Year of Election or Appointment: 2010
Trustee
Mr. Gartland also serves as Trustee of other Fidelity® funds. Mr. Gartland is Chairman and an investor in Gartland & Mellina Group Corp. (consulting, 2009-present). Previously, Mr. Gartland served as a partner and investor of Vietnam Partners LLC (investments and consulting, 2008-2011). Prior to his retirement, Mr. Gartland held a variety of positions at Morgan Stanley (financial services, 1979-2007) including Managing Director (1987-2007).
Arthur E. Johnson (1947)
Year of Election or Appointment: 2008
Trustee
Vice Chairman of the Independent Trustees
Mr. Johnson also serves as Trustee of other Fidelity® funds. Mr. Johnson serves as a member of the Board of Directors of Eaton Corporation plc (diversified power management, 2009-present) and Booz Allen Hamilton (management consulting, 2011-present). Prior to his retirement, Mr. Johnson served as Senior Vice President of Corporate Strategic Development of Lockheed Martin Corporation (defense contractor, 1999-2009). He previously served on the Board of Directors of IKON Office Solutions, Inc. (1999-2008), AGL Resources, Inc. (holding company, 2002-2016), and Delta Airlines (2005-2007). Mr. Arthur E. Johnson is not related to Ms. Abigail P. Johnson.
Michael E. Kenneally (1954)
Year of Election or Appointment: 2009
Trustee
Mr. Kenneally also serves as Trustee of other Fidelity® funds. Prior to his retirement, Mr. Kenneally served as Chairman and Global Chief Executive Officer of Credit Suisse Asset Management. Before joining Credit Suisse, he was an Executive Vice President and Chief Investment Officer for Bank of America Corporation. Earlier roles at Bank of America included Director of Research, Senior Portfolio Manager and Research Analyst, and Mr. Kenneally was awarded the Chartered Financial Analyst (CFA) designation in 1991.
Marie L. Knowles (1946)
Year of Election or Appointment: 2001
Trustee
Chairman of the Independent Trustees
Ms. Knowles also serves as Trustee of other Fidelity® funds. Prior to Ms. Knowles' retirement in June 2000, she served as Executive Vice President and Chief Financial Officer of Atlantic Richfield Company (ARCO) (diversified energy, 1996-2000). From 1993 to 1996, she was a Senior Vice President of ARCO and President of ARCO Transportation Company (pipeline and tanker operations). Ms. Knowles currently serves as a Director and Chairman of the Audit Committee of McKesson Corporation (healthcare service, since 2002). Ms. Knowles is a member of the Board of the Santa Catalina Island Company (real estate, 2009-present). Ms. Knowles is a Member of the Investment Company Institute Board of Governors and a Member of the Governing Council of the Independent Directors Council (2014-present). She also serves as a member of the Advisory Board for the School of Engineering of the University of Southern California. Previously, Ms. Knowles served as a Director of Phelps Dodge Corporation (copper mining and manufacturing, 1994-2007), URS Corporation (engineering and construction, 2000-2003) and America West (airline, 1999-2002). Ms. Knowles previously served as Vice Chairman of the Independent Trustees of certain Fidelity® funds (2012-2015).
Mark A. Murray (1954)
Year of Election or Appointment: 2016
Trustee
Mr. Murray also serves as Trustee of other Fidelity® funds. Mr. Murray is Vice Chairman (2013-present) of Meijer, Inc. (regional retail chain). Previously, Mr. Murray served as a Member of the Advisory Board of certain Fidelity® funds (2016) and as Co-Chief Executive Officer (2013-2016) and President (2006-2013) of Meijer, Inc. Mr. Murray serves as a member of the Board of Directors and Nuclear Review and Public Policy and Responsibility Committees of DTE Energy Company (diversified energy company, 2009-present). Mr. Murray also serves as a member of the Board of Directors of Spectrum Health (not-for-profit health system, 2015-present). Mr. Murray previously served as President of Grand Valley State University (2001-2006), Treasurer for the State of Michigan (1999-2001), Vice President of Finance and Administration for Michigan State University (1998-1999), and a member of the Board of Directors and Audit Committee and Chairman of the Nominating and Corporate Governance Committee of Universal Forest Products, Inc. (manufacturer and distributor of wood and wood-alternative products, 2004-2016). Mr. Murray is also a director or trustee of many community and professional organizations.
+ The information includes the Trustee's principal occupation during the last five years and other information relating to the experience, attributes, and skills relevant to the Trustee's qualifications to serve as a Trustee, which led to the conclusion that the Trustee should serve as a Trustee for the fund.
Advisory Board Members and Officers:
Correspondence intended for an officer may be sent to Fidelity Investments, 245 Summer Street, Boston, Massachusetts 02210. Officers appear below in alphabetical order.
Name, Year of Birth; Principal Occupation
Marc R. Bryant (1966)
Year of Election or Appointment: 2015
Secretary and Chief Legal Officer (CLO)
Mr. Bryant also serves as Secretary and CLO of other funds. Mr. Bryant serves as CLO, Secretary, and Senior Vice President of Fidelity Management & Research Company (investment adviser firm, 2015-present) and FMR Co., Inc. (investment adviser firm, 2015-present); Secretary of Fidelity SelectCo, LLC (investment adviser firm, 2015-present) and Fidelity Investments Money Management, Inc. (investment adviser firm, 2015-present); and CLO of Fidelity Management & Research (Hong Kong) Limited and FMR Investment Management (UK) Limited (investment adviser firms, 2015-present) and Fidelity Management & Research (Japan) Limited (investment adviser firm, 2016-present). He is Senior Vice President and Deputy General Counsel of FMR LLC (diversified financial services company). Previously, Mr. Bryant served as Secretary and CLO of Fidelity Rutland Square Trust II (2010-2014) and Assistant Secretary of Fidelity's Fixed Income and Asset Allocation Funds (2013-2015). Prior to joining Fidelity Investments, Mr. Bryant served as a Senior Vice President and the Head of Global Retail Legal for AllianceBernstein L.P. (2006-2010), and as the General Counsel for ProFund Advisors LLC (2001-2006).
Jeffrey S. Christian (1961)
Year of Election or Appointment: 2016
Assistant Treasurer
Mr. Christian also serves as Assistant Treasurer of other funds. Mr. Christian is an employee of Fidelity Investments (2003-present).
Jonathan Davis (1968)
Year of Election or Appointment: 2010
Assistant Treasurer
Mr. Davis also serves as Assistant Treasurer of other funds, and is an employee of Fidelity Investments. Previously, Mr. Davis served as Vice President and Associate General Counsel of FMR LLC (diversified financial services company, 2003-2010).
Adrien E. Deberghes (1967)
Year of Election or Appointment: 2010
Assistant Treasurer
Mr. Deberghes also serves as an officer of other funds. He serves as Executive Vice President of Fidelity Investments Money Management, Inc. (FIMM) (investment adviser firm, 2016-present) and is an employee of Fidelity Investments (2008-present). Prior to joining Fidelity Investments, Mr. Deberghes was Senior Vice President of Mutual Fund Administration at State Street Corporation (2007-2008), Senior Director of Mutual Fund Administration at Investors Bank & Trust (2005-2007), and Director of Finance for Dunkin' Brands (2000-2005). Previously, Mr. Deberghes served in other fund officer roles.
Stephanie J. Dorsey (1969)
Year of Election or Appointment: 2013
President and Treasurer
Ms. Dorsey also serves as an officer of other funds. She is an employee of Fidelity Investments (2008-present) and has served in other fund officer roles. Prior to joining Fidelity Investments, Ms. Dorsey served as Treasurer (2004-2008) of the JPMorgan Mutual Funds and Vice President (2004-2008) of JPMorgan Chase Bank.
Howard J. Galligan III (1966)
Year of Election or Appointment: 2014
Chief Financial Officer
Mr. Galligan also serves as Chief Financial Officer of other funds. Mr. Galligan serves as President of Fidelity Pricing and Cash Management Services (FPCMS) (2014-present) and as a Director of Strategic Advisers, Inc. (investment adviser firm, 2008-present). Previously, Mr. Galligan served as Chief Administrative Officer of Asset Management (2011-2014) and Chief Operating Officer and Senior Vice President of Investment Support for Strategic Advisers, Inc. (2003-2011).
Scott C. Goebel (1968)
Year of Election or Appointment: 2015
Vice President
Mr. Goebel serves as Vice President of other funds and is an employee of Fidelity Investments (2001-present). Previously, Mr. Goebel served as Senior Vice President of Fidelity Management & Research Company (FMR) (investment adviser firm, 2016), Secretary of Fidelity SelectCo, LLC (investment adviser firm, 2013-2015), Fidelity Investments Money Management, Inc. (FIMM) (investment adviser firm, 2010-2015), and Fidelity Research and Analysis Company (FRAC) (investment adviser firm, 2010-2015); General Counsel, Secretary, and Senior Vice President of FMR (investment adviser firm, 2008-2015) and FMR Co., Inc. (investment adviser firm, 2008-2015); Assistant Secretary of Fidelity Management & Research (Japan) Limited (investment adviser firm, 2008-2015) and Fidelity Management & Research (U.K.) Inc. (investment adviser firm, 2008-2015); Chief Legal Officer (CLO) of Fidelity Management & Research (Hong Kong) Limited (investment adviser firm, 2008-2015); Secretary and CLO of certain Fidelity® funds (2008-2015); Assistant Secretary of FIMM (2008-2010), FRAC (2008-2010), and certain funds (2007-2008); and as Vice President and Secretary of Fidelity Distributors Corporation (FDC) (2005-2007).
Colm A. Hogan (1973)
Year of Election or Appointment: 2016
Assistant Treasurer
Mr. Hogan also serves as an officer of other funds. Mr. Hogan is an employee of Fidelity Investments (2005-present).
Chris Maher (1972)
Year of Election or Appointment: 2013
Assistant Treasurer
Mr. Maher serves as Assistant Treasurer of other funds. Mr. Maher is Vice President of Valuation Oversight and is an employee of Fidelity Investments. Previously, Mr. Maher served as Vice President of Asset Management Compliance (2013), Vice President of the Program Management Group of FMR (investment adviser firm, 2010-2013), and Vice President of Valuation Oversight (2008-2010).
John B. McGinty, Jr. (1962)
Year of Election or Appointment: 2016
Chief Compliance Officer
Mr. McGinty also serves as Chief Compliance Officer of other funds. Mr. McGinty is Senior Vice President of Asset Management Compliance for Fidelity Investments and is an employee of Fidelity Investments (2016-present). Mr. McGinty previously served as Vice President, Senior Attorney at Eaton Vance Management (investment management firm, 2015-2016), and prior to Eaton Vance as global CCO for all firm operations and registered investment companies at GMO LLC (investment management firm, 2009-2015). Before joining GMO LLC, Mr. McGinty served as Senior Vice President, Deputy General Counsel for Fidelity Investments (2007-2009).
John F. Papandrea (1972)
Year of Election or Appointment: 2016
Anti-Money Laundering (AML) Officer
Mr. Papandrea also serves as AML Officer of other funds. Mr. Papandrea is Vice President of FMR LLC (diversified financial services company, 2008-present) and is an employee of Fidelity Investments (2005-present).
Jason P. Pogorelec (1975)
Year of Election or Appointment: 2015
Assistant Secretary
Mr. Pogorelec also serves as Assistant Secretary of other funds. Mr. Pogorelec serves as Vice President, Associate General Counsel (2010-present) and is an employee of Fidelity Investments (2006-present).
Nancy D. Prior (1967)
Year of Election or Appointment: 2014
Vice President
Ms. Prior also serves as Vice President of other funds. Ms. Prior serves as a Director of FMR Investment Management (UK) Limited (investment adviser firm, 2015-present), President (2016-present) and Director (2014-present) of Fidelity Investments Money Management, Inc. (FIMM) (investment adviser firm), President, Fixed Income (2014-present), Vice Chairman of FIAM LLC (investment adviser firm, 2014-present), and is an employee of Fidelity Investments (2002-present). Previously, Ms. Prior served as Vice President of Fidelity's Money Market Funds (2012-2014), President, Money Market and Short Duration Bond Group of Fidelity Management & Research (FMR) (investment adviser firm, 2013-2014), President, Money Market Group of FMR (2011-2013), Managing Director of Research (2009-2011), Senior Vice President and Deputy General Counsel (2007-2009), and Assistant Secretary of certain Fidelity® funds (2008-2009).
Stacie M. Smith (1974)
Year of Election or Appointment: 2013
Assistant Treasurer
Ms. Smith also serves as an officer of other funds. She is an employee of Fidelity Investments (2009-present) and has served in other fund officer roles. Prior to joining Fidelity Investments, Ms. Smith served as Senior Audit Manager of Ernst & Young LLP (accounting firm, 1996-2009). Previously, Ms. Smith served as Deputy Treasurer of certain Fidelity® funds (2013-2016).
Marc L. Spector (1972)
Year of Election or Appointment: 2016
Deputy Treasurer
Mr. Spector also serves as an officer of other funds. Mr. Spector is an employee of Fidelity Investments (2016-present). Prior to joining Fidelity Investments, Mr. Spector served as Director at the Siegfried Group (accounting firm, 2013-2016), and prior to Siegfried Group as audit senior manager at Deloitte & Touche (accounting firm, 2005-2013).
Renee Stagnone (1975)
Year of Election or Appointment: 2016
Assistant Treasurer
Ms. Stagnone also serves as an officer of other funds. Ms. Stagnone is an employee of Fidelity Investments (1997-present). Previously, Ms. Stagnone served as Deputy Treasurer of certain Fidelity® funds (2013-2016).
Christine J. Thompson (1958)
Year of Election or Appointment: 2015
Vice President of Fidelity's Bond Funds
Ms. Thompson also serves as Vice President of other funds. Ms. Thompson also serves as Chief Investment Officer of FMR's Bond Group (2010-present) and is an employee of Fidelity Investments (1985-present). Previously, Ms. Thompson served as Vice President of Fidelity's Bond Funds (2010-2012).
Shareholder Expense Example
As a shareholder of the Fund, you incur two types of costs: (1) transaction costs, including redemption fees and (2) ongoing costs, including management fees and other Fund expenses. This Example is intended to help you understand your ongoing costs (in dollars) of investing in the Fund and to compare these costs with the ongoing costs of investing in other mutual funds.
The Example is based on an investment of $1,000 invested at the beginning of the period and held for the entire period (July 1, 2016 to December 31, 2016).
Actual Expenses
The first line of the accompanying table provides information about actual account values and actual expenses. You may use the information in this line, together with the amount you invested, to estimate the expenses that you paid over the period. Simply divide your account value by $1,000.00 (for example, an $8,600 account value divided by $1,000.00 = 8.6), then multiply the result by the number in the first line under the heading entitled "Expenses Paid During Period" to estimate the expenses you paid on your account during this period. A small balance maintenance fee of $12.00 that is charged once a year may apply for certain accounts with a value of less than $2,000. This fee is not included in the table below. If it was, the estimate of expenses you paid during the period would be higher, and your ending account value lower, by this amount.
Hypothetical Example for Comparison Purposes
The second line of the accompanying table provides information about hypothetical account values and hypothetical expenses based on the Fund's actual expense ratio and an assumed rate of return of 5% per year before expenses, which is not the Fund's actual return. The hypothetical account values and expenses may not be used to estimate the actual ending account balance or expenses you paid for the period. You may use this information to compare the ongoing costs of investing in the Fund and other funds. To do so, compare this 5% hypothetical example with the 5% hypothetical examples that appear in the shareholder reports of the other funds. A small balance maintenance fee of $12.00 that is charged once a year may apply for certain accounts with a value of less than $2,000. This fee is not included in the table below. If it was, the estimate of expenses you paid during the period would be higher, and your ending account value lower, by this amount.
Please note that the expenses shown in the table are meant to highlight your ongoing costs only and do not reflect any transaction costs. Therefore, the second line of the table is useful in comparing ongoing costs only, and will not help you determine the relative total costs of owning different funds. In addition, if these transactional costs were included, your costs would have been higher.
| | Annualized Expense Ratio-A | Beginning
Account Value
July 1, 2016 | Ending
Account Value
December 31, 2016 | Expenses Paid
During Period-B
July 1, 2016
to December 31, 2016 |
| Actual | .49% | $1,000.00 | $963.20 | $2.42 |
| Hypothetical-C | | $1,000.00 | $1,022.67 | $2.49 |
A Annualized expense ratio reflects expenses net of applicable fee waivers.
B Expenses are equal to the Fund's annualized expense ratio, multiplied by the average account value over the period, multiplied by 184/366 (to reflect the one-half year period).
C 5% return per year before expenses
Distributions (Unaudited)
The Board of Trustees of Fidelity Minnesota Municipal Income Fund voted to pay on February 6, 2017, to shareholders of record at the opening of business on February 3, 2017, a distribution of $ 0.007 per share derived from capital gains realized from sales of portfolio securities.
The fund hereby designates as a capital gain dividend with respect to the taxable year ended December 31, 2016, $ 2,356,661, or, if subsequently determined to be different, the net capital gain of such year.
During fiscal year ended 2016, 100% of the fund's income dividends was free from federal income tax, and 0.86% of the fund's income dividends was subject to the federal alternative minimum tax.
The fund will notify shareholders in January 2017 of amounts for use in preparing 2016 income tax returns.
Board Approval of Investment Advisory Contracts and Management Fees
Fidelity Minnesota Municipal Income Fund
Each year, the Board of Trustees, including the Independent Trustees (together, the Board), votes on the renewal of the management contract with Fidelity Management & Research Company (FMR) and the sub-advisory agreements (together, the Advisory Contracts) for the fund. The Board, assisted by the advice of fund counsel and Independent Trustees' counsel, requests and considers a broad range of information relevant to the renewal of the Advisory Contracts throughout the year.
The Board meets regularly and, at each of its meetings, covers an extensive agenda of topics and materials and considers factors that are relevant to its annual consideration of the renewal of the fund's Advisory Contracts, including the services and support provided to the fund and its shareholders. The Board has established four standing committees (Committees) — Operations, Audit, Fair Valuation, and Governance and Nominating — each composed of and chaired by Independent Trustees with varying backgrounds, to which the Board has assigned specific subject matter responsibilities in order to enhance effective decision-making by the Board. The Operations Committee, of which all of the Independent Trustees are members, meets regularly throughout the year and considers, among other matters, information specifically related to the annual consideration of the renewal of the fund's Advisory Contracts. The Board, acting directly and through its Committees, requests and receives information concerning the annual consideration of the renewal of the fund's Advisory Contracts. The Board also meets as needed to consider matters specifically related to the Board's annual consideration of the renewal of the Advisory Contracts. Members of the Board may also meet with trustees of other Fidelity funds through ad hoc joint committees to discuss certain matters relevant to all of the Fidelity funds.
At its September 2016 meeting, the Board unanimously determined to renew the fund's Advisory Contracts. In reaching its determination, the Board considered all factors it believed relevant, including (i) the nature, extent, and quality of the services to be provided to the fund and its shareholders (including the investment performance of the fund); (ii) the competitiveness of the fund's management fee and total expense ratio relative to peer funds; (iii) the total costs of the services to be provided by and the profits to be realized by Fidelity from its relationships with the fund; and (iv) the extent to which, if any, economies of scale exist and would be realized as the fund grows, and whether any economies of scale are appropriately shared with fund shareholders.
In considering whether to renew the Advisory Contracts for the fund, the Board reached a determination, with the assistance of fund counsel and Independent Trustees' counsel and through the exercise of its business judgment, that the renewal of the Advisory Contracts was in the best interests of the fund and its shareholders and that the compensation payable under the Advisory Contracts was fair and reasonable. The Board's decision to renew the Advisory Contracts was not based on any single factor, but rather was based on a comprehensive consideration of all the information provided to the Board at its meetings throughout the year. The Board, in reaching its determination to renew the Advisory Contracts, was aware that shareholders of the fund have a broad range of investment choices available to them, including a wide choice among funds offered by Fidelity's competitors, and that the fund's shareholders, who have the opportunity to review and weigh the disclosure provided by the fund in its prospectus and other public disclosures, have chosen to invest in this fund, which is part of the Fidelity family of funds.
Nature, Extent, and Quality of Services Provided. The Board considered Fidelity's staffing as it relates to the fund, including the backgrounds of investment personnel of Fidelity, and also considered the fund's investment objective, strategies, and related investment philosophy. The Independent Trustees also had discussions with senior management of Fidelity's investment operations and investment groups. The Board considered the structure of the investment personnel compensation program and whether this structure provides appropriate incentives to act in the best interests of the fund. Additionally, the Board considered the portfolio managers' investments, if any, in the funds that they manage.
Resources Dedicated to Investment Management and Support Services. The Board reviewed the general qualifications and capabilities of Fidelity's investment staff, including its size, education, experience, and resources, as well as Fidelity's approach to recruiting, managing, and compensating investment personnel. The Board noted that Fidelity has continued to increase the resources devoted to non-U.S. offices, including expansion of Fidelity's global investment organization. The Board also noted that Fidelity's analysts have extensive resources, tools and capabilities that allow them to conduct sophisticated quantitative and fundamental analysis, as well as credit analysis of issuers, counterparties and guarantors. Further, the Board considered that Fidelity's investment professionals have sufficient access to global information and data so as to provide competitive investment results over time, and that those professionals also have access to sophisticated tools that permit them to assess portfolio construction and risk and performance attribution characteristics continuously, as well as to transmit new information and research conclusions rapidly around the world. Additionally, in its deliberations, the Board considered Fidelity's trading, risk management, compliance, and technology and operations capabilities and resources, which are integral parts of the investment management process.
Shareholder and Administrative Services. The Board considered (i) the nature, extent, quality, and cost of advisory, administrative, and shareholder services performed by FMR, the sub-advisers (together with FMR, the Investment Advisers), and their affiliates under the Advisory Contracts and under separate agreements covering transfer agency and pricing and bookkeeping services for the fund; (ii) the nature and extent of the supervision of third party service providers, principally custodians, subcustodians, and pricing vendors; and (iii) the resources devoted to, and the record of compliance with, the fund's compliance policies and procedures.
The Board noted that the growth of fund assets over time across the complex allows Fidelity to reinvest in the development of services designed to enhance the value or convenience of the Fidelity funds as investment vehicles. These services include 24-hour access to account information and market information through telephone representatives and over the Internet, investor education materials and asset allocation tools, and the expanded availability of Fidelity Investor Centers.
Investment in a Large Fund Family. The Board considered the benefits to shareholders of investing in a Fidelity fund, including the benefits of investing in a fund that is part of a large family of funds offering a variety of investment disciplines and providing a large variety of mutual fund investor services. The Board noted that Fidelity had taken, or had made recommendations that resulted in the Fidelity funds taking, a number of actions over the previous year that benefited particular funds, including: (i) continuing to dedicate additional resources to investment research and to the support of the senior management team that oversees asset management; (ii) continuing efforts to enhance Fidelity's global research capabilities; (iii) launching new funds and making other enhancements to meet client needs; (iv) broadening eligibility requirements for certain lower-priced share classes of, and streamlining the fee structure for, certain existing equity index funds; (v) lowering expense caps for certain existing funds and classes to reduce expenses paid by shareholders; (vi) eliminating redemption fees for certain variable insurance product funds and classes; (vii) continuing to launch dedicated lower cost underlying funds to meet portfolio construction needs related to expanding underlying fund options for Fidelity funds of funds, specifically for the Freedom Fund product lines; (viii) launching a lower cost share class for use by the Freedom Index Fund product line; (ix) rationalizing product lines and gaining increased efficiencies through fund mergers and share class consolidations; (x) continuing to develop, acquire and implement systems and technology to improve services to the funds and shareholders, strengthen information security, and increase efficiency; (xi) implementing investment enhancements to further strengthen Fidelity's target date product line to increase investors' probability of success in achieving their goals; (xii) accelerating the conversion of all remaining Class B shares to Class A shares, which have a lower expense structure; and (xiii) implementing changes to Fidelity's money market fund product line in response to recent regulatory reforms.
Investment Performance. The Board considered whether the fund has operated in accordance with its investment objective, as well as its record of compliance with its investment restrictions and its performance history. The Board noted that there was a portfolio management change for the fund in May 2016.
The Board took into account discussions with representatives of the Investment Advisers about fund investment performance that occur at Board meetings throughout the year. In this regard the Board noted that as part of regularly scheduled fund reviews and other reports to the Board on fund performance, the Board considers annualized return information for the fund for different time periods, measured against a securities market index ("benchmark index") and a peer group of funds with similar objectives ("peer group"), if any. In its evaluation of fund investment performance at meetings throughout the year, the Board gave particular attention to information indicating underperformance of certain Fidelity funds for specific time periods and discussed with the Investment Advisers the reasons for such underperformance.
In addition to reviewing absolute and relative fund performance, the Independent Trustees periodically consider the appropriateness of fund performance metrics in evaluating the results achieved. In general, the Independent Trustees believe that fund performance should be evaluated based on gross performance (before fees and expenses but after transaction costs) compared to appropriate benchmark indices, over appropriate time periods that may include full market cycles, and on net performance (after fees and expenses) compared to peer groups, as applicable, over the same periods, taking into account relevant factors including the following: general market conditions; expectations for interest rate levels and credit conditions; issuer-specific information including credit quality; the potential for incremental return versus the fund's benchmark index weighed against the risks involved in obtaining that incremental return, including the risk of diminished or negative total returns; and fund cash flows and other factors. Depending on the circumstances, the Independent Trustees may be satisfied with a fund's performance notwithstanding that it lags its benchmark index or peer group for certain periods.
The Independent Trustees recognize that shareholders evaluate performance on a net basis over their own holding periods, for which one-, three-, and five-year periods are often used as a proxy. For this reason, the performance information reviewed by the Board also included net cumulative calendar year total return information for the fund and an appropriate benchmark index and peer group for the most recent one-, three-, and five-year periods.
Based on its review, the Board concluded that the nature, extent, and quality of services provided to the fund under the Advisory Contracts should continue to benefit the shareholders of the fund.
Competitiveness of Management Fee and Total Expense Ratio. The Board considered the fund's management fee and total expense ratio compared to "mapped groups" of competitive funds and classes created for the purpose of facilitating the Trustees' competitive analysis of management fees and total expenses. Fidelity creates "mapped groups" by combining similar Lipper investment objective categories that have comparable investment mandates. Combining Lipper investment objective categories aids the Board's management fee and total expense ratio comparisons by broadening the competitive group used for comparison.
Management Fee. The Board considered two proprietary management fee comparisons for the 12-month periods shown in basis points (BP) in the chart below. The group of Lipper funds used by the Board for management fee comparisons is referred to below as the "Total Mapped Group" and, for the reasons explained above, is broader than the Lipper peer group used by the Board for performance comparisons. The Total Mapped Group comparison focuses on a fund's standing in terms of gross management fees before expense reimbursements or caps relative to the total universe of funds with comparable investment mandates, regardless of whether their management fee structures also are comparable. Funds with comparable investment mandates offer exposure to similar types of securities. Funds with comparable management fee structures have similar management fee contractual arrangements (
e.g., flat rate charged for advisory services, all-inclusive fee rate,
etc.). "TMG %" represents the percentage of funds in the Total Mapped Group that had management fees that were lower than the fund's. For example, a hypothetical TMG % of 20% would mean that 80% of the funds in the Total Mapped Group had higher, and 20% had lower, management fees than the fund. The fund's actual TMG %s and the number of funds in the Total Mapped Group are in the chart below. The "Asset-Size Peer Group" (ASPG) comparison focuses on a fund's standing relative to a subset of non-Fidelity funds within the Total Mapped Group that are similar in size and management fee structure. For example, if a fund is in the first quartile of the ASPG, the fund's management fee ranks in the least expensive or lowest 25% of funds in the ASPG. The ASPG represents at least 15% of the funds in the Total Mapped Group with comparable asset size and management fee structures, subject to a minimum of 50 funds (or all funds in the Total Mapped Group if fewer than 50). Additional information, such as the ASPG quartile in which the fund's management fee rate ranked, is also included in the chart and considered by the Board.
Fidelity Minnesota Municipal Income Fund
The Board noted that the fund's management fee rate ranked below the median of its Total Mapped Group and below the median of its ASPG for 2015.
The Board noted that, in 2014, the ad hoc Committee on Group Fee was formed by it and the boards of other Fidelity funds to conduct an in-depth review of the "group fee" component of the management fee of funds with such management fee structures. The Committee's focus included the mechanics of the group fee, the competitive landscape of group fee structures, Fidelity funds with no group fee component and investment products not included in group fee assets. The Board also considered that, for funds subject to the group fee, FMR agreed to voluntarily waive fees over a specified period of time in amounts designed to account for assets converted from certain funds to certain collective investment trusts.
Based on its review, the Board concluded that the fund's management fee is fair and reasonable in light of the services that the fund receives and the other factors considered.
Total Expense Ratio. In its review of the fund's total expense ratio, the Board considered the fund's management fee rate as well as other fund expenses, such as transfer agent fees, pricing and bookkeeping fees, and custodial, legal, and audit fees. The Board also noted that Fidelity may agree to waive fees and expenses from time to time, and the extent to which, if any, it has done so for the fund. As part of its review, the Board also considered the current and historical total expense ratios of the fund compared to competitive fund median expenses. The fund is compared to those funds and classes in the Total Mapped Group (used by the Board for management fee comparisons) that have a similar sales load structure.
The Board noted that the fund's total expense ratio ranked below the competitive median for 2015.
Fees Charged to Other Fidelity Clients. The Board also considered Fidelity fee structures and other information with respect to clients of Fidelity, such as other funds advised or subadvised by Fidelity, pension plan clients, and other institutional clients with similar mandates. The Board noted that an ad hoc joint committee created by it and the boards of other Fidelity funds periodically (most recently in 2013) reviews and compares Fidelity's institutional investment advisory business with its business of providing services to the Fidelity funds, including the differences in services provided, fees charged, and costs incurred, as well as competition in their respective marketplaces.
Based on its review of total expense ratios and fees charged to other Fidelity clients, the Board concluded that the fund's total expense ratio was reasonable in light of the services that the fund and its shareholders receive and the other factors considered.
Costs of the Services and Profitability. The Board considered the revenues earned and the expenses incurred by Fidelity in conducting the business of developing, marketing, distributing, managing, administering and servicing the fund and servicing the fund's shareholders. The Board also considered the level of Fidelity's profits in respect of all the Fidelity funds.
On an annual basis, Fidelity presents to the Board information about the profitability of its relationships with the fund. Fidelity calculates profitability information for each fund, as well as aggregate profitability information for groups of Fidelity funds and all Fidelity funds, using a series of detailed revenue and cost allocation methodologies which originate with the books and records of Fidelity on which Fidelity's audited financial statements are based. The Audit Committee of the Board reviews any significant changes from the prior year's methodologies.
PricewaterhouseCoopers LLP (PwC), independent registered public accounting firm and auditor to Fidelity and certain Fidelity funds, has been engaged annually by the Board as part of the Board's assessment of Fidelity's profitability analysis. PwC's engagement includes the review and assessment of the methodologies used by Fidelity in determining the revenues and expenses attributable to Fidelity's mutual fund business, and completion of agreed-upon procedures in respect of the mathematical accuracy of the fund profitability information and its conformity to established allocation methodologies. After considering PwC's reports issued under the engagement and information provided by Fidelity, the Board concluded that while other allocation methods may also be reasonable, Fidelity's profitability methodologies are reasonable in all material respects.
The Board also reviewed Fidelity's non-fund businesses and fall-out benefits related to the mutual fund business as well as cases where Fidelity's affiliates may benefit from or be related to the fund's business.
The Board considered the costs of the services provided by and the profits realized by Fidelity in connection with the operation of the fund and was satisfied that the profitability was not excessive.
Economies of Scale. The Board considered whether there have been economies of scale in respect of the management of the Fidelity funds, whether the Fidelity funds (including the fund) have appropriately benefited from any such economies of scale, and whether there is potential for realization of any further economies of scale. The Board considered the extent to which the fund will benefit from economies of scale as assets grow through increased services to the fund, through waivers or reimbursements, or through fee or expense ratio reductions. The Board also noted that a committee (the Economies of Scale Committee) created by it and the boards of other Fidelity funds periodically (most recently in 2013) analyzes whether Fidelity attains economies of scale in respect of the management and servicing of the Fidelity funds, whether the Fidelity funds have appropriately benefited from such economies of scale, and whether there is potential for realization of any further economies of scale.
The Board recognized that the fund's management contract incorporates a "group fee" structure, which provides for lower group fee rates as total group assets increase, and for higher group fee rates as total group assets decrease (with "group assets" defined to include fund assets under FMR's management plus the assets of sector funds previously under FMR's management). FMR calculates the group fee rates based on a tiered asset "breakpoint" schedule that varies based on asset class. The Board considered that the group fee is designed to deliver the benefits of economies of scale to fund shareholders when total Fidelity fund assets increase, even if assets of any particular fund are unchanged or have declined, because some portion of Fidelity's costs are attributable to services provided to all Fidelity funds, and all funds benefit if those costs can be allocated among more assets. The Board concluded that, given the group fee structure, fund shareholders will benefit from lower management fees as group assets increase at the fund complex level, regardless of whether Fidelity achieves any such economies of scale.
The Board concluded, taking into account the analysis of the Economies of Scale Committee, that economies of scale, if any, are being appropriately shared between fund shareholders and Fidelity.
Additional Information Requested by the Board. In order to develop fully the factual basis for consideration of the Fidelity funds' advisory contracts, the Board requested and received additional information on certain topics, including: (i) Fidelity's fund profitability methodology, profitability trends for certain funds, and the impact of certain factors on fund profitability results; (ii) portfolio manager changes that have occurred during the past year and the amount of the investment that each portfolio manager has made in the Fidelity fund(s) that he or she manages; (iii) Fidelity's compensation structure for portfolio managers, research analysts, and other key personnel, including its effects on fund profitability, the rationale for the compensation structure, and the extent to which current market conditions have affected retention and recruitment; (iv) the arrangements with and compensation paid to certain fund sub-advisers on behalf of the Fidelity funds; (v) Fidelity's voluntary waiver of its fees to maintain minimum yields for certain money market funds and classes as well as contractual waivers in place for certain funds; (vi) the methodology with respect to competitive fund data and peer group classifications; (vii) Fidelity's transfer agent fee, expense, and service structures for different funds and classes relative to competitive trends, and the impact of the increased use of omnibus accounts; (viii) Fidelity's long-term expectations for its offerings in the workplace investing channel; (ix) new developments in the retail and institutional marketplaces; (x) the approach to considering "fall-out" benefits; and (xi) the impact of money market reform on Fidelity's money market funds, including with respect to costs and profitability. In addition, the Board considered its discussions with Fidelity throughout the year regarding enhanced information security initiatives and the funds' fair valuation policies.
Based on its evaluation of all of the conclusions noted above, and after considering all factors it believed relevant, the Board concluded that the advisory fee structures are fair and reasonable, and that the fund's Advisory Contracts should be renewed.
Corporate Headquarters
245 Summer St.
Boston, MA 02210
www.fidelity.com
MNF-ANN-0217
1.539899.119
Fidelity® Municipal Income Fund
Annual Report December 31, 2016 |
|
Contents
To view a fund's proxy voting guidelines and proxy voting record for the 12-month period ended June 30, visit http://www.fidelity.com/proxyvotingresults or visit the Securities and Exchange Commission's (SEC) web site at http://www.sec.gov.
You may also call 1-800-544-8544 to request a free copy of the proxy voting guidelines.
Standard & Poor's, S&P and S&P 500 are registered service marks of The McGraw-Hill Companies, Inc. and have been licensed for use by Fidelity Distributors Corporation.
Other third-party marks appearing herein are the property of their respective owners.
All other marks appearing herein are registered or unregistered trademarks or service marks of FMR LLC or an affiliated company. © 2017 FMR LLC. All rights reserved.
This report and the financial statements contained herein are submitted for the general information of the shareholders of the Fund. This report is not authorized for distribution to prospective investors in the Fund unless preceded or accompanied by an effective prospectus.
A fund files its complete schedule of portfolio holdings with the SEC for the first and third quarters of each fiscal year on Form N-Q. Forms N-Q are available on the SEC’s web site at http://www.sec.gov. A fund's Forms N-Q may be reviewed and copied at the SEC’s Public Reference Room in Washington, DC. Information regarding the operation of the SEC's Public Reference Room may be obtained by calling 1-800-SEC-0330.
For a complete list of a fund's portfolio holdings, view the most recent holdings listing, semiannual report, or annual report on Fidelity's web site at http://www.fidelity.com, http://www.institutional.fidelity.com, or http://www.401k.com, as applicable.
NOT FDIC INSURED •MAY LOSE VALUE •NO BANK GUARANTEE
Neither the Fund nor Fidelity Distributors Corporation is a bank.
Performance: The Bottom Line
Average annual total return reflects the change in the value of an investment, assuming reinvestment of distributions from dividend income and capital gains (the profits earned upon the sale of securities that have grown in value, if any) and assuming a constant rate of performance each year. The hypothetical investment and the average annual total returns do not reflect the deduction of taxes that a shareholder would pay on fund distributions or the redemption of fund shares. During periods of reimbursement by Fidelity, a fund’s total return will be greater than it would be had the reimbursement not occurred. How a fund did yesterday is no guarantee of how it will do tomorrow.
Average Annual Total Returns
| For the periods ended December 31, 2016 | Past 1 year | Past 5 years | Past 10 years |
| Fidelity® Municipal Income Fund | (0.01)% | 3.66% | 4.22% |
$10,000 Over 10 Years
Let's say hypothetically that $10,000 was invested in Fidelity® Municipal Income Fund on December 31, 2006.
The chart shows how the value of your investment would have changed, and also shows how the Bloomberg Barclays Municipal Bond Index performed over the same period.

| Period Ending Values |
| $15,115 | Fidelity® Municipal Income Fund |
| $15,158 | Bloomberg Barclays Municipal Bond Index |
Effective August 24, 2016, all Barclays benchmark indices were co-branded as the Bloomberg Barclays Indices for a period of five years.
Management's Discussion of Fund Performance
Market Recap: For the 12 months ending December 31, 2016, tax-exempt bonds eked out only a 0.25% return, according to the Bloomberg Barclays Municipal Bond Index. For much of the period, fairly strong demand and a stable credit environment for state and local governments drove moderate muni returns. But a downward trend began in September and steepened through November – the worst month for the muni market since 2008 – as investors became concerned about U.S. President-elect Donald Trump’s expansionary fiscal policy ambitions, inflation and the potential for tax reform to impair tax-exempt bond valuations. Further, some theorized that changes to or repeal of the Affordable Care Act by the incoming administration and a Republican-controlled Congress may affect the prices of muni bonds issued by hospitals. Muni bonds also were hurt by market anticipation of a quarter-point increase in policy interest rates, which happened in December. At year-end, concerns about unfunded pension liabilities generally are compartmentalized to certain issuers. Looking ahead, we think the U.S. Federal Reserve is likely to raise policy interest rates further in 2017, perhaps in multiple stages.
Comments from Co-Portfolio Manager Cormac Cullen: For the year, the fund returned -0.01%, modestly lagging, net of fees, the 0.21% gain of the Bloomberg Barclays 3+ Year Municipal Bond Index. Amid substantial interest rate volatility, the portfolio managers continued to focus on longer-term objectives by seeking to generate attractive tax-exempt income and competitive risk-adjusted returns over time. The fund’s larger-than-benchmark exposure to Illinois state-backed and related credits hurt performance versus the benchmark, as the state continued to struggle to implement balanced budget practices and was hit with downgrades to its credit rating. In contrast, relative performance was helped by the advance refunding of some of our holdings, which usually result in price gains for bondholders, as the bonds’ maturities shorten and their credit quality rises. The fund also benefited from our larger-than-benchmark exposure to lower-rated investment-grade bonds in the health care sector. These securities attracted heavy demand from yield-seeking investors throughout much of the year. Coupled with the comparatively high level of income they generated, they outperformed high-quality securities.
The views expressed above reflect those of the portfolio manager(s) only through the end of the period as stated on the cover of this report and do not necessarily represent the views of Fidelity or any other person in the Fidelity organization. Any such views are subject to change at any time based upon market or other conditions and Fidelity disclaims any responsibility to update such views. These views may not be relied on as investment advice and, because investment decisions for a Fidelity fund are based on numerous factors, may not be relied on as an indication of trading intent on behalf of any Fidelity fund.
Note to Shareholders: On May 2, 2016, Cormac Cullen became Co-Manager of the fund, replacing Lead Portfolio Manager Jamie Pagliocco and joining Co-Managers Mark Sommer and Kevin Ramundo.
Investment Summary (Unaudited)
Top Five States as of December 31, 2016
| | % of fund's net assets | % of fund's net assets 6 months ago |
| Illinois | 17.8 | 16.8 |
| Florida | 13.5 | 13.9 |
| California | 11.4 | 12.7 |
| Texas | 9.8 | 10.4 |
| New York | 7.0 | 7.1 |
Top Five Sectors as of December 31, 2016
| | % of fund's net assets | % of fund's net assets 6 months ago |
| General Obligations | 29.8 | 31.3 |
| Health Care | 22.5 | 18.7 |
| Transportation | 18.7 | 17.3 |
| Escrowed/Pre-Refunded | 7.2 | 9.5 |
| Electric Utilities | 5.7 | 7.6 |
Quality Diversification (% of fund's net assets)
| As of December 31, 2016 |
| | AAA | 3.1% |
| | AA,A | 78.6% |
| | BBB | 12.9% |
| | BB and Below | 1.1% |
| | Not Rated | 2.8% |
| | Short-Term Investments and Net Other Assets | 1.5% |

| As of June 30, 2016 |
| | AAA | 3.8% |
| | AA,A | 81.1% |
| | BBB | 9.9% |
| | BB and Below | 1.1% |
| | Not Rated | 3.3% |
| | Short-Term Investments and Net Other Assets | 0.8% |

We have used ratings from Moody's Investors Service, Inc. Where Moody's® ratings are not available, we have used S&P® ratings. All ratings are as of the date indicated and do not reflect subsequent changes.
Investments December 31, 2016
Showing Percentage of Net Assets
| Municipal Bonds - 98.5% | | | |
| | | Principal Amount (000s) | Value (000s) |
| Alabama - 0.2% | | | |
| Birmingham Gen. Oblig. Series 2013 A, 0% 3/1/32 (a) | | 3,500 | 3,792 |
| Montgomery Med. Clinic Facilities: | | | |
| 4% 3/1/36 | | $500 | $478 |
| 5% 3/1/33 | | 4,000 | 4,291 |
| Univ. of Alabama at Birmingham Hosp. Rev. Series 2008 A, 5.75% 9/1/22 (Pre-Refunded to 9/1/18 @ 100) | | 3,000 | 3,221 |
|
| TOTAL ALABAMA | | | 11,782 |
|
| Alaska - 0.2% | | | |
| Alaska Int'l. Arpts. Revs. Series 2016 B, 5% 10/1/35 | | 10,800 | 11,967 |
| Arizona - 1.7% | | | |
| Arizona Ctfs. of Prtn. Series 2010 A: | | | |
| 5% 10/1/18 (FSA Insured) | | 2,670 | 2,832 |
| 5.25% 10/1/20 (FSA Insured) | | 8,000 | 8,779 |
| 5.25% 10/1/26 (FSA Insured) | | 2,570 | 2,805 |
| 5.25% 10/1/28 (FSA Insured) | | 8,345 | 9,104 |
| Arizona Health Facilities Auth. Rev. (Banner Health Sys. Proj.) Series 2007 B, 1.24%, tender 1/1/37 (b) | | 3,000 | 2,611 |
| Glendale Gen. Oblig. Series 2015, 4% 7/1/20 (FSA Insured) | | 2,600 | 2,799 |
| Goodyear McDowell Road Commercial Corridor Impt. District 5.25% 1/1/18 (AMBAC Insured) | | 1,660 | 1,694 |
| Marana Muni. Property Corp. Facilities Rev. Series 2008 A, 5% 7/1/21 | | 1,580 | 1,666 |
| Maricopa County Indl. Dev. Auth. Rev. Series 2016 A: | | | |
| 5% 1/1/31 | | 5,000 | 5,755 |
| 5% 1/1/32 | | 10,000 | 11,446 |
| 5% 1/1/33 | | 6,000 | 6,835 |
| Maricopa County Indl. Dev. Auth. Sr. Living Facilities Series 2016: | | | |
| 5.75% 1/1/36 (c) | | 740 | 666 |
| 6% 1/1/48 (c) | | 2,630 | 2,347 |
| Maricopa County Poll. Cont. Rev. (Southern California Edison Co. Proj.) Series 2000 A, 5% 6/1/35 | | 3,600 | 3,899 |
| Phoenix Civic Impt. Board Arpt. Rev. Series 2013, 5% 7/1/22 (d) | | 1,000 | 1,129 |
| Phoenix Civic Impt. Corp. Excise Tax Rev. Series 2011 C: | | | |
| 5% 7/1/22 | | 1,000 | 1,129 |
| 5% 7/1/23 | | 2,000 | 2,250 |
| Pima County Swr. Sys. Rev.: | | | |
| Series 2011 B: | | | |
| 5% 7/1/22 | | 965 | 1,092 |
| 5% 7/1/22 (Pre-Refunded to 7/1/21 @ 100) | | 535 | 606 |
| Series 2012 A: | | | |
| 5% 7/1/24 | | 1,140 | 1,308 |
| 5% 7/1/26 | | 1,000 | 1,143 |
| Salt Verde Finl. Corp. Sr. Gas Rev. Series 2007: | | | |
| 5.25% 12/1/21 | | 3,500 | 3,966 |
| 5.5% 12/1/29 | | 7,900 | 9,277 |
| Scottsdale Indl. Dev. Auth. Hosp. Rev. (Scottsdale Healthcare Proj.) Series 2006 C, 5% 9/1/35 (FSA Insured) | | 845 | 918 |
| Univ. Med. Ctr. Corp. Hosp. Rev. Series 2011, 6% 7/1/39 (Pre-Refunded to 7/1/21 @ 100) | | 3,000 | 3,507 |
| Yavapai County Indl. Dev. Auth. Series 2016, 5% 8/1/34 | | 1,200 | 1,283 |
|
| TOTAL ARIZONA | | | 90,846 |
|
| California - 11.4% | | | |
| ABAG Fin. Auth. for Nonprofit Corps. Rev. (Sharp HealthCare Proj.) Series 2009 B, 6.25% 8/1/39 | | 2,800 | 3,111 |
| ABC Unified School District Series 1997 C, 0% 8/1/28 (Nat'l. Pub. Fin. Guarantee Corp. Insured) | | 3,925 | 2,588 |
| Antelope Valley Healthcare District Rev. Series 2016 A: | | | |
| 5% 3/1/26 | | 3,305 | 3,440 |
| 5% 3/1/31 | | 7,165 | 7,218 |
| Cabrillo Unified School District Series A, 0% 8/1/20 (AMBAC Insured) | | 4,275 | 3,850 |
| California Edl. Facilities Auth. Rev. (Loyola Marymount Univ. Proj.) Series 2001 A: | | | |
| 0% 10/1/17 (Nat'l. Pub. Fin. Guarantee Corp. Insured) | | 2,050 | 2,032 |
| 0% 10/1/22 (Nat'l. Pub. Fin. Guarantee Corp. Insured) | | 5,000 | 4,289 |
| California Gen. Oblig.: | | | |
| Series 2007, 5.625% 5/1/20 | | 120 | 120 |
| 5% 3/1/19 | | 1,800 | 1,882 |
| 5% 8/1/19 (Pre-Refunded to 2/1/17 @ 100) | | 5,980 | 5,997 |
| 5% 8/1/20 (Pre-Refunded to 2/1/17 @ 100) | | 5,355 | 5,370 |
| 5% 10/1/22 | | 2,300 | 2,503 |
| 5% 11/1/24 | | 1,600 | 1,651 |
| 5.25% 9/1/23 | | 24,300 | 27,840 |
| 5.25% 12/1/33 | | 160 | 160 |
| 5.25% 4/1/35 | | 12,000 | 13,548 |
| 5.25% 3/1/38 | | 9,000 | 9,359 |
| 5.25% 11/1/40 | | 3,200 | 3,543 |
| 5.5% 4/1/28 | | 10 | 10 |
| 5.5% 4/1/30 | | 5 | 5 |
| 5.5% 3/1/40 | | 5,900 | 6,490 |
| 5.6% 3/1/36 | | 2,550 | 2,848 |
| 5.75% 4/1/31 | | 5,020 | 5,465 |
| 6% 3/1/33 | | 23,800 | 26,915 |
| 6% 4/1/38 | | 19,600 | 21,398 |
| 6% 11/1/39 | | 10,020 | 11,167 |
| 6.5% 4/1/33 | | 7,900 | 8,731 |
| California Health Facilities Fing. Auth. Rev.: | | | |
| (Catholic Healthcare West Proj.) Series 2009 E, 5.625% 7/1/25 | | 10,000 | 10,894 |
| (St. Joseph Health Sys. Proj.) Series 2009 A, 5.75% 7/1/39 | | 6,800 | 7,447 |
| (Stanford Hosp. & Clinics Proj.) Series 2010 B, 5.75% 11/15/31 | | 12,500 | 14,399 |
| California Muni. Fin. Auth. Rev. Series 2017 A: | | | |
| 5% 11/1/30 (e) | | 1,000 | 1,057 |
| 5.25% 11/1/29 (e) | | 300 | 327 |
| California Pub. Works Board Lease Rev.: | | | |
| (Coalinga State Hosp. Proj.) Series 2013 E: | | | |
| 5% 6/1/27 | | 6,730 | 7,673 |
| 5% 6/1/28 | | 6,175 | 7,017 |
| (Office of Emergency Svcs. Proj.) Series 2007 A: | | | |
| 5% 3/1/21 | | 3,515 | 3,537 |
| 5% 3/1/22 | | 1,695 | 1,706 |
| (Porterville Developmental Ctr. Hsg. Expansion and Recreation Complex Proj.) Series 2009 C, 6.25% 4/1/34 (Pre-Refunded to 4/1/19 @ 100) | | 2,825 | 3,129 |
| (Various Cap. Projs.): | | | |
| Series 2011 A: | | | |
| 5% 10/1/27 | | 10,000 | 11,210 |
| 5.25% 10/1/26 | | 5,000 | 5,668 |
| Series 2012 A: | | | |
| 5% 4/1/25 | | 4,700 | 5,320 |
| 5% 4/1/26 | | 13,495 | 15,305 |
| Series 2012 G, 5% 11/1/25 | | 4,000 | 4,574 |
| (Various Judicial Council Projs.) Series 2011 D: | | | |
| 5% 12/1/22 | | 4,100 | 4,643 |
| 5% 12/1/23 | | 7,355 | 8,315 |
| Series 2009 G1, 5.75% 10/1/30 | | 2,500 | 2,754 |
| Series 2009 I: | | | |
| 6.125% 11/1/29 (Pre-Refunded to 11/1/19 @ 100) | | 1,600 | 1,805 |
| 6.375% 11/1/34 (Pre-Refunded to 11/1/19 @ 100) | | 4,600 | 5,220 |
| Series 2010 A, 5.75% 3/1/30 | | 4,900 | 5,462 |
| California Statewide Cmntys. Dev. Auth. Rev. (Sutter Health Proj.) Series 2011 A, 6% 8/15/42 | | 10,700 | 12,317 |
| Encinitas Union School District Series 1996: | | | |
| 0% 8/1/20 (Nat'l. Pub. Fin. Guarantee Corp. Insured) | | 3,500 | 3,255 |
| 0% 8/1/21 (Nat'l. Pub. Fin. Guarantee Corp. Insured) | | 2,810 | 2,536 |
| Fontana Unified School District Gen. Oblig. 5% 5/1/19 (Assured Guaranty Corp. Insured) | | 1,300 | 1,407 |
| Long Beach Unified School District Series 2009: | | | |
| 5.5% 8/1/28 | | 235 | 258 |
| 5.5% 8/1/29 | | 125 | 137 |
| Los Angeles Cmnty. Redev. Agcy. Lease Rev. (Vermont Manchester Social Svcs. Proj.) Series 2005: | | | |
| 5% 9/1/18 (AMBAC Insured) | | 1,000 | 1,003 |
| 5% 9/1/19 (AMBAC Insured) | | 2,545 | 2,552 |
| Los Angeles Hbr. Dept. Rev. Series 2016 B: | | | |
| 5% 8/1/30 | | 2,500 | 2,989 |
| 5% 8/1/31 | | 1,000 | 1,190 |
| 5% 8/1/32 | | 3,000 | 3,554 |
| 5% 8/1/33 | | 2,450 | 2,889 |
| Los Angeles Muni. Impt. Corp. Lease Rev. Series 2012 C: | | | |
| 5% 3/1/23 | | 5,335 | 6,042 |
| 5% 3/1/27 | | 2,000 | 2,243 |
| Los Angeles Wastewtr. Sys. Rev. Series 2009 A, 5.75% 6/1/34 | | 4,325 | 4,749 |
| Madera County Ctfs. of Prtn. (Children's Hosp. Central California Proj.) Series 2010, 5.375% 3/15/36 | | 3,000 | 3,236 |
| Monrovia Unified School District Series B, 0% 8/1/29 (Nat'l. Pub. Fin. Guarantee Corp. Insured) | | 4,525 | 2,904 |
| Monterey County Pub. Impt. Corp. Ctfs. of Prtn. Series 2007, 5% 8/1/19 (AMBAC Insured) | | 2,320 | 2,369 |
| North City West School Facilities Fing. Auth. Spl. Tax Series C, 5% 9/1/19 (AMBAC Insured) | | 3,015 | 3,266 |
| Oakland Gen. Oblig. Series 2012: | | | |
| 5% 1/15/26 | | 4,535 | 5,053 |
| 5% 1/15/28 | | 4,345 | 4,826 |
| 5% 1/15/29 | | 5,370 | 5,953 |
| Oakland Unified School District Alameda County Series 2015 A: | | | |
| 5% 8/1/25 (FSA Insured) | | 2,400 | 2,893 |
| 5% 8/1/26 | | 1,025 | 1,227 |
| 5% 8/1/27 (FSA Insured) | | 1,160 | 1,385 |
| 5% 8/1/29 | | 1,750 | 2,055 |
| Oakland-Alameda County Coliseum Auth. (Oakland Coliseum Proj.) Series 2012 A: | | | |
| 5% 2/1/19 | | 4,190 | 4,501 |
| 5% 2/1/24 | | 8,200 | 9,313 |
| Palomar Health Rev. Series 2016: | | | |
| 5% 11/1/30 | | 3,000 | 3,214 |
| 5% 11/1/31 | | 1,125 | 1,200 |
| Port of Oakland Rev. Series 2012 P: | | | |
| 5% 5/1/23 (d) | | 6,455 | 7,237 |
| 5% 5/1/24 (d) | | 9,900 | 11,079 |
| Poway Unified School District: | | | |
| (District #2007-1 School Facilities Proj.) Series 2008 A, 0% 8/1/32 | | 4,900 | 2,685 |
| Series B: | | | |
| 0% 8/1/37 | | 7,800 | 3,337 |
| 0% 8/1/38 | | 10,200 | 4,170 |
| 0% 8/1/39 | | 20,100 | 7,866 |
| 0% 8/1/40 | | 3,000 | 1,124 |
| 0% 8/1/41 | | 13,610 | 4,866 |
| Poway Unified School District Pub. Fing.: | | | |
| 5% 9/1/26 | | 1,275 | 1,409 |
| 5% 9/1/29 | | 2,650 | 2,899 |
| 5% 9/1/31 | | 1,200 | 1,307 |
| Sacramento City Fing. Auth. Rev. Series A, 0% 12/1/26 (Nat'l. Pub. Fin. Guarantee Corp. Insured) | | 4,200 | 2,848 |
| Sacramento County Arpt. Sys. Rev. Series 2016 B, 5% 7/1/41 | | 2,570 | 2,816 |
| Sacramento Muni. Util. District Elec. Rev. Series 2012 Y, 5% 8/15/26 | | 10,000 | 11,402 |
| San Bernardino County Ctfs. of Prtn. (Arrowhead Proj.) Series 2009 A, 5.25% 8/1/26 | | 2,800 | 3,023 |
| San Diego Convention Ctr. Expansion Series 2012 A, 5% 4/15/25 | | 10,425 | 11,905 |
| San Diego Unified School District: | | | |
| Series 2008 C: | | | |
| 0% 7/1/34 | | 3,600 | 1,829 |
| 0% 7/1/39 | | 9,650 | 3,857 |
| 0% 7/1/41 | | 21,370 | 7,834 |
| Series 2008 E: | | | |
| 0% 7/1/47 (a) | | 7,400 | 4,122 |
| 0% 7/1/49 | | 25,500 | 6,611 |
| San Francisco City & County Arpts. Commission Int'l. Arpt. Rev. Series 2014 A, 5% 5/1/44 (d) | | 12,800 | 13,731 |
| San Joaquin County Ctfs. of Prtn. (County Administration Bldg. Proj.) Series 2007, 5% 11/15/18 (Nat'l. Pub. Fin. Guarantee Corp. Insured) | | 3,495 | 3,605 |
| San Jose Fing. Auth. Lease Rev. (Civic Ctr. Proj.) Series 2013 A: | | | |
| 5% 6/1/27 | | 4,610 | 5,268 |
| 5% 6/1/30 | | 16,190 | 18,316 |
| 5% 6/1/31 | | 11,785 | 13,288 |
| San Marcos Unified School District: | | | |
| Series 2010 A, 5% 8/1/38 | | 5,150 | 5,798 |
| Series 2010 B, 0% 8/1/47 | | 18,400 | 4,337 |
| San Mateo County Cmnty. College District Series A, 0% 9/1/26 (Nat'l. Pub. Fin. Guarantee Corp. Insured) | | 5,430 | 4,069 |
| Santa Monica-Malibu Unified School District Series 1999, 0% 8/1/20 (Nat'l. Pub. Fin. Guarantee Corp. Insured) | | 2,815 | 2,617 |
| Union Elementary School District: | | | |
| Series A, 0% 9/1/19 (Nat'l. Pub. Fin. Guarantee Corp. Insured) | | 1,750 | 1,655 |
| Series B, 0% 9/1/22 (Nat'l. Pub. Fin. Guarantee Corp. Insured) | | 1,500 | 1,280 |
| Univ. of California Regents Med. Ctr. Pool Rev. Series 2013 J, 5% 5/15/48 | | 4,000 | 4,368 |
| Univ. of California Revs. Series O, 5.25% 5/15/39 (Pre-Refunded to 5/15/19 @ 100) | | 390 | 425 |
| Washington Township Health Care District Gen. Oblig. Series 2013 A, 5.5% 8/1/38 | | 4,500 | 5,270 |
| Washington Township Health Care District Rev.: | | | |
| Series 2007 A: | | | |
| 5% 7/1/18 | | 1,185 | 1,205 |
| 5% 7/1/27 | | 1,840 | 1,860 |
| Series 2009 A, 5.75% 7/1/24 | | 1,750 | 1,878 |
| Series 2010 A, 5.5% 7/1/38 | | 3,815 | 4,138 |
| West Contra Costa Unified School District Series 2012: | | | |
| 5% 8/1/24 | | 3,625 | 4,136 |
| 5% 8/1/25 | | 10,000 | 11,382 |
|
| TOTAL CALIFORNIA | | | 622,360 |
|
| Colorado - 0.8% | | | |
| Colorado Health Facilities Auth. (Parkview Med. Ctr., Inc. Proj.) Series 2016: | | | |
| 4% 9/1/35 | | 1,500 | 1,500 |
| 5% 9/1/46 | | 6,000 | 6,644 |
| Colorado Health Facilities Auth. Retirement Hsg. Rev. (Liberty Heights Proj.): | | | |
| Series B, 0% 7/15/20 (Escrowed to Maturity) | | 5,800 | 5,405 |
| 0% 7/15/22 (Escrowed to Maturity) | | 15,700 | 13,775 |
| Colorado Health Facilities Auth. Rev. (Parkview Episcopal Med. Ctr. Proj.) Series B: | | | |
| 5% 9/1/19 | | 1,115 | 1,141 |
| 5% 9/1/22 | | 1,500 | 1,536 |
| Denver City & County Arpt. Rev. Series 2007 E, 5% 11/15/32 (Pre-Refunded to 11/15/17 @ 100) | | 2,500 | 2,585 |
| E-470 Pub. Hwy. Auth. Rev.: | | | |
| Series 2000 B, 0% 9/1/20 (Nat'l. Pub. Fin. Guarantee Corp. Insured) | | 12,075 | 10,932 |
| Series 2010 C, 5.375% 9/1/26 | | 1,000 | 1,076 |
|
| TOTAL COLORADO | | | 44,594 |
|
| Connecticut - 0.3% | | | |
| Connecticut Health & Edl. Facilities Auth. Rev. Series 2016 K, 4% 7/1/46 | | 7,315 | 7,081 |
| New Haven Gen. Oblig. Series 2016 A: | | | |
| 5% 8/15/18 (FSA Insured) | | 2,840 | 2,989 |
| 5% 8/15/21 (FSA Insured) | | 1,400 | 1,536 |
| 5% 8/15/24 (FSA Insured) | | 2,805 | 3,136 |
|
| TOTAL CONNECTICUT | | | 14,742 |
|
| Delaware - 0.1% | | | |
| Delaware Trans. Auth. (U.S. 301 Proj.) Series 2015, 5% 6/1/55 | | 4,800 | 5,269 |
| District Of Columbia - 0.8% | | | |
| District of Columbia Rev. Series B, 4.75% 6/1/32 | | 2,200 | 2,368 |
| Metropolitan Washington Arpts. Auth. Dulles Toll Road Rev. Series 2009 B: | | | |
| 0% 10/1/33 (Assured Guaranty Corp. Insured) | | 15,000 | 7,554 |
| 0% 10/1/34 (Assured Guaranty Corp. Insured) | | 15,000 | 7,176 |
| 0% 10/1/35 (Assured Guaranty Corp. Insured) | | 33,975 | 15,393 |
| 0% 10/1/39 (Assured Guaranty Corp. Insured) | | 5,030 | 1,874 |
| Metropolitan Washington DC Arpts. Auth. Sys. Rev. Series 2014 A: | | | |
| 5% 10/1/23 (d) | | 2,715 | 3,115 |
| 5% 10/1/24 (d) | | 7,000 | 8,101 |
|
| TOTAL DISTRICT OF COLUMBIA | | | 45,581 |
|
| Florida - 13.5% | | | |
| Boynton Beach Util. Sys. Rev. Series 2002, 5.5% 11/1/19 (Nat'l. Pub. Fin. Guarantee Corp. Insured) | | 3,300 | 3,647 |
| Brevard County School Board Ctfs. of Prtn. Series 2015 C: | | | |
| 5% 7/1/25 | | 2,000 | 2,345 |
| 5% 7/1/26 | | 1,000 | 1,168 |
| 5% 7/1/28 | | 1,745 | 2,019 |
| Broward County Arpt. Sys. Rev.: | | | |
| Series 2012 Q1, 5% 10/1/25 | | 5,215 | 5,860 |
| Series A: | | | |
| 5% 10/1/28 (d) | | 2,500 | 2,812 |
| 5% 10/1/30 (d) | | 3,500 | 3,887 |
| 5% 10/1/31 (d) | | 2,000 | 2,208 |
| 5% 10/1/32 (d) | | 2,400 | 2,640 |
| Broward County School Board Ctfs. of Prtn.: | | | |
| Series 2012 A: | | | |
| 5% 7/1/23 | | 21,020 | 23,908 |
| 5% 7/1/27 | | 5,695 | 6,424 |
| Series 2015 A: | | | |
| 5% 7/1/24 | | 1,915 | 2,227 |
| 5% 7/1/26 | | 7,200 | 8,348 |
| Series 2015 B: | | | |
| 5% 7/1/24 | | 1,940 | 2,256 |
| 5% 7/1/25 | | 2,355 | 2,752 |
| Citizens Property Ins. Corp.: | | | |
| Series 2011 A1: | | | |
| 5% 6/1/19 | | 1,715 | 1,847 |
| 5% 6/1/20 | | 3,000 | 3,295 |
| Series 2012 A1, 5% 6/1/21 | | 8,400 | 9,386 |
| Collier County Indl. Dev. Auth. Healthcare Facilities Rev. (NCH Healthcare Sys. Proj.) Series 2011, 6.25% 10/1/39 | | 24,450 | 27,819 |
| Duval County School Board Ctfs. of Prtn. Series 2015 B, 5% 7/1/32 | | 12,225 | 13,840 |
| Florida Board of Ed. Pub. Ed. Cap. Outlay: | | | |
| Series 2006 C, 5% 6/1/29 (Pre-Refunded to 6/1/17 @ 101) | | 4,500 | 4,616 |
| Series 2011 E, 5% 6/1/24 | | 6,600 | 7,443 |
| Series 2011 F, 5% 6/1/23 | | 6,070 | 6,848 |
| Series A, 5.5% 6/1/38 | | 2,000 | 2,130 |
| Florida Dept. of Children and Family Svcs. Ctfs. of Prtn. (South Florida Evaluation Treatment Ctr. Proj.) 5% 10/1/17 | | 2,130 | 2,136 |
| Florida Dept. of Trans. Rev. Series 2005 A: | | | |
| 5% 7/1/17 | | 3,360 | 3,370 |
| 5% 7/1/18 | | 3,320 | 3,329 |
| Florida Dev. Fin. Corp. Healthcare Facility Rev. 6% 2/1/33 | | 5,700 | 6,325 |
| Florida Gen. Oblig.: | | | |
| Series 2008 A, 5.25% 7/1/37 (Pre-Refunded to 7/1/17 @ 101) | | 3,000 | 3,093 |
| Series 2011 B, 5% 7/1/23 | | 10,175 | 11,578 |
| Florida Mid-Bay Bridge Auth. Rev.: | | | |
| Series 2015 A, 5% 10/1/35 | | 5,400 | 5,705 |
| Series 2015 C: | | | |
| 5% 10/1/30 | | 3,270 | 3,537 |
| 5% 10/1/40 | | 1,000 | 1,066 |
| Florida Muni. Pwr. Agcy. Rev.: | | | |
| (Requirements Pwr. Supply Proj.) Series 2016 A: | | | |
| 5% 10/1/30 | | 1,835 | 2,151 |
| 5% 10/1/31 | | 2,005 | 2,334 |
| (St. Lucie Proj.) Series 2012 A, 5% 10/1/26 | | 3,100 | 3,512 |
| Series 2009 A, 6.25% 10/1/31 (Pre-Refunded to 10/1/19 @ 100) | | 3,000 | 3,380 |
| Series 2015 B: | | | |
| 5% 10/1/28 | | 1,000 | 1,173 |
| 5% 10/1/30 | | 1,800 | 2,082 |
| Florida Wtr. Poll. Cont. Fing. Corp. Rev. Series 2003, 5.25% 1/15/20 | | 1,950 | 1,957 |
| Greater Orlando Aviation Auth. Arpt. Facilities Rev. Series 2016: | | | |
| 5% 10/1/24 (d) | | 3,000 | 3,452 |
| 5% 10/1/25 (d) | | 3,225 | 3,699 |
| 5% 10/1/26 (d) | | 1,700 | 1,948 |
| 5% 10/1/27 (d) | | 1,000 | 1,169 |
| Halifax Hosp. Med. Ctr. Rev.: | | | |
| 4% 6/1/27 | | 1,200 | 1,254 |
| 5% 6/1/25 | | 1,285 | 1,487 |
| 5% 6/1/26 | | 1,375 | 1,581 |
| 5% 6/1/46 | | 2,510 | 2,729 |
| Highlands County Health Facilities Auth. Rev. (Adventist Health Sys./Sunbelt, Inc. Prog.) Series 2008 B, 6% 11/15/37 | | 11,000 | 12,169 |
| Hillsborough County Indl. Dev. (H Lee Moffitt Cancer Ctr. Proj.) Series A: | | | |
| 5% 7/1/17 (Escrowed to Maturity) | | 1,930 | 1,968 |
| 5% 7/1/18 (Pre-Refunded to 7/1/17 @ 100) | | 2,125 | 2,167 |
| Hillsborough County Indl. Dev. Auth. Indl. Dev. Rev. (Health Facilities/Univ. Cmnty. Hosp. Proj.) Series 2008 B, 8% 8/15/32 (Pre-Refunded to 8/15/19 @ 101) | | 4,900 | 5,748 |
| Jacksonville Sales Tax Rev. Series 2012, 5% 10/1/24 | | 5,500 | 6,310 |
| Lake County School Board Ctfs. of Prtn. Series 2014 A: | | | |
| 5% 6/1/27 (FSA Insured) | | 1,000 | 1,136 |
| 5% 6/1/28 (FSA Insured) | | 1,000 | 1,131 |
| 5% 6/1/30 (FSA Insured) | | 1,650 | 1,843 |
| Lee County Arpt. Rev. Series 2011 A, 5.375% 10/1/32 (d) | | 5,260 | 5,818 |
| Miami Beach Wtr. & Swr. Rev. 5.5% 9/1/27 (AMBAC Insured) | | 6,000 | 6,019 |
| Miami-Dade County Aviation Rev.: | | | |
| Series 2010 A, 5.375% 10/1/41 | | 5,800 | 6,405 |
| Series 2010: | | | |
| 5.5% 10/1/30 | | 2,275 | 2,563 |
| 5.5% 10/1/30 (Pre-Refunded to 10/1/20 @ 100) | | 725 | 826 |
| Series 2012 A: | | | |
| 5% 10/1/23 (d) | | 7,500 | 8,415 |
| 5% 10/1/24 (d) | | 9,050 | 10,144 |
| 5% 10/1/30 (d) | | 7,015 | 7,683 |
| 5% 10/1/31 (d) | | 2,500 | 2,730 |
| Series 2014 A: | | | |
| 5% 10/1/28 (d) | | 4,000 | 4,432 |
| 5% 10/1/33 (d) | | 8,385 | 8,990 |
| 5% 10/1/36 (d) | | 12,755 | 13,544 |
| 5% 10/1/37 | | 11,100 | 12,164 |
| Series 2015 A: | | | |
| 5% 10/1/29 (d) | | 1,585 | 1,763 |
| 5% 10/1/31 (d) | | 1,330 | 1,466 |
| 5% 10/1/35 (d) | | 3,400 | 3,617 |
| Series 2016 A: | | | |
| 5% 10/1/29 | | 1,450 | 1,684 |
| 5% 10/1/31 | | 1,750 | 2,013 |
| Miami-Dade County Cap. Asset Acquisition Series 2012 A, 5% 10/1/26 | | 3,750 | 4,242 |
| Miami-Dade County Expressway Auth.: | | | |
| Series 2014 A, 5% 7/1/44 | | 3,000 | 3,267 |
| Series 2014 B: | | | |
| 5% 7/1/26 | | 2,500 | 2,882 |
| 5% 7/1/27 | | 1,750 | 2,007 |
| Miami-Dade County School Board Ctfs. of Prtn.: | | | |
| Series 2008 A: | | | |
| 5% 8/1/18 (AMBAC Insured) | | 4,000 | 4,224 |
| 5% 8/1/20 (AMBAC Insured) | | 2,500 | 2,627 |
| 5% 8/1/21 (AMBAC Insured) | | 5,095 | 5,353 |
| 5% 8/1/22 (AMBAC Insured) | | 3,325 | 3,492 |
| Series 2011 B, 5.625% 5/1/31 | | 6,600 | 7,440 |
| Series 2015 A: | | | |
| 5% 5/1/26 | | 5,500 | 6,375 |
| 5% 5/1/28 | | 17,710 | 20,301 |
| Series 2015 B: | | | |
| 5% 5/1/26 | | 8,500 | 9,852 |
| 5% 5/1/27 | | 17,480 | 20,134 |
| 5% 5/1/28 | | 14,465 | 16,581 |
| Series 2016 A: | | | |
| 5% 5/1/30 | | 3,900 | 4,475 |
| 5% 5/1/32 | | 16,860 | 19,172 |
| Series 2016 B, 5% 8/1/26 | | 9,230 | 10,756 |
| Miami-Dade County Transit Sales Surtax Rev. Series 2012: | | | |
| 5% 7/1/24 | | 2,255 | 2,571 |
| 5% 7/1/42 | | 1,900 | 2,082 |
| Orange County Edl. Facilities Auth. Ed. Rev. (Rollins College Proj.): | | | |
| 5.25% 12/1/32 (Pre-Refunded to 12/1/17 @ 100) | | 1,350 | 1,401 |
| 5.25% 12/1/37 (Pre-Refunded to 12/1/17 @ 100) | | 1,365 | 1,417 |
| Orange County Health Facilities Auth.: | | | |
| (Orlando Health, Inc.) Series 2009, 5.125% 10/1/26 | | 5,030 | 5,447 |
| Series 2012 A, 5% 10/1/42 | | 14,700 | 15,878 |
| Series 2012 B, 5% 10/1/42 | | 5,900 | 6,373 |
| Orange County Health Facilities Auth. Rev. (Orlando Reg'l. Health Care Sys. Proj.) Series 1996 A, 6.25% 10/1/18 (Nat'l. Pub. Fin. Guarantee Corp. Insured) | | 4,500 | 4,769 |
| Orange County School Board Ctfs. of Prtn. Series 2015 C, 5% 8/1/30 | | 8,500 | 9,721 |
| Orlando & Orange County Expressway Auth. Rev. Series 2012, 5% 7/1/22 | | 2,500 | 2,856 |
| Orlando Utils. Commission Util. Sys. Rev.: | | | |
| Series 2009 B: | | | |
| 5% 10/1/33 | | 2,115 | 2,253 |
| 5% 10/1/33 (Pre-Refunded to 4/1/19 @ 100) | | 1,585 | 1,710 |
| Series 2012 A: | | | |
| 5% 10/1/23 | | 2,300 | 2,704 |
| 5% 10/1/25 | | 1,100 | 1,323 |
| Palm Beach County Arpt. Sys. Rev. Series 2016: | | | |
| 5% 10/1/21 (d) | | 1,200 | 1,348 |
| 5% 10/1/23 (d) | | 1,325 | 1,519 |
| 5% 10/1/24 (d) | | 1,375 | 1,586 |
| 5% 10/1/25 (d) | | 2,915 | 3,375 |
| 5% 10/1/26 (d) | | 2,060 | 2,392 |
| 5% 10/1/27 (d) | | 1,000 | 1,152 |
| 5% 10/1/29 (d) | | 1,040 | 1,183 |
| 5% 10/1/30 (d) | | 1,850 | 2,090 |
| 5% 10/1/31 (d) | | 1,300 | 1,461 |
| 5% 10/1/32 (d) | | 2,000 | 2,237 |
| 5% 10/1/33 (d) | | 4,295 | 4,778 |
| Palm Beach County Health Facilities Auth. Hosp. Rev. Series 2014: | | | |
| 5% 12/1/22 | | 670 | 737 |
| 5% 12/1/23 | | 1,000 | 1,111 |
| 5% 12/1/24 | | 750 | 841 |
| 5% 12/1/25 | | 500 | 549 |
| Palm Beach County School Board Ctfs. of Prtn.: | | | |
| Series 2014 B: | | | |
| 4% 8/1/20 | | 5,000 | 5,381 |
| 5% 8/1/20 | | 6,010 | 6,675 |
| 5% 8/1/24 | | 3,500 | 4,119 |
| Series 2015 D: | | | |
| 5% 8/1/28 | | 4,035 | 4,664 |
| 5% 8/1/29 | | 13,665 | 15,706 |
| 5% 8/1/30 | | 14,105 | 16,074 |
| 5% 8/1/31 | | 14,165 | 16,018 |
| Palm Beach County Solid Waste Auth. Rev. Series 2011, 5% 10/1/24 | | 11,100 | 12,550 |
| South Florida Wtr. Mgmt. District Ctfs. of Prtn. Series 2015: | | | |
| 5% 10/1/26 | | 9,250 | 10,773 |
| 5% 10/1/29 | | 4,000 | 4,579 |
| 5% 10/1/32 | | 6,270 | 7,043 |
| South Lake County Hosp. District (South Lake Hosp., Inc.): | | | |
| Series 2009 A, 6.25% 4/1/39 | | 3,300 | 3,554 |
| Series 2010: | | | |
| 5% 10/1/25 | | 4,140 | 4,494 |
| 5.25% 10/1/34 | | 3,500 | 3,758 |
| St. Petersburg Pub. Util. Rev. Series 2009 A, 5.5% 10/1/37 (Pre-Refunded to 10/1/19 @ 100) | | 7,000 | 7,746 |
| Tallahassee Health Facilities Rev.: | | | |
| (Tallahassee Memorial Healthcare, Inc. Proj.) Series 2016 A, 5% 12/1/55 | | 6,000 | 6,205 |
| Series 2015 A: | | | |
| 4% 12/1/35 | | 3,300 | 3,132 |
| 5% 12/1/40 | | 1,900 | 1,982 |
| Tampa Health Sys. Rev. (Baycare Health Sys. Proj.) Series 2010, 5% 11/15/23 | | 8,080 | 8,872 |
| Tampa Tax Allocation (H. Lee Moffitt Cancer Ctr. Proj.) Series 2012 A, 5% 9/1/22 | | 2,300 | 2,594 |
| Volusia County School Board Ctfs. of Prtn.: | | | |
| (Florida Master Lease Prog.) Series 2016 A, 5% 8/1/32 (Build America Mutual Assurance Insured) | | 5,000 | 5,649 |
| (Master Lease Prog.) Series 2014 B, 5% 8/1/25 | | 1,775 | 2,059 |
| Walton County School Board Ctfs. of Prtn. 5.25% 7/1/18 (FSA Insured) | | 1,865 | 1,967 |
|
| TOTAL FLORIDA | | | 742,158 |
|
| Georgia - 2.6% | | | |
| Atlanta Wtr. & Wastewtr. Rev.: | | | |
| 5% 11/1/27 | | 1,000 | 1,181 |
| 5% 11/1/30 | | 2,500 | 2,912 |
| Burke County Indl. Dev. Auth. Poll. Cont. Rev. Bonds: | | | |
| (Oglethorpe Pwr. Corp. Vogtle Proj.) Series 2013 A, 2.4%, tender 4/1/20 (b) | | 8,100 | 8,125 |
| 2.2%, tender 4/2/19 (b) | | 3,000 | 3,012 |
| 2.2%, tender 4/2/19 (b) | | 300 | 301 |
| 2.2%, tender 4/2/19 (b) | | 6,500 | 6,527 |
| 2.2%, tender 4/2/19 (b) | | 4,100 | 4,117 |
| Colquitt County Dev. Auth. Rev. Series C, 0% 12/1/21 (Escrowed to Maturity) | | 10,200 | 9,251 |
| DeKalb County Hosp. Auth. Rev. (DeKalb Med. Ctr., Inc. Proj.) Series 2010: | | | |
| 6% 9/1/30 | | 7,745 | 8,563 |
| 6.125% 9/1/40 | | 9,310 | 10,148 |
| DeKalb County Wtr. & Swr. Rev. Series 2011 A: | | | |
| 5.25% 10/1/36 | | 3,000 | 3,411 |
| 5.25% 10/1/41 | | 5,600 | 6,327 |
| Fulton County Wtr. & Swr. Rev. Series 2011: | | | |
| 5% 1/1/23 | | 1,500 | 1,674 |
| 5% 1/1/24 | | 6,500 | 7,249 |
| Georgia Gen. Oblig. Series 2007 E, 5% 8/1/22 (Pre-Refunded to 8/1/17 @ 100) | | 575 | 588 |
| Georgia Muni. Elec. Auth. Pwr. Rev.: | | | |
| Series C, 5% 1/1/22 | | 7,700 | 8,733 |
| Series GG, 5% 1/1/22 | | 4,000 | 4,561 |
| Georgia Muni. Gas Auth. Rev. (Gas Portfolio III Proj.) Series S: | | | |
| 5% 10/1/22 | | 3,425 | 3,939 |
| 5% 10/1/23 | | 4,000 | 4,587 |
| Main Street Natural Gas, Inc. Georgia Gas Proj. Rev. Series A, 5.25% 9/15/19 | | 1,915 | 2,063 |
| Metropolitan Atlanta Rapid Transit Auth. Sales Tax Rev. Third Series 2009 A, 5.25% 7/1/36 | | 8,500 | 9,219 |
| Private Colleges & Univs. Auth. Rev.: | | | |
| (The Savannah College of Art and Design Projs.) Series 2014, 5% 4/1/30 | | 1,200 | 1,307 |
| (The Savannah College of Arts and Design Projs.) Series 2014, 5% 4/1/25 | | 3,500 | 3,843 |
| Richmond County Hosp. Auth. (Univ. Health Svcs., Inc. Proj.) Series 2009, 5.5% 1/1/36 (Pre-Refunded to 1/1/19 @ 100) | | 13,550 | 14,655 |
| Savannah Econ. Dev. Auth. Rev. (Southern Care Corp. Proj.) Series C, 0% 12/1/21 (Escrowed to Maturity) | | 18,045 | 16,248 |
| Valdosta & Lowndes County Hosp. (South Georgia Med. Ctr. Proj.) 5% 10/1/20 | | 1,570 | 1,612 |
|
| TOTAL GEORGIA | | | 144,153 |
|
| Hawaii - 0.5% | | | |
| Hawaii Arpts. Sys. Rev. Series 2015 A: | | | |
| 5% 7/1/41 (d) | | 7,500 | 8,097 |
| 5% 7/1/45 (d) | | 14,505 | 15,616 |
| State of Hawaii Dept. of Trans. Series 2013: | | | |
| 5.25% 8/1/24 (d) | | 2,000 | 2,292 |
| 5.25% 8/1/25 (d) | | 2,500 | 2,854 |
|
| TOTAL HAWAII | | | 28,859 |
|
| Idaho - 0.3% | | | |
| Idaho Health Facilities Auth. Rev.: | | | |
| (St. Luke's Health Sys. Proj.) Series 2008 A: | | | |
| 6.5% 11/1/28 | | 4,355 | 4,726 |
| 6.75% 11/1/37 | | 4,300 | 4,666 |
| (Trinity Health Group Proj.) 2008 B, 6.25% 12/1/33 (Pre-Refunded to 12/1/18 @ 100) | | 2,190 | 2,392 |
| Series 2015 ID, 5% 12/1/25 | | 2,750 | 3,235 |
|
| TOTAL IDAHO | | | 15,019 |
|
| Illinois - 17.8% | | | |
| Boone & Winnebago County Cmnty. Unit School District 200: | | | |
| 0% 1/1/21 (Nat'l. Pub. Fin. Guarantee Corp. Insured) | | 1,810 | 1,633 |
| 0% 1/1/22 (Nat'l. Pub. Fin. Guarantee Corp. Insured) | | 1,950 | 1,700 |
| Chicago Board of Ed.: | | | |
| Series 2008 C: | | | |
| 5.25% 12/1/23 | | 2,050 | 1,737 |
| 5.25% 12/1/24 | | 1,385 | 1,152 |
| Series 2010 F, 5% 12/1/20 | | 1,100 | 978 |
| Series 2011 A: | | | |
| 5% 12/1/41 | | 3,595 | 2,900 |
| 5.25% 12/1/41 | | 2,975 | 2,368 |
| 5.5% 12/1/39 | | 7,900 | 6,255 |
| Series 2012 A, 5% 12/1/42 | | 7,800 | 6,045 |
| Series 2015 C, 5.25% 12/1/39 | | 1,400 | 1,122 |
| Series 2016 B, 6.5% 12/1/46 | | 650 | 594 |
| Chicago Gen. Oblig.: | | | |
| Series 2004 A, 5.25% 1/1/29 (FSA Insured) | | 435 | 436 |
| Series 2009 A, 5% 1/1/22 | | 1,720 | 1,726 |
| Series A, 5% 1/1/42 (AMBAC Insured) | | 40 | 38 |
| Chicago Midway Arpt. Rev.: | | | |
| Series 2014 A: | | | |
| 5% 1/1/27 (d) | | 10,330 | 11,377 |
| 5% 1/1/28 (d) | | 14,950 | 16,320 |
| 5% 1/1/33 (d) | | 5,375 | 5,710 |
| 5% 1/1/34 (d) | | 2,600 | 2,752 |
| Series 2016 B, 5% 1/1/46 | | 6,225 | 6,819 |
| Chicago O'Hare Int'l. Arpt. Rev.: | | | |
| Series 2011 C, 6.5% 1/1/41 (Pre-Refunded to 1/1/21 @ 100) | | 19,600 | 23,180 |
| Series 2012 A, 5% 1/1/22 (d) | | 5,575 | 6,137 |
| Series 2013 B, 5% 1/1/27 | | 11,275 | 12,457 |
| Series 2013 D, 5% 1/1/27 | | 1,000 | 1,105 |
| Series 2015 A: | | | |
| 5% 1/1/25 (d) | | 4,430 | 4,995 |
| 5% 1/1/31 (d) | | 5,000 | 5,450 |
| 5% 1/1/32 (d) | | 10,100 | 10,965 |
| Series 2016 G: | | | |
| 5% 1/1/37 (d)(e) | | 2,000 | 2,160 |
| 5% 1/1/42 (d)(e) | | 1,300 | 1,393 |
| 5.25% 1/1/29 (d)(e) | | 350 | 399 |
| 5.25% 1/1/30 (d)(e) | | 325 | 369 |
| 5.25% 1/1/31 (d)(e) | | 400 | 452 |
| Chicago Transit Auth. Series 2014, 5.25% 12/1/49 | | 13,000 | 14,000 |
| Chicago Transit Auth. Cap. Grant Receipts Rev. (Fed. Transit Administration Section 5307 Proj.) Series 2008 A: | | | |
| 5.25% 6/1/23 (Assured Guaranty Corp. Insured) | | 2,425 | 2,517 |
| 5.25% 6/1/25 (Assured Guaranty Corp. Insured) | | 3,495 | 3,621 |
| Cook County Forest Preservation District: | | | |
| (Ltd. Tax Proj.) Series 2012 B, 5% 12/15/37 | | 2,500 | 2,627 |
| Series 2012 A, 5% 11/15/22 | | 2,000 | 2,212 |
| Series 2012 C, 5% 12/15/37 | | 1,000 | 1,051 |
| Cook County Gen. Oblig.: | | | |
| Series 2010 A, 5.25% 11/15/33 | | 19,775 | 20,897 |
| Series 2010 G, 5% 11/15/25 | | 3,400 | 3,620 |
| Series 2012 C, 5% 11/15/24 | | 9,400 | 10,224 |
| Series 2016 A: | | | |
| 5% 11/15/26 | | 5,000 | 5,577 |
| 5% 11/15/27 | | 1,240 | 1,374 |
| 5% 11/15/28 | | 1,750 | 1,930 |
| 5% 11/15/29 | | 4,540 | 4,977 |
| 5% 11/15/30 | | 4,000 | 4,364 |
| DuPage County Forest Preserve District Rev. Series 2000, 0% 11/1/17 | | 6,665 | 6,610 |
| Illinois Dedicated Tax Rev. Series B, 0% 12/15/18 (AMBAC Insured) | | 4,500 | 4,163 |
| Illinois Dev. Fin. Auth. Retirement Hsg. Regency Park Rev. 0% 7/15/23 (Escrowed to Maturity) | | 29,680 | 25,351 |
| Illinois Fin. Auth. Rev.: | | | |
| (Advocate Health Care Proj.) Series 2008 D, 6.5% 11/1/38 (Pre-Refunded to 11/1/18 @ 100) | | 4,300 | 4,704 |
| (Central DuPage Health Proj.) Series 2009 B, 5.375% 11/1/39 | | 6,500 | 7,030 |
| (Children's Memorial Hosp. Proj.) Series 2008 A: | | | |
| 5.25% 8/15/33 (Assured Guaranty Corp. Insured) | | 7,800 | 8,229 |
| 5.25% 8/15/47 (Assured Guaranty Corp. Insured) | | 2,000 | 2,069 |
| (Depaul Univ. Proj.) Series 2016 A: | | | |
| 4% 10/1/34 | | 1,000 | 1,014 |
| 5% 10/1/29 | | 1,000 | 1,158 |
| (Edward Hosp. Obligated Group Proj.) Series 2008 A: | | | |
| 5.5% 2/1/40 (AMBAC Insured) | | 3,165 | 3,276 |
| 6% 2/1/28 (AMBAC Insured) | | 2,855 | 2,985 |
| (Palos Cmnty. Hosp. Proj.) Series 2010 C: | | | |
| 5.375% 5/15/25 | | 25,230 | 27,871 |
| 5.375% 5/15/30 | | 6,160 | 6,763 |
| (Provena Health Proj.) Series 2010 A, 6% 5/1/28 (Pre-Refunded to 5/1/20 @ 100) | | 13,500 | 15,353 |
| (Rush Univ. Med. Ctr. Proj.) Series 2009 D, 6.625% 11/1/39 (Pre-Refunded to 5/1/19 @ 100) | | 3,915 | 4,374 |
| (Silver Cross Hosp. and Med. Ctr. Proj.) Series 2008 A, 5.5% 8/15/30 | | 1,645 | 1,711 |
| (Southern Illinois Healthcare Enterprises, Inc. Proj.) Series 2005, 5.25% 3/1/30 | | 5,900 | 6,423 |
| Series 2008 A: | | | |
| 5.625% 1/1/37 | | 27,960 | 28,794 |
| 6% 2/1/24 | | 300 | 314 |
| 6.25% 2/1/33 (AMBAC Insured) | | 300 | 314 |
| Series 2009: | | | |
| 5% 8/15/23 | | 3,685 | 4,045 |
| 5% 8/15/23 (Pre-Refunded to 8/15/20 @ 100) | | 1,865 | 2,081 |
| 6.875% 8/15/38 (Pre-Refunded to 8/15/19 @ 100) | | 430 | 487 |
| Series 2010 A: | | | |
| 5.5% 8/15/24 (Pre-Refunded to 2/15/20 @ 100) | | 2,900 | 3,233 |
| 5.5% 4/1/44 | | 1,590 | 1,705 |
| 5.5% 4/1/44 (Pre-Refunded to 4/1/19 @ 100) | | 1,410 | 1,535 |
| 5.75% 8/15/29 (Pre-Refunded to 2/15/20 @ 100) | | 2,320 | 2,604 |
| Series 2010, 5.25% 5/1/25 | | 7,000 | 7,617 |
| Series 2012 A, 5% 5/15/22 | | 2,120 | 2,397 |
| Series 2012: | | | |
| 4% 9/1/32 | | 7,460 | 7,323 |
| 5% 9/1/38 | | 23,950 | 24,661 |
| 5% 11/15/43 | | 4,395 | 4,677 |
| Series 2013: | | | |
| 5% 11/15/28 | | 2,875 | 3,187 |
| 5% 11/15/29 | | 1,400 | 1,545 |
| 5% 5/15/43 | | 10,000 | 10,527 |
| Series 2015 A: | | | |
| 5% 11/15/23 | | 500 | 583 |
| 5% 11/15/45 | | 2,410 | 2,577 |
| Series 2015 B, 5% 11/15/27 | | 3,160 | 3,567 |
| Series 2015 C: | | | |
| 5% 8/15/35 | | 6,425 | 6,836 |
| 5% 8/15/44 | | 30,850 | 32,074 |
| Series 2016 A: | | | |
| 5% 8/15/25 | | 2,380 | 2,616 |
| 5% 8/15/26 | | 3,180 | 3,487 |
| 5% 7/1/28 | | 1,230 | 1,412 |
| 5% 2/15/29 | | 5,140 | 5,767 |
| 5% 2/15/30 | | 5,425 | 6,037 |
| 5% 7/1/30 | | 710 | 805 |
| 5% 2/15/31 | | 4,375 | 4,843 |
| 5% 7/1/31 | | 535 | 603 |
| 5% 2/15/32 | | 4,250 | 4,677 |
| 5% 7/1/34 | | 3,000 | 3,340 |
| 5% 8/15/34 | | 645 | 675 |
| 5.25% 8/15/27 | | 2,255 | 2,507 |
| 5.25% 8/15/28 | | 2,895 | 3,206 |
| 5.25% 8/15/30 | | 2,225 | 2,436 |
| Series 2016 B: | | | |
| 5% 8/15/31 | | 7,365 | 8,299 |
| 5% 8/15/32 | | 1,040 | 1,165 |
| 5% 8/15/34 | | 7,515 | 8,339 |
| 5% 8/15/36 | | 10,485 | 11,551 |
| Series 2016 C: | | | |
| 4% 2/15/36 | | 2,200 | 1,916 |
| 5% 2/15/31 | | 11,500 | 12,019 |
| 5% 2/15/32 | | 1,500 | 1,560 |
| 5% 2/15/34 | | 3,525 | 3,632 |
| 5% 2/15/41 | | 8,865 | 8,942 |
| Series 2016: | | | |
| 5% 5/15/29 | | 1,255 | 1,395 |
| 5% 5/15/30 | | 2,300 | 2,538 |
| Illinois Gen. Oblig.: | | | |
| Series 2006: | | | |
| 5% 1/1/19 | | 4,200 | 4,333 |
| 5.5% 1/1/31 | | 3,000 | 3,077 |
| Series 2010: | | | |
| 5% 1/1/21 (FSA Insured) | | 2,600 | 2,754 |
| 5% 1/1/23 (FSA Insured) | | 6,600 | 6,948 |
| Series 2012 A, 5% 1/1/33 | | 4,700 | 4,584 |
| Series 2012: | | | |
| 5% 8/1/19 | | 2,500 | 2,589 |
| 5% 8/1/21 | | 2,000 | 2,077 |
| 5% 3/1/23 | | 4,000 | 4,124 |
| 5% 8/1/23 | | 3,900 | 3,999 |
| 5% 3/1/35 | | 2,000 | 1,930 |
| 5% 3/1/37 | | 1,000 | 961 |
| Series 2013 A, 5% 4/1/35 | | 1,800 | 1,737 |
| Series 2013, 5.5% 7/1/25 | | 3,310 | 3,493 |
| Series 2014: | | | |
| 5% 2/1/23 | | 4,425 | 4,558 |
| 5% 2/1/25 | | 3,440 | 3,516 |
| 5% 4/1/28 | | 2,090 | 2,101 |
| 5% 5/1/28 | | 2,150 | 2,160 |
| 5% 5/1/32 | | 8,800 | 8,615 |
| 5.25% 2/1/30 | | 9,900 | 9,999 |
| Series 2016: | | | |
| 5% 6/1/25 | | 7,295 | 7,425 |
| 5% 6/1/26 | | 990 | 1,000 |
| 5% 2/1/27 | | 7,035 | 7,068 |
| 5% 2/1/28 | | 5,660 | 5,704 |
| 5% 2/1/29 | | 5,320 | 5,328 |
| 5% 2/1/26 | | 2,325 | 2,359 |
| Illinois Health Facilities Auth. Rev.: | | | |
| (Delnor-Cmnty. Hosp. Proj.) Series 2002 D, 5.25% 5/15/32 (FSA Insured) | | 3,000 | 3,130 |
| (Lutheran Gen. Health Care Sys. Proj.) Series C, 6% 4/1/18 | | 2,015 | 2,077 |
| Illinois Muni. Elec. Agcy. Pwr. Supply Series 2015 A: | | | |
| 5% 2/1/25 | | 8,110 | 9,397 |
| 5% 2/1/26 | | 4,370 | 5,051 |
| Illinois Reg'l. Trans. Auth. Series A, 8% 6/1/17 (AMBAC Insured) | | 2,335 | 2,399 |
| Illinois Toll Hwy. Auth. Toll Hwy. Rev.: | | | |
| Series 2015 A, 5% 1/1/40 | | 13,300 | 14,560 |
| Series 2015 B, 5% 1/1/40 | | 7,400 | 8,124 |
| Series 2016 A: | | | |
| 5% 12/1/31 | | 5,000 | 5,644 |
| 5% 12/1/32 | | 7,900 | 8,891 |
| Kane, McHenry, Cook & DeKalb Counties Unit School District #300: | | | |
| Series 2014, 6.5% 1/1/20 (Escrowed to Maturity) | | 465 | 531 |
| 0% 12/1/17 (AMBAC Insured) | | 3,350 | 3,290 |
| 0% 12/1/17 (Escrowed to Maturity) | | 350 | 346 |
| 0% 12/1/21 (AMBAC Insured) | | 3,095 | 2,672 |
| 0% 12/1/21 (Escrowed to Maturity) | | 1,905 | 1,719 |
| 6.5% 1/1/20 (AMBAC Insured) | | 2,755 | 3,110 |
| 6.5% 1/1/20 (Escrowed to Maturity) | | 4,645 | 5,304 |
| Kendall, Kane & Will Counties Cmnty. Unit School District #308 Series 2016: | | | |
| 5% 2/1/34 | | 7,000 | 7,770 |
| 5% 2/1/35 | | 5,000 | 5,525 |
| 5% 2/1/36 | | 5,200 | 5,734 |
| Lake County Cmnty. High School District #117, Antioch Series B, 0% 12/1/18 (Nat'l. Pub. Fin. Guarantee Corp. Insured) | | 7,240 | 6,934 |
| McHenry & Kane Counties Cmnty. Consolidated School District #158: | | | |
| Series 2004, 0% 1/1/24 (FSA Insured) | | 4,300 | 3,442 |
| 0% 1/1/19 | | 2,955 | 2,834 |
| 0% 1/1/19 (Escrowed to Maturity) | | 45 | 44 |
| Metropolitan Pier & Exposition: | | | |
| (McCormick Place Expansion Proj.): | | | |
| Series 1992 A, 0% 6/15/20 (Nat'l. Pub. Fin. Guarantee Corp. Insured) | | 3,610 | 3,202 |
| Series 1994 A, 0% 6/15/19 (Nat'l. Pub. Fin. Guarantee Corp. Insured) | | 2,935 | 2,709 |
| Series 1996 A, 0% 6/15/23 (Nat'l. Pub. Fin. Guarantee Corp. Insured) | | 5,300 | 4,114 |
| Series 2002 A: | | | |
| 0% 12/15/30 (Nat'l. Pub. Fin. Guarantee Corp. Insured) | | 32,600 | 17,267 |
| 0% 6/15/36 (Nat'l. Pub. Fin. Guarantee Corp. Insured) | | 4,445 | 1,737 |
| Series 2010 B1: | | | |
| 0% 6/15/43 (FSA Insured) | | 45,400 | 12,204 |
| 0% 6/15/44 (FSA Insured) | | 53,800 | 13,725 |
| 0% 6/15/45 (FSA Insured) | | 27,900 | 6,753 |
| 0% 6/15/47 (FSA Insured) | | 16,540 | 3,602 |
| Series 2012 B: | | | |
| 0% 12/15/51 | | 16,200 | 2,273 |
| 5% 6/15/52 | | 17,900 | 18,035 |
| Series A, 0% 6/15/19 (Nat'l. Pub. Fin. Guarantee Corp. Insured) | | 3,345 | 3,088 |
| Series 1996 A, 0% 6/15/24 | | 3,060 | 2,260 |
| Series A, 0% 12/15/19 (Nat'l. Pub. Fin. Guarantee Corp. Insured) | | 2,155 | 1,950 |
| 5.5% 6/15/20 | | 1,625 | 1,668 |
| 5.5% 6/15/20 (Pre-Refunded to 6/15/17 @ 100) | | 375 | 386 |
| Quincy Hosp. Rev. Series 2007, 5% 11/15/18 | | 1,000 | 1,030 |
| Univ. of Illinois Board of Trustees Ctfs. of Prtn. Series 2009 A: | | | |
| 5% 10/1/17 | | 555 | 571 |
| 5% 10/1/17 (Escrowed to Maturity) | | 745 | 767 |
| 5% 10/1/18 (Pre-Refunded to 10/1/17 @ 100) | | 615 | 633 |
| 5% 10/1/20 (Pre-Refunded to 10/1/17 @ 100) | | 740 | 761 |
| 5% 10/1/20 (Pre-Refunded to 10/1/17 @ 100) | | 550 | 566 |
| Univ. of Illinois Rev.: | | | |
| (Auxiliary Facilities Sys. Proj.): | | | |
| Series 1991: | | | |
| 0% 4/1/17 (Nat'l. Pub. Fin. Guarantee Corp. Insured) | | 16,270 | 16,204 |
| 0% 4/1/20 (Nat'l. Pub. Fin. Guarantee Corp. Insured) | | 8,000 | 7,313 |
| Series 1999 A, 0% 4/1/21 (Nat'l. Pub. Fin. Guarantee Corp. Insured) | | 4,965 | 4,374 |
| Series 2010 A: | | | |
| 5% 4/1/25 | | 5,125 | 5,541 |
| 5.25% 4/1/30 | | 3,200 | 3,474 |
| Series 2013: | | | |
| 6% 10/1/42 | | 4,600 | 5,211 |
| 6.25% 10/1/38 | | 4,530 | 5,236 |
| Will County Cmnty. Unit School District #365-U: | | | |
| 0% 11/1/17 (FSA Insured) | | 3,200 | 3,154 |
| 0% 11/1/19 (Escrowed to Maturity) | | 675 | 641 |
| 0% 11/1/19 (FSA Insured) | | 4,325 | 4,034 |
| Will County Illinois Series 2016: | | | |
| 5% 11/15/31 | | 1,620 | 1,858 |
| 5% 11/15/32 | | 1,235 | 1,410 |
| 5% 11/15/33 | | 1,500 | 1,706 |
| 5% 11/15/34 | | 1,500 | 1,698 |
|
| TOTAL ILLINOIS | | | 977,371 |
|
| Indiana - 2.5% | | | |
| Crown Point Multi-School Bldg. Corp. 0% 1/15/21 (Nat'l. Pub. Fin. Guarantee Corp. Insured) | | 7,480 | 6,744 |
| Indiana Fin. Auth. Health Sys. Rev. (Sisters of Saint Francis Health Svcs., Inc. Obligated Group Proj.): | | | |
| Series 2008 C, 5.375% 11/1/32 | | 7,815 | 8,284 |
| Series 2009 A, 5.25% 11/1/39 | | 5,300 | 5,711 |
| Indiana Fin. Auth. Rev.: | | | |
| (Trinity Health Cr. Group Proj.) Series 2009 A, 5.25% 12/1/38 | | 8,000 | 8,582 |
| Series 2012: | | | |
| 5% 3/1/30 | | 3,900 | 4,223 |
| 5% 3/1/41 | | 7,070 | 7,609 |
| Series 2015 A, 5.25% 2/1/32 | | 6,020 | 7,067 |
| Series 2016: | | | |
| 4% 9/1/21 | | 400 | 427 |
| 5% 9/1/22 | | 300 | 337 |
| 5% 9/1/24 | | 675 | 769 |
| 5% 9/1/26 | | 1,075 | 1,231 |
| 5% 9/1/28 | | 3,000 | 3,392 |
| 5% 9/1/29 | | 1,000 | 1,124 |
| 5% 9/1/30 | | 1,400 | 1,565 |
| Indiana Fin. Auth. Wastewtr. Util. Rev.: | | | |
| (CWA Auth. Proj.): | | | |
| Series 2012 A, 5% 10/1/26 | | 2,545 | 2,909 |
| Series 2015 A: | | | |
| 5% 10/1/30 | | 4,820 | 5,615 |
| 5% 10/1/45 | | 25,600 | 28,219 |
| Series 2011 A, 5.25% 10/1/25 | | 1,750 | 1,978 |
| Indiana Muni. Pwr. Agcy. Pwr. Supply Sys. Rev. Series 2011 A: | | | |
| 5% 1/1/22 | | 2,000 | 2,246 |
| 5% 1/1/23 | | 1,800 | 2,013 |
| Indiana Trans. Fin. Auth. Hwy. Rev. Series 1993 A, 0% 6/1/18 (AMBAC Insured) | | 1,700 | 1,668 |
| Indianapolis Local Pub. Impt. Series 2016: | | | |
| 4% 1/1/32 (d) | | 1,000 | 1,020 |
| 4% 1/1/33 (d) | | 1,000 | 1,014 |
| 4% 1/1/35 (d) | | 2,780 | 2,789 |
| 5% 1/1/21 (d) | | 3,945 | 4,377 |
| 5% 1/1/22 (d) | | 7,000 | 7,882 |
| 5% 1/1/23 (d) | | 2,625 | 2,996 |
| 5% 1/1/26 (d) | | 1,055 | 1,231 |
| Lake Central Multi-District School Bldg. Corp. Series 2012 B: | | | |
| 4% 7/15/18 | | 400 | 415 |
| 5% 1/15/30 | | 12,040 | 13,578 |
| Zionsville Cmnty. Schools Bldg. Series 2005, 5% 7/15/20 (FSA Insured) | | 1,945 | 2,138 |
|
| TOTAL INDIANA | | | 139,153 |
|
| Iowa - 0.1% | | | |
| Iowa Fin. Auth. Health Facilities Rev. Series 2008 A, 5.625% 8/15/37 (Pre-Refunded to 8/15/19 @ 100) | | 4,800 | 5,308 |
| Kansas - 0.6% | | | |
| Kansas Dev. Fin. Agcy. (Adventist Health Sys./Sunbelt Obligated Group Proj.) Series 2009 C, 5.75% 11/15/38 | | 10,600 | 11,653 |
| Leavenworth County Unified School District #453 Gen. Oblig. Series 2009 A, 5.25% 9/1/24 (Pre-Refunded to 9/1/19 @ 100) | | 1,575 | 1,720 |
| Overland Park Sales Tax Spl. Oblig. Rev. Series 2012, 4.375% 12/15/23 | | 4,700 | 4,231 |
| Wyandotte County/Kansas City Unified Govt. Util. Sys. Rev.: | | | |
| Series 2012 A: | | | |
| 5% 9/1/23 | | 1,860 | 2,105 |
| 5% 9/1/25 | | 4,000 | 4,508 |
| Series 2016 A: | | | |
| 5% 9/1/40 | | 3,115 | 3,454 |
| 5% 9/1/45 | | 5,000 | 5,520 |
|
| TOTAL KANSAS | | | 33,191 |
|
| Kentucky - 1.1% | | | |
| Ashland Med. Ctr. Rev.: | | | |
| (Ashland Hosp. Corp. d/b/a Kings Daughters Med. Ctr. Proj.) Series 2016 A, 5% 2/1/40 | | 1,390 | 1,433 |
| (Ashland Hosp. Corp. d/b/a/ King's Daughters Med. Ctr. Proj.) Series 2010 B, 5% 2/1/22 | | 1,355 | 1,432 |
| Kenton County Arpt. Board Arpt. Rev. Series 2016: | | | |
| 5% 1/1/21 | | 650 | 723 |
| 5% 1/1/22 | | 725 | 819 |
| 5% 1/1/23 | | 425 | 486 |
| 5% 1/1/28 | | 1,585 | 1,810 |
| 5% 1/1/31 | | 1,500 | 1,687 |
| 5% 1/1/32 | | 1,500 | 1,681 |
| Kentucky Econ. Dev. Fin. Auth. Hosp. Rev.: | | | |
| (Baptist Healthcare Sys. Proj.) Series A, 5% 8/15/17 | | 3,650 | 3,735 |
| Series 2010 A, 6% 6/1/30 | | 1,795 | 1,916 |
| Series 2015 A: | | | |
| 4.5% 6/1/46 | | 2,960 | 2,803 |
| 5.25% 6/1/50 | | 18,075 | 18,707 |
| Kentucky Econ. Dev. Fin. Auth. Rev. (Ashland Hosp. Corp. d/b/a King's Daughters Med. Ctr. Proj.) Series 2010 A, 5% 2/1/30 | | 5,000 | 5,203 |
| Louisville & Jefferson County Series 2013 A: | | | |
| 5.5% 10/1/33 | | 2,900 | 3,360 |
| 5.75% 10/1/38 | | 7,410 | 8,591 |
| Pikeville Hosp. Rev. (Pikeville Med. Ctr., Inc. Proj.) Series 2011, 6.5% 3/1/41 | | 3,000 | 3,375 |
|
| TOTAL KENTUCKY | | | 57,761 |
|
| Louisiana - 0.7% | | | |
| Louisiana Citizens Property Ins. Corp. Assessment Rev. Series 2015: | | | |
| 5% 6/1/20 | | 3,000 | 3,295 |
| 5% 6/1/22 (FSA Insured) | | 4,000 | 4,557 |
| Louisiana Gen. Oblig. Series 2016 B, 5% 8/1/28 | | 1,060 | 1,233 |
| Louisiana Pub. Facilities Auth. Hosp. Rev. (Franciscan Missionaries of Our Lady Health Sys. Proj.) Series 2009, 6.75% 7/1/39 (Pre-Refunded to 7/1/19 @ 100) | | 2,100 | 2,357 |
| Louisiana Pub. Facilities Auth. Rev. (Tulane Univ. of Louisiana Proj.) Series 2016 A: | | | |
| 5% 12/15/24 | | 1,500 | 1,724 |
| 5% 12/15/25 | | 2,175 | 2,518 |
| 5% 12/15/26 | | 260 | 302 |
| 5% 12/15/28 | | 2,000 | 2,314 |
| 5% 12/15/29 | | 335 | 386 |
| 5% 12/15/30 | | 2,800 | 3,208 |
| New Orleans Aviation Board Rev.: | | | |
| (North Term. Proj.) Series 2015 B: | | | |
| 5% 1/1/29 (d) | | 2,400 | 2,656 |
| 5% 1/1/30 (d) | | 2,000 | 2,197 |
| 5% 1/1/31 (d) | | 2,500 | 2,736 |
| 5% 1/1/40 (d) | | 6,885 | 7,405 |
| Series 2007 A, 5% 1/1/17 (FSA Insured) (d) | | 1,420 | 1,420 |
|
| TOTAL LOUISIANA | | | 38,308 |
|
| Maine - 0.6% | | | |
| Maine Health & Higher Ed. Facilities Auth. Rev. Series 2013, 5% 7/1/25 | | 1,140 | 1,205 |
| Maine Health & Higher Edl. Facilities Auth. Rev. Series 2016 A: | | | |
| 5% 7/1/41 | | 7,800 | 7,876 |
| 5% 7/1/46 | | 22,035 | 22,169 |
| Maine Tpk. Auth. Tpk. Rev. Series 2015: | | | |
| 5% 7/1/32 | | 1,050 | 1,212 |
| 5% 7/1/36 | | 2,600 | 2,958 |
|
| TOTAL MAINE | | | 35,420 |
|
| Maryland - 0.9% | | | |
| Baltimore Convention Ctr. Hotel Rev. Series A, 5.25% 9/1/39 (XL Cap. Assurance, Inc. Insured) | | 4,710 | 4,714 |
| Baltimore Proj. Rev. (Wtr. Proj.) Series 2009 A, 5.75% 7/1/39 (Pre-Refunded to 7/1/19 @ 100) | | 1,250 | 1,381 |
| City of Westminster Series 2016: | | | |
| 5% 11/1/27 | | 1,595 | 1,760 |
| 5% 11/1/28 | | 2,750 | 3,023 |
| 5% 11/1/29 | | 2,910 | 3,179 |
| 5% 11/1/30 | | 3,085 | 3,357 |
| Maryland Econ. Dev. Corp. (Purple Line Lt. Rail Proj.) Series 2016 D, 5% 3/31/46 (d) | | 3,000 | 3,173 |
| Maryland Health & Higher Edl. Facilities Auth. Rev.: | | | |
| (Anne Arundel Health Sys. Proj.) Series 2010, 5% 7/1/40 | | 2,000 | 2,102 |
| (Doctors Cmnty. Hosp. Proj.) Series 2010, 5.75% 7/1/38 | | 5,090 | 5,367 |
| (Univ. of Maryland Med. Sys. Proj.) Series 2010, 5.125% 7/1/39 | | 4,400 | 4,655 |
| (Washington County Health Sys. Proj.) Series 2008, 6% 1/1/28 (Pre-Refunded to 1/1/18 @ 100) | | 5,000 | 5,239 |
| Series 2010, 5.625% 7/1/30 (Pre-Refunded to 7/1/20 @ 100) | | 2,865 | 3,243 |
| Series 2015: | | | |
| 5% 7/1/40 | | 1,000 | 1,040 |
| 5% 7/1/45 | | 5,000 | 5,175 |
| Series 2016 A: | | | |
| 4% 7/1/42 | | 1,450 | 1,353 |
| 5% 7/1/35 | | 575 | 602 |
|
| TOTAL MARYLAND | | | 49,363 |
|
| Massachusetts - 2.0% | | | |
| Massachusetts Bay Trans. Auth. Sales Tax Rev. Series 2015 A: | | | |
| 5% 7/1/40 | | 1,500 | 1,699 |
| 5% 7/1/45 | | 1,495 | 1,689 |
| Massachusetts Dev. Fin. Agcy. Rev.: | | | |
| (Boston Univ. Proj.) Series U4, 5.7% 10/1/40 (Pre-Refunded to 10/1/19 @ 100) | | 7,500 | 8,340 |
| (Lesley Univ. Proj.) Series 2016, 5% 7/1/39 | | 1,645 | 1,815 |
| Series 2011 I, 6.75% 1/1/36 | | 3,000 | 3,452 |
| Series 2015 D, 5% 7/1/44 | | 5,205 | 5,443 |
| Series 2016 A, 5% 1/1/47 | | 11,355 | 11,660 |
| Series 2016: | | | |
| 5% 10/1/29 | | 1,000 | 1,175 |
| 5% 10/1/30 | | 1,500 | 1,752 |
| 5% 7/1/31 | | 1,675 | 1,831 |
| 5% 10/1/31 | | 1,620 | 1,880 |
| 5% 7/1/46 | | 1,390 | 1,462 |
| Series BB1, 5% 10/1/46 | | 6,845 | 7,656 |
| Massachusetts Gen. Oblig. Series 2016 A, 5% 3/1/46 | | 2,175 | 2,416 |
| Massachusetts Health & Edl. Facilities Auth. Rev. (Blood Research Institute Proj.) Series A, 6.5% 2/1/22 (f) | | 1,905 | 1,912 |
| Massachusetts Port Auth. Rev.: | | | |
| Series 2016 A: | | | |
| 5% 7/1/33 | | 2,100 | 2,443 |
| 5% 7/1/34 | | 1,080 | 1,249 |
| 5% 7/1/35 | | 2,055 | 2,363 |
| 5% 7/1/37 | | 3,965 | 4,524 |
| 5% 7/1/38 | | 1,570 | 1,785 |
| Series 2016 B: | | | |
| 4% 7/1/46 (d) | | 25,130 | 25,150 |
| 5% 7/1/43 (d) | | 15,405 | 16,905 |
|
| TOTAL MASSACHUSETTS | | | 108,601 |
|
| Michigan - 1.7% | | | |
| Detroit School District Series 2012 A, 5% 5/1/23 | | 4,000 | 4,453 |
| Detroit Swr. Disp. Rev. Series 2001 E, 5.75% 7/1/31 (Pre-Refunded to 7/1/18 @ 100) | | 4,000 | 4,265 |
| Detroit Wtr. Supply Sys. Rev. Series 2006 B, 7% 7/1/36 (Pre-Refunded to 7/1/19 @ 100) | | 4,900 | 5,561 |
| DeWitt Pub. Schools Gen. Oblig. 5% 5/1/21 (Nat'l. Pub. Fin. Guarantee Corp. Insured) | | 1,650 | 1,724 |
| Kalamazoo Hosp. Fin. Auth. Hosp. Facilities Rev. Series 2016, 5% 5/15/28 | | 2,360 | 2,650 |
| Lansing Board of Wtr. & Lt. Util. Rev. 5.5% 7/1/41 | | 2,500 | 2,809 |
| Michigan Fin. Auth. Rev.: | | | |
| Series 2012 A: | | | |
| 4.125% 6/1/32 (Pre-Refunded to 6/1/22 @ 100) | | 6,325 | 7,003 |
| 5% 6/1/20 (Escrowed to Maturity) | | 2,050 | 2,273 |
| 5% 6/1/27 (Pre-Refunded to 6/1/22 @ 100) | | 3,000 | 3,456 |
| 5% 6/1/39 (Pre-Refunded to 6/1/22 @ 100) | | 6,350 | 7,314 |
| Series 2012, 5% 11/15/42 | | 11,825 | 12,908 |
| Series 2015 MI, 5% 12/1/24 | | 4,445 | 5,189 |
| Series MI: | | | |
| 5.5% 12/1/26 | | 4,500 | 5,480 |
| 5.5% 12/1/27 | | 4,750 | 5,748 |
| Michigan Gen. Oblig. Series 2016, 5% 3/15/27 | | 3,105 | 3,686 |
| Michigan Hosp. Fin. Auth. Rev.: | | | |
| Series 2012 A: | | | |
| 5% 6/1/23 | | 2,395 | 2,710 |
| 5% 6/1/26 | | 2,000 | 2,245 |
| 6.5% 12/1/33 (Pre-Refunded to 12/1/18 @ 100) | | 695 | 762 |
| 6.5% 12/1/33 (Pre-Refunded to 12/1/18 @ 100) | | 130 | 141 |
| Portage Pub. Schools Series 2016: | | | |
| 5% 11/1/30 | | 2,855 | 3,281 |
| 5% 11/1/31 | | 2,525 | 2,889 |
| 5% 11/1/36 | | 250 | 281 |
| Wayne County Arpt. Auth. Rev. Series 2015 G, 5% 12/1/28 (d) | | 5,500 | 6,113 |
|
| TOTAL MICHIGAN | | | 92,941 |
|
| Minnesota - 0.4% | | | |
| Maple Grove Health Care Facilities Series 2015, 5% 9/1/29 | | 2,830 | 3,149 |
| Maple Grove Health Care Sys. Rev.: | | | |
| (Maple Grove Hosp. Corp. Proj.) Series 2007, 5.25% 5/1/28 | | 3,500 | 3,533 |
| 5% 5/1/20 | | 1,000 | 1,010 |
| Minnesota 911 Rev. (Pub. Safety Radio Communications Sys. Proj.) Series 2009, 5% 6/1/20 (Pre-Refunded to 6/1/19 @ 100) | | 3,835 | 4,157 |
| Saint Paul Hsg. & Redev. Auth. Hosp. Rev. (HealthEast Care Sys. Proj.) Series 2015 A, 5% 11/15/44 | | 1,515 | 1,603 |
| St. Louis Park Health Care Facilities Rev. (Park Nicollet Health Svcs. Proj.) Series 2008 C, 5.5% 7/1/18 (Escrowed to Maturity) | | 5,600 | 5,950 |
|
| TOTAL MINNESOTA | | | 19,402 |
|
| Missouri - 0.4% | | | |
| Kansas City Spl. Oblig.: | | | |
| 5% 9/1/26 | | 1,185 | 1,285 |
| 5% 9/1/27 | | 490 | 531 |
| 5% 9/1/28 | | 1,000 | 1,082 |
| 5% 9/1/29 | | 1,000 | 1,080 |
| 5% 9/1/30 | | 1,390 | 1,501 |
| Missouri Dev. Fin. Board Infrastructure Facilities Rev. (City of Branson-Branson Landing Proj.) Series 2005 A, 6% 6/1/20 | | 1,500 | 1,577 |
| Missouri Health & Edl. Facilities Auth. Edl. Facilities Rev. Series 2015 B: | | | |
| 3.125% 2/1/27 | | 800 | 779 |
| 3.25% 2/1/28 | | 800 | 780 |
| 4% 2/1/40 | | 700 | 690 |
| 5% 2/1/31 | | 2,595 | 2,893 |
| 5% 2/1/33 | | 2,870 | 3,168 |
| 5% 2/1/36 | | 2,300 | 2,507 |
| 5% 2/1/45 | | 3,600 | 3,886 |
|
| TOTAL MISSOURI | | | 21,759 |
|
| Nebraska - 0.4% | | | |
| Central Plains Energy Proj. Rev. (Nebraska Gas Proj.) Series 2007 B, 1.124% 12/1/17 (b) | | 4,005 | 3,991 |
| Douglas County Hosp. Auth. #2 Health Facilities Rev.: | | | |
| 6% 8/15/23 | | 1,210 | 1,245 |
| 6% 8/15/28 | | 1,980 | 2,037 |
| 6.125% 8/15/31 | | 1,275 | 1,311 |
| Nebraska Pub. Pwr. District Rev. Series 2016 B, 5% 1/1/37 | | 11,900 | 13,276 |
|
| TOTAL NEBRASKA | | | 21,860 |
|
| Nevada - 0.1% | | | |
| Las Vegas Valley Wtr. District Wtr. Impt. Gen. Oblig. Series 2011 C, 5% 6/1/24 | | 5,415 | 6,089 |
| New Hampshire - 1.0% | | | |
| New Hampshire Bus. Fin. Auth. Rev. Series 2009 A, 6.125% 10/1/39 (Pre-Refunded to 10/1/19 @ 100) | | 9,300 | 10,434 |
| New Hampshire Health & Ed. Facilities Auth. Rev.: | | | |
| (Dartmouth College Proj.) Series 2009, 5.25% 6/1/39 (Pre-Refunded to 6/1/19 @ 100) | | 4,000 | 4,359 |
| Series 2007: | | | |
| 5% 10/1/37 | | 1,405 | 1,435 |
| 5% 10/1/37 (Pre-Refunded to 10/1/17 @ 100) | | 4,695 | 4,831 |
| Series 2012: | | | |
| 4% 7/1/32 | | 2,370 | 2,377 |
| 5% 7/1/24 | | 1,000 | 1,102 |
| 5% 7/1/25 | | 1,185 | 1,298 |
| Series 2016: | | | |
| 4% 10/1/38 | | 1,200 | 1,080 |
| 5% 10/1/24 | | 2,120 | 2,349 |
| 5% 10/1/25 | | 2,100 | 2,335 |
| 5% 10/1/29 | | 4,000 | 4,370 |
| 5% 10/1/31 | | 5,210 | 5,635 |
| 5% 10/1/33 | | 4,000 | 4,280 |
| 5% 10/1/38 | | 3,450 | 3,629 |
| New Hampshire Tpk. Sys. Rev. Series 2012 B: | | | |
| 5% 2/1/19 | | 2,000 | 2,141 |
| 5% 2/1/24 | | 1,775 | 2,000 |
|
| TOTAL NEW HAMPSHIRE | | | 53,655 |
|
| New Jersey - 4.0% | | | |
| Atlantic County Impt. Auth. (Atlantic City Campus Proj.) Series 2016 A: | | | |
| 5% 7/1/28 (FSA Insured) | | 1,040 | 1,185 |
| 5% 7/1/30 (FSA Insured) | | 2,540 | 2,861 |
| 5% 7/1/32 (FSA Insured) | | 1,250 | 1,395 |
| 5% 7/1/33 (FSA Insured) | | 1,300 | 1,444 |
| New Jersey Econ. Dev. Auth. Rev.: | | | |
| Series 2009 AA, 5.5% 12/15/29 | | 4,000 | 4,281 |
| Series 2013 NN, 5% 3/1/27 | | 69,700 | 70,914 |
| Series 2013: | | | |
| 5% 3/1/23 | | 12,200 | 12,778 |
| 5% 3/1/24 | | 17,000 | 17,834 |
| 5% 3/1/25 | | 1,900 | 1,982 |
| Series 2015 XX, 5.25% 6/15/27 | | 17,000 | 18,195 |
| Series 2016 AAA: | | | |
| 5% 6/15/41 | | 4,095 | 4,066 |
| 5.5% 6/15/31 | | 2,000 | 2,136 |
| 5.5% 6/15/32 | | 5,000 | 5,323 |
| Series 2016 BBB: | | | |
| 5% 6/15/21 | | 3,000 | 3,186 |
| 5% 6/15/22 | | 4,850 | 5,119 |
| 5% 6/15/23 | | 7,810 | 8,177 |
| New Jersey Edl. Facility Series 2016 A: | | | |
| 5% 7/1/31 | | 1,100 | 1,198 |
| 5% 7/1/32 | | 4,000 | 4,336 |
| New Jersey Health Care Facilities Fing. Auth. Rev. Series 2016 A: | | | |
| 5% 7/1/24 (e) | | 1,000 | 1,095 |
| 5% 7/1/25 (e) | | 1,000 | 1,099 |
| 5% 7/1/26 | | 1,105 | 1,251 |
| 5% 7/1/27 | | 750 | 860 |
| 5% 7/1/30 | | 1,000 | 1,119 |
| New Jersey Trans. Trust Fund Auth.: | | | |
| Series 2001 A, 6% 6/15/35 | | 3,900 | 4,312 |
| Series 2005 B, 5.5% 12/15/21 (Nat'l. Pub. Fin. Guarantee Corp. Insured) | | 5,000 | 5,553 |
| Series 2014 AA: | | | |
| 5% 6/15/23 | | 20,645 | 21,915 |
| 5% 6/15/24 | | 10,000 | 10,553 |
| Series 2016 A: | | | |
| 5% 6/15/28 | | 6,000 | 6,463 |
| 5% 6/15/29 | | 600 | 637 |
|
| TOTAL NEW JERSEY | | | 221,267 |
|
| New York - 7.0% | | | |
| Hudson Yards Infrastructure Corp. New York Rev. Series 2012 A, 5.75% 2/15/47 | | 14,600 | 16,412 |
| Long Island Pwr. Auth. Elec. Sys. Rev. Series 2012 A, 5% 9/1/42 | | 13,000 | 13,916 |
| MTA Hudson Rail Yards Trust Oblig. Series 2016 A, 5% 11/15/56 | | 15,800 | 16,984 |
| New York City Gen. Oblig.: | | | |
| Series 2003 A, 5.5% 8/1/20 (Nat'l. Pub. Fin. Guarantee Corp. Insured) | | 5 | 5 |
| Series 2007 D1, 5.125% 12/1/22 | | 1,980 | 2,052 |
| Series 2008: | | | |
| 5.25% 8/15/27 | | 9,575 | 10,162 |
| 5.25% 8/15/27 (Pre-Refunded to 8/15/18 @ 100) | | 365 | 388 |
| Series 2009, 5.625% 4/1/29 | | 1,675 | 1,825 |
| Series 2012 A1, 5% 8/1/24 | | 7,400 | 8,362 |
| Series 2012 G1, 5% 4/1/25 | | 13,700 | 15,465 |
| New York City Indl. Dev. Agcy. Civic Facility Rev. (Polytechnic Univ. NY Proj.) 5.25% 11/1/27 (ACA Finl. Guaranty Corp. Insured) | | 3,100 | 3,206 |
| New York City Indl. Dev. Agcy. Rev.: | | | |
| (Queens Baseball Stadium Proj.) 5% 1/1/19 (AMBAC Insured) | | 3,735 | 3,744 |
| (Yankee Stadium Proj.) Series 2006, 5% 3/1/31 | | 4,725 | 4,754 |
| New York City Muni. Wtr. Fin. Auth. Wtr. & Swr. Sys. Rev.: | | | |
| Series 2009 EE, 5.25% 6/15/40 | | 11,600 | 12,573 |
| Series 2009 FF 2, 5.5% 6/15/40 | | 17,800 | 19,462 |
| Series 2011 EE, 5.375% 6/15/43 | | 42,080 | 46,882 |
| Series 2012 EE, 5.25% 6/15/30 | | 17,200 | 19,859 |
| Series 2013 BB, 5% 6/15/47 | | 8,985 | 9,977 |
| New York City Transitional Fin. Auth. Bldg. Aid Rev.: | | | |
| Series 2009 S1: | | | |
| 5.5% 7/15/38 | | 1,600 | 1,689 |
| 5.625% 7/15/38 | | 2,825 | 2,987 |
| Series 2009 S3: | | | |
| 5.25% 1/15/34 | | 21,000 | 22,449 |
| 5.25% 1/15/39 | | 3,400 | 3,626 |
| 5.375% 1/15/34 | | 2,750 | 2,947 |
| Series 2009 S4: | | | |
| 5.5% 1/15/39 | | 8,800 | 9,455 |
| 5.75% 1/15/39 | | 4,100 | 4,436 |
| New York City Transitional Fin. Auth. Rev. Series 2015 E1, 5% 2/1/41 | | 2,725 | 3,063 |
| New York Dorm. Auth. Mental Health Svcs. Facilities Impt. Rev. Series 2012 A, 5% 5/15/23 | | 5,600 | 6,438 |
| New York Dorm. Auth. Personal Income Tax Rev.: | | | |
| (Ed. Proj.) Series 2008 B, 5.75% 3/15/36 | | 3,400 | 3,690 |
| Series 2014 A: | | | |
| 5% 2/15/39 | | 3,995 | 4,237 |
| 5% 2/15/39 (Pre-Refunded to 2/15/19 @ 100) | | 5 | 5 |
| New York Dorm. Auth. Revs.: | | | |
| (New York Univ. Hosp. Ctr. Proj.) Series 2007 B, 5.25% 7/1/24 (Pre-Refunded to 7/1/17 @ 100) | | 1,515 | 1,547 |
| (State Univ. Edl. Facilities Proj.) Series A, 5.875% 5/15/17 (Nat'l. Pub. Fin. Guarantee Corp. Insured) | | 3,515 | 3,578 |
| Series 2010 A, 5% 7/1/26 | | 4,000 | 4,378 |
| New York Metropolitan Trans. Auth. Dedicated Tax Fund Rev. Series 2009 B, 5% 11/15/34 | | 11,800 | 12,848 |
| New York Metropolitan Trans. Auth. Rev.: | | | |
| Series 2010 D, 5.25% 11/15/40 | | 6,600 | 7,351 |
| Series 2012 D, 5% 11/15/25 | | 25,900 | 29,515 |
| Series 2012 F, 5% 11/15/24 | | 12,400 | 14,138 |
| Series 2014 B, 5% 11/15/44 | | 8,500 | 9,280 |
| Series 2015 A1, 5% 11/15/45 | | 14,850 | 16,249 |
| New York Trans. Dev. Corp. (Laguardia Arpt. Term. B Redev. Proj.) Series 2016 A, 5% 7/1/46 (d) | | 8,000 | 8,290 |
| Niagara Falls City Niagara County Pub. Impt. 7.5% 3/1/18 (Nat'l. Pub. Fin. Guarantee Corp. Insured) | | 460 | 492 |
| Rockland County Gen. Oblig. Series 2014 A, 4% 3/1/24 (FSA Insured) | | 1,375 | 1,503 |
| Tobacco Settlement Fing. Corp. Series 2013 B, 5% 6/1/21 | | 90 | 90 |
| Triborough Bridge & Tunnel Auth. Revs. Series 2015 A, 5.25% 11/15/45 | | 4,000 | 4,600 |
|
| TOTAL NEW YORK | | | 384,909 |
|
| North Carolina - 0.4% | | | |
| Nash Health Care Sys. Health Care Facilities Rev. Series 2012, 5% 11/1/41 | | 4,625 | 4,908 |
| North Carolina Med. Care Cmnty. Health: | | | |
| Series 2012 A, 5% 11/15/26 | | 1,295 | 1,465 |
| Series 2017: | | | |
| 5% 10/1/27 (e) | | 1,000 | 1,152 |
| 5% 10/1/31 (e) | | 1,700 | 1,927 |
| North Carolina Med. Care Commission Health Care Facilities Rev. (Rex Healthcare Proj.) Series 2010 A, 5% 7/1/30 | | 7,830 | 8,529 |
| North Carolina Muni. Pwr. Agcy. #1 Catawba Elec. Rev.: | | | |
| Series 2009, 5% 1/1/30 (Pre-Refunded to 1/1/19 @ 100) | | 1,630 | 1,749 |
| 5% 1/1/30 | | 670 | 708 |
|
| TOTAL NORTH CAROLINA | | | 20,438 |
|
| North Dakota - 0.1% | | | |
| Cass County Health Care Facilities Rev. (Essentia Health Obligated Group Proj.) Series 2008, 5.125% 2/15/37 (Assured Guaranty Corp. Insured) | | 4,600 | 4,953 |
| Fargo Health Sys. Rev. (Sanford Proj.) Series 2011, 6% 11/1/28 | | 1,500 | 1,752 |
|
| TOTAL NORTH DAKOTA | | | 6,705 |
|
| Ohio - 1.6% | | | |
| Akron Bath Copley Hosp. District Rev. Series 2016, 5.25% 11/15/46 | | 7,300 | 7,792 |
| American Muni. Pwr., Inc. Rev.: | | | |
| (Freemont Energy Ctr. Proj.) Series 2012 B, 5% 2/15/42 | | 2,500 | 2,687 |
| (Prairie State Energy Campus Proj.) Series 2015, 5% 2/15/28 | | 12,100 | 13,639 |
| Buckeye Tobacco Settlement Fing. Auth. Series 2007 A1, 5% 6/1/17 | | 5,045 | 5,123 |
| Cleveland Parking Facilities Rev.: | | | |
| 5.25% 9/15/18 (Escrowed to Maturity) | | 640 | 682 |
| 5.25% 9/15/18 (FSA Insured) | | 1,360 | 1,446 |
| Columbus City School District 5% 12/1/29 | | 1,800 | 2,130 |
| Franklin County Hosp. Rev. (Nationwide Children's Hosp. Proj.) Series 2009, 5.25% 11/1/40 (Pre-Refunded to 11/1/19 @ 100) | | 1,500 | 1,654 |
| Hamilton County Convention Facilities Auth. Rev. Series 2014, 5% 12/1/25 | | 3,595 | 4,084 |
| Lake County Hosp. Facilities Rev.: | | | |
| Series 2015: | | | |
| 5% 8/15/29 | | 1,000 | 1,126 |
| 5% 8/15/30 | | 1,505 | 1,686 |
| 6% 8/15/43 | | 800 | 849 |
| 6% 8/15/43 (Pre-Refunded to 8/15/18 @ 100) | | 4,200 | 4,516 |
| Lucas County Hosp. Rev. (ProMedica Healthcare Oblig. Group Proj.) Series 2011 A, 6.5% 11/15/37 | | 6,000 | 7,068 |
| Muskingum County Hosp. Facilities (Genesis Healthcare Sys. Obligated Group Proj.) Series 2013, 5% 2/15/48 | | 11,600 | 11,848 |
| Ohio Higher Edl. Facility Commission Rev. (Cleveland Clinic Foundation Proj.) Series 2008 A, 5.5% 1/1/43 | | 1,500 | 1,558 |
| Ohio Tpk. Commission Tpk. Rev. (Infastructure Proj.) Series 2005 A, 0% 2/15/43 | | 15,000 | 5,185 |
| Scioto County Hosp. Facilities Rev. Series 2016, 5% 2/15/29 | | 2,195 | 2,513 |
| Univ. of Akron Gen. Receipts Series 2016 A, 5% 1/1/35 | | 9,500 | 10,585 |
|
| TOTAL OHIO | | | 86,171 |
|
| Oklahoma - 0.4% | | | |
| Oklahoma City Pub. Property Auth. Hotel Tax Rev. Series 2015: | | | |
| 5% 10/1/28 | | 1,270 | 1,444 |
| 5% 10/1/29 | | 700 | 792 |
| 5% 10/1/36 | | 1,000 | 1,099 |
| 5% 10/1/39 | | 1,850 | 2,024 |
| Oklahoma Dev. Fin. Auth. Rev.: | | | |
| (Saint John Health Sys. Proj.) Series 2012, 5% 2/15/42 | | 9,640 | 10,260 |
| Series 2012, 5% 2/15/24 | | 4,190 | 4,670 |
|
| TOTAL OKLAHOMA | | | 20,289 |
|
| Oregon - 0.3% | | | |
| Clackamas County School District #7J: | | | |
| 5.25% 6/1/23 | | 2,000 | 2,381 |
| 5.25% 6/1/24 (FSA Insured) | | 2,605 | 3,149 |
| Multnomah County Hosp. Facilities Auth. Rev. (Adventist Health Sys./West Proj.) Series 2009 A, 5.125% 9/1/40 | | 2,500 | 2,656 |
| Oregon Facilities Auth. Rev. (Legacy Health Sys. Proj.) Series 2009 A, 5% 3/15/30 | | 1,000 | 1,078 |
| Oregon State Dept. of Administrative Svcs. Lottery Rev. Series 2011 A, 5.25% 4/1/31 | | 5,600 | 6,329 |
| Washington County School District #15: | | | |
| 5.5% 6/15/20 (FSA Insured) | | 1,770 | 1,991 |
| 5.5% 6/15/21 (FSA Insured) | | 1,060 | 1,220 |
|
| TOTAL OREGON | | | 18,804 |
|
| Pennsylvania - 4.4% | | | |
| Allegheny County Hosp. Dev. Auth. Rev. (Univ. of Pittsburgh Med. Ctr. Proj.) Series 2009 A, 5.625% 8/15/39 | | 6,225 | 6,750 |
| Centre County Hosp. Auth. Rev. (Mount Nittany Med. Ctr. Proj.) Series 2011, 7% 11/15/46 (Pre-Refunded to 11/15/21 @ 100) | | 2,600 | 3,201 |
| Dauphin County Gen. Auth. (Pinnacle Health Sys. Proj.) Series 2016 A: | | | |
| 5% 6/1/28 | | 1,070 | 1,239 |
| 5% 6/1/29 | | 1,170 | 1,344 |
| Monroe County Hosp. Auth. Rev. Series 2016: | | | |
| 5% 7/1/26 | | 1,000 | 1,144 |
| 5% 7/1/27 | | 1,000 | 1,132 |
| 5% 7/1/28 | | 1,000 | 1,125 |
| 5% 7/1/34 | | 3,680 | 4,017 |
| 5% 7/1/36 | | 2,000 | 2,176 |
| 5% 7/1/41 | | 2,660 | 2,875 |
| Monroeville Fin. Auth. UPMC Rev. Series 2012, 5% 2/15/25 | | 4,680 | 5,523 |
| Montgomery County Higher Ed. & Health Auth. Hosp. Rev. (Abington Memorial Hosp. Proj.): | | | |
| Series 1993 A, 6% 6/1/22 (AMBAC Insured) | | 2,000 | 2,183 |
| Series 2012 A, 5% 6/1/27 | | 4,105 | 4,566 |
| Montgomery County Higher Ed. & Health Auth. Rev.: | | | |
| Series 2014 A: | | | |
| 5% 10/1/21 | | 1,320 | 1,452 |
| 5% 10/1/22 | | 1,380 | 1,521 |
| 5% 10/1/24 | | 1,165 | 1,306 |
| Series 2016 A: | | | |
| 5% 10/1/29 | | 2,600 | 2,836 |
| 5% 10/1/31 | | 4,575 | 4,937 |
| 5% 10/1/36 | | 5,400 | 5,702 |
| 5% 10/1/40 | | 3,310 | 3,482 |
| Northampton County Gen. Purp. Auth. Hosp. Rev. Series 2016 A, 5% 8/15/46 | | 24,875 | 27,091 |
| Pennsylvania Econ. Dev. Fin. Auth. Unemployment Compensation Rev. Series 2012 B, 5% 7/1/21 | | 5,300 | 5,504 |
| Pennsylvania Gen. Oblig.: | | | |
| Series 2015 1: | | | |
| 5% 3/15/29 | | 16,370 | 18,656 |
| 5% 3/15/31 | | 3,450 | 3,886 |
| Series 2015, 5% 3/15/33 | | 4,975 | 5,559 |
| Series 2016: | | | |
| 5% 2/1/27 | | 17,175 | 19,885 |
| 5% 2/1/28 | | 18,030 | 20,782 |
| Pennsylvania Higher Edl. Facilities Auth. Rev.: | | | |
| (Univ. of Pennsylvania Health Sys. Proj.) Series 2009 A, 5.25% 8/15/21 (Pre-Refunded to 8/15/19 @ 100) | | 2,900 | 3,179 |
| Series 2016: | | | |
| 5% 5/1/32 | | 1,255 | 1,426 |
| 5% 5/1/33 | | 1,700 | 1,923 |
| Philadelphia Gas Works Rev. Series 9: | | | |
| 5.25% 8/1/40 | | 2,295 | 2,481 |
| 5.25% 8/1/40 (Pre-Refunded to 8/1/20 @ 100) | | 1,455 | 1,632 |
| Philadelphia Gen. Oblig. Series 2008 A, 5.25% 12/15/32 (FSA Insured) | | 2,500 | 2,668 |
| Philadelphia School District: | | | |
| Series 2016 D, 5% 9/1/28 | | 8,100 | 8,845 |
| Series 2016 F: | | | |
| 5% 9/1/28 | | 14,010 | 15,298 |
| 5% 9/1/29 | | 26,200 | 28,477 |
| 5% 9/1/30 | | 6,815 | 7,373 |
| Scranton-Lackawanna Health & Welfare Auth. Rev. (Marywood Univ. Proj.) Series 2016, 5% 6/1/46 | | 4,000 | 3,726 |
| Southeastern Pennsylvania Trans. Auth. Rev. Series 2011: | | | |
| 5% 6/1/22 | | 1,000 | 1,116 |
| 5% 6/1/23 | | 2,500 | 2,783 |
|
| TOTAL PENNSYLVANIA | | | 240,801 |
|
| Rhode Island - 0.5% | | | |
| Rhode Island Comm Corp. Rev. Series 2016 A: | | | |
| 5% 6/15/23 | | 5,405 | 6,194 |
| 5% 6/15/24 | | 2,720 | 3,145 |
| Rhode Island Health & Edl. Bldg. Corp. Higher Ed. Facilities Rev.: | | | |
| Series 2016 B: | | | |
| 5% 9/1/31 | | 650 | 663 |
| 5% 9/1/36 | | 5,620 | 5,599 |
| Series 2016: | | | |
| 5% 5/15/30 | | 1,500 | 1,619 |
| 5% 5/15/31 | | 1,750 | 1,880 |
| 5% 5/15/33 | | 1,500 | 1,596 |
| 5% 5/15/39 | | 4,800 | 5,008 |
|
| TOTAL RHODE ISLAND | | | 25,704 |
|
| South Carolina - 2.3% | | | |
| Richland County Hosp. Facilities Rev. (Cmnty. Provider Pooled Ln. Prog.) Series A, 7.125% 7/1/17 (Escrowed to Maturity) | | 135 | 139 |
| Scago Edl. Facilities Corp. for Colleton School District (School District of Colleton County Proj.) Series 2015: | | | |
| 5% 12/1/25 | | 2,745 | 3,137 |
| 5% 12/1/28 | | 5,665 | 6,380 |
| South Carolina Jobs-Econ. Dev. Auth. Econ. Dev. Rev. Series 2013, 5% 11/1/27 | | 7,700 | 8,755 |
| South Carolina Jobs-Econ. Dev. Auth. Health Facilities Rev. (Bishop Gadsden Proj.) 5% 4/1/24 | | 4,000 | 4,023 |
| South Carolina Ports Auth. Ports Rev. Series 2015, 5.25% 7/1/55 (d) | | 6,375 | 6,882 |
| South Carolina Pub. Svc. Auth. Rev.: | | | |
| Series 2012 B, 5% 12/1/20 | | 1,500 | 1,674 |
| Series 2013 E, 5.5% 12/1/53 | | 34,335 | 38,425 |
| Series 2014 A: | | | |
| 5% 12/1/49 | | 6,500 | 7,043 |
| 5.5% 12/1/54 | | 13,185 | 14,692 |
| Series 2014 C, 5% 12/1/46 | | 3,900 | 4,275 |
| Series 2015 A, 5% 12/1/50 | | 13,210 | 14,252 |
| Series 2015 C, 5% 12/1/22 | | 8,440 | 9,737 |
| Series 2015 E, 5.25% 12/1/55 | | 5,900 | 6,457 |
|
| TOTAL SOUTH CAROLINA | | | 125,871 |
|
| South Dakota - 0.1% | | | |
| South Dakota Health & Edl. Facilities Auth. Rev. (Reg'l. Health Proj.) Series 2010: | | | |
| 4.625% 9/1/27 | | 1,000 | 1,073 |
| 5% 9/1/28 | | 3,000 | 3,288 |
|
| TOTAL SOUTH DAKOTA | | | 4,361 |
|
| Tennessee - 0.3% | | | |
| Jackson Hosp. Rev.: | | | |
| 5.75% 4/1/41 | | 1,785 | 1,865 |
| 5.75% 4/1/41 (Pre-Refunded to 4/1/18 @ 100) | | 4,815 | 5,075 |
| Memphis-Shelby County Arpt. Auth. Arpt. Rev. Series 2010 B: | | | |
| 5.75% 7/1/23 (d) | | 5,820 | 6,386 |
| 5.75% 7/1/24 (d) | | 2,400 | 2,631 |
|
| TOTAL TENNESSEE | | | 15,957 |
|
| Texas - 9.8% | | | |
| Argyle Independent School District 5.25% 8/15/40 (FSA Insured) | | 125 | 125 |
| Austin Arpt. Sys. Rev. Series 2014: | | | |
| 5% 11/15/26 (d) | | 1,000 | 1,135 |
| 5% 11/15/27 (d) | | 1,250 | 1,415 |
| 5% 11/15/28 (d) | | 1,000 | 1,128 |
| 5% 11/15/39 (d) | | 9,700 | 10,532 |
| 5% 11/15/44 (d) | | 23,455 | 25,318 |
| Austin Cmnty. College District Rev. (Convention Ctr. Proj.) Series 2002, 0% 2/1/22 (AMBAC Insured) | | 2,900 | 2,554 |
| Austin Elec. Util. Sys. Rev. 0% 5/15/18 (Nat'l. Pub. Fin. Guarantee Corp. Insured) | | 5,000 | 4,910 |
| Austin Independent School District Series 2016 A, 5% 8/1/30 | | 3,995 | 4,699 |
| Austin Wtr. & Wastewtr. Sys. Rev. Series 2016: | | | |
| 5% 11/15/27 | | 2,000 | 2,400 |
| 5% 11/15/28 | | 1,000 | 1,194 |
| 5% 11/15/29 | | 3,000 | 3,562 |
| Canyon Reg'l. Wtr. Auth. Contract Rev. (Wells Ranch Proj.): | | | |
| 5% 8/1/19 (Pre-Refunded to 8/1/17 @ 100) | | 1,695 | 1,734 |
| 5% 8/1/20 (Pre-Refunded to 8/1/17 @ 100) | | 1,780 | 1,821 |
| Central Reg'l. Mobility Auth. Series 2015 A: | | | |
| 5% 1/1/30 | | 1,650 | 1,815 |
| 5% 1/1/32 | | 1,000 | 1,091 |
| 5% 1/1/45 | | 6,000 | 6,375 |
| Coppell Independent School District 0% 8/15/20 | | 2,000 | 1,872 |
| Corpus Christi Util. Sys. Rev.: | | | |
| 5% 7/15/21 | | 4,500 | 5,055 |
| 5% 7/15/22 | | 2,500 | 2,853 |
| 5% 7/15/24 | | 2,255 | 2,576 |
| 5.25% 7/15/18 (FSA Insured) | | 3,305 | 3,378 |
| 5.25% 7/15/19 (FSA Insured) | | 4,000 | 4,087 |
| Cypress-Fairbanks Independent School District Series 2014 C, 5% 2/15/44 | | 5,300 | 5,949 |
| Dallas Fort Worth Int'l. Arpt. Rev.: | | | |
| Series 2010 A, 5% 11/1/42 | | 14,800 | 16,070 |
| Series 2012 D, 5% 11/1/42 (d) | | 2,370 | 2,513 |
| Series 2012 H, 5% 11/1/42 (d) | | 2,740 | 2,906 |
| Series 2014 D, 5% 11/1/23 (d) | | 2,795 | 3,156 |
| DeSoto Independent School District 0% 8/15/20 | | 3,335 | 3,122 |
| El Paso Gen. Oblig. Series 2016: | | | |
| 5% 8/15/34 | | 6,345 | 7,244 |
| 5% 8/15/35 | | 6,000 | 6,818 |
| 5% 8/15/36 | | 4,000 | 4,535 |
| Fort Worth Independent School District Series 2016, 5% 2/15/28 | | 3,635 | 4,339 |
| Freer Independent School District Series 2007, 5.25% 8/15/37 (Pre-Refunded to 8/15/17 @ 100) | | 895 | 918 |
| Grand Parkway Trans. Corp. Series 2013 B: | | | |
| 5% 4/1/53 | | 1,290 | 1,426 |
| 5.25% 10/1/51 | | 53,600 | 60,384 |
| 5.5% 4/1/53 | | 5,440 | 5,772 |
| Harris County Cultural Ed. Facilities Fin. Corp. Med. Facilities Rev. (Baylor College of Medicine Proj.) Series 2012 A, 5% 11/15/37 | | 14,050 | 15,019 |
| Harris County Gen. Oblig. Series 2002: | | | |
| 0% 8/15/25 (Nat'l. Pub. Fin. Guarantee Corp. Insured) | | 3,000 | 2,383 |
| 0% 8/15/28 (Nat'l. Pub. Fin. Guarantee Corp. Insured) | | 5,000 | 3,518 |
| Houston Arpt. Sys. Rev.: | | | |
| Series 2011 A: | | | |
| 5% 7/1/23 (d) | | 3,000 | 3,279 |
| 5% 7/1/25 (d) | | 1,500 | 1,632 |
| Series 2012 A, 5% 7/1/21 (d) | | 3,785 | 4,220 |
| Katy Independent School District Series 2015 A, 5% 2/15/45 | | 3,840 | 4,324 |
| Keller Independent School District Series 1996 A, 0% 8/15/17 | | 2,000 | 1,988 |
| Love Field Arpt. Modernization Rev.: | | | |
| Series 2015: | | | |
| 5% 11/1/27 (d) | | 2,150 | 2,451 |
| 5% 11/1/29 (d) | | 2,000 | 2,253 |
| 5% 11/1/32 (d) | | 3,690 | 4,110 |
| Series 2017: | | | |
| 5% 11/1/24 (d)(e) | | 1,000 | 1,148 |
| 5% 11/1/25 (d)(e) | | 1,000 | 1,151 |
| 5% 11/1/26 (d)(e) | | 1,000 | 1,156 |
| 5% 11/1/27 (d)(e) | | 1,000 | 1,148 |
| 5% 11/1/28 (d)(e) | | 1,500 | 1,714 |
| 5% 11/1/30 (d)(e) | | 1,000 | 1,133 |
| 5% 11/1/31 (d)(e) | | 1,500 | 1,692 |
| 5% 11/1/32 (d)(e) | | 1,330 | 1,493 |
| 5% 11/1/33 (d)(e) | | 1,000 | 1,117 |
| 5% 11/1/34 (d)(e) | | 1,000 | 1,113 |
| Lower Colorado River Auth. Rev. Series 2015 D: | | | |
| 5% 5/15/28 | | 2,200 | 2,528 |
| 5% 5/15/30 | | 5,000 | 5,644 |
| Mansfield Independent School District 5.5% 2/15/18 | | 40 | 40 |
| Midway Independent School District Series 2000, 0% 8/15/19 | | 3,600 | 3,452 |
| Newark Higher Ed. Fin. Corp. (Abilene Christian Univ. Proj.) Series 2016 A, 5% 4/1/30 | | 3,415 | 3,865 |
| North Texas Tollway Auth. Rev.: | | | |
| Series 2008 I, 6.2% 1/1/42 (Assured Guaranty Corp. Insured) | | 7,200 | 8,832 |
| Series 2009 A, 6.25% 1/1/39 (Pre-Refunded to 1/1/19 @ 100) | | 8,290 | 9,079 |
| Series 2009, 6.25% 1/1/39 | | 1,910 | 2,070 |
| Series 2011 A: | | | |
| 5.5% 9/1/41 | | 14,250 | 16,286 |
| 6% 9/1/41 | | 6,200 | 7,258 |
| Series 2011 D, 5% 9/1/28 | | 13,000 | 14,694 |
| Series 2014 A, 5% 1/1/25 | | 5,000 | 5,769 |
| Series 2015 B, 5% 1/1/40 | | 8,000 | 8,788 |
| Series 2016 A, 5% 1/1/31 | | 6,450 | 7,394 |
| 6% 1/1/23 | | 590 | 617 |
| 6% 1/1/24 | | 230 | 241 |
| San Antonio Arpt. Sys. Rev.: | | | |
| Series 2007 (AMT), 5.25% 7/1/20 (FSA Insured) (d) | | 3,215 | 3,273 |
| Series 2007 (AMT-SUB LIEN): | | | |
| 5% 7/1/17 (FSA Insured) (d) | | 2,385 | 2,429 |
| 5.25% 7/1/20 (FSA Insured) (d) | | 2,775 | 2,824 |
| 5.25% 7/1/19 (FSA Insured) (d) | | 2,635 | 2,682 |
| San Antonio Elec. & Gas Sys. Rev. Series 2012, 5.25% 2/1/25 | | 4,200 | 5,077 |
| San Antonio Wtr. Sys. Rev. Series 2012, 5% 5/15/25 | | 10,000 | 11,414 |
| Southwest Higher Ed. Auth. Rev. (Southern Methodist Univ. Proj.) Series 2016 A: | | | |
| 5% 10/1/25 | | 9,345 | 11,152 |
| 5% 10/1/26 | | 5,250 | 6,308 |
| 5% 10/1/27 | | 5,000 | 5,974 |
| 5% 10/1/28 | | 5,000 | 5,941 |
| 5% 10/1/29 | | 5,000 | 5,908 |
| Tarrant County Cultural Ed. Facilities Fin. Corp. Hosp. Rev.: | | | |
| (Hendrick Med. Ctr. Proj.) Series 2009 B: | | | |
| 5.25% 9/1/26 (Assured Guaranty Corp. Insured) | | 1,785 | 1,937 |
| 5.25% 9/1/27 (Assured Guaranty Corp. Insured) | | 2,375 | 2,576 |
| (Scott & White Healthcare Proj.) Series 2013 A: | | | |
| 4% 8/15/43 | | 2,200 | 2,182 |
| 5% 8/15/43 | | 4,000 | 4,406 |
| 5.75% 11/15/24 (Pre-Refunded to 11/15/18 @ 100) | | 3,925 | 4,240 |
| Tarrant County Cultural Ed. Facilities Fin. Corp. Rev. Series 2016 A: | | | |
| 4% 2/15/35 | | 5,000 | 5,044 |
| 5% 2/15/34 | | 1,900 | 2,152 |
| 5% 2/15/41 | | 8,335 | 9,254 |
| Texas Gen. Oblig.: | | | |
| Series 2016, 5% 4/1/40 | | 6,300 | 7,206 |
| 5% 4/1/25 (Pre-Refunded to 4/1/18 @ 100) | | 385 | 403 |
| 5% 4/1/25 (Pre-Refunded to 4/1/18 @ 100) | | 3,915 | 4,103 |
| Texas Private Activity Bond Surface Trans. Corp.: | | | |
| (LBJ Infrastructure Group LLC IH-635 Managed Lanes Proj.) Series 2010, 7% 6/30/40 | | 5,200 | 5,945 |
| Series 2013, 6.75% 6/30/43 (d) | | 12,600 | 14,091 |
| Texas Wtr. Dev. Board Rev. Series 2015 A: | | | |
| 5% 10/15/40 | | 11,145 | 12,651 |
| 5% 10/15/45 | | 6,355 | 7,177 |
| Weatherford Independent School District 0% 2/15/33 | | 6,985 | 3,956 |
| Ysleta Independent School District Series 2016, 5% 8/15/45 | | 15,175 | 17,094 |
|
| TOTAL TEXAS | | | 538,779 |
|
| Utah - 0.2% | | | |
| Utah Associated Muni. Pwr. Sys. Rev. (Payson Pwr. Proj.) 5% 9/1/22 | | 3,180 | 3,618 |
| Utah State Board of Regents Rev. Series 2011 B: | | | |
| 5% 8/1/24 (Pre-Refunded to 8/1/20 @ 100) | | 2,670 | 2,976 |
| 5% 8/1/25 (Pre-Refunded to 8/1/20 @ 100) | | 2,175 | 2,424 |
|
| TOTAL UTAH | | | 9,018 |
|
| Vermont - 0.1% | | | |
| Vermont Edl. & Health Bldg. Fin. Agcy. Rev. (Champlain College Proj.) Series 2016 A: | | | |
| 5% 10/15/41 | | 4,000 | 4,087 |
| 5% 10/15/46 | | 3,700 | 3,766 |
|
| TOTAL VERMONT | | | 7,853 |
|
| Virginia - 0.7% | | | |
| Fredericksburg Econ. Dev. Auth. Rev. Series 2014, 5% 6/15/25 | | 4,665 | 5,374 |
| Stafford County Econ. Dev. Auth. Hosp. Facilities Rev. Series 2016: | | | |
| 4% 6/15/37 | | 600 | 589 |
| 5% 6/15/27 | | 1,500 | 1,661 |
| 5% 6/15/30 | | 250 | 270 |
| 5% 6/15/35 | | 2,200 | 2,325 |
| Univ. of Virginia Gen. Rev. Series 2015 A, 5% 4/1/45 | | 6,000 | 6,851 |
| Virginia College Bldg. Auth. Edl. Facilities Rev. Series 2015 A: | | | |
| 5% 1/1/35 | | 1,000 | 1,133 |
| 5% 1/1/40 | | 1,750 | 1,967 |
| Virginia Small Bus. Fing. Auth. (95 Express Lane LLC Proj.) Series 2012: | | | |
| 5% 7/1/34 (d) | | 6,000 | 6,168 |
| 5% 1/1/40 (d) | | 4,200 | 4,278 |
| Winchester Econ. Dev. Auth. Series 2015: | | | |
| 5% 1/1/31 | | 2,500 | 2,824 |
| 5% 1/1/34 | | 1,500 | 1,666 |
| 5% 1/1/35 | | 1,500 | 1,658 |
|
| TOTAL VIRGINIA | | | 36,764 |
|
| Washington - 1.9% | | | |
| Chelan County Pub. Util. District #1 Columbia River-Rock Island Hydro-Elec. Sys. Rev. Series 1997 A, 0% 6/1/17 (Nat'l. Pub. Fin. Guarantee Corp. Insured) | | 7,200 | 7,158 |
| Clark County School District #37, Vancouver Series 2001 C, 0% 12/1/19 (Nat'l. Pub. Fin. Guarantee Corp. Insured) | | 2,030 | 1,930 |
| King County Swr. Rev. Series 2009, 5.25% 1/1/42 (Pre-Refunded to 1/1/19 @ 100) | | 2,035 | 2,191 |
| Port of Seattle Rev.: | | | |
| Series 2016 B: | | | |
| 5% 10/1/28 (d) | | 3,500 | 4,046 |
| 5% 10/1/30 (d) | | 1,000 | 1,145 |
| Series 2016: | | | |
| 5% 2/1/26 | | 2,000 | 2,349 |
| 5% 2/1/30 | | 3,650 | 4,182 |
| Port of Seattle Spl. Facility Rev. Series 2013: | | | |
| 5% 6/1/21 (d) | | 1,340 | 1,475 |
| 5% 6/1/22 (d) | | 1,000 | 1,112 |
| 5% 6/1/24 (d) | | 1,000 | 1,117 |
| Spokane Pub. Facilities District Hotel/Motel Tax & Sales/Use Tax Rev. Series 2013 B: | | | |
| 5% 12/1/25 | | 5,600 | 6,402 |
| 5% 12/1/27 | | 2,625 | 2,981 |
| Washington Gen. Oblig. Series R 97A: | | | |
| 0% 7/1/17 (Escrowed to Maturity) | | 7,045 | 7,009 |
| 0% 7/1/19 (Escrowed to Maturity) | | 9,100 | 8,744 |
| Washington Health Care Facilities Auth. Rev.: | | | |
| (Catholic Health Initiatives Proj.) Series 2008 D, 6.375% 10/1/36 | | 5,000 | 5,374 |
| (Overlake Hosp. Med. Ctr.) Series 2010, 5.7% 7/1/38 | | 11,300 | 12,569 |
| (Providence Health Systems Proj.): | | | |
| Series 2006 D, 5.25% 10/1/33 | | 1,500 | 1,587 |
| Series 2012 A, 5% 10/1/25 | | 5,130 | 5,829 |
| (Seattle Children's Hosp. Proj.) Series 2009, 5.625% 10/1/38 (Pre-Refunded to 10/1/19 @ 100) | | 7,550 | 8,370 |
| Series 2009, 7% 7/1/39 (Pre-Refunded to 7/1/19 @ 100) | | 3,000 | 3,393 |
| Series 2015: | | | |
| 5% 1/1/25 | | 2,000 | 2,322 |
| 5% 1/1/27 | | 1,610 | 1,856 |
| Washington Higher Ed. Facilities Auth. Rev. (Whitworth Univ. Proj.) Series 2016 A: | | | |
| 5% 10/1/27 | | 2,140 | 2,340 |
| 5% 10/1/28 | | 2,205 | 2,396 |
| 5% 10/1/35 | | 2,270 | 2,375 |
| 5% 10/1/36 | | 2,435 | 2,540 |
| 5% 10/1/40 | | 2,805 | 2,901 |
|
| TOTAL WASHINGTON | | | 105,693 |
|
| West Virginia - 0.4% | | | |
| West Virginia Econ. Dev. Auth. Solid Waste Disp. Facilities Rev. Bonds: | | | |
| (Appalachian Pwr. Co. Amos Proj.) Series 2011 A, 1.7%, tender 9/1/20 (b)(d) | | 1,750 | 1,690 |
| 1.9%, tender 4/1/19 (b) | | 9,125 | 9,087 |
| West Virginia Hosp. Fin. Auth. Hosp. Rev.: | | | |
| (West Virginia United Health Sys. Proj.) Series 2008 E, 5.625% 6/1/35 (Pre-Refunded to 12/1/18 @ 100) | | 700 | 757 |
| (West Virginia Univ. Hospitals, Inc. Proj.) Series 2003 D, 5.5% 6/1/33 (Pre-Refunded to 12/1/18 @ 100) | | 2,600 | 2,805 |
| West Virginia Univ. Revs. (West Virginia Univ. Projs.) Series 2014 A, 5% 10/1/44 | | 6,500 | 7,193 |
|
| TOTAL WEST VIRGINIA | | | 21,532 |
|
| Wisconsin - 1.1% | | | |
| Wisconsin Health & Edl. Facilities: | | | |
| Series 2014, 4% 5/1/33 | | 3,015 | 2,835 |
| Series 2016 A: | | | |
| 5% 2/15/28 | | 2,375 | 2,647 |
| 5% 2/15/29 | | 3,080 | 3,407 |
| 5% 2/15/30 | | 3,390 | 3,717 |
| 5% 2/15/42 | | 4,600 | 4,887 |
| 5% 2/15/46 | | 8,200 | 8,686 |
| Series 2016, 4% 2/15/38 | | 1,205 | 1,211 |
| Wisconsin Health & Edl. Facilities Auth. Rev.: | | | |
| (Agnesian HealthCare, Inc. Proj.): | | | |
| Series 2010: | | | |
| 5.5% 7/1/40 | | 2,375 | 2,597 |
| 5.75% 7/1/30 | | 2,655 | 2,950 |
| Series 2013 B: | | | |
| 5% 7/1/27 | | 1,205 | 1,345 |
| 5% 7/1/36 | | 5,000 | 5,414 |
| (Children's Hosp. of Wisconsin Proj.): | | | |
| Series 2008 A, 5.25% 8/15/22 | | 2,000 | 2,118 |
| Series 2008 B, 5.375% 8/15/37 | | 8,045 | 8,680 |
| Series 2012: | | | |
| 4% 10/1/23 | | 2,500 | 2,734 |
| 5% 6/1/27 | | 1,925 | 2,134 |
| 5% 6/1/39 | | 2,775 | 2,981 |
|
| TOTAL WISCONSIN | | | 58,343 |
|
| Wyoming - 0.2% | | | |
| Campbell County Solid Waste Facilities Rev. (Basin Elec. Pwr. Coop. - Dry Fork Station Facilities Proj.) Series 2009 A, 5.75% 7/15/39 | | 8,600 | 9,382 |
| TOTAL MUNICIPAL BONDS | | | |
| (Cost $5,257,744) | | | 5,396,153 |
|
| Municipal Notes - 0.2% | | | |
| Kentucky - 0.2% | | | |
| Kentucky Pub. Trans. BAN Series 2013 A, 5% 7/1/17 | | | |
| (Cost $8,722) | | 8,600 | 8,734 |
| | | Shares | Value (000s) |
|
| Money Market Funds - 0.0% | | | |
| Fidelity Municipal Cash Central Fund, 0.79% (g)(h) | | | |
| (Cost $100) | | 100,000 | 100 |
| TOTAL INVESTMENT PORTFOLIO - 98.7% | | | |
| (Cost $5,266,566) | | | 5,404,987 |
| NET OTHER ASSETS (LIABILITIES) - 1.3% | | | 72,213 |
| NET ASSETS - 100% | | | $5,477,200 |
Security Type Abbreviations
BAN – BOND ANTICIPATION NOTE
Legend
(a) Security initially issued in zero coupon form which converts to coupon form at a specified rate and date. The rate shown is the rate at period end.
(b) Coupon rates for floating and adjustable rate securities reflect the rates in effect at period end.
(c) Security exempt from registration under Rule 144A of the Securities Act of 1933. These securities may be resold in transactions exempt from registration, normally to qualified institutional buyers. At the end of the period, the value of these securities amounted to $3,013,000 or 0.1% of net assets.
(d) Private activity obligations whose interest is subject to the federal alternative minimum tax for individuals.
(e) Security or a portion of the security purchased on a delayed delivery or when-issued basis.
(f) Restricted securities - Investment in securities not registered under the Securities Act of 1933 (excluding 144A issues). At the end of the period, the value of restricted securities (excluding 144A issues) amounted to $1,912,000 or 0.0% of net assets.
(g) Information in this report regarding holdings by state and security types does not reflect the holdings of the Fidelity Municipal Cash Central Fund.
(h) Affiliated fund that is available only to investment companies and other accounts managed by Fidelity Investments. The rate quoted is the annualized seven-day yield of the fund at period end. A complete unaudited listing of the fund's holdings as of its most recent quarter end is available upon request. In addition, each Fidelity Central Fund's financial statements, which are not covered by the Fund's Report of Independent Registered Public Accounting Firm, are available on the SEC's website or upon request.
Additional information on each restricted holding is as follows:
| Security | Acquisition Date | Acquisition Cost (000s) |
| Massachusetts Health & Edl. Facilities Auth. Rev. (Blood Research Institute Proj.) Series A, 6.5% 2/1/22 | 9/3/92 | $1,796 |
Affiliated Central Funds
Information regarding fiscal year to date income earned by the Fund from investments in Fidelity Central Funds is as follows:
| Fund | Income earned |
| | (Amounts in thousands) |
| Fidelity Municipal Cash Central Fund | $122 |
| Total | $122 |
Investment Valuation
The following is a summary of the inputs used, as of December 31, 2016, involving the Fund's assets and liabilities carried at fair value. The inputs or methodology used for valuing securities may not be an indication of the risk associated with investing in those securities. For more information on valuation inputs, and their aggregation into the levels used below, please refer to the Investment Valuation section in the accompanying Notes to Financial Statements.
| | Valuation Inputs at Reporting Date: |
| Description | Total | Level 1 | Level 2 | Level 3 |
| (Amounts in thousands) | | | | |
| Investments in Securities: | | | | |
| Municipal Securities | $5,404,887 | $-- | $5,404,887 | $-- |
| Money Market Funds | 100 | 100 | -- | -- |
| Total Investments in Securities: | $5,404,987 | $100 | $5,404,887 | $-- |
Other Information
The distribution of municipal securities by revenue source, as a percentage of total Net Assets, is as follows (Unaudited):
| General Obligations | 29.8% |
| Health Care | 22.5% |
| Transportation | 18.7% |
| Escrowed/Pre-Refunded | 7.2% |
| Electric Utilities | 5.7% |
| Special Tax | 5.3% |
| Others* (Individually Less Than 5%) | 10.8% |
| | 100.0% |
* Includes net other assets
See accompanying notes which are an integral part of the financial statements.
Financial Statements
Statement of Assets and Liabilities
| Amounts in thousands (except per-share amount) | | December 31, 2016 |
| Assets | | |
Investment in securities, at value — See accompanying schedule:
Unaffiliated issuers (cost $5,266,466) | $5,404,887 | |
| Fidelity Central Funds (cost $100) | 100 | |
| Total Investments (cost $5,266,566) | | $5,404,987 |
| Cash | | 45,736 |
| Receivable for fund shares sold | | 3,327 |
| Interest receivable | | 65,182 |
| Distributions receivable from Fidelity Central Funds | | 19 |
| Prepaid expenses | | 11 |
| Other receivables | | 14 |
| Total assets | | 5,519,276 |
| Liabilities | | |
| Payable for investments purchased on a delayed delivery basis | $24,311 | |
| Payable for fund shares redeemed | 10,746 | |
| Distributions payable | 4,835 | |
| Accrued management fee | 1,653 | |
| Other affiliated payables | 456 | |
| Other payables and accrued expenses | 75 | |
| Total liabilities | | 42,076 |
| Net Assets | | $5,477,200 |
| Net Assets consist of: | | |
| Paid in capital | | $5,328,891 |
| Distributions in excess of net investment income | | (138) |
| Accumulated undistributed net realized gain (loss) on investments | | 10,026 |
| Net unrealized appreciation (depreciation) on investments | | 138,421 |
| Net Assets, for 426,065 shares outstanding | | $5,477,200 |
| Net Asset Value, offering price and redemption price per share ($5,477,200 ÷ 426,065 shares) | | $12.86 |
See accompanying notes which are an integral part of the financial statements.
Statement of Operations
| Amounts in thousands | | Year ended December 31, 2016 |
| Investment Income | | |
| Interest | | $210,977 |
| Income from Fidelity Central Funds | | 122 |
| Total income | | 211,099 |
| Expenses | | |
| Management fee | $20,630 | |
| Transfer agent fees | 4,972 | |
| Accounting fees and expenses | 689 | |
| Custodian fees and expenses | 43 | |
| Independent trustees' fees and expenses | 26 | |
| Registration fees | 97 | |
| Audit | 75 | |
| Legal | 17 | |
| Miscellaneous | 48 | |
| Total expenses before reductions | 26,597 | |
| Expense reductions | (66) | 26,531 |
| Net investment income (loss) | | 184,568 |
| Realized and Unrealized Gain (Loss) | | |
| Net realized gain (loss) on: | | |
| Investment securities: | | |
| Unaffiliated issuers | 79,050 | |
| Total net realized gain (loss) | | 79,050 |
| Change in net unrealized appreciation (depreciation) on investment securities | | (262,087) |
| Net gain (loss) | | (183,037) |
| Net increase (decrease) in net assets resulting from operations | | $1,531 |
See accompanying notes which are an integral part of the financial statements.
Statement of Changes in Net Assets
| Amounts in thousands | Year ended December 31, 2016 | Year ended December 31, 2015 |
| Increase (Decrease) in Net Assets | | |
| Operations | | |
| Net investment income (loss) | $184,568 | $195,762 |
| Net realized gain (loss) | 79,050 | 33,561 |
| Change in net unrealized appreciation (depreciation) | (262,087) | (47,495) |
| Net increase (decrease) in net assets resulting from operations | 1,531 | 181,828 |
| Distributions to shareholders from net investment income | (184,374) | (196,687) |
| Distributions to shareholders from net realized gain | (64,220) | (28,582) |
| Total distributions | (248,594) | (225,269) |
| Share transactions | | |
| Proceeds from sales of shares | 1,105,644 | 909,862 |
| Reinvestment of distributions | 169,290 | 151,510 |
| Cost of shares redeemed | (1,320,301) | (993,485) |
| Net increase (decrease) in net assets resulting from share transactions | (45,367) | 67,887 |
| Redemption fees | 120 | 50 |
| Total increase (decrease) in net assets | (292,310) | 24,496 |
| Net Assets | | |
| Beginning of period | 5,769,510 | 5,745,014 |
| End of period | $5,477,200 | $5,769,510 |
| Other Information | | |
| Distributions in excess of net investment income end of period | $(138) | $(125) |
| Shares | | |
| Sold | 82,590 | 67,590 |
| Issued in reinvestment of distributions | 12,685 | 11,269 |
| Redeemed | (98,640) | (74,016) |
| Net increase (decrease) | (3,365) | 4,843 |
See accompanying notes which are an integral part of the financial statements.
Financial Highlights — Fidelity Municipal Income Fund
| Years ended December 31, | 2016 | 2015 | 2014 | 2013 | 2012 |
| Selected Per–Share Data | | | | | |
| Net asset value, beginning of period | $13.44 | $13.53 | $12.68 | $13.57 | $13.03 |
| Income from Investment Operations | | | | | |
| Net investment income (loss)A | .437 | .460 | .475 | .479 | .483 |
| Net realized and unrealized gain (loss) | (.428) | (.021) | .851 | (.873) | .537 |
| Total from investment operations | .009 | .439 | 1.326 | (.394) | 1.020 |
| Distributions from net investment income | (.437) | (.462) | (.476) | (.478) | (.479) |
| Distributions from net realized gain | (.152) | (.067) | – | (.018) | (.001) |
| Total distributions | (.589) | (.529) | (.476) | (.496) | (.480) |
| Redemption fees added to paid in capitalA,B | – | – | – | – | – |
| Net asset value, end of period | $12.86 | $13.44 | $13.53 | $12.68 | $13.57 |
| Total ReturnC | (.01)% | 3.31% | 10.59% | (2.94)% | 7.92% |
| Ratios to Average Net AssetsD,E | | | | | |
| Expenses before reductions | .46% | .48% | .47% | .46% | .46% |
| Expenses net of fee waivers, if any | .46% | .48% | .47% | .46% | .46% |
| Expenses net of all reductions | .46% | .48% | .47% | .46% | .46% |
| Net investment income (loss) | 3.22% | 3.42% | 3.58% | 3.65% | 3.60% |
| Supplemental Data | | | | | |
| Net assets, end of period (in millions) | $5,477 | $5,770 | $5,745 | $5,337 | $6,792 |
| Portfolio turnover rateF | 25% | 14% | 9% | 10% | 10% |
A Calculated based on average shares outstanding during the period.
B Amount represents less than $.0005 per share.
C Total returns would have been lower if certain expenses had not been reduced during the applicable periods shown.
D Fees and expenses of any underlying Fidelity Central Funds are not included in the Fund's expense ratio. The Fund indirectly bears its proportionate share of the expenses of any underlying Fidelity Central Funds.
E Expense ratios reflect operating expenses of the Fund. Expenses before reductions do not reflect amounts reimbursed by the investment adviser or reductions from expense offset arrangements and do not represent the amount paid by the Fund during periods when reimbursements or reductions occur. Expenses net of fee waivers reflect expenses after reimbursement by the investment adviser but prior to reductions from expense offset arrangements. Expenses net of all reductions represent the net expenses paid by the Fund.
F Amount does not include the portfolio activity of any underlying Fidelity Central Funds.
See accompanying notes which are an integral part of the financial statements.
Notes to Financial Statements
For the period ended December 31, 2016
(Amounts in thousands except percentages)
1. Organization.
Fidelity Municipal Income Fund (the Fund) is a fund of Fidelity Municipal Trust (the Trust) and is authorized to issue an unlimited number of shares. Share transactions on the Statement of Changes in Net Assets may contain exchanges between affiliated funds. The Trust is registered under the Investment Company Act of 1940, as amended (the 1940 Act), as an open-end management investment company organized as a Massachusetts business trust.
2. Investments in Fidelity Central Funds.
The Fund invests in Fidelity Central Funds, which are open-end investment companies generally available only to other investment companies and accounts managed by the investment adviser and its affiliates. The Fund's Schedule of Investments lists each of the Fidelity Central Funds held as of period end, if any, as an investment of the Fund, but does not include the underlying holdings of each Fidelity Central Fund. As an Investing Fund, the Fund indirectly bears its proportionate share of the expenses of the underlying Fidelity Central Funds.
The Money Market Central Funds seek preservation of capital and current income and are managed by Fidelity Investments Money Management, Inc. (FIMM), an affiliate of the investment adviser. Annualized expenses of the Money Market Central Funds as of their most recent shareholder report date are less than .005%.
A complete unaudited list of holdings for each Fidelity Central Fund is available upon request or at the Securities and Exchange Commission (the SEC) website at www.sec.gov. In addition, the financial statements of the Fidelity Central Funds, which are not covered by the Fund's Report of Independent Registered Public Accounting Firm, are available on the SEC website or upon request.
3. Significant Accounting Policies.
The financial statements have been prepared in conformity with accounting principles generally accepted in the United States of America (GAAP), which require management to make certain estimates and assumptions at the date of the financial statements. Actual results could differ from those estimates. Subsequent events, if any, through the date that the financial statements were issued have been evaluated in the preparation of the financial statements. The following summarizes the significant accounting policies of the Fund:
Investment Valuation. Investments are valued as of 4:00 p.m. Eastern time on the last calendar day of the period. The Board of Trustees (the Board) has delegated the day to day responsibility for the valuation of the Fund's investments to the Fair Value Committee (the Committee) established by the Fund's investment adviser. In accordance with valuation policies and procedures approved by the Board, the Fund attempts to obtain prices from one or more third party pricing vendors or brokers to value its investments. When current market prices, quotations or currency exchange rates are not readily available or reliable, investments will be fair valued in good faith by the Committee, in accordance with procedures adopted by the Board. Factors used in determining fair value vary by investment type and may include market or investment specific events, changes in interest rates and credit quality. The frequency with which these procedures are used cannot be predicted and they may be utilized to a significant extent. The Committee oversees the Fund's valuation policies and procedures and reports to the Board on the Committee's activities and fair value determinations. The Board monitors the appropriateness of the procedures used in valuing the Fund's investments and ratifies the fair value determinations of the Committee.
The Fund categorizes the inputs to valuation techniques used to value its investments into a disclosure hierarchy consisting of three levels as shown below:
- Level 1 – quoted prices in active markets for identical investments
- Level 2 – other significant observable inputs (including quoted prices for similar investments, interest rates, prepayment speeds, etc.)
- Level 3 – unobservable inputs (including the Fund's own assumptions based on the best information available)
Valuation techniques used to value the Fund's investments by major category are as follows:
Debt securities, including restricted securities, are valued based on evaluated prices received from third party pricing vendors or from brokers who make markets in such securities. Municipal securities are valued by pricing vendors who utilize matrix pricing which considers yield or price of bonds of comparable quality, coupon, maturity and type or by broker-supplied prices. When independent prices are unavailable or unreliable, debt securities may be valued utilizing pricing methodologies which consider similar factors that would be used by third party pricing vendors. Debt securities are generally categorized as Level 2 in the hierarchy but may be Level 3 depending on the circumstances.
Investments in open-end mutual funds, including the Fidelity Central Funds, are valued at their closing net asset value (NAV) each business day and are categorized as Level 1 in the hierarchy.
Changes in valuation techniques may result in transfers in or out of an assigned level within the disclosure hierarchy. The aggregate value of investments by input level as of December 31, 2016 is included at the end of the Fund's Schedule of Investments.
Investment Transactions and Income. For financial reporting purposes, the Fund's investment holdings and NAV include trades executed through the end of the last business day of the period. The NAV per share for processing shareholder transactions is calculated as of the close of business of the New York Stock Exchange (NYSE), normally 4:00 p.m. Eastern time and includes trades executed through the end of the prior business day. Gains and losses on securities sold are determined on the basis of identified cost. Income and capital gain distributions from Fidelity Central Funds, if any, are recorded on the ex-dividend date. Interest income is accrued as earned and includes coupon interest and amortization of premium and accretion of discount on debt securities as applicable. Debt obligations may be placed on non-accrual status and related interest income may be reduced by ceasing current accruals and writing off interest receivables when the collection of all or a portion of interest has become doubtful based on consistently applied procedures. A debt obligation is removed from non-accrual status when the issuer resumes interest payments or when collectability of interest is reasonably assured.
Expenses. Expenses directly attributable to a fund are charged to that fund. Expenses attributable to more than one fund are allocated among the respective funds on the basis of relative net assets or other appropriate methods. Expense estimates are accrued in the period to which they relate and adjustments are made when actual amounts are known.
Income Tax Information and Distributions to Shareholders. Each year, the Fund intends to qualify as a regulated investment company under Subchapter M of the Internal Revenue Code, including distributing substantially all of its taxable income and realized gains. As a result, no provision for U.S. Federal income taxes is required. As of December 31, 2016, the Fund did not have any unrecognized tax benefits in the financial statements; nor is the Fund aware of any tax positions for which it is reasonably possible that the total amounts of unrecognized tax benefits will significantly change in the next twelve months. The Fund files a U.S. federal tax return, in addition to state and local tax returns as required. The Fund's federal income tax returns are subject to examination by the Internal Revenue Service (IRS) for a period of three fiscal years after they are filed. State and local tax returns may be subject to examination for an additional fiscal year depending on the jurisdiction.
Dividends are declared and recorded daily and paid monthly from net investment income. Distributions from realized gains, if any, are declared and recorded on the ex-dividend date. Income and capital gain distributions are determined in accordance with income tax regulations, which may differ from GAAP. In addition, the Fund claimed a portion of the payment made to redeeming shareholders as a distribution for income tax purposes.
Capital accounts within the financial statements are adjusted for permanent book-tax differences. These adjustments have no impact on net assets or the results of operations. Capital accounts are not adjusted for temporary book-tax differences which will reverse in a subsequent period.
Book-tax differences are primarily due to market discount, deferred trustees compensation and losses deferred due to futures contracts.
The Fund purchases municipal securities whose interest, in the opinion of the issuer, is free from federal income tax. There is no assurance that the IRS will agree with this opinion. In the event the IRS determines that the issuer does not comply with relevant tax requirements, interest payments from a security could become federally taxable, possibly retroactively to the date the security was issued.
The federal tax cost of investment securities and unrealized appreciation (depreciation) as of period end were as follows:
| Gross unrealized appreciation | $230,116 |
| Gross unrealized depreciation | (91,762) |
| Net unrealized appreciation (depreciation) on securities | $138,354 |
| Tax Cost | $5,266,633 |
The tax-based components of distributable earnings as of period end were as follows:
| Undistributed long-term capital gain | $10,026 |
| Net unrealized appreciation (depreciation) on securities and other investments | $138,354 |
The tax character of distributions paid was as follows:
| | December 31, 2016 | December 31, 2015 |
| Tax-exempt Income | $184,374 | $196,687 |
| Long-term Capital Gains | 64,220 | 28,582 |
| Total | $ 248,594 | $ 225,269 |
Short-Term Trading (Redemption) Fees. Shares held by investors in the Fund less than 30 days may have been subject to a redemption fee equal to .50% of the NAV of shares redeemed. All redemption fees, which reduce the proceeds of the shareholder redemption, are retained by the Fund and accounted for as an addition to paid in capital. In November 2016, the Board of Trustees approved the elimination of these redemption fees effective December 12, 2016.
Delayed Delivery Transactions and When-Issued Securities. During the period, the Fund transacted in securities on a delayed delivery or when-issued basis. Payment and delivery may take place after the customary settlement period for that security. The price of the underlying securities and the date when the securities will be delivered and paid for are fixed at the time the transaction is negotiated. The securities purchased on a delayed delivery or when-issued basis are identified as such in the Fund's Schedule of Investments. The Fund may receive compensation for interest forgone in the purchase of a delayed delivery or when-issued security. With respect to purchase commitments, the Fund identifies securities as segregated in its records with a value at least equal to the amount of the commitment. Losses may arise due to changes in the value of the underlying securities or if the counterparty does not perform under the contract's terms, or if the issuer does not issue the securities due to political, economic, or other factors.
Restricted Securities. The Fund may invest in securities that are subject to legal or contractual restrictions on resale. These securities generally may be resold in transactions exempt from registration or to the public if the securities are registered. Disposal of these securities may involve time-consuming negotiations and expense, and prompt sale at an acceptable price may be difficult. Information regarding restricted securities is included at the end of the Fund's Schedule of Investments.
4. Purchases and Sales of Investments.
Purchases and sales of securities, other than short-term securities, aggregated $1,419,990 and $1,466,495, respectively.
5. Fees and Other Transactions with Affiliates.
Management Fee. Fidelity Management & Research Company (the investment adviser) and its affiliates provide the Fund with investment management related services for which the Fund pays a monthly management fee. The management fee is the sum of an individual fund fee rate that is based on an annual rate of .25% of the Fund's average net assets and an annualized group fee rate that averaged 0.11% during the period. The group fee rate is based upon the average net assets of all the mutual funds advised by the investment adviser, including any mutual funds previously advised by the investment adviser that are currently advised by Fidelity SelectCo, LLC, an affiliate of the investment adviser. The group fee rate decreases as assets under management increase and increases as assets under management decrease. For the reporting period, the total annual management fee rate was .36% of the Fund's average net assets.
Transfer Agent Fees. Fidelity Investments Institutional Operations Company, Inc. (FIIOC), an affiliate of the investment adviser, is the transfer, dividend disbursing and shareholder servicing agent for the Fund. FIIOC receives account fees and asset-based fees that vary according to account size and type of account. FIIOC pays for typesetting, printing and mailing of shareholder reports, except proxy statements. For the period, transfer agent fees were equivalent to an annual rate of .09% of average net assets.
Accounting Fees. Fidelity Service Company, Inc. (FSC), an affiliate of the investment adviser, maintains the Fund's accounting records. The fee is based on the level of average net assets for each month.
Interfund Trades. The Fund may purchase from or sell securities to other Fidelity Funds under procedures adopted by the Board. The procedures have been designed to ensure these interfund trades are executed in accordance with Rule 17a-7 of the 1940 Act. Interfund trades are included within the respective purchases and sales amounts shown in the Purchases and Sales of Investments note.
6. Committed Line of Credit.
The Fund participates with other funds managed by the investment adviser or an affiliate in a $4.25 billion credit facility (the "line of credit") to be utilized for temporary or emergency purposes to fund shareholder redemptions or for other short-term liquidity purposes. The Fund has agreed to pay commitment fees on its pro-rata portion of the line of credit, which amounted to $15 and is reflected in Miscellaneous expenses on the Statement of Operations. During the period, the Fund did not borrow on this line of credit.
7. Expense Reductions.
Through arrangements with the Fund's custodian, credits realized as a result of certain uninvested cash balances were used to reduce the Fund's expenses. During the period, these credits reduced the Fund's custody expenses by $43.
In addition, during the period the investment adviser reimbursed and/or waived a portion of operating expenses in the amount of $23.
8. Other.
The Fund's organizational documents provide former and current trustees and officers with a limited indemnification against liabilities arising in connection with the performance of their duties to the Fund. In the normal course of business, the Fund may also enter into contracts that provide general indemnifications. The Fund's maximum exposure under these arrangements is unknown as this would be dependent on future claims that may be made against the Fund. The risk of material loss from such claims is considered remote.
Report of Independent Registered Public Accounting Firm
To the Trustees of Fidelity Municipal Trust and Shareholders of Fidelity Municipal Income Fund:
In our opinion, the accompanying statement of assets and liabilities, including the schedule of investments, and the related statements of operations and of changes in net assets and the financial highlights present fairly, in all material respects, the financial position of Fidelity Municipal Income Fund (a fund of Fidelity Municipal Trust) as of December 31, 2016, the results of its operations for the year then ended, the changes in its net assets for each of the two years in the period then ended and the financial highlights for each of the five years in the period then ended, in conformity with accounting principles generally accepted in the United States of America. These financial statements and financial highlights (hereafter referred to as “financial statements”) are the responsibility of the Fidelity Municipal Income Fund’s management. Our responsibility is to express an opinion on these financial statements based on our audits. We conducted our audits of these financial statements in accordance with the standards of the Public Company Accounting Oversight Board (United States). Those standards require that we plan and perform the audit to obtain reasonable assurance about whether the financial statements are free of material misstatement. An audit includes examining, on a test basis, evidence supporting the amounts and disclosures in the financial statements, assessing the accounting principles used and significant estimates made by management, and evaluating the overall financial statement presentation. We believe that our audits, which included confirmation of securities as of December 31, 2016 by correspondence with the custodian and brokers, provide a reasonable basis for our opinion.
PricewaterhouseCoopers LLP
Boston, Massachusetts
February 14, 2017
Trustees and Officers
The Trustees, Members of the Advisory Board (if any), and officers of the trust and fund, as applicable, are listed below. The Board of Trustees governs the fund and is responsible for protecting the interests of shareholders. The Trustees are experienced executives who meet periodically throughout the year to oversee the fund's activities, review contractual arrangements with companies that provide services to the fund, oversee management of the risks associated with such activities and contractual arrangements, and review the fund's performance. Each of the Trustees oversees 243 funds.
The Trustees hold office without limit in time except that (a) any Trustee may resign; (b) any Trustee may be removed by written instrument, signed by at least two-thirds of the number of Trustees prior to such removal; (c) any Trustee who requests to be retired or who has become incapacitated by illness or injury may be retired by written instrument signed by a majority of the other Trustees; and (d) any Trustee may be removed at any special meeting of shareholders by a two-thirds vote of the outstanding voting securities of the trust. Each Trustee who is not an interested person (as defined in the 1940 Act) of the trust and the fund is referred to herein as an Independent Trustee. Each Independent Trustee shall retire not later than the last day of the calendar year in which his or her 75th birthday occurs. The Independent Trustees may waive this mandatory retirement age policy with respect to individual Trustees. Officers and Advisory Board Members hold office without limit in time, except that any officer or Advisory Board Member may resign or may be removed by a vote of a majority of the Trustees at any regular meeting or any special meeting of the Trustees. Except as indicated, each individual has held the office shown or other offices in the same company for the past five years.
The fund’s Statement of Additional Information (SAI) includes more information about the Trustees. To request a free copy, call Fidelity at 1-800-544-8544.
Experience, Skills, Attributes, and Qualifications of the Trustees. The Governance and Nominating Committee has adopted a statement of policy that describes the experience, qualifications, attributes, and skills that are necessary and desirable for potential Independent Trustee candidates (Statement of Policy). The Board believes that each Trustee satisfied at the time he or she was initially elected or appointed a Trustee, and continues to satisfy, the standards contemplated by the Statement of Policy. The Governance and Nominating Committee also engages professional search firms to help identify potential Independent Trustee candidates who have the experience, qualifications, attributes, and skills consistent with the Statement of Policy. From time to time, additional criteria based on the composition and skills of the current Independent Trustees, as well as experience or skills that may be appropriate in light of future changes to board composition, business conditions, and regulatory or other developments, have also been considered by the professional search firms and the Governance and Nominating Committee. In addition, the Board takes into account the Trustees' commitment and participation in Board and committee meetings, as well as their leadership of standing and ad hoc committees throughout their tenure.
In determining that a particular Trustee was and continues to be qualified to serve as a Trustee, the Board has considered a variety of criteria, none of which, in isolation, was controlling. The Board believes that, collectively, the Trustees have balanced and diverse experience, qualifications, attributes, and skills, which allow the Board to operate effectively in governing the fund and protecting the interests of shareholders. Information about the specific experience, skills, attributes, and qualifications of each Trustee, which in each case led to the Board's conclusion that the Trustee should serve (or continue to serve) as a trustee of the fund, is provided below.
Board Structure and Oversight Function. Abigail P. Johnson is an interested person and currently serves as Chairman. The Trustees have determined that an interested Chairman is appropriate and benefits shareholders because an interested Chairman has a personal and professional stake in the quality and continuity of services provided to the fund. Independent Trustees exercise their informed business judgment to appoint an individual of their choosing to serve as Chairman, regardless of whether the Trustee happens to be independent or a member of management. The Independent Trustees have determined that they can act independently and effectively without having an Independent Trustee serve as Chairman and that a key structural component for assuring that they are in a position to do so is for the Independent Trustees to constitute a substantial majority for the Board. The Independent Trustees also regularly meet in executive session. Marie L. Knowles serves as Chairman of the Independent Trustees and as such (i) acts as a liaison between the Independent Trustees and management with respect to matters important to the Independent Trustees and (ii) with management prepares agendas for Board meetings.
Fidelity® funds are overseen by different Boards of Trustees. The fund's Board oversees Fidelity's investment-grade bond, money market, asset allocation and certain equity funds, and other Boards oversee Fidelity's high income, sector and other equity funds. The asset allocation funds may invest in Fidelity® funds that are overseen by such other Boards. The use of separate Boards, each with its own committee structure, allows the Trustees of each group of Fidelity® funds to focus on the unique issues of the funds they oversee, including common research, investment, and operational issues. On occasion, the separate Boards establish joint committees to address issues of overlapping consequences for the Fidelity® funds overseen by each Board.
The Trustees operate using a system of committees to facilitate the timely and efficient consideration of all matters of importance to the Trustees, the fund, and fund shareholders and to facilitate compliance with legal and regulatory requirements and oversight of the fund's activities and associated risks. The Board, acting through its committees, has charged FMR and its affiliates with (i) identifying events or circumstances the occurrence of which could have demonstrably adverse effects on the fund's business and/or reputation; (ii) implementing processes and controls to lessen the possibility that such events or circumstances occur or to mitigate the effects of such events or circumstances if they do occur; and (iii) creating and maintaining a system designed to evaluate continuously business and market conditions in order to facilitate the identification and implementation processes described in (i) and (ii) above. Because the day-to-day operations and activities of the fund are carried out by or through FMR, its affiliates, and other service providers, the fund's exposure to risks is mitigated but not eliminated by the processes overseen by the Trustees. While each of the Board's committees has responsibility for overseeing different aspects of the fund's activities, oversight is exercised primarily through the Operations and Audit Committees. In addition, an ad hoc Board committee of Independent Trustees has worked with FMR to enhance the Board's oversight of investment and financial risks, legal and regulatory risks, technology risks, and operational risks, including the development of additional risk reporting to the Board. Appropriate personnel, including but not limited to the fund's Chief Compliance Officer (CCO), FMR's internal auditor, the independent accountants, the fund's Treasurer and portfolio management personnel, make periodic reports to the Board's committees, as appropriate, including an annual review of Fidelity's risk management program for the Fidelity® funds. The responsibilities of each standing committee, including their oversight responsibilities, are described further under "Standing Committees of the Trustees."
Interested Trustees*:
Correspondence intended for a Trustee who is an interested person may be sent to Fidelity Investments, 245 Summer Street, Boston, Massachusetts 02210.
Name, Year of Birth; Principal Occupations and Other Relevant Experience+
Abigail P. Johnson (1961)
Year of Election or Appointment: 2009
Trustee
Chairman of the Board of Trustees
Ms. Johnson also serves as Trustee of other Fidelity® funds. Ms. Johnson serves as Chairman (2016-present), Chief Executive Officer (2014-present), and Director (2007-present) of FMR LLC (diversified financial services company), President of Fidelity Financial Services (2012-present) and President of Personal, Workplace and Institutional Services (2005-present). Ms. Johnson is Chairman and Director of FMR Co., Inc. (investment adviser firm, 2011-present) and Chairman and Director of FMR (investment adviser firm, 2011-present). Previously, Ms. Johnson served as Vice Chairman (2007-2016) and President (2013-2016) of FMR LLC, President and a Director of FMR (2001-2005), a Trustee of other investment companies advised by FMR, Fidelity Investments Money Management, Inc. (investment adviser firm), and FMR Co., Inc. (2001-2005), Senior Vice President of the Fidelity® funds (2001-2005), and managed a number of Fidelity® funds. Ms. Abigail P. Johnson and Mr. Arthur E. Johnson are not related.
Jennifer Toolin McAuliffe (1959)
Year of Election or Appointment: 2016
Trustee
Ms. McAuliffe also serves as Trustee of other Fidelity® funds. Ms. McAuliffe previously served as a Member of the Advisory Board of certain Fidelity® funds (2016) and as Co-Head of Fixed Income of Fidelity Investments Limited (now known as FIL Limited (FIL)) (diversified financial services company). Earlier roles at FIL included Director of Research for FIL’s credit and quantitative teams in London, Hong Kong and Tokyo. Ms. McAuliffe also was the Director of Research for taxable and municipal bonds at Fidelity Investments Money Management, Inc. Ms. McAuliffe is also a director or trustee of several not-for-profit entities.
* Determined to be an “Interested Trustee” by virtue of, among other things, his or her affiliation with the trust or various entities under common control with FMR.
+ The information includes the Trustee's principal occupation during the last five years and other information relating to the experience, attributes, and skills relevant to the Trustee's qualifications to serve as a Trustee, which led to the conclusion that the Trustee should serve as a Trustee for the fund.
Independent Trustees:
Correspondence intended for an Independent Trustee may be sent to Fidelity Investments, P.O. Box 55235, Boston, Massachusetts 02205-5235.
Name, Year of Birth; Principal Occupations and Other Relevant Experience+
Elizabeth S. Acton (1951)
Year of Election or Appointment: 2013
Trustee
Ms. Acton also serves as Trustee of other Fidelity® funds. Prior to her retirement in April 2012, Ms. Acton was Executive Vice President, Finance (2011-2012), Executive Vice President, Chief Financial Officer (2002-2011), and Treasurer (2004-2005) of Comerica Incorporated (financial services). Prior to joining Comerica, Ms. Acton held a variety of positions at Ford Motor Company (1983-2002), including Vice President and Treasurer (2000-2002) and Executive Vice President and Chief Financial Officer of Ford Motor Credit Company (1998-2000). Ms. Acton currently serves as a member of the Board of Directors and Audit and Finance Committees of Beazer Homes USA, Inc. (homebuilding, 2012-present). Previously, Ms. Acton served as a Member of the Advisory Board of certain Fidelity® funds (2013-2016).
John Engler (1948)
Year of Election or Appointment: 2014
Trustee
Mr. Engler also serves as Trustee of other Fidelity® funds. He serves as president of the Business Roundtable (2011-present), and on the board of directors for Universal Forest Products (manufacturer and distributor of wood and wood-alternative products, 2003-present) and K12 Inc. (technology-based education company, 2012-present). Previously, Mr. Engler served as a Member of the Advisory Board of certain Fidelity® funds (2014-2016), a trustee of The Munder Funds (2003-2014), president and CEO of the National Association of Manufacturers (2004-2011), member of the Board of Trustees of the Annie E. Casey Foundation (2004-2015), and as governor of Michigan (1991-2003). He is a past chairman of the National Governors Association.
Albert R. Gamper, Jr. (1942)
Year of Election or Appointment: 2006
Trustee
Mr. Gamper also serves as Trustee of other Fidelity® funds. Prior to his retirement in December 2004, Mr. Gamper served as Chairman of the Board of CIT Group Inc. (commercial finance). During his tenure with CIT Group Inc. Mr. Gamper served in numerous senior management positions, including Chairman (1987-1989; 1999-2001; 2002-2004), Chief Executive Officer (1987-2004), and President (2002-2003). Mr. Gamper currently serves as a member of the Board of Directors of Public Service Enterprise Group (utilities, 2000-present), and Member of the Board of Trustees of Barnabas Health Care System (1997-present). Previously, Mr. Gamper served as Chairman (2012-2015) and Vice Chairman (2011-2012) of the Independent Trustees of certain Fidelity® funds and as Chairman of the Board of Governors, Rutgers University (2004-2007).
Robert F. Gartland (1951)
Year of Election or Appointment: 2010
Trustee
Mr. Gartland also serves as Trustee of other Fidelity® funds. Mr. Gartland is Chairman and an investor in Gartland & Mellina Group Corp. (consulting, 2009-present). Previously, Mr. Gartland served as a partner and investor of Vietnam Partners LLC (investments and consulting, 2008-2011). Prior to his retirement, Mr. Gartland held a variety of positions at Morgan Stanley (financial services, 1979-2007) including Managing Director (1987-2007).
Arthur E. Johnson (1947)
Year of Election or Appointment: 2008
Trustee
Vice Chairman of the Independent Trustees
Mr. Johnson also serves as Trustee of other Fidelity® funds. Mr. Johnson serves as a member of the Board of Directors of Eaton Corporation plc (diversified power management, 2009-present) and Booz Allen Hamilton (management consulting, 2011-present). Prior to his retirement, Mr. Johnson served as Senior Vice President of Corporate Strategic Development of Lockheed Martin Corporation (defense contractor, 1999-2009). He previously served on the Board of Directors of IKON Office Solutions, Inc. (1999-2008), AGL Resources, Inc. (holding company, 2002-2016), and Delta Airlines (2005-2007). Mr. Arthur E. Johnson is not related to Ms. Abigail P. Johnson.
Michael E. Kenneally (1954)
Year of Election or Appointment: 2009
Trustee
Mr. Kenneally also serves as Trustee of other Fidelity® funds. Prior to his retirement, Mr. Kenneally served as Chairman and Global Chief Executive Officer of Credit Suisse Asset Management. Before joining Credit Suisse, he was an Executive Vice President and Chief Investment Officer for Bank of America Corporation. Earlier roles at Bank of America included Director of Research, Senior Portfolio Manager and Research Analyst, and Mr. Kenneally was awarded the Chartered Financial Analyst (CFA) designation in 1991.
Marie L. Knowles (1946)
Year of Election or Appointment: 2001
Trustee
Chairman of the Independent Trustees
Ms. Knowles also serves as Trustee of other Fidelity® funds. Prior to Ms. Knowles' retirement in June 2000, she served as Executive Vice President and Chief Financial Officer of Atlantic Richfield Company (ARCO) (diversified energy, 1996-2000). From 1993 to 1996, she was a Senior Vice President of ARCO and President of ARCO Transportation Company (pipeline and tanker operations). Ms. Knowles currently serves as a Director and Chairman of the Audit Committee of McKesson Corporation (healthcare service, since 2002). Ms. Knowles is a member of the Board of the Santa Catalina Island Company (real estate, 2009-present). Ms. Knowles is a Member of the Investment Company Institute Board of Governors and a Member of the Governing Council of the Independent Directors Council (2014-present). She also serves as a member of the Advisory Board for the School of Engineering of the University of Southern California. Previously, Ms. Knowles served as a Director of Phelps Dodge Corporation (copper mining and manufacturing, 1994-2007), URS Corporation (engineering and construction, 2000-2003) and America West (airline, 1999-2002). Ms. Knowles previously served as Vice Chairman of the Independent Trustees of certain Fidelity® funds (2012-2015).
Mark A. Murray (1954)
Year of Election or Appointment: 2016
Trustee
Mr. Murray also serves as Trustee of other Fidelity® funds. Mr. Murray is Vice Chairman (2013-present) of Meijer, Inc. (regional retail chain). Previously, Mr. Murray served as a Member of the Advisory Board of certain Fidelity® funds (2016) and as Co-Chief Executive Officer (2013-2016) and President (2006-2013) of Meijer, Inc. Mr. Murray serves as a member of the Board of Directors and Nuclear Review and Public Policy and Responsibility Committees of DTE Energy Company (diversified energy company, 2009-present). Mr. Murray also serves as a member of the Board of Directors of Spectrum Health (not-for-profit health system, 2015-present). Mr. Murray previously served as President of Grand Valley State University (2001-2006), Treasurer for the State of Michigan (1999-2001), Vice President of Finance and Administration for Michigan State University (1998-1999), and a member of the Board of Directors and Audit Committee and Chairman of the Nominating and Corporate Governance Committee of Universal Forest Products, Inc. (manufacturer and distributor of wood and wood-alternative products, 2004-2016). Mr. Murray is also a director or trustee of many community and professional organizations.
+ The information includes the Trustee's principal occupation during the last five years and other information relating to the experience, attributes, and skills relevant to the Trustee's qualifications to serve as a Trustee, which led to the conclusion that the Trustee should serve as a Trustee for the fund.
Advisory Board Members and Officers:
Correspondence intended for an officer may be sent to Fidelity Investments, 245 Summer Street, Boston, Massachusetts 02210. Officers appear below in alphabetical order.
Name, Year of Birth; Principal Occupation
Marc R. Bryant (1966)
Year of Election or Appointment: 2015
Secretary and Chief Legal Officer (CLO)
Mr. Bryant also serves as Secretary and CLO of other funds. Mr. Bryant serves as CLO, Secretary, and Senior Vice President of Fidelity Management & Research Company (investment adviser firm, 2015-present) and FMR Co., Inc. (investment adviser firm, 2015-present); Secretary of Fidelity SelectCo, LLC (investment adviser firm, 2015-present) and Fidelity Investments Money Management, Inc. (investment adviser firm, 2015-present); and CLO of Fidelity Management & Research (Hong Kong) Limited and FMR Investment Management (UK) Limited (investment adviser firms, 2015-present) and Fidelity Management & Research (Japan) Limited (investment adviser firm, 2016-present). He is Senior Vice President and Deputy General Counsel of FMR LLC (diversified financial services company). Previously, Mr. Bryant served as Secretary and CLO of Fidelity Rutland Square Trust II (2010-2014) and Assistant Secretary of Fidelity's Fixed Income and Asset Allocation Funds (2013-2015). Prior to joining Fidelity Investments, Mr. Bryant served as a Senior Vice President and the Head of Global Retail Legal for AllianceBernstein L.P. (2006-2010), and as the General Counsel for ProFund Advisors LLC (2001-2006).
Jeffrey S. Christian (1961)
Year of Election or Appointment: 2016
Assistant Treasurer
Mr. Christian also serves as Assistant Treasurer of other funds. Mr. Christian is an employee of Fidelity Investments (2003-present).
Jonathan Davis (1968)
Year of Election or Appointment: 2010
Assistant Treasurer
Mr. Davis also serves as Assistant Treasurer of other funds, and is an employee of Fidelity Investments. Previously, Mr. Davis served as Vice President and Associate General Counsel of FMR LLC (diversified financial services company, 2003-2010).
Adrien E. Deberghes (1967)
Year of Election or Appointment: 2010
Assistant Treasurer
Mr. Deberghes also serves as an officer of other funds. He serves as Executive Vice President of Fidelity Investments Money Management, Inc. (FIMM) (investment adviser firm, 2016-present) and is an employee of Fidelity Investments (2008-present). Prior to joining Fidelity Investments, Mr. Deberghes was Senior Vice President of Mutual Fund Administration at State Street Corporation (2007-2008), Senior Director of Mutual Fund Administration at Investors Bank & Trust (2005-2007), and Director of Finance for Dunkin' Brands (2000-2005). Previously, Mr. Deberghes served in other fund officer roles.
Stephanie J. Dorsey (1969)
Year of Election or Appointment: 2013
President and Treasurer
Ms. Dorsey also serves as an officer of other funds. She is an employee of Fidelity Investments (2008-present) and has served in other fund officer roles. Prior to joining Fidelity Investments, Ms. Dorsey served as Treasurer (2004-2008) of the JPMorgan Mutual Funds and Vice President (2004-2008) of JPMorgan Chase Bank.
Howard J. Galligan III (1966)
Year of Election or Appointment: 2014
Chief Financial Officer
Mr. Galligan also serves as Chief Financial Officer of other funds. Mr. Galligan serves as President of Fidelity Pricing and Cash Management Services (FPCMS) (2014-present) and as a Director of Strategic Advisers, Inc. (investment adviser firm, 2008-present). Previously, Mr. Galligan served as Chief Administrative Officer of Asset Management (2011-2014) and Chief Operating Officer and Senior Vice President of Investment Support for Strategic Advisers, Inc. (2003-2011).
Scott C. Goebel (1968)
Year of Election or Appointment: 2015
Vice President
Mr. Goebel serves as Vice President of other funds and is an employee of Fidelity Investments (2001-present). Previously, Mr. Goebel served as Senior Vice President of Fidelity Management & Research Company (FMR) (investment adviser firm, 2016), Secretary of Fidelity SelectCo, LLC (investment adviser firm, 2013-2015), Fidelity Investments Money Management, Inc. (FIMM) (investment adviser firm, 2010-2015), and Fidelity Research and Analysis Company (FRAC) (investment adviser firm, 2010-2015); General Counsel, Secretary, and Senior Vice President of FMR (investment adviser firm, 2008-2015) and FMR Co., Inc. (investment adviser firm, 2008-2015); Assistant Secretary of Fidelity Management & Research (Japan) Limited (investment adviser firm, 2008-2015) and Fidelity Management & Research (U.K.) Inc. (investment adviser firm, 2008-2015); Chief Legal Officer (CLO) of Fidelity Management & Research (Hong Kong) Limited (investment adviser firm, 2008-2015); Secretary and CLO of certain Fidelity® funds (2008-2015); Assistant Secretary of FIMM (2008-2010), FRAC (2008-2010), and certain funds (2007-2008); and as Vice President and Secretary of Fidelity Distributors Corporation (FDC) (2005-2007).
Colm A. Hogan (1973)
Year of Election or Appointment: 2016
Assistant Treasurer
Mr. Hogan also serves as an officer of other funds. Mr. Hogan is an employee of Fidelity Investments (2005-present).
Chris Maher (1972)
Year of Election or Appointment: 2013
Assistant Treasurer
Mr. Maher serves as Assistant Treasurer of other funds. Mr. Maher is Vice President of Valuation Oversight and is an employee of Fidelity Investments. Previously, Mr. Maher served as Vice President of Asset Management Compliance (2013), Vice President of the Program Management Group of FMR (investment adviser firm, 2010-2013), and Vice President of Valuation Oversight (2008-2010).
John B. McGinty, Jr. (1962)
Year of Election or Appointment: 2016
Chief Compliance Officer
Mr. McGinty also serves as Chief Compliance Officer of other funds. Mr. McGinty is Senior Vice President of Asset Management Compliance for Fidelity Investments and is an employee of Fidelity Investments (2016-present). Mr. McGinty previously served as Vice President, Senior Attorney at Eaton Vance Management (investment management firm, 2015-2016), and prior to Eaton Vance as global CCO for all firm operations and registered investment companies at GMO LLC (investment management firm, 2009-2015). Before joining GMO LLC, Mr. McGinty served as Senior Vice President, Deputy General Counsel for Fidelity Investments (2007-2009).
John F. Papandrea (1972)
Year of Election or Appointment: 2016
Anti-Money Laundering (AML) Officer
Mr. Papandrea also serves as AML Officer of other funds. Mr. Papandrea is Vice President of FMR LLC (diversified financial services company, 2008-present) and is an employee of Fidelity Investments (2005-present).
Jason P. Pogorelec (1975)
Year of Election or Appointment: 2015
Assistant Secretary
Mr. Pogorelec also serves as Assistant Secretary of other funds. Mr. Pogorelec serves as Vice President, Associate General Counsel (2010-present) and is an employee of Fidelity Investments (2006-present).
Nancy D. Prior (1967)
Year of Election or Appointment: 2014
Vice President
Ms. Prior also serves as Vice President of other funds. Ms. Prior serves as a Director of FMR Investment Management (UK) Limited (investment adviser firm, 2015-present), President (2016-present) and Director (2014-present) of Fidelity Investments Money Management, Inc. (FIMM) (investment adviser firm), President, Fixed Income (2014-present), Vice Chairman of FIAM LLC (investment adviser firm, 2014-present), and is an employee of Fidelity Investments (2002-present). Previously, Ms. Prior served as Vice President of Fidelity's Money Market Funds (2012-2014), President, Money Market and Short Duration Bond Group of Fidelity Management & Research (FMR) (investment adviser firm, 2013-2014), President, Money Market Group of FMR (2011-2013), Managing Director of Research (2009-2011), Senior Vice President and Deputy General Counsel (2007-2009), and Assistant Secretary of certain Fidelity® funds (2008-2009).
Stacie M. Smith (1974)
Year of Election or Appointment: 2013
Assistant Treasurer
Ms. Smith also serves as an officer of other funds. She is an employee of Fidelity Investments (2009-present) and has served in other fund officer roles. Prior to joining Fidelity Investments, Ms. Smith served as Senior Audit Manager of Ernst & Young LLP (accounting firm, 1996-2009). Previously, Ms. Smith served as Deputy Treasurer of certain Fidelity® funds (2013-2016).
Marc L. Spector (1972)
Year of Election or Appointment: 2016
Deputy Treasurer
Mr. Spector also serves as an officer of other funds. Mr. Spector is an employee of Fidelity Investments (2016-present). Prior to joining Fidelity Investments, Mr. Spector served as Director at the Siegfried Group (accounting firm, 2013-2016), and prior to Siegfried Group as audit senior manager at Deloitte & Touche (accounting firm, 2005-2013).
Renee Stagnone (1975)
Year of Election or Appointment: 2016
Assistant Treasurer
Ms. Stagnone also serves as an officer of other funds. Ms. Stagnone is an employee of Fidelity Investments (1997-present). Previously, Ms. Stagnone served as Deputy Treasurer of certain Fidelity® funds (2013-2016).
Christine J. Thompson (1958)
Year of Election or Appointment: 2015
Vice President of Fidelity's Bond Funds
Ms. Thompson also serves as Vice President of other funds. Ms. Thompson also serves as Chief Investment Officer of FMR's Bond Group (2010-present) and is an employee of Fidelity Investments (1985-present). Previously, Ms. Thompson served as Vice President of Fidelity's Bond Funds (2010-2012).
Shareholder Expense Example
As a shareholder of the Fund, you incur two types of costs: (1) transaction costs, including redemption fees and (2) ongoing costs, including management fees and other Fund expenses. This Example is intended to help you understand your ongoing costs (in dollars) of investing in the Fund and to compare these costs with the ongoing costs of investing in other mutual funds.
The Example is based on an investment of $1,000 invested at the beginning of the period and held for the entire period (July 1, 2016 to December 31, 2016).
Actual Expenses
The first line of the accompanying table provides information about actual account values and actual expenses. You may use the information in this line, together with the amount you invested, to estimate the expenses that you paid over the period. Simply divide your account value by $1,000.00 (for example, an $8,600 account value divided by $1,000.00 = 8.6), then multiply the result by the number in the first line under the heading entitled "Expenses Paid During Period" to estimate the expenses you paid on your account during this period. A small balance maintenance fee of $12.00 that is charged once a year may apply for certain accounts with a value of less than $2,000. This fee is not included in the table below. If it was, the estimate of expenses you paid during the period would be higher, and your ending account value lower, by this amount. In addition, the Fund, as a shareholder in the underlying Fidelity Central Funds, will indirectly bear its pro-rata share of the fees and expenses incurred by the underlying Fidelity Central Funds. These fees and expenses are not included in the Fund's annualized expense ratio used to calculate the expense estimate in the table below.
Hypothetical Example for Comparison Purposes
The second line of the accompanying table provides information about hypothetical account values and hypothetical expenses based on the Fund's actual expense ratio and an assumed rate of return of 5% per year before expenses, which is not the Fund's actual return. The hypothetical account values and expenses may not be used to estimate the actual ending account balance or expenses you paid for the period. You may use this information to compare the ongoing costs of investing in the Fund and other funds. To do so, compare this 5% hypothetical example with the 5% hypothetical examples that appear in the shareholder reports of the other funds. A small balance maintenance fee of $12.00 that is charged once a year may apply for certain accounts with a value of less than $2,000. This fee is not included in the table below. If it was, the estimate of expenses you paid during the period would be higher, and your ending account value lower, by this amount. In addition, the Fund, as a shareholder in the underlying Fidelity Central Funds, will indirectly bear its pro-rata share of the fees and expenses incurred by the underlying Fidelity Central Funds. These fees and expenses are not included in the Fund's annualized expense ratio used to calculate the expense estimate in the table below.
Please note that the expenses shown in the table are meant to highlight your ongoing costs only and do not reflect any transaction costs. Therefore, the second line of the table is useful in comparing ongoing costs only, and will not help you determine the relative total costs of owning different funds. In addition, if these transactional costs were included, your costs would have been higher.
| | Annualized Expense Ratio-A | Beginning
Account Value
July 1, 2016 | Ending
Account Value
December 31, 2016 | Expenses Paid
During Period-B
July 1, 2016
to December 31, 2016 |
| Actual | .46% | $1,000.00 | $952.40 | $2.26 |
| Hypothetical-C | | $1,000.00 | $1,022.82 | $2.34 |
A Annualized expense ratio reflects expenses net of applicable fee waivers.
B Expenses are equal to the Fund's annualized expense ratio, multiplied by the average account value over the period, multiplied by 184/366 (to reflect the one-half year period).
C 5% return per year before expenses
Distributions (Unaudited)
The Board of Trustees of Fidelity Municipal Income Fund voted to pay on February 6, 2017, to shareholders of record at the opening of business on February 3, 2017, a distribution of $.025 per share derived from capital gains realized from sales of portfolio securities.
The fund hereby designates as a capital gain dividend with respect to the taxable year ended December 31, 2016, $79,083,688 or, if subsequently determined to be different, the net capital gain of such year.
During fiscal year ended 2016, 100% of the fund's income dividends was free from federal income tax, and 6.52% of the fund's income dividends was subject to the federal alternative minimum tax.
The fund will notify shareholders in January 2017 of amounts for use in preparing 2016 income tax returns.
Board Approval of Investment Advisory Contracts and Management Fees
Fidelity Municipal Income Fund
Each year, the Board of Trustees, including the Independent Trustees (together, the Board), votes on the renewal of the management contract with Fidelity Management & Research Company (FMR) and the sub-advisory agreements (together, the Advisory Contracts) for the fund. The Board, assisted by the advice of fund counsel and Independent Trustees' counsel, requests and considers a broad range of information relevant to the renewal of the Advisory Contracts throughout the year.
The Board meets regularly and, at each of its meetings, covers an extensive agenda of topics and materials and considers factors that are relevant to its annual consideration of the renewal of the fund's Advisory Contracts, including the services and support provided to the fund and its shareholders. The Board has established four standing committees (Committees) — Operations, Audit, Fair Valuation, and Governance and Nominating — each composed of and chaired by Independent Trustees with varying backgrounds, to which the Board has assigned specific subject matter responsibilities in order to enhance effective decision-making by the Board. The Operations Committee, of which all of the Independent Trustees are members, meets regularly throughout the year and considers, among other matters, information specifically related to the annual consideration of the renewal of the fund's Advisory Contracts. The Board, acting directly and through its Committees, requests and receives information concerning the annual consideration of the renewal of the fund's Advisory Contracts. The Board also meets as needed to consider matters specifically related to the Board's annual consideration of the renewal of the Advisory Contracts. Members of the Board may also meet with trustees of other Fidelity funds through ad hoc joint committees to discuss certain matters relevant to all of the Fidelity funds.
At its September 2016 meeting, the Board unanimously determined to renew the fund's Advisory Contracts. In reaching its determination, the Board considered all factors it believed relevant, including (i) the nature, extent, and quality of the services to be provided to the fund and its shareholders (including the investment performance of the fund); (ii) the competitiveness of the fund's management fee and total expense ratio relative to peer funds; (iii) the total costs of the services to be provided by and the profits to be realized by Fidelity from its relationships with the fund; and (iv) the extent to which, if any, economies of scale exist and would be realized as the fund grows, and whether any economies of scale are appropriately shared with fund shareholders.
In considering whether to renew the Advisory Contracts for the fund, the Board reached a determination, with the assistance of fund counsel and Independent Trustees' counsel and through the exercise of its business judgment, that the renewal of the Advisory Contracts was in the best interests of the fund and its shareholders and that the compensation payable under the Advisory Contracts was fair and reasonable. The Board's decision to renew the Advisory Contracts was not based on any single factor, but rather was based on a comprehensive consideration of all the information provided to the Board at its meetings throughout the year. The Board, in reaching its determination to renew the Advisory Contracts, was aware that shareholders of the fund have a broad range of investment choices available to them, including a wide choice among funds offered by Fidelity's competitors, and that the fund's shareholders, who have the opportunity to review and weigh the disclosure provided by the fund in its prospectus and other public disclosures, have chosen to invest in this fund, which is part of the Fidelity family of funds.
Nature, Extent, and Quality of Services Provided. The Board considered Fidelity's staffing as it relates to the fund, including the backgrounds of investment personnel of Fidelity, and also considered the fund's investment objective, strategies, and related investment philosophy. The Independent Trustees also had discussions with senior management of Fidelity's investment operations and investment groups. The Board considered the structure of the investment personnel compensation program and whether this structure provides appropriate incentives to act in the best interests of the fund. Additionally, the Board considered the portfolio managers' investments, if any, in the funds that they manage.
Resources Dedicated to Investment Management and Support Services. The Board reviewed the general qualifications and capabilities of Fidelity's investment staff, including its size, education, experience, and resources, as well as Fidelity's approach to recruiting, managing, and compensating investment personnel. The Board noted that Fidelity has continued to increase the resources devoted to non-U.S. offices, including expansion of Fidelity's global investment organization. The Board also noted that Fidelity's analysts have extensive resources, tools and capabilities that allow them to conduct sophisticated quantitative and fundamental analysis, as well as credit analysis of issuers, counterparties and guarantors. Further, the Board considered that Fidelity's investment professionals have sufficient access to global information and data so as to provide competitive investment results over time, and that those professionals also have access to sophisticated tools that permit them to assess portfolio construction and risk and performance attribution characteristics continuously, as well as to transmit new information and research conclusions rapidly around the world. Additionally, in its deliberations, the Board considered Fidelity's trading, risk management, compliance, and technology and operations capabilities and resources, which are integral parts of the investment management process.
Shareholder and Administrative Services. The Board considered (i) the nature, extent, quality, and cost of advisory, administrative, and shareholder services performed by FMR, the sub-advisers (together with FMR, the Investment Advisers), and their affiliates under the Advisory Contracts and under separate agreements covering transfer agency and pricing and bookkeeping services for the fund; (ii) the nature and extent of the supervision of third party service providers, principally custodians, subcustodians, and pricing vendors; and (iii) the resources devoted to, and the record of compliance with, the fund's compliance policies and procedures.
The Board noted that the growth of fund assets over time across the complex allows Fidelity to reinvest in the development of services designed to enhance the value or convenience of the Fidelity funds as investment vehicles. These services include 24-hour access to account information and market information through telephone representatives and over the Internet, investor education materials and asset allocation tools, and the expanded availability of Fidelity Investor Centers.
Investment in a Large Fund Family. The Board considered the benefits to shareholders of investing in a Fidelity fund, including the benefits of investing in a fund that is part of a large family of funds offering a variety of investment disciplines and providing a large variety of mutual fund investor services. The Board noted that Fidelity had taken, or had made recommendations that resulted in the Fidelity funds taking, a number of actions over the previous year that benefited particular funds, including: (i) continuing to dedicate additional resources to investment research and to the support of the senior management team that oversees asset management; (ii) continuing efforts to enhance Fidelity's global research capabilities; (iii) launching new funds and making other enhancements to meet client needs; (iv) broadening eligibility requirements for certain lower-priced share classes of, and streamlining the fee structure for, certain existing equity index funds; (v) lowering expense caps for certain existing funds and classes to reduce expenses paid by shareholders; (vi) eliminating redemption fees for certain variable insurance product funds and classes; (vii) continuing to launch dedicated lower cost underlying funds to meet portfolio construction needs related to expanding underlying fund options for Fidelity funds of funds, specifically for the Freedom Fund product lines; (viii) launching a lower cost share class for use by the Freedom Index Fund product line; (ix) rationalizing product lines and gaining increased efficiencies through fund mergers and share class consolidations; (x) continuing to develop, acquire and implement systems and technology to improve services to the funds and shareholders, strengthen information security, and increase efficiency; (xi) implementing investment enhancements to further strengthen Fidelity's target date product line to increase investors' probability of success in achieving their goals; (xii) accelerating the conversion of all remaining Class B shares to Class A shares, which have a lower expense structure; and (xiii) implementing changes to Fidelity's money market fund product line in response to recent regulatory reforms.
Investment Performance. The Board considered whether the fund has operated in accordance with its investment objective, as well as its record of compliance with its investment restrictions and its performance history. The Board noted that there was a portfolio management change for the fund in May 2016.
The Board took into account discussions with representatives of the Investment Advisers about fund investment performance that occur at Board meetings throughout the year. In this regard the Board noted that as part of regularly scheduled fund reviews and other reports to the Board on fund performance, the Board considers annualized return information for the fund for different time periods, measured against a securities market index ("benchmark index") and a peer group of funds with similar objectives ("peer group"), if any. In its evaluation of fund investment performance at meetings throughout the year, the Board gave particular attention to information indicating underperformance of certain Fidelity funds for specific time periods and discussed with the Investment Advisers the reasons for such underperformance.
In addition to reviewing absolute and relative fund performance, the Independent Trustees periodically consider the appropriateness of fund performance metrics in evaluating the results achieved. In general, the Independent Trustees believe that fund performance should be evaluated based on gross performance (before fees and expenses but after transaction costs) compared to appropriate benchmark indices, over appropriate time periods that may include full market cycles, and on net performance (after fees and expenses) compared to peer groups, as applicable, over the same periods, taking into account relevant factors including the following: general market conditions; expectations for interest rate levels and credit conditions; issuer-specific information including credit quality; the potential for incremental return versus the fund's benchmark index weighed against the risks involved in obtaining that incremental return, including the risk of diminished or negative total returns; and fund cash flows and other factors. Depending on the circumstances, the Independent Trustees may be satisfied with a fund's performance notwithstanding that it lags its benchmark index or peer group for certain periods.
The Independent Trustees recognize that shareholders evaluate performance on a net basis over their own holding periods, for which one-, three-, and five-year periods are often used as a proxy. For this reason, the performance information reviewed by the Board also included net cumulative calendar year total return information for the fund and an appropriate benchmark index and peer group for the most recent one-, three-, and five-year periods.
Based on its review, the Board concluded that the nature, extent, and quality of services provided to the fund under the Advisory Contracts should continue to benefit the shareholders of the fund.
Competitiveness of Management Fee and Total Expense Ratio. The Board considered the fund's management fee and total expense ratio compared to "mapped groups" of competitive funds and classes created for the purpose of facilitating the Trustees' competitive analysis of management fees and total expenses. Fidelity creates "mapped groups" by combining similar Lipper investment objective categories that have comparable investment mandates. Combining Lipper investment objective categories aids the Board's management fee and total expense ratio comparisons by broadening the competitive group used for comparison.
Management Fee. The Board considered two proprietary management fee comparisons for the 12-month periods shown in basis points (BP) in the chart below. The group of Lipper funds used by the Board for management fee comparisons is referred to below as the "Total Mapped Group" and, for the reasons explained above, is broader than the Lipper peer group used by the Board for performance comparisons. The Total Mapped Group comparison focuses on a fund's standing in terms of gross management fees before expense reimbursements or caps relative to the total universe of funds with comparable investment mandates, regardless of whether their management fee structures also are comparable. Funds with comparable investment mandates offer exposure to similar types of securities. Funds with comparable management fee structures have similar management fee contractual arrangements (
e.g., flat rate charged for advisory services, all-inclusive fee rate,
etc.). "TMG %" represents the percentage of funds in the Total Mapped Group that had management fees that were lower than the fund's. For example, a hypothetical TMG % of 20% would mean that 80% of the funds in the Total Mapped Group had higher, and 20% had lower, management fees than the fund. The fund's actual TMG %s and the number of funds in the Total Mapped Group are in the chart below. The "Asset-Size Peer Group" (ASPG) comparison focuses on a fund's standing relative to a subset of non-Fidelity funds within the Total Mapped Group that are similar in size and management fee structure. For example, if a fund is in the first quartile of the ASPG, the fund's management fee ranks in the least expensive or lowest 25% of funds in the ASPG. The ASPG represents at least 15% of the funds in the Total Mapped Group with comparable asset size and management fee structures, subject to a minimum of 50 funds (or all funds in the Total Mapped Group if fewer than 50). Additional information, such as the ASPG quartile in which the fund's management fee rate ranked, is also included in the chart and considered by the Board.
Fidelity Municipal Income Fund
The Board noted that the fund's management fee rate ranked below the median of its Total Mapped Group and below the median of its ASPG for 2015.
The Board noted that, in 2014, the ad hoc Committee on Group Fee was formed by it and the boards of other Fidelity funds to conduct an in-depth review of the "group fee" component of the management fee of funds with such management fee structures. The Committee's focus included the mechanics of the group fee, the competitive landscape of group fee structures, Fidelity funds with no group fee component and investment products not included in group fee assets. The Board also considered that, for funds subject to the group fee, FMR agreed to voluntarily waive fees over a specified period of time in amounts designed to account for assets converted from certain funds to certain collective investment trusts.
Based on its review, the Board concluded that the fund's management fee is fair and reasonable in light of the services that the fund receives and the other factors considered.
Total Expense Ratio. In its review of the fund's total expense ratio, the Board considered the fund's management fee rate as well as other fund expenses, such as transfer agent fees, pricing and bookkeeping fees, and custodial, legal, and audit fees. The Board also noted that Fidelity may agree to waive fees and expenses from time to time, and the extent to which, if any, it has done so for the fund. As part of its review, the Board also considered the current and historical total expense ratios of the fund compared to competitive fund median expenses. The fund is compared to those funds and classes in the Total Mapped Group (used by the Board for management fee comparisons) that have a similar sales load structure.
The Board noted that the fund's total expense ratio ranked below the competitive median for 2015.
Fees Charged to Other Fidelity Clients. The Board also considered Fidelity fee structures and other information with respect to clients of Fidelity, such as other funds advised or subadvised by Fidelity, pension plan clients, and other institutional clients with similar mandates. The Board noted that an ad hoc joint committee created by it and the boards of other Fidelity funds periodically (most recently in 2013) reviews and compares Fidelity's institutional investment advisory business with its business of providing services to the Fidelity funds, including the differences in services provided, fees charged, and costs incurred, as well as competition in their respective marketplaces.
Based on its review of total expense ratios and fees charged to other Fidelity clients, the Board concluded that the fund's total expense ratio was reasonable in light of the services that the fund and its shareholders receive and the other factors considered.
Costs of the Services and Profitability. The Board considered the revenues earned and the expenses incurred by Fidelity in conducting the business of developing, marketing, distributing, managing, administering and servicing the fund and servicing the fund's shareholders. The Board also considered the level of Fidelity's profits in respect of all the Fidelity funds.
On an annual basis, Fidelity presents to the Board information about the profitability of its relationships with the fund. Fidelity calculates profitability information for each fund, as well as aggregate profitability information for groups of Fidelity funds and all Fidelity funds, using a series of detailed revenue and cost allocation methodologies which originate with the books and records of Fidelity on which Fidelity's audited financial statements are based. The Audit Committee of the Board reviews any significant changes from the prior year's methodologies.
PricewaterhouseCoopers LLP (PwC), independent registered public accounting firm and auditor to Fidelity and certain Fidelity funds, has been engaged annually by the Board as part of the Board's assessment of Fidelity's profitability analysis. PwC's engagement includes the review and assessment of the methodologies used by Fidelity in determining the revenues and expenses attributable to Fidelity's mutual fund business, and completion of agreed-upon procedures in respect of the mathematical accuracy of the fund profitability information and its conformity to established allocation methodologies. After considering PwC's reports issued under the engagement and information provided by Fidelity, the Board concluded that while other allocation methods may also be reasonable, Fidelity's profitability methodologies are reasonable in all material respects.
The Board also reviewed Fidelity's non-fund businesses and fall-out benefits related to the mutual fund business as well as cases where Fidelity's affiliates may benefit from or be related to the fund's business.
The Board considered the costs of the services provided by and the profits realized by Fidelity in connection with the operation of the fund and was satisfied that the profitability was not excessive.
Economies of Scale. The Board considered whether there have been economies of scale in respect of the management of the Fidelity funds, whether the Fidelity funds (including the fund) have appropriately benefited from any such economies of scale, and whether there is potential for realization of any further economies of scale. The Board considered the extent to which the fund will benefit from economies of scale as assets grow through increased services to the fund, through waivers or reimbursements, or through fee or expense ratio reductions. The Board also noted that a committee (the Economies of Scale Committee) created by it and the boards of other Fidelity funds periodically (most recently in 2013) analyzes whether Fidelity attains economies of scale in respect of the management and servicing of the Fidelity funds, whether the Fidelity funds have appropriately benefited from such economies of scale, and whether there is potential for realization of any further economies of scale.
The Board recognized that the fund's management contract incorporates a "group fee" structure, which provides for lower group fee rates as total group assets increase, and for higher group fee rates as total group assets decrease (with "group assets" defined to include fund assets under FMR's management plus the assets of sector funds previously under FMR's management). FMR calculates the group fee rates based on a tiered asset "breakpoint" schedule that varies based on asset class. The Board considered that the group fee is designed to deliver the benefits of economies of scale to fund shareholders when total Fidelity fund assets increase, even if assets of any particular fund are unchanged or have declined, because some portion of Fidelity's costs are attributable to services provided to all Fidelity funds, and all funds benefit if those costs can be allocated among more assets. The Board concluded that, given the group fee structure, fund shareholders will benefit from lower management fees as group assets increase at the fund complex level, regardless of whether Fidelity achieves any such economies of scale.
The Board concluded, taking into account the analysis of the Economies of Scale Committee, that economies of scale, if any, are being appropriately shared between fund shareholders and Fidelity.
Additional Information Requested by the Board. In order to develop fully the factual basis for consideration of the Fidelity funds' advisory contracts, the Board requested and received additional information on certain topics, including: (i) Fidelity's fund profitability methodology, profitability trends for certain funds, and the impact of certain factors on fund profitability results; (ii) portfolio manager changes that have occurred during the past year and the amount of the investment that each portfolio manager has made in the Fidelity fund(s) that he or she manages; (iii) Fidelity's compensation structure for portfolio managers, research analysts, and other key personnel, including its effects on fund profitability, the rationale for the compensation structure, and the extent to which current market conditions have affected retention and recruitment; (iv) the arrangements with and compensation paid to certain fund sub-advisers on behalf of the Fidelity funds; (v) Fidelity's voluntary waiver of its fees to maintain minimum yields for certain money market funds and classes as well as contractual waivers in place for certain funds; (vi) the methodology with respect to competitive fund data and peer group classifications; (vii) Fidelity's transfer agent fee, expense, and service structures for different funds and classes relative to competitive trends, and the impact of the increased use of omnibus accounts; (viii) Fidelity's long-term expectations for its offerings in the workplace investing channel; (ix) new developments in the retail and institutional marketplaces; (x) the approach to considering "fall-out" benefits; and (xi) the impact of money market reform on Fidelity's money market funds, including with respect to costs and profitability. In addition, the Board considered its discussions with Fidelity throughout the year regarding enhanced information security initiatives and the funds' fair valuation policies.
Based on its evaluation of all of the conclusions noted above, and after considering all factors it believed relevant, the Board concluded that the advisory fee structures are fair and reasonable, and that the fund's Advisory Contracts should be renewed.
Corporate Headquarters
245 Summer St.
Boston, MA 02210
www.fidelity.com
HIY-ANN-0217
1.539263.119
Fidelity® Ohio Municipal Income Fund
Fidelity® Ohio Municipal Money Market Fund
Annual Report December 31, 2016 |
|
Contents
To view a fund's proxy voting guidelines and proxy voting record for the 12-month period ended June 30, visit http://www.fidelity.com/proxyvotingresults or visit the Securities and Exchange Commission's (SEC) web site at http://www.sec.gov.
You may also call 1-800-544-8544 to request a free copy of the proxy voting guidelines.
Standard & Poor's, S&P and S&P 500 are registered service marks of The McGraw-Hill Companies, Inc. and have been licensed for use by Fidelity Distributors Corporation.
Other third-party marks appearing herein are the property of their respective owners.
All other marks appearing herein are registered or unregistered trademarks or service marks of FMR LLC or an affiliated company. © 2017 FMR LLC. All rights reserved.
This report and the financial statements contained herein are submitted for the general information of the shareholders of the Fund. This report is not authorized for distribution to prospective investors in the Fund unless preceded or accompanied by an effective prospectus.
A fund files its complete schedule of portfolio holdings with the SEC for the first and third quarters of each fiscal year on Form N-Q. Forms N-Q are available on the SEC’s web site at http://www.sec.gov. A fund's Forms N-Q may be reviewed and copied at the SEC’s Public Reference Room in Washington, DC. Information regarding the operation of the SEC's Public Reference Room may be obtained by calling 1-800-SEC-0330.
For a complete list of a fund's portfolio holdings, view the most recent holdings listing, semiannual report, or annual report on Fidelity's web site at http://www.fidelity.com, http://www.institutional.fidelity.com, or http://www.401k.com, as applicable.
NOT FDIC INSURED •MAY LOSE VALUE •NO BANK GUARANTEE
Neither the Fund nor Fidelity Distributors Corporation is a bank.
Fidelity® Ohio Municipal Income Fund
Performance: The Bottom Line
Average annual total return reflects the change in the value of an investment, assuming reinvestment of distributions from dividend income and capital gains (the profits earned upon the sale of securities that have grown in value, if any) and assuming a constant rate of performance each year. The hypothetical investment and the average annual total returns do not reflect the deduction of taxes that a shareholder would pay on fund distributions or the redemption of fund shares. During periods of reimbursement by Fidelity, a fund’s total return will be greater than it would be had the reimbursement not occurred. How a fund did yesterday is no guarantee of how it will do tomorrow.
Average Annual Total Returns
| For the periods ended December 31, 2016 | Past 1 year | Past 5 years | Past 10 years |
| Fidelity® Ohio Municipal Income Fund | 0.19% | 3.62% | 4.22% |
$10,000 Over 10 Years
Let's say hypothetically that $10,000 was invested in Fidelity® Ohio Municipal Income Fund on December 31, 2006.
The chart shows how the value of your investment would have changed, and also shows how the Bloomberg Barclays Municipal Bond Index performed over the same period.

| Period Ending Values |
| $15,120 | Fidelity® Ohio Municipal Income Fund |
| $15,158 | Bloomberg Barclays Municipal Bond Index |
Effective August 24, 2016, all Barclays benchmark indices were co-branded as the Bloomberg Barclays Indices for a period of five years.
Fidelity® Ohio Municipal Income Fund
Management's Discussion of Fund Performance
Market Recap: For the 12 months ending December 31, 2016, tax-exempt bonds eked out only a 0.25% return, according to the Bloomberg Barclays Municipal Bond Index. For much of the period, fairly strong demand and a stable credit environment for state and local governments drove moderate muni returns. But a downward trend began in September and steepened through November – the worst month for the muni market since 2008 – as investors became concerned about U.S. President-elect Donald Trump’s expansionary fiscal policy ambitions, inflation and the potential for tax reform to impair tax-exempt bond valuations. Further, some theorized that changes to or repeal of the Affordable Care Act by the incoming administration and a Republican-controlled Congress may affect the prices of muni bonds issued by hospitals. Muni bonds also were hurt by market anticipation of a quarter-point increase in policy interest rates, which happened in December. At year-end, concerns about unfunded pension liabilities generally are compartmentalized to certain issuers. Looking ahead, we think the U.S. Federal Reserve is likely to raise policy interest rates further in 2017, perhaps in multiple stages.
Comments from Co-Portfolio Manager Cormac Cullen: For the year, the fund rose 0.19%, modestly lagging, net of fees, the 0.51% return of the Bloomberg Barclays Ohio 4+ Year Enhanced Municipal Bond Index. The portfolio managers continued to focus on long-term objectives by seeking to generate attractive tax-exempt income and competitive risk-adjusted returns over time. The manner in which the fund’s investments were spread across bonds with various maturities – known as yield curve positioning – was the main drag on our relative result. The fund was bulleted, meaning it was more heavily concentrated in bonds in the intermediate-maturity range, reflecting what we viewed as the attractive valuations of these securities. However, bonds in this range underperformed most relative to shorter- and longer-term alternatives. In contrast, relative performance was helped by our overweighting in lower-rated investment-grade bonds, particularly those in the health care sector. These securities – rated A and BBB – attracted heavy demand from yield-seeking investors throughout much of the year. Coupled with the comparatively high level of income they generated, they outperformed high-quality securities, in which the fund had an underweighting for the period overall.
The views expressed above reflect those of the portfolio manager(s) only through the end of the period as stated on the cover of this report and do not necessarily represent the views of Fidelity or any other person in the Fidelity organization. Any such views are subject to change at any time based upon market or other conditions and Fidelity disclaims any responsibility to update such views. These views may not be relied on as investment advice and, because investment decisions for a Fidelity fund are based on numerous factors, may not be relied on as an indication of trading intent on behalf of any Fidelity fund.
Note to Shareholders: On May 2, 2016, Cormac Cullen, Kevin Ramundo and Mark Sommer became Co-Managers of the fund, succeeding Portfolio Manager Jamie Pagliocco.
Fidelity® Ohio Municipal Income Fund
Investment Summary (Unaudited)
Top Five Sectors as of December 31, 2016
| | % of fund's net assets | % of fund's net assets 6 months ago |
| General Obligations | 29.8 | 32.2 |
| Health Care | 26.6 | 21.3 |
| Education | 21.7 | 21.0 |
| Water & Sewer | 7.6 | 5.5 |
| Electric Utilities | 4.7 | 5.4 |
Quality Diversification (% of fund's net assets)
| As of December 31, 2016 |
| | AAA | 9.4% |
| | AA,A | 85.1% |
| | BBB | 4.1% |
| | BB and Below | 0.3% |
| | Not Rated | 1.2% |
| | Short-Term Investments and Net Other Assets* | (0.1)% |

* Short-Term Investments and Net Other Assets (Liabilities) are not included in the pie chart
| As of June 30, 2016 |
| | AAA | 8.0% |
| | AA,A | 89.0% |
| | BBB | 2.3% |
| | BB and Below | 0.8% |
| | Not Rated | 0.1% |
| | Short-Term Investments and Net Other Assets* | (0.2)% |

* Short-Term Investments and Net Other Assets (Liabilities) are not included in the pie chart
We have used ratings from Moody's Investors Service, Inc. Where Moody's® ratings are not available, we have used S&P® ratings. All ratings are as of the date indicated and do not reflect subsequent changes.
Fidelity® Ohio Municipal Income Fund
Investments December 31, 2016
Showing Percentage of Net Assets
| Municipal Bonds - 100.1% | | | |
| | | Principal Amount | Value |
| Guam - 1.6% | | | |
| Guam Gov't. Ltd. Oblig. Rev. Series 2016 A: | | | |
| 5% 12/1/21 | | $2,000,000 | $2,196,280 |
| 5% 12/1/28 | | 2,500,000 | 2,748,075 |
| 5% 12/1/32 | | 2,500,000 | 2,698,600 |
| Guam Int'l. Arpt. Auth. Rev. Series 2013 C: | | | |
| 5% 10/1/18 (a) | | 950,000 | 993,624 |
| 6.25% 10/1/34 (a) | | 900,000 | 1,025,640 |
| Guam Pwr. Auth. Rev. Series 2012 A, 5% 10/1/23 (FSA Insured) | | 1,000,000 | 1,125,780 |
|
| TOTAL GUAM | | | 10,787,999 |
|
| Ohio - 98.5% | | | |
| Akron Bath Copley Hosp. District Rev.: | | | |
| (Children's Hosp. Med. Ctr. Proj.): | | | |
| Series 2012 5% 11/15/22 | | 1,000,000 | 1,133,800 |
| Series 2012, 5% 11/15/23 | | 3,245,000 | 3,658,251 |
| Series 2016: | | | |
| 5% 11/15/22 | | 1,000,000 | 1,105,030 |
| 5.25% 11/15/34 | | 1,500,000 | 1,628,550 |
| 5.25% 11/15/41 | | 5,295,000 | 5,673,540 |
| Allen County Hosp. Facilities Rev. (Catholic Healthcare Partners Proj.) Series 2010 B, 5.25% 9/1/27 | | 5,000,000 | 5,560,600 |
| American Muni. Pwr., Inc. Rev.: | | | |
| (AMP Freemont Energy Ctr. Proj.): | | | |
| Series 2012 B, 5.25% 2/15/26 | | 6,875,000 | 7,759,056 |
| Series 2012, 5.25% 2/15/28 | | 8,040,000 | 9,036,960 |
| (Prairie State Energy Campus Proj.) Series 2015: | | | |
| 5% 2/15/28 | | 3,995,000 | 4,503,124 |
| 5% 2/15/42 | | 3,000,000 | 3,249,570 |
| 5% 2/15/38 | | 240,000 | 247,788 |
| Beavercreek City School District Series 2015: | | | |
| 5% 12/1/28 | | 1,500,000 | 1,752,225 |
| 5% 12/1/29 | | 1,500,000 | 1,745,250 |
| Bowling Green Univ. Gen. Receipts Series 2016 A: | | | |
| 5% 6/1/42 | | 1,000,000 | 1,113,080 |
| 5% 6/1/44 | | 6,080,000 | 6,757,677 |
| Buckeye Tobacco Settlement Fing. Auth. Series 2007 A1, 5% 6/1/17 | | 3,240,000 | 3,289,896 |
| Butler County Hosp. Facilities Rev.: | | | |
| (Kettering Health Network Obligated Group Proj.) Series 2011, 6.375% 4/1/36 | | 5,030,000 | 5,745,920 |
| (UC Health Proj.) Series 2010, 5.5% 11/1/40 (Pre-Refunded to 11/1/40 @ 100) | | 3,050,000 | 3,388,520 |
| Series 2016 X: | | | |
| 5% 5/15/31 | | 3,225,000 | 3,807,338 |
| 5% 5/15/32 | | 3,950,000 | 4,669,927 |
| Series 2016, 5% 11/15/45 | | 4,500,000 | 4,863,510 |
| Cincinnati City School District Ctfs. of Prtn. (Cincinnati City School District School Impt. Proj.) 5% 12/15/26 | | 4,000,000 | 4,607,480 |
| Cincinnati Gen. Oblig. Series 2015, 5.25% 12/1/29 | | 4,285,000 | 5,169,638 |
| Cincinnati Wtr. Sys. Rev.: | | | |
| Series 2015 A: | | | |
| 5% 12/1/40 | | 3,260,000 | 3,719,627 |
| 5% 12/1/45 | | 1,665,000 | 1,892,839 |
| Series A, 5% 12/1/36 | | 1,700,000 | 1,915,101 |
| Cleveland Gen. Oblig.: | | | |
| Series 2005, 5.5% 10/1/20 (AMBAC Insured) | | 7,350,000 | 8,303,222 |
| Series 2012, 5% 12/1/25 | | 2,350,000 | 2,688,682 |
| Series 2015: | | | |
| 5% 12/1/26 | | 1,500,000 | 1,759,770 |
| 5% 12/1/27 | | 2,000,000 | 2,339,480 |
| 5% 12/1/29 | | 1,250,000 | 1,450,438 |
| Series C: | | | |
| 5.25% 11/15/20 (Nat'l. Pub. Fin. Guarantee Corp. Insured) | | 1,100,000 | 1,235,663 |
| 5.25% 11/15/21 (Nat'l. Pub. Fin. Guarantee Corp. Insured) | | 1,145,000 | 1,306,834 |
| 5.25% 11/15/22 (Nat'l. Pub. Fin. Guarantee Corp. Insured) | | 1,210,000 | 1,406,081 |
| 5.25% 11/15/23 (Nat'l. Pub. Fin. Guarantee Corp. Insured) | | 1,885,000 | 2,221,623 |
| Cleveland Heights & Univ. Heights County School District Series 2014, 4.5% 12/1/47 | | 3,000,000 | 3,151,380 |
| Cleveland Muni. School District: | | | |
| Series 2013, 5% 12/1/24 | | 1,255,000 | 1,446,337 |
| Series 2015 A: | | | |
| 5% 12/1/24 | | 3,725,000 | 4,308,745 |
| 5% 12/1/27 | | 1,750,000 | 2,007,425 |
| Cleveland Ohio Wtr. Poll. Ctl. Rev. Series 2016: | | | |
| 5% 11/15/34 | | 1,190,000 | 1,352,126 |
| 5% 11/15/35 | | 1,245,000 | 1,408,456 |
| 5% 11/15/36 | | 450,000 | 507,974 |
| 5% 11/15/45 | | 2,000,000 | 2,236,480 |
| Cleveland Parking Facilities Rev. 5.25% 9/15/17 (FSA Insured) | | 3,040,000 | 3,126,762 |
| Cleveland Pub. Pwr. Sys. Rev. Series 2016 A, 5% 11/15/22 (FSA Insured) | | 3,970,000 | 4,477,842 |
| Cleveland State Univ. Gen. Receipts Series 2012: | | | |
| 5% 6/1/24 | | 1,920,000 | 2,166,758 |
| 5% 6/1/25 | | 2,500,000 | 2,820,050 |
| 5% 6/1/26 | | 3,075,000 | 3,467,124 |
| Cleveland Wtr. Rev.: | | | |
| Series 2012 X, 5% 1/1/42 | | 5,465,000 | 5,986,525 |
| Series 2015 Y: | | | |
| 4% 1/1/28 | | 650,000 | 691,548 |
| 4% 1/1/29 | | 1,040,000 | 1,099,072 |
| 4% 1/1/30 | | 1,000,000 | 1,052,950 |
| Cleveland-Cuyahoga County Port Auth. Dev. Lease Rev. (Administrative Headquarters Proj.) Series 2013, 5% 7/1/37 | | 3,000,000 | 3,566,790 |
| Columbus City School District: | | | |
| 5% 12/1/30 | | 5,000,000 | 5,890,350 |
| 5% 12/1/31 | | 5,000,000 | 5,840,850 |
| Columbus Gen. Oblig.: | | | |
| Series 2012 A, 4% 2/15/27 | | 10,000,000 | 10,824,100 |
| Series 2014 A, 4% 2/15/28 | | 5,000,000 | 5,455,100 |
| Columbus Metropolitan Library Facility Series 2012 1: | | | |
| 5% 12/1/23 | | 530,000 | 593,892 |
| 5% 12/1/23 (Pre-Refunded to 12/1/20 @ 100) | | 470,000 | 526,847 |
| Cuyahoga County Gen. Oblig. Series 2012 A: | | | |
| 4% 12/1/27 | | 1,575,000 | 1,676,871 |
| 5% 12/1/25 | | 765,000 | 856,609 |
| Dayton Gen. Oblig.: | | | |
| 4% 12/1/22 | | 750,000 | 810,180 |
| 4% 12/1/25 | | 1,540,000 | 1,649,140 |
| Dublin Gen. Oblig.: | | | |
| 4% 12/1/27 | | 500,000 | 549,475 |
| 4% 12/1/28 | | 395,000 | 432,126 |
| Fairfield County Hosp. Facilities Rev. (Fairfield Med. Ctr. Proj.) Series 2013, 5.25% 6/15/43 | | 5,000,000 | 5,261,900 |
| Fairview Park Gen. Oblig. Series 2012: | | | |
| 4% 12/1/22 | | 1,225,000 | 1,345,761 |
| 4% 12/1/23 | | 1,395,000 | 1,536,579 |
| 4% 12/1/24 | | 1,490,000 | 1,633,413 |
| Forest Hills Local School District Series 2015, 5% 12/1/46 | | 5,000,000 | 5,594,450 |
| Franklin County Convention Facilities Auth. Tax & Lease Rev. Series 2014: | | | |
| 5% 12/1/25 | | 1,250,000 | 1,468,963 |
| 5% 12/1/26 | | 3,045,000 | 3,566,487 |
| 5% 12/1/32 | | 5,920,000 | 6,761,054 |
| Franklin County Hosp. Facilities Rev.: | | | |
| (Nationwide Children's Hosp. Proj.) Series 2009, 5.25% 11/1/40 (Pre-Refunded to 11/1/19 @ 100) | | 5,000,000 | 5,511,750 |
| Series 2016 C: | | | |
| 4% 11/1/40 | | 3,000,000 | 3,012,480 |
| 5% 11/1/33 | | 2,610,000 | 2,975,739 |
| 5% 11/1/34 | | 2,155,000 | 2,444,912 |
| Granville Exempted Village School District: | | | |
| 5% 12/1/26 | | 1,720,000 | 2,032,748 |
| 5% 12/1/27 | | 1,165,000 | 1,369,772 |
| 5% 12/1/30 | | 1,130,000 | 1,310,235 |
| 5% 12/1/31 | | 600,000 | 692,652 |
| Greater Cleveland Reg'l. Transit Auth. Series 2012: | | | |
| 5% 12/1/23 | | 660,000 | 752,730 |
| 5% 12/1/23 (Pre-Refunded to 12/1/21 @ 100) | | 340,000 | 388,283 |
| 5% 12/1/24 | | 1,185,000 | 1,350,900 |
| 5% 12/1/24 (Pre-Refunded to 12/1/21 @ 100) | | 615,000 | 702,336 |
| 5% 12/1/25 (Pre-Refunded to 12/1/21 @ 100) | | 1,170,000 | 1,342,049 |
| Hamilton City School District Series 2015: | | | |
| 3.5% 12/1/31 | | 1,500,000 | 1,503,060 |
| 5% 12/1/26 | | 1,500,000 | 1,744,080 |
| 5% 12/1/28 | | 1,550,000 | 1,790,281 |
| Hamilton County Convention Facilities Auth. Rev. Series 2014: | | | |
| 5% 12/1/26 | | 1,000,000 | 1,129,870 |
| 5% 12/1/27 | | 3,825,000 | 4,303,928 |
| Hamilton County HealthCare Facilities Rev. (The Christ Hosp. Proj.) Series 2012: | | | |
| 5.25% 6/1/24 | | 3,000,000 | 3,413,010 |
| 5.25% 6/1/27 | | 3,000,000 | 3,395,190 |
| Hamilton County Healthcare Rev. (Life Enriching Cmntys. Proj.) Series 2016: | | | |
| 5% 1/1/31 | | 1,350,000 | 1,390,392 |
| 5% 1/1/36 | | 2,800,000 | 2,830,296 |
| Hamilton County Hosp. Facilities Rev. (Children's Hosp. Med. Ctr. Proj.) Series 2014 S, 5% 5/15/26 | | 5,000,000 | 5,810,000 |
| Hamilton County Student Hsg. Rev. (Stratford Heights Proj.) Series 2010, 5% 6/1/30 (FSA Insured) | | 2,500,000 | 2,710,425 |
| Hancock County Hosp. Facilities Rev. (Blanchard Valley Reg'l. Health Ctr. Proj.) Series 2011 A: | | | |
| 5% 12/1/21 | | 1,500,000 | 1,665,405 |
| 6.25% 12/1/34 | | 4,100,000 | 4,709,793 |
| Kent State Univ. Revs.: | | | |
| Series 2009 B: | | | |
| 5% 5/1/26 | | 335,000 | 358,869 |
| 5% 5/1/28 | | 415,000 | 443,689 |
| 5% 5/1/29 | | 85,000 | 90,816 |
| 5% 5/1/30 | | 95,000 | 101,432 |
| Series 2012 A: | | | |
| 5% 5/1/24 | | 1,385,000 | 1,565,341 |
| 5% 5/1/25 | | 1,500,000 | 1,688,925 |
| 5% 5/1/26 | | 1,600,000 | 1,795,584 |
| Series 2016: | | | |
| 5% 5/1/29 | | 2,000,000 | 2,349,780 |
| 5% 5/1/30 | | 1,000,000 | 1,169,530 |
| Kettering City School District Series 2017: | | | |
| 5% 12/1/17 (b) | | 2,100,000 | 2,153,193 |
| 5% 12/1/19 (b) | | 1,450,000 | 1,563,492 |
| 5% 12/1/21 (b) | | 1,775,000 | 1,979,427 |
| 5% 12/1/23 (b) | | 1,255,000 | 1,434,063 |
| 5% 12/1/25 (b) | | 1,080,000 | 1,254,733 |
| Lake County Hosp. Facilities Rev.: | | | |
| (Lake Hosp. Sys., Inc. Proj.) Series 2008 C, 5% 8/15/17 | | 1,000,000 | 1,023,490 |
| Series 2015: | | | |
| 5% 8/15/27 | | 770,000 | 876,060 |
| 5% 8/15/45 | | 7,000,000 | 7,617,050 |
| Lakewood City School District Series 2014 C: | | | |
| 5% 12/1/25 | | 1,300,000 | 1,527,721 |
| 5% 12/1/27 | | 3,215,000 | 3,735,669 |
| Lancaster Ohio City School District Series 2012: | | | |
| 5% 10/1/37 | | 2,000,000 | 2,222,720 |
| 5% 10/1/49 | | 3,000,000 | 3,254,700 |
| Lucas County Hosp. Rev.: | | | |
| (ProMedica Healthcare Oblig. Group Proj.): | | | |
| Series 2008 D, 5% 11/15/38 | | 1,090,000 | 1,141,252 |
| Series 2011 A, 6.5% 11/15/37 | | 2,800,000 | 3,298,316 |
| Series 2011 D: | | | |
| 5% 11/15/22 | | 1,000,000 | 1,131,840 |
| 5% 11/15/25 | | 5,000,000 | 5,629,650 |
| Lucas-Plaza Hsg. Dev. Corp. Mtg. Rev. (The Plaza Section 8 Assisted Proj.) Series 1991 A, 0% 6/1/24 (Escrowed to Maturity) | | 9,000,000 | 7,492,950 |
| Miami Univ. Series 2012, 4% 9/1/28 | | 2,195,000 | 2,356,793 |
| Miamisburg City School District Series 2016: | | | |
| 4% 12/1/32 | | 510,000 | 532,532 |
| 5% 12/1/28 | | 500,000 | 581,450 |
| 5% 12/1/29 | | 300,000 | 347,340 |
| Middleburg Heights Hosp. Rev.: | | | |
| Series 2011, 5.25% 8/1/41 | | 3,000,000 | 3,208,200 |
| Series 2012 A, 5% 8/1/47 | | 10,725,000 | 11,387,689 |
| Milford Exempt Village School District Series 2015: | | | |
| 3.5% 12/1/31 | | 500,000 | 503,980 |
| 5% 12/1/28 | | 1,400,000 | 1,638,364 |
| Montgomery County Rev. (Catholic Health Initiatives Proj.) Series 2008 D, 6.25% 10/1/33 | | 2,500,000 | 2,684,175 |
| Muskingum County Hosp. Facilities (Genesis Healthcare Sys. Obligated Group Proj.) Series 2013, 5% 2/15/48 | | 2,000,000 | 2,042,840 |
| North Olmsted City School District Series 2015 A: | | | |
| 5% 12/1/26 | | 665,000 | 773,029 |
| 5% 12/1/27 | | 220,000 | 255,435 |
| 5% 12/1/28 | | 365,000 | 423,542 |
| 5% 12/1/29 | | 500,000 | 579,160 |
| 5% 12/1/30 | | 750,000 | 866,168 |
| Northeast Ohio Reg'l. Swr. District Wastewtr. Rev. Series 2014, 5% 11/15/44 | | 8,815,000 | 9,825,463 |
| Northmont City School District Series 2012 A, 5% 11/1/49 | | 5,000,000 | 5,396,700 |
| Northwest Local School District Series 2015, 5% 12/1/45 | | 2,980,000 | 3,335,365 |
| Ohio Bldg. Auth. (Adult Correctional Bldg. Fund Proj.) Series 2010 A, 5% 10/1/24 | | 6,030,000 | 6,689,863 |
| Ohio Gen. Oblig.: | | | |
| Series 2011, 5.25% 9/1/23 (Pre-Refunded to 9/1/20 @ 100) | | 2,000,000 | 2,251,320 |
| Series 2012 A: | | | |
| 5% 2/1/26 | | 1,000,000 | 1,130,440 |
| 5% 2/1/27 | | 5,000,000 | 5,640,550 |
| Series 2014 C, 4% 3/1/25 | | 7,650,000 | 8,360,073 |
| Series 2015 C, 5% 11/1/28 | | 5,955,000 | 7,003,497 |
| Series Q, 5% 4/1/25 | | 1,845,000 | 2,098,485 |
| 5.375% 9/1/23 (Pre-Refunded to 3/1/18 @ 100) | | 370,000 | 388,063 |
| Ohio Higher Edl. Facility Commission Rev.: | | | |
| (Case Western Reserve Univ. Proj.): | | | |
| Series 1990 B, 6.5% 10/1/20 | | 1,610,000 | 1,769,986 |
| Series 2016: | | | |
| 5% 12/1/23 | | 1,895,000 | 2,208,092 |
| 5% 12/1/40 | | 2,000,000 | 2,236,800 |
| (Cleveland Clinic Foundation Proj.) Series 2008 A: | | | |
| 5.25% 1/1/33 | | 1,635,000 | 1,695,609 |
| 5.5% 1/1/43 | | 3,500,000 | 3,634,435 |
| (Denison Univ. 2015 Proj.): | | | |
| 5% 11/1/28 | | 1,465,000 | 1,706,286 |
| 5% 11/1/29 | | 1,250,000 | 1,448,825 |
| 5% 11/1/30 | | 2,285,000 | 2,637,461 |
| (Kenyon College 2010 Proj.) Series 2010: | | | |
| 5.25% 7/1/44 | | 875,000 | 955,526 |
| 5.25% 7/1/44 (Pre-Refunded to 7/1/20 @ 100) | | 1,875,000 | 2,098,875 |
| (Kenyon College 2015 Proj.) 5% 7/1/41 | | 5,000,000 | 5,431,850 |
| (Kenyon College 2016 Proj.) Series 2016, 5% 7/1/42 | | 4,000,000 | 4,416,280 |
| (Univ. Hosp. Health Sys. Proj.) Series 2010 A, 5.25% 1/15/23 | | 2,500,000 | 2,724,450 |
| (Univ. of Dayton Proj.): | | | |
| Series 2009, 5.5% 12/1/36 | | 5,000,000 | 5,345,900 |
| Series 2013: | | | |
| 5% 12/1/23 | | 540,000 | 617,188 |
| 5% 12/1/24 | | 585,000 | 665,508 |
| 5% 12/1/25 | | 1,000,000 | 1,136,440 |
| 5% 12/1/26 | | 1,195,000 | 1,357,353 |
| 5% 12/1/27 | | 2,300,000 | 2,605,716 |
| (Xavier Univ. Proj.) Series 2015 C: | | | |
| 5% 5/1/26 | | 1,000,000 | 1,129,780 |
| 5% 5/1/28 | | 1,000,000 | 1,118,930 |
| 5% 5/1/29 | | 855,000 | 952,744 |
| 5% 5/1/31 | | 1,005,000 | 1,110,686 |
| Ohio Hosp. Facilities Rev.: | | | |
| (Cleveland Clinic Proj.) Series 2009 A, 5.5% 1/1/39 | | 7,000,000 | 7,499,520 |
| Series 2011 A, 5% 1/1/32 | | 3,500,000 | 3,839,990 |
| Ohio Hosp. Rev.: | | | |
| Series 2013 A, 5% 1/15/27 | | 5,000,000 | 5,620,950 |
| 5% 1/15/41 | | 5,000,000 | 5,395,350 |
| 5% 1/15/46 | | 5,000,000 | 5,375,700 |
| Ohio State Univ. Gen. Receipts: | | | |
| Series 2010 D, 5% 12/1/31 | | 1,365,000 | 1,696,736 |
| Series 2012 A, 5% 6/1/24 | | 1,690,000 | 2,005,371 |
| Series 2013 A: | | | |
| 5% 6/1/28 | | 2,000,000 | 2,322,460 |
| 5% 6/1/38 | | 3,500,000 | 3,942,015 |
| Ohio Tpk. Commission Tpk. Rev.: | | | |
| (Infastructure Proj.) Series 2005 A, 0% 2/15/43 | | 10,000,000 | 3,456,600 |
| Series 2010 A, 5% 2/15/31 | | 5,475,000 | 5,952,365 |
| Ohio Univ. Gen. Receipts Athens: | | | |
| Series 2013: | | | |
| 5% 12/1/23 | | 1,000,000 | 1,150,070 |
| 5% 12/1/24 | | 5,075,000 | 5,830,515 |
| Series A, 5% 12/1/33 (FSA Insured) | | 1,190,000 | 1,242,086 |
| Ohio Wtr. Dev. Auth. Rev.: | | | |
| (Fresh Wtr. Impt. Proj.) Series 2009 B, 5% 12/1/24 | | 1,025,000 | 1,219,350 |
| Series 2016: | | | |
| 5% 12/1/35 | | 5,500,000 | 6,395,455 |
| 5% 12/1/36 | | 5,000,000 | 5,800,200 |
| 5% 12/1/37 | | 3,500,000 | 4,050,410 |
| Olentangy Local School District: | | | |
| 5% 12/1/30 | | 1,500,000 | 1,771,440 |
| 5% 12/1/32 | | 1,275,000 | 1,492,515 |
| Princeton City School District Series 2014: | | | |
| 0% 12/1/40 | | 4,000,000 | 1,544,680 |
| 0% 12/1/41 | | 4,000,000 | 1,477,200 |
| 5% 12/1/39 | | 2,750,000 | 3,132,388 |
| Reynoldsburg City School District: | | | |
| (School Facilities Construction & Impt. Proj.) 0% 12/1/17 | | 1,250,000 | 1,233,638 |
| 4% 12/1/30 | | 4,625,000 | 4,885,203 |
| Ross County Hosp. Facilities Rev. (Adena Health Sys. Proj.) Series 2008, 5.75% 12/1/35 | | 2,600,000 | 2,778,308 |
| Scioto County Hosp. Facilities Rev. Series 2016: | | | |
| 5% 2/15/28 | | 5,030,000 | 5,796,321 |
| 5% 2/15/30 | | 2,145,000 | 2,437,085 |
| 5% 2/15/32 | | 1,625,000 | 1,829,896 |
| 5% 2/15/33 | | 1,460,000 | 1,636,791 |
| 5% 2/15/34 | | 1,000,000 | 1,116,120 |
| South-Western City School District Franklin & Pickway County Series 2012 B, 5% 12/1/36 | | 2,000,000 | 2,212,900 |
| Springboro Cmnty. City School District 5.25% 12/1/20 (FSA Insured) | | 2,780,000 | 3,113,322 |
| St. Marys City School District 5% 12/1/35 (Pre-Refunded to 6/1/18 @ 100) | | 495,000 | 521,631 |
| Toledo Gen. Oblig. Series 2012 A, 5% 12/1/20 | | 1,635,000 | 1,801,525 |
| Univ. of Akron Gen. Receipts Series 2016 A: | | | |
| 5% 1/1/23 | | 460,000 | 527,450 |
| 5% 1/1/24 | | 955,000 | 1,103,254 |
| 5% 1/1/25 | | 1,025,000 | 1,187,012 |
| 5% 1/1/33 | | 7,430,000 | 8,355,184 |
| 5% 1/1/37 | | 6,000,000 | 6,654,840 |
| Univ. of Cincinnati Gen. Receipts: | | | |
| Series 2010 F, 5% 6/1/32 | | 2,000,000 | 2,206,080 |
| Series 2012 A: | | | |
| 5% 6/1/22 | | 2,000,000 | 2,298,200 |
| 5% 6/1/23 | | 2,000,000 | 2,287,180 |
| Series 2012 C: | | | |
| 4% 6/1/28 | | 2,000,000 | 2,153,460 |
| 5% 6/1/24 | | 1,230,000 | 1,420,466 |
| Series 2013 A: | | | |
| 5% 6/1/33 | | 4,085,000 | 4,585,617 |
| 5% 6/1/34 | | 5,130,000 | 5,739,598 |
| Series 2016 A: | | | |
| 5% 6/1/32 | | 745,000 | 864,312 |
| 5% 6/1/33 | | 800,000 | 923,872 |
| 5% 6/1/34 | | 585,000 | 672,487 |
| Series 2016 C: | | | |
| 5% 6/1/41 | | 2,585,000 | 2,917,715 |
| 5% 6/1/46 | | 5,500,000 | 6,184,310 |
| Willoughby-Eastlake City School District Series 2016, 5% 12/1/46 | | 4,000,000 | 4,471,800 |
| Wood County Hosp. Facilities Rev. (Hosp. Proj.) Series 2012, 5% 12/1/27 | | 3,500,000 | 3,791,410 |
| Wright State Univ. Gen. Receipts Series 2011 A, 5% 5/1/23 | | 2,665,000 | 2,958,203 |
|
| TOTAL OHIO | | | 647,220,981 |
|
| TOTAL MUNICIPAL BONDS | | | |
| (Cost $645,465,221) | | | 658,008,980 |
| TOTAL INVESTMENT PORTFOLIO - 100.1% | | | |
| (Cost $645,465,221) | | | 658,008,980 |
| NET OTHER ASSETS (LIABILITIES) - (0.1)% | | | (904,308) |
| NET ASSETS - 100% | | | $657,104,672 |
Legend
(a) Private activity obligations whose interest is subject to the federal alternative minimum tax for individuals.
(b) Security or a portion of the security purchased on a delayed delivery or when-issued basis.
Investment Valuation
All investments are categorized as Level 2 under the Fair Value Hierarchy. The inputs or methodology used for valuing securities may not be an indication of the risk associated with investing in those securities. For more information on valuation inputs please refer to the Investment Valuation section in the accompanying Notes to Financial Statements.
Other Information
The distribution of municipal securities by revenue source, as a percentage of total Net Assets, is as follows (Unaudited):
| General Obligations | 29.8% |
| Health Care | 26.6% |
| Education | 21.7% |
| Water & Sewer | 7.6% |
| Others* (Individually Less Than 5%) | 14.3% |
| | 100.0% |
* Includes net other assets
See accompanying notes which are an integral part of the financial statements.
Fidelity® Ohio Municipal Income Fund
Financial Statements
Statement of Assets and Liabilities
| | | December 31, 2016 |
| Assets | | |
Investment in securities, at value — See accompanying schedule:
Unaffiliated issuers (cost $645,465,221) | | $658,008,980 |
| Cash | | 3,156,723 |
| Receivable for fund shares sold | | 1,393,829 |
| Interest receivable | | 5,912,307 |
| Prepaid expenses | | 1,318 |
| Other receivables | | 1,884 |
| Total assets | | 668,475,041 |
| Liabilities | | |
| Payable for investments purchased on a delayed delivery basis | $8,659,019 | |
| Payable for fund shares redeemed | 1,767,894 | |
| Distributions payable | 636,284 | |
| Accrued management fee | 198,370 | |
| Other affiliated payables | 61,771 | |
| Other payables and accrued expenses | 47,031 | |
| Total liabilities | | 11,370,369 |
| Net Assets | | $657,104,672 |
| Net Assets consist of: | | |
| Paid in capital | | $643,215,385 |
| Undistributed net investment income | | 87,532 |
| Accumulated undistributed net realized gain (loss) on investments | | 1,257,996 |
| Net unrealized appreciation (depreciation) on investments | | 12,543,759 |
| Net Assets, for 55,154,575 shares outstanding | | $657,104,672 |
| Net Asset Value, offering price and redemption price per share ($657,104,672 ÷ 55,154,575 shares) | | $11.91 |
See accompanying notes which are an integral part of the financial statements.
Statement of Operations
| | | Year ended December 31, 2016 |
| Investment Income | | |
| Interest | | $22,048,742 |
| Expenses | | |
| Management fee | $2,480,120 | |
| Transfer agent fees | 575,835 | |
| Accounting fees and expenses | 158,894 | |
| Custodian fees and expenses | 5,286 | |
| Independent trustees' fees and expenses | 3,083 | |
| Registration fees | 27,053 | |
| Audit | 57,146 | |
| Legal | 4,567 | |
| Miscellaneous | 3,232 | |
| Total expenses before reductions | 3,315,216 | |
| Expense reductions | (7,857) | 3,307,359 |
| Net investment income (loss) | | 18,741,383 |
| Realized and Unrealized Gain (Loss) | | |
| Net realized gain (loss) on: | | |
| Investment securities: | | |
| Unaffiliated issuers | | 5,155,783 |
| Total net realized gain (loss) | | 5,155,783 |
| Change in net unrealized appreciation (depreciation) on investment securities | | (23,822,930) |
| Net gain (loss) | | (18,667,147) |
| Net increase (decrease) in net assets resulting from operations | | $74,236 |
See accompanying notes which are an integral part of the financial statements.
Statement of Changes in Net Assets
| | Year ended December 31, 2016 | Year ended December 31, 2015 |
| Increase (Decrease) in Net Assets | | |
| Operations | | |
| Net investment income (loss) | $18,741,383 | $18,071,800 |
| Net realized gain (loss) | 5,155,783 | 6,373,031 |
| Change in net unrealized appreciation (depreciation) | (23,822,930) | 555,975 |
| Net increase (decrease) in net assets resulting from operations | 74,236 | 25,000,806 |
| Distributions to shareholders from net investment income | (18,738,970) | (18,067,795) |
| Distributions to shareholders from net realized gain | (4,034,669) | (5,977,113) |
| Total distributions | (22,773,639) | (24,044,908) |
| Share transactions | | |
| Proceeds from sales of shares | 149,144,309 | 88,241,729 |
| Reinvestment of distributions | 13,900,966 | 14,230,292 |
| Cost of shares redeemed | (119,510,180) | (65,862,421) |
| Net increase (decrease) in net assets resulting from share transactions | 43,535,095 | 36,609,600 |
| Redemption fees | 8,229 | 1,406 |
| Total increase (decrease) in net assets | 20,843,921 | 37,566,904 |
| Net Assets | | |
| Beginning of period | 636,260,751 | 598,693,847 |
| End of period | $657,104,672 | $636,260,751 |
| Other Information | | |
| Undistributed net investment income end of period | $87,532 | $102,705 |
| Shares | | |
| Sold | 12,005,716 | 7,188,823 |
| Issued in reinvestment of distributions | 1,127,125 | 1,158,778 |
| Redeemed | (9,765,492) | (5,384,173) |
| Net increase (decrease) | 3,367,349 | 2,963,428 |
See accompanying notes which are an integral part of the financial statements.
Financial Highlights — Fidelity Ohio Municipal Income Fund
| Years ended December 31, | 2016 | 2015 | 2014 | 2013 | 2012 |
| Selected Per–Share Data | | | | | |
| Net asset value, beginning of period | $12.29 | $12.26 | $11.48 | $12.39 | $12.01 |
| Income from Investment Operations | | | | | |
| Net investment income (loss)A | .339 | .363 | .384 | .392 | .421 |
| Net realized and unrealized gain (loss) | (.308) | .147 | .780 | (.779) | .426 |
| Total from investment operations | .031 | .510 | 1.164 | (.387) | .847 |
| Distributions from net investment income | (.339) | (.363) | (.384) | (.392) | (.420) |
| Distributions from net realized gain | (.072) | (.117) | – | (.131) | (.047) |
| Total distributions | (.411) | (.480) | (.384) | (.523) | (.467) |
| Redemption fees added to paid in capitalA,B | – | – | – | – | – |
| Net asset value, end of period | $11.91 | $12.29 | $12.26 | $11.48 | $12.39 |
| Total ReturnC | .19% | 4.24% | 10.26% | (3.16)% | 7.14% |
| Ratios to Average Net AssetsD | | | | | |
| Expenses before reductions | .48% | .48% | .48% | .48% | .49% |
| Expenses net of fee waivers, if any | .48% | .48% | .48% | .48% | .49% |
| Expenses net of all reductions | .48% | .48% | .48% | .48% | .49% |
| Net investment income (loss) | 2.72% | 2.97% | 3.20% | 3.28% | 3.42% |
| Supplemental Data | | | | | |
| Net assets, end of period (000 omitted) | $657,105 | $636,261 | $598,694 | $535,347 | $647,324 |
| Portfolio turnover rate | 17% | 17% | 7% | 17% | 14% |
A Calculated based on average shares outstanding during the period.
B Amount represents less than $.0005 per share.
C Total returns would have been lower if certain expenses had not been reduced during the applicable periods shown.
D Expense ratios reflect operating expenses of the Fund. Expenses before reductions do not reflect amounts reimbursed by the investment adviser or reductions from expense offset arrangements and do not represent the amount paid by the Fund during periods when reimbursements or reductions occur. Expenses net of fee waivers reflect expenses after reimbursement by the investment adviser but prior to reductions from expense offset arrangements. Expenses net of all reductions represent the net expenses paid by the Fund.
See accompanying notes which are an integral part of the financial statements.
Fidelity® Ohio Municipal Money Market Fund
Investment Summary/Performance (Unaudited)
Effective Maturity Diversification
| Days | % of fund's investments 12/31/16 | % of fund's investments 6/30/16 | % of fund's investments 12/31/15 |
| 1 - 7 | 68.3 | 68.1 | 70.9 |
| 8 - 30 | 5.2 | 6.5 | 2.2 |
| 31 - 60 | 2.9 | 3.0 | 5.5 |
| 61 - 90 | 4.9 | 7.6 | 3.5 |
| 91 - 180 | 10.9 | 4.1 | 7.2 |
| > 180 | 7.8 | 10.7 | 10.7 |
Effective maturity is determined in accordance with the requirements of Rule 2a-7 under the Investment Company Act of 1940.
Asset Allocation (% of fund's net assets)
| As of December 31, 2016 |
| | Variable Rate Demand Notes (VRDNs) | 52.3% |
| | Tender Option Bond | 9.0% |
| | Other Municipal Security | 32.1% |
| | Investment Companies | 5.3% |
| | Net Other Assets (Liabilities) | 1.3% |

| As of June 30, 2016 |
| | Variable Rate Demand Notes (VRDNs) | 53.9% |
| | Tender Option Bond | 5.0% |
| | Other Municipal Security | 35.6% |
| | Investment Companies | 7.4% |
| | Net Other Assets (Liabilities)* | (1.9)% |

* Short-Term Investments and Net Other Assets (Liabilities) are not included in the pie chart
Current And Historical 7-Day Yields
| | 12/31/16 | 9/30/16 | 6/30/16 | 3/31/16 | 12/31/15 |
| Fidelity® Ohio Municipal Money Market Fund | 0.29% | 0.30% | 0.01% | 0.01% | 0.01% |
Yield refers to the income paid by the Fund over a given period. Yields for money market funds are usually for seven-day periods, as they are here, though they are expressed as annual percentage rates. Past performance is no guarantee of future results. Yield will vary and it's possible to lose money investing in the Fund.
Fidelity® Ohio Municipal Money Market Fund
Investments December 31, 2016
Showing Percentage of Net Assets
| Variable Rate Demand Note - 52.3% | | | |
| | | Principal Amount | Value |
| Alabama - 0.1% | | | |
| Decatur Indl. Dev. Board Exempt Facilities Rev. (Nucor Steel Decatur LLC Proj.) Series 2003 A, 1% 1/6/17, VRDN (a)(b) | | $700,000 | $700,000 |
| Arkansas - 0.9% | | | |
| Blytheville Indl. Dev. Rev. (Nucor Corp. Proj.): | | | |
| Series 1998, 1% 1/6/17, VRDN (a)(b) | | 400,000 | 400,000 |
| Series 2002, 1% 1/6/17, VRDN (a)(b) | | 2,600,000 | 2,600,000 |
| Osceola Solid Waste Disp. Rev. (Plum Point Energy Associates, LLC Proj.) Series 2006, 0.93% 1/6/17, LOC Royal Bank of Scotland PLC, VRDN (a)(b) | | 2,100,000 | 2,100,000 |
| | | | 5,100,000 |
| Delaware - 0.1% | | | |
| Delaware Econ. Dev. Auth. Rev. (Delmarva Pwr. & Lt. Co. Proj.): | | | |
| Series 1988, 0.96% 1/3/17, VRDN (a)(b) | | 300,000 | 300,000 |
| Series 1993 C, 0.95% 1/6/17, VRDN (b) | | 200,000 | 200,000 |
| Series 1994, 0.96% 1/3/17, VRDN (a)(b) | | 200,000 | 200,000 |
| | | | 700,000 |
| Georgia - 0.0% | | | |
| Monroe County Dev. Auth. Poll. Cont. Rev. (Georgia Pwr. Co. Plant Scherer Proj.) First Series 2009, 0.8% 1/6/17, VRDN (b) | | 200,000 | 200,000 |
| Indiana - 0.1% | | | |
| Indiana Dev. Fin. Auth. Envir. Rev. (PSI Energy Proj.) Series 2003 B, 0.9% 1/6/17, VRDN (a)(b) | | 600,000 | 600,000 |
| Kentucky - 0.3% | | | |
| Trimble County Poll. Cont. Rev. (Louisville Gas and Elec. Co. Proj.) Series 2016 A, 0.83% 1/6/17, VRDN (a)(b) | | 1,500,000 | 1,500,000 |
| Louisiana - 0.1% | | | |
| Saint James Parish Gen. Oblig. (Nucor Steel Louisiana LLC Proj.) Series 2010 A1, 0.95% 1/6/17, VRDN (b) | | 400,000 | 400,000 |
| Nebraska - 0.1% | | | |
| Stanton County Indl. Dev. Rev. (Nucor Corp. Proj.) Series 1996, 1% 1/6/17, VRDN (a)(b) | | 700,000 | 700,000 |
| Nevada - 0.0% | | | |
| Washoe County Gas Facilities Rev. Series 2016 E, 0.79% 1/6/17, VRDN (a)(b) | | 200,000 | 200,000 |
| Ohio - 49.4% | | | |
| Allen County Hosp. Facilities Rev.: | | | |
| (Catholic Healthcare Partners Proj.) Series 2010 C, 0.79% 1/3/17, LOC MUFG Union Bank NA, VRDN (b) | | 1,500,000 | 1,500,000 |
| Series 2012 B, 0.73% 1/6/17, VRDN (b) | | 59,000,000 | 59,000,000 |
| Athens County Port Auth. Hsg. 0.75% 1/6/17, LOC Barclays Bank PLC, VRDN (b) | | 16,375,000 | 16,375,000 |
| Cleveland Arpt. Sys. Rev.: | | | |
| Series 2008 D, 0.72% 1/6/17, LOC U.S. Bank NA, Cincinnati, VRDN (b) | | 4,500,000 | 4,500,000 |
| Series 2009 D, 0.72% 1/6/17, LOC U.S. Bank NA, Cincinnati, VRDN (b) | | 25,000,000 | 25,000,000 |
| Cuyahoga County Health Care Facilities Rev. (The A.M. McGregor Home Proj.) Series 2014, 0.8% 1/6/17, LOC Northern Trust Co., VRDN (b) | | 16,045,000 | 16,045,000 |
| Cuyahoga County Hosp. Facilities Rev. (Sisters of Charity of Saint Augustine Health Sys. Proj.) Series 2000, 0.77% 1/6/17, LOC PNC Bank NA, VRDN (b) | | 2,710,000 | 2,710,000 |
| Franklin County Health Care Facilities Rev. (Presbyterian Retirement Svcs. Proj.) Series 2005 B, 0.77% 1/6/17, LOC Comerica Bank, VRDN (b) | | 4,800,000 | 4,800,000 |
| Franklin County Hosp. Facilities Rev. Series 2009 B, 0.73% 1/6/17 (Liquidity Facility Barclays Bank PLC), VRDN (b) | | 6,000,000 | 6,000,000 |
| Greene County Hosp. Facilities Rev. Series A, 0.79% 1/6/17, LOC JPMorgan Chase Bank, VRDN (b) | | 6,235,000 | 6,235,000 |
| Hamilton County HealthCare Facilities Rev. (The Children's Home of Cincinnati Proj.) Series 2009, 0.73% 1/6/17, LOC U.S. Bank NA, Cincinnati, VRDN (b) | | 2,865,000 | 2,865,000 |
| Hamilton County Hosp. Facilities Rev. (Elizabeth Gamble Deaconess Home Assoc. Proj.) Series 2002 B, 0.77% 1/6/17, LOC PNC Bank NA, VRDN (b) | | 15,800,000 | 15,800,000 |
| Hamilton County Student Hsg. Rev. (Block 3 Proj.) Series 2004, 0.83% 1/6/17, LOC Bank of New York, New York, LOC Citizens Bank of Pennsylvania, VRDN (b) | | 11,355,000 | 11,355,000 |
| Lake County Indl. Dev. Rev. (Norshar Co. Proj.) 0.92% 1/6/17, LOC JPMorgan Chase Bank, VRDN (a)(b) | | 1,295,000 | 1,295,000 |
| Lorain County Port Auth. Edl. Facilities Rev. (St. Ignatius High School Proj.) 0.79% 1/6/17, LOC U.S. Bank NA, Cincinnati, VRDN (b) | | 2,330,000 | 2,330,000 |
| Middletown Hosp. Facilities Rev. Series 2008 A, 0.75% 1/6/17, LOC PNC Bank NA, VRDN (b) | | 24,785,000 | 24,785,000 |
| Montgomery County Hosp. Rev. Series 2016 C, 0.74% 1/3/17, LOC Barclays Bank PLC, VRDN (b) | | 1,400,000 | 1,400,000 |
| Ohio Air Quality Dev. Auth. Rev. (Ohio Valley Elec. Corp. Proj.) Series 2009 D, 0.71% 1/6/17, LOC Bank of Tokyo-Mitsubishi UFJ Ltd., VRDN (b)(c) | | 17,400,000 | 17,400,000 |
| Ohio Gen. Oblig.: | | | |
| (Infrastructure Impt. Proj.) Series 2003 D, 0.72% 1/6/17, VRDN (b) | | 10,000,000 | 10,000,000 |
| 0.72% 1/6/17, VRDN (b) | | 5,000,000 | 5,000,000 |
| Ohio Hsg. Fin. Agcy. Mtg. Rev. Series 2004 D, 0.76% 1/6/17 (Liquidity Facility Fed. Home Ln. Bank, Cincinnati), VRDN (a)(b) | | 4,750,000 | 4,750,000 |
| Ohio Hsg. Fin. Agcy. Multi-family Hsg. Rev.: | | | |
| (Pedcor Invts. Willow Lake Apts. Proj.) Series B, 0.9% 1/6/17, LOC Fed. Home Ln. Bank, Indianapolis, VRDN (a)(b) | | 245,000 | 245,000 |
| (Wingate at Belle Meadows Proj.) 0.73% 1/6/17, LOC Fed. Home Ln. Bank, Cincinnati, VRDN (a)(b) | | 8,480,000 | 8,480,000 |
| Ohio Hsg. Fin. Agcy. Residential Mtg. Rev.: | | | |
| Series 2016 G, 0.74% 1/6/17 (Liquidity Facility Fed. Home Ln. Bank, Cincinnati), VRDN (a)(b) | | 13,700,000 | 13,700,000 |
| Series 2016 H, 0.74% 1/6/17 (Liquidity Facility Fed. Home Ln. Bank, Cincinnati), VRDN (a)(b) | | 11,200,000 | 11,200,000 |
| Ohio Wtr. Dev. Auth. (Waste Mgmt., Inc. Proj.) Series B, 0.78% 1/6/17, LOC Bank of America NA, VRDN (a)(b) | | 12,100,000 | 12,100,000 |
| Village of Indian Hill Econ. Dev. Rev. (Cincinnati Country Day School Proj.) Series 1999, 0.82% 1/6/17, LOC PNC Bank NA, VRDN (b) | | 4,345,000 | 4,345,000 |
| | | | 289,215,000 |
| Texas - 0.7% | | | |
| Port Arthur Navigation District Envir. Facilities Rev. (Motiva Enterprises LLC Proj.): | | | |
| Series 2004, 0.92% 1/6/17, VRDN (a)(b) | | 2,700,000 | 2,700,000 |
| Series 2009 B, 0.85% 1/3/17, VRDN (b) | | 400,000 | 400,000 |
| Series 2010 D, 0.85% 1/3/17, VRDN (b) | | 1,000,000 | 1,000,000 |
| Port Port Arthur Navigation District Jefferson County Rev. Series 2000 B, 0.84% 1/6/17 (Total SA Guaranteed), VRDN (a)(b) | | 200,000 | 200,000 |
| | | | 4,300,000 |
| West Virginia - 0.3% | | | |
| West Virginia Econ. Dev. Auth. Solid Waste Disp. Facilities Rev.: | | | |
| (Appalachian Pwr. Co. - Amos Proj.) Series 2008 B, 1% 1/6/17, VRDN (a)(b) | | 900,000 | 900,000 |
| (Appalachian Pwr. Co.- Mountaineer Proj.) Series 2008 A, 1% 1/6/17, VRDN (a)(b) | | 600,000 | 600,000 |
| | | | 1,500,000 |
| Wyoming - 0.2% | | | |
| Converse County Poll. Cont. Rev. (PacifiCorp Proj.) Series 1994, 0.77% 1/6/17, VRDN (b) | | 1,095,000 | 1,095,000 |
| TOTAL VARIABLE RATE DEMAND NOTE | | | |
| (Cost $306,210,000) | | | 306,210,000 |
|
| Tender Option Bond - 9.0% | | | |
| Colorado - 0.1% | | | |
| Colorado Health Facilities Auth. Rev. Participating VRDN Series Floaters XF 22 41, 0.92% 1/6/17 (Liquidity Facility Citibank NA) (b)(d) | | 200,000 | 200,000 |
| Nebraska - 0.1% | | | |
| Omaha Pub. Pwr. District Elec. Rev. Participating VRDN Series 16 XF1053, 0.9% 1/6/17 (Liquidity Facility Deutsche Bank AG New York Branch) (b)(d) | | 300,000 | 300,000 |
| New Jersey - 0.0% | | | |
| New Jersey St. Trans. Trust Fund Auth. Participating VRDN Series Floaters 16 XF1059, 0.91% 1/6/17 (Liquidity Facility Deutsche Bank AG New York Branch) (b)(d) | | 200,000 | 200,000 |
| Ohio - 8.7% | | | |
| Cincinnati Wtr. Sys. Rev. Participating VRDN Series MS 3280, 0.75% 1/6/17 (Liquidity Facility Morgan Stanley Bank, West Valley City Utah) (b)(d) | | 3,330,000 | 3,330,000 |
| Columbus Gen. Oblig. Participating VRDN Series Putters 2365, 0.76% 1/6/17 (Liquidity Facility JPMorgan Chase Bank) (b)(d) | | 8,720,000 | 8,720,000 |
| Franklin County Hosp. Facilities Rev. Participating VRDN: | | | |
| Series 15 XF0244, 0.76% 1/6/17 (Liquidity Facility Toronto-Dominion Bank) (b)(d) | | 4,000,000 | 4,000,000 |
| Series 16 XL0004, 0.77% 1/6/17 (Liquidity Facility Barclays Bank PLC) (b)(d) | | 4,480,000 | 4,480,000 |
| Lucas County Gen. Oblig. Bonds Series 2016 26, 0.92%, tender 3/30/17 (Liquidity Facility U.S. Bank NA, Cincinnati) (b)(d)(e) | | 6,000,000 | 6,000,000 |
| Ohio Hosp. Facilities Rev. Participating VRDN: | | | |
| Series 16 ZF0354, 0.75% 1/6/17 (Liquidity Facility JPMorgan Chase Bank) (b)(d) | | 6,250,000 | 6,250,000 |
| Series 2015 XF0105, 0.75% 1/6/17 (Liquidity Facility JPMorgan Chase Bank) (b)(d) | | 8,500,000 | 8,500,000 |
| Series 2016 ZF0355, 0.75% 1/6/17 (Liquidity Facility JPMorgan Chase Bank) (b)(d) | | 9,805,000 | 9,805,000 |
| | | | 51,085,000 |
| South Carolina - 0.1% | | | |
| South Carolina St. Pub. Svc. Auth. Rev. Participating VRDN Series XG 0046, 0.81% 1/6/17 (Liquidity Facility Toronto-Dominion Bank) (b)(d) | | 700,000 | 700,000 |
| TOTAL TENDER OPTION BOND | | | |
| (Cost $52,485,000) | | | 52,485,000 |
|
| Other Municipal Security - 32.1% | | | |
| Georgia - 0.7% | | | |
| Main Street Natural Gas, Inc. Georgia Gas Proj. Rev. Bonds: | | | |
| Series 2010 A1, 0.83%, tender 4/3/17 (Liquidity Facility Royal Bank of Canada) (b) | | 2,600,000 | 2,600,000 |
| Series 2010 A2, 0.83%, tender 4/3/17 (Liquidity Facility Royal Bank of Canada) (b) | | 1,400,000 | 1,400,000 |
| | | | 4,000,000 |
| Kentucky - 0.0% | | | |
| Jefferson County Poll. Cont. Rev. Bonds Series 01A, 0.85% tender 1/23/17, CP mode | | 300,000 | 300,000 |
| Massachusetts - 0.3% | | | |
| Massachusetts Indl. Fin. Agcy. Poll. Cont. Rev. Bonds (New England Pwr. Co. Proj.): | | | |
| Series 1992: | | | |
| 0.9% tender 1/25/17, CP mode | | 100,000 | 100,000 |
| 0.9% tender 2/2/17, CP mode | | 400,000 | 400,000 |
| Series 1993 A, 0.9% tender 1/25/17, CP mode | | 800,000 | 800,000 |
| Series 93B, 0.8% tender 1/4/17, CP mode | | 500,000 | 500,000 |
| | | | 1,800,000 |
| New Hampshire - 0.6% | | | |
| New Hampshire Bus. Fin. Auth. Poll. Cont. Rev. Bonds: | | | |
| (New England Pwr. Co. Proj.) Series 90B, 0.85% tender 1/19/17, CP mode | | 700,000 | 700,000 |
| Series 1990 A: | | | |
| 0.95% tender 1/24/17, CP mode (a) | | 1,100,000 | 1,100,000 |
| 0.95% tender 2/2/17, CP mode (a) | | 400,000 | 400,000 |
| Series A1: | | | |
| 0.95% tender 1/30/17, CP mode (a) | | 100,000 | 100,000 |
| 0.97% tender 1/31/17, CP mode (a) | | 1,000,000 | 1,000,000 |
| | | | 3,300,000 |
| Ohio - 30.3% | | | |
| American Muni. Pwr. BAN: | | | |
| Series 2016, 2% 10/19/17 | | 6,400,000 | 6,438,271 |
| 1.25% 4/27/17 (Ohio Gen. Oblig. Guaranteed) | | 850,000 | 851,357 |
| Avon Gen. Oblig. BAN: | | | |
| Series 2016, 1.25% 1/26/17 | | 2,000,000 | 2,000,300 |
| 1.5% 1/26/17 | | 3,920,000 | 3,921,777 |
| Belmont County BAN 2% 4/21/17 | | 9,339,000 | 9,371,653 |
| Berea BAN 1.5% 3/16/17 | | 2,150,000 | 2,153,548 |
| Blendon Township BAN Series 2016, 2% 2/9/17 | | 4,500,000 | 4,505,079 |
| Clark County Gen. Oblig. BAN Series 2016 2, 1.75% 5/3/17 | | 3,100,000 | 3,107,984 |
| Columbus Gen. Oblig. BAN Series 2016, 1.75% 8/4/17 | | 3,100,000 | 3,117,036 |
| Deerfield Township BD Anticipation BAN Series 2016, 1.2% 10/26/17 | | 1,600,000 | 1,600,000 |
| Delaware Gen. Oblig. BAN 1% 4/13/17 | | 3,365,000 | 3,366,858 |
| Dublin City School District BAN 1.5% 5/2/17 | | 4,500,000 | 4,509,000 |
| Fairborn City School District BAN Series 2016, 2.25% 5/18/17 | | 5,700,000 | 5,720,314 |
| Fairborn Gen. Oblig. BAN 1.25% 3/23/17 | | 4,074,450 | 4,079,292 |
| Franklin County Hosp. Facilities Rev. Bonds: | | | |
| (U.S. Health Corp. of Columbus Proj.) Series 2011 B, 5%, tender 7/12/17 (b) | | 3,915,000 | 3,999,697 |
| Series 2013, 5% 5/15/17 | | 1,000,000 | 1,015,708 |
| Huber Heights BAN: | | | |
| Series 2016, 2.75% 12/12/17 | | 2,000,000 | 2,024,207 |
| 2% 6/1/17 | | 8,800,000 | 8,840,777 |
| Independence Gen. Oblig. BAN Series 2016 2, 2% 12/6/17 | | 1,500,000 | 1,511,702 |
| Kenston Local School District BAN Series 2016, 2% 6/29/17 | | 4,000,000 | 4,023,932 |
| Lebanon Gen. Oblig. BAN 2% 4/12/17 | | 4,600,000 | 4,614,885 |
| Licking County BAN 2% 5/24/17 | | 3,000,000 | 3,014,927 |
| Lima Gen. Oblig. BAN 1.5% 3/15/17 | | 4,295,000 | 4,301,822 |
| Logan County Gen. Oblig. BAN Series 2016, 2% 12/20/17 | | 2,300,000 | 2,311,175 |
| Marion Gen. Oblig. BAN Series 2016 2% 9/7/17 (Ohio Gen. Oblig. Guaranteed) | | 5,500,000 | 5,544,659 |
| Marysville Gen. Oblig. BAN Series 2016, 1.375% 8/24/17 | | 1,750,000 | 1,755,299 |
| Mason City School District BAN Series 2016, 1.5% 1/25/17 | | 3,900,000 | 3,902,235 |
| Mason Gen. Oblig. BAN 2% 5/24/17 | | 5,500,000 | 5,524,026 |
| Ohio Bldg. Auth. Bonds (Adult Correctional Bldg. Fund Proj.) Series 2011 B, 5% 10/1/17 | | 1,500,000 | 1,545,163 |
| Ohio Dept. of Administrative Svcs. Ctfs. of Prtn. Bonds (Ohio Administrative Knowledge Sys. Proj.) Series 2016, 5% 9/1/17 | | 2,060,000 | 2,116,600 |
| Ohio Gen. Oblig. Bonds: | | | |
| Series 2016 A, 2% 2/1/17 | | 1,750,000 | 1,751,963 |
| Series 2016 S, 3% 5/1/17 | | 380,000 | 382,588 |
| Ohio Higher Edl. Facility Commission Rev. Bonds: | | | |
| Series 08B5: | | | |
| 0.76% tender 2/23/17, CP mode | | 6,100,000 | 6,100,000 |
| 0.83% tender 1/19/17, CP mode | | 6,000,000 | 6,000,000 |
| 0.9% tender 1/4/17, CP mode | | 6,700,000 | 6,700,000 |
| 0.94% tender 1/11/17, CP mode | | 4,000,000 | 4,000,000 |
| Series 08B6, 0.8% tender 3/9/17, CP mode | | 6,000,000 | 6,000,000 |
| Ohio Mental Health Cap. Facilities Bonds (Mental Health Facilities Impt. Fund Proj.) Series 2015 A, 5% 2/1/17 | | 1,380,000 | 1,384,737 |
| Ohio Spl. Oblig. Bonds: | | | |
| (Mental Health Facilities Impt. Fund Projs.) Series 2016 A, 4% 6/1/17 | | 2,435,000 | 2,468,157 |
| Series 2015, 4% 4/1/17 | | 735,000 | 740,954 |
| Ohio State Univ. Gen. Receipts Rev. Bonds Series 3C, 0.93% tender 1/10/17, CP mode | | 6,517,000 | 6,517,000 |
| Scioto County Hosp. Facilities Rev. Bonds Series 2016, 3% 2/15/17 | | 775,000 | 777,141 |
| Union County Gen. Oblig. BAN 1.25% 3/29/17 | | 5,500,000 | 5,505,732 |
| Vandalia Gen. Oblig. BAN Series 2016 1.75% 9/7/17 | | 3,000,000 | 3,015,186 |
| Walton Hills BD Anticipation BAN Series 2016, 2% 11/29/17 (Ohio Gen. Oblig. Guaranteed) | | 860,000 | 866,571 |
| Warren County Gen. Oblig. BAN Series 2016, 1.75% 8/24/17 | | 2,000,000 | 2,011,479 |
| Wayne County Ohio BD BAN Series 2016, 2% 6/30/17 | | 4,000,000 | 4,024,066 |
| Willoughby BAN 2% 5/26/17 | | 5,680,000 | 5,707,980 |
| Winton Woods City School District BAN Series 2016, 2.5% 7/27/17 (Ohio Gen. Oblig. Guaranteed) | | 3,000,000 | 3,022,888 |
| | | | 177,765,725 |
| Virginia - 0.1% | | | |
| Halifax County Indl. Dev. Auth. Poll. Cont. Rev. Bonds Series 2016, 0.98% tender 1/25/17, CP mode (a) | | 600,000 | 600,000 |
| West Virginia - 0.1% | | | |
| Grant County Cmnty. Solid Waste Disp. Rev. Bonds Series 96, 0.96% tender 2/2/17, CP mode (a) | | 500,000 | 500,000 |
| TOTAL OTHER MUNICIPAL SECURITY | | | |
| (Cost $188,265,725) | | | 188,265,725 |
| | | Shares | Value |
|
| Investment Company - 5.3% | | | |
| Fidelity Municipal Cash Central Fund, 0.70% (f)(g) | | | |
| (Cost $31,125,810) | | 31,125,810 | 31,125,810 |
| TOTAL INVESTMENT PORTFOLIO - 98.7% | | | |
| (Cost $578,086,535) | | | 578,086,535 |
| NET OTHER ASSETS (LIABILITIES) - 1.3% | | | 7,550,923 |
| NET ASSETS - 100% | | | $585,637,458 |
Security Type Abbreviations
BAN – BOND ANTICIPATION NOTE
CP – COMMERCIAL PAPER
VRDN – VARIABLE RATE DEMAND NOTE (A debt instrument that is payable upon demand, either daily, weekly or monthly)
The date shown for securities represents the date when principal payments must be paid, taking into account any call options exercised by the issuer and any permissible maturity shortening features other than interest rate resets.
Legend
(a) Private activity obligations whose interest is subject to the federal alternative minimum tax for individuals.
(b) Coupon rates for floating and adjustable rate securities reflect the rates in effect at period end.
(c) A portion of the security sold on a delayed delivery basis.
(d) Provides evidence of ownership in one or more underlying municipal bonds.
(e) Restricted securities - Investment in securities not registered under the Securities Act of 1933 (excluding 144A issues). At the end of the period, the value of restricted securities (excluding 144A issues) amounted to $6,000,000 or 1.0% of net assets.
(f) Information in this report regarding holdings by state and security types does not reflect the holdings of the Fidelity Municipal Cash Central Fund.
(g) Affiliated fund that is available only to investment companies and other accounts managed by Fidelity Investments. The rate quoted is the annualized seven-day yield of the fund at period end. A complete unaudited listing of the fund's holdings as of its most recent quarter end is available upon request. In addition, each Fidelity Central Fund's financial statements, which are not covered by the Fund's Report of Independent Registered Public Accounting Firm, are available on the SEC's website or upon request.
Additional information on each restricted holding is as follows:
| Security | Acquisition Date | Cost |
| Lucas County Gen. Oblig. Bonds Series 2016 26, 0.92%, tender 3/30/17 (Liquidity Facility U.S. Bank NA, Cincinnati) | 12/23/16 | $6,000,000 |
Affiliated Central Funds
Information regarding fiscal year to date income earned by the Fund from investments in Fidelity Central Funds is as follows:
| Fund | Income earned |
| Fidelity Municipal Cash Central Fund | $213,126 |
| Total | $213,126 |
Investment Valuation
All investments are categorized as Level 2 under the Fair Value Hierarchy. The inputs or methodology used for valuing securities may not be an indication of the risk associated with investing in those securities. For more information on valuation inputs please refer to the Investment Valuation section in the accompanying Notes to Financial Statements.
See accompanying notes which are an integral part of the financial statements.
Fidelity® Ohio Municipal Money Market Fund
Financial Statements
Statement of Assets and Liabilities
| | | December 31, 2016 |
| Assets | | |
Investment in securities, at value — See accompanying schedule:
Unaffiliated issuers (cost $546,960,725) | $546,960,725 | |
| Fidelity Central Funds (cost $31,125,810) | 31,125,810 | |
| Total Investments (cost $578,086,535) | | $578,086,535 |
| Cash | | 78,690 |
| Receivable for securities sold on a delayed delivery basis | | 7,000,000 |
| Receivable for fund shares sold | | 92,622 |
| Interest receivable | | 1,703,564 |
| Distributions receivable from Fidelity Central Funds | | 31,010 |
| Prepaid expenses | | 1,453 |
| Other receivables | | 1,792 |
| Total assets | | 586,995,666 |
| Liabilities | | |
| Payable for fund shares redeemed | $1,069,228 | |
| Distributions payable | 3,033 | |
| Accrued management fee | 179,783 | |
| Other affiliated payables | 72,127 | |
| Other payables and accrued expenses | 34,037 | |
| Total liabilities | | 1,358,208 |
| Net Assets | | $585,637,458 |
| Net Assets consist of: | | |
| Paid in capital | | $585,593,337 |
| Accumulated undistributed net realized gain (loss) on investments | | 44,121 |
| Net Assets, for 585,031,165 shares outstanding | | $585,637,458 |
| Net Asset Value, offering price and redemption price per share ($585,637,458 ÷ 585,031,165 shares) | | $1.00 |
See accompanying notes which are an integral part of the financial statements.
Statement of Operations
| | | Year ended December 31, 2016 |
| Investment Income | | |
| Interest | | $3,357,475 |
| Income from Fidelity Central Funds | | 213,126 |
| Total income | | 3,570,601 |
| Expenses | | |
| Management fee | $2,981,901 | |
| Transfer agent fees | 1,075,738 | |
| Accounting fees and expenses | 103,533 | |
| Custodian fees and expenses | 6,473 | |
| Independent trustees' fees and expenses | 3,974 | |
| Registration fees | 33,174 | |
| Audit | 39,497 | |
| Legal | 5,589 | |
| Miscellaneous | 25,215 | |
| Total expenses before reductions | 4,275,094 | |
| Expense reductions | (1,256,012) | 3,019,082 |
| Net investment income (loss) | | 551,519 |
| Realized and Unrealized Gain (Loss) | | |
| Net realized gain (loss) on: | | |
| Investment securities: | | |
| Unaffiliated issuers | 45,183 | |
| Capital Gain Distributions from Fidelity Central Funds | 5,134 | |
| Fidelity Central Funds | 1,810 | |
| Total net realized gain (loss) | | 52,127 |
| Net increase in net assets resulting from operations | | $603,646 |
See accompanying notes which are an integral part of the financial statements.
Statement of Changes in Net Assets
| | Year ended December 31, 2016 | Year ended December 31, 2015 |
| Increase (Decrease) in Net Assets | | |
| Operations | | |
| Net investment income (loss) | $551,519 | $128,156 |
| Net realized gain (loss) | 52,127 | 133,112 |
| Net increase in net assets resulting from operations | 603,646 | 261,268 |
| Distributions to shareholders from net investment income | (550,885) | (119,843) |
| Distributions to shareholders from net realized gain | (43,302) | (34,708) |
| Total distributions | (594,187) | (154,551) |
| Share transactions at net asset value of $1.00 per share | | |
| Proceeds from sales of shares | 843,212,970 | 2,902,865,221 |
| Reinvestment of distributions | 573,677 | 144,686 |
| Cost of shares redeemed | (1,508,704,946) | (2,989,505,964) |
| Net increase (decrease) in net assets and shares resulting from share transactions | (664,918,299) | (86,496,057) |
| Total increase (decrease) in net assets | (664,908,840) | (86,389,340) |
| Net Assets | | |
| Beginning of period | 1,250,546,298 | 1,336,935,638 |
| End of period | $585,637,458 | $1,250,546,298 |
See accompanying notes which are an integral part of the financial statements.
Financial Highlights — Fidelity Ohio Municipal Money Market Fund
| Years ended December 31, | 2016 | 2015 | 2014 | 2013 | 2012 |
| Selected Per–Share Data | | | | | |
| Net asset value, beginning of period | $1.00 | $1.00 | $1.00 | $1.00 | $1.00 |
| Income from Investment Operations | | | | | |
| Net investment income (loss) | .001 | –A | –A | –A | –A |
| Net realized and unrealized gain (loss)A | – | – | – | – | – |
| Total from investment operations | .001 | –A | –A | –A | –A |
| Distributions from net investment income | (.001) | –A | –A | –A | –A |
| Distributions from net realized gain | –A | –A | –A | – | – |
| Total distributions | (.001) | –A | –A | –A | –A |
| Net asset value, end of period | $1.00 | $1.00 | $1.00 | $1.00 | $1.00 |
| Total ReturnB | .09% | .01% | .02% | .01% | .01% |
| Ratios to Average Net AssetsC,D | | | | | |
| Expenses before reductions | .52% | .52% | .51% | .52% | .52% |
| Expenses net of fee waivers, if any | .37% | .07% | .08% | .12% | .19% |
| Expenses net of all reductions | .36% | .07% | .08% | .12% | .19% |
| Net investment income (loss) | .07% | .01% | .01% | .01% | .01% |
| Supplemental Data | | | | | |
| Net assets, end of period (000 omitted) | $585,637 | $1,250,546 | $1,336,936 | $1,332,321 | $1,342,387 |
A Amount represents less than $.0005 per share.
B Total returns would have been lower if certain expenses had not been reduced during the applicable periods shown.
C Fees and expenses of any underlying Fidelity Central Funds are not included in the Fund's expense ratio. The Fund indirectly bears its proportionate share of the expenses of any underlying Fidelity Central Funds.
D Expense ratios reflect operating expenses of the Fund. Expenses before reductions do not reflect amounts reimbursed or waived or reductions from expense offset arrangements and do not represent the amount paid by the Fund during periods when reimbursements, waivers or reductions occur. Expenses net of fee waivers reflect expenses after reimbursement and waivers but prior to reductions from expense offset arrangements. Expenses net of all reductions represent the net expenses paid by the Fund.
See accompanying notes which are an integral part of the financial statements.
Notes to Financial Statements
For the period ended December 31, 2016
1. Organization.
Fidelity Ohio Municipal Income Fund (the Income Fund) is a fund of Fidelity Municipal Trust. Fidelity Ohio Municipal Money Market Fund (the Money Market Fund) is a fund of Fidelity Municipal Trust II. Each Trust is registered under the Investment Company Act of 1940, as amended (the 1940 Act), as an open-end management investment company. Fidelity Municipal Trust and Fidelity Municipal Trust II (the Trusts) are organized as a Massachusetts business trust and a Delaware statutory trust, respectively. Each Fund is authorized to issue an unlimited number of shares. Share transactions on the Statement of Changes in Net Assets may contain exchanges between affiliated funds. Effective January 1, 2016 shares of the Money Market Fund are only available for purchase by retail shareholders. Each Fund may be affected by economic and political developments in the state of Ohio.
2. Investments in Fidelity Central Funds.
The Funds may invest in Fidelity Central Funds, which are open-end investment companies generally available only to other investment companies and accounts managed by the investment adviser and its affiliates. The Funds' Schedules of Investments list each of the Fidelity Central Funds held as of period end, if any, as an investment of each Fund, but do not include the underlying holdings of each Fidelity Central Fund. As an Investing Fund, each Fund indirectly bears its proportionate share of the expenses of the underlying Fidelity Central Funds.
The Money Market Central Funds seek preservation of capital and current income and are managed by Fidelity Investments Money Management, Inc. (FIMM), an affiliate of the investment adviser. Annualized expenses of the Money Market Central Funds as of their most recent shareholder report date are less than .005%.
A complete unaudited list of holdings for each Fidelity Central Fund is available upon request or at the Securities and Exchange Commission (the SEC) website at www.sec.gov. In addition, the financial statements of the Fidelity Central Funds, which are not covered by the Funds' Report of Independent Registered Public Accounting Firm, are available on the SEC website or upon request.
3. Significant Accounting Policies.
The financial statements have been prepared in conformity with accounting principles generally accepted in the United States of America (GAAP), which require management to make certain estimates and assumptions at the date of the financial statements. Actual results could differ from those estimates. Subsequent events, if any, through the date that the financial statements were issued have been evaluated in the preparation of the financial statements. The following summarizes the significant accounting policies of the Funds:
Investment Valuation. Investments are valued as of 4:00 p.m. Eastern time on the last calendar day of the period. The Board of Trustees (the Board) has delegated the day to day responsibility for the valuation of the Income Fund's investments to the Fair Value Committee (the Committee) established by the Income Fund's investment adviser. In accordance with valuation policies and procedures approved by the Board, the Income Fund attempts to obtain prices from one or more third party pricing vendors or brokers to value its investments. When current market prices, quotations or currency exchange rates are not readily available or reliable, investments will be fair valued in good faith by the Committee, in accordance with procedures adopted by the Board. Factors used in determining fair value vary by investment type and may include market or investment specific events, changes in interest rates and credit quality. The frequency with which these procedures are used cannot be predicted and they may be utilized to a significant extent. The Committee oversees the Income Fund's valuation policies and procedures and reports to the Board on the Committee's activities and fair value determinations. The Board monitors the appropriateness of the procedures used in valuing the Income Fund's investments and ratifies the fair value determinations of the Committee.
Each Fund categorizes the inputs to valuation techniques used to value its investments into a disclosure hierarchy consisting of three levels as shown below:
- Level 1 – quoted prices in active markets for identical investments
- Level 2 – other significant observable inputs (including quoted prices for similar investments, interest rates, prepayment speeds, etc.)
- Level 3 – unobservable inputs (including the Fund's own assumptions based on the best information available)
Valuation techniques used to value each Fund's investments by major category are as follows:
For the Income Fund, debt securities, including restricted securities, are valued based on evaluated prices received from third party pricing vendors or from brokers who make markets in such securities. Municipal securities are valued by pricing vendors who utilize matrix pricing which considers yield or price of bonds of comparable quality, coupon, maturity and type or by broker-supplied prices. When independent prices are unavailable or unreliable, debt securities may be valued utilizing pricing methodologies which consider similar factors that would be used by third party pricing vendors. Debt securities are generally categorized as Level 2 in the hierarchy but may be Level 3 depending on the circumstances.
For the Money Market Fund, as permitted by compliance with certain conditions under Rule 2a-7 of the 1940 Act, securities are valued at amortized cost, which approximates fair value. The amortized cost of an instrument is determined by valuing it at its original cost and thereafter amortizing any discount or premium from its face value at a constant rate until maturity. Securities held by a money market fund are generally high quality and liquid; however, they are reflected as Level 2 because the inputs used to determine fair value are not quoted prices in an active market.
For the Income Fund, changes in valuation techniques may result in transfers in or out of an assigned level within the disclosure hierarchy.
Investment Transactions and Income. For financial reporting purposes, the Funds' investment holdings and NAV include trades executed through the end of the last business day of the period. The NAV per share for processing shareholder transactions is calculated as of the close of business of the New York Stock Exchange (NYSE), normally 4:00 p.m. Eastern time and includes trades executed through the end of the prior business day for the Income Fund and trades executed through the end of the current business day for the Money Market Fund. Gains and losses on securities sold are determined on the basis of identified cost. Income and capital gain distributions from Fidelity Central Funds, if any, are recorded on the ex-dividend date. Interest income is accrued as earned and includes coupon interest and amortization of premium and accretion of discount on debt securities as applicable. Debt obligations may be placed on non-accrual status and related interest income may be reduced by ceasing current accruals and writing off interest receivables when the collection of all or a portion of interest has become doubtful based on consistently applied procedures. A debt obligation is removed from non-accrual status when the issuer resumes interest payments or when collectability of interest is reasonably assured.
Expenses. Expenses directly attributable to a fund are charged to that fund. Expenses attributable to more than one fund are allocated among the respective funds on the basis of relative net assets or other appropriate methods. Expense estimates are accrued in the period to which they relate and adjustments are made when actual amounts are known.
Income Tax Information and Distributions to Shareholders. Each year, each Fund intends to qualify as a regulated investment company under Subchapter M of the Internal Revenue Code, including distributing substantially all of its taxable income and realized gains. As a result, no provision for U.S. Federal income taxes is required. During the period, the Money Market Fund incurred a corporate tax liability on undistributed long-term capital gain which is included as Miscellaneous expense on the Statement of Operations. As of December 31, 2016, each Fund did not have any unrecognized tax benefits in the financial statements; nor is each Fund aware of any tax positions for which it is reasonably possible that the total amounts of unrecognized tax benefits will significantly change in the next twelve months. Each Fund files a U.S. federal tax return, in addition to state and local tax returns as required. Each Fund's federal income tax returns are subject to examination by the Internal Revenue Service (IRS) for a period of three fiscal years after they are filed. State and local tax returns may be subject to examination for an additional fiscal year depending on the jurisdiction.
Dividends are declared and recorded daily and paid monthly from net investment income. Distributions from realized gains, if any, are declared and recorded on the ex-dividend date. Income and capital gain distributions are determined in accordance with income tax regulations, which may differ from GAAP. In addition, the Funds claimed a portion of the payment made to redeeming shareholders as a distribution for income tax purposes.
Capital accounts within the financial statements are adjusted for permanent book-tax differences. These adjustments have no impact on net assets or the results of operations. Capital accounts are not adjusted for temporary book-tax differences which will reverse in a subsequent period.
Book-tax differences are primarily due to market discount, deferred trustees compensation and losses deferred due to futures transactions.
The Funds purchase municipal securities whose interest, in the opinion of the issuer, is free from federal income tax. There is no assurance that the IRS will agree with this opinion. In the event the IRS determines that the issuer does not comply with relevant tax requirements, interest payments from a security could become federally taxable, possibly retroactively to the date the security was issued.
The federal tax cost of investment securities and unrealized appreciation (depreciation) as of period end were as follows for each Fund:
| | Tax cost | Gross unrealized appreciation | Gross unrealized depreciation | Net unrealized appreciation (depreciation) on securities |
| Fidelity Ohio Municipal Income Fund | $645,465,141 | $20,480,061 | $(7,936,222) | $12,543,839 |
| Fidelity Ohio Municipal Money Market Fund | 578,086,535 | – | – | – |
The tax-based components of distributable earnings as of period end were as follows for each Fund:
| | Undistributed tax-exempt income | Undistributed ordinary income | Undistributed long-term capital gain | Net unrealized appreciation (depreciation) on securities and other investments |
| Fidelity Ohio Municipal Income Fund | $88,020 | $- | $1,313,840 | $12,543,839 |
| Fidelity Ohio Municipal Money Market Fund | 991 | 34,632 | 8,712 | - |
At period end, certain of the Funds were required to defer losses on futures contracts. Loss deferrals were as follows:
| | Futures contracts |
| Fidelity Ohio Municipal Income Fund | $55,844 |
The tax character of distributions paid was as follows:
| December 31, 2016 | | | |
| | Tax-Exempt Income | Long-term Capital Gains | Total |
| Fidelity Ohio Municipal Income Fund | $18,738,970 | $4,034,669 | $22,773,639 |
| Fidelity Ohio Municipal Money Market Fund | 550,885 | 43,302 | 594,187 |
| December 31, 2015 | | | |
| | Tax-Exempt Income | Long-term Capital Gains | Total |
| Fidelity Ohio Municipal Income Fund | $18,067,795 | $5,977,113 | $24,044,908 |
| Fidelity Ohio Municipal Money Market Fund | 119,843 | 34,708 | 154,551 |
Short-Term Trading (Redemption) Fees. Shares held by investors in the Income Fund less than 30 days may be subject to a redemption fee equal to .50% of the NAV of shares redeemed. All redemption fees, which reduce the proceeds of the shareholder redemption, are retained by the Fund and accounted for as an addition to paid in capital. In November 2016, the Board of Trustees approved the elimination of these redemption fees effective December 12, 2016.
Delayed Delivery Transactions and When-Issued Securities. During the period, the Funds transacted in securities on a delayed delivery or when-issued basis. Payment and delivery may take place after the customary settlement period for that security. The price of the underlying securities and the date when the securities will be delivered and paid for are fixed at the time the transaction is negotiated. The securities purchased on a delayed delivery or when-issued basis are identified as such in each applicable Fund's Schedule of Investments. The Funds may receive compensation for interest forgone in the purchase of a delayed delivery or when-issued security. With respect to purchase commitments, each applicable Fund identifies securities as segregated in its records with a value at least equal to the amount of the commitment. Losses may arise due to changes in the value of the underlying securities or if the counterparty does not perform under the contract's terms, or if the issuer does not issue the securities due to political, economic, or other factors.
Restricted Securities. The Funds may invest in securities that are subject to legal or contractual restrictions on resale. These securities generally may be resold in transactions exempt from registration or to the public if the securities are registered. Disposal of these securities may involve time-consuming negotiations and expense, and prompt sale at an acceptable price may be difficult. Information regarding restricted securities is included at the end of each applicable Fund's Schedule of Investments.
4. Purchases and Sales of Investments.
Purchases and sales of securities, other than short-term securities, for the Income Fund aggregated $181,962,003 and $117,158,895, respectively.
5. Fees and Other Transactions with Affiliates.
Management Fee. Fidelity Management & Research Company (the investment adviser) and its affiliates provide the Funds with investment management related services for which the Funds pay a monthly management fee. The management fee is the sum of an individual fund fee rate and an annualized group fee rate. The individual fund fee rate is applied to each Fund's average net assets. The group fee rate is based upon the average net assets of all the mutual funds advised by the investment adviser, including any mutual funds previously advised by the investment adviser that are currently advised by Fidelity SelectCo, LLC, an affiliate of the investment adviser. The group fee rate decreases as assets under management increase and increases as assets under management decrease. For the reporting period, each Fund's annual management fee rate expressed as a percentage of each Fund's average net assets was as follows:
| | Individual Rate | Group Rate | Total |
| Fidelity Ohio Municipal Income Fund | .25% | .11% | .36% |
| Fidelity Ohio Municipal Money Market Fund | .25% | .11% | .36% |
Transfer Agent Fees. Fidelity Investments Institutional Operations Company, Inc. (FIIOC), an affiliate of the investment adviser, is the transfer, dividend disbursing and shareholder servicing agent for the Funds. FIIOC receives account fees and asset-based fees that vary according to account size and type of account. FIIOC pays for typesetting, printing and mailing of shareholder reports, except proxy statements. For the period, the transfer agent fees were equivalent to the following annual rates expressed as a percentage of average net assets:
| Fidelity Ohio Municipal Income Fund | .08% |
| Fidelity Ohio Municipal Money Market Fund | .13% |
Accounting Fees. Fidelity Service Company, Inc. (FSC), an affiliate of the investment adviser, maintains each Fund's accounting records. The fee is based on the level of average net assets for each month.
Interfund Trades. The Funds may purchase from or sell securities to other Fidelity Funds under procedures adopted by the Board. The procedures have been designed to ensure these interfund trades are executed in accordance with Rule 17a-7 of the 1940 Act. For the Income Fund, interfund trades are included within the respective purchases and sales amounts shown in the Purchases and Sales of Investments note.
6. Committed Line of Credit.
The Income Fund participates with other funds managed by the investment adviser or an affiliate in a $4.25 billion credit facility (the "line of credit") to be utilized for temporary or emergency purposes to fund shareholder redemptions or for other short-term liquidity purposes. The participating funds have agreed to pay commitment fees on their pro-rata portion of the line of credit, which are reflected in Miscellaneous expenses on the Statement of Operations, and are as follows:
| Fidelity Ohio Municipal Income Fund | $1,745 |
During the period, the Income Fund did not borrow on this line of credit.
7. Expense Reductions.
The investment adviser or its affiliates voluntarily agreed to waive certain fees for the Money Market Fund in order to maintain a minimum annualized yield of .01%. Such arrangements may be discontinued by the investment adviser at any time. For the period, the amount of the waiver was $1,243,842.
In addition, through arrangements with each applicable Fund's custodian, credits realized as a result of certain uninvested cash balances were used to reduce each applicable Fund's expenses. All of the applicable expense reductions are noted in the table below.
| | Custody
expense
reduction |
| Fidelity Ohio Municipal Income Fund | $5,286 |
| Fidelity Ohio Municipal Money Market Fund | 6,350 |
In addition, during the period the investment adviser reimbursed and/or waived a portion of operating expenses as follows:
| | Amount |
| Fidelity Ohio Municipal Income Fund | $2,571 |
| Fidelity Ohio Municipal Money Market Fund | 5,820 |
8. Other.
The Funds' organizational documents provide former and current trustees and officers with a limited indemnification against liabilities arising in connection with the performance of their duties to the Funds. In the normal course of business, the Funds may also enter into contracts that provide general indemnifications. The Funds' maximum exposure under these arrangements is unknown as this would be dependent on future claims that may be made against the Funds. The risk of material loss from such claims is considered remote.
Report of Independent Registered Public Accounting Firm
To the Trustees of Fidelity Municipal Trust and Fidelity Municipal Trust II and the Shareholders of Fidelity Ohio Municipal Income and Fidelity Ohio Municipal Money Market Fund:
In our opinion, the accompanying statements of assets and liabilities, including the schedules of investments, and the related statements of operations and of changes in net assets and the financial highlights present fairly, in all material respects, the financial position of Fidelity Ohio Municipal Income Fund (a fund of Fidelity Municipal Trust) and Fidelity Ohio Municipal Money Market Fund (a fund of Fidelity Municipal Trust II) (the "Funds") as of December 31, 2016 the results of each of their operations for the year then ended, the changes in each of their net assets for each of the two years in the period then ended and the financial highlights for each of the five years in the period then ended, in conformity with accounting principles generally accepted in the United States of America. These financial statements and financial highlights (hereafter referred to as “financial statements”) are the responsibility of the Funds' management. Our responsibility is to express an opinion on these financial statements based on our audits. We conducted our audits of these financial statements in accordance with the standards of the Public Company Accounting Oversight Board (United States). Those standards require that we plan and perform the audit to obtain reasonable assurance about whether the financial statements are free of material misstatement. An audit includes examining, on a test basis, evidence supporting the amounts and disclosures in the financial statements, assessing the accounting principles used and significant estimates made by management, and evaluating the overall financial statement presentation. We believe that our audits, which included confirmation of securities as of December 31, 2016 by correspondence with the custodian and brokers, provide a reasonable basis for our opinion.
PricewaterhouseCoopers LLP
Boston, Massachusetts
February 14, 2017
Trustees and Officers
The Trustees, Members of the Advisory Board (if any), and officers of the trusts and funds, as applicable, are listed below. The Board of Trustees governs each fund and is responsible for protecting the interests of shareholders. The Trustees are experienced executives who meet periodically throughout the year to oversee each fund's activities, review contractual arrangements with companies that provide services to each fund, oversee management of the risks associated with such activities and contractual arrangements, and review each fund's performance. Each of the Trustees oversees 243 funds.
The Trustees hold office without limit in time except that (a) any Trustee may resign; (b) any Trustee may be removed by written instrument, signed by at least two-thirds of the number of Trustees prior to such removal; (c) any Trustee who requests to be retired or who has become incapacitated by illness or injury may be retired by written instrument signed by a majority of the other Trustees; and (d) any Trustee may be removed at any special meeting of shareholders by a two-thirds vote of the outstanding voting securities of the trust. Each Trustee who is not an interested person (as defined in the 1940 Act) of the trust and the funds is referred to herein as an Independent Trustee. Each Independent Trustee shall retire not later than the last day of the calendar year in which his or her 75th birthday occurs. The Independent Trustees may waive this mandatory retirement age policy with respect to individual Trustees. Officers and Advisory Board Members hold office without limit in time, except that any officer or Advisory Board Member may resign or may be removed by a vote of a majority of the Trustees at any regular meeting or any special meeting of the Trustees. Except as indicated, each individual has held the office shown or other offices in the same company for the past five years.
Each fund’s Statement of Additional Information (SAI) includes more information about the Trustees. To request a free copy, call Fidelity at 1-800-544-8544.
Experience, Skills, Attributes, and Qualifications of the Trustees. The Governance and Nominating Committee has adopted a statement of policy that describes the experience, qualifications, attributes, and skills that are necessary and desirable for potential Independent Trustee candidates (Statement of Policy). The Board believes that each Trustee satisfied at the time he or she was initially elected or appointed a Trustee, and continues to satisfy, the standards contemplated by the Statement of Policy. The Governance and Nominating Committee also engages professional search firms to help identify potential Independent Trustee candidates who have the experience, qualifications, attributes, and skills consistent with the Statement of Policy. From time to time, additional criteria based on the composition and skills of the current Independent Trustees, as well as experience or skills that may be appropriate in light of future changes to board composition, business conditions, and regulatory or other developments, have also been considered by the professional search firms and the Governance and Nominating Committee. In addition, the Board takes into account the Trustees' commitment and participation in Board and committee meetings, as well as their leadership of standing and ad hoc committees throughout their tenure.
In determining that a particular Trustee was and continues to be qualified to serve as a Trustee, the Board has considered a variety of criteria, none of which, in isolation, was controlling. The Board believes that, collectively, the Trustees have balanced and diverse experience, qualifications, attributes, and skills, which allow the Board to operate effectively in governing each fund and protecting the interests of shareholders. Information about the specific experience, skills, attributes, and qualifications of each Trustee, which in each case led to the Board's conclusion that the Trustee should serve (or continue to serve) as a trustee of each fund, is provided below.
Board Structure and Oversight Function. Abigail P. Johnson is an interested person and currently serves as Chairman. The Trustees have determined that an interested Chairman is appropriate and benefits shareholders because an interested Chairman has a personal and professional stake in the quality and continuity of services provided to the funds. Independent Trustees exercise their informed business judgment to appoint an individual of their choosing to serve as Chairman, regardless of whether the Trustee happens to be independent or a member of management. The Independent Trustees have determined that they can act independently and effectively without having an Independent Trustee serve as Chairman and that a key structural component for assuring that they are in a position to do so is for the Independent Trustees to constitute a substantial majority for the Board. The Independent Trustees also regularly meet in executive session. Marie L. Knowles serves as Chairman of the Independent Trustees and as such (i) acts as a liaison between the Independent Trustees and management with respect to matters important to the Independent Trustees and (ii) with management prepares agendas for Board meetings.
Fidelity® funds are overseen by different Boards of Trustees. The funds' Board oversees Fidelity's investment-grade bond, money market, asset allocation and certain equity funds, and other Boards oversee Fidelity's high income, sector and other equity funds. The asset allocation funds may invest in Fidelity® funds that are overseen by such other Boards. The use of separate Boards, each with its own committee structure, allows the Trustees of each group of Fidelity® funds to focus on the unique issues of the funds they oversee, including common research, investment, and operational issues. On occasion, the separate Boards establish joint committees to address issues of overlapping consequences for the Fidelity® funds overseen by each Board.
The Trustees operate using a system of committees to facilitate the timely and efficient consideration of all matters of importance to the Trustees, each fund, and fund shareholders and to facilitate compliance with legal and regulatory requirements and oversight of the funds' activities and associated risks. The Board, acting through its committees, has charged FMR and its affiliates with (i) identifying events or circumstances the occurrence of which could have demonstrably adverse effects on the funds' business and/or reputation; (ii) implementing processes and controls to lessen the possibility that such events or circumstances occur or to mitigate the effects of such events or circumstances if they do occur; and (iii) creating and maintaining a system designed to evaluate continuously business and market conditions in order to facilitate the identification and implementation processes described in (i) and (ii) above. Because the day-to-day operations and activities of the funds are carried out by or through FMR, its affiliates, and other service providers, the funds' exposure to risks is mitigated but not eliminated by the processes overseen by the Trustees. While each of the Board's committees has responsibility for overseeing different aspects of the funds' activities, oversight is exercised primarily through the Operations and Audit Committees. In addition, an ad hoc Board committee of Independent Trustees has worked with FMR to enhance the Board's oversight of investment and financial risks, legal and regulatory risks, technology risks, and operational risks, including the development of additional risk reporting to the Board. The Operations Committee also worked and continues to work with FMR to enhance the stress tests required under SEC regulations for money market funds. Appropriate personnel, including but not limited to the funds' Chief Compliance Officer (CCO), FMR's internal auditor, the independent accountants, the funds' Treasurer and portfolio management personnel, make periodic reports to the Board's committees, as appropriate, including an annual review of Fidelity's risk management program for the Fidelity® funds. The responsibilities of each standing committee, including their oversight responsibilities, are described further under "Standing Committees of the Trustees."
Interested Trustees*:
Correspondence intended for a Trustee who is an interested person may be sent to Fidelity Investments, 245 Summer Street, Boston, Massachusetts 02210.
Name, Year of Birth; Principal Occupations and Other Relevant Experience+
Abigail P. Johnson (1961)
Year of Election or Appointment: 2009
Trustee
Chairman of the Board of Trustees
Ms. Johnson also serves as Trustee of other Fidelity® funds. Ms. Johnson serves as Chairman (2016-present), Chief Executive Officer (2014-present), and Director (2007-present) of FMR LLC (diversified financial services company), President of Fidelity Financial Services (2012-present) and President of Personal, Workplace and Institutional Services (2005-present). Ms. Johnson is Chairman and Director of FMR Co., Inc. (investment adviser firm, 2011-present) and Chairman and Director of FMR (investment adviser firm, 2011-present). Previously, Ms. Johnson served as Vice Chairman (2007-2016) and President (2013-2016) of FMR LLC, President and a Director of FMR (2001-2005), a Trustee of other investment companies advised by FMR, Fidelity Investments Money Management, Inc. (investment adviser firm), and FMR Co., Inc. (2001-2005), Senior Vice President of the Fidelity® funds (2001-2005), and managed a number of Fidelity® funds. Ms. Abigail P. Johnson and Mr. Arthur E. Johnson are not related.
Jennifer Toolin McAuliffe (1959)
Year of Election or Appointment: 2016
Trustee
Ms. McAuliffe also serves as Trustee of other Fidelity® funds. Ms. McAuliffe previously served as a Member of the Advisory Board of certain Fidelity® funds (2016) and as Co-Head of Fixed Income of Fidelity Investments Limited (now known as FIL Limited (FIL)) (diversified financial services company). Earlier roles at FIL included Director of Research for FIL’s credit and quantitative teams in London, Hong Kong and Tokyo. Ms. McAuliffe also was the Director of Research for taxable and municipal bonds at Fidelity Investments Money Management, Inc. Ms. McAuliffe is also a director or trustee of several not-for-profit entities.
* Determined to be an “Interested Trustee” by virtue of, among other things, his or her affiliation with the trusts or various entities under common control with FMR.
+ The information includes the Trustee's principal occupation during the last five years and other information relating to the experience, attributes, and skills relevant to the Trustee's qualifications to serve as a Trustee, which led to the conclusion that the Trustee should serve as a Trustee for each fund.
Independent Trustees:
Correspondence intended for an Independent Trustee may be sent to Fidelity Investments, P.O. Box 55235, Boston, Massachusetts 02205-5235.
Name, Year of Birth; Principal Occupations and Other Relevant Experience+
Elizabeth S. Acton (1951)
Year of Election or Appointment: 2013
Trustee
Ms. Acton also serves as Trustee of other Fidelity® funds. Prior to her retirement in April 2012, Ms. Acton was Executive Vice President, Finance (2011-2012), Executive Vice President, Chief Financial Officer (2002-2011), and Treasurer (2004-2005) of Comerica Incorporated (financial services). Prior to joining Comerica, Ms. Acton held a variety of positions at Ford Motor Company (1983-2002), including Vice President and Treasurer (2000-2002) and Executive Vice President and Chief Financial Officer of Ford Motor Credit Company (1998-2000). Ms. Acton currently serves as a member of the Board of Directors and Audit and Finance Committees of Beazer Homes USA, Inc. (homebuilding, 2012-present). Previously, Ms. Acton served as a Member of the Advisory Board of certain Fidelity® funds (2013-2016).
John Engler (1948)
Year of Election or Appointment: 2014
Trustee
Mr. Engler also serves as Trustee of other Fidelity® funds. He serves as president of the Business Roundtable (2011-present), and on the board of directors for Universal Forest Products (manufacturer and distributor of wood and wood-alternative products, 2003-present) and K12 Inc. (technology-based education company, 2012-present). Previously, Mr. Engler served as a Member of the Advisory Board of certain Fidelity® funds (2014-2016), a trustee of The Munder Funds (2003-2014), president and CEO of the National Association of Manufacturers (2004-2011), member of the Board of Trustees of the Annie E. Casey Foundation (2004-2015), and as governor of Michigan (1991-2003). He is a past chairman of the National Governors Association.
Albert R. Gamper, Jr. (1942)
Year of Election or Appointment: 2006
Trustee
Mr. Gamper also serves as Trustee of other Fidelity® funds. Prior to his retirement in December 2004, Mr. Gamper served as Chairman of the Board of CIT Group Inc. (commercial finance). During his tenure with CIT Group Inc. Mr. Gamper served in numerous senior management positions, including Chairman (1987-1989; 1999-2001; 2002-2004), Chief Executive Officer (1987-2004), and President (2002-2003). Mr. Gamper currently serves as a member of the Board of Directors of Public Service Enterprise Group (utilities, 2000-present), and Member of the Board of Trustees of Barnabas Health Care System (1997-present). Previously, Mr. Gamper served as Chairman (2012-2015) and Vice Chairman (2011-2012) of the Independent Trustees of certain Fidelity® funds and as Chairman of the Board of Governors, Rutgers University (2004-2007).
Robert F. Gartland (1951)
Year of Election or Appointment: 2010
Trustee
Mr. Gartland also serves as Trustee of other Fidelity® funds. Mr. Gartland is Chairman and an investor in Gartland & Mellina Group Corp. (consulting, 2009-present). Previously, Mr. Gartland served as a partner and investor of Vietnam Partners LLC (investments and consulting, 2008-2011). Prior to his retirement, Mr. Gartland held a variety of positions at Morgan Stanley (financial services, 1979-2007) including Managing Director (1987-2007).
Arthur E. Johnson (1947)
Year of Election or Appointment: 2008
Trustee
Vice Chairman of the Independent Trustees
Mr. Johnson also serves as Trustee of other Fidelity® funds. Mr. Johnson serves as a member of the Board of Directors of Eaton Corporation plc (diversified power management, 2009-present) and Booz Allen Hamilton (management consulting, 2011-present). Prior to his retirement, Mr. Johnson served as Senior Vice President of Corporate Strategic Development of Lockheed Martin Corporation (defense contractor, 1999-2009). He previously served on the Board of Directors of IKON Office Solutions, Inc. (1999-2008), AGL Resources, Inc. (holding company, 2002-2016), and Delta Airlines (2005-2007). Mr. Arthur E. Johnson is not related to Ms. Abigail P. Johnson.
Michael E. Kenneally (1954)
Year of Election or Appointment: 2009
Trustee
Mr. Kenneally also serves as Trustee of other Fidelity® funds. Prior to his retirement, Mr. Kenneally served as Chairman and Global Chief Executive Officer of Credit Suisse Asset Management. Before joining Credit Suisse, he was an Executive Vice President and Chief Investment Officer for Bank of America Corporation. Earlier roles at Bank of America included Director of Research, Senior Portfolio Manager and Research Analyst, and Mr. Kenneally was awarded the Chartered Financial Analyst (CFA) designation in 1991.
Marie L. Knowles (1946)
Year of Election or Appointment: 2001
Trustee
Chairman of the Independent Trustees
Ms. Knowles also serves as Trustee of other Fidelity® funds. Prior to Ms. Knowles' retirement in June 2000, she served as Executive Vice President and Chief Financial Officer of Atlantic Richfield Company (ARCO) (diversified energy, 1996-2000). From 1993 to 1996, she was a Senior Vice President of ARCO and President of ARCO Transportation Company (pipeline and tanker operations). Ms. Knowles currently serves as a Director and Chairman of the Audit Committee of McKesson Corporation (healthcare service, since 2002). Ms. Knowles is a member of the Board of the Santa Catalina Island Company (real estate, 2009-present). Ms. Knowles is a Member of the Investment Company Institute Board of Governors and a Member of the Governing Council of the Independent Directors Council (2014-present). She also serves as a member of the Advisory Board for the School of Engineering of the University of Southern California. Previously, Ms. Knowles served as a Director of Phelps Dodge Corporation (copper mining and manufacturing, 1994-2007), URS Corporation (engineering and construction, 2000-2003) and America West (airline, 1999-2002). Ms. Knowles previously served as Vice Chairman of the Independent Trustees of certain Fidelity® funds (2012-2015).
Mark A. Murray (1954)
Year of Election or Appointment: 2016
Trustee
Mr. Murray also serves as Trustee of other Fidelity® funds. Mr. Murray is Vice Chairman (2013-present) of Meijer, Inc. (regional retail chain). Previously, Mr. Murray served as a Member of the Advisory Board of certain Fidelity® funds (2016) and as Co-Chief Executive Officer (2013-2016) and President (2006-2013) of Meijer, Inc. Mr. Murray serves as a member of the Board of Directors and Nuclear Review and Public Policy and Responsibility Committees of DTE Energy Company (diversified energy company, 2009-present). Mr. Murray also serves as a member of the Board of Directors of Spectrum Health (not-for-profit health system, 2015-present). Mr. Murray previously served as President of Grand Valley State University (2001-2006), Treasurer for the State of Michigan (1999-2001), Vice President of Finance and Administration for Michigan State University (1998-1999), and a member of the Board of Directors and Audit Committee and Chairman of the Nominating and Corporate Governance Committee of Universal Forest Products, Inc. (manufacturer and distributor of wood and wood-alternative products, 2004-2016). Mr. Murray is also a director or trustee of many community and professional organizations.
+ The information includes the Trustee's principal occupation during the last five years and other information relating to the experience, attributes, and skills relevant to the Trustee's qualifications to serve as a Trustee, which led to the conclusion that the Trustee should serve as a Trustee for each fund.
Advisory Board Members and Officers:
Correspondence intended for an officer may be sent to Fidelity Investments, 245 Summer Street, Boston, Massachusetts 02210. Officers appear below in alphabetical order.
Name, Year of Birth; Principal Occupation
Marc R. Bryant (1966)
Year of Election or Appointment: 2015
Secretary and Chief Legal Officer (CLO)
Mr. Bryant also serves as Secretary and CLO of other funds. Mr. Bryant serves as CLO, Secretary, and Senior Vice President of Fidelity Management & Research Company (investment adviser firm, 2015-present) and FMR Co., Inc. (investment adviser firm, 2015-present); Secretary of Fidelity SelectCo, LLC (investment adviser firm, 2015-present) and Fidelity Investments Money Management, Inc. (investment adviser firm, 2015-present); and CLO of Fidelity Management & Research (Hong Kong) Limited and FMR Investment Management (UK) Limited (investment adviser firms, 2015-present) and Fidelity Management & Research (Japan) Limited (investment adviser firm, 2016-present). He is Senior Vice President and Deputy General Counsel of FMR LLC (diversified financial services company). Previously, Mr. Bryant served as Secretary and CLO of Fidelity Rutland Square Trust II (2010-2014) and Assistant Secretary of Fidelity's Fixed Income and Asset Allocation Funds (2013-2015). Prior to joining Fidelity Investments, Mr. Bryant served as a Senior Vice President and the Head of Global Retail Legal for AllianceBernstein L.P. (2006-2010), and as the General Counsel for ProFund Advisors LLC (2001-2006).
Jeffrey S. Christian (1961)
Year of Election or Appointment: 2016
Assistant Treasurer
Mr. Christian also serves as Assistant Treasurer of other funds. Mr. Christian is an employee of Fidelity Investments (2003-present).
Jonathan Davis (1968)
Year of Election or Appointment: 2010
Assistant Treasurer
Mr. Davis also serves as Assistant Treasurer of other funds, and is an employee of Fidelity Investments. Previously, Mr. Davis served as Vice President and Associate General Counsel of FMR LLC (diversified financial services company, 2003-2010).
Adrien E. Deberghes (1967)
Year of Election or Appointment: 2010
Assistant Treasurer
Mr. Deberghes also serves as an officer of other funds. He serves as Executive Vice President of Fidelity Investments Money Management, Inc. (FIMM) (investment adviser firm, 2016-present) and is an employee of Fidelity Investments (2008-present). Prior to joining Fidelity Investments, Mr. Deberghes was Senior Vice President of Mutual Fund Administration at State Street Corporation (2007-2008), Senior Director of Mutual Fund Administration at Investors Bank & Trust (2005-2007), and Director of Finance for Dunkin' Brands (2000-2005). Previously, Mr. Deberghes served in other fund officer roles.
Stephanie J. Dorsey (1969)
Year of Election or Appointment: 2013
President and Treasurer
Ms. Dorsey also serves as an officer of other funds. She is an employee of Fidelity Investments (2008-present) and has served in other fund officer roles. Prior to joining Fidelity Investments, Ms. Dorsey served as Treasurer (2004-2008) of the JPMorgan Mutual Funds and Vice President (2004-2008) of JPMorgan Chase Bank.
Howard J. Galligan III (1966)
Year of Election or Appointment: 2014
Chief Financial Officer
Mr. Galligan also serves as Chief Financial Officer of other funds. Mr. Galligan serves as President of Fidelity Pricing and Cash Management Services (FPCMS) (2014-present) and as a Director of Strategic Advisers, Inc. (investment adviser firm, 2008-present). Previously, Mr. Galligan served as Chief Administrative Officer of Asset Management (2011-2014) and Chief Operating Officer and Senior Vice President of Investment Support for Strategic Advisers, Inc. (2003-2011).
Scott C. Goebel (1968)
Year of Election or Appointment: 2015
Vice President
Mr. Goebel serves as Vice President of other funds and is an employee of Fidelity Investments (2001-present). Previously, Mr. Goebel served as Senior Vice President of Fidelity Management & Research Company (FMR) (investment adviser firm, 2016), Secretary of Fidelity SelectCo, LLC (investment adviser firm, 2013-2015), Fidelity Investments Money Management, Inc. (FIMM) (investment adviser firm, 2010-2015), and Fidelity Research and Analysis Company (FRAC) (investment adviser firm, 2010-2015); General Counsel, Secretary, and Senior Vice President of FMR (investment adviser firm, 2008-2015) and FMR Co., Inc. (investment adviser firm, 2008-2015); Assistant Secretary of Fidelity Management & Research (Japan) Limited (investment adviser firm, 2008-2015) and Fidelity Management & Research (U.K.) Inc. (investment adviser firm, 2008-2015); Chief Legal Officer (CLO) of Fidelity Management & Research (Hong Kong) Limited (investment adviser firm, 2008-2015); Secretary and CLO of certain Fidelity® funds (2008-2015); Assistant Secretary of FIMM (2008-2010), FRAC (2008-2010), and certain funds (2007-2008); and as Vice President and Secretary of Fidelity Distributors Corporation (FDC) (2005-2007).
Colm A. Hogan (1973)
Year of Election or Appointment: 2016
Assistant Treasurer
Mr. Hogan also serves as an officer of other funds. Mr. Hogan is an employee of Fidelity Investments (2005-present).
Timothy Huyck (1964)
Year of Election or Appointment: 2015
Vice President of Fidelity's Money Market Funds
Mr. Huyck also serves as Vice President of other funds. Mr. Huyck serves as Chief Investment Officer of Fidelity's Money Market Funds (2015-present) and is an employee of Fidelity Investments (1990-present).
Chris Maher (1972)
Year of Election or Appointment: 2013
Assistant Treasurer
Mr. Maher serves as Assistant Treasurer of other funds. Mr. Maher is Vice President of Valuation Oversight and is an employee of Fidelity Investments. Previously, Mr. Maher served as Vice President of Asset Management Compliance (2013), Vice President of the Program Management Group of FMR (investment adviser firm, 2010-2013), and Vice President of Valuation Oversight (2008-2010).
John B. McGinty, Jr. (1962)
Year of Election or Appointment: 2016
Chief Compliance Officer
Mr. McGinty also serves as Chief Compliance Officer of other funds. Mr. McGinty is Senior Vice President of Asset Management Compliance for Fidelity Investments and is an employee of Fidelity Investments (2016-present). Mr. McGinty previously served as Vice President, Senior Attorney at Eaton Vance Management (investment management firm, 2015-2016), and prior to Eaton Vance as global CCO for all firm operations and registered investment companies at GMO LLC (investment management firm, 2009-2015). Before joining GMO LLC, Mr. McGinty served as Senior Vice President, Deputy General Counsel for Fidelity Investments (2007-2009).
John F. Papandrea (1972)
Year of Election or Appointment: 2016
Anti-Money Laundering (AML) Officer
Mr. Papandrea also serves as AML Officer of other funds. Mr. Papandrea is Vice President of FMR LLC (diversified financial services company, 2008-present) and is an employee of Fidelity Investments (2005-present).
Jason P. Pogorelec (1975)
Year of Election or Appointment: 2015
Assistant Secretary
Mr. Pogorelec also serves as Assistant Secretary of other funds. Mr. Pogorelec serves as Vice President, Associate General Counsel (2010-present) and is an employee of Fidelity Investments (2006-present).
Nancy D. Prior (1967)
Year of Election or Appointment: 2014
Vice President
Ms. Prior also serves as Vice President of other funds. Ms. Prior serves as a Director of FMR Investment Management (UK) Limited (investment adviser firm, 2015-present), President (2016-present) and Director (2014-present) of Fidelity Investments Money Management, Inc. (FIMM) (investment adviser firm), President, Fixed Income (2014-present), Vice Chairman of FIAM LLC (investment adviser firm, 2014-present), and is an employee of Fidelity Investments (2002-present). Previously, Ms. Prior served as Vice President of Fidelity's Money Market Funds (2012-2014), President, Money Market and Short Duration Bond Group of Fidelity Management & Research (FMR) (investment adviser firm, 2013-2014), President, Money Market Group of FMR (2011-2013), Managing Director of Research (2009-2011), Senior Vice President and Deputy General Counsel (2007-2009), and Assistant Secretary of certain Fidelity® funds (2008-2009).
Stacie M. Smith (1974)
Year of Election or Appointment: 2013
Assistant Treasurer
Ms. Smith also serves as an officer of other funds. She is an employee of Fidelity Investments (2009-present) and has served in other fund officer roles. Prior to joining Fidelity Investments, Ms. Smith served as Senior Audit Manager of Ernst & Young LLP (accounting firm, 1996-2009). Previously, Ms. Smith served as Deputy Treasurer of certain Fidelity® funds (2013-2016).
Marc L. Spector (1972)
Year of Election or Appointment: 2016
Deputy Treasurer
Mr. Spector also serves as an officer of other funds. Mr. Spector is an employee of Fidelity Investments (2016-present). Prior to joining Fidelity Investments, Mr. Spector served as Director at the Siegfried Group (accounting firm, 2013-2016), and prior to Siegfried Group as audit senior manager at Deloitte & Touche (accounting firm, 2005-2013).
Renee Stagnone (1975)
Year of Election or Appointment: 2016
Assistant Treasurer
Ms. Stagnone also serves as an officer of other funds. Ms. Stagnone is an employee of Fidelity Investments (1997-present). Previously, Ms. Stagnone served as Deputy Treasurer of certain Fidelity® funds (2013-2016).
Christine J. Thompson (1958)
Year of Election or Appointment: 2015
Vice President of Fidelity's Bond Funds
Ms. Thompson also serves as Vice President of other funds. Ms. Thompson also serves as Chief Investment Officer of FMR's Bond Group (2010-present) and is an employee of Fidelity Investments (1985-present). Previously, Ms. Thompson served as Vice President of Fidelity's Bond Funds (2010-2012).
Shareholder Expense Example
As a shareholder of a Fund, you incur two types of costs: (1) transaction costs, including redemption fees and (2) ongoing costs, including management fees and other Fund expenses. This Example is intended to help you understand your ongoing costs (in dollars) of investing in the Funds and to compare these costs with the ongoing costs of investing in other mutual funds.
The Example is based on an investment of $1,000 invested at the beginning of the period and held for the entire period (July 1, 2016 to December 31, 2016).
Actual Expenses
The first line of the accompanying table for each fund provides information about actual account values and actual expenses. You may use the information in this line, together with the amount you invested, to estimate the expenses that you paid over the period. Simply divide your account value by $1,000.00 (for example, an $8,600 account value divided by $1,000.00 = 8.6), then multiply the result by the number in the first line for a fund under the heading entitled "Expenses Paid During Period" to estimate the expenses you paid on your account during this period. A small balance maintenance fee of $12.00 that is charged once a year may apply for certain accounts with a value of less than $2,000. This fee is not included in the table below. If it was, the estimate of expenses you paid during the period would be higher, and your ending account value lower, by this amount. In addition, each Fund, as a shareholder in the underlying Fidelity Central Funds, will indirectly bear its pro-rata share of the fees and expenses incurred by the underlying Fidelity Central Funds. These fees and expenses are not included in the Fund's annualized expense ratio used to calculate the expense estimate in the table below.
Hypothetical Example for Comparison Purposes
The second line of the accompanying table for each fund provides information about hypothetical account values and hypothetical expenses based on a fund's actual expense ratio and an assumed rate of return of 5% per year before expenses, which is not the Fund's actual return. The hypothetical account values and expenses may not be used to estimate the actual ending account balance or expenses you paid for the period. You may use this information to compare the ongoing costs of investing in the Fund and other funds. To do so, compare this 5% hypothetical example with the 5% hypothetical examples that appear in the shareholder reports of the other funds. A small balance maintenance fee of $12.00 that is charged once a year may apply for certain accounts with a value of less than $2,000. This fee is not included in the table below. If it was, the estimate of expenses you paid during the period would be higher, and your ending account value lower, by this amount. In addition, each Fund, as a shareholder in the underlying Fidelity Central Funds, will indirectly bear its pro-rata share of the fees and expenses incurred by the underlying Fidelity Central Funds. These fees and expenses are not included in the Fund's annualized expense ratio used to calculate the expense estimate in the table below.
Please note that the expenses shown in the table are meant to highlight your ongoing costs only and do not reflect any transaction costs. Therefore, the second line of the table is useful in comparing ongoing costs only, and will not help you determine the relative total costs of owning different funds. In addition, if these transactional costs were included, your costs would have been higher.
| | Annualized Expense Ratio-A | Beginning
Account Value
July 1, 2016 | Ending
Account Value
December 31, 2016 | Expenses Paid
During Period-B
July 1, 2016
to December 31, 2016 |
| Fidelity Ohio Municipal Income Fund | .48% | | | |
| Actual | | $1,000.00 | $952.60 | $2.36 |
| Hypothetical-C | | $1,000.00 | $1,022.72 | $2.44 |
| Fidelity Ohio Municipal Money Market Fund | .50% | | | |
| Actual | | $1,000.00 | $1,000.80 | $2.51 |
| Hypothetical-C | | $1,000.00 | $1,022.62 | $2.54 |
A Annualized expense ratio reflects expenses net of applicable fee waivers.
B Expenses are equal to each Fund's annualized expense ratio, multiplied by the average account value over the period, multiplied by 184/366 (to reflect the one-half year period).
C 5% return per year before expenses
Distributions (Unaudited)
The Board of Trustees of each fund voted to pay to shareholders of record at the opening of business on record date, the following distributions per share derived from capital gains realized from sales of portfolio securities, and dividends derived from net investment income:
| | Pay Date | Record Date | Dividends | Capital Gains |
| Fidelity Ohio Municipal Income Fund | 02/06/17 | 02/03/17 | $0.00 | $0.025 |
| Fidelity Ohio Municipal Money Market Fund | 02/06/17 | 02/03/17 | $0.00 | $0.0001 |
|
The funds hereby designate as capital gain dividend the amounts noted below for the taxable year ended December 31, 2016, or, if subsequently determined to be different, the net capital gain of such year.
| Fidelity Ohio Municipal Income Fund | $5,133,304 |
| Fidelity Ohio Municipal Money Market Fund | $14,121 |
|
During fiscal year ended 2016, 100% of each fund's income dividends were free from federal income tax, and .26% and 13.25% of Fidelity Ohio Municipal Fund and Fidelity Ohio Municipal Money Market Fund's income dividends , respectively, were subject to the federal alternative minimum tax.
The funds will notify shareholders in January 2017 of amounts for use in preparing 2016 income tax returns.
Board Approval of Investment Advisory Contracts and Management Fees
Fidelity Ohio Municipal Income Fund / Fidelity Ohio Municipal Money Market Fund
Each year, the Board of Trustees, including the Independent Trustees (together, the Board), votes on the renewal of the management contract with Fidelity Management & Research Company (FMR) and the sub-advisory agreements (together, the Advisory Contracts) for each fund. The Board, assisted by the advice of fund counsel and Independent Trustees' counsel, requests and considers a broad range of information relevant to the renewal of the Advisory Contracts throughout the year.
The Board meets regularly and, at each of its meetings, covers an extensive agenda of topics and materials and considers factors that are relevant to its annual consideration of the renewal of each fund's Advisory Contracts, including the services and support provided to each fund and its shareholders. The Board has established four standing committees (Committees) — Operations, Audit, Fair Valuation, and Governance and Nominating — each composed of and chaired by Independent Trustees with varying backgrounds, to which the Board has assigned specific subject matter responsibilities in order to enhance effective decision-making by the Board. The Operations Committee, of which all of the Independent Trustees are members, meets regularly throughout the year and considers, among other matters, information specifically related to the annual consideration of the renewal of each fund's Advisory Contracts. The Board, acting directly and through its Committees, requests and receives information concerning the annual consideration of the renewal of each fund's Advisory Contracts. The Board also meets as needed to consider matters specifically related to the Board's annual consideration of the renewal of the Advisory Contracts. Members of the Board may also meet with trustees of other Fidelity funds through ad hoc joint committees to discuss certain matters relevant to all of the Fidelity funds.
At its September 2016 meeting, the Board unanimously determined to renew each fund's Advisory Contracts. In reaching its determination, the Board considered all factors it believed relevant, including (i) the nature, extent, and quality of the services to be provided to each fund and its shareholders (including the investment performance of each fund); (ii) the competitiveness of each fund's management fee and total expense ratio relative to peer funds; (iii) the total costs of the services to be provided by and the profits to be realized by Fidelity from its relationships with each fund; and (iv) the extent to which, if any, economies of scale exist and would be realized as each fund grows, and whether any economies of scale are appropriately shared with fund shareholders.
In considering whether to renew the Advisory Contracts for each fund, the Board reached a determination, with the assistance of fund counsel and Independent Trustees' counsel and through the exercise of its business judgment, that the renewal of the Advisory Contracts was in the best interests of each fund and its shareholders and that the compensation payable under the Advisory Contracts was fair and reasonable. The Board's decision to renew the Advisory Contracts was not based on any single factor, but rather was based on a comprehensive consideration of all the information provided to the Board at its meetings throughout the year. The Board, in reaching its determination to renew the Advisory Contracts, was aware that shareholders of each fund have a broad range of investment choices available to them, including a wide choice among funds offered by Fidelity's competitors, and that each fund's shareholders, who have the opportunity to review and weigh the disclosure provided by the fund in its prospectus and other public disclosures, have chosen to invest in that fund, which is part of the Fidelity family of funds.
Nature, Extent, and Quality of Services Provided. The Board considered Fidelity's staffing as it relates to the funds, including the backgrounds of investment personnel of Fidelity, and also considered the funds' investment objectives, strategies, and related investment philosophies. The Independent Trustees also had discussions with senior management of Fidelity's investment operations and investment groups. The Board considered the structure of the investment personnel compensation program and whether this structure provides appropriate incentives to act in the best interests of each fund. Additionally, the Board considered the portfolio managers' investments, if any, in the funds that they manage.
Resources Dedicated to Investment Management and Support Services. The Board reviewed the general qualifications and capabilities of Fidelity's investment staff, including its size, education, experience, and resources, as well as Fidelity's approach to recruiting, managing, and compensating investment personnel. The Board noted that Fidelity has continued to increase the resources devoted to non-U.S. offices, including expansion of Fidelity's global investment organization. The Board also noted that Fidelity's analysts have extensive resources, tools and capabilities that allow them to conduct sophisticated quantitative and fundamental analysis, as well as credit analysis of issuers, counterparties and guarantors. Further, the Board considered that Fidelity's investment professionals have sufficient access to global information and data so as to provide competitive investment results over time, and that those professionals also have access to sophisticated tools that permit them to assess portfolio construction and risk and performance attribution characteristics continuously, as well as to transmit new information and research conclusions rapidly around the world. Additionally, in its deliberations, the Board considered Fidelity's trading, risk management, compliance, and technology and operations capabilities and resources, which are integral parts of the investment management process.
Shareholder and Administrative Services. The Board considered (i) the nature, extent, quality, and cost of advisory, administrative, and shareholder services performed by FMR, the sub-advisers (together with FMR, the Investment Advisers), and their affiliates under the Advisory Contracts and under separate agreements covering transfer agency and pricing and bookkeeping services for each fund; (ii) the nature and extent of the supervision of third party service providers, principally custodians, subcustodians, and pricing vendors; and (iii) the resources devoted to, and the record of compliance with, each fund's compliance policies and procedures.
The Board noted that the growth of fund assets over time across the complex allows Fidelity to reinvest in the development of services designed to enhance the value or convenience of the Fidelity funds as investment vehicles. These services include 24-hour access to account information and market information through telephone representatives and over the Internet, investor education materials and asset allocation tools, and the expanded availability of Fidelity Investor Centers.
Investment in a Large Fund Family. The Board considered the benefits to shareholders of investing in a Fidelity fund, including the benefits of investing in a fund that is part of a large family of funds offering a variety of investment disciplines and providing a large variety of mutual fund investor services. The Board noted that Fidelity had taken, or had made recommendations that resulted in the Fidelity funds taking, a number of actions over the previous year that benefited particular funds, including: (i) continuing to dedicate additional resources to investment research and to the support of the senior management team that oversees asset management; (ii) continuing efforts to enhance Fidelity's global research capabilities; (iii) launching new funds and making other enhancements to meet client needs; (iv) broadening eligibility requirements for certain lower-priced share classes of, and streamlining the fee structure for, certain existing equity index funds; (v) lowering expense caps for certain existing funds and classes to reduce expenses paid by shareholders; (vi) eliminating redemption fees for certain variable insurance product funds and classes; (vii) continuing to launch dedicated lower cost underlying funds to meet portfolio construction needs related to expanding underlying fund options for Fidelity funds of funds, specifically for the Freedom Fund product lines; (viii) launching a lower cost share class for use by the Freedom Index Fund product line; (ix) rationalizing product lines and gaining increased efficiencies through fund mergers and share class consolidations; (x) continuing to develop, acquire and implement systems and technology to improve services to the funds and shareholders, strengthen information security, and increase efficiency; (xi) implementing investment enhancements to further strengthen Fidelity's target date product line to increase investors' probability of success in achieving their goals; (xii) accelerating the conversion of all remaining Class B shares to Class A shares, which have a lower expense structure; and (xiii) implementing changes to Fidelity's money market fund product line in response to recent regulatory reforms.
Investment Performance (for Fidelity Ohio Municipal Income Fund). The Board considered whether the fund has operated in accordance with its investment objective, as well as its record of compliance with its investment restrictions and its performance history. The Board noted that there was a portfolio management change for the fund in May 2016.
The Board took into account discussions with representatives of the Investment Advisers about fund investment performance that occur at Board meetings throughout the year. In this regard the Board noted that as part of regularly scheduled fund reviews and other reports to the Board on fund performance, the Board considers annualized return information for the fund for different time periods, measured against a securities market index ("benchmark index") and a peer group of funds with similar objectives ("peer group"), if any. In its evaluation of fund investment performance at meetings throughout the year, the Board gave particular attention to information indicating underperformance of certain Fidelity funds for specific time periods and discussed with the Investment Advisers the reasons for such underperformance.
In addition to reviewing absolute and relative fund performance, the Independent Trustees periodically consider the appropriateness of fund performance metrics in evaluating the results achieved. In general, the Independent Trustees believe that fund performance should be evaluated based on gross performance (before fees and expenses but after transaction costs) compared to appropriate benchmark indices, over appropriate time periods that may include full market cycles, and on net performance (after fees and expenses) compared to peer groups, as applicable, over the same periods, taking into account relevant factors including the following: general market conditions; expectations for interest rate levels and credit conditions; issuer-specific information including credit quality; the potential for incremental return versus the fund's benchmark index weighed against the risks involved in obtaining that incremental return, including the risk of diminished or negative total returns; and fund cash flows and other factors. Depending on the circumstances, the Independent Trustees may be satisfied with a fund's performance notwithstanding that it lags its benchmark index or peer group for certain periods.
The Independent Trustees recognize that shareholders evaluate performance on a net basis over their own holding periods, for which one-, three-, and five-year periods are often used as a proxy. For this reason, the performance information reviewed by the Board also included net cumulative calendar year total return information for the fund and an appropriate benchmark index and peer group for the most recent one-, three-, and five-year periods.
Investment Performance (for Fidelity Ohio Municipal Money Market Fund). The Board considered whether the fund has operated in accordance with its investment objective, as well as its record of compliance with its investment restrictions and its performance history.
The Board took into account discussions with representatives of the Investment Advisers about fund investment performance that occur at Board meetings throughout the year. In this regard the Board noted that as part of regularly scheduled fund reviews and other reports to the Board on fund performance, the Board considers annualized return information for the fund for different time periods, measured against a peer group of funds with similar objectives ("peer group").
In addition to reviewing absolute and relative fund performance, the Independent Trustees periodically consider the appropriateness of fund performance metrics in evaluating the results achieved. In general, the Independent Trustees believe that fund performance should be evaluated based on gross performance (before fees and expenses but after transaction costs) compared to the gross performance of appropriate peer groups, over appropriate time periods that may include full market cycles, taking into account relevant factors including the following: general market conditions; expectations for interest rate levels and credit conditions; issuer-specific information including credit quality; the fund's market value NAV over time and its resilience under various stressed conditions; and fund cash flows and other factors.
The Board recognizes that in interest rate environments where many competitors waive fees to maintain a minimum yield, relative money market fund performance on a net basis (after fees and expenses) may not be particularly meaningful due to miniscule performance differences among competitor funds. Depending on the circumstances, the Independent Trustees may be satisfied with a fund's performance notwithstanding that it lags its peer group for certain periods.
The Independent Trustees recognize that shareholders evaluate performance on a net basis over their own holding periods, for which one-, three-, and five-year periods are often used as a proxy. For this reason, the performance information reviewed by the Board also included net cumulative calendar year total return information for the fund and an appropriate peer group for the most recent one-, three-, and five-year periods.
Based on its review, the Board concluded that the nature, extent, and quality of services provided to each fund under the Advisory Contracts should continue to benefit the shareholders of each fund.
Competitiveness of Management Fee and Total Expense Ratio. The Board considered each fund's management fee and total expense ratio compared to "mapped groups" of competitive funds and classes created for the purpose of facilitating the Trustees' competitive analysis of management fees and total expenses. Fidelity creates "mapped groups" by combining similar Lipper investment objective categories that have comparable investment mandates. Combining Lipper investment objective categories aids the Board's management fee and total expense ratio comparisons by broadening the competitive group used for comparison.
Management Fee. The Board considered two proprietary management fee comparisons for the 12-month periods shown in basis points (BP) in the charts below. The group of Lipper funds used by the Board for management fee comparisons is referred to below as the "Total Mapped Group" and, for the reasons explained above, is broader than the Lipper peer group used by the Board for performance comparisons. The Total Mapped Group comparison focuses on a fund's standing in terms of gross management fees before expense reimbursements or caps relative to the total universe of funds with comparable investment mandates, regardless of whether their management fee structures also are comparable. Funds with comparable investment mandates offer exposure to similar types of securities. Funds with comparable management fee structures have similar management fee contractual arrangements (
e.g., flat rate charged for advisory services, all-inclusive fee rate,
etc.). "TMG %" represents the percentage of funds in the Total Mapped Group that had management fees that were lower than a fund's. For example, a hypothetical TMG % of 20% would mean that 80% of the funds in the Total Mapped Group had higher, and 20% had lower, management fees than a fund. The funds' actual TMG %s and the number of funds in the Total Mapped Group are in the charts below. The "Asset-Size Peer Group" (ASPG) comparison focuses on a fund's standing relative to a subset of non-Fidelity funds within the Total Mapped Group that are similar in size and management fee structure. For example, if a fund is in the first quartile of the ASPG, the fund's management fee ranks in the least expensive or lowest 25% of funds in the ASPG. The ASPG represents at least 15% of the funds in the Total Mapped Group with comparable asset size and management fee structures, subject to a minimum of 50 funds (or all funds in the Total Mapped Group if fewer than 50). Additional information, such as the ASPG quartile in which a fund's management fee rate ranked, is also included in the charts and considered by the Board.
Fidelity Ohio Municipal Income Fund
The Board noted that the fund's management fee rate ranked below the median of its Total Mapped Group and below the median of its ASPG for 2015.
Fidelity Ohio Municipal Money Market Fund
The Board noted that the fund's management fee rate ranked equal to the median of its Total Mapped Group and above the median of its ASPG for 2015. The Board noted that there is a relatively small number of state-specific funds in the Lipper objective.
The Board noted that, in 2014, the ad hoc Committee on Group Fee was formed by it and the boards of other Fidelity funds to conduct an in-depth review of the "group fee" component of the management fee of funds with such management fee structures. The Committee's focus included the mechanics of the group fee, the competitive landscape of group fee structures, Fidelity funds with no group fee component and investment products not included in group fee assets. The Board also considered that, for funds subject to the group fee, FMR agreed to voluntarily waive fees over a specified period of time in amounts designed to account for assets converted from certain funds to certain collective investment trusts.
Based on its review, the Board concluded that each fund's management fee is fair and reasonable in light of the services that the fund receives and the other factors considered.
Total Expense Ratio. In its review of each fund's total expense ratio, the Board considered the fund's management fee rate as well as other fund expenses, such as transfer agent fees, pricing and bookkeeping fees, and custodial, legal, and audit fees. The Board also noted that Fidelity may agree to waive fees and expenses from time to time, and the extent to which, if any, it has done so for the funds. As part of its review, the Board also considered the current and historical total expense ratios of each fund compared to competitive fund median expenses. Each fund is compared to those funds and classes in the Total Mapped Group (used by the Board for management fee comparisons) that have a similar sales load structure.
The Board noted that each fund's total expense ratio ranked below the competitive median for 2015. The Board considered that Fidelity has been voluntarily waiving part or all of the transfer agent fees and/or management fees to maintain a minimum yield for Fidelity Ohio Municipal Money Market Fund.
Fees Charged to Other Fidelity Clients. The Board also considered Fidelity fee structures and other information with respect to clients of Fidelity, such as other funds advised or subadvised by Fidelity, pension plan clients, and other institutional clients with similar mandates. The Board noted that an ad hoc joint committee created by it and the boards of other Fidelity funds periodically (most recently in 2013) reviews and compares Fidelity's institutional investment advisory business with its business of providing services to the Fidelity funds, including the differences in services provided, fees charged, and costs incurred, as well as competition in their respective marketplaces.
Based on its review of total expense ratios and fees charged to other Fidelity clients, the Board concluded that each fund's total expense ratio was reasonable in light of the services that the fund and its shareholders receive and the other factors considered.
Costs of the Services and Profitability. The Board considered the revenues earned and the expenses incurred by Fidelity in conducting the business of developing, marketing, distributing, managing, administering and servicing each fund and servicing each fund's shareholders. The Board also considered the level of Fidelity's profits in respect of all the Fidelity funds.
On an annual basis, Fidelity presents to the Board information about the profitability of its relationships with each fund. Fidelity calculates profitability information for each fund, as well as aggregate profitability information for groups of Fidelity funds and all Fidelity funds, using a series of detailed revenue and cost allocation methodologies which originate with the books and records of Fidelity on which Fidelity's audited financial statements are based. The Audit Committee of the Board reviews any significant changes from the prior year's methodologies.
PricewaterhouseCoopers LLP (PwC), independent registered public accounting firm and auditor to Fidelity and certain Fidelity funds, has been engaged annually by the Board as part of the Board's assessment of Fidelity's profitability analysis. PwC's engagement includes the review and assessment of the methodologies used by Fidelity in determining the revenues and expenses attributable to Fidelity's mutual fund business, and completion of agreed-upon procedures in respect of the mathematical accuracy of the fund profitability information and its conformity to established allocation methodologies. After considering PwC's reports issued under the engagement and information provided by Fidelity, the Board concluded that while other allocation methods may also be reasonable, Fidelity's profitability methodologies are reasonable in all material respects.
The Board also reviewed Fidelity's non-fund businesses and fall-out benefits related to the mutual fund business as well as cases where Fidelity's affiliates may benefit from or be related to the funds' business.
The Board considered the costs of the services provided by and the profits realized by Fidelity in connection with the operation of each fund and was satisfied that the profitability was not excessive.
Economies of Scale. The Board considered whether there have been economies of scale in respect of the management of the Fidelity funds, whether the Fidelity funds (including each fund) have appropriately benefited from any such economies of scale, and whether there is potential for realization of any further economies of scale. The Board considered the extent to which each fund will benefit from economies of scale as assets grow through increased services to the fund, through waivers or reimbursements, or through fee or expense ratio reductions. The Board also noted that a committee (the Economies of Scale Committee) created by it and the boards of other Fidelity funds periodically (most recently in 2013) analyzes whether Fidelity attains economies of scale in respect of the management and servicing of the Fidelity funds, whether the Fidelity funds have appropriately benefited from such economies of scale, and whether there is potential for realization of any further economies of scale.
The Board recognized that each fund's management contract incorporates a "group fee" structure, which provides for lower group fee rates as total group assets increase, and for higher group fee rates as total group assets decrease (with "group assets" defined to include fund assets under FMR's management plus the assets of sector funds previously under FMR's management). FMR calculates the group fee rates based on a tiered asset "breakpoint" schedule that varies based on asset class. The Board considered that the group fee is designed to deliver the benefits of economies of scale to fund shareholders when total Fidelity fund assets increase, even if assets of any particular fund are unchanged or have declined, because some portion of Fidelity's costs are attributable to services provided to all Fidelity funds, and all funds benefit if those costs can be allocated among more assets. The Board concluded that, given the group fee structure, fund shareholders will benefit from lower management fees as group assets increase at the fund complex level, regardless of whether Fidelity achieves any such economies of scale.
The Board concluded, taking into account the analysis of the Economies of Scale Committee, that economies of scale, if any, are being appropriately shared between fund shareholders and Fidelity.
Additional Information Requested by the Board. In order to develop fully the factual basis for consideration of the Fidelity funds' advisory contracts, the Board requested and received additional information on certain topics, including: (i) Fidelity's fund profitability methodology, profitability trends for certain funds, and the impact of certain factors on fund profitability results; (ii) portfolio manager changes that have occurred during the past year and the amount of the investment that each portfolio manager has made in the Fidelity fund(s) that he or she manages; (iii) Fidelity's compensation structure for portfolio managers, research analysts, and other key personnel, including its effects on fund profitability, the rationale for the compensation structure, and the extent to which current market conditions have affected retention and recruitment; (iv) the arrangements with and compensation paid to certain fund sub-advisers on behalf of the Fidelity funds; (v) Fidelity's voluntary waiver of its fees to maintain minimum yields for certain money market funds and classes as well as contractual waivers in place for certain funds; (vi) the methodology with respect to competitive fund data and peer group classifications; (vii) Fidelity's transfer agent fee, expense, and service structures for different funds and classes relative to competitive trends, and the impact of the increased use of omnibus accounts; (viii) Fidelity's long-term expectations for its offerings in the workplace investing channel; (ix) new developments in the retail and institutional marketplaces; (x) the approach to considering "fall-out" benefits; and (xi) the impact of money market reform on Fidelity's money market funds, including with respect to costs and profitability. In addition, the Board considered its discussions with Fidelity throughout the year regarding enhanced information security initiatives and the funds' fair valuation policies.
Based on its evaluation of all of the conclusions noted above, and after considering all factors it believed relevant, the Board concluded that the advisory fee structures are fair and reasonable, and that each fund's Advisory Contracts should be renewed.
Proxy Voting Results
A special meeting of Fidelity® Ohio Municipal Money Market Fund's shareholders was held on February 12, 2016. The results of votes taken among shareholders on the proposal before them are reported below. Each vote reported represents one dollar of net asset value held on the record date for the meeting.
PROPOSAL 1
| To elect a Board of Trustees. |
| | # of
Votes | % of
Votes |
| Elizabeth S. Acton | | |
| Affirmative | 990,112,248.51 | 94.973 |
| Withheld | 52,412,467.62 | 5.027 |
| TOTAL | 1,042,524,716.13 | 100.000 |
| John Engler | | |
| Affirmative | 979,840,026.26 | 93.988 |
| Withheld | 62,684,689.87 | 6.012 |
| TOTAL | 1,042,524,716.13 | 100.000 |
| Albert R. Gamper, Jr. | | |
| Affirmative | 988,200,285.84 | 94.790 |
| Withheld | 54,324,430.29 | 5.210 |
| TOTAL | 1,042,524,716.13 | 100.000 |
| Robert F. Gartland | | |
| Affirmative | 990,287,516.81 | 94.990 |
| Withheld | 52,237,199.32 | 5.010 |
| TOTAL | 1,042,524,716.13 | 100.000 |
| Abigail P. Johnson | | |
| Affirmative | 986,818,518.63 | 94.657 |
| Withheld | 55,706,197.50 | 5.343 |
| TOTAL | 1,042,524,716.13 | 100.000 |
| Arthur E. Johnson | | |
| Affirmative | 988,490,870.48 | 94.818 |
| Withheld | 54,033,845.65 | 5.182 |
| TOTAL | 1,042,524,716.13 | 100.000 |
| Michael E. Kenneally | | |
| Affirmative | 990,615,595.60 | 95.021 |
| Withheld | 51,909,120.53 | 4.979 |
| TOTAL | 1,042,524,716.13 | 100.000 |
| James H. Keyes | | |
| Affirmative | 989,121,754.10 | 94.878 |
| Withheld | 53,402,962.03 | 5.122 |
| TOTAL | 1,042,524,716.13 | 100.000 |
| Marie L. Knowles | | |
| Affirmative | 987,633,370.10 | 94.735 |
| Withheld | 54,891,346.03 | 5.265 |
| TOTAL | 1,042,524,716.13 | 100.000 |
| Geoffrey A. von Kuhn | | |
| Affirmative | 987,164,185.38 | 94.690 |
| Withheld | 55,360,530.75 | 5.310 |
| TOTAL | 1,042,524,716.13 | 100.000 |
| Proposal 1 reflects trust wide proposal and voting results. |
Corporate Headquarters
245 Summer St.
Boston, MA 02210
www.fidelity.com
OFF-ANN-0217
1.540019.119
Fidelity® Pennsylvania Municipal Income Fund
Fidelity® Pennsylvania Municipal Money Market Fund
Annual Report December 31, 2016 |
|
Contents
To view a fund's proxy voting guidelines and proxy voting record for the 12-month period ended June 30, visit http://www.fidelity.com/proxyvotingresults or visit the Securities and Exchange Commission's (SEC) web site at http://www.sec.gov.
You may also call 1-800-544-8544 to request a free copy of the proxy voting guidelines.
Standard & Poor's, S&P and S&P 500 are registered service marks of The McGraw-Hill Companies, Inc. and have been licensed for use by Fidelity Distributors Corporation.
Other third-party marks appearing herein are the property of their respective owners.
All other marks appearing herein are registered or unregistered trademarks or service marks of FMR LLC or an affiliated company. © 2017 FMR LLC. All rights reserved.
This report and the financial statements contained herein are submitted for the general information of the shareholders of the Fund. This report is not authorized for distribution to prospective investors in the Fund unless preceded or accompanied by an effective prospectus.
A fund files its complete schedule of portfolio holdings with the SEC for the first and third quarters of each fiscal year on Form N-Q. Forms N-Q are available on the SEC’s web site at http://www.sec.gov. A fund's Forms N-Q may be reviewed and copied at the SEC’s Public Reference Room in Washington, DC. Information regarding the operation of the SEC's Public Reference Room may be obtained by calling 1-800-SEC-0330.
For a complete list of a fund's portfolio holdings, view the most recent holdings listing, semiannual report, or annual report on Fidelity's web site at http://www.fidelity.com, http://www.institutional.fidelity.com, or http://www.401k.com, as applicable.
NOT FDIC INSURED •MAY LOSE VALUE •NO BANK GUARANTEE
Neither the Fund nor Fidelity Distributors Corporation is a bank.
Fidelity® Pennsylvania Municipal Income Fund
Performance: The Bottom Line
Average annual total return reflects the change in the value of an investment, assuming reinvestment of distributions from dividend income and capital gains (the profits earned upon the sale of securities that have grown in value, if any) and assuming a constant rate of performance each year. The hypothetical investment and the average annual total returns do not reflect the deduction of taxes that a shareholder would pay on fund distributions or the redemption of fund shares. During periods of reimbursement by Fidelity, a fund’s total return will be greater than it would be had the reimbursement not occurred. How a fund did yesterday is no guarantee of how it will do tomorrow.
Average Annual Total Returns
| For the periods ended December 31, 2016 | Past 1 year | Past 5 years | Past 10 years |
| Fidelity® Pennsylvania Municipal Income Fund | 0.34% | 3.43% | 4.14% |
$10,000 Over 10 Years
Let's say hypothetically that $10,000 was invested in Fidelity® Pennsylvania Municipal Income Fund on December 31, 2006.
The chart shows how the value of your investment would have changed, and also shows how the Bloomberg Barclays Municipal Bond Index performed over the same period.
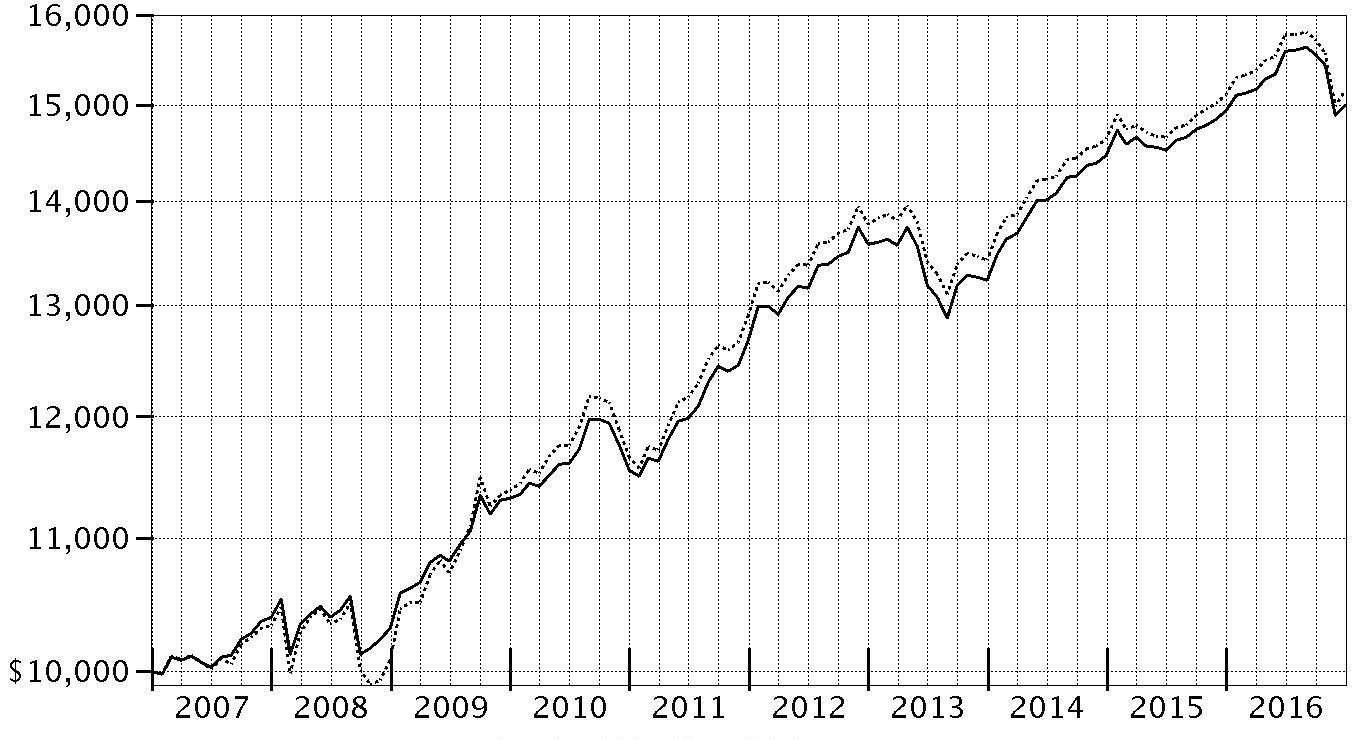
| Period Ending Values |
| $14,999 | Fidelity® Pennsylvania Municipal Income Fund |
| $15,158 | Bloomberg Barclays Municipal Bond Index |
Effective August 24, 2016, all Barclays benchmark indices were co-branded as the Bloomberg Barclays Indices for a period of five years.
Fidelity® Pennsylvania Municipal Income Fund
Management's Discussion of Fund Performance
Market Recap: For the 12 months ending December 31, 2016, tax-exempt bonds eked out only a 0.25% return, according to the Bloomberg Barclays Municipal Bond Index. For much of the period, fairly strong demand and a stable credit environment for state and local governments drove moderate muni returns. But a downward trend began in September and steepened through November – the worst month for the muni market since 2008 – as investors became concerned about U.S. President-elect Donald Trump’s expansionary fiscal policy ambitions, inflation and the potential for tax reform to impair tax-exempt bond valuations. Further, some theorized that changes to or repeal of the Affordable Care Act by the incoming administration and a Republican-controlled Congress may affect the prices of muni bonds issued by hospitals. Muni bonds also were hurt by market anticipation of a quarter-point increase in policy interest rates, which happened in December. At year-end, concerns about unfunded pension liabilities generally are compartmentalized to certain issuers. Looking ahead, we think the U.S. Federal Reserve is likely to raise policy interest rates further in 2017, perhaps in multiple stages.
Comments from Co-Portfolio Manager Mark Sommer: For the year, the fund gained 0.34%, slightly outpacing, net of fees, the 0.26% return of the Bloomberg Barclays Pennsylvania Enhanced Municipal Bond Index. The portfolio managers continued to focus on long-term investment principles by seeking to generate attractive tax-exempt income and competitive risk-adjusted returns over time. Having less exposure than the Pennsylvania index to state general obligation bonds (GOs) added relative value. These securities lagged the state index due to concerns about Pennsylvania’s sluggish economic growth relative to the national overall, depleted budget reserves and rapidly rising pension and retiree health care obligations. The fund also benefited from favorable security selection among hospital securities, with our holdings outpacing comparable securities in the index. Relative performance also was helped by the advance refunding of some of our health care and university holdings. Such refinancings usually result in price gains for bonds holders, as the bonds’ maturities shorten and credit quality rises, because they are backed by high-quality U.S. government securities – typically U.S. Treasuries. In contrast, the fund’s yield curve positioning was a drag on relative performance. We overweighted bonds in the five-year range, which was the worst-performing area of the yield curve.
The views expressed above reflect those of the portfolio manager(s) only through the end of the period as stated on the cover of this report and do not necessarily represent the views of Fidelity or any other person in the Fidelity organization. Any such views are subject to change at any time based upon market or other conditions and Fidelity disclaims any responsibility to update such views. These views may not be relied on as investment advice and, because investment decisions for a Fidelity fund are based on numerous factors, may not be relied on as an indication of trading intent on behalf of any Fidelity fund.
Notes to Shareholders: On May 2, 2016, Cormac Cullen and Kevin Ramundo joined Mark Sommer as Co-Managers of the fund.
Fidelity® Pennsylvania Municipal Income Fund
Investment Summary (Unaudited)
Top Five Sectors as of December 31, 2016
| | % of fund's net assets | % of fund's net assets 6 months ago |
| Health Care | 29.8 | 26.6 |
| General Obligations | 27.0 | 23.1 |
| Education | 12.3 | 10.7 |
| Escrowed/Pre-Refunded | 8.2 | 11.8 |
| Water & Sewer | 7.0 | 8.0 |
Quality Diversification (% of fund's net assets)
| As of December 31, 2016 |
| | AA,A | 81.9% |
| | BBB | 12.2% |
| | BB and Below | 1.2% |
| | Not Rated | 2.5% |
| | Short-Term Investments and Net Other Assets | 2.2% |

| As of June 30, 2016 |
| | AAA | 0.1% |
| | AA,A | 74.5% |
| | BBB | 15.5% |
| | BB and Below | 2.0% |
| | Not Rated | 2.4% |
| | Short-Term Investments and Net Other Assets | 5.5% |

We have used ratings from Moody's Investors Service, Inc. Where Moody's® ratings are not available, we have used S&P® ratings. All ratings are as of the date indicated and do not reflect subsequent changes.
Fidelity® Pennsylvania Municipal Income Fund
Investments December 31, 2016
Showing Percentage of Net Assets
| Municipal Bonds - 97.8% | | | |
| | | Principal Amount | Value |
| Guam - 0.6% | | | |
| Guam Int'l. Arpt. Auth. Rev. Series 2013 C: | | | |
| 5% 10/1/17 (a) | | $600,000 | $612,996 |
| 6.25% 10/1/34 (a) | | 700,000 | 797,720 |
| Guam Pwr. Auth. Rev. Series 2012 A, 5% 10/1/24 (FSA Insured) | | 900,000 | 1,010,646 |
|
| TOTAL GUAM | | | 2,421,362 |
|
| Pennsylvania - 96.0% | | | |
| Adams County Indl. Dev. Auth. Rev. (Gettysburg College Proj.) Series 2010, 5% 8/15/24 | | 1,000,000 | 1,100,320 |
| Allegheny County Series C: | | | |
| 5% 12/1/28 | | 1,000,000 | 1,142,830 |
| 5% 12/1/30 | | 1,365,000 | 1,547,610 |
| Allegheny County Arpt. Auth. Rev. Series 2006 B: | | | |
| 5% 1/1/21 (Nat'l. Pub. Fin. Guarantee Corp. Insured) (a) | | 3,190,000 | 3,499,877 |
| 5% 1/1/22 (Nat'l. Pub. Fin. Guarantee Corp. Insured) (a) | | 1,650,000 | 1,839,057 |
| Allegheny County Port Auth. Spl. Rev. 5% 3/1/17 | | 2,000,000 | 2,012,400 |
| Allegheny County Sanitation Auth. Swr. Rev.: | | | |
| Series 2010, 5% 6/1/40 (FSA Insured) | | 6,690,000 | 7,308,491 |
| 5% 12/1/29 (Build America Mutual Assurance Insured) | | 3,905,000 | 4,481,690 |
| Berks County Muni. Auth. Rev. Series 2012 A, 5% 11/1/40 | | 3,590,000 | 3,914,787 |
| Bethlehem Wtr. Auth. Rev. Series 2014: | | | |
| 5% 11/15/19 (Build America Mutual Assurance Insured) | | 1,000,000 | 1,080,100 |
| 5% 11/15/20 (Build America Mutual Assurance Insured) | | 1,000,000 | 1,099,960 |
| Bucks County Cmnty. College Auth. College Bldg. Rev. 5% 6/15/28 (Pre-Refunded to 6/15/18 @ 100) | | 250,000 | 263,820 |
| Butler County Hosp. Auth. Hosp. Rev. (Butler Health Sys. Proj.): | | | |
| Series 2009 B, 7.125% 7/1/29 (Pre-Refunded to 7/1/19 @ 100) | | 1,035,000 | 1,176,433 |
| Series 2015 A: | | | |
| 5% 7/1/26 | | 500,000 | 568,830 |
| 5% 7/1/27 | | 490,000 | 553,945 |
| 5% 7/1/28 | | 540,000 | 606,204 |
| 5% 7/1/29 | | 710,000 | 791,494 |
| 5% 7/1/30 | | 685,000 | 757,774 |
| 5% 7/1/35 | | 1,885,000 | 2,020,946 |
| 5% 7/1/39 | | 6,675,000 | 7,106,939 |
| Central Bradford Prog. Auth. Rev. Series 2011, 5.375% 12/1/41 | | 2,000,000 | 2,173,260 |
| Centre County Hosp. Auth. Rev.: | | | |
| (Mount Nittany Med. Cneter Proj.) Series 2016 A, 5% 11/15/28 | | 840,000 | 948,217 |
| (Mount Nittany Med. Ctr. Proj.): | | | |
| Series 2011, 7% 11/15/46 (Pre-Refunded to 11/15/21 @ 100) | | 2,000,000 | 2,462,020 |
| Series 2016 A: | | | |
| 4% 11/15/32 | | 350,000 | 355,740 |
| 4% 11/15/34 | | 250,000 | 251,848 |
| 4% 11/15/35 | | 200,000 | 200,586 |
| 5% 11/15/29 | | 825,000 | 925,229 |
| 5% 11/15/30 | | 685,000 | 763,782 |
| 5% 11/15/46 | | 6,605,000 | 7,062,859 |
| Series 2016 B: | | | |
| 4% 11/15/40 | | 600,000 | 593,604 |
| 4% 11/15/47 | | 3,605,000 | 3,517,362 |
| Commonwealth Fing. Auth. Rev. Series 2013 A2: | | | |
| 5% 6/1/24 | | 800,000 | 899,656 |
| 5% 6/1/25 | | 1,175,000 | 1,318,221 |
| 5% 6/1/26 | | 1,250,000 | 1,398,338 |
| 5% 6/1/42 | | 12,000,000 | 12,977,392 |
| Cumberland County Muni. Auth. Rev. (Dickinson College Proj.): | | | |
| Series 2012: | | | |
| 5% 11/1/37 | | 1,520,000 | 1,679,524 |
| 5% 11/1/42 | | 3,000,000 | 3,284,640 |
| Series 2016: | | | |
| 5% 5/1/30 | | 1,000,000 | 1,148,400 |
| 5% 5/1/31 | | 500,000 | 571,595 |
| 5% 5/1/32 | | 750,000 | 853,500 |
| 5% 5/1/33 | | 2,210,000 | 2,503,599 |
| 5% 5/1/34 | | 1,000,000 | 1,131,990 |
| Dauphin County Gen. Auth.: | | | |
| (Pinnacle Health Sys. Proj.) Series 2016 A: | | | |
| 5% 6/1/34 | | 1,275,000 | 1,416,308 |
| 5% 6/1/35 | | 1,000,000 | 1,104,110 |
| 5% 6/1/36 | | 500,000 | 550,800 |
| Series 2009: | | | |
| 5.25% 6/1/17 | | 210,000 | 213,566 |
| 5.25% 6/1/17 (Escrowed to Maturity) | | 840,000 | 854,440 |
| 5% 6/1/42 | | 7,410,000 | 7,918,993 |
| Delaware County Auth. College Rev. (Haverford College Proj.) Series 2010 A, 5% 11/15/31 | | 4,090,000 | 4,500,432 |
| Delaware County Auth. Univ. Rev.: | | | |
| Series 2010, 5.25% 12/1/31 (Pre-Refunded to 12/1/19 @ 100) | | 2,450,000 | 2,706,540 |
| Series 2012: | | | |
| 5% 8/1/21 | | 350,000 | 392,564 |
| 5% 8/1/22 | | 300,000 | 341,289 |
| Doylestown Hosp. Auth. Hosp. Rev.: | | | |
| Series 2013 A, 5% 7/1/27 | | 2,500,000 | 2,711,450 |
| Series 2016 A, 5% 7/1/46 | | 3,500,000 | 3,706,010 |
| East Stroudsburg Area School District: | | | |
| Series 2014 A, 7.75% 9/1/27 (Pre-Refunded to 9/1/17 @ 100) | | 225,000 | 234,909 |
| Series 2015 A: | | | |
| 7.5% 9/1/22 | | 115,000 | 119,776 |
| 7.5% 9/1/22 (Pre-Refunded to 9/1/17 @ 100) | | 885,000 | 922,241 |
| Erie County Hosp. Auth. Rev. (Saint Vincent Health Ctr. Proj.) Series 2010 A, 7% 7/1/27 | | 2,750,000 | 2,874,878 |
| Fox Chapel Area School District Series 2013: | | | |
| 4% 8/1/22 | | 500,000 | 548,875 |
| 5% 8/1/31 | | 3,080,000 | 3,518,715 |
| 5% 8/1/34 | | 1,000,000 | 1,130,390 |
| Franklin County Indl. Dev. Auth. (The Chambersburg Hosp. Proj.) Series 2010: | | | |
| 5.3% 7/1/30 | | 1,770,000 | 1,939,566 |
| 5.375% 7/1/42 | | 2,130,000 | 2,291,987 |
| Geisinger Auth. Health Sys. Rev. Series 2014 A, 4% 6/1/41 | | 2,000,000 | 2,012,700 |
| Indiana County Hosp. Auth. Series 2014 A: | | | |
| 5% 6/1/20 | | 650,000 | 691,555 |
| 6% 6/1/39 | | 1,625,000 | 1,780,074 |
| Lancaster County Hosp. Auth. Health Ctr. Rev. Series 2016: | | | |
| 5% 8/15/31 | | 1,000,000 | 1,139,890 |
| 5% 8/15/33 | | 1,000,000 | 1,127,590 |
| 5% 8/15/34 | | 1,000,000 | 1,122,360 |
| 5% 8/15/36 | | 1,000,000 | 1,114,580 |
| Lehigh County Indl. Dev. Auth. Poll. Cont. Rev. Bonds 0.9%, tender 8/15/17 (b) | | 4,745,000 | 4,729,152 |
| Lower Paxton Township Series 2014: | | | |
| 5% 4/1/40 | | 3,420,000 | 3,793,806 |
| 5% 4/1/44 | | 1,295,000 | 1,433,034 |
| Luzerne County Indl. Dev. Auth. Wtr. Facilities Rev. (Pennsylvania-American Wtr. Co. Proj.) Series 2009, 5.5% 12/1/39 | | 2,500,000 | 2,742,025 |
| Lycoming County Auth. Health Sys. Rev. (Susquehanna Health Sys.) Series 2009 A, 5.5% 7/1/21 | | 3,500,000 | 3,797,745 |
| Monroe County Hosp. Auth. Rev.: | | | |
| (Pocono Med. Ctr. Proj.) Series 2012 A: | | | |
| 5% 1/1/32 | | 1,400,000 | 1,494,038 |
| 5% 1/1/41 | | 3,240,000 | 3,403,134 |
| Series 2016, 5% 7/1/33 | | 3,675,000 | 4,029,711 |
| Monroeville Fin. Auth. UPMC Rev. Series 2012, 5% 2/15/26 | | 1,500,000 | 1,780,965 |
| Montgomery County Higher Ed. & Health Auth. Hosp. Rev. (Abington Memorial Hosp. Proj.): | | | |
| Series 2009 A, 5% 6/1/17 | | 2,000,000 | 2,031,940 |
| Series 2012 A: | | | |
| 5% 6/1/23 | | 3,850,000 | 4,369,173 |
| 5% 6/1/24 | | 1,500,000 | 1,694,145 |
| Montgomery County Higher Ed. & Health Auth. Rev.: | | | |
| Series 2014 A: | | | |
| 4% 10/1/19 | | 185,000 | 192,746 |
| 5% 10/1/20 | | 215,000 | 233,423 |
| 5% 10/1/21 | | 245,000 | 269,441 |
| 5% 10/1/22 | | 275,000 | 303,177 |
| 5% 10/1/23 | | 305,000 | 339,788 |
| 5% 10/1/24 | | 335,000 | 375,542 |
| 5% 10/1/25 | | 750,000 | 834,248 |
| 5% 10/1/26 | | 1,000,000 | 1,103,010 |
| 5% 10/1/27 | | 1,000,000 | 1,095,190 |
| Series 2016 A, 5% 10/1/40 | | 4,000,000 | 4,207,600 |
| Montour School District Series 2015 A: | | | |
| 5% 4/1/41 | | 1,000,000 | 1,104,910 |
| 5% 4/1/42 | | 1,000,000 | 1,104,120 |
| Northampton County Gen. Purp. Auth. Hosp. Rev. (St. Luke's Hosp. Proj.) Series 2010 A, 5.25% 8/15/18 | | 1,450,000 | 1,536,449 |
| Pennsylvania Econ. Dev. Auth. Governmental Lease (Forum Place Proj.) Series 2012: | | | |
| 5% 3/1/24 | | 1,745,000 | 1,946,687 |
| 5% 3/1/25 | | 3,255,000 | 3,626,200 |
| Pennsylvania Gen. Oblig.: | | | |
| First Series 2008, 5% 5/15/27 (Pre-Refunded to 5/15/18 @ 100) | | 805,000 | 846,610 |
| Second Series 2009, 5% 4/15/25 (Pre-Refunded to 4/15/19 @ 100) | | 500,000 | 540,205 |
| Series 2012, 5% 6/1/25 | | 10,000,000 | 11,240,300 |
| Series 2013, 5% 10/15/27 | | 2,255,000 | 2,553,291 |
| Series 2015 1, 5% 3/15/31 | | 7,000,000 | 7,885,500 |
| Series 2015, 5% 3/15/33 | | 2,880,000 | 3,217,939 |
| Series 2016, 5% 9/15/29 | | 7,000,000 | 8,055,390 |
| Pennsylvania Higher Edl. Facilities Auth. Rev.: | | | |
| (Thomas Jefferson Univ. Proj.) Series 2012: | | | |
| 5% 3/1/18 | | 250,000 | 260,453 |
| 5% 3/1/20 | | 300,000 | 327,672 |
| 5% 3/1/22 | | 275,000 | 310,324 |
| 5% 3/1/23 | | 585,000 | 663,647 |
| 5% 3/1/42 | | 3,950,000 | 4,274,611 |
| (Univ. of Pennsylvania Health Sys. Proj.) Series 2009 A, 5.25% 8/15/22 (Pre-Refunded to 8/15/19 @ 100) | | 2,655,000 | 2,910,411 |
| First Series 2012: | | | |
| 5% 4/1/20 | | 750,000 | 824,415 |
| 5% 4/1/21 | | 500,000 | 559,790 |
| 5% 4/1/22 | | 600,000 | 681,726 |
| 5% 4/1/23 | | 800,000 | 905,584 |
| 5% 4/1/24 | | 1,100,000 | 1,241,119 |
| Series 2010 E, 5% 5/15/31 | | 2,500,000 | 2,717,900 |
| Series 2010, 5% 9/1/30 (Pre-Refunded to 9/1/20 @ 100) | | 1,150,000 | 1,284,366 |
| Series 2011 A, 5% 9/1/41 (Pre-Refunded to 3/1/21 @ 100) | | 2,000,000 | 2,261,100 |
| Series 2016: | | | |
| 5% 5/1/33 | | 1,300,000 | 1,470,469 |
| 5% 5/1/34 | | 2,500,000 | 2,815,050 |
| 5% 5/1/35 | | 2,000,000 | 2,241,840 |
| Series AT-1 5% 6/15/31 | | 10,000,000 | 11,378,300 |
| Pennsylvania Pub. School Bldg. Auth. School Rev. (The School District of Harrisburg Proj.): | | | |
| Series 2014 B2: | | | |
| 5% 12/1/24 (Build America Mutual Assurance Insured) | | 1,250,000 | 1,439,000 |
| 5% 12/1/25 (Build America Mutual Assurance Insured) | | 1,250,000 | 1,438,038 |
| 5% 12/1/26 (Build America Mutual Assurance Insured) | | 1,250,000 | 1,434,225 |
| 5% 12/1/27 (Build America Mutual Assurance Insured) | | 1,010,000 | 1,149,683 |
| Series 2016 A, 5% 12/1/28 (FSA Insured) | | 5,690,000 | 6,527,397 |
| Pennsylvania State Univ.: | | | |
| Series 2010, 5% 3/1/40 | | 4,385,000 | 4,760,005 |
| Series 2015 A: | | | |
| 5% 9/1/30 | | 1,100,000 | 1,280,235 |
| 5% 9/1/31 | | 1,415,000 | 1,639,787 |
| Pennsylvania Tpk. Commission Tpk. Rev.: | | | |
| Series 2013 A2, 0% 12/1/38 (c) | | 2,500,000 | 2,520,125 |
| Series 2014 A, 5% 12/1/31 | | 865,000 | 974,258 |
| Series 2014 A2, 0% 12/1/40 (c) | | 5,500,000 | 4,141,830 |
| Series 2016 A1, 5% 12/1/46 | | 5,000,000 | 5,491,350 |
| Philadelphia Gas Works Rev.: | | | |
| (1998 Gen. Ordinance Proj.) Seventh Series, 5% 10/1/37 (Pre-Refunded to 10/1/17 @ 100) | | 5,245,000 | 5,398,574 |
| Series 1998 A: | | | |
| 5.25% 8/1/17 | | 1,205,000 | 1,234,004 |
| 5.25% 8/1/17 | | 2,350,000 | 2,400,666 |
| Series 9, 5.25% 8/1/40 | | 5,300,000 | 5,728,982 |
| 5% 8/1/29 | | 2,000,000 | 2,194,060 |
| 5% 8/1/30 | | 1,500,000 | 1,638,630 |
| 5% 8/1/31 | | 1,100,000 | 1,196,613 |
| 5% 10/1/33 | | 1,500,000 | 1,624,950 |
| 5% 10/1/34 | | 500,000 | 539,135 |
| Philadelphia Gen. Oblig. Series 2008 A, 5.25% 12/15/32 (FSA Insured) | | 6,000,000 | 6,402,060 |
| Philadelphia Hospitals & Higher Ed. Facilities Auth. Health Systems Rev. (Jefferson Health Sys. Proj.) Series 2010 B, 5.25% 5/15/30 (Pre-Refunded to 5/15/20 @ 100) | | 4,000,000 | 4,457,720 |
| Philadelphia Hospitals & Higher Ed. Facilities Auth. Hosp. Rev. (Children's Hosp. of Philadelphia Proj.) Series 2011 D, 5% 7/1/32 | | 2,500,000 | 2,772,800 |
| Philadelphia Redev. Auth. Rev.: | | | |
| Series 2012: | | | |
| 5% 4/15/21 | | 1,000,000 | 1,097,810 |
| 5% 4/15/25 | | 2,230,000 | 2,462,143 |
| Series 2015 A, 5% 4/15/29 | | 3,000,000 | 3,289,170 |
| Philadelphia School District: | | | |
| Series 2010 C, 5% 9/1/21 | | 4,000,000 | 4,249,200 |
| Series 2016 F, 5% 9/1/34 | | 4,000,000 | 4,248,360 |
| Philadelphia Wtr. & Wastewtr. Rev.: | | | |
| Series 2010 C, 5% 8/1/40 (Pre-Refunded to 8/1/20 @ 100) | | 4,000,000 | 4,306,960 |
| Series 2011 A, 5% 1/1/41 | | 2,715,000 | 2,936,816 |
| Series 2015 B, 5% 7/1/30 | | 3,500,000 | 3,987,410 |
| Pittsburgh & Allegheny County Sports & Exhibition Auth. Series 2012, 5% 2/1/25 (FSA Insured) | | 2,250,000 | 2,544,593 |
| Pittsburgh Gen. Oblig.: | | | |
| Series 2012 A, 5% 9/1/22 | | 2,000,000 | 2,265,500 |
| Series 2014: | | | |
| 5% 9/1/23 (Build America Mutual Assurance Insured) | | 575,000 | 662,998 |
| 5% 9/1/28 (Build America Mutual Assurance Insured) | | 1,300,000 | 1,504,529 |
| 5% 9/1/29 (Build America Mutual Assurance Insured) | | 1,015,000 | 1,170,143 |
| 5% 9/1/31 (Build America Mutual Assurance Insured) | | 1,165,000 | 1,332,702 |
| 5% 9/1/32 (Build America Mutual Assurance Insured) | | 1,000,000 | 1,139,520 |
| Pittsburgh School District: | | | |
| Series 2012 A, 5% 9/1/21 (FSA Insured) | | 4,000,000 | 4,491,040 |
| Series 2014 A, 5% 9/1/23 | | 1,000,000 | 1,148,680 |
| Series 2015: | | | |
| 4% 9/1/19 (FSA Insured) | | 895,000 | 949,416 |
| 5% 9/1/20 (FSA Insured) | | 1,050,000 | 1,164,797 |
| 5% 9/1/21 (FSA Insured) | | 730,000 | 823,060 |
| 5% 9/1/22 (FSA Insured) | | 885,000 | 1,009,502 |
| 5% 9/1/23 (FSA Insured) | | 1,085,000 | 1,253,208 |
| South Fork Muni. Auth. Hosp. Rev. (Conemaugh Health Sys. Proj.) Series 2010, 5.25% 7/1/23 (Pre-Refunded to 7/1/20 @ 100) | | 1,000,000 | 1,119,400 |
| Southcentral Pennsylvania Gen. Auth. Rev.: | | | |
| Series 2015: | | | |
| 4% 12/1/30 | | 1,010,000 | 1,007,303 |
| 5% 12/1/25 | | 1,285,000 | 1,454,453 |
| 5% 12/1/27 | | 1,480,000 | 1,660,590 |
| 5% 12/1/29 | | 1,000,000 | 1,114,700 |
| 6% 6/1/25 | | 1,080,000 | 1,146,701 |
| 6% 6/1/25 (Pre-Refunded to 6/1/18 @ 100) | | 1,420,000 | 1,512,016 |
| State Pub. School Bldg. Auth. College Rev.: | | | |
| (Delaware County Cmnty. College Proj.) Series 2008, 5% 10/1/20 (Pre-Refunded to 4/1/18 @ 100) | | 1,000,000 | 1,047,330 |
| (Montgomery County Cmnty. College Proj.) Series 2008: | | | |
| 5% 5/1/27 (Pre-Refunded to 5/1/18 @ 100) | | 1,775,000 | 1,864,141 |
| 5% 5/1/28 (Pre-Refunded to 5/1/18 @ 100) | | 1,000,000 | 1,050,220 |
| Univ. of Pittsburgh Commonwealth Sys. of Higher Ed. (Univ. Cap. Proj.): | | | |
| Series 2000 B, 5.25% 9/15/34 | | 2,000,000 | 2,178,980 |
| Series 2007 B, 5.25% 9/15/28 | | 2,500,000 | 2,736,175 |
| Series 2009 B, 5% 9/15/28 | | 2,000,000 | 2,144,660 |
| West Mifflin Area School District Series 2016: | | | |
| 5% 4/1/24 (FSA Insured) | | 1,250,000 | 1,390,038 |
| 5% 4/1/26 (FSA Insured) | | 1,000,000 | 1,121,680 |
| 5% 4/1/28 (FSA Insured) | | 1,390,000 | 1,549,808 |
| West Shore Area Auth. Hosp. Rev.: | | | |
| (Holy Spirit Hosp. Charity Proj.) Series 2011 B, 6% 1/1/28 | | 7,375,000 | 8,597,406 |
| Series 2011 B, 5.75% 1/1/41 | | 1,500,000 | 1,689,075 |
| Westmoreland County Indl. Dev. Auth. Rev. (Excela Health Proj.) Series 2010 A: | | | |
| 5% 7/1/19 | | 1,000,000 | 1,066,950 |
| 5% 7/1/25 | | 4,465,000 | 4,877,923 |
| 5.25% 7/1/20 | | 1,000,000 | 1,093,080 |
| Westmoreland County Muni. Auth. Muni. Svc. Rev. Series 2001 A: | | | |
| 0% 8/15/19 (Nat'l. Pub. Fin. Guarantee Corp. Insured) | | 5,000,000 | 4,746,800 |
| 0% 8/15/20 (Nat'l. Pub. Fin. Guarantee Corp. Insured) | | 2,500,000 | 2,303,475 |
| 0% 8/15/22 (Nat'l. Pub. Fin. Guarantee Corp. Insured) | | 6,550,000 | 5,641,122 |
|
| TOTAL PENNSYLVANIA | | | 434,456,578 |
|
| Pennsylvania, New Jersey - 1.2% | | | |
| Delaware River Joint Toll Bridge Commission Pennsylvania-New Jersey Bridge Rev. Series 2012 A: | | | |
| 5% 7/1/22 | | 500,000 | 569,515 |
| 5% 7/1/23 | | 1,000,000 | 1,139,030 |
| Delaware River Port Auth. Pennsylvania & New Jersey Rev. Series 2010 D, 5% 1/1/30 | | 3,500,000 | 3,786,195 |
|
| TOTAL PENNSYLVANIA, NEW JERSEY | | | 5,494,740 |
|
| TOTAL MUNICIPAL BONDS | | | |
| (Cost $433,865,849) | | | 442,372,680 |
| TOTAL INVESTMENT PORTFOLIO - 97.8% | | | |
| (Cost $433,865,849) | | | 442,372,680 |
| NET OTHER ASSETS (LIABILITIES) - 2.2% | | | 10,143,667 |
| NET ASSETS - 100% | | | $452,516,347 |
Legend
(a) Private activity obligations whose interest is subject to the federal alternative minimum tax for individuals.
(b) Coupon rates for floating and adjustable rate securities reflect the rates in effect at period end.
(c) Security initially issued in zero coupon form which converts to coupon form at a specified rate and date. The rate shown is the rate at period end.
Investment Valuation
All investments are categorized as Level 2 under the Fair Value Hierarchy. The inputs or methodology used for valuing securities may not be an indication of the risk associated with investing in those securities. For more information on valuation inputs please refer to the Investment Valuation section in the accompanying Notes to Financial Statements.
Other Information
The distribution of municipal securities by revenue source, as a percentage of total Net Assets, is as follows (Unaudited):
| Health Care | 29.8% |
| General Obligations | 27.0% |
| Education | 12.3% |
| Escrowed/Pre-Refunded | 8.2% |
| Water & Sewer | 7.0% |
| Transportation | 5.7% |
| Electric Utilities | 5.6% |
| Others* (Individually Less Than 5%) | 4.4% |
| | 100.0% |
* Includes net other assets
See accompanying notes which are an integral part of the financial statements.
Fidelity® Pennsylvania Municipal Income Fund
Financial Statements
Statement of Assets and Liabilities
| | | December 31, 2016 |
| Assets | | |
Investment in securities, at value — See accompanying schedule:
Unaffiliated issuers (cost $433,865,849) | | $442,372,680 |
| Cash | | 7,730,810 |
| Receivable for fund shares sold | | 409,398 |
| Interest receivable | | 4,972,648 |
| Prepaid expenses | | 932 |
| Other receivables | | 1,247 |
| Total assets | | 455,487,715 |
| Liabilities | | |
| Payable for fund shares redeemed | $2,335,049 | |
| Distributions payable | 406,063 | |
| Accrued management fee | 140,164 | |
| Other affiliated payables | 43,694 | |
| Other payables and accrued expenses | 46,398 | |
| Total liabilities | | 2,971,368 |
| Net Assets | | $452,516,347 |
| Net Assets consist of: | | |
| Paid in capital | | $442,988,393 |
| Distributions in excess of net investment income | | (15,768) |
| Accumulated undistributed net realized gain (loss) on investments | | 1,036,891 |
| Net unrealized appreciation (depreciation) on investments | | 8,506,831 |
| Net Assets, for 41,241,499 shares outstanding | | $452,516,347 |
| Net Asset Value, offering price and redemption price per share ($452,516,347 ÷ 41,241,499 shares) | | $10.97 |
See accompanying notes which are an integral part of the financial statements.
Statement of Operations
| | | Year ended December 31, 2016 |
| Investment Income | | |
| Interest | | $16,835,997 |
| Expenses | | |
| Management fee | $1,767,057 | |
| Transfer agent fees | 400,430 | |
| Accounting fees and expenses | 126,821 | |
| Custodian fees and expenses | 3,768 | |
| Independent trustees' fees and expenses | 2,205 | |
| Registration fees | 23,578 | |
| Audit | 57,146 | |
| Legal | 5,395 | |
| Miscellaneous | 2,327 | |
| Total expenses before reductions | 2,388,727 | |
| Expense reductions | (5,668) | 2,383,059 |
| Net investment income (loss) | | 14,452,938 |
| Realized and Unrealized Gain (Loss) | | |
| Net realized gain (loss) on: | | |
| Investment securities: | | |
| Unaffiliated issuers | | 2,987,617 |
| Total net realized gain (loss) | | 2,987,617 |
| Change in net unrealized appreciation (depreciation) on investment securities | | (16,294,175) |
| Net gain (loss) | | (13,306,558) |
| Net increase (decrease) in net assets resulting from operations | | $1,146,380 |
See accompanying notes which are an integral part of the financial statements.
Statement of Changes in Net Assets
| | Year ended December 31, 2016 | Year ended December 31, 2015 |
| Increase (Decrease) in Net Assets | | |
| Operations | | |
| Net investment income (loss) | $14,452,938 | $14,709,852 |
| Net realized gain (loss) | 2,987,617 | 1,560,659 |
| Change in net unrealized appreciation (depreciation) | (16,294,175) | (1,274,614) |
| Net increase (decrease) in net assets resulting from operations | 1,146,380 | 14,995,897 |
| Distributions to shareholders from net investment income | (14,451,215) | (14,703,703) |
| Distributions to shareholders from net realized gain | (2,138,181) | (1,756,019) |
| Total distributions | (16,589,396) | (16,459,722) |
| Share transactions | | |
| Proceeds from sales of shares | 95,463,089 | 77,063,335 |
| Reinvestment of distributions | 11,076,509 | 10,807,008 |
| Cost of shares redeemed | (106,669,870) | (71,166,482) |
| Net increase (decrease) in net assets resulting from share transactions | (130,272) | 16,703,861 |
| Redemption fees | 3,239 | 984 |
| Total increase (decrease) in net assets | (15,570,049) | 15,241,020 |
| Net Assets | | |
| Beginning of period | 468,086,396 | 452,845,376 |
| End of period | $452,516,347 | $468,086,396 |
| Other Information | | |
| Distributions in excess of net investment income end of period | $(15,768) | $(10,946) |
| Shares | | |
| Sold | 8,373,079 | 6,819,246 |
| Issued in reinvestment of distributions | 976,965 | 956,105 |
| Redeemed | (9,503,969) | (6,306,204) |
| Net increase (decrease) | (153,925) | 1,469,147 |
See accompanying notes which are an integral part of the financial statements.
Financial Highlights — Fidelity Pennsylvania Municipal Income Fund
| Years ended December 31, | 2016 | 2015 | 2014 | 2013 | 2012 |
| Selected Per–Share Data | | | | | |
| Net asset value, beginning of period | $11.31 | $11.34 | $10.77 | $11.47 | $11.10 |
| Income from Investment Operations | | | | | |
| Net investment income (loss)A | .336 | .358 | .373 | .370 | .387 |
| Net realized and unrealized gain (loss) | (.291) | .013 | .615 | (.654) | .395 |
| Total from investment operations | .045 | .371 | .988 | (.284) | .782 |
| Distributions from net investment income | (.336) | (.358) | (.373) | (.370) | (.386) |
| Distributions from net realized gain | (.049) | (.043) | (.045) | (.046) | (.026) |
| Total distributions | (.385) | (.401) | (.418) | (.416) | (.412) |
| Redemption fees added to paid in capitalA,B | – | – | – | – | – |
| Net asset value, end of period | $10.97 | $11.31 | $11.34 | $10.77 | $11.47 |
| Total ReturnC | .34% | 3.33% | 9.30% | (2.50)% | 7.13% |
| Ratios to Average Net AssetsD | | | | | |
| Expenses before reductions | .49% | .49% | .49% | .49% | .49% |
| Expenses net of fee waivers, if any | .49% | .49% | .49% | .49% | .49% |
| Expenses net of all reductions | .49% | .49% | .49% | .49% | .48% |
| Net investment income (loss) | 2.95% | 3.17% | 3.35% | 3.33% | 3.40% |
| Supplemental Data | | | | | |
| Net assets, end of period (000 omitted) | $452,516 | $468,086 | $452,845 | $404,493 | $487,622 |
| Portfolio turnover rate | 18% | 17% | 12% | 9% | 16% |
A Calculated based on average shares outstanding during the period.
B Amount represents less than $.0005 per share.
C Total returns would have been lower if certain expenses had not been reduced during the applicable periods shown.
D Expense ratios reflect operating expenses of the Fund. Expenses before reductions do not reflect amounts reimbursed by the investment adviser or reductions from expense offset arrangements and do not represent the amount paid by the Fund during periods when reimbursements or reductions occur. Expenses net of fee waivers reflect expenses after reimbursement by the investment adviser but prior to reductions from expense offset arrangements. Expenses net of all reductions represent the net expenses paid by the Fund.
See accompanying notes which are an integral part of the financial statements.
Fidelity® Pennsylvania Municipal Money Market Fund
Investment Summary/Performance (Unaudited)
Effective Maturity Diversification
| Days | % of fund's investments 12/31/16 | % of fund's investments 6/30/16 | % of fund's investments 12/31/15 |
| 1 - 7 | 77.3 | 77.3 | 79.7 |
| 8 - 30 | 1.9 | 0.5 | 1.1 |
| 31 - 60 | 8.6 | 9.3 | 3.0 |
| 61 - 90 | 2.1 | 2.1 | 2.5 |
| 91 - 180 | 5.4 | 6.1 | 5.2 |
| >180 | 4.7 | 4.7 | 8.5 |
Effective maturity is determined in accordance with the requirements of Rule 2a-7 under the Investment Company Act of 1940.
Asset Allocation (% of fund's net assets)
| As of December 31, 2016 |
| | Variable Rate Demand Notes (VRDNs) | 43.9% |
| | Tender Option Bond | 24.5% |
| | Other Municipal Security | 22.9% |
| | Investment Companies | 8.5% |
| | Net Other Assets (Liabilities) | 0.2% |

| As of June 30, 2016 |
| | Variable Rate Demand Notes (VRDNs) | 51.0% |
| | Tender Option Bond | 17.6% |
| | Other Municipal Security | 25.7% |
| | Investment Companies | 5.4% |
| | Net Other Assets (Liabilities) | 0.3% |

Current And Historical 7-Day Yields
| | 12/31/16 | 9/30/16 | 6/30/16 | 3/31/16 | 12/31/15 |
| Fidelity® Pennsylvania Municipal Money Market Fund | 0.28% | 0.30% | 0.01% | 0.01% | 0.01% |
Yield refers to the income paid by the Fund over a given period. Yields for money market funds are usually for seven-day periods, as they are here, though they are expressed as annual percentage rates. Past performance is no guarantee of future results. Yield will vary and it's possible to lose money investing in the Fund.
Fidelity® Pennsylvania Municipal Money Market Fund
Investments December 31, 2016
Showing Percentage of Net Assets
| Variable Rate Demand Note - 43.9% | | | |
| | | Principal Amount | Value |
| Alabama - 0.1% | | | |
| Decatur Indl. Dev. Board Exempt Facilities Rev. (Nucor Steel Decatur LLC Proj.) Series 2003 A, 1% 1/6/17, VRDN (a)(b) | | $400,000 | $400,000 |
| Arkansas - 0.7% | | | |
| Blytheville Indl. Dev. Rev. (Nucor Corp. Proj.) Series 1998, 1% 1/6/17, VRDN (a)(b) | | 200,000 | 200,000 |
| Osceola Solid Waste Disp. Rev. (Plum Point Energy Associates, LLC Proj.) Series 2006, 0.93% 1/6/17, LOC Royal Bank of Scotland PLC, VRDN (a)(b) | | 2,500,000 | 2,500,000 |
| | | | 2,700,000 |
| Delaware - 0.1% | | | |
| Delaware Econ. Dev. Auth. Rev. (Delmarva Pwr. & Lt. Co. Proj.): | | | |
| Series 1988, 0.96% 1/3/17, VRDN (a)(b) | | 200,000 | 200,000 |
| Series 1993 C, 0.95% 1/6/17, VRDN (b) | | 100,000 | 100,000 |
| Series 1994, 0.96% 1/3/17, VRDN (a)(b) | | 200,000 | 200,000 |
| | | | 500,000 |
| Florida - 0.8% | | | |
| Collier County Hsg. Fin. Auth. Multi-family Rev. (George Washington Carver Apts. Proj.) Series 2005, 0.82% 1/6/17, LOC PNC Bank NA, VRDN (a)(b) | | 3,340,000 | 3,340,000 |
| Georgia - 0.3% | | | |
| Burke County Indl. Dev. Auth. Poll. Cont. Rev. (Georgia Pwr. Co. Plant Vogtle Proj.) Series 2013, 0.77% 1/6/17, VRDN (b) | | 1,200,000 | 1,200,000 |
| Indiana - 0.1% | | | |
| Indiana Dev. Fin. Auth. Envir. Rev. (PSI Energy Proj.) Series 2003 B, 0.9% 1/6/17, VRDN (a)(b) | | 400,000 | 400,000 |
| Iowa - 0.1% | | | |
| Iowa Fin. Auth. Solid Disp. Waste Rev. (MidAmerican Energy Proj.) Series 2008 A, 0.8% 1/6/17, VRDN (a)(b) | | 300,000 | 300,000 |
| Kentucky - 0.2% | | | |
| Trimble County Poll. Cont. Rev. (Louisville Gas and Elec. Co. Proj.) Series 2016 A, 0.83% 1/6/17, VRDN (a)(b) | | 1,000,000 | 1,000,000 |
| Louisiana - 0.2% | | | |
| Saint James Parish Gen. Oblig. (Nucor Steel Louisiana LLC Proj.): | | | |
| Series 2010 A1, 0.95% 1/6/17, VRDN (b) | | 700,000 | 700,000 |
| Series 2010 B1, 0.94% 1/6/17, VRDN (b) | | 180,000 | 180,000 |
| | | | 880,000 |
| Nebraska - 0.1% | | | |
| Stanton County Indl. Dev. Rev. (Nucor Corp. Proj.) Series 1996, 1% 1/6/17, VRDN (a)(b) | | 400,000 | 400,000 |
| Pennsylvania - 40.9% | | | |
| Allegheny County Hosp. Dev. Auth. Rev.: | | | |
| (Children's Institute Pittsburgh Proj.) Series 2005 A, 0.78% 1/6/17, LOC PNC Bank NA, VRDN (b) | | 2,965,000 | 2,965,000 |
| (South Hills Health Sys. Proj.) Series 2000 A, 0.78% 1/6/17, LOC PNC Bank NA, VRDN (b) | | 10,000,000 | 10,000,000 |
| Allegheny County Indl. Dev. Auth. Health Care Rev. (Vincentian Collaborative Sys. Proj.) Series 2008 A, 0.78% 1/6/17, LOC PNC Bank NA, VRDN (b) | | 6,440,000 | 6,440,000 |
| Allegheny County Indl. Dev. Auth. Rev.: | | | |
| (The Watson Institute Friendship Academy Proj.) Series 2010, 0.78% 1/6/17, LOC PNC Bank NA, VRDN (b) | | 3,525,000 | 3,525,000 |
| (Union Elec. Steel Co. Proj.) Series 1996 A, 0.86% 1/6/17, LOC PNC Bank NA, VRDN (a)(b) | | 3,120,000 | 3,120,000 |
| Bucks County Indl. Dev. Auth. Rev.: | | | |
| (Lutheran Cmnty. at Telford Healthcare Ctr., Inc. Proj.) Series 2007 B, 0.9% 1/6/17, LOC Citizens Bank of Pennsylvania, VRDN (b) | | 3,415,000 | 3,415,000 |
| (Snowball Real Estate LP Proj.) 0.89% 1/6/17, LOC Wells Fargo Bank NA, VRDN (a)(b) | | 895,000 | 895,000 |
| Cap. Region Wtr. Swr. Rev. Series 2014 B, 0.77% 1/6/17, LOC Manufacturers & Traders Trust Co., VRDN (b) | | 15,800,000 | 15,800,000 |
| Chester County Health & Ed. Auth. Rev. 0.77% 1/6/17, LOC Manufacturers & Traders Trust Co., VRDN (b) | | 3,580,000 | 3,580,000 |
| Crawford County Indl. Dev. Auth. College Rev. (Allegheny College Proj.) Series 2009 B, 0.79% 1/6/17, LOC PNC Bank NA, VRDN (b) | | 2,000,000 | 2,000,000 |
| Erie County Hosp. Auth. Rev. (Saint Vincent Health Ctr. Proj.) Series 2010 B, 0.77% 1/6/17, LOC Manufacturers & Traders Trust Co., VRDN (b) | | 16,560,000 | 16,560,000 |
| Haverford Township School District Series 2009, 0.73% 1/6/17, LOC TD Banknorth, NA, VRDN (b) | | 7,960,000 | 7,960,000 |
| Lancaster Indl. Dev. Auth. Rev.: | | | |
| (Mennonite Home Proj.) 0.82% 1/6/17, LOC Manufacturers & Traders Trust Co., VRDN (b) | | 4,315,000 | 4,315,000 |
| (Willow Valley Retirement Cmntys. Proj.) Series 2009 C, 0.79% 1/6/17, LOC PNC Bank NA, VRDN (b) | | 7,100,000 | 7,100,000 |
| (Willow Valley Retirement Proj.) Series 2009 B, 0.79% 1/6/17, LOC PNC Bank NA, VRDN (b) | | 685,000 | 685,000 |
| Luzerne County Convention Ctr. Series 2012, 0.78% 1/6/17, LOC PNC Bank NA, VRDN (b) | | 2,140,000 | 2,140,000 |
| Montgomery County Redev. Auth. Multi-family Hsg. Rev. (Kingswood Apts. Proj.) Series 2001 A, 0.74% 1/6/17, LOC Fannie Mae, VRDN (b) | | 12,675,000 | 12,675,000 |
| Pennsylvania Econ. Dev. Fing. Auth. Indl. Dev. Rev.: | | | |
| (Leidy's, Inc. Proj.) Series 1995 D7, 0.9% 1/6/17, LOC PNC Bank NA, VRDN (a)(b) | | 400,000 | 400,000 |
| Series 2004 B, 0.9% 1/6/17, LOC PNC Bank NA, VRDN (b) | | 800,000 | 800,000 |
| Pennsylvania Higher Edl. Facilities Auth. Rev. (Point Park College Proj.) 0.83% 1/6/17, LOC PNC Bank NA, VRDN (b) | | 400,000 | 400,000 |
| Philadelphia Arpt. Rev.: | | | |
| Series 2005 C1, 0.75% 1/6/17, LOC TD Banknorth, NA, VRDN (a)(b) | | 18,720,000 | 18,720,000 |
| Series 2005 C2, 0.74% 1/6/17, LOC Royal Bank of Canada, VRDN (a)(b) | | 11,145,000 | 11,145,000 |
| Philadelphia Auth. for Indl. Dev. Rev.: | | | |
| (Spl. People in Northeast, Inc. Proj.) Series 2006, 0.8% 1/6/17, LOC Citizens Bank of Pennsylvania, VRDN (b) | | 1,320,000 | 1,320,000 |
| (The Franklin Institute Proj.) Series 2006, 0.74% 1/6/17, LOC Bank of America NA, VRDN (b) | | 3,555,000 | 3,555,000 |
| Philadelphia Gen. Oblig. Series 2009 B, 0.74% 1/6/17, LOC Barclays Bank PLC, VRDN (b) | | 7,400,000 | 7,400,000 |
| Pittsburgh Wtr. & Swr. Auth. Wtr. & Swr. Sys. Rev. Series 2008 B2, 0.77% 1/6/17, LOC PNC Bank NA, VRDN (b) | | 2,000,000 | 2,000,000 |
| Ridley School District Series 2009, 0.73% 1/6/17, LOC TD Banknorth, NA, VRDN (b) | | 7,380,000 | 7,380,000 |
| Westmoreland County Indl. Dev. Auth. Rev. (Excela Health Proj.) Series 2010 B, 0.78% 1/6/17, LOC PNC Bank NA, VRDN (b) | | 9,650,000 | 9,650,000 |
| | | | 165,945,000 |
| Texas - 0.1% | | | |
| Port Arthur Navigation District Envir. Facilities Rev. (Motiva Enterprises LLC Proj.) Series 2004, 0.92% 1/6/17, VRDN (a)(b) | | 200,000 | 200,000 |
| West Virginia - 0.2% | | | |
| West Virginia Econ. Dev. Auth. Solid Waste Disp. Facilities Rev.: | | | |
| (Appalachian Pwr. Co. - Amos Proj.) Series 2008 B, 1% 1/6/17, VRDN (a)(b) | | 500,000 | 500,000 |
| (Appalachian Pwr. Co.- Mountaineer Proj.) Series 2008 A, 1% 1/6/17, VRDN (a)(b) | | 400,000 | 400,000 |
| | | | 900,000 |
| TOTAL VARIABLE RATE DEMAND NOTE | | | |
| (Cost $178,165,000) | | | 178,165,000 |
|
| Tender Option Bond - 24.5% | | | |
| Colorado - 0.0% | | | |
| Colorado Health Facilities Auth. Rev. Participating VRDN Series Floaters XF 22 41, 0.92% 1/6/17 (Liquidity Facility Citibank NA) (b)(c) | | 100,000 | 100,000 |
| Nebraska - 0.1% | | | |
| Omaha Pub. Pwr. District Elec. Rev. Participating VRDN Series 16 XF1053, 0.9% 1/6/17 (Liquidity Facility Deutsche Bank AG New York Branch) (b)(c) | | 200,000 | 200,000 |
| New Jersey - 0.0% | | | |
| New Jersey St. Trans. Trust Fund Auth. Participating VRDN Series Floaters 16 XF1059, 0.91% 1/6/17 (Liquidity Facility Deutsche Bank AG New York Branch) (b)(c) | | 100,000 | 100,000 |
| Pennsylvania - 24.4% | | | |
| Geisinger Auth. Health Sys. Rev. Participating VRDN: | | | |
| Series 15 ZF0174, 0.75% 1/6/17 (Liquidity Facility JPMorgan Chase Bank) (b)(c) | | 1,785,000 | 1,785,000 |
| Series Putters 0047, 0.75% 1/6/17 (Liquidity Facility JPMorgan Chase Bank) (b)(c) | | 5,605,000 | 5,605,000 |
| 0.75% 1/6/17 (Liquidity Facility JPMorgan Chase Bank) (b)(c) | | 6,285,000 | 6,285,000 |
| Lancaster County Hosp. Auth. Health Ctr. Rev. Participating VRDN Series 16 ZF0383, 0.76% 1/6/17 (Liquidity Facility Toronto-Dominion Bank) (b)(c) | | 3,750,000 | 3,750,000 |
| Montgomery Cnty. Indl. Dev. Auth. Rev. Participating VRDN Series Floaters 62 144, 0.77% 1/6/17 (Liquidity Facility Barclays Bank PLC) (b)(c) | | 5,200,000 | 5,200,000 |
| Pennsylvania Econ. Dev. Fing. Auth. Rev. Participating VRDN Series Floaters 16 YX1028, 0.8% 1/6/17 (Liquidity Facility Barclays Bank PLC) (b)(c) | | 3,605,000 | 3,605,000 |
| Pennsylvania Gen. Oblig. Participating VRDN: | | | |
| Series 16 ZF0424, 0.75% 1/6/17 (Liquidity Facility JPMorgan Chase Bank) (b)(c) | | 4,770,000 | 4,770,000 |
| Series Floaters XF 05 34, 0.76% 1/6/17 (Liquidity Facility Toronto-Dominion Bank) (b)(c) | | 2,000,000 | 2,000,000 |
| Series MS 3382, 0.75% 1/6/17 (Liquidity Facility Morgan Stanley Bank, West Valley City Utah) (b)(c) | | 7,500,000 | 7,500,000 |
| Series Putters 4014, 0.75% 1/6/17 (Liquidity Facility JPMorgan Chase Bank) (b)(c) | | 3,000,000 | 3,000,000 |
| Series ROC II R 14070, 0.76% 1/6/17 (Liquidity Facility Citibank NA) (b)(c) | | 8,000,000 | 8,000,000 |
| Pennsylvania Health & Edl. Facilities Fing. Auth. Rev. Bonds Series E72, 0.92%, tender 3/1/17 (Liquidity Facility Royal Bank of Canada) (b)(c)(d) | | 3,100,000 | 3,100,000 |
| Pennsylvania Higher Edl. Facilities Auth. Bonds Series 2016 E75, 0.92%, tender 4/3/17 (Liquidity Facility Royal Bank of Canada) (b)(c)(d) | | 5,000,000 | 5,000,000 |
| Pennsylvania Higher Edl. Facilities Auth. Rev.: | | | |
| Bonds Series WF 11 26C, 0.92%, tender 2/9/17 (Liquidity Facility Wells Fargo Bank NA) (b)(c)(d) | | 5,900,000 | 5,900,000 |
| Participating VRDN: | | | |
| Series Floaters XG 01 06, 0.79% 1/6/17 (Liquidity Facility Bank of America NA) (b)(c) | | 4,095,000 | 4,095,000 |
| Series MS 3252, 0.75% 1/6/17 (Liquidity Facility Morgan Stanley Bank, West Valley City Utah) (b)(c) | | 5,840,000 | 5,840,000 |
| Pennsylvania Intergovernmental Coop. Auth. Spl. Tax Rev. Participating VRDN Series Putters 15 XM0010, 0.75% 1/6/17 (Liquidity Facility JPMorgan Chase Bank) (b)(c) | | 5,035,000 | 5,035,000 |
| Philadelphia Auth. For Indl. Dev. Participating VRDN: | | | |
| Series 15 ZF0167, 0.75% 1/6/17 (Liquidity Facility JPMorgan Chase Bank) (b)(c) | | 2,750,000 | 2,750,000 |
| Series Putters 14 XM0005, 0.75% 1/6/17 (Liquidity Facility JPMorgan Chase Bank) (b)(c)(e) | | 5,625,000 | 5,625,000 |
| Philadelphia Hospitals & Higher Ed. Facilities Auth. Hosp. Rev. Participating VRDN Series 15 F0114, 0.75% 1/6/17 (Liquidity Facility JPMorgan Chase Bank) (b)(c) | | 5,330,000 | 5,330,000 |
| Univ. of Pittsburgh Med. Ctr. Bonds Series RBC E53, 0.92%, tender 4/3/17 (Liquidity Facility Royal Bank of Canada) (b)(c)(d) | | 4,905,000 | 4,905,000 |
| | | | 99,080,000 |
| TOTAL TENDER OPTION BOND | | | |
| (Cost $99,480,000) | | | 99,480,000 |
|
| Other Municipal Security - 22.9% | | | |
| Georgia - 0.7% | | | |
| Main Street Natural Gas, Inc. Georgia Gas Proj. Rev. Bonds: | | | |
| Series 2010 A1, 0.83%, tender 4/3/17 (Liquidity Facility Royal Bank of Canada) (b) | | 1,800,000 | 1,800,000 |
| Series 2010 A2, 0.83%, tender 4/3/17 (Liquidity Facility Royal Bank of Canada) (b) | | 1,000,000 | 1,000,000 |
| | | | 2,800,000 |
| Kentucky - 0.0% | | | |
| Jefferson County Poll. Cont. Rev. Bonds Series 01A, 0.85% tender 1/23/17, CP mode | | 200,000 | 200,000 |
| Massachusetts - 0.4% | | | |
| Massachusetts Indl. Fin. Agcy. Poll. Cont. Rev. Bonds (New England Pwr. Co. Proj.): | | | |
| Series 1992: | | | |
| 0.9% tender 1/25/17, CP mode | | 100,000 | 100,000 |
| 0.9% tender 2/2/17, CP mode | | 300,000 | 300,000 |
| Series 1993 A, 0.9% tender 1/25/17, CP mode | | 600,000 | 600,000 |
| Series 93B, 0.85% tender 1/19/17, CP mode | | 500,000 | 500,000 |
| | | | 1,500,000 |
| New Hampshire - 0.6% | | | |
| New Hampshire Bus. Fin. Auth. Poll. Cont. Rev. Bonds: | | | |
| (New England Pwr. Co. Proj.) Series 90B, 0.8% tender 1/4/17, CP mode | | 400,000 | 400,000 |
| Series 1990 A: | | | |
| 0.95% tender 1/24/17, CP mode (a) | | 800,000 | 800,000 |
| 0.95% tender 2/2/17, CP mode (a) | | 300,000 | 300,000 |
| Series A1: | | | |
| 0.95% tender 1/30/17, CP mode (a) | | 100,000 | 100,000 |
| 0.97% tender 1/31/17, CP mode (a) | | 700,000 | 700,000 |
| | | | 2,300,000 |
| Pennsylvania - 21.0% | | | |
| Lancaster County Hosp. Auth. Health Ctr. Rev. Bonds Series 2007 B, 5% 3/15/17 (Pre-Refunded to 3/15/17 @ 100) | | 1,025,000 | 1,033,822 |
| Pennsylvania Econ. Dev. Fin. Auth. Unemployment Compensation Rev. Bonds Series 2012 A, 4% | | 2,270,000 | 2,270,000 |
| Pennsylvania Econ. Dev. Fing. Auth. Indl. Dev. Rev. Bonds Series 2014 A, 4% 2/1/17 | | 4,290,000 | 4,301,874 |
| Pennsylvania Gen. Oblig. Bonds: | | | |
| Series 2007 A, 5% 8/1/17 | | 3,000,000 | 3,070,908 |
| Series 2009: | | | |
| 5% 3/15/17 | | 1,235,000 | 1,245,587 |
| 5% 7/1/17 | | 1,500,000 | 1,530,776 |
| Series 2010 A, 5% 5/1/17 | | 3,290,000 | 3,335,639 |
| Series 2010, 5% 2/15/17 | | 5,940,000 | 5,971,370 |
| Series 2011, 5% 7/1/17 | | 1,035,000 | 1,056,228 |
| Series 2013, 5% 4/1/17 | | 2,525,000 | 2,552,344 |
| Series 2015, 5% 3/15/17 | | 2,000,000 | 2,017,385 |
| Series 2016, 5% 2/1/17 | | 5,900,000 | 5,921,373 |
| 5% 6/1/17 | | 6,000,000 | 6,105,902 |
| 5% 7/1/17 | | 6,125,000 | 6,251,798 |
| 5% 8/15/17 | | 1,500,000 | 1,540,302 |
| 5.375% 7/1/17 | | 675,000 | 689,712 |
| Philadelphia Arpt. Rev. Series B3: | | | |
| 0.81% 1/5/17, LOC Wells Fargo Bank NA, CP (a) | | 5,200,000 | 5,200,000 |
| 0.83% 3/8/17, LOC Wells Fargo Bank NA, CP (a) | | 4,200,000 | 4,200,000 |
| Philadelphia Gas Works Rev. Series 2, 0.72% 1/5/17, LOC PNC Bank NA, CP | | 4,400,000 | 4,400,000 |
| Philadelphia Gen. Oblig. TRAN Series 2016 A, 2% 6/30/17 | | 5,000,000 | 5,025,690 |
| Univ. of Pittsburgh Commonwealth Sys. of Higher Ed. Bonds: | | | |
| Series 05B, 0.65% tender 1/4/17, CP mode | | 4,400,000 | 4,400,000 |
| Series 07B, 0.88% tender 1/18/17, CP mode | | 5,000,000 | 5,000,000 |
| Series 14B1, 0.67% tender 2/14/17, CP mode | | 3,050,000 | 3,050,000 |
| Series 14B2, 0.68% tender 2/14/17, CP mode | | 5,000,000 | 5,000,000 |
| | | | 85,170,710 |
| Virginia - 0.1% | | | |
| Halifax County Indl. Dev. Auth. Poll. Cont. Rev. Bonds Series 2016, 0.98% tender 1/25/17, CP mode (a) | | 400,000 | 400,000 |
| West Virginia - 0.1% | | | |
| Grant County Cmnty. Solid Waste Disp. Rev. Bonds Series 96, 0.96% tender 2/2/17, CP mode (a) | | 300,000 | 300,000 |
| TOTAL OTHER MUNICIPAL SECURITY | | | |
| (Cost $92,670,710) | | | 92,670,710 |
| | | Shares | Value |
|
| Investment Company - 8.5% | | | |
| Fidelity Municipal Cash Central Fund, 0.79%(f)(g) | | | |
| (Cost $34,508,280) | | 34,507,750 | 34,508,280 |
| TOTAL INVESTMENT PORTFOLIO - 99.8% | | | |
| (Cost $404,823,990) | | | 404,823,990 |
| NET OTHER ASSETS (LIABILITIES) - 0.2% | | | 701,844 |
| NET ASSETS - 100% | | | $405,525,834 |
Security Type Abbreviations
CP – COMMERCIAL PAPER
TRAN – TAX AND REVENUE ANTICIPATION NOTE
VRDN – Variable Rate Demand Note (A debt instrument that is payable upon demand, either daily, weekly or monthly)
The date shown for securities represents the date when principal payments must be paid, taking into account any call options exercised by the issuer and any permissible maturity shortening features other than interest rate resets.
Legend
(a) Private activity obligations whose interest is subject to the federal alternative minimum tax for individuals.
(b) Coupon rates for floating and adjustable rate securities reflect the rates in effect at period end.
(c) Provides evidence of ownership in one or more underlying municipal bonds.
(d) Restricted securities - Investment in securities not registered under the Securities Act of 1933 (excluding 144A issues). At the end of the period, the value of restricted securities (excluding 144A issues) amounted to $18,905,000 or 4.7% of net assets.
(e) Security exempt from registration under Rule 144A of the Securities Act of 1933. These securities may be resold in transactions exempt from registration, normally to qualified institutional buyers. At the end of the period, the value of these securities amounted to $5,625,000 or 1.4% of net assets.
(f) Information in this report regarding holdings by state and security types does not reflect the holdings of the Fidelity Municipal Cash Central Fund.
(g) Affiliated fund that is available only to investment companies and other accounts managed by Fidelity Investments. The rate quoted is the annualized seven-day yield of the fund at period end. A complete unaudited listing of the fund's holdings as of its most recent quarter end is available upon request. In addition, each Fidelity Central Fund's financial statements, which are not covered by the Fund's Report of Independent Registered Public Accounting Firm, are available on the SEC's website or upon request.
Additional information on each restricted holding is as follows:
| Security | Acquisition Date | Cost |
| Pennsylvania Health & Edl. Facilities Fing. Auth. Rev. Bonds Series E72, 0.92%, tender 3/1/17 (Liquidity Facility Royal Bank of Canada) | 6/1/16 | $3,100,000 |
| Pennsylvania Higher Edl. Facilities Auth. Bonds Series 2016 E75, 0.92%, tender 4/3/17 (Liquidity Facility Royal Bank of Canada) | 7/1/16 | $5,000,000 |
| Pennsylvania Higher Edl. Facilities Auth. Rev. Bonds Series WF 11 26C, 0.92%, tender 2/9/17 (Liquidity Facility Wells Fargo Bank NA) | 8/11/16 | $5,900,000 |
| Univ. of Pittsburgh Med. Ctr. Bonds Series RBC E53, 0.92%, tender 4/3/17 (Liquidity Facility Royal Bank of Canada) | 3/31/16 | $4,905,000 |
Affiliated Central Funds
Information regarding fiscal year to date income earned by the Fund from investments in Fidelity Central Funds is as follows:
| Fund | Income earned |
| Fidelity Municipal Cash Central Fund | $161,520 |
| Total | $161,520 |
Investment Valuation
All investments are categorized as Level 2 under the Fair Value Hierarchy. The inputs or methodology used for valuing securities may not be an indication of the risk associated with investing in those securities. For more information on valuation inputs please refer to the Investment Valuation section in the accompanying Notes to Financial Statements.
See accompanying notes which are an integral part of the financial statements.
Fidelity® Pennsylvania Municipal Money Market Fund
Financial Statements
Statement of Assets and Liabilities
| | | December 31, 2016 |
| Assets | | |
Investment in securities, at value — See accompanying schedule:
Unaffiliated issuers (cost $370,315,710) | $370,315,710 | |
| Fidelity Central Funds (cost $34,508,280) | 34,508,280 | |
| Total Investments (cost $404,823,990) | | $404,823,990 |
| Receivable for fund shares sold | | 567,998 |
| Interest receivable | | 1,160,062 |
| Distributions receivable from Fidelity Central Funds | | 17,957 |
| Other receivables | | 260 |
| Total assets | | 406,570,267 |
| Liabilities | | |
| Payable to custodian bank | $454,644 | |
| Payable for fund shares redeemed | 414,115 | |
| Distributions payable | 3,722 | |
| Accrued management fee | 171,720 | |
| Other affiliated payables | 232 | |
| Total liabilities | | 1,044,433 |
| Net Assets | | $405,525,834 |
| Net Assets consist of: | | |
| Paid in capital | | $405,523,911 |
| Accumulated undistributed net realized gain (loss) on investments | | 1,923 |
| Net Assets, for 405,273,865 shares outstanding | | $405,525,834 |
| Net Asset Value, offering price and redemption price per share ($405,525,834 ÷ 405,273,865 shares) | | $1.00 |
See accompanying notes which are an integral part of the financial statements.
Statement of Operations
| | | Year ended December 31, 2016 |
| Investment Income | | |
| Interest | | $2,163,669 |
| Income from Fidelity Central Funds | | 161,520 |
| Total income | | 2,325,189 |
| Expenses | | |
| Management fee | $2,792,490 | |
| Independent trustees' fees and expenses | 2,638 | |
| Total expenses before reductions | 2,795,128 | |
| Expense reductions | (842,585) | 1,952,543 |
| Net investment income (loss) | | 372,646 |
| Realized and Unrealized Gain (Loss) | | |
| Net realized gain (loss) on: | | |
| Investment securities: | | |
| Unaffiliated issuers | 34,860 | |
| Fidelity Central Funds | 480 | |
| Total net realized gain (loss) | | 35,340 |
| Net increase in net assets resulting from operations | | $407,986 |
See accompanying notes which are an integral part of the financial statements.
Statement of Changes in Net Assets
| | Year ended December 31, 2016 | Year ended December 31, 2015 |
| Increase (Decrease) in Net Assets | | |
| Operations | | |
| Net investment income (loss) | $372,646 | $71,521 |
| Net realized gain (loss) | 35,340 | 49,955 |
| Net increase in net assets resulting from operations | 407,986 | 121,476 |
| Distributions to shareholders from net investment income | (372,232) | (71,539) |
| Distributions to shareholders from net realized gain | (25,493) | (27,761) |
| Total distributions | (397,725) | (99,300) |
| Share transactions at net asset value of $1.00 per share | | |
| Proceeds from sales of shares | 562,871,356 | 1,599,662,197 |
| Reinvestment of distributions | 376,905 | 93,316 |
| Cost of shares redeemed | (889,433,202) | (1,628,544,631) |
| Net increase (decrease) in net assets and shares resulting from share transactions | (326,184,941) | (28,789,118) |
| Total increase (decrease) in net assets | (326,174,680) | (28,766,942) |
| Net Assets | | |
| Beginning of period | 731,700,514 | 760,467,456 |
| End of period | $405,525,834 | $731,700,514 |
See accompanying notes which are an integral part of the financial statements.
Financial Highlights — Fidelity Pennsylvania Municipal Money Market Fund
| Years ended December 31, | 2016 | 2015 | 2014 | 2013 | 2012 |
| Selected Per–Share Data | | | | | |
| Net asset value, beginning of period | $1.00 | $1.00 | $1.00 | $1.00 | $1.00 |
| Income from Investment Operations | | | | | |
| Net investment income (loss) | .001 | –A | –A | –A | –A |
| Net realized and unrealized gain (loss)A | – | – | – | – | – |
| Total from investment operations | .001 | –A | –A | –A | –A |
| Distributions from net investment income | (.001) | –A | –A | –A | –A |
| Distributions from net realized gain | –A | –A | – | – | – |
| Total distributions | (.001) | –A | –A | –A | –A |
| Net asset value, end of period | $1.00 | $1.00 | $1.00 | $1.00 | $1.00 |
| Total ReturnB | .09% | .01% | .01% | .01% | .01% |
| Ratios to Average Net AssetsC,D | | | | | |
| Expenses before reductions | .50% | .50% | .50% | .50% | .50% |
| Expenses net of fee waivers, if any | .35% | .06% | .07%�� | .11% | .18% |
| Expenses net of all reductions | .35% | .06% | .07% | .11% | .18% |
| Net investment income (loss) | .07% | .01% | .01% | .01% | .01% |
| Supplemental Data | | | | | |
| Net assets, end of period (000 omitted) | $405,526 | $731,701 | $760,467 | $789,696 | $788,486 |
A Amount represents less than $.0005 per share.
B Total returns would have been lower if certain expenses had not been reduced during the applicable periods shown.
C Fees and expenses of any underlying Fidelity Central Funds are not included in the Fund's expense ratio. The Fund indirectly bears its proportionate share of the expenses of any underlying Fidelity Central Funds.
D Expense ratios reflect operating expenses of the Fund. Expenses before reductions do not reflect amounts reimbursed or waived or reductions from expense offset arrangements and do not represent the amount paid by the Fund during periods when reimbursements, waivers or reductions occur. Expenses net of fee waivers reflect expenses after reimbursement and waivers but prior to reductions from expense offset arrangements. Expenses net of all reductions represent the net expenses paid by the Fund.
See accompanying notes which are an integral part of the financial statements.
Notes to Financial Statements
For the period ended December 31, 2016
1. Organization.
Fidelity Pennsylvania Municipal Income Fund (the Income Fund) is a fund of Fidelity Municipal Trust. Fidelity Pennsylvania Municipal Money Market Fund (the Money Market Fund) is a fund of Fidelity Municipal Trust II. Each Trust is registered under the Investment Company Act of 1940, as amended (the 1940 Act), as an open-end management investment company. Fidelity Municipal Trust and Fidelity Municipal Trust II (the Trusts) are organized as a Massachusetts business trust and a Delaware statutory trust, respectively. Each Fund is authorized to issue an unlimited number of shares. Share transactions on the Statement of Changes in Net Assets may contain exchanges between affiliated funds. Effective January 1, 2016 shares of the Money Market Fund are only available for purchase by retail shareholders. Each Fund may be affected by economic and political developments in the state of Pennsylvania.
2. Investments in Fidelity Central Funds.
The Funds may invest in Fidelity Central Funds, which are open-end investment companies generally available only to other investment companies and accounts managed by the investment adviser and its affiliates. The Funds' Schedules of Investments list each of the Fidelity Central Funds held as of period end, if any, as an investment of each Fund, but do not include the underlying holdings of each Fidelity Central Fund. As an Investing Fund, each Fund indirectly bears its proportionate share of the expenses of the underlying Fidelity Central Funds.
The Money Market Central Funds seek preservation of capital and current income and are managed by Fidelity Investments Money Management, Inc. (FIMM), an affiliate of the investment adviser. Annualized expenses of the Money Market Central Funds as of their most recent shareholder report date are less than .005%.
A complete unaudited list of holdings for each Fidelity Central Fund is available upon request or at the Securities and Exchange Commission (the SEC) website at www.sec.gov. In addition, the financial statements of the Fidelity Central Funds, which are not covered by the Funds' Report of Independent Registered Public Accounting Firm, are available on the SEC website or upon request.
3. Significant Accounting Policies.
The financial statements have been prepared in conformity with accounting principles generally accepted in the United States of America (GAAP), which require management to make certain estimates and assumptions at the date of the financial statements. Actual results could differ from those estimates. Subsequent events, if any, through the date that the financial statements were issued have been evaluated in the preparation of the financial statements. The following summarizes the significant accounting policies of the Funds:
Investment Valuation. Investments are valued as of 4:00 p.m. Eastern time on the last calendar day of the period. The Board of Trustees (the Board) has delegated the day to day responsibility for the valuation of the Income Fund's investments to the Fair Value Committee (the Committee) established by the Income Fund's investment adviser. In accordance with valuation policies and procedures approved by the Board, the Income Fund attempts to obtain prices from one or more third party pricing vendors or brokers to value its investments. When current market prices, quotations or currency exchange rates are not readily available or reliable, investments will be fair valued in good faith by the Committee, in accordance with procedures adopted by the Board. Factors used in determining fair value vary by investment type and may include market or investment specific events, changes in interest rates and credit quality. The frequency with which these procedures are used cannot be predicted and they may be utilized to a significant extent. The Committee oversees the Income Fund's valuation policies and procedures and reports to the Board on the Committee's activities and fair value determinations. The Board monitors the appropriateness of the procedures used in valuing the Income Fund's investments and ratifies the fair value determinations of the Committee.
Each Fund categorizes the inputs to valuation techniques used to value its investments into a disclosure hierarchy consisting of three levels as shown below:
- Level 1 – quoted prices in active markets for identical investments
- Level 2 – other significant observable inputs (including quoted prices for similar investments, interest rates, prepayment speeds, etc.)
- Level 3 – unobservable inputs (including the Fund's own assumptions based on the best information available)
Valuation techniques used to value each Fund's investments by major category are as follows:
For the Income Fund, debt securities, including restricted securities, are valued based on evaluated prices received from third party pricing vendors or from brokers who make markets in such securities. Municipal securities are valued by pricing vendors who utilize matrix pricing which considers yield or price of bonds of comparable quality, coupon, maturity and type or by broker-supplied prices. When independent prices are unavailable or unreliable, debt securities may be valued utilizing pricing methodologies which consider similar factors that would be used by third party pricing vendors. Debt securities are generally categorized as Level 2 in the hierarchy but may be Level 3 depending on the circumstances.
For the Money Market Fund, as permitted by compliance with certain conditions under Rule 2a-7 of the 1940 Act, securities are valued at amortized cost, which approximates fair value. The amortized cost of an instrument is determined by valuing it at its original cost and thereafter amortizing any discount or premium from its face value at a constant rate until maturity. Securities held by a money market fund are generally high quality and liquid; however, they are reflected as Level 2 because the inputs used to determine fair value are not quoted prices in an active market.
For the Income Fund, changes in valuation techniques may result in transfers in or out of an assigned level within the disclosure hierarchy.
Investment Transactions and Income. For financial reporting purposes, the Funds' investment holdings and NAV include trades executed through the end of the last business day of the period. The NAV per share for processing shareholder transactions is calculated as of the close of business of the New York Stock Exchange (NYSE), normally 4:00 p.m. Eastern time and includes trades executed through the end of the prior business day for the Income Fund and trades executed through the end of the current business day for the Money Market Fund. Gains and losses on securities sold are determined on the basis of identified cost. Income and capital gain distributions from Fidelity Central Funds, if any, are recorded on the ex-dividend date. Interest income is accrued as earned and includes coupon interest and amortization of premium and accretion of discount on debt securities as applicable. Debt obligations may be placed on non-accrual status and related interest income may be reduced by ceasing current accruals and writing off interest receivables when the collection of all or a portion of interest has become doubtful based on consistently applied procedures. A debt obligation is removed from non-accrual status when the issuer resumes interest payments or when collectability of interest is reasonably assured.
Expenses. Expenses directly attributable to a fund are charged to that fund. Expenses attributable to more than one fund are allocated among the respective funds on the basis of relative net assets or other appropriate methods. Expense estimates are accrued in the period to which they relate and adjustments are made when actual amounts are known.
Income Tax Information and Distributions to Shareholders. Each year, each Fund intends to qualify as a regulated investment company under Subchapter M of the Internal Revenue Code, including distributing substantially all of its taxable income and realized gains. As a result, no provision for U.S. Federal income taxes is required. As of December 31, 2016, each Fund did not have any unrecognized tax benefits in the financial statements; nor is each Fund aware of any tax positions for which it is reasonably possible that the total amounts of unrecognized tax benefits will significantly change in the next twelve months. Each Fund files a U.S. federal tax return, in addition to state and local tax returns as required. Each Fund's federal income tax returns are subject to examination by the Internal Revenue Service (IRS) for a period of three fiscal years after they are filed. State and local tax returns may be subject to examination for an additional fiscal year depending on the jurisdiction.
Dividends are declared and recorded daily and paid monthly from net investment income. Distributions from realized gains, if any, are declared and recorded on the ex-dividend date. Income and capital gain distributions are determined in accordance with income tax regulations, which may differ from GAAP. In addition, the Funds claimed a portion of the payment made to redeeming shareholders as a distribution for income tax purposes.
Capital accounts within the financial statements are adjusted for permanent book-tax differences. These adjustments have no impact on net assets or the results of operations. Capital accounts are not adjusted for temporary book-tax differences which will reverse in a subsequent period.
Book-tax differences are primarily due to market discount, deferred trustees compensation and losses deferred due to excise tax regulations.
The Funds purchase municipal securities whose interest, in the opinion of the issuer, is free from federal income tax. There is no assurance that the IRS will agree with this opinion. In the event the IRS determines that the issuer does not comply with relevant tax requirements, interest payments from a security could become federally taxable, possibly retroactively to the date the security was issued.
The federal tax cost of investment securities and unrealized appreciation (depreciation) as of period end were as follows for each Fund:
| | Tax cost | Gross unrealized appreciation | Gross unrealized depreciation | Net unrealized appreciation (depreciation) on securities |
| Fidelity Pennsylvania Municipal Income Fund | $433,807,342 | $14,487,631 | $(5,922,293) | $8,565,338 |
| Fidelity Pennsylvania Municipal Money Market Fund | 404,823,990 | – | – | – |
The tax-based components of distributable earnings as of period end were as follows for each Fund:
| | Undistributed tax-exempt income | Undistributed long-term capital gain | Net unrealized appreciation (depreciation) on securities and other investments |
| Fidelity Pennsylvania Municipal Income Fund | $– | $1,036,890 | $8,565,338 |
| Fidelity Pennsylvania Municipal Money Market Fund | 3,894 | – | – |
Certain of the Funds intend to elect to defer to the next fiscal year capital losses recognized during the period November 1, 2015 to December 31, 2015. Loss deferrals were as follows:
| | Capital losses |
| Fidelity Pennsylvania Municipal Money Market Fund | $(1,746) |
The tax character of distributions paid was as follows:
| December 31, 2016 | | | | |
| | Tax-Exempt Income | Ordinary Income | Long-term Capital Gains | Total |
| Fidelity Pennsylvania Municipal Income Fund | $14,451,215 | $43,964 | $2,094,217 | $16,589,396 |
| Fidelity Pennsylvania Municipal Money Market Fund | 372,232 | – | 25,493 | 397,725 |
| December 31, 2015 | | | | |
| | Tax-Exempt Income | Ordinary Income | Long-term Capital Gains | Total |
| Fidelity Pennsylvania Municipal Income Fund | $14,703,703 | $– | $1,756,019 | $16,459,722 |
| Fidelity Pennsylvania Municipal Money Market Fund | 71,539 | – | 27,761 | 99,300 |
Short-Term Trading (Redemption) Fees. Shares held by investors in the Income Fund less than 30 days may be subject to a redemption fee equal to .50% of the NAV of shares redeemed. All redemption fees, which reduce the proceeds of the shareholder redemption, are retained by the Fund and accounted for as an addition to paid in capital. In November 2016, the Board of Trustees approved the elimination of these redemption fees effective December 12, 2016.
Restricted Securities. The Funds may invest in securities that are subject to legal or contractual restrictions on resale. These securities generally may be resold in transactions exempt from registration or to the public if the securities are registered. Disposal of these securities may involve time-consuming negotiations and expense, and prompt sale at an acceptable price may be difficult. Information regarding restricted securities is included at the end of each applicable Fund's Schedule of Investments.
4. Purchases and Sales of Investments.
Purchases and sales of securities, other than short-term securities, for the Income Fund aggregated $105,989,297 and $85,111,527, respectively.
5. Fees and Other Transactions with Affiliates.
Management Fee. Fidelity Management & Research Company (the investment adviser) and its affiliates provide the Income Fund with investment management related services for which the Fund pays a monthly management fee. The management fee is the sum of an individual fund fee rate that is based on an annual rate of .25% of the Fund's average net assets and an annualized group fee rate that averaged .11% during the period. The group fee rate is based upon the average net assets of all the mutual funds advised by the investment adviser, including any mutual funds previously advised by the investment adviser that are currently advised by Fidelity SelectCo, LLC, an affiliate of the investment adviser. The group fee rate decreases as assets under management increase and increases as assets under management decrease. For the reporting period, the total annual management fee rate was .36% of the Fund's average net assets.
Fidelity Management & Research Company (the investment adviser) and its affiliates provide the Money Market Fund with investment management related services for which the Fund pays a monthly management fee that is based on an annual rate of .50% of the Fund's average net assets. Under the management contract, the investment adviser pays all other expenses, except the compensation of the independent Trustees and certain other expenses such as interest expense. The management fee is reduced by an amount equal to the fees and expenses paid by the Fund to the independent Trustees.
Transfer Agent Fees. Fidelity Investments Institutional Operations Company, Inc. (FIIOC), an affiliate of the investment adviser, is the transfer, dividend disbursing and shareholder servicing agent for the Funds. Under the terms of the management fee contract, the investment adviser pays transfer agent fees on behalf of the Money Market Fund. FIIOC receives account fees and asset-based fees that vary according to account size and type of account. FIIOC pays for typesetting, printing and mailing of shareholder reports, except proxy statements. For the period, the Income Fund's transfer agent fees were equivalent to the following annual rates expressed as a percentage of average net assets:
| Fidelity Pennsylvania Municipal Income Fund | .08% |
Accounting Fees. Fidelity Service Company, Inc. (FSC), an affiliate of the investment adviser, maintains each Fund's accounting records. The fee is based on the level of average net assets for each month.
Interfund Trades. The Funds may purchase from or sell securities to other Fidelity Funds under procedures adopted by the Board. The procedures have been designed to ensure these interfund trades are executed in accordance with Rule 17a-7 of the 1940 Act. For the Income Fund, interfund trades are included within the respective purchases and sales amounts shown in the Purchases and Sales of Investments note.
6. Committed Line of Credit.
The Income Fund participates with other funds managed by the investment adviser or an affiliate in a $4.25 billion credit facility (the "line of credit") to be utilized for temporary or emergency purposes to fund shareholder redemptions or for other short-term liquidity purposes. The participating funds have agreed to pay commitment fees on their pro-rata portion of the line of credit, which are reflected in Miscellaneous expenses on the Statement of Operations, and are as follows:
| Fidelity Pennsylvania Municipal Income Fund | $1,251 |
During the period, the Income Fund did not borrow on this line of credit.
7. Expense Reductions.
The investment adviser or its affiliates voluntarily agreed to waive certain fees for the Money Market Fund in order to maintain a minimum annualized yield of .01%. Such arrangements may be discontinued by the investment adviser at any time. For the period, the amount of the waiver was $839,003.
Through arrangements with the Income Fund's custodian, credits realized as a result of certain uninvested cash balances were used to reduce fund expenses. These expense reductions are noted in the table below.
In addition, through an arrangement with the Money Market Fund's custodian, $3,582 of credits realized as a result of certain uninvested cash balances were used to reduce the Fund's management fee.
| | Custody
expense
reduction |
| Fidelity Pennsylvania Municipal Income Fund | $3,768 |
In addition, during the period the investment adviser reimbursed and/or waived a portion of operating expenses as follows:
| | Amount |
| Fidelity Pennsylvania Municipal Income Fund | $1,900 |
8. Other.
The Funds' organizational documents provide former and current trustees and officers with a limited indemnification against liabilities arising in connection with the performance of their duties to the Funds. In the normal course of business, the Funds may also enter into contracts that provide general indemnifications. The Funds' maximum exposure under these arrangements is unknown as this would be dependent on future claims that may be made against the Funds. The risk of material loss from such claims is considered remote.
Report of Independent Registered Public Accounting Firm
To the Trustees of Fidelity Municipal Trust and Fidelity Municipal Trust II and the Shareholders of Fidelity Pennsylvania Municipal Income Fund and Fidelity Pennsylvania Municipal Money Market Fund:
In our opinion, the accompanying statements of assets and liabilities, including the schedules of investments, and the related statements of operations and of changes in net assets and the financial highlights present fairly, in all material respects, the financial position of Fidelity Pennsylvania Municipal Income Fund (a fund of Fidelity Municipal Trust) and Fidelity Pennsylvania Municipal Money Market Fund (a fund of Fidelity Municipal Trust II) (the "Funds") as of December 31, 2016, the results of each of their operations for the year then ended, the changes in each of their net assets for each of the two years in the period then ended and the financial highlights for each of the five years in the period then ended, in conformity with accounting principles generally accepted in the United States of America. These financial statements and financial highlights (hereafter referred to as “financial statements”) are the responsibility of the Funds' management. Our responsibility is to express an opinion on these financial statements based on our audits. We conducted our audits of these financial statements in accordance with the standards of the Public Company Accounting Oversight Board (United States). Those standards require that we plan and perform the audit to obtain reasonable assurance about whether the financial statements are free of material misstatement. An audit includes examining, on a test basis, evidence supporting the amounts and disclosures in the financial statements, assessing the accounting principles used and significant estimates made by management, and evaluating the overall financial statement presentation. We believe that our audits, which included confirmation of securities as of December 31, 2016 by correspondence with the custodian and brokers, provide a reasonable basis for our opinion.
PricewaterhouseCoopers LLP
Boston, Massachusetts
February 15, 2017
Trustees and Officers
The Trustees, Members of the Advisory Board (if any), and officers of the trusts and funds, as applicable, are listed below. The Board of Trustees governs each fund and is responsible for protecting the interests of shareholders. The Trustees are experienced executives who meet periodically throughout the year to oversee each fund's activities, review contractual arrangements with companies that provide services to each fund, oversee management of the risks associated with such activities and contractual arrangements, and review each fund's performance. Each of the Trustees oversees 243 funds.
The Trustees hold office without limit in time except that (a) any Trustee may resign; (b) any Trustee may be removed by written instrument, signed by at least two-thirds of the number of Trustees prior to such removal; (c) any Trustee who requests to be retired or who has become incapacitated by illness or injury may be retired by written instrument signed by a majority of the other Trustees; and (d) any Trustee may be removed at any special meeting of shareholders by a two-thirds vote of the outstanding voting securities of the trust. Each Trustee who is not an interested person (as defined in the 1940 Act) of the trust and the funds is referred to herein as an Independent Trustee. Each Independent Trustee shall retire not later than the last day of the calendar year in which his or her 75th birthday occurs. The Independent Trustees may waive this mandatory retirement age policy with respect to individual Trustees. Officers and Advisory Board Members hold office without limit in time, except that any officer or Advisory Board Member may resign or may be removed by a vote of a majority of the Trustees at any regular meeting or any special meeting of the Trustees. Except as indicated, each individual has held the office shown or other offices in the same company for the past five years.
The fund’s Statement of Additional Information (SAI) includes more information about the Trustees. To request a free copy, call Fidelity at 1-800-544-8544.
Experience, Skills, Attributes, and Qualifications of the Trustees. The Governance and Nominating Committee has adopted a statement of policy that describes the experience, qualifications, attributes, and skills that are necessary and desirable for potential Independent Trustee candidates (Statement of Policy). The Board believes that each Trustee satisfied at the time he or she was initially elected or appointed a Trustee, and continues to satisfy, the standards contemplated by the Statement of Policy. The Governance and Nominating Committee also engages professional search firms to help identify potential Independent Trustee candidates who have the experience, qualifications, attributes, and skills consistent with the Statement of Policy. From time to time, additional criteria based on the composition and skills of the current Independent Trustees, as well as experience or skills that may be appropriate in light of future changes to board composition, business conditions, and regulatory or other developments, have also been considered by the professional search firms and the Governance and Nominating Committee. In addition, the Board takes into account the Trustees' commitment and participation in Board and committee meetings, as well as their leadership of standing and ad hoc committees throughout their tenure.
In determining that a particular Trustee was and continues to be qualified to serve as a Trustee, the Board has considered a variety of criteria, none of which, in isolation, was controlling. The Board believes that, collectively, the Trustees have balanced and diverse experience, qualifications, attributes, and skills, which allow the Board to operate effectively in governing each fund and protecting the interests of shareholders. Information about the specific experience, skills, attributes, and qualifications of each Trustee, which in each case led to the Board's conclusion that the Trustee should serve (or continue to serve) as a trustee of the funds, is provided below.
Board Structure and Oversight Function. Abigail P. Johnson is an interested person and currently serves as Chairman. The Trustees have determined that an interested Chairman is appropriate and benefits shareholders because an interested Chairman has a personal and professional stake in the quality and continuity of services provided to the funds. Independent Trustees exercise their informed business judgment to appoint an individual of their choosing to serve as Chairman, regardless of whether the Trustee happens to be independent or a member of management. The Independent Trustees have determined that they can act independently and effectively without having an Independent Trustee serve as Chairman and that a key structural component for assuring that they are in a position to do so is for the Independent Trustees to constitute a substantial majority for the Board. The Independent Trustees also regularly meet in executive session. Marie L. Knowles serves as Chairman of the Independent Trustees and as such (i) acts as a liaison between the Independent Trustees and management with respect to matters important to the Independent Trustees and (ii) with management prepares agendas for Board meetings.
Fidelity® funds are overseen by different Boards of Trustees. The funds' Board oversees Fidelity's investment-grade bond, money market, asset allocation and certain equity funds, and other Boards oversee Fidelity's high income, sector and other equity funds. The asset allocation funds may invest in Fidelity® funds that are overseen by such other Boards. The use of separate Boards, each with its own committee structure, allows the Trustees of each group of Fidelity® funds to focus on the unique issues of the funds they oversee, including common research, investment, and operational issues. On occasion, the separate Boards establish joint committees to address issues of overlapping consequences for the Fidelity® funds overseen by each Board.
The Trustees operate using a system of committees to facilitate the timely and efficient consideration of all matters of importance to the Trustees, each fund, and fund shareholders and to facilitate compliance with legal and regulatory requirements and oversight of the funds' activities and associated risks. The Board, acting through its committees, has charged FMR and its affiliates with (i) identifying events or circumstances the occurrence of which could have demonstrably adverse effects on the funds' business and/or reputation; (ii) implementing processes and controls to lessen the possibility that such events or circumstances occur or to mitigate the effects of such events or circumstances if they do occur; and (iii) creating and maintaining a system designed to evaluate continuously business and market conditions in order to facilitate the identification and implementation processes described in (i) and (ii) above. Because the day-to-day operations and activities of the funds are carried out by or through FMR, its affiliates, and other service providers, the funds' exposure to risks is mitigated but not eliminated by the processes overseen by the Trustees. While each of the Board's committees has responsibility for overseeing different aspects of the funds' activities, oversight is exercised primarily through the Operations and Audit Committees. In addition, an ad hoc Board committee of Independent Trustees has worked with FMR to enhance the Board's oversight of investment and financial risks, legal and regulatory risks, technology risks, and operational risks, including the development of additional risk reporting to the Board. The Operations Committee also worked and continues to work with FMR to enhance the stress tests required under SEC regulations for money market funds. Appropriate personnel, including but not limited to the funds' Chief Compliance Officer (CCO), FMR's internal auditor, the independent accountants, the funds' Treasurer and portfolio management personnel, make periodic reports to the Board's committees, as appropriate, including an annual review of Fidelity's risk management program for the Fidelity® funds. The responsibilities of each standing committee, including their oversight responsibilities, are described further under "Standing Committees of the Trustees."
Interested Trustees*:
Correspondence intended for a Trustee who is an interested person may be sent to Fidelity Investments, 245 Summer Street, Boston, Massachusetts 02210.
Name, Year of Birth; Principal Occupations and Other Relevant Experience+
Abigail P. Johnson (1961)
Year of Election or Appointment: 2009
Trustee
Chairman of the Board of Trustees
Ms. Johnson also serves as Trustee of other Fidelity® funds. Ms. Johnson serves as Chairman (2016-present), Chief Executive Officer (2014-present), and Director (2007-present) of FMR LLC (diversified financial services company), President of Fidelity Financial Services (2012-present) and President of Personal, Workplace and Institutional Services (2005-present). Ms. Johnson is Chairman and Director of FMR Co., Inc. (investment adviser firm, 2011-present) and Chairman and Director of FMR (investment adviser firm, 2011-present). Previously, Ms. Johnson served as Vice Chairman (2007-2016) and President (2013-2016) of FMR LLC, President and a Director of FMR (2001-2005), a Trustee of other investment companies advised by FMR, Fidelity Investments Money Management, Inc. (investment adviser firm), and FMR Co., Inc. (2001-2005), Senior Vice President of the Fidelity® funds (2001-2005), and managed a number of Fidelity® funds. Ms. Abigail P. Johnson and Mr. Arthur E. Johnson are not related.
Jennifer Toolin McAuliffe (1959)
Year of Election or Appointment: 2016
Trustee
Ms. McAuliffe also serves as Trustee of other Fidelity® funds. Ms. McAuliffe previously served as a Member of the Advisory Board of certain Fidelity® funds (2016) and as Co-Head of Fixed Income of Fidelity Investments Limited (now known as FIL Limited (FIL)) (diversified financial services company). Earlier roles at FIL included Director of Research for FIL’s credit and quantitative teams in London, Hong Kong and Tokyo. Ms. McAuliffe also was the Director of Research for taxable and municipal bonds at Fidelity Investments Money Management, Inc. Ms. McAuliffe is also a director or trustee of several not-for-profit entities.
* Determined to be an “Interested Trustee” by virtue of, among other things, his or her affiliation with the trusts or various entities under common control with FMR.
+ The information includes the Trustee's principal occupation during the last five years and other information relating to the experience, attributes, and skills relevant to the Trustee's qualifications to serve as a Trustee, which led to the conclusion that the Trustee should serve as a Trustee for each fund.
Independent Trustees:
Correspondence intended for an Independent Trustee may be sent to Fidelity Investments, P.O. Box 55235, Boston, Massachusetts 02205-5235.
Name, Year of Birth; Principal Occupations and Other Relevant Experience+
Elizabeth S. Acton (1951)
Year of Election or Appointment: 2013
Trustee
Ms. Acton also serves as Trustee of other Fidelity® funds. Prior to her retirement in April 2012, Ms. Acton was Executive Vice President, Finance (2011-2012), Executive Vice President, Chief Financial Officer (2002-2011), and Treasurer (2004-2005) of Comerica Incorporated (financial services). Prior to joining Comerica, Ms. Acton held a variety of positions at Ford Motor Company (1983-2002), including Vice President and Treasurer (2000-2002) and Executive Vice President and Chief Financial Officer of Ford Motor Credit Company (1998-2000). Ms. Acton currently serves as a member of the Board of Directors and Audit and Finance Committees of Beazer Homes USA, Inc. (homebuilding, 2012-present). Previously, Ms. Acton served as a Member of the Advisory Board of certain Fidelity® funds (2013-2016).
John Engler (1948)
Year of Election or Appointment: 2014
Trustee
Mr. Engler also serves as Trustee of other Fidelity® funds. He serves as president of the Business Roundtable (2011-present), and on the board of directors for Universal Forest Products (manufacturer and distributor of wood and wood-alternative products, 2003-present) and K12 Inc. (technology-based education company, 2012-present). Previously, Mr. Engler served as a Member of the Advisory Board of certain Fidelity® funds (2014-2016), a trustee of The Munder Funds (2003-2014), president and CEO of the National Association of Manufacturers (2004-2011), member of the Board of Trustees of the Annie E. Casey Foundation (2004-2015), and as governor of Michigan (1991-2003). He is a past chairman of the National Governors Association.
Albert R. Gamper, Jr. (1942)
Year of Election or Appointment: 2006
Trustee
Mr. Gamper also serves as Trustee of other Fidelity® funds. Prior to his retirement in December 2004, Mr. Gamper served as Chairman of the Board of CIT Group Inc. (commercial finance). During his tenure with CIT Group Inc. Mr. Gamper served in numerous senior management positions, including Chairman (1987-1989; 1999-2001; 2002-2004), Chief Executive Officer (1987-2004), and President (2002-2003). Mr. Gamper currently serves as a member of the Board of Directors of Public Service Enterprise Group (utilities, 2000-present), and Member of the Board of Trustees of Barnabas Health Care System (1997-present). Previously, Mr. Gamper served as Chairman (2012-2015) and Vice Chairman (2011-2012) of the Independent Trustees of certain Fidelity® funds and as Chairman of the Board of Governors, Rutgers University (2004-2007).
Robert F. Gartland (1951)
Year of Election or Appointment: 2010
Trustee
Mr. Gartland also serves as Trustee of other Fidelity® funds. Mr. Gartland is Chairman and an investor in Gartland & Mellina Group Corp. (consulting, 2009-present). Previously, Mr. Gartland served as a partner and investor of Vietnam Partners LLC (investments and consulting, 2008-2011). Prior to his retirement, Mr. Gartland held a variety of positions at Morgan Stanley (financial services, 1979-2007) including Managing Director (1987-2007).
Arthur E. Johnson (1947)
Year of Election or Appointment: 2008
Trustee
Vice Chairman of the Independent Trustees
Mr. Johnson also serves as Trustee of other Fidelity® funds. Mr. Johnson serves as a member of the Board of Directors of Eaton Corporation plc (diversified power management, 2009-present) and Booz Allen Hamilton (management consulting, 2011-present). Prior to his retirement, Mr. Johnson served as Senior Vice President of Corporate Strategic Development of Lockheed Martin Corporation (defense contractor, 1999-2009). He previously served on the Board of Directors of IKON Office Solutions, Inc. (1999-2008), AGL Resources, Inc. (holding company, 2002-2016), and Delta Airlines (2005-2007). Mr. Arthur E. Johnson is not related to Ms. Abigail P. Johnson.
Michael E. Kenneally (1954)
Year of Election or Appointment: 2009
Trustee
Mr. Kenneally also serves as Trustee of other Fidelity® funds. Prior to his retirement, Mr. Kenneally served as Chairman and Global Chief Executive Officer of Credit Suisse Asset Management. Before joining Credit Suisse, he was an Executive Vice President and Chief Investment Officer for Bank of America Corporation. Earlier roles at Bank of America included Director of Research, Senior Portfolio Manager and Research Analyst, and Mr. Kenneally was awarded the Chartered Financial Analyst (CFA) designation in 1991.
Marie L. Knowles (1946)
Year of Election or Appointment: 2001
Trustee
Chairman of the Independent Trustees
Ms. Knowles also serves as Trustee of other Fidelity® funds. Prior to Ms. Knowles' retirement in June 2000, she served as Executive Vice President and Chief Financial Officer of Atlantic Richfield Company (ARCO) (diversified energy, 1996-2000). From 1993 to 1996, she was a Senior Vice President of ARCO and President of ARCO Transportation Company (pipeline and tanker operations). Ms. Knowles currently serves as a Director and Chairman of the Audit Committee of McKesson Corporation (healthcare service, since 2002). Ms. Knowles is a member of the Board of the Santa Catalina Island Company (real estate, 2009-present). Ms. Knowles is a Member of the Investment Company Institute Board of Governors and a Member of the Governing Council of the Independent Directors Council (2014-present). She also serves as a member of the Advisory Board for the School of Engineering of the University of Southern California. Previously, Ms. Knowles served as a Director of Phelps Dodge Corporation (copper mining and manufacturing, 1994-2007), URS Corporation (engineering and construction, 2000-2003) and America West (airline, 1999-2002). Ms. Knowles previously served as Vice Chairman of the Independent Trustees of certain Fidelity® funds (2012-2015).
Mark A. Murray (1954)
Year of Election or Appointment: 2016
Trustee
Mr. Murray also serves as Trustee of other Fidelity® funds. Mr. Murray is Vice Chairman (2013-present) of Meijer, Inc. (regional retail chain). Previously, Mr. Murray served as a Member of the Advisory Board of certain Fidelity® funds (2016) and as Co-Chief Executive Officer (2013-2016) and President (2006-2013) of Meijer, Inc. Mr. Murray serves as a member of the Board of Directors and Nuclear Review and Public Policy and Responsibility Committees of DTE Energy Company (diversified energy company, 2009-present). Mr. Murray also serves as a member of the Board of Directors of Spectrum Health (not-for-profit health system, 2015-present). Mr. Murray previously served as President of Grand Valley State University (2001-2006), Treasurer for the State of Michigan (1999-2001), Vice President of Finance and Administration for Michigan State University (1998-1999), and a member of the Board of Directors and Audit Committee and Chairman of the Nominating and Corporate Governance Committee of Universal Forest Products, Inc. (manufacturer and distributor of wood and wood-alternative products, 2004-2016). Mr. Murray is also a director or trustee of many community and professional organizations.
+ The information includes the Trustee's principal occupation during the last five years and other information relating to the experience, attributes, and skills relevant to the Trustee's qualifications to serve as a Trustee, which led to the conclusion that the Trustee should serve as a Trustee for each fund.
Advisory Board Members and Officers:
Correspondence intended for an officer may be sent to Fidelity Investments, 245 Summer Street, Boston, Massachusetts 02210. Officers appear below in alphabetical order.
Name, Year of Birth; Principal Occupation
Marc R. Bryant (1966)
Year of Election or Appointment: 2015
Secretary and Chief Legal Officer (CLO)
Mr. Bryant also serves as Secretary and CLO of other funds. Mr. Bryant serves as CLO, Secretary, and Senior Vice President of Fidelity Management & Research Company (investment adviser firm, 2015-present) and FMR Co., Inc. (investment adviser firm, 2015-present); Secretary of Fidelity SelectCo, LLC (investment adviser firm, 2015-present) and Fidelity Investments Money Management, Inc. (investment adviser firm, 2015-present); and CLO of Fidelity Management & Research (Hong Kong) Limited and FMR Investment Management (UK) Limited (investment adviser firms, 2015-present) and Fidelity Management & Research (Japan) Limited (investment adviser firm, 2016-present). He is Senior Vice President and Deputy General Counsel of FMR LLC (diversified financial services company). Previously, Mr. Bryant served as Secretary and CLO of Fidelity Rutland Square Trust II (2010-2014) and Assistant Secretary of Fidelity's Fixed Income and Asset Allocation Funds (2013-2015). Prior to joining Fidelity Investments, Mr. Bryant served as a Senior Vice President and the Head of Global Retail Legal for AllianceBernstein L.P. (2006-2010), and as the General Counsel for ProFund Advisors LLC (2001-2006).
Jeffrey S. Christian (1961)
Year of Election or Appointment: 2016
Assistant Treasurer
Mr. Christian also serves as Assistant Treasurer of other funds. Mr. Christian is an employee of Fidelity Investments (2003-present).
Jonathan Davis (1968)
Year of Election or Appointment: 2010
Assistant Treasurer
Mr. Davis also serves as Assistant Treasurer of other funds, and is an employee of Fidelity Investments. Previously, Mr. Davis served as Vice President and Associate General Counsel of FMR LLC (diversified financial services company, 2003-2010).
Adrien E. Deberghes (1967)
Year of Election or Appointment: 2010
Assistant Treasurer
Mr. Deberghes also serves as an officer of other funds. He serves as Executive Vice President of Fidelity Investments Money Management, Inc. (FIMM) (investment adviser firm, 2016-present) and is an employee of Fidelity Investments (2008-present). Prior to joining Fidelity Investments, Mr. Deberghes was Senior Vice President of Mutual Fund Administration at State Street Corporation (2007-2008), Senior Director of Mutual Fund Administration at Investors Bank & Trust (2005-2007), and Director of Finance for Dunkin' Brands (2000-2005). Previously, Mr. Deberghes served in other fund officer roles.
Stephanie J. Dorsey (1969)
Year of Election or Appointment: 2013
President and Treasurer
Ms. Dorsey also serves as an officer of other funds. She is an employee of Fidelity Investments (2008-present) and has served in other fund officer roles. Prior to joining Fidelity Investments, Ms. Dorsey served as Treasurer (2004-2008) of the JPMorgan Mutual Funds and Vice President (2004-2008) of JPMorgan Chase Bank.
Howard J. Galligan III (1966)
Year of Election or Appointment: 2014
Chief Financial Officer
Mr. Galligan also serves as Chief Financial Officer of other funds. Mr. Galligan serves as President of Fidelity Pricing and Cash Management Services (FPCMS) (2014-present) and as a Director of Strategic Advisers, Inc. (investment adviser firm, 2008-present). Previously, Mr. Galligan served as Chief Administrative Officer of Asset Management (2011-2014) and Chief Operating Officer and Senior Vice President of Investment Support for Strategic Advisers, Inc. (2003-2011).
Scott C. Goebel (1968)
Year of Election or Appointment: 2015
Vice President
Mr. Goebel serves as Vice President of other funds and is an employee of Fidelity Investments (2001-present). Previously, Mr. Goebel served as Senior Vice President of Fidelity Management & Research Company (FMR) (investment adviser firm, 2016), Secretary of Fidelity SelectCo, LLC (investment adviser firm, 2013-2015), Fidelity Investments Money Management, Inc. (FIMM) (investment adviser firm, 2010-2015), and Fidelity Research and Analysis Company (FRAC) (investment adviser firm, 2010-2015); General Counsel, Secretary, and Senior Vice President of FMR (investment adviser firm, 2008-2015) and FMR Co., Inc. (investment adviser firm, 2008-2015); Assistant Secretary of Fidelity Management & Research (Japan) Limited (investment adviser firm, 2008-2015) and Fidelity Management & Research (U.K.) Inc. (investment adviser firm, 2008-2015); Chief Legal Officer (CLO) of Fidelity Management & Research (Hong Kong) Limited (investment adviser firm, 2008-2015); Secretary and CLO of certain Fidelity® funds (2008-2015); Assistant Secretary of FIMM (2008-2010), FRAC (2008-2010), and certain funds (2007-2008); and as Vice President and Secretary of Fidelity Distributors Corporation (FDC) (2005-2007).
Colm A. Hogan (1973)
Year of Election or Appointment: 2016
Assistant Treasurer
Mr. Hogan also serves as an officer of other funds. Mr. Hogan is an employee of Fidelity Investments (2005-present).
Timothy Huyck (1964)
Year of Election or Appointment: 2015
Vice President of Fidelity's Money Market Funds
Mr. Huyck also serves as Vice President of other funds. Mr. Huyck serves as Chief Investment Officer of Fidelity's Money Market Funds (2015-present) and is an employee of Fidelity Investments (1990-present).
Chris Maher (1972)
Year of Election or Appointment: 2013
Assistant Treasurer
Mr. Maher serves as Assistant Treasurer of other funds. Mr. Maher is Vice President of Valuation Oversight and is an employee of Fidelity Investments. Previously, Mr. Maher served as Vice President of Asset Management Compliance (2013), Vice President of the Program Management Group of FMR (investment adviser firm, 2010-2013), and Vice President of Valuation Oversight (2008-2010).
John B. McGinty, Jr. (1962)
Year of Election or Appointment: 2016
Chief Compliance Officer
Mr. McGinty also serves as Chief Compliance Officer of other funds. Mr. McGinty is Senior Vice President of Asset Management Compliance for Fidelity Investments and is an employee of Fidelity Investments (2016-present). Mr. McGinty previously served as Vice President, Senior Attorney at Eaton Vance Management (investment management firm, 2015-2016), and prior to Eaton Vance as global CCO for all firm operations and registered investment companies at GMO LLC (investment management firm, 2009-2015). Before joining GMO LLC, Mr. McGinty served as Senior Vice President, Deputy General Counsel for Fidelity Investments (2007-2009).
John F. Papandrea (1972)
Year of Election or Appointment: 2016
Anti-Money Laundering (AML) Officer
Mr. Papandrea also serves as AML Officer of other funds. Mr. Papandrea is Vice President of FMR LLC (diversified financial services company, 2008-present) and is an employee of Fidelity Investments (2005-present).
Jason P. Pogorelec (1975)
Year of Election or Appointment: 2015
Assistant Secretary
Mr. Pogorelec also serves as Assistant Secretary of other funds. Mr. Pogorelec serves as Vice President, Associate General Counsel (2010-present) and is an employee of Fidelity Investments (2006-present).
Nancy D. Prior (1967)
Year of Election or Appointment: 2014
Vice President
Ms. Prior also serves as Vice President of other funds. Ms. Prior serves as a Director of FMR Investment Management (UK) Limited (investment adviser firm, 2015-present), President (2016-present) and Director (2014-present) of Fidelity Investments Money Management, Inc. (FIMM) (investment adviser firm), President, Fixed Income (2014-present), Vice Chairman of FIAM LLC (investment adviser firm, 2014-present), and is an employee of Fidelity Investments (2002-present). Previously, Ms. Prior served as Vice President of Fidelity's Money Market Funds (2012-2014), President, Money Market and Short Duration Bond Group of Fidelity Management & Research (FMR) (investment adviser firm, 2013-2014), President, Money Market Group of FMR (2011-2013), Managing Director of Research (2009-2011), Senior Vice President and Deputy General Counsel (2007-2009), and Assistant Secretary of certain Fidelity® funds (2008-2009).
Stacie M. Smith (1974)
Year of Election or Appointment: 2013
Assistant Treasurer
Ms. Smith also serves as an officer of other funds. She is an employee of Fidelity Investments (2009-present) and has served in other fund officer roles. Prior to joining Fidelity Investments, Ms. Smith served as Senior Audit Manager of Ernst & Young LLP (accounting firm, 1996-2009). Previously, Ms. Smith served as Deputy Treasurer of certain Fidelity® funds (2013-2016).
Marc L. Spector (1972)
Year of Election or Appointment: 2016
Deputy Treasurer
Mr. Spector also serves as an officer of other funds. Mr. Spector is an employee of Fidelity Investments (2016-present). Prior to joining Fidelity Investments, Mr. Spector served as Director at the Siegfried Group (accounting firm, 2013-2016), and prior to Siegfried Group as audit senior manager at Deloitte & Touche (accounting firm, 2005-2013).
Renee Stagnone (1975)
Year of Election or Appointment: 2016
Assistant Treasurer
Ms. Stagnone also serves as an officer of other funds. Ms. Stagnone is an employee of Fidelity Investments (1997-present). Previously, Ms. Stagnone served as Deputy Treasurer of certain Fidelity® funds (2013-2016).
Christine J. Thompson (1958)
Year of Election or Appointment: 2015
Vice President of Fidelity's Bond Funds
Ms. Thompson also serves as Vice President of other funds. Ms. Thompson also serves as Chief Investment Officer of FMR's Bond Group (2010-present) and is an employee of Fidelity Investments (1985-present). Previously, Ms. Thompson served as Vice President of Fidelity's Bond Funds (2010-2012).
Shareholder Expense Example
As a shareholder of a Fund, you incur two types of costs: (1) transaction costs, including redemption fees and (2) ongoing costs, including management fees and other Fund expenses. This Example is intended to help you understand your ongoing costs (in dollars) of investing in the Funds and to compare these costs with the ongoing costs of investing in other mutual funds.
The Example is based on an investment of $1,000 invested at the beginning of the period and held for the entire period (July 1, 2016 to December 31, 2016).
Actual Expenses
The first line of the accompanying table for each fund provides information about actual account values and actual expenses. You may use the information in this line, together with the amount you invested, to estimate the expenses that you paid over the period. Simply divide your account value by $1,000.00 (for example, an $8,600 account value divided by $1,000.00 = 8.6), then multiply the result by the number in the first line for a fund under the heading entitled "Expenses Paid During Period" to estimate the expenses you paid on your account during this period. A small balance maintenance fee of $12.00 that is charged once a year may apply for certain accounts with a value of less than $2,000. This fee is not included in the table below. If it was, the estimate of expenses you paid during the period would be higher, and your ending account value lower, by this amount. In addition, each Fund, as a shareholder in the underlying Fidelity Central Funds, will indirectly bear its pro-rata share of the fees and expenses incurred by the underlying Fidelity Central Funds. These fees and expenses are not included in the Fund's annualized expense ratio used to calculate the expense estimate in the table below.
Hypothetical Example for Comparison Purposes
The second line of the accompanying table for each fund provides information about hypothetical account values and hypothetical expenses based on a fund's actual expense ratio and an assumed rate of return of 5% per year before expenses, which is not the Fund's actual return. The hypothetical account values and expenses may not be used to estimate the actual ending account balance or expenses you paid for the period. You may use this information to compare the ongoing costs of investing in the Fund and other funds. To do so, compare this 5% hypothetical example with the 5% hypothetical examples that appear in the shareholder reports of the other funds. A small balance maintenance fee of $12.00 that is charged once a year may apply for certain accounts with a value of less than $2,000. This fee is not included in the table below. If it was, the estimate of expenses you paid during the period would be higher, and your ending account value lower, by this amount. In addition, each Fund, as a shareholder in the underlying Fidelity Central Funds, will indirectly bear its pro-rata share of the fees and expenses incurred by the underlying Fidelity Central Funds. These fees and expenses are not included in the Fund's annualized expense ratio used to calculate the expense estimate in the table below.
Please note that the expenses shown in the table are meant to highlight your ongoing costs only and do not reflect any transaction costs. Therefore, the second line of the table is useful in comparing ongoing costs only, and will not help you determine the relative total costs of owning different funds. In addition, if these transactional costs were included, your costs would have been higher.
| | Annualized Expense Ratio-A | Beginning
Account Value
July 1, 2016 | Ending
Account Value
December 31, 2016 | Expenses Paid
During Period-B
July 1, 2016
to December 31, 2016 |
| Fidelity Pennsylvania Municipal Income Fund | .48% | | | |
| Actual | | $1,000.00 | $961.90 | $2.37 |
| Hypothetical-C | | $1,000.00 | $1,022.72 | $2.44 |
| Fidelity Pennsylvania Municipal Money Market Fund | .49% | | | |
| Actual | | $1,000.00 | $1,000.80 | $2.46 |
| Hypothetical-C | | $1,000.00 | $1,022.67 | $2.49 |
A Annualized expense ratio reflects expenses net of applicable fee waivers.
B Expenses are equal to each Fund's annualized expense ratio, multiplied by the average account value over the period, multiplied by 184/366 (to reflect the one-half year period).
C 5% return per year before expenses
Distributions (Unaudited)
The Board of Trustees of each fund voted to pay to shareholders of record at the opening of business on record date, the following distributions per share derived from capital gains realized from sales of portfolio securities, and dividends derived from net investment income:
| | Pay Date | Record Date | Dividends | Capital Gains |
| Fidelity Pennsylvania Municipal Income Fund | 02/06/17 | 02/03/17 | $0.000 | $0.027 |
| Fidelity Pennsylvania Municipal Money Market Fund | 02/06/17 | 02/03/17 | $0.000 | $0.000 |
|
The funds hereby designate as capital gain dividend the amounts noted below for the taxable year ended December 31, 2016, or, if subsequently determined to be different, the net capital gain of such year.
| Fidelity Pennsylvania Municipal Income Fund | $2,994,163 |
| Fidelity Pennsylvania Municipal Money Market Fund | $37,414 |
|
During fiscal year ended 2016, 100% of each fund's income dividends were free from federal income tax, and 0.99% of Fidelity Pennsylvania Municipal Income Fund and 16.28% of Fidelity Pennsylvania Municipal Money Market Fund income dividends were subject to the federal alternative minimum tax.
The funds will notify shareholders in January 2017 of amounts for use in preparing 2016 income tax returns.
Board Approval of Investment Advisory Contracts and Management Fees
Fidelity Pennsylvania Municipal Income Fund / Fidelity Pennsylvania Municipal Money Market Fund
Each year, the Board of Trustees, including the Independent Trustees (together, the Board), votes on the renewal of the management contract with Fidelity Management & Research Company (FMR) and the sub-advisory agreements (together, the Advisory Contracts) for each fund. The Board, assisted by the advice of fund counsel and Independent Trustees' counsel, requests and considers a broad range of information relevant to the renewal of the Advisory Contracts throughout the year.
The Board meets regularly and, at each of its meetings, covers an extensive agenda of topics and materials and considers factors that are relevant to its annual consideration of the renewal of each fund's Advisory Contracts, including the services and support provided to each fund and its shareholders. The Board has established four standing committees (Committees) — Operations, Audit, Fair Valuation, and Governance and Nominating — each composed of and chaired by Independent Trustees with varying backgrounds, to which the Board has assigned specific subject matter responsibilities in order to enhance effective decision-making by the Board. The Operations Committee, of which all of the Independent Trustees are members, meets regularly throughout the year and considers, among other matters, information specifically related to the annual consideration of the renewal of each fund's Advisory Contracts. The Board, acting directly and through its Committees, requests and receives information concerning the annual consideration of the renewal of each fund's Advisory Contracts. The Board also meets as needed to consider matters specifically related to the Board's annual consideration of the renewal of the Advisory Contracts. Members of the Board may also meet with trustees of other Fidelity funds through ad hoc joint committees to discuss certain matters relevant to all of the Fidelity funds.
At its September 2016 meeting, the Board unanimously determined to renew each fund's Advisory Contracts. In reaching its determination, the Board considered all factors it believed relevant, including (i) the nature, extent, and quality of the services to be provided to each fund and its shareholders (including the investment performance of each fund); (ii) the competitiveness of each fund's management fee and total expense ratio relative to peer funds; (iii) the total costs of the services to be provided by and the profits to be realized by Fidelity from its relationships with each fund; and (iv) the extent to which, if any, economies of scale exist and would be realized as each fund grows, and whether any economies of scale are appropriately shared with fund shareholders.
In considering whether to renew the Advisory Contracts for each fund, the Board reached a determination, with the assistance of fund counsel and Independent Trustees' counsel and through the exercise of its business judgment, that the renewal of the Advisory Contracts was in the best interests of each fund and its shareholders and that the compensation payable under the Advisory Contracts was fair and reasonable. The Board's decision to renew the Advisory Contracts was not based on any single factor, but rather was based on a comprehensive consideration of all the information provided to the Board at its meetings throughout the year. The Board, in reaching its determination to renew the Advisory Contracts, was aware that shareholders of each fund have a broad range of investment choices available to them, including a wide choice among funds offered by Fidelity's competitors, and that each fund's shareholders, who have the opportunity to review and weigh the disclosure provided by the fund in its prospectus and other public disclosures, have chosen to invest in that fund, which is part of the Fidelity family of funds.
Nature, Extent, and Quality of Services Provided. The Board considered Fidelity's staffing as it relates to the funds, including the backgrounds of investment personnel of Fidelity, and also considered the funds' investment objectives, strategies, and related investment philosophies. The Independent Trustees also had discussions with senior management of Fidelity's investment operations and investment groups. The Board considered the structure of the investment personnel compensation program and whether this structure provides appropriate incentives to act in the best interests of each fund. Additionally, the Board considered the portfolio managers' investments, if any, in the funds that they manage.
Resources Dedicated to Investment Management and Support Services. The Board reviewed the general qualifications and capabilities of Fidelity's investment staff, including its size, education, experience, and resources, as well as Fidelity's approach to recruiting, managing, and compensating investment personnel. The Board noted that Fidelity has continued to increase the resources devoted to non-U.S. offices, including expansion of Fidelity's global investment organization. The Board also noted that Fidelity's analysts have extensive resources, tools and capabilities that allow them to conduct sophisticated quantitative and fundamental analysis, as well as credit analysis of issuers, counterparties and guarantors. Further, the Board considered that Fidelity's investment professionals have sufficient access to global information and data so as to provide competitive investment results over time, and that those professionals also have access to sophisticated tools that permit them to assess portfolio construction and risk and performance attribution characteristics continuously, as well as to transmit new information and research conclusions rapidly around the world. Additionally, in its deliberations, the Board considered Fidelity's trading, risk management, compliance, and technology and operations capabilities and resources, which are integral parts of the investment management process.
Shareholder and Administrative Services. The Board considered (i) the nature, extent, quality, and cost of advisory, administrative, and shareholder services performed by FMR, the sub-advisers (together with FMR, the Investment Advisers), and their affiliates under the Advisory Contracts and under separate agreements covering transfer agency and pricing and bookkeeping services for each fund; (ii) the nature and extent of the supervision of third party service providers, principally custodians, subcustodians, and pricing vendors; and (iii) the resources devoted to, and the record of compliance with, each fund's compliance policies and procedures.
The Board noted that the growth of fund assets over time across the complex allows Fidelity to reinvest in the development of services designed to enhance the value or convenience of the Fidelity funds as investment vehicles. These services include 24-hour access to account information and market information through telephone representatives and over the Internet, investor education materials and asset allocation tools, and the expanded availability of Fidelity Investor Centers.
Investment in a Large Fund Family. The Board considered the benefits to shareholders of investing in a Fidelity fund, including the benefits of investing in a fund that is part of a large family of funds offering a variety of investment disciplines and providing a large variety of mutual fund investor services. The Board noted that Fidelity had taken, or had made recommendations that resulted in the Fidelity funds taking, a number of actions over the previous year that benefited particular funds, including: (i) continuing to dedicate additional resources to investment research and to the support of the senior management team that oversees asset management; (ii) continuing efforts to enhance Fidelity's global research capabilities; (iii) launching new funds and making other enhancements to meet client needs; (iv) broadening eligibility requirements for certain lower-priced share classes of, and streamlining the fee structure for, certain existing equity index funds; (v) lowering expense caps for certain existing funds and classes to reduce expenses paid by shareholders; (vi) eliminating redemption fees for certain variable insurance product funds and classes; (vii) continuing to launch dedicated lower cost underlying funds to meet portfolio construction needs related to expanding underlying fund options for Fidelity funds of funds, specifically for the Freedom Fund product lines; (viii) launching a lower cost share class for use by the Freedom Index Fund product line; (ix) rationalizing product lines and gaining increased efficiencies through fund mergers and share class consolidations; (x) continuing to develop, acquire and implement systems and technology to improve services to the funds and shareholders, strengthen information security, and increase efficiency; (xi) implementing investment enhancements to further strengthen Fidelity's target date product line to increase investors' probability of success in achieving their goals; (xii) accelerating the conversion of all remaining Class B shares to Class A shares, which have a lower expense structure; and (xiii) implementing changes to Fidelity's money market fund product line in response to recent regulatory reforms.
Investment Performance (for Fidelity Pennsylvania Municipal Income Fund). The Board considered whether the fund has operated in accordance with its investment objective, as well as its record of compliance with its investment restrictions and its performance history. The Board noted that there was a portfolio management change for the fund in May 2016.
The Board took into account discussions with representatives of the Investment Advisers about fund investment performance that occur at Board meetings throughout the year. In this regard the Board noted that as part of regularly scheduled fund reviews and other reports to the Board on fund performance, the Board considers annualized return information for the fund for different time periods, measured against a securities market index ("benchmark index") and a peer group of funds with similar objectives ("peer group"), if any. In its evaluation of fund investment performance at meetings throughout the year, the Board gave particular attention to information indicating underperformance of certain Fidelity funds for specific time periods and discussed with the Investment Advisers the reasons for such underperformance.
In addition to reviewing absolute and relative fund performance, the Independent Trustees periodically consider the appropriateness of fund performance metrics in evaluating the results achieved. In general, the Independent Trustees believe that fund performance should be evaluated based on gross performance (before fees and expenses but after transaction costs) compared to appropriate benchmark indices, over appropriate time periods that may include full market cycles, and on net performance (after fees and expenses) compared to peer groups, as applicable, over the same periods, taking into account relevant factors including the following: general market conditions; expectations for interest rate levels and credit conditions; issuer-specific information including credit quality; the potential for incremental return versus the fund's benchmark index weighed against the risks involved in obtaining that incremental return, including the risk of diminished or negative total returns; and fund cash flows and other factors. Depending on the circumstances, the Independent Trustees may be satisfied with a fund's performance notwithstanding that it lags its benchmark index or peer group for certain periods.
The Independent Trustees recognize that shareholders evaluate performance on a net basis over their own holding periods, for which one-, three-, and five-year periods are often used as a proxy. For this reason, the performance information reviewed by the Board also included net cumulative calendar year total return information for the fund and an appropriate benchmark index and peer group for the most recent one-, three-, and five-year periods.
Investment Performance (for Fidelity Pennsylvania Municipal Money Market Fund). The Board considered whether the fund has operated in accordance with its investment objective, as well as its record of compliance with its investment restrictions and its performance history.
The Board took into account discussions with representatives of the Investment Advisers about fund investment performance that occur at Board meetings throughout the year. In this regard the Board noted that as part of regularly scheduled fund reviews and other reports to the Board on fund performance, the Board considers annualized return information for the fund for different time periods, measured against a peer group of funds with similar objectives ("peer group").
In addition to reviewing absolute and relative fund performance, the Independent Trustees periodically consider the appropriateness of fund performance metrics in evaluating the results achieved. In general, the Independent Trustees believe that fund performance should be evaluated based on gross performance (before fees and expenses but after transaction costs) compared to the gross performance of appropriate peer groups, over appropriate time periods that may include full market cycles, taking into account relevant factors including the following: general market conditions; expectations for interest rate levels and credit conditions; issuer-specific information including credit quality; the fund's market value NAV over time and its resilience under various stressed conditions; and fund cash flows and other factors.
The Board recognizes that in interest rate environments where many competitors waive fees to maintain a minimum yield, relative money market fund performance on a net basis (after fees and expenses) may not be particularly meaningful due to miniscule performance differences among competitor funds. Depending on the circumstances, the Independent Trustees may be satisfied with a fund's performance notwithstanding that it lags its peer group for certain periods.
The Independent Trustees recognize that shareholders evaluate performance on a net basis over their own holding periods, for which one-, three-, and five-year periods are often used as a proxy. For this reason, the performance information reviewed by the Board also included net cumulative calendar year total return information for the fund and an appropriate peer group for the most recent one-, three-, and five-year periods.
Based on its review, the Board concluded that the nature, extent, and quality of services provided to each fund under the Advisory Contracts should continue to benefit the shareholders of each fund.
Competitiveness of Management Fee and Total Expense Ratio. The Board considered each fund's management fee and total expense ratio compared to "mapped groups" of competitive funds and classes created for the purpose of facilitating the Trustees' competitive analysis of management fees and total expenses. Fidelity creates "mapped groups" by combining similar Lipper investment objective categories that have comparable investment mandates. Combining Lipper investment objective categories aids the Board's management fee and total expense ratio comparisons by broadening the competitive group used for comparison.
Management Fee. The Board considered two proprietary management fee comparisons for the 12-month periods shown in basis points (BP) in the charts below. The group of Lipper funds used by the Board for management fee comparisons is referred to below as the "Total Mapped Group" and, for the reasons explained above, is broader than the Lipper peer group used by the Board for performance comparisons. The Total Mapped Group comparison focuses on a fund's standing in terms of gross management fees before expense reimbursements or caps relative to the total universe of funds with comparable investment mandates, regardless of whether their management fee structures also are comparable. Funds with comparable investment mandates offer exposure to similar types of securities. Funds with comparable management fee structures have similar management fee contractual arrangements (
e.g., flat rate charged for advisory services, all-inclusive fee rate,
etc.). "TMG %" represents the percentage of funds in the Total Mapped Group that had management fees that were lower than a fund's. For example, a hypothetical TMG % of 20% would mean that 80% of the funds in the Total Mapped Group had higher, and 20% had lower, management fees than a fund. The funds' actual TMG %s and the number of funds in the Total Mapped Group are in the charts below. The "Asset-Size Peer Group" (ASPG) comparison focuses on a fund's standing relative to a subset of non-Fidelity funds within the Total Mapped Group that are similar in size and management fee structure. For example, if a fund is in the first quartile of the ASPG, the fund's management fee ranks in the least expensive or lowest 25% of funds in the ASPG. The ASPG represents at least 15% of the funds in the Total Mapped Group with comparable asset size and management fee structures, subject to a minimum of 50 funds (or all funds in the Total Mapped Group if fewer than 50). Additional information, such as the ASPG quartile in which a fund's management fee rate ranked, is also included in the charts and considered by the Board. Because the vast majority of competitor funds' management fees do not cover non-management expenses, for a more meaningful comparison of management fees, Fidelity Pennsylvania Municipal Money Market Fund is compared on the basis of a hypothetical "net management fee," which is derived by subtracting payments made by FMR for non-management expenses (including transfer agent fees, pricing and bookkeeping fees, and fees paid to non-affiliated custodians) from the fund's all-inclusive fee. In this regard, the Board considered that net management fees can vary from year to year because of differences in non-management expenses.
Fidelity Pennsylvania Municipal Income Fund
The Board noted that the fund's management fee rate ranked below the median of its Total Mapped Group and below the median of its ASPG for 2015.
Fidelity Pennsylvania Municipal Money Market Fund
The Board noted that the fund's hypothetical net management fee rate ranked below the median of its Total Mapped Group and below the median of its ASPG for 2015.
The Board noted that, in 2014, the ad hoc Committee on Group Fee was formed by it and the boards of other Fidelity funds to conduct an in-depth review of the "group fee" component of the management fee of funds with such management fee structures. The Committee's focus included the mechanics of the group fee, the competitive landscape of group fee structures, Fidelity funds with no group fee component and investment products not included in group fee assets. The Board also considered that, for funds subject to the group fee, FMR agreed to voluntarily waive fees over a specified period of time in amounts designed to account for assets converted from certain funds to certain collective investment trusts.
Based on its review, the Board concluded that each fund's management fee is fair and reasonable in light of the services that the fund receives and the other factors considered.
Total Expense Ratio. In its review of Fidelity Pennsylvania Municipal Income Fund's total expense ratio, the Board considered the fund's management fee rate as well as other fund expenses, such as transfer agent fees, pricing and bookkeeping fees, and custodial, legal, and audit fees. The Board also noted that Fidelity may agree to waive fees and expenses from time to time, and the extent to which, if any, it has done so for the fund.
In its review of Fidelity Pennsylvania Municipal Money Market Fund's total expense ratio, the Board considered the fund's hypothetical net management fee rate as well as the fund's all-inclusive fee rate. The Board also considered other expenses, such as transfer agent fees, pricing and bookkeeping fees, and custodial, legal, and audit fees, paid by FMR under the all-inclusive arrangement. The Board also noted that Fidelity may agree to waive fees and expenses from time to time, and the extent to which, if any, it has done so for the fund.
As part of its review, the Board also considered the current and historical total expense ratios of each fund compared to competitive fund median expenses. Each fund is compared to those funds and classes in the Total Mapped Group (used by the Board for management fee comparisons) that have a similar sales load structure.
The Board noted that each fund's total expense ratio ranked below the competitive median for 2015. The Board considered that Fidelity has been voluntarily waiving part or all of the management fees to maintain a minimum yield for Fidelity Pennsylvania Municipal Money Market Fund.
Fees Charged to Other Fidelity Clients. The Board also considered Fidelity fee structures and other information with respect to clients of Fidelity, such as other funds advised or subadvised by Fidelity, pension plan clients, and other institutional clients with similar mandates. The Board noted that an ad hoc joint committee created by it and the boards of other Fidelity funds periodically (most recently in 2013) reviews and compares Fidelity's institutional investment advisory business with its business of providing services to the Fidelity funds, including the differences in services provided, fees charged, and costs incurred, as well as competition in their respective marketplaces.
Based on its review of total expense ratios and fees charged to other Fidelity clients, the Board concluded that each fund's total expense ratio was reasonable in light of the services that the fund and its shareholders receive and the other factors considered.
Costs of the Services and Profitability. The Board considered the revenues earned and the expenses incurred by Fidelity in conducting the business of developing, marketing, distributing, managing, administering and servicing each fund and servicing each fund's shareholders. The Board also considered the level of Fidelity's profits in respect of all the Fidelity funds.
On an annual basis, Fidelity presents to the Board information about the profitability of its relationships with each fund. Fidelity calculates profitability information for each fund, as well as aggregate profitability information for groups of Fidelity funds and all Fidelity funds, using a series of detailed revenue and cost allocation methodologies which originate with the books and records of Fidelity on which Fidelity's audited financial statements are based. The Audit Committee of the Board reviews any significant changes from the prior year's methodologies.
PricewaterhouseCoopers LLP (PwC), independent registered public accounting firm and auditor to Fidelity and certain Fidelity funds, has been engaged annually by the Board as part of the Board's assessment of Fidelity's profitability analysis. PwC's engagement includes the review and assessment of the methodologies used by Fidelity in determining the revenues and expenses attributable to Fidelity's mutual fund business, and completion of agreed-upon procedures in respect of the mathematical accuracy of the fund profitability information and its conformity to established allocation methodologies. After considering PwC's reports issued under the engagement and information provided by Fidelity, the Board concluded that while other allocation methods may also be reasonable, Fidelity's profitability methodologies are reasonable in all material respects.
The Board also reviewed Fidelity's non-fund businesses and fall-out benefits related to the mutual fund business as well as cases where Fidelity's affiliates may benefit from or be related to the funds' business.
The Board considered the costs of the services provided by and the profits realized by Fidelity in connection with the operation of each fund and was satisfied that the profitability was not excessive.
Economies of Scale. The Board considered whether there have been economies of scale in respect of the management of the Fidelity funds, whether the Fidelity funds (including each fund) have appropriately benefited from any such economies of scale, and whether there is potential for realization of any further economies of scale. The Board considered the extent to which each fund will benefit from economies of scale as assets grow through increased services to the fund, through waivers or reimbursements, or through fee or expense ratio reductions. The Board recognized that due to Fidelity Pennsylvania Municipal Money Market Fund's current contractual arrangements its expense ratio will not decline if the fund's operating costs decrease as assets grow, or rise as assets decrease. The Board also noted that a committee (the Economies of Scale Committee) created by it and the boards of other Fidelity funds periodically (most recently in 2013) analyzes whether Fidelity attains economies of scale in respect of the management and servicing of the Fidelity funds, whether the Fidelity funds have appropriately benefited from such economies of scale, and whether there is potential for realization of any further economies of scale.
The Board recognized that Fidelity Pennsylvania Municipal Income Fund's management contract incorporates a "group fee" structure, which provides for lower group fee rates as total group assets increase, and for higher group fee rates as total group assets decrease (with "group assets" defined to include fund assets under FMR's management plus the assets of sector funds previously under FMR's management). FMR calculates the group fee rates based on a tiered asset "breakpoint" schedule that varies based on asset class. The Board considered that the group fee is designed to deliver the benefits of economies of scale to fund shareholders when total Fidelity fund assets increase, even if assets of any particular fund are unchanged or have declined, because some portion of Fidelity's costs are attributable to services provided to all Fidelity funds, and all funds benefit if those costs can be allocated among more assets. The Board concluded that, given the group fee structure, fund shareholders will benefit from lower management fees as group assets increase at the fund complex level, regardless of whether Fidelity achieves any such economies of scale.
The Board concluded, taking into account the analysis of the Economies of Scale Committee, that economies of scale, if any, are being appropriately shared between fund shareholders and Fidelity.
Additional Information Requested by the Board. In order to develop fully the factual basis for consideration of the Fidelity funds' advisory contracts, the Board requested and received additional information on certain topics, including: (i) Fidelity's fund profitability methodology, profitability trends for certain funds, and the impact of certain factors on fund profitability results; (ii) portfolio manager changes that have occurred during the past year and the amount of the investment that each portfolio manager has made in the Fidelity fund(s) that he or she manages; (iii) Fidelity's compensation structure for portfolio managers, research analysts, and other key personnel, including its effects on fund profitability, the rationale for the compensation structure, and the extent to which current market conditions have affected retention and recruitment; (iv) the arrangements with and compensation paid to certain fund sub-advisers on behalf of the Fidelity funds; (v) Fidelity's voluntary waiver of its fees to maintain minimum yields for certain money market funds and classes as well as contractual waivers in place for certain funds; (vi) the methodology with respect to competitive fund data and peer group classifications; (vii) Fidelity's transfer agent fee, expense, and service structures for different funds and classes relative to competitive trends, and the impact of the increased use of omnibus accounts; (viii) Fidelity's long-term expectations for its offerings in the workplace investing channel; (ix) new developments in the retail and institutional marketplaces; (x) the approach to considering "fall-out" benefits; and (xi) the impact of money market reform on Fidelity's money market funds, including with respect to costs and profitability. In addition, the Board considered its discussions with Fidelity throughout the year regarding enhanced information security initiatives and the funds' fair valuation policies.
Based on its evaluation of all of the conclusions noted above, and after considering all factors it believed relevant, the Board concluded that the advisory fee structures are fair and reasonable, and that each fund's Advisory Contracts should be renewed.
Proxy Voting Results
A special meeting of Fidelity® Pennsylvania Municipal Money Market Fund's shareholders was held on February 12, 2016. The results of votes taken among shareholders on the proposal before them are reported below. Each vote reported represents one dollar of net asset value held on the record date for the meeting.
PROPOSAL 1
| To elect a Board of Trustees. |
| | # of
Votes | % of
Votes |
| Elizabeth S. Acton | | |
| Affirmative | 990,112,248.51 | 94.973 |
| Withheld | 52,412,467.62 | 5.027 |
| TOTAL | 1,042,524,716.13 | 100.000 |
| John Engler | | |
| Affirmative | 979,840,026.26 | 93.988 |
| Withheld | 62,684,689.87 | 6.012 |
| TOTAL | 1,042,524,716.13 | 100.000 |
| Albert R. Gamper, Jr. | | |
| Affirmative | 988,200,285.84 | 94.790 |
| Withheld | 54,324,430.29 | 5.210 |
| TOTAL | 1,042,524,716.13 | 100.000 |
| Robert F. Gartland | | |
| Affirmative | 990,287,516.81 | 94.990 |
| Withheld | 52,237,199.32 | 5.010 |
| TOTAL | 1,042,524,716.13 | 100.000 |
| Abigail P. Johnson | | |
| Affirmative | 986,818,518.63 | 94.657 |
| Withheld | 55,706,197.50 | 5.343 |
| TOTAL | 1,042,524,716.13 | 100.000 |
| Arthur E. Johnson | | |
| Affirmative | 988,490,870.48 | 94.818 |
| Withheld | 54,033,845.65 | 5.182 |
| TOTAL | 1,042,524,716.13 | 100.000 |
| Michael E. Kenneally | | |
| Affirmative | 990,615,595.60 | 95.021 |
| Withheld | 51,909,120.53 | 4.979 |
| TOTAL | 1,042,524,716.13 | 100.000 |
| James H. Keyes | | |
| Affirmative | 989,121,754.10 | 94.878 |
| Withheld | 53,402,962.03 | 5.122 |
| TOTAL | 1,042,524,716.13 | 100.000 |
| Marie L. Knowles | | |
| Affirmative | 987,633,370.10 | 94.735 |
| Withheld | 54,891,346.03 | 5.265 |
| TOTAL | 1,042,524,716.13 | 100.000 |
| Geoffrey A. von Kuhn | | |
| Affirmative | 987,164,185.38 | 94.690 |
| Withheld | 55,360,530.75 | 5.310 |
| TOTAL | 1,042,524,716.13 | 100.000 |
| Proposal 1 reflects trust wide proposal and voting results. |
Corporate Headquarters
245 Summer St.
Boston, MA 02210
www.fidelity.com
PFR-ANN-0217
1.540037.119
Item 2.
Code of Ethics
As of the end of the period, December 31, 2016, Fidelity Municipal Trust (the trust) has adopted a code of ethics, as defined in Item 2 of Form N-CSR, that applies to its President and Treasurer and its Chief Financial Officer. A copy of the code of ethics is filed as an exhibit to this Form N-CSR.
Item 3.
Audit Committee Financial Expert
The Board of Trustees of the trust has determined that Elizabeth S. Acton is an audit committee financial expert, as defined in Item 3 of Form N-CSR. Ms. Acton is independent for purposes of Item 3 of Form N-CSR.
Item 4.
Principal Accountant Fees and Services
Fees and Services
The following table presents fees billed by PricewaterhouseCoopers LLP (“PwC”) in each of the last two fiscal years for services rendered to Fidelity Conservative Income Municipal Bond Fund, Fidelity Limited Term Municipal Income Fund, Fidelity Michigan Municipal Income Fund, Fidelity Minnesota Municipal Income Fund, Fidelity Municipal Income Fund, Fidelity Ohio Municipal Income Fund and Fidelity Pennsylvania Municipal Income Fund (the “Funds”):
Services Billed by PwC
December 31, 2016 FeesA
| | | | |
| Audit Fees | Audit-Related Fees | Tax Fees | All Other Fees |
Fidelity Conservative Income Municipal Bond Fund | $44,000 | $- | $2,400 | $2,000 |
Fidelity Limited Term Municipal Income Fund | $51,000 | $- | $2,400 | $2,300 |
Fidelity Michigan Municipal Income Fund | $51,000 | $- | $2,400 | $2,300 |
Fidelity Minnesota Municipal Income Fund | $51,000 | $- | $2,400 | $2,300 |
Fidelity Municipal Income Fund | $68,000 | $- | $2,400 | $3,000 |
Fidelity Ohio Municipal Income Fund | $51,000 | $- | $2,400 | $2,300 |
Fidelity Pennsylvania Municipal Income Fund | $51,000 | $- | $2,400 | $2,300 |
| | | | |
| Audit Fees | Audit-Related Fees | Tax Fees | All Other Fees |
Fidelity Conservative Income Municipal Bond Fund | $43,000 | $- | $2,300 | $1,600 |
Fidelity Limited Term Municipal Income Fund | $51,000 | $- | $2,300 | $2,900 |
Fidelity Michigan Municipal Income Fund | $49,000 | $- | $2,300 | $1,700 |
Fidelity Minnesota Municipal Income Fund | $49,000 | $- | $2,300 | $1,700 |
Fidelity Municipal Income Fund | $67,000 | $- | $2,300 | $3,500 |
Fidelity Ohio Municipal Income Fund | $49,000 | $- | $2,300 | $1,700 |
Fidelity Pennsylvania Municipal Income Fund | $49,000 | $- | $2,300 | $1,700 |
A Amounts may reflect rounding.
The following table presents fees billed by PwC that were required to be approved by the Audit Committee for services that relate directly to the operations and financial reporting of the Funds and that are rendered on behalf of Fidelity Management & Research Company (“FMR”) and entities controlling, controlled by, or under common control with FMR (not including any sub-adviser whose role is primarily portfolio management and is subcontracted with or overseen by another investment adviser) that provide ongoing services to the Funds (“Fund Service Providers”):
Services Billed by PwC
| | |
| December 31, 2016A | December 31, 2015A |
Audit-Related Fees | $6,240,000 | $5,290,000 |
Tax Fees | $10,000 | $- |
All Other Fees | $- | $- |
A Amounts may reflect rounding.
“Audit-Related Fees” represent fees billed for assurance and related services that are reasonably related to the performance of the fund audit or the review of the fund's financial statements and that are not reported under Audit Fees.
“Tax Fees” represent fees billed for tax compliance, tax advice or tax planning that relate directly to the operations and financial reporting of the fund.
“All Other Fees” represent fees billed for services provided to the fund or Fund Service Provider, a significant portion of which are assurance related, that relate directly to the operations and financial reporting of the fund, excluding those services that are reported under Audit Fees, Audit-Related Fees or Tax Fees.
Assurance services must be performed by an independent public accountant.
* * *
The aggregate non-audit fees billed by PwC for services rendered to the Funds, FMR (not including any sub-adviser whose role is primarily portfolio management and is subcontracted with or overseen by another investment adviser), and any Fund Service Provider for each of the last two fiscal years of the Funds are as follows:
| | |
Billed By | December 31, 2016 A | December 31, 2015 A |
PwC | $8,250,000 | $5,675,000 |
A Amounts may reflect rounding.
The trust's Audit Committee has considered non-audit services that were not pre-approved that were provided by PwC to Fund Service Providers to be compatible with maintaining the independence of PwC in its audit of the Funds, taking into account representations from PwC, in accordance with Public Company Accounting Oversight Board rules, regarding its independence from the Funds and their related entities and FMR’s review of the appropriateness and permissibility under applicable law of such non-audit services prior to their provision to the Fund Service Providers.
Audit Committee Pre-Approval Policies and Procedures
The trust’s Audit Committee must pre-approve all audit and non-audit services provided by a fund’s independent registered public accounting firm relating to the operations or financial reporting of the fund. Prior to the commencement of any audit or non-audit services to a fund, the Audit Committee reviews the services to determine whether they are appropriate and permissible under applicable law.
The Audit Committee has adopted policies and procedures to, among other purposes, provide a framework for the Committee’s consideration of non-audit services by the audit firms that audit the Fidelity funds. The policies and procedures require that any non-audit service provided by a fund audit firm to a Fidelity fund and any non-audit service provided by a fund auditor to a Fund Service Provider that relates directly to the operations and financial reporting of a Fidelity fund (“Covered Service”) are subject to approval by the Audit Committee before such service is provided.
All Covered Services must be approved in advance of provision of the service either: (i) by formal resolution of the Audit Committee, or (ii) by oral or written approval of the service by the Chair of the Audit Committee (or if the Chair is unavailable, such other member of the Audit Committee as may be designated by the Chair to act in the Chair’s absence). The approval contemplated by (ii) above is permitted where the Treasurer determines that action on such an engagement is necessary before the next meeting of the Audit Committee.
Non-audit services provided by a fund audit firm to a Fund Service Provider that do not relate directly to the operations and financial reporting of a Fidelity fund are reported to the Audit Committee on a periodic basis.
Non-Audit Services Approved Pursuant to Rule 2-01(c)(7)(i)(C) and (ii) of Regulation S-X (“De Minimis Exception”)
There were no non-audit services approved or required to be approved by the Audit Committee pursuant to the De Minimis Exception during the Funds’ last two fiscal years relating to services provided to (i) the Funds or (ii) any Fund Service Provider that relate directly to the operations and financial reporting of the Funds.
Item 5.
Audit Committee of Listed Registrants
Not applicable.
Item 6.
Investments
(a)
Not applicable.
(b)
Not applicable
Item 7.
Disclosure of Proxy Voting Policies and Procedures for Closed-End Management Investment Companies
Not applicable.
Item 8.
Portfolio Managers of Closed-End Management Investment Companies
Not applicable.
Item 9.
Purchase of Equity Securities by Closed-End Management Investment Company and Affiliated Purchasers
Not applicable.
Item 10.
Submission of Matters to a Vote of Security Holders
There were no material changes to the procedures by which shareholders may recommend nominees to the trust’s Board of Trustees.
Item 11.
Controls and Procedures
(a)(i) The President and Treasurer and the Chief Financial Officer have concluded that the trust’s disclosure controls and procedures (as defined in Rule 30a-3(c) under the Investment Company Act) provide reasonable assurances that material information relating to the trust is made known to them by the appropriate persons, based on their evaluation of these controls and procedures as of a date within 90 days of the filing date of this report.
(a)(ii) There was no change in the trust’s internal control over financial reporting (as defined in Rule 30a-3(d) under the Investment Company Act) that occurred during the second fiscal quarter of the period covered by this report that has materially affected, or is reasonably likely to materially affect, the trust’s internal control over financial reporting.
Item 12.
Exhibits
| | |
(a) | (1) | Code of Ethics pursuant to Item 2 of Form N-CSR is filed and attached hereto as EX-99.CODE ETH. |
(a) | (2) | Certification pursuant to Rule 30a-2(a) under the Investment Company Act of 1940 (17 CFR 270.30a-2(a)) is filed and attached hereto as Exhibit 99.CERT. |
(a) | (3) | Not applicable. |
(b) | | Certification pursuant to Rule 30a-2(b) under the Investment Company Act of 1940 (17 CFR 270.30a-2(b)) is furnished and attached hereto as Exhibit 99.906CERT. |
SIGNATURES
Pursuant to the requirements of the Securities Exchange Act of 1934 and the Investment Company Act of 1940, the registrant has duly caused this report to be signed on its behalf by the undersigned, thereunto duly authorized.
Fidelity Municipal Trust
| |
By: | /s/Stephanie J. Dorsey |
| Stephanie J. Dorsey |
| President and Treasurer |
| |
Date: | February 24, 2017 |
Pursuant to the requirements of the Securities Exchange Act of 1934 and the Investment Company Act of 1940, this report has been signed below by the following persons on behalf of the registrant and in the capacities and on the dates indicated.
| |
By: | /s/Stephanie J. Dorsey |
| Stephanie J. Dorsey |
| President and Treasurer |
| |
Date: | February 24, 2017 |
| |
By: | /s/Howard J. Galligan III |
| Howard J. Galligan III |
| Chief Financial Officer |
| |
Date: | February 24, 2017 |