UNITED STATES
SECURITIES AND EXCHANGE COMMISSION
Washington, D.C. 20549
FORM N-CSR
CERTIFIED SHAREHOLDER REPORT OF REGISTERED
MANAGEMENT INVESTMENT COMPANIES
Investment Company Act file number 811-02628
Fidelity Municipal Trust
(Exact name of registrant as specified in charter)
245 Summer St., Boston, Massachusetts 02210
(Address of principal executive offices) (Zip code)
William C. Coffey, Secretary
245 Summer St.
Boston, Massachusetts 02210
(Name and address of agent for service)
Registrant's telephone number, including area code:
617-563-7000
| |
Date of fiscal year end: | December 31 |
| |
Date of reporting period: | December 31, 2018 |
Item 1.
Reports to Stockholders
Fidelity® Municipal Income Fund
Annual Report December 31, 2018 |
 |
Beginning on January 1, 2021, as permitted by regulations adopted by the Securities and Exchange Commission, paper copies of a fund’s shareholder reports will no longer be sent by mail, unless you specifically request paper copies of the reports from the fund or from your financial intermediary, such as a financial advisor, broker-dealer or bank. Instead, the reports will be made available on a website, and you will be notified by mail each time a report is posted and provided with a website link to access the report.
If you already elected to receive shareholder reports electronically, you will not be affected by this change and you need not take any action. You may elect to receive shareholder reports and other communications from a fund electronically, by contacting your financial intermediary. For Fidelity customers, visit Fidelity's web site or call Fidelity using the contact information listed below.
You may elect to receive all future reports in paper free of charge. If you wish to continue receiving paper copies of your shareholder reports, you may contact your financial intermediary or, if you are a Fidelity customer, visit Fidelity’s website, or call Fidelity at the applicable toll-free number listed below. Your election to receive reports in paper will apply to all funds held with the fund complex/your financial intermediary.
| Account Type | Website | Phone Number |
| Brokerage, Mutual Fund, or Annuity Contracts: | fidelity.com/mailpreferences | 1-800-343-3548 |
| Employer Provided Retirement Accounts: | netbenefits.fidelity.com/preferences (choose 'no' under Required Disclosures to continue to print) | 1-800-343-0860 |
| Advisor Sold Accounts Serviced Through Your Financial Intermediary: | Contact Your Financial Intermediary | Your Financial Intermediary's phone number |
| Advisor Sold Accounts Serviced by Fidelity: | institutional.fidelity.com | 1-877-208-0098 |
Contents
To view a fund's proxy voting guidelines and proxy voting record for the 12-month period ended June 30, visit http://www.fidelity.com/proxyvotingresults or visit the Securities and Exchange Commission's (SEC) web site at http://www.sec.gov.
You may also call 1-800-544-8544 to request a free copy of the proxy voting guidelines.
Standard & Poor's, S&P and S&P 500 are registered service marks of The McGraw-Hill Companies, Inc. and have been licensed for use by Fidelity Distributors Corporation.
Other third-party marks appearing herein are the property of their respective owners.
All other marks appearing herein are registered or unregistered trademarks or service marks of FMR LLC or an affiliated company. © 2019 FMR LLC. All rights reserved.
This report and the financial statements contained herein are submitted for the general information of the shareholders of the Fund. This report is not authorized for distribution to prospective investors in the Fund unless preceded or accompanied by an effective prospectus.
A fund files its complete schedule of portfolio holdings with the SEC for the first and third quarters of each fiscal year on Form N-Q. Forms N-Q are available on the SEC’s web site at http://www.sec.gov. A fund's Forms N-Q may be reviewed and copied at the SEC’s Public Reference Room in Washington, DC. Information regarding the operation of the SEC's Public Reference Room may be obtained by calling 1-800-SEC-0330.
For a complete list of a fund's portfolio holdings, view the most recent holdings listing, semiannual report, or annual report on Fidelity's web site at http://www.fidelity.com, http://www.institutional.fidelity.com, or http://www.401k.com, as applicable.
NOT FDIC INSURED •MAY LOSE VALUE •NO BANK GUARANTEE
Neither the Fund nor Fidelity Distributors Corporation is a bank.
Performance: The Bottom Line
Average annual total return reflects the change in the value of an investment, assuming reinvestment of distributions from dividend income and capital gains (the profits earned upon the sale of securities that have grown in value, if any) and assuming a constant rate of performance each year. The hypothetical investment and the average annual total returns do not reflect the deduction of taxes that a shareholder would pay on fund distributions or the redemption of fund shares. During periods of reimbursement by Fidelity, a fund’s total return will be greater than it would be had the reimbursement not occurred. How a fund did yesterday is no guarantee of how it will do tomorrow.
Average Annual Total Returns
| For the periods ended December 31, 2018 | Past 1 year | Past 5 years | Past 10 years |
| Fidelity® Municipal Income Fund | 0.80% | 4.20% | 5.15% |
$10,000 Over 10 Years
Let's say hypothetically that $10,000 was invested in Fidelity® Municipal Income Fund, a class of the fund, on December 31, 2008.
The chart shows how the value of your investment would have changed, and also shows how the Bloomberg Barclays Municipal Bond Index performed over the same period.
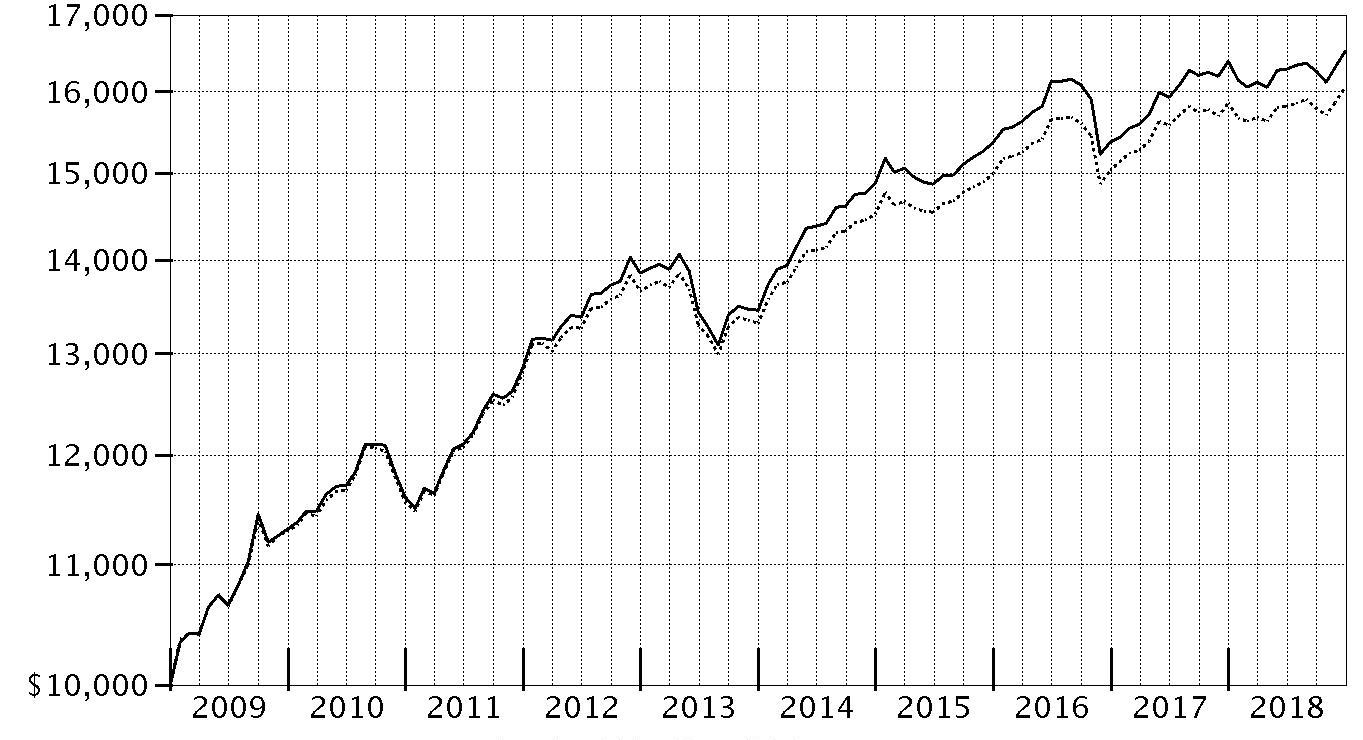
| Period Ending Values |
| $16,522 | Fidelity® Municipal Income Fund |
| $16,060 | Bloomberg Barclays Municipal Bond Index |
Management's Discussion of Fund Performance
Market Recap: Tax-exempt municipal bonds gained modestly in 2018, with the Bloomberg Barclays Municipal Bond Index returning 1.28%, supported by lower bond issuance and solid economic growth. Tax reform had a significant impact on both the supply of and demand for tax-exempt bonds the past year. In the final months of 2017, issuers accelerated their bond financings in order to issue under the old tax rules, prompting a surge in supply. Investors absorbed this excess supply, anticipating that issuance would fall significantly in 2018. The market turned lower in early 2018, as domestic fixed-income markets reacted to robust economic data and signs of inflation, before stabilizing in March and rallying through August. The municipal market experienced volatility in September and October amid concerns of an economic slowdown, then rebounded to close December near a high for the year. Gross municipal bond issuance ended 2018 down approximately 25%. There was little differentiation in performance across municipal sectors in 2018. General obligation bonds gained 1.33%, with bonds issued by states slightly outperforming those backed by local municipalities. Looking ahead, market volatility is likely to persist due to uncertainty about how the U.S. Federal Reserve will react to labor and inflation trends.
Comments from Co-Portfolio Managers Cormac Cullen, Elizah McLaughlin and Kevin Ramundo: For the year ending December 31, 2018, most of the fund's share classes (excluding sales charges, if applicable) produced a modestly positive return, net of fees, which lagged the 1.20% advance of the benchmark Bloomberg Barclays 3+ Year Municipal Bond Index. Relative to the 3+ Year benchmark, differences in the way fund holdings and index components were priced detracted from fund performance. Also detracting was the fund's underweighting to bonds backed by the state of California, some of the best performers in the national municipal marketplace. In contrast, an overweighting in lower-investment-grade bonds contributed to relative performance. The portfolio's overweighting in health care bonds also added value, and the bonds of several hospitals we favored performed quite well within the sector, providing an additional edge over the benchmark. Outsized exposure to state-backed and state-appropriated bonds from New Jersey and Illinois also contributed on a relative basis.
The views expressed above reflect those of the portfolio manager(s) only through the end of the period as stated on the cover of this report and do not necessarily represent the views of Fidelity or any other person in the Fidelity organization. Any such views are subject to change at any time based upon market or other conditions and Fidelity disclaims any responsibility to update such views. These views may not be relied on as investment advice and, because investment decisions for a Fidelity fund are based on numerous factors, may not be relied on as an indication of trading intent on behalf of any Fidelity fund.
Note to Shareholders: On September 1, 2018, Elizah McLaughlin joined the municipal bond portfolio management team, succeeding Mark Sommer, who retired from Fidelity on December 31, 2018, after 27 years with the firm.
Investment Summary (Unaudited)
Top Five States as of December 31, 2018
| | % of fund's net assets |
| Illinois | 23.4 |
| Florida | 11.2 |
| Texas | 8.4 |
| Pennsylvania | 6.8 |
| New Jersey | 6.3 |
Top Five Sectors as of December 31, 2018
| | % of fund's net assets |
| Health Care | 25.4 |
| General Obligations | 25.3 |
| Transportation | 25.1 |
| Electric Utilities | 5.9 |
| Education | 5.6 |
Quality Diversification (% of fund's net assets)
| As of December 31, 2018 |
| | AAA | 2.0% |
| | AA,A | 69.6% |
| | BBB | 20.1% |
| | BB and Below | 3.4% |
| | Not Rated | 2.4% |
| | Short-Term Investments and Net Other Assets | 2.5% |

We have used ratings from Moody's Investors Service, Inc. Where Moody's® ratings are not available, we have used S&P® ratings. All ratings are as of the date indicated and do not reflect subsequent changes.
Schedule of Investments December 31, 2018
Showing Percentage of Net Assets
| Municipal Bonds - 97.5% | | | |
| | | Principal Amount (000s) | Value (000s) |
| Alabama - 0.3% | | | |
| Auburn Univ. Gen. Fee Rev. Series 2018 A, 5% 6/1/43 | | 2,565 | 2,935 |
| Birmingham Gen. Oblig. Series 2013 A, 5% 3/1/32 | | 2,900 | 3,164 |
| Jefferson County Gen. Oblig. Series 2018 A: | | | |
| 5% 4/1/25 | | $2,550 | $2,931 |
| 5% 4/1/26 | | 2,400 | 2,790 |
| Montgomery Med. Clinic Facilities: | | | |
| 4% 3/1/36 | | 415 | 411 |
| 5% 3/1/33 | | 4,140 | 4,473 |
|
| TOTAL ALABAMA | | | 16,704 |
|
| Arizona - 1.7% | | | |
| Arizona Ctfs. of Prtn. Series 2010 A: | | | |
| 5.25% 10/1/26 (FSA Insured) | | 2,540 | 2,600 |
| 5.25% 10/1/28 (FSA Insured) | | 8,235 | 8,429 |
| Arizona Health Facilities Auth. Rev. (Banner Health Sys. Proj.) Series 2007 B, 3 month U.S. LIBOR + 0.810% 2.42%, tender 1/1/37 (a)(b) | | 2,485 | 2,366 |
| Arizona Indl. Dev. Auth. Rev. (Provident Group-Eastern Michigan Univ. Parking Proj.) Series 2018: | | | |
| 5% 5/1/48 | | 910 | 959 |
| 5% 5/1/51 | | 910 | 957 |
| Glendale Gen. Oblig. Series 2017: | | | |
| 5% 7/1/30 | | 2,080 | 2,432 |
| 5% 7/1/31 | | 3,105 | 3,618 |
| Glendale Indl. Dev. Auth. (Terraces of Phoenix Proj.) Series 2018 A: | | | |
| 5% 7/1/38 | | 235 | 240 |
| 5% 7/1/48 | | 295 | 297 |
| Maricopa County Indl. Dev. Auth. Rev. Series 2016 A: | | | |
| 5% 1/1/32 | | 8,280 | 9,506 |
| 5% 1/1/33 | | 4,965 | 5,674 |
| Maricopa County Indl. Dev. Auth. Sr. Living Facilities Series 2016: | | | |
| 5.75% 1/1/36 (c) | | 740 | 738 |
| 6% 1/1/48 (c) | | 4,540 | 4,554 |
| Phoenix Civic Impt. Board Arpt. Rev.: | | | |
| Series 2013, 5% 7/1/22 (d) | | 830 | 907 |
| Series 2017 A 5% 7/1/36 (d) | | 1,450 | 1,639 |
| Series 2017 A: | | | |
| 5% 7/1/31 (d) | | 1,695 | 1,950 |
| 5% 7/1/33 (d) | | 910 | 1,040 |
| 5% 7/1/37 (d) | | 1,075 | 1,211 |
| Series 2017 B: | | | |
| 5% 7/1/29 | | 2,070 | 2,455 |
| 5% 7/1/33 | | 2,900 | 3,375 |
| 5% 7/1/36 | | 3,310 | 3,809 |
| 5% 7/1/37 | | 2,070 | 2,373 |
| Phoenix Civic Impt. Corp. Excise Tax Rev. Series 2011 C, 5% 7/1/23 | | 1,655 | 1,779 |
| Pima County Swr. Sys. Rev. Series 2012 A, 5% 7/1/26 | | 830 | 909 |
| Salt Verde Finl. Corp. Sr. Gas Rev.: | | | |
| Series 2007: | | | |
| 5.25% 12/1/21 | | 2,900 | 3,136 |
| 5.5% 12/1/29 | | 7,370 | 8,815 |
| 5.25% 12/1/22 | | 1,240 | 1,367 |
| Scottsdale Indl. Dev. Auth. Hosp. Rev. (Scottsdale Healthcare Proj.) Series 2006 C, 5% 9/1/35 (FSA Insured) | | 870 | 905 |
| Tempe Indl. Dev. Auth. Rev. (Mirabella At Asu, Inc. Proj.): | | | |
| Series 2017 A: | | | |
| 6.125% 10/1/47 (c) | | 440 | 473 |
| 6.125% 10/1/52 (c) | | 440 | 471 |
| Series 2017 B, 6% 10/1/37 (c) | | 220 | 237 |
|
| TOTAL ARIZONA | | | 79,221 |
|
| California - 3.5% | | | |
| ABC Unified School District Series 1997 C, 0% 8/1/28 (Nat'l. Pub. Fin. Guarantee Corp. Insured) | | 3,250 | 2,462 |
| Bay Area Toll Auth. San Francisco Bay Toll Bridge Rev. Bonds Series B, 2.85%, tender 4/1/25 (a) | | 6,840 | 7,052 |
| Cabrillo Unified School District Series A, 0% 8/1/20 (AMBAC Insured) | | 3,540 | 3,431 |
| California Edl. Facilities Auth. Rev. (Loyola Marymount Univ. Proj.) Series 2001 A, 0% 10/1/22 (Nat'l. Pub. Fin. Guarantee Corp. Insured) | | 4,140 | 3,823 |
| California Gen. Oblig.: | | | |
| Series 2007, 5.625% 5/1/20 | | 100 | 100 |
| Series 2009, 6% 4/1/38 | | 6,470 | 6,532 |
| 5.25% 12/1/33 | | 150 | 150 |
| 5.25% 4/1/35 | | 7,975 | 8,683 |
| 5.5% 4/1/28 | | 10 | 10 |
| 5.5% 4/1/30 | | 5 | 5 |
| 5.5% 3/1/40 | | 5,710 | 5,925 |
| 5.6% 3/1/36 | | 2,440 | 2,536 |
| California Health Facilities Fing. Auth. Rev. (Catholic Healthcare West Proj.) Series 2009 E, 5.625% 7/1/25 | | 7,450 | 7,580 |
| California Pub. Works Board Lease Rev.: | | | |
| (Coalinga State Hosp. Proj.) Series 2013 E: | | | |
| 5% 6/1/26 | | 1,985 | 2,216 |
| 5% 6/1/28 | | 5,110 | 5,670 |
| (Various Cap. Projs.) Series 2011 A, 5.25% 10/1/26 | | 4,140 | 4,511 |
| (Various Judicial Council Projs.) Series 2011 D, 5% 12/1/22 | | 3,395 | 3,699 |
| Folsom Cordova Union School District No. 4 Series A, 0% 10/1/31 (Nat'l. Pub. Fin. Guarantee Corp. Insured) | | 1,520 | 989 |
| Golden State Tobacco Securitization Corp. Tobacco Settlement Rev. Series 2017 A1: | | | |
| 5% 6/1/23 | | 3,140 | 3,459 |
| 5% 6/1/24 | | 1,770 | 1,943 |
| Kern Cmnty. College District Gen. Oblig. Series 2006: | | | |
| 0% 11/1/28 (FSA Insured) | | 4,100 | 3,147 |
| 0% 11/1/30 (FSA Insured) | | 4,140 | 2,911 |
| Long Beach Unified School District Series 2009, 5.5% 8/1/29 | | 155 | 158 |
| Los Angeles Cmnty. Redev. Agcy. Lease Rev. (Vermont Manchester Social Svcs. Proj.) Series 2005, 5% 9/1/19 (AMBAC Insured) | | 2,105 | 2,110 |
| Los Angeles Muni. Impt. Corp. Lease Rev. Series 2012 C: | | | |
| 5% 3/1/25 | | 1,205 | 1,319 |
| 5% 3/1/27 | | 1,655 | 1,807 |
| Madera County Ctfs. of Prtn. (Children's Hosp. Central California Proj.) Series 2010, 5.375% 3/15/36 (Pre-Refunded to 3/15/20 @ 100) | | 3,310 | 3,456 |
| Monrovia Unified School District Series B, 0% 8/1/29 (Nat'l. Pub. Fin. Guarantee Corp. Insured) | | 3,745 | 2,719 |
| Oakland Gen. Oblig. Series 2012: | | | |
| 5% 1/15/26 | | 3,755 | 3,998 |
| 5% 1/15/28 | | 3,595 | 3,824 |
| Oakland Unified School District Alameda County Series 2015 A, 5% 8/1/29 | | 1,450 | 1,681 |
| Poway Unified School District: | | | |
| (District #2007-1 School Facilities Proj.) Series 2008 A, 0% 8/1/32 | | 4,885 | 3,099 |
| Series 2011, 0% 8/1/46 | | 950 | 306 |
| Series B: | | | |
| 0% 8/1/37 | | 6,455 | 3,184 |
| 0% 8/1/39 | | 19,705 | 8,793 |
| Poway Unified School District Pub. Fing.: | | | |
| 5% 9/1/24 | | 825 | 918 |
| 5% 9/1/26 | | 1,050 | 1,167 |
| 5% 9/1/29 | | 2,185 | 2,385 |
| 5% 9/1/31 | | 985 | 1,067 |
| Sacramento City Fing. Auth. Rev. Series A, 0% 12/1/26 (Nat'l. Pub. Fin. Guarantee Corp. Insured) | | 4,140 | 3,292 |
| San Bernardino County Ctfs. of Prtn. (Arrowhead Proj.) Series 2009 A, 5.25% 8/1/26 | | 3,145 | 3,205 |
| San Diego Unified School District: | | | |
| Series 2008 C, 0% 7/1/34 | | 2,980 | 1,738 |
| Series 2008 E, 0% 7/1/47 (e) | | 7,205 | 4,707 |
| San Jose Fing. Auth. Lease Rev. (Civic Ctr. Proj.) Series 2013 A: | | | |
| 5% 6/1/27 | | 3,815 | 4,277 |
| 5% 6/1/31 | | 4,790 | 5,317 |
| San Marcos Unified School District Series 2010 B, 0% 8/1/47 | | 17,635 | 5,601 |
| San Mateo County Cmnty. College District Series A, 0% 9/1/26 (Nat'l. Pub. Fin. Guarantee Corp. Insured) | | 4,495 | 3,724 |
| Union Elementary School District Series B, 0% 9/1/22 (Nat'l. Pub. Fin. Guarantee Corp. Insured) | | 1,240 | 1,150 |
| Univ. of California Regents Med. Ctr. Pool Rev. Series 2013 J, 5% 5/15/48 | | 2,485 | 2,698 |
| Washington Township Health Care District Gen. Oblig.: | | | |
| Series 2013 A, 5.5% 8/1/38 | | 3,725 | 4,310 |
| Series 2013 B, 5.5% 8/1/38 | | 830 | 960 |
| Washington Township Health Care District Rev.: | | | |
| Series 2009 A, 5.75% 7/1/24 | | 1,450 | 1,473 |
| Series 2010 A: | | | |
| 5.25% 7/1/30 | | 910 | 948 |
| 5.5% 7/1/38 | | 3,160 | 3,289 |
| West Contra Costa Unified School District Series 2012, 5% 8/1/26 | | 1,655 | 1,829 |
|
| TOTAL CALIFORNIA | | | 167,343 |
|
| Colorado - 1.2% | | | |
| Arkansas River Pwr. Auth. Rev. Series 2018 A: | | | |
| 5% 10/1/38 | | 2,080 | 2,229 |
| 5% 10/1/43 | | 2,600 | 2,756 |
| Colorado Health Facilities Auth. (Parkview Med. Ctr., Inc. Proj.) Series 2016: | | | |
| 4% 9/1/35 | | 1,365 | 1,399 |
| 4% 9/1/36 | | 1,075 | 1,098 |
| 5% 9/1/46 | | 6,045 | 6,565 |
| Colorado Health Facilities Auth. Retirement Hsg. Rev. (Liberty Heights Proj.) Series B, 0% 7/15/20 (Escrowed to Maturity) | | 5,795 | 5,615 |
| Denver City & County Arpt. Rev.: | | | |
| Series 2017 A: | | | |
| 5% 11/15/23 (d) | | 1,885 | 2,117 |
| 5% 11/15/26 (d) | | 2,855 | 3,326 |
| 5% 11/15/27 (d) | | 2,440 | 2,873 |
| Series 2018 A: | | | |
| 5% 12/1/34 (d) | | 4,245 | 5,074 |
| 5% 12/1/36 (d) | | 4,140 | 4,708 |
| 5% 12/1/37 (d) | | 8,280 | 9,364 |
| E-470 Pub. Hwy. Auth. Rev.: | | | |
| Series 2000 B, 0% 9/1/20 (Nat'l. Pub. Fin. Guarantee Corp. Insured) | | 11,240 | 10,809 |
| Series 2010 C: | | | |
| 5.25% 9/1/25 | | 830 | 868 |
| 5.375% 9/1/26 | | 830 | 869 |
|
| TOTAL COLORADO | | | 59,670 |
|
| Connecticut - 0.7% | | | |
| Connecticut Gen. Oblig.: | | | |
| Series 2014 C, 5% 6/15/25 | | 1,390 | 1,569 |
| Series 2018 F: | | | |
| 5% 9/15/23 | | 2,150 | 2,380 |
| 5% 9/15/24 | | 2,690 | 3,015 |
| 5% 9/15/25 | | 2,700 | 3,055 |
| Connecticut Health & Edl. Facilities Auth. Rev.: | | | |
| (Sacred Heart Univ., CT. Proj.) Series 2017 I-1: | | | |
| 5% 7/1/26 | | 415 | 481 |
| 5% 7/1/27 | | 290 | 339 |
| 5% 7/1/28 | | 525 | 610 |
| 5% 7/1/29 | | 330 | 382 |
| Series 2016 K, 4% 7/1/46 | | 7,315 | 7,195 |
| Series K1: | | | |
| 5% 7/1/27 | | 415 | 468 |
| 5% 7/1/29 | | 1,060 | 1,195 |
| 5% 7/1/30 | | 830 | 930 |
| 5% 7/1/33 | | 1,325 | 1,464 |
| 5% 7/1/34 | | 620 | 682 |
| Eastern Connecticut Resources Recovery Auth. Solid Waste Rev. (Wheelabrator Lisbon Proj.) Series A, 5.5% 1/1/20 (d) | | 1,265 | 1,284 |
| Hbr. Point Infra Impt. District Series 2017: | | | |
| 5% 4/1/30 (c) | | 3,785 | 4,016 |
| 5% 4/1/39 (c) | | 4,865 | 5,034 |
| New Britain Gen. Oblig. Series 2017 C, 5% 3/1/29 (FSA Insured) | | 885 | 1,033 |
|
| TOTAL CONNECTICUT | | | 35,132 |
|
| District Of Columbia - 0.6% | | | |
| District of Columbia Rev. Series B, 4.75% 6/1/32 | | 2,235 | 2,306 |
| Metropolitan Washington DC Arpts. Auth. Sys. Rev. Series 2017 A: | | | |
| 5% 10/1/28 (d) | | 5,505 | 6,429 |
| 5% 10/1/29 (d) | | 6,690 | 7,774 |
| 5% 10/1/31 (d) | | 1,200 | 1,379 |
| 5% 10/1/32 (d) | | 1,855 | 2,126 |
| 5% 10/1/33 (d) | | 910 | 1,038 |
| 5% 10/1/35 (d) | | 2,070 | 2,344 |
| 5% 10/1/42 (d) | | 4,140 | 4,591 |
|
| TOTAL DISTRICT OF COLUMBIA | | | 27,987 |
|
| Florida - 11.2% | | | |
| Brevard County School Board Ctfs. of Prtn. Series 2015 C: | | | |
| 5% 7/1/25 | | 1,655 | 1,925 |
| 5% 7/1/26 | | 1,450 | 1,670 |
| 5% 7/1/28 | | 1,445 | 1,654 |
| Broward County Arpt. Sys. Rev.: | | | |
| Series 2012 P-1, 5% 10/1/22 (d) | | 800 | 877 |
| Series 2012 Q1, 5% 10/1/25 | | 4,315 | 4,739 |
| Series 2017: | | | |
| 5% 10/1/25 (d) | | 205 | 235 |
| 5% 10/1/26 (d) | | 830 | 961 |
| 5% 10/1/27 (d) | | 830 | 969 |
| 5% 10/1/28 (d) | | 830 | 962 |
| 5% 10/1/29 (d) | | 2,200 | 2,534 |
| 5% 10/1/30 (d) | | 610 | 699 |
| 5% 10/1/32 (d) | | 2,900 | 3,300 |
| 5% 10/1/33 (d) | | 1,080 | 1,225 |
| 5% 10/1/34 (d) | | 1,055 | 1,191 |
| 5% 10/1/35 (d) | | 1,240 | 1,396 |
| 5% 10/1/36 (d) | | 1,655 | 1,855 |
| 5% 10/1/37 (d) | | 1,865 | 2,083 |
| 5% 10/1/42 (d) | | 3,520 | 3,898 |
| 5% 10/1/47 (d) | | 4,965 | 5,478 |
| Series A: | | | |
| 5% 10/1/23 (d) | | 1,180 | 1,316 |
| 5% 10/1/28 (d) | | 2,485 | 2,793 |
| 5% 10/1/30 (d) | | 2,900 | 3,231 |
| 5% 10/1/31 (d) | | 2,485 | 2,761 |
| 5% 10/1/32 (d) | | 2,320 | 2,570 |
| Broward County School Board Ctfs. of Prtn.: | | | |
| (Broward County School District Proj.) Series 2016 A, 5% 7/1/28 | | 555 | 646 |
| (Broward County School District) Series 2012 A, 5% 7/1/24 | | 1,795 | 1,961 |
| Series 2012 A: | | | |
| 5% 7/1/24 (Pre-Refunded to 7/1/22 @ 100) | | 1,845 | 2,032 |
| 5% 7/1/27 | | 4,715 | 5,112 |
| Series 2015 A: | | | |
| 5% 7/1/24 | | 1,855 | 2,122 |
| 5% 7/1/27 | | 830 | 954 |
| Series 2015 B, 5% 7/1/24 | | 2,280 | 2,609 |
| Series 2016, 5% 7/1/32 | | 1,820 | 2,081 |
| Citizens Property Ins. Corp. Series 2011 A1, 5% 6/1/19 | | 1,420 | 1,438 |
| Collier County Indl. Dev. Auth. Healthcare Facilities Rev. (NCH Healthcare Sys. Proj.) Series 2011, 6.25% 10/1/39 | | 9,550 | 10,370 |
| Duval County School Board Ctfs. of Prtn.: | | | |
| Series 2015 B: | | | |
| 5% 7/1/28 | | 1,705 | 1,951 |
| 5% 7/1/32 | | 10,120 | 11,459 |
| Series 2016 A, 5% 7/1/33 | | 1,110 | 1,267 |
| Florida Board of Ed. Pub. Ed. Cap. Outlay: | | | |
| Series 2011 E, 5% 6/1/24 | | 5,464 | 5,851 |
| Series 2011 F, 5% 6/1/23 | | 5,025 | 5,382 |
| Florida Mid-Bay Bridge Auth. Rev.: | | | |
| Series 2015 A, 5% 10/1/35 | | 5,300 | 5,777 |
| Series 2015 C: | | | |
| 5% 10/1/30 | | 2,705 | 2,977 |
| 5% 10/1/40 | | 1,655 | 1,772 |
| Florida Muni. Pwr. Agcy. Rev.: | | | |
| (Requirements Pwr. Supply Proj.) Series 2016 A: | | | |
| 5% 10/1/30 | | 1,810 | 2,103 |
| 5% 10/1/31 | | 1,975 | 2,286 |
| (St. Lucie Proj.) Series 2012 A, 5% 10/1/26 | | 3,065 | 3,358 |
| Series 2015 B: | | | |
| 5% 10/1/28 | | 830 | 956 |
| 5% 10/1/30 | | 1,490 | 1,704 |
| Greater Orlando Aviation Auth. Arpt. Facilities Rev.: | | | |
| Series 2016 A, 5% 10/1/46 (d) | | 830 | 913 |
| Series 2016: | | | |
| 5% 10/1/20 (d) | | 165 | 173 |
| 5% 10/1/21 (d) | | 1,280 | 1,374 |
| 5% 10/1/22 (d) | | 830 | 909 |
| 5% 10/1/24 (d) | | 2,485 | 2,814 |
| 5% 10/1/26 (d) | | 1,405 | 1,627 |
| 5% 10/1/27 (d) | | 830 | 970 |
| Series 2017 A: | | | |
| 5% 10/1/24 (d) | | 1,925 | 2,180 |
| 5% 10/1/25 (d) | | 830 | 952 |
| 5% 10/1/27 (d) | | 1,655 | 1,934 |
| 5% 10/1/29 (d) | | 2,485 | 2,871 |
| 5% 10/1/30 (d) | | 2,665 | 3,066 |
| 5% 10/1/32 (d) | | 5,590 | 6,379 |
| 5% 10/1/34 (d) | | 4,965 | 5,626 |
| 5% 10/1/35 (d) | | 6,565 | 7,412 |
| 5% 10/1/36 (d) | | 6,210 | 6,981 |
| 5% 10/1/37 (d) | | 5,175 | 5,792 |
| Halifax Hosp. Med. Ctr. Rev.: | | | |
| 4% 6/1/27 | | 1,165 | 1,222 |
| 5% 6/1/24 | | 230 | 257 |
| Highlands County Health Facilities Auth. Rev. Series 2008: | | | |
| 6% 11/15/37 | | 10,740 | 11,114 |
| 6% 11/15/37 (Pre-Refunded to 11/15/19 @ 100) | | 25 | 26 |
| Jacksonville Sales Tax Rev. Series 2012, 5% 10/1/25 | | 830 | 912 |
| Lake County School Board Ctfs. of Prtn. Series 2014 A: | | | |
| 5% 6/1/27 (FSA Insured) | | 830 | 929 |
| 5% 6/1/28 (FSA Insured) | | 830 | 925 |
| 5% 6/1/30 (FSA Insured) | | 1,865 | 2,065 |
| Lee County Arpt. Rev. Series 2011 A, 5.375% 10/1/32 (d) | | 5,225 | 5,570 |
| Miami-Dade County Aviation Rev.: | | | |
| Series 2010, 5.5% 10/1/30 (Pre-Refunded to 10/1/20 @ 100) | | 2,515 | 2,674 |
| Series 2012 A: | | | |
| 5% 10/1/21 (d) | | 1,575 | 1,689 |
| 5% 10/1/22 (d) | | 830 | 908 |
| 5% 10/1/23 (d) | | 6,375 | 6,955 |
| 5% 10/1/24 (d) | | 7,490 | 8,149 |
| 5% 10/1/30 (d) | | 5,810 | 6,231 |
| 5% 10/1/31 (d) | | 3,310 | 3,545 |
| Series 2014 A: | | | |
| 5% 10/1/28 (d) | | 4,140 | 4,585 |
| 5% 10/1/33 (d) | | 6,940 | 7,587 |
| 5% 10/1/36 (d) | | 13,125 | 14,269 |
| Series 2015 A: | | | |
| 5% 10/1/29 (d) | | 1,310 | 1,457 |
| 5% 10/1/31 (d) | | 1,100 | 1,215 |
| 5% 10/1/35 (d) | | 4,555 | 4,959 |
| Series 2016 A: | | | |
| 5% 10/1/29 | | 1,200 | 1,392 |
| 5% 10/1/31 | | 1,450 | 1,667 |
| Series 2017 B, 5% 10/1/40 (d) | | 10,760 | 11,923 |
| Miami-Dade County Cap. Asset Acquisition Series 2012 A, 5% 10/1/26 | | 3,105 | 3,403 |
| Miami-Dade County Expressway Auth.: | | | |
| Series 2014 A, 5% 7/1/44 | | 2,900 | 3,163 |
| Series 2014 B: | | | |
| 5% 7/1/26 | | 2,070 | 2,347 |
| 5% 7/1/27 | | 1,450 | 1,640 |
| 5% 7/1/28 | | 830 | 936 |
| Series A: | | | |
| 5% 7/1/32 | | 3,560 | 4,076 |
| 5% 7/1/33 | | 3,020 | 3,447 |
| Miami-Dade County School Board Ctfs. of Prtn.: | | | |
| Series 2011 B, 5.625% 5/1/31 | | 5,465 | 5,872 |
| Series 2015 A: | | | |
| 5% 5/1/26 | | 4,555 | 5,169 |
| 5% 5/1/27 (FSA Insured) | | 645 | 738 |
| 5% 5/1/28 | | 9,695 | 11,002 |
| 5% 5/1/29 | | 3,375 | 3,813 |
| Series 2015 B: | | | |
| 5% 5/1/26 | | 7,035 | 7,983 |
| 5% 5/1/27 | | 18,320 | 20,892 |
| Series 2016 A: | | | |
| 5% 5/1/30 | | 6,225 | 7,056 |
| 5% 5/1/32 | | 8,280 | 9,321 |
| Series 2016 B, 5% 8/1/26 | | 8,960 | 10,518 |
| Miami-Dade County Transit Sales Surtax Rev. Series 2012, 5% 7/1/42 | | 1,820 | 1,959 |
| Orange County Health Facilities Auth. Series 2012 A, 5% 10/1/42 | | 9,975 | 10,606 |
| Orange County School Board Ctfs. of Prtn.: | | | |
| Series 2015 C, 5% 8/1/30 | | 8,280 | 9,421 |
| Series 2016 C, 5% 8/1/33 | | 3,120 | 3,563 |
| Orlando Utils. Commission Util. Sys. Rev.: | | | |
| Series 2009 B, 5% 10/1/33 | | 1,750 | 1,763 |
| Series 2012 A, 5% 10/1/25 | | 910 | 1,069 |
| Palm Beach County Arpt. Sys. Rev. Series 2016: | | | |
| 5% 10/1/21 (d) | | 995 | 1,069 |
| 5% 10/1/23 (d) | | 1,095 | 1,223 |
| 5% 10/1/24 (d) | | 1,140 | 1,294 |
| 5% 10/1/27 (d) | | 830 | 961 |
| 5% 10/1/29 (d) | | 860 | 986 |
| 5% 10/1/30 (d) | | 1,530 | 1,747 |
| 5% 10/1/31 (d) | | 1,075 | 1,223 |
| 5% 10/1/32 (d) | | 1,655 | 1,877 |
| 5% 10/1/33 (d) | | 3,555 | 4,022 |
| 5% 10/1/34 (d) | | 3,730 | 4,203 |
| 5% 10/1/35 (d) | | 3,930 | 4,415 |
| Palm Beach County Health Facilities Auth. Hosp. Rev. Series 2014: | | | |
| 5% 12/1/22 | | 555 | 607 |
| 5% 12/1/23 | | 1,155 | 1,280 |
| 5% 12/1/24 | | 1,265 | 1,422 |
| 5% 12/1/25 | | 445 | 496 |
| 5% 12/1/31 | | 415 | 452 |
| Palm Beach County School Board Ctfs. of Prtn. Series 2015 D: | | | |
| 5% 8/1/28 | | 3,905 | 4,491 |
| 5% 8/1/29 | | 4,965 | 5,678 |
| 5% 8/1/31 | | 13,725 | 15,563 |
| South Florida Wtr. Mgmt. District Ctfs. of Prtn. Series 2015: | | | |
| 5% 10/1/29 | | 4,140 | 4,786 |
| 5% 10/1/32 | | 5,190 | 5,919 |
| South Lake County Hosp. District (South Lake Hosp., Inc.): | | | |
| Series 2009 A: | | | |
| 6% 4/1/29 | | 1,160 | 1,169 |
| 6.25% 4/1/39 | | 2,730 | 2,752 |
| Series 2010, 5.25% 10/1/34 | | 2,900 | 3,004 |
| South Miami Health Facilities Auth. Hosp. Rev. (Baptist Med. Ctr., FL. Proj.) Series 2017: | | | |
| 4% 8/15/33 | | 2,070 | 2,151 |
| 5% 8/15/26 | | 2,815 | 3,287 |
| 5% 8/15/27 | | 1,865 | 2,199 |
| 5% 8/15/28 | | 1,240 | 1,452 |
| 5% 8/15/30 | | 2,685 | 3,110 |
| 5% 8/15/31 | | 2,590 | 2,985 |
| 5% 8/15/32 | | 1,930 | 2,216 |
| 5% 8/15/34 | | 5,360 | 6,107 |
| 5% 8/15/35 | | 3,555 | 4,039 |
| 5% 8/15/42 | | 5,465 | 6,109 |
| 5% 8/15/47 | | 8,115 | 9,039 |
| Tallahassee Health Facilities Rev.: | | | |
| (Tallahassee Memorial Healthcare, Inc. Proj.) Series 2016 A, 5% 12/1/41 | | 910 | 979 |
| Series 2015 A, 5% 12/1/40 | | 1,820 | 1,954 |
| Tampa Tax Allocation (H. Lee Moffitt Cancer Ctr. Proj.) Series 2012 A: | | | |
| 5% 9/1/22 | | 1,905 | 2,094 |
| 5% 9/1/25 | | 340 | 372 |
| Volusia County School Board Ctfs. of Prtn.: | | | |
| (Florida Master Lease Prog.) Series 2016 A: | | | |
| 5% 8/1/29 (Build America Mutual Assurance Insured) | | 830 | 946 |
| 5% 8/1/32 (Build America Mutual Assurance Insured) | | 4,140 | 4,667 |
| (Master Lease Prog.) Series 2014 B: | | | |
| 5% 8/1/25 | | 1,470 | 1,683 |
| 5% 8/1/26 | | 280 | 319 |
|
| TOTAL FLORIDA | | | 536,792 |
|
| Georgia - 1.6% | | | |
| Atlanta Wtr. & Wastewtr. Rev. 5% 11/1/27 | | 830 | 960 |
| Bartow County Dev. Auth. Poll. Cont. Rev. Bonds (Georgia Pwr. Co. Plant Bowen Proj.) Series 1997 1, 2.05%, tender 11/19/21 (a) | | 1,655 | 1,614 |
| Burke County Indl. Dev. Auth. Poll. Cont. Rev. Bonds: | | | |
| (Oglethorpe Pwr. Corp. Vogtle Proj.) Series 2013 A, 2.4%, tender 4/1/20 (a) | | 6,290 | 6,260 |
| 2.2%, tender 4/2/19 (a) | | 2,485 | 2,484 |
| 2.2%, tender 4/2/19 (a) | | 5,380 | 5,378 |
| 2.2%, tender 4/2/19 (a) | | 3,395 | 3,393 |
| DeKalb County Wtr. & Swr. Rev. Series 2011 A, 5.25% 10/1/36 | | 2,485 | 2,674 |
| Fulton County Wtr. & Swr. Rev. Series 2011, 5% 1/1/24 | | 5,380 | 5,696 |
| Georgia Muni. Gas Auth. Rev. (Gas Portfolio III Proj.) Series S: | | | |
| 5% 10/1/22 | | 2,835 | 3,127 |
| 5% 10/1/23 | | 3,310 | 3,646 |
| Glynn-Brunswick Memorial Hosp. Auth. Rev. (Southeast Georgia Health Sys. Proj.) Series 2017: | | | |
| 4% 8/1/43 | | 1,860 | 1,803 |
| 5% 8/1/39 | | 1,705 | 1,844 |
| 5% 8/1/43 | | 2,275 | 2,456 |
| Main Street Natural Gas, Inc. Bonds Series 2018 C, 4%, tender 12/1/23 (a) | | 21,230 | 22,417 |
| Main Street Natural Gas, Inc. Georgia Gas Proj. Rev. Series A, 5.25% 9/15/19 | | 1,585 | 1,621 |
| Private Colleges & Univs. Auth. Rev. (The Savannah College of Art and Design Projs.) Series 2014: | | | |
| 5% 4/1/25 | | 2,900 | 3,247 |
| 5% 4/1/30 | | 1,655 | 1,811 |
| 5% 4/1/44 | | 3,160 | 3,363 |
| Valdosta & Lowndes County Hosp. (South Georgia Med. Ctr. Proj.) 5% 10/1/20 | | 875 | 878 |
|
| TOTAL GEORGIA | | | 74,672 |
|
| Hawaii - 0.8% | | | |
| Hawaii Arpts. Sys. Rev.: | | | |
| Series 2015 A: | | | |
| 5% 7/1/41 (d) | | 6,210 | 6,811 |
| 5% 7/1/45 (d) | | 16,455 | 18,008 |
| Series 2018 A: | | | |
| 5% 7/1/29 (d) | | 1,055 | 1,235 |
| 5% 7/1/30 (d) | | 1,240 | 1,439 |
| 5% 7/1/31 (d) | | 1,215 | 1,404 |
| 5% 7/1/32 (d) | | 1,240 | 1,428 |
| 5% 7/1/33 (d) | | 1,265 | 1,451 |
| State of Hawaii Dept. of Trans. Series 2013: | | | |
| 5% 8/1/22 (d) | | 1,305 | 1,424 |
| 5.25% 8/1/24 (d) | | 1,655 | 1,848 |
| 5.25% 8/1/25 (d) | | 2,070 | 2,295 |
|
| TOTAL HAWAII | | | 37,343 |
|
| Idaho - 0.1% | | | |
| Idaho Health Facilities Auth. Rev. Series 2015 ID, 5% 12/1/25 | | 2,275 | 2,635 |
| Illinois - 23.4% | | | |
| Boone & Winnebago County Cmnty. Unit School District 200: | | | |
| 0% 1/1/21 (Nat'l. Pub. Fin. Guarantee Corp. Insured) | | 1,500 | 1,426 |
| 0% 1/1/22 (Nat'l. Pub. Fin. Guarantee Corp. Insured) | | 1,615 | 1,493 |
| Chicago Board of Ed.: | | | |
| Series 1998 B1, 0% 12/1/21 (Nat'l. Pub. Fin. Guarantee Corp. Insured) | | 1,960 | 1,788 |
| Series 1999 A, 5.25% 12/1/21 (Nat'l. Pub. Fin. Guarantee Corp. Insured) | | 1,975 | 2,098 |
| Series 2010 F, 5% 12/1/20 | | 1,070 | 1,101 |
| Series 2011 A: | | | |
| 5% 12/1/41 | | 4,790 | 4,791 |
| 5.25% 12/1/41 | | 2,965 | 2,986 |
| 5.5% 12/1/39 | | 6,540 | 6,638 |
| Series 2012 A, 5% 12/1/42 | | 7,630 | 7,630 |
| Series 2015 C, 5.25% 12/1/39 | | 1,405 | 1,427 |
| Series 2016 B, 6.5% 12/1/46 | | 660 | 734 |
| Series 2017 A, 7% 12/1/46 (c) | | 2,320 | 2,692 |
| Series 2017 C: | | | |
| 5% 12/1/22 | | 2,175 | 2,264 |
| 5% 12/1/23 | | 1,880 | 1,965 |
| 5% 12/1/24 | | 4,770 | 5,009 |
| 5% 12/1/25 | | 2,725 | 2,866 |
| 5% 12/1/26 | | 800 | 843 |
| 5% 12/1/30 | | 2,105 | 2,181 |
| Series 2017 D: | | | |
| 5% 12/1/23 | | 2,460 | 2,571 |
| 5% 12/1/24 | | 1,030 | 1,082 |
| 5% 12/1/31 | | 2,485 | 2,564 |
| Series 2018 A: | | | |
| 5% 12/1/25 | | 830 | 873 |
| 5% 12/1/26 | | 830 | 875 |
| 5% 12/1/28 | | 3,915 | 4,115 |
| 5% 12/1/30 | | 1,655 | 1,721 |
| 5% 12/1/32 | | 950 | 981 |
| 5% 12/1/35 | | 830 | 847 |
| Series 2018 C, 5% 12/1/46 | | 3,250 | 3,226 |
| Chicago Midway Arpt. Rev.: | | | |
| Series 2014 A: | | | |
| 5% 1/1/27 (d) | | 8,550 | 9,383 |
| 5% 1/1/28 (d) | | 15,855 | 17,339 |
| 5% 1/1/33 (d) | | 4,450 | 4,806 |
| 5% 1/1/34 (d) | | 2,150 | 2,317 |
| Series 2016 A, 5% 1/1/28 (d) | | 1,655 | 1,856 |
| Series 2016 B: | | | |
| 4% 1/1/35 | | 1,305 | 1,325 |
| 5% 1/1/36 | | 1,655 | 1,818 |
| 5% 1/1/37 | | 2,235 | 2,441 |
| 5% 1/1/46 | | 5,865 | 6,331 |
| Chicago O'Hare Int'l. Arpt. Rev.: | | | |
| Series 2013 B, 5% 1/1/27 | | 5,195 | 5,702 |
| Series 2013 D, 5% 1/1/27 | | 2,650 | 2,909 |
| Series 2015 A: | | | |
| 5% 1/1/31 (d) | | 5,000 | 5,490 |
| 5% 1/1/32 (d) | | 10,100 | 11,056 |
| Series 2015 C: | | | |
| 5% 1/1/24 (d) | | 1,190 | 1,320 |
| 5% 1/1/46 (d) | | 1,985 | 2,128 |
| Series 2016 B, 5% 1/1/34 | | 5,050 | 5,622 |
| Series 2016 C: | | | |
| 5% 1/1/33 | | 2,255 | 2,520 |
| 5% 1/1/34 | | 2,610 | 2,906 |
| Series 2016 G: | | | |
| 5% 1/1/37 (d) | | 1,655 | 1,812 |
| 5% 1/1/42 (d) | | 1,655 | 1,796 |
| 5.25% 1/1/29 (d) | | 290 | 333 |
| 5.25% 1/1/31 (d) | | 330 | 376 |
| Series 2017 A, 5% 1/1/31 | | 2,925 | 3,340 |
| Series 2017 B: | | | |
| 5% 1/1/35 | | 1,740 | 1,954 |
| 5% 1/1/37 | | 7,080 | 7,893 |
| Series 2017 C: | | | |
| 5% 1/1/30 | | 495 | 568 |
| 5% 1/1/31 | | 495 | 565 |
| 5% 1/1/32 | | 540 | 613 |
| Series 2017 D: | | | |
| 5% 1/1/28 (d) | | 2,475 | 2,815 |
| 5% 1/1/29 (d) | | 2,070 | 2,342 |
| 5% 1/1/32 (d) | | 2,235 | 2,490 |
| 5% 1/1/34 (d) | | 3,360 | 3,716 |
| 5% 1/1/35 (d) | | 2,485 | 2,741 |
| 5% 1/1/36 (d) | | 3,090 | 3,395 |
| 5% 1/1/37 (d) | | 1,655 | 1,812 |
| Chicago O'Hare Int'l. Arpt. Spl. Facilities Rev. Series 2018: | | | |
| 5% 7/1/38 (d) | | 2,185 | 2,405 |
| 5% 7/1/48 (d) | | 9,030 | 9,819 |
| Chicago Transit Auth.: | | | |
| Series 2014, 5.25% 12/1/49 | | 14,900 | 16,116 |
| Series 2017, 5% 12/1/46 | | 3,395 | 3,635 |
| Chicago Transit Auth. Cap. Grant Receipts Rev. Series 2017: | | | |
| 5% 6/1/22 | | 1,670 | 1,807 |
| 5% 6/1/23 | | 1,505 | 1,657 |
| 5% 6/1/24 | | 255 | 285 |
| 5% 6/1/25 | | 255 | 288 |
| 5% 6/1/26 | | 205 | 233 |
| Cook County Forest Preservation District: | | | |
| Series 2012 A, 5% 11/15/22 | | 1,655 | 1,791 |
| Series 2012 C, 5% 12/15/21 | | 830 | 884 |
| Cook County Gen. Oblig.: | | | |
| Series 2010 A: | | | |
| 5.25% 11/15/22 | | 570 | 599 |
| 5.25% 11/15/33 | | 14,925 | 15,502 |
| Series 2010 G, 5% 11/15/25 | | 2,815 | 2,930 |
| Series 2012 C, 5% 11/15/24 | | 9,190 | 9,961 |
| Series 2016 A: | | | |
| 5% 11/15/26 | | 4,420 | 5,005 |
| 5% 11/15/27 | | 2,320 | 2,610 |
| 5% 11/15/28 | | 3,020 | 3,375 |
| 5% 11/15/29 | | 3,760 | 4,169 |
| 5% 11/15/30 | | 4,140 | 4,573 |
| Grundy & Will Counties Cmnty. School Gen. Obligan Series 2017, 5% 2/1/25 | | 745 | 844 |
| Illinois Fin. Auth. Rev.: | | | |
| (Bradley Univ. Proj.) Series 2017 C: | | | |
| 5% 8/1/29 | | 540 | 615 |
| 5% 8/1/30 | | 760 | 862 |
| 5% 8/1/32 | | 1,015 | 1,141 |
| (Depaul Univ. Proj.) Series 2016 A: | | | |
| 4% 10/1/34 | | 830 | 862 |
| 5% 10/1/29 | | 830 | 955 |
| 5% 10/1/30 | | 830 | 951 |
| 5% 10/1/35 | | 1,655 | 1,863 |
| (OSF Healthcare Sys.) Series 2018 A: | | | |
| 4.125% 5/15/47 | | 25,725 | 25,448 |
| 5% 5/15/43 | | 34,525 | 38,115 |
| (Palos Cmnty. Hosp. Proj.) Series 2010 C: | | | |
| 5.375% 5/15/25 | | 25,025 | 26,064 |
| 5.375% 5/15/30 | | 6,020 | 6,239 |
| (Presence Health Proj.) Series 2016 C: | | | |
| 3.625% 2/15/32 | | 950 | 956 |
| 4% 2/15/33 | | 225 | 236 |
| 5% 2/15/25 | | 190 | 219 |
| 5% 2/15/26 | | 2,525 | 2,948 |
| 5% 2/15/29 | | 5,110 | 5,957 |
| 5% 2/15/36 | | 1,160 | 1,304 |
| (Rosalind Franklin Univ. Research Bldg. Proj.) Series 2017 C, 5% 8/1/46 | | 830 | 886 |
| (Rush Univ. Med. Ctr. Proj.) Series 2015 A, 5% 11/15/34 | | 415 | 459 |
| Series 2009, 5% 8/15/23 (Pre-Refunded to 8/15/20 @ 100) | | 1,545 | 1,620 |
| Series 2010, 5.25% 5/1/25 | | 5,795 | 6,044 |
| Series 2012 A: | | | |
| 5% 5/15/20 | | 415 | 432 |
| 5% 5/15/22 | | 1,805 | 1,968 |
| 5% 5/15/23 | | 250 | 271 |
| Series 2012: | | | |
| 4% 9/1/32 | | 7,265 | 7,426 |
| 5% 9/1/32 | | 1,575 | 1,700 |
| 5% 9/1/38 | | 21,730 | 23,218 |
| 5% 11/15/43 | | 4,315 | 4,522 |
| Series 2013: | | | |
| 5% 11/15/24 | | 415 | 454 |
| 5% 11/15/27 | | 85 | 92 |
| 5% 11/15/28 | | 2,380 | 2,573 |
| 5% 11/15/29 | | 1,160 | 1,252 |
| 5% 5/15/43 | | 9,775 | 10,176 |
| Series 2014, 5% 8/1/38 | | 11,050 | 12,053 |
| Series 2015 A: | | | |
| 5% 11/15/21 | | 495 | 535 |
| 5% 11/15/45 | | 2,670 | 2,860 |
| Series 2015 B, 5% 11/15/27 | | 2,615 | 2,971 |
| Series 2015 C: | | | |
| 4.125% 8/15/37 | | 715 | 720 |
| 5% 8/15/35 | | 6,175 | 6,718 |
| 5% 8/15/44 | | 30,175 | 32,220 |
| Series 2016 A: | | | |
| 5% 8/15/22 | | 830 | 894 |
| 5% 7/1/24 | | 1,155 | 1,309 |
| 5% 8/15/25 | | 1,970 | 2,209 |
| 5% 8/15/26 | | 2,635 | 2,980 |
| 5% 7/1/28 | | 1,020 | 1,168 |
| 5% 2/15/29 | | 4,255 | 4,794 |
| 5% 2/15/30 | | 4,490 | 5,037 |
| 5% 7/1/30 | | 590 | 667 |
| 5% 2/15/31 | | 3,620 | 4,044 |
| 5% 7/1/31 | | 1,040 | 1,162 |
| 5% 2/15/32 | | 3,520 | 3,916 |
| 5% 7/1/33 | | 540 | 600 |
| 5% 7/1/34 | | 4,140 | 4,581 |
| 5% 8/15/34 | | 535 | 583 |
| 5% 8/15/35 | | 420 | 457 |
| 5% 7/1/36 | | 2,140 | 2,353 |
| 5% 8/15/36 | | 1,685 | 1,825 |
| 5.25% 8/15/27 | | 1,865 | 2,131 |
| 5.25% 8/15/28 | | 2,395 | 2,723 |
| 5.25% 8/15/30 | | 1,840 | 2,075 |
| 5.25% 8/15/31 | | 495 | 556 |
| Series 2016 B: | | | |
| 5% 8/15/31 | | 6,095 | 6,934 |
| 5% 8/15/32 | | 5,000 | 5,658 |
| 5% 8/15/34 | | 6,220 | 6,986 |
| 5% 8/15/36 | | 8,680 | 9,632 |
| Series 2016 C: | | | |
| 3.75% 2/15/34 | | 1,215 | 1,215 |
| 4% 2/15/36 | | 5,160 | 5,271 |
| 4% 2/15/41 | | 14,810 | 14,922 |
| 5% 2/15/22 | | 1,095 | 1,193 |
| 5% 2/15/24 | | 555 | 630 |
| 5% 2/15/30 | | 6,425 | 7,440 |
| 5% 2/15/31 | | 12,595 | 14,505 |
| 5% 2/15/32 | | 3,660 | 4,189 |
| 5% 2/15/34 | | 2,920 | 3,309 |
| 5% 2/15/41 | | 8,845 | 9,808 |
| Series 2016: | | | |
| 5% 5/15/29 | | 1,040 | 1,184 |
| 5% 12/1/29 | | 1,420 | 1,596 |
| 5% 5/15/30 | | 2,200 | 2,486 |
| 5% 12/1/46 | | 3,865 | 4,116 |
| Series 2017 A, 5% 8/1/42 | | 730 | 782 |
| Series 2017: | | | |
| 5% 7/1/26 | | 1,450 | 1,727 |
| 5% 1/1/29 | | 2,775 | 3,257 |
| 5% 7/1/33 | | 5,640 | 6,488 |
| 5% 7/1/34 | | 4,640 | 5,324 |
| 5% 7/1/35 | | 3,900 | 4,466 |
| Series 2018 A: | | | |
| 4.25% 1/1/44 | | 2,465 | 2,483 |
| 5% 1/1/44 | | 14,900 | 16,051 |
| Illinois Gen. Oblig.: | | | |
| Series 2010, 5% 1/1/21 (FSA Insured) | | 2,565 | 2,631 |
| Series 2012 A, 4% 1/1/23 | | 2,090 | 2,114 |
| Series 2012: | | | |
| 5% 8/1/21 | | 1,985 | 2,068 |
| 5% 3/1/23 | | 4,265 | 4,449 |
| 5% 8/1/23 | | 3,810 | 4,038 |
| Series 2013: | | | |
| 5% 1/1/22 | | 2,420 | 2,463 |
| 5.5% 7/1/24 | | 830 | 899 |
| 5.5% 7/1/25 | | 4,315 | 4,660 |
| Series 2014: | | | |
| 5% 2/1/22 | | 880 | 921 |
| 5% 2/1/23 | | 3,665 | 3,866 |
| 5% 2/1/25 | | 3,005 | 3,173 |
| 5% 2/1/26 | | 2,270 | 2,387 |
| 5% 4/1/28 | | 1,895 | 1,979 |
| 5% 5/1/28 | | 1,780 | 1,860 |
| 5.25% 2/1/31 | | 360 | 376 |
| Series 2016: | | | |
| 5% 2/1/23 | | 1,500 | 1,582 |
| 5% 2/1/24 | | 8,285 | 8,795 |
| 5% 6/1/25 | | 7,295 | 7,789 |
| 5% 11/1/25 | | 2,485 | 2,657 |
| 5% 6/1/26 | | 995 | 1,065 |
| 5% 2/1/27 | | 9,975 | 10,700 |
| Series 2017 D: | | | |
| 5% 11/1/22 | | 19,770 | 20,852 |
| 5% 11/1/23 | | 20,695 | 21,977 |
| 5% 11/1/24 | | 28,975 | 30,916 |
| 5% 11/1/25 | | 28,795 | 30,783 |
| 5% 11/1/26 | | 8,690 | 9,317 |
| 5% 11/1/27 | | 2,900 | 3,114 |
| Illinois Muni. Elec. Agcy. Pwr. Supply Series 2015 A: | | | |
| 5% 2/1/25 | | 6,715 | 7,664 |
| 5% 2/1/26 | | 8,585 | 9,840 |
| 5% 2/1/31 | | 3,370 | 3,802 |
| Illinois Toll Hwy. Auth. Toll Hwy. Rev.: | | | |
| Series 2015 A: | | | |
| 5% 1/1/37 | | 3,020 | 3,372 |
| 5% 1/1/40 | | 12,915 | 14,332 |
| Series 2015 B, 5% 1/1/40 | | 7,205 | 7,941 |
| Series 2016 A: | | | |
| 5% 12/1/31 | | 5,825 | 6,579 |
| 5% 12/1/32 | | 8,525 | 9,611 |
| Joliet School District #86 Gen. Oblig. Series 2002, 0% 11/1/19 (FSA Insured) | | 1,655 | 1,625 |
| Kane, McHenry, Cook & DeKalb Counties Unit School District #300: | | | |
| 0% 12/1/21 (AMBAC Insured) | | 2,560 | 2,382 |
| 0% 12/1/21 (Escrowed to Maturity) | | 1,575 | 1,487 |
| 6.5% 1/1/20 (AMBAC Insured) | | 2,600 | 2,713 |
| Kendall, Kane & Will Counties Cmnty. Unit School District #308 Series 2016: | | | |
| 5% 2/1/34 | | 5,795 | 6,447 |
| 5% 2/1/35 | | 4,140 | 4,595 |
| 5% 2/1/36 | | 7,120 | 7,874 |
| Lake County Cmnty. High School District #117, Antioch Series 2000 B, 0% 12/1/20 (Nat'l. Pub. Fin. Guarantee Corp. Insured) | | 1,495 | 1,419 |
| McHenry & Kane Counties Cmnty. Consolidated School District #158: | | | |
| Series 2003: | | | |
| 0% 1/1/19 | | 2,295 | 2,295 |
| 0% 1/1/19 (Escrowed to Maturity) | | 155 | 155 |
| Series 2004, 0% 1/1/24 (FSA Insured) | | 4,220 | 3,657 |
| 0% 1/1/19 (Escrowed to Maturity) | | 35 | 35 |
| Metropolitan Pier & Exposition: | | | |
| (McCormick Place Expansion Proj.): | | | |
| Series 1992 A, 0% 6/15/20 (Nat'l. Pub. Fin. Guarantee Corp. Insured) | | 2,990 | 2,861 |
| Series 1994 A, 0% 6/15/19 (Nat'l. Pub. Fin. Guarantee Corp. Insured) | | 5,500 | 5,431 |
| Series 1996 A, 0% 6/15/23 (Nat'l. Pub. Fin. Guarantee Corp. Insured) | | 5,215 | 4,459 |
| Series 2010 B1: | | | |
| 0% 6/15/43 (FSA Insured) | | 41,985 | 13,909 |
| 0% 6/15/44 (FSA Insured) | | 48,430 | 15,297 |
| 0% 6/15/45 (FSA Insured) | | 25,250 | 7,603 |
| 0% 6/15/47 (FSA Insured) | | 3,000 | 820 |
| Series 2012 B, 0% 12/15/51 | | 10,845 | 2,114 |
| Series A: | | | |
| 0% 6/15/22 (Nat'l. Pub. Fin. Guarantee Corp. Insured) | | 1,045 | 929 |
| 0% 12/15/24 (Nat'l. Pub. Fin. Guarantee Corp. Insured) | | 2,560 | 2,056 |
| Series 1993: | | | |
| 0% 6/15/19 | | 2,300 | 2,271 |
| 0% 6/15/19 (Escrowed to Maturity) | | 470 | 466 |
| Series 1996 A, 0% 6/15/24 | | 2,535 | 2,078 |
| Series 2002, 5.5% 6/15/20 | | 220 | 222 |
| Series 2017 B: | | | |
| 5% 12/15/25 | | 830 | 892 |
| 5% 12/15/26 | | 2,755 | 2,970 |
| 5% 12/15/27 | | 295 | 318 |
| 5% 12/15/31 | | 560 | 598 |
| 5% 12/15/34 | | 330 | 349 |
| Series A, 0% 12/15/19 (Nat'l. Pub. Fin. Guarantee Corp. Insured) | | 1,785 | 1,737 |
| Railsplitter Tobacco Settlement Auth. Rev. Series 2017: | | | |
| 5% 6/1/27 | | 4,140 | 4,713 |
| 5% 6/1/28 | | 2,275 | 2,575 |
| Univ. of Illinois Rev.: | | | |
| (Auxiliary Facilities Sys. Proj.): | | | |
| Series 1991, 0% 4/1/20 (Nat'l. Pub. Fin. Guarantee Corp. Insured) | | 6,625 | 6,430 |
| Series 1999 A: | | | |
| 0% 4/1/20 (Nat'l. Pub. Fin. Guarantee Corp. Insured) | | 1,325 | 1,286 |
| 0% 4/1/21 (Nat'l. Pub. Fin. Guarantee Corp. Insured) | | 4,110 | 3,889 |
| Series 2010 A: | | | |
| 5% 4/1/25 | | 5,070 | 5,236 |
| 5.25% 4/1/30 | | 3,475 | 3,592 |
| Series 2013: | | | |
| 6% 10/1/42 | | 4,555 | 5,099 |
| 6.25% 10/1/38 | | 4,495 | 5,094 |
| Series 2018 A, 5% 4/1/30 | | 3,425 | 3,965 |
| Will County Cmnty. Unit School District #365-U: | | | |
| Series 2007 B, 0% 11/1/26 (FSA Insured) | | 5,095 | 4,014 |
| Series 2012, 0% 11/1/25 | | 985 | 806 |
| 0% 11/1/19 (Escrowed to Maturity) | | 1,215 | 1,195 |
| 0% 11/1/19 (FSA Insured) | | 7,790 | 7,650 |
| Will County Illinois Series 2016: | | | |
| 5% 11/15/31 | | 1,340 | 1,510 |
| 5% 11/15/32 | | 1,020 | 1,146 |
| 5% 11/15/33 | | 1,240 | 1,389 |
| 5% 11/15/34 | | 1,240 | 1,385 |
|
| TOTAL ILLINOIS | | | 1,120,336 |
|
| Indiana - 1.3% | | | |
| Crown Point Multi-School Bldg. Corp. 0% 1/15/21 (Nat'l. Pub. Fin. Guarantee Corp. Insured) | | 6,195 | 5,935 |
| Indiana Fin. Auth. Rev.: | | | |
| Series 2012: | | | |
| 5% 3/1/30 | | 3,790 | 4,073 |
| 5% 3/1/41 | | 6,920 | 7,349 |
| Series 2015 A, 5.25% 2/1/32 | | 5,845 | 6,783 |
| Series 2016: | | | |
| 4% 9/1/21 | | 330 | 346 |
| 5% 9/1/22 | | 250 | 275 |
| 5% 9/1/23 | | 375 | 420 |
| 5% 9/1/24 | | 560 | 638 |
| 5% 9/1/26 | | 1,075 | 1,256 |
| 5% 9/1/27 | | 540 | 624 |
| 5% 9/1/28 | | 2,535 | 2,910 |
| 5% 9/1/29 | | 1,240 | 1,417 |
| 5% 9/1/30 | | 1,160 | 1,318 |
| Indiana Fin. Auth. Wastewtr. Util. Rev.: | | | |
| (CWA Auth. Proj.): | | | |
| Series 2012 A: | | | |
| 5% 10/1/24 | | 330 | 367 |
| 5% 10/1/26 | | 2,105 | 2,334 |
| Series 2015 A, 5% 10/1/30 | | 3,990 | 4,502 |
| Series 2011 A, 5.25% 10/1/25 | | 1,450 | 1,574 |
| Indianapolis Local Pub. Impt. Series 2016: | | | |
| 4% 1/1/32 (d) | | 830 | 860 |
| 4% 1/1/33 (d) | | 830 | 857 |
| 4% 1/1/34 (d) | | 830 | 853 |
| 4% 1/1/35 (d) | | 2,300 | 2,355 |
| 5% 1/1/26 (d) | | 875 | 1,007 |
| Lake Central Multi-District School Bldg. Corp. Series 2012 B, 5% 1/15/30 | | 1,700 | 1,866 |
| Purdue Univ. Rev. Series 2018 DD: | | | |
| 5% 7/1/34 | | 995 | 1,183 |
| 5% 7/1/35 | | 1,960 | 2,323 |
| 5% 7/1/36 | | 2,130 | 2,511 |
| 5% 7/1/37 | | 1,970 | 2,313 |
| 5% 7/1/38 | | 2,600 | 3,041 |
| Zionsville Cmnty. Schools Bldg. Series 2005, 5% 7/15/20 (FSA Insured) | | 1,610 | 1,674 |
|
| TOTAL INDIANA | | | 62,964 |
|
| Iowa - 0.1% | | | |
| Iowa Fin. Auth. Rev. Series A: | | | |
| 5% 5/15/43 | | 1,145 | 1,183 |
| 5% 5/15/48 | | 2,010 | 2,069 |
|
| TOTAL IOWA | | | 3,252 |
|
| Kansas - 0.6% | | | |
| Kansas Dev. Fin. Agcy. Series 2009: | | | |
| 5.75% 11/15/38 (Pre-Refunded to 11/15/19 @ 100) | | 230 | 237 |
| 5.75% 11/15/38 (Pre-Refunded to 11/15/19 @ 100) | | 10,120 | 10,462 |
| Wyandotte County/Kansas City Unified Govt. Util. Sys. Rev.: | | | |
| Series 2012 A: | | | |
| 5% 9/1/23 | | 1,540 | 1,689 |
| 5% 9/1/25 | | 3,310 | 3,626 |
| 5% 9/1/26 | | 1,615 | 1,768 |
| Series 2016 A: | | | |
| 5% 9/1/40 | | 3,740 | 4,165 |
| 5% 9/1/45 | | 5,630 | 6,248 |
|
| TOTAL KANSAS | | | 28,195 |
|
| Kentucky - 0.9% | | | |
| Kenton County Arpt. Board Arpt. Rev. Series 2016: | | | |
| 5% 1/1/21 | | 540 | 571 |
| 5% 1/1/22 | | 600 | 649 |
| 5% 1/1/23 | | 350 | 386 |
| 5% 1/1/28 | | 1,310 | 1,498 |
| 5% 1/1/31 | | 1,240 | 1,399 |
| 5% 1/1/32 | | 1,240 | 1,392 |
| Kentucky Econ. Dev. Fin. Auth. Rev. Louisville Arena Auth., Inc. Series 2017 A, 5% 12/1/47 (FSA Insured) | | 1,340 | 1,437 |
| Kentucky State Property & Buildings Commission Rev. (Proj. No. 119) Series 2018: | | | |
| 5% 5/1/26 | | 830 | 954 |
| 5% 5/1/27 | | 2,435 | 2,817 |
| 5% 5/1/29 | | 4,510 | 5,211 |
| 5% 5/1/32 | | 1,185 | 1,357 |
| 5% 5/1/33 | | 915 | 1,044 |
| 5% 5/1/34 | | 1,045 | 1,187 |
| 5% 5/1/35 | | 615 | 695 |
| 5% 5/1/36 | | 520 | 585 |
| Louisville & Jefferson County Series 2013 A: | | | |
| 5.5% 10/1/33 | | 2,815 | 3,144 |
| 5.75% 10/1/38 | | 7,255 | 8,127 |
| Louisville/Jefferson County Metropolitan Gov. Series 2012 A: | | | |
| 5% 12/1/28 | | 615 | 656 |
| 5% 12/1/30 | | 600 | 637 |
| Pikeville Hosp. Rev. (Pikeville Med. Ctr., Inc. Proj.) Series 2011, 6.5% 3/1/41 | | 2,485 | 2,658 |
| Trimble County Poll. Cont. Rev. Bonds (Louisville Gas and Elec. Co. Proj.) Series 2001 B, 2.55%, tender 5/3/21 (a) | | 6,730 | 6,760 |
|
| TOTAL KENTUCKY | | | 43,164 |
|
| Louisiana - 0.9% | | | |
| Louisiana Pub. Facilities Auth. Rev.: | | | |
| (Tulane Univ. of Louisiana Proj.) Series 2016 A: | | | |
| 5% 12/15/24 | | 1,240 | 1,422 |
| 5% 12/15/25 | | 2,585 | 3,002 |
| 5% 12/15/26 | | 1,045 | 1,227 |
| 5% 12/15/28 | | 1,655 | 1,913 |
| 5% 12/15/29 | | 1,175 | 1,345 |
| 5% 12/15/30 | | 2,320 | 2,637 |
| Series 2018 E: | | | |
| 5% 7/1/37 | | 1,615 | 1,802 |
| 5% 7/1/38 | | 1,260 | 1,400 |
| New Orleans Aviation Board Rev.: | | | |
| (North Term. Proj.): | | | |
| Series 2015 B: | | | |
| 5% 1/1/27 (d) | | 1,160 | 1,290 |
| 5% 1/1/29 (d) | | 4,295 | 4,733 |
| 5% 1/1/30 (d) | | 5,795 | 6,360 |
| 5% 1/1/31 (d) | | 2,070 | 2,264 |
| 5% 1/1/40 (d) | | 6,860 | 7,374 |
| Series 2017 B: | | | |
| 5% 1/1/27 (d) | | 330 | 379 |
| 5% 1/1/28 (d) | | 205 | 234 |
| 5% 1/1/32 (d) | | 330 | 369 |
| 5% 1/1/33 (d) | | 580 | 647 |
| 5% 1/1/34 (d) | | 180 | 200 |
| 5% 1/1/35 (d) | | 330 | 365 |
| Series 2017 D2: | | | |
| 5% 1/1/27 (d) | | 415 | 477 |
| 5% 1/1/28 (d) | | 595 | 680 |
| 5% 1/1/31 (d) | | 530 | 596 |
| 5% 1/1/33 (d) | | 850 | 948 |
| 5% 1/1/34 (d) | | 1,020 | 1,133 |
| 5% 1/1/36 (d) | | 775 | 855 |
| 5% 1/1/37 (d) | | 1,275 | 1,402 |
|
| TOTAL LOUISIANA | | | 45,054 |
|
| Maine - 1.1% | | | |
| Maine Health & Higher Edl. Facilities Auth. Rev.: | | | |
| (Eastern Maine Healthcare Systems Proj.) Series 2013, 5% 7/1/43 | | 3,140 | 3,273 |
| Series 2013, 5% 7/1/25 | | 1,475 | 1,592 |
| Series 2016 A: | | | |
| 4% 7/1/41 | | 1,910 | 1,847 |
| 4% 7/1/46 | | 2,680 | 2,543 |
| 5% 7/1/41 | | 8,620 | 9,122 |
| 5% 7/1/46 | | 22,975 | 24,237 |
| Series 2017 B: | | | |
| 4% 7/1/25 | | 375 | 407 |
| 4% 7/1/31 | | 580 | 608 |
| 4% 7/1/32 | | 415 | 432 |
| 4% 7/1/34 | | 835 | 864 |
| 5% 7/1/26 | | 270 | 313 |
| 5% 7/1/28 | | 420 | 488 |
| 5% 7/1/29 | | 330 | 381 |
| 5% 7/1/33 | | 830 | 941 |
| 5% 7/1/35 | | 630 | 710 |
| Series 2017 D, 5.75% 7/1/38 | | 135 | 135 |
| Maine Tpk. Auth. Tpk. Rev. Series 2015: | | | |
| 5% 7/1/32 | | 870 | 988 |
| 5% 7/1/36 | | 2,150 | 2,413 |
| 5% 7/1/38 | | 555 | 619 |
|
| TOTAL MAINE | | | 51,913 |
|
| Maryland - 0.6% | | | |
| Baltimore Proj. Rev. (Wtr. Projs.) Series 2009 A: | | | |
| 5.375% 7/1/34 (Pre-Refunded to 7/1/19 @ 100) | | 155 | 158 |
| 5.375% 7/1/34 (Pre-Refunded to 7/1/19 @ 100) | | 260 | 265 |
| City of Westminster Series 2016: | | | |
| 5% 11/1/27 | | 2,150 | 2,405 |
| 5% 11/1/28 | | 2,275 | 2,531 |
| 5% 11/1/29 | | 2,410 | 2,662 |
| 5% 11/1/30 | | 2,555 | 2,804 |
| Maryland Econ. Dev. Auth. Rev. (Ports America Chesapeake LLC. Proj.) Series 2017 A: | | | |
| 5% 6/1/30 | | 1,035 | 1,185 |
| 5% 6/1/35 | | 1,655 | 1,855 |
| Maryland Econ. Dev. Corp. (Purple Line Lt. Rail Proj.) Series 2016 D: | | | |
| 5% 3/31/41 (d) | | 1,505 | 1,584 |
| 5% 3/31/46 (d) | | 2,485 | 2,607 |
| Maryland Health & Higher Edl. Facilities Auth. Rev.: | | | |
| (Medstar Health, Inc. Proj.) Series 2017 A, 5% 5/15/45 | | 2,645 | 2,896 |
| (Univ. of Maryland Med. Sys. Proj.) Series 2008 F, 5.25% 7/1/21 | | 830 | 831 |
| Series 2010, 5.625% 7/1/30 (Pre-Refunded to 7/1/20 @ 100) | | 2,785 | 2,939 |
| Series 2015, 5% 7/1/24 | | 625 | 704 |
| Series 2016 A: | | | |
| 4% 7/1/42 | | 1,430 | 1,411 |
| 5% 7/1/35 | | 575 | 631 |
| Rockville Mayor & Council Econ. Dev. (Rfdg.-Ingleside King Farm Proj.) Series 2017: | | | |
| 2.5% 11/1/24 | | 1,455 | 1,389 |
| 3% 11/1/25 | | 1,070 | 1,038 |
| 5% 11/1/30 | | 375 | 402 |
|
| TOTAL MARYLAND | | | 30,297 |
|
| Massachusetts - 1.9% | | | |
| Massachusetts Dev. Fin. Agcy. Rev.: | | | |
| (Lawrence Gen. Hosp. MA. Proj.) Series 2017: | | | |
| 5% 7/1/25 | | 170 | 188 |
| 5% 7/1/29 | | 590 | 650 |
| 5% 7/1/30 | | 630 | 691 |
| 5% 7/1/31 | | 665 | 727 |
| 5% 7/1/32 | | 830 | 903 |
| 5% 7/1/34 | | 830 | 897 |
| 5% 7/1/37 | | 830 | 886 |
| 5% 7/1/42 | | 745 | 788 |
| (Lawrence Gen. Hosp.) Series 2017: | | | |
| 5% 7/1/19 | | 230 | 233 |
| 5% 7/1/20 | | 370 | 383 |
| 5% 7/1/21 | | 380 | 401 |
| 5% 7/1/47 | | 1,160 | 1,222 |
| (Lesley Univ. Proj.) Series 2016, 5% 7/1/39 | | 1,360 | 1,509 |
| (Partners Healthcare Sys., Inc. Proj.): | | | |
| Series 2017 S: | | | |
| 5% 7/1/30 | | 3,210 | 3,768 |
| 5% 7/1/32 | | 11,870 | 13,780 |
| 5% 7/1/34 | | 3,500 | 4,021 |
| Series 2017, 4% 7/1/41 | | 8,280 | 8,386 |
| (Tufts Med. Ctr. Proj.) Series 2011, 6.75% 1/1/36 | | 1,310 | 1,428 |
| (Univ. of Massachusetts Health Cr., Inc. Proj.) Series 2017 L, 4% 7/1/44 | | 830 | 827 |
| (Wentworth Institute of Technology Proj.) Series 2017: | | | |
| 5% 10/1/27 | | 830 | 945 |
| 5% 10/1/28 | | 875 | 990 |
| 5% 10/1/29 | | 920 | 1,037 |
| 5% 10/1/31 | | 1,015 | 1,133 |
| 5% 10/1/32 | | 1,065 | 1,185 |
| Series 2016: | | | |
| 5% 10/1/29 | | 830 | 969 |
| 5% 10/1/30 | | 1,240 | 1,439 |
| 5% 7/1/31 | | 1,385 | 1,551 |
| 5% 10/1/31 | | 1,340 | 1,547 |
| Series 2017, 5% 7/1/27 | | 535 | 594 |
| Series BB1, 5% 10/1/46 | | 345 | 385 |
| Massachusetts Edl. Fing. Auth. Rev. Series 2017 B, 4.25% 7/1/46 (d) | | 8,280 | 8,391 |
| Massachusetts Gen. Oblig.: | | | |
| Series 2016 B, 5% 7/1/31 | | 2,005 | 2,331 |
| Series 2017 A, 5% 4/1/36 | | 1,750 | 2,009 |
| Series 2017 D, 5% 2/1/33 | | 4,460 | 5,179 |
| Series 2017 F, 5% 11/1/46 | | 2,485 | 2,816 |
| Massachusetts Health & Edl. Facilities Auth. Rev. (Blood Research Institute Proj.) Series A, 6.5% 2/1/22 | | 1,155 | 1,160 |
| Massachusetts Port Auth. Rev.: | | | |
| Series 2016 A: | | | |
| 5% 7/1/33 | | 1,740 | 2,011 |
| 5% 7/1/34 | | 895 | 1,031 |
| 5% 7/1/38 | | 1,300 | 1,479 |
| Series 2016 B, 5% 7/1/43 (d) | | 7,110 | 7,837 |
| Series 2017 A, 5% 7/1/25 (d) | | 1,500 | 1,735 |
|
| TOTAL MASSACHUSETTS | | | 89,442 |
|
| Michigan - 2.0% | | | |
| Detroit Downtown Dev. Auth. Tax: | | | |
| Series 2018 A, 5% 7/1/32 (FSA Insured) | | 1,000 | 1,079 |
| Series A, 5% 7/1/34 (FSA Insured) | | 1,000 | 1,072 |
| Detroit School District School Bldg. and Site Impt. Series 2012 A, 5% 5/1/23 | | 3,310 | 3,595 |
| Great Lakes Wtr. Auth. Sew Disp. Sys. Series 2018 A: | | | |
| 5% 7/1/43 | | 2,030 | 2,299 |
| 5% 7/1/48 | | 8,725 | 9,842 |
| Kalamazoo Hosp. Fin. Auth. Hosp. Facilities Rev. Series 2016, 5% 5/15/28 | | 1,955 | 2,208 |
| Lansing Board of Wtr. & Lt. Util. Rev. 5.5% 7/1/41 | | 2,485 | 2,683 |
| Michigan Bldg. Auth. Rev. (Facilities Prog.): | | | |
| Series 2015 I, 5% 4/15/30 | | 4,140 | 4,760 |
| Series 2016 I, 5% 4/15/24 | | 245 | 280 |
| Michigan Fin. Auth. Rev.: | | | |
| (Charter County of Wayne Criminal Justice Ctr. Proj.) Series 2018, 5% 11/1/43 | | 2,570 | 2,904 |
| (Trinity Health Proj.) Series 2017: | | | |
| 5% 12/1/35 | | 1,585 | 1,806 |
| 5% 12/1/42 | | 2,140 | 2,391 |
| Series 2012 A: | | | |
| 5% 6/1/20 (Escrowed to Maturity) | | 1,695 | 1,766 |
| 5% 6/1/21 (Escrowed to Maturity) | | 290 | 310 |
| 5% 6/1/27 (Pre-Refunded to 6/1/22 @ 100) | | 2,900 | 3,187 |
| Series 2012, 5% 11/15/42 | | 8,595 | 9,156 |
| Series 2015 MI, 5% 12/1/24 | | 3,680 | 4,222 |
| Series 2016, 5% 11/15/41 | | 1,560 | 1,681 |
| Series MI, 5.5% 12/1/27 | | 3,930 | 4,622 |
| Michigan Hosp. Fin. Auth. Rev.: | | | |
| (Trinity Health Proj.) Series 2008 C, 5% 12/1/32 | | 1,240 | 1,434 |
| Series 2012 A, 5% 6/1/26 | | 1,655 | 1,801 |
| 6.5% 12/1/33 (Pre-Refunded to 12/1/18 @ 100) | | 175 | 176 |
| Portage Pub. Schools Series 2016: | | | |
| 5% 11/1/30 | | 2,365 | 2,728 |
| 5% 11/1/31 | | 2,090 | 2,402 |
| 5% 11/1/36 | | 205 | 231 |
| Wayne County Arpt. Auth. Rev.: | | | |
| Series 2015 F, 5% 12/1/27 (d) | | 5,790 | 6,581 |
| Series 2015 G, 5% 12/1/28 (d) | | 4,555 | 5,156 |
| Series 2017 A: | | | |
| 4% 12/1/33 (FSA Insured) | | 1,230 | 1,304 |
| 4% 12/1/34 (FSA Insured) | | 1,020 | 1,071 |
| 4% 12/1/35 (FSA Insured) | | 995 | 1,047 |
| 4% 12/1/36 (FSA Insured) | | 1,035 | 1,082 |
| 5% 12/1/31 | | 310 | 358 |
| 5% 12/1/32 | | 315 | 362 |
| 5% 12/1/34 | | 580 | 665 |
| 5% 12/1/35 | | 540 | 617 |
| 5% 12/1/37 | | 355 | 400 |
| Series 2017 B: | | | |
| 5% 12/1/29 (d) | | 495 | 567 |
| 5% 12/1/30 (d) | | 580 | 660 |
| 5% 12/1/31 (d) | | 660 | 748 |
| 5% 12/1/32 (d) | | 420 | 475 |
| 5% 12/1/32 (d) | | 540 | 610 |
| 5% 12/1/34 (d) | | 495 | 556 |
| 5% 12/1/35 (d) | | 540 | 605 |
| 5% 12/1/37 (d) | | 705 | 783 |
| 5% 12/1/42 (d) | | 830 | 911 |
| Series 2018 D, 5% 12/1/29 (d) | | 3,645 | 4,249 |
|
| TOTAL MICHIGAN | | | 97,442 |
|
| Minnesota - 0.2% | | | |
| Maple Grove Health Care Sys. Rev.: | | | |
| Series 2015, 5% 9/1/29 | | 2,345 | 2,587 |
| Series 2017: | | | |
| 4% 5/1/21 | | 415 | 432 |
| 5% 5/1/25 | | 660 | 755 |
| Minnesota Higher Ed. Facilities Auth. Rev. Series 2018 A: | | | |
| 5% 10/1/30 | | 615 | 699 |
| 5% 10/1/45 | | 1,370 | 1,490 |
| Moorhead Edl. Facilities Rev. (The Concordia College Corp. Proj.) Series 2016, 5% 12/1/25 | | 990 | 1,091 |
| Saint Paul Hsg. & Redev. Auth. Hosp. Rev. (HealthEast Care Sys. Proj.) Series 2015 A, 5% 11/15/44 (Pre-Refunded to 11/15/25 @ 100) | | 1,255 | 1,473 |
|
| TOTAL MINNESOTA | | | 8,527 |
|
| Missouri - 0.5% | | | |
| Cape Girardeau County Indl. Dev. Auth. (Southeast Hosp. Proj.) Series 2017 A: | | | |
| 5% 3/1/30 | | 580 | 643 |
| 5% 3/1/31 | | 620 | 683 |
| 5% 3/1/36 | | 1,240 | 1,341 |
| Kansas City Spl. Oblig.: | | | |
| 5% 9/1/26 | | 980 | 999 |
| 5% 9/1/27 | | 405 | 413 |
| 5% 9/1/28 | | 830 | 846 |
| 5% 9/1/29 | | 830 | 846 |
| 5% 9/1/30 | | 1,150 | 1,172 |
| Missouri Dev. Fin. Board Infrastructure Facilities Rev. (City of Branson-Branson Landing Proj.) Series 2005 A, 6% 6/1/20 | | 710 | 729 |
| Missouri Health & Edl. Facilities Auth. Edl. Facilities Rev. Series 2015 B: | | | |
| 3.125% 2/1/27 | | 830 | 847 |
| 3.25% 2/1/28 | | 830 | 850 |
| 4% 2/1/40 | | 660 | 670 |
| 5% 2/1/29 | | 1,025 | 1,165 |
| 5% 2/1/31 | | 2,150 | 2,419 |
| 5% 2/1/33 | | 2,375 | 2,660 |
| 5% 2/1/36 | | 2,235 | 2,479 |
| Saint Louis County Indl. Dev. Auth. Sr. Living Facilities Rev. Series 2018 A: | | | |
| 5% 9/1/38 | | 1,395 | 1,399 |
| 5.125% 9/1/48 | | 2,460 | 2,463 |
|
| TOTAL MISSOURI | | | 22,624 |
|
| Nebraska - 0.3% | | | |
| Douglas County Neb Edl. Facilities Rev. (Creighton Univ. Proj.) Series 2017: | | | |
| 4% 7/1/34 | | 830 | 892 |
| 5% 7/1/36 | | 570 | 649 |
| Nebraska Pub. Pwr. District Rev. Series 2016 B: | | | |
| 5% 1/1/37 | | 2,050 | 2,304 |
| 5% 1/1/40 | | 935 | 1,042 |
| Omaha Arpt. Auth. Arpt. Rev.: | | | |
| Series 2017 A: | | | |
| 5% 12/15/22 (d) | | 620 | 685 |
| 5% 12/15/23 (d) | | 620 | 698 |
| 5% 12/15/25 (d) | | 330 | 381 |
| 5% 12/15/26 (d) | | 1,190 | 1,390 |
| 5% 12/15/27 (d) | | 830 | 964 |
| 5% 12/15/30 (d) | | 1,240 | 1,417 |
| 5% 12/15/31 (d) | | 650 | 741 |
| 5% 12/15/33 (d) | | 660 | 749 |
| 5% 12/15/35 (d) | | 1,655 | 1,869 |
| 5% 12/15/36 (d) | | 420 | 473 |
| Series 2017 C, 5% 12/15/21 (d) | | 340 | 368 |
|
| TOTAL NEBRASKA | | | 14,622 |
|
| Nevada - 0.5% | | | |
| Clark County Arpt. Rev. (Sub Lien Proj.) Series 2017 A-1, 5% 7/1/21 (d) | | 5,770 | 6,157 |
| Clark County McCarran Int'l. Arpt. Passenger Facility Charge Rev. (Clark County Arpt. Rev. Proj.) Series 2017 B: | | | |
| 5% 7/1/20 (d) | | 1,625 | 1,693 |
| 5% 7/1/22 (d) | | 1,865 | 2,031 |
| 5% 7/1/23 (d) | | 3,310 | 3,663 |
| Las Vegas Valley Wtr. District Wtr. Impt. Gen. Oblig.: | | | |
| Series 2011 C, 5% 6/1/24 | | 4,485 | 4,797 |
| Series 2016 B, 5% 6/1/36 | | 3,750 | 4,269 |
|
| TOTAL NEVADA | | | 22,610 |
|
| New Hampshire - 1.8% | | | |
| New Hampshire Health & Ed. Facilities Auth.: | | | |
| (Concord Hosp.) Series 2017, 5% 10/1/42 | | 2,485 | 2,736 |
| (Dartmouth-Hitchcock Oblgtd Grp Proj.) Series 2018 A: | | | |
| 5% 8/1/28 | | 415 | 487 |
| 5% 8/1/30 | | 830 | 963 |
| (Dartmouth-Hitchcock Oblgtd Grp Proj.) Series 2018 A, 5% 8/1/29 | | 705 | 822 |
| (Partners Healthcare Sys., Inc. Proj.): | | | |
| Series 2017: | | | |
| 5% 7/1/29 | | 3,540 | 4,186 |
| 5% 7/1/34 | | 4,415 | 5,069 |
| Series 2017: | | | |
| 5% 7/1/28 | | 3,330 | 3,958 |
| 5% 7/1/30 | | 2,125 | 2,494 |
| 5% 7/1/31 | | 4,760 | 5,555 |
| 5% 7/1/32 | | 3,185 | 3,698 |
| 5% 7/1/33 | | 2,900 | 3,349 |
| 5% 7/1/35 | | 4,635 | 5,298 |
| 5% 7/1/36 | | 4,870 | 5,534 |
| 5% 7/1/37 | | 4,290 | 4,850 |
| Series 2017 B, 4.125% 7/1/24 (c) | | 1,750 | 1,753 |
| Series 2017 C, 3.5% 7/1/22 (c) | | 550 | 550 |
| New Hampshire Health & Ed. Facilities Auth. Rev.: | | | |
| (Covenant Health Sys., Inc. Proj.) Series 2012, 5% 7/1/42 | | 310 | 321 |
| Series 2012: | | | |
| 4% 7/1/32 | | 2,295 | 2,351 |
| 5% 7/1/24 | | 830 | 903 |
| 5% 7/1/25 | | 980 | 1,063 |
| 5% 7/1/27 | | 415 | 447 |
| Series 2016: | | | |
| 3% 10/1/20 | | 465 | 471 |
| 4% 10/1/38 | | 2,010 | 1,972 |
| 5% 10/1/22 | | 885 | 957 |
| 5% 10/1/24 | | 1,755 | 1,953 |
| 5% 10/1/25 | | 1,740 | 1,954 |
| 5% 10/1/29 | | 5,525 | 6,142 |
| 5% 10/1/31 | | 4,315 | 4,757 |
| 5% 10/1/33 | | 3,355 | 3,672 |
| 5% 10/1/38 | | 6,185 | 6,644 |
| New Hampshire Tpk. Sys. Rev. Series 2012 B, 5% 2/1/24 | | 1,470 | 1,593 |
|
| TOTAL NEW HAMPSHIRE | | | 86,502 |
|
| New Jersey - 6.3% | | | |
| Atlantic County Impt. Auth. (Atlantic City Campus Proj.) Series 2016 A: | | | |
| 5% 7/1/28 (FSA Insured) | | 860 | 986 |
| 5% 7/1/30 (FSA Insured) | | 2,105 | 2,395 |
| 5% 7/1/32 (FSA Insured) | | 1,035 | 1,170 |
| 5% 7/1/33 (FSA Insured) | | 1,075 | 1,211 |
| New Jersey Econ. Dev. Auth. Rev.: | | | |
| (New Jersey Gen. Oblig. Proj.): | | | |
| Series 2015 XX, 5% 6/15/25 | | 10,905 | 12,088 |
| Series 2017 B: | | | |
| 5% 11/1/23 | | 14,900 | 16,314 |
| 5% 11/1/24 | | 5,795 | 6,397 |
| Series 2009 AA, 5.5% 12/15/29 | | 1,380 | 1,399 |
| Series 2013 NN: | | | |
| 5% 3/1/26 | | 4,125 | 4,427 |
| 5% 3/1/27 | | 51,700 | 55,275 |
| 5% 3/1/29 | | 2,055 | 2,182 |
| Series 2013: | | | |
| 5% 3/1/23 | | 16,455 | 17,847 |
| 5% 3/1/24 | | 14,900 | 16,106 |
| 5% 3/1/25 | | 1,820 | 1,961 |
| Series 2015 XX: | | | |
| 5% 6/15/22 | | 2,720 | 2,923 |
| 5% 6/15/23 | | 4,140 | 4,511 |
| 5.25% 6/15/27 | | 14,075 | 15,640 |
| Series 2016 AAA: | | | |
| 5.5% 6/15/31 | | 1,655 | 1,861 |
| 5.5% 6/15/32 | | 4,140 | 4,634 |
| Series 2016 BBB: | | | |
| 5% 6/15/21 | | 3,310 | 3,498 |
| 5% 6/15/22 | | 5,355 | 5,754 |
| 5% 6/15/23 | | 8,620 | 9,393 |
| New Jersey Econ. Dev. Auth. Spl. Facilities Rev. (Port Newark Container Term. LLC. Proj.) Series 2017: | | | |
| 5% 10/1/21 (d) | | 1,240 | 1,319 |
| 5% 10/1/22 (d) | | 780 | 842 |
| 5% 10/1/23 (d) | | 1,240 | 1,356 |
| 5% 10/1/37 (d) | | 4,590 | 4,891 |
| 5% 10/1/47 (d) | | 7,450 | 7,832 |
| New Jersey Edl. Facility Series 2016 A: | | | |
| 5% 7/1/31 | | 1,740 | 1,931 |
| 5% 7/1/32 | | 1,985 | 2,196 |
| New Jersey Health Care Facilities Fing. Auth. Rev.: | | | |
| Series 2016 A: | | | |
| 5% 7/1/20 | | 415 | 431 |
| 5% 7/1/21 | | 275 | 293 |
| 5% 7/1/22 | | 275 | 299 |
| 5% 7/1/23 | | 970 | 1,072 |
| 5% 7/1/24 | | 1,600 | 1,792 |
| 5% 7/1/25 | | 1,660 | 1,880 |
| 5% 7/1/26 | | 915 | 1,044 |
| 5% 7/1/26 | | 275 | 314 |
| 5% 7/1/27 | | 420 | 477 |
| 5% 7/1/27 | | 620 | 726 |
| 5% 7/1/28 | | 300 | 349 |
| 5% 7/1/29 | | 580 | 652 |
| 5% 7/1/29 | | 415 | 466 |
| 5% 7/1/30 | | 690 | 770 |
| 5% 7/1/30 | | 830 | 954 |
| Series 2016: | | | |
| 4% 7/1/48 | | 2,400 | 2,323 |
| 5% 7/1/41 | | 2,865 | 3,045 |
| New Jersey Higher Ed. Student Assistance Auth. Student Ln. Rev.: | | | |
| Series 2017 1A: | | | |
| 5% 12/1/22 (d) | | 1,000 | 1,088 |
| 5% 12/1/23 (d) | | 1,675 | 1,850 |
| 5% 12/1/26 (d) | | 830 | 948 |
| Series 2017 1B, 5% 12/1/21 (d) | | 1,060 | 1,133 |
| Series 2018 B: | | | |
| 5% 12/1/25 (d) | | 3,495 | 3,959 |
| 5% 12/1/26 (d) | | 1,035 | 1,182 |
| Series 2018 C, 4% 12/1/48 (d) | | 1,835 | 1,785 |
| New Jersey Trans. Trust Fund Auth.: | | | |
| Series 2001 A, 6% 6/15/35 | | 3,230 | 3,457 |
| Series 2005 B, 5.25% 12/15/22 (AMBAC Insured) | | 330 | 362 |
| Series 2010 D, 5.25% 12/15/23 | | 5,220 | 5,784 |
| Series 2014 AA: | | | |
| 5% 6/15/23 | | 21,440 | 23,363 |
| 5% 6/15/24 | | 8,280 | 9,102 |
| Series 2016 A: | | | |
| 5% 6/15/27 | | 2,250 | 2,523 |
| 5% 6/15/28 | | 9,150 | 10,195 |
| 5% 6/15/29 | | 1,865 | 2,070 |
| Series 2016 A-2, 5% 6/15/23 | | 4,455 | 4,880 |
| South Jersey Port Corp. Rev.: | | | |
| (New Jersey Gen. Oblig. Proj.) Series 2017 B: | | | |
| 5% 1/1/42 (d) | | 2,485 | 2,656 |
| 5% 1/1/48 (d) | | 1,655 | 1,760 |
| (New Jersey Gen. Oblig. Proj.) Series 2017 B, 5% 1/1/37 (d) | | 830 | 899 |
|
| TOTAL NEW JERSEY | | | 304,222 |
|
| New York - 4.8% | | | |
| Dorm. Auth. New York Univ. Rev.: | | | |
| (Fordham Univ. Proj.) Series 2017: | | | |
| 4% 7/1/33 | | 1,035 | 1,096 |
| 4% 7/1/34 | | 1,035 | 1,090 |
| Series 2017 4% 12/1/20 (c) | | 800 | 823 |
| Series 2017: | | | |
| 4% 12/1/21 (c) | | 900 | 936 |
| 5% 12/1/22 (c) | | 1,400 | 1,524 |
| 5% 12/1/23 (c) | | 1,200 | 1,327 |
| 5% 12/1/24 (c) | | 1,100 | 1,235 |
| 5% 12/1/25 (c) | | 1,200 | 1,362 |
| Hudson Yards Infrastructure Corp. New York Rev. Series 2012 A: | | | |
| 5.75% 2/15/47 | | 5,445 | 5,835 |
| 5.75% 2/15/47 (Pre-Refunded to 2/15/21 @ 100) | | 250 | 271 |
| Long Island Pwr. Auth. Elec. Sys. Rev. Series 2012 A, 5% 9/1/42 | | 10,760 | 11,605 |
| MTA Hudson Rail Yards Trust Oblig. Series 2016 A, 5% 11/15/56 | | 26,320 | 27,963 |
| New York City Gen. Oblig.: | | | |
| Series 2003 A, 5.5% 8/1/20 (Nat'l. Pub. Fin. Guarantee Corp. Insured) | | 5 | 5 |
| Series 2009, 5.625% 4/1/29 | | 120 | 121 |
| Series 2012 A1, 5% 8/1/24 | | 6,125 | 6,575 |
| Series 2012 E, 5% 8/1/24 | | 4,140 | 4,504 |
| Series 2015 C, 5% 8/1/27 | | 580 | 668 |
| Series 2016 C and D, 5% 8/1/28 | | 2,175 | 2,527 |
| Series 2016 E, 5% 8/1/28 | | 3,645 | 4,273 |
| New York City Indl. Dev. Agcy. Rev.: | | | |
| (Queens Baseball Stadium Proj.) 5% 1/1/19 (AMBAC Insured) | | 3,090 | 3,090 |
| (Yankee Stadium Proj.) Series 2006, 5% 3/1/31 | | 3,910 | 3,938 |
| New York City Muni. Wtr. Fin. Auth. Wtr. & Swr. Sys. Rev.: | | | |
| Series 2011 EE, 5.375% 6/15/43 | | 17,505 | 18,570 |
| Series 2012 EE, 5.25% 6/15/30 | | 5,960 | 6,596 |
| Series 2013 2, 5% 6/15/47 | | 1,750 | 1,900 |
| Series 2013 BB, 5% 6/15/47 | | 7,440 | 8,165 |
| New York City Transitional Fin. Auth. Bldg. Aid Rev.: | | | |
| Series 2009 S3, 5.25% 1/15/34 | | 14,735 | 14,753 |
| Series 2015 S1, 5% 7/15/43 | | 4,140 | 4,553 |
| Series 2015 S2, 5% 7/15/35 | | 1,465 | 1,646 |
| New York Dorm. Auth. Mental Health Svcs. Facilities Impt. Rev. Series 2012 A, 5% 5/15/23 | | 4,635 | 5,089 |
| New York Dorm. Auth. Personal Income Tax Rev. Series 2014 A, 5% 2/15/39 (Pre-Refunded to 2/15/19 @ 100) | | 5 | 5 |
| New York Dorm. Auth. Revs. Series 2010 A, 5% 7/1/26 | | 3,310 | 3,452 |
| New York Dorm. Auth. Sales Tax Rev. Series 2016 A, 5% 3/15/34 | | 5,630 | 6,449 |
| New York Metropolitan Trans. Auth. Rev.: | | | |
| Series 2012 D, 5% 11/15/25 | | 25,250 | 27,572 |
| Series 2012 F, 5% 11/15/24 | | 10,265 | 11,249 |
| Series 2014 B, 5% 11/15/44 | | 8,280 | 8,920 |
| Series 2015 A1, 5% 11/15/45 | | 6,170 | 6,683 |
| New York State Dorm. Auth. Series A: | | | |
| 5% 2/15/34 | | 45 | 45 |
| 5% 2/15/39 | | 185 | 186 |
| New York Trans. Dev. Corp. (Laguardia Arpt. Term. Redev. Proj.) Series 2016 A, 5% 7/1/41 (d) | | 3,560 | 3,752 |
| New York Urban Dev. Corp. Rev.: | | | |
| (New York State Gen. Oblig. Proj.) Series 2017 A, 5% 3/15/34 | | 5,215 | 6,001 |
| Gen. Oblig. (New York State Gen. Oblig. Proj.) Series 2017 A, 5% 3/15/32 | | 4,470 | 5,186 |
| Onondaga Civic Dev. Corp. (Le Moyne College Proj.) Series 2018, 5% 1/1/43 | | 830 | 897 |
| Rockland County Gen. Oblig. Series 2014 A: | | | |
| 4% 3/1/23 (FSA Insured) | | 930 | 999 |
| 4% 3/1/24 (FSA Insured) | | 1,140 | 1,238 |
| Triborough Bridge & Tunnel Auth. Revs. Series 2015 A, 5.25% 11/15/45 | | 4,140 | 4,746 |
|
| TOTAL NEW YORK | | | 229,420 |
|
| North Carolina - 0.6% | | | |
| Charlotte Int'l. Arpt. Rev.: | | | |
| Series 2017 A: | | | |
| 5% 7/1/30 | | 1,265 | 1,495 |
| 5% 7/1/33 | | 1,040 | 1,216 |
| 5% 7/1/37 | | 2,910 | 3,348 |
| Series 2017 B: | | | |
| 5% 7/1/20 (d) | | 165 | 172 |
| 5% 7/1/21 (d) | | 175 | 187 |
| 5% 7/1/22 (d) | | 125 | 137 |
| 5% 7/1/23 (d) | | 135 | 151 |
| 5% 7/1/24 (d) | | 155 | 176 |
| 5% 7/1/25 (d) | | 85 | 98 |
| 5% 7/1/26 (d) | | 85 | 99 |
| 5% 7/1/27 (d) | | 160 | 189 |
| 5% 7/1/28 (d) | | 135 | 158 |
| 5% 7/1/29 (d) | | 195 | 227 |
| 5% 7/1/30 (d) | | 210 | 244 |
| 5% 7/1/31 (d) | | 395 | 457 |
| 5% 7/1/32 (d) | | 420 | 484 |
| 5% 7/1/33 (d) | | 440 | 505 |
| 5% 7/1/34 (d) | | 460 | 526 |
| 5% 7/1/35 (d) | | 315 | 359 |
| 5% 7/1/36 (d) | | 255 | 289 |
| 5% 7/1/37 (d) | | 300 | 339 |
| 5% 7/1/42 (d) | | 975 | 1,090 |
| Series 2017 C, 4% 7/1/32 | | 1,190 | 1,285 |
| Nash Health Care Sys. Health Care Facilities Rev.: | | | |
| Series 2012, 5% 11/1/41 | | 4,490 | 4,718 |
| 5% 11/1/30 (FSA Insured) | | 1,055 | 1,057 |
| North Carolina Med. Care Cmnty. Health: | | | |
| Series 2012 A, 5% 11/15/26 | | 1,070 | 1,153 |
| Series 2017, 5% 10/1/31 | | 1,405 | 1,448 |
| North Carolina Med. Care Commission Health Care Facilities Rev. (Rex Healthcare Proj.) Series 2010 A, 5% 7/1/30 | | 7,805 | 8,098 |
| North Carolina Muni. Pwr. Agcy. #1 Catawba Elec. Rev. Series 2009 A, 5% 1/1/30 | | 790 | 792 |
|
| TOTAL NORTH CAROLINA | | | 30,497 |
|
| North Dakota - 0.1% | | | |
| Cass County Health Care Facilities Rev. (Essentia Health Obligated Group Proj.) Series 2008, 5.125% 2/15/37 (Assured Guaranty Corp. Insured) | | 4,430 | 4,563 |
| McLean County Solid Waste Facilities Rev. (Great River Energy Projs.) Series 2010 B, 5.15% 7/1/40 | | 1,905 | 1,970 |
|
| TOTAL NORTH DAKOTA | | | 6,533 |
|
| Ohio - 1.9% | | | |
| Akron Bath Copley Hosp. District Rev. Series 2016, 5.25% 11/15/46 | | 7,285 | 7,956 |
| Allen County Hosp. Facilities Rev. (Mercy Health): | | | |
| Series 2017 A: | | | |
| 5% 8/1/25 | | 2,475 | 2,837 |
| 5% 8/1/26 | | 1,645 | 1,906 |
| 5% 8/1/27 | | 2,060 | 2,409 |
| 5% 8/1/28 | | 2,060 | 2,408 |
| 5% 8/1/29 | | 4,130 | 4,800 |
| 5% 8/1/30 | | 3,520 | 4,070 |
| Series 2017 B, 5%, tender 5/5/22 (a) | | 3,030 | 3,315 |
| American Muni. Pwr., Inc. Rev.: | | | |
| (Prairie State Energy Campus Proj.) Series 2015, 5% 2/15/28 | | 11,675 | 13,015 |
| Series 2012 B: | | | |
| 5% 2/15/42 | | 1,615 | 1,715 |
| 5% 2/15/42 (Pre-Refunded to 2/15/22 @ 100) | | 460 | 502 |
| Columbus City School District 5% 12/1/29 | | 1,740 | 2,029 |
| Franklin County Hosp. Facilities Rev. (Ohiohealth Corp. Proj.) Series 2015, 5% 5/15/40 | | 5,525 | 6,030 |
| Hamilton County Convention Facilities Auth. Rev. Series 2014: | | | |
| 5% 12/1/25 | | 2,975 | 3,298 |
| 5% 12/1/26 | | 555 | 614 |
| Lake County Hosp. Facilities Rev.: | | | |
| Series 2015: | | | |
| 5% 8/15/29 | | 1,160 | 1,294 |
| 5% 8/15/30 | | 1,245 | 1,382 |
| 5.75% 8/15/38 | | 135 | 135 |
| 6% 8/15/43 | | 660 | 662 |
| Muskingum County Hosp. Facilities (Genesis Healthcare Sys. Obligated Group Proj.) Series 2013: | | | |
| 5% 2/15/33 | | 3,685 | 3,816 |
| 5% 2/15/44 | | 4,415 | 4,507 |
| 5% 2/15/48 | | 11,260 | 11,460 |
| Ohio Tpk. Commission Tpk. Rev. (Infrastructure Proj.) Series 2005 A, 0% 2/15/42 | | 2,150 | 857 |
| Scioto County Hosp. Facilities Rev. Series 2016: | | | |
| 5% 2/15/29 | | 1,815 | 2,057 |
| 5% 2/15/34 | | 370 | 409 |
| Univ. of Akron Gen. Receipts Series 2016 A, 5% 1/1/35 | | 3,725 | 4,190 |
| Wood County Hosp. Facilities Rev. (Wood County Hosp. Assoc. Proj.) Series 2012: | | | |
| 5% 12/1/32 | | 620 | 647 |
| 5% 12/1/42 | | 825 | 848 |
|
| TOTAL OHIO | | | 89,168 |
|
| Oklahoma - 0.3% | | | |
| Canadian Cny Edl. Facilities Auth. (Mustang Pub. Schools Proj.) Series 2017: | | | |
| 5% 9/1/26 | | 2,305 | 2,696 |
| 5% 9/1/28 | | 1,210 | 1,395 |
| Oklahoma City Pub. Property Auth. Hotel Tax Rev. Series 2015: | | | |
| 5% 10/1/28 | | 1,050 | 1,211 |
| 5% 10/1/29 | | 1,160 | 1,333 |
| 5% 10/1/36 | | 830 | 938 |
| 5% 10/1/39 | | 1,655 | 1,864 |
| Oklahoma Dev. Fin. Auth. Health Sys. Rev. (OU Medicine Proj.) Series 2018 B: | | | |
| 5% 8/15/22 | | 415 | 448 |
| 5% 8/15/23 | | 215 | 236 |
| 5% 8/15/33 | | 910 | 1,006 |
| 5% 8/15/38 | | 2,650 | 2,840 |
| Oklahoma Pwr. Auth. Pwr. Supply Sys. Rev. Series 2014 A, 5% 1/1/38 | | 1,070 | 1,203 |
|
| TOTAL OKLAHOMA | | | 15,170 |
|
| Oregon - 0.0% | | | |
| Clackamas County Hosp. Facility Auth. (Willamette View Proj.) Series 2017 B, 3% 11/15/22 | | 660 | 660 |
| Oregon Facilities Auth. Rev. (Legacy Health Sys. Proj.) Series 2009 A, 5% 3/15/30 | | 830 | 855 |
| Oregon State Dept. of Administrative Svcs. Lottery Rev. Series 2011 A, 5.25% 4/1/31 | | 645 | 690 |
|
| TOTAL OREGON | | | 2,205 |
|
| Pennsylvania - 6.8% | | | |
| Allegheny County Hosp. Dev. Auth. Rev. (Univ. of Pittsburgh Med. Ctr. Proj.) Series 2009 A, 5.625% 8/15/39 | | 6,065 | 6,183 |
| Cap. Region Wtr. Wtr. Rev. Series 2018: | | | |
| 5% 7/15/27 | | 830 | 975 |
| 5% 7/15/29 | | 1,290 | 1,517 |
| 5% 7/15/32 | | 830 | 960 |
| Centre County Pennsylvania Hosp. Auth. Rev. (Mount Nittany Med. Ctr. Proj.): | | | |
| Series 2011, 7% 11/15/46 (Pre-Refunded to 11/15/21 @ 100) | | 2,565 | 2,921 |
| Series 2018 A, 5% 11/15/23 | | 1,075 | 1,201 |
| Dauphin County Gen. Auth. (Pinnacle Health Sys. Proj.) Series 2016 A: | | | |
| 5% 6/1/21 | | 290 | 309 |
| 5% 6/1/23 | | 415 | 462 |
| 5% 6/1/28 | | 885 | 1,015 |
| 5% 6/1/29 | | 970 | 1,108 |
| Delaware County Auth. Rev. (Cabrini College) Series 2017, 5% 7/1/47 | | 3,310 | 3,485 |
| Doylestown Hosp. Auth. Hosp. Rev. Series 2016 A, 5% 7/1/46 | | 1,205 | 1,247 |
| Dubois Hosp. Auth. Hosp. Rev. (Penn Highlands Healthcare Proj.) Series 2018: | | | |
| 4% 7/15/33 | | 2,070 | 2,133 |
| 4% 7/15/35 | | 2,135 | 2,182 |
| 4% 7/15/37 | | 4,140 | 4,184 |
| 5% 7/15/25 | | 330 | 378 |
| 5% 7/15/26 | | 1,035 | 1,197 |
| 5% 7/15/27 | | 1,745 | 2,032 |
| 5% 7/15/28 | | 1,285 | 1,495 |
| 5% 7/15/29 | | 1,385 | 1,603 |
| 5% 7/15/30 | | 1,815 | 2,086 |
| 5% 7/15/31 | | 1,240 | 1,420 |
| 5% 7/15/32 | | 1,305 | 1,488 |
| 5% 7/15/34 | | 1,405 | 1,591 |
| 5% 7/15/36 | | 4,150 | 4,659 |
| 5% 7/15/38 | | 4,990 | 5,525 |
| 5% 7/15/43 | | 5,795 | 6,364 |
| Lehigh County Gen. Purp. Auth. Rev. (Muhlenberg College Proj.) Series 2017, 5% 2/1/39 | | 2,140 | 2,386 |
| Lehigh County Indl. Dev. Auth. Poll. Cont. Rev. Bonds (PPL Elec. Utils. Corp. Proj.) Series 2016 A, 1.8%, tender 9/1/22 (a) | | 4,145 | 4,016 |
| Monroe County Hosp. Auth. Rev. Series 2016: | | | |
| 5% 7/1/26 | | 830 | 950 |
| 5% 7/1/27 | | 830 | 951 |
| 5% 7/1/28 | | 830 | 947 |
| 5% 7/1/34 | | 3,045 | 3,397 |
| 5% 7/1/36 | | 1,655 | 1,835 |
| Montgomery County Higher Ed. & Health Auth. Hosp. Rev. (Abington Memorial Hosp. Proj.): | | | |
| Series 1993 A, 6% 6/1/22 (AMBAC Insured) | | 1,655 | 1,823 |
| Series 2012 A, 5% 6/1/27 (Pre-Refunded to 6/1/22 @ 100) | | 3,400 | 3,731 |
| Montgomery County Higher Ed. & Health Auth. Rev.: | | | |
| Series 2014 A: | | | |
| 5% 10/1/21 | | 1,095 | 1,160 |
| 5% 10/1/22 | | 1,140 | 1,229 |
| 5% 10/1/23 | | 325 | 356 |
| 5% 10/1/24 | | 965 | 1,071 |
| 5% 10/1/25 | | 865 | 956 |
| 5% 10/1/27 | | 415 | 454 |
| Series 2016 A: | | | |
| 5% 10/1/28 | | 1,255 | 1,416 |
| 5% 10/1/29 | | 2,150 | 2,417 |
| 5% 10/1/31 | | 3,790 | 4,219 |
| 5% 10/1/36 | | 6,790 | 7,394 |
| 5% 10/1/40 | | 3,320 | 3,562 |
| Northampton County Gen. Purp. Auth. Hosp. Rev.: | | | |
| (St Lukes Hosp. & Health Ntw Proj.) Series 2016 A, 5% 8/15/36 | | 615 | 682 |
| (St. Luke's Univ. Health Network Proj.) Series 2018 A, 4% 8/15/48 | | 10,545 | 10,578 |
| Series 2016 A, 5% 8/15/46 | | 24,835 | 27,115 |
| Pennsylvania Econ. Dev. Fin. Auth. Unemployment Compensation Rev. Series 2012 B, 5% 7/1/21 | | 780 | 780 |
| Pennsylvania Higher Edl. Facilities Auth. Rev.: | | | |
| (Drexel Univ. Proj.): | | | |
| Series 2016, 5% 5/1/35 | | 2,880 | 3,200 |
| Series 2017: | | | |
| 5% 5/1/35 | | 1,025 | 1,159 |
| 5% 5/1/37 | | 1,295 | 1,449 |
| 5% 5/1/41 | | 5,860 | 6,480 |
| Series 2016: | | | |
| 5% 5/1/28 | | 415 | 476 |
| 5% 5/1/32 | | 1,040 | 1,169 |
| 5% 5/1/33 | | 1,405 | 1,575 |
| Series 2018 A, 5% 2/15/48 | | 1,575 | 1,810 |
| Philadelphia Arpt. Rev.: | | | |
| Series 2017 A: | | | |
| 5% 7/1/25 | | 830 | 962 |
| 5% 7/1/26 | | 830 | 972 |
| 5% 7/1/27 | | 660 | 780 |
| Series 2017 B: | | | |
| 5% 7/1/22 (d) | | 1,820 | 1,981 |
| 5% 7/1/22 | | 240 | 263 |
| 5% 7/1/23 (d) | | 1,240 | 1,374 |
| 5% 7/1/23 | | 415 | 465 |
| 5% 7/1/25 (d) | | 2,900 | 3,315 |
| 5% 7/1/26 (d) | | 2,485 | 2,865 |
| 5% 7/1/27(d) | | 2,070 | 2,404 |
| 5% 7/1/28 (d) | | 2,485 | 2,867 |
| 5% 7/1/29 (d) | | 1,865 | 2,140 |
| 5% 7/1/32 (d) | | 2,485 | 2,811 |
| 5% 7/1/33 (d) | | 1,865 | 2,103 |
| 5% 7/1/34 (d) | | 3,310 | 3,719 |
| 5% 7/1/37 (d) | | 3,725 | 4,141 |
| 5% 7/1/42 (d) | | 11,175 | 12,285 |
| 5% 7/1/47 (d) | | 15,730 | 17,245 |
| Philadelphia Gas Works Rev. Series 9, 5.25% 8/1/40 | | 2,305 | 2,404 |
| Philadelphia School District: | | | |
| Series 2016 D: | | | |
| 5% 9/1/25 | | 7,275 | 8,260 |
| 5% 9/1/26 | | 7,600 | 8,700 |
| 5% 9/1/27 | | 8,020 | 9,152 |
| 5% 9/1/28 | | 6,705 | 7,612 |
| Series 2016 F: | | | |
| 5% 9/1/28 | | 11,600 | 13,168 |
| 5% 9/1/29 | | 7,540 | 8,532 |
| Series 2018 A: | | | |
| 5% 9/1/36 | | 1,575 | 1,754 |
| 5% 9/1/37 | | 910 | 1,008 |
| 5% 9/1/38 | | 1,450 | 1,599 |
| Series 2018 B, 5% 9/1/43 | | 2,115 | 2,304 |
| Series F: | | | |
| 5% 9/1/30 | | 5,625 | 6,328 |
| 5% 9/1/30 (Pre-Refunded to 9/1/26 @ 100) | | 20 | 24 |
| Philadelphia Wtr. & Wastewtr. Rev. Series 2018 A: | | | |
| 5% 10/1/35 | | 4,190 | 4,828 |
| 5% 10/1/36 | | 6,210 | 7,128 |
| 5% 10/1/48 | | 6,000 | 6,716 |
| Scranton-Lackawanna Health & Welfare Auth. Rev. (Marywood Univ. Proj.) Series 2016, 5% 6/1/36 | | 3,310 | 3,338 |
| State Pub. School Bldg. Auth. Lease Rev. (Philadelphia School District Proj.) Series 2015 A, 5% 6/1/26 | | 1,055 | 1,188 |
| Union County Hosp. Auth. Rev. Series 2018 B: | | | |
| 5% 8/1/43 | | 4,605 | 5,083 |
| 5% 8/1/48 | | 5,335 | 5,872 |
|
| TOTAL PENNSYLVANIA | | | 328,153 |
|
| Rhode Island - 0.3% | | | |
| Rhode Island Health & Edl. Bldg. Corp. Higher Ed. Facilities Rev.: | | | |
| Series 2016 B: | | | |
| 5% 9/1/31 | | 655 | 703 |
| 5% 9/1/36 | | 5,810 | 6,119 |
| Series 2016, 5% 5/15/39 | | 5,215 | 5,617 |
| Rhode Island Student Ln. Auth. Student Ln. Rev. Series A, 3.5% 12/1/34 (d) | | 3,040 | 3,057 |
|
| TOTAL RHODE ISLAND | | | 15,496 |
|
| South Carolina - 3.6% | | | |
| Scago Edl. Facilities Corp. for Colleton School District (School District of Colleton County Proj.) Series 2015: | | | |
| 5% 12/1/25 | | 2,275 | 2,598 |
| 5% 12/1/26 | | 1,160 | 1,318 |
| 5% 12/1/28 | | 4,690 | 5,300 |
| South Carolina Jobs-Econ. Dev. Auth. Econ. Dev. Rev.: | | | |
| (Bon Secours Health Sys. Proj.) Series 2013, 5% 11/1/28 (Pre-Refunded to 11/1/22 @ 100) | | 2,400 | 2,654 |
| Series 2013, 5% 11/1/27 (Pre-Refunded to 11/1/22 @ 100) | | 7,535 | 8,332 |
| South Carolina Ports Auth. Ports Rev.: | | | |
| Series 2015 (AMT), 5% 7/1/45 (d) | | 4,315 | 4,665 |
| Series 2015, 5.25% 7/1/55 (d) | | 5,280 | 5,717 |
| South Carolina Pub. Svc. Auth. Rev.: | | | |
| Series 2013 E, 5.5% 12/1/53 | | 33,515 | 35,689 |
| Series 2014 A: | | | |
| 5% 12/1/49 | | 11,210 | 11,678 |
| 5.5% 12/1/54 | | 12,985 | 13,878 |
| Series 2014 C, 5% 12/1/46 | | 3,895 | 4,077 |
| Series 2015 A, 5% 12/1/50 | | 5,180 | 5,425 |
| Series 2015 C, 5% 12/1/22 | | 6,985 | 7,632 |
| Series 2015 E, 5.25% 12/1/55 | | 6,195 | 6,608 |
| Series 2016 A: | | | |
| 5% 12/1/29 | | 2,485 | 2,762 |
| 5% 12/1/38 | | 250 | 269 |
| Series 2016 B: | | | |
| 5% 12/1/31 | | 910 | 1,008 |
| 5% 12/1/41 | | 12,515 | 13,391 |
| Spartanburg County Reg'l. Health Series 2017 A: | | | |
| 4% 4/15/43 | | 15,510 | 15,521 |
| 4% 4/15/48 | | 10,815 | 10,595 |
| 5% 4/15/48 | | 12,665 | 13,782 |
|
| TOTAL SOUTH CAROLINA | | | 172,899 |
|
| South Dakota - 0.0% | | | |
| South Dakota Health & Edl. Facilities Auth. Rev.: | | | |
| (Avera Health Proj.) Series 2017, 5% 7/1/31 | | 540 | 620 |
| Series 2017: | | | |
| 5% 7/1/26 | | 250 | 292 |
| 5% 7/1/28 | | 250 | 292 |
| 5% 7/1/29 | | 470 | 546 |
|
| TOTAL SOUTH DAKOTA | | | 1,750 |
|
| Tennessee - 0.3% | | | |
| Greeneville Health & Edl. Facilities Board Series 2018 A: | | | |
| 5% 7/1/23 | | 815 | 904 |
| 5% 7/1/24 | | 1,225 | 1,358 |
| 5% 7/1/25 | | 1,225 | 1,354 |
| Memphis-Shelby County Arpt. Auth. Arpt. Rev. Series 2010 B: | | | |
| 5.75% 7/1/23 (d) | | 4,820 | 5,064 |
| 5.75% 7/1/24 (d) | | 3,310 | 3,476 |
|
| TOTAL TENNESSEE | | | 12,156 |
|
| Texas - 8.4% | | | |
| Argyle Independent School District 5.25% 8/15/40 (FSA Insured) | | 105 | 105 |
| Arlington Spl. Tax Rev. Series 2018 C, 5% 2/15/45 | | 2,565 | 2,679 |
| Austin Arpt. Sys. Rev.: | | | |
| Series 2014: | | | |
| 5% 11/15/26 (d) | | 830 | 939 |
| 5% 11/15/27 (d) | | 1,035 | 1,165 |
| 5% 11/15/28 (d) | | 1,240 | 1,389 |
| 5% 11/15/39 (d) | | 9,440 | 10,374 |
| 5% 11/15/44 (d) | | 23,065 | 25,282 |
| Series 2017 B: | | | |
| 5% 11/15/28 (d) | | 830 | 951 |
| 5% 11/15/30 (d) | | 1,275 | 1,450 |
| 5% 11/15/32 (d) | | 1,005 | 1,133 |
| 5% 11/15/35 (d) | | 1,035 | 1,154 |
| 5% 11/15/37 (d) | | 1,165 | 1,289 |
| 5% 11/15/41 (d) | | 4,725 | 5,181 |
| Austin Cmnty. College District Rev. (Convention Ctr. Proj.) Series 2002, 0% 2/1/22 (AMBAC Insured) | | 2,400 | 2,244 |
| Central Reg'l. Mobility Auth.: | | | |
| Series 2015 A: | | | |
| 5% 1/1/28 | | 1,075 | 1,204 |
| 5% 1/1/30 | | 1,365 | 1,517 |
| 5% 1/1/31 | | 395 | 437 |
| 5% 1/1/32 | | 830 | 915 |
| 5% 1/1/45 | | 5,795 | 6,233 |
| Series 2016: | | | |
| 5% 1/1/40 | | 830 | 900 |
| 5% 1/1/46 | | 565 | 610 |
| Coppell Independent School District 0% 8/15/20 | | 1,655 | 1,604 |
| Corpus Christi Util. Sys. Rev. 5% 7/15/24 | | 1,865 | 2,038 |
| Cypress-Fairbanks Independent School District Series 2014 C, 5% 2/15/44 | | 2,365 | 2,594 |
| Dallas Area Rapid Transit Sales Tax Rev. Series 2016 A, 5% 12/1/33 | | 2,150 | 2,454 |
| Dallas Fort Worth Int'l. Arpt. Rev.: | | | |
| Series 2012 D, 5% 11/1/42 (d) | | 2,295 | 2,398 |
| Series 2012 H, 5% 11/1/42 (d) | | 3,095 | 3,233 |
| Dallas Gen. Oblig. Series 2017: | | | |
| 5% 2/15/29 | | 5,445 | 6,387 |
| 5% 2/15/30 | | 1,350 | 1,577 |
| Dallas Independent School District Series 2016 A, 4% 2/15/29 | | 1,190 | 1,284 |
| DeSoto Independent School District 0% 8/15/20 | | 2,760 | 2,673 |
| Grand Parkway Trans. Corp.: | | | |
| Series 2013 B: | | | |
| 5% 4/1/53 | | 1,250 | 1,341 |
| 5.25% 10/1/51 | | 49,755 | 54,554 |
| 5.5% 4/1/53 | | 5,330 | 5,836 |
| Series 2018 A: | | | |
| 5% 10/1/38 | | 2,655 | 3,037 |
| 5% 10/1/43 | | 830 | 940 |
| Harris County Cultural Ed. Facilities Fin. Corp. Med. Facilities Rev. (Baylor College of Medicine Proj.) Series 2012 A, 5% 11/15/37 | | 4,510 | 4,871 |
| Harris County Cultural Ed. Facilities Fin. Corp. Rev. (Texas Childrens Hosp., Proj.) Series 2015-1 5% 10/1/29 | | 1,115 | 1,275 |
| Harris County Gen. Oblig. Series 2002: | | | |
| 0% 8/15/24 (Nat'l. Pub. Fin. Guarantee Corp. Insured) | | 830 | 730 |
| 0% 8/15/25 (Nat'l. Pub. Fin. Guarantee Corp. Insured) | | 2,485 | 2,117 |
| 0% 8/15/28 (Nat'l. Pub. Fin. Guarantee Corp. Insured) | | 4,140 | 3,169 |
| Houston Arpt. Sys. Rev.: | | | |
| Series 2011 A: | | | |
| 5% 7/1/23 (d) | | 2,485 | 2,646 |
| 5% 7/1/24 (d) | | 1,035 | 1,101 |
| 5% 7/1/25 (d) | | 1,240 | 1,318 |
| Series 2012 A: | | | |
| 5% 7/1/21 (d) | | 3,135 | 3,351 |
| 5% 7/1/23 (d) | | 495 | 537 |
| Series 2018 C: | | | |
| 5% 7/1/29 (d) | | 1,655 | 1,940 |
| 5% 7/1/30 (d) | | 1,765 | 2,050 |
| 5% 7/1/31 (d) | | 1,240 | 1,435 |
| 5% 7/1/32 (d) | | 1,450 | 1,667 |
| Houston Gen. Oblig. Series 2017 A: | | | |
| 5% 3/1/29 | | 3,150 | 3,708 |
| 5% 3/1/30 | | 4,140 | 4,840 |
| 5% 3/1/31 | | 3,835 | 4,459 |
| 5% 3/1/32 | | 1,635 | 1,889 |
| Houston Independent School District Series 2017, 5% 2/15/35 | | 2,815 | 3,249 |
| Houston Util. Sys. Rev.: | | | |
| Series 2014 C, 5% 5/15/28 | | 2,490 | 2,822 |
| Series 2018 D, 5% 11/15/43 | | 2,445 | 2,795 |
| Irving Hosp. Auth. Hosp. Rev. Series 2017 A: | | | |
| 5% 10/15/28 | | 390 | 442 |
| 5% 10/15/30 | | 1,570 | 1,759 |
| 5% 10/15/32 | | 830 | 921 |
| 5% 10/15/36 | | 545 | 594 |
| 5% 10/15/37 | | 930 | 1,011 |
| 5% 10/15/38 | | 1,325 | 1,436 |
| 5% 10/15/44 | | 1,310 | 1,405 |
| Love Field Arpt. Modernization Rev.: | | | |
| Series 2015: | | | |
| 5% 11/1/26 (d) | | 830 | 944 |
| 5% 11/1/27 (d) | | 1,780 | 2,016 |
| 5% 11/1/28 (d) | | 2,755 | 3,105 |
| 5% 11/1/29 (d) | | 1,655 | 1,857 |
| 5% 11/1/32 (d) | | 3,055 | 3,394 |
| Series 2017: | | | |
| 5% 11/1/22 (d) | | 620 | 680 |
| 5% 11/1/23 (d) | | 910 | 1,016 |
| 5% 11/1/24 (d) | | 830 | 940 |
| 5% 11/1/25 (d) | | 830 | 951 |
| 5% 11/1/26 (d) | | 830 | 959 |
| 5% 11/1/27 (d) | | 830 | 954 |
| 5% 11/1/28 (d) | | 1,450 | 1,660 |
| 5% 11/1/29 (d) | | 1,035 | 1,179 |
| 5% 11/1/30 (d) | | 830 | 942 |
| 5% 11/1/31 (d) | | 1,840 | 2,079 |
| 5% 11/1/32 (d) | | 2,135 | 2,412 |
| 5% 11/1/33 (d) | | 830 | 935 |
| 5% 11/1/34 (d) | | 830 | 931 |
| 5% 11/1/36 (d) | | 830 | 925 |
| Lower Colorado River Auth. Rev. Series 2015 D: | | | |
| 5% 5/15/28 | | 1,820 | 2,070 |
| 5% 5/15/30 | | 4,140 | 4,678 |
| Midway Independent School District Series 2000, 0% 8/15/19 | | 2,980 | 2,946 |
| New Hope Cultural Ed. Facilities Finc (Childrens Med. Ctr. of Dallas) Series 2017 A: | | | |
| 5% 8/15/27 | | 625 | 742 |
| 5% 8/15/29 | | 1,655 | 1,944 |
| 5% 8/15/47 | | 1,890 | 2,102 |
| Newark Higher Ed. Fin. Corp. (Abilene Christian Univ. Proj.) Series 2016 A: | | | |
| 5% 4/1/27 | | 595 | 676 |
| 5% 4/1/30 | | 2,825 | 3,165 |
| North Texas Tollway Auth. Rev.: | | | |
| (Sr. Lien Proj.) Series 2017 A, 5% 1/1/35 | | 1,820 | 2,063 |
| (Sr. Lien Proj.) Series 2017 A: | | | |
| 5% 1/1/31 | | 830 | 945 |
| 5% 1/1/33 | | 975 | 1,116 |
| 5% 1/1/34 | | 1,240 | 1,411 |
| 5% 1/1/34 | | 2,485 | 3,014 |
| 5% 1/1/36 | | 4,965 | 5,606 |
| 5% 1/1/37 | | 6,625 | 7,450 |
| 5% 1/1/38 | | 2,690 | 2,890 |
| (Sub Lien Proj.) Series 2017 B: | | | |
| 5% 1/1/26 | | 740 | 814 |
| 5% 1/1/30 | | 350 | 399 |
| 5% 1/1/31 | | 495 | 562 |
| Series 2008 I, 6.2% 1/1/42 (Assured Guaranty Corp. Insured) | | 6,870 | 8,180 |
| Series 2009, 6.25% 1/1/39 | | 1,860 | 1,866 |
| Series 2014 A, 5% 1/1/25 | | 4,965 | 5,592 |
| Series 2015 A, 5% 1/1/32 | | 2,775 | 3,090 |
| Series 2015 B, 5% 1/1/40 | | 8,280 | 8,873 |
| Series 2016 A, 5% 1/1/36 | | 1,035 | 1,158 |
| San Antonio Arpt. Sys. Rev.: | | | |
| Series 2007 (AMT), 5.25% 7/1/20 (FSA Insured) (d) | | 2,660 | 2,668 |
| Series 2007 (AMT-SUB LIEN), 5.25% 7/1/20 (FSA Insured) (d) | | 2,295 | 2,302 |
| San Antonio Gen. Oblig. Series 2018, 5% 8/1/37 | | 1,805 | 2,104 |
| San Antonio Independent School District Series 2016, 5% 8/15/31 | | 3,590 | 4,166 |
| Southwest Higher Ed. Auth. Rev. (Southern Methodist Univ., TX. Proj.) Series 2017: | | | |
| 5% 10/1/29 | | 375 | 444 |
| 5% 10/1/30 | | 580 | 683 |
| 5% 10/1/31 | | 520 | 609 |
| 5% 10/1/39 | | 1,030 | 1,174 |
| 5% 10/1/40 | | 830 | 944 |
| Tarrant County Cultural Ed. Facilities Fin. Corp. Hosp. Rev.: | | | |
| (Hendrick Med. Ctr. Proj.) Series 2009 B: | | | |
| 5.25% 9/1/26 (Assured Guaranty Corp. Insured) | | 1,480 | 1,510 |
| 5.25% 9/1/27 (Assured Guaranty Corp. Insured) | | 1,965 | 2,004 |
| 5.25% 9/1/28 (Assured Guaranty Corp. Insured) | | 1,020 | 1,040 |
| (Scott & White Healthcare Proj.) Series 2013 A, 5% 8/15/43 | | 3,310 | 3,581 |
| Tarrant County Cultural Ed. Facilities Fin. Corp. Rev. Series 2016 A: | | | |
| 4% 2/15/35 | | 4,140 | 4,294 |
| 5% 2/15/25 | | 710 | 817 |
| Texas Gen. Oblig. Series 2017 B, 5% 10/1/36 | | 3,190 | 3,685 |
| Texas Private Activity Bond Surface Trans. Corp. Series 2013, 6.75% 6/30/43 (d) | | 12,420 | 14,176 |
| Texas State Univ. Sys. Fing. Rev. Series 2017 A: | | | |
| 5% 3/15/29 | | 3,530 | 4,163 |
| 5% 3/15/31 | | 2,690 | 3,136 |
| Univ. of Houston Univ. Revs. Series 2017 A: | | | |
| 5% 2/15/32 | | 5,115 | 5,854 |
| 5% 2/15/33 | | 3,310 | 3,772 |
| 5% 2/15/34 | | 4,140 | 4,701 |
| 5% 2/15/35 | | 4,140 | 4,684 |
| 5% 2/15/36 | | 2,485 | 2,801 |
| Univ. of North Texas Univ. Rev.: | | | |
| Series 2017 A, 5% 4/15/32 | | 1,740 | 2,017 |
| Series 2018 A, 5% 4/15/44 | | 830 | 939 |
| Univ. of Texas Permanent Univ. Fund Rev. Series 2016 B, 5% 7/1/29 | | 1,685 | 1,975 |
| Weatherford Independent School District 0% 2/15/33 | | 5,785 | 3,599 |
|
| TOTAL TEXAS | | | 403,711 |
|
| Utah - 1.9% | | | |
| Salt Lake City Arpt. Rev.: | | | |
| Series 2017 A: | | | |
| 5% 7/1/22 (d) | | 1,655 | 1,807 |
| 5% 7/1/24 (d) | | 1,450 | 1,638 |
| 5% 7/1/25 (d) | | 1,655 | 1,894 |
| 5% 7/1/27 (d) | | 3,500 | 4,090 |
| 5% 7/1/29 (d) | | 3,090 | 3,563 |
| 5% 7/1/30 (d) | | 2,275 | 2,607 |
| 5% 7/1/31 (d) | | 4,345 | 4,957 |
| 5% 7/1/32 (d) | | 4,760 | 5,412 |
| 5% 7/1/33 (d) | | 3,310 | 3,750 |
| 5% 7/1/34 (d) | | 7,830 | 8,834 |
| 5% 7/1/35 (d) | | 3,310 | 3,724 |
| 5% 7/1/36 (d) | | 4,470 | 5,008 |
| 5% 7/1/37 (d) | | 3,520 | 3,930 |
| 5% 7/1/42 (d) | | 20,290 | 22,416 |
| Series 2018 A: | | | |
| 5% 7/1/31 (d) | | 2,000 | 2,307 |
| 5% 7/1/32 (d) | | 4,310 | 4,952 |
| 5% 7/1/33 (d) | | 1,420 | 1,625 |
| 5.25% 7/1/48 (d) | | 5,655 | 6,405 |
| Utah Associated Muni. Pwr. Sys. Rev. (Payson Pwr. Proj.) 5% 9/1/22 | | 2,635 | 2,900 |
|
| TOTAL UTAH | | | 91,819 |
|
| Vermont - 0.2% | | | |
| Vermont Edl. & Health Bldg. Fin. Agcy. Rev. (Champlain College Proj.) Series 2016 A: | | | |
| 5% 10/15/41 | | 3,810 | 4,070 |
| 5% 10/15/46 | | 4,720 | 5,023 |
|
| TOTAL VERMONT | | | 9,093 |
|
| Virginia - 0.6% | | | |
| Fredericksburg Econ. Dev. Auth. Rev. Series 2014: | | | |
| 5% 6/15/25 | | 3,860 | 4,309 |
| 5% 6/15/30 | | 1,035 | 1,143 |
| Stafford County Econ. Dev. Auth. Hosp. Facilities Rev.: | | | |
| (Mary Washington Hosp. Proj.) Series 2016, 3% 6/15/29 | | 525 | 518 |
| Series 2016: | | | |
| 4% 6/15/37 | | 595 | 598 |
| 5% 6/15/27 | | 1,240 | 1,414 |
| 5% 6/15/30 | | 540 | 607 |
| 5% 6/15/33 | | 350 | 389 |
| 5% 6/15/34 | | 665 | 737 |
| 5% 6/15/35 | | 1,820 | 2,011 |
| Virginia College Bldg. Auth. Edl. Facilities Rev. Series 2015 A: | | | |
| 5% 1/1/35 | | 830 | 938 |
| 5% 1/1/40 | | 1,865 | 2,095 |
| Virginia Commonwealth Trans. Board Rev. (Virginia Gen. Oblig. Proj.) Series 2017 A, 5% 5/15/32 | | 725 | 858 |
| Virginia Small Bus. Fing. Auth. (95 Express Lane LLC Proj.) Series 2012: | | | |
| 5% 7/1/34 (d) | | 4,965 | 5,174 |
| 5% 1/1/40 (d) | | 995 | 1,034 |
| Winchester Econ. Dev. Auth. Series 2015: | | | |
| 5% 1/1/31 | | 2,070 | 2,346 |
| 5% 1/1/34 | | 1,240 | 1,385 |
| 5% 1/1/35 | | 1,240 | 1,383 |
| 5% 1/1/44 | | 830 | 904 |
|
| TOTAL VIRGINIA | | | 27,843 |
|
| Washington - 1.5% | | | |
| Clark County School District #37, Vancouver Series 2001 C, 0% 12/1/19 (Nat'l. Pub. Fin. Guarantee Corp. Insured) | | 1,680 | 1,651 |
| Port of Seattle Rev. Series 2016 B: | | | |
| 5% 10/1/28 (d) | | 2,900 | 3,312 |
| 5% 10/1/30 (d) | | 1,655 | 1,875 |
| Port of Seattle Spl. Facility Rev. Series 2013: | | | |
| 5% 6/1/21 (d) | | 1,110 | 1,185 |
| 5% 6/1/22 (d) | | 830 | 905 |
| 5% 6/1/24 (d) | | 1,290 | 1,424 |
| Spokane Pub. Facilities District Hotel/Motel Tax & Sales/Use Tax Rev. Series 2013 B: | | | |
| 5% 12/1/25 | | 4,635 | 5,145 |
| 5% 12/1/27 | | 3,415 | 3,775 |
| Washington Gen. Oblig.: | | | |
| Series 2015 C: | | | |
| 5% 2/1/33 | | 2,790 | 3,147 |
| 5% 2/1/34 | | 3,450 | 3,880 |
| Series 2017 A, 5% 8/1/35 | | 620 | 710 |
| Series R-2017 A, 5% 8/1/30 | | 1,685 | 1,967 |
| Washington Health Care Facilities Auth. Rev.: | | | |
| (Catholic Health Initiatives Proj.) Series 2008 D, 6.375% 10/1/36 | | 6,625 | 6,647 |
| (Overlake Hosp. Med. Ctr., WA. Proj.) Series 2017 B: | | | |
| 5% 7/1/25 | | 675 | 770 |
| 5% 7/1/27 | | 1,285 | 1,492 |
| 5% 7/1/28 | | 1,570 | 1,838 |
| 5% 7/1/29 | | 615 | 716 |
| 5% 7/1/30 | | 735 | 849 |
| 5% 7/1/31 | | 870 | 998 |
| 5% 7/1/32 | | 1,655 | 1,889 |
| 5% 7/1/33 | | 2,345 | 2,661 |
| 5% 7/1/34 | | 540 | 609 |
| 5% 7/1/42 | | 4,685 | 5,159 |
| (Providence Health Systems Proj.) Series 2012 A, 5% 10/1/25 | | 4,245 | 4,668 |
| Series 2015: | | | |
| 5% 1/1/25 | | 1,655 | 1,880 |
| 5% 1/1/27 | | 1,910 | 2,176 |
| Washington Higher Ed. Facilities Auth. Rev. (Whitworth Univ. Proj.) Series 2016 A: | | | |
| 5% 10/1/27 | | 1,770 | 1,980 |
| 5% 10/1/28 | | 1,825 | 2,031 |
| 5% 10/1/35 | | 1,880 | 2,039 |
| 5% 10/1/36 | | 2,845 | 3,074 |
| 5% 10/1/40 | | 2,795 | 2,981 |
| Washington Hsg. Fin. Commission Nonprofit Hsg. Rev. (Judson Park Proj.) Series 2018: | | | |
| 4% 7/1/28 (c) | | 100 | 98 |
| 5% 7/1/33 (c) | | 125 | 129 |
| 5% 7/1/38 (c) | | 100 | 102 |
| 5% 7/1/48 (c) | | 400 | 406 |
|
| TOTAL WASHINGTON | | | 74,168 |
|
| West Virginia - 0.3% | | | |
| West Virginia Econ. Dev. Auth. Solid Waste Disp. Facilities Rev. Bonds (Appalachian Pwr. Co. Amos Proj.) Series 2011 A, 1.7%, tender 9/1/20 (a)(d) | | 2,575 | 2,523 |
| West Virginia Hosp. Fin. Auth. Hosp. Rev. Series 2018 A: | | | |
| 5% 1/1/31 | | 1,355 | 1,553 |
| 5% 1/1/32 | | 1,120 | 1,273 |
| West Virginia Univ. Revs. (West Virginia Univ. Projs.) Series 2014 A, 5% 10/1/44 | | 6,290 | 7,012 |
|
| TOTAL WEST VIRGINIA | | | 12,361 |
|
| Wisconsin - 1.6% | | | |
| Pub. Fin. Auth. Rev. (Denver Great Hall LLC. Proj.) Series 2017: | | | |
| 5% 9/30/37 (d) | | 2,070 | 2,263 |
| 5% 9/30/49 (d) | | 15,085 | 16,211 |
| Pub. Fin. Auth. Sr Liv Rev. (Mary's Woods At Marylhurst, Inc. Proj.): | | | |
| Series 2017 A: | | | |
| 5% 5/15/21 (c) | | 250 | 261 |
| 5% 5/15/25 (c) | | 920 | 985 |
| 5% 5/15/28 (c) | | 1,095 | 1,167 |
| 5.25% 5/15/37 (c) | | 335 | 350 |
| 5.25% 5/15/42 (c) | | 415 | 430 |
| 5.25% 5/15/47 (c) | | 410 | 423 |
| 5.25% 5/15/52 (c) | | 775 | 796 |
| Series 2017 B-1 3.95% 11/15/24 (c) | | 350 | 352 |
| Series 2017 B-2, 3.5% 11/15/23 (c) | | 445 | 445 |
| Series 2017 B-3, 3% 11/15/22 (c) | | 620 | 620 |
| Pub. Fin. Auth. Wis Edl. Facilities Series 2016: | | | |
| 5% 1/1/37 | | 5,325 | 5,520 |
| 5% 1/1/42 | | 4,275 | 4,385 |
| Pub. Fin. Auth. Wisconsin Retirement Facility Rev. Series 2018: | | | |
| 5% 10/1/43 (c) | | 735 | 739 |
| 5% 10/1/48 (c) | | 880 | 882 |
| 5% 10/1/53 (c) | | 1,500 | 1,495 |
| Wisconsin Health & Edl. Facilities: | | | |
| (Ascension Health Cr. Group Proj.) Series 2016 A, 5% 11/15/36 | | 4,140 | 4,611 |
| Series 2010: | | | |
| 5.75% 7/1/30 (Pre-Refunded to 7/1/20 @ 100) | | 970 | 1,025 |
| 5.75% 7/1/30 (Pre-Refunded to 7/1/20 @ 100) | | 1,645 | 1,738 |
| Series 2014: | | | |
| 4% 5/1/33 | | 2,920 | 2,949 |
| 5% 5/1/22 | | 660 | 710 |
| Series 2016 A: | | | |
| 5% 2/15/28 | | 1,965 | 2,227 |
| 5% 2/15/29 | | 2,550 | 2,876 |
| 5% 2/15/30 | | 2,805 | 3,147 |
| Series 2016: | | | |
| 4% 2/15/38 (Pre-Refunded to 8/15/25 @ 100) | | 1,000 | 1,103 |
| 5% 2/15/29 (Pre-Refunded to 8/15/25 @ 100) | | 360 | 419 |
| Series 2017 A: | | | |
| 5% 9/1/31 | | 830 | 922 |
| 5% 9/1/33 | | 1,425 | 1,569 |
| 5% 9/1/35 | | 1,575 | 1,723 |
| Wisconsin Health & Edl. Facilities Auth. Rev.: | | | |
| (Agnesian HealthCare, Inc. Proj.): | | | |
| Series 2010, 5.5% 7/1/40 (Pre-Refunded to 7/1/20 @ 100) | | 2,380 | 2,506 |
| Series 2013 B: | | | |
| 5% 7/1/27 (Pre-Refunded to 7/1/23 @ 100) | | 1,000 | 1,125 |
| 5% 7/1/36 (Pre-Refunded to 7/1/23 @ 100) | | 4,905 | 5,519 |
| Series 2012: | | | |
| 4% 10/1/23 | | 2,070 | 2,203 |
| 5% 6/1/27 | | 1,840 | 1,973 |
|
| TOTAL WISCONSIN | | | 75,669 |
|
| Wyoming - 0.2% | | | |
| Campbell County Solid Waste Facilities Rev. (Basin Elec. Pwr. Coop. - Dry Fork Station Facilities Proj.) Series 2009 A, 5.75% 7/15/39 | | 8,525 | 8,689 |
| TOTAL MUNICIPAL BONDS | | | |
| (Cost $4,591,281) | | | 4,675,465 |
| | | Shares | Value (000s) |
|
| Money Market Funds - 0.8% | | | |
| Fidelity Municipal Cash Central Fund, 1.77% (f)(g) | | | |
| (Cost $35,100) | | 35,096,860 | 35,100 |
| TOTAL INVESTMENT IN SECURITIES - 98.3% | | | |
| (Cost $4,626,381) | | | 4,710,565 |
| NET OTHER ASSETS (LIABILITIES) - 1.7% | | | 83,378 |
| NET ASSETS - 100% | | | $4,793,943 |
Legend
(a) Coupon rates for floating and adjustable rate securities reflect the rates in effect at period end.
(b) Coupon is indexed to a floating interest rate which may be multiplied by a specified factor and/or subject to caps or floors.
(c) Security exempt from registration under Rule 144A of the Securities Act of 1933. These securities may be resold in transactions exempt from registration, normally to qualified institutional buyers. At the end of the period, the value of these securities amounted to $37,405,000 or 0.8% of net assets.
(d) Private activity obligations whose interest is subject to the federal alternative minimum tax for individuals.
(e) Security initially issued in zero coupon form which converts to coupon form at a specified rate and date. The rate shown is the rate at period end.
(f) Information in this report regarding holdings by state and security types does not reflect the holdings of the Fidelity Municipal Cash Central Fund.
(g) Affiliated fund that is available only to investment companies and other accounts managed by Fidelity Investments. The rate quoted is the annualized seven-day yield of the fund at period end. A complete unaudited listing of the fund's holdings as of its most recent quarter end is available upon request. In addition, each Fidelity Central Fund's financial statements, which are not covered by the Fund's Report of Independent Registered Public Accounting Firm, are available on the SEC's website or upon request.
Affiliated Central Funds
Information regarding fiscal year to date income earned by the Fund from investments in Fidelity Central Funds is as follows:
| Fund | Income earned |
| | (Amounts in thousands) |
| Fidelity Municipal Cash Central Fund | $491 |
| Total | $491 |
Amounts in the income column in the above table include any capital gain distributions from underlying funds, which are presented in the corresponding line-item in the Statement of Operations if applicable.
Investment Valuation
The following is a summary of the inputs used, as of December 31, 2018, involving the Fund's assets and liabilities carried at fair value. The inputs or methodology used for valuing securities may not be an indication of the risk associated with investing in those securities. For more information on valuation inputs, and their aggregation into the levels used below, please refer to the Investment Valuation section in the accompanying Notes to Financial Statements.
| | Valuation Inputs at Reporting Date: |
| Description | Total | Level 1 | Level 2 | Level 3 |
| (Amounts in thousands) | | | | |
| Investments in Securities: | | | | |
| Municipal Securities | $4,675,465 | $-- | $4,675,465 | $-- |
| Money Market Funds | 35,100 | 35,100 | -- | -- |
| Total Investments in Securities: | $4,710,565 | $35,100 | $4,675,465 | $-- |
Other Information
The distribution of municipal securities by revenue source, as a percentage of total Net Assets, is as follows (Unaudited):
| Health Care | 25.4% |
| General Obligations | 25.3% |
| Transportation | 25.1% |
| Electric Utilities | 5.9% |
| Education | 5.6% |
| Others* (Individually Less Than 5%) | 12.7% |
| | 100.0% |
* Includes net other assets
See accompanying notes which are an integral part of the financial statements.
Financial Statements
Statement of Assets and Liabilities
| Amounts in thousands (except per-share amounts) | | December 31, 2018 |
| Assets | | |
Investment in securities, at value — See accompanying schedule:
Unaffiliated issuers (cost $4,591,281) | $4,675,465 | |
| Fidelity Central Funds (cost $35,100) | 35,100 | |
| Total Investment in Securities (cost $4,626,381) | | $4,710,565 |
| Cash | | 33,557 |
| Receivable for fund shares sold | | 6,852 |
| Interest receivable | | 59,350 |
| Distributions receivable from Fidelity Central Funds | | 44 |
| Prepaid expenses | | 9 |
| Other receivables | | 15 |
| Total assets | | 4,810,392 |
| Liabilities | | |
| Payable for fund shares redeemed | $9,935 | |
| Distributions payable | 4,445 | |
| Accrued management fee | 1,424 | |
| Distribution and service plan fees payable | 135 | |
| Other affiliated payables | 441 | |
| Other payables and accrued expenses | 69 | |
| Total liabilities | | 16,449 |
| Net Assets | | $4,793,943 |
| Net Assets consist of: | | |
| Paid in capital | | $4,711,738 |
| Total distributable earnings (loss) | | 82,205 |
| Net Assets | | $4,793,943 |
| Net Asset Value and Maximum Offering Price | | |
| Class A: | | |
| Net Asset Value and redemption price per share ($200,891 ÷ 15,761.9 shares) | | $12.75 |
| Maximum offering price per share (100/96.00 of $12.75) | | $13.28 |
| Class M: | | |
| Net Asset Value and redemption price per share ($118,540 ÷ 9,293.1 shares) | | $12.76 |
| Maximum offering price per share (100/96.00 of $12.76) | | $13.29 |
| Class C: | | |
| Net Asset Value and offering price per share ($81,655 ÷ 6,406.7 shares)(a) | | $12.75 |
| Fidelity Municipal Income Fund: | | |
| Net Asset Value, offering price and redemption price per share ($3,817,326 ÷ 299,325.5 shares) | | $12.75 |
| Class I: | | |
| Net Asset Value, offering price and redemption price per share ($554,755 ÷ 43,527.1 shares) | | $12.75 |
| Class Z: | | |
| Net Asset Value, offering price and redemption price per share ($20,776 ÷ 1,629.6 shares) | | $12.75 |
(a) Redemption price per share is equal to net asset value less any applicable contingent deferred sales charge.
See accompanying notes which are an integral part of the financial statements.
Statement of Operations
| Amounts in thousands | | Year ended December 31, 2018 |
| Investment Income | | |
| Interest | | $201,260 |
| Income from Fidelity Central Funds | | 491 |
| Total income | | 201,751 |
| Expenses | | |
| Management fee | $20,764 | |
| Transfer agent fees | 5,570 | |
| Distribution and service plan fees | 1,428 | |
| Accounting fees and expenses | 693 | |
| Custodian fees and expenses | 44 | |
| Independent trustees' fees and expenses | 28 | |
| Registration fees | 88 | |
| Audit | 65 | |
| Legal | 15 | |
| Miscellaneous | 42 | |
| Total expenses before reductions | 28,737 | |
| Expense reductions | (79) | |
| Total expenses after reductions | | 28,658 |
| Net investment income (loss) | | 173,093 |
| Realized and Unrealized Gain (Loss) | | |
| Net realized gain (loss) on: | | |
| Investment securities: | | |
| Unaffiliated issuers | 2,079 | |
| Redemptions in-kind with affiliated entities | 939 | |
| Total net realized gain (loss) | | 3,018 |
| Change in net unrealized appreciation (depreciation) on: | | |
| Investment securities: | | |
| Unaffiliated issuers | (147,650) | |
| Total change in net unrealized appreciation (depreciation) | | (147,650) |
| Net gain (loss) | | (144,632) |
| Net increase (decrease) in net assets resulting from operations | | $28,461 |
See accompanying notes which are an integral part of the financial statements.
Statement of Changes in Net Assets
| Amounts in thousands | Year ended December 31, 2018 | Year ended December 31, 2017 |
| Increase (Decrease) in Net Assets | | |
| Operations | | |
| Net investment income (loss) | $173,093 | $168,028 |
| Net realized gain (loss) | 3,018 | 106,764 |
| Change in net unrealized appreciation (depreciation) | (147,650) | 80,672 |
| Net increase (decrease) in net assets resulting from operations | 28,461 | 355,464 |
| Distributions to shareholders | (209,319) | – |
| Distributions to shareholders from net investment income | – | (167,561) |
| Distributions to shareholders from net realized gain | – | (78,395) |
| Total distributions | (209,319) | (245,956) |
| Share transactions - net increase (decrease) | (642,419) | 30,512 |
| Total increase (decrease) in net assets | (823,277) | 140,020 |
| Net Assets | | |
| Beginning of period | 5,617,220 | 5,477,200 |
| End of period | $4,793,943 | $5,617,220 |
| Other Information | | |
| Undistributed net investment income end of period | | $262 |
See accompanying notes which are an integral part of the financial statements.
Financial Highlights
Fidelity Municipal Income Fund Class A
| Year ended December 31, | 2018 A |
| Selected Per–Share Data | |
| Net asset value, beginning of period | $12.73 |
| Income from Investment Operations | |
| Net investment income (loss)B | .283 |
| Net realized and unrealized gain (loss) | .029C |
| Total from investment operations | .312 |
| Distributions from net investment income | (.284) |
| Distributions from net realized gain | (.008) |
| Total distributions | (.292) |
| Net asset value, end of period | $12.75 |
| Total ReturnD,E,F | 2.48% |
| Ratios to Average Net AssetsG,H | |
| Expenses before reductions | .78%I |
| Expenses net of fee waivers, if any | .78%I |
| Expenses net of all reductions | .78%I |
| Net investment income (loss) | 2.68%I |
| Supplemental Data | |
| Net assets, end of period (in millions) | $201 |
| Portfolio turnover rateJ | 14%K,L |
A For the period March 1, 2018 (commencement of sale of shares) to December 31, 2018.
B Calculated based on average shares outstanding during the period.
C The amount shown for a share outstanding does not correspond with the aggregate net gain (loss) on investments for the period due to the timing of sales and repurchases of shares in relation to fluctuating market values of the investments of the Fund.
D Total returns for periods of less than one year are not annualized.
E Total returns would have been lower if certain expenses had not been reduced during the applicable periods shown.
F Total returns do not include the effect of the sales charges.
G Fees and expenses of any underlying Fidelity Central Funds are not included in the Fund's expense ratio. The Fund indirectly bears its proportionate share of the expenses of any underlying Fidelity Central Funds.
H Expense ratios reflect operating expenses of the class. Expenses before reductions do not reflect amounts reimbursed by the investment adviser or reductions from expense offset arrangements and do not represent the amount paid by the class during periods when reimbursements or reductions occur. Expense ratios before reductions for start-up periods may not be representative of longer-term operating periods. Expenses net of fee waivers reflect expenses after reimbursement by the investment adviser but prior to reductions from expense offset arrangements. Expenses net of all reductions represent the net expenses paid by the class.
I Annualized
J Amount does not include the portfolio activity of any underlying Fidelity Central Funds.
K The portfolio turnover rate does not include the assets acquired in the merger.
L Portfolio turnover rate excludes securities received or delivered in-kind.
See accompanying notes which are an integral part of the financial statements.
Fidelity Municipal Income Fund Class M
| Year ended December 31, | 2018 A |
| Selected Per–Share Data | |
| Net asset value, beginning of period | $12.73 |
| Income from Investment Operations | |
| Net investment income (loss)B | .285 |
| Net realized and unrealized gain (loss) | .039C |
| Total from investment operations | .324 |
| Distributions from net investment income | (.286) |
| Distributions from net realized gain | (.008) |
| Total distributions | (.294) |
| Net asset value, end of period | $12.76 |
| Total ReturnD,E,F | 2.58% |
| Ratios to Average Net AssetsG,H | |
| Expenses before reductions | .77%I |
| Expenses net of fee waivers, if any | .77%I |
| Expenses net of all reductions | .76%I |
| Net investment income (loss) | 2.70%I |
| Supplemental Data | |
| Net assets, end of period (in millions) | $119 |
| Portfolio turnover rateJ | 14%K,L |
A For the period March 1, 2018 (commencement of sale of shares) to December 31, 2018.
B Calculated based on average shares outstanding during the period.
C The amount shown for a share outstanding does not correspond with the aggregate net gain (loss) on investments for the period due to the timing of sales and repurchases of shares in relation to fluctuating market values of the investments of the Fund.
D Total returns for periods of less than one year are not annualized.
E Total returns would have been lower if certain expenses had not been reduced during the applicable periods shown.
F Total returns do not include the effect of the sales charges.
G Fees and expenses of any underlying Fidelity Central Funds are not included in the Fund's expense ratio. The Fund indirectly bears its proportionate share of the expenses of any underlying Fidelity Central Funds.
H Expense ratios reflect operating expenses of the class. Expenses before reductions do not reflect amounts reimbursed by the investment adviser or reductions from expense offset arrangements and do not represent the amount paid by the class during periods when reimbursements or reductions occur. Expense ratios before reductions for start-up periods may not be representative of longer-term operating periods. Expenses net of fee waivers reflect expenses after reimbursement by the investment adviser but prior to reductions from expense offset arrangements. Expenses net of all reductions represent the net expenses paid by the class.
I Annualized
J Amount does not include the portfolio activity of any underlying Fidelity Central Funds.
K The portfolio turnover rate does not include the assets acquired in the merger.
L Portfolio turnover rate excludes securities received or delivered in-kind.
See accompanying notes which are an integral part of the financial statements.
Fidelity Municipal Income Fund Class C
| Year ended December 31, | 2018 A |
| Selected Per–Share Data | |
| Net asset value, beginning of period | $12.73 |
| Income from Investment Operations | |
| Net investment income (loss)B | .204 |
| Net realized and unrealized gain (loss) | .032C |
| Total from investment operations | .236 |
| Distributions from net investment income | (.208) |
| Distributions from net realized gain | (.008) |
| Total distributions | (.216) |
| Net asset value, end of period | $12.75 |
| Total ReturnD,E,F | 1.87% |
| Ratios to Average Net AssetsG,H | |
| Expenses before reductions | 1.52%I |
| Expenses net of fee waivers, if any | 1.52%I |
| Expenses net of all reductions | 1.52%I |
| Net investment income (loss) | 1.94%I |
| Supplemental Data | |
| Net assets, end of period (in millions) | $82 |
| Portfolio turnover rateJ | 14%K,L |
A For the period March 1, 2018 (commencement of sale of shares) to December 31, 2018.
B Calculated based on average shares outstanding during the period.
C The amount shown for a share outstanding does not correspond with the aggregate net gain (loss) on investments for the period due to the timing of sales and repurchases of shares in relation to fluctuating market values of the investments of the Fund.
D Total returns for periods of less than one year are not annualized.
E Total returns would have been lower if certain expenses had not been reduced during the applicable periods shown.
F Total returns do not include the effect of the contingent deferred sales charge.
G Fees and expenses of any underlying Fidelity Central Funds are not included in the Fund's expense ratio. The Fund indirectly bears its proportionate share of the expenses of any underlying Fidelity Central Funds.
H Expense ratios reflect operating expenses of the class. Expenses before reductions do not reflect amounts reimbursed by the investment adviser or reductions from expense offset arrangements and do not represent the amount paid by the class during periods when reimbursements or reductions occur. Expense ratios before reductions for start-up periods may not be representative of longer-term operating periods. Expenses net of fee waivers reflect expenses after reimbursement by the investment adviser but prior to reductions from expense offset arrangements. Expenses net of all reductions represent the net expenses paid by the class.
I Annualized
J Amount does not include the portfolio activity of any underlying Fidelity Central Funds.
K The portfolio turnover rate does not include the assets acquired in the merger.
L Portfolio turnover rate excludes securities received or delivered in-kind.
See accompanying notes which are an integral part of the financial statements.
Fidelity Municipal Income Fund
| Years ended December 31, | 2018 | 2017 | 2016 | 2015 | 2014 |
| Selected Per–Share Data | | | | | |
| Net asset value, beginning of period | $13.12 | $12.86 | $13.44 | $13.53 | $12.68 |
| Income from Investment Operations | | | | | |
| Net investment income (loss)A | .382 | .399 | .437 | .460 | .475 |
| Net realized and unrealized gain (loss) | (.286) | .444 | (.428) | (.021) | .851 |
| Total from investment operations | .096 | .843 | .009 | .439 | 1.326 |
| Distributions from net investment income | (.381) | (.398) | (.437) | (.462) | (.476) |
| Distributions from net realized gain | (.085) | (.185) | (.152) | (.067) | – |
| Total distributions | (.466) | (.583) | (.589) | (.529) | (.476) |
| Redemption fees added to paid in capitalA | – | – | –B | –B | –B |
| Net asset value, end of period | $12.75 | $13.12 | $12.86 | $13.44 | $13.53 |
| Total ReturnC | .80% | 6.67% | (.01)% | 3.31% | 10.59% |
| Ratios to Average Net AssetsD,E | | | | | |
| Expenses before reductions | .46% | .46% | .46% | .48% | .47% |
| Expenses net of fee waivers, if any | .46% | .46% | .46% | .48% | .47% |
| Expenses net of all reductions | .45% | .46% | .46% | .48% | .47% |
| Net investment income (loss) | 3.00% | 3.05% | 3.22% | 3.42% | 3.58% |
| Supplemental Data | | | | | |
| Net assets, end of period (in millions) | $3,817 | $5,617 | $5,477 | $5,770 | $5,745 |
| Portfolio turnover rateF | 14%G,H | 37% | 25% | 14% | 9% |
A Calculated based on average shares outstanding during the period.
B Amount represents less than $.0005 per share.
C Total returns would have been lower if certain expenses had not been reduced during the applicable periods shown.
D Fees and expenses of any underlying Fidelity Central Funds are not included in the Fund's expense ratio. The Fund indirectly bears its proportionate share of the expenses of any underlying Fidelity Central Funds.
E Expense ratios reflect operating expenses of the class. Expenses before reductions do not reflect amounts reimbursed by the investment adviser or reductions from expense offset arrangements and do not represent the amount paid by the class during periods when reimbursements or reductions occur. Expenses net of fee waivers reflect expenses after reimbursement by the investment adviser but prior to reductions from expense offset arrangements. Expenses net of all reductions represent the net expenses paid by the class.
F Amount does not include the portfolio activity of any underlying Fidelity Central Funds.
G The portfolio turnover rate does not include the assets acquired in the merger.
H Portfolio turnover rate excludes securities received or delivered in-kind.
See accompanying notes which are an integral part of the financial statements.
Fidelity Municipal Income Fund Class I
| Year ended December 31, | 2018 A |
| Selected Per–Share Data | |
| Net asset value, beginning of period | $12.73 |
| Income from Investment Operations | |
| Net investment income (loss)B | .309 |
| Net realized and unrealized gain (loss) | .029C |
| Total from investment operations | .338 |
| Distributions from net investment income | (.310) |
| Distributions from net realized gain | (.008) |
| Total distributions | (.318) |
| Net asset value, end of period | $12.75 |
| Total ReturnD,E | 2.69% |
| Ratios to Average Net AssetsF,G | |
| Expenses before reductions | .53%H |
| Expenses net of fee waivers, if any | .53%H |
| Expenses net of all reductions | .53%H |
| Net investment income (loss) | 2.93%H |
| Supplemental Data | |
| Net assets, end of period (in millions) | $555 |
| Portfolio turnover rateI | 14%J,K |
A For the period March 1, 2018 (commencement of sale of shares) to December 31, 2018.
B Calculated based on average shares outstanding during the period.
C The amount shown for a share outstanding does not correspond with the aggregate net gain (loss) on investments for the period due to the timing of sales and repurchases of shares in relation to fluctuating market values of the investments of the Fund.
D Total returns for periods of less than one year are not annualized.
E Total returns would have been lower if certain expenses had not been reduced during the applicable periods shown.
F Fees and expenses of any underlying Fidelity Central Funds are not included in the Fund's expense ratio. The Fund indirectly bears its proportionate share of the expenses of any underlying Fidelity Central Funds.
G Expense ratios reflect operating expenses of the class. Expenses before reductions do not reflect amounts reimbursed by the investment adviser or reductions from expense offset arrangements and do not represent the amount paid by the class during periods when reimbursements or reductions occur. Expense ratios before reductions for start-up periods may not be representative of longer-term operating periods. Expenses net of fee waivers reflect expenses after reimbursement by the investment adviser but prior to reductions from expense offset arrangements. Expenses net of all reductions represent the net expenses paid by the class.
H Annualized
I Amount does not include the portfolio activity of any underlying Fidelity Central Funds.
J The portfolio turnover rate does not include the assets acquired in the merger.
K Portfolio turnover rate excludes securities received or delivered in-kind.
See accompanying notes which are an integral part of the financial statements.
Fidelity Municipal Income Fund Class Z
| Year ended December 31, | 2018 A |
| Selected Per–Share Data | |
| Net asset value, beginning of period | $12.64 |
| Income from Investment Operations | |
| Net investment income (loss)B | .101 |
| Net realized and unrealized gain (loss) | .112C |
| Total from investment operations | .213 |
| Distributions from net investment income | (.095) |
| Distributions from net realized gain | (.008) |
| Total distributions | (.103) |
| Net asset value, end of period | $12.75 |
| Total ReturnD,E | 1.69% |
| Ratios to Average Net AssetsF,G | |
| Expenses before reductions | .42%H |
| Expenses net of fee waivers, if any | .42%H |
| Expenses net of all reductions | .42%H |
| Net investment income (loss) | 3.08%H |
| Supplemental Data | |
| Net assets, end of period (in millions) | $21 |
| Portfolio turnover rateI | 14%J,K |
A For the period October 2, 2018 (commencement of sale of shares) to December 31, 2018.
B Calculated based on average shares outstanding during the period.
C The amount shown for a share outstanding does not correspond with the aggregate net gain (loss) on investments for the period due to the timing of sales and repurchases of shares in relation to fluctuating market values of the investments of the Fund.
D Total returns for periods of less than one year are not annualized.
E Total returns would have been lower if certain expenses had not been reduced during the applicable periods shown.
F Fees and expenses of any underlying Fidelity Central Funds are not included in the Fund's expense ratio. The Fund indirectly bears its proportionate share of the expenses of any underlying Fidelity Central Funds.
G Expense ratios reflect operating expenses of the class. Expenses before reductions do not reflect amounts reimbursed by the investment adviser or reductions from expense offset arrangements and do not represent the amount paid by the class during periods when reimbursements or reductions occur. Expense ratios before reductions for start-up periods may not be representative of longer-term operating periods. Expenses net of fee waivers reflect expenses after reimbursement by the investment adviser but prior to reductions from expense offset arrangements. Expenses net of all reductions represent the net expenses paid by the class.
H Annualized
I Amount does not include the portfolio activity of any underlying Fidelity Central Funds.
J The portfolio turnover rate does not include the assets acquired in the merger.
K Portfolio turnover rate excludes securities received or delivered in-kind.
See accompanying notes which are an integral part of the financial statements.
Notes to Financial Statements
For the period ended December 31, 2018
(Amounts in thousands except percentages)
1. Organization.
Fidelity Municipal Income Fund (the Fund) is a fund of Fidelity Municipal Trust (the Trust) and is authorized to issue an unlimited number of shares. The Trust is registered under the Investment Company Act of 1940, as amended (the 1940 Act), as an open-end management investment company organized as a Massachusetts business trust. The Fund commenced sale of Class A, Class M, Class C and Class I shares on March 1, 2018 and Class Z shares on October 2, 2018. The Fund offers Class A, Class M, Class C, Fidelity Municipal Class Income Fund, Class I and Class Z shares, each of which has equal rights as to assets and voting privileges. Each class has exclusive voting rights with respect to matters that affect that class.
2. Investments in Fidelity Central Funds.
The Fund invests in Fidelity Central Funds, which are open-end investment companies generally available only to other investment companies and accounts managed by the investment adviser and its affiliates. The Fund's Schedule of Investments lists each of the Fidelity Central Funds held as of period end, if any, as an investment of the Fund, but does not include the underlying holdings of each Fidelity Central Fund. As an Investing Fund, the Fund indirectly bears its proportionate share of the expenses of the underlying Fidelity Central Funds.
The Money Market Central Funds seek preservation of capital and current income and are managed by Fidelity Investments Money Management, Inc. (FIMM), an affiliate of the investment adviser. Annualized expenses of the Money Market Central Funds as of their most recent shareholder report date are less than .005%.
A complete unaudited list of holdings for each Fidelity Central Fund is available upon request or at the Securities and Exchange Commission (the SEC) website at www.sec.gov. In addition, the financial statements of the Fidelity Central Funds, which are not covered by the Fund's Report of Independent Registered Public Accounting Firm, are available on the SEC website or upon request.
3. Significant Accounting Policies.
The Fund is an investment company and applies the accounting and reporting guidance of the Financial Accounting Standards Board (FASB) Accounting Standards Codification Topic 946 Financial Services – Investments Companies. The financial statements have been prepared in conformity with accounting principles generally accepted in the United States of America (GAAP), which require management to make certain estimates and assumptions at the date of the financial statements. Actual results could differ from those estimates. Subsequent events, if any, through the date that the financial statements were issued have been evaluated in the preparation of the financial statements. The following summarizes the significant accounting policies of the Fund:
Investment Valuation. Investments are valued as of 4:00 p.m. Eastern time on the last calendar day of the period. The Board of Trustees (the Board) has delegated the day to day responsibility for the valuation of the Fund's investments to the Fair Value Committee (the Committee) established by the Fund's investment adviser. In accordance with valuation policies and procedures approved by the Board, the Fund attempts to obtain prices from one or more third party pricing vendors or brokers to value its investments. When current market prices, quotations or currency exchange rates are not readily available or reliable, investments will be fair valued in good faith by the Committee, in accordance with procedures adopted by the Board. Factors used in determining fair value vary by investment type and may include market or investment specific events, changes in interest rates and credit quality. The frequency with which these procedures are used cannot be predicted and they may be utilized to a significant extent. The Committee oversees the Fund's valuation policies and procedures and reports to the Board on the Committee's activities and fair value determinations. The Board monitors the appropriateness of the procedures used in valuing the Fund's investments and ratifies the fair value determinations of the Committee.
The Fund categorizes the inputs to valuation techniques used to value its investments into a disclosure hierarchy consisting of three levels as shown below:
- Level 1 – quoted prices in active markets for identical investments
- Level 2 – other significant observable inputs (including quoted prices for similar investments, interest rates, prepayment speeds, etc.)
- Level 3 – unobservable inputs (including the Fund's own assumptions based on the best information available)
Valuation techniques used to value the Fund's investments by major category are as follows:
Debt securities, including restricted securities, are valued based on evaluated prices received from third party pricing vendors or from brokers who make markets in such securities. Municipal securities are valued by pricing vendors who utilize matrix pricing which considers yield or price of bonds of comparable quality, coupon, maturity and type or by broker-supplied prices. When independent prices are unavailable or unreliable, debt securities may be valued utilizing pricing methodologies which consider similar factors that would be used by third party pricing vendors. Debt securities are generally categorized as Level 2 in the hierarchy but may be Level 3 depending on the circumstances.
Investments in open-end mutual funds, including the Fidelity Central Funds, are valued at their closing net asset value (NAV) each business day and are categorized as Level 1 in the hierarchy.
Changes in valuation techniques may result in transfers in or out of an assigned level within the disclosure hierarchy. The aggregate value of investments by input level as of December 31, 2018 is included at the end of the Fund's Schedule of Investments.
Investment Transactions and Income. For financial reporting purposes, the Fund's investment holdings and NAV include trades executed through the end of the last business day of the period. The NAV per share for processing shareholder transactions is calculated as of the close of business of the New York Stock Exchange (NYSE), normally 4:00 p.m. Eastern time and includes trades executed through the end of the prior business day. Gains and losses on securities sold are determined on the basis of identified cost. Income and capital gain distributions from Fidelity Central Funds, if any, are recorded on the ex-dividend date. Interest income is accrued as earned and includes coupon interest and amortization of premium and accretion of discount on debt securities as applicable. Debt obligations may be placed on non-accrual status and related interest income may be reduced by ceasing current accruals and writing off interest receivables when the collection of all or a portion of interest has become doubtful based on consistently applied procedures. A debt obligation is removed from non-accrual status when the issuer resumes interest payments or when collectability of interest is reasonably assured.
Class Allocations and Expenses. Investment income, realized and unrealized capital gains and losses, common expenses of the Fund, and certain fund-level expense reductions, if any, are allocated daily on a pro-rata basis to each class based on the relative net assets of each class to the total net assets of the Fund. Each class differs with respect to transfer agent and distribution and service plan fees incurred. Certain expense reductions may also differ by class. For the reporting period, the allocated portion of income and expenses to each class as a percent of its average net assets may vary due to the timing of recording these transactions in relation to fluctuating net assets of the classes. Expenses directly attributable to a fund are charged to that fund. Expenses attributable to more than one fund are allocated among the respective funds on the basis of relative net assets or other appropriate methods. Expense estimates are accrued in the period to which they relate and adjustments are made when actual amounts are known.
Income Tax Information and Distributions to Shareholders. Each year, the Fund intends to qualify as a regulated investment company under Subchapter M of the Internal Revenue Code, including distributing substantially all of its taxable income and realized gains. As a result, no provision for U.S. Federal income taxes is required. As of December 31, 2018, the Fund did not have any unrecognized tax benefits in the financial statements; nor is the Fund aware of any tax positions for which it is reasonably possible that the total amounts of unrecognized tax benefits will significantly change in the next twelve months. The Fund files a U.S. federal tax return, in addition to state and local tax returns as required. The Fund's federal income tax returns are subject to examination by the Internal Revenue Service (IRS) for a period of three fiscal years after they are filed. State and local tax returns may be subject to examination for an additional fiscal year depending on the jurisdiction.
Distributions are declared and recorded daily and paid monthly from net investment income. Distributions from realized gains, if any, are declared and recorded on the ex-dividend date. Income and capital gain distributions are declared separately for each class. Income and capital gain distributions are determined in accordance with income tax regulations, which may differ from GAAP. In addition, the Fund claimed a portion of the payment made to redeeming shareholders as a distribution for income tax purposes.
Capital accounts within the financial statements are adjusted for permanent book-tax differences. These adjustments have no impact on net assets or the results of operations. Capital accounts are not adjusted for temporary book-tax differences which will reverse in a subsequent period.
Book-tax differences are primarily due to redemptions in-kind, market discount, deferred trustees compensation, losses deferred due to wash sales and excise tax regulations.
The Fund purchases municipal securities whose interest, in the opinion of the issuer, is free from federal income tax. There is no assurance that the IRS will agree with this opinion. In the event the IRS determines that the issuer does not comply with relevant tax requirements, interest payments from a security could become federally taxable, possibly retroactively to the date the security was issued.
As of period end, the cost and unrealized appreciation (depreciation) in securities, and derivatives if applicable, for federal income tax purposes were as follows:
| Gross unrealized appreciation | $114,376 |
| Gross unrealized depreciation | (29,774) |
| Net unrealized appreciation (depreciation) | $84,602 |
| Tax Cost | $4,625,964 |
The tax-based components of distributable earnings as of period end were as follows:
| Net unrealized appreciation (depreciation) on securities and other investments | $84,602 |
The Fund intends to elect to defer to its next fiscal year $2,139 of capital losses recognized during the period November 1, 2018 to December 31, 2018.
The tax character of distributions paid was as follows:
| | December 31, 2018 | December 31, 2017 |
| Tax-exempt Income | $172,933 | $167,561 |
| Long-term Capital Gains | 36,386 | 78,395 |
| Total | $209,319 | $ 245,956 |
Restricted Securities. The Fund may invest in securities that are subject to legal or contractual restrictions on resale. These securities generally may be resold in transactions exempt from registration or to the public if the securities are registered. Disposal of these securities may involve time-consuming negotiations and expense, and prompt sale at an acceptable price may be difficult. Information regarding restricted securities is included at the end of the Fund's Schedule of Investments.
New Rule Issuance. During August 2018, the U.S. Securities and Exchange Commission issued Final Rule Release No. 33-10532, Disclosure Update and Simplification. This Final Rule includes amendments specific to registered investment companies that are intended to eliminate overlap in disclosure requirements between Regulation S-X and GAAP. In accordance with these amendments, certain line-items in the Fund's financial statements have been combined or removed for the current period as outlined in the table below.
| Financial Statement | Current Line-Item Presentation | Prior Line-Item Presentation |
| Statement of Assets and Liabilities | Total distributable earnings (loss) | Undistributed/Distributions in excess of/Accumulated net investment income (loss)
Accumulated/Undistributed net realized gain (loss)
Net unrealized appreciation (depreciation) |
| Statement of Changes in Net Assets | N/A - removed | Undistributed/Distributions in excess of/Accumulated net investment income (loss) end of period |
| Statement of Changes in Net Assets | Distributions to shareholders | Distributions to shareholders from net investment income
Distributions to shareholders from net realized gain |
| Distributions to Shareholders Note to Financial Statements | Distributions to shareholders | Distributions to shareholders from net investment income
Distributions to shareholders from net realized gain |
4. Purchases and Sales of Investments.
Purchases and sales of securities, other than short-term securities, securities acquired in the merger and in-kind transactions, aggregated $779,973 and $1,501,945, respectively.
5. Fees and Other Transactions with Affiliates.
Management Fee. Fidelity Management & Research Company (the investment adviser) and its affiliates provide the Fund with investment management related services for which the Fund pays a monthly management fee. The management fee is the sum of an individual fund fee rate that is based on an annual rate of .25% of the Fund's average net assets and an annualized group fee rate that averaged .11% during the period. The group fee rate is based upon the average net assets of all the mutual funds advised by the investment adviser, including any mutual funds previously advised by the investment adviser that are currently advised by Fidelity SelectCo, LLC, an affiliate of the investment adviser. The group fee rate decreases as assets under management increase and increases as assets under management decrease. For the reporting period, the total annual management fee rate was .36% of the Fund's average net assets.
Distribution and Service Plan Fees. In accordance with Rule 12b-1 of the 1940 Act, the Fund has adopted separate Distribution and Service Plans for each class of shares. Certain classes pay Fidelity Distributors Corporation (FDC), an affiliate of the investment adviser, separate Distribution and Service Fees, each of which is based on an annual percentage of each class' average net assets. In addition, FDC may pay financial intermediaries for selling shares of the Fund and providing shareholder support services. For the period, the Distribution and Service Fee rates, total fees and amounts retained by FDC were as follows:
| | Distribution Fee | Service Fee | Total Fees | Retained by FDC |
| Class A | -% | .25% | $435 | $8 |
| Class M | -% | .25% | 254 | – |
| Class C | .75% | .25% | 739 | 24 |
| | | | $1,428 | $32 |
Sales Load. FDC may receive a front-end sales charge of up to 4.00% for selling Class A shares and Class M shares, some of which is paid to financial intermediaries for selling shares of the Fund. Depending on the holding period, FDC may receive contingent deferred sales charges levied on Class A, Class M and Class C redemptions. The deferred sales charges are 1.00% for Class C shares, .75% for certain purchases of Class A shares and .25% for certain purchases of Class M shares.
For the period, sales charge amounts retained by FDC were as follows:
| | Retained by FDC |
| Class A | $2 |
| Class M | 3 |
| Class C(a) | 3 |
| | $8 |
(a) When Class C shares are initially sold, FDC pays commissions from its own resources to financial intermediaries through which the sales are made.
Transfer Agent Fees. Fidelity Investments Institutional Operations Company, Inc. (FIIOC), an affiliate of the investment adviser, is the transfer, dividend disbursing and shareholder servicing agent for the Fund. FIIOC receives account fees and asset-based fees that vary according to the account size and type of account of the shareholders of the respective classes of the Fund, except Class Z. FIIOC receives an asset-based fee of Class Z's average net assets. FIIOC pays for typesetting, printing and mailing of shareholder reports, except proxy statements. For the period, transfer agent fees for each class were as follows:
| | Amount | % of Class-Level Average Net Assets |
| Class A | $282 | .16(a) |
| Class M | 148 | .15(a) |
| Class C | 118 | .16(a) |
| Fidelity Municipal Income Fund | 4,191 | .08 |
| Class I | 830 | .16(a) |
| Class Z | 1 | .05(a) |
| | $5,570 | |
(a) Annualized
Accounting Fees. Fidelity Service Company, Inc. (FSC), an affiliate of the investment adviser, maintains the Fund's accounting records. The fee is based on the level of average net assets for each month. For the period, the fees were equivalent to an annual rate of .01%.
Interfund Trades. The Fund may purchase from or sell securities to other Fidelity Funds under procedures adopted by the Board. The procedures have been designed to ensure these interfund trades are executed in accordance with Rule 17a-7 of the 1940 Act. Interfund trades are included within the respective purchases and sales amounts shown in the Purchases and Sales of Investments note.
Affiliated Redemptions In-Kind. During the period, 83,345 shares of the Fund were redeemed in-kind for investments, including accrued interest, and cash with a value of $1,042,642. The net realized gain of $939 on investments delivered through in-kind redemptions is included in the accompanying Statement of Operations. The amount of the in-kind redemptions is included in share transactions in the accompanying Statement of Changes in Net Assets as well as the Notes to Financial Statements. The Fund recognized no gain or loss for federal income tax purposes.
6. Committed Line of Credit.
The Fund participates with other funds managed by the investment adviser or an affiliate in a $4.25 billion credit facility (the "line of credit") to be utilized for temporary or emergency purposes to fund shareholder redemptions or for other short-term liquidity purposes. The Fund has agreed to pay commitment fees on its pro-rata portion of the line of credit, which amounted to $16 and is reflected in Miscellaneous expenses on the Statement of Operations. During the period, the Fund did not borrow on this line of credit.
7. Expense Reductions.
Through arrangements with the Fund's custodian, credits realized as a result of certain uninvested cash balances were used to reduce the Fund's expenses. During the period, these credits reduced the Fund's custody expenses by $42.
In addition, during the period the investment adviser reimbursed and/or waived a portion of fund-level operating expenses in the amount of $37.
8. Distributions to Shareholders.
Distributions to shareholders of each class were as follows:
| | Year ended
December 31, 2018(a) | Year ended
December 31, 2017 |
| Distributions to shareholders | | |
| Class A | $4,817 | $– |
| Class M | 2,830 | – |
| Class C | 1,494 | – |
| Fidelity Municipal Income Fund | 184,722 | – |
| Class I | 15,359 | – |
| Class Z | 97 | – |
| Total | $209,319 | $– |
| From net investment income | | |
| Fidelity Municipal Income Fund | $– | $167,561 |
| Total | $– | $167,561 |
| From net realized gain | | |
| Fidelity Municipal Income Fund | $– | $78,395 |
| Total | $– | $78,395 |
(a) Distributions for Class A, Class M, Class C and Class I are for the period March 1, 2018 (commencement of sale of shares) to December 31, 2018. Distributions for Class Z are for the period October 2, 2018 (commencement of sale of shares) to December 31, 2018.
9. Share Transactions.
Share transactions for each class were as follows and may contain automatic conversions between classes or exchanges between affiliated funds:
| | Shares | Shares | Dollars | Dollars |
| | Year ended December 31, 2018(a) | Year ended December 31, 2017 | Year ended December 31, 2018 (a) | Year ended December 31, 2017 |
| Class A | | | | |
| Shares sold | 1,670 | – | $21,200 | $– |
| Issued in exchange for the shares of Fidelity Advisor Municipal Income Fund | 17,474 | – | 222,273 | – |
| Reinvestment of distributions | 338 | – | 4,287 | – |
| Shares redeemed | (3,720) | – | (47,170) | – |
| Net increase (decrease) | 15,762 | – | $200,590 | $– |
| Class M | | | | |
| Shares sold | 170 | – | $2,172 | $– |
| Issued in exchange for the shares of Fidelity Advisor Municipal Income Fund | 10,358 | – | 131,854 | – |
| Reinvestment of distributions | 199 | – | 2,525 | – |
| Shares redeemed | (1,434) | – | (18,218) | – |
| Net increase (decrease) | 9,293 | – | $118,333 | $– |
| Class C | | | | |
| Shares sold | 451 | – | $5,735 | $– |
| Issued in exchange for the shares of Fidelity Advisor Municipal Income Fund | 7,653 | – | 97,341 | – |
| Reinvestment of distributions | 103 | – | 1,311 | – |
| Shares redeemed | (1,800) | – | (22,805) | – |
| Net increase (decrease) | 6,407 | – | $81,582 | $– |
| Fidelity Municipal Income Fund | | | | |
| Shares sold | 59,023 | 56,029 | $753,689 | $733,214 |
| Reinvestment of distributions | 9,833 | 12,884 | 125,182 | 168,072 |
| Shares redeemed | (197,790)(b) | (66,718) | (2,496,887)(b) | (870,774) |
| Net increase (decrease) | (128,934) | 2,195 | $(1,618,016) | $30,512 |
| Class I | | | | |
| Shares sold | 13,956 | – | $177,050 | $– |
| Issued in exchange for the shares of Fidelity Advisor Municipal Income Fund | 50,530 | – | 642,743 | – |
| Reinvestment of distributions | 642 | – | 8,146 | – |
| Shares redeemed | (21,601) | – | (273,260) | – |
| Net increase (decrease) | 43,527 | – | $554,679 | $– |
| Class Z | | | | |
| Shares sold | 1,760 | – | $22,053 | $– |
| Reinvestment of distributions | 7 | – | 95 | – |
| Shares redeemed | (137) | – | (1,735) | – |
| Net increase (decrease) | 1,630 | – | $20,413 | $– |
(a) Share transactions for Class A, Class M, Class C and Class I are for the period March 1, 2018 (commencement of sale of shares) to December 31, 2018. Share transactions for Class Z are for period October 2, 2018 (commencement of sale of shares) to December 31, 2018.
(b) Amount includes in-kind redemptions (see the Affiliated Redemptions In-Kind note for additional details).
10. Other.
The Fund's organizational documents provide former and current trustees and officers with a limited indemnification against liabilities arising in connection with the performance of their duties to the Fund. In the normal course of business, the Fund may also enter into contracts that provide general indemnifications. The Fund's maximum exposure under these arrangements is unknown as this would be dependent on future claims that may be made against the Fund. The risk of material loss from such claims is considered remote.
11. Merger Information.
On March 2, 2018, the Fund acquired all of the assets and assumed all of the liabilities of Fidelity Advisor Municipal Income Fund ("Target Fund") pursuant to an Agreement and Plan of Reorganization approved by the Board of Trustees ("The Board"). The acquisition was accomplished by an exchange of shares of each class of the Fund for corresponding shares then outstanding of the Target Fund at its net asset value on the acquisition date. In addition, the Board approved the creation of additional classes of shares that commenced sale of shares on March 1, 2018. The reorganization provides shareholders of the Target Fund access to a larger portfolio with a similar investment objective. The reorganization qualified as a tax-free reorganization for federal income tax purposes with no gain or loss recognized to the funds or their shareholders. The Target Fund's net assets of $1,094,211, including securities of $1,078,064 and unrealized appreciation of $12,741, was combined with the Fund's net assets of $5,490,715 for total net assets after the acquisition of $6,584,926.
Pro forma results of operations of the combined entity for the entire period ended December 31, 2018, as though the acquisition had occurred as of the beginning of the year (rather than on the actual acquisition date), are as follows:
| Net investment income (loss) | $178,321 |
| Total net realized gain (loss) | 3,763 |
| Total change in net unrealized appreciation (depreciation) | (175,496) |
| Net increase (decrease) in net assets resulting from operations | $6,588 |
Because the combined investment portfolios have been managed as a single portfolio since the acquisition was completed, it is not practicable to separate the amounts of revenue and earnings of the acquired fund that have been included in the Fund's accompanying Statement of Operations since March 2, 2018.
Report of Independent Registered Public Accounting Firm
To the Board of Trustees of Fidelity Municipal Trust and Shareholders of Fidelity Municipal Income Fund:
Opinion on the Financial Statements
We have audited the accompanying statement of assets and liabilities, including the schedule of investments, of Fidelity Municipal Income Fund (one of the funds constituting Fidelity Municipal Trust, referred to hereafter as the "Fund") as of December 31, 2018, the related statement of operations for the year ended December 31, 2018, the statement of changes in net assets for each of the two years in the period ended December 31, 2018, including the related notes, and the financial highlights for each of the periods indicated therein (collectively referred to as the “financial statements”). In our opinion, the financial statements present fairly, in all material respects, the financial position of the Fund as of December 31, 2018, the results of its operations for the year then ended, the changes in its net assets for each of the two years in the period ended December 31, 2018 and the financial highlights for the periods indicated therein in conformity with accounting principles generally accepted in the United States of America.
Basis for Opinion
These financial statements are the responsibility of the Fund’s management. Our responsibility is to express an opinion on the Fund’s financial statements based on our audits. We are a public accounting firm registered with the Public Company Accounting Oversight Board (United States) (PCAOB) and are required to be independent with respect to the Fund in accordance with the U.S. federal securities laws and the applicable rules and regulations of the Securities and Exchange Commission and the PCAOB.
We conducted our audits of these financial statements in accordance with the standards of the PCAOB. Those standards require that we plan and perform the audit to obtain reasonable assurance about whether the financial statements are free of material misstatement, whether due to error or fraud.
Our audits included performing procedures to assess the risks of material misstatement of the financial statements, whether due to error or fraud, and performing procedures that respond to those risks. Such procedures included examining, on a test basis, evidence regarding the amounts and disclosures in the financial statements. Our audits also included evaluating the accounting principles used and significant estimates made by management, as well as evaluating the overall presentation of the financial statements. Our procedures included confirmation of securities owned as of December 31, 2018 by correspondence with the custodian. We believe that our audits provide a reasonable basis for our opinion.
PricewaterhouseCoopers LLP
Boston, Massachusetts
February 13, 2019
We have served as the auditor of one or more investment companies in the Fidelity group of funds since 1932.
Trustees and Officers
The Trustees, Members of the Advisory Board (if any), and officers of the trust and fund, as applicable, are listed below. The Board of Trustees governs the fund and is responsible for protecting the interests of shareholders. The Trustees are experienced executives who meet periodically throughout the year to oversee the fund's activities, review contractual arrangements with companies that provide services to the fund, oversee management of the risks associated with such activities and contractual arrangements, and review the fund's performance. Each of the Trustees oversees 260 funds.
The Trustees hold office without limit in time except that (a) any Trustee may resign; (b) any Trustee may be removed by written instrument, signed by at least two-thirds of the number of Trustees prior to such removal; (c) any Trustee who requests to be retired or who has become incapacitated by illness or injury may be retired by written instrument signed by a majority of the other Trustees; and (d) any Trustee may be removed at any special meeting of shareholders by a two-thirds vote of the outstanding voting securities of the trust. Each Trustee who is not an interested person (as defined in the 1940 Act) of the trust and the fund is referred to herein as an Independent Trustee. Each Independent Trustee shall retire not later than the last day of the calendar year in which his or her 75th birthday occurs. The Independent Trustees may waive this mandatory retirement age policy with respect to individual Trustees. Officers and Advisory Board Members hold office without limit in time, except that any officer or Advisory Board Member may resign or may be removed by a vote of a majority of the Trustees at any regular meeting or any special meeting of the Trustees. Except as indicated, each individual has held the office shown or other offices in the same company for the past five years.
The fund’s Statement of Additional Information (SAI) includes more information about the Trustees. To request a free copy, call Fidelity at 1-800-544-8544.
Experience, Skills, Attributes, and Qualifications of the Trustees. The Governance and Nominating Committee has adopted a statement of policy that describes the experience, qualifications, attributes, and skills that are necessary and desirable for potential Independent Trustee candidates (Statement of Policy). The Board believes that each Trustee satisfied at the time he or she was initially elected or appointed a Trustee, and continues to satisfy, the standards contemplated by the Statement of Policy. The Governance and Nominating Committee also engages professional search firms to help identify potential Independent Trustee candidates who have the experience, qualifications, attributes, and skills consistent with the Statement of Policy. From time to time, additional criteria based on the composition and skills of the current Independent Trustees, as well as experience or skills that may be appropriate in light of future changes to board composition, business conditions, and regulatory or other developments, have also been considered by the professional search firms and the Governance and Nominating Committee. In addition, the Board takes into account the Trustees' commitment and participation in Board and committee meetings, as well as their leadership of standing and ad hoc committees throughout their tenure.
In determining that a particular Trustee was and continues to be qualified to serve as a Trustee, the Board has considered a variety of criteria, none of which, in isolation, was controlling. The Board believes that, collectively, the Trustees have balanced and diverse experience, qualifications, attributes, and skills, which allow the Board to operate effectively in governing the fund and protecting the interests of shareholders. Information about the specific experience, skills, attributes, and qualifications of each Trustee, which in each case led to the Board's conclusion that the Trustee should serve (or continue to serve) as a trustee of the fund, is provided below.
Board Structure and Oversight Function. Abigail P. Johnson is an interested person and currently serves as Chairman. The Trustees have determined that an interested Chairman is appropriate and benefits shareholders because an interested Chairman has a personal and professional stake in the quality and continuity of services provided to the fund. Independent Trustees exercise their informed business judgment to appoint an individual of their choosing to serve as Chairman, regardless of whether the Trustee happens to be independent or a member of management. The Independent Trustees have determined that they can act independently and effectively without having an Independent Trustee serve as Chairman and that a key structural component for assuring that they are in a position to do so is for the Independent Trustees to constitute a substantial majority for the Board. The Independent Trustees also regularly meet in executive session. Arthur E. Johnson serves as Chairman of the Independent Trustees and as such (i) acts as a liaison between the Independent Trustees and management with respect to matters important to the Independent Trustees and (ii) with management prepares agendas for Board meetings.
Fidelity® funds are overseen by different Boards of Trustees. The fund's Board oversees Fidelity's investment-grade bond, money market, asset allocation and certain equity funds, and other Boards oversee Fidelity's high income and other equity funds. The asset allocation funds may invest in Fidelity® funds that are overseen by such other Boards. The use of separate Boards, each with its own committee structure, allows the Trustees of each group of Fidelity® funds to focus on the unique issues of the funds they oversee, including common research, investment, and operational issues. On occasion, the separate Boards establish joint committees to address issues of overlapping consequences for the Fidelity® funds overseen by each Board.
The Trustees operate using a system of committees to facilitate the timely and efficient consideration of all matters of importance to the Trustees, the fund, and fund shareholders and to facilitate compliance with legal and regulatory requirements and oversight of the fund's activities and associated risks. The Board, acting through its committees, has charged FMR and its affiliates with (i) identifying events or circumstances the occurrence of which could have demonstrably adverse effects on the fund's business and/or reputation; (ii) implementing processes and controls to lessen the possibility that such events or circumstances occur or to mitigate the effects of such events or circumstances if they do occur; and (iii) creating and maintaining a system designed to evaluate continuously business and market conditions in order to facilitate the identification and implementation processes described in (i) and (ii) above. Because the day-to-day operations and activities of the fund are carried out by or through FMR, its affiliates, and other service providers, the fund's exposure to risks is mitigated but not eliminated by the processes overseen by the Trustees. While each of the Board's committees has responsibility for overseeing different aspects of the fund's activities, oversight is exercised primarily through the Operations and Audit Committees. In addition, an ad hoc Board committee of Independent Trustees has worked with FMR to enhance the Board's oversight of investment and financial risks, legal and regulatory risks, technology risks, and operational risks, including the development of additional risk reporting to the Board. Appropriate personnel, including but not limited to the fund's Chief Compliance Officer (CCO), FMR's internal auditor, the independent accountants, the fund's Treasurer and portfolio management personnel, make periodic reports to the Board's committees, as appropriate, including an annual review of Fidelity's risk management program for the Fidelity® funds. The responsibilities of each standing committee, including their oversight responsibilities, are described further under "Standing Committees of the Trustees."
Interested Trustees*:
Correspondence intended for a Trustee who is an interested person may be sent to Fidelity Investments, 245 Summer Street, Boston, Massachusetts 02210.
Name, Year of Birth; Principal Occupations and Other Relevant Experience+
Abigail P. Johnson (1961)
Year of Election or Appointment: 2009
Trustee
Chairman of the Board of Trustees
Ms. Johnson also serves as Trustee of other Fidelity® funds. Ms. Johnson serves as Chairman (2016-present), Chief Executive Officer (2014-present), and Director (2007-present) of FMR LLC (diversified financial services company), President of Fidelity Financial Services (2012-present) and President of Personal, Workplace and Institutional Services (2005-present). Ms. Johnson is Chairman and Director of FMR Co., Inc. (investment adviser firm, 2011-present) and Chairman and Director of FMR (investment adviser firm, 2011-present). Previously, Ms. Johnson served as Vice Chairman (2007-2016) and President (2013-2016) of FMR LLC, President and a Director of FMR (2001-2005), a Trustee of other investment companies advised by FMR, Fidelity Investments Money Management, Inc. (investment adviser firm), and FMR Co., Inc. (2001-2005), Senior Vice President of the Fidelity® funds (2001-2005), and managed a number of Fidelity® funds. Ms. Abigail P. Johnson and Mr. Arthur E. Johnson are not related.
Jennifer Toolin McAuliffe (1959)
Year of Election or Appointment: 2016
Trustee
Ms. McAuliffe also serves as Trustee of other Fidelity® funds. Ms. McAuliffe previously served as a Member of the Advisory Board of certain Fidelity® funds (2016) and as Co-Head of Fixed Income of Fidelity Investments Limited (now known as FIL Limited (FIL)) (diversified financial services company). Earlier roles at FIL included Director of Research for FIL’s credit and quantitative teams in London, Hong Kong and Tokyo. Ms. McAuliffe also was the Director of Research for taxable and municipal bonds at Fidelity Investments Money Management, Inc. Ms. McAuliffe is also a director or trustee of several not-for-profit entities.
* Determined to be an “Interested Trustee” by virtue of, among other things, his or her affiliation with the trust or various entities under common control with FMR.
+ The information includes the Trustee's principal occupation during the last five years and other information relating to the experience, attributes, and skills relevant to the Trustee's qualifications to serve as a Trustee, which led to the conclusion that the Trustee should serve as a Trustee for the fund.
Independent Trustees:
Correspondence intended for an Independent Trustee may be sent to Fidelity Investments, P.O. Box 55235, Boston, Massachusetts 02205-5235.
Name, Year of Birth; Principal Occupations and Other Relevant Experience+
Elizabeth S. Acton (1951)
Year of Election or Appointment: 2013
Trustee
Ms. Acton also serves as Trustee of other Fidelity® funds. Prior to her retirement in April 2012, Ms. Acton was Executive Vice President, Finance (2011-2012), Executive Vice President, Chief Financial Officer (2002-2011), and Treasurer (2004-2005) of Comerica Incorporated (financial services). Prior to joining Comerica, Ms. Acton held a variety of positions at Ford Motor Company (1983-2002), including Vice President and Treasurer (2000-2002) and Executive Vice President and Chief Financial Officer of Ford Motor Credit Company (1998-2000). Ms. Acton currently serves as a member of the Board of Directors and Audit and Finance Committees of Beazer Homes USA, Inc. (homebuilding, 2012-present). Previously, Ms. Acton served as a Member of the Advisory Board of certain Fidelity® funds (2013-2016).
Ann E. Dunwoody (1953)
Year of Election or Appointment: 2018
Trustee
General Dunwoody also serves as Trustee of other Fidelity® funds. General Dunwoody (United States Army, Retired) was the first woman in U.S. military history to achieve the rank of four-star general and prior to her retirement in 2012 held a variety of positions within the U.S. Army, including Commanding General, U.S. Army Material Command (2008-2012). She is the President of First to Four LLC (leadership and mentoring services, 2012-present). She also serves as a member of the Board of Directors and Nominating and Corporate Governance Committee of L3 Technologies, Inc. (communication, electronic, sensor, and aerospace systems, 2013-present), Board of Directors and Nomination and Corporate Governance Committees of Kforce Inc. (professional staffing services, 2016-present) and Board of Directors of Automattic Inc. (software engineering, 2018-present). Previously, General Dunwoody served as a Member of the Advisory Board of certain Fidelity® funds (2018), a member of the Board of Directors and Audit and Sustainability and Corporate Responsibility Committees of Republic Services, Inc. (waste collection, disposal and recycling, 2013-2016). Ms. Dunwoody also serves on several boards for non-profit organizations, including as a member of the Board of Directors, Chair of the Nomination and Governance Committee and member of the Audit Committee of Logistics Management Institute (consulting non-profit, 2012-present), a member of the Board of Directors of the Army Historical Foundation (2015-present), a member of the Council of Trustees for the Association of the United States Army (advocacy non-profit, 2013-present) and a member of the Board of Trustees of Florida Institute of Technology (2015-present) and ThanksUSA (military family education non-profit, 2014-present).
John Engler (1948)
Year of Election or Appointment: 2014
Trustee
Mr. Engler also serves as Trustee of other Fidelity® funds. He serves on the board of directors for Universal Forest Products (manufacturer and distributor of wood and wood-alternative products, 2003-present) and K12 Inc. (technology-based education company, 2012-present). Previously, Mr. Engler served as interim president of Michigan State University (2018-2019), a Member of the Advisory Board of certain Fidelity® funds (2014-2016), president of the Business Roundtable (2011-2017), a trustee of The Munder Funds (2003-2014), president and CEO of the National Association of Manufacturers (2004-2011), member of the Board of Trustees of the Annie E. Casey Foundation (2004-2015), and as governor of Michigan (1991-2003). He is a past chairman of the National Governors Association.
Robert F. Gartland (1951)
Year of Election or Appointment: 2010
Trustee
Mr. Gartland also serves as Trustee of other Fidelity® funds. Mr. Gartland is Chairman and an investor in Gartland & Mellina Group Corp. (consulting, 2009-present). Previously, Mr. Gartland served as a partner and investor of Vietnam Partners LLC (investments and consulting, 2008-2011). Prior to his retirement, Mr. Gartland held a variety of positions at Morgan Stanley (financial services, 1979-2007), including Managing Director (1987-2007), and Chase Manhattan Bank (1975-1978).
Arthur E. Johnson (1947)
Year of Election or Appointment: 2008
Trustee
Chairman of the Independent Trustees
Mr. Johnson also serves as Trustee of other Fidelity® funds. Mr. Johnson serves as a member of the Board of Directors of Eaton Corporation plc (diversified power management, 2009-present) and Booz Allen Hamilton (management consulting, 2011-present). Prior to his retirement, Mr. Johnson served as Senior Vice President of Corporate Strategic Development of Lockheed Martin Corporation (defense contractor, 1999-2009). He previously served on the Board of Directors of IKON Office Solutions, Inc. (1999-2008), AGL Resources, Inc. (holding company, 2002-2016), and Delta Airlines (2005-2007). Mr. Arthur E. Johnson is not related to Ms. Abigail P. Johnson.
Michael E. Kenneally (1954)
Year of Election or Appointment: 2009
Trustee
Vice Chairman of the Independent Trustees
Mr. Kenneally also serves as Trustee of other Fidelity® funds. Prior to his retirement, Mr. Kenneally served as Chairman and Global Chief Executive Officer of Credit Suisse Asset Management. Before joining Credit Suisse, he was an Executive Vice President and Chief Investment Officer for Bank of America Corporation. Earlier roles at Bank of America included Director of Research, Senior Portfolio Manager and Research Analyst, and Mr. Kenneally was awarded the Chartered Financial Analyst (CFA) designation in 1991.
Marie L. Knowles (1946)
Year of Election or Appointment: 2001
Trustee
Ms. Knowles also serves as Trustee of other Fidelity® funds. Prior to Ms. Knowles' retirement in June 2000, she served as Executive Vice President and Chief Financial Officer of Atlantic Richfield Company (ARCO) (diversified energy, 1996-2000). From 1993 to 1996, she was a Senior Vice President of ARCO and President of ARCO Transportation Company (pipeline and tanker operations). Ms. Knowles currently serves as a Director and Chairman of the Audit Committee of McKesson Corporation (healthcare service, since 2002). Ms. Knowles is a member of the Board of the Santa Catalina Island Company (real estate, 2009-present). Ms. Knowles is a Member of the Investment Company Institute Board of Governors and a Member of the Governing Council of the Independent Directors Council (2014-present). She also serves as a member of the Advisory Board for the School of Engineering of the University of Southern California. Previously, Ms. Knowles served as a Director of Phelps Dodge Corporation (copper mining and manufacturing, 1994-2007), URS Corporation (engineering and construction, 2000-2003) and America West (airline, 1999-2002). Ms. Knowles previously served as Chairman (2015-2018) and Vice Chairman (2012-2015) of the Independent Trustees of certain Fidelity® funds.
Mark A. Murray (1954)
Year of Election or Appointment: 2016
Trustee
Mr. Murray also serves as Trustee of other Fidelity® funds. Mr. Murray is Vice Chairman (2013-present) of Meijer, Inc. (regional retail chain). Previously, Mr. Murray served as a Member of the Advisory Board of certain Fidelity® funds (2016) and as Co-Chief Executive Officer (2013-2016) and President (2006-2013) of Meijer, Inc. Mr. Murray serves as a member of the Board of Directors and Nuclear Review and Public Policy and Responsibility Committees of DTE Energy Company (diversified energy company, 2009-present). Mr. Murray also serves as a member of the Board of Directors of Spectrum Health (not-for-profit health system, 2015-present). Mr. Murray previously served as President of Grand Valley State University (2001-2006), Treasurer for the State of Michigan (1999-2001), Vice President of Finance and Administration for Michigan State University (1998-1999), and a member of the Board of Directors and Audit Committee and Chairman of the Nominating and Corporate Governance Committee of Universal Forest Products, Inc. (manufacturer and distributor of wood and wood-alternative products, 2004-2016). Mr. Murray is also a director or trustee of many community and professional organizations.
+ The information includes the Trustee's principal occupation during the last five years and other information relating to the experience, attributes, and skills relevant to the Trustee's qualifications to serve as a Trustee, which led to the conclusion that the Trustee should serve as a Trustee for the fund.
Advisory Board Members and Officers:
Correspondence intended for an officer may be sent to Fidelity Investments, 245 Summer Street, Boston, Massachusetts 02210. Officers appear below in alphabetical order.
Name, Year of Birth; Principal Occupation
Elizabeth Paige Baumann (1968)
Year of Election or Appointment: 2017
Anti-Money Laundering (AML) Officer
Ms. Baumann also serves as AML Officer of other funds. She is Chief AML Officer (2012-present) and Senior Vice President (2014-present) of FMR LLC (diversified financial services company) and is an employee of Fidelity Investments. Previously, Ms. Baumann served as AML Officer of the funds (2012-2016), and Vice President (2007-2014) and Deputy Anti-Money Laundering Officer (2007-2012) of FMR LLC.
Craig S. Brown (1977)
Year of Election or Appointment: 2019
Assistant Treasurer
Mr. Brown also serves as Assistant Treasurer of other funds. Mr. Brown is an employee of Fidelity Investments (2013-present).
John J. Burke III (1964)
Year of Election or Appointment: 2018
Chief Financial Officer
Mr. Burke also serves as Chief Financial Officer of other funds. Mr. Burke serves as Head of Investment Operations for Fidelity Fund and Investment Operations (2018-present) and is an employee of Fidelity Investments (1998-present). Previously Mr. Burke served as head of Asset Management Investment Operations (2012-2018).
William C. Coffey (1969)
Year of Election or Appointment: 2018
Secretary and Chief Legal Officer (CLO)
Mr. Coffey also serves as Secretary and CLO of other funds. Mr. Coffey serves as CLO, Secretary, and Senior Vice President of Fidelity Management & Research Company and FMR Co., Inc. (investment adviser firms, 2018-present); Secretary of Fidelity SelectCo, LLC and Fidelity Investments Money Management, Inc. (investment adviser firms, 2018-present); and CLO of Fidelity Management & Research (Hong Kong) Limited, FMR Investment Management (UK) Limited, and Fidelity Management & Research (Japan) Limited (investment adviser firms, 2018-present). He is Senior Vice President and Deputy General Counsel of FMR LLC (diversified financial services company, 2010-present), and is an employee of Fidelity Investments. Previously, Mr. Coffey served as Assistant Secretary of certain funds (2009-2018) and as Vice President and Associate General Counsel of FMR LLC (2005-2009).
Jonathan Davis (1968)
Year of Election or Appointment: 2010
Assistant Treasurer
Mr. Davis also serves as Assistant Treasurer of other funds. Mr. Davis serves as Assistant Treasurer of FMR Capital, Inc. (2017-present) and is an employee of Fidelity Investments. Previously, Mr. Davis served as Vice President and Associate General Counsel of FMR LLC (diversified financial services company, 2003-2010).
Adrien E. Deberghes (1967)
Year of Election or Appointment: 2010
Assistant Treasurer
Mr. Deberghes also serves as an officer of other funds. He serves as Assistant Treasurer of FMR Capital, Inc. (2017-present), Executive Vice President of Fidelity Investments Money Management, Inc. (FIMM) (investment adviser firm, 2016-present), and is an employee of Fidelity Investments (2008-present). Previously, Mr. Deberghes served as President and Treasurer of certain Fidelity® funds (2013-2018). Prior to joining Fidelity Investments, Mr. Deberghes was Senior Vice President of Mutual Fund Administration at State Street Corporation (2007-2008), Senior Director of Mutual Fund Administration at Investors Bank & Trust (2005-2007), and Director of Finance for Dunkin' Brands (2000-2005). Previously, Mr. Deberghes served in other fund officer roles.
Laura M. Del Prato (1964)
Year of Election or Appointment: 2018
President and Treasurer
Ms. Del Prato also serves as an officer of other funds. Ms. Del Prato is an employee of Fidelity Investments (2017-present). Prior to joining Fidelity Investments, Ms. Del Prato served as a Managing Director and Treasurer of the JPMorgan Mutual Funds (2014-2017). Prior to JPMorgan, Ms. Del Prato served as a partner at Cohen Fund Audit Services (accounting firm, 2012-2013) and KPMG LLP (accounting firm, 2004-2012).
Colm A. Hogan (1973)
Year of Election or Appointment: 2016
Assistant Treasurer
Mr. Hogan also serves as an officer of other funds. Mr. Hogan serves as Assistant Treasurer of FMR Capital, Inc. (2017-present) and is an employee of Fidelity Investments (2005-present). Previously, Mr. Hogan served as Assistant Treasurer of certain Fidelity® funds (2016-2018).
Chris Maher (1972)
Year of Election or Appointment: 2013
Assistant Treasurer
Mr. Maher serves as Assistant Treasurer of other funds. Mr. Maher is Vice President of Valuation Oversight, serves as Assistant Treasurer of FMR Capital, Inc. (2017-present), and is an employee of Fidelity Investments. Previously, Mr. Maher served as Vice President of Asset Management Compliance (2013), Vice President of the Program Management Group of FMR (investment adviser firm, 2010-2013), and Vice President of Valuation Oversight (2008-2010).
John B. McGinty, Jr. (1962)
Year of Election or Appointment: 2016
Chief Compliance Officer
Mr. McGinty also serves as Chief Compliance Officer of other funds. Mr. McGinty is Senior Vice President of Asset Management Compliance for Fidelity Investments and is an employee of Fidelity Investments (2016-present). Mr. McGinty previously served as Vice President, Senior Attorney at Eaton Vance Management (investment management firm, 2015-2016), and prior to Eaton Vance as global CCO for all firm operations and registered investment companies at GMO LLC (investment management firm, 2009-2015). Before joining GMO LLC, Mr. McGinty served as Senior Vice President, Deputy General Counsel for Fidelity Investments (2007-2009).
Jason P. Pogorelec (1975)
Year of Election or Appointment: 2015
Assistant Secretary
Mr. Pogorelec also serves as Assistant Secretary of other funds. Mr. Pogorelec serves as Vice President, Associate General Counsel (2010-present) and is an employee of Fidelity Investments (2006-present).
Nancy D. Prior (1967)
Year of Election or Appointment: 2014
Vice President
Ms. Prior also serves as Vice President of other funds. Ms. Prior serves as President Fixed Income, High Income/Emerging Market Debt and Multi Asset Class Strategies of FIAM LLC (2018-present), President (2016-present) and Director (2014-present) of Fidelity Investments Money Management, Inc. (FIMM) (investment adviser firm), President, Fixed Income (2014-present), and is an employee of Fidelity Investments (2002-present). Previously, Ms. Prior served as Vice Chairman of FIAM LLC (investment adviser firm, 2014-2018), a Director of FMR Investment Management (UK) Limited (investment adviser firm, 2015-2018), President Multi-Asset Class Strategies of FMR's Global Asset Allocation Division (2017-2018), Vice President of Fidelity's Money Market Funds (2012-2014), President, Money Market and Short Duration Bond Group of Fidelity Management & Research (FMR) (investment adviser firm, 2013-2014), President, Money Market Group of FMR (2011-2013), Managing Director of Research (2009-2011), Senior Vice President and Deputy General Counsel (2007-2009), and Assistant Secretary of certain Fidelity® funds (2008-2009).
Stacie M. Smith (1974)
Year of Election or Appointment: 2013
Assistant Treasurer
Ms. Smith also serves as an officer of other funds. Ms. Smith serves as Assistant Treasurer of FMR Capital, Inc. (2017-present), is an employee of Fidelity Investments (2009-present), and has served in other fund officer roles. Prior to joining Fidelity Investments, Ms. Smith served as Senior Audit Manager of Ernst & Young LLP (accounting firm, 1996-2009). Previously, Ms. Smith served as Assistant Treasurer (2013-2018) and Deputy Treasurer (2013-2016) of certain Fidelity® funds.
Marc L. Spector (1972)
Year of Election or Appointment: 2016
Deputy Treasurer
Mr. Spector also serves as an officer of other funds. Mr. Spector serves as Assistant Treasurer of FMR Capital, Inc. (2017-present) and is an employee of Fidelity Investments (2016-present). Prior to joining Fidelity Investments, Mr. Spector served as Director at the Siegfried Group (accounting firm, 2013-2016), and prior to Siegfried Group as audit senior manager at Deloitte & Touche (accounting firm, 2005-2013).
Jim Wegmann (1979)
Year of Election or Appointment: 2019
Assistant Treasurer
Mr. Wegmann also serves as Assistant Treasurer of other funds. Mr. Wegmann is an employee of Fidelity Investments (2011-present).
Shareholder Expense Example
As a shareholder of the Fund, you incur two types of costs: (1) transaction costs including sales charges (loads) on purchase payments or redemption proceeds, and (2) ongoing costs, including management fees, distribution and/or service (12b-1) fees and other Fund expenses. This Example is intended to help you understand your ongoing costs (in dollars) of investing in the Fund and to compare these costs with the ongoing costs of investing in other mutual funds.
The actual expense Example is based on an investment of $1,000 invested at the beginning of the period and held for the entire period (July 1, 2018 to December 31, 2018) for Class A, class M, Class C, Fidelity Municipal Income and Class I and for the period (October 2, 2018 to December 31, 2018) for Class Z. The hypothetical expense Example is based on an investment of $1,000 invested for the one-half year period (July 1, 2018 to December 31, 2018).
Actual Expenses
The first line of the accompanying table for each class of the Fund provides information about actual account values and actual expenses. You may use the information in this line, together with the amount you invested, to estimate the expenses that you paid over the period. Simply divide your account value by $1,000.00 (for example, an $8,600 account value divided by $1,000.00 = 8.6), then multiply the result by the number in the first line for a class of the Fund under the heading entitled "Expenses Paid During Period" to estimate the expenses you paid on your account during this period. A small balance maintenance fee of $12.00 that is charged once a year may apply for certain accounts with a value of less than $2,000. This fee, which was eliminated effective August 1, 2018, is not included in the table below. If it was, the estimate of expenses you paid during the period would be higher, and your ending account value lower, by this amount. In addition, the Fund, as a shareholder in the underlying Fidelity Central Funds, will indirectly bear its pro-rata share of the fees and expenses incurred by the underlying Fidelity Central Funds. These fees and expenses are not included in the Fund's annualized expense ratio used to calculate the expense estimate in the table below.
Hypothetical Example for Comparison Purposes
The second line of the accompanying table for each class of the Fund provides information about hypothetical account values and hypothetical expenses based on a Class' actual expense ratio and an assumed rate of return of 5% per year before expenses, which is not the Class' actual return. The hypothetical account values and expenses may not be used to estimate the actual ending account balance or expenses you paid for the period. You may use this information to compare the ongoing costs of investing in the Fund and other funds. To do so, compare this 5% hypothetical example with the 5% hypothetical examples that appear in the shareholder reports of the other funds. A small balance maintenance fee of $12.00 that is charged once a year may apply for certain accounts with a value of less than $2,000. This fee, which was eliminated effective August 1, 2018, is not included in the table below. If it was, the estimate of expenses you paid during the period would be higher, and your ending account value lower, by this amount. In addition, the Fund, as a shareholder in the underlying Fidelity Central Funds, will indirectly bear its pro-rata share of the fees and expenses incurred by the underlying Fidelity Central Funds. These fees and expenses are not included in the Fund's annualized expense ratio used to calculate the expense estimate in the table below.
Please note that the expenses shown in the table are meant to highlight your ongoing costs only and do not reflect any transaction costs. Therefore, the second line of the table is useful in comparing ongoing costs only, and will not help you determine the relative total costs of owning different funds. In addition, if these transactional costs were included, your costs would have been higher.
| | Annualized Expense Ratio-A | Beginning
Account Value | Ending
Account Value
December 31, 2018 | Expenses Paid
During Period |
| Class A | .78% | | | |
| Actual | | $1,000.00 | $1,013.40 | $3.96-B |
| Hypothetical-C | | $1,000.00 | $1,021.27 | $3.97-D |
| Class M | .76% | | | |
| Actual | | $1,000.00 | $1,013.50 | $3.86-B |
| Hypothetical-C | | $1,000.00 | $1,021.37 | $3.87-D |
| Class C | 1.52% | | | |
| Actual | | $1,000.00 | $1,009.70 | $7.70-B |
| Hypothetical-C | | $1,000.00 | $1,017.54 | $7.73-D |
| Fidelity Municipal Income Fund | .45% | | | |
| Actual | | $1,000.00 | $1,014.30 | $2.28-B |
| Hypothetical-C | | $1,000.00 | $1,022.94 | $2.29-D |
| Class I | .53% | | | |
| Actual | | $1,000.00 | $1,014.70 | $2.69-B |
| Hypothetical-C | | $1,000.00 | $1,022.53 | $2.70-D |
| Class Z | .42% | | | |
| Actual | | $1,000.00 | $1,016.90 | $1.06-B |
| Hypothetical-C | | $1,000.00 | $1,023.09 | $2.14-D |
A Annualized expense ratio reflects expenses net of applicable fee waivers.
B Actual expenses are equal to each Class' annualized expense ratio, multiplied by the average account value over the period, multiplied by 184/365 (to reflect the one-half year period) for Class A, Class M, Class C, Fidelity Municipal Income Fund and Class I and multiplied by 91/365 (to reflect the period October 2, 2018 to December 31, 2018) for Class Z.
C 5% return per year before expenses
D Hypothetical expenses are equal to each Class' annualized expense ratio, multiplied by the average account value over the period, multiplied by 184/365 (to reflect the one-half year period).
Distributions (Unaudited)
Fidelity Municipal Income Fund hereby designates as a capital gain dividend with respect to the taxable year ended December 31, 2018, $4,279,491, or, if subsequently determined to be different, the net capital gain of such year.
Fidelity Advisor Municipal Income Fund hereby designates as a capital gain dividend with respect to the taxable year ended March 2, 2018, $4,878,466, or, if subsequently determined to be different, the net capital gain of such year.
During fiscal year ended December 31, 2018, 100% of the Fidelity Municipal Income Fund's income dividends was free from federal income tax, and 16.66% of the fund's income dividends was subject to the federal alternative minimum tax.
During fiscal year ended March 2, 2018, 100% of the Fidelity Advisor Municipal Income Fund's income dividends was free from federal income tax, and 19.29% of the income dividends was subject to the federal alternative minimum tax.
The funds will notify shareholders in January 2019 of amounts for use in preparing 2018 income tax returns.
Board Approval of Investment Advisory Contracts and Management Fees
Fidelity Municipal Income Fund
Each year, the Board of Trustees, including the Independent Trustees (together, the Board), votes on the renewal of the management contract with Fidelity Management & Research Company (FMR) and the sub-advisory agreements (together, the Advisory Contracts) for the fund. FMR and the sub-advisers are referred to herein as the Investment Advisers. The Board, assisted by the advice of fund counsel and Independent Trustees' counsel, requests and considers a broad range of information relevant to the renewal of the Advisory Contracts throughout the year.
The Board meets regularly and, at each of its meetings, covers an extensive agenda of topics and materials and considers factors that are relevant to its annual consideration of the renewal of the fund's Advisory Contracts, including the services and support provided to the fund and its shareholders. The Board has established four standing committees (Committees) — Operations, Audit, Fair Valuation, and Governance and Nominating — each composed of and chaired by Independent Trustees with varying backgrounds, to which the Board has assigned specific subject matter responsibilities in order to enhance effective decision-making by the Board. The Operations Committee, of which all of the Independent Trustees are members, meets regularly throughout the year and considers, among other matters, information specifically related to the annual consideration of the renewal of the fund's Advisory Contracts. The Board, acting directly and through its Committees, requests and receives information concerning the annual consideration of the renewal of the fund's Advisory Contracts. The Board also meets as needed to review matters specifically related to the Board's annual consideration of the renewal of the Advisory Contracts. Members of the Board may also meet with trustees of other Fidelity funds through joint ad hoc committees to discuss certain matters relevant to all of the Fidelity funds.
At its September 2018 meeting, the Board unanimously determined to renew the fund's Advisory Contracts. In reaching its determination, the Board considered all factors it believed relevant, including (i) the nature, extent, and quality of the services to be provided to the fund and its shareholders (including the investment performance of the fund); (ii) the competitiveness of the fund's management fee and total expense ratio relative to peer funds; (iii) the total costs of the services to be provided by and the profits to be realized by Fidelity from its relationships with the fund; and (iv) the extent to which, if any, economies of scale exist and would be realized as the fund grows, and whether any economies of scale are appropriately shared with fund shareholders.
In considering whether to renew the Advisory Contracts for the fund, the Board reached a determination, with the assistance of fund counsel and Independent Trustees' counsel and through the exercise of its business judgment, that the renewal of the Advisory Contracts was in the best interests of the fund and its shareholders and that the compensation payable under the Advisory Contracts was fair and reasonable. The Board's decision to renew the Advisory Contracts was not based on any single factor, but rather was based on a comprehensive consideration of all the information provided to the Board at its meetings throughout the year. The Board, in reaching its determination to renew the Advisory Contracts, was aware that shareholders of the fund have a broad range of investment choices available to them, including a wide choice among funds offered by Fidelity's competitors, and that the fund's shareholders, who have the opportunity to review and weigh the disclosure provided by the fund in its prospectus and other public disclosures, have chosen to invest in this fund, which is part of the Fidelity family of funds.
Nature, Extent, and Quality of Services Provided. The Board considered Fidelity's staffing as it relates to the fund, including the backgrounds of investment personnel of Fidelity, and also considered the fund's investment objective, strategies, and related investment philosophy. The Independent Trustees also had discussions with senior management of Fidelity's investment operations and investment groups. The Board considered the structure of the investment personnel compensation program and whether this structure provides appropriate incentives to act in the best interests of the fund. Additionally, the Board considered the portfolio managers' investments, if any, in the funds that they manage.
Resources Dedicated to Investment Management and Support Services. The Board reviewed the general qualifications and capabilities of Fidelity's investment staff, including its size, education, experience, and resources, as well as Fidelity's approach to recruiting, managing, and compensating investment personnel. The Board noted that Fidelity has continued to increase the resources devoted to non-U.S. offices, including expansion of Fidelity's global investment organization. The Board also noted that Fidelity's analysts have extensive resources, tools and capabilities that allow them to conduct sophisticated quantitative and fundamental analysis, as well as credit analysis of issuers, counterparties and guarantors. Further, the Board considered that Fidelity's investment professionals have sufficient access to global information and data so as to provide competitive investment results over time, and that those professionals also have access to sophisticated tools that permit them to assess portfolio construction and risk and performance attribution characteristics continuously, as well as to transmit new information and research conclusions rapidly around the world. Additionally, in its deliberations, the Board considered Fidelity's trading, risk management, compliance, and technology and operations capabilities and resources, which are integral parts of the investment management process.
Shareholder and Administrative Services. The Board considered (i) the nature, extent, quality, and cost of advisory, administrative, and shareholder services performed by the Investment Advisers and their affiliates under the Advisory Contracts and under separate agreements covering transfer agency and pricing and bookkeeping services for the fund; (ii) the nature and extent of the supervision of third party service providers, principally custodians, subcustodians, and pricing vendors; and (iii) the resources devoted to, and the record of compliance with, the fund's compliance policies and procedures.
The Board noted that the growth of fund assets over time across the complex allows Fidelity to reinvest in the development of services designed to enhance the value and convenience of the Fidelity funds as investment vehicles. These services include 24-hour access to account information and market information through telephone representatives and over the Internet, investor education materials and asset allocation tools, and the expanded availability of Fidelity Investor Centers.
Investment in a Large Fund Family. The Board considered the benefits to shareholders of investing in a Fidelity fund, including the benefits of investing in a fund that is part of a large family of funds offering a variety of investment disciplines and providing a large variety of mutual fund investor services. The Board noted that Fidelity had taken, or had made recommendations that resulted in the Fidelity funds taking, a number of actions over the previous year that benefited particular funds, including: (i) continuing to dedicate additional resources to Fidelity's investment research process, which includes meetings with management of issuers of securities in which the funds invest, and to the support of the senior management team that oversees asset management; (ii) continuing efforts to enhance Fidelity's global research capabilities; (iii) launching new funds and making other enhancements to meet client needs; (iv) launching new share classes of existing funds; (v) eliminating purchase minimums and broadening eligibility requirements for certain funds and share classes; (vi) reducing management fees and total expenses for certain growth equity funds and index funds; (vii) lowering expense caps for certain existing funds and classes, and converting certain voluntary expense caps to contractual caps, to reduce expenses borne by shareholders; (viii) eliminating short-term redemption fees for funds that had such fees; (ix) rationalizing product lines and gaining increased efficiencies from fund mergers and share class consolidations; (x) continuing to develop, acquire and implement systems and technology to improve services to the funds and shareholders, strengthen information security, and increase efficiency; and (xi) continuing to implement enhancements to further strengthen Fidelity's product line to increase investors' probability of success in achieving their investment goals, including retirement income goals.
Investment Performance. The Board considered whether the fund has operated in accordance with its investment objective, as well as its record of compliance with its investment restrictions and its performance history.
The Board took into account discussions that occur at Board meetings throughout the year with representatives of the Investment Advisers about fund investment performance. In this regard the Board noted that as part of regularly scheduled fund reviews and other reports to the Board on fund performance, the Board considers annualized return information for the fund for different time periods, measured against an appropriate securities market index ("benchmark index") and a peer group of funds with similar objectives ("peer group"), if any. In its evaluation of fund investment performance at meetings throughout the year, the Board gave particular attention to information indicating underperformance of certain Fidelity funds for specific time periods and discussed with the Investment Advisers the reasons for such underperformance.
In addition to reviewing absolute and relative fund performance, the Independent Trustees periodically consider the appropriateness of fund performance metrics in evaluating the results achieved. In general, the Independent Trustees believe that fund performance should be evaluated based on gross performance (before fees and expenses but after transaction costs) compared to appropriate benchmark indices, over appropriate time periods that may include full market cycles, and on net performance (after fees and expenses) compared to peer groups, as applicable, over the same periods, taking into account relevant factors including the following: general market conditions; expectations for interest rate levels and credit conditions; issuer-specific information including credit quality; the potential for incremental return versus the fund's benchmark index weighed against the risks involved in obtaining that incremental return, including the risk of diminished or negative total returns; and fund cash flows and other factors. Depending on the circumstances, the Independent Trustees may be satisfied with a fund's performance notwithstanding that it lags its benchmark index or peer group for certain periods.
The Independent Trustees recognize that shareholders evaluate performance on a net basis over their own holding periods, for which one-, three-, and five-year periods are often used as a proxy. For this reason, the performance information reviewed by the Board also included net cumulative calendar year total return information for the fund and an appropriate benchmark index and peer group for the most recent one-, three-, and five-year periods.
Based on its review, the Board concluded that the nature, extent, and quality of services provided to the fund under the Advisory Contracts should continue to benefit the shareholders of the fund.
Competitiveness of Management Fee and Total Expense Ratio. The Board considered the fund's management fee and total expense ratio compared to "mapped groups" of competitive funds and classes created for the purpose of facilitating the Trustees' competitive analysis of management fees and total expenses. Fidelity creates "mapped groups" by combining similar Lipper investment objective categories that have comparable investment mandates. Combining Lipper investment objective categories aids the Board's management fee and total expense ratio comparisons by broadening the competitive group used for comparison.
Management Fee. The Board considered two proprietary management fee comparisons for the 12-month periods shown in basis points (BP) in the chart below. The group of Lipper funds used by the Board for management fee comparisons is referred to below as the "Total Mapped Group" and, for the reasons explained above, is broader than the Lipper peer group used by the Board for performance comparisons. The Total Mapped Group comparison focuses on a fund's standing in terms of gross management fees before expense reimbursements or caps relative to the total universe of funds with comparable investment mandates, regardless of whether their management fee structures also are comparable. Funds with comparable investment mandates offer exposure to similar types of securities. Funds with comparable management fee structures have similar management fee contractual arrangements (
e.g., flat rate charged for advisory services, all-inclusive fee rate,
etc.). "TMG %" represents the percentage of funds in the Total Mapped Group that had management fees that were lower than the fund's. For example, a hypothetical TMG % of 20% would mean that 80% of the funds in the Total Mapped Group had higher, and 20% had lower, management fees than the fund. The fund's actual TMG %s and the number of funds in the Total Mapped Group are in the chart below. The "Asset-Size Peer Group" (ASPG) comparison focuses on a fund's standing relative to a subset of non-Fidelity funds within the Total Mapped Group that are similar in size and management fee structure. For example, if a fund is in the first quartile of the ASPG, the fund's management fee ranks in the least expensive or lowest 25% of funds in the ASPG. The ASPG represents at least 15% of the funds in the Total Mapped Group with comparable asset size and management fee structures, subject to a minimum of 50 funds (or all funds in the Total Mapped Group if fewer than 50). Additional information, such as the ASPG quartile in which the fund's management fee rate ranked, is also included in the chart and was considered by the Board.
Fidelity Municipal Income Fund
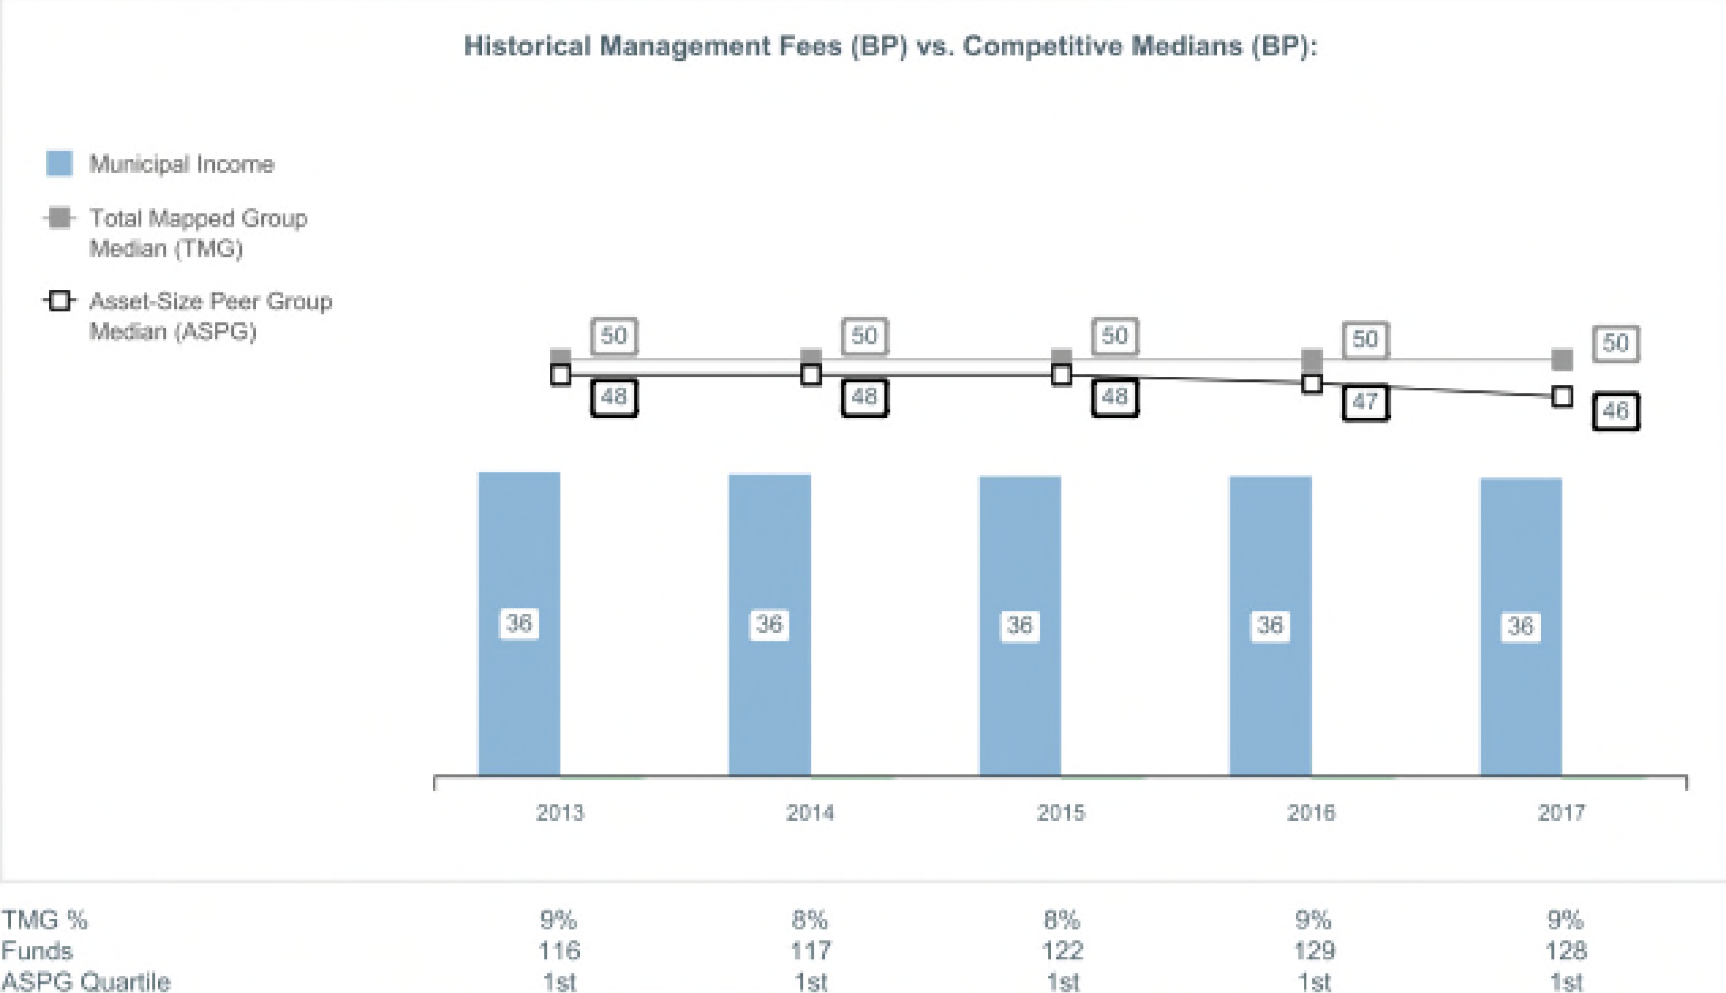
The Board noted that the fund's management fee rate ranked below the median of its Total Mapped Group and below the median of its ASPG for 2017.
The Board noted that it and the boards of other Fidelity funds formed an ad hoc Committee on Group Fee, which meets periodically, to conduct an in-depth review of the "group fee" component of the management fee of funds with such management fee structures. The Committee's focus included the mechanics of the group fee, the competitive landscape of group fee structures, Fidelity funds with no group fee component and investment products not included in group fee assets. The Board also considered that, for funds subject to the group fee, FMR agreed to voluntarily waive fees over a specified period of time in amounts designed to account for assets converted from certain funds to certain collective investment trusts.
Based on its review, the Board concluded that the fund's management fee is fair and reasonable in light of the services that the fund receives and the other factors considered.
Total Expense Ratio. In its review of the fund's total expense ratio, the Board considered the fund's management fee rate as well as other fund expenses, such as transfer agent fees, pricing and bookkeeping fees, and custodial, legal, and audit fees. The Board also noted that Fidelity may agree to waive fees and expenses from time to time, and the extent to which, if any, it has done so for the fund. As part of its review, the Board also considered the current and historical total expense ratios of the fund compared to competitive fund median expenses. The fund is compared to those funds and classes in the Total Mapped Group (used by the Board for management fee comparisons) that have a similar sales load structure.
The Board noted that the fund's total expense ratio ranked below the competitive median for 2017.
Fees Charged to Other Fidelity Clients. The Board also considered Fidelity fee structures and other information with respect to clients of Fidelity, such as other funds advised or subadvised by Fidelity, pension plan clients, and other institutional clients with similar mandates. The Board noted that a joint ad hoc committee created by it and the boards of other Fidelity funds periodically reviews and compares Fidelity's institutional investment advisory business with its business of providing services to the Fidelity funds and also noted the most recent findings of the committee. The Board noted that the committee's review included a consideration of the differences in services provided, fees charged, and costs incurred, as well as competition in the markets serving the different categories of clients.
Based on its review of total expense ratios and fees charged to other Fidelity clients, the Board concluded that the fund's total expense ratio was reasonable in light of the services that the fund and its shareholders receive and the other factors considered.
Costs of the Services and Profitability. The Board considered the revenues earned and the expenses incurred by Fidelity in conducting the business of developing, marketing, distributing, managing, administering and servicing the fund and servicing the fund's shareholders. The Board also considered the level of Fidelity's profits in respect of all the Fidelity funds.
On an annual basis, Fidelity presents to the Board information about the profitability of its relationships with the fund. Fidelity calculates profitability information for each fund, as well as aggregate profitability information for groups of Fidelity funds and all Fidelity funds, using a series of detailed revenue and cost allocation methodologies which originate with the books and records of Fidelity on which Fidelity's audited financial statements are based. The Audit Committee of the Board reviews any significant changes from the prior year's methodologies.
PricewaterhouseCoopers LLP (PwC), auditor to Fidelity and certain Fidelity funds, has been engaged annually by the Board as part of the Board's assessment of Fidelity's profitability analysis. PwC's engagement includes the review and assessment of the methodologies used by Fidelity in determining the revenues and expenses attributable to Fidelity's mutual fund business, and completion of agreed-upon procedures in respect of the mathematical accuracy of the fund profitability information and its conformity to established allocation methodologies. After considering PwC's reports issued under the engagement and information provided by Fidelity, the Board concluded that while other allocation methods may also be reasonable, Fidelity's profitability methodologies are reasonable in all material respects.
The Board also reviewed Fidelity's non-fund businesses and potential indirect benefits such businesses may have received as a result of their association with Fidelity's mutual fund business (i.e., fall-out benefits) as well as cases where Fidelity's affiliates may benefit from the fund's business. The Board noted that changes to fall-out benefits year-over-year reflect business developments at Fidelity's various businesses.
The Board considered the costs of the services provided by and the profits realized by Fidelity in connection with the operation of the fund and was satisfied that the profitability was not excessive.
Economies of Scale. The Board considered whether there have been economies of scale in respect of the management of the Fidelity funds, whether the Fidelity funds (including the fund) have appropriately benefited from any such economies of scale, and whether there is potential for realization of any further economies of scale. The Board considered the extent to which the fund will benefit from economies of scale as assets grow through increased services to the fund, through waivers or reimbursements, or through fee or expense ratio reductions. The Board also noted that a committee (the Economies of Scale Committee) created by it and the boards of other Fidelity funds periodically analyzes whether Fidelity attains economies of scale in respect of the management and servicing of the Fidelity funds, whether the Fidelity funds have appropriately benefited from such economies of scale, and whether there is potential for realization of any further economies of scale.
The Board recognized that the fund's management contract incorporates a "group fee" structure, which provides for lower group fee rates as total group assets increase, and for higher group fee rates as total group assets decrease (with "group assets" defined to include fund assets under FMR's management plus the assets of sector funds previously under FMR's management). FMR calculates the group fee rates based on a tiered asset "breakpoint" schedule that varies based on asset class. The Board considered that the group fee is designed to deliver the benefits of economies of scale to fund shareholders when total Fidelity fund assets increase, even if assets of any particular fund are unchanged or have declined, because some portion of Fidelity's costs are attributable to services provided to all Fidelity funds, and all funds benefit if those costs can be allocated among more assets. The Board concluded that, given the group fee structure, fund shareholders will benefit from lower management fees as group assets increase at the fund complex level, regardless of whether Fidelity achieves any such economies of scale.
The Board concluded, taking into account the analysis of the Economies of Scale Committee, that economies of scale, if any, are being appropriately shared between fund shareholders and Fidelity.
Additional Information Requested by the Board. In order to develop fully the factual basis for consideration of the Fidelity funds' advisory contracts, the Board requested and received additional information on certain topics, including: (i) Fidelity's fund profitability methodology, profitability trends for certain funds, the allocation of various costs to different funds, and the impact of certain factors on fund profitability results; (ii) portfolio manager changes that have occurred during the past year and the amount of the investment that each portfolio manager has made in the Fidelity fund(s) that he or she manages; (iii) Fidelity's compensation structure for portfolio managers, research analysts, and other key personnel, including its effects on fund profitability, the rationale for the compensation structure, and the extent to which current market conditions have affected retention and recruitment; (iv) the arrangements with and compensation paid to certain fund sub-advisers on behalf of the Fidelity funds and the treatment of such compensation within Fidelity's fund profitability methodology; (v) the terms of Fidelity's voluntary expense limitation agreements; (vi) the methodology with respect to competitive fund data and peer group classifications; (vii) Fidelity's transfer agent fee, expense, and service structures for different funds and classes relative to competitive trends, and the impact of the increased use of omnibus accounts; (viii) new developments in the retail and institutional marketplaces and the competitive positioning of the funds relative to other investment products and services; (ix) the impact of recent changes to the money market fund landscape, including the full implementation of money market fund reform and rising interest rates, on Fidelity's money market funds; (x) the funds' share class structures and distribution channels; and (xi) explanations regarding the relative total expense ratios of certain funds and classes, total expense competitive trends and methodologies for total expense competitive comparisons, and actions that might be taken by Fidelity to reduce total expense ratios for certain classes. In addition, the Board considered its discussions with Fidelity throughout the year regarding enhanced information security initiatives and the funds' fair valuation policies.
Based on its evaluation of all of the conclusions noted above, and after considering all factors it believed relevant, the Board concluded that the advisory fee arrangements are fair and reasonable, and that the fund's Advisory Contracts should be renewed.

Corporate Headquarters
245 Summer St.
Boston, MA 02210
www.fidelity.com
HIY-ANN-0219
1.539263.121
Fidelity® Michigan Municipal Income Fund
Fidelity® Michigan Municipal Money Market Fund
Annual Report December 31, 2018 |
|
Beginning on January 1, 2021, as permitted by regulations adopted by the Securities and Exchange Commission, paper copies of a fund’s shareholder reports will no longer be sent by mail, unless you specifically request paper copies of the reports from the fund or from your financial intermediary, such as a financial advisor, broker-dealer or bank. Instead, the reports will be made available on a website, and you will be notified by mail each time a report is posted and provided with a website link to access the report.
If you already elected to receive shareholder reports electronically, you will not be affected by this change and you need not take any action. You may elect to receive shareholder reports and other communications from a fund electronically, by contacting your financial intermediary. For Fidelity customers, visit Fidelity's web site or call Fidelity using the contact information listed below.
You may elect to receive all future reports in paper free of charge. If you wish to continue receiving paper copies of your shareholder reports, you may contact your financial intermediary or, if you are a Fidelity customer, visit Fidelity’s website, or call Fidelity at the applicable toll-free number listed below. Your election to receive reports in paper will apply to all funds held with the fund complex/your financial intermediary.
| Account Type | Website | Phone Number |
| Brokerage, Mutual Fund, or Annuity Contracts: | fidelity.com/mailpreferences | 1-800-343-3548 |
| Employer Provided Retirement Accounts: | netbenefits.fidelity.com/preferences (choose 'no' under Required Disclosures to continue to print) | 1-800-343-0860 |
| Advisor Sold Accounts Serviced Through Your Financial Intermediary: | Contact Your Financial Intermediary | Your Financial Intermediary's phone number |
| Advisor Sold Accounts Serviced by Fidelity: | institutional.fidelity.com | 1-877-208-0098 |
Contents
To view a fund's proxy voting guidelines and proxy voting record for the 12-month period ended June 30, visit http://www.fidelity.com/proxyvotingresults or visit the Securities and Exchange Commission's (SEC) web site at http://www.sec.gov.
You may also call 1-800-544-8544 to request a free copy of the proxy voting guidelines.
Standard & Poor's, S&P and S&P 500 are registered service marks of The McGraw-Hill Companies, Inc. and have been licensed for use by Fidelity Distributors Corporation.
Other third-party marks appearing herein are the property of their respective owners.
All other marks appearing herein are registered or unregistered trademarks or service marks of FMR LLC or an affiliated company. © 2019 FMR LLC. All rights reserved.
This report and the financial statements contained herein are submitted for the general information of the shareholders of the Fund. This report is not authorized for distribution to prospective investors in the Fund unless preceded or accompanied by an effective prospectus.
A fund files its complete schedule of portfolio holdings with the SEC for the first and third quarters of each fiscal year on Form N-Q. Forms N-Q are available on the SEC’s web site at http://www.sec.gov. A fund's Forms N-Q may be reviewed and copied at the SEC’s Public Reference Room in Washington, DC. Information regarding the operation of the SEC's Public Reference Room may be obtained by calling 1-800-SEC-0330.
For a complete list of a fund's portfolio holdings, view the most recent holdings listing, semiannual report, or annual report on Fidelity's web site at http://www.fidelity.com, http://www.institutional.fidelity.com, or http://www.401k.com, as applicable.
NOT FDIC INSURED •MAY LOSE VALUE •NO BANK GUARANTEE
Neither the Fund nor Fidelity Distributors Corporation is a bank.
Fidelity® Michigan Municipal Income Fund
Performance: The Bottom Line
Average annual total return reflects the change in the value of an investment, assuming reinvestment of distributions from dividend income and capital gains (the profits earned upon the sale of securities that have grown in value, if any) and assuming a constant rate of performance each year. The hypothetical investment and the average annual total returns do not reflect the deduction of taxes that a shareholder would pay on fund distributions or the redemption of fund shares. During periods of reimbursement by Fidelity, a fund’s total return will be greater than it would be had the reimbursement not occurred. How a fund did yesterday is no guarantee of how it will do tomorrow.
Average Annual Total Returns
| For the periods ended December 31, 2018 | Past 1 year | Past 5 years | Past 10 years |
| Fidelity® Michigan Municipal Income Fund | 0.90% | 3.78% | 4.26% |
$10,000 Over 10 Years
Let's say hypothetically that $10,000 was invested in Fidelity® Michigan Municipal Income Fund on December 31, 2008.
The chart shows how the value of your investment would have changed, and also shows how the Bloomberg Barclays Municipal Bond Index performed over the same period.

| Period Ending Values |
| $15,179 | Fidelity® Michigan Municipal Income Fund |
| $16,060 | Bloomberg Barclays Municipal Bond Index |
Fidelity® Michigan Municipal Income Fund
Management's Discussion of Fund Performance
Market Recap: Tax-exempt municipal bonds gained modestly in 2018, with the Bloomberg Barclays Municipal Bond Index returning 1.28%, supported by lower bond issuance and solid economic growth. Tax reform had a significant impact on both the supply of and demand for tax-exempt bonds the past year. In the final months of 2017, issuers accelerated their bond financings in order to issue under the old tax rules, prompting a surge in supply. Investors absorbed this excess supply, anticipating that issuance would fall significantly in 2018. The market turned lower in early 2018, as domestic fixed-income markets reacted to robust economic data and signs of inflation, before stabilizing in March and rallying through August. The municipal market experienced volatility in September and October amid concerns of an economic slowdown, then rebounded to close December near a high for the year. Gross municipal bond issuance ended 2018 down approximately 25%. There was little differentiation in performance across municipal sectors in 2018. General obligation bonds gained 1.33%, with bonds issued by states slightly outperforming those backed by local municipalities. Looking ahead, market volatility is likely to persist due to uncertainty about how the U.S. Federal Reserve will react to labor and inflation trends.
Comments from Co-Portfolio Managers Cormac Cullen, Elizah McLaughlin and Kevin Ramundo: For the year ending December 31, 2018, the fund gained 0.90%, net of fees, lagging the 1.93% advance of the state benchmark, the Bloomberg Barclays Michigan Enhanced Municipal Bond Index. However, the fund outpaced its Lipper peer group average. Relative to the state benchmark, differences in the way fund holdings and index components were priced detracted from fund performance. The fund's underweighting in bonds issued by Great Lakes Water Authority modestly hurt the fund's relative performance as well. These bonds were among the Michigan market's best performers for 2018. In contrast, sector allocation produced some value, including an overweighing in health care securities, which topped most other sectors of the market. Within health care, the fund's overweighting in the bonds of Ascension Health provided a notable boost to performance versus the state benchmark. Likewise, overweighting transportation securities added value, specifically the fund's overweighting in bonds issued by Wayne County Airport.
The views expressed above reflect those of the portfolio manager(s) only through the end of the period as stated on the cover of this report and do not necessarily represent the views of Fidelity or any other person in the Fidelity organization. Any such views are subject to change at any time based upon market or other conditions and Fidelity disclaims any responsibility to update such views. These views may not be relied on as investment advice and, because investment decisions for a Fidelity fund are based on numerous factors, may not be relied on as an indication of trading intent on behalf of any Fidelity fund.
Note to Shareholders: On September 1, 2018, Elizah McLaughlin joined the municipal bond portfolio management team, succeeding Mark Sommer, who retired from Fidelity on December 31, 2018, after 27 years with the firm.
Fidelity® Michigan Municipal Income Fund
Investment Summary (Unaudited)
Top Five Sectors as of December 31, 2018
| | % of fund's net assets |
| General Obligations | 29.3 |
| Health Care | 23.2 |
| Transportation | 12.6 |
| Water & Sewer | 10.1 |
| Education | 8.5 |
Quality Diversification (% of fund's net assets)
| As of December 31, 2018 |
| | AAA | 0.3% |
| | AA,A | 91.4% |
| | BBB | 1.2% |
| | BB and Below | 0.5% |
| | Not Rated | 0.7% |
| | Short-Term Investments and Net Other Assets | 5.9% |

We have used ratings from Moody's Investors Service, Inc. Where Moody's® ratings are not available, we have used S&P® ratings. All ratings are as of the date indicated and do not reflect subsequent changes.
Fidelity® Michigan Municipal Income Fund
Schedule of Investments December 31, 2018
Showing Percentage of Net Assets
| Municipal Bonds - 95.0% | | | |
| | | Principal Amount | Value |
| Guam - 0.9% | | | |
| Guam Int'l. Arpt. Auth. Rev.: | | | |
| Series 2013 C, 6.25% 10/1/34 (a) | | $1,000,000 | $1,136,040 |
| Series C, 5% 10/1/21 (a) | | 2,920,000 | 3,007,688 |
| Guam Pwr. Auth. Rev. Series 2012 A, 5% 10/1/23 (FSA Insured) | | 1,175,000 | 1,281,972 |
|
| TOTAL GUAM | | | 5,425,700 |
|
| Michigan - 94.1% | | | |
| Ann Arbor Econ. Dev. Corp. Ltd. Oblig. Rev. (Glacier Hills, Inc. Proj.) 8.375% 1/15/19 (Escrowed to Maturity) | | 386,000 | 386,842 |
| Battle Creek School District Series 2016: | | | |
| 5% 5/1/36 | | 1,500,000 | 1,686,525 |
| 5% 5/1/37 | | 1,175,000 | 1,317,022 |
| Bay City School District Rev.: | | | |
| 5% 11/1/25 | | 1,000,000 | 1,131,950 |
| 5% 11/1/26 | | 1,000,000 | 1,127,670 |
| 5% 11/1/27 | | 700,000 | 787,878 |
| 5% 11/1/28 | | 250,000 | 280,855 |
| Brandon School District Series 2016 A: | | | |
| 5% 5/1/28 | | 2,515,000 | 2,887,145 |
| 5% 5/1/29 | | 1,250,000 | 1,430,225 |
| 5% 5/1/30 | | 1,250,000 | 1,427,088 |
| 5% 5/1/34 | | 2,475,000 | 2,791,701 |
| Chippewa Valley Schools Series 2016 A: | | | |
| 5% 5/1/32 | | 1,000,000 | 1,148,550 |
| 5% 5/1/33 | | 1,000,000 | 1,143,170 |
| 5% 5/1/34 | | 1,075,000 | 1,223,157 |
| 5% 5/1/35 | | 775,000 | 877,688 |
| Clarkston Cmnty. Schools: | | | |
| Series 2016, 5% 5/1/29 | | 1,500,000 | 1,702,185 |
| 5% 5/1/28 | | 1,745,000 | 1,987,834 |
| Detroit City School District Series 2005 A, 5.25% 5/1/30 (FSA Insured) | | 2,000,000 | 2,422,960 |
| Detroit Downtown Dev. Auth. Tax Series A: | | | |
| 5% 7/1/29 (FSA Insured) | | 1,340,000 | 1,459,943 |
| 5% 7/1/31 (FSA Insured) | | 1,775,000 | 1,920,870 |
| 5% 7/1/33 (FSA Insured) | | 2,000,000 | 2,150,840 |
| 5% 7/1/34 (FSA Insured) | | 1,750,000 | 1,876,560 |
| 5% 7/1/35 (FSA Insured) | | 2,750,000 | 2,940,383 |
| 5% 7/1/37 (FSA Insured) | | 2,000,000 | 2,128,200 |
| Detroit Gen. Oblig. Series 2018: | | | |
| 5% 4/1/20 | | 750,000 | 767,693 |
| 5% 4/1/21 | | 1,000,000 | 1,036,880 |
| 5% 4/1/22 | | 725,000 | 760,540 |
| 5% 4/1/23 | | 310,000 | 328,051 |
| Detroit School District School Bldg. and Site Impt. Series 2012 A, 5% 5/1/24 | | 5,000,000 | 5,428,300 |
| Detroit Swr. Disp. Rev. Series 2006, 5% 7/1/36 | | 10,000 | 10,022 |
| Detroit Wtr. Supply Sys. Rev. Series 2006 B, 7% 7/1/36 (Pre-Refunded to 7/1/19 @ 100) | | 2,700,000 | 2,768,931 |
| Detroit/Wayne Co. Stadium Auth. Series 2012: | | | |
| 5% 10/1/21 (FSA Insured) | | 2,000,000 | 2,143,300 |
| 5% 10/1/22 (FSA Insured) | | 2,645,000 | 2,884,822 |
| 5% 10/1/26 (FSA Insured) | | 4,850,000 | 5,249,931 |
| Downriver Util. Wastewtr. Auth. Swr. Sys. Rev. Series 2018: | | | |
| 5% 4/1/33 (FSA Insured) | | 735,000 | 834,446 |
| 5% 4/1/34 (FSA Insured) | | 520,000 | 588,583 |
| 5% 4/1/35 (FSA Insured) | | 500,000 | 564,250 |
| Farmington Pub. School District Gen. Oblig.: | | | |
| 5% 5/1/25 (FSA Insured) | | 2,140,000 | 2,455,308 |
| 5% 5/1/26 (FSA Insured) | | 1,385,000 | 1,588,180 |
| 5% 5/1/27 (FSA Insured) | | 1,425,000 | 1,628,675 |
| Forest Hills Pub. Schools: | | | |
| 5% 5/1/19 | | 1,375,000 | 1,389,634 |
| 5% 5/1/20 | | 1,575,000 | 1,641,213 |
| 5% 5/1/21 | | 1,575,000 | 1,684,872 |
| Fraser Pub. School District Series 2006 B, 5% 5/1/29 | | 1,455,000 | 1,651,119 |
| Grand Rapids Pub. Schools 5% 5/1/29 (FSA Insured) | | 480,000 | 559,488 |
| Grand Rapids San. Swr. Sys. Rev.: | | | |
| Series 2018: | | | |
| 5% 1/1/31 | | 475,000 | 560,063 |
| 5% 1/1/32 | | 235,000 | 275,653 |
| 5% 1/1/33 | | 250,000 | 292,380 |
| 5% 1/1/34 | | 550,000 | 639,920 |
| 5% 1/1/35 | | 400,000 | 463,680 |
| 5% 1/1/38 | | 655,000 | 751,482 |
| 5% 1/1/43 | | 2,100,000 | 2,381,127 |
| 5% 1/1/48 | | 1,000,000 | 1,124,740 |
| Series 2012, 5% 1/1/37 | | 1,250,000 | 1,373,588 |
| Series 2014: | | | |
| 5% 1/1/27 | | 1,300,000 | 1,481,181 |
| 5% 1/1/29 | | 800,000 | 908,640 |
| 5% 1/1/30 | | 2,000,000 | 2,266,540 |
| Series 2016, 5% 1/1/37 | | 1,250,000 | 1,405,838 |
| Grand Rapids Wtr. Supply Sys.: | | | |
| Series 2016: | | | |
| 5% 1/1/31 | | 250,000 | 286,598 |
| 5% 1/1/32 | | 320,000 | 364,221 |
| 5% 1/1/33 | | 550,000 | 626,753 |
| 5% 1/1/34 | | 500,000 | 567,395 |
| 5% 1/1/35 | | 920,000 | 1,040,897 |
| 5% 1/1/36 | | 385,000 | 434,553 |
| 5% 1/1/46 | | 800,000 | 886,432 |
| Series 2018: | | | |
| 5% 1/1/43 | | 1,325,000 | 1,491,380 |
| 5% 1/1/48 | | 2,500,000 | 2,803,625 |
| Grand Traverse County Hosp. Fin. Auth.: | | | |
| Series 2011 A, 5.375% 7/1/35 | | 2,000,000 | 2,161,920 |
| Series 2014 A, 5% 7/1/47 | | 1,400,000 | 1,504,860 |
| Series 2019 A: | | | |
| 5% 7/1/44 (b) | | 1,110,000 | 1,211,299 |
| 5% 7/1/49 (b) | | 2,615,000 | 2,842,819 |
| Grand Valley Michigan State Univ. Rev.: | | | |
| Series 2014 B: | | | |
| 5% 12/1/25 | | 500,000 | 574,505 |
| 5% 12/1/26 | | 1,900,000 | 2,171,814 |
| 5% 12/1/28 | | 1,800,000 | 2,044,764 |
| Series 2018: | | | |
| 5% 12/1/34 | | 1,075,000 | 1,239,196 |
| 5% 12/1/35 | | 1,225,000 | 1,406,496 |
| 5% 12/1/37 | | 1,375,000 | 1,563,719 |
| 5% 12/1/38 | | 875,000 | 991,148 |
| 5% 12/1/43 | | 1,400,000 | 1,573,306 |
| Great Lakes Wtr. Auth. Sew Disp. Sys.: | | | |
| Series 2016 B, 5% 7/1/30 | | 2,000,000 | 2,288,320 |
| Series 2016 C, 5% 7/1/31 | | 7,000,000 | 7,973,700 |
| Series 2018 A: | | | |
| 5% 7/1/43 | | 10,000,000 | 11,323,700 |
| 5% 7/1/48 | | 5,000,000 | 5,640,200 |
| Hudsonville Pub. Schools: | | | |
| Series 2017: | | | |
| 5% 5/1/29 | | 625,000 | 730,019 |
| 5% 5/1/30 | | 1,000,000 | 1,160,760 |
| 5% 5/1/31 | | 430,000 | 497,398 |
| 5% 5/1/32 | | 1,200,000 | 1,379,460 |
| 5% 5/1/34 | | 1,000,000 | 1,141,620 |
| 5% 5/1/35 | | 1,000,000 | 1,137,680 |
| 4% 5/1/24 | | 1,220,000 | 1,311,720 |
| 4% 5/1/25 | | 500,000 | 534,175 |
| 5% 5/1/20 | | 1,000,000 | 1,041,240 |
| 5% 5/1/22 | | 600,000 | 656,844 |
| 5.25% 5/1/41 (Pre-Refunded to 5/1/21 @ 100) | | 1,750,000 | 1,886,150 |
| Ingham, Eaton and Clinton Counties Lansing School District 5% 5/1/22 | | 1,730,000 | 1,893,900 |
| Jackson County Hosp. Fin. Auth. Hosp. Rev. (Allegiance Health Proj.) Series 2010 A, 5% 6/1/37 (Pre-Refunded to 6/1/20 @ 100) | | 2,250,000 | 2,346,953 |
| Kalamazoo Hosp. Fin. Auth. Hosp. Facilities Rev. Series 2016: | | | |
| 5% 5/15/28 | | 780,000 | 880,745 |
| 5% 5/15/30 | | 5,000,000 | 5,586,300 |
| Kent Hosp. Fin. Auth. Hosp. Facilities Rev. (Spectrum Health Sys. Proj.) Series 2011 A, 5.5% 11/15/25 | | 5,000,000 | 5,457,300 |
| Kentwood Pub. Schools Series 2012: | | | |
| 4% 5/1/21 | | 1,000,000 | 1,043,150 |
| 4% 5/1/22 | | 1,000,000 | 1,059,410 |
| L'Anse Creuse Pub. Schools Series 2012, 5% 5/1/23 | | 1,500,000 | 1,598,985 |
| Lake Orion Cmnty. School District 5% 5/1/23 | | 1,915,000 | 2,139,342 |
| Lansing Board of Wtr. & Lt. Util. Rev. 5.5% 7/1/41 | | 5,000,000 | 5,398,350 |
| Lansing Cmnty. College: | | | |
| Series 2012: | | | |
| 5% 5/1/25 | | 350,000 | 383,040 |
| 5% 5/1/25 (Pre-Refunded to 5/1/22 @ 100) | | 1,190,000 | 1,307,572 |
| 5% 5/1/23 | | 1,135,000 | 1,245,606 |
| Lenawee Co. Hosp. Fin. Auth. Hosp. Rev. (ProMedica Heathcare Oblig. Group Proj.) Series 2011 B, 6% 11/15/35 (Pre-Refunded to 11/15/21 @ 100) | | 3,030,000 | 3,366,845 |
| Lincoln Consolidated School District Series 2016 A: | | | |
| 5% 5/1/28 | | 2,025,000 | 2,351,693 |
| 5% 5/1/29 | | 1,430,000 | 1,652,437 |
| 5% 5/1/31 | | 500,000 | 572,400 |
| 5% 5/1/32 | | 1,000,000 | 1,139,110 |
| Macomb Interceptor Drain Drainage District Series 2017 A: | | | |
| 5% 5/1/33 | | 2,100,000 | 2,432,535 |
| 5% 5/1/34 | | 1,750,000 | 2,018,695 |
| Marquette Board Lt. & Pwr. Elec. Util. Sys. Rev. Series 2016 A: | | | |
| 5% 7/1/29 | | 780,000 | 888,498 |
| 5% 7/1/30 | | 900,000 | 1,020,006 |
| 5% 7/1/31 | | 780,000 | 881,213 |
| 5% 7/1/32 | | 1,000,000 | 1,126,190 |
| 5% 7/1/33 | | 705,000 | 791,461 |
| Michigan Bldg. Auth. Rev.: | | | |
| (Facilities Prog.) Series 2015 1, 5% 10/15/50 | | 7,250,000 | 8,095,930 |
| Series 2009 I, 5.25% 10/15/25 (Assured Guaranty Corp. Insured) | | 2,000,000 | 2,050,680 |
| 5% 4/15/38 | | 3,000,000 | 3,375,450 |
| Michigan Fin. Auth. Rev.: | | | |
| (Charter County of Wayne Criminal Justice Ctr. Proj.) Series 2018: | | | |
| 5% 11/1/29 | | 1,135,000 | 1,350,344 |
| 5% 11/1/30 | | 1,000,000 | 1,181,240 |
| 5% 11/1/32 | | 1,000,000 | 1,171,890 |
| 5% 11/1/33 | | 2,500,000 | 2,920,425 |
| 5% 11/1/35 | | 1,000,000 | 1,157,110 |
| 5% 11/1/36 | | 1,250,000 | 1,441,813 |
| 5% 11/1/37 | | 1,500,000 | 1,719,255 |
| 5% 11/1/38 | | 1,595,000 | 1,818,061 |
| (Henry Ford Health Sys. Proj.) Series 2016: | | | |
| 5% 11/15/24 | | 2,940,000 | 3,348,983 |
| 5% 11/15/27 | | 2,530,000 | 2,920,455 |
| (Holland Cmnty. Hosp. Proj.) Series 2013 A: | | | |
| 5% 1/1/33 | | 1,250,000 | 1,348,338 |
| 5% 1/1/40 | | 3,000,000 | 3,196,350 |
| (Kalamazoo College Proj.) Series 2018: | | | |
| 5% 12/1/29 | | 1,005,000 | 1,187,548 |
| 5% 12/1/34 | | 735,000 | 849,293 |
| 5% 12/1/38 | | 735,000 | 833,225 |
| (Local Govt. Ln. Prog.) Series 2014 D, 5% 7/1/37 (FSA Insured) | | 1,000,000 | 1,097,960 |
| (Mid-Michigan Health Sys. Proj.) Series 2014, 5% 6/1/39 | | 540,000 | 589,891 |
| (Trinity Health Proj.) Series 2017: | | | |
| 5% 12/1/29 | | 500,000 | 587,500 |
| 5% 12/1/30 | | 710,000 | 828,755 |
| (Trinity Health Proj.) Series 2015, 5% 12/1/33 | | 1,220,000 | 1,307,535 |
| Series 2012 A, 5% 6/1/27 (Pre-Refunded to 6/1/22 @ 100) | | 125,000 | 137,390 |
| Series 2012: | | | |
| 5% 11/15/24 | | 660,000 | 726,838 |
| 5% 11/15/25 | | 1,000,000 | 1,098,540 |
| 5% 11/15/26 | | 800,000 | 877,592 |
| 5% 11/1/42 | | 2,000,000 | 2,151,060 |
| 5% 11/15/42 | | 3,120,000 | 3,323,798 |
| Series 2013: | | | |
| 5% 10/1/25 | | 1,255,000 | 1,393,012 |
| 5% 8/15/30 | | 4,105,000 | 4,521,493 |
| Series 2014 H1: | | | |
| 5% 10/1/22 | | 1,000,000 | 1,069,450 |
| 5% 10/1/25 | | 2,250,000 | 2,544,030 |
| 5% 10/1/39 | | 4,725,000 | 5,227,929 |
| Series 2014: | | | |
| 5% 6/1/25 | | 1,000,000 | 1,134,440 |
| 5% 6/1/26 | | 700,000 | 792,967 |
| 5% 6/1/27 | | 700,000 | 790,685 |
| Series 2015 C: | | | |
| 5% 7/1/26 | | 570,000 | 646,887 |
| 5% 7/1/27 | | 1,215,000 | 1,373,497 |
| 5% 7/1/28 | | 1,500,000 | 1,688,085 |
| 5% 7/1/35 | | 1,000,000 | 1,101,720 |
| Series 2015 D1: | | | |
| 5% 7/1/34 | | 1,250,000 | 1,380,225 |
| 5% 7/1/35 | | 500,000 | 550,860 |
| Series 2015: | | | |
| 5% 11/15/26 | | 2,250,000 | 2,563,493 |
| 5% 11/15/27 | | 3,500,000 | 3,970,085 |
| 5% 11/15/28 | | 1,855,000 | 2,092,570 |
| Series 2016 A, 5% 11/1/44 | | 6,190,000 | 6,714,045 |
| Series 2016: | | | |
| 5% 11/15/26 | | 1,010,000 | 1,178,286 |
| 5% 1/1/29 | | 1,000,000 | 1,140,230 |
| 5% 11/15/29 | | 2,950,000 | 3,362,823 |
| 5% 1/1/30 | | 1,000,000 | 1,135,470 |
| 5% 1/1/31 | | 1,170,000 | 1,323,750 |
| 5% 1/1/32 | | 1,895,000 | 2,132,519 |
| 5% 1/1/33 | | 1,915,000 | 2,149,894 |
| 5% 1/1/34 | | 2,135,000 | 2,386,887 |
| 5% 11/15/41 | | 11,710,000 | 12,616,003 |
| 5% 12/1/27 | | 1,090,000 | 1,148,686 |
| 5% 12/1/27 (Pre-Refunded to 12/1/20 @ 100) | | 10,000 | 10,579 |
| Michigan Hosp. Fin. Auth. Rev.: | | | |
| (MidMichigan Obligated Group Proj.) Series 2009 A, 6.125% 6/1/39 (Pre-Refunded to 6/1/19 @ 100) | | 3,740,000 | 3,806,946 |
| (Trinity Health Proj.) Series 2008 C: | | | |
| 5% 12/1/29 | | 1,150,000 | 1,351,250 |
| 5% 12/1/30 | | 1,700,000 | 1,984,342 |
| 5% 12/1/31 | | 3,000,000 | 3,481,320 |
| Bonds Series 2010 F4, 1.95%, tender 4/1/20 (c) | | 5,530,000 | 5,512,359 |
| Series 2016: | | | |
| 5% 11/15/46 | | 3,500,000 | 3,870,825 |
| 5% 11/15/47 | | 18,000,000 | 19,894,122 |
| 6.5% 12/1/33 (Pre-Refunded to 12/1/18 @ 100) | | 165,000 | 165,622 |
| Michigan Muni. Bond Auth. Rev. Series 2005, 5% 10/1/23 (Pre-Refunded to 10/1/19 @ 100) | | 385,000 | 394,232 |
| Michigan Strategic Fund Ltd. Oblig. Rev.: | | | |
| (Cadillac Place Office Bldg. Proj.) Series 2011, 5.25% 10/15/26 | | 3,585,000 | 3,897,791 |
| (I-75 Impt. Proj.) Series 2018, 4.25% 12/31/38 (FSA Insured) (a) | | 7,000,000 | 7,056,770 |
| Milan Area Schools Series 2019: | | | |
| 5% 5/1/30 (b) | | 605,000 | 706,894 |
| 5% 5/1/31 (b) | | 1,545,000 | 1,796,356 |
| 5% 5/1/33 (b) | | 1,805,000 | 2,076,454 |
| Oakland Univ. Rev.: | | | |
| Series 2012: | | | |
| 5% 3/1/24 | | 1,170,000 | 1,270,597 |
| 5% 3/1/25 | | 1,225,000 | 1,328,366 |
| 5% 3/1/26 | | 1,290,000 | 1,395,161 |
| Series 2013 A: | | | |
| 5% 3/1/25 | | 995,000 | 1,101,833 |
| 5% 3/1/26 | | 1,620,000 | 1,786,471 |
| 5% 3/1/27 | | 815,000 | 897,397 |
| 5% 3/1/38 | | 2,900,000 | 3,128,723 |
| Series 2014: | | | |
| 5% 3/1/28 | | 335,000 | 374,788 |
| 5% 3/1/29 | | 525,000 | 585,202 |
| 5% 3/1/39 | | 3,000,000 | 3,284,790 |
| Series 2016: | | | |
| 5% 3/1/28 | | 1,150,000 | 1,323,558 |
| 5% 3/1/41 | | 3,475,000 | 3,814,021 |
| Portage Pub. Schools Series 2016: | | | |
| 5% 11/1/32 | | 2,500,000 | 2,869,125 |
| 5% 11/1/34 | | 1,250,000 | 1,424,775 |
| 5% 11/1/35 | | 1,300,000 | 1,476,254 |
| 5% 11/1/39 | | 755,000 | 845,207 |
| Rochester Cmnty. School District: | | | |
| 4% 5/1/19 | | 1,375,000 | 1,385,256 |
| 5% 5/1/19 (Nat'l. Pub. Fin. Guarantee Corp. Insured) | | 740,000 | 747,876 |
| 5% 5/1/29 | | 1,625,000 | 1,877,769 |
| 5% 5/1/31 | | 1,500,000 | 1,719,330 |
| Roseville Cmnty. Schools: | | | |
| Series 2014: | | | |
| 5% 5/1/24 | | 780,000 | 887,944 |
| 5% 5/1/25 | | 1,000,000 | 1,156,210 |
| 5% 5/1/26 | | 1,385,000 | 1,587,307 |
| 5% 5/1/24 | | 570,000 | 648,882 |
| 5% 5/1/26 | | 1,715,000 | 1,965,510 |
| 5% 5/1/27 | | 1,795,000 | 2,050,429 |
| 5% 5/1/28 | | 1,885,000 | 2,147,317 |
| Royal Oak Hosp. Fin. Auth. Hosp. Rev. Series 2014 D: | | | |
| 5% 9/1/26 | | 1,000,000 | 1,122,890 |
| 5% 9/1/27 | | 1,175,000 | 1,313,345 |
| 5% 9/1/28 | | 1,870,000 | 2,080,618 |
| Saginaw Hosp. Fin. Auth. Hosp. Rev. (Covenant Med. Ctr., Inc.) Series 2010 H, 5% 7/1/30 | | 5,000,000 | 5,191,950 |
| Saint Clair County Gen. Oblig. 5% 4/1/26 | | 1,495,000 | 1,629,266 |
| South Haven Gen. Oblig. Series 2009, 5.125% 12/1/33 (Pre-Refunded to 12/1/19 @ 100) | | 1,000,000 | 1,030,270 |
| South Lyon Cmnty. Schools Series 2016: | | | |
| 5% 5/1/23 | | 1,575,000 | 1,762,961 |
| 5% 5/1/24 | | 3,200,000 | 3,649,760 |
| 5% 5/1/25 | | 2,355,000 | 2,728,880 |
| Warren Consolidated School District: | | | |
| Series 2016: | | | |
| 5% 5/1/23 | | 810,000 | 904,892 |
| 5% 5/1/34 | | 5,630,000 | 6,310,498 |
| Series 2017: | | | |
| 4% 5/1/23 (FSA Insured) | | 750,000 | 802,440 |
| 4% 5/1/24 (FSA Insured) | | 750,000 | 810,098 |
| 4% 5/1/25 (FSA Insured) | | 500,000 | 543,390 |
| Series 2018: | | | |
| 5% 5/1/29 | | 415,000 | 482,081 |
| 5% 5/1/30 | | 550,000 | 633,584 |
| 5% 5/1/32 | | 1,100,000 | 1,258,543 |
| 5% 5/1/34 | | 1,175,000 | 1,336,222 |
| 5% 5/1/35 | | 1,200,000 | 1,356,420 |
| 5% 5/1/36 | | 1,000,000 | 1,126,930 |
| 5% 5/1/37 | | 1,300,000 | 1,459,484 |
| 5% 5/1/38 | | 800,000 | 894,088 |
| Wayne County Arpt. Auth. Rev.: | | | |
| Series 2011 A: | | | |
| 5% 12/1/21 (a) | | 5,000,000 | 5,383,800 |
| 5% 12/1/22 (a) | | 5,260,000 | 5,669,912 |
| Series 2012 A, 5% 12/1/23 | | 2,300,000 | 2,566,570 |
| Series 2014 C: | | | |
| 5% 12/1/29 (a) | | 720,000 | 802,404 |
| 5% 12/1/31 (a) | | 860,000 | 953,000 |
| 5% 12/1/34 (a) | | 1,655,000 | 1,822,668 |
| Series 2015 D, 5% 12/1/40 (FSA Insured) | | 8,165,000 | 9,188,075 |
| Series 2015 F: | | | |
| 5% 12/1/25 (a) | | 2,735,000 | 3,127,254 |
| 5% 12/1/27 (a) | | 4,810,000 | 5,467,383 |
| Series 2015 G: | | | |
| 5% 12/1/35 | | 5,435,000 | 6,141,387 |
| 5% 12/1/36 | | 5,760,000 | 6,489,389 |
| Series 2017 A: | | | |
| 5% 12/1/37 | | 545,000 | 613,768 |
| 5% 12/1/42 | | 1,455,000 | 1,621,976 |
| Series 2017 B, 5% 12/1/47 (a) | | 450,000 | 492,264 |
| Series 2018 B, 5% 12/1/48 (a) | | 2,000,000 | 2,201,820 |
| Series 2018 D: | | | |
| 5% 12/1/30 (a) | | 4,365,000 | 5,047,773 |
| 5% 12/1/31 (a) | | 2,825,000 | 3,251,293 |
| 5% 12/1/32 (a) | | 2,945,000 | 3,365,222 |
| West Ottawa Pub. School District: | | | |
| Series 2012 A: | | | |
| 5% 5/1/25 | | 2,640,000 | 2,812,339 |
| 5% 5/1/25 (Pre-Refunded to 5/1/21 @ 100) | | 1,670,000 | 1,786,499 |
| 5% 5/1/26 | | 1,225,000 | 1,302,959 |
| 5% 5/1/26 (Pre-Refunded to 5/1/21 @ 100) | | 775,000 | 829,064 |
| Series 2014 1: | | | |
| 5% 5/1/30 | | 725,000 | 814,480 |
| 5% 5/1/32 | | 500,000 | 558,005 |
| 5% 5/1/34 | | 900,000 | 999,684 |
| 5% 5/1/35 | | 250,000 | 277,430 |
| Western Michigan Univ. Rev.: | | | |
| Series 2014: | | | |
| 5% 11/15/25 | | 320,000 | 366,966 |
| 5% 11/15/26 | | 400,000 | 458,472 |
| 5% 11/15/28 | | 650,000 | 739,661 |
| 5% 11/15/29 | | 750,000 | 850,388 |
| 5% 11/15/30 | | 855,000 | 968,450 |
| 5% 11/15/31 | | 700,000 | 791,252 |
| Series 2015 A: | | | |
| 5% 11/15/26 | | 1,000,000 | 1,146,270 |
| 5% 11/15/28 | | 2,505,000 | 2,852,444 |
| Woodhaven-Brownstown School District County of Wayne: | | | |
| 5% 5/1/36 | | 2,835,000 | 3,193,457 |
| 5% 5/1/38 | | 5,670,000 | 6,355,333 |
| Ypsilanti School District Series A: | | | |
| 5% 5/1/29 | | 1,305,000 | 1,500,489 |
| 5% 5/1/30 | | 1,550,000 | 1,777,757 |
| 5% 5/1/32 | | 2,000,000 | 2,278,220 |
| Zeeland Pub. Schools: | | | |
| 5% 5/1/27 (FSA Insured) | | 1,000,000 | 1,143,560 |
| 5% 5/1/28 (FSA Insured) | | 500,000 | 569,270 |
| 5% 5/1/29 (FSA Insured) | | 1,000,000 | 1,134,170 |
| 5% 5/1/30 (FSA Insured) | | 1,000,000 | 1,130,440 |
|
| TOTAL MICHIGAN | | | 562,379,590 |
|
| TOTAL MUNICIPAL BONDS | | | |
| (Cost $559,872,326) | | | 567,805,290 |
|
| Municipal Notes - 3.8% | | | |
| Michigan - 3.8% | | | |
| Michigan Strategic Fund Ltd. Oblig. Rev.: | | | |
| (Air Products and Chemicals, Inc. Proj.) Series 2007 V1, 1.67% 1/2/19, VRDN (c) | | 14,220,000 | $14,220,000 |
| (Henry Ford Museum & Greenfield Village Proj.) Series 2002, 1.72% 1/2/19, LOC Comerica Bank, VRDN (c) | | 700,000 | 700,000 |
| Univ. of Michigan Rev.: | | | |
| Series 2012 B, 1.63% 1/2/19, VRDN (c) | | 4,245,000 | 4,245,000 |
| Series 2012 D1, 1.53% 1/2/19, VRDN (c) | | 3,780,000 | 3,780,000 |
| TOTAL MICHIGAN | | | |
| (Cost $22,945,000) | | | 22,945,000 |
| TOTAL INVESTMENT IN SECURITIES - 98.8% | | | |
| (Cost $582,817,326) | | | 590,750,290 |
| NET OTHER ASSETS (LIABILITIES) - 1.2% | | | 6,933,708 |
| NET ASSETS - 100% | | | $597,683,998 |
Security Type Abbreviations
VRDN – VARIABLE RATE DEMAND NOTE (A debt instrument that is payable upon demand, either daily, weekly or monthly)
Legend
(a) Private activity obligations whose interest is subject to the federal alternative minimum tax for individuals.
(b) Security or a portion of the security purchased on a delayed delivery or when-issued basis.
(c) Coupon rates for floating and adjustable rate securities reflect the rates in effect at period end.
Investment Valuation
All investments are categorized as Level 2 under the Fair Value Hierarchy. The inputs or methodology used for valuing securities may not be an indication of the risk associated with investing in those securities. For more information on valuation inputs please refer to the Investment Valuation section in the accompanying Notes to Financial Statements.
Other Information
The distribution of municipal securities by revenue source, as a percentage of total Net Assets, is as follows (Unaudited):
| General Obligations | 29.3% |
| Health Care | 23.2% |
| Transportation | 12.6% |
| Water & Sewer | 10.1% |
| Education | 8.5% |
| Special Tax | 7.5% |
| Others* (Individually Less Than 5%) | 8.8% |
| | 100.0% |
* Includes net other assets
See accompanying notes which are an integral part of the financial statements.
Fidelity® Michigan Municipal Income Fund
Financial Statements
Statement of Assets and Liabilities
| | | December 31, 2018 |
| Assets | | |
Investment in securities, at value — See accompanying schedule:
Unaffiliated issuers (cost $582,817,326) | | $590,750,290 |
| Cash | | 11,716,238 |
| Receivable for fund shares sold | | 438,480 |
| Interest receivable | | 5,259,222 |
| Prepaid expenses | | 928 |
| Other receivables | | 1,636 |
| Total assets | | 608,166,794 |
| Liabilities | | |
| Payable for investments purchased on a delayed delivery basis | $8,465,623 | |
| Payable for fund shares redeemed | 1,344,423 | |
| Distributions payable | 390,032 | |
| Accrued management fee | 177,293 | |
| Other affiliated payables | 57,749 | |
| Other payables and accrued expenses | 47,676 | |
| Total liabilities | | 10,482,796 |
| Net Assets | | $597,683,998 |
| Net Assets consist of: | | |
| Paid in capital | | $590,472,083 |
| Total distributable earnings (loss) | | 7,211,915 |
| Net Assets, for 49,940,617 shares outstanding | | $597,683,998 |
| Net Asset Value, offering price and redemption price per share ($597,683,998 ÷ 49,940,617 shares) | | $11.97 |
See accompanying notes which are an integral part of the financial statements.
Statement of Operations
| | | Year ended December 31, 2018 |
| Investment Income | | |
| Interest | | $20,079,405 |
| Expenses | | |
| Management fee | $2,263,820 | |
| Transfer agent fees | 577,540 | |
| Accounting fees and expenses | 150,878 | |
| Custodian fees and expenses | 4,985 | |
| Independent trustees' fees and expenses | 2,968 | |
| Registration fees | 25,908 | |
| Audit | 54,469 | |
| Legal | 5,182 | |
| Miscellaneous | 4,694 | |
| Total expenses before reductions | 3,090,444 | |
| Expense reductions | (8,950) | |
| Total expenses after reductions | | 3,081,494 |
| Net investment income (loss) | | 16,997,911 |
| Realized and Unrealized Gain (Loss) | | |
| Net realized gain (loss) on: | | |
| Investment securities: | | |
| Unaffiliated issuers | | 904,940 |
| Total net realized gain (loss) | | 904,940 |
| Change in net unrealized appreciation (depreciation) on investment securities | | (13,434,751) |
| Net gain (loss) | | (12,529,811) |
| Net increase (decrease) in net assets resulting from operations | | $4,468,100 |
See accompanying notes which are an integral part of the financial statements.
Statement of Changes in Net Assets
| | Year ended December 31, 2018 | Year ended December 31, 2017 |
| Increase (Decrease) in Net Assets | | |
| Operations | | |
| Net investment income (loss) | $16,997,911 | $18,255,773 |
| Net realized gain (loss) | 904,940 | 3,506,039 |
| Change in net unrealized appreciation (depreciation) | (13,434,751) | 13,813,180 |
| Net increase (decrease) in net assets resulting from operations | 4,468,100 | 35,574,992 |
| Distributions to shareholders | (18,803,882) | – |
| Distributions to shareholders from net investment income | – | (18,249,642) |
| Distributions to shareholders from net realized gain | – | (2,430,358) |
| Total distributions | (18,803,882) | (20,680,000) |
| Share transactions | | |
| Proceeds from sales of shares | 78,090,250 | 118,463,304 |
| Reinvestment of distributions | 13,425,197 | 14,106,104 |
| Cost of shares redeemed | (159,878,263) | (118,716,731) |
| Net increase (decrease) in net assets resulting from share transactions | (68,362,816) | 13,852,677 |
| Total increase (decrease) in net assets | (82,698,598) | 28,747,669 |
| Net Assets | | |
| Beginning of period | 680,382,596 | 651,634,927 |
| End of period | $597,683,998 | $680,382,596 |
| Other Information | | |
| Undistributed net investment income end of period | | $36,313 |
| Shares | | |
| Sold | 6,528,754 | 9,760,527 |
| Issued in reinvestment of distributions | 1,125,982 | 1,162,710 |
| Redeemed | (13,403,469) | (9,797,566) |
| Net increase (decrease) | (5,748,733) | 1,125,671 |
See accompanying notes which are an integral part of the financial statements.
Financial Highlights
Fidelity Michigan Municipal Income Fund
| | | | | | |
| Years ended December 31, | 2018 | 2017 | 2016 | 2015 | 2014 |
| Selected Per–Share Data | | | | | |
| Net asset value, beginning of period | $12.22 | $11.94 | $12.38 | $12.33 | $11.70 |
| Income from Investment Operations | | | | | |
| Net investment income (loss)A | .319 | .333 | .352 | .387 | .422 |
| Net realized and unrealized gain (loss) | (.216) | .324 | (.364) | .050 | .642 |
| Total from investment operations | .103 | .657 | (.012) | .437 | 1.064 |
| Distributions from net investment income | (.318) | (.333) | (.353) | (.387) | (.421) |
| Distributions from net realized gain | (.035) | (.044) | (.075) | – | (.013) |
| Total distributions | (.353) | (.377) | (.428) | (.387) | (.434) |
| Redemption fees added to paid in capitalA | – | – | –B | –B | –B |
| Net asset value, end of period | $11.97 | $12.22 | $11.94 | $12.38 | $12.33 |
| Total ReturnC | .90% | 5.57% | (.16)% | 3.61% | 9.23% |
| Ratios to Average Net AssetsD | | | | | |
| Expenses before reductions | .49% | .49% | .49% | .49% | .48% |
| Expenses net of fee waivers, if any | .48% | .48% | .49% | .49% | .48% |
| Expenses net of all reductions | .48% | .48% | .48% | .49% | .48% |
| Net investment income (loss) | 2.67% | 2.74% | 2.83% | 3.15% | 3.49% |
| Supplemental Data | | | | | |
| Net assets, end of period (000 omitted) | $597,684 | $680,383 | $651,635 | $634,206 | $569,796 |
| Portfolio turnover rate | 22% | 12% | 25% | 11% | 12% |
A Calculated based on average shares outstanding during the period.
B Amount represents less than $.0005 per share.
C Total returns would have been lower if certain expenses had not been reduced during the applicable periods shown.
D Expense ratios reflect operating expenses of the Fund. Expenses before reductions do not reflect amounts reimbursed by the investment adviser or reductions from expense offset arrangements and do not represent the amount paid by the Fund during periods when reimbursements or reductions occur. Expenses net of fee waivers reflect expenses after reimbursement by the investment adviser but prior to reductions from expense offset arrangements. Expenses net of all reductions represent the net expenses paid by the Fund.
See accompanying notes which are an integral part of the financial statements.
Fidelity® Michigan Municipal Money Market Fund
Investment Summary/Performance (Unaudited)
Effective Maturity Diversification as of December 31, 2018
| Days | % of fund's investments 12/31/18 |
| 1 - 7 | 83.4 |
| 8 - 30 | 1.1 |
| 31 - 60 | 3.1 |
| 91 - 180 | 1.1 |
| >180 | 11.3 |
Effective maturity is determined in accordance with the requirements of Rule 2a-7 under the Investment Company Act of 1940.
Asset Allocation (% of fund's net assets)
| As of December 31, 2018 |
| | Variable Rate Demand Notes (VRDNs) | 44.2% |
| | Tender Option Bond | 32.3% |
| | Other Municipal Security | 15.5% |
| | Investment Companies | 7.6% |
| | Net Other Assets (Liabilities) | 0.4% |

Current 7-Day Yields
| | 12/31/18 |
| Fidelity® Michigan Municipal Money Market Fund | 1.21% |
Yield refers to the income paid by the Fund over a given period. Yield for money market funds is usually for seven-day periods, as it is here, though it is expressed as an annual percentage rate. Past performance is no guarantee of future results. Yield will vary and it's possible to lose money investing in the Fund.
Fidelity® Michigan Municipal Money Market Fund
Schedule of Investments December 31, 2018
Showing Percentage of Net Assets
| Variable Rate Demand Note - 44.2% | | | |
| | | Principal Amount | Value |
| Alabama - 0.4% | | | |
| Decatur Indl. Dev. Board Exempt Facilities Rev. (Nucor Steel Decatur LLC Proj.) Series 2003 A, 2.03% 1/7/19, VRDN (a)(b) | | $1,100,000 | $1,100,000 |
| Arkansas - 0.1% | | | |
| Blytheville Indl. Dev. Rev. (Nucor Corp. Proj.) Series 2002, 1.88% 1/7/19, VRDN (a)(b) | | 300,000 | 300,000 |
| Kansas - 0.3% | | | |
| Burlington Envir. Impt. Rev. (Kansas City Pwr. and Lt. Co. Proj.) Series 2007 A, 2% 1/7/19, VRDN (b) | | 300,000 | 300,000 |
| St Marys Kansas Poll. Cont. Rev. (Kansas Gas and Elec. Co. Proj.) Series 1994, 2.01% 1/7/19, VRDN (b) | | 700,000 | 700,000 |
| | | | 1,000,000 |
| Louisiana - 0.1% | | | |
| Saint James Parish Gen. Oblig. (Nucor Steel Louisiana LLC Proj.): | | | |
| Series 2010 A1, 2% 1/7/19, VRDN (b) | | 200,000 | 200,000 |
| Series 2010 B1, 1.98% 1/7/19, VRDN (b) | | 200,000 | 200,000 |
| | | | 400,000 |
| Michigan - 42.6% | | | |
| Central Michigan Univ. Rev. Series 2008 A, 1.78% 1/7/19, LOC JPMorgan Chase Bank, VRDN (b) | | 1,925,000 | 1,925,000 |
| Grand Traverse County Hosp. Fin. Auth. Series 2011 B, 1.75% 1/7/19, LOC JPMorgan Chase Bank, VRDN (b) | | 14,925,000 | 14,925,000 |
| Grand Valley Michigan State Univ. Rev. Series 2008 B, 1.7% 1/7/19, LOC U.S. Bank NA, Cincinnati, VRDN (b) | | 13,840,000 | 13,840,000 |
| Michigan Fin. Auth. Rev.: | | | |
| (Healthcare Equip. Ln. Prog.) Series 2015 C, 1.94% 1/7/19, LOC Fifth Third Bank, Cincinnati, VRDN (b) | | 1,500,000 | 1,500,000 |
| (Hosp. Proj.) Series 2016 E2, 1.75% 1/7/19, VRDN (b) | | 10,600,000 | 10,600,000 |
| Michigan State Univ. Revs. Series 2000 A, 1.78% 1/7/19 (Liquidity Facility Northern Trust Co.), VRDN (b) | | 10,795,000 | 10,795,000 |
| Michigan Strategic Fund Ltd. Oblig. Rev.: | | | |
| (Air Products and Chemicals, Inc. Proj.) Series 2007 V1, 1.67% 1/2/19, VRDN (b) | | 13,395,000 | 13,395,000 |
| (Consumers Energy Co. Proj.) 1.78% 1/7/19, LOC JPMorgan Chase Bank, VRDN (a)(b) | | 15,400,000 | 15,400,000 |
| (Henry Ford Museum & Greenfield Village Proj.) Series 2002, 1.72% 1/2/19, LOC Comerica Bank, VRDN (b) | | 14,350,000 | 14,350,000 |
| (The Kroger Co. Recovery Zone Facilities Bond Proj.) Series 2010, 1.75% 1/7/19, LOC Bank of Tokyo-Mitsubishi UFJ Ltd., VRDN (b) | | 15,400,000 | 15,400,000 |
| FHLMC Livonia Econ. Dev. Corp. (Madonna Univ. Proj.) Series 2009, 1.71% 1/7/19, LOC Fed. Home Ln. Bank Chicago, VRDN (b) | | 20,375,000 | 20,375,000 |
| | | | 132,505,000 |
| Nebraska - 0.2% | | | |
| Stanton County Indl. Dev. Rev. (Nucor Corp. Proj.) Series 1996, 2.03% 1/7/19, VRDN (a)(b) | | 600,000 | 600,000 |
| North Carolina - 0.1% | | | |
| Hertford County Indl. Facilities Poll. Cont. Fing. Auth. (Nucor Corp. Proj.) Series 2000 A, 1.88% 1/7/19, VRDN (a)(b) | | 200,000 | 200,000 |
| West Virginia - 0.4% | | | |
| West Virginia Econ. Dev. Auth. Solid Waste Disp. Facilities Rev.: | | | |
| (Appalachian Pwr. Co. - Amos Proj.) Series 2008 B, 1.81% 1/7/19, VRDN (a)(b) | | 500,000 | 500,000 |
| (Appalachian Pwr. Co.- Mountaineer Proj.) Series 2008 A, 1.86% 1/7/19, VRDN (a)(b) | | 600,000 | 600,000 |
| | | | 1,100,000 |
| TOTAL VARIABLE RATE DEMAND NOTE | | | |
| (Cost $137,205,000) | | | 137,205,000 |
|
| Tender Option Bond - 32.3% | | | |
| California - 0.7% | | | |
| Dignity Health Participating VRDN Series DBE 80 11, 1.91% 1/7/19 (Liquidity Facility Deutsche Bank AG New York Branch) (b)(c) | | 2,100,000 | 2,100,000 |
| Colorado - 0.1% | | | |
| Colorado Health Facilities Auth. Rev. Participating VRDN Series Floaters 018, 1.89% 2/11/19 (Liquidity Facility Barclays Bank PLC) (b)(c)(d) | | 300,000 | 300,000 |
| Connecticut - 0.3% | | | |
| Connecticut Gen. Oblig. Participating VRDN Series Floaters 014, 1.89% 2/11/19 (Liquidity Facility Barclays Bank PLC) (b)(c)(d) | | 900,000 | 900,000 |
| Florida - 0.0% | | | |
| Florida Dept. of Trans. Tpk. Rev. Bonds Series Solar 17 02, 1.84%, tender 1/31/19 (Liquidity Facility U.S. Bank NA, Cincinnati) (b)(c) | | 100,000 | 100,000 |
| Illinois - 0.2% | | | |
| Illinois Fin. Auth. Rev. Participating VRDN Series Floaters 017, 1.89% 2/11/19 (Liquidity Facility Barclays Bank PLC) (b)(c)(d) | | 600,000 | 600,000 |
| Michigan - 30.0% | | | |
| Clarkston Cmnty. Schools Participating VRDN Series Floaters G72, 1.74% 1/7/19 (Liquidity Facility Royal Bank of Canada) (b)(c) | | 2,695,000 | 2,695,000 |
| Detroit Downtown Dev. Auth. Tax Participating VRDN Series Floaters XX 11 01, 1.71% 1/7/19 (Liquidity Facility Barclays Bank PLC) (b)(c) | | 3,100,000 | 3,100,000 |
| Eastern Michigan Univ. Revs. Participating VRDN Series Floaters 009, 1.75% 1/7/19 (Liquidity Facility Barclays Bank PLC) (b)(c) | | 10,000,000 | 10,000,000 |
| Grand Rapids San. Swr. Sys. Rev. Participating VRDN Series Floaters XF 26 12, 1.74% 1/7/19 (Liquidity Facility Citibank NA) (b)(c) | | 4,000,000 | 4,000,000 |
| Michigan Bldg. Auth. Rev. Participating VRDN: | | | |
| Series Floaters XF 26 09, 1.75% 1/7/19 (Liquidity Facility Citibank NA) (b)(c) | | 800,000 | 800,000 |
| Series Floaters XM 04 65, 1.74% 1/7/19 (Liquidity Facility Morgan Stanley Bank, West Valley City Utah) (b)(c) | | 5,800,000 | 5,800,000 |
| Series Floaters ZF 26 40, 1.74% 1/7/19 (Liquidity Facility Morgan Stanley Bank, West Valley City Utah) (b)(c) | | 3,600,000 | 3,600,000 |
| Michigan Fin. Auth. Rev. Participating VRDN: | | | |
| Series 15 XF0126, 1.76% 1/7/19 (Liquidity Facility JPMorgan Chase Bank) (b)(c) | | 5,000,000 | 5,000,000 |
| Series 16 XM0223, 1.74% 1/7/19 (Liquidity Facility Citibank NA) (b)(c)(e) | | 935,000 | 935,000 |
| Series 16 ZM0166, 1.74% 1/7/19 (Liquidity Facility Royal Bank of Canada) (b)(c) | | 8,500,000 | 8,500,000 |
| Series RBC 2016 XM0132, 1.74% 1/7/19 (Liquidity Facility Royal Bank of Canada) (b)(c) | | 13,165,000 | 13,165,000 |
| Series XM 04 72, 1.74% 1/7/19 (Liquidity Facility Citibank NA) (b)(c) | | 1,750,000 | 1,750,000 |
| Series XX 1043, 1.74% 1/7/19 (Liquidity Facility Barclays Bank PLC) (b)(c) | | 1,600,000 | 1,600,000 |
| Michigan Hosp. Fin. Auth. Rev. Participating VRDN Series Floaters XM 04 08, 1.74% 1/7/19 (Liquidity Facility Morgan Stanley Bank, West Valley City Utah) (b)(c) | | 4,475,000 | 4,475,000 |
| Michigan Hsg. Dev. Auth. Single Family Mtg. Rev. Participating VRDN Series ZF 06 55, 1.73% 1/7/19 (Liquidity Facility Bank of America NA) (b)(c) | | 3,500,000 | 3,500,000 |
| Michigan St Hsg. Dev. Auth. Singl Participating VRDN: | | | |
| Series Floaters 017, 1.74% 1/7/19 (Liquidity Facility Barclays Bank PLC) (b)(c) | | 4,400,000 | 4,400,000 |
| Series Floaters 027, 1.74% 1/7/19 (Liquidity Facility Barclays Bank PLC) (b)(c) | | 3,200,000 | 3,200,000 |
| RIB Floater Trust Various States Participating VRDN Series Floaters 008, 1.74% 1/7/19 (Liquidity Facility Barclays Bank PLC) (b)(c) | | 3,900,000 | 3,900,000 |
| Univ. of Michigan Rev. Participating VRDN: | | | |
| Series 15 XF2199, 1.74% 1/7/19 (Liquidity Facility Morgan Stanley Bank, West Valley City Utah) (b)(c) | | 3,089,000 | 3,089,000 |
| Series 15 XF2205, 1.74% 1/7/19 (Liquidity Facility Citibank NA) (b)(c) | | 5,300,000 | 5,300,000 |
| Series Floaters ZF 05 90, 1.74% 1/7/19 (Liquidity Facility Toronto-Dominion Bank) (b)(c) | | 4,300,000 | 4,300,000 |
| | | | 93,109,000 |
| Montana - 0.4% | | | |
| Missoula Wtr. Sys. Rev. Participating VRDN Series Floaters 011, 1.89% 2/11/19 (Liquidity Facility Barclays Bank PLC) (b)(c)(d) | | 1,370,000 | 1,370,000 |
| Ohio - 0.2% | | | |
| Middletown Hosp. Facilities Rev. Participating VRDN Series Floaters 00 31 44, 1.89% 2/11/19 (Liquidity Facility Barclays Bank PLC) (b)(c)(d) | | 295,000 | 295,000 |
| Ohio Higher Edl. Facility Commission Rev. Participating VRDN Series 2017, 1.89% 2/11/19 (Liquidity Facility Barclays Bank PLC) (b)(c)(d) | | 300,000 | 300,000 |
| | | | 595,000 |
| Pennsylvania - 0.2% | | | |
| Berks County Muni. Auth. Rev. Participating VRDN Series Floaters 001, 1.89% 2/11/19 (Liquidity Facility Barclays Bank PLC) (b)(c)(d) | | 500,000 | 500,000 |
| Pennsylvania Tpk. Commission Tpk. Rev. Participating VRDN Series Floaters 2018 029, 1.89% 2/11/19 (Liquidity Facility Barclays Bank PLC) (b)(c)(d) | | 100,000 | 100,000 |
| | | | 600,000 |
| Texas - 0.2% | | | |
| Harris County Cultural Ed. Facilities Fin. Corp. Rev. Participating VRDN Series Floaters 010, 1.89% 2/11/19 (Liquidity Facility Barclays Bank PLC) (b)(c)(d) | | 500,000 | 500,000 |
| Virginia - 0.0% | | | |
| Virginia Pub. Bldg. Auth. Pub. Facilities Rev. Bonds Series Floaters G 40, 1.91%, tender 2/1/19 (Liquidity Facility Royal Bank of Canada) (b)(c)(d) | | 100,000 | 100,000 |
| TOTAL TENDER OPTION BOND | | | |
| (Cost $100,274,000) | | | 100,274,000 |
|
| Other Municipal Security - 15.5% | | | |
| Kentucky - 0.0% | | | |
| Jefferson County Poll. Cont. Rev. Bonds (Louisville Gas & Elec. Co. Proj.) Series 2001 A, 1.92% tender 1/3/19, CP mode | | 200,000 | 200,000 |
| Massachusetts - 0.1% | | | |
| Massachusetts Indl. Fin. Agcy. Poll. Cont. Rev. Bonds: | | | |
| (New England Pwr. Co. Proj.) Series 92, 1.78% tender 1/3/19, CP mode | | 100,000 | 100,000 |
| Series 92, 1.78% tender 2/4/19, CP mode | | 200,000 | 200,000 |
| | | | 300,000 |
| Michigan - 14.4% | | | |
| Kent Hosp. Fin. Auth. Hosp. Facilities Rev. Bonds (Spectrum Health Sys. Proj.) Series 2015 A, SIFMA Municipal Swap Index + 0.250% 1.96%, tender 7/29/19 (b)(f) | | 13,915,000 | 13,915,000 |
| Michigan Bldg. Auth. Rev.: | | | |
| Bonds Series 2013 A, 5% 4/15/19 | | 2,565,000 | 2,587,920 |
| Series 7, 1.85% 1/17/19, LOC State Street Bank & Trust Co., Boston, LOC U.S. Bank NA, Cincinnati, CP | | 3,300,000 | 3,300,000 |
| Michigan Fin. Auth. Rev. Bonds: | | | |
| Series 2012 A, 5% 7/1/19 | | 6,750,000 | 6,852,715 |
| Series 2015 A, 5% 5/15/19 | | 1,000,000 | 1,011,145 |
| Michigan State Univ. Revs. Bonds: | | | |
| Series 2010 C, 5% 8/15/19 | | 3,300,000 | 3,361,511 |
| Series 2015 A, 4% 8/15/19 | | 1,000,000 | 1,012,402 |
| Michigan Trunk Line Fund Rev. Bonds Series 2009, 5% 11/1/19 | | 690,000 | 706,933 |
| Univ. of Michigan Rev.: | | | |
| Series K1, 1.79% 3/1/19, CP | | 3,100,000 | 3,100,000 |
| Series K2: | | | |
| 1.73% 9/3/19, CP | | 2,880,000 | 2,880,000 |
| 1.81% 9/3/19, CP | | 3,000,000 | 3,000,000 |
| 1.82% 8/2/19, CP | | 3,200,000 | 3,200,000 |
| | | | 44,927,626 |
| New Hampshire - 0.9% | | | |
| New Hampshire Bus. Fin. Auth. Poll. Cont. Rev. Bonds: | | | |
| Series 1990 A, 1.83% tender 2/1/19, CP mode (a) | | 1,300,000 | 1,300,000 |
| Series 2018 A, 1.83% tender 1/3/19, CP mode (a) | | 400,000 | 400,000 |
| Series A1, 1.82% tender 1/7/19, CP mode (a) | | 1,000,000 | 1,000,000 |
| | | | 2,700,000 |
| Ohio - 0.1% | | | |
| Lancaster Port Auth. Gas Rev. Bonds Series 2014, 1 month U.S. LIBOR + 0.720% 2.294%, tender 8/1/19 (Liquidity Facility Royal Bank of Canada) (b)(f) | | 200,000 | 200,050 |
| TOTAL OTHER MUNICIPAL SECURITY | | | |
| (Cost $48,327,676) | | | 48,327,676 |
| | | Shares | Value |
|
| Investment Company - 7.6% | | | |
| Fidelity Municipal Cash Central Fund, 1.77% (g)(h) | | | |
| (Cost $23,734,801) | | 23,733,185 | 23,734,801 |
| TOTAL INVESTMENT IN SECURITIES - 99.6% | | | |
| (Cost $309,541,477) | | | 309,541,477 |
| NET OTHER ASSETS (LIABILITIES) - 0.4% | | | 1,110,095 |
| NET ASSETS - 100% | | | $310,651,572 |
Security Type Abbreviations
CP – COMMERCIAL PAPER
VRDN – VARIABLE RATE DEMAND NOTE (A debt instrument that is payable upon demand, either daily, weekly or monthly)
The date shown for securities represents the date when principal payments must be paid, taking into account any call options exercised by the issuer and any permissible maturity shortening features other than interest rate resets.
Legend
(a) Private activity obligations whose interest is subject to the federal alternative minimum tax for individuals.
(b) Coupon rates for floating and adjustable rate securities reflect the rates in effect at period end.
(c) Provides evidence of ownership in one or more underlying municipal bonds.
(d) Restricted securities - Investment in securities not registered under the Securities Act of 1933 (excluding 144A issues). At the end of the period, the value of restricted securities (excluding 144A issues) amounted to $4,965,000 or 1.6% of net assets.
(e) A portion of the security sold on a delayed delivery basis.
(f) Coupon is indexed to a floating interest rate which may be multiplied by a specified factor and/or subject to caps or floors.
(g) Information in this report regarding holdings by state and security types does not reflect the holdings of the Fidelity Municipal Cash Central Fund.
(h) Affiliated fund that is available only to investment companies and other accounts managed by Fidelity Investments. The rate quoted is the annualized seven-day yield of the fund at period end. A complete unaudited listing of the fund's holdings as of its most recent quarter end is available upon request. In addition, each Fidelity Central Fund's financial statements, which are not covered by the Fund's Report of Independent Registered Public Accounting Firm, are available on the SEC's website or upon request.
Additional information on each restricted holding is as follows:
| Security | Acquisition Date | Cost |
| Berks County Muni. Auth. Rev. Participating VRDN Series Floaters 001, 1.89% 2/11/19 (Liquidity Facility Barclays Bank PLC) | 1/18/18 | $500,000 |
| Colorado Health Facilities Auth. Rev. Participating VRDN Series Floaters 018, 1.89% 2/11/19 (Liquidity Facility Barclays Bank PLC) | 10/15/18 | $300,000 |
| Connecticut Gen. Oblig. Participating VRDN Series Floaters 014, 1.89% 2/11/19 (Liquidity Facility Barclays Bank PLC) | 6/29/17 | $900,000 |
| Harris County Cultural Ed. Facilities Fin. Corp. Rev. Participating VRDN Series Floaters 010, 1.89% 2/11/19 (Liquidity Facility Barclays Bank PLC) | 5/31/18 - 12/7/18 | $500,000 |
| Illinois Fin. Auth. Rev. Participating VRDN Series Floaters 017, 1.89% 2/11/19 (Liquidity Facility Barclays Bank PLC) | 8/16/18 | $600,000 |
| Middletown Hosp. Facilities Rev. Participating VRDN Series Floaters 00 31 44, 1.89% 2/11/19 (Liquidity Facility Barclays Bank PLC) | 9/14/17 | $295,000 |
| Missoula Wtr. Sys. Rev. Participating VRDN Series Floaters 011, 1.89% 2/11/19 (Liquidity Facility Barclays Bank PLC) | 7/20/17 - 11/3/17 | $1,370,000 |
| Ohio Higher Edl. Facility Commission Rev. Participating VRDN Series 2017, 1.89% 2/11/19 (Liquidity Facility Barclays Bank PLC) | 3/9/17 - 8/6/18 | $300,000 |
| Pennsylvania Tpk. Commission Tpk. Rev. Participating VRDN Series Floaters 2018 029, 1.89% 2/11/19 (Liquidity Facility Barclays Bank PLC) | 11/15/18 | $100,000 |
| Virginia Pub. Bldg. Auth. Pub. Facilities Rev. Bonds Series Floaters G 40, 1.91%, tender 2/1/19 (Liquidity Facility Royal Bank of Canada) | 8/2/18 | $100,000 |
Affiliated Central Funds
Information regarding fiscal year to date income earned by the Fund from investments in Fidelity Central Funds is as follows:
| Fund | Income earned |
| Fidelity Municipal Cash Central Fund | $476,883 |
| Total | $476,883 |
Amounts in the income column in the above table exclude any capital gain distributions from underlying funds, which are presented in the corresponding line-item in the Statement of Operations if applicable.
Investment Valuation
All investments are categorized as Level 2 under the Fair Value Hierarchy. The inputs or methodology used for valuing securities may not be an indication of the risk associated with investing in those securities. For more information on valuation inputs please refer to the Investment Valuation section in the accompanying Notes to Financial Statements.
See accompanying notes which are an integral part of the financial statements.
Fidelity® Michigan Municipal Money Market Fund
Financial Statements
Statement of Assets and Liabilities
| | | December 31, 2018 |
| Assets | | |
Investment in securities, at value — See accompanying schedule:
Unaffiliated issuers (cost $285,806,676) | $285,806,676 | |
| Fidelity Central Funds (cost $23,734,801) | 23,734,801 | |
| Total Investment in Securities (cost $309,541,477) | | $309,541,477 |
| Cash | | 7,520 |
| Receivable for securities sold on a delayed delivery basis | | 400,000 |
| Receivable for fund shares sold | | 263,221 |
| Interest receivable | | 812,337 |
| Distributions receivable from Fidelity Central Funds | | 33,891 |
| Prepaid expenses | | 543 |
| Other receivables | | 37 |
| Total assets | | 311,059,026 |
| Liabilities | | |
| Payable for fund shares redeemed | $222,937 | |
| Distributions payable | 12,209 | |
| Accrued management fee | 92,588 | |
| Audit fee payable | 33,722 | |
| Transfer agent fee payable | 40,887 | |
| Other affiliated payables | 4,063 | |
| Other payables and accrued expenses | 1,048 | |
| Total liabilities | | 407,454 |
| Net Assets | | $310,651,572 |
| Net Assets consist of: | | |
| Paid in capital | | $310,653,583 |
| Total distributable earnings (loss) | | (2,011) |
| Net Assets, for 310,291,017 shares outstanding | | $310,651,572 |
| Net Asset Value, offering price and redemption price per share ($310,651,572 ÷ 310,291,017 shares) | | $1.00 |
See accompanying notes which are an integral part of the financial statements.
Statement of Operations
| | | Year ended December 31, 2018 |
| Investment Income | | |
| Interest | | $4,752,393 |
| Income from Fidelity Central Funds | | 476,883 |
| Total income | | 5,229,276 |
| Expenses | | |
| Management fee | $1,282,484 | |
| Transfer agent fees | 557,964 | |
| Accounting fees and expenses | 56,299 | |
| Custodian fees and expenses | 3,255 | |
| Independent trustees' fees and expenses | 1,699 | |
| Registration fees | 23,052 | |
| Audit | 39,751 | |
| Legal | 3,677 | |
| Miscellaneous | 1,723 | |
| Total expenses before reductions | 1,969,904 | |
| Expense reductions | (2,705) | |
| Total expenses after reductions | | 1,967,199 |
| Net investment income (loss) | | 3,262,077 |
| Realized and Unrealized Gain (Loss) | | |
| Net realized gain (loss) on: | | |
| Investment securities: | | |
| Unaffiliated issuers | 11,564 | |
| Fidelity Central Funds | 4,215 | |
| Total net realized gain (loss) | | 15,779 |
| Net increase in net assets resulting from operations | | $3,277,856 |
See accompanying notes which are an integral part of the financial statements.
Statement of Changes in Net Assets
| | Year ended December 31, 2018 | Year ended December 31, 2017 |
| Increase (Decrease) in Net Assets | | |
| Operations | | |
| Net investment income (loss) | $3,262,077 | $1,722,891 |
| Net realized gain (loss) | 15,779 | 3,760 |
| Net increase in net assets resulting from operations | 3,277,856 | 1,726,651 |
| Distributions to shareholders | (3,581,532) | – |
| Distributions to shareholders from net investment income | – | (1,722,434) |
| Distributions to shareholders from net realized gain | – | (4,294) |
| Total distributions | (3,581,532) | (1,726,728) |
| Share transactions at net asset value of $1.00 per share | | |
| Proceeds from sales of shares | 35,049,609 | 35,302,513 |
| Reinvestment of distributions | 3,456,334 | 1,674,103 |
| Cost of shares redeemed | (148,370,854) | (190,525,240) |
| Net increase (decrease) in net assets and shares resulting from share transactions | (109,864,911) | (153,548,624) |
| Total increase (decrease) in net assets | (110,168,587) | (153,548,701) |
| Net Assets | | |
| Beginning of period | 420,820,159 | 574,368,860 |
| End of period | $310,651,572 | $420,820,159 |
| Other Information | | |
| Distributions in excess of net investment income end of period | | $(1,653) |
See accompanying notes which are an integral part of the financial statements.
Financial Highlights
Fidelity Michigan Municipal Money Market Fund
| | | | | | |
| Years ended December 31, | 2018 | 2017 | 2016 | 2015 | 2014 |
| Selected Per–Share Data | | | | | |
| Net asset value, beginning of period | $1.00 | $1.00 | $1.00 | $1.00 | $1.00 |
| Income from Investment Operations | | | | | |
| Net investment income (loss) | .009 | .004 | .001 | –A | –A |
| Net realized and unrealized gain (loss) | .001 | –A | .001 | –A | –A |
| Total from investment operations | .010 | .004 | .002 | –A | –A |
| Distributions from net investment income | (.009) | (.004) | (.001) | –A | –A |
| Distributions from net realized gain | (.001) | –A | (.001) | – | – |
| Total distributions | (.010) | (.004) | (.002) | –A | –A |
| Net asset value, end of period | $1.00 | $1.00 | $1.00 | $1.00 | $1.00 |
| Total ReturnB | 1.01% | .37% | .16% | .01% | .01% |
| Ratios to Average Net AssetsC,D | | | | | |
| Expenses before reductions | .55% | .53% | .52% | .53% | .53% |
| Expenses net of fee waivers, if any | .55% | .53% | .35% | .06% | .07% |
| Expenses net of all reductions | .55% | .53% | .35% | .06% | .07% |
| Net investment income (loss) | .90% | .35% | .06% | .01% | .01% |
| Supplemental Data | | | | | |
| Net assets, end of period (000 omitted) | $310,652 | $420,820 | $574,369 | $993,737 | $1,044,226 |
A Amount represents less than $.0005 per share.
B Total returns would have been lower if certain expenses had not been reduced during the applicable periods shown.
C Fees and expenses of any underlying Fidelity Central Funds are not included in the Fund's expense ratio. The Fund indirectly bears its proportionate share of the expenses of any underlying Fidelity Central Funds.
D Expense ratios reflect operating expenses of the Fund. Expenses before reductions do not reflect amounts reimbursed or waived or reductions from expense offset arrangements and do not represent the amount paid by the Fund during periods when reimbursements, waivers or reductions occur. Expenses net of fee waivers reflect expenses after reimbursement and waivers but prior to reductions from expense offset arrangements. Expenses net of all reductions represent the net expenses paid by the Fund.
See accompanying notes which are an integral part of the financial statements.
Notes to Financial Statements
For the period ended December 31, 2018
1. Organization.
Fidelity Michigan Municipal Income Fund (the Income Fund) is a fund of Fidelity Municipal Trust. Fidelity Michigan Municipal Money Market Fund (the Money Market Fund) is a fund of Fidelity Municipal Trust II. Each Trust is registered under the Investment Company Act of 1940, as amended (the 1940 Act), as an open-end management investment company. Fidelity Municipal Trust and Fidelity Municipal Trust II (the Trusts) are organized as a Massachusetts business trust and a Delaware statutory trust, respectively. The Income Fund is a non-diversified fund. Each Fund is authorized to issue an unlimited number of shares. Shares of the Money Market Fund are only available for purchase by retail shareholders. Share transactions on the Statement of Changes in Net Assets may contain exchanges between affiliated funds. Each Fund may be affected by economic and political developments in the state of Michigan.
2. Investments in Fidelity Central Funds.
The Funds may invest in Fidelity Central Funds, which are open-end investment companies generally available only to other investment companies and accounts managed by the investment adviser and its affiliates. The Funds' Schedules of Investments list each of the Fidelity Central Funds held as of period end, if any, as an investment of each Fund, but does not include the underlying holdings of each Fidelity Central Fund. As an Investing Fund, each Fund indirectly bears its proportionate share of the expenses of the underlying Fidelity Central Funds.
The Money Market Central Funds seek preservation of capital and current income and are managed by Fidelity Investments Money Management, Inc. (FIMM), an affiliate of the investment adviser. Annualized expenses of the Money Market Central Funds as of their most recent shareholder report date are less than .005%.
A complete unaudited list of holdings for each Fidelity Central Fund is available upon request or at the Securities and Exchange Commission (the SEC) website at www.sec.gov. In addition, the financial statements of the Fidelity Central Funds, which are not covered by the Funds' Report of Independent Registered Public Accounting Firm, are available on the SEC website or upon request.
3. Significant Accounting Policies.
Each Fund is an investment company and applies the accounting and reporting guidance of the Financial Accounting Standards Board (FASB) Accounting Standards Codification Topic 946 Financial Services – Investments Companies. The financial statements have been prepared in conformity with accounting principles generally accepted in the United States of America (GAAP), which require management to make certain estimates and assumptions at the date of the financial statements. Actual results could differ from those estimates. Subsequent events, if any, through the date that the financial statements were issued have been evaluated in the preparation of the financial statements. The following summarizes the significant accounting policies of the Funds:
Investment Valuation. Investments are valued as of 4:00 p.m. Eastern time on the last calendar day of the period. The Board of Trustees (the Board) has delegated the day to day responsibility for the valuation of the Income Fund's investments to the Fair Value Committee (the Committee) established by the Income Fund's investment adviser. In accordance with valuation policies and procedures approved by the Board, the Income Fund attempts to obtain prices from one or more third party pricing vendors or brokers to value its investments. When current market prices, quotations or currency exchange rates are not readily available or reliable, investments will be fair valued in good faith by the Committee, in accordance with procedures adopted by the Board. Factors used in determining fair value vary by investment type and may include market or investment specific events, changes in interest rates and credit quality. The frequency with which these procedures are used cannot be predicted and they may be utilized to a significant extent. The Committee oversees the Income Fund's valuation policies and procedures and reports to the Board on the Committee's activities and fair value determinations. The Board monitors the appropriateness of the procedures used in valuing the Income Fund's investments and ratifies the fair value determinations of the Committee.
Each Fund categorizes the inputs to valuation techniques used to value its investments into a disclosure hierarchy consisting of three levels as shown below:
- Level 1 – quoted prices in active markets for identical investments
- Level 2 – other significant observable inputs (including quoted prices for similar investments, interest rates, prepayment speeds, etc.)
- Level 3 – unobservable inputs (including the Fund's own assumptions based on the best information available)
Valuation techniques used to value each Fund's investments by major category are as follows:
For the Income Fund, debt securities, including restricted securities, are valued based on evaluated prices received from third party pricing vendors or from brokers who make markets in such securities. Municipal securities are valued by pricing vendors who utilize matrix pricing which considers yield or price of bonds of comparable quality, coupon, maturity and type or by broker-supplied prices. When independent prices are unavailable or unreliable, debt securities may be valued utilizing pricing methodologies which consider similar factors that would be used by third party pricing vendors. Debt securities are generally categorized as Level 2 in the hierarchy but may be Level 3 depending on the circumstances.
For the Money Market Fund, as permitted by compliance with certain conditions under Rule 2a-7 of the 1940 Act, securities are valued at amortized cost, which approximates fair value. The amortized cost of an instrument is determined by valuing it at its original cost and thereafter amortizing any discount or premium from its face value at a constant rate until maturity. Securities held by a money market fund are generally high quality and liquid; however, they are reflected as Level 2 because the inputs used to determine fair value are not quoted prices in an active market.
For the Income Fund, changes in valuation techniques may result in transfers in or out of an assigned level within the disclosure hierarchy.
Investment Transactions and Income. For financial reporting purposes, the Funds' investment holdings and net asset value (NAV) include trades executed through the end of the last business day of the period. The NAV per share for processing shareholder transactions is calculated as of the close of business of the New York Stock Exchange (NYSE), normally 4:00 p.m. Eastern time and includes trades executed through the end of the prior business day for the Income Fund and trades executed through the end of the current business day for the Money Market Fund. Gains and losses on securities sold are determined on the basis of identified cost. Income and capital gain distributions from Fidelity Central Funds, if any, are recorded on the ex-dividend date. Interest income is accrued as earned and includes coupon interest and amortization of premium and accretion of discount on debt securities as applicable. Debt obligations may be placed on non-accrual status and related interest income may be reduced by ceasing current accruals and writing off interest receivables when the collection of all or a portion of interest has become doubtful based on consistently applied procedures. A debt obligation is removed from non-accrual status when the issuer resumes interest payments or when collectability of interest is reasonably assured.
Expenses. Expenses directly attributable to a fund are charged to that fund. Expenses attributable to more than one fund are allocated among the respective funds on the basis of relative net assets or other appropriate methods. Expense estimates are accrued in the period to which they relate and adjustments are made when actual amounts are known.
Income Tax Information and Distributions to Shareholders. Each year, each Fund intends to qualify as a regulated investment company under Subchapter M of the Internal Revenue Code, including distributing substantially all of its taxable income and realized gains. As a result, no provision for U.S. Federal income taxes is required. As of December 31, 2018, each Fund did not have any unrecognized tax benefits in the financial statements; nor is each Fund aware of any tax positions for which it is reasonably possible that the total amounts of unrecognized tax benefits will significantly change in the next twelve months. Each Fund files a U.S. federal tax return, in addition to state and local tax returns as required. Each Fund's federal income tax returns are subject to examination by the Internal Revenue Service (IRS) for a period of three fiscal years after they are filed. State and local tax returns may be subject to examination for an additional fiscal year depending on the jurisdiction.
Distributions are declared and recorded daily and paid monthly from net investment income. Distributions from realized gains, if any, are declared and recorded on the ex-dividend date. Income and capital gain distributions are determined in accordance with income tax regulations, which may differ from GAAP. In addition, the Income Fund claimed a portion of the payment made to redeeming shareholders as a distribution for income tax purposes
Capital accounts within the financial statements are adjusted for permanent book-tax differences. These adjustments have no impact on net assets or the results of operations. Capital accounts are not adjusted for temporary book-tax differences which will reverse in a subsequent period.
Book-tax differences are primarily due to market discount, deferred trustees compensation, and losses deferred due to excise tax regulations.
The Funds purchase municipal securities whose interest, in the opinion of the issuer, is free from federal income tax. There is no assurance that the IRS will agree with this opinion. In the event the IRS determines that the issuer does not comply with relevant tax requirements, interest payments from a security could become federally taxable, possibly retroactively to the date the security was issued.
As of period end, the cost and unrealized appreciation (depreciation) in securities, and derivatives if applicable, for federal income tax purposes were as follows for each Fund:
| | Tax cost | Gross unrealized appreciation | Gross unrealized depreciation | Net unrealized appreciation (depreciation) |
| Fidelity Michigan Municipal Income Fund | $582,817,327 | $11,013,723 | $(3,080,760) | $7,932,963 |
| Fidelity Michigan Municipal Money Market Fund | 309,541,477 | – | – | – |
The tax-based components of distributable earnings as of period end were as follows for each Fund:
| | Undistributed tax-exempt income | Undistributed ordinary income | Net unrealized appreciation (depreciation) on securities and other investments |
| Fidelity Michigan Municipal Income Fund | $32,826 | $– | $7,932,963 |
| Fidelity Michigan Municipal Money Market Fund | $– | $– | $– |
Certain of the Funds intend to elect to defer to the next fiscal year capital losses recognized during the period November 1, 2018 to December 31, 2018. Loss deferrals were as follows:
| | Capital losses |
| Fidelity Michigan Municipal Income Fund | $(753,875) |
The tax character of distributions paid was as follows:
| December 31, 2018 | | | | |
| | Tax-Exempt Income | Ordinary Income | Long-term Capital Gains | Total |
| Fidelity Michigan Municipal Income Fund | $16,994,836 | $– | $1,809,046 | $18,803,882 |
| Fidelity Michigan Municipal Money Market Fund | 3,262,434 | 285,311 | 33,787 | 3,581,532 |
| December 31, 2017 | | | | |
| | Tax-Exempt Income | Ordinary Income | Long-term Capital Gains | Total |
| Fidelity Michigan Municipal Income Fund | $18,249,642 | $– | $2,430,358 | $20,680,000 |
| Fidelity Michigan Municipal Money Market Fund | 1,722,434 | 4,294 | – | 1,726,728 |
Delayed Delivery Transactions and When-Issued Securities. During the period, certain Funds transacted in securities on a delayed delivery or when-issued basis. Payment and delivery may take place after the customary settlement period for that security. The price of the underlying securities and the date when the securities will be delivered and paid for are fixed at the time the transaction is negotiated. The securities purchased on a delayed delivery or when-issued basis are identified as such in each applicable Fund's Schedule of Investments. Certain Funds may receive compensation for interest forgone in the purchase of a delayed delivery or when-issued security. With respect to purchase commitments, each applicable Fund identifies securities as segregated in its records with a value at least equal to the amount of the commitment. Losses may arise due to changes in the value of the underlying securities or if the counterparty does not perform under the contract's terms, or if the issuer does not issue the securities due to political, economic, or other factors.
Restricted Securities. The Funds may invest in securities that are subject to legal or contractual restrictions on resale. These securities generally may be resold in transactions exempt from registration or to the public if the securities are registered. Disposal of these securities may involve time-consuming negotiations and expense, and prompt sale at an acceptable price may be difficult. Information regarding restricted securities is included at the end of each applicable Fund's Schedule of Investments.
New Rule Issuance. During August 2018, the U.S. Securities and Exchange Commission issued Final Rule Release No. 33-10532, Disclosure Update and Simplification. This Final Rule includes amendments specific to registered investment companies that are intended to eliminate overlap in disclosure requirements between Regulation S-X and GAAP. In accordance with these amendments, certain line-items in the Funds' financial statements have been combined or removed for the current period as outlined in the table below.
| Financial Statement | Current Line-Item Presentation | Prior Line-Item Presentation |
| Statement of Assets and Liabilities | Total distributable earnings (loss) | Undistributed/Distributions in excess of/Accumulated net investment income (loss)
Accumulated/Undistributed net realized gain (loss)
Net unrealized appreciation (depreciation) |
| Statement of Changes in Net Assets | N/A - removed | Undistributed/Distributions in excess of/Accumulated net investment income (loss) end of period |
| Statement of Changes in Net Assets | Distributions to shareholders | Distributions to shareholders from net investment income
Distributions to shareholders from net realized gain |
4. Purchases and Sales of Investments.
Purchases and sales of securities, other than short-term securities, for the Income Fund aggregated $132,570,888 and $209,746,857, respectively.
5. Fees and Other Transactions with Affiliates.
Management Fee. Fidelity Management & Research Company (the investment adviser) and its affiliates provide the Funds with investment management related services for which the Funds pay a monthly management fee. The management fee is the sum of an individual fund fee rate and an annualized group fee rate. The individual fund fee rate is applied to each Fund's average net assets. The group fee rate is based upon the average net assets of all the mutual funds advised by the investment adviser, including any mutual funds previously advised by the investment adviser that are currently advised by Fidelity SelectCo, LLC, an affiliate of the investment adviser. The group fee rate decreases as assets under management increase and increases as assets under management decrease. For the reporting period, each Fund's annual management fee rate expressed as a percentage of each Fund's average net assets was as follows:
| | Individual Rate | Group Rate | Total |
| Fidelity Michigan Municipal Income Fund | .25% | .11% | .36% |
| Fidelity Michigan Municipal Money Market Fund | .25% | .11% | .36% |
Transfer Agent Fees. Fidelity Investments Institutional Operations Company, Inc. (FIIOC), an affiliate of the investment adviser, is the transfer, dividend disbursing and shareholder servicing agent for the Funds. FIIOC receives account fees and asset-based fees that vary according to account size and type of account. FIIOC pays for typesetting, printing and mailing of shareholder reports, except proxy statements. For the period, the transfer agent fees were equivalent to the following annual rates expressed as a percentage of average net assets:
| Fidelity Michigan Municipal Income Fund | .09% |
| Fidelity Michigan Municipal Money Market Fund | .15% |
Accounting Fees. Fidelity Service Company, Inc. (FSC), an affiliate of the investment adviser, maintains each Fund's accounting records. The fee is based on the level of average net assets for each month. For the period, the fees were equivalent to the following annual rates:
| | % of Average Net Assets |
| Fidelity Michigan Municipal Income Fund | .02 |
| Fidelity Michigan Municipal Money Market Fund | .02 |
Interfund Trades. The Funds may purchase from or sell securities to other Fidelity Funds under procedures adopted by the Board. The procedures have been designed to ensure these interfund trades are executed in accordance with Rule 17a-7 of the 1940 Act. For the Income Fund, interfund trades are included within the respective purchases and sales amounts shown in the Purchases and Sales of Investments note.
6. Committed Line of Credit.
The Income Fund participates with other funds managed by the investment adviser or an affiliate in a $4.25 billion credit facility (the "line of credit") to be utilized for temporary or emergency purposes to fund shareholder redemptions or for other short-term liquidity purposes. The participating funds have agreed to pay commitment fees on their pro-rata portion of the line of credit, which are reflected in Miscellaneous expenses on the Statement of Operations, and are as follows:
| Fidelity Michigan Municipal Income Fund | $1,790 |
During the period, the Income Fund did not borrow on this line of credit.
7. Expense Reductions.
Through arrangements with each applicable Fund's custodian, credits realized as a result of certain uninvested cash balances were used to reduce each applicable Fund's expenses. All of the applicable expense reductions are noted in the table below.
| | Custody expense reduction |
| Fidelity Michigan Municipal Income Fund | $4,893 |
| Fidelity Michigan Municipal Money Market Fund | 153 |
In addition, during the period the investment adviser reimbursed and/or waived a portion of operating expenses as follows:
| | Amount |
| Fidelity Michigan Municipal Income Fund | $4,057 |
| Fidelity Michigan Municipal Money Market Fund | 2,552 |
8. Other.
The Funds' organizational documents provide former and current trustees and officers with a limited indemnification against liabilities arising in connection with the performance of their duties to the Funds. In the normal course of business, the Funds may also enter into contracts that provide general indemnifications. The Funds' maximum exposure under these arrangements is unknown as this would be dependent on future claims that may be made against the Funds. The risk of material loss from such claims is considered remote.
Report of Independent Registered Public Accounting Firm
To the Board of Trustees of Fidelity Municipal Trust and Fidelity Municipal Trust II and Shareholders of Fidelity Michigan Municipal Income Fund and Fidelity Michigan Municipal Money Market Fund:
Opinions on the Financial Statements
We have audited the accompanying statements of assets and liabilities, including the schedules of investments, of Fidelity Michigan Municipal Income Fund (one of the funds constituting Fidelity Municipal Trust) and Fidelity Michigan Municipal Money Market Fund (one of the funds constituting Fidelity Municipal Trust II) (hereafter collectively referred to as the "Funds") as of December 31, 2018, the related statements of operations for the year ended December 31, 2018, the statements of changes in net assets for each of the two years in the period ended December 31, 2018, including the related notes, and the financial highlights for each of the five years in the period ended December 31, 2018 (collectively referred to as the “financial statements”). In our opinion, the financial statements present fairly, in all material respects, the financial position of each of the Funds as of December 31, 2018, the results of each of their operations for the year then ended, the changes in each of their net assets for each of the two years in the period ended December 31, 2018 and each of the financial highlights for each of the five years in the period ended December 31, 2018 in conformity with accounting principles generally accepted in the United States of America.
Basis for Opinions
These financial statements are the responsibility of the Funds' management. Our responsibility is to express an opinion on the Funds' financial statements based on our audits. We are a public accounting firm registered with the Public Company Accounting Oversight Board (United States) (PCAOB) and are required to be independent with respect to the Funds in accordance with the U.S. federal securities laws and the applicable rules and regulations of the Securities and Exchange Commission and the PCAOB.
We conducted our audits of these financial statements in accordance with the standards of the PCAOB. Those standards require that we plan and perform the audit to obtain reasonable assurance about whether the financial statements are free of material misstatement, whether due to error or fraud.
Our audits included performing procedures to assess the risks of material misstatement of the financial statements, whether due to error or fraud, and performing procedures that respond to those risks. Such procedures included examining, on a test basis, evidence regarding the amounts and disclosures in the financial statements. Our audits also included evaluating the accounting principles used and significant estimates made by management, as well as evaluating the overall presentation of the financial statements. Our procedures included confirmation of securities owned as of December 31, 2018 by correspondence with the custodian and brokers; when replies were not received from brokers, we performed other auditing procedures. We believe that our audits provide a reasonable basis for our opinions.
PricewaterhouseCoopers LLP
Boston, Massachusetts
February 13, 2019
We have served as the auditor of one or more investment companies in the Fidelity group of funds since 1932.
Trustees and Officers
The Trustees, Members of the Advisory Board (if any), and officers of the trusts and fund, as applicable, are listed below. The Board of Trustees governs the fund and is responsible for protecting the interests of shareholders. The Trustees are experienced executives who meet periodically throughout the year to oversee the fund's activities, review contractual arrangements with companies that provide services to the fund, oversee management of the risks associated with such activities and contractual arrangements, and review the fund's performance. Each of the Trustees oversees 260 funds.
The Trustees hold office without limit in time except that (a) any Trustee may resign; (b) any Trustee may be removed by written instrument, signed by at least two-thirds of the number of Trustees prior to such removal; (c) any Trustee who requests to be retired or who has become incapacitated by illness or injury may be retired by written instrument signed by a majority of the other Trustees; and (d) any Trustee may be removed at any special meeting of shareholders by a two-thirds vote of the outstanding voting securities of the trust. Each Trustee who is not an interested person (as defined in the 1940 Act) of the trust and the fund is referred to herein as an Independent Trustee. Each Independent Trustee shall retire not later than the last day of the calendar year in which his or her 75th birthday occurs. The Independent Trustees may waive this mandatory retirement age policy with respect to individual Trustees. Officers and Advisory Board Members hold office without limit in time, except that any officer or Advisory Board Member may resign or may be removed by a vote of a majority of the Trustees at any regular meeting or any special meeting of the Trustees. Except as indicated, each individual has held the office shown or other offices in the same company for the past five years.
The fund’s Statement of Additional Information (SAI) includes more information about the Trustees. To request a free copy, call Fidelity at 1-800-544-8544.
Experience, Skills, Attributes, and Qualifications of the Trustees. The Governance and Nominating Committee has adopted a statement of policy that describes the experience, qualifications, attributes, and skills that are necessary and desirable for potential Independent Trustee candidates (Statement of Policy). The Board believes that each Trustee satisfied at the time he or she was initially elected or appointed a Trustee, and continues to satisfy, the standards contemplated by the Statement of Policy. The Governance and Nominating Committee also engages professional search firms to help identify potential Independent Trustee candidates who have the experience, qualifications, attributes, and skills consistent with the Statement of Policy. From time to time, additional criteria based on the composition and skills of the current Independent Trustees, as well as experience or skills that may be appropriate in light of future changes to board composition, business conditions, and regulatory or other developments, have also been considered by the professional search firms and the Governance and Nominating Committee. In addition, the Board takes into account the Trustees' commitment and participation in Board and committee meetings, as well as their leadership of standing and ad hoc committees throughout their tenure.
In determining that a particular Trustee was and continues to be qualified to serve as a Trustee, the Board has considered a variety of criteria, none of which, in isolation, was controlling. The Board believes that, collectively, the Trustees have balanced and diverse experience, qualifications, attributes, and skills, which allow the Board to operate effectively in governing the fund and protecting the interests of shareholders. Information about the specific experience, skills, attributes, and qualifications of each Trustee, which in each case led to the Board's conclusion that the Trustee should serve (or continue to serve) as a trustee of the fund, is provided below.
Board Structure and Oversight Function. Abigail P. Johnson is an interested person and currently serves as Chairman. The Trustees have determined that an interested Chairman is appropriate and benefits shareholders because an interested Chairman has a personal and professional stake in the quality and continuity of services provided to the fund. Independent Trustees exercise their informed business judgment to appoint an individual of their choosing to serve as Chairman, regardless of whether the Trustee happens to be independent or a member of management. The Independent Trustees have determined that they can act independently and effectively without having an Independent Trustee serve as Chairman and that a key structural component for assuring that they are in a position to do so is for the Independent Trustees to constitute a substantial majority for the Board. The Independent Trustees also regularly meet in executive session. Arthur E. Johnson serves as Chairman of the Independent Trustees and as such (i) acts as a liaison between the Independent Trustees and management with respect to matters important to the Independent Trustees and (ii) with management prepares agendas for Board meetings.
Fidelity® funds are overseen by different Boards of Trustees. The fund's Board oversees Fidelity's investment-grade bond, money market, asset allocation and certain equity funds, and other Boards oversee Fidelity's high income and other equity funds. The asset allocation funds may invest in Fidelity® funds that are overseen by such other Boards. The use of separate Boards, each with its own committee structure, allows the Trustees of each group of Fidelity® funds to focus on the unique issues of the funds they oversee, including common research, investment, and operational issues. On occasion, the separate Boards establish joint committees to address issues of overlapping consequences for the Fidelity® funds overseen by each Board.
The Trustees operate using a system of committees to facilitate the timely and efficient consideration of all matters of importance to the Trustees, the fund, and fund shareholders and to facilitate compliance with legal and regulatory requirements and oversight of the fund's activities and associated risks. The Board, acting through its committees, has charged FMR and its affiliates with (i) identifying events or circumstances the occurrence of which could have demonstrably adverse effects on the fund's business and/or reputation; (ii) implementing processes and controls to lessen the possibility that such events or circumstances occur or to mitigate the effects of such events or circumstances if they do occur; and (iii) creating and maintaining a system designed to evaluate continuously business and market conditions in order to facilitate the identification and implementation processes described in (i) and (ii) above. Because the day-to-day operations and activities of the fund are carried out by or through FMR, its affiliates, and other service providers, the fund's exposure to risks is mitigated but not eliminated by the processes overseen by the Trustees. While each of the Board's committees has responsibility for overseeing different aspects of the fund's activities, oversight is exercised primarily through the Operations and Audit Committees. In addition, an ad hoc Board committee of Independent Trustees has worked with FMR to enhance the Board's oversight of investment and financial risks, legal and regulatory risks, technology risks, and operational risks, including the development of additional risk reporting to the Board. The Operations Committee also worked and continues to work with FMR to enhance the stress tests required under SEC regulations for money market funds. Appropriate personnel, including but not limited to the fund's Chief Compliance Officer (CCO), FMR's internal auditor, the independent accountants, the fund's Treasurer and portfolio management personnel, make periodic reports to the Board's committees, as appropriate, including an annual review of Fidelity's risk management program for the Fidelity® funds. The responsibilities of each standing committee, including their oversight responsibilities, are described further under "Standing Committees of the Trustees."
Interested Trustees*:
Correspondence intended for a Trustee who is an interested person may be sent to Fidelity Investments, 245 Summer Street, Boston, Massachusetts 02210.
Name, Year of Birth; Principal Occupations and Other Relevant Experience+
Abigail P. Johnson (1961)
Year of Election or Appointment: 2009
Trustee
Chairman of the Board of Trustees
Ms. Johnson also serves as Trustee of other Fidelity® funds. Ms. Johnson serves as Chairman (2016-present), Chief Executive Officer (2014-present), and Director (2007-present) of FMR LLC (diversified financial services company), President of Fidelity Financial Services (2012-present) and President of Personal, Workplace and Institutional Services (2005-present). Ms. Johnson is Chairman and Director of FMR Co., Inc. (investment adviser firm, 2011-present) and Chairman and Director of FMR (investment adviser firm, 2011-present). Previously, Ms. Johnson served as Vice Chairman (2007-2016) and President (2013-2016) of FMR LLC, President and a Director of FMR (2001-2005), a Trustee of other investment companies advised by FMR, Fidelity Investments Money Management, Inc. (investment adviser firm), and FMR Co., Inc. (2001-2005), Senior Vice President of the Fidelity® funds (2001-2005), and managed a number of Fidelity® funds. Ms. Abigail P. Johnson and Mr. Arthur E. Johnson are not related.
Jennifer Toolin McAuliffe (1959)
Year of Election or Appointment: 2016
Trustee
Ms. McAuliffe also serves as Trustee of other Fidelity® funds. Ms. McAuliffe previously served as a Member of the Advisory Board of certain Fidelity® funds (2016) and as Co-Head of Fixed Income of Fidelity Investments Limited (now known as FIL Limited (FIL)) (diversified financial services company). Earlier roles at FIL included Director of Research for FIL’s credit and quantitative teams in London, Hong Kong and Tokyo. Ms. McAuliffe also was the Director of Research for taxable and municipal bonds at Fidelity Investments Money Management, Inc. Ms. McAuliffe is also a director or trustee of several not-for-profit entities.
* Determined to be an “Interested Trustee” by virtue of, among other things, his or her affiliation with the trusts or various entities under common control with FMR.
+ The information includes the Trustee's principal occupation during the last five years and other information relating to the experience, attributes, and skills relevant to the Trustee's qualifications to serve as a Trustee, which led to the conclusion that the Trustee should serve as a Trustee for the fund.
Independent Trustees:
Correspondence intended for an Independent Trustee may be sent to Fidelity Investments, P.O. Box 55235, Boston, Massachusetts 02205-5235.
Name, Year of Birth; Principal Occupations and Other Relevant Experience+
Elizabeth S. Acton (1951)
Year of Election or Appointment: 2013
Trustee
Ms. Acton also serves as Trustee of other Fidelity® funds. Prior to her retirement in April 2012, Ms. Acton was Executive Vice President, Finance (2011-2012), Executive Vice President, Chief Financial Officer (2002-2011), and Treasurer (2004-2005) of Comerica Incorporated (financial services). Prior to joining Comerica, Ms. Acton held a variety of positions at Ford Motor Company (1983-2002), including Vice President and Treasurer (2000-2002) and Executive Vice President and Chief Financial Officer of Ford Motor Credit Company (1998-2000). Ms. Acton currently serves as a member of the Board of Directors and Audit and Finance Committees of Beazer Homes USA, Inc. (homebuilding, 2012-present). Previously, Ms. Acton served as a Member of the Advisory Board of certain Fidelity® funds (2013-2016).
Ann E. Dunwoody (1953)
Year of Election or Appointment: 2018
Trustee
General Dunwoody also serves as Trustee of other Fidelity® funds. General Dunwoody (United States Army, Retired) was the first woman in U.S. military history to achieve the rank of four-star general and prior to her retirement in 2012 held a variety of positions within the U.S. Army, including Commanding General, U.S. Army Material Command (2008-2012). She is the President of First to Four LLC (leadership and mentoring services, 2012-present). She also serves as a member of the Board of Directors and Nominating and Corporate Governance Committee of L3 Technologies, Inc. (communication, electronic, sensor, and aerospace systems, 2013-present), Board of Directors and Nomination and Corporate Governance Committees of Kforce Inc. (professional staffing services, 2016-present) and Board of Directors of Automattic Inc. (software engineering, 2018-present). Previously, General Dunwoody served as a Member of the Advisory Board of certain Fidelity® funds (2018), a member of the Board of Directors and Audit and Sustainability and Corporate Responsibility Committees of Republic Services, Inc. (waste collection, disposal and recycling, 2013-2016). Ms. Dunwoody also serves on several boards for non-profit organizations, including as a member of the Board of Directors, Chair of the Nomination and Governance Committee and member of the Audit Committee of Logistics Management Institute (consulting non-profit, 2012-present), a member of the Board of Directors of the Army Historical Foundation (2015-present), a member of the Council of Trustees for the Association of the United States Army (advocacy non-profit, 2013-present) and a member of the Board of Trustees of Florida Institute of Technology (2015-present) and ThanksUSA (military family education non-profit, 2014-present).
John Engler (1948)
Year of Election or Appointment: 2014
Trustee
Mr. Engler also serves as Trustee of other Fidelity® funds. He serves on the board of directors for Universal Forest Products (manufacturer and distributor of wood and wood-alternative products, 2003-present) and K12 Inc. (technology-based education company, 2012-present). Previously, Mr. Engler served as interim president of Michigan State University (2018-2019), a Member of the Advisory Board of certain Fidelity® funds (2014-2016), president of the Business Roundtable (2011-2017), a trustee of The Munder Funds (2003-2014), president and CEO of the National Association of Manufacturers (2004-2011), member of the Board of Trustees of the Annie E. Casey Foundation (2004-2015), and as governor of Michigan (1991-2003). He is a past chairman of the National Governors Association.
Robert F. Gartland (1951)
Year of Election or Appointment: 2010
Trustee
Mr. Gartland also serves as Trustee of other Fidelity® funds. Mr. Gartland is Chairman and an investor in Gartland & Mellina Group Corp. (consulting, 2009-present). Previously, Mr. Gartland served as a partner and investor of Vietnam Partners LLC (investments and consulting, 2008-2011). Prior to his retirement, Mr. Gartland held a variety of positions at Morgan Stanley (financial services, 1979-2007), including Managing Director (1987-2007), and Chase Manhattan Bank (1975-1978).
Arthur E. Johnson (1947)
Year of Election or Appointment: 2008
Trustee
Chairman of the Independent Trustees
Mr. Johnson also serves as Trustee of other Fidelity® funds. Mr. Johnson serves as a member of the Board of Directors of Eaton Corporation plc (diversified power management, 2009-present) and Booz Allen Hamilton (management consulting, 2011-present). Prior to his retirement, Mr. Johnson served as Senior Vice President of Corporate Strategic Development of Lockheed Martin Corporation (defense contractor, 1999-2009). He previously served on the Board of Directors of IKON Office Solutions, Inc. (1999-2008), AGL Resources, Inc. (holding company, 2002-2016), and Delta Airlines (2005-2007). Mr. Arthur E. Johnson is not related to Ms. Abigail P. Johnson.
Michael E. Kenneally (1954)
Year of Election or Appointment: 2009
Trustee
Vice Chairman of the Independent Trustees
Mr. Kenneally also serves as Trustee of other Fidelity® funds. Prior to his retirement, Mr. Kenneally served as Chairman and Global Chief Executive Officer of Credit Suisse Asset Management. Before joining Credit Suisse, he was an Executive Vice President and Chief Investment Officer for Bank of America Corporation. Earlier roles at Bank of America included Director of Research, Senior Portfolio Manager and Research Analyst, and Mr. Kenneally was awarded the Chartered Financial Analyst (CFA) designation in 1991.
Marie L. Knowles (1946)
Year of Election or Appointment: 2001
Trustee
Ms. Knowles also serves as Trustee of other Fidelity® funds. Prior to Ms. Knowles' retirement in June 2000, she served as Executive Vice President and Chief Financial Officer of Atlantic Richfield Company (ARCO) (diversified energy, 1996-2000). From 1993 to 1996, she was a Senior Vice President of ARCO and President of ARCO Transportation Company (pipeline and tanker operations). Ms. Knowles currently serves as a Director and Chairman of the Audit Committee of McKesson Corporation (healthcare service, since 2002). Ms. Knowles is a member of the Board of the Santa Catalina Island Company (real estate, 2009-present). Ms. Knowles is a Member of the Investment Company Institute Board of Governors and a Member of the Governing Council of the Independent Directors Council (2014-present). She also serves as a member of the Advisory Board for the School of Engineering of the University of Southern California. Previously, Ms. Knowles served as a Director of Phelps Dodge Corporation (copper mining and manufacturing, 1994-2007), URS Corporation (engineering and construction, 2000-2003) and America West (airline, 1999-2002). Ms. Knowles previously served as Chairman (2015-2018) and Vice Chairman (2012-2015) of the Independent Trustees of certain Fidelity® funds.
Mark A. Murray (1954)
Year of Election or Appointment: 2016
Trustee
Mr. Murray also serves as Trustee of other Fidelity® funds. Mr. Murray is Vice Chairman (2013-present) of Meijer, Inc. (regional retail chain). Previously, Mr. Murray served as a Member of the Advisory Board of certain Fidelity® funds (2016) and as Co-Chief Executive Officer (2013-2016) and President (2006-2013) of Meijer, Inc. Mr. Murray serves as a member of the Board of Directors and Nuclear Review and Public Policy and Responsibility Committees of DTE Energy Company (diversified energy company, 2009-present). Mr. Murray also serves as a member of the Board of Directors of Spectrum Health (not-for-profit health system, 2015-present). Mr. Murray previously served as President of Grand Valley State University (2001-2006), Treasurer for the State of Michigan (1999-2001), Vice President of Finance and Administration for Michigan State University (1998-1999), and a member of the Board of Directors and Audit Committee and Chairman of the Nominating and Corporate Governance Committee of Universal Forest Products, Inc. (manufacturer and distributor of wood and wood-alternative products, 2004-2016). Mr. Murray is also a director or trustee of many community and professional organizations.
+ The information includes the Trustee's principal occupation during the last five years and other information relating to the experience, attributes, and skills relevant to the Trustee's qualifications to serve as a Trustee, which led to the conclusion that the Trustee should serve as a Trustee for the fund.
Advisory Board Members and Officers:
Correspondence intended for an officer may be sent to Fidelity Investments, 245 Summer Street, Boston, Massachusetts 02210. Officers appear below in alphabetical order.
Name, Year of Birth; Principal Occupation
Elizabeth Paige Baumann (1968)
Year of Election or Appointment: 2017
Anti-Money Laundering (AML) Officer
Ms. Baumann also serves as AML Officer of other funds. She is Chief AML Officer (2012-present) and Senior Vice President (2014-present) of FMR LLC (diversified financial services company) and is an employee of Fidelity Investments. Previously, Ms. Baumann served as AML Officer of the funds (2012-2016), and Vice President (2007-2014) and Deputy Anti-Money Laundering Officer (2007-2012) of FMR LLC.
Craig S. Brown (1977)
Year of Election or Appointment: 2019
Assistant Treasurer
Mr. Brown also serves as Assistant Treasurer of other funds. Mr. Brown is an employee of Fidelity Investments (2013-present).
John J. Burke III (1964)
Year of Election or Appointment: 2018
Chief Financial Officer
Mr. Burke also serves as Chief Financial Officer of other funds. Mr. Burke serves as Head of Investment Operations for Fidelity Fund and Investment Operations (2018-present) and is an employee of Fidelity Investments (1998-present). Previously Mr. Burke served as head of Asset Management Investment Operations (2012-2018).
William C. Coffey (1969)
Year of Election or Appointment: 2018
Secretary and Chief Legal Officer (CLO)
Mr. Coffey also serves as Secretary and CLO of other funds. Mr. Coffey serves as CLO, Secretary, and Senior Vice President of Fidelity Management & Research Company and FMR Co., Inc. (investment adviser firms, 2018-present); Secretary of Fidelity SelectCo, LLC and Fidelity Investments Money Management, Inc. (investment adviser firms, 2018-present); and CLO of Fidelity Management & Research (Hong Kong) Limited, FMR Investment Management (UK) Limited, and Fidelity Management & Research (Japan) Limited (investment adviser firms, 2018-present). He is Senior Vice President and Deputy General Counsel of FMR LLC (diversified financial services company, 2010-present), and is an employee of Fidelity Investments. Previously, Mr. Coffey served as Assistant Secretary of certain funds (2009-2018) and as Vice President and Associate General Counsel of FMR LLC (2005-2009).
Jonathan Davis (1968)
Year of Election or Appointment: 2010
Assistant Treasurer
Mr. Davis also serves as Assistant Treasurer of other funds. Mr. Davis serves as Assistant Treasurer of FMR Capital, Inc. (2017-present) and is an employee of Fidelity Investments. Previously, Mr. Davis served as Vice President and Associate General Counsel of FMR LLC (diversified financial services company, 2003-2010).
Adrien E. Deberghes (1967)
Year of Election or Appointment: 2010
Assistant Treasurer
Mr. Deberghes also serves as an officer of other funds. He serves as Assistant Treasurer of FMR Capital, Inc. (2017-present), Executive Vice President of Fidelity Investments Money Management, Inc. (FIMM) (investment adviser firm, 2016-present), and is an employee of Fidelity Investments (2008-present). Previously, Mr. Deberghes served as President and Treasurer of certain Fidelity® funds (2013-2018). Prior to joining Fidelity Investments, Mr. Deberghes was Senior Vice President of Mutual Fund Administration at State Street Corporation (2007-2008), Senior Director of Mutual Fund Administration at Investors Bank & Trust (2005-2007), and Director of Finance for Dunkin' Brands (2000-2005). Previously, Mr. Deberghes served in other fund officer roles.
Laura M. Del Prato (1964)
Year of Election or Appointment: 2018
President and Treasurer
Ms. Del Prato also serves as an officer of other funds. Ms. Del Prato is an employee of Fidelity Investments (2017-present). Prior to joining Fidelity Investments, Ms. Del Prato served as a Managing Director and Treasurer of the JPMorgan Mutual Funds (2014-2017). Prior to JPMorgan, Ms. Del Prato served as a partner at Cohen Fund Audit Services (accounting firm, 2012-2013) and KPMG LLP (accounting firm, 2004-2012).
Colm A. Hogan (1973)
Year of Election or Appointment: 2016
Assistant Treasurer
Mr. Hogan also serves as an officer of other funds. Mr. Hogan serves as Assistant Treasurer of FMR Capital, Inc. (2017-present) and is an employee of Fidelity Investments (2005-present). Previously, Mr. Hogan served as Assistant Treasurer of certain Fidelity® funds (2016-2018).
Chris Maher (1972)
Year of Election or Appointment: 2013
Assistant Treasurer
Mr. Maher serves as Assistant Treasurer of other funds. Mr. Maher is Vice President of Valuation Oversight, serves as Assistant Treasurer of FMR Capital, Inc. (2017-present), and is an employee of Fidelity Investments. Previously, Mr. Maher served as Vice President of Asset Management Compliance (2013), Vice President of the Program Management Group of FMR (investment adviser firm, 2010-2013), and Vice President of Valuation Oversight (2008-2010).
John B. McGinty, Jr. (1962)
Year of Election or Appointment: 2016
Chief Compliance Officer
Mr. McGinty also serves as Chief Compliance Officer of other funds. Mr. McGinty is Senior Vice President of Asset Management Compliance for Fidelity Investments and is an employee of Fidelity Investments (2016-present). Mr. McGinty previously served as Vice President, Senior Attorney at Eaton Vance Management (investment management firm, 2015-2016), and prior to Eaton Vance as global CCO for all firm operations and registered investment companies at GMO LLC (investment management firm, 2009-2015). Before joining GMO LLC, Mr. McGinty served as Senior Vice President, Deputy General Counsel for Fidelity Investments (2007-2009).
Jason P. Pogorelec (1975)
Year of Election or Appointment: 2015
Assistant Secretary
Mr. Pogorelec also serves as Assistant Secretary of other funds. Mr. Pogorelec serves as Vice President, Associate General Counsel (2010-present) and is an employee of Fidelity Investments (2006-present).
Nancy D. Prior (1967)
Year of Election or Appointment: 2014
Vice President
Ms. Prior also serves as Vice President of other funds. Ms. Prior serves as President Fixed Income, High Income/Emerging Market Debt and Multi Asset Class Strategies of FIAM LLC (2018-present), President (2016-present) and Director (2014-present) of Fidelity Investments Money Management, Inc. (FIMM) (investment adviser firm), President, Fixed Income (2014-present), and is an employee of Fidelity Investments (2002-present). Previously, Ms. Prior served as Vice Chairman of FIAM LLC (investment adviser firm, 2014-2018), a Director of FMR Investment Management (UK) Limited (investment adviser firm, 2015-2018), President Multi-Asset Class Strategies of FMR's Global Asset Allocation Division (2017-2018), Vice President of Fidelity's Money Market Funds (2012-2014), President, Money Market and Short Duration Bond Group of Fidelity Management & Research (FMR) (investment adviser firm, 2013-2014), President, Money Market Group of FMR (2011-2013), Managing Director of Research (2009-2011), Senior Vice President and Deputy General Counsel (2007-2009), and Assistant Secretary of certain Fidelity® funds (2008-2009).
Stacie M. Smith (1974)
Year of Election or Appointment: 2013
Assistant Treasurer
Ms. Smith also serves as an officer of other funds. Ms. Smith serves as Assistant Treasurer of FMR Capital, Inc. (2017-present), is an employee of Fidelity Investments (2009-present), and has served in other fund officer roles. Prior to joining Fidelity Investments, Ms. Smith served as Senior Audit Manager of Ernst & Young LLP (accounting firm, 1996-2009). Previously, Ms. Smith served as Assistant Treasurer (2013-2018) and Deputy Treasurer (2013-2016) of certain Fidelity® funds.
Marc L. Spector (1972)
Year of Election or Appointment: 2016
Deputy Treasurer
Mr. Spector also serves as an officer of other funds. Mr. Spector serves as Assistant Treasurer of FMR Capital, Inc. (2017-present) and is an employee of Fidelity Investments (2016-present). Prior to joining Fidelity Investments, Mr. Spector served as Director at the Siegfried Group (accounting firm, 2013-2016), and prior to Siegfried Group as audit senior manager at Deloitte & Touche (accounting firm, 2005-2013).
Jim Wegmann (1979)
Year of Election or Appointment: 2019
Assistant Treasurer
Mr. Wegmann also serves as Assistant Treasurer of other funds. Mr. Wegmann is an employee of Fidelity Investments (2011-present).
Shareholder Expense Example
As a shareholder of the Fund, you incur two types of costs: (1) transaction costs and (2) ongoing costs, including management fees and other Fund expenses. This Example is intended to help you understand your ongoing costs (in dollars) of investing in the Fund and to compare these costs with the ongoing costs of investing in other mutual funds.
The Example is based on an investment of $1,000 invested at the beginning of the period and held for the entire period (July 1, 2018 to December 31, 2018).
Actual Expenses
The first line of the accompanying table for each fund provides information about actual account values and actual expenses. You may use the information in this line, together with the amount you invested, to estimate the expenses that you paid over the period. Simply divide your account value by $1,000.00 (for example, an $8,600 account value divided by $1,000.00 = 8.6), then multiply the result by the number in the first line for a fund under the heading entitled "Expenses Paid During Period" to estimate the expenses you paid on your account during this period. A small balance maintenance fee of $12.00 that is charged once a year may apply for certain accounts with a value of less than $2,000. This fee, which was eliminated effective August 1, 2018, is not included in the table below. If it was, the estimate of expenses you paid during the period would be higher, and your ending account value lower, by this amount. In addition, each Fund, as a shareholder in the underlying Fidelity Central Funds, will indirectly bear its pro-rata share of the fees and expenses incurred by the underlying Fidelity Central Funds. These fees and expenses are not included in the Fund's annualized expense ratio used to calculate the expense estimate in the table below.
Hypothetical Example for Comparison Purposes
The second line of the accompanying table for each fund provides information about hypothetical account values and hypothetical expenses based on a fund's actual expense ratio and an assumed rate of return of 5% per year before expenses, which is not the Fund's actual return. The hypothetical account values and expenses may not be used to estimate the actual ending account balance or expenses you paid for the period. You may use this information to compare the ongoing costs of investing in the Fund and other funds. To do so, compare this 5% hypothetical example with the 5% hypothetical examples that appear in the shareholder reports of the other funds. A small balance maintenance fee of $12.00 that is charged once a year may apply for certain accounts with a value of less than $2,000. This fee, which was eliminated effective August 1, 2018, is not included in the table below. If it was, the estimate of expenses you paid during the period would be higher, and your ending account value lower, by this amount. In addition, each Fund, as a shareholder in the underlying Fidelity Central Funds, will indirectly bear its pro-rata share of the fees and expenses incurred by the underlying Fidelity Central Funds. These fees and expenses are not included in the Fund's annualized expense ratio used to calculate the expense estimate in the table below.
Please note that the expenses shown in the table are meant to highlight your ongoing costs only and do not reflect any transaction costs. Therefore, the second line of the table is useful in comparing ongoing costs only, and will not help you determine the relative total costs of owning different funds.
| | Annualized Expense Ratio-A | Beginning
Account Value
July 1, 2018 | Ending
Account Value
December 31, 2018 | Expenses Paid
During Period-B
July 1, 2018
to December 31, 2018 |
| Fidelity Michigan Municipal Income Fund�� | .48% | | | |
| Actual | | $1,000.00 | $1,015.90 | $2.44 |
| Hypothetical-C | | $1,000.00 | $1,022.79 | $2.45 |
| Fidelity Michigan Municipal Money Market Fund | .54% | | | |
| Actual | | $1,000.00 | $1,005.10 | $2.73 |
| Hypothetical-C | | $1,000.00 | $1,022.48 | $2.75 |
A Annualized expense ratio reflects expenses net of applicable fee waivers.
B Expenses are equal to each Fund's annualized expense ratio, multiplied by the average account value over the period, multiplied by 184/ 365 (to reflect the one-half year period).
C 5% return per year before expenses
Distributions (Unaudited)
The fund hereby designates as a capital gain dividend the amount noted below for the taxable year ended December 31, 2018, or, if subsequently determined to be different, the net capital gain of such year.
| Fidelity Michigan Municipal Income Fund | $1,665,381 |
| Fidelity Michigan Municipal Money Market Fund | $20,021 |
|
During fiscal year ended 2018, 100% of Fidelity Michigan Municipal Income Fund and Fidelity Michigan Municipal Money Market Fund's income dividends were free from federal income tax, and 5.31% of Fidelity Michigan Municipal Income Fund and 13.56% of Fidelity Michigan Municipal Money Market Fund's income dividends were subject to the federal alternative minimum tax.
The funds will notify shareholders in January 2019 of amounts for use in preparing 2018 income tax returns.
Board Approval of Investment Advisory Contracts and Management Fees
Fidelity Michigan Municipal Income Fund / Fidelity Michigan Municipal Money Market Fund
Each year, the Board of Trustees, including the Independent Trustees (together, the Board), votes on the renewal of the management contract with Fidelity Management & Research Company (FMR) and the sub-advisory agreements (together, the Advisory Contracts) for each fund. FMR and the sub-advisers are referred to herein as the Investment Advisers. The Board, assisted by the advice of fund counsel and Independent Trustees' counsel, requests and considers a broad range of information relevant to the renewal of the Advisory Contracts throughout the year.
The Board meets regularly and, at each of its meetings, covers an extensive agenda of topics and materials and considers factors that are relevant to its annual consideration of the renewal of each fund's Advisory Contracts, including the services and support provided to each fund and its shareholders. The Board has established four standing committees (Committees) — Operations, Audit, Fair Valuation, and Governance and Nominating — each composed of and chaired by Independent Trustees with varying backgrounds, to which the Board has assigned specific subject matter responsibilities in order to enhance effective decision-making by the Board. The Operations Committee, of which all of the Independent Trustees are members, meets regularly throughout the year and considers, among other matters, information specifically related to the annual consideration of the renewal of each fund's Advisory Contracts. The Board, acting directly and through its Committees, requests and receives information concerning the annual consideration of the renewal of each fund's Advisory Contracts. The Board also meets as needed to review matters specifically related to the Board's annual consideration of the renewal of the Advisory Contracts. Members of the Board may also meet with trustees of other Fidelity funds through joint ad hoc committees to discuss certain matters relevant to all of the Fidelity funds.
At its September 2018 meeting, the Board unanimously determined to renew each fund's Advisory Contracts. In reaching its determination, the Board considered all factors it believed relevant, including (i) the nature, extent, and quality of the services to be provided to each fund and its shareholders (including the investment performance of each fund); (ii) the competitiveness of each fund's management fee and total expense ratio relative to peer funds; (iii) the total costs of the services to be provided by and the profits to be realized by Fidelity from its relationships with each fund; and (iv) the extent to which, if any, economies of scale exist and would be realized as each fund grows, and whether any economies of scale are appropriately shared with fund shareholders.
In considering whether to renew the Advisory Contracts for each fund, the Board reached a determination, with the assistance of fund counsel and Independent Trustees' counsel and through the exercise of its business judgment, that the renewal of the Advisory Contracts was in the best interests of each fund and its shareholders and that the compensation payable under the Advisory Contracts was fair and reasonable. The Board's decision to renew the Advisory Contracts was not based on any single factor, but rather was based on a comprehensive consideration of all the information provided to the Board at its meetings throughout the year. The Board, in reaching its determination to renew the Advisory Contracts, was aware that shareholders of each fund have a broad range of investment choices available to them, including a wide choice among funds offered by Fidelity's competitors, and that each fund's shareholders, who have the opportunity to review and weigh the disclosure provided by the fund in its prospectus and other public disclosures, have chosen to invest in that fund, which is part of the Fidelity family of funds.
Nature, Extent, and Quality of Services Provided. The Board considered Fidelity's staffing as it relates to the funds, including the backgrounds of investment personnel of Fidelity, and also considered the funds' investment objectives, strategies, and related investment philosophies. The Independent Trustees also had discussions with senior management of Fidelity's investment operations and investment groups. The Board considered the structure of the investment personnel compensation program and whether this structure provides appropriate incentives to act in the best interests of each fund. Additionally, the Board considered the portfolio managers' investments, if any, in the funds that they manage.
Resources Dedicated to Investment Management and Support Services. The Board reviewed the general qualifications and capabilities of Fidelity's investment staff, including its size, education, experience, and resources, as well as Fidelity's approach to recruiting, managing, and compensating investment personnel. The Board noted that Fidelity has continued to increase the resources devoted to non-U.S. offices, including expansion of Fidelity's global investment organization. The Board also noted that Fidelity's analysts have extensive resources, tools and capabilities that allow them to conduct sophisticated quantitative and fundamental analysis, as well as credit analysis of issuers, counterparties and guarantors. Further, the Board considered that Fidelity's investment professionals have sufficient access to global information and data so as to provide competitive investment results over time, and that those professionals also have access to sophisticated tools that permit them to assess portfolio construction and risk and performance attribution characteristics continuously, as well as to transmit new information and research conclusions rapidly around the world. Additionally, in its deliberations, the Board considered Fidelity's trading, risk management, compliance, and technology and operations capabilities and resources, which are integral parts of the investment management process.
Shareholder and Administrative Services. The Board considered (i) the nature, extent, quality, and cost of advisory, administrative, and shareholder services performed by the Investment Advisers and their affiliates under the Advisory Contracts and under separate agreements covering transfer agency and pricing and bookkeeping services for each fund; (ii) the nature and extent of the supervision of third party service providers, principally custodians, subcustodians, and pricing vendors; and (iii) the resources devoted to, and the record of compliance with, each fund's compliance policies and procedures.
The Board noted that the growth of fund assets over time across the complex allows Fidelity to reinvest in the development of services designed to enhance the value and convenience of the Fidelity funds as investment vehicles. These services include 24-hour access to account information and market information through telephone representatives and over the Internet, investor education materials and asset allocation tools, and the expanded availability of Fidelity Investor Centers.
Investment in a Large Fund Family. The Board considered the benefits to shareholders of investing in a Fidelity fund, including the benefits of investing in a fund that is part of a large family of funds offering a variety of investment disciplines and providing a large variety of mutual fund investor services. The Board noted that Fidelity had taken, or had made recommendations that resulted in the Fidelity funds taking, a number of actions over the previous year that benefited particular funds, including: (i) continuing to dedicate additional resources to Fidelity's investment research process, which includes meetings with management of issuers of securities in which the funds invest, and to the support of the senior management team that oversees asset management; (ii) continuing efforts to enhance Fidelity's global research capabilities; (iii) launching new funds and making other enhancements to meet client needs; (iv) launching new share classes of existing funds; (v) eliminating purchase minimums and broadening eligibility requirements for certain funds and share classes; (vi) reducing management fees and total expenses for certain growth equity funds and index funds; (vii) lowering expense caps for certain existing funds and classes, and converting certain voluntary expense caps to contractual caps, to reduce expenses borne by shareholders; (viii) eliminating short-term redemption fees for funds that had such fees; (ix) rationalizing product lines and gaining increased efficiencies from fund mergers and share class consolidations; (x) continuing to develop, acquire and implement systems and technology to improve services to the funds and shareholders, strengthen information security, and increase efficiency; and (xi) continuing to implement enhancements to further strengthen Fidelity's product line to increase investors' probability of success in achieving their investment goals, including retirement income goals.
Investment Performance (for Fidelity Michigan Municipal Income Fund). The Board considered whether the fund has operated in accordance with its investment objective, as well as its record of compliance with its investment restrictions and its performance history.
The Board took into account discussions that occur at Board meetings throughout the year with representatives of the Investment Advisers about fund investment performance. In this regard the Board noted that as part of regularly scheduled fund reviews and other reports to the Board on fund performance, the Board considers annualized return information for the fund for different time periods, measured against an appropriate securities market index ("benchmark index") and a peer group of funds with similar objectives ("peer group"), if any. In its evaluation of fund investment performance at meetings throughout the year, the Board gave particular attention to information indicating underperformance of certain Fidelity funds for specific time periods and discussed with the Investment Advisers the reasons for such underperformance.
In addition to reviewing absolute and relative fund performance, the Independent Trustees periodically consider the appropriateness of fund performance metrics in evaluating the results achieved. In general, the Independent Trustees believe that fund performance should be evaluated based on gross performance (before fees and expenses but after transaction costs) compared to appropriate benchmark indices, over appropriate time periods that may include full market cycles, and on net performance (after fees and expenses) compared to peer groups, as applicable, over the same periods, taking into account relevant factors including the following: general market conditions; expectations for interest rate levels and credit conditions; issuer-specific information including credit quality; the potential for incremental return versus the fund's benchmark index weighed against the risks involved in obtaining that incremental return, including the risk of diminished or negative total returns; and fund cash flows and other factors. Depending on the circumstances, the Independent Trustees may be satisfied with a fund's performance notwithstanding that it lags its benchmark index or peer group for certain periods.
The Independent Trustees recognize that shareholders evaluate performance on a net basis over their own holding periods, for which one-, three-, and five-year periods are often used as a proxy. For this reason, the performance information reviewed by the Board also included net cumulative calendar year total return information for the fund and an appropriate benchmark index and peer group for the most recent one-, three-, and five-year periods.
Investment Performance (for Fidelity Michigan Municipal Money Market Fund). The Board considered whether the fund has operated in accordance with its investment objective, as well as its record of compliance with its investment restrictions and its performance history.
The Board took into account discussions that occur at Board meetings throughout the year with representatives of the Investment Advisers about fund investment performance. In this regard the Board noted that as part of regularly scheduled fund reviews and other reports to the Board on fund performance, the Board considers annualized return information for the fund for different time periods, measured against a peer group.
In addition to reviewing absolute and relative fund performance, the Independent Trustees periodically consider the appropriateness of fund performance metrics in evaluating the results achieved. In general, the Independent Trustees believe that fund performance should be evaluated based on gross performance (before fees and expenses but after transaction costs) compared to the gross performance of appropriate peer groups, over appropriate time periods that may include full market cycles, taking into account relevant factors including the following: general market conditions; expectations for interest rate levels and credit conditions; issuer-specific information including credit quality; the fund's market value NAV over time and its resilience under various stressed conditions; and fund cash flows and other factors.
The Board recognizes that in interest rate environments where many competitors waive fees to maintain a minimum yield, relative money market fund performance on a net basis (after fees and expenses) may not be particularly meaningful due to miniscule performance differences among competitor funds. Depending on the circumstances, the Independent Trustees may be satisfied with a fund's performance notwithstanding that it lags its peer group for certain periods.
The Independent Trustees recognize that shareholders evaluate performance on a net basis over their own holding periods, for which one-, three-, and five-year periods are often used as a proxy. For this reason, the performance information reviewed by the Board also included net cumulative calendar year total return information for the fund and an appropriate peer group for the most recent one-, three-, and five-year periods.
Based on its review, the Board concluded that the nature, extent, and quality of services provided to each fund under the Advisory Contracts should continue to benefit the shareholders of each fund.
Competitiveness of Management Fee and Total Expense Ratio. The Board considered each fund's management fee and total expense ratio compared to "mapped groups" of competitive funds and classes created for the purpose of facilitating the Trustees' competitive analysis of management fees and total expenses. Fidelity creates "mapped groups" by combining similar Lipper investment objective categories that have comparable investment mandates. Combining Lipper investment objective categories aids the Board's management fee and total expense ratio comparisons by broadening the competitive group used for comparison.
Management Fee. The Board considered two proprietary management fee comparisons for the 12-month periods shown in basis points (BP) in the charts below. The group of Lipper funds used by the Board for management fee comparisons is referred to below as the "Total Mapped Group" and, for the reasons explained above, is broader than the Lipper peer group used by the Board for performance comparisons. The Total Mapped Group comparison focuses on a fund's standing in terms of gross management fees before expense reimbursements or caps relative to the total universe of funds with comparable investment mandates, regardless of whether their management fee structures also are comparable. Funds with comparable investment mandates offer exposure to similar types of securities. Funds with comparable management fee structures have similar management fee contractual arrangements (
e.g., flat rate charged for advisory services, all-inclusive fee rate,
etc.). "TMG %" represents the percentage of funds in the Total Mapped Group that had management fees that were lower than a fund's. For example, a hypothetical TMG % of 20% would mean that 80% of the funds in the Total Mapped Group had higher, and 20% had lower, management fees than a fund. The funds' actual TMG %s and the number of funds in the Total Mapped Group are in the charts below. The "Asset-Size Peer Group" (ASPG) comparison focuses on a fund's standing relative to a subset of non-Fidelity funds within the Total Mapped Group that are similar in size and management fee structure. For example, if a fund is in the first quartile of the ASPG, the fund's management fee ranks in the least expensive or lowest 25% of funds in the ASPG. The ASPG represents at least 15% of the funds in the Total Mapped Group with comparable asset size and management fee structures, subject to a minimum of 50 funds (or all funds in the Total Mapped Group if fewer than 50). Additional information, such as the ASPG quartile in which a fund's management fee rate ranked, is also included in the charts and was considered by the Board.
Fidelity Michigan Municipal Income Fund
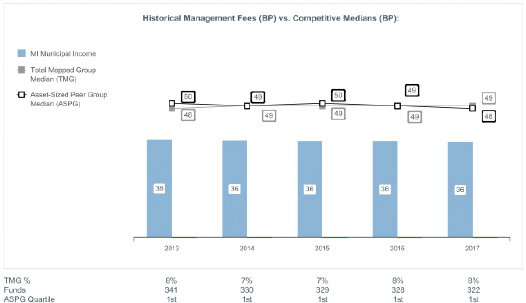
The Board noted that the fund's management fee rate ranked below the median of its Total Mapped Group and below the median of its ASPG for 2017.
Fidelity Michigan Municipal Money Market Fund
The Board noted that because there is a relatively small number of state-specific funds in the Lipper objective, Fidelity combines Lipper's separate categories for state-specific funds with all state and national money market funds to create a single mapped group. The Board considered that Fidelity is the only firm that offers a Michigan money market fund.
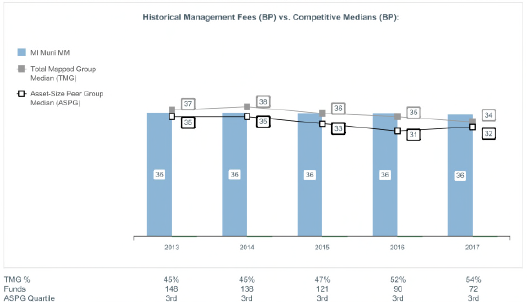
The Board noted that the fund's management fee rate ranked above the median of its Total Mapped Group and above the median of its ASPG for 2017, but considered that the management fee rate was only slightly above the Total Mapped Group and ASPG medians.
The Board noted that it and the boards of other Fidelity funds formed an ad hoc Committee on Group Fee, which meets periodically, to conduct an in-depth review of the "group fee" component of the management fee of funds with such management fee structures. The Committee's focus included the mechanics of the group fee, the competitive landscape of group fee structures, Fidelity funds with no group fee component and investment products not included in group fee assets. The Board also considered that, for funds subject to the group fee, FMR agreed to voluntarily waive fees over a specified period of time in amounts designed to account for assets converted from certain funds to certain collective investment trusts.
Based on its review, the Board concluded that each fund's management fee is fair and reasonable in light of the services that the fund receives and the other factors considered.
Total Expense Ratio. In its review of each fund's total expense ratio, the Board considered the fund's management fee rate as well as other fund expenses, such as transfer agent fees, pricing and bookkeeping fees, and custodial, legal, and audit fees. The Board also noted that Fidelity may agree to waive fees and expenses from time to time, and the extent to which, if any, it has done so for each fund. As part of its review, the Board also considered the current and historical total expense ratios of each fund compared to competitive fund median expenses. Each fund is compared to those funds and classes in the Total Mapped Group (used by the Board for management fee comparisons) that have a similar sales load structure.
The Board noted that Fidelity Michigan Municipal Income Fund's total expense ratio ranked below the competitive median for 2017 and Fidelity Michigan Municipal Money Market Fund's total expense ratio ranked above the competitive median for 2017. The Board considered that, in general, various factors can affect total expense ratios. The Board considered that the competitive data for Fidelity Michigan Municipal Money Market Fund reflects periods for which many competitor funds waived fees or reimbursed expenses in order to maintain a minimum yield. The Board also considered that, as interest rates rise, many competitors have eliminated such waivers, but the externally sourced competitive data for 2017 had not yet caught up to the fiscal periods during which competitors have stopped waiving fees to maintain minimum yields. The Board noted that, excluding fee waivers and reimbursements, the fund's total expense ratio ranked above the median, but the difference in total expense ratio was slight.
Fees Charged to Other Fidelity Clients. The Board also considered Fidelity fee structures and other information with respect to clients of Fidelity, such as other funds advised or subadvised by Fidelity, pension plan clients, and other institutional clients with similar mandates. The Board noted that a joint ad hoc committee created by it and the boards of other Fidelity funds periodically reviews and compares Fidelity's institutional investment advisory business with its business of providing services to the Fidelity funds and also noted the most recent findings of the committee. The Board noted that the committee's review included a consideration of the differences in services provided, fees charged, and costs incurred, as well as competition in the markets serving the different categories of clients.
Based on its review of total expense ratios and fees charged to other Fidelity clients, the Board concluded that each fund's total expense ratio was reasonable in light of the services that the fund and its shareholders receive and the other factors considered.
Costs of the Services and Profitability. The Board considered the revenues earned and the expenses incurred by Fidelity in conducting the business of developing, marketing, distributing, managing, administering and servicing each fund and servicing each fund's shareholders. The Board also considered the level of Fidelity's profits in respect of all the Fidelity funds.
On an annual basis, Fidelity presents to the Board information about the profitability of its relationships with each fund. Fidelity calculates profitability information for each fund, as well as aggregate profitability information for groups of Fidelity funds and all Fidelity funds, using a series of detailed revenue and cost allocation methodologies which originate with the books and records of Fidelity on which Fidelity's audited financial statements are based. The Audit Committee of the Board reviews any significant changes from the prior year's methodologies.
PricewaterhouseCoopers LLP (PwC), auditor to Fidelity and certain Fidelity funds, has been engaged annually by the Board as part of the Board's assessment of Fidelity's profitability analysis. PwC's engagement includes the review and assessment of the methodologies used by Fidelity in determining the revenues and expenses attributable to Fidelity's mutual fund business, and completion of agreed-upon procedures in respect of the mathematical accuracy of the fund profitability information and its conformity to established allocation methodologies. After considering PwC's reports issued under the engagement and information provided by Fidelity, the Board concluded that while other allocation methods may also be reasonable, Fidelity's profitability methodologies are reasonable in all material respects.
The Board also reviewed Fidelity's non-fund businesses and potential indirect benefits such businesses may have received as a result of their association with Fidelity's mutual fund business (i.e., fall-out benefits) as well as cases where Fidelity's affiliates may benefit from the funds' business. The Board noted that changes to fall-out benefits year-over-year reflect business developments at Fidelity's various businesses.
The Board considered the costs of the services provided by and the profits realized by Fidelity in connection with the operation of each fund and was satisfied that the profitability was not excessive.
Economies of Scale. The Board considered whether there have been economies of scale in respect of the management of the Fidelity funds, whether the Fidelity funds (including each fund) have appropriately benefited from any such economies of scale, and whether there is potential for realization of any further economies of scale. The Board considered the extent to which each fund will benefit from economies of scale as assets grow through increased services to the fund, through waivers or reimbursements, or through fee or expense ratio reductions. The Board also noted that a committee (the Economies of Scale Committee) created by it and the boards of other Fidelity funds periodically analyzes whether Fidelity attains economies of scale in respect of the management and servicing of the Fidelity funds, whether the Fidelity funds have appropriately benefited from such economies of scale, and whether there is potential for realization of any further economies of scale.
The Board recognized that each fund's management contract incorporates a "group fee" structure, which provides for lower group fee rates as total group assets increase, and for higher group fee rates as total group assets decrease (with "group assets" defined to include fund assets under FMR's management plus the assets of sector funds previously under FMR's management). FMR calculates the group fee rates based on a tiered asset "breakpoint" schedule that varies based on asset class. The Board considered that the group fee is designed to deliver the benefits of economies of scale to fund shareholders when total Fidelity fund assets increase, even if assets of any particular fund are unchanged or have declined, because some portion of Fidelity's costs are attributable to services provided to all Fidelity funds, and all funds benefit if those costs can be allocated among more assets. The Board concluded that, given the group fee structure, fund shareholders will benefit from lower management fees as group assets increase at the fund complex level, regardless of whether Fidelity achieves any such economies of scale.
The Board concluded, taking into account the analysis of the Economies of Scale Committee, that economies of scale, if any, are being appropriately shared between fund shareholders and Fidelity.
Additional Information Requested by the Board. In order to develop fully the factual basis for consideration of the Fidelity funds' advisory contracts, the Board requested and received additional information on certain topics, including: (i) Fidelity's fund profitability methodology, profitability trends for certain funds, the allocation of various costs to different funds, and the impact of certain factors on fund profitability results; (ii) portfolio manager changes that have occurred during the past year and the amount of the investment that each portfolio manager has made in the Fidelity fund(s) that he or she manages; (iii) Fidelity's compensation structure for portfolio managers, research analysts, and other key personnel, including its effects on fund profitability, the rationale for the compensation structure, and the extent to which current market conditions have affected retention and recruitment; (iv) the arrangements with and compensation paid to certain fund sub-advisers on behalf of the Fidelity funds and the treatment of such compensation within Fidelity's fund profitability methodology; (v) the terms of Fidelity's voluntary expense limitation agreements; (vi) the methodology with respect to competitive fund data and peer group classifications; (vii) Fidelity's transfer agent fee, expense, and service structures for different funds and classes relative to competitive trends, and the impact of the increased use of omnibus accounts; (viii) new developments in the retail and institutional marketplaces and the competitive positioning of the funds relative to other investment products and services; (ix) the impact of recent changes to the money market fund landscape, including the full implementation of money market fund reform and rising interest rates, on Fidelity's money market funds; (x) the funds' share class structures and distribution channels; and (xi) explanations regarding the relative total expense ratios of certain funds and classes, total expense competitive trends and methodologies for total expense competitive comparisons, and actions that might be taken by Fidelity to reduce total expense ratios for certain classes. In addition, the Board considered its discussions with Fidelity throughout the year regarding enhanced information security initiatives and the funds' fair valuation policies.
Based on its evaluation of all of the conclusions noted above, and after considering all factors it believed relevant, the Board concluded that the advisory fee arrangements are fair and reasonable, and that each fund's Advisory Contracts should be renewed.
Corporate Headquarters
245 Summer St.
Boston, MA 02210
www.fidelity.com
MIR-ANN-0219
1.540080.121
Fidelity® Minnesota Municipal Income Fund
Annual Report December 31, 2018 |
|
Beginning on January 1, 2021, as permitted by regulations adopted by the Securities and Exchange Commission, paper copies of a fund’s shareholder reports will no longer be sent by mail, unless you specifically request paper copies of the reports from the fund or from your financial intermediary, such as a financial advisor, broker-dealer or bank. Instead, the reports will be made available on a website, and you will be notified by mail each time a report is posted and provided with a website link to access the report.
If you already elected to receive shareholder reports electronically, you will not be affected by this change and you need not take any action. You may elect to receive shareholder reports and other communications from a fund electronically, by contacting your financial intermediary. For Fidelity customers, visit Fidelity's web site or call Fidelity using the contact information listed below.
You may elect to receive all future reports in paper free of charge. If you wish to continue receiving paper copies of your shareholder reports, you may contact your financial intermediary or, if you are a Fidelity customer, visit Fidelity’s website, or call Fidelity at the applicable toll-free number listed below. Your election to receive reports in paper will apply to all funds held with the fund complex/your financial intermediary.
| Account Type | Website | Phone Number |
| Brokerage, Mutual Fund, or Annuity Contracts: | fidelity.com/mailpreferences | 1-800-343-3548 |
| Employer Provided Retirement Accounts: | netbenefits.fidelity.com/preferences (choose 'no' under Required Disclosures to continue to print) | 1-800-343-0860 |
| Advisor Sold Accounts Serviced Through Your Financial Intermediary: | Contact Your Financial Intermediary | Your Financial Intermediary's phone number |
| Advisor Sold Accounts Serviced by Fidelity: | institutional.fidelity.com | 1-877-208-0098 |
Contents
To view a fund's proxy voting guidelines and proxy voting record for the 12-month period ended June 30, visit http://www.fidelity.com/proxyvotingresults or visit the Securities and Exchange Commission's (SEC) web site at http://www.sec.gov.
You may also call 1-800-544-8544 to request a free copy of the proxy voting guidelines.
Standard & Poor's, S&P and S&P 500 are registered service marks of The McGraw-Hill Companies, Inc. and have been licensed for use by Fidelity Distributors Corporation.
Other third-party marks appearing herein are the property of their respective owners.
All other marks appearing herein are registered or unregistered trademarks or service marks of FMR LLC or an affiliated company. © 2019 FMR LLC. All rights reserved.
This report and the financial statements contained herein are submitted for the general information of the shareholders of the Fund. This report is not authorized for distribution to prospective investors in the Fund unless preceded or accompanied by an effective prospectus.
A fund files its complete schedule of portfolio holdings with the SEC for the first and third quarters of each fiscal year on Form N-Q. Forms N-Q are available on the SEC’s web site at http://www.sec.gov. A fund's Forms N-Q may be reviewed and copied at the SEC’s Public Reference Room in Washington, DC. Information regarding the operation of the SEC's Public Reference Room may be obtained by calling 1-800-SEC-0330.
For a complete list of a fund's portfolio holdings, view the most recent holdings listing, semiannual report, or annual report on Fidelity's web site at http://www.fidelity.com, http://www.institutional.fidelity.com, or http://www.401k.com, as applicable.
NOT FDIC INSURED •MAY LOSE VALUE •NO BANK GUARANTEE
Neither the Fund nor Fidelity Distributors Corporation is a bank.
Performance: The Bottom Line
Average annual total return reflects the change in the value of an investment, assuming reinvestment of distributions from dividend income and capital gains (the profits earned upon the sale of securities that have grown in value, if any) and assuming a constant rate of performance each year. The hypothetical investment and the average annual total returns do not reflect the deduction of taxes that a shareholder would pay on fund distributions or the redemption of fund shares. During periods of reimbursement by Fidelity, a fund’s total return will be greater than it would be had the reimbursement not occurred. How a fund did yesterday is no guarantee of how it will do tomorrow.
Average Annual Total Returns
| For the periods ended December 31, 2018 | Past 1 year | Past 5 years | Past 10 years |
| Fidelity® Minnesota Municipal Income Fund | 0.65% | 3.00% | 3.89% |
$10,000 Over 10 Years
Let's say hypothetically that $10,000 was invested in Fidelity® Minnesota Municipal Income Fund on December 31, 2008.
The chart shows how the value of your investment would have changed, and also shows how the Bloomberg Barclays Municipal Bond Index performed over the same period.
| Period Ending Values |
| $14,645 | Fidelity® Minnesota Municipal Income Fund |
| $16,060 | Bloomberg Barclays Municipal Bond Index |
Management's Discussion of Fund Performance
Market Recap: Tax-exempt municipal bonds gained modestly in 2018, with the Bloomberg Barclays Municipal Bond Index returning 1.28%, supported by lower bond issuance and solid economic growth. Tax reform had a significant impact on both the supply of and demand for tax-exempt bonds the past year. In the final months of 2017, issuers accelerated their bond financings in order to issue under the old tax rules, prompting a surge in supply. Investors absorbed this excess supply, anticipating that issuance would fall significantly in 2018. The market turned lower in early 2018, as domestic fixed-income markets reacted to robust economic data and signs of inflation, before stabilizing in March and rallying through August. The municipal market experienced volatility in September and October amid concerns of an economic slowdown, then rebounded to close December near a high for the year. Gross municipal bond issuance ended 2018 down approximately 25%. There was little differentiation in performance across municipal sectors in 2018. General obligation bonds gained 1.33%, with bonds issued by states slightly outperforming those backed by local municipalities. Looking ahead, market volatility is likely to persist due to uncertainty about how the U.S. Federal Reserve will react to labor and inflation trends.
Comments from Co-Portfolio Managers Elizah McLaughlin, Cormac Cullen and Kevin Ramundo: For the fiscal year ending December 31, 2018, the fund gained 0.65%, lagging, net of fees, the 1.26% advance of the state benchmark, the Bloomberg Barclays Minnesota Enhanced Modified 2% Tobacco Municipal Bond Index. However, the fund outpaced its Lipper peer group average for the period. Relative to the state benchmark, differences in the way fund holdings and index components were priced detracted from fund performance. The fund's underweighting in bonds issued by municipal housing authorities also detracted on a relative basis as the sector outpaced the market. In contrast, the fund had modestly less sensitivity to interest rates--as measured by duration--versus the state benchmark, which made a relative contribution given the significant increase in interest rates over the past year. The portfolio's overweighting in the outperforming health care sector--which topped most other sectors of the market--also added some value.
The views expressed above reflect those of the portfolio manager(s) only through the end of the period as stated on the cover of this report and do not necessarily represent the views of Fidelity or any other person in the Fidelity organization. Any such views are subject to change at any time based upon market or other conditions and Fidelity disclaims any responsibility to update such views. These views may not be relied on as investment advice and, because investment decisions for a Fidelity fund are based on numerous factors, may not be relied on as an indication of trading intent on behalf of any Fidelity fund.
Note to Shareholders: On September 1, 2018, Elizah McLaughlin joined the municipal bond portfolio management team, succeeding Mark Sommer, who retired from Fidelity on December 31, 2018, after 27 years with the firm.
Investment Summary (Unaudited)
Top Five Sectors as of December 31, 2018
| | % of fund's net assets |
| General Obligations | 36.0 |
| Health Care | 24.7 |
| Electric Utilities | 15.8 |
| Education | 9.4 |
| Transportation | 7.6 |
Quality Diversification (% of fund's net assets)
| As of December 31, 2018 |
| | AAA | 8.0% |
| | AA,A | 82.8% |
| | BBB | 5.9% |
| | Not Rated | 1.7% |
| | Short-Term Investments and Net Other Assets | 1.6% |

We have used ratings from Moody's Investors Service, Inc. Where Moody's® ratings are not available, we have used S&P® ratings. All ratings are as of the date indicated and do not reflect subsequent changes.
Schedule of Investments December 31, 2018
Showing Percentage of Net Assets
| Municipal Bonds - 98.4% | | | |
| | | Principal Amount | Value |
| Guam - 0.4% | | | |
| Guam Int'l. Arpt. Auth. Rev. Series 2013 C, 6.25% 10/1/34 (a) | | 850,000 | 965,634 |
| Guam Pwr. Auth. Rev. Series 2012 A, 5% 10/1/21 (FSA Insured) | | 1,100,000 | 1,180,641 |
|
| TOTAL GUAM | | | 2,146,275 |
|
| Minnesota - 98.0% | | | |
| Anoka-Hennepin Independent School District 11 Series 2014 A: | | | |
| 5% 2/1/23 | | $805,000 | $892,109 |
| 5% 2/1/24 | | 1,110,000 | 1,253,978 |
| 5% 2/1/25 | | 1,015,000 | 1,144,057 |
| 5% 2/1/26 | | 1,220,000 | 1,373,256 |
| 5% 2/1/27 | | 1,285,000 | 1,445,766 |
| 5% 2/1/28 | | 1,345,000 | 1,509,843 |
| 5% 2/1/29 | | 1,415,000 | 1,586,272 |
| 5% 2/1/34 | | 1,800,000 | 2,005,128 |
| Breckenridge Gen. Oblig. (Catholic Health Initiatives Proj.) Series 2004 A, 5% 5/1/30 | | 3,910,000 | 3,952,971 |
| Chaska Elec. Rev. Series 2015 A: | | | |
| 5% 10/1/26 | | 1,000,000 | 1,162,330 |
| 5% 10/1/27 | | 1,665,000 | 1,924,041 |
| 5% 10/1/29 | | 785,000 | 897,695 |
| Chaska Independent School District #112 Gen. Oblig. (Minnesota School District Cr. Enhancement Prog.) Series 2016 A: | | | |
| 5% 2/1/30 | | 1,400,000 | 1,620,808 |
| 5% 2/1/31 | | 3,600,000 | 4,147,668 |
| Cloquet Independent School District #94 Series 2015 B: | | | |
| 5% 2/1/28 | | 3,030,000 | 3,487,803 |
| 5% 2/1/31 | | 1,245,000 | 1,425,513 |
| Ctr. City Health Care Facilities (Hazelden Betty Ford Foundation Proj.) Series 2014: | | | |
| 5% 11/1/23 | | 775,000 | 854,042 |
| 5% 11/1/25 | | 250,000 | 276,965 |
| 5% 11/1/26 | | 500,000 | 550,835 |
| 5% 11/1/27 | | 420,000 | 460,118 |
| Duluth Econ. Dev. Auth. Health Care Facilities Rev. Series 2018 A: | | | |
| 5% 2/15/43 | | 1,500,000 | 1,636,335 |
| 5% 2/15/48 | | 3,000,000 | 3,263,010 |
| 5% 2/15/58 | | 3,125,000 | 3,351,750 |
| Duluth Gen. Oblig. Series 2016 A: | | | |
| 5% 2/1/28 | | 1,660,000 | 1,937,021 |
| 5% 2/1/30 | | 1,235,000 | 1,432,390 |
| 5% 2/1/31 | | 1,495,000 | 1,726,605 |
| 5% 2/1/32 | | 2,130,000 | 2,449,585 |
| Hennepin County Gen. Oblig.: | | | |
| Series 2016 A: | | | |
| 5% 12/1/39 | | 5,250,000 | 6,024,270 |
| 5% 12/1/40 | | 7,200,000 | 8,245,440 |
| Series 2016 B, 5% 12/1/31 | | 1,135,000 | 1,335,725 |
| Jordan Ind. School District: | | | |
| Series 2014 A: | | | |
| 5% 2/1/28 | | 960,000 | 1,067,443 |
| 5% 2/1/29 (Pre-Refunded to 2/1/29 @ 100) | | 1,000,000 | 1,107,790 |
| 5% 2/1/30 (Pre-Refunded to 2/1/30 @ 100) | | 1,245,000 | 1,379,199 |
| Series A, 5% 2/1/28 (Pre-Refunded to 2/1/28 @ 100) | | 40,000 | 44,312 |
| Maple Grove Health Care Sys. Rev.: | | | |
| Series 2015: | | | |
| 4% 9/1/35 | | 1,250,000 | 1,268,213 |
| 5% 9/1/28 | | 695,000 | 769,045 |
| 5% 9/1/30 | | 1,500,000 | 1,647,540 |
| 5% 9/1/31 | | 1,300,000 | 1,422,993 |
| 5% 9/1/32 | | 1,000,000 | 1,092,120 |
| Series 2017: | | | |
| 5% 5/1/26 | | 1,355,000 | 1,569,673 |
| 5% 5/1/27 | | 1,400,000 | 1,636,390 |
| 5% 5/1/28 | | 2,000,000 | 2,311,880 |
| 5% 5/1/29 | | 1,000,000 | 1,151,940 |
| 5% 5/1/30 | | 850,000 | 971,720 |
| 5% 5/1/31 | | 510,000 | 579,416 |
| 5% 5/1/32 | | 500,000 | 564,925 |
| Minneapolis & Saint Paul Hsg. & Redev. Auth. Health Care Sys. Rev.: | | | |
| (Allina Health Sys. Proj.) Series 2017 A: | | | |
| 5% 11/15/27 | | 1,250,000 | 1,479,388 |
| 5% 11/15/28 | | 2,730,000 | 3,212,992 |
| 5% 11/15/29 | | 1,040,000 | 1,214,637 |
| (Children's Health Care Proj.): | | | |
| Series 1995 B, 5% 8/15/25 (FSA Insured) | | 3,000,000 | 3,131,160 |
| Series 2010 A, 5.25% 8/15/25 | | 1,000,000 | 1,048,970 |
| (Children's Hospitals and Clinics Proj.) Series 2004 A1, 5% 8/15/34 (FSA Insured) | | 500,000 | 520,725 |
| Minneapolis & Saint Paul Metropolitan Arpts. Commission Arpt. Rev.: | | | |
| Series 2012 B: | | | |
| 5% 1/1/26 | | 1,250,000 | 1,353,538 |
| 5% 1/1/27 | | 1,500,000 | 1,621,515 |
| Series 2014 A: | | | |
| 5% 1/1/26 | | 3,015,000 | 3,400,046 |
| 5% 1/1/28 | | 4,000,000 | 4,474,760 |
| 5% 1/1/29 | | 2,150,000 | 2,396,627 |
| 5% 1/1/30 | | 2,000,000 | 2,223,460 |
| 5% 1/1/31 | | 6,020,000 | 6,677,745 |
| Series 2016 A: | | | |
| 5% 1/1/30 | | 4,000,000 | 4,714,200 |
| 5% 1/1/31 | | 2,350,000 | 2,756,597 |
| 5% 1/1/32 | | 2,900,000 | 3,383,517 |
| Series 2016 D: | | | |
| 5% 1/1/23 (a) | | 670,000 | 738,394 |
| 5% 1/1/27 (a) | | 350,000 | 409,731 |
| 5% 1/1/28 (a) | | 430,000 | 501,023 |
| 5% 1/1/29 (a) | | 225,000 | 260,759 |
| 5% 1/1/30 (a) | | 475,000 | 547,552 |
| 5% 1/1/31 (a) | | 200,000 | 229,624 |
| 5% 1/1/32 (a) | | 200,000 | 228,550 |
| 5% 1/1/33 (a) | | 220,000 | 250,734 |
| 5% 1/1/34 (a) | | 225,000 | 255,407 |
| 5% 1/1/35 (a) | | 225,000 | 254,554 |
| 5% 1/1/36 (a) | | 220,000 | 248,070 |
| 5% 1/1/37 (a) | | 250,000 | 280,583 |
| 5% 1/1/41 (a) | | 725,000 | 806,142 |
| Minneapolis Health Care Sys. Rev.: | | | |
| Series 2015 A: | | | |
| 5% 11/15/27 (FSA Insured) | | 850,000 | 978,656 |
| 5% 11/15/28 | | 1,380,000 | 1,579,534 |
| 5% 11/15/29 | | 1,000,000 | 1,139,880 |
| 5% 11/15/30 | | 1,000,000 | 1,133,190 |
| 5% 11/15/31 | | 3,665,000 | 4,133,644 |
| 5% 11/15/32 | | 2,200,000 | 2,474,032 |
| Series 2018 A: | | | |
| 5% 11/15/35 | | 2,500,000 | 2,846,300 |
| 5% 11/15/36 | | 2,500,000 | 2,828,325 |
| Minneapolis Spl. School District: | | | |
| (MN SD Cr. Enhancement Prog.): | | | |
| Series 2017 B, 5% 2/1/29 | | 2,590,000 | 3,117,557 |
| Series 2018 A, 5% 2/1/33 | | 1,000,000 | 1,177,880 |
| Series 2018 B, 5% 2/1/33 | | 3,190,000 | 3,757,437 |
| Series 2017 A, 4% 2/1/33 | | 1,415,000 | 1,518,536 |
| Series 2017 B: | | | |
| 4% 2/1/33 | | 2,595,000 | 2,784,876 |
| 4% 2/1/34 | | 2,595,000 | 2,772,161 |
| Minneapolis Spl. School District #1 Ctfs. of Prtn. Series 2016 C, 5% 2/1/31 | | 1,915,000 | 2,225,153 |
| Minnesota Agric. & Econ. Dev. Board Rev. (Essentia Health Obligated Group Proj.) Series 2008 C1: | | | |
| 5% 2/15/30 (Assured Guaranty Corp. Insured) | | 3,750,000 | 3,853,350 |
| 5.25% 2/15/23 (Assured Guaranty Corp. Insured) | | 1,660,000 | 1,719,245 |
| Minnesota Ctfs. Prtn. (Minnesota Gen. Oblig. Proj.) Series 2014, 5% 6/1/39 | | 2,445,000 | 2,723,681 |
| Minnesota Gen. Oblig.: | | | |
| Series 2010 D: | | | |
| 5% 8/1/21 (Pre-Refunded to 8/1/20 @ 100) | | 15,000 | 15,731 |
| 5% 8/1/22 (Pre-Refunded to 8/1/20 @ 100) | | 70,000 | 73,412 |
| 5% 8/1/23 | | 9,855,000 | 10,316,510 |
| 5% 8/1/23 (Pre-Refunded to 8/1/20 @ 100) | | 145,000 | 152,067 |
| Series 2011 B: | | | |
| 5% 10/1/24 | | 2,500,000 | 2,703,425 |
| 5% 10/1/30 | | 3,000,000 | 3,231,570 |
| Series 2013 A, 5% 8/1/25 | | 3,780,000 | 4,270,115 |
| Series 2015 A, 5% 8/1/33 | | 1,900,000 | 2,188,914 |
| Series 2017 A: | | | |
| 5% 10/1/31 | | 5,000,000 | 5,963,200 |
| 5% 10/1/33 | | 3,335,000 | 3,951,575 |
| 5% 8/1/24 | | 4,780,000 | 5,283,143 |
| 5% 8/1/24 (Pre-Refunded to 8/1/22 @ 100) | | 220,000 | 242,675 |
| Minnesota Higher Ed. Facilities Auth. Rev.: | | | |
| (College of St. Scholastica, Inc. Proj.) Series Seven-H, 5.25% 12/1/35 | | 1,000,000 | 1,020,950 |
| (Macalester College, MN Proj.) Series 2017: | | | |
| 5% 3/1/28 | | 400,000 | 472,428 |
| 5% 3/1/30 | | 500,000 | 584,905 |
| (Univ. of St Thomas) Series 2017 A: | | | |
| 5% 10/1/27 | | 500,000 | 597,620 |
| 5% 10/1/28 | | 735,000 | 867,109 |
| 5% 10/1/29 | | 750,000 | 879,705 |
| 5% 10/1/30 | | 655,000 | 764,392 |
| Series 2017 A, 4% 10/1/35 | | 800,000 | 840,344 |
| Series 2017: | | | |
| 5% 3/1/28 | | 2,000,000 | 2,375,100 |
| 5% 3/1/31 | | 1,000,000 | 1,172,210 |
| 5% 10/1/31 | | 590,000 | 679,651 |
| 5% 3/1/34 | | 530,000 | 613,687 |
| 5% 10/1/34 | | 440,000 | 497,108 |
| 5% 10/1/35 | | 555,000 | 623,892 |
| Series 2018 A: | | | |
| 5% 10/1/34 | | 1,140,000 | 1,273,118 |
| 5% 10/1/45 | | 3,650,000 | 3,969,594 |
| Series Eight-G, 5% 12/1/31 | | 1,000,000 | 1,144,100 |
| Series Eight-J: | | | |
| 5% 3/1/26 | | 1,015,000 | 1,167,788 |
| 5% 3/1/27 | | 500,000 | 573,410 |
| Series Eight-L: | | | |
| 5% 4/1/28 | | 920,000 | 1,064,900 |
| 5% 4/1/29 | | 1,005,000 | 1,158,273 |
| 5% 4/1/35 | | 500,000 | 564,310 |
| Minnesota Hsg. Fin. Agcy. Series 2015 A: | | | |
| 5% 8/1/29 | | 1,000,000 | 1,128,830 |
| 5% 8/1/30 | | 1,000,000 | 1,126,060 |
| 5% 8/1/31 | | 1,000,000 | 1,123,840 |
| 5% 8/1/32 | | 1,000,000 | 1,122,740 |
| 5% 8/1/33 | | 1,000,000 | 1,120,540 |
| Minnesota Muni. Pwr. Agcy. Elec. Rev.: | | | |
| Series 2014 A: | | | |
| 5% 10/1/25 | | 200,000 | 229,128 |
| 5% 10/1/26 | | 830,000 | 947,520 |
| Series 2014: | | | |
| 5% 10/1/26 | | 630,000 | 719,202 |
| 5% 10/1/27 | | 750,000 | 853,163 |
| 5% 10/1/30 | | 1,000,000 | 1,128,400 |
| Series 2016: | | | |
| 4% 10/1/41 | | 1,000,000 | 1,034,990 |
| 5% 10/1/32 | | 1,500,000 | 1,727,130 |
| 5% 10/1/33 | | 400,000 | 459,368 |
| 5% 10/1/35 | | 400,000 | 456,088 |
| 5% 10/1/36 | | 1,000,000 | 1,135,770 |
| 5% 10/1/47 | | 2,000,000 | 2,234,940 |
| Minnesota Pub. Facilities Auth. Rev. Series 2016 A: | | | |
| 5% 3/1/29 | | 5,000,000 | 5,882,900 |
| 5% 3/1/30 | | 5,150,000 | 6,029,723 |
| Minnesota State Colleges & Univs. Board of Trustees Rev. Series 2011 A, 5% 10/1/30 | | 1,495,000 | 1,606,258 |
| Minnesota State Gen. Fdg. Rev.: | | | |
| Series 2012 B: | | | |
| 5% 3/1/27 | | 12,840,000 | 13,952,201 |
| 5% 3/1/28 | | 4,275,000 | 4,643,933 |
| 5% 3/1/29 | | 2,250,000 | 2,443,455 |
| Series 2014 A: | | | |
| 5% 6/1/27 | | 5,000,000 | 5,594,300 |
| 5% 6/1/38 | | 5,000,000 | 5,490,400 |
| Moorhead Edl. Facilities Rev. (The Concordia College Corp. Proj.) Series 2016, 5% 12/1/25 | | 2,500,000 | 2,756,125 |
| Mounds View Independent School District #621 Series 2018 A, 5% 2/1/29 | | 6,840,000 | 8,155,332 |
| North Branch Independent School District #138 Series 2017 A, 4% 2/1/29 | | 2,015,000 | 2,208,541 |
| Northern Muni. Pwr. Agcy. Elec. Sys. Rev.: | | | |
| Series 2013 A: | | | |
| 5% 1/1/23 | | 850,000 | 939,165 |
| 5% 1/1/24 | | 650,000 | 713,226 |
| 5% 1/1/25 | | 975,000 | 1,069,838 |
| 5% 1/1/31 | | 1,740,000 | 1,884,403 |
| Series 2016: | | | |
| 5% 1/1/28 | | 500,000 | 571,825 |
| 5% 1/1/29 | | 620,000 | 706,099 |
| 5% 1/1/30 | | 520,000 | 589,384 |
| 5% 1/1/31 | | 350,000 | 394,576 |
| Series 2017: | | | |
| 5% 1/1/29 | | 460,000 | 530,260 |
| 5% 1/1/31 | | 400,000 | 456,184 |
| 5% 1/1/33 | | 475,000 | 537,391 |
| 5% 1/1/35 | | 520,000 | 584,782 |
| Rochester Elec. Util. Rev.: | | | |
| Series 2013 B: | | | |
| 5% 12/1/26 | | 570,000 | 643,616 |
| 5% 12/1/27 | | 275,000 | 310,107 |
| 5% 12/1/28 | | 275,000 | 309,018 |
| 5% 12/1/43 | | 1,000,000 | 1,104,620 |
| Series 2017 A: | | | |
| 5% 12/1/42 | | 1,100,000 | 1,238,204 |
| 5% 12/1/47 | | 1,000,000 | 1,121,930 |
| Rochester Health Care Facilities Rev.: | | | |
| (Mayo Clinic Proj.) Series 2008 E, 5% 11/15/38 | | 4,000,000 | 4,134,520 |
| (Olmsted Med. Ctr. Proj.) Series 2013: | | | |
| 5% 7/1/21 | | 790,000 | 844,992 |
| 5% 7/1/22 | | 350,000 | 383,656 |
| 5% 7/1/24 | | 300,000 | 334,536 |
| 5% 7/1/27 | | 245,000 | 270,010 |
| 5% 7/1/28 | | 225,000 | 247,464 |
| 5% 7/1/33 | | 1,225,000 | 1,332,665 |
| Bonds (Mayo Foundation Proj.) Series C, 4.5%, tender 11/15/21 (b) | | 1,100,000 | 1,173,997 |
| Series 2016 B, 5% 11/15/35 | | 4,000,000 | 5,022,400 |
| Roseville Independent School District #623: | | | |
| (Minnesota Gen. Oblig.) Series 2018 A, 5% 2/1/31 | | 5,000,000 | 5,770,650 |
| (MN School District Cr. Enhancement Prog.) Series 2018 A: | | | |
| 5% 2/1/26 | | 2,400,000 | 2,805,624 |
| 5% 2/1/29 | | 5,180,000 | 6,051,639 |
| Saint Cloud Health Care Rev.: | | | |
| Series 2014 B: | | | |
| 5% 5/1/22 | | 1,950,000 | 2,128,152 |
| 5% 5/1/24 | | 1,510,000 | 1,710,860 |
| Series 2016 A: | | | |
| 5% 5/1/29 | | 1,000,000 | 1,152,670 |
| 5% 5/1/30 | | 1,000,000 | 1,145,510 |
| 5% 5/1/31 | | 1,000,000 | 1,139,820 |
| 5% 5/1/46 | | 5,000,000 | 5,487,600 |
| 5.125% 5/1/30 | | 310,000 | 322,540 |
| Saint Paul Hsg. & Redev. Auth. Hosp. Rev. (HealthEast Care Sys. Proj.) Series 2015 A: | | | |
| 5% 11/15/27 (Pre-Refunded to 11/15/25 @ 100) | | 2,515,000 | 2,950,950 |
| 5% 11/15/30 (Pre-Refunded to 11/15/25 @ 100) | | 1,585,000 | 1,859,744 |
| Saint Paul Port Auth. Lease Rev. Series 2013, 5% 12/1/21 | | 4,900,000 | 5,322,331 |
| Saint Paul Sales Tax Rev. Series 2014 G: | | | |
| 5% 11/1/26 | | 1,000,000 | 1,145,270 |
| 5% 11/1/28 | | 1,000,000 | 1,136,510 |
| Sartell Independent School District 748: | | | |
| Series 2016 A, 5% 2/1/27 | | 1,825,000 | 2,094,042 |
| Series 2016 B, 5% 2/1/26 | | 1,500,000 | 1,725,720 |
| Shakopee Health Care Facilities Rev. Series 2014: | | | |
| 5% 9/1/23 | | 1,895,000 | 2,103,924 |
| 5% 9/1/24 | | 1,000,000 | 1,126,670 |
| 5% 9/1/25 | | 1,345,000 | 1,511,605 |
| 5% 9/1/26 | | 1,575,000 | 1,759,543 |
| 5% 9/1/28 | | 1,000,000 | 1,108,870 |
| 5% 9/1/34 | | 1,065,000 | 1,150,892 |
| Southern Minnesota Muni. Pwr. Agcy. Pwr. Supply Sys. Rev.: | | | |
| (Cap. Appreciation) Series 1994 A: | | | |
| 0% 1/1/21 (Nat'l. Pub. Fin. Guarantee Corp. Insured) | | 14,670,000 | 14,060,168 |
| 0% 1/1/26 (Nat'l. Pub. Fin. Guarantee Corp. Insured) | | 3,165,000 | 2,621,854 |
| Series 2015 A: | | | |
| 5% 1/1/28 | | 1,000,000 | 1,160,910 |
| 5% 1/1/34 | | 1,695,000 | 1,918,876 |
| 5% 1/1/36 | | 1,000,000 | 1,125,340 |
| 5% 1/1/41 | | 1,000,000 | 1,112,670 |
| St. Paul Hsg. & Redev. Auth. Health Care Facilities Rev.: | | | |
| (Fairview Hsp & Hltcare Srv Sys. Proj.) 5% 11/15/47 | | 13,350,000 | 14,651,076 |
| Series 2009 A1, 5.25% 11/15/29 | | 1,475,000 | 1,523,203 |
| Series 2009 A2, 5.5% 11/15/24 | | 990,000 | 1,020,898 |
| Series 2015 A: | | | |
| 5% 7/1/29 | | 5,000,000 | 5,652,250 |
| 5% 7/1/30 | | 5,000,000 | 5,617,500 |
| Series 2017 A: | | | |
| 5% 11/15/30 | | 650,000 | 751,075 |
| 5% 11/15/31 | | 845,000 | 970,018 |
| 5% 11/15/33 | | 800,000 | 909,048 |
| 5% 11/15/34 | | 665,000 | 753,452 |
| Univ. of Minnesota Gen. Oblig.: | | | |
| Series 2016: | | | |
| 5% 4/1/37 | | 2,125,000 | 2,423,541 |
| 5% 4/1/41 | | 6,000,000 | 6,780,060 |
| Series 2017 A: | | | |
| 5% 9/1/33 | | 5,025,000 | 5,912,114 |
| 5% 9/1/37 | | 3,880,000 | 4,483,883 |
| Series 2017 B, 5% 12/1/32 | | 2,000,000 | 2,370,820 |
| Univ. of Minnesota Spl. Purp. Rev.: | | | |
| (Biomedical Science Research Facilities Fdg. Prog.) Series 2013 C, 5% 8/1/38 | | 5,275,000 | 5,844,384 |
| (State Supported Biomedical Science Research Facilities Fdg. Prog.) Series 2011 B, 5% 8/1/25 | | 2,095,000 | 2,252,649 |
| West Saint Paul Independent School District #197 Series 2012 A, 4% 2/1/24 | | 3,530,000 | 3,737,493 |
| Western Minnesota Muni. Pwr. Agcy. Pwr. Supply Rev.: | | | |
| Series 2012 A: | | | |
| 5% 1/1/26 | | 5,000,000 | 5,534,550 |
| 5% 1/1/27 | | 2,150,000 | 2,378,997 |
| 5% 1/1/30 | | 1,000,000 | 1,102,880 |
| Series 2014 A: | | | |
| 5% 1/1/31 | | 1,750,000 | 1,955,083 |
| 5% 1/1/35 | | 1,595,000 | 1,763,767 |
| 5% 1/1/40 | | 1,500,000 | 1,644,015 |
| 5% 1/1/46 | | 11,270,000 | 12,313,715 |
| Series 2015 A, 5% 1/1/31 | | 1,820,000 | 2,093,928 |
| Series 2018 A, 5% 1/1/49 | | 2,000,000 | 2,276,940 |
| White Bear Lake Minn Rev. (YMCA of Greater Twin Cities Proj.) Series 2018: | | | |
| 5% 6/1/28 | | 1,000,000 | 1,153,150 |
| 5% 6/1/30 | | 500,000 | 567,835 |
| 5% 6/1/31 | | 700,000 | 791,343 |
| 5% 6/1/33 | | 1,000,000 | 1,123,630 |
|
| TOTAL MINNESOTA | | | 512,463,292 |
|
| TOTAL MUNICIPAL BONDS | | | |
| (Cost $508,771,328) | | | 514,609,567 |
| TOTAL INVESTMENT IN SECURITIES - 98.4% | | | |
| (Cost $508,771,328) | | | 514,609,567 |
| NET OTHER ASSETS (LIABILITIES) - 1.6% | | | 8,486,653 |
| NET ASSETS - 100% | | | $523,096,220 |
Legend
(a) Private activity obligations whose interest is subject to the federal alternative minimum tax for individuals.
(b) Coupon rates for floating and adjustable rate securities reflect the rates in effect at period end.
Investment Valuation
All investments are categorized as Level 2 under the Fair Value Hierarchy. The inputs or methodology used for valuing securities may not be an indication of the risk associated with investing in those securities. For more information on valuation inputs please refer to the Investment Valuation section in the accompanying Notes to Financial Statements.
Other Information
The distribution of municipal securities by revenue source, as a percentage of total Net Assets, is as follows (Unaudited):
| General Obligations | 36.0% |
| Health Care | 24.7% |
| Electric Utilities | 15.8% |
| Education | 9.4% |
| Transportation | 7.6% |
| Others* (Individually Less Than 5%) | 6.5% |
| | 100.0% |
* Includes net other assets
See accompanying notes which are an integral part of the financial statements.
Financial Statements
Statement of Assets and Liabilities
| | | December 31, 2018 |
| Assets | | |
Investment in securities, at value — See accompanying schedule:
Unaffiliated issuers (cost $508,771,328) | | $514,609,567 |
| Cash | | 1,130,601 |
| Receivable for investments sold | | 1,041,542 |
| Receivable for fund shares sold | | 751,575 |
| Interest receivable | | 6,899,271 |
| Prepaid expenses | | 794 |
| Other receivables | | 1,348 |
| Total assets | | 524,434,698 |
| Liabilities | | |
| Payable for fund shares redeemed | $707,722 | |
| Distributions payable | 375,334 | |
| Accrued management fee | 156,444 | |
| Other affiliated payables | 51,598 | |
| Other payables and accrued expenses | 47,380 | |
| Total liabilities | | 1,338,478 |
| Net Assets | | $523,096,220 |
| Net Assets consist of: | | |
| Paid in capital | | $516,487,772 |
| Total distributable earnings (loss) | | 6,608,448 |
| Net Assets, for 45,853,219 shares outstanding | | $523,096,220 |
| Net Asset Value, offering price and redemption price per share ($523,096,220 ÷ 45,853,219 shares) | | $11.41 |
See accompanying notes which are an integral part of the financial statements.
Statement of Operations
| | | Year ended December 31, 2018 |
| Investment Income | | |
| Interest | | $16,142,701 |
| Expenses | | |
| Management fee | $1,926,539 | |
| Transfer agent fees | 506,582 | |
| Accounting fees and expenses | 136,072 | |
| Custodian fees and expenses | 4,078 | |
| Independent trustees' fees and expenses | 2,508 | |
| Registration fees | 45,914 | |
| Audit | 54,469 | |
| Legal | 9,191 | |
| Miscellaneous | 3,786 | |
| Total expenses before reductions | 2,689,139 | |
| Expense reductions | (7,378) | |
| Total expenses after reductions | | 2,681,761 |
| Net investment income (loss) | | 13,460,940 |
| Realized and Unrealized Gain (Loss) | | |
| Net realized gain (loss) on: | | |
| Investment securities: | | |
| Unaffiliated issuers | | 875,406 |
| Total net realized gain (loss) | | 875,406 |
| Change in net unrealized appreciation (depreciation) on investment securities | | (11,229,023) |
| Net gain (loss) | | (10,353,617) |
| Net increase (decrease) in net assets resulting from operations | | $3,107,323 |
See accompanying notes which are an integral part of the financial statements.
Statement of Changes in Net Assets
| | Year ended December 31, 2018 | Year ended December 31, 2017 |
| Increase (Decrease) in Net Assets | | |
| Operations | | |
| Net investment income (loss) | $13,460,940 | $13,220,804 |
| Net realized gain (loss) | 875,406 | 935,893 |
| Change in net unrealized appreciation (depreciation) | (11,229,023) | 9,763,276 |
| Net increase (decrease) in net assets resulting from operations | 3,107,323 | 23,919,973 |
| Distributions to shareholders | (14,369,680) | – |
| Distributions to shareholders from net investment income | – | (13,220,102) |
| Distributions to shareholders from net realized gain | – | (413,808) |
| Total distributions | (14,369,680) | (13,633,910) |
| Share transactions | | |
| Proceeds from sales of shares | 89,718,949 | 78,973,080 |
| Reinvestment of distributions | 9,857,381 | 9,555,900 |
| Cost of shares redeemed | (115,136,318) | (70,449,782) |
| Net increase (decrease) in net assets resulting from share transactions | (15,559,988) | 18,079,198 |
| Total increase (decrease) in net assets | (26,822,345) | 28,365,261 |
| Net Assets | | |
| Beginning of period | 549,918,565 | 521,553,304 |
| End of period | $523,096,220 | $549,918,565 |
| Other Information | | |
| Undistributed net investment income end of period | | $96,402 |
| Shares | | |
| Sold | 7,882,945 | 6,819,066 |
| Issued in reinvestment of distributions | 867,301 | 824,946 |
| Redeemed | (10,141,334) | (6,087,150) |
| Net increase (decrease) | (1,391,088) | 1,556,862 |
See accompanying notes which are an integral part of the financial statements.
Financial Highlights
Fidelity Minnesota Municipal Income Fund
| | | | | | |
| Years ended December 31, | 2018 | 2017 | 2016 | 2015 | 2014 |
| Selected Per–Share Data | | | | | |
| Net asset value, beginning of period | $11.64 | $11.42 | $11.75 | $11.77 | $11.39 |
| Income from Investment Operations | | | | | |
| Net investment income (loss)A | .282 | .285 | .300 | .317 | .329 |
| Net realized and unrealized gain (loss) | (.211) | .229 | (.286) | .030 | .443 |
| Total from investment operations | .071 | .514 | .014 | .347 | .772 |
| Distributions from net investment income | (.282) | (.285) | (.300) | (.317) | (.329) |
| Distributions from net realized gain | (.019) | (.009) | (.044) | (.050) | (.063) |
| Total distributions | (.301) | (.294) | (.344) | (.367) | (.392) |
| Redemption fees added to paid in capitalA | – | – | –B | –B | –B |
| Net asset value, end of period | $11.41 | $11.64 | $11.42 | $11.75 | $11.77 |
| Total ReturnC | .65% | 4.55% | .08% | 3.00% | 6.85% |
| Ratios to Average Net AssetsD | | | | | |
| Expenses before reductions | .50% | .49% | .50% | .50% | .49% |
| Expenses net of fee waivers, if any | .50% | .49% | .50% | .49% | .49% |
| Expenses net of all reductions | .49% | .49% | .50% | .49% | .49% |
| Net investment income (loss) | 2.48% | 2.46% | 2.54% | 2.71% | 2.82% |
| Supplemental Data | | | | | |
| Net assets, end of period (000 omitted) | $523,096 | $549,919 | $521,553 | $505,992 | $506,314 |
| Portfolio turnover rate | 14% | 11% | 13% | 13% | 15% |
A Calculated based on average shares outstanding during the period.
B Amount represents less than $.0005 per share.
C Total returns would have been lower if certain expenses had not been reduced during the applicable periods shown.
D Expense ratios reflect operating expenses of the Fund. Expenses before reductions do not reflect amounts reimbursed by the investment adviser or reductions from expense offset arrangements and do not represent the amount paid by the Fund during periods when reimbursements or reductions occur. Expenses net of fee waivers reflect expenses after reimbursement by the investment adviser but prior to reductions from expense offset arrangements. Expenses net of all reductions represent the net expenses paid by the Fund.
See accompanying notes which are an integral part of the financial statements.
Notes to Financial Statements
For the period ended December 31, 2018
1. Organization.
Fidelity Minnesota Municipal Income Fund (the Fund) is a non-diversified fund of Fidelity Municipal Trust (the Trust) and is authorized to issue an unlimited number of shares. Share transactions on the Statement of Changes in Net Assets may contain exchanges between affiliated funds. The Trust is registered under the Investment Company Act of 1940, as amended (the 1940 Act), as an open-end management investment company organized as a Massachusetts business trust. The Fund may be affected by economic and political developments in the state of Minnesota.
2. Significant Accounting Policies.
The Fund is an investment company and applies the accounting and reporting guidance of the Financial Accounting Standards Board (FASB) Accounting Standards Codification Topic 946 Financial Services – Investments Companies. The financial statements have been prepared in conformity with accounting principles generally accepted in the United States of America (GAAP), which require management to make certain estimates and assumptions at the date of the financial statements. Actual results could differ from those estimates. Subsequent events, if any, through the date that the financial statements were issued have been evaluated in the preparation of the financial statements. The following summarizes the significant accounting policies of the Fund:
Investment Valuation. Investments are valued as of 4:00 p.m. Eastern time on the last calendar day of the period. The Board of Trustees (the Board) has delegated the day to day responsibility for the valuation of the Fund's investments to the Fair Value Committee (the Committee) established by the Fund's investment adviser. In accordance with valuation policies and procedures approved by the Board, the Fund attempts to obtain prices from one or more third party pricing vendors or brokers to value its investments. When current market prices, quotations or currency exchange rates are not readily available or reliable, investments will be fair valued in good faith by the Committee, in accordance with procedures adopted by the Board. Factors used in determining fair value vary by investment type and may include market or investment specific events, changes in interest rates and credit quality. The frequency with which these procedures are used cannot be predicted and they may be utilized to a significant extent. The Committee oversees the Fund's valuation policies and procedures and reports to the Board on the Committee's activities and fair value determinations. The Board monitors the appropriateness of the procedures used in valuing the Fund's investments and ratifies the fair value determinations of the Committee.
The Fund categorizes the inputs to valuation techniques used to value its investments into a disclosure hierarchy consisting of three levels as shown below:
- Level 1 – quoted prices in active markets for identical investments
- Level 2 – other significant observable inputs (including quoted prices for similar investments, interest rates, prepayment speeds, etc.)
- Level 3 – unobservable inputs (including the Fund's own assumptions based on the best information available)
Valuation techniques used to value the Fund's investments by major category are as follows:
Debt securities, including restricted securities, are valued based on evaluated prices received from third party pricing vendors or from brokers who make markets in such securities. Municipal securities are valued by pricing vendors who utilize matrix pricing which considers yield or price of bonds of comparable quality, coupon, maturity and type or by broker-supplied prices. When independent prices are unavailable or unreliable, debt securities may be valued utilizing pricing methodologies which consider similar factors that would be used by third party pricing vendors. Debt securities are generally categorized as Level 2 in the hierarchy but may be Level 3 depending on the circumstances.
Changes in valuation techniques may result in transfers in or out of an assigned level within the disclosure hierarchy.
Investment Transactions and Income. For financial reporting purposes, the Fund's investment holdings and NAV include trades executed through the end of the last business day of the period. The NAV per share for processing shareholder transactions is calculated as of the close of business of the New York Stock Exchange (NYSE), normally 4:00 p.m. Eastern time and includes trades executed through the end of the prior business day. Gains and losses on securities sold are determined on the basis of identified cost. Interest income is accrued as earned and includes coupon interest and amortization of premium and accretion of discount on debt securities as applicable. Debt obligations may be placed on non-accrual status and related interest income may be reduced by ceasing current accruals and writing off interest receivables when the collection of all or a portion of interest has become doubtful based on consistently applied procedures. A debt obligation is removed from non-accrual status when the issuer resumes interest payments or when collectability of interest is reasonably assured.
Expenses. Expenses directly attributable to a fund are charged to that fund. Expenses attributable to more than one fund are allocated among the respective funds on the basis of relative net assets or other appropriate methods. Expense estimates are accrued in the period to which they relate and adjustments are made when actual amounts are known.
Income Tax Information and Distributions to Shareholders. Each year, the Fund intends to qualify as a regulated investment company under Subchapter M of the Internal Revenue Code, including distributing substantially all of its taxable income and realized gains. As a result, no provision for U.S. Federal income taxes is required. As of December 31, 2018, the Fund did not have any unrecognized tax benefits in the financial statements; nor is the Fund aware of any tax positions for which it is reasonably possible that the total amounts of unrecognized tax benefits will significantly change in the next twelve months. The Fund files a U.S. federal tax return, in addition to state and local tax returns as required. The Fund's federal income tax returns are subject to examination by the Internal Revenue Service (IRS) for a period of three fiscal years after they are filed. State and local tax returns may be subject to examination for an additional fiscal year depending on the jurisdiction.
Distributions are declared and recorded daily and paid monthly from net investment income. Distributions from realized gains, if any, are declared and recorded on the ex-dividend date. Income and capital gain distributions are determined in accordance with income tax regulations, which may differ from GAAP. In addition, the Fund claimed a portion of the payment made to redeeming shareholders as a distribution for income tax purposes.
Capital accounts within the financial statements are adjusted for permanent book-tax differences. These adjustments have no impact on net assets or the results of operations. Capital accounts are not adjusted for temporary book-tax differences which will reverse in a subsequent period.
Book-tax differences are primarily due to market discount and deferred trustees compensation.
The Fund purchases municipal securities whose interest, in the opinion of the issuer, is free from federal income tax. There is no assurance that the IRS will agree with this opinion. In the event the IRS determines that the issuer does not comply with relevant tax requirements, interest payments from a security could become federally taxable, possibly retroactively to the date the security was issued.
As of period end, the cost and unrealized appreciation (depreciation) in securities, and derivatives if applicable, for federal income tax purposes were as follows:
| Gross unrealized appreciation | $9,762,800 |
| Gross unrealized depreciation | (3,915,286) |
| Net unrealized appreciation (depreciation) | $5,847,514 |
| Tax Cost | $508,762,053 |
The tax-based components of distributable earnings as of period end were as follows:
| Undistributed tax-exempt income | $88,096 |
| Undistributed long-term capital gain | $672,840 |
| Net unrealized appreciation (depreciation) on securities and other investments | $5,847,514 |
The tax character of distributions paid was as follows:
| | December 31, 2018 | December 31, 2017 |
| Tax-exempt Income | $13,459,972 | $13,220,102 |
| Long-term Capital Gains | 909,708 | 413,808 |
| Total | $14,369,680 | $ 13,633,910 |
New Rule Issuance. During August 2018, the U.S. Securities and Exchange Commission issued Final Rule Release No. 33-10532, Disclosure Update and Simplification. This Final Rule includes amendments specific to registered investment companies that are intended to eliminate overlap in disclosure requirements between Regulation S-X and GAAP. In accordance with these amendments, certain line-items in the Fund's financial statements have been combined or removed for the current period as outlined in the table below.
| Financial Statement | Current Line-Item Presentation | Prior Line-Item Presentation |
| Statement of Assets and Liabilities | Total distributable earnings (loss) | Undistributed/Distributions in excess of/Accumulated net investment income (loss)
Accumulated/Undistributed net realized gain (loss)
Net unrealized appreciation (depreciation) |
| Statement of Changes in Net Assets | N/A - removed | Undistributed/Distributions in excess of/Accumulated net investment income (loss) end of period |
| Statement of Changes in Net Assets | Distributions to shareholders | Distributions to shareholders from net investment income
Distributions to shareholders from net realized gain |
3. Purchases and Sales of Investments.
Purchases and sales of securities, other than short-term securities, aggregated $75,283,341 and $87,763,352, respectively.
4. Fees and Other Transactions with Affiliates.
Management Fee. Fidelity Management & Research Company (the investment adviser) and its affiliates provide the Fund with investment management related services for which the Fund pays a monthly management fee. The management fee is the sum of an individual fund fee rate that is based on an annual rate of .25% of the Fund's average net assets and an annualized group fee rate that averaged .11% during the period. The group fee rate is based upon the average net assets of all the mutual funds advised by the investment adviser, including any mutual funds previously advised by the investment adviser that are currently advised by Fidelity SelectCo, LLC, an affiliate of the investment adviser. The group fee rate decreases as assets under management increase and increases as assets under management decrease. For the reporting period, the total annual management fee rate was .36% of the Fund's average net assets.
Transfer Agent Fees. Fidelity Investments Institutional Operations Company, Inc. (FIIOC), an affiliate of the investment adviser, is the transfer, dividend disbursing and shareholder servicing agent for the Fund. FIIOC receives account fees and asset-based fees that vary according to account size and type of account. FIIOC pays for typesetting, printing and mailing of shareholder reports, except proxy statements. For the period, transfer agent fees were equivalent to an annual rate of .09% of average net assets.
Accounting Fees. Fidelity Service Company, Inc. (FSC), an affiliate of the investment adviser, maintains the Fund's accounting records. The fee is based on the level of average net assets for each month. For the period, the fees were equivalent to an annual rate of .03%.
Interfund Trades. The Fund may purchase from or sell securities to other Fidelity Funds under procedures adopted by the Board. The procedures have been designed to ensure these interfund trades are executed in accordance with Rule 17a-7 of the 1940 Act. Interfund trades are included within the respective purchases and sales amounts shown in the Purchases and Sales of Investments note.
5. Committed Line of Credit.
The Fund participates with other funds managed by the investment adviser or an affiliate in a $4.25 billion credit facility (the "line of credit") to be utilized for temporary or emergency purposes to fund shareholder redemptions or for other short-term liquidity purposes. The Fund has agreed to pay commitment fees on its pro-rata portion of the line of credit, which amounted to $1,493 and is reflected in Miscellaneous expenses on the Statement of Operations. During the period, the Fund did not borrow on this line of credit.
6. Expense Reductions.
Through arrangements with the Fund's custodian, credits realized as a result of certain uninvested cash balances were used to reduce the Fund's expenses. During the period, these credits reduced the Fund's custody expenses by $4,078.
In addition, during the period the investment adviser reimbursed and/or waived a portion of operating expenses in the amount of $3,300.
7. Other.
The Fund's organizational documents provide former and current trustees and officers with a limited indemnification against liabilities arising in connection with the performance of their duties to the Fund. In the normal course of business, the Fund may also enter into contracts that provide general indemnifications. The Fund's maximum exposure under these arrangements is unknown as this would be dependent on future claims that may be made against the Fund. The risk of material loss from such claims is considered remote.
Report of Independent Registered Public Accounting Firm
To the Board of Trustees of Fidelity Municipal Trust and Shareholders of Fidelity Minnesota Municipal Income Fund:
Opinion on the Financial Statements
We have audited the accompanying statement of assets and liabilities, including the schedule of investments, of Fidelity Minnesota Municipal Income Fund (one of the funds constituting Fidelity Municipal Trust, referred to hereafter as the "Fund") as of December 31, 2018, the related statement of operations for the year ended December 31, 2018, the statement of changes in net assets for each of the two years in the period ended December 31, 2018, including the related notes, and the financial highlights for each of the five years in the period ended December 31, 2018 (collectively referred to as the “financial statements”). In our opinion, the financial statements present fairly, in all material respects, the financial position of the Fund as of December 31, 2018, the results of its operations for the year then ended, the changes in its net assets for each of the two years in the period ended December 31, 2018 and the financial highlights for each of the five years in the period ended December 31, 2018 in conformity with accounting principles generally accepted in the United States of America.
Basis for Opinion
These financial statements are the responsibility of the Fund’s management. Our responsibility is to express an opinion on the Fund’s financial statements based on our audits. We are a public accounting firm registered with the Public Company Accounting Oversight Board (United States) (PCAOB) and are required to be independent with respect to the Fund in accordance with the U.S. federal securities laws and the applicable rules and regulations of the Securities and Exchange Commission and the PCAOB.
We conducted our audits of these financial statements in accordance with the standards of the PCAOB. Those standards require that we plan and perform the audit to obtain reasonable assurance about whether the financial statements are free of material misstatement, whether due to error or fraud.
Our audits included performing procedures to assess the risks of material misstatement of the financial statements, whether due to error or fraud, and performing procedures that respond to those risks. Such procedures included examining, on a test basis, evidence regarding the amounts and disclosures in the financial statements. Our audits also included evaluating the accounting principles used and significant estimates made by management, as well as evaluating the overall presentation of the financial statements. Our procedures included confirmation of securities owned as of December 31, 2018 by correspondence with the custodian. We believe that our audits provide a reasonable basis for our opinion.
PricewaterhouseCoopers LLP
Boston, Massachusetts
February 8, 2019
We have served as the auditor of one or more investment companies in the Fidelity group of funds since 1932.
Trustees and Officers
The Trustees, Members of the Advisory Board (if any), and officers of the trust and fund, as applicable, are listed below. The Board of Trustees governs the fund and is responsible for protecting the interests of shareholders. The Trustees are experienced executives who meet periodically throughout the year to oversee the fund's activities, review contractual arrangements with companies that provide services to the fund, oversee management of the risks associated with such activities and contractual arrangements, and review the fund's performance. Each of the Trustees oversees 260 funds.
The Trustees hold office without limit in time except that (a) any Trustee may resign; (b) any Trustee may be removed by written instrument, signed by at least two-thirds of the number of Trustees prior to such removal; (c) any Trustee who requests to be retired or who has become incapacitated by illness or injury may be retired by written instrument signed by a majority of the other Trustees; and (d) any Trustee may be removed at any special meeting of shareholders by a two-thirds vote of the outstanding voting securities of the trust. Each Trustee who is not an interested person (as defined in the 1940 Act) of the trust and the fund is referred to herein as an Independent Trustee. Each Independent Trustee shall retire not later than the last day of the calendar year in which his or her 75th birthday occurs. The Independent Trustees may waive this mandatory retirement age policy with respect to individual Trustees. Officers and Advisory Board Members hold office without limit in time, except that any officer or Advisory Board Member may resign or may be removed by a vote of a majority of the Trustees at any regular meeting or any special meeting of the Trustees. Except as indicated, each individual has held the office shown or other offices in the same company for the past five years.
The fund’s Statement of Additional Information (SAI) includes more information about the Trustees. To request a free copy, call Fidelity at 1-800-544-8544.
Experience, Skills, Attributes, and Qualifications of the Trustees. The Governance and Nominating Committee has adopted a statement of policy that describes the experience, qualifications, attributes, and skills that are necessary and desirable for potential Independent Trustee candidates (Statement of Policy). The Board believes that each Trustee satisfied at the time he or she was initially elected or appointed a Trustee, and continues to satisfy, the standards contemplated by the Statement of Policy. The Governance and Nominating Committee also engages professional search firms to help identify potential Independent Trustee candidates who have the experience, qualifications, attributes, and skills consistent with the Statement of Policy. From time to time, additional criteria based on the composition and skills of the current Independent Trustees, as well as experience or skills that may be appropriate in light of future changes to board composition, business conditions, and regulatory or other developments, have also been considered by the professional search firms and the Governance and Nominating Committee. In addition, the Board takes into account the Trustees' commitment and participation in Board and committee meetings, as well as their leadership of standing and ad hoc committees throughout their tenure.
In determining that a particular Trustee was and continues to be qualified to serve as a Trustee, the Board has considered a variety of criteria, none of which, in isolation, was controlling. The Board believes that, collectively, the Trustees have balanced and diverse experience, qualifications, attributes, and skills, which allow the Board to operate effectively in governing the fund and protecting the interests of shareholders. Information about the specific experience, skills, attributes, and qualifications of each Trustee, which in each case led to the Board's conclusion that the Trustee should serve (or continue to serve) as a trustee of the fund, is provided below.
Board Structure and Oversight Function. Abigail P. Johnson is an interested person and currently serves as Chairman. The Trustees have determined that an interested Chairman is appropriate and benefits shareholders because an interested Chairman has a personal and professional stake in the quality and continuity of services provided to the fund. Independent Trustees exercise their informed business judgment to appoint an individual of their choosing to serve as Chairman, regardless of whether the Trustee happens to be independent or a member of management. The Independent Trustees have determined that they can act independently and effectively without having an Independent Trustee serve as Chairman and that a key structural component for assuring that they are in a position to do so is for the Independent Trustees to constitute a substantial majority for the Board. The Independent Trustees also regularly meet in executive session. Arthur E. Johnson serves as Chairman of the Independent Trustees and as such (i) acts as a liaison between the Independent Trustees and management with respect to matters important to the Independent Trustees and (ii) with management prepares agendas for Board meetings.
Fidelity® funds are overseen by different Boards of Trustees. The fund's Board oversees Fidelity's investment-grade bond, money market, asset allocation and certain equity funds, and other Boards oversee Fidelity's high income and other equity funds. The asset allocation funds may invest in Fidelity® funds that are overseen by such other Boards. The use of separate Boards, each with its own committee structure, allows the Trustees of each group of Fidelity® funds to focus on the unique issues of the funds they oversee, including common research, investment, and operational issues. On occasion, the separate Boards establish joint committees to address issues of overlapping consequences for the Fidelity® funds overseen by each Board.
The Trustees operate using a system of committees to facilitate the timely and efficient consideration of all matters of importance to the Trustees, the fund, and fund shareholders and to facilitate compliance with legal and regulatory requirements and oversight of the fund's activities and associated risks. The Board, acting through its committees, has charged FMR and its affiliates with (i) identifying events or circumstances the occurrence of which could have demonstrably adverse effects on the fund's business and/or reputation; (ii) implementing processes and controls to lessen the possibility that such events or circumstances occur or to mitigate the effects of such events or circumstances if they do occur; and (iii) creating and maintaining a system designed to evaluate continuously business and market conditions in order to facilitate the identification and implementation processes described in (i) and (ii) above. Because the day-to-day operations and activities of the fund are carried out by or through FMR, its affiliates, and other service providers, the fund's exposure to risks is mitigated but not eliminated by the processes overseen by the Trustees. While each of the Board's committees has responsibility for overseeing different aspects of the fund's activities, oversight is exercised primarily through the Operations and Audit Committees. In addition, an ad hoc Board committee of Independent Trustees has worked with FMR to enhance the Board's oversight of investment and financial risks, legal and regulatory risks, technology risks, and operational risks, including the development of additional risk reporting to the Board. Appropriate personnel, including but not limited to the fund's Chief Compliance Officer (CCO), FMR's internal auditor, the independent accountants, the fund's Treasurer and portfolio management personnel, make periodic reports to the Board's committees, as appropriate, including an annual review of Fidelity's risk management program for the Fidelity® funds. The responsibilities of each standing committee, including their oversight responsibilities, are described further under "Standing Committees of the Trustees."
Interested Trustees*:
Correspondence intended for a Trustee who is an interested person may be sent to Fidelity Investments, 245 Summer Street, Boston, Massachusetts 02210.
Name, Year of Birth; Principal Occupations and Other Relevant Experience+
Abigail P. Johnson (1961)
Year of Election or Appointment: 2009
Trustee
Chairman of the Board of Trustees
Ms. Johnson also serves as Trustee of other Fidelity® funds. Ms. Johnson serves as Chairman (2016-present), Chief Executive Officer (2014-present), and Director (2007-present) of FMR LLC (diversified financial services company), President of Fidelity Financial Services (2012-present) and President of Personal, Workplace and Institutional Services (2005-present). Ms. Johnson is Chairman and Director of FMR Co., Inc. (investment adviser firm, 2011-present) and Chairman and Director of FMR (investment adviser firm, 2011-present). Previously, Ms. Johnson served as Vice Chairman (2007-2016) and President (2013-2016) of FMR LLC, President and a Director of FMR (2001-2005), a Trustee of other investment companies advised by FMR, Fidelity Investments Money Management, Inc. (investment adviser firm), and FMR Co., Inc. (2001-2005), Senior Vice President of the Fidelity® funds (2001-2005), and managed a number of Fidelity® funds. Ms. Abigail P. Johnson and Mr. Arthur E. Johnson are not related.
Jennifer Toolin McAuliffe (1959)
Year of Election or Appointment: 2016
Trustee
Ms. McAuliffe also serves as Trustee of other Fidelity® funds. Ms. McAuliffe previously served as a Member of the Advisory Board of certain Fidelity® funds (2016) and as Co-Head of Fixed Income of Fidelity Investments Limited (now known as FIL Limited (FIL)) (diversified financial services company). Earlier roles at FIL included Director of Research for FIL’s credit and quantitative teams in London, Hong Kong and Tokyo. Ms. McAuliffe also was the Director of Research for taxable and municipal bonds at Fidelity Investments Money Management, Inc. Ms. McAuliffe is also a director or trustee of several not-for-profit entities.
* Determined to be an “Interested Trustee” by virtue of, among other things, his or her affiliation with the trust or various entities under common control with FMR.
+ The information includes the Trustee's principal occupation during the last five years and other information relating to the experience, attributes, and skills relevant to the Trustee's qualifications to serve as a Trustee, which led to the conclusion that the Trustee should serve as a Trustee for the fund.
Independent Trustees:
Correspondence intended for an Independent Trustee may be sent to Fidelity Investments, P.O. Box 55235, Boston, Massachusetts 02205-5235.
Name, Year of Birth; Principal Occupations and Other Relevant Experience+
Elizabeth S. Acton (1951)
Year of Election or Appointment: 2013
Trustee
Ms. Acton also serves as Trustee of other Fidelity® funds. Prior to her retirement in April 2012, Ms. Acton was Executive Vice President, Finance (2011-2012), Executive Vice President, Chief Financial Officer (2002-2011), and Treasurer (2004-2005) of Comerica Incorporated (financial services). Prior to joining Comerica, Ms. Acton held a variety of positions at Ford Motor Company (1983-2002), including Vice President and Treasurer (2000-2002) and Executive Vice President and Chief Financial Officer of Ford Motor Credit Company (1998-2000). Ms. Acton currently serves as a member of the Board of Directors and Audit and Finance Committees of Beazer Homes USA, Inc. (homebuilding, 2012-present). Previously, Ms. Acton served as a Member of the Advisory Board of certain Fidelity® funds (2013-2016).
Ann E. Dunwoody (1953)
Year of Election or Appointment: 2018
Trustee
General Dunwoody also serves as Trustee of other Fidelity® funds. General Dunwoody (United States Army, Retired) was the first woman in U.S. military history to achieve the rank of four-star general and prior to her retirement in 2012 held a variety of positions within the U.S. Army, including Commanding General, U.S. Army Material Command (2008-2012). She is the President of First to Four LLC (leadership and mentoring services, 2012-present). She also serves as a member of the Board of Directors and Nominating and Corporate Governance Committee of L3 Technologies, Inc. (communication, electronic, sensor, and aerospace systems, 2013-present), Board of Directors and Nomination and Corporate Governance Committees of Kforce Inc. (professional staffing services, 2016-present) and Board of Directors of Automattic Inc. (software engineering, 2018-present). Previously, General Dunwoody served as a Member of the Advisory Board of certain Fidelity® funds (2018), a member of the Board of Directors and Audit and Sustainability and Corporate Responsibility Committees of Republic Services, Inc. (waste collection, disposal and recycling, 2013-2016). Ms. Dunwoody also serves on several boards for non-profit organizations, including as a member of the Board of Directors, Chair of the Nomination and Governance Committee and member of the Audit Committee of Logistics Management Institute (consulting non-profit, 2012-present), a member of the Board of Directors of the Army Historical Foundation (2015-present), a member of the Council of Trustees for the Association of the United States Army (advocacy non-profit, 2013-present) and a member of the Board of Trustees of Florida Institute of Technology (2015-present) and ThanksUSA (military family education non-profit, 2014-present).
John Engler (1948)
Year of Election or Appointment: 2014
Trustee
Mr. Engler also serves as Trustee of other Fidelity® funds. He serves on the board of directors for Universal Forest Products (manufacturer and distributor of wood and wood-alternative products, 2003-present) and K12 Inc. (technology-based education company, 2012-present). Previously, Mr. Engler served as interim president of Michigan State University (2018-2019), a Member of the Advisory Board of certain Fidelity® funds (2014-2016), president of the Business Roundtable (2011-2017), a trustee of The Munder Funds (2003-2014), president and CEO of the National Association of Manufacturers (2004-2011), member of the Board of Trustees of the Annie E. Casey Foundation (2004-2015), and as governor of Michigan (1991-2003). He is a past chairman of the National Governors Association.
Robert F. Gartland (1951)
Year of Election or Appointment: 2010
Trustee
Mr. Gartland also serves as Trustee of other Fidelity® funds. Mr. Gartland is Chairman and an investor in Gartland & Mellina Group Corp. (consulting, 2009-present). Previously, Mr. Gartland served as a partner and investor of Vietnam Partners LLC (investments and consulting, 2008-2011). Prior to his retirement, Mr. Gartland held a variety of positions at Morgan Stanley (financial services, 1979-2007), including Managing Director (1987-2007), and Chase Manhattan Bank (1975-1978).
Arthur E. Johnson (1947)
Year of Election or Appointment: 2008
Trustee
Chairman of the Independent Trustees
Mr. Johnson also serves as Trustee of other Fidelity® funds. Mr. Johnson serves as a member of the Board of Directors of Eaton Corporation plc (diversified power management, 2009-present) and Booz Allen Hamilton (management consulting, 2011-present). Prior to his retirement, Mr. Johnson served as Senior Vice President of Corporate Strategic Development of Lockheed Martin Corporation (defense contractor, 1999-2009). He previously served on the Board of Directors of IKON Office Solutions, Inc. (1999-2008), AGL Resources, Inc. (holding company, 2002-2016), and Delta Airlines (2005-2007). Mr. Arthur E. Johnson is not related to Ms. Abigail P. Johnson.
Michael E. Kenneally (1954)
Year of Election or Appointment: 2009
Trustee
Vice Chairman of the Independent Trustees
Mr. Kenneally also serves as Trustee of other Fidelity® funds. Prior to his retirement, Mr. Kenneally served as Chairman and Global Chief Executive Officer of Credit Suisse Asset Management. Before joining Credit Suisse, he was an Executive Vice President and Chief Investment Officer for Bank of America Corporation. Earlier roles at Bank of America included Director of Research, Senior Portfolio Manager and Research Analyst, and Mr. Kenneally was awarded the Chartered Financial Analyst (CFA) designation in 1991.
Marie L. Knowles (1946)
Year of Election or Appointment: 2001
Trustee
Ms. Knowles also serves as Trustee of other Fidelity® funds. Prior to Ms. Knowles' retirement in June 2000, she served as Executive Vice President and Chief Financial Officer of Atlantic Richfield Company (ARCO) (diversified energy, 1996-2000). From 1993 to 1996, she was a Senior Vice President of ARCO and President of ARCO Transportation Company (pipeline and tanker operations). Ms. Knowles currently serves as a Director and Chairman of the Audit Committee of McKesson Corporation (healthcare service, since 2002). Ms. Knowles is a member of the Board of the Santa Catalina Island Company (real estate, 2009-present). Ms. Knowles is a Member of the Investment Company Institute Board of Governors and a Member of the Governing Council of the Independent Directors Council (2014-present). She also serves as a member of the Advisory Board for the School of Engineering of the University of Southern California. Previously, Ms. Knowles served as a Director of Phelps Dodge Corporation (copper mining and manufacturing, 1994-2007), URS Corporation (engineering and construction, 2000-2003) and America West (airline, 1999-2002). Ms. Knowles previously served as Chairman (2015-2018) and Vice Chairman (2012-2015) of the Independent Trustees of certain Fidelity® funds.
Mark A. Murray (1954)
Year of Election or Appointment: 2016
Trustee
Mr. Murray also serves as Trustee of other Fidelity® funds. Mr. Murray is Vice Chairman (2013-present) of Meijer, Inc. (regional retail chain). Previously, Mr. Murray served as a Member of the Advisory Board of certain Fidelity® funds (2016) and as Co-Chief Executive Officer (2013-2016) and President (2006-2013) of Meijer, Inc. Mr. Murray serves as a member of the Board of Directors and Nuclear Review and Public Policy and Responsibility Committees of DTE Energy Company (diversified energy company, 2009-present). Mr. Murray also serves as a member of the Board of Directors of Spectrum Health (not-for-profit health system, 2015-present). Mr. Murray previously served as President of Grand Valley State University (2001-2006), Treasurer for the State of Michigan (1999-2001), Vice President of Finance and Administration for Michigan State University (1998-1999), and a member of the Board of Directors and Audit Committee and Chairman of the Nominating and Corporate Governance Committee of Universal Forest Products, Inc. (manufacturer and distributor of wood and wood-alternative products, 2004-2016). Mr. Murray is also a director or trustee of many community and professional organizations.
+ The information includes the Trustee's principal occupation during the last five years and other information relating to the experience, attributes, and skills relevant to the Trustee's qualifications to serve as a Trustee, which led to the conclusion that the Trustee should serve as a Trustee for the fund.
Advisory Board Members and Officers:
Correspondence intended for an officer may be sent to Fidelity Investments, 245 Summer Street, Boston, Massachusetts 02210. Officers appear below in alphabetical order.
Name, Year of Birth; Principal Occupation
Elizabeth Paige Baumann (1968)
Year of Election or Appointment: 2017
Anti-Money Laundering (AML) Officer
Ms. Baumann also serves as AML Officer of other funds. She is Chief AML Officer (2012-present) and Senior Vice President (2014-present) of FMR LLC (diversified financial services company) and is an employee of Fidelity Investments. Previously, Ms. Baumann served as AML Officer of the funds (2012-2016), and Vice President (2007-2014) and Deputy Anti-Money Laundering Officer (2007-2012) of FMR LLC.
Craig S. Brown (1977)
Year of Election or Appointment: 2019
Assistant Treasurer
Mr. Brown also serves as Assistant Treasurer of other funds. Mr. Brown is an employee of Fidelity Investments (2013-present).
John J. Burke III (1964)
Year of Election or Appointment: 2018
Chief Financial Officer
Mr. Burke also serves as Chief Financial Officer of other funds. Mr. Burke serves as Head of Investment Operations for Fidelity Fund and Investment Operations (2018-present) and is an employee of Fidelity Investments (1998-present). Previously Mr. Burke served as head of Asset Management Investment Operations (2012-2018).
William C. Coffey (1969)
Year of Election or Appointment: 2018
Secretary and Chief Legal Officer (CLO)
Mr. Coffey also serves as Secretary and CLO of other funds. Mr. Coffey serves as CLO, Secretary, and Senior Vice President of Fidelity Management & Research Company and FMR Co., Inc. (investment adviser firms, 2018-present); Secretary of Fidelity SelectCo, LLC and Fidelity Investments Money Management, Inc. (investment adviser firms, 2018-present); and CLO of Fidelity Management & Research (Hong Kong) Limited, FMR Investment Management (UK) Limited, and Fidelity Management & Research (Japan) Limited (investment adviser firms, 2018-present). He is Senior Vice President and Deputy General Counsel of FMR LLC (diversified financial services company, 2010-present), and is an employee of Fidelity Investments. Previously, Mr. Coffey served as Assistant Secretary of certain funds (2009-2018) and as Vice President and Associate General Counsel of FMR LLC (2005-2009).
Jonathan Davis (1968)
Year of Election or Appointment: 2010
Assistant Treasurer
Mr. Davis also serves as Assistant Treasurer of other funds. Mr. Davis serves as Assistant Treasurer of FMR Capital, Inc. (2017-present) and is an employee of Fidelity Investments. Previously, Mr. Davis served as Vice President and Associate General Counsel of FMR LLC (diversified financial services company, 2003-2010).
Adrien E. Deberghes (1967)
Year of Election or Appointment: 2010
Assistant Treasurer
Mr. Deberghes also serves as an officer of other funds. He serves as Assistant Treasurer of FMR Capital, Inc. (2017-present), Executive Vice President of Fidelity Investments Money Management, Inc. (FIMM) (investment adviser firm, 2016-present), and is an employee of Fidelity Investments (2008-present). Previously, Mr. Deberghes served as President and Treasurer of certain Fidelity® funds (2013-2018). Prior to joining Fidelity Investments, Mr. Deberghes was Senior Vice President of Mutual Fund Administration at State Street Corporation (2007-2008), Senior Director of Mutual Fund Administration at Investors Bank & Trust (2005-2007), and Director of Finance for Dunkin' Brands (2000-2005). Previously, Mr. Deberghes served in other fund officer roles.
Laura M. Del Prato (1964)
Year of Election or Appointment: 2018
President and Treasurer
Ms. Del Prato also serves as an officer of other funds. Ms. Del Prato is an employee of Fidelity Investments (2017-present). Prior to joining Fidelity Investments, Ms. Del Prato served as a Managing Director and Treasurer of the JPMorgan Mutual Funds (2014-2017). Prior to JPMorgan, Ms. Del Prato served as a partner at Cohen Fund Audit Services (accounting firm, 2012-2013) and KPMG LLP (accounting firm, 2004-2012).
Colm A. Hogan (1973)
Year of Election or Appointment: 2016
Assistant Treasurer
Mr. Hogan also serves as an officer of other funds. Mr. Hogan serves as Assistant Treasurer of FMR Capital, Inc. (2017-present) and is an employee of Fidelity Investments (2005-present). Previously, Mr. Hogan served as Assistant Treasurer of certain Fidelity® funds (2016-2018).
Chris Maher (1972)
Year of Election or Appointment: 2013
Assistant Treasurer
Mr. Maher serves as Assistant Treasurer of other funds. Mr. Maher is Vice President of Valuation Oversight, serves as Assistant Treasurer of FMR Capital, Inc. (2017-present), and is an employee of Fidelity Investments. Previously, Mr. Maher served as Vice President of Asset Management Compliance (2013), Vice President of the Program Management Group of FMR (investment adviser firm, 2010-2013), and Vice President of Valuation Oversight (2008-2010).
John B. McGinty, Jr. (1962)
Year of Election or Appointment: 2016
Chief Compliance Officer
Mr. McGinty also serves as Chief Compliance Officer of other funds. Mr. McGinty is Senior Vice President of Asset Management Compliance for Fidelity Investments and is an employee of Fidelity Investments (2016-present). Mr. McGinty previously served as Vice President, Senior Attorney at Eaton Vance Management (investment management firm, 2015-2016), and prior to Eaton Vance as global CCO for all firm operations and registered investment companies at GMO LLC (investment management firm, 2009-2015). Before joining GMO LLC, Mr. McGinty served as Senior Vice President, Deputy General Counsel for Fidelity Investments (2007-2009).
Jason P. Pogorelec (1975)
Year of Election or Appointment: 2015
Assistant Secretary
Mr. Pogorelec also serves as Assistant Secretary of other funds. Mr. Pogorelec serves as Vice President, Associate General Counsel (2010-present) and is an employee of Fidelity Investments (2006-present).
Nancy D. Prior (1967)
Year of Election or Appointment: 2014
Vice President
Ms. Prior also serves as Vice President of other funds. Ms. Prior serves as President Fixed Income, High Income/Emerging Market Debt and Multi Asset Class Strategies of FIAM LLC (2018-present), President (2016-present) and Director (2014-present) of Fidelity Investments Money Management, Inc. (FIMM) (investment adviser firm), President, Fixed Income (2014-present), and is an employee of Fidelity Investments (2002-present). Previously, Ms. Prior served as Vice Chairman of FIAM LLC (investment adviser firm, 2014-2018), a Director of FMR Investment Management (UK) Limited (investment adviser firm, 2015-2018), President Multi-Asset Class Strategies of FMR's Global Asset Allocation Division (2017-2018), Vice President of Fidelity's Money Market Funds (2012-2014), President, Money Market and Short Duration Bond Group of Fidelity Management & Research (FMR) (investment adviser firm, 2013-2014), President, Money Market Group of FMR (2011-2013), Managing Director of Research (2009-2011), Senior Vice President and Deputy General Counsel (2007-2009), and Assistant Secretary of certain Fidelity® funds (2008-2009).
Stacie M. Smith (1974)
Year of Election or Appointment: 2013
Assistant Treasurer
Ms. Smith also serves as an officer of other funds. Ms. Smith serves as Assistant Treasurer of FMR Capital, Inc. (2017-present), is an employee of Fidelity Investments (2009-present), and has served in other fund officer roles. Prior to joining Fidelity Investments, Ms. Smith served as Senior Audit Manager of Ernst & Young LLP (accounting firm, 1996-2009). Previously, Ms. Smith served as Assistant Treasurer (2013-2018) and Deputy Treasurer (2013-2016) of certain Fidelity® funds.
Marc L. Spector (1972)
Year of Election or Appointment: 2016
Deputy Treasurer
Mr. Spector also serves as an officer of other funds. Mr. Spector serves as Assistant Treasurer of FMR Capital, Inc. (2017-present) and is an employee of Fidelity Investments (2016-present). Prior to joining Fidelity Investments, Mr. Spector served as Director at the Siegfried Group (accounting firm, 2013-2016), and prior to Siegfried Group as audit senior manager at Deloitte & Touche (accounting firm, 2005-2013).
Jim Wegmann (1979)
Year of Election or Appointment: 2019
Assistant Treasurer
Mr. Wegmann also serves as Assistant Treasurer of other funds. Mr. Wegmann is an employee of Fidelity Investments (2011-present).
Shareholder Expense Example
As a shareholder of the Fund, you incur two types of costs: (1) transaction costs and (2) ongoing costs, including management fees and other Fund expenses. This Example is intended to help you understand your ongoing costs (in dollars) of investing in the Fund and to compare these costs with the ongoing costs of investing in other mutual funds.
The Example is based on an investment of $1,000 invested at the beginning of the period and held for the entire period (July 1, 2018 to December 31, 2018).
Actual Expenses
The first line of the accompanying table provides information about actual account values and actual expenses. You may use the information in this line, together with the amount you invested, to estimate the expenses that you paid over the period. Simply divide your account value by $1,000.00 (for example, an $8,600 account value divided by $1,000.00 = 8.6), then multiply the result by the number in the first line under the heading entitled "Expenses Paid During Period" to estimate the expenses you paid on your account during this period. A small balance maintenance fee of $12.00 that is charged once a year may apply for certain accounts with a value of less than $2,000. This fee, which was eliminated effective August 1, 2018, is not included in the table below. If it was, the estimate of expenses you paid during the period would be higher, and your ending account value lower, by this amount.
Hypothetical Example for Comparison Purposes
The second line of the accompanying table provides information about hypothetical account values and hypothetical expenses based on the Fund's actual expense ratio and an assumed rate of return of 5% per year before expenses, which is not the Fund's actual return. The hypothetical account values and expenses may not be used to estimate the actual ending account balance or expenses you paid for the period. You may use this information to compare the ongoing costs of investing in the Fund and other funds. To do so, compare this 5% hypothetical example with the 5% hypothetical examples that appear in the shareholder reports of the other funds. A small balance maintenance fee of $12.00 that is charged once a year may apply for certain accounts with a value of less than $2,000. This fee, which was eliminated effective August 1, 2018, is not included in the table below. If it was, the estimate of expenses you paid during the period would be higher, and your ending account value lower, by this amount.
Please note that the expenses shown in the table are meant to highlight your ongoing costs only and do not reflect any transaction costs. Therefore, the second line of the table is useful in comparing ongoing costs only, and will not help you determine the relative total costs of owning different funds.
| | Annualized Expense Ratio-A | Beginning
Account Value
July 1, 2018 | Ending
Account Value
December 31, 2018 | Expenses Paid
During Period-B
July 1, 2018
to December 31, 2018 |
| Actual | .49% | $1,000.00 | $1,013.80 | $2.49 |
| Hypothetical-C | | $1,000.00 | $1,022.74 | $2.50 |
A Annualized expense ratio reflects expenses net of applicable fee waivers.
B Expenses are equal to the Fund's annualized expense ratio, multiplied by the average account value over the period, multiplied by 184/365 (to reflect the one-half year period).
C 5% return per year before expenses
Distributions (Unaudited)
The Board of Trustees of Fidelity Minnesota Municipal Income Fund voted to pay on February 11, 2019, to shareholders of record at the opening of business on February 8, 2019, a distribution of $ 0.016 per share derived from capital gains realized from sales of portfolio securities.
The fund hereby designates as a capital gain dividend with respect to the taxable year ended December 31, 2018, $875,406, or, if subsequently determined to be different, the net capital gain of such year.
During fiscal year ended 2018, 100% of the fund's income dividends was free from federal income tax, and 1.42% of the fund's income dividends was subject to the federal alternative minimum tax.
The fund will notify shareholders in January 2019 of amounts for use in preparing 2018 income tax returns.
Board Approval of Investment Advisory Contracts and Management Fees
Fidelity Minnesota Municipal Income Fund
Each year, the Board of Trustees, including the Independent Trustees (together, the Board), votes on the renewal of the management contract with Fidelity Management & Research Company (FMR) and the sub-advisory agreements (together, the Advisory Contracts) for the fund. FMR and the sub-advisers are referred to herein as the Investment Advisers. The Board, assisted by the advice of fund counsel and Independent Trustees' counsel, requests and considers a broad range of information relevant to the renewal of the Advisory Contracts throughout the year.
The Board meets regularly and, at each of its meetings, covers an extensive agenda of topics and materials and considers factors that are relevant to its annual consideration of the renewal of the fund's Advisory Contracts, including the services and support provided to the fund and its shareholders. The Board has established four standing committees (Committees) — Operations, Audit, Fair Valuation, and Governance and Nominating — each composed of and chaired by Independent Trustees with varying backgrounds, to which the Board has assigned specific subject matter responsibilities in order to enhance effective decision-making by the Board. The Operations Committee, of which all of the Independent Trustees are members, meets regularly throughout the year and considers, among other matters, information specifically related to the annual consideration of the renewal of the fund's Advisory Contracts. The Board, acting directly and through its Committees, requests and receives information concerning the annual consideration of the renewal of the fund's Advisory Contracts. The Board also meets as needed to review matters specifically related to the Board's annual consideration of the renewal of the Advisory Contracts. Members of the Board may also meet with trustees of other Fidelity funds through joint ad hoc committees to discuss certain matters relevant to all of the Fidelity funds.
At its September 2018 meeting, the Board unanimously determined to renew the fund's Advisory Contracts. In reaching its determination, the Board considered all factors it believed relevant, including (i) the nature, extent, and quality of the services to be provided to the fund and its shareholders (including the investment performance of the fund); (ii) the competitiveness of the fund's management fee and total expense ratio relative to peer funds; (iii) the total costs of the services to be provided by and the profits to be realized by Fidelity from its relationships with the fund; and (iv) the extent to which, if any, economies of scale exist and would be realized as the fund grows, and whether any economies of scale are appropriately shared with fund shareholders.
In considering whether to renew the Advisory Contracts for the fund, the Board reached a determination, with the assistance of fund counsel and Independent Trustees' counsel and through the exercise of its business judgment, that the renewal of the Advisory Contracts was in the best interests of the fund and its shareholders and that the compensation payable under the Advisory Contracts was fair and reasonable. The Board's decision to renew the Advisory Contracts was not based on any single factor, but rather was based on a comprehensive consideration of all the information provided to the Board at its meetings throughout the year. The Board, in reaching its determination to renew the Advisory Contracts, was aware that shareholders of the fund have a broad range of investment choices available to them, including a wide choice among funds offered by Fidelity's competitors, and that the fund's shareholders, who have the opportunity to review and weigh the disclosure provided by the fund in its prospectus and other public disclosures, have chosen to invest in this fund, which is part of the Fidelity family of funds.
Nature, Extent, and Quality of Services Provided. The Board considered Fidelity's staffing as it relates to the fund, including the backgrounds of investment personnel of Fidelity, and also considered the fund's investment objective, strategies, and related investment philosophy. The Independent Trustees also had discussions with senior management of Fidelity's investment operations and investment groups. The Board considered the structure of the investment personnel compensation program and whether this structure provides appropriate incentives to act in the best interests of the fund. Additionally, the Board considered the portfolio managers' investments, if any, in the funds that they manage.
Resources Dedicated to Investment Management and Support Services. The Board reviewed the general qualifications and capabilities of Fidelity's investment staff, including its size, education, experience, and resources, as well as Fidelity's approach to recruiting, managing, and compensating investment personnel. The Board noted that Fidelity has continued to increase the resources devoted to non-U.S. offices, including expansion of Fidelity's global investment organization. The Board also noted that Fidelity's analysts have extensive resources, tools and capabilities that allow them to conduct sophisticated quantitative and fundamental analysis, as well as credit analysis of issuers, counterparties and guarantors. Further, the Board considered that Fidelity's investment professionals have sufficient access to global information and data so as to provide competitive investment results over time, and that those professionals also have access to sophisticated tools that permit them to assess portfolio construction and risk and performance attribution characteristics continuously, as well as to transmit new information and research conclusions rapidly around the world. Additionally, in its deliberations, the Board considered Fidelity's trading, risk management, compliance, and technology and operations capabilities and resources, which are integral parts of the investment management process.
Shareholder and Administrative Services. The Board considered (i) the nature, extent, quality, and cost of advisory, administrative, and shareholder services performed by the Investment Advisers and their affiliates under the Advisory Contracts and under separate agreements covering transfer agency and pricing and bookkeeping services for the fund; (ii) the nature and extent of the supervision of third party service providers, principally custodians, subcustodians, and pricing vendors; and (iii) the resources devoted to, and the record of compliance with, the fund's compliance policies and procedures.
The Board noted that the growth of fund assets over time across the complex allows Fidelity to reinvest in the development of services designed to enhance the value and convenience of the Fidelity funds as investment vehicles. These services include 24-hour access to account information and market information through telephone representatives and over the Internet, investor education materials and asset allocation tools, and the expanded availability of Fidelity Investor Centers.
Investment in a Large Fund Family. The Board considered the benefits to shareholders of investing in a Fidelity fund, including the benefits of investing in a fund that is part of a large family of funds offering a variety of investment disciplines and providing a large variety of mutual fund investor services. The Board noted that Fidelity had taken, or had made recommendations that resulted in the Fidelity funds taking, a number of actions over the previous year that benefited particular funds, including: (i) continuing to dedicate additional resources to Fidelity's investment research process, which includes meetings with management of issuers of securities in which the funds invest, and to the support of the senior management team that oversees asset management; (ii) continuing efforts to enhance Fidelity's global research capabilities; (iii) launching new funds and making other enhancements to meet client needs; (iv) launching new share classes of existing funds; (v) eliminating purchase minimums and broadening eligibility requirements for certain funds and share classes; (vi) reducing management fees and total expenses for certain growth equity funds and index funds; (vii) lowering expense caps for certain existing funds and classes, and converting certain voluntary expense caps to contractual caps, to reduce expenses borne by shareholders; (viii) eliminating short-term redemption fees for funds that had such fees; (ix) rationalizing product lines and gaining increased efficiencies from fund mergers and share class consolidations; (x) continuing to develop, acquire and implement systems and technology to improve services to the funds and shareholders, strengthen information security, and increase efficiency; and (xi) continuing to implement enhancements to further strengthen Fidelity's product line to increase investors' probability of success in achieving their investment goals, including retirement income goals.
Investment Performance. The Board considered whether the fund has operated in accordance with its investment objective, as well as its record of compliance with its investment restrictions and its performance history.
The Board took into account discussions that occur at Board meetings throughout the year with representatives of the Investment Advisers about fund investment performance. In this regard the Board noted that as part of regularly scheduled fund reviews and other reports to the Board on fund performance, the Board considers annualized return information for the fund for different time periods, measured against an appropriate securities market index ("benchmark index") and a peer group of funds with similar objectives ("peer group"), if any. In its evaluation of fund investment performance at meetings throughout the year, the Board gave particular attention to information indicating underperformance of certain Fidelity funds for specific time periods and discussed with the Investment Advisers the reasons for such underperformance.
In addition to reviewing absolute and relative fund performance, the Independent Trustees periodically consider the appropriateness of fund performance metrics in evaluating the results achieved. In general, the Independent Trustees believe that fund performance should be evaluated based on gross performance (before fees and expenses but after transaction costs) compared to appropriate benchmark indices, over appropriate time periods that may include full market cycles, and on net performance (after fees and expenses) compared to peer groups, as applicable, over the same periods, taking into account relevant factors including the following: general market conditions; expectations for interest rate levels and credit conditions; issuer-specific information including credit quality; the potential for incremental return versus the fund's benchmark index weighed against the risks involved in obtaining that incremental return, including the risk of diminished or negative total returns; and fund cash flows and other factors. Depending on the circumstances, the Independent Trustees may be satisfied with a fund's performance notwithstanding that it lags its benchmark index or peer group for certain periods.
The Independent Trustees recognize that shareholders evaluate performance on a net basis over their own holding periods, for which one-, three-, and five-year periods are often used as a proxy. For this reason, the performance information reviewed by the Board also included net cumulative calendar year total return information for the fund and an appropriate benchmark index and peer group for the most recent one-, three-, and five-year periods.
Based on its review, the Board concluded that the nature, extent, and quality of services provided to the fund under the Advisory Contracts should continue to benefit the shareholders of the fund.
Competitiveness of Management Fee and Total Expense Ratio. The Board considered the fund's management fee and total expense ratio compared to "mapped groups" of competitive funds and classes created for the purpose of facilitating the Trustees' competitive analysis of management fees and total expenses. Fidelity creates "mapped groups" by combining similar Lipper investment objective categories that have comparable investment mandates. Combining Lipper investment objective categories aids the Board's management fee and total expense ratio comparisons by broadening the competitive group used for comparison.
Management Fee. The Board considered two proprietary management fee comparisons for the 12-month periods shown in basis points (BP) in the chart below. The group of Lipper funds used by the Board for management fee comparisons is referred to below as the "Total Mapped Group" and, for the reasons explained above, is broader than the Lipper peer group used by the Board for performance comparisons. The Total Mapped Group comparison focuses on a fund's standing in terms of gross management fees before expense reimbursements or caps relative to the total universe of funds with comparable investment mandates, regardless of whether their management fee structures also are comparable. Funds with comparable investment mandates offer exposure to similar types of securities. Funds with comparable management fee structures have similar management fee contractual arrangements (
e.g., flat rate charged for advisory services, all-inclusive fee rate,
etc.). "TMG %" represents the percentage of funds in the Total Mapped Group that had management fees that were lower than the fund's. For example, a hypothetical TMG % of 20% would mean that 80% of the funds in the Total Mapped Group had higher, and 20% had lower, management fees than the fund. The fund's actual TMG %s and the number of funds in the Total Mapped Group are in the chart below. The "Asset-Size Peer Group" (ASPG) comparison focuses on a fund's standing relative to a subset of non-Fidelity funds within the Total Mapped Group that are similar in size and management fee structure. For example, if a fund is in the first quartile of the ASPG, the fund's management fee ranks in the least expensive or lowest 25% of funds in the ASPG. The ASPG represents at least 15% of the funds in the Total Mapped Group with comparable asset size and management fee structures, subject to a minimum of 50 funds (or all funds in the Total Mapped Group if fewer than 50). Additional information, such as the ASPG quartile in which the fund's management fee rate ranked, is also included in the chart and was considered by the Board.
Fidelity Minnesota Municipal Income Fund
The Board noted that the fund's management fee rate ranked below the median of its Total Mapped Group and below the median of its ASPG for 2017.
The Board noted that it and the boards of other Fidelity funds formed an ad hoc Committee on Group Fee, which meets periodically, to conduct an in-depth review of the "group fee" component of the management fee of funds with such management fee structures. The Committee's focus included the mechanics of the group fee, the competitive landscape of group fee structures, Fidelity funds with no group fee component and investment products not included in group fee assets. The Board also considered that, for funds subject to the group fee, FMR agreed to voluntarily waive fees over a specified period of time in amounts designed to account for assets converted from certain funds to certain collective investment trusts.
Based on its review, the Board concluded that the fund's management fee is fair and reasonable in light of the services that the fund receives and the other factors considered.
Total Expense Ratio. In its review of the fund's total expense ratio, the Board considered the fund's management fee rate as well as other fund expenses, such as transfer agent fees, pricing and bookkeeping fees, and custodial, legal, and audit fees. The Board also noted that Fidelity may agree to waive fees and expenses from time to time, and the extent to which, if any, it has done so for the fund. As part of its review, the Board also considered the current and historical total expense ratios of the fund compared to competitive fund median expenses. The fund is compared to those funds and classes in the Total Mapped Group (used by the Board for management fee comparisons) that have a similar sales load structure.
The Board noted that the fund's total expense ratio ranked below the competitive median for 2017.
Fees Charged to Other Fidelity Clients. The Board also considered Fidelity fee structures and other information with respect to clients of Fidelity, such as other funds advised or subadvised by Fidelity, pension plan clients, and other institutional clients with similar mandates. The Board noted that a joint ad hoc committee created by it and the boards of other Fidelity funds periodically reviews and compares Fidelity's institutional investment advisory business with its business of providing services to the Fidelity funds and also noted the most recent findings of the committee. The Board noted that the committee's review included a consideration of the differences in services provided, fees charged, and costs incurred, as well as competition in the markets serving the different categories of clients.
Based on its review of total expense ratios and fees charged to other Fidelity clients, the Board concluded that the fund's total expense ratio was reasonable in light of the services that the fund and its shareholders receive and the other factors considered.
Costs of the Services and Profitability. The Board considered the revenues earned and the expenses incurred by Fidelity in conducting the business of developing, marketing, distributing, managing, administering and servicing the fund and servicing the fund's shareholders. The Board also considered the level of Fidelity's profits in respect of all the Fidelity funds.
On an annual basis, Fidelity presents to the Board information about the profitability of its relationships with the fund. Fidelity calculates profitability information for each fund, as well as aggregate profitability information for groups of Fidelity funds and all Fidelity funds, using a series of detailed revenue and cost allocation methodologies which originate with the books and records of Fidelity on which Fidelity's audited financial statements are based. The Audit Committee of the Board reviews any significant changes from the prior year's methodologies.
PricewaterhouseCoopers LLP (PwC), auditor to Fidelity and certain Fidelity funds, has been engaged annually by the Board as part of the Board's assessment of Fidelity's profitability analysis. PwC's engagement includes the review and assessment of the methodologies used by Fidelity in determining the revenues and expenses attributable to Fidelity's mutual fund business, and completion of agreed-upon procedures in respect of the mathematical accuracy of the fund profitability information and its conformity to established allocation methodologies. After considering PwC's reports issued under the engagement and information provided by Fidelity, the Board concluded that while other allocation methods may also be reasonable, Fidelity's profitability methodologies are reasonable in all material respects.
The Board also reviewed Fidelity's non-fund businesses and potential indirect benefits such businesses may have received as a result of their association with Fidelity's mutual fund business (i.e., fall-out benefits) as well as cases where Fidelity's affiliates may benefit from the fund's business. The Board noted that changes to fall-out benefits year-over-year reflect business developments at Fidelity's various businesses.
The Board considered the costs of the services provided by and the profits realized by Fidelity in connection with the operation of the fund and was satisfied that the profitability was not excessive.
Economies of Scale. The Board considered whether there have been economies of scale in respect of the management of the Fidelity funds, whether the Fidelity funds (including the fund) have appropriately benefited from any such economies of scale, and whether there is potential for realization of any further economies of scale. The Board considered the extent to which the fund will benefit from economies of scale as assets grow through increased services to the fund, through waivers or reimbursements, or through fee or expense ratio reductions. The Board also noted that a committee (the Economies of Scale Committee) created by it and the boards of other Fidelity funds periodically analyzes whether Fidelity attains economies of scale in respect of the management and servicing of the Fidelity funds, whether the Fidelity funds have appropriately benefited from such economies of scale, and whether there is potential for realization of any further economies of scale.
The Board recognized that the fund's management contract incorporates a "group fee" structure, which provides for lower group fee rates as total group assets increase, and for higher group fee rates as total group assets decrease (with "group assets" defined to include fund assets under FMR's management plus the assets of sector funds previously under FMR's management). FMR calculates the group fee rates based on a tiered asset "breakpoint" schedule that varies based on asset class. The Board considered that the group fee is designed to deliver the benefits of economies of scale to fund shareholders when total Fidelity fund assets increase, even if assets of any particular fund are unchanged or have declined, because some portion of Fidelity's costs are attributable to services provided to all Fidelity funds, and all funds benefit if those costs can be allocated among more assets. The Board concluded that, given the group fee structure, fund shareholders will benefit from lower management fees as group assets increase at the fund complex level, regardless of whether Fidelity achieves any such economies of scale.
The Board concluded, taking into account the analysis of the Economies of Scale Committee, that economies of scale, if any, are being appropriately shared between fund shareholders and Fidelity.
Additional Information Requested by the Board. In order to develop fully the factual basis for consideration of the Fidelity funds' advisory contracts, the Board requested and received additional information on certain topics, including: (i) Fidelity's fund profitability methodology, profitability trends for certain funds, the allocation of various costs to different funds, and the impact of certain factors on fund profitability results; (ii) portfolio manager changes that have occurred during the past year and the amount of the investment that each portfolio manager has made in the Fidelity fund(s) that he or she manages; (iii) Fidelity's compensation structure for portfolio managers, research analysts, and other key personnel, including its effects on fund profitability, the rationale for the compensation structure, and the extent to which current market conditions have affected retention and recruitment; (iv) the arrangements with and compensation paid to certain fund sub-advisers on behalf of the Fidelity funds and the treatment of such compensation within Fidelity's fund profitability methodology; (v) the terms of Fidelity's voluntary expense limitation agreements; (vi) the methodology with respect to competitive fund data and peer group classifications; (vii) Fidelity's transfer agent fee, expense, and service structures for different funds and classes relative to competitive trends, and the impact of the increased use of omnibus accounts; (viii) new developments in the retail and institutional marketplaces and the competitive positioning of the funds relative to other investment products and services; (ix) the impact of recent changes to the money market fund landscape, including the full implementation of money market fund reform and rising interest rates, on Fidelity's money market funds; (x) the funds' share class structures and distribution channels; and (xi) explanations regarding the relative total expense ratios of certain funds and classes, total expense competitive trends and methodologies for total expense competitive comparisons, and actions that might be taken by Fidelity to reduce total expense ratios for certain classes. In addition, the Board considered its discussions with Fidelity throughout the year regarding enhanced information security initiatives and the funds' fair valuation policies.
Based on its evaluation of all of the conclusions noted above, and after considering all factors it believed relevant, the Board concluded that the advisory fee arrangements are fair and reasonable, and that the fund's Advisory Contracts should be renewed.
Corporate Headquarters
245 Summer St.
Boston, MA 02210
www.fidelity.com
MNF-ANN-0219
1.539899.121
Fidelity® Ohio Municipal Income Fund
Fidelity® Ohio Municipal Money Market Fund
Annual Report December 31, 2018 |
|
Beginning on January 1, 2021, as permitted by regulations adopted by the Securities and Exchange Commission, paper copies of a fund’s shareholder reports will no longer be sent by mail, unless you specifically request paper copies of the reports from the fund or from your financial intermediary, such as a financial advisor, broker-dealer or bank. Instead, the reports will be made available on a website, and you will be notified by mail each time a report is posted and provided with a website link to access the report.
If you already elected to receive shareholder reports electronically, you will not be affected by this change and you need not take any action. You may elect to receive shareholder reports and other communications from a fund electronically, by contacting your financial intermediary. For Fidelity customers, visit Fidelity's web site or call Fidelity using the contact information listed below.
You may elect to receive all future reports in paper free of charge. If you wish to continue receiving paper copies of your shareholder reports, you may contact your financial intermediary or, if you are a Fidelity customer, visit Fidelity’s website, or call Fidelity at the applicable toll-free number listed below. Your election to receive reports in paper will apply to all funds held with the fund complex/your financial intermediary.
| Account Type | Website | Phone Number |
| Brokerage, Mutual Fund, or Annuity Contracts: | fidelity.com/mailpreferences | 1-800-343-3548 |
| Employer Provided Retirement Accounts: | netbenefits.fidelity.com/preferences (choose 'no' under Required Disclosures to continue to print) | 1-800-343-0860 |
| Advisor Sold Accounts Serviced Through Your Financial Intermediary: | Contact Your Financial Intermediary | Your Financial Intermediary's phone number |
| Advisor Sold Accounts Serviced by Fidelity: | institutional.fidelity.com | 1-877-208-0098 |
Contents
To view a fund's proxy voting guidelines and proxy voting record for the 12-month period ended June 30, visit http://www.fidelity.com/proxyvotingresults or visit the Securities and Exchange Commission's (SEC) web site at http://www.sec.gov.
You may also call 1-800-544-8544 to request a free copy of the proxy voting guidelines.
Standard & Poor's, S&P and S&P 500 are registered service marks of The McGraw-Hill Companies, Inc. and have been licensed for use by Fidelity Distributors Corporation.
Other third-party marks appearing herein are the property of their respective owners.
All other marks appearing herein are registered or unregistered trademarks or service marks of FMR LLC or an affiliated company. © 2019 FMR LLC. All rights reserved.
This report and the financial statements contained herein are submitted for the general information of the shareholders of the Fund. This report is not authorized for distribution to prospective investors in the Fund unless preceded or accompanied by an effective prospectus.
A fund files its complete schedule of portfolio holdings with the SEC for the first and third quarters of each fiscal year on Form N-Q. Forms N-Q are available on the SEC’s web site at http://www.sec.gov. A fund's Forms N-Q may be reviewed and copied at the SEC’s Public Reference Room in Washington, DC. Information regarding the operation of the SEC's Public Reference Room may be obtained by calling 1-800-SEC-0330.
For a complete list of a fund's portfolio holdings, view the most recent holdings listing, semiannual report, or annual report on Fidelity's web site at http://www.fidelity.com, http://www.institutional.fidelity.com, or http://www.401k.com, as applicable.
NOT FDIC INSURED •MAY LOSE VALUE •NO BANK GUARANTEE
Neither the Fund nor Fidelity Distributors Corporation is a bank.
Fidelity® Ohio Municipal Income Fund
Performance: The Bottom Line
Average annual total return reflects the change in the value of an investment, assuming reinvestment of distributions from dividend income and capital gains (the profits earned upon the sale of securities that have grown in value, if any) and assuming a constant rate of performance each year. The hypothetical investment and the average annual total returns do not reflect the deduction of taxes that a shareholder would pay on fund distributions or the redemption of fund shares. During periods of reimbursement by Fidelity, a fund’s total return will be greater than it would be had the reimbursement not occurred. How a fund did yesterday is no guarantee of how it will do tomorrow.
Average Annual Total Returns
| For the periods ended December 31, 2018 | Past 1 year | Past 5 years | Past 10 years |
| Fidelity® Ohio Municipal Income Fund | 0.39% | 4.15% | 4.67% |
$10,000 Over 10 Years
Let's say hypothetically that $10,000 was invested in Fidelity® Ohio Municipal Income Fund on December 31, 2008.
The chart shows how the value of your investment would have changed, and also shows how the Bloomberg Barclays Municipal Bond Index performed over the same period.
| Period Ending Values |
| $15,792 | Fidelity® Ohio Municipal Income Fund |
| $16,060 | Bloomberg Barclays Municipal Bond Index |
Fidelity® Ohio Municipal Income Fund
Management's Discussion of Fund Performance
Market Recap: Tax-exempt municipal bonds gained modestly in 2018, with the Bloomberg Barclays Municipal Bond Index returning 1.28%, supported by lower bond issuance and solid economic growth. Tax reform had a significant impact on both the supply of and demand for tax-exempt bonds the past year. In the final months of 2017, issuers accelerated their bond financings in order to issue under the old tax rules, prompting a surge in supply. Investors absorbed this excess supply, anticipating that issuance would fall significantly in 2018. The market turned lower in early 2018, as domestic fixed-income markets reacted to robust economic data and signs of inflation, before stabilizing in March and rallying through August. The municipal market experienced volatility in September and October amid concerns of an economic slowdown, then rebounded to close December near a high for the year. Gross municipal bond issuance ended 2018 down approximately 25%. There was little differentiation in performance across municipal sectors in 2018. General obligation bonds gained 1.33%, with bonds issued by states slightly outperforming those backed by local municipalities. Looking ahead, market volatility is likely to persist due to uncertainty about how the U.S. Federal Reserve will react to labor and inflation trends.
Comments from Co-Portfolio Managers Elizah McLaughlin, Cormac Cullen and Kevin Ramundo: For the fiscal year ending December 31, 2018, the fund gained 0.39%, lagging, net of fees, the 1.09% advance of the state benchmark, the Bloomberg Barclays Ohio 2+ Year Enhanced Modified 2% Municipal Bond Index. The fund also trailed its Lipper peer group average for the period. The fund's state benchmark is new as of August 1 and allows for the inclusion of shorter-maturity bonds, which lowers duration to a level more in line with the fund's competitive universe. Relative to the state benchmark, differences in the way fund holdings and index components were priced detracted from fund performance. The fund's underweighting in bonds backed by the state of Ohio and its various entities also detracted. In contrast, the portfolio's overweighting in bonds issued by the Lancaster School District, which were advance refunded during the period, boosted the relative result. An overweighting in Summa Health System also contributed, as these bonds performed comparatively well.
The views expressed above reflect those of the portfolio manager(s) only through the end of the period as stated on the cover of this report and do not necessarily represent the views of Fidelity or any other person in the Fidelity organization. Any such views are subject to change at any time based upon market or other conditions and Fidelity disclaims any responsibility to update such views. These views may not be relied on as investment advice and, because investment decisions for a Fidelity fund are based on numerous factors, may not be relied on as an indication of trading intent on behalf of any Fidelity fund.
Note to Shareholders: On September 1, 2018, Elizah McLaughlin joined the municipal bond portfolio management team, succeeding Mark Sommer, who retired from Fidelity on December 31, 2018, after 27 years with the firm.
Fidelity® Ohio Municipal Income Fund
Investment Summary (Unaudited)
Top Five Sectors as of December 31, 2018
| | % of fund's net assets |
| Health Care | 32.9 |
| Education | 24.8 |
| General Obligations | 21.2 |
| Escrowed/Pre-Refunded | 5.7 |
| Electric Utilities | 4.7 |
Quality Diversification (% of fund's net assets)
| As of December 31, 2018 |
| | AAA | 2.3% |
| | AA,A | 77.2% |
| | BBB | 8.8% |
| | BB and Below | 2.2% |
| | Not Rated | 1.4% |
| | Short-Term Investments and Net Other Assets | 8.1% |

We have used ratings from Moody's Investors Service, Inc. Where Moody's® ratings are not available, we have used S&P® ratings. All ratings are as of the date indicated and do not reflect subsequent changes.
Fidelity® Ohio Municipal Income Fund
Schedule of Investments December 31, 2018
Showing Percentage of Net Assets
| Municipal Bonds - 91.9% | | | |
| | | Principal Amount | Value |
| Guam - 0.3% | | | |
| Guam Int'l. Arpt. Auth. Rev. Series 2013 C, 6.25% 10/1/34 (a) | | 900,000 | 1,022,436 |
| Guam Pwr. Auth. Rev. Series 2012 A, 5% 10/1/23 (FSA Insured) | | 1,000,000 | 1,091,040 |
|
| TOTAL GUAM | | | 2,113,476 |
|
| Ohio - 91.6% | | | |
| Akron Bath Copley Hosp. District Rev.: | | | |
| (Children's Hosp. Med. Ctr. Proj.) Series 2012: | | $ | $ |
| 5% 11/15/22 | | 1,000,000 | 1,090,020 |
| 5% 11/15/23 | | 3,245,000 | 3,523,908 |
| Series 2016: | | | |
| 5% 11/15/22 | | 1,020,000 | 1,111,035 |
| 5.25% 11/15/34 | | 1,500,000 | 1,674,720 |
| 5.25% 11/15/41 | | 10,295,000 | 11,294,027 |
| Allen County Hosp. Facilities Rev.: | | | |
| (Mercy Health) Series 2017 A: | | | |
| 4% 8/1/36 | | 5,000,000 | 5,118,550 |
| 5% 8/1/42 | | 4,175,000 | 4,600,307 |
| Bonds Series 2017 B, 5%, tender 5/5/22 (b) | | 3,000,000 | 3,282,090 |
| American Muni. Pwr., Inc. Rev.: | | | |
| (AMP Freemont Energy Ctr. Proj.) Series 2012 B, 5.25% 2/15/26 (Pre-Refunded to 2/15/22 @ 100) | | 6,875,000 | 7,555,488 |
| (Greenup Hydroelectric Proj.) Series 2016 A, 5% 2/15/41 | | 3,005,000 | 3,306,552 |
| (Prairie State Energy Campus Proj.) Series 2015: | | | |
| 5% 2/15/28 | | 3,995,000 | 4,453,506 |
| 5% 2/15/42 | | 3,000,000 | 3,270,660 |
| Bonds (Combined Hydroelectric Proj.) Series 2018, 2.25%, tender 8/15/21 (b) | | 7,000,000 | 6,998,180 |
| Beavercreek City School District Series 2015: | | | |
| 5% 12/1/28 | | 1,500,000 | 1,731,585 |
| 5% 12/1/29 | | 1,500,000 | 1,725,300 |
| Bowling Green Univ. Gen. Receipts Series 2016 A, 5% 6/1/42 | | 1,000,000 | 1,100,370 |
| Butler County Hosp. Facilities Rev.: | | | |
| (Kettering Health Network Obligated Group Proj.) Series 2011, 6.375% 4/1/36 | | 5,030,000 | 5,476,815 |
| Series 2016 X: | | | |
| 5% 5/15/31 | | 3,225,000 | 3,931,985 |
| 5% 5/15/32 | | 3,950,000 | 4,834,089 |
| Chillicothe Hosp. Facilities Rev. (Adena Health Sys. Oblig. Group Proj.) Series 2017, 5% 12/1/47 | | 3,000,000 | 3,232,260 |
| Cincinnati City School District Ctfs. of Prtn. (Cincinnati City School District School Impt. Proj.) 5% 12/15/26 | | 4,000,000 | 4,549,640 |
| Cincinnati Gen. Oblig. Series 2015, 5.25% 12/1/29 | | 4,285,000 | 5,009,379 |
| Cleveland Arpt. Sys. Rev. Series 2018 A: | | | |
| 5% 1/1/43 (FSA Insured) (a) | | 1,750,000 | 1,929,270 |
| 5% 1/1/48 (FSA Insured) (a) | | 3,000,000 | 3,294,720 |
| Cleveland Gen. Oblig.: | | | |
| Series 2012, 5% 12/1/25 | | 2,350,000 | 2,608,312 |
| Series 2015: | | | |
| 5% 12/1/26 | | 1,500,000 | 1,734,570 |
| 5% 12/1/27 | | 2,000,000 | 2,304,540 |
| 5% 12/1/29 | | 1,250,000 | 1,429,275 |
| Series C, 5.25% 11/15/23 (Nat'l. Pub. Fin. Guarantee Corp. Insured) | | 1,885,000 | 2,152,651 |
| Cleveland Heights & Univ. Heights County School District Series 2014, 4.5% 12/1/47 | | 3,000,000 | 3,098,010 |
| Cleveland Income Tax Rev. Series 2018 A: | | | |
| 5% 10/1/29 | | 600,000 | 708,438 |
| 5% 10/1/30 | | 420,000 | 493,286 |
| 5% 10/1/31 | | 650,000 | 759,967 |
| 5% 10/1/33 | | 600,000 | 696,750 |
| 5% 10/1/36 | | 700,000 | 802,522 |
| 5% 10/1/39 | | 2,040,000 | 2,314,278 |
| 5% 10/1/43 | | 5,000,000 | 5,638,250 |
| Cleveland Muni. School District: | | | |
| Series 2013, 5% 12/1/24 | | 1,255,000 | 1,391,946 |
| Series 2015 A: | | | |
| 5% 12/1/24 | | 3,725,000 | 4,151,140 |
| 5% 12/1/27 | | 1,750,000 | 1,938,563 |
| Cleveland Ohio Wtr. Poll. Ctl. Rev. Series 2016: | | | |
| 5% 11/15/34 | | 1,190,000 | 1,341,380 |
| 5% 11/15/35 | | 1,245,000 | 1,400,077 |
| 5% 11/15/36 | | 450,000 | 504,275 |
| 5% 11/15/45 | | 2,000,000 | 2,209,900 |
| Cleveland Pub. Pwr. Sys. Rev.: | | | |
| Series 2016 A, 5% 11/15/22 (FSA Insured) | | 3,970,000 | 4,385,977 |
| Series 2018: | | | |
| 5% 11/15/23 (FSA Insured) | | 360,000 | 405,032 |
| 5% 11/15/24 (FSA Insured) | | 475,000 | 542,754 |
| 5% 11/15/25 (FSA Insured) | | 200,000 | 231,090 |
| 5% 11/15/26 (FSA Insured) | | 265,000 | 309,361 |
| 5% 11/15/27 (FSA Insured) | | 220,000 | 259,085 |
| 5% 11/15/28 (FSA Insured) | | 150,000 | 177,020 |
| 5% 11/15/29 (FSA Insured) | | 210,000 | 247,069 |
| 5% 11/15/30 (FSA Insured) | | 530,000 | 619,756 |
| 5% 11/15/32 (FSA Insured) | | 365,000 | 423,243 |
| 5% 11/15/34 (FSA Insured) | | 785,000 | 902,664 |
| 5% 11/15/36 (FSA Insured) | | 1,000,000 | 1,141,170 |
| 5% 11/15/38 (FSA Insured) | | 830,000 | 938,581 |
| Cleveland State Univ. Gen. Receipts Series 2012: | | | |
| 5% 6/1/24 | | 1,920,000 | 2,074,714 |
| 5% 6/1/25 | | 2,500,000 | 2,699,225 |
| 5% 6/1/26 | | 3,075,000 | 3,314,635 |
| Cleveland Wtr. Rev.: | | | |
| Series 2012 X, 5% 1/1/42 | | 5,465,000 | 5,861,704 |
| Series 2015 Y: | | | |
| 4% 1/1/28 | | 650,000 | 695,513 |
| 4% 1/1/29 | | 1,040,000 | 1,108,786 |
| Cleveland-Cuyahoga County Port Auth. Dev. Lease Rev. (Administrative Headquarters Proj.) Series 2013, 5% 7/1/37 | | 3,000,000 | 3,570,720 |
| Columbus City School District 5% 12/1/31 | | 5,000,000 | 5,774,900 |
| Columbus Gen. Oblig. Series 2014 A, 4% 2/15/28 | | 5,000,000 | 5,397,950 |
| Columbus Metropolitan Library Facility Series 2012 1, 5% 12/1/23 (Pre-Refunded to 12/1/20 @ 100) | | 530,000 | 561,715 |
| Cuyahoga County Gen. Oblig. Series 2012 A, 4% 12/1/27 | | 1,575,000 | 1,626,550 |
| Cuyahoga County Hosp. Rev. Series 2017: | | | |
| 5% 2/15/26 | | 1,750,000 | 1,940,785 |
| 5% 2/15/27 | | 1,700,000 | 1,896,571 |
| 5% 2/15/28 | | 2,385,000 | 2,625,170 |
| 5% 2/15/30 | | 3,000,000 | 3,273,360 |
| 5% 2/15/31 | | 1,500,000 | 1,629,015 |
| 5% 2/15/32 | | 1,450,000 | 1,567,334 |
| Dayton Gen. Oblig.: | | | |
| 4% 12/1/22 | | 750,000 | 777,833 |
| 4% 12/1/25 | | 1,540,000 | 1,592,452 |
| Fairfield County Hosp. Facilities Rev. (Fairfield Med. Ctr. Proj.) Series 2013, 5.25% 6/15/43 | | 5,000,000 | 5,269,050 |
| Fairview Park Gen. Oblig. Series 2012: | | | |
| 4% 12/1/23 | | 1,395,000 | 1,494,547 |
| 4% 12/1/24 | | 1,490,000 | 1,593,421 |
| Franklin County Convention Facilities Auth. Tax & Lease Rev. Series 2014: | | | |
| 5% 12/1/25 | | 1,250,000 | 1,433,275 |
| 5% 12/1/26 | | 3,045,000 | 3,480,618 |
| 5% 12/1/32 | | 5,920,000 | 6,711,030 |
| Franklin County Hosp. Facilities Rev.: | | | |
| (Ohiohealth Corp. Proj.) Series 2015, 5% 5/15/40 | | 3,600,000 | 3,929,256 |
| Series 2016 C: | | | |
| 4% 11/1/40 | | 3,000,000 | 3,059,550 |
| 5% 11/1/33 | | 2,610,000 | 3,004,502 |
| 5% 11/1/34 | | 2,155,000 | 2,468,725 |
| Greater Cleveland Reg'l. Transit Auth. Series 2012, 5% 12/1/23 | | 660,000 | 715,519 |
| Hamilton City School District Series 2015: | | | |
| 3.5% 12/1/31 | | 1,500,000 | 1,527,270 |
| 5% 12/1/26 | | 1,500,000 | 1,715,475 |
| 5% 12/1/28 | | 1,550,000 | 1,767,155 |
| Hamilton County Convention Facilities Auth. Rev. Series 2014: | | | |
| 5% 12/1/26 | | 1,000,000 | 1,106,560 |
| 5% 12/1/27 | | 3,825,000 | 4,227,008 |
| Hamilton County HealthCare Facilities Rev. (The Christ Hosp. Proj.) Series 2012: | | | |
| 5.25% 6/1/24 | | 3,000,000 | 3,286,620 |
| 5.25% 6/1/27 | | 3,000,000 | 3,270,120 |
| Hamilton County Healthcare Rev. (Life Enriching Cmntys. Proj.) Series 2016: | | | |
| 5% 1/1/31 | | 1,350,000 | 1,415,705 |
| 5% 1/1/36 | | 3,450,000 | 3,558,779 |
| Hamilton County Hosp. Facilities Rev. (Children's Hosp. Med. Ctr. Proj.) Series 2014 S, 5% 5/15/26 | | 5,000,000 | 5,691,300 |
| Hamilton County Student Hsg. Rev. (Stratford Heights Proj.) Series 2010, 5% 6/1/30 (FSA Insured) | | 2,500,000 | 2,598,825 |
| Hancock County Hosp. Facilities Rev. (Blanchard Valley Reg'l. Health Ctr. Proj.) Series 2011 A, 6.25% 12/1/34 (Pre-Refunded to 6/1/21 @ 100) | | 4,100,000 | 4,515,248 |
| Kent State Univ. Revs.: | | | |
| Series 2009 B: | | | |
| 5% 5/1/26 | | 335,000 | 338,363 |
| 5% 5/1/28 | | 415,000 | 419,113 |
| 5% 5/1/29 | | 85,000 | 85,837 |
| 5% 5/1/30 | | 95,000 | 95,869 |
| Series 2012 A: | | | |
| 5% 5/1/24 | | 1,385,000 | 1,512,932 |
| 5% 5/1/25 | | 1,500,000 | 1,636,545 |
| 5% 5/1/26 | | 2,220,000 | 2,419,090 |
| Series 2016: | | | |
| 5% 5/1/29 | | 2,000,000 | 2,313,980 |
| 5% 5/1/30 | | 1,125,000 | 1,294,335 |
| Kettering City School District Series 2017, 5% 12/1/25 | | 1,080,000 | 1,269,097 |
| Lake County Hosp. Facilities Rev. Series 2015: | | | |
| 5% 8/15/27 | | 770,000 | 870,154 |
| 5% 8/15/45 | | 11,000,000 | 11,805,310 |
| Lakewood City School District Series 2014 C: | | | |
| 5% 12/1/25 | | 1,300,000 | 1,502,267 |
| 5% 12/1/27 | | 3,215,000 | 3,690,209 |
| Lancaster City School District Series 2012: | | | |
| 5% 10/1/37 (Pre-Refunded to 10/1/22 @ 100) | | 2,000,000 | 2,223,000 |
| 5% 10/1/49 | | 2,860,000 | 3,076,788 |
| 5% 10/1/49 (Pre-Refunded to 10/1/22 @ 100) | | 140,000 | 155,075 |
| Lucas County Hosp. Rev. Series 2011, 5% 11/15/25 (Pre-Refunded to 11/15/21 @ 100) | | 1,780,000 | 1,931,122 |
| Lucas-Plaza Hsg. Dev. Corp. Mtg. Rev. (The Plaza Section 8 Assisted Proj.) Series 1991 A, 0% 6/1/24 (Escrowed to Maturity) | | 9,000,000 | 7,893,090 |
| Miami Univ. Series 2012, 4% 9/1/28 | | 2,195,000 | 2,303,170 |
| Miamisburg City School District Series 2016: | | | |
| 5% 12/1/28 | | 500,000 | 580,595 |
| 5% 12/1/29 | | 300,000 | 347,118 |
| Middleburg Heights Hosp. Rev.: | | | |
| Series 2011, 5.25% 8/1/41 | | 3,000,000 | 3,222,570 |
| Series 2012 A, 5% 8/1/47 | | 5,725,000 | 6,171,092 |
| Milford Exempt Village School District Series 2015: | | | |
| 3.5% 12/1/31 | | 500,000 | 507,460 |
| 5% 12/1/28 | | 1,400,000 | 1,608,796 |
| Montgomery County Rev. (Catholic Health Initiatives Proj.) Series 2008 D, 6.25% 10/1/33 | | 2,500,000 | 2,509,600 |
| Muskingum County Hosp. Facilities (Genesis Healthcare Sys. Obligated Group Proj.) Series 2013: | | | |
| 5% 2/15/44 | | 4,005,000 | 4,088,344 |
| 5% 2/15/48 | | 3,495,000 | 3,557,211 |
| North Olmsted City School District Series 2015 A: | | | |
| 5% 12/1/26 (Pre-Refunded to 12/1/23 @ 100) | | 665,000 | 758,871 |
| 5% 12/1/27 (Pre-Refunded to 12/1/23 @ 100) | | 220,000 | 251,055 |
| 5% 12/1/28 (Pre-Refunded to 12/1/23 @ 100) | | 365,000 | 416,523 |
| 5% 12/1/29 (Pre-Refunded to 12/1/23 @ 100) | | 500,000 | 570,580 |
| 5% 12/1/30 (Pre-Refunded to 12/1/23 @ 100) | | 750,000 | 855,870 |
| Northeast Ohio Reg'l. Swr. District Wastewtr. Rev. Series 2014, 5% 11/15/44 | | 8,815,000 | 9,741,633 |
| Northwest Local School District Series 2015, 5% 12/1/45 | | 2,980,000 | 3,303,330 |
| Ohio Bldg. Auth. (Adult Correctional Bldg. Fund Proj.) Series 2010 A, 5% 10/1/24 | | 6,030,000 | 6,334,153 |
| Ohio Cap. Facilities Lease (Ohio Gen. Oblig. Proj.) Series 2017 A: | | | |
| 5% 10/1/32 | | 1,625,000 | 1,899,138 |
| 5% 10/1/33 | | 1,500,000 | 1,745,475 |
| 5% 10/1/35 | | 1,450,000 | 1,672,749 |
| 5% 10/1/36 | | 1,250,000 | 1,434,763 |
| 5% 10/1/37 | | 1,430,000 | 1,635,462 |
| Ohio Gen. Oblig.: | | | |
| Series 2014 C, 4% 3/1/25 | | 5,000,000 | 5,364,150 |
| Series 2016 A, 5% 2/1/31 | | 4,255,000 | 4,902,313 |
| Ohio Higher Edl. Facility Commission Rev.: | | | |
| (Case Western Reserve Univ. Proj.): | | | |
| Series 1990 B, 6.5% 10/1/20 | | 875,000 | 918,330 |
| Series 2016, 5% 12/1/40 | | 2,000,000 | 2,249,800 |
| (Denison Univ. 2015 Proj.): | | | |
| 5% 11/1/28 | | 1,465,000 | 1,680,853 |
| 5% 11/1/29 | | 1,325,000 | 1,516,873 |
| 5% 11/1/30 | | 2,285,000 | 2,605,860 |
| (Denison Univ., Proj.) Series 2017 B, 5% 11/1/26 | | 1,505,000 | 1,780,325 |
| (Kenyon College 2010 Proj.) Series 2010, 5.25% 7/1/44 | | 875,000 | 914,025 |
| (Kenyon College 2015 Proj.) 5% 7/1/41 | | 5,100,000 | 5,590,620 |
| (Kenyon College 2016 Proj.) Series 2016, 5% 7/1/42 | | 4,000,000 | 4,423,080 |
| (Kenyon College, Oh. Proj.) Series 2017: | | | |
| 4% 7/1/36 | | 400,000 | 415,780 |
| 4% 7/1/37 | | 450,000 | 466,412 |
| 5% 7/1/28 | | 400,000 | 470,748 |
| 5% 7/1/29 | | 735,000 | 859,516 |
| 5% 7/1/30 | | 300,000 | 348,603 |
| 5% 7/1/31 | | 400,000 | 462,516 |
| 5% 7/1/33 | | 650,000 | 744,744 |
| 5% 7/1/35 | | 700,000 | 794,185 |
| 5% 7/1/42 | | 1,400,000 | 1,559,684 |
| (Univ. Hosp. Health Sys. Proj.) Series 2010 A, 5.25% 1/15/23 | | 2,500,000 | 2,580,050 |
| (Univ. of Dayton Proj.): | | | |
| Series 2013: | | | |
| 5% 12/1/23 | | 540,000 | 595,928 |
| 5% 12/1/24 | | 585,000 | 645,588 |
| 5% 12/1/25 | | 1,000,000 | 1,103,570 |
| 5% 12/1/26 | | 1,195,000 | 1,317,822 |
| 5% 12/1/27 | | 2,300,000 | 2,530,966 |
| Series 2018 B: | | | |
| 4% 12/1/33 | | 1,155,000 | 1,220,881 |
| 5% 12/1/19 | | 1,000,000 | 1,028,313 |
| 5% 12/1/21 | | 1,000,000 | 1,083,820 |
| 5% 12/1/23 | | 1,000,000 | 1,130,640 |
| 5% 12/1/25 | | 1,065,000 | 1,241,087 |
| 5% 12/1/27 | | 1,000,000 | 1,192,410 |
| 5% 12/1/29 | | 1,310,000 | 1,546,953 |
| 5% 12/1/31 | | 1,130,000 | 1,319,128 |
| 5% 12/1/35 | | 1,000,000 | 1,145,250 |
| 5% 12/1/36 | | 1,000,000 | 1,138,280 |
| (Xavier Univ. Proj.) Series 2015 C: | | | |
| 5% 5/1/26 | | 1,000,000 | 1,126,730 |
| 5% 5/1/28 | | 1,000,000 | 1,120,570 |
| 5% 5/1/29 | | 855,000 | 956,514 |
| 5% 5/1/31 | | 1,005,000 | 1,115,128 |
| Ohio Hosp. Facilities Rev.: | | | |
| Series 2011 A, 5% 1/1/32 | | 3,500,000 | 3,692,325 |
| Series 2017 A, 5% 1/1/32 | | 2,000,000 | 2,345,980 |
| Ohio Hosp. Rev.: | | | |
| Series 2013 A, 5% 1/15/27 | | 5,000,000 | 5,474,700 |
| 5% 1/15/41 | | 5,000,000 | 5,415,300 |
| Ohio Spl. Oblig.: | | | |
| ( Ohio Gen. Oblig. Proj.) Series 2017 A, 5% 4/1/32 | | 1,115,000 | 1,295,318 |
| ( Ohio Gen. Oblig. Proj.P Series 2017 A, 5% 4/1/34 | | 1,000,000 | 1,152,970 |
| (Ohio Gen. Oblig. Proj.) Series 2017 A: | | | |
| 5% 4/1/29 | | 2,535,000 | 2,992,010 |
| 5% 4/1/30 | | 2,250,000 | 2,639,205 |
| 5% 4/1/31 | | 2,000,000 | 2,333,060 |
| 5% 4/1/33 | | 1,850,000 | 2,141,801 |
| 5% 4/1/35 | | 2,395,000 | 2,753,771 |
| Ohio State Univ. Gen. Receipts: | | | |
| Series 2010 D, 5% 12/1/31 | | 1,365,000 | 1,693,487 |
| Series 2013 A: | | | |
| 5% 6/1/28 | | 2,000,000 | 2,229,700 |
| 5% 6/1/38 | | 3,500,000 | 3,855,530 |
| Ohio Tpk. Commission Tpk. Rev.: | | | |
| (Infastructure Proj.) Series 2005 A, 0% 2/15/43 | | 10,000,000 | 3,820,400 |
| Series 2017 A: | | | |
| 5% 2/15/30 | | 1,000,000 | 1,170,580 |
| 5% 2/15/31 | | 1,000,000 | 1,165,820 |
| Ohio Univ. Gen. Receipts Athens Series 2013, 5% 12/1/24 | | 5,075,000 | 5,596,609 |
| Ohio Wtr. Dev. Auth. Rev. (Fresh Wtr. Impt. Proj.) Series 2009 B, 5% 12/1/24 | | 1,025,000 | 1,180,575 |
| Olentangy Local School District 5% 12/1/32 | | 1,275,000 | 1,470,011 |
| Princeton City School District Series 2014, 5% 12/1/39 | | 2,750,000 | 3,082,200 |
| Reynoldsburg City School District 4% 12/1/30 | | 2,375,000 | 2,539,706 |
| Scioto County Hosp. Facilities Rev. Series 2016: | | | |
| 5% 2/15/24 | | 970,000 | 1,088,243 |
| 5% 2/15/28 | | 5,030,000 | 5,728,969 |
| 5% 2/15/30 | | 2,145,000 | 2,412,160 |
| 5% 2/15/32 | | 2,550,000 | 2,839,986 |
| 5% 2/15/33 | | 2,460,000 | 2,731,486 |
| 5% 2/15/34 | | 3,005,000 | 3,320,555 |
| South-Western City School District Franklin & Pickway County: | | | |
| (Intercept) Series 2012, 5% 12/1/36 | | 400,000 | 434,132 |
| Series 2012, 5% 12/1/36 (Pre-Refunded to 6/1/22 @ 100) | | 1,600,000 | 1,761,376 |
| Toledo Gen. Oblig. Series 2012 A, 5% 12/1/20 | | 1,635,000 | 1,723,650 |
| Univ. of Akron Gen. Receipts Series 2016 A: | | | |
| 5% 1/1/23 | | 460,000 | 508,995 |
| 5% 1/1/25 | | 1,025,000 | 1,174,199 |
| 5% 1/1/33 | | 5,000,000 | 5,670,300 |
| Univ. of Cincinnati Gen. Receipts: | | | |
| Series 2010 F, 5% 6/1/32 | | 2,000,000 | 2,103,820 |
| Series 2012 C: | | | |
| 4% 6/1/28 | | 2,000,000 | 2,130,300 |
| 5% 6/1/24 | | 1,230,000 | 1,362,754 |
| Series 2013 A: | | | |
| 5% 6/1/33 | | 4,085,000 | 4,507,144 |
| 5% 6/1/34 | | 5,130,000 | 5,651,105 |
| Series 2016 A: | | | |
| 5% 6/1/32 | | 745,000 | 855,066 |
| 5% 6/1/33 | | 800,000 | 914,736 |
| 5% 6/1/34 | | 585,000 | 665,549 |
| Series 2016 C, 5% 6/1/41 | | 2,585,000 | 2,882,534 |
| Univ. of Toledo Gen. Receipts: | | | |
| Series 2017 B, 5% 6/1/31 | | 2,470,000 | 2,970,175 |
| Series 2018 A: | | | |
| 5% 6/1/26 | | 600,000 | 701,334 |
| 5% 6/1/27 | | 350,000 | 413,669 |
| Village of Bluffton Hosp. Facilities Blanchard Valley Reg Health Ctr. Series 2017: | | | |
| 4% 12/1/32 | | 1,500,000 | 1,545,360 |
| 5% 12/1/25 | | 1,500,000 | 1,720,215 |
| 5% 12/1/26 | | 1,890,000 | 2,181,740 |
| 5% 12/1/27 | | 1,340,000 | 1,558,407 |
| 5% 12/1/28 | | 1,400,000 | 1,612,758 |
| 5% 12/1/29 | | 825,000 | 945,524 |
| 5% 12/1/30 | | 1,700,000 | 1,939,819 |
| 5% 12/1/31 | | 750,000 | 852,060 |
| Willoughby-Eastlake City School District Series 2016, 5% 12/1/46 | | 4,000,000 | 4,432,680 |
| Wood County Hosp. Facilities Rev.: | | | |
| (Hosp. Proj.) Series 2012, 5% 12/1/27 | | 3,500,000 | 3,696,805 |
| (Wood County Hosp. Assoc. Proj.) Series 2012: | | | |
| 5% 12/1/32 | | 2,000,000 | 2,087,140 |
| 5% 12/1/42 | | 125,000 | 128,476 |
| Wright State Univ. Gen. Receipts Series 2011 A: | | | |
| 5% 5/1/20 | | 1,650,000 | 1,701,084 |
| 5% 5/1/21 | | 1,080,000 | 1,135,642 |
| 5% 5/1/23 | | 2,665,000 | 2,788,763 |
|
| TOTAL OHIO | | | 564,359,425 |
|
| TOTAL MUNICIPAL BONDS | | | |
| (Cost $554,771,293) | | | 566,472,901 |
|
| Municipal Notes - 7.0% | | | |
| Ohio - 7.0% | | | |
| Montgomery County Hosp. Rev.: | | | |
| Series 2016 E, 1.7% 1/2/19, LOC Barclays Bank PLC, VRDN (b) | | 2,100,000 | $2,100,000 |
| Series 2016 F, 1.7% 1/2/19, LOC Barclays Bank PLC, VRDN (b) | | 3,320,000 | 3,320,000 |
| Ohio Higher Edl. Facility Commission Rev. (Cleveland Clinic Foundation Proj.) Series 2008 B4, 1.7% 1/2/19 (Liquidity Facility Barclays Bank PLC), VRDN (b) | | 9,290,000 | 9,290,000 |
| Ohio Hosp. Rev. Series 2018, 1.7% 1/2/19, LOC PNC Bank NA, VRDN (b) | | 3,040,000 | 3,040,000 |
| Ohio State Univ. Gen. Receipts Series 2010 E, 1.72% 1/7/19, VRDN (b) | | 25,000,000 | 24,999,991 |
| TOTAL MUNICIPAL NOTES | | | |
| (Cost $42,750,000) | | | 42,749,991 |
| TOTAL INVESTMENT IN SECURITIES - 98.9% | | | |
| (Cost $597,521,293) | | | 609,222,892 |
| NET OTHER ASSETS (LIABILITIES) - 1.1% | | | 7,082,700 |
| NET ASSETS - 100% | | | $616,305,592 |
Security Type Abbreviations
VRDN – VARIABLE RATE DEMAND NOTE (A debt instrument that is payable upon demand, either daily, weekly or monthly)
Legend
(a) Private activity obligations whose interest is subject to the federal alternative minimum tax for individuals.
(b) Coupon rates for floating and adjustable rate securities reflect the rates in effect at period end.
Investment Valuation
All investments are categorized as Level 2 under the Fair Value Hierarchy. The inputs or methodology used for valuing securities may not be an indication of the risk associated with investing in those securities. For more information on valuation inputs please refer to the Investment Valuation section in the accompanying Notes to Financial Statements.
Other Information
The distribution of municipal securities by revenue source, as a percentage of total Net Assets, is as follows (Unaudited):
| Health Care | 32.9% |
| Education | 24.8% |
| General Obligations | 21.2% |
| Escrowed/Pre-Refunded | 5.7% |
| Others* (Individually Less Than 5%) | 15.4% |
| | 100.0% |
* Includes net other assets
See accompanying notes which are an integral part of the financial statements.
Fidelity® Ohio Municipal Income Fund
Financial Statements
Statement of Assets and Liabilities
| | | December 31, 2018 |
| Assets | | |
Investment in securities, at value — See accompanying schedule:
Unaffiliated issuers (cost $597,521,293) | | $609,222,892 |
| Cash | | 3,824,383 |
| Receivable for fund shares sold | | 955,094 |
| Interest receivable | | 5,579,202 |
| Prepaid expenses | | 937 |
| Other receivables | | 1,568 |
| Total assets | | 619,584,076 |
| Liabilities | | |
| Payable for fund shares redeemed | $2,499,653 | |
| Distributions payable | 491,029 | |
| Accrued management fee | 183,005 | |
| Other affiliated payables | 57,197 | |
| Other payables and accrued expenses | 47,600 | |
| Total liabilities | | 3,278,484 |
| Net Assets | | $616,305,592 |
| Net Assets consist of: | | |
| Paid in capital | | $604,454,256 |
| Total distributable earnings (loss) | | 11,851,336 |
| Net Assets, for 51,820,704 shares outstanding | | $616,305,592 |
| Net Asset Value, offering price and redemption price per share ($616,305,592 ÷ 51,820,704 shares) | | $11.89 |
See accompanying notes which are an integral part of the financial statements.
Statement of Operations
| | | Year ended December 31, 2018 |
| Investment Income | | |
| Interest | | $20,431,717 |
| Expenses | | |
| Management fee | $2,280,655 | |
| Transfer agent fees | 559,886 | |
| Accounting fees and expenses | 151,617 | |
| Custodian fees and expenses | 4,889 | |
| Independent trustees' fees and expenses | 2,983 | |
| Registration fees | 24,103 | |
| Audit | 54,469 | |
| Legal | 2,808 | |
| Miscellaneous | 4,703 | |
| Total expenses before reductions | 3,086,113 | |
| Expense reductions | (8,793) | |
| Total expenses after reductions | | 3,077,320 |
| Net investment income (loss) | | 17,354,397 |
| Realized and Unrealized Gain (Loss) | | |
| Net realized gain (loss) on: | | |
| Investment securities: | | |
| Unaffiliated issuers | | 255,765 |
| Total net realized gain (loss) | | 255,765 |
| Change in net unrealized appreciation (depreciation) on investment securities | | (16,148,891) |
| Net gain (loss) | | (15,893,126) |
| Net increase (decrease) in net assets resulting from operations | | $1,461,271 |
See accompanying notes which are an integral part of the financial statements.
Statement of Changes in Net Assets
| | Year ended December 31, 2018 | Year ended December 31, 2017 |
| Increase (Decrease) in Net Assets | | |
| Operations | | |
| Net investment income (loss) | $17,354,397 | $18,088,000 |
| Net realized gain (loss) | 255,765 | 5,264,402 |
| Change in net unrealized appreciation (depreciation) | (16,148,891) | 15,306,731 |
| Net increase (decrease) in net assets resulting from operations | 1,461,271 | 38,659,133 |
| Distributions to shareholders | (19,076,332) | – |
| Distributions to shareholders from net investment income | – | (18,087,879) |
| Distributions to shareholders from net realized gain | – | (4,790,838) |
| Total distributions | (19,076,332) | (22,878,717) |
| Share transactions | | |
| Proceeds from sales of shares | 81,600,273 | 83,569,244 |
| Reinvestment of distributions | 12,319,390 | 14,264,227 |
| Cost of shares redeemed | (137,357,769) | (93,359,800) |
| Net increase (decrease) in net assets resulting from share transactions | (43,438,106) | 4,473,671 |
| Total increase (decrease) in net assets | (61,053,167) | 20,254,087 |
| Net Assets | | |
| Beginning of period | 677,358,759 | 657,104,672 |
| End of period | $616,305,592 | $677,358,759 |
| Other Information | | |
| Undistributed net investment income end of period | | $87,606 |
| Shares | | |
| Sold | 6,872,638 | 6,896,568 |
| Issued in reinvestment of distributions | 1,039,123 | 1,179,587 |
| Redeemed | (11,595,747) | (7,726,040) |
| Net increase (decrease) | (3,683,986) | 350,115 |
See accompanying notes which are an integral part of the financial statements.
Financial Highlights
Fidelity Ohio Municipal Income Fund
| | | | | | |
| Years ended December 31, | 2018 | 2017 | 2016 | 2015 | 2014 |
| Selected Per–Share Data | | | | | |
| Net asset value, beginning of period | $12.20 | $11.91 | $12.29 | $12.26 | $11.48 |
| Income from Investment Operations | | | | | |
| Net investment income (loss)A | .321 | .330 | .339 | .363 | .384 |
| Net realized and unrealized gain (loss) | (.279) | .377 | (.308) | .147 | .780 |
| Total from investment operations | .042 | .707 | .031 | .510 | 1.164 |
| Distributions from net investment income | (.321) | (.330) | (.339) | (.363) | (.384) |
| Distributions from net realized gain | (.031) | (.087) | (.072) | (.117) | – |
| Total distributions | (.352) | (.417) | (.411) | (.480) | (.384) |
| Redemption fees added to paid in capitalA | – | – | –B | –B | –B |
| Net asset value, end of period | $11.89 | $12.20 | $11.91 | $12.29 | $12.26 |
| Total ReturnC | .39% | 6.03% | .19% | 4.24% | 10.26% |
| Ratios to Average Net AssetsD | | | | | |
| Expenses before reductions | .48% | .48% | .48% | .48% | .48% |
| Expenses net of fee waivers, if any | .48% | .48% | .48% | .48% | .48% |
| Expenses net of all reductions | .48% | .48% | .48% | .48% | .48% |
| Net investment income (loss) | 2.70% | 2.73% | 2.72% | 2.97% | 3.20% |
| Supplemental Data | | | | | |
| Net assets, end of period (000 omitted) | $616,306 | $677,359 | $657,105 | $636,261 | $598,694 |
| Portfolio turnover rate | 11% | 24% | 17% | 17% | 7% |
A Calculated based on average shares outstanding during the period.
B Amount represents less than $.0005 per share.
C Total returns would have been lower if certain expenses had not been reduced during the applicable periods shown.
D Expense ratios reflect operating expenses of the Fund. Expenses before reductions do not reflect amounts reimbursed by the investment adviser or reductions from expense offset arrangements and do not represent the amount paid by the Fund during periods when reimbursements or reductions occur. Expenses net of fee waivers reflect expenses after reimbursement by the investment adviser but prior to reductions from expense offset arrangements. Expenses net of all reductions represent the net expenses paid by the Fund.
See accompanying notes which are an integral part of the financial statements.
Fidelity® Ohio Municipal Money Market Fund
Investment Summary/Performance (Unaudited)
Effective Maturity Diversification as of December 31, 2018
| Days | % of fund's investments 12/31/18 |
| 1 - 7 | 70.8 |
| 8 - 30 | 1.1 |
| 31 - 60 | 7.2 |
| 61 - 90 | 2.0 |
| 91 - 180 | 11.1 |
| >180 | 7.8 |
Effective maturity is determined in accordance with the requirements of Rule 2a-7 under the Investment Company Act of 1940.
Asset Allocation (% of fund's net assets)
| As of December 31, 2018 |
| | Variable Rate Demand Notes (VRDNs) | 39.9% |
| | Tender Option Bond | 29.4% |
| | Other Municipal Security | 24.8% |
| | Investment Companies | 6.6% |
| | Net Other Assets (Liabilities) | (0.7)*% |

* Net Other Assets (Liabilities) are not included in the pie chart
Current 7-Day Yields
| | 12/31/18 |
| Fidelity® Ohio Municipal Money Market Fund | 1.27% |
Yield refers to the income paid by the Fund over a given period. Yield for money market funds is usually for seven-day periods, as it is here, though it is expressed as an annual percentage rate. Past performance is no guarantee of future results. Yield will vary and it's possible to lose money investing in the Fund. A portion of the Fund's expenses was reimbursed and/or waived.
Fidelity® Ohio Municipal Money Market Fund
Schedule of Investments December 31, 2018
Showing Percentage of Net Assets
| Variable Rate Demand Note - 39.9% | | | |
| | | Principal Amount | Value |
| Alabama - 0.4% | | | |
| Decatur Indl. Dev. Board Exempt Facilities Rev. (Nucor Steel Decatur LLC Proj.) Series 2003 A, 2.03% 1/7/19, VRDN (a)(b) | | $1,260,000 | $1,260,000 |
| Arkansas - 1.1% | | | |
| Blytheville Indl. Dev. Rev. (Nucor Corp. Proj.): | | | |
| Series 1998, 2.03% 1/7/19, VRDN (a)(b) | | 400,000 | 400,000 |
| Series 2002, 1.88% 1/7/19, VRDN (a)(b) | | 2,700,000 | 2,700,000 |
| | | | 3,100,000 |
| Indiana - 0.4% | | | |
| Indiana Dev. Fin. Auth. Envir. Rev. (PSI Energy Proj.): | | | |
| Series 2003 A, 1.93% 1/7/19, VRDN (a)(b) | | 500,000 | 500,000 |
| Series 2003 B, 2.08% 1/7/19, VRDN (a)(b) | | 500,000 | 500,000 |
| | | | 1,000,000 |
| Kansas - 0.3% | | | |
| Burlington Envir. Impt. Rev. (Kansas City Pwr. and Lt. Co. Proj.) Series 2007 A, 2% 1/7/19, VRDN (b) | | 200,000 | 200,000 |
| St Marys Kansas Poll. Cont. Rev. (Kansas Gas and Elec. Co. Proj.) Series 1994, 2.01% 1/7/19, VRDN (b) | | 700,000 | 700,000 |
| | | | 900,000 |
| Louisiana - 0.1% | | | |
| Saint James Parish Gen. Oblig. (Nucor Steel Louisiana LLC Proj.): | | | |
| Series 2010 A1, 2% 1/7/19, VRDN (b) | | 300,000 | 300,000 |
| Series 2010 B1, 1.98% 1/7/19, VRDN (b) | | 100,000 | 100,000 |
| | | | 400,000 |
| Nebraska - 0.2% | | | |
| Stanton County Indl. Dev. Rev. (Nucor Corp. Proj.) Series 1996, 2.03% 1/7/19, VRDN (a)(b) | | 700,000 | 700,000 |
| North Carolina - 0.1% | | | |
| Hertford County Indl. Facilities Poll. Cont. Fing. Auth. (Nucor Corp. Proj.) Series 2000 A, 1.88% 1/7/19, VRDN (a)(b) | | 200,000 | 200,000 |
| Ohio - 36.9% | | | |
| Allen County Hosp. Facilities Rev. Series 2012 B, 1.73% 1/7/19, VRDN (b) | | 22,800,000 | 22,800,003 |
| Cuyahoga County Health Care Facilities Rev. (The A.M. McGregor Home Proj.) Series 2014, 1.82% 1/7/19, LOC Northern Trust Co., VRDN (b) | | 15,165,000 | 15,165,000 |
| Lake County Indl. Dev. Rev. (Norshar Co. Proj.) 1.86% 1/7/19, LOC JPMorgan Chase Bank, VRDN (a)(b) | | 905,000 | 905,000 |
| Ohio Higher Edl. Facility Commission Rev. (Cleveland Clinic Foundation Proj.) Series 2008 B4, 1.7% 1/2/19 (Liquidity Facility Barclays Bank PLC), VRDN (b) | | 3,800,000 | 3,800,000 |
| Ohio Hsg. Fin. Agcy. Residential Mtg. Rev.: | | | |
| Series 2016 F, 1.74% 1/7/19 (Liquidity Facility Fed. Home Ln. Bank, Cincinnati), VRDN (a)(b) | | 3,000,000 | 3,000,000 |
| Series 2016 G, 1.74% 1/7/19 (Liquidity Facility Fed. Home Ln. Bank, Cincinnati), VRDN (a)(b) | | 13,890,000 | 13,890,000 |
| Series 2016 H, 1.74% 1/7/19 (Liquidity Facility Fed. Home Ln. Bank, Cincinnati), VRDN (a)(b) | | 18,960,000 | 18,960,000 |
| Series 2016 I, 1.74% 1/7/19 (Liquidity Facility Fed. Home Ln. Bank, Cincinnati), VRDN (a)(b) | | 3,450,000 | 3,450,000 |
| Ohio Wtr. Dev. Auth. (Waste Mgmt., Inc. Proj.) Series B, 1.75% 1/7/19, LOC Bank of America NA, VRDN (a)(b) | | 15,000,000 | 15,000,000 |
| FHLMC Ohio Hsg. Fin. Agcy. Multi-family Hsg. Rev. (Wingate at Belle Meadows Proj.) 1.77% 1/7/19, LOC Fed. Home Ln. Bank, Cincinnati, VRDN (a)(b) | | 8,385,000 | 8,385,000 |
| FNMA Franklin County Multi-family Rev. Series 2002, 1.79% 1/7/19, LOC Fannie Mae, VRDN (a)(b) | | 4,950,000 | 4,950,000 |
| | | | 110,305,003 |
| South Carolina - 0.0% | | | |
| Berkeley County Indl. Dev. Rev. Series A, 1.92% 1/7/19, VRDN (a)(b) | | 100,000 | 100,000 |
| West Virginia - 0.4% | | | |
| West Virginia Econ. Dev. Auth. Solid Waste Disp. Facilities Rev. (Appalachian Pwr. Co.- Mountaineer Proj.) Series 2008 A, 1.86% 1/7/19, VRDN (a)(b) | | 1,200,000 | 1,200,000 |
| TOTAL VARIABLE RATE DEMAND NOTE | | | |
| (Cost $119,165,003) | | | 119,165,003 |
|
| Tender Option Bond - 29.4% | | | |
| California - 0.7% | | | |
| Dignity Health Participating VRDN Series DBE 80 11, 1.91% 1/7/19 (Liquidity Facility Deutsche Bank AG New York Branch) (b)(c) | | 2,100,000 | 2,100,000 |
| Colorado - 0.1% | | | |
| Colorado Health Facilities Auth. Rev. Participating VRDN Series Floaters 018, 1.89% 2/11/19 (Liquidity Facility Barclays Bank PLC) (b)(c)(d) | | 300,000 | 300,000 |
| Florida - 0.1% | | | |
| Florida Dept. of Trans. Tpk. Rev. Bonds Series Solar 17 02, 1.84%, tender 1/31/19 (Liquidity Facility U.S. Bank NA, Cincinnati) (b)(c) | | 100,000 | 100,000 |
| Illinois - 0.2% | | | |
| Illinois Fin. Auth. Rev. Participating VRDN Series Floaters 017, 1.89% 2/11/19 (Liquidity Facility Barclays Bank PLC) (b)(c)(d) | | 600,000 | 600,000 |
| Ohio - 28.3% | | | |
| Allen County Hosp. Facilities Rev. Participating VRDN Series Floaters XF 25 16, 1.81% 1/7/19 (Liquidity Facility Citibank NA) (b)(c) | | 4,340,000 | 4,340,000 |
| Cincinnati Wtr. Sys. Rev. Participating VRDN Series MS 3280, 1.74% 1/7/19 (Liquidity Facility Morgan Stanley Bank, West Valley City Utah) (b)(c) | | 3,750,000 | 3,750,000 |
| Cleveland Wtr. Rev. Participating VRDN Series Floaters E 119, 1.74% 1/7/19 (Liquidity Facility Royal Bank of Canada) (b)(c) | | 3,600,000 | 3,600,000 |
| Cuyahoga County Ctfs. of Prtn. Participating VRDN Series Floaters XG 02 06, 1.83% 1/7/19 (Liquidity Facility Bank of America NA) (b)(c) | | 3,200,000 | 3,200,000 |
| Forest Hills Local School District Participating VRDN Series Floaters G30, 1.74% 1/7/19 (Liquidity Facility Royal Bank of Canada) (b)(c) | | 2,300,000 | 2,300,000 |
| Franklin County Hosp. Facilities Rev. Participating VRDN: | | | |
| Series 15 XF0244, 1.75% 1/7/19 (Liquidity Facility Toronto-Dominion Bank) (b)(c) | | 2,670,000 | 2,670,000 |
| Series 16 XL0004, 1.75% 1/7/19 (Liquidity Facility Barclays Bank PLC) (b)(c) | | 4,480,000 | 4,480,000 |
| Franklin County Rev. Participating VRDN Series Floaters XF 25 90, 1.74% 1/7/19 (Liquidity Facility Citibank NA) (b)(c) | | 2,000,000 | 2,000,000 |
| Hamilton County HealthCare Facilities Rev. Participating VRDN Series XF 10 50, 1.81% 1/7/19 (Liquidity Facility Deutsche Bank AG New York Branch) (b)(c) | | 800,000 | 800,000 |
| Lakewood City School District Bonds Series Solar 0067, 1.84%, tender 2/21/19 (Liquidity Facility U.S. Bank NA, Cincinnati) (b)(c) | | 4,190,000 | 4,190,000 |
| Middletown Hosp. Facilities Rev. Participating VRDN Series Floaters 00 31 44, 1.89% 2/11/19 (Liquidity Facility Barclays Bank PLC) (b)(c)(d) | | 6,420,000 | 6,420,000 |
| Northeast Ohio Reg'l. Swr. District Wastewtr. Rev. Participating VRDN: | | | |
| Series Floaters XF 07 18, 1.74% 1/7/19 (Liquidity Facility JPMorgan Chase Bank) (b)(c) | | 3,750,000 | 3,750,000 |
| Series Floaters ZF 05 85, 1.74% 1/7/19 (Liquidity Facility Toronto-Dominion Bank) (b)(c) | | 3,170,000 | 3,170,000 |
| Series Floaters ZF 06 70, 1.74% 1/7/19 (Liquidity Facility Bank of America NA) (b)(c) | | 2,000,000 | 2,000,000 |
| Ohio Higher Edl. Facility Commission Rev. Participating VRDN: | | | |
| Series 2017, 1.89% 2/11/19 (Liquidity Facility Barclays Bank PLC) (b)(c)(d) | | 3,700,000 | 3,700,000 |
| Series XG 00 69, 1.81% 1/7/19 (Liquidity Facility Deutsche Bank AG New York Branch) (b)(c) | | 3,000,000 | 3,000,000 |
| Ohio Hosp. Facilities Rev. Participating VRDN: | | | |
| Series 16 ZF0354, 1.74% 1/1/19 (Liquidity Facility JPMorgan Chase Bank) (b)(c) | | 1,000,000 | 1,000,000 |
| Series XM 05 20, 1.74% 1/7/19 (Liquidity Facility JPMorgan Chase Bank) (b)(c) | | 6,750,000 | 6,750,000 |
| Ohio Univ. Gen. Receipts Athens Bonds Series Floaters G 27, 1.91%, tender 6/3/19 (Liquidity Facility Royal Bank of Canada) (b)(c)(d) | | 3,500,000 | 3,500,000 |
| OhioHealth Corp. Participating VRDN Series Floaters XM 04 51, 1.75% 1/7/19 (Liquidity Facility Barclays Bank PLC) (b)(c) | | 3,000,000 | 3,000,000 |
| Pittsburg WTSW Participating VRDN Series Putters 50 23, 1.74% 1/2/19 (Liquidity Facility JPMorgan Chase Bank) (b)(c) | | 3,800,000 | 3,800,000 |
| the Cleveland Clinic Foundation Participating VRDN Series Floaters XF 05 73, 1.74% 1/7/19 (Liquidity Facility Toronto-Dominion Bank) (b)(c) | | 3,990,000 | 3,990,000 |
| Univ. of Cincinnati Gen. Receipts Participating VRDN: | | | |
| Series Floaters XF 24 38, 1.74% 1/7/19 (Liquidity Facility Citibank NA) (b)(c) | | 2,000,000 | 2,000,000 |
| Series Floaters ZM 06 46, 1.74% 1/7/19 (Liquidity Facility Wells Fargo Bank NA) (b)(c) | | 3,700,000 | 3,700,000 |
| Upper Arlington City School District Participating VRDN Series Floaters XF 25 92, 1.79% 1/7/19 (Liquidity Facility Citibank NA) (b)(c) | | 3,500,000 | 3,500,000 |
| | | | 84,610,000 |
| TOTAL TENDER OPTION BOND | | | |
| (Cost $87,710,000) | | | 87,710,000 |
|
| Other Municipal Security - 24.8% | | | |
| Kentucky - 0.1% | | | |
| Jefferson County Poll. Cont. Rev. Bonds (Louisville Gas & Elec. Co. Proj.) Series 2001 A, 1.92% tender 1/3/19, CP mode | | 200,000 | 200,000 |
| Massachusetts - 0.0% | | | |
| Massachusetts Indl. Fin. Agcy. Poll. Cont. Rev. Bonds (New England Pwr. Co. Proj.) Series 92, 1.78% tender 1/3/19, CP mode | | 100,000 | 100,000 |
| New Hampshire - 0.9% | | | |
| New Hampshire Bus. Fin. Auth. Poll. Cont. Rev. Bonds: | | | |
| Series 1990 A, 1.83% tender 2/1/19, CP mode (a) | | 1,300,000 | 1,300,000 |
| Series 2018 A, 1.83% tender 1/3/19, CP mode (a) | | 400,000 | 400,000 |
| Series A1, 1.82% tender 1/7/19, CP mode (a) | | 900,000 | 900,000 |
| | | | 2,600,000 |
| Ohio - 23.8% | | | |
| Allen County Hosp. Facilities Rev. Bonds Series 2010 B, 5% 9/1/19 | | 2,000,000 | 2,039,860 |
| American Muni. Pwr. BAN: | | | |
| (City of Wapakoneta Proj.) Series 2018, 3% 6/27/19 (Ohio Gen. Oblig. Guaranteed) | | 1,000,000 | 1,005,305 |
| Series 2018: | | | |
| 3% 8/15/19 (Ohio Gen. Oblig. Guaranteed) | | 1,400,000 | 1,408,614 |
| 3% 12/5/19 (Ohio Gen. Oblig. Guaranteed) | | 1,000,000 | 1,007,809 |
| Avon Gen. Oblig. BAN Series 2018: | | | |
| 2.375% 1/23/19 | | 2,400,000 | 2,400,959 |
| 3% 9/5/19 (Ohio Gen. Oblig. Guaranteed) | | 1,750,000 | 1,762,778 |
| Batavia Ohio Loc School District BAN Series 2018, 3% 9/1/19 (Ohio Gen. Oblig. Guaranteed) | | 1,875,000 | 1,885,674 |
| Dublin City School District BAN Series 2018 B, 4.25% 4/1/19 | | 3,000,000 | 3,016,226 |
| Euclid Gen. Oblig. BAN Series 2018, 2.75% 5/2/19 (Ohio Gen. Oblig. Guaranteed) | | 1,001,000 | 1,003,439 |
| Firelands Ohio Loc School District BAN Series 2018, 3% 8/22/19 (Ohio Gen. Oblig. Guaranteed) | | 1,000,000 | 1,005,545 |
| Forest Park Gen. Oblig. BAN Series 2018 B, 3% 5/29/19 (Ohio Gen. Oblig. Guaranteed) | | 1,095,000 | 1,099,827 |
| Franklin County Rev. Bonds Series 2013 OH, 1.8%, tender 2/1/19 (b) | | 3,100,000 | 3,100,000 |
| Harrison Ohio BAN Series 2018, 3.5% 10/29/19 (Ohio Gen. Oblig. Guaranteed) | | 1,350,000 | 1,365,260 |
| Hudson City Gen. Oblig. BAN Series 2018, 3.5% 12/19/19 | | 2,000,000 | 2,023,762 |
| Kent Various Purp. Bond BAN Series 2018, 2.875% 8/21/19 | | 1,000,000 | 1,006,076 |
| Lancaster Port Auth. Gas Rev. Bonds Series 2014, 1 month U.S. LIBOR + 0.720% 2.294%, tender 8/1/19 (Liquidity Facility Royal Bank of Canada) (b)(e) | | 3,345,000 | 3,345,801 |
| Licking County BAN Series 2018, 3% 5/9/19 | | 2,100,000 | 2,107,217 |
| Lorain BAN Series 2018, 3.5% 7/17/19 (Ohio Gen. Oblig. Guaranteed) | | 1,000,000 | 1,007,223 |
| Mason Gen. Oblig. BAN Series 2018, 3% 5/16/19 | | 2,000,000 | 2,007,247 |
| Mayfield Heights Gen. Oblig. BAN Series 2018, 2.5% 4/4/19 (Ohio Gen. Oblig. Guaranteed) | | 3,300,000 | 3,305,776 |
| Miamisburg Gen. Oblig. BAN Series 2017, 3% 6/25/19 (Ohio Gen. Oblig. Guaranteed) | | 1,850,000 | 1,858,286 |
| Newark Gen. Oblig. BAN Series 2019, 4.25% 4/25/19 (f) | | 3,000,000 | 3,016,800 |
| North Ridgeville Gen. Oblig. BAN Series 2018, 3% 6/13/19 | | 1,100,000 | 1,105,251 |
| Ohio Higher Edl. Facility Commission Rev. Bonds: | | | |
| Series B5, 1.79% tender 3/5/19, CP mode | | 3,000,000 | 3,000,000 |
| Series B6, 1.79% tender 3/5/19, CP mode | | 3,000,000 | 3,000,000 |
| Oxford Gen. Oblig. BAN Series 2018, 3% 6/11/19 (Ohio Gen. Oblig. Guaranteed) | | 1,600,000 | 1,607,969 |
| Perrysburg Gen. Oblig. BAN Series 2018: | | | |
| 3% 6/4/19 | | 1,000,000 | 1,004,133 |
| 3% 10/24/19 | | 2,085,000 | 2,098,225 |
| Pickerington Gen. Oblig. BAN Series 2018, 2.375% 2/7/19 | | 2,000,000 | 2,001,344 |
| Sandusky Gen. Oblig. BAN Series 2019, 3% 10/3/19 | | 3,200,000 | 3,221,964 |
| South-Western City School District Franklin & Pickway County BAN Series 2018, 3.125% 6/4/19 | | 3,000,000 | 3,012,228 |
| Southwest Local School District: | | | |
| BAN Series 2018, 2.625% 11/13/19 (Ohio Gen. Oblig. Guaranteed) | | 1,500,000 | 1,506,029 |
| Bonds Series 2018 B, 3% 1/15/19 | | 1,000,000 | 1,000,451 |
| Uhrichsville Recreational Facilities BAN Series 2018, 3% 6/26/19 (Ohio Gen. Oblig. Guaranteed) | | 1,750,000 | 1,759,528 |
| Union Township Clermont County Gen. Oblig. BAN Series 2018, 3% 9/5/19 (Ohio Gen. Oblig. Guaranteed) | | 1,000,000 | 1,007,301 |
| Worthington City School District BAN Series 2018, 3% 4/15/19 | | 3,000,000 | 3,008,096 |
| Worthington Ohio BAN Series 2019, 3% 9/26/19 (Ohio Gen. Oblig. Guaranteed) | | 1,000,000 | 1,007,555 |
| | | | 71,119,558 |
| TOTAL OTHER MUNICIPAL SECURITY | | | |
| (Cost $74,019,558) | | | 74,019,558 |
| | | Shares | Value |
|
| Investment Company - 6.6% | | | |
| Fidelity Municipal Cash Central Fund, 1.77% (g)(h) | | | |
| (Cost $19,829,739) | | 19,827,904 | 19,829,739 |
| TOTAL INVESTMENT IN SECURITIES - 100.7% | | | |
| (Cost $300,724,300) | | | 300,724,300 |
| NET OTHER ASSETS (LIABILITIES) - (0.7)% | | | (1,988,178) |
| NET ASSETS - 100% | | | $298,736,122 |
Security Type Abbreviations
BAN – BOND ANTICIPATION NOTE
CP – COMMERCIAL PAPER
VRDN – VARIABLE RATE DEMAND NOTE (A debt instrument that is payable upon demand, either daily, weekly or monthly)
The date shown for securities represents the date when principal payments must be paid, taking into account any call options exercised by the issuer and any permissible maturity shortening features other than interest rate resets.
Legend
(a) Private activity obligations whose interest is subject to the federal alternative minimum tax for individuals.
(b) Coupon rates for floating and adjustable rate securities reflect the rates in effect at period end.
(c) Provides evidence of ownership in one or more underlying municipal bonds.
(d) Restricted securities - Investment in securities not registered under the Securities Act of 1933 (excluding 144A issues). At the end of the period, the value of restricted securities (excluding 144A issues) amounted to $14,520,000 or 4.9% of net assets.
(e) Coupon is indexed to a floating interest rate which may be multiplied by a specified factor and/or subject to caps or floors.
(f) Security or a portion of the security purchased on a delayed delivery or when-issued basis. Interest rate to be determined at settlement date.
(g) Information in this report regarding holdings by state and security types does not reflect the holdings of the Fidelity Municipal Cash Central Fund.
(h) Affiliated fund that is available only to investment companies and other accounts managed by Fidelity Investments. The rate quoted is the annualized seven-day yield of the fund at period end. A complete unaudited listing of the fund's holdings as of its most recent quarter end is available upon request. In addition, each Fidelity Central Fund's financial statements, which are not covered by the Fund's Report of Independent Registered Public Accounting Firm, are available on the SEC's website or upon request.
Additional information on each restricted holding is as follows:
| Security | Acquisition Date | Cost |
| Colorado Health Facilities Auth. Rev. Participating VRDN Series Floaters 018, 1.89% 2/11/19 (Liquidity Facility Barclays Bank PLC) | 10/15/18 | $300,000 |
| Illinois Fin. Auth. Rev. Participating VRDN Series Floaters 017, 1.89% 2/11/19 (Liquidity Facility Barclays Bank PLC) | 8/16/18 | $600,000 |
| Middletown Hosp. Facilities Rev. Participating VRDN Series Floaters 00 31 44, 1.89% 2/11/19 (Liquidity Facility Barclays Bank PLC) | 9/14/17 - 1/3/18 | $6,420,000 |
| Ohio Higher Edl. Facility Commission Rev. Participating VRDN Series 2017, 1.89% 2/11/19 (Liquidity Facility Barclays Bank PLC) | 1/11/18 - 11/21/18 | $3,700,000 |
| Ohio Univ. Gen. Receipts Athens Bonds Series Floaters G 27, 1.91%, tender 6/3/19 (Liquidity Facility Royal Bank of Canada) | 7/12/18 | $3,500,000 |
Affiliated Central Funds
Information regarding fiscal year to date income earned by the Fund from investments in Fidelity Central Funds is as follows:
| Fund | Income earned |
| Fidelity Municipal Cash Central Fund | $320,599 |
| Total | $320,599 |
Amounts in the income column in the above table exclude any capital gain distributions from underlying funds, which are presented in the corresponding line-item in the Statement of Operations if applicable.
Investment Valuation
All investments are categorized as Level 2 under the Fair Value Hierarchy. The inputs or methodology used for valuing securities may not be an indication of the risk associated with investing in those securities. For more information on valuation inputs please refer to the Investment Valuation section in the accompanying Notes to Financial Statements.
See accompanying notes which are an integral part of the financial statements.
Fidelity® Ohio Municipal Money Market Fund
Financial Statements
Statement of Assets and Liabilities
| | | December 31, 2018 |
| Assets | | |
Investment in securities, at value — See accompanying schedule:
Unaffiliated issuers (cost $280,894,561) | $280,894,561 | |
| Fidelity Central Funds (cost $19,829,739) | 19,829,739 | |
| Total Investment in Securities (cost $300,724,300) | | $300,724,300 |
| Receivable for investments sold | | 14,035,910 |
| Receivable for fund shares sold | | 269,506 |
| Interest receivable | | 1,193,419 |
| Distributions receivable from Fidelity Central Funds | | 11,903 |
| Prepaid expenses | | 513 |
| Other receivables | | 24 |
| Total assets | | 316,235,575 |
| Liabilities | | |
| Payable to custodian bank | $14,029,835 | |
| Payable for investments purchased on a delayed delivery basis | 3,016,800 | |
| Payable for fund shares redeemed | 279,844 | |
| Distributions payable | 10,134 | |
| Accrued management fee | 89,662 | |
| Other affiliated payables | 38,485 | |
| Other payables and accrued expenses | 34,693 | |
| Total liabilities | | 17,499,453 |
| Net Assets | | $298,736,122 |
| Net Assets consist of: | | |
| Paid in capital | | $298,771,670 |
| Total distributable earnings (loss) | | (35,548) |
| Net Assets, for 298,221,252 shares outstanding | | $298,736,122 |
| Net Asset Value, offering price and redemption price per share ($298,736,122 ÷ 298,221,252 shares) | | $1.00 |
See accompanying notes which are an integral part of the financial statements.
Statement of Operations
| | | Year ended December 31, 2018 |
| Investment Income | | |
| Interest | | $4,899,319 |
| Income from Fidelity Central Funds | | 320,599 |
| Total income | | 5,219,918 |
| Expenses | | |
| Management fee | $1,248,126 | |
| Transfer agent fees | 482,211 | |
| Accounting fees and expenses | 54,790 | |
| Custodian fees and expenses | 3,121 | |
| Independent trustees' fees and expenses | 1,655 | |
| Registration fees | 24,663 | |
| Audit | 39,751 | |
| Legal | 2,930 | |
| Miscellaneous | 1,701 | |
| Total expenses before reductions | 1,858,948 | |
| Expense reductions | (2,651) | |
| Total expenses after reductions | | 1,856,297 |
| Net investment income (loss) | | 3,363,621 |
| Realized and Unrealized Gain (Loss) | | |
| Net realized gain (loss) on: | | |
| Investment securities: | | |
| Unaffiliated issuers | (10,882) | |
| Fidelity Central Funds | 4,059 | |
| Total net realized gain (loss) | | (6,823) |
| Net increase in net assets resulting from operations | | $3,356,798 |
See accompanying notes which are an integral part of the financial statements.
Statement of Changes in Net Assets
| | Year ended December 31, 2018 | Year ended December 31, 2017 |
| Increase (Decrease) in Net Assets | | |
| Operations | | |
| Net investment income (loss) | $3,363,621 | $1,967,233 |
| Net realized gain (loss) | (6,823) | (28,447) |
| Net increase in net assets resulting from operations | 3,356,798 | 1,938,786 |
| Distributions to shareholders | (3,363,936) | – |
| Distributions to shareholders from net investment income | – | (1,966,726) |
| Distributions to shareholders from net realized gain | – | (56,345) |
| Total distributions | (3,363,936) | (2,023,071) |
| Share transactions at net asset value of $1.00 per share | | |
| Proceeds from sales of shares | 48,608,768 | 31,134,506 |
| Reinvestment of distributions | 3,258,209 | 1,960,003 |
| Cost of shares redeemed | (172,233,279) | (199,538,120) |
| Net increase (decrease) in net assets and shares resulting from share transactions | (120,366,302) | (166,443,611) |
| Total increase (decrease) in net assets | (120,373,440) | (166,527,896) |
| Net Assets | | |
| Beginning of period | 419,109,562 | 585,637,458 |
| End of period | $298,736,122 | $419,109,562 |
See accompanying notes which are an integral part of the financial statements.
Financial Highlights
Fidelity Ohio Municipal Money Market Fund
| | | | | | |
| Years ended December 31, | 2018 | 2017 | 2016 | 2015 | 2014 |
| Selected Per–Share Data | | | | | |
| Net asset value, beginning of period | $1.00 | $1.00 | $1.00 | $1.00 | $1.00 |
| Income from Investment Operations | | | | | |
| Net investment income (loss) | .010 | .004 | .001 | –A | –A |
| Net realized and unrealized gain (loss)A | – | – | – | – | – |
| Total from investment operations | .010 | .004 | .001 | –A | –A |
| Distributions from net investment income | (.010) | (.004) | (.001) | –A | –A |
| Distributions from net realized gain | – | –A | –A | –A | –A |
| Total distributions | (.010) | (.004) | (.001) | –A | –A |
| Net asset value, end of period | $1.00 | $1.00 | $1.00 | $1.00 | $1.00 |
| Total ReturnB | .98% | .42% | .09% | .01% | .02% |
| Ratios to Average Net AssetsC,D | | | | | |
| Expenses before reductions | .53% | .53% | .52% | .52% | .51% |
| Expenses net of fee waivers, if any | .53% | .52% | .37% | .07% | .08% |
| Expenses net of all reductions | .53% | .52% | .36% | .07% | .08% |
| Net investment income (loss) | .96% | .40% | .07% | .01% | .01% |
| Supplemental Data | | | | | |
| Net assets, end of period (000 omitted) | $298,736 | $419,110 | $585,637 | $1,250,546 | $1,336,936 |
A Amount represents less than $.0005 per share.
B Total returns would have been lower if certain expenses had not been reduced during the applicable periods shown.
C Fees and expenses of any underlying Fidelity Central Funds are not included in the Fund's expense ratio. The Fund indirectly bears its proportionate share of the expenses of any underlying Fidelity Central Funds.
D Expense ratios reflect operating expenses of the Fund. Expenses before reductions do not reflect amounts reimbursed or waived or reductions from expense offset arrangements and do not represent the amount paid by the Fund during periods when reimbursements, waivers or reductions occur. Expenses net of fee waivers reflect expenses after reimbursement and waivers but prior to reductions from expense offset arrangements. Expenses net of all reductions represent the net expenses paid by the Fund.
See accompanying notes which are an integral part of the financial statements.
Notes to Financial Statements
For the period ended December 31, 2018
1. Organization.
Fidelity Ohio Municipal Income Fund (the Income Fund) is a fund of Fidelity Municipal Trust. Fidelity Ohio Municipal Money Market Fund (the Money Market) is a fund of Fidelity Municipal Trust II. Each Trust is registered under the Investment Company Act of 1940, as amended (the 1940 Act), as an open-end management investment company. Fidelity Municipal Trust and Fidelity Municipal Trust II (the Trusts) are organized as a Massachusetts business trust and a Delaware statutory trust, respectively. Each Fund is authorized to issue an unlimited number of shares. Shares of the Money Market Fund are only available for purchase by retail shareholders. Share transactions on the Statement of Changes in Net Assets may contain exchanges between affiliated funds. Each Fund may be affected by economic and political developments in the state of Ohio.
2. Investments in Fidelity Central Funds.
The Funds may invest in Fidelity Central Funds, which are open-end investment companies generally available only to other investment companies and accounts managed by the investment adviser and its affiliates. The Funds' Schedules of Investments list each of the Fidelity Central Funds held as of period end, if any, as an investment of each Fund, but does not include the underlying holdings of each Fidelity Central Fund. As an Investing Fund, each Fund indirectly bears its proportionate share of the expenses of the underlying Fidelity Central Funds.
The Money Market Central Funds seek preservation of capital and current income and are managed by Fidelity Investments Money Management, Inc. (FIMM), an affiliate of the investment adviser. Annualized expenses of the Money Market Central Funds as of their most recent shareholder report date are less than .005%.
A complete unaudited list of holdings for each Fidelity Central Fund is available upon request or at the Securities and Exchange Commission (the SEC) website at www.sec.gov. In addition, the financial statements of the Fidelity Central Funds, which are not covered by the Funds' Report of Independent Registered Public Accounting Firm, are available on the SEC website or upon request.
3. Significant Accounting Policies.
Each Fund is an investment company and applies the accounting and reporting guidance of the Financial Accounting Standards Board (FASB) Accounting Standards Codification Topic 946 Financial Services – Investments Companies. The financial statements have been prepared in conformity with accounting principles generally accepted in the United States of America (GAAP), which require management to make certain estimates and assumptions at the date of the financial statements. Actual results could differ from those estimates. Subsequent events, if any, through the date that the financial statements were issued have been evaluated in the preparation of the financial statements. The following summarizes the significant accounting policies of the Funds:
Investment Valuation. Investments are valued as of 4:00 p.m. Eastern time on the last calendar day of the period. The Board of Trustees (the Board) has delegated the day to day responsibility for the valuation of the Income Fund's investments to the Fair Value Committee (the Committee) established by the Income Fund's investment adviser. In accordance with valuation policies and procedures approved by the Board, the Income Fund attempts to obtain prices from one or more third party pricing vendors or brokers to value its investments. When current market prices, quotations or currency exchange rates are not readily available or reliable, investments will be fair valued in good faith by the Committee, in accordance with procedures adopted by the Board. Factors used in determining fair value vary by investment type and may include market or investment specific events, changes in interest rates and credit quality. The frequency with which these procedures are used cannot be predicted and they may be utilized to a significant extent. The Committee oversees the Income Fund's valuation policies and procedures and reports to the Board on the Committee's activities and fair value determinations. The Board monitors the appropriateness of the procedures used in valuing the Income Fund's investments and ratifies the fair value determinations of the Committee.
Each Fund categorizes the inputs to valuation techniques used to value its investments into a disclosure hierarchy consisting of three levels as shown below:
- Level 1 – quoted prices in active markets for identical investments
- Level 2 – other significant observable inputs (including quoted prices for similar investments, interest rates, prepayment speeds, etc.)
- Level 3 – unobservable inputs (including the Fund's own assumptions based on the best information available)
Valuation techniques used to value each Fund's investments by major category are as follows:
For the Income Fund, debt securities, including restricted securities, are valued based on evaluated prices received from third party pricing vendors or from brokers who make markets in such securities. Municipal securities are valued by pricing vendors who utilize matrix pricing which considers yield or price of bonds of comparable quality, coupon, maturity and type or by broker-supplied prices. When independent prices are unavailable or unreliable, debt securities may be valued utilizing pricing methodologies which consider similar factors that would be used by third party pricing vendors. Debt securities are generally categorized as Level 2 in the hierarchy but may be Level 3 depending on the circumstances.
For the Money Market Fund, as permitted by compliance with certain conditions under Rule 2a-7 of the 1940 Act, securities are valued at amortized cost, which approximates fair value. The amortized cost of an instrument is determined by valuing it at its original cost and thereafter amortizing any discount or premium from its face value at a constant rate until maturity. Securities held by a money market fund are generally high quality and liquid; however, they are reflected as Level 2 because the inputs used to determine fair value are not quoted prices in an active market.
For the Income Fund, changes in valuation techniques may result in transfers in or out of an assigned level within the disclosure hierarchy.
Investment Transactions and Income. For financial reporting purposes, the Funds' investment holdings and NAV include trades executed through the end of the last business day of the period. The NAV per share for processing shareholder transactions is calculated as of the close of business of the New York Stock Exchange (NYSE), normally 4:00 p.m. Eastern time and includes trades executed through the end of the prior business day for the Income Fund and trades executed through the end of the current business day for the Money Market Fund. Gains and losses on securities sold are determined on the basis of identified cost. Income and capital gain distributions from Fidelity Central Funds, if any, are recorded on the ex-dividend date. Interest income is accrued as earned and includes coupon interest and amortization of premium and accretion of discount on debt securities as applicable. Debt obligations may be placed on non-accrual status and related interest income may be reduced by ceasing current accruals and writing off interest receivables when the collection of all or a portion of interest has become doubtful based on consistently applied procedures. A debt obligation is removed from non-accrual status when the issuer resumes interest payments or when collectability of interest is reasonably assured.
Expenses. Expenses directly attributable to a fund are charged to that fund. Expenses attributable to more than one fund are allocated among the respective funds on the basis of relative net assets or other appropriate methods. Expense estimates are accrued in the period to which they relate and adjustments are made when actual amounts are known.
Income Tax Information and Distributions to Shareholders. Each year, each Fund intends to qualify as a regulated investment company under Subchapter M of the Internal Revenue Code, including distributing substantially all of its taxable income and realized gains. As a result, no provision for U.S. Federal income taxes is required. As of December 31, 2018, each Fund did not have any unrecognized tax benefits in the financial statements; nor is each Fund aware of any tax positions for which it is reasonably possible that the total amounts of unrecognized tax benefits will significantly change in the next twelve months. Each Fund files a U.S. federal tax return, in addition to state and local tax returns as required. Each Fund's federal income tax returns are subject to examination by the Internal Revenue Service (IRS) for a period of three fiscal years after they are filed. State and local tax returns may be subject to examination for an additional fiscal year depending on the jurisdiction.
Distributions are declared and recorded daily and paid monthly from net investment income. Distributions from realized gains, if any, are declared and recorded on the ex-dividend date. Income and capital gain distributions are determined in accordance with income tax regulations, which may differ from GAAP. In addition, the Income Fund claimed a portion of the payment made to redeeming shareholders as a distribution for income tax purposes.
Capital accounts within the financial statements are adjusted for permanent book-tax differences. These adjustments have no impact on net assets or the results of operations. Capital accounts are not adjusted for temporary book-tax differences which will reverse in a subsequent period.
Book-tax differences are primarily due to market discount, deferred trustees compensation, capital loss carryforwards and losses deferred due to future transactions.
The Funds purchase municipal securities whose interest, in the opinion of the issuer, is free from federal income tax. There is no assurance that the IRS will agree with this opinion. In the event the IRS determines that the issuer does not comply with relevant tax requirements, interest payments from a security could become federally taxable, possibly retroactively to the date the security was issued.
As of period end, the cost and unrealized appreciation (depreciation) in securities, and derivatives if applicable, for federal income tax purposes were as follows for each Fund:
| | Tax cost | Gross unrealized appreciation | Gross unrealized depreciation | Net unrealized appreciation (depreciation) |
| Fidelity Ohio Municipal Income Fund | $597,521,057 | $14,013,540 | $(2,311,705) | $11,701,835 |
| Fidelity Ohio Municipal Money Market Fund | 300,724,300 | – | – | – |
The tax-based components of distributable earnings as of period end were as follows for each Fund:
| | Undistributed tax-exempt income | Undistributed ordinary income | Undistributed long-term capital gain | Capital loss carryforward | Net unrealized appreciation (depreciation) on securities and other investments |
| Fidelity Ohio Municipal Income Fund | $87,211 | $– | $92,682 | $– | $11,671,443 |
| Fidelity Ohio Municipal Money Market Fund | 971 | – | – | (36,518) | – |
Capital loss carryforwards are only available to offset future capital gains of the Funds to the extent provided by regulations and may be limited. Under the Regulated Investment Company Modernization Act of 2010 (the Act), the Funds are permitted to carry forward capital losses incurred in taxable years beginning after December 22, 2010 for an unlimited period and such capital losses are required to be used prior to any losses that expire. The capital loss carryforward information presented below, including any applicable limitation, is estimated as of fiscal period end and is subject to adjustment.
| | No expiration
Short-term |
| Fidelity Ohio Municipal Money Market Fund | $(36,518) |
The tax character of distributions paid was as follows:
| December 31, 2018 | | | |
| | Tax-Exempt Income | Long-term Capital Gains | Total |
| Fidelity Ohio Municipal Income Fund | $17,354,556 | $1,721,776 | $19,076,332 |
| Fidelity Ohio Municipal Money Market Fund | 3,363,936 | – | 3,363,936 |
| December 31, 2017 | | | | |
| | Tax-Exempt Income | Ordinary Income | Long-term Capital Gains | Total |
| Fidelity Ohio Municipal Income Fund | $18,087,879 | $– | $4,790,838 | $22,878,717 |
| Fidelity Ohio Municipal Money Market Fund | 1,966,726 | 39,442 | 16,903 | 2,023,071 |
Delayed Delivery Transactions and When-Issued Securities. During the period, certain Funds transacted in securities on a delayed delivery or when-issued basis. Payment and delivery may take place after the customary settlement period for that security. The price of the underlying securities and the date when the securities will be delivered and paid for are fixed at the time the transaction is negotiated. The securities purchased on a delayed delivery or when-issued basis are identified as such in each applicable Fund's Schedule of Investments. Certain Funds may receive compensation for interest forgone in the purchase of a delayed delivery or when-issued security. With respect to purchase commitments, each applicable Fund identifies securities as segregated in its records with a value at least equal to the amount of the commitment. Losses may arise due to changes in the value of the underlying securities or if the counterparty does not perform under the contract's terms, or if the issuer does not issue the securities due to political, economic, or other factors.
Restricted Securities. The Funds may invest in securities that are subject to legal or contractual restrictions on resale. These securities generally may be resold in transactions exempt from registration or to the public if the securities are registered. Disposal of these securities may involve time-consuming negotiations and expense, and prompt sale at an acceptable price may be difficult. Information regarding restricted securities is included at the end of each applicable Fund's Schedule of Investments.
New Rule Issuance. During August 2018, the U.S. Securities and Exchange Commission issued Final Rule Release No. 33-10532, Disclosure Update and Simplification. This Final Rule includes amendments specific to registered investment companies that are intended to eliminate overlap in disclosure requirements between Regulation S-X and GAAP. In accordance with these amendments, certain line-items in the Funds' financial statements have been combined or removed for the current period as outlined in the table below.
| Financial Statement | Current Line-Item Presentation | Prior Line-Item Presentation |
| Statement of Assets and Liabilities | Total distributable earnings (loss) | Undistributed/Distributions in excess of/Accumulated net investment income (loss)
Accumulated/Undistributed net realized gain (loss)
Net unrealized appreciation (depreciation) |
| Statement of Changes in Net Assets | N/A - removed | Undistributed/Distributions in excess of/Accumulated net investment income (loss) end of period |
| Statement of Changes in Net Assets | Distributions to shareholders | Distributions to shareholders from net investment income
Distributions to shareholders from net realized gain |
4. Purchases and Sales of Investments.
Purchases and sales of securities, other than short-term securities for the Income Fund aggregated $68,310,498 and $150,332,728, respectively.
5. Fees and Other Transactions with Affiliates.
Management Fee. Fidelity Management & Research Company (the investment adviser) and its affiliates provide the Funds with investment management related services for which the Funds pay a monthly management fee. The management fee is the sum of an individual fund fee rate and an annualized group fee rate. The individual fund fee rate is applied to each Fund's average net assets. The group fee rate is based upon the average net assets of all the mutual funds advised by the investment adviser, including any mutual funds previously advised by the investment adviser that are currently advised by Fidelity SelectCo, LLC, an affiliate of the investment adviser. The group fee rate decreases as assets under management increase and increases as assets under management decrease. For the reporting period, each Fund's annual management fee rate expressed as a percentage of each Fund's average net assets was as follows:
| | Individual Rate | Group Rate | Total |
| Fidelity Ohio Municipal Income Fund | .25% | .11% | .36% |
| Fidelity Ohio Municipal Money Market Fund | .25% | .11% | .36% |
Transfer Agent Fees. Fidelity Investments Institutional Operations Company, Inc. (FIIOC), an affiliate of the investment adviser, is the transfer, dividend disbursing and shareholder servicing agent for the Funds. FIIOC receives account fees and asset-based fees that vary according to account size and type of account. FIIOC pays for typesetting, printing and mailing of shareholder reports, except proxy statements. For the period, the transfer agent fees were equivalent to the following annual rates expressed as a percentage of average net assets:
| Fidelity Ohio Municipal Income Fund | .09% |
| Fidelity Ohio Municipal Money Market Fund | .14% |
Accounting Fees. Fidelity Service Company, Inc. (FSC), an affiliate of the investment adviser, maintains each Fund's accounting records. The fee is based on the level of average net assets for each month. For the period, the fees were equivalent to the following annual rates:
| | % of Average Net Assets |
| Fidelity Ohio Municipal Income Fund | .02 |
| Fidelity Ohio Municipal Money Market Fund | .02 |
Interfund Trades. The Funds may purchase from or sell securities to other Fidelity Funds under procedures adopted by the Board. The procedures have been designed to ensure these interfund trades are executed in accordance with Rule 17a-7 of the 1940 Act. For the Income Fund, interfund trades are included within the respective purchases and sales amounts shown in the Purchases and Sales of Investments note.
6. Committed Line of Credit.
The Income Fund participates with other funds managed by the investment adviser or an affiliate in a $4.25 billion credit facility (the "line of credit") to be utilized for temporary or emergency purposes to fund shareholder redemptions or for other short-term liquidity purposes. The participating funds have agreed to pay commitment fees on their pro-rata portion of the line of credit, which are reflected in Miscellaneous expenses on the Statement of Operations, and are as follows:
| Fidelity Ohio Municipal Income Fund | $1,792 |
During the period, the Income Fund did not borrow on this line of credit.
7. Expense Reductions.
Through arrangements with each applicable Fund's custodian, credits realized as a result of certain uninvested cash balances were used to reduce each applicable Fund's expenses. All of the applicable expense reductions are noted in the table below.
| | Custody expense reduction |
| Fidelity Ohio Municipal Income Fund | $4,745 |
| Fidelity Ohio Municipal Money Market Fund | 93 |
In addition, during the period the investment adviser reimbursed and/or waived a portion of operating expenses as follows:
| | Amount |
| Fidelity Ohio Municipal Income Fund | $4,048 |
| Fidelity Ohio Municipal Money Market Fund | 2,558 |
8. Other.
The Funds' organizational documents provide former and current trustees and officers with a limited indemnification against liabilities arising in connection with the performance of their duties to the Funds. In the normal course of business, the Funds may also enter into contracts that provide general indemnifications. The Funds' maximum exposure under these arrangements is unknown as this would be dependent on future claims that may be made against the Funds. The risk of material loss from such claims is considered remote.
Report of Independent Registered Public Accounting Firm
To the Board of Trustees of Fidelity Municipal Trust and Fidelity Municipal Trust II and Shareholders of Fidelity Ohio Municipal Income Fund and Fidelity Ohio Municipal Money Market Fund:
Opinions on the Financial Statements
We have audited the accompanying statements of assets and liabilities, including the schedules of investments, of Fidelity Ohio Municipal Income Fund (one of the funds constituting Fidelity Municipal Trust) and Fidelity Ohio Municipal Money Market Fund (one of the funds constituting Fidelity Municipal Trust II) (hereafter collectively referred to as the "Funds") as of December 31, 2018, the related statements of operations for the year ended December 31, 2018, the statements of changes in net assets for each of the two years in the period ended December 31, 2018, including the related notes, and the financial highlights for each of the five years in the period ended December 31, 2018 (collectively referred to as the “financial statements”). In our opinion, the financial statements present fairly, in all material respects, the financial position of each of the Funds as of December 31, 2018, the results of each of their operations for the year then ended, the changes in each of their net assets for each of the two years in the period ended December 31, 2018 and each of the financial highlights for each of the five years in the period ended December 31, 2018 in conformity with accounting principles generally accepted in the United States of America.
Basis for Opinions
These financial statements are the responsibility of the Funds' management. Our responsibility is to express an opinion on the Funds' financial statements based on our audits. We are a public accounting firm registered with the Public Company Accounting Oversight Board (United States) (PCAOB) and are required to be independent with respect to the Funds in accordance with the U.S. federal securities laws and the applicable rules and regulations of the Securities and Exchange Commission and the PCAOB.
We conducted our audits of these financial statements in accordance with the standards of the PCAOB. Those standards require that we plan and perform the audit to obtain reasonable assurance about whether the financial statements are free of material misstatement, whether due to error or fraud.
Our audits included performing procedures to assess the risks of material misstatement of the financial statements, whether due to error or fraud, and performing procedures that respond to those risks. Such procedures included examining, on a test basis, evidence regarding the amounts and disclosures in the financial statements. Our audits also included evaluating the accounting principles used and significant estimates made by management, as well as evaluating the overall presentation of the financial statements. Our procedures included confirmation of securities owned as of December 31, 2018 by correspondence with the custodian and broker; when replies were not received from the broker, we performed other auditing procedures. We believe that our audits provide a reasonable basis for our opinions.
PricewaterhouseCoopers LLP
Boston, Massachusetts
February 8, 2019
We have served as the auditor of one or more investment companies in the Fidelity group of funds since 1932.
Trustees and Officers
The Trustees, Members of the Advisory Board (if any), and officers of the trusts and funds, as applicable, are listed below. The Board of Trustees governs each fund and is responsible for protecting the interests of shareholders. The Trustees are experienced executives who meet periodically throughout the year to oversee each fund's activities, review contractual arrangements with companies that provide services to each fund, oversee management of the risks associated with such activities and contractual arrangements, and review each fund's performance. Each of the Trustees oversees 260 funds.
The Trustees hold office without limit in time except that (a) any Trustee may resign; (b) any Trustee may be removed by written instrument, signed by at least two-thirds of the number of Trustees prior to such removal; (c) any Trustee who requests to be retired or who has become incapacitated by illness or injury may be retired by written instrument signed by a majority of the other Trustees; and (d) any Trustee may be removed at any special meeting of shareholders by a two-thirds vote of the outstanding voting securities of the trust. Each Trustee who is not an interested person (as defined in the 1940 Act) of the trust and the fund is referred to herein as an Independent Trustee. Each Independent Trustee shall retire not later than the last day of the calendar year in which his or her 75th birthday occurs. The Independent Trustees may waive this mandatory retirement age policy with respect to individual Trustees. Officers and Advisory Board Members hold office without limit in time, except that any officer or Advisory Board Member may resign or may be removed by a vote of a majority of the Trustees at any regular meeting or any special meeting of the Trustees. Except as indicated, each individual has held the office shown or other offices in the same company for the past five years.
The fund’s Statement of Additional Information (SAI) includes more information about the Trustees. To request a free copy, call Fidelity at 1-800-544-8544.
Experience, Skills, Attributes, and Qualifications of the Trustees. The Governance and Nominating Committee has adopted a statement of policy that describes the experience, qualifications, attributes, and skills that are necessary and desirable for potential Independent Trustee candidates (Statement of Policy). The Board believes that each Trustee satisfied at the time he or she was initially elected or appointed a Trustee, and continues to satisfy, the standards contemplated by the Statement of Policy. The Governance and Nominating Committee also engages professional search firms to help identify potential Independent Trustee candidates who have the experience, qualifications, attributes, and skills consistent with the Statement of Policy. From time to time, additional criteria based on the composition and skills of the current Independent Trustees, as well as experience or skills that may be appropriate in light of future changes to board composition, business conditions, and regulatory or other developments, have also been considered by the professional search firms and the Governance and Nominating Committee. In addition, the Board takes into account the Trustees' commitment and participation in Board and committee meetings, as well as their leadership of standing and ad hoc committees throughout their tenure.
In determining that a particular Trustee was and continues to be qualified to serve as a Trustee, the Board has considered a variety of criteria, none of which, in isolation, was controlling. The Board believes that, collectively, the Trustees have balanced and diverse experience, qualifications, attributes, and skills, which allow the Board to operate effectively in governing each fund and protecting the interests of shareholders. Information about the specific experience, skills, attributes, and qualifications of each Trustee, which in each case led to the Board's conclusion that the Trustee should serve (or continue to serve) as a trustee of the funds, is provided below.
Board Structure and Oversight Function. Abigail P. Johnson is an interested person and currently serves as Chairman. The Trustees have determined that an interested Chairman is appropriate and benefits shareholders because an interested Chairman has a personal and professional stake in the quality and continuity of services provided to the fund. Independent Trustees exercise their informed business judgment to appoint an individual of their choosing to serve as Chairman, regardless of whether the Trustee happens to be independent or a member of management. The Independent Trustees have determined that they can act independently and effectively without having an Independent Trustee serve as Chairman and that a key structural component for assuring that they are in a position to do so is for the Independent Trustees to constitute a substantial majority for the Board. The Independent Trustees also regularly meet in executive session. Arthur E. Johnson serves as Chairman of the Independent Trustees and as such (i) acts as a liaison between the Independent Trustees and management with respect to matters important to the Independent Trustees and (ii) with management prepares agendas for Board meetings.
Fidelity® funds are overseen by different Boards of Trustees. The funds' Board oversees Fidelity's investment-grade bond, money market, asset allocation and certain equity funds, and other Boards oversee Fidelity's high income and other equity funds. The asset allocation funds may invest in Fidelity® funds that are overseen by such other Boards. The use of separate Boards, each with its own committee structure, allows the Trustees of each group of Fidelity® funds to focus on the unique issues of the funds they oversee, including common research, investment, and operational issues. On occasion, the separate Boards establish joint committees to address issues of overlapping consequences for the Fidelity® funds overseen by each Board.
The Trustees operate using a system of committees to facilitate the timely and efficient consideration of all matters of importance to the Trustees, each fund, and fund shareholders and to facilitate compliance with legal and regulatory requirements and oversight of the funds' activities and associated risks. The Board, acting through its committees, has charged FMR and its affiliates with (i) identifying events or circumstances the occurrence of which could have demonstrably adverse effects on the funds' business and/or reputation; (ii) implementing processes and controls to lessen the possibility that such events or circumstances occur or to mitigate the effects of such events or circumstances if they do occur; and (iii) creating and maintaining a system designed to evaluate continuously business and market conditions in order to facilitate the identification and implementation processes described in (i) and (ii) above. Because the day-to-day operations and activities of the funds are carried out by or through FMR, its affiliates, and other service providers, the funds' exposure to risks is mitigated but not eliminated by the processes overseen by the Trustees. While each of the Board's committees has responsibility for overseeing different aspects of the funds' activities, oversight is exercised primarily through the Operations and Audit Committees. In addition, an ad hoc Board committee of Independent Trustees has worked with FMR to enhance the Board's oversight of investment and financial risks, legal and regulatory risks, technology risks, and operational risks, including the development of additional risk reporting to the Board. The Operations Committee also worked and continues to work with FMR to enhance the stress tests required under SEC regulations for money market funds. Appropriate personnel, including but not limited to the funds' Chief Compliance Officer (CCO), FMR's internal auditor, the independent accountants, the funds' Treasurer and portfolio management personnel, make periodic reports to the Board's committees, as appropriate, including an annual review of Fidelity's risk management program for the Fidelity® funds. The responsibilities of each standing committee, including their oversight responsibilities, are described further under "Standing Committees of the Trustees."
Interested Trustees*:
Correspondence intended for a Trustee who is an interested person may be sent to Fidelity Investments, 245 Summer Street, Boston, Massachusetts 02210.
Name, Year of Birth; Principal Occupations and Other Relevant Experience+
Abigail P. Johnson (1961)
Year of Election or Appointment: 2009
Trustee
Chairman of the Board of Trustees
Ms. Johnson also serves as Trustee of other Fidelity® funds. Ms. Johnson serves as Chairman (2016-present), Chief Executive Officer (2014-present), and Director (2007-present) of FMR LLC (diversified financial services company), President of Fidelity Financial Services (2012-present) and President of Personal, Workplace and Institutional Services (2005-present). Ms. Johnson is Chairman and Director of FMR Co., Inc. (investment adviser firm, 2011-present) and Chairman and Director of FMR (investment adviser firm, 2011-present). Previously, Ms. Johnson served as Vice Chairman (2007-2016) and President (2013-2016) of FMR LLC, President and a Director of FMR (2001-2005), a Trustee of other investment companies advised by FMR, Fidelity Investments Money Management, Inc. (investment adviser firm), and FMR Co., Inc. (2001-2005), Senior Vice President of the Fidelity® funds (2001-2005), and managed a number of Fidelity® funds. Ms. Abigail P. Johnson and Mr. Arthur E. Johnson are not related.
Jennifer Toolin McAuliffe (1959)
Year of Election or Appointment: 2016
Trustee
Ms. McAuliffe also serves as Trustee of other Fidelity® funds. Ms. McAuliffe previously served as a Member of the Advisory Board of certain Fidelity® funds (2016) and as Co-Head of Fixed Income of Fidelity Investments Limited (now known as FIL Limited (FIL)) (diversified financial services company). Earlier roles at FIL included Director of Research for FIL’s credit and quantitative teams in London, Hong Kong and Tokyo. Ms. McAuliffe also was the Director of Research for taxable and municipal bonds at Fidelity Investments Money Management, Inc. Ms. McAuliffe is also a director or trustee of several not-for-profit entities.
* Determined to be an “Interested Trustee” by virtue of, among other things, his or her affiliation with the trusts or various entities under common control with FMR.
+ The information includes the Trustee's principal occupation during the last five years and other information relating to the experience, attributes, and skills relevant to the Trustee's qualifications to serve as a Trustee, which led to the conclusion that the Trustee should serve as a Trustee for each fund.
Independent Trustees:
Correspondence intended for an Independent Trustee may be sent to Fidelity Investments, P.O. Box 55235, Boston, Massachusetts 02205-5235.
Name, Year of Birth; Principal Occupations and Other Relevant Experience+
Elizabeth S. Acton (1951)
Year of Election or Appointment: 2013
Trustee
Ms. Acton also serves as Trustee of other Fidelity® funds. Prior to her retirement in April 2012, Ms. Acton was Executive Vice President, Finance (2011-2012), Executive Vice President, Chief Financial Officer (2002-2011), and Treasurer (2004-2005) of Comerica Incorporated (financial services). Prior to joining Comerica, Ms. Acton held a variety of positions at Ford Motor Company (1983-2002), including Vice President and Treasurer (2000-2002) and Executive Vice President and Chief Financial Officer of Ford Motor Credit Company (1998-2000). Ms. Acton currently serves as a member of the Board of Directors and Audit and Finance Committees of Beazer Homes USA, Inc. (homebuilding, 2012-present). Previously, Ms. Acton served as a Member of the Advisory Board of certain Fidelity® funds (2013-2016).
Ann E. Dunwoody (1953)
Year of Election or Appointment: 2018
Trustee
General Dunwoody also serves as Trustee of other Fidelity® funds. General Dunwoody (United States Army, Retired) was the first woman in U.S. military history to achieve the rank of four-star general and prior to her retirement in 2012 held a variety of positions within the U.S. Army, including Commanding General, U.S. Army Material Command (2008-2012). She is the President of First to Four LLC (leadership and mentoring services, 2012-present). She also serves as a member of the Board of Directors and Nominating and Corporate Governance Committee of L3 Technologies, Inc. (communication, electronic, sensor, and aerospace systems, 2013-present), Board of Directors and Nomination and Corporate Governance Committees of Kforce Inc. (professional staffing services, 2016-present) and Board of Directors of Automattic Inc. (software engineering, 2018-present). Previously, General Dunwoody served as a Member of the Advisory Board of certain Fidelity® funds (2018), a member of the Board of Directors and Audit and Sustainability and Corporate Responsibility Committees of Republic Services, Inc. (waste collection, disposal and recycling, 2013-2016). Ms. Dunwoody also serves on several boards for non-profit organizations, including as a member of the Board of Directors, Chair of the Nomination and Governance Committee and member of the Audit Committee of Logistics Management Institute (consulting non-profit, 2012-present), a member of the Board of Directors of the Army Historical Foundation (2015-present), a member of the Council of Trustees for the Association of the United States Army (advocacy non-profit, 2013-present) and a member of the Board of Trustees of Florida Institute of Technology (2015-present) and ThanksUSA (military family education non-profit, 2014-present).
John Engler (1948)
Year of Election or Appointment: 2014
Trustee
Mr. Engler also serves as Trustee of other Fidelity® funds. He serves on the board of directors for Universal Forest Products (manufacturer and distributor of wood and wood-alternative products, 2003-present) and K12 Inc. (technology-based education company, 2012-present). Previously, Mr. Engler served as interim president of Michigan State University (2018-2019), a Member of the Advisory Board of certain Fidelity® funds (2014-2016), president of the Business Roundtable (2011-2017), a trustee of The Munder Funds (2003-2014), president and CEO of the National Association of Manufacturers (2004-2011), member of the Board of Trustees of the Annie E. Casey Foundation (2004-2015), and as governor of Michigan (1991-2003). He is a past chairman of the National Governors Association.
Robert F. Gartland (1951)
Year of Election or Appointment: 2010
Trustee
Mr. Gartland also serves as Trustee of other Fidelity® funds. Mr. Gartland is Chairman and an investor in Gartland & Mellina Group Corp. (consulting, 2009-present). Previously, Mr. Gartland served as a partner and investor of Vietnam Partners LLC (investments and consulting, 2008-2011). Prior to his retirement, Mr. Gartland held a variety of positions at Morgan Stanley (financial services, 1979-2007), including Managing Director (1987-2007), and Chase Manhattan Bank (1975-1978).
Arthur E. Johnson (1947)
Year of Election or Appointment: 2008
Trustee
Chairman of the Independent Trustees
Mr. Johnson also serves as Trustee of other Fidelity® funds. Mr. Johnson serves as a member of the Board of Directors of Eaton Corporation plc (diversified power management, 2009-present) and Booz Allen Hamilton (management consulting, 2011-present). Prior to his retirement, Mr. Johnson served as Senior Vice President of Corporate Strategic Development of Lockheed Martin Corporation (defense contractor, 1999-2009). He previously served on the Board of Directors of IKON Office Solutions, Inc. (1999-2008), AGL Resources, Inc. (holding company, 2002-2016), and Delta Airlines (2005-2007). Mr. Arthur E. Johnson is not related to Ms. Abigail P. Johnson.
Michael E. Kenneally (1954)
Year of Election or Appointment: 2009
Trustee
Vice Chairman of the Independent Trustees
Mr. Kenneally also serves as Trustee of other Fidelity® funds. Prior to his retirement, Mr. Kenneally served as Chairman and Global Chief Executive Officer of Credit Suisse Asset Management. Before joining Credit Suisse, he was an Executive Vice President and Chief Investment Officer for Bank of America Corporation. Earlier roles at Bank of America included Director of Research, Senior Portfolio Manager and Research Analyst, and Mr. Kenneally was awarded the Chartered Financial Analyst (CFA) designation in 1991.
Marie L. Knowles (1946)
Year of Election or Appointment: 2001
Trustee
Ms. Knowles also serves as Trustee of other Fidelity® funds. Prior to Ms. Knowles' retirement in June 2000, she served as Executive Vice President and Chief Financial Officer of Atlantic Richfield Company (ARCO) (diversified energy, 1996-2000). From 1993 to 1996, she was a Senior Vice President of ARCO and President of ARCO Transportation Company (pipeline and tanker operations). Ms. Knowles currently serves as a Director and Chairman of the Audit Committee of McKesson Corporation (healthcare service, since 2002). Ms. Knowles is a member of the Board of the Santa Catalina Island Company (real estate, 2009-present). Ms. Knowles is a Member of the Investment Company Institute Board of Governors and a Member of the Governing Council of the Independent Directors Council (2014-present). She also serves as a member of the Advisory Board for the School of Engineering of the University of Southern California. Previously, Ms. Knowles served as a Director of Phelps Dodge Corporation (copper mining and manufacturing, 1994-2007), URS Corporation (engineering and construction, 2000-2003) and America West (airline, 1999-2002). Ms. Knowles previously served as Chairman (2015-2018) and Vice Chairman (2012-2015) of the Independent Trustees of certain Fidelity® funds.
Mark A. Murray (1954)
Year of Election or Appointment: 2016
Trustee
Mr. Murray also serves as Trustee of other Fidelity® funds. Mr. Murray is Vice Chairman (2013-present) of Meijer, Inc. (regional retail chain). Previously, Mr. Murray served as a Member of the Advisory Board of certain Fidelity® funds (2016) and as Co-Chief Executive Officer (2013-2016) and President (2006-2013) of Meijer, Inc. Mr. Murray serves as a member of the Board of Directors and Nuclear Review and Public Policy and Responsibility Committees of DTE Energy Company (diversified energy company, 2009-present). Mr. Murray also serves as a member of the Board of Directors of Spectrum Health (not-for-profit health system, 2015-present). Mr. Murray previously served as President of Grand Valley State University (2001-2006), Treasurer for the State of Michigan (1999-2001), Vice President of Finance and Administration for Michigan State University (1998-1999), and a member of the Board of Directors and Audit Committee and Chairman of the Nominating and Corporate Governance Committee of Universal Forest Products, Inc. (manufacturer and distributor of wood and wood-alternative products, 2004-2016). Mr. Murray is also a director or trustee of many community and professional organizations.
+ The information includes the Trustee's principal occupation during the last five years and other information relating to the experience, attributes, and skills relevant to the Trustee's qualifications to serve as a Trustee, which led to the conclusion that the Trustee should serve as a Trustee for each fund.
Advisory Board Members and Officers:
Correspondence intended for an officer may be sent to Fidelity Investments, 245 Summer Street, Boston, Massachusetts 02210. Officers appear below in alphabetical order.
Name, Year of Birth; Principal Occupation
Elizabeth Paige Baumann (1968)
Year of Election or Appointment: 2017
Anti-Money Laundering (AML) Officer
Ms. Baumann also serves as AML Officer of other funds. She is Chief AML Officer (2012-present) and Senior Vice President (2014-present) of FMR LLC (diversified financial services company) and is an employee of Fidelity Investments. Previously, Ms. Baumann served as AML Officer of the funds (2012-2016), and Vice President (2007-2014) and Deputy Anti-Money Laundering Officer (2007-2012) of FMR LLC.
Craig S. Brown (1977)
Year of Election or Appointment: 2019
Assistant Treasurer
Mr. Brown also serves as Assistant Treasurer of other funds. Mr. Brown is an employee of Fidelity Investments (2013-present).
John J. Burke III (1964)
Year of Election or Appointment: 2018
Chief Financial Officer
Mr. Burke also serves as Chief Financial Officer of other funds. Mr. Burke serves as Head of Investment Operations for Fidelity Fund and Investment Operations (2018-present) and is an employee of Fidelity Investments (1998-present). Previously Mr. Burke served as head of Asset Management Investment Operations (2012-2018).
William C. Coffey (1969)
Year of Election or Appointment: 2018
Secretary and Chief Legal Officer (CLO)
Mr. Coffey also serves as Secretary and CLO of other funds. Mr. Coffey serves as CLO, Secretary, and Senior Vice President of Fidelity Management & Research Company and FMR Co., Inc. (investment adviser firms, 2018-present); Secretary of Fidelity SelectCo, LLC and Fidelity Investments Money Management, Inc. (investment adviser firms, 2018-present); and CLO of Fidelity Management & Research (Hong Kong) Limited, FMR Investment Management (UK) Limited, and Fidelity Management & Research (Japan) Limited (investment adviser firms, 2018-present). He is Senior Vice President and Deputy General Counsel of FMR LLC (diversified financial services company, 2010-present), and is an employee of Fidelity Investments. Previously, Mr. Coffey served as Assistant Secretary of certain funds (2009-2018) and as Vice President and Associate General Counsel of FMR LLC (2005-2009).
Jonathan Davis (1968)
Year of Election or Appointment: 2010
Assistant Treasurer
Mr. Davis also serves as Assistant Treasurer of other funds. Mr. Davis serves as Assistant Treasurer of FMR Capital, Inc. (2017-present) and is an employee of Fidelity Investments. Previously, Mr. Davis served as Vice President and Associate General Counsel of FMR LLC (diversified financial services company, 2003-2010).
Adrien E. Deberghes (1967)
Year of Election or Appointment: 2010
Assistant Treasurer
Mr. Deberghes also serves as an officer of other funds. He serves as Assistant Treasurer of FMR Capital, Inc. (2017-present), Executive Vice President of Fidelity Investments Money Management, Inc. (FIMM) (investment adviser firm, 2016-present), and is an employee of Fidelity Investments (2008-present). Previously, Mr. Deberghes served as President and Treasurer of certain Fidelity® funds (2013-2018). Prior to joining Fidelity Investments, Mr. Deberghes was Senior Vice President of Mutual Fund Administration at State Street Corporation (2007-2008), Senior Director of Mutual Fund Administration at Investors Bank & Trust (2005-2007), and Director of Finance for Dunkin' Brands (2000-2005). Previously, Mr. Deberghes served in other fund officer roles.
Laura M. Del Prato (1964)
Year of Election or Appointment: 2018
President and Treasurer
Ms. Del Prato also serves as an officer of other funds. Ms. Del Prato is an employee of Fidelity Investments (2017-present). Prior to joining Fidelity Investments, Ms. Del Prato served as a Managing Director and Treasurer of the JPMorgan Mutual Funds (2014-2017). Prior to JPMorgan, Ms. Del Prato served as a partner at Cohen Fund Audit Services (accounting firm, 2012-2013) and KPMG LLP (accounting firm, 2004-2012).
Colm A. Hogan (1973)
Year of Election or Appointment: 2016
Assistant Treasurer
Mr. Hogan also serves as an officer of other funds. Mr. Hogan serves as Assistant Treasurer of FMR Capital, Inc. (2017-present) and is an employee of Fidelity Investments (2005-present). Previously, Mr. Hogan served as Assistant Treasurer of certain Fidelity® funds (2016-2018).
Chris Maher (1972)
Year of Election or Appointment: 2013
Assistant Treasurer
Mr. Maher serves as Assistant Treasurer of other funds. Mr. Maher is Vice President of Valuation Oversight, serves as Assistant Treasurer of FMR Capital, Inc. (2017-present), and is an employee of Fidelity Investments. Previously, Mr. Maher served as Vice President of Asset Management Compliance (2013), Vice President of the Program Management Group of FMR (investment adviser firm, 2010-2013), and Vice President of Valuation Oversight (2008-2010).
John B. McGinty, Jr. (1962)
Year of Election or Appointment: 2016
Chief Compliance Officer
Mr. McGinty also serves as Chief Compliance Officer of other funds. Mr. McGinty is Senior Vice President of Asset Management Compliance for Fidelity Investments and is an employee of Fidelity Investments (2016-present). Mr. McGinty previously served as Vice President, Senior Attorney at Eaton Vance Management (investment management firm, 2015-2016), and prior to Eaton Vance as global CCO for all firm operations and registered investment companies at GMO LLC (investment management firm, 2009-2015). Before joining GMO LLC, Mr. McGinty served as Senior Vice President, Deputy General Counsel for Fidelity Investments (2007-2009).
Jason P. Pogorelec (1975)
Year of Election or Appointment: 2015
Assistant Secretary
Mr. Pogorelec also serves as Assistant Secretary of other funds. Mr. Pogorelec serves as Vice President, Associate General Counsel (2010-present) and is an employee of Fidelity Investments (2006-present).
Nancy D. Prior (1967)
Year of Election or Appointment: 2014
Vice President
Ms. Prior also serves as Vice President of other funds. Ms. Prior serves as President Fixed Income, High Income/Emerging Market Debt and Multi Asset Class Strategies of FIAM LLC (2018-present), President (2016-present) and Director (2014-present) of Fidelity Investments Money Management, Inc. (FIMM) (investment adviser firm), President, Fixed Income (2014-present), and is an employee of Fidelity Investments (2002-present). Previously, Ms. Prior served as Vice Chairman of FIAM LLC (investment adviser firm, 2014-2018), a Director of FMR Investment Management (UK) Limited (investment adviser firm, 2015-2018), President Multi-Asset Class Strategies of FMR's Global Asset Allocation Division (2017-2018), Vice President of Fidelity's Money Market Funds (2012-2014), President, Money Market and Short Duration Bond Group of Fidelity Management & Research (FMR) (investment adviser firm, 2013-2014), President, Money Market Group of FMR (2011-2013), Managing Director of Research (2009-2011), Senior Vice President and Deputy General Counsel (2007-2009), and Assistant Secretary of certain Fidelity® funds (2008-2009).
Stacie M. Smith (1974)
Year of Election or Appointment: 2013
Assistant Treasurer
Ms. Smith also serves as an officer of other funds. Ms. Smith serves as Assistant Treasurer of FMR Capital, Inc. (2017-present), is an employee of Fidelity Investments (2009-present), and has served in other fund officer roles. Prior to joining Fidelity Investments, Ms. Smith served as Senior Audit Manager of Ernst & Young LLP (accounting firm, 1996-2009). Previously, Ms. Smith served as Assistant Treasurer (2013-2018) and Deputy Treasurer (2013-2016) of certain Fidelity® funds.
Marc L. Spector (1972)
Year of Election or Appointment: 2016
Deputy Treasurer
Mr. Spector also serves as an officer of other funds. Mr. Spector serves as Assistant Treasurer of FMR Capital, Inc. (2017-present) and is an employee of Fidelity Investments (2016-present). Prior to joining Fidelity Investments, Mr. Spector served as Director at the Siegfried Group (accounting firm, 2013-2016), and prior to Siegfried Group as audit senior manager at Deloitte & Touche (accounting firm, 2005-2013).
Jim Wegmann (1979)
Year of Election or Appointment: 2019
Assistant Treasurer
Mr. Wegmann also serves as Assistant Treasurer of other funds. Mr. Wegmann is an employee of Fidelity Investments (2011-present).
Shareholder Expense Example
As a shareholder of a Fund, you incur two types of costs: (1) transaction costs and (2) ongoing costs, including management fees and other Fund expenses. This Example is intended to help you understand your ongoing costs (in dollars) of investing in the Funds and to compare these costs with the ongoing costs of investing in other mutual funds.
The Example is based on an investment of $1,000 invested at the beginning of the period and held for the entire period (July 1, 2018 to December 31, 2018).
Actual Expenses
The first line of the accompanying table for each fund provides information about actual account values and actual expenses. You may use the information in this line, together with the amount you invested, to estimate the expenses that you paid over the period. Simply divide your account value by $1,000.00 (for example, an $8,600 account value divided by $1,000.00 = 8.6), then multiply the result by the number in the first line for a fund under the heading entitled "Expenses Paid During Period" to estimate the expenses you paid on your account during this period. A small balance maintenance fee of $12.00 that is charged once a year may apply for certain accounts with a value of less than $2,000. This fee, which was eliminated effective August 1, 2018, is not included in the table below. If it was, the estimate of expenses you paid during the period would be higher, and your ending account value lower, by this amount. In addition, each Fund, as a shareholder in the underlying Fidelity Central Funds, will indirectly bear its pro-rata share of the fees and expenses incurred by the underlying Fidelity Central Funds. These fees and expenses are not included in the Fund's annualized expense ratio used to calculate the expense estimate in the table below.
Hypothetical Example for Comparison Purposes
The second line of the accompanying table for each fund provides information about hypothetical account values and hypothetical expenses based on a fund's actual expense ratio and an assumed rate of return of 5% per year before expenses, which is not the Fund's actual return. The hypothetical account values and expenses may not be used to estimate the actual ending account balance or expenses you paid for the period. You may use this information to compare the ongoing costs of investing in the Fund and other funds. To do so, compare this 5% hypothetical example with the 5% hypothetical examples that appear in the shareholder reports of the other funds. A small balance maintenance fee of $12.00 that is charged once a year may apply for certain accounts with a value of less than $2,000. This fee, which was eliminated effective August 1, 2018, is not included in the table below. If it was, the estimate of expenses you paid during the period would be higher, and your ending account value lower, by this amount. In addition, each Fund, as a shareholder in the underlying Fidelity Central Funds, will indirectly bear its pro-rata share of the fees and expenses incurred by the underlying Fidelity Central Funds. These fees and expenses are not included in the Fund's annualized expense ratio used to calculate the expense estimate in the table below.
Please note that the expenses shown in the table are meant to highlight your ongoing costs only and do not reflect any transaction costs. Therefore, the second line of the table is useful in comparing ongoing costs only, and will not help you determine the relative total costs of owning different funds.
| | Annualized Expense Ratio-A | Beginning
Account Value
July 1, 2018 | Ending
Account Value
December 31, 2018 | Expenses Paid
During Period-B
July 1, 2018
to December 31, 2018 |
| Fidelity Ohio Municipal Income Fund | .48% | | | |
| Actual | | $1,000.00 | $1,013.60 | $2.44 |
| Hypothetical-C | | $1,000.00 | $1,022.79 | $2.45 |
| Fidelity Ohio Municipal Money Market Fund | .52% | | | |
| Actual | | $1,000.00 | $1,005.40 | $2.63 |
| Hypothetical-C | | $1,000.00 | $1,022.58 | $2.65 |
A Annualized expense ratio reflects expenses net of applicable fee waivers.
B Expenses are equal to each Fund's annualized expense ratio, multiplied by the average account value over the period, multiplied by 184/ 365 (to reflect the one-half year period).
C 5% return per year before expenses
Distributions (Unaudited)
The Board of Trustees of each fund voted to pay to shareholders of record at the opening of business on record date, the following distributions per share derived from capital gains realized from sales of portfolio securities:
| | Pay Date | Record Date | Capital Gains |
| Fidelity Ohio Municipal Income Fund | 02/11/19 | 02/08/19 | $0.0030 |
| Fidelity Ohio Municipal Money Market Fund | 02/11/19 | 02/08/19 | $0.0008 |
The funds hereby designate as capital gain dividend the amounts noted below for the taxable year ended December 31, 2018, or, if subsequently determined to be different, the net capital gain of such year.
| Fidelity Ohio Municipal Income Fund | $242,260 |
During fiscal year ended 2018, 100% of each fund's income dividends were free from federal income tax, and 0.63% and 26.37% of Fidelity Ohio Municipal Income Fund and Fidelity Ohio Municipal Money Market Fund's income dividends, respectively, were subject to the federal alternative minimum tax.
The funds will notify shareholders in January 2019 of amounts for use in preparing 2018 income tax returns.
Board Approval of Investment Advisory Contracts and Management Fees
Fidelity Ohio Municipal Income Fund / Fidelity Ohio Municipal Money Market Fund
Each year, the Board of Trustees, including the Independent Trustees (together, the Board), votes on the renewal of the management contract with Fidelity Management & Research Company (FMR) and the sub-advisory agreements (together, the Advisory Contracts) for each fund. FMR and the sub-advisers are referred to herein as the Investment Advisers. The Board, assisted by the advice of fund counsel and Independent Trustees' counsel, requests and considers a broad range of information relevant to the renewal of the Advisory Contracts throughout the year.
The Board meets regularly and, at each of its meetings, covers an extensive agenda of topics and materials and considers factors that are relevant to its annual consideration of the renewal of each fund's Advisory Contracts, including the services and support provided to each fund and its shareholders. The Board has established four standing committees (Committees) — Operations, Audit, Fair Valuation, and Governance and Nominating — each composed of and chaired by Independent Trustees with varying backgrounds, to which the Board has assigned specific subject matter responsibilities in order to enhance effective decision-making by the Board. The Operations Committee, of which all of the Independent Trustees are members, meets regularly throughout the year and considers, among other matters, information specifically related to the annual consideration of the renewal of each fund's Advisory Contracts. The Board, acting directly and through its Committees, requests and receives information concerning the annual consideration of the renewal of each fund's Advisory Contracts. The Board also meets as needed to review matters specifically related to the Board's annual consideration of the renewal of the Advisory Contracts. Members of the Board may also meet with trustees of other Fidelity funds through joint ad hoc committees to discuss certain matters relevant to all of the Fidelity funds.
At its September 2018 meeting, the Board unanimously determined to renew each fund's Advisory Contracts. In reaching its determination, the Board considered all factors it believed relevant, including (i) the nature, extent, and quality of the services to be provided to each fund and its shareholders (including the investment performance of each fund); (ii) the competitiveness of each fund's management fee and total expense ratio relative to peer funds; (iii) the total costs of the services to be provided by and the profits to be realized by Fidelity from its relationships with each fund; and (iv) the extent to which, if any, economies of scale exist and would be realized as each fund grows, and whether any economies of scale are appropriately shared with fund shareholders.
In considering whether to renew the Advisory Contracts for each fund, the Board reached a determination, with the assistance of fund counsel and Independent Trustees' counsel and through the exercise of its business judgment, that the renewal of the Advisory Contracts was in the best interests of each fund and its shareholders and that the compensation payable under the Advisory Contracts was fair and reasonable. The Board's decision to renew the Advisory Contracts was not based on any single factor, but rather was based on a comprehensive consideration of all the information provided to the Board at its meetings throughout the year. The Board, in reaching its determination to renew the Advisory Contracts, was aware that shareholders of each fund have a broad range of investment choices available to them, including a wide choice among funds offered by Fidelity's competitors, and that each fund's shareholders, who have the opportunity to review and weigh the disclosure provided by the fund in its prospectus and other public disclosures, have chosen to invest in that fund, which is part of the Fidelity family of funds.
Nature, Extent, and Quality of Services Provided. The Board considered Fidelity's staffing as it relates to the funds, including the backgrounds of investment personnel of Fidelity, and also considered the funds' investment objectives, strategies, and related investment philosophies. The Independent Trustees also had discussions with senior management of Fidelity's investment operations and investment groups. The Board considered the structure of the investment personnel compensation program and whether this structure provides appropriate incentives to act in the best interests of each fund. Additionally, the Board considered the portfolio managers' investments, if any, in the funds that they manage.
Resources Dedicated to Investment Management and Support Services. The Board reviewed the general qualifications and capabilities of Fidelity's investment staff, including its size, education, experience, and resources, as well as Fidelity's approach to recruiting, managing, and compensating investment personnel. The Board noted that Fidelity has continued to increase the resources devoted to non-U.S. offices, including expansion of Fidelity's global investment organization. The Board also noted that Fidelity's analysts have extensive resources, tools and capabilities that allow them to conduct sophisticated quantitative and fundamental analysis, as well as credit analysis of issuers, counterparties and guarantors. Further, the Board considered that Fidelity's investment professionals have sufficient access to global information and data so as to provide competitive investment results over time, and that those professionals also have access to sophisticated tools that permit them to assess portfolio construction and risk and performance attribution characteristics continuously, as well as to transmit new information and research conclusions rapidly around the world. Additionally, in its deliberations, the Board considered Fidelity's trading, risk management, compliance, and technology and operations capabilities and resources, which are integral parts of the investment management process.
Shareholder and Administrative Services. The Board considered (i) the nature, extent, quality, and cost of advisory, administrative, and shareholder services performed by the Investment Advisers and their affiliates under the Advisory Contracts and under separate agreements covering transfer agency and pricing and bookkeeping services for each fund; (ii) the nature and extent of the supervision of third party service providers, principally custodians, subcustodians, and pricing vendors; and (iii) the resources devoted to, and the record of compliance with, each fund's compliance policies and procedures.
The Board noted that the growth of fund assets over time across the complex allows Fidelity to reinvest in the development of services designed to enhance the value and convenience of the Fidelity funds as investment vehicles. These services include 24-hour access to account information and market information through telephone representatives and over the Internet, investor education materials and asset allocation tools, and the expanded availability of Fidelity Investor Centers.
Investment in a Large Fund Family. The Board considered the benefits to shareholders of investing in a Fidelity fund, including the benefits of investing in a fund that is part of a large family of funds offering a variety of investment disciplines and providing a large variety of mutual fund investor services. The Board noted that Fidelity had taken, or had made recommendations that resulted in the Fidelity funds taking, a number of actions over the previous year that benefited particular funds, including: (i) continuing to dedicate additional resources to Fidelity's investment research process, which includes meetings with management of issuers of securities in which the funds invest, and to the support of the senior management team that oversees asset management; (ii) continuing efforts to enhance Fidelity's global research capabilities; (iii) launching new funds and making other enhancements to meet client needs; (iv) launching new share classes of existing funds; (v) eliminating purchase minimums and broadening eligibility requirements for certain funds and share classes; (vi) reducing management fees and total expenses for certain growth equity funds and index funds; (vii) lowering expense caps for certain existing funds and classes, and converting certain voluntary expense caps to contractual caps, to reduce expenses borne by shareholders; (viii) eliminating short-term redemption fees for funds that had such fees; (ix) rationalizing product lines and gaining increased efficiencies from fund mergers and share class consolidations; (x) continuing to develop, acquire and implement systems and technology to improve services to the funds and shareholders, strengthen information security, and increase efficiency; and (xi) continuing to implement enhancements to further strengthen Fidelity's product line to increase investors' probability of success in achieving their investment goals, including retirement income goals.
Investment Performance (for Fidelity Ohio Municipal Income Fund). The Board considered whether the fund has operated in accordance with its investment objective, as well as its record of compliance with its investment restrictions and its performance history.
The Board took into account discussions that occur at Board meetings throughout the year with representatives of the Investment Advisers about fund investment performance. In this regard the Board noted that as part of regularly scheduled fund reviews and other reports to the Board on fund performance, the Board considers annualized return information for the fund for different time periods, measured against an appropriate securities market index ("benchmark index") and a peer group of funds with similar objectives ("peer group"), if any. In its evaluation of fund investment performance at meetings throughout the year, the Board gave particular attention to information indicating underperformance of certain Fidelity funds for specific time periods and discussed with the Investment Advisers the reasons for such underperformance.
In addition to reviewing absolute and relative fund performance, the Independent Trustees periodically consider the appropriateness of fund performance metrics in evaluating the results achieved. In general, the Independent Trustees believe that fund performance should be evaluated based on gross performance (before fees and expenses but after transaction costs) compared to appropriate benchmark indices, over appropriate time periods that may include full market cycles, and on net performance (after fees and expenses) compared to peer groups, as applicable, over the same periods, taking into account relevant factors including the following: general market conditions; expectations for interest rate levels and credit conditions; issuer-specific information including credit quality; the potential for incremental return versus the fund's benchmark index weighed against the risks involved in obtaining that incremental return, including the risk of diminished or negative total returns; and fund cash flows and other factors. Depending on the circumstances, the Independent Trustees may be satisfied with a fund's performance notwithstanding that it lags its benchmark index or peer group for certain periods.
The Independent Trustees recognize that shareholders evaluate performance on a net basis over their own holding periods, for which one-, three-, and five-year periods are often used as a proxy. For this reason, the performance information reviewed by the Board also included net cumulative calendar year total return information for the fund and an appropriate benchmark index and peer group for the most recent one-, three-, and five-year periods.
Investment Performance (for Fidelity Ohio Municipal Money Market Fund). The Board considered whether the fund has operated in accordance with its investment objective, as well as its record of compliance with its investment restrictions and its performance history.
The Board took into account discussions that occur at Board meetings throughout the year with representatives of the Investment Advisers about fund investment performance. In this regard the Board noted that as part of regularly scheduled fund reviews and other reports to the Board on fund performance, the Board considers annualized return information for the fund for different time periods, measured against a peer group.
In addition to reviewing absolute and relative fund performance, the Independent Trustees periodically consider the appropriateness of fund performance metrics in evaluating the results achieved. In general, the Independent Trustees believe that fund performance should be evaluated based on gross performance (before fees and expenses but after transaction costs) compared to the gross performance of appropriate peer groups, over appropriate time periods that may include full market cycles, taking into account relevant factors including the following: general market conditions; expectations for interest rate levels and credit conditions; issuer-specific information including credit quality; the fund's market value NAV over time and its resilience under various stressed conditions; and fund cash flows and other factors.
The Board recognizes that in interest rate environments where many competitors waive fees to maintain a minimum yield, relative money market fund performance on a net basis (after fees and expenses) may not be particularly meaningful due to miniscule performance differences among competitor funds. Depending on the circumstances, the Independent Trustees may be satisfied with a fund's performance notwithstanding that it lags its peer group for certain periods.
The Independent Trustees recognize that shareholders evaluate performance on a net basis over their own holding periods, for which one-, three-, and five-year periods are often used as a proxy. For this reason, the performance information reviewed by the Board also included net cumulative calendar year total return information for the fund and an appropriate peer group for the most recent one-, three-, and five-year periods.
Based on its review, the Board concluded that the nature, extent, and quality of services provided to each fund under the Advisory Contracts should continue to benefit the shareholders of each fund.
Competitiveness of Management Fee and Total Expense Ratio. The Board considered each fund's management fee and total expense ratio compared to "mapped groups" of competitive funds and classes created for the purpose of facilitating the Trustees' competitive analysis of management fees and total expenses. Fidelity creates "mapped groups" by combining similar Lipper investment objective categories that have comparable investment mandates. Combining Lipper investment objective categories aids the Board's management fee and total expense ratio comparisons by broadening the competitive group used for comparison.
Management Fee. The Board considered two proprietary management fee comparisons for the 12-month periods shown in basis points (BP) in the charts below. The group of Lipper funds used by the Board for management fee comparisons is referred to below as the "Total Mapped Group" and, for the reasons explained above, is broader than the Lipper peer group used by the Board for performance comparisons. The Total Mapped Group comparison focuses on a fund's standing in terms of gross management fees before expense reimbursements or caps relative to the total universe of funds with comparable investment mandates, regardless of whether their management fee structures also are comparable. Funds with comparable investment mandates offer exposure to similar types of securities. Funds with comparable management fee structures have similar management fee contractual arrangements (
e.g., flat rate charged for advisory services, all-inclusive fee rate,
etc.). "TMG %" represents the percentage of funds in the Total Mapped Group that had management fees that were lower than a fund's. For example, a hypothetical TMG % of 20% would mean that 80% of the funds in the Total Mapped Group had higher, and 20% had lower, management fees than a fund. The funds' actual TMG %s and the number of funds in the Total Mapped Group are in the charts below. The "Asset-Size Peer Group" (ASPG) comparison focuses on a fund's standing relative to a subset of non-Fidelity funds within the Total Mapped Group that are similar in size and management fee structure. For example, if a fund is in the first quartile of the ASPG, the fund's management fee ranks in the least expensive or lowest 25% of funds in the ASPG. The ASPG represents at least 15% of the funds in the Total Mapped Group with comparable asset size and management fee structures, subject to a minimum of 50 funds (or all funds in the Total Mapped Group if fewer than 50). Additional information, such as the ASPG quartile in which a fund's management fee rate ranked, is also included in the charts and was considered by the Board.
Fidelity Ohio Municipal Income Fund
The Board noted that the fund's management fee rate ranked below the median of its Total Mapped Group and below the median of its ASPG for 2017.
Fidelity Ohio Municipal Money Market Fund
The Board noted that because there is a relatively small number of state-specific funds in the Lipper objective, Fidelity combines Lipper's separate categories for state-specific funds with all state and national money market funds to create a single mapped group. The Board considered that Fidelity is the only firm that offers an Ohio money market fund.
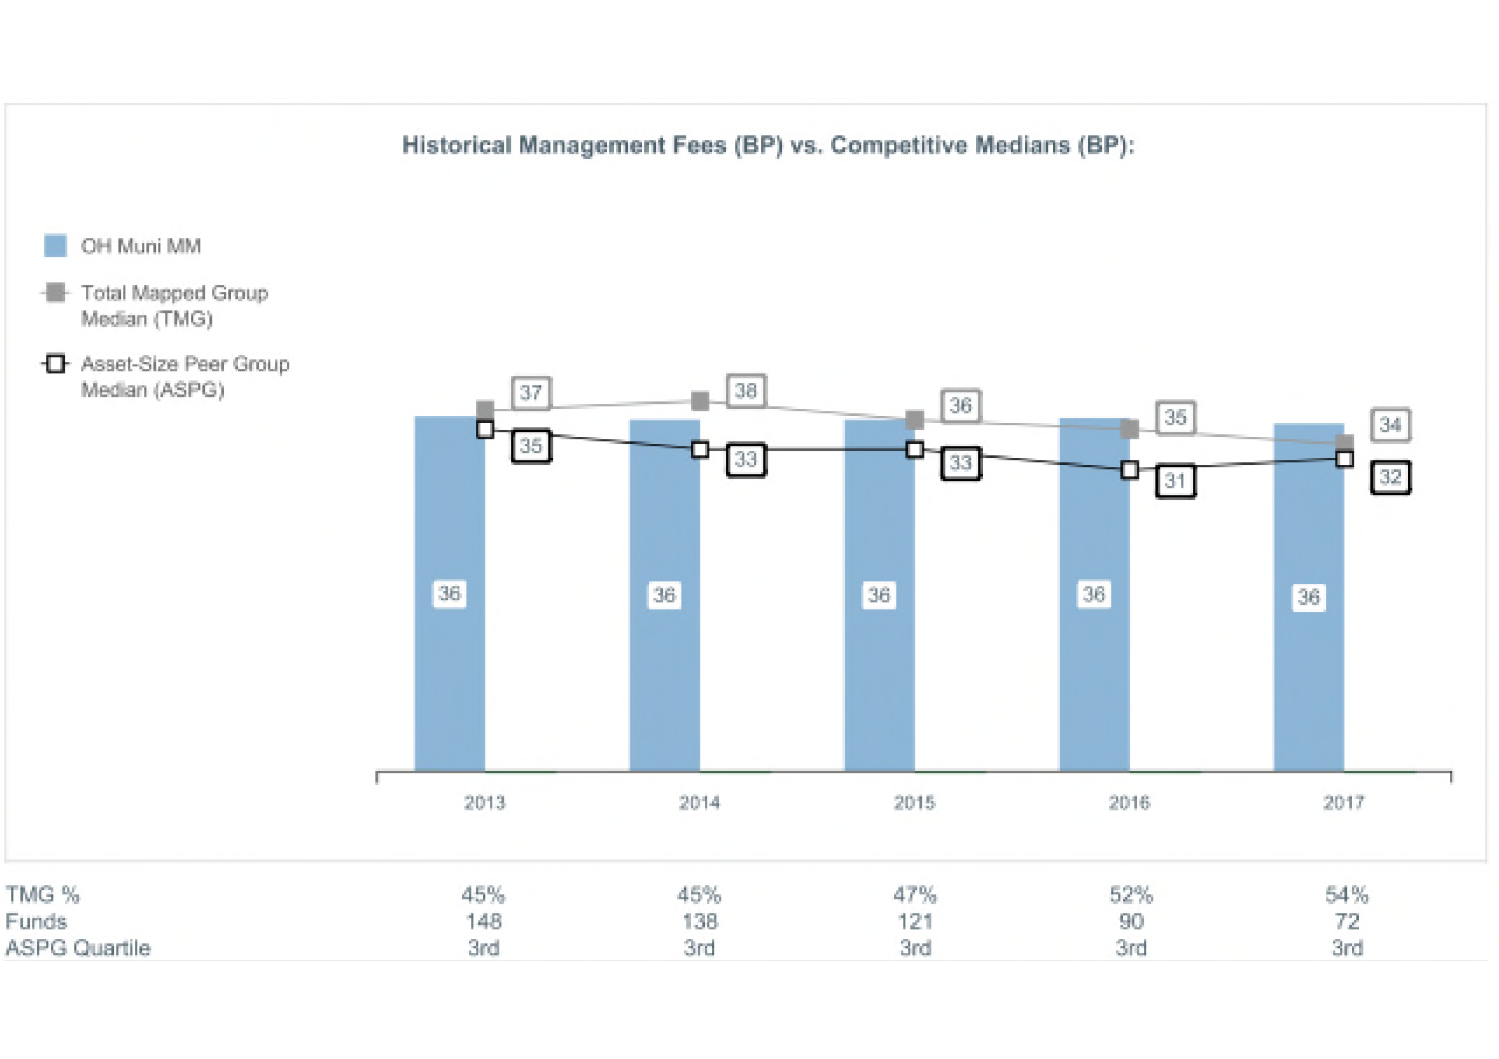
The Board noted that the fund's management fee rate ranked above the median of its Total Mapped Group and above the median of its ASPG for 2017, but considered that the management fee rate was only slightly above the Total Mapped Group and ASPG medians.
The Board noted that it and the boards of other Fidelity funds formed an ad hoc Committee on Group Fee, which meets periodically, to conduct an in-depth review of the "group fee" component of the management fee of funds with such management fee structures. The Committee's focus included the mechanics of the group fee, the competitive landscape of group fee structures, Fidelity funds with no group fee component and investment products not included in group fee assets. The Board also considered that, for funds subject to the group fee, FMR agreed to voluntarily waive fees over a specified period of time in amounts designed to account for assets converted from certain funds to certain collective investment trusts.
Based on its review, the Board concluded that each fund's management fee is fair and reasonable in light of the services that the fund receives and the other factors considered.
Total Expense Ratio. In its review of each fund's total expense ratio, the Board considered the fund's management fee rate as well as other fund expenses, such as transfer agent fees, pricing and bookkeeping fees, and custodial, legal, and audit fees. The Board also noted that Fidelity may agree to waive fees and expenses from time to time, and the extent to which, if any, it has done so for each fund. As part of its review, the Board also considered the current and historical total expense ratios of each fund compared to competitive fund median expenses. Each fund is compared to those funds and classes in the Total Mapped Group (used by the Board for management fee comparisons) that have a similar sales load structure.
The Board noted that Fidelity Ohio Municipal Income Fund's total expense ratio ranked below the competitive median for 2017 and Fidelity Ohio Municipal Money Market Fund's total expense ratio ranked above the competitive median for 2017. The Board considered that, in general, various factors can affect total expense ratios. The Board considered that the competitive data for Fidelity Ohio Municipal Money Market Fund reflects periods for which many competitor funds waived fees or reimbursed expenses in order to maintain a minimum yield. The Board also considered that, as interest rates rise, many competitors have eliminated such waivers, but the externally sourced competitive data for 2017 had not yet caught up to the fiscal periods during which competitors have stopped waiving fees to maintain minimum yields. The Board noted that, excluding fee waivers and reimbursements, the fund's total expense ratio ranked above the median, but the difference in total expense ratio was slight.
Fees Charged to Other Fidelity Clients. The Board also considered Fidelity fee structures and other information with respect to clients of Fidelity, such as other funds advised or subadvised by Fidelity, pension plan clients, and other institutional clients with similar mandates. The Board noted that a joint ad hoc committee created by it and the boards of other Fidelity funds periodically reviews and compares Fidelity's institutional investment advisory business with its business of providing services to the Fidelity funds and also noted the most recent findings of the committee. The Board noted that the committee's review included a consideration of the differences in services provided, fees charged, and costs incurred, as well as competition in the markets serving the different categories of clients.
Based on its review of total expense ratios and fees charged to other Fidelity clients, the Board concluded that each fund's total expense ratio was reasonable in light of the services that the fund and its shareholders receive and the other factors considered.
Costs of the Services and Profitability. The Board considered the revenues earned and the expenses incurred by Fidelity in conducting the business of developing, marketing, distributing, managing, administering and servicing each fund and servicing each fund's shareholders. The Board also considered the level of Fidelity's profits in respect of all the Fidelity funds.
On an annual basis, Fidelity presents to the Board information about the profitability of its relationships with each fund. Fidelity calculates profitability information for each fund, as well as aggregate profitability information for groups of Fidelity funds and all Fidelity funds, using a series of detailed revenue and cost allocation methodologies which originate with the books and records of Fidelity on which Fidelity's audited financial statements are based. The Audit Committee of the Board reviews any significant changes from the prior year's methodologies.
PricewaterhouseCoopers LLP (PwC), auditor to Fidelity and certain Fidelity funds, has been engaged annually by the Board as part of the Board's assessment of Fidelity's profitability analysis. PwC's engagement includes the review and assessment of the methodologies used by Fidelity in determining the revenues and expenses attributable to Fidelity's mutual fund business, and completion of agreed-upon procedures in respect of the mathematical accuracy of the fund profitability information and its conformity to established allocation methodologies. After considering PwC's reports issued under the engagement and information provided by Fidelity, the Board concluded that while other allocation methods may also be reasonable, Fidelity's profitability methodologies are reasonable in all material respects.
The Board also reviewed Fidelity's non-fund businesses and potential indirect benefits such businesses may have received as a result of their association with Fidelity's mutual fund business (i.e., fall-out benefits) as well as cases where Fidelity's affiliates may benefit from the funds' business. The Board noted that changes to fall-out benefits year-over-year reflect business developments at Fidelity's various businesses.
The Board considered the costs of the services provided by and the profits realized by Fidelity in connection with the operation of each fund and was satisfied that the profitability was not excessive.
Economies of Scale. The Board considered whether there have been economies of scale in respect of the management of the Fidelity funds, whether the Fidelity funds (including each fund) have appropriately benefited from any such economies of scale, and whether there is potential for realization of any further economies of scale. The Board considered the extent to which each fund will benefit from economies of scale as assets grow through increased services to the fund, through waivers or reimbursements, or through fee or expense ratio reductions. The Board also noted that a committee (the Economies of Scale Committee) created by it and the boards of other Fidelity funds periodically analyzes whether Fidelity attains economies of scale in respect of the management and servicing of the Fidelity funds, whether the Fidelity funds have appropriately benefited from such economies of scale, and whether there is potential for realization of any further economies of scale.
The Board recognized that each fund's management contract incorporates a "group fee" structure, which provides for lower group fee rates as total group assets increase, and for higher group fee rates as total group assets decrease (with "group assets" defined to include fund assets under FMR's management plus the assets of sector funds previously under FMR's management). FMR calculates the group fee rates based on a tiered asset "breakpoint" schedule that varies based on asset class. The Board considered that the group fee is designed to deliver the benefits of economies of scale to fund shareholders when total Fidelity fund assets increase, even if assets of any particular fund are unchanged or have declined, because some portion of Fidelity's costs are attributable to services provided to all Fidelity funds, and all funds benefit if those costs can be allocated among more assets. The Board concluded that, given the group fee structure, fund shareholders will benefit from lower management fees as group assets increase at the fund complex level, regardless of whether Fidelity achieves any such economies of scale.
The Board concluded, taking into account the analysis of the Economies of Scale Committee, that economies of scale, if any, are being appropriately shared between fund shareholders and Fidelity.
Additional Information Requested by the Board. In order to develop fully the factual basis for consideration of the Fidelity funds' advisory contracts, the Board requested and received additional information on certain topics, including: (i) Fidelity's fund profitability methodology, profitability trends for certain funds, the allocation of various costs to different funds, and the impact of certain factors on fund profitability results; (ii) portfolio manager changes that have occurred during the past year and the amount of the investment that each portfolio manager has made in the Fidelity fund(s) that he or she manages; (iii) Fidelity's compensation structure for portfolio managers, research analysts, and other key personnel, including its effects on fund profitability, the rationale for the compensation structure, and the extent to which current market conditions have affected retention and recruitment; (iv) the arrangements with and compensation paid to certain fund sub-advisers on behalf of the Fidelity funds and the treatment of such compensation within Fidelity's fund profitability methodology; (v) the terms of Fidelity's voluntary expense limitation agreements; (vi) the methodology with respect to competitive fund data and peer group classifications; (vii) Fidelity's transfer agent fee, expense, and service structures for different funds and classes relative to competitive trends, and the impact of the increased use of omnibus accounts; (viii) new developments in the retail and institutional marketplaces and the competitive positioning of the funds relative to other investment products and services; (ix) the impact of recent changes to the money market fund landscape, including the full implementation of money market fund reform and rising interest rates, on Fidelity's money market funds; (x) the funds' share class structures and distribution channels; and (xi) explanations regarding the relative total expense ratios of certain funds and classes, total expense competitive trends and methodologies for total expense competitive comparisons, and actions that might be taken by Fidelity to reduce total expense ratios for certain classes. In addition, the Board considered its discussions with Fidelity throughout the year regarding enhanced information security initiatives and the funds' fair valuation policies.
Based on its evaluation of all of the conclusions noted above, and after considering all factors it believed relevant, the Board concluded that the advisory fee arrangements are fair and reasonable, and that each fund's Advisory Contracts should be renewed.
Corporate Headquarters
245 Summer St.
Boston, MA 02210
www.fidelity.com
OFF-ANN-0219
1.540019.121
Fidelity® Pennsylvania Municipal Income Fund
Fidelity® Pennsylvania Municipal Money Market Fund
Annual Report December 31, 2018 |
|
Beginning on January 1, 2021, as permitted by regulations adopted by the Securities and Exchange Commission, paper copies of a fund’s shareholder reports will no longer be sent by mail, unless you specifically request paper copies of the reports from the fund or from your financial intermediary, such as a financial advisor, broker-dealer or bank. Instead, the reports will be made available on a website, and you will be notified by mail each time a report is posted and provided with a website link to access the report.
If you already elected to receive shareholder reports electronically, you will not be affected by this change and you need not take any action. You may elect to receive shareholder reports and other communications from a fund electronically, by contacting your financial intermediary. For Fidelity customers, visit Fidelity's web site or call Fidelity using the contact information listed below.
You may elect to receive all future reports in paper free of charge. If you wish to continue receiving paper copies of your shareholder reports, you may contact your financial intermediary or, if you are a Fidelity customer, visit Fidelity’s website, or call Fidelity at the applicable toll-free number listed below. Your election to receive reports in paper will apply to all funds held with the fund complex/your financial intermediary.
| Account Type | Website | Phone Number |
| Brokerage, Mutual Fund, or Annuity Contracts: | fidelity.com/mailpreferences | 1-800-343-3548 |
| Employer Provided Retirement Accounts: | netbenefits.fidelity.com/preferences (choose 'no' under Required Disclosures to continue to print) | 1-800-343-0860 |
| Advisor Sold Accounts Serviced Through Your Financial Intermediary: | Contact Your Financial Intermediary | Your Financial Intermediary's phone number |
| Advisor Sold Accounts Serviced by Fidelity: | institutional.fidelity.com | 1-877-208-0098 |
Contents
To view a fund's proxy voting guidelines and proxy voting record for the 12-month period ended June 30, visit http://www.fidelity.com/proxyvotingresults or visit the Securities and Exchange Commission's (SEC) web site at http://www.sec.gov.
You may also call 1-800-544-8544 to request a free copy of the proxy voting guidelines.
Standard & Poor's, S&P and S&P 500 are registered service marks of The McGraw-Hill Companies, Inc. and have been licensed for use by Fidelity Distributors Corporation.
Other third-party marks appearing herein are the property of their respective owners.
All other marks appearing herein are registered or unregistered trademarks or service marks of FMR LLC or an affiliated company. © 2019 FMR LLC. All rights reserved.
This report and the financial statements contained herein are submitted for the general information of the shareholders of the Fund. This report is not authorized for distribution to prospective investors in the Fund unless preceded or accompanied by an effective prospectus.
A fund files its complete schedule of portfolio holdings with the SEC for the first and third quarters of each fiscal year on Form N-Q. Forms N-Q are available on the SEC’s web site at http://www.sec.gov. A fund's Forms N-Q may be reviewed and copied at the SEC’s Public Reference Room in Washington, DC. Information regarding the operation of the SEC's Public Reference Room may be obtained by calling 1-800-SEC-0330.
For a complete list of a fund's portfolio holdings, view the most recent holdings listing, semiannual report, or annual report on Fidelity's web site at http://www.fidelity.com, http://www.institutional.fidelity.com, or http://www.401k.com, as applicable.
NOT FDIC INSURED •MAY LOSE VALUE •NO BANK GUARANTEE
Neither the Fund nor Fidelity Distributors Corporation is a bank.
Fidelity® Pennsylvania Municipal Income Fund
Performance: The Bottom Line
Average annual total return reflects the change in the value of an investment, assuming reinvestment of distributions from dividend income and capital gains (the profits earned upon the sale of securities that have grown in value, if any) and assuming a constant rate of performance each year. The hypothetical investment and the average annual total returns do not reflect the deduction of taxes that a shareholder would pay on fund distributions or the redemption of fund shares. During periods of reimbursement by Fidelity, a fund’s total return will be greater than it would be had the reimbursement not occurred. How a fund did yesterday is no guarantee of how it will do tomorrow.
Average Annual Total Returns
| For the periods ended December 31, 2018 | Past 1 year | Past 5 years | Past 10 years |
| Fidelity® Pennsylvania Municipal Income Fund | 0.84% | 3.79% | 4.45% |
$10,000 Over 10 Years
Let's say hypothetically that $10,000 was invested in Fidelity® Pennsylvania Municipal Income Fund on December 31, 2008.
The chart shows how the value of your investment would have changed, and also shows how the Bloomberg Barclays Municipal Bond Index performed over the same period.
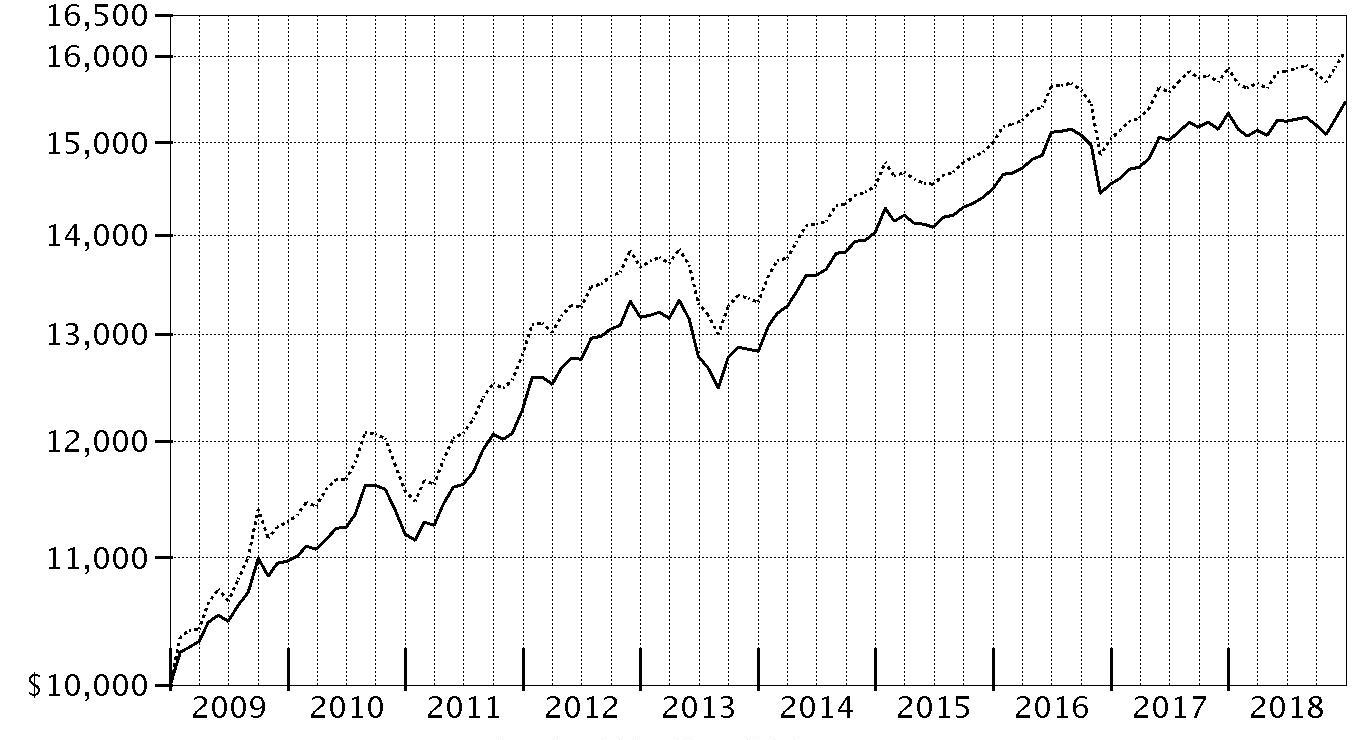
| Period Ending Values |
| $15,456 | Fidelity® Pennsylvania Municipal Income Fund |
| $16,060 | Bloomberg Barclays Municipal Bond Index |
Fidelity® Pennsylvania Municipal Income Fund
Management's Discussion of Fund Performance
Market Recap: Tax-exempt municipal bonds gained modestly in 2018, with the Bloomberg Barclays Municipal Bond Index returning 1.28%, supported by lower bond issuance and solid economic growth. Tax reform had a significant impact on both the supply of and demand for tax-exempt bonds the past year. In the final months of 2017, issuers accelerated their bond financings in order to issue under the old tax rules, prompting a surge in supply. Investors absorbed this excess supply, anticipating that issuance would fall significantly in 2018. The market turned lower in early 2018, as domestic fixed-income markets reacted to robust economic data and signs of inflation, before stabilizing in March and rallying through August. The municipal market experienced volatility in September and October amid concerns of an economic slowdown, then rebounded to close December near a high for the year. Gross municipal bond issuance ended 2018 down approximately 25%. There was little differentiation in performance across municipal sectors in 2018. General obligation bonds gained 1.33%, with bonds issued by states slightly outperforming those backed by local municipalities. Looking ahead, market volatility is likely to persist due to uncertainty about how the U.S. Federal Reserve will react to labor and inflation trends.
Comments from Co-Portfolio Managers Cormac Cullen, Elizah McLaughlin and Kevin Ramundo: For the year ending December 31, 2018, the fund gained 0.84%, net of fees, lagging the 1.49% advance of the state benchmark, the Bloomberg Barclays Pennsylvania Enhanced Municipal Bond Index and also trailing its Lipper peer group average. Relative to the state benchmark, differences in the way fund holdings and index components were priced detracted from fund performance. The fund's underweighting in general obligation bonds backed by the state of Pennsylvania also detracted. These securities outperformed many other bonds issued across Pennsylvania, due partly to improved investor sentiment toward the state's credit. In contrast, the portfolio's overweighting in health care bonds contributed, as these securities outpaced most other sectors of the market, benefiting from a fairly stable environment for the sector and the comparatively high level of income they produced. Additionally, security selection among health care bonds added value.
The views expressed above reflect those of the portfolio manager(s) only through the end of the period as stated on the cover of this report and do not necessarily represent the views of Fidelity or any other person in the Fidelity organization. Any such views are subject to change at any time based upon market or other conditions and Fidelity disclaims any responsibility to update such views. These views may not be relied on as investment advice and, because investment decisions for a Fidelity fund are based on numerous factors, may not be relied on as an indication of trading intent on behalf of any Fidelity fund.
Note to Shareholders: On September 1, 2018, Elizah McLaughlin joined the municipal bond portfolio management team, succeeding Mark Sommer, who retired from Fidelity on December 31, 2018, after 27 years with the firm.
Fidelity® Pennsylvania Municipal Income Fund
Investment Summary (Unaudited)
Top Five Sectors as of December 31, 2018
| | % of fund's net assets |
| Health Care | 27.8 |
| General Obligations | 23.6 |
| Education | 13.9 |
| Transportation | 13.5 |
| Water & Sewer | 11.8 |
Quality Diversification (% of fund's net assets)
| As of December 31, 2018 |
| | AA,A | 90.0% |
| | BBB | 5.7% |
| | BB and Below | 2.2% |
| | Not Rated | 0.6% |
| | Short-Term Investments and Net Other Assets | 1.5% |

We have used ratings from Moody's Investors Service, Inc. Where Moody's® ratings are not available, we have used S&P® ratings. All ratings are as of the date indicated and do not reflect subsequent changes.
Fidelity® Pennsylvania Municipal Income Fund
Schedule of Investments December 31, 2018
Showing Percentage of Net Assets
| Municipal Bonds - 98.5% | | | |
| | | Principal Amount | Value |
| Guam - 0.1% | | | |
| Guam Int'l. Arpt. Auth. Rev. Series 2013 C, 6.25% 10/1/34 (a) | | 700,000 | 795,228 |
| Pennsylvania - 96.1% | | | |
| Adams County Indl. Dev. Auth. Rev. (Gettysburg College Proj.) Series 2010, 5% 8/15/24 | | 1,000,000 | 1,045,350 |
| Allegheny County Series C: | | | |
| 5% 12/1/28 | | $1,000,000 | $1,137,740 |
| 5% 12/1/30 | | 1,365,000 | 1,544,197 |
| Allegheny County Arpt. Auth. Rev. Series 2006 B, 5% 1/1/22 (Nat'l. Pub. Fin. Guarantee Corp. Insured) (a) | | 1,650,000 | 1,776,704 |
| Allegheny County Higher Ed. Bldg. Auth. Univ. Rev. Series 2018: | | | |
| 5% 3/1/33 | | 1,570,000 | 1,806,254 |
| 5% 3/1/34 | | 2,250,000 | 2,576,993 |
| Allegheny County Sanitation Auth. Swr. Rev.: | | | |
| Series 2010, 5% 6/1/40 (FSA Insured) | | 6,690,000 | 7,009,046 |
| Series 2018, 5% 6/1/43 | | 4,750,000 | 5,337,243 |
| 5% 12/1/29 (Build America Mutual Assurance Insured) | | 3,905,000 | 4,470,366 |
| Berks County Muni. Auth. Rev. Series 2012 A, 5% 11/1/40 | | 3,590,000 | 3,810,965 |
| Butler County Hosp. Auth. Hosp. Rev. (Butler Health Sys. Proj.) Series 2015 A: | | | |
| 5% 7/1/26 | | 500,000 | 560,490 |
| 5% 7/1/27 | | 490,000 | 547,438 |
| 5% 7/1/28 | | 540,000 | 602,964 |
| 5% 7/1/29 | | 710,000 | 792,339 |
| 5% 7/1/30 | | 685,000 | 761,028 |
| 5% 7/1/35 | | 1,885,000 | 2,064,018 |
| 5% 7/1/39 | | 6,675,000 | 7,215,875 |
| Cap. Region Wtr. Wtr. Rev. Series 2018: | | | |
| 5% 7/15/28 | | 1,300,000 | 1,536,639 |
| 5% 7/15/30 | | 1,500,000 | 1,751,190 |
| 5% 7/15/31 | | 1,250,000 | 1,451,438 |
| Central Bradford Prog. Auth. Rev. Series 2011, 5.375% 12/1/41 | | 2,000,000 | 2,147,020 |
| Centre County Pennsylvania Hosp. Auth. Rev. (Mount Nittany Med. Ctr. Proj.): | | | |
| Series 2011, 7% 11/15/46 (Pre-Refunded to 11/15/21 @ 100) | | 2,000,000 | 2,277,800 |
| Series 2016 A: | | | |
| 4% 11/15/32 | | 350,000 | 362,754 |
| 4% 11/15/34 | | 250,000 | 257,410 |
| 4% 11/15/35 | | 200,000 | 205,558 |
| 5% 11/15/28 | | 840,000 | 956,936 |
| 5% 11/15/29 | | 1,625,000 | 1,845,773 |
| 5% 11/15/30 | | 685,000 | 773,502 |
| 5% 11/15/46 | | 6,605,000 | 7,175,408 |
| Series 2016 B: | | | |
| 4% 11/15/40 | | 600,000 | 606,084 |
| 4% 11/15/47 | | 3,605,000 | 3,613,472 |
| Series 2018 A: | | | |
| 5% 11/15/26 | | 1,140,000 | 1,315,936 |
| 5% 11/15/27 | | 225,000 | 261,702 |
| 5% 11/15/28 | | 200,000 | 231,270 |
| 5% 11/15/29 | | 200,000 | 230,428 |
| Commonwealth Fing. Auth. Rev. Series 2013 A2: | | | |
| 5% 6/1/24 | | 800,000 | 866,624 |
| 5% 6/1/25 | | 1,175,000 | 1,272,055 |
| 5% 6/1/26 | | 1,250,000 | 1,351,975 |
| 5% 6/1/42 | | 12,000,000 | 12,812,511 |
| Cumberland County Muni. Auth. Rev. (Dickinson College Proj.): | | | |
| Series 2012: | | | |
| 5% 11/1/37 | | 1,520,000 | 1,637,663 |
| 5% 11/1/42 | | 3,000,000 | 3,220,950 |
| Series 2016: | | | |
| 5% 5/1/30 | | 1,000,000 | 1,144,800 |
| 5% 5/1/31 | | 500,000 | 569,555 |
| 5% 5/1/32 | | 750,000 | 850,628 |
| 5% 5/1/33 | | 2,210,000 | 2,498,737 |
| 5% 5/1/34 | | 1,000,000 | 1,126,440 |
| Dauphin County Gen. Auth.: | | | |
| (Pinnacle Health Sys. Proj.) Series 2016 A: | | | |
| 5% 6/1/34 | | 1,275,000 | 1,418,208 |
| 5% 6/1/35 | | 1,000,000 | 1,109,540 |
| 5% 6/1/36 | | 500,000 | 552,695 |
| 5% 6/1/42 | | 7,410,000 | 7,857,268 |
| Delaware County Auth. Univ. Rev. Series 2012: | | | |
| 5% 8/1/21 | | 350,000 | 376,432 |
| 5% 8/1/22 | | 300,000 | 330,156 |
| Doylestown Hosp. Auth. Hosp. Rev.: | | | |
| Series 2013 A: | | | |
| 5% 7/1/23 | | 1,090,000 | 1,175,314 |
| 5% 7/1/27 | | 2,500,000 | 2,651,500 |
| Series 2016 A, 5% 7/1/46 | | 3,500,000 | 3,621,520 |
| Erie County Hosp. Auth. Rev. (Saint Vincent Health Ctr. Proj.) Series 2010 A, 7% 7/1/27 (Pre-Refunded to 7/1/20 @ 100) | | 2,750,000 | 2,953,555 |
| Fox Chapel Area School District Series 2013: | | | |
| 4% 8/1/22 | | 500,000 | 534,000 |
| 5% 8/1/31 | | 3,080,000 | 3,394,283 |
| 5% 8/1/34 | | 1,000,000 | 1,095,920 |
| Franklin County Indl. Dev. Auth. (The Chambersburg Hosp. Proj.) Series 2010: | | | |
| 5.3% 7/1/30 | | 1,770,000 | 1,848,623 |
| 5.375% 7/1/42 | | 2,130,000 | 2,222,144 |
| Geisinger Auth. Health Sys. Rev.: | | | |
| Series 2014 A, 4% 6/1/41 | | 2,000,000 | 2,027,160 |
| Series 2017 A2, 5% 2/15/39 | | 1,880,000 | 2,101,633 |
| Indiana County Hosp. Auth. Series 2014 A: | | | |
| 5% 6/1/20 | | 650,000 | 667,544 |
| 6% 6/1/39 | | 1,625,000 | 1,745,656 |
| Lackawanna County Indl. Dev. Auth. Rev. (Univ. of Scranton Proj.) Series 2017: | | | |
| 5% 11/1/24 | | 590,000 | 669,166 |
| 5% 11/1/25 | | 665,000 | 760,208 |
| 5% 11/1/27 | | 1,105,000 | 1,278,021 |
| Lancaster County Hosp. Auth. Health Ctr. Rev. Series 2016: | | | |
| 5% 8/15/31 | | 1,000,000 | 1,145,500 |
| 5% 8/15/33 | | 1,000,000 | 1,135,250 |
| 5% 8/15/34 | | 1,000,000 | 1,129,440 |
| 5% 8/15/36 | | 1,000,000 | 1,120,780 |
| Lehigh County Gen. Purp. Auth. Rev. (Muhlenberg College Proj.) Series 2017, 5% 2/1/39 | | 4,000,000 | 4,460,600 |
| Lower Paxton Township Series 2014: | | | |
| 5% 4/1/40 | | 3,420,000 | 3,798,594 |
| 5% 4/1/44 | | 1,295,000 | 1,435,676 |
| Luzerne County Indl. Dev. Auth. Wtr. Facilities Rev. (Pennsylvania-American Wtr. Co. Proj.) Series 2009, 5.5% 12/1/39 | | 2,500,000 | 2,565,725 |
| Monroe County Hosp. Auth. Rev. Series 2016, 5% 7/1/33 | | 3,675,000 | 4,115,302 |
| Monroeville Fin. Auth. UPMC Rev. Series 2012, 5% 2/15/26 | | 1,500,000 | 1,740,930 |
| Montgomery County Higher Ed. & Health Auth. Rev.: | | | |
| Series 2014 A: | | | |
| 4% 10/1/19 | | 185,000 | 186,809 |
| 5% 10/1/20 | | 215,000 | 223,361 |
| 5% 10/1/21 | | 245,000 | 259,600 |
| 5% 10/1/22 | | 275,000 | 296,557 |
| 5% 10/1/23 | | 1,305,000 | 1,428,022 |
| 5% 10/1/24 | | 335,000 | 371,776 |
| 5% 10/1/25 | | 750,000 | 828,998 |
| 5% 10/1/26 | | 1,000,000 | 1,100,330 |
| 5% 10/1/27 | | 1,000,000 | 1,094,820 |
| Series 2016 A, 5% 10/1/40 | | 4,000,000 | 4,291,440 |
| Series 2018 A, 5% 9/1/26 | | 1,500,000 | 1,740,645 |
| Montgomery County Indl. Dev. Auth. Series 2017: | | | |
| 5% 12/1/33 | | 2,150,000 | 2,498,730 |
| 5% 12/1/35 | | 1,000,000 | 1,154,910 |
| 5% 12/1/36 | | 2,660,000 | 3,059,213 |
| 5% 12/1/37 | | 1,515,000 | 1,736,311 |
| Montour School District Series 2015 A: | | | |
| 5% 4/1/41 | | 1,000,000 | 1,094,400 |
| 5% 4/1/42 | | 1,000,000 | 1,093,770 |
| Northampton County Gen. Purp. Auth. Hosp. Rev. (St. Luke's Univ. Health Network Proj.) Series 2018 A: | | | |
| 4% 8/15/48 | | 4,500,000 | 4,514,130 |
| 5% 8/15/43 | | 2,000,000 | 2,215,540 |
| 5% 8/15/48 | | 2,500,000 | 2,763,000 |
| Northampton County Gen. Purp. College Rev. (Lafayette College Proj.) Series 2017, 5% 11/1/47 | | 2,170,000 | 2,423,999 |
| Pennsylvania Ctfs. Prtn. Series 2018 A: | | | |
| 5% 7/1/28 | | 400,000 | 462,104 |
| 5% 7/1/29 | | 300,000 | 345,294 |
| 5% 7/1/30 | | 375,000 | 429,064 |
| 5% 7/1/31 | | 425,000 | 484,470 |
| Pennsylvania Econ. Dev. Auth. Governmental Lease (Forum Place Proj.) Series 2012: | | | |
| 5% 3/1/24 | | 1,745,000 | 1,857,587 |
| 5% 3/1/25 | | 3,255,000 | 3,455,866 |
| Pennsylvania Gen. Oblig.: | | | |
| Series 2013, 5% 10/15/27 | | 2,255,000 | 2,502,216 |
| Series 2015 1, 5% 3/15/31 | | 7,000,000 | 7,870,660 |
| Series 2015, 5% 3/15/33 | | 2,880,000 | 3,210,451 |
| Series 2017, 5% 1/1/28 | | 7,000,000 | 8,128,890 |
| Pennsylvania Higher Edl. Facilities Auth. Rev.: | | | |
| (Drexel Univ. Proj.) Series 2016, 5% 5/1/35 | | 2,000,000 | 2,222,360 |
| (Thomas Jefferson Univ. Proj.) Series 2012: | | | |
| 5% 3/1/20 | | 300,000 | 310,446 |
| 5% 3/1/22 | | 275,000 | 298,645 |
| 5% 3/1/23 | | 585,000 | 639,920 |
| First Series 2012: | | | |
| 5% 4/1/20 | | 750,000 | 778,343 |
| 5% 4/1/21 | | 500,000 | 532,860 |
| 5% 4/1/22 | | 600,000 | 654,672 |
| 5% 4/1/23 | | 800,000 | 871,056 |
| 5% 4/1/24 | | 1,100,000 | 1,195,898 |
| Series 2010 E, 5% 5/15/31 | | 2,500,000 | 2,596,075 |
| Series 2016, 5% 5/1/33 | | 2,200,000 | 2,465,914 |
| Series 2018 A, 5% 2/15/48 | | 4,000,000 | 4,596,000 |
| Series AT-1 5% 6/15/31 | | 5,000,000 | 5,666,650 |
| Pennsylvania Pub. School Bldg. Auth. School Rev. (The School District of Harrisburg Proj.): | | | |
| Series 2014 B2: | | | |
| 5% 12/1/24 (Build America Mutual Assurance Insured) | | 1,250,000 | 1,419,238 |
| 5% 12/1/25 (Build America Mutual Assurance Insured) | | 1,250,000 | 1,412,638 |
| 5% 12/1/26 (Build America Mutual Assurance Insured) | | 1,250,000 | 1,408,263 |
| 5% 12/1/27 (Build America Mutual Assurance Insured) | | 1,010,000 | 1,134,351 |
| Series 2016 A, 5% 12/1/28 (FSA Insured) | | 5,690,000 | 6,559,546 |
| Pennsylvania State Univ.: | | | |
| Series 2010, 5% 3/1/40 | | 4,385,000 | 4,522,294 |
| Series 2015 A: | | | |
| 5% 9/1/30 | | 1,100,000 | 1,269,202 |
| 5% 9/1/31 | | 1,415,000 | 1,627,024 |
| Pennsylvania Tpk. Commission Tpk. Rev.: | | | |
| (Sub Lien Proj.) Series 2017 B-1, 5% 6/1/34 | | 5,000,000 | 5,530,700 |
| Series 2013 A2, 5% 12/1/38 | | 2,500,000 | 2,750,100 |
| Series 2014 A, 5% 12/1/31 | | 865,000 | 959,536 |
| Series 2014 A2, 0% 12/1/40 (b) | | 5,500,000 | 4,658,830 |
| Series 2017 A1: | | | |
| 5% 12/1/30 | | 3,500,000 | 4,023,040 |
| 5% 12/1/31 | | 2,000,000 | 2,288,820 |
| 5% 12/1/33 | | 1,500,000 | 1,705,365 |
| Series 2018 A2, 5% 12/1/43 | | 5,000,000 | 5,570,200 |
| Philadelphia Arpt. Rev. Series 2017 B: | | | |
| 5% 7/1/25 (a) | | 5,500,000 | 6,287,655 |
| 5% 7/1/31 (a) | | 1,000,000 | 1,135,340 |
| 5% 7/1/33 (a) | | 2,250,000 | 2,536,673 |
| 5% 7/1/37 (a) | | 1,480,000 | 1,645,360 |
| 5% 7/1/42 (a) | | 4,000,000 | 4,397,480 |
| Philadelphia Gas Works Rev.: | | | |
| Series 9, 5.25% 8/1/40 | | 5,300,000 | 5,528,218 |
| 5% 8/1/29 | | 2,000,000 | 2,257,500 |
| 5% 8/1/30�� | | 1,500,000 | 1,686,420 |
| 5% 8/1/31 | | 1,100,000 | 1,232,506 |
| 5% 10/1/33 | | 1,500,000 | 1,681,650 |
| 5% 10/1/34 | | 500,000 | 558,370 |
| Philadelphia Gen. Oblig. Series 2017 A, 5% 8/1/30 | | 1,500,000 | 1,709,550 |
| Philadelphia Hospitals & Higher Ed. Facilities Auth. Hosp. Rev. (Children's Hosp. of Philadelphia Proj.) Series 2011 D, 5% 7/1/32 | | 2,500,000 | 2,666,500 |
| Philadelphia Redev. Auth. Rev.: | | | |
| Series 2012: | | | |
| 5% 4/15/21 | | 1,000,000 | 1,056,030 |
| 5% 4/15/25 | | 2,230,000 | 2,393,660 |
| Series 2015 A, 5% 4/15/29 | | 3,000,000 | 3,306,810 |
| Philadelphia School District: | | | |
| Series 2010 C, 5% 9/1/21 | | 4,000,000 | 4,166,920 |
| Series 2016 F, 5% 9/1/34 | | 4,000,000 | 4,442,520 |
| Series 2018 A: | | | |
| 5% 9/1/29 | | 1,250,000 | 1,442,413 |
| 5% 9/1/30 | | 1,000,000 | 1,145,850 |
| 5% 9/1/33 | | 1,000,000 | 1,129,890 |
| Philadelphia Wtr. & Wastewtr. Rev.: | | | |
| Series 2010 C, 5% 8/1/40 | | 4,000,000 | 4,154,960 |
| Series 2011 A, 5% 1/1/41 | | 2,715,000 | 2,830,605 |
| Series 2015 B, 5% 7/1/30 | | 3,500,000 | 3,978,835 |
| Series 2017 B: | | | |
| 5% 11/1/29 | | 3,000,000 | 3,520,620 |
| 5% 11/1/30 | | 3,700,000 | 4,313,719 |
| Pittsburgh & Alleg County Parkin Series 2017: | | | |
| 5% 12/15/23 | | 500,000 | 559,585 |
| 5% 12/15/24 | | 440,000 | 499,937 |
| 5% 12/15/31 | | 1,000,000 | 1,134,110 |
| 5% 12/15/32 | | 500,000 | 565,810 |
| 5% 12/15/33 | | 500,000 | 563,745 |
| Pittsburgh & Allegheny County Sports & Exhibition Auth. Series 2012, 5% 2/1/25 (FSA Insured) | | 2,250,000 | 2,450,993 |
| Pittsburgh Gen. Oblig.: | | | |
| Series 2012 A, 5% 9/1/22 | | 2,000,000 | 2,191,460 |
| Series 2014: | | | |
| 5% 9/1/23 (Build America Mutual Assurance Insured) | | 575,000 | 644,040 |
| 5% 9/1/28 (Build America Mutual Assurance Insured) | | 1,300,000 | 1,465,399 |
| 5% 9/1/29 (Build America Mutual Assurance Insured) | | 1,015,000 | 1,140,160 |
| 5% 9/1/31 (Build America Mutual Assurance Insured) | | 1,165,000 | 1,301,503 |
| 5% 9/1/32 (Build America Mutual Assurance Insured) | | 1,000,000 | 1,114,950 |
| Pittsburgh School District: | | | |
| Series 2014 A, 5% 9/1/23 | | 1,000,000 | 1,102,020 |
| Series 2015: | | | |
| 5% 9/1/21 (FSA Insured) | | 730,000 | 787,050 |
| 5% 9/1/22 (FSA Insured) | | 885,000 | 975,951 |
| 5% 9/1/23 (FSA Insured) | | 1,085,000 | 1,220,397 |
| Reading School District Series 2017: | | | |
| 5% 3/1/35 (FSA Insured) | | 1,000,000 | 1,132,180 |
| 5% 3/1/36 (FSA Insured) | | 1,050,000 | 1,183,959 |
| 5% 3/1/37 (FSA Insured) | | 1,600,000 | 1,796,800 |
| Saint Mary Hosp. Auth. Health Sys. Rev. (Trinity Health Proj.) Series 2012 B: | | | |
| 5% 11/15/24 | | 500,000 | 573,975 |
| 5% 11/15/26 | | 1,500,000 | 1,767,420 |
| 5% 11/15/27 | | 1,500,000 | 1,784,700 |
| 5% 11/15/28 | | 4,170,000 | 4,921,643 |
| Southcentral Pennsylvania Gen. Auth. Rev. Series 2015: | | | |
| 4% 12/1/30 | | 1,040,000 | 1,081,371 |
| 5% 12/1/20 | | 30,000 | 31,627 |
| 5% 12/1/21 | | 145,000 | 156,214 |
| 5% 12/1/22 | | 30,000 | 33,024 |
| 5% 12/1/25 | | 1,285,000 | 1,487,709 |
| 5% 12/1/27 | | 1,480,000 | 1,691,255 |
| 5% 12/1/29 | | 1,000,000 | 1,130,630 |
| Southeastern Pennsylvania Trans. Auth. Rev. Series 2017: | | | |
| 5% 6/1/27 | | 1,400,000 | 1,662,822 |
| 5% 6/1/29 | | 3,500,000 | 4,116,420 |
| Susquehanna Area Reg'l. Arp Auth. Series 2017: | | | |
| 5% 1/1/35 (a) | | 1,000,000 | 1,085,940 |
| 5% 1/1/38 (a) | | 1,125,000 | 1,213,695 |
| West Mifflin Area School District Series 2016: | | | |
| 5% 4/1/24 (FSA Insured) | | 1,250,000 | 1,386,438 |
| 5% 4/1/26 (FSA Insured) | | 1,000,000 | 1,134,190 |
| 5% 4/1/28 (FSA Insured) | | 1,390,000 | 1,570,533 |
| West Shore Area Auth. Hosp. Rev. Series 2011 B, 5.75% 1/1/41 | | 1,500,000 | 1,648,005 |
| Westmoreland County Indl. Dev. Auth. Rev. (Excela Health Proj.) Series 2010 A: | | | |
| 5% 7/1/19 | | 1,000,000 | 1,014,835 |
| 5% 7/1/25 | | 4,465,000 | 4,643,109 |
| 5.25% 7/1/20 | | 1,000,000 | 1,047,310 |
| Westmoreland County Muni. Auth. Muni. Svc. Rev. Series 2001 A: | | | |
| 0% 8/15/19 (Nat'l. Pub. Fin. Guarantee Corp. Insured) | | 5,000,000 | 4,929,983 |
| 0% 8/15/20 (Nat'l. Pub. Fin. Guarantee Corp. Insured) | | 2,500,000 | 2,406,575 |
| 0% 8/15/22 (Nat'l. Pub. Fin. Guarantee Corp. Insured) | | 6,550,000 | 5,987,093 |
|
| TOTAL PENNSYLVANIA | | | 434,783,179 |
|
| Pennsylvania, New Jersey - 2.3% | | | |
| Delaware River Joint Toll Bridge Commission Pennsylvania-New Jersey Bridge Rev. Series 2012 A: | | | |
| 5% 7/1/22 | | 500,000 | 548,255 |
| 5% 7/1/23 | | 1,000,000 | 1,094,390 |
| Delaware River Port Auth. Pennsylvania & New Jersey Rev.: | | | |
| Series 2010 D, 5% 1/1/30 (Pre-Refunded to 1/1/20 @ 100) | | 3,500,000 | 3,607,800 |
| Series 2018 A: | | | |
| 5% 1/1/37 | | 1,000,000 | 1,159,430 |
| 5% 1/1/38 | | 1,300,000 | 1,501,214 |
| 5% 1/1/39 | | 1,000,000 | 1,150,160 |
| 5% 1/1/40 | | 1,100,000 | 1,261,128 |
|
| TOTAL PENNSYLVANIA, NEW JERSEY | | | 10,322,377 |
|
| TOTAL MUNICIPAL BONDS | | | |
| (Cost $439,413,763) | | | 445,900,784 |
| TOTAL INVESTMENT IN SECURITIES - 98.5% | | | |
| (Cost $439,413,763) | | | 445,900,784 |
| NET OTHER ASSETS (LIABILITIES) - 1.5% | | | 6,618,062 |
| NET ASSETS - 100% | | | $452,518,846 |
Legend
(a) Private activity obligations whose interest is subject to the federal alternative minimum tax for individuals.
(b) Security initially issued in zero coupon form which converts to coupon form at a specified rate and date. The rate shown is the rate at period end.
Investment Valuation
All investments are categorized as Level 2 under the Fair Value Hierarchy. The inputs or methodology used for valuing securities may not be an indication of the risk associated with investing in those securities. For more information on valuation inputs please refer to the Investment Valuation section in the accompanying Notes to Financial Statements.
Other Information
The distribution of municipal securities by revenue source, as a percentage of total Net Assets, is as follows (Unaudited):
| Health Care | 27.8% |
| General Obligations | 23.6% |
| Education | 13.9% |
| Transportation | 13.5% |
| Water & Sewer | 11.8% |
| Others* (Individually Less Than 5%) | 9.4% |
| | 100.0% |
* Includes net other assets
See accompanying notes which are an integral part of the financial statements.
Fidelity® Pennsylvania Municipal Income Fund
Financial Statements
Statement of Assets and Liabilities
| | | December 31, 2018 |
| Assets | | |
Investment in securities, at value — See accompanying schedule:
Unaffiliated issuers (cost $439,413,763) | | $445,900,784 |
| Cash | | 3,492,676 |
| Receivable for fund shares sold | | 332,738 |
| Interest receivable | | 5,170,295 |
| Prepaid expenses | | 671 |
| Other receivables | | 1,107 |
| Total assets | | 454,898,271 |
| Liabilities | | |
| Payable for fund shares redeemed | $1,711,546 | |
| Distributions payable | 447,541 | |
| Accrued management fee | 134,149 | |
| Other affiliated payables | 39,044 | |
| Other payables and accrued expenses | 47,145 | |
| Total liabilities | | 2,379,425 |
| Net Assets | | $452,518,846 |
| Net Assets consist of: | | |
| Paid in capital | | $446,037,351 |
| Total distributable earnings (loss) | | 6,481,495 |
| Net Assets, for 41,434,070 shares outstanding | | $452,518,846 |
| Net Asset Value, offering price and redemption price per share ($452,518,846 ÷ 41,434,070 shares) | | $10.92 |
See accompanying notes which are an integral part of the financial statements.
Statement of Operations
| | | Year ended December 31, 2018 |
| Investment Income | | |
| Interest | | $15,539,244 |
| Expenses | | |
| Management fee | $1,646,430 | |
| Transfer agent fees | 365,429 | |
| Accounting fees and expenses | 119,996 | |
| Custodian fees and expenses | 3,395 | |
| Independent trustees' fees and expenses | 2,149 | |
| Registration fees | 21,729 | |
| Audit | 54,469 | |
| Legal | 4,797 | |
| Miscellaneous | 3,007 | |
| Total expenses before reductions | 2,221,401 | |
| Expense reductions | (6,267) | |
| Total expenses after reductions | | 2,215,134 |
| Net investment income (loss) | | 13,324,110 |
| Realized and Unrealized Gain (Loss) | | |
| Net realized gain (loss) on: | | |
| Investment securities: | | |
| Unaffiliated issuers | | 741,589 |
| Total net realized gain (loss) | | 741,589 |
| Change in net unrealized appreciation (depreciation) on investment securities | | (10,508,596) |
| Net gain (loss) | | (9,767,007) |
| Net increase (decrease) in net assets resulting from operations | | $3,557,103 |
See accompanying notes which are an integral part of the financial statements.
Statement of Changes in Net Assets
| | Year ended December 31, 2018 | Year ended December 31, 2017 |
| Increase (Decrease) in Net Assets | | |
| Operations | | |
| Net investment income (loss) | $13,324,110 | $13,746,398 |
| Net realized gain (loss) | 741,589 | 1,971,622 |
| Change in net unrealized appreciation (depreciation) | (10,508,596) | 8,488,786 |
| Net increase (decrease) in net assets resulting from operations | 3,557,103 | 24,206,806 |
| Distributions to shareholders | (14,772,428) | – |
| Distributions to shareholders from net investment income | – | (13,738,825) |
| Distributions to shareholders from net realized gain | – | (1,974,339) |
| Total distributions | (14,772,428) | (15,713,164) |
| Share transactions | | |
| Proceeds from sales of shares | 79,027,190 | 75,219,672 |
| Reinvestment of distributions | 9,313,841 | 10,400,543 |
| Cost of shares redeemed | (105,011,723) | (66,225,341) |
| Net increase (decrease) in net assets resulting from share transactions | (16,670,692) | 19,394,874 |
| Total increase (decrease) in net assets | (27,886,017) | 27,888,516 |
| Net Assets | | |
| Beginning of period | 480,404,863 | 452,516,347 |
| End of period | $452,518,846 | $480,404,863 |
| Other Information | | |
| Distributions in excess of net investment income end of period | | $(10,134) |
| Shares | | |
| Sold | 7,249,452 | 6,763,475 |
| Issued in reinvestment of distributions | 854,361 | 936,558 |
| Redeemed | (9,646,855) | (5,964,420) |
| Net increase (decrease) | (1,543,042) | 1,735,613 |
See accompanying notes which are an integral part of the financial statements.
Financial Highlights
Fidelity Pennsylvania Municipal Income Fund
| | | | | | |
| Years ended December 31, | 2018 | 2017 | 2016 | 2015 | 2014 |
| Selected Per–Share Data | | | | | |
| Net asset value, beginning of period | $11.18 | $10.97 | $11.31 | $11.34 | $10.77 |
| Income from Investment Operations | | | | | |
| Net investment income (loss)A | .314 | .328 | .336 | .358 | .373 |
| Net realized and unrealized gain (loss) | (.226) | .257 | (.291) | .013 | .615 |
| Total from investment operations | .088 | .585 | .045 | .371 | .988 |
| Distributions from net investment income | (.314) | (.328) | (.336) | (.358) | (.373) |
| Distributions from net realized gain | (.034) | (.047) | (.049) | (.043) | (.045) |
| Total distributions | (.348) | (.375) | (.385) | (.401) | (.418) |
| Redemption fees added to paid in capitalA | – | – | –B | –B | –B |
| Net asset value, end of period | $10.92 | $11.18 | $10.97 | $11.31 | $11.34 |
| Total ReturnC | .84% | 5.41% | .34% | 3.33% | 9.30% |
| Ratios to Average Net AssetsD | | | | | |
| Expenses before reductions | .48% | .48% | .49% | .49% | .49% |
| Expenses net of fee waivers, if any | .48% | .48% | .49% | .49% | .49% |
| Expenses net of all reductions | .48% | .48% | .49% | .49% | .49% |
| Net investment income (loss) | 2.88% | 2.95% | 2.95% | 3.17% | 3.35% |
| Supplemental Data | | | | | |
| Net assets, end of period (000 omitted) | $452,519 | $480,405 | $452,516 | $468,086 | $452,845 |
| Portfolio turnover rate | 15% | 12% | 18% | 17% | 12% |
A Calculated based on average shares outstanding during the period.
B Amount represents less than $.0005 per share.
C Total returns would have been lower if certain expenses had not been reduced during the applicable periods shown.
D Expense ratios reflect operating expenses of the Fund. Expenses before reductions do not reflect amounts reimbursed by the investment adviser or reductions from expense offset arrangements and do not represent the amount paid by the Fund during periods when reimbursements or reductions occur. Expenses net of fee waivers reflect expenses after reimbursement by the investment adviser but prior to reductions from expense offset arrangements. Expenses net of all reductions represent the net expenses paid by the Fund.
See accompanying notes which are an integral part of the financial statements.
Fidelity® Pennsylvania Municipal Money Market Fund
Investment Summary/Performance (Unaudited)
Effective Maturity Diversification as of December 31, 2018
| Days | % of fund's investments 12/31/18 |
| 1 - 7 | 90.3 |
| 8 - 30 | 3.5 |
| 31 - 60 | 2.3 |
| 61 - 90 | 0.4 |
| 91 - 180 | 1.2 |
| > 180 | 2.3 |
Effective maturity is determined in accordance with the requirements of Rule 2a-7 under the Investment Company Act of 1940.
Asset Allocation (% of fund's net assets)
| As of December 31, 2018 |
| | Variable Rate Demand Notes (VRDNs) | 26.3% |
| | Tender Option Bond | 57.1% |
| | Other Municipal Security | 8.5% |
| | Investment Companies | 7.9% |
| | Net Other Assets (Liabilities) | 0.2% |

Current 7-Day Yields
| | 12/31/18 |
| Fidelity® Pennsylvania Municipal Money Market Fund | 1.27% |
Yield refers to the income paid by the Fund over a given period. Yield for money market funds is usually for seven-day periods, as it is here, though it is expressed as an annual percentage rate. Past performance is no guarantee of future results. Yield will vary and it's possible to lose money investing in the Fund.
Fidelity® Pennsylvania Municipal Money Market Fund
Schedule of Investments December 31, 2018
Showing Percentage of Net Assets
| Variable Rate Demand Note - 26.3% | | | |
| | | Principal Amount | Value |
| Alabama - 0.5% | | | |
| Decatur Indl. Dev. Board Exempt Facilities Rev. (Nucor Steel Decatur LLC Proj.) Series 2003 A, 2.03% 1/7/19, VRDN (a)(b) | | $800,000 | $800,000 |
| West Jefferson Indl. Dev. Series 2008, 1.8% 1/7/19, VRDN (b) | | 500,000 | 500,000 |
| | | | 1,300,000 |
| Arkansas - 0.1% | | | |
| Blytheville Indl. Dev. Rev. (Nucor Corp. Proj.): | | | |
| Series 1998, 2.03% 1/7/19, VRDN (a)(b) | | 200,000 | 200,000 |
| Series 2002, 1.88% 1/7/19, VRDN (a)(b) | | 100,000 | 100,000 |
| | | | 300,000 |
| Delaware - 0.0% | | | |
| Delaware Econ. Dev. Auth. Rev. (Delmarva Pwr. & Lt. Co. Proj.) Series 1999 B, 1.79% 1/7/19, VRDN (a)(b) | | 100,000 | 100,000 |
| Indiana - 0.4% | | | |
| Indiana Dev. Fin. Auth. Envir. Rev. (PSI Energy Proj.): | | | |
| Series 2003 A, 1.93% 1/7/19, VRDN (a)(b) | | 400,000 | 400,000 |
| Series 2003 B, 2.08% 1/7/19, VRDN (a)(b) | | 200,000 | 200,000 |
| Lawrenceburg Poll. Cont. Rev. (Indiana Michigan Pwr. Co. Proj.) Series H, 1.81% 1/7/19, VRDN (b) | | 400,000 | 400,000 |
| | | | 1,000,000 |
| Kansas - 0.3% | | | |
| Burlington Envir. Impt. Rev. (Kansas City Pwr. and Lt. Co. Proj.) Series 2007 B, 2% 1/7/19, VRDN (b) | | 200,000 | 200,000 |
| St Marys Kansas Poll. Cont. Rev. Series 1994, 2.01% 1/7/19, VRDN (b) | | 500,000 | 500,000 |
| | | | 700,000 |
| Kentucky - 0.2% | | | |
| Trimble County Poll. Cont. Rev. (Louisville Gas and Elec. Co. Proj.) Series 2016 A, 1.88% 1/7/19, VRDN (a)(b) | | 400,000 | 400,000 |
| Louisiana - 0.4% | | | |
| Saint James Parish Gen. Oblig. (Nucor Steel Louisiana LLC Proj.): | | | |
| Series 2010 A1, 2% 1/7/19, VRDN (b) | | 900,000 | 900,000 |
| Series 2010 B1, 1.98% 1/7/19, VRDN (b) | | 100,000 | 100,000 |
| | | | 1,000,000 |
| Nebraska - 0.2% | | | |
| Stanton County Indl. Dev. Rev. (Nucor Corp. Proj.) Series 1996, 2.03% 1/7/19, VRDN (a)(b) | | 400,000 | 400,000 |
| North Carolina - 0.0% | | | |
| Hertford County Indl. Facilities Poll. Cont. Fing. Auth. (Nucor Corp. Proj.) Series 2000 A, 1.88% 1/7/19, VRDN (a)(b) | | 100,000 | 100,000 |
| Pennsylvania - 23.6% | | | |
| Allegheny County Indl. Dev. Auth. Rev. (Union Elec. Steel Co. Proj.) Series 1996 A, 1.75% 1/7/19, LOC PNC Bank NA, VRDN (a)(b) | | 4,120,000 | 4,120,000 |
| Beaver County Indl. Dev. Auth. Series 2018 A, 1.7% 1/7/19, LOC BMO Harris Bank NA, VRDN (b) | | 2,400,000 | 2,400,000 |
| Chester County Health & Ed. Auth. Rev. 1.76% 1/7/19, LOC Manufacturers & Traders Trust Co., VRDN (b) | | 3,235,000 | 3,235,000 |
| Lancaster Indl. Dev. Auth. Rev.: | | | |
| (Mennonite Home Proj.) 1.81% 1/7/19, LOC Manufacturers & Traders Trust Co., VRDN (b) | | 2,600,000 | 2,600,000 |
| (Willow Valley Retirement Proj.) Series 2009 B, 1.71% 1/7/19, LOC PNC Bank NA, VRDN (b) | | 8,340,000 | 8,340,000 |
| Lower Merion School District Series 2009 A, 1.67% 1/7/19, LOC U.S. Bank NA, Cincinnati, VRDN (b) | | 4,000,000 | 4,000,000 |
| Pennsylvania Econ. Dev. Fing. Auth. Indl. Dev. Rev.: | | | |
| (Leidy's, Inc. Proj.) Series 1995 D7, 1.75% 1/7/19, LOC PNC Bank NA, VRDN (a)(b) | | 300,000 | 300,000 |
| Series 2004 B, 1.75% 1/7/19, LOC PNC Bank NA, VRDN (b) | | 200,000 | 200,000 |
| Pennsylvania Higher Edl. Facilities Auth. Rev. (Keystone College Proj.) Series 2001 H5, 1.71% 1/7/19, LOC PNC Bank NA, VRDN (b) | | 4,275,000 | 4,275,000 |
| Philadelphia Arpt. Rev.: | | | |
| Series 2005 C1, 1.7% 1/7/19, LOC TD Banknorth, NA, VRDN (a)(b) | | 3,055,000 | 3,055,000 |
| Series 2005 C2, 1.68% 1/7/19, LOC Royal Bank of Canada, VRDN (a)(b) | | 1,060,000 | 1,060,000 |
| Philadelphia Auth. for Indl. Dev. Rev.: | | | |
| (Spl. People in Northeast, Inc. Proj.) Series 2006, 2.06% 1/7/19, LOC Citizens Bank of Pennsylvania, VRDN (b) | | 1,095,000 | 1,095,000 |
| (The Franklin Institute Proj.) Series 2006, 1.98% 1/7/19, LOC Bank of America NA, VRDN (b) | | 2,950,000 | 2,950,000 |
| Philadelphia Auth. Indl. Dev. Lease Rev. Series 2007 B3, 1.71% 1/7/19, LOC PNC Bank NA, VRDN (b) | | 2,400,000 | 2,400,000 |
| Ridley School District Series 2009, 1.7% 1/7/19, LOC TD Banknorth, NA, VRDN (b) | | 1,200,000 | 1,200,000 |
| Washington County Hosp. Auth. Rev. (Monongahela Valley Hosp. Proj.) Series 2018 C, 1.75% 1/7/19, LOC Citizens Bank of Pennsylvania, VRDN (b) | | 2,700,000 | 2,700,000 |
| FNMA Montgomery County Redev. Auth. Multi-family Hsg. Rev. (Kingswood Apts. Proj.) Series 2001 A, 1.77% 1/7/19, LOC Fannie Mae, VRDN (b) | | 12,675,000 | 12,675,000 |
| | | | 56,605,000 |
| West Virginia - 0.6% | | | |
| West Virginia Econ. Dev. Auth. Solid Waste Disp. Facilities Rev.: | | | |
| (Appalachian Pwr. Co. - Amos Proj.) Series 2008 B, 1.81% 1/7/19, VRDN (a)(b) | | 600,000 | 600,000 |
| (Appalachian Pwr. Co.- Mountaineer Proj.) Series 2008 A, 1.86% 1/7/19, VRDN (a)(b) | | 800,000 | 800,000 |
| | | | 1,400,000 |
| TOTAL VARIABLE RATE DEMAND NOTE | | | |
| (Cost $63,305,000) | | | 63,305,000 |
|
| Tender Option Bond - 57.1% | | | |
| California - 0.7% | | | |
| Dignity Health Participating VRDN Series DBE 80 11, 1.91% 1/7/19 (Liquidity Facility Deutsche Bank AG New York Branch) (b)(c) | | 1,600,000 | 1,600,000 |
| Pennsylvania - 56.4% | | | |
| Allegheny County Participating VRDN Series Floaters XM 06 63, 1.81% 1/7/19 (Liquidity Facility Morgan Stanley Bank, West Valley City Utah) (b)(c) | | 2,600,000 | 2,600,000 |
| Allegheny County Sanitation Auth. Swr. Rev. Participating VRDN Series Floaters XM 00 82, 1.74% 1/7/19 (Liquidity Facility Barclays Bank PLC) (b)(c) | | 1,165,000 | 1,165,000 |
| Berks County Muni. Auth. Rev. Participating VRDN Series Floaters 001, 1.89% 2/11/19 (Liquidity Facility Barclays Bank PLC) (b)(c)(d) | | 3,500,000 | 3,500,000 |
| Delaware Valley Reg'l. Fin. Auth. Local Govt. Rev. Participating VRDN Series Floaters XG 02 01, 1.75% 1/7/19 (Liquidity Facility Barclays Bank PLC) (b)(c) | | 3,000,000 | 3,000,000 |
| Geisinger Auth. Health Sys. Rev. Participating VRDN: | | | |
| Series Floaters XF 05 43, 1.74% 1/7/19 (Liquidity Facility Royal Bank of Canada) (b)(c) | | 4,000,000 | 4,000,000 |
| Series Floaters XF 06 02, 1.74% 1/7/19 (Liquidity Facility Toronto-Dominion Bank) (b)(c) | | 4,695,000 | 4,695,000 |
| Series Floaters XM 06 13, 1.73% 1/7/19 (Liquidity Facility JPMorgan Chase Bank) (b)(c) | | 1,700,000 | 1,700,000 |
| Series Putters 0047, 1.73% 1/7/19 (Liquidity Facility JPMorgan Chase Bank) (b)(c) | | 4,605,000 | 4,605,000 |
| Lancaster County Hosp. Auth. Health Ctr. Rev. Participating VRDN Series 16 ZF0383, 1.75% 1/7/19 (Liquidity Facility Toronto-Dominion Bank)(b)(c) | | 3,750,000 | 3,750,000 |
| Northampton County Gen. Purp. College Rev. Participating VRDN: | | | |
| Series Floaters XL 00 48, 1.74% 1/7/19 (Liquidity Facility Morgan Stanley Bank, West Valley City Utah) (b)(c) | | 3,400,000 | 3,400,000 |
| Series Floaters ZM 05 17, 1.74% 1/7/19 (Liquidity Facility Morgan Stanley Bank, West Valley City Utah) (b)(c) | | 7,500,000 | 7,500,000 |
| Pennsylvania Econ. Dev. Participating VRDN Series XM 0048, 1.81% 1/7/19 (Liquidity Facility Deutsche Bank AG New York Branch) (b)(c) | | 3,053,500 | 3,053,500 |
| Pennsylvania Econ. Dev. Fing. Auth. Rev. Participating VRDN Series Floaters 16 YX1028, 1.76% 1/7/19 (Liquidity Facility Barclays Bank PLC) (b)(c) | | 6,405,000 | 6,405,000 |
| Pennsylvania Gen. Oblig. Participating VRDN: | | | |
| Series Floaters XF 24 54, 1.74% 1/7/19 (Liquidity Facility Barclays Bank PLC) (b)(c) | | 5,200,000 | 5,200,000 |
| Series Floaters XG 01 80, 1.71% 1/7/19 (Liquidity Facility Bank of America NA) (b)(c) | | 4,400,000 | 4,400,000 |
| Series Floaters ZF 04 24, 1.73% 1/7/19 (Liquidity Facility JPMorgan Chase Bank) (b)(c) | | 2,770,000 | 2,770,000 |
| Series Floaters ZF 06 71, 1.71% 1/7/19 (Liquidity Facility Bank of America NA) (b)(c) | | 3,330,000 | 3,330,000 |
| Series Floaters ZM 06 50, 1.71% 1/7/19 (Liquidity Facility Bank of America NA) (b)(c) | | 4,000,000 | 4,000,000 |
| Pennsylvania Higher Edl. Facilities Auth. Rev.: | | | |
| Participating VRDN: | | | |
| Series Floaters XF 25 53, 1.72% 1/7/19 (Liquidity Facility Citibank NA) (b)(c) | | 2,740,000 | 2,740,000 |
| Series Floaters XG 01 06, 1.7% 1/7/19 (Liquidity Facility Bank of America NA) (b)(c) | | 4,095,000 | 4,095,000 |
| Series MS 3252, 1.74% 1/7/19 (Liquidity Facility Morgan Stanley Bank, West Valley City Utah) (b)(c) | | 5,840,000 | 5,840,000 |
| Series WF 11 26C, SIFMA Municipal Swap Index + 0.280% 1.89%, tender 1/24/19 (Liquidity Facility Wells Fargo Bank NA) (b)(c)(d)(e) | | 5,900,000 | 5,900,000 |
| Pennsylvania Intergovernmental Coop. Auth. Spl. Tax Rev. Participating VRDN Series Putters 15 XM0010, 1.73% 1/7/19 (Liquidity Facility JPMorgan Chase Bank) (b)(c) | | 5,035,000 | 5,035,000 |
| Pennsylvania Tpk. Commission Tpk. Rev.: | | | |
| Participating VRDN: | | | |
| Series Floaters E 101, 1.74% 1/7/19 (Liquidity Facility Royal Bank of Canada) (b)(c) | | 6,200,000 | 6,200,000 |
| Series XX 10 44, 1.74% 1/7/19 (Liquidity Facility Barclays Bank PLC) (b)(c) | | 1,600,000 | 1,600,000 |
| Series Floaters G 43, SIFMA Municipal Swap Index + 0.200% 1.91%, tender 6/3/19 (Liquidity Facility Royal Bank of Canada) (b)(c)(d)(e) | | 2,500,000 | 2,500,000 |
| Philadelphia Auth. For Indl. Dev. Participating VRDN Series Putters 14 XM0005, 1.73% 1/7/19 (Liquidity Facility JPMorgan Chase Bank) (b)(c)(f) | | 4,625,000 | 4,625,000 |
| Philadelphia Hospitals & Higher Ed. Facilities Auth. Hosp. Rev. Participating VRDN Series 15 F0114, 1.73% 1/7/19 (Liquidity Facility JPMorgan Chase Bank) (b)(c) | | 5,330,000 | 5,330,000 |
| Philadelphia Wtr. & Wastewtr. Rev. Participating VRDN Series 2017, 1.74% 1/7/19 (Liquidity Facility Barclays Bank PLC) (b)(c) | | 3,160,000 | 3,160,000 |
| Univ. of Pittsburgh Med. Ctr. Bonds Series RBC E53, 1.74%, tender 1/7/19 (Liquidity Facility Royal Bank of Canada) (b)(c) | | 19,470,000 | 19,470,000 |
| | | | 135,568,500 |
| TOTAL TENDER OPTION BOND | | | |
| (Cost $137,168,500) | | | 137,168,500 |
|
| Other Municipal Security - 8.5% | | | |
| Georgia - 0.8% | | | |
| Main Street Natural Gas, Inc. Georgia Gas Proj. Rev. Bonds Series 2010 A1, SIFMA Municipal Swap Index + 0.100% 1.81%, tender 2/1/19 (Liquidity Facility Royal Bank of Canada) (b)(e) | | 1,865,000 | 1,865,000 |
| Kentucky - 0.0% | | | |
| Jefferson County Poll. Cont. Rev. Bonds (Louisville Gas & Elec. Co. Proj.) Series 2001 A, 1.92% tender 1/3/19, CP mode | | 100,000 | 100,000 |
| Massachusetts - 0.0% | | | |
| Massachusetts Indl. Fin. Agcy. Poll. Cont. Rev. Bonds (New England Pwr. Co. Proj.) Series 92, 1.78% tender 1/3/19, CP mode | | 100,000 | 100,000 |
| New Hampshire - 0.5% | | | |
| New Hampshire Bus. Fin. Auth. Poll. Cont. Rev. Bonds: | | | |
| Series 2018 A, 1.83% tender 1/3/19, CP mode (a) | | 300,000 | 300,000 |
| Series A1, 1.82% tender 1/7/19, CP mode (a) | | 800,000 | 800,000 |
| | | | 1,100,000 |
| Ohio - 0.1% | | | |
| Lancaster Port Auth. Gas Rev. Bonds Series 2014, 1 month U.S. LIBOR + 0.720% 2.294%, tender 8/1/19 (Liquidity Facility Royal Bank of Canada) (b)(e) | | 200,000 | 200,050 |
| Pennsylvania - 7.1% | | | |
| Allegheny County Hosp. Dev. Auth. Rev. Bonds Series 2010 A, 5% 5/15/19 | | 500,000 | 505,336 |
| Cumberland County Muni. Auth. Rev. Bonds (Diakon Lutheran Social Ministries Proj.) Series 2009, 6.375% 1/1/19 (Pre-Refunded to 1/1/19 @ 100) | | 4,905,000 | 4,905,000 |
| Pennsylvania Econ. Dev. Fin. Auth. Unemployment Compensation Rev. Bonds Series 2012 A: | | | |
| 4% 1/1/19 | | 810,000 | 810,000 |
| 5% 7/1/19 | | 630,000 | 639,363 |
| Pennsylvania Gen. Oblig. Bonds: | | | |
| Series 2009, 5% 7/1/19 | | 2,720,000 | 2,760,528 |
| Series 2016, 5% 9/15/19 | | 150,000 | 153,018 |
| Pennsylvania State Univ. Bonds Series A, 5% 3/1/19 (Pre-Refunded to 3/1/19 @ 100) | | 2,000,000 | 2,010,168 |
| Philadelphia Arpt. Rev. Series B2, 1.93% 1/30/19, LOC PNC Bank NA, CP (a) | | 2,400,000 | 2,400,000 |
| Saint Mary Hosp. Auth. Health Sys. Rev. Bonds (Catholic Health East Proj.) Series 2010B, 5% 11/15/19 (Pre-Refunded to 11/15/19 @ 100) | | 1,860,000 | 1,906,247 |
| Univ. of Pittsburgh Commonwealth Sys. of Higher Ed. Bonds Series B, 5.5% 3/15/19 (Pre-Refunded to 3/15/19 @ 100) | | 1,000,000 | 1,007,363 |
| | | | 17,097,023 |
| TOTAL OTHER MUNICIPAL SECURITY | | | |
| (Cost $20,462,073) | | | 20,462,073 |
| | | Shares | Value |
|
| Investment Company - 7.9% | | | |
| Fidelity Municipal Cash Central Fund, 1.77% (g)(h) | | | |
| (Cost $18,886,477) | | 18,885,299 | 18,886,477 |
| TOTAL INVESTMENT IN SECURITIES - 99.8% | | | |
| (Cost $239,822,050) | | | 239,822,050 |
| NET OTHER ASSETS (LIABILITIES) - 0.2% | | | 590,257 |
| NET ASSETS - 100% | | | $240,412,307 |
Security Type Abbreviations
VRDN – VARIABLE RATE DEMAND NOTE (A debt instrument that is payable upon demand, either daily, weekly or monthly)
CP – COMMERCIAL PAPER
The date shown for securities represents the date when principal payments must be paid, taking into account any call options exercised by the issuer and any permissible maturity shortening features other than interest rate resets.
Legend
(a) Private activity obligations whose interest is subject to the federal alternative minimum tax for individuals.
(b) Coupon rates for floating and adjustable rate securities reflect the rates in effect at period end.
(c) Provides evidence of ownership in one or more underlying municipal bonds.
(d) Restricted securities - Investment in securities not registered under the Securities Act of 1933 (excluding 144A issues). At the end of the period, the value of restricted securities (excluding 144A issues) amounted to $11,900,000 or 4.9% of net assets.
(e) Coupon is indexed to a floating interest rate which may be multiplied by a specified factor and/or subject to caps or floors.
(f) Security exempt from registration under Rule 144A of the Securities Act of 1933. These securities may be resold in transactions exempt from registration, normally to qualified institutional buyers. At the end of the period, the value of these securities amounted to $4,625,000 or 1.9% of net assets.
(g) Information in this report regarding holdings by state and security types does not reflect the holdings of the Fidelity Municipal Cash Central Fund.
(h) Affiliated fund that is available only to investment companies and other accounts managed by Fidelity Investments. The rate quoted is the annualized seven-day yield of the fund at period end. A complete unaudited listing of the fund's holdings as of its most recent quarter end is available upon request. In addition, each Fidelity Central Fund's financial statements, which are not covered by the Fund's Report of Independent Registered Public Accounting Firm, are available on the SEC's website or upon request.
Additional information on each restricted holding is as follows:
| Security | Acquisition Date | Cost |
| Berks County Muni. Auth. Rev. Participating VRDN Series Floaters 001, 1.89% 2/11/19 (Liquidity Facility Barclays Bank PLC) | 1/18/18 - 7/6/18 | $3,500,000 |
| Pennsylvania Higher Edl. Facilities Auth. Rev. Series WF 11 26C, SIFMA Municipal Swap Index + 0.280% 1.89%, tender 1/24/19 (Liquidity Facility Wells Fargo Bank NA) | 8/11/16 | $5,900,000 |
| Pennsylvania Tpk. Commission Tpk. Rev. Series Floaters G 43, SIFMA Municipal Swap Index + 0.200% 1.91%, tender 6/3/19 (Liquidity Facility Royal Bank of Canada) | 8/2/18 | $2,500,000 |
Affiliated Central Funds
Information regarding fiscal year to date income earned by the Fund from investments in Fidelity Central Funds is as follows:
| Fund | Income earned |
| Fidelity Municipal Cash Central Fund | $333,258 |
| Total | $333,258 |
Amounts in the income column in the above table exclude any capital gain distributions from underlying funds, which are presented in the corresponding line-item in the Statement of Operations if applicable.
Investment Valuation
All investments are categorized as Level 2 under the Fair Value Hierarchy. The inputs or methodology used for valuing securities may not be an indication of the risk associated with investing in those securities. For more information on valuation inputs please refer to the Investment Valuation section in the accompanying Notes to Financial Statements.
See accompanying notes which are an integral part of the financial statements.
Fidelity® Pennsylvania Municipal Money Market Fund
Financial Statements
Statement of Assets and Liabilities
| | | December 31, 2018 |
| Assets | | |
Investment in securities, at value — See accompanying schedule:
Unaffiliated issuers (cost $220,935,573) | $220,935,573 | |
| Fidelity Central Funds (cost $18,886,477) | 18,886,477 | |
| Total Investment in Securities (cost $239,822,050) | | $239,822,050 |
| Receivable for fund shares sold | | 288,865 |
| Dividends receivable | | 28,148 |
| Interest receivable | | 972,630 |
| Other receivables | | 6 |
| Total assets | | 241,111,699 |
| Liabilities | | |
| Payable to custodian bank | $62,573 | |
| Payable for fund shares redeemed | 522,167 | |
| Distributions payable | 13,985 | |
| Accrued management fee | 100,667 | |
| Total liabilities | | 699,392 |
| Net Assets | | $240,412,307 |
| Net Assets consist of: | | |
| Paid in capital | | $240,416,852 |
| Total distributable earnings (loss) | | (4,545) |
| Net Assets, for 240,163,953 shares outstanding | | $240,412,307 |
| Net Asset Value, offering price and redemption price per share ($240,412,307 ÷ 240,163,953 shares) | | $1.00 |
See accompanying notes which are an integral part of the financial statements.
Statement of Operations
| | | Year ended December 31, 2018 |
| Investment Income | | |
| Interest | | $3,445,987 |
| Income from Fidelity Central Funds | | 333,258 |
| Total income | | 3,779,245 |
| Expenses | | |
| Management fee | $1,296,260 | |
| Independent trustees' fees and expenses | 1,209 | |
| Total expenses before reductions | 1,297,469 | |
| Expense reductions | (91) | |
| Total expenses after reductions | | 1,297,378 |
| Net investment income (loss) | | 2,481,867 |
| Realized and Unrealized Gain (Loss) | | |
| Net realized gain (loss) on: | | |
| Investment securities: | | |
| Unaffiliated issuers | (8,933) | |
| Fidelity Central Funds | 1,126 | |
| Total net realized gain (loss) | | (7,807) |
| Net increase in net assets resulting from operations | | $2,474,060 |
See accompanying notes which are an integral part of the financial statements.
Statement of Changes in Net Assets
| | Year ended December 31, 2018 | Year ended December 31, 2017 |
| Increase (Decrease) in Net Assets | | |
| Operations | | |
| Net investment income (loss) | $2,481,867 | $1,276,381 |
| Net realized gain (loss) | (7,807) | 33,574 |
| Net increase in net assets resulting from operations | 2,474,060 | 1,309,955 |
| Distributions to shareholders | (2,482,188) | – |
| Distributions to shareholders from net investment income | – | (1,276,467) |
| Distributions to shareholders from net realized gain | – | (28,975) |
| Total distributions | (2,482,188) | (1,305,442) |
| Share transactions at net asset value of $1.00 per share | | |
| Proceeds from sales of shares | 39,484,580 | 36,618,519 |
| Reinvestment of distributions | 2,343,361 | 1,243,608 |
| Cost of shares redeemed | (86,401,616) | (158,398,364) |
| Net increase (decrease) in net assets and shares resulting from share transactions | (44,573,675) | (120,536,237) |
| Total increase (decrease) in net assets | (44,581,803) | (120,531,724) |
| Net Assets | | |
| Beginning of period | 284,994,110 | 405,525,834 |
| End of period | $240,412,307 | $284,994,110 |
| Other Information | | |
| Undistributed net investment income end of period | | $1 |
See accompanying notes which are an integral part of the financial statements.
Financial Highlights
Fidelity Pennsylvania Municipal Money Market Fund
| | | | | | |
| Years ended December 31, | 2018 | 2017 | 2016 | 2015 | 2014 |
| Selected Per–Share Data | | | | | |
| Net asset value, beginning of period | $1.00 | $1.00 | $1.00 | $1.00 | $1.00 |
| Income from Investment Operations | | | | | |
| Net investment income (loss) | .010 | .004 | .001 | –A | –A |
| Net realized and unrealized gain (loss)A | – | – | – | – | – |
| Total from investment operations | .010 | .004 | .001 | –A | –A |
| Distributions from net investment income | (.010) | (.004) | (.001) | –A | –A |
| Distributions from net realized gain | – | –A | –A | –A | – |
| Total distributions | (.010) | (.004) | (.001) | –A | –A |
| Net asset value, end of period | $1.00 | $1.00 | $1.00 | $1.00 | $1.00 |
| Total ReturnB | .97% | .40% | .09% | .01% | .01% |
| Ratios to Average Net AssetsC,D | | | | | |
| Expenses before reductions | .50% | .50% | .50% | .50% | .50% |
| Expenses net of fee waivers, if any | .50% | .50% | .35% | .06% | .07% |
| Expenses net of all reductions | .50% | .50% | .35% | .06% | .07% |
| Net investment income (loss) | .96% | .38% | .07% | .01% | .01% |
| Supplemental Data | | | | | |
| Net assets, end of period (000 omitted) | $240,412 | $284,994 | $405,526 | $731,701 | $760,467 |
A Amount represents less than $.0005 per share.
B Total returns would have been lower if certain expenses had not been reduced during the applicable periods shown.
C Fees and expenses of any underlying Fidelity Central Funds are not included in the Fund's expense ratio. The Fund indirectly bears its proportionate share of the expenses of any underlying Fidelity Central Funds.
D Expense ratios reflect operating expenses of the Fund. Expenses before reductions do not reflect amounts reimbursed or waived or reductions from expense offset arrangements and do not represent the amount paid by the Fund during periods when reimbursements, waivers or reductions occur. Expenses net of fee waivers reflect expenses after reimbursement and waivers but prior to reductions from expense offset arrangements. Expenses net of all reductions represent the net expenses paid by the Fund.
See accompanying notes which are an integral part of the financial statements.
Notes to Financial Statements
For the period ended December 31, 2018
1. Organization.
Fidelity Pennsylvania Municipal Income Fund (the Income Fund) is a fund of Fidelity Municipal Trust. Fidelity Pennsylvania Municipal Money Market Fund (the Money Market Fund) is a fund of Fidelity Municipal Trust II. Each Trust is registered under the Investment Company Act of 1940, as amended (the 1940 Act), as an open-end management investment company. Fidelity Municipal Trust and Fidelity Municipal Trust II (the Trusts) are organized as a Massachusetts business trust and a Delaware statutory trust, respectively. Each Fund is authorized to issue an unlimited number of shares. Shares of the Money Market Fund are only available for purchase by retail shareholders. Share transactions on the Statement of Changes in Net Assets may contain exchanges between affiliated funds. Each Fund may be affected by economic and political developments in the state of Pennsylvania.
2. Investments in Fidelity Central Funds.
The Funds may invest in Fidelity Central Funds, which are open-end investment companies generally available only to other investment companies and accounts managed by the investment adviser and its affiliates. The Funds' Schedules of Investments list each of the Fidelity Central Funds held as of period end, if any, as an investment of each Fund, but do not include the underlying holdings of each Fidelity Central Fund. As an Investing Fund, each Fund indirectly bears its proportionate share of the expenses of the underlying Fidelity Central Funds.
The Money Market Central Funds seek preservation of capital and current income and are managed by Fidelity Investments Money Management, Inc. (FIMM), an affiliate of the investment adviser. Annualized expenses of the Money Market Central Funds as of their most recent shareholder report date are less than .005%.
A complete unaudited list of holdings for each Fidelity Central Fund is available upon request or at the Securities and Exchange Commission (the SEC) website at www.sec.gov. In addition, the financial statements of the Fidelity Central Funds, which are not covered by the Funds' Report of Independent Registered Public Accounting Firm, are available on the SEC website or upon request.
3. Significant Accounting Policies.
Each Fund is an investment company and applies the accounting and reporting guidance of the Financial Accounting Standards Board (FASB) Accounting Standards Codification Topic 946 Financial Services – Investments Companies. The financial statements have been prepared in conformity with accounting principles generally accepted in the United States of America (GAAP), which require management to make certain estimates and assumptions at the date of the financial statements. Actual results could differ from those estimates. Subsequent events, if any, through the date that the financial statements were issued have been evaluated in the preparation of the financial statements. The following summarizes the significant accounting policies of the Funds:
Investment Valuation. Investments are valued as of 4:00 p.m. Eastern time on the last calendar day of the period. The Board of Trustees (the Board) has delegated the day to day responsibility for the valuation of the Income Fund's investments to the Fair Value Committee (the Committee) established by the Income Fund's investment adviser. In accordance with valuation policies and procedures approved by the Board, the Income Fund attempts to obtain prices from one or more third party pricing vendors or brokers to value its investments. When current market prices, quotations or currency exchange rates are not readily available or reliable, investments will be fair valued in good faith by the Committee, in accordance with procedures adopted by the Board. Factors used in determining fair value vary by investment type and may include market or investment specific events, changes in interest rates and credit quality. The frequency with which these procedures are used cannot be predicted and they may be utilized to a significant extent. The Committee oversees the Income Fund's valuation policies and procedures and reports to the Board on the Committee's activities and fair value determinations. The Board monitors the appropriateness of the procedures used in valuing the Income Fund's investments and ratifies the fair value determinations of the Committee.
Each Fund categorizes the inputs to valuation techniques used to value its investments into a disclosure hierarchy consisting of three levels as shown below:
- Level 1 – quoted prices in active markets for identical investments
- Level 2 – other significant observable inputs (including quoted prices for similar investments, interest rates, prepayment speeds, etc.)
- Level 3 – unobservable inputs (including the Fund's own assumptions based on the best information available)
Valuation techniques used to value each Fund's investments by major category are as follows:
For the Income Fund, debt securities, including restricted securities, are valued based on evaluated prices received from third party pricing vendors or from brokers who make markets in such securities. Municipal securities are valued by pricing vendors who utilize matrix pricing which considers yield or price of bonds of comparable quality, coupon, maturity and type or by broker-supplied prices. When independent prices are unavailable or unreliable, debt securities may be valued utilizing pricing methodologies which consider similar factors that would be used by third party pricing vendors. Debt securities are generally categorized as Level 2 in the hierarchy but may be Level 3 depending on the circumstances.
For the Money Market Fund, as permitted by compliance with certain conditions under Rule 2a-7 of the 1940 Act, securities are valued at amortized cost, which approximates fair value. The amortized cost of an instrument is determined by valuing it at its original cost and thereafter amortizing any discount or premium from its face value at a constant rate until maturity. Securities held by a money market fund are generally high quality and liquid; however, they are reflected as Level 2 because the inputs used to determine fair value are not quoted prices in an active market.
For the Income Fund, changes in valuation techniques may result in transfers in or out of an assigned level within the disclosure hierarchy.
Investment Transactions and Income. For financial reporting purposes, the Funds' investment holdings and NAV include trades executed through the end of the last business day of the period. The NAV per share for processing shareholder transactions is calculated as of the close of business of the New York Stock Exchange (NYSE), normally 4:00 p.m. Eastern time and includes trades executed through the end of the prior business day for the Income Fund and trades executed through the end of the current business day for the Money Market Fund. Gains and losses on securities sold are determined on the basis of identified cost. Income and capital gain distributions from Fidelity Central Funds, if any, are recorded on the ex-dividend date. Interest income is accrued as earned and includes coupon interest and amortization of premium and accretion of discount on debt securities as applicable. Debt obligations may be placed on non-accrual status and related interest income may be reduced by ceasing current accruals and writing off interest receivables when the collection of all or a portion of interest has become doubtful based on consistently applied procedures. A debt obligation is removed from non-accrual status when the issuer resumes interest payments or when collectability of interest is reasonably assured.
Expenses. Expenses directly attributable to a fund are charged to that fund. Expenses attributable to more than one fund are allocated among the respective funds on the basis of relative net assets or other appropriate methods. Expense estimates are accrued in the period to which they relate and adjustments are made when actual amounts are known.
Income Tax Information and Distributions to Shareholders. Each year, each Fund intends to qualify as a regulated investment company under Subchapter M of the Internal Revenue Code, including distributing substantially all of its taxable income and realized gains. As a result, no provision for U.S. Federal income taxes is required. As of December 31, 2018, each Fund did not have any unrecognized tax benefits in the financial statements; nor is each Fund aware of any tax positions for which it is reasonably possible that the total amounts of unrecognized tax benefits will significantly change in the next twelve months. Each Fund files a U.S. federal tax return, in addition to state and local tax returns as required. Each Fund's federal income tax returns are subject to examination by the Internal Revenue Service (IRS) for a period of three fiscal years after they are filed. State and local tax returns may be subject to examination for an additional fiscal year depending on the jurisdiction.
Distributions are declared and recorded daily and paid monthly from net investment income. Distributions from realized gains, if any, are declared and recorded on the ex-dividend date. Income and capital gain distributions are determined in accordance with income tax regulations, which may differ from GAAP. In addition, the Income Fund claimed a portion of the payment made to redeeming shareholders as a distribution for income tax purposes.
Capital accounts within the financial statements are adjusted for permanent book-tax differences. These adjustments have no impact on net assets or the results of operations. Capital accounts are not adjusted for temporary book-tax differences which will reverse in a subsequent period.
Book-tax differences are primarily due to market discount and deferred trustees compensation and losses deferred due to wash sales.
The Funds purchase municipal securities whose interest, in the opinion of the issuer, is free from federal income tax. There is no assurance that the IRS will agree with this opinion. In the event the IRS determines that the issuer does not comply with relevant tax requirements, interest payments from a security could become federally taxable, possibly retroactively to the date the security was issued.
As of period end, the cost and unrealized appreciation (depreciation) in securities, and derivatives if applicable, for federal income tax purposes were as follows for each Fund:
| | Tax cost | Gross unrealized appreciation | Gross unrealized depreciation | Net unrealized appreciation (depreciation) |
| Fidelity Pennsylvania Municipal Income Fund | $439,399,125 | $9,074,371 | $(2,572,712) | $6,501,659 |
| Fidelity Pennsylvania Municipal Money Market Fund | 239,822,050 | – | – | – |
The tax-based components of distributable earnings as of period end were as follows for each Fund:
| | Undistributed tax-exempt income | Undistributed ordinary income | Undistributed long-term capital gain | Capital loss carryforward | Net unrealized appreciation (depreciation) on securities and other investments |
| Fidelity Pennsylvania Municipal Income Fund | $– | $– | $51,186 | $– | $6,501,659 |
| Fidelity Pennsylvania Municipal Money Market Fund | 3,262 | 1 | – | (7,675) | – |
Capital loss carryforwards are only available to offset future capital gains of the Funds to the extent provided by regulations and may be limited. Under the Regulated Investment Company Modernization Act of 2010 (the Act), the Funds are permitted to carry forward capital losses incurred in taxable years beginning after December 22, 2010 for an unlimited period and such capital losses are required to be used prior to any losses that expire. The capital loss carryforward information presented below, including any applicable limitation, is estimated as of fiscal period end and is subject to adjustment.
| | No expiration
Short-term |
| Fidelity Pennsylvania Municipal Money Market Fund | $(7,675) |
The tax character of distributions paid was as follows:
| December 31, 2018 | | | |
| | Tax-Exempt Income | Long-term Capital Gains | Total |
| Fidelity Pennsylvania Municipal Income Fund | $13,320,710 | $1,451,718 | $14,772,428 |
| Fidelity Pennsylvania Municipal Money Market Fund | 2,482,188 | – | 2,482,188 |
| December 31, 2017 | | | |
| | Tax-Exempt Income | Long-term Capital Gains | Total |
| Fidelity Pennsylvania Municipal Income Fund | $13,738,825 | $1,974,339 | $15,713,164 |
| Fidelity Pennsylvania Municipal Money Market Fund | 1,276,467 | 28,975 | 1,305,442 |
Restricted Securities. The Funds may invest in securities that are subject to legal or contractual restrictions on resale. These securities generally may be resold in transactions exempt from registration or to the public if the securities are registered. Disposal of these securities may involve time-consuming negotiations and expense, and prompt sale at an acceptable price may be difficult. Information regarding restricted securities is included at the end of each applicable Fund's Schedule of Investments.
New Rule Issuance. During August 2018, the U.S. Securities and Exchange Commission issued Final Rule Release No. 33-10532, Disclosure Update and Simplification. This Final Rule includes amendments specific to registered investment companies that are intended to eliminate overlap in disclosure requirements between Regulation S-X and GAAP. In accordance with these amendments, certain line-items in the Fund's financial statements have been combined or removed for the current period as outlined in the table below.
| Financial Statement | Current Line-Item Presentation | Prior Line-Item Presentation |
| Statement of Assets and Liabilities | Total distributable earnings (loss) | Undistributed/Distributions in excess of/Accumulated net investment income (loss)
Accumulated/Undistributed net realized gain (loss)
Net unrealized appreciation (depreciation) |
| Statement of Changes in Net Assets | N/A - removed | Undistributed/Distributions in excess of/Accumulated net investment income (loss) end of period |
| Statement of Changes in Net Assets | Distributions to shareholders | Distributions to shareholders from net investment income
Distributions to shareholders from net realized gain |
4. Purchases and Sales of Investments.
Purchases and sales of securities, other than short-term securities, for the Income Fund aggregated $67,422,978 and $87,094,190, respectively.
5. Fees and Other Transactions with Affiliates.
Management Fee. Fidelity Management & Research Company (the investment adviser) and its affiliates provide the Income Fund with investment management related services for which the Fund pays a monthly management fee. The management fee is the sum of an individual fund fee rate that is based on an annual rate of .25% of the Fund's average net assets and an annualized group fee rate that averaged .11% during the period. The group fee rate is based upon the average net assets of all the mutual funds advised by the investment adviser, including any mutual funds previously advised by the investment adviser that are currently advised by Fidelity SelectCo, LLC, an affiliate of the investment adviser. The group fee rate decreases as assets under management increase and increases as assets under management decrease. For the reporting period, the total annual management fee rate was .36% of the Fund's average net assets.
Fidelity Management & Research Company (the investment adviser) and its affiliates provide the Money Market Fund with investment management related services for which the Fund pays a monthly management fee that is based on an annual rate of .50% of the Fund's average net assets. Under the management contract, the investment adviser pays all other expenses, except the compensation of the independent Trustees and certain other expenses such as other expenses such as interest expense. The management fee is reduced by an amount equal to the fees and expenses paid by the Fund to the independent Trustees.
Transfer Agent Fees. Fidelity Investments Institutional Operations Company, Inc. (FIIOC), an affiliate of the investment adviser, is the transfer, dividend disbursing and shareholder servicing agent for the Funds. Under the terms of the management fee contract, the investment adviser pays transfer agent fees on behalf of the Money Market Fund. FIIOC receives account fees and asset-based fees that vary according to account size and type of account. FIIOC pays for typesetting, printing and mailing of shareholder reports, except proxy statements. For the period, the Income Fund's transfer agent fees were equivalent to the following annual rates expressed as a percentage of average net assets:
| Fidelity Pennsylvania Municipal Income Fund | .08% |
Accounting Fees. Fidelity Service Company, Inc. (FSC), an affiliate of the investment adviser, maintains each Fund's accounting records. The fee is based on the level of average net assets for each month. For the period, the fees were equivalent to the following annual rates:
| | % of Average Net Assets |
| Fidelity Pennsylvania Municipal Income Fund | .03 |
Interfund Trades. The Funds may purchase from or sell securities to other Fidelity Funds under procedures adopted by the Board. The procedures have been designed to ensure these interfund trades are executed in accordance with Rule 17a-7 of the 1940 Act. For the Income Fund, interfund trades are included within the respective purchases and sales amounts shown in the Purchases and Sales of Investments note.
6. Committed Line of Credit.
The Income Fund participates with other funds managed by the investment adviser or an affiliate in a $4.25 billion credit facility (the "line of credit") to be utilized for temporary or emergency purposes to fund shareholder redemptions or for other short-term liquidity purposes. The participating funds have agreed to pay commitment fees on their pro-rata portion of the line of credit, which are reflected in Miscellaneous expenses on the Statement of Operations, and are as follows:
| Fidelity Pennsylvania Municipal Income Fund | $1,282 |
During the period, the Income Fund did not borrow on this line of credit.
7. Expense Reductions.
Through arrangements with the Income Fund's custodian, credits realized as a result of certain uninvested cash balances were used to reduce fund expenses. These expense reductions are noted in the table below.
| | | Custody expense reduction | | |
| Fidelity Pennsylvania Municipal Income Fund | | $3,395 | | |
In addition, through an arrangement with the Money Market Fund's custodian, $91 of credits realized as a result of certain uninvested cash balances were used to reduce the Fund's management fee.
In addition, during the period the investment adviser reimbursed and/or waived a portion of operating expenses as follows:
| | Amount |
| Fidelity Pennsylvania Municipal Income Fund | $2,872 |
8. Other.
The Funds' organizational documents provide former and current trustees and officers with a limited indemnification against liabilities arising in connection with the performance of their duties to the Funds. In the normal course of business, the Funds may also enter into contracts that provide general indemnifications. The Funds' maximum exposure under these arrangements is unknown as this would be dependent on future claims that may be made against the Funds. The risk of material loss from such claims is considered remote.
Report of Independent Registered Public Accounting Firm
To the Board of Trustees of Fidelity Municipal Trust and Fidelity Municipal Trust II and Shareholders of Fidelity Pennsylvania Municipal Income Fund and Fidelity Pennsylvania Municipal Money Market Fund:
Opinions on the Financial Statements
We have audited the accompanying statements of assets and liabilities, including the schedules of investments, of Fidelity Pennsylvania Municipal Income Fund (one of the funds constituting Fidelity Municipal Trust) and Fidelity Pennsylvania Municipal Money Market Fund (one of the funds constituting Fidelity Municipal Trust II) (hereafter collectively referred to as the "Funds") as of December 31, 2018, the related statements of operations for the year ended December 31, 2018, the statements of changes in net assets for each of the two years in the period ended December 31, 2018, including the related notes, and the financial highlights for each of the five years in the period ended December 31, 2018 (collectively referred to as the “financial statements”). In our opinion, the financial statements present fairly, in all material respects, the financial position of each of the Funds as of December 31, 2018, the results of each of their operations for the year then ended, the changes in each of their net assets for each of the two years in the period ended December 31, 2018 and each of the financial highlights for each of the five years in the period ended December 31, 2018 in conformity with accounting principles generally accepted in the United States of America.
Basis for Opinions
These financial statements are the responsibility of the Funds' management. Our responsibility is to express an opinion on the Funds' financial statements based on our audits. We are a public accounting firm registered with the Public Company Accounting Oversight Board (United States) (PCAOB) and are required to be independent with respect to the Funds in accordance with the U.S. federal securities laws and the applicable rules and regulations of the Securities and Exchange Commission and the PCAOB.
We conducted our audits of these financial statements in accordance with the standards of the PCAOB. Those standards require that we plan and perform the audit to obtain reasonable assurance about whether the financial statements are free of material misstatement, whether due to error or fraud.
Our audits included performing procedures to assess the risks of material misstatement of the financial statements, whether due to error or fraud, and performing procedures that respond to those risks. Such procedures included examining, on a test basis, evidence regarding the amounts and disclosures in the financial statements. Our audits also included evaluating the accounting principles used and significant estimates made by management, as well as evaluating the overall presentation of the financial statements. Our procedures included confirmation of securities owned as of December 31, 2018 by correspondence with the custodian. We believe that our audits provide a reasonable basis for our opinions.
PricewaterhouseCoopers LLP
Boston, Massachusetts
February 13, 2019
We have served as the auditor of one or more investment companies in the Fidelity group of funds since 1932.
Trustees and Officers
The Trustees, Members of the Advisory Board (if any), and officers of the trusts and fund, as applicable, are listed below. The Board of Trustees governs the fund and is responsible for protecting the interests of shareholders. The Trustees are experienced executives who meet periodically throughout the year to oversee the fund's activities, review contractual arrangements with companies that provide services to the fund, oversee management of the risks associated with such activities and contractual arrangements, and review the fund's performance. Each of the Trustees oversees 260 funds.
The Trustees hold office without limit in time except that (a) any Trustee may resign; (b) any Trustee may be removed by written instrument, signed by at least two-thirds of the number of Trustees prior to such removal; (c) any Trustee who requests to be retired or who has become incapacitated by illness or injury may be retired by written instrument signed by a majority of the other Trustees; and (d) any Trustee may be removed at any special meeting of shareholders by a two-thirds vote of the outstanding voting securities of the trust. Each Trustee who is not an interested person (as defined in the 1940 Act) of the trust and the fund is referred to herein as an Independent Trustee. Each Independent Trustee shall retire not later than the last day of the calendar year in which his or her 75th birthday occurs. The Independent Trustees may waive this mandatory retirement age policy with respect to individual Trustees. Officers and Advisory Board Members hold office without limit in time, except that any officer or Advisory Board Member may resign or may be removed by a vote of a majority of the Trustees at any regular meeting or any special meeting of the Trustees. Except as indicated, each individual has held the office shown or other offices in the same company for the past five years.
The fund’s Statement of Additional Information (SAI) includes more information about the Trustees. To request a free copy, call Fidelity at 1-800-544-8544.
Experience, Skills, Attributes, and Qualifications of the Trustees. The Governance and Nominating Committee has adopted a statement of policy that describes the experience, qualifications, attributes, and skills that are necessary and desirable for potential Independent Trustee candidates (Statement of Policy). The Board believes that each Trustee satisfied at the time he or she was initially elected or appointed a Trustee, and continues to satisfy, the standards contemplated by the Statement of Policy. The Governance and Nominating Committee also engages professional search firms to help identify potential Independent Trustee candidates who have the experience, qualifications, attributes, and skills consistent with the Statement of Policy. From time to time, additional criteria based on the composition and skills of the current Independent Trustees, as well as experience or skills that may be appropriate in light of future changes to board composition, business conditions, and regulatory or other developments, have also been considered by the professional search firms and the Governance and Nominating Committee. In addition, the Board takes into account the Trustees' commitment and participation in Board and committee meetings, as well as their leadership of standing and ad hoc committees throughout their tenure.
In determining that a particular Trustee was and continues to be qualified to serve as a Trustee, the Board has considered a variety of criteria, none of which, in isolation, was controlling. The Board believes that, collectively, the Trustees have balanced and diverse experience, qualifications, attributes, and skills, which allow the Board to operate effectively in governing the fund and protecting the interests of shareholders. Information about the specific experience, skills, attributes, and qualifications of each Trustee, which in each case led to the Board's conclusion that the Trustee should serve (or continue to serve) as a trustee of the fund, is provided below.
Board Structure and Oversight Function. Abigail P. Johnson is an interested person and currently serves as Chairman. The Trustees have determined that an interested Chairman is appropriate and benefits shareholders because an interested Chairman has a personal and professional stake in the quality and continuity of services provided to the fund. Independent Trustees exercise their informed business judgment to appoint an individual of their choosing to serve as Chairman, regardless of whether the Trustee happens to be independent or a member of management. The Independent Trustees have determined that they can act independently and effectively without having an Independent Trustee serve as Chairman and that a key structural component for assuring that they are in a position to do so is for the Independent Trustees to constitute a substantial majority for the Board. The Independent Trustees also regularly meet in executive session. Arthur E. Johnson serves as Chairman of the Independent Trustees and as such (i) acts as a liaison between the Independent Trustees and management with respect to matters important to the Independent Trustees and (ii) with management prepares agendas for Board meetings.
Fidelity® funds are overseen by different Boards of Trustees. The fund's Board oversees Fidelity's investment-grade bond, money market, asset allocation and certain equity funds, and other Boards oversee Fidelity's high income and other equity funds. The asset allocation funds may invest in Fidelity® funds that are overseen by such other Boards. The use of separate Boards, each with its own committee structure, allows the Trustees of each group of Fidelity® funds to focus on the unique issues of the funds they oversee, including common research, investment, and operational issues. On occasion, the separate Boards establish joint committees to address issues of overlapping consequences for the Fidelity® funds overseen by each Board.
The Trustees operate using a system of committees to facilitate the timely and efficient consideration of all matters of importance to the Trustees, the fund, and fund shareholders and to facilitate compliance with legal and regulatory requirements and oversight of the fund's activities and associated risks. The Board, acting through its committees, has charged FMR and its affiliates with (i) identifying events or circumstances the occurrence of which could have demonstrably adverse effects on the fund's business and/or reputation; (ii) implementing processes and controls to lessen the possibility that such events or circumstances occur or to mitigate the effects of such events or circumstances if they do occur; and (iii) creating and maintaining a system designed to evaluate continuously business and market conditions in order to facilitate the identification and implementation processes described in (i) and (ii) above. Because the day-to-day operations and activities of the fund are carried out by or through FMR, its affiliates, and other service providers, the fund's exposure to risks is mitigated but not eliminated by the processes overseen by the Trustees. While each of the Board's committees has responsibility for overseeing different aspects of the fund's activities, oversight is exercised primarily through the Operations and Audit Committees. In addition, an ad hoc Board committee of Independent Trustees has worked with FMR to enhance the Board's oversight of investment and financial risks, legal and regulatory risks, technology risks, and operational risks, including the development of additional risk reporting to the Board. The Operations Committee also worked and continues to work with FMR to enhance the stress tests required under SEC regulations for money market funds. Appropriate personnel, including but not limited to the fund's Chief Compliance Officer (CCO), FMR's internal auditor, the independent accountants, the fund's Treasurer and portfolio management personnel, make periodic reports to the Board's committees, as appropriate, including an annual review of Fidelity's risk management program for the Fidelity® funds. The responsibilities of each standing committee, including their oversight responsibilities, are described further under "Standing Committees of the Trustees."
Interested Trustees*:
Correspondence intended for a Trustee who is an interested person may be sent to Fidelity Investments, 245 Summer Street, Boston, Massachusetts 02210.
Name, Year of Birth; Principal Occupations and Other Relevant Experience+
Abigail P. Johnson (1961)
Year of Election or Appointment: 2009
Trustee
Chairman of the Board of Trustees
Ms. Johnson also serves as Trustee of other Fidelity® funds. Ms. Johnson serves as Chairman (2016-present), Chief Executive Officer (2014-present), and Director (2007-present) of FMR LLC (diversified financial services company), President of Fidelity Financial Services (2012-present) and President of Personal, Workplace and Institutional Services (2005-present). Ms. Johnson is Chairman and Director of FMR Co., Inc. (investment adviser firm, 2011-present) and Chairman and Director of FMR (investment adviser firm, 2011-present). Previously, Ms. Johnson served as Vice Chairman (2007-2016) and President (2013-2016) of FMR LLC, President and a Director of FMR (2001-2005), a Trustee of other investment companies advised by FMR, Fidelity Investments Money Management, Inc. (investment adviser firm), and FMR Co., Inc. (2001-2005), Senior Vice President of the Fidelity® funds (2001-2005), and managed a number of Fidelity® funds. Ms. Abigail P. Johnson and Mr. Arthur E. Johnson are not related.
Jennifer Toolin McAuliffe (1959)
Year of Election or Appointment: 2016
Trustee
Ms. McAuliffe also serves as Trustee of other Fidelity® funds. Ms. McAuliffe previously served as a Member of the Advisory Board of certain Fidelity® funds (2016) and as Co-Head of Fixed Income of Fidelity Investments Limited (now known as FIL Limited (FIL)) (diversified financial services company). Earlier roles at FIL included Director of Research for FIL’s credit and quantitative teams in London, Hong Kong and Tokyo. Ms. McAuliffe also was the Director of Research for taxable and municipal bonds at Fidelity Investments Money Management, Inc. Ms. McAuliffe is also a director or trustee of several not-for-profit entities.
* Determined to be an “Interested Trustee” by virtue of, among other things, his or her affiliation with the trust or various entities under common control with FMR.
+ The information includes the Trustee's principal occupation during the last five years and other information relating to the experience, attributes, and skills relevant to the Trustee's qualifications to serve as a Trustee, which led to the conclusion that the Trustee should serve as a Trustee for the fund.
Independent Trustees:
Correspondence intended for an Independent Trustee may be sent to Fidelity Investments, P.O. Box 55235, Boston, Massachusetts 02205-5235.
Name, Year of Birth; Principal Occupations and Other Relevant Experience+
Elizabeth S. Acton (1951)
Year of Election or Appointment: 2013
Trustee
Ms. Acton also serves as Trustee of other Fidelity® funds. Prior to her retirement in April 2012, Ms. Acton was Executive Vice President, Finance (2011-2012), Executive Vice President, Chief Financial Officer (2002-2011), and Treasurer (2004-2005) of Comerica Incorporated (financial services). Prior to joining Comerica, Ms. Acton held a variety of positions at Ford Motor Company (1983-2002), including Vice President and Treasurer (2000-2002) and Executive Vice President and Chief Financial Officer of Ford Motor Credit Company (1998-2000). Ms. Acton currently serves as a member of the Board of Directors and Audit and Finance Committees of Beazer Homes USA, Inc. (homebuilding, 2012-present). Previously, Ms. Acton served as a Member of the Advisory Board of certain Fidelity® funds (2013-2016).
Ann E. Dunwoody (1953)
Year of Election or Appointment: 2018
Trustee
General Dunwoody also serves as Trustee of other Fidelity® funds. General Dunwoody (United States Army, Retired) was the first woman in U.S. military history to achieve the rank of four-star general and prior to her retirement in 2012 held a variety of positions within the U.S. Army, including Commanding General, U.S. Army Material Command (2008-2012). She is the President of First to Four LLC (leadership and mentoring services, 2012-present). She also serves as a member of the Board of Directors and Nominating and Corporate Governance Committee of L3 Technologies, Inc. (communication, electronic, sensor, and aerospace systems, 2013-present), Board of Directors and Nomination and Corporate Governance Committees of Kforce Inc. (professional staffing services, 2016-present) and Board of Directors of Automattic Inc. (software engineering, 2018-present). Previously, General Dunwoody served as a Member of the Advisory Board of certain Fidelity® funds (2018), a member of the Board of Directors and Audit and Sustainability and Corporate Responsibility Committees of Republic Services, Inc. (waste collection, disposal and recycling, 2013-2016). Ms. Dunwoody also serves on several boards for non-profit organizations, including as a member of the Board of Directors, Chair of the Nomination and Governance Committee and member of the Audit Committee of Logistics Management Institute (consulting non-profit, 2012-present), a member of the Board of Directors of the Army Historical Foundation (2015-present), a member of the Council of Trustees for the Association of the United States Army (advocacy non-profit, 2013-present) and a member of the Board of Trustees of Florida Institute of Technology (2015-present) and ThanksUSA (military family education non-profit, 2014-present).
John Engler (1948)
Year of Election or Appointment: 2014
Trustee
Mr. Engler also serves as Trustee of other Fidelity® funds. He serves on the board of directors for Universal Forest Products (manufacturer and distributor of wood and wood-alternative products, 2003-present) and K12 Inc. (technology-based education company, 2012-present). Previously, Mr. Engler served as interim president of Michigan State University (2018-2019), a Member of the Advisory Board of certain Fidelity® funds (2014-2016), president of the Business Roundtable (2011-2017), a trustee of The Munder Funds (2003-2014), president and CEO of the National Association of Manufacturers (2004-2011), member of the Board of Trustees of the Annie E. Casey Foundation (2004-2015), and as governor of Michigan (1991-2003). He is a past chairman of the National Governors Association.
Robert F. Gartland (1951)
Year of Election or Appointment: 2010
Trustee
Mr. Gartland also serves as Trustee of other Fidelity® funds. Mr. Gartland is Chairman and an investor in Gartland & Mellina Group Corp. (consulting, 2009-present). Previously, Mr. Gartland served as a partner and investor of Vietnam Partners LLC (investments and consulting, 2008-2011). Prior to his retirement, Mr. Gartland held a variety of positions at Morgan Stanley (financial services, 1979-2007), including Managing Director (1987-2007), and Chase Manhattan Bank (1975-1978).
Arthur E. Johnson (1947)
Year of Election or Appointment: 2008
Trustee
Chairman of the Independent Trustees
Mr. Johnson also serves as Trustee of other Fidelity® funds. Mr. Johnson serves as a member of the Board of Directors of Eaton Corporation plc (diversified power management, 2009-present) and Booz Allen Hamilton (management consulting, 2011-present). Prior to his retirement, Mr. Johnson served as Senior Vice President of Corporate Strategic Development of Lockheed Martin Corporation (defense contractor, 1999-2009). He previously served on the Board of Directors of IKON Office Solutions, Inc. (1999-2008), AGL Resources, Inc. (holding company, 2002-2016), and Delta Airlines (2005-2007). Mr. Arthur E. Johnson is not related to Ms. Abigail P. Johnson.
Michael E. Kenneally (1954)
Year of Election or Appointment: 2009
Trustee
Vice Chairman of the Independent Trustees
Mr. Kenneally also serves as Trustee of other Fidelity® funds. Prior to his retirement, Mr. Kenneally served as Chairman and Global Chief Executive Officer of Credit Suisse Asset Management. Before joining Credit Suisse, he was an Executive Vice President and Chief Investment Officer for Bank of America Corporation. Earlier roles at Bank of America included Director of Research, Senior Portfolio Manager and Research Analyst, and Mr. Kenneally was awarded the Chartered Financial Analyst (CFA) designation in 1991.
Marie L. Knowles (1946)
Year of Election or Appointment: 2001
Trustee
Ms. Knowles also serves as Trustee of other Fidelity® funds. Prior to Ms. Knowles' retirement in June 2000, she served as Executive Vice President and Chief Financial Officer of Atlantic Richfield Company (ARCO) (diversified energy, 1996-2000). From 1993 to 1996, she was a Senior Vice President of ARCO and President of ARCO Transportation Company (pipeline and tanker operations). Ms. Knowles currently serves as a Director and Chairman of the Audit Committee of McKesson Corporation (healthcare service, since 2002). Ms. Knowles is a member of the Board of the Santa Catalina Island Company (real estate, 2009-present). Ms. Knowles is a Member of the Investment Company Institute Board of Governors and a Member of the Governing Council of the Independent Directors Council (2014-present). She also serves as a member of the Advisory Board for the School of Engineering of the University of Southern California. Previously, Ms. Knowles served as a Director of Phelps Dodge Corporation (copper mining and manufacturing, 1994-2007), URS Corporation (engineering and construction, 2000-2003) and America West (airline, 1999-2002). Ms. Knowles previously served as Chairman (2015-2018) and Vice Chairman (2012-2015) of the Independent Trustees of certain Fidelity® funds.
Mark A. Murray (1954)
Year of Election or Appointment: 2016
Trustee
Mr. Murray also serves as Trustee of other Fidelity® funds. Mr. Murray is Vice Chairman (2013-present) of Meijer, Inc. (regional retail chain). Previously, Mr. Murray served as a Member of the Advisory Board of certain Fidelity® funds (2016) and as Co-Chief Executive Officer (2013-2016) and President (2006-2013) of Meijer, Inc. Mr. Murray serves as a member of the Board of Directors and Nuclear Review and Public Policy and Responsibility Committees of DTE Energy Company (diversified energy company, 2009-present). Mr. Murray also serves as a member of the Board of Directors of Spectrum Health (not-for-profit health system, 2015-present). Mr. Murray previously served as President of Grand Valley State University (2001-2006), Treasurer for the State of Michigan (1999-2001), Vice President of Finance and Administration for Michigan State University (1998-1999), and a member of the Board of Directors and Audit Committee and Chairman of the Nominating and Corporate Governance Committee of Universal Forest Products, Inc. (manufacturer and distributor of wood and wood-alternative products, 2004-2016). Mr. Murray is also a director or trustee of many community and professional organizations.
+ The information includes the Trustee's principal occupation during the last five years and other information relating to the experience, attributes, and skills relevant to the Trustee's qualifications to serve as a Trustee, which led to the conclusion that the Trustee should serve as a Trustee for the fund.
Advisory Board Members and Officers:
Correspondence intended for an officer may be sent to Fidelity Investments, 245 Summer Street, Boston, Massachusetts 02210. Officers appear below in alphabetical order.
Name, Year of Birth; Principal Occupation
Elizabeth Paige Baumann (1968)
Year of Election or Appointment: 2017
Anti-Money Laundering (AML) Officer
Ms. Baumann also serves as AML Officer of other funds. She is Chief AML Officer (2012-present) and Senior Vice President (2014-present) of FMR LLC (diversified financial services company) and is an employee of Fidelity Investments. Previously, Ms. Baumann served as AML Officer of the funds (2012-2016), and Vice President (2007-2014) and Deputy Anti-Money Laundering Officer (2007-2012) of FMR LLC.
Craig S. Brown (1977)
Year of Election or Appointment: 2019
Assistant Treasurer
Mr. Brown also serves as Assistant Treasurer of other funds. Mr. Brown is an employee of Fidelity Investments (2013-present).
John J. Burke III (1964)
Year of Election or Appointment: 2018
Chief Financial Officer
Mr. Burke also serves as Chief Financial Officer of other funds. Mr. Burke serves as Head of Investment Operations for Fidelity Fund and Investment Operations (2018-present) and is an employee of Fidelity Investments (1998-present). Previously Mr. Burke served as head of Asset Management Investment Operations (2012-2018).
William C. Coffey (1969)
Year of Election or Appointment: 2018
Secretary and Chief Legal Officer (CLO)
Mr. Coffey also serves as Secretary and CLO of other funds. Mr. Coffey serves as CLO, Secretary, and Senior Vice President of Fidelity Management & Research Company and FMR Co., Inc. (investment adviser firms, 2018-present); Secretary of Fidelity SelectCo, LLC and Fidelity Investments Money Management, Inc. (investment adviser firms, 2018-present); and CLO of Fidelity Management & Research (Hong Kong) Limited, FMR Investment Management (UK) Limited, and Fidelity Management & Research (Japan) Limited (investment adviser firms, 2018-present). He is Senior Vice President and Deputy General Counsel of FMR LLC (diversified financial services company, 2010-present), and is an employee of Fidelity Investments. Previously, Mr. Coffey served as Assistant Secretary of certain funds (2009-2018) and as Vice President and Associate General Counsel of FMR LLC (2005-2009).
Jonathan Davis (1968)
Year of Election or Appointment: 2010
Assistant Treasurer
Mr. Davis also serves as Assistant Treasurer of other funds. Mr. Davis serves as Assistant Treasurer of FMR Capital, Inc. (2017-present) and is an employee of Fidelity Investments. Previously, Mr. Davis served as Vice President and Associate General Counsel of FMR LLC (diversified financial services company, 2003-2010).
Adrien E. Deberghes (1967)
Year of Election or Appointment: 2010
Assistant Treasurer
Mr. Deberghes also serves as an officer of other funds. He serves as Assistant Treasurer of FMR Capital, Inc. (2017-present), Executive Vice President of Fidelity Investments Money Management, Inc. (FIMM) (investment adviser firm, 2016-present), and is an employee of Fidelity Investments (2008-present). Previously, Mr. Deberghes served as President and Treasurer of certain Fidelity® funds (2013-2018). Prior to joining Fidelity Investments, Mr. Deberghes was Senior Vice President of Mutual Fund Administration at State Street Corporation (2007-2008), Senior Director of Mutual Fund Administration at Investors Bank & Trust (2005-2007), and Director of Finance for Dunkin' Brands (2000-2005). Previously, Mr. Deberghes served in other fund officer roles.
Laura M. Del Prato (1964)
Year of Election or Appointment: 2018
President and Treasurer
Ms. Del Prato also serves as an officer of other funds. Ms. Del Prato is an employee of Fidelity Investments (2017-present). Prior to joining Fidelity Investments, Ms. Del Prato served as a Managing Director and Treasurer of the JPMorgan Mutual Funds (2014-2017). Prior to JPMorgan, Ms. Del Prato served as a partner at Cohen Fund Audit Services (accounting firm, 2012-2013) and KPMG LLP (accounting firm, 2004-2012).
Colm A. Hogan (1973)
Year of Election or Appointment: 2016
Assistant Treasurer
Mr. Hogan also serves as an officer of other funds. Mr. Hogan serves as Assistant Treasurer of FMR Capital, Inc. (2017-present) and is an employee of Fidelity Investments (2005-present). Previously, Mr. Hogan served as Assistant Treasurer of certain Fidelity® funds (2016-2018).
Chris Maher (1972)
Year of Election or Appointment: 2013
Assistant Treasurer
Mr. Maher serves as Assistant Treasurer of other funds. Mr. Maher is Vice President of Valuation Oversight, serves as Assistant Treasurer of FMR Capital, Inc. (2017-present), and is an employee of Fidelity Investments. Previously, Mr. Maher served as Vice President of Asset Management Compliance (2013), Vice President of the Program Management Group of FMR (investment adviser firm, 2010-2013), and Vice President of Valuation Oversight (2008-2010).
John B. McGinty, Jr. (1962)
Year of Election or Appointment: 2016
Chief Compliance Officer
Mr. McGinty also serves as Chief Compliance Officer of other funds. Mr. McGinty is Senior Vice President of Asset Management Compliance for Fidelity Investments and is an employee of Fidelity Investments (2016-present). Mr. McGinty previously served as Vice President, Senior Attorney at Eaton Vance Management (investment management firm, 2015-2016), and prior to Eaton Vance as global CCO for all firm operations and registered investment companies at GMO LLC (investment management firm, 2009-2015). Before joining GMO LLC, Mr. McGinty served as Senior Vice President, Deputy General Counsel for Fidelity Investments (2007-2009).
Jason P. Pogorelec (1975)
Year of Election or Appointment: 2015
Assistant Secretary
Mr. Pogorelec also serves as Assistant Secretary of other funds. Mr. Pogorelec serves as Vice President, Associate General Counsel (2010-present) and is an employee of Fidelity Investments (2006-present).
Nancy D. Prior (1967)
Year of Election or Appointment: 2014
Vice President
Ms. Prior also serves as Vice President of other funds. Ms. Prior serves as President Fixed Income, High Income/Emerging Market Debt and Multi Asset Class Strategies of FIAM LLC (2018-present), President (2016-present) and Director (2014-present) of Fidelity Investments Money Management, Inc. (FIMM) (investment adviser firm), President, Fixed Income (2014-present), and is an employee of Fidelity Investments (2002-present). Previously, Ms. Prior served as Vice Chairman of FIAM LLC (investment adviser firm, 2014-2018), a Director of FMR Investment Management (UK) Limited (investment adviser firm, 2015-2018), President Multi-Asset Class Strategies of FMR's Global Asset Allocation Division (2017-2018), Vice President of Fidelity's Money Market Funds (2012-2014), President, Money Market and Short Duration Bond Group of Fidelity Management & Research (FMR) (investment adviser firm, 2013-2014), President, Money Market Group of FMR (2011-2013), Managing Director of Research (2009-2011), Senior Vice President and Deputy General Counsel (2007-2009), and Assistant Secretary of certain Fidelity® funds (2008-2009).
Stacie M. Smith (1974)
Year of Election or Appointment: 2013
Assistant Treasurer
Ms. Smith also serves as an officer of other funds. Ms. Smith serves as Assistant Treasurer of FMR Capital, Inc. (2017-present), is an employee of Fidelity Investments (2009-present), and has served in other fund officer roles. Prior to joining Fidelity Investments, Ms. Smith served as Senior Audit Manager of Ernst & Young LLP (accounting firm, 1996-2009). Previously, Ms. Smith served as Assistant Treasurer (2013-2018) and Deputy Treasurer (2013-2016) of certain Fidelity® funds.
Marc L. Spector (1972)
Year of Election or Appointment: 2016
Deputy Treasurer
Mr. Spector also serves as an officer of other funds. Mr. Spector serves as Assistant Treasurer of FMR Capital, Inc. (2017-present) and is an employee of Fidelity Investments (2016-present). Prior to joining Fidelity Investments, Mr. Spector served as Director at the Siegfried Group (accounting firm, 2013-2016), and prior to Siegfried Group as audit senior manager at Deloitte & Touche (accounting firm, 2005-2013).
Jim Wegmann (1979)
Year of Election or Appointment: 2019
Assistant Treasurer
Mr. Wegmann also serves as Assistant Treasurer of other funds. Mr. Wegmann is an employee of Fidelity Investments (2011-present).
Shareholder Expense Example
As a shareholder of the Fund, you incur two types of costs: (1) transaction costs, and (2) ongoing costs, including management fees and other Fund expenses. This Example is intended to help you understand your ongoing costs (in dollars) of investing in the Fund and to compare these costs with the ongoing costs of investing in other mutual funds.
The Example is based on an investment of $1,000 invested at the beginning of the period and held for the entire period (July 1, 2018 to December 31, 2018).
Actual Expenses
The first line of the accompanying table provides information about actual account values and actual expenses. You may use the information in this line, together with the amount you invested, to estimate the expenses that you paid over the period. Simply divide your account value by $1,000.00 (for example, an $8,600 account value divided by $1,000.00 = 8.6), then multiply the result by the number in the first line under the heading entitled "Expenses Paid During Period" to estimate the expenses you paid on your account during this period. A small balance maintenance fee of $12.00 that is charged once a year may apply for certain accounts with a value of less than $2,000. This fee, which was eliminated effective August 1, 2018, is not included in the table below. If it was, the estimate of expenses you paid during the period would be higher, and your ending account value lower, by this amount.
Hypothetical Example for Comparison Purposes
The second line of the accompanying table provides information about hypothetical account values and hypothetical expenses based on the Fund's actual expense ratio and an assumed rate of return of 5% per year before expenses, which is not the Fund's actual return. The hypothetical account values and expenses may not be used to estimate the actual ending account balance or expenses you paid for the period. You may use this information to compare the ongoing costs of investing in the Fund and other funds. To do so, compare this 5% hypothetical example with the 5% hypothetical examples that appear in the shareholder reports of the other funds. A small balance maintenance fee of $12.00 that is charged once a year may apply for certain accounts with a value of less than $2,000. This fee, which was eliminated effective August 1, 2018, is not included in the table below. If it was, the estimate of expenses you paid during the period would be higher, and your ending account value lower, by this amount.
Please note that the expenses shown in the table are meant to highlight your ongoing costs only and do not reflect any transaction costs. Therefore, the second line of the table is useful in comparing ongoing costs only, and will not help you determine the relative total costs of owning different funds.
| | Annualized Expense Ratio-A | Beginning
Account Value
July 1, 2018 | Ending
Account Value
December 31, 2018 | Expenses Paid
During Period-B
July 1, 2018
to December 31, 2018 |
| Fidelity Pennsylvania Municipal Income Fund | .47% | | | |
| Actual | | $1,000.00 | $1,014.00 | $2.39 |
| Hypothetical-C | | $1,000.00 | $1,022.84 | $2.40 |
| Fidelity Pennsylvania Municipal Money Market Fund | .50% | | | |
| Actual | | $1,000.00 | $1,005.30 | $2.53 |
| Hypothetical-C | | $1,000.00 | $1,022.68 | $2.55 |
A Annualized expense ratio reflects expenses net of applicable fee waivers.
B Expenses are equal to each Fund's annualized expense ratio, multiplied by the average account value over the period, multiplied by 184/ 365 (to reflect the one-half year period).
C 5% return per year before expenses
Distributions (Unaudited)
The Board of Trustees of each fund voted to pay to shareholders of record at the opening of business on record date, the following distributions per share derived from capital gains realized from sales of portfolio securities:
| | Pay Date | Record Date | Capital Gains |
| Fidelity Pennsylvania Municipal Money Market Fund | 02/11/19 | 02/08/19 | $0.000 |
| Fidelity Pennsylvania Municipal Income Fund | 02/11/19 | 02/08/19 | $0.003 |
|
The Fidelity Pennsylvania Municipal Income Fund hereby designates as capital gain dividend with respect to the taxable year ended December 31, 2018, $741,589,or, if subsequently determined to be different, the net capital gain of such year.
During fiscal year ended 2018, 100% of each fund's income dividends were free from federal income tax, and 14.39% of Fidelity Pennsylvania Municipal Money Market Fund and 4.06% of Fidelity Pennsylvania Municipal Income Fund were subject to the federal alternative minimum tax.
The funds will notify shareholders in January 2019 of amounts for use in preparing 2018 income tax returns.
Board Approval of Investment Advisory Contracts and Management Fees
Fidelity Pennsylvania Municipal Income Fund / Fidelity Pennsylvania Municipal Money Market Fund
Each year, the Board of Trustees, including the Independent Trustees (together, the Board), votes on the renewal of the management contract with Fidelity Management & Research Company (FMR) and the sub-advisory agreements (together, the Advisory Contracts) for each fund. FMR and the sub-advisers are referred to herein as the Investment Advisers. The Board, assisted by the advice of fund counsel and Independent Trustees' counsel, requests and considers a broad range of information relevant to the renewal of the Advisory Contracts throughout the year.
The Board meets regularly and, at each of its meetings, covers an extensive agenda of topics and materials and considers factors that are relevant to its annual consideration of the renewal of each fund's Advisory Contracts, including the services and support provided to each fund and its shareholders. The Board has established four standing committees (Committees) — Operations, Audit, Fair Valuation, and Governance and Nominating — each composed of and chaired by Independent Trustees with varying backgrounds, to which the Board has assigned specific subject matter responsibilities in order to enhance effective decision-making by the Board. The Operations Committee, of which all of the Independent Trustees are members, meets regularly throughout the year and considers, among other matters, information specifically related to the annual consideration of the renewal of each fund's Advisory Contracts. The Board, acting directly and through its Committees, requests and receives information concerning the annual consideration of the renewal of each fund's Advisory Contracts. The Board also meets as needed to review matters specifically related to the Board's annual consideration of the renewal of the Advisory Contracts. Members of the Board may also meet with trustees of other Fidelity funds through joint ad hoc committees to discuss certain matters relevant to all of the Fidelity funds.
At its September 2018 meeting, the Board unanimously determined to renew each fund's Advisory Contracts. In reaching its determination, the Board considered all factors it believed relevant, including (i) the nature, extent, and quality of the services to be provided to each fund and its shareholders (including the investment performance of each fund); (ii) the competitiveness of each fund's management fee and total expense ratio relative to peer funds; (iii) the total costs of the services to be provided by and the profits to be realized by Fidelity from its relationships with each fund; and (iv) the extent to which, if any, economies of scale exist and would be realized as each fund grows, and whether any economies of scale are appropriately shared with fund shareholders.
In considering whether to renew the Advisory Contracts for each fund, the Board reached a determination, with the assistance of fund counsel and Independent Trustees' counsel and through the exercise of its business judgment, that the renewal of the Advisory Contracts was in the best interests of each fund and its shareholders and that the compensation payable under the Advisory Contracts was fair and reasonable. The Board's decision to renew the Advisory Contracts was not based on any single factor, but rather was based on a comprehensive consideration of all the information provided to the Board at its meetings throughout the year. The Board, in reaching its determination to renew the Advisory Contracts, was aware that shareholders of each fund have a broad range of investment choices available to them, including a wide choice among funds offered by Fidelity's competitors, and that each fund's shareholders, who have the opportunity to review and weigh the disclosure provided by the fund in its prospectus and other public disclosures, have chosen to invest in that fund, which is part of the Fidelity family of funds.
Nature, Extent, and Quality of Services Provided. The Board considered Fidelity's staffing as it relates to the funds, including the backgrounds of investment personnel of Fidelity, and also considered the funds' investment objectives, strategies, and related investment philosophies. The Independent Trustees also had discussions with senior management of Fidelity's investment operations and investment groups. The Board considered the structure of the investment personnel compensation program and whether this structure provides appropriate incentives to act in the best interests of each fund. Additionally, the Board considered the portfolio managers' investments, if any, in the funds that they manage.
Resources Dedicated to Investment Management and Support Services. The Board reviewed the general qualifications and capabilities of Fidelity's investment staff, including its size, education, experience, and resources, as well as Fidelity's approach to recruiting, managing, and compensating investment personnel. The Board noted that Fidelity has continued to increase the resources devoted to non-U.S. offices, including expansion of Fidelity's global investment organization. The Board also noted that Fidelity's analysts have extensive resources, tools and capabilities that allow them to conduct sophisticated quantitative and fundamental analysis, as well as credit analysis of issuers, counterparties and guarantors. Further, the Board considered that Fidelity's investment professionals have sufficient access to global information and data so as to provide competitive investment results over time, and that those professionals also have access to sophisticated tools that permit them to assess portfolio construction and risk and performance attribution characteristics continuously, as well as to transmit new information and research conclusions rapidly around the world. Additionally, in its deliberations, the Board considered Fidelity's trading, risk management, compliance, and technology and operations capabilities and resources, which are integral parts of the investment management process.
Shareholder and Administrative Services. The Board considered (i) the nature, extent, quality, and cost of advisory, administrative, and shareholder services performed by the Investment Advisers and their affiliates under the Advisory Contracts and under separate agreements covering transfer agency and pricing and bookkeeping services for each fund; (ii) the nature and extent of the supervision of third party service providers, principally custodians, subcustodians, and pricing vendors; and (iii) the resources devoted to, and the record of compliance with, each fund's compliance policies and procedures.
The Board noted that the growth of fund assets over time across the complex allows Fidelity to reinvest in the development of services designed to enhance the value and convenience of the Fidelity funds as investment vehicles. These services include 24-hour access to account information and market information through telephone representatives and over the Internet, investor education materials and asset allocation tools, and the expanded availability of Fidelity Investor Centers.
Investment in a Large Fund Family. The Board considered the benefits to shareholders of investing in a Fidelity fund, including the benefits of investing in a fund that is part of a large family of funds offering a variety of investment disciplines and providing a large variety of mutual fund investor services. The Board noted that Fidelity had taken, or had made recommendations that resulted in the Fidelity funds taking, a number of actions over the previous year that benefited particular funds, including: (i) continuing to dedicate additional resources to Fidelity's investment research process, which includes meetings with management of issuers of securities in which the funds invest, and to the support of the senior management team that oversees asset management; (ii) continuing efforts to enhance Fidelity's global research capabilities; (iii) launching new funds and making other enhancements to meet client needs; (iv) launching new share classes of existing funds; (v) eliminating purchase minimums and broadening eligibility requirements for certain funds and share classes; (vi) reducing management fees and total expenses for certain growth equity funds and index funds; (vii) lowering expense caps for certain existing funds and classes, and converting certain voluntary expense caps to contractual caps, to reduce expenses borne by shareholders; (viii) eliminating short-term redemption fees for funds that had such fees; (ix) rationalizing product lines and gaining increased efficiencies from fund mergers and share class consolidations; (x) continuing to develop, acquire and implement systems and technology to improve services to the funds and shareholders, strengthen information security, and increase efficiency; and (xi) continuing to implement enhancements to further strengthen Fidelity's product line to increase investors' probability of success in achieving their investment goals, including retirement income goals.
Investment Performance (for Fidelity Pennsylvania Municipal Income Fund). The Board considered whether the fund has operated in accordance with its investment objective, as well as its record of compliance with its investment restrictions and its performance history.
The Board took into account discussions that occur at Board meetings throughout the year with representatives of the Investment Advisers about fund investment performance. In this regard the Board noted that as part of regularly scheduled fund reviews and other reports to the Board on fund performance, the Board considers annualized return information for the fund for different time periods, measured against an appropriate securities market index ("benchmark index") and a peer group of funds with similar objectives ("peer group"), if any. In its evaluation of fund investment performance at meetings throughout the year, the Board gave particular attention to information indicating underperformance of certain Fidelity funds for specific time periods and discussed with the Investment Advisers the reasons for such underperformance.
In addition to reviewing absolute and relative fund performance, the Independent Trustees periodically consider the appropriateness of fund performance metrics in evaluating the results achieved. In general, the Independent Trustees believe that fund performance should be evaluated based on gross performance (before fees and expenses but after transaction costs) compared to appropriate benchmark indices, over appropriate time periods that may include full market cycles, and on net performance (after fees and expenses) compared to peer groups, as applicable, over the same periods, taking into account relevant factors including the following: general market conditions; expectations for interest rate levels and credit conditions; issuer-specific information including credit quality; the potential for incremental return versus the fund's benchmark index weighed against the risks involved in obtaining that incremental return, including the risk of diminished or negative total returns; and fund cash flows and other factors. Depending on the circumstances, the Independent Trustees may be satisfied with a fund's performance notwithstanding that it lags its benchmark index or peer group for certain periods.
The Independent Trustees recognize that shareholders evaluate performance on a net basis over their own holding periods, for which one-, three-, and five-year periods are often used as a proxy. For this reason, the performance information reviewed by the Board also included net cumulative calendar year total return information for the fund and an appropriate benchmark index and peer group for the most recent one-, three-, and five-year periods.
Investment Performance (for Fidelity Pennsylvania Municipal Money Market Fund). The Board considered whether the fund has operated in accordance with its investment objective, as well as its record of compliance with its investment restrictions and its performance history.
The Board took into account discussions that occur at Board meetings throughout the year with representatives of the Investment Advisers about fund investment performance. In this regard the Board noted that as part of regularly scheduled fund reviews and other reports to the Board on fund performance, the Board considers annualized return information for the fund for different time periods, measured against a peer group.
In addition to reviewing absolute and relative fund performance, the Independent Trustees periodically consider the appropriateness of fund performance metrics in evaluating the results achieved. In general, the Independent Trustees believe that fund performance should be evaluated based on gross performance (before fees and expenses but after transaction costs) compared to the gross performance of appropriate peer groups, over appropriate time periods that may include full market cycles, taking into account relevant factors including the following: general market conditions; expectations for interest rate levels and credit conditions; issuer-specific information including credit quality; the fund's market value NAV over time and its resilience under various stressed conditions; and fund cash flows and other factors.
The Board recognizes that in interest rate environments where many competitors waive fees to maintain a minimum yield, relative money market fund performance on a net basis (after fees and expenses) may not be particularly meaningful due to miniscule performance differences among competitor funds. Depending on the circumstances, the Independent Trustees may be satisfied with a fund's performance notwithstanding that it lags its peer group for certain periods.
The Independent Trustees recognize that shareholders evaluate performance on a net basis over their own holding periods, for which one-, three-, and five-year periods are often used as a proxy. For this reason, the performance information reviewed by the Board also included net cumulative calendar year total return information for the fund and an appropriate peer group for the most recent one-, three-, and five-year periods.
Based on its review, the Board concluded that the nature, extent, and quality of services provided to each fund under the Advisory Contracts should continue to benefit the shareholders of each fund.
Competitiveness of Management Fee and Total Expense Ratio. The Board considered each fund's management fee and total expense ratio compared to "mapped groups" of competitive funds and classes created for the purpose of facilitating the Trustees' competitive analysis of management fees and total expenses. Fidelity creates "mapped groups" by combining similar Lipper investment objective categories that have comparable investment mandates. Combining Lipper investment objective categories aids the Board's management fee and total expense ratio comparisons by broadening the competitive group used for comparison.
Management Fee. The Board considered two proprietary management fee comparisons for the 12-month periods shown in basis points (BP) in the charts below. The group of Lipper funds used by the Board for management fee comparisons is referred to below as the "Total Mapped Group" and, for the reasons explained above, is broader than the Lipper peer group used by the Board for performance comparisons. The Total Mapped Group comparison focuses on a fund's standing in terms of gross management fees before expense reimbursements or caps relative to the total universe of funds with comparable investment mandates, regardless of whether their management fee structures also are comparable. Funds with comparable investment mandates offer exposure to similar types of securities. Funds with comparable management fee structures have similar management fee contractual arrangements (
e.g., flat rate charged for advisory services, all-inclusive fee rate,
etc.). "TMG %" represents the percentage of funds in the Total Mapped Group that had management fees that were lower than a fund's. For example, a hypothetical TMG % of 20% would mean that 80% of the funds in the Total Mapped Group had higher, and 20% had lower, management fees than a fund. The funds' actual TMG %s and the number of funds in the Total Mapped Group are in the charts below. The "Asset-Size Peer Group" (ASPG) comparison focuses on a fund's standing relative to a subset of non-Fidelity funds within the Total Mapped Group that are similar in size and management fee structure. For example, if a fund is in the first quartile of the ASPG, the fund's management fee ranks in the least expensive or lowest 25% of funds in the ASPG. The ASPG represents at least 15% of the funds in the Total Mapped Group with comparable asset size and management fee structures, subject to a minimum of 50 funds (or all funds in the Total Mapped Group if fewer than 50). Additional information, such as the ASPG quartile in which a fund's management fee rate ranked, is also included in the charts and was considered by the Board.
Fidelity Pennsylvania Municipal Income Fund
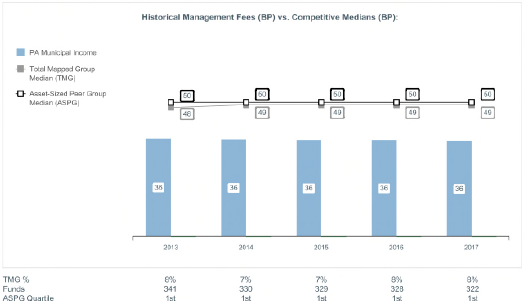
The Board noted that the fund's management fee rate ranked below the median of its Total Mapped Group and below the median of its ASPG for 2017.
Fidelity Pennsylvania Municipal Money Market Fund
Because the vast majority of competitor funds' management fees do not cover non-management expenses, in prior years, Fidelity Pennsylvania Municipal Money Market Fund was compared on the basis of a hypothetical "net management fee," which was derived by subtracting payments made by FMR for non-management expenses (including transfer agent fees, pricing and bookkeeping fees, and fees paid to non-affiliated custodians) from the fund's all-inclusive fee. Fidelity no longer calculates a hypothetical net management fee for Fidelity Pennsylvania Municipal Money Market Fund and, as a result, the chart does not include a hypothetical net management fee for 2017. The Board noted that because there is a relatively small number of state-specific funds in the Lipper objective, Fidelity combines Lipper's separate categories for state-specific funds with all state and national money market funds to create a single mapped group.
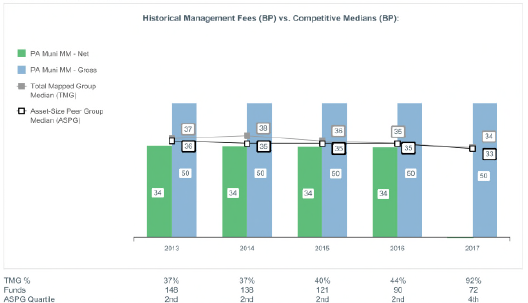
The Board noted that the fund's management fee rate ranked above the median of its Total Mapped Group and above the median of its ASPG for 2017, but also noted that the management fees of most competitor funds do not cover non-management expenses.
The Board noted that it and the boards of other Fidelity funds formed an ad hoc Committee on Group Fee, which meets periodically, to conduct an in-depth review of the "group fee" component of the management fee of funds with such management fee structures. The Committee's focus included the mechanics of the group fee, the competitive landscape of group fee structures, Fidelity funds with no group fee component and investment products not included in group fee assets. The Board also considered that, for funds subject to the group fee, FMR agreed to voluntarily waive fees over a specified period of time in amounts designed to account for assets converted from certain funds to certain collective investment trusts.
Based on its review, the Board concluded that each fund's management fee is fair and reasonable in light of the services that the fund receives and the other factors considered.
Total Expense Ratio. In its review of Fidelity Pennsylvania Municipal Income Fund's total expense ratio, the Board considered the fund's management fee rate as well as other fund expenses, such as transfer agent fees, pricing and bookkeeping fees, and custodial, legal, and audit fees. The Board also noted that Fidelity may agree to waive fees and expenses from time to time, and the extent to which, if any, it has done so for the fund.
In its review of Fidelity Pennsylvania Municipal Money Market Fund's total expense ratio, the Board considered the fund's all-inclusive fee rate. The Board also considered other expenses, such as transfer agent fees, pricing and bookkeeping fees, and custodial, legal, and audit fees, paid by FMR under the all-inclusive arrangement. The Board also noted that Fidelity may agree to waive fees and expenses from time to time, and the extent to which, if any, it has done so for the fund.
As part of its review, the Board also considered the current and historical total expense ratios of each fund compared to competitive fund median expenses. Each fund is compared to those funds and classes in the Total Mapped Group (used by the Board for management fee comparisons) that have a similar sales load structure.
The Board noted that Fidelity Pennsylvania Municipal Income Fund's total expense ratio ranked below the competitive median for 2017 and Fidelity Pennsylvania Municipal Money Market Fund's total expense ratio ranked above the competitive median for 2017. The Board considered that, in general, various factors can affect total expense ratios. The Board considered that the competitive data for Fidelity Pennsylvania Municipal Money Market Fund reflects periods for which many competitor funds waived fees or reimbursed expenses in order to maintain a minimum yield. The Board also considered that, as interest rates rise, many competitors have eliminated such waivers, but the externally sourced competitive data for 2017 had not yet caught up to the fiscal periods during which competitors have stopped waiving fees to maintain minimum yields. The Board noted that, excluding fee waivers and reimbursements, the fund's total expense ratio ranked equal to the median.
Fees Charged to Other Fidelity Clients. The Board also considered Fidelity fee structures and other information with respect to clients of Fidelity, such as other funds advised or subadvised by Fidelity, pension plan clients, and other institutional clients with similar mandates. The Board noted that a joint ad hoc committee created by it and the boards of other Fidelity funds periodically reviews and compares Fidelity's institutional investment advisory business with its business of providing services to the Fidelity funds and also noted the most recent findings of the committee. The Board noted that the committee's review included a consideration of the differences in services provided, fees charged, and costs incurred, as well as competition in the markets serving the different categories of clients.
Based on its review of total expense ratios and fees charged to other Fidelity clients, the Board concluded that each fund's total expense ratio was reasonable in light of the services that the fund and its shareholders receive and the other factors considered.
Costs of the Services and Profitability. The Board considered the revenues earned and the expenses incurred by Fidelity in conducting the business of developing, marketing, distributing, managing, administering and servicing each fund and servicing each fund's shareholders. The Board also considered the level of Fidelity's profits in respect of all the Fidelity funds.
On an annual basis, Fidelity presents to the Board information about the profitability of its relationships with each fund. Fidelity calculates profitability information for each fund, as well as aggregate profitability information for groups of Fidelity funds and all Fidelity funds, using a series of detailed revenue and cost allocation methodologies which originate with the books and records of Fidelity on which Fidelity's audited financial statements are based. The Audit Committee of the Board reviews any significant changes from the prior year's methodologies.
PricewaterhouseCoopers LLP (PwC), auditor to Fidelity and certain Fidelity funds, has been engaged annually by the Board as part of the Board's assessment of Fidelity's profitability analysis. PwC's engagement includes the review and assessment of the methodologies used by Fidelity in determining the revenues and expenses attributable to Fidelity's mutual fund business, and completion of agreed-upon procedures in respect of the mathematical accuracy of the fund profitability information and its conformity to established allocation methodologies. After considering PwC's reports issued under the engagement and information provided by Fidelity, the Board concluded that while other allocation methods may also be reasonable, Fidelity's profitability methodologies are reasonable in all material respects.
The Board also reviewed Fidelity's non-fund businesses and potential indirect benefits such businesses may have received as a result of their association with Fidelity's mutual fund business (i.e., fall-out benefits) as well as cases where Fidelity's affiliates may benefit from the funds' business. The Board noted that changes to fall-out benefits year-over-year reflect business developments at Fidelity's various businesses.
The Board considered the costs of the services provided by and the profits realized by Fidelity in connection with the operation of each fund and was satisfied that the profitability was not excessive.
Economies of Scale. The Board considered whether there have been economies of scale in respect of the management of the Fidelity funds, whether the Fidelity funds (including each fund) have appropriately benefited from any such economies of scale, and whether there is potential for realization of any further economies of scale. The Board considered the extent to which each fund will benefit from economies of scale as assets grow through increased services to the fund, through waivers or reimbursements, or through fee or expense ratio reductions. The Board recognized that, due to Fidelity Pennsylvania Municipal Money Market Fund's current contractual arrangements, its expense ratio will not decline if the fund's operating costs decrease as assets grow, or rise as assets decrease. The Board also noted that a committee (the Economies of Scale Committee) created by it and the boards of other Fidelity funds periodically analyzes whether Fidelity attains economies of scale in respect of the management and servicing of the Fidelity funds, whether the Fidelity funds have appropriately benefited from such economies of scale, and whether there is potential for realization of any further economies of scale.
The Board recognized that Fidelity Pennsylvania Municipal Income Fund's management contract incorporates a "group fee" structure, which provides for lower group fee rates as total group assets increase, and for higher group fee rates as total group assets decrease (with "group assets" defined to include fund assets under FMR's management plus the assets of sector funds previously under FMR's management). FMR calculates the group fee rates based on a tiered asset "breakpoint" schedule that varies based on asset class. The Board considered that the group fee is designed to deliver the benefits of economies of scale to fund shareholders when total Fidelity fund assets increase, even if assets of any particular fund are unchanged or have declined, because some portion of Fidelity's costs are attributable to services provided to all Fidelity funds, and all funds benefit if those costs can be allocated among more assets. The Board concluded that, given the group fee structure, fund shareholders will benefit from lower management fees as group assets increase at the fund complex level, regardless of whether Fidelity achieves any such economies of scale.
The Board concluded, taking into account the analysis of the Economies of Scale Committee, that economies of scale, if any, are being appropriately shared between fund shareholders and Fidelity.
Additional Information Requested by the Board. In order to develop fully the factual basis for consideration of the Fidelity funds' advisory contracts, the Board requested and received additional information on certain topics, including: (i) Fidelity's fund profitability methodology, profitability trends for certain funds, the allocation of various costs to different funds, and the impact of certain factors on fund profitability results; (ii) portfolio manager changes that have occurred during the past year and the amount of the investment that each portfolio manager has made in the Fidelity fund(s) that he or she manages; (iii) Fidelity's compensation structure for portfolio managers, research analysts, and other key personnel, including its effects on fund profitability, the rationale for the compensation structure, and the extent to which current market conditions have affected retention and recruitment; (iv) the arrangements with and compensation paid to certain fund sub-advisers on behalf of the Fidelity funds and the treatment of such compensation within Fidelity's fund profitability methodology; (v) the terms of Fidelity's voluntary expense limitation agreements; (vi) the methodology with respect to competitive fund data and peer group classifications; (vii) Fidelity's transfer agent fee, expense, and service structures for different funds and classes relative to competitive trends, and the impact of the increased use of omnibus accounts; (viii) new developments in the retail and institutional marketplaces and the competitive positioning of the funds relative to other investment products and services; (ix) the impact of recent changes to the money market fund landscape, including the full implementation of money market fund reform and rising interest rates, on Fidelity's money market funds; (x) the funds' share class structures and distribution channels; and (xi) explanations regarding the relative total expense ratios of certain funds and classes, total expense competitive trends and methodologies for total expense competitive comparisons, and actions that might be taken by Fidelity to reduce total expense ratios for certain classes. In addition, the Board considered its discussions with Fidelity throughout the year regarding enhanced information security initiatives and the funds' fair valuation policies.
Based on its evaluation of all of the conclusions noted above, and after considering all factors it believed relevant, the Board concluded that the advisory fee arrangements are fair and reasonable, and that each fund's Advisory Contracts should be renewed.
Corporate Headquarters
245 Summer St.
Boston, MA 02210
www.fidelity.com
PFR-ANN-0219
1.540037.121
Fidelity Advisor® Limited Term Municipal Income Fund - Class A, Class M, Class C, Class I and Class Z
Annual Report December 31, 2018 Class A, Class M, Class C, Class I and Class Z are classes of Fidelity® Limited Term Municipal Income Fund |
|
Beginning on January 1, 2021, as permitted by regulations adopted by the Securities and Exchange Commission, paper copies of a fund’s shareholder reports will no longer be sent by mail, unless you specifically request paper copies of the reports from the fund or from your financial intermediary, such as a financial advisor, broker-dealer or bank. Instead, the reports will be made available on a website, and you will be notified by mail each time a report is posted and provided with a website link to access the report.
If you already elected to receive shareholder reports electronically, you will not be affected by this change and you need not take any action. You may elect to receive shareholder reports and other communications from a fund electronically, by contacting your financial intermediary. For Fidelity customers, visit Fidelity's web site or call Fidelity using the contact information listed below.
You may elect to receive all future reports in paper free of charge. If you wish to continue receiving paper copies of your shareholder reports, you may contact your financial intermediary or, if you are a Fidelity customer, visit Fidelity’s website, or call Fidelity at the applicable toll-free number listed below. Your election to receive reports in paper will apply to all funds held with the fund complex/your financial intermediary.
| Account Type | Website | Phone Number |
| Brokerage, Mutual Fund, or Annuity Contracts: | fidelity.com/mailpreferences | 1-800-343-3548 |
| Employer Provided Retirement Accounts: | netbenefits.fidelity.com/preferences (choose 'no' under Required Disclosures to continue to print) | 1-800-343-0860 |
| Advisor Sold Accounts Serviced Through Your Financial Intermediary: | Contact Your Financial Intermediary | Your Financial Intermediary's phone number |
| Advisor Sold Accounts Serviced by Fidelity: | institutional.fidelity.com | 1-877-208-0098 |
Contents
To view a fund's proxy voting guidelines and proxy voting record for the 12-month period ended June 30, visit http://www.fidelity.com/proxyvotingresults or visit the Securities and Exchange Commission's (SEC) web site at http://www.sec.gov.
You may also call 1-877-208-0098 to request a free copy of the proxy voting guidelines.
Standard & Poor's, S&P and S&P 500 are registered service marks of The McGraw-Hill Companies, Inc. and have been licensed for use by Fidelity Distributors Corporation.
Other third-party marks appearing herein are the property of their respective owners.
All other marks appearing herein are registered or unregistered trademarks or service marks of FMR LLC or an affiliated company. © 2019 FMR LLC. All rights reserved.
This report and the financial statements contained herein are submitted for the general information of the shareholders of the Fund. This report is not authorized for distribution to prospective investors in the Fund unless preceded or accompanied by an effective prospectus.
A fund files its complete schedule of portfolio holdings with the SEC for the first and third quarters of each fiscal year on Form N-Q. Forms N-Q are available on the SEC’s web site at http://www.sec.gov. A fund's Forms N-Q may be reviewed and copied at the SEC’s Public Reference Room in Washington, DC. Information regarding the operation of the SEC's Public Reference Room may be obtained by calling 1-800-SEC-0330.
For a complete list of a fund's portfolio holdings, view the most recent holdings listing, semiannual report, or annual report on Fidelity's web site at http://www.fidelity.com, http://www.institutional.fidelity.com, or http://www.401k.com, as applicable.
NOT FDIC INSURED •MAY LOSE VALUE •NO BANK GUARANTEE
Neither the Fund nor Fidelity Distributors Corporation is a bank.
Performance: The Bottom Line
Average annual total return reflects the change in the value of an investment, assuming reinvestment of distributions from dividend income and capital gains (the profits earned upon the sale of securities that have grown in value, if any) and assuming a constant rate of performance each year. The hypothetical investment and the average annual total returns do not reflect the deduction of taxes that a shareholder would pay on fund distributions or the redemption of fund shares. During periods of reimbursement by Fidelity, a fund’s total return will be greater than it would be had the reimbursement not occurred. How a fund did yesterday is no guarantee of how it will do tomorrow.
Average Annual Total Returns
| For the periods ended December 31, 2018 | Past 1 year | Past 5 years | Past 10 years |
| Class A (incl. 2.75% sales charge) | (1.85)% | 0.41% | 1.48% |
| Class M (incl. 2.75% sales charge) | (1.80)% | 0.45% | 1.50% |
| Class C (incl. contingent deferred sales charge) | (0.81)% | 0.22% | 1.01% |
| Class I | 1.29% | 1.23% | 2.02% |
| Class Z | 1.31% | 1.24% | 2.03% |
Class C shares' contingent deferred sales charges included in the past one year, past five years and past ten years total return figures are 1%, 0% and 0%, respectively.
The initial offering of Class Z shares took place on October 2, 2018. Returns prior to October 2, 2018, are those of Class I.
$10,000 Over 10 Years
Let's say hypothetically that $10,000 was invested in Fidelity Advisor® Limited Term Municipal Income Fund - Class A on December 31, 2008, and the current 2.75% sales charge was paid.
The chart shows how the value of your investment would have changed, and also shows how the Bloomberg Barclays Municipal Bond Index performed over the same period.
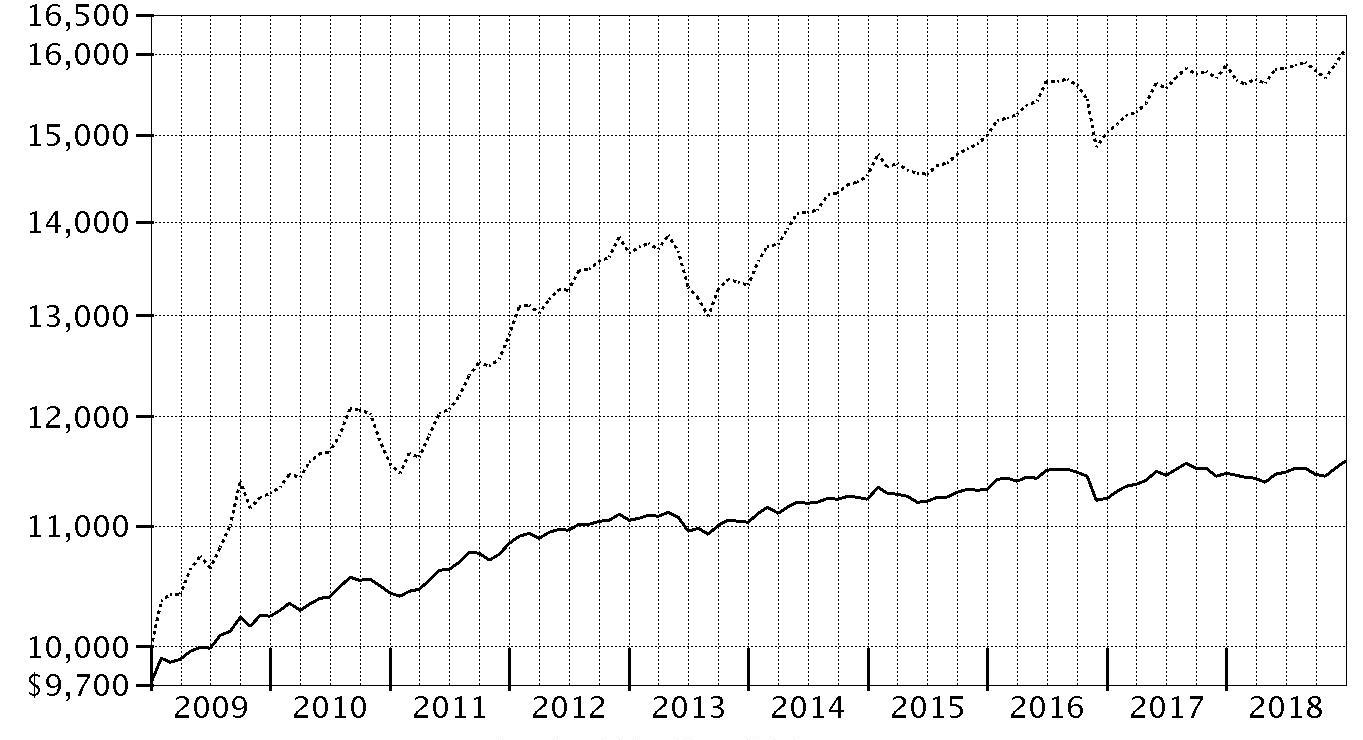
| Period Ending Values |
| $11,583 | Fidelity Advisor® Limited Term Municipal Income Fund - Class A |
| $16,060 | Bloomberg Barclays Municipal Bond Index |
Management's Discussion of Fund Performance
Market Recap: Tax-exempt municipal bonds gained modestly in 2018, with the Bloomberg Barclays Municipal Bond Index returning 1.28%, supported by lower bond issuance and solid economic growth. Tax reform had a significant impact on both the supply of and demand for tax-exempt bonds the past year. In the final months of 2017, issuers accelerated their bond financings in order to issue under the old tax rules, prompting a surge in supply. Investors absorbed this excess supply, anticipating that issuance would fall significantly in 2018. The market turned lower in early 2018, as domestic fixed-income markets reacted to robust economic data and signs of inflation, before stabilizing in March and rallying through August. The municipal market experienced volatility in September and October amid concerns of an economic slowdown, then rebounded to close December near a high for the year. Gross municipal bond issuance ended 2018 down approximately 25%. There was little differentiation in performance across municipal sectors in 2018. General obligation bonds gained 1.33%, with bonds issued by states slightly outperforming those backed by local municipalities. Looking ahead, market volatility is likely to persist due to uncertainty about how the U.S. Federal Reserve will react to labor and inflation trends.
Comments from Co-Portfolio Managers Cormac Cullen, Elizah McLaughlin and Kevin Ramundo: For the year ending December 31, 2018, the fund's share classes (excluding sales charges, if applicable) produced a modestly positive return, net of fees, which lagged the 1.75% advance of the benchmark, the Bloomberg Barclays 1-6 Year Municipal Bond Index. Relative to this benchmark, differences in the way fund holdings and index components were priced detracted from fund performance. Duration positioning, or the fund's sensitivity to changes in interest rates, hurt modestly. The fund maintained a bit shorter duration than the benchmark, which worked against fund performance. We also lost a bit a ground versus the benchmark because of our underweighting to bonds backed by the state of California, which were some of the best performers in the national municipal marketplace. In contrast, an overweighting in lower-investment-grade bonds contributed to relative performance. Sector allocation produced some value as well, particularly the portfolio's overweighting in health care securities.
The views expressed above reflect those of the portfolio manager(s) only through the end of the period as stated on the cover of this report and do not necessarily represent the views of Fidelity or any other person in the Fidelity organization. Any such views are subject to change at any time based upon market or other conditions and Fidelity disclaims any responsibility to update such views. These views may not be relied on as investment advice and, because investment decisions for a Fidelity fund are based on numerous factors, may not be relied on as an indication of trading intent on behalf of any Fidelity fund.
Note to Shareholders: On September 1, 2018, Elizah McLaughlin joined the municipal bond portfolio management team, succeeding Mark Sommer, who retired from Fidelity on December 31, 2018, after 27 years with the firm.
Investment Summary (Unaudited)
Top Five States as of December 31, 2018
| | % of fund's net assets |
| Illinois | 13.9 |
| Texas | 12.5 |
| Florida | 9.9 |
| New Jersey | 6.5 |
| New York | 4.5 |
Top Five Sectors as of December 31, 2018
| | % of fund's net assets |
| General Obligations | 36.7 |
| Transportation | 16.5 |
| Health Care | 12.3 |
| Electric Utilities | 7.9 |
| Education | 4.5 |
Quality Diversification (% of fund's net assets)
| As of December 31, 2018 |
| | AAA | 11.4% |
| | AA,A | 60.8% |
| | BBB | 16.2% |
| | BB and Below | 0.9% |
| | Not Rated | 4.6% |
| | Short-Term Investments and Net Other Assets | 6.1% |

We have used ratings from Moody's Investors Service, Inc. Where Moody's® ratings are not available, we have used S&P® ratings. All ratings are as of the date indicated and do not reflect subsequent changes.
Schedule of Investments December 31, 2018
Showing Percentage of Net Assets
| Municipal Bonds - 94.1% | | | |
| | | Principal Amount (000s) | Value (000s) |
| Alabama - 0.8% | | | |
| Jefferson County Gen. Oblig. Series 2018 B, 5% 4/1/21 | | 2,630 | 2,799 |
| Mobile County Board of School Commissioners: | | | |
| Series 2016 A: | | $ | $ |
| 5% 3/1/22 | | 585 | 630 |
| 5% 3/1/23 | | 830 | 910 |
| 5% 3/1/24 | | 1,225 | 1,362 |
| 5% 3/1/25 | | 1,225 | 1,378 |
| Series 2016 B: | | | |
| 5% 3/1/22 | | 980 | 1,056 |
| 5% 3/1/24 | | 980 | 1,089 |
| Mobile Indl. Dev. Board Poll. Cont. Rev. Bonds Series 2009 E, 1.85%, tender 3/24/20 (a) | | 4,810 | 4,779 |
| Montgomery Med. Clinic Facilities Series 2015: | | | |
| 5% 3/1/20 | | 2,825 | 2,902 |
| 5% 3/1/21 | | 490 | 514 |
| 5% 3/1/22 | | 3,145 | 3,367 |
| 5% 3/1/25 | | 1,465 | 1,634 |
|
| TOTAL ALABAMA | | | 22,420 |
|
| Alaska - 0.6% | | | |
| Anchorage Gen. Oblig.: | | | |
| Series A: | | | |
| 5% 9/1/20 | | 1,065 | 1,120 |
| 5% 9/1/22 | | 1,175 | 1,303 |
| Series B: | | | |
| 5% 9/1/20 | | 1,955 | 2,055 |
| 5% 9/1/22 | | 1,395 | 1,547 |
| Series C: | | | |
| 5% 9/1/19 | | 2,105 | 2,150 |
| 5% 9/1/20 | | 1,230 | 1,293 |
| 5% 9/1/22 | | 980 | 1,087 |
| Series D, 5% 9/1/20 | | 1,955 | 2,055 |
| North Slope Borough Gen. Oblig. Series 2017 A, 5% 6/30/21 (Pre-Refunded to 6/30/20 @ 100) | | 850 | 890 |
| Valdez Marine Term. Rev. (BP Pipelines (Alaska), Inc. Proj.) Series 2003 B, 5% 1/1/21 | | 4,500 | 4,742 |
|
| TOTAL ALASKA | | | 18,242 |
|
| Arizona - 3.3% | | | |
| Arizona Health Facilities Auth. Rev. (Scottsdale Lincoln Hospitals Proj.) Series 2014 A: | | | |
| 5% 12/1/19 | | 600 | 616 |
| 5% 12/1/20 | | 800 | 845 |
| 5% 12/1/21 | | 1,080 | 1,167 |
| 5% 12/1/22 | | 785 | 867 |
| 5% 12/1/23 | | 980 | 1,103 |
| 5% 12/1/24 | | 1,465 | 1,676 |
| Arizona State Lottery Rev. Series 2019: | | | |
| 5% 7/1/21 (b) | | 2,560 | 2,681 |
| 5% 7/1/22 (b) | | 2,045 | 2,192 |
| Chandler Indl. Dev. Auth. Indl. Dev. Rev. Bonds (Intel Corp. Proj.) Series 2007, 2.7%, tender 8/14/23 (a)(c) | | 12,500 | 12,538 |
| Glendale Gen. Oblig.: | | | |
| Series 2015: | | | |
| 4% 7/1/19 (FSA Insured) | | 585 | 591 |
| 5% 7/1/22 (FSA Insured) | | 980 | 1,078 |
| Series 2017: | | | |
| 5% 7/1/21 | | 2,900 | 3,110 |
| 5% 7/1/22 | | 3,320 | 3,646 |
| Glendale Trans. Excise Tax Rev.: | | | |
| 5% 7/1/21 (FSA Insured) | | 735 | 791 |
| 5% 7/1/22 (FSA Insured) | | 1,145 | 1,264 |
| 5% 7/1/23 (FSA Insured) | | 1,365 | 1,538 |
| Maricopa County Cmnty. College District (Arizona Gen. Obligations Bonds Proj. of 2004) Series 2011 D, 4.25% 7/1/25 (Pre-Refunded to 7/1/21 @ 100) | | 6,090 | 6,440 |
| Maricopa County Indl. Dev. Auth. Rev. Series 2016 A: | | | |
| 5% 1/1/25 | | 4,675 | 5,381 |
| 5% 1/1/26 | | 10,485 | 12,238 |
| Maricopa County School District #28 Kyrene Elementary Series 2010 B: | | | |
| 4% 7/1/19 | | 880 | 890 |
| 4% 7/1/20 | | 1,330 | 1,373 |
| Phoenix Indl. Solid Waste Disp. Rev. Bonds (Republic Svc., Inc. Proj.) Series 2013, 2.15%, tender 2/1/19 (a)(c) | | 17,000 | 16,996 |
| Pima County Ctfs. of Prtn. Series 2014: | | | |
| 5% 12/1/21 | | 2,160 | 2,343 |
| 5% 12/1/22 | | 2,415 | 2,682 |
| 5% 12/1/23 | | 3,350 | 3,799 |
| Pima County Swr. Sys. Rev.: | | | |
| Series 2011 B, 5% 7/1/19 | | 3,155 | 3,205 |
| Series 2012 A, 5% 7/1/19 | | 1,515 | 1,539 |
| Tempe Indl. Dev. Auth. Rev. (Mirabella At Asu, Inc. Proj.) Series 2017 B, 4% 10/1/23 (d) | | 3,915 | 3,918 |
|
| TOTAL ARIZONA | | | 96,507 |
|
| California - 3.0% | | | |
| Alameda Corridor Trans. Auth. Rev.: | | | |
| Series 2004, 0% 10/1/19 | | 260 | 255 |
| Series 2013 A, 5% 10/1/22 | | 2,140 | 2,384 |
| Bay Area Toll Auth. San Francisco Bay Toll Bridge Rev. Bonds: | | | |
| Series A, 2.95%, tender 4/1/26 (a) | | 5,075 | 5,248 |
| Series B, 2.85%, tender 4/1/25 (a) | | 4,150 | 4,279 |
| Series C, 2.1%, tender 4/1/22 (a) | | 3,875 | 3,882 |
| California Gen. Oblig.: | | | |
| Bonds 3%, tender 12/1/19 (a) | | 5,600 | 5,631 |
| 5.25% 9/1/22 | | 1,535 | 1,721 |
| California Muni. Fin. Auth. Rev. (LINXS APM Proj.) Series 2018 A: | | | |
| 5% 12/31/23 (c) | | 860 | 954 |
| 5% 6/30/24 (c) | | 665 | 742 |
| 5% 12/31/24 (c) | | 800 | 898 |
| 5% 6/30/25 (c) | | 1,000 | 1,127 |
| 5% 12/31/25 (c) | | 1,760 | 1,997 |
| 5% 6/30/26 (c) | | 1,360 | 1,546 |
| 5% 12/31/26 (c) | | 2,570 | 2,939 |
| 5% 6/30/27 (c) | | 1,910 | 2,185 |
| 5% 12/31/27 (c) | | 3,000 | 3,452 |
| California Poll. Cont. Fing. Auth. Solid Waste Disp. Rev. Bonds (Republic Svcs., Inc. Proj.) Series 2010 A, 2.15%, tender 2/1/19 (a)(c)(d) | | 10,400 | 10,398 |
| California Pub. Works Board Lease Rev.: | | | |
| (Riverside Campus Proj.) Series 2012 H, 5% 4/1/22 | | 980 | 1,077 |
| (Various Cap. Projs.): | | | |
| Series 2011 A, 5% 10/1/20 | | 2,470 | 2,609 |
| Series 2012 A, 5% 4/1/21 | | 3,175 | 3,397 |
| Series 2012 G, 5% 11/1/22 | | 1,225 | 1,365 |
| Series 2012 C, 5% 6/1/21 | | 1,780 | 1,913 |
| Golden State Tobacco Securitization Corp. Tobacco Settlement Rev.: | | | |
| Series 2013 A, 4% 6/1/21 | | 3,425 | 3,594 |
| Series 2017 A1: | | | |
| 5% 6/1/21 | | 1,205 | 1,285 |
| 5% 6/1/22 | | 1,685 | 1,830 |
| 5% 6/1/23 | | 1,925 | 2,121 |
| 5% 6/1/24 | | 1,085 | 1,191 |
| Series A, 0% 6/1/24 (AMBAC Insured) | | 3,390 | 2,981 |
| Oakland Unified School District Alameda County Series 2013, 5.5% 8/1/23 | | 980 | 1,115 |
| Palomar Health Rev. Series 2016: | | | |
| 5% 11/1/23 | | 1,955 | 2,158 |
| 5% 11/1/24 | | 1,955 | 2,189 |
| Port of Oakland Rev. Series 2012 P, 5% 5/1/21 (c) | | 2,445 | 2,607 |
| Rancho Cucamonga Redev. Agcy. (Rancho Redev. Proj.): | | | |
| 5% 9/1/23 (FSA Insured) | | 1,320 | 1,499 |
| 5% 9/1/24 (FSA Insured) | | 2,250 | 2,610 |
| San Pablo Redev. Agcy. Series 2014 A, 5% 6/15/24 (FSA Insured) | | 1,350 | 1,551 |
|
| TOTAL CALIFORNIA | | | 86,730 |
|
| Colorado - 1.1% | | | |
| Colorado Health Facilities Auth. Retirement Hsg. Rev. (Liberty Heights Proj.) 0% 7/15/22 (Escrowed to Maturity) | | 1,840 | 1,702 |
| Colorado Health Facilities Auth. Rev. Bonds Series 2008 D3, 5%, tender 11/12/21 (a) | | 5,170 | 5,515 |
| Colorado Reg'l. Trans. District Ctfs. of Prtn.: | | | |
| Series 2013 A, 5% 6/1/23 | | 4,400 | 4,933 |
| Series 2014 A, 5% 6/1/23 | | 3,775 | 4,232 |
| Denver City & County Arpt. Rev. Series 2017 A, 5% 11/15/19 (c) | | 2,520 | 2,585 |
| E-470 Pub. Hwy. Auth. Rev.: | | | |
| Series 2000 B: | | | |
| 0% 9/1/19 (Nat'l. Pub. Fin. Guarantee Corp. Insured) | | 8,140 | 8,026 |
| 0% 9/1/20 (Nat'l. Pub. Fin. Guarantee Corp. Insured) | | 2,775 | 2,668 |
| Series 2015 A: | | | |
| 5% 9/1/19 | | 980 | 998 |
| 5% 9/1/20 | | 980 | 1,022 |
|
| TOTAL COLORADO | | | 31,681 |
|
| Connecticut - 3.0% | | | |
| Connecticut Gen. Oblig.: | | | |
| Series 2012 C, 5% 6/1/21 | | 22,910 | 24,347 |
| Series 2016 A, 5% 3/15/26 | | 1,925 | 2,185 |
| Connecticut Health & Edl. Facilities Auth. Rev.: | | | |
| Bonds: | | | |
| Series 2010 A, 1.8%, tender 2/9/21 (a) | | 16,680 | 16,632 |
| Series 2015 A, 2.05%, tender 7/21/21 (a) | | 16,315 | 16,363 |
| Series X2, 1.8%, tender 2/9/21 (a) | | 12,000 | 11,966 |
| Series 2018 S: | | | |
| 5% 7/1/23 | | 1,455 | 1,626 |
| 5% 7/1/24 | | 1,000 | 1,135 |
| Connecticut Hsg. Fin. Auth. Series 2013 B2, 4% 11/15/32 | | 3,860 | 3,953 |
| Hbr. Point Infra Impt. District Series 2010 A, 7.875% 4/1/39 (Pre-Refunded to 4/1/20 @ 100) | | 6,281 | 6,741 |
| New Haven Gen. Oblig. Series 2016 A: | | | |
| 5% 8/15/23 (Escrowed to Maturity) | | 880 | 995 |
| 5% 8/15/25 (FSA Insured) | | 980 | 1,132 |
|
| TOTAL CONNECTICUT | | | 87,075 |
|
| Delaware, New Jersey - 0.2% | | | |
| Delaware River & Bay Auth. Rev. Series 2014 C: | | | |
| 5% 1/1/20 | | 2,445 | 2,519 |
| 5% 1/1/21 | | 1,955 | 2,073 |
|
| TOTAL DELAWARE, NEW JERSEY | | | 4,592 |
|
| District Of Columbia - 1.0% | | | |
| Metropolitan Washington DC Arpts. Auth. Sys. Rev.: | | | |
| Series 2012 A, 5% 10/1/22 (c) | | 6,185 | 6,790 |
| Series 2014 A, 5% 10/1/23 (c) | | 435 | 486 |
| Series 2017 A: | | | |
| 5% 10/1/26 (c) | | 6,555 | 7,627 |
| 5% 10/1/27 (c) | | 4,890 | 5,744 |
| Series 2018 A, 5% 10/1/21 (c) | | 3,595 | 3,866 |
| Washington Convention & Sports Auth. Series 2018 A, 5% 10/1/21 | | 5,000 | 5,394 |
|
| TOTAL DISTRICT OF COLUMBIA | | | 29,907 |
|
| Florida - 9.9% | | | |
| Brevard County School Board Ctfs. of Prtn.: | | | |
| Series 2014, 5% 7/1/21 | | 980 | 1,051 |
| Series 2015 C: | | | |
| 5% 7/1/21 | | 635 | 681 |
| 5% 7/1/22 | | 3,645 | 4,001 |
| 5% 7/1/23 | | 2,935 | 3,296 |
| Broward County Arpt. Sys. Rev.: | | | |
| Series 2012 Q1, 5% 10/1/21 | | 980 | 1,058 |
| Series A: | | | |
| 5% 10/1/22 (c) | | 2,935 | 3,218 |
| 5% 10/1/23 (c) | | 3,930 | 4,384 |
| Broward County School Board Ctfs. of Prtn.: | | | |
| (Broward County School District Proj.) Series 2017 C, 5% 7/1/22 | | 3,180 | 3,497 |
| Series 2012 A, 5% 7/1/19 | | 6,845 | 6,953 |
| Series 2015 A: | | | |
| 5% 7/1/19 | | 2,055 | 2,088 |
| 5% 7/1/20 | | 3,915 | 4,094 |
| 5% 7/1/21 | | 4,400 | 4,727 |
| 5% 7/1/22 | | 3,425 | 3,766 |
| 5% 7/1/23 | | 2,690 | 3,022 |
| 5% 7/1/24 | | 1,290 | 1,476 |
| Series 2015 B: | | | |
| 5% 7/1/19 | | 1,955 | 1,986 |
| 5% 7/1/20 | | 2,935 | 3,069 |
| 5% 7/1/21 | | 6,120 | 6,575 |
| 5% 7/1/22 | | 4,490 | 4,938 |
| 5% 7/1/23 | | 2,690 | 3,022 |
| 5% 7/1/24 | | 1,120 | 1,281 |
| Citizens Property Ins. Corp. (Citizens Pla Proj.) Series 2012 A-1, 5% 6/1/20 | | 5,155 | 5,371 |
| Clearwater Wtr. and Swr. Rev. Series 2011: | | | |
| 5% 12/1/19 | | 1,780 | 1,832 |
| 5% 12/1/20 | | 980 | 1,038 |
| Florida Board of Ed. Lottery Rev. Series 2016 B, 5% 7/1/24 | | 9,801 | 11,346 |
| Florida Dev. Fin. Corp. Healthcare Facility Rev. (Univ. Health Proj.) Series 2013 A: | | | |
| 5% 2/1/19 | | 1,420 | 1,422 |
| 5% 2/1/20 | | 1,980 | 2,021 |
| Florida Mid-Bay Bridge Auth. Rev. Series 2015 A: | | | |
| 5% 10/1/21 | | 1,010 | 1,083 |
| 5% 10/1/22 | | 1,955 | 2,135 |
| 5% 10/1/23 | | 1,240 | 1,378 |
| 5% 10/1/24 | | 1,955 | 2,204 |
| 5% 10/1/25 | | 1,710 | 1,948 |
| 5% 10/1/26 | | 1,955 | 2,210 |
| Greater Orlando Aviation Auth. Arpt. Facilities Rev.: | | | |
| Series 2011 C: | | | |
| 5% 10/1/19 | | 1,670 | 1,711 |
| 5% 10/1/20 | | 980 | 1,035 |
| Series 2017 A: | | | |
| 5% 10/1/25 (c) | | 980 | 1,124 |
| 5% 10/1/26 (c) | | 1,955 | 2,264 |
| Halifax Hosp. Med. Ctr. Rev. Series 2015, 5% 6/1/23 | | 1,295 | 1,425 |
| Hillsborough County School District Sales Tax Rev. Series 2015 B, 5% 10/1/22 (FSA Insured) | | 1,975 | 2,182 |
| Indian River County School Board Ctfs. of Prtn. Series 2014: | | | |
| 5% 7/1/20 | | 915 | 957 |
| 5% 7/1/22 | | 1,955 | 2,143 |
| 5% 7/1/23 | | 1,955 | 2,189 |
| JEA Wtr. & Swr. Sys. Rev. Series 2010 D: | | | |
| 5% 10/1/21 | | 640 | 665 |
| 5% 10/1/21 (Pre-Refunded to 4/1/20 @ 100) | | 1,260 | 1,308 |
| Manatee County Rev. Series 2013: | | | |
| 5% 10/1/19 | | 1,225 | 1,254 |
| 5% 10/1/20 | | 1,955 | 2,062 |
| 5% 10/1/21 | | 1,955 | 2,112 |
| 5% 10/1/22 | | 980 | 1,084 |
| Manatee County School District Series 2017, 5% 10/1/24 (FSA Insured) | | 1,270 | 1,465 |
| Miami-Dade County Aviation Rev.: | | | |
| Series 2010, 5% 10/1/22 | | 1,700 | 1,788 |
| Series 2017 B, 5% 10/1/20 (c) | | 2,075 | 2,172 |
| Miami-Dade County Expressway Auth.: | | | |
| (Waste Mgmt., Inc. of Florida Proj.): | | | |
| Series 2013, 5% 7/1/19 | | 1,955 | 1,985 |
| 5% 7/1/20 | | 980 | 1,025 |
| 5% 7/1/21 | | 1,955 | 2,096 |
| 5% 7/1/22 | | 1,955 | 2,146 |
| 5% 7/1/23 | | 1,955 | 2,144 |
| Series 2014 A, 5% 7/1/24 | | 610 | 697 |
| Series 2014 B: | | | |
| 5% 7/1/22 | | 1,465 | 1,608 |
| 5% 7/1/23 | | 3,180 | 3,569 |
| Miami-Dade County Gen. Oblig. (Parks Prog.) Series 2015 A, 5% 11/1/22 | | 3,795 | 4,215 |
| Miami-Dade County School Board Ctfs. of Prtn.: | | | |
| Bonds Series 2014 A, 5%, tender 5/1/24 (a) | | 8,010 | 9,033 |
| Series 2014 D: | | | |
| 5% 11/1/20 | | 4,770 | 5,031 |
| 5% 11/1/21 | | 6,140 | 6,635 |
| 5% 11/1/22 | | 2,850 | 3,146 |
| 5% 11/1/23 | | 7,485 | 8,429 |
| Series 2015 A: | | | |
| 5% 5/1/19 | | 980 | 990 |
| 5% 5/1/20 | | 2,050 | 2,133 |
| 5% 5/1/21 | | 3,915 | 4,177 |
| 5% 5/1/22 | | 3,640 | 3,976 |
| 5% 5/1/23 | | 6,360 | 7,094 |
| Series 2015 B, 5% 5/1/24 | | 28,915 | 32,870 |
| Series 2016 A, 5% 8/1/27 | | 5,440 | 6,304 |
| Miami-Dade County Transit Sales Surtax Rev. Series 2012, 5% 7/1/19 | | 1,225 | 1,244 |
| Orange County Health Facilities Auth. Series 2009, 5.25% 10/1/19 | | 1,220 | 1,250 |
| Orlando & Orange County Expressway Auth. Rev. Series 2012, 5% 7/1/19 | | 980 | 995 |
| Orlando Utils. Commission Util. Sys. Rev. Series 2011 B, 5% 10/1/19 | | 2,275 | 2,329 |
| Palm Beach County Health Facilities Auth. Hosp. Rev. Series 2014: | | | |
| 4% 12/1/19 | | 980 | 994 |
| 5% 12/1/20 | | 1,395 | 1,463 |
| 5% 12/1/21 | | 1,465 | 1,572 |
| 5% 12/1/23 | | 190 | 211 |
| 5% 12/1/24 | | 380 | 427 |
| Palm Beach County School Board Ctfs. of Prtn.: | | | |
| Series 2014 B: | | | |
| 4% 8/1/19 | | 4,525 | 4,583 |
| 4% 8/1/21 | | 3,950 | 4,151 |
| 5% 8/1/19 | | 2,935 | 2,989 |
| 5% 8/1/21 | | 5,185 | 5,585 |
| 5% 8/1/22 | | 980 | 1,082 |
| Series 2015 B: | | | |
| 5% 8/1/19 | | 2,675 | 2,725 |
| 5% 8/1/20 | | 1,710 | 1,793 |
| Pasco County School District Sales Tax Rev. Series 2013: | | | |
| 5% 10/1/19 | | 1,075 | 1,100 |
| 5% 10/1/20 | | 980 | 1,031 |
| 5% 10/1/21 | | 980 | 1,056 |
| 5% 10/1/22 | | 980 | 1,079 |
| Pasco County Solid Waste Disp. & Resource Recovery Sys. Rev. Series 2011, 5% 10/1/19 (c) | | 1,980 | 2,025 |
| Seminole County School Board Ctfs. of Prtn. Series 2016 C: | | | |
| 5% 7/1/25 | | 980 | 1,138 |
| 5% 7/1/26 | | 1,115 | 1,313 |
| Tallahassee Health Facilities Rev. (Tallahassee Memorial Healthcare, Inc. Proj.) Series 2016 A, 5% 12/1/21 | | 1,135 | 1,218 |
| Tampa Bay Wtr. Reg'l. Wtr. Supply Auth. Util. Sys. Rev. Series 2005, 5.5% 10/1/22 (FGIC Insured) | | 1,340 | 1,511 |
| Tampa Tax Allocation (H. Lee Moffitt Cancer Ctr. Proj.) Series 2012 A, 5% 9/1/20 | | 1,760 | 1,845 |
| Volusia County School Board Ctfs. of Prtn. (Master Lease Prog.) Series 2014 B, 5% 8/1/19 | | 305 | 310 |
|
| TOTAL FLORIDA | | | 287,433 |
|
| Georgia - 2.1% | | | |
| Atlanta Arpt. Rev.: | | | |
| 5% 1/1/22 | | 980 | 1,068 |
| 5% 1/1/23 | | 980 | 1,092 |
| 5% 1/1/24 | | 1,125 | 1,281 |
| Burke County Indl. Dev. Auth. Poll. Cont. Rev. Bonds (Oglethorpe Pwr. Corp. Vogtle Proj.) Series 2013 A, 2.4%, tender 4/1/20 (a) | | 9,780 | 9,733 |
| Georgia Muni. Elec. Auth. Pwr. Rev.: | | | |
| (Unrefunded Balance Proj.) Series 2008: | | | |
| 5.75% 1/1/19 (Escrowed to Maturity) | | 3,785 | 3,785 |
| 5.75% 1/1/20 | | 905 | 906 |
| Series GG: | | | |
| 5% 1/1/20 | | 660 | 679 |
| 5% 1/1/21 | | 1,635 | 1,724 |
| Georgia Muni. Gas Auth. Rev. (Gas Portfolio III Proj.): | | | |
| Series 2014 U: | | | |
| 5% 10/1/19 | | 1,465 | 1,498 |
| 5% 10/1/22 | | 980 | 1,081 |
| 5% 10/1/23 | | 2,365 | 2,657 |
| Series R, 5% 10/1/21 | | 4,890 | 5,270 |
| Main Street Natural Gas, Inc. Bonds Series 2018 C, 4%, tender 12/1/23 (a) | | 13,910 | 14,688 |
| Monroe County Dev. Auth. Poll. Cont. Rev. Bonds: | | | |
| (Georgia Pwr. Co. Plant Scherer Proj.) Series 2009, 2.35%, tender 12/11/20 (a) | | 4,610 | 4,572 |
| (Gulf Pwr. Co. Plant Scherer Proj.) Series 2002 1, 2%, tender 6/25/20 (a) | | 6,000 | 5,965 |
| Private Colleges & Univs. Auth. Rev. (The Savannah College of Arts and Design Projs.) Series 2014, 5% 4/1/21 | | 3,260 | 3,470 |
|
| TOTAL GEORGIA | | | 59,469 |
|
| Hawaii - 0.6% | | | |
| Hawaii Arpts. Sys. Rev. Series 2011, 5% 7/1/19 (c) | | 3,915 | 3,972 |
| Honolulu City & County Gen. Oblig. Series 2017 D: | | | |
| 5% 9/1/24 | | 1,200 | 1,388 |
| 5% 9/1/25 | | 2,935 | 3,455 |
| State of Hawaii Dept. of Trans. Series 2013: | | | |
| 5% 8/1/19 (c) | | 1,370 | 1,394 |
| 5% 8/1/20 (c) | | 2,985 | 3,119 |
| 5% 8/1/21 (c) | | 540 | 577 |
| 5% 8/1/22 (c) | | 2,030 | 2,215 |
| 5% 8/1/23 (c) | | 1,440 | 1,597 |
|
| TOTAL HAWAII | | | 17,717 |
|
| Illinois - 13.4% | | | |
| Chicago Board of Ed.: | | | |
| Series 1998 B1, 0% 12/1/21 (Nat'l. Pub. Fin. Guarantee Corp. Insured) | | 9,780 | 8,919 |
| Series 2010 F, 5% 12/1/20 | | 745 | 767 |
| Series 2017 C: | | | |
| 5% 12/1/26 | | 485 | 511 |
| 5% 12/1/27 | | 2,830 | 2,977 |
| Series 2018 C, 5% 12/1/24 | | 13,000 | 13,650 |
| Chicago Gen. Oblig. (City Colleges Proj.) Series 1999: | | | |
| 0% 1/1/19 (Nat'l. Pub. Fin. Guarantee Corp. Insured) | | 9,590 | 9,590 |
| 0% 1/1/20 (Nat'l. Pub. Fin. Guarantee Corp. Insured) | | 14,435 | 14,055 |
| Chicago Midway Arpt. Rev.: | | | |
| Series 2014 B: | | | |
| 5% 1/1/20 | | 610 | 628 |
| 5% 1/1/21 | | 390 | 413 |
| 5% 1/1/23 | | 2,445 | 2,692 |
| 5% 1/1/22 | | 4,890 | 5,277 |
| 5% 1/1/23 | | 5,770 | 6,352 |
| Chicago Motor Fuel Tax Rev. Series 2013: | | | |
| 5% 1/1/19 | | 245 | 245 |
| 5% 1/1/20 | | 295 | 300 |
| 5% 1/1/21 | | 390 | 403 |
| 5% 1/1/22 | | 295 | 308 |
| 5% 1/1/23 | | 525 | 554 |
| Chicago O'Hare Int'l. Arpt. Rev.: | | | |
| Series 2012 A, 5% 1/1/21 | | 1,370 | 1,452 |
| Series 2012 B, 5% 1/1/21 (c) | | 4,505 | 4,747 |
| Series 2013 B, 5% 1/1/22 | | 3,915 | 4,255 |
| Series 2013 D, 5% 1/1/22 | | 3,150 | 3,423 |
| Series 2017 D, 5% 1/1/27 (c) | | 1,470 | 1,681 |
| Chicago Transit Auth. Cap. Grant Receipts Rev. Series 2017: | | | |
| 4% 6/1/19 | | 2,755 | 2,776 |
| 5% 6/1/20 | | 2,430 | 2,520 |
| 5% 6/1/21 | | 2,305 | 2,443 |
| 5% 6/1/25 | | 1,225 | 1,382 |
| Chicago Wastewtr. Transmission Rev. Series 2012: | | | |
| 5% 1/1/19 | | 1,280 | 1,280 |
| 5% 1/1/23 | | 1,175 | 1,259 |
| Cook County Gen. Oblig.: | | | |
| Series 2009 C, 5% 11/15/21 | | 8,390 | 8,584 |
| Series 2010 A, 5.25% 11/15/22 | | 4,850 | 5,099 |
| Series 2011 A, 5.25% 11/15/22 | | 980 | 1,059 |
| Series 2012 C: | | | |
| 5% 11/15/19 | | 3,130 | 3,207 |
| 5% 11/15/20 | | 7,055 | 7,397 |
| 5% 11/15/21 | | 5,465 | 5,858 |
| 5% 11/15/22 | | 1,260 | 1,377 |
| Series 2014 A: | | | |
| 5% 11/15/20 | | 980 | 1,028 |
| 5% 11/15/21 | | 490 | 525 |
| 5% 11/15/22 | | 1,325 | 1,448 |
| Illinois Edl. Facilities Auth. Rev. Bonds (Univ. of Chicago Proj.) Series B2, 1.55%, tender 2/13/20 (a) | | 9,780 | 9,731 |
| Illinois Fin. Auth. Rev.: | | | |
| (Bradley Univ. Proj.) Series 2017 C, 5% 8/1/26 | | 1,650 | 1,883 |
| (OSF Healthcare Sys.) Series 2018 A: | | | |
| 5% 5/15/26 | | 4,300 | 4,966 |
| 5% 5/15/27 | | 9,260 | 10,762 |
| (Provena Health Proj.) Series 2010 A, 5.75% 5/1/19 (Escrowed to Maturity) | | 2,590 | 2,624 |
| (Southern Illinois Healthcare Enterprises, Inc. Proj.) Series 2005, 5.25% 3/1/30 (Pre-Refunded to 3/1/20 @ 100) | | 4,650 | 4,830 |
| Bonds: | | | |
| (Ascension Health Cr. Group Proj.) Series 2012 E2, 1.75%, tender 4/1/21 (a) | | 3,000 | 2,966 |
| Series 2017 B, 5%, tender 12/15/22 (a) | | 4,325 | 4,788 |
| Series E, 2.25%, tender 4/29/22 (a) | | 22,430 | 22,344 |
| Series 2011 IL, 5% 12/1/22 (Pre-Refunded to 12/1/21 @ 100) | | 1,110 | 1,204 |
| Series 2012 A, 5% 5/15/23 | | 1,270 | 1,378 |
| Series 2012: | | | |
| 5% 9/1/19 | | 1,090 | 1,113 |
| 5% 9/1/20 | | 1,440 | 1,511 |
| 5% 9/1/21 | | 2,000 | 2,153 |
| 5% 9/1/22 | | 3,455 | 3,807 |
| Series 2015 A: | | | |
| 5% 11/15/22 | | 490 | 541 |
| 5% 11/15/24 | | 1,490 | 1,699 |
| 5% 11/15/25 | | 1,905 | 2,195 |
| 5% 11/15/26 | | 1,955 | 2,240 |
| Series 2015 B: | | | |
| 5% 11/15/20 | | 1,615 | 1,702 |
| 5% 11/15/24 | | 1,910 | 2,187 |
| Series 2016 A: | | | |
| 5% 8/15/20 | | 490 | 508 |
| 5% 2/15/21 | | 735 | 779 |
| 5% 8/15/21 | | 685 | 725 |
| 5% 2/15/23 | | 980 | 1,084 |
| 5% 8/15/23 | | 1,465 | 1,603 |
| 5% 8/15/24 | | 2,135 | 2,367 |
| Series 2016 C: | | | |
| 5% 2/15/20 | | 4,970 | 5,119 |
| 5% 2/15/22 | | 3,335 | 3,633 |
| 5% 2/15/23 | | 4,470 | 4,975 |
| 5% 2/15/24 | | 5,220 | 5,921 |
| Series 2016: | | | |
| 5% 7/1/22 | | 2,895 | 3,188 |
| 5% 5/15/25 | | 490 | 560 |
| 5% 5/15/26 | | 980 | 1,132 |
| 5% 5/15/27 | | 1,225 | 1,408 |
| Series 2017: | | | |
| 5% 1/1/23 | | 1,465 | 1,632 |
| 5% 1/1/25 | | 2,260 | 2,627 |
| 5% 1/1/27 | | 1,955 | 2,321 |
| Illinois Gen. Oblig.: | | | |
| Series 2010, 5% 1/1/21 (FSA Insured) | | 1,565 | 1,605 |
| Series 2012 A, 4% 1/1/23 | | 1,245 | 1,259 |
| Series 2012: | | | |
| 5% 3/1/19 | | 5,380 | 5,402 |
| 5% 8/1/19 | | 2,600 | 2,638 |
| 5% 8/1/20 | | 6,750 | 6,956 |
| 5% 8/1/21 | | 2,360 | 2,459 |
| 5% 8/1/22 | | 5,675 | 5,970 |
| Series 2013: | | | |
| 5% 7/1/21 | | 6,360 | 6,620 |
| 5% 7/1/22 | | 10,740 | 11,287 |
| Series 2014: | | | |
| 5% 2/1/22 | | 2,935 | 3,070 |
| 5% 4/1/23 | | 2,165 | 2,288 |
| 5% 2/1/25 | | 2,275 | 2,402 |
| Series 2016: | | | |
| 5% 11/1/20 | | 2,310 | 2,385 |
| 5% 1/1/26 | | 2,150 | 2,299 |
| 5% 2/1/26 | | 10,525 | 11,255 |
| Series 2017 B, 5% 11/1/19 | | 7,875 | 8,037 |
| Illinois Muni. Elec. Agcy. Pwr. Supply Series 2015 A, 5% 2/1/23 | | 1,180 | 1,301 |
| Illinois Reg'l. Trans. Auth. Series 2017 A: | | | |
| 5% 7/1/20 | | 1,320 | 1,377 |
| 5% 7/1/21 | | 1,320 | 1,407 |
| McHenry County Cmnty. School District #200 Series 2006 B: | | | |
| 0% 1/15/24 | | 4,715 | 4,111 |
| 0% 1/15/25 | | 4,915 | 4,141 |
| 0% 1/15/26 | | 3,695 | 2,999 |
| McHenry County Conservation District Gen. Oblig. Series 2014: | | | |
| 5% 2/1/19 | | 2,235 | 2,240 |
| 5% 2/1/20 | | 2,225 | 2,298 |
| 5% 2/1/23 | | 2,175 | 2,413 |
| Railsplitter Tobacco Settlement Auth. Rev.: | | | |
| Series 2010: | | | |
| 5.5% 6/1/23 (Pre-Refunded to 6/1/21 @ 100) | | 11,285 | 12,229 |
| 6% 6/1/28 (Pre-Refunded to 6/1/21 @ 100) | | 7,655 | 8,385 |
| Series 2017, 5% 6/1/22 | | 9,780 | 10,581 |
|
| TOTAL ILLINOIS | | | 386,061 |
|
| Indiana - 2.2% | | | |
| Indiana Fin. Auth. Econ. Dev. Rev. Bonds (Republic Svcs., Inc. Proj.) Series A, 2.35%, tender 3/1/19 (a)(c) | | 4,000 | 3,999 |
| Indiana Fin. Auth. Hosp. Rev. Series 2013: | | | |
| 5% 8/15/22 | | 685 | 754 |
| 5% 8/15/23 | | 980 | 1,100 |
| Indiana Fin. Auth. Rev. Series 2012: | | | |
| 5% 3/1/20 | | 635 | 658 |
| 5% 3/1/21 | | 1,200 | 1,269 |
| Indiana Fin. Auth. Wastewtr. Util. Rev. (CWA Auth. Proj.): | | | |
| Series 2012 A: | | | |
| 5% 10/1/20 | | 805 | 847 |
| 5% 10/1/22 | | 1,565 | 1,727 |
| Series 2014 A: | | | |
| 5% 10/1/20 | | 365 | 384 |
| 5% 10/1/21 | | 370 | 399 |
| 5% 10/1/22 | | 660 | 728 |
| Series 2015 A: | | | |
| 5% 10/1/24 | | 1,460 | 1,671 |
| 5% 10/1/25 | | 1,590 | 1,833 |
| Indiana Muni. Pwr. Agcy. Pwr. Supply Sys. Rev. Series 2011 A: | | | |
| 5% 1/1/19 | | 1,440 | 1,440 |
| 5% 1/1/20 | | 1,225 | 1,263 |
| Indianapolis Local Pub. Impt. (Indianapolis Arpt. Auth. Proj.) Series 2016 A1: | | | |
| 5% 1/1/21 (c) | | 2,690 | 2,837 |
| 5% 1/1/23 (c) | | 1,940 | 2,132 |
| 5% 1/1/24 (c) | | 2,715 | 3,037 |
| 5% 1/1/25 (c) | | 2,845 | 3,232 |
| Lake Central Multi-District School Bldg. Corp. Series 2012 B: | | | |
| 4% 1/15/19 | | 980 | 981 |
| 4% 1/15/20 | | 1,315 | 1,343 |
| 4% 1/15/21 | | 1,225 | 1,275 |
| 5% 7/15/19 | | 1,645 | 1,672 |
| 5% 7/15/20 | | 1,145 | 1,198 |
| 5% 7/15/21 | | 980 | 1,052 |
| Whiting Envir. Facilities Rev.: | | | |
| (BP Products North America, Inc. Proj.) Series 2009, 5.25% 1/1/21 | | 4,160 | 4,404 |
| Bonds (BP Products North America, Inc. Proj.) Series 2015, 5%, tender 11/1/22 (a)(c) | | 21,505 | 23,340 |
|
| TOTAL INDIANA | | | 64,575 |
|
| Kansas - 0.3% | | | |
| Desoto Usd # 232 Series 2015 A, 5% 9/1/22 | | 1,525 | 1,686 |
| Johnson County Unified School District # 233 Series 2016 B, 5% 9/1/23 | | 1,430 | 1,617 |
| Wichita Hosp. Facilities Rev. Series 2011 IV A, 5% 11/15/20 (Escrowed to Maturity) | | 2,685 | 2,837 |
| Wyandotte County/Kansas City Unified Govt. Util. Sys. Rev. Series 2016 A: | | | |
| 5% 9/1/22 | | 490 | 539 |
| 5% 9/1/23 | | 710 | 797 |
| 5% 9/1/25 | | 785 | 907 |
|
| TOTAL KANSAS | | | 8,383 |
|
| Kentucky - 1.5% | | | |
| Ashland Med. Ctr. Rev.: | | | |
| (Ashland Hosp. Corp. D/B/A King's Daughters Med. Ctr. Proj.) Series 2016 A, 5% 2/1/24 | | 1,330 | 1,457 |
| (Ashland Hosp. Corp. D/B/A Kings Daughters Med. Ctr. Proj.) Series 2016 A, 5% 2/1/25 | | 980 | 1,085 |
| Kentucky Econ. Dev. Fin. Auth. Bonds Series 2009 B, 2.7%, tender 11/10/21 (a) | | 8,805 | 8,839 |
| Kentucky Econ. Dev. Fin. Auth. Hosp. Rev. Series 2015 A: | | | |
| 5% 6/1/20 | | 1,380 | 1,423 |
| 5% 6/1/22 | | 1,525 | 1,628 |
| 5% 6/1/24 | | 1,655 | 1,812 |
| Kentucky State Property & Buildings Commission Rev. (Kentucky St Proj.) Series D, 5% 5/1/21 | | 980 | 1,041 |
| Kentucky, Inc. Pub. Energy Bonds Series C1, 4%, tender 6/1/25 (a) | | 15,000 | 15,731 |
| Louisville/Jefferson County Metropolitan Govt. Poll. Cont. Rev. Bonds (Louisville Gas & Elec. Co. Proj.) Series 2003 A, 1.5%, tender 4/1/19 (a) | | 7,345 | 7,333 |
| Univ. Louisville Revs. Series 2016 C, 3% 9/1/21 | | 2,315 | 2,368 |
|
| TOTAL KENTUCKY | | | 42,717 |
|
| Louisiana - 2.2% | | | |
| Louisiana Citizens Property Ins. Corp. Assessment Rev. Series 2015: | | | |
| 5% 6/1/19 | | 9,145 | 9,265 |
| 5% 6/1/21 (FSA Insured) | | 4,890 | 5,242 |
| Louisiana Gen. Oblig.: | | | |
| Series 2012 A, 5% 8/1/22 | | 1,480 | 1,636 |
| Series 2012 C, 5% 7/15/21 | | 3,305 | 3,556 |
| Series 2014 D1, 5% 12/1/22 | | 1,275 | 1,420 |
| Series 2016 B: | | | |
| 5% 8/1/22 | | 14,185 | 15,657 |
| 5% 8/1/23 | | 6,115 | 6,902 |
| Series 2016 D, 5% 9/1/22 | | 6,220 | 6,887 |
| Louisiana Stadium and Exposition District Series 2013 A: | | | |
| 5% 7/1/21 | | 1,465 | 1,569 |
| 5% 7/1/22 | | 980 | 1,075 |
| New Orleans Aviation Board Rev.: | | | |
| (North Term. Proj.) Series 2017 B: | | | |
| 5% 1/1/23 (c) | | 300 | 328 |
| 5% 1/1/24 (c) | | 195 | 217 |
| 5% 1/1/25 (c) | | 195 | 220 |
| 5% 1/1/26 (c) | | 490 | 558 |
| Series 2017 D2: | | | |
| 5% 1/1/23 (c) | | 390 | 427 |
| 5% 1/1/24 (c) | | 735 | 817 |
| 5% 1/1/25 (c) | | 490 | 552 |
| New Orleans Gen. Oblig. Series 2012, 5% 12/1/20 | | 2,740 | 2,886 |
| Tobacco Settlement Fing. Corp. Series 2013 A, 5% 5/15/23 | | 4,400 | 4,799 |
|
| TOTAL LOUISIANA | | | 64,013 |
|
| Maine - 0.2% | | | |
| Maine Tpk. Auth. Tpk. Rev. Series 2015: | | | |
| 5% 7/1/21 | | 2,350 | 2,528 |
| 5% 7/1/22 | | 1,810 | 1,996 |
| 5% 7/1/24 | | 2,300 | 2,647 |
|
| TOTAL MAINE | | | 7,171 |
|
| Maryland - 2.0% | | | |
| Baltimore Proj. Rev. Series 2017 D: | | | |
| 5% 7/1/24 | | 3,220 | 3,700 |
| 5% 7/1/25 | | 3,380 | 3,948 |
| Maryland Econ. Dev. Auth. Rev. (Ports America Chesapeake LLC. Proj.) Series 2017 A: | | | |
| 4% 6/1/19 | | 2,400 | 2,419 |
| 4% 6/1/20 | | 2,960 | 3,034 |
| 5% 6/1/21 | | 1,640 | 1,742 |
| 5% 6/1/22 | | 1,750 | 1,893 |
| Maryland Gen. Oblig. Series 2017 B, 5% 8/1/25 | | 27,300 | 32,213 |
| Maryland Health & Higher Edl. Facilities Auth. Rev. Series 2015: | | | |
| 5% 7/1/19 | | 390 | 395 |
| 5% 7/1/22 | | 880 | 958 |
| 5% 7/1/23 | | 980 | 1,087 |
| 5% 7/1/24 | | 1,955 | 2,202 |
| 5% 7/1/25 | | 1,730 | 1,974 |
| Rockville Mayor & Council Econ. Dev. (Rfdg.-Ingleside King Farm Proj.) Series 2017: | | | |
| 2.5% 11/1/24 | | 850 | 812 |
| 3% 11/1/25 | | 625 | 606 |
|
| TOTAL MARYLAND | | | 56,983 |
|
| Massachusetts - 1.9% | | | |
| Massachusetts Dev. Fin. Agcy. Rev.: | | | |
| Series 2012, 5% 7/1/31 (Pre-Refunded to 7/1/21 @ 100) | | 1,035 | 1,111 |
| Series 2016 A, 5% 7/15/22 | | 1,240 | 1,374 |
| Series 2016 I: | | | |
| 5% 7/1/21 | | 490 | 523 |
| 5% 7/1/22 | | 585 | 637 |
| 5% 7/1/23 | | 660 | 732 |
| 5% 7/1/24 | | 1,075 | 1,211 |
| 5% 7/1/25 | | 980 | 1,118 |
| 5% 7/1/26 | | 980 | 1,129 |
| Massachusetts Edl. Fing. Auth. Rev. Series 2013, 5% 7/1/19 (c) | | 4,620 | 4,684 |
| Massachusetts Gen. Oblig.: | | | |
| Bonds Series 2014 D1, 1.05%, tender 7/1/20 (a) | | 31,300 | 30,824 |
| Series 2016 B, 5% 7/1/22 | | 1,685 | 1,863 |
| Series C, 5.5% 12/1/22 | | 4,160 | 4,724 |
| Massachusetts Port Auth. Rev. Series 2017 A: | | | |
| 5% 7/1/24 (c) | | 3,005 | 3,420 |
| 5% 7/1/25 (c) | | 1,115 | 1,290 |
|
| TOTAL MASSACHUSETTS | | | 54,640 |
|
| Michigan - 3.8% | | | |
| Clarkston Cmnty. Schools 5% 5/1/22 | | 1,635 | 1,786 |
| Detroit Downtown Dev. Auth. Tax Series A, 5% 7/1/24 (FSA Insured) | | 1,000 | 1,116 |
| Detroit Swr. Disp. Rev. Series 2006 D, 3 month U.S. LIBOR + 0.600% 2.205% 7/1/32 (a)(e) | | 3,980 | 3,798 |
| Grand Blanc Cmnty. Schools Series 2013: | | | |
| 5% 5/1/19 | | 1,200 | 1,213 |
| 5% 5/1/20 | | 2,575 | 2,681 |
| 5% 5/1/21 | | 2,105 | 2,249 |
| 5% 5/1/22 | | 1,810 | 1,982 |
| Grand Rapids Pub. Schools 5% 5/1/23 (FSA Insured) | | 1,275 | 1,424 |
| Kalamazoo Hosp. Fin. Auth. Hosp. Facilities Rev. Series 2016: | | | |
| 5% 5/15/22 | | 980 | 1,064 |
| 5% 5/15/24 | | 540 | 606 |
| 5% 5/15/25 | | 635 | 723 |
| 5% 5/15/26 | | 610 | 702 |
| Kent Hosp. Fin. Auth. Hosp. Facilities Rev. (Spectrum Health Sys. Proj.) Series 2011 A, 5% 11/15/19 | | 980 | 1,006 |
| Michigan Bldg. Auth. Rev. (Facilities Prog.) Series 2016 I: | | | |
| 5% 4/15/22 | | 980 | 1,076 |
| 5% 4/15/23 | | 1,320 | 1,482 |
| 5% 4/15/24 | | 1,450 | 1,659 |
| Michigan Fin. Auth. Rev.: | | | |
| Bonds 1.1%, tender 8/15/19 (a) | | 4,155 | 4,129 |
| Series 2015 A: | | | |
| 5% 8/1/22 | | 2,350 | 2,579 |
| 5% 8/1/23 | | 3,715 | 4,160 |
| Michigan Gen. Oblig. Series 2016: | | | |
| 5% 3/15/20 | | 3,255 | 3,376 |
| 5% 3/15/21 | | 980 | 1,044 |
| 5% 3/15/22 | | 2,280 | 2,489 |
| 5% 3/15/23 | | 3,915 | 4,374 |
| 5% 3/15/24 | | 6,760 | 7,706 |
| Michigan Hosp. Fin. Auth. Rev. Bonds: | | | |
| (Ascension Health Cr. Group Proj.) Series F5, 2.4%, tender 3/15/23 (a) | | 3,535 | 3,529 |
| Series 2005 A4, 1.625%, tender 11/1/19 (a) | | 6,615 | 6,585 |
| Series 2010 F4, 1.95%, tender 4/1/20 (a) | | 6,400 | 6,380 |
| Michigan Strategic Fund Ltd. Oblig. Rev. Bonds Series CC, 1.45%, tender 9/1/21 (a) | | 7,040 | 6,768 |
| Portage Pub. Schools Series 2016: | | | |
| 5% 5/1/23 | | 1,990 | 2,221 |
| 5% 11/1/23 | | 1,335 | 1,505 |
| 5% 5/1/24 | | 1,880 | 2,140 |
| 5% 11/1/24 | | 1,955 | 2,246 |
| 5% 5/1/25 | | 1,100 | 1,274 |
| 5% 11/1/25 | | 1,195 | 1,394 |
| 5% 5/1/26 | | 1,665 | 1,960 |
| 5% 11/1/26 | | 1,155 | 1,357 |
| 5% 11/1/28 | | 985 | 1,147 |
| Royal Oak Hosp. Fin. Auth. Hosp. Rev. Series 2014 D: | | | |
| 5% 9/1/21 | | 1,465 | 1,575 |
| 5% 9/1/23 | | 490 | 550 |
| Spring Lake Pub. Schools: | | | |
| Series 2014, 5% 5/1/19 | | 2,250 | 2,273 |
| 5% 11/1/19 | | 2,715 | 2,785 |
| 5% 5/1/20 | | 3,550 | 3,696 |
| 5% 11/1/20 | | 1,705 | 1,800 |
| 5% 5/1/21 | | 4,020 | 4,299 |
|
| TOTAL MICHIGAN | | | 109,908 |
|
| Minnesota - 0.7% | | | |
| Minneapolis & Saint Paul Metropolitan Arpts. Commission Arpt. Rev.: | | | |
| Series 2014 A: | | | |
| 5% 1/1/22 | | 980 | 1,067 |
| 5% 1/1/23 | | 980 | 1,093 |
| Series 2014 B: | | | |
| 5% 1/1/21 (c) | | 2,240 | 2,367 |
| 5% 1/1/22 (c) | | 1,955 | 2,113 |
| 5% 1/1/23 (c) | | 980 | 1,080 |
| Moorhead Edl. Facilities Rev. (The Concordia College Corp. Proj.) Series 2016, 5% 12/1/25 | | 2,950 | 3,252 |
| Northern Muni. Pwr. Agcy. Elec. Sys. Rev. Series 2017: | | | |
| 5% 1/1/22 | | 1,160 | 1,256 |
| 5% 1/1/23 | | 1,115 | 1,232 |
| 5% 1/1/24 | | 1,560 | 1,755 |
| Western Minnesota Muni. Pwr. Agcy. Pwr. Supply Rev. Series 2014 A: | | | |
| 5% 1/1/22 | | 980 | 1,067 |
| 5% 1/1/23 | | 1,465 | 1,631 |
| 5% 1/1/24 | | 980 | 1,114 |
|
| TOTAL MINNESOTA | | | 19,027 |
|
| Missouri - 0.2% | | | |
| Cape Girardeau County Indl. Dev. Auth. (Southeast Hosp. Proj.) Series 2017 A: | | | |
| 5% 3/1/19 | | 295 | 296 |
| 5% 3/1/20 | | 320 | 329 |
| 5% 3/1/21 | | 390 | 409 |
| 5% 3/1/22 | | 585 | 624 |
| 5% 3/1/23 | | 980 | 1,062 |
| 5% 3/1/24 | | 685 | 752 |
| 5% 3/1/25 | | 710 | 788 |
| 5% 3/1/26 | | 980 | 1,097 |
|
| TOTAL MISSOURI | | | 5,357 |
|
| Nevada - 2.5% | | | |
| Clark County Arpt. Rev.: | | | |
| (Sub Lien Proj.) Series 2017 A-1, 5% 7/1/22 (c) | | 3,915 | 4,262 |
| Series 2017 C, 5% 7/1/21 (c) | | 7,785 | 8,298 |
| Clark County School District: | | | |
| Series 2016 A: | | | |
| 5% 6/15/21 | | 1,470 | 1,569 |
| 5% 6/15/23 | | 1,285 | 1,430 |
| Series 2016 D, 5% 6/15/23 | | 10,000 | 11,127 |
| Series 2017 A, 5% 6/15/22 | | 2,800 | 3,054 |
| Series 2017 C: | | | |
| 5% 6/15/21 | | 9,030 | 9,639 |
| 5% 6/15/23 | | 4,550 | 5,063 |
| Humboldt County Nev Poll. Cont. Rev. Bonds (Sierra Pacific Pwr. Co. Proj.) Series 2016 A, 1.25%, tender 6/3/19 (a) | | 1,955 | 1,947 |
| Nevada Dept. of Bus. & Industry Bonds (Republic Svcs., Inc. Proj.) Series 2001, 2.5%, tender 6/3/19 (a)(c)(d) | | 10,400 | 10,401 |
| Nevada Gen. Oblig.: | | | |
| Series 2012 B, 5% 8/1/20 | | 2,180 | 2,287 |
| Series 2013 D1, 5% 3/1/24 | | 2,640 | 2,952 |
| Washoe County Gas & Wtr. Facilities Bonds (Sierra Pacific Pwr. Co. Proj.) Series 2016 B, 3%, tender 6/1/22 (a) | | 5,185 | 5,290 |
| Washoe County Gas Facilities Rev. Bonds (Sierra Pacific Pwr. Co. Proj.) Series 2016 A, 1.5%, tender 6/3/19 (a)(c) | | 5,990 | 5,970 |
|
| TOTAL NEVADA | | | 73,289 |
|
| New Hampshire - 0.6% | | | |
| New Hampshire Health & Ed. Facilities Auth.: | | | |
| Series 2017 B, 4.125% 7/1/24 (d) | | 1,010 | 1,012 |
| Series 2017 C, 3.5% 7/1/22 (d) | | 335 | 335 |
| New Hampshire Health & Ed. Facilities Auth. Rev.: | | | |
| (Dartmouth-Hitchcock Obligated Group Proj.) Series 2010, 5% 8/1/40 (Pre-Refunded to 8/1/20 @ 100) | | 6,000 | 6,288 |
| (Southern NH Med. Ctr. Proj.) Series 2016, 3% 10/1/21 | | 1,375 | 1,397 |
| Series 2012: | | | |
| 4% 7/1/20 | | 2,645 | 2,712 |
| 4% 7/1/21 | | 1,485 | 1,547 |
| Series 2016: | | | |
| 5% 10/1/21 | | 1,225 | 1,302 |
| 5% 10/1/23 | | 2,785 | 3,058 |
|
| TOTAL NEW HAMPSHIRE | | | 17,651 |
|
| New Jersey - 6.5% | | | |
| Camden County Impt. Auth. Health Care Redev. Rev. Series 2014 A: | | | |
| 5% 2/15/20 | | 3,030 | 3,122 |
| 5% 2/15/21 | | 2,445 | 2,582 |
| 5% 2/15/22 | | 2,445 | 2,642 |
| 5% 2/15/23 | | 2,770 | 3,048 |
| New Jersey Econ. Dev. Auth. Rev.: | | | |
| (Provident Montclair Proj.) Series 2017: | | | |
| 4% 6/1/22 (FSA Insured) | | 980 | 1,031 |
| 5% 6/1/23 (FSA Insured) | | 1,230 | 1,357 |
| 5% 6/1/24 (FSA Insured) | | 980 | 1,097 |
| Series 2005 K, 5.5% 12/15/19 | | 7,855 | 8,088 |
| Series 2011 EE: | | | |
| 5% 9/1/20 | | 1,320 | 1,376 |
| 5% 9/1/20 (Escrowed to Maturity) | | 3,570 | 3,747 |
| Series 2012 II: | | | |
| 5% 3/1/21 | | 6,650 | 6,986 |
| 5% 3/1/22 | | 6,155 | 6,579 |
| Series 2013, 5% 3/1/23 | | 5,870 | 6,366 |
| Series 2014 PP, 5% 6/15/19 | | 16,630 | 16,836 |
| New Jersey Econ. Dev. Auth. Spl. Facilities Rev. (Port Newark Container Term. LLC. Proj.) Series 2017 5% 10/1/26 (c) | | 2,130 | 2,373 |
| New Jersey Edl. Facility: | | | |
| Series 2014: | | | |
| 5% 6/15/20 | | 10,760 | 11,164 |
| 5% 6/15/21 | | 10,760 | 11,372 |
| Series 2016 A: | | | |
| 5% 7/1/21 | | 2,150 | 2,273 |
| 5% 7/1/22 | | 6,160 | 6,636 |
| 5% 7/1/23 | | 3,315 | 3,633 |
| 5% 7/1/24 | | 7,740 | 8,606 |
| New Jersey Health Care Facilities Fing. Auth. Rev. Series 2016 A: | | | |
| 5% 7/1/19 | | 1,465 | 1,484 |
| 5% 7/1/21 | | 170 | 181 |
| 5% 7/1/22 | | 170 | 185 |
| 5% 7/1/23 | | 595 | 658 |
| 5% 7/1/24 | | 475 | 532 |
| 5% 7/1/24 | | 1,200 | 1,374 |
| 5% 7/1/24 | | 985 | 1,103 |
| 5% 7/1/25 | | 515 | 583 |
| 5% 7/1/26 | | 170 | 194 |
| 5% 7/1/27 | | 255 | 290 |
| New Jersey Higher Ed. Student Assistance Auth. Student Ln. Rev.: | | | |
| Series 2013, 5% 12/1/19 (c) | | 3,765 | 3,852 |
| Series 2017 1A: | | | |
| 5% 12/1/22 (c) | | 750 | 816 |
| 5% 12/1/23 (c) | | 1,930 | 2,132 |
| Series 2017 1B, 5% 12/1/21 (c) | | 795 | 850 |
| New Jersey Tpk. Auth. Tpk. Rev.: | | | |
| Bonds Series 2017 C5, 1 month U.S. LIBOR + 0.460% 2.104%, tender 1/1/21 (a)(e) | | 10,485 | 10,485 |
| Series 2013 A: | | | |
| 5% 1/1/24 (Pre-Refunded to 7/1/22 @ 100) | | 3,895 | 4,306 |
| 5% 1/1/24 (Pre-Refunded to 7/1/22 @ 100) | | 355 | 392 |
| Series 2017 C1, 1 month U.S. LIBOR + 0.340% 1.984% 1/1/21 (a)(e) | | 1,170 | 1,168 |
| New Jersey Trans. Trust Fund Auth.: | | | |
| Series 2003 B, 5.25% 12/15/19 | | 3,785 | 3,888 |
| Series 2012 AA, 5% 6/15/19 | | 1,465 | 1,483 |
| Series 2013 A: | | | |
| 5% 12/15/19 | | 6,315 | 6,472 |
| 5% 6/15/20 | | 17,605 | 18,266 |
| Series 2016 A, 5% 6/15/27 | | 3,960 | 4,440 |
| Series 2018 A, 5% 6/15/24 | | 5,000 | 5,544 |
| New Jersey Transit Corp. Ctfs. of Prtn. Series 2014 A, 5% 9/15/21 | | 4,795 | 5,098 |
|
| TOTAL NEW JERSEY | | | 186,690 |
|
| New Mexico - 0.6% | | | |
| Farmington Poll. Cont. Rev. Bonds (Southern California Edison Co. Four Corners Proj.): | | | |
| Series 2005 B, 1.875%, tender 4/1/20 (a) | | 10,785 | 10,656 |
| Series 2011, 1.875%, tender 4/1/20 (a) | | 6,155 | 6,081 |
|
| TOTAL NEW MEXICO | | | 16,737 |
|
| New York - 4.0% | | | |
| Dorm. Auth. New York Univ. Rev. Series 2016 A: | | | |
| 5% 7/1/22 | | 490 | 537 |
| 5% 7/1/24 | | 1,810 | 2,062 |
| Dutchess County Local Dev. Corp. Rev. (Health Quest Systems, Inc. Proj.) Series 2010 A, 5% 7/1/19 (Assured Guaranty Corp. Insured) (FSA Insured) | | 625 | 634 |
| Long Island Pwr. Auth. Elec. Sys. Rev. Series 2016 B: | | | |
| 5% 9/1/25 | | 2,740 | 3,196 |
| 5% 9/1/26 | | 1,220 | 1,440 |
| New York City Gen. Oblig. Series 2015 C, 5% 8/1/25 | | 1,665 | 1,932 |
| New York City Transitional Fin. Auth. Rev.: | | | |
| Series 2012 A, 5% 11/1/20 | | 4,400 | 4,652 |
| Series B: | | | |
| 5% 11/1/20 | | 4,160 | 4,270 |
| 5% 11/1/20 (Pre-Refunded to 11/1/19 @ 100) | | 1,660 | 1,704 |
| New York Dorm. Auth. Mental Health Svcs. Facilities Impt. Rev. Series 2012 A, 4% 5/15/20 | | 7,825 | 8,062 |
| New York Metropolitan Trans. Auth. Rev.: | | | |
| Bonds Series 2018 A, 5%, tender 11/15/20 (a) | | 20,000 | 21,014 |
| Series 2003 B, 5.25% 11/15/19 (Nat'l. Pub. Fin. Guarantee Corp. Insured) | | 5,085 | 5,232 |
| Series 2008 B2: | | | |
| 5% 11/15/19 | | 6,050 | 6,211 |
| 5% 11/15/20 | | 5,380 | 5,681 |
| 5% 11/15/21 | | 3,915 | 4,225 |
| Series 2012 B, 5% 11/15/22 | | 1,955 | 2,151 |
| Series 2012 E: | | | |
| 4% 11/15/19 | | 1,710 | 1,741 |
| 5% 11/15/21 | | 2,380 | 2,568 |
| Series 2012 F, 5% 11/15/19 | | 4,890 | 5,020 |
| Series 2014 C, 5% 11/15/21 | | 2,740 | 2,957 |
| Series 2016 B, 5% 11/15/21 | | 2,150 | 2,320 |
| New York Thruway Auth. Gen. Rev. Series 2013 A, 5% 5/1/19 | | 22,280 | 22,517 |
| New York Urban Dev. Corp. Rev. Series 2017 A, 5% 3/15/22 | | 1,265 | 1,387 |
| Yonkers Gen. Oblig. Series 2017 C, 5% 10/1/22 (Build America Mutual Assurance Insured) | | 2,490 | 2,756 |
|
| TOTAL NEW YORK | | | 114,269 |
|
| North Carolina - 0.8% | | | |
| Dare County Ctfs. of Prtn. Series 2012 B: | | | |
| 4% 6/1/20 | | 980 | 1,010 |
| 5% 6/1/19 | | 1,275 | 1,292 |
| North Carolina Cap. Facilities Fin. Agcy. Rev. Bonds (Republic Svcs., Inc. Proj.) Series 2013, 2.35%, tender 3/15/19 (a)(c) | | 1,750 | 1,750 |
| North Carolina Grant Anticipation Rev. Series 2017: | | | |
| 5% 3/1/21 | | 4,890 | 5,210 |
| 5% 3/1/22 | | 3,580 | 3,907 |
| 5% 3/1/23 | | 3,580 | 3,996 |
| North Carolina Muni. Pwr. Agcy. #1 Catawba Elec. Rev. Series 2015 E: | | | |
| 5% 1/1/22 | | 4,890 | 5,317 |
| 5% 1/1/23 | | 1,465 | 1,628 |
|
| TOTAL NORTH CAROLINA | | | 24,110 |
|
| Ohio - 3.4% | | | |
| Akron Bath Copley Hosp. District Rev. Series 2016, 5% 11/15/24 | | 1,955 | 2,185 |
| Allen County Hosp. Facilities Rev. Bonds (Mercy Health) Series 2017 B, 5%, tender 5/5/22 (a) | | 5,280 | 5,776 |
| American Muni. Pwr., Inc. Rev. Bonds: | | | |
| (Combined Hydroelectric Proj.) Series 2018, 2.25%, tender 8/15/21 (a) | | 2,500 | 2,499 |
| Series B, 5%, tender 8/15/20 (a) | | 38,935 | 40,235 |
| Cleveland Arpt. Sys. Rev.: | | | |
| Series 2016 A, 5% 1/1/26 (FSA Insured) | | 490 | 557 |
| 5% 1/1/20 (FSA Insured) | | 415 | 428 |
| 5% 1/1/22 (FSA Insured) | | 1,295 | 1,403 |
| 5% 1/1/24 (FSA Insured) | | 1,175 | 1,323 |
| 5% 1/1/25 (FSA Insured) | | 1,225 | 1,399 |
| Fairfield County Hosp. Facilities Rev. (Fairfield Med. Ctr. Proj.) Series 2013: | | | |
| 5% 6/15/22 | | 2,100 | 2,261 |
| 5% 6/15/23 | | 1,815 | 1,982 |
| Franklin County Hosp. Facilities Rev. Series 2016 C, 5% 11/1/23 | | 2,800 | 3,174 |
| Hamilton County Convention Facilities Auth. Rev. Series 2014: | | | |
| 5% 12/1/19 | | 1,870 | 1,921 |
| 5% 12/1/20 | | 2,155 | 2,276 |
| 5% 12/1/21 | | 2,000 | 2,152 |
| Ohio Gen. Oblig. Series 2012 C, 5% 9/15/21 | | 4,255 | 4,606 |
| Ohio Hosp. Facilities Rev. Series 2017 A: | | | |
| 4% 1/1/20 | | 2,365 | 2,414 |
| 5% 1/1/21 | | 2,640 | 2,797 |
| 5% 1/1/22 | | 1,665 | 1,809 |
| 5% 1/1/23 | | 1,955 | 2,173 |
| 5% 1/1/24 | | 1,690 | 1,916 |
| 5% 1/1/25 | | 2,035 | 2,347 |
| Scioto County Hosp. Facilities Rev. Series 2016: | | | |
| 5% 2/15/21 | | 1,295 | 1,370 |
| 5% 2/15/22 | | 1,075 | 1,163 |
| 5% 2/15/23 | | 2,075 | 2,289 |
| 5% 2/15/24 | | 1,605 | 1,801 |
| 5% 2/15/25 | | 1,675 | 1,906 |
| 5% 2/15/26 | | 1,225 | 1,409 |
|
| TOTAL OHIO | | | 97,571 |
|
| Oklahoma - 0.3% | | | |
| Oklahoma Dev. Fin. Auth. Health Sys. Rev. (OU Medicine Proj.) Series 2018 B: | | | |
| 5% 8/15/24 | | 500 | 555 |
| 5% 8/15/25 | | 500 | 561 |
| 5% 8/15/26 | | 800 | 906 |
| Oklahoma Dev. Fin. Auth. Rev.: | | | |
| (Saint John Health Sys. Proj.) Series 2012, 5% 2/15/23 (Pre-Refunded to 2/15/22 @ 100) | | 2,545 | 2,778 |
| Series 2004 A, 2.375% 12/1/21 (a) | | 1,320 | 1,308 |
| Series 2012, 5% 2/15/21 (Escrowed to Maturity) | | 1,565 | 1,665 |
|
| TOTAL OKLAHOMA | | | 7,773 |
|
| Oregon - 0.5% | | | |
| Clackamas County Hosp. Facility Auth. (Willamette View Proj.) Series 2017 B, 3% 11/15/22 | | 390 | 390 |
| Oregon Bus. Dev. Commn Recovery Zone Facility Bonds (Intel Corp. Proj.) Series 232, 2.4%, tender 8/14/23 (a) | | 14,000 | 14,061 |
|
| TOTAL OREGON | | | 14,451 |
|
| Pennsylvania - 1.5% | | | |
| Lehigh County Indl. Dev. Auth. Poll. Cont. Rev. Bonds: | | | |
| (PPL Elec. Utils. Corp. Proj.) Series 2016 A, 1.8%, tender 9/1/22 (a) | | 2,445 | 2,369 |
| Series B, 1.8%, tender 8/15/22 (a) | | 3,245 | 3,145 |
| Montgomery County Higher Ed. & Health Auth. Rev. Series 2014 A: | | | |
| 4% 10/1/19 | | 645 | 651 |
| 5% 10/1/20 | | 1,230 | 1,278 |
| 5% 10/1/23 | | 190 | 208 |
| Pennsylvania Econ. Dev. Auth. Governmental Lease (Forum Place Proj.) Series 2012: | | | |
| 5% 3/1/19 | | 2,260 | 2,271 |
| 5% 3/1/20 | | 2,095 | 2,163 |
| Pennsylvania Econ. Dev. Fing. Auth. Solid Waste Disp. Rev. Bonds: | | | |
| (Waste Mgmt., Inc. Proj.) Series 2013, 2.15%, tender 2/1/19 (a)(c) | | 5,900 | 5,899 |
| (Waste Mgmt., Inc. Proj.): | | | |
| Series 2009, 2.8%, tender 12/1/21 (a) | | 1,700 | 1,704 |
| Series 2017 A, 1.7%, tender 8/3/20 (a)(c) | | 3,220 | 3,174 |
| Pennsylvania Gen. Oblig. Series 2011, 5% 7/1/21 | | 1,860 | 1,996 |
| Pennsylvania Higher Edl. Facilities Auth. Rev. Series 2014: | | | |
| 5% 12/1/19 | | 335 | 345 |
| 5% 12/1/21 | | 270 | 294 |
| 5% 12/1/22 | | 835 | 928 |
| Pennsylvania Indl. Dev. Auth. Rev. Series 2012, 5% 7/1/21 | | 1,140 | 1,222 |
| Pennsylvania Pub. School Bldg. Auth. School Rev. (The School District of Harrisburg Proj.) Series 2016 A, 5% 12/1/21 (FSA Insured) | | 4,890 | 5,258 |
| Philadelphia Arpt. Rev.: | | | |
| Series 2017 A, 5% 7/1/24 | | 490 | 560 |
| Series 2017 B, 5% 7/1/24 (c) | | 2,445 | 2,760 |
| Philadelphia Gas Works Rev. Series 15, 5% 8/1/21 | | 1,225 | 1,312 |
| Philadelphia School District Series 2018 A: | | | |
| 5% 9/1/24 | | 1,000 | 1,123 |
| 5% 9/1/25 | | 700 | 795 |
| 5% 9/1/26 | | 750 | 859 |
| Reading School District Series 2017: | | | |
| 5% 3/1/25 (FSA Insured) | | 320 | 365 |
| 5% 3/1/26 (FSA Insured) | | 260 | 300 |
| 5% 3/1/27 (FSA Insured) | | 250 | 291 |
| 5% 3/1/28 (FSA Insured) | | 245 | 285 |
| Southeastern Pennsylvania Trans. Auth. Rev. Series 2011, 5% 6/1/19 | | 195 | 197 |
| Unionville-Chadds Ford School District Gen. Oblig. Series 2009, 5% 6/1/20 | | 1,165 | 1,181 |
|
| TOTAL PENNSYLVANIA | | | 42,933 |
|
| Rhode Island - 1.2% | | | |
| Rhode Island Health & Edl. Bldg. Corp. Higher Ed. Facilities Rev.: | | | |
| Series 2013 A, 5% 5/15/19 | | 1,465 | 1,482 |
| Series 2016: | | | |
| 5% 5/15/20 | | 645 | 668 |
| 5% 5/15/21 | | 1,475 | 1,563 |
| 5% 5/15/22 | | 1,955 | 2,112 |
| 5% 5/15/23 | | 1,180 | 1,296 |
| 5% 5/15/24 | | 2,300 | 2,561 |
| 5% 5/15/25 | | 5,385 | 6,071 |
| Rhode Island Health & Edl. Bldg. Corp. Pub. Schools Rev.: | | | |
| (Providence Proj.) Series 2015 A, 3% 5/15/19 (FSA Insured) | | 6,275 | 6,303 |
| Series 2015, 5% 5/15/25 (FSA Insured) | | 5,910 | 6,793 |
| Tobacco Setlement Fing. Corp. Series 2015 A: | | | |
| 5% 6/1/26 | | 3,425 | 3,784 |
| 5% 6/1/27 | | 980 | 1,073 |
|
| TOTAL RHODE ISLAND | | | 33,706 |
|
| South Carolina - 0.7% | | | |
| Lancaster County School District ( South Carolina Gen. Oblig. Proj.) Series 2017, 5% 3/1/22 | | 2,020 | 2,212 |
| Lexington County Health Svcs. District, Inc. Hosp. Rev. Series 2011, 5% 11/1/19 | | 1,165 | 1,192 |
| Richland County School District #2 Gen. Oblig. (South Carolina Gen. Oblig. Proj.) Series 2015 A, 5% 2/1/23 | | 2,565 | 2,870 |
| Scago Edl. Facilities Corp. for Colleton School District (School District of Colleton County Proj.) Series 2015: | | | |
| 5% 12/1/23 | | 4,345 | 4,870 |
| 5% 12/1/26 | | 1,075 | 1,222 |
| South Carolina Jobs-Econ. Dev. Auth. Econ. Dev. Rev. (Bon Secours Health Sys. Proj.) Series 2013, 5% 11/1/28 (Pre-Refunded to 11/1/22 @ 100) | | 1,465 | 1,620 |
| South Carolina Pub. Svc. Auth. Rev.: | | | |
| Series 2012 B, 5% 12/1/20 | | 980 | 1,030 |
| Series 2014 C: | | | |
| 5% 12/1/22 | | 1,075 | 1,175 |
| 5% 12/1/23 | | 4,890 | 5,430 |
|
| TOTAL SOUTH CAROLINA | | | 21,621 |
|
| South Dakota - 0.1% | | | |
| South Dakota Health & Edl. Facilities Auth. Rev.: | | | |
| Series 2011, 5% 9/1/19 (Escrowed to Maturity) | | 1,230 | 1,256 |
| Series 2014 B: | | | |
| 4% 11/1/19 | | 390 | 397 |
| 4% 11/1/20 | | 610 | 632 |
| 4% 11/1/21 | | 490 | 517 |
| 5% 11/1/22 | | 365 | 403 |
|
| TOTAL SOUTH DAKOTA | | | 3,205 |
|
| Tennessee - 0.5% | | | |
| Johnson City Health & Edl. Hosp. Rev. Series 2010 A, 6.5% 7/1/38 (Pre-Refunded to 7/1/20 @ 100) | | 1,745 | 1,862 |
| Knox County Health Edl. & Hsg. Facilities Board Rev. Series 2016: | | | |
| 5% 9/1/25 | | 1,635 | 1,824 |
| 5% 9/1/26 | | 1,795 | 2,010 |
| Sumner County Gen. Oblig. Series 2011, 5% 6/1/22 | | 3,500 | 3,753 |
| Tennessee Energy Acquisition Corp. Bonds (Gas Rev. Proj.) Series A, 4%, tender 5/1/23 (a) | | 6,040 | 6,276 |
|
| TOTAL TENNESSEE | | | 15,725 |
|
| Texas - 11.5% | | | |
| Aledo Independent School District Series 2015, 0% 2/15/24 | | 1,195 | 1,062 |
| Carroll Independent School District Series 2009 C, 5.25% 2/15/19 | | 980 | 984 |
| Central Reg'l. Mobility Auth. Series 2016: | | | |
| 5% 1/1/21 | | 490 | 515 |
| 5% 1/1/22 | | 1,465 | 1,572 |
| 5% 1/1/23 | | 2,395 | 2,617 |
| 5% 1/1/24 | | 3,295 | 3,660 |
| 5% 1/1/26 | | 2,800 | 3,191 |
| Cypress-Fairbanks Independent School District Bonds: | | | |
| Series 2014 B2, 1.4%, tender 8/17/20 (a) | | 3,220 | 3,186 |
| Series 2014 B3, 1.4%, tender 8/17/20 (a) | | 3,485 | 3,448 |
| Series 2015 B2, 2.125%, tender 8/16/21 (a) | | 16,000 | 15,982 |
| Dallas County Gen. Oblig. Series 2016 5% 8/15/22 | | 3,445 | 3,806 |
| Dallas Fort Worth Int'l. Arpt. Rev.: | | | |
| Series 2013 F: | | | |
| 5% 11/1/19 | | 1,955 | 2,004 |
| 5% 11/1/20 | | 1,465 | 1,545 |
| 5% 11/1/21 | | 2,935 | 3,176 |
| 5% 11/1/22 | | 4,890 | 5,411 |
| Series 2014 D, 5% 11/1/23 (c) | | 1,905 | 2,124 |
| Dallas Independent School District Bonds: | | | |
| Series 2016 B3, 5%, tender 2/15/19 (a) | | 5,870 | 5,892 |
| Series 2016 B4, 5%, tender 2/15/20 (a) | | 6,845 | 7,070 |
| Series 2016 B5, 5%, tender 2/15/21 (a) | | 7,825 | 8,291 |
| Series 2016: | | | |
| 5%, tender 2/15/22 (a) | | 150 | 164 |
| 5%, tender 2/15/22 (a) | | 9,630 | 10,468 |
| Denton Independent School District Series 2016, 0% 8/15/25 | | 1,610 | 1,379 |
| Fort Bend Independent School District Bonds: | | | |
| Series C, 1.35%, tender 8/1/20 (a) | | 1,735 | 1,716 |
| Series D, 1.5%, tender 8/1/21 (a) | | 3,130 | 3,074 |
| Fort Worth Gen. Oblig. Series 2015 A, 5% 3/1/23 | | 1,670 | 1,858 |
| Fort Worth Independent School District Series 2015, 5% 2/15/22 | | 1,580 | 1,727 |
| Gregg County Health Facilities Dev. Series 2012 C, 5% 7/1/42 (Pre-Refunded to 7/1/22 @ 100) | | 6,135 | 6,745 |
| Harris County Flood Cont. District Series 2010 A, 5% 10/1/34 (Pre-Refunded to 10/1/20 @ 100) | | 1,500 | 1,581 |
| Houston Arpt. Sys. Rev.: | | | |
| Series 2012 A, 5% 7/1/23 (c) | | 1,955 | 2,119 |
| Series 2018 A: | | | |
| 5% 7/1/23 (c) | | 750 | 835 |
| 5% 7/1/25 (c) | | 1,550 | 1,777 |
| Houston Gen. Oblig. Series 2013 A, 5% 3/1/22 | | 5,520 | 6,034 |
| Houston Independent School District: | | | |
| Bonds: | | | |
| Series 2012, 2.4%, tender 6/1/21 (a) | | 12,235 | 12,306 |
| Series 2013 B, 2.4%, tender 6/1/21 (a) | | 5,880 | 5,914 |
| Series 2017, 3% 2/15/22 | | 13,810 | 14,263 |
| Humble Independent School District Series 2016 B, 5% 2/15/22 | | 3,970 | 4,337 |
| Leander Independent School District Series 2013 A, 0% 8/15/21 | | 1,870 | 1,775 |
| Lewisville Independent School District Series 1996, 0% 8/15/21 | | 2,110 | 1,997 |
| Lower Colorado River Auth. Rev. Series 2010 B, 5% 5/15/21 | | 2,965 | 3,083 |
| Mansfield Independent School District Series 2016, 5% 2/15/24 | | 4,185 | 4,775 |
| Mission Econ. Dev. Corp. Solid Waste Disp. Rev. Bonds (Republic Svcs., Inc. Proj.) Series 2008 A, 2.15%, tender 2/1/19 (a)(c) | | 4,300 | 4,299 |
| Newark Higher Ed. Fin. Corp. (Abilene Christian Univ. Proj.) Series 2016 A, 5% 4/1/26 | | 2,425 | 2,771 |
| North East Texas Independent School District Bonds Series 2013 B, 1.42%, tender 8/1/21 (a) | | 2,705 | 2,653 |
| North Harris County Reg'l. Wtr. Auth. Series 2013, 4% 12/15/22 | | 1,545 | 1,657 |
| North Texas Tollway Auth. Rev.: | | | |
| Bonds Series 2012 C, 1.95%, tender 1/1/19 (a) | | 8,315 | 8,315 |
| Series 2011 A, 5.5% 9/1/41 (Pre-Refunded to 9/1/21 @ 100) | | 16,800 | 18,343 |
| Series 2011 D, 5% 9/1/28 (Pre-Refunded to 9/1/21 @ 100) | | 4,100 | 4,424 |
| Northside Independent School District Bonds: | | | |
| Series 2011 A, 2%, tender 6/1/19 (a) | | 5,795 | 5,797 |
| 2%, tender 6/1/21 (a) | | 11,865 | 11,801 |
| Plano Independent School District Series 2016 A, 5% 2/15/22 | | 7,270 | 7,951 |
| Sam Rayburn Muni. Pwr. Agcy. Series 2012, 5% 10/1/20 | | 980 | 1,024 |
| San Antonio Elec. & Gas Sys. Rev. Bonds: | | | |
| Series 2015 B, 2%, tender 12/1/21 (a) | | 3,965 | 3,932 |
| Series 2018, 2.75%, tender 12/1/22 (a) | | 10,100 | 10,242 |
| San Antonio Pub. Facilities Corp. and Rfdg. Lease (Convention Ctr. Proj.) Series 2012: | | | |
| 5% 9/15/20 | | 980 | 1,032 |
| 5% 9/15/21 | | 980 | 1,056 |
| 5% 9/15/22 | | 3,365 | 3,699 |
| San Antonio Wtr. Sys. Rev.: | | | |
| Bonds Series 2013 F, 2%, tender 11/1/21 (a) | | 7,420 | 7,373 |
| Series 2012, 4% 5/15/19 | | 1,465 | 1,477 |
| Southwest Higher Ed. Auth. Rev. (Southern Methodist Univ. Proj.) Series 2016 A: | | | |
| 5% 10/1/20 | | 3,405 | 3,589 |
| 5% 10/1/21 | | 2,935 | 3,170 |
| Tarrant County Cultural Ed. Facilities Fin. Corp. Hosp. Rev.: | | | |
| (Scott & White Healthcare Proj.) Series 2013 A: | | | |
| 5% 8/15/21 | | 735 | 791 |
| 5% 8/15/23 | | 980 | 1,099 |
| Series 2013: | | | |
| 5% 9/1/19 | | 640 | 653 |
| 5% 9/1/20 | | 895 | 939 |
| Tarrant County Cultural Ed. Facilities Fin. Corp. Retirement Facility Rev. (Mrc Crestview Proj.) Series 2010, 8.125% 11/15/44 (Pre-Refunded to 11/15/20 @ 100) | | 2,875 | 3,196 |
| Tarrant County Cultural Ed. Facilities Fin. Corp. Rev.: | | | |
| Series 2016 A, 5% 2/15/26 | | 1,465 | 1,708 |
| Series 2017 A, 5% 2/15/24 | | 1,955 | 2,213 |
| Texas Gen. Oblig. Series 2018, 4% 8/1/21 (c) | | 2,340 | 2,457 |
| Texas Trans. Commission Central Texas Tpk. Sys. Rev. Bonds Series 2015 A, 5%, tender 4/1/20 (a) | | 17,160 | 17,763 |
| Texas Wtr. Dev. Board Rev. Series 2018 B: | | | |
| 5% 10/15/21 | | 3,750 | 4,066 |
| 5% 4/15/22 | | 5,500 | 6,038 |
| 5% 10/15/22 | | 3,170 | 3,520 |
| 5% 4/15/23 | | 4,000 | 4,490 |
| 5% 10/15/23 | | 2,000 | 2,268 |
| Tomball Independent School District Bonds Series 2014 B2, 2.125%, tender 8/15/21 (a) | | 4,920 | 4,916 |
| Trinity River Auth. Reg'l. Wastewtr. Sys. Rev. Series 2016, 5% 8/1/23 | | 1,550 | 1,750 |
| Univ. of Texas Board of Regents Sys. Rev.: | | | |
| Series 2010 B, 5% 8/15/21 | | 1,760 | 1,900 |
| Series 2010, 5% 8/15/22 | | 2,670 | 2,956 |
| Series 2016 E, 5% 8/15/22 | | 1,495 | 1,655 |
|
| TOTAL TEXAS | | | 332,446 |
|
| Utah - 0.5% | | | |
| Intermountain Pwr. Agcy. Pwr. Supply Rev. Series 2018 A, 5% 7/1/21 | | 12,655 | 13,613 |
| Virginia - 1.4% | | | |
| Chesapeake Trans. Sys. Toll Road Rev. Series 2012 A: | | | |
| 4% 7/15/20 | | 590 | 604 |
| 5% 7/15/21 | | 390 | 413 |
| Commonwealth Trans. Board Grant Anticipation Rev. Series 2012 A, 5% 9/15/22 (Pre-Refunded to 3/15/22 @ 100) | | 2,150 | 2,359 |
| Fairfax County Gen. Oblig. 5% 10/1/21 | | 2,935 | 3,183 |
| Fredericksburg Econ. Dev. Auth. Rev. Series 2014, 5% 6/15/24 | | 2,290 | 2,563 |
| Louisa Indl. Dev. Auth. Poll. Cont. Rev. Bonds Series 2008 B, 2.15%, tender 9/1/20 (a) | | 2,605 | 2,598 |
| Stafford County Econ. Dev. Auth. Hosp. Facilities Rev. Series 2016: | | | |
| 5% 6/15/24 | | 1,185 | 1,326 |
| 5% 6/15/25 | | 980 | 1,111 |
| 5% 6/15/26 | | 1,680 | 1,922 |
| Virginia Pub. Bldg. Auth. Pub. Facilities Rev.: | | | |
| Series 2013 A, 5% 8/1/22 | | 3,695 | 4,096 |
| Series 2016 A, 5% 8/1/22 | | 5,230 | 5,798 |
| Virginia Pub. School Auth. School Fing. Series 2015 A, 5% 8/1/22 | | 11,525 | 12,751 |
| York County Econ. Dev. Auth. Poll. Cont. Rev. Bonds (Virginia Elec. and Pwr. Co. Proj.) Series 2009 A, 1.875%, tender 5/16/19 (a) | | 2,445 | 2,442 |
|
| TOTAL VIRGINIA | | | 41,166 |
|
| Washington - 1.5% | | | |
| Grant County Pub. Util. District #2 Series 2012 A: | | | |
| 5% 1/1/20 | | 1,345 | 1,386 |
| 5% 1/1/21 | | 1,825 | 1,934 |
| Port of Seattle Rev. Series 2016 B: | | | |
| 5% 10/1/20 (c) | | 2,870 | 3,017 |
| 5% 10/1/21 (c) | | 2,720 | 2,931 |
| 5% 10/1/22 (c) | | 2,445 | 2,686 |
| 5% 10/1/23 (c) | | 2,965 | 3,320 |
| Tacoma Elec. Sys. Rev.: | | | |
| Series 2013 A: | | | |
| 4% 1/1/21 | | 195 | 203 |
| 4% 1/1/21 (Escrowed to Maturity) | | 1,760 | 1,832 |
| 5% 1/1/21 | | 1,730 | 1,837 |
| Series 2017: | | | |
| 5% 1/1/22 | | 785 | 855 |
| 5% 1/1/25 | | 660 | 764 |
| 5% 1/1/26 | | 390 | 459 |
| Tobacco Settlement Auth. Rev. Series 2013, 5% 6/1/22 | | 2,165 | 2,323 |
| Washington Fed. Hwy. Grant Anticipation Rev. (SR 520 Corridor Prog.) Series 2012 F, 5% 9/1/21 | | 5,070 | 5,477 |
| Washington Health Care Facilities Auth. Rev.: | | | |
| (Virginia Mason Med. Ctr. Proj.) Series 2017: | | | |
| 5% 8/15/25 | | 980 | 1,096 |
| 5% 8/15/26 | | 1,955 | 2,200 |
| 5% 8/15/27 | | 2,125 | 2,401 |
| Series 2012, 5% 12/1/42 (Pre-Refunded to 12/1/21 @ 100) | | 8,390 | 9,113 |
|
| TOTAL WASHINGTON | | | 43,834 |
|
| West Virginia - 0.4% | | | |
| West Virginia Econ. Dev. Auth. Solid Waste Disp. Facilities Rev. Bonds: | | | |
| (Appalachian Pwr. Co. Amos Proj.) Series 2011 A, 1.7%, tender 9/1/20 (a)(c) | | 6,610 | 6,477 |
| 1.9%, tender 4/1/19 (a) | | 6,150 | 6,144 |
|
| TOTAL WEST VIRGINIA | | | 12,621 |
|
| Wisconsin - 1.6% | | | |
| Madison Gen. Oblig. Series 2014 A, 5% 10/1/21 | | 3,145 | 3,411 |
| Milwaukee County Arpt. Rev. Series 2013 A: | | | |
| 5% 12/1/20 (c) | | 1,300 | 1,369 |
| 5% 12/1/22 (c) | | 1,440 | 1,581 |
| 5.25% 12/1/23 (c) | | 1,505 | 1,697 |
| Pub. Fin. Auth. Sr Liv Rev. (Mary's Woods At Marylhurst, Inc. Proj.): | | | |
| Series 2017 A: | | | |
| 5% 5/15/19 (d) | | 340 | 343 |
| 5% 5/15/23 (d) | | 365 | 389 |
| Series 2017 B-1 3.95% 11/15/24 (d) | | 210 | 211 |
| Series 2017 B-2, 3.5% 11/15/23 (d) | | 275 | 275 |
| Series 2017 B-3, 3% 11/15/22 (d) | | 370 | 370 |
| Wisconsin Health & Edl. Facilities: | | | |
| (Hosp. Sisters Svcs., Inc.) Series 2014 A, 5% 11/15/22 | | 3,305 | 3,645 |
| Bonds Series 2018 B: | | | |
| 5%, tender 1/25/23 (a) | | 8,000 | 8,866 |
| 5%, tender 1/31/24 (a) | | 8,810 | 9,948 |
| Series 2014: | | | |
| 4% 5/1/19 | | 280 | 281 |
| 5% 5/1/20 | | 400 | 413 |
| 5% 5/1/21 | | 625 | 659 |
| Wisconsin Health & Edl. Facilities Auth. Rev. Series 2012, 5% 10/1/21 | | 1,370 | 1,479 |
| Wisconsin St Gen. Fund Annual Appropriation Series 2019 A: | | | |
| 5% 5/1/21 (b) | | 2,000 | 2,137 |
| 5% 5/1/22 (b) | | 8,100 | 8,877 |
|
| TOTAL WISCONSIN | | | 45,951 |
|
| TOTAL MUNICIPAL BONDS | | | |
| (Cost $2,723,917) | | | 2,719,970 |
|
| Municipal Notes - 2.0% | | | |
| Illinois - 0.5% | | | |
| Chicago Board of Ed. Participating VRDN Series Floaters XG 01 08, 1.89% 1/7/19 (a)(f) | | 13,990 | $13,990 |
| New York - 0.5% | | | |
| Ithaca Gen. Oblig. BAN Series 2018 A, 2.75% 2/15/19 | | 8,400 | 8,409 |
| New York Metropolitan Trans. Auth. Rev. BAN: | | | |
| Series 2018 B, 5% 5/15/20 | | 3,500 | 3,636 |
| Series 2018 C, 5% 9/1/21 | | 3,435 | 3,681 |
|
| TOTAL NEW YORK | | | 15,726 |
|
| Texas - 1.0% | | | |
| Lower Neches Valley Auth. Indl. Dev. Corp. Rev. (ExxonMobil Proj.) Series 2010, 1.64% 1/2/19, VRDN (a) | | 1,030 | 1,030 |
| Port Arthur Navigation District Envir. Facilities Rev. (Motiva Enterprises LLC Proj.): | | | |
| Series 2001 A, 2.05% 1/2/19, VRDN (a) | | 1,825 | 1,825 |
| Series 2010 B, 2.05% 1/2/19, VRDN (a) | | 1,000 | 1,000 |
| Series 2010 D: | | | |
| 2.03% 1/7/19, VRDN (a) | | 4,500 | 4,500 |
| 2.1% 1/7/19, VRDN (a) | | 900 | 900 |
| Texas Gen. Oblig. TRAN Series 2018, 4% 8/29/19 | | 20,000 | 20,286 |
|
| TOTAL TEXAS | | | 29,541 |
|
| TOTAL MUNICIPAL NOTES | | | |
| (Cost $59,213) | | | 59,257 |
| | | Shares | Value (000s) |
|
| Money Market Funds - 2.7% | | | |
| Fidelity Municipal Cash Central Fund, 1.77% (g)(h) | | | |
| (Cost $78,095) | | 78,082,192 | 78,089 |
| TOTAL INVESTMENT IN SECURITIES - 98.8% | | | |
| (Cost $2,861,225) | | | 2,857,316 |
| NET OTHER ASSETS (LIABILITIES) - 1.2% | | | 34,508 |
| NET ASSETS - 100% | | | $2,891,824 |
Security Type Abbreviations
BAN – BOND ANTICIPATION NOTE
TRAN – TAX AND REVENUE ANTICIPATION NOTE
VRDN – VARIABLE RATE DEMAND NOTE (A debt instrument that is payable upon demand, either daily, weekly or monthly)
Legend
(a) Coupon rates for floating and adjustable rate securities reflect the rates in effect at period end.
(b) Security or a portion of the security purchased on a delayed delivery or when-issued basis.
(c) Private activity obligations whose interest is subject to the federal alternative minimum tax for individuals.
(d) Security exempt from registration under Rule 144A of the Securities Act of 1933. These securities may be resold in transactions exempt from registration, normally to qualified institutional buyers. At the end of the period, the value of these securities amounted to $27,652,000 or 1.0% of net assets.
(e) Coupon is indexed to a floating interest rate which may be multiplied by a specified factor and/or subject to caps or floors.
(f) Provides evidence of ownership in one or more underlying municipal bonds.
(g) Information in this report regarding holdings by state and security types does not reflect the holdings of the Fidelity Municipal Cash Central Fund.
(h) Affiliated fund that is available only to investment companies and other accounts managed by Fidelity Investments. The rate quoted is the annualized seven-day yield of the fund at period end. A complete unaudited listing of the fund's holdings as of its most recent quarter end is available upon request. In addition, each Fidelity Central Fund's financial statements, which are not covered by the Fund's Report of Independent Registered Public Accounting Firm, are available on the SEC's website or upon request.
Affiliated Central Funds
Information regarding fiscal year to date income earned by the Fund from investments in Fidelity Central Funds is as follows:
| Fund | Income earned |
| | (Amounts in thousands) |
| Fidelity Municipal Cash Central Fund | $70 |
| Total | $70 |
Amounts in the income column in the above table include any capital gain distributions from underlying funds, which are presented in the corresponding line-item in the Statement of Operations if applicable.
Investment Valuation
The following is a summary of the inputs used, as of December 31, 2018, involving the Fund's assets and liabilities carried at fair value. The inputs or methodology used for valuing securities may not be an indication of the risk associated with investing in those securities. For more information on valuation inputs, and their aggregation into the levels used below, please refer to the Investment Valuation section in the accompanying Notes to Financial Statements.
| | Valuation Inputs at Reporting Date: |
| Description | Total | Level 1 | Level 2 | Level 3 |
| (Amounts in thousands) | | | | |
| Investments in Securities: | | | | |
| Municipal Securities | $2,779,227 | $-- | $2,779,227 | $-- |
| Money Market Funds | 78,089 | 78,089 | -- | -- |
| Total Investments in Securities: | $2,857,316 | $78,089 | $2,779,227 | $-- |
Other Information
The distribution of municipal securities by revenue source, as a percentage of total Net Assets, is as follows (Unaudited):
| General Obligations | 36.7% |
| Transportation | 16.5% |
| Health Care | 12.3% |
| Electric Utilities | 7.9% |
| Others* (Individually Less Than 5%) | 26.6% |
| | 100.0% |
* Includes net other assets
See accompanying notes which are an integral part of the financial statements.
Financial Statements
Statement of Assets and Liabilities
| Amounts in thousands (except per-share amounts) | | December 31, 2018 |
| Assets | | |
Investment in securities, at value — See accompanying schedule:
Unaffiliated issuers (cost $2,783,130) | $2,779,227 | |
| Fidelity Central Funds (cost $78,095) | 78,089 | |
| Total Investment in Securities (cost $2,861,225) | | $2,857,316 |
| Cash | | 22,650 |
| Receivable for fund shares sold | | 8,249 |
| Interest receivable | | 31,636 |
| Distributions receivable from Fidelity Central Funds | | 34 |
| Prepaid expenses | | 4 |
| Other receivables | | 7 |
| Total assets | | 2,919,896 |
| Liabilities | | |
| Payable for investments purchased | | |
| Regular delivery | $2,740 | |
| Delayed delivery | 15,723 | |
| Payable for fund shares redeemed | 7,427 | |
| Distributions payable | 949 | |
| Accrued management fee | 839 | |
| Distribution and service plan fees payable | 63 | |
| Other affiliated payables | 268 | |
| Other payables and accrued expenses | 63 | |
| Total liabilities | | 28,072 |
| Net Assets | | $2,891,824 |
| Net Assets consist of: | | |
| Paid in capital | | $2,896,873 |
| Total distributable earnings (loss) | | (5,049) |
| Net Assets | | $2,891,824 |
| Net Asset Value and Maximum Offering Price | | |
| Class A: | | |
| Net Asset Value and redemption price per share ($154,923 ÷ 14,769 shares) | | $10.49 |
| Maximum offering price per share (100/97.25 of $10.49) | | $10.79 |
| Class M: | | |
| Net Asset Value and redemption price per share ($15,096 ÷ 1,442 shares) | | $10.47 |
| Maximum offering price per share (100/97.25 of $10.47) | | $10.77 |
| Class C: | | |
| Net Asset Value and offering price per share ($32,110 ÷ 3,067 shares)(a) | | $10.47 |
| Limited Term Municipal Income: | | |
| Net Asset Value, offering price and redemption price per share ($2,393,317 ÷ 228,556 shares) | | $10.47 |
| Class I: | | |
| Net Asset Value, offering price and redemption price per share ($268,839 ÷ 25,660 shares) | | $10.48 |
| Class Z: | | |
| Net Asset Value, offering price and redemption price per share ($27,539 ÷ 2,629 shares) | | $10.48 |
(a) Redemption price per share is equal to net asset value less any applicable contingent deferred sales charge.
See accompanying notes which are an integral part of the financial statements.
Statement of Operations
| Amounts in thousands | | Year ended December 31, 2018 |
| Investment Income | | |
| Interest | | $63,127 |
| Income from Fidelity Central Funds | | 70 |
| Total income | | 63,197 |
| Expenses | | |
| Management fee | $10,738 | |
| Transfer agent fees | 2,902 | |
| Distribution and service plan fees | 855 | |
| Accounting fees and expenses | 523 | |
| Custodian fees and expenses | 22 | |
| Independent trustees' fees and expenses | 14 | |
| Registration fees | 133 | |
| Audit | 65 | |
| Legal | 5 | |
| Miscellaneous | 22 | |
| Total expenses before reductions | 15,279 | |
| Expense reductions | (43) | |
| Total expenses after reductions | | 15,236 |
| Net investment income (loss) | | 47,961 |
| Realized and Unrealized Gain (Loss) | | |
| Net realized gain (loss) on: | | |
| Investment securities: | | |
| Unaffiliated issuers | (1,101) | |
| Redemptions in-kind with affiliated entities | 220 | |
| Total net realized gain (loss) | | (881) |
| Change in net unrealized appreciation (depreciation) on: | | |
| Investment securities: | | |
| Unaffiliated issuers | (12,214) | |
| Fidelity Central Funds | (6) | |
| Total change in net unrealized appreciation (depreciation) | | (12,220) |
| Net gain (loss) | | (13,101) |
| Net increase (decrease) in net assets resulting from operations | | $34,860 |
See accompanying notes which are an integral part of the financial statements.
Statement of Changes in Net Assets
| Amounts in thousands | Year ended December 31, 2018 | Year ended December 31, 2017 |
| Increase (Decrease) in Net Assets | | |
| Operations | | |
| Net investment income (loss) | $47,961 | $49,838 |
| Net realized gain (loss) | (881) | 3,266 |
| Change in net unrealized appreciation (depreciation) | (12,220) | 24,605 |
| Net increase (decrease) in net assets resulting from operations | 34,860 | 77,709 |
| Distributions to shareholders | (48,484) | – |
| Distributions to shareholders from net investment income | – | (49,775) |
| Distributions to shareholders from net realized gain | – | (2,284) |
| Total distributions | (48,484) | (52,059) |
| Share transactions - net increase (decrease) | (451,938) | (133,264) |
| Total increase (decrease) in net assets | (465,562) | (107,614) |
| Net Assets | | |
| Beginning of period | 3,357,386 | 3,465,000 |
| End of period | $2,891,824 | $3,357,386 |
| Other Information | | |
| Undistributed net investment income end of period | | $12 |
See accompanying notes which are an integral part of the financial statements.
Financial Highlights
Fidelity Limited Term Municipal Income Fund Class A
| Years ended December 31, | 2018 | 2017 | 2016 | 2015 | 2014 |
| Selected Per–Share Data | | | | | |
| Net asset value, beginning of period | $10.53 | $10.45 | $10.64 | $10.71 | $10.68 |
| Income from Investment Operations | | | | | |
| Net investment income (loss)A | .135 | .122 | .118 | .129 | .153 |
| Net realized and unrealized gain (loss) | (.038) | .086 | (.188) | (.048) | .046 |
| Total from investment operations | .097 | .208 | (.070) | .081 | .199 |
| Distributions from net investment income | (.135) | (.121) | (.118) | (.130) | (.153) |
| Distributions from net realized gain | (.002) | (.007) | (.002) | (.021) | (.016) |
| Total distributions | (.137) | (.128) | (.120) | (.151) | (.169) |
| Redemption fees added to paid in capitalA | – | – | –B | –B | –B |
| Net asset value, end of period | $10.49 | $10.53 | $10.45 | $10.64 | $10.71 |
| Total ReturnC,D | .93% | 2.00% | (.68)% | .76% | 1.87% |
| Ratios to Average Net AssetsE,F | | | | | |
| Expenses before reductions | .81% | .81% | .80% | .81% | .79% |
| Expenses net of fee waivers, if any | .81% | .81% | .80% | .81% | .79% |
| Expenses net of all reductions | .81% | .81% | .80% | .81% | .79% |
| Net investment income (loss) | 1.28% | 1.15% | 1.10% | 1.21% | 1.42% |
| Supplemental Data | | | | | |
| Net assets, end of period (in millions) | $155 | $234 | $317 | $377 | $397 |
| Portfolio turnover rateG | 27%H | 33% | 31% | 30% | 21% |
A Calculated based on average shares outstanding during the period.
B Amount represents less than $.0005 per share.
C Total returns would have been lower if certain expenses had not been reduced during the applicable periods shown.
D Total returns do not include the effect of the sales charges.
E Fees and expenses of any underlying Fidelity Central Funds are not included in the Fund's expense ratio. The Fund indirectly bears its proportionate share of the expenses of any underlying Fidelity Central Funds.
F Expense ratios reflect operating expenses of the class. Expenses before reductions do not reflect amounts reimbursed by the investment adviser or reductions from expense offset arrangements and do not represent the amount paid by the class during periods when reimbursements or reductions occur. Expenses net of fee waivers reflect expenses after reimbursement by the investment adviser but prior to reductions from expense offset arrangements. Expenses net of all reductions represent the net expenses paid by the class.
G Amount does not include the portfolio activity of any underlying Fidelity Central Funds.
H Portfolio turnover rate excludes securities received or delivered in-kind.
See accompanying notes which are an integral part of the financial statements.
Fidelity Limited Term Municipal Income Fund Class M
| Years ended December 31, | 2018 | 2017 | 2016 | 2015 | 2014 |
| Selected Per–Share Data | | | | | |
| Net asset value, beginning of period | $10.51 | $10.43 | $10.62 | $10.69 | $10.66 |
| Income from Investment Operations | | | | | |
| Net investment income (loss)A | .139 | .126 | .121 | .134 | .157 |
| Net realized and unrealized gain (loss) | (.038) | .087 | (.188) | (.049) | .046 |
| Total from investment operations | .101 | .213 | (.067) | .085 | .203 |
| Distributions from net investment income | (.139) | (.126) | (.121) | (.134) | (.157) |
| Distributions from net realized gain | (.002) | (.007) | (.002) | (.021) | (.016) |
| Total distributions | (.141) | (.133) | (.123) | (.155) | (.173) |
| Redemption fees added to paid in capitalA | – | – | –B | –B | –B |
| Net asset value, end of period | $10.47 | $10.51 | $10.43 | $10.62 | $10.69 |
| Total ReturnC,D | .98% | 2.04% | (.65)% | .80% | 1.91% |
| Ratios to Average Net AssetsE,F | | | | | |
| Expenses before reductions | .76% | .77% | .77% | .77% | .76% |
| Expenses net of fee waivers, if any | .76% | .76% | .77% | .77% | .76% |
| Expenses net of all reductions | .76% | .76% | .77% | .77% | .75% |
| Net investment income (loss) | 1.33% | 1.19% | 1.14% | 1.25% | 1.46% |
| Supplemental Data | | | | | |
| Net assets, end of period (in millions) | $15 | $17 | $20 | $22 | $25 |
| Portfolio turnover rateG | 27%H | 33% | 31% | 30% | 21% |
A Calculated based on average shares outstanding during the period.
B Amount represents less than $.0005 per share.
C Total returns would have been lower if certain expenses had not been reduced during the applicable periods shown.
D Total returns do not include the effect of the sales charges.
E Fees and expenses of any underlying Fidelity Central Funds are not included in the Fund's expense ratio. The Fund indirectly bears its proportionate share of the expenses of any underlying Fidelity Central Funds.
F Expense ratios reflect operating expenses of the class. Expenses before reductions do not reflect amounts reimbursed by the investment adviser or reductions from expense offset arrangements and do not represent the amount paid by the class during periods when reimbursements or reductions occur. Expenses net of fee waivers reflect expenses after reimbursement by the investment adviser but prior to reductions from expense offset arrangements. Expenses net of all reductions represent the net expenses paid by the class.
G Amount does not include the portfolio activity of any underlying Fidelity Central Funds.
H Portfolio turnover rate excludes securities received or delivered in-kind.
See accompanying notes which are an integral part of the financial statements.
Fidelity Limited Term Municipal Income Fund Class C
| Years ended December 31, | 2018 | 2017 | 2016 | 2015 | 2014 |
| Selected Per–Share Data | | | | | |
| Net asset value, beginning of period | $10.51 | $10.43 | $10.62 | $10.69 | $10.66 |
| Income from Investment Operations | | | | | |
| Net investment income (loss)A | .057 | .043 | .038 | .050 | .072 |
| Net realized and unrealized gain (loss) | (.038) | .087 | (.188) | (.049) | .046 |
| Total from investment operations | .019 | .130 | (.150) | .001 | .118 |
| Distributions from net investment income | (.057) | (.043) | (.038) | (.050) | (.072) |
| Distributions from net realized gain | (.002) | (.007) | (.002) | (.021) | (.016) |
| Total distributions | (.059) | (.050) | (.040) | (.071) | (.088) |
| Redemption fees added to paid in capitalA | – | – | –B | –B | –B |
| Net asset value, end of period | $10.47 | $10.51 | $10.43 | $10.62 | $10.69 |
| Total ReturnC,D | .19% | 1.24% | (1.42)% | .01% | 1.11% |
| Ratios to Average Net AssetsE,F | | | | | |
| Expenses before reductions | 1.55% | 1.55% | 1.55% | 1.55% | 1.54% |
| Expenses net of fee waivers, if any | 1.55% | 1.55% | 1.55% | 1.55% | 1.54% |
| Expenses net of all reductions | 1.54% | 1.55% | 1.55% | 1.55% | 1.54% |
| Net investment income (loss) | .55% | .41% | .35% | .47% | .67% |
| Supplemental Data | | | | | |
| Net assets, end of period (in millions) | $32 | $40 | $53 | $63 | $65 |
| Portfolio turnover rateG | 27%H | 33% | 31% | 30% | 21% |
A Calculated based on average shares outstanding during the period.
B Amount represents less than $.0005 per share.
C Total returns would have been lower if certain expenses had not been reduced during the applicable periods shown.
D Total returns do not include the effect of the contingent deferred sales charge.
E Fees and expenses of any underlying Fidelity Central Funds are not included in the Fund's expense ratio. The Fund indirectly bears its proportionate share of the expenses of any underlying Fidelity Central Funds.
F Expense ratios reflect operating expenses of the class. Expenses before reductions do not reflect amounts reimbursed by the investment adviser or reductions from expense offset arrangements and do not represent the amount paid by the class during periods when reimbursements or reductions occur. Expenses net of fee waivers reflect expenses after reimbursement by the investment adviser but prior to reductions from expense offset arrangements. Expenses net of all reductions represent the net expenses paid by the class.
G Amount does not include the portfolio activity of any underlying Fidelity Central Funds.
H Portfolio turnover rate excludes securities received or delivered in-kind.
See accompanying notes which are an integral part of the financial statements.
Fidelity Limited Term Municipal Income Fund
| Years ended December 31, | 2018 | 2017 | 2016 | 2015 | 2014 |
| Selected Per–Share Data | | | | | |
| Net asset value, beginning of period | $10.51 | $10.43 | $10.63 | $10.69 | $10.66 |
| Income from Investment Operations | | | | | |
| Net investment income (loss)A | .170 | .157 | .152 | .164 | .186 |
| Net realized and unrealized gain (loss) | (.038) | .087 | (.198) | (.039) | .046 |
| Total from investment operations | .132 | .244 | (.046) | .125 | .232 |
| Distributions from net investment income | (.170) | (.157) | (.152) | (.164) | (.186) |
| Distributions from net realized gain | (.002) | (.007) | (.002) | (.021) | (.016) |
| Total distributions | (.172) | (.164) | (.154) | (.185) | (.202) |
| Redemption fees added to paid in capitalA | – | – | –B | –B | –B |
| Net asset value, end of period | $10.47 | $10.51 | $10.43 | $10.63 | $10.69 |
| Total ReturnC | 1.28% | 2.35% | (.45)% | 1.18% | 2.19% |
| Ratios to Average Net AssetsD,E | | | | | |
| Expenses before reductions | .46% | .47% | .48% | .48% | .48% |
| Expenses net of fee waivers, if any | .46% | .47% | .48% | .48% | .48% |
| Expenses net of all reductions | .46% | .47% | .48% | .48% | .48% |
| Net investment income (loss) | 1.63% | 1.49% | 1.43% | 1.54% | 1.73% |
| Supplemental Data | | | | | |
| Net assets, end of period (in millions) | $2,393 | $2,740 | $2,779 | $3,058 | $3,225 |
| Portfolio turnover rateF | 27%G | 33% | 31% | 30% | 21% |
A Calculated based on average shares outstanding during the period.
B Amount represents less than $.0005 per share.
C Total returns would have been lower if certain expenses had not been reduced during the applicable periods shown.
D Fees and expenses of any underlying Fidelity Central Funds are not included in the Fund's expense ratio. The Fund indirectly bears its proportionate share of the expenses of any underlying Fidelity Central Funds.
E Expense ratios reflect operating expenses of the class. Expenses before reductions do not reflect amounts reimbursed by the investment adviser or reductions from expense offset arrangements and do not represent the amount paid by the class during periods when reimbursements or reductions occur. Expenses net of fee waivers reflect expenses after reimbursement by the investment adviser but prior to reductions from expense offset arrangements. Expenses net of all reductions represent the net expenses paid by the class.
F Amount does not include the portfolio activity of any underlying Fidelity Central Funds.
G Portfolio turnover rate excludes securities received or delivered in-kind.
See accompanying notes which are an integral part of the financial statements.
Fidelity Limited Term Municipal Income Fund Class I
| Years ended December 31, | 2018 | 2017 | 2016 | 2015 | 2014 |
| Selected Per–Share Data | | | | | |
| Net asset value, beginning of period | $10.51 | $10.44 | $10.63 | $10.70 | $10.67 |
| Income from Investment Operations | | | | | |
| Net investment income (loss)A | .162 | .149 | .145 | .156 | .179 |
| Net realized and unrealized gain (loss) | (.028) | .077 | (.188) | (.048) | .046 |
| Total from investment operations | .134 | .226 | (.043) | .108 | .225 |
| Distributions from net investment income | (.162) | (.149) | (.145) | (.157) | (.179) |
| Distributions from net realized gain | (.002) | (.007) | (.002) | (.021) | (.016) |
| Total distributions | (.164) | (.156) | (.147) | (.178) | (.195) |
| Redemption fees added to paid in capitalA | – | – | –B | –B | –B |
| Net asset value, end of period | $10.48 | $10.51 | $10.44 | $10.63 | $10.70 |
| Total ReturnC | 1.29% | 2.17% | (.42)% | 1.02% | 2.12% |
| Ratios to Average Net AssetsD,E | | | | | |
| Expenses before reductions | .54% | .54% | .55% | .55% | .55% |
| Expenses net of fee waivers, if any | .54% | .54% | .55% | .55% | .55% |
| Expenses net of all reductions | .54% | .54% | .54% | .55% | .54% |
| Net investment income (loss) | 1.55% | 1.42% | 1.36% | 1.47% | 1.67% |
| Supplemental Data | | | | | |
| Net assets, end of period (in millions) | $269 | $327 | $297 | $276 | $263 |
| Portfolio turnover rateF | 27%G | 33% | 31% | 30% | 21% |
A Calculated based on average shares outstanding during the period.
B Amount represents less than $.0005 per share.
C Total returns would have been lower if certain expenses had not been reduced during the applicable periods shown.
D Fees and expenses of any underlying Fidelity Central Funds are not included in the Fund's expense ratio. The Fund indirectly bears its proportionate share of the expenses of any underlying Fidelity Central Funds.
E Expense ratios reflect operating expenses of the class. Expenses before reductions do not reflect amounts reimbursed by the investment adviser or reductions from expense offset arrangements and do not represent the amount paid by the class during periods when reimbursements or reductions occur. Expenses net of fee waivers reflect expenses after reimbursement by the investment adviser but prior to reductions from expense offset arrangements. Expenses net of all reductions represent the net expenses paid by the class.
F Amount does not include the portfolio activity of any underlying Fidelity Central Funds.
G Portfolio turnover rate excludes securities received or delivered in-kind.
See accompanying notes which are an integral part of the financial statements.
Fidelity Limited Term Municipal Income Fund Class Z
| Year ended December 31, | 2018 A |
| Selected Per–Share Data | |
| Net asset value, beginning of period | $10.41 |
| Income from Investment Operations | |
| Net investment income (loss)B | .048 |
| Net realized and unrealized gain (loss) | .067 |
| Total from investment operations | .115 |
| Distributions from net investment income | (.045) |
| Distributions from net realized gain | – |
| Total distributions | (.045) |
| Net asset value, end of period | $10.48 |
| Total ReturnC,D | 1.11% |
| Ratios to Average Net AssetsE,F | |
| Expenses before reductions | .43%G |
| Expenses net of fee waivers, if any | .43%G |
| Expenses net of all reductions | .43%G |
| Net investment income (loss) | 1.78%G |
| Supplemental Data | |
| Net assets, end of period (in millions) | $28 |
| Portfolio turnover rateH | 27%I |
A For the period October 2, 2018 (commencement of sale of shares) to December 31, 2018.
B Calculated based on average shares outstanding during the period.
C Total returns for periods of less than one year are not annualized.
D Total returns would have been lower if certain expenses had not been reduced during the applicable periods shown.
E Fees and expenses of any underlying Fidelity Central Funds are not included in the Fund's expense ratio. The Fund indirectly bears its proportionate share of the expenses of any underlying Fidelity Central Funds.
F Expense ratios reflect operating expenses of the class. Expenses before reductions do not reflect amounts reimbursed by the investment adviser or reductions from expense offset arrangements and do not represent the amount paid by the class during periods when reimbursements or reductions occur. Expense ratios before reductions for start-up periods may not be representative of longer-term operating periods. Expenses net of fee waivers reflect expenses after reimbursement by the investment adviser but prior to reductions from expense offset arrangements. Expenses net of all reductions represent the net expenses paid by the class.
G Annualized
H Amount does not include the portfolio activity of any underlying Fidelity Central Funds.
I Portfolio turnover rate excludes securities received or delivered in-kind.
See accompanying notes which are an integral part of the financial statements.
Notes to Financial Statements
For the period ended December 31, 2018
(Amounts in thousands except percentages)
1. Organization.
Fidelity Limited Term Municipal Income Fund (the Fund) is a fund of Fidelity Municipal Trust (the Trust) and is authorized to issue an unlimited number of shares. The Trust is registered under the Investment Company Act of 1940, as amended (the 1940 Act), as an open-end management investment company organized as a Massachusetts business trust. The Fund commenced sale of Class Z shares on October 2, 2018. The Fund offers Class A, Class M, Class C, Limited Term Municipal Income, Class I and Class Z shares, each of which has equal rights as to assets and voting privileges. Each class has exclusive voting rights with respect to matters that affect that class.
2. Investments in Fidelity Central Funds.
The Fund invests in Fidelity Central Funds, which are open-end investment companies generally available only to other investment companies and accounts managed by the investment adviser and its affiliates. The Fund's Schedule of Investments lists each of the Fidelity Central Funds held as of period end, if any, as an investment of the Fund, but does not include the underlying holdings of each Fidelity Central Fund. As an Investing Fund, the Fund indirectly bears its proportionate share of the expenses of the underlying Fidelity Central Funds.
The Money Market Central Funds seek preservation of capital and current income and are managed by Fidelity Investments Money Management, Inc. (FIMM), an affiliate of the investment adviser. Annualized expenses of the Money Market Central Funds as of their most recent shareholder report date are less than .005%.
A complete unaudited list of holdings for each Fidelity Central Fund is available upon request or at the Securities and Exchange Commission (the SEC) website at www.sec.gov. In addition, the financial statements of the Fidelity Central Funds, which are not covered by the Fund's Report of Independent Registered Public Accounting Firm, are available on the SEC website or upon request.
3. Significant Accounting Policies.
The Fund is an investment company and applies the accounting and reporting guidance of the Financial Accounting Standards Board (FASB) Accounting Standards Codification Topic 946 Financial Services – Investments Companies. The financial statements have been prepared in conformity with accounting principles generally accepted in the United States of America (GAAP), which require management to make certain estimates and assumptions at the date of the financial statements. Actual results could differ from those estimates. Subsequent events, if any, through the date that the financial statements were issued have been evaluated in the preparation of the financial statements. The following summarizes the significant accounting policies of the Fund:
Investment Valuation. Investments are valued as of 4:00 p.m. Eastern time on the last calendar day of the period. The Board of Trustees (the Board) has delegated the day to day responsibility for the valuation of the Fund's investments to the Fair Value Committee (the Committee) established by the Fund's investment adviser. In accordance with valuation policies and procedures approved by the Board, the Fund attempts to obtain prices from one or more third party pricing vendors or brokers to value its investments. When current market prices, quotations or currency exchange rates are not readily available or reliable, investments will be fair valued in good faith by the Committee, in accordance with procedures adopted by the Board. Factors used in determining fair value vary by investment type and may include market or investment specific events, changes in interest rates and credit quality. The frequency with which these procedures are used cannot be predicted and they may be utilized to a significant extent. The Committee oversees the Fund's valuation policies and procedures and reports to the Board on the Committee's activities and fair value determinations. The Board monitors the appropriateness of the procedures used in valuing the Fund's investments and ratifies the fair value determinations of the Committee.
The Fund categorizes the inputs to valuation techniques used to value its investments into a disclosure hierarchy consisting of three levels as shown below:
- Level 1 – quoted prices in active markets for identical investments
- Level 2 – other significant observable inputs (including quoted prices for similar investments, interest rates, prepayment speeds, etc.)
- Level 3 – unobservable inputs (including the Fund's own assumptions based on the best information available)
Valuation techniques used to value the Fund's investments by major category are as follows:
Debt securities, including restricted securities, are valued based on evaluated prices received from third party pricing vendors or from brokers who make markets in such securities. Municipal securities are valued by pricing vendors who utilize matrix pricing which considers yield or price of bonds of comparable quality, coupon, maturity and type or by broker-supplied prices. When independent prices are unavailable or unreliable, debt securities may be valued utilizing pricing methodologies which consider similar factors that would be used by third party pricing vendors. Debt securities are generally categorized as Level 2 in the hierarchy but may be Level 3 depending on the circumstances.
Investments in open-end mutual funds, including the Fidelity Central Funds, are valued at their closing net asset value (NAV) each business day and are categorized as Level 1 in the hierarchy.
Changes in valuation techniques may result in transfers in or out of an assigned level within the disclosure hierarchy. The aggregate value of investments by input level as of December 31, 2018 is included at the end of the Fund's Schedule of Investments.
Investment Transactions and Income. For financial reporting purposes, the Fund's investment holdings and NAV include trades executed through the end of the last business day of the period. The NAV per share for processing shareholder transactions is calculated as of the close of business of the New York Stock Exchange (NYSE), normally 4:00 p.m. Eastern time and includes trades executed through the end of the prior business day. Gains and losses on securities sold are determined on the basis of identified cost. Interest income is accrued as earned and includes coupon interest and amortization of premium and accretion of discount on debt securities as applicable. Debt obligations may be placed on non-accrual status and related interest income may be reduced by ceasing current accruals and writing off interest receivables when the collection of all or a portion of interest has become doubtful based on consistently applied procedures. A debt obligation is removed from non-accrual status when the issuer resumes interest payments or when collectability of interest is reasonably assured.
Class Allocations and Expenses. Investment income, realized and unrealized capital gains and losses, common expenses of the Fund, and certain fund-level expense reductions, if any, are allocated daily on a pro-rata basis to each class based on the relative net assets of each class to the total net assets of the Fund. Each class differs with respect to transfer agent and distribution and service plan fees incurred. Certain expense reductions may also differ by class. For the reporting period, the allocated portion of income and expenses to each class as a percent of its average net assets may vary due to the timing of recording these transactions in relation to fluctuating net assets of the classes. Expenses directly attributable to a fund are charged to that fund. Expenses attributable to more than one fund are allocated among the respective funds on the basis of relative net assets or other appropriate methods. Expense estimates are accrued in the period to which they relate and adjustments are made when actual amounts are known.
Income Tax Information and Distributions to Shareholders. Each year, the Fund intends to qualify as a regulated investment company under Subchapter M of the Internal Revenue Code, including distributing substantially all of its taxable income and realized gains. As a result, no provision for U.S. Federal income taxes is required. As of December 31, 2018, the Fund did not have any unrecognized tax benefits in the financial statements; nor is the Fund aware of any tax positions for which it is reasonably possible that the total amounts of unrecognized tax benefits will significantly change in the next twelve months. The Fund files a U.S. federal tax return, in addition to state and local tax returns as required. The Fund's federal income tax returns are subject to examination by the Internal Revenue Service (IRS) for a period of three fiscal years after they are filed. State and local tax returns may be subject to examination for an additional fiscal year depending on the jurisdiction.
Distributions are declared and recorded daily and paid monthly from net investment income. Distributions from realized gains, if any, are declared and recorded on the ex-dividend date. Income and capital gain distributions are declared separately for each class. Income and capital gain distributions are determined in accordance with income tax regulations, which may differ from GAAP.
Capital accounts within the financial statements are adjusted for permanent book-tax differences. These adjustments have no impact on net assets or the results of operations. Capital accounts are not adjusted for temporary book-tax differences which will reverse in a subsequent period.
Book-tax differences are primarily due to market discount, redemptions in kind, deferred trustees compensation and losses deferred due to wash sales.
The Fund purchases municipal securities whose interest, in the opinion of the issuer, is free from federal income tax. There is no assurance that the (IRS) will agree with this opinion. In the event the IRS determines that the issuer does not comply with relevant tax requirements, interest payments from a security could become federally taxable, possibly retroactively to the date the security was issued.
As of period end, the cost and unrealized appreciation (depreciation) in securities, and derivatives if applicable, for federal income tax purposes were as follows:
| Gross unrealized appreciation | $13,525 |
| Gross unrealized depreciation | (17,419) |
| Net unrealized appreciation (depreciation) | $(3,894) |
| Tax Cost | $2,861,210 |
The tax-based components of distributable earnings as of period end were as follows:
| Capital loss carryforward | $(1,111) |
| Net unrealized appreciation (depreciation) on securities and other investments | $(3,894) |
Capital loss carryforwards are only available to offset future capital gains of the Fund to the extent provided by regulations and may be limited. Under the Regulated Investment Company Modernization Act of 2010 (the Act), the Fund is permitted to carry forward capital losses incurred in taxable years beginning after December 22, 2010 for an unlimited period and such capital losses are required to be used prior to any losses that expire. The capital loss carryforward information presented below, including any applicable limitation, is estimated as of fiscal period end and is subject to adjustment.
| No expiration | |
| Short-term | $(1,020) |
| Long-term | (91) |
| Total no expiration | $(1,111) |
| Total capital loss carryforward | $(1,111) |
The tax character of distributions paid was as follows:
| | December 31, 2018 | December 31, 2017 |
| Tax-exempt Income | $47,865 | $49,775 |
| Long-term Capital Gains | 619 | 2,284 |
| Total | $48,484 | $ 52,059 |
Delayed Delivery Transactions and When-Issued Securities. During the period, the Fund transacted in securities on a delayed delivery or when-issued basis. Payment and delivery may take place after the customary settlement period for that security. The price of the underlying securities and the date when the securities will be delivered and paid for are fixed at the time the transaction is negotiated. The securities purchased on a delayed delivery or when-issued basis are identified as such in the Fund's Schedule of Investments. The Fund may receive compensation for interest forgone in the purchase of a delayed delivery or when-issued security. With respect to purchase commitments, the Fund identifies securities as segregated in its records with a value at least equal to the amount of the commitment. Losses may arise due to changes in the value of the underlying securities or if the counterparty does not perform under the contract's terms, or if the issuer does not issue the securities due to political, economic, or other factors.
Restricted Securities. The Fund may invest in securities that are subject to legal or contractual restrictions on resale. These securities generally may be resold in transactions exempt from registration or to the public if the securities are registered. Disposal of these securities may involve time-consuming negotiations and expense, and prompt sale at an acceptable price may be difficult. Information regarding restricted securities is included at the end of the Fund's Schedule of Investments.
New Rule Issuance. During August 2018, the U.S. Securities and Exchange Commission issued Final Rule Release No. 33-10532, Disclosure Update and Simplification. This Final Rule includes amendments specific to registered investment companies that are intended to eliminate overlap in disclosure requirements between Regulation S-X and GAAP. In accordance with these amendments, certain line-items in the Fund's financial statements have been combined or removed for the current period as outlined in the table below.
| Financial Statement | Current Line-Item Presentation | Prior Line-Item Presentation |
| Statement of Assets and Liabilities | Total distributable earnings (loss) | Undistributed/Distributions in excess of/Accumulated net investment income (loss)
Accumulated/Undistributed net realized gain (loss)
Net unrealized appreciation (depreciation) |
| Statement of Changes in Net Assets | N/A - removed | Undistributed/Distributions in excess of/Accumulated net investment income (loss) end of period |
| Statement of Changes in Net Assets | Distributions to shareholders | Distributions to shareholders from net investment income
Distributions to shareholders from net realized gain |
| Distributions to Shareholders Note to Financial Statements | Distributions to shareholders | Distributions to shareholders from net investment income
Distributions to shareholders from net realized gain |
4. Purchases and Sales of Investments.
Purchases and sales of securities, other than short-term securities and in-kind transactions, aggregated $776,167 and $864,416, respectively.
5. Fees and Other Transactions with Affiliates.
Management Fee. Fidelity Management & Research Company (the investment adviser) and its affiliates provide the Fund with investment management related services for which the Fund pays a monthly management fee. The management fee is the sum of an individual fund fee rate that is based on an annual rate of .25% of the Fund's average net assets and an annualized group fee rate that averaged .11% during the period. The group fee rate is based upon the average net assets of all the mutual funds advised by the investment adviser, including any mutual funds previously advised by the investment adviser that are currently advised by Fidelity SelectCo, LLC, an affiliate of the investment adviser. The group fee rate decreases as assets under management increase and increases as assets under management decrease. For the reporting period, the total annual management fee rate was .36% of the Fund's average net assets.
Distribution and Service Plan Fees. In accordance with Rule 12b-1 of the 1940 Act, the Fund has adopted separate Distribution and Service Plans for each class of shares. Certain classes pay Fidelity Distributors Corporation (FDC), an affiliate of the investment adviser, separate Distribution and Service Fees, each of which is based on an annual percentage of each class' average net assets. In addition, FDC may pay financial intermediaries for selling shares of the Fund and providing shareholder support services. For the period, the Distribution and Service Fee rates, total fees and amounts retained by FDC were as follows:
| | Distribution Fee | Service Fee | Total Fees | Retained by FDC |
| Class A | -% | .25% | $468 | $33 |
| Class M | -% | .25% | 39 | – |
| Class C | .75% | .25% | 348 | 18 |
| | | | $855 | $51 |
Sales Load. FDC may receive a front-end sales charge of up to 2.75% for selling Class A shares and Class M shares, some of which is paid to financial intermediaries for selling shares of the Fund. Depending on the holding period, FDC may receive contingent deferred sales charges levied on Class A, Class M and Class C redemptions. The deferred sales charges are 1.00% for Class C shares, .75% or .50% for certain purchases of Class A shares and .25% for certain purchases of Class M shares.
For the period, sales charge amounts retained by FDC were as follows:
| | Retained by FDC |
| Class A | $1 |
| Class M | 8 |
| Class C(a) | 4 |
| | $13 |
(a) When Class C shares are initially sold, FDC pays commissions from its own resources to financial intermediaries through which the sales are made.
Transfer Agent Fees. Fidelity Investments Institutional Operations Company, Inc. (FIIOC), an affiliate of the investment adviser, is the transfer, dividend disbursing and shareholder servicing agent for the Fund. FIIOC receives account fees and asset-based fees that vary according to the account size and type of account of the shareholders of the respective classes of the Fund, except for Class Z. FIIOC receives an asset-based fee of Class Z's average net assets. FIIOC pays for typesetting, printing and mailing of shareholder reports, except proxy statements. For the period, transfer agent fees for each class were as follows:
| | Amount | % of Class-Level Average Net Assets |
| Class A | $328 | .18 |
| Class M | 20 | .13 |
| Class C | 57 | .16 |
| Limited Term Municipal Income | 1,995 | .08 |
| Class I | 500 | .16 |
| Class Z | 2 | .05(a) |
| | $2,902 | |
(a) Annualized
Accounting Fees. Fidelity Service Company, Inc. (FSC), an affiliate of the investment adviser, maintains the Fund's accounting records. The fee is based on the level of average net assets for each month. For the period, the fees were equivalent to an annual rate of .02%.
Interfund Trades. The Fund may purchase from or sell securities to other Fidelity Funds under procedures adopted by the Board. The procedures have been designed to ensure these interfund trades are executed in accordance with Rule 17a-7 of the 1940 Act. Interfund trades are included within the respective purchases and sales amounts shown in the Purchases and Sales of Investments note.
Affiliated Redemptions In-Kind. During the period, 6,984 shares of the Fund were redeemed in-kind for investments, including accrued interest, and cash with a value of $73,334. The net realized gain of $220 on investments delivered through in-kind redemptions is included in the accompanying Statement of Operations. The amount of the in-kind redemptions is included in share transactions in the accompanying Statement of Changes in Net Assets as well as the Notes to Financial Statements. The Fund recognized no gain or loss for federal income tax purposes.
6. Committed Line of Credit.
The Fund participates with other funds managed by the investment adviser or an affiliate in a $4.25 billion credit facility (the "line of credit") to be utilized for temporary or emergency purposes to fund shareholder redemptions or for other short-term liquidity purposes. The Fund has agreed to pay commitment fees on its pro-rata portion of the line of credit, which amounted to $9 and is reflected in Miscellaneous expenses on the Statement of Operations. During the period, the Fund did not borrow on this line of credit.
7. Expense Reductions.
Through arrangements with the Fund's custodian, credits realized as a result of certain uninvested cash balances were used to reduce the Fund's expenses. During the period, these credits reduced the Fund's custody expenses by $21.
During the period, credits reduced each class' transfer agent expense in the amount of less than five hundred dollars.
In addition, during the period the investment adviser reimbursed and/or waived a portion of fund-level operating expenses in the amount of $20.
8. Distributions to Shareholders.
Distributions to shareholders of each class were as follows:
| | Year ended
December 31, 2018(a) | Year ended
December 31, 2017 |
| Distributions to shareholders | | |
| Class A | $2,440 | $– |
| Class M | 211 | – |
| Class C | 196 | – |
| Limited Term Municipal Income | 40,730 | – |
| Class I | 4,853 | – |
| Class Z | 54 | – |
| Total | $48,484 | $– |
| From net investment income | | |
| Class A | $– | $3,137 |
| Class M | – | 217 |
| Class C | – | 188 |
| Limited Term Municipal Income | – | 41,725 |
| Class I | – | 4,508 |
| Total | $– | $49,775 |
| From net realized gain | | |
| Class A | $– | $164 |
| Class M | – | 12 |
| Class C | – | 28 |
| Limited Term Municipal Income | – | 1,861 |
| Class I | – | 219 |
| Total | $– | $2,284 |
(a) Distributions for Class Z are for the period October 2, 2018 (commencement of sale of shares) to December 31, 2018.
9. Share Transactions.
Share transactions for each class were as follows and may contain automatic conversions between classes or exchanges between affiliated funds:
| | Shares | Shares | Dollars | Dollars |
| | Year ended December 31, 2018 (a) | Year ended December 31, 2017 | Year ended December 31, 2018 (a) | Year ended December 31, 2017 |
| Class A | | | | |
| Shares sold | 3,881 | 6,469 | $40,594 | $68,276 |
| Reinvestment of distributions | 221 | 291 | 2,313 | 3,075 |
| Shares redeemed | (11,559) | (14,837) | (120,913) | (156,574) |
| Net increase (decrease) | (7,457) | (8,077) | $(78,006) | $(85,223) |
| Class M | | | | |
| Shares sold | 566 | 265 | $5,917 | $2,798 |
| Reinvestment of distributions | 19 | 21 | 202 | 219 |
| Shares redeemed | (765) | (553) | (7,999) | (5,829) |
| Net increase (decrease) | (180) | (267) | $(1,880) | $(2,812) |
| Class C | | | | |
| Shares sold | 439 | 368 | $4,574 | $3,894 |
| Reinvestment of distributions | 17 | 18 | 173 | 187 |
| Shares redeemed | (1,196) | (1,645) | (12,485) | (17,354) |
| Net increase (decrease) | (740) | (1,259) | $(7,738) | $(13,273) |
| Limited Term Municipal Income | | | | |
| Shares sold | 67,006 | 69,026 | $700,289 | $727,315 |
| Reinvestment of distributions | 2,921 | 3,031 | 30,494 | 31,978 |
| Shares redeemed | (102,066)(b) | (77,778) | (1,066,085)(b) | (819,524) |
| Net increase (decrease) | (32,139) | (5,721) | $(335,302) | $(60,231) |
| Class I | | | | |
| Shares sold | 11,071 | 15,546 | $115,733 | $164,081 |
| Reinvestment of distributions | 403 | 383 | 4,212 | 4,047 |
| Shares redeemed | (16,897) | (13,255) | (176,288) | (139,853) |
| Net increase (decrease) | (5,423) | 2,674 | $(56,343) | $28,275 |
| Class Z | | | | |
| Shares sold | 2,844 | – | $29,574 | $– |
| Reinvestment of distributions | 5 | – | 51 | – |
| Shares redeemed | (220) | – | (2,294) | – |
| Net increase (decrease) | 2,629 | – | $27,331 | $– |
(a) Share transactions for Class Z are for the period October 2, 2018 (commencement of sale of shares) to December 31, 2018
(b) Amount includes in-kind redemptions (see the Affiliated Redemptions In-Kind note for additional details)
10. Other.
The Fund's organizational documents provide former and current trustees and officers with a limited indemnification against liabilities arising in connection with the performance of their duties to the Fund. In the normal course of business, the Fund may also enter into contracts that provide general indemnifications. The Fund's maximum exposure under these arrangements is unknown as this would be dependent on future claims that may be made against the Fund. The risk of material loss from such claims is considered remote.
Report of Independent Registered Public Accounting Firm
To the Board of Trustees of Fidelity Municipal Trust and Shareholders of Fidelity Limited Term Municipal Income Fund:
Opinion on the Financial Statements
We have audited the accompanying statement of assets and liabilities, including the schedule of investments, of Fidelity Limited Term Municipal Income Fund (one of the funds constituting Fidelity Municipal Trust, referred to hereafter as the "Fund") as of December 31, 2018, the related statement of operations for the year ended December 31, 2018, the statement of changes in net assets for each of the two years in the period ended December 31, 2018, including the related notes, and the financial highlights for each of the periods indicated therein (collectively referred to as the “financial statements”). In our opinion, the financial statements present fairly, in all material respects, the financial position of the Fund as of December 31, 2018, the results of its operations for the year then ended, the changes in its net assets for each of the two years in the period ended December 31, 2018 and the financial highlights for each of the periods indicated therein in conformity with accounting principles generally accepted in the United States of America.
Basis for Opinion
These financial statements are the responsibility of the Fund’s management. Our responsibility is to express an opinion on the Fund’s financial statements based on our audits. We are a public accounting firm registered with the Public Company Accounting Oversight Board (United States) (PCAOB) and are required to be independent with respect to the Fund in accordance with the U.S. federal securities laws and the applicable rules and regulations of the Securities and Exchange Commission and the PCAOB.
We conducted our audits of these financial statements in accordance with the standards of the PCAOB. Those standards require that we plan and perform the audit to obtain reasonable assurance about whether the financial statements are free of material misstatement, whether due to error or fraud.
Our audits included performing procedures to assess the risks of material misstatement of the financial statements, whether due to error or fraud, and performing procedures that respond to those risks. Such procedures included examining, on a test basis, evidence regarding the amounts and disclosures in the financial statements. Our audits also included evaluating the accounting principles used and significant estimates made by management, as well as evaluating the overall presentation of the financial statements. Our procedures included confirmation of securities owned as of December 31, 2018 by correspondence with the custodian and brokers; when replies were not received from brokers, we performed other auditing procedures. We believe that our audits provide a reasonable basis for our opinion.
PricewaterhouseCoopers LLP
Boston, Massachusetts
February 13, 2019
We have served as the auditor of one or more investment companies in the Fidelity group of funds since 1932.
Trustees and Officers
The Trustees, Members of the Advisory Board (if any), and officers of the trust and fund, as applicable, are listed below. The Board of Trustees governs the fund and is responsible for protecting the interests of shareholders. The Trustees are experienced executives who meet periodically throughout the year to oversee the fund's activities, review contractual arrangements with companies that provide services to the fund, oversee management of the risks associated with such activities and contractual arrangements, and review the fund's performance. Each of the Trustees oversees 260 funds.
The Trustees hold office without limit in time except that (a) any Trustee may resign; (b) any Trustee may be removed by written instrument, signed by at least two-thirds of the number of Trustees prior to such removal; (c) any Trustee who requests to be retired or who has become incapacitated by illness or injury may be retired by written instrument signed by a majority of the other Trustees; and (d) any Trustee may be removed at any special meeting of shareholders by a two-thirds vote of the outstanding voting securities of the trust. Each Trustee who is not an interested person (as defined in the 1940 Act) of the trust and the fund is referred to herein as an Independent Trustee. Each Independent Trustee shall retire not later than the last day of the calendar year in which his or her 75th birthday occurs. The Independent Trustees may waive this mandatory retirement age policy with respect to individual Trustees. Officers and Advisory Board Members hold office without limit in time, except that any officer or Advisory Board Member may resign or may be removed by a vote of a majority of the Trustees at any regular meeting or any special meeting of the Trustees. Except as indicated, each individual has held the office shown or other offices in the same company for the past five years.
The fund’s Statement of Additional Information (SAI) includes more information about the Trustees. To request a free copy, call Fidelity at 1-877-208-0098.
Experience, Skills, Attributes, and Qualifications of the Trustees. The Governance and Nominating Committee has adopted a statement of policy that describes the experience, qualifications, attributes, and skills that are necessary and desirable for potential Independent Trustee candidates (Statement of Policy). The Board believes that each Trustee satisfied at the time he or she was initially elected or appointed a Trustee, and continues to satisfy, the standards contemplated by the Statement of Policy. The Governance and Nominating Committee also engages professional search firms to help identify potential Independent Trustee candidates who have the experience, qualifications, attributes, and skills consistent with the Statement of Policy. From time to time, additional criteria based on the composition and skills of the current Independent Trustees, as well as experience or skills that may be appropriate in light of future changes to board composition, business conditions, and regulatory or other developments, have also been considered by the professional search firms and the Governance and Nominating Committee. In addition, the Board takes into account the Trustees' commitment and participation in Board and committee meetings, as well as their leadership of standing and ad hoc committees throughout their tenure.
In determining that a particular Trustee was and continues to be qualified to serve as a Trustee, the Board has considered a variety of criteria, none of which, in isolation, was controlling. The Board believes that, collectively, the Trustees have balanced and diverse experience, qualifications, attributes, and skills, which allow the Board to operate effectively in governing the fund and protecting the interests of shareholders. Information about the specific experience, skills, attributes, and qualifications of each Trustee, which in each case led to the Board's conclusion that the Trustee should serve (or continue to serve) as a trustee of the fund, is provided below.
Board Structure and Oversight Function. Abigail P. Johnson is an interested person and currently serves as Chairman. The Trustees have determined that an interested Chairman is appropriate and benefits shareholders because an interested Chairman has a personal and professional stake in the quality and continuity of services provided to the fund. Independent Trustees exercise their informed business judgment to appoint an individual of their choosing to serve as Chairman, regardless of whether the Trustee happens to be independent or a member of management. The Independent Trustees have determined that they can act independently and effectively without having an Independent Trustee serve as Chairman and that a key structural component for assuring that they are in a position to do so is for the Independent Trustees to constitute a substantial majority for the Board. The Independent Trustees also regularly meet in executive session. Arthur E. Johnson serves as Chairman of the Independent Trustees and as such (i) acts as a liaison between the Independent Trustees and management with respect to matters important to the Independent Trustees and (ii) with management prepares agendas for Board meetings.
Fidelity® funds are overseen by different Boards of Trustees. The fund's Board oversees Fidelity's investment-grade bond, money market, asset allocation and certain equity funds, and other Boards oversee Fidelity's high income and other equity funds. The asset allocation funds may invest in Fidelity® funds that are overseen by such other Boards. The use of separate Boards, each with its own committee structure, allows the Trustees of each group of Fidelity® funds to focus on the unique issues of the funds they oversee, including common research, investment, and operational issues. On occasion, the separate Boards establish joint committees to address issues of overlapping consequences for the Fidelity® funds overseen by each Board.
The Trustees operate using a system of committees to facilitate the timely and efficient consideration of all matters of importance to the Trustees, the fund, and fund shareholders and to facilitate compliance with legal and regulatory requirements and oversight of the fund's activities and associated risks. The Board, acting through its committees, has charged FMR and its affiliates with (i) identifying events or circumstances the occurrence of which could have demonstrably adverse effects on the fund's business and/or reputation; (ii) implementing processes and controls to lessen the possibility that such events or circumstances occur or to mitigate the effects of such events or circumstances if they do occur; and (iii) creating and maintaining a system designed to evaluate continuously business and market conditions in order to facilitate the identification and implementation processes described in (i) and (ii) above. Because the day-to-day operations and activities of the fund are carried out by or through FMR, its affiliates, and other service providers, the fund's exposure to risks is mitigated but not eliminated by the processes overseen by the Trustees. While each of the Board's committees has responsibility for overseeing different aspects of the fund's activities, oversight is exercised primarily through the Operations and Audit Committees. In addition, an ad hoc Board committee of Independent Trustees has worked with FMR to enhance the Board's oversight of investment and financial risks, legal and regulatory risks, technology risks, and operational risks, including the development of additional risk reporting to the Board. Appropriate personnel, including but not limited to the fund's Chief Compliance Officer (CCO), FMR's internal auditor, the independent accountants, the fund's Treasurer and portfolio management personnel, make periodic reports to the Board's committees, as appropriate, including an annual review of Fidelity's risk management program for the Fidelity® funds. The responsibilities of each standing committee, including their oversight responsibilities, are described further under "Standing Committees of the Trustees."
Interested Trustees*:
Correspondence intended for a Trustee who is an interested person may be sent to Fidelity Investments, 245 Summer Street, Boston, Massachusetts 02210.
Name, Year of Birth; Principal Occupations and Other Relevant Experience+
Abigail P. Johnson (1961)
Year of Election or Appointment: 2009
Trustee
Chairman of the Board of Trustees
Ms. Johnson also serves as Trustee of other Fidelity® funds. Ms. Johnson serves as Chairman (2016-present), Chief Executive Officer (2014-present), and Director (2007-present) of FMR LLC (diversified financial services company), President of Fidelity Financial Services (2012-present) and President of Personal, Workplace and Institutional Services (2005-present). Ms. Johnson is Chairman and Director of FMR Co., Inc. (investment adviser firm, 2011-present) and Chairman and Director of FMR (investment adviser firm, 2011-present). Previously, Ms. Johnson served as Vice Chairman (2007-2016) and President (2013-2016) of FMR LLC, President and a Director of FMR (2001-2005), a Trustee of other investment companies advised by FMR, Fidelity Investments Money Management, Inc. (investment adviser firm), and FMR Co., Inc. (2001-2005), Senior Vice President of the Fidelity® funds (2001-2005), and managed a number of Fidelity® funds. Ms. Abigail P. Johnson and Mr. Arthur E. Johnson are not related.
Jennifer Toolin McAuliffe (1959)
Year of Election or Appointment: 2016
Trustee
Ms. McAuliffe also serves as Trustee of other Fidelity® funds. Ms. McAuliffe previously served as a Member of the Advisory Board of certain Fidelity® funds (2016) and as Co-Head of Fixed Income of Fidelity Investments Limited (now known as FIL Limited (FIL)) (diversified financial services company). Earlier roles at FIL included Director of Research for FIL’s credit and quantitative teams in London, Hong Kong and Tokyo. Ms. McAuliffe also was the Director of Research for taxable and municipal bonds at Fidelity Investments Money Management, Inc. Ms. McAuliffe is also a director or trustee of several not-for-profit entities.
* Determined to be an “Interested Trustee” by virtue of, among other things, his or her affiliation with the trust or various entities under common control with FMR.
+ The information includes the Trustee's principal occupation during the last five years and other information relating to the experience, attributes, and skills relevant to the Trustee's qualifications to serve as a Trustee, which led to the conclusion that the Trustee should serve as a Trustee for the fund.
Independent Trustees:
Correspondence intended for an Independent Trustee may be sent to Fidelity Investments, P.O. Box 55235, Boston, Massachusetts 02205-5235.
Name, Year of Birth; Principal Occupations and Other Relevant Experience+
Elizabeth S. Acton (1951)
Year of Election or Appointment: 2013
Trustee
Ms. Acton also serves as Trustee of other Fidelity® funds. Prior to her retirement in April 2012, Ms. Acton was Executive Vice President, Finance (2011-2012), Executive Vice President, Chief Financial Officer (2002-2011), and Treasurer (2004-2005) of Comerica Incorporated (financial services). Prior to joining Comerica, Ms. Acton held a variety of positions at Ford Motor Company (1983-2002), including Vice President and Treasurer (2000-2002) and Executive Vice President and Chief Financial Officer of Ford Motor Credit Company (1998-2000). Ms. Acton currently serves as a member of the Board of Directors and Audit and Finance Committees of Beazer Homes USA, Inc. (homebuilding, 2012-present). Previously, Ms. Acton served as a Member of the Advisory Board of certain Fidelity® funds (2013-2016).
Ann E. Dunwoody (1953)
Year of Election or Appointment: 2018
Trustee
General Dunwoody also serves as Trustee of other Fidelity® funds. General Dunwoody (United States Army, Retired) was the first woman in U.S. military history to achieve the rank of four-star general and prior to her retirement in 2012 held a variety of positions within the U.S. Army, including Commanding General, U.S. Army Material Command (2008-2012). She is the President of First to Four LLC (leadership and mentoring services, 2012-present). She also serves as a member of the Board of Directors and Nominating and Corporate Governance Committee of L3 Technologies, Inc. (communication, electronic, sensor, and aerospace systems, 2013-present), Board of Directors and Nomination and Corporate Governance Committees of Kforce Inc. (professional staffing services, 2016-present) and Board of Directors of Automattic Inc. (software engineering, 2018-present). Previously, General Dunwoody served as a Member of the Advisory Board of certain Fidelity® funds (2018), a member of the Board of Directors and Audit and Sustainability and Corporate Responsibility Committees of Republic Services, Inc. (waste collection, disposal and recycling, 2013-2016). Ms. Dunwoody also serves on several boards for non-profit organizations, including as a member of the Board of Directors, Chair of the Nomination and Governance Committee and member of the Audit Committee of Logistics Management Institute (consulting non-profit, 2012-present), a member of the Board of Directors of the Army Historical Foundation (2015-present), a member of the Council of Trustees for the Association of the United States Army (advocacy non-profit, 2013-present) and a member of the Board of Trustees of Florida Institute of Technology (2015-present) and ThanksUSA (military family education non-profit, 2014-present).
John Engler (1948)
Year of Election or Appointment: 2014
Trustee
Mr. Engler also serves as Trustee of other Fidelity® funds. He serves on the board of directors for Universal Forest Products (manufacturer and distributor of wood and wood-alternative products, 2003-present) and K12 Inc. (technology-based education company, 2012-present). Previously, Mr. Engler served as interim president of Michigan State University (2018-2019), a Member of the Advisory Board of certain Fidelity® funds (2014-2016), president of the Business Roundtable (2011-2017), a trustee of The Munder Funds (2003-2014), president and CEO of the National Association of Manufacturers (2004-2011), member of the Board of Trustees of the Annie E. Casey Foundation (2004-2015), and as governor of Michigan (1991-2003). He is a past chairman of the National Governors Association.
Robert F. Gartland (1951)
Year of Election or Appointment: 2010
Trustee
Mr. Gartland also serves as Trustee of other Fidelity® funds. Mr. Gartland is Chairman and an investor in Gartland & Mellina Group Corp. (consulting, 2009-present). Previously, Mr. Gartland served as a partner and investor of Vietnam Partners LLC (investments and consulting, 2008-2011). Prior to his retirement, Mr. Gartland held a variety of positions at Morgan Stanley (financial services, 1979-2007), including Managing Director (1987-2007), and Chase Manhattan Bank (1975-1978).
Arthur E. Johnson (1947)
Year of Election or Appointment: 2008
Trustee
Chairman of the Independent Trustees
Mr. Johnson also serves as Trustee of other Fidelity® funds. Mr. Johnson serves as a member of the Board of Directors of Eaton Corporation plc (diversified power management, 2009-present) and Booz Allen Hamilton (management consulting, 2011-present). Prior to his retirement, Mr. Johnson served as Senior Vice President of Corporate Strategic Development of Lockheed Martin Corporation (defense contractor, 1999-2009). He previously served on the Board of Directors of IKON Office Solutions, Inc. (1999-2008), AGL Resources, Inc. (holding company, 2002-2016), and Delta Airlines (2005-2007). Mr. Arthur E. Johnson is not related to Ms. Abigail P. Johnson.
Michael E. Kenneally (1954)
Year of Election or Appointment: 2009
Trustee
Vice Chairman of the Independent Trustees
Mr. Kenneally also serves as Trustee of other Fidelity® funds. Prior to his retirement, Mr. Kenneally served as Chairman and Global Chief Executive Officer of Credit Suisse Asset Management. Before joining Credit Suisse, he was an Executive Vice President and Chief Investment Officer for Bank of America Corporation. Earlier roles at Bank of America included Director of Research, Senior Portfolio Manager and Research Analyst, and Mr. Kenneally was awarded the Chartered Financial Analyst (CFA) designation in 1991.
Marie L. Knowles (1946)
Year of Election or Appointment: 2001
Trustee
Ms. Knowles also serves as Trustee of other Fidelity® funds. Prior to Ms. Knowles' retirement in June 2000, she served as Executive Vice President and Chief Financial Officer of Atlantic Richfield Company (ARCO) (diversified energy, 1996-2000). From 1993 to 1996, she was a Senior Vice President of ARCO and President of ARCO Transportation Company (pipeline and tanker operations). Ms. Knowles currently serves as a Director and Chairman of the Audit Committee of McKesson Corporation (healthcare service, since 2002). Ms. Knowles is a member of the Board of the Santa Catalina Island Company (real estate, 2009-present). Ms. Knowles is a Member of the Investment Company Institute Board of Governors and a Member of the Governing Council of the Independent Directors Council (2014-present). She also serves as a member of the Advisory Board for the School of Engineering of the University of Southern California. Previously, Ms. Knowles served as a Director of Phelps Dodge Corporation (copper mining and manufacturing, 1994-2007), URS Corporation (engineering and construction, 2000-2003) and America West (airline, 1999-2002). Ms. Knowles previously served as Chairman (2015-2018) and Vice Chairman (2012-2015) of the Independent Trustees of certain Fidelity® funds.
Mark A. Murray (1954)
Year of Election or Appointment: 2016
Trustee
Mr. Murray also serves as Trustee of other Fidelity® funds. Mr. Murray is Vice Chairman (2013-present) of Meijer, Inc. (regional retail chain). Previously, Mr. Murray served as a Member of the Advisory Board of certain Fidelity® funds (2016) and as Co-Chief Executive Officer (2013-2016) and President (2006-2013) of Meijer, Inc. Mr. Murray serves as a member of the Board of Directors and Nuclear Review and Public Policy and Responsibility Committees of DTE Energy Company (diversified energy company, 2009-present). Mr. Murray also serves as a member of the Board of Directors of Spectrum Health (not-for-profit health system, 2015-present). Mr. Murray previously served as President of Grand Valley State University (2001-2006), Treasurer for the State of Michigan (1999-2001), Vice President of Finance and Administration for Michigan State University (1998-1999), and a member of the Board of Directors and Audit Committee and Chairman of the Nominating and Corporate Governance Committee of Universal Forest Products, Inc. (manufacturer and distributor of wood and wood-alternative products, 2004-2016). Mr. Murray is also a director or trustee of many community and professional organizations.
+ The information includes the Trustee's principal occupation during the last five years and other information relating to the experience, attributes, and skills relevant to the Trustee's qualifications to serve as a Trustee, which led to the conclusion that the Trustee should serve as a Trustee for the fund.
Advisory Board Members and Officers:
Correspondence intended for an officer may be sent to Fidelity Investments, 245 Summer Street, Boston, Massachusetts 02210. Officers appear below in alphabetical order.
Name, Year of Birth; Principal Occupation
Elizabeth Paige Baumann (1968)
Year of Election or Appointment: 2017
Anti-Money Laundering (AML) Officer
Ms. Baumann also serves as AML Officer of other funds. She is Chief AML Officer (2012-present) and Senior Vice President (2014-present) of FMR LLC (diversified financial services company) and is an employee of Fidelity Investments. Previously, Ms. Baumann served as AML Officer of the funds (2012-2016), and Vice President (2007-2014) and Deputy Anti-Money Laundering Officer (2007-2012) of FMR LLC.
Craig S. Brown (1977)
Year of Election or Appointment: 2019
Assistant Treasurer
Mr. Brown also serves as Assistant Treasurer of other funds. Mr. Brown is an employee of Fidelity Investments (2013-present).
John J. Burke III (1964)
Year of Election or Appointment: 2018
Chief Financial Officer
Mr. Burke also serves as Chief Financial Officer of other funds. Mr. Burke serves as Head of Investment Operations for Fidelity Fund and Investment Operations (2018-present) and is an employee of Fidelity Investments (1998-present). Previously Mr. Burke served as head of Asset Management Investment Operations (2012-2018).
William C. Coffey (1969)
Year of Election or Appointment: 2018
Secretary and Chief Legal Officer (CLO)
Mr. Coffey also serves as Secretary and CLO of other funds. Mr. Coffey serves as CLO, Secretary, and Senior Vice President of Fidelity Management & Research Company and FMR Co., Inc. (investment adviser firms, 2018-present); Secretary of Fidelity SelectCo, LLC and Fidelity Investments Money Management, Inc. (investment adviser firms, 2018-present); and CLO of Fidelity Management & Research (Hong Kong) Limited, FMR Investment Management (UK) Limited, and Fidelity Management & Research (Japan) Limited (investment adviser firms, 2018-present). He is Senior Vice President and Deputy General Counsel of FMR LLC (diversified financial services company, 2010-present), and is an employee of Fidelity Investments. Previously, Mr. Coffey served as Assistant Secretary of certain funds (2009-2018) and as Vice President and Associate General Counsel of FMR LLC (2005-2009).
Jonathan Davis (1968)
Year of Election or Appointment: 2010
Assistant Treasurer
Mr. Davis also serves as Assistant Treasurer of other funds. Mr. Davis serves as Assistant Treasurer of FMR Capital, Inc. (2017-present) and is an employee of Fidelity Investments. Previously, Mr. Davis served as Vice President and Associate General Counsel of FMR LLC (diversified financial services company, 2003-2010).
Adrien E. Deberghes (1967)
Year of Election or Appointment: 2010
Assistant Treasurer
Mr. Deberghes also serves as an officer of other funds. He serves as Assistant Treasurer of FMR Capital, Inc. (2017-present), Executive Vice President of Fidelity Investments Money Management, Inc. (FIMM) (investment adviser firm, 2016-present), and is an employee of Fidelity Investments (2008-present). Previously, Mr. Deberghes served as President and Treasurer of certain Fidelity® funds (2013-2018). Prior to joining Fidelity Investments, Mr. Deberghes was Senior Vice President of Mutual Fund Administration at State Street Corporation (2007-2008), Senior Director of Mutual Fund Administration at Investors Bank & Trust (2005-2007), and Director of Finance for Dunkin' Brands (2000-2005). Previously, Mr. Deberghes served in other fund officer roles.
Laura M. Del Prato (1964)
Year of Election or Appointment: 2018
President and Treasurer
Ms. Del Prato also serves as an officer of other funds. Ms. Del Prato is an employee of Fidelity Investments (2017-present). Prior to joining Fidelity Investments, Ms. Del Prato served as a Managing Director and Treasurer of the JPMorgan Mutual Funds (2014-2017). Prior to JPMorgan, Ms. Del Prato served as a partner at Cohen Fund Audit Services (accounting firm, 2012-2013) and KPMG LLP (accounting firm, 2004-2012).
Colm A. Hogan (1973)
Year of Election or Appointment: 2016
Assistant Treasurer
Mr. Hogan also serves as an officer of other funds. Mr. Hogan serves as Assistant Treasurer of FMR Capital, Inc. (2017-present) and is an employee of Fidelity Investments (2005-present). Previously, Mr. Hogan served as Assistant Treasurer of certain Fidelity® funds (2016-2018).
Chris Maher (1972)
Year of Election or Appointment: 2013
Assistant Treasurer
Mr. Maher serves as Assistant Treasurer of other funds. Mr. Maher is Vice President of Valuation Oversight, serves as Assistant Treasurer of FMR Capital, Inc. (2017-present), and is an employee of Fidelity Investments. Previously, Mr. Maher served as Vice President of Asset Management Compliance (2013), Vice President of the Program Management Group of FMR (investment adviser firm, 2010-2013), and Vice President of Valuation Oversight (2008-2010).
John B. McGinty, Jr. (1962)
Year of Election or Appointment: 2016
Chief Compliance Officer
Mr. McGinty also serves as Chief Compliance Officer of other funds. Mr. McGinty is Senior Vice President of Asset Management Compliance for Fidelity Investments and is an employee of Fidelity Investments (2016-present). Mr. McGinty previously served as Vice President, Senior Attorney at Eaton Vance Management (investment management firm, 2015-2016), and prior to Eaton Vance as global CCO for all firm operations and registered investment companies at GMO LLC (investment management firm, 2009-2015). Before joining GMO LLC, Mr. McGinty served as Senior Vice President, Deputy General Counsel for Fidelity Investments (2007-2009).
Jason P. Pogorelec (1975)
Year of Election or Appointment: 2015
Assistant Secretary
Mr. Pogorelec also serves as Assistant Secretary of other funds. Mr. Pogorelec serves as Vice President, Associate General Counsel (2010-present) and is an employee of Fidelity Investments (2006-present).
Nancy D. Prior (1967)
Year of Election or Appointment: 2014
Vice President
Ms. Prior also serves as Vice President of other funds. Ms. Prior serves as President Fixed Income, High Income/Emerging Market Debt and Multi Asset Class Strategies of FIAM LLC (2018-present), President (2016-present) and Director (2014-present) of Fidelity Investments Money Management, Inc. (FIMM) (investment adviser firm), President, Fixed Income (2014-present), and is an employee of Fidelity Investments (2002-present). Previously, Ms. Prior served as Vice Chairman of FIAM LLC (investment adviser firm, 2014-2018), a Director of FMR Investment Management (UK) Limited (investment adviser firm, 2015-2018), President Multi-Asset Class Strategies of FMR's Global Asset Allocation Division (2017-2018), Vice President of Fidelity's Money Market Funds (2012-2014), President, Money Market and Short Duration Bond Group of Fidelity Management & Research (FMR) (investment adviser firm, 2013-2014), President, Money Market Group of FMR (2011-2013), Managing Director of Research (2009-2011), Senior Vice President and Deputy General Counsel (2007-2009), and Assistant Secretary of certain Fidelity® funds (2008-2009).
Stacie M. Smith (1974)
Year of Election or Appointment: 2013
Assistant Treasurer
Ms. Smith also serves as an officer of other funds. Ms. Smith serves as Assistant Treasurer of FMR Capital, Inc. (2017-present), is an employee of Fidelity Investments (2009-present), and has served in other fund officer roles. Prior to joining Fidelity Investments, Ms. Smith served as Senior Audit Manager of Ernst & Young LLP (accounting firm, 1996-2009). Previously, Ms. Smith served as Assistant Treasurer (2013-2018) and Deputy Treasurer (2013-2016) of certain Fidelity® funds.
Marc L. Spector (1972)
Year of Election or Appointment: 2016
Deputy Treasurer
Mr. Spector also serves as an officer of other funds. Mr. Spector serves as Assistant Treasurer of FMR Capital, Inc. (2017-present) and is an employee of Fidelity Investments (2016-present). Prior to joining Fidelity Investments, Mr. Spector served as Director at the Siegfried Group (accounting firm, 2013-2016), and prior to Siegfried Group as audit senior manager at Deloitte & Touche (accounting firm, 2005-2013).
Jim Wegmann (1979)
Year of Election or Appointment: 2019
Assistant Treasurer
Mr. Wegmann also serves as Assistant Treasurer of other funds. Mr. Wegmann is an employee of Fidelity Investments (2011-present).
Shareholder Expense Example
As a shareholder of the Fund, you incur two types of costs: (1) transaction costs, including sales charges (loads) on purchase payments or redemption proceeds, and (2) ongoing costs, including management fees, distribution and/or service (12b-1) fees and other Fund expenses. This Example is intended to help you understand your ongoing costs (in dollars) of investing in the Fund and to compare these costs with the ongoing costs of investing in other mutual funds.
The actual expense Example is based on an investment of $1,000 invested at the beginning of the period and held for the entire period (July 1, 2018 to December 31, 2018) for Class A, Class M, Class C, and Class I and for the period (October 2, 2018 to December 31, 2018) for Class Z. The hypothetical expense Example is based on an investment of $1,000 invested for the one-half year period (July 1, 2018 to December 31, 2018).
Actual Expenses
The first line of the accompanying table for each class of the Fund provides information about actual account values and actual expenses. You may use the information in this line, together with the amount you invested, to estimate the expenses that you paid over the period. Simply divide your account value by $1,000.00 (for example, an $8,600 account value divided by $1,000.00 = 8.6), then multiply the result by the number in the first line for a class of the Fund under the heading entitled "Expenses Paid During Period" to estimate the expenses you paid on your account during this period. A small balance maintenance fee of $12.00 that is charged once a year may apply for certain accounts with a value of less than $2,000. This fee, which was eliminated effective August 1, 2018, is not included in the table below. If it was, the estimate of expenses you paid during the period would be higher, and your ending account value lower, by this amount. In addition, the Fund, as a shareholder in the underlying Fidelity Central Funds, will indirectly bear its pro-rata share of the fees and expenses incurred by the underlying Fidelity Central Funds. These fees and expenses are not included in the Fund's annualized expense ratio used to calculate the expense estimate in the table below.
Hypothetical Example for Comparison Purposes
The second line of the accompanying table for each class of the Fund provides information about hypothetical account values and hypothetical expenses based on a Class' actual expense ratio and an assumed rate of return of 5% per year before expenses, which is not the Class' actual return. The hypothetical account values and expenses may not be used to estimate the actual ending account balance or expenses you paid for the period. You may use this information to compare the ongoing costs of investing in the Fund and other funds. To do so, compare this 5% hypothetical example with the 5% hypothetical examples that appear in the shareholder reports of the other funds. A small balance maintenance fee of $12.00 that is charged once a year may apply for certain accounts with a value of less than $2,000. This fee, which was eliminated effective August 1, 2018, is not included in the table below. If it was, the estimate of expenses you paid during the period would be higher, and your ending account value lower, by this amount. In addition, the Fund, as a shareholder in the underlying Fidelity Central Funds, will indirectly bear its pro-rata share of the fees and expenses incurred by the underlying Fidelity Central Funds. These fees and expenses are not included in the Fund's annualized expense ratio used to calculate the expense estimate in the table below.
Please note that the expenses shown in the table are meant to highlight your ongoing costs only and do not reflect any transaction costs. Therefore, the second line of the table is useful in comparing ongoing costs only, and will not help you determine the relative total costs of owning different funds. In addition, if these transactional costs were included, your costs would have been higher.
| | Annualized Expense Ratio-A | Beginning
Account Value
| Ending
Account Value
December 31, 2018 | Expenses Paid
During Period
|
| Class A | .80% | | | |
| Actual | | $1,000.00 | $1,008.70 | $4.05-B |
| Hypothetical-C | | $1,000.00 | $1,021.17 | $4.08-D |
| Class M | .75% | | | |
| Actual | | $1,000.00 | $1,009.00 | $3.80-B |
| Hypothetical-C | | $1,000.00 | $1,021.42 | $3.82-D |
| Class C | 1.53% | | | |
| Actual | | $1,000.00 | $1,005.00 | $7.73-B |
| Hypothetical-C | | $1,000.00 | $1,017.49 | $7.78-D |
| Limited Term Municipal Income | .46% | | | |
| Actual | | $1,000.00 | $1,010.50 | $2.33-B |
| Hypothetical-C | | $1,000.00 | $1,022.89 | $2.35-D |
| Class I | .54% | | | |
| Actual | | $1,000.00 | $1,010.10 | $2.74-B |
| Hypothetical-C | | $1,000.00 | $1,022.48 | $2.75-D |
| Class Z | .43% | | | |
| Actual | | $1,000.00 | $1,011.10 | $1.08-B |
| Hypothetical-C | | $1,000.00 | $1,023.04 | $2.19-D |
A Annualized expense ratio reflects expenses net of applicable fee waivers.
B Actual Expenses are equal to each Class' annualized expense ratio, multiplied by the average account value over the period, multiplied by 184/365 (to reflect the one-half year period) for Class A, Class M, Class C and Class I and multiplied by 91/365 (to reflect the period October 2, 2018 to December 31, 2018) for Class Z.
C 5% return per year before expenses
D Hypothetical expenses are equal to each Class' annualized expense ratio, multiplied by the average account value over the period, multiplied by 184/365 (to reflect the one-half year period).
Distributions (Unaudited)
During fiscal year ended 2018, 100% of the fund's income dividends were free from federal income tax, and 8.86% of the fund's income dividends was subject to the federal alternative minimum tax.
The fund will notify shareholders in January 2019 of amounts for use in preparing 2018 income tax returns.
Board Approval of Investment Advisory Contracts and Management Fees
Fidelity Limited Term Municipal Income Fund
Each year, the Board of Trustees, including the Independent Trustees (together, the Board), votes on the renewal of the management contract with Fidelity Management & Research Company (FMR) and the sub-advisory agreements (together, the Advisory Contracts) for the fund. FMR and the sub-advisers are referred to herein as the Investment Advisers. The Board, assisted by the advice of fund counsel and Independent Trustees' counsel, requests and considers a broad range of information relevant to the renewal of the Advisory Contracts throughout the year.
The Board meets regularly and, at each of its meetings, covers an extensive agenda of topics and materials and considers factors that are relevant to its annual consideration of the renewal of the fund's Advisory Contracts, including the services and support provided to the fund and its shareholders. The Board has established four standing committees (Committees) — Operations, Audit, Fair Valuation, and Governance and Nominating — each composed of and chaired by Independent Trustees with varying backgrounds, to which the Board has assigned specific subject matter responsibilities in order to enhance effective decision-making by the Board. The Operations Committee, of which all of the Independent Trustees are members, meets regularly throughout the year and considers, among other matters, information specifically related to the annual consideration of the renewal of the fund's Advisory Contracts. The Board, acting directly and through its Committees, requests and receives information concerning the annual consideration of the renewal of the fund's Advisory Contracts. The Board also meets as needed to review matters specifically related to the Board's annual consideration of the renewal of the Advisory Contracts. Members of the Board may also meet with trustees of other Fidelity funds through joint ad hoc committees to discuss certain matters relevant to all of the Fidelity funds.
At its September 2018 meeting, the Board unanimously determined to renew the fund's Advisory Contracts. In reaching its determination, the Board considered all factors it believed relevant, including (i) the nature, extent, and quality of the services to be provided to the fund and its shareholders (including the investment performance of the fund); (ii) the competitiveness of the fund's management fee and total expense ratio relative to peer funds; (iii) the total costs of the services to be provided by and the profits to be realized by Fidelity from its relationships with the fund; and (iv) the extent to which, if any, economies of scale exist and would be realized as the fund grows, and whether any economies of scale are appropriately shared with fund shareholders.
In considering whether to renew the Advisory Contracts for the fund, the Board reached a determination, with the assistance of fund counsel and Independent Trustees' counsel and through the exercise of its business judgment, that the renewal of the Advisory Contracts was in the best interests of the fund and its shareholders and that the compensation payable under the Advisory Contracts was fair and reasonable. The Board's decision to renew the Advisory Contracts was not based on any single factor, but rather was based on a comprehensive consideration of all the information provided to the Board at its meetings throughout the year. The Board, in reaching its determination to renew the Advisory Contracts, was aware that shareholders of the fund have a broad range of investment choices available to them, including a wide choice among funds offered by Fidelity's competitors, and that the fund's shareholders, who have the opportunity to review and weigh the disclosure provided by the fund in its prospectus and other public disclosures, have chosen to invest in this fund, which is part of the Fidelity family of funds.
Nature, Extent, and Quality of Services Provided. The Board considered Fidelity's staffing as it relates to the fund, including the backgrounds of investment personnel of Fidelity, and also considered the fund's investment objective, strategies, and related investment philosophy. The Independent Trustees also had discussions with senior management of Fidelity's investment operations and investment groups. The Board considered the structure of the investment personnel compensation program and whether this structure provides appropriate incentives to act in the best interests of the fund. Additionally, the Board considered the portfolio managers' investments, if any, in the funds that they manage.
Resources Dedicated to Investment Management and Support Services. The Board reviewed the general qualifications and capabilities of Fidelity's investment staff, including its size, education, experience, and resources, as well as Fidelity's approach to recruiting, managing, and compensating investment personnel. The Board noted that Fidelity has continued to increase the resources devoted to non-U.S. offices, including expansion of Fidelity's global investment organization. The Board also noted that Fidelity's analysts have extensive resources, tools and capabilities that allow them to conduct sophisticated quantitative and fundamental analysis, as well as credit analysis of issuers, counterparties and guarantors. Further, the Board considered that Fidelity's investment professionals have sufficient access to global information and data so as to provide competitive investment results over time, and that those professionals also have access to sophisticated tools that permit them to assess portfolio construction and risk and performance attribution characteristics continuously, as well as to transmit new information and research conclusions rapidly around the world. Additionally, in its deliberations, the Board considered Fidelity's trading, risk management, compliance, and technology and operations capabilities and resources, which are integral parts of the investment management process.
Shareholder and Administrative Services. The Board considered (i) the nature, extent, quality, and cost of advisory, administrative, and shareholder services performed by the Investment Advisers and their affiliates under the Advisory Contracts and under separate agreements covering transfer agency and pricing and bookkeeping services for the fund; (ii) the nature and extent of the supervision of third party service providers, principally custodians, subcustodians, and pricing vendors; and (iii) the resources devoted to, and the record of compliance with, the fund's compliance policies and procedures.
The Board noted that the growth of fund assets over time across the complex allows Fidelity to reinvest in the development of services designed to enhance the value and convenience of the Fidelity funds as investment vehicles. These services include 24-hour access to account information and market information through telephone representatives and over the Internet, investor education materials and asset allocation tools, and the expanded availability of Fidelity Investor Centers.
Investment in a Large Fund Family. The Board considered the benefits to shareholders of investing in a Fidelity fund, including the benefits of investing in a fund that is part of a large family of funds offering a variety of investment disciplines and providing a large variety of mutual fund investor services. The Board noted that Fidelity had taken, or had made recommendations that resulted in the Fidelity funds taking, a number of actions over the previous year that benefited particular funds, including: (i) continuing to dedicate additional resources to Fidelity's investment research process, which includes meetings with management of issuers of securities in which the funds invest, and to the support of the senior management team that oversees asset management; (ii) continuing efforts to enhance Fidelity's global research capabilities; (iii) launching new funds and making other enhancements to meet client needs; (iv) launching new share classes of existing funds; (v) eliminating purchase minimums and broadening eligibility requirements for certain funds and share classes; (vi) reducing management fees and total expenses for certain growth equity funds and index funds; (vii) lowering expense caps for certain existing funds and classes, and converting certain voluntary expense caps to contractual caps, to reduce expenses borne by shareholders; (viii) eliminating short-term redemption fees for funds that had such fees; (ix) rationalizing product lines and gaining increased efficiencies from fund mergers and share class consolidations; (x) continuing to develop, acquire and implement systems and technology to improve services to the funds and shareholders, strengthen information security, and increase efficiency; and (xi) continuing to implement enhancements to further strengthen Fidelity's product line to increase investors' probability of success in achieving their investment goals, including retirement income goals.
Investment Performance. The Board considered whether the fund has operated in accordance with its investment objective, as well as its record of compliance with its investment restrictions and its performance history.
The Board took into account discussions that occur at Board meetings throughout the year with representatives of the Investment Advisers about fund investment performance. In this regard the Board noted that as part of regularly scheduled fund reviews and other reports to the Board on fund performance, the Board considers annualized return information for the fund for different time periods, measured against an appropriate securities market index ("benchmark index") and a peer group of funds with similar objectives ("peer group"), if any. In its evaluation of fund investment performance at meetings throughout the year, the Board gave particular attention to information indicating underperformance of certain Fidelity funds for specific time periods and discussed with the Investment Advisers the reasons for such underperformance.
In addition to reviewing absolute and relative fund performance, the Independent Trustees periodically consider the appropriateness of fund performance metrics in evaluating the results achieved. In general, the Independent Trustees believe that fund performance should be evaluated based on gross performance (before fees and expenses but after transaction costs) compared to appropriate benchmark indices, over appropriate time periods that may include full market cycles, and on net performance (after fees and expenses) compared to peer groups, as applicable, over the same periods, taking into account relevant factors including the following: general market conditions; expectations for interest rate levels and credit conditions; issuer-specific information including credit quality; the potential for incremental return versus the fund's benchmark index weighed against the risks involved in obtaining that incremental return, including the risk of diminished or negative total returns; and fund cash flows and other factors. Depending on the circumstances, the Independent Trustees may be satisfied with a fund's performance notwithstanding that it lags its benchmark index or peer group for certain periods.
The Independent Trustees recognize that shareholders evaluate performance on a net basis over their own holding periods, for which one-, three-, and five-year periods are often used as a proxy. For this reason, the performance information reviewed by the Board also included net cumulative calendar year total return information for the fund and an appropriate benchmark index and peer group for the most recent one-, three-, and five-year periods.
Based on its review, the Board concluded that the nature, extent, and quality of services provided to the fund under the Advisory Contracts should continue to benefit the shareholders of the fund.
Competitiveness of Management Fee and Total Expense Ratio. The Board considered the fund's management fee and total expense ratio compared to "mapped groups" of competitive funds and classes created for the purpose of facilitating the Trustees' competitive analysis of management fees and total expenses. Fidelity creates "mapped groups" by combining similar Lipper investment objective categories that have comparable investment mandates. Combining Lipper investment objective categories aids the Board's management fee and total expense ratio comparisons by broadening the competitive group used for comparison.
Management Fee. The Board considered two proprietary management fee comparisons for the 12-month periods shown in basis points (BP) in the chart below. The group of Lipper funds used by the Board for management fee comparisons is referred to below as the "Total Mapped Group" and, for the reasons explained above, is broader than the Lipper peer group used by the Board for performance comparisons. The Total Mapped Group comparison focuses on a fund's standing in terms of gross management fees before expense reimbursements or caps relative to the total universe of funds with comparable investment mandates, regardless of whether their management fee structures also are comparable. Funds with comparable investment mandates offer exposure to similar types of securities. Funds with comparable management fee structures have similar management fee contractual arrangements (
e.g., flat rate charged for advisory services, all-inclusive fee rate,
etc.). "TMG %" represents the percentage of funds in the Total Mapped Group that had management fees that were lower than the fund's. For example, a hypothetical TMG % of 20% would mean that 80% of the funds in the Total Mapped Group had higher, and 20% had lower, management fees than the fund. The fund's actual TMG %s and the number of funds in the Total Mapped Group are in the chart below. The "Asset-Size Peer Group" (ASPG) comparison focuses on a fund's standing relative to a subset of non-Fidelity funds within the Total Mapped Group that are similar in size and management fee structure. For example, if a fund is in the first quartile of the ASPG, the fund's management fee ranks in the least expensive or lowest 25% of funds in the ASPG. The ASPG represents at least 15% of the funds in the Total Mapped Group with comparable asset size and management fee structures, subject to a minimum of 50 funds (or all funds in the Total Mapped Group if fewer than 50). Additional information, such as the ASPG quartile in which the fund's management fee rate ranked, is also included in the chart and was considered by the Board.
Fidelity Limited Term Municipal Income Fund

The Board noted that the fund's management fee rate ranked below the median of its Total Mapped Group and below the median of its ASPG for 2017.
The Board noted that it and the boards of other Fidelity funds formed an ad hoc Committee on Group Fee, which meets periodically, to conduct an in-depth review of the "group fee" component of the management fee of funds with such management fee structures. The Committee's focus included the mechanics of the group fee, the competitive landscape of group fee structures, Fidelity funds with no group fee component and investment products not included in group fee assets. The Board also considered that, for funds subject to the group fee, FMR agreed to voluntarily waive fees over a specified period of time in amounts designed to account for assets converted from certain funds to certain collective investment trusts.
Based on its review, the Board concluded that the fund's management fee is fair and reasonable in light of the services that the fund receives and the other factors considered.
Total Expense Ratio. In its review of each class's total expense ratio, the Board considered the fund's management fee rate as well as other fund or class expenses, as applicable, such as transfer agent fees, pricing and bookkeeping fees, fund-paid 12b-1 fees, and custodial, legal, and audit fees. The Board also noted that Fidelity may agree to waive fees and expenses from time to time, and the extent to which, if any, it has done so for the fund. As part of its review, the Board also considered the current and historical total expense ratios of each class of the fund compared to competitive fund median expenses. Each class of the fund is compared to those funds and classes in the Total Mapped Group (used by the Board for management fee comparisons) that have a similar sales load structure.
The Board noted that the total expense ratio of the retail class ranked below the competitive median for 2017 and the total expense ratio of each of Class A, Class M, Class C, and Class I ranked above the competitive median for 2017. The Board considered that, in general, various factors can affect total expense ratios. The Board noted that the total expense ratio of each of Class A, Class M, Class C, and Class I was above the competitive median because these classes are primarily comprised of omnibus assets, which are charged a flat asset-based transfer agent fee that is generally higher than the effective transfer agent fee rate for the retail class, which has a lower percentage of omnibus assets. The Board noted that an additional reason for Class M's total expense ratio being above the competitive median is Class M's higher 12b-1 fees. Class M has a higher 12b-1 fee, but a lower front-end sales charge, than traditionally priced front-end sales charge classes. The Board considered that Class M is primarily sold load-waived to retirement plans and intermediary wrap programs where its 0.50% 12b-1 fee is comparable to competing no-load, higher 12b-1 fee classes designed specifically for retirement plans and wrap programs. The Board noted that the total expense ratio of Class C was also above the competitive median because of its 1.00% 12b-1 fee. The Board noted that the fund offers multiple classes, each of which has a different sales load and 12b-1 fee structure, and that the multiple structures are intended to offer a range of pricing options for the intermediary market. The Board also noted that the total expense ratios of the classes vary primarily by the level of their 12b-1 fees, although differences in transfer agent fees may also cause expenses to vary from class to class.
Fees Charged to Other Fidelity Clients. The Board also considered Fidelity fee structures and other information with respect to clients of Fidelity, such as other funds advised or subadvised by Fidelity, pension plan clients, and other institutional clients with similar mandates. The Board noted that a joint ad hoc committee created by it and the boards of other Fidelity funds periodically reviews and compares Fidelity's institutional investment advisory business with its business of providing services to the Fidelity funds and also noted the most recent findings of the committee. The Board noted that the committee's review included a consideration of the differences in services provided, fees charged, and costs incurred, as well as competition in the markets serving the different categories of clients.
Based on its review of total expense ratios and fees charged to other Fidelity clients, the Board concluded that the total expense ratio of each class of the fund was reasonable in light of the services that the fund and its shareholders receive and the other factors considered.
Costs of the Services and Profitability. The Board considered the revenues earned and the expenses incurred by Fidelity in conducting the business of developing, marketing, distributing, managing, administering and servicing the fund and servicing the fund's shareholders. The Board also considered the level of Fidelity's profits in respect of all the Fidelity funds.
On an annual basis, Fidelity presents to the Board information about the profitability of its relationships with the fund. Fidelity calculates profitability information for each fund, as well as aggregate profitability information for groups of Fidelity funds and all Fidelity funds, using a series of detailed revenue and cost allocation methodologies which originate with the books and records of Fidelity on which Fidelity's audited financial statements are based. The Audit Committee of the Board reviews any significant changes from the prior year's methodologies.
PricewaterhouseCoopers LLP (PwC), auditor to Fidelity and certain Fidelity funds, has been engaged annually by the Board as part of the Board's assessment of Fidelity's profitability analysis. PwC's engagement includes the review and assessment of the methodologies used by Fidelity in determining the revenues and expenses attributable to Fidelity's mutual fund business, and completion of agreed-upon procedures in respect of the mathematical accuracy of the fund profitability information and its conformity to established allocation methodologies. After considering PwC's reports issued under the engagement and information provided by Fidelity, the Board concluded that while other allocation methods may also be reasonable, Fidelity's profitability methodologies are reasonable in all material respects.
The Board also reviewed Fidelity's non-fund businesses and potential indirect benefits such businesses may have received as a result of their association with Fidelity's mutual fund business (i.e., fall-out benefits) as well as cases where Fidelity's affiliates may benefit from the fund's business. The Board noted that changes to fall-out benefits year-over-year reflect business developments at Fidelity's various businesses.
The Board considered the costs of the services provided by and the profits realized by Fidelity in connection with the operation of the fund and was satisfied that the profitability was not excessive.
Economies of Scale. The Board considered whether there have been economies of scale in respect of the management of the Fidelity funds, whether the Fidelity funds (including the fund) have appropriately benefited from any such economies of scale, and whether there is potential for realization of any further economies of scale. The Board considered the extent to which the fund will benefit from economies of scale as assets grow through increased services to the fund, through waivers or reimbursements, or through fee or expense ratio reductions. The Board also noted that a committee (the Economies of Scale Committee) created by it and the boards of other Fidelity funds periodically analyzes whether Fidelity attains economies of scale in respect of the management and servicing of the Fidelity funds, whether the Fidelity funds have appropriately benefited from such economies of scale, and whether there is potential for realization of any further economies of scale.
The Board recognized that the fund's management contract incorporates a "group fee" structure, which provides for lower group fee rates as total group assets increase, and for higher group fee rates as total group assets decrease (with "group assets" defined to include fund assets under FMR's management plus the assets of sector funds previously under FMR's management). FMR calculates the group fee rates based on a tiered asset "breakpoint" schedule that varies based on asset class. The Board considered that the group fee is designed to deliver the benefits of economies of scale to fund shareholders when total Fidelity fund assets increase, even if assets of any particular fund are unchanged or have declined, because some portion of Fidelity's costs are attributable to services provided to all Fidelity funds, and all funds benefit if those costs can be allocated among more assets. The Board concluded that, given the group fee structure, fund shareholders will benefit from lower management fees as group assets increase at the fund complex level, regardless of whether Fidelity achieves any such economies of scale.
The Board concluded, taking into account the analysis of the Economies of Scale Committee, that economies of scale, if any, are being appropriately shared between fund shareholders and Fidelity.
Additional Information Requested by the Board. In order to develop fully the factual basis for consideration of the Fidelity funds' advisory contracts, the Board requested and received additional information on certain topics, including: (i) Fidelity's fund profitability methodology, profitability trends for certain funds, the allocation of various costs to different funds, and the impact of certain factors on fund profitability results; (ii) portfolio manager changes that have occurred during the past year and the amount of the investment that each portfolio manager has made in the Fidelity fund(s) that he or she manages; (iii) Fidelity's compensation structure for portfolio managers, research analysts, and other key personnel, including its effects on fund profitability, the rationale for the compensation structure, and the extent to which current market conditions have affected retention and recruitment; (iv) the arrangements with and compensation paid to certain fund sub-advisers on behalf of the Fidelity funds and the treatment of such compensation within Fidelity's fund profitability methodology; (v) the terms of Fidelity's voluntary expense limitation agreements; (vi) the methodology with respect to competitive fund data and peer group classifications; (vii) Fidelity's transfer agent fee, expense, and service structures for different funds and classes relative to competitive trends, and the impact of the increased use of omnibus accounts; (viii) new developments in the retail and institutional marketplaces and the competitive positioning of the funds relative to other investment products and services; (ix) the impact of recent changes to the money market fund landscape, including the full implementation of money market fund reform and rising interest rates, on Fidelity's money market funds; (x) the funds' share class structures and distribution channels; and (xi) explanations regarding the relative total expense ratios of certain funds and classes, total expense competitive trends and methodologies for total expense competitive comparisons, and actions that might be taken by Fidelity to reduce total expense ratios for certain classes. In addition, the Board considered its discussions with Fidelity throughout the year regarding enhanced information security initiatives and the funds' fair valuation policies.
Based on its evaluation of all of the conclusions noted above, and after considering all factors it believed relevant, the Board concluded that the advisory fee arrangements are fair and reasonable, and that the fund's Advisory Contracts should be renewed.
ASTM-ANN-0219
1.796592.115
Fidelity® Limited Term Municipal Income Fund
Annual Report December 31, 2018 |
|
Beginning on January 1, 2021, as permitted by regulations adopted by the Securities and Exchange Commission, paper copies of a fund’s shareholder reports will no longer be sent by mail, unless you specifically request paper copies of the reports from the fund or from your financial intermediary, such as a financial advisor, broker-dealer or bank. Instead, the reports will be made available on a website, and you will be notified by mail each time a report is posted and provided with a website link to access the report.
If you already elected to receive shareholder reports electronically, you will not be affected by this change and you need not take any action. You may elect to receive shareholder reports and other communications from a fund electronically, by contacting your financial intermediary. For Fidelity customers, visit Fidelity's web site or call Fidelity using the contact information listed below.
You may elect to receive all future reports in paper free of charge. If you wish to continue receiving paper copies of your shareholder reports, you may contact your financial intermediary or, if you are a Fidelity customer, visit Fidelity’s website, or call Fidelity at the applicable toll-free number listed below. Your election to receive reports in paper will apply to all funds held with the fund complex/your financial intermediary.
| Account Type | Website | Phone Number |
| Brokerage, Mutual Fund, or Annuity Contracts: | fidelity.com/mailpreferences | 1-800-343-3548 |
| Employer Provided Retirement Accounts: | netbenefits.fidelity.com/preferences (choose 'no' under Required Disclosures to continue to print) | 1-800-343-0860 |
| Advisor Sold Accounts Serviced Through Your Financial Intermediary: | Contact Your Financial Intermediary | Your Financial Intermediary's phone number |
| Advisor Sold Accounts Serviced by Fidelity: | institutional.fidelity.com | 1-877-208-0098 |
Contents
To view a fund's proxy voting guidelines and proxy voting record for the 12-month period ended June 30, visit http://www.fidelity.com/proxyvotingresults or visit the Securities and Exchange Commission's (SEC) web site at http://www.sec.gov.
You may also call 1-800-544-8544 to request a free copy of the proxy voting guidelines.
Standard & Poor's, S&P and S&P 500 are registered service marks of The McGraw-Hill Companies, Inc. and have been licensed for use by Fidelity Distributors Corporation.
Other third-party marks appearing herein are the property of their respective owners.
All other marks appearing herein are registered or unregistered trademarks or service marks of FMR LLC or an affiliated company. © 2019 FMR LLC. All rights reserved.
This report and the financial statements contained herein are submitted for the general information of the shareholders of the Fund. This report is not authorized for distribution to prospective investors in the Fund unless preceded or accompanied by an effective prospectus.
A fund files its complete schedule of portfolio holdings with the SEC for the first and third quarters of each fiscal year on Form N-Q. Forms N-Q are available on the SEC’s web site at http://www.sec.gov. A fund's Forms N-Q may be reviewed and copied at the SEC’s Public Reference Room in Washington, DC. Information regarding the operation of the SEC's Public Reference Room may be obtained by calling 1-800-SEC-0330.
For a complete list of a fund's portfolio holdings, view the most recent holdings listing, semiannual report, or annual report on Fidelity's web site at http://www.fidelity.com, http://www.institutional.fidelity.com, or http://www.401k.com, as applicable.
NOT FDIC INSURED •MAY LOSE VALUE •NO BANK GUARANTEE
Neither the Fund nor Fidelity Distributors Corporation is a bank.
Performance: The Bottom Line
Average annual total return reflects the change in the value of an investment, assuming reinvestment of distributions from dividend income and capital gains (the profits earned upon the sale of securities that have grown in value, if any) and assuming a constant rate of performance each year. The hypothetical investment and the average annual total returns do not reflect the deduction of taxes that a shareholder would pay on fund distributions or the redemption of fund shares. During periods of reimbursement by Fidelity, a fund’s total return will be greater than it would be had the reimbursement not occurred. How a fund did yesterday is no guarantee of how it will do tomorrow.
Average Annual Total Returns
| For the periods ended December 31, 2018 | Past 1 year | Past 5 years | Past 10 years |
| Fidelity® Limited Term Municipal Income Fund | 1.28% | 1.30% | 2.07% |
$10,000 Over 10 Years
Let's say hypothetically that $10,000 was invested in Fidelity® Limited Term Municipal Income Fund, a class of the fund, on December 31, 2008.
The chart shows how the value of your investment would have changed, and also shows how the Bloomberg Barclays Municipal Bond Index performed over the same period.
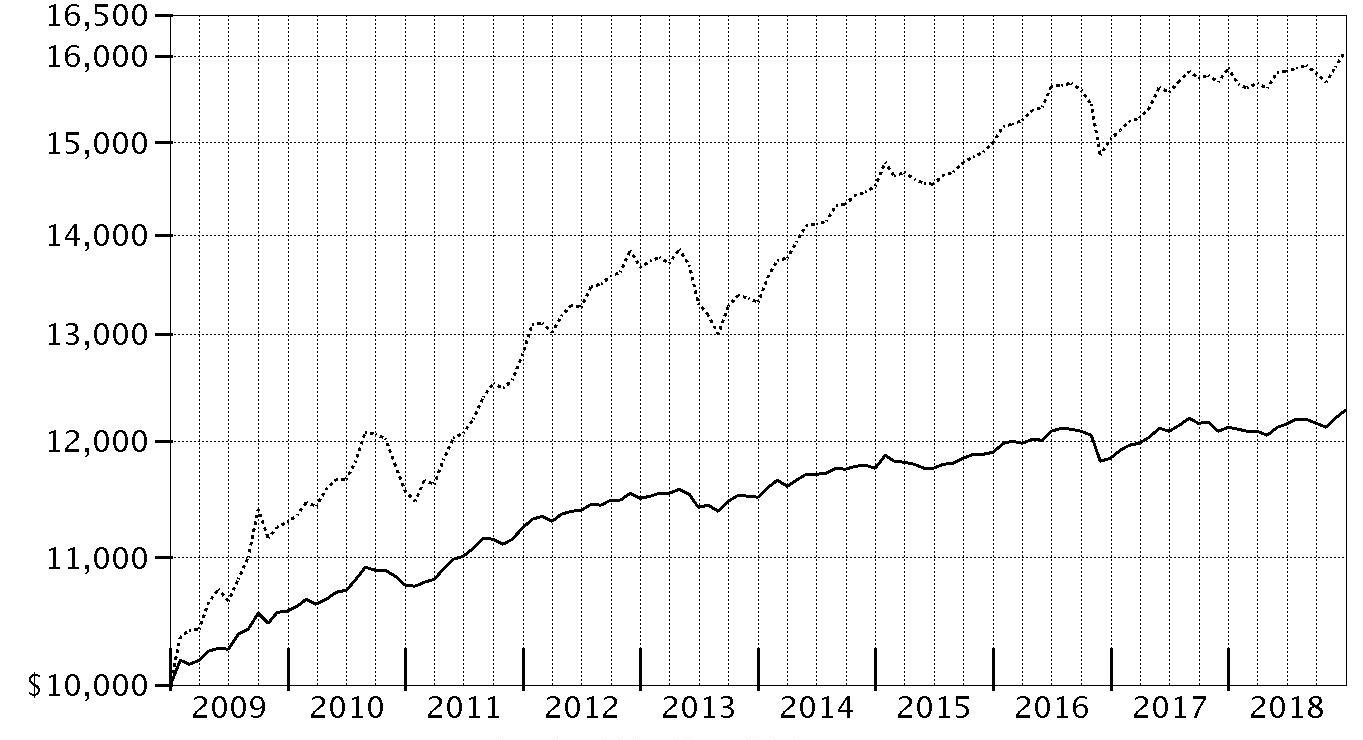
| Period Ending Values |
| $12,280 | Fidelity® Limited Term Municipal Income Fund |
| $16,060 | Bloomberg Barclays Municipal Bond Index |
Management's Discussion of Fund Performance
Market Recap: Tax-exempt municipal bonds gained modestly in 2018, with the Bloomberg Barclays Municipal Bond Index returning 1.28%, supported by lower bond issuance and solid economic growth. Tax reform had a significant impact on both the supply of and demand for tax-exempt bonds the past year. In the final months of 2017, issuers accelerated their bond financings in order to issue under the old tax rules, prompting a surge in supply. Investors absorbed this excess supply, anticipating that issuance would fall significantly in 2018. The market turned lower in early 2018, as domestic fixed-income markets reacted to robust economic data and signs of inflation, before stabilizing in March and rallying through August. The municipal market experienced volatility in September and October amid concerns of an economic slowdown, then rebounded to close December near a high for the year. Gross municipal bond issuance ended 2018 down approximately 25%. There was little differentiation in performance across municipal sectors in 2018. General obligation bonds gained 1.33%, with bonds issued by states slightly outperforming those backed by local municipalities. Looking ahead, market volatility is likely to persist due to uncertainty about how the U.S. Federal Reserve will react to labor and inflation trends.
Comments from Co-Portfolio Managers Cormac Cullen, Elizah McLaughlin and Kevin Ramundo: For the year ending December 31, 2018, the fund's share classes (excluding sales charges, if applicable) produced a modestly positive return, net of fees, which lagged the 1.75% advance of the benchmark, the Bloomberg Barclays 1-6 Year Municipal Bond Index. Relative to this benchmark, differences in the way fund holdings and index components were priced detracted from fund performance. Duration positioning, or the fund's sensitivity to changes in interest rates, hurt modestly. The fund maintained a bit shorter duration than the benchmark, which worked against fund performance. We also lost a bit a ground versus the benchmark because of our underweighting to bonds backed by the state of California, which were some of the best performers in the national municipal marketplace. In contrast, an overweighting in lower-investment-grade bonds contributed to relative performance. Sector allocation produced some value as well, particularly the portfolio's overweighting in health care securities.
The views expressed above reflect those of the portfolio manager(s) only through the end of the period as stated on the cover of this report and do not necessarily represent the views of Fidelity or any other person in the Fidelity organization. Any such views are subject to change at any time based upon market or other conditions and Fidelity disclaims any responsibility to update such views. These views may not be relied on as investment advice and, because investment decisions for a Fidelity fund are based on numerous factors, may not be relied on as an indication of trading intent on behalf of any Fidelity fund.
Note to Shareholders: On September 1, 2018, Elizah McLaughlin joined the municipal bond portfolio management team, succeeding Mark Sommer, who retired from Fidelity on December 31, 2018, after 27 years with the firm.
Investment Summary (Unaudited)
Top Five States as of December 31, 2018
| | % of fund's net assets |
| Illinois | 13.9 |
| Texas | 12.5 |
| Florida | 9.9 |
| New Jersey | 6.5 |
| New York | 4.5 |
Top Five Sectors as of December 31, 2018
| | % of fund's net assets |
| General Obligations | 36.7 |
| Transportation | 16.5 |
| Health Care | 12.3 |
| Electric Utilities | 7.9 |
| Education | 4.5 |
Quality Diversification (% of fund's net assets)
| As of December 31, 2018 |
| | AAA | 11.4% |
| | AA,A | 60.8% |
| | BBB | 16.2% |
| | BB and Below | 0.9% |
| | Not Rated | 4.6% |
| | Short-Term Investments and Net Other Assets | 6.1% |

We have used ratings from Moody's Investors Service, Inc. Where Moody's® ratings are not available, we have used S&P® ratings. All ratings are as of the date indicated and do not reflect subsequent changes.
Schedule of Investments December 31, 2018
Showing Percentage of Net Assets
| Municipal Bonds - 94.1% | | | |
| | | Principal Amount (000s) | Value (000s) |
| Alabama - 0.8% | | | |
| Jefferson County Gen. Oblig. Series 2018 B, 5% 4/1/21 | | 2,630 | 2,799 |
| Mobile County Board of School Commissioners: | | | |
| Series 2016 A: | | $ | $ |
| 5% 3/1/22 | | 585 | 630 |
| 5% 3/1/23 | | 830 | 910 |
| 5% 3/1/24 | | 1,225 | 1,362 |
| 5% 3/1/25 | | 1,225 | 1,378 |
| Series 2016 B: | | | |
| 5% 3/1/22 | | 980 | 1,056 |
| 5% 3/1/24 | | 980 | 1,089 |
| Mobile Indl. Dev. Board Poll. Cont. Rev. Bonds Series 2009 E, 1.85%, tender 3/24/20 (a) | | 4,810 | 4,779 |
| Montgomery Med. Clinic Facilities Series 2015: | | | |
| 5% 3/1/20 | | 2,825 | 2,902 |
| 5% 3/1/21 | | 490 | 514 |
| 5% 3/1/22 | | 3,145 | 3,367 |
| 5% 3/1/25 | | 1,465 | 1,634 |
|
| TOTAL ALABAMA | | | 22,420 |
|
| Alaska - 0.6% | | | |
| Anchorage Gen. Oblig.: | | | |
| Series A: | | | |
| 5% 9/1/20 | | 1,065 | 1,120 |
| 5% 9/1/22 | | 1,175 | 1,303 |
| Series B: | | | |
| 5% 9/1/20 | | 1,955 | 2,055 |
| 5% 9/1/22 | | 1,395 | 1,547 |
| Series C: | | | |
| 5% 9/1/19 | | 2,105 | 2,150 |
| 5% 9/1/20 | | 1,230 | 1,293 |
| 5% 9/1/22 | | 980 | 1,087 |
| Series D, 5% 9/1/20 | | 1,955 | 2,055 |
| North Slope Borough Gen. Oblig. Series 2017 A, 5% 6/30/21 (Pre-Refunded to 6/30/20 @ 100) | | 850 | 890 |
| Valdez Marine Term. Rev. (BP Pipelines (Alaska), Inc. Proj.) Series 2003 B, 5% 1/1/21 | | 4,500 | 4,742 |
|
| TOTAL ALASKA | | | 18,242 |
|
| Arizona - 3.3% | | | |
| Arizona Health Facilities Auth. Rev. (Scottsdale Lincoln Hospitals Proj.) Series 2014 A: | | | |
| 5% 12/1/19 | | 600 | 616 |
| 5% 12/1/20 | | 800 | 845 |
| 5% 12/1/21 | | 1,080 | 1,167 |
| 5% 12/1/22 | | 785 | 867 |
| 5% 12/1/23 | | 980 | 1,103 |
| 5% 12/1/24 | | 1,465 | 1,676 |
| Arizona State Lottery Rev. Series 2019: | | | |
| 5% 7/1/21 (b) | | 2,560 | 2,681 |
| 5% 7/1/22 (b) | | 2,045 | 2,192 |
| Chandler Indl. Dev. Auth. Indl. Dev. Rev. Bonds (Intel Corp. Proj.) Series 2007, 2.7%, tender 8/14/23 (a)(c) | | 12,500 | 12,538 |
| Glendale Gen. Oblig.: | | | |
| Series 2015: | | | |
| 4% 7/1/19 (FSA Insured) | | 585 | 591 |
| 5% 7/1/22 (FSA Insured) | | 980 | 1,078 |
| Series 2017: | | | |
| 5% 7/1/21 | | 2,900 | 3,110 |
| 5% 7/1/22 | | 3,320 | 3,646 |
| Glendale Trans. Excise Tax Rev.: | | | |
| 5% 7/1/21 (FSA Insured) | | 735 | 791 |
| 5% 7/1/22 (FSA Insured) | | 1,145 | 1,264 |
| 5% 7/1/23 (FSA Insured) | | 1,365 | 1,538 |
| Maricopa County Cmnty. College District (Arizona Gen. Obligations Bonds Proj. of 2004) Series 2011 D, 4.25% 7/1/25 (Pre-Refunded to 7/1/21 @ 100) | | 6,090 | 6,440 |
| Maricopa County Indl. Dev. Auth. Rev. Series 2016 A: | | | |
| 5% 1/1/25 | | 4,675 | 5,381 |
| 5% 1/1/26 | | 10,485 | 12,238 |
| Maricopa County School District #28 Kyrene Elementary Series 2010 B: | | | |
| 4% 7/1/19 | | 880 | 890 |
| 4% 7/1/20 | | 1,330 | 1,373 |
| Phoenix Indl. Solid Waste Disp. Rev. Bonds (Republic Svc., Inc. Proj.) Series 2013, 2.15%, tender 2/1/19 (a)(c) | | 17,000 | 16,996 |
| Pima County Ctfs. of Prtn. Series 2014: | | | |
| 5% 12/1/21 | | 2,160 | 2,343 |
| 5% 12/1/22 | | 2,415 | 2,682 |
| 5% 12/1/23 | | 3,350 | 3,799 |
| Pima County Swr. Sys. Rev.: | | | |
| Series 2011 B, 5% 7/1/19 | | 3,155 | 3,205 |
| Series 2012 A, 5% 7/1/19 | | 1,515 | 1,539 |
| Tempe Indl. Dev. Auth. Rev. (Mirabella At Asu, Inc. Proj.) Series 2017 B, 4% 10/1/23 (d) | | 3,915 | 3,918 |
|
| TOTAL ARIZONA | | | 96,507 |
|
| California - 3.0% | | | |
| Alameda Corridor Trans. Auth. Rev.: | | | |
| Series 2004, 0% 10/1/19 | | 260 | 255 |
| Series 2013 A, 5% 10/1/22 | | 2,140 | 2,384 |
| Bay Area Toll Auth. San Francisco Bay Toll Bridge Rev. Bonds: | | | |
| Series A, 2.95%, tender 4/1/26 (a) | | 5,075 | 5,248 |
| Series B, 2.85%, tender 4/1/25 (a) | | 4,150 | 4,279 |
| Series C, 2.1%, tender 4/1/22 (a) | | 3,875 | 3,882 |
| California Gen. Oblig.: | | | |
| Bonds 3%, tender 12/1/19 (a) | | 5,600 | 5,631 |
| 5.25% 9/1/22 | | 1,535 | 1,721 |
| California Muni. Fin. Auth. Rev. (LINXS APM Proj.) Series 2018 A: | | | |
| 5% 12/31/23 (c) | | 860 | 954 |
| 5% 6/30/24 (c) | | 665 | 742 |
| 5% 12/31/24 (c) | | 800 | 898 |
| 5% 6/30/25 (c) | | 1,000 | 1,127 |
| 5% 12/31/25 (c) | | 1,760 | 1,997 |
| 5% 6/30/26 (c) | | 1,360 | 1,546 |
| 5% 12/31/26 (c) | | 2,570 | 2,939 |
| 5% 6/30/27 (c) | | 1,910 | 2,185 |
| 5% 12/31/27 (c) | | 3,000 | 3,452 |
| California Poll. Cont. Fing. Auth. Solid Waste Disp. Rev. Bonds (Republic Svcs., Inc. Proj.) Series 2010 A, 2.15%, tender 2/1/19 (a)(c)(d) | | 10,400 | 10,398 |
| California Pub. Works Board Lease Rev.: | | | |
| (Riverside Campus Proj.) Series 2012 H, 5% 4/1/22 | | 980 | 1,077 |
| (Various Cap. Projs.): | | | |
| Series 2011 A, 5% 10/1/20 | | 2,470 | 2,609 |
| Series 2012 A, 5% 4/1/21 | | 3,175 | 3,397 |
| Series 2012 G, 5% 11/1/22 | | 1,225 | 1,365 |
| Series 2012 C, 5% 6/1/21 | | 1,780 | 1,913 |
| Golden State Tobacco Securitization Corp. Tobacco Settlement Rev.: | | | |
| Series 2013 A, 4% 6/1/21 | | 3,425 | 3,594 |
| Series 2017 A1: | | | |
| 5% 6/1/21 | | 1,205 | 1,285 |
| 5% 6/1/22 | | 1,685 | 1,830 |
| 5% 6/1/23 | | 1,925 | 2,121 |
| 5% 6/1/24 | | 1,085 | 1,191 |
| Series A, 0% 6/1/24 (AMBAC Insured) | | 3,390 | 2,981 |
| Oakland Unified School District Alameda County Series 2013, 5.5% 8/1/23 | | 980 | 1,115 |
| Palomar Health Rev. Series 2016: | | | |
| 5% 11/1/23 | | 1,955 | 2,158 |
| 5% 11/1/24 | | 1,955 | 2,189 |
| Port of Oakland Rev. Series 2012 P, 5% 5/1/21 (c) | | 2,445 | 2,607 |
| Rancho Cucamonga Redev. Agcy. (Rancho Redev. Proj.): | | | |
| 5% 9/1/23 (FSA Insured) | | 1,320 | 1,499 |
| 5% 9/1/24 (FSA Insured) | | 2,250 | 2,610 |
| San Pablo Redev. Agcy. Series 2014 A, 5% 6/15/24 (FSA Insured) | | 1,350 | 1,551 |
|
| TOTAL CALIFORNIA | | | 86,730 |
|
| Colorado - 1.1% | | | |
| Colorado Health Facilities Auth. Retirement Hsg. Rev. (Liberty Heights Proj.) 0% 7/15/22 (Escrowed to Maturity) | | 1,840 | 1,702 |
| Colorado Health Facilities Auth. Rev. Bonds Series 2008 D3, 5%, tender 11/12/21 (a) | | 5,170 | 5,515 |
| Colorado Reg'l. Trans. District Ctfs. of Prtn.: | | | |
| Series 2013 A, 5% 6/1/23 | | 4,400 | 4,933 |
| Series 2014 A, 5% 6/1/23 | | 3,775 | 4,232 |
| Denver City & County Arpt. Rev. Series 2017 A, 5% 11/15/19 (c) | | 2,520 | 2,585 |
| E-470 Pub. Hwy. Auth. Rev.: | | | |
| Series 2000 B: | | | |
| 0% 9/1/19 (Nat'l. Pub. Fin. Guarantee Corp. Insured) | | 8,140 | 8,026 |
| 0% 9/1/20 (Nat'l. Pub. Fin. Guarantee Corp. Insured) | | 2,775 | 2,668 |
| Series 2015 A: | | | |
| 5% 9/1/19 | | 980 | 998 |
| 5% 9/1/20 | | 980 | 1,022 |
|
| TOTAL COLORADO | | | 31,681 |
|
| Connecticut - 3.0% | | | |
| Connecticut Gen. Oblig.: | | | |
| Series 2012 C, 5% 6/1/21 | | 22,910 | 24,347 |
| Series 2016 A, 5% 3/15/26 | | 1,925 | 2,185 |
| Connecticut Health & Edl. Facilities Auth. Rev.: | | | |
| Bonds: | | | |
| Series 2010 A, 1.8%, tender 2/9/21 (a) | | 16,680 | 16,632 |
| Series 2015 A, 2.05%, tender 7/21/21 (a) | | 16,315 | 16,363 |
| Series X2, 1.8%, tender 2/9/21 (a) | | 12,000 | 11,966 |
| Series 2018 S: | | | |
| 5% 7/1/23 | | 1,455 | 1,626 |
| 5% 7/1/24 | | 1,000 | 1,135 |
| Connecticut Hsg. Fin. Auth. Series 2013 B2, 4% 11/15/32 | | 3,860 | 3,953 |
| Hbr. Point Infra Impt. District Series 2010 A, 7.875% 4/1/39 (Pre-Refunded to 4/1/20 @ 100) | | 6,281 | 6,741 |
| New Haven Gen. Oblig. Series 2016 A: | | | |
| 5% 8/15/23 (Escrowed to Maturity) | | 880 | 995 |
| 5% 8/15/25 (FSA Insured) | | 980 | 1,132 |
|
| TOTAL CONNECTICUT | | | 87,075 |
|
| Delaware, New Jersey - 0.2% | | | |
| Delaware River & Bay Auth. Rev. Series 2014 C: | | | |
| 5% 1/1/20 | | 2,445 | 2,519 |
| 5% 1/1/21 | | 1,955 | 2,073 |
|
| TOTAL DELAWARE, NEW JERSEY | | | 4,592 |
|
| District Of Columbia - 1.0% | | | |
| Metropolitan Washington DC Arpts. Auth. Sys. Rev.: | | | |
| Series 2012 A, 5% 10/1/22 (c) | | 6,185 | 6,790 |
| Series 2014 A, 5% 10/1/23 (c) | | 435 | 486 |
| Series 2017 A: | | | |
| 5% 10/1/26 (c) | | 6,555 | 7,627 |
| 5% 10/1/27 (c) | | 4,890 | 5,744 |
| Series 2018 A, 5% 10/1/21 (c) | | 3,595 | 3,866 |
| Washington Convention & Sports Auth. Series 2018 A, 5% 10/1/21 | | 5,000 | 5,394 |
|
| TOTAL DISTRICT OF COLUMBIA | | | 29,907 |
|
| Florida - 9.9% | | | |
| Brevard County School Board Ctfs. of Prtn.: | | | |
| Series 2014, 5% 7/1/21 | | 980 | 1,051 |
| Series 2015 C: | | | |
| 5% 7/1/21 | | 635 | 681 |
| 5% 7/1/22 | | 3,645 | 4,001 |
| 5% 7/1/23 | | 2,935 | 3,296 |
| Broward County Arpt. Sys. Rev.: | | | |
| Series 2012 Q1, 5% 10/1/21 | | 980 | 1,058 |
| Series A: | | | |
| 5% 10/1/22 (c) | | 2,935 | 3,218 |
| 5% 10/1/23 (c) | | 3,930 | 4,384 |
| Broward County School Board Ctfs. of Prtn.: | | | |
| (Broward County School District Proj.) Series 2017 C, 5% 7/1/22 | | 3,180 | 3,497 |
| Series 2012 A, 5% 7/1/19 | | 6,845 | 6,953 |
| Series 2015 A: | | | |
| 5% 7/1/19 | | 2,055 | 2,088 |
| 5% 7/1/20 | | 3,915 | 4,094 |
| 5% 7/1/21 | | 4,400 | 4,727 |
| 5% 7/1/22 | | 3,425 | 3,766 |
| 5% 7/1/23 | | 2,690 | 3,022 |
| 5% 7/1/24 | | 1,290 | 1,476 |
| Series 2015 B: | | | |
| 5% 7/1/19 | | 1,955 | 1,986 |
| 5% 7/1/20 | | 2,935 | 3,069 |
| 5% 7/1/21 | | 6,120 | 6,575 |
| 5% 7/1/22 | | 4,490 | 4,938 |
| 5% 7/1/23 | | 2,690 | 3,022 |
| 5% 7/1/24 | | 1,120 | 1,281 |
| Citizens Property Ins. Corp. (Citizens Pla Proj.) Series 2012 A-1, 5% 6/1/20 | | 5,155 | 5,371 |
| Clearwater Wtr. and Swr. Rev. Series 2011: | | | |
| 5% 12/1/19 | | 1,780 | 1,832 |
| 5% 12/1/20 | | 980 | 1,038 |
| Florida Board of Ed. Lottery Rev. Series 2016 B, 5% 7/1/24 | | 9,801 | 11,346 |
| Florida Dev. Fin. Corp. Healthcare Facility Rev. (Univ. Health Proj.) Series 2013 A: | | | |
| 5% 2/1/19 | | 1,420 | 1,422 |
| 5% 2/1/20 | | 1,980 | 2,021 |
| Florida Mid-Bay Bridge Auth. Rev. Series 2015 A: | | | |
| 5% 10/1/21 | | 1,010 | 1,083 |
| 5% 10/1/22 | | 1,955 | 2,135 |
| 5% 10/1/23 | | 1,240 | 1,378 |
| 5% 10/1/24 | | 1,955 | 2,204 |
| 5% 10/1/25 | | 1,710 | 1,948 |
| 5% 10/1/26 | | 1,955 | 2,210 |
| Greater Orlando Aviation Auth. Arpt. Facilities Rev.: | | | |
| Series 2011 C: | | | |
| 5% 10/1/19 | | 1,670 | 1,711 |
| 5% 10/1/20 | | 980 | 1,035 |
| Series 2017 A: | | | |
| 5% 10/1/25 (c) | | 980 | 1,124 |
| 5% 10/1/26 (c) | | 1,955 | 2,264 |
| Halifax Hosp. Med. Ctr. Rev. Series 2015, 5% 6/1/23 | | 1,295 | 1,425 |
| Hillsborough County School District Sales Tax Rev. Series 2015 B, 5% 10/1/22 (FSA Insured) | | 1,975 | 2,182 |
| Indian River County School Board Ctfs. of Prtn. Series 2014: | | | |
| 5% 7/1/20 | | 915 | 957 |
| 5% 7/1/22 | | 1,955 | 2,143 |
| 5% 7/1/23 | | 1,955 | 2,189 |
| JEA Wtr. & Swr. Sys. Rev. Series 2010 D: | | | |
| 5% 10/1/21 | | 640 | 665 |
| 5% 10/1/21 (Pre-Refunded to 4/1/20 @ 100) | | 1,260 | 1,308 |
| Manatee County Rev. Series 2013: | | | |
| 5% 10/1/19 | | 1,225 | 1,254 |
| 5% 10/1/20 | | 1,955 | 2,062 |
| 5% 10/1/21 | | 1,955 | 2,112 |
| 5% 10/1/22 | | 980 | 1,084 |
| Manatee County School District Series 2017, 5% 10/1/24 (FSA Insured) | | 1,270 | 1,465 |
| Miami-Dade County Aviation Rev.: | | | |
| Series 2010, 5% 10/1/22 | | 1,700 | 1,788 |
| Series 2017 B, 5% 10/1/20 (c) | | 2,075 | 2,172 |
| Miami-Dade County Expressway Auth.: | | | |
| (Waste Mgmt., Inc. of Florida Proj.): | | | |
| Series 2013, 5% 7/1/19 | | 1,955 | 1,985 |
| 5% 7/1/20 | | 980 | 1,025 |
| 5% 7/1/21 | | 1,955 | 2,096 |
| 5% 7/1/22 | | 1,955 | 2,146 |
| 5% 7/1/23 | | 1,955 | 2,144 |
| Series 2014 A, 5% 7/1/24 | | 610 | 697 |
| Series 2014 B: | | | |
| 5% 7/1/22 | | 1,465 | 1,608 |
| 5% 7/1/23 | | 3,180 | 3,569 |
| Miami-Dade County Gen. Oblig. (Parks Prog.) Series 2015 A, 5% 11/1/22 | | 3,795 | 4,215 |
| Miami-Dade County School Board Ctfs. of Prtn.: | | | |
| Bonds Series 2014 A, 5%, tender 5/1/24 (a) | | 8,010 | 9,033 |
| Series 2014 D: | | | |
| 5% 11/1/20 | | 4,770 | 5,031 |
| 5% 11/1/21 | | 6,140 | 6,635 |
| 5% 11/1/22 | | 2,850 | 3,146 |
| 5% 11/1/23 | | 7,485 | 8,429 |
| Series 2015 A: | | | |
| 5% 5/1/19 | | 980 | 990 |
| 5% 5/1/20 | | 2,050 | 2,133 |
| 5% 5/1/21 | | 3,915 | 4,177 |
| 5% 5/1/22 | | 3,640 | 3,976 |
| 5% 5/1/23 | | 6,360 | 7,094 |
| Series 2015 B, 5% 5/1/24 | | 28,915 | 32,870 |
| Series 2016 A, 5% 8/1/27 | | 5,440 | 6,304 |
| Miami-Dade County Transit Sales Surtax Rev. Series 2012, 5% 7/1/19 | | 1,225 | 1,244 |
| Orange County Health Facilities Auth. Series 2009, 5.25% 10/1/19 | | 1,220 | 1,250 |
| Orlando & Orange County Expressway Auth. Rev. Series 2012, 5% 7/1/19 | | 980 | 995 |
| Orlando Utils. Commission Util. Sys. Rev. Series 2011 B, 5% 10/1/19 | | 2,275 | 2,329 |
| Palm Beach County Health Facilities Auth. Hosp. Rev. Series 2014: | | | |
| 4% 12/1/19 | | 980 | 994 |
| 5% 12/1/20 | | 1,395 | 1,463 |
| 5% 12/1/21 | | 1,465 | 1,572 |
| 5% 12/1/23 | | 190 | 211 |
| 5% 12/1/24 | | 380 | 427 |
| Palm Beach County School Board Ctfs. of Prtn.: | | | |
| Series 2014 B: | | | |
| 4% 8/1/19 | | 4,525 | 4,583 |
| 4% 8/1/21 | | 3,950 | 4,151 |
| 5% 8/1/19 | | 2,935 | 2,989 |
| 5% 8/1/21 | | 5,185 | 5,585 |
| 5% 8/1/22 | | 980 | 1,082 |
| Series 2015 B: | | | |
| 5% 8/1/19 | | 2,675 | 2,725 |
| 5% 8/1/20 | | 1,710 | 1,793 |
| Pasco County School District Sales Tax Rev. Series 2013: | | | |
| 5% 10/1/19 | | 1,075 | 1,100 |
| 5% 10/1/20 | | 980 | 1,031 |
| 5% 10/1/21 | | 980 | 1,056 |
| 5% 10/1/22 | | 980 | 1,079 |
| Pasco County Solid Waste Disp. & Resource Recovery Sys. Rev. Series 2011, 5% 10/1/19 (c) | | 1,980 | 2,025 |
| Seminole County School Board Ctfs. of Prtn. Series 2016 C: | | | |
| 5% 7/1/25 | | 980 | 1,138 |
| 5% 7/1/26 | | 1,115 | 1,313 |
| Tallahassee Health Facilities Rev. (Tallahassee Memorial Healthcare, Inc. Proj.) Series 2016 A, 5% 12/1/21 | | 1,135 | 1,218 |
| Tampa Bay Wtr. Reg'l. Wtr. Supply Auth. Util. Sys. Rev. Series 2005, 5.5% 10/1/22 (FGIC Insured) | | 1,340 | 1,511 |
| Tampa Tax Allocation (H. Lee Moffitt Cancer Ctr. Proj.) Series 2012 A, 5% 9/1/20 | | 1,760 | 1,845 |
| Volusia County School Board Ctfs. of Prtn. (Master Lease Prog.) Series 2014 B, 5% 8/1/19 | | 305 | 310 |
|
| TOTAL FLORIDA | | | 287,433 |
|
| Georgia - 2.1% | | | |
| Atlanta Arpt. Rev.: | | | |
| 5% 1/1/22 | | 980 | 1,068 |
| 5% 1/1/23 | | 980 | 1,092 |
| 5% 1/1/24 | | 1,125 | 1,281 |
| Burke County Indl. Dev. Auth. Poll. Cont. Rev. Bonds (Oglethorpe Pwr. Corp. Vogtle Proj.) Series 2013 A, 2.4%, tender 4/1/20 (a) | | 9,780 | 9,733 |
| Georgia Muni. Elec. Auth. Pwr. Rev.: | | | |
| (Unrefunded Balance Proj.) Series 2008: | | | |
| 5.75% 1/1/19 (Escrowed to Maturity) | | 3,785 | 3,785 |
| 5.75% 1/1/20 | | 905 | 906 |
| Series GG: | | | |
| 5% 1/1/20 | | 660 | 679 |
| 5% 1/1/21 | | 1,635 | 1,724 |
| Georgia Muni. Gas Auth. Rev. (Gas Portfolio III Proj.): | | | |
| Series 2014 U: | | | |
| 5% 10/1/19 | | 1,465 | 1,498 |
| 5% 10/1/22 | | 980 | 1,081 |
| 5% 10/1/23 | | 2,365 | 2,657 |
| Series R, 5% 10/1/21 | | 4,890 | 5,270 |
| Main Street Natural Gas, Inc. Bonds Series 2018 C, 4%, tender 12/1/23 (a) | | 13,910 | 14,688 |
| Monroe County Dev. Auth. Poll. Cont. Rev. Bonds: | | | |
| (Georgia Pwr. Co. Plant Scherer Proj.) Series 2009, 2.35%, tender 12/11/20 (a) | | 4,610 | 4,572 |
| (Gulf Pwr. Co. Plant Scherer Proj.) Series 2002 1, 2%, tender 6/25/20 (a) | | 6,000 | 5,965 |
| Private Colleges & Univs. Auth. Rev. (The Savannah College of Arts and Design Projs.) Series 2014, 5% 4/1/21 | | 3,260 | 3,470 |
|
| TOTAL GEORGIA | | | 59,469 |
|
| Hawaii - 0.6% | | | |
| Hawaii Arpts. Sys. Rev. Series 2011, 5% 7/1/19 (c) | | 3,915 | 3,972 |
| Honolulu City & County Gen. Oblig. Series 2017 D: | | | |
| 5% 9/1/24 | | 1,200 | 1,388 |
| 5% 9/1/25 | | 2,935 | 3,455 |
| State of Hawaii Dept. of Trans. Series 2013: | | | |
| 5% 8/1/19 (c) | | 1,370 | 1,394 |
| 5% 8/1/20 (c) | | 2,985 | 3,119 |
| 5% 8/1/21 (c) | | 540 | 577 |
| 5% 8/1/22 (c) | | 2,030 | 2,215 |
| 5% 8/1/23 (c) | | 1,440 | 1,597 |
|
| TOTAL HAWAII | | | 17,717 |
|
| Illinois - 13.4% | | | |
| Chicago Board of Ed.: | | | |
| Series 1998 B1, 0% 12/1/21 (Nat'l. Pub. Fin. Guarantee Corp. Insured) | | 9,780 | 8,919 |
| Series 2010 F, 5% 12/1/20 | | 745 | 767 |
| Series 2017 C: | | | |
| 5% 12/1/26 | | 485 | 511 |
| 5% 12/1/27 | | 2,830 | 2,977 |
| Series 2018 C, 5% 12/1/24 | | 13,000 | 13,650 |
| Chicago Gen. Oblig. (City Colleges Proj.) Series 1999: | | | |
| 0% 1/1/19 (Nat'l. Pub. Fin. Guarantee Corp. Insured) | | 9,590 | 9,590 |
| 0% 1/1/20 (Nat'l. Pub. Fin. Guarantee Corp. Insured) | | 14,435 | 14,055 |
| Chicago Midway Arpt. Rev.: | | | |
| Series 2014 B: | | | |
| 5% 1/1/20 | | 610 | 628 |
| 5% 1/1/21 | | 390 | 413 |
| 5% 1/1/23 | | 2,445 | 2,692 |
| 5% 1/1/22 | | 4,890 | 5,277 |
| 5% 1/1/23 | | 5,770 | 6,352 |
| Chicago Motor Fuel Tax Rev. Series 2013: | | | |
| 5% 1/1/19 | | 245 | 245 |
| 5% 1/1/20 | | 295 | 300 |
| 5% 1/1/21 | | 390 | 403 |
| 5% 1/1/22 | | 295 | 308 |
| 5% 1/1/23 | | 525 | 554 |
| Chicago O'Hare Int'l. Arpt. Rev.: | | | |
| Series 2012 A, 5% 1/1/21 | | 1,370 | 1,452 |
| Series 2012 B, 5% 1/1/21 (c) | | 4,505 | 4,747 |
| Series 2013 B, 5% 1/1/22 | | 3,915 | 4,255 |
| Series 2013 D, 5% 1/1/22 | | 3,150 | 3,423 |
| Series 2017 D, 5% 1/1/27 (c) | | 1,470 | 1,681 |
| Chicago Transit Auth. Cap. Grant Receipts Rev. Series 2017: | | | |
| 4% 6/1/19 | | 2,755 | 2,776 |
| 5% 6/1/20 | | 2,430 | 2,520 |
| 5% 6/1/21 | | 2,305 | 2,443 |
| 5% 6/1/25 | | 1,225 | 1,382 |
| Chicago Wastewtr. Transmission Rev. Series 2012: | | | |
| 5% 1/1/19 | | 1,280 | 1,280 |
| 5% 1/1/23 | | 1,175 | 1,259 |
| Cook County Gen. Oblig.: | | | |
| Series 2009 C, 5% 11/15/21 | | 8,390 | 8,584 |
| Series 2010 A, 5.25% 11/15/22 | | 4,850 | 5,099 |
| Series 2011 A, 5.25% 11/15/22 | | 980 | 1,059 |
| Series 2012 C: | | | |
| 5% 11/15/19 | | 3,130 | 3,207 |
| 5% 11/15/20 | | 7,055 | 7,397 |
| 5% 11/15/21 | | 5,465 | 5,858 |
| 5% 11/15/22 | | 1,260 | 1,377 |
| Series 2014 A: | | | |
| 5% 11/15/20 | | 980 | 1,028 |
| 5% 11/15/21 | | 490 | 525 |
| 5% 11/15/22 | | 1,325 | 1,448 |
| Illinois Edl. Facilities Auth. Rev. Bonds (Univ. of Chicago Proj.) Series B2, 1.55%, tender 2/13/20 (a) | | 9,780 | 9,731 |
| Illinois Fin. Auth. Rev.: | | | |
| (Bradley Univ. Proj.) Series 2017 C, 5% 8/1/26 | | 1,650 | 1,883 |
| (OSF Healthcare Sys.) Series 2018 A: | | | |
| 5% 5/15/26 | | 4,300 | 4,966 |
| 5% 5/15/27 | | 9,260 | 10,762 |
| (Provena Health Proj.) Series 2010 A, 5.75% 5/1/19 (Escrowed to Maturity) | | 2,590 | 2,624 |
| (Southern Illinois Healthcare Enterprises, Inc. Proj.) Series 2005, 5.25% 3/1/30 (Pre-Refunded to 3/1/20 @ 100) | | 4,650 | 4,830 |
| Bonds: | | | |
| (Ascension Health Cr. Group Proj.) Series 2012 E2, 1.75%, tender 4/1/21 (a) | | 3,000 | 2,966 |
| Series 2017 B, 5%, tender 12/15/22 (a) | | 4,325 | 4,788 |
| Series E, 2.25%, tender 4/29/22 (a) | | 22,430 | 22,344 |
| Series 2011 IL, 5% 12/1/22 (Pre-Refunded to 12/1/21 @ 100) | | 1,110 | 1,204 |
| Series 2012 A, 5% 5/15/23 | | 1,270 | 1,378 |
| Series 2012: | | | |
| 5% 9/1/19 | | 1,090 | 1,113 |
| 5% 9/1/20 | | 1,440 | 1,511 |
| 5% 9/1/21 | | 2,000 | 2,153 |
| 5% 9/1/22 | | 3,455 | 3,807 |
| Series 2015 A: | | | |
| 5% 11/15/22 | | 490 | 541 |
| 5% 11/15/24 | | 1,490 | 1,699 |
| 5% 11/15/25 | | 1,905 | 2,195 |
| 5% 11/15/26 | | 1,955 | 2,240 |
| Series 2015 B: | | | |
| 5% 11/15/20 | | 1,615 | 1,702 |
| 5% 11/15/24 | | 1,910 | 2,187 |
| Series 2016 A: | | | |
| 5% 8/15/20 | | 490 | 508 |
| 5% 2/15/21 | | 735 | 779 |
| 5% 8/15/21 | | 685 | 725 |
| 5% 2/15/23 | | 980 | 1,084 |
| 5% 8/15/23 | | 1,465 | 1,603 |
| 5% 8/15/24 | | 2,135 | 2,367 |
| Series 2016 C: | | | |
| 5% 2/15/20 | | 4,970 | 5,119 |
| 5% 2/15/22 | | 3,335 | 3,633 |
| 5% 2/15/23 | | 4,470 | 4,975 |
| 5% 2/15/24 | | 5,220 | 5,921 |
| Series 2016: | | | |
| 5% 7/1/22 | | 2,895 | 3,188 |
| 5% 5/15/25 | | 490 | 560 |
| 5% 5/15/26 | | 980 | 1,132 |
| 5% 5/15/27 | | 1,225 | 1,408 |
| Series 2017: | | | |
| 5% 1/1/23 | | 1,465 | 1,632 |
| 5% 1/1/25 | | 2,260 | 2,627 |
| 5% 1/1/27 | | 1,955 | 2,321 |
| Illinois Gen. Oblig.: | | | |
| Series 2010, 5% 1/1/21 (FSA Insured) | | 1,565 | 1,605 |
| Series 2012 A, 4% 1/1/23 | | 1,245 | 1,259 |
| Series 2012: | | | |
| 5% 3/1/19 | | 5,380 | 5,402 |
| 5% 8/1/19 | | 2,600 | 2,638 |
| 5% 8/1/20 | | 6,750 | 6,956 |
| 5% 8/1/21 | | 2,360 | 2,459 |
| 5% 8/1/22 | | 5,675 | 5,970 |
| Series 2013: | | | |
| 5% 7/1/21 | | 6,360 | 6,620 |
| 5% 7/1/22 | | 10,740 | 11,287 |
| Series 2014: | | | |
| 5% 2/1/22 | | 2,935 | 3,070 |
| 5% 4/1/23 | | 2,165 | 2,288 |
| 5% 2/1/25 | | 2,275 | 2,402 |
| Series 2016: | | | |
| 5% 11/1/20 | | 2,310 | 2,385 |
| 5% 1/1/26 | | 2,150 | 2,299 |
| 5% 2/1/26 | | 10,525 | 11,255 |
| Series 2017 B, 5% 11/1/19 | | 7,875 | 8,037 |
| Illinois Muni. Elec. Agcy. Pwr. Supply Series 2015 A, 5% 2/1/23 | | 1,180 | 1,301 |
| Illinois Reg'l. Trans. Auth. Series 2017 A: | | | |
| 5% 7/1/20 | | 1,320 | 1,377 |
| 5% 7/1/21 | | 1,320 | 1,407 |
| McHenry County Cmnty. School District #200 Series 2006 B: | | | |
| 0% 1/15/24 | | 4,715 | 4,111 |
| 0% 1/15/25 | | 4,915 | 4,141 |
| 0% 1/15/26 | | 3,695 | 2,999 |
| McHenry County Conservation District Gen. Oblig. Series 2014: | | | |
| 5% 2/1/19 | | 2,235 | 2,240 |
| 5% 2/1/20 | | 2,225 | 2,298 |
| 5% 2/1/23 | | 2,175 | 2,413 |
| Railsplitter Tobacco Settlement Auth. Rev.: | | | |
| Series 2010: | | | |
| 5.5% 6/1/23 (Pre-Refunded to 6/1/21 @ 100) | | 11,285 | 12,229 |
| 6% 6/1/28 (Pre-Refunded to 6/1/21 @ 100) | | 7,655 | 8,385 |
| Series 2017, 5% 6/1/22 | | 9,780 | 10,581 |
|
| TOTAL ILLINOIS | | | 386,061 |
|
| Indiana - 2.2% | | | |
| Indiana Fin. Auth. Econ. Dev. Rev. Bonds (Republic Svcs., Inc. Proj.) Series A, 2.35%, tender 3/1/19 (a)(c) | | 4,000 | 3,999 |
| Indiana Fin. Auth. Hosp. Rev. Series 2013: | | | |
| 5% 8/15/22 | | 685 | 754 |
| 5% 8/15/23 | | 980 | 1,100 |
| Indiana Fin. Auth. Rev. Series 2012: | | | |
| 5% 3/1/20 | | 635 | 658 |
| 5% 3/1/21 | | 1,200 | 1,269 |
| Indiana Fin. Auth. Wastewtr. Util. Rev. (CWA Auth. Proj.): | | | |
| Series 2012 A: | | | |
| 5% 10/1/20 | | 805 | 847 |
| 5% 10/1/22 | | 1,565 | 1,727 |
| Series 2014 A: | | | |
| 5% 10/1/20 | | 365 | 384 |
| 5% 10/1/21 | | 370 | 399 |
| 5% 10/1/22 | | 660 | 728 |
| Series 2015 A: | | | |
| 5% 10/1/24 | | 1,460 | 1,671 |
| 5% 10/1/25 | | 1,590 | 1,833 |
| Indiana Muni. Pwr. Agcy. Pwr. Supply Sys. Rev. Series 2011 A: | | | |
| 5% 1/1/19 | | 1,440 | 1,440 |
| 5% 1/1/20 | | 1,225 | 1,263 |
| Indianapolis Local Pub. Impt. (Indianapolis Arpt. Auth. Proj.) Series 2016 A1: | | | |
| 5% 1/1/21 (c) | | 2,690 | 2,837 |
| 5% 1/1/23 (c) | | 1,940 | 2,132 |
| 5% 1/1/24 (c) | | 2,715 | 3,037 |
| 5% 1/1/25 (c) | | 2,845 | 3,232 |
| Lake Central Multi-District School Bldg. Corp. Series 2012 B: | | | |
| 4% 1/15/19 | | 980 | 981 |
| 4% 1/15/20 | | 1,315 | 1,343 |
| 4% 1/15/21 | | 1,225 | 1,275 |
| 5% 7/15/19 | | 1,645 | 1,672 |
| 5% 7/15/20 | | 1,145 | 1,198 |
| 5% 7/15/21 | | 980 | 1,052 |
| Whiting Envir. Facilities Rev.: | | | |
| (BP Products North America, Inc. Proj.) Series 2009, 5.25% 1/1/21 | | 4,160 | 4,404 |
| Bonds (BP Products North America, Inc. Proj.) Series 2015, 5%, tender 11/1/22 (a)(c) | | 21,505 | 23,340 |
|
| TOTAL INDIANA | | | 64,575 |
|
| Kansas - 0.3% | | | |
| Desoto Usd # 232 Series 2015 A, 5% 9/1/22 | | 1,525 | 1,686 |
| Johnson County Unified School District # 233 Series 2016 B, 5% 9/1/23 | | 1,430 | 1,617 |
| Wichita Hosp. Facilities Rev. Series 2011 IV A, 5% 11/15/20 (Escrowed to Maturity) | | 2,685 | 2,837 |
| Wyandotte County/Kansas City Unified Govt. Util. Sys. Rev. Series 2016 A: | | | |
| 5% 9/1/22 | | 490 | 539 |
| 5% 9/1/23 | | 710 | 797 |
| 5% 9/1/25 | | 785 | 907 |
|
| TOTAL KANSAS | | | 8,383 |
|
| Kentucky - 1.5% | | | |
| Ashland Med. Ctr. Rev.: | | | |
| (Ashland Hosp. Corp. D/B/A King's Daughters Med. Ctr. Proj.) Series 2016 A, 5% 2/1/24 | | 1,330 | 1,457 |
| (Ashland Hosp. Corp. D/B/A Kings Daughters Med. Ctr. Proj.) Series 2016 A, 5% 2/1/25 | | 980 | 1,085 |
| Kentucky Econ. Dev. Fin. Auth. Bonds Series 2009 B, 2.7%, tender 11/10/21 (a) | | 8,805 | 8,839 |
| Kentucky Econ. Dev. Fin. Auth. Hosp. Rev. Series 2015 A: | | | |
| 5% 6/1/20 | | 1,380 | 1,423 |
| 5% 6/1/22 | | 1,525 | 1,628 |
| 5% 6/1/24 | | 1,655 | 1,812 |
| Kentucky State Property & Buildings Commission Rev. (Kentucky St Proj.) Series D, 5% 5/1/21 | | 980 | 1,041 |
| Kentucky, Inc. Pub. Energy Bonds Series C1, 4%, tender 6/1/25 (a) | | 15,000 | 15,731 |
| Louisville/Jefferson County Metropolitan Govt. Poll. Cont. Rev. Bonds (Louisville Gas & Elec. Co. Proj.) Series 2003 A, 1.5%, tender 4/1/19 (a) | | 7,345 | 7,333 |
| Univ. Louisville Revs. Series 2016 C, 3% 9/1/21 | | 2,315 | 2,368 |
|
| TOTAL KENTUCKY | | | 42,717 |
|
| Louisiana - 2.2% | | | |
| Louisiana Citizens Property Ins. Corp. Assessment Rev. Series 2015: | | | |
| 5% 6/1/19 | | 9,145 | 9,265 |
| 5% 6/1/21 (FSA Insured) | | 4,890 | 5,242 |
| Louisiana Gen. Oblig.: | | | |
| Series 2012 A, 5% 8/1/22 | | 1,480 | 1,636 |
| Series 2012 C, 5% 7/15/21 | | 3,305 | 3,556 |
| Series 2014 D1, 5% 12/1/22 | | 1,275 | 1,420 |
| Series 2016 B: | | | |
| 5% 8/1/22 | | 14,185 | 15,657 |
| 5% 8/1/23 | | 6,115 | 6,902 |
| Series 2016 D, 5% 9/1/22 | | 6,220 | 6,887 |
| Louisiana Stadium and Exposition District Series 2013 A: | | | |
| 5% 7/1/21 | | 1,465 | 1,569 |
| 5% 7/1/22 | | 980 | 1,075 |
| New Orleans Aviation Board Rev.: | | | |
| (North Term. Proj.) Series 2017 B: | | | |
| 5% 1/1/23 (c) | | 300 | 328 |
| 5% 1/1/24 (c) | | 195 | 217 |
| 5% 1/1/25 (c) | | 195 | 220 |
| 5% 1/1/26 (c) | | 490 | 558 |
| Series 2017 D2: | | | |
| 5% 1/1/23 (c) | | 390 | 427 |
| 5% 1/1/24 (c) | | 735 | 817 |
| 5% 1/1/25 (c) | | 490 | 552 |
| New Orleans Gen. Oblig. Series 2012, 5% 12/1/20 | | 2,740 | 2,886 |
| Tobacco Settlement Fing. Corp. Series 2013 A, 5% 5/15/23 | | 4,400 | 4,799 |
|
| TOTAL LOUISIANA | | | 64,013 |
|
| Maine - 0.2% | | | |
| Maine Tpk. Auth. Tpk. Rev. Series 2015: | | | |
| 5% 7/1/21 | | 2,350 | 2,528 |
| 5% 7/1/22 | | 1,810 | 1,996 |
| 5% 7/1/24 | | 2,300 | 2,647 |
|
| TOTAL MAINE | | | 7,171 |
|
| Maryland - 2.0% | | | |
| Baltimore Proj. Rev. Series 2017 D: | | | |
| 5% 7/1/24 | | 3,220 | 3,700 |
| 5% 7/1/25 | | 3,380 | 3,948 |
| Maryland Econ. Dev. Auth. Rev. (Ports America Chesapeake LLC. Proj.) Series 2017 A: | | | |
| 4% 6/1/19 | | 2,400 | 2,419 |
| 4% 6/1/20 | | 2,960 | 3,034 |
| 5% 6/1/21 | | 1,640 | 1,742 |
| 5% 6/1/22 | | 1,750 | 1,893 |
| Maryland Gen. Oblig. Series 2017 B, 5% 8/1/25 | | 27,300 | 32,213 |
| Maryland Health & Higher Edl. Facilities Auth. Rev. Series 2015: | | | |
| 5% 7/1/19 | | 390 | 395 |
| 5% 7/1/22 | | 880 | 958 |
| 5% 7/1/23 | | 980 | 1,087 |
| 5% 7/1/24 | | 1,955 | 2,202 |
| 5% 7/1/25 | | 1,730 | 1,974 |
| Rockville Mayor & Council Econ. Dev. (Rfdg.-Ingleside King Farm Proj.) Series 2017: | | | |
| 2.5% 11/1/24 | | 850 | 812 |
| 3% 11/1/25 | | 625 | 606 |
|
| TOTAL MARYLAND | | | 56,983 |
|
| Massachusetts - 1.9% | | | |
| Massachusetts Dev. Fin. Agcy. Rev.: | | | |
| Series 2012, 5% 7/1/31 (Pre-Refunded to 7/1/21 @ 100) | | 1,035 | 1,111 |
| Series 2016 A, 5% 7/15/22 | | 1,240 | 1,374 |
| Series 2016 I: | | | |
| 5% 7/1/21 | | 490 | 523 |
| 5% 7/1/22 | | 585 | 637 |
| 5% 7/1/23 | | 660 | 732 |
| 5% 7/1/24 | | 1,075 | 1,211 |
| 5% 7/1/25 | | 980 | 1,118 |
| 5% 7/1/26 | | 980 | 1,129 |
| Massachusetts Edl. Fing. Auth. Rev. Series 2013, 5% 7/1/19 (c) | | 4,620 | 4,684 |
| Massachusetts Gen. Oblig.: | | | |
| Bonds Series 2014 D1, 1.05%, tender 7/1/20 (a) | | 31,300 | 30,824 |
| Series 2016 B, 5% 7/1/22 | | 1,685 | 1,863 |
| Series C, 5.5% 12/1/22 | | 4,160 | 4,724 |
| Massachusetts Port Auth. Rev. Series 2017 A: | | | |
| 5% 7/1/24 (c) | | 3,005 | 3,420 |
| 5% 7/1/25 (c) | | 1,115 | 1,290 |
|
| TOTAL MASSACHUSETTS | | | 54,640 |
|
| Michigan - 3.8% | | | |
| Clarkston Cmnty. Schools 5% 5/1/22 | | 1,635 | 1,786 |
| Detroit Downtown Dev. Auth. Tax Series A, 5% 7/1/24 (FSA Insured) | | 1,000 | 1,116 |
| Detroit Swr. Disp. Rev. Series 2006 D, 3 month U.S. LIBOR + 0.600% 2.205% 7/1/32 (a)(e) | | 3,980 | 3,798 |
| Grand Blanc Cmnty. Schools Series 2013: | | | |
| 5% 5/1/19 | | 1,200 | 1,213 |
| 5% 5/1/20 | | 2,575 | 2,681 |
| 5% 5/1/21 | | 2,105 | 2,249 |
| 5% 5/1/22 | | 1,810 | 1,982 |
| Grand Rapids Pub. Schools 5% 5/1/23 (FSA Insured) | | 1,275 | 1,424 |
| Kalamazoo Hosp. Fin. Auth. Hosp. Facilities Rev. Series 2016: | | | |
| 5% 5/15/22 | | 980 | 1,064 |
| 5% 5/15/24 | | 540 | 606 |
| 5% 5/15/25 | | 635 | 723 |
| 5% 5/15/26 | | 610 | 702 |
| Kent Hosp. Fin. Auth. Hosp. Facilities Rev. (Spectrum Health Sys. Proj.) Series 2011 A, 5% 11/15/19 | | 980 | 1,006 |
| Michigan Bldg. Auth. Rev. (Facilities Prog.) Series 2016 I: | | | |
| 5% 4/15/22 | | 980 | 1,076 |
| 5% 4/15/23 | | 1,320 | 1,482 |
| 5% 4/15/24 | | 1,450 | 1,659 |
| Michigan Fin. Auth. Rev.: | | | |
| Bonds 1.1%, tender 8/15/19 (a) | | 4,155 | 4,129 |
| Series 2015 A: | | | |
| 5% 8/1/22 | | 2,350 | 2,579 |
| 5% 8/1/23 | | 3,715 | 4,160 |
| Michigan Gen. Oblig. Series 2016: | | | |
| 5% 3/15/20 | | 3,255 | 3,376 |
| 5% 3/15/21 | | 980 | 1,044 |
| 5% 3/15/22 | | 2,280 | 2,489 |
| 5% 3/15/23 | | 3,915 | 4,374 |
| 5% 3/15/24 | | 6,760 | 7,706 |
| Michigan Hosp. Fin. Auth. Rev. Bonds: | | | |
| (Ascension Health Cr. Group Proj.) Series F5, 2.4%, tender 3/15/23 (a) | | 3,535 | 3,529 |
| Series 2005 A4, 1.625%, tender 11/1/19 (a) | | 6,615 | 6,585 |
| Series 2010 F4, 1.95%, tender 4/1/20 (a) | | 6,400 | 6,380 |
| Michigan Strategic Fund Ltd. Oblig. Rev. Bonds Series CC, 1.45%, tender 9/1/21 (a) | | 7,040 | 6,768 |
| Portage Pub. Schools Series 2016: | | | |
| 5% 5/1/23 | | 1,990 | 2,221 |
| 5% 11/1/23 | | 1,335 | 1,505 |
| 5% 5/1/24 | | 1,880 | 2,140 |
| 5% 11/1/24 | | 1,955 | 2,246 |
| 5% 5/1/25 | | 1,100 | 1,274 |
| 5% 11/1/25 | | 1,195 | 1,394 |
| 5% 5/1/26 | | 1,665 | 1,960 |
| 5% 11/1/26 | | 1,155 | 1,357 |
| 5% 11/1/28 | | 985 | 1,147 |
| Royal Oak Hosp. Fin. Auth. Hosp. Rev. Series 2014 D: | | | |
| 5% 9/1/21 | | 1,465 | 1,575 |
| 5% 9/1/23 | | 490 | 550 |
| Spring Lake Pub. Schools: | | | |
| Series 2014, 5% 5/1/19 | | 2,250 | 2,273 |
| 5% 11/1/19 | | 2,715 | 2,785 |
| 5% 5/1/20 | | 3,550 | 3,696 |
| 5% 11/1/20 | | 1,705 | 1,800 |
| 5% 5/1/21 | | 4,020 | 4,299 |
|
| TOTAL MICHIGAN | | | 109,908 |
|
| Minnesota - 0.7% | | | |
| Minneapolis & Saint Paul Metropolitan Arpts. Commission Arpt. Rev.: | | | |
| Series 2014 A: | | | |
| 5% 1/1/22 | | 980 | 1,067 |
| 5% 1/1/23 | | 980 | 1,093 |
| Series 2014 B: | | | |
| 5% 1/1/21 (c) | | 2,240 | 2,367 |
| 5% 1/1/22 (c) | | 1,955 | 2,113 |
| 5% 1/1/23 (c) | | 980 | 1,080 |
| Moorhead Edl. Facilities Rev. (The Concordia College Corp. Proj.) Series 2016, 5% 12/1/25 | | 2,950 | 3,252 |
| Northern Muni. Pwr. Agcy. Elec. Sys. Rev. Series 2017: | | | |
| 5% 1/1/22 | | 1,160 | 1,256 |
| 5% 1/1/23 | | 1,115 | 1,232 |
| 5% 1/1/24 | | 1,560 | 1,755 |
| Western Minnesota Muni. Pwr. Agcy. Pwr. Supply Rev. Series 2014 A: | | | |
| 5% 1/1/22 | | 980 | 1,067 |
| 5% 1/1/23 | | 1,465 | 1,631 |
| 5% 1/1/24 | | 980 | 1,114 |
|
| TOTAL MINNESOTA | | | 19,027 |
|
| Missouri - 0.2% | | | |
| Cape Girardeau County Indl. Dev. Auth. (Southeast Hosp. Proj.) Series 2017 A: | | | |
| 5% 3/1/19 | | 295 | 296 |
| 5% 3/1/20 | | 320 | 329 |
| 5% 3/1/21 | | 390 | 409 |
| 5% 3/1/22 | | 585 | 624 |
| 5% 3/1/23 | | 980 | 1,062 |
| 5% 3/1/24 | | 685 | 752 |
| 5% 3/1/25 | | 710 | 788 |
| 5% 3/1/26 | | 980 | 1,097 |
|
| TOTAL MISSOURI | | | 5,357 |
|
| Nevada - 2.5% | | | |
| Clark County Arpt. Rev.: | | | |
| (Sub Lien Proj.) Series 2017 A-1, 5% 7/1/22 (c) | | 3,915 | 4,262 |
| Series 2017 C, 5% 7/1/21 (c) | | 7,785 | 8,298 |
| Clark County School District: | | | |
| Series 2016 A: | | | |
| 5% 6/15/21 | | 1,470 | 1,569 |
| 5% 6/15/23 | | 1,285 | 1,430 |
| Series 2016 D, 5% 6/15/23 | | 10,000 | 11,127 |
| Series 2017 A, 5% 6/15/22 | | 2,800 | 3,054 |
| Series 2017 C: | | | |
| 5% 6/15/21 | | 9,030 | 9,639 |
| 5% 6/15/23 | | 4,550 | 5,063 |
| Humboldt County Nev Poll. Cont. Rev. Bonds (Sierra Pacific Pwr. Co. Proj.) Series 2016 A, 1.25%, tender 6/3/19 (a) | | 1,955 | 1,947 |
| Nevada Dept. of Bus. & Industry Bonds (Republic Svcs., Inc. Proj.) Series 2001, 2.5%, tender 6/3/19 (a)(c)(d) | | 10,400 | 10,401 |
| Nevada Gen. Oblig.: | | | |
| Series 2012 B, 5% 8/1/20 | | 2,180 | 2,287 |
| Series 2013 D1, 5% 3/1/24 | | 2,640 | 2,952 |
| Washoe County Gas & Wtr. Facilities Bonds (Sierra Pacific Pwr. Co. Proj.) Series 2016 B, 3%, tender 6/1/22 (a) | | 5,185 | 5,290 |
| Washoe County Gas Facilities Rev. Bonds (Sierra Pacific Pwr. Co. Proj.) Series 2016 A, 1.5%, tender 6/3/19 (a)(c) | | 5,990 | 5,970 |
|
| TOTAL NEVADA | | | 73,289 |
|
| New Hampshire - 0.6% | | | |
| New Hampshire Health & Ed. Facilities Auth.: | | | |
| Series 2017 B, 4.125% 7/1/24 (d) | | 1,010 | 1,012 |
| Series 2017 C, 3.5% 7/1/22 (d) | | 335 | 335 |
| New Hampshire Health & Ed. Facilities Auth. Rev.: | | | |
| (Dartmouth-Hitchcock Obligated Group Proj.) Series 2010, 5% 8/1/40 (Pre-Refunded to 8/1/20 @ 100) | | 6,000 | 6,288 |
| (Southern NH Med. Ctr. Proj.) Series 2016, 3% 10/1/21 | | 1,375 | 1,397 |
| Series 2012: | | | |
| 4% 7/1/20 | | 2,645 | 2,712 |
| 4% 7/1/21 | | 1,485 | 1,547 |
| Series 2016: | | | |
| 5% 10/1/21 | | 1,225 | 1,302 |
| 5% 10/1/23 | | 2,785 | 3,058 |
|
| TOTAL NEW HAMPSHIRE | | | 17,651 |
|
| New Jersey - 6.5% | | | |
| Camden County Impt. Auth. Health Care Redev. Rev. Series 2014 A: | | | |
| 5% 2/15/20 | | 3,030 | 3,122 |
| 5% 2/15/21 | | 2,445 | 2,582 |
| 5% 2/15/22 | | 2,445 | 2,642 |
| 5% 2/15/23 | | 2,770 | 3,048 |
| New Jersey Econ. Dev. Auth. Rev.: | | | |
| (Provident Montclair Proj.) Series 2017: | | | |
| 4% 6/1/22 (FSA Insured) | | 980 | 1,031 |
| 5% 6/1/23 (FSA Insured) | | 1,230 | 1,357 |
| 5% 6/1/24 (FSA Insured) | | 980 | 1,097 |
| Series 2005 K, 5.5% 12/15/19 | | 7,855 | 8,088 |
| Series 2011 EE: | | | |
| 5% 9/1/20 | | 1,320 | 1,376 |
| 5% 9/1/20 (Escrowed to Maturity) | | 3,570 | 3,747 |
| Series 2012 II: | | | |
| 5% 3/1/21 | | 6,650 | 6,986 |
| 5% 3/1/22 | | 6,155 | 6,579 |
| Series 2013, 5% 3/1/23 | | 5,870 | 6,366 |
| Series 2014 PP, 5% 6/15/19 | | 16,630 | 16,836 |
| New Jersey Econ. Dev. Auth. Spl. Facilities Rev. (Port Newark Container Term. LLC. Proj.) Series 2017 5% 10/1/26 (c) | | 2,130 | 2,373 |
| New Jersey Edl. Facility: | | | |
| Series 2014: | | | |
| 5% 6/15/20 | | 10,760 | 11,164 |
| 5% 6/15/21 | | 10,760 | 11,372 |
| Series 2016 A: | | | |
| 5% 7/1/21 | | 2,150 | 2,273 |
| 5% 7/1/22 | | 6,160 | 6,636 |
| 5% 7/1/23 | | 3,315 | 3,633 |
| 5% 7/1/24 | | 7,740 | 8,606 |
| New Jersey Health Care Facilities Fing. Auth. Rev. Series 2016 A: | | | |
| 5% 7/1/19 | | 1,465 | 1,484 |
| 5% 7/1/21 | | 170 | 181 |
| 5% 7/1/22 | | 170 | 185 |
| 5% 7/1/23 | | 595 | 658 |
| 5% 7/1/24 | | 475 | 532 |
| 5% 7/1/24 | | 1,200 | 1,374 |
| 5% 7/1/24 | | 985 | 1,103 |
| 5% 7/1/25 | | 515 | 583 |
| 5% 7/1/26 | | 170 | 194 |
| 5% 7/1/27 | | 255 | 290 |
| New Jersey Higher Ed. Student Assistance Auth. Student Ln. Rev.: | | | |
| Series 2013, 5% 12/1/19 (c) | | 3,765 | 3,852 |
| Series 2017 1A: | | | |
| 5% 12/1/22 (c) | | 750 | 816 |
| 5% 12/1/23 (c) | | 1,930 | 2,132 |
| Series 2017 1B, 5% 12/1/21 (c) | | 795 | 850 |
| New Jersey Tpk. Auth. Tpk. Rev.: | | | |
| Bonds Series 2017 C5, 1 month U.S. LIBOR + 0.460% 2.104%, tender 1/1/21 (a)(e) | | 10,485 | 10,485 |
| Series 2013 A: | | | |
| 5% 1/1/24 (Pre-Refunded to 7/1/22 @ 100) | | 3,895 | 4,306 |
| 5% 1/1/24 (Pre-Refunded to 7/1/22 @ 100) | | 355 | 392 |
| Series 2017 C1, 1 month U.S. LIBOR + 0.340% 1.984% 1/1/21 (a)(e) | | 1,170 | 1,168 |
| New Jersey Trans. Trust Fund Auth.: | | | |
| Series 2003 B, 5.25% 12/15/19 | | 3,785 | 3,888 |
| Series 2012 AA, 5% 6/15/19 | | 1,465 | 1,483 |
| Series 2013 A: | | | |
| 5% 12/15/19 | | 6,315 | 6,472 |
| 5% 6/15/20 | | 17,605 | 18,266 |
| Series 2016 A, 5% 6/15/27 | | 3,960 | 4,440 |
| Series 2018 A, 5% 6/15/24 | | 5,000 | 5,544 |
| New Jersey Transit Corp. Ctfs. of Prtn. Series 2014 A, 5% 9/15/21 | | 4,795 | 5,098 |
|
| TOTAL NEW JERSEY | | | 186,690 |
|
| New Mexico - 0.6% | | | |
| Farmington Poll. Cont. Rev. Bonds (Southern California Edison Co. Four Corners Proj.): | | | |
| Series 2005 B, 1.875%, tender 4/1/20 (a) | | 10,785 | 10,656 |
| Series 2011, 1.875%, tender 4/1/20 (a) | | 6,155 | 6,081 |
|
| TOTAL NEW MEXICO | | | 16,737 |
|
| New York - 4.0% | | | |
| Dorm. Auth. New York Univ. Rev. Series 2016 A: | | | |
| 5% 7/1/22 | | 490 | 537 |
| 5% 7/1/24 | | 1,810 | 2,062 |
| Dutchess County Local Dev. Corp. Rev. (Health Quest Systems, Inc. Proj.) Series 2010 A, 5% 7/1/19 (Assured Guaranty Corp. Insured) (FSA Insured) | | 625 | 634 |
| Long Island Pwr. Auth. Elec. Sys. Rev. Series 2016 B: | | | |
| 5% 9/1/25 | | 2,740 | 3,196 |
| 5% 9/1/26 | | 1,220 | 1,440 |
| New York City Gen. Oblig. Series 2015 C, 5% 8/1/25 | | 1,665 | 1,932 |
| New York City Transitional Fin. Auth. Rev.: | | | |
| Series 2012 A, 5% 11/1/20 | | 4,400 | 4,652 |
| Series B: | | | |
| 5% 11/1/20 | | 4,160 | 4,270 |
| 5% 11/1/20 (Pre-Refunded to 11/1/19 @ 100) | | 1,660 | 1,704 |
| New York Dorm. Auth. Mental Health Svcs. Facilities Impt. Rev. Series 2012 A, 4% 5/15/20 | | 7,825 | 8,062 |
| New York Metropolitan Trans. Auth. Rev.: | | | |
| Bonds Series 2018 A, 5%, tender 11/15/20 (a) | | 20,000 | 21,014 |
| Series 2003 B, 5.25% 11/15/19 (Nat'l. Pub. Fin. Guarantee Corp. Insured) | | 5,085 | 5,232 |
| Series 2008 B2: | | | |
| 5% 11/15/19 | | 6,050 | 6,211 |
| 5% 11/15/20 | | 5,380 | 5,681 |
| 5% 11/15/21 | | 3,915 | 4,225 |
| Series 2012 B, 5% 11/15/22 | | 1,955 | 2,151 |
| Series 2012 E: | | | |
| 4% 11/15/19 | | 1,710 | 1,741 |
| 5% 11/15/21 | | 2,380 | 2,568 |
| Series 2012 F, 5% 11/15/19 | | 4,890 | 5,020 |
| Series 2014 C, 5% 11/15/21 | | 2,740 | 2,957 |
| Series 2016 B, 5% 11/15/21 | | 2,150 | 2,320 |
| New York Thruway Auth. Gen. Rev. Series 2013 A, 5% 5/1/19 | | 22,280 | 22,517 |
| New York Urban Dev. Corp. Rev. Series 2017 A, 5% 3/15/22 | | 1,265 | 1,387 |
| Yonkers Gen. Oblig. Series 2017 C, 5% 10/1/22 (Build America Mutual Assurance Insured) | | 2,490 | 2,756 |
|
| TOTAL NEW YORK | | | 114,269 |
|
| North Carolina - 0.8% | | | |
| Dare County Ctfs. of Prtn. Series 2012 B: | | | |
| 4% 6/1/20 | | 980 | 1,010 |
| 5% 6/1/19 | | 1,275 | 1,292 |
| North Carolina Cap. Facilities Fin. Agcy. Rev. Bonds (Republic Svcs., Inc. Proj.) Series 2013, 2.35%, tender 3/15/19 (a)(c) | | 1,750 | 1,750 |
| North Carolina Grant Anticipation Rev. Series 2017: | | | |
| 5% 3/1/21 | | 4,890 | 5,210 |
| 5% 3/1/22 | | 3,580 | 3,907 |
| 5% 3/1/23 | | 3,580 | 3,996 |
| North Carolina Muni. Pwr. Agcy. #1 Catawba Elec. Rev. Series 2015 E: | | | |
| 5% 1/1/22 | | 4,890 | 5,317 |
| 5% 1/1/23 | | 1,465 | 1,628 |
|
| TOTAL NORTH CAROLINA | | | 24,110 |
|
| Ohio - 3.4% | | | |
| Akron Bath Copley Hosp. District Rev. Series 2016, 5% 11/15/24 | | 1,955 | 2,185 |
| Allen County Hosp. Facilities Rev. Bonds (Mercy Health) Series 2017 B, 5%, tender 5/5/22 (a) | | 5,280 | 5,776 |
| American Muni. Pwr., Inc. Rev. Bonds: | | | |
| (Combined Hydroelectric Proj.) Series 2018, 2.25%, tender 8/15/21 (a) | | 2,500 | 2,499 |
| Series B, 5%, tender 8/15/20 (a) | | 38,935 | 40,235 |
| Cleveland Arpt. Sys. Rev.: | | | |
| Series 2016 A, 5% 1/1/26 (FSA Insured) | | 490 | 557 |
| 5% 1/1/20 (FSA Insured) | | 415 | 428 |
| 5% 1/1/22 (FSA Insured) | | 1,295 | 1,403 |
| 5% 1/1/24 (FSA Insured) | | 1,175 | 1,323 |
| 5% 1/1/25 (FSA Insured) | | 1,225 | 1,399 |
| Fairfield County Hosp. Facilities Rev. (Fairfield Med. Ctr. Proj.) Series 2013: | | | |
| 5% 6/15/22 | | 2,100 | 2,261 |
| 5% 6/15/23 | | 1,815 | 1,982 |
| Franklin County Hosp. Facilities Rev. Series 2016 C, 5% 11/1/23 | | 2,800 | 3,174 |
| Hamilton County Convention Facilities Auth. Rev. Series 2014: | | | |
| 5% 12/1/19 | | 1,870 | 1,921 |
| 5% 12/1/20 | | 2,155 | 2,276 |
| 5% 12/1/21 | | 2,000 | 2,152 |
| Ohio Gen. Oblig. Series 2012 C, 5% 9/15/21 | | 4,255 | 4,606 |
| Ohio Hosp. Facilities Rev. Series 2017 A: | | | |
| 4% 1/1/20 | | 2,365 | 2,414 |
| 5% 1/1/21 | | 2,640 | 2,797 |
| 5% 1/1/22 | | 1,665 | 1,809 |
| 5% 1/1/23 | | 1,955 | 2,173 |
| 5% 1/1/24 | | 1,690 | 1,916 |
| 5% 1/1/25 | | 2,035 | 2,347 |
| Scioto County Hosp. Facilities Rev. Series 2016: | | | |
| 5% 2/15/21 | | 1,295 | 1,370 |
| 5% 2/15/22 | | 1,075 | 1,163 |
| 5% 2/15/23 | | 2,075 | 2,289 |
| 5% 2/15/24 | | 1,605 | 1,801 |
| 5% 2/15/25 | | 1,675 | 1,906 |
| 5% 2/15/26 | | 1,225 | 1,409 |
|
| TOTAL OHIO | | | 97,571 |
|
| Oklahoma - 0.3% | | | |
| Oklahoma Dev. Fin. Auth. Health Sys. Rev. (OU Medicine Proj.) Series 2018 B: | | | |
| 5% 8/15/24 | | 500 | 555 |
| 5% 8/15/25 | | 500 | 561 |
| 5% 8/15/26 | | 800 | 906 |
| Oklahoma Dev. Fin. Auth. Rev.: | | | |
| (Saint John Health Sys. Proj.) Series 2012, 5% 2/15/23 (Pre-Refunded to 2/15/22 @ 100) | | 2,545 | 2,778 |
| Series 2004 A, 2.375% 12/1/21 (a) | | 1,320 | 1,308 |
| Series 2012, 5% 2/15/21 (Escrowed to Maturity) | | 1,565 | 1,665 |
|
| TOTAL OKLAHOMA | | | 7,773 |
|
| Oregon - 0.5% | | | |
| Clackamas County Hosp. Facility Auth. (Willamette View Proj.) Series 2017 B, 3% 11/15/22 | | 390 | 390 |
| Oregon Bus. Dev. Commn Recovery Zone Facility Bonds (Intel Corp. Proj.) Series 232, 2.4%, tender 8/14/23 (a) | | 14,000 | 14,061 |
|
| TOTAL OREGON | | | 14,451 |
|
| Pennsylvania - 1.5% | | | |
| Lehigh County Indl. Dev. Auth. Poll. Cont. Rev. Bonds: | | | |
| (PPL Elec. Utils. Corp. Proj.) Series 2016 A, 1.8%, tender 9/1/22 (a) | | 2,445 | 2,369 |
| Series B, 1.8%, tender 8/15/22 (a) | | 3,245 | 3,145 |
| Montgomery County Higher Ed. & Health Auth. Rev. Series 2014 A: | | | |
| 4% 10/1/19 | | 645 | 651 |
| 5% 10/1/20 | | 1,230 | 1,278 |
| 5% 10/1/23 | | 190 | 208 |
| Pennsylvania Econ. Dev. Auth. Governmental Lease (Forum Place Proj.) Series 2012: | | | |
| 5% 3/1/19 | | 2,260 | 2,271 |
| 5% 3/1/20 | | 2,095 | 2,163 |
| Pennsylvania Econ. Dev. Fing. Auth. Solid Waste Disp. Rev. Bonds: | | | |
| (Waste Mgmt., Inc. Proj.) Series 2013, 2.15%, tender 2/1/19 (a)(c) | | 5,900 | 5,899 |
| (Waste Mgmt., Inc. Proj.): | | | |
| Series 2009, 2.8%, tender 12/1/21 (a) | | 1,700 | 1,704 |
| Series 2017 A, 1.7%, tender 8/3/20 (a)(c) | | 3,220 | 3,174 |
| Pennsylvania Gen. Oblig. Series 2011, 5% 7/1/21 | | 1,860 | 1,996 |
| Pennsylvania Higher Edl. Facilities Auth. Rev. Series 2014: | | | |
| 5% 12/1/19 | | 335 | 345 |
| 5% 12/1/21 | | 270 | 294 |
| 5% 12/1/22 | | 835 | 928 |
| Pennsylvania Indl. Dev. Auth. Rev. Series 2012, 5% 7/1/21 | | 1,140 | 1,222 |
| Pennsylvania Pub. School Bldg. Auth. School Rev. (The School District of Harrisburg Proj.) Series 2016 A, 5% 12/1/21 (FSA Insured) | | 4,890 | 5,258 |
| Philadelphia Arpt. Rev.: | | | |
| Series 2017 A, 5% 7/1/24 | | 490 | 560 |
| Series 2017 B, 5% 7/1/24 (c) | | 2,445 | 2,760 |
| Philadelphia Gas Works Rev. Series 15, 5% 8/1/21 | | 1,225 | 1,312 |
| Philadelphia School District Series 2018 A: | | | |
| 5% 9/1/24 | | 1,000 | 1,123 |
| 5% 9/1/25 | | 700 | 795 |
| 5% 9/1/26 | | 750 | 859 |
| Reading School District Series 2017: | | | |
| 5% 3/1/25 (FSA Insured) | | 320 | 365 |
| 5% 3/1/26 (FSA Insured) | | 260 | 300 |
| 5% 3/1/27 (FSA Insured) | | 250 | 291 |
| 5% 3/1/28 (FSA Insured) | | 245 | 285 |
| Southeastern Pennsylvania Trans. Auth. Rev. Series 2011, 5% 6/1/19 | | 195 | 197 |
| Unionville-Chadds Ford School District Gen. Oblig. Series 2009, 5% 6/1/20 | | 1,165 | 1,181 |
|
| TOTAL PENNSYLVANIA | | | 42,933 |
|
| Rhode Island - 1.2% | | | |
| Rhode Island Health & Edl. Bldg. Corp. Higher Ed. Facilities Rev.: | | | |
| Series 2013 A, 5% 5/15/19 | | 1,465 | 1,482 |
| Series 2016: | | | |
| 5% 5/15/20 | | 645 | 668 |
| 5% 5/15/21 | | 1,475 | 1,563 |
| 5% 5/15/22 | | 1,955 | 2,112 |
| 5% 5/15/23 | | 1,180 | 1,296 |
| 5% 5/15/24 | | 2,300 | 2,561 |
| 5% 5/15/25 | | 5,385 | 6,071 |
| Rhode Island Health & Edl. Bldg. Corp. Pub. Schools Rev.: | | | |
| (Providence Proj.) Series 2015 A, 3% 5/15/19 (FSA Insured) | | 6,275 | 6,303 |
| Series 2015, 5% 5/15/25 (FSA Insured) | | 5,910 | 6,793 |
| Tobacco Setlement Fing. Corp. Series 2015 A: | | | |
| 5% 6/1/26 | | 3,425 | 3,784 |
| 5% 6/1/27 | | 980 | 1,073 |
|
| TOTAL RHODE ISLAND | | | 33,706 |
|
| South Carolina - 0.7% | | | |
| Lancaster County School District ( South Carolina Gen. Oblig. Proj.) Series 2017, 5% 3/1/22 | | 2,020 | 2,212 |
| Lexington County Health Svcs. District, Inc. Hosp. Rev. Series 2011, 5% 11/1/19 | | 1,165 | 1,192 |
| Richland County School District #2 Gen. Oblig. (South Carolina Gen. Oblig. Proj.) Series 2015 A, 5% 2/1/23 | | 2,565 | 2,870 |
| Scago Edl. Facilities Corp. for Colleton School District (School District of Colleton County Proj.) Series 2015: | | | |
| 5% 12/1/23 | | 4,345 | 4,870 |
| 5% 12/1/26 | | 1,075 | 1,222 |
| South Carolina Jobs-Econ. Dev. Auth. Econ. Dev. Rev. (Bon Secours Health Sys. Proj.) Series 2013, 5% 11/1/28 (Pre-Refunded to 11/1/22 @ 100) | | 1,465 | 1,620 |
| South Carolina Pub. Svc. Auth. Rev.: | | | |
| Series 2012 B, 5% 12/1/20 | | 980 | 1,030 |
| Series 2014 C: | | | |
| 5% 12/1/22 | | 1,075 | 1,175 |
| 5% 12/1/23 | | 4,890 | 5,430 |
|
| TOTAL SOUTH CAROLINA | | | 21,621 |
|
| South Dakota - 0.1% | | | |
| South Dakota Health & Edl. Facilities Auth. Rev.: | | | |
| Series 2011, 5% 9/1/19 (Escrowed to Maturity) | | 1,230 | 1,256 |
| Series 2014 B: | | | |
| 4% 11/1/19 | | 390 | 397 |
| 4% 11/1/20 | | 610 | 632 |
| 4% 11/1/21 | | 490 | 517 |
| 5% 11/1/22 | | 365 | 403 |
|
| TOTAL SOUTH DAKOTA | | | 3,205 |
|
| Tennessee - 0.5% | | | |
| Johnson City Health & Edl. Hosp. Rev. Series 2010 A, 6.5% 7/1/38 (Pre-Refunded to 7/1/20 @ 100) | | 1,745 | 1,862 |
| Knox County Health Edl. & Hsg. Facilities Board Rev. Series 2016: | | | |
| 5% 9/1/25 | | 1,635 | 1,824 |
| 5% 9/1/26 | | 1,795 | 2,010 |
| Sumner County Gen. Oblig. Series 2011, 5% 6/1/22 | | 3,500 | 3,753 |
| Tennessee Energy Acquisition Corp. Bonds (Gas Rev. Proj.) Series A, 4%, tender 5/1/23 (a) | | 6,040 | 6,276 |
|
| TOTAL TENNESSEE | | | 15,725 |
|
| Texas - 11.5% | | | |
| Aledo Independent School District Series 2015, 0% 2/15/24 | | 1,195 | 1,062 |
| Carroll Independent School District Series 2009 C, 5.25% 2/15/19 | | 980 | 984 |
| Central Reg'l. Mobility Auth. Series 2016: | | | |
| 5% 1/1/21 | | 490 | 515 |
| 5% 1/1/22 | | 1,465 | 1,572 |
| 5% 1/1/23 | | 2,395 | 2,617 |
| 5% 1/1/24 | | 3,295 | 3,660 |
| 5% 1/1/26 | | 2,800 | 3,191 |
| Cypress-Fairbanks Independent School District Bonds: | | | |
| Series 2014 B2, 1.4%, tender 8/17/20 (a) | | 3,220 | 3,186 |
| Series 2014 B3, 1.4%, tender 8/17/20 (a) | | 3,485 | 3,448 |
| Series 2015 B2, 2.125%, tender 8/16/21 (a) | | 16,000 | 15,982 |
| Dallas County Gen. Oblig. Series 2016 5% 8/15/22 | | 3,445 | 3,806 |
| Dallas Fort Worth Int'l. Arpt. Rev.: | | | |
| Series 2013 F: | | | |
| 5% 11/1/19 | | 1,955 | 2,004 |
| 5% 11/1/20 | | 1,465 | 1,545 |
| 5% 11/1/21 | | 2,935 | 3,176 |
| 5% 11/1/22 | | 4,890 | 5,411 |
| Series 2014 D, 5% 11/1/23 (c) | | 1,905 | 2,124 |
| Dallas Independent School District Bonds: | | | |
| Series 2016 B3, 5%, tender 2/15/19 (a) | | 5,870 | 5,892 |
| Series 2016 B4, 5%, tender 2/15/20 (a) | | 6,845 | 7,070 |
| Series 2016 B5, 5%, tender 2/15/21 (a) | | 7,825 | 8,291 |
| Series 2016: | | | |
| 5%, tender 2/15/22 (a) | | 150 | 164 |
| 5%, tender 2/15/22 (a) | | 9,630 | 10,468 |
| Denton Independent School District Series 2016, 0% 8/15/25 | | 1,610 | 1,379 |
| Fort Bend Independent School District Bonds: | | | |
| Series C, 1.35%, tender 8/1/20 (a) | | 1,735 | 1,716 |
| Series D, 1.5%, tender 8/1/21 (a) | | 3,130 | 3,074 |
| Fort Worth Gen. Oblig. Series 2015 A, 5% 3/1/23 | | 1,670 | 1,858 |
| Fort Worth Independent School District Series 2015, 5% 2/15/22 | | 1,580 | 1,727 |
| Gregg County Health Facilities Dev. Series 2012 C, 5% 7/1/42 (Pre-Refunded to 7/1/22 @ 100) | | 6,135 | 6,745 |
| Harris County Flood Cont. District Series 2010 A, 5% 10/1/34 (Pre-Refunded to 10/1/20 @ 100) | | 1,500 | 1,581 |
| Houston Arpt. Sys. Rev.: | | | |
| Series 2012 A, 5% 7/1/23 (c) | | 1,955 | 2,119 |
| Series 2018 A: | | | |
| 5% 7/1/23 (c) | | 750 | 835 |
| 5% 7/1/25 (c) | | 1,550 | 1,777 |
| Houston Gen. Oblig. Series 2013 A, 5% 3/1/22 | | 5,520 | 6,034 |
| Houston Independent School District: | | | |
| Bonds: | | | |
| Series 2012, 2.4%, tender 6/1/21 (a) | | 12,235 | 12,306 |
| Series 2013 B, 2.4%, tender 6/1/21 (a) | | 5,880 | 5,914 |
| Series 2017, 3% 2/15/22 | | 13,810 | 14,263 |
| Humble Independent School District Series 2016 B, 5% 2/15/22 | | 3,970 | 4,337 |
| Leander Independent School District Series 2013 A, 0% 8/15/21 | | 1,870 | 1,775 |
| Lewisville Independent School District Series 1996, 0% 8/15/21 | | 2,110 | 1,997 |
| Lower Colorado River Auth. Rev. Series 2010 B, 5% 5/15/21 | | 2,965 | 3,083 |
| Mansfield Independent School District Series 2016, 5% 2/15/24 | | 4,185 | 4,775 |
| Mission Econ. Dev. Corp. Solid Waste Disp. Rev. Bonds (Republic Svcs., Inc. Proj.) Series 2008 A, 2.15%, tender 2/1/19 (a)(c) | | 4,300 | 4,299 |
| Newark Higher Ed. Fin. Corp. (Abilene Christian Univ. Proj.) Series 2016 A, 5% 4/1/26 | | 2,425 | 2,771 |
| North East Texas Independent School District Bonds Series 2013 B, 1.42%, tender 8/1/21 (a) | | 2,705 | 2,653 |
| North Harris County Reg'l. Wtr. Auth. Series 2013, 4% 12/15/22 | | 1,545 | 1,657 |
| North Texas Tollway Auth. Rev.: | | | |
| Bonds Series 2012 C, 1.95%, tender 1/1/19 (a) | | 8,315 | 8,315 |
| Series 2011 A, 5.5% 9/1/41 (Pre-Refunded to 9/1/21 @ 100) | | 16,800 | 18,343 |
| Series 2011 D, 5% 9/1/28 (Pre-Refunded to 9/1/21 @ 100) | | 4,100 | 4,424 |
| Northside Independent School District Bonds: | | | |
| Series 2011 A, 2%, tender 6/1/19 (a) | | 5,795 | 5,797 |
| 2%, tender 6/1/21 (a) | | 11,865 | 11,801 |
| Plano Independent School District Series 2016 A, 5% 2/15/22 | | 7,270 | 7,951 |
| Sam Rayburn Muni. Pwr. Agcy. Series 2012, 5% 10/1/20 | | 980 | 1,024 |
| San Antonio Elec. & Gas Sys. Rev. Bonds: | | | |
| Series 2015 B, 2%, tender 12/1/21 (a) | | 3,965 | 3,932 |
| Series 2018, 2.75%, tender 12/1/22 (a) | | 10,100 | 10,242 |
| San Antonio Pub. Facilities Corp. and Rfdg. Lease (Convention Ctr. Proj.) Series 2012: | | | |
| 5% 9/15/20 | | 980 | 1,032 |
| 5% 9/15/21 | | 980 | 1,056 |
| 5% 9/15/22 | | 3,365 | 3,699 |
| San Antonio Wtr. Sys. Rev.: | | | |
| Bonds Series 2013 F, 2%, tender 11/1/21 (a) | | 7,420 | 7,373 |
| Series 2012, 4% 5/15/19 | | 1,465 | 1,477 |
| Southwest Higher Ed. Auth. Rev. (Southern Methodist Univ. Proj.) Series 2016 A: | | | |
| 5% 10/1/20 | | 3,405 | 3,589 |
| 5% 10/1/21 | | 2,935 | 3,170 |
| Tarrant County Cultural Ed. Facilities Fin. Corp. Hosp. Rev.: | | | |
| (Scott & White Healthcare Proj.) Series 2013 A: | | | |
| 5% 8/15/21 | | 735 | 791 |
| 5% 8/15/23 | | 980 | 1,099 |
| Series 2013: | | | |
| 5% 9/1/19 | | 640 | 653 |
| 5% 9/1/20 | | 895 | 939 |
| Tarrant County Cultural Ed. Facilities Fin. Corp. Retirement Facility Rev. (Mrc Crestview Proj.) Series 2010, 8.125% 11/15/44 (Pre-Refunded to 11/15/20 @ 100) | | 2,875 | 3,196 |
| Tarrant County Cultural Ed. Facilities Fin. Corp. Rev.: | | | |
| Series 2016 A, 5% 2/15/26 | | 1,465 | 1,708 |
| Series 2017 A, 5% 2/15/24 | | 1,955 | 2,213 |
| Texas Gen. Oblig. Series 2018, 4% 8/1/21 (c) | | 2,340 | 2,457 |
| Texas Trans. Commission Central Texas Tpk. Sys. Rev. Bonds Series 2015 A, 5%, tender 4/1/20 (a) | | 17,160 | 17,763 |
| Texas Wtr. Dev. Board Rev. Series 2018 B: | | | |
| 5% 10/15/21 | | 3,750 | 4,066 |
| 5% 4/15/22 | | 5,500 | 6,038 |
| 5% 10/15/22 | | 3,170 | 3,520 |
| 5% 4/15/23 | | 4,000 | 4,490 |
| 5% 10/15/23 | | 2,000 | 2,268 |
| Tomball Independent School District Bonds Series 2014 B2, 2.125%, tender 8/15/21 (a) | | 4,920 | 4,916 |
| Trinity River Auth. Reg'l. Wastewtr. Sys. Rev. Series 2016, 5% 8/1/23 | | 1,550 | 1,750 |
| Univ. of Texas Board of Regents Sys. Rev.: | | | |
| Series 2010 B, 5% 8/15/21 | | 1,760 | 1,900 |
| Series 2010, 5% 8/15/22 | | 2,670 | 2,956 |
| Series 2016 E, 5% 8/15/22 | | 1,495 | 1,655 |
|
| TOTAL TEXAS | | | 332,446 |
|
| Utah - 0.5% | | | |
| Intermountain Pwr. Agcy. Pwr. Supply Rev. Series 2018 A, 5% 7/1/21 | | 12,655 | 13,613 |
| Virginia - 1.4% | | | |
| Chesapeake Trans. Sys. Toll Road Rev. Series 2012 A: | | | |
| 4% 7/15/20 | | 590 | 604 |
| 5% 7/15/21 | | 390 | 413 |
| Commonwealth Trans. Board Grant Anticipation Rev. Series 2012 A, 5% 9/15/22 (Pre-Refunded to 3/15/22 @ 100) | | 2,150 | 2,359 |
| Fairfax County Gen. Oblig. 5% 10/1/21 | | 2,935 | 3,183 |
| Fredericksburg Econ. Dev. Auth. Rev. Series 2014, 5% 6/15/24 | | 2,290 | 2,563 |
| Louisa Indl. Dev. Auth. Poll. Cont. Rev. Bonds Series 2008 B, 2.15%, tender 9/1/20 (a) | | 2,605 | 2,598 |
| Stafford County Econ. Dev. Auth. Hosp. Facilities Rev. Series 2016: | | | |
| 5% 6/15/24 | | 1,185 | 1,326 |
| 5% 6/15/25 | | 980 | 1,111 |
| 5% 6/15/26 | | 1,680 | 1,922 |
| Virginia Pub. Bldg. Auth. Pub. Facilities Rev.: | | | |
| Series 2013 A, 5% 8/1/22 | | 3,695 | 4,096 |
| Series 2016 A, 5% 8/1/22 | | 5,230 | 5,798 |
| Virginia Pub. School Auth. School Fing. Series 2015 A, 5% 8/1/22 | | 11,525 | 12,751 |
| York County Econ. Dev. Auth. Poll. Cont. Rev. Bonds (Virginia Elec. and Pwr. Co. Proj.) Series 2009 A, 1.875%, tender 5/16/19 (a) | | 2,445 | 2,442 |
|
| TOTAL VIRGINIA | | | 41,166 |
|
| Washington - 1.5% | | | |
| Grant County Pub. Util. District #2 Series 2012 A: | | | |
| 5% 1/1/20 | | 1,345 | 1,386 |
| 5% 1/1/21 | | 1,825 | 1,934 |
| Port of Seattle Rev. Series 2016 B: | | | |
| 5% 10/1/20 (c) | | 2,870 | 3,017 |
| 5% 10/1/21 (c) | | 2,720 | 2,931 |
| 5% 10/1/22 (c) | | 2,445 | 2,686 |
| 5% 10/1/23 (c) | | 2,965 | 3,320 |
| Tacoma Elec. Sys. Rev.: | | | |
| Series 2013 A: | | | |
| 4% 1/1/21 | | 195 | 203 |
| 4% 1/1/21 (Escrowed to Maturity) | | 1,760 | 1,832 |
| 5% 1/1/21 | | 1,730 | 1,837 |
| Series 2017: | | | |
| 5% 1/1/22 | | 785 | 855 |
| 5% 1/1/25 | | 660 | 764 |
| 5% 1/1/26 | | 390 | 459 |
| Tobacco Settlement Auth. Rev. Series 2013, 5% 6/1/22 | | 2,165 | 2,323 |
| Washington Fed. Hwy. Grant Anticipation Rev. (SR 520 Corridor Prog.) Series 2012 F, 5% 9/1/21 | | 5,070 | 5,477 |
| Washington Health Care Facilities Auth. Rev.: | | | |
| (Virginia Mason Med. Ctr. Proj.) Series 2017: | | | |
| 5% 8/15/25 | | 980 | 1,096 |
| 5% 8/15/26 | | 1,955 | 2,200 |
| 5% 8/15/27 | | 2,125 | 2,401 |
| Series 2012, 5% 12/1/42 (Pre-Refunded to 12/1/21 @ 100) | | 8,390 | 9,113 |
|
| TOTAL WASHINGTON | | | 43,834 |
|
| West Virginia - 0.4% | | | |
| West Virginia Econ. Dev. Auth. Solid Waste Disp. Facilities Rev. Bonds: | | | |
| (Appalachian Pwr. Co. Amos Proj.) Series 2011 A, 1.7%, tender 9/1/20 (a)(c) | | 6,610 | 6,477 |
| 1.9%, tender 4/1/19 (a) | | 6,150 | 6,144 |
|
| TOTAL WEST VIRGINIA | | | 12,621 |
|
| Wisconsin - 1.6% | | | |
| Madison Gen. Oblig. Series 2014 A, 5% 10/1/21 | | 3,145 | 3,411 |
| Milwaukee County Arpt. Rev. Series 2013 A: | | | |
| 5% 12/1/20 (c) | | 1,300 | 1,369 |
| 5% 12/1/22 (c) | | 1,440 | 1,581 |
| 5.25% 12/1/23 (c) | | 1,505 | 1,697 |
| Pub. Fin. Auth. Sr Liv Rev. (Mary's Woods At Marylhurst, Inc. Proj.): | | | |
| Series 2017 A: | | | |
| 5% 5/15/19 (d) | | 340 | 343 |
| 5% 5/15/23 (d) | | 365 | 389 |
| Series 2017 B-1 3.95% 11/15/24 (d) | | 210 | 211 |
| Series 2017 B-2, 3.5% 11/15/23 (d) | | 275 | 275 |
| Series 2017 B-3, 3% 11/15/22 (d) | | 370 | 370 |
| Wisconsin Health & Edl. Facilities: | | | |
| (Hosp. Sisters Svcs., Inc.) Series 2014 A, 5% 11/15/22 | | 3,305 | 3,645 |
| Bonds Series 2018 B: | | | |
| 5%, tender 1/25/23 (a) | | 8,000 | 8,866 |
| 5%, tender 1/31/24 (a) | | 8,810 | 9,948 |
| Series 2014: | | | |
| 4% 5/1/19 | | 280 | 281 |
| 5% 5/1/20 | | 400 | 413 |
| 5% 5/1/21 | | 625 | 659 |
| Wisconsin Health & Edl. Facilities Auth. Rev. Series 2012, 5% 10/1/21 | | 1,370 | 1,479 |
| Wisconsin St Gen. Fund Annual Appropriation Series 2019 A: | | | |
| 5% 5/1/21 (b) | | 2,000 | 2,137 |
| 5% 5/1/22 (b) | | 8,100 | 8,877 |
|
| TOTAL WISCONSIN | | | 45,951 |
|
| TOTAL MUNICIPAL BONDS | | | |
| (Cost $2,723,917) | | | 2,719,970 |
|
| Municipal Notes - 2.0% | | | |
| Illinois - 0.5% | | | |
| Chicago Board of Ed. Participating VRDN Series Floaters XG 01 08, 1.89% 1/7/19 (a)(f) | | 13,990 | $13,990 |
| New York - 0.5% | | | |
| Ithaca Gen. Oblig. BAN Series 2018 A, 2.75% 2/15/19 | | 8,400 | 8,409 |
| New York Metropolitan Trans. Auth. Rev. BAN: | | | |
| Series 2018 B, 5% 5/15/20 | | 3,500 | 3,636 |
| Series 2018 C, 5% 9/1/21 | | 3,435 | 3,681 |
|
| TOTAL NEW YORK | | | 15,726 |
|
| Texas - 1.0% | | | |
| Lower Neches Valley Auth. Indl. Dev. Corp. Rev. (ExxonMobil Proj.) Series 2010, 1.64% 1/2/19, VRDN (a) | | 1,030 | 1,030 |
| Port Arthur Navigation District Envir. Facilities Rev. (Motiva Enterprises LLC Proj.): | | | |
| Series 2001 A, 2.05% 1/2/19, VRDN (a) | | 1,825 | 1,825 |
| Series 2010 B, 2.05% 1/2/19, VRDN (a) | | 1,000 | 1,000 |
| Series 2010 D: | | | |
| 2.03% 1/7/19, VRDN (a) | | 4,500 | 4,500 |
| 2.1% 1/7/19, VRDN (a) | | 900 | 900 |
| Texas Gen. Oblig. TRAN Series 2018, 4% 8/29/19 | | 20,000 | 20,286 |
|
| TOTAL TEXAS | | | 29,541 |
|
| TOTAL MUNICIPAL NOTES | | | |
| (Cost $59,213) | | | 59,257 |
| | | Shares | Value (000s) |
|
| Money Market Funds - 2.7% | | | |
| Fidelity Municipal Cash Central Fund, 1.77% (g)(h) | | | |
| (Cost $78,095) | | 78,082,192 | 78,089 |
| TOTAL INVESTMENT IN SECURITIES - 98.8% | | | |
| (Cost $2,861,225) | | | 2,857,316 |
| NET OTHER ASSETS (LIABILITIES) - 1.2% | | | 34,508 |
| NET ASSETS - 100% | | | $2,891,824 |
Security Type Abbreviations
BAN – BOND ANTICIPATION NOTE
TRAN – TAX AND REVENUE ANTICIPATION NOTE
VRDN – VARIABLE RATE DEMAND NOTE (A debt instrument that is payable upon demand, either daily, weekly or monthly)
Legend
(a) Coupon rates for floating and adjustable rate securities reflect the rates in effect at period end.
(b) Security or a portion of the security purchased on a delayed delivery or when-issued basis.
(c) Private activity obligations whose interest is subject to the federal alternative minimum tax for individuals.
(d) Security exempt from registration under Rule 144A of the Securities Act of 1933. These securities may be resold in transactions exempt from registration, normally to qualified institutional buyers. At the end of the period, the value of these securities amounted to $27,652,000 or 1.0% of net assets.
(e) Coupon is indexed to a floating interest rate which may be multiplied by a specified factor and/or subject to caps or floors.
(f) Provides evidence of ownership in one or more underlying municipal bonds.
(g) Information in this report regarding holdings by state and security types does not reflect the holdings of the Fidelity Municipal Cash Central Fund.
(h) Affiliated fund that is available only to investment companies and other accounts managed by Fidelity Investments. The rate quoted is the annualized seven-day yield of the fund at period end. A complete unaudited listing of the fund's holdings as of its most recent quarter end is available upon request. In addition, each Fidelity Central Fund's financial statements, which are not covered by the Fund's Report of Independent Registered Public Accounting Firm, are available on the SEC's website or upon request.
Affiliated Central Funds
Information regarding fiscal year to date income earned by the Fund from investments in Fidelity Central Funds is as follows:
| Fund | Income earned |
| | (Amounts in thousands) |
| Fidelity Municipal Cash Central Fund | $70 |
| Total | $70 |
Amounts in the income column in the above table include any capital gain distributions from underlying funds, which are presented in the corresponding line-item in the Statement of Operations if applicable.
Investment Valuation
The following is a summary of the inputs used, as of December 31, 2018, involving the Fund's assets and liabilities carried at fair value. The inputs or methodology used for valuing securities may not be an indication of the risk associated with investing in those securities. For more information on valuation inputs, and their aggregation into the levels used below, please refer to the Investment Valuation section in the accompanying Notes to Financial Statements.
| | Valuation Inputs at Reporting Date: |
| Description | Total | Level 1 | Level 2 | Level 3 |
| (Amounts in thousands) | | | | |
| Investments in Securities: | | | | |
| Municipal Securities | $2,779,227 | $-- | $2,779,227 | $-- |
| Money Market Funds | 78,089 | 78,089 | -- | -- |
| Total Investments in Securities: | $2,857,316 | $78,089 | $2,779,227 | $-- |
Other Information
The distribution of municipal securities by revenue source, as a percentage of total Net Assets, is as follows (Unaudited):
| General Obligations | 36.7% |
| Transportation | 16.5% |
| Health Care | 12.3% |
| Electric Utilities | 7.9% |
| Others* (Individually Less Than 5%) | 26.6% |
| | 100.0% |
* Includes net other assets
See accompanying notes which are an integral part of the financial statements.
Financial Statements
Statement of Assets and Liabilities
| Amounts in thousands (except per-share amounts) | | December 31, 2018 |
| Assets | | |
Investment in securities, at value — See accompanying schedule:
Unaffiliated issuers (cost $2,783,130) | $2,779,227 | |
| Fidelity Central Funds (cost $78,095) | 78,089 | |
| Total Investment in Securities (cost $2,861,225) | | $2,857,316 |
| Cash | | 22,650 |
| Receivable for fund shares sold | | 8,249 |
| Interest receivable | | 31,636 |
| Distributions receivable from Fidelity Central Funds | | 34 |
| Prepaid expenses | | 4 |
| Other receivables | | 7 |
| Total assets | | 2,919,896 |
| Liabilities | | |
| Payable for investments purchased | | |
| Regular delivery | $2,740 | |
| Delayed delivery | 15,723 | |
| Payable for fund shares redeemed | 7,427 | |
| Distributions payable | 949 | |
| Accrued management fee | 839 | |
| Distribution and service plan fees payable | 63 | |
| Other affiliated payables | 268 | |
| Other payables and accrued expenses | 63 | |
| Total liabilities | | 28,072 |
| Net Assets | | $2,891,824 |
| Net Assets consist of: | | |
| Paid in capital | | $2,896,873 |
| Total distributable earnings (loss) | | (5,049) |
| Net Assets | | $2,891,824 |
| Net Asset Value and Maximum Offering Price | | |
| Class A: | | |
| Net Asset Value and redemption price per share ($154,923 ÷ 14,769 shares) | | $10.49 |
| Maximum offering price per share (100/97.25 of $10.49) | | $10.79 |
| Class M: | | |
| Net Asset Value and redemption price per share ($15,096 ÷ 1,442 shares) | | $10.47 |
| Maximum offering price per share (100/97.25 of $10.47) | | $10.77 |
| Class C: | | |
| Net Asset Value and offering price per share ($32,110 ÷ 3,067 shares)(a) | | $10.47 |
| Limited Term Municipal Income: | | |
| Net Asset Value, offering price and redemption price per share ($2,393,317 ÷ 228,556 shares) | | $10.47 |
| Class I: | | |
| Net Asset Value, offering price and redemption price per share ($268,839 ÷ 25,660 shares) | | $10.48 |
| Class Z: | | |
| Net Asset Value, offering price and redemption price per share ($27,539 ÷ 2,629 shares) | | $10.48 |
(a) Redemption price per share is equal to net asset value less any applicable contingent deferred sales charge.
See accompanying notes which are an integral part of the financial statements.
Statement of Operations
| Amounts in thousands | | Year ended December 31, 2018 |
| Investment Income | | |
| Interest | | $63,127 |
| Income from Fidelity Central Funds | | 70 |
| Total income | | 63,197 |
| Expenses | | |
| Management fee | $10,738 | |
| Transfer agent fees | 2,902 | |
| Distribution and service plan fees | 855 | |
| Accounting fees and expenses | 523 | |
| Custodian fees and expenses | 22 | |
| Independent trustees' fees and expenses | 14 | |
| Registration fees | 133 | |
| Audit | 65 | |
| Legal | 5 | |
| Miscellaneous | 22 | |
| Total expenses before reductions | 15,279 | |
| Expense reductions | (43) | |
| Total expenses after reductions | | 15,236 |
| Net investment income (loss) | | 47,961 |
| Realized and Unrealized Gain (Loss) | | |
| Net realized gain (loss) on: | | |
| Investment securities: | | |
| Unaffiliated issuers | (1,101) | |
| Redemptions in-kind with affiliated entities | 220 | |
| Total net realized gain (loss) | | (881) |
| Change in net unrealized appreciation (depreciation) on: | | |
| Investment securities: | | |
| Unaffiliated issuers | (12,214) | |
| Fidelity Central Funds | (6) | |
| Total change in net unrealized appreciation (depreciation) | | (12,220) |
| Net gain (loss) | | (13,101) |
| Net increase (decrease) in net assets resulting from operations | | $34,860 |
See accompanying notes which are an integral part of the financial statements.
Statement of Changes in Net Assets
| Amounts in thousands | Year ended December 31, 2018 | Year ended December 31, 2017 |
| Increase (Decrease) in Net Assets | | |
| Operations | | |
| Net investment income (loss) | $47,961 | $49,838 |
| Net realized gain (loss) | (881) | 3,266 |
| Change in net unrealized appreciation (depreciation) | (12,220) | 24,605 |
| Net increase (decrease) in net assets resulting from operations | 34,860 | 77,709 |
| Distributions to shareholders | (48,484) | – |
| Distributions to shareholders from net investment income | – | (49,775) |
| Distributions to shareholders from net realized gain | – | (2,284) |
| Total distributions | (48,484) | (52,059) |
| Share transactions - net increase (decrease) | (451,938) | (133,264) |
| Total increase (decrease) in net assets | (465,562) | (107,614) |
| Net Assets | | |
| Beginning of period | 3,357,386 | 3,465,000 |
| End of period | $2,891,824 | $3,357,386 |
| Other Information | | |
| Undistributed net investment income end of period | | $12 |
See accompanying notes which are an integral part of the financial statements.
Financial Highlights
Fidelity Limited Term Municipal Income Fund Class A
| Years ended December 31, | 2018 | 2017 | 2016 | 2015 | 2014 |
| Selected Per–Share Data | | | | | |
| Net asset value, beginning of period | $10.53 | $10.45 | $10.64 | $10.71 | $10.68 |
| Income from Investment Operations | | | | | |
| Net investment income (loss)A | .135 | .122 | .118 | .129 | .153 |
| Net realized and unrealized gain (loss) | (.038) | .086 | (.188) | (.048) | .046 |
| Total from investment operations | .097 | .208 | (.070) | .081 | .199 |
| Distributions from net investment income | (.135) | (.121) | (.118) | (.130) | (.153) |
| Distributions from net realized gain | (.002) | (.007) | (.002) | (.021) | (.016) |
| Total distributions | (.137) | (.128) | (.120) | (.151) | (.169) |
| Redemption fees added to paid in capitalA | – | – | –B | –B | –B |
| Net asset value, end of period | $10.49 | $10.53 | $10.45 | $10.64 | $10.71 |
| Total ReturnC,D | .93% | 2.00% | (.68)% | .76% | 1.87% |
| Ratios to Average Net AssetsE,F | | | | | |
| Expenses before reductions | .81% | .81% | .80% | .81% | .79% |
| Expenses net of fee waivers, if any | .81% | .81% | .80% | .81% | .79% |
| Expenses net of all reductions | .81% | .81% | .80% | .81% | .79% |
| Net investment income (loss) | 1.28% | 1.15% | 1.10% | 1.21% | 1.42% |
| Supplemental Data | | | | | |
| Net assets, end of period (in millions) | $155 | $234 | $317 | $377 | $397 |
| Portfolio turnover rateG | 27%H | 33% | 31% | 30% | 21% |
A Calculated based on average shares outstanding during the period.
B Amount represents less than $.0005 per share.
C Total returns would have been lower if certain expenses had not been reduced during the applicable periods shown.
D Total returns do not include the effect of the sales charges.
E Fees and expenses of any underlying Fidelity Central Funds are not included in the Fund's expense ratio. The Fund indirectly bears its proportionate share of the expenses of any underlying Fidelity Central Funds.
F Expense ratios reflect operating expenses of the class. Expenses before reductions do not reflect amounts reimbursed by the investment adviser or reductions from expense offset arrangements and do not represent the amount paid by the class during periods when reimbursements or reductions occur. Expenses net of fee waivers reflect expenses after reimbursement by the investment adviser but prior to reductions from expense offset arrangements. Expenses net of all reductions represent the net expenses paid by the class.
G Amount does not include the portfolio activity of any underlying Fidelity Central Funds.
H Portfolio turnover rate excludes securities received or delivered in-kind.
See accompanying notes which are an integral part of the financial statements.
Fidelity Limited Term Municipal Income Fund Class M
| Years ended December 31, | 2018 | 2017 | 2016 | 2015 | 2014 |
| Selected Per–Share Data | | | | | |
| Net asset value, beginning of period | $10.51 | $10.43 | $10.62 | $10.69 | $10.66 |
| Income from Investment Operations | | | | | |
| Net investment income (loss)A | .139 | .126 | .121 | .134 | .157 |
| Net realized and unrealized gain (loss) | (.038) | .087 | (.188) | (.049) | .046 |
| Total from investment operations | .101 | .213 | (.067) | .085 | .203 |
| Distributions from net investment income | (.139) | (.126) | (.121) | (.134) | (.157) |
| Distributions from net realized gain | (.002) | (.007) | (.002) | (.021) | (.016) |
| Total distributions | (.141) | (.133) | (.123) | (.155) | (.173) |
| Redemption fees added to paid in capitalA | – | – | –B | –B | –B |
| Net asset value, end of period | $10.47 | $10.51 | $10.43 | $10.62 | $10.69 |
| Total ReturnC,D | .98% | 2.04% | (.65)% | .80% | 1.91% |
| Ratios to Average Net AssetsE,F | | | | | |
| Expenses before reductions | .76% | .77% | .77% | .77% | .76% |
| Expenses net of fee waivers, if any | .76% | .76% | .77% | .77% | .76% |
| Expenses net of all reductions | .76% | .76% | .77% | .77% | .75% |
| Net investment income (loss) | 1.33% | 1.19% | 1.14% | 1.25% | 1.46% |
| Supplemental Data | | | | | |
| Net assets, end of period (in millions) | $15 | $17 | $20 | $22 | $25 |
| Portfolio turnover rateG | 27%H | 33% | 31% | 30% | 21% |
A Calculated based on average shares outstanding during the period.
B Amount represents less than $.0005 per share.
C Total returns would have been lower if certain expenses had not been reduced during the applicable periods shown.
D Total returns do not include the effect of the sales charges.
E Fees and expenses of any underlying Fidelity Central Funds are not included in the Fund's expense ratio. The Fund indirectly bears its proportionate share of the expenses of any underlying Fidelity Central Funds.
F Expense ratios reflect operating expenses of the class. Expenses before reductions do not reflect amounts reimbursed by the investment adviser or reductions from expense offset arrangements and do not represent the amount paid by the class during periods when reimbursements or reductions occur. Expenses net of fee waivers reflect expenses after reimbursement by the investment adviser but prior to reductions from expense offset arrangements. Expenses net of all reductions represent the net expenses paid by the class.
G Amount does not include the portfolio activity of any underlying Fidelity Central Funds.
H Portfolio turnover rate excludes securities received or delivered in-kind.
See accompanying notes which are an integral part of the financial statements.
Fidelity Limited Term Municipal Income Fund Class C
| Years ended December 31, | 2018 | 2017 | 2016 | 2015 | 2014 |
| Selected Per–Share Data | | | | | |
| Net asset value, beginning of period | $10.51 | $10.43 | $10.62 | $10.69 | $10.66 |
| Income from Investment Operations | | | | | |
| Net investment income (loss)A | .057 | .043 | .038 | .050 | .072 |
| Net realized and unrealized gain (loss) | (.038) | .087 | (.188) | (.049) | .046 |
| Total from investment operations | .019 | .130 | (.150) | .001 | .118 |
| Distributions from net investment income | (.057) | (.043) | (.038) | (.050) | (.072) |
| Distributions from net realized gain | (.002) | (.007) | (.002) | (.021) | (.016) |
| Total distributions | (.059) | (.050) | (.040) | (.071) | (.088) |
| Redemption fees added to paid in capitalA | – | – | –B | –B | –B |
| Net asset value, end of period | $10.47 | $10.51 | $10.43 | $10.62 | $10.69 |
| Total ReturnC,D | .19% | 1.24% | (1.42)% | .01% | 1.11% |
| Ratios to Average Net AssetsE,F | | | | | |
| Expenses before reductions | 1.55% | 1.55% | 1.55% | 1.55% | 1.54% |
| Expenses net of fee waivers, if any | 1.55% | 1.55% | 1.55% | 1.55% | 1.54% |
| Expenses net of all reductions | 1.54% | 1.55% | 1.55% | 1.55% | 1.54% |
| Net investment income (loss) | .55% | .41% | .35% | .47% | .67% |
| Supplemental Data | | | | | |
| Net assets, end of period (in millions) | $32 | $40 | $53 | $63 | $65 |
| Portfolio turnover rateG | 27%H | 33% | 31% | 30% | 21% |
A Calculated based on average shares outstanding during the period.
B Amount represents less than $.0005 per share.
C Total returns would have been lower if certain expenses had not been reduced during the applicable periods shown.
D Total returns do not include the effect of the contingent deferred sales charge.
E Fees and expenses of any underlying Fidelity Central Funds are not included in the Fund's expense ratio. The Fund indirectly bears its proportionate share of the expenses of any underlying Fidelity Central Funds.
F Expense ratios reflect operating expenses of the class. Expenses before reductions do not reflect amounts reimbursed by the investment adviser or reductions from expense offset arrangements and do not represent the amount paid by the class during periods when reimbursements or reductions occur. Expenses net of fee waivers reflect expenses after reimbursement by the investment adviser but prior to reductions from expense offset arrangements. Expenses net of all reductions represent the net expenses paid by the class.
G Amount does not include the portfolio activity of any underlying Fidelity Central Funds.
H Portfolio turnover rate excludes securities received or delivered in-kind.
See accompanying notes which are an integral part of the financial statements.
Fidelity Limited Term Municipal Income Fund
| Years ended December 31, | 2018 | 2017 | 2016 | 2015 | 2014 |
| Selected Per–Share Data | | | | | |
| Net asset value, beginning of period | $10.51 | $10.43 | $10.63 | $10.69 | $10.66 |
| Income from Investment Operations | | | | | |
| Net investment income (loss)A | .170 | .157 | .152 | .164 | .186 |
| Net realized and unrealized gain (loss) | (.038) | .087 | (.198) | (.039) | .046 |
| Total from investment operations | .132 | .244 | (.046) | .125 | .232 |
| Distributions from net investment income | (.170) | (.157) | (.152) | (.164) | (.186) |
| Distributions from net realized gain | (.002) | (.007) | (.002) | (.021) | (.016) |
| Total distributions | (.172) | (.164) | (.154) | (.185) | (.202) |
| Redemption fees added to paid in capitalA | – | – | –B | –B | –B |
| Net asset value, end of period | $10.47 | $10.51 | $10.43 | $10.63 | $10.69 |
| Total ReturnC | 1.28% | 2.35% | (.45)% | 1.18% | 2.19% |
| Ratios to Average Net AssetsD,E | | | | | |
| Expenses before reductions | .46% | .47% | .48% | .48% | .48% |
| Expenses net of fee waivers, if any | .46% | .47% | .48% | .48% | .48% |
| Expenses net of all reductions | .46% | .47% | .48% | .48% | .48% |
| Net investment income (loss) | 1.63% | 1.49% | 1.43% | 1.54% | 1.73% |
| Supplemental Data | | | | | |
| Net assets, end of period (in millions) | $2,393 | $2,740 | $2,779 | $3,058 | $3,225 |
| Portfolio turnover rateF | 27%G | 33% | 31% | 30% | 21% |
A Calculated based on average shares outstanding during the period.
B Amount represents less than $.0005 per share.
C Total returns would have been lower if certain expenses had not been reduced during the applicable periods shown.
D Fees and expenses of any underlying Fidelity Central Funds are not included in the Fund's expense ratio. The Fund indirectly bears its proportionate share of the expenses of any underlying Fidelity Central Funds.
E Expense ratios reflect operating expenses of the class. Expenses before reductions do not reflect amounts reimbursed by the investment adviser or reductions from expense offset arrangements and do not represent the amount paid by the class during periods when reimbursements or reductions occur. Expenses net of fee waivers reflect expenses after reimbursement by the investment adviser but prior to reductions from expense offset arrangements. Expenses net of all reductions represent the net expenses paid by the class.
F Amount does not include the portfolio activity of any underlying Fidelity Central Funds.
G Portfolio turnover rate excludes securities received or delivered in-kind.
See accompanying notes which are an integral part of the financial statements.
Fidelity Limited Term Municipal Income Fund Class I
| Years ended December 31, | 2018 | 2017 | 2016 | 2015 | 2014 |
| Selected Per–Share Data | | | | | |
| Net asset value, beginning of period | $10.51 | $10.44 | $10.63 | $10.70 | $10.67 |
| Income from Investment Operations | | | | | |
| Net investment income (loss)A | .162 | .149 | .145 | .156 | .179 |
| Net realized and unrealized gain (loss) | (.028) | .077 | (.188) | (.048) | .046 |
| Total from investment operations | .134 | .226 | (.043) | .108 | .225 |
| Distributions from net investment income | (.162) | (.149) | (.145) | (.157) | (.179) |
| Distributions from net realized gain | (.002) | (.007) | (.002) | (.021) | (.016) |
| Total distributions | (.164) | (.156) | (.147) | (.178) | (.195) |
| Redemption fees added to paid in capitalA | – | – | –B | –B | –B |
| Net asset value, end of period | $10.48 | $10.51 | $10.44 | $10.63 | $10.70 |
| Total ReturnC | 1.29% | 2.17% | (.42)% | 1.02% | 2.12% |
| Ratios to Average Net AssetsD,E | | | | | |
| Expenses before reductions | .54% | .54% | .55% | .55% | .55% |
| Expenses net of fee waivers, if any | .54% | .54% | .55% | .55% | .55% |
| Expenses net of all reductions | .54% | .54% | .54% | .55% | .54% |
| Net investment income (loss) | 1.55% | 1.42% | 1.36% | 1.47% | 1.67% |
| Supplemental Data | | | | | |
| Net assets, end of period (in millions) | $269 | $327 | $297 | $276 | $263 |
| Portfolio turnover rateF | 27%G | 33% | 31% | 30% | 21% |
A Calculated based on average shares outstanding during the period.
B Amount represents less than $.0005 per share.
C Total returns would have been lower if certain expenses had not been reduced during the applicable periods shown.
D Fees and expenses of any underlying Fidelity Central Funds are not included in the Fund's expense ratio. The Fund indirectly bears its proportionate share of the expenses of any underlying Fidelity Central Funds.
E Expense ratios reflect operating expenses of the class. Expenses before reductions do not reflect amounts reimbursed by the investment adviser or reductions from expense offset arrangements and do not represent the amount paid by the class during periods when reimbursements or reductions occur. Expenses net of fee waivers reflect expenses after reimbursement by the investment adviser but prior to reductions from expense offset arrangements. Expenses net of all reductions represent the net expenses paid by the class.
F Amount does not include the portfolio activity of any underlying Fidelity Central Funds.
G Portfolio turnover rate excludes securities received or delivered in-kind.
See accompanying notes which are an integral part of the financial statements.
Fidelity Limited Term Municipal Income Fund Class Z
| Year ended December 31, | 2018 A |
| Selected Per–Share Data | |
| Net asset value, beginning of period | $10.41 |
| Income from Investment Operations | |
| Net investment income (loss)B | .048 |
| Net realized and unrealized gain (loss) | .067 |
| Total from investment operations | .115 |
| Distributions from net investment income | (.045) |
| Distributions from net realized gain | – |
| Total distributions | (.045) |
| Net asset value, end of period | $10.48 |
| Total ReturnC,D | 1.11% |
| Ratios to Average Net AssetsE,F | |
| Expenses before reductions | .43%G |
| Expenses net of fee waivers, if any | .43%G |
| Expenses net of all reductions | .43%G |
| Net investment income (loss) | 1.78%G |
| Supplemental Data | |
| Net assets, end of period (in millions) | $28 |
| Portfolio turnover rateH | 27%I |
A For the period October 2, 2018 (commencement of sale of shares) to December 31, 2018.
B Calculated based on average shares outstanding during the period.
C Total returns for periods of less than one year are not annualized.
D Total returns would have been lower if certain expenses had not been reduced during the applicable periods shown.
E Fees and expenses of any underlying Fidelity Central Funds are not included in the Fund's expense ratio. The Fund indirectly bears its proportionate share of the expenses of any underlying Fidelity Central Funds.
F Expense ratios reflect operating expenses of the class. Expenses before reductions do not reflect amounts reimbursed by the investment adviser or reductions from expense offset arrangements and do not represent the amount paid by the class during periods when reimbursements or reductions occur. Expense ratios before reductions for start-up periods may not be representative of longer-term operating periods. Expenses net of fee waivers reflect expenses after reimbursement by the investment adviser but prior to reductions from expense offset arrangements. Expenses net of all reductions represent the net expenses paid by the class.
G Annualized
H Amount does not include the portfolio activity of any underlying Fidelity Central Funds.
I Portfolio turnover rate excludes securities received or delivered in-kind.
See accompanying notes which are an integral part of the financial statements.
Notes to Financial Statements
For the period ended December 31, 2018
(Amounts in thousands except percentages)
1. Organization.
Fidelity Limited Term Municipal Income Fund (the Fund) is a fund of Fidelity Municipal Trust (the Trust) and is authorized to issue an unlimited number of shares. The Trust is registered under the Investment Company Act of 1940, as amended (the 1940 Act), as an open-end management investment company organized as a Massachusetts business trust. The Fund commenced sale of Class Z shares on October 2, 2018. The Fund offers Class A, Class M, Class C, Limited Term Municipal Income, Class I and Class Z shares, each of which has equal rights as to assets and voting privileges. Each class has exclusive voting rights with respect to matters that affect that class.
2. Investments in Fidelity Central Funds.
The Fund invests in Fidelity Central Funds, which are open-end investment companies generally available only to other investment companies and accounts managed by the investment adviser and its affiliates. The Fund's Schedule of Investments lists each of the Fidelity Central Funds held as of period end, if any, as an investment of the Fund, but does not include the underlying holdings of each Fidelity Central Fund. As an Investing Fund, the Fund indirectly bears its proportionate share of the expenses of the underlying Fidelity Central Funds.
The Money Market Central Funds seek preservation of capital and current income and are managed by Fidelity Investments Money Management, Inc. (FIMM), an affiliate of the investment adviser. Annualized expenses of the Money Market Central Funds as of their most recent shareholder report date are less than .005%.
A complete unaudited list of holdings for each Fidelity Central Fund is available upon request or at the Securities and Exchange Commission (the SEC) website at www.sec.gov. In addition, the financial statements of the Fidelity Central Funds, which are not covered by the Fund's Report of Independent Registered Public Accounting Firm, are available on the SEC website or upon request.
3. Significant Accounting Policies.
The Fund is an investment company and applies the accounting and reporting guidance of the Financial Accounting Standards Board (FASB) Accounting Standards Codification Topic 946 Financial Services – Investments Companies. The financial statements have been prepared in conformity with accounting principles generally accepted in the United States of America (GAAP), which require management to make certain estimates and assumptions at the date of the financial statements. Actual results could differ from those estimates. Subsequent events, if any, through the date that the financial statements were issued have been evaluated in the preparation of the financial statements. The following summarizes the significant accounting policies of the Fund:
Investment Valuation. Investments are valued as of 4:00 p.m. Eastern time on the last calendar day of the period. The Board of Trustees (the Board) has delegated the day to day responsibility for the valuation of the Fund's investments to the Fair Value Committee (the Committee) established by the Fund's investment adviser. In accordance with valuation policies and procedures approved by the Board, the Fund attempts to obtain prices from one or more third party pricing vendors or brokers to value its investments. When current market prices, quotations or currency exchange rates are not readily available or reliable, investments will be fair valued in good faith by the Committee, in accordance with procedures adopted by the Board. Factors used in determining fair value vary by investment type and may include market or investment specific events, changes in interest rates and credit quality. The frequency with which these procedures are used cannot be predicted and they may be utilized to a significant extent. The Committee oversees the Fund's valuation policies and procedures and reports to the Board on the Committee's activities and fair value determinations. The Board monitors the appropriateness of the procedures used in valuing the Fund's investments and ratifies the fair value determinations of the Committee.
The Fund categorizes the inputs to valuation techniques used to value its investments into a disclosure hierarchy consisting of three levels as shown below:
- Level 1 – quoted prices in active markets for identical investments
- Level 2 – other significant observable inputs (including quoted prices for similar investments, interest rates, prepayment speeds, etc.)
- Level 3 – unobservable inputs (including the Fund's own assumptions based on the best information available)
Valuation techniques used to value the Fund's investments by major category are as follows:
Debt securities, including restricted securities, are valued based on evaluated prices received from third party pricing vendors or from brokers who make markets in such securities. Municipal securities are valued by pricing vendors who utilize matrix pricing which considers yield or price of bonds of comparable quality, coupon, maturity and type or by broker-supplied prices. When independent prices are unavailable or unreliable, debt securities may be valued utilizing pricing methodologies which consider similar factors that would be used by third party pricing vendors. Debt securities are generally categorized as Level 2 in the hierarchy but may be Level 3 depending on the circumstances.
Investments in open-end mutual funds, including the Fidelity Central Funds, are valued at their closing net asset value (NAV) each business day and are categorized as Level 1 in the hierarchy.
Changes in valuation techniques may result in transfers in or out of an assigned level within the disclosure hierarchy. The aggregate value of investments by input level as of December 31, 2018 is included at the end of the Fund's Schedule of Investments.
Investment Transactions and Income. For financial reporting purposes, the Fund's investment holdings and NAV include trades executed through the end of the last business day of the period. The NAV per share for processing shareholder transactions is calculated as of the close of business of the New York Stock Exchange (NYSE), normally 4:00 p.m. Eastern time and includes trades executed through the end of the prior business day. Gains and losses on securities sold are determined on the basis of identified cost. Interest income is accrued as earned and includes coupon interest and amortization of premium and accretion of discount on debt securities as applicable. Debt obligations may be placed on non-accrual status and related interest income may be reduced by ceasing current accruals and writing off interest receivables when the collection of all or a portion of interest has become doubtful based on consistently applied procedures. A debt obligation is removed from non-accrual status when the issuer resumes interest payments or when collectability of interest is reasonably assured.
Class Allocations and Expenses. Investment income, realized and unrealized capital gains and losses, common expenses of the Fund, and certain fund-level expense reductions, if any, are allocated daily on a pro-rata basis to each class based on the relative net assets of each class to the total net assets of the Fund. Each class differs with respect to transfer agent and distribution and service plan fees incurred. Certain expense reductions may also differ by class. For the reporting period, the allocated portion of income and expenses to each class as a percent of its average net assets may vary due to the timing of recording these transactions in relation to fluctuating net assets of the classes. Expenses directly attributable to a fund are charged to that fund. Expenses attributable to more than one fund are allocated among the respective funds on the basis of relative net assets or other appropriate methods. Expense estimates are accrued in the period to which they relate and adjustments are made when actual amounts are known.
Income Tax Information and Distributions to Shareholders. Each year, the Fund intends to qualify as a regulated investment company under Subchapter M of the Internal Revenue Code, including distributing substantially all of its taxable income and realized gains. As a result, no provision for U.S. Federal income taxes is required. As of December 31, 2018, the Fund did not have any unrecognized tax benefits in the financial statements; nor is the Fund aware of any tax positions for which it is reasonably possible that the total amounts of unrecognized tax benefits will significantly change in the next twelve months. The Fund files a U.S. federal tax return, in addition to state and local tax returns as required. The Fund's federal income tax returns are subject to examination by the Internal Revenue Service (IRS) for a period of three fiscal years after they are filed. State and local tax returns may be subject to examination for an additional fiscal year depending on the jurisdiction.
Distributions are declared and recorded daily and paid monthly from net investment income. Distributions from realized gains, if any, are declared and recorded on the ex-dividend date. Income and capital gain distributions are declared separately for each class. Income and capital gain distributions are determined in accordance with income tax regulations, which may differ from GAAP.
Capital accounts within the financial statements are adjusted for permanent book-tax differences. These adjustments have no impact on net assets or the results of operations. Capital accounts are not adjusted for temporary book-tax differences which will reverse in a subsequent period.
Book-tax differences are primarily due to market discount, redemptions in kind, deferred trustees compensation and losses deferred due to wash sales.
The Fund purchases municipal securities whose interest, in the opinion of the issuer, is free from federal income tax. There is no assurance that the (IRS) will agree with this opinion. In the event the IRS determines that the issuer does not comply with relevant tax requirements, interest payments from a security could become federally taxable, possibly retroactively to the date the security was issued.
As of period end, the cost and unrealized appreciation (depreciation) in securities, and derivatives if applicable, for federal income tax purposes were as follows:
| Gross unrealized appreciation | $13,525 |
| Gross unrealized depreciation | (17,419) |
| Net unrealized appreciation (depreciation) | $(3,894) |
| Tax Cost | $2,861,210 |
The tax-based components of distributable earnings as of period end were as follows:
| Capital loss carryforward | $(1,111) |
| Net unrealized appreciation (depreciation) on securities and other investments | $(3,894) |
Capital loss carryforwards are only available to offset future capital gains of the Fund to the extent provided by regulations and may be limited. Under the Regulated Investment Company Modernization Act of 2010 (the Act), the Fund is permitted to carry forward capital losses incurred in taxable years beginning after December 22, 2010 for an unlimited period and such capital losses are required to be used prior to any losses that expire. The capital loss carryforward information presented below, including any applicable limitation, is estimated as of fiscal period end and is subject to adjustment.
| No expiration | |
| Short-term | $(1,020) |
| Long-term | (91) |
| Total no expiration | $(1,111) |
| Total capital loss carryforward | $(1,111) |
The tax character of distributions paid was as follows:
| | December 31, 2018 | December 31, 2017 |
| Tax-exempt Income | $47,865 | $49,775 |
| Long-term Capital Gains | 619 | 2,284 |
| Total | $48,484 | $ 52,059 |
Delayed Delivery Transactions and When-Issued Securities. During the period, the Fund transacted in securities on a delayed delivery or when-issued basis. Payment and delivery may take place after the customary settlement period for that security. The price of the underlying securities and the date when the securities will be delivered and paid for are fixed at the time the transaction is negotiated. The securities purchased on a delayed delivery or when-issued basis are identified as such in the Fund's Schedule of Investments. The Fund may receive compensation for interest forgone in the purchase of a delayed delivery or when-issued security. With respect to purchase commitments, the Fund identifies securities as segregated in its records with a value at least equal to the amount of the commitment. Losses may arise due to changes in the value of the underlying securities or if the counterparty does not perform under the contract's terms, or if the issuer does not issue the securities due to political, economic, or other factors.
Restricted Securities. The Fund may invest in securities that are subject to legal or contractual restrictions on resale. These securities generally may be resold in transactions exempt from registration or to the public if the securities are registered. Disposal of these securities may involve time-consuming negotiations and expense, and prompt sale at an acceptable price may be difficult. Information regarding restricted securities is included at the end of the Fund's Schedule of Investments.
New Rule Issuance. During August 2018, the U.S. Securities and Exchange Commission issued Final Rule Release No. 33-10532, Disclosure Update and Simplification. This Final Rule includes amendments specific to registered investment companies that are intended to eliminate overlap in disclosure requirements between Regulation S-X and GAAP. In accordance with these amendments, certain line-items in the Fund's financial statements have been combined or removed for the current period as outlined in the table below.
| Financial Statement | Current Line-Item Presentation | Prior Line-Item Presentation |
| Statement of Assets and Liabilities | Total distributable earnings (loss) | Undistributed/Distributions in excess of/Accumulated net investment income (loss)
Accumulated/Undistributed net realized gain (loss)
Net unrealized appreciation (depreciation) |
| Statement of Changes in Net Assets | N/A - removed | Undistributed/Distributions in excess of/Accumulated net investment income (loss) end of period |
| Statement of Changes in Net Assets | Distributions to shareholders | Distributions to shareholders from net investment income
Distributions to shareholders from net realized gain |
| Distributions to Shareholders Note to Financial Statements | Distributions to shareholders | Distributions to shareholders from net investment income
Distributions to shareholders from net realized gain |
4. Purchases and Sales of Investments.
Purchases and sales of securities, other than short-term securities and in-kind transactions, aggregated $776,167 and $864,416, respectively.
5. Fees and Other Transactions with Affiliates.
Management Fee. Fidelity Management & Research Company (the investment adviser) and its affiliates provide the Fund with investment management related services for which the Fund pays a monthly management fee. The management fee is the sum of an individual fund fee rate that is based on an annual rate of .25% of the Fund's average net assets and an annualized group fee rate that averaged .11% during the period. The group fee rate is based upon the average net assets of all the mutual funds advised by the investment adviser, including any mutual funds previously advised by the investment adviser that are currently advised by Fidelity SelectCo, LLC, an affiliate of the investment adviser. The group fee rate decreases as assets under management increase and increases as assets under management decrease. For the reporting period, the total annual management fee rate was .36% of the Fund's average net assets.
Distribution and Service Plan Fees. In accordance with Rule 12b-1 of the 1940 Act, the Fund has adopted separate Distribution and Service Plans for each class of shares. Certain classes pay Fidelity Distributors Corporation (FDC), an affiliate of the investment adviser, separate Distribution and Service Fees, each of which is based on an annual percentage of each class' average net assets. In addition, FDC may pay financial intermediaries for selling shares of the Fund and providing shareholder support services. For the period, the Distribution and Service Fee rates, total fees and amounts retained by FDC were as follows:
| | Distribution Fee | Service Fee | Total Fees | Retained by FDC |
| Class A | -% | .25% | $468 | $33 |
| Class M | -% | .25% | 39 | – |
| Class C | .75% | .25% | 348 | 18 |
| | | | $855 | $51 |
Sales Load. FDC may receive a front-end sales charge of up to 2.75% for selling Class A shares and Class M shares, some of which is paid to financial intermediaries for selling shares of the Fund. Depending on the holding period, FDC may receive contingent deferred sales charges levied on Class A, Class M and Class C redemptions. The deferred sales charges are 1.00% for Class C shares, .75% or .50% for certain purchases of Class A shares and .25% for certain purchases of Class M shares.
For the period, sales charge amounts retained by FDC were as follows:
| | Retained by FDC |
| Class A | $1 |
| Class M | 8 |
| Class C(a) | 4 |
| | $13 |
(a) When Class C shares are initially sold, FDC pays commissions from its own resources to financial intermediaries through which the sales are made.
Transfer Agent Fees. Fidelity Investments Institutional Operations Company, Inc. (FIIOC), an affiliate of the investment adviser, is the transfer, dividend disbursing and shareholder servicing agent for the Fund. FIIOC receives account fees and asset-based fees that vary according to the account size and type of account of the shareholders of the respective classes of the Fund, except for Class Z. FIIOC receives an asset-based fee of Class Z's average net assets. FIIOC pays for typesetting, printing and mailing of shareholder reports, except proxy statements. For the period, transfer agent fees for each class were as follows:
| | Amount | % of Class-Level Average Net Assets |
| Class A | $328 | .18 |
| Class M | 20 | .13 |
| Class C | 57 | .16 |
| Limited Term Municipal Income | 1,995 | .08 |
| Class I | 500 | .16 |
| Class Z | 2 | .05(a) |
| | $2,902 | |
(a) Annualized
Accounting Fees. Fidelity Service Company, Inc. (FSC), an affiliate of the investment adviser, maintains the Fund's accounting records. The fee is based on the level of average net assets for each month. For the period, the fees were equivalent to an annual rate of .02%.
Interfund Trades. The Fund may purchase from or sell securities to other Fidelity Funds under procedures adopted by the Board. The procedures have been designed to ensure these interfund trades are executed in accordance with Rule 17a-7 of the 1940 Act. Interfund trades are included within the respective purchases and sales amounts shown in the Purchases and Sales of Investments note.
Affiliated Redemptions In-Kind. During the period, 6,984 shares of the Fund were redeemed in-kind for investments, including accrued interest, and cash with a value of $73,334. The net realized gain of $220 on investments delivered through in-kind redemptions is included in the accompanying Statement of Operations. The amount of the in-kind redemptions is included in share transactions in the accompanying Statement of Changes in Net Assets as well as the Notes to Financial Statements. The Fund recognized no gain or loss for federal income tax purposes.
6. Committed Line of Credit.
The Fund participates with other funds managed by the investment adviser or an affiliate in a $4.25 billion credit facility (the "line of credit") to be utilized for temporary or emergency purposes to fund shareholder redemptions or for other short-term liquidity purposes. The Fund has agreed to pay commitment fees on its pro-rata portion of the line of credit, which amounted to $9 and is reflected in Miscellaneous expenses on the Statement of Operations. During the period, the Fund did not borrow on this line of credit.
7. Expense Reductions.
Through arrangements with the Fund's custodian, credits realized as a result of certain uninvested cash balances were used to reduce the Fund's expenses. During the period, these credits reduced the Fund's custody expenses by $21.
During the period, credits reduced each class' transfer agent expense in the amount of less than five hundred dollars.
In addition, during the period the investment adviser reimbursed and/or waived a portion of fund-level operating expenses in the amount of $20.
8. Distributions to Shareholders.
Distributions to shareholders of each class were as follows:
| | Year ended
December 31, 2018(a) | Year ended
December 31, 2017 |
| Distributions to shareholders | | |
| Class A | $2,440 | $– |
| Class M | 211 | – |
| Class C | 196 | – |
| Limited Term Municipal Income | 40,730 | – |
| Class I | 4,853 | – |
| Class Z | 54 | – |
| Total | $48,484 | $– |
| From net investment income | | |
| Class A | $– | $3,137 |
| Class M | – | 217 |
| Class C | – | 188 |
| Limited Term Municipal Income | – | 41,725 |
| Class I | – | 4,508 |
| Total | $– | $49,775 |
| From net realized gain | | |
| Class A | $– | $164 |
| Class M | – | 12 |
| Class C | – | 28 |
| Limited Term Municipal Income | – | 1,861 |
| Class I | – | 219 |
| Total | $– | $2,284 |
(a) Distributions for Class Z are for the period October 2, 2018 (commencement of sale of shares) to December 31, 2018.
9. Share Transactions.
Share transactions for each class were as follows and may contain automatic conversions between classes or exchanges between affiliated funds:
| | Shares | Shares | Dollars | Dollars |
| | Year ended December 31, 2018 (a) | Year ended December 31, 2017 | Year ended December 31, 2018 (a) | Year ended December 31, 2017 |
| Class A | | | | |
| Shares sold | 3,881 | 6,469 | $40,594 | $68,276 |
| Reinvestment of distributions | 221 | 291 | 2,313 | 3,075 |
| Shares redeemed | (11,559) | (14,837) | (120,913) | (156,574) |
| Net increase (decrease) | (7,457) | (8,077) | $(78,006) | $(85,223) |
| Class M | | | | |
| Shares sold | 566 | 265 | $5,917 | $2,798 |
| Reinvestment of distributions | 19 | 21 | 202 | 219 |
| Shares redeemed | (765) | (553) | (7,999) | (5,829) |
| Net increase (decrease) | (180) | (267) | $(1,880) | $(2,812) |
| Class C | | | | |
| Shares sold | 439 | 368 | $4,574 | $3,894 |
| Reinvestment of distributions | 17 | 18 | 173 | 187 |
| Shares redeemed | (1,196) | (1,645) | (12,485) | (17,354) |
| Net increase (decrease) | (740) | (1,259) | $(7,738) | $(13,273) |
| Limited Term Municipal Income | | | | |
| Shares sold | 67,006 | 69,026 | $700,289 | $727,315 |
| Reinvestment of distributions | 2,921 | 3,031 | 30,494 | 31,978 |
| Shares redeemed | (102,066)(b) | (77,778) | (1,066,085)(b) | (819,524) |
| Net increase (decrease) | (32,139) | (5,721) | $(335,302) | $(60,231) |
| Class I | | | | |
| Shares sold | 11,071 | 15,546 | $115,733 | $164,081 |
| Reinvestment of distributions | 403 | 383 | 4,212 | 4,047 |
| Shares redeemed | (16,897) | (13,255) | (176,288) | (139,853) |
| Net increase (decrease) | (5,423) | 2,674 | $(56,343) | $28,275 |
| Class Z | | | | |
| Shares sold | 2,844 | – | $29,574 | $– |
| Reinvestment of distributions | 5 | – | 51 | – |
| Shares redeemed | (220) | – | (2,294) | – |
| Net increase (decrease) | 2,629 | – | $27,331 | $– |
(a) Share transactions for Class Z are for the period October 2, 2018 (commencement of sale of shares) to December 31, 2018
(b) Amount includes in-kind redemptions (see the Affiliated Redemptions In-Kind note for additional details)
10. Other.
The Fund's organizational documents provide former and current trustees and officers with a limited indemnification against liabilities arising in connection with the performance of their duties to the Fund. In the normal course of business, the Fund may also enter into contracts that provide general indemnifications. The Fund's maximum exposure under these arrangements is unknown as this would be dependent on future claims that may be made against the Fund. The risk of material loss from such claims is considered remote.
Report of Independent Registered Public Accounting Firm
To the Board of Trustees of Fidelity Municipal Trust and Shareholders of Fidelity Limited Term Municipal Income Fund:
Opinion on the Financial Statements
We have audited the accompanying statement of assets and liabilities, including the schedule of investments, of Fidelity Limited Term Municipal Income Fund (one of the funds constituting Fidelity Municipal Trust, referred to hereafter as the "Fund") as of December 31, 2018, the related statement of operations for the year ended December 31, 2018, the statement of changes in net assets for each of the two years in the period ended December 31, 2018, including the related notes, and the financial highlights for each of the periods indicated therein (collectively referred to as the “financial statements”). In our opinion, the financial statements present fairly, in all material respects, the financial position of the Fund as of December 31, 2018, the results of its operations for the year then ended, the changes in its net assets for each of the two years in the period ended December 31, 2018 and the financial highlights for each of the periods indicated therein in conformity with accounting principles generally accepted in the United States of America.
Basis for Opinion
These financial statements are the responsibility of the Fund’s management. Our responsibility is to express an opinion on the Fund’s financial statements based on our audits. We are a public accounting firm registered with the Public Company Accounting Oversight Board (United States) (PCAOB) and are required to be independent with respect to the Fund in accordance with the U.S. federal securities laws and the applicable rules and regulations of the Securities and Exchange Commission and the PCAOB.
We conducted our audits of these financial statements in accordance with the standards of the PCAOB. Those standards require that we plan and perform the audit to obtain reasonable assurance about whether the financial statements are free of material misstatement, whether due to error or fraud.
Our audits included performing procedures to assess the risks of material misstatement of the financial statements, whether due to error or fraud, and performing procedures that respond to those risks. Such procedures included examining, on a test basis, evidence regarding the amounts and disclosures in the financial statements. Our audits also included evaluating the accounting principles used and significant estimates made by management, as well as evaluating the overall presentation of the financial statements. Our procedures included confirmation of securities owned as of December 31, 2018 by correspondence with the custodian and brokers; when replies were not received from brokers, we performed other auditing procedures. We believe that our audits provide a reasonable basis for our opinion.
PricewaterhouseCoopers LLP
Boston, Massachusetts
February 13, 2019
We have served as the auditor of one or more investment companies in the Fidelity group of funds since 1932.
Trustees and Officers
The Trustees, Members of the Advisory Board (if any), and officers of the trust and fund, as applicable, are listed below. The Board of Trustees governs the fund and is responsible for protecting the interests of shareholders. The Trustees are experienced executives who meet periodically throughout the year to oversee the fund's activities, review contractual arrangements with companies that provide services to the fund, oversee management of the risks associated with such activities and contractual arrangements, and review the fund's performance. Each of the Trustees oversees 260 funds.
The Trustees hold office without limit in time except that (a) any Trustee may resign; (b) any Trustee may be removed by written instrument, signed by at least two-thirds of the number of Trustees prior to such removal; (c) any Trustee who requests to be retired or who has become incapacitated by illness or injury may be retired by written instrument signed by a majority of the other Trustees; and (d) any Trustee may be removed at any special meeting of shareholders by a two-thirds vote of the outstanding voting securities of the trust. Each Trustee who is not an interested person (as defined in the 1940 Act) of the trust and the fund is referred to herein as an Independent Trustee. Each Independent Trustee shall retire not later than the last day of the calendar year in which his or her 75th birthday occurs. The Independent Trustees may waive this mandatory retirement age policy with respect to individual Trustees. Officers and Advisory Board Members hold office without limit in time, except that any officer or Advisory Board Member may resign or may be removed by a vote of a majority of the Trustees at any regular meeting or any special meeting of the Trustees. Except as indicated, each individual has held the office shown or other offices in the same company for the past five years.
The fund’s Statement of Additional Information (SAI) includes more information about the Trustees. To request a free copy, call Fidelity at 1-800-544-8544.
Experience, Skills, Attributes, and Qualifications of the Trustees. The Governance and Nominating Committee has adopted a statement of policy that describes the experience, qualifications, attributes, and skills that are necessary and desirable for potential Independent Trustee candidates (Statement of Policy). The Board believes that each Trustee satisfied at the time he or she was initially elected or appointed a Trustee, and continues to satisfy, the standards contemplated by the Statement of Policy. The Governance and Nominating Committee also engages professional search firms to help identify potential Independent Trustee candidates who have the experience, qualifications, attributes, and skills consistent with the Statement of Policy. From time to time, additional criteria based on the composition and skills of the current Independent Trustees, as well as experience or skills that may be appropriate in light of future changes to board composition, business conditions, and regulatory or other developments, have also been considered by the professional search firms and the Governance and Nominating Committee. In addition, the Board takes into account the Trustees' commitment and participation in Board and committee meetings, as well as their leadership of standing and ad hoc committees throughout their tenure.
In determining that a particular Trustee was and continues to be qualified to serve as a Trustee, the Board has considered a variety of criteria, none of which, in isolation, was controlling. The Board believes that, collectively, the Trustees have balanced and diverse experience, qualifications, attributes, and skills, which allow the Board to operate effectively in governing the fund and protecting the interests of shareholders. Information about the specific experience, skills, attributes, and qualifications of each Trustee, which in each case led to the Board's conclusion that the Trustee should serve (or continue to serve) as a trustee of the fund, is provided below.
Board Structure and Oversight Function. Abigail P. Johnson is an interested person and currently serves as Chairman. The Trustees have determined that an interested Chairman is appropriate and benefits shareholders because an interested Chairman has a personal and professional stake in the quality and continuity of services provided to the fund. Independent Trustees exercise their informed business judgment to appoint an individual of their choosing to serve as Chairman, regardless of whether the Trustee happens to be independent or a member of management. The Independent Trustees have determined that they can act independently and effectively without having an Independent Trustee serve as Chairman and that a key structural component for assuring that they are in a position to do so is for the Independent Trustees to constitute a substantial majority for the Board. The Independent Trustees also regularly meet in executive session. Arthur E. Johnson serves as Chairman of the Independent Trustees and as such (i) acts as a liaison between the Independent Trustees and management with respect to matters important to the Independent Trustees and (ii) with management prepares agendas for Board meetings.
Fidelity® funds are overseen by different Boards of Trustees. The fund's Board oversees Fidelity's investment-grade bond, money market, asset allocation and certain equity funds, and other Boards oversee Fidelity's high income and other equity funds. The asset allocation funds may invest in Fidelity® funds that are overseen by such other Boards. The use of separate Boards, each with its own committee structure, allows the Trustees of each group of Fidelity® funds to focus on the unique issues of the funds they oversee, including common research, investment, and operational issues. On occasion, the separate Boards establish joint committees to address issues of overlapping consequences for the Fidelity® funds overseen by each Board.
The Trustees operate using a system of committees to facilitate the timely and efficient consideration of all matters of importance to the Trustees, the fund, and fund shareholders and to facilitate compliance with legal and regulatory requirements and oversight of the fund's activities and associated risks. The Board, acting through its committees, has charged FMR and its affiliates with (i) identifying events or circumstances the occurrence of which could have demonstrably adverse effects on the fund's business and/or reputation; (ii) implementing processes and controls to lessen the possibility that such events or circumstances occur or to mitigate the effects of such events or circumstances if they do occur; and (iii) creating and maintaining a system designed to evaluate continuously business and market conditions in order to facilitate the identification and implementation processes described in (i) and (ii) above. Because the day-to-day operations and activities of the fund are carried out by or through FMR, its affiliates, and other service providers, the fund's exposure to risks is mitigated but not eliminated by the processes overseen by the Trustees. While each of the Board's committees has responsibility for overseeing different aspects of the fund's activities, oversight is exercised primarily through the Operations and Audit Committees. In addition, an ad hoc Board committee of Independent Trustees has worked with FMR to enhance the Board's oversight of investment and financial risks, legal and regulatory risks, technology risks, and operational risks, including the development of additional risk reporting to the Board. Appropriate personnel, including but not limited to the fund's Chief Compliance Officer (CCO), FMR's internal auditor, the independent accountants, the fund's Treasurer and portfolio management personnel, make periodic reports to the Board's committees, as appropriate, including an annual review of Fidelity's risk management program for the Fidelity® funds. The responsibilities of each standing committee, including their oversight responsibilities, are described further under "Standing Committees of the Trustees."
Interested Trustees*:
Correspondence intended for a Trustee who is an interested person may be sent to Fidelity Investments, 245 Summer Street, Boston, Massachusetts 02210.
Name, Year of Birth; Principal Occupations and Other Relevant Experience+
Abigail P. Johnson (1961)
Year of Election or Appointment: 2009
Trustee
Chairman of the Board of Trustees
Ms. Johnson also serves as Trustee of other Fidelity® funds. Ms. Johnson serves as Chairman (2016-present), Chief Executive Officer (2014-present), and Director (2007-present) of FMR LLC (diversified financial services company), President of Fidelity Financial Services (2012-present) and President of Personal, Workplace and Institutional Services (2005-present). Ms. Johnson is Chairman and Director of FMR Co., Inc. (investment adviser firm, 2011-present) and Chairman and Director of FMR (investment adviser firm, 2011-present). Previously, Ms. Johnson served as Vice Chairman (2007-2016) and President (2013-2016) of FMR LLC, President and a Director of FMR (2001-2005), a Trustee of other investment companies advised by FMR, Fidelity Investments Money Management, Inc. (investment adviser firm), and FMR Co., Inc. (2001-2005), Senior Vice President of the Fidelity® funds (2001-2005), and managed a number of Fidelity® funds. Ms. Abigail P. Johnson and Mr. Arthur E. Johnson are not related.
Jennifer Toolin McAuliffe (1959)
Year of Election or Appointment: 2016
Trustee
Ms. McAuliffe also serves as Trustee of other Fidelity® funds. Ms. McAuliffe previously served as a Member of the Advisory Board of certain Fidelity® funds (2016) and as Co-Head of Fixed Income of Fidelity Investments Limited (now known as FIL Limited (FIL)) (diversified financial services company). Earlier roles at FIL included Director of Research for FIL’s credit and quantitative teams in London, Hong Kong and Tokyo. Ms. McAuliffe also was the Director of Research for taxable and municipal bonds at Fidelity Investments Money Management, Inc. Ms. McAuliffe is also a director or trustee of several not-for-profit entities.
* Determined to be an “Interested Trustee” by virtue of, among other things, his or her affiliation with the trust or various entities under common control with FMR.
+ The information includes the Trustee's principal occupation during the last five years and other information relating to the experience, attributes, and skills relevant to the Trustee's qualifications to serve as a Trustee, which led to the conclusion that the Trustee should serve as a Trustee for the fund.
Independent Trustees:
Correspondence intended for an Independent Trustee may be sent to Fidelity Investments, P.O. Box 55235, Boston, Massachusetts 02205-5235.
Name, Year of Birth; Principal Occupations and Other Relevant Experience+
Elizabeth S. Acton (1951)
Year of Election or Appointment: 2013
Trustee
Ms. Acton also serves as Trustee of other Fidelity® funds. Prior to her retirement in April 2012, Ms. Acton was Executive Vice President, Finance (2011-2012), Executive Vice President, Chief Financial Officer (2002-2011), and Treasurer (2004-2005) of Comerica Incorporated (financial services). Prior to joining Comerica, Ms. Acton held a variety of positions at Ford Motor Company (1983-2002), including Vice President and Treasurer (2000-2002) and Executive Vice President and Chief Financial Officer of Ford Motor Credit Company (1998-2000). Ms. Acton currently serves as a member of the Board of Directors and Audit and Finance Committees of Beazer Homes USA, Inc. (homebuilding, 2012-present). Previously, Ms. Acton served as a Member of the Advisory Board of certain Fidelity® funds (2013-2016).
Ann E. Dunwoody (1953)
Year of Election or Appointment: 2018
Trustee
General Dunwoody also serves as Trustee of other Fidelity® funds. General Dunwoody (United States Army, Retired) was the first woman in U.S. military history to achieve the rank of four-star general and prior to her retirement in 2012 held a variety of positions within the U.S. Army, including Commanding General, U.S. Army Material Command (2008-2012). She is the President of First to Four LLC (leadership and mentoring services, 2012-present). She also serves as a member of the Board of Directors and Nominating and Corporate Governance Committee of L3 Technologies, Inc. (communication, electronic, sensor, and aerospace systems, 2013-present), Board of Directors and Nomination and Corporate Governance Committees of Kforce Inc. (professional staffing services, 2016-present) and Board of Directors of Automattic Inc. (software engineering, 2018-present). Previously, General Dunwoody served as a Member of the Advisory Board of certain Fidelity® funds (2018), a member of the Board of Directors and Audit and Sustainability and Corporate Responsibility Committees of Republic Services, Inc. (waste collection, disposal and recycling, 2013-2016). Ms. Dunwoody also serves on several boards for non-profit organizations, including as a member of the Board of Directors, Chair of the Nomination and Governance Committee and member of the Audit Committee of Logistics Management Institute (consulting non-profit, 2012-present), a member of the Board of Directors of the Army Historical Foundation (2015-present), a member of the Council of Trustees for the Association of the United States Army (advocacy non-profit, 2013-present) and a member of the Board of Trustees of Florida Institute of Technology (2015-present) and ThanksUSA (military family education non-profit, 2014-present).
John Engler (1948)
Year of Election or Appointment: 2014
Trustee
Mr. Engler also serves as Trustee of other Fidelity® funds. He serves on the board of directors for Universal Forest Products (manufacturer and distributor of wood and wood-alternative products, 2003-present) and K12 Inc. (technology-based education company, 2012-present). Previously, Mr. Engler served as interim president of Michigan State University (2018-2019), a Member of the Advisory Board of certain Fidelity® funds (2014-2016), president of the Business Roundtable (2011-2017), a trustee of The Munder Funds (2003-2014), president and CEO of the National Association of Manufacturers (2004-2011), member of the Board of Trustees of the Annie E. Casey Foundation (2004-2015), and as governor of Michigan (1991-2003). He is a past chairman of the National Governors Association.
Robert F. Gartland (1951)
Year of Election or Appointment: 2010
Trustee
Mr. Gartland also serves as Trustee of other Fidelity® funds. Mr. Gartland is Chairman and an investor in Gartland & Mellina Group Corp. (consulting, 2009-present). Previously, Mr. Gartland served as a partner and investor of Vietnam Partners LLC (investments and consulting, 2008-2011). Prior to his retirement, Mr. Gartland held a variety of positions at Morgan Stanley (financial services, 1979-2007), including Managing Director (1987-2007), and Chase Manhattan Bank (1975-1978).
Arthur E. Johnson (1947)
Year of Election or Appointment: 2008
Trustee
Chairman of the Independent Trustees
Mr. Johnson also serves as Trustee of other Fidelity® funds. Mr. Johnson serves as a member of the Board of Directors of Eaton Corporation plc (diversified power management, 2009-present) and Booz Allen Hamilton (management consulting, 2011-present). Prior to his retirement, Mr. Johnson served as Senior Vice President of Corporate Strategic Development of Lockheed Martin Corporation (defense contractor, 1999-2009). He previously served on the Board of Directors of IKON Office Solutions, Inc. (1999-2008), AGL Resources, Inc. (holding company, 2002-2016), and Delta Airlines (2005-2007). Mr. Arthur E. Johnson is not related to Ms. Abigail P. Johnson.
Michael E. Kenneally (1954)
Year of Election or Appointment: 2009
Trustee
Vice Chairman of the Independent Trustees
Mr. Kenneally also serves as Trustee of other Fidelity® funds. Prior to his retirement, Mr. Kenneally served as Chairman and Global Chief Executive Officer of Credit Suisse Asset Management. Before joining Credit Suisse, he was an Executive Vice President and Chief Investment Officer for Bank of America Corporation. Earlier roles at Bank of America included Director of Research, Senior Portfolio Manager and Research Analyst, and Mr. Kenneally was awarded the Chartered Financial Analyst (CFA) designation in 1991.
Marie L. Knowles (1946)
Year of Election or Appointment: 2001
Trustee
Ms. Knowles also serves as Trustee of other Fidelity® funds. Prior to Ms. Knowles' retirement in June 2000, she served as Executive Vice President and Chief Financial Officer of Atlantic Richfield Company (ARCO) (diversified energy, 1996-2000). From 1993 to 1996, she was a Senior Vice President of ARCO and President of ARCO Transportation Company (pipeline and tanker operations). Ms. Knowles currently serves as a Director and Chairman of the Audit Committee of McKesson Corporation (healthcare service, since 2002). Ms. Knowles is a member of the Board of the Santa Catalina Island Company (real estate, 2009-present). Ms. Knowles is a Member of the Investment Company Institute Board of Governors and a Member of the Governing Council of the Independent Directors Council (2014-present). She also serves as a member of the Advisory Board for the School of Engineering of the University of Southern California. Previously, Ms. Knowles served as a Director of Phelps Dodge Corporation (copper mining and manufacturing, 1994-2007), URS Corporation (engineering and construction, 2000-2003) and America West (airline, 1999-2002). Ms. Knowles previously served as Chairman (2015-2018) and Vice Chairman (2012-2015) of the Independent Trustees of certain Fidelity® funds.
Mark A. Murray (1954)
Year of Election or Appointment: 2016
Trustee
Mr. Murray also serves as Trustee of other Fidelity® funds. Mr. Murray is Vice Chairman (2013-present) of Meijer, Inc. (regional retail chain). Previously, Mr. Murray served as a Member of the Advisory Board of certain Fidelity® funds (2016) and as Co-Chief Executive Officer (2013-2016) and President (2006-2013) of Meijer, Inc. Mr. Murray serves as a member of the Board of Directors and Nuclear Review and Public Policy and Responsibility Committees of DTE Energy Company (diversified energy company, 2009-present). Mr. Murray also serves as a member of the Board of Directors of Spectrum Health (not-for-profit health system, 2015-present). Mr. Murray previously served as President of Grand Valley State University (2001-2006), Treasurer for the State of Michigan (1999-2001), Vice President of Finance and Administration for Michigan State University (1998-1999), and a member of the Board of Directors and Audit Committee and Chairman of the Nominating and Corporate Governance Committee of Universal Forest Products, Inc. (manufacturer and distributor of wood and wood-alternative products, 2004-2016). Mr. Murray is also a director or trustee of many community and professional organizations.
+ The information includes the Trustee's principal occupation during the last five years and other information relating to the experience, attributes, and skills relevant to the Trustee's qualifications to serve as a Trustee, which led to the conclusion that the Trustee should serve as a Trustee for the fund.
Advisory Board Members and Officers:
Correspondence intended for an officer may be sent to Fidelity Investments, 245 Summer Street, Boston, Massachusetts 02210. Officers appear below in alphabetical order.
Name, Year of Birth; Principal Occupation
Elizabeth Paige Baumann (1968)
Year of Election or Appointment: 2017
Anti-Money Laundering (AML) Officer
Ms. Baumann also serves as AML Officer of other funds. She is Chief AML Officer (2012-present) and Senior Vice President (2014-present) of FMR LLC (diversified financial services company) and is an employee of Fidelity Investments. Previously, Ms. Baumann served as AML Officer of the funds (2012-2016), and Vice President (2007-2014) and Deputy Anti-Money Laundering Officer (2007-2012) of FMR LLC.
Craig S. Brown (1977)
Year of Election or Appointment: 2019
Assistant Treasurer
Mr. Brown also serves as Assistant Treasurer of other funds. Mr. Brown is an employee of Fidelity Investments (2013-present).
John J. Burke III (1964)
Year of Election or Appointment: 2018
Chief Financial Officer
Mr. Burke also serves as Chief Financial Officer of other funds. Mr. Burke serves as Head of Investment Operations for Fidelity Fund and Investment Operations (2018-present) and is an employee of Fidelity Investments (1998-present). Previously Mr. Burke served as head of Asset Management Investment Operations (2012-2018).
William C. Coffey (1969)
Year of Election or Appointment: 2018
Secretary and Chief Legal Officer (CLO)
Mr. Coffey also serves as Secretary and CLO of other funds. Mr. Coffey serves as CLO, Secretary, and Senior Vice President of Fidelity Management & Research Company and FMR Co., Inc. (investment adviser firms, 2018-present); Secretary of Fidelity SelectCo, LLC and Fidelity Investments Money Management, Inc. (investment adviser firms, 2018-present); and CLO of Fidelity Management & Research (Hong Kong) Limited, FMR Investment Management (UK) Limited, and Fidelity Management & Research (Japan) Limited (investment adviser firms, 2018-present). He is Senior Vice President and Deputy General Counsel of FMR LLC (diversified financial services company, 2010-present), and is an employee of Fidelity Investments. Previously, Mr. Coffey served as Assistant Secretary of certain funds (2009-2018) and as Vice President and Associate General Counsel of FMR LLC (2005-2009).
Jonathan Davis (1968)
Year of Election or Appointment: 2010
Assistant Treasurer
Mr. Davis also serves as Assistant Treasurer of other funds. Mr. Davis serves as Assistant Treasurer of FMR Capital, Inc. (2017-present) and is an employee of Fidelity Investments. Previously, Mr. Davis served as Vice President and Associate General Counsel of FMR LLC (diversified financial services company, 2003-2010).
Adrien E. Deberghes (1967)
Year of Election or Appointment: 2010
Assistant Treasurer
Mr. Deberghes also serves as an officer of other funds. He serves as Assistant Treasurer of FMR Capital, Inc. (2017-present), Executive Vice President of Fidelity Investments Money Management, Inc. (FIMM) (investment adviser firm, 2016-present), and is an employee of Fidelity Investments (2008-present). Previously, Mr. Deberghes served as President and Treasurer of certain Fidelity® funds (2013-2018). Prior to joining Fidelity Investments, Mr. Deberghes was Senior Vice President of Mutual Fund Administration at State Street Corporation (2007-2008), Senior Director of Mutual Fund Administration at Investors Bank & Trust (2005-2007), and Director of Finance for Dunkin' Brands (2000-2005). Previously, Mr. Deberghes served in other fund officer roles.
Laura M. Del Prato (1964)
Year of Election or Appointment: 2018
President and Treasurer
Ms. Del Prato also serves as an officer of other funds. Ms. Del Prato is an employee of Fidelity Investments (2017-present). Prior to joining Fidelity Investments, Ms. Del Prato served as a Managing Director and Treasurer of the JPMorgan Mutual Funds (2014-2017). Prior to JPMorgan, Ms. Del Prato served as a partner at Cohen Fund Audit Services (accounting firm, 2012-2013) and KPMG LLP (accounting firm, 2004-2012).
Colm A. Hogan (1973)
Year of Election or Appointment: 2016
Assistant Treasurer
Mr. Hogan also serves as an officer of other funds. Mr. Hogan serves as Assistant Treasurer of FMR Capital, Inc. (2017-present) and is an employee of Fidelity Investments (2005-present). Previously, Mr. Hogan served as Assistant Treasurer of certain Fidelity® funds (2016-2018).
Chris Maher (1972)
Year of Election or Appointment: 2013
Assistant Treasurer
Mr. Maher serves as Assistant Treasurer of other funds. Mr. Maher is Vice President of Valuation Oversight, serves as Assistant Treasurer of FMR Capital, Inc. (2017-present), and is an employee of Fidelity Investments. Previously, Mr. Maher served as Vice President of Asset Management Compliance (2013), Vice President of the Program Management Group of FMR (investment adviser firm, 2010-2013), and Vice President of Valuation Oversight (2008-2010).
John B. McGinty, Jr. (1962)
Year of Election or Appointment: 2016
Chief Compliance Officer
Mr. McGinty also serves as Chief Compliance Officer of other funds. Mr. McGinty is Senior Vice President of Asset Management Compliance for Fidelity Investments and is an employee of Fidelity Investments (2016-present). Mr. McGinty previously served as Vice President, Senior Attorney at Eaton Vance Management (investment management firm, 2015-2016), and prior to Eaton Vance as global CCO for all firm operations and registered investment companies at GMO LLC (investment management firm, 2009-2015). Before joining GMO LLC, Mr. McGinty served as Senior Vice President, Deputy General Counsel for Fidelity Investments (2007-2009).
Jason P. Pogorelec (1975)
Year of Election or Appointment: 2015
Assistant Secretary
Mr. Pogorelec also serves as Assistant Secretary of other funds. Mr. Pogorelec serves as Vice President, Associate General Counsel (2010-present) and is an employee of Fidelity Investments (2006-present).
Nancy D. Prior (1967)
Year of Election or Appointment: 2014
Vice President
Ms. Prior also serves as Vice President of other funds. Ms. Prior serves as President Fixed Income, High Income/Emerging Market Debt and Multi Asset Class Strategies of FIAM LLC (2018-present), President (2016-present) and Director (2014-present) of Fidelity Investments Money Management, Inc. (FIMM) (investment adviser firm), President, Fixed Income (2014-present), and is an employee of Fidelity Investments (2002-present). Previously, Ms. Prior served as Vice Chairman of FIAM LLC (investment adviser firm, 2014-2018), a Director of FMR Investment Management (UK) Limited (investment adviser firm, 2015-2018), President Multi-Asset Class Strategies of FMR's Global Asset Allocation Division (2017-2018), Vice President of Fidelity's Money Market Funds (2012-2014), President, Money Market and Short Duration Bond Group of Fidelity Management & Research (FMR) (investment adviser firm, 2013-2014), President, Money Market Group of FMR (2011-2013), Managing Director of Research (2009-2011), Senior Vice President and Deputy General Counsel (2007-2009), and Assistant Secretary of certain Fidelity® funds (2008-2009).
Stacie M. Smith (1974)
Year of Election or Appointment: 2013
Assistant Treasurer
Ms. Smith also serves as an officer of other funds. Ms. Smith serves as Assistant Treasurer of FMR Capital, Inc. (2017-present), is an employee of Fidelity Investments (2009-present), and has served in other fund officer roles. Prior to joining Fidelity Investments, Ms. Smith served as Senior Audit Manager of Ernst & Young LLP (accounting firm, 1996-2009). Previously, Ms. Smith served as Assistant Treasurer (2013-2018) and Deputy Treasurer (2013-2016) of certain Fidelity® funds.
Marc L. Spector (1972)
Year of Election or Appointment: 2016
Deputy Treasurer
Mr. Spector also serves as an officer of other funds. Mr. Spector serves as Assistant Treasurer of FMR Capital, Inc. (2017-present) and is an employee of Fidelity Investments (2016-present). Prior to joining Fidelity Investments, Mr. Spector served as Director at the Siegfried Group (accounting firm, 2013-2016), and prior to Siegfried Group as audit senior manager at Deloitte & Touche (accounting firm, 2005-2013).
Jim Wegmann (1979)
Year of Election or Appointment: 2019
Assistant Treasurer
Mr. Wegmann also serves as Assistant Treasurer of other funds. Mr. Wegmann is an employee of Fidelity Investments (2011-present).
Shareholder Expense Example
As a shareholder of the Fund, you incur two types of costs: (1) transaction costs, including sales charges (loads) on purchase payments or redemption proceeds, and (2) ongoing costs, including management fees, distribution and/or service (12b-1) fees and other Fund expenses. This Example is intended to help you understand your ongoing costs (in dollars) of investing in the Fund and to compare these costs with the ongoing costs of investing in other mutual funds.
The actual expense Example is based on an investment of $1,000 invested at the beginning of the period and held for the entire period (July 1, 2018 to December 31, 2018) for Class A, Class M, Class C, and Class I and for the period (October 2, 2018 to December 31, 2018) for Class Z. The hypothetical expense Example is based on an investment of $1,000 invested for the one-half year period (July 1, 2018 to December 31, 2018).
Actual Expenses
The first line of the accompanying table for each class of the Fund provides information about actual account values and actual expenses. You may use the information in this line, together with the amount you invested, to estimate the expenses that you paid over the period. Simply divide your account value by $1,000.00 (for example, an $8,600 account value divided by $1,000.00 = 8.6), then multiply the result by the number in the first line for a class of the Fund under the heading entitled "Expenses Paid During Period" to estimate the expenses you paid on your account during this period. A small balance maintenance fee of $12.00 that is charged once a year may apply for certain accounts with a value of less than $2,000. This fee, which was eliminated effective August 1, 2018, is not included in the table below. If it was, the estimate of expenses you paid during the period would be higher, and your ending account value lower, by this amount. In addition, the Fund, as a shareholder in the underlying Fidelity Central Funds, will indirectly bear its pro-rata share of the fees and expenses incurred by the underlying Fidelity Central Funds. These fees and expenses are not included in the Fund's annualized expense ratio used to calculate the expense estimate in the table below.
Hypothetical Example for Comparison Purposes
The second line of the accompanying table for each class of the Fund provides information about hypothetical account values and hypothetical expenses based on a Class' actual expense ratio and an assumed rate of return of 5% per year before expenses, which is not the Class' actual return. The hypothetical account values and expenses may not be used to estimate the actual ending account balance or expenses you paid for the period. You may use this information to compare the ongoing costs of investing in the Fund and other funds. To do so, compare this 5% hypothetical example with the 5% hypothetical examples that appear in the shareholder reports of the other funds. A small balance maintenance fee of $12.00 that is charged once a year may apply for certain accounts with a value of less than $2,000. This fee, which was eliminated effective August 1, 2018, is not included in the table below. If it was, the estimate of expenses you paid during the period would be higher, and your ending account value lower, by this amount. In addition, the Fund, as a shareholder in the underlying Fidelity Central Funds, will indirectly bear its pro-rata share of the fees and expenses incurred by the underlying Fidelity Central Funds. These fees and expenses are not included in the Fund's annualized expense ratio used to calculate the expense estimate in the table below.
Please note that the expenses shown in the table are meant to highlight your ongoing costs only and do not reflect any transaction costs. Therefore, the second line of the table is useful in comparing ongoing costs only, and will not help you determine the relative total costs of owning different funds. In addition, if these transactional costs were included, your costs would have been higher.
| | Annualized Expense Ratio-A | Beginning
Account Value
| Ending
Account Value
December 31, 2018 | Expenses Paid
During Period
|
| Class A | .80% | | | |
| Actual | | $1,000.00 | $1,008.70 | $4.05-B |
| Hypothetical-C | | $1,000.00 | $1,021.17 | $4.08-D |
| Class M | .75% | | | |
| Actual | | $1,000.00 | $1,009.00 | $3.80-B |
| Hypothetical-C | | $1,000.00 | $1,021.42 | $3.82-D |
| Class C | 1.53% | | | |
| Actual | | $1,000.00 | $1,005.00 | $7.73-B |
| Hypothetical-C | | $1,000.00 | $1,017.49 | $7.78-D |
| Limited Term Municipal Income | .46% | | | |
| Actual | | $1,000.00 | $1,010.50 | $2.33-B |
| Hypothetical-C | | $1,000.00 | $1,022.89 | $2.35-D |
| Class I | .54% | | | |
| Actual | | $1,000.00 | $1,010.10 | $2.74-B |
| Hypothetical-C | | $1,000.00 | $1,022.48 | $2.75-D |
| Class Z | .43% | | | |
| Actual | | $1,000.00 | $1,011.10 | $1.08-B |
| Hypothetical-C | | $1,000.00 | $1,023.04 | $2.19-D |
A Annualized expense ratio reflects expenses net of applicable fee waivers.
B Actual Expenses are equal to each Class' annualized expense ratio, multiplied by the average account value over the period, multiplied by 184/365 (to reflect the one-half year period) for Class A, Class M, Class C and Class I and multiplied by 91/365 (to reflect the period October 2, 2018 to December 31, 2018) for Class Z.
C 5% return per year before expenses
D Hypothetical expenses are equal to each Class' annualized expense ratio, multiplied by the average account value over the period, multiplied by 184/365 (to reflect the one-half year period).
Distributions (Unaudited)
During fiscal year ended 2018, 100% of the fund's income dividends were free from federal income tax, and 8.86% of the fund's income dividends was subject to the federal alternative minimum tax.
The fund will notify shareholders in January 2019 of amounts for use in preparing 2018 income tax returns.
Board Approval of Investment Advisory Contracts and Management Fees
Fidelity Limited Term Municipal Income Fund
Each year, the Board of Trustees, including the Independent Trustees (together, the Board), votes on the renewal of the management contract with Fidelity Management & Research Company (FMR) and the sub-advisory agreements (together, the Advisory Contracts) for the fund. FMR and the sub-advisers are referred to herein as the Investment Advisers. The Board, assisted by the advice of fund counsel and Independent Trustees' counsel, requests and considers a broad range of information relevant to the renewal of the Advisory Contracts throughout the year.
The Board meets regularly and, at each of its meetings, covers an extensive agenda of topics and materials and considers factors that are relevant to its annual consideration of the renewal of the fund's Advisory Contracts, including the services and support provided to the fund and its shareholders. The Board has established four standing committees (Committees) — Operations, Audit, Fair Valuation, and Governance and Nominating — each composed of and chaired by Independent Trustees with varying backgrounds, to which the Board has assigned specific subject matter responsibilities in order to enhance effective decision-making by the Board. The Operations Committee, of which all of the Independent Trustees are members, meets regularly throughout the year and considers, among other matters, information specifically related to the annual consideration of the renewal of the fund's Advisory Contracts. The Board, acting directly and through its Committees, requests and receives information concerning the annual consideration of the renewal of the fund's Advisory Contracts. The Board also meets as needed to review matters specifically related to the Board's annual consideration of the renewal of the Advisory Contracts. Members of the Board may also meet with trustees of other Fidelity funds through joint ad hoc committees to discuss certain matters relevant to all of the Fidelity funds.
At its September 2018 meeting, the Board unanimously determined to renew the fund's Advisory Contracts. In reaching its determination, the Board considered all factors it believed relevant, including (i) the nature, extent, and quality of the services to be provided to the fund and its shareholders (including the investment performance of the fund); (ii) the competitiveness of the fund's management fee and total expense ratio relative to peer funds; (iii) the total costs of the services to be provided by and the profits to be realized by Fidelity from its relationships with the fund; and (iv) the extent to which, if any, economies of scale exist and would be realized as the fund grows, and whether any economies of scale are appropriately shared with fund shareholders.
In considering whether to renew the Advisory Contracts for the fund, the Board reached a determination, with the assistance of fund counsel and Independent Trustees' counsel and through the exercise of its business judgment, that the renewal of the Advisory Contracts was in the best interests of the fund and its shareholders and that the compensation payable under the Advisory Contracts was fair and reasonable. The Board's decision to renew the Advisory Contracts was not based on any single factor, but rather was based on a comprehensive consideration of all the information provided to the Board at its meetings throughout the year. The Board, in reaching its determination to renew the Advisory Contracts, was aware that shareholders of the fund have a broad range of investment choices available to them, including a wide choice among funds offered by Fidelity's competitors, and that the fund's shareholders, who have the opportunity to review and weigh the disclosure provided by the fund in its prospectus and other public disclosures, have chosen to invest in this fund, which is part of the Fidelity family of funds.
Nature, Extent, and Quality of Services Provided. The Board considered Fidelity's staffing as it relates to the fund, including the backgrounds of investment personnel of Fidelity, and also considered the fund's investment objective, strategies, and related investment philosophy. The Independent Trustees also had discussions with senior management of Fidelity's investment operations and investment groups. The Board considered the structure of the investment personnel compensation program and whether this structure provides appropriate incentives to act in the best interests of the fund. Additionally, the Board considered the portfolio managers' investments, if any, in the funds that they manage.
Resources Dedicated to Investment Management and Support Services. The Board reviewed the general qualifications and capabilities of Fidelity's investment staff, including its size, education, experience, and resources, as well as Fidelity's approach to recruiting, managing, and compensating investment personnel. The Board noted that Fidelity has continued to increase the resources devoted to non-U.S. offices, including expansion of Fidelity's global investment organization. The Board also noted that Fidelity's analysts have extensive resources, tools and capabilities that allow them to conduct sophisticated quantitative and fundamental analysis, as well as credit analysis of issuers, counterparties and guarantors. Further, the Board considered that Fidelity's investment professionals have sufficient access to global information and data so as to provide competitive investment results over time, and that those professionals also have access to sophisticated tools that permit them to assess portfolio construction and risk and performance attribution characteristics continuously, as well as to transmit new information and research conclusions rapidly around the world. Additionally, in its deliberations, the Board considered Fidelity's trading, risk management, compliance, and technology and operations capabilities and resources, which are integral parts of the investment management process.
Shareholder and Administrative Services. The Board considered (i) the nature, extent, quality, and cost of advisory, administrative, and shareholder services performed by the Investment Advisers and their affiliates under the Advisory Contracts and under separate agreements covering transfer agency and pricing and bookkeeping services for the fund; (ii) the nature and extent of the supervision of third party service providers, principally custodians, subcustodians, and pricing vendors; and (iii) the resources devoted to, and the record of compliance with, the fund's compliance policies and procedures.
The Board noted that the growth of fund assets over time across the complex allows Fidelity to reinvest in the development of services designed to enhance the value and convenience of the Fidelity funds as investment vehicles. These services include 24-hour access to account information and market information through telephone representatives and over the Internet, investor education materials and asset allocation tools, and the expanded availability of Fidelity Investor Centers.
Investment in a Large Fund Family. The Board considered the benefits to shareholders of investing in a Fidelity fund, including the benefits of investing in a fund that is part of a large family of funds offering a variety of investment disciplines and providing a large variety of mutual fund investor services. The Board noted that Fidelity had taken, or had made recommendations that resulted in the Fidelity funds taking, a number of actions over the previous year that benefited particular funds, including: (i) continuing to dedicate additional resources to Fidelity's investment research process, which includes meetings with management of issuers of securities in which the funds invest, and to the support of the senior management team that oversees asset management; (ii) continuing efforts to enhance Fidelity's global research capabilities; (iii) launching new funds and making other enhancements to meet client needs; (iv) launching new share classes of existing funds; (v) eliminating purchase minimums and broadening eligibility requirements for certain funds and share classes; (vi) reducing management fees and total expenses for certain growth equity funds and index funds; (vii) lowering expense caps for certain existing funds and classes, and converting certain voluntary expense caps to contractual caps, to reduce expenses borne by shareholders; (viii) eliminating short-term redemption fees for funds that had such fees; (ix) rationalizing product lines and gaining increased efficiencies from fund mergers and share class consolidations; (x) continuing to develop, acquire and implement systems and technology to improve services to the funds and shareholders, strengthen information security, and increase efficiency; and (xi) continuing to implement enhancements to further strengthen Fidelity's product line to increase investors' probability of success in achieving their investment goals, including retirement income goals.
Investment Performance. The Board considered whether the fund has operated in accordance with its investment objective, as well as its record of compliance with its investment restrictions and its performance history.
The Board took into account discussions that occur at Board meetings throughout the year with representatives of the Investment Advisers about fund investment performance. In this regard the Board noted that as part of regularly scheduled fund reviews and other reports to the Board on fund performance, the Board considers annualized return information for the fund for different time periods, measured against an appropriate securities market index ("benchmark index") and a peer group of funds with similar objectives ("peer group"), if any. In its evaluation of fund investment performance at meetings throughout the year, the Board gave particular attention to information indicating underperformance of certain Fidelity funds for specific time periods and discussed with the Investment Advisers the reasons for such underperformance.
In addition to reviewing absolute and relative fund performance, the Independent Trustees periodically consider the appropriateness of fund performance metrics in evaluating the results achieved. In general, the Independent Trustees believe that fund performance should be evaluated based on gross performance (before fees and expenses but after transaction costs) compared to appropriate benchmark indices, over appropriate time periods that may include full market cycles, and on net performance (after fees and expenses) compared to peer groups, as applicable, over the same periods, taking into account relevant factors including the following: general market conditions; expectations for interest rate levels and credit conditions; issuer-specific information including credit quality; the potential for incremental return versus the fund's benchmark index weighed against the risks involved in obtaining that incremental return, including the risk of diminished or negative total returns; and fund cash flows and other factors. Depending on the circumstances, the Independent Trustees may be satisfied with a fund's performance notwithstanding that it lags its benchmark index or peer group for certain periods.
The Independent Trustees recognize that shareholders evaluate performance on a net basis over their own holding periods, for which one-, three-, and five-year periods are often used as a proxy. For this reason, the performance information reviewed by the Board also included net cumulative calendar year total return information for the fund and an appropriate benchmark index and peer group for the most recent one-, three-, and five-year periods.
Based on its review, the Board concluded that the nature, extent, and quality of services provided to the fund under the Advisory Contracts should continue to benefit the shareholders of the fund.
Competitiveness of Management Fee and Total Expense Ratio. The Board considered the fund's management fee and total expense ratio compared to "mapped groups" of competitive funds and classes created for the purpose of facilitating the Trustees' competitive analysis of management fees and total expenses. Fidelity creates "mapped groups" by combining similar Lipper investment objective categories that have comparable investment mandates. Combining Lipper investment objective categories aids the Board's management fee and total expense ratio comparisons by broadening the competitive group used for comparison.
Management Fee. The Board considered two proprietary management fee comparisons for the 12-month periods shown in basis points (BP) in the chart below. The group of Lipper funds used by the Board for management fee comparisons is referred to below as the "Total Mapped Group" and, for the reasons explained above, is broader than the Lipper peer group used by the Board for performance comparisons. The Total Mapped Group comparison focuses on a fund's standing in terms of gross management fees before expense reimbursements or caps relative to the total universe of funds with comparable investment mandates, regardless of whether their management fee structures also are comparable. Funds with comparable investment mandates offer exposure to similar types of securities. Funds with comparable management fee structures have similar management fee contractual arrangements (
e.g., flat rate charged for advisory services, all-inclusive fee rate,
etc.). "TMG %" represents the percentage of funds in the Total Mapped Group that had management fees that were lower than the fund's. For example, a hypothetical TMG % of 20% would mean that 80% of the funds in the Total Mapped Group had higher, and 20% had lower, management fees than the fund. The fund's actual TMG %s and the number of funds in the Total Mapped Group are in the chart below. The "Asset-Size Peer Group" (ASPG) comparison focuses on a fund's standing relative to a subset of non-Fidelity funds within the Total Mapped Group that are similar in size and management fee structure. For example, if a fund is in the first quartile of the ASPG, the fund's management fee ranks in the least expensive or lowest 25% of funds in the ASPG. The ASPG represents at least 15% of the funds in the Total Mapped Group with comparable asset size and management fee structures, subject to a minimum of 50 funds (or all funds in the Total Mapped Group if fewer than 50). Additional information, such as the ASPG quartile in which the fund's management fee rate ranked, is also included in the chart and was considered by the Board.
Fidelity Limited Term Municipal Income Fund
The Board noted that the fund's management fee rate ranked below the median of its Total Mapped Group and below the median of its ASPG for 2017.
The Board noted that it and the boards of other Fidelity funds formed an ad hoc Committee on Group Fee, which meets periodically, to conduct an in-depth review of the "group fee" component of the management fee of funds with such management fee structures. The Committee's focus included the mechanics of the group fee, the competitive landscape of group fee structures, Fidelity funds with no group fee component and investment products not included in group fee assets. The Board also considered that, for funds subject to the group fee, FMR agreed to voluntarily waive fees over a specified period of time in amounts designed to account for assets converted from certain funds to certain collective investment trusts.
Based on its review, the Board concluded that the fund's management fee is fair and reasonable in light of the services that the fund receives and the other factors considered.
Total Expense Ratio. In its review of each class's total expense ratio, the Board considered the fund's management fee rate as well as other fund or class expenses, as applicable, such as transfer agent fees, pricing and bookkeeping fees, fund-paid 12b-1 fees, and custodial, legal, and audit fees. The Board also noted that Fidelity may agree to waive fees and expenses from time to time, and the extent to which, if any, it has done so for the fund. As part of its review, the Board also considered the current and historical total expense ratios of each class of the fund compared to competitive fund median expenses. Each class of the fund is compared to those funds and classes in the Total Mapped Group (used by the Board for management fee comparisons) that have a similar sales load structure.
The Board noted that the total expense ratio of the retail class ranked below the competitive median for 2017 and the total expense ratio of each of Class A, Class M, Class C, and Class I ranked above the competitive median for 2017. The Board considered that, in general, various factors can affect total expense ratios. The Board noted that the total expense ratio of each of Class A, Class M, Class C, and Class I was above the competitive median because these classes are primarily comprised of omnibus assets, which are charged a flat asset-based transfer agent fee that is generally higher than the effective transfer agent fee rate for the retail class, which has a lower percentage of omnibus assets. The Board noted that an additional reason for Class M's total expense ratio being above the competitive median is Class M's higher 12b-1 fees. Class M has a higher 12b-1 fee, but a lower front-end sales charge, than traditionally priced front-end sales charge classes. The Board considered that Class M is primarily sold load-waived to retirement plans and intermediary wrap programs where its 0.50% 12b-1 fee is comparable to competing no-load, higher 12b-1 fee classes designed specifically for retirement plans and wrap programs. The Board noted that the total expense ratio of Class C was also above the competitive median because of its 1.00% 12b-1 fee. The Board noted that the fund offers multiple classes, each of which has a different sales load and 12b-1 fee structure, and that the multiple structures are intended to offer a range of pricing options for the intermediary market. The Board also noted that the total expense ratios of the classes vary primarily by the level of their 12b-1 fees, although differences in transfer agent fees may also cause expenses to vary from class to class.
Fees Charged to Other Fidelity Clients. The Board also considered Fidelity fee structures and other information with respect to clients of Fidelity, such as other funds advised or subadvised by Fidelity, pension plan clients, and other institutional clients with similar mandates. The Board noted that a joint ad hoc committee created by it and the boards of other Fidelity funds periodically reviews and compares Fidelity's institutional investment advisory business with its business of providing services to the Fidelity funds and also noted the most recent findings of the committee. The Board noted that the committee's review included a consideration of the differences in services provided, fees charged, and costs incurred, as well as competition in the markets serving the different categories of clients.
Based on its review of total expense ratios and fees charged to other Fidelity clients, the Board concluded that the total expense ratio of each class of the fund was reasonable in light of the services that the fund and its shareholders receive and the other factors considered.
Costs of the Services and Profitability. The Board considered the revenues earned and the expenses incurred by Fidelity in conducting the business of developing, marketing, distributing, managing, administering and servicing the fund and servicing the fund's shareholders. The Board also considered the level of Fidelity's profits in respect of all the Fidelity funds.
On an annual basis, Fidelity presents to the Board information about the profitability of its relationships with the fund. Fidelity calculates profitability information for each fund, as well as aggregate profitability information for groups of Fidelity funds and all Fidelity funds, using a series of detailed revenue and cost allocation methodologies which originate with the books and records of Fidelity on which Fidelity's audited financial statements are based. The Audit Committee of the Board reviews any significant changes from the prior year's methodologies.
PricewaterhouseCoopers LLP (PwC), auditor to Fidelity and certain Fidelity funds, has been engaged annually by the Board as part of the Board's assessment of Fidelity's profitability analysis. PwC's engagement includes the review and assessment of the methodologies used by Fidelity in determining the revenues and expenses attributable to Fidelity's mutual fund business, and completion of agreed-upon procedures in respect of the mathematical accuracy of the fund profitability information and its conformity to established allocation methodologies. After considering PwC's reports issued under the engagement and information provided by Fidelity, the Board concluded that while other allocation methods may also be reasonable, Fidelity's profitability methodologies are reasonable in all material respects.
The Board also reviewed Fidelity's non-fund businesses and potential indirect benefits such businesses may have received as a result of their association with Fidelity's mutual fund business (i.e., fall-out benefits) as well as cases where Fidelity's affiliates may benefit from the fund's business. The Board noted that changes to fall-out benefits year-over-year reflect business developments at Fidelity's various businesses.
The Board considered the costs of the services provided by and the profits realized by Fidelity in connection with the operation of the fund and was satisfied that the profitability was not excessive.
Economies of Scale. The Board considered whether there have been economies of scale in respect of the management of the Fidelity funds, whether the Fidelity funds (including the fund) have appropriately benefited from any such economies of scale, and whether there is potential for realization of any further economies of scale. The Board considered the extent to which the fund will benefit from economies of scale as assets grow through increased services to the fund, through waivers or reimbursements, or through fee or expense ratio reductions. The Board also noted that a committee (the Economies of Scale Committee) created by it and the boards of other Fidelity funds periodically analyzes whether Fidelity attains economies of scale in respect of the management and servicing of the Fidelity funds, whether the Fidelity funds have appropriately benefited from such economies of scale, and whether there is potential for realization of any further economies of scale.
The Board recognized that the fund's management contract incorporates a "group fee" structure, which provides for lower group fee rates as total group assets increase, and for higher group fee rates as total group assets decrease (with "group assets" defined to include fund assets under FMR's management plus the assets of sector funds previously under FMR's management). FMR calculates the group fee rates based on a tiered asset "breakpoint" schedule that varies based on asset class. The Board considered that the group fee is designed to deliver the benefits of economies of scale to fund shareholders when total Fidelity fund assets increase, even if assets of any particular fund are unchanged or have declined, because some portion of Fidelity's costs are attributable to services provided to all Fidelity funds, and all funds benefit if those costs can be allocated among more assets. The Board concluded that, given the group fee structure, fund shareholders will benefit from lower management fees as group assets increase at the fund complex level, regardless of whether Fidelity achieves any such economies of scale.
The Board concluded, taking into account the analysis of the Economies of Scale Committee, that economies of scale, if any, are being appropriately shared between fund shareholders and Fidelity.
Additional Information Requested by the Board. In order to develop fully the factual basis for consideration of the Fidelity funds' advisory contracts, the Board requested and received additional information on certain topics, including: (i) Fidelity's fund profitability methodology, profitability trends for certain funds, the allocation of various costs to different funds, and the impact of certain factors on fund profitability results; (ii) portfolio manager changes that have occurred during the past year and the amount of the investment that each portfolio manager has made in the Fidelity fund(s) that he or she manages; (iii) Fidelity's compensation structure for portfolio managers, research analysts, and other key personnel, including its effects on fund profitability, the rationale for the compensation structure, and the extent to which current market conditions have affected retention and recruitment; (iv) the arrangements with and compensation paid to certain fund sub-advisers on behalf of the Fidelity funds and the treatment of such compensation within Fidelity's fund profitability methodology; (v) the terms of Fidelity's voluntary expense limitation agreements; (vi) the methodology with respect to competitive fund data and peer group classifications; (vii) Fidelity's transfer agent fee, expense, and service structures for different funds and classes relative to competitive trends, and the impact of the increased use of omnibus accounts; (viii) new developments in the retail and institutional marketplaces and the competitive positioning of the funds relative to other investment products and services; (ix) the impact of recent changes to the money market fund landscape, including the full implementation of money market fund reform and rising interest rates, on Fidelity's money market funds; (x) the funds' share class structures and distribution channels; and (xi) explanations regarding the relative total expense ratios of certain funds and classes, total expense competitive trends and methodologies for total expense competitive comparisons, and actions that might be taken by Fidelity to reduce total expense ratios for certain classes. In addition, the Board considered its discussions with Fidelity throughout the year regarding enhanced information security initiatives and the funds' fair valuation policies.
Based on its evaluation of all of the conclusions noted above, and after considering all factors it believed relevant, the Board concluded that the advisory fee arrangements are fair and reasonable, and that the fund's Advisory Contracts should be renewed.
Corporate Headquarters
245 Summer St.
Boston, MA 02210
www.fidelity.com
STM-ANN-0219
1.536709.122
Fidelity® Conservative Income Municipal Bond Fund Fidelity® Conservative Income Municipal Bond Fund and
Institutional Class
Annual Report December 31, 2018 |
|
Beginning on January 1, 2021, as permitted by regulations adopted by the Securities and Exchange Commission, paper copies of a fund’s shareholder reports will no longer be sent by mail, unless you specifically request paper copies of the reports from the fund or from your financial intermediary, such as a financial advisor, broker-dealer or bank. Instead, the reports will be made available on a website, and you will be notified by mail each time a report is posted and provided with a website link to access the report.
If you already elected to receive shareholder reports electronically, you will not be affected by this change and you need not take any action. You may elect to receive shareholder reports and other communications from a fund electronically, by contacting your financial intermediary. For Fidelity customers, visit Fidelity's web site or call Fidelity using the contact information listed below.
You may elect to receive all future reports in paper free of charge. If you wish to continue receiving paper copies of your shareholder reports, you may contact your financial intermediary or, if you are a Fidelity customer, visit Fidelity’s website, or call Fidelity at the applicable toll-free number listed below. Your election to receive reports in paper will apply to all funds held with the fund complex/your financial intermediary.
| Account Type | Website | Phone Number |
| Brokerage, Mutual Fund, or Annuity Contracts: | fidelity.com/mailpreferences | 1-800-343-3548 |
| Employer Provided Retirement Accounts: | netbenefits.fidelity.com/preferences (choose 'no' under Required Disclosures to continue to print) | 1-800-343-0860 |
| Advisor Sold Accounts Serviced Through Your Financial Intermediary: | Contact Your Financial Intermediary | Your Financial Intermediary's phone number |
| Advisor Sold Accounts Serviced by Fidelity: | institutional.fidelity.com | 1-877-208-0098 |
Contents
To view a fund's proxy voting guidelines and proxy voting record for the 12-month period ended June 30, visit http://www.fidelity.com/proxyvotingresults or visit the Securities and Exchange Commission's (SEC) web site at http://www.sec.gov.
You may also call 1-800-544-8544 to request a free copy of the proxy voting guidelines.
Standard & Poor's, S&P and S&P 500 are registered service marks of The McGraw-Hill Companies, Inc. and have been licensed for use by Fidelity Distributors Corporation.
Other third-party marks appearing herein are the property of their respective owners.
All other marks appearing herein are registered or unregistered trademarks or service marks of FMR LLC or an affiliated company. © 2019 FMR LLC. All rights reserved.
This report and the financial statements contained herein are submitted for the general information of the shareholders of the Fund. This report is not authorized for distribution to prospective investors in the Fund unless preceded or accompanied by an effective prospectus.
A fund files its complete schedule of portfolio holdings with the SEC for the first and third quarters of each fiscal year on Form N-Q. Forms N-Q are available on the SEC’s web site at http://www.sec.gov. A fund's Forms N-Q may be reviewed and copied at the SEC’s Public Reference Room in Washington, DC. Information regarding the operation of the SEC's Public Reference Room may be obtained by calling 1-800-SEC-0330.
For a complete list of a fund's portfolio holdings, view the most recent holdings listing, semiannual report, or annual report on Fidelity's web site at http://www.fidelity.com, http://www.institutional.fidelity.com, or http://www.401k.com, as applicable.
NOT FDIC INSURED •MAY LOSE VALUE •NO BANK GUARANTEE
Neither the Fund nor Fidelity Distributors Corporation is a bank.
Performance: The Bottom Line
Average annual total return reflects the change in the value of an investment, assuming reinvestment of distributions from dividend income and capital gains (the profits earned upon the sale of securities that have grown in value, if any) and assuming a constant rate of performance each year. The hypothetical investment and the average annual total returns do not reflect the deduction of taxes that a shareholder would pay on fund distributions or the redemption of fund shares. During periods of reimbursement by Fidelity, a fund’s total return will be greater than it would be had the reimbursement not occurred. How a fund did yesterday is no guarantee of how it will do tomorrow.
Average Annual Total Returns
| For the periods ended December 31, 2018 | Past 1 year | Past 5 years | Life of fundA |
| Fidelity® Conservative Income Municipal Bond Fund | 1.45% | 0.67% | 0.68% |
| Institutional Class | 1.56% | 0.77% | 0.78% |
A From October 15, 2013
$10,000 Over Life of Fund
Let's say hypothetically that $10,000 was invested in Fidelity® Conservative Income Municipal Bond Fund, a class of the fund, on October 15, 2013, when the fund started.
The chart shows how the value of your investment would have changed, and also shows how the Bloomberg Barclays Municipal Bond 1 Year (1-2 Y) Index performed over the same period.
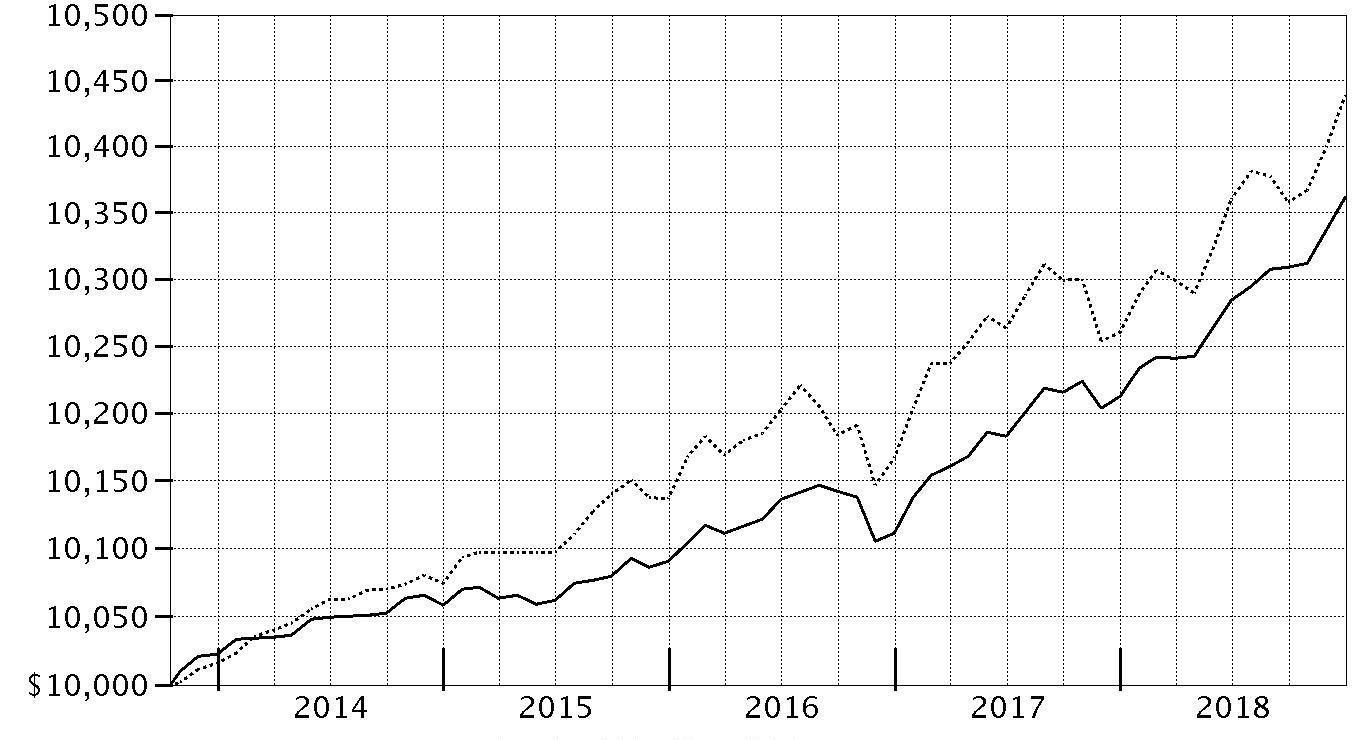
| Period Ending Values |
| $10,361 | Fidelity® Conservative Income Municipal Bond Fund |
| $10,439 | Bloomberg Barclays Municipal Bond 1 Year (1-2 Y) Index |
Management's Discussion of Fund Performance
Market Recap: Tax-exempt municipal bonds gained modestly in 2018, with the Bloomberg Barclays Municipal Bond Index returning 1.28%, supported by lower bond issuance and solid economic growth. Tax reform had a significant impact on both the supply of and demand for tax-exempt bonds the past year. In the final months of 2017, issuers accelerated their bond financings in order to issue under the old tax rules, prompting a surge in supply. Investors absorbed this excess supply, anticipating that issuance would fall significantly in 2018. The market turned lower in early 2018, as domestic fixed-income markets reacted to robust economic data and signs of inflation, before stabilizing in March and rallying through August. The municipal market experienced volatility in September and October amid concerns of an economic slowdown, then rebounded to close December near a high for the year. Gross municipal bond issuance ended 2018 down approximately 25%. There was little differentiation in performance across municipal sectors in 2018. General obligation bonds gained 1.33%, with bonds issued by states slightly outperforming those backed by local municipalities. Looking ahead, market volatility is likely to persist due to uncertainty about how the U.S. Federal Reserve will react to labor and inflation trends.
Comments from Co-Portfolio Managers Doug McGinley, Elizah McLaughlin and Robert Mandeville: For the fiscal ending December 31, 2018, the fund's share classes gained about 1.5%, roughly in line, net of fees, with the 1.60% advance of the fund's composite benchmark, an equal-weighted blend of the Bloomberg Barclays Municipal Bond 1 Year (1-2Y) Index and the iMoneyNet All Tax-Free National Retail Money Market Funds Average™. The fund slightly topped the return of its Lipper peer group average. The fund's interest-rate sensitivity was less than that of the composite benchmark, which was a slight advantage versus the index when one-year and two-year rates rose strongly in March and April, and again in August and September, although it cost us the fund bit of ground late in the period when rates trended lower. Owning investment-grade floating-rate notes helped limit the fund's interest-rate risk and boost its yields, while also contributing versus the composite benchmark. The portfolio's overweight exposure to fixed-rate health care securities and corporate-backed munis also helped, as securities in these categories posted better-than-average returns. An overweighting in fixed-rate one-year notes issued by local governments was slightly beneficial. In addition, overweighting state-backed bonds from Connecticut, Illinois and New Jersey added value.
The views expressed above reflect those of the portfolio manager(s) only through the end of the period as stated on the cover of this report and do not necessarily represent the views of Fidelity or any other person in the Fidelity organization. Any such views are subject to change at any time based upon market or other conditions and Fidelity disclaims any responsibility to update such views. These views may not be relied on as investment advice and, because investment decisions for a Fidelity fund are based on numerous factors, may not be relied on as an indication of trading intent on behalf of any Fidelity fund.
Note to Shareholders: On September 29, 2018, Robert Mandeville assumed co-management responsibilities for the fund, joining Doug McGinley and Elizah McLaughlin.
Investment Summary (Unaudited)
Maturity Diversification as of December 31, 2018
| | % of fund's investments |
| 1 - 7 | 34.4 |
| 8 - 30 | 1.9 |
| 31 - 60 | 3.8 |
| 61 - 90 | 1.9 |
| 91 - 180 | 12.1 |
| > 180 | 45.9 |
The date shown for securities represents the date when principal payments must be paid, taking into account any call options exercised by the issuer and any permissible maturity shortening features other than interest rate resets.
Top Five States as of December 31, 2018
| | % of fund's net assets |
| New Jersey | 17.2 |
| New York | 9.5 |
| Texas | 7.3 |
| Illinois | 6.2 |
| California | 5.9 |
Top Five Sectors as of December 31, 2018
| | % of fund's net assets |
| General Obligations | 32.0 |
| Synthetics | 18.1 |
| Electric Utilities | 15.2 |
| Industrial Development | 8.0 |
| Health Care | 7.6 |
Quality Diversification (% of fund's net assets)
| As of December 31, 2018 |
| | AAA | 2.6% |
| | AA,A | 35.5% |
| | BBB | 4.6% |
| | BB and Below | 0.1% |
| | Not Rated | 1.4% |
| | Short-Term Investments and Net Other Assets | 55.8% |

We have used ratings from Moody's Investors Service, Inc. Where Moody's® ratings are not available, we have used S&P® ratings. All ratings are as of the date indicated and do not reflect subsequent changes.
Schedule of Investments December 31, 2018
Showing Percentage of Net Assets
| Municipal Bonds - 42.6% | | | |
| | | Principal Amount | Value |
| Alabama - 0.9% | | | |
| Mobile County Board of School Commissioners: | | | |
| Series 2016 A, 3% 3/1/19 | | $410,000 | $410,625 |
| Series 2016 B, 5% 3/1/19 | | 670,000 | 673,159 |
| Mobile Indl. Dev. Board Poll. Cont. Rev. Bonds Series 2009 E, 1.85%, tender 3/24/20 (a) | | 15,770,000 | 15,667,653 |
|
| TOTAL ALABAMA | | | 16,751,437 |
|
| Alaska - 0.3% | | | |
| North Slope Borough Gen. Oblig. Series 2017 A, 5% 6/30/21 (Pre-Refunded to 6/30/20 @ 100) | | 440,000 | 460,698 |
| Valdez Marine Term. Rev. (BP Pipelines (Alaska), Inc. Proj.): | | | |
| Series 2003 B, 5% 1/1/21 | | 2,800,000 | 2,950,472 |
| Series 2003 C, 5% 1/1/21 | | 1,435,000 | 1,512,117 |
|
| TOTAL ALASKA | | | 4,923,287 |
|
| Arizona - 0.8% | | | |
| Arizona Health Facilities Auth. Rev. (Banner Health Sys. Proj.) Series 2015 A, 5% 1/1/20 | | 2,000,000 | 2,060,789 |
| Arizona State Lottery Rev. Series 2019: | | | |
| 5% 7/1/21 (b) | | 1,575,000 | 1,649,734 |
| 5% 7/1/22 (b) | | 1,265,000 | 1,355,991 |
| Coconino County Poll. Cont. Corp. Rev. Bonds (Nevada Pwr. Co. Projs.): | | | |
| Series 2017 A, 1.8%, tender 5/21/20 (a)(c) | | 6,615,000 | 6,563,932 |
| Series 2017 B, 1.6%, tender 5/21/20 (a) | | 820,000 | 812,554 |
| Maricopa County Indl. Dev. Auth. Rev. Series 2016 A, 5% 1/1/20 | | 2,360,000 | 2,431,731 |
|
| TOTAL ARIZONA | | | 14,874,731 |
|
| Arkansas - 0.2% | | | |
| Little Rock School District Series 2017, 3% 2/1/21 | | 3,255,000 | 3,314,208 |
| California - 0.7% | | | |
| California Infrastructure and Econ. Dev. Bank Rev. Bonds Series 2018 A, 0.004% x 1 month U.S. LIBOR 2.133%, tender 8/1/21 (a)(d) | | 13,270,000 | 13,247,441 |
| Colorado - 0.9% | | | |
| Colorado Reg'l. Trans. District Ctfs. of Prtn. Series 2013 A, 5% 6/1/20 | | 185,000 | 193,023 |
| Colorado Univ. Co. Hosp. Auth. Rev. Bonds: | | | |
| Series 2017C-1, 4%, tender 3/1/20 (a) | | 8,460,000 | 8,562,028 |
| Series 2017C-2, 5%, tender 3/1/22 (a) | | 1,345,000 | 1,442,149 |
| Denver City & County Arpt. Rev. Series 2017 A, 5% 11/15/19 (c) | | 1,060,000 | 1,087,533 |
| E-470 Pub. Hwy. Auth. Rev.: | | | |
| Series 2000 B: | | | |
| 0% 9/1/19 (Nat'l. Pub. Fin. Guarantee Corp. Insured) | | 3,480,000 | 3,431,370 |
| 0% 9/1/20 (Nat'l. Pub. Fin. Guarantee Corp. Insured) | | 1,300,000 | 1,250,106 |
| Series 2015 A: | | | |
| 2.35% 9/1/20 | | 300,000 | 300,045 |
| 5% 9/1/20 | | 845,000 | 881,386 |
|
| TOTAL COLORADO | | | 17,147,640 |
|
| Connecticut - 4.3% | | | |
| Connecticut Gen. Oblig.: | | | |
| Series 2005 B, 5.25% 6/1/19 | | 1,245,000 | 1,262,331 |
| Series 2011 C, SIFMA Municipal Swap Index + 1.100% 2.81% 5/15/19 (a)(d) | | 3,720,000 | 3,729,093 |
| Series 2011 D, 5% 11/1/19 | | 1,880,000 | 1,926,335 |
| Series 2012 A: | | | |
| SIFMA Municipal Swap Index + 1.100% 2.81% 4/15/19 (a)(d) | | 1,505,000 | 1,507,985 |
| SIFMA Municipal Swap Index + 1.250% 2.96% 4/15/20 (a)(d) | | 9,665,000 | 9,750,535 |
| Series 2012 C: | | | |
| 5% 6/1/19 | | 370,000 | 374,774 |
| 5% 6/1/20 | | 1,940,000 | 2,019,443 |
| Series 2012 D, SIFMA Municipal Swap Index + 0.920% 2.63% 9/15/19 (a)(d) | | 1,870,000 | 1,876,690 |
| Series 2013 A: | | | |
| SIFMA Municipal Swap Index + 0.550% 2.26% 3/1/19 (a)(d) | | 795,000 | 795,193 |
| SIFMA Municipal Swap Index + 0.650% 2.36% 3/1/20 (a)(d) | | 220,000 | 220,277 |
| 5% 10/15/19 | | 1,040,000 | 1,064,838 |
| Series 2013 D: | | | |
| SIFMA Municipal Swap Index + 0.880% 2.59% 8/15/19 (a)(d) | | 745,000 | 747,179 |
| 5% 8/15/20 | | 560,000 | 586,124 |
| Series 2014 B, SIFMA Municipal Swap Index + 0.490% 2.2% 3/1/19 (a)(d) | | 310,000 | 310,045 |
| Series 2014 C, 5% 6/15/20 | | 1,155,000 | 1,203,591 |
| Series 2014 E, 5% 9/1/19 | | 1,245,000 | 1,270,537 |
| Series 2015 E, 5% 8/1/19 | | 570,000 | 580,263 |
| Series 2015 F, 5% 11/15/20 | | 530,000 | 558,376 |
| Series 2016 B: | | | |
| 5% 5/15/19 | | 2,465,000 | 2,493,442 |
| 5% 5/15/20 | | 1,495,000 | 1,554,516 |
| 5% 5/15/21 | | 5,345,000 | 5,674,145 |
| Series 2016 E: | | | |
| 4% 10/15/19 | | 2,565,000 | 2,606,424 |
| 5% 10/15/20 | | 3,460,000 | 3,637,117 |
| Series 2016 G, 5% 11/1/19 | | 1,620,000 | 1,659,927 |
| Series 2017 A, 5% 4/15/20 | | 7,935,000 | 8,231,769 |
| Series 2017 B: | | | |
| 5% 4/15/19 | | 1,880,000 | 1,896,801 |
| 5% 4/15/20 | | 300,000 | 311,220 |
| Series 2018 A, 5% 4/15/20 | | 1,315,000 | 1,364,181 |
| Series 2018 B: | | | |
| 5% 4/15/21 | | 3,285,000 | 3,481,082 |
| 5% 4/15/22 | | 1,315,000 | 1,420,989 |
| Series A, 5% 2/15/21 | | 4,425,000 | 4,440,266 |
| Series D, SIFMA Municipal Swap Index + 1.020% 2.73% 8/15/20 (a)(d) | | 1,935,000 | 1,948,216 |
| Connecticut Health & Edl. Facilities Auth. Rev.: | | | |
| Bonds: | | | |
| (Ascension Health Cr. Group Proj.) Series 1999 B, 1.65%, tender 3/1/19 (a) | | 1,885,000 | 1,884,607 |
| (Yale New Haven Hosp. Proj.) Series B, 1 month U.S. LIBOR + 0.550% 2.124%, tender 1/2/19 (a)(d) | | 3,125,000 | 3,125,053 |
| Series 2016 CT, 3% 12/1/19 | | 445,000 | 449,679 |
| Series A, 5% 7/1/20 | | 1,400,000 | 1,463,224 |
| Connecticut Spl. Tax Oblig. Trans. Infrastructure Rev.: | | | |
| Series 2011 A, 5% 12/1/19 | | 250,000 | 256,894 |
| Series 2014 A, 5% 9/1/20 | | 420,000 | 440,194 |
| Naugatuck Ctfs. of Prtn. (Naugatuck Incineration Facilities Proj.) Series 2014 A: | | | |
| 5% 6/15/19 (c) | | 725,000 | 734,815 |
| 5% 6/15/20 (c) | | 920,000 | 958,971 |
| New Britain Gen. Oblig. Series 2017 A: | | | |
| 5% 3/1/20 (FSA Insured) | | 185,000 | 191,551 |
| 5% 3/1/21 (FSA Insured) | | 255,000 | 270,815 |
| Stratford Gen. Oblig. Series 2017, 4% 7/1/19 (FSA Insured) | | 480,000 | 485,127 |
|
| TOTAL CONNECTICUT | | | 80,764,634 |
|
| District Of Columbia - 0.2% | | | |
| Metropolitan Washington DC Arpts. Auth. Sys. Rev.: | | | |
| Series 2010 B, 5% 10/1/19 (c) | | 1,295,000 | 1,321,972 |
| Series 2015 B, 2.75% 10/1/19 (c) | | 2,000,000 | 2,008,631 |
|
| TOTAL DISTRICT OF COLUMBIA | | | 3,330,603 |
|
| Florida - 2.6% | | | |
| Broward County Arpt. Sys. Rev. Series 2012 P1, 4% 10/1/19 (c) | | 1,690,000 | 1,714,685 |
| Broward County Port Facilities Rev. Series 2011 B, 5% 9/1/21 (c) | | 645,000 | 690,892 |
| Citizens Property Ins. Corp.: | | | |
| Series 2011 A1, 5% 6/1/19 | | 4,085,000 | 4,137,534 |
| Series 2012 A1, 5% 6/1/21 | | 7,885,000 | 8,448,620 |
| Escambia County Poll. Cont. Rev. Bonds Series 1997, 2.1%, tender 4/11/19 (a) | | 2,270,000 | 2,268,581 |
| Greater Orlando Aviation Auth. Arpt. Facilities Rev. Series 2016, 5% 10/1/20 (c) | | 150,000 | 157,541 |
| Hillsborough County Aviation Auth. Rev. Series 2013 A, 5% 10/1/20 (c) | | 1,465,000 | 1,538,646 |
| Jacksonville Elec. Auth. Elec. Sys. Rev.: | | | |
| Series 2013 A, 5% 10/1/20 | | 4,400,000 | 4,625,852 |
| Series 2013 D, 5% 10/1/20 | | 660,000 | 690,855 |
| Series 2017 3A, 5% 10/1/19 | | 1,000,000 | 1,022,703 |
| Lakeland Hosp. Sys. Rev. Series 2016, 5% 11/15/19 | | 195,000 | 200,082 |
| Miami-Dade County Aviation Rev.: | | | |
| Series 2012 A: | | | |
| 5% 10/1/20 (c) | | 1,175,000 | 1,229,931 |
| 5% 10/1/21 (c) | | 710,000 | 761,269 |
| Series 2015 A, 5% 10/1/19 (c) | | 5,500,000 | 5,612,495 |
| Series 2017 B, 5% 10/1/19 (c) | | 3,905,000 | 3,984,872 |
| Series A1, 5% 10/1/21 | | 200,000 | 210,654 |
| Miami-Dade County Indl. Dev. Auth. Solid Waste Disp. Rev. Bonds (Waste Mgmt. of Florida Proj.) Series 2018, 2.85%, tender 8/2/21 (a)(c) | | 1,560,000 | 1,565,382 |
| Miami-Dade County Pub. Facilities Rev. Series 2015 A, 5% 6/1/19 | | 1,210,000 | 1,225,460 |
| Miami-Dade County School Board Ctfs. of Prtn.: | | | |
| (Miami-Dade County School District) Series 2012 B-2, 4% 4/1/20 | | 400,000 | 410,224 |
| Series 2014 D, 5% 11/1/20 | | 485,000 | 511,510 |
| Series 2015 A: | | | |
| 5% 5/1/20 | | 2,270,000 | 2,361,481 |
| 5% 5/1/21 | | 885,000 | 944,233 |
| Series 2016 C, 5% 2/1/20 | | 1,360,000 | 1,404,744 |
| Palm Beach County School Board Ctfs. of Prtn. Series 2014 B, 4% 8/1/19 | | 260,000 | 263,330 |
| Tampa Solid Waste Sys. Rev.: | | | |
| Series 2010, 5% 10/1/19 (FSA Insured) (c) | | 745,000 | 761,131 |
| Series 2013, 5% 10/1/20 (c) | | 490,000 | 514,284 |
| Tampa Tax Allocation (H. Lee Moffitt Cancer Ctr. Proj.) Series 2016 A: | | | |
| 5% 9/1/19 | | 375,000 | 382,492 |
| 5% 9/1/20 | | 435,000 | 455,984 |
|
| TOTAL FLORIDA | | | 48,095,467 |
|
| Georgia - 1.6% | | | |
| Clarke County Hosp. Auth. Series 2016: | | | |
| 5% 7/1/19 | | 855,000 | 868,066 |
| 5% 7/1/20 | | 560,000 | 585,122 |
| Cobb County Kennestone Hosp. Auth. Rev. (Wellstar Health Sys., Inc. Proj.) Series 2017 A: | | | |
| 5% 4/1/19 | | 95,000 | 95,777 |
| 5% 4/1/20 | | 130,000 | 134,913 |
| 5% 4/1/21 | | 300,000 | 319,170 |
| Fulton County Dev. Auth. Hosp. R (Wellstar Health Sys., Inc. Proj.) Series 2017 A: | | | |
| 3% 4/1/19 | | 110,000 | 110,366 |
| 5% 4/1/20 | | 110,000 | 114,157 |
| 5% 4/1/21 | | 245,000 | 260,656 |
| Fulton County Dev. Auth. (Piedmont Healthcare, Inc. Proj.) Series 2016, 5% 7/1/20 | | 370,000 | 386,598 |
| Georgia Muni. Elec. Auth. Pwr. Rev.: | | | |
| (Gen. Resolution Proj.) Series 2008 A, 5.25% 1/1/19 | | 625,000 | 625,000 |
| (Unrefunded Balance Proj.) Series 2008, 5.75% 1/1/19 (Escrowed to Maturity) | | 425,000 | 425,000 |
| Series 2008 A: | | | |
| 5.25% 1/1/19 | | 415,000 | 415,000 |
| 5.25% 1/1/21 | | 400,000 | 422,152 |
| Series 2009 B, 5% 1/1/20 | | 9,825,000 | 10,100,996 |
| Series 2011 A: | | | |
| 5% 1/1/19 | | 2,170,000 | 2,170,000 |
| 5% 1/1/20 | | 775,000 | 796,771 |
| 5% 1/1/21 | | 3,625,000 | 3,808,208 |
| Series 2015 A: | | | |
| 5% 1/1/20 | | 815,000 | 837,894 |
| 5% 1/1/21 | | 745,000 | 782,652 |
| Series 2016 A: | | | |
| 4% 1/1/19 | | 650,000 | 650,000 |
| 4% 1/1/21 | | 820,000 | 845,559 |
| 5% 1/1/19 | | 1,115,000 | 1,115,000 |
| 5% 1/1/20 | | 1,360,000 | 1,398,204 |
| Series C, 5% 1/1/22 | | 430,000 | 461,085 |
| Series GG: | | | |
| 5% 1/1/20 | | 355,000 | 365,079 |
| 5% 1/1/21 | | 635,000 | 669,506 |
| Griffin-Spalding County Hosp. (Wellstar Health Sys., Inc. Proj.) Series 2017 A: | | | |
| 3% 4/1/19 | | 350,000 | 351,165 |
| 3% 4/1/20 | | 110,000 | 111,465 |
| 3% 4/1/21 | | 100,000 | 102,027 |
| Lagrange-Troup County Hosp. Rev. (Wellstar Health Sys., Inc. Proj.) Series 2017 A: | | | |
| 5% 4/1/20 | | 95,000 | 98,590 |
| 5% 4/1/21 | | 240,000 | 255,336 |
|
| TOTAL GEORGIA | | | 29,681,514 |
|
| Idaho - 0.1% | | | |
| Idaho Hsg. & Fin. Assoc. Single Family Mtg. (Idaho St Garvee Proj.) Series 2017 A: | | | |
| 5% 7/15/20 | | 445,000 | 464,918 |
| 5% 7/15/21 | | 660,000 | 708,160 |
|
| TOTAL IDAHO | | | 1,173,078 |
|
| Illinois - 4.0% | | | |
| Champaign County Ill Cmnty. Unit Series 2017, 5% 1/1/21 | | 745,000 | 787,137 |
| Chicago Metropolitan Wtr. Reclamation District of Greater Chicago Series 2014 D, 5% 12/1/19 | | 1,620,000 | 1,664,377 |
| Chicago O'Hare Int'l. Arpt. Rev.: | | | |
| Series 2010 D, 5.25% 1/1/19 (c) | | 3,600,000 | 3,600,000 |
| Series 2011 B, 5% 1/1/19 | | 325,000 | 325,000 |
| Series 2012 B, 4% 1/1/20 (c) | | 6,365,000 | 6,477,711 |
| Series 2015 A, 5% 1/1/19 (c) | | 355,000 | 355,000 |
| Series 2018 A, 5% 1/1/20 (c) | | 800,000 | 821,993 |
| Chicago Park District Gen. Oblig.: | | | |
| Series 2011 B, 4% 1/1/19 | | 200,000 | 200,000 |
| Series 2013 D, 5% 1/1/20 | | 645,000 | 660,611 |
| Chicago Transit Auth. Cap. Grant Receipts Rev.: | | | |
| Series 2015, 5% 6/1/19 | | 700,000 | 708,074 |
| Series 2017: | | | |
| 4% 6/1/19 | | 1,070,000 | 1,078,210 |
| 5% 6/1/20 | | 2,280,000 | 2,364,292 |
| 5% 6/1/21 | | 975,000 | 1,033,549 |
| Cook County Gen. Oblig.: | | | |
| Series 2014 A, 3% 11/15/19 | | 965,000 | 972,406 |
| Series 2018, 5% 11/15/19 | | 1,115,000 | 1,142,598 |
| Illinois Fin. Auth. Rev.: | | | |
| (Hosp. Sisters Svcs., Inc. Proj.) Series 2012 C, 5% 8/15/20 | | 2,005,000 | 2,102,463 |
| (OSF Healthcare Sys.) Series 2018 A, 5% 5/15/19 | | 800,000 | 808,934 |
| (Rush Univ. Med. Ctr. Proj.) Series 2015 A, 5% 11/15/19 | | 1,415,000 | 1,451,383 |
| Bonds: | | | |
| (Advocate Health Care Network Proj.): | | | |
| Series 2008 A1, 5%, tender 1/15/20 (a) | | 1,300,000 | 1,339,410 |
| Series 2008 A2, 5%, tender 2/12/20 (a) | | 1,165,000 | 1,202,839 |
| (Ascension Health Cr. Group Proj.) Series 2012 E2, 1.75%, tender 4/1/21 (a) | | 2,100,000 | 2,076,207 |
| Series 2012 A, 5% 5/15/19 | | 1,085,000 | 1,097,117 |
| Series 2016 A: | | | |
| 5% 7/1/19 | | 445,000 | 451,292 |
| 5% 8/15/19 | | 370,000 | 375,433 |
| Series 2016 D, 5% 2/15/20 | | 1,475,000 | 1,524,590 |
| Series 2016, 5% 11/15/19 | | 260,000 | 266,572 |
| Illinois Gen. Oblig.: | | | |
| Series 2006 A, 5% 6/1/19 | | 485,000 | 490,052 |
| Series 2010, 5% 1/1/19 (FSA Insured) | | 4,450,000 | 4,450,000 |
| Series 2012, 5% 3/1/19 | | 300,000 | 301,242 |
| Series 2016, 5% 6/1/19 | | 350,000 | 353,646 |
| Series 2017 B, 5% 11/1/19 | | 9,000,000 | 9,185,128 |
| Series 2018 A, 5% 5/1/19 | | 8,500,000 | 8,570,740 |
| Illinois Muni. Elec. Agcy. Pwr. Supply: | | | |
| Series 2007 C, 5.25% 2/1/20 | | 430,000 | 445,196 |
| Series 2015 A, 5% 2/1/21 | | 980,000 | 1,037,467 |
| Illinois Reg'l. Trans. Auth.: | | | |
| Series 2010A, 5% 7/1/20 | | 1,305,000 | 1,341,788 |
| Series 2011 A, 5% 6/1/19 (FSA Insured) | | 3,055,000 | 3,092,640 |
| Series 2014 A, 5% 6/1/19 | | 585,000 | 592,208 |
| Series 2017 A: | | | |
| 5% 7/1/20 | | 520,000 | 542,620 |
| 5% 7/1/21 | | 520,000 | 554,237 |
| Railsplitter Tobacco Settlement Auth. Rev. Series 2010: | | | |
| 5% 6/1/19 | | 3,250,000 | 3,287,485 |
| 5.125% 6/1/19 | | 1,630,000 | 1,649,629 |
| 5.25% 6/1/20 | | 1,535,000 | 1,598,135 |
| Univ. of Illinois Board of Trustees Ctfs. of Prtn. Series 2016 A, 4% 8/15/19 | | 500,000 | 506,182 |
| Univ. of Illinois Rev.: | | | |
| Series 2001 A, 5.5% 4/1/19 | | 620,000 | 625,344 |
| Series 2001 B, 5.5% 4/1/19 | | 315,000 | 317,715 |
|
| TOTAL ILLINOIS | | | 73,828,652 |
|
| Indiana - 0.5% | | | |
| Indiana Fin. Auth. (Citizens Energy Group Wtr. Proj.) Series 2014 A, 5% 10/1/19 | | 340,000 | 347,872 |
| Indiana Fin. Auth. Rev. Series 2016: | | | |
| 3% 9/1/19 | | 185,000 | 186,096 |
| 4% 9/1/20 | | 370,000 | 381,226 |
| Indiana Health Facility Fing. Auth. Rev. Bonds Series 2001 A2, 4%, tender 3/1/19 (a) | | 1,710,000 | 1,716,060 |
| Indianapolis Local Pub. Impt.: | | | |
| (Indianapolis Arpt. Auth. Proj.) Series 2016 A1, 5% 1/1/19 (c) | | 1,445,000 | 1,445,000 |
| Series 2016, 5% 1/1/20 (c) | | 2,000,000 | 2,058,383 |
| Whiting Envir. Facilities Rev. (BP Products North America, Inc. Proj.) Series 2009, 5.25% 1/1/21 | | 2,510,000 | 2,657,061 |
|
| TOTAL INDIANA | | | 8,791,698 |
|
| Kansas - 0.1% | | | |
| Kansas Dev. Fin. Agcy. Series 2009, 5.25% 11/15/21 | | 1,270,000 | 1,303,922 |
| Kentucky - 2.2% | | | |
| Ashland Med. Ctr. Rev. (Ashland Hosp. Corp. D/B/A King's Daughters Med. Ctr. Proj.) Series 2016 A, 4% 2/1/20 | | 595,000 | 602,961 |
| Carroll County Poll. Ctlr Rev. Bonds (Kentucky Utils. Co. Proj.) Series 2016 A, 1.05%, tender 9/1/19 (a) | | 12,000,000 | 11,916,073 |
| Kenton County Arpt. Board Arpt. Rev. Series 2016, 5% 1/1/20 | | 160,000 | 164,719 |
| Kentucky Bond Dev. Corp. (Lexington Ctr. Corp. Proj.) Series 2018 A, 5% 9/1/19 | | 855,000 | 871,853 |
| Kentucky State Property & Buildings Commission Rev.: | | | |
| (Kentucky St Proj.): | | | |
| Series 2009, 5.25% 2/1/19 (Assured Guaranty Corp. Insured) | | 465,000 | 466,220 |
| Series D: | | | |
| 5% 5/1/20 | | 3,645,000 | 3,780,157 |
| 5% 5/1/21 | | 555,000 | 589,410 |
| (Kentucky St Proj.): | | | |
| Series 2005 5% 8/1/21 (Nat'l. Pub. Fin. Guarantee Corp. Insured) | | 835,000 | 893,701 |
| Series 2005, 5% 8/1/20 (Nat'l. Pub. Fin. Guarantee Corp. Insured) | | 1,050,000 | 1,095,833 |
| Series 2010, 5% 8/1/20 | | 1,785,000 | 1,862,915 |
| (Proj. No. 117) Series B, 3% 5/1/20 | | 1,570,000 | 1,587,349 |
| (Proj. No. 98) Series 2010, 4% 8/1/19 | | 675,000 | 683,020 |
| Series 2015 B, 5% 8/1/19 | | 1,820,000 | 1,852,028 |
| Series 2016 B, 5% 11/1/19 | | 2,110,000 | 2,161,828 |
| Series 2016, 3% 4/1/21 | | 775,000 | 788,493 |
| Series B, 5% 8/1/21 | | 520,000 | 556,286 |
| Kentucky, Inc. Pub. Energy Series 2018 B, 4% 7/1/21 | | 2,200,000 | 2,277,704 |
| Louisville & Jefferson County (Norton Healthcare, Inc. Proj.) Series 2016 A, 5% 10/1/19 | | 1,415,000 | 1,445,638 |
| Louisville/Jefferson County Metropolitan Govt. Poll. Cont. Rev. Bonds (Louisville Gas & Elec. Co. Proj.) Series 2003 A, 1.5%, tender 4/1/19 (a) | | 2,245,000 | 2,241,407 |
| Trimble County Poll. Cont. Rev. Bonds (Louisville Gas and Elec. Co. Proj.) Series 2001 B, 2.55%, tender 5/3/21 (a) | | 5,580,000 | 5,605,110 |
|
| TOTAL KENTUCKY | | | 41,442,705 |
|
| Louisiana - 1.2% | | | |
| Louisiana Citizens Property Ins. Corp. Assessment Rev. Series 2015: | | | |
| 5% 6/1/19 | | 835,000 | 845,946 |
| 5% 6/1/20 | | 4,750,000 | 4,952,635 |
| 5% 6/1/21 (FSA Insured) | | 1,600,000 | 1,715,152 |
| Louisiana Pub. Facilities Auth. Rev.: | | | |
| (Ochsner Clinic Foundation Proj.) Series 2015, 5% 5/15/21 | | 520,000 | 553,758 |
| (Tulane Univ. of Louisiana Proj.) Series 2016 A, 5% 12/15/19 | | 745,000 | 766,277 |
| Series 2009 A, 5.25% 7/1/20 (Escrowed to Maturity) | | 2,530,000 | 2,646,633 |
| New Orleans Aviation Board Rev.: | | | |
| (North Term. Proj.) Series 2017 B, 5% 1/1/22 (c) | | 520,000 | 559,463 |
| Series 2017 D1: | | | |
| 5% 1/1/19 | | 445,000 | 445,000 |
| 5% 1/1/20 | | 745,000 | 767,793 |
| Series 2017 D2: | | | |
| 5% 1/1/19 (c) | | 560,000 | 560,000 |
| 5% 1/1/20 (c) | | 150,000 | 154,289 |
| 5% 1/1/21 (c) | | 370,000 | 389,736 |
| 5% 1/1/22 (c) | | 655,000 | 704,708 |
| Tobacco Settlement Fing. Corp. Series 2013 A: | | | |
| 5% 5/15/19 | | 4,525,000 | 4,571,011 |
| 5% 5/15/20 | | 1,135,000 | 1,174,566 |
| 5% 5/15/21 | | 930,000 | 982,638 |
|
| TOTAL LOUISIANA | | | 21,789,605 |
|
| Maine - 0.0% | | | |
| Maine Health & Higher Edl. Facilities Auth. Rev. Series 2017 B, 4% 7/1/21 | | 250,000 | 261,548 |
| Massachusetts - 1.2% | | | |
| Massachusetts Dept. of Trans. Metropolitan Hwy. Sys. Rev. Series 2010 B, 5% 1/1/20 | | 370,000 | 381,692 |
| Massachusetts Dev. Fin. Agcy. Rev.: | | | |
| (Lesley Univ. Proj.) Series 2016, 5% 7/1/20 | | 765,000 | 799,547 |
| Series 2012 G, 5% 10/1/19 | | 600,000 | 613,442 |
| Massachusetts Edl. Fing. Auth. Rev.: | | | |
| Series 2016 J, 5% 7/1/21 (c) | | 2,540,000 | 2,700,884 |
| Series 2017 A: | | | |
| 3% 7/1/19 (c) | | 185,000 | 185,751 |
| 4% 7/1/20 (c) | | 280,000 | 287,036 |
| Massachusetts Gen. Oblig.: | | | |
| Bonds Series 2014 D1, 1.05%, tender 7/1/20 (a) | | 3,720,000 | 3,663,382 |
| Series 2017 B, SIFMA Municipal Swap Index + 0.600% 2.31% 2/1/20 (a)(d) | | 13,020,000 | 13,043,045 |
| Massachusetts Health & Edl. Facilities Auth. Rev. (Partners Healthcare Sys., Inc. Proj.) Series 2010, 5% 7/1/21 | | 420,000 | 426,439 |
|
| TOTAL MASSACHUSETTS | | | 22,101,218 |
|
| Michigan - 2.3% | | | |
| Clarkston Cmnty. Schools Series 2016 I, 4% 5/1/20 | | 255,000 | 262,186 |
| Detroit Downtown Dev. Auth. Tax: | | | |
| Series 1, 5% 7/1/21 (FSA Insured) | | 1,185,000 | 1,255,034 |
| Series A, 5% 7/1/22 (FSA Insured) | | 650,000 | 703,827 |
| Ferris State Univ. Rev. Series 2016: | | | |
| 5% 10/1/19 | | 285,000 | 291,492 |
| 5% 10/1/20 | | 400,000 | 420,884 |
| Grand Haven Area Pub. Schools Series 2013, 3% 5/1/20 | | 370,000 | 375,746 |
| Grand Rapids Pub. Schools: | | | |
| Series 2016, 5% 5/1/19 (FSA Insured) | | 1,560,000 | 1,576,188 |
| 5% 5/1/19 (FSA Insured) | | 335,000 | 338,476 |
| Grand Valley Michigan State Univ. Rev. Series 2011, 5% 2/1/20 | | 975,000 | 1,007,078 |
| Huron Valley School District Series 2011, 5% 5/1/21 | | 1,475,000 | 1,571,981 |
| Ingham, Eaton and Clinton Counties Lansing School District Series 2016 I, 5% 5/1/19 | | 570,000 | 575,915 |
| Kalamazoo Hosp. Fin. Auth. Hosp. Facilities Rev. (Bronson Methodist Hsp, MI. Proj.) Series 2006, 5% 5/15/19 (FSA Insured) | | 745,000 | 752,713 |
| Kent Hosp. Fin. Auth. Hosp. Facilities Rev. (Spectrum Health Sys. Proj.) Series 2011 A, 5% 11/15/20 | | 470,000 | 495,700 |
| Lake Orion Cmnty. School District 5% 5/1/19 | | 670,000 | 676,997 |
| Lapeer Cmnty. Schools Series 2016: | | | |
| 4% 5/1/19 | | 415,000 | 417,821 |
| 4% 5/1/20 | | 905,000 | 929,064 |
| Lincoln Consolidated School District Series 2016 A, 5% 5/1/19 | | 745,000 | 752,607 |
| Michigan Fin. Auth. Rev.: | | | |
| (Mclaren Health Care Corp. Proj.) 5% 5/15/21 | | 370,000 | 395,260 |
| Bonds 1.1%, tender 8/15/19 (a) | | 975,000 | 968,875 |
| Series 2015 A, 5% 5/15/19 | | 355,000 | 358,951 |
| Series 2016: | | | |
| 3% 1/1/19 | | 75,000 | 75,000 |
| 3% 1/1/20 | | 110,000 | 110,969 |
| 5% 11/15/19 | | 495,000 | 507,511 |
| Michigan Gen. Oblig. Series 2016, 5% 3/15/20 | | 815,000 | 845,204 |
| Michigan Hosp. Fin. Auth. Rev. Bonds Series 2010 F4, 1.95%, tender 4/1/20 (a) | | 3,930,000 | 3,917,463 |
| Michigan Strategic Fund Exempt Facilities Rev. Bonds (Waste Mgmt., Inc. Proj.) 2.85%, tender 8/2/21 (a)(c) | | 10,500,000 | 10,538,850 |
| Milan Area Schools Series 2019, 5% 5/1/22 (b) | | 675,000 | 731,545 |
| Mount Clemens Cmnty. School District Series 2017 A: | | | |
| 5% 5/1/19 | | 530,000 | 535,500 |
| 5% 5/1/20 | | 630,000 | 656,485 |
| Portage Pub. Schools Series 2016: | | | |
| 5% 5/1/19 | | 465,000 | 469,902 |
| 5% 5/1/20 | | 500,000 | 520,820 |
| Rochester Cmnty. School District 5% 5/1/19 (Nat'l. Pub. Fin. Guarantee Corp. Insured) | | 285,000 | 288,033 |
| Royal Oak City School District Series 2018, 4% 5/1/20 | | 300,000 | 308,694 |
| Warren Consolidated School District Series 2016, 4% 5/1/19 | | 745,000 | 750,065 |
| Wayne County Arpt. Auth. Rev.: | | | |
| Series 2011 A, 5% 12/1/19 (c) | | 2,890,000 | 2,966,514 |
| Series 2017 A: | | | |
| 5% 12/1/19 | | 930,000 | 956,759 |
| 5% 12/1/20 | | 445,000 | 471,282 |
| Series 2017 B: | | | |
| 5% 12/1/19 (c) | | 845,000 | 867,372 |
| 5% 12/1/20 (c) | | 535,000 | 563,596 |
| Ypsilanti School District Series A, 4% 5/1/19 | | 1,375,000 | 1,384,347 |
| Zeeland Pub. Schools Series 2015, 5% 5/1/21 | | 1,285,000 | 1,364,966 |
|
| TOTAL MICHIGAN | | | 42,957,672 |
|
| Minnesota - 0.1% | | | |
| Southern Minnesota Muni. Pwr. Agcy. Pwr. Supply Sys. Rev. (Cap. Appreciation) Series 1994 A, 0% 1/1/19 (Nat'l. Pub. Fin. Guarantee Corp. Insured) | | 1,210,000 | 1,210,000 |
| Missouri - 0.0% | | | |
| Kansas City Santn Swr. Sys. R Series 2018 B, 5% 1/1/20 | | 300,000 | 309,540 |
| Missouri Health & Edl. Facilities Rev. Series 2016, 5% 5/15/20 | | 590,000 | 613,730 |
|
| TOTAL MISSOURI | | | 923,270 |
|
| Montana - 0.1% | | | |
| Montana Facility Fin. Auth. Rev. Series 2016: | | | |
| 5% 2/15/19 | | 780,000 | 782,726 |
| 5% 2/15/20 | | 1,290,000 | 1,332,931 |
|
| TOTAL MONTANA | | | 2,115,657 |
|
| Nevada - 0.9% | | | |
| Clark County Arpt. Rev.: | | | |
| (Sub Lien Proj.) Series 2017 A-1, 5% 7/1/20 (c) | | 2,445,000 | 2,547,299 |
| Series 2013 A, 5% 7/1/20 (c) | | 1,520,000 | 1,582,457 |
| Series 2017 C, 5% 7/1/21 (c) | | 4,830,000 | 5,148,007 |
| Clark County Poll. Cont. Rev. Bonds (Nevada Pwr. Co. Projs.) Series 2017, 1.6%, tender 5/21/20 (a) | | 3,080,000 | 3,052,034 |
| Clark County School District: | | | |
| Series 2007 A, 4.5% 6/15/19 | | 250,000 | 253,088 |
| Series 2015 D, 5% 6/15/20 | | 440,000 | 459,413 |
| Series 2016 A, 5% 6/15/21 | | 425,000 | 453,649 |
| Series 2016 D, 5% 6/15/19 | | 785,000 | 796,304 |
| Series 2017 B, 5% 6/15/19 | | 595,000 | 603,568 |
| Washoe County Gas Facilities Rev. Bonds (Sierra Pacific Pwr. Co. Proj.) Series 2016 A, 1.5%, tender 6/3/19 (a)(c) | | 1,040,000 | 1,036,468 |
|
| TOTAL NEVADA | | | 15,932,287 |
|
| New Hampshire - 0.1% | | | |
| New Hampshire Health & Ed. Facilities Auth. Rev.: | | | |
| (Southern NH Med. Ctr. Proj.) Series 2016: | | | |
| 3% 10/1/19 | | 460,000 | 463,067 |
| 3% 10/1/21 | | 570,000 | 579,325 |
| Series 2016, 3% 10/1/20 | | 820,000 | 829,742 |
|
| TOTAL NEW HAMPSHIRE | | | 1,872,134 |
|
| New Jersey - 5.7% | | | |
| Garden State Preservation Trust Open Space & Farmland Preservation Series 2012 A, 5% 11/1/19 | | 6,735,000 | 6,879,686 |
| Jersey City Gen. Oblig. Series 2015, 4% 2/15/20 (FSA Insured) | | 391,000 | 400,638 |
| New Jersey Econ. Dev. Auth. Rev.: | | | |
| (New Jersey Gen. Oblig. Proj.): | | | |
| Series 2008 A, 5% 5/1/19 | | 295,000 | 297,670 |
| Series 2009 AA, 5.25% 12/15/20 | | 745,000 | 754,938 |
| Series 2011 EE, 4.5% 9/1/20 | | 170,000 | 175,887 |
| Series 2017 B, 5% 11/1/19 | | 2,480,000 | 2,534,926 |
| Series 2013, 5% 3/1/20 | | 3,030,000 | 3,122,051 |
| Series 2014 PP, 5% 6/15/19 | | 985,000 | 997,221 |
| Series 2017 DDD: | | | |
| 5% 6/15/19 | | 370,000 | 374,591 |
| 5% 6/15/20 | | 370,000 | 383,894 |
| Series PP, 5% 6/15/20 | | 150,000 | 155,633 |
| New Jersey Edl. Facility ( William Paterson College Proj.) Series 2017 B, 5% 7/1/20 | | 357,000 | 373,283 |
| New Jersey Gen. Oblig.: | | | |
| Series 2005 L, 5.25% 7/15/19 | | 445,000 | 453,037 |
| Series 2014, 5% 6/1/19 | | 465,000 | 471,019 |
| Series 2016 T, 5% 6/1/20 | | 510,000 | 531,757 |
| New Jersey Health Care Facilities Fing. Auth. Rev.: | | | |
| Series 2010, 5% 1/1/19 | | 165,000 | 165,000 |
| Series 2016 A, 5% 7/1/19 | | 300,000 | 304,525 |
| Series 2016: | | | |
| 5% 7/1/19 | | 755,000 | 766,425 |
| 5% 7/1/20 | | 1,500,000 | 1,566,840 |
| 4% 7/1/19 (Escrowed to Maturity) | | 180,000 | 181,905 |
| New Jersey Higher Ed. Student Assistance Auth. Student Ln. Rev.: | | | |
| Series 2011 1, 5% 12/1/20 (c) | | 6,345,000 | 6,643,913 |
| Series 2011-1, 5.5% 12/1/21 (c) | | 6,345,000 | 6,868,653 |
| Series 2013: | | | |
| 4% 12/1/20 (c) | | 1,905,000 | 1,957,254 |
| 5% 12/1/19 (c) | | 500,000 | 511,499 |
| Series 2014 1A: | | | |
| 5% 12/1/20 (c) | | 6,000,000 | 6,282,660 |
| 5% 12/1/21 (c) | | 4,500,000 | 4,808,655 |
| Series 2016 1A, 5% 12/1/21 (c) | | 2,000,000 | 2,137,180 |
| Series 2017 1B: | | | |
| 5% 12/1/19 (c) | | 1,970,000 | 2,015,306 |
| 5% 12/1/20 (c) | | 2,725,000 | 2,853,375 |
| Series 2018 B: | | | |
| 5% 12/1/20 (c) | | 1,875,000 | 1,963,331 |
| 5% 12/1/21 (c) | | 1,290,000 | 1,378,481 |
| New Jersey Tobacco Settlement Fing. Corp. Series 2018 A: | | | |
| 5% 6/1/19 | | 2,210,000 | 2,236,954 |
| 5% 6/1/20 | | 2,230,000 | 2,318,152 |
| 5% 6/1/21 | | 4,890,000 | 5,195,478 |
| 5% 6/1/22 | | 55,000 | 59,374 |
| New Jersey Tpk. Auth. Tpk. Rev. Series 2017 C1, 1 month U.S. LIBOR + 0.340% 1.984% 1/1/21 (a)(d) | | 485,000 | 484,151 |
| New Jersey Trans. Trust Fund Auth.: | | | |
| Series 1999 A, 5.75% 6/15/20 | | 205,000 | 211,603 |
| Series 2013 A: | | | |
| 5% 12/15/19 | | 195,000 | 199,861 |
| 5% 6/15/20 | | 695,000 | 721,097 |
| Series 2013 AA, 5% 6/15/19 | | 355,000 | 359,404 |
| Series 2016 A, 5% 6/15/20 | | 12,285,000 | 12,762,395 |
| Series 2018 A: | | | |
| 4% 6/15/20 | | 575,000 | 589,185 |
| 5% 6/15/21 | | 6,530,000 | 6,913,964 |
| 5% 6/15/22 | | 11,015,000 | 11,878,025 |
| Series AA, 5% 6/15/20 | | 125,000 | 129,694 |
| New Jersey Transit Corp. Ctfs. of Prtn. Series 2014 A, 5% 9/15/19 | | 3,860,000 | 3,941,072 |
|
| TOTAL NEW JERSEY | | | 106,311,642 |
|
| New Mexico - 0.1% | | | |
| Farmington Poll. Cont. Rev. Bonds (Southern California Edison Co. Four Corners Proj.): | | | |
| Series 2005 A, 1.875%, tender 4/1/20 (a) | | 1,490,000 | 1,472,165 |
| Series 2005 B, 1.875%, tender 4/1/20 (a) | | 1,300,000 | 1,284,439 |
|
| TOTAL NEW MEXICO | | | 2,756,604 |
|
| New York - 0.2% | | | |
| Long Island Pwr. Auth. Elec. Sys. Rev. Series 2000 A, 0% 6/1/19 (FSA Insured) | | 400,000 | 396,770 |
| New York City Gen. Oblig. Series 2015 F, SIFMA Municipal Swap Index + 0.650% 2.36% 2/15/19 (a)(d) | | 745,000 | 745,313 |
| New York Metropolitan Trans. Auth. Rev.: | | | |
| Bonds Series 2015 C, 4%, tender 11/15/20 (a) | | 1,000,000 | 1,029,220 |
| Series 2018 B, 5% 5/15/20 | | 900,000 | 934,902 |
|
| TOTAL NEW YORK | | | 3,106,205 |
|
| North Carolina - 0.1% | | | |
| North Carolina Muni. Pwr. Agcy. #1 Catawba Elec. Rev.: | | | |
| Series 2010 A, 5% 1/1/20 | | 330,000 | 340,129 |
| Series 2012 A, 5% 1/1/19 | | 485,000 | 485,000 |
| Series C, 5% 1/1/21 | | 355,000 | 355,856 |
|
| TOTAL NORTH CAROLINA | | | 1,180,985 |
|
| Ohio - 1.3% | | | |
| Allen County Hosp. Facilities Rev. Bonds (Mercy Health Proj.) Series 2015 B, SIFMA Municipal Swap Index + 0.750% 2.46%, tender 5/1/20 (a)(d) | | 11,660,000 | 11,678,656 |
| Cleveland Ctfs. of Prtn. Series 2010 A, 5% 11/15/19 | | 1,665,000 | 1,704,760 |
| Cleveland Pub. Pwr. Sys. Rev. Series 2016 A, 5% 11/15/19 | | 1,405,000 | 1,441,985 |
| Franklin County Hosp. Facilities Rev. Bonds (Ohio Health Corp.) Series 2018 B, SIFMA Municipal Swap Index + 0.430% 2.14%, tender 11/15/21 (a)(d) | | 7,100,000 | 7,102,911 |
| Hamilton County HealthCare Facilities Rev. (Christ Hosp., OH. Proj.) Series 2012, 5% 6/1/20 | | 645,000 | 671,135 |
| Ohio Higher Edl. Facility Commission Rev.: | | | |
| (Kenyon College, Oh. Proj.) Series 2017, 4% 7/1/19 | | 150,000 | 151,528 |
| (Kenyon College, Oh. Proj.) Series 2017, 4% 7/1/20 | | 150,000 | 154,463 |
| Scioto County Hosp. Facilities Rev. Series 2016, 5% 2/15/20 | | 1,615,000 | 1,665,485 |
| Univ. of Akron Gen. Receipts Series 2010 A: | | | |
| 5% 1/1/19 (Escrowed to Maturity) | | 290,000 | 290,000 |
| 5% 1/1/19 (FSA Insured) | | 265,000 | 265,000 |
|
| TOTAL OHIO | | | 25,125,923 |
|
| Oklahoma - 0.0% | | | |
| Oklahoma County Fin. Auth. Edl. Facilities (Midwest City- Del City School Dis Proj.) Series 2018: | | | |
| 5% 10/1/19 | | 345,000 | 352,910 |
| 5% 10/1/21 | | 510,000 | 546,965 |
|
| TOTAL OKLAHOMA | | | 899,875 |
|
| Oregon - 0.0% | | | |
| Oregon Facilities Auth. Rev.: | | | |
| (Legacy Health Proj.) Series 2011 A, 5.25% 5/1/19 | | 260,000 | 262,840 |
| Series 2011 C, 5% 10/1/20 | | 310,000 | 326,238 |
|
| TOTAL OREGON | | | 589,078 |
|
| Pennsylvania - 3.3% | | | |
| Adams County Indl. Dev. Auth. Rev. Series 2010, 5% 8/15/20 | | 1,310,000 | 1,372,618 |
| Allegheny County Arpt. Auth. Rev. Series 2006 B: | | | |
| 5% 1/1/19 (c) | | 1,450,000 | 1,450,000 |
| 5% 1/1/22 (Nat'l. Pub. Fin. Guarantee Corp. Insured) (c) | | 625,000 | 672,994 |
| Allegheny County Hosp. Dev. Auth. Rev. Series 2010 A, 5% 5/15/19 | | 780,000 | 788,884 |
| Doylestown Hosp. Auth. Hosp. Rev. Series 2016 B, 5% 7/1/20 | | 430,000 | 443,115 |
| Lycoming County Auth. College Rev. Series 2016, 4% 10/1/19 | | 745,000 | 755,660 |
| Monroeville Fin. Auth. UPMC Rev. Series 2014 B, 3% 2/1/19 | | 145,000 | 145,141 |
| Pennsylvania Ctfs. Prtn. Series 2018 A, 5% 7/1/21 | | 350,000 | 372,607 |
| Pennsylvania Econ. Dev. Fing. Auth. Indl. Dev. Rev. Series 2014 A, 4% 2/1/19 | | 130,000 | 130,226 |
| Pennsylvania Gen. Oblig.: | | | |
| Series 2010 A, 5% 5/1/20 | | 575,000 | 598,247 |
| Series 2016: | | | |
| 5% 1/15/19 | | 240,000 | 240,266 |
| 5% 1/15/21 | | 420,000 | 445,066 |
| 5% 1/15/22 | | 3,110,000 | 3,376,558 |
| Pennsylvania Tpk. Commission Tpk. Rev.: | | | |
| Series 2013, SIFMA Municipal Swap Index + 1.150% 2.86% 12/1/19 (a)(d) | | 1,170,000 | 1,173,468 |
| Series 2018 A1: | | | |
| SIFMA Municipal Swap Index + 0.350% 2.06% 12/1/20 (a)(d) | | 5,100,000 | 5,088,576 |
| SIFMA Municipal Swap Index + 0.430% 2.14% 12/1/21 (a)(d) | | 10,010,000 | 9,982,773 |
| Series 2018 B, SIFMA Municipal Swap Index + 0.500% 2.21% 12/1/21 (a)(d) | | 6,410,000 | 6,405,834 |
| Philadelphia Arpt. Rev.: | | | |
| Series 2010 D, 5% 6/15/21 (c) | | 1,425,000 | 1,484,736 |
| Series 2011 A, 5% 6/15/21 (c) | | 510,000 | 542,864 |
| Series 2015 A, 5% 6/15/19 (c) | | 890,000 | 901,485 |
| Philadelphia Gas Works Rev.: | | | |
| Series 2015 13: | | | |
| 5% 8/1/19 | | 1,750,000 | 1,780,083 |
| 5% 8/1/20 | | 1,835,000 | 1,918,878 |
| 5% 8/1/21 | | 1,770,000 | 1,896,272 |
| Series 2016 14: | | | |
| 5% 10/1/19 | | 3,715,000 | 3,796,554 |
| 5% 10/1/20 | | 1,345,000 | 1,412,613 |
| Series 2017 15, 4% 8/1/20 | | 370,000 | 381,200 |
| Pittsburgh & Alleg County Parkin Series 2017, 4% 12/15/19 | | 245,000 | 249,586 |
| Reading School District Series 2017, 5% 3/1/21 (FSA Insured) | | 150,000 | 158,616 |
| Saint Mary Hosp. Auth. Health Sys. Rev. (Catholic Health East Proj.) Series 2010B, 5% 11/15/19 (Pre-Refunded to 11/15/19 @ 100) | | 600,000 | 616,267 |
| Univ. of Pittsburgh Commonwealth Sys. of Higher Ed. Series 2018, SIFMA Municipal Swap Index + 0.240% 1.95% 9/15/21 (a)(d) | | 12,700,000 | 12,696,698 |
|
| TOTAL PENNSYLVANIA | | | 61,277,885 |
|
| Rhode Island - 0.3% | | | |
| Rhode Island Student Ln. Auth. Student Ln. Rev. Series A, 5% 12/1/21 (c) | | 500,000 | 532,410 |
| Tobacco Setlement Fing. Corp. Series 2015 A: | | | |
| 5% 6/1/20 | | 3,500,000 | 3,636,360 |
| 5% 6/1/21 | | 765,000 | 812,231 |
|
| TOTAL RHODE ISLAND | | | 4,981,001 |
|
| South Carolina - 0.5% | | | |
| Lexington County Health Svcs. District, Inc. Hosp. Rev. Series 2011, 5% 11/1/19 | | 1,300,000 | 1,330,198 |
| Piedmont Muni. Pwr. Agcy. Elec. Rev.: | | | |
| Series 2009 A, 5% 1/1/20 | | 5,135,000 | 5,291,075 |
| Series 2017 A, 5% 1/1/19 | | 410,000 | 410,000 |
| Series 2017 B, 4% 1/1/19 | | 600,000 | 600,000 |
| South Carolina Jobs-Econ. Dev. Auth. (Anmed Health Proj.) Series 2016, 5% 2/1/20 | | 560,000 | 577,814 |
| South Carolina Pub. Svc. Auth. Rev.: | | | |
| Series 2010 B, 4% 1/1/20 (Escrowed to Maturity) | | 225,000 | 229,722 |
| Series 2012 D, 4% 12/1/19 (Escrowed to Maturity) | | 195,000 | 198,750 |
|
| TOTAL SOUTH CAROLINA | | | 8,637,559 |
|
| Tennessee - 0.3% | | | |
| Jackson Hosp. Rev. Series 2018 A, 5% 4/1/21 | | 500,000 | 530,590 |
| Knox County Health Edl. & Hsg. Facilities Series 2016 A, 3% 1/1/19 | | 370,000 | 370,000 |
| Memphis-Shelby County Arpt. Auth. Arpt. Rev.: | | | |
| Series 2010 B, 5.5% 7/1/19 (c) | | 1,950,000 | 1,983,118 |
| Series 2011 C, 5% 7/1/19 (c) | | 1,210,000 | 1,226,928 |
| Nashville and Davidson County Metropolitan Govt. Health & Edl. Facilities Board Rev. Bonds Series 2001 B, 1.55%, tender 11/3/20 (a) | | 2,375,000 | 2,343,175 |
|
| TOTAL TENNESSEE | | | 6,453,811 |
|
| Texas - 1.2% | | | |
| Austin-Bergstrom Landhost Ente Series 2017: | | | |
| 5% 10/1/19 | | 395,000 | 403,286 |
| 5% 10/1/20 | | 675,000 | 707,387 |
| 5% 10/1/21 | | 810,000 | 868,936 |
| Dallas County Util. and Reclamation District Series 2016: | | | |
| 5% 2/15/19 | | 1,610,000 | 1,615,895 |
| 5% 2/15/20 | | 980,000 | 1,012,840 |
| 5% 2/15/22 | | 1,000,000 | 1,087,020 |
| Dallas Fort Worth Int'l. Arpt. Rev. Series 2012 F, 5% 11/1/20 (c) | | 600,000 | 631,464 |
| Harris County Cultural Ed. Facilities Fin. Corp. Med. Facilities Rev. (Baylor College of Medicine Proj.) Series 2016, 5% 11/15/19 | | 1,350,000 | 1,385,065 |
| Harris County Cultural Ed. Facilities Fin. Corp. Rev.: | | | |
| Bonds: | | | |
| Series 2014 B, 2.29%, tender 1/3/19 (a) | | 3,820,000 | 3,822,764 |
| Series 2015 3, 1 month U.S. LIBOR + 0.850% 2.554%, tender 6/1/20 (a)(d) | | 1,935,000 | 1,945,778 |
| Series 2013 B, SIFMA Municipal Swap Index + 0.900% 2.61% 6/1/22 (a)(d) | | 600,000 | 604,194 |
| Series 2015, 5% 10/1/20 | | 600,000 | 630,798 |
| Houston Arpt. Sys. Rev.: | | | |
| (Houston TX Arpt. Sys. Rev. Subord Proj.) Series 2011 A, 5% 7/1/21 (c) | | 1,325,000 | 1,416,240 |
| Series 2011 A, 5% 7/1/19 (c) | | 805,000 | 816,942 |
| Series 2018 A, 5% 7/1/21 (c) | | 525,000 | 561,152 |
| Irving Hosp. Auth. Hosp. Rev. Series 2017 A: | | | |
| 5% 10/15/20 | | 370,000 | 387,412 |
| 5% 10/15/21 | | 185,000 | 198,128 |
| Love Field Arpt. Modernization Rev. Series 2015, 5% 11/1/19 (c) | | 745,000 | 763,237 |
| Lower Colorado River Auth. Rev.: | | | |
| (LCRA Transmission Svcs. Corp. Proj.) Series 2010, 5% 5/15/22 | | 1,100,000 | 1,144,242 |
| Series 2010: | | | |
| 5% 5/15/20 | | 240,000 | 250,018 |
| 5% 5/15/21 | | 1,255,000 | 1,305,476 |
| Lubbock Health Facilities Dev. Corp. Rev. (St. Joseph Health Sys. Proj.) Series 2008 B, 5% 7/1/19 | | 705,000 | 716,652 |
| Royse City Independent School District Series 2014, 0% 2/15/20 | | 415,000 | 405,833 |
|
| TOTAL TEXAS | | | 22,680,759 |
|
| Virginia - 1.1% | | | |
| Halifax County Indl. Dev. Auth. Bonds 2.15%, tender 9/1/20 (a) | | 2,225,000 | 2,219,193 |
| Louisa Indl. Dev. Auth. Poll. Cont. Rev. Bonds: | | | |
| Series 2008 A, 1.75%, tender 5/16/19 (a) | | 1,390,000 | 1,387,733 |
| Series 2008 B, 2.15%, tender 9/1/20 (a) | | 4,170,000 | 4,159,116 |
| Lynchburg Econ. Dev. (Centra Health Proj.) Series A: | | | |
| 5% 1/1/19 | | 255,000 | 255,000 |
| 5% 1/1/20 | | 370,000 | 380,949 |
| Wise County Indl. Dev. Auth. Waste & Sewage Rev. Bonds: | | | |
| (Virginia Elec. and Pwr. Co. Proj.) Series 2010 A, 1.875%, tender 6/1/20 (a) | | 8,240,000 | 8,190,478 |
| Series 2009 A, 2.15%, tender 9/1/20 (a) | | 2,135,000 | 2,129,428 |
| York County Econ. Dev. Auth. Poll. Cont. Rev. Bonds (Virginia Elec. and Pwr. Co. Proj.) Series 2009 A, 1.875%, tender 5/16/19 (a) | | 1,660,000 | 1,658,051 |
|
| TOTAL VIRGINIA | | | 20,379,948 |
|
| Washington - 0.6% | | | |
| Port of Seattle Rev.: | | | |
| Series 2010 C, 5% 2/1/20 (c) | | 2,080,000 | 2,147,080 |
| Series 2015 B, 5% 3/1/20 | | 685,000 | 709,900 |
| Series 2015 C, 5% 4/1/21 (c) | | 1,565,000 | 1,663,939 |
| Tobacco Settlement Auth. Rev. Series 2013, 5% 6/1/20 | | 3,405,000 | 3,522,234 |
| Washington Gen. Oblig. Series 2000 S-5, 0% 1/1/19 (Nat'l. Pub. Fin. Guarantee Corp. Insured) | | 975,000 | 975,000 |
| Washington Health Care Facilities Auth. Rev.: | | | |
| (MultiCare Health Sys. Proj.) Series 2010 A, 5.25% 8/15/19 | | 950,000 | 969,576 |
| (Providence Health Systems Proj.) Series 2011 B, 5% 10/1/19 | | 790,000 | 808,054 |
| Bonds Series 2012 B, 5%, tender 10/1/21 (a) | | 350,000 | 377,311 |
| Series 2012 A, 5% 10/1/19 | | 500,000 | 511,427 |
|
| TOTAL WASHINGTON | | | 11,684,521 |
|
| West Virginia - 1.3% | | | |
| Harrison County Commission Solid Waste Disp. Rev. Bonds (Monongahela Pwr. Co. Proj.) Series 2018 A, 3%, tender 10/15/21 (a)(c) | | 16,300,000 | 16,200,407 |
| Mason Co. Poll. Cont. Rev. (Appalachian Pwr. Co. Proj.) Series 2003 L, 2.75% 10/1/22 | | 4,455,000 | 4,437,626 |
| West Virginia Econ. Dev. Auth. Poll. Cont. Rev. (Appalachian Pwr. Co. - Amos Proj.) Series 2008 D, 3.25% 5/1/19 | | 185,000 | 185,192 |
| West Virginia Econ. Dev. Auth. Solid Waste Disp. Facilities Rev. Bonds: | | | |
| (Appalachian Pwr. Co. Amos Proj.) Series 2011 A, 1.7%, tender 9/1/20 (a)(c) | | 2,320,000 | 2,273,298 |
| 1.9%, tender 4/1/19 (a) | | 695,000 | 694,327 |
|
| TOTAL WEST VIRGINIA | | | 23,790,850 |
|
| Wisconsin - 1.3% | | | |
| Milwaukee County Arpt. Rev. Series 2016 A, 5% 12/1/19 (c) | | 1,810,000 | 1,858,751 |
| Wisconsin Health & Edl. Facilities: | | | |
| (Agnesian Healthcare Proj.) Series 2017: | | | |
| 4% 7/1/19 | | 300,000 | 302,744 |
| 5% 7/1/21 | | 300,000 | 320,055 |
| Bonds: | | | |
| (Ascension Health Cr. Group Proj.) Series 2013 B: | | | |
| 5%, tender 6/1/20 (a) | | 4,210,000 | 4,369,854 |
| 5%, tender 6/1/21 (a) | | 4,145,000 | 4,407,959 |
| Series 2013 B, 4%, tender 5/30/19 (a) | | 4,005,000 | 4,038,144 |
| Series 2018 C, SIFMA Municipal Swap Index + 0.450% 2.16%, tender 7/27/22 (a)(d) | | 9,960,000 | 9,910,897 |
|
| TOTAL WISCONSIN | | | 25,208,404 |
|
| TOTAL MUNICIPAL BONDS | | | |
| (Cost $794,726,983) | | | 792,899,458 |
|
| Municipal Notes - 55.2% | | | |
| Alabama - 0.1% | | | |
| Decatur Indl. Dev. Board Exempt Facilities Rev. (Nucor Steel Decatur LLC Proj.) Series 2003 A, 2.03% 1/7/19, VRDN (a)(c) | | 2,158,000 | $2,158,000 |
| California - 5.2% | | | |
| California Infrastructure & Econ. Dev. Bank Rev. (Pacific Gas & Elec. Co. Proj.) Series 2009 A, 2.08% 1/2/19, LOC MUFG Union Bank NA, VRDN (a) | | 1,750,000 | 1,750,000 |
| California Poll. Cont. Fing. Auth. Ctfs. of Prtn. (Pacific Gas & Elec. Co. Proj.) Series 1996 C, 2.15% 1/2/19, LOC Mizuho Corporate Bank Ltd., VRDN (a) | | 38,450,000 | 38,450,000 |
| El Centro Reg'l. Med. Cen Participating VRDN Series Floaters XF 10 72, 2.06% 1/7/19 (Liquidity Facility Deutsche Bank AG New York Branch) (a)(e) | | 11,580,000 | 11,580,000 |
| San Francisco Calif. City & Cnty. Arpts. Commn. Int'l. Arpt. Rev. Participating VRDN Series 15 ZF 01 64, 1.96% 1/7/19 (Liquidity Facility JPMorgan Chase Bank) (a)(c)(e) | | 4,960,000 | 4,960,000 |
| San Francisco City & County Arpts. Commission Int'l. Arpt. Rev. Participating VRDN: | | | |
| Series Floaters ZM 06 41, 1.96% 1/7/19 (Liquidity Facility JPMorgan Chase Bank) (a)(c)(e) | | 8,225,000 | 8,225,000 |
| Series Floaters ZM 06 44, 1.96% 1/7/19 (Liquidity Facility JPMorgan Chase Bank) (a)(c)(e) | | 11,235,000 | 11,235,000 |
| San Jose Int. Arpt. Rev. Participating VRDN Series 2017, 2.06% 1/7/19 (Liquidity Facility Citibank NA) (a)(c)(e) | | 20,000,000 | 20,000,000 |
| Shafter Indl. Dev. Auth. Indl. Dev. Rev. 2.2% 1/7/19, LOC Deutsche Bank AG, VRDN (a)(c) | | 920,000 | 920,000 |
|
| TOTAL CALIFORNIA | | | 97,120,000 |
|
| Colorado - 0.8% | | | |
| Colorado Edl. & Cultural Facilities Auth. Rev. (Mesivta of Greater Los Angeles Proj.) Series 2005, 2.06% 1/7/19, LOC Deutsche Bank AG, VRDN (a) | | 2,380,000 | 2,380,000 |
| Colorado Hsg. & Fin. Auth. Econ. Dev. (Pacific Instruments Proj.) Series 2000, 1.9% 1/7/19, LOC Wells Fargo Bank NA, VRDN (a)(c) | | 585,000 | 585,000 |
| Denver City & County Arpt. Rev. Participating VRDN Series Floaters XM 07 15, 2.01% 1/7/19 (Liquidity Facility Morgan Stanley Bank, West Valley City Utah) (a)(c)(e) | | 12,395,000 | 12,395,000 |
|
| TOTAL COLORADO | | | 15,360,000 |
|
| Connecticut - 0.2% | | | |
| New Britain Gen. Oblig. BAN Series 2018, 5% 12/19/19 | | 4,100,000 | 4,208,067 |
| Delaware - 0.3% | | | |
| Delaware Econ. Dev. Auth. Rev. (Delmarva Pwr. & Lt. Co. Proj.) Series 1994, 1.81% 1/2/19, VRDN (a)(c) | | 5,300,000 | 5,300,000 |
| District Of Columbia - 0.8% | | | |
| District of Columbia Rev. Participating VRDN Series Floaters XF 10 78, 2.11% 1/7/19 (Liquidity Facility Deutsche Bank AG New York Branch) (a)(e) | | 14,030,000 | 14,030,000 |
| Florida - 3.0% | | | |
| Aqua One Cmnty. Dev. District Fla Participating VRDN Series Floaters XF 10 76, 2.06% 1/7/19 (Liquidity Facility Deutsche Bank AG New York Branch) (a)(e) | | 8,955,000 | 8,955,000 |
| Avenir Cmnty. Dev. District Participating VRDN Series Floaters XF 10 74, 2.06% 1/7/19 (Liquidity Facility Deutsche Bank AG New York Branch) (a)(e) | | 2,250,000 | 2,250,000 |
| Broward County Arpt. Sys. Rev. Participating VRDN Series Floaters XL 00 88, 2.06% 1/7/19 (Liquidity Facility Citibank NA) (a)(c)(e) | | 15,730,000 | 15,730,000 |
| Collier County Indl. Dev. Auth. Rev. (Var March Proj.) Series 2004, 1.85% 1/7/19, LOC Wells Fargo Bank NA, VRDN (a)(c) | | 220,000 | 220,000 |
| Jacksonville Elec. Auth. Elec. Sys. Rev. Series 2000 A, 2.15% tender 1/17/19 (Liquidity Facility U.S. Bank NA, Cincinnati), CP mode | | 15,000,000 | 14,999,990 |
| Mirada Cmnty. Dev. District Participating VRDN Series Floaters XF 10 75, 2.06% 1/7/19 (Liquidity Facility Deutsche Bank AG New York Branch) (a)(e) | | 13,175,000 | 13,175,000 |
|
| TOTAL FLORIDA | | | 55,329,990 |
|
| Georgia - 1.9% | | | |
| Appling County Dev. Auth. Poll. Cont. Rev. (Georgia Pwr. Co. Plant Hatch Proj.) 1.77% 1/2/19, VRDN (a) | | 2,800,000 | 2,800,000 |
| Burke County Indl. Dev. Auth. Poll. Cont. Rev. (Georgia Pwr. Co. Plant Vogtle Proj.): | | | |
| First Series 2009, 1.8% 1/2/19, VRDN (a) | | 505,000 | 505,000 |
| Second Series 1995, 1.77% 1/2/19, VRDN (a) | | 10,000,000 | 10,000,000 |
| Series 2012, 1.83% 1/2/19, VRDN (a)(c) | | 17,910,000 | 17,910,000 |
| Series 2018, 1.76% 1/2/19, VRDN (a) | | 1,200,000 | 1,200,000 |
| Heard County Dev. Auth. Poll. Cont. Rev. Series 2007, 1.82% 1/2/19, VRDN (a)(c) | | 2,300,000 | 2,300,000 |
|
| TOTAL GEORGIA | | | 34,715,000 |
|
| Idaho - 0.1% | | | |
| Idaho Health Facilities Auth. Rev. Participating VRDN Series 16 XG 00 66, 1.94% 1/7/19 (Liquidity Facility Deutsche Bank AG New York Branch) (a)(e) | | 1,116,000 | 1,116,000 |
| Illinois - 2.2% | | | |
| Chicago O'Hare Int'l. Arpt. Rev. Participating VRDN Series Floaters XL 00 49, 1.96% 1/7/19 (Liquidity Facility Citibank NA) (a)(c)(e) | | 11,660,000 | 11,660,000 |
| Chicago Park District Gen. Oblig. Participating VRDN Series ROC II R 11935, 2.16% 1/7/19 (Liquidity Facility Citibank NA) (a)(e) | | 6,975,000 | 6,975,000 |
| Chicago Transit Auth. Rev. Bonds Participating VRDN Series XM 00 53, 1.96% 1/7/19 (Liquidity Facility Citibank NA) (a)(e) | | 12,205,000 | 12,205,000 |
| Cook County Gen. Oblig. Participating VRDN Series 2015 XF0124, 1.94% 1/7/19 (Liquidity Facility JPMorgan Chase Bank) (a)(e) | | 3,720,000 | 3,720,000 |
| Illinois Gen. Oblig. Participating VRDN Series 15 XF 1006, 1.94% 1/7/19 (Liquidity Facility Deutsche Bank AG) (a)(e) | | 6,621,500 | 6,621,500 |
|
| TOTAL ILLINOIS | | | 41,181,500 |
|
| Indiana - 0.7% | | | |
| Indiana Dev. Fin. Auth. Envir. Rev. (PSI Energy Proj.) Series 2003 B, 2.08% 1/7/19, VRDN (a)(c) | | 13,755,000 | 13,755,000 |
| Iowa - 0.5% | | | |
| Hills Health Facilities Rev. Participating VRDN Series Floaters XF 10 73, 2.06% 1/7/19 (Liquidity Facility Deutsche Bank AG New York Branch) (a)(e) | | 9,100,000 | 9,100,000 |
| Louisiana - 2.4% | | | |
| New Orleans Aviation Board Rev. Participating VRDN: | | | |
| Series Floater ZF 24 97, 1.96% 1/7/19 (Liquidity Facility Citibank NA) (a)(c)(e) | | 7,500,000 | 7,500,000 |
| Series Floaters XL 00 46, 1.96% 1/7/19 (Liquidity Facility Citibank NA) (a)(c)(e) | | 13,340,000 | 13,340,000 |
| Series Floaters ZM 05 58, 1.96% 1/7/19 (Liquidity Facility Citibank NA) (a)(c)(e) | | 7,500,000 | 7,500,000 |
| Saint James Parish Gen. Oblig. (Nucor Steel Louisiana LLC Proj.): | | | |
| Series 2010 A1, 2% 1/7/19, VRDN (a) | | 10,000,000 | 10,000,000 |
| Series 2010 B1, 1.98% 1/7/19, VRDN (a) | | 6,000,000 | 6,000,000 |
|
| TOTAL LOUISIANA | | | 44,340,000 |
|
| Maine - 0.0% | | | |
| Auburn Rev. Oblig. Secs Series 2001, 2% 1/7/19, LOC TD Banknorth, NA, VRDN (a)(c) | | 380,000 | 380,000 |
| Massachusetts - 1.2% | | | |
| Massachusetts Edl. Fing. Auth. Rev. Participating VRDN Series Floaters XF 23 06, 1.96% 1/7/19 (Liquidity Facility Morgan Stanley Bank, West Valley City Utah) (a)(c)(e) | | 17,820,000 | 17,820,000 |
| Nahant BAN Series 2018 A, 3% 6/28/19 | | 1,700,000 | 1,706,242 |
| Templeton BAN Series A, 3.25% 2/27/19 | | 3,200,000 | 3,204,699 |
|
| TOTAL MASSACHUSETTS | | | 22,730,941 |
|
| Mississippi - 0.6% | | | |
| Mississippi Bus. Fin. Corp. Solid Waste Disp. Rev. (Gulf Pwr. Co. Proj.) Series 2012, 1.85% 1/2/19, VRDN (a)(c) | | 11,000,000 | 11,000,000 |
| Nebraska - 0.1% | | | |
| Stanton County Indl. Dev. Rev. Series 1998, 2.03% 1/7/19, VRDN (a)(c) | | 900,000 | 900,000 |
| Nevada - 0.9% | | | |
| Clark County Arpt. Rev. Participating VRDN Series ROC II R 11823, 1.91% 1/7/19 (Liquidity Facility Citibank NA) (a)(e) | | 16,250,000 | 16,250,000 |
| Sparks Econ. Dev. Rev. (RIX Industries Proj.) Series 2002, 1.9% 1/7/19, LOC Wells Fargo Bank NA, VRDN (a)(c) | | 340,000 | 340,000 |
|
| TOTAL NEVADA | | | 16,590,000 |
|
| New Jersey - 11.5% | | | |
| Bloomingdale BAN Series 2018, 3% 3/5/19 | | 6,868,381 | 6,880,246 |
| Borough of Riverdale BAN Series 2018, 3% 9/13/19 | | 4,050,000 | 4,077,550 |
| Caldwell BAN Series 2018, 3% 2/20/19 | | 4,843,417 | 4,849,651 |
| Carteret Gen. Oblig. BAN Series 2018, 2.75% 2/1/19 | | 10,714,000 | 10,720,874 |
| Chester Township Gen. Oblig. BAN Series 2018, 3% 10/11/19 | | 5,580,000 | 5,623,458 |
| Delran Township BAN Series 2018, 3% 10/25/19 | | 8,900,000 | 8,967,020 |
| East Brunswick Township Gen. Oblig. BAN: | | | |
| Series 2018, 3% 3/14/19 | | 8,975,000 | 8,993,279 |
| Series 2019, 3.5% 1/10/20 (b) | | 3,100,000 | 3,139,337 |
| Englewood Gen. Oblig. BAN Series 2018, 3% 4/2/19 | | 24,370,000 | 24,437,675 |
| Gloucester Township BAN Series 2018 B, 3% 6/20/19 | | 20,094,801 | 20,178,184 |
| Highland Park Gen. Oblig. BAN Series 2018, 3% 4/16/19 | | 5,300,000 | 5,315,338 |
| Holmdel Township Gen. Oblig. BAN Series 2018, 2.5% 1/15/19 | | 4,936,000 | 4,936,975 |
| Long Beach Township Gen. Oblig. BAN Series 2018 A, 3% 3/14/19 | | 6,300,000 | 6,313,339 |
| Long Branch Gen. Oblig. BAN Series 2018 B, 2.75% 2/8/19 | | 23,534,415 | 23,552,226 |
| Maple Shade Township BAN Series 2018: | | | |
| 3% 6/27/19 | | 5,607,877 | 5,634,853 |
| 3% 6/27/19 | | 7,900,000 | 7,938,001 |
| Millburn Township Gen. Oblig. BAN Series 2018, 3% 6/14/19 | | 5,200,000 | 5,221,023 |
| Millstone Township Gen. Oblig. BAN Series 2018, 3% 9/10/19 | | 5,128,000 | 5,163,172 |
| Roselle County of Union BAN Series 2018, 3.5% 12/6/19 | | 4,800,000 | 4,853,843 |
| Saddle Brook Township Gen. Oblig. BAN Series 2018, 3% 5/30/19 | | 8,550,000 | 8,581,169 |
| South River Borough Gen. Oblig. BAN Series 2018, 3.5% 12/10/19 | | 9,407,250 | 9,529,847 |
| Teaneck Township Gen. Oblig. BAN Series 2018, 3% 6/28/19 | | 3,700,000 | 3,715,383 |
| Vineland Gen. Oblig. BAN Series 2018, 3.5% 11/14/19 | | 8,200,000 | 8,296,522 |
| Wall Township Gen. Oblig. BAN Series 2018, 3% 6/28/19 | | 16,856,000 | 16,926,898 |
|
| TOTAL NEW JERSEY | | | 213,845,863 |
|
| New York - 9.3% | | | |
| Amsterdam City School District BAN Series 2018, 3% 6/28/19 | | 19,900,000 | 19,984,669 |
| Broome County Gen. Oblig. BAN Series 2018 A, 3% 5/3/19 | | 11,400,000 | 11,439,606 |
| Eden BAN Series 2018, 3% 3/7/19 | | 5,830,000 | 5,840,075 |
| Eden N Y Cent School District BAN Series 2019, 3% 6/6/19 | | 5,000,000 | 5,021,116 |
| Geneva BAN Series 2018, 3% 5/8/19 | | 10,500,000 | 10,532,857 |
| Geneva Hsg. Auth. Rev. Series 2000, 2.32% 1/7/19, VRDN (a)(c) | | 1,165,000 | 1,165,000 |
| Gloversville School District BAN Series 2018, 3% 10/18/19 | | 23,145,000 | 23,309,654 |
| Ithaca Gen. Oblig. BAN Series 2018 A, 2.75% 2/15/19 | | 3,987,414 | 3,991,503 |
| North Rose-Wolcott Central School District Wayne County BAN Series 2018, 3.5% 7/26/19 | | 16,000,000 | 16,134,403 |
| Onondaga County Indl. Dev. Agcy. Indl. Dev. Rev. (Var G A Braun, Inc. Proj.) Series 2007, 2.01% 1/7/19, LOC Manufacturers & Traders Trust Co., VRDN (a)(c) | | 4,250,000 | 4,250,000 |
| Penn Yan NY Central School District BAN Series 2018, 3% 7/19/19 | | 8,400,000 | 8,439,036 |
| Poughkeepsie Town BAN Series 2018, 3% 3/8/19 | | 7,450,000 | 7,463,075 |
| Putnam County Indl. Dev. Agcy. Rev. Series 2006 A, 2.15% 1/7/19, LOC RBS Citizens NA, VRDN (a) | | 4,035,000 | 4,035,000 |
| Queensbury Union Free School District BAN Series 2018: | | | |
| 2.75% 4/26/19 | | 1,000,000 | 1,001,916 |
| 3% 7/12/19 | | 10,200,000 | 10,246,820 |
| Sidney Cent School District BAN Series 2018, 3% 7/10/19 | | 4,798,077 | 4,818,630 |
| South Glens Falls Central School District BAN: | | | |
| Series 2018 A, 3% 7/26/19 | | 12,500,000 | 12,573,504 |
| Series 2018 B, 3% 7/26/19 | | 1,099,950 | 1,106,418 |
| Troy Rensselaer County BAN: | | | |
| Series 2018 A, 2.75% 2/8/19 | | 8,771,733 | 8,778,017 |
| Series B, 3% 8/2/19 | | 12,440,695 | 12,500,810 |
| Ulster County Indl. Dev. Agcy. I (Selux Corp. Proj.) Series A: | | | |
| 2.09% 1/7/19, LOC Manufacturers & Traders Trust Co., VRDN (a)(c) | | 270,000 | 270,000 |
| 2.09% 1/7/19, LOC Manufacturers & Traders Trust Co., VRDN (a)(c) | | 205,000 | 205,000 |
|
| TOTAL NEW YORK | | | 173,107,109 |
|
| North Carolina - 0.2% | | | |
| North Carolina Cap. Impt. Ltd. Bonds Series WF 11 136C, SIFMA Municipal Swap Index + 0.280% 1.99%, tender 1/24/19 (Liquidity Facility Wells Fargo Bank NA) (a)(d)(e)(f) | | 4,040,000 | 4,040,000 |
| Ohio - 0.7% | | | |
| Akron Income Tax Rev. BAN Series 2018, 3.5% 12/10/19 | | 5,350,000 | 5,420,723 |
| Belmont County BAN Series 2018 A, 3% 4/18/19 | | 4,200,000 | 4,213,632 |
| East Clinton Local School District BAN Series 2019, 2.8% 12/3/19 | | 2,200,000 | 2,210,927 |
| Napoleon City Captial Facilities BAN Series 2018, 2.75% 2/27/19 | | 1,600,000 | 1,601,535 |
|
| TOTAL OHIO | | | 13,446,817 |
|
| Pennsylvania - 0.5% | | | |
| Berks County Indl. Dev. Auth. Rev. (KTB Real Estate Partnership Proj.) 1.9% 1/7/19, LOC Manufacturers & Traders Trust Co., VRDN (a)(c) | | 185,000 | 185,000 |
| Montgomery County Higher Ed. & Health Auth. Rev. Series 2018 D, 2.01% 1/6/22, VRDN (a) | | 9,540,000 | 9,540,000 |
| Montgomery County Indl. Dev. Auth. Rev. (Var-FXD-Big Little Assoc. Proj.) Series 1999, 1.9% 1/2/19, LOC Wells Fargo Bank NA, VRDN (a) | | 100,000 | 100,000 |
|
| TOTAL PENNSYLVANIA | | | 9,825,000 |
|
| South Carolina - 1.8% | | | |
| Berkeley County Indl. Dev. Rev. (Nucor Corp. Proj.): | | | |
| Series 1995, 2.03% 1/7/19, VRDN (a)(c) | | 11,700,000 | 11,700,000 |
| Series 1997, 2.03% 1/7/19, VRDN (a)(c) | | 3,800,000 | 3,800,000 |
| South Carolina Jobs-Econ. Dev. Auth. Econ. Dev. Rev. Series 2001, 1.84% 1/7/19, LOC Wells Fargo Bank NA, VRDN (a)(c) | | 1,800,000 | 1,800,000 |
| South Carolina Pub. Svc. Auth. Rev. Participating VRDN: | | | |
| Series Floaters XG 02 09, 2.06% 1/7/19 (Liquidity Facility Toronto-Dominion Bank) (a)(e) | | 4,625,000 | 4,625,000 |
| Series Floaters XM 03 84, 1.96% 1/7/19 (Liquidity Facility JPMorgan Chase Bank) (a)(e) | | 10,000,000 | 10,000,000 |
| South Carolina St. Pub. Svc. Auth. Rev. Participating VRDN Series XG 0046, 2.06% 1/7/19 (Liquidity Facility Toronto-Dominion Bank) (a)(e) | | 2,165,000 | 2,165,000 |
|
| TOTAL SOUTH CAROLINA | | | 34,090,000 |
|
| Tennessee - 0.1% | | | |
| Memphis-Shelby County Indl. Dev. Board Facilities Rev. Series 2007, 2.03% 1/7/19, VRDN (a)(c) | | 2,230,000 | 2,230,000 |
| Texas - 6.1% | | | |
| Dallas Fort Worth Int'l. Arpt. Rev. Participating VRDN Series Floaters XF 10 61, 1.93% 1/7/19 (Liquidity Facility Deutsche Bank AG New York Branch) (a)(c)(e) | | 8,370,000 | 8,370,000 |
| Port Arthur Navigation District Envir. Facilities Rev. (Motiva Enterprises LLC Proj.): | | | |
| Series 2004, 2.12% 1/7/19, VRDN (a)(c) | | 57,485,000 | 57,484,988 |
| Series 2010 D: | | | |
| 2.03% 1/7/19, VRDN (a) | | 30,565,000 | 30,565,000 |
| 2.1% 1/7/19, VRDN (a) | | 6,250,000 | 6,250,000 |
| Texas Gen. Oblig. Bonds Series WF 1183C, SIFMA Municipal Swap Index + 0.350% 2.06%, tender 1/24/19 (Liquidity Facility Wells Fargo Bank NA) (a)(c)(d)(e)(f) | | 11,030,000 | 11,030,000 |
|
| TOTAL TEXAS | | | 113,699,988 |
|
| Utah - 1.9% | | | |
| Salt Lake City Arpt. Rev. Participating VRDN: | | | |
| Series 17 XM 0493, 1.96% 1/7/19 (Liquidity Facility Morgan Stanley Bank, West Valley City Utah) (a)(c)(e) | | 20,500,000 | 20,500,000 |
| Series Floaters XM 06 99, 2.06% 1/7/19 (Liquidity Facility Cr. Suisse AG) (a)(c)(e) | | 6,400,000 | 6,400,000 |
| Series Floaters ZM 05 51, 1.96% 1/7/19 (Liquidity Facility Citibank NA) (a)(c)(e) | | 7,500,000 | 7,500,000 |
|
| TOTAL UTAH | | | 34,400,000 |
|
| Washington - 0.8% | | | |
| Seattle Hsg. Auth. Rev. (Douglas Apts. Proj.) 1.85% 1/7/19, LOC KeyBank NA, VRDN (a) | | 535,000 | 535,000 |
| Washington Econ. Dev. Fin. Auth. Rev. Participating VRDN Series Floaters 005, 2.06% 2/11/19 (Liquidity Facility Barclays Bank PLC) (a)(c)(e)(f) | | 5,020,000 | 5,020,000 |
| Washington Health Care Facilities Auth. Rev. Participating VRDN Series Floaters XF 00 42, 1.94% 1/7/19 (Liquidity Facility JPMorgan Chase Bank) (a)(e) | | 8,605,000 | 8,605,000 |
|
| TOTAL WASHINGTON | | | 14,160,000 |
|
| West Virginia - 0.9% | | | |
| West Virginia Hosp. Fin. Auth. Hosp. Rev. Series 2018 E, 1.98% 1/6/22, VRDN (a) | | 16,885,000 | 16,885,000 |
| Wisconsin - 0.4% | | | |
| Wisconsin Health & Edl. Facilities Participating VRDN Series 2017 ZF 2412, 1.96% 1/7/19 (Liquidity Facility Citibank NA) (a)(e) | | 7,500,000 | 7,500,000 |
| TOTAL MUNICIPAL NOTES | | | |
| (Cost $1,026,599,287) | | | 1,026,544,275 |
| | | Shares | Value |
|
| Money Market Funds - 1.7% | | | |
| Fidelity Municipal Cash Central Fund, 1.77% (g)(h) | | | |
| (Cost $31,282,000) | | 31,278,872 | 31,282,000 |
| TOTAL INVESTMENT IN SECURITIES - 99.5% | | | |
| (Cost $1,852,608,270) | | | 1,850,725,733 |
| NET OTHER ASSETS (LIABILITIES) - 0.5% | | | 8,774,520 |
| NET ASSETS - 100% | | | $1,859,500,253 |
Security Type Abbreviations
BAN – BOND ANTICIPATION NOTE
CP – COMMERCIAL PAPER
VRDN – VARIABLE RATE DEMAND NOTE (A debt instrument that is payable upon demand, either daily, weekly or monthly)
Legend
(a) Coupon rates for floating and adjustable rate securities reflect the rates in effect at period end.
(b) Security or a portion of the security purchased on a delayed delivery or when-issued basis.
(c) Private activity obligations whose interest is subject to the federal alternative minimum tax for individuals.
(d) Coupon is indexed to a floating interest rate which may be multiplied by a specified factor and/or subject to caps or floors.
(e) Provides evidence of ownership in one or more underlying municipal bonds.
(f) Restricted securities - Investment in securities not registered under the Securities Act of 1933 (excluding 144A issues). At the end of the period, the value of restricted securities (excluding 144A issues) amounted to $20,090,000 or 1.1% of net assets.
(g) Information in this report regarding holdings by state and security types does not reflect the holdings of the Fidelity Municipal Cash Central Fund.
(h) Affiliated fund that is available only to investment companies and other accounts managed by Fidelity Investments. The rate quoted is the annualized seven-day yield of the fund at period end. A complete unaudited listing of the fund's holdings as of its most recent quarter end is available upon request. In addition, each Fidelity Central Fund's financial statements, which are not covered by the Fund's Report of Independent Registered Public Accounting Firm, are available on the SEC's website or upon request.
Additional information on each restricted holding is as follows:
| Security | Acquisition Date | Acquisition Cost |
| North Carolina Cap. Impt. Ltd. Bonds Series WF 11 136C, SIFMA Municipal Swap Index + 0.280% 1.99%, tender 1/24/19 (Liquidity Facility Wells Fargo Bank NA) | 7/25/18 | $4,040,000 |
| Texas Gen. Oblig. Bonds Series WF 1183C, SIFMA Municipal Swap Index + 0.350% 2.06%, tender 1/24/19 (Liquidity Facility Wells Fargo Bank NA) | 7/25/18 | $11,030,000 |
| Washington Econ. Dev. Fin. Auth. Rev. Participating VRDN Series Floaters 005, 2.06% 2/11/19 (Liquidity Facility Barclays Bank PLC) | 3/1/18 | $5,020,000 |
Affiliated Central Funds
Information regarding fiscal year to date income earned by the Fund from investments in Fidelity Central Funds is as follows:
| Fund | Income earned |
| Fidelity Municipal Cash Central Fund | $202,935 |
| Total | $202,935 |
Amounts in the income column in the above table include any capital gain distributions from underlying funds, which are presented in the corresponding line-item in the Statement of Operations if applicable.
Investment Valuation
The following is a summary of the inputs used, as of December 31, 2018, involving the Fund's assets and liabilities carried at fair value. The inputs or methodology used for valuing securities may not be an indication of the risk associated with investing in those securities. For more information on valuation inputs, and their aggregation into the levels used below, please refer to the Investment Valuation section in the accompanying Notes to Financial Statements.
| | Valuation Inputs at Reporting Date: |
| Description | Total | Level 1 | Level 2 | Level 3 |
| Investments in Securities: | | | | |
| Municipal Securities | $1,819,443,733 | $-- | $1,819,443,733 | $-- |
| Money Market Funds | 31,282,000 | 31,282,000 | -- | -- |
| Total Investments in Securities: | $1,850,725,733 | $31,282,000 | $1,819,443,733 | $-- |
Other Information
The distribution of municipal securities by revenue source, as a percentage of total Net Assets, is as follows (Unaudited):
| General Obligations | 32.0% |
| Synthetics | 18.1% |
| Electric Utilities | 15.2% |
| Industrial Development | 8.0% |
| Health Care | 7.6% |
| Transportation | 7.2% |
| Others* (Individually Less Than 5%) | 11.9% |
| | 100.0% |
* Includes net other assets
See accompanying notes which are an integral part of the financial statements.
Financial Statements
Statement of Assets and Liabilities
| | | December 31, 2018 |
| Assets | | |
Investment in securities, at value — See accompanying schedule:
Unaffiliated issuers (cost $1,821,326,270) | $1,819,443,733 | |
| Fidelity Central Funds (cost $31,282,000) | 31,282,000 | |
| Total Investment in Securities (cost $1,852,608,270) | | $1,850,725,733 |
| Cash | | 7,765 |
| Receivable for fund shares sold | | 6,348,033 |
| Interest receivable | | 14,984,067 |
| Distributions receivable from Fidelity Central Funds | | 8,717 |
| Receivable from investment adviser for expense reductions | | 128,727 |
| Other receivables | | 101 |
| Total assets | | 1,872,203,143 |
| Liabilities | | |
| Payable for investments purchased | | |
| Regular delivery | $2,213,056 | |
| Delayed delivery | 6,858,294 | |
| Payable for fund shares redeemed | 2,180,305 | |
| Distributions payable | 927,211 | |
| Accrued management fee | 440,604 | |
| Other affiliated payables | 83,420 | |
| Total liabilities | | 12,702,890 |
| Net Assets | | $1,859,500,253 |
| Net Assets consist of: | | |
| Paid in capital | | $1,861,811,368 |
| Total distributable earnings (loss) | | (2,311,115) |
| Net Assets | | $1,859,500,253 |
| Net Asset Value and Maximum Offering Price | | |
| Conservative Income Municipal Bond: | | |
| Net Asset Value, offering price and redemption price per share ($251,810,920 ÷ 25,140,568 shares) | | $10.02 |
| Institutional Class: | | |
| Net Asset Value, offering price and redemption price per share ($1,607,689,333 ÷ 160,503,255 shares) | | $10.02 |
See accompanying notes which are an integral part of the financial statements.
Statement of Operations
| | | Year ended December 31, 2018 |
| Investment Income | | |
| Interest | | $28,993,361 |
| Income from Fidelity Central Funds | | 202,935 |
| Total income | | 29,196,296 |
| Expenses | | |
| Management fee | $5,187,854 | |
| Transfer agent fees | 985,557 | |
| Independent trustees' fees and expenses | 8,063 | |
| Commitment fees | 4,814 | |
| Total expenses before reductions | 6,186,288 | |
| Expense reductions | (1,603,749) | |
| Total expenses after reductions | | 4,582,539 |
| Net investment income (loss) | | 24,613,757 |
| Realized and Unrealized Gain (Loss) | | |
| Net realized gain (loss) on: | | |
| Investment securities: | | |
| Unaffiliated issuers | (302,693) | |
| Redemptions in-kind with affiliated entities | (778,563 ) | |
| Total net realized gain (loss) | | (1,081,256) |
| Change in net unrealized appreciation (depreciation) on investment securities | | 2,603,795 |
| Net gain (loss) | | 1,522,539 |
| Net increase (decrease) in net assets resulting from operations | | $26,136,296 |
See accompanying notes which are an integral part of the financial statements.
Statement of Changes in Net Assets
| | Year ended December 31, 2018 | Year ended December 31, 2017 |
| Increase (Decrease) in Net Assets | | |
| Operations | | |
| Net investment income (loss) | $24,613,757 | $15,744,485 |
| Net realized gain (loss) | (1,081,256) | 38,043 |
| Change in net unrealized appreciation (depreciation) | 2,603,795 | (930,541) |
| Net increase (decrease) in net assets resulting from operations | 26,136,296 | 14,851,987 |
| Distributions to shareholders | (24,774,551) | – |
| Distributions to shareholders from net investment income | – | (15,720,425) |
| Distributions to shareholders from net realized gain | – | (379,460) |
| Total distributions | (24,774,551) | (16,099,885) |
| Share transactions - net increase (decrease) | (65,694,840) | 916,349,984 |
| Total increase (decrease) in net assets | (64,333,095) | 915,102,086 |
| Net Assets | | |
| Beginning of period | 1,923,833,348 | 1,008,731,262 |
| End of period | $1,859,500,253 | $1,923,833,348 |
| Other Information | | |
| Undistributed net investment income end of period | | $22,782 |
See accompanying notes which are an integral part of the financial statements.
Financial Highlights
Fidelity Conservative Income Municipal Bond Fund
| Years ended December 31, | 2018 | 2017 | 2016 | 2015 | 2014 |
| Selected Per–Share Data | | | | | |
| Net asset value, beginning of period | $10.01 | $10.00 | $10.04 | $10.04 | $10.02 |
| Income from Investment Operations | | | | | |
| Net investment income (loss)A | .134 | .090 | .062 | .032 | .015 |
| Net realized and unrealized gain (loss) | .011 | .010 | (.041) | –B | .021 |
| Total from investment operations | .145 | .100 | .021 | .032 | .036 |
| Distributions from net investment income | (.134) | (.088) | (.059) | (.031) | (.015) |
| Distributions from net realized gain | (.001) | (.002) | (.002) | (.001) | (.001) |
| Total distributions | (.135) | (.090) | (.061) | (.032) | (.016) |
| Net asset value, end of period | $10.02 | $10.01 | $10.00 | $10.04 | $10.04 |
| Total ReturnC | 1.45% | 1.00% | .21% | .32% | .36% |
| Ratios to Average Net AssetsD,E | | | | | |
| Expenses before reductions | .40% | .40% | .40% | .40% | .40% |
| Expenses net of fee waivers, if any | .35% | .35% | .35% | .39% | .40% |
| Expenses net of all reductions | .35% | .35% | .35% | .39% | .40% |
| Net investment income (loss) | 1.34% | .90% | .62% | .32% | .15% |
| Supplemental Data | | | | | |
| Net assets, end of period (000 omitted) | $251,811 | $234,599 | $164,586 | $73,914 | $45,107 |
| Portfolio turnover rateF | 45%G | 33% | 36% | 32% | 51% |
A Calculated based on average shares outstanding during the period.
B Amounts represents less than $.0005 per share.
C Total returns would have been lower if certain expenses had not been reduced during the applicable periods shown.
D Fees and expenses of any underlying Fidelity Central Funds are not included in the Fund's expense ratio. The Fund indirectly bears its proportionate share of the expenses of any underlying Fidelity Central Funds.
E Expense ratios reflect operating expenses of the class. Expenses before reductions do not reflect amounts reimbursed by the investment adviser or reductions from expense offset arrangements and do not represent the amount paid by the class during periods when reimbursements or reductions occur. Expenses net of fee waivers reflect expenses after reimbursement by the investment adviser but prior to reductions from expense offset arrangements. Expenses net of all reductions represent the net expenses paid by the class.
F Amount does not include the portfolio activity of any underlying Fidelity Central Funds.
G Portfolio turnover rate excludes securities received or delivered in-kind.
See accompanying notes which are an integral part of the financial statements.
Fidelity Conservative Income Municipal Bond Fund Institutional Class
| Years ended December 31, | 2018 | 2017 | 2016 | 2015 | 2014 |
| Selected Per–Share Data | | | | | |
| Net asset value, beginning of period | $10.01 | $10.00 | $10.04 | $10.04 | $10.02 |
| Income from Investment Operations | | | | | |
| Net investment income (loss)A | .144 | .099 | .071 | .042 | .025 |
| Net realized and unrealized gain (loss) | .011 | .011 | (.040) | –B | .021 |
| Total from investment operations | .155 | .110 | .031 | .042 | .046 |
| Distributions from net investment income | (.144) | (.098) | (.069) | (.041) | (.025) |
| Distributions from net realized gain | (.001) | (.002) | (.002) | (.001) | (.001) |
| Total distributions | (.145) | (.100) | (.071) | (.042) | (.026) |
| Net asset value, end of period | $10.02 | $10.01 | $10.00 | $10.04 | $10.04 |
| Total ReturnC | 1.56% | 1.11% | .31% | .42% | .46% |
| Ratios to Average Net AssetsD,E | | | | | |
| Expenses before reductions | .35% | .35% | .35% | .35% | .35% |
| Expenses net of fee waivers, if any | .25% | .25% | .25% | .29% | .30% |
| Expenses net of all reductions | .25% | .25% | .25% | .29% | .30% |
| Net investment income (loss) | 1.44% | 1.00% | .72% | .42% | .25% |
| Supplemental Data | | | | | |
| Net assets, end of period (000 omitted) | $1,607,689 | $1,689,234 | $844,145 | $290,823 | $143,491 |
| Portfolio turnover rateF | 45%G | 33% | 36% | 32% | 51% |
A Calculated based on average shares outstanding during the period.
B Amounts represent less than $.0005 per share.
C Total returns would have been lower if certain expenses had not been reduced during the applicable periods shown.
D Fees and expenses of any underlying Fidelity Central Funds are not included in the Fund's expense ratio. The Fund indirectly bears its proportionate share of the expenses of any underlying Fidelity Central Funds.
E Expense ratios reflect operating expenses of the class. Expenses before reductions do not reflect amounts reimbursed by the investment adviser or reductions from expense offset arrangements and do not represent the amount paid by the class during periods when reimbursements or reductions occur. Expenses net of fee waivers reflect expenses after reimbursement by the investment adviser but prior to reductions from expense offset arrangements. Expenses net of all reductions represent the net expenses paid by the class.
F Amount does not include the portfolio activity of any underlying Fidelity Central Funds.
G Portfolio turnover rate excludes securities received or delivered in-kind.
See accompanying notes which are an integral part of the financial statements.
Notes to Financial Statements
For the period ended December 31, 2018
1. Organization.
Fidelity Conservative Income Municipal Bond Fund (the Fund) is a fund of Fidelity Municipal Trust (the Trust) and is authorized to issue an unlimited number of shares. The Trust is registered under the Investment Company Act of 1940, as amended (the 1940 Act), as an open-end management investment company organized as a Massachusetts business trust. The Fund offers Conservative Income Municipal Bond and Institutional Class shares, each of which has equal rights as to assets and voting privileges. Each class has exclusive voting rights with respect to matters that affect that class.
2. Investments in Fidelity Central Funds.
The Fund invests in Fidelity Central Funds, which are open-end investment companies generally available only to other investment companies and accounts managed by the investment adviser and its affiliates. The Fund's Schedule of Investments lists each of the Fidelity Central Funds held as of period end, if any, as an investment of the Fund, but does not include the underlying holdings of each Fidelity Central Fund. As an Investing Fund, the Fund indirectly bears its proportionate share of the expenses of the underlying Fidelity Central Funds.
The Money Market Central Funds seek preservation of capital and current income and are managed by Fidelity Investments Money Management, Inc. (FIMM), an affiliate of the investment adviser. Annualized expenses of the Money Market Central Funds as of their most recent shareholder report date are less than .005%.
A complete unaudited list of holdings for each Fidelity Central Fund is available upon request or at the Securities and Exchange Commission (the SEC) website at www.sec.gov. In addition, the financial statements of the Fidelity Central Funds, which are not covered by the Fund's Report of Independent Registered Public Accounting Firm, are available on the SEC website or upon request.
3. Significant Accounting Policies.
The Fund is an investment company and applies the accounting and reporting guidance of the Financial Accounting Standards Board (FASB) Accounting Standards Codification Topic 946 Financial Services – Investments Companies. The financial statements have been prepared in conformity with accounting principles generally accepted in the United States of America (GAAP), which require management to make certain estimates and assumptions at the date of the financial statements. Actual results could differ from those estimates. Subsequent events, if any, through the date that the financial statements were issued have been evaluated in the preparation of the financial statements. The following summarizes the significant accounting policies of the Fund:
Investment Valuation. Investments are valued as of 4:00 p.m. Eastern time on the last calendar day of the period. The Board of Trustees (the Board) has delegated the day to day responsibility for the valuation of the Fund's investments to the Fair Value Committee (the Committee) established by the Fund's investment adviser. In accordance with valuation policies and procedures approved by the Board, the Fund attempts to obtain prices from one or more third party pricing vendors or brokers to value its investments. When current market prices, quotations or currency exchange rates are not readily available or reliable, investments will be fair valued in good faith by the Committee, in accordance with procedures adopted by the Board. Factors used in determining fair value vary by investment type and may include market or investment specific events, changes in interest rates and credit quality. The frequency with which these procedures are used cannot be predicted and they may be utilized to a significant extent. The Committee oversees the Fund's valuation policies and procedures and reports to the Board on the Committee's activities and fair value determinations. The Board monitors the appropriateness of the procedures used in valuing Fund's investments and ratifies the fair value determinations of the Committee.
The Fund categorizes the inputs to valuation techniques used to value its investments into a disclosure hierarchy consisting of three levels as shown below:
- Level 1 – quoted prices in active markets for identical investments
- Level 2 – other significant observable inputs (including quoted prices for similar investments, interest rates, prepayment speeds, etc.)
- Level 3 – unobservable inputs (including the Fund's own assumptions based on the best information available)
Valuation techniques used to value the Fund's investments by major category are as follows:
Debt securities, including restricted securities, are valued based on evaluated prices received from third party pricing vendors or from brokers who make markets in such securities. Municipal securities are valued by pricing vendors who utilize matrix pricing which considers yield or price of bonds of comparable quality, coupon, maturity and type or by broker-supplied prices. When independent prices are unavailable or unreliable, debt securities may be valued utilizing pricing methodologies which consider similar factors that would be used by third party pricing vendors. Debt securities are generally categorized as Level 2 in the hierarchy but may be Level 3 depending on the circumstances.
Investments in open-end mutual funds, including the Fidelity Central Funds, are valued at their closing net asset value (NAV) each business day and are categorized as Level 1 in the hierarchy.
Changes in valuation techniques may result in transfers in or out of an assigned level within the disclosure hierarchy. The aggregate value of investments by input level as of December 31, 2018 is included at the end of the Fund's Schedule of Investments.
Investment Transactions and Income. For financial reporting purposes, the Fund's investment holdings and NAV include trades executed through the end of the last business day of the period. The NAV per share for processing shareholder transactions is calculated as of the close of business of the New York Stock Exchange (NYSE), normally 4:00 p.m. Eastern time and includes trades executed through the end of the prior business day. Gains and losses on securities sold are determined on the basis of identified cost. Income and capital gain distributions from Fidelity Central Funds, if any, are recorded on the ex-dividend date. Interest income is accrued as earned and includes coupon interest and amortization of premium and accretion of discount on debt securities as applicable.
Class Allocations and Expenses. Investment income, realized and unrealized capital gains and losses, common expenses of the Fund, and certain fund-level expense reductions, if any, are allocated daily on a pro-rata basis to each class based on the relative net assets of each class to the total net assets of the Fund. Each class differs with respect to transfer agent fees incurred. Certain expense reductions may also differ by class. For the reporting period, the allocated portion of income and expenses to each class as a percent of its average net assets may vary due to the timing of recording these transactions in relation to fluctuating net assets of the classes. Expenses directly attributable to a fund are charged to that fund. Expenses attributable to more than one fund are allocated among the respective funds on the basis of relative net assets or other appropriate methods. Expense estimates are accrued in the period to which they relate and adjustments are made when actual amounts are known.
Income Tax Information and Distributions to Shareholders. Each year, the Fund intends to qualify as a regulated investment company under Subchapter M of the Internal Revenue Code, including distributing substantially all of its taxable income and realized gains. As a result, no provision for U.S. Federal income taxes is required. As of December 31, 2018, the Fund did not have any unrecognized tax benefits in the financial statements; nor is the Fund aware of any tax positions for which it is reasonably possible that the total amounts of unrecognized tax benefits will significantly change in the next twelve months. The Fund files a U.S. federal tax return, in addition to state and local tax returns as required. The Fund's federal income tax returns are subject to examination by the Internal Revenue Service (IRS) for a period of three fiscal years after they are filed. State and local tax returns may be subject to examination for an additional fiscal year depending on the jurisdiction.
Distributions are declared and recorded daily and paid monthly from net investment income. Distributions from realized gains, if any, are declared and recorded on the ex-dividend date. Income and capital gain distributions are declared separately for each class. Income and capital gain distributions are determined in accordance with income tax regulations, which may differ from GAAP.
Capital accounts within the financial statements are adjusted for permanent book-tax differences. These adjustments have no impact on net assets or the results of operations. Capital accounts are not adjusted for temporary book-tax differences which will reverse in a subsequent period.
Book-tax differences are primarily due to market discount, redemptions in kind, capital loss carryforwards, and losses deferred due to wash sales and excise tax regulations.
The Fund purchases municipal securities whose interest, in the opinion of the issuer, is free from federal income tax. There is no assurance that the IRS will agree with this opinion. In the event the IRS determines that the issuer does not comply with relevant tax requirements, interest payments from a security could become federally taxable, possibly retroactively to the date the security was issued.
As of period end, the cost and unrealized appreciation (depreciation) in securities, and derivatives if applicable, for federal income tax purposes were as follows:
| Gross unrealized appreciation | $804,932 |
| Gross unrealized depreciation | (2,679,952) |
| Net unrealized appreciation (depreciation) | $(1,875,020) |
| Tax Cost | $1,852,600,753 |
The tax-based components of distributable earnings as of period end were as follows:
| Undistributed tax-exempt income | $7,288 |
| Capital loss carryforward | $(443,382) |
| Net unrealized appreciation (depreciation) on securities and other investments | $(1,875,020) |
Capital loss carryforwards are only available to offset future capital gains of the Fund to the extent provided by regulations and may be limited. Under the Regulated Investment Company Modernization Act of 2010 (the Act), the Fund is permitted to carry forward capital losses incurred in taxable years beginning after December 22, 2010 for an unlimited period and such capital losses are required to be used prior to any losses that expire. The capital loss carryforward information presented below, including any applicable limitation, is estimated as of fiscal period end and is subject to adjustment.
| No expiration | |
| Short-term | $(225,881) |
| Long-term | (217,501) |
| Total capital loss carryforward | $(443,382) |
The tax character of distributions paid was as follows:
| | December 31, 2018 | December 31, 2017 |
| Tax-exempt Income | $24,605,734 | $15,720,425 |
| Ordinary Income | 168,817 | 379,460 |
| Total | $24,774,551 | $ 16,099,885 |
Delayed Delivery Transactions and When-Issued Securities. During the period, the Fund transacted in securities on a delayed delivery or when-issued basis. Payment and delivery may take place after the customary settlement period for that security. The price of the underlying securities and the date when the securities will be delivered and paid for are fixed at the time the transaction is negotiated. The securities purchased on a delayed delivery or when-issued basis are identified as such in the Fund's Schedule of Investments. The Fund may receive compensation for interest forgone in the purchase of a delayed delivery or when-issued security. With respect to purchase commitments, the Fund identifies securities as segregated in its records with a value at least equal to the amount of the commitment. Losses may arise due to changes in the value of the underlying securities or if the counterparty does not perform under the contract's terms, or if the issuer does not issue the securities due to political, economic, or other factors.
Restricted Securities. The Fund may invest in securities that are subject to legal or contractual restrictions on resale. These securities generally may be resold in transactions exempt from registration or to the public if the securities are registered. Disposal of these securities may involve time-consuming negotiations and expense, and prompt sale at an acceptable price may be difficult. Information regarding restricted securities is included at the end of the Fund's Schedule of Investments.
New Rule Issuance. During August 2018, the U.S. Securities and Exchange Commission issued Final Rule Release No. 33-10532, Disclosure Update and Simplification. This Final Rule includes amendments specific to registered investment companies that are intended to eliminate overlap in disclosure requirements between Regulation S-X and GAAP. In accordance with these amendments, certain line-items in the Fund's financial statements have been combined or removed for the current period as outlined in the table below.
| Financial Statement | Current Line-Item Presentation | Prior Line-Item Presentation |
| Statement of Assets and Liabilities | Total distributable earnings (loss) | Undistributed/Distributions in excess of/Accumulated net investment income (loss)
Accumulated/Undistributed net realized gain (loss)
Net unrealized appreciation (depreciation) |
| Statement of Changes in Net Assets | N/A - removed | Undistributed/Distributions in excess of/Accumulated net investment income (loss) end of period |
| Statement of Changes in Net Assets | Distributions to shareholders | Distributions to shareholders from net investment income
Distributions to shareholders from net realized gain |
| Distributions to Shareholders Note to Financial Statements | Distributions to shareholders | Distributions to shareholders from net investment income
Distributions to shareholders from net realized gain |
4. Purchases and Sales of Investments.
Purchases and sales of securities, other than short-term securities and in-kind transactions, aggregated $814,801,882 and $448,283,411, respectively.
5. Fees and Other Transactions with Affiliates.
Management Fee. Fidelity Management & Research Company (the investment adviser) and its affiliates provide the Fund with investment management related services for which the Fund pays a monthly management fee that is based on an annual rate of .30% of the Fund's average net assets. Under the management contract, the investment adviser pays all other fund-level expenses, except the compensation of the independent Trustees and certain other expenses such as interest expense, including commitment fees.
Transfer Agent Fees. Fidelity Investments Institutional Operations Company, Inc. (FIIOC), an affiliate of the investment adviser, is the transfer, dividend disbursing and shareholder servicing agent for the Fund. FIIOC receives asset-based fees of .10% and .05% of average net assets for Conservative Income Municipal Bond and Institutional Class, respectively. FIIOC pays for typesetting, printing and mailing of shareholder reports, except proxy statements. For the period, transfer agent fees for each class were as follows:
| | | Amount |
| Conservative Income Municipal Bond | | $241,830 |
| Institutional Class | | 743,727 |
| | | $985,557 |
Interfund Trades. The Funds may purchase from or sell securities to other Fidelity Funds under procedures adopted by the Board. The procedures have been designed to ensure these interfund trades are executed in accordance with Rule 17a-7 of the 1940 Act. Interfund trades are included within the respective purchases and sales amounts shown in the Purchases and Sales of Investments note.
Affiliated Redemptions In-Kind. During the period, 55,039,919 shares of the Fund were redeemed in-kind for investments, including accrued interest, with a value of $551,499,983. The net realized loss of $(778,563) on investments delivered through in-kind redemptions is included in the accompanying Statement of Operations. The amount of the in-kind redemptions is included in share transactions in the accompanying Statement of Changes in Net Assets as well as the Notes to Financial Statements. The Fund recognized no gain or loss for federal income tax purposes.
6. Committed Line of Credit.
The Fund participates with other funds managed by the investment adviser or an affiliate in a $4.25 billion credit facility (the "line of credit") to be utilized for temporary or emergency purposes to fund shareholder redemptions or for other short-term liquidity purposes. The Fund has agreed to pay commitment fees on its pro-rata portion of the line of credit, which amounted to $4,814 and is reflected in Commitment fees on the Statement of Operations. During the period, the Fund did not borrow on this line of credit.
7. Expense Reductions.
The investment adviser contractually agreed to reimburse each class to the extent annual operating expenses exceeded certain levels of class-level average net assets as noted in the table below. This reimbursement will remain in place through April 30, 2020. Some expenses, for example the compensation of the independent Trustees, and certain other expenses such as interest expense, are excluded from this reimbursement.
The following classes were in reimbursement during the period:
| | Expense Limitations | Reimbursement |
| Conservative Income Municipal Bond | .35% | $120,170 |
| Institutional Class | .25% | 1,482,492 |
| | | $1,602,662 |
In addition, through arrangements with the Fund's custodian, credits realized as a result of certain uninvested cash balances were used to reduce the Fund's expenses. During the period, these credits reduced the Fund's management fee by $1,087.
8. Distributions to Shareholders.
Distributions to shareholders of each class were as follows:
| | Year ended
December 31, 2018 | Year ended
December 31, 2017 |
| Distributions to shareholders | | |
| Conservative Income Municipal Bond | $3,247,996 | $– |
| Institutional Class | 21,526,555 | – |
| Total | $24,774,551 | $– |
| From net investment income | | |
| Conservative Income Municipal Bond | $– | $1,835,306 |
| Institutional Class | – | 13,885,119 |
| Total | $– | $15,720,425 |
| From net realized gain | | |
| Conservative Income Municipal Bond | $– | $48,134 |
| Institutional Class | – | 331,326 |
| Total | $– | $379,460 |
9. Share Transactions.
Share transactions for each class were as follows and may contain automatic conversions between classes or exchanges between affiliated funds:
| | Shares | Shares | Dollars | Dollars |
| | Year ended December 31, 2018 | Year ended December 31, 2017 | Year ended December 31, 2018 | Year ended December 31, 2017 |
| Conservative Income Municipal Bond | | | | |
| Shares sold | 17,356,623 | 21,955,447 | $173,753,090 | $220,293,518 |
| Reinvestment of distributions | 261,161 | 147,067 | 2,614,969 | 1,475,009 |
| Shares redeemed | (15,912,352) | (15,119,985) | (159,258,683) | (151,688,958) |
| Net increase (decrease) | 1,705,432 | 6,982,529 | $17,109,376 | $70,079,569 |
| Institutional Class | | | | |
| Shares sold | 194,198,866 | 150,371,751 | $1,944,266,168 | $1,508,502,028 |
| Reinvestment of distributions | 1,414,041 | 917,401 | 14,158,673 | 9,201,705 |
| Shares redeemed | (203,850,365)(a) | (66,929,721) | (2,041,229,057)(a) | (671,433,318) |
| Net increase (decrease) | (8,237,458) | 84,359,431 | $(82,804,216) | $846,270,415 |
(a) Amount includes in-kind redemptions (see the Affiliated Redemptions In-Kind note for additional details).
10. Other.
The Fund's organizational documents provide former and current trustees and officers with a limited indemnification against liabilities arising in connection with the performance of their duties to the Fund. In the normal course of business, the Fund may also enter into contracts that provide general indemnifications. The Fund's maximum exposure under these arrangements is unknown as this would be dependent on future claims that may be made against the Fund. The risk of material loss from such claims is considered remote.
Report of Independent Registered Public Accounting Firm
To the Board of Trustees of Fidelity Municipal Trust and Shareholders of Fidelity Conservative Income Municipal Bond Fund:
Opinion on the Financial Statements
We have audited the accompanying statement of assets and liabilities, including the schedule of investments, of Fidelity Conservative Income Municipal Bond Fund (one of the funds constituting Fidelity Municipal Trust, referred to hereafter as the "Fund") as of December 31, 2018, the related statement of operations for the year ended December 31, 2018, the statement of changes in net assets for each of the two years in the period ended December 31, 2018, including the related notes, and the financial highlights for each of the five years in the period ended December 31, 2018 (collectively referred to as the “financial statements”). In our opinion, the financial statements present fairly, in all material respects, the financial position of the Fund as of December 31, 2018, the results of its operations for the year then ended, the changes in its net assets for each of the two years in the period ended December 31, 2018 and the financial highlights for each of the five years in the period ended December 31, 2018 in conformity with accounting principles generally accepted in the United States of America.
Basis for Opinion
These financial statements are the responsibility of the Fund’s management. Our responsibility is to express an opinion on the Fund’s financial statements based on our audits. We are a public accounting firm registered with the Public Company Accounting Oversight Board (United States) (PCAOB) and are required to be independent with respect to the Fund in accordance with the U.S. federal securities laws and the applicable rules and regulations of the Securities and Exchange Commission and the PCAOB.
We conducted our audits of these financial statements in accordance with the standards of the PCAOB. Those standards require that we plan and perform the audit to obtain reasonable assurance about whether the financial statements are free of material misstatement, whether due to error or fraud.
Our audits included performing procedures to assess the risks of material misstatement of the financial statements, whether due to error or fraud, and performing procedures that respond to those risks. Such procedures included examining, on a test basis, evidence regarding the amounts and disclosures in the financial statements. Our audits also included evaluating the accounting principles used and significant estimates made by management, as well as evaluating the overall presentation of the financial statements. Our procedures included confirmation of securities owned as of December 31, 2018 by correspondence with the custodian and brokers; when replies were not received from brokers, we performed other auditing procedures. We believe that our audits provide a reasonable basis for our opinion.
PricewaterhouseCoopers LLP
Boston, Massachusetts
February 14, 2019
We have served as the auditor of one or more investment companies in the Fidelity group of funds since 1932.
Trustees and Officers
The Trustees, Members of the Advisory Board (if any), and officers of the trust and fund, as applicable, are listed below. The Board of Trustees governs the fund and is responsible for protecting the interests of shareholders. The Trustees are experienced executives who meet periodically throughout the year to oversee the fund's activities, review contractual arrangements with companies that provide services to the fund, oversee management of the risks associated with such activities and contractual arrangements, and review the fund's performance. Each of the Trustees oversees 260 funds.
The Trustees hold office without limit in time except that (a) any Trustee may resign; (b) any Trustee may be removed by written instrument, signed by at least two-thirds of the number of Trustees prior to such removal; (c) any Trustee who requests to be retired or who has become incapacitated by illness or injury may be retired by written instrument signed by a majority of the other Trustees; and (d) any Trustee may be removed at any special meeting of shareholders by a two-thirds vote of the outstanding voting securities of the trust. Each Trustee who is not an interested person (as defined in the 1940 Act) of the trust and the fund is referred to herein as an Independent Trustee. Each Independent Trustee shall retire not later than the last day of the calendar year in which his or her 75th birthday occurs. The Independent Trustees may waive this mandatory retirement age policy with respect to individual Trustees. Officers and Advisory Board Members hold office without limit in time, except that any officer or Advisory Board Member may resign or may be removed by a vote of a majority of the Trustees at any regular meeting or any special meeting of the Trustees. Except as indicated, each individual has held the office shown or other offices in the same company for the past five years.
The fund’s Statement of Additional Information (SAI) includes more information about the Trustees. To request a free copy, call Fidelity at 1-800-544-8544.
Experience, Skills, Attributes, and Qualifications of the Trustees. The Governance and Nominating Committee has adopted a statement of policy that describes the experience, qualifications, attributes, and skills that are necessary and desirable for potential Independent Trustee candidates (Statement of Policy). The Board believes that each Trustee satisfied at the time he or she was initially elected or appointed a Trustee, and continues to satisfy, the standards contemplated by the Statement of Policy. The Governance and Nominating Committee also engages professional search firms to help identify potential Independent Trustee candidates who have the experience, qualifications, attributes, and skills consistent with the Statement of Policy. From time to time, additional criteria based on the composition and skills of the current Independent Trustees, as well as experience or skills that may be appropriate in light of future changes to board composition, business conditions, and regulatory or other developments, have also been considered by the professional search firms and the Governance and Nominating Committee. In addition, the Board takes into account the Trustees' commitment and participation in Board and committee meetings, as well as their leadership of standing and ad hoc committees throughout their tenure.
In determining that a particular Trustee was and continues to be qualified to serve as a Trustee, the Board has considered a variety of criteria, none of which, in isolation, was controlling. The Board believes that, collectively, the Trustees have balanced and diverse experience, qualifications, attributes, and skills, which allow the Board to operate effectively in governing the fund and protecting the interests of shareholders. Information about the specific experience, skills, attributes, and qualifications of each Trustee, which in each case led to the Board's conclusion that the Trustee should serve (or continue to serve) as a trustee of the fund, is provided below.
Board Structure and Oversight Function. Abigail P. Johnson is an interested person and currently serves as Chairman. The Trustees have determined that an interested Chairman is appropriate and benefits shareholders because an interested Chairman has a personal and professional stake in the quality and continuity of services provided to the fund. Independent Trustees exercise their informed business judgment to appoint an individual of their choosing to serve as Chairman, regardless of whether the Trustee happens to be independent or a member of management. The Independent Trustees have determined that they can act independently and effectively without having an Independent Trustee serve as Chairman and that a key structural component for assuring that they are in a position to do so is for the Independent Trustees to constitute a substantial majority for the Board. The Independent Trustees also regularly meet in executive session. Arthur E. Johnson serves as Chairman of the Independent Trustees and as such (i) acts as a liaison between the Independent Trustees and management with respect to matters important to the Independent Trustees and (ii) with management prepares agendas for Board meetings.
Fidelity® funds are overseen by different Boards of Trustees. The fund's Board oversees Fidelity's investment-grade bond, money market, asset allocation and certain equity funds, and other Boards oversee Fidelity's high income and other equity funds. The asset allocation funds may invest in Fidelity® funds that are overseen by such other Boards. The use of separate Boards, each with its own committee structure, allows the Trustees of each group of Fidelity® funds to focus on the unique issues of the funds they oversee, including common research, investment, and operational issues. On occasion, the separate Boards establish joint committees to address issues of overlapping consequences for the Fidelity® funds overseen by each Board.
The Trustees operate using a system of committees to facilitate the timely and efficient consideration of all matters of importance to the Trustees, the fund, and fund shareholders and to facilitate compliance with legal and regulatory requirements and oversight of the fund's activities and associated risks. The Board, acting through its committees, has charged FMR and its affiliates with (i) identifying events or circumstances the occurrence of which could have demonstrably adverse effects on the fund's business and/or reputation; (ii) implementing processes and controls to lessen the possibility that such events or circumstances occur or to mitigate the effects of such events or circumstances if they do occur; and (iii) creating and maintaining a system designed to evaluate continuously business and market conditions in order to facilitate the identification and implementation processes described in (i) and (ii) above. Because the day-to-day operations and activities of the fund are carried out by or through FMR, its affiliates, and other service providers, the fund's exposure to risks is mitigated but not eliminated by the processes overseen by the Trustees. While each of the Board's committees has responsibility for overseeing different aspects of the fund's activities, oversight is exercised primarily through the Operations and Audit Committees. In addition, an ad hoc Board committee of Independent Trustees has worked with FMR to enhance the Board's oversight of investment and financial risks, legal and regulatory risks, technology risks, and operational risks, including the development of additional risk reporting to the Board. Appropriate personnel, including but not limited to the fund's Chief Compliance Officer (CCO), FMR's internal auditor, the independent accountants, the fund's Treasurer and portfolio management personnel, make periodic reports to the Board's committees, as appropriate, including an annual review of Fidelity's risk management program for the Fidelity® funds. The responsibilities of each standing committee, including their oversight responsibilities, are described further under "Standing Committees of the Trustees."
Interested Trustees*:
Correspondence intended for a Trustee who is an interested person may be sent to Fidelity Investments, 245 Summer Street, Boston, Massachusetts 02210.
Name, Year of Birth; Principal Occupations and Other Relevant Experience+
Abigail P. Johnson (1961)
Year of Election or Appointment: 2009
Trustee
Chairman of the Board of Trustees
Ms. Johnson also serves as Trustee of other Fidelity® funds. Ms. Johnson serves as Chairman (2016-present), Chief Executive Officer (2014-present), and Director (2007-present) of FMR LLC (diversified financial services company), President of Fidelity Financial Services (2012-present) and President of Personal, Workplace and Institutional Services (2005-present). Ms. Johnson is Chairman and Director of FMR Co., Inc. (investment adviser firm, 2011-present) and Chairman and Director of FMR (investment adviser firm, 2011-present). Previously, Ms. Johnson served as Vice Chairman (2007-2016) and President (2013-2016) of FMR LLC, President and a Director of FMR (2001-2005), a Trustee of other investment companies advised by FMR, Fidelity Investments Money Management, Inc. (investment adviser firm), and FMR Co., Inc. (2001-2005), Senior Vice President of the Fidelity® funds (2001-2005), and managed a number of Fidelity® funds. Ms. Abigail P. Johnson and Mr. Arthur E. Johnson are not related.
Jennifer Toolin McAuliffe (1959)
Year of Election or Appointment: 2016
Trustee
Ms. McAuliffe also serves as Trustee of other Fidelity® funds. Ms. McAuliffe previously served as a Member of the Advisory Board of certain Fidelity® funds (2016) and as Co-Head of Fixed Income of Fidelity Investments Limited (now known as FIL Limited (FIL)) (diversified financial services company). Earlier roles at FIL included Director of Research for FIL’s credit and quantitative teams in London, Hong Kong and Tokyo. Ms. McAuliffe also was the Director of Research for taxable and municipal bonds at Fidelity Investments Money Management, Inc. Ms. McAuliffe is also a director or trustee of several not-for-profit entities.
* Determined to be an “Interested Trustee” by virtue of, among other things, his or her affiliation with the trust or various entities under common control with FMR.
+ The information includes the Trustee's principal occupation during the last five years and other information relating to the experience, attributes, and skills relevant to the Trustee's qualifications to serve as a Trustee, which led to the conclusion that the Trustee should serve as a Trustee for the fund.
Independent Trustees:
Correspondence intended for an Independent Trustee may be sent to Fidelity Investments, P.O. Box 55235, Boston, Massachusetts 02205-5235.
Name, Year of Birth; Principal Occupations and Other Relevant Experience+
Elizabeth S. Acton (1951)
Year of Election or Appointment: 2013
Trustee
Ms. Acton also serves as Trustee of other Fidelity® funds. Prior to her retirement in April 2012, Ms. Acton was Executive Vice President, Finance (2011-2012), Executive Vice President, Chief Financial Officer (2002-2011), and Treasurer (2004-2005) of Comerica Incorporated (financial services). Prior to joining Comerica, Ms. Acton held a variety of positions at Ford Motor Company (1983-2002), including Vice President and Treasurer (2000-2002) and Executive Vice President and Chief Financial Officer of Ford Motor Credit Company (1998-2000). Ms. Acton currently serves as a member of the Board of Directors and Audit and Finance Committees of Beazer Homes USA, Inc. (homebuilding, 2012-present). Previously, Ms. Acton served as a Member of the Advisory Board of certain Fidelity® funds (2013-2016).
Ann E. Dunwoody (1953)
Year of Election or Appointment: 2018
Trustee
General Dunwoody also serves as Trustee of other Fidelity® funds. General Dunwoody (United States Army, Retired) was the first woman in U.S. military history to achieve the rank of four-star general and prior to her retirement in 2012 held a variety of positions within the U.S. Army, including Commanding General, U.S. Army Material Command (2008-2012). She is the President of First to Four LLC (leadership and mentoring services, 2012-present). She also serves as a member of the Board of Directors and Nominating and Corporate Governance Committee of L3 Technologies, Inc. (communication, electronic, sensor, and aerospace systems, 2013-present), Board of Directors and Nomination and Corporate Governance Committees of Kforce Inc. (professional staffing services, 2016-present) and Board of Directors of Automattic Inc. (software engineering, 2018-present). Previously, General Dunwoody served as a Member of the Advisory Board of certain Fidelity® funds (2018), a member of the Board of Directors and Audit and Sustainability and Corporate Responsibility Committees of Republic Services, Inc. (waste collection, disposal and recycling, 2013-2016). Ms. Dunwoody also serves on several boards for non-profit organizations, including as a member of the Board of Directors, Chair of the Nomination and Governance Committee and member of the Audit Committee of Logistics Management Institute (consulting non-profit, 2012-present), a member of the Board of Directors of the Army Historical Foundation (2015-present), a member of the Council of Trustees for the Association of the United States Army (advocacy non-profit, 2013-present) and a member of the Board of Trustees of Florida Institute of Technology (2015-present) and ThanksUSA (military family education non-profit, 2014-present).
John Engler (1948)
Year of Election or Appointment: 2014
Trustee
Mr. Engler also serves as Trustee of other Fidelity® funds. He serves on the board of directors for Universal Forest Products (manufacturer and distributor of wood and wood-alternative products, 2003-present) and K12 Inc. (technology-based education company, 2012-present). Previously, Mr. Engler served as interim president of Michigan State University (2018-2019), a Member of the Advisory Board of certain Fidelity® funds (2014-2016), president of the Business Roundtable (2011-2017), a trustee of The Munder Funds (2003-2014), president and CEO of the National Association of Manufacturers (2004-2011), member of the Board of Trustees of the Annie E. Casey Foundation (2004-2015), and as governor of Michigan (1991-2003). He is a past chairman of the National Governors Association.
Robert F. Gartland (1951)
Year of Election or Appointment: 2010
Trustee
Mr. Gartland also serves as Trustee of other Fidelity® funds. Mr. Gartland is Chairman and an investor in Gartland & Mellina Group Corp. (consulting, 2009-present). Previously, Mr. Gartland served as a partner and investor of Vietnam Partners LLC (investments and consulting, 2008-2011). Prior to his retirement, Mr. Gartland held a variety of positions at Morgan Stanley (financial services, 1979-2007), including Managing Director (1987-2007), and Chase Manhattan Bank (1975-1978).
Arthur E. Johnson (1947)
Year of Election or Appointment: 2008
Trustee
Chairman of the Independent Trustees
Mr. Johnson also serves as Trustee of other Fidelity® funds. Mr. Johnson serves as a member of the Board of Directors of Eaton Corporation plc (diversified power management, 2009-present) and Booz Allen Hamilton (management consulting, 2011-present). Prior to his retirement, Mr. Johnson served as Senior Vice President of Corporate Strategic Development of Lockheed Martin Corporation (defense contractor, 1999-2009). He previously served on the Board of Directors of IKON Office Solutions, Inc. (1999-2008), AGL Resources, Inc. (holding company, 2002-2016), and Delta Airlines (2005-2007). Mr. Arthur E. Johnson is not related to Ms. Abigail P. Johnson.
Michael E. Kenneally (1954)
Year of Election or Appointment: 2009
Trustee
Vice Chairman of the Independent Trustees
Mr. Kenneally also serves as Trustee of other Fidelity® funds. Prior to his retirement, Mr. Kenneally served as Chairman and Global Chief Executive Officer of Credit Suisse Asset Management. Before joining Credit Suisse, he was an Executive Vice President and Chief Investment Officer for Bank of America Corporation. Earlier roles at Bank of America included Director of Research, Senior Portfolio Manager and Research Analyst, and Mr. Kenneally was awarded the Chartered Financial Analyst (CFA) designation in 1991.
Marie L. Knowles (1946)
Year of Election or Appointment: 2001
Trustee
Ms. Knowles also serves as Trustee of other Fidelity® funds. Prior to Ms. Knowles' retirement in June 2000, she served as Executive Vice President and Chief Financial Officer of Atlantic Richfield Company (ARCO) (diversified energy, 1996-2000). From 1993 to 1996, she was a Senior Vice President of ARCO and President of ARCO Transportation Company (pipeline and tanker operations). Ms. Knowles currently serves as a Director and Chairman of the Audit Committee of McKesson Corporation (healthcare service, since 2002). Ms. Knowles is a member of the Board of the Santa Catalina Island Company (real estate, 2009-present). Ms. Knowles is a Member of the Investment Company Institute Board of Governors and a Member of the Governing Council of the Independent Directors Council (2014-present). She also serves as a member of the Advisory Board for the School of Engineering of the University of Southern California. Previously, Ms. Knowles served as a Director of Phelps Dodge Corporation (copper mining and manufacturing, 1994-2007), URS Corporation (engineering and construction, 2000-2003) and America West (airline, 1999-2002). Ms. Knowles previously served as Chairman (2015-2018) and Vice Chairman (2012-2015) of the Independent Trustees of certain Fidelity® funds.
Mark A. Murray (1954)
Year of Election or Appointment: 2016
Trustee
Mr. Murray also serves as Trustee of other Fidelity® funds. Mr. Murray is Vice Chairman (2013-present) of Meijer, Inc. (regional retail chain). Previously, Mr. Murray served as a Member of the Advisory Board of certain Fidelity® funds (2016) and as Co-Chief Executive Officer (2013-2016) and President (2006-2013) of Meijer, Inc. Mr. Murray serves as a member of the Board of Directors and Nuclear Review and Public Policy and Responsibility Committees of DTE Energy Company (diversified energy company, 2009-present). Mr. Murray also serves as a member of the Board of Directors of Spectrum Health (not-for-profit health system, 2015-present). Mr. Murray previously served as President of Grand Valley State University (2001-2006), Treasurer for the State of Michigan (1999-2001), Vice President of Finance and Administration for Michigan State University (1998-1999), and a member of the Board of Directors and Audit Committee and Chairman of the Nominating and Corporate Governance Committee of Universal Forest Products, Inc. (manufacturer and distributor of wood and wood-alternative products, 2004-2016). Mr. Murray is also a director or trustee of many community and professional organizations.
+ The information includes the Trustee's principal occupation during the last five years and other information relating to the experience, attributes, and skills relevant to the Trustee's qualifications to serve as a Trustee, which led to the conclusion that the Trustee should serve as a Trustee for the fund.
Advisory Board Members and Officers:
Correspondence intended for an officer may be sent to Fidelity Investments, 245 Summer Street, Boston, Massachusetts 02210. Officers appear below in alphabetical order.
Name, Year of Birth; Principal Occupation
Elizabeth Paige Baumann (1968)
Year of Election or Appointment: 2017
Anti-Money Laundering (AML) Officer
Ms. Baumann also serves as AML Officer of other funds. She is Chief AML Officer (2012-present) and Senior Vice President (2014-present) of FMR LLC (diversified financial services company) and is an employee of Fidelity Investments. Previously, Ms. Baumann served as AML Officer of the funds (2012-2016), and Vice President (2007-2014) and Deputy Anti-Money Laundering Officer (2007-2012) of FMR LLC.
Craig S. Brown (1977)
Year of Election or Appointment: 2019
Assistant Treasurer
Mr. Brown also serves as Assistant Treasurer of other funds. Mr. Brown is an employee of Fidelity Investments (2013-present).
John J. Burke III (1964)
Year of Election or Appointment: 2018
Chief Financial Officer
Mr. Burke also serves as Chief Financial Officer of other funds. Mr. Burke serves as Head of Investment Operations for Fidelity Fund and Investment Operations (2018-present) and is an employee of Fidelity Investments (1998-present). Previously Mr. Burke served as head of Asset Management Investment Operations (2012-2018).
William C. Coffey (1969)
Year of Election or Appointment: 2018
Secretary and Chief Legal Officer (CLO)
Mr. Coffey also serves as Secretary and CLO of other funds. Mr. Coffey serves as CLO, Secretary, and Senior Vice President of Fidelity Management & Research Company and FMR Co., Inc. (investment adviser firms, 2018-present); Secretary of Fidelity SelectCo, LLC and Fidelity Investments Money Management, Inc. (investment adviser firms, 2018-present); and CLO of Fidelity Management & Research (Hong Kong) Limited, FMR Investment Management (UK) Limited, and Fidelity Management & Research (Japan) Limited (investment adviser firms, 2018-present). He is Senior Vice President and Deputy General Counsel of FMR LLC (diversified financial services company, 2010-present), and is an employee of Fidelity Investments. Previously, Mr. Coffey served as Assistant Secretary of certain funds (2009-2018) and as Vice President and Associate General Counsel of FMR LLC (2005-2009).
Jonathan Davis (1968)
Year of Election or Appointment: 2010
Assistant Treasurer
Mr. Davis also serves as Assistant Treasurer of other funds. Mr. Davis serves as Assistant Treasurer of FMR Capital, Inc. (2017-present) and is an employee of Fidelity Investments. Previously, Mr. Davis served as Vice President and Associate General Counsel of FMR LLC (diversified financial services company, 2003-2010).
Adrien E. Deberghes (1967)
Year of Election or Appointment: 2010
Assistant Treasurer
Mr. Deberghes also serves as an officer of other funds. He serves as Assistant Treasurer of FMR Capital, Inc. (2017-present), Executive Vice President of Fidelity Investments Money Management, Inc. (FIMM) (investment adviser firm, 2016-present), and is an employee of Fidelity Investments (2008-present). Previously, Mr. Deberghes served as President and Treasurer of certain Fidelity® funds (2013-2018). Prior to joining Fidelity Investments, Mr. Deberghes was Senior Vice President of Mutual Fund Administration at State Street Corporation (2007-2008), Senior Director of Mutual Fund Administration at Investors Bank & Trust (2005-2007), and Director of Finance for Dunkin' Brands (2000-2005). Previously, Mr. Deberghes served in other fund officer roles.
Laura M. Del Prato (1964)
Year of Election or Appointment: 2018
President and Treasurer
Ms. Del Prato also serves as an officer of other funds. Ms. Del Prato is an employee of Fidelity Investments (2017-present). Prior to joining Fidelity Investments, Ms. Del Prato served as a Managing Director and Treasurer of the JPMorgan Mutual Funds (2014-2017). Prior to JPMorgan, Ms. Del Prato served as a partner at Cohen Fund Audit Services (accounting firm, 2012-2013) and KPMG LLP (accounting firm, 2004-2012).
Colm A. Hogan (1973)
Year of Election or Appointment: 2016
Assistant Treasurer
Mr. Hogan also serves as an officer of other funds. Mr. Hogan serves as Assistant Treasurer of FMR Capital, Inc. (2017-present) and is an employee of Fidelity Investments (2005-present). Previously, Mr. Hogan served as Assistant Treasurer of certain Fidelity® funds (2016-2018).
Chris Maher (1972)
Year of Election or Appointment: 2013
Assistant Treasurer
Mr. Maher serves as Assistant Treasurer of other funds. Mr. Maher is Vice President of Valuation Oversight, serves as Assistant Treasurer of FMR Capital, Inc. (2017-present), and is an employee of Fidelity Investments. Previously, Mr. Maher served as Vice President of Asset Management Compliance (2013), Vice President of the Program Management Group of FMR (investment adviser firm, 2010-2013), and Vice President of Valuation Oversight (2008-2010).
John B. McGinty, Jr. (1962)
Year of Election or Appointment: 2016
Chief Compliance Officer
Mr. McGinty also serves as Chief Compliance Officer of other funds. Mr. McGinty is Senior Vice President of Asset Management Compliance for Fidelity Investments and is an employee of Fidelity Investments (2016-present). Mr. McGinty previously served as Vice President, Senior Attorney at Eaton Vance Management (investment management firm, 2015-2016), and prior to Eaton Vance as global CCO for all firm operations and registered investment companies at GMO LLC (investment management firm, 2009-2015). Before joining GMO LLC, Mr. McGinty served as Senior Vice President, Deputy General Counsel for Fidelity Investments (2007-2009).
Jason P. Pogorelec (1975)
Year of Election or Appointment: 2015
Assistant Secretary
Mr. Pogorelec also serves as Assistant Secretary of other funds. Mr. Pogorelec serves as Vice President, Associate General Counsel (2010-present) and is an employee of Fidelity Investments (2006-present).
Nancy D. Prior (1967)
Year of Election or Appointment: 2014
Vice President
Ms. Prior also serves as Vice President of other funds. Ms. Prior serves as President Fixed Income, High Income/Emerging Market Debt and Multi Asset Class Strategies of FIAM LLC (2018-present), President (2016-present) and Director (2014-present) of Fidelity Investments Money Management, Inc. (FIMM) (investment adviser firm), President, Fixed Income (2014-present), and is an employee of Fidelity Investments (2002-present). Previously, Ms. Prior served as Vice Chairman of FIAM LLC (investment adviser firm, 2014-2018), a Director of FMR Investment Management (UK) Limited (investment adviser firm, 2015-2018), President Multi-Asset Class Strategies of FMR's Global Asset Allocation Division (2017-2018), Vice President of Fidelity's Money Market Funds (2012-2014), President, Money Market and Short Duration Bond Group of Fidelity Management & Research (FMR) (investment adviser firm, 2013-2014), President, Money Market Group of FMR (2011-2013), Managing Director of Research (2009-2011), Senior Vice President and Deputy General Counsel (2007-2009), and Assistant Secretary of certain Fidelity® funds (2008-2009).
Stacie M. Smith (1974)
Year of Election or Appointment: 2013
Assistant Treasurer
Ms. Smith also serves as an officer of other funds. Ms. Smith serves as Assistant Treasurer of FMR Capital, Inc. (2017-present), is an employee of Fidelity Investments (2009-present), and has served in other fund officer roles. Prior to joining Fidelity Investments, Ms. Smith served as Senior Audit Manager of Ernst & Young LLP (accounting firm, 1996-2009). Previously, Ms. Smith served as Assistant Treasurer (2013-2018) and Deputy Treasurer (2013-2016) of certain Fidelity® funds.
Marc L. Spector (1972)
Year of Election or Appointment: 2016
Deputy Treasurer
Mr. Spector also serves as an officer of other funds. Mr. Spector serves as Assistant Treasurer of FMR Capital, Inc. (2017-present) and is an employee of Fidelity Investments (2016-present). Prior to joining Fidelity Investments, Mr. Spector served as Director at the Siegfried Group (accounting firm, 2013-2016), and prior to Siegfried Group as audit senior manager at Deloitte & Touche (accounting firm, 2005-2013).
Jim Wegmann (1979)
Year of Election or Appointment: 2019
Assistant Treasurer
Mr. Wegmann also serves as Assistant Treasurer of other funds. Mr. Wegmann is an employee of Fidelity Investments (2011-present).
Shareholder Expense Example
As a shareholder of the Fund, you incur two types of costs: (1) transaction costs and (2) ongoing costs, including management fees and other Fund expenses. This Example is intended to help you understand your ongoing costs (in dollars) of investing in the Fund and to compare these costs with the ongoing costs of investing in other mutual funds.
The Example is based on an investment of $1,000 invested at the beginning of the period and held for the entire period (July 1, 2018 to December 31, 2018).
Actual Expenses
The first line of the accompanying table for each class of the Fund provides information about actual account values and actual expenses. You may use the information in this line, together with the amount you invested, to estimate the expenses that you paid over the period. Simply divide your account value by $1,000.00 (for example, an $8,600 account value divided by $1,000.00 = 8.6), then multiply the result by the number in the first line for a class of the Fund under the heading entitled "Expenses Paid During Period" to estimate the expenses you paid on your account during this period. A small balance maintenance fee of $12.00 that is charged once a year may apply for certain accounts with a value of less than $2,000. This fee, which was eliminated effective August 1, 2018, is not included in the table below. If it was, the estimate of expenses you paid during the period would be higher, and your ending account value lower, by this amount. In addition, the Fund, as a shareholder in the underlying Fidelity Central Funds, will indirectly bear its pro-rata share of the fees and expenses incurred by the underlying Fidelity Central Funds. These fees and expenses are not included in the Fund's annualized expense ratio used to calculate the expense estimate in the table below.
Hypothetical Example for Comparison Purposes
The second line of the accompanying table for each class of the Fund provides information about hypothetical account values and hypothetical expenses based on a Class' actual expense ratio and an assumed rate of return of 5% per year before expenses, which is not the Class' actual return. The hypothetical account values and expenses may not be used to estimate the actual ending account balance or expenses you paid for the period. You may use this information to compare the ongoing costs of investing in the Fund and other funds. To do so, compare this 5% hypothetical example with the 5% hypothetical examples that appear in the shareholder reports of the other funds. A small balance maintenance fee of $12.00 that is charged once a year may apply for certain accounts with a value of less than $2,000. This fee, which was eliminated effective August 1, 2018, is not included in the table below. If it was, the estimate of expenses you paid during the period would be higher, and your ending account value lower, by this amount. In addition, the Fund, as a shareholder in the underlying Fidelity Central Funds, will indirectly bear its pro-rata share of the fees and expenses incurred by the underlying Fidelity Central Funds. These fees and expenses are not included in the Fund's annualized expense ratio used to calculate the expense estimate in the table below.
Please note that the expenses shown in the table are meant to highlight your ongoing costs only and do not reflect any transaction costs. Therefore, the second line of the table is useful in comparing ongoing costs only, and will not help you determine the relative total costs of owning different funds.
| | Annualized Expense Ratio-A | Beginning
Account Value
July 1, 2018 | Ending
Account Value
December 31, 2018 | Expenses Paid
During Period-B
July 1, 2018
to December 31, 2018 |
| Conservative Income Municipal Bond | .35% | | | |
| Actual | | $1,000.00 | $1,007.50 | $1.77 |
| Hypothetical-C | | $1,000.00 | $1,023.44 | $1.79 |
| Institutional Class | .25% | | | |
| Actual | | $1,000.00 | $1,008.00 | $1.27 |
| Hypothetical-C | | $1,000.00 | $1,023.95 | $1.28 |
A Annualized expense ratio reflects expenses net of applicable fee waivers.
B Expenses are equal to each Class' annualized expense ratio, multiplied by the average account value over the period, multiplied by 184/365 (to reflect the one-half year period).
C 5% return per year before expenses
Distributions (Unaudited)
During fiscal year ended 2018, 100% of the fund's income dividends were free from federal income tax, and 25.02% of the fund's income dividends was subject to the federal alternative minimum tax.
The fund will notify shareholders in January 2019 of amounts for use in preparing 2018 income tax returns.
Board Approval of Investment Advisory Contracts and Management Fees
Fidelity Conservative Income Municipal Bond Fund
Each year, the Board of Trustees, including the Independent Trustees (together, the Board), votes on the renewal of the management contract with Fidelity Management & Research Company (FMR) and the sub-advisory agreements (together, the Advisory Contracts) for the fund. FMR and the sub-advisers are referred to herein as the Investment Advisers. The Board, assisted by the advice of fund counsel and Independent Trustees' counsel, requests and considers a broad range of information relevant to the renewal of the Advisory Contracts throughout the year.
The Board meets regularly and, at each of its meetings, covers an extensive agenda of topics and materials and considers factors that are relevant to its annual consideration of the renewal of the fund's Advisory Contracts, including the services and support provided to the fund and its shareholders. The Board has established four standing committees (Committees) — Operations, Audit, Fair Valuation, and Governance and Nominating — each composed of and chaired by Independent Trustees with varying backgrounds, to which the Board has assigned specific subject matter responsibilities in order to enhance effective decision-making by the Board. The Operations Committee, of which all of the Independent Trustees are members, meets regularly throughout the year and considers, among other matters, information specifically related to the annual consideration of the renewal of the fund's Advisory Contracts. The Board, acting directly and through its Committees, requests and receives information concerning the annual consideration of the renewal of the fund's Advisory Contracts. The Board also meets as needed to review matters specifically related to the Board's annual consideration of the renewal of the Advisory Contracts. Members of the Board may also meet with trustees of other Fidelity funds through joint ad hoc committees to discuss certain matters relevant to all of the Fidelity funds.
At its September 2018 meeting, the Board unanimously determined to renew the fund's Advisory Contracts. In reaching its determination, the Board considered all factors it believed relevant, including (i) the nature, extent, and quality of the services to be provided to the fund and its shareholders (including the investment performance of the fund); (ii) the competitiveness of the fund's management fee and total expense ratio relative to peer funds; (iii) the total costs of the services to be provided by and the profits to be realized by Fidelity from its relationships with the fund; and (iv) the extent to which, if any, economies of scale exist and would be realized as the fund grows, and whether any economies of scale are appropriately shared with fund shareholders.
In considering whether to renew the Advisory Contracts for the fund, the Board reached a determination, with the assistance of fund counsel and Independent Trustees' counsel and through the exercise of its business judgment, that the renewal of the Advisory Contracts was in the best interests of the fund and its shareholders and that the compensation payable under the Advisory Contracts was fair and reasonable. The Board's decision to renew the Advisory Contracts was not based on any single factor, but rather was based on a comprehensive consideration of all the information provided to the Board at its meetings throughout the year. The Board, in reaching its determination to renew the Advisory Contracts, was aware that shareholders of the fund have a broad range of investment choices available to them, including a wide choice among funds offered by Fidelity's competitors, and that the fund's shareholders, who have the opportunity to review and weigh the disclosure provided by the fund in its prospectus and other public disclosures, have chosen to invest in this fund, which is part of the Fidelity family of funds.
Nature, Extent, and Quality of Services Provided. The Board considered Fidelity's staffing as it relates to the fund, including the backgrounds of investment personnel of Fidelity, and also considered the fund's investment objective, strategies, and related investment philosophy. The Independent Trustees also had discussions with senior management of Fidelity's investment operations and investment groups. The Board considered the structure of the investment personnel compensation program and whether this structure provides appropriate incentives to act in the best interests of the fund. Additionally, the Board considered the portfolio managers' investments, if any, in the funds that they manage.
Resources Dedicated to Investment Management and Support Services. The Board reviewed the general qualifications and capabilities of Fidelity's investment staff, including its size, education, experience, and resources, as well as Fidelity's approach to recruiting, managing, and compensating investment personnel. The Board noted that Fidelity has continued to increase the resources devoted to non-U.S. offices, including expansion of Fidelity's global investment organization. The Board also noted that Fidelity's analysts have extensive resources, tools and capabilities that allow them to conduct sophisticated quantitative and fundamental analysis, as well as credit analysis of issuers, counterparties and guarantors. Further, the Board considered that Fidelity's investment professionals have sufficient access to global information and data so as to provide competitive investment results over time, and that those professionals also have access to sophisticated tools that permit them to assess portfolio construction and risk and performance attribution characteristics continuously, as well as to transmit new information and research conclusions rapidly around the world. Additionally, in its deliberations, the Board considered Fidelity's trading, risk management, compliance, and technology and operations capabilities and resources, which are integral parts of the investment management process.
Shareholder and Administrative Services. The Board considered (i) the nature, extent, quality, and cost of advisory, administrative, and shareholder services performed by the Investment Advisers and their affiliates under the Advisory Contracts and under separate agreements covering transfer agency and pricing and bookkeeping services for the fund; (ii) the nature and extent of the supervision of third party service providers, principally custodians, subcustodians, and pricing vendors; and (iii) the resources devoted to, and the record of compliance with, the fund's compliance policies and procedures.
The Board noted that the growth of fund assets over time across the complex allows Fidelity to reinvest in the development of services designed to enhance the value and convenience of the Fidelity funds as investment vehicles. These services include 24-hour access to account information and market information through telephone representatives and over the Internet, investor education materials and asset allocation tools, and the expanded availability of Fidelity Investor Centers.
Investment in a Large Fund Family. The Board considered the benefits to shareholders of investing in a Fidelity fund, including the benefits of investing in a fund that is part of a large family of funds offering a variety of investment disciplines and providing a large variety of mutual fund investor services. The Board noted that Fidelity had taken, or had made recommendations that resulted in the Fidelity funds taking, a number of actions over the previous year that benefited particular funds, including: (i) continuing to dedicate additional resources to Fidelity's investment research process, which includes meetings with management of issuers of securities in which the funds invest, and to the support of the senior management team that oversees asset management; (ii) continuing efforts to enhance Fidelity's global research capabilities; (iii) launching new funds and making other enhancements to meet client needs; (iv) launching new share classes of existing funds; (v) eliminating purchase minimums and broadening eligibility requirements for certain funds and share classes; (vi) reducing management fees and total expenses for certain growth equity funds and index funds; (vii) lowering expense caps for certain existing funds and classes, and converting certain voluntary expense caps to contractual caps, to reduce expenses borne by shareholders; (viii) eliminating short-term redemption fees for funds that had such fees; (ix) rationalizing product lines and gaining increased efficiencies from fund mergers and share class consolidations; (x) continuing to develop, acquire and implement systems and technology to improve services to the funds and shareholders, strengthen information security, and increase efficiency; and (xi) continuing to implement enhancements to further strengthen Fidelity's product line to increase investors' probability of success in achieving their investment goals, including retirement income goals.
Investment Performance. The Board considered whether the fund has operated in accordance with its investment objective, as well as its record of compliance with its investment restrictions and its performance history.
The Board took into account discussions that occur at Board meetings throughout the year with representatives of the Investment Advisers about fund investment performance. In this regard the Board noted that as part of regularly scheduled fund reviews and other reports to the Board on fund performance, the Board considers annualized return information for the fund for different time periods, measured against an appropriate securities market index ("benchmark index") and a peer group of funds with similar objectives ("peer group"), if any. In its evaluation of fund investment performance at meetings throughout the year, the Board gave particular attention to information indicating underperformance of certain Fidelity funds for specific time periods and discussed with the Investment Advisers the reasons for such underperformance.
In addition to reviewing absolute and relative fund performance, the Independent Trustees periodically consider the appropriateness of fund performance metrics in evaluating the results achieved. In general, the Independent Trustees believe that fund performance should be evaluated based on gross performance (before fees and expenses but after transaction costs) compared to appropriate benchmark indices, over appropriate time periods that may include full market cycles, and on net performance (after fees and expenses) compared to peer groups, as applicable, over the same periods, taking into account relevant factors including the following: general market conditions; expectations for interest rate levels and credit conditions; issuer-specific information including credit quality; the potential for incremental return versus the fund's benchmark index weighed against the risks involved in obtaining that incremental return, including the risk of diminished or negative total returns; and fund cash flows and other factors. Depending on the circumstances, the Independent Trustees may be satisfied with a fund's performance notwithstanding that it lags its benchmark index or peer group for certain periods.
The Independent Trustees recognize that shareholders evaluate performance on a net basis over their own holding periods, for which one-, three-, and five-year periods are often used as a proxy. For this reason, the performance information reviewed by the Board also included net cumulative calendar year total return information for the fund and an appropriate benchmark index and peer group for the most recent one- and three-year periods.
Based on its review, the Board concluded that the nature, extent, and quality of services provided to the fund under the Advisory Contracts should continue to benefit the shareholders of the fund.
Competitiveness of Management Fee and Total Expense Ratio. The Board considered the fund's management fee and total expense ratio compared to "mapped groups" of competitive funds and classes created for the purpose of facilitating the Trustees' competitive analysis of management fees and total expenses. Fidelity creates "mapped groups" by combining similar Lipper investment objective categories that have comparable investment mandates. Combining Lipper investment objective categories aids the Board's management fee and total expense ratio comparisons by broadening the competitive group used for comparison.
Management Fee. The Board considered two proprietary management fee comparisons for the 12-month (or shorter) periods shown in basis points (BP) in the chart below. The group of Lipper funds used by the Board for management fee comparisons is referred to below as the "Total Mapped Group" and, for the reasons explained above, is broader than the Lipper peer group used by the Board for performance comparisons. The Total Mapped Group comparison focuses on a fund's standing in terms of gross management fees before expense reimbursements or caps relative to the total universe of funds with comparable investment mandates, regardless of whether their management fee structures also are comparable. Funds with comparable investment mandates offer exposure to similar types of securities. Funds with comparable management fee structures have similar management fee contractual arrangements (
e.g., flat rate charged for advisory services, all-inclusive fee rate,
etc.). "TMG %" represents the percentage of funds in the Total Mapped Group that had management fees that were lower than the fund's. For example, a hypothetical TMG % of 20% would mean that 80% of the funds in the Total Mapped Group had higher, and 20% had lower, management fees than the fund. The fund's actual TMG %s and the number of funds in the Total Mapped Group are in the chart below. The "Asset-Size Peer Group" (ASPG) comparison focuses on a fund's standing relative to a subset of non-Fidelity funds within the Total Mapped Group that are similar in size and management fee structure. For example, if a fund is in the first quartile of the ASPG, the fund's management fee ranks in the least expensive or lowest 25% of funds in the ASPG. The ASPG represents at least 15% of the funds in the Total Mapped Group with comparable asset size and management fee structures, subject to a minimum of 50 funds (or all funds in the Total Mapped Group if fewer than 50). Additional information, such as the ASPG quartile in which the fund's management fee rate ranked, is also included in the chart and was considered by the Board. Because the vast majority of competitor funds' management fees do not cover non-management expenses, in prior years, the fund was compared on the basis of a hypothetical "net management fee," which was derived by subtracting payments made by FMR for "fund-level" non-management expenses (including pricing and bookkeeping fees and fees paid to non-affiliated custodians) from the fund's management fee. Fidelity no longer calculates a hypothetical net management fee for the fund and, as a result, the chart does not include a hypothetical net management fee for 2017.
Fidelity Conservative Income Municipal Bond Fund
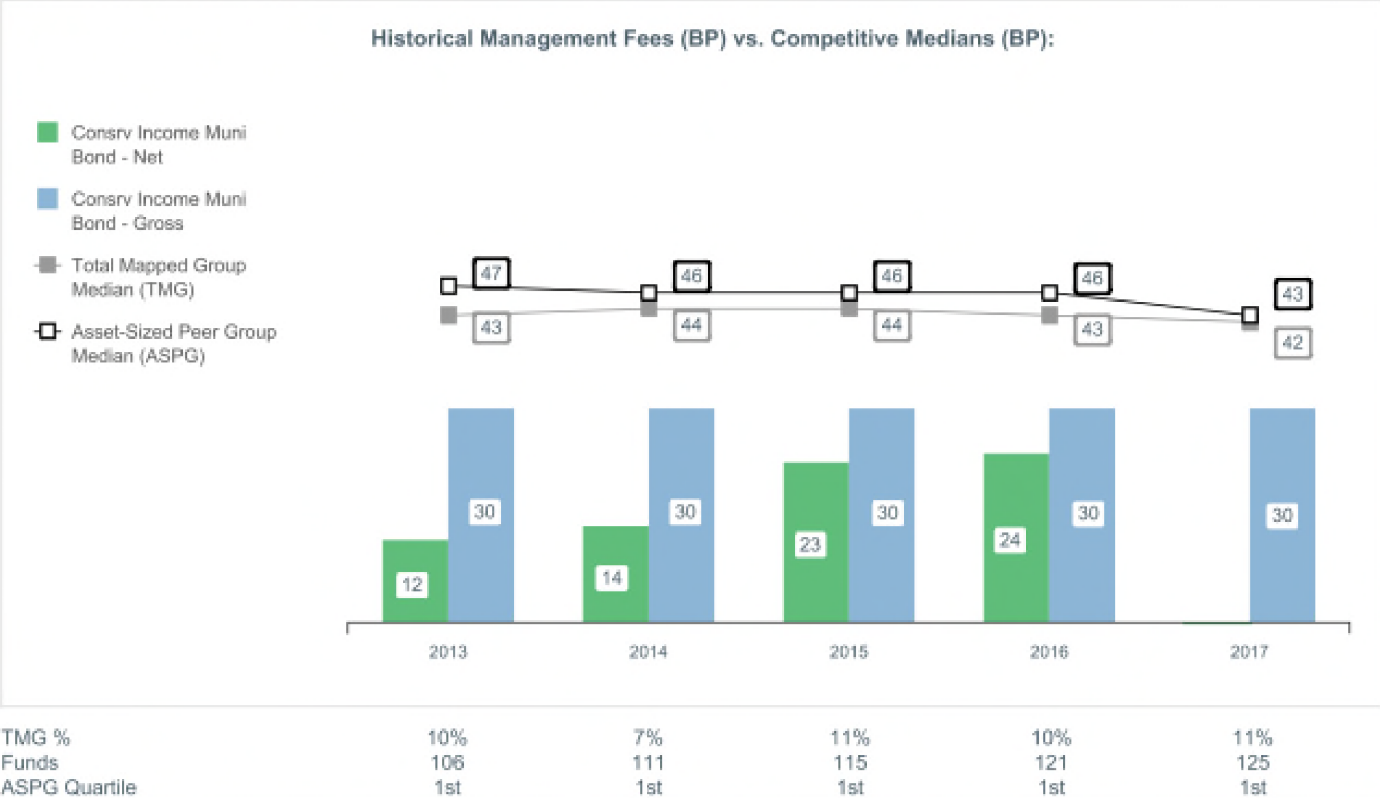
The Board noted that the fund's management fee rate ranked below the median of its Total Mapped Group and below the median of its ASPG for 2017.
The Board noted that it and the boards of other Fidelity funds formed an ad hoc Committee on Group Fee, which meets periodically, to conduct an in-depth review of the "group fee" component of the management fee of funds with such management fee structures. The Committee's focus included the mechanics of the group fee, the competitive landscape of group fee structures, Fidelity funds with no group fee component (such as the fund) and investment products not included in group fee assets. The Board also considered that, for funds subject to the group fee, FMR agreed to voluntarily waive fees over a specified period of time in amounts designed to account for assets converted from certain funds to certain collective investment trusts.
Based on its review, the Board concluded that the fund's management fee is fair and reasonable in light of the services that the fund receives and the other factors considered.
Total Expense Ratio. In its review of each class's total expense ratio, the Board considered the fund's management fee rate as well as other "fund-level" expenses, such as pricing and bookkeeping fees and custodial, legal, and audit fees, paid by FMR under the fund's management contract. The Board also considered other "class-level" expenses, such as transfer agent fees. The Board also noted that Fidelity may agree to waive fees and expenses from time to time, and the extent to which, if any, it has done so for the fund. As part of its review, the Board also considered the current and historical total expense ratios of each class of the fund compared to competitive fund median expenses. Each class of the fund is compared to those funds and classes in the Total Mapped Group (used by the Board for management fee comparisons) that have a similar sales load structure.
The Board noted that the total expense ratio of each class ranked below the competitive median for 2017.
The Board further considered that FMR has contractually agreed to reimburse Institutional Class and the retail class of the fund to the extent that total operating expenses (excluding interest, certain taxes, certain securities lending costs, brokerage commissions, fees and expenses of the Independent Trustees, extraordinary expenses, and acquired fund fees and expenses, if any), as a percentage of their respective average net assets, exceed 0.25% and 0.35% through February 28, 2019.
Fees Charged to Other Fidelity Clients. The Board also considered Fidelity fee structures and other information with respect to clients of Fidelity, such as other funds advised or subadvised by Fidelity, pension plan clients, and other institutional clients with similar mandates. The Board noted that a joint ad hoc committee created by it and the boards of other Fidelity funds periodically reviews and compares Fidelity's institutional investment advisory business with its business of providing services to the Fidelity funds and also noted the most recent findings of the committee. The Board noted that the committee's review included a consideration of the differences in services provided, fees charged, and costs incurred, as well as competition in the markets serving the different categories of clients.
Based on its review of total expense ratios and fees charged to other Fidelity clients, the Board concluded that the total expense ratio of each class of the fund was reasonable in light of the services that the fund and its shareholders receive and the other factors considered.
Costs of the Services and Profitability. The Board considered the revenues earned and the expenses incurred by Fidelity in conducting the business of developing, marketing, distributing, managing, administering and servicing the fund and servicing the fund's shareholders. The Board also considered the level of Fidelity's profits in respect of all the Fidelity funds.
On an annual basis, Fidelity presents to the Board information about the profitability of its relationships with the fund. Fidelity calculates profitability information for each fund, as well as aggregate profitability information for groups of Fidelity funds and all Fidelity funds, using a series of detailed revenue and cost allocation methodologies which originate with the books and records of Fidelity on which Fidelity's audited financial statements are based. The Audit Committee of the Board reviews any significant changes from the prior year's methodologies.
PricewaterhouseCoopers LLP (PwC), auditor to Fidelity and certain Fidelity funds, has been engaged annually by the Board as part of the Board's assessment of Fidelity's profitability analysis. PwC's engagement includes the review and assessment of the methodologies used by Fidelity in determining the revenues and expenses attributable to Fidelity's mutual fund business, and completion of agreed-upon procedures in respect of the mathematical accuracy of the fund profitability information and its conformity to established allocation methodologies. After considering PwC's reports issued under the engagement and information provided by Fidelity, the Board concluded that while other allocation methods may also be reasonable, Fidelity's profitability methodologies are reasonable in all material respects.
The Board also reviewed Fidelity's non-fund businesses and potential indirect benefits such businesses may have received as a result of their association with Fidelity's mutual fund business (i.e., fall-out benefits) as well as cases where Fidelity's affiliates may benefit from the fund's business. The Board noted that changes to fall-out benefits year-over-year reflect business developments at Fidelity's various businesses.
The Board considered the costs of the services provided by and the profits realized by Fidelity in connection with the operation of the fund and was satisfied that the profitability was not excessive.
Economies of Scale. The Board considered whether there have been economies of scale in respect of the management of the Fidelity funds, whether the Fidelity funds (including the fund) have appropriately benefited from any such economies of scale, and whether there is potential for realization of any further economies of scale. The Board considered the extent to which the fund will benefit from economies of scale as assets grow through increased services to the fund, through waivers or reimbursements, or through fee or expense ratio reductions. The Board also noted that a committee (the Economies of Scale Committee) created by it and the boards of other Fidelity funds periodically analyzes whether Fidelity attains economies of scale in respect of the management and servicing of the Fidelity funds, whether the Fidelity funds have appropriately benefited from such economies of scale, and whether there is potential for realization of any further economies of scale.
The Board concluded, taking into account the analysis of the Economies of Scale Committee, that economies of scale, if any, are being appropriately shared between fund shareholders and Fidelity.
Additional Information Requested by the Board. In order to develop fully the factual basis for consideration of the Fidelity funds' advisory contracts, the Board requested and received additional information on certain topics, including: (i) Fidelity's fund profitability methodology, profitability trends for certain funds, the allocation of various costs to different funds, and the impact of certain factors on fund profitability results; (ii) portfolio manager changes that have occurred during the past year and the amount of the investment that each portfolio manager has made in the Fidelity fund(s) that he or she manages; (iii) Fidelity's compensation structure for portfolio managers, research analysts, and other key personnel, including its effects on fund profitability, the rationale for the compensation structure, and the extent to which current market conditions have affected retention and recruitment; (iv) the arrangements with and compensation paid to certain fund sub-advisers on behalf of the Fidelity funds and the treatment of such compensation within Fidelity's fund profitability methodology; (v) the terms of Fidelity's voluntary expense limitation agreements; (vi) the methodology with respect to competitive fund data and peer group classifications; (vii) Fidelity's transfer agent fee, expense, and service structures for different funds and classes relative to competitive trends, and the impact of the increased use of omnibus accounts; (viii) new developments in the retail and institutional marketplaces and the competitive positioning of the funds relative to other investment products and services; (ix) the impact of recent changes to the money market fund landscape, including the full implementation of money market fund reform and rising interest rates, on Fidelity's money market funds; (x) the funds' share class structures and distribution channels; and (xi) explanations regarding the relative total expense ratios of certain funds and classes, total expense competitive trends and methodologies for total expense competitive comparisons, and actions that might be taken by Fidelity to reduce total expense ratios for certain classes. In addition, the Board considered its discussions with Fidelity throughout the year regarding enhanced information security initiatives and the funds' fair valuation policies.
Based on its evaluation of all of the conclusions noted above, and after considering all factors it believed relevant, the Board concluded that the advisory fee arrangements are fair and reasonable, and that the fund's Advisory Contracts should be renewed.
Corporate Headquarters
245 Summer St.
Boston, MA 02210
www.fidelity.com
CMB-ANN-0219
1.967792.105
Fidelity Flex℠ Funds Fidelity Flex℠ Municipal Income Fund
Annual Report December 31, 2018 |
|
Beginning on January 1, 2021, as permitted by regulations adopted by the Securities and Exchange Commission, paper copies of a fund’s shareholder reports will no longer be sent by mail, unless you specifically request paper copies of the reports from the fund or from your financial intermediary, such as a financial advisor, broker-dealer or bank. Instead, the reports will be made available on a website, and you will be notified by mail each time a report is posted and provided with a website link to access the report.
If you already elected to receive shareholder reports electronically, you will not be affected by this change and you need not take any action. You may elect to receive shareholder reports and other communications from a fund electronically, by contacting your financial intermediary. For Fidelity customers, visit Fidelity's web site or call Fidelity using the contact information listed below.
You may elect to receive all future reports in paper free of charge. If you wish to continue receiving paper copies of your shareholder reports, you may contact your financial intermediary or, if you are a Fidelity customer, visit Fidelity’s website, or call Fidelity at the applicable toll-free number listed below. Your election to receive reports in paper will apply to all funds held with the fund complex/your financial intermediary.
| Account Type | Website | Phone Number |
| Brokerage, Mutual Fund, or Annuity Contracts: | fidelity.com/mailpreferences | 1-800-343-3548 |
| Employer Provided Retirement Accounts: | netbenefits.fidelity.com/preferences (choose 'no' under Required Disclosures to continue to print) | 1-800-343-0860 |
| Advisor Sold Accounts Serviced Through Your Financial Intermediary: | Contact Your Financial Intermediary | Your Financial Intermediary's phone number |
| Advisor Sold Accounts Serviced by Fidelity: | institutional.fidelity.com | 1-877-208-0098 |
Contents
To view a fund's proxy voting guidelines and proxy voting record for the 12-month period ended June 30, visit http://www.fidelity.com/proxyvotingresults or visit the Securities and Exchange Commission's (SEC) web site at http://www.sec.gov.
You may also call 1-800-835-5092 to request a free copy of the proxy voting guidelines.
Standard & Poor's, S&P and S&P 500 are registered service marks of The McGraw-Hill Companies, Inc. and have been licensed for use by Fidelity Distributors Corporation.
Other third-party marks appearing herein are the property of their respective owners.
All other marks appearing herein are registered or unregistered trademarks or service marks of FMR LLC or an affiliated company. © 2019 FMR LLC. All rights reserved.
This report and the financial statements contained herein are submitted for the general information of the shareholders of the Fund. This report is not authorized for distribution to prospective investors in the Fund unless preceded or accompanied by an effective prospectus.
A fund files its complete schedule of portfolio holdings with the SEC for the first and third quarters of each fiscal year on Form N-Q. Forms N-Q are available on the SEC’s web site at http://www.sec.gov. A fund's Forms N-Q may be reviewed and copied at the SEC’s Public Reference Room in Washington, DC. Information regarding the operation of the SEC's Public Reference Room may be obtained by calling 1-800-SEC-0330.
For a complete list of a fund's portfolio holdings, view the most recent holdings listing, semiannual report, or annual report on Fidelity's web site at http://www.fidelity.com, http://www.institutional.fidelity.com, or http://www.401k.com, as applicable.
NOT FDIC INSURED •MAY LOSE VALUE •NO BANK GUARANTEE
Neither the Fund nor Fidelity Distributors Corporation is a bank.
Performance: The Bottom Line
Average annual total return reflects the change in the value of an investment, assuming reinvestment of distributions from dividend income and capital gains (the profits earned upon the sale of securities that have grown in value, if any) and assuming a constant rate of performance each year. The hypothetical investment and the average annual total returns do not reflect the deduction of taxes that a shareholder would pay on fund distributions or the redemption of fund shares. During periods of reimbursement by Fidelity, a fund’s total return will be greater than it would be had the reimbursement not occurred. How a fund did yesterday is no guarantee of how it will do tomorrow.
Average Annual Total Returns
| For the periods ended December 31, 2018 | Past 1 year | Life of fundA |
| Fidelity Flex℠ Municipal Income Fund | 0.71% | 1.26% |
A From October 12, 2017
$10,000 Over Life of Fund
Let's say hypothetically that $10,000 was invested in Fidelity Flex℠ Municipal Income Fund on October 12, 2017, when the fund started.
The chart shows how the value of your investment would have changed, and also shows how the Bloomberg Barclays Municipal Bond Index performed over the same period.
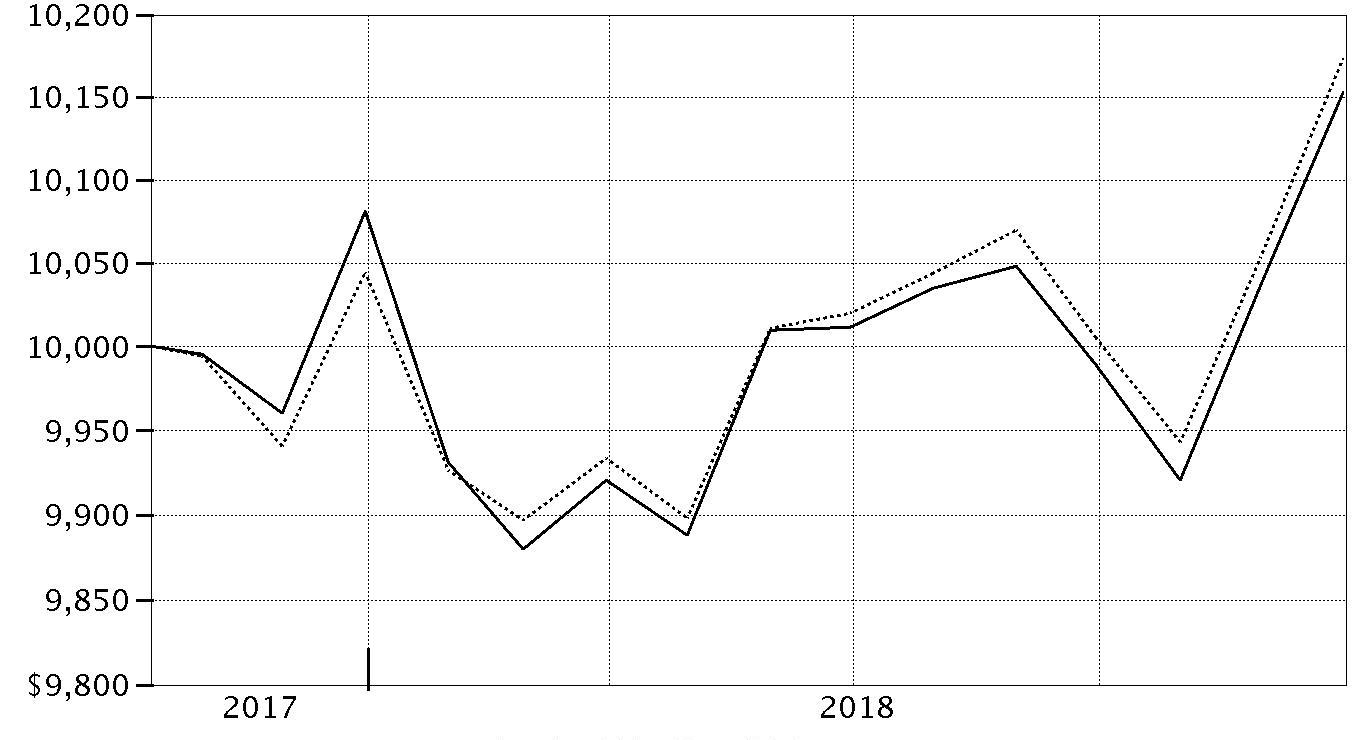
| Period Ending Values |
| $10,153 | Fidelity Flex℠ Municipal Income Fund |
| $10,174 | Bloomberg Barclays Municipal Bond Index |
Management's Discussion of Fund Performance
Market Recap: Tax-exempt municipal bonds gained modestly in 2018, with the Bloomberg Barclays Municipal Bond Index returning 1.28%, supported by lower bond issuance and solid economic growth. Tax reform had a significant impact on both the supply of and demand for tax-exempt bonds the past year. In the final months of 2017, issuers accelerated their bond financings in order to issue under the old tax rules, prompting a surge in supply. Investors absorbed this excess supply, anticipating that issuance would fall significantly in 2018. The market turned lower in early 2018, as domestic fixed-income markets reacted to robust economic data and signs of inflation, before stabilizing in March and rallying through August. The municipal market experienced volatility in September and October amid concerns of an economic slowdown, then rebounded to close December near a high for the year. Gross municipal bond issuance ended 2018 down approximately 25%. There was little differentiation in performance across municipal sectors in 2018. General obligation bonds gained 1.33%, with bonds issued by states slightly outperforming those backed by local municipalities. Looking ahead, market volatility is likely to persist due to uncertainty about how the U.S. Federal Reserve will react to labor and inflation trends.
Comments from Co-Portfolio Managers Cormac Cullen, Elizah McLaughlin and Kevin Ramundo: For 2018, the fund returned 0.71%, lagging, net of fees, the 1.28% advance of the benchmark Bloomberg Barclays Municipal Bond Index. For the year overall, the fund's performance was hurt by its large first-half cash position, as we received new flows into the fund. Since municipal bonds produced gains during that time frame, it was detrimental to hold cash that produced no return. In the second half of the period, when the fund was fully invested, differences in the way fund holdings and index components were priced detracted from fund performance relative to the benchmark. Also detracting were a handful of holdings that lagged the benchmark for reasons unique to their issuers, structure or maturity. In contrast, the fund's interest-rate sensitivity, as measured by its duration, was somewhat less than that of the benchmark from July through December. This proved beneficial as interest rates rose during much of that span. That said, the portfolio's shorter duration (less sensitivity to interest rates) hurt relative performance in November and December when interest rates moved lower.
The views expressed above reflect those of the portfolio manager(s) only through the end of the period as stated on the cover of this report and do not necessarily represent the views of Fidelity or any other person in the Fidelity organization. Any such views are subject to change at any time based upon market or other conditions and Fidelity disclaims any responsibility to update such views. These views may not be relied on as investment advice and, because investment decisions for a Fidelity fund are based on numerous factors, may not be relied on as an indication of trading intent on behalf of any Fidelity fund.
Note to Shareholders: On September 1, 2018, Elizah McLaughlin joined the Municipal Bond Portfolio Management Team. Elizah succeeded Mark Sommer, who retired from Fidelity on December 31, 2018, after more than 25 years with the firm.
Investment Summary (Unaudited)
Top Five States as of December 31, 2018
| | % of fund's net assets |
| Illinois | 20.4 |
| Texas | 11.4 |
| Pennsylvania | 6.6 |
| Ohio | 6.0 |
| New Jersey | 5.9 |
Top Five Sectors as of December 31, 2018
| | % of fund's net assets |
| Health Care | 27.6 |
| General Obligations | 18.5 |
| Education | 15.4 |
| Transportation | 11.2 |
| Electric Utilities | 7.8 |
Quality Diversification (% of fund's net assets)
| As of December 31, 2018 |
| | AAA | 4.0% |
| | AA,A | 66.0% |
| | BBB | 16.1% |
| | BB and Below | 2.1% |
| | Not Rated | 3.7% |
| | Short-Term Investments and Net Other Assets | 8.1% |

We have used ratings from Moody's Investors Service, Inc. Where Moody's® ratings are not available, we have used S&P® ratings. All ratings are as of the date indicated and do not reflect subsequent changes.
Schedule of Investments December 31, 2018
Showing Percentage of Net Assets
| Municipal Bonds - 91.9% | | | |
| | | Principal Amount | Value |
| Alabama - 1.1% | | | |
| Auburn Univ. Gen. Fee Rev. Series 2018 A, 5% 6/1/43 | | 100,000 | 114,437 |
| Jefferson County Gen. Oblig. Series 2018 A: | | | |
| 5% 4/1/25 | | $100,000 | $114,928 |
| 5% 4/1/26 | | 100,000 | 116,252 |
| Mobile Indl. Dev. Board Poll. Cont. Rev. Bonds Series 2009 E, 1.85%, tender 3/24/20 (a) | | 900,000 | 894,159 |
|
| TOTAL ALABAMA | | | 1,239,776 |
|
| Alaska - 0.0% | | | |
| Alaska Int'l. Arpts. Revs. Series 2010 A, 5% 10/1/23 (b) | | 30,000 | 31,455 |
| Arizona - 2.8% | | | |
| Arizona Board of Regents Arizona State Univ. Rev. Series 2012 A, 5% 7/1/32 (Pre-Refunded to 7/1/22 @ 100) | | 10,000 | 11,011 |
| Arizona Health Facilities Auth. Rev. (Banner Health Sys. Proj.) Series 2015 A, 5% 1/1/21 | | 25,000 | 26,469 |
| Arizona Indl. Dev. Auth. Rev. (Provident Group-Eastern Michigan Univ. Parking Proj.) Series 2018: | | | |
| 5% 5/1/26 | | 450,000 | 502,830 |
| 5% 5/1/29 | | 290,000 | 324,841 |
| 5% 5/1/33 | | 565,000 | 622,466 |
| Arizona State Lottery Rev. Series 2019, 5% 7/1/23 (c) | | 415,000 | 454,342 |
| Chandler Indl. Dev. Auth. Indl. Dev. Rev. Bonds (Intel Corp. Proj.) Series 2007, 2.7%, tender 8/14/23 (a)(b) | | 500,000 | 501,505 |
| Glendale Indl. Dev. Auth. (Terraces of Phoenix Proj.) Series 2018 A: | | | |
| 5% 7/1/38 | | 10,000 | 10,201 |
| 5% 7/1/48 | | 10,000 | 10,083 |
| Maricopa County Indl. Dev. Auth. Sr. Living Facilities Series 2016, 6% 1/1/48 (d) | | 200,000 | 200,628 |
| Phoenix Civic Impt. Board Arpt. Rev. Series 2017 A, 5% 7/1/31 (b) | | 400,000 | 460,244 |
| Univ. of Arizona Univ. Revs. Series 2015 A, 5% 6/1/22 | | 10,000 | 11,016 |
|
| TOTAL ARIZONA | | | 3,135,636 |
|
| California - 0.5% | | | |
| California Muni. Fin. Auth. Rev. (Linxs APM Proj.) Series 2018 A, 5% 12/31/47 (b) | | 500,000 | 542,870 |
| Colorado - 2.0% | | | |
| Arkansas River Pwr. Auth. Rev. Series 2018 A: | | | |
| 5% 10/1/38 | | 40,000 | 42,866 |
| 5% 10/1/43 | | 50,000 | 53,005 |
| Colorado Health Facilities Auth. (Parkview Med. Ctr., Inc. Proj.) Series 2016, 4% 9/1/35 | | 35,000 | 35,882 |
| Colorado Health Facilities Auth. Retirement Hsg. Rev. (Liberty Heights Proj.) 0% 7/15/22 (Escrowed to Maturity) | | 380,000 | 351,485 |
| Colorado Health Facilities Auth. Rev. Bonds Series 2016 C, 5%, tender 11/15/26 (a) | | 275,000 | 323,169 |
| Denver City & County Arpt. Rev.: | | | |
| Series 2017 A: | | | |
| 5% 11/15/23 (b) | | 25,000 | 28,078 |
| 5% 11/15/26 (b) | | 50,000 | 58,254 |
| Series 2018 A, 5% 12/1/34 (b) | | 1,125,000 | 1,344,758 |
|
| TOTAL COLORADO | | | 2,237,497 |
|
| Connecticut - 2.7% | | | |
| Connecticut Gen. Oblig. Series 2018 F: | | | |
| 5% 9/15/24 | | 100,000 | 112,072 |
| 5% 9/15/25 | | 100,000 | 113,155 |
| Connecticut Health & Edl. Facilities Auth. Rev.: | | | |
| Series 2012 J, 4% 7/1/19 | | 100,000 | 100,875 |
| Series A, 5% 7/1/26 | | 105,000 | 111,624 |
| Series F, 5% 7/1/21 (Escrowed to Maturity) | | 2,215,000 | 2,371,423 |
| Series K3, 5% 7/1/43 | | 215,000 | 230,441 |
|
| TOTAL CONNECTICUT | | | 3,039,590 |
|
| District Of Columbia - 0.3% | | | |
| Washington Convention & Sports Auth. Series 2018 A: | | | |
| 5% 10/1/23 | | 100,000 | 112,642 |
| 5% 10/1/24 | | 100,000 | 114,622 |
| 5% 10/1/25 | | 100,000 | 116,165 |
|
| TOTAL DISTRICT OF COLUMBIA | | | 343,429 |
|
| Florida - 4.8% | | | |
| Atlantic Beach Health Care facilities Series A, 5% 11/15/43 | | 255,000 | 268,377 |
| Broward County Arpt. Sys. Rev.: | | | |
| Series 2012 Q1, 5% 10/1/21 | | 250,000 | 269,995 |
| Series 2017: | | | |
| 5% 10/1/28 (b) | | 430,000 | 498,207 |
| 5% 10/1/42 (b) | | 1,365,000 | 1,511,519 |
| Broward County School Board Ctfs. of Prtn. Series 2015 A, 5% 7/1/23 | | 50,000 | 56,165 |
| Greater Orlando Aviation Auth. Arpt. Facilities Rev. Series 2017 A, 5% 10/1/31 (b) | | 125,000 | 143,270 |
| Jacksonville Elec. Auth. Elec. Sys. Rev. Series 2013 D, 5% 10/1/20 | | 1,480,000 | 1,549,190 |
| Lee County Arpt. Rev. Series 2011 A, 5.375% 10/1/32 (b) | | 25,000 | 26,652 |
| Miami-Dade County Aviation Rev. Series 2015 A, 5% 10/1/27 (b) | | 200,000 | 224,640 |
| Miami-Dade County Expressway Auth. Series 2014 A, 5% 7/1/25 | | 395,000 | 450,628 |
| Miami-Dade County School Board Ctfs. of Prtn.: | | | |
| Bonds Series 2014 A, 5%, tender 5/1/24 (a) | | 100,000 | 112,767 |
| Series 2015 D, 5% 2/1/26 | | 10,000 | 11,655 |
| South Miami Health Facilities Auth. Hosp. Rev. (Baptist Med. Ctr., FL. Proj.) Series 2017, 5% 8/15/26 | | 100,000 | 116,785 |
| Tampa Hosp. Rev. (H Lee Moffitt Cancer Ctr. Proj.) Series 2016 B, 5% 7/1/29 | | 25,000 | 28,352 |
|
| TOTAL FLORIDA | | | 5,268,202 |
|
| Georgia - 1.3% | | | |
| Georgia Muni. Elec. Auth. Pwr. Rev.: | | | |
| Series 2018 A, 5% 1/1/22 | | 375,000 | 404,138 |
| Series HH, 5% 1/1/22 | | 425,000 | 458,023 |
| Glynn-Brunswick Memorial Hosp. Auth. Rev. (Southeast Georgia Health Sys. Proj.) Series 2017: | | | |
| 4% 8/1/43 | | 5,000 | 4,848 |
| 5% 8/1/39 | | 5,000 | 5,407 |
| 5% 8/1/43 | | 5,000 | 5,398 |
| Main Street Natural Gas, Inc. Bonds Series 2018 C, 4%, tender 12/1/23 (a) | | 500,000 | 527,960 |
|
| TOTAL GEORGIA | | | 1,405,774 |
|
| Hawaii - 0.1% | | | |
| Hawaii Arpts. Sys. Rev. Series 2018 A, 5% 7/1/33 (b) | | 125,000 | 143,408 |
| Illinois - 20.4% | | | |
| Chicago Board of Ed.: | | | |
| Series 1998 B1, 0% 12/1/21 (Nat'l. Pub. Fin. Guarantee Corp. Insured) | | 45,000 | 41,040 |
| Series 2012 A, 5% 12/1/42 | | 500,000 | 499,980 |
| Series 2018 A: | | | |
| 5% 12/1/29 | | 350,000 | 365,852 |
| 5% 12/1/31 | | 150,000 | 155,210 |
| Series 2018 C, 5% 12/1/46 | | 200,000 | 198,502 |
| Chicago Midway Arpt. Rev.: | | | |
| Series 2014 B, 5% 1/1/26 | | 100,000 | 111,620 |
| Series 2016 B: | | | |
| 4% 1/1/35 | | 200,000 | 203,050 |
| 5% 1/1/46 | | 2,000,000 | 2,158,940 |
| Chicago O'Hare Int'l. Arpt. Rev. Series 2017 B, 5% 1/1/37 | | 50,000 | 55,744 |
| Chicago O'Hare Int'l. Arpt. Spl. Facilities Rev. Series 2018: | | | |
| 5% 7/1/38 (b) | | 50,000 | 55,038 |
| 5% 7/1/48 (b) | | 400,000 | 434,964 |
| Cook County Gen. Oblig.: | | | |
| Series 2009 C, 5% 11/15/21 | | 100,000 | 102,318 |
| Series 2011 A, 5.25% 11/15/23 | | 50,000 | 53,751 |
| Series 2016 A: | | | |
| 5% 11/15/23 | | 10,000 | 11,114 |
| 5% 11/15/31 | | 500,000 | 550,805 |
| Illinois Fin. Auth. Rev.: | | | |
| (Bradley Univ. Proj.) Series 2017 C, 5% 8/1/30 | | 615,000 | 697,453 |
| (Depaul Univ., IL Proj.): | | | |
| Series 2016 A, 5% 10/1/28 | | 10,000 | 11,552 |
| Series 2016, 5% 10/1/29 | | 30,000 | 34,520 |
| (OSF Healthcare Sys.) Series 2018 A: | | | |
| 4.125% 5/15/47 | | 750,000 | 741,923 |
| 5% 5/15/43 | | 790,000 | 872,152 |
| (Presence Health Proj.) Series 2016 C, 5% 2/15/36 | | 15,000 | 16,859 |
| Bonds Series E, 2.25%, tender 4/29/22 (a) | | 3,695,000 | 3,680,848 |
| Series 2011 IL: | | | |
| 4% 12/1/20 | | 100,000 | 103,979 |
| 5% 12/1/22 (Pre-Refunded to 12/1/21 @ 100) | | 5,000 | 5,424 |
| Series 2012 A, 5% 5/15/41 | | 695,000 | 733,461 |
| Series 2013, 5% 11/15/24 | | 65,000 | 71,178 |
| Series 2014, 5% 8/1/38 | | 10,000 | 10,907 |
| Series 2015 A: | | | |
| 5% 11/15/20 | | 760,000 | 800,835 |
| 5% 11/15/23 | | 10,000 | 11,226 |
| 5% 11/15/25 | | 150,000 | 172,806 |
| 5% 11/15/45 | | 300,000 | 321,378 |
| Series 2015 C: | | | |
| 4.125% 8/15/37 | | 60,000 | 60,395 |
| 5% 8/15/26 | | 35,000 | 39,283 |
| Series 2016 A: | | | |
| 5% 8/15/24 | | 65,000 | 72,062 |
| 5% 7/1/31 | | 30,000 | 33,531 |
| 5% 7/1/33 | | 10,000 | 11,107 |
| 5% 7/1/36 | | 45,000 | 49,478 |
| Series 2016 B, 5% 8/15/35 | | 250,000 | 278,343 |
| Series 2016 C: | | | |
| 4% 2/15/41 | | 40,000 | 40,302 |
| 5% 2/15/34 | | 50,000 | 56,655 |
| Series 2016: | | | |
| 5% 12/1/23 | | 155,000 | 171,667 |
| 5% 5/15/29 | | 10,000 | 11,384 |
| 5% 12/1/29 | | 620,000 | 697,010 |
| 5% 12/1/33 | | 485,000 | 535,445 |
| 5% 12/1/40 | | 85,000 | 90,908 |
| 5% 12/1/46 | | 95,000 | 101,164 |
| Series 2017 A, 5% 7/15/42 | | 1,000,000 | 1,109,580 |
| Series 2018 A: | | | |
| 4.25% 1/1/44 | | 55,000 | 55,409 |
| 5% 1/1/38 | | 225,000 | 244,514 |
| 5% 1/1/44 | | 340,000 | 366,272 |
| Illinois Gen. Oblig.: | | | |
| Serie 2014, 5% 4/1/24 | | 100,000 | 106,287 |
| Series 2013, 5% 7/1/23 | | 10,000 | 10,593 |
| Series 2016: | | | |
| 5% 2/1/21 | | 30,000 | 31,064 |
| 5% 2/1/27 | | 1,000,000 | 1,072,700 |
| 5% 11/1/29 | | 1,400,000 | 1,477,798 |
| Series 2017 D: | | | |
| 5% 11/1/24 | | 730,000 | 778,910 |
| 5% 11/1/27 | | 250,000 | 268,428 |
| Series 2017, 4% 2/1/24 | | 15,000 | 15,199 |
| Kane, Cook & DuPage Counties School District #46 Elgin Series 2003 B, 0% 1/1/22 (Escrowed to Maturity) | | 100,000 | 93,853 |
| Kendall, Kane & Will Counties Cmnty. Unit School District #308: | | | |
| Series 2008, 0% 2/1/25 (FSA Insured) | | 315,000 | 265,066 |
| Series 2011, 5.5% 2/1/22 | | 100,000 | 109,236 |
| Metropolitan Pier & Exposition: | | | |
| (McCormick Place Expansion Proj.) Series 2010 B1, 0% 6/15/43 (FSA Insured) | | 10,000 | 3,313 |
| Series 1994 A, 0% 6/15/25 | | 25,000 | 19,598 |
| Series 1994, 0% 6/15/28 (Nat'l. Pub. Fin. Guarantee Corp. Insured) | | 1,200,000 | 812,460 |
| Series 2012 B, 5% 6/15/23 | | 10,000 | 10,490 |
| Railsplitter Tobacco Settlement Auth. Rev. Series 2010, 5.5% 6/1/23 (Pre-Refunded to 6/1/21 @ 100) | | 105,000 | 113,787 |
| Univ. of Illinois Board of Trustees Ctfs. of Prtn. (Univ. of Illinois Rev. Proj.) Series 2014 A, 5% 10/1/26 | | 15,000 | 16,875 |
| Univ. of Illinois Rev. Series 2018 A, 5% 4/1/30 | | 100,000 | 115,775 |
|
| TOTAL ILLINOIS | | | 22,630,370 |
|
| Indiana - 0.3% | | | |
| Indiana Fin. Auth. Rev.: | | | |
| Series 2012, 5% 3/1/23 | | 35,000 | 37,998 |
| Series 2016: | | | |
| 5% 9/1/24 | | 20,000 | 22,793 |
| 5% 9/1/30 | | 50,000 | 56,797 |
| Purdue Univ. Rev. Series 2018 DD, 5% 7/1/38 | | 205,000 | 239,764 |
|
| TOTAL INDIANA | | | 357,352 |
|
| Iowa - 0.1% | | | |
| Iowa Fin. Auth. Rev. Series A: | | | |
| 5% 5/15/43 | | 25,000 | 25,827 |
| 5% 5/15/48 | | 40,000 | 41,183 |
|
| TOTAL IOWA | | | 67,010 |
|
| Kentucky - 2.1% | | | |
| Ashland Med. Ctr. Rev. (King's Daugthers Med. Ctr. Proj.) Series 2010 B, 4.5% 2/1/25 | | 25,000 | 25,365 |
| Kentucky State Property & Buildings Commission Rev.: | | | |
| (Proj. No. 118) Series 2018, 5% 4/1/25 | | 175,000 | 199,491 |
| (Proj. No. 119) Series 2018: | | | |
| 5% 5/1/26 | | 60,000 | 68,988 |
| 5% 5/1/29 | | 85,000 | 98,215 |
| 5% 5/1/32 | | 20,000 | 22,900 |
| 5% 5/1/33 | | 15,000 | 17,110 |
| 5% 5/1/34 | | 20,000 | 22,727 |
| 5% 5/1/35 | | 10,000 | 11,295 |
| 5% 5/1/36 | | 10,000 | 11,244 |
| 5% 5/1/38 | | 1,000,000 | 1,117,610 |
| Louisville & Jefferson County Series 2016 A, 5% 10/1/32 | | 70,000 | 78,172 |
| Louisville/Jefferson County Metropolitan Gov. Series 2012, 5% 12/1/35 | | 125,000 | 131,634 |
| Pikeville Hosp. Rev. Series 2011: | | | |
| 6% 3/1/20 | | 25,000 | 26,009 |
| 6% 3/1/22 | | 240,000 | 256,507 |
| 6% 3/1/22 (Pre-Refunded to 3/1/21 @ 100) | | 75,000 | 81,479 |
| Trimble County Poll. Cont. Rev. Bonds (Louisville Gas and Elec. Co. Proj.) Series 2001 B, 2.55%, tender 5/3/21 (a) | | 200,000 | 200,900 |
|
| TOTAL KENTUCKY | | | 2,369,646 |
|
| Louisiana - 0.2% | | | |
| Louisiana Pub. Facilities Auth. Rev. (Tulane Univ. of Louisiana Proj.): | | | |
| Series 2016 A, 5% 12/15/28 | | 15,000 | 17,337 |
| Series 2017 A, 5% 12/15/32 | | 165,000 | 188,920 |
|
| TOTAL LOUISIANA | | | 206,257 |
|
| Maine - 0.8% | | | |
| Maine Health & Higher Edl. Facilities Auth. Rev.: | | | |
| (Eastern Maine Healthcare Systems Proj.) Series 2013, 5% 7/1/43 | | 50,000 | 52,122 |
| (Univ. of New England) Series 2017 A, 4% 7/1/22 | | 20,000 | 21,225 |
| Series 2014, 5% 7/1/30 | | 585,000 | 650,122 |
| Series 2016 A: | | | |
| 4% 7/1/46 | | 5,000 | 4,744 |
| 5% 7/1/46 | | 125,000 | 131,866 |
| Series 2017 B, 5% 7/1/29 | | 10,000 | 11,555 |
|
| TOTAL MAINE | | | 871,634 |
|
| Maryland - 0.2% | | | |
| Maryland Health & Higher Edl. Facilities Auth. Rev. (Medstar Health, Inc. Proj.) Series 2017 A, 5% 5/15/45 | | 150,000 | 164,255 |
| Massachusetts - 1.8% | | | |
| Massachusetts Dev. Fin. Agcy. Rev.: | | | |
| (Lawrence Gen. Hosp.): | | | |
| Series 2014 A, 5.25% 7/1/34 | | 40,000 | 43,243 |
| Series 2017: | | | |
| 5% 7/1/19 | | 100,000 | 101,191 |
| 5% 7/1/20 | | 100,000 | 103,495 |
| 5% 7/1/21 | | 100,000 | 105,611 |
| 5% 7/1/47 | | 100,000 | 105,374 |
| Series 2016 A, 5% 1/1/31 | | 40,000 | 44,477 |
| Series 2016 I, 5% 7/1/30 | | 195,000 | 218,915 |
| Series 2017 A, 5% 1/1/37 | | 1,050,000 | 1,151,105 |
| Massachusetts Gen. Oblig. Series 2018 A, 5% 1/1/36 | | 100,000 | 116,006 |
|
| TOTAL MASSACHUSETTS | | | 1,989,417 |
|
| Michigan - 0.8% | | | |
| Detroit Downtown Dev. Auth. Tax Series A, 5% 7/1/37 (FSA Insured) | | 40,000 | 42,564 |
| Great Lakes Wtr. Auth. Mich Wtr. Series 2016 D, 5% 7/1/27 | | 100,000 | 116,321 |
| Great Lakes Wtr. Auth. Sew Disp. Sys. Series 2018 A, 5% 7/1/48 | | 200,000 | 225,608 |
| Michigan Fin. Auth. Rev.: | | | |
| (Charter County of Wayne Criminal Justice Ctr. Proj.) Series 2018, 5% 11/1/43 | | 50,000 | 56,500 |
| Series 2016, 5% 11/15/41 | | 30,000 | 32,321 |
| Michigan Hosp. Fin. Auth. Rev. (Trinity Health Proj.) Series 2008 C, 5% 12/1/32 | | 10,000 | 11,562 |
| Wayne County Arpt. Auth. Rev.: | | | |
| Series 2011 A, 5% 12/1/19 (b) | | 100,000 | 102,648 |
| Series 2017 A, 5% 12/1/29 | | 45,000 | 52,758 |
| Series 2017 B, 5% 12/1/42 (b) | | 150,000 | 164,564 |
| Series 2018 D, 5% 12/1/29 (b) | | 85,000 | 99,083 |
|
| TOTAL MICHIGAN | | | 903,929 |
|
| Minnesota - 1.1% | | | |
| Maple Grove Health Care Sys. Rev. ( North Memorial Med. Ctr., Proj.) Series 2015, 4% 9/1/21 | | 25,000 | 25,900 |
| Minnesota Higher Ed. Facilities Auth. Rev. Series 2018 A: | | | |
| 5% 10/1/30 | | 500,000 | 568,080 |
| 5% 10/1/45 | | 30,000 | 32,627 |
| White Bear Lake Minn Rev. (YMCA of Greater Twin Cities Proj.) Series 2018, 5% 6/1/22 | | 490,000 | 533,659 |
|
| TOTAL MINNESOTA | | | 1,160,266 |
|
| Missouri - 1.1% | | | |
| Missouri Health & Edl. Facilities Rev. Series 2018 A, 5% 11/15/43 | | 1,000,000 | 1,112,960 |
| Saint Louis County Indl. Dev. Auth. Sr. Living Facilities Rev. Series 2018 A: | | | |
| 5% 9/1/38 | | 30,000 | 30,089 |
| 5.125% 9/1/48 | | 55,000 | 55,058 |
|
| TOTAL MISSOURI | | | 1,198,107 |
|
| Montana - 0.0% | | | |
| Montana Facility Fin. Auth. Rev. (Benefis Health Sys. Proj.) Series 2016, 5% 2/15/32 | | 30,000 | 33,627 |
| New Hampshire - 0.8% | | | |
| New Hampshire Health & Ed. Facilities Auth. (Dartmouth-Hitchcock Oblgtd Grp Proj.) Series 2018 A: | | | |
| 5% 8/1/23 | | 200,000 | 224,072 |
| 5% 8/1/26 | | 105,000 | 123,493 |
| 5% 8/1/37 | | 100,000 | 111,577 |
| New Hampshire Health & Ed. Facilities Auth. Rev.: | | | |
| (Covenant Health Sys., Inc. Proj.) Series 2012, 5% 7/1/42 | | 310,000 | 321,039 |
| (Southern NH Med. Ctr. Proj.) Series 2016, 3% 10/1/21 | | 50,000 | 50,818 |
| Series 2016, 5% 10/1/22 | | 85,000 | 91,946 |
|
| TOTAL NEW HAMPSHIRE | | | 922,945 |
|
| New Jersey - 5.9% | | | |
| New Jersey Econ. Dev. Auth. Rev.: | | | |
| (New Jersey Gen. Oblig. Proj.) Series 2017 B, 5% 11/1/23 | | 25,000 | 27,372 |
| Series 2013 NN, 5% 3/1/29 | | 1,000,000 | 1,061,950 |
| Series 2013: | | | |
| 5% 3/1/23 | | 25,000 | 27,115 |
| 5% 3/1/24 | | 70,000 | 75,664 |
| Series 2017 DDD, 5% 6/15/30 | | 1,000,000 | 1,095,100 |
| New Jersey Health Care Facilities Fing. Auth. Rev. Series 2016: | | | |
| 4% 7/1/48 | | 100,000 | 96,800 |
| 5% 7/1/41 | | 65,000 | 69,087 |
| New Jersey Higher Ed. Student Assistance Auth. Student Ln. Rev.: | | | |
| Series 2011-1, 5.5% 12/1/21 (b) | | 80,000 | 86,602 |
| Series 2017 1A, 5% 12/1/26 (b) | | 200,000 | 228,432 |
| Series 2018 B: | | | |
| 5% 12/1/25 (b) | | 500,000 | 566,320 |
| 5% 12/1/26 (b) | | 315,000 | 359,780 |
| 5% 12/1/27 (b) | | 850,000 | 977,738 |
| 5% 12/1/28 (b) | | 750,000 | 861,563 |
| Series 2018 C, 4% 12/1/48 (b) | | 35,000 | 34,046 |
| New Jersey Trans. Trust Fund Auth.: | | | |
| Series 2003 B, 5.25% 12/15/19 | | 250,000 | 256,816 |
| Series 2009 A, 0% 12/15/36 | | 160,000 | 70,603 |
| Series 2014 AA, 5% 6/15/25 | | 100,000 | 109,827 |
| Series 2016 A, 5% 6/15/27 | | 160,000 | 179,403 |
| Series 2018 A: | | | |
| 5% 12/15/32 | | 100,000 | 109,603 |
| 5% 12/15/33 | | 100,000 | 108,998 |
| 5% 12/15/35 | | 100,000 | 108,140 |
|
| TOTAL NEW JERSEY | | | 6,510,959 |
|
| New York - 4.5% | | | |
| Buffalo and Erie County Indl. Land Rev. (Catholic Health Sys., Inc. Proj.) Series 2015, 5% 7/1/25 | | 400,000 | 455,744 |
| Hudson Yards Infrastructure Corp. New York Rev. Series 2017 A, 5% 2/15/37 | | 2,420,000 | 2,753,234 |
| MTA Hudson Rail Yards Trust Oblig. Series 2016 A, 5% 11/15/56 | | 100,000 | 106,241 |
| New York City Gen. Oblig. Series 2018 A, 5% 8/1/24 | | 100,000 | 115,187 |
| New York City Transitional Fin. Auth. Rev. Series 2016 E, 5% 2/1/37 | | 1,000,000 | 1,123,270 |
| New York Dorm. Auth. Personal Income Tax Rev. (New York State Pit Proj.) Series 2012 D, 5% 2/15/22 (Escrowed to Maturity) | | 10,000 | 10,899 |
| New York Metropolitan Trans. Auth. Rev. Series 2016 A, 5% 11/15/31 | | 100,000 | 112,846 |
| Onondaga Civic Dev. Corp. (Le Moyne College Proj.) Series 2015, 5% 7/1/27 | | 295,000 | 328,477 |
|
| TOTAL NEW YORK | | | 5,005,898 |
|
| Ohio - 6.0% | | | |
| Allen County Hosp. Facilities Rev.: | | | |
| (Mercy Health) Series 2017 A: | | | |
| 5% 8/1/25 | | 10,000 | 11,462 |
| 5% 8/1/26 | | 290,000 | 336,072 |
| 5% 8/1/27 | | 10,000 | 11,692 |
| 5% 8/1/28 | | 10,000 | 11,691 |
| 5% 8/1/29 | | 10,000 | 11,622 |
| 5% 8/1/30 | | 10,000 | 11,562 |
| Bonds (Mercy Health) Series 2017 B, 5%, tender 5/5/22 (a) | | 10,000 | 10,940 |
| American Muni. Pwr., Inc. Rev.: | | | |
| Bonds (Combined Hydroelectric Proj.) Series 2018, 2.25%, tender 8/15/21 (a) | | 500,000 | 499,870 |
| Series 2017 A, 5% 2/15/21 | | 30,000 | 31,868 |
| Fairfield County Hosp. Facilities Rev. (Fairfield Med. Ctr. Proj.) Series 2013, 4.25% 6/15/24 | | 110,000 | 113,554 |
| Hamilton County HealthCare Facilities Rev. (The Christ Hosp. Proj.) Series 2012, 5.25% 6/1/24 | | 2,900,000 | 3,177,066 |
| Lucas County Hosp. Rev. Series 2011, 5% 11/15/23 (Pre-Refunded to 11/15/21 @ 100) | | 20,000 | 21,698 |
| Muskingum County Hosp. Facilities (Genesis Healthcare Sys. Obligated Group Proj.) Series 2013: | | | |
| 4% 2/15/23 | | 315,000 | 323,048 |
| 5% 2/15/44 | | 100,000 | 102,081 |
| Steubenville Hosp. Rev. (Trinity Health Proj.) Series 2010, 4.125% 10/1/21 (Pre-Refunded to 2/1/20 @ 100) | | 15,000 | 15,353 |
| Univ. of Toledo Gen. Receipts Series 2018 A: | | | |
| 5% 6/1/20 | | 645,000 | 672,329 |
| 5% 6/1/21 | | 865,000 | 925,135 |
| 5% 6/1/22 | | 330,000 | 360,997 |
| Wood County Hosp. Facilities Rev. (Wood County Hosp. Assoc. Proj.) Series 2012, 5% 12/1/32 | | 15,000 | 15,654 |
|
| TOTAL OHIO | | | 6,663,694 |
|
| Oklahoma - 0.7% | | | |
| Oklahoma Dev. Fin. Auth. Health Sys. Rev. (OU Medicine Proj.) Series 2018 B: | | | |
| 5% 8/15/23 | | 200,000 | 219,288 |
| 5.5% 8/15/57 | | 515,000 | 564,080 |
|
| TOTAL OKLAHOMA | | | 783,368 |
|
| Oregon - 0.5% | | | |
| Oregon Bus. Dev. Commn Recovery Zone Facility Bonds (Intel Corp. Proj.) Series 232, 2.4%, tender 8/14/23 (a) | | 500,000 | 502,170 |
| Pennsylvania - 6.6% | | | |
| Centre County Pennsylvania Hosp. Auth. Rev. (Mount Nittany Med. Ctr. Proj.): | | | |
| Series 2016 A, 5% 11/15/46 | | 2,250,000 | 2,444,310 |
| Series 2018 A: | | | |
| 5% 11/15/22 | | 100,000 | 109,854 |
| 5% 11/15/25 | | 100,000 | 114,527 |
| Doylestown Hosp. Auth. Hosp. Rev. Series 2016 A, 5% 7/1/46 | | 20,000 | 20,694 |
| Dubois Hosp. Auth. Hosp. Rev. (Penn Highlands Healthcare Proj.) Series 2018: | | | |
| 4% 7/15/37 | | 40,000 | 40,423 |
| 5% 7/15/36 | | 500,000 | 561,355 |
| Lehigh County Gen. Purp. Auth. Rev. (Muhlenberg College Proj.) Series 2017, 5% 2/1/39 | | 60,000 | 66,909 |
| Northampton County Gen. Purp. Auth. Hosp. Rev.: | | | |
| (St. Luke's Univ. Health Network Proj.) Series 2018 A, 4% 8/15/48 | | 195,000 | 195,612 |
| Series 2016 A, 5% 8/15/46 | | 50,000 | 54,591 |
| Pennsylvania Ctfs. Prtn. Series 2018 A: | | | |
| 5% 7/1/23 | | 250,000 | 276,638 |
| 5% 7/1/24 | | 300,000 | 336,807 |
| 5% 7/1/25 | | 300,000 | 339,513 |
| 5% 7/1/26 | | 455,000 | 518,618 |
| 5% 7/1/27 | | 500,000 | 574,090 |
| 5% 7/1/34 | | 450,000 | 506,930 |
| Pennsylvania Higher Edl. Facilities Auth. Rev.: | | | |
| (Drexel Univ. Proj.): | | | |
| Series 2016, 5% 5/1/35 | | 500,000 | 555,590 |
| Series 2017, 5% 5/1/35 | | 10,000 | 11,309 |
| Series 2018 A, 5% 2/15/48 | | 100,000 | 114,900 |
| Philadelphia Gas Works Rev. Series 2015 13, 5% 8/1/21 | | 100,000 | 107,134 |
| Philadelphia School District: | | | |
| Series 2018 A, 5% 9/1/25 | | 50,000 | 56,771 |
| Series 2018 B, 5% 9/1/43 | | 50,000 | 54,474 |
| Southcentral Pennsylvania Gen. Auth. Rev. (Hanover Hosp., Inc. PA Proj.) Series 2015, 5% 12/1/28 | | 45,000 | 51,120 |
| Union County Hosp. Auth. Rev. Series 2018 B, 5% 8/1/43 | | 185,000 | 204,203 |
|
| TOTAL PENNSYLVANIA | | | 7,316,372 |
|
| Rhode Island - 0.7% | | | |
| Rhode Island Health & Edl. Bldg. Corp. Higher Ed. Facilities Rev. Series 2016: | | | |
| 5% 5/15/21 | | 25,000 | 26,486 |
| 5% 5/15/39 | | 50,000 | 53,855 |
| Rhode Island Student Ln. Auth. Student Ln. Rev. Series A, 5% 12/1/23 (b) | | 625,000 | 685,263 |
|
| TOTAL RHODE ISLAND | | | 765,604 |
|
| South Carolina - 3.0% | | | |
| South Carolina Jobs-Econ. Dev. Auth. Econ. Dev. Rev. (Bon Secours Health Sys. Proj.) Series 2013, 5% 11/1/28 (Pre-Refunded to 11/1/22 @ 100) | | 180,000 | 199,028 |
| South Carolina Pub. Svc. Auth. Rev.: | | | |
| Series 2010 B, 5% 1/1/21 (Pre-Refunded to 7/1/20 @ 100) | | 5,000 | 5,231 |
| Series 2014 A: | | | |
| 5% 12/1/49 | | 440,000 | 458,379 |
| 5.5% 12/1/54 | | 140,000 | 149,631 |
| Series 2014 C, 5% 12/1/46 | | 20,000 | 20,936 |
| Series 2015 A, 5% 12/1/50 | | 75,000 | 78,554 |
| Series 2015 E, 5.25% 12/1/55 | | 25,000 | 26,668 |
| Series 2016 A: | | | |
| 5% 12/1/26 | | 140,000 | 158,878 |
| 5% 12/1/29 | | 500,000 | 555,810 |
| 5% 12/1/33 | | 15,000 | 16,406 |
| 5% 12/1/38 | | 75,000 | 80,663 |
| Series 2016 B: | | | |
| 5% 12/1/31 | | 105,000 | 116,257 |
| 5% 12/1/35 | | 120,000 | 131,041 |
| 5% 12/1/41 | | 175,000 | 187,252 |
| South Carolina Trans. Infrastructure Bank Rev. Series 2016 A, 5% 10/1/25 | | 500,000 | 584,900 |
| Spartanburg County Reg'l. Health Series 2017 A: | | | |
| 4% 4/15/43 | | 30,000 | 30,022 |
| 4% 4/15/48 | | 20,000 | 19,593 |
| 5% 4/15/48 | | 415,000 | 451,595 |
|
| TOTAL SOUTH CAROLINA | | | 3,270,844 |
|
| Tennessee - 1.7% | | | |
| Greeneville Health & Edl. Facilities Board Series 2018 A: | | | |
| 5% 7/1/23 | | 15,000 | 16,639 |
| 5% 7/1/24 | | 20,000 | 22,167 |
| 5% 7/1/25 | | 20,000 | 22,104 |
| Memphis-Shelby County Arpt. Auth. Arpt. Rev. Series 2018, 5% 7/1/38 (b) | | 1,000,000 | 1,112,590 |
| Tennessee Energy Acquisition Corp. Bonds: | | | |
| (Gas Rev. Proj.) Series A, 4%, tender 5/1/23 (a) | | 460,000 | 477,954 |
| Series 2018, 4%, tender 11/1/49 | | 180,000 | 188,762 |
|
| TOTAL TENNESSEE | | | 1,840,216 |
|
| Texas - 11.4% | | | |
| Arlington Spl. Tax Rev. Series 2018 C, 5% 2/15/45 | | 50,000 | 52,223 |
| Austin Cmnty. College District Rev. (Highland Campus Parking Garage Proj.) Series 2018 C: | | | |
| 5% 8/1/25 | | 200,000 | 230,674 |
| 5% 8/1/26 | | 200,000 | 233,266 |
| Austin Elec. Util. Sys. Rev. Series 2017, 5% 11/15/35 | | 1,480,000 | 1,696,036 |
| Austin-Bergstrom Landhost Ente Series 2017, 5% 10/1/22 | | 115,000 | 125,858 |
| Dallas Fort Worth Int'l. Arpt. Rev. Series 2014 B, 5% 11/1/22 (b) | | 115,000 | 126,002 |
| Dallas Gen. Oblig. Series 2014, 5% 2/15/24 | | 1,500,000 | 1,704,495 |
| Dallas Independent School District Series 2016 A, 4% 2/15/29 | | 500,000 | 539,630 |
| Grand Parkway Trans. Corp.: | | | |
| Series 2013 B, 5.25% 10/1/51 | | 30,000 | 32,894 |
| Series 2018 A, 5% 10/1/43 | | 450,000 | 509,738 |
| Houston Arpt. Sys. Rev. Series 2018 C, 5% 7/1/30 (b) | | 120,000 | 139,379 |
| Houston Gen. Oblig. Series 2017 A: | | | |
| 5% 3/1/25 | | 500,000 | 579,925 |
| 5% 3/1/32 | | 25,000 | 28,888 |
| Love Field Arpt. Modernization Rev. Series 2017, 5% 11/1/31 (b) | | 25,000 | 28,241 |
| Lower Colorado River Auth. Rev. LCRA Transmission Corp. Series 2011 B, 5% 5/15/22 | | 300,000 | 320,481 |
| New Hope Cultural Ed. Facilities Finc (Childrens Med. Ctr. of Dallas) Series 2017 A: | | | |
| 5% 8/15/27 | | 10,000 | 11,876 |
| 5% 8/15/47 | | 10,000 | 11,123 |
| North Central Texas Health Facilities Dev. Corp. (Childrens Med. Ctr. of Dallas Proj.) Series 2012, 5% 8/15/32 (Pre-Refunded to 8/15/22 @ 100) | | 100,000 | 110,599 |
| San Antonio Elec. & Gas Sys. Rev. Series 2017, 5% 2/1/33 | | 5,000 | 5,802 |
| San Antonio Gen. Oblig. Series 2018, 5% 8/1/37 | | 40,000 | 46,616 |
| Tarrant County Cultural Ed. Facilities Fin. Corp. Hosp. Rev. (Scott & White Healthcare Proj.) Series 2013 A, 5% 8/15/21 | | 60,000 | 64,549 |
| Tarrant County Cultural Ed. Facilities Fin. Corp. Rev.: | | | |
| Series 2016 A, 5% 2/15/47 | | 2,335,000 | 2,572,236 |
| Series 2017 A, 5% 2/15/24 | | 265,000 | 300,030 |
| Texas Gen. Oblig. Series 2017 B, 5% 10/1/36 | | 100,000 | 115,528 |
| Univ. of Houston Univ. Revs. Series 2017 A: | | | |
| 5% 2/15/29 | | 1,000,000 | 1,159,210 |
| 5% 2/15/30 | | 690,000 | 796,453 |
| Univ. of North Texas Univ. Rev. Series 2018 A, 5% 4/15/44 | | 450,000 | 509,184 |
| Waco Gen. Oblig. Series 2015, 5% 2/1/25 | | 500,000 | 567,420 |
|
| TOTAL TEXAS | | | 12,618,356 |
|
| Utah - 0.3% | | | |
| Salt Lake City Arpt. Rev.: | | | |
| Series 2017 A, 5% 7/1/24 (b) | | 10,000 | 11,298 |
| Series 2018 A: | | | |
| 5% 7/1/33 (b) | | 175,000 | 200,309 |
| 5.25% 7/1/48 (b) | | 130,000 | 147,233 |
|
| TOTAL UTAH | | | 358,840 |
|
| Virginia - 1.6% | | | |
| Roanoke Econ. Dev. Auth. Edl. Facilities Series 2018 A: | | | |
| 5% 9/1/23 | | 360,000 | 392,890 |
| 5% 9/1/24 | | 315,000 | 347,738 |
| 5% 9/1/27 | | 875,000 | 986,230 |
| Winchester Econ. Dev. Auth. (Valley Health Proj.) Series 2015, 5% 1/1/22 | | 50,000 | 54,263 |
|
| TOTAL VIRGINIA | | | 1,781,121 |
|
| Washington - 2.9% | | | |
| Port of Seattle Rev. Series 2015 C, 5% 4/1/24 (b) | | 50,000 | 56,185 |
| Washington Gen. Oblig.: | | | |
| Series 2013 A, 5% 7/1/23 | | 5,000 | 5,511 |
| Series 2017 A, 5% 8/1/35 | | 2,500,000 | 2,863,950 |
| Washington Health Care Facilities Auth. Rev.: | | | |
| (Catholic Health Initiatives Proj.) Series 2008 D, 6.375% 10/1/36 | | 5,000 | 5,016 |
| (Overlake Hosp. Med. Ctr., WA. Proj.) Series 2017 B: | | | |
| 5% 7/1/25 | | 5,000 | 5,700 |
| 5% 7/1/30 | | 5,000 | 5,775 |
| 5% 7/1/31 | | 10,000 | 11,473 |
| 5% 7/1/42 | | 100,000 | 110,110 |
| Washington Hsg. Fin. Commission Nonprofit Hsg. Rev. (Judson Park Proj.) Series 2018, 5% 7/1/38 (d) | | 100,000 | 102,222 |
|
| TOTAL WASHINGTON | | | 3,165,942 |
|
| West Virginia - 0.1% | | | |
| West Virginia Hosp. Fin. Auth. Hosp. Rev. Series 2018 A, 5% 1/1/32 | | 50,000 | 56,822 |
| Wisconsin - 0.7% | | | |
| Pub. Fin. Auth. Rev.: | | | |
| (Denver Great Hall LLC. Proj.) Series 2017, 5% 9/30/49 (b) | | 235,000 | 252,538 |
| (Denver Int. Arpt. Great Hall Proj.) Series 2017, 5% 9/30/24 (b) | | 10,000 | 11,126 |
| Pub. Fin. Auth. Sr Liv Rev. (Mary's Woods At Marylhurst, Inc. Proj.) Series 2017 B-1 3.95% 11/15/24 (d) | | 5,000 | 5,025 |
| Pub. Fin. Auth. Wis Edl. Facilities Series 2018 A: | | | |
| 5.25% 10/1/43 | | 160,000 | 169,890 |
| 5.25% 10/1/48 | | 160,000 | 168,725 |
| Pub. Fin. Auth. Wisconsin Retirement Facility Rev. Series 2018: | | | |
| 5% 10/1/43 (d) | | 15,000 | 15,091 |
| 5% 10/1/48 (d) | | 15,000 | 15,033 |
| 5% 10/1/53 (d) | | 30,000 | 29,900 |
| Wisconsin Health & Edl. Facilities Auth. Rev. (Mercy Alliance, Inc. Proj.) Series 2012, 5% 6/1/19 | | 100,000 | 101,149 |
|
| TOTAL WISCONSIN | | | 768,477 |
|
| TOTAL MUNICIPAL BONDS | | | |
| (Cost $101,175,936) | | | 101,671,135 |
| | | Shares | Value |
|
| Money Market Funds - 7.5% | | | |
| Fidelity Municipal Cash Central Fund, 1.77% (e)(f) | | | |
| (Cost $8,299,998) | | 8,299,170 | 8,299,980 |
| TOTAL INVESTMENT IN SECURITIES - 99.4% | | | |
| (Cost $109,475,934) | | | 109,971,115 |
| NET OTHER ASSETS (LIABILITIES) - 0.6% | | | 708,595 |
| NET ASSETS - 100% | | | $110,679,710 |
Legend
(a) Coupon rates for floating and adjustable rate securities reflect the rates in effect at period end.
(b) Private activity obligations whose interest is subject to the federal alternative minimum tax for individuals.
(c) Security or a portion of the security purchased on a delayed delivery or when-issued basis.
(d) Security exempt from registration under Rule 144A of the Securities Act of 1933. These securities may be resold in transactions exempt from registration, normally to qualified institutional buyers. At the end of the period, the value of these securities amounted to $367,899 or 0.3% of net assets.
(e) Information in this report regarding holdings by state and security types does not reflect the holdings of the Fidelity Municipal Cash Central Fund.
(f) Affiliated fund that is available only to investment companies and other accounts managed by Fidelity Investments. The rate quoted is the annualized seven-day yield of the fund at period end. A complete unaudited listing of the fund's holdings as of its most recent quarter end is available upon request. In addition, each Fidelity Central Fund's financial statements, which are not covered by the Fund's Report of Independent Registered Public Accounting Firm, are available on the SEC's website or upon request.
Affiliated Central Funds
Information regarding fiscal year to date income earned by the Fund from investments in Fidelity Central Funds is as follows:
| Fund | Income earned |
| Fidelity Municipal Cash Central Fund | $78,694 |
| Total | $78,694 |
Amounts in the income column in the above table include any capital gain distributions from underlying funds, which are presented in the corresponding line-item in the Statement of Operations if applicable.
Investment Valuation
The following is a summary of the inputs used, as of December 31, 2018, involving the Fund's assets and liabilities carried at fair value. The inputs or methodology used for valuing securities may not be an indication of the risk associated with investing in those securities. For more information on valuation inputs, and their aggregation into the levels used below, please refer to the Investment Valuation section in the accompanying Notes to Financial Statements.
| | Valuation Inputs at Reporting Date: |
| Description | Total | Level 1 | Level 2 | Level 3 |
| Investments in Securities: | | | | |
| Municipal Securities | $101,671,135 | $-- | $101,671,135 | $-- |
| Money Market Funds | 8,299,980 | 8,299,980 | -- | -- |
| Total Investments in Securities: | $109,971,115 | $8,299,980 | $101,671,135 | $-- |
Other Information
The distribution of municipal securities by revenue source, as a percentage of total Net Assets, is as follows (Unaudited):
| Health Care | 27.6% |
| General Obligations | 18.5% |
| Education | 15.4% |
| Transportation | 11.2% |
| Electric Utilities | 7.8% |
| Money Market Funds | 7.5% |
| Special Tax | 5.6% |
| Others* (Individually Less Than 5%) | 6.4% |
| | 100.0% |
* Includes net other assets
See accompanying notes which are an integral part of the financial statements.
Financial Statements
Statement of Assets and Liabilities
| | | December 31, 2018 |
| Assets | | |
Investment in securities, at value — See accompanying schedule:
Unaffiliated issuers (cost $101,175,936) | $101,671,135 | |
| Fidelity Central Funds (cost $8,299,998) | 8,299,980 | |
| Total Investment in Securities (cost $109,475,934) | | $109,971,115 |
| Cash | | 241,055 |
| Receivable for fund shares sold | | 181,353 |
| Interest receivable | | 1,155,042 |
| Distributions receivable from Fidelity Central Funds | | 14,852 |
| Other receivables | | 458 |
| Total assets | | 111,563,875 |
| Liabilities | | |
| Payable for investments purchased on a delayed delivery basis | $451,537 | |
| Payable for fund shares redeemed | 156,239 | |
| Distributions payable | 276,389 | |
| Total liabilities | | 884,165 |
| Net Assets | | $110,679,710 |
| Net Assets consist of: | | |
| Paid in capital | | $110,469,776 |
| Total distributable earnings (loss) | | 209,934 |
| Net Assets, for 11,233,982 shares outstanding | | $110,679,710 |
| Net Asset Value, offering price and redemption price per share ($110,679,710 ÷ 11,233,982 shares) | | $9.85 |
See accompanying notes which are an integral part of the financial statements.
Statement of Operations
| | | Year ended December 31, 2018 |
| Investment Income | | |
| Interest | | $2,018,667 |
| Income from Fidelity Central Funds | | 78,694 |
| Total income | | 2,097,361 |
| Expenses | | |
| Independent trustees' fees and expenses | $319 | |
| Commitment fees | 118 | |
| Total expenses | | 437 |
| Net investment income (loss) | | 2,096,924 |
| Realized and Unrealized Gain (Loss) | | |
| Net realized gain (loss) on: | | |
| Investment securities: | | |
| Unaffiliated issuers | (282,724) | |
| Total net realized gain (loss) | | (282,724) |
| Change in net unrealized appreciation (depreciation) on: | | |
| Investment securities: | | |
| Unaffiliated issuers | 454,815 | |
| Fidelity Central Funds | (11) | |
| Total change in net unrealized appreciation (depreciation) | | 454,804 |
| Net gain (loss) | | 172,080 |
| Net increase (decrease) in net assets resulting from operations | | $2,269,004 |
See accompanying notes which are an integral part of the financial statements.
Statement of Changes in Net Assets
| | Year ended December 31, 2018 | For the period
October 12, 2017 (commencement of operations) to December 31, 2017 |
| Increase (Decrease) in Net Assets | | |
| Operations | | |
| Net investment income (loss) | $2,096,924 | $40,386 |
| Net realized gain (loss) | (282,724) | (2,264) |
| Change in net unrealized appreciation (depreciation) | 454,804 | 40,377 |
| Net increase (decrease) in net assets resulting from operations | 2,269,004 | 78,499 |
| Distributions to shareholders | (2,096,254) | – |
| Distributions to shareholders from net investment income | – | (40,309) |
| Distributions to shareholders from net realized gain | – | (1,007) |
| Total distributions | (2,096,254) | (41,316) |
| Share transactions | | |
| Proceeds from sales of shares | 146,892,882 | 10,050,000 |
| Reinvestment of distributions | 71,016 | 41,115 |
| Cost of shares redeemed | (46,585,236) | – |
| Net increase (decrease) in net assets resulting from share transactions | 100,378,662 | 10,091,115 |
| Total increase (decrease) in net assets | 100,551,412 | 10,128,298 |
| Net Assets | | |
| Beginning of period | 10,128,298 | – |
| End of period | $110,679,710 | $10,128,298 |
| Other Information | | |
| Distributions in excess of net investment income end of period | | $(849) |
| Shares | | |
| Sold | 14,973,498 | 1,004,995 |
| Issued in reinvestment of distributions | 7,225 | 4,113 |
| Redeemed | (4,755,849) | – |
| Net increase (decrease) | 10,224,874 | 1,009,108 |
See accompanying notes which are an integral part of the financial statements.
Financial Highlights
Fidelity Flex Municipal Income Fund
| | | |
| Years ended December 31, | 2018 | 2017 A |
| Selected Per–Share Data | | |
| Net asset value, beginning of period | $10.04 | $10.00 |
| Income from Investment Operations | | |
| Net investment income (loss)B | .261 | .040 |
| Net realized and unrealized gain (loss) | (.193)C | .041 |
| Total from investment operations | .068 | .081 |
| Distributions from net investment income | (.258) | (.040) |
| Distributions from net realized gain | – | (.001) |
| Total distributions | (.258) | (.041) |
| Net asset value, end of period | $9.85 | $10.04 |
| Total ReturnD | .71% | .81% |
| Ratios to Average Net AssetsE,F | | |
| Expenses before reductionsG | -% | - %H |
| Expenses net of fee waivers, if anyG | -% | - %H |
| Expenses net of all reductionsG | -% | - %H |
| Net investment income (loss) | 2.69% | 1.81%H |
| Supplemental Data | | |
| Net assets, end of period (000 omitted) | $110,680 | $10,128 |
| Portfolio turnover rateI | 73% | 35%J |
A For the period October 12, 2017 (commencement of operations) to December 31, 2017.
B Calculated based on average shares outstanding during the period.
C The amount shown for a share outstanding does not correspond with the aggregate net gain (loss) on investments for the period due to the timing of sales and repurchases of shares in relation to fluctuating market values of the investments of the Fund.
D Total returns for periods of less than one year are not annualized.
E Fees and expenses of any underlying Fidelity Central Funds are not included in the Fund's expense ratio. The Fund indirectly bears its proportionate share of the expenses of any underlying Fidelity Central Funds.
F Expense ratios reflect operating expenses of the Fund. Expenses before reductions do not reflect amounts reimbursed by the investment adviser or reductions from expense offset arrangements and do not represent the amount paid by the Fund during periods when reimbursements or reductions occur. Expenses net of fee waivers reflect expenses after reimbursement by the investment adviser but prior to reductions from expense offset arrangements. Expenses net of all reductions represent the net expenses paid by the Fund.
G Amount represents less than .005%.
H Annualized
I Amount does not include the portfolio activity of any underlying Fidelity Central Funds.
J Amount not annualized.
See accompanying notes which are an integral part of the financial statements.
Notes to Financial Statements
For the period ended December 31, 2018
1. Organization.
Fidelity Flex Municipal Income Fund (the Fund) is a fund of Fidelity Municipal Trust (the Trust) and is authorized to issue an unlimited number of shares. Share transactions on the Statement of Changes in Net Assets may contain exchanges between affiliated funds. The Trust is registered under the Investment Company Act of 1940, as amended (the 1940 Act), as an open-end management investment company organized as a Massachusetts business trust. The Fund is available only to certain fee-based accounts offered by Fidelity.
2. Investments in Fidelity Central Funds.
The Fund invests in Fidelity Central Funds, which are open-end investment companies generally available only to other investment companies and accounts managed by the investment adviser and its affiliates. The Fund's Schedule of Investments lists each of the Fidelity Central Funds held as of period end, if any, as an investment of the Fund, but does not include the underlying holdings of each Fidelity Central Fund. As an Investing Fund, the Fund indirectly bears its proportionate share of the expenses of the underlying Fidelity Central Funds.
The Money Market Central Funds seek preservation of capital and current income and are managed by Fidelity Investments Money Management, Inc. (FIMM), an affiliate of the investment adviser. Annualized expenses of the Money Market Central Funds as of their most recent shareholder report date are less than .005%.
A complete unaudited list of holdings for each Fidelity Central Fund is available upon request or at the Securities and Exchange Commission (the SEC) website at www.sec.gov. In addition, the financial statements of the Fidelity Central Funds, which are not covered by the Fund's Report of Independent Registered Public Accounting Firm, are available on the SEC website or upon request.
3. Significant Accounting Policies.
The Fund is an investment company and applies the accounting and reporting guidance of the Financial Accounting Standards Board (FASB) Accounting Standards Codification Topic 946 Financial Services – Investments Companies. The financial statements have been prepared in conformity with accounting principles generally accepted in the United States of America (GAAP), which require management to make certain estimates and assumptions at the date of the financial statements. Actual results could differ from those estimates. Subsequent events, if any, through the date that the financial statements were issued have been evaluated in the preparation of the financial statements. The following summarizes the significant accounting policies of the Fund:
Investment Valuation. Investments are valued as of 4:00 p.m. Eastern time on the last calendar day of the period. The Board of Trustees (the Board) has delegated the day to day responsibility for the valuation of the Fund's investments to the Fair Value Committee (the Committee) established by the Fund's investment adviser. In accordance with valuation policies and procedures approved by the Board, the Fund attempts to obtain prices from one or more third party pricing vendors or brokers to value its investments. When current market prices, quotations or currency exchange rates are not readily available or reliable, investments will be fair valued in good faith by the Committee, in accordance with procedures adopted by the Board. Factors used in determining fair value vary by investment type and may include market or investment specific events, changes in interest rates and credit quality. The frequency with which these procedures are used cannot be predicted and they may be utilized to a significant extent. The Committee oversees the Fund's valuation policies and procedures and reports to the Board on the Committee's activities and fair value determinations. The Board monitors the appropriateness of the procedures used in valuing the Fund's investments and ratifies the fair value determinations of the Committee.
The Fund categorizes the inputs to valuation techniques used to value its investments into a disclosure hierarchy consisting of three levels as shown below:
- Level 1 – quoted prices in active markets for identical investments
- Level 2 – other significant observable inputs (including quoted prices for similar investments, interest rates, prepayment speeds, etc.)
- Level 3 – unobservable inputs (including the Fund's own assumptions based on the best information available)
Valuation techniques used to value the Fund's investments by major category are as follows:
Debt securities, including restricted securities, are valued based on evaluated prices received from third party pricing vendors or from brokers who make markets in such securities. Municipal securities are valued by pricing vendors who utilize matrix pricing which considers yield or price of bonds of comparable quality, coupon, maturity and type or by broker-supplied prices. When independent prices are unavailable or unreliable, debt securities may be valued utilizing pricing methodologies which consider similar factors that would be used by third party pricing vendors. Debt securities are generally categorized as Level 2 in the hierarchy but may be Level 3 depending on the circumstances.
Investments in open-end mutual funds, including the Fidelity Central Funds, are valued at their closing net asset value (NAV) each business day and are categorized as Level 1 in the hierarchy.
Changes in valuation techniques may result in transfers in or out of an assigned level within the disclosure hierarchy. The aggregate value of investments by input level as of December 31, 2018 is included at the end of the Fund's Schedule of Investments.
Investment Transactions and Income. For financial reporting purposes, the Fund's investment holdings and NAV include trades executed through the end of the last business day of the period. The NAV per share for processing shareholder transactions is calculated as of the close of business of the New York Stock Exchange (NYSE), normally 4:00 p.m. Eastern time and includes trades executed through the end of the prior business day. Gains and losses on securities sold are determined on the basis of identified cost. Income and capital gain distributions from Fidelity Central Funds, if any, are recorded on the ex-dividend date. Interest income is accrued as earned and includes coupon interest and amortization of premium and accretion of discount on debt securities as applicable. Debt obligations may be placed on non-accrual status and related interest income may be reduced by ceasing current accruals and writing off interest receivables when the collection of all or a portion of interest has become doubtful based on consistently applied procedures. A debt obligation is removed from non-accrual status when the issuer resumes interest payments or when collectability of interest is reasonably assured.
Expenses. Expenses directly attributable to a fund are charged to that fund. Expenses attributable to more than one fund are allocated among the respective funds on the basis of relative net assets or other appropriate methods. Expense estimates are accrued in the period to which they relate and adjustments are made when actual amounts are known.
Income Tax Information and Distributions to Shareholders. Each year, the Fund intends to qualify as a regulated investment company under Subchapter M of the Internal Revenue Code, including distributing substantially all of its taxable income and realized gains. As a result, no provision for U.S. Federal income taxes is required. As of December 31, 2018, the Fund did not have any unrecognized tax benefits in the financial statements; nor is the Fund aware of any tax positions for which it is reasonably possible that the total amounts of unrecognized tax benefits will significantly change in the next twelve months. The Fund files a U.S. federal tax return, in addition to state and local tax returns as required. The Fund's federal income tax returns are subject to examination by the Internal Revenue Service (IRS) for a period of three fiscal years after they are filed. State and local tax returns may be subject to examination for an additional fiscal year depending on the jurisdiction.
Distributions are declared and recorded daily and paid monthly from net investment income. Distributions from realized gains, if any, are declared and recorded on the ex-dividend date. Income and capital gain distributions are determined in accordance with income tax regulations, which may differ from GAAP.
Capital accounts within the financial statements are adjusted for permanent book-tax differences. These adjustments have no impact on net assets or the results of operations. Capital accounts are not adjusted for temporary book-tax differences which will reverse in a subsequent period.
Book-tax differences are primarily due market discount and capital loss carryforwards.
The Fund purchases municipal securities whose interest, in the opinion of the issuer, is free from federal income tax. There is no assurance that the IRS will agree with this opinion. In the event the IRS determines that the issuer does not comply with relevant tax requirements, interest payments from a security could become federally taxable, possibly retroactively to the date the security was issued.
As of period end, the cost and unrealized appreciation (depreciation) in securities, and derivatives if applicable, for federal income tax purposes were as follows:
| Gross unrealized appreciation | $804,133 |
| Gross unrealized depreciation | (308,595) |
| Net unrealized appreciation (depreciation) | $495,538 |
| Tax Cost | $109,475,577 |
The tax-based components of distributable earnings as of period end were as follows:
| Capital loss carryforward | $(285,068) |
| Net unrealized appreciation (depreciation) on securities and other investments | $495,538 |
Capital loss carryforwards are only available to offset future capital gains of the Fund to the extent provided by regulations and may be limited. Under the Regulated Investment Company Modernization Act of 2010 (the Act), the Fund is permitted to carry forward capital losses incurred in taxable years beginning after December 22, 2010 for an unlimited period and such capital losses are required to be used prior to any losses that expire. The capital loss carryforward information presented below, including any applicable limitation, is estimated as of fiscal period end and is subject to adjustment.
| No expiration | |
| Short-term | $(270,486) |
| Long-term | (14,582) |
| Total capital loss carryforward | $(285,068) |
The tax character of distributions paid was as follows:
| | December 31, 2018 | December 31, 2017(a) |
| Tax-exempt Income | $2,096,254 | $40,309 |
| Ordinary Income | - | 1,007 |
| Total | $2,096,254 | $ 41,316 |
(a) For the period October 12, 2017 (commencement of operations) to December 31, 2017.
Delayed Delivery Transactions and When-Issued Securities. During the period, the Fund transacted in securities on a delayed delivery or when-issued basis. Payment and delivery may take place after the customary settlement period for that security. The price of the underlying securities and the date when the securities will be delivered and paid for are fixed at the time the transaction is negotiated. The securities purchased on a delayed delivery or when-issued basis are identified as such in the Fund's Schedule of Investments. The Fund may receive compensation for interest forgone in the purchase of a delayed delivery or when-issued security. With respect to purchase commitments, the Fund identifies securities as segregated in its records with a value at least equal to the amount of the commitment. Losses may arise due to changes in the value of the underlying securities or if the counterparty does not perform under the contract's terms, or if the issuer does not issue the securities due to political, economic, or other factors.
Restricted Securities. The Fund may invest in securities that are subject to legal or contractual restrictions on resale. These securities generally may be resold in transactions exempt from registration or to the public if the securities are registered. Disposal of these securities may involve time-consuming negotiations and expense, and prompt sale at an acceptable price may be difficult. Information regarding restricted securities is included at the end of the Fund's Schedule of Investments.
New Rule Issuance. During August 2018, the U.S. Securities and Exchange Commission issued Final Rule Release No. 33-10532, Disclosure Update and Simplification. This Final Rule includes amendments specific to registered investment companies that are intended to eliminate overlap in disclosure requirements between Regulation S-X and GAAP. In accordance with these amendments, certain line-items in the Fund's financial statements have been combined or removed for the current period as outlined in the table below.
| Financial Statement | Current Line-Item Presentation | Prior Line-Item Presentation |
| Statement of Assets and Liabilities | Total distributable earnings (loss) | Undistributed/Distributions in excess of/Accumulated net investment income (loss)
Accumulated/Undistributed net realized gain (loss)
Net unrealized appreciation (depreciation) |
| Statement of Changes in Net Assets | N/A - removed | Undistributed/Distributions in excess of/Accumulated net investment income (loss) end of period |
| Statement of Changes in Net Assets | Distributions to shareholders | Distributions to shareholders from net investment income
Distributions to shareholders from net realized gain |
4. Purchases and Sales of Investments.
Purchases and sales of securities, other than short-term securities, aggregated $143,237,717 and $48,854,447, respectively.
5. Fees and Other Transactions with Affiliates.
Management Fee. Fidelity Management & Research Company (the investment adviser) and its affiliates provide the Fund with investment management related services and the Fund does not pay any fees for these services. Under the management contract, the investment adviser or an affiliate pays all other expenses of the Fund, excluding fees and expenses of the independent Trustees, and certain miscellaneous expenses such as proxy and shareholder meeting expenses.
Interfund Trades. The Fund may purchase from or sell securities to other Fidelity Funds under procedures adopted by the Board. The procedures have been designed to ensure these interfund trades are executed in accordance with Rule 17a-7 of the 1940 Act. Interfund trades are included within the respective purchases and sales amounts shown in the Purchases and Sales of Investments note.
6. Committed Line of Credit.
The Fund participates with other funds managed by the investment adviser or an affiliate in a $4.25 billion credit facility (the "line of credit") to be utilized for temporary or emergency purposes to fund shareholder redemptions or for other short-term liquidity purposes. The Fund has agreed to pay commitment fees on its pro-rata portion of the line of credit, which amounted to $118 and is reflected in Commitment fees on the Statement of Operations. During the period, the Fund did not borrow on this line of credit.
7. Other.
The Fund's organizational documents provide former and current trustees and officers with a limited indemnification against liabilities arising in connection with the performance of their duties to the Fund. In the normal course of business, the Fund may also enter into contracts that provide general indemnifications. The Fund's maximum exposure under these arrangements is unknown as this would be dependent on future claims that may be made against the Fund. The risk of material loss from such claims is considered remote.
Report of Independent Registered Public Accounting Firm
To the Board of Trustees of Fidelity Municipal Trust and Shareholders of Fidelity Flex Municipal Income Fund:
Opinion on the Financial Statements
We have audited the accompanying statement of assets and liabilities, including the schedule of investments, of Fidelity Flex Municipal Income Fund (one of the funds constituting Fidelity Municipal Trust, referred to hereafter as the "Fund") as of December 31, 2018, the related statement of operations for the year ended December 31, 2018 and the statement of changes in net assets and the financial highlights for the year ended December 31, 2018 and for the period October 12, 2017 (commencement of operations) through December 31, 2017, including the related notes (collectively referred to as the “financial statements”). In our opinion, the financial statements present fairly, in all material respects, the financial position of the Fund as of December 31, 2018, the results of its operations for the year ended December 31, 2018, and the changes in its net assets and the financial highlights for the year ended December 31, 2018 and for the period October 12, 2017 (commencement of operations) through December 31, 2017 in conformity with accounting principles generally accepted in the United States of America.
Basis for Opinion
These financial statements are the responsibility of the Fund’s management. Our responsibility is to express an opinion on the Fund’s financial statements based on our audits. We are a public accounting firm registered with the Public Company Accounting Oversight Board (United States) (PCAOB) and are required to be independent with respect to the Fund in accordance with the U.S. federal securities laws and the applicable rules and regulations of the Securities and Exchange Commission and the PCAOB.
We conducted our audits of these financial statements in accordance with the standards of the PCAOB. Those standards require that we plan and perform the audit to obtain reasonable assurance about whether the financial statements are free of material misstatement, whether due to error or fraud.
Our audits included performing procedures to assess the risks of material misstatement of the financial statements, whether due to error or fraud, and performing procedures that respond to those risks. Such procedures included examining, on a test basis, evidence regarding the amounts and disclosures in the financial statements. Our audits also included evaluating the accounting principles used and significant estimates made by management, as well as evaluating the overall presentation of the financial statements. Our procedures included confirmation of securities owned as of December 31, 2018 by correspondence with the custodian and brokers; when replies were not received from brokers, we performed other auditing procedures. We believe that our audits provide a reasonable basis for our opinion.
PricewaterhouseCoopers LLP
Boston, Massachusetts
February 14, 2019
We have served as the auditor of one or more investment companies in the Fidelity group of funds since 1932.
Trustees and Officers
The Trustees, Members of the Advisory Board (if any), and officers of the trust and fund, as applicable, are listed below. The Board of Trustees governs the fund and is responsible for protecting the interests of shareholders. The Trustees are experienced executives who meet periodically throughout the year to oversee the fund's activities, review contractual arrangements with companies that provide services to the fund, oversee management of the risks associated with such activities and contractual arrangements, and review the fund's performance. Each of the Trustees oversees 260 funds.
The Trustees hold office without limit in time except that (a) any Trustee may resign; (b) any Trustee may be removed by written instrument, signed by at least two-thirds of the number of Trustees prior to such removal; (c) any Trustee who requests to be retired or who has become incapacitated by illness or injury may be retired by written instrument signed by a majority of the other Trustees; and (d) any Trustee may be removed at any special meeting of shareholders by a two-thirds vote of the outstanding voting securities of the trust. Each Trustee who is not an interested person (as defined in the 1940 Act) of the trust and the fund is referred to herein as an Independent Trustee. Each Independent Trustee shall retire not later than the last day of the calendar year in which his or her 75th birthday occurs. The Independent Trustees may waive this mandatory retirement age policy with respect to individual Trustees. Officers and Advisory Board Members hold office without limit in time, except that any officer or Advisory Board Member may resign or may be removed by a vote of a majority of the Trustees at any regular meeting or any special meeting of the Trustees. Except as indicated, each individual has held the office shown or other offices in the same company for the past five years.
The fund’s Statement of Additional Information (SAI) includes more information about the Trustees. To request a free copy, call Fidelity at 1-800-835-5092 (plan accounts) or 1-800-544-3455 (all other accounts).
Experience, Skills, Attributes, and Qualifications of the Trustees. The Governance and Nominating Committee has adopted a statement of policy that describes the experience, qualifications, attributes, and skills that are necessary and desirable for potential Independent Trustee candidates (Statement of Policy). The Board believes that each Trustee satisfied at the time he or she was initially elected or appointed a Trustee, and continues to satisfy, the standards contemplated by the Statement of Policy. The Governance and Nominating Committee also engages professional search firms to help identify potential Independent Trustee candidates who have the experience, qualifications, attributes, and skills consistent with the Statement of Policy. From time to time, additional criteria based on the composition and skills of the current Independent Trustees, as well as experience or skills that may be appropriate in light of future changes to board composition, business conditions, and regulatory or other developments, have also been considered by the professional search firms and the Governance and Nominating Committee. In addition, the Board takes into account the Trustees' commitment and participation in Board and committee meetings, as well as their leadership of standing and ad hoc committees throughout their tenure.
In determining that a particular Trustee was and continues to be qualified to serve as a Trustee, the Board has considered a variety of criteria, none of which, in isolation, was controlling. The Board believes that, collectively, the Trustees have balanced and diverse experience, qualifications, attributes, and skills, which allow the Board to operate effectively in governing the fund and protecting the interests of shareholders. Information about the specific experience, skills, attributes, and qualifications of each Trustee, which in each case led to the Board's conclusion that the Trustee should serve (or continue to serve) as a trustee of the fund, is provided below.
Board Structure and Oversight Function. Abigail P. Johnson is an interested person and currently serves as Chairman. The Trustees have determined that an interested Chairman is appropriate and benefits shareholders because an interested Chairman has a personal and professional stake in the quality and continuity of services provided to the fund. Independent Trustees exercise their informed business judgment to appoint an individual of their choosing to serve as Chairman, regardless of whether the Trustee happens to be independent or a member of management. The Independent Trustees have determined that they can act independently and effectively without having an Independent Trustee serve as Chairman and that a key structural component for assuring that they are in a position to do so is for the Independent Trustees to constitute a substantial majority for the Board. The Independent Trustees also regularly meet in executive session. Arthur E. Johnson serves as Chairman of the Independent Trustees and as such (i) acts as a liaison between the Independent Trustees and management with respect to matters important to the Independent Trustees and (ii) with management prepares agendas for Board meetings.
Fidelity® funds are overseen by different Boards of Trustees. The fund's Board oversees Fidelity's investment-grade bond, money market, asset allocation and certain equity funds, and other Boards oversee Fidelity's high income and other equity funds. The asset allocation funds may invest in Fidelity® funds that are overseen by such other Boards. The use of separate Boards, each with its own committee structure, allows the Trustees of each group of Fidelity® funds to focus on the unique issues of the funds they oversee, including common research, investment, and operational issues. On occasion, the separate Boards establish joint committees to address issues of overlapping consequences for the Fidelity® funds overseen by each Board.
The Trustees operate using a system of committees to facilitate the timely and efficient consideration of all matters of importance to the Trustees, the fund, and fund shareholders and to facilitate compliance with legal and regulatory requirements and oversight of the fund's activities and associated risks. The Board, acting through its committees, has charged FMR and its affiliates with (i) identifying events or circumstances the occurrence of which could have demonstrably adverse effects on the fund's business and/or reputation; (ii) implementing processes and controls to lessen the possibility that such events or circumstances occur or to mitigate the effects of such events or circumstances if they do occur; and (iii) creating and maintaining a system designed to evaluate continuously business and market conditions in order to facilitate the identification and implementation processes described in (i) and (ii) above. Because the day-to-day operations and activities of the fund are carried out by or through FMR, its affiliates, and other service providers, the fund's exposure to risks is mitigated but not eliminated by the processes overseen by the Trustees. While each of the Board's committees has responsibility for overseeing different aspects of the fund's activities, oversight is exercised primarily through the Operations and Audit Committees. In addition, an ad hoc Board committee of Independent Trustees has worked with FMR to enhance the Board's oversight of investment and financial risks, legal and regulatory risks, technology risks, and operational risks, including the development of additional risk reporting to the Board. Appropriate personnel, including but not limited to the fund's Chief Compliance Officer (CCO), FMR's internal auditor, the independent accountants, the fund's Treasurer and portfolio management personnel, make periodic reports to the Board's committees, as appropriate, including an annual review of Fidelity's risk management program for the Fidelity® funds. The responsibilities of each standing committee, including their oversight responsibilities, are described further under "Standing Committees of the Trustees."
Interested Trustees*:
Correspondence intended for a Trustee who is an interested person may be sent to Fidelity Investments, 245 Summer Street, Boston, Massachusetts 02210.
Name, Year of Birth; Principal Occupations and Other Relevant Experience+
Abigail P. Johnson (1961)
Year of Election or Appointment: 2009
Trustee
Chairman of the Board of Trustees
Ms. Johnson also serves as Trustee of other Fidelity® funds. Ms. Johnson serves as Chairman (2016-present), Chief Executive Officer (2014-present), and Director (2007-present) of FMR LLC (diversified financial services company), President of Fidelity Financial Services (2012-present) and President of Personal, Workplace and Institutional Services (2005-present). Ms. Johnson is Chairman and Director of FMR Co., Inc. (investment adviser firm, 2011-present) and Chairman and Director of FMR (investment adviser firm, 2011-present). Previously, Ms. Johnson served as Vice Chairman (2007-2016) and President (2013-2016) of FMR LLC, President and a Director of FMR (2001-2005), a Trustee of other investment companies advised by FMR, Fidelity Investments Money Management, Inc. (investment adviser firm), and FMR Co., Inc. (2001-2005), Senior Vice President of the Fidelity® funds (2001-2005), and managed a number of Fidelity® funds. Ms. Abigail P. Johnson and Mr. Arthur E. Johnson are not related.
Jennifer Toolin McAuliffe (1959)
Year of Election or Appointment: 2016
Trustee
Ms. McAuliffe also serves as Trustee of other Fidelity® funds. Ms. McAuliffe previously served as a Member of the Advisory Board of certain Fidelity® funds (2016) and as Co-Head of Fixed Income of Fidelity Investments Limited (now known as FIL Limited (FIL)) (diversified financial services company). Earlier roles at FIL included Director of Research for FIL’s credit and quantitative teams in London, Hong Kong and Tokyo. Ms. McAuliffe also was the Director of Research for taxable and municipal bonds at Fidelity Investments Money Management, Inc. Ms. McAuliffe is also a director or trustee of several not-for-profit entities.
* Determined to be an “Interested Trustee” by virtue of, among other things, his or her affiliation with the trust or various entities under common control with FMR.
+ The information includes the Trustee's principal occupation during the last five years and other information relating to the experience, attributes, and skills relevant to the Trustee's qualifications to serve as a Trustee, which led to the conclusion that the Trustee should serve as a Trustee for the fund.
Independent Trustees:
Correspondence intended for an Independent Trustee may be sent to Fidelity Investments, P.O. Box 55235, Boston, Massachusetts 02205-5235.
Name, Year of Birth; Principal Occupations and Other Relevant Experience+
Elizabeth S. Acton (1951)
Year of Election or Appointment: 2013
Trustee
Ms. Acton also serves as Trustee of other Fidelity® funds. Prior to her retirement in April 2012, Ms. Acton was Executive Vice President, Finance (2011-2012), Executive Vice President, Chief Financial Officer (2002-2011), and Treasurer (2004-2005) of Comerica Incorporated (financial services). Prior to joining Comerica, Ms. Acton held a variety of positions at Ford Motor Company (1983-2002), including Vice President and Treasurer (2000-2002) and Executive Vice President and Chief Financial Officer of Ford Motor Credit Company (1998-2000). Ms. Acton currently serves as a member of the Board of Directors and Audit and Finance Committees of Beazer Homes USA, Inc. (homebuilding, 2012-present). Previously, Ms. Acton served as a Member of the Advisory Board of certain Fidelity® funds (2013-2016).
Ann E. Dunwoody (1953)
Year of Election or Appointment: 2018
Trustee
General Dunwoody also serves as Trustee of other Fidelity® funds. General Dunwoody (United States Army, Retired) was the first woman in U.S. military history to achieve the rank of four-star general and prior to her retirement in 2012 held a variety of positions within the U.S. Army, including Commanding General, U.S. Army Material Command (2008-2012). She is the President of First to Four LLC (leadership and mentoring services, 2012-present). She also serves as a member of the Board of Directors and Nominating and Corporate Governance Committee of L3 Technologies, Inc. (communication, electronic, sensor, and aerospace systems, 2013-present), Board of Directors and Nomination and Corporate Governance Committees of Kforce Inc. (professional staffing services, 2016-present) and Board of Directors of Automattic Inc. (software engineering, 2018-present). Previously, General Dunwoody served as a Member of the Advisory Board of certain Fidelity® funds (2018), a member of the Board of Directors and Audit and Sustainability and Corporate Responsibility Committees of Republic Services, Inc. (waste collection, disposal and recycling, 2013-2016). Ms. Dunwoody also serves on several boards for non-profit organizations, including as a member of the Board of Directors, Chair of the Nomination and Governance Committee and member of the Audit Committee of Logistics Management Institute (consulting non-profit, 2012-present), a member of the Board of Directors of the Army Historical Foundation (2015-present), a member of the Council of Trustees for the Association of the United States Army (advocacy non-profit, 2013-present) and a member of the Board of Trustees of Florida Institute of Technology (2015-present) and ThanksUSA (military family education non-profit, 2014-present).
John Engler (1948)
Year of Election or Appointment: 2014
Trustee
Mr. Engler also serves as Trustee of other Fidelity® funds. He serves on the board of directors for Universal Forest Products (manufacturer and distributor of wood and wood-alternative products, 2003-present) and K12 Inc. (technology-based education company, 2012-present). Previously, Mr. Engler served as interim president of Michigan State University (2018-2019), a Member of the Advisory Board of certain Fidelity® funds (2014-2016), president of the Business Roundtable (2011-2017), a trustee of The Munder Funds (2003-2014), president and CEO of the National Association of Manufacturers (2004-2011), member of the Board of Trustees of the Annie E. Casey Foundation (2004-2015), and as governor of Michigan (1991-2003). He is a past chairman of the National Governors Association.
Robert F. Gartland (1951)
Year of Election or Appointment: 2010
Trustee
Mr. Gartland also serves as Trustee of other Fidelity® funds. Mr. Gartland is Chairman and an investor in Gartland & Mellina Group Corp. (consulting, 2009-present). Previously, Mr. Gartland served as a partner and investor of Vietnam Partners LLC (investments and consulting, 2008-2011). Prior to his retirement, Mr. Gartland held a variety of positions at Morgan Stanley (financial services, 1979-2007), including Managing Director (1987-2007), and Chase Manhattan Bank (1975-1978).
Arthur E. Johnson (1947)
Year of Election or Appointment: 2008
Trustee
Chairman of the Independent Trustees
Mr. Johnson also serves as Trustee of other Fidelity® funds. Mr. Johnson serves as a member of the Board of Directors of Eaton Corporation plc (diversified power management, 2009-present) and Booz Allen Hamilton (management consulting, 2011-present). Prior to his retirement, Mr. Johnson served as Senior Vice President of Corporate Strategic Development of Lockheed Martin Corporation (defense contractor, 1999-2009). He previously served on the Board of Directors of IKON Office Solutions, Inc. (1999-2008), AGL Resources, Inc. (holding company, 2002-2016), and Delta Airlines (2005-2007). Mr. Arthur E. Johnson is not related to Ms. Abigail P. Johnson.
Michael E. Kenneally (1954)
Year of Election or Appointment: 2009
Trustee
Vice Chairman of the Independent Trustees
Mr. Kenneally also serves as Trustee of other Fidelity® funds. Prior to his retirement, Mr. Kenneally served as Chairman and Global Chief Executive Officer of Credit Suisse Asset Management. Before joining Credit Suisse, he was an Executive Vice President and Chief Investment Officer for Bank of America Corporation. Earlier roles at Bank of America included Director of Research, Senior Portfolio Manager and Research Analyst, and Mr. Kenneally was awarded the Chartered Financial Analyst (CFA) designation in 1991.
Marie L. Knowles (1946)
Year of Election or Appointment: 2001
Trustee
Ms. Knowles also serves as Trustee of other Fidelity® funds. Prior to Ms. Knowles' retirement in June 2000, she served as Executive Vice President and Chief Financial Officer of Atlantic Richfield Company (ARCO) (diversified energy, 1996-2000). From 1993 to 1996, she was a Senior Vice President of ARCO and President of ARCO Transportation Company (pipeline and tanker operations). Ms. Knowles currently serves as a Director and Chairman of the Audit Committee of McKesson Corporation (healthcare service, since 2002). Ms. Knowles is a member of the Board of the Santa Catalina Island Company (real estate, 2009-present). Ms. Knowles is a Member of the Investment Company Institute Board of Governors and a Member of the Governing Council of the Independent Directors Council (2014-present). She also serves as a member of the Advisory Board for the School of Engineering of the University of Southern California. Previously, Ms. Knowles served as a Director of Phelps Dodge Corporation (copper mining and manufacturing, 1994-2007), URS Corporation (engineering and construction, 2000-2003) and America West (airline, 1999-2002). Ms. Knowles previously served as Chairman (2015-2018) and Vice Chairman (2012-2015) of the Independent Trustees of certain Fidelity® funds.
Mark A. Murray (1954)
Year of Election or Appointment: 2016
Trustee
Mr. Murray also serves as Trustee of other Fidelity® funds. Mr. Murray is Vice Chairman (2013-present) of Meijer, Inc. (regional retail chain). Previously, Mr. Murray served as a Member of the Advisory Board of certain Fidelity® funds (2016) and as Co-Chief Executive Officer (2013-2016) and President (2006-2013) of Meijer, Inc. Mr. Murray serves as a member of the Board of Directors and Nuclear Review and Public Policy and Responsibility Committees of DTE Energy Company (diversified energy company, 2009-present). Mr. Murray also serves as a member of the Board of Directors of Spectrum Health (not-for-profit health system, 2015-present). Mr. Murray previously served as President of Grand Valley State University (2001-2006), Treasurer for the State of Michigan (1999-2001), Vice President of Finance and Administration for Michigan State University (1998-1999), and a member of the Board of Directors and Audit Committee and Chairman of the Nominating and Corporate Governance Committee of Universal Forest Products, Inc. (manufacturer and distributor of wood and wood-alternative products, 2004-2016). Mr. Murray is also a director or trustee of many community and professional organizations.
+ The information includes the Trustee's principal occupation during the last five years and other information relating to the experience, attributes, and skills relevant to the Trustee's qualifications to serve as a Trustee, which led to the conclusion that the Trustee should serve as a Trustee for the fund.
Advisory Board Members and Officers:
Correspondence intended for an officer may be sent to Fidelity Investments, 245 Summer Street, Boston, Massachusetts 02210. Officers appear below in alphabetical order.
Name, Year of Birth; Principal Occupation
Elizabeth Paige Baumann (1968)
Year of Election or Appointment: 2017
Anti-Money Laundering (AML) Officer
Ms. Baumann also serves as AML Officer of other funds. She is Chief AML Officer (2012-present) and Senior Vice President (2014-present) of FMR LLC (diversified financial services company) and is an employee of Fidelity Investments. Previously, Ms. Baumann served as AML Officer of the funds (2012-2016), and Vice President (2007-2014) and Deputy Anti-Money Laundering Officer (2007-2012) of FMR LLC.
Craig S. Brown (1977)
Year of Election or Appointment: 2019
Assistant Treasurer
Mr. Brown also serves as Assistant Treasurer of other funds. Mr. Brown is an employee of Fidelity Investments (2013-present).
John J. Burke III (1964)
Year of Election or Appointment: 2018
Chief Financial Officer
Mr. Burke also serves as Chief Financial Officer of other funds. Mr. Burke serves as Head of Investment Operations for Fidelity Fund and Investment Operations (2018-present) and is an employee of Fidelity Investments (1998-present). Previously Mr. Burke served as head of Asset Management Investment Operations (2012-2018).
William C. Coffey (1969)
Year of Election or Appointment: 2018
Secretary and Chief Legal Officer (CLO)
Mr. Coffey also serves as Secretary and CLO of other funds. Mr. Coffey serves as CLO, Secretary, and Senior Vice President of Fidelity Management & Research Company and FMR Co., Inc. (investment adviser firms, 2018-present); Secretary of Fidelity SelectCo, LLC and Fidelity Investments Money Management, Inc. (investment adviser firms, 2018-present); and CLO of Fidelity Management & Research (Hong Kong) Limited, FMR Investment Management (UK) Limited, and Fidelity Management & Research (Japan) Limited (investment adviser firms, 2018-present). He is Senior Vice President and Deputy General Counsel of FMR LLC (diversified financial services company, 2010-present), and is an employee of Fidelity Investments. Previously, Mr. Coffey served as Assistant Secretary of certain funds (2009-2018) and as Vice President and Associate General Counsel of FMR LLC (2005-2009).
Jonathan Davis (1968)
Year of Election or Appointment: 2010
Assistant Treasurer
Mr. Davis also serves as Assistant Treasurer of other funds. Mr. Davis serves as Assistant Treasurer of FMR Capital, Inc. (2017-present) and is an employee of Fidelity Investments. Previously, Mr. Davis served as Vice President and Associate General Counsel of FMR LLC (diversified financial services company, 2003-2010).
Adrien E. Deberghes (1967)
Year of Election or Appointment: 2010
Assistant Treasurer
Mr. Deberghes also serves as an officer of other funds. He serves as Assistant Treasurer of FMR Capital, Inc. (2017-present), Executive Vice President of Fidelity Investments Money Management, Inc. (FIMM) (investment adviser firm, 2016-present), and is an employee of Fidelity Investments (2008-present). Previously, Mr. Deberghes served as President and Treasurer of certain Fidelity® funds (2013-2018). Prior to joining Fidelity Investments, Mr. Deberghes was Senior Vice President of Mutual Fund Administration at State Street Corporation (2007-2008), Senior Director of Mutual Fund Administration at Investors Bank & Trust (2005-2007), and Director of Finance for Dunkin' Brands (2000-2005). Previously, Mr. Deberghes served in other fund officer roles.
Laura M. Del Prato (1964)
Year of Election or Appointment: 2018
President and Treasurer
Ms. Del Prato also serves as an officer of other funds. Ms. Del Prato is an employee of Fidelity Investments (2017-present). Prior to joining Fidelity Investments, Ms. Del Prato served as a Managing Director and Treasurer of the JPMorgan Mutual Funds (2014-2017). Prior to JPMorgan, Ms. Del Prato served as a partner at Cohen Fund Audit Services (accounting firm, 2012-2013) and KPMG LLP (accounting firm, 2004-2012).
Colm A. Hogan (1973)
Year of Election or Appointment: 2016
Assistant Treasurer
Mr. Hogan also serves as an officer of other funds. Mr. Hogan serves as Assistant Treasurer of FMR Capital, Inc. (2017-present) and is an employee of Fidelity Investments (2005-present). Previously, Mr. Hogan served as Assistant Treasurer of certain Fidelity® funds (2016-2018).
Chris Maher (1972)
Year of Election or Appointment: 2013
Assistant Treasurer
Mr. Maher serves as Assistant Treasurer of other funds. Mr. Maher is Vice President of Valuation Oversight, serves as Assistant Treasurer of FMR Capital, Inc. (2017-present), and is an employee of Fidelity Investments. Previously, Mr. Maher served as Vice President of Asset Management Compliance (2013), Vice President of the Program Management Group of FMR (investment adviser firm, 2010-2013), and Vice President of Valuation Oversight (2008-2010).
John B. McGinty, Jr. (1962)
Year of Election or Appointment: 2016
Chief Compliance Officer
Mr. McGinty also serves as Chief Compliance Officer of other funds. Mr. McGinty is Senior Vice President of Asset Management Compliance for Fidelity Investments and is an employee of Fidelity Investments (2016-present). Mr. McGinty previously served as Vice President, Senior Attorney at Eaton Vance Management (investment management firm, 2015-2016), and prior to Eaton Vance as global CCO for all firm operations and registered investment companies at GMO LLC (investment management firm, 2009-2015). Before joining GMO LLC, Mr. McGinty served as Senior Vice President, Deputy General Counsel for Fidelity Investments (2007-2009).
Jason P. Pogorelec (1975)
Year of Election or Appointment: 2015
Assistant Secretary
Mr. Pogorelec also serves as Assistant Secretary of other funds. Mr. Pogorelec serves as Vice President, Associate General Counsel (2010-present) and is an employee of Fidelity Investments (2006-present).
Nancy D. Prior (1967)
Year of Election or Appointment: 2014
Vice President
Ms. Prior also serves as Vice President of other funds. Ms. Prior serves as President Fixed Income, High Income/Emerging Market Debt and Multi Asset Class Strategies of FIAM LLC (2018-present), President (2016-present) and Director (2014-present) of Fidelity Investments Money Management, Inc. (FIMM) (investment adviser firm), President, Fixed Income (2014-present), and is an employee of Fidelity Investments (2002-present). Previously, Ms. Prior served as Vice Chairman of FIAM LLC (investment adviser firm, 2014-2018), a Director of FMR Investment Management (UK) Limited (investment adviser firm, 2015-2018), President Multi-Asset Class Strategies of FMR's Global Asset Allocation Division (2017-2018), Vice President of Fidelity's Money Market Funds (2012-2014), President, Money Market and Short Duration Bond Group of Fidelity Management & Research (FMR) (investment adviser firm, 2013-2014), President, Money Market Group of FMR (2011-2013), Managing Director of Research (2009-2011), Senior Vice President and Deputy General Counsel (2007-2009), and Assistant Secretary of certain Fidelity® funds (2008-2009).
Stacie M. Smith (1974)
Year of Election or Appointment: 2013
Assistant Treasurer
Ms. Smith also serves as an officer of other funds. Ms. Smith serves as Assistant Treasurer of FMR Capital, Inc. (2017-present), is an employee of Fidelity Investments (2009-present), and has served in other fund officer roles. Prior to joining Fidelity Investments, Ms. Smith served as Senior Audit Manager of Ernst & Young LLP (accounting firm, 1996-2009). Previously, Ms. Smith served as Assistant Treasurer (2013-2018) and Deputy Treasurer (2013-2016) of certain Fidelity® funds.
Marc L. Spector (1972)
Year of Election or Appointment: 2016
Deputy Treasurer
Mr. Spector also serves as an officer of other funds. Mr. Spector serves as Assistant Treasurer of FMR Capital, Inc. (2017-present) and is an employee of Fidelity Investments (2016-present). Prior to joining Fidelity Investments, Mr. Spector served as Director at the Siegfried Group (accounting firm, 2013-2016), and prior to Siegfried Group as audit senior manager at Deloitte & Touche (accounting firm, 2005-2013).
Jim Wegmann (1979)
Year of Election or Appointment: 2019
Assistant Treasurer
Mr. Wegmann also serves as Assistant Treasurer of other funds. Mr. Wegmann is an employee of Fidelity Investments (2011-present).
Shareholder Expense Example
As a shareholder of the Fund, you incur two types of costs: (1) transaction costs and (2) ongoing costs, including other Fund expenses. This Example is intended to help you understand your ongoing costs (in dollars) of investing in the Fund and to compare these costs with the ongoing costs of investing in other mutual funds.
The Example is based on an investment of $1,000 invested at the beginning of the period and held for the entire period (July 1, 2018 to December 31, 2018).
Actual Expenses
The first line of the accompanying table provides information about actual account values and actual expenses. You may use the information in this line, together with the amount you invested, to estimate the expenses that you paid over the period. Simply divide your account value by $1,000.00 (for example, an $8,600 account value divided by $1,000.00 = 8.6), then multiply the result by the number in the first line under the heading entitled "Expenses Paid During Period" to estimate the expenses you paid on your account during this period. In addition, the Fund, as a shareholder in the underlying Fidelity Central Funds, will indirectly bear its pro-rata share of the fees and expenses incurred by the underlying Fidelity Central Funds. These fees and expenses are not included in the Fund's annualized expense ratio used to calculate the expense estimate in the table below.
Hypothetical Example for Comparison Purposes
The second line of the accompanying table provides information about hypothetical account values and hypothetical expenses based on the Fund's actual expense ratio and an assumed rate of return of 5% per year before expenses, which is not the Fund's actual return. The hypothetical account values and expenses may not be used to estimate the actual ending account balance or expenses you paid for the period. You may use this information to compare the ongoing costs of investing in the Fund and other funds. To do so, compare this 5% hypothetical example with the 5% hypothetical examples that appear in the shareholder reports of the other funds. In addition, the Fund, as a shareholder in the underlying Fidelity Central Funds, will indirectly bear its pro-rata share of the fees and expenses incurred by the underlying Fidelity Central Funds. These fees and expenses are not included in the Fund's annualized expense ratio used to calculate the expense estimate in the table below.
Please note that the expenses shown in the table are meant to highlight your ongoing costs only and do not reflect any transaction costs. Therefore, the second line of the table is useful in comparing ongoing costs only, and will not help you determine the relative total costs of owning different funds.
| | Annualized Expense Ratio-A | Beginning
Account Value
July 1, 2018 | Ending
Account Value
December 31, 2018 | Expenses Paid
During Period-B
July 1, 2018
to December 31, 2018 |
| Actual | - %-C | $1,000.00 | $1,014.10 | $--D |
| Hypothetical-E | | $1,000.00 | $1,025.21 | $--D |
A Annualized expense ratio reflects expenses net of applicable fee waivers.
B Expenses are equal to the Fund's annualized expense ratio, multiplied by the average account value over the period, multiplied by 184/365 (to reflect the one-half year period).
C Amount represents less than .005%.
D Amount represents less than $.005.
E 5% return per year before expenses
Distributions (Unaudited)
During fiscal year ended 2018, 100% of the fund's income dividends was free from federal income tax, and 15.51% of the fund's income dividends was subject to the federal alternative minimum tax.
The fund will notify shareholders in January 2019 of amounts for use in preparing 2018 income tax returns.
Board Approval of Investment Advisory Contracts and Management Fees
Fidelity Flex Municipal Income Fund
Each year, the Board of Trustees, including the Independent Trustees (together, the Board), votes on the renewal of the management contract with Fidelity Management & Research Company (FMR) and the sub-advisory agreements (together, the Advisory Contracts) for the fund. FMR and the sub-advisers are referred to herein as the Investment Advisers. The Board, assisted by the advice of fund counsel and Independent Trustees' counsel, requests and considers a broad range of information relevant to the renewal of the Advisory Contracts throughout the year.
The Board meets regularly and, at each of its meetings, covers an extensive agenda of topics and materials and considers factors that are relevant to its annual consideration of the renewal of the fund's Advisory Contracts, including the services and support provided to the fund and its shareholders. The Board has established four standing committees (Committees) — Operations, Audit, Fair Valuation, and Governance and Nominating — each composed of and chaired by Independent Trustees with varying backgrounds, to which the Board has assigned specific subject matter responsibilities in order to enhance effective decision-making by the Board. The Operations Committee, of which all of the Independent Trustees are members, meets regularly throughout the year and considers, among other matters, information specifically related to the annual consideration of the renewal of the fund's Advisory Contracts. The Board, acting directly and through its Committees, requests and receives information concerning the annual consideration of the renewal of the fund's Advisory Contracts. The Board also meets as needed to review matters specifically related to the Board's annual consideration of the renewal of the Advisory Contracts. Members of the Board may also meet with trustees of other Fidelity funds through joint ad hoc committees to discuss certain matters relevant to all of the Fidelity funds.
At its September 2018 meeting, the Board unanimously determined to renew the fund's Advisory Contracts. In considering whether to renew the Advisory Contracts for the fund, the Board considered all factors it believed relevant and reached a determination, with the assistance of fund counsel and Independent Trustees' counsel and through the exercise of its business judgment, that the renewal of the Advisory Contracts was in the best interests of the fund and its shareholders and the fact that no fee is payable under the management contract was fair and reasonable.
Nature, Extent, and Quality of Services Provided. The Board considered Fidelity's staffing as it relates to the fund, including the backgrounds of investment personnel of Fidelity, and also considered the fund's investment objective, strategies, and related investment philosophy. The Independent Trustees also had discussions with senior management of Fidelity's investment operations and investment groups. The Board considered the structure of the investment personnel compensation program and whether this structure provides appropriate incentives to act in the best interests of the fund. Additionally, the Board considered the portfolio managers' investments, if any, in the funds that they manage.
Resources Dedicated to Investment Management and Support Services. The Board reviewed the general qualifications and capabilities of Fidelity's investment staff, including its size, education, experience, and resources, as well as Fidelity's approach to recruiting, managing, and compensating investment personnel. The Board noted that Fidelity has continued to increase the resources devoted to non-U.S. offices, including expansion of Fidelity's global investment organization. The Board also noted that Fidelity's analysts have extensive resources, tools and capabilities that allow them to conduct sophisticated quantitative and fundamental analysis, as well as credit analysis of issuers, counterparties and guarantors. Further, the Board considered that Fidelity's investment professionals have sufficient access to global information and data so as to provide competitive investment results over time, and that those professionals also have access to sophisticated tools that permit them to assess portfolio construction and risk and performance attribution characteristics continuously, as well as to transmit new information and research conclusions rapidly around the world. Additionally, in its deliberations, the Board considered Fidelity's trading, risk management, compliance, and technology and operations capabilities and resources, which are integral parts of the investment management process.
Shareholder and Administrative Services. The Board considered (i) the nature, extent, quality, and cost of advisory, administrative, and shareholder services performed by the Investment Advisers and their affiliates under the Advisory Contracts and under separate agreements covering transfer agency, pricing and bookkeeping, and securities lending services for the fund; (ii) the nature and extent of the supervision of third party service providers, principally custodians, subcustodians, and pricing vendors; and (iii) the resources devoted to, and the record of compliance with, the fund's compliance policies and procedures.
The Board noted that the growth of fund assets over time across the complex allows Fidelity to reinvest in the development of services designed to enhance the value and convenience of the Fidelity funds as investment vehicles. These services include 24-hour access to account information and market information through telephone representatives and over the Internet, investor education materials and asset allocation tools, and the expanded availability of Fidelity Investor Centers.
Investment in a Large Fund Family. The Board considered the benefits to shareholders of investing in a Fidelity fund, including the benefits of investing in a fund that is part of a large family of funds offering a variety of investment disciplines and providing a large variety of mutual fund investor services. The Board noted that Fidelity had taken, or had made recommendations that resulted in the Fidelity funds taking, a number of actions over the previous year that benefited particular funds, including: (i) continuing to dedicate additional resources to Fidelity's investment research process, which includes meetings with management of issuers of securities in which the funds invest, and to the support of the senior management team that oversees asset management; (ii) continuing efforts to enhance Fidelity's global research capabilities; (iii) launching new funds and making other enhancements to meet client needs; (iv) launching new share classes of existing funds; (v) eliminating purchase minimums and broadening eligibility requirements for certain funds and share classes; (vi) reducing management fees and total expenses for certain growth equity funds and index funds; (vii) lowering expense caps for certain existing funds and classes, and converting certain voluntary expense caps to contractual caps, to reduce expenses borne by shareholders; (viii) eliminating short-term redemption fees for funds that had such fees; (ix) rationalizing product lines and gaining increased efficiencies from fund mergers and share class consolidations; (x) continuing to develop, acquire and implement systems and technology to improve services to the funds and shareholders, strengthen information security, and increase efficiency; and (xi) continuing to implement enhancements to further strengthen Fidelity's product line to increase investors' probability of success in achieving their investment goals, including retirement income goals.
Investment Performance. The Board considered whether the fund has operated in accordance with its investment objective, as well as its record of compliance with its investment restrictions. As the fund recently commenced operations, the Board did not believe that it was appropriate to assign significant weight to its limited investment performance.
Based on its review, the Board concluded that the nature, extent, and quality of services provided to the fund under the Advisory Contracts should continue to benefit the shareholders of the fund.
Competitiveness of Management Fee and Total Expense Ratio. The Board noted that the fund is available exclusively to certain Fidelity fee-based programs. The Board considered that the fund does not pay FMR a management fee for investment advisory services, but that FMR is indirectly compensated for its services out of the program fees. The Board also noted that FMR or an affiliate undertakes to pay all operating expenses of the fund, except Independent Trustee fees and expenses, proxy and shareholder meeting expenses, interest, taxes, brokerage expenses, and extraordinary expenses (such as litigation expenses).
Based on its review, the Board considered that the fund does not pay a management fee and concluded that the total expense ratio of the fund was reasonable in light of the services that the fund and its shareholders receive and the other factors considered.
Costs of the Services and Profitability. The Board considered the level of Fidelity's profits in respect of all the Fidelity funds.
PricewaterhouseCoopers LLP (PwC), auditor to Fidelity and certain Fidelity funds, has been engaged annually by the Board as part of the Board's assessment of Fidelity's profitability analysis. PwC's engagement includes the review and assessment of the methodologies used by Fidelity in determining the revenues and expenses attributable to Fidelity's mutual fund business, and completion of agreed-upon procedures in respect of the mathematical accuracy of the fund profitability information and its conformity to established allocation methodologies. After considering PwC's reports issued under the engagement and information provided by Fidelity, the Board concluded that while other allocation methods may also be reasonable, Fidelity's profitability methodologies are reasonable in all material respects.
The Board also reviewed Fidelity's non-fund businesses and potential indirect benefits such businesses may have received as a result of their association with Fidelity's mutual fund business (i.e., fall-out benefits) as well as cases where Fidelity's affiliates may benefit from the fund's business. The Board noted that changes to fall-out benefits year-over-year reflect business developments at Fidelity's various businesses.
The Board concluded that the costs of the services provided by and the profits realized by Fidelity in connection with the operation of the fund were not relevant to the renewal of the Advisory Contracts because the fund pays no advisory fees and FMR or an affiliate bears all expenses of the fund, with limited exceptions.
Economies of Scale. The Board concluded that because the fund pays no advisory fees and FMR bears all expenses of the fund with certain limited exceptions, the realization of economies of scale was not a material factor in the Board's decision to renew the fund's Advisory Contract.
Additional Information Requested by the Board. In order to develop fully the factual basis for consideration of the Fidelity funds' advisory contracts, the Board requested and received additional information on certain topics, including: (i) Fidelity's fund profitability methodology, profitability trends for certain funds, the allocation of various costs to different funds, and the impact of certain factors on fund profitability results; (ii) portfolio manager changes that have occurred during the past year and the amount of the investment that each portfolio manager has made in the Fidelity fund(s) that he or she manages; (iii) Fidelity's compensation structure for portfolio managers, research analysts, and other key personnel, including its effects on fund profitability, the rationale for the compensation structure, and the extent to which current market conditions have affected retention and recruitment; (iv) the arrangements with and compensation paid to certain fund sub-advisers on behalf of the Fidelity funds and the treatment of such compensation within Fidelity's fund profitability methodology; (v) the terms of Fidelity's voluntary expense limitation agreements; (vi) the methodology with respect to competitive fund data and peer group classifications; (vii) Fidelity's transfer agent fee, expense, and service structures for different funds and classes relative to competitive trends, and the impact of the increased use of omnibus accounts; (viii) new developments in the retail and institutional marketplaces and the competitive positioning of the funds relative to other investment products and services; (ix) the impact of recent changes to the money market fund landscape, including the full implementation of money market fund reform and rising interest rates, on Fidelity's money market funds; (x) the funds' share class structures and distribution channels; and (xi) explanations regarding the relative total expense ratios of certain funds and classes, total expense competitive trends and methodologies for total expense competitive comparisons, and actions that might be taken by Fidelity to reduce total expense ratios for certain classes. In addition, the Board considered its discussions with Fidelity throughout the year regarding enhanced information security initiatives and the funds' fair valuation policies.
Based on its evaluation of all of the conclusions noted above, and after considering all factors it believed relevant, the Board concluded that the advisory fee arrangements are fair and reasonable, and that the fund's Advisory Contracts should be renewed.
Corporate Headquarters
245 Summer St.
Boston, MA 02210
www.fidelity.com
XLI-ANN-0219
1.9884856.101
Fidelity Flex℠ Funds Fidelity Flex℠ Conservative Income Municipal Bond Fund
Annual Report December 31, 2018 |
|
Beginning on January 1, 2021, as permitted by regulations adopted by the Securities and Exchange Commission, paper copies of a fund’s shareholder reports will no longer be sent by mail, unless you specifically request paper copies of the reports from the fund or from your financial intermediary, such as a financial advisor, broker-dealer or bank. Instead, the reports will be made available on a website, and you will be notified by mail each time a report is posted and provided with a website link to access the report.
If you already elected to receive shareholder reports electronically, you will not be affected by this change and you need not take any action. You may elect to receive shareholder reports and other communications from a fund electronically, by contacting your financial intermediary. For Fidelity customers, visit Fidelity's web site or call Fidelity using the contact information listed below.
You may elect to receive all future reports in paper free of charge. If you wish to continue receiving paper copies of your shareholder reports, you may contact your financial intermediary or, if you are a Fidelity customer, visit Fidelity’s website, or call Fidelity at the applicable toll-free number listed below. Your election to receive reports in paper will apply to all funds held with the fund complex/your financial intermediary.
| Account Type | Website | Phone Number |
| Brokerage, Mutual Fund, or Annuity Contracts: | fidelity.com/mailpreferences | 1-800-343-3548 |
| Employer Provided Retirement Accounts: | netbenefits.fidelity.com/preferences (choose 'no' under Required Disclosures to continue to print) | 1-800-343-0860 |
| Advisor Sold Accounts Serviced Through Your Financial Intermediary: | Contact Your Financial Intermediary | Your Financial Intermediary's phone number |
| Advisor Sold Accounts Serviced by Fidelity: | institutional.fidelity.com | 1-877-208-0098 |
Contents
To view a fund's proxy voting guidelines and proxy voting record for the 12-month period ended June 30, visit http://www.fidelity.com/proxyvotingresults or visit the Securities and Exchange Commission's (SEC) web site at http://www.sec.gov.
You may also call 1-800-835-5092 to request a free copy of the proxy voting guidelines.
Standard & Poor's, S&P and S&P 500 are registered service marks of The McGraw-Hill Companies, Inc. and have been licensed for use by Fidelity Distributors Corporation.
Other third-party marks appearing herein are the property of their respective owners.
All other marks appearing herein are registered or unregistered trademarks or service marks of FMR LLC or an affiliated company. © 2019 FMR LLC. All rights reserved.
This report and the financial statements contained herein are submitted for the general information of the shareholders of the Fund. This report is not authorized for distribution to prospective investors in the Fund unless preceded or accompanied by an effective prospectus.
A fund files its complete schedule of portfolio holdings with the SEC for the first and third quarters of each fiscal year on Form N-Q. Forms N-Q are available on the SEC’s web site at http://www.sec.gov. A fund's Forms N-Q may be reviewed and copied at the SEC’s Public Reference Room in Washington, DC. Information regarding the operation of the SEC's Public Reference Room may be obtained by calling 1-800-SEC-0330.
For a complete list of a fund's portfolio holdings, view the most recent holdings listing, semiannual report, or annual report on Fidelity's web site at http://www.fidelity.com, http://www.institutional.fidelity.com, or http://www.401k.com, as applicable.
NOT FDIC INSURED •MAY LOSE VALUE •NO BANK GUARANTEE
Neither the Fund nor Fidelity Distributors Corporation is a bank.
Performance: The Bottom Line
Average annual total return reflects the change in the value of an investment, assuming reinvestment of distributions from dividend income and capital gains (the profits earned upon the sale of securities that have grown in value, if any) and assuming a constant rate of performance each year. The hypothetical investment and the average annual total returns do not reflect the deduction of taxes that a shareholder would pay on fund distributions or the redemption of fund shares. During periods of reimbursement by Fidelity, a fund’s total return will be greater than it would be had the reimbursement not occurred. How a fund did yesterday is no guarantee of how it will do tomorrow.
Average Annual Total Returns
| For the periods ended December 31, 2018 | Past 1 year | Life of fundA |
| Fidelity Flex℠ Conservative Income Municipal Bond Fund | 1.77% | 1.51% |
A From October 12, 2017
$10,000 Over Life of Fund
Let's say hypothetically that $10,000 was invested in Fidelity Flex℠ Conservative Income Municipal Bond Fund on October 12, 2017, when the fund started.
The chart shows how the value of your investment would have changed, and also shows how the Bloomberg Barclays Municipal Bond 1 Year (1-2 Y) Index performed over the same period.
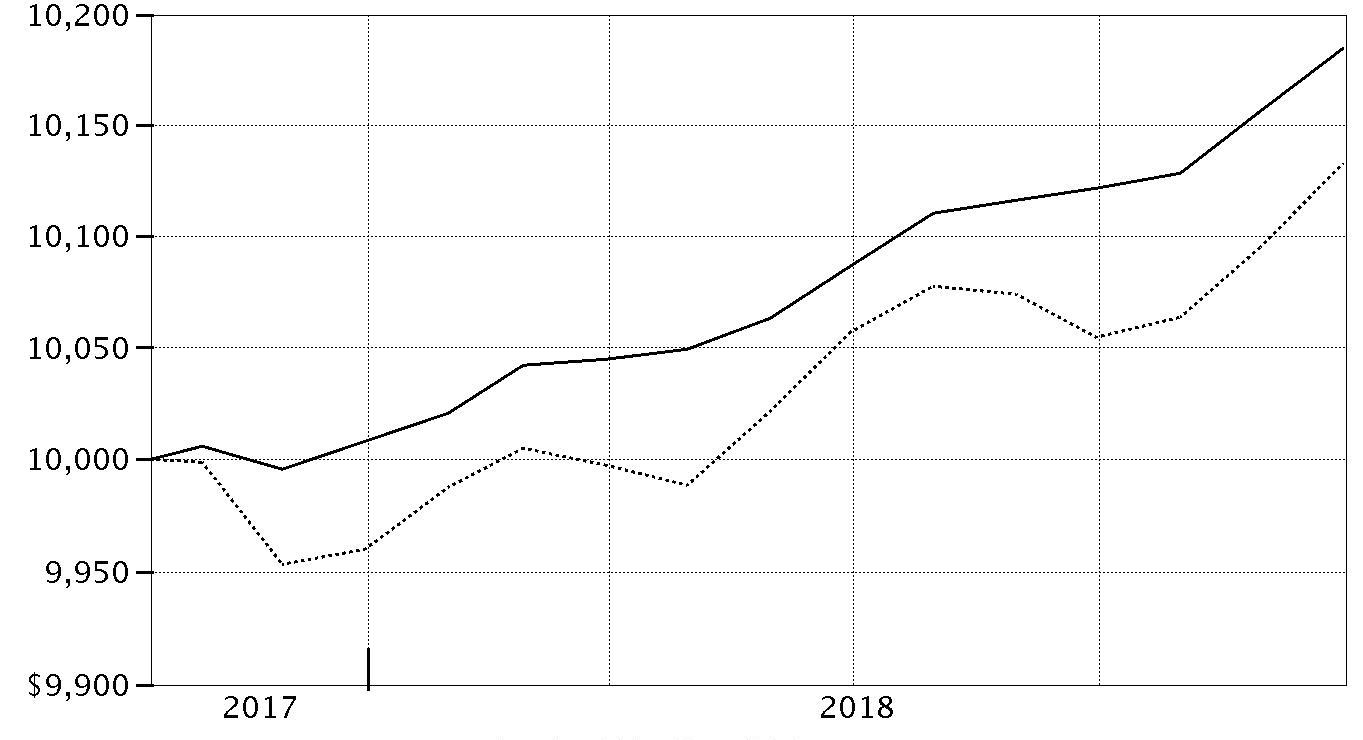
| Period Ending Values |
| $10,185 | Fidelity Flex℠ Conservative Income Municipal Bond Fund |
| $10,133 | Bloomberg Barclays Municipal Bond 1 Year (1-2 Y) Index |
Management's Discussion of Fund Performance
Market Recap: Tax-exempt municipal bonds gained modestly in 2018, with the Bloomberg Barclays Municipal Bond Index returning 1.28%, supported by lower bond issuance and solid economic growth. Tax reform had a significant impact on both the supply of and demand for tax-exempt bonds the past year. In the final months of 2017, issuers accelerated their bond financings in order to issue under the old tax rules, prompting a surge in supply. Investors absorbed this excess supply, anticipating that issuance would fall significantly in 2018. The market turned lower in early 2018, as domestic fixed-income markets reacted to robust economic data and signs of inflation, before stabilizing in March and rallying through August. The municipal market experienced volatility in September and October amid concerns of an economic slowdown, then rebounded to close December near a high for the year. Gross municipal bond issuance ended 2018 down approximately 25%. There was little differentiation in performance across municipal sectors in 2018. General obligation bonds gained 1.33%, with bonds issued by states slightly outperforming those backed by local municipalities. Looking ahead, market volatility is likely to persist due to uncertainty about how the U.S. Federal Reserve will react to labor and inflation trends.
Comments from Co-Portfolio Managers Doug McGinley, Elizah McLaughlin and Robert Mandeville: For 2018, the fund returned 1.77%, net of fees, slightly topping the 1.60% advance of the fund's composite benchmark, an equal-weighted blend of the Bloomberg Barclays Municipal Bond 1 Year (1-2Y) Index and the iMoneyNet All Tax-Free National Retail Money Market Funds Average™. The fund's interest-rate sensitivity was less than that of the composite index, which was a slight relative advantage when one-year and two-year rates rose strongly in March and April, and again in August and September, although it detracted a bit late in the period when rates trended lower. Owning investment-grade floating-rate notes helped limit the fund's interest-rate risk and boost its yield, while also contributing versus the benchmark. The portfolio's overweight exposure to fixed-rate health care securities and corporate-backed munis also helped, as these categories posted better-than-average returns. An overweighting in fixed-rate one-year notes issued by local governments was slightly beneficial. In addition, overweighting state-backed bonds from Connecticut, Illinois and New Jersey added value.
The views expressed above reflect those of the portfolio manager(s) only through the end of the period as stated on the cover of this report and do not necessarily represent the views of Fidelity or any other person in the Fidelity organization. Any such views are subject to change at any time based upon market or other conditions and Fidelity disclaims any responsibility to update such views. These views may not be relied on as investment advice and, because investment decisions for a Fidelity fund are based on numerous factors, may not be relied on as an indication of trading intent on behalf of any Fidelity fund.
Note to Shareholders: On September 29, 2018, Robert Mandeville assumed co-management responsibilities for the fund, joining Doug McGinley and Elizah McLaughlin.
Investment Summary (Unaudited)
Maturity Diversification as of December 31, 2018
| | % of fund's investments |
| 1 - 7 | 28.7 |
| 8 - 30 | 1.1 |
| 31 - 60 | 0.5 |
| 91 - 180 | 12.5 |
| > 180 | 57.2 |
The date shown for securities represents the date when principal payments must be paid, taking into account any call options exercised by the issuer and any permissible maturity shortening features other than interest rate resets.
Top Five States as of December 31, 2018
| | % of fund's net assets |
| New Jersey | 16.8 |
| Illinois | 12.9 |
| Florida | 7.6 |
| Texas | 7.2 |
| New York | 6.6 |
Top Five Sectors as of December 31, 2018
| | % of fund's net assets |
| General Obligations | 29.8 |
| Electric Utilities | 21.7 |
| Synthetics | 10.6 |
| Health Care | 9.9 |
| Transportation | 8.0 |
Quality Diversification (% of fund's net assets)
| As of December 31, 2018 |
| | AAA | 4.6% |
| | AA,A | 47.3% |
| | BBB | 5.1% |
| | BB and Below | 1.4% |
| | Not Rated | 3.7% |
| | Short-Term Investments and Net Other Assets | 37.9% |

We have used ratings from Moody's Investors Service, Inc. Where Moody's® ratings are not available, we have used S&P® ratings. All ratings are as of the date indicated and do not reflect subsequent changes.
Schedule of Investments December 31, 2018
Showing Percentage of Net Assets
| Municipal Bonds - 61.1% | | | |
| | | Principal Amount | Value |
| Alabama - 1.2% | | | |
| Mobile Indl. Dev. Board Poll. Cont. Rev. Bonds Series 2009 E, 1.85%, tender 3/24/20 (a) | | 450,000 | 447,080 |
| Arizona - 0.9% | | | |
| Arizona Health Facilities Auth. Rev. (Banner Health Sys. Proj.) Series 2015 A, 5% 1/1/20 | | 100,000 | 103,039 |
| Arizona State Lottery Rev. Series 2019, 5% 7/1/20 (b) | | 100,000 | 102,075 |
| Coconino County Poll. Cont. Corp. Rev. Bonds (Nevada Pwr. Co. Projs.) Series 2017 A, 1.8%, tender 5/21/20 (a)(c) | | 50,000 | 49,614 |
| Univ. Med. Ctr. Corp. Hosp. Rev. Series 2009, 6.5% 7/1/39 (Pre-Refunded to 7/1/19 @ 100) | | 60,000 | 61,382 |
|
| TOTAL ARIZONA | | | 316,110 |
|
| California - 0.7% | | | |
| California Infrastructure and Econ. Dev. Bank Rev. Bonds Series 2018 C, 1 month U.S. LIBOR + 0.380% 2.133%, tender 8/1/21 (a)(d) | | 245,000 | 244,584 |
| Colorado - 0.7% | | | |
| Colorado Univ. Co. Hosp. Auth. Rev. Bonds Series 2017C-1, 4%, tender 3/1/20 (a) | | 200,000 | 202,412 |
| E-470 Pub. Hwy. Auth. Rev. Series 2015 A, 5% 9/1/20 | | 50,000 | 52,153 |
|
| TOTAL COLORADO | | | 254,565 |
|
| Connecticut - 2.9% | | | |
| Connecticut Gen. Oblig.: | | | |
| Series 2012 A, SIFMA Municipal Swap Index + 1.250% 2.96% 4/15/20 (a)(d) | | $100,000 | $100,885 |
| Series 2016 B, 4% 5/15/20 | | 200,000 | 205,280 |
| Series 2017 B, 5% 4/15/19 | | 50,000 | 50,447 |
| Series A, 5% 2/15/21 | | 75,000 | 75,259 |
| Connecticut Spl. Tax Oblig. Trans. Infrastructure Rev.: | | | |
| Series 2011 A, 5% 12/1/19 | | 225,000 | 231,205 |
| Series 2015 B, 5% 8/1/20 | | 175,000 | 182,999 |
| Series 2016 A, 5% 9/1/21 | | 220,000 | 235,596 |
|
| TOTAL CONNECTICUT | | | 1,081,671 |
|
| Florida - 5.6% | | | |
| Broward County School Board Ctfs. of Prtn. Series 2015 A, 5% 7/1/19 | | 50,000 | 50,791 |
| Citizens Property Ins. Corp. Series 2011 A1, 5% 6/1/19 | | 250,000 | 253,215 |
| Escambia County Poll. Cont. Rev. Bonds Series 1997, 2.1%, tender 4/11/19 (a) | | 375,000 | 374,766 |
| Jacksonville Elec. Auth. Elec. Sys. Rev.: | | | |
| Series 2012 A, 5% 10/1/20 | | 200,000 | 209,350 |
| Series 2013 D, 5% 10/1/21 | | 200,000 | 214,166 |
| Series 2014 A, 5% 10/1/19 | | 215,000 | 219,736 |
| Jea Bulk Pwr. Supply Sys. Rev. Series 2014 A, 3.5% 10/1/19 | | 400,000 | 404,552 |
| Miami-Dade County Indl. Dev. Auth. Solid Waste Disp. Rev. Bonds (Waste Mgmt. of Florida Proj.) Series 2018, 2.85%, tender 8/2/21 (a)(c) | | 150,000 | 150,518 |
| Palm Beach County School Board Ctfs. of Prtn. Series 2014 B, 5% 8/1/19 | | 100,000 | 101,853 |
| Pasco County School District Sales Tax Rev. Series 2013, 5% 10/1/19 | | 75,000 | 76,748 |
|
| TOTAL FLORIDA | | | 2,055,695 |
|
| Georgia - 3.2% | | | |
| Georgia Muni. Elec. Auth. Pwr. Rev.: | | | |
| (Gen. Resolution Proj.) Series 2008 A, 5.25% 1/1/21 | | 225,000 | 237,461 |
| (Gen. Resolution Projs.) Series 2009 B, 5% 1/1/20 | | 200,000 | 205,618 |
| Series 2009 B, 5% 1/1/20 | | 295,000 | 303,287 |
| Series 2011 A, 5% 1/1/21 | | 120,000 | 126,065 |
| Monroe County Dev. Auth. Poll. Cont. Rev. Bonds (Gulf Pwr. Co. Plant Scherer Proj.) Series 2002 1, 2%, tender 6/25/20 (a) | | 100,000 | 99,422 |
| Private Colleges & Univs. Auth. Rev. (The Savannah College of Art and Design Projs.) Series 2014, 5% 4/1/19 | | 200,000 | 201,541 |
|
| TOTAL GEORGIA | | | 1,173,394 |
|
| Illinois - 12.9% | | | |
| Chicago Metropolitan Wtr. Reclamation District of Greater Chicago: | | | |
| Series 2011 B, 5% 12/1/19 | | 165,000 | 169,520 |
| Series 2014 D, 5% 12/1/19 | | 50,000 | 51,370 |
| Chicago Midway Arpt. Rev. Series 2014 B, 5% 1/1/19 | | 300,000 | 300,000 |
| Chicago O'Hare Int'l. Arpt. Rev.: | | | |
| Series 2010 D, 5.25% 1/1/19 (c) | | 100,000 | 100,000 |
| Series 2011 B, 5% 1/1/19 | | 150,000 | 150,000 |
| Series 2012 B, 4% 1/1/20 (c) | | 135,000 | 137,391 |
| Series 2013 A, 4% 1/1/19 (c) | | 200,000 | 200,000 |
| Chicago Park District Gen. Oblig.: | | | |
| Series 2013, 5% 1/1/20 | | 515,000 | 527,465 |
| Series 2015 C, 4% 1/1/19 | | 215,000 | 215,000 |
| Series 2018 E, 5% 11/15/19 | | 170,000 | 174,267 |
| Cook County Gen. Oblig.: | | | |
| Series 2009 C, 5% 11/15/21 | | 100,000 | 102,318 |
| Series 2011 A, 5% 11/15/19 | | 475,000 | 486,757 |
| Illinois Edl. Facilities Auth. Rev. Bonds (Univ. of Chicago Proj.) Series B2, 1.55%, tender 2/13/20 (a) | | 250,000 | 248,740 |
| Illinois Fin. Auth. Rev.: | | | |
| Bonds (Advocate Health Care Network Proj.) Series 2008 A2, 5%, tender 2/12/20 (a) | | 345,000 | 356,206 |
| Series 2009, 5% 8/15/20 | | 100,000 | 104,731 |
| Illinois Gen. Oblig.: | | | |
| Series 2006, 5% 1/1/19 | | 75,000 | 75,000 |
| Series 2010, 5% 1/1/21 (FSA Insured) | | 165,000 | 169,224 |
| Series 2017 B, 5% 11/1/19 | | 200,000 | 204,114 |
| Series 2018 A, 5% 5/1/19 | | 300,000 | 302,497 |
| Illinois Muni. Elec. Agcy. Pwr. Supply Series 2015 A, 5% 2/1/21 | | 170,000 | 179,969 |
| Railsplitter Tobacco Settlement Auth. Rev.: | | | |
| Series 2010, 5.375% 6/1/21 | | 330,000 | 352,938 |
| Series 2017, 5% 6/1/22 | | 135,000 | 146,059 |
|
| TOTAL ILLINOIS | | | 4,753,566 |
|
| Kansas - 0.6% | | | |
| Kansas Dev. Fin. Agcy. Series 2009, 5.5% 11/15/22 | | 200,000 | 205,996 |
| Kentucky - 3.1% | | | |
| Kentucky State Property & Buildings Commission Rev.: | | | |
| (Kentucky St Proj.) Series 2010, 5% 8/1/20 | | 575,000 | 600,099 |
| (Proj. No. 83) Series 2004, 5% 10/1/19 (AMBAC Insured) | | 200,000 | 204,496 |
| Kentucky, Inc. Pub. Energy Series 2018 B, 4% 7/1/21 | | 100,000 | 103,532 |
| Trimble County Poll. Cont. Rev. Bonds (Louisville Gas and Elec. Co. Proj.) Series 2001 B, 2.55%, tender 5/3/21 (a) | | 250,000 | 251,125 |
|
| TOTAL KENTUCKY | | | 1,159,252 |
|
| Louisiana - 1.0% | | | |
| Louisiana Citizens Property Ins. Corp. Assessment Rev. Series 2015, 5% 6/1/19 | | 150,000 | 151,966 |
| Louisiana Pub. Facilities Auth. Rev. (Ochsner Clinic Foundation Proj.) Series 2017, 4% 5/15/19 | | 225,000 | 226,588 |
|
| TOTAL LOUISIANA | | | 378,554 |
|
| Massachusetts - 0.3% | | | |
| Massachusetts Edl. Fing. Auth. Rev. Series 2010 A, 5.5% 1/1/22 | | 100,000 | 103,520 |
| Michigan - 5.7% | | | |
| Detroit Downtown Dev. Auth. Tax Series 1, 5% 7/1/19 (FSA Insured) | | 130,000 | 131,761 |
| Grand Traverse County Hosp. Fin. Auth. Series 2011 A, 5% 7/1/20 | | 115,000 | 119,985 |
| Michigan Fin. Auth. Rev.: | | | |
| (Henry Ford Health Sys. Proj.) Series 2016, 5% 11/15/20 | | 200,000 | 210,370 |
| Series 2010 A, 5% 12/1/19 | | 160,000 | 164,560 |
| Series 2015 A: | | | |
| 4% 8/1/19 | | 520,000 | 526,058 |
| 5% 5/15/20 | | 125,000 | 130,045 |
| Michigan Hosp. Fin. Auth. Rev. Bonds (Ascension Health Cr. Group Proj.) Series F5, 1.9%, tender 4/1/21 (a) | | 180,000 | 178,547 |
| Milan Area Schools Series 2019, 5% 5/1/21 (b) | | 170,000 | 180,222 |
| Wayne County Arpt. Auth. Rev.: | | | |
| (Detroit Metropolitan Wayne County Arpt.) Series 2015 G, 5% 12/1/19 | | 200,000 | 205,755 |
| Series 2011 A, 5% 12/1/19 (c) | | 260,000 | 266,884 |
|
| TOTAL MICHIGAN | | | 2,114,187 |
|
| Minnesota - 0.7% | | | |
| Southern Minnesota Muni. Pwr. Agcy. Pwr. Supply Sys. Rev. (Cap. Appreciation) Series 1994 A, 0% 1/1/19 (Nat'l. Pub. Fin. Guarantee Corp. Insured) | | 250,000 | 250,000 |
| Nebraska - 1.7% | | | |
| Nebraska Pub. Pwr. District Rev.: | | | |
| Series 2013 A, 5% 1/1/19 | | 350,000 | 350,000 |
| Series 2014, 5% 1/1/19 | | 70,000 | 70,000 |
| Series 2016, 5% 1/1/19 | | 200,000 | 200,000 |
|
| TOTAL NEBRASKA | | | 620,000 |
|
| Nevada - 0.6% | | | |
| Clark County Arpt. Rev. (Sub Lien Proj.) Series 2017 A-1, 5% 7/1/20 (c) | | 200,000 | 208,368 |
| New Jersey - 8.9% | | | |
| New Jersey Econ. Dev. Auth. Rev.: | | | |
| Series 2013, 5% 3/1/20 | | 10,000 | 10,304 |
| Series 2015 XX, 5% 6/15/20 | | 245,000 | 254,200 |
| New Jersey Edl. Facilities Auth. Rev. Series 2012 A, 5% 7/1/19 | | 50,000 | 50,774 |
| New Jersey Edl. Facility Series 2015 G, 4% 7/1/20 | | 175,000 | 180,416 |
| New Jersey Health Care Facilities Fing. Auth. Rev. Series 2016 A, 4% 7/1/19 | | 200,000 | 202,037 |
| New Jersey Higher Ed. Student Assistance Auth. Student Ln. Rev.: | | | |
| Series 2011 1, 5% 12/1/20 (c) | | 135,000 | 141,360 |
| Series 2012 1A, 4% 12/1/19 (c) | | 210,000 | 212,950 |
| Series 2013, 4% 12/1/20 (c) | | 40,000 | 41,097 |
| Series 2015 1A, 5% 12/1/21 (c) | | 600,000 | 641,154 |
| Series 2018 B, 5% 12/1/20 (c) | | 100,000 | 104,711 |
| New Jersey Tobacco Settlement Fing. Corp. Series 2018 A: | | | |
| 5% 6/1/19 | | 100,000 | 101,220 |
| 5% 6/1/21 | | 100,000 | 106,247 |
| New Jersey Trans. Trust Fund Auth.: | | | |
| Series 2003 B. 5.25% 12/15/19 | | 90,000 | 92,454 |
| Series 2012 AA, 5% 6/15/19 | | 50,000 | 50,620 |
| Series 2016 A, 5% 6/15/20 | | 115,000 | 119,469 |
| Series 2018 A: | | | |
| 5% 6/15/21 | | 125,000 | 132,350 |
| 5% 6/15/22 | | 210,000 | 226,454 |
| New Jersey Transit Corp. Ctfs. of Prtn. Series 2014 A, 5% 9/15/21 | | 570,000 | 606,041 |
|
| TOTAL NEW JERSEY | | | 3,273,858 |
|
| Ohio - 0.3% | | | |
| Franklin County Hosp. Facilities Rev. Bonds (Ohio Health Corp.) Series 2018 B, SIFMA Municipal Swap Index + 0.430% 2.14%, tender 11/15/21 (a)(d) | | 100,000 | 100,041 |
| Oklahoma - 0.6% | | | |
| Oklahoma Pwr. Auth. Pwr. Supply Sys. Rev. Series 2014 A, 5% 1/1/19 | | 235,000 | 235,000 |
| Pennsylvania - 3.2% | | | |
| Allegheny County Arpt. Auth. Rev. Series 2006 B, 5% 1/1/19 (c) | | 50,000 | 50,000 |
| Pennsylvania Gen. Oblig.: | | | |
| Series 2011, 5% 11/15/20 | | 60,000 | 63,360 |
| Series 2016, 5% 1/15/22 | | 140,000 | 151,999 |
| Pennsylvania Higher Edl. Facilities Auth. Rev.: | | | |
| (Thomas Jefferson Univ. Proj.) Series 2012, 5% 3/1/20 | | 50,000 | 51,741 |
| First Series 2012, 5% 4/1/21 | | 125,000 | 133,215 |
| Pennsylvania Tpk. Commission Tpk. Rev.: | | | |
| Series 2018 A1: | | | |
| SIFMA Municipal Swap Index + 0.350% 2.06% 12/1/20 (a)(d) | | 100,000 | 99,776 |
| SIFMA Municipal Swap Index + 0.430% 2.14% 12/1/21 (a)(d) | | 200,000 | 199,456 |
| Series 2018 B, SIFMA Municipal Swap Index + 0.500% 2.21% 12/1/21 (a)(d) | | 130,000 | 129,916 |
| Univ. of Pittsburgh Commonwealth Sys. of Higher Ed. Series 2018, SIFMA Municipal Swap Index + 0.240% 1.95% 9/15/21 (a)(d) | | 300,000 | 299,922 |
|
| TOTAL PENNSYLVANIA | | | 1,179,385 |
|
| Rhode Island - 0.6% | | | |
| Rhode Island Health and Edl. Bldg. Corp. Higher Ed. Facility Rev. Series 2015, 5% 11/1/21 | | 200,000 | 216,066 |
| Tennessee - 0.3% | | | |
| Jackson Hosp. Rev. Series 2018 A, 5% 4/1/20 | | 100,000 | 103,528 |
| Texas - 1.6% | | | |
| Bridgeport Independent School District Series 2010, 4% 8/15/20 | | 340,000 | 344,668 |
| Lower Colorado River Auth. Rev. Series 2012 B, 5% 5/15/21 | | 245,000 | 262,020 |
|
| TOTAL TEXAS | | | 606,688 |
|
| Virginia - 0.9% | | | |
| Louisa Indl. Dev. Auth. Poll. Cont. Rev. Bonds Series 2008 B, 2.15%, tender 9/1/20 (a) | | 250,000 | 249,348 |
| Wise County Indl. Dev. Auth. Waste & Sewage Rev. Bonds: | | | |
| (Virginia Elec. and Pwr. Co. Proj.) Series 2010 A, 1.875%, tender 6/1/20 (a) | | 25,000 | 24,850 |
| Series 2009 A, 2.15%, tender 9/1/20 (a) | | 50,000 | 49,870 |
|
| TOTAL VIRGINIA | | | 324,068 |
|
| Washington - 0.1% | | | |
| Port of Seattle Rev. Series 2010 C, 5% 2/1/20 (c) | | 45,000 | 46,451 |
| West Virginia - 1.1% | | | |
| Harrison County Commission Solid Waste Disp. Rev. Bonds (Monongahela Pwr. Co. Proj.) Series 2018 A, 3%, tender 10/15/21 (a)(c) | | 300,000 | 298,167 |
| Mason Co. Poll. Cont. Rev. (Appalachian Pwr. Co. Proj.) Series 2003 L, 2.75% 10/1/22 | | 100,000 | 99,610 |
|
| TOTAL WEST VIRGINIA | | | 397,777 |
|
| Wisconsin - 1.7% | | | |
| Wisconsin Health & Edl. Facilities Bonds Series 2018 C, SIFMA Municipal Swap Index + 0.450% 2.16%, tender 7/27/22 (a)(d) | | 155,000 | 154,236 |
| Wisconsin Health & Edl. Facilities Auth. (Unitypoint Health Proj.) Series 2014 A, 5% 12/1/19 | | 200,000 | 205,240 |
| Wisconsin Health & Edl. Facilities Auth. Rev. Series 2009 A, 5.5% 12/15/20 | | 250,000 | 258,263 |
|
| TOTAL WISCONSIN | | | 617,739 |
|
| TOTAL MUNICIPAL BONDS | | | |
| (Cost $22,451,319) | | | 22,467,143 |
|
| Municipal Notes - 39.0% | | | |
| California - 3.1% | | | |
| California Infrastructure & Econ. Dev. Bank Rev. (Pacific Gas & Elec. Co. Proj.) Series 2009 A, 2.08% 1/2/19, LOC MUFG Union Bank NA, VRDN (a) | | 240,000 | $240,000 |
| California Poll. Cont. Fing. Auth. Ctfs. of Prtn. (Pacific Gas & Elec. Co. Proj.) Series 1996 C, 2.15% 1/2/19, LOC Mizuho Corporate Bank Ltd., VRDN (a) | | 700,000 | 700,000 |
| El Centro Reg'l. Med. Cen Participating VRDN Series Floaters XF 10 72, 2.06% 1/7/19 (Liquidity Facility Deutsche Bank AG New York Branch) (a)(e) | | 200,000 | 200,000 |
|
| TOTAL CALIFORNIA | | | 1,140,000 |
|
| Colorado - 3.2% | | | |
| Colorado Hsg. & Fin. Auth. Econ. Dev. (Pacific Instruments Proj.) Series 2000, 1.9% 1/7/19, LOC Wells Fargo Bank NA, VRDN (a)(c) | | 165,000 | 165,000 |
| Denver City & County Arpt. Rev. Participating VRDN Series Floaters XL 00 90, 2.01% 1/7/19 (Liquidity Facility Morgan Stanley Bank, West Valley City Utah) (a)(c)(e) | | 1,000,000 | 1,000,000 |
|
| TOTAL COLORADO | | | 1,165,000 |
|
| Connecticut - 0.3% | | | |
| New Britain Gen. Oblig. BAN Series 2018, 5% 12/19/19 | | 100,000 | 102,636 |
| District Of Columbia - 0.8% | | | |
| District of Columbia Rev. Participating VRDN Series Floaters XF 10 78, 2.11% 1/7/19 (Liquidity Facility Deutsche Bank AG New York Branch) (a)(e) | | 300,000 | 300,000 |
| Florida - 2.0% | | | |
| Aqua One Cmnty. Dev. District Fla Participating VRDN Series Floaters XF 10 76, 2.06% 1/7/19 (Liquidity Facility Deutsche Bank AG New York Branch) (a)(e) | | 200,000 | 200,000 |
| Avenir Cmnty. Dev. District Participating VRDN Series Floaters XF 10 74, 2.06% 1/7/19 (Liquidity Facility Deutsche Bank AG New York Branch) (a)(e) | | 325,000 | 325,000 |
| Broward County Arpt. Sys. Rev. Participating VRDN Series Floaters XL 00 88, 2.06% 1/7/19 (Liquidity Facility Citibank NA) (a)(c)(e) | | 200,000 | 200,000 |
|
| TOTAL FLORIDA | | | 725,000 |
|
| Georgia - 1.1% | | | |
| Burke County Indl. Dev. Auth. Poll. Cont. Rev. (Georgia Pwr. Co. Plant Vogtle Proj.) Second Series 1995, 1.77% 1/2/19, VRDN (a) | | 400,000 | 400,000 |
| Indiana - 3.3% | | | |
| Indiana Dev. Fin. Auth. Envir. Rev. (PSI Energy Proj.) Series 2003 B, 2.08% 1/7/19, VRDN (a)(c) | | 1,230,000 | 1,229,991 |
| Iowa - 0.5% | | | |
| Hills Health Facilities Rev. Participating VRDN Series Floaters XF 10 73, 2.06% 1/7/19 (Liquidity Facility Deutsche Bank AG New York Branch) (a)(e) | | 200,000 | 200,000 |
| Massachusetts - 1.1% | | | |
| Massachusetts Edl. Fing. Auth. Rev. Participating VRDN Series Floaters XF 23 06, 1.96% 1/7/19 (Liquidity Facility Morgan Stanley Bank, West Valley City Utah) (a)(c)(e) | | 200,000 | 200,000 |
| Nahant BAN Series 2018 A, 3% 6/28/19 | | 100,000 | 100,367 |
| Templeton BAN Series A, 3.25% 2/27/19 | | 100,000 | 100,147 |
|
| TOTAL MASSACHUSETTS | | | 400,514 |
|
| Nevada - 2.7% | | | |
| Clark County Arpt. Rev. Participating VRDN Series ROC II R 11823, 1.91% 1/7/19 (Liquidity Facility Citibank NA) (a)(e) | | 1,000,000 | 1,000,000 |
| New Jersey - 7.9% | | | |
| Borough of Riverdale BAN Series 2018, 3% 9/13/19 | | 100,000 | 100,680 |
| Caldwell BAN Series 2018, 3% 2/20/19 | | 100,000 | 100,129 |
| Chester Township Gen. Oblig. BAN Series 2018, 3% 10/11/19 | | 100,000 | 100,779 |
| Delran Township BAN Series 2018, 3% 10/25/19 | | 200,000 | 201,506 |
| East Brunswick Township Gen. Oblig. BAN Series 2019, 3.5% 1/10/20 (b) | | 100,000 | 101,269 |
| Gloucester Township BAN Series 2018 B, 3% 6/20/19 | | 600,000 | 602,490 |
| Holmdel Township Gen. Oblig. BAN Series 2018, 2.5% 1/15/19 | | 100,000 | 100,020 |
| Maple Shade Township BAN Series 2018: | | | |
| 3% 6/27/19 | | 200,000 | 200,962 |
| 3% 6/27/19 | | 200,000 | 200,962 |
| Millburn Township Gen. Oblig. BAN Series 2018, 3% 6/14/19 | | 100,000 | 100,404 |
| Millstone Township Gen. Oblig. BAN Series 2018, 3% 9/10/19 | | 100,000 | 100,686 |
| Roselle County of Union BAN Series 2018, 3.5% 12/6/19 | | 100,000 | 101,122 |
| Saddle Brook Township Gen. Oblig. BAN Series 2018, 3% 5/30/19 | | 300,000 | 301,094 |
| Teaneck Township Gen. Oblig. BAN Series 2018, 3% 6/28/19 | | 100,000 | 100,416 |
| Vineland Gen. Oblig. BAN Series 2018, 3.5% 11/14/19 | | 200,000 | 202,354 |
| Wall Township Gen. Oblig. BAN Series 2018, 3% 6/28/19 | | 300,000 | 301,262 |
|
| TOTAL NEW JERSEY | | | 2,916,135 |
|
| New York - 6.6% | | | |
| Amsterdam City School District BAN Series 2018, 3% 6/28/19 | | 400,000 | 401,702 |
| Eden N Y Cent School District BAN Series 2019, 3% 6/6/19 | | 100,000 | 100,422 |
| Geneva BAN Series 2018, 3% 5/8/19 | | 400,000 | 401,252 |
| Geneva Hsg. Auth. Rev. Series 2000, 2.32% 1/7/19, VRDN (a)(c) | | 100,000 | 100,000 |
| Gloversville School District BAN Series 2018, 3% 10/18/19 | | 500,000 | 503,557 |
| New York Metropolitan Trans. Auth. Rev. BAN Series 2018 B, 5% 5/15/21 | | 115,000 | 122,419 |
| Penn Yan NY Central School District BAN Series 2018, 3% 7/19/19 | | 200,000 | 200,929 |
| Queensbury Union Free School District BAN Series 2018, 3% 7/12/19 | | 200,000 | 200,918 |
| Sidney Cent School District BAN Series 2018, 3% 7/10/19 | | 100,000 | 100,428 |
| Troy Rensselaer County BAN Series B, 3% 8/2/19 | | 300,000 | 301,450 |
|
| TOTAL NEW YORK | | | 2,433,077 |
|
| North Carolina - 0.3% | | | |
| North Carolina Cap. Impt. Ltd. Bonds Series WF 11 136C, SIFMA Municipal Swap Index + 0.280% 1.99%, tender 1/24/19 (Liquidity Facility Wells Fargo Bank NA) (a)(d)(e)(f) | | 100,000 | 100,000 |
| Ohio - 0.5% | | | |
| Belmont County BAN Series 2018 A, 3% 4/18/19 | | 100,000 | 100,325 |
| East Clinton Local School District BAN Series 2019, 2.8% 12/3/19 | | 100,000 | 100,497 |
|
| TOTAL OHIO | | | 200,822 |
|
| Texas - 5.6% | | | |
| Port Arthur Navigation District Envir. Facilities Rev. (Motiva Enterprises LLC Proj.): | | | |
| Series 2004, 2.12% 1/7/19, VRDN (a)(c) | | 900,000 | 900,000 |
| Series 2010 D: | | | |
| 2.03% 1/7/19, VRDN (a) | | 800,000 | 800,000 |
| 2.1% 1/7/19, VRDN (a) | | 150,000 | 150,000 |
| Texas Gen. Oblig. Bonds Series WF 1183C, SIFMA Municipal Swap Index + 0.350% 2.06%, tender 1/24/19 (Liquidity Facility Wells Fargo Bank NA) (a)(c)(d)(e)(f) | | 210,000 | 210,000 |
|
| TOTAL TEXAS | | | 2,060,000 |
|
| TOTAL MUNICIPAL NOTES | | | |
| (Cost $14,374,625) | | | 14,373,175 |
| | | Shares | Value |
|
| Money Market Funds - 0.3% | | | |
| Fidelity Municipal Cash Central Fund, 1.77% (g)(h) | | | |
| (Cost $100,000) | | 99,990 | 100,000 |
| TOTAL INVESTMENT IN SECURITIES - 100.4% | | | |
| (Cost $36,925,944) | | | 36,940,318 |
| NET OTHER ASSETS (LIABILITIES) - (0.4)% | | | (153,080) |
| NET ASSETS - 100% | | | $36,787,238 |
Security Type Abbreviations
BAN – BOND ANTICIPATION NOTE
VRDN – VARIABLE RATE DEMAND NOTE (A debt instrument that is payable upon demand, either daily, weekly or monthly)
Legend
(a) Coupon rates for floating and adjustable rate securities reflect the rates in effect at period end.
(b) Security or a portion of the security purchased on a delayed delivery or when-issued basis.
(c) Private activity obligations whose interest is subject to the federal alternative minimum tax for individuals.
(d) Coupon is indexed to a floating interest rate which may be multiplied by a specified factor and/or subject to caps or floors.
(e) Provides evidence of ownership in one or more underlying municipal bonds.
(f) Restricted securities - Investment in securities not registered under the Securities Act of 1933 (excluding 144A issues). At the end of the period, the value of restricted securities (excluding 144A issues) amounted to $310,000 or 0.8% of net assets.
(g) Information in this report regarding holdings by state and security types does not reflect the holdings of the Fidelity Municipal Cash Central Fund.
(h) Affiliated fund that is available only to investment companies and other accounts managed by Fidelity Investments. The rate quoted is the annualized seven-day yield of the fund at period end. A complete unaudited listing of the fund's holdings as of its most recent quarter end is available upon request. In addition, each Fidelity Central Fund's financial statements, which are not covered by the Fund's Report of Independent Registered Public Accounting Firm, are available on the SEC's website or upon request.
Additional information on each restricted holding is as follows:
| Security | Acquisition Date | Acquisition Cost |
| North Carolina Cap. Impt. Ltd. Bonds Series WF 11 136C, SIFMA Municipal Swap Index + 0.280% 1.99%, tender 1/24/19 (Liquidity Facility Wells Fargo Bank NA) | 7/25/18 | $100,000 |
| Texas Gen. Oblig. Bonds Series WF 1183C, SIFMA Municipal Swap Index + 0.350% 2.06%, tender 1/24/19 (Liquidity Facility Wells Fargo Bank NA) | 7/25/18 | $210,000 |
Affiliated Central Funds
Information regarding fiscal year to date income earned by the Fund from investments in Fidelity Central Funds is as follows:
| Fund | Income earned |
| Fidelity Municipal Cash Central Fund | $6,753 |
| Total | $6,753 |
Amounts in the income column in the above table include any capital gain distributions from underlying funds, which are presented in the corresponding line-item in the Statement of Operations if applicable.
Investment Valuation
The following is a summary of the inputs used, as of December 31, 2018, involving the Fund's assets and liabilities carried at fair value. The inputs or methodology used for valuing securities may not be an indication of the risk associated with investing in those securities. For more information on valuation inputs, and their aggregation into the levels used below, please refer to the Investment Valuation section in the accompanying Notes to Financial Statements.
| | Valuation Inputs at Reporting Date: |
| Description | Total | Level 1 | Level 2 | Level 3 |
| Investments in Securities: | | | | |
| Municipal Securities | $36,840,318 | $-- | $36,840,318 | $-- |
| Money Market Funds | 100,000 | 100,000 | -- | -- |
| Total Investments in Securities: | $36,940,318 | $100,000 | $36,840,318 | $-- |
Other Information
The distribution of municipal securities by revenue source, as a percentage of total Net Assets, is as follows (Unaudited):
| General Obligations | 29.8% |
| Electric Utilities | 21.7% |
| Synthetics | 10.6% |
| Health Care | 9.9% |
| Transportation | 8.0% |
| Education | 7.1% |
| Industrial Development | 5.5% |
| Others* (Individually Less Than 5%) | 7.4% |
| | 100.0% |
* Includes net other assets
See accompanying notes which are an integral part of the financial statements.
Financial Statements
Statement of Assets and Liabilities
| | | December 31, 2018 |
| Assets | | |
Investment in securities, at value — See accompanying schedule:
Unaffiliated issuers (cost $36,825,944) | $36,840,318 | |
| Fidelity Central Funds (cost $100,000) | 100,000 | |
| Total Investment in Securities (cost $36,925,944) | | $36,940,318 |
| Cash | | 67,693 |
| Receivable for fund shares sold | | 56,867 |
| Interest receivable | | 343,148 |
| Distributions receivable from Fidelity Central Funds | | 136 |
| Total assets | | 37,408,162 |
| Liabilities | | |
| Payable for investments purchased | | |
| Regular delivery | $122,172 | |
| Delayed delivery | 382,380 | |
| Payable for fund shares redeemed | 69,429 | |
| Distributions payable | 46,943 | |
| Total liabilities | | 620,924 |
| Net Assets | | $36,787,238 |
| Net Assets consist of: | | |
| Paid in capital | | $36,772,651 |
| Total distributable earnings (loss) | | 14,587 |
| Net Assets, for 3,685,206 shares outstanding | | $36,787,238 |
| Net Asset Value, offering price and redemption price per share ($36,787,238 ÷ 3,685,206 shares) | | $9.98 |
See accompanying notes which are an integral part of the financial statements.
Statement of Operations
| | | Year ended December 31, 2018 |
| Investment Income | | |
| Interest | | $491,938 |
| Income from Fidelity Central Funds | | 6,753 |
| Total income | | 498,691 |
| Expenses | | |
| Independent trustees' fees and expenses | $117 | |
| Commitment fees | 42 | |
| Total expenses before reductions | 159 | |
| Expense reductions | (14) | |
| Total expenses after reductions | | 145 |
| Net investment income (loss) | | 498,546 |
| Realized and Unrealized Gain (Loss) | | |
| Net realized gain (loss) on: | | |
| Investment securities: | | |
| Unaffiliated issuers | 1,219 | |
| Total net realized gain (loss) | | 1,219 |
| Change in net unrealized appreciation (depreciation) on investment securities | | 31,816 |
| Net gain (loss) | | 33,035 |
| Net increase (decrease) in net assets resulting from operations | | $531,581 |
See accompanying notes which are an integral part of the financial statements.
Statement of Changes in Net Assets
| | Year ended December 31, 2018 | For the period
October 12, 2017 (commencement of operations) to December 31, 2017 |
| Increase (Decrease) in Net Assets | | |
| Operations | | |
| Net investment income (loss) | $498,546 | $28,132 |
| Net realized gain (loss) | 1,219 | (122) |
| Change in net unrealized appreciation (depreciation) | 31,816 | (17,442) |
| Net increase (decrease) in net assets resulting from operations | 531,581 | 10,568 |
| Distributions to shareholders | (502,074) | – |
| Distributions to shareholders from net investment income | – | (28,094) |
| Total distributions | (502,074) | (28,094) |
| Share transactions | | |
| Proceeds from sales of shares | 37,244,080 | 10,010,000 |
| Reinvestment of distributions | 176,879 | 28,097 |
| Cost of shares redeemed | (10,683,799) | – |
| Net increase (decrease) in net assets resulting from share transactions | 26,737,160 | 10,038,097 |
| Total increase (decrease) in net assets | 26,766,667 | 10,020,571 |
| Net Assets | | |
| Beginning of period | 10,020,571 | – |
| End of period | $36,787,238 | $10,020,571 |
| Other Information | | |
| Undistributed net investment income end of period | | $39 |
| Shares | | |
| Sold | 3,734,777 | 1,001,000 |
| Issued in reinvestment of distributions | 17,730 | 2,814 |
| Redeemed | (1,071,115) | – |
| Net increase (decrease) | 2,681,392 | 1,003,814 |
See accompanying notes which are an integral part of the financial statements.
Financial Highlights
Fidelity Flex Conservative Income Municipal Bond Fund
| | | |
| Years ended December 31, | 2018 | 2017 A |
| Selected Per–Share Data | | |
| Net asset value, beginning of period | $9.98 | $10.00 |
| Income from Investment Operations | | |
| Net investment income (loss)B | .179 | .028 |
| Net realized and unrealized gain (loss) | (.004)C | (.020) |
| Total from investment operations | .175 | .008 |
| Distributions from net investment income | (.174) | (.028) |
| Distributions from net realized gain | (.001) | – |
| Total distributions | (.175) | (.028) |
| Net asset value, end of period | $9.98 | $9.98 |
| Total ReturnD,E | 1.77% | .08% |
| Ratios to Average Net AssetsF,G | | |
| Expenses before reductionsH | -% | - %I |
| Expenses net of fee waivers, if anyH | -% | - %I |
| Expenses net of all reductionsH | -% | - %I |
| Net investment income (loss) | 1.81% | 1.27%I |
| Supplemental Data | | |
| Net assets, end of period (000 omitted) | $36,787 | $10,021 |
| Portfolio turnover rateJ | 11% | - %K |
A For the period October 12, 2017 (commencement of operations) to December 31, 2017.
B Calculated based on average shares outstanding during the period.
C The amount shown for a share outstanding does not correspond with the aggregate net gain (loss) on investments for the period due to the timing of sales and repurchases of shares in relation to fluctuating market values of the investments of the Fund.
D Total returns for periods of less than one year are not annualized.
E Total returns would have been lower if certain expenses had not been reduced during the applicable periods shown.
F Fees and expenses of any underlying Fidelity Central Funds are not included in the Fund's expense ratio. The Fund indirectly bears its proportionate share of the expenses of any underlying Fidelity Central Funds.
G Expense ratios reflect operating expenses of the Fund. Expenses before reductions do not reflect amounts reimbursed by the investment adviser or reductions from expense offset arrangements and do not represent the amount paid by the Fund during periods when reimbursements or reductions occur. Expenses net of fee waivers reflect expenses after reimbursement by the investment adviser but prior to reductions from expense offset arrangements. Expenses net of all reductions represent the net expenses paid by the Fund.
H Amount represents less than .005%.
I Annualized
J Amount does not include the portfolio activity of any underlying Fidelity Central Funds.
K Amount not annualized.
See accompanying notes which are an integral part of the financial statements.
Notes to Financial Statements
For the period ended December 31, 2018
1. Organization.
Fidelity Flex Conservative Income Municipal Bond Fund (the Fund) is a fund of Fidelity Municipal Trust (the Trust) and is authorized to issue an unlimited number of shares. Share transactions on the Statement of Changes in Net Assets may contain exchanges between affiliated funds. The Trust is registered under the Investment Company Act of 1940, as amended (the 1940 Act), as an open-end management investment company organized as a Massachusetts business trust. The Fund is available only to certain fee-based accounts offered by Fidelity.
2. Investments in Fidelity Central Funds.
The Fund invests in Fidelity Central Funds, which are open-end investment companies generally available only to other investment companies and accounts managed by the investment adviser and its affiliates. The Fund's Schedule of Investments lists each of the Fidelity Central Funds held as of period end, if any, as an investment of the Fund, but does not include the underlying holdings of each Fidelity Central Fund. As an Investing Fund, the Fund indirectly bears its proportionate share of the expenses of the underlying Fidelity Central Funds.
The Money Market Central Funds seek preservation of capital and current income and are managed by Fidelity Investments Money Management, Inc. (FIMM), an affiliate of the investment adviser. Annualized expenses of the Money Market Central Funds as of their most recent shareholder report date are less than .005%.
A complete unaudited list of holdings for each Fidelity Central Fund is available upon request or at the Securities and Exchange Commission (the SEC) website at www.sec.gov. In addition, the financial statements of the Fidelity Central Funds, which are not covered by the Fund's Report of Independent Registered Public Accounting Firm, are available on the SEC website or upon request.
3. Significant Accounting Policies.
The Fund is an investment company and applies the accounting and reporting guidance of the Financial Accounting Standards Board (FASB) Accounting Standards Codification Topic 946 Financial Services – Investments Companies. The financial statements have been prepared in conformity with accounting principles generally accepted in the United States of America (GAAP), which require management to make certain estimates and assumptions at the date of the financial statements. Actual results could differ from those estimates. Subsequent events, if any, through the date that the financial statements were issued have been evaluated in the preparation of the financial statements. The following summarizes the significant accounting policies of the Fund:
Investment Valuation. Investments are valued as of 4:00 p.m. Eastern time on the last calendar day of the period. The Board of Trustees (the Board) has delegated the day to day responsibility for the valuation of the Fund's investments to the Fair Value Committee (the Committee) established by the Fund's investment adviser. In accordance with valuation policies and procedures approved by the Board, the Fund attempts to obtain prices from one or more third party pricing vendors or brokers to value its investments. When current market prices, quotations or currency exchange rates are not readily available or reliable, investments will be fair valued in good faith by the Committee, in accordance with procedures adopted by the Board. Factors used in determining fair value vary by investment type and may include market or investment specific events, changes in interest rates and credit quality. The frequency with which these procedures are used cannot be predicted and they may be utilized to a significant extent. The Committee oversees the Fund's valuation policies and procedures and reports to the Board on the Committee's activities and fair value determinations. The Board monitors the appropriateness of the procedures used in valuing the Fund's investments and ratifies the fair value determinations of the Committee.
The Fund categorizes the inputs to valuation techniques used to value its investments into a disclosure hierarchy consisting of three levels as shown below:
- Level 1 – quoted prices in active markets for identical investments
- Level 2 – other significant observable inputs (including quoted prices for similar investments, interest rates, prepayment speeds, etc.)
- Level 3 – unobservable inputs (including the Fund's own assumptions based on the best information available)
Valuation techniques used to value the Fund's investments by major category are as follows:
Debt securities, including restricted securities, are valued based on evaluated prices received from third party pricing vendors or from brokers who make markets in such securities. Municipal securities are valued by pricing vendors who utilize matrix pricing which considers yield or price of bonds of comparable quality, coupon, maturity and type or by broker-supplied prices. When independent prices are unavailable or unreliable, debt securities may be valued utilizing pricing methodologies which consider similar factors that would be used by third party pricing vendors. Debt securities are generally categorized as Level 2 in the hierarchy but may be Level 3 depending on the circumstances.
Investments in open-end mutual funds, including the Fidelity Central Funds, are valued at their closing net asset value (NAV) each business day and are categorized as Level 1 in the hierarchy.
Changes in valuation techniques may result in transfers in or out of an assigned level within the disclosure hierarchy. The aggregate value of investments by input level as of December 31, 2018 is included at the end of the Fund's Schedule of Investments.
Investment Transactions and Income. For financial reporting purposes, the Fund's investment holdings and NAV include trades executed through the end of the last business day of the period. The NAV per share for processing shareholder transactions is calculated as of the close of business of the New York Stock Exchange (NYSE), normally 4:00 p.m. Eastern time and includes trades executed through the end of the prior business day. Gains and losses on securities sold are determined on the basis of identified cost. Income and capital gain distributions from Fidelity Central Funds, if any, are recorded on the ex-dividend date. Interest income is accrued as earned and includes coupon interest and amortization of premium and accretion of discount on debt securities as applicable. Debt obligations may be placed on non-accrual status and related interest income may be reduced by ceasing current accruals and writing off interest receivables when the collection of all or a portion of interest has become doubtful based on consistently applied procedures. A debt obligation is removed from non-accrual status when the issuer resumes interest payments or when collectability of interest is reasonably assured.
Expenses. Expenses directly attributable to a fund are charged to that fund. Expenses attributable to more than one fund are allocated among the respective funds on the basis of relative net assets or other appropriate methods. Expense estimates are accrued in the period to which they relate and adjustments are made when actual amounts are known.
Income Tax Information and Distributions to Shareholders. Each year, the Fund intends to qualify as a regulated investment company under Subchapter M of the Internal Revenue Code, including distributing substantially all of its taxable income and realized gains. As a result, no provision for U.S. Federal income taxes is required. As of December 31, 2018, the Fund did not have any unrecognized tax benefits in the financial statements; nor is the Fund aware of any tax positions for which it is reasonably possible that the total amounts of unrecognized tax benefits will significantly change in the next twelve months. The Fund files a U.S. federal tax return, in addition to state and local tax returns as required. The Fund's federal income tax returns are subject to examination by the Internal Revenue Service (IRS) for a period of three fiscal years after they are filed. State and local tax returns may be subject to examination for an additional fiscal year depending on the jurisdiction.
Distributions are declared and recorded daily and paid monthly from net investment income. Distributions from realized gains, if any, are declared and recorded on the ex-dividend date. Income and capital gain distributions are determined in accordance with income tax regulations, which may differ from GAAP.
Capital accounts within the financial statements are adjusted for permanent book-tax differences. These adjustments have no impact on net assets or the results of operations. Capital accounts are not adjusted for temporary book-tax differences which will reverse in a subsequent period.
Book-tax differences are primarily due to market discount.
The Fund purchases municipal securities whose interest, in the opinion of the issuer, is free from federal income tax. There is no assurance that the IRS will agree with this opinion. In the event the IRS determines that the issuer does not comply with relevant tax requirements, interest payments from a security could become federally taxable, possibly retroactively to the date the security was issued.
As of period end, the cost and unrealized appreciation (depreciation) in securities, and derivatives if applicable, for federal income tax purposes were as follows:
| Gross unrealized appreciation | $39,255 |
| Gross unrealized depreciation | (24,785) |
| Net unrealized appreciation (depreciation) | $14,470 |
| Tax Cost | $36,925,848 |
The tax-based components of distributable earnings as of period end were as follows:
| Undistributed tax-exempt income | $116 |
| Net unrealized appreciation (depreciation) on securities and other investments | $14,470 |
The tax character of distributions paid was as follows:
| | December 31, 2018 | December 31, 2017(a) |
| Tax-exempt Income | $498,399 | $28,094 |
| Ordinary Income | 3,675 | – |
| Total | $ 502,074 | $ 28,094 |
(a) For the period October 12, 2017 (commencement of operations) to December 31, 2017.
Delayed Delivery Transactions and When-Issued Securities. During the period, the Fund transacted in securities on a delayed delivery or when-issued basis. Payment and delivery may take place after the customary settlement period for that security. The price of the underlying securities and the date when the securities will be delivered and paid for are fixed at the time the transaction is negotiated. The securities purchased on a delayed delivery or when-issued basis are identified as such in the Fund's Schedule of Investments. The Fund may receive compensation for interest forgone in the purchase of a delayed delivery or when-issued security. With respect to purchase commitments, the Fund identifies securities as segregated in its records with a value at least equal to the amount of the commitment. Losses may arise due to changes in the value of the underlying securities or if the counterparty does not perform under the contract's terms, or if the issuer does not issue the securities due to political, economic, or other factors.
Restricted Securities. The Fund may invest in securities that are subject to legal or contractual restrictions on resale. These securities generally may be resold in transactions exempt from registration or to the public if the securities are registered. Disposal of these securities may involve time-consuming negotiations and expense, and prompt sale at an acceptable price may be difficult. Information regarding restricted securities is included at the end of the Fund's Schedule of Investments.
New Rule Issuance. During August 2018, the U.S. Securities and Exchange Commission issued Final Rule Release No. 33-10532, Disclosure Update and Simplification. This Final Rule includes amendments specific to registered investment companies that are intended to eliminate overlap in disclosure requirements between Regulation S-X and GAAP. In accordance with these amendments, certain line-items in the Fund's financial statements have been combined or removed for the current period as outlined in the table below.
| Financial Statement | Current Line-Item Presentation | Prior Line-Item Presentation |
| Statement of Assets and Liabilities | Total distributable earnings (loss) | Undistributed/Distributions in excess of/Accumulated net investment income (loss)
Accumulated/Undistributed net realized gain (loss)
Net unrealized appreciation (depreciation) |
| Statement of Changes in Net Assets | N/A - removed | Undistributed/Distributions in excess of/Accumulated net investment income (loss) end of period |
| Statement of Changes in Net Assets | Distributions to shareholders | Distributions to shareholders from net investment income
Distributions to shareholders from net realized gain |
4. Purchases and Sales of Investments.
Purchases and sales of securities, other than short-term securities, aggregated $22,469,958 and $1,430,500, respectively.
5. Fees and Other Transactions with Affiliates.
Management Fee. Fidelity Management & Research Company (the investment adviser) and its affiliates provide the Fund with investment management related services and the Fund does not pay any fees for these services. Under the management contract, the investment adviser or an affiliate pays all other expenses of the Fund, excluding fees and expenses of the independent Trustees, and certain miscellaneous expenses such as proxy and shareholder meeting expenses.
Interfund Trades. The Fund may purchase from or sell securities to other Fidelity Funds under procedures adopted by the Board. The procedures have been designed to ensure these interfund trades are executed in accordance with Rule 17a-7 of the 1940 Act. Interfund trades are included within the respective purchases and sales amounts shown in the Purchases and Sales of Investments note.
6. Committed Line of Credit.
The Fund participates with other funds managed by the investment adviser or an affiliate in a $4.25 billion credit facility (the "line of credit") to be utilized for temporary or emergency purposes to fund shareholder redemptions or for other short-term liquidity purposes. The Fund has agreed to pay commitment fees on its pro-rata portion of the line of credit, which amounted to $42 and is reflected in Commitment fees on the Statement of Operations. During the period, the Fund did not borrow on this line of credit.
7. Expense Reductions.
Through arrangements with the Fund's custodian, credits realized as a result of certain uninvested cash balances were used to reduce the Fund's expenses. During the period, these credits reduced the Fund's custody expenses by $14.
8. Other.
The Fund's organizational documents provide former and current trustees and officers with a limited indemnification against liabilities arising in connection with the performance of their duties to the Fund. In the normal course of business, the Fund may also enter into contracts that provide general indemnifications. The Fund's maximum exposure under these arrangements is unknown as this would be dependent on future claims that may be made against the Fund. The risk of material loss from such claims is considered remote.
At the end of the period, the investment adviser or its affiliates were the owners of record of approximately 28% of the total outstanding shares of the Fund.
Report of Independent Registered Public Accounting Firm
To the Board of Trustees of Fidelity Municipal Trust and Shareholders of Fidelity Flex Conservative Income Municipal Bond Fund:
Opinion on the Financial Statements
We have audited the accompanying statement of assets and liabilities, including the schedule of investments, of Fidelity Flex Conservative Income Municipal Bond Fund (one of the funds constituting Fidelity Municipal Trust, referred to hereafter as the "Fund") as of December 31, 2018, the related statement of operations for the year ended December 31, 2018 and the statement of changes in net assets and the financial highlights for the year ended December 31, 2018 and for the period October 12, 2017 (commencement of operations) through December 31, 2017, including the related notes (collectively referred to as the “financial statements”). In our opinion, the financial statements present fairly, in all material respects, the financial position of the Fund as of December 31, 2018, the results of its operations for the year ended December 31, 2018, and the changes in its net assets and the financial highlights for the year ended December 31, 2018 and for the period October 12, 2017 (commencement of operations) through December 31, 2017 in conformity with accounting principles generally accepted in the United States of America.
Basis for Opinion
These financial statements are the responsibility of the Fund’s management. Our responsibility is to express an opinion on the Fund’s financial statements based on our audits. We are a public accounting firm registered with the Public Company Accounting Oversight Board (United States) (PCAOB) and are required to be independent with respect to the Fund in accordance with the U.S. federal securities laws and the applicable rules and regulations of the Securities and Exchange Commission and the PCAOB.
We conducted our audits of these financial statements in accordance with the standards of the PCAOB. Those standards require that we plan and perform the audit to obtain reasonable assurance about whether the financial statements are free of material misstatement, whether due to error or fraud.
Our audits included performing procedures to assess the risks of material misstatement of the financial statements, whether due to error or fraud, and performing procedures that respond to those risks. Such procedures included examining, on a test basis, evidence regarding the amounts and disclosures in the financial statements. Our audits also included evaluating the accounting principles used and significant estimates made by management, as well as evaluating the overall presentation of the financial statements. Our procedures included confirmation of securities owned as of December 31, 2018 by correspondence with the custodian and brokers; when replies were not received from brokers, we performed other auditing procedures. We believe that our audits provide a reasonable basis for our opinion.
PricewaterhouseCoopers LLP
Boston, Massachusetts
February 14, 2019
We have served as the auditor of one or more investment companies in the Fidelity group of funds since 1932.
Trustees and Officers
The Trustees, Members of the Advisory Board (if any), and officers of the trust and fund, as applicable, are listed below. The Board of Trustees governs the fund and is responsible for protecting the interests of shareholders. The Trustees are experienced executives who meet periodically throughout the year to oversee the fund's activities, review contractual arrangements with companies that provide services to the fund, oversee management of the risks associated with such activities and contractual arrangements, and review the fund's performance. Each of the Trustees oversees 260 funds.
The Trustees hold office without limit in time except that (a) any Trustee may resign; (b) any Trustee may be removed by written instrument, signed by at least two-thirds of the number of Trustees prior to such removal; (c) any Trustee who requests to be retired or who has become incapacitated by illness or injury may be retired by written instrument signed by a majority of the other Trustees; and (d) any Trustee may be removed at any special meeting of shareholders by a two-thirds vote of the outstanding voting securities of the trust. Each Trustee who is not an interested person (as defined in the 1940 Act) of the trust and the fund is referred to herein as an Independent Trustee. Each Independent Trustee shall retire not later than the last day of the calendar year in which his or her 75th birthday occurs. The Independent Trustees may waive this mandatory retirement age policy with respect to individual Trustees. Officers and Advisory Board Members hold office without limit in time, except that any officer or Advisory Board Member may resign or may be removed by a vote of a majority of the Trustees at any regular meeting or any special meeting of the Trustees. Except as indicated, each individual has held the office shown or other offices in the same company for the past five years.
The fund’s Statement of Additional Information (SAI) includes more information about the Trustees. To request a free copy, call Fidelity at 1-800-544-3455.
Experience, Skills, Attributes, and Qualifications of the Trustees. The Governance and Nominating Committee has adopted a statement of policy that describes the experience, qualifications, attributes, and skills that are necessary and desirable for potential Independent Trustee candidates (Statement of Policy). The Board believes that each Trustee satisfied at the time he or she was initially elected or appointed a Trustee, and continues to satisfy, the standards contemplated by the Statement of Policy. The Governance and Nominating Committee also engages professional search firms to help identify potential Independent Trustee candidates who have the experience, qualifications, attributes, and skills consistent with the Statement of Policy. From time to time, additional criteria based on the composition and skills of the current Independent Trustees, as well as experience or skills that may be appropriate in light of future changes to board composition, business conditions, and regulatory or other developments, have also been considered by the professional search firms and the Governance and Nominating Committee. In addition, the Board takes into account the Trustees' commitment and participation in Board and committee meetings, as well as their leadership of standing and ad hoc committees throughout their tenure.
In determining that a particular Trustee was and continues to be qualified to serve as a Trustee, the Board has considered a variety of criteria, none of which, in isolation, was controlling. The Board believes that, collectively, the Trustees have balanced and diverse experience, qualifications, attributes, and skills, which allow the Board to operate effectively in governing the fund and protecting the interests of shareholders. Information about the specific experience, skills, attributes, and qualifications of each Trustee, which in each case led to the Board's conclusion that the Trustee should serve (or continue to serve) as a trustee of the fund, is provided below.
Board Structure and Oversight Function. Abigail P. Johnson is an interested person and currently serves as Chairman. The Trustees have determined that an interested Chairman is appropriate and benefits shareholders because an interested Chairman has a personal and professional stake in the quality and continuity of services provided to the fund. Independent Trustees exercise their informed business judgment to appoint an individual of their choosing to serve as Chairman, regardless of whether the Trustee happens to be independent or a member of management. The Independent Trustees have determined that they can act independently and effectively without having an Independent Trustee serve as Chairman and that a key structural component for assuring that they are in a position to do so is for the Independent Trustees to constitute a substantial majority for the Board. The Independent Trustees also regularly meet in executive session. Arthur E. Johnson serves as Chairman of the Independent Trustees and as such (i) acts as a liaison between the Independent Trustees and management with respect to matters important to the Independent Trustees and (ii) with management prepares agendas for Board meetings.
Fidelity® funds are overseen by different Boards of Trustees. The fund's Board oversees Fidelity's investment-grade bond, money market, asset allocation and certain equity funds, and other Boards oversee Fidelity's high income and other equity funds. The asset allocation funds may invest in Fidelity® funds that are overseen by such other Boards. The use of separate Boards, each with its own committee structure, allows the Trustees of each group of Fidelity® funds to focus on the unique issues of the funds they oversee, including common research, investment, and operational issues. On occasion, the separate Boards establish joint committees to address issues of overlapping consequences for the Fidelity® funds overseen by each Board.
The Trustees operate using a system of committees to facilitate the timely and efficient consideration of all matters of importance to the Trustees, the fund, and fund shareholders and to facilitate compliance with legal and regulatory requirements and oversight of the fund's activities and associated risks. The Board, acting through its committees, has charged FMR and its affiliates with (i) identifying events or circumstances the occurrence of which could have demonstrably adverse effects on the fund's business and/or reputation; (ii) implementing processes and controls to lessen the possibility that such events or circumstances occur or to mitigate the effects of such events or circumstances if they do occur; and (iii) creating and maintaining a system designed to evaluate continuously business and market conditions in order to facilitate the identification and implementation processes described in (i) and (ii) above. Because the day-to-day operations and activities of the fund are carried out by or through FMR, its affiliates, and other service providers, the fund's exposure to risks is mitigated but not eliminated by the processes overseen by the Trustees. While each of the Board's committees has responsibility for overseeing different aspects of the fund's activities, oversight is exercised primarily through the Operations and Audit Committees. In addition, an ad hoc Board committee of Independent Trustees has worked with FMR to enhance the Board's oversight of investment and financial risks, legal and regulatory risks, technology risks, and operational risks, including the development of additional risk reporting to the Board. Appropriate personnel, including but not limited to the fund's Chief Compliance Officer (CCO), FMR's internal auditor, the independent accountants, the fund's Treasurer and portfolio management personnel, make periodic reports to the Board's committees, as appropriate, including an annual review of Fidelity's risk management program for the Fidelity® funds. The responsibilities of each standing committee, including their oversight responsibilities, are described further under "Standing Committees of the Trustees."
Interested Trustees*:
Correspondence intended for a Trustee who is an interested person may be sent to Fidelity Investments, 245 Summer Street, Boston, Massachusetts 02210.
Name, Year of Birth; Principal Occupations and Other Relevant Experience+
Abigail P. Johnson (1961)
Year of Election or Appointment: 2009
Trustee
Chairman of the Board of Trustees
Ms. Johnson also serves as Trustee of other Fidelity® funds. Ms. Johnson serves as Chairman (2016-present), Chief Executive Officer (2014-present), and Director (2007-present) of FMR LLC (diversified financial services company), President of Fidelity Financial Services (2012-present) and President of Personal, Workplace and Institutional Services (2005-present). Ms. Johnson is Chairman and Director of FMR Co., Inc. (investment adviser firm, 2011-present) and Chairman and Director of FMR (investment adviser firm, 2011-present). Previously, Ms. Johnson served as Vice Chairman (2007-2016) and President (2013-2016) of FMR LLC, President and a Director of FMR (2001-2005), a Trustee of other investment companies advised by FMR, Fidelity Investments Money Management, Inc. (investment adviser firm), and FMR Co., Inc. (2001-2005), Senior Vice President of the Fidelity® funds (2001-2005), and managed a number of Fidelity® funds. Ms. Abigail P. Johnson and Mr. Arthur E. Johnson are not related.
Jennifer Toolin McAuliffe (1959)
Year of Election or Appointment: 2016
Trustee
Ms. McAuliffe also serves as Trustee of other Fidelity® funds. Ms. McAuliffe previously served as a Member of the Advisory Board of certain Fidelity® funds (2016) and as Co-Head of Fixed Income of Fidelity Investments Limited (now known as FIL Limited (FIL)) (diversified financial services company). Earlier roles at FIL included Director of Research for FIL’s credit and quantitative teams in London, Hong Kong and Tokyo. Ms. McAuliffe also was the Director of Research for taxable and municipal bonds at Fidelity Investments Money Management, Inc. Ms. McAuliffe is also a director or trustee of several not-for-profit entities.
* Determined to be an “Interested Trustee” by virtue of, among other things, his or her affiliation with the trust or various entities under common control with FMR.
+ The information includes the Trustee's principal occupation during the last five years and other information relating to the experience, attributes, and skills relevant to the Trustee's qualifications to serve as a Trustee, which led to the conclusion that the Trustee should serve as a Trustee for the fund.
Independent Trustees:
Correspondence intended for an Independent Trustee may be sent to Fidelity Investments, P.O. Box 55235, Boston, Massachusetts 02205-5235.
Name, Year of Birth; Principal Occupations and Other Relevant Experience+
Elizabeth S. Acton (1951)
Year of Election or Appointment: 2013
Trustee
Ms. Acton also serves as Trustee of other Fidelity® funds. Prior to her retirement in April 2012, Ms. Acton was Executive Vice President, Finance (2011-2012), Executive Vice President, Chief Financial Officer (2002-2011), and Treasurer (2004-2005) of Comerica Incorporated (financial services). Prior to joining Comerica, Ms. Acton held a variety of positions at Ford Motor Company (1983-2002), including Vice President and Treasurer (2000-2002) and Executive Vice President and Chief Financial Officer of Ford Motor Credit Company (1998-2000). Ms. Acton currently serves as a member of the Board of Directors and Audit and Finance Committees of Beazer Homes USA, Inc. (homebuilding, 2012-present). Previously, Ms. Acton served as a Member of the Advisory Board of certain Fidelity® funds (2013-2016).
Ann E. Dunwoody (1953)
Year of Election or Appointment: 2018
Trustee
General Dunwoody also serves as Trustee of other Fidelity® funds. General Dunwoody (United States Army, Retired) was the first woman in U.S. military history to achieve the rank of four-star general and prior to her retirement in 2012 held a variety of positions within the U.S. Army, including Commanding General, U.S. Army Material Command (2008-2012). She is the President of First to Four LLC (leadership and mentoring services, 2012-present). She also serves as a member of the Board of Directors and Nominating and Corporate Governance Committee of L3 Technologies, Inc. (communication, electronic, sensor, and aerospace systems, 2013-present), Board of Directors and Nomination and Corporate Governance Committees of Kforce Inc. (professional staffing services, 2016-present) and Board of Directors of Automattic Inc. (software engineering, 2018-present). Previously, General Dunwoody served as a Member of the Advisory Board of certain Fidelity® funds (2018), a member of the Board of Directors and Audit and Sustainability and Corporate Responsibility Committees of Republic Services, Inc. (waste collection, disposal and recycling, 2013-2016). Ms. Dunwoody also serves on several boards for non-profit organizations, including as a member of the Board of Directors, Chair of the Nomination and Governance Committee and member of the Audit Committee of Logistics Management Institute (consulting non-profit, 2012-present), a member of the Board of Directors of the Army Historical Foundation (2015-present), a member of the Council of Trustees for the Association of the United States Army (advocacy non-profit, 2013-present) and a member of the Board of Trustees of Florida Institute of Technology (2015-present) and ThanksUSA (military family education non-profit, 2014-present).
John Engler (1948)
Year of Election or Appointment: 2014
Trustee
Mr. Engler also serves as Trustee of other Fidelity® funds. He serves on the board of directors for Universal Forest Products (manufacturer and distributor of wood and wood-alternative products, 2003-present) and K12 Inc. (technology-based education company, 2012-present). Previously, Mr. Engler served as interim president of Michigan State University (2018-2019), a Member of the Advisory Board of certain Fidelity® funds (2014-2016), president of the Business Roundtable (2011-2017), a trustee of The Munder Funds (2003-2014), president and CEO of the National Association of Manufacturers (2004-2011), member of the Board of Trustees of the Annie E. Casey Foundation (2004-2015), and as governor of Michigan (1991-2003). He is a past chairman of the National Governors Association.
Robert F. Gartland (1951)
Year of Election or Appointment: 2010
Trustee
Mr. Gartland also serves as Trustee of other Fidelity® funds. Mr. Gartland is Chairman and an investor in Gartland & Mellina Group Corp. (consulting, 2009-present). Previously, Mr. Gartland served as a partner and investor of Vietnam Partners LLC (investments and consulting, 2008-2011). Prior to his retirement, Mr. Gartland held a variety of positions at Morgan Stanley (financial services, 1979-2007), including Managing Director (1987-2007), and Chase Manhattan Bank (1975-1978).
Arthur E. Johnson (1947)
Year of Election or Appointment: 2008
Trustee
Chairman of the Independent Trustees
Mr. Johnson also serves as Trustee of other Fidelity® funds. Mr. Johnson serves as a member of the Board of Directors of Eaton Corporation plc (diversified power management, 2009-present) and Booz Allen Hamilton (management consulting, 2011-present). Prior to his retirement, Mr. Johnson served as Senior Vice President of Corporate Strategic Development of Lockheed Martin Corporation (defense contractor, 1999-2009). He previously served on the Board of Directors of IKON Office Solutions, Inc. (1999-2008), AGL Resources, Inc. (holding company, 2002-2016), and Delta Airlines (2005-2007). Mr. Arthur E. Johnson is not related to Ms. Abigail P. Johnson.
Michael E. Kenneally (1954)
Year of Election or Appointment: 2009
Trustee
Vice Chairman of the Independent Trustees
Mr. Kenneally also serves as Trustee of other Fidelity® funds. Prior to his retirement, Mr. Kenneally served as Chairman and Global Chief Executive Officer of Credit Suisse Asset Management. Before joining Credit Suisse, he was an Executive Vice President and Chief Investment Officer for Bank of America Corporation. Earlier roles at Bank of America included Director of Research, Senior Portfolio Manager and Research Analyst, and Mr. Kenneally was awarded the Chartered Financial Analyst (CFA) designation in 1991.
Marie L. Knowles (1946)
Year of Election or Appointment: 2001
Trustee
Ms. Knowles also serves as Trustee of other Fidelity® funds. Prior to Ms. Knowles' retirement in June 2000, she served as Executive Vice President and Chief Financial Officer of Atlantic Richfield Company (ARCO) (diversified energy, 1996-2000). From 1993 to 1996, she was a Senior Vice President of ARCO and President of ARCO Transportation Company (pipeline and tanker operations). Ms. Knowles currently serves as a Director and Chairman of the Audit Committee of McKesson Corporation (healthcare service, since 2002). Ms. Knowles is a member of the Board of the Santa Catalina Island Company (real estate, 2009-present). Ms. Knowles is a Member of the Investment Company Institute Board of Governors and a Member of the Governing Council of the Independent Directors Council (2014-present). She also serves as a member of the Advisory Board for the School of Engineering of the University of Southern California. Previously, Ms. Knowles served as a Director of Phelps Dodge Corporation (copper mining and manufacturing, 1994-2007), URS Corporation (engineering and construction, 2000-2003) and America West (airline, 1999-2002). Ms. Knowles previously served as Chairman (2015-2018) and Vice Chairman (2012-2015) of the Independent Trustees of certain Fidelity® funds.
Mark A. Murray (1954)
Year of Election or Appointment: 2016
Trustee
Mr. Murray also serves as Trustee of other Fidelity® funds. Mr. Murray is Vice Chairman (2013-present) of Meijer, Inc. (regional retail chain). Previously, Mr. Murray served as a Member of the Advisory Board of certain Fidelity® funds (2016) and as Co-Chief Executive Officer (2013-2016) and President (2006-2013) of Meijer, Inc. Mr. Murray serves as a member of the Board of Directors and Nuclear Review and Public Policy and Responsibility Committees of DTE Energy Company (diversified energy company, 2009-present). Mr. Murray also serves as a member of the Board of Directors of Spectrum Health (not-for-profit health system, 2015-present). Mr. Murray previously served as President of Grand Valley State University (2001-2006), Treasurer for the State of Michigan (1999-2001), Vice President of Finance and Administration for Michigan State University (1998-1999), and a member of the Board of Directors and Audit Committee and Chairman of the Nominating and Corporate Governance Committee of Universal Forest Products, Inc. (manufacturer and distributor of wood and wood-alternative products, 2004-2016). Mr. Murray is also a director or trustee of many community and professional organizations.
+ The information includes the Trustee's principal occupation during the last five years and other information relating to the experience, attributes, and skills relevant to the Trustee's qualifications to serve as a Trustee, which led to the conclusion that the Trustee should serve as a Trustee for the fund.
Advisory Board Members and Officers:
Correspondence intended for an officer may be sent to Fidelity Investments, 245 Summer Street, Boston, Massachusetts 02210. Officers appear below in alphabetical order.
Name, Year of Birth; Principal Occupation
Elizabeth Paige Baumann (1968)
Year of Election or Appointment: 2017
Anti-Money Laundering (AML) Officer
Ms. Baumann also serves as AML Officer of other funds. She is Chief AML Officer (2012-present) and Senior Vice President (2014-present) of FMR LLC (diversified financial services company) and is an employee of Fidelity Investments. Previously, Ms. Baumann served as AML Officer of the funds (2012-2016), and Vice President (2007-2014) and Deputy Anti-Money Laundering Officer (2007-2012) of FMR LLC.
Craig S. Brown (1977)
Year of Election or Appointment: 2019
Assistant Treasurer
Mr. Brown also serves as Assistant Treasurer of other funds. Mr. Brown is an employee of Fidelity Investments (2013-present).
John J. Burke III (1964)
Year of Election or Appointment: 2018
Chief Financial Officer
Mr. Burke also serves as Chief Financial Officer of other funds. Mr. Burke serves as Head of Investment Operations for Fidelity Fund and Investment Operations (2018-present) and is an employee of Fidelity Investments (1998-present). Previously Mr. Burke served as head of Asset Management Investment Operations (2012-2018).
William C. Coffey (1969)
Year of Election or Appointment: 2018
Secretary and Chief Legal Officer (CLO)
Mr. Coffey also serves as Secretary and CLO of other funds. Mr. Coffey serves as CLO, Secretary, and Senior Vice President of Fidelity Management & Research Company and FMR Co., Inc. (investment adviser firms, 2018-present); Secretary of Fidelity SelectCo, LLC and Fidelity Investments Money Management, Inc. (investment adviser firms, 2018-present); and CLO of Fidelity Management & Research (Hong Kong) Limited, FMR Investment Management (UK) Limited, and Fidelity Management & Research (Japan) Limited (investment adviser firms, 2018-present). He is Senior Vice President and Deputy General Counsel of FMR LLC (diversified financial services company, 2010-present), and is an employee of Fidelity Investments. Previously, Mr. Coffey served as Assistant Secretary of certain funds (2009-2018) and as Vice President and Associate General Counsel of FMR LLC (2005-2009).
Jonathan Davis (1968)
Year of Election or Appointment: 2010
Assistant Treasurer
Mr. Davis also serves as Assistant Treasurer of other funds. Mr. Davis serves as Assistant Treasurer of FMR Capital, Inc. (2017-present) and is an employee of Fidelity Investments. Previously, Mr. Davis served as Vice President and Associate General Counsel of FMR LLC (diversified financial services company, 2003-2010).
Adrien E. Deberghes (1967)
Year of Election or Appointment: 2010
Assistant Treasurer
Mr. Deberghes also serves as an officer of other funds. He serves as Assistant Treasurer of FMR Capital, Inc. (2017-present), Executive Vice President of Fidelity Investments Money Management, Inc. (FIMM) (investment adviser firm, 2016-present), and is an employee of Fidelity Investments (2008-present). Previously, Mr. Deberghes served as President and Treasurer of certain Fidelity® funds (2013-2018). Prior to joining Fidelity Investments, Mr. Deberghes was Senior Vice President of Mutual Fund Administration at State Street Corporation (2007-2008), Senior Director of Mutual Fund Administration at Investors Bank & Trust (2005-2007), and Director of Finance for Dunkin' Brands (2000-2005). Previously, Mr. Deberghes served in other fund officer roles.
Laura M. Del Prato (1964)
Year of Election or Appointment: 2018
President and Treasurer
Ms. Del Prato also serves as an officer of other funds. Ms. Del Prato is an employee of Fidelity Investments (2017-present). Prior to joining Fidelity Investments, Ms. Del Prato served as a Managing Director and Treasurer of the JPMorgan Mutual Funds (2014-2017). Prior to JPMorgan, Ms. Del Prato served as a partner at Cohen Fund Audit Services (accounting firm, 2012-2013) and KPMG LLP (accounting firm, 2004-2012).
Colm A. Hogan (1973)
Year of Election or Appointment: 2016
Assistant Treasurer
Mr. Hogan also serves as an officer of other funds. Mr. Hogan serves as Assistant Treasurer of FMR Capital, Inc. (2017-present) and is an employee of Fidelity Investments (2005-present). Previously, Mr. Hogan served as Assistant Treasurer of certain Fidelity® funds (2016-2018).
Chris Maher (1972)
Year of Election or Appointment: 2013
Assistant Treasurer
Mr. Maher serves as Assistant Treasurer of other funds. Mr. Maher is Vice President of Valuation Oversight, serves as Assistant Treasurer of FMR Capital, Inc. (2017-present), and is an employee of Fidelity Investments. Previously, Mr. Maher served as Vice President of Asset Management Compliance (2013), Vice President of the Program Management Group of FMR (investment adviser firm, 2010-2013), and Vice President of Valuation Oversight (2008-2010).
John B. McGinty, Jr. (1962)
Year of Election or Appointment: 2016
Chief Compliance Officer
Mr. McGinty also serves as Chief Compliance Officer of other funds. Mr. McGinty is Senior Vice President of Asset Management Compliance for Fidelity Investments and is an employee of Fidelity Investments (2016-present). Mr. McGinty previously served as Vice President, Senior Attorney at Eaton Vance Management (investment management firm, 2015-2016), and prior to Eaton Vance as global CCO for all firm operations and registered investment companies at GMO LLC (investment management firm, 2009-2015). Before joining GMO LLC, Mr. McGinty served as Senior Vice President, Deputy General Counsel for Fidelity Investments (2007-2009).
Jason P. Pogorelec (1975)
Year of Election or Appointment: 2015
Assistant Secretary
Mr. Pogorelec also serves as Assistant Secretary of other funds. Mr. Pogorelec serves as Vice President, Associate General Counsel (2010-present) and is an employee of Fidelity Investments (2006-present).
Nancy D. Prior (1967)
Year of Election or Appointment: 2014
Vice President
Ms. Prior also serves as Vice President of other funds. Ms. Prior serves as President Fixed Income, High Income/Emerging Market Debt and Multi Asset Class Strategies of FIAM LLC (2018-present), President (2016-present) and Director (2014-present) of Fidelity Investments Money Management, Inc. (FIMM) (investment adviser firm), President, Fixed Income (2014-present), and is an employee of Fidelity Investments (2002-present). Previously, Ms. Prior served as Vice Chairman of FIAM LLC (investment adviser firm, 2014-2018), a Director of FMR Investment Management (UK) Limited (investment adviser firm, 2015-2018), President Multi-Asset Class Strategies of FMR's Global Asset Allocation Division (2017-2018), Vice President of Fidelity's Money Market Funds (2012-2014), President, Money Market and Short Duration Bond Group of Fidelity Management & Research (FMR) (investment adviser firm, 2013-2014), President, Money Market Group of FMR (2011-2013), Managing Director of Research (2009-2011), Senior Vice President and Deputy General Counsel (2007-2009), and Assistant Secretary of certain Fidelity® funds (2008-2009).
Stacie M. Smith (1974)
Year of Election or Appointment: 2013
Assistant Treasurer
Ms. Smith also serves as an officer of other funds. Ms. Smith serves as Assistant Treasurer of FMR Capital, Inc. (2017-present), is an employee of Fidelity Investments (2009-present), and has served in other fund officer roles. Prior to joining Fidelity Investments, Ms. Smith served as Senior Audit Manager of Ernst & Young LLP (accounting firm, 1996-2009). Previously, Ms. Smith served as Assistant Treasurer (2013-2018) and Deputy Treasurer (2013-2016) of certain Fidelity® funds.
Marc L. Spector (1972)
Year of Election or Appointment: 2016
Deputy Treasurer
Mr. Spector also serves as an officer of other funds. Mr. Spector serves as Assistant Treasurer of FMR Capital, Inc. (2017-present) and is an employee of Fidelity Investments (2016-present). Prior to joining Fidelity Investments, Mr. Spector served as Director at the Siegfried Group (accounting firm, 2013-2016), and prior to Siegfried Group as audit senior manager at Deloitte & Touche (accounting firm, 2005-2013).
Jim Wegmann (1979)
Year of Election or Appointment: 2019
Assistant Treasurer
Mr. Wegmann also serves as Assistant Treasurer of other funds. Mr. Wegmann is an employee of Fidelity Investments (2011-present).
Shareholder Expense Example
As a shareholder of the Fund, you incur two types of costs: (1) transaction costs and (2) ongoing costs, including other Fund expenses. This Example is intended to help you understand your ongoing costs (in dollars) of investing in the Fund and to compare these costs with the ongoing costs of investing in other mutual funds.
The Example is based on an investment of $1,000 invested at the beginning of the period and held for the entire period (July 1, 2018 to December 31, 2018).
Actual Expenses
The first line of the accompanying table provides information about actual account values and actual expenses. You may use the information in this line, together with the amount you invested, to estimate the expenses that you paid over the period. Simply divide your account value by $1,000.00 (for example, an $8,600 account value divided by $1,000.00 = 8.6), then multiply the result by the number in the first line under the heading entitled "Expenses Paid During Period" to estimate the expenses you paid on your account during this period. In addition, the Fund, as a shareholder in the underlying Fidelity Central Funds, will indirectly bear its pro-rata share of the fees and expenses incurred by the underlying Fidelity Central Funds. These fees and expenses are not included in the Fund's annualized expense ratio used to calculate the expense estimate in the table below.
Hypothetical Example for Comparison Purposes
The second line of the accompanying table provides information about hypothetical account values and hypothetical expenses based on the Fund's actual expense ratio and an assumed rate of return of 5% per year before expenses, which is not the Fund's actual return. The hypothetical account values and expenses may not be used to estimate the actual ending account balance or expenses you paid for the period. You may use this information to compare the ongoing costs of investing in the Fund and other funds. To do so, compare this 5% hypothetical example with the 5% hypothetical examples that appear in the shareholder reports of the other funds. In addition, the Fund, as a shareholder in the underlying Fidelity Central Funds, will indirectly bear its pro-rata share of the fees and expenses incurred by the underlying Fidelity Central Funds. These fees and expenses are not included in the Fund's annualized expense ratio used to calculate the expense estimate in the table below.
Please note that the expenses shown in the table are meant to highlight your ongoing costs only and do not reflect any transaction costs. Therefore, the second line of the table is useful in comparing ongoing costs only, and will not help you determine the relative total costs of owning different funds.
| | Annualized Expense Ratio-A | Beginning
Account Value
July 1, 2018 | Ending
Account Value
December 31, 2018 | Expenses Paid
During Period-B
July 1, 2018
to December 31, 2018 |
| Actual | - %-C | $1,000.00 | $1,009.70 | $--D |
| Hypothetical-E | | $1,000.00 | $1,025.21 | $--D |
A Annualized expense ratio reflects expenses net of applicable fee waivers.
B Expenses are equal to the Fund's annualized expense ratio, multiplied by the average account value over the period, multiplied by 184/365 (to reflect the one-half year period).
C Amount represents less than .005%.
D Amount represents less than $.005.
E 5% return per year before expenses
Distributions (Unaudited)
During fiscal year ended 2018, 100% of the fund's income dividends was free from federal income tax, and 20.94% of the fund's income dividends was subject to the federal alternative minimum tax.
The fund will notify shareholders in January 2019 of amounts for use in preparing 2018 income tax returns.
Board Approval of Investment Advisory Contracts and Management Fees
Fidelity Flex Conservative Income Municipal Bond Fund
Each year, the Board of Trustees, including the Independent Trustees (together, the Board), votes on the renewal of the management contract with Fidelity Management & Research Company (FMR) and the sub-advisory agreements (together, the Advisory Contracts) for the fund. FMR and the sub-advisers are referred to herein as the Investment Advisers. The Board, assisted by the advice of fund counsel and Independent Trustees' counsel, requests and considers a broad range of information relevant to the renewal of the Advisory Contracts throughout the year.
The Board meets regularly and, at each of its meetings, covers an extensive agenda of topics and materials and considers factors that are relevant to its annual consideration of the renewal of the fund's Advisory Contracts, including the services and support provided to the fund and its shareholders. The Board has established four standing committees (Committees) — Operations, Audit, Fair Valuation, and Governance and Nominating — each composed of and chaired by Independent Trustees with varying backgrounds, to which the Board has assigned specific subject matter responsibilities in order to enhance effective decision-making by the Board. The Operations Committee, of which all of the Independent Trustees are members, meets regularly throughout the year and considers, among other matters, information specifically related to the annual consideration of the renewal of the fund's Advisory Contracts. The Board, acting directly and through its Committees, requests and receives information concerning the annual consideration of the renewal of the fund's Advisory Contracts. The Board also meets as needed to review matters specifically related to the Board's annual consideration of the renewal of the Advisory Contracts. Members of the Board may also meet with trustees of other Fidelity funds through joint ad hoc committees to discuss certain matters relevant to all of the Fidelity funds.
At its September 2018 meeting, the Board unanimously determined to renew the fund's Advisory Contracts. In considering whether to renew the Advisory Contracts for the fund, the Board considered all factors it believed relevant and reached a determination, with the assistance of fund counsel and Independent Trustees' counsel and through the exercise of its business judgment, that the renewal of the Advisory Contracts was in the best interests of the fund and its shareholders and the fact that no fee is payable under the management contract was fair and reasonable.
Nature, Extent, and Quality of Services Provided. The Board considered Fidelity's staffing as it relates to the fund, including the backgrounds of investment personnel of Fidelity, and also considered the fund's investment objective, strategies, and related investment philosophy. The Independent Trustees also had discussions with senior management of Fidelity's investment operations and investment groups. The Board considered the structure of the investment personnel compensation program and whether this structure provides appropriate incentives to act in the best interests of the fund. Additionally, the Board considered the portfolio managers' investments, if any, in the funds that they manage.
Resources Dedicated to Investment Management and Support Services. The Board reviewed the general qualifications and capabilities of Fidelity's investment staff, including its size, education, experience, and resources, as well as Fidelity's approach to recruiting, managing, and compensating investment personnel. The Board noted that Fidelity has continued to increase the resources devoted to non-U.S. offices, including expansion of Fidelity's global investment organization. The Board also noted that Fidelity's analysts have extensive resources, tools and capabilities that allow them to conduct sophisticated quantitative and fundamental analysis, as well as credit analysis of issuers, counterparties and guarantors. Further, the Board considered that Fidelity's investment professionals have sufficient access to global information and data so as to provide competitive investment results over time, and that those professionals also have access to sophisticated tools that permit them to assess portfolio construction and risk and performance attribution characteristics continuously, as well as to transmit new information and research conclusions rapidly around the world. Additionally, in its deliberations, the Board considered Fidelity's trading, risk management, compliance, and technology and operations capabilities and resources, which are integral parts of the investment management process.
Shareholder and Administrative Services. The Board considered (i) the nature, extent, quality, and cost of advisory, administrative, and shareholder services performed by the Investment Advisers and their affiliates under the Advisory Contracts and under separate agreements covering transfer agency, pricing and bookkeeping, and securities lending services for the fund; (ii) the nature and extent of the supervision of third party service providers, principally custodians, subcustodians, and pricing vendors; and (iii) the resources devoted to, and the record of compliance with, the fund's compliance policies and procedures.
The Board noted that the growth of fund assets over time across the complex allows Fidelity to reinvest in the development of services designed to enhance the value and convenience of the Fidelity funds as investment vehicles. These services include 24-hour access to account information and market information through telephone representatives and over the Internet, investor education materials and asset allocation tools, and the expanded availability of Fidelity Investor Centers.
Investment in a Large Fund Family. The Board considered the benefits to shareholders of investing in a Fidelity fund, including the benefits of investing in a fund that is part of a large family of funds offering a variety of investment disciplines and providing a large variety of mutual fund investor services. The Board noted that Fidelity had taken, or had made recommendations that resulted in the Fidelity funds taking, a number of actions over the previous year that benefited particular funds, including: (i) continuing to dedicate additional resources to Fidelity's investment research process, which includes meetings with management of issuers of securities in which the funds invest, and to the support of the senior management team that oversees asset management; (ii) continuing efforts to enhance Fidelity's global research capabilities; (iii) launching new funds and making other enhancements to meet client needs; (iv) launching new share classes of existing funds; (v) eliminating purchase minimums and broadening eligibility requirements for certain funds and share classes; (vi) reducing management fees and total expenses for certain growth equity funds and index funds; (vii) lowering expense caps for certain existing funds and classes, and converting certain voluntary expense caps to contractual caps, to reduce expenses borne by shareholders; (viii) eliminating short-term redemption fees for funds that had such fees; (ix) rationalizing product lines and gaining increased efficiencies from fund mergers and share class consolidations; (x) continuing to develop, acquire and implement systems and technology to improve services to the funds and shareholders, strengthen information security, and increase efficiency; and (xi) continuing to implement enhancements to further strengthen Fidelity's product line to increase investors' probability of success in achieving their investment goals, including retirement income goals.
Investment Performance. The Board considered whether the fund has operated in accordance with its investment objective, as well as its record of compliance with its investment restrictions. As the fund recently commenced operations, the Board did not believe that it was appropriate to assign significant weight to its limited investment performance.
Based on its review, the Board concluded that the nature, extent, and quality of services provided to the fund under the Advisory Contracts should continue to benefit the shareholders of the fund.
Competitiveness of Management Fee and Total Expense Ratio. The Board noted that the fund is available exclusively to certain Fidelity fee-based programs. The Board considered that the fund does not pay FMR a management fee for investment advisory services, but that FMR is indirectly compensated for its services out of the program fees. The Board also noted that FMR or an affiliate undertakes to pay all operating expenses of the fund, except Independent Trustee fees and expenses, proxy and shareholder meeting expenses, interest, taxes, brokerage expenses, and extraordinary expenses (such as litigation expenses).
Based on its review, the Board considered that the fund does not pay a management fee and concluded that the total expense ratio of the fund was reasonable in light of the services that the fund and its shareholders receive and the other factors considered.
Costs of the Services and Profitability. The Board considered the level of Fidelity's profits in respect of all the Fidelity funds.
PricewaterhouseCoopers LLP (PwC), auditor to Fidelity and certain Fidelity funds, has been engaged annually by the Board as part of the Board's assessment of Fidelity's profitability analysis. PwC's engagement includes the review and assessment of the methodologies used by Fidelity in determining the revenues and expenses attributable to Fidelity's mutual fund business, and completion of agreed-upon procedures in respect of the mathematical accuracy of the fund profitability information and its conformity to established allocation methodologies. After considering PwC's reports issued under the engagement and information provided by Fidelity, the Board concluded that while other allocation methods may also be reasonable, Fidelity's profitability methodologies are reasonable in all material respects.
The Board also reviewed Fidelity's non-fund businesses and potential indirect benefits such businesses may have received as a result of their association with Fidelity's mutual fund business (i.e., fall-out benefits) as well as cases where Fidelity's affiliates may benefit from the fund's business. The Board noted that changes to fall-out benefits year-over-year reflect business developments at Fidelity's various businesses.
The Board concluded that the costs of the services provided by and the profits realized by Fidelity in connection with the operation of the fund were not relevant to the renewal of the Advisory Contracts because the fund pays no advisory fees and FMR or an affiliate bears all expenses of the fund, with limited exceptions.
Economies of Scale. The Board concluded that because the fund pays no advisory fees and FMR bears all expenses of the fund with certain limited exceptions, the realization of economies of scale was not a material factor in the Board's decision to renew the fund's Advisory Contract.
Additional Information Requested by the Board. In order to develop fully the factual basis for consideration of the Fidelity funds' advisory contracts, the Board requested and received additional information on certain topics, including: (i) Fidelity's fund profitability methodology, profitability trends for certain funds, the allocation of various costs to different funds, and the impact of certain factors on fund profitability results; (ii) portfolio manager changes that have occurred during the past year and the amount of the investment that each portfolio manager has made in the Fidelity fund(s) that he or she manages; (iii) Fidelity's compensation structure for portfolio managers, research analysts, and other key personnel, including its effects on fund profitability, the rationale for the compensation structure, and the extent to which current market conditions have affected retention and recruitment; (iv) the arrangements with and compensation paid to certain fund sub-advisers on behalf of the Fidelity funds and the treatment of such compensation within Fidelity's fund profitability methodology; (v) the terms of Fidelity's voluntary expense limitation agreements; (vi) the methodology with respect to competitive fund data and peer group classifications; (vii) Fidelity's transfer agent fee, expense, and service structures for different funds and classes relative to competitive trends, and the impact of the increased use of omnibus accounts; (viii) new developments in the retail and institutional marketplaces and the competitive positioning of the funds relative to other investment products and services; (ix) the impact of recent changes to the money market fund landscape, including the full implementation of money market fund reform and rising interest rates, on Fidelity's money market funds; (x) the funds' share class structures and distribution channels; and (xi) explanations regarding the relative total expense ratios of certain funds and classes, total expense competitive trends and methodologies for total expense competitive comparisons, and actions that might be taken by Fidelity to reduce total expense ratios for certain classes. In addition, the Board considered its discussions with Fidelity throughout the year regarding enhanced information security initiatives and the funds' fair valuation policies.
Based on its evaluation of all of the conclusions noted above, and after considering all factors it believed relevant, the Board concluded that the advisory fee arrangements are fair and reasonable, and that the fund's Advisory Contracts should be renewed.
Corporate Headquarters
245 Summer St.
Boston, MA 02210
www.fidelity.com
XCB-ANN-0219
1.9884863.101
Fidelity Advisor® Municipal Income Fund - Class A, Class M, Class C, Class I and Class Z
Annual Report December 31, 2018 Class A, Class M, Class C, Class I and Class Z are classes of Fidelity® Municipal Income Fund |
|
Beginning on January 1, 2021, as permitted by regulations adopted by the Securities and Exchange Commission, paper copies of a fund’s shareholder reports will no longer be sent by mail, unless you specifically request paper copies of the reports from the fund or from your financial intermediary, such as a financial advisor, broker-dealer or bank. Instead, the reports will be made available on a website, and you will be notified by mail each time a report is posted and provided with a website link to access the report.
If you already elected to receive shareholder reports electronically, you will not be affected by this change and you need not take any action. You may elect to receive shareholder reports and other communications from a fund electronically, by contacting your financial intermediary. For Fidelity customers, visit Fidelity's web site or call Fidelity using the contact information listed below.
You may elect to receive all future reports in paper free of charge. If you wish to continue receiving paper copies of your shareholder reports, you may contact your financial intermediary or, if you are a Fidelity customer, visit Fidelity’s website, or call Fidelity at the applicable toll-free number listed below. Your election to receive reports in paper will apply to all funds held with the fund complex/your financial intermediary.
| Account Type | Website | Phone Number |
| Brokerage, Mutual Fund, or Annuity Contracts: | fidelity.com/mailpreferences | 1-800-343-3548 |
| Employer Provided Retirement Accounts: | netbenefits.fidelity.com/preferences (choose 'no' under Required Disclosures to continue to print) | 1-800-343-0860 |
| Advisor Sold Accounts Serviced Through Your Financial Intermediary: | Contact Your Financial Intermediary | Your Financial Intermediary's phone number |
| Advisor Sold Accounts Serviced by Fidelity: | institutional.fidelity.com | 1-877-208-0098 |
Contents
To view a fund's proxy voting guidelines and proxy voting record for the 12-month period ended June 30, visit http://www.fidelity.com/proxyvotingresults or visit the Securities and Exchange Commission's (SEC) web site at http://www.sec.gov.
You may also call 1-877-208-0098 to request a free copy of the proxy voting guidelines.
Standard & Poor's, S&P and S&P 500 are registered service marks of The McGraw-Hill Companies, Inc. and have been licensed for use by Fidelity Distributors Corporation.
Other third-party marks appearing herein are the property of their respective owners.
All other marks appearing herein are registered or unregistered trademarks or service marks of FMR LLC or an affiliated company. © 2019 FMR LLC. All rights reserved.
This report and the financial statements contained herein are submitted for the general information of the shareholders of the Fund. This report is not authorized for distribution to prospective investors in the Fund unless preceded or accompanied by an effective prospectus.
A fund files its complete schedule of portfolio holdings with the SEC for the first and third quarters of each fiscal year on Form N-Q. Forms N-Q are available on the SEC’s web site at http://www.sec.gov. A fund's Forms N-Q may be reviewed and copied at the SEC’s Public Reference Room in Washington, DC. Information regarding the operation of the SEC's Public Reference Room may be obtained by calling 1-800-SEC-0330.
For a complete list of a fund's portfolio holdings, view the most recent holdings listing, semiannual report, or annual report on Fidelity's web site at http://www.fidelity.com, http://www.institutional.fidelity.com, or http://www.401k.com, as applicable.
NOT FDIC INSURED •MAY LOSE VALUE •NO BANK GUARANTEE
Neither the Fund nor Fidelity Distributors Corporation is a bank.
Performance: The Bottom Line
Average annual total return reflects the change in the value of an investment, assuming reinvestment of distributions from dividend income and capital gains (the profits earned upon the sale of securities that have grown in value, if any) and assuming a constant rate of performance each year. The hypothetical investment and the average annual total returns do not reflect the deduction of taxes that a shareholder would pay on fund distributions or the redemption of fund shares. During periods of reimbursement by Fidelity, a fund’s total return will be greater than it would be had the reimbursement not occurred. How a fund did yesterday is no guarantee of how it will do tomorrow.
Average Annual Total Returns
| For the periods ended December 31, 2018 | Past 1 year | Past 5 years | Past 10 years |
| Class A (incl. 4.00% sales charge) | (3.50)% | 3.30% | 4.69% |
| Class M (incl. 4% sales charge) | (3.41)% | 3.31% | 4.70% |
| Class C (incl. contingent deferred sales charge) | (1.05)% | 4.02% | 5.06% |
| Class I | 0.73% | 4.19% | 5.14% |
| Class Z | 0.75% | 4.19% | 5.14% |
Class A shares bear a 0.25% 12b-1 fee. The initial offering of Class A shares took place on March 1, 2018. Returns prior to March 1, 2018, are those of Fidelity® Municipal Income Fund, the original class of the fund, which has no 12b-1 fee. Had Class A's 12b-1 fee been reflected, returns prior to March 1, 2018, would have been lower.
Class C shares bear a 1.00% 12b-1 fee. The initial offering of Class C shares took place on March 1, 2018. Returns prior to March 1, 2018, are those of Fidelity® Municipal Income Fund, the original class of the fund, which has no 12b-1 fee. Had Class C's 12b-1 fee been reflected, returns prior to March 1, 2018, would have been lower.
Class C shares' contingent deferred sales charges included in the past one year, past five years and past ten years total return figures are 1%, 0% and 0%, respectively.
The initial offering of Class I shares took place on March 1, 2018. Returns prior to March 1, 2018 are those of Fidelity® Municipal Income Fund, the original class of the fund.
The initial offering of Class Z shares took place on October 2, 2018. Returns prior to October 2, 2018, are those of Class I. Returns between March 1, 2018 and October 2, 2018, are those of Class I. Returns prior to March 1, 2018, are those of Fidelity Municipal Income Fund, the original class of the fund.
Class M shares bear a 0.25% 12b-1 fee. The initial offering of Class M shares took place on March 1, 2018. Returns prior to March 1, 2018, are those of Fidelity® Municipal Income Fund, the original class of the fund, which has no 12b-1 fee. Had Class M's 12b-1 fee been reflected, returns prior to March 1, 2018, would have been lower.
$10,000 Over 10 Years
Let's say hypothetically that $10,000 was invested in Fidelity Advisor® Municipal Income Fund - Class A on December 31, 2008, and the current 4.00% sales charge was paid.
The chart shows how the value of your investment would have changed, and also shows how the Bloomberg Barclays Municipal Bond Index performed over the same period.
See previous page for additional information regarding the performance of Class A.
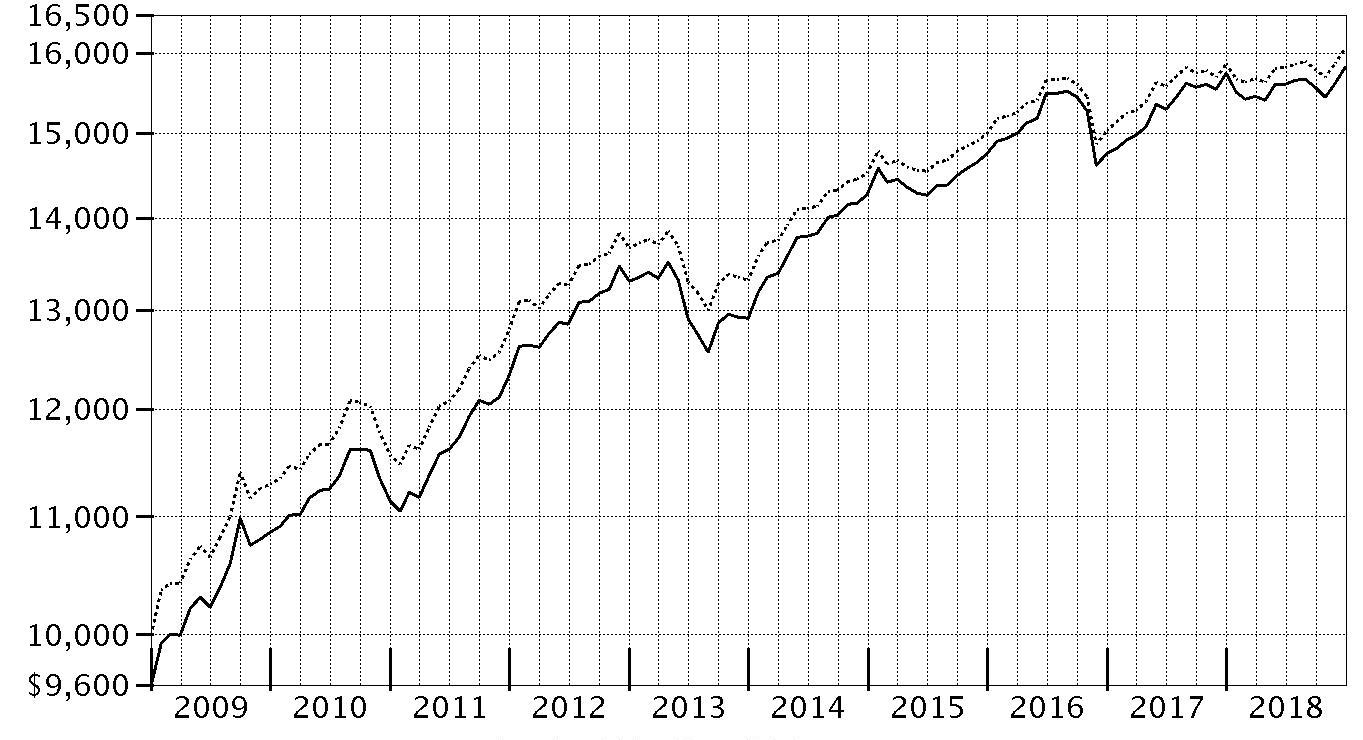
| Period Ending Values |
| $15,818 | Fidelity Advisor® Municipal Income Fund - Class A |
| $16,060 | Bloomberg Barclays Municipal Bond Index |
Management's Discussion of Fund Performance
Market Recap: Tax-exempt municipal bonds gained modestly in 2018, with the Bloomberg Barclays Municipal Bond Index returning 1.28%, supported by lower bond issuance and solid economic growth. Tax reform had a significant impact on both the supply of and demand for tax-exempt bonds the past year. In the final months of 2017, issuers accelerated their bond financings in order to issue under the old tax rules, prompting a surge in supply. Investors absorbed this excess supply, anticipating that issuance would fall significantly in 2018. The market turned lower in early 2018, as domestic fixed-income markets reacted to robust economic data and signs of inflation, before stabilizing in March and rallying through August. The municipal market experienced volatility in September and October amid concerns of an economic slowdown, then rebounded to close December near a high for the year. Gross municipal bond issuance ended 2018 down approximately 25%. There was little differentiation in performance across municipal sectors in 2018. General obligation bonds gained 1.33%, with bonds issued by states slightly outperforming those backed by local municipalities. Looking ahead, market volatility is likely to persist due to uncertainty about how the U.S. Federal Reserve will react to labor and inflation trends.
Comments from Co-Portfolio Managers Cormac Cullen, Elizah McLaughlin and Kevin Ramundo: For the year ending December 31, 2018, most of the fund's share classes (excluding sales charges, if applicable) produced a modestly positive return, net of fees, which lagged the 1.20% advance of the benchmark Bloomberg Barclays 3+ Year Municipal Bond Index. Relative to the 3+ Year benchmark, differences in the way fund holdings and index components were priced detracted from fund performance. Also detracting was the fund's underweighting to bonds backed by the state of California, some of the best performers in the national municipal marketplace. In contrast, an overweighting in lower-investment-grade bonds contributed to relative performance. The portfolio's overweighting in health care bonds also added value, and the bonds of several hospitals we favored performed quite well within the sector, providing an additional edge over the benchmark. Outsized exposure to state-backed and state-appropriated bonds from New Jersey and Illinois also contributed on a relative basis.
The views expressed above reflect those of the portfolio manager(s) only through the end of the period as stated on the cover of this report and do not necessarily represent the views of Fidelity or any other person in the Fidelity organization. Any such views are subject to change at any time based upon market or other conditions and Fidelity disclaims any responsibility to update such views. These views may not be relied on as investment advice and, because investment decisions for a Fidelity fund are based on numerous factors, may not be relied on as an indication of trading intent on behalf of any Fidelity fund.
Note to Shareholders: On September 1, 2018, Elizah McLaughlin joined the municipal bond portfolio management team, succeeding Mark Sommer, who retired from Fidelity on December 31, 2018, after 27 years with the firm.
Investment Summary (Unaudited)
Top Five States as of December 31, 2018
| | % of fund's net assets |
| Illinois | 23.4 |
| Florida | 11.2 |
| Texas | 8.4 |
| Pennsylvania | 6.8 |
| New Jersey | 6.3 |
Top Five Sectors as of December 31, 2018
| | % of fund's net assets |
| Health Care | 25.4 |
| General Obligations | 25.3 |
| Transportation | 25.1 |
| Electric Utilities | 5.9 |
| Education | 5.6 |
Quality Diversification (% of fund's net assets)
| As of December 31, 2018 |
| | AAA | 2.0% |
| | AA,A | 69.6% |
| | BBB | 20.1% |
| | BB and Below | 3.4% |
| | Not Rated | 2.4% |
| | Short-Term Investments and Net Other Assets | 2.5% |

We have used ratings from Moody's Investors Service, Inc. Where Moody's® ratings are not available, we have used S&P® ratings. All ratings are as of the date indicated and do not reflect subsequent changes.
Schedule of Investments December 31, 2018
Showing Percentage of Net Assets
| Municipal Bonds - 97.5% | | | |
| | | Principal Amount (000s) | Value (000s) |
| Alabama - 0.3% | | | |
| Auburn Univ. Gen. Fee Rev. Series 2018 A, 5% 6/1/43 | | 2,565 | 2,935 |
| Birmingham Gen. Oblig. Series 2013 A, 5% 3/1/32 | | 2,900 | 3,164 |
| Jefferson County Gen. Oblig. Series 2018 A: | | | |
| 5% 4/1/25 | | $2,550 | $2,931 |
| 5% 4/1/26 | | 2,400 | 2,790 |
| Montgomery Med. Clinic Facilities: | | | |
| 4% 3/1/36 | | 415 | 411 |
| 5% 3/1/33 | | 4,140 | 4,473 |
|
| TOTAL ALABAMA | | | 16,704 |
|
| Arizona - 1.7% | | | |
| Arizona Ctfs. of Prtn. Series 2010 A: | | | |
| 5.25% 10/1/26 (FSA Insured) | | 2,540 | 2,600 |
| 5.25% 10/1/28 (FSA Insured) | | 8,235 | 8,429 |
| Arizona Health Facilities Auth. Rev. (Banner Health Sys. Proj.) Series 2007 B, 3 month U.S. LIBOR + 0.810% 2.42%, tender 1/1/37 (a)(b) | | 2,485 | 2,366 |
| Arizona Indl. Dev. Auth. Rev. (Provident Group-Eastern Michigan Univ. Parking Proj.) Series 2018: | | | |
| 5% 5/1/48 | | 910 | 959 |
| 5% 5/1/51 | | 910 | 957 |
| Glendale Gen. Oblig. Series 2017: | | | |
| 5% 7/1/30 | | 2,080 | 2,432 |
| 5% 7/1/31 | | 3,105 | 3,618 |
| Glendale Indl. Dev. Auth. (Terraces of Phoenix Proj.) Series 2018 A: | | | |
| 5% 7/1/38 | | 235 | 240 |
| 5% 7/1/48 | | 295 | 297 |
| Maricopa County Indl. Dev. Auth. Rev. Series 2016 A: | | | |
| 5% 1/1/32 | | 8,280 | 9,506 |
| 5% 1/1/33 | | 4,965 | 5,674 |
| Maricopa County Indl. Dev. Auth. Sr. Living Facilities Series 2016: | | | |
| 5.75% 1/1/36 (c) | | 740 | 738 |
| 6% 1/1/48 (c) | | 4,540 | 4,554 |
| Phoenix Civic Impt. Board Arpt. Rev.: | | | |
| Series 2013, 5% 7/1/22 (d) | | 830 | 907 |
| Series 2017 A 5% 7/1/36 (d) | | 1,450 | 1,639 |
| Series 2017 A: | | | |
| 5% 7/1/31 (d) | | 1,695 | 1,950 |
| 5% 7/1/33 (d) | | 910 | 1,040 |
| 5% 7/1/37 (d) | | 1,075 | 1,211 |
| Series 2017 B: | | | |
| 5% 7/1/29 | | 2,070 | 2,455 |
| 5% 7/1/33 | | 2,900 | 3,375 |
| 5% 7/1/36 | | 3,310 | 3,809 |
| 5% 7/1/37 | | 2,070 | 2,373 |
| Phoenix Civic Impt. Corp. Excise Tax Rev. Series 2011 C, 5% 7/1/23 | | 1,655 | 1,779 |
| Pima County Swr. Sys. Rev. Series 2012 A, 5% 7/1/26 | | 830 | 909 |
| Salt Verde Finl. Corp. Sr. Gas Rev.: | | | |
| Series 2007: | | | |
| 5.25% 12/1/21 | | 2,900 | 3,136 |
| 5.5% 12/1/29 | | 7,370 | 8,815 |
| 5.25% 12/1/22 | | 1,240 | 1,367 |
| Scottsdale Indl. Dev. Auth. Hosp. Rev. (Scottsdale Healthcare Proj.) Series 2006 C, 5% 9/1/35 (FSA Insured) | | 870 | 905 |
| Tempe Indl. Dev. Auth. Rev. (Mirabella At Asu, Inc. Proj.): | | | |
| Series 2017 A: | | | |
| 6.125% 10/1/47 (c) | | 440 | 473 |
| 6.125% 10/1/52 (c) | | 440 | 471 |
| Series 2017 B, 6% 10/1/37 (c) | | 220 | 237 |
|
| TOTAL ARIZONA | | | 79,221 |
|
| California - 3.5% | | | |
| ABC Unified School District Series 1997 C, 0% 8/1/28 (Nat'l. Pub. Fin. Guarantee Corp. Insured) | | 3,250 | 2,462 |
| Bay Area Toll Auth. San Francisco Bay Toll Bridge Rev. Bonds Series B, 2.85%, tender 4/1/25 (a) | | 6,840 | 7,052 |
| Cabrillo Unified School District Series A, 0% 8/1/20 (AMBAC Insured) | | 3,540 | 3,431 |
| California Edl. Facilities Auth. Rev. (Loyola Marymount Univ. Proj.) Series 2001 A, 0% 10/1/22 (Nat'l. Pub. Fin. Guarantee Corp. Insured) | | 4,140 | 3,823 |
| California Gen. Oblig.: | | | |
| Series 2007, 5.625% 5/1/20 | | 100 | 100 |
| Series 2009, 6% 4/1/38 | | 6,470 | 6,532 |
| 5.25% 12/1/33 | | 150 | 150 |
| 5.25% 4/1/35 | | 7,975 | 8,683 |
| 5.5% 4/1/28 | | 10 | 10 |
| 5.5% 4/1/30 | | 5 | 5 |
| 5.5% 3/1/40 | | 5,710 | 5,925 |
| 5.6% 3/1/36 | | 2,440 | 2,536 |
| California Health Facilities Fing. Auth. Rev. (Catholic Healthcare West Proj.) Series 2009 E, 5.625% 7/1/25 | | 7,450 | 7,580 |
| California Pub. Works Board Lease Rev.: | | | |
| (Coalinga State Hosp. Proj.) Series 2013 E: | | | |
| 5% 6/1/26 | | 1,985 | 2,216 |
| 5% 6/1/28 | | 5,110 | 5,670 |
| (Various Cap. Projs.) Series 2011 A, 5.25% 10/1/26 | | 4,140 | 4,511 |
| (Various Judicial Council Projs.) Series 2011 D, 5% 12/1/22 | | 3,395 | 3,699 |
| Folsom Cordova Union School District No. 4 Series A, 0% 10/1/31 (Nat'l. Pub. Fin. Guarantee Corp. Insured) | | 1,520 | 989 |
| Golden State Tobacco Securitization Corp. Tobacco Settlement Rev. Series 2017 A1: | | | |
| 5% 6/1/23 | | 3,140 | 3,459 |
| 5% 6/1/24 | | 1,770 | 1,943 |
| Kern Cmnty. College District Gen. Oblig. Series 2006: | | | |
| 0% 11/1/28 (FSA Insured) | | 4,100 | 3,147 |
| 0% 11/1/30 (FSA Insured) | | 4,140 | 2,911 |
| Long Beach Unified School District Series 2009, 5.5% 8/1/29 | | 155 | 158 |
| Los Angeles Cmnty. Redev. Agcy. Lease Rev. (Vermont Manchester Social Svcs. Proj.) Series 2005, 5% 9/1/19 (AMBAC Insured) | | 2,105 | 2,110 |
| Los Angeles Muni. Impt. Corp. Lease Rev. Series 2012 C: | | | |
| 5% 3/1/25 | | 1,205 | 1,319 |
| 5% 3/1/27 | | 1,655 | 1,807 |
| Madera County Ctfs. of Prtn. (Children's Hosp. Central California Proj.) Series 2010, 5.375% 3/15/36 (Pre-Refunded to 3/15/20 @ 100) | | 3,310 | 3,456 |
| Monrovia Unified School District Series B, 0% 8/1/29 (Nat'l. Pub. Fin. Guarantee Corp. Insured) | | 3,745 | 2,719 |
| Oakland Gen. Oblig. Series 2012: | | | |
| 5% 1/15/26 | | 3,755 | 3,998 |
| 5% 1/15/28 | | 3,595 | 3,824 |
| Oakland Unified School District Alameda County Series 2015 A, 5% 8/1/29 | | 1,450 | 1,681 |
| Poway Unified School District: | | | |
| (District #2007-1 School Facilities Proj.) Series 2008 A, 0% 8/1/32 | | 4,885 | 3,099 |
| Series 2011, 0% 8/1/46 | | 950 | 306 |
| Series B: | | | |
| 0% 8/1/37 | | 6,455 | 3,184 |
| 0% 8/1/39 | | 19,705 | 8,793 |
| Poway Unified School District Pub. Fing.: | | | |
| 5% 9/1/24 | | 825 | 918 |
| 5% 9/1/26 | | 1,050 | 1,167 |
| 5% 9/1/29 | | 2,185 | 2,385 |
| 5% 9/1/31 | | 985 | 1,067 |
| Sacramento City Fing. Auth. Rev. Series A, 0% 12/1/26 (Nat'l. Pub. Fin. Guarantee Corp. Insured) | | 4,140 | 3,292 |
| San Bernardino County Ctfs. of Prtn. (Arrowhead Proj.) Series 2009 A, 5.25% 8/1/26 | | 3,145 | 3,205 |
| San Diego Unified School District: | | | |
| Series 2008 C, 0% 7/1/34 | | 2,980 | 1,738 |
| Series 2008 E, 0% 7/1/47 (e) | | 7,205 | 4,707 |
| San Jose Fing. Auth. Lease Rev. (Civic Ctr. Proj.) Series 2013 A: | | | |
| 5% 6/1/27 | | 3,815 | 4,277 |
| 5% 6/1/31 | | 4,790 | 5,317 |
| San Marcos Unified School District Series 2010 B, 0% 8/1/47 | | 17,635 | 5,601 |
| San Mateo County Cmnty. College District Series A, 0% 9/1/26 (Nat'l. Pub. Fin. Guarantee Corp. Insured) | | 4,495 | 3,724 |
| Union Elementary School District Series B, 0% 9/1/22 (Nat'l. Pub. Fin. Guarantee Corp. Insured) | | 1,240 | 1,150 |
| Univ. of California Regents Med. Ctr. Pool Rev. Series 2013 J, 5% 5/15/48 | | 2,485 | 2,698 |
| Washington Township Health Care District Gen. Oblig.: | | | |
| Series 2013 A, 5.5% 8/1/38 | | 3,725 | 4,310 |
| Series 2013 B, 5.5% 8/1/38 | | 830 | 960 |
| Washington Township Health Care District Rev.: | | | |
| Series 2009 A, 5.75% 7/1/24 | | 1,450 | 1,473 |
| Series 2010 A: | | | |
| 5.25% 7/1/30 | | 910 | 948 |
| 5.5% 7/1/38 | | 3,160 | 3,289 |
| West Contra Costa Unified School District Series 2012, 5% 8/1/26 | | 1,655 | 1,829 |
|
| TOTAL CALIFORNIA | | | 167,343 |
|
| Colorado - 1.2% | | | |
| Arkansas River Pwr. Auth. Rev. Series 2018 A: | | | |
| 5% 10/1/38 | | 2,080 | 2,229 |
| 5% 10/1/43 | | 2,600 | 2,756 |
| Colorado Health Facilities Auth. (Parkview Med. Ctr., Inc. Proj.) Series 2016: | | | |
| 4% 9/1/35 | | 1,365 | 1,399 |
| 4% 9/1/36 | | 1,075 | 1,098 |
| 5% 9/1/46 | | 6,045 | 6,565 |
| Colorado Health Facilities Auth. Retirement Hsg. Rev. (Liberty Heights Proj.) Series B, 0% 7/15/20 (Escrowed to Maturity) | | 5,795 | 5,615 |
| Denver City & County Arpt. Rev.: | | | |
| Series 2017 A: | | | |
| 5% 11/15/23 (d) | | 1,885 | 2,117 |
| 5% 11/15/26 (d) | | 2,855 | 3,326 |
| 5% 11/15/27 (d) | | 2,440 | 2,873 |
| Series 2018 A: | | | |
| 5% 12/1/34 (d) | | 4,245 | 5,074 |
| 5% 12/1/36 (d) | | 4,140 | 4,708 |
| 5% 12/1/37 (d) | | 8,280 | 9,364 |
| E-470 Pub. Hwy. Auth. Rev.: | | | |
| Series 2000 B, 0% 9/1/20 (Nat'l. Pub. Fin. Guarantee Corp. Insured) | | 11,240 | 10,809 |
| Series 2010 C: | | | |
| 5.25% 9/1/25 | | 830 | 868 |
| 5.375% 9/1/26 | | 830 | 869 |
|
| TOTAL COLORADO | | | 59,670 |
|
| Connecticut - 0.7% | | | |
| Connecticut Gen. Oblig.: | | | |
| Series 2014 C, 5% 6/15/25 | | 1,390 | 1,569 |
| Series 2018 F: | | | |
| 5% 9/15/23 | | 2,150 | 2,380 |
| 5% 9/15/24 | | 2,690 | 3,015 |
| 5% 9/15/25 | | 2,700 | 3,055 |
| Connecticut Health & Edl. Facilities Auth. Rev.: | | | |
| (Sacred Heart Univ., CT. Proj.) Series 2017 I-1: | | | |
| 5% 7/1/26 | | 415 | 481 |
| 5% 7/1/27 | | 290 | 339 |
| 5% 7/1/28 | | 525 | 610 |
| 5% 7/1/29 | | 330 | 382 |
| Series 2016 K, 4% 7/1/46 | | 7,315 | 7,195 |
| Series K1: | | | |
| 5% 7/1/27 | | 415 | 468 |
| 5% 7/1/29 | | 1,060 | 1,195 |
| 5% 7/1/30 | | 830 | 930 |
| 5% 7/1/33 | | 1,325 | 1,464 |
| 5% 7/1/34 | | 620 | 682 |
| Eastern Connecticut Resources Recovery Auth. Solid Waste Rev. (Wheelabrator Lisbon Proj.) Series A, 5.5% 1/1/20 (d) | | 1,265 | 1,284 |
| Hbr. Point Infra Impt. District Series 2017: | | | |
| 5% 4/1/30 (c) | | 3,785 | 4,016 |
| 5% 4/1/39 (c) | | 4,865 | 5,034 |
| New Britain Gen. Oblig. Series 2017 C, 5% 3/1/29 (FSA Insured) | | 885 | 1,033 |
|
| TOTAL CONNECTICUT | | | 35,132 |
|
| District Of Columbia - 0.6% | | | |
| District of Columbia Rev. Series B, 4.75% 6/1/32 | | 2,235 | 2,306 |
| Metropolitan Washington DC Arpts. Auth. Sys. Rev. Series 2017 A: | | | |
| 5% 10/1/28 (d) | | 5,505 | 6,429 |
| 5% 10/1/29 (d) | | 6,690 | 7,774 |
| 5% 10/1/31 (d) | | 1,200 | 1,379 |
| 5% 10/1/32 (d) | | 1,855 | 2,126 |
| 5% 10/1/33 (d) | | 910 | 1,038 |
| 5% 10/1/35 (d) | | 2,070 | 2,344 |
| 5% 10/1/42 (d) | | 4,140 | 4,591 |
|
| TOTAL DISTRICT OF COLUMBIA | | | 27,987 |
|
| Florida - 11.2% | | | |
| Brevard County School Board Ctfs. of Prtn. Series 2015 C: | | | |
| 5% 7/1/25 | | 1,655 | 1,925 |
| 5% 7/1/26 | | 1,450 | 1,670 |
| 5% 7/1/28 | | 1,445 | 1,654 |
| Broward County Arpt. Sys. Rev.: | | | |
| Series 2012 P-1, 5% 10/1/22 (d) | | 800 | 877 |
| Series 2012 Q1, 5% 10/1/25 | | 4,315 | 4,739 |
| Series 2017: | | | |
| 5% 10/1/25 (d) | | 205 | 235 |
| 5% 10/1/26 (d) | | 830 | 961 |
| 5% 10/1/27 (d) | | 830 | 969 |
| 5% 10/1/28 (d) | | 830 | 962 |
| 5% 10/1/29 (d) | | 2,200 | 2,534 |
| 5% 10/1/30 (d) | | 610 | 699 |
| 5% 10/1/32 (d) | | 2,900 | 3,300 |
| 5% 10/1/33 (d) | | 1,080 | 1,225 |
| 5% 10/1/34 (d) | | 1,055 | 1,191 |
| 5% 10/1/35 (d) | | 1,240 | 1,396 |
| 5% 10/1/36 (d) | | 1,655 | 1,855 |
| 5% 10/1/37 (d) | | 1,865 | 2,083 |
| 5% 10/1/42 (d) | | 3,520 | 3,898 |
| 5% 10/1/47 (d) | | 4,965 | 5,478 |
| Series A: | | | |
| 5% 10/1/23 (d) | | 1,180 | 1,316 |
| 5% 10/1/28 (d) | | 2,485 | 2,793 |
| 5% 10/1/30 (d) | | 2,900 | 3,231 |
| 5% 10/1/31 (d) | | 2,485 | 2,761 |
| 5% 10/1/32 (d) | | 2,320 | 2,570 |
| Broward County School Board Ctfs. of Prtn.: | | | |
| (Broward County School District Proj.) Series 2016 A, 5% 7/1/28 | | 555 | 646 |
| (Broward County School District) Series 2012 A, 5% 7/1/24 | | 1,795 | 1,961 |
| Series 2012 A: | | | |
| 5% 7/1/24 (Pre-Refunded to 7/1/22 @ 100) | | 1,845 | 2,032 |
| 5% 7/1/27 | | 4,715 | 5,112 |
| Series 2015 A: | | | |
| 5% 7/1/24 | | 1,855 | 2,122 |
| 5% 7/1/27 | | 830 | 954 |
| Series 2015 B, 5% 7/1/24 | | 2,280 | 2,609 |
| Series 2016, 5% 7/1/32 | | 1,820 | 2,081 |
| Citizens Property Ins. Corp. Series 2011 A1, 5% 6/1/19 | | 1,420 | 1,438 |
| Collier County Indl. Dev. Auth. Healthcare Facilities Rev. (NCH Healthcare Sys. Proj.) Series 2011, 6.25% 10/1/39 | | 9,550 | 10,370 |
| Duval County School Board Ctfs. of Prtn.: | | | |
| Series 2015 B: | | | |
| 5% 7/1/28 | | 1,705 | 1,951 |
| 5% 7/1/32 | | 10,120 | 11,459 |
| Series 2016 A, 5% 7/1/33 | | 1,110 | 1,267 |
| Florida Board of Ed. Pub. Ed. Cap. Outlay: | | | |
| Series 2011 E, 5% 6/1/24 | | 5,464 | 5,851 |
| Series 2011 F, 5% 6/1/23 | | 5,025 | 5,382 |
| Florida Mid-Bay Bridge Auth. Rev.: | | | |
| Series 2015 A, 5% 10/1/35 | | 5,300 | 5,777 |
| Series 2015 C: | | | |
| 5% 10/1/30 | | 2,705 | 2,977 |
| 5% 10/1/40 | | 1,655 | 1,772 |
| Florida Muni. Pwr. Agcy. Rev.: | | | |
| (Requirements Pwr. Supply Proj.) Series 2016 A: | | | |
| 5% 10/1/30 | | 1,810 | 2,103 |
| 5% 10/1/31 | | 1,975 | 2,286 |
| (St. Lucie Proj.) Series 2012 A, 5% 10/1/26 | | 3,065 | 3,358 |
| Series 2015 B: | | | |
| 5% 10/1/28 | | 830 | 956 |
| 5% 10/1/30 | | 1,490 | 1,704 |
| Greater Orlando Aviation Auth. Arpt. Facilities Rev.: | | | |
| Series 2016 A, 5% 10/1/46 (d) | | 830 | 913 |
| Series 2016: | | | |
| 5% 10/1/20 (d) | | 165 | 173 |
| 5% 10/1/21 (d) | | 1,280 | 1,374 |
| 5% 10/1/22 (d) | | 830 | 909 |
| 5% 10/1/24 (d) | | 2,485 | 2,814 |
| 5% 10/1/26 (d) | | 1,405 | 1,627 |
| 5% 10/1/27 (d) | | 830 | 970 |
| Series 2017 A: | | | |
| 5% 10/1/24 (d) | | 1,925 | 2,180 |
| 5% 10/1/25 (d) | | 830 | 952 |
| 5% 10/1/27 (d) | | 1,655 | 1,934 |
| 5% 10/1/29 (d) | | 2,485 | 2,871 |
| 5% 10/1/30 (d) | | 2,665 | 3,066 |
| 5% 10/1/32 (d) | | 5,590 | 6,379 |
| 5% 10/1/34 (d) | | 4,965 | 5,626 |
| 5% 10/1/35 (d) | | 6,565 | 7,412 |
| 5% 10/1/36 (d) | | 6,210 | 6,981 |
| 5% 10/1/37 (d) | | 5,175 | 5,792 |
| Halifax Hosp. Med. Ctr. Rev.: | | | |
| 4% 6/1/27 | | 1,165 | 1,222 |
| 5% 6/1/24 | | 230 | 257 |
| Highlands County Health Facilities Auth. Rev. Series 2008: | | | |
| 6% 11/15/37 | | 10,740 | 11,114 |
| 6% 11/15/37 (Pre-Refunded to 11/15/19 @ 100) | | 25 | 26 |
| Jacksonville Sales Tax Rev. Series 2012, 5% 10/1/25 | | 830 | 912 |
| Lake County School Board Ctfs. of Prtn. Series 2014 A: | | | |
| 5% 6/1/27 (FSA Insured) | | 830 | 929 |
| 5% 6/1/28 (FSA Insured) | | 830 | 925 |
| 5% 6/1/30 (FSA Insured) | | 1,865 | 2,065 |
| Lee County Arpt. Rev. Series 2011 A, 5.375% 10/1/32 (d) | | 5,225 | 5,570 |
| Miami-Dade County Aviation Rev.: | | | |
| Series 2010, 5.5% 10/1/30 (Pre-Refunded to 10/1/20 @ 100) | | 2,515 | 2,674 |
| Series 2012 A: | | | |
| 5% 10/1/21 (d) | | 1,575 | 1,689 |
| 5% 10/1/22 (d) | | 830 | 908 |
| 5% 10/1/23 (d) | | 6,375 | 6,955 |
| 5% 10/1/24 (d) | | 7,490 | 8,149 |
| 5% 10/1/30 (d) | | 5,810 | 6,231 |
| 5% 10/1/31 (d) | | 3,310 | 3,545 |
| Series 2014 A: | | | |
| 5% 10/1/28 (d) | | 4,140 | 4,585 |
| 5% 10/1/33 (d) | | 6,940 | 7,587 |
| 5% 10/1/36 (d) | | 13,125 | 14,269 |
| Series 2015 A: | | | |
| 5% 10/1/29 (d) | | 1,310 | 1,457 |
| 5% 10/1/31 (d) | | 1,100 | 1,215 |
| 5% 10/1/35 (d) | | 4,555 | 4,959 |
| Series 2016 A: | | | |
| 5% 10/1/29 | | 1,200 | 1,392 |
| 5% 10/1/31 | | 1,450 | 1,667 |
| Series 2017 B, 5% 10/1/40 (d) | | 10,760 | 11,923 |
| Miami-Dade County Cap. Asset Acquisition Series 2012 A, 5% 10/1/26 | | 3,105 | 3,403 |
| Miami-Dade County Expressway Auth.: | | | |
| Series 2014 A, 5% 7/1/44 | | 2,900 | 3,163 |
| Series 2014 B: | | | |
| 5% 7/1/26 | | 2,070 | 2,347 |
| 5% 7/1/27 | | 1,450 | 1,640 |
| 5% 7/1/28 | | 830 | 936 |
| Series A: | | | |
| 5% 7/1/32 | | 3,560 | 4,076 |
| 5% 7/1/33 | | 3,020 | 3,447 |
| Miami-Dade County School Board Ctfs. of Prtn.: | | | |
| Series 2011 B, 5.625% 5/1/31 | | 5,465 | 5,872 |
| Series 2015 A: | | | |
| 5% 5/1/26 | | 4,555 | 5,169 |
| 5% 5/1/27 (FSA Insured) | | 645 | 738 |
| 5% 5/1/28 | | 9,695 | 11,002 |
| 5% 5/1/29 | | 3,375 | 3,813 |
| Series 2015 B: | | | |
| 5% 5/1/26 | | 7,035 | 7,983 |
| 5% 5/1/27 | | 18,320 | 20,892 |
| Series 2016 A: | | | |
| 5% 5/1/30 | | 6,225 | 7,056 |
| 5% 5/1/32 | | 8,280 | 9,321 |
| Series 2016 B, 5% 8/1/26 | | 8,960 | 10,518 |
| Miami-Dade County Transit Sales Surtax Rev. Series 2012, 5% 7/1/42 | | 1,820 | 1,959 |
| Orange County Health Facilities Auth. Series 2012 A, 5% 10/1/42 | | 9,975 | 10,606 |
| Orange County School Board Ctfs. of Prtn.: | | | |
| Series 2015 C, 5% 8/1/30 | | 8,280 | 9,421 |
| Series 2016 C, 5% 8/1/33 | | 3,120 | 3,563 |
| Orlando Utils. Commission Util. Sys. Rev.: | | | |
| Series 2009 B, 5% 10/1/33 | | 1,750 | 1,763 |
| Series 2012 A, 5% 10/1/25 | | 910 | 1,069 |
| Palm Beach County Arpt. Sys. Rev. Series 2016: | | | |
| 5% 10/1/21 (d) | | 995 | 1,069 |
| 5% 10/1/23 (d) | | 1,095 | 1,223 |
| 5% 10/1/24 (d) | | 1,140 | 1,294 |
| 5% 10/1/27 (d) | | 830 | 961 |
| 5% 10/1/29 (d) | | 860 | 986 |
| 5% 10/1/30 (d) | | 1,530 | 1,747 |
| 5% 10/1/31 (d) | | 1,075 | 1,223 |
| 5% 10/1/32 (d) | | 1,655 | 1,877 |
| 5% 10/1/33 (d) | | 3,555 | 4,022 |
| 5% 10/1/34 (d) | | 3,730 | 4,203 |
| 5% 10/1/35 (d) | | 3,930 | 4,415 |
| Palm Beach County Health Facilities Auth. Hosp. Rev. Series 2014: | | | |
| 5% 12/1/22 | | 555 | 607 |
| 5% 12/1/23 | | 1,155 | 1,280 |
| 5% 12/1/24 | | 1,265 | 1,422 |
| 5% 12/1/25 | | 445 | 496 |
| 5% 12/1/31 | | 415 | 452 |
| Palm Beach County School Board Ctfs. of Prtn. Series 2015 D: | | | |
| 5% 8/1/28 | | 3,905 | 4,491 |
| 5% 8/1/29 | | 4,965 | 5,678 |
| 5% 8/1/31 | | 13,725 | 15,563 |
| South Florida Wtr. Mgmt. District Ctfs. of Prtn. Series 2015: | | | |
| 5% 10/1/29 | | 4,140 | 4,786 |
| 5% 10/1/32 | | 5,190 | 5,919 |
| South Lake County Hosp. District (South Lake Hosp., Inc.): | | | |
| Series 2009 A: | | | |
| 6% 4/1/29 | | 1,160 | 1,169 |
| 6.25% 4/1/39 | | 2,730 | 2,752 |
| Series 2010, 5.25% 10/1/34 | | 2,900 | 3,004 |
| South Miami Health Facilities Auth. Hosp. Rev. (Baptist Med. Ctr., FL. Proj.) Series 2017: | | | |
| 4% 8/15/33 | | 2,070 | 2,151 |
| 5% 8/15/26 | | 2,815 | 3,287 |
| 5% 8/15/27 | | 1,865 | 2,199 |
| 5% 8/15/28 | | 1,240 | 1,452 |
| 5% 8/15/30 | | 2,685 | 3,110 |
| 5% 8/15/31 | | 2,590 | 2,985 |
| 5% 8/15/32 | | 1,930 | 2,216 |
| 5% 8/15/34 | | 5,360 | 6,107 |
| 5% 8/15/35 | | 3,555 | 4,039 |
| 5% 8/15/42 | | 5,465 | 6,109 |
| 5% 8/15/47 | | 8,115 | 9,039 |
| Tallahassee Health Facilities Rev.: | | | |
| (Tallahassee Memorial Healthcare, Inc. Proj.) Series 2016 A, 5% 12/1/41 | | 910 | 979 |
| Series 2015 A, 5% 12/1/40 | | 1,820 | 1,954 |
| Tampa Tax Allocation (H. Lee Moffitt Cancer Ctr. Proj.) Series 2012 A: | | | |
| 5% 9/1/22 | | 1,905 | 2,094 |
| 5% 9/1/25 | | 340 | 372 |
| Volusia County School Board Ctfs. of Prtn.: | | | |
| (Florida Master Lease Prog.) Series 2016 A: | | | |
| 5% 8/1/29 (Build America Mutual Assurance Insured) | | 830 | 946 |
| 5% 8/1/32 (Build America Mutual Assurance Insured) | | 4,140 | 4,667 |
| (Master Lease Prog.) Series 2014 B: | | | |
| 5% 8/1/25 | | 1,470 | 1,683 |
| 5% 8/1/26 | | 280 | 319 |
|
| TOTAL FLORIDA | | | 536,792 |
|
| Georgia - 1.6% | | | |
| Atlanta Wtr. & Wastewtr. Rev. 5% 11/1/27 | | 830 | 960 |
| Bartow County Dev. Auth. Poll. Cont. Rev. Bonds (Georgia Pwr. Co. Plant Bowen Proj.) Series 1997 1, 2.05%, tender 11/19/21 (a) | | 1,655 | 1,614 |
| Burke County Indl. Dev. Auth. Poll. Cont. Rev. Bonds: | | | |
| (Oglethorpe Pwr. Corp. Vogtle Proj.) Series 2013 A, 2.4%, tender 4/1/20 (a) | | 6,290 | 6,260 |
| 2.2%, tender 4/2/19 (a) | | 2,485 | 2,484 |
| 2.2%, tender 4/2/19 (a) | | 5,380 | 5,378 |
| 2.2%, tender 4/2/19 (a) | | 3,395 | 3,393 |
| DeKalb County Wtr. & Swr. Rev. Series 2011 A, 5.25% 10/1/36 | | 2,485 | 2,674 |
| Fulton County Wtr. & Swr. Rev. Series 2011, 5% 1/1/24 | | 5,380 | 5,696 |
| Georgia Muni. Gas Auth. Rev. (Gas Portfolio III Proj.) Series S: | | | |
| 5% 10/1/22 | | 2,835 | 3,127 |
| 5% 10/1/23 | | 3,310 | 3,646 |
| Glynn-Brunswick Memorial Hosp. Auth. Rev. (Southeast Georgia Health Sys. Proj.) Series 2017: | | | |
| 4% 8/1/43 | | 1,860 | 1,803 |
| 5% 8/1/39 | | 1,705 | 1,844 |
| 5% 8/1/43 | | 2,275 | 2,456 |
| Main Street Natural Gas, Inc. Bonds Series 2018 C, 4%, tender 12/1/23 (a) | | 21,230 | 22,417 |
| Main Street Natural Gas, Inc. Georgia Gas Proj. Rev. Series A, 5.25% 9/15/19 | | 1,585 | 1,621 |
| Private Colleges & Univs. Auth. Rev. (The Savannah College of Art and Design Projs.) Series 2014: | | | |
| 5% 4/1/25 | | 2,900 | 3,247 |
| 5% 4/1/30 | | 1,655 | 1,811 |
| 5% 4/1/44 | | 3,160 | 3,363 |
| Valdosta & Lowndes County Hosp. (South Georgia Med. Ctr. Proj.) 5% 10/1/20 | | 875 | 878 |
|
| TOTAL GEORGIA | | | 74,672 |
|
| Hawaii - 0.8% | | | |
| Hawaii Arpts. Sys. Rev.: | | | |
| Series 2015 A: | | | |
| 5% 7/1/41 (d) | | 6,210 | 6,811 |
| 5% 7/1/45 (d) | | 16,455 | 18,008 |
| Series 2018 A: | | | |
| 5% 7/1/29 (d) | | 1,055 | 1,235 |
| 5% 7/1/30 (d) | | 1,240 | 1,439 |
| 5% 7/1/31 (d) | | 1,215 | 1,404 |
| 5% 7/1/32 (d) | | 1,240 | 1,428 |
| 5% 7/1/33 (d) | | 1,265 | 1,451 |
| State of Hawaii Dept. of Trans. Series 2013: | | | |
| 5% 8/1/22 (d) | | 1,305 | 1,424 |
| 5.25% 8/1/24 (d) | | 1,655 | 1,848 |
| 5.25% 8/1/25 (d) | | 2,070 | 2,295 |
|
| TOTAL HAWAII | | | 37,343 |
|
| Idaho - 0.1% | | | |
| Idaho Health Facilities Auth. Rev. Series 2015 ID, 5% 12/1/25 | | 2,275 | 2,635 |
| Illinois - 23.4% | | | |
| Boone & Winnebago County Cmnty. Unit School District 200: | | | |
| 0% 1/1/21 (Nat'l. Pub. Fin. Guarantee Corp. Insured) | | 1,500 | 1,426 |
| 0% 1/1/22 (Nat'l. Pub. Fin. Guarantee Corp. Insured) | | 1,615 | 1,493 |
| Chicago Board of Ed.: | | | |
| Series 1998 B1, 0% 12/1/21 (Nat'l. Pub. Fin. Guarantee Corp. Insured) | | 1,960 | 1,788 |
| Series 1999 A, 5.25% 12/1/21 (Nat'l. Pub. Fin. Guarantee Corp. Insured) | | 1,975 | 2,098 |
| Series 2010 F, 5% 12/1/20 | | 1,070 | 1,101 |
| Series 2011 A: | | | |
| 5% 12/1/41 | | 4,790 | 4,791 |
| 5.25% 12/1/41 | | 2,965 | 2,986 |
| 5.5% 12/1/39 | | 6,540 | 6,638 |
| Series 2012 A, 5% 12/1/42 | | 7,630 | 7,630 |
| Series 2015 C, 5.25% 12/1/39 | | 1,405 | 1,427 |
| Series 2016 B, 6.5% 12/1/46 | | 660 | 734 |
| Series 2017 A, 7% 12/1/46 (c) | | 2,320 | 2,692 |
| Series 2017 C: | | | |
| 5% 12/1/22 | | 2,175 | 2,264 |
| 5% 12/1/23 | | 1,880 | 1,965 |
| 5% 12/1/24 | | 4,770 | 5,009 |
| 5% 12/1/25 | | 2,725 | 2,866 |
| 5% 12/1/26 | | 800 | 843 |
| 5% 12/1/30 | | 2,105 | 2,181 |
| Series 2017 D: | | | |
| 5% 12/1/23 | | 2,460 | 2,571 |
| 5% 12/1/24 | | 1,030 | 1,082 |
| 5% 12/1/31 | | 2,485 | 2,564 |
| Series 2018 A: | | | |
| 5% 12/1/25 | | 830 | 873 |
| 5% 12/1/26 | | 830 | 875 |
| 5% 12/1/28 | | 3,915 | 4,115 |
| 5% 12/1/30 | | 1,655 | 1,721 |
| 5% 12/1/32 | | 950 | 981 |
| 5% 12/1/35 | | 830 | 847 |
| Series 2018 C, 5% 12/1/46 | | 3,250 | 3,226 |
| Chicago Midway Arpt. Rev.: | | | |
| Series 2014 A: | | | |
| 5% 1/1/27 (d) | | 8,550 | 9,383 |
| 5% 1/1/28 (d) | | 15,855 | 17,339 |
| 5% 1/1/33 (d) | | 4,450 | 4,806 |
| 5% 1/1/34 (d) | | 2,150 | 2,317 |
| Series 2016 A, 5% 1/1/28 (d) | | 1,655 | 1,856 |
| Series 2016 B: | | | |
| 4% 1/1/35 | | 1,305 | 1,325 |
| 5% 1/1/36 | | 1,655 | 1,818 |
| 5% 1/1/37 | | 2,235 | 2,441 |
| 5% 1/1/46 | | 5,865 | 6,331 |
| Chicago O'Hare Int'l. Arpt. Rev.: | | | |
| Series 2013 B, 5% 1/1/27 | | 5,195 | 5,702 |
| Series 2013 D, 5% 1/1/27 | | 2,650 | 2,909 |
| Series 2015 A: | | | |
| 5% 1/1/31 (d) | | 5,000 | 5,490 |
| 5% 1/1/32 (d) | | 10,100 | 11,056 |
| Series 2015 C: | | | |
| 5% 1/1/24 (d) | | 1,190 | 1,320 |
| 5% 1/1/46 (d) | | 1,985 | 2,128 |
| Series 2016 B, 5% 1/1/34 | | 5,050 | 5,622 |
| Series 2016 C: | | | |
| 5% 1/1/33 | | 2,255 | 2,520 |
| 5% 1/1/34 | | 2,610 | 2,906 |
| Series 2016 G: | | | |
| 5% 1/1/37 (d) | | 1,655 | 1,812 |
| 5% 1/1/42 (d) | | 1,655 | 1,796 |
| 5.25% 1/1/29 (d) | | 290 | 333 |
| 5.25% 1/1/31 (d) | | 330 | 376 |
| Series 2017 A, 5% 1/1/31 | | 2,925 | 3,340 |
| Series 2017 B: | | | |
| 5% 1/1/35 | | 1,740 | 1,954 |
| 5% 1/1/37 | | 7,080 | 7,893 |
| Series 2017 C: | | | |
| 5% 1/1/30 | | 495 | 568 |
| 5% 1/1/31 | | 495 | 565 |
| 5% 1/1/32 | | 540 | 613 |
| Series 2017 D: | | | |
| 5% 1/1/28 (d) | | 2,475 | 2,815 |
| 5% 1/1/29 (d) | | 2,070 | 2,342 |
| 5% 1/1/32 (d) | | 2,235 | 2,490 |
| 5% 1/1/34 (d) | | 3,360 | 3,716 |
| 5% 1/1/35 (d) | | 2,485 | 2,741 |
| 5% 1/1/36 (d) | | 3,090 | 3,395 |
| 5% 1/1/37 (d) | | 1,655 | 1,812 |
| Chicago O'Hare Int'l. Arpt. Spl. Facilities Rev. Series 2018: | | | |
| 5% 7/1/38 (d) | | 2,185 | 2,405 |
| 5% 7/1/48 (d) | | 9,030 | 9,819 |
| Chicago Transit Auth.: | | | |
| Series 2014, 5.25% 12/1/49 | | 14,900 | 16,116 |
| Series 2017, 5% 12/1/46 | | 3,395 | 3,635 |
| Chicago Transit Auth. Cap. Grant Receipts Rev. Series 2017: | | | |
| 5% 6/1/22 | | 1,670 | 1,807 |
| 5% 6/1/23 | | 1,505 | 1,657 |
| 5% 6/1/24 | | 255 | 285 |
| 5% 6/1/25 | | 255 | 288 |
| 5% 6/1/26 | | 205 | 233 |
| Cook County Forest Preservation District: | | | |
| Series 2012 A, 5% 11/15/22 | | 1,655 | 1,791 |
| Series 2012 C, 5% 12/15/21 | | 830 | 884 |
| Cook County Gen. Oblig.: | | | |
| Series 2010 A: | | | |
| 5.25% 11/15/22 | | 570 | 599 |
| 5.25% 11/15/33 | | 14,925 | 15,502 |
| Series 2010 G, 5% 11/15/25 | | 2,815 | 2,930 |
| Series 2012 C, 5% 11/15/24 | | 9,190 | 9,961 |
| Series 2016 A: | | | |
| 5% 11/15/26 | | 4,420 | 5,005 |
| 5% 11/15/27 | | 2,320 | 2,610 |
| 5% 11/15/28 | | 3,020 | 3,375 |
| 5% 11/15/29 | | 3,760 | 4,169 |
| 5% 11/15/30 | | 4,140 | 4,573 |
| Grundy & Will Counties Cmnty. School Gen. Obligan Series 2017, 5% 2/1/25 | | 745 | 844 |
| Illinois Fin. Auth. Rev.: | | | |
| (Bradley Univ. Proj.) Series 2017 C: | | | |
| 5% 8/1/29 | | 540 | 615 |
| 5% 8/1/30 | | 760 | 862 |
| 5% 8/1/32 | | 1,015 | 1,141 |
| (Depaul Univ. Proj.) Series 2016 A: | | | |
| 4% 10/1/34 | | 830 | 862 |
| 5% 10/1/29 | | 830 | 955 |
| 5% 10/1/30 | | 830 | 951 |
| 5% 10/1/35 | | 1,655 | 1,863 |
| (OSF Healthcare Sys.) Series 2018 A: | | | |
| 4.125% 5/15/47 | | 25,725 | 25,448 |
| 5% 5/15/43 | | 34,525 | 38,115 |
| (Palos Cmnty. Hosp. Proj.) Series 2010 C: | | | |
| 5.375% 5/15/25 | | 25,025 | 26,064 |
| 5.375% 5/15/30 | | 6,020 | 6,239 |
| (Presence Health Proj.) Series 2016 C: | | | |
| 3.625% 2/15/32 | | 950 | 956 |
| 4% 2/15/33 | | 225 | 236 |
| 5% 2/15/25 | | 190 | 219 |
| 5% 2/15/26 | | 2,525 | 2,948 |
| 5% 2/15/29 | | 5,110 | 5,957 |
| 5% 2/15/36 | | 1,160 | 1,304 |
| (Rosalind Franklin Univ. Research Bldg. Proj.) Series 2017 C, 5% 8/1/46 | | 830 | 886 |
| (Rush Univ. Med. Ctr. Proj.) Series 2015 A, 5% 11/15/34 | | 415 | 459 |
| Series 2009, 5% 8/15/23 (Pre-Refunded to 8/15/20 @ 100) | | 1,545 | 1,620 |
| Series 2010, 5.25% 5/1/25 | | 5,795 | 6,044 |
| Series 2012 A: | | | |
| 5% 5/15/20 | | 415 | 432 |
| 5% 5/15/22 | | 1,805 | 1,968 |
| 5% 5/15/23 | | 250 | 271 |
| Series 2012: | | | |
| 4% 9/1/32 | | 7,265 | 7,426 |
| 5% 9/1/32 | | 1,575 | 1,700 |
| 5% 9/1/38 | | 21,730 | 23,218 |
| 5% 11/15/43 | | 4,315 | 4,522 |
| Series 2013: | | | |
| 5% 11/15/24 | | 415 | 454 |
| 5% 11/15/27 | | 85 | 92 |
| 5% 11/15/28 | | 2,380 | 2,573 |
| 5% 11/15/29 | | 1,160 | 1,252 |
| 5% 5/15/43 | | 9,775 | 10,176 |
| Series 2014, 5% 8/1/38 | | 11,050 | 12,053 |
| Series 2015 A: | | | |
| 5% 11/15/21 | | 495 | 535 |
| 5% 11/15/45 | | 2,670 | 2,860 |
| Series 2015 B, 5% 11/15/27 | | 2,615 | 2,971 |
| Series 2015 C: | | | |
| 4.125% 8/15/37 | | 715 | 720 |
| 5% 8/15/35 | | 6,175 | 6,718 |
| 5% 8/15/44 | | 30,175 | 32,220 |
| Series 2016 A: | | | |
| 5% 8/15/22 | | 830 | 894 |
| 5% 7/1/24 | | 1,155 | 1,309 |
| 5% 8/15/25 | | 1,970 | 2,209 |
| 5% 8/15/26 | | 2,635 | 2,980 |
| 5% 7/1/28 | | 1,020 | 1,168 |
| 5% 2/15/29 | | 4,255 | 4,794 |
| 5% 2/15/30 | | 4,490 | 5,037 |
| 5% 7/1/30 | | 590 | 667 |
| 5% 2/15/31 | | 3,620 | 4,044 |
| 5% 7/1/31 | | 1,040 | 1,162 |
| 5% 2/15/32 | | 3,520 | 3,916 |
| 5% 7/1/33 | | 540 | 600 |
| 5% 7/1/34 | | 4,140 | 4,581 |
| 5% 8/15/34 | | 535 | 583 |
| 5% 8/15/35 | | 420 | 457 |
| 5% 7/1/36 | | 2,140 | 2,353 |
| 5% 8/15/36 | | 1,685 | 1,825 |
| 5.25% 8/15/27 | | 1,865 | 2,131 |
| 5.25% 8/15/28 | | 2,395 | 2,723 |
| 5.25% 8/15/30 | | 1,840 | 2,075 |
| 5.25% 8/15/31 | | 495 | 556 |
| Series 2016 B: | | | |
| 5% 8/15/31 | | 6,095 | 6,934 |
| 5% 8/15/32 | | 5,000 | 5,658 |
| 5% 8/15/34 | | 6,220 | 6,986 |
| 5% 8/15/36 | | 8,680 | 9,632 |
| Series 2016 C: | | | |
| 3.75% 2/15/34 | | 1,215 | 1,215 |
| 4% 2/15/36 | | 5,160 | 5,271 |
| 4% 2/15/41 | | 14,810 | 14,922 |
| 5% 2/15/22 | | 1,095 | 1,193 |
| 5% 2/15/24 | | 555 | 630 |
| 5% 2/15/30 | | 6,425 | 7,440 |
| 5% 2/15/31 | | 12,595 | 14,505 |
| 5% 2/15/32 | | 3,660 | 4,189 |
| 5% 2/15/34 | | 2,920 | 3,309 |
| 5% 2/15/41 | | 8,845 | 9,808 |
| Series 2016: | | | |
| 5% 5/15/29 | | 1,040 | 1,184 |
| 5% 12/1/29 | | 1,420 | 1,596 |
| 5% 5/15/30 | | 2,200 | 2,486 |
| 5% 12/1/46 | | 3,865 | 4,116 |
| Series 2017 A, 5% 8/1/42 | | 730 | 782 |
| Series 2017: | | | |
| 5% 7/1/26 | | 1,450 | 1,727 |
| 5% 1/1/29 | | 2,775 | 3,257 |
| 5% 7/1/33 | | 5,640 | 6,488 |
| 5% 7/1/34 | | 4,640 | 5,324 |
| 5% 7/1/35 | | 3,900 | 4,466 |
| Series 2018 A: | | | |
| 4.25% 1/1/44 | | 2,465 | 2,483 |
| 5% 1/1/44 | | 14,900 | 16,051 |
| Illinois Gen. Oblig.: | | | |
| Series 2010, 5% 1/1/21 (FSA Insured) | | 2,565 | 2,631 |
| Series 2012 A, 4% 1/1/23 | | 2,090 | 2,114 |
| Series 2012: | | | |
| 5% 8/1/21 | | 1,985 | 2,068 |
| 5% 3/1/23 | | 4,265 | 4,449 |
| 5% 8/1/23 | | 3,810 | 4,038 |
| Series 2013: | | | |
| 5% 1/1/22 | | 2,420 | 2,463 |
| 5.5% 7/1/24 | | 830 | 899 |
| 5.5% 7/1/25 | | 4,315 | 4,660 |
| Series 2014: | | | |
| 5% 2/1/22 | | 880 | 921 |
| 5% 2/1/23 | | 3,665 | 3,866 |
| 5% 2/1/25 | | 3,005 | 3,173 |
| 5% 2/1/26 | | 2,270 | 2,387 |
| 5% 4/1/28 | | 1,895 | 1,979 |
| 5% 5/1/28 | | 1,780 | 1,860 |
| 5.25% 2/1/31 | | 360 | 376 |
| Series 2016: | | | |
| 5% 2/1/23 | | 1,500 | 1,582 |
| 5% 2/1/24 | | 8,285 | 8,795 |
| 5% 6/1/25 | | 7,295 | 7,789 |
| 5% 11/1/25 | | 2,485 | 2,657 |
| 5% 6/1/26 | | 995 | 1,065 |
| 5% 2/1/27 | | 9,975 | 10,700 |
| Series 2017 D: | | | |
| 5% 11/1/22 | | 19,770 | 20,852 |
| 5% 11/1/23 | | 20,695 | 21,977 |
| 5% 11/1/24 | | 28,975 | 30,916 |
| 5% 11/1/25 | | 28,795 | 30,783 |
| 5% 11/1/26 | | 8,690 | 9,317 |
| 5% 11/1/27 | | 2,900 | 3,114 |
| Illinois Muni. Elec. Agcy. Pwr. Supply Series 2015 A: | | | |
| 5% 2/1/25 | | 6,715 | 7,664 |
| 5% 2/1/26 | | 8,585 | 9,840 |
| 5% 2/1/31 | | 3,370 | 3,802 |
| Illinois Toll Hwy. Auth. Toll Hwy. Rev.: | | | |
| Series 2015 A: | | | |
| 5% 1/1/37 | | 3,020 | 3,372 |
| 5% 1/1/40 | | 12,915 | 14,332 |
| Series 2015 B, 5% 1/1/40 | | 7,205 | 7,941 |
| Series 2016 A: | | | |
| 5% 12/1/31 | | 5,825 | 6,579 |
| 5% 12/1/32 | | 8,525 | 9,611 |
| Joliet School District #86 Gen. Oblig. Series 2002, 0% 11/1/19 (FSA Insured) | | 1,655 | 1,625 |
| Kane, McHenry, Cook & DeKalb Counties Unit School District #300: | | | |
| 0% 12/1/21 (AMBAC Insured) | | 2,560 | 2,382 |
| 0% 12/1/21 (Escrowed to Maturity) | | 1,575 | 1,487 |
| 6.5% 1/1/20 (AMBAC Insured) | | 2,600 | 2,713 |
| Kendall, Kane & Will Counties Cmnty. Unit School District #308 Series 2016: | | | |
| 5% 2/1/34 | | 5,795 | 6,447 |
| 5% 2/1/35 | | 4,140 | 4,595 |
| 5% 2/1/36 | | 7,120 | 7,874 |
| Lake County Cmnty. High School District #117, Antioch Series 2000 B, 0% 12/1/20 (Nat'l. Pub. Fin. Guarantee Corp. Insured) | | 1,495 | 1,419 |
| McHenry & Kane Counties Cmnty. Consolidated School District #158: | | | |
| Series 2003: | | | |
| 0% 1/1/19 | | 2,295 | 2,295 |
| 0% 1/1/19 (Escrowed to Maturity) | | 155 | 155 |
| Series 2004, 0% 1/1/24 (FSA Insured) | | 4,220 | 3,657 |
| 0% 1/1/19 (Escrowed to Maturity) | | 35 | 35 |
| Metropolitan Pier & Exposition: | | | |
| (McCormick Place Expansion Proj.): | | | |
| Series 1992 A, 0% 6/15/20 (Nat'l. Pub. Fin. Guarantee Corp. Insured) | | 2,990 | 2,861 |
| Series 1994 A, 0% 6/15/19 (Nat'l. Pub. Fin. Guarantee Corp. Insured) | | 5,500 | 5,431 |
| Series 1996 A, 0% 6/15/23 (Nat'l. Pub. Fin. Guarantee Corp. Insured) | | 5,215 | 4,459 |
| Series 2010 B1: | | | |
| 0% 6/15/43 (FSA Insured) | | 41,985 | 13,909 |
| 0% 6/15/44 (FSA Insured) | | 48,430 | 15,297 |
| 0% 6/15/45 (FSA Insured) | | 25,250 | 7,603 |
| 0% 6/15/47 (FSA Insured) | | 3,000 | 820 |
| Series 2012 B, 0% 12/15/51 | | 10,845 | 2,114 |
| Series A: | | | |
| 0% 6/15/22 (Nat'l. Pub. Fin. Guarantee Corp. Insured) | | 1,045 | 929 |
| 0% 12/15/24 (Nat'l. Pub. Fin. Guarantee Corp. Insured) | | 2,560 | 2,056 |
| Series 1993: | | | |
| 0% 6/15/19 | | 2,300 | 2,271 |
| 0% 6/15/19 (Escrowed to Maturity) | | 470 | 466 |
| Series 1996 A, 0% 6/15/24 | | 2,535 | 2,078 |
| Series 2002, 5.5% 6/15/20 | | 220 | 222 |
| Series 2017 B: | | | |
| 5% 12/15/25 | | 830 | 892 |
| 5% 12/15/26 | | 2,755 | 2,970 |
| 5% 12/15/27 | | 295 | 318 |
| 5% 12/15/31 | | 560 | 598 |
| 5% 12/15/34 | | 330 | 349 |
| Series A, 0% 12/15/19 (Nat'l. Pub. Fin. Guarantee Corp. Insured) | | 1,785 | 1,737 |
| Railsplitter Tobacco Settlement Auth. Rev. Series 2017: | | | |
| 5% 6/1/27 | | 4,140 | 4,713 |
| 5% 6/1/28 | | 2,275 | 2,575 |
| Univ. of Illinois Rev.: | | | |
| (Auxiliary Facilities Sys. Proj.): | | | |
| Series 1991, 0% 4/1/20 (Nat'l. Pub. Fin. Guarantee Corp. Insured) | | 6,625 | 6,430 |
| Series 1999 A: | | | |
| 0% 4/1/20 (Nat'l. Pub. Fin. Guarantee Corp. Insured) | | 1,325 | 1,286 |
| 0% 4/1/21 (Nat'l. Pub. Fin. Guarantee Corp. Insured) | | 4,110 | 3,889 |
| Series 2010 A: | | | |
| 5% 4/1/25 | | 5,070 | 5,236 |
| 5.25% 4/1/30 | | 3,475 | 3,592 |
| Series 2013: | | | |
| 6% 10/1/42 | | 4,555 | 5,099 |
| 6.25% 10/1/38 | | 4,495 | 5,094 |
| Series 2018 A, 5% 4/1/30 | | 3,425 | 3,965 |
| Will County Cmnty. Unit School District #365-U: | | | |
| Series 2007 B, 0% 11/1/26 (FSA Insured) | | 5,095 | 4,014 |
| Series 2012, 0% 11/1/25 | | 985 | 806 |
| 0% 11/1/19 (Escrowed to Maturity) | | 1,215 | 1,195 |
| 0% 11/1/19 (FSA Insured) | | 7,790 | 7,650 |
| Will County Illinois Series 2016: | | | |
| 5% 11/15/31 | | 1,340 | 1,510 |
| 5% 11/15/32 | | 1,020 | 1,146 |
| 5% 11/15/33 | | 1,240 | 1,389 |
| 5% 11/15/34 | | 1,240 | 1,385 |
|
| TOTAL ILLINOIS | | | 1,120,336 |
|
| Indiana - 1.3% | | | |
| Crown Point Multi-School Bldg. Corp. 0% 1/15/21 (Nat'l. Pub. Fin. Guarantee Corp. Insured) | | 6,195 | 5,935 |
| Indiana Fin. Auth. Rev.: | | | |
| Series 2012: | | | |
| 5% 3/1/30 | | 3,790 | 4,073 |
| 5% 3/1/41 | | 6,920 | 7,349 |
| Series 2015 A, 5.25% 2/1/32 | | 5,845 | 6,783 |
| Series 2016: | | | |
| 4% 9/1/21 | | 330 | 346 |
| 5% 9/1/22 | | 250 | 275 |
| 5% 9/1/23 | | 375 | 420 |
| 5% 9/1/24 | | 560 | 638 |
| 5% 9/1/26 | | 1,075 | 1,256 |
| 5% 9/1/27 | | 540 | 624 |
| 5% 9/1/28 | | 2,535 | 2,910 |
| 5% 9/1/29 | | 1,240 | 1,417 |
| 5% 9/1/30 | | 1,160 | 1,318 |
| Indiana Fin. Auth. Wastewtr. Util. Rev.: | | | |
| (CWA Auth. Proj.): | | | |
| Series 2012 A: | | | |
| 5% 10/1/24 | | 330 | 367 |
| 5% 10/1/26 | | 2,105 | 2,334 |
| Series 2015 A, 5% 10/1/30 | | 3,990 | 4,502 |
| Series 2011 A, 5.25% 10/1/25 | | 1,450 | 1,574 |
| Indianapolis Local Pub. Impt. Series 2016: | | | |
| 4% 1/1/32 (d) | | 830 | 860 |
| 4% 1/1/33 (d) | | 830 | 857 |
| 4% 1/1/34 (d) | | 830 | 853 |
| 4% 1/1/35 (d) | | 2,300 | 2,355 |
| 5% 1/1/26 (d) | | 875 | 1,007 |
| Lake Central Multi-District School Bldg. Corp. Series 2012 B, 5% 1/15/30 | | 1,700 | 1,866 |
| Purdue Univ. Rev. Series 2018 DD: | | | |
| 5% 7/1/34 | | 995 | 1,183 |
| 5% 7/1/35 | | 1,960 | 2,323 |
| 5% 7/1/36 | | 2,130 | 2,511 |
| 5% 7/1/37 | | 1,970 | 2,313 |
| 5% 7/1/38 | | 2,600 | 3,041 |
| Zionsville Cmnty. Schools Bldg. Series 2005, 5% 7/15/20 (FSA Insured) | | 1,610 | 1,674 |
|
| TOTAL INDIANA | | | 62,964 |
|
| Iowa - 0.1% | | | |
| Iowa Fin. Auth. Rev. Series A: | | | |
| 5% 5/15/43 | | 1,145 | 1,183 |
| 5% 5/15/48 | | 2,010 | 2,069 |
|
| TOTAL IOWA | | | 3,252 |
|
| Kansas - 0.6% | | | |
| Kansas Dev. Fin. Agcy. Series 2009: | | | |
| 5.75% 11/15/38 (Pre-Refunded to 11/15/19 @ 100) | | 230 | 237 |
| 5.75% 11/15/38 (Pre-Refunded to 11/15/19 @ 100) | | 10,120 | 10,462 |
| Wyandotte County/Kansas City Unified Govt. Util. Sys. Rev.: | | | |
| Series 2012 A: | | | |
| 5% 9/1/23 | | 1,540 | 1,689 |
| 5% 9/1/25 | | 3,310 | 3,626 |
| 5% 9/1/26 | | 1,615 | 1,768 |
| Series 2016 A: | | | |
| 5% 9/1/40 | | 3,740 | 4,165 |
| 5% 9/1/45 | | 5,630 | 6,248 |
|
| TOTAL KANSAS | | | 28,195 |
|
| Kentucky - 0.9% | | | |
| Kenton County Arpt. Board Arpt. Rev. Series 2016: | | | |
| 5% 1/1/21 | | 540 | 571 |
| 5% 1/1/22 | | 600 | 649 |
| 5% 1/1/23 | | 350 | 386 |
| 5% 1/1/28 | | 1,310 | 1,498 |
| 5% 1/1/31 | | 1,240 | 1,399 |
| 5% 1/1/32 | | 1,240 | 1,392 |
| Kentucky Econ. Dev. Fin. Auth. Rev. Louisville Arena Auth., Inc. Series 2017 A, 5% 12/1/47 (FSA Insured) | | 1,340 | 1,437 |
| Kentucky State Property & Buildings Commission Rev. (Proj. No. 119) Series 2018: | | | |
| 5% 5/1/26 | | 830 | 954 |
| 5% 5/1/27 | | 2,435 | 2,817 |
| 5% 5/1/29 | | 4,510 | 5,211 |
| 5% 5/1/32 | | 1,185 | 1,357 |
| 5% 5/1/33 | | 915 | 1,044 |
| 5% 5/1/34 | | 1,045 | 1,187 |
| 5% 5/1/35 | | 615 | 695 |
| 5% 5/1/36 | | 520 | 585 |
| Louisville & Jefferson County Series 2013 A: | | | |
| 5.5% 10/1/33 | | 2,815 | 3,144 |
| 5.75% 10/1/38 | | 7,255 | 8,127 |
| Louisville/Jefferson County Metropolitan Gov. Series 2012 A: | | | |
| 5% 12/1/28 | | 615 | 656 |
| 5% 12/1/30 | | 600 | 637 |
| Pikeville Hosp. Rev. (Pikeville Med. Ctr., Inc. Proj.) Series 2011, 6.5% 3/1/41 | | 2,485 | 2,658 |
| Trimble County Poll. Cont. Rev. Bonds (Louisville Gas and Elec. Co. Proj.) Series 2001 B, 2.55%, tender 5/3/21 (a) | | 6,730 | 6,760 |
|
| TOTAL KENTUCKY | | | 43,164 |
|
| Louisiana - 0.9% | | | |
| Louisiana Pub. Facilities Auth. Rev.: | | | |
| (Tulane Univ. of Louisiana Proj.) Series 2016 A: | | | |
| 5% 12/15/24 | | 1,240 | 1,422 |
| 5% 12/15/25 | | 2,585 | 3,002 |
| 5% 12/15/26 | | 1,045 | 1,227 |
| 5% 12/15/28 | | 1,655 | 1,913 |
| 5% 12/15/29 | | 1,175 | 1,345 |
| 5% 12/15/30 | | 2,320 | 2,637 |
| Series 2018 E: | | | |
| 5% 7/1/37 | | 1,615 | 1,802 |
| 5% 7/1/38 | | 1,260 | 1,400 |
| New Orleans Aviation Board Rev.: | | | |
| (North Term. Proj.): | | | |
| Series 2015 B: | | | |
| 5% 1/1/27 (d) | | 1,160 | 1,290 |
| 5% 1/1/29 (d) | | 4,295 | 4,733 |
| 5% 1/1/30 (d) | | 5,795 | 6,360 |
| 5% 1/1/31 (d) | | 2,070 | 2,264 |
| 5% 1/1/40 (d) | | 6,860 | 7,374 |
| Series 2017 B: | | | |
| 5% 1/1/27 (d) | | 330 | 379 |
| 5% 1/1/28 (d) | | 205 | 234 |
| 5% 1/1/32 (d) | | 330 | 369 |
| 5% 1/1/33 (d) | | 580 | 647 |
| 5% 1/1/34 (d) | | 180 | 200 |
| 5% 1/1/35 (d) | | 330 | 365 |
| Series 2017 D2: | | | |
| 5% 1/1/27 (d) | | 415 | 477 |
| 5% 1/1/28 (d) | | 595 | 680 |
| 5% 1/1/31 (d) | | 530 | 596 |
| 5% 1/1/33 (d) | | 850 | 948 |
| 5% 1/1/34 (d) | | 1,020 | 1,133 |
| 5% 1/1/36 (d) | | 775 | 855 |
| 5% 1/1/37 (d) | | 1,275 | 1,402 |
|
| TOTAL LOUISIANA | | | 45,054 |
|
| Maine - 1.1% | | | |
| Maine Health & Higher Edl. Facilities Auth. Rev.: | | | |
| (Eastern Maine Healthcare Systems Proj.) Series 2013, 5% 7/1/43 | | 3,140 | 3,273 |
| Series 2013, 5% 7/1/25 | | 1,475 | 1,592 |
| Series 2016 A: | | | |
| 4% 7/1/41 | | 1,910 | 1,847 |
| 4% 7/1/46 | | 2,680 | 2,543 |
| 5% 7/1/41 | | 8,620 | 9,122 |
| 5% 7/1/46 | | 22,975 | 24,237 |
| Series 2017 B: | | | |
| 4% 7/1/25 | | 375 | 407 |
| 4% 7/1/31 | | 580 | 608 |
| 4% 7/1/32 | | 415 | 432 |
| 4% 7/1/34 | | 835 | 864 |
| 5% 7/1/26 | | 270 | 313 |
| 5% 7/1/28 | | 420 | 488 |
| 5% 7/1/29 | | 330 | 381 |
| 5% 7/1/33 | | 830 | 941 |
| 5% 7/1/35 | | 630 | 710 |
| Series 2017 D, 5.75% 7/1/38 | | 135 | 135 |
| Maine Tpk. Auth. Tpk. Rev. Series 2015: | | | |
| 5% 7/1/32 | | 870 | 988 |
| 5% 7/1/36 | | 2,150 | 2,413 |
| 5% 7/1/38 | | 555 | 619 |
|
| TOTAL MAINE | | | 51,913 |
|
| Maryland - 0.6% | | | |
| Baltimore Proj. Rev. (Wtr. Projs.) Series 2009 A: | | | |
| 5.375% 7/1/34 (Pre-Refunded to 7/1/19 @ 100) | | 155 | 158 |
| 5.375% 7/1/34 (Pre-Refunded to 7/1/19 @ 100) | | 260 | 265 |
| City of Westminster Series 2016: | | | |
| 5% 11/1/27 | | 2,150 | 2,405 |
| 5% 11/1/28 | | 2,275 | 2,531 |
| 5% 11/1/29 | | 2,410 | 2,662 |
| 5% 11/1/30 | | 2,555 | 2,804 |
| Maryland Econ. Dev. Auth. Rev. (Ports America Chesapeake LLC. Proj.) Series 2017 A: | | | |
| 5% 6/1/30 | | 1,035 | 1,185 |
| 5% 6/1/35 | | 1,655 | 1,855 |
| Maryland Econ. Dev. Corp. (Purple Line Lt. Rail Proj.) Series 2016 D: | | | |
| 5% 3/31/41 (d) | | 1,505 | 1,584 |
| 5% 3/31/46 (d) | | 2,485 | 2,607 |
| Maryland Health & Higher Edl. Facilities Auth. Rev.: | | | |
| (Medstar Health, Inc. Proj.) Series 2017 A, 5% 5/15/45 | | 2,645 | 2,896 |
| (Univ. of Maryland Med. Sys. Proj.) Series 2008 F, 5.25% 7/1/21 | | 830 | 831 |
| Series 2010, 5.625% 7/1/30 (Pre-Refunded to 7/1/20 @ 100) | | 2,785 | 2,939 |
| Series 2015, 5% 7/1/24 | | 625 | 704 |
| Series 2016 A: | | | |
| 4% 7/1/42 | | 1,430 | 1,411 |
| 5% 7/1/35 | | 575 | 631 |
| Rockville Mayor & Council Econ. Dev. (Rfdg.-Ingleside King Farm Proj.) Series 2017: | | | |
| 2.5% 11/1/24 | | 1,455 | 1,389 |
| 3% 11/1/25 | | 1,070 | 1,038 |
| 5% 11/1/30 | | 375 | 402 |
|
| TOTAL MARYLAND | | | 30,297 |
|
| Massachusetts - 1.9% | | | |
| Massachusetts Dev. Fin. Agcy. Rev.: | | | |
| (Lawrence Gen. Hosp. MA. Proj.) Series 2017: | | | |
| 5% 7/1/25 | | 170 | 188 |
| 5% 7/1/29 | | 590 | 650 |
| 5% 7/1/30 | | 630 | 691 |
| 5% 7/1/31 | | 665 | 727 |
| 5% 7/1/32 | | 830 | 903 |
| 5% 7/1/34 | | 830 | 897 |
| 5% 7/1/37 | | 830 | 886 |
| 5% 7/1/42 | | 745 | 788 |
| (Lawrence Gen. Hosp.) Series 2017: | | | |
| 5% 7/1/19 | | 230 | 233 |
| 5% 7/1/20 | | 370 | 383 |
| 5% 7/1/21 | | 380 | 401 |
| 5% 7/1/47 | | 1,160 | 1,222 |
| (Lesley Univ. Proj.) Series 2016, 5% 7/1/39 | | 1,360 | 1,509 |
| (Partners Healthcare Sys., Inc. Proj.): | | | |
| Series 2017 S: | | | |
| 5% 7/1/30 | | 3,210 | 3,768 |
| 5% 7/1/32 | | 11,870 | 13,780 |
| 5% 7/1/34 | | 3,500 | 4,021 |
| Series 2017, 4% 7/1/41 | | 8,280 | 8,386 |
| (Tufts Med. Ctr. Proj.) Series 2011, 6.75% 1/1/36 | | 1,310 | 1,428 |
| (Univ. of Massachusetts Health Cr., Inc. Proj.) Series 2017 L, 4% 7/1/44 | | 830 | 827 |
| (Wentworth Institute of Technology Proj.) Series 2017: | | | |
| 5% 10/1/27 | | 830 | 945 |
| 5% 10/1/28 | | 875 | 990 |
| 5% 10/1/29 | | 920 | 1,037 |
| 5% 10/1/31 | | 1,015 | 1,133 |
| 5% 10/1/32 | | 1,065 | 1,185 |
| Series 2016: | | | |
| 5% 10/1/29 | | 830 | 969 |
| 5% 10/1/30 | | 1,240 | 1,439 |
| 5% 7/1/31 | | 1,385 | 1,551 |
| 5% 10/1/31 | | 1,340 | 1,547 |
| Series 2017, 5% 7/1/27 | | 535 | 594 |
| Series BB1, 5% 10/1/46 | | 345 | 385 |
| Massachusetts Edl. Fing. Auth. Rev. Series 2017 B, 4.25% 7/1/46 (d) | | 8,280 | 8,391 |
| Massachusetts Gen. Oblig.: | | | |
| Series 2016 B, 5% 7/1/31 | | 2,005 | 2,331 |
| Series 2017 A, 5% 4/1/36 | | 1,750 | 2,009 |
| Series 2017 D, 5% 2/1/33 | | 4,460 | 5,179 |
| Series 2017 F, 5% 11/1/46 | | 2,485 | 2,816 |
| Massachusetts Health & Edl. Facilities Auth. Rev. (Blood Research Institute Proj.) Series A, 6.5% 2/1/22 | | 1,155 | 1,160 |
| Massachusetts Port Auth. Rev.: | | | |
| Series 2016 A: | | | |
| 5% 7/1/33 | | 1,740 | 2,011 |
| 5% 7/1/34 | | 895 | 1,031 |
| 5% 7/1/38 | | 1,300 | 1,479 |
| Series 2016 B, 5% 7/1/43 (d) | | 7,110 | 7,837 |
| Series 2017 A, 5% 7/1/25 (d) | | 1,500 | 1,735 |
|
| TOTAL MASSACHUSETTS | | | 89,442 |
|
| Michigan - 2.0% | | | |
| Detroit Downtown Dev. Auth. Tax: | | | |
| Series 2018 A, 5% 7/1/32 (FSA Insured) | | 1,000 | 1,079 |
| Series A, 5% 7/1/34 (FSA Insured) | | 1,000 | 1,072 |
| Detroit School District School Bldg. and Site Impt. Series 2012 A, 5% 5/1/23 | | 3,310 | 3,595 |
| Great Lakes Wtr. Auth. Sew Disp. Sys. Series 2018 A: | | | |
| 5% 7/1/43 | | 2,030 | 2,299 |
| 5% 7/1/48 | | 8,725 | 9,842 |
| Kalamazoo Hosp. Fin. Auth. Hosp. Facilities Rev. Series 2016, 5% 5/15/28 | | 1,955 | 2,208 |
| Lansing Board of Wtr. & Lt. Util. Rev. 5.5% 7/1/41 | | 2,485 | 2,683 |
| Michigan Bldg. Auth. Rev. (Facilities Prog.): | | | |
| Series 2015 I, 5% 4/15/30 | | 4,140 | 4,760 |
| Series 2016 I, 5% 4/15/24 | | 245 | 280 |
| Michigan Fin. Auth. Rev.: | | | |
| (Charter County of Wayne Criminal Justice Ctr. Proj.) Series 2018, 5% 11/1/43 | | 2,570 | 2,904 |
| (Trinity Health Proj.) Series 2017: | | | |
| 5% 12/1/35 | | 1,585 | 1,806 |
| 5% 12/1/42 | | 2,140 | 2,391 |
| Series 2012 A: | | | |
| 5% 6/1/20 (Escrowed to Maturity) | | 1,695 | 1,766 |
| 5% 6/1/21 (Escrowed to Maturity) | | 290 | 310 |
| 5% 6/1/27 (Pre-Refunded to 6/1/22 @ 100) | | 2,900 | 3,187 |
| Series 2012, 5% 11/15/42 | | 8,595 | 9,156 |
| Series 2015 MI, 5% 12/1/24 | | 3,680 | 4,222 |
| Series 2016, 5% 11/15/41 | | 1,560 | 1,681 |
| Series MI, 5.5% 12/1/27 | | 3,930 | 4,622 |
| Michigan Hosp. Fin. Auth. Rev.: | | | |
| (Trinity Health Proj.) Series 2008 C, 5% 12/1/32 | | 1,240 | 1,434 |
| Series 2012 A, 5% 6/1/26 | | 1,655 | 1,801 |
| 6.5% 12/1/33 (Pre-Refunded to 12/1/18 @ 100) | | 175 | 176 |
| Portage Pub. Schools Series 2016: | | | |
| 5% 11/1/30 | | 2,365 | 2,728 |
| 5% 11/1/31 | | 2,090 | 2,402 |
| 5% 11/1/36 | | 205 | 231 |
| Wayne County Arpt. Auth. Rev.: | | | |
| Series 2015 F, 5% 12/1/27 (d) | | 5,790 | 6,581 |
| Series 2015 G, 5% 12/1/28 (d) | | 4,555 | 5,156 |
| Series 2017 A: | | | |
| 4% 12/1/33 (FSA Insured) | | 1,230 | 1,304 |
| 4% 12/1/34 (FSA Insured) | | 1,020 | 1,071 |
| 4% 12/1/35 (FSA Insured) | | 995 | 1,047 |
| 4% 12/1/36 (FSA Insured) | | 1,035 | 1,082 |
| 5% 12/1/31 | | 310 | 358 |
| 5% 12/1/32 | | 315 | 362 |
| 5% 12/1/34 | | 580 | 665 |
| 5% 12/1/35 | | 540 | 617 |
| 5% 12/1/37 | | 355 | 400 |
| Series 2017 B: | | | |
| 5% 12/1/29 (d) | | 495 | 567 |
| 5% 12/1/30 (d) | | 580 | 660 |
| 5% 12/1/31 (d) | | 660 | 748 |
| 5% 12/1/32 (d) | | 420 | 475 |
| 5% 12/1/32 (d) | | 540 | 610 |
| 5% 12/1/34 (d) | | 495 | 556 |
| 5% 12/1/35 (d) | | 540 | 605 |
| 5% 12/1/37 (d) | | 705 | 783 |
| 5% 12/1/42 (d) | | 830 | 911 |
| Series 2018 D, 5% 12/1/29 (d) | | 3,645 | 4,249 |
|
| TOTAL MICHIGAN | | | 97,442 |
|
| Minnesota - 0.2% | | | |
| Maple Grove Health Care Sys. Rev.: | | | |
| Series 2015, 5% 9/1/29 | | 2,345 | 2,587 |
| Series 2017: | | | |
| 4% 5/1/21 | | 415 | 432 |
| 5% 5/1/25 | | 660 | 755 |
| Minnesota Higher Ed. Facilities Auth. Rev. Series 2018 A: | | | |
| 5% 10/1/30 | | 615 | 699 |
| 5% 10/1/45 | | 1,370 | 1,490 |
| Moorhead Edl. Facilities Rev. (The Concordia College Corp. Proj.) Series 2016, 5% 12/1/25 | | 990 | 1,091 |
| Saint Paul Hsg. & Redev. Auth. Hosp. Rev. (HealthEast Care Sys. Proj.) Series 2015 A, 5% 11/15/44 (Pre-Refunded to 11/15/25 @ 100) | | 1,255 | 1,473 |
|
| TOTAL MINNESOTA | | | 8,527 |
|
| Missouri - 0.5% | | | |
| Cape Girardeau County Indl. Dev. Auth. (Southeast Hosp. Proj.) Series 2017 A: | | | |
| 5% 3/1/30 | | 580 | 643 |
| 5% 3/1/31 | | 620 | 683 |
| 5% 3/1/36 | | 1,240 | 1,341 |
| Kansas City Spl. Oblig.: | | | |
| 5% 9/1/26 | | 980 | 999 |
| 5% 9/1/27 | | 405 | 413 |
| 5% 9/1/28 | | 830 | 846 |
| 5% 9/1/29 | | 830 | 846 |
| 5% 9/1/30 | | 1,150 | 1,172 |
| Missouri Dev. Fin. Board Infrastructure Facilities Rev. (City of Branson-Branson Landing Proj.) Series 2005 A, 6% 6/1/20 | | 710 | 729 |
| Missouri Health & Edl. Facilities Auth. Edl. Facilities Rev. Series 2015 B: | | | |
| 3.125% 2/1/27 | | 830 | 847 |
| 3.25% 2/1/28 | | 830 | 850 |
| 4% 2/1/40 | | 660 | 670 |
| 5% 2/1/29 | | 1,025 | 1,165 |
| 5% 2/1/31 | | 2,150 | 2,419 |
| 5% 2/1/33 | | 2,375 | 2,660 |
| 5% 2/1/36 | | 2,235 | 2,479 |
| Saint Louis County Indl. Dev. Auth. Sr. Living Facilities Rev. Series 2018 A: | | | |
| 5% 9/1/38 | | 1,395 | 1,399 |
| 5.125% 9/1/48 | | 2,460 | 2,463 |
|
| TOTAL MISSOURI | | | 22,624 |
|
| Nebraska - 0.3% | | | |
| Douglas County Neb Edl. Facilities Rev. (Creighton Univ. Proj.) Series 2017: | | | |
| 4% 7/1/34 | | 830 | 892 |
| 5% 7/1/36 | | 570 | 649 |
| Nebraska Pub. Pwr. District Rev. Series 2016 B: | | | |
| 5% 1/1/37 | | 2,050 | 2,304 |
| 5% 1/1/40 | | 935 | 1,042 |
| Omaha Arpt. Auth. Arpt. Rev.: | | | |
| Series 2017 A: | | | |
| 5% 12/15/22 (d) | | 620 | 685 |
| 5% 12/15/23 (d) | | 620 | 698 |
| 5% 12/15/25 (d) | | 330 | 381 |
| 5% 12/15/26 (d) | | 1,190 | 1,390 |
| 5% 12/15/27 (d) | | 830 | 964 |
| 5% 12/15/30 (d) | | 1,240 | 1,417 |
| 5% 12/15/31 (d) | | 650 | 741 |
| 5% 12/15/33 (d) | | 660 | 749 |
| 5% 12/15/35 (d) | | 1,655 | 1,869 |
| 5% 12/15/36 (d) | | 420 | 473 |
| Series 2017 C, 5% 12/15/21 (d) | | 340 | 368 |
|
| TOTAL NEBRASKA | | | 14,622 |
|
| Nevada - 0.5% | | | |
| Clark County Arpt. Rev. (Sub Lien Proj.) Series 2017 A-1, 5% 7/1/21 (d) | | 5,770 | 6,157 |
| Clark County McCarran Int'l. Arpt. Passenger Facility Charge Rev. (Clark County Arpt. Rev. Proj.) Series 2017 B: | | | |
| 5% 7/1/20 (d) | | 1,625 | 1,693 |
| 5% 7/1/22 (d) | | 1,865 | 2,031 |
| 5% 7/1/23 (d) | | 3,310 | 3,663 |
| Las Vegas Valley Wtr. District Wtr. Impt. Gen. Oblig.: | | | |
| Series 2011 C, 5% 6/1/24 | | 4,485 | 4,797 |
| Series 2016 B, 5% 6/1/36 | | 3,750 | 4,269 |
|
| TOTAL NEVADA | | | 22,610 |
|
| New Hampshire - 1.8% | | | |
| New Hampshire Health & Ed. Facilities Auth.: | | | |
| (Concord Hosp.) Series 2017, 5% 10/1/42 | | 2,485 | 2,736 |
| (Dartmouth-Hitchcock Oblgtd Grp Proj.) Series 2018 A: | | | |
| 5% 8/1/28 | | 415 | 487 |
| 5% 8/1/30 | | 830 | 963 |
| (Dartmouth-Hitchcock Oblgtd Grp Proj.) Series 2018 A, 5% 8/1/29 | | 705 | 822 |
| (Partners Healthcare Sys., Inc. Proj.): | | | |
| Series 2017: | | | |
| 5% 7/1/29 | | 3,540 | 4,186 |
| 5% 7/1/34 | | 4,415 | 5,069 |
| Series 2017: | | | |
| 5% 7/1/28 | | 3,330 | 3,958 |
| 5% 7/1/30 | | 2,125 | 2,494 |
| 5% 7/1/31 | | 4,760 | 5,555 |
| 5% 7/1/32 | | 3,185 | 3,698 |
| 5% 7/1/33 | | 2,900 | 3,349 |
| 5% 7/1/35 | | 4,635 | 5,298 |
| 5% 7/1/36 | | 4,870 | 5,534 |
| 5% 7/1/37 | | 4,290 | 4,850 |
| Series 2017 B, 4.125% 7/1/24 (c) | | 1,750 | 1,753 |
| Series 2017 C, 3.5% 7/1/22 (c) | | 550 | 550 |
| New Hampshire Health & Ed. Facilities Auth. Rev.: | | | |
| (Covenant Health Sys., Inc. Proj.) Series 2012, 5% 7/1/42 | | 310 | 321 |
| Series 2012: | | | |
| 4% 7/1/32 | | 2,295 | 2,351 |
| 5% 7/1/24 | | 830 | 903 |
| 5% 7/1/25 | | 980 | 1,063 |
| 5% 7/1/27 | | 415 | 447 |
| Series 2016: | | | |
| 3% 10/1/20 | | 465 | 471 |
| 4% 10/1/38 | | 2,010 | 1,972 |
| 5% 10/1/22 | | 885 | 957 |
| 5% 10/1/24 | | 1,755 | 1,953 |
| 5% 10/1/25 | | 1,740 | 1,954 |
| 5% 10/1/29 | | 5,525 | 6,142 |
| 5% 10/1/31 | | 4,315 | 4,757 |
| 5% 10/1/33 | | 3,355 | 3,672 |
| 5% 10/1/38 | | 6,185 | 6,644 |
| New Hampshire Tpk. Sys. Rev. Series 2012 B, 5% 2/1/24 | | 1,470 | 1,593 |
|
| TOTAL NEW HAMPSHIRE | | | 86,502 |
|
| New Jersey - 6.3% | | | |
| Atlantic County Impt. Auth. (Atlantic City Campus Proj.) Series 2016 A: | | | |
| 5% 7/1/28 (FSA Insured) | | 860 | 986 |
| 5% 7/1/30 (FSA Insured) | | 2,105 | 2,395 |
| 5% 7/1/32 (FSA Insured) | | 1,035 | 1,170 |
| 5% 7/1/33 (FSA Insured) | | 1,075 | 1,211 |
| New Jersey Econ. Dev. Auth. Rev.: | | | |
| (New Jersey Gen. Oblig. Proj.): | | | |
| Series 2015 XX, 5% 6/15/25 | | 10,905 | 12,088 |
| Series 2017 B: | | | |
| 5% 11/1/23 | | 14,900 | 16,314 |
| 5% 11/1/24 | | 5,795 | 6,397 |
| Series 2009 AA, 5.5% 12/15/29 | | 1,380 | 1,399 |
| Series 2013 NN: | | | |
| 5% 3/1/26 | | 4,125 | 4,427 |
| 5% 3/1/27 | | 51,700 | 55,275 |
| 5% 3/1/29 | | 2,055 | 2,182 |
| Series 2013: | | | |
| 5% 3/1/23 | | 16,455 | 17,847 |
| 5% 3/1/24 | | 14,900 | 16,106 |
| 5% 3/1/25 | | 1,820 | 1,961 |
| Series 2015 XX: | | | |
| 5% 6/15/22 | | 2,720 | 2,923 |
| 5% 6/15/23 | | 4,140 | 4,511 |
| 5.25% 6/15/27 | | 14,075 | 15,640 |
| Series 2016 AAA: | | | |
| 5.5% 6/15/31 | | 1,655 | 1,861 |
| 5.5% 6/15/32 | | 4,140 | 4,634 |
| Series 2016 BBB: | | | |
| 5% 6/15/21 | | 3,310 | 3,498 |
| 5% 6/15/22 | | 5,355 | 5,754 |
| 5% 6/15/23 | | 8,620 | 9,393 |
| New Jersey Econ. Dev. Auth. Spl. Facilities Rev. (Port Newark Container Term. LLC. Proj.) Series 2017: | | | |
| 5% 10/1/21 (d) | | 1,240 | 1,319 |
| 5% 10/1/22 (d) | | 780 | 842 |
| 5% 10/1/23 (d) | | 1,240 | 1,356 |
| 5% 10/1/37 (d) | | 4,590 | 4,891 |
| 5% 10/1/47 (d) | | 7,450 | 7,832 |
| New Jersey Edl. Facility Series 2016 A: | | | |
| 5% 7/1/31 | | 1,740 | 1,931 |
| 5% 7/1/32 | | 1,985 | 2,196 |
| New Jersey Health Care Facilities Fing. Auth. Rev.: | | | |
| Series 2016 A: | | | |
| 5% 7/1/20 | | 415 | 431 |
| 5% 7/1/21 | | 275 | 293 |
| 5% 7/1/22 | | 275 | 299 |
| 5% 7/1/23 | | 970 | 1,072 |
| 5% 7/1/24 | | 1,600 | 1,792 |
| 5% 7/1/25 | | 1,660 | 1,880 |
| 5% 7/1/26 | | 915 | 1,044 |
| 5% 7/1/26 | | 275 | 314 |
| 5% 7/1/27 | | 420 | 477 |
| 5% 7/1/27 | | 620 | 726 |
| 5% 7/1/28 | | 300 | 349 |
| 5% 7/1/29 | | 580 | 652 |
| 5% 7/1/29 | | 415 | 466 |
| 5% 7/1/30 | | 690 | 770 |
| 5% 7/1/30 | | 830 | 954 |
| Series 2016: | | | |
| 4% 7/1/48 | | 2,400 | 2,323 |
| 5% 7/1/41 | | 2,865 | 3,045 |
| New Jersey Higher Ed. Student Assistance Auth. Student Ln. Rev.: | | | |
| Series 2017 1A: | | | |
| 5% 12/1/22 (d) | | 1,000 | 1,088 |
| 5% 12/1/23 (d) | | 1,675 | 1,850 |
| 5% 12/1/26 (d) | | 830 | 948 |
| Series 2017 1B, 5% 12/1/21 (d) | | 1,060 | 1,133 |
| Series 2018 B: | | | |
| 5% 12/1/25 (d) | | 3,495 | 3,959 |
| 5% 12/1/26 (d) | | 1,035 | 1,182 |
| Series 2018 C, 4% 12/1/48 (d) | | 1,835 | 1,785 |
| New Jersey Trans. Trust Fund Auth.: | | | |
| Series 2001 A, 6% 6/15/35 | | 3,230 | 3,457 |
| Series 2005 B, 5.25% 12/15/22 (AMBAC Insured) | | 330 | 362 |
| Series 2010 D, 5.25% 12/15/23 | | 5,220 | 5,784 |
| Series 2014 AA: | | | |
| 5% 6/15/23 | | 21,440 | 23,363 |
| 5% 6/15/24 | | 8,280 | 9,102 |
| Series 2016 A: | | | |
| 5% 6/15/27 | | 2,250 | 2,523 |
| 5% 6/15/28 | | 9,150 | 10,195 |
| 5% 6/15/29 | | 1,865 | 2,070 |
| Series 2016 A-2, 5% 6/15/23 | | 4,455 | 4,880 |
| South Jersey Port Corp. Rev.: | | | |
| (New Jersey Gen. Oblig. Proj.) Series 2017 B: | | | |
| 5% 1/1/42 (d) | | 2,485 | 2,656 |
| 5% 1/1/48 (d) | | 1,655 | 1,760 |
| (New Jersey Gen. Oblig. Proj.) Series 2017 B, 5% 1/1/37 (d) | | 830 | 899 |
|
| TOTAL NEW JERSEY | | | 304,222 |
|
| New York - 4.8% | | | |
| Dorm. Auth. New York Univ. Rev.: | | | |
| (Fordham Univ. Proj.) Series 2017: | | | |
| 4% 7/1/33 | | 1,035 | 1,096 |
| 4% 7/1/34 | | 1,035 | 1,090 |
| Series 2017 4% 12/1/20 (c) | | 800 | 823 |
| Series 2017: | | | |
| 4% 12/1/21 (c) | | 900 | 936 |
| 5% 12/1/22 (c) | | 1,400 | 1,524 |
| 5% 12/1/23 (c) | | 1,200 | 1,327 |
| 5% 12/1/24 (c) | | 1,100 | 1,235 |
| 5% 12/1/25 (c) | | 1,200 | 1,362 |
| Hudson Yards Infrastructure Corp. New York Rev. Series 2012 A: | | | |
| 5.75% 2/15/47 | | 5,445 | 5,835 |
| 5.75% 2/15/47 (Pre-Refunded to 2/15/21 @ 100) | | 250 | 271 |
| Long Island Pwr. Auth. Elec. Sys. Rev. Series 2012 A, 5% 9/1/42 | | 10,760 | 11,605 |
| MTA Hudson Rail Yards Trust Oblig. Series 2016 A, 5% 11/15/56 | | 26,320 | 27,963 |
| New York City Gen. Oblig.: | | | |
| Series 2003 A, 5.5% 8/1/20 (Nat'l. Pub. Fin. Guarantee Corp. Insured) | | 5 | 5 |
| Series 2009, 5.625% 4/1/29 | | 120 | 121 |
| Series 2012 A1, 5% 8/1/24 | | 6,125 | 6,575 |
| Series 2012 E, 5% 8/1/24 | | 4,140 | 4,504 |
| Series 2015 C, 5% 8/1/27 | | 580 | 668 |
| Series 2016 C and D, 5% 8/1/28 | | 2,175 | 2,527 |
| Series 2016 E, 5% 8/1/28 | | 3,645 | 4,273 |
| New York City Indl. Dev. Agcy. Rev.: | | | |
| (Queens Baseball Stadium Proj.) 5% 1/1/19 (AMBAC Insured) | | 3,090 | 3,090 |
| (Yankee Stadium Proj.) Series 2006, 5% 3/1/31 | | 3,910 | 3,938 |
| New York City Muni. Wtr. Fin. Auth. Wtr. & Swr. Sys. Rev.: | | | |
| Series 2011 EE, 5.375% 6/15/43 | | 17,505 | 18,570 |
| Series 2012 EE, 5.25% 6/15/30 | | 5,960 | 6,596 |
| Series 2013 2, 5% 6/15/47 | | 1,750 | 1,900 |
| Series 2013 BB, 5% 6/15/47 | | 7,440 | 8,165 |
| New York City Transitional Fin. Auth. Bldg. Aid Rev.: | | | |
| Series 2009 S3, 5.25% 1/15/34 | | 14,735 | 14,753 |
| Series 2015 S1, 5% 7/15/43 | | 4,140 | 4,553 |
| Series 2015 S2, 5% 7/15/35 | | 1,465 | 1,646 |
| New York Dorm. Auth. Mental Health Svcs. Facilities Impt. Rev. Series 2012 A, 5% 5/15/23 | | 4,635 | 5,089 |
| New York Dorm. Auth. Personal Income Tax Rev. Series 2014 A, 5% 2/15/39 (Pre-Refunded to 2/15/19 @ 100) | | 5 | 5 |
| New York Dorm. Auth. Revs. Series 2010 A, 5% 7/1/26 | | 3,310 | 3,452 |
| New York Dorm. Auth. Sales Tax Rev. Series 2016 A, 5% 3/15/34 | | 5,630 | 6,449 |
| New York Metropolitan Trans. Auth. Rev.: | | | |
| Series 2012 D, 5% 11/15/25 | | 25,250 | 27,572 |
| Series 2012 F, 5% 11/15/24 | | 10,265 | 11,249 |
| Series 2014 B, 5% 11/15/44 | | 8,280 | 8,920 |
| Series 2015 A1, 5% 11/15/45 | | 6,170 | 6,683 |
| New York State Dorm. Auth. Series A: | | | |
| 5% 2/15/34 | | 45 | 45 |
| 5% 2/15/39 | | 185 | 186 |
| New York Trans. Dev. Corp. (Laguardia Arpt. Term. Redev. Proj.) Series 2016 A, 5% 7/1/41 (d) | | 3,560 | 3,752 |
| New York Urban Dev. Corp. Rev.: | | | |
| (New York State Gen. Oblig. Proj.) Series 2017 A, 5% 3/15/34 | | 5,215 | 6,001 |
| Gen. Oblig. (New York State Gen. Oblig. Proj.) Series 2017 A, 5% 3/15/32 | | 4,470 | 5,186 |
| Onondaga Civic Dev. Corp. (Le Moyne College Proj.) Series 2018, 5% 1/1/43 | | 830 | 897 |
| Rockland County Gen. Oblig. Series 2014 A: | | | |
| 4% 3/1/23 (FSA Insured) | | 930 | 999 |
| 4% 3/1/24 (FSA Insured) | | 1,140 | 1,238 |
| Triborough Bridge & Tunnel Auth. Revs. Series 2015 A, 5.25% 11/15/45 | | 4,140 | 4,746 |
|
| TOTAL NEW YORK | | | 229,420 |
|
| North Carolina - 0.6% | | | |
| Charlotte Int'l. Arpt. Rev.: | | | |
| Series 2017 A: | | | |
| 5% 7/1/30 | | 1,265 | 1,495 |
| 5% 7/1/33 | | 1,040 | 1,216 |
| 5% 7/1/37 | | 2,910 | 3,348 |
| Series 2017 B: | | | |
| 5% 7/1/20 (d) | | 165 | 172 |
| 5% 7/1/21 (d) | | 175 | 187 |
| 5% 7/1/22 (d) | | 125 | 137 |
| 5% 7/1/23 (d) | | 135 | 151 |
| 5% 7/1/24 (d) | | 155 | 176 |
| 5% 7/1/25 (d) | | 85 | 98 |
| 5% 7/1/26 (d) | | 85 | 99 |
| 5% 7/1/27 (d) | | 160 | 189 |
| 5% 7/1/28 (d) | | 135 | 158 |
| 5% 7/1/29 (d) | | 195 | 227 |
| 5% 7/1/30 (d) | | 210 | 244 |
| 5% 7/1/31 (d) | | 395 | 457 |
| 5% 7/1/32 (d) | | 420 | 484 |
| 5% 7/1/33 (d) | | 440 | 505 |
| 5% 7/1/34 (d) | | 460 | 526 |
| 5% 7/1/35 (d) | | 315 | 359 |
| 5% 7/1/36 (d) | | 255 | 289 |
| 5% 7/1/37 (d) | | 300 | 339 |
| 5% 7/1/42 (d) | | 975 | 1,090 |
| Series 2017 C, 4% 7/1/32 | | 1,190 | 1,285 |
| Nash Health Care Sys. Health Care Facilities Rev.: | | | |
| Series 2012, 5% 11/1/41 | | 4,490 | 4,718 |
| 5% 11/1/30 (FSA Insured) | | 1,055 | 1,057 |
| North Carolina Med. Care Cmnty. Health: | | | |
| Series 2012 A, 5% 11/15/26 | | 1,070 | 1,153 |
| Series 2017, 5% 10/1/31 | | 1,405 | 1,448 |
| North Carolina Med. Care Commission Health Care Facilities Rev. (Rex Healthcare Proj.) Series 2010 A, 5% 7/1/30 | | 7,805 | 8,098 |
| North Carolina Muni. Pwr. Agcy. #1 Catawba Elec. Rev. Series 2009 A, 5% 1/1/30 | | 790 | 792 |
|
| TOTAL NORTH CAROLINA | | | 30,497 |
|
| North Dakota - 0.1% | | | |
| Cass County Health Care Facilities Rev. (Essentia Health Obligated Group Proj.) Series 2008, 5.125% 2/15/37 (Assured Guaranty Corp. Insured) | | 4,430 | 4,563 |
| McLean County Solid Waste Facilities Rev. (Great River Energy Projs.) Series 2010 B, 5.15% 7/1/40 | | 1,905 | 1,970 |
|
| TOTAL NORTH DAKOTA | | | 6,533 |
|
| Ohio - 1.9% | | | |
| Akron Bath Copley Hosp. District Rev. Series 2016, 5.25% 11/15/46 | | 7,285 | 7,956 |
| Allen County Hosp. Facilities Rev. (Mercy Health): | | | |
| Series 2017 A: | | | |
| 5% 8/1/25 | | 2,475 | 2,837 |
| 5% 8/1/26 | | 1,645 | 1,906 |
| 5% 8/1/27 | | 2,060 | 2,409 |
| 5% 8/1/28 | | 2,060 | 2,408 |
| 5% 8/1/29 | | 4,130 | 4,800 |
| 5% 8/1/30 | | 3,520 | 4,070 |
| Series 2017 B, 5%, tender 5/5/22 (a) | | 3,030 | 3,315 |
| American Muni. Pwr., Inc. Rev.: | | | |
| (Prairie State Energy Campus Proj.) Series 2015, 5% 2/15/28 | | 11,675 | 13,015 |
| Series 2012 B: | | | |
| 5% 2/15/42 | | 1,615 | 1,715 |
| 5% 2/15/42 (Pre-Refunded to 2/15/22 @ 100) | | 460 | 502 |
| Columbus City School District 5% 12/1/29 | | 1,740 | 2,029 |
| Franklin County Hosp. Facilities Rev. (Ohiohealth Corp. Proj.) Series 2015, 5% 5/15/40 | | 5,525 | 6,030 |
| Hamilton County Convention Facilities Auth. Rev. Series 2014: | | | |
| 5% 12/1/25 | | 2,975 | 3,298 |
| 5% 12/1/26 | | 555 | 614 |
| Lake County Hosp. Facilities Rev.: | | | |
| Series 2015: | | | |
| 5% 8/15/29 | | 1,160 | 1,294 |
| 5% 8/15/30 | | 1,245 | 1,382 |
| 5.75% 8/15/38 | | 135 | 135 |
| 6% 8/15/43 | | 660 | 662 |
| Muskingum County Hosp. Facilities (Genesis Healthcare Sys. Obligated Group Proj.) Series 2013: | | | |
| 5% 2/15/33 | | 3,685 | 3,816 |
| 5% 2/15/44 | | 4,415 | 4,507 |
| 5% 2/15/48 | | 11,260 | 11,460 |
| Ohio Tpk. Commission Tpk. Rev. (Infrastructure Proj.) Series 2005 A, 0% 2/15/42 | | 2,150 | 857 |
| Scioto County Hosp. Facilities Rev. Series 2016: | | | |
| 5% 2/15/29 | | 1,815 | 2,057 |
| 5% 2/15/34 | | 370 | 409 |
| Univ. of Akron Gen. Receipts Series 2016 A, 5% 1/1/35 | | 3,725 | 4,190 |
| Wood County Hosp. Facilities Rev. (Wood County Hosp. Assoc. Proj.) Series 2012: | | | |
| 5% 12/1/32 | | 620 | 647 |
| 5% 12/1/42 | | 825 | 848 |
|
| TOTAL OHIO | | | 89,168 |
|
| Oklahoma - 0.3% | | | |
| Canadian Cny Edl. Facilities Auth. (Mustang Pub. Schools Proj.) Series 2017: | | | |
| 5% 9/1/26 | | 2,305 | 2,696 |
| 5% 9/1/28 | | 1,210 | 1,395 |
| Oklahoma City Pub. Property Auth. Hotel Tax Rev. Series 2015: | | | |
| 5% 10/1/28 | | 1,050 | 1,211 |
| 5% 10/1/29 | | 1,160 | 1,333 |
| 5% 10/1/36 | | 830 | 938 |
| 5% 10/1/39 | | 1,655 | 1,864 |
| Oklahoma Dev. Fin. Auth. Health Sys. Rev. (OU Medicine Proj.) Series 2018 B: | | | |
| 5% 8/15/22 | | 415 | 448 |
| 5% 8/15/23 | | 215 | 236 |
| 5% 8/15/33 | | 910 | 1,006 |
| 5% 8/15/38 | | 2,650 | 2,840 |
| Oklahoma Pwr. Auth. Pwr. Supply Sys. Rev. Series 2014 A, 5% 1/1/38 | | 1,070 | 1,203 |
|
| TOTAL OKLAHOMA | | | 15,170 |
|
| Oregon - 0.0% | | | |
| Clackamas County Hosp. Facility Auth. (Willamette View Proj.) Series 2017 B, 3% 11/15/22 | | 660 | 660 |
| Oregon Facilities Auth. Rev. (Legacy Health Sys. Proj.) Series 2009 A, 5% 3/15/30 | | 830 | 855 |
| Oregon State Dept. of Administrative Svcs. Lottery Rev. Series 2011 A, 5.25% 4/1/31 | | 645 | 690 |
|
| TOTAL OREGON | | | 2,205 |
|
| Pennsylvania - 6.8% | | | |
| Allegheny County Hosp. Dev. Auth. Rev. (Univ. of Pittsburgh Med. Ctr. Proj.) Series 2009 A, 5.625% 8/15/39 | | 6,065 | 6,183 |
| Cap. Region Wtr. Wtr. Rev. Series 2018: | | | |
| 5% 7/15/27 | | 830 | 975 |
| 5% 7/15/29 | | 1,290 | 1,517 |
| 5% 7/15/32 | | 830 | 960 |
| Centre County Pennsylvania Hosp. Auth. Rev. (Mount Nittany Med. Ctr. Proj.): | | | |
| Series 2011, 7% 11/15/46 (Pre-Refunded to 11/15/21 @ 100) | | 2,565 | 2,921 |
| Series 2018 A, 5% 11/15/23 | | 1,075 | 1,201 |
| Dauphin County Gen. Auth. (Pinnacle Health Sys. Proj.) Series 2016 A: | | | |
| 5% 6/1/21 | | 290 | 309 |
| 5% 6/1/23 | | 415 | 462 |
| 5% 6/1/28 | | 885 | 1,015 |
| 5% 6/1/29 | | 970 | 1,108 |
| Delaware County Auth. Rev. (Cabrini College) Series 2017, 5% 7/1/47 | | 3,310 | 3,485 |
| Doylestown Hosp. Auth. Hosp. Rev. Series 2016 A, 5% 7/1/46 | | 1,205 | 1,247 |
| Dubois Hosp. Auth. Hosp. Rev. (Penn Highlands Healthcare Proj.) Series 2018: | | | |
| 4% 7/15/33 | | 2,070 | 2,133 |
| 4% 7/15/35 | | 2,135 | 2,182 |
| 4% 7/15/37 | | 4,140 | 4,184 |
| 5% 7/15/25 | | 330 | 378 |
| 5% 7/15/26 | | 1,035 | 1,197 |
| 5% 7/15/27 | | 1,745 | 2,032 |
| 5% 7/15/28 | | 1,285 | 1,495 |
| 5% 7/15/29 | | 1,385 | 1,603 |
| 5% 7/15/30 | | 1,815 | 2,086 |
| 5% 7/15/31 | | 1,240 | 1,420 |
| 5% 7/15/32 | | 1,305 | 1,488 |
| 5% 7/15/34 | | 1,405 | 1,591 |
| 5% 7/15/36 | | 4,150 | 4,659 |
| 5% 7/15/38 | | 4,990 | 5,525 |
| 5% 7/15/43 | | 5,795 | 6,364 |
| Lehigh County Gen. Purp. Auth. Rev. (Muhlenberg College Proj.) Series 2017, 5% 2/1/39 | | 2,140 | 2,386 |
| Lehigh County Indl. Dev. Auth. Poll. Cont. Rev. Bonds (PPL Elec. Utils. Corp. Proj.) Series 2016 A, 1.8%, tender 9/1/22 (a) | | 4,145 | 4,016 |
| Monroe County Hosp. Auth. Rev. Series 2016: | | | |
| 5% 7/1/26 | | 830 | 950 |
| 5% 7/1/27 | | 830 | 951 |
| 5% 7/1/28 | | 830 | 947 |
| 5% 7/1/34 | | 3,045 | 3,397 |
| 5% 7/1/36 | | 1,655 | 1,835 |
| Montgomery County Higher Ed. & Health Auth. Hosp. Rev. (Abington Memorial Hosp. Proj.): | | | |
| Series 1993 A, 6% 6/1/22 (AMBAC Insured) | | 1,655 | 1,823 |
| Series 2012 A, 5% 6/1/27 (Pre-Refunded to 6/1/22 @ 100) | | 3,400 | 3,731 |
| Montgomery County Higher Ed. & Health Auth. Rev.: | | | |
| Series 2014 A: | | | |
| 5% 10/1/21 | | 1,095 | 1,160 |
| 5% 10/1/22 | | 1,140 | 1,229 |
| 5% 10/1/23 | | 325 | 356 |
| 5% 10/1/24 | | 965 | 1,071 |
| 5% 10/1/25 | | 865 | 956 |
| 5% 10/1/27 | | 415 | 454 |
| Series 2016 A: | | | |
| 5% 10/1/28 | | 1,255 | 1,416 |
| 5% 10/1/29 | | 2,150 | 2,417 |
| 5% 10/1/31 | | 3,790 | 4,219 |
| 5% 10/1/36 | | 6,790 | 7,394 |
| 5% 10/1/40 | | 3,320 | 3,562 |
| Northampton County Gen. Purp. Auth. Hosp. Rev.: | | | |
| (St Lukes Hosp. & Health Ntw Proj.) Series 2016 A, 5% 8/15/36 | | 615 | 682 |
| (St. Luke's Univ. Health Network Proj.) Series 2018 A, 4% 8/15/48 | | 10,545 | 10,578 |
| Series 2016 A, 5% 8/15/46 | | 24,835 | 27,115 |
| Pennsylvania Econ. Dev. Fin. Auth. Unemployment Compensation Rev. Series 2012 B, 5% 7/1/21 | | 780 | 780 |
| Pennsylvania Higher Edl. Facilities Auth. Rev.: | | | |
| (Drexel Univ. Proj.): | | | |
| Series 2016, 5% 5/1/35 | | 2,880 | 3,200 |
| Series 2017: | | | |
| 5% 5/1/35 | | 1,025 | 1,159 |
| 5% 5/1/37 | | 1,295 | 1,449 |
| 5% 5/1/41 | | 5,860 | 6,480 |
| Series 2016: | | | |
| 5% 5/1/28 | | 415 | 476 |
| 5% 5/1/32 | | 1,040 | 1,169 |
| 5% 5/1/33 | | 1,405 | 1,575 |
| Series 2018 A, 5% 2/15/48 | | 1,575 | 1,810 |
| Philadelphia Arpt. Rev.: | | | |
| Series 2017 A: | | | |
| 5% 7/1/25 | | 830 | 962 |
| 5% 7/1/26 | | 830 | 972 |
| 5% 7/1/27 | | 660 | 780 |
| Series 2017 B: | | | |
| 5% 7/1/22 (d) | | 1,820 | 1,981 |
| 5% 7/1/22 | | 240 | 263 |
| 5% 7/1/23 (d) | | 1,240 | 1,374 |
| 5% 7/1/23 | | 415 | 465 |
| 5% 7/1/25 (d) | | 2,900 | 3,315 |
| 5% 7/1/26 (d) | | 2,485 | 2,865 |
| 5% 7/1/27(d) | | 2,070 | 2,404 |
| 5% 7/1/28 (d) | | 2,485 | 2,867 |
| 5% 7/1/29 (d) | | 1,865 | 2,140 |
| 5% 7/1/32 (d) | | 2,485 | 2,811 |
| 5% 7/1/33 (d) | | 1,865 | 2,103 |
| 5% 7/1/34 (d) | | 3,310 | 3,719 |
| 5% 7/1/37 (d) | | 3,725 | 4,141 |
| 5% 7/1/42 (d) | | 11,175 | 12,285 |
| 5% 7/1/47 (d) | | 15,730 | 17,245 |
| Philadelphia Gas Works Rev. Series 9, 5.25% 8/1/40 | | 2,305 | 2,404 |
| Philadelphia School District: | | | |
| Series 2016 D: | | | |
| 5% 9/1/25 | | 7,275 | 8,260 |
| 5% 9/1/26 | | 7,600 | 8,700 |
| 5% 9/1/27 | | 8,020 | 9,152 |
| 5% 9/1/28 | | 6,705 | 7,612 |
| Series 2016 F: | | | |
| 5% 9/1/28 | | 11,600 | 13,168 |
| 5% 9/1/29 | | 7,540 | 8,532 |
| Series 2018 A: | | | |
| 5% 9/1/36 | | 1,575 | 1,754 |
| 5% 9/1/37 | | 910 | 1,008 |
| 5% 9/1/38 | | 1,450 | 1,599 |
| Series 2018 B, 5% 9/1/43 | | 2,115 | 2,304 |
| Series F: | | | |
| 5% 9/1/30 | | 5,625 | 6,328 |
| 5% 9/1/30 (Pre-Refunded to 9/1/26 @ 100) | | 20 | 24 |
| Philadelphia Wtr. & Wastewtr. Rev. Series 2018 A: | | | |
| 5% 10/1/35 | | 4,190 | 4,828 |
| 5% 10/1/36 | | 6,210 | 7,128 |
| 5% 10/1/48 | | 6,000 | 6,716 |
| Scranton-Lackawanna Health & Welfare Auth. Rev. (Marywood Univ. Proj.) Series 2016, 5% 6/1/36 | | 3,310 | 3,338 |
| State Pub. School Bldg. Auth. Lease Rev. (Philadelphia School District Proj.) Series 2015 A, 5% 6/1/26 | | 1,055 | 1,188 |
| Union County Hosp. Auth. Rev. Series 2018 B: | | | |
| 5% 8/1/43 | | 4,605 | 5,083 |
| 5% 8/1/48 | | 5,335 | 5,872 |
|
| TOTAL PENNSYLVANIA | | | 328,153 |
|
| Rhode Island - 0.3% | | | |
| Rhode Island Health & Edl. Bldg. Corp. Higher Ed. Facilities Rev.: | | | |
| Series 2016 B: | | | |
| 5% 9/1/31 | | 655 | 703 |
| 5% 9/1/36 | | 5,810 | 6,119 |
| Series 2016, 5% 5/15/39 | | 5,215 | 5,617 |
| Rhode Island Student Ln. Auth. Student Ln. Rev. Series A, 3.5% 12/1/34 (d) | | 3,040 | 3,057 |
|
| TOTAL RHODE ISLAND | | | 15,496 |
|
| South Carolina - 3.6% | | | |
| Scago Edl. Facilities Corp. for Colleton School District (School District of Colleton County Proj.) Series 2015: | | | |
| 5% 12/1/25 | | 2,275 | 2,598 |
| 5% 12/1/26 | | 1,160 | 1,318 |
| 5% 12/1/28 | | 4,690 | 5,300 |
| South Carolina Jobs-Econ. Dev. Auth. Econ. Dev. Rev.: | | | |
| (Bon Secours Health Sys. Proj.) Series 2013, 5% 11/1/28 (Pre-Refunded to 11/1/22 @ 100) | | 2,400 | 2,654 |
| Series 2013, 5% 11/1/27 (Pre-Refunded to 11/1/22 @ 100) | | 7,535 | 8,332 |
| South Carolina Ports Auth. Ports Rev.: | | | |
| Series 2015 (AMT), 5% 7/1/45 (d) | | 4,315 | 4,665 |
| Series 2015, 5.25% 7/1/55 (d) | | 5,280 | 5,717 |
| South Carolina Pub. Svc. Auth. Rev.: | | | |
| Series 2013 E, 5.5% 12/1/53 | | 33,515 | 35,689 |
| Series 2014 A: | | | |
| 5% 12/1/49 | | 11,210 | 11,678 |
| 5.5% 12/1/54 | | 12,985 | 13,878 |
| Series 2014 C, 5% 12/1/46 | | 3,895 | 4,077 |
| Series 2015 A, 5% 12/1/50 | | 5,180 | 5,425 |
| Series 2015 C, 5% 12/1/22 | | 6,985 | 7,632 |
| Series 2015 E, 5.25% 12/1/55 | | 6,195 | 6,608 |
| Series 2016 A: | | | |
| 5% 12/1/29 | | 2,485 | 2,762 |
| 5% 12/1/38 | | 250 | 269 |
| Series 2016 B: | | | |
| 5% 12/1/31 | | 910 | 1,008 |
| 5% 12/1/41 | | 12,515 | 13,391 |
| Spartanburg County Reg'l. Health Series 2017 A: | | | |
| 4% 4/15/43 | | 15,510 | 15,521 |
| 4% 4/15/48 | | 10,815 | 10,595 |
| 5% 4/15/48 | | 12,665 | 13,782 |
|
| TOTAL SOUTH CAROLINA | | | 172,899 |
|
| South Dakota - 0.0% | | | |
| South Dakota Health & Edl. Facilities Auth. Rev.: | | | |
| (Avera Health Proj.) Series 2017, 5% 7/1/31 | | 540 | 620 |
| Series 2017: | | | |
| 5% 7/1/26 | | 250 | 292 |
| 5% 7/1/28 | | 250 | 292 |
| 5% 7/1/29 | | 470 | 546 |
|
| TOTAL SOUTH DAKOTA | | | 1,750 |
|
| Tennessee - 0.3% | | | |
| Greeneville Health & Edl. Facilities Board Series 2018 A: | | | |
| 5% 7/1/23 | | 815 | 904 |
| 5% 7/1/24 | | 1,225 | 1,358 |
| 5% 7/1/25 | | 1,225 | 1,354 |
| Memphis-Shelby County Arpt. Auth. Arpt. Rev. Series 2010 B: | | | |
| 5.75% 7/1/23 (d) | | 4,820 | 5,064 |
| 5.75% 7/1/24 (d) | | 3,310 | 3,476 |
|
| TOTAL TENNESSEE | | | 12,156 |
|
| Texas - 8.4% | | | |
| Argyle Independent School District 5.25% 8/15/40 (FSA Insured) | | 105 | 105 |
| Arlington Spl. Tax Rev. Series 2018 C, 5% 2/15/45 | | 2,565 | 2,679 |
| Austin Arpt. Sys. Rev.: | | | |
| Series 2014: | | | |
| 5% 11/15/26 (d) | | 830 | 939 |
| 5% 11/15/27 (d) | | 1,035 | 1,165 |
| 5% 11/15/28 (d) | | 1,240 | 1,389 |
| 5% 11/15/39 (d) | | 9,440 | 10,374 |
| 5% 11/15/44 (d) | | 23,065 | 25,282 |
| Series 2017 B: | | | |
| 5% 11/15/28 (d) | | 830 | 951 |
| 5% 11/15/30 (d) | | 1,275 | 1,450 |
| 5% 11/15/32 (d) | | 1,005 | 1,133 |
| 5% 11/15/35 (d) | | 1,035 | 1,154 |
| 5% 11/15/37 (d) | | 1,165 | 1,289 |
| 5% 11/15/41 (d) | | 4,725 | 5,181 |
| Austin Cmnty. College District Rev. (Convention Ctr. Proj.) Series 2002, 0% 2/1/22 (AMBAC Insured) | | 2,400 | 2,244 |
| Central Reg'l. Mobility Auth.: | | | |
| Series 2015 A: | | | |
| 5% 1/1/28 | | 1,075 | 1,204 |
| 5% 1/1/30 | | 1,365 | 1,517 |
| 5% 1/1/31 | | 395 | 437 |
| 5% 1/1/32 | | 830 | 915 |
| 5% 1/1/45 | | 5,795 | 6,233 |
| Series 2016: | | | |
| 5% 1/1/40 | | 830 | 900 |
| 5% 1/1/46 | | 565 | 610 |
| Coppell Independent School District 0% 8/15/20 | | 1,655 | 1,604 |
| Corpus Christi Util. Sys. Rev. 5% 7/15/24 | | 1,865 | 2,038 |
| Cypress-Fairbanks Independent School District Series 2014 C, 5% 2/15/44 | | 2,365 | 2,594 |
| Dallas Area Rapid Transit Sales Tax Rev. Series 2016 A, 5% 12/1/33 | | 2,150 | 2,454 |
| Dallas Fort Worth Int'l. Arpt. Rev.: | | | |
| Series 2012 D, 5% 11/1/42 (d) | | 2,295 | 2,398 |
| Series 2012 H, 5% 11/1/42 (d) | | 3,095 | 3,233 |
| Dallas Gen. Oblig. Series 2017: | | | |
| 5% 2/15/29 | | 5,445 | 6,387 |
| 5% 2/15/30 | | 1,350 | 1,577 |
| Dallas Independent School District Series 2016 A, 4% 2/15/29 | | 1,190 | 1,284 |
| DeSoto Independent School District 0% 8/15/20 | | 2,760 | 2,673 |
| Grand Parkway Trans. Corp.: | | | |
| Series 2013 B: | | | |
| 5% 4/1/53 | | 1,250 | 1,341 |
| 5.25% 10/1/51 | | 49,755 | 54,554 |
| 5.5% 4/1/53 | | 5,330 | 5,836 |
| Series 2018 A: | | | |
| 5% 10/1/38 | | 2,655 | 3,037 |
| 5% 10/1/43 | | 830 | 940 |
| Harris County Cultural Ed. Facilities Fin. Corp. Med. Facilities Rev. (Baylor College of Medicine Proj.) Series 2012 A, 5% 11/15/37 | | 4,510 | 4,871 |
| Harris County Cultural Ed. Facilities Fin. Corp. Rev. (Texas Childrens Hosp., Proj.) Series 2015-1 5% 10/1/29 | | 1,115 | 1,275 |
| Harris County Gen. Oblig. Series 2002: | | | |
| 0% 8/15/24 (Nat'l. Pub. Fin. Guarantee Corp. Insured) | | 830 | 730 |
| 0% 8/15/25 (Nat'l. Pub. Fin. Guarantee Corp. Insured) | | 2,485 | 2,117 |
| 0% 8/15/28 (Nat'l. Pub. Fin. Guarantee Corp. Insured) | | 4,140 | 3,169 |
| Houston Arpt. Sys. Rev.: | | | |
| Series 2011 A: | | | |
| 5% 7/1/23 (d) | | 2,485 | 2,646 |
| 5% 7/1/24 (d) | | 1,035 | 1,101 |
| 5% 7/1/25 (d) | | 1,240 | 1,318 |
| Series 2012 A: | | | |
| 5% 7/1/21 (d) | | 3,135 | 3,351 |
| 5% 7/1/23 (d) | | 495 | 537 |
| Series 2018 C: | | | |
| 5% 7/1/29 (d) | | 1,655 | 1,940 |
| 5% 7/1/30 (d) | | 1,765 | 2,050 |
| 5% 7/1/31 (d) | | 1,240 | 1,435 |
| 5% 7/1/32 (d) | | 1,450 | 1,667 |
| Houston Gen. Oblig. Series 2017 A: | | | |
| 5% 3/1/29 | | 3,150 | 3,708 |
| 5% 3/1/30 | | 4,140 | 4,840 |
| 5% 3/1/31 | | 3,835 | 4,459 |
| 5% 3/1/32 | | 1,635 | 1,889 |
| Houston Independent School District Series 2017, 5% 2/15/35 | | 2,815 | 3,249 |
| Houston Util. Sys. Rev.: | | | |
| Series 2014 C, 5% 5/15/28 | | 2,490 | 2,822 |
| Series 2018 D, 5% 11/15/43 | | 2,445 | 2,795 |
| Irving Hosp. Auth. Hosp. Rev. Series 2017 A: | | | |
| 5% 10/15/28 | | 390 | 442 |
| 5% 10/15/30 | | 1,570 | 1,759 |
| 5% 10/15/32 | | 830 | 921 |
| 5% 10/15/36 | | 545 | 594 |
| 5% 10/15/37 | | 930 | 1,011 |
| 5% 10/15/38 | | 1,325 | 1,436 |
| 5% 10/15/44 | | 1,310 | 1,405 |
| Love Field Arpt. Modernization Rev.: | | | |
| Series 2015: | | | |
| 5% 11/1/26 (d) | | 830 | 944 |
| 5% 11/1/27 (d) | | 1,780 | 2,016 |
| 5% 11/1/28 (d) | | 2,755 | 3,105 |
| 5% 11/1/29 (d) | | 1,655 | 1,857 |
| 5% 11/1/32 (d) | | 3,055 | 3,394 |
| Series 2017: | | | |
| 5% 11/1/22 (d) | | 620 | 680 |
| 5% 11/1/23 (d) | | 910 | 1,016 |
| 5% 11/1/24 (d) | | 830 | 940 |
| 5% 11/1/25 (d) | | 830 | 951 |
| 5% 11/1/26 (d) | | 830 | 959 |
| 5% 11/1/27 (d) | | 830 | 954 |
| 5% 11/1/28 (d) | | 1,450 | 1,660 |
| 5% 11/1/29 (d) | | 1,035 | 1,179 |
| 5% 11/1/30 (d) | | 830 | 942 |
| 5% 11/1/31 (d) | | 1,840 | 2,079 |
| 5% 11/1/32 (d) | | 2,135 | 2,412 |
| 5% 11/1/33 (d) | | 830 | 935 |
| 5% 11/1/34 (d) | | 830 | 931 |
| 5% 11/1/36 (d) | | 830 | 925 |
| Lower Colorado River Auth. Rev. Series 2015 D: | | | |
| 5% 5/15/28 | | 1,820 | 2,070 |
| 5% 5/15/30 | | 4,140 | 4,678 |
| Midway Independent School District Series 2000, 0% 8/15/19 | | 2,980 | 2,946 |
| New Hope Cultural Ed. Facilities Finc (Childrens Med. Ctr. of Dallas) Series 2017 A: | | | |
| 5% 8/15/27 | | 625 | 742 |
| 5% 8/15/29 | | 1,655 | 1,944 |
| 5% 8/15/47 | | 1,890 | 2,102 |
| Newark Higher Ed. Fin. Corp. (Abilene Christian Univ. Proj.) Series 2016 A: | | | |
| 5% 4/1/27 | | 595 | 676 |
| 5% 4/1/30 | | 2,825 | 3,165 |
| North Texas Tollway Auth. Rev.: | | | |
| (Sr. Lien Proj.) Series 2017 A, 5% 1/1/35 | | 1,820 | 2,063 |
| (Sr. Lien Proj.) Series 2017 A: | | | |
| 5% 1/1/31 | | 830 | 945 |
| 5% 1/1/33 | | 975 | 1,116 |
| 5% 1/1/34 | | 1,240 | 1,411 |
| 5% 1/1/34 | | 2,485 | 3,014 |
| 5% 1/1/36 | | 4,965 | 5,606 |
| 5% 1/1/37 | | 6,625 | 7,450 |
| 5% 1/1/38 | | 2,690 | 2,890 |
| (Sub Lien Proj.) Series 2017 B: | | | |
| 5% 1/1/26 | | 740 | 814 |
| 5% 1/1/30 | | 350 | 399 |
| 5% 1/1/31 | | 495 | 562 |
| Series 2008 I, 6.2% 1/1/42 (Assured Guaranty Corp. Insured) | | 6,870 | 8,180 |
| Series 2009, 6.25% 1/1/39 | | 1,860 | 1,866 |
| Series 2014 A, 5% 1/1/25 | | 4,965 | 5,592 |
| Series 2015 A, 5% 1/1/32 | | 2,775 | 3,090 |
| Series 2015 B, 5% 1/1/40 | | 8,280 | 8,873 |
| Series 2016 A, 5% 1/1/36 | | 1,035 | 1,158 |
| San Antonio Arpt. Sys. Rev.: | | | |
| Series 2007 (AMT), 5.25% 7/1/20 (FSA Insured) (d) | | 2,660 | 2,668 |
| Series 2007 (AMT-SUB LIEN), 5.25% 7/1/20 (FSA Insured) (d) | | 2,295 | 2,302 |
| San Antonio Gen. Oblig. Series 2018, 5% 8/1/37 | | 1,805 | 2,104 |
| San Antonio Independent School District Series 2016, 5% 8/15/31 | | 3,590 | 4,166 |
| Southwest Higher Ed. Auth. Rev. (Southern Methodist Univ., TX. Proj.) Series 2017: | | | |
| 5% 10/1/29 | | 375 | 444 |
| 5% 10/1/30 | | 580 | 683 |
| 5% 10/1/31 | | 520 | 609 |
| 5% 10/1/39 | | 1,030 | 1,174 |
| 5% 10/1/40 | | 830 | 944 |
| Tarrant County Cultural Ed. Facilities Fin. Corp. Hosp. Rev.: | | | |
| (Hendrick Med. Ctr. Proj.) Series 2009 B: | | | |
| 5.25% 9/1/26 (Assured Guaranty Corp. Insured) | | 1,480 | 1,510 |
| 5.25% 9/1/27 (Assured Guaranty Corp. Insured) | | 1,965 | 2,004 |
| 5.25% 9/1/28 (Assured Guaranty Corp. Insured) | | 1,020 | 1,040 |
| (Scott & White Healthcare Proj.) Series 2013 A, 5% 8/15/43 | | 3,310 | 3,581 |
| Tarrant County Cultural Ed. Facilities Fin. Corp. Rev. Series 2016 A: | | | |
| 4% 2/15/35 | | 4,140 | 4,294 |
| 5% 2/15/25 | | 710 | 817 |
| Texas Gen. Oblig. Series 2017 B, 5% 10/1/36 | | 3,190 | 3,685 |
| Texas Private Activity Bond Surface Trans. Corp. Series 2013, 6.75% 6/30/43 (d) | | 12,420 | 14,176 |
| Texas State Univ. Sys. Fing. Rev. Series 2017 A: | | | |
| 5% 3/15/29 | | 3,530 | 4,163 |
| 5% 3/15/31 | | 2,690 | 3,136 |
| Univ. of Houston Univ. Revs. Series 2017 A: | | | |
| 5% 2/15/32 | | 5,115 | 5,854 |
| 5% 2/15/33 | | 3,310 | 3,772 |
| 5% 2/15/34 | | 4,140 | 4,701 |
| 5% 2/15/35 | | 4,140 | 4,684 |
| 5% 2/15/36 | | 2,485 | 2,801 |
| Univ. of North Texas Univ. Rev.: | | | |
| Series 2017 A, 5% 4/15/32 | | 1,740 | 2,017 |
| Series 2018 A, 5% 4/15/44 | | 830 | 939 |
| Univ. of Texas Permanent Univ. Fund Rev. Series 2016 B, 5% 7/1/29 | | 1,685 | 1,975 |
| Weatherford Independent School District 0% 2/15/33 | | 5,785 | 3,599 |
|
| TOTAL TEXAS | | | 403,711 |
|
| Utah - 1.9% | | | |
| Salt Lake City Arpt. Rev.: | | | |
| Series 2017 A: | | | |
| 5% 7/1/22 (d) | | 1,655 | 1,807 |
| 5% 7/1/24 (d) | | 1,450 | 1,638 |
| 5% 7/1/25 (d) | | 1,655 | 1,894 |
| 5% 7/1/27 (d) | | 3,500 | 4,090 |
| 5% 7/1/29 (d) | | 3,090 | 3,563 |
| 5% 7/1/30 (d) | | 2,275 | 2,607 |
| 5% 7/1/31 (d) | | 4,345 | 4,957 |
| 5% 7/1/32 (d) | | 4,760 | 5,412 |
| 5% 7/1/33 (d) | | 3,310 | 3,750 |
| 5% 7/1/34 (d) | | 7,830 | 8,834 |
| 5% 7/1/35 (d) | | 3,310 | 3,724 |
| 5% 7/1/36 (d) | | 4,470 | 5,008 |
| 5% 7/1/37 (d) | | 3,520 | 3,930 |
| 5% 7/1/42 (d) | | 20,290 | 22,416 |
| Series 2018 A: | | | |
| 5% 7/1/31 (d) | | 2,000 | 2,307 |
| 5% 7/1/32 (d) | | 4,310 | 4,952 |
| 5% 7/1/33 (d) | | 1,420 | 1,625 |
| 5.25% 7/1/48 (d) | | 5,655 | 6,405 |
| Utah Associated Muni. Pwr. Sys. Rev. (Payson Pwr. Proj.) 5% 9/1/22 | | 2,635 | 2,900 |
|
| TOTAL UTAH | | | 91,819 |
|
| Vermont - 0.2% | | | |
| Vermont Edl. & Health Bldg. Fin. Agcy. Rev. (Champlain College Proj.) Series 2016 A: | | | |
| 5% 10/15/41 | | 3,810 | 4,070 |
| 5% 10/15/46 | | 4,720 | 5,023 |
|
| TOTAL VERMONT | | | 9,093 |
|
| Virginia - 0.6% | | | |
| Fredericksburg Econ. Dev. Auth. Rev. Series 2014: | | | |
| 5% 6/15/25 | | 3,860 | 4,309 |
| 5% 6/15/30 | | 1,035 | 1,143 |
| Stafford County Econ. Dev. Auth. Hosp. Facilities Rev.: | | | |
| (Mary Washington Hosp. Proj.) Series 2016, 3% 6/15/29 | | 525 | 518 |
| Series 2016: | | | |
| 4% 6/15/37 | | 595 | 598 |
| 5% 6/15/27 | | 1,240 | 1,414 |
| 5% 6/15/30 | | 540 | 607 |
| 5% 6/15/33 | | 350 | 389 |
| 5% 6/15/34 | | 665 | 737 |
| 5% 6/15/35 | | 1,820 | 2,011 |
| Virginia College Bldg. Auth. Edl. Facilities Rev. Series 2015 A: | | | |
| 5% 1/1/35 | | 830 | 938 |
| 5% 1/1/40 | | 1,865 | 2,095 |
| Virginia Commonwealth Trans. Board Rev. (Virginia Gen. Oblig. Proj.) Series 2017 A, 5% 5/15/32 | | 725 | 858 |
| Virginia Small Bus. Fing. Auth. (95 Express Lane LLC Proj.) Series 2012: | | | |
| 5% 7/1/34 (d) | | 4,965 | 5,174 |
| 5% 1/1/40 (d) | | 995 | 1,034 |
| Winchester Econ. Dev. Auth. Series 2015: | | | |
| 5% 1/1/31 | | 2,070 | 2,346 |
| 5% 1/1/34 | | 1,240 | 1,385 |
| 5% 1/1/35 | | 1,240 | 1,383 |
| 5% 1/1/44 | | 830 | 904 |
|
| TOTAL VIRGINIA | | | 27,843 |
|
| Washington - 1.5% | | | |
| Clark County School District #37, Vancouver Series 2001 C, 0% 12/1/19 (Nat'l. Pub. Fin. Guarantee Corp. Insured) | | 1,680 | 1,651 |
| Port of Seattle Rev. Series 2016 B: | | | |
| 5% 10/1/28 (d) | | 2,900 | 3,312 |
| 5% 10/1/30 (d) | | 1,655 | 1,875 |
| Port of Seattle Spl. Facility Rev. Series 2013: | | | |
| 5% 6/1/21 (d) | | 1,110 | 1,185 |
| 5% 6/1/22 (d) | | 830 | 905 |
| 5% 6/1/24 (d) | | 1,290 | 1,424 |
| Spokane Pub. Facilities District Hotel/Motel Tax & Sales/Use Tax Rev. Series 2013 B: | | | |
| 5% 12/1/25 | | 4,635 | 5,145 |
| 5% 12/1/27 | | 3,415 | 3,775 |
| Washington Gen. Oblig.: | | | |
| Series 2015 C: | | | |
| 5% 2/1/33 | | 2,790 | 3,147 |
| 5% 2/1/34 | | 3,450 | 3,880 |
| Series 2017 A, 5% 8/1/35 | | 620 | 710 |
| Series R-2017 A, 5% 8/1/30 | | 1,685 | 1,967 |
| Washington Health Care Facilities Auth. Rev.: | | | |
| (Catholic Health Initiatives Proj.) Series 2008 D, 6.375% 10/1/36 | | 6,625 | 6,647 |
| (Overlake Hosp. Med. Ctr., WA. Proj.) Series 2017 B: | | | |
| 5% 7/1/25 | | 675 | 770 |
| 5% 7/1/27 | | 1,285 | 1,492 |
| 5% 7/1/28 | | 1,570 | 1,838 |
| 5% 7/1/29 | | 615 | 716 |
| 5% 7/1/30 | | 735 | 849 |
| 5% 7/1/31 | | 870 | 998 |
| 5% 7/1/32 | | 1,655 | 1,889 |
| 5% 7/1/33 | | 2,345 | 2,661 |
| 5% 7/1/34 | | 540 | 609 |
| 5% 7/1/42 | | 4,685 | 5,159 |
| (Providence Health Systems Proj.) Series 2012 A, 5% 10/1/25 | | 4,245 | 4,668 |
| Series 2015: | | | |
| 5% 1/1/25 | | 1,655 | 1,880 |
| 5% 1/1/27 | | 1,910 | 2,176 |
| Washington Higher Ed. Facilities Auth. Rev. (Whitworth Univ. Proj.) Series 2016 A: | | | |
| 5% 10/1/27 | | 1,770 | 1,980 |
| 5% 10/1/28 | | 1,825 | 2,031 |
| 5% 10/1/35 | | 1,880 | 2,039 |
| 5% 10/1/36 | | 2,845 | 3,074 |
| 5% 10/1/40 | | 2,795 | 2,981 |
| Washington Hsg. Fin. Commission Nonprofit Hsg. Rev. (Judson Park Proj.) Series 2018: | | | |
| 4% 7/1/28 (c) | | 100 | 98 |
| 5% 7/1/33 (c) | | 125 | 129 |
| 5% 7/1/38 (c) | | 100 | 102 |
| 5% 7/1/48 (c) | | 400 | 406 |
|
| TOTAL WASHINGTON | | | 74,168 |
|
| West Virginia - 0.3% | | | |
| West Virginia Econ. Dev. Auth. Solid Waste Disp. Facilities Rev. Bonds (Appalachian Pwr. Co. Amos Proj.) Series 2011 A, 1.7%, tender 9/1/20 (a)(d) | | 2,575 | 2,523 |
| West Virginia Hosp. Fin. Auth. Hosp. Rev. Series 2018 A: | | | |
| 5% 1/1/31 | | 1,355 | 1,553 |
| 5% 1/1/32 | | 1,120 | 1,273 |
| West Virginia Univ. Revs. (West Virginia Univ. Projs.) Series 2014 A, 5% 10/1/44 | | 6,290 | 7,012 |
|
| TOTAL WEST VIRGINIA | | | 12,361 |
|
| Wisconsin - 1.6% | | | |
| Pub. Fin. Auth. Rev. (Denver Great Hall LLC. Proj.) Series 2017: | | | |
| 5% 9/30/37 (d) | | 2,070 | 2,263 |
| 5% 9/30/49 (d) | | 15,085 | 16,211 |
| Pub. Fin. Auth. Sr Liv Rev. (Mary's Woods At Marylhurst, Inc. Proj.): | | | |
| Series 2017 A: | | | |
| 5% 5/15/21 (c) | | 250 | 261 |
| 5% 5/15/25 (c) | | 920 | 985 |
| 5% 5/15/28 (c) | | 1,095 | 1,167 |
| 5.25% 5/15/37 (c) | | 335 | 350 |
| 5.25% 5/15/42 (c) | | 415 | 430 |
| 5.25% 5/15/47 (c) | | 410 | 423 |
| 5.25% 5/15/52 (c) | | 775 | 796 |
| Series 2017 B-1 3.95% 11/15/24 (c) | | 350 | 352 |
| Series 2017 B-2, 3.5% 11/15/23 (c) | | 445 | 445 |
| Series 2017 B-3, 3% 11/15/22 (c) | | 620 | 620 |
| Pub. Fin. Auth. Wis Edl. Facilities Series 2016: | | | |
| 5% 1/1/37 | | 5,325 | 5,520 |
| 5% 1/1/42 | | 4,275 | 4,385 |
| Pub. Fin. Auth. Wisconsin Retirement Facility Rev. Series 2018: | | | |
| 5% 10/1/43 (c) | | 735 | 739 |
| 5% 10/1/48 (c) | | 880 | 882 |
| 5% 10/1/53 (c) | | 1,500 | 1,495 |
| Wisconsin Health & Edl. Facilities: | | | |
| (Ascension Health Cr. Group Proj.) Series 2016 A, 5% 11/15/36 | | 4,140 | 4,611 |
| Series 2010: | | | |
| 5.75% 7/1/30 (Pre-Refunded to 7/1/20 @ 100) | | 970 | 1,025 |
| 5.75% 7/1/30 (Pre-Refunded to 7/1/20 @ 100) | | 1,645 | 1,738 |
| Series 2014: | | | |
| 4% 5/1/33 | | 2,920 | 2,949 |
| 5% 5/1/22 | | 660 | 710 |
| Series 2016 A: | | | |
| 5% 2/15/28 | | 1,965 | 2,227 |
| 5% 2/15/29 | | 2,550 | 2,876 |
| 5% 2/15/30 | | 2,805 | 3,147 |
| Series 2016: | | | |
| 4% 2/15/38 (Pre-Refunded to 8/15/25 @ 100) | | 1,000 | 1,103 |
| 5% 2/15/29 (Pre-Refunded to 8/15/25 @ 100) | | 360 | 419 |
| Series 2017 A: | | | |
| 5% 9/1/31 | | 830 | 922 |
| 5% 9/1/33 | | 1,425 | 1,569 |
| 5% 9/1/35 | | 1,575 | 1,723 |
| Wisconsin Health & Edl. Facilities Auth. Rev.: | | | |
| (Agnesian HealthCare, Inc. Proj.): | | | |
| Series 2010, 5.5% 7/1/40 (Pre-Refunded to 7/1/20 @ 100) | | 2,380 | 2,506 |
| Series 2013 B: | | | |
| 5% 7/1/27 (Pre-Refunded to 7/1/23 @ 100) | | 1,000 | 1,125 |
| 5% 7/1/36 (Pre-Refunded to 7/1/23 @ 100) | | 4,905 | 5,519 |
| Series 2012: | | | |
| 4% 10/1/23 | | 2,070 | 2,203 |
| 5% 6/1/27 | | 1,840 | 1,973 |
|
| TOTAL WISCONSIN | | | 75,669 |
|
| Wyoming - 0.2% | | | |
| Campbell County Solid Waste Facilities Rev. (Basin Elec. Pwr. Coop. - Dry Fork Station Facilities Proj.) Series 2009 A, 5.75% 7/15/39 | | 8,525 | 8,689 |
| TOTAL MUNICIPAL BONDS | | | |
| (Cost $4,591,281) | | | 4,675,465 |
| | | Shares | Value (000s) |
|
| Money Market Funds - 0.8% | | | |
| Fidelity Municipal Cash Central Fund, 1.77% (f)(g) | | | |
| (Cost $35,100) | | 35,096,860 | 35,100 |
| TOTAL INVESTMENT IN SECURITIES - 98.3% | | | |
| (Cost $4,626,381) | | | 4,710,565 |
| NET OTHER ASSETS (LIABILITIES) - 1.7% | | | 83,378 |
| NET ASSETS - 100% | | | $4,793,943 |
Legend
(a) Coupon rates for floating and adjustable rate securities reflect the rates in effect at period end.
(b) Coupon is indexed to a floating interest rate which may be multiplied by a specified factor and/or subject to caps or floors.
(c) Security exempt from registration under Rule 144A of the Securities Act of 1933. These securities may be resold in transactions exempt from registration, normally to qualified institutional buyers. At the end of the period, the value of these securities amounted to $37,405,000 or 0.8% of net assets.
(d) Private activity obligations whose interest is subject to the federal alternative minimum tax for individuals.
(e) Security initially issued in zero coupon form which converts to coupon form at a specified rate and date. The rate shown is the rate at period end.
(f) Information in this report regarding holdings by state and security types does not reflect the holdings of the Fidelity Municipal Cash Central Fund.
(g) Affiliated fund that is available only to investment companies and other accounts managed by Fidelity Investments. The rate quoted is the annualized seven-day yield of the fund at period end. A complete unaudited listing of the fund's holdings as of its most recent quarter end is available upon request. In addition, each Fidelity Central Fund's financial statements, which are not covered by the Fund's Report of Independent Registered Public Accounting Firm, are available on the SEC's website or upon request.
Affiliated Central Funds
Information regarding fiscal year to date income earned by the Fund from investments in Fidelity Central Funds is as follows:
| Fund | Income earned |
| | (Amounts in thousands) |
| Fidelity Municipal Cash Central Fund | $491 |
| Total | $491 |
Amounts in the income column in the above table include any capital gain distributions from underlying funds, which are presented in the corresponding line-item in the Statement of Operations if applicable.
Investment Valuation
The following is a summary of the inputs used, as of December 31, 2018, involving the Fund's assets and liabilities carried at fair value. The inputs or methodology used for valuing securities may not be an indication of the risk associated with investing in those securities. For more information on valuation inputs, and their aggregation into the levels used below, please refer to the Investment Valuation section in the accompanying Notes to Financial Statements.
| | Valuation Inputs at Reporting Date: |
| Description | Total | Level 1 | Level 2 | Level 3 |
| (Amounts in thousands) | | | | |
| Investments in Securities: | | | | |
| Municipal Securities | $4,675,465 | $-- | $4,675,465 | $-- |
| Money Market Funds | 35,100 | 35,100 | -- | -- |
| Total Investments in Securities: | $4,710,565 | $35,100 | $4,675,465 | $-- |
Other Information
The distribution of municipal securities by revenue source, as a percentage of total Net Assets, is as follows (Unaudited):
| Health Care | 25.4% |
| General Obligations | 25.3% |
| Transportation | 25.1% |
| Electric Utilities | 5.9% |
| Education | 5.6% |
| Others* (Individually Less Than 5%) | 12.7% |
| | 100.0% |
* Includes net other assets
See accompanying notes which are an integral part of the financial statements.
Financial Statements
Statement of Assets and Liabilities
| Amounts in thousands (except per-share amounts) | | December 31, 2018 |
| Assets | | |
Investment in securities, at value — See accompanying schedule:
Unaffiliated issuers (cost $4,591,281) | $4,675,465 | |
| Fidelity Central Funds (cost $35,100) | 35,100 | |
| Total Investment in Securities (cost $4,626,381) | | $4,710,565 |
| Cash | | 33,557 |
| Receivable for fund shares sold | | 6,852 |
| Interest receivable | | 59,350 |
| Distributions receivable from Fidelity Central Funds | | 44 |
| Prepaid expenses | | 9 |
| Other receivables | | 15 |
| Total assets | | 4,810,392 |
| Liabilities | | |
| Payable for fund shares redeemed | $9,935 | |
| Distributions payable | 4,445 | |
| Accrued management fee | 1,424 | |
| Distribution and service plan fees payable | 135 | |
| Other affiliated payables | 441 | |
| Other payables and accrued expenses | 69 | |
| Total liabilities | | 16,449 |
| Net Assets | | $4,793,943 |
| Net Assets consist of: | | |
| Paid in capital | | $4,711,738 |
| Total distributable earnings (loss) | | 82,205 |
| Net Assets | | $4,793,943 |
| Net Asset Value and Maximum Offering Price | | |
| Class A: | | |
| Net Asset Value and redemption price per share ($200,891 ÷ 15,761.9 shares) | | $12.75 |
| Maximum offering price per share (100/96.00 of $12.75) | | $13.28 |
| Class M: | | |
| Net Asset Value and redemption price per share ($118,540 ÷ 9,293.1 shares) | | $12.76 |
| Maximum offering price per share (100/96.00 of $12.76) | | $13.29 |
| Class C: | | |
| Net Asset Value and offering price per share ($81,655 ÷ 6,406.7 shares)(a) | | $12.75 |
| Fidelity Municipal Income Fund: | | |
| Net Asset Value, offering price and redemption price per share ($3,817,326 ÷ 299,325.5 shares) | | $12.75 |
| Class I: | | |
| Net Asset Value, offering price and redemption price per share ($554,755 ÷ 43,527.1 shares) | | $12.75 |
| Class Z: | | |
| Net Asset Value, offering price and redemption price per share ($20,776 ÷ 1,629.6 shares) | | $12.75 |
(a) Redemption price per share is equal to net asset value less any applicable contingent deferred sales charge.
See accompanying notes which are an integral part of the financial statements.
Statement of Operations
| Amounts in thousands | | Year ended December 31, 2018 |
| Investment Income | | |
| Interest | | $201,260 |
| Income from Fidelity Central Funds | | 491 |
| Total income | | 201,751 |
| Expenses | | |
| Management fee | $20,764 | |
| Transfer agent fees | 5,570 | |
| Distribution and service plan fees | 1,428 | |
| Accounting fees and expenses | 693 | |
| Custodian fees and expenses | 44 | |
| Independent trustees' fees and expenses | 28 | |
| Registration fees | 88 | |
| Audit | 65 | |
| Legal | 15 | |
| Miscellaneous | 42 | |
| Total expenses before reductions | 28,737 | |
| Expense reductions | (79) | |
| Total expenses after reductions | | 28,658 |
| Net investment income (loss) | | 173,093 |
| Realized and Unrealized Gain (Loss) | | |
| Net realized gain (loss) on: | | |
| Investment securities: | | |
| Unaffiliated issuers | 2,079 | |
| Redemptions in-kind with affiliated entities | 939 | |
| Total net realized gain (loss) | | 3,018 |
| Change in net unrealized appreciation (depreciation) on: | | |
| Investment securities: | | |
| Unaffiliated issuers | (147,650) | |
| Total change in net unrealized appreciation (depreciation) | | (147,650) |
| Net gain (loss) | | (144,632) |
| Net increase (decrease) in net assets resulting from operations | | $28,461 |
See accompanying notes which are an integral part of the financial statements.
Statement of Changes in Net Assets
| Amounts in thousands | Year ended December 31, 2018 | Year ended December 31, 2017 |
| Increase (Decrease) in Net Assets | | |
| Operations | | |
| Net investment income (loss) | $173,093 | $168,028 |
| Net realized gain (loss) | 3,018 | 106,764 |
| Change in net unrealized appreciation (depreciation) | (147,650) | 80,672 |
| Net increase (decrease) in net assets resulting from operations | 28,461 | 355,464 |
| Distributions to shareholders | (209,319) | – |
| Distributions to shareholders from net investment income | – | (167,561) |
| Distributions to shareholders from net realized gain | – | (78,395) |
| Total distributions | (209,319) | (245,956) |
| Share transactions - net increase (decrease) | (642,419) | 30,512 |
| Total increase (decrease) in net assets | (823,277) | 140,020 |
| Net Assets | | |
| Beginning of period | 5,617,220 | 5,477,200 |
| End of period | $4,793,943 | $5,617,220 |
| Other Information | | |
| Undistributed net investment income end of period | | $262 |
See accompanying notes which are an integral part of the financial statements.
Financial Highlights
Fidelity Municipal Income Fund Class A
| Year ended December 31, | 2018 A |
| Selected Per–Share Data | |
| Net asset value, beginning of period | $12.73 |
| Income from Investment Operations | |
| Net investment income (loss)B | .283 |
| Net realized and unrealized gain (loss) | .029C |
| Total from investment operations | .312 |
| Distributions from net investment income | (.284) |
| Distributions from net realized gain | (.008) |
| Total distributions | (.292) |
| Net asset value, end of period | $12.75 |
| Total ReturnD,E,F | 2.48% |
| Ratios to Average Net AssetsG,H | |
| Expenses before reductions | .78%I |
| Expenses net of fee waivers, if any | .78%I |
| Expenses net of all reductions | .78%I |
| Net investment income (loss) | 2.68%I |
| Supplemental Data | |
| Net assets, end of period (in millions) | $201 |
| Portfolio turnover rateJ | 14%K,L |
A For the period March 1, 2018 (commencement of sale of shares) to December 31, 2018.
B Calculated based on average shares outstanding during the period.
C The amount shown for a share outstanding does not correspond with the aggregate net gain (loss) on investments for the period due to the timing of sales and repurchases of shares in relation to fluctuating market values of the investments of the Fund.
D Total returns for periods of less than one year are not annualized.
E Total returns would have been lower if certain expenses had not been reduced during the applicable periods shown.
F Total returns do not include the effect of the sales charges.
G Fees and expenses of any underlying Fidelity Central Funds are not included in the Fund's expense ratio. The Fund indirectly bears its proportionate share of the expenses of any underlying Fidelity Central Funds.
H Expense ratios reflect operating expenses of the class. Expenses before reductions do not reflect amounts reimbursed by the investment adviser or reductions from expense offset arrangements and do not represent the amount paid by the class during periods when reimbursements or reductions occur. Expense ratios before reductions for start-up periods may not be representative of longer-term operating periods. Expenses net of fee waivers reflect expenses after reimbursement by the investment adviser but prior to reductions from expense offset arrangements. Expenses net of all reductions represent the net expenses paid by the class.
I Annualized
J Amount does not include the portfolio activity of any underlying Fidelity Central Funds.
K The portfolio turnover rate does not include the assets acquired in the merger.
L Portfolio turnover rate excludes securities received or delivered in-kind.
See accompanying notes which are an integral part of the financial statements.
Fidelity Municipal Income Fund Class M
| Year ended December 31, | 2018 A |
| Selected Per–Share Data | |
| Net asset value, beginning of period | $12.73 |
| Income from Investment Operations | |
| Net investment income (loss)B | .285 |
| Net realized and unrealized gain (loss) | .039C |
| Total from investment operations | .324 |
| Distributions from net investment income | (.286) |
| Distributions from net realized gain | (.008) |
| Total distributions | (.294) |
| Net asset value, end of period | $12.76 |
| Total ReturnD,E,F | 2.58% |
| Ratios to Average Net AssetsG,H | |
| Expenses before reductions | .77%I |
| Expenses net of fee waivers, if any | .77%I |
| Expenses net of all reductions | .76%I |
| Net investment income (loss) | 2.70%I |
| Supplemental Data | |
| Net assets, end of period (in millions) | $119 |
| Portfolio turnover rateJ | 14%K,L |
A For the period March 1, 2018 (commencement of sale of shares) to December 31, 2018.
B Calculated based on average shares outstanding during the period.
C The amount shown for a share outstanding does not correspond with the aggregate net gain (loss) on investments for the period due to the timing of sales and repurchases of shares in relation to fluctuating market values of the investments of the Fund.
D Total returns for periods of less than one year are not annualized.
E Total returns would have been lower if certain expenses had not been reduced during the applicable periods shown.
F Total returns do not include the effect of the sales charges.
G Fees and expenses of any underlying Fidelity Central Funds are not included in the Fund's expense ratio. The Fund indirectly bears its proportionate share of the expenses of any underlying Fidelity Central Funds.
H Expense ratios reflect operating expenses of the class. Expenses before reductions do not reflect amounts reimbursed by the investment adviser or reductions from expense offset arrangements and do not represent the amount paid by the class during periods when reimbursements or reductions occur. Expense ratios before reductions for start-up periods may not be representative of longer-term operating periods. Expenses net of fee waivers reflect expenses after reimbursement by the investment adviser but prior to reductions from expense offset arrangements. Expenses net of all reductions represent the net expenses paid by the class.
I Annualized
J Amount does not include the portfolio activity of any underlying Fidelity Central Funds.
K The portfolio turnover rate does not include the assets acquired in the merger.
L Portfolio turnover rate excludes securities received or delivered in-kind.
See accompanying notes which are an integral part of the financial statements.
Fidelity Municipal Income Fund Class C
| Year ended December 31, | 2018 A |
| Selected Per–Share Data | |
| Net asset value, beginning of period | $12.73 |
| Income from Investment Operations | |
| Net investment income (loss)B | .204 |
| Net realized and unrealized gain (loss) | .032C |
| Total from investment operations | .236 |
| Distributions from net investment income | (.208) |
| Distributions from net realized gain | (.008) |
| Total distributions | (.216) |
| Net asset value, end of period | $12.75 |
| Total ReturnD,E,F | 1.87% |
| Ratios to Average Net AssetsG,H | |
| Expenses before reductions | 1.52%I |
| Expenses net of fee waivers, if any | 1.52%I |
| Expenses net of all reductions | 1.52%I |
| Net investment income (loss) | 1.94%I |
| Supplemental Data | |
| Net assets, end of period (in millions) | $82 |
| Portfolio turnover rateJ | 14%K,L |
A For the period March 1, 2018 (commencement of sale of shares) to December 31, 2018.
B Calculated based on average shares outstanding during the period.
C The amount shown for a share outstanding does not correspond with the aggregate net gain (loss) on investments for the period due to the timing of sales and repurchases of shares in relation to fluctuating market values of the investments of the Fund.
D Total returns for periods of less than one year are not annualized.
E Total returns would have been lower if certain expenses had not been reduced during the applicable periods shown.
F Total returns do not include the effect of the contingent deferred sales charge.
G Fees and expenses of any underlying Fidelity Central Funds are not included in the Fund's expense ratio. The Fund indirectly bears its proportionate share of the expenses of any underlying Fidelity Central Funds.
H Expense ratios reflect operating expenses of the class. Expenses before reductions do not reflect amounts reimbursed by the investment adviser or reductions from expense offset arrangements and do not represent the amount paid by the class during periods when reimbursements or reductions occur. Expense ratios before reductions for start-up periods may not be representative of longer-term operating periods. Expenses net of fee waivers reflect expenses after reimbursement by the investment adviser but prior to reductions from expense offset arrangements. Expenses net of all reductions represent the net expenses paid by the class.
I Annualized
J Amount does not include the portfolio activity of any underlying Fidelity Central Funds.
K The portfolio turnover rate does not include the assets acquired in the merger.
L Portfolio turnover rate excludes securities received or delivered in-kind.
See accompanying notes which are an integral part of the financial statements.
Fidelity Municipal Income Fund
| Years ended December 31, | 2018 | 2017 | 2016 | 2015 | 2014 |
| Selected Per–Share Data | | | | | |
| Net asset value, beginning of period | $13.12 | $12.86 | $13.44 | $13.53 | $12.68 |
| Income from Investment Operations | | | | | |
| Net investment income (loss)A | .382 | .399 | .437 | .460 | .475 |
| Net realized and unrealized gain (loss) | (.286) | .444 | (.428) | (.021) | .851 |
| Total from investment operations | .096 | .843 | .009 | .439 | 1.326 |
| Distributions from net investment income | (.381) | (.398) | (.437) | (.462) | (.476) |
| Distributions from net realized gain | (.085) | (.185) | (.152) | (.067) | – |
| Total distributions | (.466) | (.583) | (.589) | (.529) | (.476) |
| Redemption fees added to paid in capitalA | – | – | –B | –B | –B |
| Net asset value, end of period | $12.75 | $13.12 | $12.86 | $13.44 | $13.53 |
| Total ReturnC | .80% | 6.67% | (.01)% | 3.31% | 10.59% |
| Ratios to Average Net AssetsD,E | | | | | |
| Expenses before reductions | .46% | .46% | .46% | .48% | .47% |
| Expenses net of fee waivers, if any | .46% | .46% | .46% | .48% | .47% |
| Expenses net of all reductions | .45% | .46% | .46% | .48% | .47% |
| Net investment income (loss) | 3.00% | 3.05% | 3.22% | 3.42% | 3.58% |
| Supplemental Data | | | | | |
| Net assets, end of period (in millions) | $3,817 | $5,617 | $5,477 | $5,770 | $5,745 |
| Portfolio turnover rateF | 14%G,H | 37% | 25% | 14% | 9% |
A Calculated based on average shares outstanding during the period.
B Amount represents less than $.0005 per share.
C Total returns would have been lower if certain expenses had not been reduced during the applicable periods shown.
D Fees and expenses of any underlying Fidelity Central Funds are not included in the Fund's expense ratio. The Fund indirectly bears its proportionate share of the expenses of any underlying Fidelity Central Funds.
E Expense ratios reflect operating expenses of the class. Expenses before reductions do not reflect amounts reimbursed by the investment adviser or reductions from expense offset arrangements and do not represent the amount paid by the class during periods when reimbursements or reductions occur. Expenses net of fee waivers reflect expenses after reimbursement by the investment adviser but prior to reductions from expense offset arrangements. Expenses net of all reductions represent the net expenses paid by the class.
F Amount does not include the portfolio activity of any underlying Fidelity Central Funds.
G The portfolio turnover rate does not include the assets acquired in the merger.
H Portfolio turnover rate excludes securities received or delivered in-kind.
See accompanying notes which are an integral part of the financial statements.
Fidelity Municipal Income Fund Class I
| Year ended December 31, | 2018 A |
| Selected Per–Share Data | |
| Net asset value, beginning of period | $12.73 |
| Income from Investment Operations | |
| Net investment income (loss)B | .309 |
| Net realized and unrealized gain (loss) | .029C |
| Total from investment operations | .338 |
| Distributions from net investment income | (.310) |
| Distributions from net realized gain | (.008) |
| Total distributions | (.318) |
| Net asset value, end of period | $12.75 |
| Total ReturnD,E | 2.69% |
| Ratios to Average Net AssetsF,G | |
| Expenses before reductions | .53%H |
| Expenses net of fee waivers, if any | .53%H |
| Expenses net of all reductions | .53%H |
| Net investment income (loss) | 2.93%H |
| Supplemental Data | |
| Net assets, end of period (in millions) | $555 |
| Portfolio turnover rateI | 14%J,K |
A For the period March 1, 2018 (commencement of sale of shares) to December 31, 2018.
B Calculated based on average shares outstanding during the period.
C The amount shown for a share outstanding does not correspond with the aggregate net gain (loss) on investments for the period due to the timing of sales and repurchases of shares in relation to fluctuating market values of the investments of the Fund.
D Total returns for periods of less than one year are not annualized.
E Total returns would have been lower if certain expenses had not been reduced during the applicable periods shown.
F Fees and expenses of any underlying Fidelity Central Funds are not included in the Fund's expense ratio. The Fund indirectly bears its proportionate share of the expenses of any underlying Fidelity Central Funds.
G Expense ratios reflect operating expenses of the class. Expenses before reductions do not reflect amounts reimbursed by the investment adviser or reductions from expense offset arrangements and do not represent the amount paid by the class during periods when reimbursements or reductions occur. Expense ratios before reductions for start-up periods may not be representative of longer-term operating periods. Expenses net of fee waivers reflect expenses after reimbursement by the investment adviser but prior to reductions from expense offset arrangements. Expenses net of all reductions represent the net expenses paid by the class.
H Annualized
I Amount does not include the portfolio activity of any underlying Fidelity Central Funds.
J The portfolio turnover rate does not include the assets acquired in the merger.
K Portfolio turnover rate excludes securities received or delivered in-kind.
See accompanying notes which are an integral part of the financial statements.
Fidelity Municipal Income Fund Class Z
| Year ended December 31, | 2018 A |
| Selected Per–Share Data | |
| Net asset value, beginning of period | $12.64 |
| Income from Investment Operations | |
| Net investment income (loss)B | .101 |
| Net realized and unrealized gain (loss) | .112C |
| Total from investment operations | .213 |
| Distributions from net investment income | (.095) |
| Distributions from net realized gain | (.008) |
| Total distributions | (.103) |
| Net asset value, end of period | $12.75 |
| Total ReturnD,E | 1.69% |
| Ratios to Average Net AssetsF,G | |
| Expenses before reductions | .42%H |
| Expenses net of fee waivers, if any | .42%H |
| Expenses net of all reductions | .42%H |
| Net investment income (loss) | 3.08%H |
| Supplemental Data | |
| Net assets, end of period (in millions) | $21 |
| Portfolio turnover rateI | 14%J,K |
A For the period October 2, 2018 (commencement of sale of shares) to December 31, 2018.
B Calculated based on average shares outstanding during the period.
C The amount shown for a share outstanding does not correspond with the aggregate net gain (loss) on investments for the period due to the timing of sales and repurchases of shares in relation to fluctuating market values of the investments of the Fund.
D Total returns for periods of less than one year are not annualized.
E Total returns would have been lower if certain expenses had not been reduced during the applicable periods shown.
F Fees and expenses of any underlying Fidelity Central Funds are not included in the Fund's expense ratio. The Fund indirectly bears its proportionate share of the expenses of any underlying Fidelity Central Funds.
G Expense ratios reflect operating expenses of the class. Expenses before reductions do not reflect amounts reimbursed by the investment adviser or reductions from expense offset arrangements and do not represent the amount paid by the class during periods when reimbursements or reductions occur. Expense ratios before reductions for start-up periods may not be representative of longer-term operating periods. Expenses net of fee waivers reflect expenses after reimbursement by the investment adviser but prior to reductions from expense offset arrangements. Expenses net of all reductions represent the net expenses paid by the class.
H Annualized
I Amount does not include the portfolio activity of any underlying Fidelity Central Funds.
J The portfolio turnover rate does not include the assets acquired in the merger.
K Portfolio turnover rate excludes securities received or delivered in-kind.
See accompanying notes which are an integral part of the financial statements.
Notes to Financial Statements
For the period ended December 31, 2018
(Amounts in thousands except percentages)
1. Organization.
Fidelity Municipal Income Fund (the Fund) is a fund of Fidelity Municipal Trust (the Trust) and is authorized to issue an unlimited number of shares. The Trust is registered under the Investment Company Act of 1940, as amended (the 1940 Act), as an open-end management investment company organized as a Massachusetts business trust. The Fund commenced sale of Class A, Class M, Class C and Class I shares on March 1, 2018 and Class Z shares on October 2, 2018. The Fund offers Class A, Class M, Class C, Fidelity Municipal Class Income Fund, Class I and Class Z shares, each of which has equal rights as to assets and voting privileges. Each class has exclusive voting rights with respect to matters that affect that class.
2. Investments in Fidelity Central Funds.
The Fund invests in Fidelity Central Funds, which are open-end investment companies generally available only to other investment companies and accounts managed by the investment adviser and its affiliates. The Fund's Schedule of Investments lists each of the Fidelity Central Funds held as of period end, if any, as an investment of the Fund, but does not include the underlying holdings of each Fidelity Central Fund. As an Investing Fund, the Fund indirectly bears its proportionate share of the expenses of the underlying Fidelity Central Funds.
The Money Market Central Funds seek preservation of capital and current income and are managed by Fidelity Investments Money Management, Inc. (FIMM), an affiliate of the investment adviser. Annualized expenses of the Money Market Central Funds as of their most recent shareholder report date are less than .005%.
A complete unaudited list of holdings for each Fidelity Central Fund is available upon request or at the Securities and Exchange Commission (the SEC) website at www.sec.gov. In addition, the financial statements of the Fidelity Central Funds, which are not covered by the Fund's Report of Independent Registered Public Accounting Firm, are available on the SEC website or upon request.
3. Significant Accounting Policies.
The Fund is an investment company and applies the accounting and reporting guidance of the Financial Accounting Standards Board (FASB) Accounting Standards Codification Topic 946 Financial Services – Investments Companies. The financial statements have been prepared in conformity with accounting principles generally accepted in the United States of America (GAAP), which require management to make certain estimates and assumptions at the date of the financial statements. Actual results could differ from those estimates. Subsequent events, if any, through the date that the financial statements were issued have been evaluated in the preparation of the financial statements. The following summarizes the significant accounting policies of the Fund:
Investment Valuation. Investments are valued as of 4:00 p.m. Eastern time on the last calendar day of the period. The Board of Trustees (the Board) has delegated the day to day responsibility for the valuation of the Fund's investments to the Fair Value Committee (the Committee) established by the Fund's investment adviser. In accordance with valuation policies and procedures approved by the Board, the Fund attempts to obtain prices from one or more third party pricing vendors or brokers to value its investments. When current market prices, quotations or currency exchange rates are not readily available or reliable, investments will be fair valued in good faith by the Committee, in accordance with procedures adopted by the Board. Factors used in determining fair value vary by investment type and may include market or investment specific events, changes in interest rates and credit quality. The frequency with which these procedures are used cannot be predicted and they may be utilized to a significant extent. The Committee oversees the Fund's valuation policies and procedures and reports to the Board on the Committee's activities and fair value determinations. The Board monitors the appropriateness of the procedures used in valuing the Fund's investments and ratifies the fair value determinations of the Committee.
The Fund categorizes the inputs to valuation techniques used to value its investments into a disclosure hierarchy consisting of three levels as shown below:
- Level 1 – quoted prices in active markets for identical investments
- Level 2 – other significant observable inputs (including quoted prices for similar investments, interest rates, prepayment speeds, etc.)
- Level 3 – unobservable inputs (including the Fund's own assumptions based on the best information available)
Valuation techniques used to value the Fund's investments by major category are as follows:
Debt securities, including restricted securities, are valued based on evaluated prices received from third party pricing vendors or from brokers who make markets in such securities. Municipal securities are valued by pricing vendors who utilize matrix pricing which considers yield or price of bonds of comparable quality, coupon, maturity and type or by broker-supplied prices. When independent prices are unavailable or unreliable, debt securities may be valued utilizing pricing methodologies which consider similar factors that would be used by third party pricing vendors. Debt securities are generally categorized as Level 2 in the hierarchy but may be Level 3 depending on the circumstances.
Investments in open-end mutual funds, including the Fidelity Central Funds, are valued at their closing net asset value (NAV) each business day and are categorized as Level 1 in the hierarchy.
Changes in valuation techniques may result in transfers in or out of an assigned level within the disclosure hierarchy. The aggregate value of investments by input level as of December 31, 2018 is included at the end of the Fund's Schedule of Investments.
Investment Transactions and Income. For financial reporting purposes, the Fund's investment holdings and NAV include trades executed through the end of the last business day of the period. The NAV per share for processing shareholder transactions is calculated as of the close of business of the New York Stock Exchange (NYSE), normally 4:00 p.m. Eastern time and includes trades executed through the end of the prior business day. Gains and losses on securities sold are determined on the basis of identified cost. Income and capital gain distributions from Fidelity Central Funds, if any, are recorded on the ex-dividend date. Interest income is accrued as earned and includes coupon interest and amortization of premium and accretion of discount on debt securities as applicable. Debt obligations may be placed on non-accrual status and related interest income may be reduced by ceasing current accruals and writing off interest receivables when the collection of all or a portion of interest has become doubtful based on consistently applied procedures. A debt obligation is removed from non-accrual status when the issuer resumes interest payments or when collectability of interest is reasonably assured.
Class Allocations and Expenses. Investment income, realized and unrealized capital gains and losses, common expenses of the Fund, and certain fund-level expense reductions, if any, are allocated daily on a pro-rata basis to each class based on the relative net assets of each class to the total net assets of the Fund. Each class differs with respect to transfer agent and distribution and service plan fees incurred. Certain expense reductions may also differ by class. For the reporting period, the allocated portion of income and expenses to each class as a percent of its average net assets may vary due to the timing of recording these transactions in relation to fluctuating net assets of the classes. Expenses directly attributable to a fund are charged to that fund. Expenses attributable to more than one fund are allocated among the respective funds on the basis of relative net assets or other appropriate methods. Expense estimates are accrued in the period to which they relate and adjustments are made when actual amounts are known.
Income Tax Information and Distributions to Shareholders. Each year, the Fund intends to qualify as a regulated investment company under Subchapter M of the Internal Revenue Code, including distributing substantially all of its taxable income and realized gains. As a result, no provision for U.S. Federal income taxes is required. As of December 31, 2018, the Fund did not have any unrecognized tax benefits in the financial statements; nor is the Fund aware of any tax positions for which it is reasonably possible that the total amounts of unrecognized tax benefits will significantly change in the next twelve months. The Fund files a U.S. federal tax return, in addition to state and local tax returns as required. The Fund's federal income tax returns are subject to examination by the Internal Revenue Service (IRS) for a period of three fiscal years after they are filed. State and local tax returns may be subject to examination for an additional fiscal year depending on the jurisdiction.
Distributions are declared and recorded daily and paid monthly from net investment income. Distributions from realized gains, if any, are declared and recorded on the ex-dividend date. Income and capital gain distributions are declared separately for each class. Income and capital gain distributions are determined in accordance with income tax regulations, which may differ from GAAP. In addition, the Fund claimed a portion of the payment made to redeeming shareholders as a distribution for income tax purposes.
Capital accounts within the financial statements are adjusted for permanent book-tax differences. These adjustments have no impact on net assets or the results of operations. Capital accounts are not adjusted for temporary book-tax differences which will reverse in a subsequent period.
Book-tax differences are primarily due to redemptions in-kind, market discount, deferred trustees compensation, losses deferred due to wash sales and excise tax regulations.
The Fund purchases municipal securities whose interest, in the opinion of the issuer, is free from federal income tax. There is no assurance that the IRS will agree with this opinion. In the event the IRS determines that the issuer does not comply with relevant tax requirements, interest payments from a security could become federally taxable, possibly retroactively to the date the security was issued.
As of period end, the cost and unrealized appreciation (depreciation) in securities, and derivatives if applicable, for federal income tax purposes were as follows:
| Gross unrealized appreciation | $114,376 |
| Gross unrealized depreciation | (29,774) |
| Net unrealized appreciation (depreciation) | $84,602 |
| Tax Cost | $4,625,964 |
The tax-based components of distributable earnings as of period end were as follows:
| Net unrealized appreciation (depreciation) on securities and other investments | $84,602 |
The Fund intends to elect to defer to its next fiscal year $2,139 of capital losses recognized during the period November 1, 2018 to December 31, 2018.
The tax character of distributions paid was as follows:
| | December 31, 2018 | December 31, 2017 |
| Tax-exempt Income | $172,933 | $167,561 |
| Long-term Capital Gains | 36,386 | 78,395 |
| Total | $209,319 | $ 245,956 |
Restricted Securities. The Fund may invest in securities that are subject to legal or contractual restrictions on resale. These securities generally may be resold in transactions exempt from registration or to the public if the securities are registered. Disposal of these securities may involve time-consuming negotiations and expense, and prompt sale at an acceptable price may be difficult. Information regarding restricted securities is included at the end of the Fund's Schedule of Investments.
New Rule Issuance. During August 2018, the U.S. Securities and Exchange Commission issued Final Rule Release No. 33-10532, Disclosure Update and Simplification. This Final Rule includes amendments specific to registered investment companies that are intended to eliminate overlap in disclosure requirements between Regulation S-X and GAAP. In accordance with these amendments, certain line-items in the Fund's financial statements have been combined or removed for the current period as outlined in the table below.
| Financial Statement | Current Line-Item Presentation | Prior Line-Item Presentation |
| Statement of Assets and Liabilities | Total distributable earnings (loss) | Undistributed/Distributions in excess of/Accumulated net investment income (loss)
Accumulated/Undistributed net realized gain (loss)
Net unrealized appreciation (depreciation) |
| Statement of Changes in Net Assets | N/A - removed | Undistributed/Distributions in excess of/Accumulated net investment income (loss) end of period |
| Statement of Changes in Net Assets | Distributions to shareholders | Distributions to shareholders from net investment income
Distributions to shareholders from net realized gain |
| Distributions to Shareholders Note to Financial Statements | Distributions to shareholders | Distributions to shareholders from net investment income
Distributions to shareholders from net realized gain |
4. Purchases and Sales of Investments.
Purchases and sales of securities, other than short-term securities, securities acquired in the merger and in-kind transactions, aggregated $779,973 and $1,501,945, respectively.
5. Fees and Other Transactions with Affiliates.
Management Fee. Fidelity Management & Research Company (the investment adviser) and its affiliates provide the Fund with investment management related services for which the Fund pays a monthly management fee. The management fee is the sum of an individual fund fee rate that is based on an annual rate of .25% of the Fund's average net assets and an annualized group fee rate that averaged .11% during the period. The group fee rate is based upon the average net assets of all the mutual funds advised by the investment adviser, including any mutual funds previously advised by the investment adviser that are currently advised by Fidelity SelectCo, LLC, an affiliate of the investment adviser. The group fee rate decreases as assets under management increase and increases as assets under management decrease. For the reporting period, the total annual management fee rate was .36% of the Fund's average net assets.
Distribution and Service Plan Fees. In accordance with Rule 12b-1 of the 1940 Act, the Fund has adopted separate Distribution and Service Plans for each class of shares. Certain classes pay Fidelity Distributors Corporation (FDC), an affiliate of the investment adviser, separate Distribution and Service Fees, each of which is based on an annual percentage of each class' average net assets. In addition, FDC may pay financial intermediaries for selling shares of the Fund and providing shareholder support services. For the period, the Distribution and Service Fee rates, total fees and amounts retained by FDC were as follows:
| | Distribution Fee | Service Fee | Total Fees | Retained by FDC |
| Class A | -% | .25% | $435 | $8 |
| Class M | -% | .25% | 254 | – |
| Class C | .75% | .25% | 739 | 24 |
| | | | $1,428 | $32 |
Sales Load. FDC may receive a front-end sales charge of up to 4.00% for selling Class A shares and Class M shares, some of which is paid to financial intermediaries for selling shares of the Fund. Depending on the holding period, FDC may receive contingent deferred sales charges levied on Class A, Class M and Class C redemptions. The deferred sales charges are 1.00% for Class C shares, .75% for certain purchases of Class A shares and .25% for certain purchases of Class M shares.
For the period, sales charge amounts retained by FDC were as follows:
| | Retained by FDC |
| Class A | $2 |
| Class M | 3 |
| Class C(a) | 3 |
| | $8 |
(a) When Class C shares are initially sold, FDC pays commissions from its own resources to financial intermediaries through which the sales are made.
Transfer Agent Fees. Fidelity Investments Institutional Operations Company, Inc. (FIIOC), an affiliate of the investment adviser, is the transfer, dividend disbursing and shareholder servicing agent for the Fund. FIIOC receives account fees and asset-based fees that vary according to the account size and type of account of the shareholders of the respective classes of the Fund, except Class Z. FIIOC receives an asset-based fee of Class Z's average net assets. FIIOC pays for typesetting, printing and mailing of shareholder reports, except proxy statements. For the period, transfer agent fees for each class were as follows:
| | Amount | % of Class-Level Average Net Assets |
| Class A | $282 | .16(a) |
| Class M | 148 | .15(a) |
| Class C | 118 | .16(a) |
| Fidelity Municipal Income Fund | 4,191 | .08 |
| Class I | 830 | .16(a) |
| Class Z | 1 | .05(a) |
| | $5,570 | |
(a) Annualized
Accounting Fees. Fidelity Service Company, Inc. (FSC), an affiliate of the investment adviser, maintains the Fund's accounting records. The fee is based on the level of average net assets for each month. For the period, the fees were equivalent to an annual rate of .01%.
Interfund Trades. The Fund may purchase from or sell securities to other Fidelity Funds under procedures adopted by the Board. The procedures have been designed to ensure these interfund trades are executed in accordance with Rule 17a-7 of the 1940 Act. Interfund trades are included within the respective purchases and sales amounts shown in the Purchases and Sales of Investments note.
Affiliated Redemptions In-Kind. During the period, 83,345 shares of the Fund were redeemed in-kind for investments, including accrued interest, and cash with a value of $1,042,642. The net realized gain of $939 on investments delivered through in-kind redemptions is included in the accompanying Statement of Operations. The amount of the in-kind redemptions is included in share transactions in the accompanying Statement of Changes in Net Assets as well as the Notes to Financial Statements. The Fund recognized no gain or loss for federal income tax purposes.
6. Committed Line of Credit.
The Fund participates with other funds managed by the investment adviser or an affiliate in a $4.25 billion credit facility (the "line of credit") to be utilized for temporary or emergency purposes to fund shareholder redemptions or for other short-term liquidity purposes. The Fund has agreed to pay commitment fees on its pro-rata portion of the line of credit, which amounted to $16 and is reflected in Miscellaneous expenses on the Statement of Operations. During the period, the Fund did not borrow on this line of credit.
7. Expense Reductions.
Through arrangements with the Fund's custodian, credits realized as a result of certain uninvested cash balances were used to reduce the Fund's expenses. During the period, these credits reduced the Fund's custody expenses by $42.
In addition, during the period the investment adviser reimbursed and/or waived a portion of fund-level operating expenses in the amount of $37.
8. Distributions to Shareholders.
Distributions to shareholders of each class were as follows:
| | Year ended
December 31, 2018(a) | Year ended
December 31, 2017 |
| Distributions to shareholders | | |
| Class A | $4,817 | $– |
| Class M | 2,830 | – |
| Class C | 1,494 | – |
| Fidelity Municipal Income Fund | 184,722 | – |
| Class I | 15,359 | – |
| Class Z | 97 | – |
| Total | $209,319 | $– |
| From net investment income | | |
| Fidelity Municipal Income Fund | $– | $167,561 |
| Total | $– | $167,561 |
| From net realized gain | | |
| Fidelity Municipal Income Fund | $– | $78,395 |
| Total | $– | $78,395 |
(a) Distributions for Class A, Class M, Class C and Class I are for the period March 1, 2018 (commencement of sale of shares) to December 31, 2018. Distributions for Class Z are for the period October 2, 2018 (commencement of sale of shares) to December 31, 2018.
9. Share Transactions.
Share transactions for each class were as follows and may contain automatic conversions between classes or exchanges between affiliated funds:
| | Shares | Shares | Dollars | Dollars |
| | Year ended December 31, 2018(a) | Year ended December 31, 2017 | Year ended December 31, 2018 (a) | Year ended December 31, 2017 |
| Class A | | | | |
| Shares sold | 1,670 | – | $21,200 | $– |
| Issued in exchange for the shares of Fidelity Advisor Municipal Income Fund | 17,474 | – | 222,273 | – |
| Reinvestment of distributions | 338 | – | 4,287 | – |
| Shares redeemed | (3,720) | – | (47,170) | – |
| Net increase (decrease) | 15,762 | – | $200,590 | $– |
| Class M | | | | |
| Shares sold | 170 | – | $2,172 | $– |
| Issued in exchange for the shares of Fidelity Advisor Municipal Income Fund | 10,358 | – | 131,854 | – |
| Reinvestment of distributions | 199 | – | 2,525 | – |
| Shares redeemed | (1,434) | – | (18,218) | – |
| Net increase (decrease) | 9,293 | – | $118,333 | $– |
| Class C | | | | |
| Shares sold | 451 | – | $5,735 | $– |
| Issued in exchange for the shares of Fidelity Advisor Municipal Income Fund | 7,653 | – | 97,341 | – |
| Reinvestment of distributions | 103 | – | 1,311 | – |
| Shares redeemed | (1,800) | – | (22,805) | – |
| Net increase (decrease) | 6,407 | – | $81,582 | $– |
| Fidelity Municipal Income Fund | | | | |
| Shares sold | 59,023 | 56,029 | $753,689 | $733,214 |
| Reinvestment of distributions | 9,833 | 12,884 | 125,182 | 168,072 |
| Shares redeemed | (197,790)(b) | (66,718) | (2,496,887)(b) | (870,774) |
| Net increase (decrease) | (128,934) | 2,195 | $(1,618,016) | $30,512 |
| Class I | | | | |
| Shares sold | 13,956 | – | $177,050 | $– |
| Issued in exchange for the shares of Fidelity Advisor Municipal Income Fund | 50,530 | – | 642,743 | – |
| Reinvestment of distributions | 642 | – | 8,146 | – |
| Shares redeemed | (21,601) | – | (273,260) | – |
| Net increase (decrease) | 43,527 | – | $554,679 | $– |
| Class Z | | | | |
| Shares sold | 1,760 | – | $22,053 | $– |
| Reinvestment of distributions | 7 | – | 95 | – |
| Shares redeemed | (137) | – | (1,735) | – |
| Net increase (decrease) | 1,630 | – | $20,413 | $– |
(a) Share transactions for Class A, Class M, Class C and Class I are for the period March 1, 2018 (commencement of sale of shares) to December 31, 2018. Share transactions for Class Z are for period October 2, 2018 (commencement of sale of shares) to December 31, 2018.
(b) Amount includes in-kind redemptions (see the Affiliated Redemptions In-Kind note for additional details).
10. Other.
The Fund's organizational documents provide former and current trustees and officers with a limited indemnification against liabilities arising in connection with the performance of their duties to the Fund. In the normal course of business, the Fund may also enter into contracts that provide general indemnifications. The Fund's maximum exposure under these arrangements is unknown as this would be dependent on future claims that may be made against the Fund. The risk of material loss from such claims is considered remote.
11. Merger Information.
On March 2, 2018, the Fund acquired all of the assets and assumed all of the liabilities of Fidelity Advisor Municipal Income Fund ("Target Fund") pursuant to an Agreement and Plan of Reorganization approved by the Board of Trustees ("The Board"). The acquisition was accomplished by an exchange of shares of each class of the Fund for corresponding shares then outstanding of the Target Fund at its net asset value on the acquisition date. In addition, the Board approved the creation of additional classes of shares that commenced sale of shares on March 1, 2018. The reorganization provides shareholders of the Target Fund access to a larger portfolio with a similar investment objective. The reorganization qualified as a tax-free reorganization for federal income tax purposes with no gain or loss recognized to the funds or their shareholders. The Target Fund's net assets of $1,094,211, including securities of $1,078,064 and unrealized appreciation of $12,741, was combined with the Fund's net assets of $5,490,715 for total net assets after the acquisition of $6,584,926.
Pro forma results of operations of the combined entity for the entire period ended December 31, 2018, as though the acquisition had occurred as of the beginning of the year (rather than on the actual acquisition date), are as follows:
| Net investment income (loss) | $178,321 |
| Total net realized gain (loss) | 3,763 |
| Total change in net unrealized appreciation (depreciation) | (175,496) |
| Net increase (decrease) in net assets resulting from operations | $6,588 |
Because the combined investment portfolios have been managed as a single portfolio since the acquisition was completed, it is not practicable to separate the amounts of revenue and earnings of the acquired fund that have been included in the Fund's accompanying Statement of Operations since March 2, 2018.
Report of Independent Registered Public Accounting Firm
To the Board of Trustees of Fidelity Municipal Trust and Shareholders of Fidelity Municipal Income Fund:
Opinion on the Financial Statements
We have audited the accompanying statement of assets and liabilities, including the schedule of investments, of Fidelity Municipal Income Fund (one of the funds constituting Fidelity Municipal Trust, referred to hereafter as the "Fund") as of December 31, 2018, the related statement of operations for the year ended December 31, 2018, the statement of changes in net assets for each of the two years in the period ended December 31, 2018, including the related notes, and the financial highlights for each of the periods indicated therein (collectively referred to as the “financial statements”). In our opinion, the financial statements present fairly, in all material respects, the financial position of the Fund as of December 31, 2018, the results of its operations for the year then ended, the changes in its net assets for each of the two years in the period ended December 31, 2018 and the financial highlights for the periods indicated therein in conformity with accounting principles generally accepted in the United States of America.
Basis for Opinion
These financial statements are the responsibility of the Fund’s management. Our responsibility is to express an opinion on the Fund’s financial statements based on our audits. We are a public accounting firm registered with the Public Company Accounting Oversight Board (United States) (PCAOB) and are required to be independent with respect to the Fund in accordance with the U.S. federal securities laws and the applicable rules and regulations of the Securities and Exchange Commission and the PCAOB.
We conducted our audits of these financial statements in accordance with the standards of the PCAOB. Those standards require that we plan and perform the audit to obtain reasonable assurance about whether the financial statements are free of material misstatement, whether due to error or fraud.
Our audits included performing procedures to assess the risks of material misstatement of the financial statements, whether due to error or fraud, and performing procedures that respond to those risks. Such procedures included examining, on a test basis, evidence regarding the amounts and disclosures in the financial statements. Our audits also included evaluating the accounting principles used and significant estimates made by management, as well as evaluating the overall presentation of the financial statements. Our procedures included confirmation of securities owned as of December 31, 2018 by correspondence with the custodian. We believe that our audits provide a reasonable basis for our opinion.
PricewaterhouseCoopers LLP
Boston, Massachusetts
February 13, 2019
We have served as the auditor of one or more investment companies in the Fidelity group of funds since 1932.
Trustees and Officers
The Trustees, Members of the Advisory Board (if any), and officers of the trust and fund, as applicable, are listed below. The Board of Trustees governs the fund and is responsible for protecting the interests of shareholders. The Trustees are experienced executives who meet periodically throughout the year to oversee the fund's activities, review contractual arrangements with companies that provide services to the fund, oversee management of the risks associated with such activities and contractual arrangements, and review the fund's performance. Each of the Trustees oversees 260 funds.
The Trustees hold office without limit in time except that (a) any Trustee may resign; (b) any Trustee may be removed by written instrument, signed by at least two-thirds of the number of Trustees prior to such removal; (c) any Trustee who requests to be retired or who has become incapacitated by illness or injury may be retired by written instrument signed by a majority of the other Trustees; and (d) any Trustee may be removed at any special meeting of shareholders by a two-thirds vote of the outstanding voting securities of the trust. Each Trustee who is not an interested person (as defined in the 1940 Act) of the trust and the fund is referred to herein as an Independent Trustee. Each Independent Trustee shall retire not later than the last day of the calendar year in which his or her 75th birthday occurs. The Independent Trustees may waive this mandatory retirement age policy with respect to individual Trustees. Officers and Advisory Board Members hold office without limit in time, except that any officer or Advisory Board Member may resign or may be removed by a vote of a majority of the Trustees at any regular meeting or any special meeting of the Trustees. Except as indicated, each individual has held the office shown or other offices in the same company for the past five years.
The fund’s Statement of Additional Information (SAI) includes more information about the Trustees. To request a free copy, call Fidelity at 1-800-544-8544.
Experience, Skills, Attributes, and Qualifications of the Trustees. The Governance and Nominating Committee has adopted a statement of policy that describes the experience, qualifications, attributes, and skills that are necessary and desirable for potential Independent Trustee candidates (Statement of Policy). The Board believes that each Trustee satisfied at the time he or she was initially elected or appointed a Trustee, and continues to satisfy, the standards contemplated by the Statement of Policy. The Governance and Nominating Committee also engages professional search firms to help identify potential Independent Trustee candidates who have the experience, qualifications, attributes, and skills consistent with the Statement of Policy. From time to time, additional criteria based on the composition and skills of the current Independent Trustees, as well as experience or skills that may be appropriate in light of future changes to board composition, business conditions, and regulatory or other developments, have also been considered by the professional search firms and the Governance and Nominating Committee. In addition, the Board takes into account the Trustees' commitment and participation in Board and committee meetings, as well as their leadership of standing and ad hoc committees throughout their tenure.
In determining that a particular Trustee was and continues to be qualified to serve as a Trustee, the Board has considered a variety of criteria, none of which, in isolation, was controlling. The Board believes that, collectively, the Trustees have balanced and diverse experience, qualifications, attributes, and skills, which allow the Board to operate effectively in governing the fund and protecting the interests of shareholders. Information about the specific experience, skills, attributes, and qualifications of each Trustee, which in each case led to the Board's conclusion that the Trustee should serve (or continue to serve) as a trustee of the fund, is provided below.
Board Structure and Oversight Function. Abigail P. Johnson is an interested person and currently serves as Chairman. The Trustees have determined that an interested Chairman is appropriate and benefits shareholders because an interested Chairman has a personal and professional stake in the quality and continuity of services provided to the fund. Independent Trustees exercise their informed business judgment to appoint an individual of their choosing to serve as Chairman, regardless of whether the Trustee happens to be independent or a member of management. The Independent Trustees have determined that they can act independently and effectively without having an Independent Trustee serve as Chairman and that a key structural component for assuring that they are in a position to do so is for the Independent Trustees to constitute a substantial majority for the Board. The Independent Trustees also regularly meet in executive session. Arthur E. Johnson serves as Chairman of the Independent Trustees and as such (i) acts as a liaison between the Independent Trustees and management with respect to matters important to the Independent Trustees and (ii) with management prepares agendas for Board meetings.
Fidelity® funds are overseen by different Boards of Trustees. The fund's Board oversees Fidelity's investment-grade bond, money market, asset allocation and certain equity funds, and other Boards oversee Fidelity's high income and other equity funds. The asset allocation funds may invest in Fidelity® funds that are overseen by such other Boards. The use of separate Boards, each with its own committee structure, allows the Trustees of each group of Fidelity® funds to focus on the unique issues of the funds they oversee, including common research, investment, and operational issues. On occasion, the separate Boards establish joint committees to address issues of overlapping consequences for the Fidelity® funds overseen by each Board.
The Trustees operate using a system of committees to facilitate the timely and efficient consideration of all matters of importance to the Trustees, the fund, and fund shareholders and to facilitate compliance with legal and regulatory requirements and oversight of the fund's activities and associated risks. The Board, acting through its committees, has charged FMR and its affiliates with (i) identifying events or circumstances the occurrence of which could have demonstrably adverse effects on the fund's business and/or reputation; (ii) implementing processes and controls to lessen the possibility that such events or circumstances occur or to mitigate the effects of such events or circumstances if they do occur; and (iii) creating and maintaining a system designed to evaluate continuously business and market conditions in order to facilitate the identification and implementation processes described in (i) and (ii) above. Because the day-to-day operations and activities of the fund are carried out by or through FMR, its affiliates, and other service providers, the fund's exposure to risks is mitigated but not eliminated by the processes overseen by the Trustees. While each of the Board's committees has responsibility for overseeing different aspects of the fund's activities, oversight is exercised primarily through the Operations and Audit Committees. In addition, an ad hoc Board committee of Independent Trustees has worked with FMR to enhance the Board's oversight of investment and financial risks, legal and regulatory risks, technology risks, and operational risks, including the development of additional risk reporting to the Board. Appropriate personnel, including but not limited to the fund's Chief Compliance Officer (CCO), FMR's internal auditor, the independent accountants, the fund's Treasurer and portfolio management personnel, make periodic reports to the Board's committees, as appropriate, including an annual review of Fidelity's risk management program for the Fidelity® funds. The responsibilities of each standing committee, including their oversight responsibilities, are described further under "Standing Committees of the Trustees."
Interested Trustees*:
Correspondence intended for a Trustee who is an interested person may be sent to Fidelity Investments, 245 Summer Street, Boston, Massachusetts 02210.
Name, Year of Birth; Principal Occupations and Other Relevant Experience+
Abigail P. Johnson (1961)
Year of Election or Appointment: 2009
Trustee
Chairman of the Board of Trustees
Ms. Johnson also serves as Trustee of other Fidelity® funds. Ms. Johnson serves as Chairman (2016-present), Chief Executive Officer (2014-present), and Director (2007-present) of FMR LLC (diversified financial services company), President of Fidelity Financial Services (2012-present) and President of Personal, Workplace and Institutional Services (2005-present). Ms. Johnson is Chairman and Director of FMR Co., Inc. (investment adviser firm, 2011-present) and Chairman and Director of FMR (investment adviser firm, 2011-present). Previously, Ms. Johnson served as Vice Chairman (2007-2016) and President (2013-2016) of FMR LLC, President and a Director of FMR (2001-2005), a Trustee of other investment companies advised by FMR, Fidelity Investments Money Management, Inc. (investment adviser firm), and FMR Co., Inc. (2001-2005), Senior Vice President of the Fidelity® funds (2001-2005), and managed a number of Fidelity® funds. Ms. Abigail P. Johnson and Mr. Arthur E. Johnson are not related.
Jennifer Toolin McAuliffe (1959)
Year of Election or Appointment: 2016
Trustee
Ms. McAuliffe also serves as Trustee of other Fidelity® funds. Ms. McAuliffe previously served as a Member of the Advisory Board of certain Fidelity® funds (2016) and as Co-Head of Fixed Income of Fidelity Investments Limited (now known as FIL Limited (FIL)) (diversified financial services company). Earlier roles at FIL included Director of Research for FIL’s credit and quantitative teams in London, Hong Kong and Tokyo. Ms. McAuliffe also was the Director of Research for taxable and municipal bonds at Fidelity Investments Money Management, Inc. Ms. McAuliffe is also a director or trustee of several not-for-profit entities.
* Determined to be an “Interested Trustee” by virtue of, among other things, his or her affiliation with the trust or various entities under common control with FMR.
+ The information includes the Trustee's principal occupation during the last five years and other information relating to the experience, attributes, and skills relevant to the Trustee's qualifications to serve as a Trustee, which led to the conclusion that the Trustee should serve as a Trustee for the fund.
Independent Trustees:
Correspondence intended for an Independent Trustee may be sent to Fidelity Investments, P.O. Box 55235, Boston, Massachusetts 02205-5235.
Name, Year of Birth; Principal Occupations and Other Relevant Experience+
Elizabeth S. Acton (1951)
Year of Election or Appointment: 2013
Trustee
Ms. Acton also serves as Trustee of other Fidelity® funds. Prior to her retirement in April 2012, Ms. Acton was Executive Vice President, Finance (2011-2012), Executive Vice President, Chief Financial Officer (2002-2011), and Treasurer (2004-2005) of Comerica Incorporated (financial services). Prior to joining Comerica, Ms. Acton held a variety of positions at Ford Motor Company (1983-2002), including Vice President and Treasurer (2000-2002) and Executive Vice President and Chief Financial Officer of Ford Motor Credit Company (1998-2000). Ms. Acton currently serves as a member of the Board of Directors and Audit and Finance Committees of Beazer Homes USA, Inc. (homebuilding, 2012-present). Previously, Ms. Acton served as a Member of the Advisory Board of certain Fidelity® funds (2013-2016).
Ann E. Dunwoody (1953)
Year of Election or Appointment: 2018
Trustee
General Dunwoody also serves as Trustee of other Fidelity® funds. General Dunwoody (United States Army, Retired) was the first woman in U.S. military history to achieve the rank of four-star general and prior to her retirement in 2012 held a variety of positions within the U.S. Army, including Commanding General, U.S. Army Material Command (2008-2012). She is the President of First to Four LLC (leadership and mentoring services, 2012-present). She also serves as a member of the Board of Directors and Nominating and Corporate Governance Committee of L3 Technologies, Inc. (communication, electronic, sensor, and aerospace systems, 2013-present), Board of Directors and Nomination and Corporate Governance Committees of Kforce Inc. (professional staffing services, 2016-present) and Board of Directors of Automattic Inc. (software engineering, 2018-present). Previously, General Dunwoody served as a Member of the Advisory Board of certain Fidelity® funds (2018), a member of the Board of Directors and Audit and Sustainability and Corporate Responsibility Committees of Republic Services, Inc. (waste collection, disposal and recycling, 2013-2016). Ms. Dunwoody also serves on several boards for non-profit organizations, including as a member of the Board of Directors, Chair of the Nomination and Governance Committee and member of the Audit Committee of Logistics Management Institute (consulting non-profit, 2012-present), a member of the Board of Directors of the Army Historical Foundation (2015-present), a member of the Council of Trustees for the Association of the United States Army (advocacy non-profit, 2013-present) and a member of the Board of Trustees of Florida Institute of Technology (2015-present) and ThanksUSA (military family education non-profit, 2014-present).
John Engler (1948)
Year of Election or Appointment: 2014
Trustee
Mr. Engler also serves as Trustee of other Fidelity® funds. He serves on the board of directors for Universal Forest Products (manufacturer and distributor of wood and wood-alternative products, 2003-present) and K12 Inc. (technology-based education company, 2012-present). Previously, Mr. Engler served as interim president of Michigan State University (2018-2019), a Member of the Advisory Board of certain Fidelity® funds (2014-2016), president of the Business Roundtable (2011-2017), a trustee of The Munder Funds (2003-2014), president and CEO of the National Association of Manufacturers (2004-2011), member of the Board of Trustees of the Annie E. Casey Foundation (2004-2015), and as governor of Michigan (1991-2003). He is a past chairman of the National Governors Association.
Robert F. Gartland (1951)
Year of Election or Appointment: 2010
Trustee
Mr. Gartland also serves as Trustee of other Fidelity® funds. Mr. Gartland is Chairman and an investor in Gartland & Mellina Group Corp. (consulting, 2009-present). Previously, Mr. Gartland served as a partner and investor of Vietnam Partners LLC (investments and consulting, 2008-2011). Prior to his retirement, Mr. Gartland held a variety of positions at Morgan Stanley (financial services, 1979-2007), including Managing Director (1987-2007), and Chase Manhattan Bank (1975-1978).
Arthur E. Johnson (1947)
Year of Election or Appointment: 2008
Trustee
Chairman of the Independent Trustees
Mr. Johnson also serves as Trustee of other Fidelity® funds. Mr. Johnson serves as a member of the Board of Directors of Eaton Corporation plc (diversified power management, 2009-present) and Booz Allen Hamilton (management consulting, 2011-present). Prior to his retirement, Mr. Johnson served as Senior Vice President of Corporate Strategic Development of Lockheed Martin Corporation (defense contractor, 1999-2009). He previously served on the Board of Directors of IKON Office Solutions, Inc. (1999-2008), AGL Resources, Inc. (holding company, 2002-2016), and Delta Airlines (2005-2007). Mr. Arthur E. Johnson is not related to Ms. Abigail P. Johnson.
Michael E. Kenneally (1954)
Year of Election or Appointment: 2009
Trustee
Vice Chairman of the Independent Trustees
Mr. Kenneally also serves as Trustee of other Fidelity® funds. Prior to his retirement, Mr. Kenneally served as Chairman and Global Chief Executive Officer of Credit Suisse Asset Management. Before joining Credit Suisse, he was an Executive Vice President and Chief Investment Officer for Bank of America Corporation. Earlier roles at Bank of America included Director of Research, Senior Portfolio Manager and Research Analyst, and Mr. Kenneally was awarded the Chartered Financial Analyst (CFA) designation in 1991.
Marie L. Knowles (1946)
Year of Election or Appointment: 2001
Trustee
Ms. Knowles also serves as Trustee of other Fidelity® funds. Prior to Ms. Knowles' retirement in June 2000, she served as Executive Vice President and Chief Financial Officer of Atlantic Richfield Company (ARCO) (diversified energy, 1996-2000). From 1993 to 1996, she was a Senior Vice President of ARCO and President of ARCO Transportation Company (pipeline and tanker operations). Ms. Knowles currently serves as a Director and Chairman of the Audit Committee of McKesson Corporation (healthcare service, since 2002). Ms. Knowles is a member of the Board of the Santa Catalina Island Company (real estate, 2009-present). Ms. Knowles is a Member of the Investment Company Institute Board of Governors and a Member of the Governing Council of the Independent Directors Council (2014-present). She also serves as a member of the Advisory Board for the School of Engineering of the University of Southern California. Previously, Ms. Knowles served as a Director of Phelps Dodge Corporation (copper mining and manufacturing, 1994-2007), URS Corporation (engineering and construction, 2000-2003) and America West (airline, 1999-2002). Ms. Knowles previously served as Chairman (2015-2018) and Vice Chairman (2012-2015) of the Independent Trustees of certain Fidelity® funds.
Mark A. Murray (1954)
Year of Election or Appointment: 2016
Trustee
Mr. Murray also serves as Trustee of other Fidelity® funds. Mr. Murray is Vice Chairman (2013-present) of Meijer, Inc. (regional retail chain). Previously, Mr. Murray served as a Member of the Advisory Board of certain Fidelity® funds (2016) and as Co-Chief Executive Officer (2013-2016) and President (2006-2013) of Meijer, Inc. Mr. Murray serves as a member of the Board of Directors and Nuclear Review and Public Policy and Responsibility Committees of DTE Energy Company (diversified energy company, 2009-present). Mr. Murray also serves as a member of the Board of Directors of Spectrum Health (not-for-profit health system, 2015-present). Mr. Murray previously served as President of Grand Valley State University (2001-2006), Treasurer for the State of Michigan (1999-2001), Vice President of Finance and Administration for Michigan State University (1998-1999), and a member of the Board of Directors and Audit Committee and Chairman of the Nominating and Corporate Governance Committee of Universal Forest Products, Inc. (manufacturer and distributor of wood and wood-alternative products, 2004-2016). Mr. Murray is also a director or trustee of many community and professional organizations.
+ The information includes the Trustee's principal occupation during the last five years and other information relating to the experience, attributes, and skills relevant to the Trustee's qualifications to serve as a Trustee, which led to the conclusion that the Trustee should serve as a Trustee for the fund.
Advisory Board Members and Officers:
Correspondence intended for an officer may be sent to Fidelity Investments, 245 Summer Street, Boston, Massachusetts 02210. Officers appear below in alphabetical order.
Name, Year of Birth; Principal Occupation
Elizabeth Paige Baumann (1968)
Year of Election or Appointment: 2017
Anti-Money Laundering (AML) Officer
Ms. Baumann also serves as AML Officer of other funds. She is Chief AML Officer (2012-present) and Senior Vice President (2014-present) of FMR LLC (diversified financial services company) and is an employee of Fidelity Investments. Previously, Ms. Baumann served as AML Officer of the funds (2012-2016), and Vice President (2007-2014) and Deputy Anti-Money Laundering Officer (2007-2012) of FMR LLC.
Craig S. Brown (1977)
Year of Election or Appointment: 2019
Assistant Treasurer
Mr. Brown also serves as Assistant Treasurer of other funds. Mr. Brown is an employee of Fidelity Investments (2013-present).
John J. Burke III (1964)
Year of Election or Appointment: 2018
Chief Financial Officer
Mr. Burke also serves as Chief Financial Officer of other funds. Mr. Burke serves as Head of Investment Operations for Fidelity Fund and Investment Operations (2018-present) and is an employee of Fidelity Investments (1998-present). Previously Mr. Burke served as head of Asset Management Investment Operations (2012-2018).
William C. Coffey (1969)
Year of Election or Appointment: 2018
Secretary and Chief Legal Officer (CLO)
Mr. Coffey also serves as Secretary and CLO of other funds. Mr. Coffey serves as CLO, Secretary, and Senior Vice President of Fidelity Management & Research Company and FMR Co., Inc. (investment adviser firms, 2018-present); Secretary of Fidelity SelectCo, LLC and Fidelity Investments Money Management, Inc. (investment adviser firms, 2018-present); and CLO of Fidelity Management & Research (Hong Kong) Limited, FMR Investment Management (UK) Limited, and Fidelity Management & Research (Japan) Limited (investment adviser firms, 2018-present). He is Senior Vice President and Deputy General Counsel of FMR LLC (diversified financial services company, 2010-present), and is an employee of Fidelity Investments. Previously, Mr. Coffey served as Assistant Secretary of certain funds (2009-2018) and as Vice President and Associate General Counsel of FMR LLC (2005-2009).
Jonathan Davis (1968)
Year of Election or Appointment: 2010
Assistant Treasurer
Mr. Davis also serves as Assistant Treasurer of other funds. Mr. Davis serves as Assistant Treasurer of FMR Capital, Inc. (2017-present) and is an employee of Fidelity Investments. Previously, Mr. Davis served as Vice President and Associate General Counsel of FMR LLC (diversified financial services company, 2003-2010).
Adrien E. Deberghes (1967)
Year of Election or Appointment: 2010
Assistant Treasurer
Mr. Deberghes also serves as an officer of other funds. He serves as Assistant Treasurer of FMR Capital, Inc. (2017-present), Executive Vice President of Fidelity Investments Money Management, Inc. (FIMM) (investment adviser firm, 2016-present), and is an employee of Fidelity Investments (2008-present). Previously, Mr. Deberghes served as President and Treasurer of certain Fidelity® funds (2013-2018). Prior to joining Fidelity Investments, Mr. Deberghes was Senior Vice President of Mutual Fund Administration at State Street Corporation (2007-2008), Senior Director of Mutual Fund Administration at Investors Bank & Trust (2005-2007), and Director of Finance for Dunkin' Brands (2000-2005). Previously, Mr. Deberghes served in other fund officer roles.
Laura M. Del Prato (1964)
Year of Election or Appointment: 2018
President and Treasurer
Ms. Del Prato also serves as an officer of other funds. Ms. Del Prato is an employee of Fidelity Investments (2017-present). Prior to joining Fidelity Investments, Ms. Del Prato served as a Managing Director and Treasurer of the JPMorgan Mutual Funds (2014-2017). Prior to JPMorgan, Ms. Del Prato served as a partner at Cohen Fund Audit Services (accounting firm, 2012-2013) and KPMG LLP (accounting firm, 2004-2012).
Colm A. Hogan (1973)
Year of Election or Appointment: 2016
Assistant Treasurer
Mr. Hogan also serves as an officer of other funds. Mr. Hogan serves as Assistant Treasurer of FMR Capital, Inc. (2017-present) and is an employee of Fidelity Investments (2005-present). Previously, Mr. Hogan served as Assistant Treasurer of certain Fidelity® funds (2016-2018).
Chris Maher (1972)
Year of Election or Appointment: 2013
Assistant Treasurer
Mr. Maher serves as Assistant Treasurer of other funds. Mr. Maher is Vice President of Valuation Oversight, serves as Assistant Treasurer of FMR Capital, Inc. (2017-present), and is an employee of Fidelity Investments. Previously, Mr. Maher served as Vice President of Asset Management Compliance (2013), Vice President of the Program Management Group of FMR (investment adviser firm, 2010-2013), and Vice President of Valuation Oversight (2008-2010).
John B. McGinty, Jr. (1962)
Year of Election or Appointment: 2016
Chief Compliance Officer
Mr. McGinty also serves as Chief Compliance Officer of other funds. Mr. McGinty is Senior Vice President of Asset Management Compliance for Fidelity Investments and is an employee of Fidelity Investments (2016-present). Mr. McGinty previously served as Vice President, Senior Attorney at Eaton Vance Management (investment management firm, 2015-2016), and prior to Eaton Vance as global CCO for all firm operations and registered investment companies at GMO LLC (investment management firm, 2009-2015). Before joining GMO LLC, Mr. McGinty served as Senior Vice President, Deputy General Counsel for Fidelity Investments (2007-2009).
Jason P. Pogorelec (1975)
Year of Election or Appointment: 2015
Assistant Secretary
Mr. Pogorelec also serves as Assistant Secretary of other funds. Mr. Pogorelec serves as Vice President, Associate General Counsel (2010-present) and is an employee of Fidelity Investments (2006-present).
Nancy D. Prior (1967)
Year of Election or Appointment: 2014
Vice President
Ms. Prior also serves as Vice President of other funds. Ms. Prior serves as President Fixed Income, High Income/Emerging Market Debt and Multi Asset Class Strategies of FIAM LLC (2018-present), President (2016-present) and Director (2014-present) of Fidelity Investments Money Management, Inc. (FIMM) (investment adviser firm), President, Fixed Income (2014-present), and is an employee of Fidelity Investments (2002-present). Previously, Ms. Prior served as Vice Chairman of FIAM LLC (investment adviser firm, 2014-2018), a Director of FMR Investment Management (UK) Limited (investment adviser firm, 2015-2018), President Multi-Asset Class Strategies of FMR's Global Asset Allocation Division (2017-2018), Vice President of Fidelity's Money Market Funds (2012-2014), President, Money Market and Short Duration Bond Group of Fidelity Management & Research (FMR) (investment adviser firm, 2013-2014), President, Money Market Group of FMR (2011-2013), Managing Director of Research (2009-2011), Senior Vice President and Deputy General Counsel (2007-2009), and Assistant Secretary of certain Fidelity® funds (2008-2009).
Stacie M. Smith (1974)
Year of Election or Appointment: 2013
Assistant Treasurer
Ms. Smith also serves as an officer of other funds. Ms. Smith serves as Assistant Treasurer of FMR Capital, Inc. (2017-present), is an employee of Fidelity Investments (2009-present), and has served in other fund officer roles. Prior to joining Fidelity Investments, Ms. Smith served as Senior Audit Manager of Ernst & Young LLP (accounting firm, 1996-2009). Previously, Ms. Smith served as Assistant Treasurer (2013-2018) and Deputy Treasurer (2013-2016) of certain Fidelity® funds.
Marc L. Spector (1972)
Year of Election or Appointment: 2016
Deputy Treasurer
Mr. Spector also serves as an officer of other funds. Mr. Spector serves as Assistant Treasurer of FMR Capital, Inc. (2017-present) and is an employee of Fidelity Investments (2016-present). Prior to joining Fidelity Investments, Mr. Spector served as Director at the Siegfried Group (accounting firm, 2013-2016), and prior to Siegfried Group as audit senior manager at Deloitte & Touche (accounting firm, 2005-2013).
Jim Wegmann (1979)
Year of Election or Appointment: 2019
Assistant Treasurer
Mr. Wegmann also serves as Assistant Treasurer of other funds. Mr. Wegmann is an employee of Fidelity Investments (2011-present).
Shareholder Expense Example
As a shareholder of the Fund, you incur two types of costs: (1) transaction costs including sales charges (loads) on purchase payments or redemption proceeds, and (2) ongoing costs, including management fees, distribution and/or service (12b-1) fees and other Fund expenses. This Example is intended to help you understand your ongoing costs (in dollars) of investing in the Fund and to compare these costs with the ongoing costs of investing in other mutual funds.
The actual expense Example is based on an investment of $1,000 invested at the beginning of the period and held for the entire period (July 1, 2018 to December 31, 2018) for Class A, class M, Class C, Fidelity Municipal Income and Class I and for the period (October 2, 2018 to December 31, 2018) for Class Z. The hypothetical expense Example is based on an investment of $1,000 invested for the one-half year period (July 1, 2018 to December 31, 2018).
Actual Expenses
The first line of the accompanying table for each class of the Fund provides information about actual account values and actual expenses. You may use the information in this line, together with the amount you invested, to estimate the expenses that you paid over the period. Simply divide your account value by $1,000.00 (for example, an $8,600 account value divided by $1,000.00 = 8.6), then multiply the result by the number in the first line for a class of the Fund under the heading entitled "Expenses Paid During Period" to estimate the expenses you paid on your account during this period. A small balance maintenance fee of $12.00 that is charged once a year may apply for certain accounts with a value of less than $2,000. This fee, which was eliminated effective August 1, 2018, is not included in the table below. If it was, the estimate of expenses you paid during the period would be higher, and your ending account value lower, by this amount. In addition, the Fund, as a shareholder in the underlying Fidelity Central Funds, will indirectly bear its pro-rata share of the fees and expenses incurred by the underlying Fidelity Central Funds. These fees and expenses are not included in the Fund's annualized expense ratio used to calculate the expense estimate in the table below.
Hypothetical Example for Comparison Purposes
The second line of the accompanying table for each class of the Fund provides information about hypothetical account values and hypothetical expenses based on a Class' actual expense ratio and an assumed rate of return of 5% per year before expenses, which is not the Class' actual return. The hypothetical account values and expenses may not be used to estimate the actual ending account balance or expenses you paid for the period. You may use this information to compare the ongoing costs of investing in the Fund and other funds. To do so, compare this 5% hypothetical example with the 5% hypothetical examples that appear in the shareholder reports of the other funds. A small balance maintenance fee of $12.00 that is charged once a year may apply for certain accounts with a value of less than $2,000. This fee, which was eliminated effective August 1, 2018, is not included in the table below. If it was, the estimate of expenses you paid during the period would be higher, and your ending account value lower, by this amount. In addition, the Fund, as a shareholder in the underlying Fidelity Central Funds, will indirectly bear its pro-rata share of the fees and expenses incurred by the underlying Fidelity Central Funds. These fees and expenses are not included in the Fund's annualized expense ratio used to calculate the expense estimate in the table below.
Please note that the expenses shown in the table are meant to highlight your ongoing costs only and do not reflect any transaction costs. Therefore, the second line of the table is useful in comparing ongoing costs only, and will not help you determine the relative total costs of owning different funds. In addition, if these transactional costs were included, your costs would have been higher.
| | Annualized Expense Ratio-A | Beginning
Account Value | Ending
Account Value
December 31, 2018 | Expenses Paid
During Period |
| Class A | .78% | | | |
| Actual | | $1,000.00 | $1,013.40 | $3.96-B |
| Hypothetical-C | | $1,000.00 | $1,021.27 | $3.97-D |
| Class M | .76% | | | |
| Actual | | $1,000.00 | $1,013.50 | $3.86-B |
| Hypothetical-C | | $1,000.00 | $1,021.37 | $3.87-D |
| Class C | 1.52% | | | |
| Actual | | $1,000.00 | $1,009.70 | $7.70-B |
| Hypothetical-C | | $1,000.00 | $1,017.54 | $7.73-D |
| Fidelity Municipal Income Fund | .45% | | | |
| Actual | | $1,000.00 | $1,014.30 | $2.28-B |
| Hypothetical-C | | $1,000.00 | $1,022.94 | $2.29-D |
| Class I | .53% | | | |
| Actual | | $1,000.00 | $1,014.70 | $2.69-B |
| Hypothetical-C | | $1,000.00 | $1,022.53 | $2.70-D |
| Class Z | .42% | | | |
| Actual | | $1,000.00 | $1,016.90 | $1.06-B |
| Hypothetical-C | | $1,000.00 | $1,023.09 | $2.14-D |
A Annualized expense ratio reflects expenses net of applicable fee waivers.
B Actual expenses are equal to each Class' annualized expense ratio, multiplied by the average account value over the period, multiplied by 184/365 (to reflect the one-half year period) for Class A, Class M, Class C, Fidelity Municipal Income Fund and Class I and multiplied by 91/365 (to reflect the period October 2, 2018 to December 31, 2018) for Class Z.
C 5% return per year before expenses
D Hypothetical expenses are equal to each Class' annualized expense ratio, multiplied by the average account value over the period, multiplied by 184/365 (to reflect the one-half year period).
Distributions (Unaudited)
Fidelity Municipal Income Fund hereby designates as a capital gain dividend with respect to the taxable year ended December 31, 2018, $4,279,491, or, if subsequently determined to be different, the net capital gain of such year.
Fidelity Advisor Municipal Income Fund hereby designates as a capital gain dividend with respect to the taxable year ended March 2, 2018, $4,878,466, or, if subsequently determined to be different, the net capital gain of such year.
During fiscal year ended December 31, 2018, 100% of the Fidelity Municipal Income Fund's income dividends was free from federal income tax, and 16.66% of the fund's income dividends was subject to the federal alternative minimum tax.
During fiscal year ended March 2, 2018, 100% of the Fidelity Advisor Municipal Income Fund's income dividends was free from federal income tax, and 19.29% of the income dividends was subject to the federal alternative minimum tax.
The funds will notify shareholders in January 2019 of amounts for use in preparing 2018 income tax returns.
Board Approval of Investment Advisory Contracts and Management Fees
Fidelity Municipal Income Fund
Each year, the Board of Trustees, including the Independent Trustees (together, the Board), votes on the renewal of the management contract with Fidelity Management & Research Company (FMR) and the sub-advisory agreements (together, the Advisory Contracts) for the fund. FMR and the sub-advisers are referred to herein as the Investment Advisers. The Board, assisted by the advice of fund counsel and Independent Trustees' counsel, requests and considers a broad range of information relevant to the renewal of the Advisory Contracts throughout the year.
The Board meets regularly and, at each of its meetings, covers an extensive agenda of topics and materials and considers factors that are relevant to its annual consideration of the renewal of the fund's Advisory Contracts, including the services and support provided to the fund and its shareholders. The Board has established four standing committees (Committees) — Operations, Audit, Fair Valuation, and Governance and Nominating — each composed of and chaired by Independent Trustees with varying backgrounds, to which the Board has assigned specific subject matter responsibilities in order to enhance effective decision-making by the Board. The Operations Committee, of which all of the Independent Trustees are members, meets regularly throughout the year and considers, among other matters, information specifically related to the annual consideration of the renewal of the fund's Advisory Contracts. The Board, acting directly and through its Committees, requests and receives information concerning the annual consideration of the renewal of the fund's Advisory Contracts. The Board also meets as needed to review matters specifically related to the Board's annual consideration of the renewal of the Advisory Contracts. Members of the Board may also meet with trustees of other Fidelity funds through joint ad hoc committees to discuss certain matters relevant to all of the Fidelity funds.
At its September 2018 meeting, the Board unanimously determined to renew the fund's Advisory Contracts. In reaching its determination, the Board considered all factors it believed relevant, including (i) the nature, extent, and quality of the services to be provided to the fund and its shareholders (including the investment performance of the fund); (ii) the competitiveness of the fund's management fee and total expense ratio relative to peer funds; (iii) the total costs of the services to be provided by and the profits to be realized by Fidelity from its relationships with the fund; and (iv) the extent to which, if any, economies of scale exist and would be realized as the fund grows, and whether any economies of scale are appropriately shared with fund shareholders.
In considering whether to renew the Advisory Contracts for the fund, the Board reached a determination, with the assistance of fund counsel and Independent Trustees' counsel and through the exercise of its business judgment, that the renewal of the Advisory Contracts was in the best interests of the fund and its shareholders and that the compensation payable under the Advisory Contracts was fair and reasonable. The Board's decision to renew the Advisory Contracts was not based on any single factor, but rather was based on a comprehensive consideration of all the information provided to the Board at its meetings throughout the year. The Board, in reaching its determination to renew the Advisory Contracts, was aware that shareholders of the fund have a broad range of investment choices available to them, including a wide choice among funds offered by Fidelity's competitors, and that the fund's shareholders, who have the opportunity to review and weigh the disclosure provided by the fund in its prospectus and other public disclosures, have chosen to invest in this fund, which is part of the Fidelity family of funds.
Nature, Extent, and Quality of Services Provided. The Board considered Fidelity's staffing as it relates to the fund, including the backgrounds of investment personnel of Fidelity, and also considered the fund's investment objective, strategies, and related investment philosophy. The Independent Trustees also had discussions with senior management of Fidelity's investment operations and investment groups. The Board considered the structure of the investment personnel compensation program and whether this structure provides appropriate incentives to act in the best interests of the fund. Additionally, the Board considered the portfolio managers' investments, if any, in the funds that they manage.
Resources Dedicated to Investment Management and Support Services. The Board reviewed the general qualifications and capabilities of Fidelity's investment staff, including its size, education, experience, and resources, as well as Fidelity's approach to recruiting, managing, and compensating investment personnel. The Board noted that Fidelity has continued to increase the resources devoted to non-U.S. offices, including expansion of Fidelity's global investment organization. The Board also noted that Fidelity's analysts have extensive resources, tools and capabilities that allow them to conduct sophisticated quantitative and fundamental analysis, as well as credit analysis of issuers, counterparties and guarantors. Further, the Board considered that Fidelity's investment professionals have sufficient access to global information and data so as to provide competitive investment results over time, and that those professionals also have access to sophisticated tools that permit them to assess portfolio construction and risk and performance attribution characteristics continuously, as well as to transmit new information and research conclusions rapidly around the world. Additionally, in its deliberations, the Board considered Fidelity's trading, risk management, compliance, and technology and operations capabilities and resources, which are integral parts of the investment management process.
Shareholder and Administrative Services. The Board considered (i) the nature, extent, quality, and cost of advisory, administrative, and shareholder services performed by the Investment Advisers and their affiliates under the Advisory Contracts and under separate agreements covering transfer agency and pricing and bookkeeping services for the fund; (ii) the nature and extent of the supervision of third party service providers, principally custodians, subcustodians, and pricing vendors; and (iii) the resources devoted to, and the record of compliance with, the fund's compliance policies and procedures.
The Board noted that the growth of fund assets over time across the complex allows Fidelity to reinvest in the development of services designed to enhance the value and convenience of the Fidelity funds as investment vehicles. These services include 24-hour access to account information and market information through telephone representatives and over the Internet, investor education materials and asset allocation tools, and the expanded availability of Fidelity Investor Centers.
Investment in a Large Fund Family. The Board considered the benefits to shareholders of investing in a Fidelity fund, including the benefits of investing in a fund that is part of a large family of funds offering a variety of investment disciplines and providing a large variety of mutual fund investor services. The Board noted that Fidelity had taken, or had made recommendations that resulted in the Fidelity funds taking, a number of actions over the previous year that benefited particular funds, including: (i) continuing to dedicate additional resources to Fidelity's investment research process, which includes meetings with management of issuers of securities in which the funds invest, and to the support of the senior management team that oversees asset management; (ii) continuing efforts to enhance Fidelity's global research capabilities; (iii) launching new funds and making other enhancements to meet client needs; (iv) launching new share classes of existing funds; (v) eliminating purchase minimums and broadening eligibility requirements for certain funds and share classes; (vi) reducing management fees and total expenses for certain growth equity funds and index funds; (vii) lowering expense caps for certain existing funds and classes, and converting certain voluntary expense caps to contractual caps, to reduce expenses borne by shareholders; (viii) eliminating short-term redemption fees for funds that had such fees; (ix) rationalizing product lines and gaining increased efficiencies from fund mergers and share class consolidations; (x) continuing to develop, acquire and implement systems and technology to improve services to the funds and shareholders, strengthen information security, and increase efficiency; and (xi) continuing to implement enhancements to further strengthen Fidelity's product line to increase investors' probability of success in achieving their investment goals, including retirement income goals.
Investment Performance. The Board considered whether the fund has operated in accordance with its investment objective, as well as its record of compliance with its investment restrictions and its performance history.
The Board took into account discussions that occur at Board meetings throughout the year with representatives of the Investment Advisers about fund investment performance. In this regard the Board noted that as part of regularly scheduled fund reviews and other reports to the Board on fund performance, the Board considers annualized return information for the fund for different time periods, measured against an appropriate securities market index ("benchmark index") and a peer group of funds with similar objectives ("peer group"), if any. In its evaluation of fund investment performance at meetings throughout the year, the Board gave particular attention to information indicating underperformance of certain Fidelity funds for specific time periods and discussed with the Investment Advisers the reasons for such underperformance.
In addition to reviewing absolute and relative fund performance, the Independent Trustees periodically consider the appropriateness of fund performance metrics in evaluating the results achieved. In general, the Independent Trustees believe that fund performance should be evaluated based on gross performance (before fees and expenses but after transaction costs) compared to appropriate benchmark indices, over appropriate time periods that may include full market cycles, and on net performance (after fees and expenses) compared to peer groups, as applicable, over the same periods, taking into account relevant factors including the following: general market conditions; expectations for interest rate levels and credit conditions; issuer-specific information including credit quality; the potential for incremental return versus the fund's benchmark index weighed against the risks involved in obtaining that incremental return, including the risk of diminished or negative total returns; and fund cash flows and other factors. Depending on the circumstances, the Independent Trustees may be satisfied with a fund's performance notwithstanding that it lags its benchmark index or peer group for certain periods.
The Independent Trustees recognize that shareholders evaluate performance on a net basis over their own holding periods, for which one-, three-, and five-year periods are often used as a proxy. For this reason, the performance information reviewed by the Board also included net cumulative calendar year total return information for the fund and an appropriate benchmark index and peer group for the most recent one-, three-, and five-year periods.
Based on its review, the Board concluded that the nature, extent, and quality of services provided to the fund under the Advisory Contracts should continue to benefit the shareholders of the fund.
Competitiveness of Management Fee and Total Expense Ratio. The Board considered the fund's management fee and total expense ratio compared to "mapped groups" of competitive funds and classes created for the purpose of facilitating the Trustees' competitive analysis of management fees and total expenses. Fidelity creates "mapped groups" by combining similar Lipper investment objective categories that have comparable investment mandates. Combining Lipper investment objective categories aids the Board's management fee and total expense ratio comparisons by broadening the competitive group used for comparison.
Management Fee. The Board considered two proprietary management fee comparisons for the 12-month periods shown in basis points (BP) in the chart below. The group of Lipper funds used by the Board for management fee comparisons is referred to below as the "Total Mapped Group" and, for the reasons explained above, is broader than the Lipper peer group used by the Board for performance comparisons. The Total Mapped Group comparison focuses on a fund's standing in terms of gross management fees before expense reimbursements or caps relative to the total universe of funds with comparable investment mandates, regardless of whether their management fee structures also are comparable. Funds with comparable investment mandates offer exposure to similar types of securities. Funds with comparable management fee structures have similar management fee contractual arrangements (
e.g., flat rate charged for advisory services, all-inclusive fee rate,
etc.). "TMG %" represents the percentage of funds in the Total Mapped Group that had management fees that were lower than the fund's. For example, a hypothetical TMG % of 20% would mean that 80% of the funds in the Total Mapped Group had higher, and 20% had lower, management fees than the fund. The fund's actual TMG %s and the number of funds in the Total Mapped Group are in the chart below. The "Asset-Size Peer Group" (ASPG) comparison focuses on a fund's standing relative to a subset of non-Fidelity funds within the Total Mapped Group that are similar in size and management fee structure. For example, if a fund is in the first quartile of the ASPG, the fund's management fee ranks in the least expensive or lowest 25% of funds in the ASPG. The ASPG represents at least 15% of the funds in the Total Mapped Group with comparable asset size and management fee structures, subject to a minimum of 50 funds (or all funds in the Total Mapped Group if fewer than 50). Additional information, such as the ASPG quartile in which the fund's management fee rate ranked, is also included in the chart and was considered by the Board.
Fidelity Municipal Income Fund
The Board noted that the fund's management fee rate ranked below the median of its Total Mapped Group and below the median of its ASPG for 2017.
The Board noted that it and the boards of other Fidelity funds formed an ad hoc Committee on Group Fee, which meets periodically, to conduct an in-depth review of the "group fee" component of the management fee of funds with such management fee structures. The Committee's focus included the mechanics of the group fee, the competitive landscape of group fee structures, Fidelity funds with no group fee component and investment products not included in group fee assets. The Board also considered that, for funds subject to the group fee, FMR agreed to voluntarily waive fees over a specified period of time in amounts designed to account for assets converted from certain funds to certain collective investment trusts.
Based on its review, the Board concluded that the fund's management fee is fair and reasonable in light of the services that the fund receives and the other factors considered.
Total Expense Ratio. In its review of the fund's total expense ratio, the Board considered the fund's management fee rate as well as other fund expenses, such as transfer agent fees, pricing and bookkeeping fees, and custodial, legal, and audit fees. The Board also noted that Fidelity may agree to waive fees and expenses from time to time, and the extent to which, if any, it has done so for the fund. As part of its review, the Board also considered the current and historical total expense ratios of the fund compared to competitive fund median expenses. The fund is compared to those funds and classes in the Total Mapped Group (used by the Board for management fee comparisons) that have a similar sales load structure.
The Board noted that the fund's total expense ratio ranked below the competitive median for 2017.
Fees Charged to Other Fidelity Clients. The Board also considered Fidelity fee structures and other information with respect to clients of Fidelity, such as other funds advised or subadvised by Fidelity, pension plan clients, and other institutional clients with similar mandates. The Board noted that a joint ad hoc committee created by it and the boards of other Fidelity funds periodically reviews and compares Fidelity's institutional investment advisory business with its business of providing services to the Fidelity funds and also noted the most recent findings of the committee. The Board noted that the committee's review included a consideration of the differences in services provided, fees charged, and costs incurred, as well as competition in the markets serving the different categories of clients.
Based on its review of total expense ratios and fees charged to other Fidelity clients, the Board concluded that the fund's total expense ratio was reasonable in light of the services that the fund and its shareholders receive and the other factors considered.
Costs of the Services and Profitability. The Board considered the revenues earned and the expenses incurred by Fidelity in conducting the business of developing, marketing, distributing, managing, administering and servicing the fund and servicing the fund's shareholders. The Board also considered the level of Fidelity's profits in respect of all the Fidelity funds.
On an annual basis, Fidelity presents to the Board information about the profitability of its relationships with the fund. Fidelity calculates profitability information for each fund, as well as aggregate profitability information for groups of Fidelity funds and all Fidelity funds, using a series of detailed revenue and cost allocation methodologies which originate with the books and records of Fidelity on which Fidelity's audited financial statements are based. The Audit Committee of the Board reviews any significant changes from the prior year's methodologies.
PricewaterhouseCoopers LLP (PwC), auditor to Fidelity and certain Fidelity funds, has been engaged annually by the Board as part of the Board's assessment of Fidelity's profitability analysis. PwC's engagement includes the review and assessment of the methodologies used by Fidelity in determining the revenues and expenses attributable to Fidelity's mutual fund business, and completion of agreed-upon procedures in respect of the mathematical accuracy of the fund profitability information and its conformity to established allocation methodologies. After considering PwC's reports issued under the engagement and information provided by Fidelity, the Board concluded that while other allocation methods may also be reasonable, Fidelity's profitability methodologies are reasonable in all material respects.
The Board also reviewed Fidelity's non-fund businesses and potential indirect benefits such businesses may have received as a result of their association with Fidelity's mutual fund business (i.e., fall-out benefits) as well as cases where Fidelity's affiliates may benefit from the fund's business. The Board noted that changes to fall-out benefits year-over-year reflect business developments at Fidelity's various businesses.
The Board considered the costs of the services provided by and the profits realized by Fidelity in connection with the operation of the fund and was satisfied that the profitability was not excessive.
Economies of Scale. The Board considered whether there have been economies of scale in respect of the management of the Fidelity funds, whether the Fidelity funds (including the fund) have appropriately benefited from any such economies of scale, and whether there is potential for realization of any further economies of scale. The Board considered the extent to which the fund will benefit from economies of scale as assets grow through increased services to the fund, through waivers or reimbursements, or through fee or expense ratio reductions. The Board also noted that a committee (the Economies of Scale Committee) created by it and the boards of other Fidelity funds periodically analyzes whether Fidelity attains economies of scale in respect of the management and servicing of the Fidelity funds, whether the Fidelity funds have appropriately benefited from such economies of scale, and whether there is potential for realization of any further economies of scale.
The Board recognized that the fund's management contract incorporates a "group fee" structure, which provides for lower group fee rates as total group assets increase, and for higher group fee rates as total group assets decrease (with "group assets" defined to include fund assets under FMR's management plus the assets of sector funds previously under FMR's management). FMR calculates the group fee rates based on a tiered asset "breakpoint" schedule that varies based on asset class. The Board considered that the group fee is designed to deliver the benefits of economies of scale to fund shareholders when total Fidelity fund assets increase, even if assets of any particular fund are unchanged or have declined, because some portion of Fidelity's costs are attributable to services provided to all Fidelity funds, and all funds benefit if those costs can be allocated among more assets. The Board concluded that, given the group fee structure, fund shareholders will benefit from lower management fees as group assets increase at the fund complex level, regardless of whether Fidelity achieves any such economies of scale.
The Board concluded, taking into account the analysis of the Economies of Scale Committee, that economies of scale, if any, are being appropriately shared between fund shareholders and Fidelity.
Additional Information Requested by the Board. In order to develop fully the factual basis for consideration of the Fidelity funds' advisory contracts, the Board requested and received additional information on certain topics, including: (i) Fidelity's fund profitability methodology, profitability trends for certain funds, the allocation of various costs to different funds, and the impact of certain factors on fund profitability results; (ii) portfolio manager changes that have occurred during the past year and the amount of the investment that each portfolio manager has made in the Fidelity fund(s) that he or she manages; (iii) Fidelity's compensation structure for portfolio managers, research analysts, and other key personnel, including its effects on fund profitability, the rationale for the compensation structure, and the extent to which current market conditions have affected retention and recruitment; (iv) the arrangements with and compensation paid to certain fund sub-advisers on behalf of the Fidelity funds and the treatment of such compensation within Fidelity's fund profitability methodology; (v) the terms of Fidelity's voluntary expense limitation agreements; (vi) the methodology with respect to competitive fund data and peer group classifications; (vii) Fidelity's transfer agent fee, expense, and service structures for different funds and classes relative to competitive trends, and the impact of the increased use of omnibus accounts; (viii) new developments in the retail and institutional marketplaces and the competitive positioning of the funds relative to other investment products and services; (ix) the impact of recent changes to the money market fund landscape, including the full implementation of money market fund reform and rising interest rates, on Fidelity's money market funds; (x) the funds' share class structures and distribution channels; and (xi) explanations regarding the relative total expense ratios of certain funds and classes, total expense competitive trends and methodologies for total expense competitive comparisons, and actions that might be taken by Fidelity to reduce total expense ratios for certain classes. In addition, the Board considered its discussions with Fidelity throughout the year regarding enhanced information security initiatives and the funds' fair valuation policies.
Based on its evaluation of all of the conclusions noted above, and after considering all factors it believed relevant, the Board concluded that the advisory fee arrangements are fair and reasonable, and that the fund's Advisory Contracts should be renewed.
Corporate Headquarters
245 Summer St.
Boston, MA 02210
www.fidelity.com
AHIY-ANN-0219
1.9886976.100
Item 2.
Code of Ethics
As of the end of the period, December 31, 2018, Fidelity Municipal Trust (the trust) has adopted a code of ethics, as defined in Item 2 of Form N-CSR, that applies to its President and Treasurer and its Chief Financial Officer. A copy of the code of ethics is filed as an exhibit to this Form N-CSR.
Item 3.
Audit Committee Financial Expert
The Board of Trustees of the trust has determined that Elizabeth S. Acton is an audit committee financial expert, as defined in Item 3 of Form N-CSR. Ms. Acton is independent for purposes of Item 3 of Form N-CSR.
Item 4.
Principal Accountant Fees and Services
Fees and Services
The following table presents fees billed by PricewaterhouseCoopers LLP (“PwC”) in each of the last two fiscal years for services rendered to Fidelity Conservative Income Municipal Bond Fund, Fidelity Flex Conservative Income Municipal Bond Fund, Fidelity Flex Municipal Income Fund, Fidelity Limited Term Municipal Income Fund, Fidelity Michigan Municipal Income Fund, Fidelity Minnesota Municipal Income Fund, Fidelity Municipal Income Fund, Fidelity Ohio Municipal Income Fund and Fidelity Pennsylvania Municipal Income Fund (the “Funds”):
Services Billed by PwC
December 31, 2018 FeesA
| | | | |
| Audit Fees | Audit-Related Fees | Tax Fees | All Other Fees |
Fidelity Conservative Income Municipal Bond Fund | $50,000 | $4,100 | $2,200 | $2,400 |
Fidelity Flex Conservative Income Municipal Bond Fund | $44,000 | $3,700 | $2,800 | $2,200 |
Fidelity Flex Municipal Income Fund | $44,000 | $3,700 | $2,800 | $2,200 |
Fidelity Limited Term Municipal Income Fund | $57,000 | $4,700 | $2,200 | $2,700 |
Fidelity Michigan Municipal Income Fund | $48,000 | $4,000 | $2,200 | $2,300 |
Fidelity Minnesota Municipal Income Fund | $48,000 | $4,000 | $2,200 | $2,300 |
Fidelity Municipal Income Fund | $63,000 | $5,200 | $5,300 | $3,000 |
Fidelity Ohio Municipal Income Fund | $48,000 | $4,000 | $2,200 | $2,300 |
Fidelity Pennsylvania Municipal Income Fund | $48,000 | $4,000 | $2,200 | $2,300 |
December 31, 2017 FeesA,B
| | | | |
| Audit Fees | Audit-Related Fees | Tax Fees | All Other Fees |
Fidelity Conservative Income Municipal Bond Fund | $40,000 | $3,600 | $2,400 | $1,800 |
Fidelity Flex Conservative Income Municipal Bond Fund | $44,000 | $700 | $2,400 | $300 |
Fidelity Flex Municipal Income Fund | $44,000 | $700 | $2,400 | $300 |
Fidelity Limited Term Municipal Income Fund | $46,000 | $4,100 | $2,400 | $2,100 |
Fidelity Michigan Municipal Income Fund | $46,000 | $4,200 | $2,400 | $2,100 |
Fidelity Minnesota Municipal Income Fund | $46,000 | $4,200 | $2,400 | $2,100 |
Fidelity Municipal Income Fund | $62,000 | $5,500 | $2,400 | $2,800 |
Fidelity Ohio Municipal Income Fund | $46,000 | $4,200 | $2,400 | $2,100 |
Fidelity Pennsylvania Municipal Income Fund | $46,000 | $4,200 | $2,400 | $2,100 |
AAmounts may reflect rounding.
BFidelity Flex Conservative Income Municipal Bond Fund and Fidelity Flex Municipal Income Fund commenced operations on October 12, 2017.
The following table presents fees billed by PwC that were required to be approved by the Audit Committee for services that relate directly to the operations and financial reporting of the Funds and that are rendered on behalf of Fidelity Management & Research Company (“FMR”) and entities controlling, controlled by, or under common control with FMR (not including any sub-adviser whose role is primarily portfolio management and is subcontracted with or overseen by another investment adviser) that provide ongoing services to the Funds (“Fund Service Providers”):
Services Billed by PwC
| | |
| December 31, 2018A | December 31, 2017A,B |
Audit-Related Fees | $7,930,000 | $8,470,000 |
Tax Fees | $20,000 | $160,000 |
All Other Fees | $- | $- |
A Amounts may reflect rounding.
BMay include amounts billed prior to the Fidelity Flex Conservative Income Municipal Bond Fund and Fidelity Flex Municipal Income Fund’s commencement of operations.
“Audit-Related Fees” represent fees billed for assurance and related services that are reasonably related to the performance of the fund audit or the review of the fund's financial statements and that are not reported under Audit Fees.
“Tax Fees” represent fees billed for tax compliance, tax advice or tax planning that relate directly to the operations and financial reporting of the fund.
“All Other Fees” represent fees billed for services provided to the fund or Fund Service Provider, a significant portion of which are assurance related, that relate directly to the operations and financial reporting of the fund, excluding those services that are reported under Audit Fees, Audit-Related Fees or Tax Fees.
Assurance services must be performed by an independent public accountant.
* * *
The aggregate non-audit fees billed by PwC for services rendered to the Funds, FMR (not including any sub-adviser whose role is primarily portfolio management and is subcontracted with or overseen by another investment adviser), and any Fund Service Provider for each of the last two fiscal years of the Funds are as follows:
| | |
Billed By | December 31, 2018A | December 31, 2017A,B |
PwC | $11,210,000 | $10,785,000 |
A Amounts may reflect rounding.
BMay include amounts billed prior to the Fidelity Flex Conservative Income Municipal Bond Fund and Fidelity Flex Municipal Income Fund’s commencement of operations.
The trust's Audit Committee has considered non-audit services that were not pre-approved that were provided by PwC to Fund Service Providers to be compatible with maintaining the independence of PwC in its audit of the Funds, taking into account representations from PwC, in accordance with Public Company Accounting Oversight Board rules, regarding its independence from the Funds and their related entities and FMR’s review of the appropriateness and permissibility under applicable law of such non-audit services prior to their provision to the Fund Service Providers.
Audit Committee Pre-Approval Policies and Procedures
The trust’s Audit Committee must pre-approve all audit and non-audit services provided by a fund’s independent registered public accounting firm relating to the operations or financial reporting of the fund. Prior to the commencement of any audit or non-audit services to a fund, the Audit Committee reviews the services to determine whether they are appropriate and permissible under applicable law.
The Audit Committee has adopted policies and procedures to, among other purposes, provide a framework for the Committee’s consideration of non-audit services by the audit firms that audit the Fidelity funds. The policies and procedures require that any non-audit service provided by a fund audit firm to a Fidelity fund and any non-audit service provided by a fund auditor to a Fund Service Provider that relates directly to the operations and financial reporting of a Fidelity fund (“Covered Service”) are subject to approval by the Audit Committee before such service is provided.
All Covered Services must be approved in advance of provision of the service either: (i) by formal resolution of the Audit Committee, or (ii) by oral or written approval of the service by the Chair of the Audit Committee (or if the Chair is unavailable, such other member of the Audit Committee as may be designated by the Chair to act in the Chair’s absence). The approval contemplated by (ii) above is permitted where the Treasurer determines that action on such an engagement is necessary before the next meeting of the Audit Committee.
Non-audit services provided by a fund audit firm to a Fund Service Provider that do not relate directly to the operations and financial reporting of a Fidelity fund are reported to the Audit Committee periodically.
Non-Audit Services Approved Pursuant to Rule 2-01(c)(7)(i)(C) and (ii) of Regulation S-X (“De Minimis Exception”)
There were no non-audit services approved or required to be approved by the Audit Committee pursuant to the De Minimis Exception during the Funds’ last two fiscal years relating to services provided to (i) the Funds or (ii) any Fund Service Provider that relate directly to the operations and financial reporting of the Funds.
Item 5.
Audit Committee of Listed Registrants
Not applicable.
Item 6.
Investments
(a)
Not applicable.
(b)
Not applicable
Item 7.
Disclosure of Proxy Voting Policies and Procedures for Closed-End Management Investment Companies
Not applicable.
Item 8.
Portfolio Managers of Closed-End Management Investment Companies
Not applicable.
Item 9.
Purchase of Equity Securities by Closed-End Management Investment Company and Affiliated Purchasers
Not applicable.
Item 10.
Submission of Matters to a Vote of Security Holders
There were no material changes to the procedures by which shareholders may recommend nominees to the trust’s Board of Trustees.
Item 11.
Controls and Procedures
(a)(i) The President and Treasurer and the Chief Financial Officer have concluded that the trust’s disclosure controls and procedures (as defined in Rule 30a-3(c) under the Investment Company Act) provide reasonable assurances that material information relating to the trust is made known to them by the appropriate persons, based on their evaluation of these controls and procedures as of a date within 90 days of the filing date of this report.
(a)(ii) There was no change in the trust’s internal control over financial reporting (as defined in Rule 30a-3(d) under the Investment Company Act) that occurred during the period covered by this report that has materially affected, or is reasonably likely to materially affect, the trust’s internal control over financial reporting.
Item 12.
Disclosure of Securities Lending Activities for Closed-End Management
Investment Companies
Not applicable.
Item 13.
Exhibits
| | |
(a) | (1) | Code of Ethics pursuant to Item 2 of Form N-CSR is filed and attached hereto as EX-99.CODE ETH. |
(a) | (2) | Certification pursuant to Rule 30a-2(a) under the Investment Company Act of 1940 (17 CFR 270.30a-2(a)) is filed and attached hereto as Exhibit 99.CERT. |
(a) | (3) | Not applicable. |
(b) | | Certification pursuant to Rule 30a-2(b) under the Investment Company Act of 1940 (17 CFR 270.30a-2(b)) is furnished and attached hereto as Exhibit 99.906CERT. |
SIGNATURES
Pursuant to the requirements of the Securities Exchange Act of 1934 and the Investment Company Act of 1940, the registrant has duly caused this report to be signed on its behalf by the undersigned, thereunto duly authorized.
Fidelity Municipal Trust
| |
By: | /s/Laura M. Del Prato |
| Laura M. Del Prato |
| President and Treasurer |
| |
Date: | February 26, 2019 |
Pursuant to the requirements of the Securities Exchange Act of 1934 and the Investment Company Act of 1940, this report has been signed below by the following persons on behalf of the registrant and in the capacities and on the dates indicated.
| |
By: | /s/Laura M. Del Prato |
| Laura M. Del Prato |
| President and Treasurer |
| |
Date: | February 26, 2019 |
| |
By: | /s/John J. Burke III |
| John J. Burke III |
| Chief Financial Officer |
| |
Date: | February 26, 2019 |