UNITED STATES
SECURITIES AND EXCHANGE COMMISSION
Washington, D.C. 20549
FORM N-CSR
CERTIFIED SHAREHOLDER REPORT OF REGISTERED
MANAGEMENT INVESTMENT COMPANIES
Investment Company Act file number 811-3221
Fidelity Charles Street Trust
(Exact name of registrant as specified in charter)
82 Devonshire St., Boston, Massachusetts 02109
(Address of principal executive offices) (Zip code)
Scott C. Goebel, Secretary
82 Devonshire St.
Boston, Massachusetts 02109
(Name and address of agent for service)
Registrant's telephone number, including area code: 617-563-7000
Date of fiscal year end: | September 30 |
| |
Date of reporting period: | September 30, 2008 |
Item 1. Reports to Stockholders
Fidelity Asset Manager® Funds -
20%, 30%, 40%, 50%, 60%, 70%, 85%
Annual Report
September 30, 2008
(2_fidelity_logos) (Registered_Trademark)
Contents
To view a fund's proxy voting guidelines and proxy voting record for the 12-month period ended June 30, visit http://www.fidelity.com (search for "proxy voting guidelines") or visit the Securities and Exchange Commission's (SEC) web site at http://www.sec.gov. You may also call 1-800-544-8544 to request a free copy of the proxy voting guidelines.
Standard & Poor's, S&P and S&P 500 are registered service marks of The McGraw-Hill Companies, Inc. and have been licensed for use by Fidelity Distributors Corporation.
Other third party marks appearing herein are the property of their respective owners.
All other marks appearing herein are registered or unregistered trademarks or service marks of FMR LLC or an affiliated company.
Annual Report
This report and the financial statements contained herein are submitted for the general information of the shareholders of the funds. This report is not authorized for distribution to prospective investors in the funds unless preceded or accompanied by an effective prospectus.
A fund files its complete schedule of portfolio holdings with the SEC for the first and third quarters of each fiscal year on Form N-Q. Forms N-Q are available on the SEC's web site at http://www.sec.gov. A fund's Forms N-Q may be reviewed and copied at the SEC's Public Reference Room in Washington, DC. Information regarding the operation of the SEC's Public Reference Room may be obtained by calling 1-800-SEC-0330. For a complete list of a fund's portfolio holdings, view the most recent holdings listing, semiannual report, or annual report on Fidelity's web site at http://www.fidelity.com or http://www.advisor.fidelity.com, as applicable.
NOT FDIC INSURED · MAY LOSE VALUE · NO BANK GUARANTEE
Neither the funds nor Fidelity Distributors Corporation is a bank.
Annual Report
Dear Shareholder:
Turmoil has been the watchword for the world's securities markets in 2008, with domestic and international stocks down sharply amid the global credit squeeze. A flight to quality boosted returns for U.S. Treasuries, one of the few asset classes with positive results heading into the latter stages of the year. Financial markets are always unpredictable, but there are a number of time-tested principles that can put the historical odds in your favor.
One of the basic tenets is to invest for the long term. Over time, riding out the markets' inevitable ups and downs has proven much more effective than selling into panic or chasing the hottest trend. Even missing only a few of the markets' best days can significantly diminish investor returns. Patience also affords the benefits of compounding - of earning interest on additional income or reinvested dividends and capital gains. There are tax advantages and cost benefits to consider as well. The more you sell, the more taxes you pay, and the more you trade, the higher the costs. While staying the course doesn't eliminate risk, it can considerably lessen the effect of short-term declines.
You can further manage your investing risk through diversification. And today, more than ever, geographic diversification should be taken into account. Studies
indicate that asset allocation is the single most important determinant of a portfolio's long-term success. The right mix of stocks, bonds and cash - aligned to your particular risk tolerance and investment objective - is very important. Age-appropriate rebalancing is also an essential aspect of asset allocation. For younger investors, an emphasis on equities - which historically have been the best-performing asset class over time - is encouraged. As investors near their specific goal, such as retirement or sending a child to college, consideration may be given to replacing volatile assets (e.g. common stocks) with more-stable fixed investments (bonds or savings plans).
A third investment principle - investing regularly - can help lower the average cost of your purchases. Investing a certain amount of money each month or quarter helps ensure you won't pay for all your shares at market highs. This strategy - known as dollar cost averaging - also reduces unconstructive "emotion" from investing, helping shareholders avoid selling weak performers just prior to an upswing, or chasing a hot performer just before a correction.
We invite you to contact us via the Internet, through our Investor Centers or over the phone. It is our privilege to provide you the information you need to make the investments that are right for you.
Sincerely,
/s/Edward C. Johnson 3d
Edward C. Johnson 3d
Annual Report
Fidelity Asset Manager 20%
Average annual total return reflects the change in the value of an investment, assuming reinvestment of the class's dividend income and capital gains (the profits earned upon the sale of securities that have grown in value, if any) and assuming a constant rate of performance each year. The $10,000 table and the fund's returns do not reflect the deduction of taxes that a shareholder would pay on fund distributions or the redemption of fund shares. During periods of reimbursement by Fidelity, a fund's total return will be greater than it would be had the reimbursement not occurred. How a fund did yesterday is no guarantee of how it will do tomorrow.
Average Annual Total Returns
Periods ended September 30, 2008 | Past 1
year | Past 5
years | Past 10
years |
Asset Manager 20% | -6.90% | 4.19% | 4.58% |
$10,000 Over 10 Years
Let's say hypothetically that $10,000 was invested in Asset Manager 20%, a class of the fund, on September 30, 1998. The chart shows how the value of your investment would have changed, and also shows how the Lehman Brothers® U.S. Aggregate Index performed over the same period.
-
Annual Report
Fidelity Asset Manager 30%
Performance: The Bottom Line
Average annual total return reflects the change in the value of an investment, assuming reinvestment of the class' dividend income and capital gains (the profits earned upon the sale of securities that have grown in value, if any) and assuming a constant rate of performance each year. The $10,000 table and the fund's returns do not reflect the deduction of taxes that a shareholder would pay on fund distributions or the redemption of fund shares. During periods of reimbursement by Fidelity, a fund's total return will be greater than it would be had the reimbursement not occurred. How a fund did yesterday is no guarantee of how it will do tomorrow.
Average annual total returns take Asset Manager 30%'s cumulative total return and show you what would have happened if Asset Manager 30% shares had performed at a constant rate each year. These numbers will be reported once the fund is a year old.
$10,000 Over Life of Fund
Let's say hypothetically that $10,000 was invested in Asset Manager 30%, a class of the fund, on October 9, 2007, when the fund started. The chart shows how the value of your investment would have changed, and also shows how the Lehman Brothers® U.S. Aggregate Index performed over the same period.
Annual Report
Fidelity Asset Manager 40%
Performance: The Bottom Line
Average annual total return reflects the change in the value of an investment, assuming reinvestment of the class' dividend income and capital gains (the profits earned upon the sale of securities that have grown in value, if any) and assuming a constant rate of performance each year. The $10,000 table and the fund's returns do not reflect the deduction of taxes that a shareholder would pay on fund distributions or the redemption of fund shares. During periods of reimbursement by Fidelity, a fund's total return will be greater than it would be had the reimbursement not occurred. How a fund did yesterday is no guarantee of how it will do tomorrow.
Average annual total returns take Asset Manager 40%'s cumulative total return and show you what would have happened if Asset Manager 40% shares had performed at a constant rate each year. These numbers will be reported once the fund is a year old.
$10,000 Over Life of Fund
Let's say hypothetically that $10,000 was invested in Asset Manager 40%, a class of the fund, on Ocotber 9, 2007, when the fund started. The chart shows how the value of your investment would have changed, and also shows how the Lehman Brothers U.S. Aggregate Index performed over the same period.
Annual Report
Fidelity Asset Manager 50%
Performance: The Bottom Line
Average annual total return reflects the change in the value of an investment, assuming reinvestment of the class' dividend income and capital gains (the profits earned upon the sale of securities that have grown in value, if any) and assuming a constant rate of performance each year. The $10,000 table and the fund's returns do not reflect the deduction of taxes that a shareholder would pay on fund distributions or the redemption of fund shares. During periods of reimbursement by Fidelity, a fund's total return will be greater than it would be had the reimbursement not occurred. How a fund did yesterday is no guarantee of how it will do tomorrow.
Average Annual Total Returns
Periods ended September 30, 2008 | Past 1
year | Past 5
years | Past 10
years |
Asset Manager 50% | -16.34% | 2.73% | 4.00% |
$10,000 Over 10 Years
Let's say hypothetically that $10,000 was invested in Asset Manager 50%, a class of the fund, on September 30, 1998. The chart shows how the value of your investment would have changed, and also shows how the Standard & Poor's 500 SM Index (S&P 500 ®) performed over the same period.
Annual Report
Fidelity Asset Manager 60%
Performance: The Bottom Line
Average annual total return reflects the change in the value of an investment, assuming reinvestment of the class' dividend income and capital gains (the profits earned upon the sale of securities that have grown in value, if any) and assuming a constant rate of performance each year. The $10,000 table and the fund's returns do not reflect the deduction of taxes that a shareholder would pay on fund distributions or the redemption of fund shares. During periods of reimbursement by Fidelity, a fund's total return will be greater than it would be had the reimbursement not occurred. How a fund did yesterday is no guarantee of how it will do tomorrow.
Average annual total returns take Asset Manager 60%'s cumulative total return and show you what would have happened if Asset Manager 60% shares had performed at a constant rate each year. These numbers will be reported once the fund is a year old.
$10,000 Over Life of Fund
Let's say hypothetically that $10,000 was invested in Asset Manager 60%, a class of the fund, on October 9, 2007, when the fund started. The chart shows how the value of your investment would have changed, and also shows how the S&P 500 performed over the same period.

Annual Report
Fidelity Asset Manager 70%
Performance: The Bottom Line
Average annual total return reflects the change in the value of an investment, assuming reinvestment of the class' dividend income and capital gains (the profits earned upon the sale of securities that have grown in value, if any) and assuming a constant rate of performance each year. The $10,000 table and the fund's returns do not reflect the deduction of taxes that a shareholder would pay on fund distributions or the redemption of fund shares. During periods of reimbursement by Fidelity, a fund's total return will be greater than it would be had the reimbursement not occurred. How a fund did yesterday is no guarantee of how it will do tomorrow.
Average Annual Total Returns
Periods ended September 30, 2008 | Past 1
year | Past 5
years | Past 10
years |
Asset Manager 70% | -21.46% | 2.48% | 2.61% |
$10,000 Over 10 Years
Let's say hypothetically that $10,000 was invested in Asset Manager 70%, a class of the fund, on September 30, 1998. The chart shows how the value of your investment would have changed, and also shows how the S&P 500 Index performed over the same period.
Annual Report
Fidelity Asset Manager 85%
Performance: The Bottom Line
Average annual total return reflects the change in the value of an investment, assuming reinvestment of the class' dividend income and capital gains (the profits earned upon the sale of securities that have grown in value, if any) and assuming a constant rate of performance each year. The $10,000 table and the fund's returns do not reflect the deduction of taxes that a shareholder would pay on fund distributions or the redemption of fund shares. During periods of reimbursement by Fidelity, a fund's total return will be greater than it would be had the reimbursement not occurred. How a fund did yesterday is no guarantee of how it will do tomorrow.
Average Annual Total Returns
Periods ended September 30, 2008 | Past 1
year | Past 5
years | Life of
fundA |
Asset Manager 85% | -24.43% | 4.55% | 2.67% |
A From September 24, 1999
$10,000 Over Life of Fund
Let's say hypothetically that $10,000 was invested in Asset Manager 85%, a class of the fund, on September 24, 1999, when the fund started. The chart shows how the value of your investment would have changed, and also shows how the S&P 500 performed over the same period.
Annual Report
Comments from Derek Young, who became sole Portfolio Manager of Fidelity Asset Manager® Funds on July 1, 2008
The Standard & Poor's 500SM Index declined 21.98% during the 12-month period ending September 30, 2008, amid a backdrop of falling home values, tight credit and scarce liquidity. Of the 10 major market sectors represented in the S&P 500®, only one managed a positive return: consumer staples, which barely nudged into the black with an increase of just under 1%. The remaining nine all suffered double-digit losses, led by the roughly 39% decline of the financials sector. In the final quarter of the period, under the strain of the credit crisis and dwindling capital, several of the largest institutions on Wall Street went bankrupt, were forced into acquisitions or were seized by the U.S. government. The Dow Jones Industrial AverageSM plummeted roughly 778 points on September 29 - its worst single-day point loss ever - and was down 19.85% for the year as a whole. International stocks fared much worse than their domestic counterparts. The MSCI® Europe, Australasia, Far East (EAFE®) Index - a performance monitor of developed markets outside the United States and Canada - fell 30.39%, a loss exacerbated by the renewed strength of the U.S. dollar. Unlike the stock market, the overall investment-grade bond market was positive, gaining 3.65% as measured by the Lehman Brothers® U.S. Aggregate Index. Conversely, the Merrill Lynch® U.S. High Yield Master II Constrained Index, a gauge of lower-quality but typically higher-yielding debt, dropped 11.09%.
The past year was a difficult stretch for the Asset Managers amid increasingly treacherous market conditions. Across the seven funds - including the 30%, 40% and 60% portfolios, which were just under a year old - greater exposure to riskier asset classes, such as equities, resulted in lower absolute returns and, in concert with weak overall security selection, a high degree of underperformance versus the composite benchmarks. (For fund-specific returns, please see the performance section of this report.) Security selection was decidedly negative in the equity and investment-grade bond categories, and asset allocation was ineffective this period. It was an unforgiving environment for riskier assets, as the burgeoning global financial crisis spawned a massive flight to quality. As such, it proved perilous to favor equities and high-yield/floating-rate debt - the latter of which was not represented in Asset Manager 85% - relative to stronger-performing investment-grade bonds and cash. An inherent growth orientation and bias toward higher-beta - meaning more-volatile - stocks were major factors working against us amid the sharp downturn in the market. In total, eight of the 10 underlying domestic equity sector central funds lagged their respective components of the Dow Jones Wilshire 5000 Composite IndexSM, with particularly weak results coming from technology, utilities, energy, consumer staples and financials - and with security selection to blame in each case. Conversely, the industrials sector is where we fared the best, driven by good stock picks. Consumer discretionary was the only other positive. Elsewhere, we struggled early in the period within the international equity component - not included in Asset Manager 20% and 30%, and which transitioned in December to a Fidelity central fund - and that loss more than offset the benefit from underweighting the foreign "sleeve." The funds' collective bond holdings trailed the Lehman Brothers U.S. Aggregate Index due to weak results from the investment-grade central fund, which had exposure to the sell-off in subprime mortgage securities. Although allocations to high yield and floating rate detracted, excess returns from the high-yield and floating-rate central funds helped curb some of the damage. The strategic cash component, including the money market central fund - in Asset Manager 20%, 50% and 70% - outperformed as well.
The views expressed above reflect those of the portfolio manager(s) only through the end of the period as stated on the cover of this report and do not necessarily represent the views of Fidelity or any other person in the Fidelity organization. Any such views are subject to change at any time based upon market or other conditions and Fidelity disclaims any responsibility to update such views. These views may not be relied on as investment advice and, because investment decisions for a Fidelity fund are based on numerous factors, may not be relied on as an indication of trading intent on behalf of any Fidelity fund.
Annual Report
The Funds invest in Fidelity Central Funds, which are open-end investment companies with similar investment objectives to those of the Funds, available only to other mutual funds and accounts managed by Fidelity Management & Research Company, (FMR) and its affiliates. In addition to the direct expenses incurred by the Funds presented in the table, as a shareholder of the underlying Fidelity Central Funds, the Funds also indirectly bear their proportionate share of the expenses of the underlying Fidelity Central Funds. These expenses are not included in the Funds' annualized expense ratio used to calculate either the actual or hypothetical expense estimates presented in the table below.
As a shareholder of a Fund, you incur two types of costs: (1) transaction costs, including sales charges (loads) on purchase payments or redemption proceeds, and (2) ongoing costs, including management fees, distribution and/or service (12b-1) fees and other Fund expenses. This Example is intended to help you understand your ongoing costs (in dollars) of investing in the Funds and to compare these costs with the ongoing costs of investing in other mutual funds.
The actual expense Example is based on an investment of $1,000 invested at the beginning of the period and held for the entire period (April 1, 2008 to September 30, 2008) for each class of Fidelity Asset Manager 20%, Fidelity Asset Manager 30%, Fidelity Asset Manager 40%, Fidelity Asset Manager 50%, Fidelity Asset Manager 60%, Fidelity Asset Manager 85% and Asset Manager 70% Class and for the entire period (September 23, 2008 to September 30, 2008) for Class A, T, B, C and Institutional Class of Fidelity Asset Manager 70% Fund.
The hypothetical expense Example is based on an investment of $1,000 invested for the one-half year period (April 1, 2008 to September 30, 2008).
Actual Expenses
The first line of the accompanying table for each class of each fund provides information about actual account values and actual expenses. You may use the information in this line, together with the amount you invested, to estimate the expenses that you paid over the period. Simply divide your account value by $1,000.00 (for example, an $8,600 account value divided by $1,000.00 = 8.6), then multiply the result by the number in the first line for a class of the fund under the heading entitled "Expenses Paid During Period" to estimate the expenses you paid on your account during this period. A small balance maintenance fee of $12.00 that is charged once a year may apply for certain accounts with a value of less than $2,000. This fee is not included in the table below. If it was, the estimate of expenses you paid during the period would be higher, and your ending account value lower, by this amount.
Hypothetical Example for Comparison Purposes
The second line of the accompanying table for each class of each fund provides information about hypothetical account values and hypothetical expenses based on a Class' actual expense ratio and an assumed rate of return of 5% per year before expenses, which is not the Class' actual return. The hypothetical account values and expenses may not be used to estimate the actual ending account balance or expenses you paid for the period. You may use this information to compare the ongoing costs of investing in the Fund and other funds. To do so, compare this 5% hypothetical example with the 5% hypothetical examples that appear in the shareholder reports of the other funds. A small balance maintenance fee of $12.00 that is charged once a year may apply for certain accounts with a value of less than $2,000. This fee is not included in the table below. If it was, the estimate of expenses you paid during the period would be higher, and your ending account value lower, by this amount.
Please note that the expenses shown in the table are meant to highlight your ongoing costs only and do not reflect any transaction costs. Therefore, the second line of the table is useful in comparing ongoing costs only, and will not help you determine the relative total costs of owning different funds. In addition, if these transactional costs were included, your costs would have been higher.
| Annualized
Expense Ratio | Beginning
Account Value | Ending
Account Value
September 30, 2008 | Expenses Paid
During Period |
Fidelity Asset Manager 20% | | | | |
Class A | .87% | | | |
Actual | | $ 1,000.00 | $ 952.90 | $ 4.25 B |
Hypothetical A | | $ 1,000.00 | $ 1,020.65 | $ 4.39 C |
Class T | 1.13% | | | |
Actual | | $ 1,000.00 | $ 951.70 | $ 5.51B |
Hypothetical A | | $ 1,000.00 | $ 1,019.35 | $ 5.70 C |
Class B | 1.66% | | | |
Actual | | $ 1,000.00 | $ 949.20 | $ 8.09 B* |
Hypothetical A | | $ 1,000.00 | $ 1,016.70 | $ 8.37 C* |
Class C | 1.65% | | | |
Actual | | $ 1,000.00 | $ 949.40 | $ 8.04 B |
Hypothetical A | | $ 1,000.00 | $ 1,016.75 | $ 8.32 C |
Asset Manager 20% | .56% | | | |
Actual | | $ 1,000.00 | $ 954.40 | $ 2.74 B |
Hypothetical A | | $ 1,000.00 | $ 1,022.20 | $ 2.83 C |
Institutional Class | .57% | | | |
Actual | | $ 1,000.00 | $ 953.60 | $ 2.78 B |
Hypothetical A | | $ 1,000.00 | $ 1,022.15 | $ 2.88 C |
| Annualized
Expense Ratio | Beginning
Account Value | Ending
Account Value
September 30, 2008 | Expenses Paid
During Period |
Fidelity Asset Manager 30% | | | | |
Class A | .94% | | | |
Actual | | $ 1,000.00 | $ 931.20 | $ 4.54B* |
HypotheticalA | | $ 1,000.00 | $ 1,020.30 | $ 4.75C* |
Class T | 1.18% | | | |
Actual | | $ 1,000.00 | $ 930.20 | $ 5.69B* |
Hypothetical A | | $ 1,000.00 | $ 1,019.10 | $ 5.96C* |
Class B | 1.68% | | | |
Actual | | $ 1,000.00 | $ 927.80 | $ 8.10B* |
HypotheticalA | | $ 1,000.00 | $ 1,016.60 | $ 8.47C* |
Class C | 1.70% | | | |
Actual | | $ 1,000.00 | $ 927.90 | $ 8.19B* |
Hypothetical A | | $ 1,000.00 | $ 1,016.50 | $ 8.57C* |
Asset Manager 30% | .69% | | | |
Actual | | $ 1,000.00 | $ 932.30 | $ 3.33B* |
Hypothetical A | | $ 1,000.00 | $ 1,021.55 | $ 3.49C* |
Institutional Class | .68% | | | |
Actual | | $ 1,000.00 | $ 932.30 | $ 3.28B* |
Hypothetical A | | $ 1,000.00 | $ 1,021.60 | $ 3.44C* |
Fidelity Asset Manager 40% | | | | |
Class A | .93% | | | |
Actual | | $ 1,000.00 | $ 920.20 | $ 4.46B* |
Hypothetical A | | $ 1,000.00 | $ 1,020.35 | $ 4.70C* |
Class T | 1.19% | | | |
Actual | | $ 1,000.00 | $ 918.20 | $ 5.71B* |
Hypothetical A | | $ 1,000.00 | $ 1,019.05 | $ 6.01C* |
Class B | 1.68% | | | |
Actual | | $ 1,000.00 | $ 915.70 | $ 8.05B* |
Hypothetical A | | $ 1,000.00 | $ 1,016.60 | $ 8.47C* |
Class C | 1.69% | | | |
Actual | | $ 1,000.00 | $ 916.50 | $ 8.10B* |
Hypothetical A | | $ 1,000.00 | $ 1,016.55 | $ 8.52C* |
Asset Manager 40% | .69% | | | |
Actual | | $ 1,000.00 | $ 921.40 | $ 3.31B* |
Hypothetical A | | $ 1,000.00 | $ 1,021.55 | $ 3.49C* |
Institutional Class | .68% | | | |
Actual | | $ 1,000.00 | $ 921.40 | $ 3.27B* |
Hypothetical A | | $ 1,000.00 | $ 1,021.60 | $ 3.44C* |
Fidelity Asset Manager 50% | | | | |
Class A | .99% | | | |
Actual | | $ 1,000.00 | $ 903.50 | $ 4.71B |
Hypothetical A | | $ 1,000.00 | $ 1,020.05 | $ 5.00C |
Class T | 1.24% | | | |
Actual | | $ 1,000.00 | $ 902.20 | $ 5.90B |
Hypothetical A | | $ 1,000.00 | $ 1,018.80 | $ 6.26C |
Class B | 1.80% | | | |
Actual | | $ 1,000.00 | $ 899.70 | $ 8.55B |
Hypothetical A | | $ 1,000.00 | $ 1,016.00 | $ 9.07C |
| Annualized
Expense Ratio | Beginning
Account Value | Ending
Account Value
September 30, 2008 | Expenses Paid
During Period |
Fidelity Asset Manager 50% | | | | |
Class C | 1.77% | | | |
Actual | | $ 1,000.00 | $ 899.80 | $ 8.41B |
Hypothetical A | | $ 1,000.00 | $ 1,016.15 | $ 8.92C |
Asset Manager 50% | .71% | | | |
Actual | | $ 1,000.00 | $ 903.90 | $ 3.38B |
Hypothetical A | | $ 1,000.00 | $ 1,021.45 | $ 3.59C |
Institutional Class | .67% | | | |
Actual | | $ 1,000.00 | $ 904.70 | $ 3.19B |
Hypothetical A | | $ 1,000.00 | $ 1,021.65 | $ 3.39C |
Fidelity Asset Manager 60% | | | | |
Class A | 1.12% | | | |
Actual | | $ 1,000.00 | $ 894.30 | $ 5.30B* |
Hypothetical A | | $ 1,000.00 | $ 1,019.40 | $ 5.65C* |
Class T | 1.37% | | | |
Actual | | $ 1,000.00 | $ 893.00 | $ 6.48B* |
Hypothetical A | | $ 1,000.00 | $ 1,018.15 | $ 6.91C* |
Class B | 1.88% | | | |
Actual | | $ 1,000.00 | $ 890.60 | $ 8.89B* |
Hypothetical A | | $ 1,000.00 | $ 1,015.60 | $ 9.47C* |
Class C | 1.88% | | | |
Actual | | $ 1,000.00 | $ 890.60 | $ 8.89B* |
Hypothetical A | | $ 1,000.00 | $ 1,015.60 | $ 9.47C* |
Asset Manager 60% | .87% | | | |
Actual | | $ 1,000.00 | $ 895.40 | $ 4.12B* |
Hypothetical A | | $ 1,000.00 | $ 1,020.65 | $ 4.39C* |
Institutional Class | .88% | | | |
Actual | | $ 1,000.00 | $ 895.40 | $ 4.17B* |
Hypothetical A | | $ 1,000.00 | $ 1,020.60 | $ 4.45C* |
Fidelity Asset Manager 70% | | | | |
Class A | 1.25% | | | |
Actual | | $ 1,000.00 | $ 963.20 | $ .27B |
Hypothetical A | | $ 1,000.00 | $ 1,018.75 | $ 6.31C |
Class T | 1.50% | | | |
Actual | | $ 1,000.00 | $ 963.20 | $ .32B |
Hypothetical A | | $ 1,000.00 | $ 1,017.50 | $ 7.57C |
Class B | 2.00% | | | |
Actual | | $ 1,000.00 | $ 963.20 | $ .43B |
Hypothetical A | | $ 1,000.00 | $ 1,015.00 | $ 10.08C |
Class C | 2.00% | | | |
Actual | | $ 1,000.00 | $ 963.20 | $ .43B |
Hypothetical A | | $ 1,000.00 | $ 1,015.00 | $ 10.08C |
Asset Manager 70% | .80% | | | |
Actual | | $ 1,000.00 | $ 877.00 | $ 3.75B |
Hypothetical A | | $ 1,000.00 | $ 1,021.00 | $ 4.04C |
Institutional Class | 1.00% | | | |
Actual | | $ 1,000.00 | $ 963.20 | $ .21B |
Hypothetical A | | $ 1,000.00 | $ 1,020.00 | $ 5.05C |
| Annualized
Expense Ratio | Beginning
Account Value | Ending
Account Value
September 30, 2008 | Expenses Paid
During Period |
Fidelity Asset Manager 85% | | | | |
Class A | 1.14% | | | |
Actual | | $ 1,000.00 | $ 860.10 | $ 5.30B |
Hypothetical A | | $ 1,000.00 | $ 1,019.30 | $ 5.76C |
Class T | 1.39% | | | |
Actual | | $ 1,000.00 | $ 859.10 | $ 6.46B |
Hypothetical A | | $ 1,000.00 | $ 1,018.05 | $ 7.01C |
Class B | 1.94% | | | |
Actual | | $ 1,000.00 | $ 856.20 | $ 9.00B |
Hypothetical A | | $ 1,000.00 | $ 1,015.30 | $ 9.77C |
Class C | 1.91% | | | |
Actual | | $ 1,000.00 | $ 856.70 | $ 8.87B |
Hypothetical A | | $ 1,000.00 | $ 1,015.45 | $ 9.62C |
Asset Manager 85% | .88% | | | |
Actual | | $ 1,000.00 | $ 860.60 | $ 4.09B |
Hypothetical A | | $ 1,000.00 | $ 1,020.60 | $ 4.45C |
Institutional Class | .78% | | | |
Actual | | $ 1,000.00 | $ 861.40 | $ 3.63B |
Hypothetical A | | $ 1,000.00 | $ 1,021.10 | $ 3.94C |
A 5% return per year before expenses
B Actual expenses are equal to each Class' annualized expense ratio, multiplied by the average account value over the period, multiplied by 183/366 (to reflect the one-half year period) for each class of Fidelity Asset Manager 20%, Fidelity Asset Manager 30%, Fidelity Asset Manager 40%, Fidelity Asset Manager 50%, Fidelity Asset Manager 60%, Fidelity Asset Manager 85% and Asset Manager 70% Class and multiplied by 8/366 (to reflect the period September 23, 2008 to September 30, 2008) for Class A, T, B, C and Institutional Class of Fidelity Asset Manager 70% Fund.
C Hypothetical expenses are equal to each Class' annualized expense ratio, multiplied by the average account value over the period, multiplied by 183/366 (to reflect the one-half year period).
The fees and expenses of the underlying Fidelity Central Funds in which the Fund invests are not included in the Fund's annualized expense ratio.
In addition to the expenses noted above, the Funds also indirectly bear their proportionate share of the expenses of the underlying Fidelity Central Funds. Annualized expenses of the underlying Fidelity Central Funds as of their most recent fiscal half-year ranged from less than ..01% to .03%.
* If changes to voluntary expense limitations, effective May 1, 2008 had been in effect during the entire period, the annualized expense ratios and the expenses paid in the actual and hypothetical examples above would have been as follows:
| Annualized
Expense Ratio | Expenses
Paid |
Fidelity Asset Manager 20% | | |
Class B | 1.65% | |
Actual | | $ 8.04 |
Hypothetical A | | $ 8.32 |
| Annualized
Expense Ratio | Expenses
Paid |
Fidelity Asset Manager 30% | | |
Class A | .90% | |
Actual | | $ 4.35 |
HypotheticalA | | $ 4.55 |
Class T | 1.15% | |
Actual | | $ 5.55 |
Hypothetical A | | $ 5.81 |
Class B | 1.65% | |
Actual | | $ 7.95 |
HypotheticalA | | $ 8.32 |
Class C | 1.65% | |
Actual | | $ 7.95 |
Hypothetical A | | $ 8.32 |
Asset Manager 30% | .65% | |
Actual | | $ 3.14 |
Hypothetical A | | $ 3.29 |
Institutional Class | .65% | |
Actual | | $ 3.14 |
Hypothetical A | | $ 3.29 |
Fidelity Asset Manager 40% | | |
Class A | .90% | |
Actual | | $ 4.32 |
Hypothetical A | | $ 4.55 |
Class T | 1.15% | |
Actual | | $ 5.52 |
Hypothetical A | | $ 5.81 |
Class B | 1.65% | |
Actual | | $ 7.90 |
Hypothetical A | | $ 8.32 |
Class C | 1.65% | |
Actual | | $ 7.91 |
Hypothetical A | | $ 8.32 |
Asset Manager 40% | .65% | |
Actual | | $ 3.12 |
Hypothetical A | | $ 3.29 |
Institutional Class | .65% | |
Actual | | $ 3.12 |
Hypothetical A | | $ 3.29 |
Fidelity Asset Manager 60% | | |
Class A | 1.10% | |
Actual | | $ 5.21 |
Hypothetical A | | $ 5.55 |
Class T | 1.35% | |
Actual | | $ 6.39 |
Hypothetical A | | $ 6.81 |
Class B | 1.85% | |
Actual | | $ 8.74 |
Hypothetical A | | $ 9.32 |
Class C | 1.85% | |
Actual | | $ 8.74 |
Hypothetical A | | $ 9.32 |
| Annualized
Expense Ratio | Expenses
Paid |
Asset Manager 60% | .85% | |
Actual | | $ 4.03 |
Hypothetical A | | $ 4.29 |
Institutional Class | .85% | |
Actual | | $ 4.03 |
Hypothetical A | | $ 4.29 |
A 5% return per year before expenses
Annual Report
Fidelity Asset Manager 20%
Investment Changes (Unaudited)
The information in the following tables is based on the combined investments of the Fund and its pro-rata share of the investments of Fidelity's Equity and Fixed-Income Central Funds.
Top Five Bond Issuers as of September 30, 2008 |
(with maturities greater than one year) | % of fund's
net assets | % of fund's net assets
6 months ago |
Fannie Mae | 17.8 | 16.4 |
Freddie Mac | 6.6 | 5.8 |
U.S. Treasury Obligations | 2.8 | 5.4 |
Government National Mortgage Association | 2.5 | 1.9 |
Wells Fargo Mortgage Backed Securities Trust | 0.8 | 0.6 |
| 30.5 | |
Quality Diversification (% of fund's net assets) |
As of September 30, 2008 | As of March 31, 2008 |
 | U.S. Government and
U.S. Government
Agency Obligations 30.0% | | | U.S. Government and
U.S. Government
Agency Obligations 29.8% | |
 | AAA,AA,A 14.1% | | | AAA,AA,A 12.9% | |
 | BBB 10.2% | | | BBB 9.5% | |
 | BB and Below 5.2% | | | BB and Below 4.6% | |
 | Not Rated 0.7% | | | Not Rated 0.4% | |
 | Equities 20.1% | | | Equities 20.2% | |
 | Short-Term
Investments and
Net Other Assets 19.7% | | | Short-Term
Investments and
Net Other Assets 22.6% | |

We have used ratings from Moody's® Investors Services, Inc. Where Moody's ratings are not available, we have used S&P® ratings. All ratings are as of the report date and do not reflect subsequent downgrades. Percentages are adjusted for the effect of futures contracts, if applicable. |
Top Five Stocks as of September 30, 2008 |
| % of fund's
net assets | % of fund's net assets
6 months ago |
Apple, Inc. | 0.3 | 0.1 |
Procter & Gamble Co. | 0.3 | 0.3 |
General Electric Co. | 0.3 | 0.2 |
Bank of America Corp. | 0.2 | 0.2 |
JPMorgan Chase & Co. | 0.2 | 0.2 |
| 1.3 | |
Asset Allocation (% of fund's net assets) |
As of September 30, 2008 | As of March 31, 2008 |
| Stock class and
Equity Futures 19.8% | | | Stock class and
Equity Futures 20.1% | |
 | Bond class 59.3% | | | Bond class 57.1% | |
 | Short-term class 20.9% | |  | Short-term class 22.8% | |
 | | |  | | |
| | | | | |

Asset allocations in the pie charts reflect the categorization of assets as defined in the Fund's prospectus in effect as of the time periods indicated above. Percentages are adjusted for the effect of futures contracts and swap contracts, if applicable. |
Annual Report
Fidelity Asset Manager 20%
Investment Summary (Unaudited)
The information in the following table is based on the direct investments of the Fund.
Fund Holdings as of September 30, 2008 |
| % of fund's
net assets |
Equity Central Funds | |
Fidelity Financials Central Fund | 2.9 |
Fidelity Information Technology Central Fund | 2.7 |
Fidelity Health Care Central Fund | 2.4 |
Fidelity Industrials Central Fund | 2.2 |
Fidelity Energy Central Fund | 2.0 |
Fidelity Consumer Discretionary Central Fund | 1.9 |
Fidelity Consumer Staples Central Fund | 1.9 |
Fidelity Materials Central Fund | 0.7 |
Fidelity Utilities Central Fund | 0.7 |
Fidelity Telecom Services Central Fund | 0.5 |
Total Equity Central Funds | 17.9 |
Fixed-Income Central Funds | |
Investment Grade Fixed-Income Funds | 47.3 |
High Yield Fixed-Income Funds | 4.8 |
Total Fixed-Income Central Funds | 52.1 |
Money Market Central Funds | 26.5 |
Other Short-Term Investments and Net Other Assets | 3.5 |
Total | 100.0 |
At period end, foreign investments including the Fund's pro-rata share of the underlying Central Funds was 8.3% of net assets.
A holdings listing for the Fund, which presents direct holdings as well as the pro-rata share of any securities and other investments held indirectly through its investment in underlying non-money market Fidelity Central Funds, is available at fidelity.com and/or advisor.fidelity.com, as applicable.
Annual Report
Fidelity Asset Manager 20%
Investments September 30, 2008
Showing Percentage of Net Assets
Equity Central Funds - 17.9% |
| Shares | | Value |
Fidelity Consumer Discretionary Central Fund (c) | 464,228 | | $ 42,899,299 |
Fidelity Consumer Staples Central Fund (c) | 376,453 | | 43,280,780 |
Fidelity Energy Central Fund (c) | 416,109 | | 45,971,670 |
Fidelity Financials Central Fund (c) | 1,017,804 | | 67,032,602 |
Fidelity Health Care Central Fund (c) | 542,393 | | 54,027,771 |
Fidelity Industrials Central Fund (c) | 478,739 | | 50,521,309 |
Fidelity Information Technology Central Fund (c) | 641,036 | | 62,956,141 |
Fidelity Materials Central Fund (c) | 139,413 | | 15,341,018 |
Fidelity Telecom Services Central Fund (c) | 141,217 | | 12,667,166 |
Fidelity Utilities Central Fund (c) | 165,501 | | 15,447,872 |
TOTAL EQUITY CENTRAL FUNDS (Cost $450,570,473) | 410,145,628 |
Fixed-Income Central Funds - 52.1% |
| | | |
Investment Grade Fixed-Income Funds - 47.3% |
Fidelity Tactical Income Central
Fund (c) | 12,051,566 | | 1,082,230,662 |
High Yield Fixed-Income Funds - 4.8% |
Fidelity Floating Rate Central Fund (c) | 798,060 | | 67,675,508 |
Fidelity High Income Central
Fund 1 (c) | 494,043 | | 42,245,646 |
TOTAL HIGH YIELD FIXED-INCOME FUNDS | 109,921,154 |
TOTAL FIXED-INCOME CENTRAL FUNDS (Cost $1,301,464,978) | 1,192,151,816 |
Money Market Central Funds - 26.5% |
| | | |
Fidelity Cash Central Fund, 1.92% (a) | 399,717,455 | | 399,717,455 |
Fidelity Money Market Central Fund, 3.13% (a) | 205,550,134 | | 205,550,134 |
TOTAL MONEY MARKET CENTRAL FUNDS (Cost $605,267,589) | 605,267,589 |
U.S. Treasury Obligations - 0.2% |
| Principal Amount | | |
U.S. Treasury Bills, yield at date of purchase 1.61% to 1.79% 10/2/08 to 12/4/08 (b)
(Cost $3,603,031) | | $ 3,610,000 | | 3,607,262 |
TOTAL INVESTMENT PORTFOLIO - 96.7% (Cost $2,360,906,071) | | 2,211,172,295 |
NET OTHER ASSETS - 3.3% | | 74,522,066 |
NET ASSETS - 100% | $ 2,285,694,361 |
Futures Contracts |
| Expiration Date | | Underlying Face Amount at Value | | Unrealized Appreciation/ (Depreciation) |
Purchased |
Equity Index Contracts |
944 CME E-mini S&P 500 Index Contracts | Dec. 2008 | | $ 55,101,280 | | $ (1,367,696) |
|
The face value of futures purchased as a percentage of net assets - 2.4% |
Legend |
(a) Affiliated fund that is available only to investment companies and other accounts managed by Fidelity Investments. The rate quoted is the annualized seven-day yield of the fund at period end. A complete unaudited listing of the fund's holdings as of its most recent quarter end is available upon request. |
(b) Security or a portion of the security was pledged to cover margin requirements for futures contracts. At the period end, the value of securities pledged amounted to $3,607,262. |
(c) Affiliated fund that is available only to investment companies and other accounts managed by Fidelity Investments. A complete unaudited schedule of portfolio holdings for each Fidelity Central Fund is filed with the SEC for the first and third quarters of each fiscal year on Form N-Q and is available upon request or at the SEC's web site at www.sec.gov. An unaudited holdings listing for the Fund, which presents direct holdings as well as the pro rata share of securities and other investments held indirectly through its investment in underlying non-money market Fidelity Central Funds, is available at fidelity.com and/or advisor.fidelity.com, as applicable. In addition, each Fidelity Central Fund's financial statements, which are not covered by the Fund's Report of Independent Registered Public Accounting Firm, are available on the SEC's web site or upon request. |
Affiliated Central Funds |
Information regarding fiscal year to date income earned by the Fund from investments in Fidelity Central Funds is as follows: |
Fund | Income earned |
Fidelity Cash Central Fund | $ 16,489,202 |
Fidelity Consumer Discretionary Central Fund | 681,483 |
Fidelity Consumer Staples Central Fund | 961,688 |
Fidelity Energy Central Fund | 464,208 |
Fidelity Financials Central Fund | 2,469,629 |
Fidelity Floating Rate Central Fund | 4,151,295 |
Fidelity Health Care Central Fund | 566,719 |
Fidelity High Income Central Fund 1 | 3,532,110 |
Fidelity Industrials Central Fund | 895,762 |
Fidelity Information Technology Central Fund | 561,743 |
Fidelity Materials Central Fund | 331,453 |
Fidelity Money Market Central Fund | 5,405,459 |
Fidelity Security Lending Cash Central Fund | 13 |
Fidelity Tactical Income Central Fund | 60,742,957 |
Fidelity Telecom Services Central Fund | 342,786 |
Fidelity Utilities Central Fund | 404,892 |
Total | $ 98,001,399 |
Additional information regarding the Fund's fiscal year to date purchases and sales, including the ownership percentage, of the non-money market Central Funds is as follows: |
Fund | Value, beginning
of period | Purchases | Sales
Proceeds | Value,
end of period | % ownership,
end of period |
Fidelity Consumer Discretionary Central Fund | $ 48,742,000 | $ 7,818,561 | $ 1,478,152 | $ 42,899,299 | 8.1% |
Fidelity Consumer Staples Central Fund | 39,907,000 | 7,691,211 | 286,155 | 43,280,780 | 8.1% |
Fidelity Energy Central Fund | 50,544,000 | 9,532,230 | 1,797,002 | 45,971,670 | 8.1% |
Fidelity Financials Central Fund | 90,663,000 | 16,765,459 | - | 67,032,602 | 8.1% |
Fidelity Floating Rate Central Fund | 61,332,000 | 15,486,712 | - | 67,675,508 | 2.7% |
Fidelity Health Care Central Fund | 54,673,000 | 9,947,575 | 192,237 | 54,027,771 | 8.1% |
Fidelity High Income Central Fund 1 | 39,618,000 | 9,341,883 | 726,589 | 42,245,646 | 16.9% |
Fidelity Industrials Central Fund | 55,944,000 | 9,669,584 | 2,005,862 | 50,521,309 | 8.1% |
Fidelity Information Technology Central Fund | 78,426,000 | 14,851,589 | - | 62,956,141 | 8.1% |
Fidelity Materials Central Fund | 17,546,000 | 3,171,895 | 473,885 | 15,341,018 | 8.1% |
Fidelity Tactical Income Central Fund | 1,187,781,000 | 60,742,956 | 76,710,124 | 1,082,230,662 | 26.8% |
Fidelity Telecom Services Central Fund | 16,929,000 | 3,460,426 | - | 12,667,166 | 8.1% |
Fidelity Utilities Central Fund | 17,006,000 | 3,319,929 | - | 15,447,872 | 8.1% |
Total | $ 1,759,111,000 | $ 171,800,010 | $ 83,670,006 | $ 1,602,297,444 | |
Income Tax Information |
The fund intends to elect to defer to its fiscal year ending September 30, 2009 approximately $69,973,438 of losses recognized during the period November 1, 2007 to September 30, 2008. |
See accompanying notes which are an integral part of the financial statements.
Annual Report
Fidelity Asset Manager 20%
Financial Statements
Statement of Assets and Liabilities
| September 30, 2008 |
| | |
Assets | | |
Investment in securities, at value - See accompanying schedule: Unaffiliated issuers (cost $3,603,031) | $ 3,607,262 | |
Fidelity Central Funds (cost $2,357,303,040) | 2,207,565,033 | |
Total Investments (cost $2,360,906,071) | | $ 2,211,172,295 |
Receivable for investments sold | | 76,710,123 |
Receivable for fund shares sold | | 4,879,263 |
Distributions receivable from Fidelity Central Funds | | 6,910,881 |
Receivable for daily variation on futures contracts | | 2,293,919 |
Prepaid expenses | | 1,431 |
Receivable from investment adviser for expense reductions | | 77 |
Other receivables | | 2,375 |
Total assets | | 2,301,970,364 |
| | |
Liabilities | | |
Payable for investments purchased | $ 5,578,298 | |
Payable for fund shares redeemed | 9,541,418 | |
Accrued management fee | 828,549 | |
Distribution fees payable | 8,389 | |
Other affiliated payables | 275,278 | |
Other payables and accrued expenses | 44,071 | |
Total liabilities | | 16,276,003 |
| | |
Net Assets | | $ 2,285,694,361 |
Net Assets consist of: | | |
Paid in capital | | $ 2,498,607,571 |
Undistributed net investment income | | 11,795,814 |
Accumulated undistributed net realized gain (loss) on investments | | (73,607,552) |
Net unrealized appreciation (depreciation) on investments | | (151,101,472) |
Net Assets | | $ 2,285,694,361 |
| | |
Calculation of Maximum Offering Price Class A:
Net Asset Value and redemption price per share ($8,030,406 ÷ 707,729 shares) | | $ 11.35 |
| | |
Maximum offering price per share (100/94.25 of $11.35) | | $ 12.04 |
Class T:
Net Asset Value and redemption price per share ($4,914,664 ÷ 433,806 shares) | | $ 11.33 |
| | |
Maximum offering price per share (100/96.50 of $11.33) | | $ 11.74 |
Class B:
Net Asset Value and offering price per share ($1,974,774 ÷ 174,523 shares)A | | $ 11.32 |
| | |
Class C:
Net Asset Value and offering price per share ($3,668,173 ÷ 324,415 shares)A | | $ 11.31 |
| | |
| | |
Asset Manager 20%:
Net Asset Value, offering price and redemption price per share ($2,265,384,037 ÷ 199,443,138 shares) | | $ 11.36 |
| | |
Institutional Class:
Net Asset Value, offering price and redemption price per share ($1,722,307 ÷ 151,681 shares) | | $ 11.35 |
A Redemption price per share is equal to net asset value less any applicable contingent deferred sales charge.
See accompanying notes which are an integral part of the financial statements.
Annual Report
Fidelity Asset Manager 20%
Financial Statements - continued
Statement of Operations
| Year ended September 30, 2008 |
| | |
Investment Income | | |
Interest | | $ 2,582,587 |
Income from Fidelity Central Funds | | 98,001,399 |
Total income | | 100,583,986 |
| | |
Expenses | | |
Management fee | $ 10,330,950 | |
Transfer agent fees | 2,571,229 | |
Distribution fees | 82,764 | |
Accounting fees and expenses | 806,153 | |
Custodian fees and expenses | 5,241 | |
Independent trustees' compensation | 10,162 | |
Registration fees | 132,869 | |
Audit | 66,001 | |
Legal | 19,452 | |
Miscellaneous | 35,554 | |
Total expenses before reductions | 14,060,375 | |
Expense reductions | (61,790) | 13,998,585 |
Net investment income (loss) | | 86,585,401 |
Realized and Unrealized Gain (Loss) Net realized gain (loss) on: | | |
Investment securities: | | |
Unaffiliated issuers | 328,965 | |
Fidelity Central Funds | (6,407,818) | |
Futures contracts | (11,991,143) | |
Total net realized gain (loss) | | (18,069,996) |
Change in net unrealized appreciation (depreciation) on: Investment securities | (238,533,322) | |
Futures contracts | (2,742,149) | |
Total change in net unrealized appreciation (depreciation) | | (241,275,471) |
Net gain (loss) | | (259,345,467) |
Net increase (decrease) in net assets resulting from operations | | $ (172,760,066) |
Statement of Changes in Net Assets
| Year ended
September 30, 2008 | Year ended
September 30, 2007 |
Increase (Decrease) in Net Assets | | |
Operations | | |
Net investment income (loss) | $ 86,585,401 | $ 96,617,040 |
Net realized gain (loss) | (18,069,996) | 9,978,060 |
Change in net unrealized appreciation (depreciation) | (241,275,471) | 54,096,502 |
Net increase (decrease) in net assets resulting from operations | (172,760,066) | 160,691,602 |
Distributions to shareholders from net investment income | (91,104,113) | (97,255,232) |
Distributions to shareholders from net realized gain | (49,576,396) | (97,648,324) |
Total distributions | (140,680,509) | (194,903,556) |
Share transactions - net increase (decrease) | 79,342,713 | 423,253,884 |
Total increase (decrease) in net assets | (234,097,862) | 389,041,930 |
| | |
Net Assets | | |
Beginning of period | 2,519,792,223 | 2,130,750,293 |
End of period (including undistributed net investment income of $11,795,814 and undistributed net investment income of $12,670,043, respectively) | $ 2,285,694,361 | $ 2,519,792,223 |
See accompanying notes which are an integral part of the financial statements.
Annual Report
Financial Highlights - Class A
Years ended September 30, | 2008 | 2007 G |
Selected Per-Share Data | | |
Net asset value, beginning of period | $ 12.90 | $ 13.13 |
Income from Investment Operations | | |
Net investment income (loss) E | .39 | .48 |
Net realized and unrealized gain (loss) | (1.27) | .40 |
Total from investment operations | (.88) | .88 |
Distributions from net investment income | (.42) | (.52) |
Distributions from net realized gain | (.25) | (.59) |
Total distributions | (.67) | (1.11) |
Net asset value, end of period | $ 11.35 | $ 12.90 |
Total Return B, C, D | (7.18)% | 7.03% |
Ratios to Average Net Assets H | | |
Expenses before reductions | .86% | .87% A |
Expenses net of fee waivers, if any | .86% | .87% A |
Expenses net of all reductions | .86% | .87% A |
Net investment income (loss) | 3.18% | 3.84% A |
Supplemental Data | | |
Net assets, end of period (000 omitted) | $ 8,030 | $ 3,422 |
Portfolio turnover rate F | 5% | 6% |
A Annualized
B Total returns for periods of less than one year are not annualized.
C Total returns would have been lower had certain expenses not been reduced during the periods shown.
D Total returns do not include the effect of the sales charges.
E Calculated based on average shares outstanding during the period.
F Amount does not include the portfolio activity of any underlying Fidelity Central Funds.
G For the period October 2, 2006 (commencement of sale of shares) to September 30, 2007.
H Expense ratios reflect operating expenses of the class. Expenses before reductions do not reflect amounts reimbursed by the investment adviser or reductions from brokerage service arrangements or other expense offset arrangements and do not represent the amount paid by the class during periods when reimbursements or reductions occur. Expense ratios before reductions for start-up periods may not be representative of longer-term operating periods. Expenses net of fee waivers reflect expenses after reimbursement by the investment adviser but prior to reductions from brokerage service arrangements or other expense offset arrangements. Expenses net of all reductions represent the net expenses paid by the class. Fees and expenses of the underlying Fidelity Central Funds are not included in the Fund's expense ratio. The Fund indirectly bears its proportionate share of the expenses of any underlying Fidelity Central Funds. Based on their most recent shareholder report date, the expenses ranged from less than .01% to .03%.
Financial Highlights - Class T
Years ended September 30, | 2008 | 2007 G |
Selected Per-Share Data | | |
Net asset value, beginning of period | $ 12.88 | $ 13.13 |
Income from Investment Operations | | |
Net investment income (loss) E | .36 | .45 |
Net realized and unrealized gain (loss) | (1.28) | .40 |
Total from investment operations | (.92) | .85 |
Distributions from net investment income | (.38) | (.51) |
Distributions from net realized gain | (.25) | (.59) |
Total distributions | (.63) | (1.10) |
Net asset value, end of period | $ 11.33 | $ 12.88 |
Total Return B, C, D | (7.43)% | 6.75% |
Ratios to Average Net Assets H | | |
Expenses before reductions | 1.12% | 1.11% A |
Expenses net of fee waivers, if any | 1.12% | 1.11% A |
Expenses net of all reductions | 1.12% | 1.11% A |
Net investment income (loss) | 2.93% | 3.60% A |
Supplemental Data | | |
Net assets, end of period (000 omitted) | $ 4,915 | $ 3,954 |
Portfolio turnover rate F | 5% | 6% |
A Annualized
B Total returns for periods of less than one year are not annualized.
C Total returns would have been lower had certain expenses not been reduced during the periods shown.
D Total returns do not include the effect of the sales charges.
E Calculated based on average shares outstanding during the period.
F Amount does not include the portfolio activity of any underlying Fidelity Central Funds.
G For the period October 2, 2006 (commencement of sale of shares) to September 30, 2007.
H Expense ratios reflect operating expenses of the class. Expenses before reductions do not reflect amounts reimbursed by the investment adviser or reductions from brokerage service arrangements or other expense offset arrangements and do not represent the amount paid by the class during periods when reimbursements or reductions occur. Expense ratios before reductions for start-up periods may not be representative of longer-term operating periods. Expenses net of fee waivers reflect expenses after reimbursement by the investment adviser but prior to reductions from brokerage service arrangements or other expense offset arrangements. Expenses net of all reductions represent the net expenses paid by the class. Fees and expenses of the underlying Fidelity Central Funds are not included in the Fund's expense ratio. The Fund indirectly bears its proportionate share of the expenses of any underlying Fidelity Central Funds. Based on their most recent shareholder report date, the expenses ranged from less than .01% to .03%.
See accompanying notes which are an integral part of the financial statements.
Annual Report
Financial Highlights - Class B
Years ended September 30, | 2008 | 2007 G |
Selected Per-Share Data | | |
Net asset value, beginning of period | $ 12.87 | $ 13.13 |
Income from Investment Operations | | |
Net investment income (loss) E | .29 | .39 |
Net realized and unrealized gain (loss) | (1.27) | .38 |
Total from investment operations | (.98) | .77 |
Distributions from net investment income | (.32) | (.44) |
Distributions from net realized gain | (.25) | (.59) |
Total distributions | (.57) | (1.03) |
Net asset value, end of period | $ 11.32 | $ 12.87 |
Total Return B, C, D | (7.89)% | 6.13% |
Ratios to Average Net Assets H | | |
Expenses before reductions | 1.67% | 1.65% A |
Expenses net of fee waivers, if any | 1.66% | 1.65% A |
Expenses net of all reductions | 1.66% | 1.65% A |
Net investment income (loss) | 2.38% | 3.06% A |
Supplemental Data | | |
Net assets, end of period (000 omitted) | $ 1,975 | $ 991 |
Portfolio turnover rate F | 5% | 6% |
A Annualized
B Total returns for periods of less than one year are not annualized.
C Total returns would have been lower had certain expenses not been reduced during the periods shown.
D Total returns do not include the effect of the contingent deferred sales charge.
E Calculated based on average shares outstanding during the period.
F Amount does not include the portfolio activity of any underlying Fidelity Central Funds.
G For the period October 2, 2006 (commencement of sale of shares) to September 30, 2007.
H Expense ratios reflect operating expenses of the class. Expenses before reductions do not reflect amounts reimbursed by the investment adviser or reductions from brokerage service arrangements or other expense offset arrangements and do not represent the amount paid by the class during periods when reimbursements or reductions occur. Expense ratios before reductions for start-up periods may not be representative of longer-term operating periods. Expenses net of fee waivers reflect expenses after reimbursement by the investment adviser but prior to reductions from brokerage service arrangements or other expense offset arrangements. Expenses net of all reductions represent the net expenses paid by the class. Fees and expenses of the underlying Fidelity Central Funds are not included in the Fund's expense ratio. The Fund indirectly bears its proportionate share of the expenses of any underlying Fidelity Central Funds. Based on their most recent shareholder report date, the expenses ranged from less than .01 to .03%.
Financial Highlights - Class C
Years ended September 30, | 2008 | 2007 G |
Selected Per-Share Data | | |
Net asset value, beginning of period | $ 12.86 | $ 13.13 |
Income from Investment Operations | | |
Net investment income (loss) E | .29 | .39 |
Net realized and unrealized gain (loss) | (1.26) | .38 |
Total from investment operations | (.97) | .77 |
Distributions from net investment income | (.33) | (.45) |
Distributions from net realized gain | (.25) | (.59) |
Total distributions | (.58) | (1.04) |
Net asset value, end of period | $ 11.31 | $ 12.86 |
Total Return B, C, D | (7.87)% | 6.15% |
Ratios to Average Net Assets H | | |
Expenses before reductions | 1.65% | 1.64%A |
Expenses net of fee waivers, if any | 1.65% | 1.64%A |
Expenses net of all reductions | 1.64% | 1.64%A |
Net investment income (loss) | 2.40% | 3.07%A |
Supplemental Data | | |
Net assets, end of period (000 omitted) | $ 3,668 | $ 1,697 |
Portfolio turnover rate F | 5% | 6% |
A Annualized
B Total returns for periods of less than one year are not annualized.
C Total returns would have been lower had certain expenses not been reduced during the periods shown.
D Total returns do not include the effect of the contingent deferred sales charge.
E Calculated based on average shares outstanding during the period.
F Amount does not include the portfolio activity of any underlying Fidelity Central Funds.
G For the period October 2, 2006 (commencement of sale of shares) to September 30, 2007.
H Expense ratios reflect operating expenses of the class. Expenses before reductions do not reflect amounts reimbursed by the investment adviser or reductions from brokerage service arrangements or other expense offset arrangements and do not represent the amount paid by the class during periods when reimbursements or reductions occur. Expense ratios before reductions for start-up periods may not be representative of longer-term operating periods. Expenses net of fee waivers reflect expenses after reimbursement by the investment adviser but prior to reductions from brokerage service arrangements or other expense offset arrangements. Expenses net of all reductions represent the net expenses paid by the class. Fees and expenses of the underlying Fidelity Central Funds are not included in the Fund's expense ratio. The Fund indirectly bears its proportionate share of the expenses of any underlying Fidelity Central Funds. Based on their most recent shareholder report date, the expenses ranged from less than .01% to .03%.
See accompanying notes which are an integral part of the financial statements.
Annual Report
Financial Highlights - Asset Manager 20%
Years ended September 30, | 2008 | 2007 | 2006 | 2005 | 2004 |
Selected Per-Share Data | | | | | |
Net asset value, beginning of period | $ 12.91 | $ 13.14 | $ 13.00 | $ 12.25 | $ 11.80 |
Income from Investment Operations | | | | | |
Net investment income (loss) B | .43 | .53 | .46 | .33 | .23 |
Net realized and unrealized gain (loss) | (1.28) | .38 | .39 | .74 | .45 |
Total from investment operations | (.85) | .91 | .85 | 1.07 | .68 |
Distributions from net investment income | (.45) | (.55) | (.43) | (.32) | (.23) |
Distributions from net realized gain | (.25) | (.59) | (.28) | - | - |
Total distributions | (.70) | (1.14) | (.71) | (.32) | (.23) |
Net asset value, end of period | $ 11.36 | $ 12.91 | $ 13.14 | $ 13.00 | $ 12.25 |
Total Return A | (6.90)% | 7.26% | 6.77% | 8.85% | 5.80% |
Ratios to Average Net Assets D | | | | | |
Expenses before reductions | .56% | .57% | .58% | .60% | .63% |
Expenses net of fee waivers, if any | .56% | .57% | .58% | .60% | .63% |
Expenses net of all reductions | .56% | .57% | .57% | .58% | .61% |
Net investment income (loss) | 3.48% | 4.15% | 3.58% | 2.64% | 1.86% |
Supplemental Data | | | | | |
Net assets, end of period (000 omitted) | $ 2,265,384 | $ 2,509,481 | $ 2,130,750 | $ 1,724,038 | $ 1,395,000 |
Portfolio turnover rate C | 5% | 6% | 81% E | 81% E | 232% |
A Total returns would have been lower had certain expenses not been reduced during the periods shown.
B Calculated based on average shares outstanding during the period.
C Amount does not include the portfolio activity of any underlying Fidelity Central Funds.
D Expense ratios reflect operating expenses of the class. Expenses before reductions do not reflect amounts reimbursed by the investment adviser or reductions from brokerage service arrangements or other expense offset arrangements and do not represent the amount paid by the class during periods when reimbursements or reductions occur. Expenses net of fee waivers reflect expenses after reimbursement by the investment adviser but prior to reductions from brokerage service arrangements or other expense offset arrangements. Expenses net of all reductions represent the net expenses paid by the class. Fees and expenses of the underlying Fidelity Central Funds are not included in the Fund's expense ratio. The Fund indirectly bears its proportionate share of the expenses of any underlying Fidelity Central Funds. Based on their most recent shareholder report date, the expenses ranged from less than .01% to .03%.
E Portfolio turnover rate excludes securities received or delivered in-kind.
Financial Highlights - Institutional Class
Years ended September 30, | 2008 | 2007 F |
Selected Per-Share Data | | |
Net asset value, beginning of period | $ 12.90 | $ 13.13 |
Income from Investment Operations | | |
Net investment income (loss) D | .42 | .53 |
Net realized and unrealized gain (loss) | (1.27) | .38 |
Total from investment operations | (.85) | .91 |
Distributions from net investment income | (.45) | (.55) |
Distributions from net realized gain | (.25) | (.59) |
Total distributions | (.70) | (1.14) |
Net asset value, end of period | $ 11.35 | $ 12.90 |
Total Return B, C | (6.91)% | 7.24% |
Ratios to Average Net Assets | | |
Expenses before reductions | .57% | .59% A |
Expenses net of fee waivers, if any | .57% | .59% A |
Expenses net of all reductions | .56% | .59% A |
Net investment income (loss) | 3.48% | 4.13% A |
Supplemental Data | | |
Net assets, end of period (000 omitted) | $ 1,722 | $ 248 |
Portfolio turnover rate E | 5% | 6% |
A Annualized
B Total returns for periods of less than one year are not annualized.
C Total returns would have been lower had certain expenses not been reduced during the periods shown.
D Calculated based on average shares outstanding during the period.
E Amount does not include the portfolio activity of any underlying Fidelity Central Funds.
F For the period October 2, 2006 (commencement of sale of shares) to September 30, 2007.
G Expense ratios reflect operating expenses of the class. Expenses before reductions do not reflect amounts reimbursed by the investment adviser or reductions from brokerage service arrangements or other expense offset arrangements and do not represent the amount paid by the class during periods when reimbursements or reductions occur. Expense ratios before reductions for start-up periods may not be representative of longer-term operating periods. Expenses net of fee waivers reflect expenses after reimbursement by the investment adviser but prior to reductions from brokerage service arrangements or other expense offset arrangements. Expenses net of all reductions represent the net expenses paid by the class. Fees and expenses of the underlying Fidelity Central Funds are not included in the Fund's expense ratio. The Fund indirectly bears its proportionate share of the expenses of any underlying Fidelity Central Funds. Based on their most recent shareholder report date, the expenses ranged from less than .01% to .03%.
See accompanying notes which are an integral part of the financial statements.
Annual Report
Fidelity Asset Manager 30%
Investment Changes (Unaudited)
The information in the following tables is based on the combined investments of the Fund and its pro-rata share of the investments of Fidelity's Equity and Fixed-Income Central Funds.
Top Five Bond Issuers as of September 30, 2008 |
(with maturities greater than one year) | % of fund's
net assets | % of fund's net assets
6 months ago |
Fannie Mae | 16.5 | 15.4 |
Freddie Mac | 6.3 | 5.4 |
U.S. Treasury Obligations | 2.7 | 5.0 |
Government National Mortgage Association | 2.4 | 1.8 |
Wells Fargo Mortgage Backed Securities Trust | 0.4 | 0.5 |
| 28.3 | |
Quality Diversification (% of fund's net assets) |
As of September 30, 2008 | As of March 31, 2008 |
| U.S. Government and
U.S. Government
Agency Obligations 29.0% | | | U.S. Government and
U.S. Government
Agency Obligations 27.8% | |
| AAA,AA,A 13.6% | | | AAA,AA,A 12.0% | |
| BBB 9.7% | | | BBB 8.6% | |
| BB and Below 5.9% | | | BB and Below 4.6% | |
| Not Rated 0.7% | | | Not Rated 0.4% | |
| Equities 30.8% | | | Equities 30.2% | |
| Short-Term
Investments and
Net Other Assets 10.3% | | | Short-Term
Investments and
Net Other Assets 16.4% | |

We have used ratings from Moody's® Investors Services, Inc. Where Moody's ratings are not available, we have used S&P® ratings. All ratings are as of the report date and do not reflect subsequent downgrades. Percentages are adjusted for the effect of futures contracts, if applicable. |
Top Five Stocks as of September 30, 2008 |
| % of fund's
net assets | % of fund's net assets
6 months ago |
Apple, Inc. | 0.5 | 0.1 |
Procter & Gamble Co. | 0.5 | 0.5 |
General Electric Co. | 0.4 | 0.3 |
Bank of America Corp. | 0.4 | 0.2 |
JPMorgan Chase & Co. | 0.4 | 0.3 |
| 2.2 | |
Asset Allocation (% of fund's net assets) |
As of September 30, 2008 | As of March 31, 2008 |
| Stock class and
Equity Futures 31.0% | | | Stock class and
Equity Futures 30.2% | |
| Bond class 65.4% | | | Bond class 53.6% | |
 | Short-term class 3.6% | |  | Short-term class 16.2% | |
| | | | | |
| | | | | |

Asset allocations in the pie charts reflect the categorization of assets as defined in the Fund's prospectus in effect as of the time periods indicated above. Percentages are adjusted for the effect of futures contracts and swap contracts, if applicable. |
Annual Report
Fidelity Asset Manager 30%
Investment Summary (Unaudited)
The information in the following table is based on the direct investments of the Fund.
Fund Holdings as of September 30, 2008 |
| % of fund's
net assets |
Equity Central Funds | |
Fidelity Financials Central Fund | 5.0 |
Fidelity Information Technology Central Fund | 4.7 |
Fidelity Health Care Central Fund | 4.0 |
Fidelity Industrials Central Fund | 3.7 |
Fidelity Energy Central Fund | 3.4 |
Fidelity Consumer Discretionary Central Fund | 3.2 |
Fidelity Consumer Staples Central Fund | 3.2 |
Fidelity Materials Central Fund | 1.1 |
Fidelity Utilities Central Fund | 1.1 |
Fidelity Telecom Services Central Fund | 0.9 |
Total Equity Central Funds | 30.3 |
Fixed-Income Central Funds | |
Investment Grade Fixed-Income Funds | 45.6 |
High Yield Fixed-Income Funds | 5.4 |
Total Fixed-Income Central Funds | 51.0 |
Money Market Central Funds | 7.8 |
Other Short-Term Investments and Net Other Assets | 10.9 |
Total | 100.0 |
At period end, foreign investments including the Fund's pro-rata share of the underlying Central Funds was 10.2% of net assets.
A holdings listing for the Fund, which presents direct holdings as well as the pro-rata share of any securities and other investments held indirectly through its investment in underlying non-money market Fidelity Central Funds, is available at fidelity.com and/or advisor.fidelity.com, as applicable.
Annual Report
Fidelity Asset Manager 30%
Investments September 30, 2008
Showing Percentage of Net Assets
Equity Central Funds - 30.3% |
| Shares | | Value |
Fidelity Consumer Discretionary Central Fund (c) | 10,443 | | $ 965,072 |
Fidelity Consumer Staples Central Fund (c) | 8,468 | | 973,588 |
Fidelity Energy Central Fund (c) | 9,360 | | 1,034,093 |
Fidelity Financials Central Fund (c) | 22,895 | | 1,507,852 |
Fidelity Health Care Central Fund (c) | 12,201 | | 1,215,308 |
Fidelity Industrials Central Fund (c) | 10,769 | | 1,136,447 |
Fidelity Information Technology Central Fund (c) | 14,420 | | 1,416,220 |
Fidelity Materials Central Fund (c) | 3,137 | | 345,142 |
Fidelity Telecom Services Central Fund (c) | 3,177 | | 285,000 |
Fidelity Utilities Central Fund (c) | 3,723 | | 347,516 |
TOTAL EQUITY CENTRAL FUNDS (Cost $11,149,154) | 9,226,238 |
Fixed-Income Central Funds - 51.0% |
| | | |
Investment Grade Fixed-Income Funds - 45.6% |
Fidelity Tactical Income Central Fund (c) | 154,524 | | 13,876,261 |
High Yield Fixed-Income Funds - 5.4% |
Fidelity Floating Rate Central Fund (c) | 11,954 | | 1,013,697 |
Fidelity High Income Central Fund 1 (c) | 7,456 | | 637,595 |
TOTAL HIGH YIELD FIXED-INCOME FUNDS | 1,651,292 |
TOTAL FIXED-INCOME CENTRAL FUNDS (Cost $16,612,497) | 15,527,553 |
Money Market Central Funds - 7.8% |
| | | |
Fidelity Cash Central Fund, 1.92% (a)
(Cost $2,358,372) | 2,358,372 | | 2,358,372 |
U.S. Treasury Obligations - 0.3% |
| Principal Amount | | |
U.S. Treasury Bills, yield at date of purchase 1.59% to 1.68% 10/16/08 to 12/4/08 (b)
(Cost $99,813) | | $ 100,000 | | 99,912 |
TOTAL INVESTMENT PORTFOLIO - 89.4% (Cost $30,219,836) | | 27,212,075 |
NET OTHER ASSETS - 10.6% | | 3,220,883 |
NET ASSETS - 100% | $ 30,432,958 |
Futures Contracts |
| Expiration Date | | Underlying Face Amount at Value | | Unrealized Appreciation/
(Depreciation) |
Purchased |
Equity Index Contracts |
7 CME E-mini S&P 500 Index Contracts | Dec. 2008 | | $ 408,590 | | $ (10,142) |
|
The face value of futures purchased as a percentage of net assets - 1.3% |
Legend |
(a) Affiliated fund that is available only to investment companies and other accounts managed by Fidelity Investments. The rate quoted is the annualized seven-day yield of the fund at period end. A complete unaudited listing of the fund's holdings as of its most recent quarter end is available upon request. |
(b) Security or a portion of the security was pledged to cover margin requirements for futures contracts. At the period end, the value of securities pledged amounted to $99,912. |
(c) Affiliated fund that is available only to investment companies and other accounts managed by Fidelity Investments. A complete unaudited schedule of portfolio holdings for each Fidelity Central Fund is filed with the SEC for the first and third quarters of each fiscal year on Form N-Q and is available upon request or at the SEC's web site at www.sec.gov. An unaudited holdings listing for the Fund, which presents direct holdings as well as the pro rata share of securities and other investments held indirectly through its investment in underlying non-money market Fidelity Central Funds, is available at fidelity.com and/or advisor.fidelity.com, as applicable. In addition, each Fidelity Central Fund's financial statements, which are not covered by the Fund's Report of Independent Registered Public Accounting Firm, are available on the SEC's web site or upon request. |
Affiliated Central Funds |
Information regarding fiscal year to date income earned by the Fund from investments in Fidelity Central Funds is as follows: |
Fund | Income earned |
Fidelity Cash Central Fund | $ 126,630 |
Fidelity Consumer Discretionary Central Fund | 11,313 |
Fidelity Consumer Staples Central Fund | 17,493 |
Fidelity Energy Central Fund | 7,904 |
Fidelity Financials Central Fund | 41,255 |
Fidelity Floating Rate Central Fund | 31,738 |
Fidelity Health Care Central Fund | 9,870 |
Fidelity High Income Central Fund 1 | 41,594 |
Fidelity Industrials Central Fund | 15,847 |
Fidelity Information Technology Central Fund | 10,350 |
Fidelity Materials Central Fund | 5,127 |
Fidelity Tactical Income Central Fund | 543,253 |
Fidelity Telecom Services Central Fund | 5,543 |
Fidelity Utilities Central Fund | 6,603 |
Total | $ 874,520 |
Additional information regarding the Fund's fiscal year to date purchases and sales, including the ownership percentage, of the non-money market Central Funds is as follows: |
Fund | Value, beginning of period | Purchases | Sales
Proceeds | Value,
end of period | % ownership, end of period |
Fidelity Consumer Discretionary Central Fund | $ - | $ 1,300,434 | $ 212,724 | $ 965,072 | 0.2% |
Fidelity Consumer Staples Central Fund | - | 1,226,622 | 182,341 | 973,588 | 0.2% |
Fidelity Energy Central Fund | - | 1,569,570 | 231,401 | 1,034,093 | 0.2% |
Fidelity Financials Central Fund | - | 2,321,162 | 273,823 | 1,507,852 | 0.2% |
Fidelity Floating Rate Central Fund | - | 1,106,392 | - | 1,013,697 | 0.0% |
Fidelity Health Care Central Fund | - | 1,629,474 | 227,457 | 1,215,308 | 0.2% |
Fidelity High Income Central Fund 1 | - | 791,216 | 84,098 | 637,595 | 0.3% |
Fidelity Industrials Central Fund | - | 1,570,303 | 258,828 | 1,136,447 | 0.2% |
Fidelity Information Technology Central Fund | - | 2,100,972 | 275,186 | 1,416,220 | 0.2% |
Fidelity Materials Central Fund | - | 512,585 | 78,086 | 345,142 | 0.2% |
Fidelity Tactical Income Central Fund | - | 18,003,783 | 2,950,377 | 13,876,261 | 0.3% |
Fidelity Telecom Services Central Fund | - | 434,178 | 54,899 | 285,000 | 0.2% |
Fidelity Utilities Central Fund | - | 524,152 | 66,721 | 347,516 | 0.2% |
Total | $ - | $ 33,090,843 | $ 4,895,941 | $ 24,753,791 | |
Other Information (Unaudited) |
The information in the following table is based on the combined investment of the Fund and its pro-rata share of the investments of Fidelity's Equity and Fixed-Income Central Funds. |
Distribution of investments by country of issue, as a percentage of total net assets, is as follows. Percentages are adjusted for the effect of future contracts, if applicable. |
United States of America | 89.8% |
United Kingdom | 1.9% |
Bermuda | 1.4% |
Canada | 1.4% |
Others (individually less than 1%) | 5.5% |
| 100.0% |
Income Tax Information |
At September 30, 2008, the fund had a capital loss carryforward of approximately $10,213 all of which will expire on September 30, 2016. |
The fund intends to elect to defer to its fiscal year ending September 30, 2009 approximately $1,196,733 of losses recognized during the period November 1, 2007 to September 30, 2008. |
See accompanying notes which are an integral part of the financial statements.
Annual Report
Fidelity Asset Manager 30%
Financial Statements
Statement of Assets and Liabilities
| September 30, 2008 |
| | |
Assets | | |
Investment in securities, at value - See accompanying schedule: Unaffiliated issuers (cost $99,813) | $ 99,912 | |
Fidelity Central Funds (cost $30,120,023) | 27,112,163 | |
Total Investments (cost $30,219,836) | | $ 27,212,075 |
Receivable for investments sold | | 2,950,379 |
Receivable for fund shares sold | | 305,106 |
Distributions receivable from Fidelity Central Funds | | 92,916 |
Receivable for daily variation on futures contracts | | 17,010 |
Prepaid expenses | | 1 |
Receivable from investment adviser for expense reductions | | 46,977 |
Total assets | | 30,624,464 |
| | |
Liabilities | | |
Payable for investments purchased | $ 81,331 | |
Payable for fund shares redeemed | 61,048 | |
Accrued management fee | 12,234 | |
Distribution fees payable | 2,159 | |
Other affiliated payables | 4,732 | |
Other payables and accrued expenses | 30,002 | |
Total liabilities | | 191,506 |
| | |
Net Assets | | $ 30,432,958 |
Net Assets consist of: | | |
Paid in capital | | $ 33,932,858 |
Undistributed net investment income | | 143,916 |
Accumulated undistributed net realized gain (loss) on investments | | (625,913) |
Net unrealized appreciation (depreciation) on investments | | (3,017,903) |
Net Assets | | $ 30,432,958 |
| | |
Calculation of Maximum Offering Price Class A:
Net Asset Value and redemption price per share ($1,158,843 ÷ 133,868 shares) | | $ 8.66 |
| | |
Maximum offering price per share (100/94.25 of $8.66) | | $ 9.19 |
Class T:
Net Asset Value and redemption price per share ($1,073,595 ÷ 124,068 shares) | | $ 8.65 |
| | |
Maximum offering price per share (100/96.50 of $8.65) | | $ 8.96 |
Class B:
Net Asset Value and offering price per share ($480,437 ÷ 55,549 shares)A | | $ 8.65 |
| | |
Class C:
Net Asset Value and offering price per share ($1,495,201 ÷ 173,104 shares)A | | $ 8.64 |
| | |
| | |
Asset Manager 30%:
Net Asset Value, offering price and redemption price per share ($26,015,730 ÷ 3,003,894 shares) | | $ 8.66 |
| | |
Instutional Class:
Net Asset Value, offering price and redemption price per share ($209,152 ÷ 24,150 shares) | | $ 8.66 |
A Redemption price per share is equal to net asset value less any applicable contingent deferred sales charge.
See accompanying notes which are an integral part of the financial statements.
Annual Report
Fidelity Asset Manager 30%
Financial Statements - continued
Statement of Operations
For the period October 9, 2007 (commencement of operations) to September 30, 2008 |
| | |
Investment Income | | |
Interest | | $ 15,347 |
Income from Fidelity Central Funds | | 874,520 |
Total income | | 889,867 |
| | |
Expenses | | |
Management fee | $ 102,657 | |
Transfer agent fees | 28,798 | |
Distribution fees | 13,809 | |
Accounting fees and expenses | 10,257 | |
Custodian fees and expenses | 4,989 | |
Independent trustees' compensation | 88 | |
Registration fees | 125,968 | |
Audit | 36,904 | |
Legal | 49 | |
Miscellaneous | 2,038 | |
Total expenses before reductions | 325,557 | |
Expense reductions | (133,170) | 192,387 |
Net investment income (loss) | | 697,480 |
Realized and Unrealized Gain (Loss) Net realized gain (loss) on: | | |
Investment securities: | | |
Fidelity Central Funds | (433,159) | |
Futures contracts | (151,102) | |
Total net realized gain (loss) | | (584,261) |
Change in net unrealized appreciation (depreciation) on: Investment securities | (3,007,761) | |
Futures contracts | (10,142) | |
Total change in net unrealized appreciation (depreciation) | | (3,017,903) |
Net gain (loss) | | (3,602,164) |
Net increase (decrease) in net assets resulting from operations | | $ (2,904,684) |
Statement of Changes in Net Assets
| For the period
October 9, 2007 (commencement of operations) to September 30, 2008 |
Increase (Decrease) in Net Assets | |
Operations | |
Net investment income (loss) | $ 697,480 |
Net realized gain (loss) | (584,261) |
Change in net unrealized appreciation (depreciation) | (3,017,903) |
Net increase (decrease) in net assets resulting from operations | (2,904,684) |
Distributions to shareholders from net investment income | (595,233) |
Share transactions - net increase (decrease) | 33,932,875 |
Total increase (decrease) in net assets | 30,432,958 |
| |
Net Assets | |
Beginning of period | - |
End of period (including undistributed net investment income of $143,916) | $ 30,432,958 |
See accompanying notes which are an integral part of the financial statements.
Annual Report
Financial Highlights - Class A
Year ended September 30, | 2008 G |
Selected Per-Share Data | |
Net asset value, beginning of period | $ 10.00 |
Income from Investment Operations | |
Net investment income (loss) E | .24 |
Net realized and unrealized gain (loss) | (1.39) |
Total from investment operations | (1.15) |
Distributions from net investment income | (.19) |
Net asset value, end of period | $ 8.66 |
Total Return B, C, D | (11.63)% |
Ratios to Average Net Assets H | |
Expenses before reductions | 1.66% A |
Expenses net of fee waivers, if any | .98% A |
Expenses net of all reductions | .98% A |
Net investment income (loss) | 2.63% A |
Supplemental Data | |
Net assets, end of period (000 omitted) | $ 1,159 |
Portfolio turnover rate F | 24%A |
A Annualized
B Total returns for periods of less than one year are not annualized.
C Total returns would have been lower had certain expenses not been reduced during the periods shown.
D Total returns do not include the effect of the sales charges.
E Calculated based on average shares outstanding during the period.
F Amount does not include the portfolio activity of any underlying Fidelity Central Funds.
G For the period October 9, 2007 (commencement of operations) to September 30, 2008.
H Expense ratios reflect operating expenses of the class. Expenses before reductions do not reflect amounts reimbursed by the investment adviser or reductions from brokerage service arrangements or other expense offset arrangements and do not represent the amount paid by the class during periods when reimbursements or reductions occur. Expense ratios before reductions for start-up periods may not be representative of longer-term operating periods. Expenses net of fee waivers reflect expenses after reimbursement by the investment adviser but prior to reductions from brokerage service arrangements or other expense offset arrangements. Expenses net of all reductions represent the net expenses paid by the class. Fees and expenses of the underlying Fidelity Central Funds are not included in the Fund's expense ratio. The Fund indirectly bears its proportionate share of the expenses of any underlying Fidelity Central Funds. Based on their most recent shareholder report date, the expenses ranged from less than .01% to .03%.
Financial Highlights - Class T
Year ended September 30, | 2008 G |
Selected Per-Share Data | |
Net asset value, beginning of period | $ 10.00 |
Income from Investment Operations | |
Net investment income (loss) E | .22 |
Net realized and unrealized gain (loss) | (1.40) |
Total from investment operations | (1.18) |
Distributions from net investment income | ��(.17) |
Net asset value, end of period | $ 8.65 |
Total Return B, C, D | (11.91)% |
Ratios to Average Net Assets H | |
Expenses before reductions | 1.97% A |
Expenses net of fee waivers, if any | 1.20% A |
Expenses net of all reductions | 1.20% A |
Net investment income (loss) | 2.41% A |
Supplemental Data | |
Net assets, end of period (000 omitted) | $ 1,074 |
Portfolio turnover rate F | 24%A |
A Annualized
B Total returns for periods of less than one year are not annualized.
C Total returns would have been lower had certain expenses not been reduced during the periods shown.
D Total returns do not include the effect of the sales charges.
E Calculated based on average shares outstanding during the period.
F Amount does not include the portfolio activity of any underlying Fidelity Central Funds.
G For the period October 9, 2007 (commencement of operations) to September 30, 2008.
H Expense ratios reflect operating expenses of the class. Expenses before reductions do not reflect amounts reimbursed by the investment adviser or reductions from brokerage service arrangements or other expense offset arrangements and do not represent the amount paid by the class during periods when reimbursements or reductions occur. Expense ratios before reductions for start-up periods may not be representative of longer-term operating periods. Expenses net of fee waivers reflect expenses after reimbursement by the investment adviser but prior to reductions from brokerage service arrangements or other expense offset arrangements. Expenses net of all reductions represent the net expenses paid by the class. Fees and expenses of the underlying Fidelity Central Funds are not included in the Fund's expense ratio. The Fund indirectly bears its proportionate share of the expenses of any underlying Fidelity Central Funds. Based on their most recent shareholder report date, the expenses ranged from less than .01% to .03%.
See accompanying notes which are an integral part of the financial statements.
Annual Report
Financial Highlights - Class B
Year ended September 30, | 2008 G |
Selected Per-Share Data | |
Net asset value, beginning of period | $ 10.00 |
Income from Investment Operations | |
Net investment income (loss) E | .17 |
Net realized and unrealized gain (loss) | (1.39) |
Total from investment operations | (1.22) |
Distributions from net investment income | (.13) |
Net asset value, end of period | $ 8.65 |
Total Return B, C, D | (12.30)% |
Ratios to Average Net Assets H | |
Expenses before reductions | 2.71% A |
Expenses net of fee waivers, if any | 1.73% A |
Expenses net of all reductions | 1.73% A |
Net investment income (loss) | 1.87% A |
Supplemental Data | |
Net assets, end of period (000 omitted) | $ 480 |
Portfolio turnover rate F | 24%A |
A Annualized
B Total returns for periods of less than one year are not annualized.
C Total returns would have been lower had certain expenses not been reduced during the periods shown.
D Total returns do not include the effect of the contingent deferred sales charge.
E Calculated based on average shares outstanding during the period.
F Amount does not include the portfolio activity of any underlying Fidelity Central Funds.
G For the period October 9, 2007 (commencement of operations) to September 30, 2008.
H Expense ratios reflect operating expenses of the class. Expenses before reductions do not reflect amounts reimbursed by the investment adviser or reductions from brokerage service arrangements or other expense offset arrangements and do not represent the amount paid by the class during periods when reimbursements or reductions occur. Expense ratios before reductions for start-up periods may not be representative of longer-term operating periods. Expenses net of fee waivers reflect expenses after reimbursement by the investment adviser but prior to reductions from brokerage service arrangements or other expense offset arrangements. Expenses net of all reductions represent the net expenses paid by the class. Fees and expenses of the underlying Fidelity Central Funds are not included in the Fund's expense ratio. The Fund indirectly bears its proportionate share of the expenses of any underlying Fidelity Central Funds. Based on their most recent shareholder report date, the expenses ranged from less than .01% to .03%.
Financial Highlights - Class C
Year ended September 30, | 2008 G |
Selected Per-Share Data | |
Net asset value, beginning of period | $ 10.00 |
Income from Investment Operations | |
Net investment income (loss) E | .17 |
Net realized and unrealized gain (loss) | (1.39) |
Total from investment operations | (1.22) |
Distributions from net investment income | (.14) |
Net asset value, end of period | $ 8.64 |
Total Return B, C, D | (12.30)% |
Ratios to Average Net Assets H | |
Expenses before reductions | 2.37% A |
Expenses net of fee waivers, if any | 1.70% A |
Expenses net of all reductions | 1.70% A |
Net investment income (loss) | 1.91% A |
Supplemental Data | |
Net assets, end of period (000 omitted) | $ 1,495 |
Portfolio turnover rate F | 24%A |
A Annualized
B Total returns for periods of less than one year are not annualized.
C Total returns would have been lower had certain expenses not been reduced during the periods shown.
D Total returns do not include the effect of the contingent deferred sales charge.
E Calculated based on average shares outstanding during the period.
F Amount does not include the portfolio activity of any underlying Fidelity Central Funds.
G For the period October 9, 2007 (commencement of operations) to September 30, 2008.
H Expense ratios reflect operating expenses of the class. Expenses before reductions do not reflect amounts reimbursed by the investment adviser or reductions from brokerage service arrangements or other expense offset arrangements and do not represent the amount paid by the class during periods when reimbursements or reductions occur. Expense ratios before reductions for start-up periods may not be representative of longer-term operating periods. Expenses net of fee waivers reflect expenses after reimbursement by the investment adviser but prior to reductions from brokerage service arrangements or other expense offset arrangements. Expenses net of all reductions represent the net expenses paid by the class. Fees and expenses of the underlying Fidelity Central Funds are not included in the Fund's expense ratio. The Fund indirectly bears its proportionate share of the expenses of any underlying Fidelity Central Funds. Based on their most recent shareholder report date, the expenses ranged from less than .01% to .03%.
See accompanying notes which are an integral part of the financial statements.
Annual Report
Financial Highlights - Asset Manager 30%
Year ended September 30, | 2008 F |
Selected Per-Share Data | |
Net asset value, beginning of period | $ 10.00 |
Income from Investment Operations | |
Net investment income (loss) D | .26 |
Net realized and unrealized gain (loss) | (1.39) |
Total from investment operations | (1.13) |
Distributions from net investment income | (.21) |
Net asset value, end of period | $ 8.66 |
Total Return B, C | (11.43)% |
Ratios to Average Net AssetsG | |
Expenses before reductions | 1.24% A |
Expenses net of fee waivers, if any | .73% A |
Expenses net of all reductions | .72% A |
Net investment income (loss) | 2.88% A |
Supplemental Data | |
Net assets, end of period (000 omitted) | $ 26,016 |
Portfolio turnover rate E | 24% A |
A Annualized
B Total returns for periods of less than one year are not annualized.
C Total returns would have been lower had certain expenses not been reduced during the periods shown.
D Calculated based on average shares outstanding during the period.
E Amount does not include the portfolio activity of any underlying Fidelity Central Funds.
F For the period October 9, 2007 (commencement of operations) to September 30, 2008.
G Expense ratios reflect operating expenses of the class. Expenses before reductions do not reflect amounts reimbursed by the investment adviser or reductions from brokerage service arrangements or other expense offset arrangements and do not represent the amount paid by the class during periods when reimbursements or reductions occur. Expense ratios before reductions for start-up periods may not be representative of longer-term operating periods. Expenses net of fee waivers reflect expenses after reimbursement by the investment adviser but prior to reductions from brokerage service arrangements or other expense offset arrangements. Expenses net of all reductions represent the net expenses paid by the class. Fees and expenses of the underlying Fidelity Central Funds are not included in the Fund's expense ratio. The Fund indirectly bears its proportionate share of the expenses of any underlying Fidelity Central Funds. Based on their most recent shareholder report date, the expenses ranged from less than .01% to .03%.
Financial Highlights - Institutional Class
Year ended September 30, | 2008 F |
Selected Per-Share Data | |
Net asset value, beginning of period | $ 10.00 |
Income from Investment Operations | |
Net investment income (loss) D | .26 |
Net realized and unrealized gain (loss) | (1.39) |
Total from investment operations | (1.13) |
Distributions from net investment income | (.21) |
Net asset value, end of period | $ 8.66 |
Total Return B, C | (11.45)% |
Ratios to Average Net AssetsG | |
Expenses before reductions | 1.76% A |
Expenses net of fee waivers, if any | .75% A |
Expenses net of all reductions | .75% A |
Net investment income (loss) | 2.86% A |
Supplemental Data | |
Net assets, end of period (000 omitted) | $ 209 |
Portfolio turnover rate E | 24% A |
A Annualized
B Total returns for periods of less than one year are not annualized.
C Total returns would have been lower had certain expenses not been reduced during the periods shown.
D Calculated based on average shares outstanding during the period.
E Amount does not include the portfolio activity of any underlying Fidelity Central Funds.
F For the period October 9, 2007 (commencement of operations) to September 30, 2008.
G Expense ratios reflect operating expenses of the class. Expenses before reductions do not reflect amounts reimbursed by the investment adviser or reductions from brokerage service arrangements or other expense offset arrangements and do not represent the amount paid by the class during periods when reimbursements or reductions occur. Expense ratios before reductions for start-up periods may not be representative of longer-term operating periods. Expenses net of fee waivers reflect expenses after reimbursement by the investment adviser but prior to reductions from brokerage service arrangements or other expense offset arrangements. Expenses net of all reductions represent the net expenses paid by the class. Fees and expenses of the underlying Fidelity Central Funds are not included in the Fund's expense ratio. The Fund indirectly bears its proportionate share of the expenses of any underlying Fidelity Central Funds. Based on their most recent shareholder report date, the expenses ranged from less than .01% to .03%.
See accompanying notes which are an integral part of the financial statements.
Annual Report
Fidelity Asset Manager 40%
Investment Changes (Unaudited)
The information in the following tables is based on the combined investments of the Fund and its pro-rata share of the investments of Fidelity's Equity and Fixed-Income Central Funds.
Top Five Bond Issuers as of September 30, 2008 |
(with maturities greater than one year) | % of fund's
net assets | % of fund's net assets
6 months ago |
Fannie Mae | 14.0 | 14.1 |
Freddie Mac | 5.2 | 4.9 |
U.S. Treasury Obligations | 2.3 | 4.6 |
Government National Mortgage Association | 2.1 | 1.6 |
Wells Fargo Mortgage Backed Securities Trust | 0.4 | 0.4 |
| 24.0 | |
Quality Diversification (% of fund's net assets) |
As of September 30, 2008 | As of March 31, 2008 |
| U.S. Government and
U.S. Government
Agency Obligations 24.8% | | | U.S. Government and
U.S. Government
Agency Obligations 25.5% | |
| AAA,AA,A 11.8% | | | AAA,AA,A 10.8% | |
| BBB 8.2% | | | BBB 8.0% | |
 | BB and below 4.6% | | | BB and below 4.5% | |
| Not Rated 0.6% | | | Not Rated 0.4% | |
| Equities 39.5% | | | Equities 40.9% | |
| Short-Term
Investments and
Net Other Assets 10.5% | | | Short-Term
Investments and Net Other Assets 9.9% | |

We have used ratings from Moody's® Investors Services, Inc. Where Moody's ratings are not available, we have used S&P® ratings. All ratings are as of the report date and do not reflect subsequent downgrades. Percentages are adjusted for the effect of futures contracts, if applicable. |
Top Five Stocks as of September 30, 2008 |
| % of fund's
net assets | % of fund's net assets
6 months ago |
Apple, Inc. | 0.6 | 0.1 |
Procter & Gamble Co. | 0.6 | 0.6 |
General Electric Co. | 0.5 | 0.4 |
Bank of America Corp. | 0.4 | 0.3 |
JPMorgan Chase & Co. | 0.4 | 0.4 |
| 2.5 | |
Asset Allocation (% of fund's net assets) |
As of September 30, 2008 | As of March 31, 2008 |
| Stock class and
Equity Futures 39.4% | | | Stock class and
Equity Futures 41.0% | |
| Bond class 45.2% | | | Bond class 49.4% | |
| Short-term class 15.4% | | | Short-term class 9.6% | |
| | | | | |
| | | | | |

Asset allocations in the pie charts reflect the categorization of assets as defined in the Fund's prospectus in effect as of the time periods indicated above. Percentages are adjusted for the effect of futures contracts and swap contracts, if applicable. |
Annual Report
Fidelity Asset Manager 40%
Investment Summary (Unaudited)
The information in the following table is based on the direct investments of the Fund.
Fund Holdings as of September 30, 2008 |
| % of fund's
net assets |
Equity Central Funds | |
Fidelity Financials Central Fund | 5.7 |
Fidelity Information Technology Central Fund | 5.3 |
Fidelity Health Care Central Fund | 4.6 |
Fidelity Industrials Central Fund | 4.3 |
Fidelity Energy Central Fund | 3.9 |
Fidelity International Equity Central Fund | 3.9 |
Fidelity Consumer Staples Central Fund | 3.7 |
Fidelity Consumer Discretionary Central Fund | 3.6 |
Fidelity Materials Central Fund | 1.3 |
Fidelity Utilities Central Fund | 1.3 |
Fidelity Telecom Services Central Fund | 1.1 |
Total Equity Central Funds | 38.7 |
Fixed-Income Central Funds | |
Investment Grade Fixed-Income Funds | 39.1 |
High Yield Fixed-Income Funds | 4.3 |
Total Fixed-Income Central Funds | 43.4 |
Money Market Central Funds | 18.5 |
Other Short-Term Investments and Net Other Assets | (0.6) |
Total | 100.0 |
At period end, foreign investments including the Fund's pro-rata share of the underlying Central Funds was 13.8% of net assets.
A holdings listing for the Fund, which presents direct holdings as well as the pro-rata share of any securities and other investments held indirectly through its investment in underlying non-money market Fidelity Central Funds, is available at fidelity.com and/or advisor.fidelity.com, as applicable.
Annual Report
Fidelity Asset Manager 40%
Investments September 30, 2008
Showing Percentage of Net Assets
Equity Central Funds - 38.7% |
| Shares | | Value |
Fidelity Consumer Discretionary Central Fund (c) | 7,437 | | $ 687,216 |
Fidelity Consumer Staples Central Fund (c) | 6,031 | | 693,355 |
Fidelity Energy Central Fund (c) | 6,666 | | 736,460 |
Fidelity Financials Central Fund (c) | 16,305 | | 1,073,867 |
Fidelity Health Care Central Fund (c) | 8,689 | | 865,513 |
Fidelity Industrials Central Fund (c) | 7,669 | | 809,331 |
Fidelity Information Technology Central Fund (c) | 10,269 | | 1,008,502 |
Fidelity International Equity Central
Fund (c) | 11,101 | | 745,109 |
Fidelity Materials Central Fund (c) | 2,233 | | 245,701 |
Fidelity Telecom Services Central Fund (c) | 2,262 | | 202,857 |
Fidelity Utilities Central Fund (c) | 2,650 | | 247,387 |
TOTAL EQUITY CENTRAL FUNDS (Cost $9,475,308) | 7,315,298 |
Fixed-Income Central Funds - 43.4% |
| | | |
Investment Grade Fixed-Income Funds - 39.1% |
Fidelity Tactical Income Central Fund (c) | 82,188 | | 7,380,508 |
High Yield Fixed-Income Funds - 4.3% |
Fidelity Floating Rate Central Fund (c) | 5,945 | | 504,178 |
Fidelity High Income Central Fund 1 (c) | 3,699 | | 316,276 |
TOTAL HIGH YIELD FIXED-INCOME FUNDS | 820,454 |
TOTAL FIXED-INCOME CENTRAL FUNDS (Cost $8,781,994) | 8,200,962 |
Money Market Central Funds - 18.5% |
| | | |
Fidelity Cash Central Fund, 1.92% (a)
(Cost $3,498,011) | 3,498,011 | | 3,498,011 |
U.S. Treasury Obligations - 0.3% |
| Principal Amount | | |
U.S. Treasury Bills, yield at date of purchase 1.59% 10/16/08 (b)
(Cost $49,965) | | $ 50,000 | | 49,975 |
TOTAL INVESTMENT PORTFOLIO - 100.9% (Cost $21,805,278) | | 19,064,246 |
NET OTHER ASSETS - (0.9)% | | (162,201) |
NET ASSETS - 100% | $ 18,902,045 |
Futures Contracts |
| Expiration Date | | Underlying Face Amount at Value | | Unrealized Appreciation/(Depreciation) |
Purchased |
Equity Index Contracts |
6 CME E-mini S&P 500 Index Contracts | Dec. 2008 | | $ 350,220 | | $ (8,693) |
|
The face value of futures purchased as a percentage of net assets - 1.9% |
Legend |
(a) Affiliated fund that is available only to investment companies and other accounts managed by Fidelity Investments. The rate quoted is the annualized seven-day yield of the fund at period end. A complete unaudited listing of the fund's holdings as of its most recent quarter end is available upon request. |
(b) Security or a portion of the security was pledged to cover margin requirements for futures contracts. At the period end, the value of securities pledged amounted to $49,975. |
(c) Affiliated fund that is available only to investment companies and other accounts managed by Fidelity Investments. A complete unaudited schedule of portfolio holdings for each Fidelity Central Fund is filed with the SEC for the first and third quarters of each fiscal year on Form N-Q and is available upon request or at the SEC's web site at www.sec.gov. An unaudited holdings listing for the Fund, which presents direct holdings as well as the pro rata share of securities and other investments held indirectly through its investment in underlying non-money market Fidelity Central Funds, is available at fidelity.com and/or advisor.fidelity.com, as applicable. In addition, each Fidelity Central Fund's financial statements, which are not covered by the Fund's Report of Independent Registered Public Accounting Firm, are available on the SEC's web site or upon request. |
Affiliated Central Funds |
Information regarding fiscal year to date income earned by the Fund from investments in Fidelity Central Funds is as follows: |
Fund | Income earned |
Fidelity Cash Central Fund | $ 73,418 |
Fidelity Consumer Discretionary Central Fund | 8,175 |
Fidelity Consumer Staples Central Fund | 11,925 |
Fidelity Energy Central Fund | 5,589 |
Fidelity Financials Central Fund | 29,659 |
Fidelity Floating Rate Central Fund | 20,040 |
Fidelity Health Care Central Fund | 6,769 |
Fidelity High Income Central Fund 1 | 22,008 |
Fidelity Industrials Central Fund | 10,831 |
Fidelity Information Technology Central Fund | 6,968 |
Fidelity International Equity Central Fund | 18,366 |
Fidelity Materials Central Fund | 3,763 |
Fidelity Tactical Income Central Fund | 284,658 |
Fidelity Telecom Services Central Fund | 3,980 |
Fidelity Utilities Central Fund | 4,836 |
Total | $ 510,985 |
Additional information regarding the Fund's fiscal year to date purchases and sales, including the ownership percentage, of the non-money market Central Funds is as follows: |
Fund | Value, beginning of period | Purchases | Sales
Proceeds | Value,
end of period | % ownership, end of period |
Fidelity Consumer Discretionary Central Fund | $ - | $ 848,840 | $ 18,997 | $ 687,216 | 0.1% |
Fidelity Consumer Staples Central Fund | - | 754,397 | 3,566 | 693,355 | 0.1% |
Fidelity Energy Central Fund | - | 995,695 | 23,160 | 736,460 | 0.1% |
Fidelity Financials Central Fund | - | 1,549,389 | - | 1,073,867 | 0.1% |
Fidelity Floating Rate Central Fund | - | 560,534 | - | 504,178 | 0.0% |
Fidelity Health Care Central Fund | - | 1,005,463 | 2,454 | 865,513 | 0.1% |
Fidelity High Income Central Fund 1 | - | 368,764 | 12,994 | 316,276 | 0.1% |
Fidelity Industrials Central Fund | - | 1,015,214 | 25,730 | 809,331 | 0.1% |
Fidelity Information Technology Central Fund | - | 1,409,786 | 8,250 | 1,008,502 | 0.1% |
Fidelity International Equity Central Fund | - | 1,040,428 | - | 745,109 | 0.1% |
Fidelity Materials Central Fund | - | 329,911 | 5,970 | 245,701 | 0.1% |
Fidelity Tactical Income Central Fund | - | 7,866,585 | - | 7,380,508 | 0.2% |
Fidelity Telecom Services Central Fund | - | 291,464 | - | 202,857 | 0.1% |
Fidelity Utilities Central Fund | - | 326,107 | - | 247,387 | 0.1% |
Total | $ - | $ 18,362,577 | $ 101,121 | $ 15,516,260 | |
Other Information (Unaudited) |
The information in the following table is based on the combined investment of the Fund and its pro-rata share of the investments of Fidelity's Equity and Fixed-Income Central Funds. |
Distribution of investments by country of issue, as a percentage of total net assets, is as follows. Percentages are adjusted for the effect of futures contracts, if applicable. |
United States of America | 86.2% |
United Kingdom | 2.4% |
Bermuda | 1.5% |
Canada | 1.3% |
Switzerland | 1.2% |
Japan | 1.0% |
Others (individually less than 1%) | 6.4% |
| 100.0% |
Income Tax Information |
At September 30, 2008, the fund had a capital loss carryforward of approximately $101,011 all of which will expire on September 30, 2016. |
The fund intends to elect to defer to its fiscal year ending September 30, 2009 approximately $1,131,101 of losses recognized during the period November 1, 2007 to September 30, 2008. |
See accompanying notes which are an integral part of the financial statements.
Annual Report
Fidelity Asset Manager 40%
Statement of Assets and Liabilities
| September 30, 2008 |
| | |
Assets | | |
Investment in securities, at value - See accompanying schedule: Unaffiliated issuers (cost $49,965) | $ 49,975 | |
Fidelity Central Funds (cost $21,755,313) | 19,014,271 | |
Total Investments (cost $21,805,278) | | $ 19,064,246 |
Receivable for fund shares sold | | 169,812 |
Distributions receivable from Fidelity Central Funds | | 41,892 |
Receivable for daily variation on futures contracts | | 14,580 |
Prepaid expenses | | 3 |
Receivable from investment adviser for expense reductions | | 30,347 |
Total assets | | 19,320,880 |
| | |
Liabilities | | |
Payable for investments purchased | $ 256,583 | |
Payable for fund shares redeemed | 119,514 | |
Accrued management fee | 6,674 | |
Distribution fees payable | 3,557 | |
Other affiliated payables | 2,496 | |
Other payables and accrued expenses | 30,011 | |
Total liabilities | | 418,835 |
| | |
Net Assets | | $ 18,902,045 |
Net Assets consist of: | | |
Paid in capital | | $ 21,598,672 |
Undistributed net investment income | | 131,642 |
Accumulated undistributed net realized gain (loss) on investments and foreign currency transactions | | (78,544) |
Net unrealized appreciation (depreciation) on investments | | (2,749,725) |
Net Assets | | $ 18,902,045 |
| | |
Calculation of Maximum Offering Price Class A:
Net Asset Value and redemption price per share ($2,032,604 ÷ 241,385 shares) | | $ 8.42 |
| | |
Maximum offering price per share (100/94.25 of $8.42) | | $ 8.93 |
Class T:
Net Asset Value and redemption price per share ($1,839,582 ÷ 218,637 shares) | | $ 8.41 |
| | |
Maximum offering price per share (100/96.50 of $8.41) | | $ 8.72 |
Class B:
Net Asset Value and offering price per share ($1,378,427 ÷ 164,016 shares)A | | $ 8.40 |
| | |
Class C:
Net Asset Value and offering price per share ($1,383,696 ÷ 164,606 shares)A | | $ 8.41 |
| | |
| | |
Asset Manager 40%:
Net Asset Value, offering price and redemption price per share ($10,929,086 ÷ 1,297,117 shares) | | $ 8.43 |
| | |
Institutional Class:
Net Asset Value, offering price and redemption price per share ($1,338,650 ÷ 158,863 shares) | | $ 8.43 |
A Redemption price per share is equal to net asset value less any applicable contingent deferred sales charge.
See accompanying notes which are an integral part of the financial statements.
Annual Report
Statement of Operations
For the period October 9, 2007 (commencement of operations) to September 30, 2008 |
| | |
Investment Income | | |
Interest | | $ 2,124 |
Income from Fidelity Central Funds | | 510,985 |
Total income | | 513,109 |
| | |
Expenses | | |
Management fee | $ 60,461 | |
Transfer agent fees | 17,548 | |
Distribution fees | 41,312 | |
Accounting fees and expenses | 6,045 | |
Custodian fees and expenses | 4,989 | |
Independent trustees' compensation | 53 | |
Registration fees | 114,542 | |
Audit | 36,878 | |
Legal | 30 | |
Miscellaneous | 2,049 | |
Total expenses before reductions | 283,907 | |
Expense reductions | (134,669) | 149,238 |
Net investment income (loss) | | 363,871 |
Realized and Unrealized Gain (Loss) Net realized gain (loss) on: | | |
Investment securities: | | |
Fidelity Central Funds | (4,134) | |
Foreign currency transactions | (174) | |
Futures contracts | (78,098) | |
Total net realized gain (loss) | | (82,406) |
Change in net unrealized appreciation (depreciation) on: Investment securities | (2,741,032) | |
Futures contracts | (8,693) | |
Total change in net unrealized appreciation (depreciation) | | (2,749,725) |
Net gain (loss) | | (2,832,131) |
Net increase (decrease) in net assets resulting from operations | | $ (2,468,260) |
Statement of Changes in Net Assets
| For the period
October 9, 2007 (commencement of operations) to September 30, 2008 |
Increase (Decrease) in Net Assets | |
Operations | |
Net investment income (loss) | $ 363,871 |
Net realized gain (loss) | (82,406) |
Change in net unrealized appreciation (depreciation) | (2,749,725) |
Net increase (decrease) in net assets resulting from operations | (2,468,260) |
Distributions to shareholders from net investment income | (228,368) |
Share transactions - net increase (decrease) | 21,598,673 |
Total increase (decrease) in net assets | 18,902,045 |
| |
Net Assets | |
Beginning of period | - |
End of period (including undistributed net investment income of $131,642) | $ 18,902,045 |
See accompanying notes which are an integral part of the financial statements.
Annual Report
Financial Highlights - Class A
Year ended September 30, | 2008 G |
Selected Per-Share Data | |
Net asset value, beginning of period | $ 10.00 |
Income from Investment Operations | |
Net investment income (loss) E | .23 |
Net realized and unrealized gain (loss) | (1.66) |
Total from investment operations | (1.43) |
Distributions from net investment income | (.15) |
Net asset value, end of period | $ 8.42 |
Total Return B, C, D | (14.43)% |
Ratios to Average Net Assets H | |
Expenses before reductions | 1.91% A |
Expenses net of fee waivers, if any | 1.00% A |
Expenses net of all reductions | 1.00% A |
Net investment income (loss) | 2.52% A |
Supplemental Data | |
Net assets, end of period (000 omitted) | $ 2,033 |
Portfolio turnover rate F | 1%A |
A Annualized
B Total returns for periods of less than one year are not annualized.
C Total returns would have been lower had certain expenses not been reduced during the periods shown.
D Total returns do not include the effect of the sales charges.
E Calculated based on average shares outstanding during the period.
F Amount does not include the portfolio activity of any underlying Fidelity Central Funds.
G For the period October 9, 2007 (commencement of operations) to September 30, 2008.
H Expense ratios reflect operating expenses of the class. Expenses before reductions do not reflect amounts reimbursed by the investment adviser or reductions from brokerage service arrangements or other expense offset arrangements and do not represent the amount paid by the class during periods when reimbursements or reductions occur. Expense ratios before reductions for start-up periods may not be representative of longer-term operating periods. Expenses net of fee waivers reflect expenses after reimbursement by the investment adviser but prior to reductions from brokerage service arrangements or other expense offset arrangements. Expenses net of all reductions represent the net expenses paid by the class. Fees and expenses of the underlying Fidelity Central Funds are not included in the Fund's expense ratio. The Fund indirectly bears its proportionate share of the expenses of any underlying Fidelity Central Funds. Based on their most recent shareholder report date, the expenses ranged from less than .01% to .03%.
Financial Highlights - Class T
Year ended September 30, | 2008 G |
Selected Per-Share Data | |
Net asset value, beginning of period | $ 10.00 |
Income from Investment Operations | |
Net investment income (loss) E | .21 |
Net realized and unrealized gain (loss) | (1.66) |
Total from investment operations | (1.45) |
Distributions from net investment income | (.14) |
Net asset value, end of period | $ 8.41 |
Total Return B, C, D | (14.67)% |
Ratios to Average Net Assets H | |
Expenses before reductions | 2.15% A |
Expenses net of fee waivers, if any | 1.25% A |
Expenses net of all reductions | 1.25% A |
Net investment income (loss) | 2.27% A |
Supplemental Data | |
Net assets, end of period (000 omitted) | $ 1,840 |
Portfolio turnover rate F | 1%A |
A Annualized
B Total returns for periods of less than one year are not annualized.
C Total returns would have been lower had certain expenses not been reduced during the periods shown.
D Total returns do not include the effect of the sales charges.
E Calculated based on average shares outstanding during the period.
F Amount does not include the portfolio activity of any underlying Fidelity Central Funds.
G For the period October 9, 2007 (commencement of operations) to September 30, 2008.
H Expense ratios reflect operating expenses of the class. Expenses before reductions do not reflect amounts reimbursed by the investment adviser or reductions from brokerage service arrangements or other expense offset arrangements and do not represent the amount paid by the class during periods when reimbursements or reductions occur. Expense ratios before reductions for start-up periods may not be representative of longer-term operating periods. Expenses net of fee waivers reflect expenses after reimbursement by the investment adviser but prior to reductions from brokerage service arrangements or other expense offset arrangements. Expenses net of all reductions represent the net expenses paid by the class. Fees and expenses of the underlying Fidelity Central Funds are not included in the Fund's expense ratio. The Fund indirectly bears its proportionate share of the expenses of any underlying Fidelity Central Funds. Based on their most recent shareholder report date, the expenses ranged from less than .01% to .03%.
See accompanying notes which are an integral part of the financial statements.
Annual Report
Financial Highlights - Class B
Year ended September 30, | 2008 G |
Selected Per-Share Data | |
Net asset value, beginning of period | $ 10.00 |
Income from Investment Operations | |
Net investment income (loss) E | .16 |
Net realized and unrealized gain (loss) | (1.66) |
Total from investment operations | (1.50) |
Distributions from net investment income | (.10) |
Net asset value, end of period | $ 8.40 |
Total Return B, C, D | (15.09)% |
Ratios to Average Net Assets H | |
Expenses before reductions | 2.64% A |
Expenses net of fee waivers, if any | 1.77% A |
Expenses net of all reductions | 1.77% A |
Net investment income (loss) | 1.76% A |
Supplemental Data | |
Net assets, end of period (000 omitted) | $ 1,378 |
Portfolio turnover rate F | 1%A |
A Annualized
B Total returns for periods of less than one year are not annualized.
C Total returns would have been lower had certain expenses not been reduced during the periods shown.
D Total returns do not include the effect of the contingent deferred sales charge.
E Calculated based on average shares outstanding during the period.
F Amount does not include the portfolio activity of any underlying Fidelity Central Funds.
G For the period October 9, 2007 (commencement of operations) to September 30, 2008.
H Expense ratios reflect operating expenses of the class. Expenses before reductions do not reflect amounts reimbursed by the investment adviser or reductions from brokerage service arrangements or other expense offset arrangements and do not represent the amount paid by the class during periods when reimbursements or reductions occur. Expense ratios before reductions for start-up periods may not be representative of longer-term operating periods. Expenses net of fee waivers reflect expenses after reimbursement by the investment adviser but prior to reductions from brokerage service arrangements or other expense offset arrangements. Expenses net of all reductions represent the net expenses paid by the class. Fees and expenses of the underlying Fidelity Central Funds are not included in the Fund's expense ratio. The Fund indirectly bears its proportionate share of the expenses of any underlying Fidelity Central Funds. Based on their most recent shareholder report date, the expenses ranged from less than .01% to .03%.
Financial Highlights - Class C
Year ended September 30, | 2008 G |
Selected Per-Share Data | |
Net asset value, beginning of period | $ 10.00 |
Income from Investment Operations | |
Net investment income (loss) E | .16 |
Net realized and unrealized gain (loss) | (1.65) |
Total from investment operations | (1.49) |
Distributions from net investment income | (.10) |
Net asset value, end of period | $ 8.41 |
Total Return B, C, D | (15.01)% |
Ratios to Average Net Assets H | |
Expenses before reductions | 2.66% A |
Expenses net of fee waivers, if any | 1.76% A |
Expenses net of all reductions | 1.76% A |
Net investment income (loss) | 1.76% A |
Supplemental Data | |
Net assets, end of period (000 omitted) | $ 1,384 |
Portfolio turnover rate F | 1%A |
A Annualized
B Total returns for periods of less than one year are not annualized.
C Total returns would have been lower had certain expenses not been reduced during the periods shown.
D Total returns do not include the effect of the contingent deferred sales charge.
E Calculated based on average shares outstanding during the period.
F Amount does not include the portfolio activity of any underlying Fidelity Central Funds.
G For the period October 9, 2007 (commencement of operations) to September 30, 2008.
H Expense ratios reflect operating expenses of the class. Expenses before reductions do not reflect amounts reimbursed by the investment adviser or reductions from brokerage service arrangements or other expense offset arrangements and do not represent the amount paid by the class during periods when reimbursements or reductions occur. Expense ratios before reductions for start-up periods may not be representative of longer-term operating periods. Expenses net of fee waivers reflect expenses after reimbursement by the investment adviser but prior to reductions from brokerage service arrangements or other expense offset arrangements. Expenses net of all reductions represent the net expenses paid by the class. Fees and expenses of the underlying Fidelity Central Funds are not included in the Fund's expense ratio. The Fund indirectly bears its proportionate share of the expenses of any underlying Fidelity Central Funds. Based on their most recent shareholder report date, the expenses ranged from less than .01% to .03%.
See accompanying notes which are an integral part of the financial statements.
Annual Report
Financial Highlights - Asset Manager 40%
Year ended September 30, | 2008 F |
Selected Per-Share Data | |
Net asset value, beginning of period | $ 10.00 |
Income from Investment Operations | |
Net investment income (loss) D | .25 |
Net realized and unrealized gain (loss) | (1.65) |
Total from investment operations | (1.40) |
Distributions from net investment income | (.17) |
Net asset value, end of period | $ 8.43 |
Total Return B, C | (14.18)% |
Ratios to Average Net Assets G | |
Expenses before reductions | 1.68% A |
Expenses net of fee waivers, if any | .72% A |
Expenses net of all reductions | .72% A |
Net investment income (loss) | 2.80% A |
Supplemental Data | |
Net assets, end of period (000 omitted) | $ 10,929 |
Portfolio turnover rate E | 1%A |
A Annualized
B Total returns for periods of less than one year are not annualized.
C Total returns would have been lower had certain expenses not been reduced during the periods shown.
D Calculated based on average shares outstanding during the period.
E Amount does not include the portfolio activity of any underlying Fidelity Central Funds.
F For the period October 9, 2007 (commencement of operations) to September 30, 2008.
G Expense ratios reflect operating expenses of the class. Expenses before reductions do not reflect amounts reimbursed by the investment adviser or reductions from brokerage service arrangements or other expense offset arrangements and do not represent the amount paid by the class during periods when reimbursements or reductions occur. Expense ratios before reductions for start-up periods may not be representative of longer-term operating periods. Expenses net of fee waivers reflect expenses after reimbursement by the investment adviser but prior to reductions from brokerage service arrangements or other expense offset arrangements. Expenses net of all reductions represent the net expenses paid by the class. Fees and expenses of the underlying Fidelity Central Funds are not included in the Fund's expense ratio. The Fund indirectly bears its proportionate share of the expenses of any underlying Fidelity Central Funds. Based on their most recent shareholder report date, the expenses ranged from less than .01% to .03%.
Financial Highlights - Institutional Class
Year ended September 30, | 2008 F |
Selected Per-Share Data | |
Net asset value, beginning of period | $ 10.00 |
Income from Investment Operations | |
Net investment income (loss) D | .25 |
Net realized and unrealized gain (loss) | (1.65) |
Total from investment operations | (1.40) |
Distributions from net investment income | (.17) |
Net asset value, end of period | $ 8.43 |
Total Return B, C | (14.18)% |
Ratios to Average Net Assets G | |
Expenses before reductions | 1.63% A |
Expenses net of fee waivers, if any | .76% A |
Expenses net of all reductions | .76% A |
Net investment income (loss) | 2.76% A |
Supplemental Data | |
Net assets, end of period (000 omitted) | $ 1,339 |
Portfolio turnover rate E | 1%A |
A Annualized
B Total returns for periods of less than one year are not annualized.
C Total returns would have been lower had certain expenses not been reduced during the periods shown.
D Calculated based on average shares outstanding during the period.
E Amount does not include the portfolio activity of any underlying Fidelity Central Funds.
F For the period October 9, 2007 (commencement of operations) to September 30, 2008.
G Expense ratios reflect operating expenses of the class. Expenses before reductions do not reflect amounts reimbursed by the investment adviser or reductions from brokerage service arrangements or other expense offset arrangements and do not represent the amount paid by the class during periods when reimbursements or reductions occur. Expense ratios before reductions for start-up periods may not be representative of longer-term operating periods. Expenses net of fee waivers reflect expenses after reimbursement by the investment adviser but prior to reductions from brokerage service arrangements or other expense offset arrangements. Expenses net of all reductions represent the net expenses paid by the class. Fees and expenses of the underlying Fidelity Central Funds are not included in the Fund's expense ratio. The Fund indirectly bears its proportionate share of the expenses of any underlying Fidelity Central Funds. Based on their most recent shareholder report date, the expenses ranged from less than .01% to .03%.
See accompanying notes which are an integral part of the financial statements.
Annual Report
Fidelity Asset Manager 50%
Investment Changes (Unaudited)
The information in the following tables is based on the combined investments of the Fund and its pro-rata share of the investments of Fidelity's Equity and Fixed-Income Central Funds.
Top Ten Stocks as of September 30, 2008 |
| % of fund's
net assets | % of fund's net assets
6 months ago |
Apple, Inc. | 0.8 | 0.1 |
Procter & Gamble Co. | 0.8 | 0.7 |
General Electric Co. | 0.6 | 0.5 |
Bank of America Corp. | 0.5 | 0.4 |
JPMorgan Chase & Co. | 0.5 | 0.5 |
Wells Fargo & Co. | 0.5 | 0.4 |
The Coca-Cola Co. | 0.5 | 0.5 |
Genentech, Inc. | 0.5 | 0.1 |
PepsiCo, Inc. | 0.4 | 0.4 |
Citigroup, Inc. | 0.4 | 0.4 |
| 5.5 | |
Top Five Bond Issuers as of September 30, 2008 |
(with maturities greater than one year) | % of fund's
net assets | % of fund's net assets
6 months ago |
Fannie Mae | 14.4 | 13.2 |
Freddie Mac | 5.3 | 4.6 |
U.S. Treasury Obligations | 2.3 | 4.3 |
Government National Mortgage Association | 2.0 | 1.5 |
Wells Fargo Mortgage Backed Securities Trust | 0.5 | 0.4 |
| 24.5 | |
Asset Allocation (% of fund's net assets) |
As of September 30, 2008 | As of March 31, 2008 |
| Stock class and
Equity Futures 51.2% | | | Stock class and
Equity Futures 51.2% | |
| Bond class 50.5% | | | Bond class 46.6% | |
 | Short-term class* (1.7)% | |  | Short-term class 2.2% | |
| | | | | |
| | | | | |

Asset allocations in the pie charts reflect the categorization of assets as defined in the Fund's prospectus in effect as of the time periods indicated above. Percentages are adjusted for the effect of futures contracts and swap contracts, if applicable. |
* Short-term class is not included in the pie chart. |
Annual Report
Fidelity Asset Manager 50%
Investment Summary (Unaudited)
The information in the following table is based on the direct investments of the Fund.
Fund Holdings as of September 30, 2008 |
| % of fund's
net assets |
Equity Central Funds | |
Fidelity Financials Central Fund | 7.2 |
Fidelity Information Technology Central Fund | 6.8 |
Fidelity Health Care Central Fund | 5.8 |
Fidelity Industrials Central Fund | 5.5 |
Fidelity Energy Central Fund | 5.0 |
Fidelity Consumer Staples Central Fund | 4.7 |
Fidelity Consumer Discretionary Central Fund | 4.6 |
Fidelity International Equity Central Fund | 4.2 |
Fidelity Utilities Central Fund | 1.7 |
Fidelity Materials Central Fund | 1.6 |
Fidelity Telecom Services Central Fund | 1.4 |
Total Equity Central Funds | 48.5 |
Fixed-Income Central Funds | |
Investment Grade Fixed-Income Funds | 37.8 |
High Yield Fixed-Income Funds | 5.1 |
Total Fixed-Income Central Funds | 42.9 |
Money Market Central Funds | 4.4 |
Other Short-Term Investments and Net Other Assets | 4.2 |
Total | 100.0 |
At period end, foreign investments including the Fund's pro-rata share of the underlying Central Funds was 15.6% of net assets.
A holdings listing for the Fund, which presents direct holdings as well as the pro-rata share of any securities and other investments held indirectly through its investment in underlying non-money market Fidelity Central Funds, is available at fidelity.com and/or advisor.fidelity.com, as applicable.
Annual Report
Fidelity Asset Manager 50%
Investments September 30, 2008
Showing Percentage of Net Assets
Equity Central Funds - 48.5% |
| Shares | | Value |
Fidelity Consumer Discretionary Central Fund (c) | 3,170,836 | | $ 293,016,928 |
Fidelity Consumer Staples Central Fund (c) | 2,571,302 | | 295,622,548 |
Fidelity Energy Central Fund (c) | 2,842,164 | | 314,002,263 |
Fidelity Financials Central Fund (c) | 6,951,945 | | 457,855,099 |
Fidelity Health Care Central Fund (c) | 3,704,728 | | 369,027,997 |
Fidelity Industrials Central Fund (c) | 3,269,947 | | 345,077,478 |
Fidelity Information Technology Central Fund (c) | 4,378,494 | | 430,011,894 |
Fidelity International Equity Central Fund (c) | 3,978,961 | | 267,067,885 |
Fidelity Materials Central Fund (c) | 952,243 | | 104,784,844 |
Fidelity Telecom Services Central Fund (c) | 964,561 | | 86,521,154 |
Fidelity Utilities Central Fund (c) | 1,130,427 | | 105,514,101 |
TOTAL EQUITY CENTRAL FUNDS (Cost $3,338,875,549) | 3,068,502,191 |
Fixed-Income Central Funds - 42.9% |
| | | |
Investment Grade Fixed-Income Funds - 37.8% |
Fidelity Tactical Income Central
Fund (c) | 26,622,633 | | 2,390,712,422 |
High Yield Fixed-Income Funds - 5.1% |
Fidelity Floating Rate Central Fund (c) | 2,313,297 | | 196,167,573 |
Fidelity High Income Central
Fund 1 (c) | 1,437,819 | | 122,947,937 |
TOTAL HIGH YIELD FIXED-INCOME FUNDS | 319,115,510 |
TOTAL FIXED-INCOME CENTRAL FUNDS (Cost $2,962,114,909) | 2,709,827,932 |
Money Market Central Funds - 4.4% |
| | | |
Fidelity Money Market Central Fund, 3.13% (a)
(Cost $280,013,442) | 280,013,442 | | 280,013,442 |
U.S. Treasury Obligations - 0.3% |
| Principal
Amount | | |
U.S. Treasury Bills, yield at date of purchase 1.59% to 1.68% 10/9/08 to 12/4/08 (b)
(Cost $18,865,185) | $ 18,900,000 | | 18,884,472 |
TOTAL INVESTMENT PORTFOLIO - 96.1% (Cost $6,599,869,085) | | 6,077,228,037 |
NET OTHER ASSETS - 3.9% | | 244,786,430 |
NET ASSETS - 100% | $ 6,322,014,467 |
Futures Contracts |
| Expiration Date | | Underlying Face Amount at Value | | Unrealized Appreciation/
(Depreciation) |
Purchased |
Equity Index Contracts |
4,412 CME E-mini S&P 500 Index Contracts | Dec. 2008 | | $ 257,528,440 | | $ (6,392,238) |
The face value of futures purchased as a percentage of net assets - 4.1% |
Legend |
(a) Affiliated fund that is available only to investment companies and other accounts managed by Fidelity Investments. The rate quoted is the annualized seven-day yield of the fund at period end. A complete unaudited listing of the fund's holdings as of its most recent quarter end is available upon request. |
(b) Security or a portion of the security was pledged to cover margin requirements for futures contracts. At the period end, the value of securities pledged amounted to $18,884,472. |
(c) Affiliated fund that is available only to investment companies and other accounts managed by Fidelity Investments. A complete unaudited schedule of portfolio holdings for each Fidelity Central Fund is filed with the SEC for the first and third quarters of each fiscal year on Form N-Q and is available upon request or at the SEC's web site at www.sec.gov. An unaudited holdings listing for the Fund, which presents direct holdings as well as the pro rata share of securities and other investments held indirectly through its investment in underlying non-money market Fidelity Central Funds, is available at fidelity.com and/or advisor.fidelity.com, as applicable. In addition, each Fidelity Central Fund's financial statements, which are not covered by the Fund's Report of Independent Registered Public Accounting Firm, are available on the SEC's web site or upon request. |
Affiliated Central Funds |
Information regarding fiscal year to date income earned by the Fund from investments in Fidelity Central Funds is as follows: |
Fund | Income earned |
Fidelity Cash Central Fund | $ 4,772,695 |
Fidelity Consumer Discretionary Central Fund | 5,133,776 |
Fidelity Consumer Staples Central Fund | 7,158,660 |
Fidelity Energy Central Fund | 3,472,331 |
Fidelity Financials Central Fund | 18,566,252 |
Fidelity Floating Rate Central Fund | 14,457,624 |
Fidelity Health Care Central Fund | 4,260,999 |
Fidelity High Income Central Fund 1 | 10,900,140 |
Fidelity Industrials Central Fund | 6,694,115 |
Fidelity Information Technology Central Fund | 4,177,665 |
Fidelity International Equity Central Fund | 8,198,636 |
Fidelity Materials Central Fund | 2,524,209 |
Fidelity Money Market Central Fund | 14,418,304 |
Fidelity Securities Lending Cash Central Fund | 14,209 |
Fidelity Tactical Income Central Fund | 157,109,083 |
Fidelity Telecom Services Central Fund | 2,596,771 |
Fidelity Utilities Central Fund | 3,046,836 |
Total | $ 267,502,305 |
Additional information regarding the Fund's fiscal year to date purchases and sales, including the ownership percentage, of the non-money market Central Funds is as follows: |
Fund | Value, beginning of period | Purchases | Sales
Proceeds | Value,
end of period | % ownership,
end of period |
Fidelity Consumer Discretionary Central Fund | $ 412,360,000 | $ 2,215,273 | $ 26,219,372 | $ 293,016,928 | 55.2% |
Fidelity Consumer Staples Central Fund | 337,240,000 | 3,243,954 | 16,409,489 | 295,622,548 | 55.2% |
Fidelity Energy Central Fund | 427,750,000 | 131,408 | 34,221,179 | 314,002,263 | 55.2% |
Fidelity Financials Central Fund | 765,273,000 | 6,377,816 | 3,515,130 | 457,855,099 | 55.2% |
Fidelity Floating Rate Central Fund | 271,825,000 | 6,149,178 | 52,651,959 | 196,167,573 | 7.7% |
Fidelity Health Care Central Fund | 462,483,000 | 1,668,863 | 18,829,514 | 369,027,997 | 55.2% |
Fidelity High Income Central Fund 1 | 153,712,000 | 5,312,032 | 17,798,226 | 122,947,937 | 49.2% |
Fidelity Industrials Central Fund | 473,294,000 | 2,893,657 | 34,112,669 | 345,077,478 | 55.2% |
Fidelity Information Technology Central Fund | 662,781,000 | 2,117,964 | 7,335,749 | 430,011,894 | 55.2% |
Fidelity International Equity Central Fund | - | 394,714,744 | - | 267,067,885 | 43.0% |
Fidelity Materials Central Fund | 148,405,000 | 859,244 | 10,223,019 | 104,784,844 | 55.2% |
Fidelity Tactical Income Central Fund | 3,496,910,000 | 157,109,084 | 1,046,420,760 | 2,390,712,422 | 59.2% |
Fidelity Telecom Services Central Fund | 143,131,000 | 3,153,969 | 281,220 | 86,521,154 | 55.2% |
Fidelity Utilities Central Fund | 143,573,000 | 1,489,114 | 5,876,159 | 105,514,101 | 55.2% |
Total | $ 7,898,737,000 | $ 587,436,300 | $ 1,273,894,445 | $ 5,778,330,123 | |
Other Information (Unaudited) |
The information in the following tables is based on the combined investment of the Fund and its pro-rata share of the investments of Fidelity's Equity and Fixed-Income Central Funds. The composition of credit quality ratings as a percentage of net assets is as follows: |
U.S. Government and U.S. Government Agency Obligations | 24.1% |
AAA,AA,A | 11.4% |
BBB | 7.9% |
BB | 2.7% |
B | 2.0% |
CCC,CC,C | 0.5% |
Not Rated | 0.7% |
Equities | 51.3% |
Short-Term Investments and Net Other Assets | (0.6)% |
| 100.0% |
We have used ratings from Moody's® Investors Services, Inc. Where Moody's ratings are not available, we have used S&P® ratings. All ratings are as of the report date and do not reflect subsequent downgrades. Percentages are adjusted for the effect of futures contracts, if applicable. |
Distribution of investments by country of issue, as a percentage of total net assets, is as follows. Percentages are adjusted for the effect of futures contracts, if applicable. |
United States of America | 84.4% |
United Kingdom | 2.8% |
Bermuda | 1.7% |
Canada | 1.6% |
Switzerland | 1.3% |
Japan | 1.0% |
Others (individually less than 1%) | 7.2% |
| 100.0% |
Income Tax Information |
The fund intends to elect to defer to its fiscal year ending September 30, 2009 approximately $288,485,511 of losses recognized during the period November 1, 2007 to September 30, 2008. |
See accompanying notes which are an integral part of the financial statements.
Annual Report
Fidelity Asset Manager 50%
Statement of Assets and Liabilities
| September 30, 2008 |
| | |
Assets | | |
Investment in securities, at value - See accompanying schedule: Unaffiliated issuers (cost $18,865,185) | $ 18,884,472 | |
Fidelity Central Funds (cost $6,581,003,900) | 6,058,343,565 | |
Total Investments (cost $6,599,869,085) | | $ 6,077,228,037 |
Cash | | 96 |
Receivable for investments sold | | 278,320,014 |
Receivable for fund shares sold | | 2,582,266 |
Distributions receivable from Fidelity Central Funds | | 14,316,556 |
Receivable for daily variation on futures contracts | | 11,074,120 |
Prepaid expenses | | 5,041 |
Other receivables | | 293,321 |
Total assets | | 6,383,819,451 |
| | |
Liabilities | | |
Payable for investments purchased | $ 13,297,985 | |
Payable for fund shares redeemed | 14,214,704 | |
Accrued management fee | 2,834,874 | |
Distribution fees payable | 10,089 | |
Notes payable to affiliates | 29,971,000 | |
Other affiliated payables | 1,163,239 | |
Other payables and accrued expenses | 313,093 | |
Total liabilities | | 61,804,984 |
| | |
Net Assets | | $ 6,322,014,467 |
Net Assets consist of: | | |
Paid in capital | | $ 7,229,405,198 |
Undistributed net investment income | | 64,010,831 |
Accumulated undistributed net realized gain (loss) on investments and foreign currency transactions | | (442,368,276) |
Net unrealized appreciation (depreciation) on investments | | (529,033,286) |
Net Assets | | $ 6,322,014,467 |
| | |
Calculation of Maximum Offering Price Class A:
Net Asset Value and redemption price per share ($10,611,260 ÷ 819,550 shares) | | $ 12.95 |
| | |
Maximum offering price per share (100/94.25 of $12.95) | | $ 13.74 |
Class T:
Net Asset Value and redemption price per share ($5,474,554 ÷ 423,117 shares) | | $ 12.94 |
| | |
Maximum offering price per share (100/96.50 of $12.94) | | $ 13.41 |
Class B:
Net Asset Value and offering price per share ($2,083,555 ÷ 161,425 shares)A | | $ 12.91 |
| | |
Class C:
Net Asset Value and offering price per share ($4,294,133 ÷ 332,972 shares)A | | $ 12.90 |
| | |
| | |
Asset Manager 50%:
Net Asset Value, offering price and redemption price per share ($6,299,082,145 ÷ 485,541,027 shares) | | $ 12.97 |
| | |
Institutional Class:
Net Asset Value, offering price and redemption price per share ($468,820 ÷ 36,159 shares) | | $ 12.97 |
A Redemption price per share is equal to net asset value less any applicable contingent deferred sales charge.
See accompanying notes which are an integral part of the financial statements.
Annual Report
Statement of Operations
| Year ended September 30, 2008 |
| | |
Investment Income | | |
Dividends | | $ 96,284 |
Interest | | 492,323 |
Income from Fidelity Central Funds | | 267,502,305 |
Total income | | 268,090,912 |
| | |
Expenses | | |
Management fee | $ 39,492,324 | |
Transfer agent fees | 13,515,826 | |
Distribution fees | 103,117 | |
Accounting and security lending fees | 1,481,195 | |
Custodian fees and expenses | 29,388 | |
Independent trustees' compensation | 32,571 | |
Depreciation in deferred trustee compensation account | (1,197) | |
Registration fees | 97,913 | |
Audit | 90,609 | |
Legal | 87,111 | |
Interest | 44,852 | |
Miscellaneous | 145,136 | |
Total expenses before reductions | 55,118,845 | |
Expense reductions | (519,105) | 54,599,740 |
Net investment income (loss) | | 213,491,172 |
Realized and Unrealized Gain (Loss) Net realized gain (loss) on: | | |
Investment securities: | | |
Unaffiliated issuers (net of foreign taxes of $213,100) | 15,155,000 | |
Fidelity Central Funds | (8,912,254) | |
Foreign currency transactions | (99,661) | |
Futures contracts | (64,525,694) | |
Total net realized gain (loss) | | (58,382,609) |
Change in net unrealized appreciation (depreciation) on: Investment securities (net of decrease in deferred foreign taxes of $107,640) | (1,444,700,646) | |
Assets and liabilities in foreign currencies | (2,347) | |
Futures contracts | (17,274,497) | |
Total change in net unrealized appreciation (depreciation) | | (1,461,977,490) |
Net gain (loss) | | (1,520,360,099) |
Net increase (decrease) in net assets resulting from operations | | $ (1,306,868,927) |
Statement of Changes in Net Assets
| Year ended
September 30, 2008 | Year ended
September 30, 2007 |
Increase (Decrease) in Net Assets | | |
Operations | | |
Net investment income (loss) | $ 213,491,172 | $ 267,544,083 |
Net realized gain (loss) | (58,382,609) | 291,165,801 |
Change in net unrealized appreciation (depreciation) | (1,461,977,490) | 485,622,259 |
Net increase (decrease) in net assets resulting from operations | (1,306,868,927) | 1,044,332,143 |
Distributions to shareholders from net investment income | (239,866,976) | (271,879,077) |
Distributions to shareholders from net realized gain | (556,509,728) | (485,946,437) |
Total distributions | (796,376,704) | (757,825,514) |
Share transactions - net increase (decrease) | (541,463,365) | (523,997,125) |
Total increase (decrease) in net assets | (2,644,708,996) | (237,490,496) |
| | |
Net Assets | | |
Beginning of period | 8,966,723,463 | 9,204,213,959 |
End of period (including undistributed net investment income of $64,010,831 and undistributed net investment income of $82,560,257, respectively) | $ 6,322,014,467 | $ 8,966,723,463 |
See accompanying notes which are an integral part of the financial statements.
Annual Report
Financial Highlights - Class A
Years ended September 30, | 2008 | 2007 G |
Selected Per-Share Data | | |
Net asset value, beginning of period | $ 17.08 | $ 16.57 |
Income from Investment Operations | | |
Net investment income (loss) E | .36 | .43 |
Net realized and unrealized gain (loss) | (2.96) | 1.45 |
Total from investment operations | (2.60) | 1.88 |
Distributions from net investment income | (.43) | (.47) |
Distributions from net realized gain | (1.10) | (.90) |
Total distributions | (1.53) | (1.37) |
Net asset value, end of period | $ 12.95 | $ 17.08 |
Total Return B, C, D | (16.56)% | 11.93% |
Ratios to Average Net Assets H | | |
Expenses before reductions | .99% | 1.01% A |
Expenses net of fee waivers, if any | .99% | 1.01% A |
Expenses net of all reductions | .98% | 1.00% A |
Net investment income (loss) | 2.46% | 2.62% A |
Supplemental Data | | |
Net assets, end of period (000 omitted) | $ 10,611 | $ 4,432 |
Portfolio turnover rate F | 8% | 12% |
A Annualized
B Total returns for periods of less than one year are not annualized.
C Total returns would have been lower had certain expenses not been reduced during the periods shown.
D Total returns do not include the effect of the sales charges.
E Calculated based on average shares outstanding during the period.
F Amount does not include the portfolio activity of any underlying Fidelity Central Funds.
G For the period October 2, 2006 (commencement of sale of shares) to September 30, 2007.
H Expense ratios reflect operating expenses of the class. Expenses before reductions do not reflect amounts reimbursed by the investment adviser or reductions from brokerage service arrangements or other expense offset arrangements and do not represent the amount paid by the class during periods when reimbursements or reductions occur. Expense ratios before reductions for start-up periods may not be representative of longer-term operating periods. Expenses net of fee waivers reflect expenses after reimbursement by the investment adviser but prior to reductions from brokerage service arrangements or other expense offset arrangements. Expenses net of all reductions represent the net expenses paid by the class. Fees and expenses of the underlying Fidelity Central Funds are not included in the Fund's expense ratio. The Fund indirectly bears its proportionate share of the expenses of any underlying Fidelity Central Funds. Based on their most recent shareholder report date, the expenses ranged from less than .01% to .03%.
Financial Highlights - Class T
Years ended September 30, | 2008 | 2007 G |
Selected Per-Share Data | | |
Net asset value, beginning of period | $ 17.06 | $ 16.57 |
Income from Investment Operations | | |
Net investment income (loss) E | .33 | .39 |
Net realized and unrealized gain (loss) | (2.96) | 1.46 |
Total from investment operations | (2.63) | 1.85 |
Distributions from net investment income | (.39) | (.46) |
Distributions from net realized gain | (1.10) | (.90) |
Total distributions | (1.49) | (1.36) |
Net asset value, end of period | $ 12.94 | $ 17.06 |
Total Return B, C, D | (16.76)% | 11.68% |
Ratios to Average Net Assets H | | |
Expenses before reductions | 1.24% | 1.24% A |
Expenses net of fee waivers, if any | 1.24% | 1.24% A |
Expenses net of all reductions | 1.23% | 1.23% A |
Net investment income (loss) | 2.21% | 2.40% A |
Supplemental Data | | |
Net assets, end of period (000 omitted) | $ 5,475 | $ 3,148 |
Portfolio turnover rate F | 8% | 12% |
A Annualized
B Total returns for periods of less than one year are not annualized.
C Total returns would have been lower had certain expenses not been reduced during the periods shown.
D Total returns do not include the effect of the sales charges.
E Calculated based on average shares outstanding during the period.
F Amount does not include the portfolio activity of any underlying Fidelity Central Funds.
G For the period October 2, 2006 (commencement of sale of shares) to September 30, 2007.
H Expense ratios reflect operating expenses of the class. Expenses before reductions do not reflect amounts reimbursed by the investment adviser or reductions from brokerage service arrangements or other expense offset arrangements and do not represent the amount paid by the class during periods when reimbursements or reductions occur. Expense ratios before reductions for start-up periods may not be representative of longer-term operating periods. Expenses net of fee waivers reflect expenses after reimbursement by the investment adviser but prior to reductions from brokerage service arrangements or other expense offset arrangements. Expenses net of all reductions represent the net expenses paid by the class. Fees and expenses of the underlying Fidelity Central Funds are not included in the Fund's expense ratio. The Fund indirectly bears its proportionate share of the expenses of any underlying Fidelity Central Funds. Based on their recent shareholder report date, the expenses ranged from less than .01% to .03%.
See accompanying notes which are an integral part of the financial statements.
Annual Report
Financial Highlights - Class B
Years ended September 30, | 2008 | 2007 G |
Selected Per-Share Data | | |
Net asset value, beginning of period | $ 17.02 | $ 16.57 |
Income from Investment Operations | | |
Net investment income (loss) E | .24 | .30 |
Net realized and unrealized gain (loss) | (2.96) | 1.46 |
Total from investment operations | (2.72) | 1.76 |
Distributions from net investment income | (.29) | (.41) |
Distributions from net realized gain | (1.10) | (.90) |
Total distributions | (1.39) | (1.31) |
Net asset value, end of period | $ 12.91 | $ 17.02 |
Total Return B, C, D | (17.26)% | 11.03% |
Ratios to Average Net Assets H | | |
Expenses before reductions | 1.79% | 1.79% A |
Expenses net of fee waivers, if any | 1.79% | 1.79% A |
Expenses net of all reductions | 1.79% | 1.78% A |
Net investment income (loss) | 1.65% | 1.84% A |
Supplemental Data | | |
Net assets, end of period (000 omitted) | $ 2,084 | $ 1,007 |
Portfolio turnover rate F | 8% | 12% |
A Annualized
B Total returns for periods of less than one year are not annualized.
C Total returns would have been lower had certain expenses not been reduced during the periods shown.
D Total returns do not include the effect of the contingent deferred sales charge.
E Calculated based on average shares outstanding during the period.
F Amount does not include the portfolio activity of any underlying Fidelity Central Funds.
G For the period October 2, 2006 (commencement of sale of shares) to September 30, 2007.
H Expense ratios reflect operating expenses of the class. Expenses before reductions do not reflect amounts reimbursed by the investment adviser or reductions from brokerage service arrangements or other expense offset arrangements and do not represent the amount paid by the class during periods when reimbursements or reductions occur. Expense ratios before reductions for start-up periods may not be representative of longer-term operating periods. Expenses net of fee waivers reflect expenses after reimbursement by the investment adviser but prior to reductions from brokerage service arrangements or other expense offset arrangements. Expenses net of all reductions represent the net expenses paid by the class. Fees and expenses of the underlying Fidelity Central Funds are not included in the Fund's expense ratio. The Fund indirectly bears its proportionate share of the expenses of any underlying Fidelity Central Funds. Based on their recent shareholder report date, the expenses ranged from less than .01% to .03%.
Financial Highlights - Class C
Years ended September 30, | 2008 | 2007 G |
Selected Per-Share Data | | |
Net asset value, beginning of period | $ 17.00 | $ 16.57 |
Income from Investment Operations | | |
Net investment income (loss) E | .25 | .31 |
Net realized and unrealized gain (loss) | (2.95) | 1.45 |
Total from investment operations | (2.70) | 1.76 |
Distributions from net investment income | (.30) | (.43) |
Distributions from net realized gain | (1.10) | (.90) |
Total distributions | (1.40) | (1.33) |
Net asset value, end of period | $ 12.90 | $ 17.00 |
Total Return B, C, D | (17.18)% | 11.08% |
Ratios to Average Net Assets H | | |
Expenses before reductions | 1.76% | 1.75% A |
Expenses net of fee waivers, if any | 1.76% | 1.75% A |
Expenses net of all reductions | 1.76% | 1.74% A |
Net investment income (loss) | 1.68% | 1.88% A |
Supplemental Data | | |
Net assets, end of period (000 omitted) | $ 4,294 | $ 2,840 |
Portfolio turnover rate F | 8% | 12% |
A Annualized
B Total returns for periods of less than one year are not annualized.
C Total returns would have been lower had certain expenses not been reduced during the periods shown.
D Total returns do not include the effect of the contingent deferred sales charge.
E Calculated based on average shares outstanding during the period.
F Amount does not include the portfolio activity of any underlying Fidelity Central Funds.
G For the period October 2, 2006 (commencement of sale of shares) to September 30, 2007.
H Expense ratios reflect operating expenses of the class. Expenses before reductions do not reflect amounts reimbursed by the investment adviser or reductions from brokerage service arrangements or other expense offset arrangements and do not represent the amount paid by the class during periods when reimbursements or reductions occur. Expense ratios before reductions for start-up periods may not be representative of longer-term operating periods. Expenses net of fee waivers reflect expenses after reimbursement by the investment adviser but prior to reductions from brokerage service arrangements or other expense offset arrangements. Expenses net of all reductions represent the net expenses paid by the class. Fees and expenses of the underlying Fidelity Central Funds are not included in the Fund's expense ratio. The Fund indirectly bears its proportionate share of the expenses of any underlying Fidelity Central Funds. Based on their recent shareholder report date, the expenses ranged from less than .01% to .03%.
See accompanying notes which are an integral part of the financial statements.
Annual Report
Financial Highlights - Asset Manager 50%
Years ended September 30, | 2008 | 2007 | 2006 | 2005 | 2004 |
Selected Per-Share Data | | | | | |
Net asset value, beginning of period | $ 17.10 | $ 16.60 | $ 16.28 | $ 15.58 | $ 14.95 |
Income from Investment Operations | | | | | |
Net investment income (loss) B | .41 | .49 | .45 | .41 D | .33 |
Net realized and unrealized gain (loss) | (2.97) | 1.41 | .73 | .69 | .57 |
Total from investment operations | (2.56) | 1.90 | 1.18 | 1.10 | .90 |
Distributions from net investment income | (.47) | (.50) | (.45) | (.40) | (.27) |
Distributions from net realized gain | (1.10) | (.90) | (.41) | - | - |
Total distributions | (1.57) | (1.40) | (.86) | (.40) | (.27) |
Net asset value, end of period | $ 12.97 | $ 17.10 | $ 16.60 | $ 16.28 | $ 15.58 |
Total Return A | (16.34)% | 12.02% | 7.50% | 7.15% | 6.00% |
Ratios to Average Net Assets E | | | | | |
Expenses before reductions | .71% | .71% | .72% | .73% | .74% |
Expenses net of fee waivers, if any | .71% | .71% | .72% | .73% | .74% |
Expenses net of all reductions | .70% | .70% | .71% | .72% | .73% |
Net investment income (loss) | 2.74% | 2.93% | 2.79% | 2.55% D | 2.12% |
Supplemental Data | | | | | |
Net assets, end of period (000 omitted) | $ 6,299,082 | $ 8,955,110 | $ 9,204,214 | $ 10,189,947 | $ 10,903,313 |
Portfolio turnover rate C | 8% | 12% | 65% F | 32% F | 78% |
A Total returns would have been lower had certain expenses not been reduced during the periods shown.
B Calculated based on average shares outstanding during the period.
C Amount does not include the portfolio activity of any underlying Fidelity Central Funds.
D Investment income per share reflects a special dividend which amounted to $0.04 per share. Excluding the special dividend, the ratio of net investment income (loss) to average net assets would have been 2.28%.
E Expense ratios reflect operating expenses of the class. Expenses before reductions do not reflect amounts reimbursed by the investment adviser or reductions from brokerage service arrangements or other expense offset arrangements and do not represent the amount paid by the class during periods when reimbursements or reductions occur. Expenses net of fee waivers reflect expenses after reimbursement by the investment adviser but prior to reductions from brokerage service arrangements or other expense offset arrangements. Expenses net of all reductions represent the net expenses paid by the class. Fees and expenses of the underlying Fidelity Central Funds are not included in the Fund's expense ratio. The Fund indirectly bears its proportionate share of the expenses of any underlying Fidelity Central Funds. Based on their most recent shareholder report date, the expenses ranged from less than .01% to .03%.
F Portfolio turnover rate excludes securities received or delivered in-kind.
Financial Highlights - Institutional Class
Years ended September 30, | 2008 | 2007 F |
Selected Per-Share Data | | |
Net asset value, beginning of period | $ 17.11 | $ 16.57 |
Income from Investment Operations | | |
Net investment income (loss) D | .42 | .48 |
Net realized and unrealized gain (loss) | (2.98) | 1.46 |
Total from investment operations | (2.56) | 1.94 |
Distributions from net investment income | (.48) | (.50) |
Distributions from net realized gain | (1.10) | (.90) |
Total distributions | (1.58) | (1.40) |
Net asset value, end of period | $ 12.97 | $ 17.11 |
Total Return B, C | (16.30)% | 12.20% |
Ratios to Average Net Assets G | | |
Expenses before reductions | .67% | .72% A |
Expenses net of fee waivers, if any | .67% | .72% A |
Expenses net of all reductions | .67% | .72% A |
Net investment income (loss) | 2.77% | 2.91% A |
Supplemental Data | | |
Net assets, end of period (000 omitted) | $ 469 | $ 186 |
Portfolio turnover rate E | 8% | 12% |
A Annualized
B Total returns for periods of less than one year are not annualized.
C Total returns would have been lower had certain expenses not been reduced during the periods shown.
D Calculated based on average shares outstanding during the period.
E Amount does not include the portfolio activity of any underlying Fidelity Central Funds.
F For the period October 2, 2006 (commencement of sale of shares) to September 30, 2007.
G Expense ratios reflect operating expenses of the class. Expenses before reductions do not reflect amounts reimbursed by the investment adviser or reductions from brokerage service arrangements or other expense offset arrangements and do not represent the amount paid by the class during periods when reimbursements or reductions occur. Expense ratios before reductions for start-up periods may not be representative of longer-term operating periods. Expenses net of fee waivers reflect expenses after reimbursement by the investment adviser but prior to reductions from brokerage service arrangements or other expense offset arrangements. Expenses net of all reductions represent the net expenses paid by the class. Fees and expenses of the underlying Fidelity Central Funds are not included in the Fund's expense ratio. The Fund indirectly bears its proportionate share of the expenses of any underlying Fidelity Central Funds. Based on their most recent shareholder report date, the expenses ranged from less than .01% to .03%.
See accompanying notes which are an integral part of the financial statements.
Annual Report
Fidelity Asset Manager 60%
Investment Changes (Unaudited)
The information in the following tables is based on the combined investments of the Fund and its pro-rata share of the investments of Fidelity's Equity and Fixed-Income Central Funds.
Top Ten Stocks as of September 30, 2008 |
| % of fund's
net assets | % of fund's net assets
6 months ago |
Apple, Inc. | 0.9 | 0.1 |
Procter & Gamble Co. | 0.9 | 0.8 |
General Electric Co. | 0.7 | 0.6 |
Bank of America Corp. | 0.6 | 0.4 |
JPMorgan Chase & Co. | 0.6 | 0.6 |
Wells Fargo & Co. | 0.6 | 0.4 |
The Coca-Cola Co. | 0.6 | 0.5 |
Genentech, Inc. | 0.5 | 0.2 |
PepsiCo, Inc. | 0.5 | 0.4 |
Citigroup, Inc. | 0.4 | 0.4 |
| 6.3 | |
Asset Allocation (% of fund's net assets) |
As of September 30, 2008 | As of March 31, 2008 |
| Stock class and
Equity Futures 58.4% | | | Stock class and
Equity Futures 61.2% | |
| Bond class 25.1% | | | Bond class 39.8% | |
| Short-term class 16.5% | |  | Short-term class* (1.0)% | |
| | | | | |
| | | | | |

Asset allocations in the pie charts reflect the categorization of assets as defined in the Fund's prospectus in effect as of the time periods indicated above. Percentages are adjusted for the effect of futures contracts and swap contracts, if applicable. |
*Short-term class is not included in the pie chart.
Annual Report
Fidelity Asset Manager 60%
The information in the following table is based on the direct investments of the Fund.
Fund Holdings as of September 30, 2008 |
| % of fund's
net assets |
Equity Central Funds | |
Fidelity Financials Central Fund | 8.4 |
Fidelity Information Technology Central Fund | 7.9 |
Fidelity Health Care Central Fund | 6.8 |
Fidelity Industrials Central Fund | 6.4 |
Fidelity International Central Fund | 5.9 |
Fidelity Energy Central Fund | 5.8 |
Fidelity Consumer Staples Central Fund | 5.4 |
Fidelity Consumer Discretionary Central Fund | 5.4 |
Fidelity Utilities Central Fund | 1.9 |
Fidelity Materials Central Fund | 1.9 |
Fidelity Telecom Services Central Fund | 1.6 |
Total Equity Central Funds | 57.4 |
Fixed-Income Central Funds | |
Investment Grade Fixed-Income Funds | 28.9 |
High Yield Fixed-Income Funds | 3.2 |
Total Fixed-Income Central Funds | 32.1 |
Money Market Central Funds | 18.9 |
Other Short-Term Investments and Net Other Assets | (8.4) |
Total | 100.0 |
At period end, foreign investments including the Fund's pro-rata share of the underlying Central Funds was 17.7% of net assets.
A holdings listing for the Fund, which presents direct holdings as well as the pro-rata share of any securities and other investments held indirectly through its investment in underlying non-money market Fidelity Central Funds, is available at fidelity.com and/or advisor.fidelity.com, as applicable.
Annual Report
Fidelity Asset Manager 60%
Investments September 30, 2008
Showing Percentage of Net Assets
Equity Central Funds - 57.4% |
| Shares | | Value |
Fidelity Consumer Discretionary Central Fund (c) | 17,544 | | $ 1,621,243 |
Fidelity Consumer Staples Central Fund (c) | 14,227 | | 1,635,731 |
Fidelity Energy Central Fund (c) | 15,726 | | 1,737,408 |
Fidelity Financials Central Fund (c) | 38,466 | | 2,533,356 |
Fidelity Health Care Central Fund (c) | 20,499 | | 2,041,880 |
Fidelity Industrials Central Fund (c) | 18,093 | | 1,909,359 |
Fidelity Information Technology Central Fund (c) | 24,227 | | 2,379,293 |
Fidelity International Equity Central Fund (c) | 26,254 | | 1,762,191 |
Fidelity Materials Central Fund (c) | 5,268 | | 579,741 |
Fidelity Telecom Services Central Fund (c) | 5,337 | | 478,691 |
Fidelity Utilities Central Fund (c) | 6,255 | | 583,808 |
TOTAL EQUITY CENTRAL FUNDS (Cost $21,047,033) | 17,262,701 |
Fixed-Income Central Funds - 32.1% |
| | | |
Investment Grade Fixed-Income Funds - 28.9% |
Fidelity Tactical Income Central Fund (c) | 96,750 | | 8,688,176 |
High Yield Fixed-Income Funds - 3.2% |
Fidelity Floating Rate Central Fund (c) | 7,065 | | 599,148 |
Fidelity High Income Central Fund 1 (c) | 4,406 | | 376,783 |
TOTAL HIGH YIELD FIXED-INCOME FUNDS | 975,931 |
TOTAL FIXED-INCOME CENTRAL FUNDS (Cost $10,153,069) | 9,664,107 |
Money Market Central Funds - 18.9% |
| | | |
Fidelity Cash Central Fund, 1.92% (a)
(Cost $5,674,692) | 5,674,692 | | 5,674,692 |
U.S. Treasury Obligations - 0.2% |
| Principal Amount | | |
U.S. Treasury Bills, yield at date of purchase 1.59% to 1.68% 10/16/08 to 12/4/08 (b)
(Cost $59,935) | | $ 60,000 | | 59,963 |
TOTAL INVESTMENT PORTFOLIO - 108.6% (Cost $36,934,729) | | 32,661,463 |
NET OTHER ASSETS - (8.6)% | | (2,578,348) |
NET ASSETS - 100% | $ 30,083,115 |
Futures Contracts |
| Expiration Date | | Underlying Face Amount at Value | | Unrealized Appreciation/(Depreciation) |
Purchased |
Equity Index Contracts |
15 CME E-mini S&P 500 Index Contracts | Dec. 2008 | | $ 875,550 | | $ (21,732) |
The face value of futures purchased as a percentage of net assets - 2.9% |
Legend |
(a) Affiliated fund that is available only to investment companies and other accounts managed by Fidelity Investments. The rate quoted is the annualized seven-day yield of the fund at period end. A complete unaudited listing of the fund's holdings as of its most recent quarter end is available upon request. |
(b) Security or a portion of the security was pledged to cover margin requirements for futures contracts. At the period end, the value of securities pledged amounted to $59,963. |
(c) Affiliated fund that is available only to investment companies and other accounts managed by Fidelity Investments. A complete unaudited schedule of portfolio holdings for each Fidelity Central Fund is filed with the SEC for the first and third quarters of each fiscal year on Form N-Q and is available upon request or at the SEC's web site at www.sec.gov. An unaudited holdings listing for the Fund, which presents direct holdings as well as the pro rata share of securities and other investments held indirectly through its investment in underlying non-money market Fidelity Central Funds, is available at fidelity.com and/or advisor.fidelity.com, as applicable. In addition, each Fidelity Central Fund's financial statements, which are not covered by the Fund's Report of Independent Registered Public Accounting Firm, are available on the SEC's web site or upon request. |
Affiliated Central Funds |
Information regarding fiscal year to date income earned by the Fund from investments in Fidelity Central Funds is as follows: |
Fund | Income earned |
Fidelity Cash Central Fund | $ 46,200 |
Fidelity Consumer Discretionary Central Fund | 12,405 |
Fidelity Consumer Staples Central Fund | 17,971 |
Fidelity Energy Central Fund | 8,216 |
Fidelity Financials Central Fund | 44,448 |
Fidelity Floating Rate Central Fund | 19,452 |
Fidelity Health Care Central Fund | 9,473 |
Fidelity High Income Central Fund 1 | 21,786 |
Fidelity Industrials Central Fund | 15,728 |
Fidelity Information Technology Central Fund | 10,164 |
Fidelity International Equity Central Fund | 37,157 |
Fidelity Materials Central Fund | 5,193 |
Fidelity Tactical Income Central Fund | 202,389 |
Fidelity Telecom Services Central Fund | 5,498 |
Fidelity Utilities Central Fund | 7,251 |
Total | $ 463,331 |
Additional information regarding the Fund's fiscal year to date purchases and sales, including the ownership percentage, of the non-money market Central Funds is as follows: |
Fund | Value, beginning of period | Purchases | Sales
Proceeds | Value,
end of period | % ownership, end of period |
Fidelity Consumer Discretionary Central Fund | $ - | $ 1,874,289 | $ 26,464 | $ 1,621,243 | 0.3% |
Fidelity Consumer Staples Central Fund | - | 1,763,895 | 5,094 | 1,635,731 | 0.3% |
Fidelity Energy Central Fund | - | 2,249,148 | 32,120 | 1,737,408 | 0.3% |
Fidelity Financials Central Fund | - | 3,180,617 | - | 2,533,356 | 0.3% |
Fidelity Floating Rate Central Fund | - | 659,847 | - | 599,148 | 0.0% |
Fidelity Health Care Central Fund | - | 2,264,856 | 3,414 | 2,041,880 | 0.3% |
Fidelity High Income Central Fund 1 | - | 449,300 | 28,002 | 376,783 | 0.2% |
Fidelity Industrials Central Fund | - | 2,280,270 | 36,049 | 1,909,359 | 0.3% |
Fidelity Information Technology Central Fund | - | 3,031,997 | - | 2,379,293 | 0.3% |
Fidelity International Equity Central Fund | - | 2,430,054 | - | 1,762,191 | 0.3% |
Fidelity Materials Central Fund | - | 746,137 | 8,390 | 579,741 | 0.3% |
Fidelity Tactical Income Central Fund | - | 9,487,732 | 400,062 | 8,688,176 | 0.2% |
Fidelity Telecom Services Central Fund | - | 613,427 | - | 478,691 | 0.3% |
Fidelity Utilities Central Fund | - | 728,780 | - | 583,808 | 0.3% |
Total | $ - | $ 31,760,349 | $ 539,595 | $ 26,926,808 | |
Other Information (Unaudited) |
The information in the following tables is based on the combined investment of the Fund and its pro-rata share of the investments of Fidelity's Equity and Fixed-Income Central Funds. The composition of credit quality ratings as a percentage of net assets is as follows: |
U.S. Government and U.S. Government Agency Obligations | 18.2% |
AAA,AA,A | 9.0% |
BBB | 6.0% |
BB | 1.8% |
B | 1.3% |
CCC,CC,C | 0.2% |
Not Rated | 0.6% |
Equities | 58.6% |
Short-Term Investments and Net Other Assets | 4.3% |
| 100.0% |
We have used ratings from Moody's® Investors Services, Inc. Where Moody's ratings are not available, we have used S&P® ratings. All ratings are as of the report date and do not reflect subsequent downgrades. Percentages are adjusted for the effect of futures contracts, if applicable. |
Distribution of investments by country of issue, as a percentage of total net assets, is as follows. Percentages are adjusted for the effect of futures contracts, if applicable. |
United States of America | 82.3% |
United Kingdom | 2.9% |
Bermuda | 2.0% |
Switzerland | 1.6% |
Canada | 1.6% |
Japan | 1.4% |
Cayman Islands | 1.0% |
Germany | 1.0% |
France | 1.0% |
Others (individually less than 1%) | 5.2% |
| 100.0% |
Income Tax Information |
At September 30, 2008, the fund had a capital loss carryforward of approximately $76,825 all of which will expire on September 30, 2016. |
The fund intends to elect to defer to its fiscal year ending September 30, 2009 approximately $1,768,211 of losses recognized during the period November 1, 2007 to September 30, 2008. |
See accompanying notes which are an integral part of the financial statements.
Annual Report
Fidelity Asset Manager 60%
Statement of Assets and Liabilities
| September 30, 2008 |
| | |
Assets | | |
Investment in securities, at value - See accompanying schedule: Unaffiliated issuers (cost $59,935) | $ 59,963 | |
Fidelity Central Funds (cost $36,874,794) | 32,601,500 | |
Total Investments (cost $36,934,729) | | $ 32,661,463 |
Cash | | 24,163 |
Receivable for fund shares sold | | 66,702 |
Distributions receivable from Fidelity Central Funds | | 39,671 |
Receivable for daily variation on futures contracts | | 36,450 |
Receivable from investment adviser for expense reductions | | 43,276 |
Other affiliated receivables | | 1,410 |
Total assets | | 32,873,135 |
| | |
Liabilities | | |
Payable for investments purchased | $ 2,588,863 | |
Payable for fund shares redeemed | 150,148 | |
Accrued management fee | 12,821 | |
Distribution fees payable | 3,516 | |
Other affiliated payables | 4,666 | |
Other payables and accrued expenses | 30,006 | |
Total liabilities | | 2,790,020 |
| | |
Net Assets | | $ 30,083,115 |
Net Assets consist of: | | |
Paid in capital | | $ 34,337,349 |
Undistributed net investment income | | 231,837 |
Accumulated undistributed net realized gain (loss) on investments and foreign currency transactions | | (191,073) |
Net unrealized appreciation (depreciation) on investments | | (4,294,998) |
Net Assets | | $ 30,083,115 |
| | |
Calculation of Maximum Offering Price Class A:
Net Asset Value and redemption price per share ($3,134,919 ÷ 394,354 shares) | | $ 7.95 |
| | |
Maximum offering price per share (100/94.25 of $7.95) | | $ 8.44 |
Class T:
Net Asset Value and redemption price per share ($1,228,087 ÷ 154,853 shares) | | $ 7.93 |
| | |
Maximum offering price per share (100/96.50 of $7.93) | | $ 8.22 |
Class B:
Net Asset Value and offering price per share ($1,073,692 ÷ 135,858 shares)A | | $ 7.90 |
| | |
Class C:
Net Asset Value and offering price per share ($1,642,529 ÷ 207,830 shares)A | | $ 7.90 |
| | |
| | |
Asset Manager 60%:
Net Asset Value, offering price and redemption price per share ($22,211,872 ÷ 2,789,550 shares) | | $ 7.96 |
| | |
Institutional Class:
Net Asset Value, offering price and redemption price per share ($792,016 ÷ 99,464 shares) | | $ 7.96 |
A Redemption price per share is equal to net asset value less any applicable contingent deferred sales charge.
See accompanying notes which are an integral part of the financial statements.
Annual Report
Fidelity Asset Manager 60%
Financial Statements - continued
Statement of Operations
For the period October 9, 2007 (commencement of operations) to September 30, 2008 |
| | |
Investment Income | | |
Interest | | $ 4,248 |
Income from Fidelity Central Funds | | 463,331 |
Total income | | 467,579 |
| | |
Expenses | | |
Management fee | $ 82,594 | |
Transfer agent fees | 26,521 | |
Distribution fees | 29,670 | |
Accounting fees and expenses | 7,292 | |
Custodian fees and expenses | 5,014 | |
Independent trustees' compensation | 50 | |
Registration fees | 117,494 | |
Audit | 36,878 | |
Legal | 27 | |
Miscellaneous | 2,039 | |
Total expenses before reductions | 307,579 | |
Expense reductions | (144,088) | 163,491 |
Net investment income (loss) | | 304,088 |
Realized and Unrealized Gain (Loss) Net realized gain (loss) on: | | |
Investment securities: | | |
Fidelity Central Funds | (20,554) | |
Foreign currency transactions | (50) | |
Futures contracts | (206,048) | |
Total net realized gain (loss) | | (226,652) |
Change in net unrealized appreciation (depreciation) on: Investment securities | (4,273,266) | |
Futures contracts | (21,732) | |
Total change in net unrealized appreciation (depreciation) | | (4,294,998) |
Net gain (loss) | | (4,521,650) |
Net increase (decrease) in net assets resulting from operations | | $ (4,217,562) |
Statement of Changes in Net Assets
| For the period
October 9, 2007 (commencement of operations) to September 30, 2008 |
Increase (Decrease) in Net Assets | |
Operations | |
Net investment income (loss) | $ 304,088 |
Net realized gain (loss) | (226,652) |
Change in net unrealized appreciation (depreciation) | (4,294,998) |
Net increase (decrease) in net assets resulting from operations | (4,217,562) |
Distributions to shareholders from net investment income | (36,701) |
Share transactions - net increase (decrease) | 34,337,378 |
Total increase (decrease) in net assets | 30,083,115 |
| |
Net Assets | |
Beginning of period | - |
End of period (including undistributed net investment income of $231,837) | $ 30,083,115 |
See accompanying notes which are an integral part of the financial statements.
Annual Report
Financial Highlights - Class A
Year ended September 30, | 2008 G |
Selected Per-Share Data | |
Net asset value, beginning of period | $ 10.00 |
Income from Investment Operations | |
Net investment income (loss) E | .17 |
Net realized and unrealized gain (loss) | (2.18) |
Total from investment operations | (2.01) |
Distributions from net investment income | (.04) |
Net asset value, end of period | $ 7.95 |
Total Return B, C, D | (20.16)% |
Ratios to Average Net Assets H | |
Expenses before reductions | 2.18% A |
Expenses net of fee waivers, if any | 1.16% A |
Expenses net of all reductions | 1.16% A |
Net investment income (loss) | 1.99% A |
Supplemental Data | |
Net assets, end of period (000 omitted) | $ 3,135 |
Portfolio turnover rate F | 4% A |
A Annualized
B Total returns for periods of less than one year are not annualized.
C Total returns would have been lower had certain expenses not been reduced during the periods shown.
D Total returns do not include the effect of the sales charges.
E Calculated based on average shares outstanding during the period.
F Amount does not include the portfolio activity of any underlying Fidelity Central Funds.
G For the period October 9, 2007 (commencement of operations) to September 30, 2008.
H Expense ratios reflect operating expenses of the class. Expenses before reductions do not reflect amounts reimbursed by the investment adviser or reductions from brokerage service arrangements or other expense offset arrangements and do not represent the amount paid by the class during periods when reimbursements or reductions occur. Expense ratios before reductions for start-up periods may not be representative of longer-term operating periods. Expenses net of fee waivers reflect expenses after reimbursement by the investment adviser but prior to reductions from brokerage service arrangements or other expense offset arrangements. Expenses net of all reductions represent the net expenses paid by the class. Fees and expenses of the underlying Fidelity Central Funds are not included in the Fund's expense ratio. The Fund indirectly bears its proportionate share of the expenses of any underlying Fidelity Central Funds. Based on their most recent shareholder report date, the expenses ranged from less than .01% to .03%.
Financial Highlights - Class T
Year ended September 30, | 2008 G |
Selected Per-Share Data | |
Net asset value, beginning of period | $ 10.00 |
Income from Investment Operations | |
Net investment income (loss) E | .15 |
Net realized and unrealized gain (loss) | (2.19) |
Total from investment operations | (2.04) |
Distributions from net investment income | (.03) |
Net asset value, end of period | $ 7.93 |
Total Return B, C, D | (20.42)% |
Ratios to Average Net Assets H | |
Expenses before reductions | 2.34% A |
Expenses net of fee waivers, if any | 1.42% A |
Expenses net of all reductions | 1.42% A |
Net investment income (loss) | 1.73% A |
Supplemental Data | |
Net assets, end of period (000 omitted) | $ 1,228 |
Portfolio turnover rate F | 4% A |
A Annualized
B Total returns for periods of less than one year are not annualized.
C Total returns would have been lower had certain expenses not been reduced during the periods shown.
D Total returns do not include the effect of the sales charges.
E Calculated based on average shares outstanding during the period.
F Amount does not include the portfolio activity of any underlying Fidelity Central Funds.
G For the period October 9, 2007 (commencement of operations) to September 30, 2008.
H Expense ratios reflect operating expenses of the class. Expenses before reductions do not reflect amounts reimbursed by the investment adviser or reductions from brokerage service arrangements or other expense offset arrangements and do not represent the amount paid by the class during periods when reimbursements or reductions occur. Expense ratios before reductions for start-up periods may not be representative of longer-term operating periods. Expenses net of fee waivers reflect expenses after reimbursement by the investment adviser but prior to reductions from brokerage service arrangements or other expense offset arrangements. Expenses net of all reductions represent the net expenses paid by the class. Fees and expenses of the underlying Fidelity Central Funds are not included in the Fund's expense ratio. The Fund indirectly bears its proportionate share of the expenses of any underlying Fidelity Central Funds. Based on their most recent shareholder report date, the expenses ranged from less than .01% to .03%.
See accompanying notes which are an integral part of the financial statements.
Annual Report
Financial Highlights - Class B
Year ended September 30, | 2008 G |
Selected Per-Share Data | |
Net asset value, beginning of period | $ 10.00 |
Income from Investment Operations | |
Net investment income (loss) E | .11 |
Net realized and unrealized gain (loss) | (2.19) |
Total from investment operations | (2.08) |
Distributions from net investment income | (.02) |
Net asset value, end of period | $ 7.90 |
Total Return B, C, D | (20.81)% |
Ratios to Average Net Assets H | |
Expenses before reductions | 2.85% A |
Expenses net of fee waivers, if any | 1.92% A |
Expenses net of all reductions | 1.92% A |
Net investment income (loss) | 1.23% A |
Supplemental Data | |
Net assets, end of period (000 omitted) | $ 1,074 |
Portfolio turnover rate F | 4% A |
A Annualized
B Total returns for periods of less than one year are not annualized.
C Total returns would have been lower had certain expenses not been reduced during the periods shown.
D Total returns do not include the effect of the contingent deferred sales charge.
E Calculated based on average shares outstanding during the period.
F Amount does not include the portfolio activity of any underlying Fidelity Central Funds.
G For the period October 9, 2007 (commencement of operations) to September 30, 2008.
H Expense ratios reflect operating expenses of the class. Expenses before reductions do not reflect amounts reimbursed by the investment adviser or reductions from brokerage service arrangements or other expense offset arrangements and do not represent the amount paid by the class during periods when reimbursements or reductions occur. Expense ratios before reductions for start-up periods may not be representative of longer-term operating periods. Expenses net of fee waivers reflect expenses after reimbursement by the investment adviser but prior to reductions from brokerage service arrangements or other expense offset arrangements. Expenses net of all reductions represent the net expenses paid by the class. Fees and expenses of the underlying Fidelity Central Funds are not included in the Fund's expense ratio. The Fund indirectly bears its proportionate share of the expenses of any underlying Fidelity Central Funds. Based on their most recent shareholder report date, the expenses ranged from less than .01% to .03%.
Financial Highlights - Class C
Year ended September 30, | 2008 G |
Selected Per-Share Data | |
Net asset value, beginning of period | $ 10.00 |
Income from Investment Operations | |
Net investment income (loss) E | .11 |
Net realized and unrealized gain (loss) | (2.19) |
Total from investment operations | (2.08) |
Distributions from net investment income | (.02) |
Net asset value, end of period | $ 7.90 |
Total Return B, C, D | (20.81)% |
Ratios to Average Net Assets H | |
Expenses before reductions | 2.80% A |
Expenses net of fee waivers, if any | 1.91% A |
Expenses net of all reductions | 1.91% A |
Net investment income (loss) | 1.24% A |
Supplemental Data | |
Net assets, end of period (000 omitted) | $ 1,643 |
Portfolio turnover rate F | 4% A |
A Annualized
B Total returns for periods of less than one year are not annualized.
C Total returns would have been lower had certain expenses not been reduced during the periods shown.
D Total returns do not include the effect of the contingent deferred sales charge.
E Calculated based on average shares outstanding during the period.
F Amount does not include the portfolio activity of any underlying Fidelity Central Funds.
G For the period October 9, 2007 (commencement of operations) to September 30, 2008.
H Expense ratios reflect operating expenses of the class. Expenses before reductions do not reflect amounts reimbursed by the investment adviser or reductions from brokerage service arrangements or other expense offset arrangements and do not represent the amount paid by the class during periods when reimbursements or reductions occur. Expense ratios before reductions for start-up periods may not be representative of longer-term operating periods. Expenses net of fee waivers reflect expenses after reimbursement by the investment adviser but prior to reductions from brokerage service arrangements or other expense offset arrangements. Expenses net of all reductions represent the net expenses paid by the class. Fees and expenses of the underlying Fidelity Central Funds are not included in the Fund's expense ratio. The Fund indirectly bears its proportionate share of the expenses of any underlying Fidelity Central Funds. Based on their most recent shareholder report date, the expenses ranged from less than .01% to .03%.
See accompanying notes which are an integral part of the financial statements.
Annual Report
Financial Highlights - Asset Manager 60%
Year ended September 30, | 2008 F |
Selected Per-Share Data | |
Net asset value, beginning of period | $ 10.00 |
Income from Investment Operations | |
Net investment income (loss) D | .19 |
Net realized and unrealized gain (loss) | (2.18) |
Total from investment operations | (1.99) |
Distributions from net investment income | (.05) |
Net asset value, end of period | $ 7.96 |
Total Return B, C | (20.03)% |
Ratios to Average Net Assets G | |
Expenses before reductions | 1.87% A |
Expenses net of fee waivers, if any | .89% A |
Expenses net of all reductions | .89% A |
Net investment income (loss) | 2.26% A |
Supplemental Data | |
Net assets, end of period (000 omitted) | $ 22,212 |
Portfolio turnover rate E | 4% A |
A Annualized
B Total returns for periods of less than one year are not annualized.
C Total returns would have been lower had certain expenses not been reduced during the periods shown.
D Calculated based on average shares outstanding during the period.
E Amount does not include the portfolio activity of any underlying Fidelity Central Funds.
F For the period October 9, 2007 (commencement of operations) to September 30, 2008.
G Expense ratios reflect operating expenses of the class. Expenses before reductions do not reflect amounts reimbursed by the investment adviser or reductions from brokerage service arrangements or other expense offset arrangements and do not represent the amount paid by the class during periods when reimbursements or reductions occur. Expense ratios before reductions for start-up periods may not be representative of longer-term operating periods. Expenses net of fee waivers reflect expenses after reimbursement by the investment adviser but prior to reductions from brokerage service arrangements or other expense offset arrangements. Expenses net of all reductions represent the net expenses paid by the class. Fees and expenses of the underlying Fidelity Central Funds are not included in the Fund's expense ratio. The Fund indirectly bears its proportionate share of the expenses of any underlying Fidelity Central Funds. Based on their most recent shareholder report date, the expenses ranged from less than .01% to .03%.
Financial Highlights - Institutional Class
Year ended September 30, | 2008 F |
Selected Per-Share Data | |
Net asset value, beginning of period | $ 10.00 |
Income from Investment Operations | |
Net investment income (loss) D | .20 |
Net realized and unrealized gain (loss) | (2.19) |
Total from investment operations | (1.99) |
Distributions from net investment income | (.05) |
Net asset value, end of period | $ 7.96 |
Total Return B, C | (20.03)% |
Ratios to Average Net Assets G | |
Expenses before reductions | 1.86% A |
Expenses net of fee waivers, if any | .94% A |
Expenses net of all reductions | .93% A |
Net investment income (loss) | 2.22% A |
Supplemental Data | |
Net assets, end of period (000 omitted) | $ 792 |
Portfolio turnover rate E | 4% A |
A Annualized
B Total returns for periods of less than one year are not annualized.
C Total returns would have been lower had certain expenses not been reduced during the periods shown.
D Calculated based on average shares outstanding during the period.
E Amount does not include the portfolio activity of any underlying Fidelity Central Funds.
F For the period October 9, 2007 (commencement of operations) to September 30, 2008.
G Expense ratios reflect operating expenses of the class. Expenses before reductions do not reflect amounts reimbursed by the investment adviser or reductions from brokerage service arrangements or other expense offset arrangements and do not represent the amount paid by the class during periods when reimbursements or reductions occur. Expense ratios before reductions for start-up periods may not be representative of longer-term operating periods. Expenses net of fee waivers reflect expenses after reimbursement by the investment adviser but prior to reductions from brokerage service arrangements or other expense offset arrangements. Expenses net of all reductions represent the net expenses paid by the class. Fees and expenses of the underlying Fidelity Central Funds are not included in the Fund's expense ratio. The Fund indirectly bears its proportionate share of the expenses of any underlying Fidelity Central Funds. Based on their most recent shareholder report date, the expenses ranged from less than .01% to .03%.
See accompanying notes which are an integral part of the financial statements.
Annual Report
Fidelity Asset Manager 70%
Investment Changes (Unaudited)
The information in the following tables is based on the combined investments of the Fund and its pro-rata share of the investments of Fidelity's Equity and Fixed-Income Central Funds. |
Top Ten Stocks as of September 30, 2008 |
| % of fund's
net assets | % of fund's net assets
6 months ago |
Apple, Inc. | 1.1 | 0.1 |
Procter & Gamble Co. | 1.1 | 1.0 |
General Electric Co. | 0.8 | 0.7 |
Bank of America Corp. | 0.7 | 0.5 |
JPMorgan Chase & Co. | 0.7 | 0.6 |
Wells Fargo & Co. | 0.7 | 0.5 |
The Coca-Cola Co. | 0.7 | 0.6 |
Genentech, Inc. | 0.6 | 0.2 |
PepsiCo, Inc. | 0.6 | 0.5 |
Citigroup, Inc. | 0.5 | 0.5 |
| 7.5 | |
Asset Allocation (% of fund's net assets) |
As of September 30, 2008 | As of March 31, 2008 |
 | Stock class and
Equity Futures 71.1% | | | Stock class and
Equity Futures 71.2% | |
| Bond class 27.7% | | | Bond class 29.1% | |
| Short-term class 1.2% | |  | Short-term class* (0.3)% | |
| | | | | |
| | | | | |

Asset allocations in the pie charts reflect the categorization of assets as defined in the Fund's prospectus in effect as of the time periods indicated above. Percentages are adjusted for the effect of futures contracts and swap contracts, if applicable.
*Short-term class is not included in the pie chart.
Annual Report
Fidelity Asset Manager 70%
The information in the following table is based on the direct investments of the Fund.
Fund Holdings as of September 30, 2008 |
| % of fund's
net assets |
Equity Central Funds | |
Fidelity Financials Central Fund | 9.9 |
Fidelity Information Technology Central Fund | 9.3 |
Fidelity International Equity Central Fund | 8.5 |
Fidelity Health Care Central Fund | 8.0 |
Fidelity Industrials Central Fund | 7.5 |
Fidelity Energy Central Fund | 6.8 |
Fidelity Consumer Staples Central Fund | 6.4 |
Fidelity Consumer Discretionary Central Fund | 6.3 |
Fidelity Utilities Central Fund | 2.3 |
Fidelity Materials Central Fund | 2.3 |
Fidelity Telecom Services Central Fund | 1.9 |
Total Equity Central Funds | 69.2 |
Fixed-Income Central Funds | |
Investment Grade Fixed-Income Funds | 20.1 |
High Yield Fixed-Income Funds | 5.1 |
Total Fixed-Income Central Funds | 25.2 |
Money Market Central Funds | 4.2 |
Other Short-Term Investments and Net Other Assets | 1.4 |
Total | 100.0 |
At period end, foreign investments, including the Fund's pro-rata share of the underlying Central Funds, was 21.1% of net assets. |
A holdings listing for the Fund, which presents direct holdings as well as the pro-rata share of any securities and other investments held indirectly through its investment in underlying non-money market Fidelity Central Funds, is available at fidelity.com and/or advisor.fidelity.com, as applicable. |
Annual Report
Fidelity Asset Manager 70%
Investments September 30, 2008
Showing Percentage of Net Assets
Equity Central Funds - 69.2% |
| Shares | | Value |
Fidelity Consumer Discretionary Central Fund (c) | 1,715,859 | | $ 158,562,571 |
Fidelity Consumer Staples Central Fund (c) | 1,391,428 | | 159,972,498 |
Fidelity Energy Central Fund (c) | 1,538,632 | | 169,988,020 |
Fidelity Financials Central Fund (c) | 3,761,960 | | 247,762,683 |
Fidelity Health Care Central Fund (c) | 2,004,770 | | 199,695,136 |
Fidelity Industrials Central Fund (c) | 1,769,492 | | 186,734,449 |
Fidelity Information Technology Central Fund (c) | 2,369,368 | | 232,695,598 |
Fidelity International Equity Central Fund (c) | 3,180,837 | | 213,497,810 |
Fidelity Materials Central Fund (c) | 515,294 | | 56,702,977 |
Fidelity Telecom Services Central Fund (c) | 521,960 | | 46,819,800 |
Fidelity Utilities Central Fund (c) | 611,717 | | 57,097,620 |
TOTAL EQUITY CENTRAL FUNDS (Cost $2,011,177,373) | 1,729,529,162 |
Fixed-Income Central Funds - 25.2% |
| | | |
Investment Grade Fixed-Income Funds - 20.1% |
Fidelity Tactical Income Central Fund (c) | 5,575,444 | | 500,674,871 |
High Yield Fixed-Income Funds - 5.1% |
Fidelity Floating Rate Central Fund (c) | 933,020 | | 79,120,080 |
Fidelity High Income Central Fund 1 (c) | 576,544 | | 49,300,279 |
TOTAL HIGH YIELD FIXED-INCOME FUNDS | 128,420,359 |
TOTAL FIXED-INCOME CENTRAL FUNDS (Cost $693,449,085) | 629,095,230 |
Money Market Central Funds - 4.2% |
| | | |
Fidelity Cash Central Fund, 1.92% (a) | 96,741,635 | | 96,741,635 |
Fidelity Money Market Central Fund, 3.13% (a) | 8,056,119 | | 8,056,119 |
TOTAL MONEY MARKET CENTRAL FUNDS (Cost $104,797,754) | 104,797,754 |
U.S. Treasury Obligations - 0.4% |
| Principal Amount | | |
U.S. Treasury Bills, yield at date of purchase 1.61% to 1.68% 10/9/08 to 12/4/08 (b)
(Cost $8,992,975) | | $ 9,020,000 | | 9,008,683 |
TOTAL INVESTMENT PORTFOLIO - 99.0% (Cost $2,818,417,187) | | 2,472,430,829 |
NET OTHER ASSETS - 1.0% | | 25,512,177 |
NET ASSETS - 100% | $ 2,497,943,006 |
Futures Contracts |
| Expiration Date | | Underlying Face Amount at Value | | Unrealized Appreciation/
(Depreciation) |
Purchased |
Equity Index Contracts |
1,641 CME E-mini S&P 500 Index Contracts | Dec. 2008 | | $ 95,785,170 | | $ (2,377,530) |
|
The face value of futures purchased as a percentage of net assets - 3.8% |
Legend |
(a) Affiliated fund that is available only to investment companies and other accounts managed by Fidelity Investments. The rate quoted is the annualized seven-day yield of the fund at period end. A complete unaudited listing of the fund's holdings as of its most recent quarter end is available upon request. |
(b) Security or a portion of the security was pledged to cover margin requirements for futures contracts. At the period end, the value of securities pledged amounted to $7,790,086. |
(c) Affiliated fund that is available only to investment companies and other accounts managed by Fidelity Investments. A complete unaudited schedule of portfolio holdings for each Fidelity Central Fund is filed with the SEC for the first and third quarters of each fiscal year on Form N-Q and is available upon request or at the SEC's web site at www.sec.gov. An unaudited holdings listing for the Fund, which presents direct holdings as well as the pro rata share of securities and other investments held indirectly through its investment in underlying non-money market Fidelity Central Funds, is available at fidelity.com and/or advisor.fidelity.com, as applicable. In addition, each Fidelity Central Fund's financial statements, which are not covered by the Fund's Report of Independent Registered Public Accounting Firm, are available on the SEC's web site or upon request. |
Affiliated Central Funds |
Information regarding fiscal year to date income earned by the Fund from investments in Fidelity Central Funds is as follows: |
Fund | Income earned |
Fidelity Cash Central Fund | $ 5,112,219 |
Fidelity Consumer Discretionary Central Fund | 2,482,274 |
Fidelity Consumer Staples Central Fund | 3,464,230 |
Fidelity Energy Central Fund | 1,683,927 |
Fidelity Financials Central Fund | 8,986,884 |
Fidelity Floating Rate Central Fund | 5,094,023 |
Fidelity Health Care Central Fund | 2,055,707 |
Fidelity High Income Central Fund 1 | 3,907,479 |
Fidelity Industrials Central Fund | 3,236,620 |
Fidelity Information Technology Central Fund | 2,023,480 |
Fidelity International Equity Central Fund | 5,962,293 |
Fidelity Materials Central Fund | 1,216,545 |
Fidelity Money Market Central Fund | 311,765 |
Fidelity Securities Lending Cash Central Fund | 9,184 |
Fidelity Tactical Income Central Fund | 31,810,323 |
Fidelity Telecom Services Central Fund | 1,254,332 |
Fidelity Utilities Central Fund | 1,477,077 |
Total | $ 80,088,362 |
Additional information regarding the Fund's fiscal year to date purchases and sales, including the ownership percentage, of the non-money market Central Funds is as follows: |
Fund | Value, beginning
of period | Purchases* | Sales
Proceeds | Value,
end of period | % ownership, end of period |
Fidelity Consumer Discretionary Central Fund | $ 196,579,000 | $ 15,410,310 | $ 6,523,263 | $ 158,562,571 | 29.9% |
Fidelity Consumer Staples Central Fund | 160,773,000 | 15,762,176 | 2,198,698 | 159,972,498 | 29.9% |
Fidelity Energy Central Fund | 203,830,000 | 16,060,222 | 7,848,992 | 169,988,020 | 29.9% |
Fidelity Financials Central Fund | 365,226,000 | 34,093,068 | - | 247,762,683 | 29.9% |
Fidelity Floating Rate Central Fund | 87,902,000 | 16,412,837 | 14,388,125 | 79,120,080 | 3.1% |
Fidelity Health Care Central Fund | 220,312,000 | 18,700,382 | 1,966,219 | 199,695,136 | 29.9% |
Fidelity High Income Central Fund 1 | 54,188,000 | 8,009,808 | 6,201,447 | 49,300,279 | 19.7% |
Fidelity Industrials Central Fund | 225,622,000 | 18,241,274 | 8,723,783 | 186,734,449 | 29.9% |
Fidelity Information Technology Central Fund | 315,933,000 | 29,198,195 | - | 232,695,598 | 29.9% |
Fidelity International Equity Central Fund | - | 308,104,047 | - | 213,497,810 | 34.4% |
Fidelity Materials Central Fund | 70,728,000 | 5,680,545 | 2,222,435 | 56,702,977 | 29.9% |
Fidelity Tactical Income Central Fund | 682,133,000 | 79,497,621 | 216,349,097 | 500,674,871 | 12.4% |
Fidelity Telecom Services Central Fund | 68,234,000 | 7,659,274 | - | 46,819,800 | 29.9% |
Fidelity Utilities Central Fund | 68,507,000 | 5,882,827 | 492,172 | 57,097,620 | 29.9% |
Total | $ 2,719,967,000 | $ 578,712,586 | $ 266,914,231 | $ 2,358,624,392 | |
* Includes the value of shares received through merger activity - see Note 14 of the Notes to Financial Statements. |
Other Information (Unaudited) |
The information in the following tables is based on the combined investment of the Fund and its pro-rata share of the investments of Fidelity's Equity and Fixed-Income Central Funds. The composition of credit quality ratings as a percentage of net assets is as follows: |
U.S. Government and U.S. Government Agency Obligations | 12.7% |
AAA,AA,A | 6.6% |
BBB | 4.0% |
BB | 2.4% |
B | 2.0% |
CCC,CC,C | 0.4% |
Not Rated | 0.5% |
Equities | 71.0% |
Short-Term Investments and Net Other Assets | 0.4% |
| 100.0% |
We have used ratings from Moody's® Investors Services, Inc. Where Moody's ratings are not available, we have used S&P® ratings. All ratings are as of the report date and do not reflect subsequent downgrades. Percentages are adjusted for the effect of futures contracts, if applicable. |
Distribution of investments by country of issue, as a percentage of total net assets, is as follows. Percentages are adjusted for the effect of futures contracts, if applicable. |
United States of America | 78.9% |
United Kingdom | 3.8% |
Bermuda | 2.2% |
Switzerland | 2.0% |
Japan | 1.9% |
Canada | 1.5% |
Germany | 1.4% |
France | 1.2% |
Cayman Islands | 1.2% |
Others (individually less than 1%) | 5.9% |
| 100.0% |
Income Tax Information |
At September 30, 2008, the fund had a capital loss carryforward of approximately $100,045,622 of which $82,273,070 and $17,772,552 will expire on September 30, 2011 and 2016, respectively. The capital loss carryforward expiring September 30, 2016 was acquired from Fidelity Advisor Asset Manager 70% Fund. Capital loss carryforwards are only available to offset future capital gains of the Fund to the extent provided by regulations and may be limited. |
The fund intends to elect to defer to its fiscal year ending September 30, 2009 approximately $171,539,364 of losses recognized during the period November 1, 2007 to September 30, 2008. |
|
See accompanying notes which are an integral part of the financial statements.
Annual Report
Fidelity Asset Manager 70%
Financial Statements
Statement of Assets and Liabilities
| September 30, 2008 |
| | |
Assets | | |
Investment in securities, at value - See accompanying schedule: Unaffiliated issuers (cost $8,992,975) | $ 9,008,683 | |
Fidelity Central Funds (cost $2,809,424,212) | 2,463,422,146 | |
Total Investments (cost $2,818,417,187) | | $ 2,472,430,829 |
Cash | | 350 |
Receivable for investments sold | | 25,570,011 |
Receivable for fund shares sold | | 1,609,251 |
Dividends receivable | | 13,469 |
Distributions receivable from Fidelity Central Funds | | 3,135,420 |
Receivable for daily variation on futures contracts | | 4,118,909 |
Prepaid expenses | | 1,860 |
Receivable from investment adviser for expense reductions | | 1,223 |
Other receivables | | 77,722 |
Total assets | | 2,506,959,044 |
| | |
Liabilities | | |
Payable for investments purchased | $ 3,014,110 | |
Payable for fund shares redeemed | 4,235,933 | |
Accrued management fee | 1,130,637 | |
Distribution fees payable | 8,590 | |
Other affiliated payables | 490,296 | |
Other payables and accrued expenses | 136,472 | |
Total liabilities | | 9,016,038 |
| | |
Net Assets | | $ 2,497,943,006 |
Net Assets consist of: | | |
Paid in capital | | $ 3,055,165,272 |
Undistributed net investment income | | 41,473,665 |
Accumulated undistributed net realized gain (loss) on investments and foreign currency transactions | | (250,332,921) |
Net unrealized appreciation (depreciation) on investments and assets and liabilities in foreign currencies | | (348,363,010) |
Net Assets | | $ 2,497,943,006 |
| | |
Calculation of Maximum Offering Price Class A:
Net Asset Value and redemption price per share ($89,034,028 ÷ 6,536,105 shares) | | $ 13.62 |
| | |
Maximum offering price per share (100/94.25 of $13.62) | | $ 14.45 |
Class T:
Net Asset Value and redemption price per share ($52,477,998 ÷ 3,852,600 shares) | | $ 13.62 |
| | |
Maximum offering price per share (100/96.50 of $13.62) | | $ 14.11 |
Class B:
Net Asset Value and offering price per share ($23,526,441 ÷ 1,727,341 shares)A | | $ 13.62 |
| | |
Class C:
Net Asset Value and offering price per share ($37,762,253 ÷ 2,772,581 shares)A | | $ 13.62 |
| | |
Asset Manager 70%:
Net Asset Value, offering price and redemption price per share ($2,269,425,048 ÷ 166,619,009 shares) | | $ 13.62 |
| | |
Institutional Class:
Net Asset Value, offering price and redemption price per share ($25,717,238 ÷ 1,887,817 shares) | | $ 13.62 |
A Redemption price per share is equal to net asset value less any applicable contingent deferred sales charge.
See accompanying notes which are an integral part of the financial statements.
Annual Report
Statement of Operations
| Year ended September 30, 2008 |
| | |
Investment Income | | |
Dividends | | $ 42,406 |
Interest | | 311,945 |
Income from Fidelity Central Funds | | 80,088,362 |
Total income | | 80,442,713 |
| | |
Expenses | | |
Management fee | $ 15,716,293 | |
Transfer agent fees | 5,310,219 | |
Distribution fees | 8,590 | |
Accounting and security lending fees | 1,066,029 | |
Custodian fees and expenses | 19,718 | |
Independent trustees' compensation | 11,785 | |
Depreciation in deferred trustee compensation account | (351) | |
Registration fees | 32,261 | |
Audit | 75,766 | |
Legal | 37,864 | |
Miscellaneous | 54,343 | |
Total expenses before reductions | 22,332,517 | |
Expense reductions | (268,805) | 22,063,712 |
Net investment income (loss) | | 58,379,001 |
Realized and Unrealized Gain (Loss) Net realized gain (loss) on: | | |
Investment securities: | | |
Unaffiliated issuers (net of foreign taxes of $97,686) | 1,272,849 | |
Fidelity Central Funds | (629,652) | |
Foreign currency transactions | (423,277) | |
Futures contracts | (21,326,537) | |
Total net realized gain (loss) | | (21,106,617) |
Change in net unrealized appreciation (depreciation) on: Investment securities (net of decrease in deferred foreign taxes of $49,309) | (676,297,073) | |
Assets and liabilities in foreign currencies | 911 | |
Futures contracts | (13,136,378) | |
Total change in net unrealized appreciation (depreciation) | | (689,432,540) |
Net gain (loss) | | (710,539,157) |
Net increase (decrease) in net assets resulting from operations | | $ (652,160,156) |
Statement of Changes in Net Assets
| Year ended
September 30,
2008 | Year ended
September 30,
2007 |
Increase (Decrease) in Net Assets | | |
Operations | | |
Net investment income (loss) | $ 58,379,001 | $ 72,467,198 |
Net realized gain (loss) | (21,106,617) | 97,197,631 |
Change in net unrealized appreciation (depreciation) | (689,432,540) | 279,530,728 |
Net increase (decrease) in net assets resulting from operations | (652,160,156) | 449,195,557 |
Distributions to shareholders from net investment income | (72,024,349) | (74,718,985) |
Distributions to shareholders from net realized gain | (3,513,384) | - |
Total distributions | (75,537,733) | (74,718,985) |
Share transactions - net increase (decrease) | (36,451,983) | (249,477,581) |
Total increase (decrease) in net assets | (764,149,872) | 124,998,991 |
| | |
Net Assets | | |
Beginning of period | 3,262,092,878 | 3,137,093,887 |
End of period (including undistributed net investment income of $41,473,665 and undistributed net investment income of $56,361,068, respectively) | $ 2,497,943,006 | $ 3,262,092,878 |
See accompanying notes which are an integral part of the financial statements.
Annual Report
Financial Highlights - Class A
Year ended September 30, | 2008 G |
Selected Per-Share Data | |
Net asset value, beginning of period | $ 14.14 |
Income from Investment Operations | |
Net investment income (loss) E | .00 J |
Net realized and unrealized gain (loss) | (.52) |
Total from investment operations | (.52) |
Net asset value, end of period | $ 13.62 |
Total Return B, C, D | (3.68)% |
Ratios to Average Net Assets H | |
Expenses before reductions | 1.31% A |
Expenses net of fee waivers, if any | 1.25% A |
Expenses net of all reductions | 1.24% A |
Net investment income (loss) | 1.60% A |
Supplemental Data | |
Net assets, end of period (000 omitted) | $ 89,034 |
Portfolio turnover rate F | 14% I |
A Annualized
B Total returns for periods of less than one year are not annualized.
C Total returns would have been lower had certain expenses not been reduced during the periods shown.
D Total returns do not include the effect of the sales charges.
E Calculated based on average shares outstanding during the period.
F Amount does not include the portfolio activity of any underlying Fidelity Central Funds.
G For the period September 23, 2008 (commencement of sale of shares) to September 30, 2008.
H Expense ratios reflect operating expenses of the class. Expenses before reductions do not reflect amounts reimbursed by the investment adviser or reductions from brokerage service arrangements or other expense offset arrangements and do not represent the amount paid by the class during periods when reimbursements or reductions occur. Expense ratios before reductions for start-up periods may not be representative of longer-term operating periods. Expenses net of fee waivers reflect expenses after reimbursement by the investment adviser but prior to reductions from brokerage service arrangements or other expense offset arrangements. Expenses net of all reductions represent the net expenses paid by the class. Fees and expenses of the underlying Fidelity Central Funds are not included in the Fund's expense ratio. The Fund indirectly bears its proportionate share of the expenses of any underlying Fidelity Central Funds. Based on their most recent shareholder report date, the expenses ranged from less than .01% to .03%.
I The portfolio turnover rate does not include the assets acquired in the merger.
J Amount represents less than $.01 per share.
Financial Highlights - Class T
Year ended September 30, | 2008 G |
Selected Per-Share Data | |
Net asset value, beginning of period | $ 14.14 |
Income from Investment Operations | |
Net investment income (loss) E | .00 J |
Net realized and unrealized gain (loss) | (.52) |
Total from investment operations | (.52) |
Net asset value, end of period | $ 13.62 |
Total Return B, C, D | (3.68)% |
Ratios to Average Net Assets H | |
Expenses before reductions | 1.56% A |
Expenses net of fee waivers, if any | 1.50% A |
Expenses net of all reductions | 1.49% A |
Net investment income (loss) | 1.35% A |
Supplemental Data | |
Net assets, end of period (000 omitted) | $ 52,478 |
Portfolio turnover rate F | 14% I |
A Annualized
B Total returns for periods of less than one year are not annualized.
C Total returns would have been lower had certain expenses not been reduced during the periods shown.
D Total returns do not include the effect of the sales charges.
E Calculated based on average shares outstanding during the period.
F Amount does not include the portfolio activity of any underlying Fidelity Central Funds.
G For the period September 23, 2008 (commencement of sale of shares) to September 30, 2008.
H Expense ratios reflect operating expenses of the class. Expenses before reductions do not reflect amounts reimbursed by the investment adviser or reductions from brokerage service arrangements or other expense offset arrangements and do not represent the amount paid by the class during periods when reimbursements or reductions occur. Expense ratios before reductions for start-up periods may not be representative of longer-term operating periods. Expenses net of fee waivers reflect expenses after reimbursement by the investment adviser but prior to reductions from brokerage service arrangements or other expense offset arrangements. Expenses net of all reductions represent the net expenses paid by the class. Fees and expenses of the underlying Fidelity Central Funds are not included in the Fund's expense ratio. The Fund indirectly bears its proportionate share of the expenses of any underlying Fidelity Central Funds. Based on their most recent shareholder report date, the expenses ranged from less than .01% to .03%.
I The portfolio turnover rate does not include the assets acquired in the merger.
J Amount represents less than $.01 per share.
See accompanying notes which are an integral part of the financial statements.
Annual Report
Financial Highlights - Class B
Year ended September 30, | 2008 G |
Selected Per-Share Data | |
Net asset value, beginning of period | $ 14.14 |
Income from Investment Operations | |
Net investment income (loss) E | .00 J |
Net realized and unrealized gain (loss) | (.52) |
Total from investment operations | (.52) |
Net asset value, end of period | $ 13.62 |
Total Return B, C, D | (3.68)% |
Ratios to Average Net Assets H | |
Expenses before reductions | 2.06% A |
Expenses net of fee waivers, if any | 2.00% A |
Expenses net of all reductions | 1.99% A |
Net investment income (loss) | .85% A |
Supplemental Data | |
Net assets, end of period (000 omitted) | $ 23,526 |
Portfolio turnover rate F | 14% I |
A Annualized
B Total returns for periods of less than one year are not annualized.
C Total returns would have been lower had certain expenses not been reduced during the periods shown.
D Total returns do not include the effect of the contingent deferred sales charge.
E Calculated based on average shares outstanding during the period.
F Amount does not include the portfolio activity of any underlying Fidelity Central Funds.
G For the period September 23, 2008 (commencement of sale of shares) to September 30, 2008.
H Expense ratios reflect operating expenses of the class. Expenses before reductions do not reflect amounts reimbursed by the investment adviser or reductions from brokerage service arrangements or other expense offset arrangements and do not represent the amount paid by the class during periods when reimbursements or reductions occur. Expense ratios before reductions for start-up periods may not be representative of longer-term operating periods. Expenses net of fee waivers reflect expenses after reimbursement by the investment adviser but prior to reductions from brokerage service arrangements or other expense offset arrangements. Expenses net of all reductions represent the net expenses paid by the class. Fees and expenses of the underlying Fidelity Central Funds are not included in the Fund's expense ratio. The Fund indirectly bears its proportionate share of the expenses of any underlying Fidelity Central Funds. Based on their most recent shareholder report date, the expenses ranged from less than .01% to .03%.
I The portfolio turnover rate does not include the assets acquired in the merger.
J Amount represents less than $.01 per share.
Financial Highlights - Class C
Year ended September 30, | 2008 G |
Selected Per-Share Data | |
Net asset value, beginning of period | $ 14.14 |
Income from Investment Operations | |
Net investment income (loss) E | .00 J |
Net realized and unrealized gain (loss) | (.52) |
Total from investment operations | (.52) |
Net asset value, end of period | $ 13.62 |
Total Return B, C, D | (3.68)% |
Ratios to Average Net Assets H | |
Expenses before reductions | 2.07% A |
Expenses net of fee waivers, if any | 2.00% A |
Expenses net of all reductions | 1.99% A |
Net investment income (loss) | .85% A |
Supplemental Data | |
Net assets, end of period (000 omitted) | $ 37,762 |
Portfolio turnover rate F | 14% I |
A Annualized
B Total returns for periods of less than one year are not annualized.
C Total returns would have been lower had certain expenses not been reduced during the periods shown.
D Total returns do not include the effect of the contingent deferred sales charge.
E Calculated based on average shares outstanding during the period.
F Amount does not include the portfolio activity of any underlying Fidelity Central Funds.
G For the period September 23, 2008 (commencement of sale of shares) to September 30, 2008.
H Expense ratios reflect operating expenses of the class. Expenses before reductions do not reflect amounts reimbursed by the investment adviser or reductions from brokerage service arrangements or other expense offset arrangements and do not represent the amount paid by the class during periods when reimbursements or reductions occur. Expense ratios before reductions for start-up periods may not be representative of longer-term operating periods. Expenses net of fee waivers reflect expenses after reimbursement by the investment adviser but prior to reductions from brokerage service arrangements or other expense offset arrangements. Expenses net of all reductions represent the net expenses paid by the class. Fees and expenses of the underlying Fidelity Central Funds are not included in the Fund's expense ratio. The Fund indirectly bears its proportionate share of the expenses of any underlying Fidelity Central Funds. Based on their most recent shareholder report date, the expenses ranged from less than .01% to .03%.
I The portfolio turnover rate does not include the assets acquired in the merger.
J Amount represents less than $.01 per share.
See accompanying notes which are an integral part of the financial statements.
Annual Report
Financial Highlights - Asset Manager 70%
Years ended September 30, | 2008 | 2007 | 2006 | 2005 | 2004 |
Selected Per-Share Data | | | | | |
Net asset value, beginning of period | $ 17.78 | $ 15.82 | $ 14.94 | $ 14.10 | $ 13.47 |
Income from Investment Operations | | | | | |
Net investment income (loss) B | .33 | .38 | .34 | .31 D | .25 |
Net realized and unrealized gain (loss) | (4.06) | 1.97 | .84 | .85 | .69 |
Total from investment operations | (3.73) | 2.35 | 1.18 | 1.16 | .94 |
Distributions from net investment income | (.41) | (.39) | (.29) | (.32) | (.31) |
Distributions from net realized gain | (.02) | - | (.01) | - | - |
Total distributions | (.43) | (.39) | (.30) | (.32) | (.31) |
Net asset value, end of period | $ 13.62 | $ 17.78 | $ 15.82 | $ 14.94 | $ 14.10 |
Total Return A | (21.46)% | 15.07% | 7.98% | 8.28% | 6.99% |
Ratios to Average Net Assets E | | | | | |
Expenses before reductions | .79% | .80% | .81% | .82% | .83% |
Expenses net of fee waivers, if any | .79% | .80% | .81% | .82% | .83% |
Expenses net of all reductions | .78% | .78% | .79% | .80% | .82% |
Net investment income (loss) | 2.07% | 2.26% | 2.20% | 2.11% D | 1.77% |
Supplemental Data | | | | | |
Net assets, end of period (in millions) | $ 2,269 | $ 3,262 | $ 3,137 | $ 3,284 | $ 3,588 |
Portfolio turnover rate C | 14% F | 14% | 82% G | 37% G | 67% |
A Total returns would have been lower had certain expenses not been reduced during the periods shown.
B Calculated based on average shares outstanding during the period.
C Amount does not include the portfolio activity of any underlying Fidelity Central Funds.
D Investment income per share reflects a special dividend which amounted to $.06 per share. Excluding the special dividend, the ratio of net investment income (loss) to average net assets would have been 1.73%.
E Expense ratios reflect operating expenses of the class. Expenses before reductions do not reflect amounts reimbursed by the investment adviser or reductions from brokerage service arrangements or other expense offset arrangements and do not represent the amount paid by the class during periods when reimbursements or reductions occur. Expenses net of fee waivers reflect expenses after reimbursement by the investment adviser but prior to reductions from brokerage service arrangements or other expense offset arrangements. Expenses net of all reductions represent the net expenses paid by the class. Fees and expenses of the underlying Fidelity Central Funds are not included in the Fund's expense ratio. The Fund indirectly bears its proportionate share of the expenses of any underlying Fidelity Central Funds. Based on their most recent shareholder report date, the expenses ranged from less than .01% to .03%.
F The portfolio turnover rate does not include the assets acquired in the merger.
G Portfolio turnover rate excludes securities received or delivered in-kind.
Financial Highlights - Institutional Class
Year ended September 30, | 2008 F |
Selected Per-Share Data | |
Net asset value, beginning of period | $ 14.14 |
Income from Investment Operations | |
Net investment income (loss) D | .00 I |
Net realized and unrealized gain (loss) | (.52) |
Total from investment operations | (.52) |
Net asset value, end of period | $ 13.62 |
Total Return B, C | (3.68)% |
Ratios to Average Net Assets G | |
Expenses before reductions | 1.06% A |
Expenses net of fee waivers, if any | 1.00% A |
Expenses net of all reductions | .99% A |
Net investment income (loss) | 1.85% A |
Supplemental Data | |
Net assets, end of period (000 omitted) | $ 25,717 |
Portfolio turnover rate E | 14% H |
A Annualized
B Total returns for periods of less than one year are not annualized.
C Total returns would have been lower had certain expenses not been reduced during the periods shown.
D Calculated based on average shares outstanding during the period.
E Amount does not include the portfolio activity of any underlying Fidelity Central Funds.
F For the period September 23, 2008 (commencement of sale of shares) to September 30, 2008.
G Expense ratios reflect operating expenses of the class. Expenses before reductions do not reflect amounts reimbursed by the investment adviser or reductions from brokerage service arrangements or other expense offset arrangements and do not represent the amount paid by the class during periods when reimbursements or reductions occur. Expense ratios before reductions for start-up periods may not be representative of longer-term operating periods. Expenses net of fee waivers reflect expenses after reimbursement by the investment adviser but prior to reductions from brokerage service arrangements or other expense offset arrangements. Expenses net of all reductions represent the net expenses paid by the class. Fees and expenses of the underlying Fidelity Central Funds are not included in the Fund's expense ratio. The Fund indirectly bears its proportionate share of the expenses of any underlying Fidelity Central Funds. Based on their most recent shareholder report date, the expenses ranged from less than .01% to .03%.
H The portfolio turnover rate does not include the assets acquired in the merger.
I Amount represents less than $.01 per share.
See accompanying notes which are an integral part of the financial statements.
Annual Report
Fidelity Asset Manager 85%
Investment Changes (Unaudited)
The information in the following tables is based on the combined investments of the Fund and its pro-rata share of the investments of Fidelity's Equity and Fixed-Income Central Funds. |
Top Ten Stocks as of September 30, 2008 |
| % of fund's
net assets | % of fund's net assets
6 months ago |
Apple, Inc. | 1.2 | 0.1 |
Procter & Gamble Co. | 1.2 | 1.0 |
General Electric Co. | 0.9 | 0.7 |
Bank of America Corp. | 0.8 | 0.5 |
JPMorgan Chase & Co. | 0.8 | 0.7 |
Wells Fargo & Co. | 0.8 | 0.5 |
The Coca-Cola Co. | 0.7 | 0.7 |
Genentech, Inc. | 0.7 | 0.2 |
Nestle SA (Reg.) | 0.7 | 0.6 |
PepsiCo, Inc. | 0.6 | 0.6 |
| 8.4 | |
Asset Allocation (% of fund's net assets) |
As of September 30, 2008 | As of March 31, 2008 |
| Stock class and
Equity Futures 85.1% | | | Stock class and
Equity Futures 84.1% | |
| Bond class 12.4% | | | Bond class 12.5% | |
| Short-term class 2.5% | | | Short-term class 3.4% | |

Asset allocations in the pie charts reflect the categorization of assets as defined in the Fund's prospectus in effect as of the time periods indicated above. Percentages are adjusted for the effect of futures contracts and swap contracts, if applicable.
Annual Report
Fidelity Asset Manager 85%
The information in the following table is based on the direct investments of the Fund.
Fund Holdings as of September 30, 2008 |
| % of fund's
net assets |
Equity Central Funds | |
Fidelity International Equity Central Fund | 12.8 |
Fidelity Financials Central Fund | 10.9 |
Fidelity Information Technology Central Fund | 10.2 |
Fidelity Health Care Central Fund | 8.8 |
Fidelity Industrials Central Fund | 8.2 |
Fidelity Energy Central Fund | 7.4 |
Fidelity Consumer Staples Central Fund | 7.0 |
Fidelity Consumer Discretionary Central Fund | 7.0 |
Fidelity Utilities Central Fund | 2.5 |
Fidelity Materials Central Fund | 2.5 |
Fidelity Telecom Services Central Fund | 2.0 |
Total Equity Central Funds | 79.3 |
Fixed-Income Central Funds | |
Investment Grade Fixed-Income Funds | 7.8 |
High Yield Fixed-Income Funds | 1.2 |
Total Fixed-Income Central Funds | 9.0 |
Money Market Central Funds | 8.3 |
Other Short-Term Investments and Net Other Assets | 3.4 |
Total | 100.0 |
At period end, foreign investments, including the Fund's pro-rata share of the underlying Central Funds, was 24.7% of net assets. |
A holdings listing for the Fund, which presents direct holdings as well as the pro-rata share of any securities and other investments held indirectly through its investment in underlying non-money market Fidelity Central Funds, is available at fidelity.com and/or advisor.fidelity.com, as applicable. |
Annual Report
Fidelity Asset Manager 85%
Investments September 30, 2008
Showing Percentage of Net Assets
Equity Central Funds - 79.3% |
| Shares | | Value |
Fidelity Consumer Discretionary Central Fund (c) | 350,213 | | $ 32,363,171 |
Fidelity Consumer Staples Central Fund (c) | 283,995 | | 32,650,885 |
Fidelity Energy Central Fund (c) | 313,912 | | 34,680,962 |
Fidelity Financials Central Fund (c) | 767,829 | | 50,569,247 |
Fidelity Health Care Central Fund (c) | 409,180 | | 40,758,469 |
Fidelity Industrials Central Fund (c) | 361,159 | | 38,113,161 |
Fidelity Information Technology Central Fund (c) | 483,597 | | 47,494,035 |
Fidelity International Equity Central Fund (c) | 881,791 | | 59,185,813 |
Fidelity Materials Central Fund (c) | 105,173 | | 11,573,244 |
Fidelity Telecom Services Central Fund (c) | 106,534 | | 9,556,098 |
Fidelity Utilities Central Fund (c) | 124,853 | | 11,653,791 |
TOTAL EQUITY CENTRAL FUNDS (Cost $435,028,392) | 368,598,876 |
Fixed-Income Central Funds - 9.0% |
| | | |
Investment Grade Fixed-Income Funds - 7.8% |
Fidelity Tactical Income Central Fund (c) | 405,245 | | 36,391,037 |
High Yield Fixed-Income Funds - 1.2% |
Fidelity High Income Central Fund 1 (c) | 63,970 | | 5,470,107 |
TOTAL FIXED-INCOME CENTRAL FUNDS (Cost $45,537,377) | 41,861,144 |
Money Market Central Funds - 8.3% |
| | | |
Fidelity Cash Central Fund, 1.92% (a)
(Cost $38,653,762) | 38,653,762 | | 38,653,762 |
U.S. Treasury Obligations - 0.6% |
| Principal Amount | | |
U.S. Treasury Bills, yield at date of purchase 1.59% to 1.68% 10/16/08 to 12/4/08 (b)
(Cost $2,892,141) | | $ 2,900,000 | | 2,896,626 |
TOTAL INVESTMENT PORTFOLIO - 97.2% (Cost $522,111,672) | | 452,010,408 |
NET OTHER ASSETS - 2.8% | | 13,198,380 |
NET ASSETS - 100% | $ 465,208,788 |
Futures Contracts |
| Expiration Date | | Underlying Face Amount at Value | | Unrealized Appreciation/
(Depreciation) |
Purchased |
Equity Index Contracts |
645 CME E-mini S&P 500 Index Contracts | Dec. 2008 | | $ 37,648,650 | | $ (934,495) |
|
The face value of futures purchased as a percentage of net assets - 8.1% |
Legend |
(a) Affiliated fund that is available only to investment companies and other accounts managed by Fidelity Investments. The rate quoted is the annualized seven-day yield of the fund at period end. A complete unaudited listing of the fund's holdings as of its most recent quarter end is available upon request. |
(b) Security or a portion of the security was pledged to cover margin requirements for futures contracts. At the period end, the value of securities pledged amounted to $2,896,626. |
(c) Affiliated fund that is available only to investment companies and other accounts managed by Fidelity Investments. A complete unaudited schedule of portfolio holdings for each Fidelity Central Fund is filed with the SEC for the first and third quarters of each fiscal year on Form N-Q and is available upon request or at the SEC's web site at www.sec.gov. An unaudited holdings listing for the Fund, which presents direct holdings as well as the pro rata share of securities and other investments held indirectly through its investment in underlying non-money market Fidelity Central Funds, is available at fidelity.com and/or advisor.fidelity.com, as applicable. In addition, each Fidelity Central Fund's financial statements, which are not covered by the Fund's Report of Independent Registered Public Accounting Firm, are available on the SEC's web site or upon request. |
Affiliated Central Funds |
Information regarding fiscal year to date income earned by the Fund from investments in Fidelity Central Funds is as follows: |
Fund | Income earned |
Fidelity Cash Central Fund | $ 2,014,566 |
Fidelity Consumer Discretionary Central Fund | 527,503 |
Fidelity Consumer Staples Central Fund | 740,245 |
Fidelity Energy Central Fund | 358,448 |
Fidelity Financials Central Fund | 1,909,323 |
Fidelity Health Care Central Fund | 436,247 |
Fidelity High Income Central Fund 1 | 499,436 |
Fidelity Industrials Central Fund | 687,589 |
Fidelity Information Technology Central Fund | 432,249 |
Fidelity International Equity Central Fund | 1,742,195 |
Fidelity Materials Central Fund | 256,289 |
Fidelity Securities Lending Cash Central Fund | 4,304 |
Fidelity Tactical Income Central Fund | 3,021,104 |
Fidelity Telecom Services Central Fund | 265,683 |
Fidelity Utilities Central Fund | 314,452 |
Total | $ 13,209,633 |
Additional information regarding the Fund's fiscal year to date purchases and sales, including the ownership percentage, of the non-money market Central Funds is as follows: |
Fund | Value, beginning of period | Purchases | Sales
Proceeds | Value,
end of period | % ownership, end of period |
Fidelity Consumer Discretionary Central Fund | $ 38,476,813 | $ 4,818,364 | $ 1,141,365 | $ 32,363,171 | 6.1% |
Fidelity Consumer Staples Central Fund | 31,481,455 | 4,503,980 | 220,952 | 32,650,885 | 6.1% |
Fidelity Energy Central Fund | 39,903,408 | 5,609,264 | 1,387,562 | 34,680,962 | 6.1% |
Fidelity Financials Central Fund | 71,344,905 | 10,935,446 | - | 50,569,247 | 6.1% |
Fidelity Health Care Central Fund | 43,134,603 | 5,594,696 | 148,392 | 40,758,469 | 6.1% |
Fidelity High Income Central Fund 1 | 8,946,922 | 236,339 | 2,899,743 | 5,470,107 | 2.2% |
Fidelity Industrials Central Fund | 44,167,755 | 5,855,085 | 1,548,888 | 38,113,161 | 6.1% |
Fidelity Information Technology Central Fund | 61,814,912 | 9,468,853 | - | 47,494,035 | 6.1% |
Fidelity International Equity Central Fund | - | 86,885,029 | - | 59,185,813 | 9.5% |
Fidelity Materials Central Fund | 13,842,100 | 1,918,350 | 365,780 | 11,573,244 | 6.1% |
Fidelity Tactical Income Central Fund | 65,379,747 | 3,021,104 | 27,750,019 | 36,391,037 | 0.9% |
Fidelity Telecom Services Central Fund | 13,358,236 | 2,259,071 | - | 9,556,098 | 6.1% |
Fidelity Utilities Central Fund | 13,416,809 | 1,886,006 | - | 11,653,791 | 6.1% |
Total | $ 445,267,665 | $ 142,991,587 | $ 35,462,701 | $ 410,460,020 | |
Other Information (Unaudited) |
The information in the following tables is based on the combined investment of the Fund and its pro-rata share of the investments of Fidelity's Equity and Fixed-Income Central Funds. The composition of credit quality ratings as a percentage of net assets is as follows: |
U.S. Government and U.S. Government Agency Obligations | 4.9% |
AAA,AA,A | 2.7% |
BBB | 1.4% |
BB | 0.8% |
B | 0.6% |
CCC,CC,C | 0.0% |
Not Rated | 0.0% |
Equities | 85.0% |
Short-Term Investments and Net Other Assets | 4.6% |
| 100.0% |
We have used ratings from Moody's® Investors Services, Inc. Where Moody's ratings are not available, we have used S&P® ratings. All ratings are as of the report date and do not reflect subsequent downgrades. Percentages are adjusted for the effect of futures contracts, if applicable. |
Distribution of investments by country of issue, as a percentage of total net assets, is as follows. Percentages are adjusted for the effect of futures contracts, if applicable. |
United States of America | 75.3% |
United Kingdom | 4.5% |
Japan | 2.6% |
Switzerland | 2.5% |
Bermuda | 2.4% |
Germany | 1.9% |
France | 1.6% |
Canada | 1.3% |
Cayman Islands | 1.3% |
Others (individually less than 1%) | 6.6% |
| 100.0% |
Income Tax Information |
At September 30, 2008, the fund had a capital loss carryforward of approximately $36,329,826 all of which will expire on September 30, 2011. |
The fund intends to elect to defer to its fiscal year ending September 30, 2009 approximately $49,933,286 of losses recognized during the period November 1, 2007 to September 30, 2008. |
See accompanying notes which are an integral part of the financial statements.
Annual Report
Fidelity Asset Manager 85%
Financial Statements
Statement of Assets and Liabilities
| September 30, 2008 |
| | |
Assets | | |
Investment in securities, at value - See accompanying schedule: Unaffiliated issuers (cost $2,892,141) | $ 2,896,626 | |
Fidelity Central Funds (cost $519,219,531) | 449,113,782 | |
Total Investments (cost $522,111,672) | | $ 452,010,408 |
Foreign currency held at value (cost $256,819) | | 256,867 |
Receivable for investments sold | | 11,801,516 |
Receivable for fund shares sold | | 656,649 |
Dividends receivable | | 28,231 |
Distributions receivable from Fidelity Central Funds | | 355,556 |
Receivable for daily variation on futures contracts | | 1,618,950 |
Prepaid expenses | | 344 |
Other receivables | | 4,840 |
Total assets | | 466,733,361 |
| | |
Liabilities | | |
Payable for investments purchased | $ 243,702 | |
Payable for fund shares redeemed | 867,015 | |
Accrued management fee | 230,868 | |
Transfer agent fee payable | 109,378 | |
Distribution fees payable | 10,949 | |
Other affiliated payables | 16,088 | |
Other payables and accrued expenses | 46,573 | |
Total liabilities | | 1,524,573 |
| | |
Net Assets | | $ 465,208,788 |
Net Assets consist of: | | |
Paid in capital | | $ 609,982,994 |
Undistributed net investment income | | 5,554,274 |
Accumulated undistributed net realized gain (loss) on investments and foreign currency transactions | | (79,295,918) |
Net unrealized appreciation (depreciation) on investments and assets and liabilities in foreign currencies | | (71,032,562) |
Net Assets | | $ 465,208,788 |
| | |
Calculation of Maximum Offering Price Class A:
Net Asset Value and redemption price per share ($12,886,680 ÷ 1,177,641 shares) | | $ 10.94 |
| | |
Maximum offering price per share (100/94.25 of $10.94) | | $ 11.61 |
Class T:
Net Asset Value and redemption price per share ($4,090,064 ÷ 374,947 shares) | | $ 10.91 |
| | |
Maximum offering price per share (100/96.50 of $10.91) | | $ 11.31 |
Class B:
Net Asset Value and offering price per share ($2,451,670 ÷ 226,082 shares)A | | $ 10.84 |
| | |
Class C:
Net Asset Value and offering price per share ($5,016,717 ÷ 463,742 shares)A | | $ 10.82 |
| | |
Asset Manager 85%:
Net Asset Value, offering price and redemption price per share ($440,040,090 ÷ 40,027,464 shares) | | $ 10.99 |
| | |
Institutional Class:
Net Asset Value, offering price and redemption price per share ($723,567 ÷ 65,769 shares) | | $ 11.00 |
A Redemption price per share is equal to net asset value less any applicable contingent deferred sales charge.
See accompanying notes which are an integral part of the financial statements.
Annual Report
Statement of Operations
| Year ended September 30, 2008 |
| | |
Investment Income | | |
Dividends | | $ 17,977 |
Interest | | 83,167 |
Income from Fidelity Central Funds | | 13,209,633 |
Total income | | 13,310,777 |
| | |
Expenses | | |
Management fee | $ 3,095,396 | |
Transfer agent fees | 1,344,535 | |
Distribution fees | 113,275 | |
Accounting and security lending fees | 209,934 | |
Custodian fees and expenses | 13,169 | |
Independent trustees' compensation | 2,289 | |
Registration fees | 95,346 | |
Audit | 71,199 | |
Legal | 5,114 | |
Miscellaneous | 11,611 | |
Total expenses before reductions | 4,961,868 | |
Expense reductions | (75,556) | 4,886,312 |
Net investment income (loss) | | 8,424,465 |
Realized and Unrealized Gain (Loss) Net realized gain (loss) on: | | |
Investment securities: | | |
Unaffiliated issuers (net of foreign taxes of $41,077) | (807,442) | |
Fidelity Central Funds | 22,498 | |
Foreign currency transactions | (68,546) | |
Futures contracts | (11,182,323) | |
Total net realized gain (loss) | | (12,035,813) |
Change in net unrealized appreciation (depreciation) on: Investment securities (net of decrease in deferred foreign taxes of $20,675) | (143,908,270) | |
Assets and liabilities in foreign currencies | 9,087 | |
Futures contracts | (3,136,558) | |
Total change in net unrealized appreciation (depreciation) | | (147,035,741) |
Net gain (loss) | | (159,071,554) |
Net increase (decrease) in net assets resulting from operations | | $ (150,647,089) |
Statement of Changes in Net Assets
| Year ended
September 30,
2008 | Year ended
September 30,
2007 |
Increase (Decrease) in Net Assets | | |
Operations | | |
Net investment income (loss) | $ 8,424,465 | $ 8,364,040 |
Net realized gain (loss) | (12,035,813) | 16,447,618 |
Change in net unrealized appreciation (depreciation) | (147,035,741) | 57,830,856 |
Net increase (decrease) in net assets resulting from operations | (150,647,089) | 82,642,514 |
Distributions to shareholders from net investment income | (9,363,481) | (7,445,590) |
Distributions to shareholders from net realized gain | (1,224,803) | (712,648) |
Total distributions | (10,588,284) | (8,158,238) |
Share transactions - net increase (decrease) | 35,772,420 | 67,356,167 |
Total increase (decrease) in net assets | (125,462,953) | 141,840,443 |
| | |
Net Assets | | |
Beginning of period | 590,671,741 | 448,831,298 |
End of period (including undistributed net investment income of $5,554,274 and undistributed net investment income of $7,388,012, respectively) | $ 465,208,788 | $ 590,671,741 |
See accompanying notes which are an integral part of the financial statements.
Annual Report
Financial Highlights - Class A
Years ended September 30, | 2008 | 2007 G |
Selected Per-Share Data | | |
Net asset value, beginning of period | $ 14.77 | $ 12.75 |
Income from Investment Operations | | |
Net investment income (loss) E | .17 | .19 |
Net realized and unrealized gain (loss) | (3.74) | 2.05 |
Total from investment operations | (3.57) | 2.24 |
Distributions from net investment income | (.23) | (.20) |
Distributions from net realized gain | (.03) | (.02) |
Total distributions | (.26) | (.22) |
Net asset value, end of period | $ 10.94 | $ 14.77 |
Total Return B, C, D | (24.59)% | 17.78% |
Ratios to Average Net Assets H | | |
Expenses before reductions | 1.13% | 1.14% A |
Expenses net of fee waivers, if any | 1.13% | 1.14% A |
Expenses net of all reductions | 1.12% | 1.12% A |
Net investment income (loss) | 1.28% | 1.36% A |
Supplemental Data | | |
Net assets, end of period (000 omitted) | $ 12,887 | $ 7,348 |
Portfolio turnover rate F | 20% | 31% |
A Annualized
B Total returns for periods of less than one year are not annualized.
C Total returns would have been lower had certain expenses not been reduced during the periods shown.
D Total returns do not include the effect of the sales charges.
E Calculated based on average shares outstanding during the period.
F Amount does not include the portfolio activity of any underlying Fidelity Central Funds.
G For the period October 2, 2006 (commencement of sale of shares) to September 30, 2007.
H Expense ratios reflect operating expenses of the class. Expenses before reductions do not reflect amounts reimbursed by the investment adviser or reductions from brokerage service arrangements or other expense offset arrangements and do not represent the amount paid by the class during periods when reimbursements or reductions occur. Expense ratios before reductions for start-up periods may not be representative of longer-term operating periods. Expenses net of fee waivers reflect expenses after reimbursement by the investment adviser but prior to reductions from brokerage service arrangements or other expense offset arrangements. Expenses net of all reductions represent the net expenses paid by the class. Fees and expenses of the underlying Fidelity Central Funds are not included in the Fund's expense ratio. The Fund indirectly bears its proportionate share of the expenses of any underlying Fidelity Central Funds. Based on their most recent shareholder report date, the expenses ranged from less than .01% to .03%.
Financial Highlights - Class T
Years ended September 30, | 2008 | 2007 G |
Selected Per-Share Data | | |
Net asset value, beginning of period | $ 14.74 | $ 12.75 |
Income from Investment Operations | | |
Net investment income (loss) E | .13 | .15 |
Net realized and unrealized gain (loss) | (3.73) | 2.06 |
Total from investment operations | (3.60) | 2.21 |
Distributions from net investment income | (.20) | (.20) |
Distributions from net realized gain | (.03) | (.02) |
Total distributions | (.23) | (.22) |
Net asset value, end of period | $ 10.91 | $ 14.74 |
Total Return B, C, D | (24.76)% | 17.46% |
Ratios to Average Net Assets H | | |
Expenses before reductions | 1.38% | 1.42% A |
Expenses net of fee waivers, if any | 1.38% | 1.42% A |
Expenses net of all reductions | 1.37% | 1.41% A |
Net investment income (loss) | 1.02% | 1.07% A |
Supplemental Data | | |
Net assets, end of period (000 omitted) | $ 4,090 | $ 1,792 |
Portfolio turnover rate F | 20% | 31% |
A Annualized
B Total returns for periods of less than one year are not annualized.
C Total returns would have been lower had certain expenses not been reduced during the periods shown.
D Total returns do not include the effect of the sales charges.
E Calculated based on average shares outstanding during the period.
F Amount does not include the portfolio activity of any underlying Fidelity Central Funds.
G For the period October 2, 2006 (commencement of sale of shares) to September 30, 2007.
H Expense ratios reflect operating expenses of the class. Expenses before reductions do not reflect amounts reimbursed by the investment adviser or reductions from brokerage service arrangements or other expense offset arrangements and do not represent the amount paid by the class during periods when reimbursements or reductions occur. Expense ratios before reductions for start-up periods may not be representative of longer-term operating periods. Expenses net of fee waivers reflect expenses after reimbursement by the investment adviser but prior to reductions from brokerage service arrangements or other expense offset arrangements. Expenses net of all reductions represent the net expenses paid by the class. Fees and expenses of the underlying Fidelity Central Funds are not included in the Fund's expense ratio. The Fund indirectly bears its proportionate share of the expenses of any underlying Fidelity Central Funds. Based on their most recent shareholder report date, the expenses ranged from less than .01% to .03%.
See accompanying notes which are an integral part of the financial statements.
Annual Report
Financial Highlights - Class B
Years ended September 30, | 2008 | 2007 G |
Selected Per-Share Data | | |
Net asset value, beginning of period | $ 14.69 | $ 12.75 |
Income from Investment Operations | | |
Net investment income (loss) E | .06 | .08 |
Net realized and unrealized gain (loss) | (3.72) | 2.07 |
Total from investment operations | (3.66) | 2.15 |
Distributions from net investment income | (.16) | (.19) |
Distributions from net realized gain | (.03) | (.02) |
Total distributions | (.19) | (.21) |
Net asset value, end of period | $ 10.84 | $ 14.69 |
Total Return B, C, D | (25.21)% | 16.98% |
Ratios to Average Net Assets H | | |
Expenses before reductions | 1.93% | 1.93% A |
Expenses net of fee waivers, if any | 1.93% | 1.93% A |
Expenses net of all reductions | 1.92% | 1.92% A |
Net investment income (loss) | .47% | .56% A |
Supplemental Data | | |
Net assets, end of period (000 omitted) | $ 2,452 | $ 1,632 |
Portfolio turnover rate F | 20% | 31% |
A Annualized
B Total returns for periods of less than one year are not annualized.
C Total returns would have been lower had certain expenses not been reduced during the periods shown.
D Total returns do not include the effect of the contingent deferred sales charge.
E Calculated based on average shares outstanding during the period.
F Amount does not include the portfolio activity of any underlying Fidelity Central Funds.
G For the period October 2, 2006 (commencement of sale of shares) to September 30, 2007.
H Expense ratios reflect operating expenses of the class. Expenses before reductions do not reflect amounts reimbursed by the investment adviser or reductions from brokerage service arrangements or other expense offset arrangements and do not represent the amount paid by the class during periods when reimbursements or reductions occur. Expense ratios before reductions for start-up periods may not be representative of longer-term operating periods. Expenses net of fee waivers reflect expenses after reimbursement by the investment adviser but prior to reductions from brokerage service arrangements or other expense offset arrangements. Expenses net of all reductions represent the net expenses paid by the class. Fees and expenses of the underlying Fidelity Central Funds are not included in the Fund's expense ratio. The Fund indirectly bears its proportionate share of the expenses of any underlying Fidelity Central Funds. Based on their most recent shareholder report date, the expenses ranged from less than .01% to .03%.
Financial Highlights - Class C
Years ended September 30, | 2008 | 2007 G |
Selected Per-Share Data | | |
Net asset value, beginning of period | $ 14.67 | $ 12.75 |
Income from Investment Operations | | |
Net investment income (loss) E | .07 | .08 |
Net realized and unrealized gain (loss) | (3.71) | 2.06 |
Total from investment operations | (3.64) | 2.14 |
Distributions from net investment income | (.18) | (.20) |
Distributions from net realized gain | (.03) | (.02) |
Total distributions | (.21) | (.22) |
Net asset value, end of period | $ 10.82 | $ 14.67 |
Total Return B, C, D | (25.16)% | 16.90% |
Ratios to Average Net Assets H | | |
Expenses before reductions | 1.90% | 1.91% A |
Expenses net of fee waivers, if any | 1.90% | 1.91% A |
Expenses net of all reductions | 1.89% | 1.90% A |
Net investment income (loss) | .51% | .58% A |
Supplemental Data | | |
Net assets, end of period (000 omitted) | $ 5,017 | $ 3,194 |
Portfolio turnover rate F | 20% | 31% |
A Annualized
B Total returns for periods of less than one year are not annualized.
C Total returns would have been lower had certain expenses not been reduced during the periods shown.
D Total returns do not include the effect of the contingent deferred sales charge.
E Calculated based on average shares outstanding during the period.
F Amount does not include the portfolio activity of any underlying Fidelity Central Funds.
G For the period October 2, 2006 (commencement of sale of shares) to September 30, 2007.
H Expense ratios reflect operating expenses of the class. Expenses before reductions do not reflect amounts reimbursed by the investment adviser or reductions from brokerage service arrangements or other expense offset arrangements and do not represent the amount paid by the class during periods when reimbursements or reductions occur. Expense ratios before reductions for start-up periods may not be representative of longer-term operating periods. Expenses net of fee waivers reflect expenses after reimbursement by the investment adviser but prior to reductions from brokerage service arrangements or other expense offset arrangements. Expenses net of all reductions represent the net expenses paid by the class. Fees and expenses of the underlying Fidelity Central Funds are not included in the Fund's expense ratio. The Fund indirectly bears its proportionate share of the expenses of any underlying Fidelity Central Funds. Based on their most recent shareholder report date, the expenses ranged from less than .01% to .03%.
See accompanying notes which are an integral part of the financial statements.
Annual Report
Financial Highlights - Asset Manager 85%
Years ended September 30, | 2008 | 2007 | 2006 | 2005 | 2004 |
Selected Per-Share Data | | | | | |
Net asset value, beginning of period | $ 14.81 | $ 12.79 | $ 11.69 | $ 10.29 | $ 9.26 |
Income from Investment Operations | | | | | |
Net investment income (loss) B | .20 | .23 | .18 | .06 D | .05 |
Net realized and unrealized gain (loss) | (3.76) | 2.02 | .98 | 1.40 | 1.04 |
Total from investment operations | (3.56) | 2.25 | 1.16 | 1.46 | 1.09 |
Distributions from net investment income | (.23) | (.21) | (.06) | (.06) | (.06) |
Distributions from net realized gain | (.03) | (.02) | - | - | - |
Total distributions | (.26) | (.23) | (.06) | (.06) | (.06) |
Net asset value, end of period | $ 10.99 | $ 14.81 | $ 12.79 | $ 11.69 | $ 10.29 |
Total Return A | (24.43)% | 17.77% | 9.95% | 14.22% | 11.79% |
Ratios to Average Net Assets E | | | | | |
Expenses before reductions | .87% | .89% | .91% | .92% | .94% |
Expenses net of fee waivers, if any | .87% | .87% | .91% | .92% | .94% |
Expenses net of all reductions | .86% | .86% | .87% | .89% | .91% |
Net investment income (loss) | 1.54% | 1.62% | 1.50% | .53% D | .52% |
Supplemental Data | | | | | |
Net assets, end of period (000 omitted) | $ 440,040 | $ 576,458 | $ 448,831 | $ 403,221 | $ 352,600 |
Portfolio turnover rate C | 20% | 31% | 187% F | 71% F | 86% |
A Total returns would have been lower had certain expenses not been reduced during the periods shown.
B Calculated based on average shares outstanding during the period.
C Amount does not include the portfolio activity of any underlying Fidelity Central Funds.
D Investment income per share reflects a special dividend which amounted to $.02 per share. Excluding the special dividend, the ratio of net investment income (loss) to average net assets would have been .39%.
E Expense ratios reflect operating expenses of the class. Expenses before reductions do not reflect amounts reimbursed by the investment adviser or reductions from brokerage service arrangements or other expense offset arrangements and do not represent the amount paid by the class during periods when reimbursements or reductions occur. Expenses net of fee waivers reflect expenses after reimbursement by the investment adviser but prior to reductions from brokerage service arrangements or other expense offset arrangements. Expenses net of all reductions represent the net expenses paid by the class. Fees and expenses of the underlying Fidelity Central Funds are not included in the Fund's expense ratio. The Fund indirectly bears its proportionate share of the expenses of any underlying Fidelity Central Funds. Based on their most recent shareholder report date, the expenses ranged from less than .01% to .03%.
F Portfolio turnover rate excludes securities received or delivered in-kind.
Financial Highlights - Institutional Class
Years ended September 30, | 2008 | 2007 F |
Selected Per-Share Data | | |
Net asset value, beginning of period | $ 14.82 | $ 12.75 |
Income from Investment Operations | | |
Net investment income (loss) D | .21 | .23 |
Net realized and unrealized gain (loss) | (3.76) | 2.07 |
Total from investment operations | (3.55) | 2.30 |
Distributions from net investment income | (.24) | (.21) |
Distributions from net realized gain | (.03) | (.02) |
Total distributions | (.27) | (.23) |
Net asset value, end of period | $ 11.00 | $ 14.82 |
Total Return B, C | (24.35)% | 18.24% |
Ratios to Average Net Assets G | | |
Expenses before reductions | .78% | .82% A |
Expenses net of fee waivers, if any | .78% | .82% A |
Expenses net of all reductions | .77% | .81% A |
Net investment income (loss) | 1.62% | 1.67% A |
Supplemental Data | | |
Net assets, end of period (000 omitted) | $ 724 | $ 247 |
Portfolio turnover rate E | 20% | 31% |
A Annualized
B Total returns for periods of less than one year are not annualized.
C Total returns would have been lower had certain expenses not been reduced during the periods shown.
D Calculated based on average shares outstanding during the period.
E Amount does not include the portfolio activity of any underlying Fidelity Central Funds.
F For the period October 2, 2006 (commencement of sale of shares) to September 30, 2007.
G Expense ratios reflect operating expenses of the class. Expenses before reductions do not reflect amounts reimbursed by the investment adviser or reductions from brokerage service arrangements or other expense offset arrangements and do not represent the amount paid by the class during periods when reimbursements or reductions occur. Expense ratios before reductions for start-up periods may not be representative of longer-term operating periods. Expenses net of fee waivers reflect expenses after reimbursement by the investment adviser but prior to reductions from brokerage service arrangements or other expense offset arrangements. Expenses net of all reductions represent the net expenses paid by the class. Fees and expenses of the underlying Fidelity Central Funds are not included in the Fund's expense ratio. The Fund indirectly bears its proportionate share of the expenses of any underlying Fidelity Central Funds. Based on their most recent shareholder report date, the expenses ranged from less than .01% to .03%.
See accompanying notes which are an integral part of the financial statements.
Annual Report
Notes to Financial Statements
For the period ended September 30, 2008
1. Organization.
Fidelity Asset Manager 20%, Fidelity Asset Manager 30%, Fidelity Asset Manager 40%, Fidelity Asset Manager 50%, Fidelity Asset Manager 60%, Fidelity Asset Manager 70% and Fidelity Asset Manager 85% (the Funds) are funds of Fidelity Charles Street Trust (the trust). The trust is registered under the Investment Company Act of 1940, as amended (the 1940 Act), as an open-end management investment company organized as a Massachusetts business trust. Each Fund is authorized to issue an unlimited number of shares. Each Fund offers Class A, Class T, Class B, Class C, Asset Manager and Institutional Class shares, each of which has equal rights as to assets and voting privileges. Each class has exclusive voting rights with respect to matters that affect that class. Fidelity Asset Manager 70% commenced sale of Class A, Class T, Class B, Class C, and Institutional Class shares and the existing class was designated Asset Manager 70% on September 23, 2008. Class B shares will automatically convert to Class A shares after a holding period of seven years from the initial date of purchase. Investment income, realized and unrealized capital gains and losses, the common expenses of the Fund, and certain fund-level expense reductions, if any, are allocated on a pro rata basis to each class based on the relative net assets of each class to the total net assets of the Fund. Each class differs with respect to transfer agent and distribution and service plan fees incurred. Certain expense reductions also differ by class.
2. Investments in Fidelity Central Funds.
The Funds may invest in Fidelity Central Funds, which are open-end investment companies available only to other investment companies and accounts managed by Fidelity Management & Research Company (FMR) and its affiliates. The Funds' Schedules of Investments list each of the Fidelity Central Funds held as of period end, if any, as an investment of each Fund, but does not include the underlying holdings of each Fidelity Central Fund. As an Investing Fund, the Funds indirectly bear their proportionate share of the expenses of the underlying Fidelity Central Funds.
Based on their investment objective, each Fidelity Central Fund may invest or participate in various investment vehicles or strategies that are similar to those of each Fund. These strategies are consistent with the investment objectives of each Fund and may involve certain economic risks which may cause a decline in value of each of the Fidelity Central Funds and thus a decline in the value of each Fund. The following summarizes the Funds' investment in each Fidelity Central Fund.
Fidelity Central Fund | Investment Manager | Investment Objective | Investment Practices | Expense Ratio* |
Fidelity Equity Sector Central Funds | Fidelity Management & Research Company, Inc. (FMRC) | Each fund seeks capital appreciation by investing primarily in common stocks, with a concentration in a particular industry. | Foreign Securities Repurchase Agreements Restricted Securities | less than .01% to .02% |
Fidelity International Equity Central Fund | FMRC | Seeks capital appreciation by investing primarily in non-U.S. based common stocks, including securities of issuers located in emerging markets. | Foreign Securities Repurchase Agreements | .03% |
Fidelity Floating Rate Central Fund | FMRC | Seeks a high level of income by normally investing in floating rate loans and other floating rate securities. | Loans & Direct Debt Instruments Repurchase Agreements Restricted Securities | less than .01% |
Fidelity High Income Central Fund 1 | FMRC | Seeks a high level of income and may also seek capital appreciation by investing primarily in debt securities, preferred stocks, and convertible securities, with an emphasis on lower-quality debt securities. | Loans & Direct Debt Instruments Repurchase Agreements Restricted Securities | less than .01% |
Fidelity Tactical Income Central Fund | Fidelity Investments Money Management, Inc. (FIMM) | Seeks a high level of income by normally investing in investment-grade debt securities. | Delayed Delivery & When Issued Securities Mortgage Dollar Rolls Repurchase Agreements Restricted Securities Swap Agreements | less than .01% |
Fidelity Money Market Central Funds | FIMM | Seeks to obtain a high level of current income consistent with the preservation of capital and liquidity. | Short-term Investments | less than .01% |
* Expenses expressed as a percentage of average net assets and are as of each underlying Central Fund's most recent annual or semi-annual shareholder report.
Annual Report
Notes to Financial Statements - continued
2. Investments in Fidelity Central Funds - continued
An unaudited holdings listing for each Fund, which presents direct holdings as well as the pro rata share of any securities and other investments held indirectly through each Fund's investment in underlying non-money market Fidelity Central Funds, is available at fidelity.com and/or advisor.fidelity.com, as applicable. A complete unaudited list of holdings for each Fidelity Central Fund is available upon request or at the SEC's web site at www.sec.gov. In addition, the financial statements of the Fidelity Central Funds, which are not covered by the Funds' Reports of Independent Registered Public Accounting Firm, are available on the SEC's web site or upon request.
3. Significant Accounting Policies.
The financial statements have been prepared in conformity with accounting principles generally accepted in the United States of America, which require management to make certain estimates and assumptions at the date of the financial statements. Actual results could differ from those estimates. The following summarizes the significant accounting policies of the Funds:
Security Valuation. Investments are valued as of 4:00 p.m. Eastern time on the last calendar day of the period. Wherever possible, each Fund uses independent pricing services approved by the Board of Trustees to value their investments.
Equity securities, including restricted securities, for which market quotations are readily available, are valued at the last reported sale price or official closing price as reported by an independent pricing service on the primary market or exchange on which they are traded. In the event there were no sales during the day or closing prices are not available, securities are valued at the last quoted bid price. Debt securities, including restricted securities, are valued by independent pricing services or by dealers who make markets in such securities. Pricing services consider yield or price of bonds of comparable quality, coupon, maturity and type as well as dealer supplied prices. Futures contracts are valued at the settlement price established each day by the board of trade or exchange on which they are traded. Investments in open-end mutual funds, including the Fidelity Central Funds, are valued at their closing net asset value each business day. Short-term securities with remaining maturities of sixty days or less for which quotations are not readily available are valued at amortized cost, which approximates value.
When current market prices or quotations are not readily available or reliable, valuations may be determined in good faith in accordance with procedures adopted by the Board of Trustees. Factors used in determining value may include significant market or security specific events, changes in interest rates and credit quality, and developments in foreign markets which are monitored by evaluating the performance of ADRs, futures contracts and exchange-traded funds. The frequency with which these procedures are used cannot be predicted and may be utilized to a significant extent. The value of securities used for net asset value (NAV) calculation under these procedures may differ from published prices for the same securities.
Foreign Currency. Certain Funds may use foreign currency contracts to facilitate transactions in foreign-denominated securities. Losses from these transactions may arise from changes in the value of the foreign currency or if the counterparties do not perform under the contracts' terms.
Foreign-denominated assets, including investment securities, and liabilities are translated into U.S. dollars at the exchange rate at period end. Purchases and sales of investment securities, income and dividends received and expenses denominated in foreign currencies are translated into U.S. dollars at the exchange rate in effect on the transaction date.
The effects of exchange rate fluctuations on investments are included with the net realized and unrealized gain (loss) on investment securities. Other foreign currency transactions resulting in realized and unrealized gain (loss) are disclosed separately.
Investment Transactions and Income. For financial reporting purposes, the Funds' investment holdings and NAV include trades executed through the end of the last business day of the period. The NAV per share for processing shareholder transactions is calculated as of the close of business of the New York Stock Exchange (NYSE), normally 4:00 pm Eastern time and includes trades executed through the end of the prior business day. Gains and losses on securities sold are determined on the basis of identified cost and may include proceeds received from litigation. Dividend income is recorded on the ex-dividend date. Non-cash dividends included in dividend income, if any, are recorded at the fair market value of the securities received. Interest income and distributions from the Fidelity Central Funds are accrued as earned. Interest income includes coupon interest and amortization of premium and accretion of discount on debt securities. Investment income is recorded net of foreign taxes withheld where recovery of such taxes is uncertain.
Expenses. Most expenses of the trust can be directly attributed to a fund. Expenses which cannot be directly attributed are apportioned among each Fund in the trust. Expense estimates are accrued in the period to which they relate and adjustments are made when actual amounts are known. Expenses included in the accompanying financial statements reflect the expenses of each Fund and do not include any expenses of the Fidelity Central Funds. Although not included in each Fund's expenses, each Fund indirectly bears its proportionate share of the Fidelity Central Funds' expenses through the impact of these expenses on each Fidelity Central Fund's net asset value. Based on their most recent shareholder report date, expenses of the Fidelity Central Funds ranged from less than .01% to .03%.
Annual Report
3. Significant Accounting Policies - continued
Deferred Trustee Compensation. Under a Deferred Compensation Plan (the Plan) for Fidelity Asset Manager 50% and Fidelity Asset Manager 70%, Independent Trustees must defer receipt of a portion of, and may elect to defer receipt of an additional portion of, their annual compensation. Deferred amounts are invested in a cross-section of Fidelity funds, are marked-to-market and remain in the Fund until distributed in accordance with the Plan. The investment of deferred amounts and the offsetting payable to the Trustees are included in the accompanying Statement of Assets and Liabilities.
Income Tax Information and Distributions to Shareholders. Each year, each Fund intends to qualify as a regulated investment company by distributing substantially all of its taxable income and realized gains under Subchapter M of the Internal Revenue Code and filing its U.S. federal tax return. As a result, no provision for income taxes is required. Each Fund is subject to the provisions of FASB Interpretation No. 48, Accounting for Uncertainties in Income Taxes (FIN 48). FIN 48 sets forth a minimum threshold for financial statement recognition of the benefit of a tax position taken or expected to be taken in a tax return. The implementation of FIN 48 did not result in any unrecognized tax benefits in the accompanying financial statements. Each of the Funds' federal tax returns for the prior three fiscal years remains subject to examination by the Internal Revenue Service (IRS). Foreign taxes are provided for based on each Fund's understanding of the tax rules and rates that exist in the foreign markets in which it invests.
Distributions are recorded on the ex-dividend date. Income dividends and capital gain distributions are declared separately for each class. Income and capital gain distributions are determined in accordance with income tax regulations, which may differ from generally accepted accounting principles.
Capital accounts within the financial statements are adjusted for permanent book-tax differences. These adjustments have no impact on net assets or the results of operations. Temporary book-tax differences will reverse in a subsequent period.
Book-tax differences are primarily due to futures transactions, foreign currency transactions, certain foreign taxes, passive foreign investment companies (PFIC), market discount, partnerships (including allocations from Fidelity Central Funds), deferred trustees compensation, capital loss carryforwards and losses deferred due to wash sales and excise tax regulations.
The tax-basis components of distributable earnings and the federal tax cost as of period end were as follows for each Fund:
| Cost for Federal
Income Tax Purposes | Unrealized
Appreciation | Unrealized
Depreciation | Net Unrealized
Appreciation/
(Depreciation) |
Fidelity Asset Manager 20% | $ 2,366,330,190 | $ 12,057,286 | $ (167,215,181) | $ (155,157,895) |
Fidelity Asset Manager 30% | 29,648,950 | 262 | (2,437,137) | (2,436,875) |
Fidelity Asset Manager 40% | 20,660,400 | 65 | (1,596,219) | (1,596,154) |
Fidelity Asset Manager 50% | 6,763,591,475 | 90,074,183 | (776,437,621) | (686,363,438) |
Fidelity Asset Manager 60% | 35,302,499 | 5,822 | (2,646,858) | (2,641,036) |
Fidelity Asset Manager 70% | 2,799,541,819 | 38,688,032 | (365,799,022) | (327,110,990) |
Fidelity Asset Manager 85% | 516,075,883 | 6,555,566 | (70,621,041) | (64,065,475) |
| Undistributed
Ordinary Income | Undistributed
Long-term
Capital Gain | Capital Loss
Carryforward |
Fidelity Asset Manager 20% | $ 11,796,488 | $ 422,310 | $ - |
Fidelity Asset Manager 30% | 143,916 | - | (10,213) |
Fidelity Asset Manager 40% | 131,643 | - | (101,011) |
Fidelity Asset Manager 50% | 67,738,925 | - | - |
Fidelity Asset Manager 60% | 231,837 | - | (76,825) |
Fidelity Asset Manager 70% | 41,565,845 | - | (100,045,622) |
Fidelity Asset Manager 85% | 5,554,380 | - | (36,329,826) |
The tax character of distributions paid was as follows:
September 30, 2008 | | | |
| Ordinary Income | Long-term
Capital Gains | Total |
Fidelity Asset Manager 20% | $ 124,816,062 | $ 15,864,447 | $ 140,680,509 |
Fidelity Asset Manager 30% | 595,233 | - | 595,233 |
Fidelity Asset Manager 40% | 228,368 | - | 228,368 |
Fidelity Asset Manager 50% | 609,187,068 | 187,189,636 | 796,376,704 |
Fidelity Asset Manager 60% | 36,701 | - | 36,701 |
Fidelity Asset Manager 70% | 75,537,733 | - | 75,537,733 |
Fidelity Asset Manager 85% | 10,588,284 | - | 10,588,284 |
Annual Report
Notes to Financial Statements - continued
3. Significant Accounting Policies - continued
Income Tax Information and Distributions to Shareholders - continued
September 30, 2007 | | | |
| Ordinary Income | Long-term
Capital Gains | Total |
Fidelity Asset Manager 20% | $ 136,976,584 | $ 57,926,972 | $ 194,903,556 |
Fidelity Asset Manager 50% | 396,065,388 | 361,760,126 | 757,825,514 |
Fidelity Asset Manager 70% | 74,718,985 | - | 74,718,985 |
Fidelity Asset Manager 85% | 8,158,238 | - | 8,158,238 |
New Accounting Pronouncements. In September 2006, Statement of Financial Accounting Standards No. 157, Fair Value Measurements (SFAS 157), was issued and is effective for fiscal years beginning after November 15, 2007. SFAS 157 defines fair value, establishes a framework for measuring fair value and results in expanded disclosures about fair value measurements.
In addition, in March 2008, Statement of Financial Accounting Standards No. 161, Disclosures about Derivative Instruments and Hedging Activities (SFAS 161), was issued and is effective for reporting periods beginning after November 15, 2008. SFAS 161 requires enhanced disclosures to provide information about the reasons the Funds invest in derivative instruments, the accounting treatment and the effect derivatives have on financial performance.
4. Operating Policies.
Repurchase Agreements. FMR has received an Exemptive Order from the Securities and Exchange Commission (the SEC) which permits certain Funds and other affiliated entities of FMR to transfer uninvested cash balances into joint trading accounts which are then invested in repurchase agreements. Certain Funds may also invest directly with institutions in repurchase agreements. Repurchase agreements are collateralized by government or non-government securities. Upon settlement date, collateral is held in segregated accounts with custodian banks and may be obtained in the event of a default of the counterparty. Each applicable Fund monitors, on a daily basis, the value of the collateral to ensure it is at least equal to the principal amount of the repurchase agreement (including accrued interest). In the event of a default by the counterparty, realization of the collateral proceeds could be delayed, during which time the value of the collateral may decline.
Futures Contracts. Certain Funds may use futures contracts to manage their exposure to the stock market. Buying futures tends to increase a fund's exposure to the underlying instrument, while selling futures tends to decrease a fund's exposure to the underlying instrument or hedge other fund investments. Upon entering into a futures contract, a fund is required to deposit with a clearing broker, no later than the following business day, an amount ("initial margin") equal to a certain percentage of the face value of the contract. The initial margin may be in the form of cash or securities and is transferred to a segregated account on settlement date. Subsequent payments ("variation margin") are made or received by a fund depending on the daily fluctuations in the value of the futures contract and are accounted for as unrealized gains or losses. Realized gains (losses) are recorded upon the expiration or closing of the futures contract. Securities deposited to meet margin requirements are identified in each applicable fund's Schedule of Investments. Futures contracts involve, to varying degrees, risk of loss in excess of any futures variation margin reflected in each applicable fund's Statement of Assets and Liabilities. The underlying face amount at value of any open futures contracts at period end is shown in each applicable fund's Schedule of Investments under the caption "Futures Contracts." This amount reflects each contract's exposure to the underlying instrument at period end. Losses may arise from changes in the value of the underlying instruments or if the counterparties do not perform under the contract's terms.
5. Purchases and Sales of Investments.
Purchases and sales of securities (including the Equity and Fixed-Income Central Funds), other than short-term securities, are noted in the table below.
| Purchases ($) | Sales ($) |
Fidelity Asset Manager 20% | 171,800,010 | 83,670,006 |
Fidelity Asset Manager 30% | 33,090,843 | 4,895,941 |
Fidelity Asset Manager 40% | 18,362,577 | 101,121 |
Fidelity Asset Manager 50% | 604,143,707 | 1,602,065,571 |
Fidelity Asset Manager 60% | 31,760,349 | 539,595 |
Fidelity Asset Manager 70% | 368,231,329 | 415,955,703 |
Fidelity Asset Manager 85% | 146,921,804 | 98,178,529 |
Annual Report
6. Fees and Other Transactions with Affiliates.
Management Fee. FMR and its affiliates provide the Funds with investment management related services for which the Funds pay a monthly management fee. The management fee is the sum of an individual fund fee rate and a group fee rate. The individual fund fee rate is applied to each Fund's average net assets. The group fee rate is based upon the average net assets of all the mutual funds advised by FMR. The group fee rate decreases as assets under management increase and increases as assets under management decrease. For the period, each Fund's annual management fee rate expressed as a percentage of each Fund's average net assets was as follows:
| Individual Rate | Group Rate | Total |
Fidelity Asset Manager 20% | .30% | .12% | .42% |
Fidelity Asset Manager 30% | .30% | .12% | .42% |
Fidelity Asset Manager 40% | .30% | .12% | .42% |
Fidelity Asset Manager 50% | .25% | .26% | .51% |
Fidelity Asset Manager 60% | .30% | .26% | .56% |
Fidelity Asset Manager 70% | .30% | .26% | .56% |
Fidelity Asset Manager 85% | .30% | .26% | .56% |
FMR pays a portion of the management fees received from the Funds to the Fidelity Central Funds' investment advisers, who are also affiliates, for managing the assets of the Fidelity Central Funds.
Distribution and Service Plan. In accordance with Rule 12b-1 of the 1940 Act, the Fund has adopted separate Distribution and Service Plans for each class of shares. Certain classes pay Fidelity Distributors Corporation (FDC), an affiliate of FMR, separate Distribution and Service Fees, each of which is based on an annual percentage of each class' average net assets. In addition, FDC may pay financial intermediaries for selling shares of the Fund and providing shareholder support services. For the period, the Distribution and Service Fee rates and the total amounts paid to and retained by FDC were as follows:
Fidelity Asset Manager 20% | Distribution
Fee | Service
Fee | Paid to
FDC | Retained
by FDC |
Class A | .00% | .25% | $ 16,841 | $ 3,422 |
Class T | .25% | .25% | 22,751 | 259 |
Class B | .75% | .25% | 15,959 | 12,106 |
Class C | .75% | .25% | 27,213 | 13,462 |
| | | $ 82,764 | $ 29,249 |
Fidelity Asset Manager 30% | | | | |
Class A | .00% | .25% | $ 1,787 | $ 392 |
Class T | .25% | .25% | 2,276 | 689 |
Class B | .75% | .25% | 2,484 | 2,211 |
Class C | .75% | .25% | 7,262 | 6,613 |
| | | $ 13,809 | $ 9,905 |
Fidelity Asset Manager 40% | | | | |
Class A | .00% | .25% | $ 4,314 | $ 3,457 |
Class T | .25% | .25% | 8,264 | 6,915 |
Class B | .75% | .25% | 13,919 | 13,889 |
Class C | .75% | .25% | 14,815 | 14,721 |
| | | $ 41,312 | $ 38,982 |
Fidelity Asset Manager 50% | | | | |
Class A | .00% | .25% | $ 20,613 | $ 5,970 |
Class T | .25% | .25% | 24,930 | 248 |
Class B | .75% | .25% | 18,320 | 13,886 |
Class C | .75% | .25% | 39,254 | 27,533 |
| | | $ 103,117 | $ 47,637 |
Fidelity Asset Manager 60% | | | | |
Class A | .00% | .25% | $ 4,672 | $ 2,746 |
Class T | .25% | .25% | 4,938 | 3,563 |
Class B | .75% | .25% | 8,905 | 8,453 |
Class C | .75% | .25% | 11,155 | 8,678 |
| | | $ 29,670 | $ 23,440 |
Annual Report
Notes to Financial Statements - continued
6. Fees and Other Transactions with Affiliates - continued
Distribution and Service Plan - continued
Fidelity Asset Manager 70% | Distribution
Fee | Service
Fee | Paid to
FDC | Retained
by FDC |
Class A | .00% | .25% | $ 1,735 | $ - |
Class T | .25% | .25% | 2,053 | - |
Class B | .75% | .25% | 1,847 | 1,385 |
Class C | .75% | .25% | 2,955 | - |
| | | $ 8,590 | $ 1,385 |
Fidelity Asset Manager 85% | | | | |
Class A | .00% | .25% | $ 28,319 | $ 3,184 |
Class T | .25% | .25% | 15,076 | 245 |
Class B | .75% | .25% | 22,977 | 17,369 |
Class C | .75% | .25% | 46,903 | 30,918 |
| | | $ 113,275 | $ 51,716 |
Sales Load. FDC receives a front-end sales charge of up to 5.75% for selling Class A shares, and 3.50% for selling Class T shares, some of which is paid to financial intermediaries for selling shares of the Fund. FDC receives the proceeds of contingent deferred sales charges levied on Class A, Class T, Class B, and Class C redemptions. These charges depend on the holding period. The deferred sales charges range from 5% to 1% for Class B, 1% for Class C, 1.00% to .50% for certain purchases of Class A shares and .25% for certain purchases of Class T shares.
For the period, sales charge amounts retained by FDC were as follows:
Fidelity Asset Manager 20% | Retained
by FDC |
Class A | $ 24,014 |
Class T | 3,692 |
Class B* | 2,543 |
Class C* | 1,199 |
| $ 31,448 |
Fidelity Asset Manager 30% | |
Class A | $ 1,961 |
Class T | 475 |
Class C* | 824 |
| $ 3,260 |
Fidelity Asset Manager 40% | |
Class A | $ 3,663 |
Class T | 234 |
Class B* | 95 |
| $ 3,992 |
Fidelity Asset Manager 50% | |
Class A | $ 30,625 |
Class T | 4,653 |
Class B* | 2,586 |
Class C* | 1,428 |
| $ 39,292 |
Fidelity Asset Manager 60% | |
Class A | $ 4,205 |
Class T | 1,339 |
Class C* | 208 |
| $ 5,752 |
Fidelity Asset Manager 70% | |
Class A | $ 615 |
Class T | 273 |
Class B* | 182 |
| $ 1,070 |
Annual Report
6. Fees and Other Transactions with Affiliates - continued
Sales Load - continued
Fidelity Asset Manager 85% | Retained
by FDC |
Class A | $ 33,337 |
Class T | 8,812 |
Class B* | 3,631 |
Class C* | 2,666 |
| $ 48,446 |
* When Class B and Class C shares are initially sold, FDC pays commissions from its own resources to financial intermediaries through which the sales are made.
Transfer Agent Fees. Fidelity Investments Institutional Operations Company, Inc. (FIIOC), an affiliate of FMR, is the transfer, dividend disbursing and shareholder servicing agent for each class of the Funds. FIIOC receives account fees and asset-based fees that vary according to the account size and type of account of the shareholders of the respective classes of each Fund. FIIOC pays for typesetting, printing and mailing of shareholder reports, except proxy statements. Prior to January 1, 2008, Fidelity Service Company Inc., (FSC), also an affiliate of FMR, was the transfer agent for Asset Manager 20%, Asset Manager 50%, Asset Manager 70% and Asset Manager 85%. For the period, each class paid the following transfer agent fees:
Fidelity Asset Manager 20% | Amount | % of
Average
Net Assets |
Class A | $ 10,339 | .15 |
Class T | 7,180 | .16 |
Class B | 3,355 | .21 |
Class C | 5,086 | .19 |
Asset Manager 20% | 2,543,268 | .10 |
Institutional Class | 2,001 | .11 |
| $ 2,571,229 | |
Fidelity Asset Manager 30% | | |
Class A | $ 1,050 | .15 * |
Class T | 681 | .15 * |
Class B | 443 | .18 * |
Class C | 1,121 | .15 * |
Asset Manager 30% | 25,306 | .11 * |
Institutional Class | 197 | .12 * |
| $ 28,798 | |
Fidelity Asset Manager 40% | | |
Class A | $ 2,392 | .14 * |
Class T | 2,162 | .13 * |
Class B | 1,671 | .12 * |
Class C | 1,876 | .13 * |
Asset Manager 40% | 7,821 | .11 * |
Institutional Class | 1,626 | .12 * |
| $ 17,548 | |
Fidelity Asset Manager 50% | | |
Class A | $ 16,972 | .21 |
Class T | 10,130 | .20 |
Class B | 4,707 | .26 |
Class C | 8,962 | .23 |
Asset Manager 50% | 13,473,964 | .17 |
Institutional Class | 1,091 | .14 |
| $ 13,515,826 | |
Annual Report
Notes to Financial Statements - continued
6. Fees and Other Transactions with Affiliates - continued
Transfer Agent Fees - continued
Fidelity Asset Manager 60% | Amount | % of
Average
Net Assets |
Class A | $ 3,912 | .21 * |
Class T | 1,906 | .19 * |
Class B | 1,594 | .18 * |
Class C | 1,960 | .18 * |
Asset Manager 60% | 15,916 | .17 * |
Institutional Class | 1,233 | .14 * |
| $ 26,521 | |
Fidelity Asset Manager 70% | | |
Class A | $ 2,082 | .30 * |
Class T | 1,232 | .30 * |
Class B | 554 | .30 * |
Class C | 887 | .30 * |
Asset Manager 70% | 5,304,859 | .19 |
Institutional Class | 605 | .30 * |
| $ 5,310,219 | |
Fidelity Asset Manager 85% | | |
Class A | $ 28,117 | .25 |
Class T | 7,617 | .25 |
Class B | 6,942 | .30 |
Class C | 12,475 | .27 |
Asset Manager 85% | 1,288,694 | .24 |
Institutional Class | 690 | .15 |
| $ 1,344,535 | |
* Annualized
Accounting and Security Lending Fees. FSC maintains each Fund's accounting records. The accounting fee is based on the level of average net assets for the month. Under a separate contract, FSC administers the security lending program. The security lending fee is based on the number and duration of lending transactions.
Brokerage Commissions. Certain Funds placed a portion of their portfolio transactions with brokerage firms which are affiliates of the investment adviser. The commissions paid to these affiliated firms were as follows:
| Amount |
Fidelity Asset Manager 50% | $ 315 |
Fidelity Asset Manager 70% | 146 |
Fidelity Asset Manager 85% | 67 |
Interfund Lending Program. Pursuant to an Exemptive Order issued by the SEC, the Funds, along with other registered investment companies having management contracts with FMR, may participate in an interfund lending program. This program provides an alternative credit facility allowing the funds to borrow from, or lend money to, other participating affiliated funds. Any open loans, including accrued interest, at period end are presented under the caption "Notes Payable to Affiliates" in the Fund's Statement of Assets and Liabilities. Each applicable fund's activity in this program during the period for which loans were outstanding was as follows:
| Borrower or Lender | Average Daily Loan Balance | Weighted Average Interest Rate | Interest Expense |
Fidelity Asset Manager 50% | Borrower | $ 21,397,875 | 4.43% | $ 42,138 |
Annual Report
7. Committed Line of Credit.
Certain Funds participate with other funds managed by FMR in a $4.2 billion credit facility (the "line of credit") to be utilized for temporary or emergency purposes to fund shareholder redemptions or for other short-term liquidity purposes. The participating funds have agreed to pay commitment fees on their pro rata portion of the line of credit, which is reflected in Miscellaneous Expense on the Statement of Operations, and is as follows:
| Amount |
Fidelity Asset Manager 20% | $ 4,746 |
Fidelity Asset Manager 30% | 23 |
Fidelity Asset Manager 40% | 12 |
Fidelity Asset Manager 50% | 15,661 |
Fidelity Asset Manager 60% | 11 |
Fidelity Asset Manager 70% | 5,655 |
Fidelity Asset Manager 85% | 1,072 |
During the period, there were no borrowings on this line of credit.
8. Security Lending.
Certain Funds lend portfolio securities from time to time in order to earn additional income. On the settlement date of the loan, each applicable Fund receives collateral (in the form of U.S. Treasury obligations, letters of credit and/or cash) against the loaned securities and maintains collateral in an amount not less than 100% of the market value of the loaned securities during the period of the loan. The market value of the loaned securities is determined at the close of business of the Funds and any additional required collateral is delivered to the Funds on the next business day. If the borrower defaults on its obligation to return the securities loaned because of insolvency or other reasons, a fund could experience delays and costs in recovering the securities loaned or in gaining access to the collateral. Any cash collateral received is invested in the Fidelity Securities Lending Cash Central Fund. At period end, there were no security loans outstanding. Security lending income represents the income earned on investing cash collateral, less fees and expenses associated with the loan, plus any premium payments that may be received on the loan of certain types of securities. Security lending income is presented on each applicable Fund's Statement of Operations as a component of income from Fidelity Central Funds. Net income from lending portfolio securities during the period amounted to:
Fidelity Asset Manager 20% | $ 13 |
Fidelity Asset Manager 50% | 14,209 |
Fidelity Asset Manager 70% | 9,184 |
Fidelity Asset Manager 85% | 4,304 |
9. Bank Borrowings.
Each Fund is permitted to have bank borrowings for temporary or emergency purposes to fund shareholder redemptions. Each Fund has established borrowing arrangements with certain banks. The interest rate on the borrowings is the bank's base rate, as revised from time to time. At period end, there were no bank borrowings outstanding. Each applicable Fund's activity in this program during the period for which loans were outstanding was as follows:
| Average Daily
Loan Balance | Weighted Average Interest Rate | Interest Expense |
Fidelity Asset Manager 50% | $ 8,989,400 | 2.17% | $ 2,714 |
10. Expense Reductions.
FMR voluntarily agreed to reimburse a portion of certain class' operating expenses. During the period, this reimbursement reduced these class' expenses as noted in the table below.
| | Reimbursement
from adviser |
Asset Manager 20% | | $ 9,475 |
Asset Manager 50% | | 9,620 |
Asset Manager 85% | | 9,680 |
FMR voluntarily agreed to reimburse Funds to the extent annual operating expenses exceeded certain levels of average net assets as noted in the table below. Some expenses, for example interest expense, including commitment fees, are excluded from this reimbursement.
Annual Report
Notes to Financial Statements - continued
10. Expense Reductions - continued
The following classes of each applicable Fund were in reimbursement during the period:
| Expense
Limitations | Reimbursement
from adviser |
Fidelity Asset Manager 20% | | |
Class B | 1.85% - 1.65%* | $ 117 |
Fidelity Asset Manager 30% | | |
Class A | 1.10% - .90%* | 4,867 |
Class T | 1.35% - 1.15%* | 3,547 |
Class B | 1.85% - 1.65%* | 2,422 |
Class C | 1.85% - 1.65%* | 4,885 |
Asset Manager 30% | .85% - .65%* | 115,600 |
Institutional Class | .85% - .65%* | 1,630 |
Fidelity Asset Manager 40% | | |
Class A | 1.10% - .90%* | 15,717 |
Class T | 1.35% - 1.15%* | 14,873 |
Class B | 1.85% - 1.65%* | 12,131 |
Class C | 1.85% - 1.65%* | 13,271 |
Asset Manager 40% | .85% - .65%* | 66,187 |
Institutional Class | .85% - .65%* | 12,254 |
Fidelity Asset Manager 60% | | |
Class A | 1.25% - 1.10%* | 19,044 |
Class T | 1.50% - 1.35%* | 9,100 |
Class B | 2.00% - 1.85%* | 8,240 |
Class C | 2.00% - 1.85%* | 9,962 |
Asset Manager 60% | 1.00% - .85%* | 89,562 |
Institutional Class | 1.00% - .85%* | 7,842 |
Fidelity Asset Manager 70% | | |
Class A | 1.25% | 475 |
Class T | 1.50% | 282 |
Class B | 2.00% | 127 |
Class C | 2.00% | 208 |
Institutional Class | 1.00% | 131 |
* Expense limitation in effect at period end.
Many of the brokers with whom FMR places trades on behalf of certain Funds and certain Equity Central Funds provided services to these Funds in addition to trade execution. These services included payments of expenses on behalf of each applicable Fund. In addition, through arrangements with each applicable Fund's custodian and each class' transfer agent, credits realized as a result of uninvested cash balances were used to reduce the Fund's expenses. All of the applicable expense reductions are noted in the table below.
| Brokerage Service Arrangements | Custody
expense
reduction | Transfer
Agent
expense
reduction |
| | | |
Fidelity Asset Manager 20% | $ 20,515 | $ 196 | $ - |
Asset Manager 20% | - | - | 31,456 |
Institutional Class | - | - | 31 |
Fidelity Asset Manager 30% | 183 | 36 | - |
Fidelity Asset Manager 40% | 229 | 7 | - |
Fidelity Asset Manager 50% | 359,222 | - | - |
Class A | - | - | 115 |
Asset Manager 50% | - | - | 150,145 |
Institutional Class | - | - | 3 |
Fidelity Asset Manager 60% | 338 | - | - |
Fidelity Asset Manager 70% | 200,769 | - | - |
Asset Manager 70% | - | - | 66,813 |
Fidelity Asset Manager 85% | 56,201 | 226 | - |
Class A | - | - | 133 |
Asset Manager 85% | - | - | 9,316 |
Annual Report
11. Other.
The Funds' organizational documents provide former and current trustees and officers with a limited indemnification against liabilities arising in connection with the performance of their duties to the Funds. In the normal course of business, the Funds may also enter into contracts that provide general indemnifications. The Funds' maximum exposure under these arrangements is unknown as this would be dependent on future claims that may be made against the Funds. The risk of material loss from such claims is considered remote.
At the end of the period, FMR or its affiliates were owners of record of more than 10% of the outstanding shares of the following funds:
| Affiliated % |
Fund | |
Fidelity Asset Manager 40% | 36% |
Fidelity Asset Manager 60% | 13% |
In December 2006, the Independent Trustees, with the assistance of independent counsel, completed an investigation regarding gifts, gratuities and business entertainment provided by certain brokers to certain individuals who were employed on FMR's domestic equity trading desk during the period 2002 to 2004. The Independent Trustees and FMR agreed that, despite the absence of proof that the Fidelity mutual funds experienced diminished execution quality as a result of the improper receipt of gifts and business entertainment, the conduct at issue was serious and was worthy of redress. Accordingly, the Independent Trustees requested, and FMR agreed to make, a payment of $42 million plus accrued interest, which equaled approximately $7.3 million, to certain Fidelity mutual funds.
In March 2008, the Trustees approved a method for allocating this payment among the funds and, in total, FMR paid each fund the following amounts, which is recorded in each applicable Fund's accompanying Statement of Operations:
Fidelity Asset Manager 20% | $ 81,877 |
Fidelity Asset Manager 50% | 615,567 |
Fidelity Asset Manager 70% | 282,743 |
Fidelity Asset Manager 85% | 59,143 |
In a related administrative order dated March 5, 2008, the U.S. Securities and Exchange Commission ("SEC") announced a settlement with FMR and FMR Co., Inc. (an affiliate of FMR) involving the SEC's regulatory rules for investment advisers and the improper receipt of gifts, gratuities and business entertainment. Without admitting or denying the SEC's findings, FMR agreed to pay an $8 million civil penalty to the United States Treasury.
12. Distributions to Shareholders.
Distributions to shareholders of each class were as follows:
Years ended September 30, | 2008 | 2007 A |
Fidelity Asset Manager 20% | | |
From net investment income | | |
Class A | $ 217,282 | $ 39,791 |
Class T | 139,471 | 49,051 |
Class B | 38,980 | 12,517 |
Class C | 66,883 | 20,780 |
Asset Manager 20% | 90,572,886 | 97,126,066 |
Institutional Class | 68,611 | 7,027 |
Total | $ 91,104,113 | $ 97,255,232 |
From net realized gain | | |
Class A | $ 111,897 | $ 5,081 |
Class T | 88,892 | 20,043 |
Class B | 24,291 | 9,970 |
Class C | 35,012 | 9,436 |
Asset Manager 20% | 49,278,678 | 97,599,264 |
Institutional Class | 37,626 | 4,530 |
Total | $ 49,576,396 | $ 97,648,324 |
Annual Report
Notes to Financial Statements - continued
12. Distributions to Shareholders - continued
Years ended September 30, | 2008 | 2007 A |
Fidelity Asset Manager 30% B | | |
From net investment income | | |
Class A | $ 15,489 | $ - |
Class T | 9,224 | - |
Class B | 3,594 | - |
Class C | 12,880 | - |
Asset Manager 30% | 550,353 | - |
Institutional Class | 3,693 | - |
Total | $ 595,233 | $ - |
Fidelity Asset Manager 40% B | | |
From net investment income | | |
Class A | $ 27,725 | $ - |
Class T | 24,685 | - |
Class B | 15,306 | - |
Class C | 15,599 | - |
Asset Manager 40% | 119,398 | - |
Institutional Class | 25,655 | - |
Total | $ 228,368 | $ - |
Fidelity Asset Manager 50% | | |
From net investment income | | |
Class A | $ 185,719 | $ 24,674 |
Class T | 112,972 | 23,998 |
Class B | 29,127 | 8,690 |
Class C | 67,942 | 16,728 |
Asset Manager 50% | 239,444,583 | 271,801,549 |
Institutional Class | 26,633 | 3,438 |
Total | $ 239,866,976 | $ 271,879,077 |
From net realized gain | | |
Class A | $ 359,333 | $ 12,138 |
Class T | 290,067 | 16,061 |
Class B | 98,729 | 7,032 |
Class C | 225,372 | 9,224 |
Asset Manager 50% | 555,465,189 | 485,895,701 |
Institutional Class | 71,038 | 6,281 |
Total | $ 556,509,728 | $ 485,946,437 |
Fidelity Asset Manager 60% B | | |
From net investment income | | |
Class A | $ 7,307 | $ - |
Class T | 2,841 | - |
Class B | 1,840 | - |
Class C | 1,840 | - |
Asset Manager 60% | 18,398 | - |
Institutional Class | 4,475 | - |
Total | $ 36,701 | $ - |
Fidelity Asset Manager 70% | | |
From net investment income | | |
Asset Manager 70% | $ 72,024,349 | $ 74,718,985 |
From net realized gain | | |
Asset Manager 70% | $ 3,513,384 | $ - |
Annual Report
12. Distributions to Shareholders - continued
Years ended September 30, | 2008 | 2007 A |
Fidelity Asset Manager 85% | | |
From net investment income | | |
Class A | $ 150,986 | $ 3,111 |
Class T | 34,666 | 3,070 |
Class B | 23,020 | 2,303 |
Class C | 54,595 | 5,563 |
Asset Manager 85% | 9,096,274 | 7,429,888 |
Institutional Class | 3,940 | 1,655 |
Total | $ 9,363,481 | $ 7,445,590 |
From net realized gain | | |
Class A | $ 20,022 | $ 362 |
Class T | 5,093 | 315 |
Class B | 4,288 | 249 |
Class C | 9,298 | 571 |
Asset Manager 85% | 1,185,614 | 710,994 |
Institutional Class | 488 | 157 |
Total | $ 1,224,803 | $ 712,648 |
A Distributions for Class A, Class T, Class B, Class C and Institutional Class are for the period October 2, 2006 (commencement of sale of shares) to September 30, 2007.
B For the period October 9, 2007 (commencement of operations) to September 30, 2008.
13. Share Transactions.
Transactions for each class of shares were as follows:
| Shares | Dollars |
Years ended September 30, | 2008 | 2007A | 2008 | 2007A |
Fidelity Asset Manager 20% | | | | |
Class A | | | | |
Shares sold | 723,971 | 271,096 | $ 8,907,277 | $ 3,462,355 |
Reinvestment of distributions | 20,064 | 2,590 | 246,151 | 32,986 |
Shares redeemed | (301,654) | (8,338) | (3,651,098) | (106,244) |
Net increase (decrease) | 442,381 | 265,348 | $ 5,502,330 | $ 3,389,097 |
Class T | | | | |
Shares sold | 207,033 | 314,428 | $ 2,528,153 | $ 4,039,296 |
Reinvestment of distributions | 16,854 | 5,054 | 207,671 | 64,229 |
Shares redeemed | (97,145) | (12,418) | (1,189,971) | (158,426) |
Net increase (decrease) | 126,742 | 307,064 | $ 1,545,853 | $ 3,945,099 |
Class B | | | | |
Shares sold | 148,755 | 87,110 | $ 1,806,819 | $ 1,119,230 |
Reinvestment of distributions | 4,541 | 1,586 | 55,799 | 20,151 |
Shares redeemed | (55,802) | (11,667) | (672,403) | (148,544) |
Net increase (decrease) | 97,494 | 77,029 | $ 1,190,215 | $ 990,837 |
Class C | | | | |
Shares sold | 269,755 | 138,353 | $ 3,257,302 | $ 1,774,788 |
Reinvestment of distributions | 5,896 | 1,740 | 72,166 | 22,123 |
Shares redeemed | (83,185) | (8,144) | (1,003,632) | (103,462) |
Net increase (decrease) | 192,466 | 131,949 | $ 2,325,836 | $ 1,693,449 |
Asset Manager 20% | | | | |
Shares sold | 58,898,445 | 63,397,753 | $ 723,714,675 | $ 815,352,615 |
Reinvestment of distributions | 10,897,714 | 14,705,597 | 134,543,532 | 187,331,699 |
Shares redeemed | (64,781,528) | (45,831,913) | (791,199,186) | (589,696,416) |
Net increase (decrease) | 5,014,631 | 32,271,437 | $ 67,059,021 | $ 412,987,898 |
Institutional Class | | | | |
Shares sold | 180,834 | 18,496 | $ 2,308,608 | $ 238,374 |
Reinvestment of distributions | 8,001 | 717 | 98,769 | 9,130 |
Shares redeemed | (56,367) | - | (687,919) | - |
Net increase (decrease) | 132,468 | 19,213 | $ 1,719,458 | $ 247,504 |
Annual Report
Notes to Financial Statements - continued
13. Share Transactions - continued
| Shares | Dollars |
Years ended September 30, | 2008 | 2007A | 2008 | 2007A |
Fidelity Asset Manager 30% B | | | | |
Class A | | | | |
Shares sold | 144,653 | - | $ 1,379,463 | $ - |
Reinvestment of distributions | 1,332 | - | 12,471 | - |
Shares redeemed | (12,117) | - | (111,408) | - |
Net increase (decrease) | 133,868 | - | $ 1,280,526 | $ - |
Class T | | | | |
Shares sold | 133,157 | - | $ 1,249,065 | $ - |
Reinvestment of distributions | 983 | - | 9,168 | - |
Shares redeemed | (10,072) | - | (93,877) | - |
Net increase (decrease) | 124,068 | - | $ 1,164,356 | $ - |
Class B | | | | |
Shares sold | 55,559 | - | $ 524,350 | $ - |
Reinvestment of distributions | 382 | - | 3,594 | - |
Shares redeemed | (392) | - | (3,644) | - |
Net increase (decrease) | 55,549 | - | $ 524,300 | $ - |
Class C | | | | |
Shares sold | 186,960 | - | $ 1,749,175 | $ - |
Reinvestment of distributions | 1,370 | - | 12,797 | - |
Shares redeemed | (15,226) | - | (143,734) | - |
Net increase (decrease) | 173,104 | - | $ 1,618,238 | $ - |
Asset Manager 30% | | | | |
Shares sold | 5,359,391 | - | $ 50,914,907 | $ - |
Reinvestment of distributions | 56,102 | - | 525,162 | - |
Shares redeemed | (2,411,599) | - | (22,329,751) | - |
Net increase (decrease) | 3,003,894 | - | $ 29,110,318 | $ - |
Institutional Class | | | | |
Shares sold | 23,759 | - | $ 231,444 | $ - |
Reinvestment of distributions | 391 | - | 3,693 | - |
Net increase (decrease) | 24,150 | - | $ 235,137 | $ - |
Fidelity Asset Manager 40%B | | | | |
Class A | | | | |
Shares sold | 250,703 | - | $ 2,436,280 | $ - |
Reinvestment of distributions | 2,933 | - | 27,298 | - |
Shares redeemed | (12,251) | - | (109,719) | - |
Net increase (decrease) | 241,385 | - | $ 2,353,859 | $ - |
Class T | | | | |
Shares sold | 227,454 | - | $ 2,214,040 | $ - |
Reinvestment of distributions | 2,641 | - | 24,648 | - |
Shares redeemed | (11,458) | - | (102,562) | - |
Net increase (decrease) | 218,637 | - | $ 2,136,126 | $ - |
Class B | | | | |
Shares sold | 164,587 | - | $ 1,626,346 | $ - |
Reinvestment of distributions | 1,632 | - | 15,307 | - |
Shares redeemed | (2,203) | - | (19,407) | - |
Net increase (decrease) | 164,016 | - | $ 1,622,246 | $ - |
Class C | | | | |
Shares sold | 185,184 | - | $ 1,826,153 | $ - |
Reinvestment of distributions | 1,654 | - | 15,523 | - |
Shares redeemed | (22,232) | - | (200,684) | - |
Net increase (decrease) | 164,606 | - | $ 1,640,992 | $ - |
Annual Report
13. Share Transactions - continued
| Shares | Dollars |
Years ended September 30, | 2008 | 2007A | 2008 | 2007A |
Asset Manager 40% | | | | |
Shares sold | 1,762,049 | - | $ 16,509,845 | $ - |
Reinvestment of distributions | 12,657 | - | 116,657 | - |
Shares redeemed | (477,589) | - | (4,363,370) | - |
Net increase (decrease) | 1,297,117 | - | $ 12,263,132 | $ - |
Institutional Class | | | | |
Shares sold | 156,120 | - | $ 1,556,663 | $ - |
Reinvestment of distributions | 2,743 | - | 25,655 | - |
Net increase (decrease) | 158,863 | - | $ 1,582,318 | $ - |
Fidelity Asset Manager 50% | | | | |
Class A | | | | |
Shares sold | 701,937 | 289,790 | $ 10,522,398 | $ 4,808,317 |
Reinvestment of distributions | 34,512 | 2,223 | 528,926 | 36,700 |
Shares redeemed | (176,302) | (32,610) | (2,573,190) | (544,306) |
Net increase (decrease) | 560,147 | 259,403 | $ 8,478,134 | $ 4,300,711 |
Class T | | | | |
Shares sold | 321,333 | 190,527 | $ 4,828,159 | $ 3,166,113 |
Reinvestment of distributions | 25,741 | 2,395 | 396,949 | 39,464 |
Shares redeemed | (108,476) | (8,403) | (1,580,570) | (140,444) |
Net increase (decrease) | 238,598 | 184,519 | $ 3,644,538 | $ 3,065,133 |
Class B | | | | |
Shares sold | 140,799 | 70,302 | $ 2,118,896 | $ 1,168,687 |
Reinvestment of distributions | 6,699 | 894 | 103,082 | 14,680 |
Shares redeemed | (45,273) | (11,996) | (662,500) | (199,588) |
Net increase (decrease) | 102,225 | 59,200 | $ 1,559,478 | $ 983,779 |
Class C | | | | |
Shares sold | 230,335 | 169,588 | $ 3,467,980 | $ 2,814,455 |
Reinvestment of distributions | 14,272 | 1,375 | 220,179 | 22,635 |
Shares redeemed | (78,688) | (3,910) | (1,165,992) | (64,143) |
Net increase (decrease) | 165,919 | 167,053 | $ 2,522,167 | $ 2,772,947 |
Asset Manager 50% | | | | |
Shares sold | 28,976,509 | 35,519,889 | $ 439,124,893 | $ 590,109,148 |
Reinvestment of distributions | 49,866,308 | 45,243,905 | 772,727,250 | 737,377,217 |
Shares redeemed | (116,862,705) | (111,732,894) | (1,770,033,572) | (1,862,786,005) |
Net increase (decrease) | (38,019,888) | (30,969,100) | $ (558,181,429) | $ (535,299,640) |
Institutional Class | | | | |
Shares sold | 64,415 | 11,204 | $ 1,084,439 | $ 185,721 |
Reinvestment of distributions | 6,272 | 596 | 97,072 | 9,719 |
Shares redeemed | (45,377) | (951) | (667,764) | (15,495) |
Net increase (decrease) | 25,310 | 10,849 | $ 513,747 | $ 179,945 |
Fidelity Asset Manager 60%B | | | | |
Class A | | | | |
Shares sold | 508,064 | - | $ 4,661,791 | $ - |
Reinvestment of distributions | 761 | - | 7,307 | - |
Shares redeemed | (114,471) | - | (1,028,696) | - |
Net increase (decrease) | 394,354 | - | $ 3,640,402 | $ - |
Class T | | | | |
Shares sold | 186,969 | - | $ 1,747,896 | $ - |
Reinvestment of distributions | 283 | - | 2,720 | - |
Shares redeemed | (32,399) | - | (277,952) | - |
Net increase (decrease) | 154,853 | - | $ 1,472,664 | $ - |
Class B | | | | |
Shares sold | 138,223 | - | $ 1,314,613 | $ - |
Reinvestment of distributions | 192 | - | 1,840 | - |
Shares redeemed | (2,557) | - | (22,565) | - |
Net increase (decrease) | 135,858 | - | $ 1,293,888 | $ - |
Annual Report
Notes to Financial Statements - continued
13. Share Transactions - continued
| Shares | Dollars |
Years ended September 30, | 2008 | 2007A | 2008 | 2007A |
Class C | | | | |
Shares sold | 210,884 | - | $ 1,970,860 | $ - |
Reinvestment of distributions | 192 | - | 1,840 | - |
Shares redeemed | (3,246) | - | (27,889) | - |
Net increase (decrease) | 207,830 | - | $ 1,944,811 | $ - |
Asset Manager 60% | | | | |
Shares sold | 3,150,368 | - | $ 28,160,474 | $ - |
Reinvestment of distributions | 1,882 | - | 18,064 | - |
Shares redeemed | (362,700) | - | (3,178,965) | - |
Net increase (decrease) | 2,789,550 | - | $ 24,999,573 | $ - |
Institutional Class | | | | |
Shares sold | 99,914 | - | $ 989,544 | $ - |
Reinvestment of distributions | 466 | - | 4,475 | - |
Shares redeemed | (916) | - | (7,979) | - |
Net increase (decrease) | 99,464 | - | $ 986,040 | $ - |
Fidelity Asset Manager 70% | | | | |
Class AC | | | | |
Shares sold | 20,467 | - | $ 370,778 | $ - |
Issued in exchange for shares of Fidelity Advisor Asset Manager 70% Fund | 6,533,497 | - | 92,514,323 | - |
Shares redeemed | (17,859) | - | (315,305) | - |
Net increase (decrease) | 6,536,105 | - | $ 92,569,796 | $ - |
Class TC | | | | |
Shares sold | 5,194 | - | $ 138,458 | $ - |
Issued in exchange for shares of Fidelity Advisor Asset Manager 70% Fund | 3,860,173 | - | 54,660,040 | - |
Shares redeemed | (12,767) | - | (237,608) | - |
Net increase (decrease) | 3,852,600 | - | $ 54,560,890 | $ - |
Class BC | | | | |
Shares sold | 8,599 | - | $ 132,691 | $ - |
Issued in exchange for shares of Fidelity Advisor Asset Manager 70% Fund | 1,725,798 | - | 24,437,297 | - |
Shares redeemed | (7,056) | - | (105,755) | - |
Net increase (decrease) | 1,727,341 | - | $ 24,464,233 | $ - |
Class CC | | | | |
Shares sold | 2,918 | - | $ 217,647 | $ - |
Issued in exchange for shares of Fidelity Advisor Asset Manager 70% Fund | 2,780,313 | - | 39,369,233 | - |
Shares redeemed | (10,650) | - | (326,514) | - |
Net increase (decrease) | 2,772,581 | - | $ 39,260,366 | $ - |
Asset Manager 70% | | | | |
Shares sold | 12,436,796 | 14,701,427 | $ 201,255,406 | $ 246,834,990 |
Reinvestment of distributions | 4,363,853 | 4,501,586 | 74,272,772 | 73,510,900 |
Shares redeemed | (33,660,002) | (33,997,871) | (549,568,450) | (569,823,471) |
Net increase (decrease) | (16,859,353) | (14,794,858) | $ (274,040,272) | $ (249,477,581) |
Institutional ClassC | | | | |
Shares sold | 10,330 | - | $ 152,572 | $ - |
Issued in exchange for shares of Fidelity Advisor Asset Manager 70% Fund | 1,881,221 | - | 26,638,086 | - |
Shares redeemed | (3,734) | - | (57,654) | - |
Net increase (decrease) | 1,887,817 | - | $ 26,733,004 | $ - |
Fidelity Asset Manager 85% | | | | |
Class A | | | | |
Shares sold | 881,000 | 533,617 | $ 11,708,813 | $ 7,482,672 |
Reinvestment of distributions | 11,613 | 259 | 164,450 | 3,472 |
Shares redeemed | (212,398) | (36,450) | (2,755,503) | (505,258) |
Net increase (decrease) | 680,215 | 497,426 | $ 9,117,760 | $ 6,980,886 |
Annual Report
13. Share Transactions - continued
| Shares | Dollars |
Years ended September 30, | 2008 | 2007A | 2008 | 2007A |
Class T | | | | |
Shares sold | 302,865 | 132,362 | $ 3,973,155 | $ 1,878,689 |
Reinvestment of distributions | 2,802 | 252 | 39,626 | 3,385 |
Shares redeemed | (52,286) | (11,048) | (680,328) | (158,492) |
Net increase (decrease) | 253,381 | 121,566 | $ 3,332,453 | $ 1,723,582 |
Class B | | | | |
Shares sold | 152,342 | 113,822 | $ 2,031,969 | $ 1,577,374 |
Reinvestment of distributions | 1,841 | 179 | 26,000 | 2,400 |
Shares redeemed | (39,226) | (2,876) | (510,836) | (40,678) |
Net increase (decrease) | 114,957 | 111,125 | $ 1,547,133 | $ 1,539,096 |
Class C | | | | |
Shares sold | 329,559 | 228,834 | $ 4,362,588 | $ 3,208,263 |
Reinvestment of distributions | 3,034 | 447 | 42,720 | 5,995 |
Shares redeemed | (86,632) | (11,500) | (1,115,724) | (161,700) |
Net increase (decrease) | 245,961 | 217,781 | $ 3,289,584 | $ 3,052,558 |
Asset Manager 85% | | | | |
Shares sold | 11,096,127 | 11,993,958 | $ 149,870,831 | $ 166,840,157 |
Reinvestment of distributions | 709,187 | 595,752 | 10,063,914 | 7,989,027 |
Shares redeemed | (10,707,014) | (8,742,465) | (142,112,234) | (120,993,870) |
Net increase (decrease) | 1,098,300 | 3,847,245 | $ 17,822,511 | $ 53,835,314 |
Institutional Class | | | | |
Shares sold | 62,723 | 16,534 | $ 834,204 | $ 222,919 |
Reinvestment of distributions | 180 | 135 | 2,553 | 1,812 |
Shares redeemed | (13,803) | - | (173,778) | - |
Net increase (decrease) | 49,100 | 16,669 | $ 662,979 | $ 224,731 |
A Share transactions for Class A, Class T, Class B, Class C and Institutional Class are for the period October 2, 2006 (commencement of sale of shares) to September 30, 2007.
B For the period October 9, 2007 (commencement of operations) to September 30, 2008.
C For the period September 23, 2008 (commencement of operations) to September 30, 2008.
14. Merger Information.
On September 26, 2008, Fidelity Asset Manager 70% acquired all of the assets and assumed all of the liabilities of Fidelity Advisor Asset Manager 70% Fund pursuant to an agreement and plan of reorganization approved by the Board of Trustees on May 15, 2008. The acquisition was accomplished by an exchange of 6,533,497, 3,860,173, 1,725,798, 2,780,313 and 1,881,221 shares of Class A, Class T, Class B, Class C and Institutional Class of the Fund, respectively, for 9,324,617, 5,534,757, 2,486,431, 4,011,919, and 2,679,998 shares then outstanding of Class A, Class T, Class B, Class C and Institutional Class (valued at $9.92, $9.88, $9.83, $9.81, and $9.94, per share for Class A, Class T, Class B, Class C and Institutional Class, respectively) of the Fidelity Advisor Asset Manager 70% Fund. The reorganization qualified as a tax-free reorganization for federal income tax purposes with no gain or loss recognized to the funds or their shareholders. The Fidelity Advisor Asset Manager 70% Fund's net assets, including $21,261,054 of unrealized depreciation, were combined with the Fund's net assets of $2,365,472,024 for total net assets after the acquisition of $2,603,091,003.
15. Credit Risk.
The Funds invest a portion of their assets, directly or indirectly, in structured securities of issuers backed by residential mortgage loans, credit card receivables and automotive loans. The value and related income of these securities is sensitive to changes in economic conditions, including delinquencies and/or defaults. Continuing shifts in the market's perception of credit quality on structured securities have resulted in increased volatility of market price and periods of decreased market activity that have adversely impacted the valuation of certain issuers of the Funds.
Annual Report
Report of Independent Registered Public Accounting Firm
To the Trustees of Fidelity Charles Street Trust and Shareholders of Fidelity Asset Manager 20%, Fidelity Asset Manager 50%, Fidelity Asset Manager 70% and Fidelity Asset Manager 85%:
We have audited the accompanying statements of assets and liabilities of Fidelity Asset Manager 20%, Fidelity Asset Manager 50%, Fidelity Asset Manager 70% and Fidelity Asset Manager 85% (the Funds), each a fund of Fidelity Charles Street Trust, including the schedules of investments as of September 30, 2008, and the related statements of operations for the year then ended, the statement of changes in net assets for each of the two years in the period then ended, and the financial highlights for each of the periods presented. These financial statements and financial highlights are the responsibility of the Fund's management. Our responsibility is to express an opinion on these financial statements and financial highlights based on our audits.
We conducted our audits in accordance with standards of the Public Company Accounting Oversight Board (United States). Those standards require that we plan and perform the audit to obtain reasonable assurance about whether the financial statements and financial highlights are free of material misstatement. The Funds are not required to have, nor were we engaged to perform, audits of their internal control over financial reporting. Our audits included consideration of internal control over financial reporting as a basis for designing audit procedures that are appropriate in the circumstances, but not for the purpose of expressing an opinion on the effectiveness of the Funds' internal control over financial reporting. Accordingly, we express no such opinion. An audit also includes examining, on a test basis, evidence supporting the amounts and disclosures in the financial statements, assessing the accounting principles used and significant estimates made by management, as well as evaluating the overall financial statement presentation. Our procedures included confirmation of securities owned as of September 30, 2008, by correspondence with the custodians and brokers; where replies were not received from brokers, we performed other auditing procedures. We believe that our audits provide a reasonable basis for our opinion.
In our opinion, the financial statements and financial highlights referred to above present fairly, in all material respects, the financial position of Fidelity Asset Manager 20%, Fidelity Asset Manager 50%, Fidelity Asset Manager 70% and Fidelity Asset Manager 85% as of September 30, 2008, the results of their operations for the year then ended, the changes in their net assets for each of the two years in the period then ended, and their financial highlights for each of the periods presented, in conformity with accounting principles generally accepted in the United States of America.
/s/ Deloitte & Touche LLP
DELOITTE & TOUCHE LLP
Boston, Massachusetts
November 28, 2008
Annual Report
Report of Independent Registered Public Accounting Firm
To the Trustees of Fidelity Charles Street Trust and the Shareholders of Fidelity Asset Manager 30%, Fidelity Asset Manager 40% and Fidelity Asset Manager 60%:
In our opinion, the accompanying statements of assets and liabilities, including the schedules of investments, and the related statements of operations and of changes in net assets and the financial highlights present fairly, in all material respects, the financial position of Fidelity Asset Manager 30%, Fidelity Asset Manager 40% and Fidelity Asset Manager 60% (funds of Fidelity Charles Street Trust) at September 30, 2008, and the results of each of their operations for the period indicated, the changes in their net assets for the period indicated and the financial highlights for the period indicated, in conformity with accounting principles generally accepted in the United States of America. These financial statements and financial highlights (hereafter referred to as "financial statements") are the responsibility of the Fidelity Charles Street Trust and Fidelity Charles Street Trust's management. Our responsibility is to express an opinion on these financial statements based on our audits. We conducted our audits of these financial statements in accordance with the standards of the Public Company Accounting Oversight Board (United States). Those standards require that we plan and perform the audit to obtain reasonable assurance about whether the financial statements are free of material misstatement. An audit includes examining, on a test basis, evidence supporting the amounts and disclosures in the financial statements, assessing the accounting principles used and significant estimates made by management, and evaluating the overall financial statement presentation. We believe that our audits, which included confirmation of securities at September 30, 2008 by correspondence with the transfer agent and brokers, provide a reasonable basis for our opinion.
/s/ PricewaterhouseCoopers LLP
PricewaterhouseCoopers LLP
Boston, Massachusetts
November 25, 2008
Annual Report
The Trustees, Member of the Advisory Board, and executive officers of the trust and funds, as applicable, are listed below. The Board of Trustees governs each fund and is responsible for protecting the interests of shareholders. The Trustees are experienced executives who meet periodically throughout the year to oversee each fund's activities, review contractual arrangements with companies that provide services to each fund, and review each fund's performance. Except for Edward C. Johnson 3d and James C. Curvey, each of the Trustees oversees 159 funds advised by FMR or an affiliate. Messrs. Johnson and Curvey oversee 379 funds advised by FMR or an affiliate.
The Trustees hold office without limit in time except that (a) any Trustee may resign; (b) any Trustee may be removed by written instrument, signed by at least two-thirds of the number of Trustees prior to such removal; (c) any Trustee who requests to be retired or who has become incapacitated by illness or injury may be retired by written instrument signed by a majority of the other Trustees; and (d) any Trustee may be removed at any special meeting of shareholders by a two-thirds vote of the outstanding voting securities of the trust. Each Trustee who is not an interested person (as defined in the 1940 Act) (Independent Trustee), shall retire not later than the last day of the calendar year in which his or her 72nd birthday occurs. The Independent Trustees may waive this mandatory retirement age policy with respect to individual Trustees. The executive officers and Advisory Board Member hold office without limit in time, except that any officer and Advisory Board Member may resign or may be removed by a vote of a majority of the Trustees at any regular meeting or any special meeting of the Trustees. Except as indicated, each individual has held the office shown or other offices in the same company for the past five years.
The funds' Statement of Additional Information (SAI) includes more information about the Trustees. To request a free copy, call Fidelity at 1-800-544-8544.
Interested Trustees*:
Correspondence intended for each Trustee who is an interested person may be sent to Fidelity Investments, 82 Devonshire Street, Boston, Massachusetts 02109.
Name, Age; Principal Occupation |
Edward C. Johnson 3d (78) |
| Year of Election or Appointment: 1981 Mr. Johnson is Chairman of the Board of Trustees. Mr. Johnson serves as Chief Executive Officer, Chairman, and a Director of FMR LLC; Chairman and a Director of FMR; Chairman and a Director of Fidelity Research & Analysis Company (FRAC); Chairman and a Director of Fidelity Investments Money Management, Inc.; and Chairman and a Director of FMR Co., Inc. In addition, Mr. Johnson serves as Chairman and Director of FIL Limited. Previously, Mr. Johnson served as President of FMR LLC (2006-2007). Mr. Edward C. Johnson 3d and Mr. Arthur E. Johnson are not related. |
James C. Curvey (73) |
| Year of Election or Appointment: 2007 Mr. Curvey also serves as Trustee (2007-present) of other investment companies advised by FMR. Mr. Curvey is a Director of FMR and FMR Co., Inc. (2007-present). Mr. Curvey is also Vice Chairman (2006-present) and Director of FMR LLC. In addition, Mr. Curvey serves as an Overseer for the Boston Symphony Orchestra and a member of the Trustees of Villanova University. |
* Trustees have been determined to be "Interested Trustees" by virtue of, among other things, their affiliation with the d trust or various entities under common control with FMR. FMR Corp. merged with and into FMR LLC on October 1, 2007. Any references to FMR LLC for prior periods are deemed to be references to the prior entity.
Independent Trustees:
Correspondence intended for each Independent Trustee (that is, the Trustees other than the Interested Trustees) may be sent to Fidelity Investments, P.O. Box 55235, Boston, Massachusetts 02205-5235.
Name, Age; Principal Occupation |
Albert R. Gamper, Jr. (66) |
| Year of Election or Appointment: 2006 Prior to his retirement in December 2004, Mr. Gamper served as Chairman of the Board of CIT Group Inc. (commercial finance). During his tenure with CIT Group Inc. Mr. Gamper served in numerous senior management positions, including Chairman (1987-1989; 1999-2001; 2002-2004), Chief Executive Officer (1987-2004), and President (1989-2002). He currently serves as a member of the Board of Directors of Public Service Enterprise Group (utilities), a member of the Board of Governors, Rutgers University (2004-present), and Chairman of the Board of Saint Barnabas Health Care System. Previously, Mr. Gamper served as Chairman of the Board of Governors, Rutgers University (2004-2007). |
George H. Heilmeier (72) |
| Year of Election or Appointment: 2004 Dr. Heilmeier is Chairman Emeritus of Telcordia Technologies (communication software and systems), where prior to his retirement, he served as company Chairman and Chief Executive Officer. He currently serves on the Boards of Directors of The Mitre Corporation (systems engineering and information technology support for the government), and HRL Laboratories (private research and development, 2004-present). He is Chairman of the General Motors Science & Technology Advisory Board and a Life Fellow of the Institute of Electrical and Electronics Engineers (IEEE). Dr. Heilmeier is a member of the Defense Science Board and the National Security Agency Advisory Board. He is also a member of the National Academy of Engineering, the American Academy of Arts and Sciences, and the Board of Overseers of the School of Engineering and Applied Science of the University of Pennsylvania. Previously, Dr. Heilmeier served as a Director of TRW Inc. (automotive, space, defense, and information technology), Compaq, Automatic Data Processing, Inc. (ADP) (technology-based business outsourcing), INET Technologies Inc. (telecommunications network surveillance, 2001-2004), and Teletech Holdings (customer management services). He is the recipient of the 2005 Kyoto Prize in Advanced Technology for his invention of the liquid crystal display, and a member of the Consumer Electronics Hall of Fame. |
Arthur E. Johnson (61) |
| Year of Election or Appointment: 2008 Mr. Johnson serves as Senior Vice President of Corporate Strategic Development of Lockheed Martin Corporation (defense contractor). In addition, Mr. Johnson serves as a member of the Board of Directors of AGL Resources, Inc. (holding company), and IKON Office Solutions, Inc. (document management systems and services). Mr. Arthur E. Johnson and Mr. Edward C. Johnson 3d are not related. |
James H. Keyes (68) |
| Year of Election or Appointment: 2007 Prior to his retirement in 2003, Mr. Keyes was Chairman, President, and Chief Executive Officer of Johnson Controls, Inc. (automotive supplier, 1993-2003). He currently serves as a member of the boards of Navistar International Corporation (manufacture and sale of trucks, buses, and diesel engines) and Pitney Bowes, Inc. (integrated mail, messaging, and document management solutions). Previously, Mr. Keyes served as a member of the Board of LSI Logic Corporation (semiconductor technologies, 1984-2008). |
Marie L. Knowles (61) |
| Year of Election or Appointment: 2001 Prior to Ms. Knowles' retirement in June 2000, she served as Executive Vice President and Chief Financial Officer of Atlantic Richfield Company (ARCO) (diversified energy, 1996-2000). From 1993 to 1996, she was a Senior Vice President of ARCO and President of ARCO Transportation Company. She served as a Director of ARCO from 1996 to 1998. She currently serves as a Director of McKesson Corporation (healthcare service). Ms. Knowles is a Trustee of the Brookings Institution and the Catalina Island Conservancy and also serves as a member of the Advisory Board for the School of Engineering of the University of Southern California. Previously, Ms. Knowles served as a Director of Phelps Dodge Corporation (copper mining and manufacturing, 1994-2007). |
Kenneth L. Wolfe (69) |
| Year of Election or Appointment: 2005 Mr. Wolfe is Chairman and a Director of Hershey Foods Corporation (2007-present), where prior to his retirement in 2001, he was Chairman and Chief Executive Officer. Mr. Wolfe currently serves as a member of the board of Revlon Inc. (2004-present). Previously, Mr. Wolfe served as a member of the boards of Adelphia Communications Corporation (2003-2006) and Bausch & Lomb, Inc. (1993-2007). |
Advisory Board Member and Executive Officers**:
Correspondence intended for each executive officer and Mr. Lynch may be sent to Fidelity Investments, 82 Devonshire Street, Boston, Massachusetts 02109.
Name, Age; Principal Occupation |
Peter S. Lynch (64) |
| Year of Election or Appointment: 2003 Member of the Advisory Board of the Fidelity Funds. Mr. Lynch is Vice Chairman and a Director of FMR, and Vice Chairman (2001-present) and a Director of FMR Co., Inc. Previously, Mr. Lynch served as a Trustee of the Fidelity funds (1990-2003). In addition, he serves as a Trustee of Boston College and as the Chairman of the Inner-City Scholarship Fund. Previously, Mr. Lynch served on the Special Olympics International Board of Directors (1997-2006). |
John R. Hebble (50) |
| Year of Election or Appointment: 2008 President and Treasurer of Fidelity's Fixed Income and Asset Allocation Funds. Mr. Hebble is an employee of Fidelity Investments (2003-present). Before joining Fidelity Investments, Mr. Hebble worked at Deutsche Asset Management where he served as Director of Fund Accounting (2002-2003) and Assistant Treasurer of the Scudder Funds. |
Ren Y. Cheng (51) |
| Year of Election or Appointment: 2007 Vice President of Asset Allocation Funds. Mr. Cheng also serves as Group Chief Investment Officer, Asset Allocation of FMR. Previously, Mr. Cheng served as a portfolio manager for the Fidelity Freedom Funds. |
Boyce I. Greer (52) |
| Year of Election or Appointment: 2005 or 2006 Vice President of Fidelity's Fixed-Income Funds (2006) and Asset Allocation Funds (2005). Mr. Greer is also a Trustee of other investment companies advised by FMR (2003-present). Mr. Greer is President and a Director of Fidelity Investments Money Management, Inc. (2007-present), and an Executive Vice President of FMR and FMR Co., Inc. (2005-present). Previously, Mr. Greer served as a Director and Managing Director of Strategic Advisers, Inc. (2002-2005). |
Scott C. Goebel (40) |
| Year of Election or Appointment: 2008 Secretary and Chief Legal Officer (CLO) of the Fidelity funds. Mr. Goebel also serves as General Counsel, Secretary, and Senior Vice President of FMR (2008-present); Deputy General Counsel of FMR LLC; Chief Legal Secretary of Fidelity Management & Research (Hong Kong) Limited (2008-present) and Assistant Secretary of Fidelity Management & Research (Japan) Inc. (2008-
present). Previously, Mr. Goebel served as Assistant Secretary of the Funds (2007-2008) and as Vice President and Secretary of Fidelity Distributors Corporation (FDC) (2005-2007). |
Nancy D. Prior (41) |
| Year of Election or Appointment: 2008 Assistant Secretary of Fidelity's Fixed Income and Asset Allocation Funds. Ms. Prior is an employee of Fidelity Investments (2002-present). |
Holly C. Laurent (54) |
| Year of Election or Appointment: 2008 Anti-Money Laundering (AML) Officer of the Fidelity funds. Ms. Laurent is an employee of Fidelity Investments. Previously, Ms. Laurent was Senior Vice President and Head of Legal for Fidelity Business Services India Pvt. Ltd. (2006-2008), Senior Vice President, Deputy General Counsel and Group Head for FMR LLC (2005-2006). |
Christine Reynolds (50) |
| Year of Election or Appointment: 2008 Chief Financial Officer of the Fidelity funds. Ms. Reynolds became President of Fidelity Pricing and Cash Management Services (FPCMS) in August 2008. She served as Chief Operating Officer of FPCMS from 2007 through July 2008. Previously, Ms. Reynolds served as President, Treasurer, and Anti-Money Laundering officer of the Fidelity funds (2004-2007). Before joining Fidelity Investments, Ms. Reynolds worked at PricewaterhouseCoopers LLP (PwC) (1980-2002), where she was an audit partner with PwC's investment management practice. |
Michael H. Whitaker (41) |
| Year of Election or Appointment: 2008 Chief Compliance Officer of Fidelity's Fixed Income and Asset Allocation Funds. Mr. Whitaker is an employee of Fidelity Investments (2007-present). Prior to joining Fidelity Investments, Mr. Whitaker worked at MFS Investment Management where he served as Senior Vice President and Chief Compliance Officer (2004-2006), and Assistant General Counsel. |
Bryan A. Mehrmann (47) |
| Year of Election or Appointment: 2005 Deputy Treasurer of the Fidelity funds. Mr. Mehrmann is an employee of Fidelity Investments. Previously, Mr. Mehrmann served as Vice President of Fidelity Investments Institutional Services Group (FIIS)/Fidelity Investments Institutional Operations Corporation, Inc. (FIIOC) Client Services (1998-2004). |
Stephanie J. Dorsey (39) |
| Year of Election or Appointment: 2008 Deputy Treasurer of Fidelity's Fixed-Income and Asset Allocation Funds. Ms. Dorsey is an employee of Fidelity Investments (2008-present). Previously, Ms. Dorsey served as Treasurer (2004-2008) and Accounting Group Manager (2003) of JPMorgan Chase Bank. |
Robert G. Byrnes (41) |
| Year of Election or Appointment: 2005 Assistant Treasurer of the Fidelity funds. Mr. Byrnes is an employee of Fidelity Investments (2005-present). Previously, Mr. Byrnes served as Vice President of Fidelity Pricing and Cash Management Services (FPCMS) (2003-2005). Before joining Fidelity Investments, Mr. Byrnes worked at Deutsche Asset Management where he served as Vice President of the Investment Operations Group (2000-2003). |
Peter L. Lydecker (54) |
| Year of Election or Appointment: 2004 Assistant Treasurer of the Fidelity funds. Mr. Lydecker is an employee of Fidelity Investments. |
Paul M. Murphy (61) |
| Year of Election or Appointment: 2007 Assistant Treasurer of the Fidelity funds. Mr. Murphy is an employee of Fidelity Investments (2007-present). Previously, Mr. Murphy served as Chief Financial Officer of the Fidelity Funds (2005-2006), Vice President and Associate General Counsel of FMR (2007), and Senior Vice President of Fidelity Pricing and Cash Management Services (FPCMS) (1994-2007). |
Gary W. Ryan (50) |
| Year of Election or Appointment: 2005 Assistant Treasurer of the Fidelity funds. Mr. Ryan is an employee of Fidelity Investments. Previously, Mr. Ryan served as Vice President of Fund Reporting in Fidelity Pricing and Cash Management Services (FPCMS) (1999-2005). |
** FMR Corp. merged with and into FMR LLC on October 1, 2007. Any references to FMR LLC for prior periods are deemed to be references to the prior entity.
Annual Report
The funds hereby designate as capital gain dividend the amounts noted below for the taxable year ended September 30, 2008, or, if subsequently determined to be different, the net capital gain of such year.
Fund | |
Asset Manager 20% | 3,666,317 |
Asset Manager 30% | 0 |
Asset Manager 40% | 0 |
Asset Manager 50% | 34,524,195 |
Asset Manager 60% | 0 |
Asset Manager 70% | 0 |
Asset Manager 85% | 0 |
A percentage of the dividends distributed during the fiscal year for the following funds was derived from interest on U.S. Government securities which is generally exempt from state income tax:
Asset Manager 20% | 3.95% |
Asset Manager 30% | 4.26% |
Asset Manager 40% | 3.90% |
Asset Manager 50% | 2.00% |
Asset Manager 60% | 3.16% |
Asset Manager 70% | 2.32% |
Asset Manager 85% | 3.42% |
The funds hereby designate the amounts noted below as distributions paid during the period January 1, 2008 to September 30, 2008 as qualifying to be taxed as interest-related dividends for nonresident alien shareholders:
Fund | |
Asset Manager 20% | $ 75,862,942 |
Asset Manager 30% | $ 595,233 |
Asset Manager 40% | $ 228,368 |
Asset Manager 50% | $ 163,501,537 |
Asset Manager 60% | $ 36,701 |
Asset Manager 70% | $ 33,001,038 |
Asset Manager 85% | $ 3,001,780 |
A percentage of the dividends distributed during the fiscal year for the following funds qualifiy for the dividends-received deduction for corporate shareholders:
Asset Manager 20% | |
December 2007 | 2% |
February 2008 | 7% |
March 2008 | 7% |
April 2008 | 7% |
May 2008 | 7% |
June 2008 | 7% |
July 2008 | 7% |
August 2008 | 7% |
September 2008 | 7% |
Asset Manager 30% | |
November 2007 | 13% |
December 2007 | 14% |
March 2008 | 13% |
April 2008 | 13% |
May 2008 | 13% |
June 2008 | 13% |
July 2008 | 13% |
August 2008 | 13% |
September 2008 | 13% |
Asset Manager 40% | |
December 2007 | 14% |
April 2008 | 24% |
July 2008 | 25% |
Asset Manager 50% | |
December 2007 | 3% |
April 2008 | 27% |
July 2008 | 27% |
Asset Manager 60% | |
December 2007 | 25% |
Asset Manager 70% | |
December 2007 | 7% |
Asset Manager 85% | |
December 21, 2007 | 10% |
December 28, 2007 | 10% |
A percentage of the dividends distributed during the fiscal year for the following funds may be taken into account as a dividend for purposes of the maximum rate under section 1(h)(11) of the Internal Revenue Code.
Asset Manager 20% | |
December 2007 | 3% |
February 2008 | 9% |
March 2008 | 9% |
April 2008 | 9% |
May 2008 | 9% |
June 2008 | 9% |
July 2008 | 9% |
August 2008 | 9% |
September 2008 | 9% |
Asset Manager 30% | |
November 2007 | 13% |
December 2007 | 14% |
March 2008 | 17% |
April 2008 | 17% |
May 2008 | 16% |
June 2008 | 17% |
July 2008 | 17% |
August 2008 | 17% |
September 2008 | 17% |
Asset Manager 40% | |
December 2007 | 16% |
April 2008 | 37% |
July 2008 | 38% |
Asset Manager 50% | |
December 2007 | 3% |
April 2008 | 39% |
July 2008 | 39% |
Asset Manager 60% | |
December 2007 | 28% |
Asset Manager 70% | |
December 2007 | 34% |
Asset Manager 85% | |
December 21, 2007 | 49% |
December 28, 2007 | 48% |
The fund will notify shareholders in January 2009 of amounts for use in preparing 2008 income tax returns.
Annual Report
Board Approval of Investment Advisory Contracts and Management Fees
Fidelity Asset Manager 20%
Fidelity Asset Manager 30%
Fidelity Asset Manager 40%
Fidelity Asset Manager 50%
Fidelity Asset Manager 60%
Fidelity Asset Manager 70%
Fidelity Asset Manager 85%
Each year, typically in June, the Board of Trustees, including the Independent Trustees (together, the Board), votes on the renewal of the management contract and sub-advisory agreements (together, the Advisory Contracts) for each fund. The Board, assisted by the advice of fund counsel and Independent Trustees' counsel, requests and considers a broad range of information throughout the year.
The Board meets regularly and, acting directly and through its separate committees, requests and receives information concerning, and considers at each of its meetings factors that are relevant to, its annual consideration of the renewal of each fund's Advisory Contracts, including the services and support provided to each fund and its shareholders. At the time of the renewal, the Board had 12 standing committees, each composed of Independent Trustees with varying backgrounds, to which the Board has assigned specific subject matter responsibilities in order to enhance effective decision-making by the Board. Each committee has a written charter outlining the structure and purposes of the committee. The Board also meets as needed to consider matters specifically related to the Board's annual consideration of the renewal of each fund's Advisory Contracts.
At its June 2008 meeting, the Board of Trustees, including the Independent Trustees, unanimously determined to renew each fund's Advisory Contracts. In reaching its determination, the Board considered all factors it believed relevant, including (i) the nature, extent, and quality of the services to be provided to each fund and its shareholders (including the investment performance of each fund); (ii) the competitiveness of each fund's management fee and total expenses; (iii) the total costs of the services to be provided by and the profits to be realized by Fidelity from its relationship with the fund; (iv) the extent to which economies of scale would be realized as each fund grows; and (v) whether fee levels reflect these economies of scale, if any, for the benefit of fund shareholders. The Board also approved agreements with foreign sub-advisers Fidelity Management & Research (Japan) Inc. and Fidelity Management & Research (Hong Kong) Limited, as well as amendments to the funds' agreements with Fidelity Management & Research (U.K.) Inc.
In considering whether to renew the Advisory Contracts for each fund, the Board ultimately reached a determination, with the assistance of fund counsel and Independent Trustees' counsel and through the exercise of its business judgment, that the renewal of the Advisory Contracts and the compensation to be received by Fidelity under the management contracts is consistent with Fidelity's fiduciary duty under applicable law. The Board's decision to renew the Advisory Contracts was not based on any single factor noted above, but rather was based on a comprehensive consideration of all the information provided to the Board at its meetings throughout the year. The Board, in reaching its determination to renew the Advisory Contracts, is aware that shareholders in each fund have a broad range of investment choices available to them, including a wide choice among mutual funds offered by competitors to Fidelity, and that each fund's shareholders, with the opportunity to review and weigh the disclosure provided by the fund in its prospectus and other public disclosures, have chosen to invest in that fund, managed by Fidelity.
Nature, Extent, and Quality of Services Provided. The Board considered staffing within the investment adviser, FMR, and the sub-advisers (together, the Investment Advisers), including the backgrounds of the funds' investment personnel and the funds' investment objectives and disciplines. The Independent Trustees also had discussions with senior management of Fidelity's investment operations and investment groups. The Board considered the structure of the portfolio manager compensation program and whether this structure provides appropriate incentives.
Resources Dedicated to Investment Management and Support Services. The Board reviewed the size, education, and experience of the Investment Advisers' investment staff, their use of technology, and the Investment Advisers' approach to recruiting, training, and retaining portfolio managers and other research, advisory, and management personnel. The Board noted that Fidelity's analysts have access to a variety of technological tools that enable them to perform both fundamental and quantitative analysis and to specialize in various disciplines. The Board considered Fidelity's extensive global research capabilities that enable the Investment Advisers to aggregate data from various sources in an effort to produce positive investment results. The Board also considered that Fidelity's portfolio managers and analysts have access to daily portfolio attribution that allows for monitoring of a fund's portfolio, as well as an electronic communication system that provides immediate real-time access to research concerning issuers and credit enhancers.
Shareholder and Administrative Services. The Board considered (i) the nature, extent, quality, and cost of advisory, administrative, distribution, and shareholder services performed by the Investment Advisers and their affiliates under each fund's Advisory Contracts and under separate agreements covering transfer agency, pricing and bookkeeping, and securities lending services for each fund; (ii) the nature and extent of the Investment Advisers' supervision of third party service providers, principally custodians and subcustodians; and (iii) the resources devoted to, and the record of compliance with, each fund's compliance policies and procedures. The Board also reviewed the allocation of fund brokerage, including allocations to brokers affiliated with the Investment Advisers, the use of brokerage commissions to pay fund expenses, and the use of "soft" commission dollars to pay for research services. The Board further considered that Fidelity voluntarily pays for market data out of its own resources.
Annual Report
The Board noted that the growth of fund assets across the complex allows Fidelity to reinvest in the development of services designed to enhance the value or convenience of the Fidelity funds as investment vehicles. These services include 24 hour access to account information and market information through phone representatives and over the Internet, and investor education materials and asset allocation tools.
Investment in a Large Fund Family. The Board considered the benefits to shareholders of investing in a Fidelity fund, including the benefits of investing in a fund that is part of a large family of funds offering a variety of investment disciplines and providing for a large variety of mutual fund investor services. For example, fund shareholders are offered the privilege of exchanging shares of a fund for shares of other Fidelity funds, as set forth in the fund's prospectus, without paying a sales charge. The Board noted that Fidelity has taken a number of actions over the previous year that benefited particular funds, including (i) dedicating additional resources to investment research and to restructure the investment research teams; (ii) contractually agreeing to reduce the management fees on Fidelity's Institutional Money Market Funds and launching Class IV and Institutional Class of certain of these funds; (iii) reducing the transfer agent fees for the Fidelity Select Portfolios and Investor Class of the VIP funds; and (iv) launching Class K of 29 equity funds as a lower-fee class available to certain employer-sponsored retirement plans.
Investment Performance (Asset Manager 20%, Asset Manager 50%, Asset Manager 70%, and Asset Manager 85%). The Board considered whether each fund has operated within its investment objective, as well as its record of compliance with its investment restrictions. It also reviewed each fund's absolute investment performance for each class, as well as each fund's relative investment performance measured against (i) a proprietary custom index, and (ii) a peer group of mutual funds deemed appropriate by the Board over multiple periods.
For Asset Manager 20% and Asset Manager 50%, the following charts considered by the Board show, over the one-, three-, and five-year periods ended December 31, 2007, as available, the cumulative total returns of the retail class and Class B of each fund, the cumulative total returns of a proprietary custom index ("benchmark"), and a range of cumulative total returns of a peer group of mutual funds identified by Morningstar, Inc. as having an investment style similar to that of the fund based on underlying portfolio holdings. The returns of the retail class and Class B show the performance of the highest and lowest performing classes, respectively.
For Asset Manger 70%, the following charts considered by the Board show, over the one-, three-, and five-year periods ended December 31, 2007, the fund's cumulative total returns, the cumulative total returns of a proprietary custom index ("benchmark"), and a range of cumulative total returns of a peer group of mutual funds identified by Morningstar, Inc. as having an investment style similar to that of the fund based on underlying portfolio holdings.
For Asset Manager 85%, the following charts considered by the Board show, over the one-, three-, and five-year periods ended December 31, 2007, as available, the cumulative total returns of Asset Manager 85% (retail class) and Class C of the fund, the cumulative total returns of a proprietary custom index ("benchmark"), and a range of cumulative total returns of a peer group of mutual funds identified by Morningstar, Inc. as having an investment style similar to that of the fund based on underlying portfolio holdings. The returns of Asset Manager 85% (retail class) and Class C of the fund show the performance of the highest and lowest performing classes, respectively.
The box within each chart shows the 25th percentile return (bottom of box) and the 75th percentile return (top of box) of the peer group. Returns shown above the box are in the first quartile and returns shown below the box are in the fourth quartile. The percentage beaten numbers noted below each chart correspond to the percentile box and represent the percentage of funds in the peer group whose performance was equal to or lower than that of the class indicated. Each fund's proprietary custom index is an index developed by FMR that represents the performance of the fund's asset classes according to their respective weightings in the fund's neutral mix.
Annual Report
Board Approval of Investment Advisory Contracts and Management Fees - continued
Fidelity Asset Manager 20%
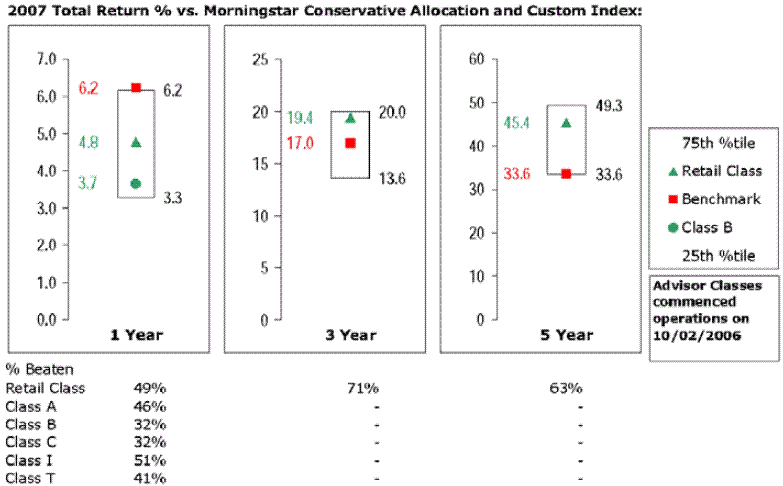
The Board reviewed the fund's relative investment performance against its peer group and stated that the performance of Asset Manager 20% (retail class) of the fund was in the third quartile for the one-year period and the second quartile for the three- and five-year periods. The Board also stated that the investment performance of Asset Manager 20% (retail class) of the fund compared favorably to its benchmark for the three- and five-year periods, although the fund's one-year cumulative total return was lower than its benchmark. The Board considered that the variations in performance among the fund's classes reflect the variations in class expenses, which result in lower performance for higher expense classes.
Fidelity Asset Manager 50%
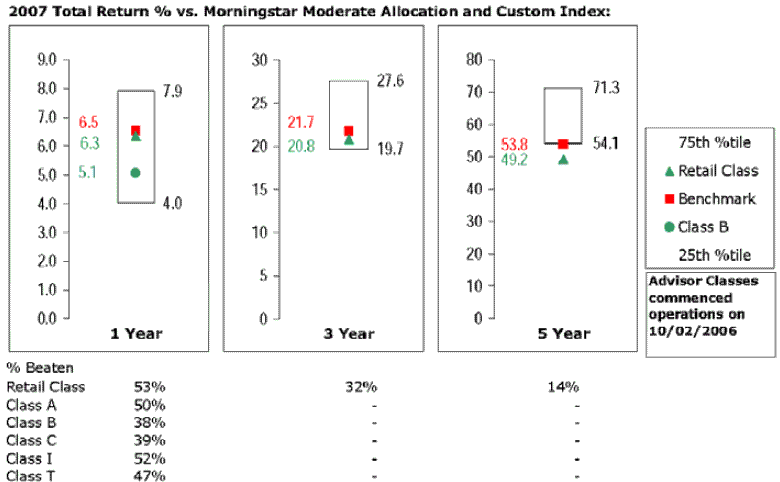
The Board reviewed the fund's relative investment performance against its peer group and stated that the performance of Asset Manager 50% (retail class) of the fund was in the second quartile for the one-year period, the third quartile for the three-year period, and the fourth quartile for the five-year period. The Board also stated that the investment performance of the fund was lower than its benchmark for all the periods shown. The Board considered that the variations in performance among the fund's classes reflect the variations in class expenses, which result in lower performance for higher expense classes.
Annual Report
Fidelity Asset Manager 70%
The Board reviewed the fund's relative investment performance against its peer group and stated that the performance of the fund was in the second quartile for the one-year period and the third quartile for the three- and five-year periods. The Board also stated that the investment performance of the fund was lower than its benchmark for the three- and five-year periods, although the fund's one-year cumulative total return compared favorably to its benchmark.
Fidelity Asset Manager 85%
The Board reviewed the fund's relative investment performance against its peer group and stated that the performance of Asset Manager 85% (retail class) of the fund was in the fourth quartile for the one-year period, the second quartile for the three-year period, and the first quartile for the five-year period. The Board also stated that the investment performance of Asset Manager 85% (retail class) of the fund compared favorably to its benchmark for all the periods shown. The Board considered that the variations in performance among the fund's classes reflect the variations in class expenses, which result in lower performance for higher expense classes.
The Board considered that FMR has taken steps to refocus and strengthen equity research, equity portfolio management, and compliance.
Based on its review, and giving particular weight to the nature and quality of the resources dedicated by the Investment Advisers to maintain and improve relative performance, the Board concluded that the nature, extent, and quality of the services provided to each fund will benefit the fund's shareholders, particularly in light of the Board's view that each fund's shareholders benefit from investing in a fund that is part of a large family of funds offering a variety of investment disciplines and services.
Annual Report
Board Approval of Investment Advisory Contracts and Management Fees - continued
Investment Performance (Asset Manager 30%, Asset Manager 40%, and Asset Manager 60%). The Board considered whether each fund has operated within its investment objective, as well as its record of compliance with its investment restrictions. The Board noted that it is not possible to evaluate performance in any comprehensive fashion because each fund had been in operation for less than one calendar year. Once a fund has been in operation for at least one calendar year, the Board will review each fund's absolute investment performance for each class, as well as each fund's relative investment performance for each class measured against a proprietary custom index and a peer group of mutual funds.
The Board considered that FMR has taken steps to refocus and strengthen equity research, equity portfolio management, and compliance.
Based on its review, and giving particular weight to the nature and quality of the resources dedicated by the Investment Advisers to maintain and improve relative performance, the Board concluded that the nature, extent, and quality of the services provided to each fund will benefit each fund's shareholders, particularly in light of the Board's view that each fund's shareholders benefit from investing in a fund that is part of a large family of funds offering a variety of investment disciplines and services.
Competitiveness of Management Fee and Total Fund Expenses. The Board considered each fund's management fee and total expenses compared to "mapped groups" of competitive funds and classes. Fidelity creates "mapped groups" by combining similar Lipper investment objective categories that have comparable management fee characteristics. Combining Lipper investment objective categories aids the Board's management fee and total expense comparisons by broadening the competitive group used for comparison and by reducing the number of universes to which various Fidelity funds are compared.
The Board considered two proprietary management fee comparisons for the 12-month periods shown in the chart below. The group of Lipper funds used by the Board for management fee comparisons is referred to below as the "Total Mapped Group." The Total Mapped Group comparison focuses on a fund's standing relative to the total universe of comparable funds available to investors, in terms of gross management fees before expense reimbursements or caps. "TMG %" represents the percentage of funds in the Total Mapped Group that had management fees that were lower than a fund's. For example, a TMG % of 23% would mean that 77% of the funds in the Total Mapped Group had higher management fees than a fund. The "Asset-Size Peer Group" (ASPG) comparison focuses on a fund's standing relative to non-Fidelity funds similar in size to the fund within the Total Mapped Group. The ASPG represents at least 15% of the funds in the Total Mapped Group with comparable asset size and management fee characteristics, subject to a minimum of 50 funds (or all funds in the Total Mapped Group if fewer than 50). Additional information, such as the ASPG quartile in which a fund's management fee ranked, is also included in the chart and considered by the Board.
Fidelity Asset Manager 20%
Annual Report
Fidelity Asset Manager 30%
Fidelity Asset Manager 40%
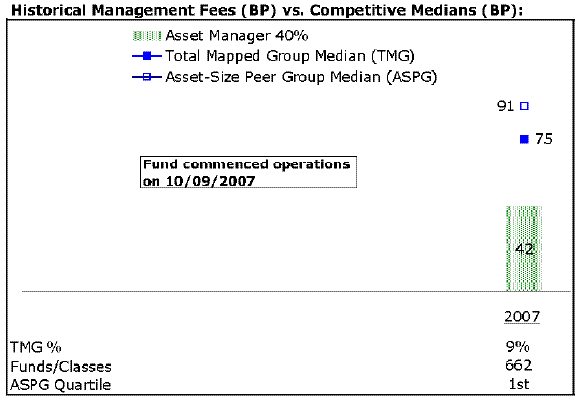
Annual Report
Board Approval of Investment Advisory Contracts and Management Fees - continued
Fidelity Asset Manager 50%
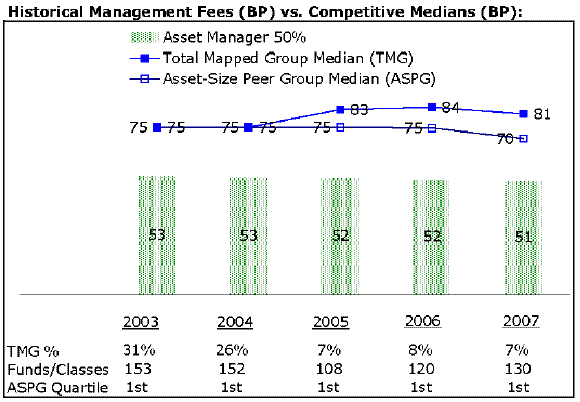
Fidelity Asset Manager 60%

Annual Report
Fidelity Asset Manager 70%
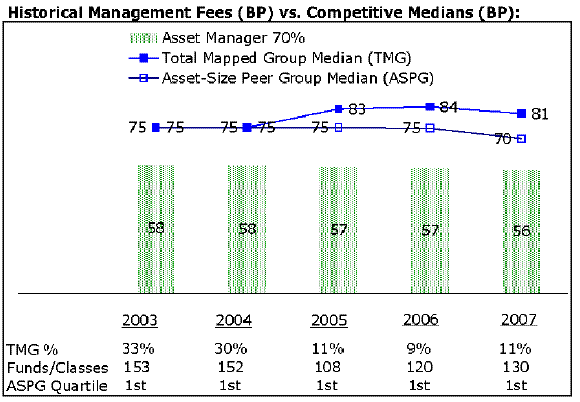
Fidelity Asset Manager 85%
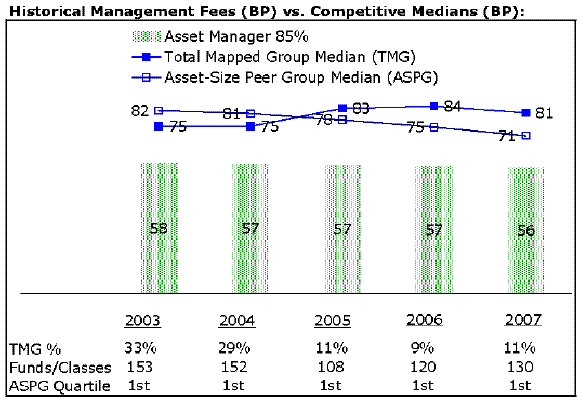
The Board noted that each fund's management fee ranked below the median of its Total Mapped Group and below the median of its ASPG for 2007.
Based on its review, the Board concluded that each fund's management fee was fair and reasonable in light of the services that the fund receives and the other factors considered.
In its review of the total expenses of Asset Manager 70%, the Board considered the fund's management fee as well as other fund expenses, such as transfer agent fees, pricing and bookkeeping fees, and custodial, legal, and audit fees. The Board also noted the effects of any waivers and reimbursements on fees and expenses. As part of its review, the Board also considered current and historical total expenses of the fund compared to competitive fund median expenses. The fund is compared to those funds and classes in the Total Mapped Group (used by the Board for management fee comparisons) that have a similar sales load structure.
In its review of the total expenses of each class of Asset Manager 20%, Asset Manager 30%, Asset Manager 40%, Asset Manager 50%, Asset Manager 60% and Asset Manager 85%, the Board considered the fund's management fee as well as other fund or class expenses, as applicable, such as transfer agent fees, pricing and bookkeeping fees, fund-paid 12b-1 fees, and custodial, legal, and audit fees. The Board also noted the effects of any waivers and reimbursements on fees and expenses. As part of its review, the Board also considered current and historical total expenses of each class of the fund compared to competitive fund median expenses. Each class of the fund is compared to those funds and classes in the Total Mapped Group (used by the Board for management fee comparisons) that have a similar sales load structure.
Annual Report
Board Approval of Investment Advisory Contracts and Management Fees - continued
The Board noted that Asset Manager 20%, Asset Manager 30%, Asset Manager 40%, Asset Manager 50%, Asset Manager 60% and Asset Manager 85% offer multiple classes, each of which has a different sales load and 12b-1 fee structure, and that the multiple structures are intended to offer a range of pricing options for the intermediary market. The Board also noted that the total expenses of the classes vary primarily by the level of their 12b-1 fees, although differences in transfer agent fees may also cause expenses to vary from class to class.
The Board noted that the total expenses of Asset Manager 70% ranked below its competitive median for 2007.
The Board noted that the total expenses of each class of Asset Manager 20% ranked below its competitive median for 2007.
The Board noted that the total expenses of each of Class A, Class B, Class C, Institutional Class, and Asset Manager 30% (retail class) of Asset Manager 30% ranked below its competitive median for the period, and the total expenses of Class T ranked above its competitive median for the period. The Board considered that the total expenses for Class T were above the median primarily because its 12b-1 fee is higher than the typical front-end load class.
The Board noted that the total expenses of each of Class A, Class B, Class C, Institutional Class, and Asset Manager 40% (retail class) of Asset Manager 40% ranked below its competitive median for the period, and the total expenses of Class T ranked above its competitive median for the period. The Board considered that the total expenses for Class T were above the median primarily because its 12b-1 fee is higher than the typical front-end load class.
The Board noted that the total expenses of each of Class A, Class B, Class C, Institutional Class, and Asset Manager 50% (retail class) of Asset Manager 50% ranked below its competitive median for 2007, and the total expenses of Class T ranked above its competitive median for 2007. The Board considered that the total expenses for Class T were above the median primarily because its 12b-1 fee is higher than the typical front-end load class.
The Board noted that the total expenses of Asset Manager 60% (retail class) of Asset Manager 60% ranked equal to its competitive median for the period, and the total expenses of Class A, Class T, Class B, Class C, and Institutional Class ranked above its competitive median for the period. The Board considered that the total expenses of Class B and Class C were above the median primarily due to higher transfer agent fees. The Board considered that the total expenses for Class T were above the median primarily because its 12b-1 fee is higher than the typical front-end load class.
The Board noted that the total expenses of each of Class A, Class B, Class C, Institutional Class and Asset Manager 85% (retail class) of Asset Manager 85% ranked below its competitive median for 2007, and the total expenses of Class T ranked above its competitive median for 2007. The Board considered that total expenses for Class T were above the median primarily because its 12b-1 fee is higher than the typical front-end load class.
In its review of total expenses, the Board also considered Fidelity fee structures and other information on clients that FMR and its affiliates service in other competitive markets, such as other mutual funds advised or subadvised by FMR or its affiliates, pension plan clients, and other institutional clients.
Based on its review, the Board concluded that the total expenses of Asset Manager 70% and the total expenses of each class of Asset Manager 20%, Asset Manager 30%, Asset Manager 40%, Asset Manager 50%, Asset Manager 60% and Asset Manager 85% were reasonable, although in some cases above the median of the universe presented for comparison, in light of the services that the fund and its shareholders receive and the other factors considered.
Costs of the Services and Profitability. The Board considered the revenues earned and the expenses incurred by Fidelity in conducting the business of developing, marketing, distributing, managing, administering and servicing each fund and its shareholders. The Board also considered the level of Fidelity's profits in respect of all the Fidelity funds.
On an annual basis, FMR presents to the Board Fidelity's profitability for each fund. Fidelity calculates the profitability for each fund, as well as aggregate profitability for groups of Fidelity funds and all Fidelity funds, using a series of detailed revenue and cost allocation methodologies which originate with the audited books and records of Fidelity. The Audit Committee of the Board reviews any significant changes from the prior year's methodologies.
PricewaterhouseCoopers LLP (PwC), independent registered public accounting firm and auditor to Fidelity and certain Fidelity funds, has been engaged annually by the Board as part of the Board's assessment of the results of Fidelity's profitability analysis. PwC's engagement includes the review and assessment of Fidelity's methodologies used in determining the revenues and expenses attributable to Fidelity's mutual fund business, and completion of agreed-upon procedures surrounding the mathematical accuracy of fund profitability and its conformity to allocation methodologies. After considering PwC's reports issued under the engagement and information provided by Fidelity, the Board believes that while other allocation methods may also be reasonable, Fidelity's profitability methodologies are reasonable in all material respects.
The Board has also reviewed Fidelity's non-fund businesses and any fall-out benefits related to the mutual fund business as well as cases where Fidelity's affiliates may benefit from or be related to the funds' business.
Annual Report
The Board considered the costs of the services provided by and the profits realized by Fidelity in connection with the operation of each fund and determined that the amount of profit is a fair entrepreneurial profit for the management of each fund.
Economies of Scale. The Board considered whether there have been economies of scale in respect of the management of the Fidelity funds, whether the Fidelity funds (including each fund) have appropriately benefited from any such economies of scale, and whether there is potential for realization of any further economies of scale. The Board considered the extent to which each fund will benefit from economies of scale through increased services to the fund, through waivers or reimbursements, or through fee or expense reductions.
The Board recognized that each fund's management contract incorporates a "group fee" structure, which provides for lower group fee rates as total fund assets under FMR's management increase, and for higher group fee rates as total fund assets under FMR's management decrease. FMR determines the group fee rates based on a tiered asset "breakpoint" schedule. The Board considered that the group fee is designed to deliver the benefits of economies of scale to fund shareholders when total fund assets increase, even if assets of any particular fund are unchanged or have declined, because some portion of Fidelity's costs are attributable to services provided to all Fidelity funds, and all funds benefit if those costs can be allocated among more assets. The Board concluded that, given the group fee structure, fund shareholders will achieve a certain level of economies of scale as assets under FMR's management increase at the fund complex level, regardless of whether Fidelity achieves any such economies of scale.
The Board further concluded that any potential economies of scale are being shared between fund shareholders and Fidelity in an appropriate manner.
Additional Information Requested by the Board. In order to develop fully the factual basis for consideration of the Fidelity funds' Advisory Contracts, the Board requested and received additional information on certain topics, including (i) fund performance trends and actions to be taken by FMR to improve certain funds' overall performance; (ii) portfolio manager changes that have occurred during the past year; (iii) Fidelity's fund profitability methodology, the profitability of certain fund service providers, and profitability trends for certain funds; (iv) Fidelity's compensation structure for portfolio managers and key personnel, including its effects on fund profitability and the extent to which portfolio manager compensation is linked to fund performance; (v) Fidelity's fee structures; (vi) the funds' sub-advisory arrangements; and (vii) accounts managed by Fidelity other than the Fidelity funds.
Based on its evaluation of all of the conclusions noted above, and after considering all material factors, the Board ultimately concluded that the advisory fee structures are fair and reasonable, and that each fund's Advisory Contracts should be renewed.
Annual Report
Managing Your Investments
Fidelity offers several ways to conveniently manage your personal investments via your telephone or PC. You can access your account information, conduct trades and research your investments 24 hours a day.
By Phone
Fidelity Automated Service Telephone provides a single toll-free number to access account balances, positions, quotes and trading. It's easy to navigate the service, and on your first call, the system will help you create a personal identification number (PIN) for security.
(phone_graphic)
Fidelity Automated Service Telephone (FAST®)
1-800-544-5555
Press
 For mutual fund and brokerage trading.
 For quotes.*
 For account balances and holdings.
 To review orders and mutual fund activity.
 To change your PIN.

 To speak to a Fidelity representative.
By PC
Fidelity's web site on the Internet provides a wide range of information, including daily financial news, fund performance, interactive planning tools and news about Fidelity products and services.
(computer_graphic)
Fidelity's Web Site
www.fidelity.com
* When you call the quotes line, please remember that a fund's yield and return will vary and, except for money market funds, share price will also vary. This means that you may have a gain or loss when you sell your shares. There is no assurance that money market funds will be able to maintain a stable $1 share price; an investment in a money market fund is not insured or guaranteed by the U.S. government. Total returns are historical and include changes in share price, reinvestment of dividends and capital gains, and the effects of any sales charges.
Annual Report
To Write Fidelity
We'll give your correspondence immediate attention and send you written confirmation upon completion of your request.
(letter_graphic)
Making Changes
To Your Account
(such as changing name, address, bank, etc.)
Fidelity Investments
P.O. Box 770001
Cincinnati, OH 45277-0002
(letter_graphic)
For Non-Retirement
Accounts
Buying shares
Fidelity Investments
P.O. Box 770001
Cincinnati, OH 45277-0003
Overnight Express
Fidelity Investments
Attn: Distribution Services
100 Crosby Parkway - KC1H
Covington, KY 41015
Selling shares
Fidelity Investments
P.O. Box 770001
Cincinnati, OH 45277-0035
Overnight Express
Fidelity Investments
Attn: Distribution Services
100 Crosby Parkway - KC1H
Covington, KY 41015
General Correspondence
Fidelity Investments
P.O. Box 500
Merrimack, NH 03054-0500
(letter_graphic)
For Retirement
Accounts
Buying shares
Fidelity Investments
P.O. Box 770001
Cincinnati, OH 45277-0003
Selling shares
Fidelity Investments
P.O. Box 770001
Cincinnati, OH 45277-0035
Overnight Express
Fidelity Investments
Attn: Distribution Services
100 Crosby Parkway - KC1H
Covington, KY 41015
General Correspondence
Fidelity Investments
P.O. Box 500
Merrimack, NH 03054-0500
Annual Report
To Visit Fidelity
For directions and hours,
please call 1-800-544-9797.
Arizona
7001 West Ray Road
Chandler, AZ
15445 N. Scottsdale Road
Scottsdale, AZ
California
815 East Birch Street
Brea, CA
1411 Chapin Avenue
Burlingame, CA
851 East Hamilton Avenue
Campbell, CA
19200 Von Karman Avenue
Irvine, CA
601 Larkspur Landing Circle
Larkspur, CA
2000 Avenue of the Stars
Los Angeles, CA
27101 Puerta Real
Mission Viejo, CA
73-575 El Paseo
Palm Desert, CA
251 University Avenue
Palo Alto, CA
123 South Lake Avenue
Pasadena, CA
16656 Bernardo Ctr. Drive
Rancho Bernardo, CA
1220 Roseville Parkway
Roseville, CA
1740 Arden Way
Sacramento, CA
7676 Hazard Center Drive
San Diego, CA
11943 El Camino Real
San Diego, CA
8 Montgomery Street
San Francisco, CA
3793 State Street
Santa Barbara, CA
1200 Wilshire Boulevard
Santa Monica, CA
398 West El Camino Real
Sunnyvale, CA
111 South Westlake Blvd
Thousand Oaks, CA
21701 Hawthorne Boulevard
Torrance, CA
2001 North Main Street
Walnut Creek, CA
6326 Canoga Avenue
Woodland Hills, CA
Colorado
281 East Flatiron Circle
Broomfield, CO
1625 Broadway
Denver, CO
9185 Westview Road
Lone Tree, CO
Connecticut
48 West Putnam Avenue
Greenwich, CT
265 Church Street
New Haven, CT
300 Atlantic Street
Stamford, CT
29 South Main Street
West Hartford, CT
Delaware
400 Delaware Avenue
Wilmington, DE
Florida
175 East Altamonte Drive
Altamonte Springs, FL
4400 N. Federal Highway
Boca Raton, FL
121 Alhambra Plaza
Coral Gables, FL
2948 N. Federal Highway
Ft. Lauderdale, FL
4671 Town Center Parkway
Jacksonville, FL
8880 Tamiami Trail, North
Naples, FL
230 Royal Palm Way
Palm Beach, FL
3501 PGA Boulevard
Palm Beach Gardens, FL
3550 Tamiami Trail, South
Sarasota, FL
1502 N. Westshore Blvd.
Tampa, FL
2465 State Road 7
Wellington, FL
Georgia
3445 Peachtree Road, N.E.
Atlanta, GA
1000 Abernathy Road
Atlanta, GA
Illinois
One North LaSalle Street
Chicago, IL
401 North Michigan Avenue
Chicago, IL
One Skokie Valley Road
Highland Park, IL
1415 West 22nd Street
Oak Brook, IL
15105 S LaGrange Road
Orland Park, IL
1572 East Golf Road
Schaumburg, IL
Indiana
4729 East 82nd Street
Indianapolis, IN
8480 Keystone Crossing
Indianapolis, IN
Kansas
5400 College Boulevard
Overland Park, KS
Maine
Three Canal Plaza
Portland, ME
Maryland
7315 Wisconsin Avenue
Bethesda, MD
610 York Road
Towson, MD
Massachusetts
801 Boylston Street
Boston, MA
155 Congress Street
Boston, MA
300 Granite Street
Braintree, MA
44 Mall Road
Burlington, MA
238 Main Street
Cambridge, MA
200 Endicott Street
Danvers, MA
405 Cochituate Road
Framingham, MA
551 Boston Turnpike
Shrewsbury, MA
Michigan
500 E. Eisenhower Pkwy.
Ann Arbor, MI
280 Old N. Woodward Ave.
Birmingham, MI
30200 Northwestern Hwy.
Farmington Hills, MI
43420 Grand River Avenue
Novi, MI
Minnesota
7740 France Avenue South
Edina, MN
8342 3rd Street North
Oakdale, MN
Missouri
1524 South Lindbergh Blvd.
St. Louis, MO
Nevada
2225 Village Walk Drive
Henderson, NV
New Jersey
501 Route 73 South
Marlton, NJ
150 Essex Street
Millburn, NJ
35 Morris Street
Morristown, NJ
396 Route 17, North
Paramus, NJ
3518 Route 1 North
Princeton, NJ
530 Broad Street
Shrewsbury, NJ
New Mexico
2261 Q Street NE
Albuquerque, NM
New York
1130 Franklin Avenue
Garden City, NY
37 West Jericho Turnpike
Huntington Station, NY
1271 Avenue of the Americas
New York, NY
980 Madison Avenue
New York, NY
61 Broadway
New York, NY
350 Park Avenue
New York, NY
200 Fifth Avenue
New York, NY
733 Third Avenue
New York, NY
11 Penn Plaza
New York, NY
2070 Broadway
New York, NY
1075 Northern Blvd.
Roslyn, NY
799 Central Park Avenue
Scarsdale, NY
North Carolina
4611 Sharon Road
Charlotte, NC
7011 Fayetteville Road
Durham, NC
Ohio
3805 Edwards Road
Cincinnati, OH
1324 Polaris Parkway
Columbus, OH
1800 Crocker Road
Westlake, OH
28699 Chagrin Boulevard
Woodmere Village, OH
Oregon
7493 SW Bridgeport Road
Tigard, OR
Pennsylvania
600 West DeKalb Pike
King of Prussia, PA
1735 Market Street
Philadelphia, PA
12001 Perry Highway
Wexford, PA
Rhode Island
10 Memorial Boulevard
Providence, RI
Tennessee
3018 Peoples Street
Johnson City, TN
7628 West Farmington Blvd.
Germantown, TN
2035 Mallory Lane
Franklin, TN
Texas
10000 Research Boulevard
Austin, TX
4001 Northwest Parkway
Dallas, TX
12532 Memorial Drive
Houston, TX
2701 Drexel Drive
Houston, TX
6560 Fannin Street
Houston, TX
1701 Lake Robbins Drive
The Woodlands, TX
6500 N. MacArthur Blvd.
Irving, TX
6005 West Park Boulevard
Plano, TX
14100 San Pedro
San Antonio, TX
1576 East Southlake Blvd.
Southlake, TX
Utah
279 West South Temple
Salt Lake City, UT
Virginia
1861 International Drive
McLean, VA
Washington
10500 NE 8th Street
Bellevue, WA
1518 6th Avenue
Seattle, WA
Washington, DC
1900 K Street, N.W.
Washington, DC
Wisconsin
16020 West Bluemound Road
Brookfield, WI
Fidelity Brokerage Services, Inc., 100 Summer St., Boston, MA 02110 Member NYSE/SIPC
Annual Report
Investment Adviser
Fidelity Management & Research Company
Boston, MA
Investment Sub-Advisers
FMR Co., Inc.
Fidelity Investments Money Management, Inc.
Fidelity Management & Research
(U.K.) Inc.
Fidelity Research & Analysis Company
Fidelity Investments
Japan Limited
FIL Investment Advisors
FIL Investment Advisors
(U.K.) Ltd.
Fidelity Management & Research
(Japan) Inc.
Fidelity Management & Research
(Hong Kong) Limited
General Distributor
Fidelity Distributors Corporation
Boston, MA
Transfer and Service Agents
Fidelity Investments Institutional Operations Company, Inc.
Boston, MA
Fidelity Service Company, Inc.
Boston, MA
Custodian
JPMorgan Chase Bank
New York, NY
AR-UANN-1108
1.885699.100
Fidelity Advisor Asset Manager® Funds -
20%, 30%, 40%, 50%, 60%, 70%, 85% -
Class A, Class T, Class B, and Class C
Annual Report
September 30, 2008
Each Class A, Class T, Class B and Class C are
classes of Fidelity Asset Manager® Funds
(2_fidelity_logos) (Registered_Trademark)
Contents
To view a fund's proxy voting guidelines and proxy voting record for the 12-month period ended June 30, visit http://www.fidelity.com (search for "proxy voting guidelines") or visit the Securities and Exchange Commission's (SEC) web site at http://www.sec.gov. You may also call 1-877-208-0098 to request a free copy of the proxy voting guidelines.
Standard & Poor's, S&P and S&P 500 are registered service marks of The McGraw-Hill Companies, Inc. and have been licensed for use by Fidelity Distributors Corporation.
Other third party marks appearing herein are the property of their respective owners.
All other marks appearing herein are registered or unregistered trademarks or service marks of FMR LLC or an affiliated company.
Annual Report
This report and the financial statements contained herein are submitted for the general information of the shareholders of the funds. This report is not authorized for distribution to prospective investors in the funds unless preceded or accompanied by an effective prospectus.
A fund files its complete schedule of portfolio holdings with the SEC for the first and third quarters of each fiscal year on Form N-Q. Forms N-Q are available on the SEC's web site at http://www.sec.gov. A fund's Forms N-Q may be reviewed and copied at the SEC's Public Reference Room in Washington, DC. Information regarding the operation of the SEC's Public Reference Room may be obtained by calling 1-800-SEC-0330. For a complete list of a fund's portfolio holdings, view the most recent quarterly holdings listing, semiannual report, or annual report on Fidelity's web site at http://www.advisor.fidelity.com.
NOT FDIC INSURED · MAY LOSE VALUE · NO BANK GUARANTEE
Neither the funds nor Fidelity Distributors Corporation is a bank.
Annual Report
Dear Shareholder:
Turmoil has been the watchword for the world's securities markets in 2008, with domestic and international stocks down sharply amid the global credit squeeze. A flight to quality boosted returns for U.S. Treasuries, one of the few asset classes with positive results heading into the latter stages of the year. Financial markets are always unpredictable, but there are a number of time-tested principles that can put the historical odds in your favor.
One of the basic tenets is to invest for the long term. Over time, riding out the markets' inevitable ups and downs has proven much more effective than selling into panic or chasing the hottest trend. Even missing only a few of the markets' best days can significantly diminish investor returns. Patience also affords the benefits of compounding - of earning interest on additional income or reinvested dividends and capital gains. There are tax advantages and cost benefits to consider as well. The more you sell, the more taxes you pay, and the more you trade, the higher the costs. While staying the course doesn't eliminate risk, it can considerably lessen the effect of short-term declines.
You can further manage your investing risk through diversification. And today, more than ever, geographic diversification should be taken into account. Studies
indicate that asset allocation is the single most important determinant of a portfolio's long-term success. The right mix of stocks, bonds and cash - aligned to your particular risk tolerance and investment objective - is very important. Age-appropriate rebalancing is also an essential aspect of asset allocation. For younger investors, an emphasis on equities - which historically have been the best-performing asset class over time - is encouraged. As investors near their specific goal, such as retirement or sending a child to college, consideration may be given to replacing volatile assets (e.g. common stocks) with more-stable fixed investments (bonds or savings plans).
A third investment principle - investing regularly - can help lower the average cost of your purchases. Investing a certain amount of money each month or quarter helps ensure you won't pay for all your shares at market highs. This strategy - known as dollar cost averaging - also reduces unconstructive "emotion" from investing, helping shareholders avoid selling weak performers just prior to an upswing, or chasing a hot performer just before a correction.
We invite you to contact us via the Internet, through our Investor Centers or over the phone. It is our privilege to provide you the information you need to make the investments that are right for you.
Sincerely,
/s/Edward C. Johnson 3d
Edward C. Johnson 3d
Annual Report
Fidelity Advisor Asset Manager 20% - Class A, T, B, and C
Average annual total return reflects the change in the value of an investment, assuming reinvestment of the class' dividend income and capital gains (the profits earned upon the sale of securities that have grown in value, if any) and assuming a constant rate of performance each year. The $10,000 table and the fund's returns do not reflect the deduction of taxes that a shareholder would pay on fund distributions or the redemption of fund shares. During periods of reimbursement by Fidelity, a fund's total return will be greater than it would be had the reimbursement not occurred. How a fund did yesterday is no guarantee of how it will do tomorrow.
Average Annual Total Returns
Periods ended September 30, 2008 | Past 1
year | Past 5
years | Past 10
years |
Class A (incl. 5.75% sales charge) A | -12.51% | 2.84% | 3.90% |
Class T (incl. 3.50% sales charge) B | -10.67% | 3.22% | 4.09% |
Class B (incl. contingent deferred sales charge) C | -12.29% | 3.40% | 4.35% |
Class C (incl. contingent deferred sales charge) D | -8.75% | 3.74% | 4.35% |
A Class A shares bear a 0.25% 12b-1 fee. The initial offering of Class A shares took place on October 2, 2006. Returns prior to October 2, 2006 are those of Asset Manager 20%, the original class of the fund, which has no 12b-1 fee. Had Class A shares' 12b-1 fee been reflected, returns prior to October 2, 2006 would have been lower.
B Class T shares bear a 0.50% 12b-1 fee. The initial offering of Class T shares took place on October 2, 2006. Returns prior to October 2, 2006 are those of Asset Manager 20%, the original class of the fund, which has no 12b-1 fee. Had Class T shares' 12b-1 fee been reflected, returns prior to October 2, 2006 would have been lower.
C Class B shares bear a 1.00% 12b-1 fee. The initial offering of Class B shares took place on October 2, 2006. Returns prior to October 2, 2006 are those of Asset Manager 20%, the original class of the fund, which has no 12b-1 fee. Had Class B shares' 12b-1 fee been reflected, returns prior to October 2, 2006 would have been lower. Class B shares' contingent deferred sales charge included in the past one year, past 5 years, and past 10 years total return figures are 5%, 2%, and 0%, respectively.
D Class C shares bear a 1.00% 12b-1 fee. The initial offering of Class C shares took place on October 2, 2006. Returns prior to October 2, 2006 are those of Asset Manager 20%, the original class of the fund, which has no 12b-1 fee. Had Class C shares' 12b-1 fee been reflected, returns prior to October 2, 2006 would have been lower. Class C shares' contingent deferred sales charge included in the past one year, past 5 years, and past 10 years total return figures are 1%, 0%, and 0%, respectively.
$10,000 Over 10 Years
Let's say hypothetically that $10,000 was invested in Fidelity Advisor Asset Manager® 20% - Class A on September 30, 1998, and the current 5.75% sales charge was paid. The chart shows how the value of your investment would have changed, and also shows how the Lehman Brothers® U.S. Aggregate Index performed over the same period. The initial offering of Class A took place on October 2, 2006. See above for additional information regarding the performance of Class A.
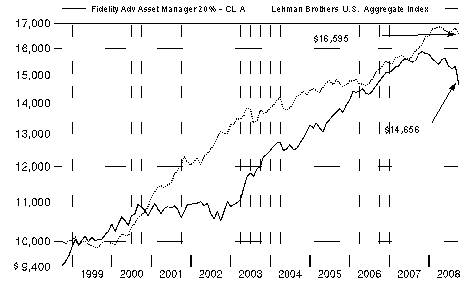
In prior years, the performance from year to year was represented by the performance of Class T. Going forward, the fund's performance will be represented by Class A for consistency with other fund materials.
Annual Report
Fidelity Advisor Asset Manager 30% - Class A, T, B, and C
Performance: The Bottom Line
Average annual total return reflects the change in the value of an investment, assuming reinvestment of the class' dividend income and capital gains (the profits earned upon the sale of securities that have grown in value, if any) and assuming a constant rate of performance each year. The $10,000 table and the fund's returns do not reflect the deduction of taxes that a shareholder would pay on fund distributions or the redemption of fund shares. During periods of reimbursement by Fidelity, a fund's total return will be greater than it would be had the reimbursement not occurred. How a fund did yesterday is no guarantee of how it will do tomorrow.
Average annual total returns take Fidelity Advisor Asset Manager 30%'s cumulative total return and show you what would have happened if Fidelity Advisor Asset Manager 30% shares had performed at a constant rate each year. These numbers will be reported once the fund is a year old.
$10,000 Over Life of Fund
Let's say hypothetically that $10,000 was invested in Fidelity Advisor Asset Manager 30% - Class A on October 9, 2007, when the fund started, and the current 5.75% sales charge was paid. The chart shows how the value of your investment would have changed, and also shows how the Lehman Brothers U.S. Aggregate Index performed over the same period.
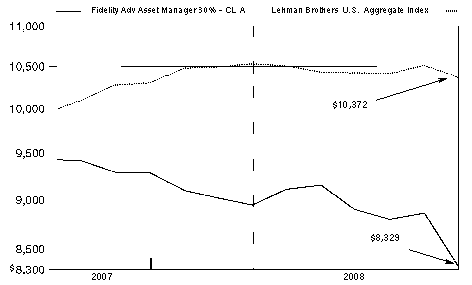
Annual Report
Fidelity Advisor Asset Manager 40% - Class A, T, B, and C
Performance: The Bottom Line
Average annual total return reflects the change in the value of an investment, assuming reinvestment of the class' dividend income and capital gains (the profits earned upon the sale of securities that have grown in value, if any) and assuming a constant rate of performance each year. The $10,000 table and the fund's returns do not reflect the deduction of taxes that a shareholder would pay on fund distributions or the redemption of fund shares. During periods of reimbursement by Fidelity, a fund's total return will be greater than it would be had the reimbursement not occurred. How a fund did yesterday is no guarantee of how it will do tomorrow.
Average annual total returns take Fidelity Advisor Asset Manager 40%'s cumulative total return and show you what would have happened if Fidelity Advisor Asset Manager 40% shares had performed at a constant rate each year. These numbers will be reported once the fund is a year old.
$10,000 Over Life of Fund
Let's say hypothetically that $10,000 was invested in Fidelity Advisor Asset Manager 40% - Class A on October 9, 2007, when the fund started, and the current 5.75% sales charge was paid. The chart shows how the value of your investment would have changed, and also shows how the Lehman Brothers U.S. Aggregate Index performed over the same period.
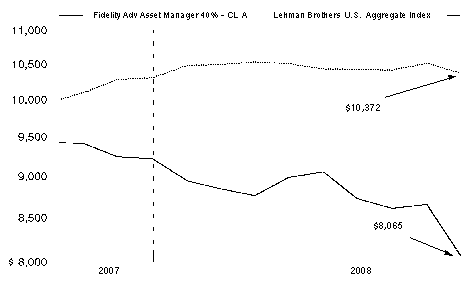
Annual Report
Fidelity Advisor Asset Manager 50% - Class A, T, B, and C
Performance: The Bottom Line
Average annual total return reflects the change in the value of an investment, assuming reinvestment of the class' dividend income and capital gains (the profits earned upon the sale of securities that have grown in value, if any) and assuming a constant rate of performance each year. The $10,000 table and the fund's returns do not reflect the deduction of taxes that a shareholder would pay on fund distributions or the redemption of fund shares. During periods of reimbursement by Fidelity, a fund's total return will be greater than it would be had the reimbursement not occurred. How a fund did yesterday is no guarantee of how it will do tomorrow.
Average Annual Total Returns
Periods ended September 30, 2008 | Past 1
year | Past 5
years | Past 10
years |
Class A (incl. 5.75% sales charge) A | -21.36% | 1.42% | 3.33% |
Class T (incl. 3.50% sales charge) B | -19.67% | 1.80% | 3.52% |
Class B (incl. contingent deferred sales charge) C | -21.06% | 1.98% | 3.78% |
Class C (incl. contingent deferred sales charge) D | -17.94% | 2.32% | 3.79% |
A Class A shares bear a 0.25% 12b-1 fee. The initial offering of Class A shares took place on October 2, 2006. Returns prior to October 2, 2006 are those of Asset Manager 50%, the original class of the fund, which has no 12b-1 fee. Had Class A shares' 12b-1 fee been reflected, returns prior to October 2, 2006 would have been lower.
B Class T shares bear a 0.50% 12b-1 fee. The initial offering of Class T shares took place on October 2, 2006. Returns prior to October 2, 2006 are those of Asset Manager 50%, the original class of the fund, which has no 12b-1 fee. Had Class T shares' 12b-1 fee been reflected, returns prior to October 2, 2006 would have been lower.
C Class B shares bear a 1.00% 12b-1 fee. The initial offering of Class B shares took place on October 2, 2006. Returns prior to October 2, 2006 are those of Asset Manager 50%, the original class of the fund, which has no 12b-1 fee. Had Class B shares' 12b-1 fee been reflected, returns prior to October 2, 2006 would have been lower. Class B shares' contingent deferred sales charge included in the past one year, past five years, and past ten years total return figures are 5%, 2%, and 0%, respectively.
D Class C shares bear a 1.00% 12b-1 fee. The initial offering of Class C shares took place on October 2, 2006. Returns prior to October 2, 2006 are those of Asset Manager 50%, the original class of the fund, which has no 12b-1 fee. Had Class C shares' 12b-1 fee been reflected, returns prior to October 2, 2006 would have been lower. Class C shares' contingent deferred sales charge included in the past one year, past five years, and past ten years total return figures are 1%, 0%, and 0%, respectively.
$10,000 Over 10 Years
Let's say hypothetically that $10,000 was invested in Fidelity Advisor Asset Manager 50% - Class A on September 30, 1998, and the current 5.75% sales charge was paid. The chart shows how the value of your investment would have changed, and also shows how the Standard & Poor's 500SM Index (S&P 500®) performed over the same period. The initial offering of Class A took place on October 2, 2006. See above for additional information regarding the performance of Class A.
In prior years, the performance from year to year was represented by the performance of Class T. Going forward, the fund's performance will be represented by Class A for consistency with other fund materials.
Annual Report
Fidelity Advisor Asset Manager 60% - Class A, T, B, and C
Performance: The Bottom Line
Average annual total return reflects the change in the value of an investment, assuming reinvestment of the class' dividend income and capital gains (the profits earned upon the sale of securities that have grown in value, if any) and assuming a constant rate of performance each year. The $10,000 table and the fund's returns do not reflect the deduction of taxes that a shareholder would pay on fund distributions or the redemption of fund shares. During periods of reimbursement by Fidelity, a fund's total return will be greater than it would be had the reimbursement not occurred. How a fund did yesterday is no guarantee of how it will do tomorrow.
Average annual total returns take Fidelity Advisor Asset Manager 60%'s cumulative total return and show you what would have happened if Fidelity Advisor Asset Manager 60% shares had performed at a constant rate each year. These numbers will be reported once the fund is a year old.
$10,000 Over Life of Fund
Let's say hypothetically that $10,000 was invested in Fidelity Advisor Asset Manager 60% - Class A on October 9, 2007, when the fund started, and the current 5.75% sales charge was paid. The chart shows how the value of your investment would have changed, and also shows how the S&P 500 performed over the same period.

Annual Report
Fidelity Advisor Asset Manager 70% - Class A, T, B, and C
Performance: The Bottom Line
Average annual total return reflects the change in the value of an investment, assuming reinvestment of the class' dividend income and capital gains (the profits earned upon the sale of securities that have grown in value, if any) and assuming a constant rate of performance each year. The $10,000 table and the fund's returns do not reflect the deduction of taxes that a shareholder would pay on fund distributions or the redemption of fund shares. During periods of reimbursement by Fidelity, a fund's total return will be greater than it would be had the reimbursement not occurred. How a fund did yesterday is no guarantee of how it will do tomorrow. Returns may reflect the conversion of Class B shares to Class A shares after a maximum of seven years.
Average Annual Total Returns
Periods ended September 30, 2008 | Past 1
year | Past 5
years | Past 10
years |
Class A (incl. 5.75% sales charge) A | -25.98% | 1.28% | 2.01% |
Class T (incl. 3.50% sales charge) B | -24.21% | 1.76% | 2.25% |
Class B (incl. contingent deferred sales charge)C | -25.29% | 2.12% | 2.61% |
Class C (incl. contingent deferred sales charge) D | -22.23% | 2.48% | 2.61% |
A Class A shares bear a 0.25% 12b-1 fee. The initial offering of Class A shares took place on September 23, 2008. Returns prior to September 23, 2008 are those of Asset Manager 70%, the original class of the fund, which has no 12b-1 fee. Had Class A shares' 12b-1 fee been reflected, returns prior to September 23, 2008 would have been lower.
B Class T shares bear a 0.50% 12b-1 fee. The initial offering of Class T shares took place on September 23, 2008. Returns prior to September 23, 2008 are those of Asset Manager 70%, the original class of the fund, which has no 12b-1 fee. Had Class T shares' 12b-1 fee been reflected, returns prior to September 23, 2008 would have been lower.
C Class B shares bear a 1.00% 12b-1 fee. The initial offering of Class B shares took place on September 23, 2008. Returns prior to September 23, 2008 are those of Asset Manager 70%, the original class of the fund, which has no 12b-1 fee. Had Class B shares' 12b-1 fee been reflected, returns prior to September 23, 2008 would have been lower. Class B shares' contingent deferred sales charge included in the past one year, past five years, and past 10 years total return figures are 5%, 2%, and 0%, respectively.
D Class C shares bear a 1.00% 12b-1 fee. The initial offering of Class C shares took place on September 23, 2008. Returns prior to September 23, 2008 are those of Asset Manager 70%, the original class of the fund, which has no 12b-1 fee. Had Class C shares' 12b-1 fee been reflected, returns prior to September 23, 2008 would have been lower. Class C shares' contingent deferred sales charge included in the past one year, past five years, and past 10 years total return figures are 1%, 0%, and 0%, respectively.
$10,000 Over 10 Years
Let's say hypothetically that $10,000 was invested in Fidelity Advisor Asset Manager 70% - Class A on September 30, 1998, and the current 5.75% sales charge was paid. The chart shows how the value of your investment would have changed, and also shows how the S&P 500 performed over the same period. The initial offering of Class A took place on September 23, 2008. See above for additional information regarding the performance of Class A.
Annual Report
Fidelity Advisor Asset Manager 85% - Class A, T, B, and C
Performance: The Bottom Line
Average annual total return reflects the change in the value of an investment, assuming reinvestment of the class' dividend income and capital gains (the profits earned upon the sale of securities that have grown in value, if any) and assuming a constant rate of performance each year. The $10,000 table and the fund's returns do not reflect the deduction of taxes that a shareholder would pay on fund distributions or the redemption of fund shares. During periods of reimbursement by Fidelity, a fund's total return will be greater than it would be had the reimbursement not occurred. How a fund did yesterday is no guarantee of how it will do tomorrow.
Average Annual Total Returns
Periods ended September 30, 2008 | Past 1
year | Past 5
years | Life of
fundA |
Class A (incl. 5.75% sales charge) B | -28.93% | 3.22% | 1.94% |
Class T (incl. 3.50% sales charge) C | -27.39% | 3.60% | 2.15% |
Class B (incl. contingent deferred sales charge) D | -28.90% | 3.79% | 2.44% |
Class C (incl. contingent deferred sales charge) E | -25.90% | 4.13% | 2.44% |
A From September 24, 1999.
B Class A shares bear a 0.25% 12b-1 fee. The initial offering of Class A shares took place on October 2, 2006. Returns prior to October 2, 2006 are those of Asset Manager 85%, the original class of the fund, which has no 12b-1 fee. Had Class A shares' 12b-1 fee been reflected, returns prior to October 2, 2006 would have been lower.
C Class T shares bear a 0.50% 12b-1 fee. The initial offering of Class T shares took place on October 2, 2006. Returns prior to October 2, 2006 are those of Asset Manager 85%, the original class of the fund, which has no 12b-1 fee. Had Class T shares' 12b-1 fee been reflected, returns prior to October 2, 2006 would have been lower.
D Class B shares bear a 1.00% 12b-1 fee. The initial offering of Class B shares took place on October 2, 2006. Returns prior to October 2, 2006 are those of Asset Manager 85%, the original class of the fund, which has no 12b-1 fee. Had Class B shares' 12b-1 fee been reflected, returns prior to October 2, 2006 would have been lower. Class B shares' contingent deferred sales charge included in the past one year, past five years, and life of fund total return figures are 5%, 2%, and 0%, respectively.
E Class C shares bear a 1.00% 12b-1 fee. The initial offering of Class C shares took place on October 2, 2006. Returns prior to October 2, 2006 are those of Asset Manager 85%, the original class of the fund, which has no 12b-1 fee. Had Class C shares' 12b-1 fee been reflected, returns prior to October 2, 2006 would have been lower. Class C shares' contingent deferred sales charge included in the past one year, past five years, and life of fund total return figures are 1%, 0%, and 0%, respectively.
$10,000 Over Life of Fund
Let's say hypothetically that $10,000 was invested in Fidelity Advisor Asset Manager 85% - Class A on September 24, 1999, when the fund started, and the current 5.75% sales charge was paid. The chart shows how the value of your investment would have changed, and also shows how the S&P 500 performed over the same period. The initial offering of Class A took place on October 2, 2006. See above for additional information regarding the performance of Class A.
In prior years, the performance from year to year was represented by the performance of Class T. Going forward, the fund's performance will be represented by Class A for consistency with other fund materials.
Annual Report
Comments from Derek Young, who became sole Portfolio Manager of Fidelity Advisor Asset Manager Funds on July 1, 2008
The Standard & Poor's 500SM Index declined 21.98% during the 12-month period ending September 30, 2008, amid a backdrop of falling home values, tight credit and scarce liquidity. Of the 10 major market sectors represented in the S&P 500®, only one managed a positive return: consumer staples, which barely nudged into the black with an increase of just under 1%. The remaining nine all suffered double-digit losses, led by the roughly 39% decline of the financials sector. In the final quarter of the period, under the strain of the credit crisis and dwindling capital, several of the largest institutions on Wall Street went bankrupt, were forced into acquisitions or were seized by the U.S. government. The Dow Jones Industrial AverageSM plummeted roughly 778 points on September 29 - its worst single-day point loss ever - and was down 19.85% for the year as a whole. International stocks fared much worse than their domestic counterparts. The MSCI® Europe, Australasia, Far East (EAFE®) Index - a performance monitor of developed markets outside the United States and Canada - fell 30.39%, a loss exacerbated by the renewed strength of the U.S. dollar. Unlike the stock market, the overall investment-grade bond market was positive, gaining 3.65% as measured by the Lehman Brothers® U.S. Aggregate Index. Conversely, the Merrill Lynch® U.S. High Yield Master II Constrained Index, a gauge of lower-quality but typically higher-yielding debt, dropped 11.09%.
The past year was a difficult stretch for the Advisor Asset Managers amid increasingly treacherous market conditions. Across the seven funds - including the 30%, 40% and 60% portfolios, which were just under a year old - greater exposure to riskier asset classes, such as equities, resulted in lower absolute returns and, in concert with weak overall security selection, a high degree of underperformance versus the composite benchmarks. (For fund-specific returns, please see the performance section of this report.) Security selection was decidedly negative in the equity and investment-grade bond categories, and asset allocation was ineffective this period. It was an unforgiving environment for riskier assets, as the burgeoning global financial crisis spawned a massive flight to quality. As such, it proved perilous to favor equities and high-yield/floating-rate debt - the latter of which was not represented in Advisor Asset Manager 85% - relative to stronger-performing investment-grade bonds and cash. An inherent growth orientation and bias toward higher-beta - meaning more-volatile - stocks were major factors working against us amid the sharp downturn in the market. In total, eight of the 10 underlying domestic equity sector central funds lagged their respective components of the Dow Jones Wilshire 5000 Composite IndexSM, with particularly weak results coming from technology, utilities, energy, consumer staples and financials - and with security selection to blame in each case. Conversely, the industrials sector is where we fared the best, driven by good stock picks. Consumer discretionary was the only other positive. Elsewhere, we struggled early in the period within the international equity component - not included in Advisor Asset Manager 20% and 30%, and which transitioned in December to a Fidelity central fund - and that loss more than offset the benefit from underweighting the foreign "sleeve." The funds' collective bond holdings trailed the Lehman Brothers U.S. Aggregate Index due to weak results from the investment-grade central fund, which had exposure to the sell-off in subprime mortgage securities. Although allocations to high yield and floating rate detracted, excess returns from the high-yield and floating-rate central funds helped curb some of the damage. The strategic cash component, including the money market central fund - in Advisor Asset Manager 20%, 50% and 70% - outperformed as well.
The views expressed above reflect those of the portfolio manager(s) only through the end of the period as stated on the cover of this report and do not necessarily represent the views of Fidelity or any other person in the Fidelity organization. Any such views are subject to change at any time based upon market or other conditions and Fidelity disclaims any responsibility to update such views. These views may not be relied on as investment advice and, because investment decisions for a Fidelity fund are based on numerous factors, may not be relied on as an indication of trading intent on behalf of any Fidelity fund.
Annual Report
The Funds invest in Fidelity Central Funds, which are open-end investment companies with similar investment objectives to those of the Funds, available only to other mutual funds and accounts managed by Fidelity Management & Research Company, (FMR) and its affiliates. In addition to the direct expenses incurred by the Funds presented in the table, as a shareholder of the underlying Fidelity Central Funds, the Funds also indirectly bear their proportionate share of the expenses of the underlying Fidelity Central Funds. These expenses are not included in the Funds' annualized expense ratio used to calculate either the actual or hypothetical expense estimates presented in the table below.
As a shareholder of a Fund, you incur two types of costs: (1) transaction costs, including sales charges (loads) on purchase payments or redemption proceeds, and (2) ongoing costs, including management fees, distribution and/or service (12b-1) fees and other Fund expenses. This Example is intended to help you understand your ongoing costs (in dollars) of investing in the Funds and to compare these costs with the ongoing costs of investing in other mutual funds.
The actual expense Example is based on an investment of $1,000 invested at the beginning of the period and held for the entire period (April 1, 2008 to September 30, 2008) for each class of Fidelity Asset Manager 20%, Fidelity Asset Manager 30%, Fidelity Asset Manager 40%, Fidelity Asset Manager 50%, Fidelity Asset Manager 60%, Fidelity Asset Manager 85% and Asset Manager 70% Class and for the entire period (September 23, 2008 to September 30, 2008) for Class A, T, B, C and Institutional Class of Fidelity Asset Manager 70% Fund.
The hypothetical expense Example is based on an investment of $1,000 invested for the one-half year period (April 1, 2008 to September 30, 2008).
Actual Expenses
The first line of the accompanying table for each class of each fund provides information about actual account values and actual expenses. You may use the information in this line, together with the amount you invested, to estimate the expenses that you paid over the period. Simply divide your account value by $1,000.00 (for example, an $8,600 account value divided by $1,000.00 = 8.6), then multiply the result by the number in the first line for a class of the fund under the heading entitled "Expenses Paid During Period" to estimate the expenses you paid on your account during this period. A small balance maintenance fee of $12.00 that is charged once a year may apply for certain accounts with a value of less than $2,000. This fee is not included in the table below. If it was, the estimate of expenses you paid during the period would be higher, and your ending account value lower, by this amount.
Hypothetical Example for Comparison Purposes
The second line of the accompanying table for each class of each fund provides information about hypothetical account values and hypothetical expenses based on a Class' actual expense ratio and an assumed rate of return of 5% per year before expenses, which is not the Class' actual return. The hypothetical account values and expenses may not be used to estimate the actual ending account balance or expenses you paid for the period. You may use this information to compare the ongoing costs of investing in the Fund and other funds. To do so, compare this 5% hypothetical example with the 5% hypothetical examples that appear in the shareholder reports of the other funds. A small balance maintenance fee of $12.00 that is charged once a year may apply for certain accounts with a value of less than $2,000. This fee is not included in the table below. If it was, the estimate of expenses you paid during the period would be higher, and your ending account value lower, by this amount.
Please note that the expenses shown in the table are meant to highlight your ongoing costs only and do not reflect any transaction costs. Therefore, the second line of the table is useful in comparing ongoing costs only, and will not help you determine the relative total costs of owning different funds. In addition, if these transactional costs were included, your costs would have been higher.
| Annualized
Expense Ratio | Beginning
Account Value | Ending
Account Value
September 30, 2008 | Expenses Paid
During Period |
Fidelity Asset Manager 20% | | | | |
Class A | .87% | | | |
Actual | | $ 1,000.00 | $ 952.90 | $ 4.25 B |
Hypothetical A | | $ 1,000.00 | $ 1,020.65 | $ 4.39 C |
Class T | 1.13% | | | |
Actual | | $ 1,000.00 | $ 951.70 | $ 5.51B |
Hypothetical A | | $ 1,000.00 | $ 1,019.35 | $ 5.70 C |
Class B | 1.66% | | | |
Actual | | $ 1,000.00 | $ 949.20 | $ 8.09 B* |
Hypothetical A | | $ 1,000.00 | $ 1,016.70 | $ 8.37 C* |
Class C | 1.65% | | | |
Actual | | $ 1,000.00 | $ 949.40 | $ 8.04 B |
Hypothetical A | | $ 1,000.00 | $ 1,016.75 | $ 8.32 C |
Asset Manager 20% | .56% | | | |
Actual | | $ 1,000.00 | $ 954.40 | $ 2.74 B |
Hypothetical A | | $ 1,000.00 | $ 1,022.20 | $ 2.83 C |
Institutional Class | .57% | | | |
Actual | | $ 1,000.00 | $ 953.60 | $ 2.78 B |
Hypothetical A | | $ 1,000.00 | $ 1,022.15 | $ 2.88 C |
| Annualized
Expense Ratio | Beginning
Account Value | Ending
Account Value
September 30, 2008 | Expenses Paid
During Period |
Fidelity Asset Manager 30% | | | | |
Class A | .94% | | | |
Actual | | $ 1,000.00 | $ 931.20 | $ 4.54B* |
HypotheticalA | | $ 1,000.00 | $ 1,020.30 | $ 4.75C* |
Class T | 1.18% | | | |
Actual | | $ 1,000.00 | $ 930.20 | $ 5.69B* |
Hypothetical A | | $ 1,000.00 | $ 1,019.10 | $ 5.96C* |
Class B | 1.68% | | | |
Actual | | $ 1,000.00 | $ 927.80 | $ 8.10B* |
HypotheticalA | | $ 1,000.00 | $ 1,016.60 | $ 8.47C* |
Class C | 1.70% | | | |
Actual | | $ 1,000.00 | $ 927.90 | $ 8.19B* |
Hypothetical A | | $ 1,000.00 | $ 1,016.50 | $ 8.57C* |
Asset Manager 30% | .69% | | | |
Actual | | $ 1,000.00 | $ 932.30 | $ 3.33B* |
Hypothetical A | | $ 1,000.00 | $ 1,021.55 | $ 3.49C* |
Institutional Class | .68% | | | |
Actual | | $ 1,000.00 | $ 932.30 | $ 3.28B* |
Hypothetical A | | $ 1,000.00 | $ 1,021.60 | $ 3.44C* |
Fidelity Asset Manager 40% | | | | |
Class A | .93% | | | |
Actual | | $ 1,000.00 | $ 920.20 | $ 4.46B* |
Hypothetical A | | $ 1,000.00 | $ 1,020.35 | $ 4.70C* |
Class T | 1.19% | | | |
Actual | | $ 1,000.00 | $ 918.20 | $ 5.71B* |
Hypothetical A | | $ 1,000.00 | $ 1,019.05 | $ 6.01C* |
Class B | 1.68% | | | |
Actual | | $ 1,000.00 | $ 915.70 | $ 8.05B* |
Hypothetical A | | $ 1,000.00 | $ 1,016.60 | $ 8.47C* |
Class C | 1.69% | | | |
Actual | | $ 1,000.00 | $ 916.50 | $ 8.10B* |
Hypothetical A | | $ 1,000.00 | $ 1,016.55 | $ 8.52C* |
Asset Manager 40% | .69% | | | |
Actual | | $ 1,000.00 | $ 921.40 | $ 3.31B* |
Hypothetical A | | $ 1,000.00 | $ 1,021.55 | $ 3.49C* |
Institutional Class | .68% | | | |
Actual | | $ 1,000.00 | $ 921.40 | $ 3.27B* |
Hypothetical A | | $ 1,000.00 | $ 1,021.60 | $ 3.44C* |
Fidelity Asset Manager 50% | | | | |
Class A | .99% | | | |
Actual | | $ 1,000.00 | $ 903.50 | $ 4.71B |
Hypothetical A | | $ 1,000.00 | $ 1,020.05 | $ 5.00C |
Class T | 1.24% | | | |
Actual | | $ 1,000.00 | $ 902.20 | $ 5.90B |
Hypothetical A | | $ 1,000.00 | $ 1,018.80 | $ 6.26C |
Class B | 1.80% | | | |
Actual | | $ 1,000.00 | $ 899.70 | $ 8.55B |
Hypothetical A | | $ 1,000.00 | $ 1,016.00 | $ 9.07C |
| Annualized
Expense Ratio | Beginning
Account Value | Ending
Account Value
September 30, 2008 | Expenses Paid
During Period |
Fidelity Asset Manager 50% | | | | |
Class C | 1.77% | | | |
Actual | | $ 1,000.00 | $ 899.80 | $ 8.41B |
Hypothetical A | | $ 1,000.00 | $ 1,016.15 | $ 8.92C |
Asset Manager 50% | .71% | | | |
Actual | | $ 1,000.00 | $ 903.90 | $ 3.38B |
Hypothetical A | | $ 1,000.00 | $ 1,021.45 | $ 3.59C |
Institutional Class | .67% | | | |
Actual | | $ 1,000.00 | $ 904.70 | $ 3.19B |
Hypothetical A | | $ 1,000.00 | $ 1,021.65 | $ 3.39C |
Fidelity Asset Manager 60% | | | | |
Class A | 1.12% | | | |
Actual | | $ 1,000.00 | $ 894.30 | $ 5.30B* |
Hypothetical A | | $ 1,000.00 | $ 1,019.40 | $ 5.65C* |
Class T | 1.37% | | | |
Actual | | $ 1,000.00 | $ 893.00 | $ 6.48B* |
Hypothetical A | | $ 1,000.00 | $ 1,018.15 | $ 6.91C* |
Class B | 1.88% | | | |
Actual | | $ 1,000.00 | $ 890.60 | $ 8.89B* |
Hypothetical A | | $ 1,000.00 | $ 1,015.60 | $ 9.47C* |
Class C | 1.88% | | | |
Actual | | $ 1,000.00 | $ 890.60 | $ 8.89B* |
Hypothetical A | | $ 1,000.00 | $ 1,015.60 | $ 9.47C* |
Asset Manager 60% | .87% | | | |
Actual | | $ 1,000.00 | $ 895.40 | $ 4.12B* |
Hypothetical A | | $ 1,000.00 | $ 1,020.65 | $ 4.39C* |
Institutional Class | .88% | | | |
Actual | | $ 1,000.00 | $ 895.40 | $ 4.17B* |
Hypothetical A | | $ 1,000.00 | $ 1,020.60 | $ 4.45C* |
Fidelity Asset Manager 70% | | | | |
Class A | 1.25% | | | |
Actual | | $ 1,000.00 | $ 963.20 | $ .27B |
Hypothetical A | | $ 1,000.00 | $ 1,018.75 | $ 6.31C |
Class T | 1.50% | | | |
Actual | | $ 1,000.00 | $ 963.20 | $ .32B |
Hypothetical A | | $ 1,000.00 | $ 1,017.50 | $ 7.57C |
Class B | 2.00% | | | |
Actual | | $ 1,000.00 | $ 963.20 | $ .43B |
Hypothetical A | | $ 1,000.00 | $ 1,015.00 | $ 10.08C |
Class C | 2.00% | | | |
Actual | | $ 1,000.00 | $ 963.20 | $ .43B |
Hypothetical A | | $ 1,000.00 | $ 1,015.00 | $ 10.08C |
Asset Manager 70% | .80% | | | |
Actual | | $ 1,000.00 | $ 877.00 | $ 3.75B |
Hypothetical A | | $ 1,000.00 | $ 1,021.00 | $ 4.04C |
Institutional Class | 1.00% | | | |
Actual | | $ 1,000.00 | $ 963.20 | $ .21B |
Hypothetical A | | $ 1,000.00 | $ 1,020.00 | $ 5.05C |
| Annualized
Expense Ratio | Beginning
Account Value | Ending
Account Value
September 30, 2008 | Expenses Paid
During Period |
Fidelity Asset Manager 85% | | | | |
Class A | 1.14% | | | |
Actual | | $ 1,000.00 | $ 860.10 | $ 5.30B |
Hypothetical A | | $ 1,000.00 | $ 1,019.30 | $ 5.76C |
Class T | 1.39% | | | |
Actual | | $ 1,000.00 | $ 859.10 | $ 6.46B |
Hypothetical A | | $ 1,000.00 | $ 1,018.05 | $ 7.01C |
Class B | 1.94% | | | |
Actual | | $ 1,000.00 | $ 856.20 | $ 9.00B |
Hypothetical A | | $ 1,000.00 | $ 1,015.30 | $ 9.77C |
Class C | 1.91% | | | |
Actual | | $ 1,000.00 | $ 856.70 | $ 8.87B |
Hypothetical A | | $ 1,000.00 | $ 1,015.45 | $ 9.62C |
Asset Manager 85% | .88% | | | |
Actual | | $ 1,000.00 | $ 860.60 | $ 4.09B |
Hypothetical A | | $ 1,000.00 | $ 1,020.60 | $ 4.45C |
Institutional Class | .78% | | | |
Actual | | $ 1,000.00 | $ 861.40 | $ 3.63B |
Hypothetical A | | $ 1,000.00 | $ 1,021.10 | $ 3.94C |
A 5% return per year before expenses
B Actual expenses are equal to each Class' annualized expense ratio, multiplied by the average account value over the period, multiplied by 183/366 (to reflect the one-half year period) for each class of Fidelity Asset Manager 20%, Fidelity Asset Manager 30%, Fidelity Asset Manager 40%, Fidelity Asset Manager 50%, Fidelity Asset Manager 60%, Fidelity Asset Manager 85% and Asset Manager 70% Class and multiplied by 8/366 (to reflect the period September 23, 2008 to September 30, 2008) for Class A, T, B, C and Institutional Class of Fidelity Asset Manager 70% Fund.
C Hypothetical expenses are equal to each Class' annualized expense ratio, multiplied by the average account value over the period, multiplied by 183/366 (to reflect the one-half year period).
The fees and expenses of the underlying Fidelity Central Funds in which the Fund invests are not included in the Fund's annualized expense ratio.
In addition to the expenses noted above, the Funds also indirectly bear their proportionate share of the expenses of the underlying Fidelity Central Funds. Annualized expenses of the underlying Fidelity Central Funds as of their most recent fiscal half-year ranged from less than ..01% to .03%.
* If changes to voluntary expense limitations, effective May 1, 2008 had been in effect during the entire period, the annualized expense ratios and the expenses paid in the actual and hypothetical examples above would have been as follows:
| Annualized
Expense Ratio | Expenses
Paid |
Fidelity Asset Manager 20% | | |
Class B | 1.65% | |
Actual | | $ 8.04 |
Hypothetical A | | $ 8.32 |
| Annualized
Expense Ratio | Expenses
Paid |
Fidelity Asset Manager 30% | | |
Class A | .90% | |
Actual | | $ 4.35 |
HypotheticalA | | $ 4.55 |
Class T | 1.15% | |
Actual | | $ 5.55 |
Hypothetical A | | $ 5.81 |
Class B | 1.65% | |
Actual | | $ 7.95 |
HypotheticalA | | $ 8.32 |
Class C | 1.65% | |
Actual | | $ 7.95 |
Hypothetical A | | $ 8.32 |
Asset Manager 30% | .65% | |
Actual | | $ 3.14 |
Hypothetical A | | $ 3.29 |
Institutional Class | .65% | |
Actual | | $ 3.14 |
Hypothetical A | | $ 3.29 |
Fidelity Asset Manager 40% | | |
Class A | .90% | |
Actual | | $ 4.32 |
Hypothetical A | | $ 4.55 |
Class T | 1.15% | |
Actual | | $ 5.52 |
Hypothetical A | | $ 5.81 |
Class B | 1.65% | |
Actual | | $ 7.90 |
Hypothetical A | | $ 8.32 |
Class C | 1.65% | |
Actual | | $ 7.91 |
Hypothetical A | | $ 8.32 |
Asset Manager 40% | .65% | |
Actual | | $ 3.12 |
Hypothetical A | | $ 3.29 |
Institutional Class | .65% | |
Actual | | $ 3.12 |
Hypothetical A | | $ 3.29 |
Fidelity Asset Manager 60% | | |
Class A | 1.10% | |
Actual | | $ 5.21 |
Hypothetical A | | $ 5.55 |
Class T | 1.35% | |
Actual | | $ 6.39 |
Hypothetical A | | $ 6.81 |
Class B | 1.85% | |
Actual | | $ 8.74 |
Hypothetical A | | $ 9.32 |
Class C | 1.85% | |
Actual | | $ 8.74 |
Hypothetical A | | $ 9.32 |
| Annualized
Expense Ratio | Expenses
Paid |
Asset Manager 60% | .85% | |
Actual | | $ 4.03 |
Hypothetical A | | $ 4.29 |
Institutional Class | .85% | |
Actual | | $ 4.03 |
Hypothetical A | | $ 4.29 |
A 5% return per year before expenses
Annual Report
Fidelity Asset Manager 20%
Investment Changes (Unaudited)
The information in the following tables is based on the combined investments of the Fund and its pro-rata share of the investments of Fidelity's Equity and Fixed-Income Central Funds.
Top Five Bond Issuers as of September 30, 2008 |
(with maturities greater than one year) | % of fund's
net assets | % of fund's net assets
6 months ago |
Fannie Mae | 17.8 | 16.4 |
Freddie Mac | 6.6 | 5.8 |
U.S. Treasury Obligations | 2.8 | 5.4 |
Government National Mortgage Association | 2.5 | 1.9 |
Wells Fargo Mortgage Backed Securities Trust | 0.8 | 0.6 |
| 30.5 | |
Quality Diversification (% of fund's net assets) |
As of September 30, 2008 | As of March 31, 2008 |
| U.S. Government and
U.S. Government
Agency Obligations 30.0% | | | U.S. Government and
U.S. Government
Agency Obligations 29.8% | |
| AAA,AA,A 14.1% | | | AAA,AA,A 12.9% | |
| BBB 10.2% | | | BBB 9.5% | |
| BB and Below 5.2% | | | BB and Below 4.6% | |
| Not Rated 0.7% | | | Not Rated 0.4% | |
| Equities 20.1% | | | Equities 20.2% | |
| Short-Term
Investments and
Net Other Assets 19.7% | | | Short-Term
Investments and
Net Other Assets 22.6% | |

We have used ratings from Moody's® Investors Services, Inc. Where Moody's ratings are not available, we have used S&P® ratings. All ratings are as of the report date and do not reflect subsequent downgrades. Percentages are adjusted for the effect of futures contracts, if applicable. |
Top Five Stocks as of September 30, 2008 |
| % of fund's
net assets | % of fund's net assets
6 months ago |
Apple, Inc. | 0.3 | 0.1 |
Procter & Gamble Co. | 0.3 | 0.3 |
General Electric Co. | 0.3 | 0.2 |
Bank of America Corp. | 0.2 | 0.2 |
JPMorgan Chase & Co. | 0.2 | 0.2 |
| 1.3 | |
Asset Allocation (% of fund's net assets) |
As of September 30, 2008 | As of March 31, 2008 |
| Stock class and
Equity Futures 19.8% | | | Stock class and
Equity Futures 20.1% | |
| Bond class 59.3% | | | Bond class 57.1% | |
| Short-term class 20.9% | | | Short-term class 22.8% | |
| | | | | |
| | | | | |

Asset allocations in the pie charts reflect the categorization of assets as defined in the Fund's prospectus in effect as of the time periods indicated above. Percentages are adjusted for the effect of futures contracts and swap contracts, if applicable. |
Annual Report
Fidelity Asset Manager 20%
Investment Summary (Unaudited)
The information in the following table is based on the direct investments of the Fund.
Fund Holdings as of September 30, 2008 |
| % of fund's
net assets |
Equity Central Funds | |
Fidelity Financials Central Fund | 2.9 |
Fidelity Information Technology Central Fund | 2.7 |
Fidelity Health Care Central Fund | 2.4 |
Fidelity Industrials Central Fund | 2.2 |
Fidelity Energy Central Fund | 2.0 |
Fidelity Consumer Discretionary Central Fund | 1.9 |
Fidelity Consumer Staples Central Fund | 1.9 |
Fidelity Materials Central Fund | 0.7 |
Fidelity Utilities Central Fund | 0.7 |
Fidelity Telecom Services Central Fund | 0.5 |
Total Equity Central Funds | 17.9 |
Fixed-Income Central Funds | |
Investment Grade Fixed-Income Funds | 47.3 |
High Yield Fixed-Income Funds | 4.8 |
Total Fixed-Income Central Funds | 52.1 |
Money Market Central Funds | 26.5 |
Other Short-Term Investments and Net Other Assets | 3.5 |
Total | 100.0 |
At period end, foreign investments including the Fund's pro-rata share of the underlying Central Funds was 8.3% of net assets.
A holdings listing for the Fund, which presents direct holdings as well as the pro-rata share of any securities and other investments held indirectly through its investment in underlying non-money market Fidelity Central Funds, is available at fidelity.com and/or advisor.fidelity.com, as applicable.
Annual Report
Fidelity Asset Manager 20%
Investments September 30, 2008
Showing Percentage of Net Assets
Equity Central Funds - 17.9% |
| Shares | | Value |
Fidelity Consumer Discretionary Central Fund (c) | 464,228 | | $ 42,899,299 |
Fidelity Consumer Staples Central Fund (c) | 376,453 | | 43,280,780 |
Fidelity Energy Central Fund (c) | 416,109 | | 45,971,670 |
Fidelity Financials Central Fund (c) | 1,017,804 | | 67,032,602 |
Fidelity Health Care Central Fund (c) | 542,393 | | 54,027,771 |
Fidelity Industrials Central Fund (c) | 478,739 | | 50,521,309 |
Fidelity Information Technology Central Fund (c) | 641,036 | | 62,956,141 |
Fidelity Materials Central Fund (c) | 139,413 | | 15,341,018 |
Fidelity Telecom Services Central Fund (c) | 141,217 | | 12,667,166 |
Fidelity Utilities Central Fund (c) | 165,501 | | 15,447,872 |
TOTAL EQUITY CENTRAL FUNDS (Cost $450,570,473) | 410,145,628 |
Fixed-Income Central Funds - 52.1% |
| | | |
Investment Grade Fixed-Income Funds - 47.3% |
Fidelity Tactical Income Central
Fund (c) | 12,051,566 | | 1,082,230,662 |
High Yield Fixed-Income Funds - 4.8% |
Fidelity Floating Rate Central Fund (c) | 798,060 | | 67,675,508 |
Fidelity High Income Central
Fund 1 (c) | 494,043 | | 42,245,646 |
TOTAL HIGH YIELD FIXED-INCOME FUNDS | 109,921,154 |
TOTAL FIXED-INCOME CENTRAL FUNDS (Cost $1,301,464,978) | 1,192,151,816 |
Money Market Central Funds - 26.5% |
| | | |
Fidelity Cash Central Fund, 1.92% (a) | 399,717,455 | | 399,717,455 |
Fidelity Money Market Central Fund, 3.13% (a) | 205,550,134 | | 205,550,134 |
TOTAL MONEY MARKET CENTRAL FUNDS (Cost $605,267,589) | 605,267,589 |
U.S. Treasury Obligations - 0.2% |
| Principal Amount | | |
U.S. Treasury Bills, yield at date of purchase 1.61% to 1.79% 10/2/08 to 12/4/08 (b)
(Cost $3,603,031) | | $ 3,610,000 | | 3,607,262 |
TOTAL INVESTMENT PORTFOLIO - 96.7% (Cost $2,360,906,071) | | 2,211,172,295 |
NET OTHER ASSETS - 3.3% | | 74,522,066 |
NET ASSETS - 100% | $ 2,285,694,361 |
Futures Contracts |
| Expiration Date | | Underlying Face Amount at Value | | Unrealized Appreciation/ (Depreciation) |
Purchased |
Equity Index Contracts |
944 CME E-mini S&P 500 Index Contracts | Dec. 2008 | | $ 55,101,280 | | $ (1,367,696) |
|
The face value of futures purchased as a percentage of net assets - 2.4% |
Legend |
(a) Affiliated fund that is available only to investment companies and other accounts managed by Fidelity Investments. The rate quoted is the annualized seven-day yield of the fund at period end. A complete unaudited listing of the fund's holdings as of its most recent quarter end is available upon request. |
(b) Security or a portion of the security was pledged to cover margin requirements for futures contracts. At the period end, the value of securities pledged amounted to $3,607,262. |
(c) Affiliated fund that is available only to investment companies and other accounts managed by Fidelity Investments. A complete unaudited schedule of portfolio holdings for each Fidelity Central Fund is filed with the SEC for the first and third quarters of each fiscal year on Form N-Q and is available upon request or at the SEC's web site at www.sec.gov. An unaudited holdings listing for the Fund, which presents direct holdings as well as the pro rata share of securities and other investments held indirectly through its investment in underlying non-money market Fidelity Central Funds, is available at fidelity.com and/or advisor.fidelity.com, as applicable. In addition, each Fidelity Central Fund's financial statements, which are not covered by the Fund's Report of Independent Registered Public Accounting Firm, are available on the SEC's web site or upon request. |
Affiliated Central Funds |
Information regarding fiscal year to date income earned by the Fund from investments in Fidelity Central Funds is as follows: |
Fund | Income earned |
Fidelity Cash Central Fund | $ 16,489,202 |
Fidelity Consumer Discretionary Central Fund | 681,483 |
Fidelity Consumer Staples Central Fund | 961,688 |
Fidelity Energy Central Fund | 464,208 |
Fidelity Financials Central Fund | 2,469,629 |
Fidelity Floating Rate Central Fund | 4,151,295 |
Fidelity Health Care Central Fund | 566,719 |
Fidelity High Income Central Fund 1 | 3,532,110 |
Fidelity Industrials Central Fund | 895,762 |
Fidelity Information Technology Central Fund | 561,743 |
Fidelity Materials Central Fund | 331,453 |
Fidelity Money Market Central Fund | 5,405,459 |
Fidelity Security Lending Cash Central Fund | 13 |
Fidelity Tactical Income Central Fund | 60,742,957 |
Fidelity Telecom Services Central Fund | 342,786 |
Fidelity Utilities Central Fund | 404,892 |
Total | $ 98,001,399 |
Additional information regarding the Fund's fiscal year to date purchases and sales, including the ownership percentage, of the non-money market Central Funds is as follows: |
Fund | Value, beginning
of period | Purchases | Sales
Proceeds | Value,
end of period | % ownership,
end of period |
Fidelity Consumer Discretionary Central Fund | $ 48,742,000 | $ 7,818,561 | $ 1,478,152 | $ 42,899,299 | 8.1% |
Fidelity Consumer Staples Central Fund | 39,907,000 | 7,691,211 | 286,155 | 43,280,780 | 8.1% |
Fidelity Energy Central Fund | 50,544,000 | 9,532,230 | 1,797,002 | 45,971,670 | 8.1% |
Fidelity Financials Central Fund | 90,663,000 | 16,765,459 | - | 67,032,602 | 8.1% |
Fidelity Floating Rate Central Fund | 61,332,000 | 15,486,712 | - | 67,675,508 | 2.7% |
Fidelity Health Care Central Fund | 54,673,000 | 9,947,575 | 192,237 | 54,027,771 | 8.1% |
Fidelity High Income Central Fund 1 | 39,618,000 | 9,341,883 | 726,589 | 42,245,646 | 16.9% |
Fidelity Industrials Central Fund | 55,944,000 | 9,669,584 | 2,005,862 | 50,521,309 | 8.1% |
Fidelity Information Technology Central Fund | 78,426,000 | 14,851,589 | - | 62,956,141 | 8.1% |
Fidelity Materials Central Fund | 17,546,000 | 3,171,895 | 473,885 | 15,341,018 | 8.1% |
Fidelity Tactical Income Central Fund | 1,187,781,000 | 60,742,956 | 76,710,124 | 1,082,230,662 | 26.8% |
Fidelity Telecom Services Central Fund | 16,929,000 | 3,460,426 | - | 12,667,166 | 8.1% |
Fidelity Utilities Central Fund | 17,006,000 | 3,319,929 | - | 15,447,872 | 8.1% |
Total | $ 1,759,111,000 | $ 171,800,010 | $ 83,670,006 | $ 1,602,297,444 | |
Income Tax Information |
The fund intends to elect to defer to its fiscal year ending September 30, 2009 approximately $69,973,438 of losses recognized during the period November 1, 2007 to September 30, 2008. |
See accompanying notes which are an integral part of the financial statements.
Annual Report
Fidelity Asset Manager 20%
Financial Statements
Statement of Assets and Liabilities
| September 30, 2008 |
| | |
Assets | | |
Investment in securities, at value - See accompanying schedule: Unaffiliated issuers (cost $3,603,031) | $ 3,607,262 | |
Fidelity Central Funds (cost $2,357,303,040) | 2,207,565,033 | |
Total Investments (cost $2,360,906,071) | | $ 2,211,172,295 |
Receivable for investments sold | | 76,710,123 |
Receivable for fund shares sold | | 4,879,263 |
Distributions receivable from Fidelity Central Funds | | 6,910,881 |
Receivable for daily variation on futures contracts | | 2,293,919 |
Prepaid expenses | | 1,431 |
Receivable from investment adviser for expense reductions | | 77 |
Other receivables | | 2,375 |
Total assets | | 2,301,970,364 |
| | |
Liabilities | | |
Payable for investments purchased | $ 5,578,298 | |
Payable for fund shares redeemed | 9,541,418 | |
Accrued management fee | 828,549 | |
Distribution fees payable | 8,389 | |
Other affiliated payables | 275,278 | |
Other payables and accrued expenses | 44,071 | |
Total liabilities | | 16,276,003 |
| | |
Net Assets | | $ 2,285,694,361 |
Net Assets consist of: | | |
Paid in capital | | $ 2,498,607,571 |
Undistributed net investment income | | 11,795,814 |
Accumulated undistributed net realized gain (loss) on investments | | (73,607,552) |
Net unrealized appreciation (depreciation) on investments | | (151,101,472) |
Net Assets | | $ 2,285,694,361 |
| | |
Calculation of Maximum Offering Price Class A:
Net Asset Value and redemption price per share ($8,030,406 ÷ 707,729 shares) | | $ 11.35 |
| | |
Maximum offering price per share (100/94.25 of $11.35) | | $ 12.04 |
Class T:
Net Asset Value and redemption price per share ($4,914,664 ÷ 433,806 shares) | | $ 11.33 |
| | |
Maximum offering price per share (100/96.50 of $11.33) | | $ 11.74 |
Class B:
Net Asset Value and offering price per share ($1,974,774 ÷ 174,523 shares)A | | $ 11.32 |
| | |
Class C:
Net Asset Value and offering price per share ($3,668,173 ÷ 324,415 shares)A | | $ 11.31 |
| | |
| | |
Asset Manager 20%:
Net Asset Value, offering price and redemption price per share ($2,265,384,037 ÷ 199,443,138 shares) | | $ 11.36 |
| | |
Institutional Class:
Net Asset Value, offering price and redemption price per share ($1,722,307 ÷ 151,681 shares) | | $ 11.35 |
A Redemption price per share is equal to net asset value less any applicable contingent deferred sales charge.
See accompanying notes which are an integral part of the financial statements.
Annual Report
Fidelity Asset Manager 20%
Financial Statements - continued
Statement of Operations
| Year ended September 30, 2008 |
| | |
Investment Income | | |
Interest | | $ 2,582,587 |
Income from Fidelity Central Funds | | 98,001,399 |
Total income | | 100,583,986 |
| | |
Expenses | | |
Management fee | $ 10,330,950 | |
Transfer agent fees | 2,571,229 | |
Distribution fees | 82,764 | |
Accounting fees and expenses | 806,153 | |
Custodian fees and expenses | 5,241 | |
Independent trustees' compensation | 10,162 | |
Registration fees | 132,869 | |
Audit | 66,001 | |
Legal | 19,452 | |
Miscellaneous | 35,554 | |
Total expenses before reductions | 14,060,375 | |
Expense reductions | (61,790) | 13,998,585 |
Net investment income (loss) | | 86,585,401 |
Realized and Unrealized Gain (Loss) Net realized gain (loss) on: | | |
Investment securities: | | |
Unaffiliated issuers | 328,965 | |
Fidelity Central Funds | (6,407,818) | |
Futures contracts | (11,991,143) | |
Total net realized gain (loss) | | (18,069,996) |
Change in net unrealized appreciation (depreciation) on: Investment securities | (238,533,322) | |
Futures contracts | (2,742,149) | |
Total change in net unrealized appreciation (depreciation) | | (241,275,471) |
Net gain (loss) | | (259,345,467) |
Net increase (decrease) in net assets resulting from operations | | $ (172,760,066) |
Statement of Changes in Net Assets
| Year ended
September 30, 2008 | Year ended
September 30, 2007 |
Increase (Decrease) in Net Assets | | |
Operations | | |
Net investment income (loss) | $ 86,585,401 | $ 96,617,040 |
Net realized gain (loss) | (18,069,996) | 9,978,060 |
Change in net unrealized appreciation (depreciation) | (241,275,471) | 54,096,502 |
Net increase (decrease) in net assets resulting from operations | (172,760,066) | 160,691,602 |
Distributions to shareholders from net investment income | (91,104,113) | (97,255,232) |
Distributions to shareholders from net realized gain | (49,576,396) | (97,648,324) |
Total distributions | (140,680,509) | (194,903,556) |
Share transactions - net increase (decrease) | 79,342,713 | 423,253,884 |
Total increase (decrease) in net assets | (234,097,862) | 389,041,930 |
| | |
Net Assets | | |
Beginning of period | 2,519,792,223 | 2,130,750,293 |
End of period (including undistributed net investment income of $11,795,814 and undistributed net investment income of $12,670,043, respectively) | $ 2,285,694,361 | $ 2,519,792,223 |
See accompanying notes which are an integral part of the financial statements.
Annual Report
Financial Highlights - Class A
Years ended September 30, | 2008 | 2007 G |
Selected Per-Share Data | | |
Net asset value, beginning of period | $ 12.90 | $ 13.13 |
Income from Investment Operations | | |
Net investment income (loss) E | .39 | .48 |
Net realized and unrealized gain (loss) | (1.27) | .40 |
Total from investment operations | (.88) | .88 |
Distributions from net investment income | (.42) | (.52) |
Distributions from net realized gain | (.25) | (.59) |
Total distributions | (.67) | (1.11) |
Net asset value, end of period | $ 11.35 | $ 12.90 |
Total Return B, C, D | (7.18)% | 7.03% |
Ratios to Average Net Assets H | | |
Expenses before reductions | .86% | .87% A |
Expenses net of fee waivers, if any | .86% | .87% A |
Expenses net of all reductions | .86% | .87% A |
Net investment income (loss) | 3.18% | 3.84% A |
Supplemental Data | | |
Net assets, end of period (000 omitted) | $ 8,030 | $ 3,422 |
Portfolio turnover rate F | 5% | 6% |
A Annualized
B Total returns for periods of less than one year are not annualized.
C Total returns would have been lower had certain expenses not been reduced during the periods shown.
D Total returns do not include the effect of the sales charges.
E Calculated based on average shares outstanding during the period.
F Amount does not include the portfolio activity of any underlying Fidelity Central Funds.
G For the period October 2, 2006 (commencement of sale of shares) to September 30, 2007.
H Expense ratios reflect operating expenses of the class. Expenses before reductions do not reflect amounts reimbursed by the investment adviser or reductions from brokerage service arrangements or other expense offset arrangements and do not represent the amount paid by the class during periods when reimbursements or reductions occur. Expense ratios before reductions for start-up periods may not be representative of longer-term operating periods. Expenses net of fee waivers reflect expenses after reimbursement by the investment adviser but prior to reductions from brokerage service arrangements or other expense offset arrangements. Expenses net of all reductions represent the net expenses paid by the class. Fees and expenses of the underlying Fidelity Central Funds are not included in the Fund's expense ratio. The Fund indirectly bears its proportionate share of the expenses of any underlying Fidelity Central Funds. Based on their most recent shareholder report date, the expenses ranged from less than .01% to .03%.
Financial Highlights - Class T
Years ended September 30, | 2008 | 2007 G |
Selected Per-Share Data | | |
Net asset value, beginning of period | $ 12.88 | $ 13.13 |
Income from Investment Operations | | |
Net investment income (loss) E | .36 | .45 |
Net realized and unrealized gain (loss) | (1.28) | .40 |
Total from investment operations | (.92) | .85 |
Distributions from net investment income | (.38) | (.51) |
Distributions from net realized gain | (.25) | (.59) |
Total distributions | (.63) | (1.10) |
Net asset value, end of period | $ 11.33 | $ 12.88 |
Total Return B, C, D | (7.43)% | 6.75% |
Ratios to Average Net Assets H | | |
Expenses before reductions | 1.12% | 1.11% A |
Expenses net of fee waivers, if any | 1.12% | 1.11% A |
Expenses net of all reductions | 1.12% | 1.11% A |
Net investment income (loss) | 2.93% | 3.60% A |
Supplemental Data | | |
Net assets, end of period (000 omitted) | $ 4,915 | $ 3,954 |
Portfolio turnover rate F | 5% | 6% |
A Annualized
B Total returns for periods of less than one year are not annualized.
C Total returns would have been lower had certain expenses not been reduced during the periods shown.
D Total returns do not include the effect of the sales charges.
E Calculated based on average shares outstanding during the period.
F Amount does not include the portfolio activity of any underlying Fidelity Central Funds.
G For the period October 2, 2006 (commencement of sale of shares) to September 30, 2007.
H Expense ratios reflect operating expenses of the class. Expenses before reductions do not reflect amounts reimbursed by the investment adviser or reductions from brokerage service arrangements or other expense offset arrangements and do not represent the amount paid by the class during periods when reimbursements or reductions occur. Expense ratios before reductions for start-up periods may not be representative of longer-term operating periods. Expenses net of fee waivers reflect expenses after reimbursement by the investment adviser but prior to reductions from brokerage service arrangements or other expense offset arrangements. Expenses net of all reductions represent the net expenses paid by the class. Fees and expenses of the underlying Fidelity Central Funds are not included in the Fund's expense ratio. The Fund indirectly bears its proportionate share of the expenses of any underlying Fidelity Central Funds. Based on their most recent shareholder report date, the expenses ranged from less than .01% to .03%.
See accompanying notes which are an integral part of the financial statements.
Annual Report
Financial Highlights - Class B
Years ended September 30, | 2008 | 2007 G |
Selected Per-Share Data | | |
Net asset value, beginning of period | $ 12.87 | $ 13.13 |
Income from Investment Operations | | |
Net investment income (loss) E | .29 | .39 |
Net realized and unrealized gain (loss) | (1.27) | .38 |
Total from investment operations | (.98) | .77 |
Distributions from net investment income | (.32) | (.44) |
Distributions from net realized gain | (.25) | (.59) |
Total distributions | (.57) | (1.03) |
Net asset value, end of period | $ 11.32 | $ 12.87 |
Total Return B, C, D | (7.89)% | 6.13% |
Ratios to Average Net Assets H | | |
Expenses before reductions | 1.67% | 1.65% A |
Expenses net of fee waivers, if any | 1.66% | 1.65% A |
Expenses net of all reductions | 1.66% | 1.65% A |
Net investment income (loss) | 2.38% | 3.06% A |
Supplemental Data | | |
Net assets, end of period (000 omitted) | $ 1,975 | $ 991 |
Portfolio turnover rate F | 5% | 6% |
A Annualized
B Total returns for periods of less than one year are not annualized.
C Total returns would have been lower had certain expenses not been reduced during the periods shown.
D Total returns do not include the effect of the contingent deferred sales charge.
E Calculated based on average shares outstanding during the period.
F Amount does not include the portfolio activity of any underlying Fidelity Central Funds.
G For the period October 2, 2006 (commencement of sale of shares) to September 30, 2007.
H Expense ratios reflect operating expenses of the class. Expenses before reductions do not reflect amounts reimbursed by the investment adviser or reductions from brokerage service arrangements or other expense offset arrangements and do not represent the amount paid by the class during periods when reimbursements or reductions occur. Expense ratios before reductions for start-up periods may not be representative of longer-term operating periods. Expenses net of fee waivers reflect expenses after reimbursement by the investment adviser but prior to reductions from brokerage service arrangements or other expense offset arrangements. Expenses net of all reductions represent the net expenses paid by the class. Fees and expenses of the underlying Fidelity Central Funds are not included in the Fund's expense ratio. The Fund indirectly bears its proportionate share of the expenses of any underlying Fidelity Central Funds. Based on their most recent shareholder report date, the expenses ranged from less than .01 to .03%.
Financial Highlights - Class C
Years ended September 30, | 2008 | 2007 G |
Selected Per-Share Data | | |
Net asset value, beginning of period | $ 12.86 | $ 13.13 |
Income from Investment Operations | | |
Net investment income (loss) E | .29 | .39 |
Net realized and unrealized gain (loss) | (1.26) | .38 |
Total from investment operations | (.97) | .77 |
Distributions from net investment income | (.33) | (.45) |
Distributions from net realized gain | (.25) | (.59) |
Total distributions | (.58) | (1.04) |
Net asset value, end of period | $ 11.31 | $ 12.86 |
Total Return B, C, D | (7.87)% | 6.15% |
Ratios to Average Net Assets H | | |
Expenses before reductions | 1.65% | 1.64%A |
Expenses net of fee waivers, if any | 1.65% | 1.64%A |
Expenses net of all reductions | 1.64% | 1.64%A |
Net investment income (loss) | 2.40% | 3.07%A |
Supplemental Data | | |
Net assets, end of period (000 omitted) | $ 3,668 | $ 1,697 |
Portfolio turnover rate F | 5% | 6% |
A Annualized
B Total returns for periods of less than one year are not annualized.
C Total returns would have been lower had certain expenses not been reduced during the periods shown.
D Total returns do not include the effect of the contingent deferred sales charge.
E Calculated based on average shares outstanding during the period.
F Amount does not include the portfolio activity of any underlying Fidelity Central Funds.
G For the period October 2, 2006 (commencement of sale of shares) to September 30, 2007.
H Expense ratios reflect operating expenses of the class. Expenses before reductions do not reflect amounts reimbursed by the investment adviser or reductions from brokerage service arrangements or other expense offset arrangements and do not represent the amount paid by the class during periods when reimbursements or reductions occur. Expense ratios before reductions for start-up periods may not be representative of longer-term operating periods. Expenses net of fee waivers reflect expenses after reimbursement by the investment adviser but prior to reductions from brokerage service arrangements or other expense offset arrangements. Expenses net of all reductions represent the net expenses paid by the class. Fees and expenses of the underlying Fidelity Central Funds are not included in the Fund's expense ratio. The Fund indirectly bears its proportionate share of the expenses of any underlying Fidelity Central Funds. Based on their most recent shareholder report date, the expenses ranged from less than .01% to .03%.
See accompanying notes which are an integral part of the financial statements.
Annual Report
Financial Highlights - Asset Manager 20%
Years ended September 30, | 2008 | 2007 | 2006 | 2005 | 2004 |
Selected Per-Share Data | | | | | |
Net asset value, beginning of period | $ 12.91 | $ 13.14 | $ 13.00 | $ 12.25 | $ 11.80 |
Income from Investment Operations | | | | | |
Net investment income (loss) B | .43 | .53 | .46 | .33 | .23 |
Net realized and unrealized gain (loss) | (1.28) | .38 | .39 | .74 | .45 |
Total from investment operations | (.85) | .91 | .85 | 1.07 | .68 |
Distributions from net investment income | (.45) | (.55) | (.43) | (.32) | (.23) |
Distributions from net realized gain | (.25) | (.59) | (.28) | - | - |
Total distributions | (.70) | (1.14) | (.71) | (.32) | (.23) |
Net asset value, end of period | $ 11.36 | $ 12.91 | $ 13.14 | $ 13.00 | $ 12.25 |
Total Return A | (6.90)% | 7.26% | 6.77% | 8.85% | 5.80% |
Ratios to Average Net Assets D | | | | | |
Expenses before reductions | .56% | .57% | .58% | .60% | .63% |
Expenses net of fee waivers, if any | .56% | .57% | .58% | .60% | .63% |
Expenses net of all reductions | .56% | .57% | .57% | .58% | .61% |
Net investment income (loss) | 3.48% | 4.15% | 3.58% | 2.64% | 1.86% |
Supplemental Data | | | | | |
Net assets, end of period (000 omitted) | $ 2,265,384 | $ 2,509,481 | $ 2,130,750 | $ 1,724,038 | $ 1,395,000 |
Portfolio turnover rate C | 5% | 6% | 81% E | 81% E | 232% |
A Total returns would have been lower had certain expenses not been reduced during the periods shown.
B Calculated based on average shares outstanding during the period.
C Amount does not include the portfolio activity of any underlying Fidelity Central Funds.
D Expense ratios reflect operating expenses of the class. Expenses before reductions do not reflect amounts reimbursed by the investment adviser or reductions from brokerage service arrangements or other expense offset arrangements and do not represent the amount paid by the class during periods when reimbursements or reductions occur. Expenses net of fee waivers reflect expenses after reimbursement by the investment adviser but prior to reductions from brokerage service arrangements or other expense offset arrangements. Expenses net of all reductions represent the net expenses paid by the class. Fees and expenses of the underlying Fidelity Central Funds are not included in the Fund's expense ratio. The Fund indirectly bears its proportionate share of the expenses of any underlying Fidelity Central Funds. Based on their most recent shareholder report date, the expenses ranged from less than .01% to .03%.
E Portfolio turnover rate excludes securities received or delivered in-kind.
Financial Highlights - Institutional Class
Years ended September 30, | 2008 | 2007 F |
Selected Per-Share Data | | |
Net asset value, beginning of period | $ 12.90 | $ 13.13 |
Income from Investment Operations | | |
Net investment income (loss) D | .42 | .53 |
Net realized and unrealized gain (loss) | (1.27) | .38 |
Total from investment operations | (.85) | .91 |
Distributions from net investment income | (.45) | (.55) |
Distributions from net realized gain | (.25) | (.59) |
Total distributions | (.70) | (1.14) |
Net asset value, end of period | $ 11.35 | $ 12.90 |
Total Return B, C | (6.91)% | 7.24% |
Ratios to Average Net Assets | | |
Expenses before reductions | .57% | .59% A |
Expenses net of fee waivers, if any | .57% | .59% A |
Expenses net of all reductions | .56% | .59% A |
Net investment income (loss) | 3.48% | 4.13% A |
Supplemental Data | | |
Net assets, end of period (000 omitted) | $ 1,722 | $ 248 |
Portfolio turnover rate E | 5% | 6% |
A Annualized
B Total returns for periods of less than one year are not annualized.
C Total returns would have been lower had certain expenses not been reduced during the periods shown.
D Calculated based on average shares outstanding during the period.
E Amount does not include the portfolio activity of any underlying Fidelity Central Funds.
F For the period October 2, 2006 (commencement of sale of shares) to September 30, 2007.
G Expense ratios reflect operating expenses of the class. Expenses before reductions do not reflect amounts reimbursed by the investment adviser or reductions from brokerage service arrangements or other expense offset arrangements and do not represent the amount paid by the class during periods when reimbursements or reductions occur. Expense ratios before reductions for start-up periods may not be representative of longer-term operating periods. Expenses net of fee waivers reflect expenses after reimbursement by the investment adviser but prior to reductions from brokerage service arrangements or other expense offset arrangements. Expenses net of all reductions represent the net expenses paid by the class. Fees and expenses of the underlying Fidelity Central Funds are not included in the Fund's expense ratio. The Fund indirectly bears its proportionate share of the expenses of any underlying Fidelity Central Funds. Based on their most recent shareholder report date, the expenses ranged from less than .01% to .03%.
See accompanying notes which are an integral part of the financial statements.
Annual Report
Fidelity Asset Manager 30%
Investment Changes (Unaudited)
The information in the following tables is based on the combined investments of the Fund and its pro-rata share of the investments of Fidelity's Equity and Fixed-Income Central Funds.
Top Five Bond Issuers as of September 30, 2008 |
(with maturities greater than one year) | % of fund's
net assets | % of fund's net assets
6 months ago |
Fannie Mae | 16.5 | 15.4 |
Freddie Mac | 6.3 | 5.4 |
U.S. Treasury Obligations | 2.7 | 5.0 |
Government National Mortgage Association | 2.4 | 1.8 |
Wells Fargo Mortgage Backed Securities Trust | 0.4 | 0.5 |
| 28.3 | |
Quality Diversification (% of fund's net assets) |
As of September 30, 2008 | As of March 31, 2008 |
| U.S. Government and
U.S. Government
Agency Obligations 29.0% | | | U.S. Government and
U.S. Government
Agency Obligations 27.8% | |
| AAA,AA,A 13.6% | | | AAA,AA,A 12.0% | |
| BBB 9.7% | | | BBB 8.6% | |
| BB and Below 5.9% | | | BB and Below 4.6% | |
| Not Rated 0.7% | | | Not Rated 0.4% | |
| Equities 30.8% | | | Equities 30.2% | |
| Short-Term
Investments and
Net Other Assets 10.3% | | | Short-Term
Investments and
Net Other Assets 16.4% | |

We have used ratings from Moody's® Investors Services, Inc. Where Moody's ratings are not available, we have used S&P® ratings. All ratings are as of the report date and do not reflect subsequent downgrades. Percentages are adjusted for the effect of futures contracts, if applicable. |
Top Five Stocks as of September 30, 2008 |
| % of fund's
net assets | % of fund's net assets
6 months ago |
Apple, Inc. | 0.5 | 0.1 |
Procter & Gamble Co. | 0.5 | 0.5 |
General Electric Co. | 0.4 | 0.3 |
Bank of America Corp. | 0.4 | 0.2 |
JPMorgan Chase & Co. | 0.4 | 0.3 |
| 2.2 | |
Asset Allocation (% of fund's net assets) |
As of September 30, 2008 | As of March 31, 2008 |
| Stock class and
Equity Futures 31.0% | | | Stock class and
Equity Futures 30.2% | |
| Bond class 65.4% | | | Bond class 53.6% | |
| Short-term class 3.6% | | | Short-term class 16.2% | |
| | | | | |
| | | | | |
Asset allocations in the pie charts reflect the categorization of assets as defined in the Fund's prospectus in effect as of the time periods indicated above. Percentages are adjusted for the effect of futures contracts and swap contracts, if applicable. |
Annual Report
Fidelity Asset Manager 30%
Investment Summary (Unaudited)
The information in the following table is based on the direct investments of the Fund.
Fund Holdings as of September 30, 2008 |
| % of fund's
net assets |
Equity Central Funds | |
Fidelity Financials Central Fund | 5.0 |
Fidelity Information Technology Central Fund | 4.7 |
Fidelity Health Care Central Fund | 4.0 |
Fidelity Industrials Central Fund | 3.7 |
Fidelity Energy Central Fund | 3.4 |
Fidelity Consumer Discretionary Central Fund | 3.2 |
Fidelity Consumer Staples Central Fund | 3.2 |
Fidelity Materials Central Fund | 1.1 |
Fidelity Utilities Central Fund | 1.1 |
Fidelity Telecom Services Central Fund | 0.9 |
Total Equity Central Funds | 30.3 |
Fixed-Income Central Funds | |
Investment Grade Fixed-Income Funds | 45.6 |
High Yield Fixed-Income Funds | 5.4 |
Total Fixed-Income Central Funds | 51.0 |
Money Market Central Funds | 7.8 |
Other Short-Term Investments and Net Other Assets | 10.9 |
Total | 100.0 |
At period end, foreign investments including the Fund's pro-rata share of the underlying Central Funds was 10.2% of net assets.
A holdings listing for the Fund, which presents direct holdings as well as the pro-rata share of any securities and other investments held indirectly through its investment in underlying non-money market Fidelity Central Funds, is available at fidelity.com and/or advisor.fidelity.com, as applicable.
Annual Report
Fidelity Asset Manager 30%
Investments September 30, 2008
Showing Percentage of Net Assets
Equity Central Funds - 30.3% |
| Shares | | Value |
Fidelity Consumer Discretionary Central Fund (c) | 10,443 | | $ 965,072 |
Fidelity Consumer Staples Central Fund (c) | 8,468 | | 973,588 |
Fidelity Energy Central Fund (c) | 9,360 | | 1,034,093 |
Fidelity Financials Central Fund (c) | 22,895 | | 1,507,852 |
Fidelity Health Care Central Fund (c) | 12,201 | | 1,215,308 |
Fidelity Industrials Central Fund (c) | 10,769 | | 1,136,447 |
Fidelity Information Technology Central Fund (c) | 14,420 | | 1,416,220 |
Fidelity Materials Central Fund (c) | 3,137 | | 345,142 |
Fidelity Telecom Services Central Fund (c) | 3,177 | | 285,000 |
Fidelity Utilities Central Fund (c) | 3,723 | | 347,516 |
TOTAL EQUITY CENTRAL FUNDS (Cost $11,149,154) | 9,226,238 |
Fixed-Income Central Funds - 51.0% |
| | | |
Investment Grade Fixed-Income Funds - 45.6% |
Fidelity Tactical Income Central Fund (c) | 154,524 | | 13,876,261 |
High Yield Fixed-Income Funds - 5.4% |
Fidelity Floating Rate Central Fund (c) | 11,954 | | 1,013,697 |
Fidelity High Income Central Fund 1 (c) | 7,456 | | 637,595 |
TOTAL HIGH YIELD FIXED-INCOME FUNDS | 1,651,292 |
TOTAL FIXED-INCOME CENTRAL FUNDS (Cost $16,612,497) | 15,527,553 |
Money Market Central Funds - 7.8% |
| | | |
Fidelity Cash Central Fund, 1.92% (a)
(Cost $2,358,372) | 2,358,372 | | 2,358,372 |
U.S. Treasury Obligations - 0.3% |
| Principal Amount | | |
U.S. Treasury Bills, yield at date of purchase 1.59% to 1.68% 10/16/08 to 12/4/08 (b)
(Cost $99,813) | | $ 100,000 | | 99,912 |
TOTAL INVESTMENT PORTFOLIO - 89.4% (Cost $30,219,836) | | 27,212,075 |
NET OTHER ASSETS - 10.6% | | 3,220,883 |
NET ASSETS - 100% | $ 30,432,958 |
Futures Contracts |
| Expiration Date | | Underlying Face Amount at Value | | Unrealized Appreciation/
(Depreciation) |
Purchased |
Equity Index Contracts |
7 CME E-mini S&P 500 Index Contracts | Dec. 2008 | | $ 408,590 | | $ (10,142) |
|
The face value of futures purchased as a percentage of net assets - 1.3% |
Legend |
(a) Affiliated fund that is available only to investment companies and other accounts managed by Fidelity Investments. The rate quoted is the annualized seven-day yield of the fund at period end. A complete unaudited listing of the fund's holdings as of its most recent quarter end is available upon request. |
(b) Security or a portion of the security was pledged to cover margin requirements for futures contracts. At the period end, the value of securities pledged amounted to $99,912. |
(c) Affiliated fund that is available only to investment companies and other accounts managed by Fidelity Investments. A complete unaudited schedule of portfolio holdings for each Fidelity Central Fund is filed with the SEC for the first and third quarters of each fiscal year on Form N-Q and is available upon request or at the SEC's web site at www.sec.gov. An unaudited holdings listing for the Fund, which presents direct holdings as well as the pro rata share of securities and other investments held indirectly through its investment in underlying non-money market Fidelity Central Funds, is available at fidelity.com and/or advisor.fidelity.com, as applicable. In addition, each Fidelity Central Fund's financial statements, which are not covered by the Fund's Report of Independent Registered Public Accounting Firm, are available on the SEC's web site or upon request. |
Affiliated Central Funds |
Information regarding fiscal year to date income earned by the Fund from investments in Fidelity Central Funds is as follows: |
Fund | Income earned |
Fidelity Cash Central Fund | $ 126,630 |
Fidelity Consumer Discretionary Central Fund | 11,313 |
Fidelity Consumer Staples Central Fund | 17,493 |
Fidelity Energy Central Fund | 7,904 |
Fidelity Financials Central Fund | 41,255 |
Fidelity Floating Rate Central Fund | 31,738 |
Fidelity Health Care Central Fund | 9,870 |
Fidelity High Income Central Fund 1 | 41,594 |
Fidelity Industrials Central Fund | 15,847 |
Fidelity Information Technology Central Fund | 10,350 |
Fidelity Materials Central Fund | 5,127 |
Fidelity Tactical Income Central Fund | 543,253 |
Fidelity Telecom Services Central Fund | 5,543 |
Fidelity Utilities Central Fund | 6,603 |
Total | $ 874,520 |
Additional information regarding the Fund's fiscal year to date purchases and sales, including the ownership percentage, of the non-money market Central Funds is as follows: |
Fund | Value, beginning of period | Purchases | Sales
Proceeds | Value,
end of period | % ownership, end of period |
Fidelity Consumer Discretionary Central Fund | $ - | $ 1,300,434 | $ 212,724 | $ 965,072 | 0.2% |
Fidelity Consumer Staples Central Fund | - | 1,226,622 | 182,341 | 973,588 | 0.2% |
Fidelity Energy Central Fund | - | 1,569,570 | 231,401 | 1,034,093 | 0.2% |
Fidelity Financials Central Fund | - | 2,321,162 | 273,823 | 1,507,852 | 0.2% |
Fidelity Floating Rate Central Fund | - | 1,106,392 | - | 1,013,697 | 0.0% |
Fidelity Health Care Central Fund | - | 1,629,474 | 227,457 | 1,215,308 | 0.2% |
Fidelity High Income Central Fund 1 | - | 791,216 | 84,098 | 637,595 | 0.3% |
Fidelity Industrials Central Fund | - | 1,570,303 | 258,828 | 1,136,447 | 0.2% |
Fidelity Information Technology Central Fund | - | 2,100,972 | 275,186 | 1,416,220 | 0.2% |
Fidelity Materials Central Fund | - | 512,585 | 78,086 | 345,142 | 0.2% |
Fidelity Tactical Income Central Fund | - | 18,003,783 | 2,950,377 | 13,876,261 | 0.3% |
Fidelity Telecom Services Central Fund | - | 434,178 | 54,899 | 285,000 | 0.2% |
Fidelity Utilities Central Fund | - | 524,152 | 66,721 | 347,516 | 0.2% |
Total | $ - | $ 33,090,843 | $ 4,895,941 | $ 24,753,791 | |
Other Information (Unaudited) |
The information in the following table is based on the combined investment of the Fund and its pro-rata share of the investments of Fidelity's Equity and Fixed-Income Central Funds. |
Distribution of investments by country of issue, as a percentage of total net assets, is as follows. Percentages are adjusted for the effect of future contracts, if applicable. |
United States of America | 89.8% |
United Kingdom | 1.9% |
Bermuda | 1.4% |
Canada | 1.4% |
Others (individually less than 1%) | 5.5% |
| 100.0% |
Income Tax Information |
At September 30, 2008, the fund had a capital loss carryforward of approximately $10,213 all of which will expire on September 30, 2016. |
The fund intends to elect to defer to its fiscal year ending September 30, 2009 approximately $1,196,733 of losses recognized during the period November 1, 2007 to September 30, 2008. |
See accompanying notes which are an integral part of the financial statements.
Annual Report
Fidelity Asset Manager 30%
Financial Statements
Statement of Assets and Liabilities
| September 30, 2008 |
| | |
Assets | | |
Investment in securities, at value - See accompanying schedule: Unaffiliated issuers (cost $99,813) | $ 99,912 | |
Fidelity Central Funds (cost $30,120,023) | 27,112,163 | |
Total Investments (cost $30,219,836) | | $ 27,212,075 |
Receivable for investments sold | | 2,950,379 |
Receivable for fund shares sold | | 305,106 |
Distributions receivable from Fidelity Central Funds | | 92,916 |
Receivable for daily variation on futures contracts | | 17,010 |
Prepaid expenses | | 1 |
Receivable from investment adviser for expense reductions | | 46,977 |
Total assets | | 30,624,464 |
| | |
Liabilities | | |
Payable for investments purchased | $ 81,331 | |
Payable for fund shares redeemed | 61,048 | |
Accrued management fee | 12,234 | |
Distribution fees payable | 2,159 | |
Other affiliated payables | 4,732 | |
Other payables and accrued expenses | 30,002 | |
Total liabilities | | 191,506 |
| | |
Net Assets | | $ 30,432,958 |
Net Assets consist of: | | |
Paid in capital | | $ 33,932,858 |
Undistributed net investment income | | 143,916 |
Accumulated undistributed net realized gain (loss) on investments | | (625,913) |
Net unrealized appreciation (depreciation) on investments | | (3,017,903) |
Net Assets | | $ 30,432,958 |
| | |
Calculation of Maximum Offering Price Class A:
Net Asset Value and redemption price per share ($1,158,843 ÷ 133,868 shares) | | $ 8.66 |
| | |
Maximum offering price per share (100/94.25 of $8.66) | | $ 9.19 |
Class T:
Net Asset Value and redemption price per share ($1,073,595 ÷ 124,068 shares) | | $ 8.65 |
| | |
Maximum offering price per share (100/96.50 of $8.65) | | $ 8.96 |
Class B:
Net Asset Value and offering price per share ($480,437 ÷ 55,549 shares)A | | $ 8.65 |
| | |
Class C:
Net Asset Value and offering price per share ($1,495,201 ÷ 173,104 shares)A | | $ 8.64 |
| | |
| | |
Asset Manager 30%:
Net Asset Value, offering price and redemption price per share ($26,015,730 ÷ 3,003,894 shares) | | $ 8.66 |
| | |
Instutional Class:
Net Asset Value, offering price and redemption price per share ($209,152 ÷ 24,150 shares) | | $ 8.66 |
A Redemption price per share is equal to net asset value less any applicable contingent deferred sales charge.
See accompanying notes which are an integral part of the financial statements.
Annual Report
Fidelity Asset Manager 30%
Financial Statements - continued
Statement of Operations
For the period October 9, 2007 (commencement of operations) to September 30, 2008 |
| | |
Investment Income | | |
Interest | | $ 15,347 |
Income from Fidelity Central Funds | | 874,520 |
Total income | | 889,867 |
| | |
Expenses | | |
Management fee | $ 102,657 | |
Transfer agent fees | 28,798 | |
Distribution fees | 13,809 | |
Accounting fees and expenses | 10,257 | |
Custodian fees and expenses | 4,989 | |
Independent trustees' compensation | 88 | |
Registration fees | 125,968 | |
Audit | 36,904 | |
Legal | 49 | |
Miscellaneous | 2,038 | |
Total expenses before reductions | 325,557 | |
Expense reductions | (133,170) | 192,387 |
Net investment income (loss) | | 697,480 |
Realized and Unrealized Gain (Loss) Net realized gain (loss) on: | | |
Investment securities: | | |
Fidelity Central Funds | (433,159) | |
Futures contracts | (151,102) | |
Total net realized gain (loss) | | (584,261) |
Change in net unrealized appreciation (depreciation) on: Investment securities | (3,007,761) | |
Futures contracts | (10,142) | |
Total change in net unrealized appreciation (depreciation) | | (3,017,903) |
Net gain (loss) | | (3,602,164) |
Net increase (decrease) in net assets resulting from operations | | $ (2,904,684) |
Statement of Changes in Net Assets
| For the period
October 9, 2007 (commencement of operations) to September 30, 2008 |
Increase (Decrease) in Net Assets | |
Operations | |
Net investment income (loss) | $ 697,480 |
Net realized gain (loss) | (584,261) |
Change in net unrealized appreciation (depreciation) | (3,017,903) |
Net increase (decrease) in net assets resulting from operations | (2,904,684) |
Distributions to shareholders from net investment income | (595,233) |
Share transactions - net increase (decrease) | 33,932,875 |
Total increase (decrease) in net assets | 30,432,958 |
| |
Net Assets | |
Beginning of period | - |
End of period (including undistributed net investment income of $143,916) | $ 30,432,958 |
See accompanying notes which are an integral part of the financial statements.
Annual Report
Financial Highlights - Class A
Year ended September 30, | 2008 G |
Selected Per-Share Data | |
Net asset value, beginning of period | $ 10.00 |
Income from Investment Operations | |
Net investment income (loss) E | .24 |
Net realized and unrealized gain (loss) | (1.39) |
Total from investment operations | (1.15) |
Distributions from net investment income | (.19) |
Net asset value, end of period | $ 8.66 |
Total Return B, C, D | (11.63)% |
Ratios to Average Net Assets H | |
Expenses before reductions | 1.66% A |
Expenses net of fee waivers, if any | .98% A |
Expenses net of all reductions | .98% A |
Net investment income (loss) | 2.63% A |
Supplemental Data | |
Net assets, end of period (000 omitted) | $ 1,159 |
Portfolio turnover rate F | 24%A |
A Annualized
B Total returns for periods of less than one year are not annualized.
C Total returns would have been lower had certain expenses not been reduced during the periods shown.
D Total returns do not include the effect of the sales charges.
E Calculated based on average shares outstanding during the period.
F Amount does not include the portfolio activity of any underlying Fidelity Central Funds.
G For the period October 9, 2007 (commencement of operations) to September 30, 2008.
H Expense ratios reflect operating expenses of the class. Expenses before reductions do not reflect amounts reimbursed by the investment adviser or reductions from brokerage service arrangements or other expense offset arrangements and do not represent the amount paid by the class during periods when reimbursements or reductions occur. Expense ratios before reductions for start-up periods may not be representative of longer-term operating periods. Expenses net of fee waivers reflect expenses after reimbursement by the investment adviser but prior to reductions from brokerage service arrangements or other expense offset arrangements. Expenses net of all reductions represent the net expenses paid by the class. Fees and expenses of the underlying Fidelity Central Funds are not included in the Fund's expense ratio. The Fund indirectly bears its proportionate share of the expenses of any underlying Fidelity Central Funds. Based on their most recent shareholder report date, the expenses ranged from less than .01% to .03%.
Financial Highlights - Class T
Year ended September 30, | 2008 G |
Selected Per-Share Data | |
Net asset value, beginning of period | $ 10.00 |
Income from Investment Operations | |
Net investment income (loss) E | .22 |
Net realized and unrealized gain (loss) | (1.40) |
Total from investment operations | (1.18) |
Distributions from net investment income | (.17) |
Net asset value, end of period | $ 8.65 |
Total Return B, C, D | (11.91)% |
Ratios to Average Net Assets H | |
Expenses before reductions | 1.97% A |
Expenses net of fee waivers, if any | 1.20% A |
Expenses net of all reductions | 1.20% A |
Net investment income (loss) | 2.41% A |
Supplemental Data | |
Net assets, end of period (000 omitted) | $ 1,074 |
Portfolio turnover rate F | 24%A |
A Annualized
B Total returns for periods of less than one year are not annualized.
C Total returns would have been lower had certain expenses not been reduced during the periods shown.
D Total returns do not include the effect of the sales charges.
E Calculated based on average shares outstanding during the period.
F Amount does not include the portfolio activity of any underlying Fidelity Central Funds.
G For the period October 9, 2007 (commencement of operations) to September 30, 2008.
H Expense ratios reflect operating expenses of the class. Expenses before reductions do not reflect amounts reimbursed by the investment adviser or reductions from brokerage service arrangements or other expense offset arrangements and do not represent the amount paid by the class during periods when reimbursements or reductions occur. Expense ratios before reductions for start-up periods may not be representative of longer-term operating periods. Expenses net of fee waivers reflect expenses after reimbursement by the investment adviser but prior to reductions from brokerage service arrangements or other expense offset arrangements. Expenses net of all reductions represent the net expenses paid by the class. Fees and expenses of the underlying Fidelity Central Funds are not included in the Fund's expense ratio. The Fund indirectly bears its proportionate share of the expenses of any underlying Fidelity Central Funds. Based on their most recent shareholder report date, the expenses ranged from less than .01% to .03%.
See accompanying notes which are an integral part of the financial statements.
Annual Report
Financial Highlights - Class B
Year ended September 30, | 2008 G |
Selected Per-Share Data | |
Net asset value, beginning of period | $ 10.00 |
Income from Investment Operations | |
Net investment income (loss) E | .17 |
Net realized and unrealized gain (loss) | (1.39) |
Total from investment operations | (1.22) |
Distributions from net investment income | (.13) |
Net asset value, end of period | $ 8.65 |
Total Return B, C, D | (12.30)% |
Ratios to Average Net Assets H | |
Expenses before reductions | 2.71% A |
Expenses net of fee waivers, if any | 1.73% A |
Expenses net of all reductions | 1.73% A |
Net investment income (loss) | 1.87% A |
Supplemental Data | |
Net assets, end of period (000 omitted) | $ 480 |
Portfolio turnover rate F | 24%A |
A Annualized
B Total returns for periods of less than one year are not annualized.
C Total returns would have been lower had certain expenses not been reduced during the periods shown.
D Total returns do not include the effect of the contingent deferred sales charge.
E Calculated based on average shares outstanding during the period.
F Amount does not include the portfolio activity of any underlying Fidelity Central Funds.
G For the period October 9, 2007 (commencement of operations) to September 30, 2008.
H Expense ratios reflect operating expenses of the class. Expenses before reductions do not reflect amounts reimbursed by the investment adviser or reductions from brokerage service arrangements or other expense offset arrangements and do not represent the amount paid by the class during periods when reimbursements or reductions occur. Expense ratios before reductions for start-up periods may not be representative of longer-term operating periods. Expenses net of fee waivers reflect expenses after reimbursement by the investment adviser but prior to reductions from brokerage service arrangements or other expense offset arrangements. Expenses net of all reductions represent the net expenses paid by the class. Fees and expenses of the underlying Fidelity Central Funds are not included in the Fund's expense ratio. The Fund indirectly bears its proportionate share of the expenses of any underlying Fidelity Central Funds. Based on their most recent shareholder report date, the expenses ranged from less than .01% to .03%.
Financial Highlights - Class C
Year ended September 30, | 2008 G |
Selected Per-Share Data | |
Net asset value, beginning of period | $ 10.00 |
Income from Investment Operations | |
Net investment income (loss) E | .17 |
Net realized and unrealized gain (loss) | (1.39) |
Total from investment operations | (1.22) |
Distributions from net investment income | (.14) |
Net asset value, end of period | $ 8.64 |
Total Return B, C, D | (12.30)% |
Ratios to Average Net Assets H | |
Expenses before reductions | 2.37% A |
Expenses net of fee waivers, if any | 1.70% A |
Expenses net of all reductions | 1.70% A |
Net investment income (loss) | 1.91% A |
Supplemental Data | |
Net assets, end of period (000 omitted) | $ 1,495 |
Portfolio turnover rate F | 24%A |
A Annualized
B Total returns for periods of less than one year are not annualized.
C Total returns would have been lower had certain expenses not been reduced during the periods shown.
D Total returns do not include the effect of the contingent deferred sales charge.
E Calculated based on average shares outstanding during the period.
F Amount does not include the portfolio activity of any underlying Fidelity Central Funds.
G For the period October 9, 2007 (commencement of operations) to September 30, 2008.
H Expense ratios reflect operating expenses of the class. Expenses before reductions do not reflect amounts reimbursed by the investment adviser or reductions from brokerage service arrangements or other expense offset arrangements and do not represent the amount paid by the class during periods when reimbursements or reductions occur. Expense ratios before reductions for start-up periods may not be representative of longer-term operating periods. Expenses net of fee waivers reflect expenses after reimbursement by the investment adviser but prior to reductions from brokerage service arrangements or other expense offset arrangements. Expenses net of all reductions represent the net expenses paid by the class. Fees and expenses of the underlying Fidelity Central Funds are not included in the Fund's expense ratio. The Fund indirectly bears its proportionate share of the expenses of any underlying Fidelity Central Funds. Based on their most recent shareholder report date, the expenses ranged from less than .01% to .03%.
See accompanying notes which are an integral part of the financial statements.
Annual Report
Financial Highlights - Asset Manager 30%
Year ended September 30, | 2008 F |
Selected Per-Share Data | |
Net asset value, beginning of period | $ 10.00 |
Income from Investment Operations | |
Net investment income (loss) D | .26 |
Net realized and unrealized gain (loss) | (1.39) |
Total from investment operations | (1.13) |
Distributions from net investment income | (.21) |
Net asset value, end of period | $ 8.66 |
Total Return B, C | (11.43)% |
Ratios to Average Net AssetsG | |
Expenses before reductions | 1.24% A |
Expenses net of fee waivers, if any | .73% A |
Expenses net of all reductions | .72% A |
Net investment income (loss) | 2.88% A |
Supplemental Data | |
Net assets, end of period (000 omitted) | $ 26,016 |
Portfolio turnover rate E | 24% A |
A Annualized
B Total returns for periods of less than one year are not annualized.
C Total returns would have been lower had certain expenses not been reduced during the periods shown.
D Calculated based on average shares outstanding during the period.
E Amount does not include the portfolio activity of any underlying Fidelity Central Funds.
F For the period October 9, 2007 (commencement of operations) to September 30, 2008.
G Expense ratios reflect operating expenses of the class. Expenses before reductions do not reflect amounts reimbursed by the investment adviser or reductions from brokerage service arrangements or other expense offset arrangements and do not represent the amount paid by the class during periods when reimbursements or reductions occur. Expense ratios before reductions for start-up periods may not be representative of longer-term operating periods. Expenses net of fee waivers reflect expenses after reimbursement by the investment adviser but prior to reductions from brokerage service arrangements or other expense offset arrangements. Expenses net of all reductions represent the net expenses paid by the class. Fees and expenses of the underlying Fidelity Central Funds are not included in the Fund's expense ratio. The Fund indirectly bears its proportionate share of the expenses of any underlying Fidelity Central Funds. Based on their most recent shareholder report date, the expenses ranged from less than .01% to .03%.
Financial Highlights - Institutional Class
Year ended September 30, | 2008 F |
Selected Per-Share Data | |
Net asset value, beginning of period | $ 10.00 |
Income from Investment Operations | |
Net investment income (loss) D | .26 |
Net realized and unrealized gain (loss) | (1.39) |
Total from investment operations | (1.13) |
Distributions from net investment income | (.21) |
Net asset value, end of period | $ 8.66 |
Total Return B, C | (11.45)% |
Ratios to Average Net AssetsG | |
Expenses before reductions | 1.76% A |
Expenses net of fee waivers, if any | .75% A |
Expenses net of all reductions | .75% A |
Net investment income (loss) | 2.86% A |
Supplemental Data | |
Net assets, end of period (000 omitted) | $ 209 |
Portfolio turnover rate E | 24% A |
A Annualized
B Total returns for periods of less than one year are not annualized.
C Total returns would have been lower had certain expenses not been reduced during the periods shown.
D Calculated based on average shares outstanding during the period.
E Amount does not include the portfolio activity of any underlying Fidelity Central Funds.
F For the period October 9, 2007 (commencement of operations) to September 30, 2008.
G Expense ratios reflect operating expenses of the class. Expenses before reductions do not reflect amounts reimbursed by the investment adviser or reductions from brokerage service arrangements or other expense offset arrangements and do not represent the amount paid by the class during periods when reimbursements or reductions occur. Expense ratios before reductions for start-up periods may not be representative of longer-term operating periods. Expenses net of fee waivers reflect expenses after reimbursement by the investment adviser but prior to reductions from brokerage service arrangements or other expense offset arrangements. Expenses net of all reductions represent the net expenses paid by the class. Fees and expenses of the underlying Fidelity Central Funds are not included in the Fund's expense ratio. The Fund indirectly bears its proportionate share of the expenses of any underlying Fidelity Central Funds. Based on their most recent shareholder report date, the expenses ranged from less than .01% to .03%.
See accompanying notes which are an integral part of the financial statements.
Annual Report
Fidelity Asset Manager 40%
Investment Changes (Unaudited)
The information in the following tables is based on the combined investments of the Fund and its pro-rata share of the investments of Fidelity's Equity and Fixed-Income Central Funds.
Top Five Bond Issuers as of September 30, 2008 |
(with maturities greater than one year) | % of fund's
net assets | % of fund's net assets
6 months ago |
Fannie Mae | 14.0 | 14.1 |
Freddie Mac | 5.2 | 4.9 |
U.S. Treasury Obligations | 2.3 | 4.6 |
Government National Mortgage Association | 2.1 | 1.6 |
Wells Fargo Mortgage Backed Securities Trust | 0.4 | 0.4 |
| 24.0 | |
Quality Diversification (% of fund's net assets) |
As of September 30, 2008 | As of March 31, 2008 |
| U.S. Government and
U.S. Government
Agency Obligations 24.8% | | | U.S. Government and
U.S. Government
Agency Obligations 25.5% | |
| AAA,AA,A 11.8% | | | AAA,AA,A 10.8% | |
| BBB 8.2% | | | BBB 8.0% | |
| BB and below 4.6% | | | BB and below 4.5% | |
| Not Rated 0.6% | | | Not Rated 0.4% | |
| Equities 39.5% | | | Equities 40.9% | |
| Short-Term
Investments and
Net Other Assets 10.5% | | | Short-Term
Investments and Net Other Assets 9.9% | |
We have used ratings from Moody's® Investors Services, Inc. Where Moody's ratings are not available, we have used S&P® ratings. All ratings are as of the report date and do not reflect subsequent downgrades. Percentages are adjusted for the effect of futures contracts, if applicable. |
Top Five Stocks as of September 30, 2008 |
| % of fund's
net assets | % of fund's net assets
6 months ago |
Apple, Inc. | 0.6 | 0.1 |
Procter & Gamble Co. | 0.6 | 0.6 |
General Electric Co. | 0.5 | 0.4 |
Bank of America Corp. | 0.4 | 0.3 |
JPMorgan Chase & Co. | 0.4 | 0.4 |
| 2.5 | |
Asset Allocation (% of fund's net assets) |
As of September 30, 2008 | As of March 31, 2008 |
| Stock class and
Equity Futures 39.4% | | | Stock class and
Equity Futures 41.0% | |
| Bond class 45.2% | | | Bond class 49.4% | |
| Short-term class 15.4% | | | Short-term class 9.6% | |
| | | | | |
| | | | | |
Asset allocations in the pie charts reflect the categorization of assets as defined in the Fund's prospectus in effect as of the time periods indicated above. Percentages are adjusted for the effect of futures contracts and swap contracts, if applicable. |
Annual Report
Fidelity Asset Manager 40%
Investment Summary (Unaudited)
The information in the following table is based on the direct investments of the Fund.
Fund Holdings as of September 30, 2008 |
| % of fund's
net assets |
Equity Central Funds | |
Fidelity Financials Central Fund | 5.7 |
Fidelity Information Technology Central Fund | 5.3 |
Fidelity Health Care Central Fund | 4.6 |
Fidelity Industrials Central Fund | 4.3 |
Fidelity Energy Central Fund | 3.9 |
Fidelity International Equity Central Fund | 3.9 |
Fidelity Consumer Staples Central Fund | 3.7 |
Fidelity Consumer Discretionary Central Fund | 3.6 |
Fidelity Materials Central Fund | 1.3 |
Fidelity Utilities Central Fund | 1.3 |
Fidelity Telecom Services Central Fund | 1.1 |
Total Equity Central Funds | 38.7 |
Fixed-Income Central Funds | |
Investment Grade Fixed-Income Funds | 39.1 |
High Yield Fixed-Income Funds | 4.3 |
Total Fixed-Income Central Funds | 43.4 |
Money Market Central Funds | 18.5 |
Other Short-Term Investments and Net Other Assets | (0.6) |
Total | 100.0 |
At period end, foreign investments including the Fund's pro-rata share of the underlying Central Funds was 13.8% of net assets.
A holdings listing for the Fund, which presents direct holdings as well as the pro-rata share of any securities and other investments held indirectly through its investment in underlying non-money market Fidelity Central Funds, is available at fidelity.com and/or advisor.fidelity.com, as applicable.
Annual Report
Fidelity Asset Manager 40%
Investments September 30, 2008
Showing Percentage of Net Assets
Equity Central Funds - 38.7% |
| Shares | | Value |
Fidelity Consumer Discretionary Central Fund (c) | 7,437 | | $ 687,216 |
Fidelity Consumer Staples Central Fund (c) | 6,031 | | 693,355 |
Fidelity Energy Central Fund (c) | 6,666 | | 736,460 |
Fidelity Financials Central Fund (c) | 16,305 | | 1,073,867 |
Fidelity Health Care Central Fund (c) | 8,689 | | 865,513 |
Fidelity Industrials Central Fund (c) | 7,669 | | 809,331 |
Fidelity Information Technology Central Fund (c) | 10,269 | | 1,008,502 |
Fidelity International Equity Central
Fund (c) | 11,101 | | 745,109 |
Fidelity Materials Central Fund (c) | 2,233 | | 245,701 |
Fidelity Telecom Services Central Fund (c) | 2,262 | | 202,857 |
Fidelity Utilities Central Fund (c) | 2,650 | | 247,387 |
TOTAL EQUITY CENTRAL FUNDS (Cost $9,475,308) | 7,315,298 |
Fixed-Income Central Funds - 43.4% |
| | | |
Investment Grade Fixed-Income Funds - 39.1% |
Fidelity Tactical Income Central Fund (c) | 82,188 | | 7,380,508 |
High Yield Fixed-Income Funds - 4.3% |
Fidelity Floating Rate Central Fund (c) | 5,945 | | 504,178 |
Fidelity High Income Central Fund 1 (c) | 3,699 | | 316,276 |
TOTAL HIGH YIELD FIXED-INCOME FUNDS | 820,454 |
TOTAL FIXED-INCOME CENTRAL FUNDS (Cost $8,781,994) | 8,200,962 |
Money Market Central Funds - 18.5% |
| | | |
Fidelity Cash Central Fund, 1.92% (a)
(Cost $3,498,011) | 3,498,011 | | 3,498,011 |
U.S. Treasury Obligations - 0.3% |
| Principal Amount | | |
U.S. Treasury Bills, yield at date of purchase 1.59% 10/16/08 (b)
(Cost $49,965) | | $ 50,000 | | 49,975 |
TOTAL INVESTMENT PORTFOLIO - 100.9% (Cost $21,805,278) | | 19,064,246 |
NET OTHER ASSETS - (0.9)% | | (162,201) |
NET ASSETS - 100% | $ 18,902,045 |
Futures Contracts |
| Expiration Date | | Underlying Face Amount at Value | | Unrealized Appreciation/(Depreciation) |
Purchased |
Equity Index Contracts |
6 CME E-mini S&P 500 Index Contracts | Dec. 2008 | | $ 350,220 | | $ (8,693) |
|
The face value of futures purchased as a percentage of net assets - 1.9% |
Legend |
(a) Affiliated fund that is available only to investment companies and other accounts managed by Fidelity Investments. The rate quoted is the annualized seven-day yield of the fund at period end. A complete unaudited listing of the fund's holdings as of its most recent quarter end is available upon request. |
(b) Security or a portion of the security was pledged to cover margin requirements for futures contracts. At the period end, the value of securities pledged amounted to $49,975. |
(c) Affiliated fund that is available only to investment companies and other accounts managed by Fidelity Investments. A complete unaudited schedule of portfolio holdings for each Fidelity Central Fund is filed with the SEC for the first and third quarters of each fiscal year on Form N-Q and is available upon request or at the SEC's web site at www.sec.gov. An unaudited holdings listing for the Fund, which presents direct holdings as well as the pro rata share of securities and other investments held indirectly through its investment in underlying non-money market Fidelity Central Funds, is available at fidelity.com and/or advisor.fidelity.com, as applicable. In addition, each Fidelity Central Fund's financial statements, which are not covered by the Fund's Report of Independent Registered Public Accounting Firm, are available on the SEC's web site or upon request. |
Affiliated Central Funds |
Information regarding fiscal year to date income earned by the Fund from investments in Fidelity Central Funds is as follows: |
Fund | Income earned |
Fidelity Cash Central Fund | $ 73,418 |
Fidelity Consumer Discretionary Central Fund | 8,175 |
Fidelity Consumer Staples Central Fund | 11,925 |
Fidelity Energy Central Fund | 5,589 |
Fidelity Financials Central Fund | 29,659 |
Fidelity Floating Rate Central Fund | 20,040 |
Fidelity Health Care Central Fund | 6,769 |
Fidelity High Income Central Fund 1 | 22,008 |
Fidelity Industrials Central Fund | 10,831 |
Fidelity Information Technology Central Fund | 6,968 |
Fidelity International Equity Central Fund | 18,366 |
Fidelity Materials Central Fund | 3,763 |
Fidelity Tactical Income Central Fund | 284,658 |
Fidelity Telecom Services Central Fund | 3,980 |
Fidelity Utilities Central Fund | 4,836 |
Total | $ 510,985 |
Additional information regarding the Fund's fiscal year to date purchases and sales, including the ownership percentage, of the non-money market Central Funds is as follows: |
Fund | Value, beginning of period | Purchases | Sales
Proceeds | Value,
end of period | % ownership, end of period |
Fidelity Consumer Discretionary Central Fund | $ - | $ 848,840 | $ 18,997 | $ 687,216 | 0.1% |
Fidelity Consumer Staples Central Fund | - | 754,397 | 3,566 | 693,355 | 0.1% |
Fidelity Energy Central Fund | - | 995,695 | 23,160 | 736,460 | 0.1% |
Fidelity Financials Central Fund | - | 1,549,389 | - | 1,073,867 | 0.1% |
Fidelity Floating Rate Central Fund | - | 560,534 | - | 504,178 | 0.0% |
Fidelity Health Care Central Fund | - | 1,005,463 | 2,454 | 865,513 | 0.1% |
Fidelity High Income Central Fund 1 | - | 368,764 | 12,994 | 316,276 | 0.1% |
Fidelity Industrials Central Fund | - | 1,015,214 | 25,730 | 809,331 | 0.1% |
Fidelity Information Technology Central Fund | - | 1,409,786 | 8,250 | 1,008,502 | 0.1% |
Fidelity International Equity Central Fund | - | 1,040,428 | - | 745,109 | 0.1% |
Fidelity Materials Central Fund | - | 329,911 | 5,970 | 245,701 | 0.1% |
Fidelity Tactical Income Central Fund | - | 7,866,585 | - | 7,380,508 | 0.2% |
Fidelity Telecom Services Central Fund | - | 291,464 | - | 202,857 | 0.1% |
Fidelity Utilities Central Fund | - | 326,107 | - | 247,387 | 0.1% |
Total | $ - | $ 18,362,577 | $ 101,121 | $ 15,516,260 | |
Other Information (Unaudited) |
The information in the following table is based on the combined investment of the Fund and its pro-rata share of the investments of Fidelity's Equity and Fixed-Income Central Funds. |
Distribution of investments by country of issue, as a percentage of total net assets, is as follows. Percentages are adjusted for the effect of futures contracts, if applicable. |
United States of America | 86.2% |
United Kingdom | 2.4% |
Bermuda | 1.5% |
Canada | 1.3% |
Switzerland | 1.2% |
Japan | 1.0% |
Others (individually less than 1%) | 6.4% |
| 100.0% |
Income Tax Information |
At September 30, 2008, the fund had a capital loss carryforward of approximately $101,011 all of which will expire on September 30, 2016. |
The fund intends to elect to defer to its fiscal year ending September 30, 2009 approximately $1,131,101 of losses recognized during the period November 1, 2007 to September 30, 2008. |
See accompanying notes which are an integral part of the financial statements.
Annual Report
Fidelity Asset Manager 40%
Statement of Assets and Liabilities
| September 30, 2008 |
| | |
Assets | | |
Investment in securities, at value - See accompanying schedule: Unaffiliated issuers (cost $49,965) | $ 49,975 | |
Fidelity Central Funds (cost $21,755,313) | 19,014,271 | |
Total Investments (cost $21,805,278) | | $ 19,064,246 |
Receivable for fund shares sold | | 169,812 |
Distributions receivable from Fidelity Central Funds | | 41,892 |
Receivable for daily variation on futures contracts | | 14,580 |
Prepaid expenses | | 3 |
Receivable from investment adviser for expense reductions | | 30,347 |
Total assets | | 19,320,880 |
| | |
Liabilities | | |
Payable for investments purchased | $ 256,583 | |
Payable for fund shares redeemed | 119,514 | |
Accrued management fee | 6,674 | |
Distribution fees payable | 3,557 | |
Other affiliated payables | 2,496 | |
Other payables and accrued expenses | 30,011 | |
Total liabilities | | 418,835 |
| | |
Net Assets | | $ 18,902,045 |
Net Assets consist of: | | |
Paid in capital | | $ 21,598,672 |
Undistributed net investment income | | 131,642 |
Accumulated undistributed net realized gain (loss) on investments and foreign currency transactions | | (78,544) |
Net unrealized appreciation (depreciation) on investments | | (2,749,725) |
Net Assets | | $ 18,902,045 |
| | |
Calculation of Maximum Offering Price Class A:
Net Asset Value and redemption price per share ($2,032,604 ÷ 241,385 shares) | | $ 8.42 |
| | |
Maximum offering price per share (100/94.25 of $8.42) | | $ 8.93 |
Class T:
Net Asset Value and redemption price per share ($1,839,582 ÷ 218,637 shares) | | $ 8.41 |
| | |
Maximum offering price per share (100/96.50 of $8.41) | | $ 8.72 |
Class B:
Net Asset Value and offering price per share ($1,378,427 ÷ 164,016 shares)A | | $ 8.40 |
| | |
Class C:
Net Asset Value and offering price per share ($1,383,696 ÷ 164,606 shares)A | | $ 8.41 |
| | |
| | |
Asset Manager 40%:
Net Asset Value, offering price and redemption price per share ($10,929,086 ÷ 1,297,117 shares) | | $ 8.43 |
| | |
Institutional Class:
Net Asset Value, offering price and redemption price per share ($1,338,650 ÷ 158,863 shares) | | $ 8.43 |
A Redemption price per share is equal to net asset value less any applicable contingent deferred sales charge.
See accompanying notes which are an integral part of the financial statements.
Annual Report
Statement of Operations
For the period October 9, 2007 (commencement of operations) to September 30, 2008 |
| | |
Investment Income | | |
Interest | | $ 2,124 |
Income from Fidelity Central Funds | | 510,985 |
Total income | | 513,109 |
| | |
Expenses | | |
Management fee | $ 60,461 | |
Transfer agent fees | 17,548 | |
Distribution fees | 41,312 | |
Accounting fees and expenses | 6,045 | |
Custodian fees and expenses | 4,989 | |
Independent trustees' compensation | 53 | |
Registration fees | 114,542 | |
Audit | 36,878 | |
Legal | 30 | |
Miscellaneous | 2,049 | |
Total expenses before reductions | 283,907 | |
Expense reductions | (134,669) | 149,238 |
Net investment income (loss) | | 363,871 |
Realized and Unrealized Gain (Loss) Net realized gain (loss) on: | | |
Investment securities: | | |
Fidelity Central Funds | (4,134) | |
Foreign currency transactions | (174) | |
Futures contracts | (78,098) | |
Total net realized gain (loss) | | (82,406) |
Change in net unrealized appreciation (depreciation) on: Investment securities | (2,741,032) | |
Futures contracts | (8,693) | |
Total change in net unrealized appreciation (depreciation) | | (2,749,725) |
Net gain (loss) | | (2,832,131) |
Net increase (decrease) in net assets resulting from operations | | $ (2,468,260) |
Statement of Changes in Net Assets
| For the period
October 9, 2007 (commencement of operations) to September 30, 2008 |
Increase (Decrease) in Net Assets | |
Operations | |
Net investment income (loss) | $ 363,871 |
Net realized gain (loss) | (82,406) |
Change in net unrealized appreciation (depreciation) | (2,749,725) |
Net increase (decrease) in net assets resulting from operations | (2,468,260) |
Distributions to shareholders from net investment income | (228,368) |
Share transactions - net increase (decrease) | 21,598,673 |
Total increase (decrease) in net assets | 18,902,045 |
| |
Net Assets | |
Beginning of period | - |
End of period (including undistributed net investment income of $131,642) | $ 18,902,045 |
See accompanying notes which are an integral part of the financial statements.
Annual Report
Financial Highlights - Class A
Year ended September 30, | 2008 G |
Selected Per-Share Data | |
Net asset value, beginning of period | $ 10.00 |
Income from Investment Operations | |
Net investment income (loss) E | .23 |
Net realized and unrealized gain (loss) | (1.66) |
Total from investment operations | (1.43) |
Distributions from net investment income | (.15) |
Net asset value, end of period | $ 8.42 |
Total Return B, C, D | (14.43)% |
Ratios to Average Net Assets H | |
Expenses before reductions | 1.91% A |
Expenses net of fee waivers, if any | 1.00% A |
Expenses net of all reductions | 1.00% A |
Net investment income (loss) | 2.52% A |
Supplemental Data | |
Net assets, end of period (000 omitted) | $ 2,033 |
Portfolio turnover rate F | 1%A |
A Annualized
B Total returns for periods of less than one year are not annualized.
C Total returns would have been lower had certain expenses not been reduced during the periods shown.
D Total returns do not include the effect of the sales charges.
E Calculated based on average shares outstanding during the period.
F Amount does not include the portfolio activity of any underlying Fidelity Central Funds.
G For the period October 9, 2007 (commencement of operations) to September 30, 2008.
H Expense ratios reflect operating expenses of the class. Expenses before reductions do not reflect amounts reimbursed by the investment adviser or reductions from brokerage service arrangements or other expense offset arrangements and do not represent the amount paid by the class during periods when reimbursements or reductions occur. Expense ratios before reductions for start-up periods may not be representative of longer-term operating periods. Expenses net of fee waivers reflect expenses after reimbursement by the investment adviser but prior to reductions from brokerage service arrangements or other expense offset arrangements. Expenses net of all reductions represent the net expenses paid by the class. Fees and expenses of the underlying Fidelity Central Funds are not included in the Fund's expense ratio. The Fund indirectly bears its proportionate share of the expenses of any underlying Fidelity Central Funds. Based on their most recent shareholder report date, the expenses ranged from less than .01% to .03%.
Financial Highlights - Class T
Year ended September 30, | 2008 G |
Selected Per-Share Data | |
Net asset value, beginning of period | $ 10.00 |
Income from Investment Operations | |
Net investment income (loss) E | .21 |
Net realized and unrealized gain (loss) | (1.66) |
Total from investment operations | (1.45) |
Distributions from net investment income | (.14) |
Net asset value, end of period | $ 8.41 |
Total Return B, C, D | (14.67)% |
Ratios to Average Net Assets H | |
Expenses before reductions | 2.15% A |
Expenses net of fee waivers, if any | 1.25% A |
Expenses net of all reductions | 1.25% A |
Net investment income (loss) | 2.27% A |
Supplemental Data | |
Net assets, end of period (000 omitted) | $ 1,840 |
Portfolio turnover rate F | 1%A |
A Annualized
B Total returns for periods of less than one year are not annualized.
C Total returns would have been lower had certain expenses not been reduced during the periods shown.
D Total returns do not include the effect of the sales charges.
E Calculated based on average shares outstanding during the period.
F Amount does not include the portfolio activity of any underlying Fidelity Central Funds.
G For the period October 9, 2007 (commencement of operations) to September 30, 2008.
H Expense ratios reflect operating expenses of the class. Expenses before reductions do not reflect amounts reimbursed by the investment adviser or reductions from brokerage service arrangements or other expense offset arrangements and do not represent the amount paid by the class during periods when reimbursements or reductions occur. Expense ratios before reductions for start-up periods may not be representative of longer-term operating periods. Expenses net of fee waivers reflect expenses after reimbursement by the investment adviser but prior to reductions from brokerage service arrangements or other expense offset arrangements. Expenses net of all reductions represent the net expenses paid by the class. Fees and expenses of the underlying Fidelity Central Funds are not included in the Fund's expense ratio. The Fund indirectly bears its proportionate share of the expenses of any underlying Fidelity Central Funds. Based on their most recent shareholder report date, the expenses ranged from less than .01% to .03%.
See accompanying notes which are an integral part of the financial statements.
Annual Report
Financial Highlights - Class B
Year ended September 30, | 2008 G |
Selected Per-Share Data | |
Net asset value, beginning of period | $ 10.00 |
Income from Investment Operations | |
Net investment income (loss) E | .16 |
Net realized and unrealized gain (loss) | (1.66) |
Total from investment operations | (1.50) |
Distributions from net investment income | (.10) |
Net asset value, end of period | $ 8.40 |
Total Return B, C, D | (15.09)% |
Ratios to Average Net Assets H | |
Expenses before reductions | 2.64% A |
Expenses net of fee waivers, if any | 1.77% A |
Expenses net of all reductions | 1.77% A |
Net investment income (loss) | 1.76% A |
Supplemental Data | |
Net assets, end of period (000 omitted) | $ 1,378 |
Portfolio turnover rate F | 1%A |
A Annualized
B Total returns for periods of less than one year are not annualized.
C Total returns would have been lower had certain expenses not been reduced during the periods shown.
D Total returns do not include the effect of the contingent deferred sales charge.
E Calculated based on average shares outstanding during the period.
F Amount does not include the portfolio activity of any underlying Fidelity Central Funds.
G For the period October 9, 2007 (commencement of operations) to September 30, 2008.
H Expense ratios reflect operating expenses of the class. Expenses before reductions do not reflect amounts reimbursed by the investment adviser or reductions from brokerage service arrangements or other expense offset arrangements and do not represent the amount paid by the class during periods when reimbursements or reductions occur. Expense ratios before reductions for start-up periods may not be representative of longer-term operating periods. Expenses net of fee waivers reflect expenses after reimbursement by the investment adviser but prior to reductions from brokerage service arrangements or other expense offset arrangements. Expenses net of all reductions represent the net expenses paid by the class. Fees and expenses of the underlying Fidelity Central Funds are not included in the Fund's expense ratio. The Fund indirectly bears its proportionate share of the expenses of any underlying Fidelity Central Funds. Based on their most recent shareholder report date, the expenses ranged from less than .01% to .03%.
Financial Highlights - Class C
Year ended September 30, | 2008 G |
Selected Per-Share Data | |
Net asset value, beginning of period | $ 10.00 |
Income from Investment Operations | |
Net investment income (loss) E | .16 |
Net realized and unrealized gain (loss) | (1.65) |
Total from investment operations | (1.49) |
Distributions from net investment income | (.10) |
Net asset value, end of period | $ 8.41 |
Total Return B, C, D | (15.01)% |
Ratios to Average Net Assets H | |
Expenses before reductions | 2.66% A |
Expenses net of fee waivers, if any | 1.76% A |
Expenses net of all reductions | 1.76% A |
Net investment income (loss) | 1.76% A |
Supplemental Data | |
Net assets, end of period (000 omitted) | $ 1,384 |
Portfolio turnover rate F | 1%A |
A Annualized
B Total returns for periods of less than one year are not annualized.
C Total returns would have been lower had certain expenses not been reduced during the periods shown.
D Total returns do not include the effect of the contingent deferred sales charge.
E Calculated based on average shares outstanding during the period.
F Amount does not include the portfolio activity of any underlying Fidelity Central Funds.
G For the period October 9, 2007 (commencement of operations) to September 30, 2008.
H Expense ratios reflect operating expenses of the class. Expenses before reductions do not reflect amounts reimbursed by the investment adviser or reductions from brokerage service arrangements or other expense offset arrangements and do not represent the amount paid by the class during periods when reimbursements or reductions occur. Expense ratios before reductions for start-up periods may not be representative of longer-term operating periods. Expenses net of fee waivers reflect expenses after reimbursement by the investment adviser but prior to reductions from brokerage service arrangements or other expense offset arrangements. Expenses net of all reductions represent the net expenses paid by the class. Fees and expenses of the underlying Fidelity Central Funds are not included in the Fund's expense ratio. The Fund indirectly bears its proportionate share of the expenses of any underlying Fidelity Central Funds. Based on their most recent shareholder report date, the expenses ranged from less than .01% to .03%.
See accompanying notes which are an integral part of the financial statements.
Annual Report
Financial Highlights - Asset Manager 40%
Year ended September 30, | 2008 F |
Selected Per-Share Data | |
Net asset value, beginning of period | $ 10.00 |
Income from Investment Operations | |
Net investment income (loss) D | .25 |
Net realized and unrealized gain (loss) | (1.65) |
Total from investment operations | (1.40) |
Distributions from net investment income | (.17) |
Net asset value, end of period | $ 8.43 |
Total Return B, C | (14.18)% |
Ratios to Average Net Assets G | |
Expenses before reductions | 1.68% A |
Expenses net of fee waivers, if any | .72% A |
Expenses net of all reductions | .72% A |
Net investment income (loss) | 2.80% A |
Supplemental Data | |
Net assets, end of period (000 omitted) | $ 10,929 |
Portfolio turnover rate E | 1%A |
A Annualized
B Total returns for periods of less than one year are not annualized.
C Total returns would have been lower had certain expenses not been reduced during the periods shown.
D Calculated based on average shares outstanding during the period.
E Amount does not include the portfolio activity of any underlying Fidelity Central Funds.
F For the period October 9, 2007 (commencement of operations) to September 30, 2008.
G Expense ratios reflect operating expenses of the class. Expenses before reductions do not reflect amounts reimbursed by the investment adviser or reductions from brokerage service arrangements or other expense offset arrangements and do not represent the amount paid by the class during periods when reimbursements or reductions occur. Expense ratios before reductions for start-up periods may not be representative of longer-term operating periods. Expenses net of fee waivers reflect expenses after reimbursement by the investment adviser but prior to reductions from brokerage service arrangements or other expense offset arrangements. Expenses net of all reductions represent the net expenses paid by the class. Fees and expenses of the underlying Fidelity Central Funds are not included in the Fund's expense ratio. The Fund indirectly bears its proportionate share of the expenses of any underlying Fidelity Central Funds. Based on their most recent shareholder report date, the expenses ranged from less than .01% to .03%.
Financial Highlights - Institutional Class
Year ended September 30, | 2008 F |
Selected Per-Share Data | |
Net asset value, beginning of period | $ 10.00 |
Income from Investment Operations | |
Net investment income (loss) D | .25 |
Net realized and unrealized gain (loss) | (1.65) |
Total from investment operations | (1.40) |
Distributions from net investment income | (.17) |
Net asset value, end of period | $ 8.43 |
Total Return B, C | (14.18)% |
Ratios to Average Net Assets G | |
Expenses before reductions | 1.63% A |
Expenses net of fee waivers, if any | .76% A |
Expenses net of all reductions | .76% A |
Net investment income (loss) | 2.76% A |
Supplemental Data | |
Net assets, end of period (000 omitted) | $ 1,339 |
Portfolio turnover rate E | 1%A |
A Annualized
B Total returns for periods of less than one year are not annualized.
C Total returns would have been lower had certain expenses not been reduced during the periods shown.
D Calculated based on average shares outstanding during the period.
E Amount does not include the portfolio activity of any underlying Fidelity Central Funds.
F For the period October 9, 2007 (commencement of operations) to September 30, 2008.
G Expense ratios reflect operating expenses of the class. Expenses before reductions do not reflect amounts reimbursed by the investment adviser or reductions from brokerage service arrangements or other expense offset arrangements and do not represent the amount paid by the class during periods when reimbursements or reductions occur. Expense ratios before reductions for start-up periods may not be representative of longer-term operating periods. Expenses net of fee waivers reflect expenses after reimbursement by the investment adviser but prior to reductions from brokerage service arrangements or other expense offset arrangements. Expenses net of all reductions represent the net expenses paid by the class. Fees and expenses of the underlying Fidelity Central Funds are not included in the Fund's expense ratio. The Fund indirectly bears its proportionate share of the expenses of any underlying Fidelity Central Funds. Based on their most recent shareholder report date, the expenses ranged from less than .01% to .03%.
See accompanying notes which are an integral part of the financial statements.
Annual Report
Fidelity Asset Manager 50%
Investment Changes (Unaudited)
The information in the following tables is based on the combined investments of the Fund and its pro-rata share of the investments of Fidelity's Equity and Fixed-Income Central Funds.
Top Ten Stocks as of September 30, 2008 |
| % of fund's
net assets | % of fund's net assets
6 months ago |
Apple, Inc. | 0.8 | 0.1 |
Procter & Gamble Co. | 0.8 | 0.7 |
General Electric Co. | 0.6 | 0.5 |
Bank of America Corp. | 0.5 | 0.4 |
JPMorgan Chase & Co. | 0.5 | 0.5 |
Wells Fargo & Co. | 0.5 | 0.4 |
The Coca-Cola Co. | 0.5 | 0.5 |
Genentech, Inc. | 0.5 | 0.1 |
PepsiCo, Inc. | 0.4 | 0.4 |
Citigroup, Inc. | 0.4 | 0.4 |
| 5.5 | |
Top Five Bond Issuers as of September 30, 2008 |
(with maturities greater than one year) | % of fund's
net assets | % of fund's net assets
6 months ago |
Fannie Mae | 14.4 | 13.2 |
Freddie Mac | 5.3 | 4.6 |
U.S. Treasury Obligations | 2.3 | 4.3 |
Government National Mortgage Association | 2.0 | 1.5 |
Wells Fargo Mortgage Backed Securities Trust | 0.5 | 0.4 |
| 24.5 | |
Asset Allocation (% of fund's net assets) |
As of September 30, 2008 | As of March 31, 2008 |
| Stock class and
Equity Futures 51.2% | | | Stock class and
Equity Futures 51.2% | |
| Bond class 50.5% | | | Bond class 46.6% | |
| Short-term class* (1.7)% | | | Short-term class 2.2% | |
| | | | | |
| | | | | |
Asset allocations in the pie charts reflect the categorization of assets as defined in the Fund's prospectus in effect as of the time periods indicated above. Percentages are adjusted for the effect of futures contracts and swap contracts, if applicable. |
* Short-term class is not included in the pie chart. |
Annual Report
Fidelity Asset Manager 50%
Investment Summary (Unaudited)
The information in the following table is based on the direct investments of the Fund.
Fund Holdings as of September 30, 2008 |
| % of fund's
net assets |
Equity Central Funds | |
Fidelity Financials Central Fund | 7.2 |
Fidelity Information Technology Central Fund | 6.8 |
Fidelity Health Care Central Fund | 5.8 |
Fidelity Industrials Central Fund | 5.5 |
Fidelity Energy Central Fund | 5.0 |
Fidelity Consumer Staples Central Fund | 4.7 |
Fidelity Consumer Discretionary Central Fund | 4.6 |
Fidelity International Equity Central Fund | 4.2 |
Fidelity Utilities Central Fund | 1.7 |
Fidelity Materials Central Fund | 1.6 |
Fidelity Telecom Services Central Fund | 1.4 |
Total Equity Central Funds | 48.5 |
Fixed-Income Central Funds | |
Investment Grade Fixed-Income Funds | 37.8 |
High Yield Fixed-Income Funds | 5.1 |
Total Fixed-Income Central Funds | 42.9 |
Money Market Central Funds | 4.4 |
Other Short-Term Investments and Net Other Assets | 4.2 |
Total | 100.0 |
At period end, foreign investments including the Fund's pro-rata share of the underlying Central Funds was 15.6% of net assets.
A holdings listing for the Fund, which presents direct holdings as well as the pro-rata share of any securities and other investments held indirectly through its investment in underlying non-money market Fidelity Central Funds, is available at fidelity.com and/or advisor.fidelity.com, as applicable.
Annual Report
Fidelity Asset Manager 50%
Investments September 30, 2008
Showing Percentage of Net Assets
Equity Central Funds - 48.5% |
| Shares | | Value |
Fidelity Consumer Discretionary Central Fund (c) | 3,170,836 | | $ 293,016,928 |
Fidelity Consumer Staples Central Fund (c) | 2,571,302 | | 295,622,548 |
Fidelity Energy Central Fund (c) | 2,842,164 | | 314,002,263 |
Fidelity Financials Central Fund (c) | 6,951,945 | | 457,855,099 |
Fidelity Health Care Central Fund (c) | 3,704,728 | | 369,027,997 |
Fidelity Industrials Central Fund (c) | 3,269,947 | | 345,077,478 |
Fidelity Information Technology Central Fund (c) | 4,378,494 | | 430,011,894 |
Fidelity International Equity Central Fund (c) | 3,978,961 | | 267,067,885 |
Fidelity Materials Central Fund (c) | 952,243 | | 104,784,844 |
Fidelity Telecom Services Central Fund (c) | 964,561 | | 86,521,154 |
Fidelity Utilities Central Fund (c) | 1,130,427 | | 105,514,101 |
TOTAL EQUITY CENTRAL FUNDS (Cost $3,338,875,549) | 3,068,502,191 |
Fixed-Income Central Funds - 42.9% |
| | | |
Investment Grade Fixed-Income Funds - 37.8% |
Fidelity Tactical Income Central
Fund (c) | 26,622,633 | | 2,390,712,422 |
High Yield Fixed-Income Funds - 5.1% |
Fidelity Floating Rate Central Fund (c) | 2,313,297 | | 196,167,573 |
Fidelity High Income Central
Fund 1 (c) | 1,437,819 | | 122,947,937 |
TOTAL HIGH YIELD FIXED-INCOME FUNDS | 319,115,510 |
TOTAL FIXED-INCOME CENTRAL FUNDS (Cost $2,962,114,909) | 2,709,827,932 |
Money Market Central Funds - 4.4% |
| | | |
Fidelity Money Market Central Fund, 3.13% (a)
(Cost $280,013,442) | 280,013,442 | | 280,013,442 |
U.S. Treasury Obligations - 0.3% |
| Principal
Amount | | |
U.S. Treasury Bills, yield at date of purchase 1.59% to 1.68% 10/9/08 to 12/4/08 (b)
(Cost $18,865,185) | $ 18,900,000 | | 18,884,472 |
TOTAL INVESTMENT PORTFOLIO - 96.1% (Cost $6,599,869,085) | | 6,077,228,037 |
NET OTHER ASSETS - 3.9% | | 244,786,430 |
NET ASSETS - 100% | $ 6,322,014,467 |
Futures Contracts |
| Expiration Date | | Underlying Face Amount at Value | | Unrealized Appreciation/
(Depreciation) |
Purchased |
Equity Index Contracts |
4,412 CME E-mini S&P 500 Index Contracts | Dec. 2008 | | $ 257,528,440 | | $ (6,392,238) |
The face value of futures purchased as a percentage of net assets - 4.1% |
Legend |
(a) Affiliated fund that is available only to investment companies and other accounts managed by Fidelity Investments. The rate quoted is the annualized seven-day yield of the fund at period end. A complete unaudited listing of the fund's holdings as of its most recent quarter end is available upon request. |
(b) Security or a portion of the security was pledged to cover margin requirements for futures contracts. At the period end, the value of securities pledged amounted to $18,884,472. |
(c) Affiliated fund that is available only to investment companies and other accounts managed by Fidelity Investments. A complete unaudited schedule of portfolio holdings for each Fidelity Central Fund is filed with the SEC for the first and third quarters of each fiscal year on Form N-Q and is available upon request or at the SEC's web site at www.sec.gov. An unaudited holdings listing for the Fund, which presents direct holdings as well as the pro rata share of securities and other investments held indirectly through its investment in underlying non-money market Fidelity Central Funds, is available at fidelity.com and/or advisor.fidelity.com, as applicable. In addition, each Fidelity Central Fund's financial statements, which are not covered by the Fund's Report of Independent Registered Public Accounting Firm, are available on the SEC's web site or upon request. |
Affiliated Central Funds |
Information regarding fiscal year to date income earned by the Fund from investments in Fidelity Central Funds is as follows: |
Fund | Income earned |
Fidelity Cash Central Fund | $ 4,772,695 |
Fidelity Consumer Discretionary Central Fund | 5,133,776 |
Fidelity Consumer Staples Central Fund | 7,158,660 |
Fidelity Energy Central Fund | 3,472,331 |
Fidelity Financials Central Fund | 18,566,252 |
Fidelity Floating Rate Central Fund | 14,457,624 |
Fidelity Health Care Central Fund | 4,260,999 |
Fidelity High Income Central Fund 1 | 10,900,140 |
Fidelity Industrials Central Fund | 6,694,115 |
Fidelity Information Technology Central Fund | 4,177,665 |
Fidelity International Equity Central Fund | 8,198,636 |
Fidelity Materials Central Fund | 2,524,209 |
Fidelity Money Market Central Fund | 14,418,304 |
Fidelity Securities Lending Cash Central Fund | 14,209 |
Fidelity Tactical Income Central Fund | 157,109,083 |
Fidelity Telecom Services Central Fund | 2,596,771 |
Fidelity Utilities Central Fund | 3,046,836 |
Total | $ 267,502,305 |
Additional information regarding the Fund's fiscal year to date purchases and sales, including the ownership percentage, of the non-money market Central Funds is as follows: |
Fund | Value, beginning of period | Purchases | Sales
Proceeds | Value,
end of period | % ownership,
end of period |
Fidelity Consumer Discretionary Central Fund | $ 412,360,000 | $ 2,215,273 | $ 26,219,372 | $ 293,016,928 | 55.2% |
Fidelity Consumer Staples Central Fund | 337,240,000 | 3,243,954 | 16,409,489 | 295,622,548 | 55.2% |
Fidelity Energy Central Fund | 427,750,000 | 131,408 | 34,221,179 | 314,002,263 | 55.2% |
Fidelity Financials Central Fund | 765,273,000 | 6,377,816 | 3,515,130 | 457,855,099 | 55.2% |
Fidelity Floating Rate Central Fund | 271,825,000 | 6,149,178 | 52,651,959 | 196,167,573 | 7.7% |
Fidelity Health Care Central Fund | 462,483,000 | 1,668,863 | 18,829,514 | 369,027,997 | 55.2% |
Fidelity High Income Central Fund 1 | 153,712,000 | 5,312,032 | 17,798,226 | 122,947,937 | 49.2% |
Fidelity Industrials Central Fund | 473,294,000 | 2,893,657 | 34,112,669 | 345,077,478 | 55.2% |
Fidelity Information Technology Central Fund | 662,781,000 | 2,117,964 | 7,335,749 | 430,011,894 | 55.2% |
Fidelity International Equity Central Fund | - | 394,714,744 | - | 267,067,885 | 43.0% |
Fidelity Materials Central Fund | 148,405,000 | 859,244 | 10,223,019 | 104,784,844 | 55.2% |
Fidelity Tactical Income Central Fund | 3,496,910,000 | 157,109,084 | 1,046,420,760 | 2,390,712,422 | 59.2% |
Fidelity Telecom Services Central Fund | 143,131,000 | 3,153,969 | 281,220 | 86,521,154 | 55.2% |
Fidelity Utilities Central Fund | 143,573,000 | 1,489,114 | 5,876,159 | 105,514,101 | 55.2% |
Total | $ 7,898,737,000 | $ 587,436,300 | $ 1,273,894,445 | $ 5,778,330,123 | |
Other Information (Unaudited) |
The information in the following tables is based on the combined investment of the Fund and its pro-rata share of the investments of Fidelity's Equity and Fixed-Income Central Funds. The composition of credit quality ratings as a percentage of net assets is as follows: |
U.S. Government and U.S. Government Agency Obligations | 24.1% |
AAA,AA,A | 11.4% |
BBB | 7.9% |
BB | 2.7% |
B | 2.0% |
CCC,CC,C | 0.5% |
Not Rated | 0.7% |
Equities | 51.3% |
Short-Term Investments and Net Other Assets | (0.6)% |
| 100.0% |
We have used ratings from Moody's® Investors Services, Inc. Where Moody's ratings are not available, we have used S&P® ratings. All ratings are as of the report date and do not reflect subsequent downgrades. Percentages are adjusted for the effect of futures contracts, if applicable. |
Distribution of investments by country of issue, as a percentage of total net assets, is as follows. Percentages are adjusted for the effect of futures contracts, if applicable. |
United States of America | 84.4% |
United Kingdom | 2.8% |
Bermuda | 1.7% |
Canada | 1.6% |
Switzerland | 1.3% |
Japan | 1.0% |
Others (individually less than 1%) | 7.2% |
| 100.0% |
Income Tax Information |
The fund intends to elect to defer to its fiscal year ending September 30, 2009 approximately $288,485,511 of losses recognized during the period November 1, 2007 to September 30, 2008. |
See accompanying notes which are an integral part of the financial statements.
Annual Report
Fidelity Asset Manager 50%
Statement of Assets and Liabilities
| September 30, 2008 |
| | |
Assets | | |
Investment in securities, at value - See accompanying schedule: Unaffiliated issuers (cost $18,865,185) | $ 18,884,472 | |
Fidelity Central Funds (cost $6,581,003,900) | 6,058,343,565 | |
Total Investments (cost $6,599,869,085) | | $ 6,077,228,037 |
Cash | | 96 |
Receivable for investments sold | | 278,320,014 |
Receivable for fund shares sold | | 2,582,266 |
Distributions receivable from Fidelity Central Funds | | 14,316,556 |
Receivable for daily variation on futures contracts | | 11,074,120 |
Prepaid expenses | | 5,041 |
Other receivables | | 293,321 |
Total assets | | 6,383,819,451 |
| | |
Liabilities | | |
Payable for investments purchased | $ 13,297,985 | |
Payable for fund shares redeemed | 14,214,704 | |
Accrued management fee | 2,834,874 | |
Distribution fees payable | 10,089 | |
Notes payable to affiliates | 29,971,000 | |
Other affiliated payables | 1,163,239 | |
Other payables and accrued expenses | 313,093 | |
Total liabilities | | 61,804,984 |
| | |
Net Assets | | $ 6,322,014,467 |
Net Assets consist of: | | |
Paid in capital | | $ 7,229,405,198 |
Undistributed net investment income | | 64,010,831 |
Accumulated undistributed net realized gain (loss) on investments and foreign currency transactions | | (442,368,276) |
Net unrealized appreciation (depreciation) on investments | | (529,033,286) |
Net Assets | | $ 6,322,014,467 |
| | |
Calculation of Maximum Offering Price Class A:
Net Asset Value and redemption price per share ($10,611,260 ÷ 819,550 shares) | | $ 12.95 |
| | |
Maximum offering price per share (100/94.25 of $12.95) | | $ 13.74 |
Class T:
Net Asset Value and redemption price per share ($5,474,554 ÷ 423,117 shares) | | $ 12.94 |
| | |
Maximum offering price per share (100/96.50 of $12.94) | | $ 13.41 |
Class B:
Net Asset Value and offering price per share ($2,083,555 ÷ 161,425 shares)A | | $ 12.91 |
| | |
Class C:
Net Asset Value and offering price per share ($4,294,133 ÷ 332,972 shares)A | | $ 12.90 |
| | |
| | |
Asset Manager 50%:
Net Asset Value, offering price and redemption price per share ($6,299,082,145 ÷ 485,541,027 shares) | | $ 12.97 |
| | |
Institutional Class:
Net Asset Value, offering price and redemption price per share ($468,820 ÷ 36,159 shares) | | $ 12.97 |
A Redemption price per share is equal to net asset value less any applicable contingent deferred sales charge.
See accompanying notes which are an integral part of the financial statements.
Annual Report
Statement of Operations
| Year ended September 30, 2008 |
| | |
Investment Income | | |
Dividends | | $ 96,284 |
Interest | | 492,323 |
Income from Fidelity Central Funds | | 267,502,305 |
Total income | | 268,090,912 |
| | |
Expenses | | |
Management fee | $ 39,492,324 | |
Transfer agent fees | 13,515,826 | |
Distribution fees | 103,117 | |
Accounting and security lending fees | 1,481,195 | |
Custodian fees and expenses | 29,388 | |
Independent trustees' compensation | 32,571 | |
Depreciation in deferred trustee compensation account | (1,197) | |
Registration fees | 97,913 | |
Audit | 90,609 | |
Legal | 87,111 | |
Interest | 44,852 | |
Miscellaneous | 145,136 | |
Total expenses before reductions | 55,118,845 | |
Expense reductions | (519,105) | 54,599,740 |
Net investment income (loss) | | 213,491,172 |
Realized and Unrealized Gain (Loss) Net realized gain (loss) on: | | |
Investment securities: | | |
Unaffiliated issuers (net of foreign taxes of $213,100) | 15,155,000 | |
Fidelity Central Funds | (8,912,254) | |
Foreign currency transactions | (99,661) | |
Futures contracts | (64,525,694) | |
Total net realized gain (loss) | | (58,382,609) |
Change in net unrealized appreciation (depreciation) on: Investment securities (net of decrease in deferred foreign taxes of $107,640) | (1,444,700,646) | |
Assets and liabilities in foreign currencies | (2,347) | |
Futures contracts | (17,274,497) | |
Total change in net unrealized appreciation (depreciation) | | (1,461,977,490) |
Net gain (loss) | | (1,520,360,099) |
Net increase (decrease) in net assets resulting from operations | | $ (1,306,868,927) |
Statement of Changes in Net Assets
| Year ended
September 30, 2008 | Year ended
September 30, 2007 |
Increase (Decrease) in Net Assets | | |
Operations | | |
Net investment income (loss) | $ 213,491,172 | $ 267,544,083 |
Net realized gain (loss) | (58,382,609) | 291,165,801 |
Change in net unrealized appreciation (depreciation) | (1,461,977,490) | 485,622,259 |
Net increase (decrease) in net assets resulting from operations | (1,306,868,927) | 1,044,332,143 |
Distributions to shareholders from net investment income | (239,866,976) | (271,879,077) |
Distributions to shareholders from net realized gain | (556,509,728) | (485,946,437) |
Total distributions | (796,376,704) | (757,825,514) |
Share transactions - net increase (decrease) | (541,463,365) | (523,997,125) |
Total increase (decrease) in net assets | (2,644,708,996) | (237,490,496) |
| | |
Net Assets | | |
Beginning of period | 8,966,723,463 | 9,204,213,959 |
End of period (including undistributed net investment income of $64,010,831 and undistributed net investment income of $82,560,257, respectively) | $ 6,322,014,467 | $ 8,966,723,463 |
See accompanying notes which are an integral part of the financial statements.
Annual Report
Financial Highlights - Class A
Years ended September 30, | 2008 | 2007 G |
Selected Per-Share Data | | |
Net asset value, beginning of period | $ 17.08 | $ 16.57 |
Income from Investment Operations | | |
Net investment income (loss) E | .36 | .43 |
Net realized and unrealized gain (loss) | (2.96) | 1.45 |
Total from investment operations | (2.60) | 1.88 |
Distributions from net investment income | (.43) | (.47) |
Distributions from net realized gain | (1.10) | (.90) |
Total distributions | (1.53) | (1.37) |
Net asset value, end of period | $ 12.95 | $ 17.08 |
Total Return B, C, D | (16.56)% | 11.93% |
Ratios to Average Net Assets H | | |
Expenses before reductions | .99% | 1.01% A |
Expenses net of fee waivers, if any | .99% | 1.01% A |
Expenses net of all reductions | .98% | 1.00% A |
Net investment income (loss) | 2.46% | 2.62% A |
Supplemental Data | | |
Net assets, end of period (000 omitted) | $ 10,611 | $ 4,432 |
Portfolio turnover rate F | 8% | 12% |
A Annualized
B Total returns for periods of less than one year are not annualized.
C Total returns would have been lower had certain expenses not been reduced during the periods shown.
D Total returns do not include the effect of the sales charges.
E Calculated based on average shares outstanding during the period.
F Amount does not include the portfolio activity of any underlying Fidelity Central Funds.
G For the period October 2, 2006 (commencement of sale of shares) to September 30, 2007.
H Expense ratios reflect operating expenses of the class. Expenses before reductions do not reflect amounts reimbursed by the investment adviser or reductions from brokerage service arrangements or other expense offset arrangements and do not represent the amount paid by the class during periods when reimbursements or reductions occur. Expense ratios before reductions for start-up periods may not be representative of longer-term operating periods. Expenses net of fee waivers reflect expenses after reimbursement by the investment adviser but prior to reductions from brokerage service arrangements or other expense offset arrangements. Expenses net of all reductions represent the net expenses paid by the class. Fees and expenses of the underlying Fidelity Central Funds are not included in the Fund's expense ratio. The Fund indirectly bears its proportionate share of the expenses of any underlying Fidelity Central Funds. Based on their most recent shareholder report date, the expenses ranged from less than .01% to .03%.
Financial Highlights - Class T
Years ended September 30, | 2008 | 2007 G |
Selected Per-Share Data | | |
Net asset value, beginning of period | $ 17.06 | $ 16.57 |
Income from Investment Operations | | |
Net investment income (loss) E | .33 | .39 |
Net realized and unrealized gain (loss) | (2.96) | 1.46 |
Total from investment operations | (2.63) | 1.85 |
Distributions from net investment income | (.39) | (.46) |
Distributions from net realized gain | (1.10) | (.90) |
Total distributions | (1.49) | (1.36) |
Net asset value, end of period | $ 12.94 | $ 17.06 |
Total Return B, C, D | (16.76)% | 11.68% |
Ratios to Average Net Assets H | | |
Expenses before reductions | 1.24% | 1.24% A |
Expenses net of fee waivers, if any | 1.24% | 1.24% A |
Expenses net of all reductions | 1.23% | 1.23% A |
Net investment income (loss) | 2.21% | 2.40% A |
Supplemental Data | | |
Net assets, end of period (000 omitted) | $ 5,475 | $ 3,148 |
Portfolio turnover rate F | 8% | 12% |
A Annualized
B Total returns for periods of less than one year are not annualized.
C Total returns would have been lower had certain expenses not been reduced during the periods shown.
D Total returns do not include the effect of the sales charges.
E Calculated based on average shares outstanding during the period.
F Amount does not include the portfolio activity of any underlying Fidelity Central Funds.
G For the period October 2, 2006 (commencement of sale of shares) to September 30, 2007.
H Expense ratios reflect operating expenses of the class. Expenses before reductions do not reflect amounts reimbursed by the investment adviser or reductions from brokerage service arrangements or other expense offset arrangements and do not represent the amount paid by the class during periods when reimbursements or reductions occur. Expense ratios before reductions for start-up periods may not be representative of longer-term operating periods. Expenses net of fee waivers reflect expenses after reimbursement by the investment adviser but prior to reductions from brokerage service arrangements or other expense offset arrangements. Expenses net of all reductions represent the net expenses paid by the class. Fees and expenses of the underlying Fidelity Central Funds are not included in the Fund's expense ratio. The Fund indirectly bears its proportionate share of the expenses of any underlying Fidelity Central Funds. Based on their recent shareholder report date, the expenses ranged from less than .01% to .03%.
See accompanying notes which are an integral part of the financial statements.
Annual Report
Financial Highlights - Class B
Years ended September 30, | 2008 | 2007 G |
Selected Per-Share Data | | |
Net asset value, beginning of period | $ 17.02 | $ 16.57 |
Income from Investment Operations | | |
Net investment income (loss) E | .24 | .30 |
Net realized and unrealized gain (loss) | (2.96) | 1.46 |
Total from investment operations | (2.72) | 1.76 |
Distributions from net investment income | (.29) | (.41) |
Distributions from net realized gain | (1.10) | (.90) |
Total distributions | (1.39) | (1.31) |
Net asset value, end of period | $ 12.91 | $ 17.02 |
Total Return B, C, D | (17.26)% | 11.03% |
Ratios to Average Net Assets H | | |
Expenses before reductions | 1.79% | 1.79% A |
Expenses net of fee waivers, if any | 1.79% | 1.79% A |
Expenses net of all reductions | 1.79% | 1.78% A |
Net investment income (loss) | 1.65% | 1.84% A |
Supplemental Data | | |
Net assets, end of period (000 omitted) | $ 2,084 | $ 1,007 |
Portfolio turnover rate F | 8% | 12% |
A Annualized
B Total returns for periods of less than one year are not annualized.
C Total returns would have been lower had certain expenses not been reduced during the periods shown.
D Total returns do not include the effect of the contingent deferred sales charge.
E Calculated based on average shares outstanding during the period.
F Amount does not include the portfolio activity of any underlying Fidelity Central Funds.
G For the period October 2, 2006 (commencement of sale of shares) to September 30, 2007.
H Expense ratios reflect operating expenses of the class. Expenses before reductions do not reflect amounts reimbursed by the investment adviser or reductions from brokerage service arrangements or other expense offset arrangements and do not represent the amount paid by the class during periods when reimbursements or reductions occur. Expense ratios before reductions for start-up periods may not be representative of longer-term operating periods. Expenses net of fee waivers reflect expenses after reimbursement by the investment adviser but prior to reductions from brokerage service arrangements or other expense offset arrangements. Expenses net of all reductions represent the net expenses paid by the class. Fees and expenses of the underlying Fidelity Central Funds are not included in the Fund's expense ratio. The Fund indirectly bears its proportionate share of the expenses of any underlying Fidelity Central Funds. Based on their recent shareholder report date, the expenses ranged from less than .01% to .03%.
Financial Highlights - Class C
Years ended September 30, | 2008 | 2007 G |
Selected Per-Share Data | | |
Net asset value, beginning of period | $ 17.00 | $ 16.57 |
Income from Investment Operations | | |
Net investment income (loss) E | .25 | .31 |
Net realized and unrealized gain (loss) | (2.95) | 1.45 |
Total from investment operations | (2.70) | 1.76 |
Distributions from net investment income | (.30) | (.43) |
Distributions from net realized gain | (1.10) | (.90) |
Total distributions | (1.40) | (1.33) |
Net asset value, end of period | $ 12.90 | $ 17.00 |
Total Return B, C, D | (17.18)% | 11.08% |
Ratios to Average Net Assets H | | |
Expenses before reductions | 1.76% | 1.75% A |
Expenses net of fee waivers, if any | 1.76% | 1.75% A |
Expenses net of all reductions | 1.76% | 1.74% A |
Net investment income (loss) | 1.68% | 1.88% A |
Supplemental Data | | |
Net assets, end of period (000 omitted) | $ 4,294 | $ 2,840 |
Portfolio turnover rate F | 8% | 12% |
A Annualized
B Total returns for periods of less than one year are not annualized.
C Total returns would have been lower had certain expenses not been reduced during the periods shown.
D Total returns do not include the effect of the contingent deferred sales charge.
E Calculated based on average shares outstanding during the period.
F Amount does not include the portfolio activity of any underlying Fidelity Central Funds.
G For the period October 2, 2006 (commencement of sale of shares) to September 30, 2007.
H Expense ratios reflect operating expenses of the class. Expenses before reductions do not reflect amounts reimbursed by the investment adviser or reductions from brokerage service arrangements or other expense offset arrangements and do not represent the amount paid by the class during periods when reimbursements or reductions occur. Expense ratios before reductions for start-up periods may not be representative of longer-term operating periods. Expenses net of fee waivers reflect expenses after reimbursement by the investment adviser but prior to reductions from brokerage service arrangements or other expense offset arrangements. Expenses net of all reductions represent the net expenses paid by the class. Fees and expenses of the underlying Fidelity Central Funds are not included in the Fund's expense ratio. The Fund indirectly bears its proportionate share of the expenses of any underlying Fidelity Central Funds. Based on their recent shareholder report date, the expenses ranged from less than .01% to .03%.
See accompanying notes which are an integral part of the financial statements.
Annual Report
Financial Highlights - Asset Manager 50%
Years ended September 30, | 2008 | 2007 | 2006 | 2005 | 2004 |
Selected Per-Share Data | | | | | |
Net asset value, beginning of period | $ 17.10 | $ 16.60 | $ 16.28 | $ 15.58 | $ 14.95 |
Income from Investment Operations | | | | | |
Net investment income (loss) B | .41 | .49 | .45 | .41 D | .33 |
Net realized and unrealized gain (loss) | (2.97) | 1.41 | .73 | .69 | .57 |
Total from investment operations | (2.56) | 1.90 | 1.18 | 1.10 | .90 |
Distributions from net investment income | (.47) | (.50) | (.45) | (.40) | (.27) |
Distributions from net realized gain | (1.10) | (.90) | (.41) | - | - |
Total distributions | (1.57) | (1.40) | (.86) | (.40) | (.27) |
Net asset value, end of period | $ 12.97 | $ 17.10 | $ 16.60 | $ 16.28 | $ 15.58 |
Total Return A | (16.34)% | 12.02% | 7.50% | 7.15% | 6.00% |
Ratios to Average Net Assets E | | | | | |
Expenses before reductions | .71% | .71% | .72% | .73% | .74% |
Expenses net of fee waivers, if any | .71% | .71% | .72% | .73% | .74% |
Expenses net of all reductions | .70% | .70% | .71% | .72% | .73% |
Net investment income (loss) | 2.74% | 2.93% | 2.79% | 2.55% D | 2.12% |
Supplemental Data | | | | | |
Net assets, end of period (000 omitted) | $ 6,299,082 | $ 8,955,110 | $ 9,204,214 | $ 10,189,947 | $ 10,903,313 |
Portfolio turnover rate C | 8% | 12% | 65% F | 32% F | 78% |
A Total returns would have been lower had certain expenses not been reduced during the periods shown.
B Calculated based on average shares outstanding during the period.
C Amount does not include the portfolio activity of any underlying Fidelity Central Funds.
D Investment income per share reflects a special dividend which amounted to $0.04 per share. Excluding the special dividend, the ratio of net investment income (loss) to average net assets would have been 2.28%.
E Expense ratios reflect operating expenses of the class. Expenses before reductions do not reflect amounts reimbursed by the investment adviser or reductions from brokerage service arrangements or other expense offset arrangements and do not represent the amount paid by the class during periods when reimbursements or reductions occur. Expenses net of fee waivers reflect expenses after reimbursement by the investment adviser but prior to reductions from brokerage service arrangements or other expense offset arrangements. Expenses net of all reductions represent the net expenses paid by the class. Fees and expenses of the underlying Fidelity Central Funds are not included in the Fund's expense ratio. The Fund indirectly bears its proportionate share of the expenses of any underlying Fidelity Central Funds. Based on their most recent shareholder report date, the expenses ranged from less than .01% to .03%.
F Portfolio turnover rate excludes securities received or delivered in-kind.
Financial Highlights - Institutional Class
Years ended September 30, | 2008 | 2007 F |
Selected Per-Share Data | | |
Net asset value, beginning of period | $ 17.11 | $ 16.57 |
Income from Investment Operations | | |
Net investment income (loss) D | .42 | .48 |
Net realized and unrealized gain (loss) | (2.98) | 1.46 |
Total from investment operations | (2.56) | 1.94 |
Distributions from net investment income | (.48) | (.50) |
Distributions from net realized gain | (1.10) | (.90) |
Total distributions | (1.58) | (1.40) |
Net asset value, end of period | $ 12.97 | $ 17.11 |
Total Return B, C | (16.30)% | 12.20% |
Ratios to Average Net Assets G | | |
Expenses before reductions | .67% | .72% A |
Expenses net of fee waivers, if any | .67% | .72% A |
Expenses net of all reductions | .67% | .72% A |
Net investment income (loss) | 2.77% | 2.91% A |
Supplemental Data | | |
Net assets, end of period (000 omitted) | $ 469 | $ 186 |
Portfolio turnover rate E | 8% | 12% |
A Annualized
B Total returns for periods of less than one year are not annualized.
C Total returns would have been lower had certain expenses not been reduced during the periods shown.
D Calculated based on average shares outstanding during the period.
E Amount does not include the portfolio activity of any underlying Fidelity Central Funds.
F For the period October 2, 2006 (commencement of sale of shares) to September 30, 2007.
G Expense ratios reflect operating expenses of the class. Expenses before reductions do not reflect amounts reimbursed by the investment adviser or reductions from brokerage service arrangements or other expense offset arrangements and do not represent the amount paid by the class during periods when reimbursements or reductions occur. Expense ratios before reductions for start-up periods may not be representative of longer-term operating periods. Expenses net of fee waivers reflect expenses after reimbursement by the investment adviser but prior to reductions from brokerage service arrangements or other expense offset arrangements. Expenses net of all reductions represent the net expenses paid by the class. Fees and expenses of the underlying Fidelity Central Funds are not included in the Fund's expense ratio. The Fund indirectly bears its proportionate share of the expenses of any underlying Fidelity Central Funds. Based on their most recent shareholder report date, the expenses ranged from less than .01% to .03%.
See accompanying notes which are an integral part of the financial statements.
Annual Report
Fidelity Asset Manager 60%
Investment Changes (Unaudited)
The information in the following tables is based on the combined investments of the Fund and its pro-rata share of the investments of Fidelity's Equity and Fixed-Income Central Funds.
Top Ten Stocks as of September 30, 2008 |
| % of fund's
net assets | % of fund's net assets
6 months ago |
Apple, Inc. | 0.9 | 0.1 |
Procter & Gamble Co. | 0.9 | 0.8 |
General Electric Co. | 0.7 | 0.6 |
Bank of America Corp. | 0.6 | 0.4 |
JPMorgan Chase & Co. | 0.6 | 0.6 |
Wells Fargo & Co. | 0.6 | 0.4 |
The Coca-Cola Co. | 0.6 | 0.5 |
Genentech, Inc. | 0.5 | 0.2 |
PepsiCo, Inc. | 0.5 | 0.4 |
Citigroup, Inc. | 0.4 | 0.4 |
| 6.3 | |
Asset Allocation (% of fund's net assets) |
As of September 30, 2008 | As of March 31, 2008 |
| Stock class and
Equity Futures 58.4% | | | Stock class and
Equity Futures 61.2% | |
| Bond class 25.1% | | | Bond class 39.8% | |
| Short-term class 16.5% | | | Short-term class* (1.0)% | |
| | | | | |
| | | | | |
Asset allocations in the pie charts reflect the categorization of assets as defined in the Fund's prospectus in effect as of the time periods indicated above. Percentages are adjusted for the effect of futures contracts and swap contracts, if applicable. |
*Short-term class is not included in the pie chart.
Annual Report
Fidelity Asset Manager 60%
The information in the following table is based on the direct investments of the Fund.
Fund Holdings as of September 30, 2008 |
| % of fund's
net assets |
Equity Central Funds | |
Fidelity Financials Central Fund | 8.4 |
Fidelity Information Technology Central Fund | 7.9 |
Fidelity Health Care Central Fund | 6.8 |
Fidelity Industrials Central Fund | 6.4 |
Fidelity International Central Fund | 5.9 |
Fidelity Energy Central Fund | 5.8 |
Fidelity Consumer Staples Central Fund | 5.4 |
Fidelity Consumer Discretionary Central Fund | 5.4 |
Fidelity Utilities Central Fund | 1.9 |
Fidelity Materials Central Fund | 1.9 |
Fidelity Telecom Services Central Fund | 1.6 |
Total Equity Central Funds | 57.4 |
Fixed-Income Central Funds | |
Investment Grade Fixed-Income Funds | 28.9 |
High Yield Fixed-Income Funds | 3.2 |
Total Fixed-Income Central Funds | 32.1 |
Money Market Central Funds | 18.9 |
Other Short-Term Investments and Net Other Assets | (8.4) |
Total | 100.0 |
At period end, foreign investments including the Fund's pro-rata share of the underlying Central Funds was 17.7% of net assets.
A holdings listing for the Fund, which presents direct holdings as well as the pro-rata share of any securities and other investments held indirectly through its investment in underlying non-money market Fidelity Central Funds, is available at fidelity.com and/or advisor.fidelity.com, as applicable.
Annual Report
Fidelity Asset Manager 60%
Investments September 30, 2008
Showing Percentage of Net Assets
Equity Central Funds - 57.4% |
| Shares | | Value |
Fidelity Consumer Discretionary Central Fund (c) | 17,544 | | $ 1,621,243 |
Fidelity Consumer Staples Central Fund (c) | 14,227 | | 1,635,731 |
Fidelity Energy Central Fund (c) | 15,726 | | 1,737,408 |
Fidelity Financials Central Fund (c) | 38,466 | | 2,533,356 |
Fidelity Health Care Central Fund (c) | 20,499 | | 2,041,880 |
Fidelity Industrials Central Fund (c) | 18,093 | | 1,909,359 |
Fidelity Information Technology Central Fund (c) | 24,227 | | 2,379,293 |
Fidelity International Equity Central Fund (c) | 26,254 | | 1,762,191 |
Fidelity Materials Central Fund (c) | 5,268 | | 579,741 |
Fidelity Telecom Services Central Fund (c) | 5,337 | | 478,691 |
Fidelity Utilities Central Fund (c) | 6,255 | | 583,808 |
TOTAL EQUITY CENTRAL FUNDS (Cost $21,047,033) | 17,262,701 |
Fixed-Income Central Funds - 32.1% |
| | | |
Investment Grade Fixed-Income Funds - 28.9% |
Fidelity Tactical Income Central Fund (c) | 96,750 | | 8,688,176 |
High Yield Fixed-Income Funds - 3.2% |
Fidelity Floating Rate Central Fund (c) | 7,065 | | 599,148 |
Fidelity High Income Central Fund 1 (c) | 4,406 | | 376,783 |
TOTAL HIGH YIELD FIXED-INCOME FUNDS | 975,931 |
TOTAL FIXED-INCOME CENTRAL FUNDS (Cost $10,153,069) | 9,664,107 |
Money Market Central Funds - 18.9% |
| | | |
Fidelity Cash Central Fund, 1.92% (a)
(Cost $5,674,692) | 5,674,692 | | 5,674,692 |
U.S. Treasury Obligations - 0.2% |
| Principal Amount | | |
U.S. Treasury Bills, yield at date of purchase 1.59% to 1.68% 10/16/08 to 12/4/08 (b)
(Cost $59,935) | | $ 60,000 | | 59,963 |
TOTAL INVESTMENT PORTFOLIO - 108.6% (Cost $36,934,729) | | 32,661,463 |
NET OTHER ASSETS - (8.6)% | | (2,578,348) |
NET ASSETS - 100% | $ 30,083,115 |
Futures Contracts |
| Expiration Date | | Underlying Face Amount at Value | | Unrealized Appreciation/(Depreciation) |
Purchased |
Equity Index Contracts |
15 CME E-mini S&P 500 Index Contracts | Dec. 2008 | | $ 875,550 | | $ (21,732) |
The face value of futures purchased as a percentage of net assets - 2.9% |
Legend |
(a) Affiliated fund that is available only to investment companies and other accounts managed by Fidelity Investments. The rate quoted is the annualized seven-day yield of the fund at period end. A complete unaudited listing of the fund's holdings as of its most recent quarter end is available upon request. |
(b) Security or a portion of the security was pledged to cover margin requirements for futures contracts. At the period end, the value of securities pledged amounted to $59,963. |
(c) Affiliated fund that is available only to investment companies and other accounts managed by Fidelity Investments. A complete unaudited schedule of portfolio holdings for each Fidelity Central Fund is filed with the SEC for the first and third quarters of each fiscal year on Form N-Q and is available upon request or at the SEC's web site at www.sec.gov. An unaudited holdings listing for the Fund, which presents direct holdings as well as the pro rata share of securities and other investments held indirectly through its investment in underlying non-money market Fidelity Central Funds, is available at fidelity.com and/or advisor.fidelity.com, as applicable. In addition, each Fidelity Central Fund's financial statements, which are not covered by the Fund's Report of Independent Registered Public Accounting Firm, are available on the SEC's web site or upon request. |
Affiliated Central Funds |
Information regarding fiscal year to date income earned by the Fund from investments in Fidelity Central Funds is as follows: |
Fund | Income earned |
Fidelity Cash Central Fund | $ 46,200 |
Fidelity Consumer Discretionary Central Fund | 12,405 |
Fidelity Consumer Staples Central Fund | 17,971 |
Fidelity Energy Central Fund | 8,216 |
Fidelity Financials Central Fund | 44,448 |
Fidelity Floating Rate Central Fund | 19,452 |
Fidelity Health Care Central Fund | 9,473 |
Fidelity High Income Central Fund 1 | 21,786 |
Fidelity Industrials Central Fund | 15,728 |
Fidelity Information Technology Central Fund | 10,164 |
Fidelity International Equity Central Fund | 37,157 |
Fidelity Materials Central Fund | 5,193 |
Fidelity Tactical Income Central Fund | 202,389 |
Fidelity Telecom Services Central Fund | 5,498 |
Fidelity Utilities Central Fund | 7,251 |
Total | $ 463,331 |
Additional information regarding the Fund's fiscal year to date purchases and sales, including the ownership percentage, of the non-money market Central Funds is as follows: |
Fund | Value, beginning of period | Purchases | Sales
Proceeds | Value,
end of period | % ownership, end of period |
Fidelity Consumer Discretionary Central Fund | $ - | $ 1,874,289 | $ 26,464 | $ 1,621,243 | 0.3% |
Fidelity Consumer Staples Central Fund | - | 1,763,895 | 5,094 | 1,635,731 | 0.3% |
Fidelity Energy Central Fund | - | 2,249,148 | 32,120 | 1,737,408 | 0.3% |
Fidelity Financials Central Fund | - | 3,180,617 | - | 2,533,356 | 0.3% |
Fidelity Floating Rate Central Fund | - | 659,847 | - | 599,148 | 0.0% |
Fidelity Health Care Central Fund | - | 2,264,856 | 3,414 | 2,041,880 | 0.3% |
Fidelity High Income Central Fund 1 | - | 449,300 | 28,002 | 376,783 | 0.2% |
Fidelity Industrials Central Fund | - | 2,280,270 | 36,049 | 1,909,359 | 0.3% |
Fidelity Information Technology Central Fund | - | 3,031,997 | - | 2,379,293 | 0.3% |
Fidelity International Equity Central Fund | - | 2,430,054 | - | 1,762,191 | 0.3% |
Fidelity Materials Central Fund | - | 746,137 | 8,390 | 579,741 | 0.3% |
Fidelity Tactical Income Central Fund | - | 9,487,732 | 400,062 | 8,688,176 | 0.2% |
Fidelity Telecom Services Central Fund | - | 613,427 | - | 478,691 | 0.3% |
Fidelity Utilities Central Fund | - | 728,780 | - | 583,808 | 0.3% |
Total | $ - | $ 31,760,349 | $ 539,595 | $ 26,926,808 | |
Other Information (Unaudited) |
The information in the following tables is based on the combined investment of the Fund and its pro-rata share of the investments of Fidelity's Equity and Fixed-Income Central Funds. The composition of credit quality ratings as a percentage of net assets is as follows: |
U.S. Government and U.S. Government Agency Obligations | 18.2% |
AAA,AA,A | 9.0% |
BBB | 6.0% |
BB | 1.8% |
B | 1.3% |
CCC,CC,C | 0.2% |
Not Rated | 0.6% |
Equities | 58.6% |
Short-Term Investments and Net Other Assets | 4.3% |
| 100.0% |
We have used ratings from Moody's® Investors Services, Inc. Where Moody's ratings are not available, we have used S&P® ratings. All ratings are as of the report date and do not reflect subsequent downgrades. Percentages are adjusted for the effect of futures contracts, if applicable. |
Distribution of investments by country of issue, as a percentage of total net assets, is as follows. Percentages are adjusted for the effect of futures contracts, if applicable. |
United States of America | 82.3% |
United Kingdom | 2.9% |
Bermuda | 2.0% |
Switzerland | 1.6% |
Canada | 1.6% |
Japan | 1.4% |
Cayman Islands | 1.0% |
Germany | 1.0% |
France | 1.0% |
Others (individually less than 1%) | 5.2% |
| 100.0% |
Income Tax Information |
At September 30, 2008, the fund had a capital loss carryforward of approximately $76,825 all of which will expire on September 30, 2016. |
The fund intends to elect to defer to its fiscal year ending September 30, 2009 approximately $1,768,211 of losses recognized during the period November 1, 2007 to September 30, 2008. |
See accompanying notes which are an integral part of the financial statements.
Annual Report
Fidelity Asset Manager 60%
Statement of Assets and Liabilities
| September 30, 2008 |
| | |
Assets | | |
Investment in securities, at value - See accompanying schedule: Unaffiliated issuers (cost $59,935) | $ 59,963 | |
Fidelity Central Funds (cost $36,874,794) | 32,601,500 | |
Total Investments (cost $36,934,729) | | $ 32,661,463 |
Cash | | 24,163 |
Receivable for fund shares sold | | 66,702 |
Distributions receivable from Fidelity Central Funds | | 39,671 |
Receivable for daily variation on futures contracts | | 36,450 |
Receivable from investment adviser for expense reductions | | 43,276 |
Other affiliated receivables | | 1,410 |
Total assets | | 32,873,135 |
| | |
Liabilities | | |
Payable for investments purchased | $ 2,588,863 | |
Payable for fund shares redeemed | 150,148 | |
Accrued management fee | 12,821 | |
Distribution fees payable | 3,516 | |
Other affiliated payables | 4,666 | |
Other payables and accrued expenses | 30,006 | |
Total liabilities | | 2,790,020 |
| | |
Net Assets | | $ 30,083,115 |
Net Assets consist of: | | |
Paid in capital | | $ 34,337,349 |
Undistributed net investment income | | 231,837 |
Accumulated undistributed net realized gain (loss) on investments and foreign currency transactions | | (191,073) |
Net unrealized appreciation (depreciation) on investments | | (4,294,998) |
Net Assets | | $ 30,083,115 |
| | |
Calculation of Maximum Offering Price Class A:
Net Asset Value and redemption price per share ($3,134,919 ÷ 394,354 shares) | | $ 7.95 |
| | |
Maximum offering price per share (100/94.25 of $7.95) | | $ 8.44 |
Class T:
Net Asset Value and redemption price per share ($1,228,087 ÷ 154,853 shares) | | $ 7.93 |
| | |
Maximum offering price per share (100/96.50 of $7.93) | | $ 8.22 |
Class B:
Net Asset Value and offering price per share ($1,073,692 ÷ 135,858 shares)A | | $ 7.90 |
| | |
Class C:
Net Asset Value and offering price per share ($1,642,529 ÷ 207,830 shares)A | | $ 7.90 |
| | |
| | |
Asset Manager 60%:
Net Asset Value, offering price and redemption price per share ($22,211,872 ÷ 2,789,550 shares) | | $ 7.96 |
| | |
Institutional Class:
Net Asset Value, offering price and redemption price per share ($792,016 ÷ 99,464 shares) | | $ 7.96 |
A Redemption price per share is equal to net asset value less any applicable contingent deferred sales charge.
See accompanying notes which are an integral part of the financial statements.
Annual Report
Fidelity Asset Manager 60%
Financial Statements - continued
Statement of Operations
For the period October 9, 2007 (commencement of operations) to September 30, 2008 |
| | |
Investment Income | | |
Interest | | $ 4,248 |
Income from Fidelity Central Funds | | 463,331 |
Total income | | 467,579 |
| | |
Expenses | | |
Management fee | $ 82,594 | |
Transfer agent fees | 26,521 | |
Distribution fees | 29,670 | |
Accounting fees and expenses | 7,292 | |
Custodian fees and expenses | 5,014 | |
Independent trustees' compensation | 50 | |
Registration fees | 117,494 | |
Audit | 36,878 | |
Legal | 27 | |
Miscellaneous | 2,039 | |
Total expenses before reductions | 307,579 | |
Expense reductions | (144,088) | 163,491 |
Net investment income (loss) | | 304,088 |
Realized and Unrealized Gain (Loss) Net realized gain (loss) on: | | |
Investment securities: | | |
Fidelity Central Funds | (20,554) | |
Foreign currency transactions | (50) | |
Futures contracts | (206,048) | |
Total net realized gain (loss) | | (226,652) |
Change in net unrealized appreciation (depreciation) on: Investment securities | (4,273,266) | |
Futures contracts | (21,732) | |
Total change in net unrealized appreciation (depreciation) | | (4,294,998) |
Net gain (loss) | | (4,521,650) |
Net increase (decrease) in net assets resulting from operations | | $ (4,217,562) |
Statement of Changes in Net Assets
| For the period
October 9, 2007 (commencement of operations) to September 30, 2008 |
Increase (Decrease) in Net Assets | |
Operations | |
Net investment income (loss) | $ 304,088 |
Net realized gain (loss) | (226,652) |
Change in net unrealized appreciation (depreciation) | (4,294,998) |
Net increase (decrease) in net assets resulting from operations | (4,217,562) |
Distributions to shareholders from net investment income | (36,701) |
Share transactions - net increase (decrease) | 34,337,378 |
Total increase (decrease) in net assets | 30,083,115 |
| |
Net Assets | |
Beginning of period | - |
End of period (including undistributed net investment income of $231,837) | $ 30,083,115 |
See accompanying notes which are an integral part of the financial statements.
Annual Report
Financial Highlights - Class A
Year ended September 30, | 2008 G |
Selected Per-Share Data | |
Net asset value, beginning of period | $ 10.00 |
Income from Investment Operations | |
Net investment income (loss) E | .17 |
Net realized and unrealized gain (loss) | (2.18) |
Total from investment operations | (2.01) |
Distributions from net investment income | (.04) |
Net asset value, end of period | $ 7.95 |
Total Return B, C, D | (20.16)% |
Ratios to Average Net Assets H | |
Expenses before reductions | 2.18% A |
Expenses net of fee waivers, if any | 1.16% A |
Expenses net of all reductions | 1.16% A |
Net investment income (loss) | 1.99% A |
Supplemental Data | |
Net assets, end of period (000 omitted) | $ 3,135 |
Portfolio turnover rate F | 4% A |
A Annualized
B Total returns for periods of less than one year are not annualized.
C Total returns would have been lower had certain expenses not been reduced during the periods shown.
D Total returns do not include the effect of the sales charges.
E Calculated based on average shares outstanding during the period.
F Amount does not include the portfolio activity of any underlying Fidelity Central Funds.
G For the period October 9, 2007 (commencement of operations) to September 30, 2008.
H Expense ratios reflect operating expenses of the class. Expenses before reductions do not reflect amounts reimbursed by the investment adviser or reductions from brokerage service arrangements or other expense offset arrangements and do not represent the amount paid by the class during periods when reimbursements or reductions occur. Expense ratios before reductions for start-up periods may not be representative of longer-term operating periods. Expenses net of fee waivers reflect expenses after reimbursement by the investment adviser but prior to reductions from brokerage service arrangements or other expense offset arrangements. Expenses net of all reductions represent the net expenses paid by the class. Fees and expenses of the underlying Fidelity Central Funds are not included in the Fund's expense ratio. The Fund indirectly bears its proportionate share of the expenses of any underlying Fidelity Central Funds. Based on their most recent shareholder report date, the expenses ranged from less than .01% to .03%.
Financial Highlights - Class T
Year ended September 30, | 2008 G |
Selected Per-Share Data | |
Net asset value, beginning of period | $ 10.00 |
Income from Investment Operations | |
Net investment income (loss) E | .15 |
Net realized and unrealized gain (loss) | (2.19) |
Total from investment operations | (2.04) |
Distributions from net investment income | (.03) |
Net asset value, end of period | $ 7.93 |
Total Return B, C, D | (20.42)% |
Ratios to Average Net Assets H | |
Expenses before reductions | 2.34% A |
Expenses net of fee waivers, if any | 1.42% A |
Expenses net of all reductions | 1.42% A |
Net investment income (loss) | 1.73% A |
Supplemental Data | |
Net assets, end of period (000 omitted) | $ 1,228 |
Portfolio turnover rate F | 4% A |
A Annualized
B Total returns for periods of less than one year are not annualized.
C Total returns would have been lower had certain expenses not been reduced during the periods shown.
D Total returns do not include the effect of the sales charges.
E Calculated based on average shares outstanding during the period.
F Amount does not include the portfolio activity of any underlying Fidelity Central Funds.
G For the period October 9, 2007 (commencement of operations) to September 30, 2008.
H Expense ratios reflect operating expenses of the class. Expenses before reductions do not reflect amounts reimbursed by the investment adviser or reductions from brokerage service arrangements or other expense offset arrangements and do not represent the amount paid by the class during periods when reimbursements or reductions occur. Expense ratios before reductions for start-up periods may not be representative of longer-term operating periods. Expenses net of fee waivers reflect expenses after reimbursement by the investment adviser but prior to reductions from brokerage service arrangements or other expense offset arrangements. Expenses net of all reductions represent the net expenses paid by the class. Fees and expenses of the underlying Fidelity Central Funds are not included in the Fund's expense ratio. The Fund indirectly bears its proportionate share of the expenses of any underlying Fidelity Central Funds. Based on their most recent shareholder report date, the expenses ranged from less than .01% to .03%.
See accompanying notes which are an integral part of the financial statements.
Annual Report
Financial Highlights - Class B
Year ended September 30, | 2008 G |
Selected Per-Share Data | |
Net asset value, beginning of period | $ 10.00 |
Income from Investment Operations | |
Net investment income (loss) E | .11 |
Net realized and unrealized gain (loss) | (2.19) |
Total from investment operations | (2.08) |
Distributions from net investment income | (.02) |
Net asset value, end of period | $ 7.90 |
Total Return B, C, D | (20.81)% |
Ratios to Average Net Assets H | |
Expenses before reductions | 2.85% A |
Expenses net of fee waivers, if any | 1.92% A |
Expenses net of all reductions | 1.92% A |
Net investment income (loss) | 1.23% A |
Supplemental Data | |
Net assets, end of period (000 omitted) | $ 1,074 |
Portfolio turnover rate F | 4% A |
A Annualized
B Total returns for periods of less than one year are not annualized.
C Total returns would have been lower had certain expenses not been reduced during the periods shown.
D Total returns do not include the effect of the contingent deferred sales charge.
E Calculated based on average shares outstanding during the period.
F Amount does not include the portfolio activity of any underlying Fidelity Central Funds.
G For the period October 9, 2007 (commencement of operations) to September 30, 2008.
H Expense ratios reflect operating expenses of the class. Expenses before reductions do not reflect amounts reimbursed by the investment adviser or reductions from brokerage service arrangements or other expense offset arrangements and do not represent the amount paid by the class during periods when reimbursements or reductions occur. Expense ratios before reductions for start-up periods may not be representative of longer-term operating periods. Expenses net of fee waivers reflect expenses after reimbursement by the investment adviser but prior to reductions from brokerage service arrangements or other expense offset arrangements. Expenses net of all reductions represent the net expenses paid by the class. Fees and expenses of the underlying Fidelity Central Funds are not included in the Fund's expense ratio. The Fund indirectly bears its proportionate share of the expenses of any underlying Fidelity Central Funds. Based on their most recent shareholder report date, the expenses ranged from less than .01% to .03%.
Financial Highlights - Class C
Year ended September 30, | 2008 G |
Selected Per-Share Data | |
Net asset value, beginning of period | $ 10.00 |
Income from Investment Operations | |
Net investment income (loss) E | .11 |
Net realized and unrealized gain (loss) | (2.19) |
Total from investment operations | (2.08) |
Distributions from net investment income | (.02) |
Net asset value, end of period | $ 7.90 |
Total Return B, C, D | (20.81)% |
Ratios to Average Net Assets H | |
Expenses before reductions | 2.80% A |
Expenses net of fee waivers, if any | 1.91% A |
Expenses net of all reductions | 1.91% A |
Net investment income (loss) | 1.24% A |
Supplemental Data | |
Net assets, end of period (000 omitted) | $ 1,643 |
Portfolio turnover rate F | 4% A |
A Annualized
B Total returns for periods of less than one year are not annualized.
C Total returns would have been lower had certain expenses not been reduced during the periods shown.
D Total returns do not include the effect of the contingent deferred sales charge.
E Calculated based on average shares outstanding during the period.
F Amount does not include the portfolio activity of any underlying Fidelity Central Funds.
G For the period October 9, 2007 (commencement of operations) to September 30, 2008.
H Expense ratios reflect operating expenses of the class. Expenses before reductions do not reflect amounts reimbursed by the investment adviser or reductions from brokerage service arrangements or other expense offset arrangements and do not represent the amount paid by the class during periods when reimbursements or reductions occur. Expense ratios before reductions for start-up periods may not be representative of longer-term operating periods. Expenses net of fee waivers reflect expenses after reimbursement by the investment adviser but prior to reductions from brokerage service arrangements or other expense offset arrangements. Expenses net of all reductions represent the net expenses paid by the class. Fees and expenses of the underlying Fidelity Central Funds are not included in the Fund's expense ratio. The Fund indirectly bears its proportionate share of the expenses of any underlying Fidelity Central Funds. Based on their most recent shareholder report date, the expenses ranged from less than .01% to .03%.
See accompanying notes which are an integral part of the financial statements.
Annual Report
Financial Highlights - Asset Manager 60%
Year ended September 30, | 2008 F |
Selected Per-Share Data | |
Net asset value, beginning of period | $ 10.00 |
Income from Investment Operations | |
Net investment income (loss) D | .19 |
Net realized and unrealized gain (loss) | (2.18) |
Total from investment operations | (1.99) |
Distributions from net investment income | (.05) |
Net asset value, end of period | $ 7.96 |
Total Return B, C | (20.03)% |
Ratios to Average Net Assets G | |
Expenses before reductions | 1.87% A |
Expenses net of fee waivers, if any | .89% A |
Expenses net of all reductions | .89% A |
Net investment income (loss) | 2.26% A |
Supplemental Data | |
Net assets, end of period (000 omitted) | $ 22,212 |
Portfolio turnover rate E | 4% A |
A Annualized
B Total returns for periods of less than one year are not annualized.
C Total returns would have been lower had certain expenses not been reduced during the periods shown.
D Calculated based on average shares outstanding during the period.
E Amount does not include the portfolio activity of any underlying Fidelity Central Funds.
F For the period October 9, 2007 (commencement of operations) to September 30, 2008.
G Expense ratios reflect operating expenses of the class. Expenses before reductions do not reflect amounts reimbursed by the investment adviser or reductions from brokerage service arrangements or other expense offset arrangements and do not represent the amount paid by the class during periods when reimbursements or reductions occur. Expense ratios before reductions for start-up periods may not be representative of longer-term operating periods. Expenses net of fee waivers reflect expenses after reimbursement by the investment adviser but prior to reductions from brokerage service arrangements or other expense offset arrangements. Expenses net of all reductions represent the net expenses paid by the class. Fees and expenses of the underlying Fidelity Central Funds are not included in the Fund's expense ratio. The Fund indirectly bears its proportionate share of the expenses of any underlying Fidelity Central Funds. Based on their most recent shareholder report date, the expenses ranged from less than .01% to .03%.
Financial Highlights - Institutional Class
Year ended September 30, | 2008 F |
Selected Per-Share Data | |
Net asset value, beginning of period | $ 10.00 |
Income from Investment Operations | |
Net investment income (loss) D | .20 |
Net realized and unrealized gain (loss) | (2.19) |
Total from investment operations | (1.99) |
Distributions from net investment income | (.05) |
Net asset value, end of period | $ 7.96 |
Total Return B, C | (20.03)% |
Ratios to Average Net Assets G | |
Expenses before reductions | 1.86% A |
Expenses net of fee waivers, if any | .94% A |
Expenses net of all reductions | .93% A |
Net investment income (loss) | 2.22% A |
Supplemental Data | |
Net assets, end of period (000 omitted) | $ 792 |
Portfolio turnover rate E | 4% A |
A Annualized
B Total returns for periods of less than one year are not annualized.
C Total returns would have been lower had certain expenses not been reduced during the periods shown.
D Calculated based on average shares outstanding during the period.
E Amount does not include the portfolio activity of any underlying Fidelity Central Funds.
F For the period October 9, 2007 (commencement of operations) to September 30, 2008.
G Expense ratios reflect operating expenses of the class. Expenses before reductions do not reflect amounts reimbursed by the investment adviser or reductions from brokerage service arrangements or other expense offset arrangements and do not represent the amount paid by the class during periods when reimbursements or reductions occur. Expense ratios before reductions for start-up periods may not be representative of longer-term operating periods. Expenses net of fee waivers reflect expenses after reimbursement by the investment adviser but prior to reductions from brokerage service arrangements or other expense offset arrangements. Expenses net of all reductions represent the net expenses paid by the class. Fees and expenses of the underlying Fidelity Central Funds are not included in the Fund's expense ratio. The Fund indirectly bears its proportionate share of the expenses of any underlying Fidelity Central Funds. Based on their most recent shareholder report date, the expenses ranged from less than .01% to .03%.
See accompanying notes which are an integral part of the financial statements.
Annual Report
Fidelity Asset Manager 70%
Investment Changes (Unaudited)
The information in the following tables is based on the combined investments of the Fund and its pro-rata share of the investments of Fidelity's Equity and Fixed-Income Central Funds. |
Top Ten Stocks as of September 30, 2008 |
| % of fund's
net assets | % of fund's net assets
6 months ago |
Apple, Inc. | 1.1 | 0.1 |
Procter & Gamble Co. | 1.1 | 1.0 |
General Electric Co. | 0.8 | 0.7 |
Bank of America Corp. | 0.7 | 0.5 |
JPMorgan Chase & Co. | 0.7 | 0.6 |
Wells Fargo & Co. | 0.7 | 0.5 |
The Coca-Cola Co. | 0.7 | 0.6 |
Genentech, Inc. | 0.6 | 0.2 |
PepsiCo, Inc. | 0.6 | 0.5 |
Citigroup, Inc. | 0.5 | 0.5 |
| 7.5 | |
Asset Allocation (% of fund's net assets) |
As of September 30, 2008 | As of March 31, 2008 |
| Stock class and
Equity Futures 71.1% | | | Stock class and
Equity Futures 71.2% | |
| Bond class 27.7% | | | Bond class 29.1% | |
| Short-term class 1.2% | | | Short-term class* (0.3)% | |
| | | | | |
| | | | | |
Asset allocations in the pie charts reflect the categorization of assets as defined in the Fund's prospectus in effect as of the time periods indicated above. Percentages are adjusted for the effect of futures contracts and swap contracts, if applicable.
*Short-term class is not included in the pie chart.
Annual Report
Fidelity Asset Manager 70%
The information in the following table is based on the direct investments of the Fund.
Fund Holdings as of September 30, 2008 |
| % of fund's
net assets |
Equity Central Funds | |
Fidelity Financials Central Fund | 9.9 |
Fidelity Information Technology Central Fund | 9.3 |
Fidelity International Equity Central Fund | 8.5 |
Fidelity Health Care Central Fund | 8.0 |
Fidelity Industrials Central Fund | 7.5 |
Fidelity Energy Central Fund | 6.8 |
Fidelity Consumer Staples Central Fund | 6.4 |
Fidelity Consumer Discretionary Central Fund | 6.3 |
Fidelity Utilities Central Fund | 2.3 |
Fidelity Materials Central Fund | 2.3 |
Fidelity Telecom Services Central Fund | 1.9 |
Total Equity Central Funds | 69.2 |
Fixed-Income Central Funds | |
Investment Grade Fixed-Income Funds | 20.1 |
High Yield Fixed-Income Funds | 5.1 |
Total Fixed-Income Central Funds | 25.2 |
Money Market Central Funds | 4.2 |
Other Short-Term Investments and Net Other Assets | 1.4 |
Total | 100.0 |
At period end, foreign investments, including the Fund's pro-rata share of the underlying Central Funds, was 21.1% of net assets. |
A holdings listing for the Fund, which presents direct holdings as well as the pro-rata share of any securities and other investments held indirectly through its investment in underlying non-money market Fidelity Central Funds, is available at fidelity.com and/or advisor.fidelity.com, as applicable. |
Annual Report
Fidelity Asset Manager 70%
Investments September 30, 2008
Showing Percentage of Net Assets
Equity Central Funds - 69.2% |
| Shares | | Value |
Fidelity Consumer Discretionary Central Fund (c) | 1,715,859 | | $ 158,562,571 |
Fidelity Consumer Staples Central Fund (c) | 1,391,428 | | 159,972,498 |
Fidelity Energy Central Fund (c) | 1,538,632 | | 169,988,020 |
Fidelity Financials Central Fund (c) | 3,761,960 | | 247,762,683 |
Fidelity Health Care Central Fund (c) | 2,004,770 | | 199,695,136 |
Fidelity Industrials Central Fund (c) | 1,769,492 | | 186,734,449 |
Fidelity Information Technology Central Fund (c) | 2,369,368 | | 232,695,598 |
Fidelity International Equity Central Fund (c) | 3,180,837 | | 213,497,810 |
Fidelity Materials Central Fund (c) | 515,294 | | 56,702,977 |
Fidelity Telecom Services Central Fund (c) | 521,960 | | 46,819,800 |
Fidelity Utilities Central Fund (c) | 611,717 | | 57,097,620 |
TOTAL EQUITY CENTRAL FUNDS (Cost $2,011,177,373) | 1,729,529,162 |
Fixed-Income Central Funds - 25.2% |
| | | |
Investment Grade Fixed-Income Funds - 20.1% |
Fidelity Tactical Income Central Fund (c) | 5,575,444 | | 500,674,871 |
High Yield Fixed-Income Funds - 5.1% |
Fidelity Floating Rate Central Fund (c) | 933,020 | | 79,120,080 |
Fidelity High Income Central Fund 1 (c) | 576,544 | | 49,300,279 |
TOTAL HIGH YIELD FIXED-INCOME FUNDS | 128,420,359 |
TOTAL FIXED-INCOME CENTRAL FUNDS (Cost $693,449,085) | 629,095,230 |
Money Market Central Funds - 4.2% |
| | | |
Fidelity Cash Central Fund, 1.92% (a) | 96,741,635 | | 96,741,635 |
Fidelity Money Market Central Fund, 3.13% (a) | 8,056,119 | | 8,056,119 |
TOTAL MONEY MARKET CENTRAL FUNDS (Cost $104,797,754) | 104,797,754 |
U.S. Treasury Obligations - 0.4% |
| Principal Amount | | |
U.S. Treasury Bills, yield at date of purchase 1.61% to 1.68% 10/9/08 to 12/4/08 (b)
(Cost $8,992,975) | | $ 9,020,000 | | 9,008,683 |
TOTAL INVESTMENT PORTFOLIO - 99.0% (Cost $2,818,417,187) | | 2,472,430,829 |
NET OTHER ASSETS - 1.0% | | 25,512,177 |
NET ASSETS - 100% | $ 2,497,943,006 |
Futures Contracts |
| Expiration Date | | Underlying Face Amount at Value | | Unrealized Appreciation/
(Depreciation) |
Purchased |
Equity Index Contracts |
1,641 CME E-mini S&P 500 Index Contracts | Dec. 2008 | | $ 95,785,170 | | $ (2,377,530) |
|
The face value of futures purchased as a percentage of net assets - 3.8% |
Legend |
(a) Affiliated fund that is available only to investment companies and other accounts managed by Fidelity Investments. The rate quoted is the annualized seven-day yield of the fund at period end. A complete unaudited listing of the fund's holdings as of its most recent quarter end is available upon request. |
(b) Security or a portion of the security was pledged to cover margin requirements for futures contracts. At the period end, the value of securities pledged amounted to $7,790,086. |
(c) Affiliated fund that is available only to investment companies and other accounts managed by Fidelity Investments. A complete unaudited schedule of portfolio holdings for each Fidelity Central Fund is filed with the SEC for the first and third quarters of each fiscal year on Form N-Q and is available upon request or at the SEC's web site at www.sec.gov. An unaudited holdings listing for the Fund, which presents direct holdings as well as the pro rata share of securities and other investments held indirectly through its investment in underlying non-money market Fidelity Central Funds, is available at fidelity.com and/or advisor.fidelity.com, as applicable. In addition, each Fidelity Central Fund's financial statements, which are not covered by the Fund's Report of Independent Registered Public Accounting Firm, are available on the SEC's web site or upon request. |
Affiliated Central Funds |
Information regarding fiscal year to date income earned by the Fund from investments in Fidelity Central Funds is as follows: |
Fund | Income earned |
Fidelity Cash Central Fund | $ 5,112,219 |
Fidelity Consumer Discretionary Central Fund | 2,482,274 |
Fidelity Consumer Staples Central Fund | 3,464,230 |
Fidelity Energy Central Fund | 1,683,927 |
Fidelity Financials Central Fund | 8,986,884 |
Fidelity Floating Rate Central Fund | 5,094,023 |
Fidelity Health Care Central Fund | 2,055,707 |
Fidelity High Income Central Fund 1 | 3,907,479 |
Fidelity Industrials Central Fund | 3,236,620 |
Fidelity Information Technology Central Fund | 2,023,480 |
Fidelity International Equity Central Fund | 5,962,293 |
Fidelity Materials Central Fund | 1,216,545 |
Fidelity Money Market Central Fund | 311,765 |
Fidelity Securities Lending Cash Central Fund | 9,184 |
Fidelity Tactical Income Central Fund | 31,810,323 |
Fidelity Telecom Services Central Fund | 1,254,332 |
Fidelity Utilities Central Fund | 1,477,077 |
Total | $ 80,088,362 |
Additional information regarding the Fund's fiscal year to date purchases and sales, including the ownership percentage, of the non-money market Central Funds is as follows: |
Fund | Value, beginning
of period | Purchases* | Sales
Proceeds | Value,
end of period | % ownership, end of period |
Fidelity Consumer Discretionary Central Fund | $ 196,579,000 | $ 15,410,310 | $ 6,523,263 | $ 158,562,571 | 29.9% |
Fidelity Consumer Staples Central Fund | 160,773,000 | 15,762,176 | 2,198,698 | 159,972,498 | 29.9% |
Fidelity Energy Central Fund | 203,830,000 | 16,060,222 | 7,848,992 | 169,988,020 | 29.9% |
Fidelity Financials Central Fund | 365,226,000 | 34,093,068 | - | 247,762,683 | 29.9% |
Fidelity Floating Rate Central Fund | 87,902,000 | 16,412,837 | 14,388,125 | 79,120,080 | 3.1% |
Fidelity Health Care Central Fund | 220,312,000 | 18,700,382 | 1,966,219 | 199,695,136 | 29.9% |
Fidelity High Income Central Fund 1 | 54,188,000 | 8,009,808 | 6,201,447 | 49,300,279 | 19.7% |
Fidelity Industrials Central Fund | 225,622,000 | 18,241,274 | 8,723,783 | 186,734,449 | 29.9% |
Fidelity Information Technology Central Fund | 315,933,000 | 29,198,195 | - | 232,695,598 | 29.9% |
Fidelity International Equity Central Fund | - | 308,104,047 | - | 213,497,810 | 34.4% |
Fidelity Materials Central Fund | 70,728,000 | 5,680,545 | 2,222,435 | 56,702,977 | 29.9% |
Fidelity Tactical Income Central Fund | 682,133,000 | 79,497,621 | 216,349,097 | 500,674,871 | 12.4% |
Fidelity Telecom Services Central Fund | 68,234,000 | 7,659,274 | - | 46,819,800 | 29.9% |
Fidelity Utilities Central Fund | 68,507,000 | 5,882,827 | 492,172 | 57,097,620 | 29.9% |
Total | $ 2,719,967,000 | $ 578,712,586 | $ 266,914,231 | $ 2,358,624,392 | |
* Includes the value of shares received through merger activity - see Note 14 of the Notes to Financial Statements. |
Other Information (Unaudited) |
The information in the following tables is based on the combined investment of the Fund and its pro-rata share of the investments of Fidelity's Equity and Fixed-Income Central Funds. The composition of credit quality ratings as a percentage of net assets is as follows: |
U.S. Government and U.S. Government Agency Obligations | 12.7% |
AAA,AA,A | 6.6% |
BBB | 4.0% |
BB | 2.4% |
B | 2.0% |
CCC,CC,C | 0.4% |
Not Rated | 0.5% |
Equities | 71.0% |
Short-Term Investments and Net Other Assets | 0.4% |
| 100.0% |
We have used ratings from Moody's® Investors Services, Inc. Where Moody's ratings are not available, we have used S&P® ratings. All ratings are as of the report date and do not reflect subsequent downgrades. Percentages are adjusted for the effect of futures contracts, if applicable. |
Distribution of investments by country of issue, as a percentage of total net assets, is as follows. Percentages are adjusted for the effect of futures contracts, if applicable. |
United States of America | 78.9% |
United Kingdom | 3.8% |
Bermuda | 2.2% |
Switzerland | 2.0% |
Japan | 1.9% |
Canada | 1.5% |
Germany | 1.4% |
France | 1.2% |
Cayman Islands | 1.2% |
Others (individually less than 1%) | 5.9% |
| 100.0% |
Income Tax Information |
At September 30, 2008, the fund had a capital loss carryforward of approximately $100,045,622 of which $82,273,070 and $17,772,552 will expire on September 30, 2011 and 2016, respectively. The capital loss carryforward expiring September 30, 2016 was acquired from Fidelity Advisor Asset Manager 70% Fund. Capital loss carryforwards are only available to offset future capital gains of the Fund to the extent provided by regulations and may be limited. |
The fund intends to elect to defer to its fiscal year ending September 30, 2009 approximately $171,539,364 of losses recognized during the period November 1, 2007 to September 30, 2008. |
|
See accompanying notes which are an integral part of the financial statements.
Annual Report
Fidelity Asset Manager 70%
Financial Statements
Statement of Assets and Liabilities
| September 30, 2008 |
| | |
Assets | | |
Investment in securities, at value - See accompanying schedule: Unaffiliated issuers (cost $8,992,975) | $ 9,008,683 | |
Fidelity Central Funds (cost $2,809,424,212) | 2,463,422,146 | |
Total Investments (cost $2,818,417,187) | | $ 2,472,430,829 |
Cash | | 350 |
Receivable for investments sold | | 25,570,011 |
Receivable for fund shares sold | | 1,609,251 |
Dividends receivable | | 13,469 |
Distributions receivable from Fidelity Central Funds | | 3,135,420 |
Receivable for daily variation on futures contracts | | 4,118,909 |
Prepaid expenses | | 1,860 |
Receivable from investment adviser for expense reductions | | 1,223 |
Other receivables | | 77,722 |
Total assets | | 2,506,959,044 |
| | |
Liabilities | | |
Payable for investments purchased | $ 3,014,110 | |
Payable for fund shares redeemed | 4,235,933 | |
Accrued management fee | 1,130,637 | |
Distribution fees payable | 8,590 | |
Other affiliated payables | 490,296 | |
Other payables and accrued expenses | 136,472 | |
Total liabilities | | 9,016,038 |
| | |
Net Assets | | $ 2,497,943,006 |
Net Assets consist of: | | |
Paid in capital | | $ 3,055,165,272 |
Undistributed net investment income | | 41,473,665 |
Accumulated undistributed net realized gain (loss) on investments and foreign currency transactions | | (250,332,921) |
Net unrealized appreciation (depreciation) on investments and assets and liabilities in foreign currencies | | (348,363,010) |
Net Assets | | $ 2,497,943,006 |
| | |
Calculation of Maximum Offering Price Class A:
Net Asset Value and redemption price per share ($89,034,028 ÷ 6,536,105 shares) | | $ 13.62 |
| | |
Maximum offering price per share (100/94.25 of $13.62) | | $ 14.45 |
Class T:
Net Asset Value and redemption price per share ($52,477,998 ÷ 3,852,600 shares) | | $ 13.62 |
| | |
Maximum offering price per share (100/96.50 of $13.62) | | $ 14.11 |
Class B:
Net Asset Value and offering price per share ($23,526,441 ÷ 1,727,341 shares)A | | $ 13.62 |
| | |
Class C:
Net Asset Value and offering price per share ($37,762,253 ÷ 2,772,581 shares)A | | $ 13.62 |
| | |
Asset Manager 70%:
Net Asset Value, offering price and redemption price per share ($2,269,425,048 ÷ 166,619,009 shares) | | $ 13.62 |
| | |
Institutional Class:
Net Asset Value, offering price and redemption price per share ($25,717,238 ÷ 1,887,817 shares) | | $ 13.62 |
A Redemption price per share is equal to net asset value less any applicable contingent deferred sales charge.
See accompanying notes which are an integral part of the financial statements.
Annual Report
Statement of Operations
| Year ended September 30, 2008 |
| | |
Investment Income | | |
Dividends | | $ 42,406 |
Interest | | 311,945 |
Income from Fidelity Central Funds | | 80,088,362 |
Total income | | 80,442,713 |
| | |
Expenses | | |
Management fee | $ 15,716,293 | |
Transfer agent fees | 5,310,219 | |
Distribution fees | 8,590 | |
Accounting and security lending fees | 1,066,029 | |
Custodian fees and expenses | 19,718 | |
Independent trustees' compensation | 11,785 | |
Depreciation in deferred trustee compensation account | (351) | |
Registration fees | 32,261 | |
Audit | 75,766 | |
Legal | 37,864 | |
Miscellaneous | 54,343 | |
Total expenses before reductions | 22,332,517 | |
Expense reductions | (268,805) | 22,063,712 |
Net investment income (loss) | | 58,379,001 |
Realized and Unrealized Gain (Loss) Net realized gain (loss) on: | | |
Investment securities: | | |
Unaffiliated issuers (net of foreign taxes of $97,686) | 1,272,849 | |
Fidelity Central Funds | (629,652) | |
Foreign currency transactions | (423,277) | |
Futures contracts | (21,326,537) | |
Total net realized gain (loss) | | (21,106,617) |
Change in net unrealized appreciation (depreciation) on: Investment securities (net of decrease in deferred foreign taxes of $49,309) | (676,297,073) | |
Assets and liabilities in foreign currencies | 911 | |
Futures contracts | (13,136,378) | |
Total change in net unrealized appreciation (depreciation) | | (689,432,540) |
Net gain (loss) | | (710,539,157) |
Net increase (decrease) in net assets resulting from operations | | $ (652,160,156) |
Statement of Changes in Net Assets
| Year ended
September 30,
2008 | Year ended
September 30,
2007 |
Increase (Decrease) in Net Assets | | |
Operations | | |
Net investment income (loss) | $ 58,379,001 | $ 72,467,198 |
Net realized gain (loss) | (21,106,617) | 97,197,631 |
Change in net unrealized appreciation (depreciation) | (689,432,540) | 279,530,728 |
Net increase (decrease) in net assets resulting from operations | (652,160,156) | 449,195,557 |
Distributions to shareholders from net investment income | (72,024,349) | (74,718,985) |
Distributions to shareholders from net realized gain | (3,513,384) | - |
Total distributions | (75,537,733) | (74,718,985) |
Share transactions - net increase (decrease) | (36,451,983) | (249,477,581) |
Total increase (decrease) in net assets | (764,149,872) | 124,998,991 |
| | |
Net Assets | | |
Beginning of period | 3,262,092,878 | 3,137,093,887 |
End of period (including undistributed net investment income of $41,473,665 and undistributed net investment income of $56,361,068, respectively) | $ 2,497,943,006 | $ 3,262,092,878 |
See accompanying notes which are an integral part of the financial statements.
Annual Report
Financial Highlights - Class A
Year ended September 30, | 2008 G |
Selected Per-Share Data | |
Net asset value, beginning of period | $ 14.14 |
Income from Investment Operations | |
Net investment income (loss) E | .00 J |
Net realized and unrealized gain (loss) | (.52) |
Total from investment operations | (.52) |
Net asset value, end of period | $ 13.62 |
Total Return B, C, D | (3.68)% |
Ratios to Average Net Assets H | |
Expenses before reductions | 1.31% A |
Expenses net of fee waivers, if any | 1.25% A |
Expenses net of all reductions | 1.24% A |
Net investment income (loss) | 1.60% A |
Supplemental Data | |
Net assets, end of period (000 omitted) | $ 89,034 |
Portfolio turnover rate F | 14% I |
A Annualized
B Total returns for periods of less than one year are not annualized.
C Total returns would have been lower had certain expenses not been reduced during the periods shown.
D Total returns do not include the effect of the sales charges.
E Calculated based on average shares outstanding during the period.
F Amount does not include the portfolio activity of any underlying Fidelity Central Funds.
G For the period September 23, 2008 (commencement of sale of shares) to September 30, 2008.
H Expense ratios reflect operating expenses of the class. Expenses before reductions do not reflect amounts reimbursed by the investment adviser or reductions from brokerage service arrangements or other expense offset arrangements and do not represent the amount paid by the class during periods when reimbursements or reductions occur. Expense ratios before reductions for start-up periods may not be representative of longer-term operating periods. Expenses net of fee waivers reflect expenses after reimbursement by the investment adviser but prior to reductions from brokerage service arrangements or other expense offset arrangements. Expenses net of all reductions represent the net expenses paid by the class. Fees and expenses of the underlying Fidelity Central Funds are not included in the Fund's expense ratio. The Fund indirectly bears its proportionate share of the expenses of any underlying Fidelity Central Funds. Based on their most recent shareholder report date, the expenses ranged from less than .01% to .03%.
I The portfolio turnover rate does not include the assets acquired in the merger.
J Amount represents less than $.01 per share.
Financial Highlights - Class T
Year ended September 30, | 2008 G |
Selected Per-Share Data | |
Net asset value, beginning of period | $ 14.14 |
Income from Investment Operations | |
Net investment income (loss) E | .00 J |
Net realized and unrealized gain (loss) | (.52) |
Total from investment operations | (.52) |
Net asset value, end of period | $ 13.62 |
Total Return B, C, D | (3.68)% |
Ratios to Average Net Assets H | |
Expenses before reductions | 1.56% A |
Expenses net of fee waivers, if any | 1.50% A |
Expenses net of all reductions | 1.49% A |
Net investment income (loss) | 1.35% A |
Supplemental Data | |
Net assets, end of period (000 omitted) | $ 52,478 |
Portfolio turnover rate F | 14% I |
A Annualized
B Total returns for periods of less than one year are not annualized.
C Total returns would have been lower had certain expenses not been reduced during the periods shown.
D Total returns do not include the effect of the sales charges.
E Calculated based on average shares outstanding during the period.
F Amount does not include the portfolio activity of any underlying Fidelity Central Funds.
G For the period September 23, 2008 (commencement of sale of shares) to September 30, 2008.
H Expense ratios reflect operating expenses of the class. Expenses before reductions do not reflect amounts reimbursed by the investment adviser or reductions from brokerage service arrangements or other expense offset arrangements and do not represent the amount paid by the class during periods when reimbursements or reductions occur. Expense ratios before reductions for start-up periods may not be representative of longer-term operating periods. Expenses net of fee waivers reflect expenses after reimbursement by the investment adviser but prior to reductions from brokerage service arrangements or other expense offset arrangements. Expenses net of all reductions represent the net expenses paid by the class. Fees and expenses of the underlying Fidelity Central Funds are not included in the Fund's expense ratio. The Fund indirectly bears its proportionate share of the expenses of any underlying Fidelity Central Funds. Based on their most recent shareholder report date, the expenses ranged from less than .01% to .03%.
I The portfolio turnover rate does not include the assets acquired in the merger.
J Amount represents less than $.01 per share.
See accompanying notes which are an integral part of the financial statements.
Annual Report
Financial Highlights - Class B
Year ended September 30, | 2008 G |
Selected Per-Share Data | |
Net asset value, beginning of period | $ 14.14 |
Income from Investment Operations | |
Net investment income (loss) E | .00 J |
Net realized and unrealized gain (loss) | (.52) |
Total from investment operations | (.52) |
Net asset value, end of period | $ 13.62 |
Total Return B, C, D | (3.68)% |
Ratios to Average Net Assets H | |
Expenses before reductions | 2.06% A |
Expenses net of fee waivers, if any | 2.00% A |
Expenses net of all reductions | 1.99% A |
Net investment income (loss) | .85% A |
Supplemental Data | |
Net assets, end of period (000 omitted) | $ 23,526 |
Portfolio turnover rate F | 14% I |
A Annualized
B Total returns for periods of less than one year are not annualized.
C Total returns would have been lower had certain expenses not been reduced during the periods shown.
D Total returns do not include the effect of the contingent deferred sales charge.
E Calculated based on average shares outstanding during the period.
F Amount does not include the portfolio activity of any underlying Fidelity Central Funds.
G For the period September 23, 2008 (commencement of sale of shares) to September 30, 2008.
H Expense ratios reflect operating expenses of the class. Expenses before reductions do not reflect amounts reimbursed by the investment adviser or reductions from brokerage service arrangements or other expense offset arrangements and do not represent the amount paid by the class during periods when reimbursements or reductions occur. Expense ratios before reductions for start-up periods may not be representative of longer-term operating periods. Expenses net of fee waivers reflect expenses after reimbursement by the investment adviser but prior to reductions from brokerage service arrangements or other expense offset arrangements. Expenses net of all reductions represent the net expenses paid by the class. Fees and expenses of the underlying Fidelity Central Funds are not included in the Fund's expense ratio. The Fund indirectly bears its proportionate share of the expenses of any underlying Fidelity Central Funds. Based on their most recent shareholder report date, the expenses ranged from less than .01% to .03%.
I The portfolio turnover rate does not include the assets acquired in the merger.
J Amount represents less than $.01 per share.
Financial Highlights - Class C
Year ended September 30, | 2008 G |
Selected Per-Share Data | |
Net asset value, beginning of period | $ 14.14 |
Income from Investment Operations | |
Net investment income (loss) E | .00 J |
Net realized and unrealized gain (loss) | (.52) |
Total from investment operations | (.52) |
Net asset value, end of period | $ 13.62 |
Total Return B, C, D | (3.68)% |
Ratios to Average Net Assets H | |
Expenses before reductions | 2.07% A |
Expenses net of fee waivers, if any | 2.00% A |
Expenses net of all reductions | 1.99% A |
Net investment income (loss) | .85% A |
Supplemental Data | |
Net assets, end of period (000 omitted) | $ 37,762 |
Portfolio turnover rate F | 14% I |
A Annualized
B Total returns for periods of less than one year are not annualized.
C Total returns would have been lower had certain expenses not been reduced during the periods shown.
D Total returns do not include the effect of the contingent deferred sales charge.
E Calculated based on average shares outstanding during the period.
F Amount does not include the portfolio activity of any underlying Fidelity Central Funds.
G For the period September 23, 2008 (commencement of sale of shares) to September 30, 2008.
H Expense ratios reflect operating expenses of the class. Expenses before reductions do not reflect amounts reimbursed by the investment adviser or reductions from brokerage service arrangements or other expense offset arrangements and do not represent the amount paid by the class during periods when reimbursements or reductions occur. Expense ratios before reductions for start-up periods may not be representative of longer-term operating periods. Expenses net of fee waivers reflect expenses after reimbursement by the investment adviser but prior to reductions from brokerage service arrangements or other expense offset arrangements. Expenses net of all reductions represent the net expenses paid by the class. Fees and expenses of the underlying Fidelity Central Funds are not included in the Fund's expense ratio. The Fund indirectly bears its proportionate share of the expenses of any underlying Fidelity Central Funds. Based on their most recent shareholder report date, the expenses ranged from less than .01% to .03%.
I The portfolio turnover rate does not include the assets acquired in the merger.
J Amount represents less than $.01 per share.
See accompanying notes which are an integral part of the financial statements.
Annual Report
Financial Highlights - Asset Manager 70%
Years ended September 30, | 2008 | 2007 | 2006 | 2005 | 2004 |
Selected Per-Share Data | | | | | |
Net asset value, beginning of period | $ 17.78 | $ 15.82 | $ 14.94 | $ 14.10 | $ 13.47 |
Income from Investment Operations | | | | | |
Net investment income (loss) B | .33 | .38 | .34 | .31 D | .25 |
Net realized and unrealized gain (loss) | (4.06) | 1.97 | .84 | .85 | .69 |
Total from investment operations | (3.73) | 2.35 | 1.18 | 1.16 | .94 |
Distributions from net investment income | (.41) | (.39) | (.29) | (.32) | (.31) |
Distributions from net realized gain | (.02) | - | (.01) | - | - |
Total distributions | (.43) | (.39) | (.30) | (.32) | (.31) |
Net asset value, end of period | $ 13.62 | $ 17.78 | $ 15.82 | $ 14.94 | $ 14.10 |
Total Return A | (21.46)% | 15.07% | 7.98% | 8.28% | 6.99% |
Ratios to Average Net Assets E | | | | | |
Expenses before reductions | .79% | .80% | .81% | .82% | .83% |
Expenses net of fee waivers, if any | .79% | .80% | .81% | .82% | .83% |
Expenses net of all reductions | .78% | .78% | .79% | .80% | .82% |
Net investment income (loss) | 2.07% | 2.26% | 2.20% | 2.11% D | 1.77% |
Supplemental Data | | | | | |
Net assets, end of period (in millions) | $ 2,269 | $ 3,262 | $ 3,137 | $ 3,284 | $ 3,588 |
Portfolio turnover rate C | 14% F | 14% | 82% G | 37% G | 67% |
A Total returns would have been lower had certain expenses not been reduced during the periods shown.
B Calculated based on average shares outstanding during the period.
C Amount does not include the portfolio activity of any underlying Fidelity Central Funds.
D Investment income per share reflects a special dividend which amounted to $.06 per share. Excluding the special dividend, the ratio of net investment income (loss) to average net assets would have been 1.73%.
E Expense ratios reflect operating expenses of the class. Expenses before reductions do not reflect amounts reimbursed by the investment adviser or reductions from brokerage service arrangements or other expense offset arrangements and do not represent the amount paid by the class during periods when reimbursements or reductions occur. Expenses net of fee waivers reflect expenses after reimbursement by the investment adviser but prior to reductions from brokerage service arrangements or other expense offset arrangements. Expenses net of all reductions represent the net expenses paid by the class. Fees and expenses of the underlying Fidelity Central Funds are not included in the Fund's expense ratio. The Fund indirectly bears its proportionate share of the expenses of any underlying Fidelity Central Funds. Based on their most recent shareholder report date, the expenses ranged from less than .01% to .03%.
F The portfolio turnover rate does not include the assets acquired in the merger.
G Portfolio turnover rate excludes securities received or delivered in-kind.
Financial Highlights - Institutional Class
Year ended September 30, | 2008 F |
Selected Per-Share Data | |
Net asset value, beginning of period | $ 14.14 |
Income from Investment Operations | |
Net investment income (loss) D | .00 I |
Net realized and unrealized gain (loss) | (.52) |
Total from investment operations | (.52) |
Net asset value, end of period | $ 13.62 |
Total Return B, C | (3.68)% |
Ratios to Average Net Assets G | |
Expenses before reductions | 1.06% A |
Expenses net of fee waivers, if any | 1.00% A |
Expenses net of all reductions | .99% A |
Net investment income (loss) | 1.85% A |
Supplemental Data | |
Net assets, end of period (000 omitted) | $ 25,717 |
Portfolio turnover rate E | 14% H |
A Annualized
B Total returns for periods of less than one year are not annualized.
C Total returns would have been lower had certain expenses not been reduced during the periods shown.
D Calculated based on average shares outstanding during the period.
E Amount does not include the portfolio activity of any underlying Fidelity Central Funds.
F For the period September 23, 2008 (commencement of sale of shares) to September 30, 2008.
G Expense ratios reflect operating expenses of the class. Expenses before reductions do not reflect amounts reimbursed by the investment adviser or reductions from brokerage service arrangements or other expense offset arrangements and do not represent the amount paid by the class during periods when reimbursements or reductions occur. Expense ratios before reductions for start-up periods may not be representative of longer-term operating periods. Expenses net of fee waivers reflect expenses after reimbursement by the investment adviser but prior to reductions from brokerage service arrangements or other expense offset arrangements. Expenses net of all reductions represent the net expenses paid by the class. Fees and expenses of the underlying Fidelity Central Funds are not included in the Fund's expense ratio. The Fund indirectly bears its proportionate share of the expenses of any underlying Fidelity Central Funds. Based on their most recent shareholder report date, the expenses ranged from less than .01% to .03%.
H The portfolio turnover rate does not include the assets acquired in the merger.
I Amount represents less than $.01 per share.
See accompanying notes which are an integral part of the financial statements.
Annual Report
Fidelity Asset Manager 85%
Investment Changes (Unaudited)
The information in the following tables is based on the combined investments of the Fund and its pro-rata share of the investments of Fidelity's Equity and Fixed-Income Central Funds. |
Top Ten Stocks as of September 30, 2008 |
| % of fund's
net assets | % of fund's net assets
6 months ago |
Apple, Inc. | 1.2 | 0.1 |
Procter & Gamble Co. | 1.2 | 1.0 |
General Electric Co. | 0.9 | 0.7 |
Bank of America Corp. | 0.8 | 0.5 |
JPMorgan Chase & Co. | 0.8 | 0.7 |
Wells Fargo & Co. | 0.8 | 0.5 |
The Coca-Cola Co. | 0.7 | 0.7 |
Genentech, Inc. | 0.7 | 0.2 |
Nestle SA (Reg.) | 0.7 | 0.6 |
PepsiCo, Inc. | 0.6 | 0.6 |
| 8.4 | |
Asset Allocation (% of fund's net assets) |
As of September 30, 2008 | As of March 31, 2008 |
| Stock class and
Equity Futures 85.1% | | | Stock class and
Equity Futures 84.1% | |
| Bond class 12.4% | | | Bond class 12.5% | |
| Short-term class 2.5% | | | Short-term class 3.4% | |
Asset allocations in the pie charts reflect the categorization of assets as defined in the Fund's prospectus in effect as of the time periods indicated above. Percentages are adjusted for the effect of futures contracts and swap contracts, if applicable.
Annual Report
Fidelity Asset Manager 85%
The information in the following table is based on the direct investments of the Fund.
Fund Holdings as of September 30, 2008 |
| % of fund's
net assets |
Equity Central Funds | |
Fidelity International Equity Central Fund | 12.8 |
Fidelity Financials Central Fund | 10.9 |
Fidelity Information Technology Central Fund | 10.2 |
Fidelity Health Care Central Fund | 8.8 |
Fidelity Industrials Central Fund | 8.2 |
Fidelity Energy Central Fund | 7.4 |
Fidelity Consumer Staples Central Fund | 7.0 |
Fidelity Consumer Discretionary Central Fund | 7.0 |
Fidelity Utilities Central Fund | 2.5 |
Fidelity Materials Central Fund | 2.5 |
Fidelity Telecom Services Central Fund | 2.0 |
Total Equity Central Funds | 79.3 |
Fixed-Income Central Funds | |
Investment Grade Fixed-Income Funds | 7.8 |
High Yield Fixed-Income Funds | 1.2 |
Total Fixed-Income Central Funds | 9.0 |
Money Market Central Funds | 8.3 |
Other Short-Term Investments and Net Other Assets | 3.4 |
Total | 100.0 |
At period end, foreign investments, including the Fund's pro-rata share of the underlying Central Funds, was 24.7% of net assets. |
A holdings listing for the Fund, which presents direct holdings as well as the pro-rata share of any securities and other investments held indirectly through its investment in underlying non-money market Fidelity Central Funds, is available at fidelity.com and/or advisor.fidelity.com, as applicable. |
Annual Report
Fidelity Asset Manager 85%
Investments September 30, 2008
Showing Percentage of Net Assets
Equity Central Funds - 79.3% |
| Shares | | Value |
Fidelity Consumer Discretionary Central Fund (c) | 350,213 | | $ 32,363,171 |
Fidelity Consumer Staples Central Fund (c) | 283,995 | | 32,650,885 |
Fidelity Energy Central Fund (c) | 313,912 | | 34,680,962 |
Fidelity Financials Central Fund (c) | 767,829 | | 50,569,247 |
Fidelity Health Care Central Fund (c) | 409,180 | | 40,758,469 |
Fidelity Industrials Central Fund (c) | 361,159 | | 38,113,161 |
Fidelity Information Technology Central Fund (c) | 483,597 | | 47,494,035 |
Fidelity International Equity Central Fund (c) | 881,791 | | 59,185,813 |
Fidelity Materials Central Fund (c) | 105,173 | | 11,573,244 |
Fidelity Telecom Services Central Fund (c) | 106,534 | | 9,556,098 |
Fidelity Utilities Central Fund (c) | 124,853 | | 11,653,791 |
TOTAL EQUITY CENTRAL FUNDS (Cost $435,028,392) | 368,598,876 |
Fixed-Income Central Funds - 9.0% |
| | | |
Investment Grade Fixed-Income Funds - 7.8% |
Fidelity Tactical Income Central Fund (c) | 405,245 | | 36,391,037 |
High Yield Fixed-Income Funds - 1.2% |
Fidelity High Income Central Fund 1 (c) | 63,970 | | 5,470,107 |
TOTAL FIXED-INCOME CENTRAL FUNDS (Cost $45,537,377) | 41,861,144 |
Money Market Central Funds - 8.3% |
| | | |
Fidelity Cash Central Fund, 1.92% (a)
(Cost $38,653,762) | 38,653,762 | | 38,653,762 |
U.S. Treasury Obligations - 0.6% |
| Principal Amount | | |
U.S. Treasury Bills, yield at date of purchase 1.59% to 1.68% 10/16/08 to 12/4/08 (b)
(Cost $2,892,141) | | $ 2,900,000 | | 2,896,626 |
TOTAL INVESTMENT PORTFOLIO - 97.2% (Cost $522,111,672) | | 452,010,408 |
NET OTHER ASSETS - 2.8% | | 13,198,380 |
NET ASSETS - 100% | $ 465,208,788 |
Futures Contracts |
| Expiration Date | | Underlying Face Amount at Value | | Unrealized Appreciation/
(Depreciation) |
Purchased |
Equity Index Contracts |
645 CME E-mini S&P 500 Index Contracts | Dec. 2008 | | $ 37,648,650 | | $ (934,495) |
|
The face value of futures purchased as a percentage of net assets - 8.1% |
Legend |
(a) Affiliated fund that is available only to investment companies and other accounts managed by Fidelity Investments. The rate quoted is the annualized seven-day yield of the fund at period end. A complete unaudited listing of the fund's holdings as of its most recent quarter end is available upon request. |
(b) Security or a portion of the security was pledged to cover margin requirements for futures contracts. At the period end, the value of securities pledged amounted to $2,896,626. |
(c) Affiliated fund that is available only to investment companies and other accounts managed by Fidelity Investments. A complete unaudited schedule of portfolio holdings for each Fidelity Central Fund is filed with the SEC for the first and third quarters of each fiscal year on Form N-Q and is available upon request or at the SEC's web site at www.sec.gov. An unaudited holdings listing for the Fund, which presents direct holdings as well as the pro rata share of securities and other investments held indirectly through its investment in underlying non-money market Fidelity Central Funds, is available at fidelity.com and/or advisor.fidelity.com, as applicable. In addition, each Fidelity Central Fund's financial statements, which are not covered by the Fund's Report of Independent Registered Public Accounting Firm, are available on the SEC's web site or upon request. |
Affiliated Central Funds |
Information regarding fiscal year to date income earned by the Fund from investments in Fidelity Central Funds is as follows: |
Fund | Income earned |
Fidelity Cash Central Fund | $ 2,014,566 |
Fidelity Consumer Discretionary Central Fund | 527,503 |
Fidelity Consumer Staples Central Fund | 740,245 |
Fidelity Energy Central Fund | 358,448 |
Fidelity Financials Central Fund | 1,909,323 |
Fidelity Health Care Central Fund | 436,247 |
Fidelity High Income Central Fund 1 | 499,436 |
Fidelity Industrials Central Fund | 687,589 |
Fidelity Information Technology Central Fund | 432,249 |
Fidelity International Equity Central Fund | 1,742,195 |
Fidelity Materials Central Fund | 256,289 |
Fidelity Securities Lending Cash Central Fund | 4,304 |
Fidelity Tactical Income Central Fund | 3,021,104 |
Fidelity Telecom Services Central Fund | 265,683 |
Fidelity Utilities Central Fund | 314,452 |
Total | $ 13,209,633 |
Additional information regarding the Fund's fiscal year to date purchases and sales, including the ownership percentage, of the non-money market Central Funds is as follows: |
Fund | Value, beginning of period | Purchases | Sales
Proceeds | Value,
end of period | % ownership, end of period |
Fidelity Consumer Discretionary Central Fund | $ 38,476,813 | $ 4,818,364 | $ 1,141,365 | $ 32,363,171 | 6.1% |
Fidelity Consumer Staples Central Fund | 31,481,455 | 4,503,980 | 220,952 | 32,650,885 | 6.1% |
Fidelity Energy Central Fund | 39,903,408 | 5,609,264 | 1,387,562 | 34,680,962 | 6.1% |
Fidelity Financials Central Fund | 71,344,905 | 10,935,446 | - | 50,569,247 | 6.1% |
Fidelity Health Care Central Fund | 43,134,603 | 5,594,696 | 148,392 | 40,758,469 | 6.1% |
Fidelity High Income Central Fund 1 | 8,946,922 | 236,339 | 2,899,743 | 5,470,107 | 2.2% |
Fidelity Industrials Central Fund | 44,167,755 | 5,855,085 | 1,548,888 | 38,113,161 | 6.1% |
Fidelity Information Technology Central Fund | 61,814,912 | 9,468,853 | - | 47,494,035 | 6.1% |
Fidelity International Equity Central Fund | - | 86,885,029 | - | 59,185,813 | 9.5% |
Fidelity Materials Central Fund | 13,842,100 | 1,918,350 | 365,780 | 11,573,244 | 6.1% |
Fidelity Tactical Income Central Fund | 65,379,747 | 3,021,104 | 27,750,019 | 36,391,037 | 0.9% |
Fidelity Telecom Services Central Fund | 13,358,236 | 2,259,071 | - | 9,556,098 | 6.1% |
Fidelity Utilities Central Fund | 13,416,809 | 1,886,006 | - | 11,653,791 | 6.1% |
Total | $ 445,267,665 | $ 142,991,587 | $ 35,462,701 | $ 410,460,020 | |
Other Information (Unaudited) |
The information in the following tables is based on the combined investment of the Fund and its pro-rata share of the investments of Fidelity's Equity and Fixed-Income Central Funds. The composition of credit quality ratings as a percentage of net assets is as follows: |
U.S. Government and U.S. Government Agency Obligations | 4.9% |
AAA,AA,A | 2.7% |
BBB | 1.4% |
BB | 0.8% |
B | 0.6% |
CCC,CC,C | 0.0% |
Not Rated | 0.0% |
Equities | 85.0% |
Short-Term Investments and Net Other Assets | 4.6% |
| 100.0% |
We have used ratings from Moody's® Investors Services, Inc. Where Moody's ratings are not available, we have used S&P® ratings. All ratings are as of the report date and do not reflect subsequent downgrades. Percentages are adjusted for the effect of futures contracts, if applicable. |
Distribution of investments by country of issue, as a percentage of total net assets, is as follows. Percentages are adjusted for the effect of futures contracts, if applicable. |
United States of America | 75.3% |
United Kingdom | 4.5% |
Japan | 2.6% |
Switzerland | 2.5% |
Bermuda | 2.4% |
Germany | 1.9% |
France | 1.6% |
Canada | 1.3% |
Cayman Islands | 1.3% |
Others (individually less than 1%) | 6.6% |
| 100.0% |
Income Tax Information |
At September 30, 2008, the fund had a capital loss carryforward of approximately $36,329,826 all of which will expire on September 30, 2011. |
The fund intends to elect to defer to its fiscal year ending September 30, 2009 approximately $49,933,286 of losses recognized during the period November 1, 2007 to September 30, 2008. |
See accompanying notes which are an integral part of the financial statements.
Annual Report
Fidelity Asset Manager 85%
Financial Statements
Statement of Assets and Liabilities
| September 30, 2008 |
| | |
Assets | | |
Investment in securities, at value - See accompanying schedule: Unaffiliated issuers (cost $2,892,141) | $ 2,896,626 | |
Fidelity Central Funds (cost $519,219,531) | 449,113,782 | |
Total Investments (cost $522,111,672) | | $ 452,010,408 |
Foreign currency held at value (cost $256,819) | | 256,867 |
Receivable for investments sold | | 11,801,516 |
Receivable for fund shares sold | | 656,649 |
Dividends receivable | | 28,231 |
Distributions receivable from Fidelity Central Funds | | 355,556 |
Receivable for daily variation on futures contracts | | 1,618,950 |
Prepaid expenses | | 344 |
Other receivables | | 4,840 |
Total assets | | 466,733,361 |
| | |
Liabilities | | |
Payable for investments purchased | $ 243,702 | |
Payable for fund shares redeemed | 867,015 | |
Accrued management fee | 230,868 | |
Transfer agent fee payable | 109,378 | |
Distribution fees payable | 10,949 | |
Other affiliated payables | 16,088 | |
Other payables and accrued expenses | 46,573 | |
Total liabilities | | 1,524,573 |
| | |
Net Assets | | $ 465,208,788 |
Net Assets consist of: | | |
Paid in capital | | $ 609,982,994 |
Undistributed net investment income | | 5,554,274 |
Accumulated undistributed net realized gain (loss) on investments and foreign currency transactions | | (79,295,918) |
Net unrealized appreciation (depreciation) on investments and assets and liabilities in foreign currencies | | (71,032,562) |
Net Assets | | $ 465,208,788 |
| | |
Calculation of Maximum Offering Price Class A:
Net Asset Value and redemption price per share ($12,886,680 ÷ 1,177,641 shares) | | $ 10.94 |
| | |
Maximum offering price per share (100/94.25 of $10.94) | | $ 11.61 |
Class T:
Net Asset Value and redemption price per share ($4,090,064 ÷ 374,947 shares) | | $ 10.91 |
| | |
Maximum offering price per share (100/96.50 of $10.91) | | $ 11.31 |
Class B:
Net Asset Value and offering price per share ($2,451,670 ÷ 226,082 shares)A | | $ 10.84 |
| | |
Class C:
Net Asset Value and offering price per share ($5,016,717 ÷ 463,742 shares)A | | $ 10.82 |
| | |
Asset Manager 85%:
Net Asset Value, offering price and redemption price per share ($440,040,090 ÷ 40,027,464 shares) | | $ 10.99 |
| | |
Institutional Class:
Net Asset Value, offering price and redemption price per share ($723,567 ÷ 65,769 shares) | | $ 11.00 |
A Redemption price per share is equal to net asset value less any applicable contingent deferred sales charge.
See accompanying notes which are an integral part of the financial statements.
Annual Report
Statement of Operations
| Year ended September 30, 2008 |
| | |
Investment Income | | |
Dividends | | $ 17,977 |
Interest | | 83,167 |
Income from Fidelity Central Funds | | 13,209,633 |
Total income | | 13,310,777 |
| | |
Expenses | | |
Management fee | $ 3,095,396 | |
Transfer agent fees | 1,344,535 | |
Distribution fees | 113,275 | |
Accounting and security lending fees | 209,934 | |
Custodian fees and expenses | 13,169 | |
Independent trustees' compensation | 2,289 | |
Registration fees | 95,346 | |
Audit | 71,199 | |
Legal | 5,114 | |
Miscellaneous | 11,611 | |
Total expenses before reductions | 4,961,868 | |
Expense reductions | (75,556) | 4,886,312 |
Net investment income (loss) | | 8,424,465 |
Realized and Unrealized Gain (Loss) Net realized gain (loss) on: | | |
Investment securities: | | |
Unaffiliated issuers (net of foreign taxes of $41,077) | (807,442) | |
Fidelity Central Funds | 22,498 | |
Foreign currency transactions | (68,546) | |
Futures contracts | (11,182,323) | |
Total net realized gain (loss) | | (12,035,813) |
Change in net unrealized appreciation (depreciation) on: Investment securities (net of decrease in deferred foreign taxes of $20,675) | (143,908,270) | |
Assets and liabilities in foreign currencies | 9,087 | |
Futures contracts | (3,136,558) | |
Total change in net unrealized appreciation (depreciation) | | (147,035,741) |
Net gain (loss) | | (159,071,554) |
Net increase (decrease) in net assets resulting from operations | | $ (150,647,089) |
Statement of Changes in Net Assets
| Year ended
September 30,
2008 | Year ended
September 30,
2007 |
Increase (Decrease) in Net Assets | | |
Operations | | |
Net investment income (loss) | $ 8,424,465 | $ 8,364,040 |
Net realized gain (loss) | (12,035,813) | 16,447,618 |
Change in net unrealized appreciation (depreciation) | (147,035,741) | 57,830,856 |
Net increase (decrease) in net assets resulting from operations | (150,647,089) | 82,642,514 |
Distributions to shareholders from net investment income | (9,363,481) | (7,445,590) |
Distributions to shareholders from net realized gain | (1,224,803) | (712,648) |
Total distributions | (10,588,284) | (8,158,238) |
Share transactions - net increase (decrease) | 35,772,420 | 67,356,167 |
Total increase (decrease) in net assets | (125,462,953) | 141,840,443 |
| | |
Net Assets | | |
Beginning of period | 590,671,741 | 448,831,298 |
End of period (including undistributed net investment income of $5,554,274 and undistributed net investment income of $7,388,012, respectively) | $ 465,208,788 | $ 590,671,741 |
See accompanying notes which are an integral part of the financial statements.
Annual Report
Financial Highlights - Class A
Years ended September 30, | 2008 | 2007 G |
Selected Per-Share Data | | |
Net asset value, beginning of period | $ 14.77 | $ 12.75 |
Income from Investment Operations | | |
Net investment income (loss) E | .17 | .19 |
Net realized and unrealized gain (loss) | (3.74) | 2.05 |
Total from investment operations | (3.57) | 2.24 |
Distributions from net investment income | (.23) | (.20) |
Distributions from net realized gain | (.03) | (.02) |
Total distributions | (.26) | (.22) |
Net asset value, end of period | $ 10.94 | $ 14.77 |
Total Return B, C, D | (24.59)% | 17.78% |
Ratios to Average Net Assets H | | |
Expenses before reductions | 1.13% | 1.14% A |
Expenses net of fee waivers, if any | 1.13% | 1.14% A |
Expenses net of all reductions | 1.12% | 1.12% A |
Net investment income (loss) | 1.28% | 1.36% A |
Supplemental Data | | |
Net assets, end of period (000 omitted) | $ 12,887 | $ 7,348 |
Portfolio turnover rate F | 20% | 31% |
A Annualized
B Total returns for periods of less than one year are not annualized.
C Total returns would have been lower had certain expenses not been reduced during the periods shown.
D Total returns do not include the effect of the sales charges.
E Calculated based on average shares outstanding during the period.
F Amount does not include the portfolio activity of any underlying Fidelity Central Funds.
G For the period October 2, 2006 (commencement of sale of shares) to September 30, 2007.
H Expense ratios reflect operating expenses of the class. Expenses before reductions do not reflect amounts reimbursed by the investment adviser or reductions from brokerage service arrangements or other expense offset arrangements and do not represent the amount paid by the class during periods when reimbursements or reductions occur. Expense ratios before reductions for start-up periods may not be representative of longer-term operating periods. Expenses net of fee waivers reflect expenses after reimbursement by the investment adviser but prior to reductions from brokerage service arrangements or other expense offset arrangements. Expenses net of all reductions represent the net expenses paid by the class. Fees and expenses of the underlying Fidelity Central Funds are not included in the Fund's expense ratio. The Fund indirectly bears its proportionate share of the expenses of any underlying Fidelity Central Funds. Based on their most recent shareholder report date, the expenses ranged from less than .01% to .03%.
Financial Highlights - Class T
Years ended September 30, | 2008 | 2007 G |
Selected Per-Share Data | | |
Net asset value, beginning of period | $ 14.74 | $ 12.75 |
Income from Investment Operations | | |
Net investment income (loss) E | .13 | .15 |
Net realized and unrealized gain (loss) | (3.73) | 2.06 |
Total from investment operations | (3.60) | 2.21 |
Distributions from net investment income | (.20) | (.20) |
Distributions from net realized gain | (.03) | (.02) |
Total distributions | (.23) | (.22) |
Net asset value, end of period | $ 10.91 | $ 14.74 |
Total Return B, C, D | (24.76)% | 17.46% |
Ratios to Average Net Assets H | | |
Expenses before reductions | 1.38% | 1.42% A |
Expenses net of fee waivers, if any | 1.38% | 1.42% A |
Expenses net of all reductions | 1.37% | 1.41% A |
Net investment income (loss) | 1.02% | 1.07% A |
Supplemental Data | | |
Net assets, end of period (000 omitted) | $ 4,090 | $ 1,792 |
Portfolio turnover rate F | 20% | 31% |
A Annualized
B Total returns for periods of less than one year are not annualized.
C Total returns would have been lower had certain expenses not been reduced during the periods shown.
D Total returns do not include the effect of the sales charges.
E Calculated based on average shares outstanding during the period.
F Amount does not include the portfolio activity of any underlying Fidelity Central Funds.
G For the period October 2, 2006 (commencement of sale of shares) to September 30, 2007.
H Expense ratios reflect operating expenses of the class. Expenses before reductions do not reflect amounts reimbursed by the investment adviser or reductions from brokerage service arrangements or other expense offset arrangements and do not represent the amount paid by the class during periods when reimbursements or reductions occur. Expense ratios before reductions for start-up periods may not be representative of longer-term operating periods. Expenses net of fee waivers reflect expenses after reimbursement by the investment adviser but prior to reductions from brokerage service arrangements or other expense offset arrangements. Expenses net of all reductions represent the net expenses paid by the class. Fees and expenses of the underlying Fidelity Central Funds are not included in the Fund's expense ratio. The Fund indirectly bears its proportionate share of the expenses of any underlying Fidelity Central Funds. Based on their most recent shareholder report date, the expenses ranged from less than .01% to .03%.
See accompanying notes which are an integral part of the financial statements.
Annual Report
Financial Highlights - Class B
Years ended September 30, | 2008 | 2007 G |
Selected Per-Share Data | | |
Net asset value, beginning of period | $ 14.69 | $ 12.75 |
Income from Investment Operations | | |
Net investment income (loss) E | .06 | .08 |
Net realized and unrealized gain (loss) | (3.72) | 2.07 |
Total from investment operations | (3.66) | 2.15 |
Distributions from net investment income | (.16) | (.19) |
Distributions from net realized gain | (.03) | (.02) |
Total distributions | (.19) | (.21) |
Net asset value, end of period | $ 10.84 | $ 14.69 |
Total Return B, C, D | (25.21)% | 16.98% |
Ratios to Average Net Assets H | | |
Expenses before reductions | 1.93% | 1.93% A |
Expenses net of fee waivers, if any | 1.93% | 1.93% A |
Expenses net of all reductions | 1.92% | 1.92% A |
Net investment income (loss) | .47% | .56% A |
Supplemental Data | | |
Net assets, end of period (000 omitted) | $ 2,452 | $ 1,632 |
Portfolio turnover rate F | 20% | 31% |
A Annualized
B Total returns for periods of less than one year are not annualized.
C Total returns would have been lower had certain expenses not been reduced during the periods shown.
D Total returns do not include the effect of the contingent deferred sales charge.
E Calculated based on average shares outstanding during the period.
F Amount does not include the portfolio activity of any underlying Fidelity Central Funds.
G For the period October 2, 2006 (commencement of sale of shares) to September 30, 2007.
H Expense ratios reflect operating expenses of the class. Expenses before reductions do not reflect amounts reimbursed by the investment adviser or reductions from brokerage service arrangements or other expense offset arrangements and do not represent the amount paid by the class during periods when reimbursements or reductions occur. Expense ratios before reductions for start-up periods may not be representative of longer-term operating periods. Expenses net of fee waivers reflect expenses after reimbursement by the investment adviser but prior to reductions from brokerage service arrangements or other expense offset arrangements. Expenses net of all reductions represent the net expenses paid by the class. Fees and expenses of the underlying Fidelity Central Funds are not included in the Fund's expense ratio. The Fund indirectly bears its proportionate share of the expenses of any underlying Fidelity Central Funds. Based on their most recent shareholder report date, the expenses ranged from less than .01% to .03%.
Financial Highlights - Class C
Years ended September 30, | 2008 | 2007 G |
Selected Per-Share Data | | |
Net asset value, beginning of period | $ 14.67 | $ 12.75 |
Income from Investment Operations | | |
Net investment income (loss) E | .07 | .08 |
Net realized and unrealized gain (loss) | (3.71) | 2.06 |
Total from investment operations | (3.64) | 2.14 |
Distributions from net investment income | (.18) | (.20) |
Distributions from net realized gain | (.03) | (.02) |
Total distributions | (.21) | (.22) |
Net asset value, end of period | $ 10.82 | $ 14.67 |
Total Return B, C, D | (25.16)% | 16.90% |
Ratios to Average Net Assets H | | |
Expenses before reductions | 1.90% | 1.91% A |
Expenses net of fee waivers, if any | 1.90% | 1.91% A |
Expenses net of all reductions | 1.89% | 1.90% A |
Net investment income (loss) | .51% | .58% A |
Supplemental Data | | |
Net assets, end of period (000 omitted) | $ 5,017 | $ 3,194 |
Portfolio turnover rate F | 20% | 31% |
A Annualized
B Total returns for periods of less than one year are not annualized.
C Total returns would have been lower had certain expenses not been reduced during the periods shown.
D Total returns do not include the effect of the contingent deferred sales charge.
E Calculated based on average shares outstanding during the period.
F Amount does not include the portfolio activity of any underlying Fidelity Central Funds.
G For the period October 2, 2006 (commencement of sale of shares) to September 30, 2007.
H Expense ratios reflect operating expenses of the class. Expenses before reductions do not reflect amounts reimbursed by the investment adviser or reductions from brokerage service arrangements or other expense offset arrangements and do not represent the amount paid by the class during periods when reimbursements or reductions occur. Expense ratios before reductions for start-up periods may not be representative of longer-term operating periods. Expenses net of fee waivers reflect expenses after reimbursement by the investment adviser but prior to reductions from brokerage service arrangements or other expense offset arrangements. Expenses net of all reductions represent the net expenses paid by the class. Fees and expenses of the underlying Fidelity Central Funds are not included in the Fund's expense ratio. The Fund indirectly bears its proportionate share of the expenses of any underlying Fidelity Central Funds. Based on their most recent shareholder report date, the expenses ranged from less than .01% to .03%.
See accompanying notes which are an integral part of the financial statements.
Annual Report
Financial Highlights - Asset Manager 85%
Years ended September 30, | 2008 | 2007 | 2006 | 2005 | 2004 |
Selected Per-Share Data | | | | | |
Net asset value, beginning of period | $ 14.81 | $ 12.79 | $ 11.69 | $ 10.29 | $ 9.26 |
Income from Investment Operations | | | | | |
Net investment income (loss) B | .20 | .23 | .18 | .06 D | .05 |
Net realized and unrealized gain (loss) | (3.76) | 2.02 | .98 | 1.40 | 1.04 |
Total from investment operations | (3.56) | 2.25 | 1.16 | 1.46 | 1.09 |
Distributions from net investment income | (.23) | (.21) | (.06) | (.06) | (.06) |
Distributions from net realized gain | (.03) | (.02) | - | - | - |
Total distributions | (.26) | (.23) | (.06) | (.06) | (.06) |
Net asset value, end of period | $ 10.99 | $ 14.81 | $ 12.79 | $ 11.69 | $ 10.29 |
Total Return A | (24.43)% | 17.77% | 9.95% | 14.22% | 11.79% |
Ratios to Average Net Assets E | | | | | |
Expenses before reductions | .87% | .89% | .91% | .92% | .94% |
Expenses net of fee waivers, if any | .87% | .87% | .91% | .92% | .94% |
Expenses net of all reductions | .86% | .86% | .87% | .89% | .91% |
Net investment income (loss) | 1.54% | 1.62% | 1.50% | .53% D | .52% |
Supplemental Data | | | | | |
Net assets, end of period (000 omitted) | $ 440,040 | $ 576,458 | $ 448,831 | $ 403,221 | $ 352,600 |
Portfolio turnover rate C | 20% | 31% | 187% F | 71% F | 86% |
A Total returns would have been lower had certain expenses not been reduced during the periods shown.
B Calculated based on average shares outstanding during the period.
C Amount does not include the portfolio activity of any underlying Fidelity Central Funds.
D Investment income per share reflects a special dividend which amounted to $.02 per share. Excluding the special dividend, the ratio of net investment income (loss) to average net assets would have been .39%.
E Expense ratios reflect operating expenses of the class. Expenses before reductions do not reflect amounts reimbursed by the investment adviser or reductions from brokerage service arrangements or other expense offset arrangements and do not represent the amount paid by the class during periods when reimbursements or reductions occur. Expenses net of fee waivers reflect expenses after reimbursement by the investment adviser but prior to reductions from brokerage service arrangements or other expense offset arrangements. Expenses net of all reductions represent the net expenses paid by the class. Fees and expenses of the underlying Fidelity Central Funds are not included in the Fund's expense ratio. The Fund indirectly bears its proportionate share of the expenses of any underlying Fidelity Central Funds. Based on their most recent shareholder report date, the expenses ranged from less than .01% to .03%.
F Portfolio turnover rate excludes securities received or delivered in-kind.
Financial Highlights - Institutional Class
Years ended September 30, | 2008 | 2007 F |
Selected Per-Share Data | | |
Net asset value, beginning of period | $ 14.82 | $ 12.75 |
Income from Investment Operations | | |
Net investment income (loss) D | .21 | .23 |
Net realized and unrealized gain (loss) | (3.76) | 2.07 |
Total from investment operations | (3.55) | 2.30 |
Distributions from net investment income | (.24) | (.21) |
Distributions from net realized gain | (.03) | (.02) |
Total distributions | (.27) | (.23) |
Net asset value, end of period | $ 11.00 | $ 14.82 |
Total Return B, C | (24.35)% | 18.24% |
Ratios to Average Net Assets G | | |
Expenses before reductions | .78% | .82% A |
Expenses net of fee waivers, if any | .78% | .82% A |
Expenses net of all reductions | .77% | .81% A |
Net investment income (loss) | 1.62% | 1.67% A |
Supplemental Data | | |
Net assets, end of period (000 omitted) | $ 724 | $ 247 |
Portfolio turnover rate E | 20% | 31% |
A Annualized
B Total returns for periods of less than one year are not annualized.
C Total returns would have been lower had certain expenses not been reduced during the periods shown.
D Calculated based on average shares outstanding during the period.
E Amount does not include the portfolio activity of any underlying Fidelity Central Funds.
F For the period October 2, 2006 (commencement of sale of shares) to September 30, 2007.
G Expense ratios reflect operating expenses of the class. Expenses before reductions do not reflect amounts reimbursed by the investment adviser or reductions from brokerage service arrangements or other expense offset arrangements and do not represent the amount paid by the class during periods when reimbursements or reductions occur. Expense ratios before reductions for start-up periods may not be representative of longer-term operating periods. Expenses net of fee waivers reflect expenses after reimbursement by the investment adviser but prior to reductions from brokerage service arrangements or other expense offset arrangements. Expenses net of all reductions represent the net expenses paid by the class. Fees and expenses of the underlying Fidelity Central Funds are not included in the Fund's expense ratio. The Fund indirectly bears its proportionate share of the expenses of any underlying Fidelity Central Funds. Based on their most recent shareholder report date, the expenses ranged from less than .01% to .03%.
See accompanying notes which are an integral part of the financial statements.
Annual Report
Notes to Financial Statements
For the period ended September 30, 2008
1. Organization.
Fidelity Asset Manager 20%, Fidelity Asset Manager 30%, Fidelity Asset Manager 40%, Fidelity Asset Manager 50%, Fidelity Asset Manager 60%, Fidelity Asset Manager 70% and Fidelity Asset Manager 85% (the Funds) are funds of Fidelity Charles Street Trust (the trust). The trust is registered under the Investment Company Act of 1940, as amended (the 1940 Act), as an open-end management investment company organized as a Massachusetts business trust. Each Fund is authorized to issue an unlimited number of shares. Each Fund offers Class A, Class T, Class B, Class C, Asset Manager and Institutional Class shares, each of which has equal rights as to assets and voting privileges. Each class has exclusive voting rights with respect to matters that affect that class. Fidelity Asset Manager 70% commenced sale of Class A, Class T, Class B, Class C, and Institutional Class shares and the existing class was designated Asset Manager 70% on September 23, 2008. Class B shares will automatically convert to Class A shares after a holding period of seven years from the initial date of purchase. Investment income, realized and unrealized capital gains and losses, the common expenses of the Fund, and certain fund-level expense reductions, if any, are allocated on a pro rata basis to each class based on the relative net assets of each class to the total net assets of the Fund. Each class differs with respect to transfer agent and distribution and service plan fees incurred. Certain expense reductions also differ by class.
2. Investments in Fidelity Central Funds.
The Funds may invest in Fidelity Central Funds, which are open-end investment companies available only to other investment companies and accounts managed by Fidelity Management & Research Company (FMR) and its affiliates. The Funds' Schedules of Investments list each of the Fidelity Central Funds held as of period end, if any, as an investment of each Fund, but does not include the underlying holdings of each Fidelity Central Fund. As an Investing Fund, the Funds indirectly bear their proportionate share of the expenses of the underlying Fidelity Central Funds.
Based on their investment objective, each Fidelity Central Fund may invest or participate in various investment vehicles or strategies that are similar to those of each Fund. These strategies are consistent with the investment objectives of each Fund and may involve certain economic risks which may cause a decline in value of each of the Fidelity Central Funds and thus a decline in the value of each Fund. The following summarizes the Funds' investment in each Fidelity Central Fund.
Fidelity Central Fund | Investment Manager | Investment Objective | Investment Practices | Expense Ratio* |
Fidelity Equity Sector Central Funds | Fidelity Management & Research Company, Inc. (FMRC) | Each fund seeks capital appreciation by investing primarily in common stocks, with a concentration in a particular industry. | Foreign Securities Repurchase Agreements Restricted Securities | less than .01% to .02% |
Fidelity International Equity Central Fund | FMRC | Seeks capital appreciation by investing primarily in non-U.S. based common stocks, including securities of issuers located in emerging markets. | Foreign Securities Repurchase Agreements | .03% |
Fidelity Floating Rate Central Fund | FMRC | Seeks a high level of income by normally investing in floating rate loans and other floating rate securities. | Loans & Direct Debt Instruments Repurchase Agreements Restricted Securities | less than .01% |
Fidelity High Income Central Fund 1 | FMRC | Seeks a high level of income and may also seek capital appreciation by investing primarily in debt securities, preferred stocks, and convertible securities, with an emphasis on lower-quality debt securities. | Loans & Direct Debt Instruments Repurchase Agreements Restricted Securities | less than .01% |
Fidelity Tactical Income Central Fund | Fidelity Investments Money Management, Inc. (FIMM) | Seeks a high level of income by normally investing in investment-grade debt securities. | Delayed Delivery & When Issued Securities Mortgage Dollar Rolls Repurchase Agreements Restricted Securities Swap Agreements | less than .01% |
Fidelity Money Market Central Funds | FIMM | Seeks to obtain a high level of current income consistent with the preservation of capital and liquidity. | Short-term Investments | less than .01% |
* Expenses expressed as a percentage of average net assets and are as of each underlying Central Fund's most recent annual or semi-annual shareholder report.
Annual Report
Notes to Financial Statements - continued
2. Investments in Fidelity Central Funds - continued
An unaudited holdings listing for each Fund, which presents direct holdings as well as the pro rata share of any securities and other investments held indirectly through each Fund's investment in underlying non-money market Fidelity Central Funds, is available at fidelity.com and/or advisor.fidelity.com, as applicable. A complete unaudited list of holdings for each Fidelity Central Fund is available upon request or at the SEC's web site at www.sec.gov. In addition, the financial statements of the Fidelity Central Funds, which are not covered by the Funds' Reports of Independent Registered Public Accounting Firm, are available on the SEC's web site or upon request.
3. Significant Accounting Policies.
The financial statements have been prepared in conformity with accounting principles generally accepted in the United States of America, which require management to make certain estimates and assumptions at the date of the financial statements. Actual results could differ from those estimates. The following summarizes the significant accounting policies of the Funds:
Security Valuation. Investments are valued as of 4:00 p.m. Eastern time on the last calendar day of the period. Wherever possible, each Fund uses independent pricing services approved by the Board of Trustees to value their investments.
Equity securities, including restricted securities, for which market quotations are readily available, are valued at the last reported sale price or official closing price as reported by an independent pricing service on the primary market or exchange on which they are traded. In the event there were no sales during the day or closing prices are not available, securities are valued at the last quoted bid price. Debt securities, including restricted securities, are valued by independent pricing services or by dealers who make markets in such securities. Pricing services consider yield or price of bonds of comparable quality, coupon, maturity and type as well as dealer supplied prices. Futures contracts are valued at the settlement price established each day by the board of trade or exchange on which they are traded. Investments in open-end mutual funds, including the Fidelity Central Funds, are valued at their closing net asset value each business day. Short-term securities with remaining maturities of sixty days or less for which quotations are not readily available are valued at amortized cost, which approximates value.
When current market prices or quotations are not readily available or reliable, valuations may be determined in good faith in accordance with procedures adopted by the Board of Trustees. Factors used in determining value may include significant market or security specific events, changes in interest rates and credit quality, and developments in foreign markets which are monitored by evaluating the performance of ADRs, futures contracts and exchange-traded funds. The frequency with which these procedures are used cannot be predicted and may be utilized to a significant extent. The value of securities used for net asset value (NAV) calculation under these procedures may differ from published prices for the same securities.
Foreign Currency. Certain Funds may use foreign currency contracts to facilitate transactions in foreign-denominated securities. Losses from these transactions may arise from changes in the value of the foreign currency or if the counterparties do not perform under the contracts' terms.
Foreign-denominated assets, including investment securities, and liabilities are translated into U.S. dollars at the exchange rate at period end. Purchases and sales of investment securities, income and dividends received and expenses denominated in foreign currencies are translated into U.S. dollars at the exchange rate in effect on the transaction date.
The effects of exchange rate fluctuations on investments are included with the net realized and unrealized gain (loss) on investment securities. Other foreign currency transactions resulting in realized and unrealized gain (loss) are disclosed separately.
Investment Transactions and Income. For financial reporting purposes, the Funds' investment holdings and NAV include trades executed through the end of the last business day of the period. The NAV per share for processing shareholder transactions is calculated as of the close of business of the New York Stock Exchange (NYSE), normally 4:00 pm Eastern time and includes trades executed through the end of the prior business day. Gains and losses on securities sold are determined on the basis of identified cost and may include proceeds received from litigation. Dividend income is recorded on the ex-dividend date. Non-cash dividends included in dividend income, if any, are recorded at the fair market value of the securities received. Interest income and distributions from the Fidelity Central Funds are accrued as earned. Interest income includes coupon interest and amortization of premium and accretion of discount on debt securities. Investment income is recorded net of foreign taxes withheld where recovery of such taxes is uncertain.
Expenses. Most expenses of the trust can be directly attributed to a fund. Expenses which cannot be directly attributed are apportioned among each Fund in the trust. Expense estimates are accrued in the period to which they relate and adjustments are made when actual amounts are known. Expenses included in the accompanying financial statements reflect the expenses of each Fund and do not include any expenses of the Fidelity Central Funds. Although not included in each Fund's expenses, each Fund indirectly bears its proportionate share of the Fidelity Central Funds' expenses through the impact of these expenses on each Fidelity Central Fund's net asset value. Based on their most recent shareholder report date, expenses of the Fidelity Central Funds ranged from less than .01% to .03%.
Annual Report
3. Significant Accounting Policies - continued
Deferred Trustee Compensation. Under a Deferred Compensation Plan (the Plan) for Fidelity Asset Manager 50% and Fidelity Asset Manager 70%, Independent Trustees must defer receipt of a portion of, and may elect to defer receipt of an additional portion of, their annual compensation. Deferred amounts are invested in a cross-section of Fidelity funds, are marked-to-market and remain in the Fund until distributed in accordance with the Plan. The investment of deferred amounts and the offsetting payable to the Trustees are included in the accompanying Statement of Assets and Liabilities.
Income Tax Information and Distributions to Shareholders. Each year, each Fund intends to qualify as a regulated investment company by distributing substantially all of its taxable income and realized gains under Subchapter M of the Internal Revenue Code and filing its U.S. federal tax return. As a result, no provision for income taxes is required. Each Fund is subject to the provisions of FASB Interpretation No. 48, Accounting for Uncertainties in Income Taxes (FIN 48). FIN 48 sets forth a minimum threshold for financial statement recognition of the benefit of a tax position taken or expected to be taken in a tax return. The implementation of FIN 48 did not result in any unrecognized tax benefits in the accompanying financial statements. Each of the Funds' federal tax returns for the prior three fiscal years remains subject to examination by the Internal Revenue Service (IRS). Foreign taxes are provided for based on each Fund's understanding of the tax rules and rates that exist in the foreign markets in which it invests.
Distributions are recorded on the ex-dividend date. Income dividends and capital gain distributions are declared separately for each class. Income and capital gain distributions are determined in accordance with income tax regulations, which may differ from generally accepted accounting principles.
Capital accounts within the financial statements are adjusted for permanent book-tax differences. These adjustments have no impact on net assets or the results of operations. Temporary book-tax differences will reverse in a subsequent period.
Book-tax differences are primarily due to futures transactions, foreign currency transactions, certain foreign taxes, passive foreign investment companies (PFIC), market discount, partnerships (including allocations from Fidelity Central Funds), deferred trustees compensation, capital loss carryforwards and losses deferred due to wash sales and excise tax regulations.
The tax-basis components of distributable earnings and the federal tax cost as of period end were as follows for each Fund:
| Cost for Federal
Income Tax Purposes | Unrealized
Appreciation | Unrealized
Depreciation | Net Unrealized
Appreciation/
(Depreciation) |
Fidelity Asset Manager 20% | $ 2,366,330,190 | $ 12,057,286 | $ (167,215,181) | $ (155,157,895) |
Fidelity Asset Manager 30% | 29,648,950 | 262 | (2,437,137) | (2,436,875) |
Fidelity Asset Manager 40% | 20,660,400 | 65 | (1,596,219) | (1,596,154) |
Fidelity Asset Manager 50% | 6,763,591,475 | 90,074,183 | (776,437,621) | (686,363,438) |
Fidelity Asset Manager 60% | 35,302,499 | 5,822 | (2,646,858) | (2,641,036) |
Fidelity Asset Manager 70% | 2,799,541,819 | 38,688,032 | (365,799,022) | (327,110,990) |
Fidelity Asset Manager 85% | 516,075,883 | 6,555,566 | (70,621,041) | (64,065,475) |
| Undistributed
Ordinary Income | Undistributed
Long-term
Capital Gain | Capital Loss
Carryforward |
Fidelity Asset Manager 20% | $ 11,796,488 | $ 422,310 | $ - |
Fidelity Asset Manager 30% | 143,916 | - | (10,213) |
Fidelity Asset Manager 40% | 131,643 | - | (101,011) |
Fidelity Asset Manager 50% | 67,738,925 | - | - |
Fidelity Asset Manager 60% | 231,837 | - | (76,825) |
Fidelity Asset Manager 70% | 41,565,845 | - | (100,045,622) |
Fidelity Asset Manager 85% | 5,554,380 | - | (36,329,826) |
The tax character of distributions paid was as follows:
September 30, 2008 | | | |
| Ordinary Income | Long-term
Capital Gains | Total |
Fidelity Asset Manager 20% | $ 124,816,062 | $ 15,864,447 | $ 140,680,509 |
Fidelity Asset Manager 30% | 595,233 | - | 595,233 |
Fidelity Asset Manager 40% | 228,368 | - | 228,368 |
Fidelity Asset Manager 50% | 609,187,068 | 187,189,636 | 796,376,704 |
Fidelity Asset Manager 60% | 36,701 | - | 36,701 |
Fidelity Asset Manager 70% | 75,537,733 | - | 75,537,733 |
Fidelity Asset Manager 85% | 10,588,284 | - | 10,588,284 |
Annual Report
Notes to Financial Statements - continued
3. Significant Accounting Policies - continued
Income Tax Information and Distributions to Shareholders - continued
September 30, 2007 | | | |
| Ordinary Income | Long-term
Capital Gains | Total |
Fidelity Asset Manager 20% | $ 136,976,584 | $ 57,926,972 | $ 194,903,556 |
Fidelity Asset Manager 50% | 396,065,388 | 361,760,126 | 757,825,514 |
Fidelity Asset Manager 70% | 74,718,985 | - | 74,718,985 |
Fidelity Asset Manager 85% | 8,158,238 | - | 8,158,238 |
New Accounting Pronouncements. In September 2006, Statement of Financial Accounting Standards No. 157, Fair Value Measurements (SFAS 157), was issued and is effective for fiscal years beginning after November 15, 2007. SFAS 157 defines fair value, establishes a framework for measuring fair value and results in expanded disclosures about fair value measurements.
In addition, in March 2008, Statement of Financial Accounting Standards No. 161, Disclosures about Derivative Instruments and Hedging Activities (SFAS 161), was issued and is effective for reporting periods beginning after November 15, 2008. SFAS 161 requires enhanced disclosures to provide information about the reasons the Funds invest in derivative instruments, the accounting treatment and the effect derivatives have on financial performance.
4. Operating Policies.
Repurchase Agreements. FMR has received an Exemptive Order from the Securities and Exchange Commission (the SEC) which permits certain Funds and other affiliated entities of FMR to transfer uninvested cash balances into joint trading accounts which are then invested in repurchase agreements. Certain Funds may also invest directly with institutions in repurchase agreements. Repurchase agreements are collateralized by government or non-government securities. Upon settlement date, collateral is held in segregated accounts with custodian banks and may be obtained in the event of a default of the counterparty. Each applicable Fund monitors, on a daily basis, the value of the collateral to ensure it is at least equal to the principal amount of the repurchase agreement (including accrued interest). In the event of a default by the counterparty, realization of the collateral proceeds could be delayed, during which time the value of the collateral may decline.
Futures Contracts. Certain Funds may use futures contracts to manage their exposure to the stock market. Buying futures tends to increase a fund's exposure to the underlying instrument, while selling futures tends to decrease a fund's exposure to the underlying instrument or hedge other fund investments. Upon entering into a futures contract, a fund is required to deposit with a clearing broker, no later than the following business day, an amount ("initial margin") equal to a certain percentage of the face value of the contract. The initial margin may be in the form of cash or securities and is transferred to a segregated account on settlement date. Subsequent payments ("variation margin") are made or received by a fund depending on the daily fluctuations in the value of the futures contract and are accounted for as unrealized gains or losses. Realized gains (losses) are recorded upon the expiration or closing of the futures contract. Securities deposited to meet margin requirements are identified in each applicable fund's Schedule of Investments. Futures contracts involve, to varying degrees, risk of loss in excess of any futures variation margin reflected in each applicable fund's Statement of Assets and Liabilities. The underlying face amount at value of any open futures contracts at period end is shown in each applicable fund's Schedule of Investments under the caption "Futures Contracts." This amount reflects each contract's exposure to the underlying instrument at period end. Losses may arise from changes in the value of the underlying instruments or if the counterparties do not perform under the contract's terms.
5. Purchases and Sales of Investments.
Purchases and sales of securities (including the Equity and Fixed-Income Central Funds), other than short-term securities, are noted in the table below.
| Purchases ($) | Sales ($) |
Fidelity Asset Manager 20% | 171,800,010 | 83,670,006 |
Fidelity Asset Manager 30% | 33,090,843 | 4,895,941 |
Fidelity Asset Manager 40% | 18,362,577 | 101,121 |
Fidelity Asset Manager 50% | 604,143,707 | 1,602,065,571 |
Fidelity Asset Manager 60% | 31,760,349 | 539,595 |
Fidelity Asset Manager 70% | 368,231,329 | 415,955,703 |
Fidelity Asset Manager 85% | 146,921,804 | 98,178,529 |
Annual Report
6. Fees and Other Transactions with Affiliates.
Management Fee. FMR and its affiliates provide the Funds with investment management related services for which the Funds pay a monthly management fee. The management fee is the sum of an individual fund fee rate and a group fee rate. The individual fund fee rate is applied to each Fund's average net assets. The group fee rate is based upon the average net assets of all the mutual funds advised by FMR. The group fee rate decreases as assets under management increase and increases as assets under management decrease. For the period, each Fund's annual management fee rate expressed as a percentage of each Fund's average net assets was as follows:
| Individual Rate | Group Rate | Total |
Fidelity Asset Manager 20% | .30% | .12% | .42% |
Fidelity Asset Manager 30% | .30% | .12% | .42% |
Fidelity Asset Manager 40% | .30% | .12% | .42% |
Fidelity Asset Manager 50% | .25% | .26% | .51% |
Fidelity Asset Manager 60% | .30% | .26% | .56% |
Fidelity Asset Manager 70% | .30% | .26% | .56% |
Fidelity Asset Manager 85% | .30% | .26% | .56% |
FMR pays a portion of the management fees received from the Funds to the Fidelity Central Funds' investment advisers, who are also affiliates, for managing the assets of the Fidelity Central Funds.
Distribution and Service Plan. In accordance with Rule 12b-1 of the 1940 Act, the Fund has adopted separate Distribution and Service Plans for each class of shares. Certain classes pay Fidelity Distributors Corporation (FDC), an affiliate of FMR, separate Distribution and Service Fees, each of which is based on an annual percentage of each class' average net assets. In addition, FDC may pay financial intermediaries for selling shares of the Fund and providing shareholder support services. For the period, the Distribution and Service Fee rates and the total amounts paid to and retained by FDC were as follows:
Fidelity Asset Manager 20% | Distribution
Fee | Service
Fee | Paid to
FDC | Retained
by FDC |
Class A | .00% | .25% | $ 16,841 | $ 3,422 |
Class T | .25% | .25% | 22,751 | 259 |
Class B | .75% | .25% | 15,959 | 12,106 |
Class C | .75% | .25% | 27,213 | 13,462 |
| | | $ 82,764 | $ 29,249 |
Fidelity Asset Manager 30% | | | | |
Class A | .00% | .25% | $ 1,787 | $ 392 |
Class T | .25% | .25% | 2,276 | 689 |
Class B | .75% | .25% | 2,484 | 2,211 |
Class C | .75% | .25% | 7,262 | 6,613 |
| | | $ 13,809 | $ 9,905 |
Fidelity Asset Manager 40% | | | | |
Class A | .00% | .25% | $ 4,314 | $ 3,457 |
Class T | .25% | .25% | 8,264 | 6,915 |
Class B | .75% | .25% | 13,919 | 13,889 |
Class C | .75% | .25% | 14,815 | 14,721 |
| | | $ 41,312 | $ 38,982 |
Fidelity Asset Manager 50% | | | | |
Class A | .00% | .25% | $ 20,613 | $ 5,970 |
Class T | .25% | .25% | 24,930 | 248 |
Class B | .75% | .25% | 18,320 | 13,886 |
Class C | .75% | .25% | 39,254 | 27,533 |
| | | $ 103,117 | $ 47,637 |
Fidelity Asset Manager 60% | | | | |
Class A | .00% | .25% | $ 4,672 | $ 2,746 |
Class T | .25% | .25% | 4,938 | 3,563 |
Class B | .75% | .25% | 8,905 | 8,453 |
Class C | .75% | .25% | 11,155 | 8,678 |
| | | $ 29,670 | $ 23,440 |
Annual Report
Notes to Financial Statements - continued
6. Fees and Other Transactions with Affiliates - continued
Distribution and Service Plan - continued
Fidelity Asset Manager 70% | Distribution
Fee | Service
Fee | Paid to
FDC | Retained
by FDC |
Class A | .00% | .25% | $ 1,735 | $ - |
Class T | .25% | .25% | 2,053 | - |
Class B | .75% | .25% | 1,847 | 1,385 |
Class C | .75% | .25% | 2,955 | - |
| | | $ 8,590 | $ 1,385 |
Fidelity Asset Manager 85% | | | | |
Class A | .00% | .25% | $ 28,319 | $ 3,184 |
Class T | .25% | .25% | 15,076 | 245 |
Class B | .75% | .25% | 22,977 | 17,369 |
Class C | .75% | .25% | 46,903 | 30,918 |
| | | $ 113,275 | $ 51,716 |
Sales Load. FDC receives a front-end sales charge of up to 5.75% for selling Class A shares, and 3.50% for selling Class T shares, some of which is paid to financial intermediaries for selling shares of the Fund. FDC receives the proceeds of contingent deferred sales charges levied on Class A, Class T, Class B, and Class C redemptions. These charges depend on the holding period. The deferred sales charges range from 5% to 1% for Class B, 1% for Class C, 1.00% to .50% for certain purchases of Class A shares and .25% for certain purchases of Class T shares.
For the period, sales charge amounts retained by FDC were as follows:
Fidelity Asset Manager 20% | Retained
by FDC |
Class A | $ 24,014 |
Class T | 3,692 |
Class B* | 2,543 |
Class C* | 1,199 |
| $ 31,448 |
Fidelity Asset Manager 30% | |
Class A | $ 1,961 |
Class T | 475 |
Class C* | 824 |
| $ 3,260 |
Fidelity Asset Manager 40% | |
Class A | $ 3,663 |
Class T | 234 |
Class B* | 95 |
| $ 3,992 |
Fidelity Asset Manager 50% | |
Class A | $ 30,625 |
Class T | 4,653 |
Class B* | 2,586 |
Class C* | 1,428 |
| $ 39,292 |
Fidelity Asset Manager 60% | |
Class A | $ 4,205 |
Class T | 1,339 |
Class C* | 208 |
| $ 5,752 |
Fidelity Asset Manager 70% | |
Class A | $ 615 |
Class T | 273 |
Class B* | 182 |
| $ 1,070 |
Annual Report
6. Fees and Other Transactions with Affiliates - continued
Sales Load - continued
Fidelity Asset Manager 85% | Retained
by FDC |
Class A | $ 33,337 |
Class T | 8,812 |
Class B* | 3,631 |
Class C* | 2,666 |
| $ 48,446 |
* When Class B and Class C shares are initially sold, FDC pays commissions from its own resources to financial intermediaries through which the sales are made.
Transfer Agent Fees. Fidelity Investments Institutional Operations Company, Inc. (FIIOC), an affiliate of FMR, is the transfer, dividend disbursing and shareholder servicing agent for each class of the Funds. FIIOC receives account fees and asset-based fees that vary according to the account size and type of account of the shareholders of the respective classes of each Fund. FIIOC pays for typesetting, printing and mailing of shareholder reports, except proxy statements. Prior to January 1, 2008, Fidelity Service Company Inc., (FSC), also an affiliate of FMR, was the transfer agent for Asset Manager 20%, Asset Manager 50%, Asset Manager 70% and Asset Manager 85%. For the period, each class paid the following transfer agent fees:
Fidelity Asset Manager 20% | Amount | % of
Average
Net Assets |
Class A | $ 10,339 | .15 |
Class T | 7,180 | .16 |
Class B | 3,355 | .21 |
Class C | 5,086 | .19 |
Asset Manager 20% | 2,543,268 | .10 |
Institutional Class | 2,001 | .11 |
| $ 2,571,229 | |
Fidelity Asset Manager 30% | | |
Class A | $ 1,050 | .15 * |
Class T | 681 | .15 * |
Class B | 443 | .18 * |
Class C | 1,121 | .15 * |
Asset Manager 30% | 25,306 | .11 * |
Institutional Class | 197 | .12 * |
| $ 28,798 | |
Fidelity Asset Manager 40% | | |
Class A | $ 2,392 | .14 * |
Class T | 2,162 | .13 * |
Class B | 1,671 | .12 * |
Class C | 1,876 | .13 * |
Asset Manager 40% | 7,821 | .11 * |
Institutional Class | 1,626 | .12 * |
| $ 17,548 | |
Fidelity Asset Manager 50% | | |
Class A | $ 16,972 | .21 |
Class T | 10,130 | .20 |
Class B | 4,707 | .26 |
Class C | 8,962 | .23 |
Asset Manager 50% | 13,473,964 | .17 |
Institutional Class | 1,091 | .14 |
| $ 13,515,826 | |
Annual Report
Notes to Financial Statements - continued
6. Fees and Other Transactions with Affiliates - continued
Transfer Agent Fees - continued
Fidelity Asset Manager 60% | Amount | % of
Average
Net Assets |
Class A | $ 3,912 | .21 * |
Class T | 1,906 | .19 * |
Class B | 1,594 | .18 * |
Class C | 1,960 | .18 * |
Asset Manager 60% | 15,916 | .17 * |
Institutional Class | 1,233 | .14 * |
| $ 26,521 | |
Fidelity Asset Manager 70% | | |
Class A | $ 2,082 | .30 * |
Class T | 1,232 | .30 * |
Class B | 554 | .30 * |
Class C | 887 | .30 * |
Asset Manager 70% | 5,304,859 | .19 |
Institutional Class | 605 | .30 * |
| $ 5,310,219 | |
Fidelity Asset Manager 85% | | |
Class A | $ 28,117 | .25 |
Class T | 7,617 | .25 |
Class B | 6,942 | .30 |
Class C | 12,475 | .27 |
Asset Manager 85% | 1,288,694 | .24 |
Institutional Class | 690 | .15 |
| $ 1,344,535 | |
* Annualized
Accounting and Security Lending Fees. FSC maintains each Fund's accounting records. The accounting fee is based on the level of average net assets for the month. Under a separate contract, FSC administers the security lending program. The security lending fee is based on the number and duration of lending transactions.
Brokerage Commissions. Certain Funds placed a portion of their portfolio transactions with brokerage firms which are affiliates of the investment adviser. The commissions paid to these affiliated firms were as follows:
| Amount |
Fidelity Asset Manager 50% | $ 315 |
Fidelity Asset Manager 70% | 146 |
Fidelity Asset Manager 85% | 67 |
Interfund Lending Program. Pursuant to an Exemptive Order issued by the SEC, the Funds, along with other registered investment companies having management contracts with FMR, may participate in an interfund lending program. This program provides an alternative credit facility allowing the funds to borrow from, or lend money to, other participating affiliated funds. Any open loans, including accrued interest, at period end are presented under the caption "Notes Payable to Affiliates" in the Fund's Statement of Assets and Liabilities. Each applicable fund's activity in this program during the period for which loans were outstanding was as follows:
| Borrower or Lender | Average Daily Loan Balance | Weighted Average Interest Rate | Interest Expense |
Fidelity Asset Manager 50% | Borrower | $ 21,397,875 | 4.43% | $ 42,138 |
Annual Report
7. Committed Line of Credit.
Certain Funds participate with other funds managed by FMR in a $4.2 billion credit facility (the "line of credit") to be utilized for temporary or emergency purposes to fund shareholder redemptions or for other short-term liquidity purposes. The participating funds have agreed to pay commitment fees on their pro rata portion of the line of credit, which is reflected in Miscellaneous Expense on the Statement of Operations, and is as follows:
| Amount |
Fidelity Asset Manager 20% | $ 4,746 |
Fidelity Asset Manager 30% | 23 |
Fidelity Asset Manager 40% | 12 |
Fidelity Asset Manager 50% | 15,661 |
Fidelity Asset Manager 60% | 11 |
Fidelity Asset Manager 70% | 5,655 |
Fidelity Asset Manager 85% | 1,072 |
During the period, there were no borrowings on this line of credit.
8. Security Lending.
Certain Funds lend portfolio securities from time to time in order to earn additional income. On the settlement date of the loan, each applicable Fund receives collateral (in the form of U.S. Treasury obligations, letters of credit and/or cash) against the loaned securities and maintains collateral in an amount not less than 100% of the market value of the loaned securities during the period of the loan. The market value of the loaned securities is determined at the close of business of the Funds and any additional required collateral is delivered to the Funds on the next business day. If the borrower defaults on its obligation to return the securities loaned because of insolvency or other reasons, a fund could experience delays and costs in recovering the securities loaned or in gaining access to the collateral. Any cash collateral received is invested in the Fidelity Securities Lending Cash Central Fund. At period end, there were no security loans outstanding. Security lending income represents the income earned on investing cash collateral, less fees and expenses associated with the loan, plus any premium payments that may be received on the loan of certain types of securities. Security lending income is presented on each applicable Fund's Statement of Operations as a component of income from Fidelity Central Funds. Net income from lending portfolio securities during the period amounted to:
Fidelity Asset Manager 20% | $ 13 |
Fidelity Asset Manager 50% | 14,209 |
Fidelity Asset Manager 70% | 9,184 |
Fidelity Asset Manager 85% | 4,304 |
9. Bank Borrowings.
Each Fund is permitted to have bank borrowings for temporary or emergency purposes to fund shareholder redemptions. Each Fund has established borrowing arrangements with certain banks. The interest rate on the borrowings is the bank's base rate, as revised from time to time. At period end, there were no bank borrowings outstanding. Each applicable Fund's activity in this program during the period for which loans were outstanding was as follows:
| Average Daily
Loan Balance | Weighted Average Interest Rate | Interest Expense |
Fidelity Asset Manager 50% | $ 8,989,400 | 2.17% | $ 2,714 |
10. Expense Reductions.
FMR voluntarily agreed to reimburse a portion of certain class' operating expenses. During the period, this reimbursement reduced these class' expenses as noted in the table below.
| | Reimbursement
from adviser |
Asset Manager 20% | | $ 9,475 |
Asset Manager 50% | | 9,620 |
Asset Manager 85% | | 9,680 |
FMR voluntarily agreed to reimburse Funds to the extent annual operating expenses exceeded certain levels of average net assets as noted in the table below. Some expenses, for example interest expense, including commitment fees, are excluded from this reimbursement.
Annual Report
Notes to Financial Statements - continued
10. Expense Reductions - continued
The following classes of each applicable Fund were in reimbursement during the period:
| Expense
Limitations | Reimbursement
from adviser |
Fidelity Asset Manager 20% | | |
Class B | 1.85% - 1.65%* | $ 117 |
Fidelity Asset Manager 30% | | |
Class A | 1.10% - .90%* | 4,867 |
Class T | 1.35% - 1.15%* | 3,547 |
Class B | 1.85% - 1.65%* | 2,422 |
Class C | 1.85% - 1.65%* | 4,885 |
Asset Manager 30% | .85% - .65%* | 115,600 |
Institutional Class | .85% - .65%* | 1,630 |
Fidelity Asset Manager 40% | | |
Class A | 1.10% - .90%* | 15,717 |
Class T | 1.35% - 1.15%* | 14,873 |
Class B | 1.85% - 1.65%* | 12,131 |
Class C | 1.85% - 1.65%* | 13,271 |
Asset Manager 40% | .85% - .65%* | 66,187 |
Institutional Class | .85% - .65%* | 12,254 |
Fidelity Asset Manager 60% | | |
Class A | 1.25% - 1.10%* | 19,044 |
Class T | 1.50% - 1.35%* | 9,100 |
Class B | 2.00% - 1.85%* | 8,240 |
Class C | 2.00% - 1.85%* | 9,962 |
Asset Manager 60% | 1.00% - .85%* | 89,562 |
Institutional Class | 1.00% - .85%* | 7,842 |
Fidelity Asset Manager 70% | | |
Class A | 1.25% | 475 |
Class T | 1.50% | 282 |
Class B | 2.00% | 127 |
Class C | 2.00% | 208 |
Institutional Class | 1.00% | 131 |
* Expense limitation in effect at period end.
Many of the brokers with whom FMR places trades on behalf of certain Funds and certain Equity Central Funds provided services to these Funds in addition to trade execution. These services included payments of expenses on behalf of each applicable Fund. In addition, through arrangements with each applicable Fund's custodian and each class' transfer agent, credits realized as a result of uninvested cash balances were used to reduce the Fund's expenses. All of the applicable expense reductions are noted in the table below.
| Brokerage Service Arrangements | Custody
expense
reduction | Transfer
Agent
expense
reduction |
| | | |
Fidelity Asset Manager 20% | $ 20,515 | $ 196 | $ - |
Asset Manager 20% | - | - | 31,456 |
Institutional Class | - | - | 31 |
Fidelity Asset Manager 30% | 183 | 36 | - |
Fidelity Asset Manager 40% | 229 | 7 | - |
Fidelity Asset Manager 50% | 359,222 | - | - |
Class A | - | - | 115 |
Asset Manager 50% | - | - | 150,145 |
Institutional Class | - | - | 3 |
Fidelity Asset Manager 60% | 338 | - | - |
Fidelity Asset Manager 70% | 200,769 | - | - |
Asset Manager 70% | - | - | 66,813 |
Fidelity Asset Manager 85% | 56,201 | 226 | - |
Class A | - | - | 133 |
Asset Manager 85% | - | - | 9,316 |
Annual Report
11. Other.
The Funds' organizational documents provide former and current trustees and officers with a limited indemnification against liabilities arising in connection with the performance of their duties to the Funds. In the normal course of business, the Funds may also enter into contracts that provide general indemnifications. The Funds' maximum exposure under these arrangements is unknown as this would be dependent on future claims that may be made against the Funds. The risk of material loss from such claims is considered remote.
At the end of the period, FMR or its affiliates were owners of record of more than 10% of the outstanding shares of the following funds:
| Affiliated % |
Fund | |
Fidelity Asset Manager 40% | 36% |
Fidelity Asset Manager 60% | 13% |
In December 2006, the Independent Trustees, with the assistance of independent counsel, completed an investigation regarding gifts, gratuities and business entertainment provided by certain brokers to certain individuals who were employed on FMR's domestic equity trading desk during the period 2002 to 2004. The Independent Trustees and FMR agreed that, despite the absence of proof that the Fidelity mutual funds experienced diminished execution quality as a result of the improper receipt of gifts and business entertainment, the conduct at issue was serious and was worthy of redress. Accordingly, the Independent Trustees requested, and FMR agreed to make, a payment of $42 million plus accrued interest, which equaled approximately $7.3 million, to certain Fidelity mutual funds.
In March 2008, the Trustees approved a method for allocating this payment among the funds and, in total, FMR paid each fund the following amounts, which is recorded in each applicable Fund's accompanying Statement of Operations:
Fidelity Asset Manager 20% | $ 81,877 |
Fidelity Asset Manager 50% | 615,567 |
Fidelity Asset Manager 70% | 282,743 |
Fidelity Asset Manager 85% | 59,143 |
In a related administrative order dated March 5, 2008, the U.S. Securities and Exchange Commission ("SEC") announced a settlement with FMR and FMR Co., Inc. (an affiliate of FMR) involving the SEC's regulatory rules for investment advisers and the improper receipt of gifts, gratuities and business entertainment. Without admitting or denying the SEC's findings, FMR agreed to pay an $8 million civil penalty to the United States Treasury.
12. Distributions to Shareholders.
Distributions to shareholders of each class were as follows:
Years ended September 30, | 2008 | 2007 A |
Fidelity Asset Manager 20% | | |
From net investment income | | |
Class A | $ 217,282 | $ 39,791 |
Class T | 139,471 | 49,051 |
Class B | 38,980 | 12,517 |
Class C | 66,883 | 20,780 |
Asset Manager 20% | 90,572,886 | 97,126,066 |
Institutional Class | 68,611 | 7,027 |
Total | $ 91,104,113 | $ 97,255,232 |
From net realized gain | | |
Class A | $ 111,897 | $ 5,081 |
Class T | 88,892 | 20,043 |
Class B | 24,291 | 9,970 |
Class C | 35,012 | 9,436 |
Asset Manager 20% | 49,278,678 | 97,599,264 |
Institutional Class | 37,626 | 4,530 |
Total | $ 49,576,396 | $ 97,648,324 |
Annual Report
Notes to Financial Statements - continued
12. Distributions to Shareholders - continued
Years ended September 30, | 2008 | 2007 A |
Fidelity Asset Manager 30% B | | |
From net investment income | | |
Class A | $ 15,489 | $ - |
Class T | 9,224 | - |
Class B | 3,594 | - |
Class C | 12,880 | - |
Asset Manager 30% | 550,353 | - |
Institutional Class | 3,693 | - |
Total | $ 595,233 | $ - |
Fidelity Asset Manager 40% B | | |
From net investment income | | |
Class A | $ 27,725 | $ - |
Class T | 24,685 | - |
Class B | 15,306 | - |
Class C | 15,599 | - |
Asset Manager 40% | 119,398 | - |
Institutional Class | 25,655 | - |
Total | $ 228,368 | $ - |
Fidelity Asset Manager 50% | | |
From net investment income | | |
Class A | $ 185,719 | $ 24,674 |
Class T | 112,972 | 23,998 |
Class B | 29,127 | 8,690 |
Class C | 67,942 | 16,728 |
Asset Manager 50% | 239,444,583 | 271,801,549 |
Institutional Class | 26,633 | 3,438 |
Total | $ 239,866,976 | $ 271,879,077 |
From net realized gain | | |
Class A | $ 359,333 | $ 12,138 |
Class T | 290,067 | 16,061 |
Class B | 98,729 | 7,032 |
Class C | 225,372 | 9,224 |
Asset Manager 50% | 555,465,189 | 485,895,701 |
Institutional Class | 71,038 | 6,281 |
Total | $ 556,509,728 | $ 485,946,437 |
Fidelity Asset Manager 60% B | | |
From net investment income | | |
Class A | $ 7,307 | $ - |
Class T | 2,841 | - |
Class B | 1,840 | - |
Class C | 1,840 | - |
Asset Manager 60% | 18,398 | - |
Institutional Class | 4,475 | - |
Total | $ 36,701 | $ - |
Fidelity Asset Manager 70% | | |
From net investment income | | |
Asset Manager 70% | $ 72,024,349 | $ 74,718,985 |
From net realized gain | | |
Asset Manager 70% | $ 3,513,384 | $ - |
Annual Report
12. Distributions to Shareholders - continued
Years ended September 30, | 2008 | 2007 A |
Fidelity Asset Manager 85% | | |
From net investment income | | |
Class A | $ 150,986 | $ 3,111 |
Class T | 34,666 | 3,070 |
Class B | 23,020 | 2,303 |
Class C | 54,595 | 5,563 |
Asset Manager 85% | 9,096,274 | 7,429,888 |
Institutional Class | 3,940 | 1,655 |
Total | $ 9,363,481 | $ 7,445,590 |
From net realized gain | | |
Class A | $ 20,022 | $ 362 |
Class T | 5,093 | 315 |
Class B | 4,288 | 249 |
Class C | 9,298 | 571 |
Asset Manager 85% | 1,185,614 | 710,994 |
Institutional Class | 488 | 157 |
Total | $ 1,224,803 | $ 712,648 |
A Distributions for Class A, Class T, Class B, Class C and Institutional Class are for the period October 2, 2006 (commencement of sale of shares) to September 30, 2007.
B For the period October 9, 2007 (commencement of operations) to September 30, 2008.
13. Share Transactions.
Transactions for each class of shares were as follows:
| Shares | Dollars |
Years ended September 30, | 2008 | 2007A | 2008 | 2007A |
Fidelity Asset Manager 20% | | | | |
Class A | | | | |
Shares sold | 723,971 | 271,096 | $ 8,907,277 | $ 3,462,355 |
Reinvestment of distributions | 20,064 | 2,590 | 246,151 | 32,986 |
Shares redeemed | (301,654) | (8,338) | (3,651,098) | (106,244) |
Net increase (decrease) | 442,381 | 265,348 | $ 5,502,330 | $ 3,389,097 |
Class T | | | | |
Shares sold | 207,033 | 314,428 | $ 2,528,153 | $ 4,039,296 |
Reinvestment of distributions | 16,854 | 5,054 | 207,671 | 64,229 |
Shares redeemed | (97,145) | (12,418) | (1,189,971) | (158,426) |
Net increase (decrease) | 126,742 | 307,064 | $ 1,545,853 | $ 3,945,099 |
Class B | | | | |
Shares sold | 148,755 | 87,110 | $ 1,806,819 | $ 1,119,230 |
Reinvestment of distributions | 4,541 | 1,586 | 55,799 | 20,151 |
Shares redeemed | (55,802) | (11,667) | (672,403) | (148,544) |
Net increase (decrease) | 97,494 | 77,029 | $ 1,190,215 | $ 990,837 |
Class C | | | | |
Shares sold | 269,755 | 138,353 | $ 3,257,302 | $ 1,774,788 |
Reinvestment of distributions | 5,896 | 1,740 | 72,166 | 22,123 |
Shares redeemed | (83,185) | (8,144) | (1,003,632) | (103,462) |
Net increase (decrease) | 192,466 | 131,949 | $ 2,325,836 | $ 1,693,449 |
Asset Manager 20% | | | | |
Shares sold | 58,898,445 | 63,397,753 | $ 723,714,675 | $ 815,352,615 |
Reinvestment of distributions | 10,897,714 | 14,705,597 | 134,543,532 | 187,331,699 |
Shares redeemed | (64,781,528) | (45,831,913) | (791,199,186) | (589,696,416) |
Net increase (decrease) | 5,014,631 | 32,271,437 | $ 67,059,021 | $ 412,987,898 |
Institutional Class | | | | |
Shares sold | 180,834 | 18,496 | $ 2,308,608 | $ 238,374 |
Reinvestment of distributions | 8,001 | 717 | 98,769 | 9,130 |
Shares redeemed | (56,367) | - | (687,919) | - |
Net increase (decrease) | 132,468 | 19,213 | $ 1,719,458 | $ 247,504 |
Annual Report
Notes to Financial Statements - continued
13. Share Transactions - continued
| Shares | Dollars |
Years ended September 30, | 2008 | 2007A | 2008 | 2007A |
Fidelity Asset Manager 30% B | | | | |
Class A | | | | |
Shares sold | 144,653 | - | $ 1,379,463 | $ - |
Reinvestment of distributions | 1,332 | - | 12,471 | - |
Shares redeemed | (12,117) | - | (111,408) | - |
Net increase (decrease) | 133,868 | - | $ 1,280,526 | $ - |
Class T | | | | |
Shares sold | 133,157 | - | $ 1,249,065 | $ - |
Reinvestment of distributions | 983 | - | 9,168 | - |
Shares redeemed | (10,072) | - | (93,877) | - |
Net increase (decrease) | 124,068 | - | $ 1,164,356 | $ - |
Class B | | | | |
Shares sold | 55,559 | - | $ 524,350 | $ - |
Reinvestment of distributions | 382 | - | 3,594 | - |
Shares redeemed | (392) | - | (3,644) | - |
Net increase (decrease) | 55,549 | - | $ 524,300 | $ - |
Class C | | | | |
Shares sold | 186,960 | - | $ 1,749,175 | $ - |
Reinvestment of distributions | 1,370 | - | 12,797 | - |
Shares redeemed | (15,226) | - | (143,734) | - |
Net increase (decrease) | 173,104 | - | $ 1,618,238 | $ - |
Asset Manager 30% | | | | |
Shares sold | 5,359,391 | - | $ 50,914,907 | $ - |
Reinvestment of distributions | 56,102 | - | 525,162 | - |
Shares redeemed | (2,411,599) | - | (22,329,751) | - |
Net increase (decrease) | 3,003,894 | - | $ 29,110,318 | $ - |
Institutional Class | | | | |
Shares sold | 23,759 | - | $ 231,444 | $ - |
Reinvestment of distributions | 391 | - | 3,693 | - |
Net increase (decrease) | 24,150 | - | $ 235,137 | $ - |
Fidelity Asset Manager 40%B | | | | |
Class A | | | | |
Shares sold | 250,703 | - | $ 2,436,280 | $ - |
Reinvestment of distributions | 2,933 | - | 27,298 | - |
Shares redeemed | (12,251) | - | (109,719) | - |
Net increase (decrease) | 241,385 | - | $ 2,353,859 | $ - |
Class T | | | | |
Shares sold | 227,454 | - | $ 2,214,040 | $ - |
Reinvestment of distributions | 2,641 | - | 24,648 | - |
Shares redeemed | (11,458) | - | (102,562) | - |
Net increase (decrease) | 218,637 | - | $ 2,136,126 | $ - |
Class B | | | | |
Shares sold | 164,587 | - | $ 1,626,346 | $ - |
Reinvestment of distributions | 1,632 | - | 15,307 | - |
Shares redeemed | (2,203) | - | (19,407) | - |
Net increase (decrease) | 164,016 | - | $ 1,622,246 | $ - |
Class C | | | | |
Shares sold | 185,184 | - | $ 1,826,153 | $ - |
Reinvestment of distributions | 1,654 | - | 15,523 | - |
Shares redeemed | (22,232) | - | (200,684) | - |
Net increase (decrease) | 164,606 | - | $ 1,640,992 | $ - |
Annual Report
13. Share Transactions - continued
| Shares | Dollars |
Years ended September 30, | 2008 | 2007A | 2008 | 2007A |
Asset Manager 40% | | | | |
Shares sold | 1,762,049 | - | $ 16,509,845 | $ - |
Reinvestment of distributions | 12,657 | - | 116,657 | - |
Shares redeemed | (477,589) | - | (4,363,370) | - |
Net increase (decrease) | 1,297,117 | - | $ 12,263,132 | $ - |
Institutional Class | | | | |
Shares sold | 156,120 | - | $ 1,556,663 | $ - |
Reinvestment of distributions | 2,743 | - | 25,655 | - |
Net increase (decrease) | 158,863 | - | $ 1,582,318 | $ - |
Fidelity Asset Manager 50% | | | | |
Class A | | | | |
Shares sold | 701,937 | 289,790 | $ 10,522,398 | $ 4,808,317 |
Reinvestment of distributions | 34,512 | 2,223 | 528,926 | 36,700 |
Shares redeemed | (176,302) | (32,610) | (2,573,190) | (544,306) |
Net increase (decrease) | 560,147 | 259,403 | $ 8,478,134 | $ 4,300,711 |
Class T | | | | |
Shares sold | 321,333 | 190,527 | $ 4,828,159 | $ 3,166,113 |
Reinvestment of distributions | 25,741 | 2,395 | 396,949 | 39,464 |
Shares redeemed | (108,476) | (8,403) | (1,580,570) | (140,444) |
Net increase (decrease) | 238,598 | 184,519 | $ 3,644,538 | $ 3,065,133 |
Class B | | | | |
Shares sold | 140,799 | 70,302 | $ 2,118,896 | $ 1,168,687 |
Reinvestment of distributions | 6,699 | 894 | 103,082 | 14,680 |
Shares redeemed | (45,273) | (11,996) | (662,500) | (199,588) |
Net increase (decrease) | 102,225 | 59,200 | $ 1,559,478 | $ 983,779 |
Class C | | | | |
Shares sold | 230,335 | 169,588 | $ 3,467,980 | $ 2,814,455 |
Reinvestment of distributions | 14,272 | 1,375 | 220,179 | 22,635 |
Shares redeemed | (78,688) | (3,910) | (1,165,992) | (64,143) |
Net increase (decrease) | 165,919 | 167,053 | $ 2,522,167 | $ 2,772,947 |
Asset Manager 50% | | | | |
Shares sold | 28,976,509 | 35,519,889 | $ 439,124,893 | $ 590,109,148 |
Reinvestment of distributions | 49,866,308 | 45,243,905 | 772,727,250 | 737,377,217 |
Shares redeemed | (116,862,705) | (111,732,894) | (1,770,033,572) | (1,862,786,005) |
Net increase (decrease) | (38,019,888) | (30,969,100) | $ (558,181,429) | $ (535,299,640) |
Institutional Class | | | | |
Shares sold | 64,415 | 11,204 | $ 1,084,439 | $ 185,721 |
Reinvestment of distributions | 6,272 | 596 | 97,072 | 9,719 |
Shares redeemed | (45,377) | (951) | (667,764) | (15,495) |
Net increase (decrease) | 25,310 | 10,849 | $ 513,747 | $ 179,945 |
Fidelity Asset Manager 60%B | | | | |
Class A | | | | |
Shares sold | 508,064 | - | $ 4,661,791 | $ - |
Reinvestment of distributions | 761 | - | 7,307 | - |
Shares redeemed | (114,471) | - | (1,028,696) | - |
Net increase (decrease) | 394,354 | - | $ 3,640,402 | $ - |
Class T | | | | |
Shares sold | 186,969 | - | $ 1,747,896 | $ - |
Reinvestment of distributions | 283 | - | 2,720 | - |
Shares redeemed | (32,399) | - | (277,952) | - |
Net increase (decrease) | 154,853 | - | $ 1,472,664 | $ - |
Class B | | | | |
Shares sold | 138,223 | - | $ 1,314,613 | $ - |
Reinvestment of distributions | 192 | - | 1,840 | - |
Shares redeemed | (2,557) | - | (22,565) | - |
Net increase (decrease) | 135,858 | - | $ 1,293,888 | $ - |
Annual Report
Notes to Financial Statements - continued
13. Share Transactions - continued
| Shares | Dollars |
Years ended September 30, | 2008 | 2007A | 2008 | 2007A |
Class C | | | | |
Shares sold | 210,884 | - | $ 1,970,860 | $ - |
Reinvestment of distributions | 192 | - | 1,840 | - |
Shares redeemed | (3,246) | - | (27,889) | - |
Net increase (decrease) | 207,830 | - | $ 1,944,811 | $ - |
Asset Manager 60% | | | | |
Shares sold | 3,150,368 | - | $ 28,160,474 | $ - |
Reinvestment of distributions | 1,882 | - | 18,064 | - |
Shares redeemed | (362,700) | - | (3,178,965) | - |
Net increase (decrease) | 2,789,550 | - | $ 24,999,573 | $ - |
Institutional Class | | | | |
Shares sold | 99,914 | - | $ 989,544 | $ - |
Reinvestment of distributions | 466 | - | 4,475 | - |
Shares redeemed | (916) | - | (7,979) | - |
Net increase (decrease) | 99,464 | - | $ 986,040 | $ - |
Fidelity Asset Manager 70% | | | | |
Class AC | | | | |
Shares sold | 20,467 | - | $ 370,778 | $ - |
Issued in exchange for shares of Fidelity Advisor Asset Manager 70% Fund | 6,533,497 | - | 92,514,323 | - |
Shares redeemed | (17,859) | - | (315,305) | - |
Net increase (decrease) | 6,536,105 | - | $ 92,569,796 | $ - |
Class TC | | | | |
Shares sold | 5,194 | - | $ 138,458 | $ - |
Issued in exchange for shares of Fidelity Advisor Asset Manager 70% Fund | 3,860,173 | - | 54,660,040 | - |
Shares redeemed | (12,767) | - | (237,608) | - |
Net increase (decrease) | 3,852,600 | - | $ 54,560,890 | $ - |
Class BC | | | | |
Shares sold | 8,599 | - | $ 132,691 | $ - |
Issued in exchange for shares of Fidelity Advisor Asset Manager 70% Fund | 1,725,798 | - | 24,437,297 | - |
Shares redeemed | (7,056) | - | (105,755) | - |
Net increase (decrease) | 1,727,341 | - | $ 24,464,233 | $ - |
Class CC | | | | |
Shares sold | 2,918 | - | $ 217,647 | $ - |
Issued in exchange for shares of Fidelity Advisor Asset Manager 70% Fund | 2,780,313 | - | 39,369,233 | - |
Shares redeemed | (10,650) | - | (326,514) | - |
Net increase (decrease) | 2,772,581 | - | $ 39,260,366 | $ - |
Asset Manager 70% | | | | |
Shares sold | 12,436,796 | 14,701,427 | $ 201,255,406 | $ 246,834,990 |
Reinvestment of distributions | 4,363,853 | 4,501,586 | 74,272,772 | 73,510,900 |
Shares redeemed | (33,660,002) | (33,997,871) | (549,568,450) | (569,823,471) |
Net increase (decrease) | (16,859,353) | (14,794,858) | $ (274,040,272) | $ (249,477,581) |
Institutional ClassC | | | | |
Shares sold | 10,330 | - | $ 152,572 | $ - |
Issued in exchange for shares of Fidelity Advisor Asset Manager 70% Fund | 1,881,221 | - | 26,638,086 | - |
Shares redeemed | (3,734) | - | (57,654) | - |
Net increase (decrease) | 1,887,817 | - | $ 26,733,004 | $ - |
Fidelity Asset Manager 85% | | | | |
Class A | | | | |
Shares sold | 881,000 | 533,617 | $ 11,708,813 | $ 7,482,672 |
Reinvestment of distributions | 11,613 | 259 | 164,450 | 3,472 |
Shares redeemed | (212,398) | (36,450) | (2,755,503) | (505,258) |
Net increase (decrease) | 680,215 | 497,426 | $ 9,117,760 | $ 6,980,886 |
Annual Report
13. Share Transactions - continued
| Shares | Dollars |
Years ended September 30, | 2008 | 2007A | 2008 | 2007A |
Class T | | | | |
Shares sold | 302,865 | 132,362 | $ 3,973,155 | $ 1,878,689 |
Reinvestment of distributions | 2,802 | 252 | 39,626 | 3,385 |
Shares redeemed | (52,286) | (11,048) | (680,328) | (158,492) |
Net increase (decrease) | 253,381 | 121,566 | $ 3,332,453 | $ 1,723,582 |
Class B | | | | |
Shares sold | 152,342 | 113,822 | $ 2,031,969 | $ 1,577,374 |
Reinvestment of distributions | 1,841 | 179 | 26,000 | 2,400 |
Shares redeemed | (39,226) | (2,876) | (510,836) | (40,678) |
Net increase (decrease) | 114,957 | 111,125 | $ 1,547,133 | $ 1,539,096 |
Class C | | | | |
Shares sold | 329,559 | 228,834 | $ 4,362,588 | $ 3,208,263 |
Reinvestment of distributions | 3,034 | 447 | 42,720 | 5,995 |
Shares redeemed | (86,632) | (11,500) | (1,115,724) | (161,700) |
Net increase (decrease) | 245,961 | 217,781 | $ 3,289,584 | $ 3,052,558 |
Asset Manager 85% | | | | |
Shares sold | 11,096,127 | 11,993,958 | $ 149,870,831 | $ 166,840,157 |
Reinvestment of distributions | 709,187 | 595,752 | 10,063,914 | 7,989,027 |
Shares redeemed | (10,707,014) | (8,742,465) | (142,112,234) | (120,993,870) |
Net increase (decrease) | 1,098,300 | 3,847,245 | $ 17,822,511 | $ 53,835,314 |
Institutional Class | | | | |
Shares sold | 62,723 | 16,534 | $ 834,204 | $ 222,919 |
Reinvestment of distributions | 180 | 135 | 2,553 | 1,812 |
Shares redeemed | (13,803) | - | (173,778) | - |
Net increase (decrease) | 49,100 | 16,669 | $ 662,979 | $ 224,731 |
A Share transactions for Class A, Class T, Class B, Class C and Institutional Class are for the period October 2, 2006 (commencement of sale of shares) to September 30, 2007.
B For the period October 9, 2007 (commencement of operations) to September 30, 2008.
C For the period September 23, 2008 (commencement of operations) to September 30, 2008.
14. Merger Information.
On September 26, 2008, Fidelity Asset Manager 70% acquired all of the assets and assumed all of the liabilities of Fidelity Advisor Asset Manager 70% Fund pursuant to an agreement and plan of reorganization approved by the Board of Trustees on May 15, 2008. The acquisition was accomplished by an exchange of 6,533,497, 3,860,173, 1,725,798, 2,780,313 and 1,881,221 shares of Class A, Class T, Class B, Class C and Institutional Class of the Fund, respectively, for 9,324,617, 5,534,757, 2,486,431, 4,011,919, and 2,679,998 shares then outstanding of Class A, Class T, Class B, Class C and Institutional Class (valued at $9.92, $9.88, $9.83, $9.81, and $9.94, per share for Class A, Class T, Class B, Class C and Institutional Class, respectively) of the Fidelity Advisor Asset Manager 70% Fund. The reorganization qualified as a tax-free reorganization for federal income tax purposes with no gain or loss recognized to the funds or their shareholders. The Fidelity Advisor Asset Manager 70% Fund's net assets, including $21,261,054 of unrealized depreciation, were combined with the Fund's net assets of $2,365,472,024 for total net assets after the acquisition of $2,603,091,003.
15. Credit Risk.
The Funds invest a portion of their assets, directly or indirectly, in structured securities of issuers backed by residential mortgage loans, credit card receivables and automotive loans. The value and related income of these securities is sensitive to changes in economic conditions, including delinquencies and/or defaults. Continuing shifts in the market's perception of credit quality on structured securities have resulted in increased volatility of market price and periods of decreased market activity that have adversely impacted the valuation of certain issuers of the Funds.
Annual Report
Report of Independent Registered Public Accounting Firm
To the Trustees of Fidelity Charles Street Trust and Shareholders of Fidelity Asset Manager 20%, Fidelity Asset Manager 50%, Fidelity Asset Manager 70% and Fidelity Asset Manager 85%:
We have audited the accompanying statements of assets and liabilities of Fidelity Asset Manager 20%, Fidelity Asset Manager 50%, Fidelity Asset Manager 70% and Fidelity Asset Manager 85% (the Funds), each a fund of Fidelity Charles Street Trust, including the schedules of investments as of September 30, 2008, and the related statements of operations for the year then ended, the statement of changes in net assets for each of the two years in the period then ended, and the financial highlights for each of the periods presented. These financial statements and financial highlights are the responsibility of the Fund's management. Our responsibility is to express an opinion on these financial statements and financial highlights based on our audits.
We conducted our audits in accordance with standards of the Public Company Accounting Oversight Board (United States). Those standards require that we plan and perform the audit to obtain reasonable assurance about whether the financial statements and financial highlights are free of material misstatement. The Funds are not required to have, nor were we engaged to perform, audits of their internal control over financial reporting. Our audits included consideration of internal control over financial reporting as a basis for designing audit procedures that are appropriate in the circumstances, but not for the purpose of expressing an opinion on the effectiveness of the Funds' internal control over financial reporting. Accordingly, we express no such opinion. An audit also includes examining, on a test basis, evidence supporting the amounts and disclosures in the financial statements, assessing the accounting principles used and significant estimates made by management, as well as evaluating the overall financial statement presentation. Our procedures included confirmation of securities owned as of September 30, 2008, by correspondence with the custodians and brokers; where replies were not received from brokers, we performed other auditing procedures. We believe that our audits provide a reasonable basis for our opinion.
In our opinion, the financial statements and financial highlights referred to above present fairly, in all material respects, the financial position of Fidelity Asset Manager 20%, Fidelity Asset Manager 50%, Fidelity Asset Manager 70% and Fidelity Asset Manager 85% as of September 30, 2008, the results of their operations for the year then ended, the changes in their net assets for each of the two years in the period then ended, and their financial highlights for each of the periods presented, in conformity with accounting principles generally accepted in the United States of America.
/s/ Deloitte & Touche LLP
DELOITTE & TOUCHE LLP
Boston, Massachusetts
November 28, 2008
Annual Report
Report of Independent Registered Public Accounting Firm
To the Trustees of Fidelity Charles Street Trust and the Shareholders of Fidelity Asset Manager 30%, Fidelity Asset Manager 40% and Fidelity Asset Manager 60%:
In our opinion, the accompanying statements of assets and liabilities, including the schedules of investments, and the related statements of operations and of changes in net assets and the financial highlights present fairly, in all material respects, the financial position of Fidelity Asset Manager 30%, Fidelity Asset Manager 40% and Fidelity Asset Manager 60% (funds of Fidelity Charles Street Trust) at September 30, 2008, and the results of each of their operations for the period indicated, the changes in their net assets for the period indicated and the financial highlights for the period indicated, in conformity with accounting principles generally accepted in the United States of America. These financial statements and financial highlights (hereafter referred to as "financial statements") are the responsibility of the Fidelity Charles Street Trust and Fidelity Charles Street Trust's management. Our responsibility is to express an opinion on these financial statements based on our audits. We conducted our audits of these financial statements in accordance with the standards of the Public Company Accounting Oversight Board (United States). Those standards require that we plan and perform the audit to obtain reasonable assurance about whether the financial statements are free of material misstatement. An audit includes examining, on a test basis, evidence supporting the amounts and disclosures in the financial statements, assessing the accounting principles used and significant estimates made by management, and evaluating the overall financial statement presentation. We believe that our audits, which included confirmation of securities at September 30, 2008 by correspondence with the transfer agent and brokers, provide a reasonable basis for our opinion.
/s/ PricewaterhouseCoopers LLP
PricewaterhouseCoopers LLP
Boston, Massachusetts
November 25, 2008
Annual Report
The Trustees, Member of the Advisory Board, and executive officers of the trust and funds, as applicable, are listed below. The Board of Trustees governs each fund and is responsible for protecting the interests of shareholders. The Trustees are experienced executives who meet periodically throughout the year to oversee each fund's activities, review contractual arrangements with companies that provide services to each fund, and review each fund's performance. Except for Edward C. Johnson 3d and James C. Curvey, each of the Trustees oversees 159 funds advised by FMR or an affiliate. Messrs. Johnson and Curvey oversee 379 funds advised by FMR or an affiliate.
The Trustees hold office without limit in time except that (a) any Trustee may resign; (b) any Trustee may be removed by written instrument, signed by at least two-thirds of the number of Trustees prior to such removal; (c) any Trustee who requests to be retired or who has become incapacitated by illness or injury may be retired by written instrument signed by a majority of the other Trustees; and (d) any Trustee may be removed at any special meeting of shareholders by a two-thirds vote of the outstanding voting securities of the trust. Each Trustee who is not an interested person (as defined in the 1940 Act) (Independent Trustee), shall retire not later than the last day of the calendar year in which his or her 72nd birthday occurs. The Independent Trustees may waive this mandatory retirement age policy with respect to individual Trustees. The executive officers and Advisory Board Member hold office without limit in time, except that any officer and Advisory Board Member may resign or may be removed by a vote of a majority of the Trustees at any regular meeting or any special meeting of the Trustees. Except as indicated, each individual has held the office shown or other offices in the same company for the past five years.
The funds' Statement of Additional Information (SAI) includes more information about the Trustees. To request a free copy, call Fidelity at 1-877-208-0098.
Interested Trustees*:
Correspondence intended for each Trustee who is an interested person may be sent to Fidelity Investments, 82 Devonshire Street, Boston, Massachusetts 02109.
Name, Age; Principal Occupation |
Edward C. Johnson 3d (78) |
| Year of Election or Appointment: 1981 Mr. Johnson is Chairman of the Board of Trustees. Mr. Johnson serves as Chief Executive Officer, Chairman, and a Director of FMR LLC; Chairman and a Director of FMR; Chairman and a Director of Fidelity Research & Analysis Company (FRAC); Chairman and a Director of Fidelity Investments Money Management, Inc.; and Chairman and a Director of FMR Co., Inc. In addition, Mr. Johnson serves as Chairman and Director of FIL Limited. Previously, Mr. Johnson served as President of FMR LLC (2006-2007). Mr. Edward C. Johnson 3d and Mr. Arthur E. Johnson are not related. |
James C. Curvey (73) |
| Year of Election or Appointment: 2007 Mr. Curvey also serves as Trustee (2007-present) of other investment companies advised by FMR. Mr. Curvey is a Director of FMR and FMR Co., Inc. (2007-present). Mr. Curvey is also Vice Chairman (2006-present) and Director of FMR LLC. In addition, Mr. Curvey serves as an Overseer for the Boston Symphony Orchestra and a member of the Trustees of Villanova University. |
* Trustees have been determined to be "Interested Trustees" by virtue of, among other things, their affiliation with the trust or various entities under common control with FMR. FMR Corp. merged with and into FMR LLC on October 1, 2007. Any references to FMR LLC for prior periods are deemed to be references to the prior entity.
Independent Trustees:
Correspondence intended for each Independent Trustee (that is, the Trustees other than the Interested Trustees) may be sent to Fidelity Investments, P.O. Box 55235, Boston, Massachusetts 02205-5235.
Name, Age; Principal Occupation |
Albert R. Gamper, Jr. (66) |
| Year of Election or Appointment: 2006 Prior to his retirement in December 2004, Mr. Gamper served as Chairman of the Board of CIT Group Inc. (commercial finance). During his tenure with CIT Group Inc. Mr. Gamper served in numerous senior management positions, including Chairman (1987-1989; 1999-2001; 2002-2004), Chief Executive Officer (1987-2004), and President (1989-2002). He currently serves as a member of the Board of Directors of Public Service Enterprise Group (utilities), a member of the Board of Governors, Rutgers University (2004-present), and Chairman of the Board of Saint Barnabas Health Care System. Previously, Mr. Gamper served as Chairman of the Board of Governors, Rutgers University (2004-2007). |
George H. Heilmeier (72) |
| Year of Election or Appointment: 2004 Dr. Heilmeier is Chairman Emeritus of Telcordia Technologies (communication software and systems), where prior to his retirement, he served as company Chairman and Chief Executive Officer. He currently serves on the Boards of Directors of The Mitre Corporation (systems engineering and information technology support for the government), and HRL Laboratories (private research and development, 2004-present). He is Chairman of the General Motors Science & Technology Advisory Board and a Life Fellow of the Institute of Electrical and Electronics Engineers (IEEE). Dr. Heilmeier is a member of the Defense Science Board and the National Security Agency Advisory Board. He is also a member of the National Academy of Engineering, the American Academy of Arts and Sciences, and the Board of Overseers of the School of Engineering and Applied Science of the University of Pennsylvania. Previously, Dr. Heilmeier served as a Director of TRW Inc. (automotive, space, defense, and information technology), Compaq, Automatic Data Processing, Inc. (ADP) (technology-based business outsourcing), INET Technologies Inc. (telecommunications network surveillance, 2001-2004), and Teletech Holdings (customer management services). He is the recipient of the 2005 Kyoto Prize in Advanced Technology for his invention of the liquid crystal display, and a member of the Consumer Electronics Hall of Fame. |
Arthur E. Johnson (61) |
| Year of Election or Appointment: 2008 Mr. Johnson serves as Senior Vice President of Corporate Strategic Development of Lockheed Martin Corporation (defense contractor). In addition, Mr. Johnson serves as a member of the Board of Directors of AGL Resources, Inc. (holding company), and IKON Office Solutions, Inc. (document management systems and services). Mr. Arthur E. Johnson and Mr. Edward C. Johnson 3d are not related. |
James H. Keyes (68) |
| Year of Election or Appointment: 2007 Prior to his retirement in 2003, Mr. Keyes was Chairman, President, and Chief Executive Officer of Johnson Controls, Inc. (automotive supplier, 1993-2003). He currently serves as a member of the boards of Navistar International Corporation (manufacture and sale of trucks, buses, and diesel engines) and Pitney Bowes, Inc. (integrated mail, messaging, and document management solutions). Previously, Mr. Keyes served as a member of the Board of LSI Logic Corporation (semiconductor technologies, 1984-2008). |
Marie L. Knowles (61) |
| Year of Election or Appointment: 2001 Prior to Ms. Knowles' retirement in June 2000, she served as Executive Vice President and Chief Financial Officer of Atlantic Richfield Company (ARCO) (diversified energy, 1996-2000). From 1993 to 1996, she was a Senior Vice President of ARCO and President of ARCO Transportation Company. She served as a Director of ARCO from 1996 to 1998. She currently serves as a Director of McKesson Corporation (healthcare service). Ms. Knowles is a Trustee of the Brookings Institution and the Catalina Island Conservancy and also serves as a member of the Advisory Board for the School of Engineering of the University of Southern California. Previously, Ms. Knowles served as a Director of Phelps Dodge Corporation (copper mining and manufacturing, 1994-2007). |
Kenneth L. Wolfe (69) |
| Year of Election or Appointment: 2005 Mr. Wolfe is Chairman and a Director of Hershey Foods Corporation (2007-present), where prior to his retirement in 2001, he was Chairman and Chief Executive Officer. Mr. Wolfe currently serves as a member of the board of Revlon Inc. (2004-present). Previously, Mr. Wolfe served as a member of the boards of Adelphia Communications Corporation (2003-2006) and Bausch & Lomb, Inc. (1993-2007). |
Advisory Board Member and Executive Officers**:
Correspondence intended for each executive officer and Mr. Lynch may be sent to Fidelity Investments, 82 Devonshire Street, Boston, Massachusetts 02109.
Name, Age; Principal Occupation |
Peter S. Lynch (64) |
| Year of Election or Appointment: 2003 Member of the Advisory Board of the Fidelity Funds. Mr. Lynch is Vice Chairman and a Director of FMR, and Vice Chairman (2001-present) and a Director of FMR Co., Inc. Previously, Mr. Lynch served as a Trustee of the Fidelity funds (1990-2003). In addition, he serves as a Trustee of Boston College and as the Chairman of the Inner-City Scholarship Fund. Previously, Mr. Lynch served on the Special Olympics International Board of Directors (1997-2006). |
John R. Hebble (50) |
| Year of Election or Appointment: 2008 President and Treasurer of Fidelity's Fixed Income and Asset Allocation Funds. Mr. Hebble is an employee of Fidelity Investments (2003-present). Before joining Fidelity Investments, Mr. Hebble worked at Deutsche Asset Management where he served as Director of Fund Accounting (2002-2003) and Assistant Treasurer of the Scudder Funds. |
Ren Y. Cheng (51) |
| Year of Election or Appointment: 2007 Vice President of Asset Allocation Funds. Mr. Cheng also serves as Group Chief Investment Officer, Asset Allocation of FMR. Previously, Mr. Cheng served as a portfolio manager for the Fidelity Freedom Funds. |
Boyce I. Greer (52) |
| Year of Election or Appointment: 2005 or 2006 Vice President of Fidelity's Fixed-Income Funds (2006) and Asset Allocation Funds (2005). Mr. Greer is also a Trustee of other investment companies advised by FMR (2003-present). Mr. Greer is President and a Director of Fidelity Investments Money Management, Inc. (2007-present), and an Executive Vice President of FMR and FMR Co., Inc. (2005-present). Previously, Mr. Greer served as a Director and Managing Director of Strategic Advisers, Inc. (2002-2005). |
Scott C. Goebel (40) |
| Year of Election or Appointment: 2008 Secretary and Chief Legal Officer (CLO) of the Fidelity funds. Mr. Goebel also serves as General Counsel, Secretary, and Senior Vice President of FMR (2008-present); Deputy General Counsel of FMR LLC; Chief Legal Secretary of Fidelity Management & Research (Hong Kong) Limited (2008-present) and Assistant Secretary of Fidelity Management & Research (Japan) Inc. (2008-present). Previously, Mr. Goebel served as Assistant Secretary of the Funds (2007-2008) and as Vice President and Secretary of Fidelity Distributors Corporation (FDC) (2005-2007). |
Nancy D. Prior (41) |
| Year of Election or Appointment: 2008 Assistant Secretary of Fidelity's Fixed Income and Asset Allocation Funds. Ms. Prior is an employee of Fidelity Investments (2002-present). |
Holly C. Laurent (54) |
| Year of Election or Appointment: 2008 Anti-Money Laundering (AML) Officer of the Fidelity funds. Ms. Laurent is an employee of Fidelity Investments. Previously, Ms. Laurent was Senior Vice President and Head of Legal for Fidelity Business Services India Pvt. Ltd. (2006-2008), Senior Vice President, Deputy General Counsel and Group Head for FMR LLC (2005-2006). |
Christine Reynolds (50) |
| Year of Election or Appointment: 2008 Chief Financial Officer of the Fidelity funds. Ms. Reynolds became President of Fidelity Pricing and Cash Management Services (FPCMS) in August 2008. She served as Chief Operating Officer of FPCMS from 2007 through July 2008. Previously, Ms. Reynolds served as President, Treasurer, and Anti-Money Laundering officer of the Fidelity funds (2004-2007). Before joining Fidelity Investments, Ms. Reynolds worked at PricewaterhouseCoopers LLP (PwC) (1980-2002), where she was an audit partner with PwC's investment management practice. |
Michael H. Whitaker (41) |
| Year of Election or Appointment: 2008 Chief Compliance Officer of Fidelity's Fixed Income and Asset Allocation Funds. Mr. Whitaker is an employee of Fidelity Investments (2007-present). Prior to joining Fidelity Investments, Mr. Whitaker worked at MFS Investment Management where he served as Senior Vice President and Chief Compliance Officer (2004-2006), and Assistant General Counsel. |
Bryan A. Mehrmann (47) |
| Year of Election or Appointment: 2005 Deputy Treasurer of the Fidelity funds. Mr. Mehrmann is an employee of Fidelity Investments. Previously, Mr. Mehrmann served as Vice President of Fidelity Investments Institutional Services Group (FIIS)/Fidelity Investments Institutional Operations Corporation, Inc. (FIIOC) Client Services (1998-2004). |
Stephanie J. Dorsey (39) |
| Year of Election or Appointment: 2008 Deputy Treasurer of Fidelity's Fixed-Income and Asset Allocation Funds. Ms. Dorsey is an employee of Fidelity Investments (2008-present). Previously, Ms. Dorsey served as Treasurer (2004-2008) and Accounting Group Manager (2003) of JPMorgan Chase Bank. |
Robert G. Byrnes (41) |
| Year of Election or Appointment: 2005 Assistant Treasurer of the Fidelity funds. Mr. Byrnes is an employee of Fidelity Investments (2005-present). Previously, Mr. Byrnes served as Vice President of Fidelity Pricing and Cash Management Services (FPCMS) (2003-2005). Before joining Fidelity Investments, Mr. Byrnes worked at Deutsche Asset Management where he served as Vice President of the Investment Operations Group (2000-2003). |
Peter L. Lydecker (54) |
| Year of Election or Appointment: 2004 Assistant Treasurer of the Fidelity funds. Mr. Lydecker is an employee of Fidelity Investments. |
Paul M. Murphy (61) |
| Year of Election or Appointment: 2007 Assistant Treasurer of the Fidelity funds. Mr. Murphy is an employee of Fidelity Investments (2007-present). Previously, Mr. Murphy served as Chief Financial Officer of the Fidelity Funds (2005-2006), Vice President and Associate General Counsel of FMR (2007), and Senior Vice President of Fidelity Pricing and Cash Management Services (FPCMS) (1994-2007). |
Gary W. Ryan (50) |
| Year of Election or Appointment: 2005 Assistant Treasurer of the Fidelity funds. Mr. Ryan is an employee of Fidelity Investments. Previously, Mr. Ryan served as Vice President of Fund Reporting in Fidelity Pricing and Cash Management Services (FPCMS) (1999-2005). |
** FMR Corp. merged with and into FMR LLC on October 1, 2007. Any references to FMR LLC for prior periods are deemed to be references to the prior entity.
Annual Report
The funds hereby designate as capital gain dividend the amounts noted below for the taxable year ended September 30, 2008, or, if subsequently determined to be different, the net capital gain of such year.
Fund | |
Asset Manager 20% | $3,666,317 |
Asset Manager 30% | 0 |
Asset Manager 40% | 0 |
Asset Manager 50% | $34,524,195 |
Asset Manager 60% | 0 |
Asset Manager 70% | $1,125,885 |
Asset Manager 85% | 0 |
A percentage of the dividends distributed during the fiscal year for the following funds was derived from interest on U.S. Government securities which is generally exempt from state income tax:
Asset Manager 20% | |
Class A | 3.95% |
Class T | 3.95% |
Class B | 3.95% |
Class C | 3.95% |
Asset Manager 30% | |
Class A | 4.26% |
Class T | 4.26% |
Class B | 4.26% |
Class C | 4.26% |
Asset Manager 40% | |
Class A | 3.90% |
Class T | 3.90% |
Class B | 3.90% |
Class C | 3.90% |
Asset Manager 50% | |
Class A | 2.00% |
Class T | 2.00% |
Class B | 2.00% |
Class C | 2.00% |
Asset Manager 60% | |
Class A | 3.16% |
Class T | 3.16% |
Class B | 3.16% |
Class C | 3.16% |
Asset Manager 70% | |
Class A | 3.10% |
Class T | 3.10% |
Class B | 3.10% |
Class C | 3.10% |
Asset Manager 85% | |
Class A | 3.42% |
Class T | 3.42% |
Class B | 3.42% |
Class C | 3.42% |
Annual Report
Distributions (Unaudited) - continued
The funds hereby designate the amounts noted below as distributions paid during the period January 1, 2008 to September 30, 2008 as qualifying to be taxed as interest-related dividends for nonresident alien shareholders:
Fund | |
Asset Manager 20% | $75,862,942 |
Asset Manager 30% | $595,233 |
Asset Manager 40% | $228,368 |
Asset Manager 50% | $163,501,537 |
Asset Manager 60% | $36,701 |
Asset Manager 70% | $2,253,397 |
Asset Manager 85% | $3,001,780 |
A percentage of the dividends distributed during the fiscal year for the following funds qualifiy for the dividends-received deduction for corporate shareholders:
Asset Manager 20% | Class A | Class T | Class B | Class C |
December 2007 | 2% | 2% | 2% | 2% |
February 2008 | 7% | 8% | 9% | 9% |
March 2008 | 7% | 8% | 9% | 9% |
April 2008 | 7% | 8% | 10% | 10% |
May 2008 | 7% | 8% | 11% | 10% |
June 2008 | 7% | 8% | 10% | 9% |
July 2008 | 7% | 8% | 11% | 10% |
August 2008 | 8% | 8% | 11% | 10% |
September 2008 | 8% | 8% | 10% | 10% |
Asset Manager 30% | Class A | Class T | Class B | Class C |
November 2007 | 16% | 18% | 29% | 29% |
December 2007 | 17% | 19% | 24% | 24% |
March 2008 | 14% | 18% | 32% | 17% |
April 2008 | 14% | 14% | 19% | 16% |
May 2008 | 14% | 16% | 21% | 23% |
June 2008 | 14% | 15% | 19% | 19% |
July 2008 | 14% | 16% | 21% | 21% |
August 2008 | 14% | 15% | 19% | 21% |
September 2008 | 14% | 15% | 18% | 18% |
Asset Manager 40% | Class A | Class T | Class B | Class C |
December 2007 | 15% | 17% | 21% | 21% |
April 2008 | 28% | 30% | 45% | 45% |
July 2008 | 28% | 32% | 44% | 47% |
Asset Manager 50% | Class A | Class T | Class B | Class C |
December 2007 | 3% | 3% | 3% | 3% |
April 2008 | 30% | 34% | 42% | 43% |
July 2008 | 30% | 34% | 49% | 44% |
Asset Manager 60% | Class A | Class T | Class B | Class C |
December 2007 | 28% | 33% | 49% | 49% |
Asset Manager 70% | Class A | Class T | Class B | Class C |
December 2007 | 4% | 4% | 4% | 4% |
April 2008 | 35% | 42% | 100% | 100% |
July 2008 | 36% | 42% | 63% | 59% |
September 2008 | 37% | 42% | 61% | 57% |
Asset Manager 85% | Class A | Class T | Class B | Class C |
December 21, 2007 | 10% | 11% | 14% | 13% |
December 28, 2007 | 10% | 10% | 10% | 10% |
Annual Report
A percentage of the dividends distributed during the fiscal year for the following funds may be taken into account as a dividend for purposes of the maximum rate under section 1(h)(11) of the Internal Revenue Code.
Asset Manager 20% | Class A | Class T | Class B | Class C |
December 2007 | 3% | 3% | 4% | 4% |
February 2008 | 9% | 10% | 12% | 11% |
March 2008 | 9% | 10% | 12% | 11% |
April 2008 | 9% | 10% | 12% | 12% |
May 2008 | 10% | 10% | 13% | 13% |
June 2008 | 9% | 10% | 12% | 12% |
July 2008 | 10% | 11% | 13% | 13% |
August 2008 | 10% | 11% | 14% | 13% |
September 2008 | 10% | 10% | 13% | 13% |
Asset Manager 30% | Class A | Class T | Class B | Class C |
November 2007 | 16% | 18% | 28% | 28% |
December 2007 | 16% | 18% | 23% | 23% |
March 2008 | 18% | 23% | 40% | 21% |
April 2008 | 18% | 18% | 25% | 20% |
May 2008 | 18% | 21% | 27% | 29% |
June 2008 | 18% | 20% | 24% | 24% |
July 2008 | 18% | 21% | 27% | 27% |
August 2008 | 18% | 19% | 24% | 26% |
September 2008 | 18% | 19% | 23% | 23% |
Asset Manager 40% | Class A | Class T | Class B | Class C |
December 2007 | 17% | 19% | 24% | 24% |
April 2008 | 42% | 46% | 68% | 68% |
July 2008 | 42% | 49% | 67% | 72% |
Asset Manager 50% | Class A | Class T | Class B | Class C |
December 2007 | 3% | 3% | 4% | 4% |
April 2008 | 43% | 48% | 60% | 62% |
July 2008 | 42% | 48% | 70% | 63% |
Asset Manager 60% | Class A | Class T | Class B | Class C |
December 2007 | 31% | 37% | 55% | 55% |
Asset Manager 70% | Class A | Class T | Class B | Class C |
December 2007 | 5% | 5% | 5% | 5% |
April 2008 | 61% | 73% | 100% | 100% |
July 2008 | 56% | 65% | 98% | 91% |
September 2008 | 57% | 65% | 94% | 88% |
Asset Manager 85% | Class A | Class T | Class B | Class C |
December 21, 2007 | 50% | 55% | 68% | 63% |
December 28, 2007 | 48% | 48% | 48% | 48% |
The fund will notify shareholders in January 2009 of amounts for use in preparing 2008 income tax returns.
Annual Report
Board Approval of Investment Advisory Contracts and Management Fees
Fidelity Asset Manager 20%
Fidelity Asset Manager 30%
Fidelity Asset Manager 40%
Fidelity Asset Manager 50%
Fidelity Asset Manager 60%
Fidelity Asset Manager 70%
Fidelity Asset Manager 85%
Each year, typically in June, the Board of Trustees, including the Independent Trustees (together, the Board), votes on the renewal of the management contract and sub-advisory agreements (together, the Advisory Contracts) for each fund. The Board, assisted by the advice of fund counsel and Independent Trustees' counsel, requests and considers a broad range of information throughout the year.
The Board meets regularly and, acting directly and through its separate committees, requests and receives information concerning, and considers at each of its meetings factors that are relevant to, its annual consideration of the renewal of each fund's Advisory Contracts, including the services and support provided to each fund and its shareholders. At the time of the renewal, the Board had 12 standing committees, each composed of Independent Trustees with varying backgrounds, to which the Board has assigned specific subject matter responsibilities in order to enhance effective decision-making by the Board. Each committee has a written charter outlining the structure and purposes of the committee. The Board also meets as needed to consider matters specifically related to the Board's annual consideration of the renewal of each fund's Advisory Contracts.
At its June 2008 meeting, the Board of Trustees, including the Independent Trustees, unanimously determined to renew each fund's Advisory Contracts. In reaching its determination, the Board considered all factors it believed relevant, including (i) the nature, extent, and quality of the services to be provided to each fund and its shareholders (including the investment performance of each fund); (ii) the competitiveness of each fund's management fee and total expenses; (iii) the total costs of the services to be provided by and the profits to be realized by Fidelity from its relationship with the fund; (iv) the extent to which economies of scale would be realized as each fund grows; and (v) whether fee levels reflect these economies of scale, if any, for the benefit of fund shareholders. The Board also approved agreements with foreign sub-advisers Fidelity Management & Research (Japan) Inc. and Fidelity Management & Research (Hong Kong) Limited, as well as amendments to the funds' agreements with Fidelity Management & Research (U.K.) Inc.
In considering whether to renew the Advisory Contracts for each fund, the Board ultimately reached a determination, with the assistance of fund counsel and Independent Trustees' counsel and through the exercise of its business judgment, that the renewal of the Advisory Contracts and the compensation to be received by Fidelity under the management contracts is consistent with Fidelity's fiduciary duty under applicable law. The Board's decision to renew the Advisory Contracts was not based on any single factor noted above, but rather was based on a comprehensive consideration of all the information provided to the Board at its meetings throughout the year. The Board, in reaching its determination to renew the Advisory Contracts, is aware that shareholders in each fund have a broad range of investment choices available to them, including a wide choice among mutual funds offered by competitors to Fidelity, and that each fund's shareholders, with the opportunity to review and weigh the disclosure provided by the fund in its prospectus and other public disclosures, have chosen to invest in that fund, managed by Fidelity.
Nature, Extent, and Quality of Services Provided. The Board considered staffing within the investment adviser, FMR, and the sub-advisers (together, the Investment Advisers), including the backgrounds of the funds' investment personnel and the funds' investment objectives and disciplines. The Independent Trustees also had discussions with senior management of Fidelity's investment operations and investment groups. The Board considered the structure of the portfolio manager compensation program and whether this structure provides appropriate incentives.
Resources Dedicated to Investment Management and Support Services. The Board reviewed the size, education, and experience of the Investment Advisers' investment staff, their use of technology, and the Investment Advisers' approach to recruiting, training, and retaining portfolio managers and other research, advisory, and management personnel. The Board noted that Fidelity's analysts have access to a variety of technological tools that enable them to perform both fundamental and quantitative analysis and to specialize in various disciplines. The Board considered Fidelity's extensive global research capabilities that enable the Investment Advisers to aggregate data from various sources in an effort to produce positive investment results. The Board also considered that Fidelity's portfolio managers and analysts have access to daily portfolio attribution that allows for monitoring of a fund's portfolio, as well as an electronic communication system that provides immediate real-time access to research concerning issuers and credit enhancers.
Shareholder and Administrative Services. The Board considered (i) the nature, extent, quality, and cost of advisory, administrative, distribution, and shareholder services performed by the Investment Advisers and their affiliates under each fund's Advisory Contracts and under separate agreements covering transfer agency, pricing and bookkeeping, and securities lending services for each fund; (ii) the nature and extent of the Investment Advisers' supervision of third party service providers, principally custodians and subcustodians; and (iii) the resources devoted to, and the record of compliance with, each fund's compliance policies and procedures. The Board also reviewed the allocation of fund brokerage, including allocations to brokers affiliated with the Investment Advisers, the use of brokerage commissions to pay fund expenses, and the use of "soft" commission dollars to pay for research services. The Board further considered that Fidelity voluntarily pays for market data out of its own resources.
Annual Report
The Board noted that the growth of fund assets across the complex allows Fidelity to reinvest in the development of services designed to enhance the value or convenience of the Fidelity funds as investment vehicles. These services include 24 hour access to account information and market information through phone representatives and over the Internet, and investor education materials and asset allocation tools.
Investment in a Large Fund Family. The Board considered the benefits to shareholders of investing in a Fidelity fund, including the benefits of investing in a fund that is part of a large family of funds offering a variety of investment disciplines and providing for a large variety of mutual fund investor services. For example, fund shareholders are offered the privilege of exchanging shares of a fund for shares of other Fidelity funds, as set forth in the fund's prospectus, without paying a sales charge. The Board noted that Fidelity has taken a number of actions over the previous year that benefited particular funds, including (i) dedicating additional resources to investment research and to restructure the investment research teams; (ii) contractually agreeing to reduce the management fees on Fidelity's Institutional Money Market Funds and launching Class IV and Institutional Class of certain of these funds; (iii) reducing the transfer agent fees for the Fidelity Select Portfolios and Investor Class of the VIP funds; and (iv) launching Class K of 29 equity funds as a lower-fee class available to certain employer-sponsored retirement plans.
Investment Performance (Asset Manager 20%, Asset Manager 50%, Asset Manager 70%, and Asset Manager 85%). The Board considered whether each fund has operated within its investment objective, as well as its record of compliance with its investment restrictions. It also reviewed each fund's absolute investment performance for each class, as well as each fund's relative investment performance measured against (i) a proprietary custom index, and (ii) a peer group of mutual funds deemed appropriate by the Board over multiple periods.
For Asset Manager 20% and Asset Manager 50%, the following charts considered by the Board show, over the one-, three-, and five-year periods ended December 31, 2007, as available, the cumulative total returns of the retail class and Class B of each fund, the cumulative total returns of a proprietary custom index ("benchmark"), and a range of cumulative total returns of a peer group of mutual funds identified by Morningstar, Inc. as having an investment style similar to that of the fund based on underlying portfolio holdings. The returns of the retail class and Class B show the performance of the highest and lowest performing classes, respectively.
For Asset Manger 70%, the following charts considered by the Board show, over the one-, three-, and five-year periods ended December 31, 2007, the fund's cumulative total returns, the cumulative total returns of a proprietary custom index ("benchmark"), and a range of cumulative total returns of a peer group of mutual funds identified by Morningstar, Inc. as having an investment style similar to that of the fund based on underlying portfolio holdings.
For Asset Manager 85%, the following charts considered by the Board show, over the one-, three-, and five-year periods ended December 31, 2007, as available, the cumulative total returns of Asset Manager 85% (retail class) and Class C of the fund, the cumulative total returns of a proprietary custom index ("benchmark"), and a range of cumulative total returns of a peer group of mutual funds identified by Morningstar, Inc. as having an investment style similar to that of the fund based on underlying portfolio holdings. The returns of Asset Manager 85% (retail class) and Class C of the fund show the performance of the highest and lowest performing classes, respectively.
The box within each chart shows the 25th percentile return (bottom of box) and the 75th percentile return (top of box) of the peer group. Returns shown above the box are in the first quartile and returns shown below the box are in the fourth quartile. The percentage beaten numbers noted below each chart correspond to the percentile box and represent the percentage of funds in the peer group whose performance was equal to or lower than that of the class indicated. Each fund's proprietary custom index is an index developed by FMR that represents the performance of the fund's asset classes according to their respective weightings in the fund's neutral mix.
Annual Report
Board Approval of Investment Advisory Contracts and Management Fees - continued
Fidelity Asset Manager 20%
The Board reviewed the fund's relative investment performance against its peer group and stated that the performance of Asset Manager 20% (retail class) of the fund was in the third quartile for the one-year period and the second quartile for the three- and five-year periods. The Board also stated that the investment performance of Asset Manager 20% (retail class) of the fund compared favorably to its benchmark for the three- and five-year periods, although the fund's one-year cumulative total return was lower than its benchmark. The Board considered that the variations in performance among the fund's classes reflect the variations in class expenses, which result in lower performance for higher expense classes.
Fidelity Asset Manager 50%
The Board reviewed the fund's relative investment performance against its peer group and stated that the performance of Asset Manager 50% (retail class) of the fund was in the second quartile for the one-year period, the third quartile for the three-year period, and the fourth quartile for the five-year period. The Board also stated that the investment performance of the fund was lower than its benchmark for all the periods shown. The Board considered that the variations in performance among the fund's classes reflect the variations in class expenses, which result in lower performance for higher expense classes.
Annual Report
Fidelity Asset Manager 70%
The Board reviewed the fund's relative investment performance against its peer group and stated that the performance of the fund was in the second quartile for the one-year period and the third quartile for the three- and five-year periods. The Board also stated that the investment performance of the fund was lower than its benchmark for the three- and five-year periods, although the fund's one-year cumulative total return compared favorably to its benchmark.
Fidelity Asset Manager 85%
The Board reviewed the fund's relative investment performance against its peer group and stated that the performance of Asset Manager 85% (retail class) of the fund was in the fourth quartile for the one-year period, the second quartile for the three-year period, and the first quartile for the five-year period. The Board also stated that the investment performance of Asset Manager 85% (retail class) of the fund compared favorably to its benchmark for all the periods shown. The Board considered that the variations in performance among the fund's classes reflect the variations in class expenses, which result in lower performance for higher expense classes.
The Board considered that FMR has taken steps to refocus and strengthen equity research, equity portfolio management, and compliance.
Based on its review, and giving particular weight to the nature and quality of the resources dedicated by the Investment Advisers to maintain and improve relative performance, the Board concluded that the nature, extent, and quality of the services provided to each fund will benefit the fund's shareholders, particularly in light of the Board's view that each fund's shareholders benefit from investing in a fund that is part of a large family of funds offering a variety of investment disciplines and services.
Annual Report
Board Approval of Investment Advisory Contracts and Management Fees - continued
Investment Performance (Asset Manager 30%, Asset Manager 40%, and Asset Manager 60%). The Board considered whether each fund has operated within its investment objective, as well as its record of compliance with its investment restrictions. The Board noted that it is not possible to evaluate performance in any comprehensive fashion because each fund had been in operation for less than one calendar year. Once a fund has been in operation for at least one calendar year, the Board will review each fund's absolute investment performance for each class, as well as each fund's relative investment performance for each class measured against a proprietary custom index and a peer group of mutual funds.
The Board considered that FMR has taken steps to refocus and strengthen equity research, equity portfolio management, and compliance.
Based on its review, and giving particular weight to the nature and quality of the resources dedicated by the Investment Advisers to maintain and improve relative performance, the Board concluded that the nature, extent, and quality of the services provided to each fund will benefit each fund's shareholders, particularly in light of the Board's view that each fund's shareholders benefit from investing in a fund that is part of a large family of funds offering a variety of investment disciplines and services.
Competitiveness of Management Fee and Total Fund Expenses. The Board considered each fund's management fee and total expenses compared to "mapped groups" of competitive funds and classes. Fidelity creates "mapped groups" by combining similar Lipper investment objective categories that have comparable management fee characteristics. Combining Lipper investment objective categories aids the Board's management fee and total expense comparisons by broadening the competitive group used for comparison and by reducing the number of universes to which various Fidelity funds are compared.
The Board considered two proprietary management fee comparisons for the 12-month periods shown in the chart below. The group of Lipper funds used by the Board for management fee comparisons is referred to below as the "Total Mapped Group." The Total Mapped Group comparison focuses on a fund's standing relative to the total universe of comparable funds available to investors, in terms of gross management fees before expense reimbursements or caps. "TMG %" represents the percentage of funds in the Total Mapped Group that had management fees that were lower than a fund's. For example, a TMG % of 23% would mean that 77% of the funds in the Total Mapped Group had higher management fees than a fund. The "Asset-Size Peer Group" (ASPG) comparison focuses on a fund's standing relative to non-Fidelity funds similar in size to the fund within the Total Mapped Group. The ASPG represents at least 15% of the funds in the Total Mapped Group with comparable asset size and management fee characteristics, subject to a minimum of 50 funds (or all funds in the Total Mapped Group if fewer than 50). Additional information, such as the ASPG quartile in which a fund's management fee ranked, is also included in the chart and considered by the Board.
Fidelity Asset Manager 20%
Annual Report
Fidelity Asset Manager 30%
Fidelity Asset Manager 40%
Annual Report
Board Approval of Investment Advisory Contracts and Management Fees - continued
Fidelity Asset Manager 50%
Fidelity Asset Manager 60%
Annual Report
Fidelity Asset Manager 70%
Fidelity Asset Manager 85%
The Board noted that each fund's management fee ranked below the median of its Total Mapped Group and below the median of its ASPG for 2007.
Based on its review, the Board concluded that each fund's management fee was fair and reasonable in light of the services that the fund receives and the other factors considered.
In its review of the total expenses of Asset Manager 70%, the Board considered the fund's management fee as well as other fund expenses, such as transfer agent fees, pricing and bookkeeping fees, and custodial, legal, and audit fees. The Board also noted the effects of any waivers and reimbursements on fees and expenses. As part of its review, the Board also considered current and historical total expenses of the fund compared to competitive fund median expenses. The fund is compared to those funds and classes in the Total Mapped Group (used by the Board for management fee comparisons) that have a similar sales load structure.
In its review of the total expenses of each class of Asset Manager 20%, Asset Manager 30%, Asset Manager 40%, Asset Manager 50%, Asset Manager 60% and Asset Manager 85%, the Board considered the fund's management fee as well as other fund or class expenses, as applicable, such as transfer agent fees, pricing and bookkeeping fees, fund-paid 12b-1 fees, and custodial, legal, and audit fees. The Board also noted the effects of any waivers and reimbursements on fees and expenses. As part of its review, the Board also considered current and historical total expenses of each class of the fund compared to competitive fund median expenses. Each class of the fund is compared to those funds and classes in the Total Mapped Group (used by the Board for management fee comparisons) that have a similar sales load structure.
Annual Report
Board Approval of Investment Advisory Contracts and Management Fees - continued
The Board noted that Asset Manager 20%, Asset Manager 30%, Asset Manager 40%, Asset Manager 50%, Asset Manager 60% and Asset Manager 85% offer multiple classes, each of which has a different sales load and 12b-1 fee structure, and that the multiple structures are intended to offer a range of pricing options for the intermediary market. The Board also noted that the total expenses of the classes vary primarily by the level of their 12b-1 fees, although differences in transfer agent fees may also cause expenses to vary from class to class.
The Board noted that the total expenses of Asset Manager 70% ranked below its competitive median for 2007.
The Board noted that the total expenses of each class of Asset Manager 20% ranked below its competitive median for 2007.
The Board noted that the total expenses of each of Class A, Class B, Class C, Institutional Class, and Asset Manager 30% (retail class) of Asset Manager 30% ranked below its competitive median for the period, and the total expenses of Class T ranked above its competitive median for the period. The Board considered that the total expenses for Class T were above the median primarily because its 12b-1 fee is higher than the typical front-end load class.
The Board noted that the total expenses of each of Class A, Class B, Class C, Institutional Class, and Asset Manager 40% (retail class) of Asset Manager 40% ranked below its competitive median for the period, and the total expenses of Class T ranked above its competitive median for the period. The Board considered that the total expenses for Class T were above the median primarily because its 12b-1 fee is higher than the typical front-end load class.
The Board noted that the total expenses of each of Class A, Class B, Class C, Institutional Class, and Asset Manager 50% (retail class) of Asset Manager 50% ranked below its competitive median for 2007, and the total expenses of Class T ranked above its competitive median for 2007. The Board considered that the total expenses for Class T were above the median primarily because its 12b-1 fee is higher than the typical front-end load class.
The Board noted that the total expenses of Asset Manager 60% (retail class) of Asset Manager 60% ranked equal to its competitive median for the period, and the total expenses of Class A, Class T, Class B, Class C, and Institutional Class ranked above its competitive median for the period. The Board considered that the total expenses of Class B and Class C were above the median primarily due to higher transfer agent fees. The Board considered that the total expenses for Class T were above the median primarily because its 12b-1 fee is higher than the typical front-end load class.
The Board noted that the total expenses of each of Class A, Class B, Class C, Institutional Class and Asset Manager 85% (retail class) of Asset Manager 85% ranked below its competitive median for 2007, and the total expenses of Class T ranked above its competitive median for 2007. The Board considered that total expenses for Class T were above the median primarily because its 12b-1 fee is higher than the typical front-end load class.
In its review of total expenses, the Board also considered Fidelity fee structures and other information on clients that FMR and its affiliates service in other competitive markets, such as other mutual funds advised or subadvised by FMR or its affiliates, pension plan clients, and other institutional clients.
Based on its review, the Board concluded that the total expenses of Asset Manager 70% and the total expenses of each class of Asset Manager 20%, Asset Manager 30%, Asset Manager 40%, Asset Manager 50%, Asset Manager 60% and Asset Manager 85% were reasonable, although in some cases above the median of the universe presented for comparison, in light of the services that the fund and its shareholders receive and the other factors considered.
Costs of the Services and Profitability. The Board considered the revenues earned and the expenses incurred by Fidelity in conducting the business of developing, marketing, distributing, managing, administering and servicing each fund and its shareholders. The Board also considered the level of Fidelity's profits in respect of all the Fidelity funds.
On an annual basis, FMR presents to the Board Fidelity's profitability for each fund. Fidelity calculates the profitability for each fund, as well as aggregate profitability for groups of Fidelity funds and all Fidelity funds, using a series of detailed revenue and cost allocation methodologies which originate with the audited books and records of Fidelity. The Audit Committee of the Board reviews any significant changes from the prior year's methodologies.
PricewaterhouseCoopers LLP (PwC), independent registered public accounting firm and auditor to Fidelity and certain Fidelity funds, has been engaged annually by the Board as part of the Board's assessment of the results of Fidelity's profitability analysis. PwC's engagement includes the review and assessment of Fidelity's methodologies used in determining the revenues and expenses attributable to Fidelity's mutual fund business, and completion of agreed-upon procedures surrounding the mathematical accuracy of fund profitability and its conformity to allocation methodologies. After considering PwC's reports issued under the engagement and information provided by Fidelity, the Board believes that while other allocation methods may also be reasonable, Fidelity's profitability methodologies are reasonable in all material respects.
The Board has also reviewed Fidelity's non-fund businesses and any fall-out benefits related to the mutual fund business as well as cases where Fidelity's affiliates may benefit from or be related to the funds' business.
Annual Report
The Board considered the costs of the services provided by and the profits realized by Fidelity in connection with the operation of each fund and determined that the amount of profit is a fair entrepreneurial profit for the management of each fund.
Economies of Scale. The Board considered whether there have been economies of scale in respect of the management of the Fidelity funds, whether the Fidelity funds (including each fund) have appropriately benefited from any such economies of scale, and whether there is potential for realization of any further economies of scale. The Board considered the extent to which each fund will benefit from economies of scale through increased services to the fund, through waivers or reimbursements, or through fee or expense reductions.
The Board recognized that each fund's management contract incorporates a "group fee" structure, which provides for lower group fee rates as total fund assets under FMR's management increase, and for higher group fee rates as total fund assets under FMR's management decrease. FMR determines the group fee rates based on a tiered asset "breakpoint" schedule. The Board considered that the group fee is designed to deliver the benefits of economies of scale to fund shareholders when total fund assets increase, even if assets of any particular fund are unchanged or have declined, because some portion of Fidelity's costs are attributable to services provided to all Fidelity funds, and all funds benefit if those costs can be allocated among more assets. The Board concluded that, given the group fee structure, fund shareholders will achieve a certain level of economies of scale as assets under FMR's management increase at the fund complex level, regardless of whether Fidelity achieves any such economies of scale.
The Board further concluded that any potential economies of scale are being shared between fund shareholders and Fidelity in an appropriate manner.
Additional Information Requested by the Board. In order to develop fully the factual basis for consideration of the Fidelity funds' Advisory Contracts, the Board requested and received additional information on certain topics, including (i) fund performance trends and actions to be taken by FMR to improve certain funds' overall performance; (ii) portfolio manager changes that have occurred during the past year; (iii) Fidelity's fund profitability methodology, the profitability of certain fund service providers, and profitability trends for certain funds; (iv) Fidelity's compensation structure for portfolio managers and key personnel, including its effects on fund profitability and the extent to which portfolio manager compensation is linked to fund performance; (v) Fidelity's fee structures; (vi) the funds' sub-advisory arrangements; and (vii) accounts managed by Fidelity other than the Fidelity funds.
Based on its evaluation of all of the conclusions noted above, and after considering all material factors, the Board ultimately concluded that the advisory fee structures are fair and reasonable, and that each fund's Advisory Contracts should be renewed.
Annual Report
Investment Adviser
Fidelity Management & Research Company
Boston, MA
Investment Sub-Advisers
FMR Co., Inc.
Fidelity Investments Money Management, Inc.
Fidelity Management & Research (U.K.) Inc.
Fidelity Research & Analysis Company
Fidelity Investments Japan Limited
FIL Investment Advisors
FIL Investment Advisors (U.K.) Ltd.
Fidelity Management & Research (Japan) Inc.
Fidelity Management & Research (Hong Kong) Limited
General Distributor
Fidelity Distributors Corporation
Boston, MA
Transfer and Service Agents
Fidelity Investments Institutional Operations Company, Inc.
Boston, MA
Fidelity Service Company, Inc.
Boston, MA
Custodian
JPMorgan Chase Bank
New York, NY

AAR-UANN-1108
1.885697.100
Fidelity Advisor Asset Manager® Funds -
20%, 30%, 40%, 50%, 60%, 70%, 85% -
Institutional Class
Annual Report
September 30, 2008
Each Institutional Class is a class
of Fidelity Asset Manager® Funds
(2_fidelity_logos) (Registered_Trademark)
Contents
To view a fund's proxy voting guidelines and proxy voting record for the 12-month period ended June 30, visit http://www.fidelity.com (search for "proxy voting guidelines") or visit the Securities and Exchange Commission's (SEC) web site at http://www.sec.gov. You may also call 1-877-208-0098 to request a free copy of the proxy voting guidelines.
Standard & Poor's, S&P and S&P 500 are registered service marks of The McGraw-Hill Companies, Inc. and have been licensed for use by Fidelity Distributors Corporation.
Other third party marks appearing herein are the property of their respective owners.
All other marks appearing herein are registered or unregistered trademarks or service marks of FMR LLC or an affiliated company.
Annual Report
This report and the financial statements contained herein are submitted for the general information of the shareholders of the funds. This report is not authorized for distribution to prospective investors in the funds unless preceded or accompanied by an effective prospectus.
A fund files its complete schedule of portfolio holdings with the SEC for the first and third quarters of each fiscal year on Form N-Q. Forms N-Q are available on the SEC's web site at http://www.sec.gov. A fund's Forms N-Q may be reviewed and copied at the SEC's Public Reference Room in Washington, DC. Information regarding the operation of the SEC's Public Reference Room may be obtained by calling 1-800-SEC-0330. For a complete list of a fund's portfolio holdings, view the most recent quarterly holdings listing, semiannual report, or annual report on Fidelity's web site at http://www.advisor.fidelity.com.
NOT FDIC INSURED · MAY LOSE VALUE · NO BANK GUARANTEE
Neither the funds nor Fidelity Distributors Corporation is a bank.
Annual Report
Dear Shareholder:
Turmoil has been the watchword for the world's securities markets in 2008, with domestic and international stocks down sharply amid the global credit squeeze. A flight to quality boosted returns for U.S. Treasuries, one of the few asset classes with positive results heading into the latter stages of the year. Financial markets are always unpredictable, but there are a number of time-tested principles that can put the historical odds in your favor.
One of the basic tenets is to invest for the long term. Over time, riding out the markets' inevitable ups and downs has proven much more effective than selling into panic or chasing the hottest trend. Even missing only a few of the markets' best days can significantly diminish investor returns. Patience also affords the benefits of compounding - of earning interest on additional income or reinvested dividends and capital gains. There are tax advantages and cost benefits to consider as well. The more you sell, the more taxes you pay, and the more you trade, the higher the costs. While staying the course doesn't eliminate risk, it can considerably lessen the effect of short-term declines.
You can further manage your investing risk through diversification. And today, more than ever, geographic diversification should be taken into account. Studies
indicate that asset allocation is the single most important determinant of a portfolio's long-term success. The right mix of stocks, bonds and cash - aligned to your particular risk tolerance and investment objective - is very important. Age-appropriate rebalancing is also an essential aspect of asset allocation. For younger investors, an emphasis on equities - which historically have been the best-performing asset class over time - is encouraged. As investors near their specific goal, such as retirement or sending a child to college, consideration may be given to replacing volatile assets (e.g. common stocks) with more-stable fixed investments (bonds or savings plans).
A third investment principle - investing regularly - can help lower the average cost of your purchases. Investing a certain amount of money each month or quarter helps ensure you won't pay for all your shares at market highs. This strategy - known as dollar cost averaging - also reduces unconstructive "emotion" from investing, helping shareholders avoid selling weak performers just prior to an upswing, or chasing a hot performer just before a correction.
We invite you to contact us via the Internet, through our Investor Centers or over the phone. It is our privilege to provide you the information you need to make the investments that are right for you.
Sincerely,
/s/Edward C. Johnson 3d
Edward C. Johnson 3d
Annual Report
Fidelity Advisor Asset Manager 20% - Institutional Class
Average annual total return reflects the change in the value of an investment, assuming reinvestment of the class' dividend income and capital gains (the profits earned upon the sale of securities that have grown in value, if any) and assuming a constant rate of performance each year. The $10,000 table and the fund's returns do not reflect the deduction of taxes that a shareholder would pay on fund distributions or the redemption of fund shares. During periods of reimbursement by Fidelity, a fund's total return will be greater than it would be had the reimbursement not occurred. How a fund did yesterday is no guarantee of how it will do tomorrow.
Average Annual Total Returns
Periods ended September 30, 2008 | | Past 1
year | Past 5
years | Past 10
years |
Institutional Class A | | -6.91% | 4.17% | 4.56% |
A The initial offering of Institutional Class shares took place on October 2, 2006. Returns prior to October 2, 2006 are those of Asset Manager 20%, the original class of the fund.
$10,000 Over 10 Years
Let's say hypothetically that $10,000 was invested in Fidelity Advisor Asset Manager® 20% - Institutional Class on September 30, 1998. The chart shows how the value of your investment would have changed, and also shows how the Lehman Brothers® U.S. Aggregate Index performed over the same period. The initial offering of Institutional Class took place on October 2, 2006. See above for additional information regarding the performance of Institutional Class.
Annual Report
Fidelity Advisor Asset Manager 30% - Institutional Class
Performance: The Bottom Line
Average annual total return reflects the change in the value of an investment, assuming reinvestment of the class' dividend income and capital gains (the profits earned upon the sale of securities that have grown in value, if any) and assuming a constant rate of performance each year. The $10,000 table and the fund's returns do not reflect the deduction of taxes that a shareholder would pay on fund distributions or the redemption of fund shares. During periods of reimbursement by Fidelity, a fund's total return will be greater than it would be had the reimbursement not occurred. How a fund did yesterday is no guarantee of how it will do tomorrow.
Average annual total returns take Fidelity Advisor Asset Manager 30%'s cumulative total return and show you what would have happened if Fidelity Advisor Asset Manager 30% shares had performed at a constant rate each year. These numbers will be reported once the fund is a year old.
$10,000 Over Life of Fund
Let's say hypothetically that $10,000 was invested in Fidelity Advisor Asset Manager 30% - Institutional Class on October 9, 2007, when the fund started. The chart shows how the value of your investment would have changed, and also shows how the Lehman Brothers U.S. Aggregate Index performed over the same period.
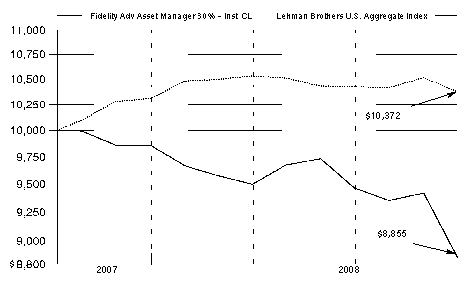
Annual Report
Fidelity Advisor Asset Manager 40% - Institutional Class
Performance: The Bottom Line
Average annual total return reflects the change in the value of an investment, assuming reinvestment of the class' dividend income and capital gains (the profits earned upon the sale of securities that have grown in value, if any) and assuming a constant rate of performance each year. The $10,000 table and the fund's returns do not reflect the deduction of taxes that a shareholder would pay on fund distributions or the redemption of fund shares. During periods of reimbursement by Fidelity, a fund's total return will be greater than it would be had the reimbursement not occurred. How a fund did yesterday is no guarantee of how it will do tomorrow.
Average annual total returns take Fidelity Advisor Asset Manager 40%'s cumulative total return and show you what would have happened if Fidelity Advisor Asset Manager 40% shares had performed at a constant rate each year. These numbers will be reported once the fund is a year old.
$10,000 Over Life of Fund
Let's say hypothetically that $10,000 was invested in Fidelity Advisor Asset Manager 40% - Institutional Class on October 9, 2007, when the fund started. The chart shows how the value of your investment would have changed, and also shows how the Lehman Brothers U.S. Aggregate Index performed over the same period.
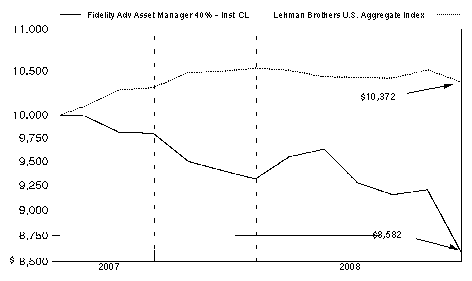
Annual Report
Fidelity Advisor Asset Manager 50% - Institutional Class
Performance: The Bottom Line
Average annual total return reflects the change in the value of an investment, assuming reinvestment of the class' dividend income and capital gains (the profits earned upon the sale of securities that have grown in value, if any) and assuming a constant rate of performance each year. The $10,000 table and the fund's returns do not reflect the deduction of taxes that a shareholder would pay on fund distributions or the redemption of fund shares. During periods of reimbursement by Fidelity, a fund's total return will be greater than it would be had the reimbursement not occurred. How a fund did yesterday is no guarantee of how it will do tomorrow.
Average Annual Total Returns
Periods ended September 30, 2008 | | Past 1
year | Past 5
years | Past 10
years |
Institutional Class A | | -16.30% | 2.75% | 4.01% |
A The initial offering of Institutional Class shares took place on October 2, 2006. Returns prior to October 2, 2006 are those of Asset Manager 50%, the original class of the fund.
$10,000 Over 10 Years
Let's say hypothetically that $10,000 was invested in Fidelity Advisor Asset Manager 50% - Institutional Class on September 30, 1998. The chart shows how the value of your investment would have changed, and also shows how the Standard & Poor's 500SM Index (S&P 500®) performed over the same period. The initial offering of Institutional Class took place on October 2, 2006. See above for additional information regarding the performance of the Institutional Class.
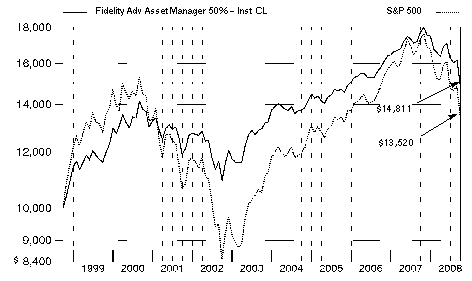
Annual Report
Fidelity Advisor Asset Manager 60% - Institutional Class
Performance: The Bottom Line
Average annual total return reflects the change in the value of an investment, assuming reinvestment of the class' dividend income and capital gains (the profits earned upon the sale of securities that have grown in value, if any) and assuming a constant rate of performance each year. The $10,000 table and the fund's returns do not reflect the deduction of taxes that a shareholder would pay on fund distributions or the redemption of fund shares. During periods of reimbursement by Fidelity, a fund's total return will be greater than it would be had the reimbursement not occurred. How a fund did yesterday is no guarantee of how it will do tomorrow.
Average annual total returns take Fidelity Advisor Asset Manager 60%'s cumulative total return and show you what would have happened if Fidelity Advisor Asset Manager 60% shares had performed at a constant rate each year. These numbers will be reported once the fund is a year old.
$10,000 Over Life of Fund
Let's say hypothetically that $10,000 was invested in Fidelity Advisor Asset Manager 60% - Institutional Class on October 9, 2007, when the fund started. The chart shows how the value of your investment would have changed, and also shows how the S&P 500 performed over the same period.
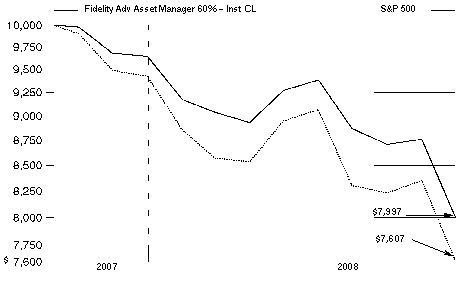
Annual Report
Fidelity Advisor Asset Manager 70% - Institutional Class
Performance: The Bottom Line
Average annual total return reflects the change in the value of an investment, assuming reinvestment of the class' dividend income and capital gains (the profits earned upon the sale of securities that have grown in value, if any) and assuming a constant rate of performance each year. The $10,000 table and the fund's returns do not reflect the deduction of taxes that a shareholder would pay on fund distributions or the redemption of fund shares. During periods of reimbursement by Fidelity, a fund's total return will be greater than it would be had the reimbursement not occurred. How a fund did yesterday is no guarantee of how it will do tomorrow.
Average Annual Total Returns
Periods ended September 30, 2008 | | Past 1
year | Past 5
years | Past 10
years |
Institutional Class A | | -21.46% | 2.48% | 2.61% |
A The initial offering of Institutional Class shares took place on September 23, 2008. Returns prior to September 23, 2008 are those of Asset Manager 70%, the original class of the fund.
$10,000 Over 10 Years
Let's say hypothetically that $10,000 was invested in Fidelity Advisor Asset Manager 70% - Institutional Class on September 30, 1998. The chart shows how the value of your investment would have changed, and also shows how the S&P 500 performed over the same period. The initial offering of Institutional Class took place on September 30, 2008. See above for additional information regarding the performance of Institutional Class.
Annual Report
Fidelity Advisor Asset Manager 85% - Institutional Class
Performance: The Bottom Line
Average annual total return reflects the change in the value of an investment, assuming reinvestment of the class' dividend income and capital gains (the profits earned upon the sale of securities that have grown in value, if any) and assuming a constant rate of performance each year. The $10,000 table and the fund's returns do not reflect the deduction of taxes that a shareholder would pay on fund distributions or the redemption of fund shares. During periods of reimbursement by Fidelity, a fund's total return will be greater than it would be had the reimbursement not occurred. How a fund did yesterday is no guarantee of how it will do tomorrow.
Average Annual Total Returns
Periods ended September 30, 2008 | | Past 1
year | Past 5
years | Life of
fundA |
Institutional Class B | | -24.35% | 4.59% | 2.69% |
A From September 24, 1999.
B The initial offering of Institutional Class shares took place on October 2, 2006. Returns prior to October 2, 2006 are those of Asset Manager 85%, the original class of the fund.
$10,000 Over Life of Fund
Let's say hypothetically that $10,000 was invested in Fidelity Advisor Asset Manager 85% - Institutional Class on September 24, 1999, when the fund started. The chart shows how the value of your investment would have changed, and also shows how the S&P 500 performed over the same period. The initial offering of Institutional Class took place on October 2, 2006. See above for additional information regarding the performance of Institutional Class.
Annual Report
Comments from Derek Young, who became sole Portfolio Manager of Fidelity Advisor Asset Manager Funds on July 1, 2008
The Standard & Poor's 500SM Index declined 21.98% during the 12-month period ending September 30, 2008, amid a backdrop of falling home values, tight credit and scarce liquidity. Of the 10 major market sectors represented in the S&P 500®, only one managed a positive return: consumer staples, which barely nudged into the black with an increase of just under 1%. The remaining nine all suffered double-digit losses, led by the roughly 39% decline of the financials sector. In the final quarter of the period, under the strain of the credit crisis and dwindling capital, several of the largest institutions on Wall Street went bankrupt, were forced into acquisitions or were seized by the U.S. government. The Dow Jones Industrial AverageSM plummeted roughly 778 points on September 29 - its worst single-day point loss ever - and was down 19.85% for the year as a whole. International stocks fared much worse than their domestic counterparts. The MSCI® Europe, Australasia, Far East (EAFE®) Index - a performance monitor of developed markets outside the United States and Canada - fell 30.39%, a loss exacerbated by the renewed strength of the U.S. dollar. Unlike the stock market, the overall investment-grade bond market was positive, gaining 3.65% as measured by the Lehman Brothers® U.S. Aggregate Index. Conversely, the Merrill Lynch® U.S. High Yield Master II Constrained Index, a gauge of lower-quality but typically higher-yielding debt, dropped 11.09%.
The past year was a difficult stretch for the Advisor Asset Managers amid increasingly treacherous market conditions. Across the seven funds - including the 30%, 40% and 60% portfolios, which were just under a year old - greater exposure to riskier asset classes, such as equities, resulted in lower absolute returns and, in concert with weak overall security selection, a high degree of underperformance versus the composite benchmarks. (For fund-specific returns, please see the performance section of this report.) Security selection was decidedly negative in the equity and investment-grade bond categories, and asset allocation was ineffective this period. It was an unforgiving environment for riskier assets, as the burgeoning global financial crisis spawned a massive flight to quality. As such, it proved perilous to favor equities and high-yield/floating-rate debt - the latter of which was not represented in Advisor Asset Manager 85% - relative to stronger-performing investment-grade bonds and cash. An inherent growth orientation and bias toward higher-beta - meaning more-volatile - stocks were major factors working against us amid the sharp downturn in the market. In total, eight of the 10 underlying domestic equity sector central funds lagged their respective components of the Dow Jones Wilshire 5000 Composite IndexSM, with particularly weak results coming from technology, utilities, energy, consumer staples and financials - and with security selection to blame in each case. Conversely, the industrials sector is where we fared the best, driven by good stock picks. Consumer discretionary was the only other positive. Elsewhere, we struggled early in the period within the international equity component - not included in Advisor Asset Manager 20% and 30%, and which transitioned in December to a Fidelity central fund - and that loss more than offset the benefit from underweighting the foreign "sleeve." The funds' collective bond holdings trailed the Lehman Brothers U.S. Aggregate Index due to weak results from the investment-grade central fund, which had exposure to the sell-off in subprime mortgage securities. Although allocations to high yield and floating rate detracted, excess returns from the high-yield and floating-rate central funds helped curb some of the damage. The strategic cash component, including the money market central fund - in Advisor Asset Manager 20%, 50% and 70% - outperformed as well.
The views expressed above reflect those of the portfolio manager(s) only through the end of the period as stated on the cover of this report and do not necessarily represent the views of Fidelity or any other person in the Fidelity organization. Any such views are subject to change at any time based upon market or other conditions and Fidelity disclaims any responsibility to update such views. These views may not be relied on as investment advice and, because investment decisions for a Fidelity fund are based on numerous factors, may not be relied on as an indication of trading intent on behalf of any Fidelity fund.
Annual Report
The Funds invest in Fidelity Central Funds, which are open-end investment companies with similar investment objectives to those of the Funds, available only to other mutual funds and accounts managed by Fidelity Management & Research Company, (FMR) and its affiliates. In addition to the direct expenses incurred by the Funds presented in the table, as a shareholder of the underlying Fidelity Central Funds, the Funds also indirectly bear their proportionate share of the expenses of the underlying Fidelity Central Funds. These expenses are not included in the Funds' annualized expense ratio used to calculate either the actual or hypothetical expense estimates presented in the table below.
As a shareholder of a Fund, you incur two types of costs: (1) transaction costs, including sales charges (loads) on purchase payments or redemption proceeds, and (2) ongoing costs, including management fees, distribution and/or service (12b-1) fees and other Fund expenses. This Example is intended to help you understand your ongoing costs (in dollars) of investing in the Funds and to compare these costs with the ongoing costs of investing in other mutual funds.
The actual expense Example is based on an investment of $1,000 invested at the beginning of the period and held for the entire period (April 1, 2008 to September 30, 2008) for each class of Fidelity Asset Manager 20%, Fidelity Asset Manager 30%, Fidelity Asset Manager 40%, Fidelity Asset Manager 50%, Fidelity Asset Manager 60%, Fidelity Asset Manager 85% and Asset Manager 70% Class and for the entire period (September 23, 2008 to September 30, 2008) for Class A, T, B, C and Institutional Class of Fidelity Asset Manager 70% Fund.
The hypothetical expense Example is based on an investment of $1,000 invested for the one-half year period (April 1, 2008 to September 30, 2008).
Actual Expenses
The first line of the accompanying table for each class of each fund provides information about actual account values and actual expenses. You may use the information in this line, together with the amount you invested, to estimate the expenses that you paid over the period. Simply divide your account value by $1,000.00 (for example, an $8,600 account value divided by $1,000.00 = 8.6), then multiply the result by the number in the first line for a class of the fund under the heading entitled "Expenses Paid During Period" to estimate the expenses you paid on your account during this period. A small balance maintenance fee of $12.00 that is charged once a year may apply for certain accounts with a value of less than $2,000. This fee is not included in the table below. If it was, the estimate of expenses you paid during the period would be higher, and your ending account value lower, by this amount.
Hypothetical Example for Comparison Purposes
The second line of the accompanying table for each class of each fund provides information about hypothetical account values and hypothetical expenses based on a Class' actual expense ratio and an assumed rate of return of 5% per year before expenses, which is not the Class' actual return. The hypothetical account values and expenses may not be used to estimate the actual ending account balance or expenses you paid for the period. You may use this information to compare the ongoing costs of investing in the Fund and other funds. To do so, compare this 5% hypothetical example with the 5% hypothetical examples that appear in the shareholder reports of the other funds. A small balance maintenance fee of $12.00 that is charged once a year may apply for certain accounts with a value of less than $2,000. This fee is not included in the table below. If it was, the estimate of expenses you paid during the period would be higher, and your ending account value lower, by this amount.
Please note that the expenses shown in the table are meant to highlight your ongoing costs only and do not reflect any transaction costs. Therefore, the second line of the table is useful in comparing ongoing costs only, and will not help you determine the relative total costs of owning different funds. In addition, if these transactional costs were included, your costs would have been higher.
| Annualized
Expense Ratio | Beginning
Account Value | Ending
Account Value
September 30, 2008 | Expenses Paid
During Period |
Fidelity Asset Manager 20% | | | | |
Class A | .87% | | | |
Actual | | $ 1,000.00 | $ 952.90 | $ 4.25 B |
Hypothetical A | | $ 1,000.00 | $ 1,020.65 | $ 4.39 C |
Class T | 1.13% | | | |
Actual | | $ 1,000.00 | $ 951.70 | $ 5.51B |
Hypothetical A | | $ 1,000.00 | $ 1,019.35 | $ 5.70 C |
Class B | 1.66% | | | |
Actual | | $ 1,000.00 | $ 949.20 | $ 8.09 B* |
Hypothetical A | | $ 1,000.00 | $ 1,016.70 | $ 8.37 C* |
Class C | 1.65% | | | |
Actual | | $ 1,000.00 | $ 949.40 | $ 8.04 B |
Hypothetical A | | $ 1,000.00 | $ 1,016.75 | $ 8.32 C |
Asset Manager 20% | .56% | | | |
Actual | | $ 1,000.00 | $ 954.40 | $ 2.74 B |
Hypothetical A | | $ 1,000.00 | $ 1,022.20 | $ 2.83 C |
Institutional Class | .57% | | | |
Actual | | $ 1,000.00 | $ 953.60 | $ 2.78 B |
Hypothetical A | | $ 1,000.00 | $ 1,022.15 | $ 2.88 C |
| Annualized
Expense Ratio | Beginning
Account Value | Ending
Account Value
September 30, 2008 | Expenses Paid
During Period |
Fidelity Asset Manager 30% | | | | |
Class A | .94% | | | |
Actual | | $ 1,000.00 | $ 931.20 | $ 4.54B* |
HypotheticalA | | $ 1,000.00 | $ 1,020.30 | $ 4.75C* |
Class T | 1.18% | | | |
Actual | | $ 1,000.00 | $ 930.20 | $ 5.69B* |
Hypothetical A | | $ 1,000.00 | $ 1,019.10 | $ 5.96C* |
Class B | 1.68% | | | |
Actual | | $ 1,000.00 | $ 927.80 | $ 8.10B* |
HypotheticalA | | $ 1,000.00 | $ 1,016.60 | $ 8.47C* |
Class C | 1.70% | | | |
Actual | | $ 1,000.00 | $ 927.90 | $ 8.19B* |
Hypothetical A | | $ 1,000.00 | $ 1,016.50 | $ 8.57C* |
Asset Manager 30% | .69% | | | |
Actual | | $ 1,000.00 | $ 932.30 | $ 3.33B* |
Hypothetical A | | $ 1,000.00 | $ 1,021.55 | $ 3.49C* |
Institutional Class | .68% | | | |
Actual | | $ 1,000.00 | $ 932.30 | $ 3.28B* |
Hypothetical A | | $ 1,000.00 | $ 1,021.60 | $ 3.44C* |
Fidelity Asset Manager 40% | | | | |
Class A | .93% | | | |
Actual | | $ 1,000.00 | $ 920.20 | $ 4.46B* |
Hypothetical A | | $ 1,000.00 | $ 1,020.35 | $ 4.70C* |
Class T | 1.19% | | | |
Actual | | $ 1,000.00 | $ 918.20 | $ 5.71B* |
Hypothetical A | | $ 1,000.00 | $ 1,019.05 | $ 6.01C* |
Class B | 1.68% | | | |
Actual | | $ 1,000.00 | $ 915.70 | $ 8.05B* |
Hypothetical A | | $ 1,000.00 | $ 1,016.60 | $ 8.47C* |
Class C | 1.69% | | | |
Actual | | $ 1,000.00 | $ 916.50 | $ 8.10B* |
Hypothetical A | | $ 1,000.00 | $ 1,016.55 | $ 8.52C* |
Asset Manager 40% | .69% | | | |
Actual | | $ 1,000.00 | $ 921.40 | $ 3.31B* |
Hypothetical A | | $ 1,000.00 | $ 1,021.55 | $ 3.49C* |
Institutional Class | .68% | | | |
Actual | | $ 1,000.00 | $ 921.40 | $ 3.27B* |
Hypothetical A | | $ 1,000.00 | $ 1,021.60 | $ 3.44C* |
Fidelity Asset Manager 50% | | | | |
Class A | .99% | | | |
Actual | | $ 1,000.00 | $ 903.50 | $ 4.71B |
Hypothetical A | | $ 1,000.00 | $ 1,020.05 | $ 5.00C |
Class T | 1.24% | | | |
Actual | | $ 1,000.00 | $ 902.20 | $ 5.90B |
Hypothetical A | | $ 1,000.00 | $ 1,018.80 | $ 6.26C |
Class B | 1.80% | | | |
Actual | | $ 1,000.00 | $ 899.70 | $ 8.55B |
Hypothetical A | | $ 1,000.00 | $ 1,016.00 | $ 9.07C |
| Annualized
Expense Ratio | Beginning
Account Value | Ending
Account Value
September 30, 2008 | Expenses Paid
During Period |
Fidelity Asset Manager 50% | | | | |
Class C | 1.77% | | | |
Actual | | $ 1,000.00 | $ 899.80 | $ 8.41B |
Hypothetical A | | $ 1,000.00 | $ 1,016.15 | $ 8.92C |
Asset Manager 50% | .71% | | | |
Actual | | $ 1,000.00 | $ 903.90 | $ 3.38B |
Hypothetical A | | $ 1,000.00 | $ 1,021.45 | $ 3.59C |
Institutional Class | .67% | | | |
Actual | | $ 1,000.00 | $ 904.70 | $ 3.19B |
Hypothetical A | | $ 1,000.00 | $ 1,021.65 | $ 3.39C |
Fidelity Asset Manager 60% | | | | |
Class A | 1.12% | | | |
Actual | | $ 1,000.00 | $ 894.30 | $ 5.30B* |
Hypothetical A | | $ 1,000.00 | $ 1,019.40 | $ 5.65C* |
Class T | 1.37% | | | |
Actual | | $ 1,000.00 | $ 893.00 | $ 6.48B* |
Hypothetical A | | $ 1,000.00 | $ 1,018.15 | $ 6.91C* |
Class B | 1.88% | | | |
Actual | | $ 1,000.00 | $ 890.60 | $ 8.89B* |
Hypothetical A | | $ 1,000.00 | $ 1,015.60 | $ 9.47C* |
Class C | 1.88% | | | |
Actual | | $ 1,000.00 | $ 890.60 | $ 8.89B* |
Hypothetical A | | $ 1,000.00 | $ 1,015.60 | $ 9.47C* |
Asset Manager 60% | .87% | | | |
Actual | | $ 1,000.00 | $ 895.40 | $ 4.12B* |
Hypothetical A | | $ 1,000.00 | $ 1,020.65 | $ 4.39C* |
Institutional Class | .88% | | | |
Actual | | $ 1,000.00 | $ 895.40 | $ 4.17B* |
Hypothetical A | | $ 1,000.00 | $ 1,020.60 | $ 4.45C* |
Fidelity Asset Manager 70% | | | | |
Class A | 1.25% | | | |
Actual | | $ 1,000.00 | $ 963.20 | $ .27B |
Hypothetical A | | $ 1,000.00 | $ 1,018.75 | $ 6.31C |
Class T | 1.50% | | | |
Actual | | $ 1,000.00 | $ 963.20 | $ .32B |
Hypothetical A | | $ 1,000.00 | $ 1,017.50 | $ 7.57C |
Class B | 2.00% | | | |
Actual | | $ 1,000.00 | $ 963.20 | $ .43B |
Hypothetical A | | $ 1,000.00 | $ 1,015.00 | $ 10.08C |
Class C | 2.00% | | | |
Actual | | $ 1,000.00 | $ 963.20 | $ .43B |
Hypothetical A | | $ 1,000.00 | $ 1,015.00 | $ 10.08C |
Asset Manager 70% | .80% | | | |
Actual | | $ 1,000.00 | $ 877.00 | $ 3.75B |
Hypothetical A | | $ 1,000.00 | $ 1,021.00 | $ 4.04C |
Institutional Class | 1.00% | | | |
Actual | | $ 1,000.00 | $ 963.20 | $ .21B |
Hypothetical A | | $ 1,000.00 | $ 1,020.00 | $ 5.05C |
| Annualized
Expense Ratio | Beginning
Account Value | Ending
Account Value
September 30, 2008 | Expenses Paid
During Period |
Fidelity Asset Manager 85% | | | | |
Class A | 1.14% | | | |
Actual | | $ 1,000.00 | $ 860.10 | $ 5.30B |
Hypothetical A | | $ 1,000.00 | $ 1,019.30 | $ 5.76C |
Class T | 1.39% | | | |
Actual | | $ 1,000.00 | $ 859.10 | $ 6.46B |
Hypothetical A | | $ 1,000.00 | $ 1,018.05 | $ 7.01C |
Class B | 1.94% | | | |
Actual | | $ 1,000.00 | $ 856.20 | $ 9.00B |
Hypothetical A | | $ 1,000.00 | $ 1,015.30 | $ 9.77C |
Class C | 1.91% | | | |
Actual | | $ 1,000.00 | $ 856.70 | $ 8.87B |
Hypothetical A | | $ 1,000.00 | $ 1,015.45 | $ 9.62C |
Asset Manager 85% | .88% | | | |
Actual | | $ 1,000.00 | $ 860.60 | $ 4.09B |
Hypothetical A | | $ 1,000.00 | $ 1,020.60 | $ 4.45C |
Institutional Class | .78% | | | |
Actual | | $ 1,000.00 | $ 861.40 | $ 3.63B |
Hypothetical A | | $ 1,000.00 | $ 1,021.10 | $ 3.94C |
A 5% return per year before expenses
B Actual expenses are equal to each Class' annualized expense ratio, multiplied by the average account value over the period, multiplied by 183/366 (to reflect the one-half year period) for each class of Fidelity Asset Manager 20%, Fidelity Asset Manager 30%, Fidelity Asset Manager 40%, Fidelity Asset Manager 50%, Fidelity Asset Manager 60%, Fidelity Asset Manager 85% and Asset Manager 70% Class and multiplied by 8/366 (to reflect the period September 23, 2008 to September 30, 2008) for Class A, T, B, C and Institutional Class of Fidelity Asset Manager 70% Fund.
C Hypothetical expenses are equal to each Class' annualized expense ratio, multiplied by the average account value over the period, multiplied by 183/366 (to reflect the one-half year period).
The fees and expenses of the underlying Fidelity Central Funds in which the Fund invests are not included in the Fund's annualized expense ratio.
In addition to the expenses noted above, the Funds also indirectly bear their proportionate share of the expenses of the underlying Fidelity Central Funds. Annualized expenses of the underlying Fidelity Central Funds as of their most recent fiscal half-year ranged from less than ..01% to .03%.
* If changes to voluntary expense limitations, effective May 1, 2008 had been in effect during the entire period, the annualized expense ratios and the expenses paid in the actual and hypothetical examples above would have been as follows:
| Annualized
Expense Ratio | Expenses
Paid |
Fidelity Asset Manager 20% | | |
Class B | 1.65% | |
Actual | | $ 8.04 |
Hypothetical A | | $ 8.32 |
| Annualized
Expense Ratio | Expenses
Paid |
Fidelity Asset Manager 30% | | |
Class A | .90% | |
Actual | | $ 4.35 |
HypotheticalA | | $ 4.55 |
Class T | 1.15% | |
Actual | | $ 5.55 |
Hypothetical A | | $ 5.81 |
Class B | 1.65% | |
Actual | | $ 7.95 |
HypotheticalA | | $ 8.32 |
Class C | 1.65% | |
Actual | | $ 7.95 |
Hypothetical A | | $ 8.32 |
Asset Manager 30% | .65% | |
Actual | | $ 3.14 |
Hypothetical A | | $ 3.29 |
Institutional Class | .65% | |
Actual | | $ 3.14 |
Hypothetical A | | $ 3.29 |
Fidelity Asset Manager 40% | | |
Class A | .90% | |
Actual | | $ 4.32 |
Hypothetical A | | $ 4.55 |
Class T | 1.15% | |
Actual | | $ 5.52 |
Hypothetical A | | $ 5.81 |
Class B | 1.65% | |
Actual | | $ 7.90 |
Hypothetical A | | $ 8.32 |
Class C | 1.65% | |
Actual | | $ 7.91 |
Hypothetical A | | $ 8.32 |
Asset Manager 40% | .65% | |
Actual | | $ 3.12 |
Hypothetical A | | $ 3.29 |
Institutional Class | .65% | |
Actual | | $ 3.12 |
Hypothetical A | | $ 3.29 |
Fidelity Asset Manager 60% | | |
Class A | 1.10% | |
Actual | | $ 5.21 |
Hypothetical A | | $ 5.55 |
Class T | 1.35% | |
Actual | | $ 6.39 |
Hypothetical A | | $ 6.81 |
Class B | 1.85% | |
Actual | | $ 8.74 |
Hypothetical A | | $ 9.32 |
Class C | 1.85% | |
Actual | | $ 8.74 |
Hypothetical A | | $ 9.32 |
| Annualized
Expense Ratio | Expenses
Paid |
Asset Manager 60% | .85% | |
Actual | | $ 4.03 |
Hypothetical A | | $ 4.29 |
Institutional Class | .85% | |
Actual | | $ 4.03 |
Hypothetical A | | $ 4.29 |
A 5% return per year before expenses
Annual Report
Fidelity Asset Manager 20%
Investment Changes (Unaudited)
The information in the following tables is based on the combined investments of the Fund and its pro-rata share of the investments of Fidelity's Equity and Fixed-Income Central Funds.
Top Five Bond Issuers as of September 30, 2008 |
(with maturities greater than one year) | % of fund's
net assets | % of fund's net assets
6 months ago |
Fannie Mae | 17.8 | 16.4 |
Freddie Mac | 6.6 | 5.8 |
U.S. Treasury Obligations | 2.8 | 5.4 |
Government National Mortgage Association | 2.5 | 1.9 |
Wells Fargo Mortgage Backed Securities Trust | 0.8 | 0.6 |
| 30.5 | |
Quality Diversification (% of fund's net assets) |
As of September 30, 2008 | As of March 31, 2008 |
| U.S. Government and
U.S. Government
Agency Obligations 30.0% | | | U.S. Government and
U.S. Government
Agency Obligations 29.8% | |
| AAA,AA,A 14.1% | | | AAA,AA,A 12.9% | |
| BBB 10.2% | | | BBB 9.5% | |
| BB and Below 5.2% | | | BB and Below 4.6% | |
| Not Rated 0.7% | | | Not Rated 0.4% | |
| Equities 20.1% | | | Equities 20.2% | |
| Short-Term
Investments and
Net Other Assets 19.7% | | | Short-Term
Investments and
Net Other Assets 22.6% | |
We have used ratings from Moody's® Investors Services, Inc. Where Moody's ratings are not available, we have used S&P® ratings. All ratings are as of the report date and do not reflect subsequent downgrades. Percentages are adjusted for the effect of futures contracts, if applicable. |
Top Five Stocks as of September 30, 2008 |
| % of fund's
net assets | % of fund's net assets
6 months ago |
Apple, Inc. | 0.3 | 0.1 |
Procter & Gamble Co. | 0.3 | 0.3 |
General Electric Co. | 0.3 | 0.2 |
Bank of America Corp. | 0.2 | 0.2 |
JPMorgan Chase & Co. | 0.2 | 0.2 |
| 1.3 | |
Asset Allocation (% of fund's net assets) |
As of September 30, 2008 | As of March 31, 2008 |
| Stock class and
Equity Futures 19.8% | | | Stock class and
Equity Futures 20.1% | |
| Bond class 59.3% | | | Bond class 57.1% | |
| Short-term class 20.9% | | | Short-term class 22.8% | |
| | | | | |
| | | | | |
Asset allocations in the pie charts reflect the categorization of assets as defined in the Fund's prospectus in effect as of the time periods indicated above. Percentages are adjusted for the effect of futures contracts and swap contracts, if applicable. |
Annual Report
Fidelity Asset Manager 20%
Investment Summary (Unaudited)
The information in the following table is based on the direct investments of the Fund.
Fund Holdings as of September 30, 2008 |
| % of fund's
net assets |
Equity Central Funds | |
Fidelity Financials Central Fund | 2.9 |
Fidelity Information Technology Central Fund | 2.7 |
Fidelity Health Care Central Fund | 2.4 |
Fidelity Industrials Central Fund | 2.2 |
Fidelity Energy Central Fund | 2.0 |
Fidelity Consumer Discretionary Central Fund | 1.9 |
Fidelity Consumer Staples Central Fund | 1.9 |
Fidelity Materials Central Fund | 0.7 |
Fidelity Utilities Central Fund | 0.7 |
Fidelity Telecom Services Central Fund | 0.5 |
Total Equity Central Funds | 17.9 |
Fixed-Income Central Funds | |
Investment Grade Fixed-Income Funds | 47.3 |
High Yield Fixed-Income Funds | 4.8 |
Total Fixed-Income Central Funds | 52.1 |
Money Market Central Funds | 26.5 |
Other Short-Term Investments and Net Other Assets | 3.5 |
Total | 100.0 |
At period end, foreign investments including the Fund's pro-rata share of the underlying Central Funds was 8.3% of net assets.
A holdings listing for the Fund, which presents direct holdings as well as the pro-rata share of any securities and other investments held indirectly through its investment in underlying non-money market Fidelity Central Funds, is available at fidelity.com and/or advisor.fidelity.com, as applicable.
Annual Report
Fidelity Asset Manager 20%
Investments September 30, 2008
Showing Percentage of Net Assets
Equity Central Funds - 17.9% |
| Shares | | Value |
Fidelity Consumer Discretionary Central Fund (c) | 464,228 | | $ 42,899,299 |
Fidelity Consumer Staples Central Fund (c) | 376,453 | | 43,280,780 |
Fidelity Energy Central Fund (c) | 416,109 | | 45,971,670 |
Fidelity Financials Central Fund (c) | 1,017,804 | | 67,032,602 |
Fidelity Health Care Central Fund (c) | 542,393 | | 54,027,771 |
Fidelity Industrials Central Fund (c) | 478,739 | | 50,521,309 |
Fidelity Information Technology Central Fund (c) | 641,036 | | 62,956,141 |
Fidelity Materials Central Fund (c) | 139,413 | | 15,341,018 |
Fidelity Telecom Services Central Fund (c) | 141,217 | | 12,667,166 |
Fidelity Utilities Central Fund (c) | 165,501 | | 15,447,872 |
TOTAL EQUITY CENTRAL FUNDS (Cost $450,570,473) | 410,145,628 |
Fixed-Income Central Funds - 52.1% |
| | | |
Investment Grade Fixed-Income Funds - 47.3% |
Fidelity Tactical Income Central
Fund (c) | 12,051,566 | | 1,082,230,662 |
High Yield Fixed-Income Funds - 4.8% |
Fidelity Floating Rate Central Fund (c) | 798,060 | | 67,675,508 |
Fidelity High Income Central
Fund 1 (c) | 494,043 | | 42,245,646 |
TOTAL HIGH YIELD FIXED-INCOME FUNDS | 109,921,154 |
TOTAL FIXED-INCOME CENTRAL FUNDS (Cost $1,301,464,978) | 1,192,151,816 |
Money Market Central Funds - 26.5% |
| | | |
Fidelity Cash Central Fund, 1.92% (a) | 399,717,455 | | 399,717,455 |
Fidelity Money Market Central Fund, 3.13% (a) | 205,550,134 | | 205,550,134 |
TOTAL MONEY MARKET CENTRAL FUNDS (Cost $605,267,589) | 605,267,589 |
U.S. Treasury Obligations - 0.2% |
| Principal Amount | | |
U.S. Treasury Bills, yield at date of purchase 1.61% to 1.79% 10/2/08 to 12/4/08 (b)
(Cost $3,603,031) | | $ 3,610,000 | | 3,607,262 |
TOTAL INVESTMENT PORTFOLIO - 96.7% (Cost $2,360,906,071) | | 2,211,172,295 |
NET OTHER ASSETS - 3.3% | | 74,522,066 |
NET ASSETS - 100% | $ 2,285,694,361 |
Futures Contracts |
| Expiration Date | | Underlying Face Amount at Value | | Unrealized Appreciation/ (Depreciation) |
Purchased |
Equity Index Contracts |
944 CME E-mini S&P 500 Index Contracts | Dec. 2008 | | $ 55,101,280 | | $ (1,367,696) |
|
The face value of futures purchased as a percentage of net assets - 2.4% |
Legend |
(a) Affiliated fund that is available only to investment companies and other accounts managed by Fidelity Investments. The rate quoted is the annualized seven-day yield of the fund at period end. A complete unaudited listing of the fund's holdings as of its most recent quarter end is available upon request. |
(b) Security or a portion of the security was pledged to cover margin requirements for futures contracts. At the period end, the value of securities pledged amounted to $3,607,262. |
(c) Affiliated fund that is available only to investment companies and other accounts managed by Fidelity Investments. A complete unaudited schedule of portfolio holdings for each Fidelity Central Fund is filed with the SEC for the first and third quarters of each fiscal year on Form N-Q and is available upon request or at the SEC's web site at www.sec.gov. An unaudited holdings listing for the Fund, which presents direct holdings as well as the pro rata share of securities and other investments held indirectly through its investment in underlying non-money market Fidelity Central Funds, is available at fidelity.com and/or advisor.fidelity.com, as applicable. In addition, each Fidelity Central Fund's financial statements, which are not covered by the Fund's Report of Independent Registered Public Accounting Firm, are available on the SEC's web site or upon request. |
Affiliated Central Funds |
Information regarding fiscal year to date income earned by the Fund from investments in Fidelity Central Funds is as follows: |
Fund | Income earned |
Fidelity Cash Central Fund | $ 16,489,202 |
Fidelity Consumer Discretionary Central Fund | 681,483 |
Fidelity Consumer Staples Central Fund | 961,688 |
Fidelity Energy Central Fund | 464,208 |
Fidelity Financials Central Fund | 2,469,629 |
Fidelity Floating Rate Central Fund | 4,151,295 |
Fidelity Health Care Central Fund | 566,719 |
Fidelity High Income Central Fund 1 | 3,532,110 |
Fidelity Industrials Central Fund | 895,762 |
Fidelity Information Technology Central Fund | 561,743 |
Fidelity Materials Central Fund | 331,453 |
Fidelity Money Market Central Fund | 5,405,459 |
Fidelity Security Lending Cash Central Fund | 13 |
Fidelity Tactical Income Central Fund | 60,742,957 |
Fidelity Telecom Services Central Fund | 342,786 |
Fidelity Utilities Central Fund | 404,892 |
Total | $ 98,001,399 |
Additional information regarding the Fund's fiscal year to date purchases and sales, including the ownership percentage, of the non-money market Central Funds is as follows: |
Fund | Value, beginning
of period | Purchases | Sales
Proceeds | Value,
end of period | % ownership,
end of period |
Fidelity Consumer Discretionary Central Fund | $ 48,742,000 | $ 7,818,561 | $ 1,478,152 | $ 42,899,299 | 8.1% |
Fidelity Consumer Staples Central Fund | 39,907,000 | 7,691,211 | 286,155 | 43,280,780 | 8.1% |
Fidelity Energy Central Fund | 50,544,000 | 9,532,230 | 1,797,002 | 45,971,670 | 8.1% |
Fidelity Financials Central Fund | 90,663,000 | 16,765,459 | - | 67,032,602 | 8.1% |
Fidelity Floating Rate Central Fund | 61,332,000 | 15,486,712 | - | 67,675,508 | 2.7% |
Fidelity Health Care Central Fund | 54,673,000 | 9,947,575 | 192,237 | 54,027,771 | 8.1% |
Fidelity High Income Central Fund 1 | 39,618,000 | 9,341,883 | 726,589 | 42,245,646 | 16.9% |
Fidelity Industrials Central Fund | 55,944,000 | 9,669,584 | 2,005,862 | 50,521,309 | 8.1% |
Fidelity Information Technology Central Fund | 78,426,000 | 14,851,589 | - | 62,956,141 | 8.1% |
Fidelity Materials Central Fund | 17,546,000 | 3,171,895 | 473,885 | 15,341,018 | 8.1% |
Fidelity Tactical Income Central Fund | 1,187,781,000 | 60,742,956 | 76,710,124 | 1,082,230,662 | 26.8% |
Fidelity Telecom Services Central Fund | 16,929,000 | 3,460,426 | - | 12,667,166 | 8.1% |
Fidelity Utilities Central Fund | 17,006,000 | 3,319,929 | - | 15,447,872 | 8.1% |
Total | $ 1,759,111,000 | $ 171,800,010 | $ 83,670,006 | $ 1,602,297,444 | |
Income Tax Information |
The fund intends to elect to defer to its fiscal year ending September 30, 2009 approximately $69,973,438 of losses recognized during the period November 1, 2007 to September 30, 2008. |
See accompanying notes which are an integral part of the financial statements.
Annual Report
Fidelity Asset Manager 20%
Financial Statements
Statement of Assets and Liabilities
| September 30, 2008 |
| | |
Assets | | |
Investment in securities, at value - See accompanying schedule: Unaffiliated issuers (cost $3,603,031) | $ 3,607,262 | |
Fidelity Central Funds (cost $2,357,303,040) | 2,207,565,033 | |
Total Investments (cost $2,360,906,071) | | $ 2,211,172,295 |
Receivable for investments sold | | 76,710,123 |
Receivable for fund shares sold | | 4,879,263 |
Distributions receivable from Fidelity Central Funds | | 6,910,881 |
Receivable for daily variation on futures contracts | | 2,293,919 |
Prepaid expenses | | 1,431 |
Receivable from investment adviser for expense reductions | | 77 |
Other receivables | | 2,375 |
Total assets | | 2,301,970,364 |
| | |
Liabilities | | |
Payable for investments purchased | $ 5,578,298 | |
Payable for fund shares redeemed | 9,541,418 | |
Accrued management fee | 828,549 | |
Distribution fees payable | 8,389 | |
Other affiliated payables | 275,278 | |
Other payables and accrued expenses | 44,071 | |
Total liabilities | | 16,276,003 |
| | |
Net Assets | | $ 2,285,694,361 |
Net Assets consist of: | | |
Paid in capital | | $ 2,498,607,571 |
Undistributed net investment income | | 11,795,814 |
Accumulated undistributed net realized gain (loss) on investments | | (73,607,552) |
Net unrealized appreciation (depreciation) on investments | | (151,101,472) |
Net Assets | | $ 2,285,694,361 |
| | |
Calculation of Maximum Offering Price Class A:
Net Asset Value and redemption price per share ($8,030,406 ÷ 707,729 shares) | | $ 11.35 |
| | |
Maximum offering price per share (100/94.25 of $11.35) | | $ 12.04 |
Class T:
Net Asset Value and redemption price per share ($4,914,664 ÷ 433,806 shares) | | $ 11.33 |
| | |
Maximum offering price per share (100/96.50 of $11.33) | | $ 11.74 |
Class B:
Net Asset Value and offering price per share ($1,974,774 ÷ 174,523 shares)A | | $ 11.32 |
| | |
Class C:
Net Asset Value and offering price per share ($3,668,173 ÷ 324,415 shares)A | | $ 11.31 |
| | |
| | |
Asset Manager 20%:
Net Asset Value, offering price and redemption price per share ($2,265,384,037 ÷ 199,443,138 shares) | | $ 11.36 |
| | |
Institutional Class:
Net Asset Value, offering price and redemption price per share ($1,722,307 ÷ 151,681 shares) | | $ 11.35 |
A Redemption price per share is equal to net asset value less any applicable contingent deferred sales charge.
See accompanying notes which are an integral part of the financial statements.
Annual Report
Fidelity Asset Manager 20%
Financial Statements - continued
Statement of Operations
| Year ended September 30, 2008 |
| | |
Investment Income | | |
Interest | | $ 2,582,587 |
Income from Fidelity Central Funds | | 98,001,399 |
Total income | | 100,583,986 |
| | |
Expenses | | |
Management fee | $ 10,330,950 | |
Transfer agent fees | 2,571,229 | |
Distribution fees | 82,764 | |
Accounting fees and expenses | 806,153 | |
Custodian fees and expenses | 5,241 | |
Independent trustees' compensation | 10,162 | |
Registration fees | 132,869 | |
Audit | 66,001 | |
Legal | 19,452 | |
Miscellaneous | 35,554 | |
Total expenses before reductions | 14,060,375 | |
Expense reductions | (61,790) | 13,998,585 |
Net investment income (loss) | | 86,585,401 |
Realized and Unrealized Gain (Loss) Net realized gain (loss) on: | | |
Investment securities: | | |
Unaffiliated issuers | 328,965 | |
Fidelity Central Funds | (6,407,818) | |
Futures contracts | (11,991,143) | |
Total net realized gain (loss) | | (18,069,996) |
Change in net unrealized appreciation (depreciation) on: Investment securities | (238,533,322) | |
Futures contracts | (2,742,149) | |
Total change in net unrealized appreciation (depreciation) | | (241,275,471) |
Net gain (loss) | | (259,345,467) |
Net increase (decrease) in net assets resulting from operations | | $ (172,760,066) |
Statement of Changes in Net Assets
| Year ended
September 30, 2008 | Year ended
September 30, 2007 |
Increase (Decrease) in Net Assets | | |
Operations | | |
Net investment income (loss) | $ 86,585,401 | $ 96,617,040 |
Net realized gain (loss) | (18,069,996) | 9,978,060 |
Change in net unrealized appreciation (depreciation) | (241,275,471) | 54,096,502 |
Net increase (decrease) in net assets resulting from operations | (172,760,066) | 160,691,602 |
Distributions to shareholders from net investment income | (91,104,113) | (97,255,232) |
Distributions to shareholders from net realized gain | (49,576,396) | (97,648,324) |
Total distributions | (140,680,509) | (194,903,556) |
Share transactions - net increase (decrease) | 79,342,713 | 423,253,884 |
Total increase (decrease) in net assets | (234,097,862) | 389,041,930 |
| | |
Net Assets | | |
Beginning of period | 2,519,792,223 | 2,130,750,293 |
End of period (including undistributed net investment income of $11,795,814 and undistributed net investment income of $12,670,043, respectively) | $ 2,285,694,361 | $ 2,519,792,223 |
See accompanying notes which are an integral part of the financial statements.
Annual Report
Financial Highlights - Class A
Years ended September 30, | 2008 | 2007 G |
Selected Per-Share Data | | |
Net asset value, beginning of period | $ 12.90 | $ 13.13 |
Income from Investment Operations | | |
Net investment income (loss) E | .39 | .48 |
Net realized and unrealized gain (loss) | (1.27) | .40 |
Total from investment operations | (.88) | .88 |
Distributions from net investment income | (.42) | (.52) |
Distributions from net realized gain | (.25) | (.59) |
Total distributions | (.67) | (1.11) |
Net asset value, end of period | $ 11.35 | $ 12.90 |
Total Return B, C, D | (7.18)% | 7.03% |
Ratios to Average Net Assets H | | |
Expenses before reductions | .86% | .87% A |
Expenses net of fee waivers, if any | .86% | .87% A |
Expenses net of all reductions | .86% | .87% A |
Net investment income (loss) | 3.18% | 3.84% A |
Supplemental Data | | |
Net assets, end of period (000 omitted) | $ 8,030 | $ 3,422 |
Portfolio turnover rate F | 5% | 6% |
A Annualized
B Total returns for periods of less than one year are not annualized.
C Total returns would have been lower had certain expenses not been reduced during the periods shown.
D Total returns do not include the effect of the sales charges.
E Calculated based on average shares outstanding during the period.
F Amount does not include the portfolio activity of any underlying Fidelity Central Funds.
G For the period October 2, 2006 (commencement of sale of shares) to September 30, 2007.
H Expense ratios reflect operating expenses of the class. Expenses before reductions do not reflect amounts reimbursed by the investment adviser or reductions from brokerage service arrangements or other expense offset arrangements and do not represent the amount paid by the class during periods when reimbursements or reductions occur. Expense ratios before reductions for start-up periods may not be representative of longer-term operating periods. Expenses net of fee waivers reflect expenses after reimbursement by the investment adviser but prior to reductions from brokerage service arrangements or other expense offset arrangements. Expenses net of all reductions represent the net expenses paid by the class. Fees and expenses of the underlying Fidelity Central Funds are not included in the Fund's expense ratio. The Fund indirectly bears its proportionate share of the expenses of any underlying Fidelity Central Funds. Based on their most recent shareholder report date, the expenses ranged from less than .01% to .03%.
Financial Highlights - Class T
Years ended September 30, | 2008 | 2007 G |
Selected Per-Share Data | | |
Net asset value, beginning of period | $ 12.88 | $ 13.13 |
Income from Investment Operations | | |
Net investment income (loss) E | .36 | .45 |
Net realized and unrealized gain (loss) | (1.28) | .40 |
Total from investment operations | (.92) | .85 |
Distributions from net investment income | (.38) | (.51) |
Distributions from net realized gain | (.25) | (.59) |
Total distributions | (.63) | (1.10) |
Net asset value, end of period | $ 11.33 | $ 12.88 |
Total Return B, C, D | (7.43)% | 6.75% |
Ratios to Average Net Assets H | | |
Expenses before reductions | 1.12% | 1.11% A |
Expenses net of fee waivers, if any | 1.12% | 1.11% A |
Expenses net of all reductions | 1.12% | 1.11% A |
Net investment income (loss) | 2.93% | 3.60% A |
Supplemental Data | | |
Net assets, end of period (000 omitted) | $ 4,915 | $ 3,954 |
Portfolio turnover rate F | 5% | 6% |
A Annualized
B Total returns for periods of less than one year are not annualized.
C Total returns would have been lower had certain expenses not been reduced during the periods shown.
D Total returns do not include the effect of the sales charges.
E Calculated based on average shares outstanding during the period.
F Amount does not include the portfolio activity of any underlying Fidelity Central Funds.
G For the period October 2, 2006 (commencement of sale of shares) to September 30, 2007.
H Expense ratios reflect operating expenses of the class. Expenses before reductions do not reflect amounts reimbursed by the investment adviser or reductions from brokerage service arrangements or other expense offset arrangements and do not represent the amount paid by the class during periods when reimbursements or reductions occur. Expense ratios before reductions for start-up periods may not be representative of longer-term operating periods. Expenses net of fee waivers reflect expenses after reimbursement by the investment adviser but prior to reductions from brokerage service arrangements or other expense offset arrangements. Expenses net of all reductions represent the net expenses paid by the class. Fees and expenses of the underlying Fidelity Central Funds are not included in the Fund's expense ratio. The Fund indirectly bears its proportionate share of the expenses of any underlying Fidelity Central Funds. Based on their most recent shareholder report date, the expenses ranged from less than .01% to .03%.
See accompanying notes which are an integral part of the financial statements.
Annual Report
Financial Highlights - Class B
Years ended September 30, | 2008 | 2007 G |
Selected Per-Share Data | | |
Net asset value, beginning of period | $ 12.87 | $ 13.13 |
Income from Investment Operations | | |
Net investment income (loss) E | .29 | .39 |
Net realized and unrealized gain (loss) | (1.27) | .38 |
Total from investment operations | (.98) | .77 |
Distributions from net investment income | (.32) | (.44) |
Distributions from net realized gain | (.25) | (.59) |
Total distributions | (.57) | (1.03) |
Net asset value, end of period | $ 11.32 | $ 12.87 |
Total Return B, C, D | (7.89)% | 6.13% |
Ratios to Average Net Assets H | | |
Expenses before reductions | 1.67% | 1.65% A |
Expenses net of fee waivers, if any | 1.66% | 1.65% A |
Expenses net of all reductions | 1.66% | 1.65% A |
Net investment income (loss) | 2.38% | 3.06% A |
Supplemental Data | | |
Net assets, end of period (000 omitted) | $ 1,975 | $ 991 |
Portfolio turnover rate F | 5% | 6% |
A Annualized
B Total returns for periods of less than one year are not annualized.
C Total returns would have been lower had certain expenses not been reduced during the periods shown.
D Total returns do not include the effect of the contingent deferred sales charge.
E Calculated based on average shares outstanding during the period.
F Amount does not include the portfolio activity of any underlying Fidelity Central Funds.
G For the period October 2, 2006 (commencement of sale of shares) to September 30, 2007.
H Expense ratios reflect operating expenses of the class. Expenses before reductions do not reflect amounts reimbursed by the investment adviser or reductions from brokerage service arrangements or other expense offset arrangements and do not represent the amount paid by the class during periods when reimbursements or reductions occur. Expense ratios before reductions for start-up periods may not be representative of longer-term operating periods. Expenses net of fee waivers reflect expenses after reimbursement by the investment adviser but prior to reductions from brokerage service arrangements or other expense offset arrangements. Expenses net of all reductions represent the net expenses paid by the class. Fees and expenses of the underlying Fidelity Central Funds are not included in the Fund's expense ratio. The Fund indirectly bears its proportionate share of the expenses of any underlying Fidelity Central Funds. Based on their most recent shareholder report date, the expenses ranged from less than .01 to .03%.
Financial Highlights - Class C
Years ended September 30, | 2008 | 2007 G |
Selected Per-Share Data | | |
Net asset value, beginning of period | $ 12.86 | $ 13.13 |
Income from Investment Operations | | |
Net investment income (loss) E | .29 | .39 |
Net realized and unrealized gain (loss) | (1.26) | .38 |
Total from investment operations | (.97) | .77 |
Distributions from net investment income | (.33) | (.45) |
Distributions from net realized gain | (.25) | (.59) |
Total distributions | (.58) | (1.04) |
Net asset value, end of period | $ 11.31 | $ 12.86 |
Total Return B, C, D | (7.87)% | 6.15% |
Ratios to Average Net Assets H | | |
Expenses before reductions | 1.65% | 1.64%A |
Expenses net of fee waivers, if any | 1.65% | 1.64%A |
Expenses net of all reductions | 1.64% | 1.64%A |
Net investment income (loss) | 2.40% | 3.07%A |
Supplemental Data | | |
Net assets, end of period (000 omitted) | $ 3,668 | $ 1,697 |
Portfolio turnover rate F | 5% | 6% |
A Annualized
B Total returns for periods of less than one year are not annualized.
C Total returns would have been lower had certain expenses not been reduced during the periods shown.
D Total returns do not include the effect of the contingent deferred sales charge.
E Calculated based on average shares outstanding during the period.
F Amount does not include the portfolio activity of any underlying Fidelity Central Funds.
G For the period October 2, 2006 (commencement of sale of shares) to September 30, 2007.
H Expense ratios reflect operating expenses of the class. Expenses before reductions do not reflect amounts reimbursed by the investment adviser or reductions from brokerage service arrangements or other expense offset arrangements and do not represent the amount paid by the class during periods when reimbursements or reductions occur. Expense ratios before reductions for start-up periods may not be representative of longer-term operating periods. Expenses net of fee waivers reflect expenses after reimbursement by the investment adviser but prior to reductions from brokerage service arrangements or other expense offset arrangements. Expenses net of all reductions represent the net expenses paid by the class. Fees and expenses of the underlying Fidelity Central Funds are not included in the Fund's expense ratio. The Fund indirectly bears its proportionate share of the expenses of any underlying Fidelity Central Funds. Based on their most recent shareholder report date, the expenses ranged from less than .01% to .03%.
See accompanying notes which are an integral part of the financial statements.
Annual Report
Financial Highlights - Asset Manager 20%
Years ended September 30, | 2008 | 2007 | 2006 | 2005 | 2004 |
Selected Per-Share Data | | | | | |
Net asset value, beginning of period | $ 12.91 | $ 13.14 | $ 13.00 | $ 12.25 | $ 11.80 |
Income from Investment Operations | | | | | |
Net investment income (loss) B | .43 | .53 | .46 | .33 | .23 |
Net realized and unrealized gain (loss) | (1.28) | .38 | .39 | .74 | .45 |
Total from investment operations | (.85) | .91 | .85 | 1.07 | .68 |
Distributions from net investment income | (.45) | (.55) | (.43) | (.32) | (.23) |
Distributions from net realized gain | (.25) | (.59) | (.28) | - | - |
Total distributions | (.70) | (1.14) | (.71) | (.32) | (.23) |
Net asset value, end of period | $ 11.36 | $ 12.91 | $ 13.14 | $ 13.00 | $ 12.25 |
Total Return A | (6.90)% | 7.26% | 6.77% | 8.85% | 5.80% |
Ratios to Average Net Assets D | | | | | |
Expenses before reductions | .56% | .57% | .58% | .60% | .63% |
Expenses net of fee waivers, if any | .56% | .57% | .58% | .60% | .63% |
Expenses net of all reductions | .56% | .57% | .57% | .58% | .61% |
Net investment income (loss) | 3.48% | 4.15% | 3.58% | 2.64% | 1.86% |
Supplemental Data | | | | | |
Net assets, end of period (000 omitted) | $ 2,265,384 | $ 2,509,481 | $ 2,130,750 | $ 1,724,038 | $ 1,395,000 |
Portfolio turnover rate C | 5% | 6% | 81% E | 81% E | 232% |
A Total returns would have been lower had certain expenses not been reduced during the periods shown.
B Calculated based on average shares outstanding during the period.
C Amount does not include the portfolio activity of any underlying Fidelity Central Funds.
D Expense ratios reflect operating expenses of the class. Expenses before reductions do not reflect amounts reimbursed by the investment adviser or reductions from brokerage service arrangements or other expense offset arrangements and do not represent the amount paid by the class during periods when reimbursements or reductions occur. Expenses net of fee waivers reflect expenses after reimbursement by the investment adviser but prior to reductions from brokerage service arrangements or other expense offset arrangements. Expenses net of all reductions represent the net expenses paid by the class. Fees and expenses of the underlying Fidelity Central Funds are not included in the Fund's expense ratio. The Fund indirectly bears its proportionate share of the expenses of any underlying Fidelity Central Funds. Based on their most recent shareholder report date, the expenses ranged from less than .01% to .03%.
E Portfolio turnover rate excludes securities received or delivered in-kind.
Financial Highlights - Institutional Class
Years ended September 30, | 2008 | 2007 F |
Selected Per-Share Data | | |
Net asset value, beginning of period | $ 12.90 | $ 13.13 |
Income from Investment Operations | | |
Net investment income (loss) D | .42 | .53 |
Net realized and unrealized gain (loss) | (1.27) | .38 |
Total from investment operations | (.85) | .91 |
Distributions from net investment income | (.45) | (.55) |
Distributions from net realized gain | (.25) | (.59) |
Total distributions | (.70) | (1.14) |
Net asset value, end of period | $ 11.35 | $ 12.90 |
Total Return B, C | (6.91)% | 7.24% |
Ratios to Average Net Assets | | |
Expenses before reductions | .57% | .59% A |
Expenses net of fee waivers, if any | .57% | .59% A |
Expenses net of all reductions | .56% | .59% A |
Net investment income (loss) | 3.48% | 4.13% A |
Supplemental Data | | |
Net assets, end of period (000 omitted) | $ 1,722 | $ 248 |
Portfolio turnover rate E | 5% | 6% |
A Annualized
B Total returns for periods of less than one year are not annualized.
C Total returns would have been lower had certain expenses not been reduced during the periods shown.
D Calculated based on average shares outstanding during the period.
E Amount does not include the portfolio activity of any underlying Fidelity Central Funds.
F For the period October 2, 2006 (commencement of sale of shares) to September 30, 2007.
G Expense ratios reflect operating expenses of the class. Expenses before reductions do not reflect amounts reimbursed by the investment adviser or reductions from brokerage service arrangements or other expense offset arrangements and do not represent the amount paid by the class during periods when reimbursements or reductions occur. Expense ratios before reductions for start-up periods may not be representative of longer-term operating periods. Expenses net of fee waivers reflect expenses after reimbursement by the investment adviser but prior to reductions from brokerage service arrangements or other expense offset arrangements. Expenses net of all reductions represent the net expenses paid by the class. Fees and expenses of the underlying Fidelity Central Funds are not included in the Fund's expense ratio. The Fund indirectly bears its proportionate share of the expenses of any underlying Fidelity Central Funds. Based on their most recent shareholder report date, the expenses ranged from less than .01% to .03%.
See accompanying notes which are an integral part of the financial statements.
Annual Report
Fidelity Asset Manager 30%
Investment Changes (Unaudited)
The information in the following tables is based on the combined investments of the Fund and its pro-rata share of the investments of Fidelity's Equity and Fixed-Income Central Funds.
Top Five Bond Issuers as of September 30, 2008 |
(with maturities greater than one year) | % of fund's
net assets | % of fund's net assets
6 months ago |
Fannie Mae | 16.5 | 15.4 |
Freddie Mac | 6.3 | 5.4 |
U.S. Treasury Obligations | 2.7 | 5.0 |
Government National Mortgage Association | 2.4 | 1.8 |
Wells Fargo Mortgage Backed Securities Trust | 0.4 | 0.5 |
| 28.3 | |
Quality Diversification (% of fund's net assets) |
As of September 30, 2008 | As of March 31, 2008 |
| U.S. Government and
U.S. Government
Agency Obligations 29.0% | | | U.S. Government and
U.S. Government
Agency Obligations 27.8% | |
| AAA,AA,A 13.6% | | | AAA,AA,A 12.0% | |
| BBB 9.7% | | | BBB 8.6% | |
| BB and Below 5.9% | | | BB and Below 4.6% | |
| Not Rated 0.7% | | | Not Rated 0.4% | |
| Equities 30.8% | | | Equities 30.2% | |
| Short-Term
Investments and
Net Other Assets 10.3% | | | Short-Term
Investments and
Net Other Assets 16.4% | |
We have used ratings from Moody's® Investors Services, Inc. Where Moody's ratings are not available, we have used S&P® ratings. All ratings are as of the report date and do not reflect subsequent downgrades. Percentages are adjusted for the effect of futures contracts, if applicable. |
Top Five Stocks as of September 30, 2008 |
| % of fund's
net assets | % of fund's net assets
6 months ago |
Apple, Inc. | 0.5 | 0.1 |
Procter & Gamble Co. | 0.5 | 0.5 |
General Electric Co. | 0.4 | 0.3 |
Bank of America Corp. | 0.4 | 0.2 |
JPMorgan Chase & Co. | 0.4 | 0.3 |
| 2.2 | |
Asset Allocation (% of fund's net assets) |
As of September 30, 2008 | As of March 31, 2008 |
| Stock class and
Equity Futures 31.0% | | | Stock class and
Equity Futures 30.2% | |
| Bond class 65.4% | | | Bond class 53.6% | |
| Short-term class 3.6% | | | Short-term class 16.2% | |
| | | | | |
| | | | | |
Asset allocations in the pie charts reflect the categorization of assets as defined in the Fund's prospectus in effect as of the time periods indicated above. Percentages are adjusted for the effect of futures contracts and swap contracts, if applicable. |
Annual Report
Fidelity Asset Manager 30%
Investment Summary (Unaudited)
The information in the following table is based on the direct investments of the Fund.
Fund Holdings as of September 30, 2008 |
| % of fund's
net assets |
Equity Central Funds | |
Fidelity Financials Central Fund | 5.0 |
Fidelity Information Technology Central Fund | 4.7 |
Fidelity Health Care Central Fund | 4.0 |
Fidelity Industrials Central Fund | 3.7 |
Fidelity Energy Central Fund | 3.4 |
Fidelity Consumer Discretionary Central Fund | 3.2 |
Fidelity Consumer Staples Central Fund | 3.2 |
Fidelity Materials Central Fund | 1.1 |
Fidelity Utilities Central Fund | 1.1 |
Fidelity Telecom Services Central Fund | 0.9 |
Total Equity Central Funds | 30.3 |
Fixed-Income Central Funds | |
Investment Grade Fixed-Income Funds | 45.6 |
High Yield Fixed-Income Funds | 5.4 |
Total Fixed-Income Central Funds | 51.0 |
Money Market Central Funds | 7.8 |
Other Short-Term Investments and Net Other Assets | 10.9 |
Total | 100.0 |
At period end, foreign investments including the Fund's pro-rata share of the underlying Central Funds was 10.2% of net assets.
A holdings listing for the Fund, which presents direct holdings as well as the pro-rata share of any securities and other investments held indirectly through its investment in underlying non-money market Fidelity Central Funds, is available at fidelity.com and/or advisor.fidelity.com, as applicable.
Annual Report
Fidelity Asset Manager 30%
Investments September 30, 2008
Showing Percentage of Net Assets
Equity Central Funds - 30.3% |
| Shares | | Value |
Fidelity Consumer Discretionary Central Fund (c) | 10,443 | | $ 965,072 |
Fidelity Consumer Staples Central Fund (c) | 8,468 | | 973,588 |
Fidelity Energy Central Fund (c) | 9,360 | | 1,034,093 |
Fidelity Financials Central Fund (c) | 22,895 | | 1,507,852 |
Fidelity Health Care Central Fund (c) | 12,201 | | 1,215,308 |
Fidelity Industrials Central Fund (c) | 10,769 | | 1,136,447 |
Fidelity Information Technology Central Fund (c) | 14,420 | | 1,416,220 |
Fidelity Materials Central Fund (c) | 3,137 | | 345,142 |
Fidelity Telecom Services Central Fund (c) | 3,177 | | 285,000 |
Fidelity Utilities Central Fund (c) | 3,723 | | 347,516 |
TOTAL EQUITY CENTRAL FUNDS (Cost $11,149,154) | 9,226,238 |
Fixed-Income Central Funds - 51.0% |
| | | |
Investment Grade Fixed-Income Funds - 45.6% |
Fidelity Tactical Income Central Fund (c) | 154,524 | | 13,876,261 |
High Yield Fixed-Income Funds - 5.4% |
Fidelity Floating Rate Central Fund (c) | 11,954 | | 1,013,697 |
Fidelity High Income Central Fund 1 (c) | 7,456 | | 637,595 |
TOTAL HIGH YIELD FIXED-INCOME FUNDS | 1,651,292 |
TOTAL FIXED-INCOME CENTRAL FUNDS (Cost $16,612,497) | 15,527,553 |
Money Market Central Funds - 7.8% |
| | | |
Fidelity Cash Central Fund, 1.92% (a)
(Cost $2,358,372) | 2,358,372 | | 2,358,372 |
U.S. Treasury Obligations - 0.3% |
| Principal Amount | | |
U.S. Treasury Bills, yield at date of purchase 1.59% to 1.68% 10/16/08 to 12/4/08 (b)
(Cost $99,813) | | $ 100,000 | | 99,912 |
TOTAL INVESTMENT PORTFOLIO - 89.4% (Cost $30,219,836) | | 27,212,075 |
NET OTHER ASSETS - 10.6% | | 3,220,883 |
NET ASSETS - 100% | $ 30,432,958 |
Futures Contracts |
| Expiration Date | | Underlying Face Amount at Value | | Unrealized Appreciation/
(Depreciation) |
Purchased |
Equity Index Contracts |
7 CME E-mini S&P 500 Index Contracts | Dec. 2008 | | $ 408,590 | | $ (10,142) |
|
The face value of futures purchased as a percentage of net assets - 1.3% |
Legend |
(a) Affiliated fund that is available only to investment companies and other accounts managed by Fidelity Investments. The rate quoted is the annualized seven-day yield of the fund at period end. A complete unaudited listing of the fund's holdings as of its most recent quarter end is available upon request. |
(b) Security or a portion of the security was pledged to cover margin requirements for futures contracts. At the period end, the value of securities pledged amounted to $99,912. |
(c) Affiliated fund that is available only to investment companies and other accounts managed by Fidelity Investments. A complete unaudited schedule of portfolio holdings for each Fidelity Central Fund is filed with the SEC for the first and third quarters of each fiscal year on Form N-Q and is available upon request or at the SEC's web site at www.sec.gov. An unaudited holdings listing for the Fund, which presents direct holdings as well as the pro rata share of securities and other investments held indirectly through its investment in underlying non-money market Fidelity Central Funds, is available at fidelity.com and/or advisor.fidelity.com, as applicable. In addition, each Fidelity Central Fund's financial statements, which are not covered by the Fund's Report of Independent Registered Public Accounting Firm, are available on the SEC's web site or upon request. |
Affiliated Central Funds |
Information regarding fiscal year to date income earned by the Fund from investments in Fidelity Central Funds is as follows: |
Fund | Income earned |
Fidelity Cash Central Fund | $ 126,630 |
Fidelity Consumer Discretionary Central Fund | 11,313 |
Fidelity Consumer Staples Central Fund | 17,493 |
Fidelity Energy Central Fund | 7,904 |
Fidelity Financials Central Fund | 41,255 |
Fidelity Floating Rate Central Fund | 31,738 |
Fidelity Health Care Central Fund | 9,870 |
Fidelity High Income Central Fund 1 | 41,594 |
Fidelity Industrials Central Fund | 15,847 |
Fidelity Information Technology Central Fund | 10,350 |
Fidelity Materials Central Fund | 5,127 |
Fidelity Tactical Income Central Fund | 543,253 |
Fidelity Telecom Services Central Fund | 5,543 |
Fidelity Utilities Central Fund | 6,603 |
Total | $ 874,520 |
Additional information regarding the Fund's fiscal year to date purchases and sales, including the ownership percentage, of the non-money market Central Funds is as follows: |
Fund | Value, beginning of period | Purchases | Sales
Proceeds | Value,
end of period | % ownership, end of period |
Fidelity Consumer Discretionary Central Fund | $ - | $ 1,300,434 | $ 212,724 | $ 965,072 | 0.2% |
Fidelity Consumer Staples Central Fund | - | 1,226,622 | 182,341 | 973,588 | 0.2% |
Fidelity Energy Central Fund | - | 1,569,570 | 231,401 | 1,034,093 | 0.2% |
Fidelity Financials Central Fund | - | 2,321,162 | 273,823 | 1,507,852 | 0.2% |
Fidelity Floating Rate Central Fund | - | 1,106,392 | - | 1,013,697 | 0.0% |
Fidelity Health Care Central Fund | - | 1,629,474 | 227,457 | 1,215,308 | 0.2% |
Fidelity High Income Central Fund 1 | - | 791,216 | 84,098 | 637,595 | 0.3% |
Fidelity Industrials Central Fund | - | 1,570,303 | 258,828 | 1,136,447 | 0.2% |
Fidelity Information Technology Central Fund | - | 2,100,972 | 275,186 | 1,416,220 | 0.2% |
Fidelity Materials Central Fund | - | 512,585 | 78,086 | 345,142 | 0.2% |
Fidelity Tactical Income Central Fund | - | 18,003,783 | 2,950,377 | 13,876,261 | 0.3% |
Fidelity Telecom Services Central Fund | - | 434,178 | 54,899 | 285,000 | 0.2% |
Fidelity Utilities Central Fund | - | 524,152 | 66,721 | 347,516 | 0.2% |
Total | $ - | $ 33,090,843 | $ 4,895,941 | $ 24,753,791 | |
Other Information (Unaudited) |
The information in the following table is based on the combined investment of the Fund and its pro-rata share of the investments of Fidelity's Equity and Fixed-Income Central Funds. |
Distribution of investments by country of issue, as a percentage of total net assets, is as follows. Percentages are adjusted for the effect of future contracts, if applicable. |
United States of America | 89.8% |
United Kingdom | 1.9% |
Bermuda | 1.4% |
Canada | 1.4% |
Others (individually less than 1%) | 5.5% |
| 100.0% |
Income Tax Information |
At September 30, 2008, the fund had a capital loss carryforward of approximately $10,213 all of which will expire on September 30, 2016. |
The fund intends to elect to defer to its fiscal year ending September 30, 2009 approximately $1,196,733 of losses recognized during the period November 1, 2007 to September 30, 2008. |
See accompanying notes which are an integral part of the financial statements.
Annual Report
Fidelity Asset Manager 30%
Financial Statements
Statement of Assets and Liabilities
| September 30, 2008 |
| | |
Assets | | |
Investment in securities, at value - See accompanying schedule: Unaffiliated issuers (cost $99,813) | $ 99,912 | |
Fidelity Central Funds (cost $30,120,023) | 27,112,163 | |
Total Investments (cost $30,219,836) | | $ 27,212,075 |
Receivable for investments sold | | 2,950,379 |
Receivable for fund shares sold | | 305,106 |
Distributions receivable from Fidelity Central Funds | | 92,916 |
Receivable for daily variation on futures contracts | | 17,010 |
Prepaid expenses | | 1 |
Receivable from investment adviser for expense reductions | | 46,977 |
Total assets | | 30,624,464 |
| | |
Liabilities | | |
Payable for investments purchased | $ 81,331 | |
Payable for fund shares redeemed | 61,048 | |
Accrued management fee | 12,234 | |
Distribution fees payable | 2,159 | |
Other affiliated payables | 4,732 | |
Other payables and accrued expenses | 30,002 | |
Total liabilities | | 191,506 |
| | |
Net Assets | | $ 30,432,958 |
Net Assets consist of: | | |
Paid in capital | | $ 33,932,858 |
Undistributed net investment income | | 143,916 |
Accumulated undistributed net realized gain (loss) on investments | | (625,913) |
Net unrealized appreciation (depreciation) on investments | | (3,017,903) |
Net Assets | | $ 30,432,958 |
| | |
Calculation of Maximum Offering Price Class A:
Net Asset Value and redemption price per share ($1,158,843 ÷ 133,868 shares) | | $ 8.66 |
| | |
Maximum offering price per share (100/94.25 of $8.66) | | $ 9.19 |
Class T:
Net Asset Value and redemption price per share ($1,073,595 ÷ 124,068 shares) | | $ 8.65 |
| | |
Maximum offering price per share (100/96.50 of $8.65) | | $ 8.96 |
Class B:
Net Asset Value and offering price per share ($480,437 ÷ 55,549 shares)A | | $ 8.65 |
| | |
Class C:
Net Asset Value and offering price per share ($1,495,201 ÷ 173,104 shares)A | | $ 8.64 |
| | |
| | |
Asset Manager 30%:
Net Asset Value, offering price and redemption price per share ($26,015,730 ÷ 3,003,894 shares) | | $ 8.66 |
| | |
Instutional Class:
Net Asset Value, offering price and redemption price per share ($209,152 ÷ 24,150 shares) | | $ 8.66 |
A Redemption price per share is equal to net asset value less any applicable contingent deferred sales charge.
See accompanying notes which are an integral part of the financial statements.
Annual Report
Fidelity Asset Manager 30%
Financial Statements - continued
Statement of Operations
For the period October 9, 2007 (commencement of operations) to September 30, 2008 |
| | |
Investment Income | | |
Interest | | $ 15,347 |
Income from Fidelity Central Funds | | 874,520 |
Total income | | 889,867 |
| | |
Expenses | | |
Management fee | $ 102,657 | |
Transfer agent fees | 28,798 | |
Distribution fees | 13,809 | |
Accounting fees and expenses | 10,257 | |
Custodian fees and expenses | 4,989 | |
Independent trustees' compensation | 88 | |
Registration fees | 125,968 | |
Audit | 36,904 | |
Legal | 49 | |
Miscellaneous | 2,038 | |
Total expenses before reductions | 325,557 | |
Expense reductions | (133,170) | 192,387 |
Net investment income (loss) | | 697,480 |
Realized and Unrealized Gain (Loss) Net realized gain (loss) on: | | |
Investment securities: | | |
Fidelity Central Funds | (433,159) | |
Futures contracts | (151,102) | |
Total net realized gain (loss) | | (584,261) |
Change in net unrealized appreciation (depreciation) on: Investment securities | (3,007,761) | |
Futures contracts | (10,142) | |
Total change in net unrealized appreciation (depreciation) | | (3,017,903) |
Net gain (loss) | | (3,602,164) |
Net increase (decrease) in net assets resulting from operations | | $ (2,904,684) |
Statement of Changes in Net Assets
| For the period
October 9, 2007 (commencement of operations) to September 30, 2008 |
Increase (Decrease) in Net Assets | |
Operations | |
Net investment income (loss) | $ 697,480 |
Net realized gain (loss) | (584,261) |
Change in net unrealized appreciation (depreciation) | (3,017,903) |
Net increase (decrease) in net assets resulting from operations | (2,904,684) |
Distributions to shareholders from net investment income | (595,233) |
Share transactions - net increase (decrease) | 33,932,875 |
Total increase (decrease) in net assets | 30,432,958 |
| |
Net Assets | |
Beginning of period | - |
End of period (including undistributed net investment income of $143,916) | $ 30,432,958 |
See accompanying notes which are an integral part of the financial statements.
Annual Report
Financial Highlights - Class A
Year ended September 30, | 2008 G |
Selected Per-Share Data | |
Net asset value, beginning of period | $ 10.00 |
Income from Investment Operations | |
Net investment income (loss) E | .24 |
Net realized and unrealized gain (loss) | (1.39) |
Total from investment operations | (1.15) |
Distributions from net investment income | (.19) |
Net asset value, end of period | $ 8.66 |
Total Return B, C, D | (11.63)% |
Ratios to Average Net Assets H | |
Expenses before reductions | 1.66% A |
Expenses net of fee waivers, if any | .98% A |
Expenses net of all reductions | .98% A |
Net investment income (loss) | 2.63% A |
Supplemental Data | |
Net assets, end of period (000 omitted) | $ 1,159 |
Portfolio turnover rate F | 24%A |
A Annualized
B Total returns for periods of less than one year are not annualized.
C Total returns would have been lower had certain expenses not been reduced during the periods shown.
D Total returns do not include the effect of the sales charges.
E Calculated based on average shares outstanding during the period.
F Amount does not include the portfolio activity of any underlying Fidelity Central Funds.
G For the period October 9, 2007 (commencement of operations) to September 30, 2008.
H Expense ratios reflect operating expenses of the class. Expenses before reductions do not reflect amounts reimbursed by the investment adviser or reductions from brokerage service arrangements or other expense offset arrangements and do not represent the amount paid by the class during periods when reimbursements or reductions occur. Expense ratios before reductions for start-up periods may not be representative of longer-term operating periods. Expenses net of fee waivers reflect expenses after reimbursement by the investment adviser but prior to reductions from brokerage service arrangements or other expense offset arrangements. Expenses net of all reductions represent the net expenses paid by the class. Fees and expenses of the underlying Fidelity Central Funds are not included in the Fund's expense ratio. The Fund indirectly bears its proportionate share of the expenses of any underlying Fidelity Central Funds. Based on their most recent shareholder report date, the expenses ranged from less than .01% to .03%.
Financial Highlights - Class T
Year ended September 30, | 2008 G |
Selected Per-Share Data | |
Net asset value, beginning of period | $ 10.00 |
Income from Investment Operations | |
Net investment income (loss) E | .22 |
Net realized and unrealized gain (loss) | (1.40) |
Total from investment operations | (1.18) |
Distributions from net investment income | (.17) |
Net asset value, end of period | $ 8.65 |
Total Return B, C, D | (11.91)% |
Ratios to Average Net Assets H | |
Expenses before reductions | 1.97% A |
Expenses net of fee waivers, if any | 1.20% A |
Expenses net of all reductions | 1.20% A |
Net investment income (loss) | 2.41% A |
Supplemental Data | |
Net assets, end of period (000 omitted) | $ 1,074 |
Portfolio turnover rate F | 24%A |
A Annualized
B Total returns for periods of less than one year are not annualized.
C Total returns would have been lower had certain expenses not been reduced during the periods shown.
D Total returns do not include the effect of the sales charges.
E Calculated based on average shares outstanding during the period.
F Amount does not include the portfolio activity of any underlying Fidelity Central Funds.
G For the period October 9, 2007 (commencement of operations) to September 30, 2008.
H Expense ratios reflect operating expenses of the class. Expenses before reductions do not reflect amounts reimbursed by the investment adviser or reductions from brokerage service arrangements or other expense offset arrangements and do not represent the amount paid by the class during periods when reimbursements or reductions occur. Expense ratios before reductions for start-up periods may not be representative of longer-term operating periods. Expenses net of fee waivers reflect expenses after reimbursement by the investment adviser but prior to reductions from brokerage service arrangements or other expense offset arrangements. Expenses net of all reductions represent the net expenses paid by the class. Fees and expenses of the underlying Fidelity Central Funds are not included in the Fund's expense ratio. The Fund indirectly bears its proportionate share of the expenses of any underlying Fidelity Central Funds. Based on their most recent shareholder report date, the expenses ranged from less than .01% to .03%.
See accompanying notes which are an integral part of the financial statements.
Annual Report
Financial Highlights - Class B
Year ended September 30, | 2008 G |
Selected Per-Share Data | |
Net asset value, beginning of period | $ 10.00 |
Income from Investment Operations | |
Net investment income (loss) E | .17 |
Net realized and unrealized gain (loss) | (1.39) |
Total from investment operations | (1.22) |
Distributions from net investment income | (.13) |
Net asset value, end of period | $ 8.65 |
Total Return B, C, D | (12.30)% |
Ratios to Average Net Assets H | |
Expenses before reductions | 2.71% A |
Expenses net of fee waivers, if any | 1.73% A |
Expenses net of all reductions | 1.73% A |
Net investment income (loss) | 1.87% A |
Supplemental Data | |
Net assets, end of period (000 omitted) | $ 480 |
Portfolio turnover rate F | 24%A |
A Annualized
B Total returns for periods of less than one year are not annualized.
C Total returns would have been lower had certain expenses not been reduced during the periods shown.
D Total returns do not include the effect of the contingent deferred sales charge.
E Calculated based on average shares outstanding during the period.
F Amount does not include the portfolio activity of any underlying Fidelity Central Funds.
G For the period October 9, 2007 (commencement of operations) to September 30, 2008.
H Expense ratios reflect operating expenses of the class. Expenses before reductions do not reflect amounts reimbursed by the investment adviser or reductions from brokerage service arrangements or other expense offset arrangements and do not represent the amount paid by the class during periods when reimbursements or reductions occur. Expense ratios before reductions for start-up periods may not be representative of longer-term operating periods. Expenses net of fee waivers reflect expenses after reimbursement by the investment adviser but prior to reductions from brokerage service arrangements or other expense offset arrangements. Expenses net of all reductions represent the net expenses paid by the class. Fees and expenses of the underlying Fidelity Central Funds are not included in the Fund's expense ratio. The Fund indirectly bears its proportionate share of the expenses of any underlying Fidelity Central Funds. Based on their most recent shareholder report date, the expenses ranged from less than .01% to .03%.
Financial Highlights - Class C
Year ended September 30, | 2008 G |
Selected Per-Share Data | |
Net asset value, beginning of period | $ 10.00 |
Income from Investment Operations | |
Net investment income (loss) E | .17 |
Net realized and unrealized gain (loss) | (1.39) |
Total from investment operations | (1.22) |
Distributions from net investment income | (.14) |
Net asset value, end of period | $ 8.64 |
Total Return B, C, D | (12.30)% |
Ratios to Average Net Assets H | |
Expenses before reductions | 2.37% A |
Expenses net of fee waivers, if any | 1.70% A |
Expenses net of all reductions | 1.70% A |
Net investment income (loss) | 1.91% A |
Supplemental Data | |
Net assets, end of period (000 omitted) | $ 1,495 |
Portfolio turnover rate F | 24%A |
A Annualized
B Total returns for periods of less than one year are not annualized.
C Total returns would have been lower had certain expenses not been reduced during the periods shown.
D Total returns do not include the effect of the contingent deferred sales charge.
E Calculated based on average shares outstanding during the period.
F Amount does not include the portfolio activity of any underlying Fidelity Central Funds.
G For the period October 9, 2007 (commencement of operations) to September 30, 2008.
H Expense ratios reflect operating expenses of the class. Expenses before reductions do not reflect amounts reimbursed by the investment adviser or reductions from brokerage service arrangements or other expense offset arrangements and do not represent the amount paid by the class during periods when reimbursements or reductions occur. Expense ratios before reductions for start-up periods may not be representative of longer-term operating periods. Expenses net of fee waivers reflect expenses after reimbursement by the investment adviser but prior to reductions from brokerage service arrangements or other expense offset arrangements. Expenses net of all reductions represent the net expenses paid by the class. Fees and expenses of the underlying Fidelity Central Funds are not included in the Fund's expense ratio. The Fund indirectly bears its proportionate share of the expenses of any underlying Fidelity Central Funds. Based on their most recent shareholder report date, the expenses ranged from less than .01% to .03%.
See accompanying notes which are an integral part of the financial statements.
Annual Report
Financial Highlights - Asset Manager 30%
Year ended September 30, | 2008 F |
Selected Per-Share Data | |
Net asset value, beginning of period | $ 10.00 |
Income from Investment Operations | |
Net investment income (loss) D | .26 |
Net realized and unrealized gain (loss) | (1.39) |
Total from investment operations | (1.13) |
Distributions from net investment income | (.21) |
Net asset value, end of period | $ 8.66 |
Total Return B, C | (11.43)% |
Ratios to Average Net AssetsG | |
Expenses before reductions | 1.24% A |
Expenses net of fee waivers, if any | .73% A |
Expenses net of all reductions | .72% A |
Net investment income (loss) | 2.88% A |
Supplemental Data | |
Net assets, end of period (000 omitted) | $ 26,016 |
Portfolio turnover rate E | 24% A |
A Annualized
B Total returns for periods of less than one year are not annualized.
C Total returns would have been lower had certain expenses not been reduced during the periods shown.
D Calculated based on average shares outstanding during the period.
E Amount does not include the portfolio activity of any underlying Fidelity Central Funds.
F For the period October 9, 2007 (commencement of operations) to September 30, 2008.
G Expense ratios reflect operating expenses of the class. Expenses before reductions do not reflect amounts reimbursed by the investment adviser or reductions from brokerage service arrangements or other expense offset arrangements and do not represent the amount paid by the class during periods when reimbursements or reductions occur. Expense ratios before reductions for start-up periods may not be representative of longer-term operating periods. Expenses net of fee waivers reflect expenses after reimbursement by the investment adviser but prior to reductions from brokerage service arrangements or other expense offset arrangements. Expenses net of all reductions represent the net expenses paid by the class. Fees and expenses of the underlying Fidelity Central Funds are not included in the Fund's expense ratio. The Fund indirectly bears its proportionate share of the expenses of any underlying Fidelity Central Funds. Based on their most recent shareholder report date, the expenses ranged from less than .01% to .03%.
Financial Highlights - Institutional Class
Year ended September 30, | 2008 F |
Selected Per-Share Data | |
Net asset value, beginning of period | $ 10.00 |
Income from Investment Operations | |
Net investment income (loss) D | .26 |
Net realized and unrealized gain (loss) | (1.39) |
Total from investment operations | (1.13) |
Distributions from net investment income | (.21) |
Net asset value, end of period | $ 8.66 |
Total Return B, C | (11.45)% |
Ratios to Average Net AssetsG | |
Expenses before reductions | 1.76% A |
Expenses net of fee waivers, if any | .75% A |
Expenses net of all reductions | .75% A |
Net investment income (loss) | 2.86% A |
Supplemental Data | |
Net assets, end of period (000 omitted) | $ 209 |
Portfolio turnover rate E | 24% A |
A Annualized
B Total returns for periods of less than one year are not annualized.
C Total returns would have been lower had certain expenses not been reduced during the periods shown.
D Calculated based on average shares outstanding during the period.
E Amount does not include the portfolio activity of any underlying Fidelity Central Funds.
F For the period October 9, 2007 (commencement of operations) to September 30, 2008.
G Expense ratios reflect operating expenses of the class. Expenses before reductions do not reflect amounts reimbursed by the investment adviser or reductions from brokerage service arrangements or other expense offset arrangements and do not represent the amount paid by the class during periods when reimbursements or reductions occur. Expense ratios before reductions for start-up periods may not be representative of longer-term operating periods. Expenses net of fee waivers reflect expenses after reimbursement by the investment adviser but prior to reductions from brokerage service arrangements or other expense offset arrangements. Expenses net of all reductions represent the net expenses paid by the class. Fees and expenses of the underlying Fidelity Central Funds are not included in the Fund's expense ratio. The Fund indirectly bears its proportionate share of the expenses of any underlying Fidelity Central Funds. Based on their most recent shareholder report date, the expenses ranged from less than .01% to .03%.
See accompanying notes which are an integral part of the financial statements.
Annual Report
Fidelity Asset Manager 40%
Investment Changes (Unaudited)
The information in the following tables is based on the combined investments of the Fund and its pro-rata share of the investments of Fidelity's Equity and Fixed-Income Central Funds.
Top Five Bond Issuers as of September 30, 2008 |
(with maturities greater than one year) | % of fund's
net assets | % of fund's net assets
6 months ago |
Fannie Mae | 14.0 | 14.1 |
Freddie Mac | 5.2 | 4.9 |
U.S. Treasury Obligations | 2.3 | 4.6 |
Government National Mortgage Association | 2.1 | 1.6 |
Wells Fargo Mortgage Backed Securities Trust | 0.4 | 0.4 |
| 24.0 | |
Quality Diversification (% of fund's net assets) |
As of September 30, 2008 | As of March 31, 2008 |
| U.S. Government and
U.S. Government
Agency Obligations 24.8% | | | U.S. Government and
U.S. Government
Agency Obligations 25.5% | |
| AAA,AA,A 11.8% | | | AAA,AA,A 10.8% | |
| BBB 8.2% | | | BBB 8.0% | |
| BB and below 4.6% | | | BB and below 4.5% | |
| Not Rated 0.6% | | | Not Rated 0.4% | |
| Equities 39.5% | | | Equities 40.9% | |
| Short-Term
Investments and
Net Other Assets 10.5% | | | Short-Term
Investments and Net Other Assets 9.9% | |
We have used ratings from Moody's® Investors Services, Inc. Where Moody's ratings are not available, we have used S&P® ratings. All ratings are as of the report date and do not reflect subsequent downgrades. Percentages are adjusted for the effect of futures contracts, if applicable. |
Top Five Stocks as of September 30, 2008 |
| % of fund's
net assets | % of fund's net assets
6 months ago |
Apple, Inc. | 0.6 | 0.1 |
Procter & Gamble Co. | 0.6 | 0.6 |
General Electric Co. | 0.5 | 0.4 |
Bank of America Corp. | 0.4 | 0.3 |
JPMorgan Chase & Co. | 0.4 | 0.4 |
| 2.5 | |
Asset Allocation (% of fund's net assets) |
As of September 30, 2008 | As of March 31, 2008 |
| Stock class and
Equity Futures 39.4% | | | Stock class and
Equity Futures 41.0% | |
| Bond class 45.2% | | | Bond class 49.4% | |
| Short-term class 15.4% | | | Short-term class 9.6% | |
| | | | | |
| | | | | |
Asset allocations in the pie charts reflect the categorization of assets as defined in the Fund's prospectus in effect as of the time periods indicated above. Percentages are adjusted for the effect of futures contracts and swap contracts, if applicable. |
Annual Report
Fidelity Asset Manager 40%
Investment Summary (Unaudited)
The information in the following table is based on the direct investments of the Fund.
Fund Holdings as of September 30, 2008 |
| % of fund's
net assets |
Equity Central Funds | |
Fidelity Financials Central Fund | 5.7 |
Fidelity Information Technology Central Fund | 5.3 |
Fidelity Health Care Central Fund | 4.6 |
Fidelity Industrials Central Fund | 4.3 |
Fidelity Energy Central Fund | 3.9 |
Fidelity International Equity Central Fund | 3.9 |
Fidelity Consumer Staples Central Fund | 3.7 |
Fidelity Consumer Discretionary Central Fund | 3.6 |
Fidelity Materials Central Fund | 1.3 |
Fidelity Utilities Central Fund | 1.3 |
Fidelity Telecom Services Central Fund | 1.1 |
Total Equity Central Funds | 38.7 |
Fixed-Income Central Funds | |
Investment Grade Fixed-Income Funds | 39.1 |
High Yield Fixed-Income Funds | 4.3 |
Total Fixed-Income Central Funds | 43.4 |
Money Market Central Funds | 18.5 |
Other Short-Term Investments and Net Other Assets | (0.6) |
Total | 100.0 |
At period end, foreign investments including the Fund's pro-rata share of the underlying Central Funds was 13.8% of net assets.
A holdings listing for the Fund, which presents direct holdings as well as the pro-rata share of any securities and other investments held indirectly through its investment in underlying non-money market Fidelity Central Funds, is available at fidelity.com and/or advisor.fidelity.com, as applicable.
Annual Report
Fidelity Asset Manager 40%
Investments September 30, 2008
Showing Percentage of Net Assets
Equity Central Funds - 38.7% |
| Shares | | Value |
Fidelity Consumer Discretionary Central Fund (c) | 7,437 | | $ 687,216 |
Fidelity Consumer Staples Central Fund (c) | 6,031 | | 693,355 |
Fidelity Energy Central Fund (c) | 6,666 | | 736,460 |
Fidelity Financials Central Fund (c) | 16,305 | | 1,073,867 |
Fidelity Health Care Central Fund (c) | 8,689 | | 865,513 |
Fidelity Industrials Central Fund (c) | 7,669 | | 809,331 |
Fidelity Information Technology Central Fund (c) | 10,269 | | 1,008,502 |
Fidelity International Equity Central
Fund (c) | 11,101 | | 745,109 |
Fidelity Materials Central Fund (c) | 2,233 | | 245,701 |
Fidelity Telecom Services Central Fund (c) | 2,262 | | 202,857 |
Fidelity Utilities Central Fund (c) | 2,650 | | 247,387 |
TOTAL EQUITY CENTRAL FUNDS (Cost $9,475,308) | 7,315,298 |
Fixed-Income Central Funds - 43.4% |
| | | |
Investment Grade Fixed-Income Funds - 39.1% |
Fidelity Tactical Income Central Fund (c) | 82,188 | | 7,380,508 |
High Yield Fixed-Income Funds - 4.3% |
Fidelity Floating Rate Central Fund (c) | 5,945 | | 504,178 |
Fidelity High Income Central Fund 1 (c) | 3,699 | | 316,276 |
TOTAL HIGH YIELD FIXED-INCOME FUNDS | 820,454 |
TOTAL FIXED-INCOME CENTRAL FUNDS (Cost $8,781,994) | 8,200,962 |
Money Market Central Funds - 18.5% |
| | | |
Fidelity Cash Central Fund, 1.92% (a)
(Cost $3,498,011) | 3,498,011 | | 3,498,011 |
U.S. Treasury Obligations - 0.3% |
| Principal Amount | | |
U.S. Treasury Bills, yield at date of purchase 1.59% 10/16/08 (b)
(Cost $49,965) | | $ 50,000 | | 49,975 |
TOTAL INVESTMENT PORTFOLIO - 100.9% (Cost $21,805,278) | | 19,064,246 |
NET OTHER ASSETS - (0.9)% | | (162,201) |
NET ASSETS - 100% | $ 18,902,045 |
Futures Contracts |
| Expiration Date | | Underlying Face Amount at Value | | Unrealized Appreciation/(Depreciation) |
Purchased |
Equity Index Contracts |
6 CME E-mini S&P 500 Index Contracts | Dec. 2008 | | $ 350,220 | | $ (8,693) |
|
The face value of futures purchased as a percentage of net assets - 1.9% |
Legend |
(a) Affiliated fund that is available only to investment companies and other accounts managed by Fidelity Investments. The rate quoted is the annualized seven-day yield of the fund at period end. A complete unaudited listing of the fund's holdings as of its most recent quarter end is available upon request. |
(b) Security or a portion of the security was pledged to cover margin requirements for futures contracts. At the period end, the value of securities pledged amounted to $49,975. |
(c) Affiliated fund that is available only to investment companies and other accounts managed by Fidelity Investments. A complete unaudited schedule of portfolio holdings for each Fidelity Central Fund is filed with the SEC for the first and third quarters of each fiscal year on Form N-Q and is available upon request or at the SEC's web site at www.sec.gov. An unaudited holdings listing for the Fund, which presents direct holdings as well as the pro rata share of securities and other investments held indirectly through its investment in underlying non-money market Fidelity Central Funds, is available at fidelity.com and/or advisor.fidelity.com, as applicable. In addition, each Fidelity Central Fund's financial statements, which are not covered by the Fund's Report of Independent Registered Public Accounting Firm, are available on the SEC's web site or upon request. |
Affiliated Central Funds |
Information regarding fiscal year to date income earned by the Fund from investments in Fidelity Central Funds is as follows: |
Fund | Income earned |
Fidelity Cash Central Fund | $ 73,418 |
Fidelity Consumer Discretionary Central Fund | 8,175 |
Fidelity Consumer Staples Central Fund | 11,925 |
Fidelity Energy Central Fund | 5,589 |
Fidelity Financials Central Fund | 29,659 |
Fidelity Floating Rate Central Fund | 20,040 |
Fidelity Health Care Central Fund | 6,769 |
Fidelity High Income Central Fund 1 | 22,008 |
Fidelity Industrials Central Fund | 10,831 |
Fidelity Information Technology Central Fund | 6,968 |
Fidelity International Equity Central Fund | 18,366 |
Fidelity Materials Central Fund | 3,763 |
Fidelity Tactical Income Central Fund | 284,658 |
Fidelity Telecom Services Central Fund | 3,980 |
Fidelity Utilities Central Fund | 4,836 |
Total | $ 510,985 |
Additional information regarding the Fund's fiscal year to date purchases and sales, including the ownership percentage, of the non-money market Central Funds is as follows: |
Fund | Value, beginning of period | Purchases | Sales
Proceeds | Value,
end of period | % ownership, end of period |
Fidelity Consumer Discretionary Central Fund | $ - | $ 848,840 | $ 18,997 | $ 687,216 | 0.1% |
Fidelity Consumer Staples Central Fund | - | 754,397 | 3,566 | 693,355 | 0.1% |
Fidelity Energy Central Fund | - | 995,695 | 23,160 | 736,460 | 0.1% |
Fidelity Financials Central Fund | - | 1,549,389 | - | 1,073,867 | 0.1% |
Fidelity Floating Rate Central Fund | - | 560,534 | - | 504,178 | 0.0% |
Fidelity Health Care Central Fund | - | 1,005,463 | 2,454 | 865,513 | 0.1% |
Fidelity High Income Central Fund 1 | - | 368,764 | 12,994 | 316,276 | 0.1% |
Fidelity Industrials Central Fund | - | 1,015,214 | 25,730 | 809,331 | 0.1% |
Fidelity Information Technology Central Fund | - | 1,409,786 | 8,250 | 1,008,502 | 0.1% |
Fidelity International Equity Central Fund | - | 1,040,428 | - | 745,109 | 0.1% |
Fidelity Materials Central Fund | - | 329,911 | 5,970 | 245,701 | 0.1% |
Fidelity Tactical Income Central Fund | - | 7,866,585 | - | 7,380,508 | 0.2% |
Fidelity Telecom Services Central Fund | - | 291,464 | - | 202,857 | 0.1% |
Fidelity Utilities Central Fund | - | 326,107 | - | 247,387 | 0.1% |
Total | $ - | $ 18,362,577 | $ 101,121 | $ 15,516,260 | |
Other Information (Unaudited) |
The information in the following table is based on the combined investment of the Fund and its pro-rata share of the investments of Fidelity's Equity and Fixed-Income Central Funds. |
Distribution of investments by country of issue, as a percentage of total net assets, is as follows. Percentages are adjusted for the effect of futures contracts, if applicable. |
United States of America | 86.2% |
United Kingdom | 2.4% |
Bermuda | 1.5% |
Canada | 1.3% |
Switzerland | 1.2% |
Japan | 1.0% |
Others (individually less than 1%) | 6.4% |
| 100.0% |
Income Tax Information |
At September 30, 2008, the fund had a capital loss carryforward of approximately $101,011 all of which will expire on September 30, 2016. |
The fund intends to elect to defer to its fiscal year ending September 30, 2009 approximately $1,131,101 of losses recognized during the period November 1, 2007 to September 30, 2008. |
See accompanying notes which are an integral part of the financial statements.
Annual Report
Fidelity Asset Manager 40%
Statement of Assets and Liabilities
| September 30, 2008 |
| | |
Assets | | |
Investment in securities, at value - See accompanying schedule: Unaffiliated issuers (cost $49,965) | $ 49,975 | |
Fidelity Central Funds (cost $21,755,313) | 19,014,271 | |
Total Investments (cost $21,805,278) | | $ 19,064,246 |
Receivable for fund shares sold | | 169,812 |
Distributions receivable from Fidelity Central Funds | | 41,892 |
Receivable for daily variation on futures contracts | | 14,580 |
Prepaid expenses | | 3 |
Receivable from investment adviser for expense reductions | | 30,347 |
Total assets | | 19,320,880 |
| | |
Liabilities | | |
Payable for investments purchased | $ 256,583 | |
Payable for fund shares redeemed | 119,514 | |
Accrued management fee | 6,674 | |
Distribution fees payable | 3,557 | |
Other affiliated payables | 2,496 | |
Other payables and accrued expenses | 30,011 | |
Total liabilities | | 418,835 |
| | |
Net Assets | | $ 18,902,045 |
Net Assets consist of: | | |
Paid in capital | | $ 21,598,672 |
Undistributed net investment income | | 131,642 |
Accumulated undistributed net realized gain (loss) on investments and foreign currency transactions | | (78,544) |
Net unrealized appreciation (depreciation) on investments | | (2,749,725) |
Net Assets | | $ 18,902,045 |
| | |
Calculation of Maximum Offering Price Class A:
Net Asset Value and redemption price per share ($2,032,604 ÷ 241,385 shares) | | $ 8.42 |
| | |
Maximum offering price per share (100/94.25 of $8.42) | | $ 8.93 |
Class T:
Net Asset Value and redemption price per share ($1,839,582 ÷ 218,637 shares) | | $ 8.41 |
| | |
Maximum offering price per share (100/96.50 of $8.41) | | $ 8.72 |
Class B:
Net Asset Value and offering price per share ($1,378,427 ÷ 164,016 shares)A | | $ 8.40 |
| | |
Class C:
Net Asset Value and offering price per share ($1,383,696 ÷ 164,606 shares)A | | $ 8.41 |
| | |
| | |
Asset Manager 40%:
Net Asset Value, offering price and redemption price per share ($10,929,086 ÷ 1,297,117 shares) | | $ 8.43 |
| | |
Institutional Class:
Net Asset Value, offering price and redemption price per share ($1,338,650 ÷ 158,863 shares) | | $ 8.43 |
A Redemption price per share is equal to net asset value less any applicable contingent deferred sales charge.
See accompanying notes which are an integral part of the financial statements.
Annual Report
Statement of Operations
For the period October 9, 2007 (commencement of operations) to September 30, 2008 |
| | |
Investment Income | | |
Interest | | $ 2,124 |
Income from Fidelity Central Funds | | 510,985 |
Total income | | 513,109 |
| | |
Expenses | | |
Management fee | $ 60,461 | |
Transfer agent fees | 17,548 | |
Distribution fees | 41,312 | |
Accounting fees and expenses | 6,045 | |
Custodian fees and expenses | 4,989 | |
Independent trustees' compensation | 53 | |
Registration fees | 114,542 | |
Audit | 36,878 | |
Legal | 30 | |
Miscellaneous | 2,049 | |
Total expenses before reductions | 283,907 | |
Expense reductions | (134,669) | 149,238 |
Net investment income (loss) | | 363,871 |
Realized and Unrealized Gain (Loss) Net realized gain (loss) on: | | |
Investment securities: | | |
Fidelity Central Funds | (4,134) | |
Foreign currency transactions | (174) | |
Futures contracts | (78,098) | |
Total net realized gain (loss) | | (82,406) |
Change in net unrealized appreciation (depreciation) on: Investment securities | (2,741,032) | |
Futures contracts | (8,693) | |
Total change in net unrealized appreciation (depreciation) | | (2,749,725) |
Net gain (loss) | | (2,832,131) |
Net increase (decrease) in net assets resulting from operations | | $ (2,468,260) |
Statement of Changes in Net Assets
| For the period
October 9, 2007 (commencement of operations) to September 30, 2008 |
Increase (Decrease) in Net Assets | |
Operations | |
Net investment income (loss) | $ 363,871 |
Net realized gain (loss) | (82,406) |
Change in net unrealized appreciation (depreciation) | (2,749,725) |
Net increase (decrease) in net assets resulting from operations | (2,468,260) |
Distributions to shareholders from net investment income | (228,368) |
Share transactions - net increase (decrease) | 21,598,673 |
Total increase (decrease) in net assets | 18,902,045 |
| |
Net Assets | |
Beginning of period | - |
End of period (including undistributed net investment income of $131,642) | $ 18,902,045 |
See accompanying notes which are an integral part of the financial statements.
Annual Report
Financial Highlights - Class A
Year ended September 30, | 2008 G |
Selected Per-Share Data | |
Net asset value, beginning of period | $ 10.00 |
Income from Investment Operations | |
Net investment income (loss) E | .23 |
Net realized and unrealized gain (loss) | (1.66) |
Total from investment operations | (1.43) |
Distributions from net investment income | (.15) |
Net asset value, end of period | $ 8.42 |
Total Return B, C, D | (14.43)% |
Ratios to Average Net Assets H | |
Expenses before reductions | 1.91% A |
Expenses net of fee waivers, if any | 1.00% A |
Expenses net of all reductions | 1.00% A |
Net investment income (loss) | 2.52% A |
Supplemental Data | |
Net assets, end of period (000 omitted) | $ 2,033 |
Portfolio turnover rate F | 1%A |
A Annualized
B Total returns for periods of less than one year are not annualized.
C Total returns would have been lower had certain expenses not been reduced during the periods shown.
D Total returns do not include the effect of the sales charges.
E Calculated based on average shares outstanding during the period.
F Amount does not include the portfolio activity of any underlying Fidelity Central Funds.
G For the period October 9, 2007 (commencement of operations) to September 30, 2008.
H Expense ratios reflect operating expenses of the class. Expenses before reductions do not reflect amounts reimbursed by the investment adviser or reductions from brokerage service arrangements or other expense offset arrangements and do not represent the amount paid by the class during periods when reimbursements or reductions occur. Expense ratios before reductions for start-up periods may not be representative of longer-term operating periods. Expenses net of fee waivers reflect expenses after reimbursement by the investment adviser but prior to reductions from brokerage service arrangements or other expense offset arrangements. Expenses net of all reductions represent the net expenses paid by the class. Fees and expenses of the underlying Fidelity Central Funds are not included in the Fund's expense ratio. The Fund indirectly bears its proportionate share of the expenses of any underlying Fidelity Central Funds. Based on their most recent shareholder report date, the expenses ranged from less than .01% to .03%.
Financial Highlights - Class T
Year ended September 30, | 2008 G |
Selected Per-Share Data | |
Net asset value, beginning of period | $ 10.00 |
Income from Investment Operations | |
Net investment income (loss) E | .21 |
Net realized and unrealized gain (loss) | (1.66) |
Total from investment operations | (1.45) |
Distributions from net investment income | (.14) |
Net asset value, end of period | $ 8.41 |
Total Return B, C, D | (14.67)% |
Ratios to Average Net Assets H | |
Expenses before reductions | 2.15% A |
Expenses net of fee waivers, if any | 1.25% A |
Expenses net of all reductions | 1.25% A |
Net investment income (loss) | 2.27% A |
Supplemental Data | |
Net assets, end of period (000 omitted) | $ 1,840 |
Portfolio turnover rate F | 1%A |
A Annualized
B Total returns for periods of less than one year are not annualized.
C Total returns would have been lower had certain expenses not been reduced during the periods shown.
D Total returns do not include the effect of the sales charges.
E Calculated based on average shares outstanding during the period.
F Amount does not include the portfolio activity of any underlying Fidelity Central Funds.
G For the period October 9, 2007 (commencement of operations) to September 30, 2008.
H Expense ratios reflect operating expenses of the class. Expenses before reductions do not reflect amounts reimbursed by the investment adviser or reductions from brokerage service arrangements or other expense offset arrangements and do not represent the amount paid by the class during periods when reimbursements or reductions occur. Expense ratios before reductions for start-up periods may not be representative of longer-term operating periods. Expenses net of fee waivers reflect expenses after reimbursement by the investment adviser but prior to reductions from brokerage service arrangements or other expense offset arrangements. Expenses net of all reductions represent the net expenses paid by the class. Fees and expenses of the underlying Fidelity Central Funds are not included in the Fund's expense ratio. The Fund indirectly bears its proportionate share of the expenses of any underlying Fidelity Central Funds. Based on their most recent shareholder report date, the expenses ranged from less than .01% to .03%.
See accompanying notes which are an integral part of the financial statements.
Annual Report
Financial Highlights - Class B
Year ended September 30, | 2008 G |
Selected Per-Share Data | |
Net asset value, beginning of period | $ 10.00 |
Income from Investment Operations | |
Net investment income (loss) E | .16 |
Net realized and unrealized gain (loss) | (1.66) |
Total from investment operations | (1.50) |
Distributions from net investment income | (.10) |
Net asset value, end of period | $ 8.40 |
Total Return B, C, D | (15.09)% |
Ratios to Average Net Assets H | |
Expenses before reductions | 2.64% A |
Expenses net of fee waivers, if any | 1.77% A |
Expenses net of all reductions | 1.77% A |
Net investment income (loss) | 1.76% A |
Supplemental Data | |
Net assets, end of period (000 omitted) | $ 1,378 |
Portfolio turnover rate F | 1%A |
A Annualized
B Total returns for periods of less than one year are not annualized.
C Total returns would have been lower had certain expenses not been reduced during the periods shown.
D Total returns do not include the effect of the contingent deferred sales charge.
E Calculated based on average shares outstanding during the period.
F Amount does not include the portfolio activity of any underlying Fidelity Central Funds.
G For the period October 9, 2007 (commencement of operations) to September 30, 2008.
H Expense ratios reflect operating expenses of the class. Expenses before reductions do not reflect amounts reimbursed by the investment adviser or reductions from brokerage service arrangements or other expense offset arrangements and do not represent the amount paid by the class during periods when reimbursements or reductions occur. Expense ratios before reductions for start-up periods may not be representative of longer-term operating periods. Expenses net of fee waivers reflect expenses after reimbursement by the investment adviser but prior to reductions from brokerage service arrangements or other expense offset arrangements. Expenses net of all reductions represent the net expenses paid by the class. Fees and expenses of the underlying Fidelity Central Funds are not included in the Fund's expense ratio. The Fund indirectly bears its proportionate share of the expenses of any underlying Fidelity Central Funds. Based on their most recent shareholder report date, the expenses ranged from less than .01% to .03%.
Financial Highlights - Class C
Year ended September 30, | 2008 G |
Selected Per-Share Data | |
Net asset value, beginning of period | $ 10.00 |
Income from Investment Operations | |
Net investment income (loss) E | .16 |
Net realized and unrealized gain (loss) | (1.65) |
Total from investment operations | (1.49) |
Distributions from net investment income | (.10) |
Net asset value, end of period | $ 8.41 |
Total Return B, C, D | (15.01)% |
Ratios to Average Net Assets H | |
Expenses before reductions | 2.66% A |
Expenses net of fee waivers, if any | 1.76% A |
Expenses net of all reductions | 1.76% A |
Net investment income (loss) | 1.76% A |
Supplemental Data | |
Net assets, end of period (000 omitted) | $ 1,384 |
Portfolio turnover rate F | 1%A |
A Annualized
B Total returns for periods of less than one year are not annualized.
C Total returns would have been lower had certain expenses not been reduced during the periods shown.
D Total returns do not include the effect of the contingent deferred sales charge.
E Calculated based on average shares outstanding during the period.
F Amount does not include the portfolio activity of any underlying Fidelity Central Funds.
G For the period October 9, 2007 (commencement of operations) to September 30, 2008.
H Expense ratios reflect operating expenses of the class. Expenses before reductions do not reflect amounts reimbursed by the investment adviser or reductions from brokerage service arrangements or other expense offset arrangements and do not represent the amount paid by the class during periods when reimbursements or reductions occur. Expense ratios before reductions for start-up periods may not be representative of longer-term operating periods. Expenses net of fee waivers reflect expenses after reimbursement by the investment adviser but prior to reductions from brokerage service arrangements or other expense offset arrangements. Expenses net of all reductions represent the net expenses paid by the class. Fees and expenses of the underlying Fidelity Central Funds are not included in the Fund's expense ratio. The Fund indirectly bears its proportionate share of the expenses of any underlying Fidelity Central Funds. Based on their most recent shareholder report date, the expenses ranged from less than .01% to .03%.
See accompanying notes which are an integral part of the financial statements.
Annual Report
Financial Highlights - Asset Manager 40%
Year ended September 30, | 2008 F |
Selected Per-Share Data | |
Net asset value, beginning of period | $ 10.00 |
Income from Investment Operations | |
Net investment income (loss) D | .25 |
Net realized and unrealized gain (loss) | (1.65) |
Total from investment operations | (1.40) |
Distributions from net investment income | (.17) |
Net asset value, end of period | $ 8.43 |
Total Return B, C | (14.18)% |
Ratios to Average Net Assets G | |
Expenses before reductions | 1.68% A |
Expenses net of fee waivers, if any | .72% A |
Expenses net of all reductions | .72% A |
Net investment income (loss) | 2.80% A |
Supplemental Data | |
Net assets, end of period (000 omitted) | $ 10,929 |
Portfolio turnover rate E | 1%A |
A Annualized
B Total returns for periods of less than one year are not annualized.
C Total returns would have been lower had certain expenses not been reduced during the periods shown.
D Calculated based on average shares outstanding during the period.
E Amount does not include the portfolio activity of any underlying Fidelity Central Funds.
F For the period October 9, 2007 (commencement of operations) to September 30, 2008.
G Expense ratios reflect operating expenses of the class. Expenses before reductions do not reflect amounts reimbursed by the investment adviser or reductions from brokerage service arrangements or other expense offset arrangements and do not represent the amount paid by the class during periods when reimbursements or reductions occur. Expense ratios before reductions for start-up periods may not be representative of longer-term operating periods. Expenses net of fee waivers reflect expenses after reimbursement by the investment adviser but prior to reductions from brokerage service arrangements or other expense offset arrangements. Expenses net of all reductions represent the net expenses paid by the class. Fees and expenses of the underlying Fidelity Central Funds are not included in the Fund's expense ratio. The Fund indirectly bears its proportionate share of the expenses of any underlying Fidelity Central Funds. Based on their most recent shareholder report date, the expenses ranged from less than .01% to .03%.
Financial Highlights - Institutional Class
Year ended September 30, | 2008 F |
Selected Per-Share Data | |
Net asset value, beginning of period | $ 10.00 |
Income from Investment Operations | |
Net investment income (loss) D | .25 |
Net realized and unrealized gain (loss) | (1.65) |
Total from investment operations | (1.40) |
Distributions from net investment income | (.17) |
Net asset value, end of period | $ 8.43 |
Total Return B, C | (14.18)% |
Ratios to Average Net Assets G | |
Expenses before reductions | 1.63% A |
Expenses net of fee waivers, if any | .76% A |
Expenses net of all reductions | .76% A |
Net investment income (loss) | 2.76% A |
Supplemental Data | |
Net assets, end of period (000 omitted) | $ 1,339 |
Portfolio turnover rate E | 1%A |
A Annualized
B Total returns for periods of less than one year are not annualized.
C Total returns would have been lower had certain expenses not been reduced during the periods shown.
D Calculated based on average shares outstanding during the period.
E Amount does not include the portfolio activity of any underlying Fidelity Central Funds.
F For the period October 9, 2007 (commencement of operations) to September 30, 2008.
G Expense ratios reflect operating expenses of the class. Expenses before reductions do not reflect amounts reimbursed by the investment adviser or reductions from brokerage service arrangements or other expense offset arrangements and do not represent the amount paid by the class during periods when reimbursements or reductions occur. Expense ratios before reductions for start-up periods may not be representative of longer-term operating periods. Expenses net of fee waivers reflect expenses after reimbursement by the investment adviser but prior to reductions from brokerage service arrangements or other expense offset arrangements. Expenses net of all reductions represent the net expenses paid by the class. Fees and expenses of the underlying Fidelity Central Funds are not included in the Fund's expense ratio. The Fund indirectly bears its proportionate share of the expenses of any underlying Fidelity Central Funds. Based on their most recent shareholder report date, the expenses ranged from less than .01% to .03%.
See accompanying notes which are an integral part of the financial statements.
Annual Report
Fidelity Asset Manager 50%
Investment Changes (Unaudited)
The information in the following tables is based on the combined investments of the Fund and its pro-rata share of the investments of Fidelity's Equity and Fixed-Income Central Funds.
Top Ten Stocks as of September 30, 2008 |
| % of fund's
net assets | % of fund's net assets
6 months ago |
Apple, Inc. | 0.8 | 0.1 |
Procter & Gamble Co. | 0.8 | 0.7 |
General Electric Co. | 0.6 | 0.5 |
Bank of America Corp. | 0.5 | 0.4 |
JPMorgan Chase & Co. | 0.5 | 0.5 |
Wells Fargo & Co. | 0.5 | 0.4 |
The Coca-Cola Co. | 0.5 | 0.5 |
Genentech, Inc. | 0.5 | 0.1 |
PepsiCo, Inc. | 0.4 | 0.4 |
Citigroup, Inc. | 0.4 | 0.4 |
| 5.5 | |
Top Five Bond Issuers as of September 30, 2008 |
(with maturities greater than one year) | % of fund's
net assets | % of fund's net assets
6 months ago |
Fannie Mae | 14.4 | 13.2 |
Freddie Mac | 5.3 | 4.6 |
U.S. Treasury Obligations | 2.3 | 4.3 |
Government National Mortgage Association | 2.0 | 1.5 |
Wells Fargo Mortgage Backed Securities Trust | 0.5 | 0.4 |
| 24.5 | |
Asset Allocation (% of fund's net assets) |
As of September 30, 2008 | As of March 31, 2008 |
| Stock class and
Equity Futures 51.2% | | | Stock class and
Equity Futures 51.2% | |
| Bond class 50.5% | | | Bond class 46.6% | |
| Short-term class* (1.7)% | | | Short-term class 2.2% | |
| | | | | |
| | | | | |
Asset allocations in the pie charts reflect the categorization of assets as defined in the Fund's prospectus in effect as of the time periods indicated above. Percentages are adjusted for the effect of futures contracts and swap contracts, if applicable. |
* Short-term class is not included in the pie chart. |
Annual Report
Fidelity Asset Manager 50%
Investment Summary (Unaudited)
The information in the following table is based on the direct investments of the Fund.
Fund Holdings as of September 30, 2008 |
| % of fund's
net assets |
Equity Central Funds | |
Fidelity Financials Central Fund | 7.2 |
Fidelity Information Technology Central Fund | 6.8 |
Fidelity Health Care Central Fund | 5.8 |
Fidelity Industrials Central Fund | 5.5 |
Fidelity Energy Central Fund | 5.0 |
Fidelity Consumer Staples Central Fund | 4.7 |
Fidelity Consumer Discretionary Central Fund | 4.6 |
Fidelity International Equity Central Fund | 4.2 |
Fidelity Utilities Central Fund | 1.7 |
Fidelity Materials Central Fund | 1.6 |
Fidelity Telecom Services Central Fund | 1.4 |
Total Equity Central Funds | 48.5 |
Fixed-Income Central Funds | |
Investment Grade Fixed-Income Funds | 37.8 |
High Yield Fixed-Income Funds | 5.1 |
Total Fixed-Income Central Funds | 42.9 |
Money Market Central Funds | 4.4 |
Other Short-Term Investments and Net Other Assets | 4.2 |
Total | 100.0 |
At period end, foreign investments including the Fund's pro-rata share of the underlying Central Funds was 15.6% of net assets.
A holdings listing for the Fund, which presents direct holdings as well as the pro-rata share of any securities and other investments held indirectly through its investment in underlying non-money market Fidelity Central Funds, is available at fidelity.com and/or advisor.fidelity.com, as applicable.
Annual Report
Fidelity Asset Manager 50%
Investments September 30, 2008
Showing Percentage of Net Assets
Equity Central Funds - 48.5% |
| Shares | | Value |
Fidelity Consumer Discretionary Central Fund (c) | 3,170,836 | | $ 293,016,928 |
Fidelity Consumer Staples Central Fund (c) | 2,571,302 | | 295,622,548 |
Fidelity Energy Central Fund (c) | 2,842,164 | | 314,002,263 |
Fidelity Financials Central Fund (c) | 6,951,945 | | 457,855,099 |
Fidelity Health Care Central Fund (c) | 3,704,728 | | 369,027,997 |
Fidelity Industrials Central Fund (c) | 3,269,947 | | 345,077,478 |
Fidelity Information Technology Central Fund (c) | 4,378,494 | | 430,011,894 |
Fidelity International Equity Central Fund (c) | 3,978,961 | | 267,067,885 |
Fidelity Materials Central Fund (c) | 952,243 | | 104,784,844 |
Fidelity Telecom Services Central Fund (c) | 964,561 | | 86,521,154 |
Fidelity Utilities Central Fund (c) | 1,130,427 | | 105,514,101 |
TOTAL EQUITY CENTRAL FUNDS (Cost $3,338,875,549) | 3,068,502,191 |
Fixed-Income Central Funds - 42.9% |
| | | |
Investment Grade Fixed-Income Funds - 37.8% |
Fidelity Tactical Income Central
Fund (c) | 26,622,633 | | 2,390,712,422 |
High Yield Fixed-Income Funds - 5.1% |
Fidelity Floating Rate Central Fund (c) | 2,313,297 | | 196,167,573 |
Fidelity High Income Central
Fund 1 (c) | 1,437,819 | | 122,947,937 |
TOTAL HIGH YIELD FIXED-INCOME FUNDS | 319,115,510 |
TOTAL FIXED-INCOME CENTRAL FUNDS (Cost $2,962,114,909) | 2,709,827,932 |
Money Market Central Funds - 4.4% |
| | | |
Fidelity Money Market Central Fund, 3.13% (a)
(Cost $280,013,442) | 280,013,442 | | 280,013,442 |
U.S. Treasury Obligations - 0.3% |
| Principal
Amount | | |
U.S. Treasury Bills, yield at date of purchase 1.59% to 1.68% 10/9/08 to 12/4/08 (b)
(Cost $18,865,185) | $ 18,900,000 | | 18,884,472 |
TOTAL INVESTMENT PORTFOLIO - 96.1% (Cost $6,599,869,085) | | 6,077,228,037 |
NET OTHER ASSETS - 3.9% | | 244,786,430 |
NET ASSETS - 100% | $ 6,322,014,467 |
Futures Contracts |
| Expiration Date | | Underlying Face Amount at Value | | Unrealized Appreciation/
(Depreciation) |
Purchased |
Equity Index Contracts |
4,412 CME E-mini S&P 500 Index Contracts | Dec. 2008 | | $ 257,528,440 | | $ (6,392,238) |
The face value of futures purchased as a percentage of net assets - 4.1% |
Legend |
(a) Affiliated fund that is available only to investment companies and other accounts managed by Fidelity Investments. The rate quoted is the annualized seven-day yield of the fund at period end. A complete unaudited listing of the fund's holdings as of its most recent quarter end is available upon request. |
(b) Security or a portion of the security was pledged to cover margin requirements for futures contracts. At the period end, the value of securities pledged amounted to $18,884,472. |
(c) Affiliated fund that is available only to investment companies and other accounts managed by Fidelity Investments. A complete unaudited schedule of portfolio holdings for each Fidelity Central Fund is filed with the SEC for the first and third quarters of each fiscal year on Form N-Q and is available upon request or at the SEC's web site at www.sec.gov. An unaudited holdings listing for the Fund, which presents direct holdings as well as the pro rata share of securities and other investments held indirectly through its investment in underlying non-money market Fidelity Central Funds, is available at fidelity.com and/or advisor.fidelity.com, as applicable. In addition, each Fidelity Central Fund's financial statements, which are not covered by the Fund's Report of Independent Registered Public Accounting Firm, are available on the SEC's web site or upon request. |
Affiliated Central Funds |
Information regarding fiscal year to date income earned by the Fund from investments in Fidelity Central Funds is as follows: |
Fund | Income earned |
Fidelity Cash Central Fund | $ 4,772,695 |
Fidelity Consumer Discretionary Central Fund | 5,133,776 |
Fidelity Consumer Staples Central Fund | 7,158,660 |
Fidelity Energy Central Fund | 3,472,331 |
Fidelity Financials Central Fund | 18,566,252 |
Fidelity Floating Rate Central Fund | 14,457,624 |
Fidelity Health Care Central Fund | 4,260,999 |
Fidelity High Income Central Fund 1 | 10,900,140 |
Fidelity Industrials Central Fund | 6,694,115 |
Fidelity Information Technology Central Fund | 4,177,665 |
Fidelity International Equity Central Fund | 8,198,636 |
Fidelity Materials Central Fund | 2,524,209 |
Fidelity Money Market Central Fund | 14,418,304 |
Fidelity Securities Lending Cash Central Fund | 14,209 |
Fidelity Tactical Income Central Fund | 157,109,083 |
Fidelity Telecom Services Central Fund | 2,596,771 |
Fidelity Utilities Central Fund | 3,046,836 |
Total | $ 267,502,305 |
Additional information regarding the Fund's fiscal year to date purchases and sales, including the ownership percentage, of the non-money market Central Funds is as follows: |
Fund | Value, beginning of period | Purchases | Sales
Proceeds | Value,
end of period | % ownership,
end of period |
Fidelity Consumer Discretionary Central Fund | $ 412,360,000 | $ 2,215,273 | $ 26,219,372 | $ 293,016,928 | 55.2% |
Fidelity Consumer Staples Central Fund | 337,240,000 | 3,243,954 | 16,409,489 | 295,622,548 | 55.2% |
Fidelity Energy Central Fund | 427,750,000 | 131,408 | 34,221,179 | 314,002,263 | 55.2% |
Fidelity Financials Central Fund | 765,273,000 | 6,377,816 | 3,515,130 | 457,855,099 | 55.2% |
Fidelity Floating Rate Central Fund | 271,825,000 | 6,149,178 | 52,651,959 | 196,167,573 | 7.7% |
Fidelity Health Care Central Fund | 462,483,000 | 1,668,863 | 18,829,514 | 369,027,997 | 55.2% |
Fidelity High Income Central Fund 1 | 153,712,000 | 5,312,032 | 17,798,226 | 122,947,937 | 49.2% |
Fidelity Industrials Central Fund | 473,294,000 | 2,893,657 | 34,112,669 | 345,077,478 | 55.2% |
Fidelity Information Technology Central Fund | 662,781,000 | 2,117,964 | 7,335,749 | 430,011,894 | 55.2% |
Fidelity International Equity Central Fund | - | 394,714,744 | - | 267,067,885 | 43.0% |
Fidelity Materials Central Fund | 148,405,000 | 859,244 | 10,223,019 | 104,784,844 | 55.2% |
Fidelity Tactical Income Central Fund | 3,496,910,000 | 157,109,084 | 1,046,420,760 | 2,390,712,422 | 59.2% |
Fidelity Telecom Services Central Fund | 143,131,000 | 3,153,969 | 281,220 | 86,521,154 | 55.2% |
Fidelity Utilities Central Fund | 143,573,000 | 1,489,114 | 5,876,159 | 105,514,101 | 55.2% |
Total | $ 7,898,737,000 | $ 587,436,300 | $ 1,273,894,445 | $ 5,778,330,123 | |
Other Information (Unaudited) |
The information in the following tables is based on the combined investment of the Fund and its pro-rata share of the investments of Fidelity's Equity and Fixed-Income Central Funds. The composition of credit quality ratings as a percentage of net assets is as follows: |
U.S. Government and U.S. Government Agency Obligations | 24.1% |
AAA,AA,A | 11.4% |
BBB | 7.9% |
BB | 2.7% |
B | 2.0% |
CCC,CC,C | 0.5% |
Not Rated | 0.7% |
Equities | 51.3% |
Short-Term Investments and Net Other Assets | (0.6)% |
| 100.0% |
We have used ratings from Moody's® Investors Services, Inc. Where Moody's ratings are not available, we have used S&P® ratings. All ratings are as of the report date and do not reflect subsequent downgrades. Percentages are adjusted for the effect of futures contracts, if applicable. |
Distribution of investments by country of issue, as a percentage of total net assets, is as follows. Percentages are adjusted for the effect of futures contracts, if applicable. |
United States of America | 84.4% |
United Kingdom | 2.8% |
Bermuda | 1.7% |
Canada | 1.6% |
Switzerland | 1.3% |
Japan | 1.0% |
Others (individually less than 1%) | 7.2% |
| 100.0% |
Income Tax Information |
The fund intends to elect to defer to its fiscal year ending September 30, 2009 approximately $288,485,511 of losses recognized during the period November 1, 2007 to September 30, 2008. |
See accompanying notes which are an integral part of the financial statements.
Annual Report
Fidelity Asset Manager 50%
Statement of Assets and Liabilities
| September 30, 2008 |
| | |
Assets | | |
Investment in securities, at value - See accompanying schedule: Unaffiliated issuers (cost $18,865,185) | $ 18,884,472 | |
Fidelity Central Funds (cost $6,581,003,900) | 6,058,343,565 | |
Total Investments (cost $6,599,869,085) | | $ 6,077,228,037 |
Cash | | 96 |
Receivable for investments sold | | 278,320,014 |
Receivable for fund shares sold | | 2,582,266 |
Distributions receivable from Fidelity Central Funds | | 14,316,556 |
Receivable for daily variation on futures contracts | | 11,074,120 |
Prepaid expenses | | 5,041 |
Other receivables | | 293,321 |
Total assets | | 6,383,819,451 |
| | |
Liabilities | | |
Payable for investments purchased | $ 13,297,985 | |
Payable for fund shares redeemed | 14,214,704 | |
Accrued management fee | 2,834,874 | |
Distribution fees payable | 10,089 | |
Notes payable to affiliates | 29,971,000 | |
Other affiliated payables | 1,163,239 | |
Other payables and accrued expenses | 313,093 | |
Total liabilities | | 61,804,984 |
| | |
Net Assets | | $ 6,322,014,467 |
Net Assets consist of: | | |
Paid in capital | | $ 7,229,405,198 |
Undistributed net investment income | | 64,010,831 |
Accumulated undistributed net realized gain (loss) on investments and foreign currency transactions | | (442,368,276) |
Net unrealized appreciation (depreciation) on investments | | (529,033,286) |
Net Assets | | $ 6,322,014,467 |
| | |
Calculation of Maximum Offering Price Class A:
Net Asset Value and redemption price per share ($10,611,260 ÷ 819,550 shares) | | $ 12.95 |
| | |
Maximum offering price per share (100/94.25 of $12.95) | | $ 13.74 |
Class T:
Net Asset Value and redemption price per share ($5,474,554 ÷ 423,117 shares) | | $ 12.94 |
| | |
Maximum offering price per share (100/96.50 of $12.94) | | $ 13.41 |
Class B:
Net Asset Value and offering price per share ($2,083,555 ÷ 161,425 shares)A | | $ 12.91 |
| | |
Class C:
Net Asset Value and offering price per share ($4,294,133 ÷ 332,972 shares)A | | $ 12.90 |
| | |
| | |
Asset Manager 50%:
Net Asset Value, offering price and redemption price per share ($6,299,082,145 ÷ 485,541,027 shares) | | $ 12.97 |
| | |
Institutional Class:
Net Asset Value, offering price and redemption price per share ($468,820 ÷ 36,159 shares) | | $ 12.97 |
A Redemption price per share is equal to net asset value less any applicable contingent deferred sales charge.
See accompanying notes which are an integral part of the financial statements.
Annual Report
Statement of Operations
| Year ended September 30, 2008 |
| | |
Investment Income | | |
Dividends | | $ 96,284 |
Interest | | 492,323 |
Income from Fidelity Central Funds | | 267,502,305 |
Total income | | 268,090,912 |
| | |
Expenses | | |
Management fee | $ 39,492,324 | |
Transfer agent fees | 13,515,826 | |
Distribution fees | 103,117 | |
Accounting and security lending fees | 1,481,195 | |
Custodian fees and expenses | 29,388 | |
Independent trustees' compensation | 32,571 | |
Depreciation in deferred trustee compensation account | (1,197) | |
Registration fees | 97,913 | |
Audit | 90,609 | |
Legal | 87,111 | |
Interest | 44,852 | |
Miscellaneous | 145,136 | |
Total expenses before reductions | 55,118,845 | |
Expense reductions | (519,105) | 54,599,740 |
Net investment income (loss) | | 213,491,172 |
Realized and Unrealized Gain (Loss) Net realized gain (loss) on: | | |
Investment securities: | | |
Unaffiliated issuers (net of foreign taxes of $213,100) | 15,155,000 | |
Fidelity Central Funds | (8,912,254) | |
Foreign currency transactions | (99,661) | |
Futures contracts | (64,525,694) | |
Total net realized gain (loss) | | (58,382,609) |
Change in net unrealized appreciation (depreciation) on: Investment securities (net of decrease in deferred foreign taxes of $107,640) | (1,444,700,646) | |
Assets and liabilities in foreign currencies | (2,347) | |
Futures contracts | (17,274,497) | |
Total change in net unrealized appreciation (depreciation) | | (1,461,977,490) |
Net gain (loss) | | (1,520,360,099) |
Net increase (decrease) in net assets resulting from operations | | $ (1,306,868,927) |
Statement of Changes in Net Assets
| Year ended
September 30, 2008 | Year ended
September 30, 2007 |
Increase (Decrease) in Net Assets | | |
Operations | | |
Net investment income (loss) | $ 213,491,172 | $ 267,544,083 |
Net realized gain (loss) | (58,382,609) | 291,165,801 |
Change in net unrealized appreciation (depreciation) | (1,461,977,490) | 485,622,259 |
Net increase (decrease) in net assets resulting from operations | (1,306,868,927) | 1,044,332,143 |
Distributions to shareholders from net investment income | (239,866,976) | (271,879,077) |
Distributions to shareholders from net realized gain | (556,509,728) | (485,946,437) |
Total distributions | (796,376,704) | (757,825,514) |
Share transactions - net increase (decrease) | (541,463,365) | (523,997,125) |
Total increase (decrease) in net assets | (2,644,708,996) | (237,490,496) |
| | |
Net Assets | | |
Beginning of period | 8,966,723,463 | 9,204,213,959 |
End of period (including undistributed net investment income of $64,010,831 and undistributed net investment income of $82,560,257, respectively) | $ 6,322,014,467 | $ 8,966,723,463 |
See accompanying notes which are an integral part of the financial statements.
Annual Report
Financial Highlights - Class A
Years ended September 30, | 2008 | 2007 G |
Selected Per-Share Data | | |
Net asset value, beginning of period | $ 17.08 | $ 16.57 |
Income from Investment Operations | | |
Net investment income (loss) E | .36 | .43 |
Net realized and unrealized gain (loss) | (2.96) | 1.45 |
Total from investment operations | (2.60) | 1.88 |
Distributions from net investment income | (.43) | (.47) |
Distributions from net realized gain | (1.10) | (.90) |
Total distributions | (1.53) | (1.37) |
Net asset value, end of period | $ 12.95 | $ 17.08 |
Total Return B, C, D | (16.56)% | 11.93% |
Ratios to Average Net Assets H | | |
Expenses before reductions | .99% | 1.01% A |
Expenses net of fee waivers, if any | .99% | 1.01% A |
Expenses net of all reductions | .98% | 1.00% A |
Net investment income (loss) | 2.46% | 2.62% A |
Supplemental Data | | |
Net assets, end of period (000 omitted) | $ 10,611 | $ 4,432 |
Portfolio turnover rate F | 8% | 12% |
A Annualized
B Total returns for periods of less than one year are not annualized.
C Total returns would have been lower had certain expenses not been reduced during the periods shown.
D Total returns do not include the effect of the sales charges.
E Calculated based on average shares outstanding during the period.
F Amount does not include the portfolio activity of any underlying Fidelity Central Funds.
G For the period October 2, 2006 (commencement of sale of shares) to September 30, 2007.
H Expense ratios reflect operating expenses of the class. Expenses before reductions do not reflect amounts reimbursed by the investment adviser or reductions from brokerage service arrangements or other expense offset arrangements and do not represent the amount paid by the class during periods when reimbursements or reductions occur. Expense ratios before reductions for start-up periods may not be representative of longer-term operating periods. Expenses net of fee waivers reflect expenses after reimbursement by the investment adviser but prior to reductions from brokerage service arrangements or other expense offset arrangements. Expenses net of all reductions represent the net expenses paid by the class. Fees and expenses of the underlying Fidelity Central Funds are not included in the Fund's expense ratio. The Fund indirectly bears its proportionate share of the expenses of any underlying Fidelity Central Funds. Based on their most recent shareholder report date, the expenses ranged from less than .01% to .03%.
Financial Highlights - Class T
Years ended September 30, | 2008 | 2007 G |
Selected Per-Share Data | | |
Net asset value, beginning of period | $ 17.06 | $ 16.57 |
Income from Investment Operations | | |
Net investment income (loss) E | .33 | .39 |
Net realized and unrealized gain (loss) | (2.96) | 1.46 |
Total from investment operations | (2.63) | 1.85 |
Distributions from net investment income | (.39) | (.46) |
Distributions from net realized gain | (1.10) | (.90) |
Total distributions | (1.49) | (1.36) |
Net asset value, end of period | $ 12.94 | $ 17.06 |
Total Return B, C, D | (16.76)% | 11.68% |
Ratios to Average Net Assets H | | |
Expenses before reductions | 1.24% | 1.24% A |
Expenses net of fee waivers, if any | 1.24% | 1.24% A |
Expenses net of all reductions | 1.23% | 1.23% A |
Net investment income (loss) | 2.21% | 2.40% A |
Supplemental Data | | |
Net assets, end of period (000 omitted) | $ 5,475 | $ 3,148 |
Portfolio turnover rate F | 8% | 12% |
A Annualized
B Total returns for periods of less than one year are not annualized.
C Total returns would have been lower had certain expenses not been reduced during the periods shown.
D Total returns do not include the effect of the sales charges.
E Calculated based on average shares outstanding during the period.
F Amount does not include the portfolio activity of any underlying Fidelity Central Funds.
G For the period October 2, 2006 (commencement of sale of shares) to September 30, 2007.
H Expense ratios reflect operating expenses of the class. Expenses before reductions do not reflect amounts reimbursed by the investment adviser or reductions from brokerage service arrangements or other expense offset arrangements and do not represent the amount paid by the class during periods when reimbursements or reductions occur. Expense ratios before reductions for start-up periods may not be representative of longer-term operating periods. Expenses net of fee waivers reflect expenses after reimbursement by the investment adviser but prior to reductions from brokerage service arrangements or other expense offset arrangements. Expenses net of all reductions represent the net expenses paid by the class. Fees and expenses of the underlying Fidelity Central Funds are not included in the Fund's expense ratio. The Fund indirectly bears its proportionate share of the expenses of any underlying Fidelity Central Funds. Based on their recent shareholder report date, the expenses ranged from less than .01% to .03%.
See accompanying notes which are an integral part of the financial statements.
Annual Report
Financial Highlights - Class B
Years ended September 30, | 2008 | 2007 G |
Selected Per-Share Data | | |
Net asset value, beginning of period | $ 17.02 | $ 16.57 |
Income from Investment Operations | | |
Net investment income (loss) E | .24 | .30 |
Net realized and unrealized gain (loss) | (2.96) | 1.46 |
Total from investment operations | (2.72) | 1.76 |
Distributions from net investment income | (.29) | (.41) |
Distributions from net realized gain | (1.10) | (.90) |
Total distributions | (1.39) | (1.31) |
Net asset value, end of period | $ 12.91 | $ 17.02 |
Total Return B, C, D | (17.26)% | 11.03% |
Ratios to Average Net Assets H | | |
Expenses before reductions | 1.79% | 1.79% A |
Expenses net of fee waivers, if any | 1.79% | 1.79% A |
Expenses net of all reductions | 1.79% | 1.78% A |
Net investment income (loss) | 1.65% | 1.84% A |
Supplemental Data | | |
Net assets, end of period (000 omitted) | $ 2,084 | $ 1,007 |
Portfolio turnover rate F | 8% | 12% |
A Annualized
B Total returns for periods of less than one year are not annualized.
C Total returns would have been lower had certain expenses not been reduced during the periods shown.
D Total returns do not include the effect of the contingent deferred sales charge.
E Calculated based on average shares outstanding during the period.
F Amount does not include the portfolio activity of any underlying Fidelity Central Funds.
G For the period October 2, 2006 (commencement of sale of shares) to September 30, 2007.
H Expense ratios reflect operating expenses of the class. Expenses before reductions do not reflect amounts reimbursed by the investment adviser or reductions from brokerage service arrangements or other expense offset arrangements and do not represent the amount paid by the class during periods when reimbursements or reductions occur. Expense ratios before reductions for start-up periods may not be representative of longer-term operating periods. Expenses net of fee waivers reflect expenses after reimbursement by the investment adviser but prior to reductions from brokerage service arrangements or other expense offset arrangements. Expenses net of all reductions represent the net expenses paid by the class. Fees and expenses of the underlying Fidelity Central Funds are not included in the Fund's expense ratio. The Fund indirectly bears its proportionate share of the expenses of any underlying Fidelity Central Funds. Based on their recent shareholder report date, the expenses ranged from less than .01% to .03%.
Financial Highlights - Class C
Years ended September 30, | 2008 | 2007 G |
Selected Per-Share Data | | |
Net asset value, beginning of period | $ 17.00 | $ 16.57 |
Income from Investment Operations | | |
Net investment income (loss) E | .25 | .31 |
Net realized and unrealized gain (loss) | (2.95) | 1.45 |
Total from investment operations | (2.70) | 1.76 |
Distributions from net investment income | (.30) | (.43) |
Distributions from net realized gain | (1.10) | (.90) |
Total distributions | (1.40) | (1.33) |
Net asset value, end of period | $ 12.90 | $ 17.00 |
Total Return B, C, D | (17.18)% | 11.08% |
Ratios to Average Net Assets H | | |
Expenses before reductions | 1.76% | 1.75% A |
Expenses net of fee waivers, if any | 1.76% | 1.75% A |
Expenses net of all reductions | 1.76% | 1.74% A |
Net investment income (loss) | 1.68% | 1.88% A |
Supplemental Data | | |
Net assets, end of period (000 omitted) | $ 4,294 | $ 2,840 |
Portfolio turnover rate F | 8% | 12% |
A Annualized
B Total returns for periods of less than one year are not annualized.
C Total returns would have been lower had certain expenses not been reduced during the periods shown.
D Total returns do not include the effect of the contingent deferred sales charge.
E Calculated based on average shares outstanding during the period.
F Amount does not include the portfolio activity of any underlying Fidelity Central Funds.
G For the period October 2, 2006 (commencement of sale of shares) to September 30, 2007.
H Expense ratios reflect operating expenses of the class. Expenses before reductions do not reflect amounts reimbursed by the investment adviser or reductions from brokerage service arrangements or other expense offset arrangements and do not represent the amount paid by the class during periods when reimbursements or reductions occur. Expense ratios before reductions for start-up periods may not be representative of longer-term operating periods. Expenses net of fee waivers reflect expenses after reimbursement by the investment adviser but prior to reductions from brokerage service arrangements or other expense offset arrangements. Expenses net of all reductions represent the net expenses paid by the class. Fees and expenses of the underlying Fidelity Central Funds are not included in the Fund's expense ratio. The Fund indirectly bears its proportionate share of the expenses of any underlying Fidelity Central Funds. Based on their recent shareholder report date, the expenses ranged from less than .01% to .03%.
See accompanying notes which are an integral part of the financial statements.
Annual Report
Financial Highlights - Asset Manager 50%
Years ended September 30, | 2008 | 2007 | 2006 | 2005 | 2004 |
Selected Per-Share Data | | | | | |
Net asset value, beginning of period | $ 17.10 | $ 16.60 | $ 16.28 | $ 15.58 | $ 14.95 |
Income from Investment Operations | | | | | |
Net investment income (loss) B | .41 | .49 | .45 | .41 D | .33 |
Net realized and unrealized gain (loss) | (2.97) | 1.41 | .73 | .69 | .57 |
Total from investment operations | (2.56) | 1.90 | 1.18 | 1.10 | .90 |
Distributions from net investment income | (.47) | (.50) | (.45) | (.40) | (.27) |
Distributions from net realized gain | (1.10) | (.90) | (.41) | - | - |
Total distributions | (1.57) | (1.40) | (.86) | (.40) | (.27) |
Net asset value, end of period | $ 12.97 | $ 17.10 | $ 16.60 | $ 16.28 | $ 15.58 |
Total Return A | (16.34)% | 12.02% | 7.50% | 7.15% | 6.00% |
Ratios to Average Net Assets E | | | | | |
Expenses before reductions | .71% | .71% | .72% | .73% | .74% |
Expenses net of fee waivers, if any | .71% | .71% | .72% | .73% | .74% |
Expenses net of all reductions | .70% | .70% | .71% | .72% | .73% |
Net investment income (loss) | 2.74% | 2.93% | 2.79% | 2.55% D | 2.12% |
Supplemental Data | | | | | |
Net assets, end of period (000 omitted) | $ 6,299,082 | $ 8,955,110 | $ 9,204,214 | $ 10,189,947 | $ 10,903,313 |
Portfolio turnover rate C | 8% | 12% | 65% F | 32% F | 78% |
A Total returns would have been lower had certain expenses not been reduced during the periods shown.
B Calculated based on average shares outstanding during the period.
C Amount does not include the portfolio activity of any underlying Fidelity Central Funds.
D Investment income per share reflects a special dividend which amounted to $0.04 per share. Excluding the special dividend, the ratio of net investment income (loss) to average net assets would have been 2.28%.
E Expense ratios reflect operating expenses of the class. Expenses before reductions do not reflect amounts reimbursed by the investment adviser or reductions from brokerage service arrangements or other expense offset arrangements and do not represent the amount paid by the class during periods when reimbursements or reductions occur. Expenses net of fee waivers reflect expenses after reimbursement by the investment adviser but prior to reductions from brokerage service arrangements or other expense offset arrangements. Expenses net of all reductions represent the net expenses paid by the class. Fees and expenses of the underlying Fidelity Central Funds are not included in the Fund's expense ratio. The Fund indirectly bears its proportionate share of the expenses of any underlying Fidelity Central Funds. Based on their most recent shareholder report date, the expenses ranged from less than .01% to .03%.
F Portfolio turnover rate excludes securities received or delivered in-kind.
Financial Highlights - Institutional Class
Years ended September 30, | 2008 | 2007 F |
Selected Per-Share Data | | |
Net asset value, beginning of period | $ 17.11 | $ 16.57 |
Income from Investment Operations | | |
Net investment income (loss) D | .42 | .48 |
Net realized and unrealized gain (loss) | (2.98) | 1.46 |
Total from investment operations | (2.56) | 1.94 |
Distributions from net investment income | (.48) | (.50) |
Distributions from net realized gain | (1.10) | (.90) |
Total distributions | (1.58) | (1.40) |
Net asset value, end of period | $ 12.97 | $ 17.11 |
Total Return B, C | (16.30)% | 12.20% |
Ratios to Average Net Assets G | | |
Expenses before reductions | .67% | .72% A |
Expenses net of fee waivers, if any | .67% | .72% A |
Expenses net of all reductions | .67% | .72% A |
Net investment income (loss) | 2.77% | 2.91% A |
Supplemental Data | | |
Net assets, end of period (000 omitted) | $ 469 | $ 186 |
Portfolio turnover rate E | 8% | 12% |
A Annualized
B Total returns for periods of less than one year are not annualized.
C Total returns would have been lower had certain expenses not been reduced during the periods shown.
D Calculated based on average shares outstanding during the period.
E Amount does not include the portfolio activity of any underlying Fidelity Central Funds.
F For the period October 2, 2006 (commencement of sale of shares) to September 30, 2007.
G Expense ratios reflect operating expenses of the class. Expenses before reductions do not reflect amounts reimbursed by the investment adviser or reductions from brokerage service arrangements or other expense offset arrangements and do not represent the amount paid by the class during periods when reimbursements or reductions occur. Expense ratios before reductions for start-up periods may not be representative of longer-term operating periods. Expenses net of fee waivers reflect expenses after reimbursement by the investment adviser but prior to reductions from brokerage service arrangements or other expense offset arrangements. Expenses net of all reductions represent the net expenses paid by the class. Fees and expenses of the underlying Fidelity Central Funds are not included in the Fund's expense ratio. The Fund indirectly bears its proportionate share of the expenses of any underlying Fidelity Central Funds. Based on their most recent shareholder report date, the expenses ranged from less than .01% to .03%.
See accompanying notes which are an integral part of the financial statements.
Annual Report
Fidelity Asset Manager 60%
Investment Changes (Unaudited)
The information in the following tables is based on the combined investments of the Fund and its pro-rata share of the investments of Fidelity's Equity and Fixed-Income Central Funds.
Top Ten Stocks as of September 30, 2008 |
| % of fund's
net assets | % of fund's net assets
6 months ago |
Apple, Inc. | 0.9 | 0.1 |
Procter & Gamble Co. | 0.9 | 0.8 |
General Electric Co. | 0.7 | 0.6 |
Bank of America Corp. | 0.6 | 0.4 |
JPMorgan Chase & Co. | 0.6 | 0.6 |
Wells Fargo & Co. | 0.6 | 0.4 |
The Coca-Cola Co. | 0.6 | 0.5 |
Genentech, Inc. | 0.5 | 0.2 |
PepsiCo, Inc. | 0.5 | 0.4 |
Citigroup, Inc. | 0.4 | 0.4 |
| 6.3 | |
Asset Allocation (% of fund's net assets) |
As of September 30, 2008 | As of March 31, 2008 |
| Stock class and
Equity Futures 58.4% | | | Stock class and
Equity Futures 61.2% | |
| Bond class 25.1% | | | Bond class 39.8% | |
| Short-term class 16.5% | | | Short-term class* (1.0)% | |
| | | | | |
| | | | | |
Asset allocations in the pie charts reflect the categorization of assets as defined in the Fund's prospectus in effect as of the time periods indicated above. Percentages are adjusted for the effect of futures contracts and swap contracts, if applicable. |
*Short-term class is not included in the pie chart.
Annual Report
Fidelity Asset Manager 60%
The information in the following table is based on the direct investments of the Fund.
Fund Holdings as of September 30, 2008 |
| % of fund's
net assets |
Equity Central Funds | |
Fidelity Financials Central Fund | 8.4 |
Fidelity Information Technology Central Fund | 7.9 |
Fidelity Health Care Central Fund | 6.8 |
Fidelity Industrials Central Fund | 6.4 |
Fidelity International Central Fund | 5.9 |
Fidelity Energy Central Fund | 5.8 |
Fidelity Consumer Staples Central Fund | 5.4 |
Fidelity Consumer Discretionary Central Fund | 5.4 |
Fidelity Utilities Central Fund | 1.9 |
Fidelity Materials Central Fund | 1.9 |
Fidelity Telecom Services Central Fund | 1.6 |
Total Equity Central Funds | 57.4 |
Fixed-Income Central Funds | |
Investment Grade Fixed-Income Funds | 28.9 |
High Yield Fixed-Income Funds | 3.2 |
Total Fixed-Income Central Funds | 32.1 |
Money Market Central Funds | 18.9 |
Other Short-Term Investments and Net Other Assets | (8.4) |
Total | 100.0 |
At period end, foreign investments including the Fund's pro-rata share of the underlying Central Funds was 17.7% of net assets.
A holdings listing for the Fund, which presents direct holdings as well as the pro-rata share of any securities and other investments held indirectly through its investment in underlying non-money market Fidelity Central Funds, is available at fidelity.com and/or advisor.fidelity.com, as applicable.
Annual Report
Fidelity Asset Manager 60%
Investments September 30, 2008
Showing Percentage of Net Assets
Equity Central Funds - 57.4% |
| Shares | | Value |
Fidelity Consumer Discretionary Central Fund (c) | 17,544 | | $ 1,621,243 |
Fidelity Consumer Staples Central Fund (c) | 14,227 | | 1,635,731 |
Fidelity Energy Central Fund (c) | 15,726 | | 1,737,408 |
Fidelity Financials Central Fund (c) | 38,466 | | 2,533,356 |
Fidelity Health Care Central Fund (c) | 20,499 | | 2,041,880 |
Fidelity Industrials Central Fund (c) | 18,093 | | 1,909,359 |
Fidelity Information Technology Central Fund (c) | 24,227 | | 2,379,293 |
Fidelity International Equity Central Fund (c) | 26,254 | | 1,762,191 |
Fidelity Materials Central Fund (c) | 5,268 | | 579,741 |
Fidelity Telecom Services Central Fund (c) | 5,337 | | 478,691 |
Fidelity Utilities Central Fund (c) | 6,255 | | 583,808 |
TOTAL EQUITY CENTRAL FUNDS (Cost $21,047,033) | 17,262,701 |
Fixed-Income Central Funds - 32.1% |
| | | |
Investment Grade Fixed-Income Funds - 28.9% |
Fidelity Tactical Income Central Fund (c) | 96,750 | | 8,688,176 |
High Yield Fixed-Income Funds - 3.2% |
Fidelity Floating Rate Central Fund (c) | 7,065 | | 599,148 |
Fidelity High Income Central Fund 1 (c) | 4,406 | | 376,783 |
TOTAL HIGH YIELD FIXED-INCOME FUNDS | 975,931 |
TOTAL FIXED-INCOME CENTRAL FUNDS (Cost $10,153,069) | 9,664,107 |
Money Market Central Funds - 18.9% |
| | | |
Fidelity Cash Central Fund, 1.92% (a)
(Cost $5,674,692) | 5,674,692 | | 5,674,692 |
U.S. Treasury Obligations - 0.2% |
| Principal Amount | | |
U.S. Treasury Bills, yield at date of purchase 1.59% to 1.68% 10/16/08 to 12/4/08 (b)
(Cost $59,935) | | $ 60,000 | | 59,963 |
TOTAL INVESTMENT PORTFOLIO - 108.6% (Cost $36,934,729) | | 32,661,463 |
NET OTHER ASSETS - (8.6)% | | (2,578,348) |
NET ASSETS - 100% | $ 30,083,115 |
Futures Contracts |
| Expiration Date | | Underlying Face Amount at Value | | Unrealized Appreciation/(Depreciation) |
Purchased |
Equity Index Contracts |
15 CME E-mini S&P 500 Index Contracts | Dec. 2008 | | $ 875,550 | | $ (21,732) |
The face value of futures purchased as a percentage of net assets - 2.9% |
Legend |
(a) Affiliated fund that is available only to investment companies and other accounts managed by Fidelity Investments. The rate quoted is the annualized seven-day yield of the fund at period end. A complete unaudited listing of the fund's holdings as of its most recent quarter end is available upon request. |
(b) Security or a portion of the security was pledged to cover margin requirements for futures contracts. At the period end, the value of securities pledged amounted to $59,963. |
(c) Affiliated fund that is available only to investment companies and other accounts managed by Fidelity Investments. A complete unaudited schedule of portfolio holdings for each Fidelity Central Fund is filed with the SEC for the first and third quarters of each fiscal year on Form N-Q and is available upon request or at the SEC's web site at www.sec.gov. An unaudited holdings listing for the Fund, which presents direct holdings as well as the pro rata share of securities and other investments held indirectly through its investment in underlying non-money market Fidelity Central Funds, is available at fidelity.com and/or advisor.fidelity.com, as applicable. In addition, each Fidelity Central Fund's financial statements, which are not covered by the Fund's Report of Independent Registered Public Accounting Firm, are available on the SEC's web site or upon request. |
Affiliated Central Funds |
Information regarding fiscal year to date income earned by the Fund from investments in Fidelity Central Funds is as follows: |
Fund | Income earned |
Fidelity Cash Central Fund | $ 46,200 |
Fidelity Consumer Discretionary Central Fund | 12,405 |
Fidelity Consumer Staples Central Fund | 17,971 |
Fidelity Energy Central Fund | 8,216 |
Fidelity Financials Central Fund | 44,448 |
Fidelity Floating Rate Central Fund | 19,452 |
Fidelity Health Care Central Fund | 9,473 |
Fidelity High Income Central Fund 1 | 21,786 |
Fidelity Industrials Central Fund | 15,728 |
Fidelity Information Technology Central Fund | 10,164 |
Fidelity International Equity Central Fund | 37,157 |
Fidelity Materials Central Fund | 5,193 |
Fidelity Tactical Income Central Fund | 202,389 |
Fidelity Telecom Services Central Fund | 5,498 |
Fidelity Utilities Central Fund | 7,251 |
Total | $ 463,331 |
Additional information regarding the Fund's fiscal year to date purchases and sales, including the ownership percentage, of the non-money market Central Funds is as follows: |
Fund | Value, beginning of period | Purchases | Sales
Proceeds | Value,
end of period | % ownership, end of period |
Fidelity Consumer Discretionary Central Fund | $ - | $ 1,874,289 | $ 26,464 | $ 1,621,243 | 0.3% |
Fidelity Consumer Staples Central Fund | - | 1,763,895 | 5,094 | 1,635,731 | 0.3% |
Fidelity Energy Central Fund | - | 2,249,148 | 32,120 | 1,737,408 | 0.3% |
Fidelity Financials Central Fund | - | 3,180,617 | - | 2,533,356 | 0.3% |
Fidelity Floating Rate Central Fund | - | 659,847 | - | 599,148 | 0.0% |
Fidelity Health Care Central Fund | - | 2,264,856 | 3,414 | 2,041,880 | 0.3% |
Fidelity High Income Central Fund 1 | - | 449,300 | 28,002 | 376,783 | 0.2% |
Fidelity Industrials Central Fund | - | 2,280,270 | 36,049 | 1,909,359 | 0.3% |
Fidelity Information Technology Central Fund | - | 3,031,997 | - | 2,379,293 | 0.3% |
Fidelity International Equity Central Fund | - | 2,430,054 | - | 1,762,191 | 0.3% |
Fidelity Materials Central Fund | - | 746,137 | 8,390 | 579,741 | 0.3% |
Fidelity Tactical Income Central Fund | - | 9,487,732 | 400,062 | 8,688,176 | 0.2% |
Fidelity Telecom Services Central Fund | - | 613,427 | - | 478,691 | 0.3% |
Fidelity Utilities Central Fund | - | 728,780 | - | 583,808 | 0.3% |
Total | $ - | $ 31,760,349 | $ 539,595 | $ 26,926,808 | |
Other Information (Unaudited) |
The information in the following tables is based on the combined investment of the Fund and its pro-rata share of the investments of Fidelity's Equity and Fixed-Income Central Funds. The composition of credit quality ratings as a percentage of net assets is as follows: |
U.S. Government and U.S. Government Agency Obligations | 18.2% |
AAA,AA,A | 9.0% |
BBB | 6.0% |
BB | 1.8% |
B | 1.3% |
CCC,CC,C | 0.2% |
Not Rated | 0.6% |
Equities | 58.6% |
Short-Term Investments and Net Other Assets | 4.3% |
| 100.0% |
We have used ratings from Moody's® Investors Services, Inc. Where Moody's ratings are not available, we have used S&P® ratings. All ratings are as of the report date and do not reflect subsequent downgrades. Percentages are adjusted for the effect of futures contracts, if applicable. |
Distribution of investments by country of issue, as a percentage of total net assets, is as follows. Percentages are adjusted for the effect of futures contracts, if applicable. |
United States of America | 82.3% |
United Kingdom | 2.9% |
Bermuda | 2.0% |
Switzerland | 1.6% |
Canada | 1.6% |
Japan | 1.4% |
Cayman Islands | 1.0% |
Germany | 1.0% |
France | 1.0% |
Others (individually less than 1%) | 5.2% |
| 100.0% |
Income Tax Information |
At September 30, 2008, the fund had a capital loss carryforward of approximately $76,825 all of which will expire on September 30, 2016. |
The fund intends to elect to defer to its fiscal year ending September 30, 2009 approximately $1,768,211 of losses recognized during the period November 1, 2007 to September 30, 2008. |
See accompanying notes which are an integral part of the financial statements.
Annual Report
Fidelity Asset Manager 60%
Statement of Assets and Liabilities
| September 30, 2008 |
| | |
Assets | | |
Investment in securities, at value - See accompanying schedule: Unaffiliated issuers (cost $59,935) | $ 59,963 | |
Fidelity Central Funds (cost $36,874,794) | 32,601,500 | |
Total Investments (cost $36,934,729) | | $ 32,661,463 |
Cash | | 24,163 |
Receivable for fund shares sold | | 66,702 |
Distributions receivable from Fidelity Central Funds | | 39,671 |
Receivable for daily variation on futures contracts | | 36,450 |
Receivable from investment adviser for expense reductions | | 43,276 |
Other affiliated receivables | | 1,410 |
Total assets | | 32,873,135 |
| | |
Liabilities | | |
Payable for investments purchased | $ 2,588,863 | |
Payable for fund shares redeemed | 150,148 | |
Accrued management fee | 12,821 | |
Distribution fees payable | 3,516 | |
Other affiliated payables | 4,666 | |
Other payables and accrued expenses | 30,006 | |
Total liabilities | | 2,790,020 |
| | |
Net Assets | | $ 30,083,115 |
Net Assets consist of: | | |
Paid in capital | | $ 34,337,349 |
Undistributed net investment income | | 231,837 |
Accumulated undistributed net realized gain (loss) on investments and foreign currency transactions | | (191,073) |
Net unrealized appreciation (depreciation) on investments | | (4,294,998) |
Net Assets | | $ 30,083,115 |
| | |
Calculation of Maximum Offering Price Class A:
Net Asset Value and redemption price per share ($3,134,919 ÷ 394,354 shares) | | $ 7.95 |
| | |
Maximum offering price per share (100/94.25 of $7.95) | | $ 8.44 |
Class T:
Net Asset Value and redemption price per share ($1,228,087 ÷ 154,853 shares) | | $ 7.93 |
| | |
Maximum offering price per share (100/96.50 of $7.93) | | $ 8.22 |
Class B:
Net Asset Value and offering price per share ($1,073,692 ÷ 135,858 shares)A | | $ 7.90 |
| | |
Class C:
Net Asset Value and offering price per share ($1,642,529 ÷ 207,830 shares)A | | $ 7.90 |
| | |
| | |
Asset Manager 60%:
Net Asset Value, offering price and redemption price per share ($22,211,872 ÷ 2,789,550 shares) | | $ 7.96 |
| | |
Institutional Class:
Net Asset Value, offering price and redemption price per share ($792,016 ÷ 99,464 shares) | | $ 7.96 |
A Redemption price per share is equal to net asset value less any applicable contingent deferred sales charge.
See accompanying notes which are an integral part of the financial statements.
Annual Report
Fidelity Asset Manager 60%
Financial Statements - continued
Statement of Operations
For the period October 9, 2007 (commencement of operations) to September 30, 2008 |
| | |
Investment Income | | |
Interest | | $ 4,248 |
Income from Fidelity Central Funds | | 463,331 |
Total income | | 467,579 |
| | |
Expenses | | |
Management fee | $ 82,594 | |
Transfer agent fees | 26,521 | |
Distribution fees | 29,670 | |
Accounting fees and expenses | 7,292 | |
Custodian fees and expenses | 5,014 | |
Independent trustees' compensation | 50 | |
Registration fees | 117,494 | |
Audit | 36,878 | |
Legal | 27 | |
Miscellaneous | 2,039 | |
Total expenses before reductions | 307,579 | |
Expense reductions | (144,088) | 163,491 |
Net investment income (loss) | | 304,088 |
Realized and Unrealized Gain (Loss) Net realized gain (loss) on: | | |
Investment securities: | | |
Fidelity Central Funds | (20,554) | |
Foreign currency transactions | (50) | |
Futures contracts | (206,048) | |
Total net realized gain (loss) | | (226,652) |
Change in net unrealized appreciation (depreciation) on: Investment securities | (4,273,266) | |
Futures contracts | (21,732) | |
Total change in net unrealized appreciation (depreciation) | | (4,294,998) |
Net gain (loss) | | (4,521,650) |
Net increase (decrease) in net assets resulting from operations | | $ (4,217,562) |
Statement of Changes in Net Assets
| For the period
October 9, 2007 (commencement of operations) to September 30, 2008 |
Increase (Decrease) in Net Assets | |
Operations | |
Net investment income (loss) | $ 304,088 |
Net realized gain (loss) | (226,652) |
Change in net unrealized appreciation (depreciation) | (4,294,998) |
Net increase (decrease) in net assets resulting from operations | (4,217,562) |
Distributions to shareholders from net investment income | (36,701) |
Share transactions - net increase (decrease) | 34,337,378 |
Total increase (decrease) in net assets | 30,083,115 |
| |
Net Assets | |
Beginning of period | - |
End of period (including undistributed net investment income of $231,837) | $ 30,083,115 |
See accompanying notes which are an integral part of the financial statements.
Annual Report
Financial Highlights - Class A
Year ended September 30, | 2008 G |
Selected Per-Share Data | |
Net asset value, beginning of period | $ 10.00 |
Income from Investment Operations | |
Net investment income (loss) E | .17 |
Net realized and unrealized gain (loss) | (2.18) |
Total from investment operations | (2.01) |
Distributions from net investment income | (.04) |
Net asset value, end of period | $ 7.95 |
Total Return B, C, D | (20.16)% |
Ratios to Average Net Assets H | |
Expenses before reductions | 2.18% A |
Expenses net of fee waivers, if any | 1.16% A |
Expenses net of all reductions | 1.16% A |
Net investment income (loss) | 1.99% A |
Supplemental Data | |
Net assets, end of period (000 omitted) | $ 3,135 |
Portfolio turnover rate F | 4% A |
A Annualized
B Total returns for periods of less than one year are not annualized.
C Total returns would have been lower had certain expenses not been reduced during the periods shown.
D Total returns do not include the effect of the sales charges.
E Calculated based on average shares outstanding during the period.
F Amount does not include the portfolio activity of any underlying Fidelity Central Funds.
G For the period October 9, 2007 (commencement of operations) to September 30, 2008.
H Expense ratios reflect operating expenses of the class. Expenses before reductions do not reflect amounts reimbursed by the investment adviser or reductions from brokerage service arrangements or other expense offset arrangements and do not represent the amount paid by the class during periods when reimbursements or reductions occur. Expense ratios before reductions for start-up periods may not be representative of longer-term operating periods. Expenses net of fee waivers reflect expenses after reimbursement by the investment adviser but prior to reductions from brokerage service arrangements or other expense offset arrangements. Expenses net of all reductions represent the net expenses paid by the class. Fees and expenses of the underlying Fidelity Central Funds are not included in the Fund's expense ratio. The Fund indirectly bears its proportionate share of the expenses of any underlying Fidelity Central Funds. Based on their most recent shareholder report date, the expenses ranged from less than .01% to .03%.
Financial Highlights - Class T
Year ended September 30, | 2008 G |
Selected Per-Share Data | |
Net asset value, beginning of period | $ 10.00 |
Income from Investment Operations | |
Net investment income (loss) E | .15 |
Net realized and unrealized gain (loss) | (2.19) |
Total from investment operations | (2.04) |
Distributions from net investment income | (.03) |
Net asset value, end of period | $ 7.93 |
Total Return B, C, D | (20.42)% |
Ratios to Average Net Assets H | |
Expenses before reductions | 2.34% A |
Expenses net of fee waivers, if any | 1.42% A |
Expenses net of all reductions | 1.42% A |
Net investment income (loss) | 1.73% A |
Supplemental Data | |
Net assets, end of period (000 omitted) | $ 1,228 |
Portfolio turnover rate F | 4% A |
A Annualized
B Total returns for periods of less than one year are not annualized.
C Total returns would have been lower had certain expenses not been reduced during the periods shown.
D Total returns do not include the effect of the sales charges.
E Calculated based on average shares outstanding during the period.
F Amount does not include the portfolio activity of any underlying Fidelity Central Funds.
G For the period October 9, 2007 (commencement of operations) to September 30, 2008.
H Expense ratios reflect operating expenses of the class. Expenses before reductions do not reflect amounts reimbursed by the investment adviser or reductions from brokerage service arrangements or other expense offset arrangements and do not represent the amount paid by the class during periods when reimbursements or reductions occur. Expense ratios before reductions for start-up periods may not be representative of longer-term operating periods. Expenses net of fee waivers reflect expenses after reimbursement by the investment adviser but prior to reductions from brokerage service arrangements or other expense offset arrangements. Expenses net of all reductions represent the net expenses paid by the class. Fees and expenses of the underlying Fidelity Central Funds are not included in the Fund's expense ratio. The Fund indirectly bears its proportionate share of the expenses of any underlying Fidelity Central Funds. Based on their most recent shareholder report date, the expenses ranged from less than .01% to .03%.
See accompanying notes which are an integral part of the financial statements.
Annual Report
Financial Highlights - Class B
Year ended September 30, | 2008 G |
Selected Per-Share Data | |
Net asset value, beginning of period | $ 10.00 |
Income from Investment Operations | |
Net investment income (loss) E | .11 |
Net realized and unrealized gain (loss) | (2.19) |
Total from investment operations | (2.08) |
Distributions from net investment income | (.02) |
Net asset value, end of period | $ 7.90 |
Total Return B, C, D | (20.81)% |
Ratios to Average Net Assets H | |
Expenses before reductions | 2.85% A |
Expenses net of fee waivers, if any | 1.92% A |
Expenses net of all reductions | 1.92% A |
Net investment income (loss) | 1.23% A |
Supplemental Data | |
Net assets, end of period (000 omitted) | $ 1,074 |
Portfolio turnover rate F | 4% A |
A Annualized
B Total returns for periods of less than one year are not annualized.
C Total returns would have been lower had certain expenses not been reduced during the periods shown.
D Total returns do not include the effect of the contingent deferred sales charge.
E Calculated based on average shares outstanding during the period.
F Amount does not include the portfolio activity of any underlying Fidelity Central Funds.
G For the period October 9, 2007 (commencement of operations) to September 30, 2008.
H Expense ratios reflect operating expenses of the class. Expenses before reductions do not reflect amounts reimbursed by the investment adviser or reductions from brokerage service arrangements or other expense offset arrangements and do not represent the amount paid by the class during periods when reimbursements or reductions occur. Expense ratios before reductions for start-up periods may not be representative of longer-term operating periods. Expenses net of fee waivers reflect expenses after reimbursement by the investment adviser but prior to reductions from brokerage service arrangements or other expense offset arrangements. Expenses net of all reductions represent the net expenses paid by the class. Fees and expenses of the underlying Fidelity Central Funds are not included in the Fund's expense ratio. The Fund indirectly bears its proportionate share of the expenses of any underlying Fidelity Central Funds. Based on their most recent shareholder report date, the expenses ranged from less than .01% to .03%.
Financial Highlights - Class C
Year ended September 30, | 2008 G |
Selected Per-Share Data | |
Net asset value, beginning of period | $ 10.00 |
Income from Investment Operations | |
Net investment income (loss) E | .11 |
Net realized and unrealized gain (loss) | (2.19) |
Total from investment operations | (2.08) |
Distributions from net investment income | (.02) |
Net asset value, end of period | $ 7.90 |
Total Return B, C, D | (20.81)% |
Ratios to Average Net Assets H | |
Expenses before reductions | 2.80% A |
Expenses net of fee waivers, if any | 1.91% A |
Expenses net of all reductions | 1.91% A |
Net investment income (loss) | 1.24% A |
Supplemental Data | |
Net assets, end of period (000 omitted) | $ 1,643 |
Portfolio turnover rate F | 4% A |
A Annualized
B Total returns for periods of less than one year are not annualized.
C Total returns would have been lower had certain expenses not been reduced during the periods shown.
D Total returns do not include the effect of the contingent deferred sales charge.
E Calculated based on average shares outstanding during the period.
F Amount does not include the portfolio activity of any underlying Fidelity Central Funds.
G For the period October 9, 2007 (commencement of operations) to September 30, 2008.
H Expense ratios reflect operating expenses of the class. Expenses before reductions do not reflect amounts reimbursed by the investment adviser or reductions from brokerage service arrangements or other expense offset arrangements and do not represent the amount paid by the class during periods when reimbursements or reductions occur. Expense ratios before reductions for start-up periods may not be representative of longer-term operating periods. Expenses net of fee waivers reflect expenses after reimbursement by the investment adviser but prior to reductions from brokerage service arrangements or other expense offset arrangements. Expenses net of all reductions represent the net expenses paid by the class. Fees and expenses of the underlying Fidelity Central Funds are not included in the Fund's expense ratio. The Fund indirectly bears its proportionate share of the expenses of any underlying Fidelity Central Funds. Based on their most recent shareholder report date, the expenses ranged from less than .01% to .03%.
See accompanying notes which are an integral part of the financial statements.
Annual Report
Financial Highlights - Asset Manager 60%
Year ended September 30, | 2008 F |
Selected Per-Share Data | |
Net asset value, beginning of period | $ 10.00 |
Income from Investment Operations | |
Net investment income (loss) D | .19 |
Net realized and unrealized gain (loss) | (2.18) |
Total from investment operations | (1.99) |
Distributions from net investment income | (.05) |
Net asset value, end of period | $ 7.96 |
Total Return B, C | (20.03)% |
Ratios to Average Net Assets G | |
Expenses before reductions | 1.87% A |
Expenses net of fee waivers, if any | .89% A |
Expenses net of all reductions | .89% A |
Net investment income (loss) | 2.26% A |
Supplemental Data | |
Net assets, end of period (000 omitted) | $ 22,212 |
Portfolio turnover rate E | 4% A |
A Annualized
B Total returns for periods of less than one year are not annualized.
C Total returns would have been lower had certain expenses not been reduced during the periods shown.
D Calculated based on average shares outstanding during the period.
E Amount does not include the portfolio activity of any underlying Fidelity Central Funds.
F For the period October 9, 2007 (commencement of operations) to September 30, 2008.
G Expense ratios reflect operating expenses of the class. Expenses before reductions do not reflect amounts reimbursed by the investment adviser or reductions from brokerage service arrangements or other expense offset arrangements and do not represent the amount paid by the class during periods when reimbursements or reductions occur. Expense ratios before reductions for start-up periods may not be representative of longer-term operating periods. Expenses net of fee waivers reflect expenses after reimbursement by the investment adviser but prior to reductions from brokerage service arrangements or other expense offset arrangements. Expenses net of all reductions represent the net expenses paid by the class. Fees and expenses of the underlying Fidelity Central Funds are not included in the Fund's expense ratio. The Fund indirectly bears its proportionate share of the expenses of any underlying Fidelity Central Funds. Based on their most recent shareholder report date, the expenses ranged from less than .01% to .03%.
Financial Highlights - Institutional Class
Year ended September 30, | 2008 F |
Selected Per-Share Data | |
Net asset value, beginning of period | $ 10.00 |
Income from Investment Operations | |
Net investment income (loss) D | .20 |
Net realized and unrealized gain (loss) | (2.19) |
Total from investment operations | (1.99) |
Distributions from net investment income | (.05) |
Net asset value, end of period | $ 7.96 |
Total Return B, C | (20.03)% |
Ratios to Average Net Assets G | |
Expenses before reductions | 1.86% A |
Expenses net of fee waivers, if any | .94% A |
Expenses net of all reductions | .93% A |
Net investment income (loss) | 2.22% A |
Supplemental Data | |
Net assets, end of period (000 omitted) | $ 792 |
Portfolio turnover rate E | 4% A |
A Annualized
B Total returns for periods of less than one year are not annualized.
C Total returns would have been lower had certain expenses not been reduced during the periods shown.
D Calculated based on average shares outstanding during the period.
E Amount does not include the portfolio activity of any underlying Fidelity Central Funds.
F For the period October 9, 2007 (commencement of operations) to September 30, 2008.
G Expense ratios reflect operating expenses of the class. Expenses before reductions do not reflect amounts reimbursed by the investment adviser or reductions from brokerage service arrangements or other expense offset arrangements and do not represent the amount paid by the class during periods when reimbursements or reductions occur. Expense ratios before reductions for start-up periods may not be representative of longer-term operating periods. Expenses net of fee waivers reflect expenses after reimbursement by the investment adviser but prior to reductions from brokerage service arrangements or other expense offset arrangements. Expenses net of all reductions represent the net expenses paid by the class. Fees and expenses of the underlying Fidelity Central Funds are not included in the Fund's expense ratio. The Fund indirectly bears its proportionate share of the expenses of any underlying Fidelity Central Funds. Based on their most recent shareholder report date, the expenses ranged from less than .01% to .03%.
See accompanying notes which are an integral part of the financial statements.
Annual Report
Fidelity Asset Manager 70%
Investment Changes (Unaudited)
The information in the following tables is based on the combined investments of the Fund and its pro-rata share of the investments of Fidelity's Equity and Fixed-Income Central Funds. |
Top Ten Stocks as of September 30, 2008 |
| % of fund's
net assets | % of fund's net assets
6 months ago |
Apple, Inc. | 1.1 | 0.1 |
Procter & Gamble Co. | 1.1 | 1.0 |
General Electric Co. | 0.8 | 0.7 |
Bank of America Corp. | 0.7 | 0.5 |
JPMorgan Chase & Co. | 0.7 | 0.6 |
Wells Fargo & Co. | 0.7 | 0.5 |
The Coca-Cola Co. | 0.7 | 0.6 |
Genentech, Inc. | 0.6 | 0.2 |
PepsiCo, Inc. | 0.6 | 0.5 |
Citigroup, Inc. | 0.5 | 0.5 |
| 7.5 | |
Asset Allocation (% of fund's net assets) |
As of September 30, 2008 | As of March 31, 2008 |
| Stock class and
Equity Futures 71.1% | | | Stock class and
Equity Futures 71.2% | |
| Bond class 27.7% | | | Bond class 29.1% | |
| Short-term class 1.2% | | | Short-term class* (0.3)% | |
| | | | | |
| | | | | |
Asset allocations in the pie charts reflect the categorization of assets as defined in the Fund's prospectus in effect as of the time periods indicated above. Percentages are adjusted for the effect of futures contracts and swap contracts, if applicable.
*Short-term class is not included in the pie chart.
Annual Report
Fidelity Asset Manager 70%
The information in the following table is based on the direct investments of the Fund.
Fund Holdings as of September 30, 2008 |
| % of fund's
net assets |
Equity Central Funds | |
Fidelity Financials Central Fund | 9.9 |
Fidelity Information Technology Central Fund | 9.3 |
Fidelity International Equity Central Fund | 8.5 |
Fidelity Health Care Central Fund | 8.0 |
Fidelity Industrials Central Fund | 7.5 |
Fidelity Energy Central Fund | 6.8 |
Fidelity Consumer Staples Central Fund | 6.4 |
Fidelity Consumer Discretionary Central Fund | 6.3 |
Fidelity Utilities Central Fund | 2.3 |
Fidelity Materials Central Fund | 2.3 |
Fidelity Telecom Services Central Fund | 1.9 |
Total Equity Central Funds | 69.2 |
Fixed-Income Central Funds | |
Investment Grade Fixed-Income Funds | 20.1 |
High Yield Fixed-Income Funds | 5.1 |
Total Fixed-Income Central Funds | 25.2 |
Money Market Central Funds | 4.2 |
Other Short-Term Investments and Net Other Assets | 1.4 |
Total | 100.0 |
At period end, foreign investments, including the Fund's pro-rata share of the underlying Central Funds, was 21.1% of net assets. |
A holdings listing for the Fund, which presents direct holdings as well as the pro-rata share of any securities and other investments held indirectly through its investment in underlying non-money market Fidelity Central Funds, is available at fidelity.com and/or advisor.fidelity.com, as applicable. |
Annual Report
Fidelity Asset Manager 70%
Investments September 30, 2008
Showing Percentage of Net Assets
Equity Central Funds - 69.2% |
| Shares | | Value |
Fidelity Consumer Discretionary Central Fund (c) | 1,715,859 | | $ 158,562,571 |
Fidelity Consumer Staples Central Fund (c) | 1,391,428 | | 159,972,498 |
Fidelity Energy Central Fund (c) | 1,538,632 | | 169,988,020 |
Fidelity Financials Central Fund (c) | 3,761,960 | | 247,762,683 |
Fidelity Health Care Central Fund (c) | 2,004,770 | | 199,695,136 |
Fidelity Industrials Central Fund (c) | 1,769,492 | | 186,734,449 |
Fidelity Information Technology Central Fund (c) | 2,369,368 | | 232,695,598 |
Fidelity International Equity Central Fund (c) | 3,180,837 | | 213,497,810 |
Fidelity Materials Central Fund (c) | 515,294 | | 56,702,977 |
Fidelity Telecom Services Central Fund (c) | 521,960 | | 46,819,800 |
Fidelity Utilities Central Fund (c) | 611,717 | | 57,097,620 |
TOTAL EQUITY CENTRAL FUNDS (Cost $2,011,177,373) | 1,729,529,162 |
Fixed-Income Central Funds - 25.2% |
| | | |
Investment Grade Fixed-Income Funds - 20.1% |
Fidelity Tactical Income Central Fund (c) | 5,575,444 | | 500,674,871 |
High Yield Fixed-Income Funds - 5.1% |
Fidelity Floating Rate Central Fund (c) | 933,020 | | 79,120,080 |
Fidelity High Income Central Fund 1 (c) | 576,544 | | 49,300,279 |
TOTAL HIGH YIELD FIXED-INCOME FUNDS | 128,420,359 |
TOTAL FIXED-INCOME CENTRAL FUNDS (Cost $693,449,085) | 629,095,230 |
Money Market Central Funds - 4.2% |
| | | |
Fidelity Cash Central Fund, 1.92% (a) | 96,741,635 | | 96,741,635 |
Fidelity Money Market Central Fund, 3.13% (a) | 8,056,119 | | 8,056,119 |
TOTAL MONEY MARKET CENTRAL FUNDS (Cost $104,797,754) | 104,797,754 |
U.S. Treasury Obligations - 0.4% |
| Principal Amount | | |
U.S. Treasury Bills, yield at date of purchase 1.61% to 1.68% 10/9/08 to 12/4/08 (b)
(Cost $8,992,975) | | $ 9,020,000 | | 9,008,683 |
TOTAL INVESTMENT PORTFOLIO - 99.0% (Cost $2,818,417,187) | | 2,472,430,829 |
NET OTHER ASSETS - 1.0% | | 25,512,177 |
NET ASSETS - 100% | $ 2,497,943,006 |
Futures Contracts |
| Expiration Date | | Underlying Face Amount at Value | | Unrealized Appreciation/
(Depreciation) |
Purchased |
Equity Index Contracts |
1,641 CME E-mini S&P 500 Index Contracts | Dec. 2008 | | $ 95,785,170 | | $ (2,377,530) |
|
The face value of futures purchased as a percentage of net assets - 3.8% |
Legend |
(a) Affiliated fund that is available only to investment companies and other accounts managed by Fidelity Investments. The rate quoted is the annualized seven-day yield of the fund at period end. A complete unaudited listing of the fund's holdings as of its most recent quarter end is available upon request. |
(b) Security or a portion of the security was pledged to cover margin requirements for futures contracts. At the period end, the value of securities pledged amounted to $7,790,086. |
(c) Affiliated fund that is available only to investment companies and other accounts managed by Fidelity Investments. A complete unaudited schedule of portfolio holdings for each Fidelity Central Fund is filed with the SEC for the first and third quarters of each fiscal year on Form N-Q and is available upon request or at the SEC's web site at www.sec.gov. An unaudited holdings listing for the Fund, which presents direct holdings as well as the pro rata share of securities and other investments held indirectly through its investment in underlying non-money market Fidelity Central Funds, is available at fidelity.com and/or advisor.fidelity.com, as applicable. In addition, each Fidelity Central Fund's financial statements, which are not covered by the Fund's Report of Independent Registered Public Accounting Firm, are available on the SEC's web site or upon request. |
Affiliated Central Funds |
Information regarding fiscal year to date income earned by the Fund from investments in Fidelity Central Funds is as follows: |
Fund | Income earned |
Fidelity Cash Central Fund | $ 5,112,219 |
Fidelity Consumer Discretionary Central Fund | 2,482,274 |
Fidelity Consumer Staples Central Fund | 3,464,230 |
Fidelity Energy Central Fund | 1,683,927 |
Fidelity Financials Central Fund | 8,986,884 |
Fidelity Floating Rate Central Fund | 5,094,023 |
Fidelity Health Care Central Fund | 2,055,707 |
Fidelity High Income Central Fund 1 | 3,907,479 |
Fidelity Industrials Central Fund | 3,236,620 |
Fidelity Information Technology Central Fund | 2,023,480 |
Fidelity International Equity Central Fund | 5,962,293 |
Fidelity Materials Central Fund | 1,216,545 |
Fidelity Money Market Central Fund | 311,765 |
Fidelity Securities Lending Cash Central Fund | 9,184 |
Fidelity Tactical Income Central Fund | 31,810,323 |
Fidelity Telecom Services Central Fund | 1,254,332 |
Fidelity Utilities Central Fund | 1,477,077 |
Total | $ 80,088,362 |
Additional information regarding the Fund's fiscal year to date purchases and sales, including the ownership percentage, of the non-money market Central Funds is as follows: |
Fund | Value, beginning
of period | Purchases* | Sales
Proceeds | Value,
end of period | % ownership, end of period |
Fidelity Consumer Discretionary Central Fund | $ 196,579,000 | $ 15,410,310 | $ 6,523,263 | $ 158,562,571 | 29.9% |
Fidelity Consumer Staples Central Fund | 160,773,000 | 15,762,176 | 2,198,698 | 159,972,498 | 29.9% |
Fidelity Energy Central Fund | 203,830,000 | 16,060,222 | 7,848,992 | 169,988,020 | 29.9% |
Fidelity Financials Central Fund | 365,226,000 | 34,093,068 | - | 247,762,683 | 29.9% |
Fidelity Floating Rate Central Fund | 87,902,000 | 16,412,837 | 14,388,125 | 79,120,080 | 3.1% |
Fidelity Health Care Central Fund | 220,312,000 | 18,700,382 | 1,966,219 | 199,695,136 | 29.9% |
Fidelity High Income Central Fund 1 | 54,188,000 | 8,009,808 | 6,201,447 | 49,300,279 | 19.7% |
Fidelity Industrials Central Fund | 225,622,000 | 18,241,274 | 8,723,783 | 186,734,449 | 29.9% |
Fidelity Information Technology Central Fund | 315,933,000 | 29,198,195 | - | 232,695,598 | 29.9% |
Fidelity International Equity Central Fund | - | 308,104,047 | - | 213,497,810 | 34.4% |
Fidelity Materials Central Fund | 70,728,000 | 5,680,545 | 2,222,435 | 56,702,977 | 29.9% |
Fidelity Tactical Income Central Fund | 682,133,000 | 79,497,621 | 216,349,097 | 500,674,871 | 12.4% |
Fidelity Telecom Services Central Fund | 68,234,000 | 7,659,274 | - | 46,819,800 | 29.9% |
Fidelity Utilities Central Fund | 68,507,000 | 5,882,827 | 492,172 | 57,097,620 | 29.9% |
Total | $ 2,719,967,000 | $ 578,712,586 | $ 266,914,231 | $ 2,358,624,392 | |
* Includes the value of shares received through merger activity - see Note 14 of the Notes to Financial Statements. |
Other Information (Unaudited) |
The information in the following tables is based on the combined investment of the Fund and its pro-rata share of the investments of Fidelity's Equity and Fixed-Income Central Funds. The composition of credit quality ratings as a percentage of net assets is as follows: |
U.S. Government and U.S. Government Agency Obligations | 12.7% |
AAA,AA,A | 6.6% |
BBB | 4.0% |
BB | 2.4% |
B | 2.0% |
CCC,CC,C | 0.4% |
Not Rated | 0.5% |
Equities | 71.0% |
Short-Term Investments and Net Other Assets | 0.4% |
| 100.0% |
We have used ratings from Moody's® Investors Services, Inc. Where Moody's ratings are not available, we have used S&P® ratings. All ratings are as of the report date and do not reflect subsequent downgrades. Percentages are adjusted for the effect of futures contracts, if applicable. |
Distribution of investments by country of issue, as a percentage of total net assets, is as follows. Percentages are adjusted for the effect of futures contracts, if applicable. |
United States of America | 78.9% |
United Kingdom | 3.8% |
Bermuda | 2.2% |
Switzerland | 2.0% |
Japan | 1.9% |
Canada | 1.5% |
Germany | 1.4% |
France | 1.2% |
Cayman Islands | 1.2% |
Others (individually less than 1%) | 5.9% |
| 100.0% |
Income Tax Information |
At September 30, 2008, the fund had a capital loss carryforward of approximately $100,045,622 of which $82,273,070 and $17,772,552 will expire on September 30, 2011 and 2016, respectively. The capital loss carryforward expiring September 30, 2016 was acquired from Fidelity Advisor Asset Manager 70% Fund. Capital loss carryforwards are only available to offset future capital gains of the Fund to the extent provided by regulations and may be limited. |
The fund intends to elect to defer to its fiscal year ending September 30, 2009 approximately $171,539,364 of losses recognized during the period November 1, 2007 to September 30, 2008. |
|
See accompanying notes which are an integral part of the financial statements.
Annual Report
Fidelity Asset Manager 70%
Financial Statements
Statement of Assets and Liabilities
| September 30, 2008 |
| | |
Assets | | |
Investment in securities, at value - See accompanying schedule: Unaffiliated issuers (cost $8,992,975) | $ 9,008,683 | |
Fidelity Central Funds (cost $2,809,424,212) | 2,463,422,146 | |
Total Investments (cost $2,818,417,187) | | $ 2,472,430,829 |
Cash | | 350 |
Receivable for investments sold | | 25,570,011 |
Receivable for fund shares sold | | 1,609,251 |
Dividends receivable | | 13,469 |
Distributions receivable from Fidelity Central Funds | | 3,135,420 |
Receivable for daily variation on futures contracts | | 4,118,909 |
Prepaid expenses | | 1,860 |
Receivable from investment adviser for expense reductions | | 1,223 |
Other receivables | | 77,722 |
Total assets | | 2,506,959,044 |
| | |
Liabilities | | |
Payable for investments purchased | $ 3,014,110 | |
Payable for fund shares redeemed | 4,235,933 | |
Accrued management fee | 1,130,637 | |
Distribution fees payable | 8,590 | |
Other affiliated payables | 490,296 | |
Other payables and accrued expenses | 136,472 | |
Total liabilities | | 9,016,038 |
| | |
Net Assets | | $ 2,497,943,006 |
Net Assets consist of: | | |
Paid in capital | | $ 3,055,165,272 |
Undistributed net investment income | | 41,473,665 |
Accumulated undistributed net realized gain (loss) on investments and foreign currency transactions | | (250,332,921) |
Net unrealized appreciation (depreciation) on investments and assets and liabilities in foreign currencies | | (348,363,010) |
Net Assets | | $ 2,497,943,006 |
| | |
Calculation of Maximum Offering Price Class A:
Net Asset Value and redemption price per share ($89,034,028 ÷ 6,536,105 shares) | | $ 13.62 |
| | |
Maximum offering price per share (100/94.25 of $13.62) | | $ 14.45 |
Class T:
Net Asset Value and redemption price per share ($52,477,998 ÷ 3,852,600 shares) | | $ 13.62 |
| | |
Maximum offering price per share (100/96.50 of $13.62) | | $ 14.11 |
Class B:
Net Asset Value and offering price per share ($23,526,441 ÷ 1,727,341 shares)A | | $ 13.62 |
| | |
Class C:
Net Asset Value and offering price per share ($37,762,253 ÷ 2,772,581 shares)A | | $ 13.62 |
| | |
Asset Manager 70%:
Net Asset Value, offering price and redemption price per share ($2,269,425,048 ÷ 166,619,009 shares) | | $ 13.62 |
| | |
Institutional Class:
Net Asset Value, offering price and redemption price per share ($25,717,238 ÷ 1,887,817 shares) | | $ 13.62 |
A Redemption price per share is equal to net asset value less any applicable contingent deferred sales charge.
See accompanying notes which are an integral part of the financial statements.
Annual Report
Statement of Operations
| Year ended September 30, 2008 |
| | |
Investment Income | | |
Dividends | | $ 42,406 |
Interest | | 311,945 |
Income from Fidelity Central Funds | | 80,088,362 |
Total income | | 80,442,713 |
| | |
Expenses | | |
Management fee | $ 15,716,293 | |
Transfer agent fees | 5,310,219 | |
Distribution fees | 8,590 | |
Accounting and security lending fees | 1,066,029 | |
Custodian fees and expenses | 19,718 | |
Independent trustees' compensation | 11,785 | |
Depreciation in deferred trustee compensation account | (351) | |
Registration fees | 32,261 | |
Audit | 75,766 | |
Legal | 37,864 | |
Miscellaneous | 54,343 | |
Total expenses before reductions | 22,332,517 | |
Expense reductions | (268,805) | 22,063,712 |
Net investment income (loss) | | 58,379,001 |
Realized and Unrealized Gain (Loss) Net realized gain (loss) on: | | |
Investment securities: | | |
Unaffiliated issuers (net of foreign taxes of $97,686) | 1,272,849 | |
Fidelity Central Funds | (629,652) | |
Foreign currency transactions | (423,277) | |
Futures contracts | (21,326,537) | |
Total net realized gain (loss) | | (21,106,617) |
Change in net unrealized appreciation (depreciation) on: Investment securities (net of decrease in deferred foreign taxes of $49,309) | (676,297,073) | |
Assets and liabilities in foreign currencies | 911 | |
Futures contracts | (13,136,378) | |
Total change in net unrealized appreciation (depreciation) | | (689,432,540) |
Net gain (loss) | | (710,539,157) |
Net increase (decrease) in net assets resulting from operations | | $ (652,160,156) |
Statement of Changes in Net Assets
| Year ended
September 30,
2008 | Year ended
September 30,
2007 |
Increase (Decrease) in Net Assets | | |
Operations | | |
Net investment income (loss) | $ 58,379,001 | $ 72,467,198 |
Net realized gain (loss) | (21,106,617) | 97,197,631 |
Change in net unrealized appreciation (depreciation) | (689,432,540) | 279,530,728 |
Net increase (decrease) in net assets resulting from operations | (652,160,156) | 449,195,557 |
Distributions to shareholders from net investment income | (72,024,349) | (74,718,985) |
Distributions to shareholders from net realized gain | (3,513,384) | - |
Total distributions | (75,537,733) | (74,718,985) |
Share transactions - net increase (decrease) | (36,451,983) | (249,477,581) |
Total increase (decrease) in net assets | (764,149,872) | 124,998,991 |
| | |
Net Assets | | |
Beginning of period | 3,262,092,878 | 3,137,093,887 |
End of period (including undistributed net investment income of $41,473,665 and undistributed net investment income of $56,361,068, respectively) | $ 2,497,943,006 | $ 3,262,092,878 |
See accompanying notes which are an integral part of the financial statements.
Annual Report
Financial Highlights - Class A
Year ended September 30, | 2008 G |
Selected Per-Share Data | |
Net asset value, beginning of period | $ 14.14 |
Income from Investment Operations | |
Net investment income (loss) E | .00 J |
Net realized and unrealized gain (loss) | (.52) |
Total from investment operations | (.52) |
Net asset value, end of period | $ 13.62 |
Total Return B, C, D | (3.68)% |
Ratios to Average Net Assets H | |
Expenses before reductions | 1.31% A |
Expenses net of fee waivers, if any | 1.25% A |
Expenses net of all reductions | 1.24% A |
Net investment income (loss) | 1.60% A |
Supplemental Data | |
Net assets, end of period (000 omitted) | $ 89,034 |
Portfolio turnover rate F | 14% I |
A Annualized
B Total returns for periods of less than one year are not annualized.
C Total returns would have been lower had certain expenses not been reduced during the periods shown.
D Total returns do not include the effect of the sales charges.
E Calculated based on average shares outstanding during the period.
F Amount does not include the portfolio activity of any underlying Fidelity Central Funds.
G For the period September 23, 2008 (commencement of sale of shares) to September 30, 2008.
H Expense ratios reflect operating expenses of the class. Expenses before reductions do not reflect amounts reimbursed by the investment adviser or reductions from brokerage service arrangements or other expense offset arrangements and do not represent the amount paid by the class during periods when reimbursements or reductions occur. Expense ratios before reductions for start-up periods may not be representative of longer-term operating periods. Expenses net of fee waivers reflect expenses after reimbursement by the investment adviser but prior to reductions from brokerage service arrangements or other expense offset arrangements. Expenses net of all reductions represent the net expenses paid by the class. Fees and expenses of the underlying Fidelity Central Funds are not included in the Fund's expense ratio. The Fund indirectly bears its proportionate share of the expenses of any underlying Fidelity Central Funds. Based on their most recent shareholder report date, the expenses ranged from less than .01% to .03%.
I The portfolio turnover rate does not include the assets acquired in the merger.
J Amount represents less than $.01 per share.
Financial Highlights - Class T
Year ended September 30, | 2008 G |
Selected Per-Share Data | |
Net asset value, beginning of period | $ 14.14 |
Income from Investment Operations | |
Net investment income (loss) E | .00 J |
Net realized and unrealized gain (loss) | (.52) |
Total from investment operations | (.52) |
Net asset value, end of period | $ 13.62 |
Total Return B, C, D | (3.68)% |
Ratios to Average Net Assets H | |
Expenses before reductions | 1.56% A |
Expenses net of fee waivers, if any | 1.50% A |
Expenses net of all reductions | 1.49% A |
Net investment income (loss) | 1.35% A |
Supplemental Data | |
Net assets, end of period (000 omitted) | $ 52,478 |
Portfolio turnover rate F | 14% I |
A Annualized
B Total returns for periods of less than one year are not annualized.
C Total returns would have been lower had certain expenses not been reduced during the periods shown.
D Total returns do not include the effect of the sales charges.
E Calculated based on average shares outstanding during the period.
F Amount does not include the portfolio activity of any underlying Fidelity Central Funds.
G For the period September 23, 2008 (commencement of sale of shares) to September 30, 2008.
H Expense ratios reflect operating expenses of the class. Expenses before reductions do not reflect amounts reimbursed by the investment adviser or reductions from brokerage service arrangements or other expense offset arrangements and do not represent the amount paid by the class during periods when reimbursements or reductions occur. Expense ratios before reductions for start-up periods may not be representative of longer-term operating periods. Expenses net of fee waivers reflect expenses after reimbursement by the investment adviser but prior to reductions from brokerage service arrangements or other expense offset arrangements. Expenses net of all reductions represent the net expenses paid by the class. Fees and expenses of the underlying Fidelity Central Funds are not included in the Fund's expense ratio. The Fund indirectly bears its proportionate share of the expenses of any underlying Fidelity Central Funds. Based on their most recent shareholder report date, the expenses ranged from less than .01% to .03%.
I The portfolio turnover rate does not include the assets acquired in the merger.
J Amount represents less than $.01 per share.
See accompanying notes which are an integral part of the financial statements.
Annual Report
Financial Highlights - Class B
Year ended September 30, | 2008 G |
Selected Per-Share Data | |
Net asset value, beginning of period | $ 14.14 |
Income from Investment Operations | |
Net investment income (loss) E | .00 J |
Net realized and unrealized gain (loss) | (.52) |
Total from investment operations | (.52) |
Net asset value, end of period | $ 13.62 |
Total Return B, C, D | (3.68)% |
Ratios to Average Net Assets H | |
Expenses before reductions | 2.06% A |
Expenses net of fee waivers, if any | 2.00% A |
Expenses net of all reductions | 1.99% A |
Net investment income (loss) | .85% A |
Supplemental Data | |
Net assets, end of period (000 omitted) | $ 23,526 |
Portfolio turnover rate F | 14% I |
A Annualized
B Total returns for periods of less than one year are not annualized.
C Total returns would have been lower had certain expenses not been reduced during the periods shown.
D Total returns do not include the effect of the contingent deferred sales charge.
E Calculated based on average shares outstanding during the period.
F Amount does not include the portfolio activity of any underlying Fidelity Central Funds.
G For the period September 23, 2008 (commencement of sale of shares) to September 30, 2008.
H Expense ratios reflect operating expenses of the class. Expenses before reductions do not reflect amounts reimbursed by the investment adviser or reductions from brokerage service arrangements or other expense offset arrangements and do not represent the amount paid by the class during periods when reimbursements or reductions occur. Expense ratios before reductions for start-up periods may not be representative of longer-term operating periods. Expenses net of fee waivers reflect expenses after reimbursement by the investment adviser but prior to reductions from brokerage service arrangements or other expense offset arrangements. Expenses net of all reductions represent the net expenses paid by the class. Fees and expenses of the underlying Fidelity Central Funds are not included in the Fund's expense ratio. The Fund indirectly bears its proportionate share of the expenses of any underlying Fidelity Central Funds. Based on their most recent shareholder report date, the expenses ranged from less than .01% to .03%.
I The portfolio turnover rate does not include the assets acquired in the merger.
J Amount represents less than $.01 per share.
Financial Highlights - Class C
Year ended September 30, | 2008 G |
Selected Per-Share Data | |
Net asset value, beginning of period | $ 14.14 |
Income from Investment Operations | |
Net investment income (loss) E | .00 J |
Net realized and unrealized gain (loss) | (.52) |
Total from investment operations | (.52) |
Net asset value, end of period | $ 13.62 |
Total Return B, C, D | (3.68)% |
Ratios to Average Net Assets H | |
Expenses before reductions | 2.07% A |
Expenses net of fee waivers, if any | 2.00% A |
Expenses net of all reductions | 1.99% A |
Net investment income (loss) | .85% A |
Supplemental Data | |
Net assets, end of period (000 omitted) | $ 37,762 |
Portfolio turnover rate F | 14% I |
A Annualized
B Total returns for periods of less than one year are not annualized.
C Total returns would have been lower had certain expenses not been reduced during the periods shown.
D Total returns do not include the effect of the contingent deferred sales charge.
E Calculated based on average shares outstanding during the period.
F Amount does not include the portfolio activity of any underlying Fidelity Central Funds.
G For the period September 23, 2008 (commencement of sale of shares) to September 30, 2008.
H Expense ratios reflect operating expenses of the class. Expenses before reductions do not reflect amounts reimbursed by the investment adviser or reductions from brokerage service arrangements or other expense offset arrangements and do not represent the amount paid by the class during periods when reimbursements or reductions occur. Expense ratios before reductions for start-up periods may not be representative of longer-term operating periods. Expenses net of fee waivers reflect expenses after reimbursement by the investment adviser but prior to reductions from brokerage service arrangements or other expense offset arrangements. Expenses net of all reductions represent the net expenses paid by the class. Fees and expenses of the underlying Fidelity Central Funds are not included in the Fund's expense ratio. The Fund indirectly bears its proportionate share of the expenses of any underlying Fidelity Central Funds. Based on their most recent shareholder report date, the expenses ranged from less than .01% to .03%.
I The portfolio turnover rate does not include the assets acquired in the merger.
J Amount represents less than $.01 per share.
See accompanying notes which are an integral part of the financial statements.
Annual Report
Financial Highlights - Asset Manager 70%
Years ended September 30, | 2008 | 2007 | 2006 | 2005 | 2004 |
Selected Per-Share Data | | | | | |
Net asset value, beginning of period | $ 17.78 | $ 15.82 | $ 14.94 | $ 14.10 | $ 13.47 |
Income from Investment Operations | | | | | |
Net investment income (loss) B | .33 | .38 | .34 | .31 D | .25 |
Net realized and unrealized gain (loss) | (4.06) | 1.97 | .84 | .85 | .69 |
Total from investment operations | (3.73) | 2.35 | 1.18 | 1.16 | .94 |
Distributions from net investment income | (.41) | (.39) | (.29) | (.32) | (.31) |
Distributions from net realized gain | (.02) | - | (.01) | - | - |
Total distributions | (.43) | (.39) | (.30) | (.32) | (.31) |
Net asset value, end of period | $ 13.62 | $ 17.78 | $ 15.82 | $ 14.94 | $ 14.10 |
Total Return A | (21.46)% | 15.07% | 7.98% | 8.28% | 6.99% |
Ratios to Average Net Assets E | | | | | |
Expenses before reductions | .79% | .80% | .81% | .82% | .83% |
Expenses net of fee waivers, if any | .79% | .80% | .81% | .82% | .83% |
Expenses net of all reductions | .78% | .78% | .79% | .80% | .82% |
Net investment income (loss) | 2.07% | 2.26% | 2.20% | 2.11% D | 1.77% |
Supplemental Data | | | | | |
Net assets, end of period (in millions) | $ 2,269 | $ 3,262 | $ 3,137 | $ 3,284 | $ 3,588 |
Portfolio turnover rate C | 14% F | 14% | 82% G | 37% G | 67% |
A Total returns would have been lower had certain expenses not been reduced during the periods shown.
B Calculated based on average shares outstanding during the period.
C Amount does not include the portfolio activity of any underlying Fidelity Central Funds.
D Investment income per share reflects a special dividend which amounted to $.06 per share. Excluding the special dividend, the ratio of net investment income (loss) to average net assets would have been 1.73%.
E Expense ratios reflect operating expenses of the class. Expenses before reductions do not reflect amounts reimbursed by the investment adviser or reductions from brokerage service arrangements or other expense offset arrangements and do not represent the amount paid by the class during periods when reimbursements or reductions occur. Expenses net of fee waivers reflect expenses after reimbursement by the investment adviser but prior to reductions from brokerage service arrangements or other expense offset arrangements. Expenses net of all reductions represent the net expenses paid by the class. Fees and expenses of the underlying Fidelity Central Funds are not included in the Fund's expense ratio. The Fund indirectly bears its proportionate share of the expenses of any underlying Fidelity Central Funds. Based on their most recent shareholder report date, the expenses ranged from less than .01% to .03%.
F The portfolio turnover rate does not include the assets acquired in the merger.
G Portfolio turnover rate excludes securities received or delivered in-kind.
Financial Highlights - Institutional Class
Year ended September 30, | 2008 F |
Selected Per-Share Data | |
Net asset value, beginning of period | $ 14.14 |
Income from Investment Operations | |
Net investment income (loss) D | .00 I |
Net realized and unrealized gain (loss) | (.52) |
Total from investment operations | (.52) |
Net asset value, end of period | $ 13.62 |
Total Return B, C | (3.68)% |
Ratios to Average Net Assets G | |
Expenses before reductions | 1.06% A |
Expenses net of fee waivers, if any | 1.00% A |
Expenses net of all reductions | .99% A |
Net investment income (loss) | 1.85% A |
Supplemental Data | |
Net assets, end of period (000 omitted) | $ 25,717 |
Portfolio turnover rate E | 14% H |
A Annualized
B Total returns for periods of less than one year are not annualized.
C Total returns would have been lower had certain expenses not been reduced during the periods shown.
D Calculated based on average shares outstanding during the period.
E Amount does not include the portfolio activity of any underlying Fidelity Central Funds.
F For the period September 23, 2008 (commencement of sale of shares) to September 30, 2008.
G Expense ratios reflect operating expenses of the class. Expenses before reductions do not reflect amounts reimbursed by the investment adviser or reductions from brokerage service arrangements or other expense offset arrangements and do not represent the amount paid by the class during periods when reimbursements or reductions occur. Expense ratios before reductions for start-up periods may not be representative of longer-term operating periods. Expenses net of fee waivers reflect expenses after reimbursement by the investment adviser but prior to reductions from brokerage service arrangements or other expense offset arrangements. Expenses net of all reductions represent the net expenses paid by the class. Fees and expenses of the underlying Fidelity Central Funds are not included in the Fund's expense ratio. The Fund indirectly bears its proportionate share of the expenses of any underlying Fidelity Central Funds. Based on their most recent shareholder report date, the expenses ranged from less than .01% to .03%.
H The portfolio turnover rate does not include the assets acquired in the merger.
I Amount represents less than $.01 per share.
See accompanying notes which are an integral part of the financial statements.
Annual Report
Fidelity Asset Manager 85%
Investment Changes (Unaudited)
The information in the following tables is based on the combined investments of the Fund and its pro-rata share of the investments of Fidelity's Equity and Fixed-Income Central Funds. |
Top Ten Stocks as of September 30, 2008 |
| % of fund's
net assets | % of fund's net assets
6 months ago |
Apple, Inc. | 1.2 | 0.1 |
Procter & Gamble Co. | 1.2 | 1.0 |
General Electric Co. | 0.9 | 0.7 |
Bank of America Corp. | 0.8 | 0.5 |
JPMorgan Chase & Co. | 0.8 | 0.7 |
Wells Fargo & Co. | 0.8 | 0.5 |
The Coca-Cola Co. | 0.7 | 0.7 |
Genentech, Inc. | 0.7 | 0.2 |
Nestle SA (Reg.) | 0.7 | 0.6 |
PepsiCo, Inc. | 0.6 | 0.6 |
| 8.4 | |
Asset Allocation (% of fund's net assets) |
As of September 30, 2008 | As of March 31, 2008 |
| Stock class and
Equity Futures 85.1% | | | Stock class and
Equity Futures 84.1% | |
| Bond class 12.4% | | | Bond class 12.5% | |
| Short-term class 2.5% | | | Short-term class 3.4% | |
Asset allocations in the pie charts reflect the categorization of assets as defined in the Fund's prospectus in effect as of the time periods indicated above. Percentages are adjusted for the effect of futures contracts and swap contracts, if applicable.
Annual Report
Fidelity Asset Manager 85%
The information in the following table is based on the direct investments of the Fund.
Fund Holdings as of September 30, 2008 |
| % of fund's
net assets |
Equity Central Funds | |
Fidelity International Equity Central Fund | 12.8 |
Fidelity Financials Central Fund | 10.9 |
Fidelity Information Technology Central Fund | 10.2 |
Fidelity Health Care Central Fund | 8.8 |
Fidelity Industrials Central Fund | 8.2 |
Fidelity Energy Central Fund | 7.4 |
Fidelity Consumer Staples Central Fund | 7.0 |
Fidelity Consumer Discretionary Central Fund | 7.0 |
Fidelity Utilities Central Fund | 2.5 |
Fidelity Materials Central Fund | 2.5 |
Fidelity Telecom Services Central Fund | 2.0 |
Total Equity Central Funds | 79.3 |
Fixed-Income Central Funds | |
Investment Grade Fixed-Income Funds | 7.8 |
High Yield Fixed-Income Funds | 1.2 |
Total Fixed-Income Central Funds | 9.0 |
Money Market Central Funds | 8.3 |
Other Short-Term Investments and Net Other Assets | 3.4 |
Total | 100.0 |
At period end, foreign investments, including the Fund's pro-rata share of the underlying Central Funds, was 24.7% of net assets. |
A holdings listing for the Fund, which presents direct holdings as well as the pro-rata share of any securities and other investments held indirectly through its investment in underlying non-money market Fidelity Central Funds, is available at fidelity.com and/or advisor.fidelity.com, as applicable. |
Annual Report
Fidelity Asset Manager 85%
Investments September 30, 2008
Showing Percentage of Net Assets
Equity Central Funds - 79.3% |
| Shares | | Value |
Fidelity Consumer Discretionary Central Fund (c) | 350,213 | | $ 32,363,171 |
Fidelity Consumer Staples Central Fund (c) | 283,995 | | 32,650,885 |
Fidelity Energy Central Fund (c) | 313,912 | | 34,680,962 |
Fidelity Financials Central Fund (c) | 767,829 | | 50,569,247 |
Fidelity Health Care Central Fund (c) | 409,180 | | 40,758,469 |
Fidelity Industrials Central Fund (c) | 361,159 | | 38,113,161 |
Fidelity Information Technology Central Fund (c) | 483,597 | | 47,494,035 |
Fidelity International Equity Central Fund (c) | 881,791 | | 59,185,813 |
Fidelity Materials Central Fund (c) | 105,173 | | 11,573,244 |
Fidelity Telecom Services Central Fund (c) | 106,534 | | 9,556,098 |
Fidelity Utilities Central Fund (c) | 124,853 | | 11,653,791 |
TOTAL EQUITY CENTRAL FUNDS (Cost $435,028,392) | 368,598,876 |
Fixed-Income Central Funds - 9.0% |
| | | |
Investment Grade Fixed-Income Funds - 7.8% |
Fidelity Tactical Income Central Fund (c) | 405,245 | | 36,391,037 |
High Yield Fixed-Income Funds - 1.2% |
Fidelity High Income Central Fund 1 (c) | 63,970 | | 5,470,107 |
TOTAL FIXED-INCOME CENTRAL FUNDS (Cost $45,537,377) | 41,861,144 |
Money Market Central Funds - 8.3% |
| | | |
Fidelity Cash Central Fund, 1.92% (a)
(Cost $38,653,762) | 38,653,762 | | 38,653,762 |
U.S. Treasury Obligations - 0.6% |
| Principal Amount | | |
U.S. Treasury Bills, yield at date of purchase 1.59% to 1.68% 10/16/08 to 12/4/08 (b)
(Cost $2,892,141) | | $ 2,900,000 | | 2,896,626 |
TOTAL INVESTMENT PORTFOLIO - 97.2% (Cost $522,111,672) | | 452,010,408 |
NET OTHER ASSETS - 2.8% | | 13,198,380 |
NET ASSETS - 100% | $ 465,208,788 |
Futures Contracts |
| Expiration Date | | Underlying Face Amount at Value | | Unrealized Appreciation/
(Depreciation) |
Purchased |
Equity Index Contracts |
645 CME E-mini S&P 500 Index Contracts | Dec. 2008 | | $ 37,648,650 | | $ (934,495) |
|
The face value of futures purchased as a percentage of net assets - 8.1% |
Legend |
(a) Affiliated fund that is available only to investment companies and other accounts managed by Fidelity Investments. The rate quoted is the annualized seven-day yield of the fund at period end. A complete unaudited listing of the fund's holdings as of its most recent quarter end is available upon request. |
(b) Security or a portion of the security was pledged to cover margin requirements for futures contracts. At the period end, the value of securities pledged amounted to $2,896,626. |
(c) Affiliated fund that is available only to investment companies and other accounts managed by Fidelity Investments. A complete unaudited schedule of portfolio holdings for each Fidelity Central Fund is filed with the SEC for the first and third quarters of each fiscal year on Form N-Q and is available upon request or at the SEC's web site at www.sec.gov. An unaudited holdings listing for the Fund, which presents direct holdings as well as the pro rata share of securities and other investments held indirectly through its investment in underlying non-money market Fidelity Central Funds, is available at fidelity.com and/or advisor.fidelity.com, as applicable. In addition, each Fidelity Central Fund's financial statements, which are not covered by the Fund's Report of Independent Registered Public Accounting Firm, are available on the SEC's web site or upon request. |
Affiliated Central Funds |
Information regarding fiscal year to date income earned by the Fund from investments in Fidelity Central Funds is as follows: |
Fund | Income earned |
Fidelity Cash Central Fund | $ 2,014,566 |
Fidelity Consumer Discretionary Central Fund | 527,503 |
Fidelity Consumer Staples Central Fund | 740,245 |
Fidelity Energy Central Fund | 358,448 |
Fidelity Financials Central Fund | 1,909,323 |
Fidelity Health Care Central Fund | 436,247 |
Fidelity High Income Central Fund 1 | 499,436 |
Fidelity Industrials Central Fund | 687,589 |
Fidelity Information Technology Central Fund | 432,249 |
Fidelity International Equity Central Fund | 1,742,195 |
Fidelity Materials Central Fund | 256,289 |
Fidelity Securities Lending Cash Central Fund | 4,304 |
Fidelity Tactical Income Central Fund | 3,021,104 |
Fidelity Telecom Services Central Fund | 265,683 |
Fidelity Utilities Central Fund | 314,452 |
Total | $ 13,209,633 |
Additional information regarding the Fund's fiscal year to date purchases and sales, including the ownership percentage, of the non-money market Central Funds is as follows: |
Fund | Value, beginning of period | Purchases | Sales
Proceeds | Value,
end of period | % ownership, end of period |
Fidelity Consumer Discretionary Central Fund | $ 38,476,813 | $ 4,818,364 | $ 1,141,365 | $ 32,363,171 | 6.1% |
Fidelity Consumer Staples Central Fund | 31,481,455 | 4,503,980 | 220,952 | 32,650,885 | 6.1% |
Fidelity Energy Central Fund | 39,903,408 | 5,609,264 | 1,387,562 | 34,680,962 | 6.1% |
Fidelity Financials Central Fund | 71,344,905 | 10,935,446 | - | 50,569,247 | 6.1% |
Fidelity Health Care Central Fund | 43,134,603 | 5,594,696 | 148,392 | 40,758,469 | 6.1% |
Fidelity High Income Central Fund 1 | 8,946,922 | 236,339 | 2,899,743 | 5,470,107 | 2.2% |
Fidelity Industrials Central Fund | 44,167,755 | 5,855,085 | 1,548,888 | 38,113,161 | 6.1% |
Fidelity Information Technology Central Fund | 61,814,912 | 9,468,853 | - | 47,494,035 | 6.1% |
Fidelity International Equity Central Fund | - | 86,885,029 | - | 59,185,813 | 9.5% |
Fidelity Materials Central Fund | 13,842,100 | 1,918,350 | 365,780 | 11,573,244 | 6.1% |
Fidelity Tactical Income Central Fund | 65,379,747 | 3,021,104 | 27,750,019 | 36,391,037 | 0.9% |
Fidelity Telecom Services Central Fund | 13,358,236 | 2,259,071 | - | 9,556,098 | 6.1% |
Fidelity Utilities Central Fund | 13,416,809 | 1,886,006 | - | 11,653,791 | 6.1% |
Total | $ 445,267,665 | $ 142,991,587 | $ 35,462,701 | $ 410,460,020 | |
Other Information (Unaudited) |
The information in the following tables is based on the combined investment of the Fund and its pro-rata share of the investments of Fidelity's Equity and Fixed-Income Central Funds. The composition of credit quality ratings as a percentage of net assets is as follows: |
U.S. Government and U.S. Government Agency Obligations | 4.9% |
AAA,AA,A | 2.7% |
BBB | 1.4% |
BB | 0.8% |
B | 0.6% |
CCC,CC,C | 0.0% |
Not Rated | 0.0% |
Equities | 85.0% |
Short-Term Investments and Net Other Assets | 4.6% |
| 100.0% |
We have used ratings from Moody's® Investors Services, Inc. Where Moody's ratings are not available, we have used S&P® ratings. All ratings are as of the report date and do not reflect subsequent downgrades. Percentages are adjusted for the effect of futures contracts, if applicable. |
Distribution of investments by country of issue, as a percentage of total net assets, is as follows. Percentages are adjusted for the effect of futures contracts, if applicable. |
United States of America | 75.3% |
United Kingdom | 4.5% |
Japan | 2.6% |
Switzerland | 2.5% |
Bermuda | 2.4% |
Germany | 1.9% |
France | 1.6% |
Canada | 1.3% |
Cayman Islands | 1.3% |
Others (individually less than 1%) | 6.6% |
| 100.0% |
Income Tax Information |
At September 30, 2008, the fund had a capital loss carryforward of approximately $36,329,826 all of which will expire on September 30, 2011. |
The fund intends to elect to defer to its fiscal year ending September 30, 2009 approximately $49,933,286 of losses recognized during the period November 1, 2007 to September 30, 2008. |
See accompanying notes which are an integral part of the financial statements.
Annual Report
Fidelity Asset Manager 85%
Financial Statements
Statement of Assets and Liabilities
| September 30, 2008 |
| | |
Assets | | |
Investment in securities, at value - See accompanying schedule: Unaffiliated issuers (cost $2,892,141) | $ 2,896,626 | |
Fidelity Central Funds (cost $519,219,531) | 449,113,782 | |
Total Investments (cost $522,111,672) | | $ 452,010,408 |
Foreign currency held at value (cost $256,819) | | 256,867 |
Receivable for investments sold | | 11,801,516 |
Receivable for fund shares sold | | 656,649 |
Dividends receivable | | 28,231 |
Distributions receivable from Fidelity Central Funds | | 355,556 |
Receivable for daily variation on futures contracts | | 1,618,950 |
Prepaid expenses | | 344 |
Other receivables | | 4,840 |
Total assets | | 466,733,361 |
| | |
Liabilities | | |
Payable for investments purchased | $ 243,702 | |
Payable for fund shares redeemed | 867,015 | |
Accrued management fee | 230,868 | |
Transfer agent fee payable | 109,378 | |
Distribution fees payable | 10,949 | |
Other affiliated payables | 16,088 | |
Other payables and accrued expenses | 46,573 | |
Total liabilities | | 1,524,573 |
| | |
Net Assets | | $ 465,208,788 |
Net Assets consist of: | | |
Paid in capital | | $ 609,982,994 |
Undistributed net investment income | | 5,554,274 |
Accumulated undistributed net realized gain (loss) on investments and foreign currency transactions | | (79,295,918) |
Net unrealized appreciation (depreciation) on investments and assets and liabilities in foreign currencies | | (71,032,562) |
Net Assets | | $ 465,208,788 |
| | |
Calculation of Maximum Offering Price Class A:
Net Asset Value and redemption price per share ($12,886,680 ÷ 1,177,641 shares) | | $ 10.94 |
| | |
Maximum offering price per share (100/94.25 of $10.94) | | $ 11.61 |
Class T:
Net Asset Value and redemption price per share ($4,090,064 ÷ 374,947 shares) | | $ 10.91 |
| | |
Maximum offering price per share (100/96.50 of $10.91) | | $ 11.31 |
Class B:
Net Asset Value and offering price per share ($2,451,670 ÷ 226,082 shares)A | | $ 10.84 |
| | |
Class C:
Net Asset Value and offering price per share ($5,016,717 ÷ 463,742 shares)A | | $ 10.82 |
| | |
Asset Manager 85%:
Net Asset Value, offering price and redemption price per share ($440,040,090 ÷ 40,027,464 shares) | | $ 10.99 |
| | |
Institutional Class:
Net Asset Value, offering price and redemption price per share ($723,567 ÷ 65,769 shares) | | $ 11.00 |
A Redemption price per share is equal to net asset value less any applicable contingent deferred sales charge.
See accompanying notes which are an integral part of the financial statements.
Annual Report
Statement of Operations
| Year ended September 30, 2008 |
| | |
Investment Income | | |
Dividends | | $ 17,977 |
Interest | | 83,167 |
Income from Fidelity Central Funds | | 13,209,633 |
Total income | | 13,310,777 |
| | |
Expenses | | |
Management fee | $ 3,095,396 | |
Transfer agent fees | 1,344,535 | |
Distribution fees | 113,275 | |
Accounting and security lending fees | 209,934 | |
Custodian fees and expenses | 13,169 | |
Independent trustees' compensation | 2,289 | |
Registration fees | 95,346 | |
Audit | 71,199 | |
Legal | 5,114 | |
Miscellaneous | 11,611 | |
Total expenses before reductions | 4,961,868 | |
Expense reductions | (75,556) | 4,886,312 |
Net investment income (loss) | | 8,424,465 |
Realized and Unrealized Gain (Loss) Net realized gain (loss) on: | | |
Investment securities: | | |
Unaffiliated issuers (net of foreign taxes of $41,077) | (807,442) | |
Fidelity Central Funds | 22,498 | |
Foreign currency transactions | (68,546) | |
Futures contracts | (11,182,323) | |
Total net realized gain (loss) | | (12,035,813) |
Change in net unrealized appreciation (depreciation) on: Investment securities (net of decrease in deferred foreign taxes of $20,675) | (143,908,270) | |
Assets and liabilities in foreign currencies | 9,087 | |
Futures contracts | (3,136,558) | |
Total change in net unrealized appreciation (depreciation) | | (147,035,741) |
Net gain (loss) | | (159,071,554) |
Net increase (decrease) in net assets resulting from operations | | $ (150,647,089) |
Statement of Changes in Net Assets
| Year ended
September 30,
2008 | Year ended
September 30,
2007 |
Increase (Decrease) in Net Assets | | |
Operations | | |
Net investment income (loss) | $ 8,424,465 | $ 8,364,040 |
Net realized gain (loss) | (12,035,813) | 16,447,618 |
Change in net unrealized appreciation (depreciation) | (147,035,741) | 57,830,856 |
Net increase (decrease) in net assets resulting from operations | (150,647,089) | 82,642,514 |
Distributions to shareholders from net investment income | (9,363,481) | (7,445,590) |
Distributions to shareholders from net realized gain | (1,224,803) | (712,648) |
Total distributions | (10,588,284) | (8,158,238) |
Share transactions - net increase (decrease) | 35,772,420 | 67,356,167 |
Total increase (decrease) in net assets | (125,462,953) | 141,840,443 |
| | |
Net Assets | | |
Beginning of period | 590,671,741 | 448,831,298 |
End of period (including undistributed net investment income of $5,554,274 and undistributed net investment income of $7,388,012, respectively) | $ 465,208,788 | $ 590,671,741 |
See accompanying notes which are an integral part of the financial statements.
Annual Report
Financial Highlights - Class A
Years ended September 30, | 2008 | 2007 G |
Selected Per-Share Data | | |
Net asset value, beginning of period | $ 14.77 | $ 12.75 |
Income from Investment Operations | | |
Net investment income (loss) E | .17 | .19 |
Net realized and unrealized gain (loss) | (3.74) | 2.05 |
Total from investment operations | (3.57) | 2.24 |
Distributions from net investment income | (.23) | (.20) |
Distributions from net realized gain | (.03) | (.02) |
Total distributions | (.26) | (.22) |
Net asset value, end of period | $ 10.94 | $ 14.77 |
Total Return B, C, D | (24.59)% | 17.78% |
Ratios to Average Net Assets H | | |
Expenses before reductions | 1.13% | 1.14% A |
Expenses net of fee waivers, if any | 1.13% | 1.14% A |
Expenses net of all reductions | 1.12% | 1.12% A |
Net investment income (loss) | 1.28% | 1.36% A |
Supplemental Data | | |
Net assets, end of period (000 omitted) | $ 12,887 | $ 7,348 |
Portfolio turnover rate F | 20% | 31% |
A Annualized
B Total returns for periods of less than one year are not annualized.
C Total returns would have been lower had certain expenses not been reduced during the periods shown.
D Total returns do not include the effect of the sales charges.
E Calculated based on average shares outstanding during the period.
F Amount does not include the portfolio activity of any underlying Fidelity Central Funds.
G For the period October 2, 2006 (commencement of sale of shares) to September 30, 2007.
H Expense ratios reflect operating expenses of the class. Expenses before reductions do not reflect amounts reimbursed by the investment adviser or reductions from brokerage service arrangements or other expense offset arrangements and do not represent the amount paid by the class during periods when reimbursements or reductions occur. Expense ratios before reductions for start-up periods may not be representative of longer-term operating periods. Expenses net of fee waivers reflect expenses after reimbursement by the investment adviser but prior to reductions from brokerage service arrangements or other expense offset arrangements. Expenses net of all reductions represent the net expenses paid by the class. Fees and expenses of the underlying Fidelity Central Funds are not included in the Fund's expense ratio. The Fund indirectly bears its proportionate share of the expenses of any underlying Fidelity Central Funds. Based on their most recent shareholder report date, the expenses ranged from less than .01% to .03%.
Financial Highlights - Class T
Years ended September 30, | 2008 | 2007 G |
Selected Per-Share Data | | |
Net asset value, beginning of period | $ 14.74 | $ 12.75 |
Income from Investment Operations | | |
Net investment income (loss) E | .13 | .15 |
Net realized and unrealized gain (loss) | (3.73) | 2.06 |
Total from investment operations | (3.60) | 2.21 |
Distributions from net investment income | (.20) | (.20) |
Distributions from net realized gain | (.03) | (.02) |
Total distributions | (.23) | (.22) |
Net asset value, end of period | $ 10.91 | $ 14.74 |
Total Return B, C, D | (24.76)% | 17.46% |
Ratios to Average Net Assets H | | |
Expenses before reductions | 1.38% | 1.42% A |
Expenses net of fee waivers, if any | 1.38% | 1.42% A |
Expenses net of all reductions | 1.37% | 1.41% A |
Net investment income (loss) | 1.02% | 1.07% A |
Supplemental Data | | |
Net assets, end of period (000 omitted) | $ 4,090 | $ 1,792 |
Portfolio turnover rate F | 20% | 31% |
A Annualized
B Total returns for periods of less than one year are not annualized.
C Total returns would have been lower had certain expenses not been reduced during the periods shown.
D Total returns do not include the effect of the sales charges.
E Calculated based on average shares outstanding during the period.
F Amount does not include the portfolio activity of any underlying Fidelity Central Funds.
G For the period October 2, 2006 (commencement of sale of shares) to September 30, 2007.
H Expense ratios reflect operating expenses of the class. Expenses before reductions do not reflect amounts reimbursed by the investment adviser or reductions from brokerage service arrangements or other expense offset arrangements and do not represent the amount paid by the class during periods when reimbursements or reductions occur. Expense ratios before reductions for start-up periods may not be representative of longer-term operating periods. Expenses net of fee waivers reflect expenses after reimbursement by the investment adviser but prior to reductions from brokerage service arrangements or other expense offset arrangements. Expenses net of all reductions represent the net expenses paid by the class. Fees and expenses of the underlying Fidelity Central Funds are not included in the Fund's expense ratio. The Fund indirectly bears its proportionate share of the expenses of any underlying Fidelity Central Funds. Based on their most recent shareholder report date, the expenses ranged from less than .01% to .03%.
See accompanying notes which are an integral part of the financial statements.
Annual Report
Financial Highlights - Class B
Years ended September 30, | 2008 | 2007 G |
Selected Per-Share Data | | |
Net asset value, beginning of period | $ 14.69 | $ 12.75 |
Income from Investment Operations | | |
Net investment income (loss) E | .06 | .08 |
Net realized and unrealized gain (loss) | (3.72) | 2.07 |
Total from investment operations | (3.66) | 2.15 |
Distributions from net investment income | (.16) | (.19) |
Distributions from net realized gain | (.03) | (.02) |
Total distributions | (.19) | (.21) |
Net asset value, end of period | $ 10.84 | $ 14.69 |
Total Return B, C, D | (25.21)% | 16.98% |
Ratios to Average Net Assets H | | |
Expenses before reductions | 1.93% | 1.93% A |
Expenses net of fee waivers, if any | 1.93% | 1.93% A |
Expenses net of all reductions | 1.92% | 1.92% A |
Net investment income (loss) | .47% | .56% A |
Supplemental Data | | |
Net assets, end of period (000 omitted) | $ 2,452 | $ 1,632 |
Portfolio turnover rate F | 20% | 31% |
A Annualized
B Total returns for periods of less than one year are not annualized.
C Total returns would have been lower had certain expenses not been reduced during the periods shown.
D Total returns do not include the effect of the contingent deferred sales charge.
E Calculated based on average shares outstanding during the period.
F Amount does not include the portfolio activity of any underlying Fidelity Central Funds.
G For the period October 2, 2006 (commencement of sale of shares) to September 30, 2007.
H Expense ratios reflect operating expenses of the class. Expenses before reductions do not reflect amounts reimbursed by the investment adviser or reductions from brokerage service arrangements or other expense offset arrangements and do not represent the amount paid by the class during periods when reimbursements or reductions occur. Expense ratios before reductions for start-up periods may not be representative of longer-term operating periods. Expenses net of fee waivers reflect expenses after reimbursement by the investment adviser but prior to reductions from brokerage service arrangements or other expense offset arrangements. Expenses net of all reductions represent the net expenses paid by the class. Fees and expenses of the underlying Fidelity Central Funds are not included in the Fund's expense ratio. The Fund indirectly bears its proportionate share of the expenses of any underlying Fidelity Central Funds. Based on their most recent shareholder report date, the expenses ranged from less than .01% to .03%.
Financial Highlights - Class C
Years ended September 30, | 2008 | 2007 G |
Selected Per-Share Data | | |
Net asset value, beginning of period | $ 14.67 | $ 12.75 |
Income from Investment Operations | | |
Net investment income (loss) E | .07 | .08 |
Net realized and unrealized gain (loss) | (3.71) | 2.06 |
Total from investment operations | (3.64) | 2.14 |
Distributions from net investment income | (.18) | (.20) |
Distributions from net realized gain | (.03) | (.02) |
Total distributions | (.21) | (.22) |
Net asset value, end of period | $ 10.82 | $ 14.67 |
Total Return B, C, D | (25.16)% | 16.90% |
Ratios to Average Net Assets H | | |
Expenses before reductions | 1.90% | 1.91% A |
Expenses net of fee waivers, if any | 1.90% | 1.91% A |
Expenses net of all reductions | 1.89% | 1.90% A |
Net investment income (loss) | .51% | .58% A |
Supplemental Data | | |
Net assets, end of period (000 omitted) | $ 5,017 | $ 3,194 |
Portfolio turnover rate F | 20% | 31% |
A Annualized
B Total returns for periods of less than one year are not annualized.
C Total returns would have been lower had certain expenses not been reduced during the periods shown.
D Total returns do not include the effect of the contingent deferred sales charge.
E Calculated based on average shares outstanding during the period.
F Amount does not include the portfolio activity of any underlying Fidelity Central Funds.
G For the period October 2, 2006 (commencement of sale of shares) to September 30, 2007.
H Expense ratios reflect operating expenses of the class. Expenses before reductions do not reflect amounts reimbursed by the investment adviser or reductions from brokerage service arrangements or other expense offset arrangements and do not represent the amount paid by the class during periods when reimbursements or reductions occur. Expense ratios before reductions for start-up periods may not be representative of longer-term operating periods. Expenses net of fee waivers reflect expenses after reimbursement by the investment adviser but prior to reductions from brokerage service arrangements or other expense offset arrangements. Expenses net of all reductions represent the net expenses paid by the class. Fees and expenses of the underlying Fidelity Central Funds are not included in the Fund's expense ratio. The Fund indirectly bears its proportionate share of the expenses of any underlying Fidelity Central Funds. Based on their most recent shareholder report date, the expenses ranged from less than .01% to .03%.
See accompanying notes which are an integral part of the financial statements.
Annual Report
Financial Highlights - Asset Manager 85%
Years ended September 30, | 2008 | 2007 | 2006 | 2005 | 2004 |
Selected Per-Share Data | | | | | |
Net asset value, beginning of period | $ 14.81 | $ 12.79 | $ 11.69 | $ 10.29 | $ 9.26 |
Income from Investment Operations | | | | | |
Net investment income (loss) B | .20 | .23 | .18 | .06 D | .05 |
Net realized and unrealized gain (loss) | (3.76) | 2.02 | .98 | 1.40 | 1.04 |
Total from investment operations | (3.56) | 2.25 | 1.16 | 1.46 | 1.09 |
Distributions from net investment income | (.23) | (.21) | (.06) | (.06) | (.06) |
Distributions from net realized gain | (.03) | (.02) | - | - | - |
Total distributions | (.26) | (.23) | (.06) | (.06) | (.06) |
Net asset value, end of period | $ 10.99 | $ 14.81 | $ 12.79 | $ 11.69 | $ 10.29 |
Total Return A | (24.43)% | 17.77% | 9.95% | 14.22% | 11.79% |
Ratios to Average Net Assets E | | | | | |
Expenses before reductions | .87% | .89% | .91% | .92% | .94% |
Expenses net of fee waivers, if any | .87% | .87% | .91% | .92% | .94% |
Expenses net of all reductions | .86% | .86% | .87% | .89% | .91% |
Net investment income (loss) | 1.54% | 1.62% | 1.50% | .53% D | .52% |
Supplemental Data | | | | | |
Net assets, end of period (000 omitted) | $ 440,040 | $ 576,458 | $ 448,831 | $ 403,221 | $ 352,600 |
Portfolio turnover rate C | 20% | 31% | 187% F | 71% F | 86% |
A Total returns would have been lower had certain expenses not been reduced during the periods shown.
B Calculated based on average shares outstanding during the period.
C Amount does not include the portfolio activity of any underlying Fidelity Central Funds.
D Investment income per share reflects a special dividend which amounted to $.02 per share. Excluding the special dividend, the ratio of net investment income (loss) to average net assets would have been .39%.
E Expense ratios reflect operating expenses of the class. Expenses before reductions do not reflect amounts reimbursed by the investment adviser or reductions from brokerage service arrangements or other expense offset arrangements and do not represent the amount paid by the class during periods when reimbursements or reductions occur. Expenses net of fee waivers reflect expenses after reimbursement by the investment adviser but prior to reductions from brokerage service arrangements or other expense offset arrangements. Expenses net of all reductions represent the net expenses paid by the class. Fees and expenses of the underlying Fidelity Central Funds are not included in the Fund's expense ratio. The Fund indirectly bears its proportionate share of the expenses of any underlying Fidelity Central Funds. Based on their most recent shareholder report date, the expenses ranged from less than .01% to .03%.
F Portfolio turnover rate excludes securities received or delivered in-kind.
Financial Highlights - Institutional Class
Years ended September 30, | 2008 | 2007 F |
Selected Per-Share Data | | |
Net asset value, beginning of period | $ 14.82 | $ 12.75 |
Income from Investment Operations | | |
Net investment income (loss) D | .21 | .23 |
Net realized and unrealized gain (loss) | (3.76) | 2.07 |
Total from investment operations | (3.55) | 2.30 |
Distributions from net investment income | (.24) | (.21) |
Distributions from net realized gain | (.03) | (.02) |
Total distributions | (.27) | (.23) |
Net asset value, end of period | $ 11.00 | $ 14.82 |
Total Return B, C | (24.35)% | 18.24% |
Ratios to Average Net Assets G | | |
Expenses before reductions | .78% | .82% A |
Expenses net of fee waivers, if any | .78% | .82% A |
Expenses net of all reductions | .77% | .81% A |
Net investment income (loss) | 1.62% | 1.67% A |
Supplemental Data | | |
Net assets, end of period (000 omitted) | $ 724 | $ 247 |
Portfolio turnover rate E | 20% | 31% |
A Annualized
B Total returns for periods of less than one year are not annualized.
C Total returns would have been lower had certain expenses not been reduced during the periods shown.
D Calculated based on average shares outstanding during the period.
E Amount does not include the portfolio activity of any underlying Fidelity Central Funds.
F For the period October 2, 2006 (commencement of sale of shares) to September 30, 2007.
G Expense ratios reflect operating expenses of the class. Expenses before reductions do not reflect amounts reimbursed by the investment adviser or reductions from brokerage service arrangements or other expense offset arrangements and do not represent the amount paid by the class during periods when reimbursements or reductions occur. Expense ratios before reductions for start-up periods may not be representative of longer-term operating periods. Expenses net of fee waivers reflect expenses after reimbursement by the investment adviser but prior to reductions from brokerage service arrangements or other expense offset arrangements. Expenses net of all reductions represent the net expenses paid by the class. Fees and expenses of the underlying Fidelity Central Funds are not included in the Fund's expense ratio. The Fund indirectly bears its proportionate share of the expenses of any underlying Fidelity Central Funds. Based on their most recent shareholder report date, the expenses ranged from less than .01% to .03%.
See accompanying notes which are an integral part of the financial statements.
Annual Report
Notes to Financial Statements
For the period ended September 30, 2008
1. Organization.
Fidelity Asset Manager 20%, Fidelity Asset Manager 30%, Fidelity Asset Manager 40%, Fidelity Asset Manager 50%, Fidelity Asset Manager 60%, Fidelity Asset Manager 70% and Fidelity Asset Manager 85% (the Funds) are funds of Fidelity Charles Street Trust (the trust). The trust is registered under the Investment Company Act of 1940, as amended (the 1940 Act), as an open-end management investment company organized as a Massachusetts business trust. Each Fund is authorized to issue an unlimited number of shares. Each Fund offers Class A, Class T, Class B, Class C, Asset Manager and Institutional Class shares, each of which has equal rights as to assets and voting privileges. Each class has exclusive voting rights with respect to matters that affect that class. Fidelity Asset Manager 70% commenced sale of Class A, Class T, Class B, Class C, and Institutional Class shares and the existing class was designated Asset Manager 70% on September 23, 2008. Class B shares will automatically convert to Class A shares after a holding period of seven years from the initial date of purchase. Investment income, realized and unrealized capital gains and losses, the common expenses of the Fund, and certain fund-level expense reductions, if any, are allocated on a pro rata basis to each class based on the relative net assets of each class to the total net assets of the Fund. Each class differs with respect to transfer agent and distribution and service plan fees incurred. Certain expense reductions also differ by class.
2. Investments in Fidelity Central Funds.
The Funds may invest in Fidelity Central Funds, which are open-end investment companies available only to other investment companies and accounts managed by Fidelity Management & Research Company (FMR) and its affiliates. The Funds' Schedules of Investments list each of the Fidelity Central Funds held as of period end, if any, as an investment of each Fund, but does not include the underlying holdings of each Fidelity Central Fund. As an Investing Fund, the Funds indirectly bear their proportionate share of the expenses of the underlying Fidelity Central Funds.
Based on their investment objective, each Fidelity Central Fund may invest or participate in various investment vehicles or strategies that are similar to those of each Fund. These strategies are consistent with the investment objectives of each Fund and may involve certain economic risks which may cause a decline in value of each of the Fidelity Central Funds and thus a decline in the value of each Fund. The following summarizes the Funds' investment in each Fidelity Central Fund.
Fidelity Central Fund | Investment Manager | Investment Objective | Investment Practices | Expense Ratio* |
Fidelity Equity Sector Central Funds | Fidelity Management & Research Company, Inc. (FMRC) | Each fund seeks capital appreciation by investing primarily in common stocks, with a concentration in a particular industry. | Foreign Securities Repurchase Agreements Restricted Securities | less than .01% to .02% |
Fidelity International Equity Central Fund | FMRC | Seeks capital appreciation by investing primarily in non-U.S. based common stocks, including securities of issuers located in emerging markets. | Foreign Securities Repurchase Agreements | .03% |
Fidelity Floating Rate Central Fund | FMRC | Seeks a high level of income by normally investing in floating rate loans and other floating rate securities. | Loans & Direct Debt Instruments Repurchase Agreements Restricted Securities | less than .01% |
Fidelity High Income Central Fund 1 | FMRC | Seeks a high level of income and may also seek capital appreciation by investing primarily in debt securities, preferred stocks, and convertible securities, with an emphasis on lower-quality debt securities. | Loans & Direct Debt Instruments Repurchase Agreements Restricted Securities | less than .01% |
Fidelity Tactical Income Central Fund | Fidelity Investments Money Management, Inc. (FIMM) | Seeks a high level of income by normally investing in investment-grade debt securities. | Delayed Delivery & When Issued Securities Mortgage Dollar Rolls Repurchase Agreements Restricted Securities Swap Agreements | less than .01% |
Fidelity Money Market Central Funds | FIMM | Seeks to obtain a high level of current income consistent with the preservation of capital and liquidity. | Short-term Investments | less than .01% |
* Expenses expressed as a percentage of average net assets and are as of each underlying Central Fund's most recent annual or semi-annual shareholder report.
Annual Report
Notes to Financial Statements - continued
2. Investments in Fidelity Central Funds - continued
An unaudited holdings listing for each Fund, which presents direct holdings as well as the pro rata share of any securities and other investments held indirectly through each Fund's investment in underlying non-money market Fidelity Central Funds, is available at fidelity.com and/or advisor.fidelity.com, as applicable. A complete unaudited list of holdings for each Fidelity Central Fund is available upon request or at the SEC's web site at www.sec.gov. In addition, the financial statements of the Fidelity Central Funds, which are not covered by the Funds' Reports of Independent Registered Public Accounting Firm, are available on the SEC's web site or upon request.
3. Significant Accounting Policies.
The financial statements have been prepared in conformity with accounting principles generally accepted in the United States of America, which require management to make certain estimates and assumptions at the date of the financial statements. Actual results could differ from those estimates. The following summarizes the significant accounting policies of the Funds:
Security Valuation. Investments are valued as of 4:00 p.m. Eastern time on the last calendar day of the period. Wherever possible, each Fund uses independent pricing services approved by the Board of Trustees to value their investments.
Equity securities, including restricted securities, for which market quotations are readily available, are valued at the last reported sale price or official closing price as reported by an independent pricing service on the primary market or exchange on which they are traded. In the event there were no sales during the day or closing prices are not available, securities are valued at the last quoted bid price. Debt securities, including restricted securities, are valued by independent pricing services or by dealers who make markets in such securities. Pricing services consider yield or price of bonds of comparable quality, coupon, maturity and type as well as dealer supplied prices. Futures contracts are valued at the settlement price established each day by the board of trade or exchange on which they are traded. Investments in open-end mutual funds, including the Fidelity Central Funds, are valued at their closing net asset value each business day. Short-term securities with remaining maturities of sixty days or less for which quotations are not readily available are valued at amortized cost, which approximates value.
When current market prices or quotations are not readily available or reliable, valuations may be determined in good faith in accordance with procedures adopted by the Board of Trustees. Factors used in determining value may include significant market or security specific events, changes in interest rates and credit quality, and developments in foreign markets which are monitored by evaluating the performance of ADRs, futures contracts and exchange-traded funds. The frequency with which these procedures are used cannot be predicted and may be utilized to a significant extent. The value of securities used for net asset value (NAV) calculation under these procedures may differ from published prices for the same securities.
Foreign Currency. Certain Funds may use foreign currency contracts to facilitate transactions in foreign-denominated securities. Losses from these transactions may arise from changes in the value of the foreign currency or if the counterparties do not perform under the contracts' terms.
Foreign-denominated assets, including investment securities, and liabilities are translated into U.S. dollars at the exchange rate at period end. Purchases and sales of investment securities, income and dividends received and expenses denominated in foreign currencies are translated into U.S. dollars at the exchange rate in effect on the transaction date.
The effects of exchange rate fluctuations on investments are included with the net realized and unrealized gain (loss) on investment securities. Other foreign currency transactions resulting in realized and unrealized gain (loss) are disclosed separately.
Investment Transactions and Income. For financial reporting purposes, the Funds' investment holdings and NAV include trades executed through the end of the last business day of the period. The NAV per share for processing shareholder transactions is calculated as of the close of business of the New York Stock Exchange (NYSE), normally 4:00 pm Eastern time and includes trades executed through the end of the prior business day. Gains and losses on securities sold are determined on the basis of identified cost and may include proceeds received from litigation. Dividend income is recorded on the ex-dividend date. Non-cash dividends included in dividend income, if any, are recorded at the fair market value of the securities received. Interest income and distributions from the Fidelity Central Funds are accrued as earned. Interest income includes coupon interest and amortization of premium and accretion of discount on debt securities. Investment income is recorded net of foreign taxes withheld where recovery of such taxes is uncertain.
Expenses. Most expenses of the trust can be directly attributed to a fund. Expenses which cannot be directly attributed are apportioned among each Fund in the trust. Expense estimates are accrued in the period to which they relate and adjustments are made when actual amounts are known. Expenses included in the accompanying financial statements reflect the expenses of each Fund and do not include any expenses of the Fidelity Central Funds. Although not included in each Fund's expenses, each Fund indirectly bears its proportionate share of the Fidelity Central Funds' expenses through the impact of these expenses on each Fidelity Central Fund's net asset value. Based on their most recent shareholder report date, expenses of the Fidelity Central Funds ranged from less than .01% to .03%.
Annual Report
3. Significant Accounting Policies - continued
Deferred Trustee Compensation. Under a Deferred Compensation Plan (the Plan) for Fidelity Asset Manager 50% and Fidelity Asset Manager 70%, Independent Trustees must defer receipt of a portion of, and may elect to defer receipt of an additional portion of, their annual compensation. Deferred amounts are invested in a cross-section of Fidelity funds, are marked-to-market and remain in the Fund until distributed in accordance with the Plan. The investment of deferred amounts and the offsetting payable to the Trustees are included in the accompanying Statement of Assets and Liabilities.
Income Tax Information and Distributions to Shareholders. Each year, each Fund intends to qualify as a regulated investment company by distributing substantially all of its taxable income and realized gains under Subchapter M of the Internal Revenue Code and filing its U.S. federal tax return. As a result, no provision for income taxes is required. Each Fund is subject to the provisions of FASB Interpretation No. 48, Accounting for Uncertainties in Income Taxes (FIN 48). FIN 48 sets forth a minimum threshold for financial statement recognition of the benefit of a tax position taken or expected to be taken in a tax return. The implementation of FIN 48 did not result in any unrecognized tax benefits in the accompanying financial statements. Each of the Funds' federal tax returns for the prior three fiscal years remains subject to examination by the Internal Revenue Service (IRS). Foreign taxes are provided for based on each Fund's understanding of the tax rules and rates that exist in the foreign markets in which it invests.
Distributions are recorded on the ex-dividend date. Income dividends and capital gain distributions are declared separately for each class. Income and capital gain distributions are determined in accordance with income tax regulations, which may differ from generally accepted accounting principles.
Capital accounts within the financial statements are adjusted for permanent book-tax differences. These adjustments have no impact on net assets or the results of operations. Temporary book-tax differences will reverse in a subsequent period.
Book-tax differences are primarily due to futures transactions, foreign currency transactions, certain foreign taxes, passive foreign investment companies (PFIC), market discount, partnerships (including allocations from Fidelity Central Funds), deferred trustees compensation, capital loss carryforwards and losses deferred due to wash sales and excise tax regulations.
The tax-basis components of distributable earnings and the federal tax cost as of period end were as follows for each Fund:
| Cost for Federal
Income Tax Purposes | Unrealized
Appreciation | Unrealized
Depreciation | Net Unrealized
Appreciation/
(Depreciation) |
Fidelity Asset Manager 20% | $ 2,366,330,190 | $ 12,057,286 | $ (167,215,181) | $ (155,157,895) |
Fidelity Asset Manager 30% | 29,648,950 | 262 | (2,437,137) | (2,436,875) |
Fidelity Asset Manager 40% | 20,660,400 | 65 | (1,596,219) | (1,596,154) |
Fidelity Asset Manager 50% | 6,763,591,475 | 90,074,183 | (776,437,621) | (686,363,438) |
Fidelity Asset Manager 60% | 35,302,499 | 5,822 | (2,646,858) | (2,641,036) |
Fidelity Asset Manager 70% | 2,799,541,819 | 38,688,032 | (365,799,022) | (327,110,990) |
Fidelity Asset Manager 85% | 516,075,883 | 6,555,566 | (70,621,041) | (64,065,475) |
| Undistributed
Ordinary Income | Undistributed
Long-term
Capital Gain | Capital Loss
Carryforward |
Fidelity Asset Manager 20% | $ 11,796,488 | $ 422,310 | $ - |
Fidelity Asset Manager 30% | 143,916 | - | (10,213) |
Fidelity Asset Manager 40% | 131,643 | - | (101,011) |
Fidelity Asset Manager 50% | 67,738,925 | - | - |
Fidelity Asset Manager 60% | 231,837 | - | (76,825) |
Fidelity Asset Manager 70% | 41,565,845 | - | (100,045,622) |
Fidelity Asset Manager 85% | 5,554,380 | - | (36,329,826) |
The tax character of distributions paid was as follows:
September 30, 2008 | | | |
| Ordinary Income | Long-term
Capital Gains | Total |
Fidelity Asset Manager 20% | $ 124,816,062 | $ 15,864,447 | $ 140,680,509 |
Fidelity Asset Manager 30% | 595,233 | - | 595,233 |
Fidelity Asset Manager 40% | 228,368 | - | 228,368 |
Fidelity Asset Manager 50% | 609,187,068 | 187,189,636 | 796,376,704 |
Fidelity Asset Manager 60% | 36,701 | - | 36,701 |
Fidelity Asset Manager 70% | 75,537,733 | - | 75,537,733 |
Fidelity Asset Manager 85% | 10,588,284 | - | 10,588,284 |
Annual Report
Notes to Financial Statements - continued
3. Significant Accounting Policies - continued
Income Tax Information and Distributions to Shareholders - continued
September 30, 2007 | | | |
| Ordinary Income | Long-term
Capital Gains | Total |
Fidelity Asset Manager 20% | $ 136,976,584 | $ 57,926,972 | $ 194,903,556 |
Fidelity Asset Manager 50% | 396,065,388 | 361,760,126 | 757,825,514 |
Fidelity Asset Manager 70% | 74,718,985 | - | 74,718,985 |
Fidelity Asset Manager 85% | 8,158,238 | - | 8,158,238 |
New Accounting Pronouncements. In September 2006, Statement of Financial Accounting Standards No. 157, Fair Value Measurements (SFAS 157), was issued and is effective for fiscal years beginning after November 15, 2007. SFAS 157 defines fair value, establishes a framework for measuring fair value and results in expanded disclosures about fair value measurements.
In addition, in March 2008, Statement of Financial Accounting Standards No. 161, Disclosures about Derivative Instruments and Hedging Activities (SFAS 161), was issued and is effective for reporting periods beginning after November 15, 2008. SFAS 161 requires enhanced disclosures to provide information about the reasons the Funds invest in derivative instruments, the accounting treatment and the effect derivatives have on financial performance.
4. Operating Policies.
Repurchase Agreements. FMR has received an Exemptive Order from the Securities and Exchange Commission (the SEC) which permits certain Funds and other affiliated entities of FMR to transfer uninvested cash balances into joint trading accounts which are then invested in repurchase agreements. Certain Funds may also invest directly with institutions in repurchase agreements. Repurchase agreements are collateralized by government or non-government securities. Upon settlement date, collateral is held in segregated accounts with custodian banks and may be obtained in the event of a default of the counterparty. Each applicable Fund monitors, on a daily basis, the value of the collateral to ensure it is at least equal to the principal amount of the repurchase agreement (including accrued interest). In the event of a default by the counterparty, realization of the collateral proceeds could be delayed, during which time the value of the collateral may decline.
Futures Contracts. Certain Funds may use futures contracts to manage their exposure to the stock market. Buying futures tends to increase a fund's exposure to the underlying instrument, while selling futures tends to decrease a fund's exposure to the underlying instrument or hedge other fund investments. Upon entering into a futures contract, a fund is required to deposit with a clearing broker, no later than the following business day, an amount ("initial margin") equal to a certain percentage of the face value of the contract. The initial margin may be in the form of cash or securities and is transferred to a segregated account on settlement date. Subsequent payments ("variation margin") are made or received by a fund depending on the daily fluctuations in the value of the futures contract and are accounted for as unrealized gains or losses. Realized gains (losses) are recorded upon the expiration or closing of the futures contract. Securities deposited to meet margin requirements are identified in each applicable fund's Schedule of Investments. Futures contracts involve, to varying degrees, risk of loss in excess of any futures variation margin reflected in each applicable fund's Statement of Assets and Liabilities. The underlying face amount at value of any open futures contracts at period end is shown in each applicable fund's Schedule of Investments under the caption "Futures Contracts." This amount reflects each contract's exposure to the underlying instrument at period end. Losses may arise from changes in the value of the underlying instruments or if the counterparties do not perform under the contract's terms.
5. Purchases and Sales of Investments.
Purchases and sales of securities (including the Equity and Fixed-Income Central Funds), other than short-term securities, are noted in the table below.
| Purchases ($) | Sales ($) |
Fidelity Asset Manager 20% | 171,800,010 | 83,670,006 |
Fidelity Asset Manager 30% | 33,090,843 | 4,895,941 |
Fidelity Asset Manager 40% | 18,362,577 | 101,121 |
Fidelity Asset Manager 50% | 604,143,707 | 1,602,065,571 |
Fidelity Asset Manager 60% | 31,760,349 | 539,595 |
Fidelity Asset Manager 70% | 368,231,329 | 415,955,703 |
Fidelity Asset Manager 85% | 146,921,804 | 98,178,529 |
Annual Report
6. Fees and Other Transactions with Affiliates.
Management Fee. FMR and its affiliates provide the Funds with investment management related services for which the Funds pay a monthly management fee. The management fee is the sum of an individual fund fee rate and a group fee rate. The individual fund fee rate is applied to each Fund's average net assets. The group fee rate is based upon the average net assets of all the mutual funds advised by FMR. The group fee rate decreases as assets under management increase and increases as assets under management decrease. For the period, each Fund's annual management fee rate expressed as a percentage of each Fund's average net assets was as follows:
| Individual Rate | Group Rate | Total |
Fidelity Asset Manager 20% | .30% | .12% | .42% |
Fidelity Asset Manager 30% | .30% | .12% | .42% |
Fidelity Asset Manager 40% | .30% | .12% | .42% |
Fidelity Asset Manager 50% | .25% | .26% | .51% |
Fidelity Asset Manager 60% | .30% | .26% | .56% |
Fidelity Asset Manager 70% | .30% | .26% | .56% |
Fidelity Asset Manager 85% | .30% | .26% | .56% |
FMR pays a portion of the management fees received from the Funds to the Fidelity Central Funds' investment advisers, who are also affiliates, for managing the assets of the Fidelity Central Funds.
Distribution and Service Plan. In accordance with Rule 12b-1 of the 1940 Act, the Fund has adopted separate Distribution and Service Plans for each class of shares. Certain classes pay Fidelity Distributors Corporation (FDC), an affiliate of FMR, separate Distribution and Service Fees, each of which is based on an annual percentage of each class' average net assets. In addition, FDC may pay financial intermediaries for selling shares of the Fund and providing shareholder support services. For the period, the Distribution and Service Fee rates and the total amounts paid to and retained by FDC were as follows:
Fidelity Asset Manager 20% | Distribution
Fee | Service
Fee | Paid to
FDC | Retained
by FDC |
Class A | .00% | .25% | $ 16,841 | $ 3,422 |
Class T | .25% | .25% | 22,751 | 259 |
Class B | .75% | .25% | 15,959 | 12,106 |
Class C | .75% | .25% | 27,213 | 13,462 |
| | | $ 82,764 | $ 29,249 |
Fidelity Asset Manager 30% | | | | |
Class A | .00% | .25% | $ 1,787 | $ 392 |
Class T | .25% | .25% | 2,276 | 689 |
Class B | .75% | .25% | 2,484 | 2,211 |
Class C | .75% | .25% | 7,262 | 6,613 |
| | | $ 13,809 | $ 9,905 |
Fidelity Asset Manager 40% | | | | |
Class A | .00% | .25% | $ 4,314 | $ 3,457 |
Class T | .25% | .25% | 8,264 | 6,915 |
Class B | .75% | .25% | 13,919 | 13,889 |
Class C | .75% | .25% | 14,815 | 14,721 |
| | | $ 41,312 | $ 38,982 |
Fidelity Asset Manager 50% | | | | |
Class A | .00% | .25% | $ 20,613 | $ 5,970 |
Class T | .25% | .25% | 24,930 | 248 |
Class B | .75% | .25% | 18,320 | 13,886 |
Class C | .75% | .25% | 39,254 | 27,533 |
| | | $ 103,117 | $ 47,637 |
Fidelity Asset Manager 60% | | | | |
Class A | .00% | .25% | $ 4,672 | $ 2,746 |
Class T | .25% | .25% | 4,938 | 3,563 |
Class B | .75% | .25% | 8,905 | 8,453 |
Class C | .75% | .25% | 11,155 | 8,678 |
| | | $ 29,670 | $ 23,440 |
Annual Report
Notes to Financial Statements - continued
6. Fees and Other Transactions with Affiliates - continued
Distribution and Service Plan - continued
Fidelity Asset Manager 70% | Distribution
Fee | Service
Fee | Paid to
FDC | Retained
by FDC |
Class A | .00% | .25% | $ 1,735 | $ - |
Class T | .25% | .25% | 2,053 | - |
Class B | .75% | .25% | 1,847 | 1,385 |
Class C | .75% | .25% | 2,955 | - |
| | | $ 8,590 | $ 1,385 |
Fidelity Asset Manager 85% | | | | |
Class A | .00% | .25% | $ 28,319 | $ 3,184 |
Class T | .25% | .25% | 15,076 | 245 |
Class B | .75% | .25% | 22,977 | 17,369 |
Class C | .75% | .25% | 46,903 | 30,918 |
| | | $ 113,275 | $ 51,716 |
Sales Load. FDC receives a front-end sales charge of up to 5.75% for selling Class A shares, and 3.50% for selling Class T shares, some of which is paid to financial intermediaries for selling shares of the Fund. FDC receives the proceeds of contingent deferred sales charges levied on Class A, Class T, Class B, and Class C redemptions. These charges depend on the holding period. The deferred sales charges range from 5% to 1% for Class B, 1% for Class C, 1.00% to .50% for certain purchases of Class A shares and .25% for certain purchases of Class T shares.
For the period, sales charge amounts retained by FDC were as follows:
Fidelity Asset Manager 20% | Retained
by FDC |
Class A | $ 24,014 |
Class T | 3,692 |
Class B* | 2,543 |
Class C* | 1,199 |
| $ 31,448 |
Fidelity Asset Manager 30% | |
Class A | $ 1,961 |
Class T | 475 |
Class C* | 824 |
| $ 3,260 |
Fidelity Asset Manager 40% | |
Class A | $ 3,663 |
Class T | 234 |
Class B* | 95 |
| $ 3,992 |
Fidelity Asset Manager 50% | |
Class A | $ 30,625 |
Class T | 4,653 |
Class B* | 2,586 |
Class C* | 1,428 |
| $ 39,292 |
Fidelity Asset Manager 60% | |
Class A | $ 4,205 |
Class T | 1,339 |
Class C* | 208 |
| $ 5,752 |
Fidelity Asset Manager 70% | |
Class A | $ 615 |
Class T | 273 |
Class B* | 182 |
| $ 1,070 |
Annual Report
6. Fees and Other Transactions with Affiliates - continued
Sales Load - continued
Fidelity Asset Manager 85% | Retained
by FDC |
Class A | $ 33,337 |
Class T | 8,812 |
Class B* | 3,631 |
Class C* | 2,666 |
| $ 48,446 |
* When Class B and Class C shares are initially sold, FDC pays commissions from its own resources to financial intermediaries through which the sales are made.
Transfer Agent Fees. Fidelity Investments Institutional Operations Company, Inc. (FIIOC), an affiliate of FMR, is the transfer, dividend disbursing and shareholder servicing agent for each class of the Funds. FIIOC receives account fees and asset-based fees that vary according to the account size and type of account of the shareholders of the respective classes of each Fund. FIIOC pays for typesetting, printing and mailing of shareholder reports, except proxy statements. Prior to January 1, 2008, Fidelity Service Company Inc., (FSC), also an affiliate of FMR, was the transfer agent for Asset Manager 20%, Asset Manager 50%, Asset Manager 70% and Asset Manager 85%. For the period, each class paid the following transfer agent fees:
Fidelity Asset Manager 20% | Amount | % of
Average
Net Assets |
Class A | $ 10,339 | .15 |
Class T | 7,180 | .16 |
Class B | 3,355 | .21 |
Class C | 5,086 | .19 |
Asset Manager 20% | 2,543,268 | .10 |
Institutional Class | 2,001 | .11 |
| $ 2,571,229 | |
Fidelity Asset Manager 30% | | |
Class A | $ 1,050 | .15 * |
Class T | 681 | .15 * |
Class B | 443 | .18 * |
Class C | 1,121 | .15 * |
Asset Manager 30% | 25,306 | .11 * |
Institutional Class | 197 | .12 * |
| $ 28,798 | |
Fidelity Asset Manager 40% | | |
Class A | $ 2,392 | .14 * |
Class T | 2,162 | .13 * |
Class B | 1,671 | .12 * |
Class C | 1,876 | .13 * |
Asset Manager 40% | 7,821 | .11 * |
Institutional Class | 1,626 | .12 * |
| $ 17,548 | |
Fidelity Asset Manager 50% | | |
Class A | $ 16,972 | .21 |
Class T | 10,130 | .20 |
Class B | 4,707 | .26 |
Class C | 8,962 | .23 |
Asset Manager 50% | 13,473,964 | .17 |
Institutional Class | 1,091 | .14 |
| $ 13,515,826 | |
Annual Report
Notes to Financial Statements - continued
6. Fees and Other Transactions with Affiliates - continued
Transfer Agent Fees - continued
Fidelity Asset Manager 60% | Amount | % of
Average
Net Assets |
Class A | $ 3,912 | .21 * |
Class T | 1,906 | .19 * |
Class B | 1,594 | .18 * |
Class C | 1,960 | .18 * |
Asset Manager 60% | 15,916 | .17 * |
Institutional Class | 1,233 | .14 * |
| $ 26,521 | |
Fidelity Asset Manager 70% | | |
Class A | $ 2,082 | .30 * |
Class T | 1,232 | .30 * |
Class B | 554 | .30 * |
Class C | 887 | .30 * |
Asset Manager 70% | 5,304,859 | .19 |
Institutional Class | 605 | .30 * |
| $ 5,310,219 | |
Fidelity Asset Manager 85% | | |
Class A | $ 28,117 | .25 |
Class T | 7,617 | .25 |
Class B | 6,942 | .30 |
Class C | 12,475 | .27 |
Asset Manager 85% | 1,288,694 | .24 |
Institutional Class | 690 | .15 |
| $ 1,344,535 | |
* Annualized
Accounting and Security Lending Fees. FSC maintains each Fund's accounting records. The accounting fee is based on the level of average net assets for the month. Under a separate contract, FSC administers the security lending program. The security lending fee is based on the number and duration of lending transactions.
Brokerage Commissions. Certain Funds placed a portion of their portfolio transactions with brokerage firms which are affiliates of the investment adviser. The commissions paid to these affiliated firms were as follows:
| Amount |
Fidelity Asset Manager 50% | $ 315 |
Fidelity Asset Manager 70% | 146 |
Fidelity Asset Manager 85% | 67 |
Interfund Lending Program. Pursuant to an Exemptive Order issued by the SEC, the Funds, along with other registered investment companies having management contracts with FMR, may participate in an interfund lending program. This program provides an alternative credit facility allowing the funds to borrow from, or lend money to, other participating affiliated funds. Any open loans, including accrued interest, at period end are presented under the caption "Notes Payable to Affiliates" in the Fund's Statement of Assets and Liabilities. Each applicable fund's activity in this program during the period for which loans were outstanding was as follows:
| Borrower or Lender | Average Daily Loan Balance | Weighted Average Interest Rate | Interest Expense |
Fidelity Asset Manager 50% | Borrower | $ 21,397,875 | 4.43% | $ 42,138 |
Annual Report
7. Committed Line of Credit.
Certain Funds participate with other funds managed by FMR in a $4.2 billion credit facility (the "line of credit") to be utilized for temporary or emergency purposes to fund shareholder redemptions or for other short-term liquidity purposes. The participating funds have agreed to pay commitment fees on their pro rata portion of the line of credit, which is reflected in Miscellaneous Expense on the Statement of Operations, and is as follows:
| Amount |
Fidelity Asset Manager 20% | $ 4,746 |
Fidelity Asset Manager 30% | 23 |
Fidelity Asset Manager 40% | 12 |
Fidelity Asset Manager 50% | 15,661 |
Fidelity Asset Manager 60% | 11 |
Fidelity Asset Manager 70% | 5,655 |
Fidelity Asset Manager 85% | 1,072 |
During the period, there were no borrowings on this line of credit.
8. Security Lending.
Certain Funds lend portfolio securities from time to time in order to earn additional income. On the settlement date of the loan, each applicable Fund receives collateral (in the form of U.S. Treasury obligations, letters of credit and/or cash) against the loaned securities and maintains collateral in an amount not less than 100% of the market value of the loaned securities during the period of the loan. The market value of the loaned securities is determined at the close of business of the Funds and any additional required collateral is delivered to the Funds on the next business day. If the borrower defaults on its obligation to return the securities loaned because of insolvency or other reasons, a fund could experience delays and costs in recovering the securities loaned or in gaining access to the collateral. Any cash collateral received is invested in the Fidelity Securities Lending Cash Central Fund. At period end, there were no security loans outstanding. Security lending income represents the income earned on investing cash collateral, less fees and expenses associated with the loan, plus any premium payments that may be received on the loan of certain types of securities. Security lending income is presented on each applicable Fund's Statement of Operations as a component of income from Fidelity Central Funds. Net income from lending portfolio securities during the period amounted to:
Fidelity Asset Manager 20% | $ 13 |
Fidelity Asset Manager 50% | 14,209 |
Fidelity Asset Manager 70% | 9,184 |
Fidelity Asset Manager 85% | 4,304 |
9. Bank Borrowings.
Each Fund is permitted to have bank borrowings for temporary or emergency purposes to fund shareholder redemptions. Each Fund has established borrowing arrangements with certain banks. The interest rate on the borrowings is the bank's base rate, as revised from time to time. At period end, there were no bank borrowings outstanding. Each applicable Fund's activity in this program during the period for which loans were outstanding was as follows:
| Average Daily
Loan Balance | Weighted Average Interest Rate | Interest Expense |
Fidelity Asset Manager 50% | $ 8,989,400 | 2.17% | $ 2,714 |
10. Expense Reductions.
FMR voluntarily agreed to reimburse a portion of certain class' operating expenses. During the period, this reimbursement reduced these class' expenses as noted in the table below.
| | Reimbursement
from adviser |
Asset Manager 20% | | $ 9,475 |
Asset Manager 50% | | 9,620 |
Asset Manager 85% | | 9,680 |
FMR voluntarily agreed to reimburse Funds to the extent annual operating expenses exceeded certain levels of average net assets as noted in the table below. Some expenses, for example interest expense, including commitment fees, are excluded from this reimbursement.
Annual Report
Notes to Financial Statements - continued
10. Expense Reductions - continued
The following classes of each applicable Fund were in reimbursement during the period:
| Expense
Limitations | Reimbursement
from adviser |
Fidelity Asset Manager 20% | | |
Class B | 1.85% - 1.65%* | $ 117 |
Fidelity Asset Manager 30% | | |
Class A | 1.10% - .90%* | 4,867 |
Class T | 1.35% - 1.15%* | 3,547 |
Class B | 1.85% - 1.65%* | 2,422 |
Class C | 1.85% - 1.65%* | 4,885 |
Asset Manager 30% | .85% - .65%* | 115,600 |
Institutional Class | .85% - .65%* | 1,630 |
Fidelity Asset Manager 40% | | |
Class A | 1.10% - .90%* | 15,717 |
Class T | 1.35% - 1.15%* | 14,873 |
Class B | 1.85% - 1.65%* | 12,131 |
Class C | 1.85% - 1.65%* | 13,271 |
Asset Manager 40% | .85% - .65%* | 66,187 |
Institutional Class | .85% - .65%* | 12,254 |
Fidelity Asset Manager 60% | | |
Class A | 1.25% - 1.10%* | 19,044 |
Class T | 1.50% - 1.35%* | 9,100 |
Class B | 2.00% - 1.85%* | 8,240 |
Class C | 2.00% - 1.85%* | 9,962 |
Asset Manager 60% | 1.00% - .85%* | 89,562 |
Institutional Class | 1.00% - .85%* | 7,842 |
Fidelity Asset Manager 70% | | |
Class A | 1.25% | 475 |
Class T | 1.50% | 282 |
Class B | 2.00% | 127 |
Class C | 2.00% | 208 |
Institutional Class | 1.00% | 131 |
* Expense limitation in effect at period end.
Many of the brokers with whom FMR places trades on behalf of certain Funds and certain Equity Central Funds provided services to these Funds in addition to trade execution. These services included payments of expenses on behalf of each applicable Fund. In addition, through arrangements with each applicable Fund's custodian and each class' transfer agent, credits realized as a result of uninvested cash balances were used to reduce the Fund's expenses. All of the applicable expense reductions are noted in the table below.
| Brokerage Service Arrangements | Custody
expense
reduction | Transfer
Agent
expense
reduction |
| | | |
Fidelity Asset Manager 20% | $ 20,515 | $ 196 | $ - |
Asset Manager 20% | - | - | 31,456 |
Institutional Class | - | - | 31 |
Fidelity Asset Manager 30% | 183 | 36 | - |
Fidelity Asset Manager 40% | 229 | 7 | - |
Fidelity Asset Manager 50% | 359,222 | - | - |
Class A | - | - | 115 |
Asset Manager 50% | - | - | 150,145 |
Institutional Class | - | - | 3 |
Fidelity Asset Manager 60% | 338 | - | - |
Fidelity Asset Manager 70% | 200,769 | - | - |
Asset Manager 70% | - | - | 66,813 |
Fidelity Asset Manager 85% | 56,201 | 226 | - |
Class A | - | - | 133 |
Asset Manager 85% | - | - | 9,316 |
Annual Report
11. Other.
The Funds' organizational documents provide former and current trustees and officers with a limited indemnification against liabilities arising in connection with the performance of their duties to the Funds. In the normal course of business, the Funds may also enter into contracts that provide general indemnifications. The Funds' maximum exposure under these arrangements is unknown as this would be dependent on future claims that may be made against the Funds. The risk of material loss from such claims is considered remote.
At the end of the period, FMR or its affiliates were owners of record of more than 10% of the outstanding shares of the following funds:
| Affiliated % |
Fund | |
Fidelity Asset Manager 40% | 36% |
Fidelity Asset Manager 60% | 13% |
In December 2006, the Independent Trustees, with the assistance of independent counsel, completed an investigation regarding gifts, gratuities and business entertainment provided by certain brokers to certain individuals who were employed on FMR's domestic equity trading desk during the period 2002 to 2004. The Independent Trustees and FMR agreed that, despite the absence of proof that the Fidelity mutual funds experienced diminished execution quality as a result of the improper receipt of gifts and business entertainment, the conduct at issue was serious and was worthy of redress. Accordingly, the Independent Trustees requested, and FMR agreed to make, a payment of $42 million plus accrued interest, which equaled approximately $7.3 million, to certain Fidelity mutual funds.
In March 2008, the Trustees approved a method for allocating this payment among the funds and, in total, FMR paid each fund the following amounts, which is recorded in each applicable Fund's accompanying Statement of Operations:
Fidelity Asset Manager 20% | $ 81,877 |
Fidelity Asset Manager 50% | 615,567 |
Fidelity Asset Manager 70% | 282,743 |
Fidelity Asset Manager 85% | 59,143 |
In a related administrative order dated March 5, 2008, the U.S. Securities and Exchange Commission ("SEC") announced a settlement with FMR and FMR Co., Inc. (an affiliate of FMR) involving the SEC's regulatory rules for investment advisers and the improper receipt of gifts, gratuities and business entertainment. Without admitting or denying the SEC's findings, FMR agreed to pay an $8 million civil penalty to the United States Treasury.
12. Distributions to Shareholders.
Distributions to shareholders of each class were as follows:
Years ended September 30, | 2008 | 2007 A |
Fidelity Asset Manager 20% | | |
From net investment income | | |
Class A | $ 217,282 | $ 39,791 |
Class T | 139,471 | 49,051 |
Class B | 38,980 | 12,517 |
Class C | 66,883 | 20,780 |
Asset Manager 20% | 90,572,886 | 97,126,066 |
Institutional Class | 68,611 | 7,027 |
Total | $ 91,104,113 | $ 97,255,232 |
From net realized gain | | |
Class A | $ 111,897 | $ 5,081 |
Class T | 88,892 | 20,043 |
Class B | 24,291 | 9,970 |
Class C | 35,012 | 9,436 |
Asset Manager 20% | 49,278,678 | 97,599,264 |
Institutional Class | 37,626 | 4,530 |
Total | $ 49,576,396 | $ 97,648,324 |
Annual Report
Notes to Financial Statements - continued
12. Distributions to Shareholders - continued
Years ended September 30, | 2008 | 2007 A |
Fidelity Asset Manager 30% B | | |
From net investment income | | |
Class A | $ 15,489 | $ - |
Class T | 9,224 | - |
Class B | 3,594 | - |
Class C | 12,880 | - |
Asset Manager 30% | 550,353 | - |
Institutional Class | 3,693 | - |
Total | $ 595,233 | $ - |
Fidelity Asset Manager 40% B | | |
From net investment income | | |
Class A | $ 27,725 | $ - |
Class T | 24,685 | - |
Class B | 15,306 | - |
Class C | 15,599 | - |
Asset Manager 40% | 119,398 | - |
Institutional Class | 25,655 | - |
Total | $ 228,368 | $ - |
Fidelity Asset Manager 50% | | |
From net investment income | | |
Class A | $ 185,719 | $ 24,674 |
Class T | 112,972 | 23,998 |
Class B | 29,127 | 8,690 |
Class C | 67,942 | 16,728 |
Asset Manager 50% | 239,444,583 | 271,801,549 |
Institutional Class | 26,633 | 3,438 |
Total | $ 239,866,976 | $ 271,879,077 |
From net realized gain | | |
Class A | $ 359,333 | $ 12,138 |
Class T | 290,067 | 16,061 |
Class B | 98,729 | 7,032 |
Class C | 225,372 | 9,224 |
Asset Manager 50% | 555,465,189 | 485,895,701 |
Institutional Class | 71,038 | 6,281 |
Total | $ 556,509,728 | $ 485,946,437 |
Fidelity Asset Manager 60% B | | |
From net investment income | | |
Class A | $ 7,307 | $ - |
Class T | 2,841 | - |
Class B | 1,840 | - |
Class C | 1,840 | - |
Asset Manager 60% | 18,398 | - |
Institutional Class | 4,475 | - |
Total | $ 36,701 | $ - |
Fidelity Asset Manager 70% | | |
From net investment income | | |
Asset Manager 70% | $ 72,024,349 | $ 74,718,985 |
From net realized gain | | |
Asset Manager 70% | $ 3,513,384 | $ - |
Annual Report
12. Distributions to Shareholders - continued
Years ended September 30, | 2008 | 2007 A |
Fidelity Asset Manager 85% | | |
From net investment income | | |
Class A | $ 150,986 | $ 3,111 |
Class T | 34,666 | 3,070 |
Class B | 23,020 | 2,303 |
Class C | 54,595 | 5,563 |
Asset Manager 85% | 9,096,274 | 7,429,888 |
Institutional Class | 3,940 | 1,655 |
Total | $ 9,363,481 | $ 7,445,590 |
From net realized gain | | |
Class A | $ 20,022 | $ 362 |
Class T | 5,093 | 315 |
Class B | 4,288 | 249 |
Class C | 9,298 | 571 |
Asset Manager 85% | 1,185,614 | 710,994 |
Institutional Class | 488 | 157 |
Total | $ 1,224,803 | $ 712,648 |
A Distributions for Class A, Class T, Class B, Class C and Institutional Class are for the period October 2, 2006 (commencement of sale of shares) to September 30, 2007.
B For the period October 9, 2007 (commencement of operations) to September 30, 2008.
13. Share Transactions.
Transactions for each class of shares were as follows:
| Shares | Dollars |
Years ended September 30, | 2008 | 2007A | 2008 | 2007A |
Fidelity Asset Manager 20% | | | | |
Class A | | | | |
Shares sold | 723,971 | 271,096 | $ 8,907,277 | $ 3,462,355 |
Reinvestment of distributions | 20,064 | 2,590 | 246,151 | 32,986 |
Shares redeemed | (301,654) | (8,338) | (3,651,098) | (106,244) |
Net increase (decrease) | 442,381 | 265,348 | $ 5,502,330 | $ 3,389,097 |
Class T | | | | |
Shares sold | 207,033 | 314,428 | $ 2,528,153 | $ 4,039,296 |
Reinvestment of distributions | 16,854 | 5,054 | 207,671 | 64,229 |
Shares redeemed | (97,145) | (12,418) | (1,189,971) | (158,426) |
Net increase (decrease) | 126,742 | 307,064 | $ 1,545,853 | $ 3,945,099 |
Class B | | | | |
Shares sold | 148,755 | 87,110 | $ 1,806,819 | $ 1,119,230 |
Reinvestment of distributions | 4,541 | 1,586 | 55,799 | 20,151 |
Shares redeemed | (55,802) | (11,667) | (672,403) | (148,544) |
Net increase (decrease) | 97,494 | 77,029 | $ 1,190,215 | $ 990,837 |
Class C | | | | |
Shares sold | 269,755 | 138,353 | $ 3,257,302 | $ 1,774,788 |
Reinvestment of distributions | 5,896 | 1,740 | 72,166 | 22,123 |
Shares redeemed | (83,185) | (8,144) | (1,003,632) | (103,462) |
Net increase (decrease) | 192,466 | 131,949 | $ 2,325,836 | $ 1,693,449 |
Asset Manager 20% | | | | |
Shares sold | 58,898,445 | 63,397,753 | $ 723,714,675 | $ 815,352,615 |
Reinvestment of distributions | 10,897,714 | 14,705,597 | 134,543,532 | 187,331,699 |
Shares redeemed | (64,781,528) | (45,831,913) | (791,199,186) | (589,696,416) |
Net increase (decrease) | 5,014,631 | 32,271,437 | $ 67,059,021 | $ 412,987,898 |
Institutional Class | | | | |
Shares sold | 180,834 | 18,496 | $ 2,308,608 | $ 238,374 |
Reinvestment of distributions | 8,001 | 717 | 98,769 | 9,130 |
Shares redeemed | (56,367) | - | (687,919) | - |
Net increase (decrease) | 132,468 | 19,213 | $ 1,719,458 | $ 247,504 |
Annual Report
Notes to Financial Statements - continued
13. Share Transactions - continued
| Shares | Dollars |
Years ended September 30, | 2008 | 2007A | 2008 | 2007A |
Fidelity Asset Manager 30% B | | | | |
Class A | | | | |
Shares sold | 144,653 | - | $ 1,379,463 | $ - |
Reinvestment of distributions | 1,332 | - | 12,471 | - |
Shares redeemed | (12,117) | - | (111,408) | - |
Net increase (decrease) | 133,868 | - | $ 1,280,526 | $ - |
Class T | | | | |
Shares sold | 133,157 | - | $ 1,249,065 | $ - |
Reinvestment of distributions | 983 | - | 9,168 | - |
Shares redeemed | (10,072) | - | (93,877) | - |
Net increase (decrease) | 124,068 | - | $ 1,164,356 | $ - |
Class B | | | | |
Shares sold | 55,559 | - | $ 524,350 | $ - |
Reinvestment of distributions | 382 | - | 3,594 | - |
Shares redeemed | (392) | - | (3,644) | - |
Net increase (decrease) | 55,549 | - | $ 524,300 | $ - |
Class C | | | | |
Shares sold | 186,960 | - | $ 1,749,175 | $ - |
Reinvestment of distributions | 1,370 | - | 12,797 | - |
Shares redeemed | (15,226) | - | (143,734) | - |
Net increase (decrease) | 173,104 | - | $ 1,618,238 | $ - |
Asset Manager 30% | | | | |
Shares sold | 5,359,391 | - | $ 50,914,907 | $ - |
Reinvestment of distributions | 56,102 | - | 525,162 | - |
Shares redeemed | (2,411,599) | - | (22,329,751) | - |
Net increase (decrease) | 3,003,894 | - | $ 29,110,318 | $ - |
Institutional Class | | | | |
Shares sold | 23,759 | - | $ 231,444 | $ - |
Reinvestment of distributions | 391 | - | 3,693 | - |
Net increase (decrease) | 24,150 | - | $ 235,137 | $ - |
Fidelity Asset Manager 40%B | | | | |
Class A | | | | |
Shares sold | 250,703 | - | $ 2,436,280 | $ - |
Reinvestment of distributions | 2,933 | - | 27,298 | - |
Shares redeemed | (12,251) | - | (109,719) | - |
Net increase (decrease) | 241,385 | - | $ 2,353,859 | $ - |
Class T | | | | |
Shares sold | 227,454 | - | $ 2,214,040 | $ - |
Reinvestment of distributions | 2,641 | - | 24,648 | - |
Shares redeemed | (11,458) | - | (102,562) | - |
Net increase (decrease) | 218,637 | - | $ 2,136,126 | $ - |
Class B | | | | |
Shares sold | 164,587 | - | $ 1,626,346 | $ - |
Reinvestment of distributions | 1,632 | - | 15,307 | - |
Shares redeemed | (2,203) | - | (19,407) | - |
Net increase (decrease) | 164,016 | - | $ 1,622,246 | $ - |
Class C | | | | |
Shares sold | 185,184 | - | $ 1,826,153 | $ - |
Reinvestment of distributions | 1,654 | - | 15,523 | - |
Shares redeemed | (22,232) | - | (200,684) | - |
Net increase (decrease) | 164,606 | - | $ 1,640,992 | $ - |
Annual Report
13. Share Transactions - continued
| Shares | Dollars |
Years ended September 30, | 2008 | 2007A | 2008 | 2007A |
Asset Manager 40% | | | | |
Shares sold | 1,762,049 | - | $ 16,509,845 | $ - |
Reinvestment of distributions | 12,657 | - | 116,657 | - |
Shares redeemed | (477,589) | - | (4,363,370) | - |
Net increase (decrease) | 1,297,117 | - | $ 12,263,132 | $ - |
Institutional Class | | | | |
Shares sold | 156,120 | - | $ 1,556,663 | $ - |
Reinvestment of distributions | 2,743 | - | 25,655 | - |
Net increase (decrease) | 158,863 | - | $ 1,582,318 | $ - |
Fidelity Asset Manager 50% | | | | |
Class A | | | | |
Shares sold | 701,937 | 289,790 | $ 10,522,398 | $ 4,808,317 |
Reinvestment of distributions | 34,512 | 2,223 | 528,926 | 36,700 |
Shares redeemed | (176,302) | (32,610) | (2,573,190) | (544,306) |
Net increase (decrease) | 560,147 | 259,403 | $ 8,478,134 | $ 4,300,711 |
Class T | | | | |
Shares sold | 321,333 | 190,527 | $ 4,828,159 | $ 3,166,113 |
Reinvestment of distributions | 25,741 | 2,395 | 396,949 | 39,464 |
Shares redeemed | (108,476) | (8,403) | (1,580,570) | (140,444) |
Net increase (decrease) | 238,598 | 184,519 | $ 3,644,538 | $ 3,065,133 |
Class B | | | | |
Shares sold | 140,799 | 70,302 | $ 2,118,896 | $ 1,168,687 |
Reinvestment of distributions | 6,699 | 894 | 103,082 | 14,680 |
Shares redeemed | (45,273) | (11,996) | (662,500) | (199,588) |
Net increase (decrease) | 102,225 | 59,200 | $ 1,559,478 | $ 983,779 |
Class C | | | | |
Shares sold | 230,335 | 169,588 | $ 3,467,980 | $ 2,814,455 |
Reinvestment of distributions | 14,272 | 1,375 | 220,179 | 22,635 |
Shares redeemed | (78,688) | (3,910) | (1,165,992) | (64,143) |
Net increase (decrease) | 165,919 | 167,053 | $ 2,522,167 | $ 2,772,947 |
Asset Manager 50% | | | | |
Shares sold | 28,976,509 | 35,519,889 | $ 439,124,893 | $ 590,109,148 |
Reinvestment of distributions | 49,866,308 | 45,243,905 | 772,727,250 | 737,377,217 |
Shares redeemed | (116,862,705) | (111,732,894) | (1,770,033,572) | (1,862,786,005) |
Net increase (decrease) | (38,019,888) | (30,969,100) | $ (558,181,429) | $ (535,299,640) |
Institutional Class | | | | |
Shares sold | 64,415 | 11,204 | $ 1,084,439 | $ 185,721 |
Reinvestment of distributions | 6,272 | 596 | 97,072 | 9,719 |
Shares redeemed | (45,377) | (951) | (667,764) | (15,495) |
Net increase (decrease) | 25,310 | 10,849 | $ 513,747 | $ 179,945 |
Fidelity Asset Manager 60%B | | | | |
Class A | | | | |
Shares sold | 508,064 | - | $ 4,661,791 | $ - |
Reinvestment of distributions | 761 | - | 7,307 | - |
Shares redeemed | (114,471) | - | (1,028,696) | - |
Net increase (decrease) | 394,354 | - | $ 3,640,402 | $ - |
Class T | | | | |
Shares sold | 186,969 | - | $ 1,747,896 | $ - |
Reinvestment of distributions | 283 | - | 2,720 | - |
Shares redeemed | (32,399) | - | (277,952) | - |
Net increase (decrease) | 154,853 | - | $ 1,472,664 | $ - |
Class B | | | | |
Shares sold | 138,223 | - | $ 1,314,613 | $ - |
Reinvestment of distributions | 192 | - | 1,840 | - |
Shares redeemed | (2,557) | - | (22,565) | - |
Net increase (decrease) | 135,858 | - | $ 1,293,888 | $ - |
Annual Report
Notes to Financial Statements - continued
13. Share Transactions - continued
| Shares | Dollars |
Years ended September 30, | 2008 | 2007A | 2008 | 2007A |
Class C | | | | |
Shares sold | 210,884 | - | $ 1,970,860 | $ - |
Reinvestment of distributions | 192 | - | 1,840 | - |
Shares redeemed | (3,246) | - | (27,889) | - |
Net increase (decrease) | 207,830 | - | $ 1,944,811 | $ - |
Asset Manager 60% | | | | |
Shares sold | 3,150,368 | - | $ 28,160,474 | $ - |
Reinvestment of distributions | 1,882 | - | 18,064 | - |
Shares redeemed | (362,700) | - | (3,178,965) | - |
Net increase (decrease) | 2,789,550 | - | $ 24,999,573 | $ - |
Institutional Class | | | | |
Shares sold | 99,914 | - | $ 989,544 | $ - |
Reinvestment of distributions | 466 | - | 4,475 | - |
Shares redeemed | (916) | - | (7,979) | - |
Net increase (decrease) | 99,464 | - | $ 986,040 | $ - |
Fidelity Asset Manager 70% | | | | |
Class AC | | | | |
Shares sold | 20,467 | - | $ 370,778 | $ - |
Issued in exchange for shares of Fidelity Advisor Asset Manager 70% Fund | 6,533,497 | - | 92,514,323 | - |
Shares redeemed | (17,859) | - | (315,305) | - |
Net increase (decrease) | 6,536,105 | - | $ 92,569,796 | $ - |
Class TC | | | | |
Shares sold | 5,194 | - | $ 138,458 | $ - |
Issued in exchange for shares of Fidelity Advisor Asset Manager 70% Fund | 3,860,173 | - | 54,660,040 | - |
Shares redeemed | (12,767) | - | (237,608) | - |
Net increase (decrease) | 3,852,600 | - | $ 54,560,890 | $ - |
Class BC | | | | |
Shares sold | 8,599 | - | $ 132,691 | $ - |
Issued in exchange for shares of Fidelity Advisor Asset Manager 70% Fund | 1,725,798 | - | 24,437,297 | - |
Shares redeemed | (7,056) | - | (105,755) | - |
Net increase (decrease) | 1,727,341 | - | $ 24,464,233 | $ - |
Class CC | | | | |
Shares sold | 2,918 | - | $ 217,647 | $ - |
Issued in exchange for shares of Fidelity Advisor Asset Manager 70% Fund | 2,780,313 | - | 39,369,233 | - |
Shares redeemed | (10,650) | - | (326,514) | - |
Net increase (decrease) | 2,772,581 | - | $ 39,260,366 | $ - |
Asset Manager 70% | | | | |
Shares sold | 12,436,796 | 14,701,427 | $ 201,255,406 | $ 246,834,990 |
Reinvestment of distributions | 4,363,853 | 4,501,586 | 74,272,772 | 73,510,900 |
Shares redeemed | (33,660,002) | (33,997,871) | (549,568,450) | (569,823,471) |
Net increase (decrease) | (16,859,353) | (14,794,858) | $ (274,040,272) | $ (249,477,581) |
Institutional ClassC | | | | |
Shares sold | 10,330 | - | $ 152,572 | $ - |
Issued in exchange for shares of Fidelity Advisor Asset Manager 70% Fund | 1,881,221 | - | 26,638,086 | - |
Shares redeemed | (3,734) | - | (57,654) | - |
Net increase (decrease) | 1,887,817 | - | $ 26,733,004 | $ - |
Fidelity Asset Manager 85% | | | | |
Class A | | | | |
Shares sold | 881,000 | 533,617 | $ 11,708,813 | $ 7,482,672 |
Reinvestment of distributions | 11,613 | 259 | 164,450 | 3,472 |
Shares redeemed | (212,398) | (36,450) | (2,755,503) | (505,258) |
Net increase (decrease) | 680,215 | 497,426 | $ 9,117,760 | $ 6,980,886 |
Annual Report
13. Share Transactions - continued
| Shares | Dollars |
Years ended September 30, | 2008 | 2007A | 2008 | 2007A |
Class T | | | | |
Shares sold | 302,865 | 132,362 | $ 3,973,155 | $ 1,878,689 |
Reinvestment of distributions | 2,802 | 252 | 39,626 | 3,385 |
Shares redeemed | (52,286) | (11,048) | (680,328) | (158,492) |
Net increase (decrease) | 253,381 | 121,566 | $ 3,332,453 | $ 1,723,582 |
Class B | | | | |
Shares sold | 152,342 | 113,822 | $ 2,031,969 | $ 1,577,374 |
Reinvestment of distributions | 1,841 | 179 | 26,000 | 2,400 |
Shares redeemed | (39,226) | (2,876) | (510,836) | (40,678) |
Net increase (decrease) | 114,957 | 111,125 | $ 1,547,133 | $ 1,539,096 |
Class C | | | | |
Shares sold | 329,559 | 228,834 | $ 4,362,588 | $ 3,208,263 |
Reinvestment of distributions | 3,034 | 447 | 42,720 | 5,995 |
Shares redeemed | (86,632) | (11,500) | (1,115,724) | (161,700) |
Net increase (decrease) | 245,961 | 217,781 | $ 3,289,584 | $ 3,052,558 |
Asset Manager 85% | | | | |
Shares sold | 11,096,127 | 11,993,958 | $ 149,870,831 | $ 166,840,157 |
Reinvestment of distributions | 709,187 | 595,752 | 10,063,914 | 7,989,027 |
Shares redeemed | (10,707,014) | (8,742,465) | (142,112,234) | (120,993,870) |
Net increase (decrease) | 1,098,300 | 3,847,245 | $ 17,822,511 | $ 53,835,314 |
Institutional Class | | | | |
Shares sold | 62,723 | 16,534 | $ 834,204 | $ 222,919 |
Reinvestment of distributions | 180 | 135 | 2,553 | 1,812 |
Shares redeemed | (13,803) | - | (173,778) | - |
Net increase (decrease) | 49,100 | 16,669 | $ 662,979 | $ 224,731 |
A Share transactions for Class A, Class T, Class B, Class C and Institutional Class are for the period October 2, 2006 (commencement of sale of shares) to September 30, 2007.
B For the period October 9, 2007 (commencement of operations) to September 30, 2008.
C For the period September 23, 2008 (commencement of operations) to September 30, 2008.
14. Merger Information.
On September 26, 2008, Fidelity Asset Manager 70% acquired all of the assets and assumed all of the liabilities of Fidelity Advisor Asset Manager 70% Fund pursuant to an agreement and plan of reorganization approved by the Board of Trustees on May 15, 2008. The acquisition was accomplished by an exchange of 6,533,497, 3,860,173, 1,725,798, 2,780,313 and 1,881,221 shares of Class A, Class T, Class B, Class C and Institutional Class of the Fund, respectively, for 9,324,617, 5,534,757, 2,486,431, 4,011,919, and 2,679,998 shares then outstanding of Class A, Class T, Class B, Class C and Institutional Class (valued at $9.92, $9.88, $9.83, $9.81, and $9.94, per share for Class A, Class T, Class B, Class C and Institutional Class, respectively) of the Fidelity Advisor Asset Manager 70% Fund. The reorganization qualified as a tax-free reorganization for federal income tax purposes with no gain or loss recognized to the funds or their shareholders. The Fidelity Advisor Asset Manager 70% Fund's net assets, including $21,261,054 of unrealized depreciation, were combined with the Fund's net assets of $2,365,472,024 for total net assets after the acquisition of $2,603,091,003.
15. Credit Risk.
The Funds invest a portion of their assets, directly or indirectly, in structured securities of issuers backed by residential mortgage loans, credit card receivables and automotive loans. The value and related income of these securities is sensitive to changes in economic conditions, including delinquencies and/or defaults. Continuing shifts in the market's perception of credit quality on structured securities have resulted in increased volatility of market price and periods of decreased market activity that have adversely impacted the valuation of certain issuers of the Funds.
Annual Report
Report of Independent Registered Public Accounting Firm
To the Trustees of Fidelity Charles Street Trust and Shareholders of Fidelity Asset Manager 20%, Fidelity Asset Manager 50%, Fidelity Asset Manager 70% and Fidelity Asset Manager 85%:
We have audited the accompanying statements of assets and liabilities of Fidelity Asset Manager 20%, Fidelity Asset Manager 50%, Fidelity Asset Manager 70% and Fidelity Asset Manager 85% (the Funds), each a fund of Fidelity Charles Street Trust, including the schedules of investments as of September 30, 2008, and the related statements of operations for the year then ended, the statement of changes in net assets for each of the two years in the period then ended, and the financial highlights for each of the periods presented. These financial statements and financial highlights are the responsibility of the Fund's management. Our responsibility is to express an opinion on these financial statements and financial highlights based on our audits.
We conducted our audits in accordance with standards of the Public Company Accounting Oversight Board (United States). Those standards require that we plan and perform the audit to obtain reasonable assurance about whether the financial statements and financial highlights are free of material misstatement. The Funds are not required to have, nor were we engaged to perform, audits of their internal control over financial reporting. Our audits included consideration of internal control over financial reporting as a basis for designing audit procedures that are appropriate in the circumstances, but not for the purpose of expressing an opinion on the effectiveness of the Funds' internal control over financial reporting. Accordingly, we express no such opinion. An audit also includes examining, on a test basis, evidence supporting the amounts and disclosures in the financial statements, assessing the accounting principles used and significant estimates made by management, as well as evaluating the overall financial statement presentation. Our procedures included confirmation of securities owned as of September 30, 2008, by correspondence with the custodians and brokers; where replies were not received from brokers, we performed other auditing procedures. We believe that our audits provide a reasonable basis for our opinion.
In our opinion, the financial statements and financial highlights referred to above present fairly, in all material respects, the financial position of Fidelity Asset Manager 20%, Fidelity Asset Manager 50%, Fidelity Asset Manager 70% and Fidelity Asset Manager 85% as of September 30, 2008, the results of their operations for the year then ended, the changes in their net assets for each of the two years in the period then ended, and their financial highlights for each of the periods presented, in conformity with accounting principles generally accepted in the United States of America.
/s/ Deloitte & Touche LLP
DELOITTE & TOUCHE LLP
Boston, Massachusetts
November 28, 2008
Annual Report
Report of Independent Registered Public Accounting Firm
To the Trustees of Fidelity Charles Street Trust and the Shareholders of Fidelity Asset Manager 30%, Fidelity Asset Manager 40% and Fidelity Asset Manager 60%:
In our opinion, the accompanying statements of assets and liabilities, including the schedules of investments, and the related statements of operations and of changes in net assets and the financial highlights present fairly, in all material respects, the financial position of Fidelity Asset Manager 30%, Fidelity Asset Manager 40% and Fidelity Asset Manager 60% (funds of Fidelity Charles Street Trust) at September 30, 2008, and the results of each of their operations for the period indicated, the changes in their net assets for the period indicated and the financial highlights for the period indicated, in conformity with accounting principles generally accepted in the United States of America. These financial statements and financial highlights (hereafter referred to as "financial statements") are the responsibility of the Fidelity Charles Street Trust and Fidelity Charles Street Trust's management. Our responsibility is to express an opinion on these financial statements based on our audits. We conducted our audits of these financial statements in accordance with the standards of the Public Company Accounting Oversight Board (United States). Those standards require that we plan and perform the audit to obtain reasonable assurance about whether the financial statements are free of material misstatement. An audit includes examining, on a test basis, evidence supporting the amounts and disclosures in the financial statements, assessing the accounting principles used and significant estimates made by management, and evaluating the overall financial statement presentation. We believe that our audits, which included confirmation of securities at September 30, 2008 by correspondence with the transfer agent and brokers, provide a reasonable basis for our opinion.
/s/ PricewaterhouseCoopers LLP
PricewaterhouseCoopers LLP
Boston, Massachusetts
November 25, 2008
Annual Report
The Trustees, Member of the Advisory Board, and executive officers of the trust and funds, as applicable, are listed below. The Board of Trustees governs each fund and is responsible for protecting the interests of shareholders. The Trustees are experienced executives who meet periodically throughout the year to oversee each fund's activities, review contractual arrangements with companies that provide services to each fund, and review each fund's performance. Except for Edward C. Johnson 3d and James C. Curvey, each of the Trustees oversees 159 funds advised by FMR or an affiliate. Messrs. Johnson and Curvey oversee 379 funds advised by FMR or an affiliate.
The Trustees hold office without limit in time except that (a) any Trustee may resign; (b) any Trustee may be removed by written instrument, signed by at least two-thirds of the number of Trustees prior to such removal; (c) any Trustee who requests to be retired or who has become incapacitated by illness or injury may be retired by written instrument signed by a majority of the other Trustees; and (d) any Trustee may be removed at any special meeting of shareholders by a two-thirds vote of the outstanding voting securities of the trust. Each Trustee who is not an interested person (as defined in the 1940 Act) (Independent Trustee), shall retire not later than the last day of the calendar year in which his or her 72nd birthday occurs. The Independent Trustees may waive this mandatory retirement age policy with respect to individual Trustees. The executive officers and Advisory Board Member hold office without limit in time, except that any officer and Advisory Board Member may resign or may be removed by a vote of a majority of the Trustees at any regular meeting or any special meeting of the Trustees. Except as indicated, each individual has held the office shown or other offices in the same company for the past five years.
The funds' Statement of Additional Information (SAI) includes more information about the Trustees. To request a free copy, call Fidelity at 1-877-208-0098.
Interested Trustees*:
Correspondence intended for each Trustee who is an interested person may be sent to Fidelity Investments, 82 Devonshire Street, Boston, Massachusetts 02109.
Name, Age; Principal Occupation |
Edward C. Johnson 3d (78) |
| Year of Election or Appointment: 1981 Mr. Johnson is Chairman of the Board of Trustees. Mr. Johnson serves as Chief Executive Officer, Chairman, and a Director of FMR LLC; Chairman and a Director of FMR; Chairman and a Director of Fidelity Research & Analysis Company (FRAC); Chairman and a Director of Fidelity Investments Money Management, Inc.; and Chairman and a Director of FMR Co., Inc. In addition, Mr. Johnson serves as Chairman and Director of FIL Limited. Previously, Mr. Johnson served as President of FMR LLC (2006-2007). Mr. Edward C. Johnson 3d and Mr. Arthur E. Johnson are not related. |
James C. Curvey (73) |
| Year of Election or Appointment: 2007 Mr. Curvey also serves as Trustee (2007-present) of other investment companies advised by FMR. Mr. Curvey is a Director of FMR and FMR Co., Inc. (2007-present). Mr. Curvey is also Vice Chairman (2006-present) and Director of FMR LLC. In addition, Mr. Curvey serves as an Overseer for the Boston Symphony Orchestra and a member of the Trustees of Villanova University. |
* Trustees have been determined to be "Interested Trustees" by virtue of, among other things, their affiliation with the trust or various entities under common control with FMR. FMR Corp. merged with and into FMR LLC on October 1, 2007. Any references to FMR LLC for prior periods are deemed to be references to the prior entity.
Independent Trustees:
Correspondence intended for each Independent Trustee (that is, the Trustees other than the Interested Trustees) may be sent to Fidelity Investments, P.O. Box 55235, Boston, Massachusetts 02205-5235.
Name, Age; Principal Occupation |
Albert R. Gamper, Jr. (66) |
| Year of Election or Appointment: 2006 Prior to his retirement in December 2004, Mr. Gamper served as Chairman of the Board of CIT Group Inc. (commercial finance). During his tenure with CIT Group Inc. Mr. Gamper served in numerous senior management positions, including Chairman (1987-1989; 1999-2001; 2002-2004), Chief Executive Officer (1987-2004), and President (1989-2002). He currently serves as a member of the Board of Directors of Public Service Enterprise Group (utilities), a member of the Board of Governors, Rutgers University (2004-present), and Chairman of the Board of Saint Barnabas Health Care System. Previously, Mr. Gamper served as Chairman of the Board of Governors, Rutgers University (2004-2007). |
George H. Heilmeier (72) |
| Year of Election or Appointment: 2004 Dr. Heilmeier is Chairman Emeritus of Telcordia Technologies (communication software and systems), where prior to his retirement, he served as company Chairman and Chief Executive Officer. He currently serves on the Boards of Directors of The Mitre Corporation (systems engineering and information technology support for the government), and HRL Laboratories (private research and development, 2004-present). He is Chairman of the General Motors Science & Technology Advisory Board and a Life Fellow of the Institute of Electrical and Electronics Engineers (IEEE). Dr. Heilmeier is a member of the Defense Science Board and the National Security Agency Advisory Board. He is also a member of the National Academy of Engineering, the American Academy of Arts and Sciences, and the Board of Overseers of the School of Engineering and Applied Science of the University of Pennsylvania. Previously, Dr. Heilmeier served as a Director of TRW Inc. (automotive, space, defense, and information technology), Compaq, Automatic Data Processing, Inc. (ADP) (technology-based business outsourcing), INET Technologies Inc. (telecommunications network surveillance, 2001-2004), and Teletech Holdings (customer management services). He is the recipient of the 2005 Kyoto Prize in Advanced Technology for his invention of the liquid crystal display, and a member of the Consumer Electronics Hall of Fame. |
Arthur E. Johnson (61) |
| Year of Election or Appointment: 2008 Mr. Johnson serves as Senior Vice President of Corporate Strategic Development of Lockheed Martin Corporation (defense contractor). In addition, Mr. Johnson serves as a member of the Board of Directors of AGL Resources, Inc. (holding company), and IKON Office Solutions, Inc. (document management systems and services). Mr. Arthur E. Johnson and Mr. Edward C. Johnson 3d are not related. |
James H. Keyes (68) |
| Year of Election or Appointment: 2007 Prior to his retirement in 2003, Mr. Keyes was Chairman, President, and Chief Executive Officer of Johnson Controls, Inc. (automotive supplier, 1993-2003). He currently serves as a member of the boards of Navistar International Corporation (manufacture and sale of trucks, buses, and diesel engines) and Pitney Bowes, Inc. (integrated mail, messaging, and document management solutions). Previously, Mr. Keyes served as a member of the Board of LSI Logic Corporation (semiconductor technologies, 1984-2008). |
Marie L. Knowles (61) |
| Year of Election or Appointment: 2001 Prior to Ms. Knowles' retirement in June 2000, she served as Executive Vice President and Chief Financial Officer of Atlantic Richfield Company (ARCO) (diversified energy, 1996-2000). From 1993 to 1996, she was a Senior Vice President of ARCO and President of ARCO Transportation Company. She served as a Director of ARCO from 1996 to 1998. She currently serves as a Director of McKesson Corporation (healthcare service). Ms. Knowles is a Trustee of the Brookings Institution and the Catalina Island Conservancy and also serves as a member of the Advisory Board for the School of Engineering of the University of Southern California. Previously, Ms. Knowles served as a Director of Phelps Dodge Corporation (copper mining and manufacturing, 1994-2007). |
Kenneth L. Wolfe (69) |
| Year of Election or Appointment: 2005 Mr. Wolfe is Chairman and a Director of Hershey Foods Corporation (2007-present), where prior to his retirement in 2001, he was Chairman and Chief Executive Officer. Mr. Wolfe currently serves as a member of the board of Revlon Inc. (2004-present). Previously, Mr. Wolfe served as a member of the boards of Adelphia Communications Corporation (2003-2006) and Bausch & Lomb, Inc. (1993-2007). |
Advisory Board Member and Executive Officers**:
Correspondence intended for each executive officer and Mr. Lynch may be sent to Fidelity Investments, 82 Devonshire Street, Boston, Massachusetts 02109.
Name, Age; Principal Occupation |
Peter S. Lynch (64) |
| Year of Election or Appointment: 2003 Member of the Advisory Board of the Fidelity Funds. Mr. Lynch is Vice Chairman and a Director of FMR, and Vice Chairman (2001-present) and a Director of FMR Co., Inc. Previously, Mr. Lynch served as a Trustee of the Fidelity funds (1990-2003). In addition, he serves as a Trustee of Boston College and as the Chairman of the Inner-City Scholarship Fund. Previously, Mr. Lynch served on the Special Olympics International Board of Directors (1997-2006). |
John R. Hebble (50) |
| Year of Election or Appointment: 2008 President and Treasurer of Fidelity's Fixed Income and Asset Allocation Funds. Mr. Hebble is an employee of Fidelity Investments (2003-present). Before joining Fidelity Investments, Mr. Hebble worked at Deutsche Asset Management where he served as Director of Fund Accounting (2002-2003) and Assistant Treasurer of the Scudder Funds. |
Ren Y. Cheng (51) |
| Year of Election or Appointment: 2007 Vice President of Asset Allocation Funds. Mr. Cheng also serves as Group Chief Investment Officer, Asset Allocation of FMR. Previously, Mr. Cheng served as a portfolio manager for the Fidelity Freedom Funds. |
Boyce I. Greer (52) |
| Year of Election or Appointment: 2005 or 2006 Vice President of Fidelity's Fixed-Income Funds (2006) and Asset Allocation Funds (2005). Mr. Greer is also a Trustee of other investment companies advised by FMR (2003-present). Mr. Greer is President and a Director of Fidelity Investments Money Management, Inc. (2007-present), and an Executive Vice President of FMR and FMR Co., Inc. (2005-present). Previously, Mr. Greer served as a Director and Managing Director of Strategic Advisers, Inc. (2002-2005). |
Scott C. Goebel (40) |
| Year of Election or Appointment: 2008 Secretary and Chief Legal Officer (CLO) of the Fidelity funds. Mr. Goebel also serves as General Counsel, Secretary, and Senior Vice President of FMR (2008-present); Deputy General Counsel of FMR LLC; Chief Legal Secretary of Fidelity Management & Research (Hong Kong) Limited (2008-present) and Assistant Secretary of Fidelity Management & Research (Japan) Inc. (2008-present). Previously, Mr. Goebel served as Assistant Secretary of the Funds (2007-2008) and as Vice President and Secretary of Fidelity Distributors Corporation (FDC) (2005-2007). |
Nancy D. Prior (41) |
| Year of Election or Appointment: 2008 Assistant Secretary of Fidelity's Fixed Income and Asset Allocation Funds. Ms. Prior is an employee of Fidelity Investments (2002-present). |
Holly C. Laurent (54) |
| Year of Election or Appointment: 2008 Anti-Money Laundering (AML) Officer of the Fidelity funds. Ms. Laurent is an employee of Fidelity Investments. Previously, Ms. Laurent was Senior Vice President and Head of Legal for Fidelity Business Services India Pvt. Ltd. (2006-2008), Senior Vice President, Deputy General Counsel and Group Head for FMR LLC (2005-2006). |
Christine Reynolds (50) |
| Year of Election or Appointment: 2008 Chief Financial Officer of the Fidelity funds. Ms. Reynolds became President of Fidelity Pricing and Cash Management Services (FPCMS) in August 2008. She served as Chief Operating Officer of FPCMS from 2007 through July 2008. Previously, Ms. Reynolds served as President, Treasurer, and Anti-Money Laundering officer of the Fidelity funds (2004-2007). Before joining Fidelity Investments, Ms. Reynolds worked at PricewaterhouseCoopers LLP (PwC) (1980-2002), where she was an audit partner with PwC's investment management practice. |
Michael H. Whitaker (41) |
| Year of Election or Appointment: 2008 Chief Compliance Officer of Fidelity's Fixed Income and Asset Allocation Funds. Mr. Whitaker is an employee of Fidelity Investments (2007-present). Prior to joining Fidelity Investments, Mr. Whitaker worked at MFS Investment Management where he served as Senior Vice President and Chief Compliance Officer (2004-2006), and Assistant General Counsel. |
Bryan A. Mehrmann (47) |
| Year of Election or Appointment: 2005 Deputy Treasurer of the Fidelity funds. Mr. Mehrmann is an employee of Fidelity Investments. Previously, Mr. Mehrmann served as Vice President of Fidelity Investments Institutional Services Group (FIIS)/Fidelity Investments Institutional Operations Corporation, Inc. (FIIOC) Client Services (1998-2004). |
Stephanie J. Dorsey (39) |
| Year of Election or Appointment: 2008 Deputy Treasurer of Fidelity's Fixed-Income and Asset Allocation Funds. Ms. Dorsey is an employee of Fidelity Investments (2008-present). Previously, Ms. Dorsey served as Treasurer (2004-2008) and Accounting Group Manager (2003) of JPMorgan Chase Bank. |
Robert G. Byrnes (41) |
| Year of Election or Appointment: 2005 Assistant Treasurer of the Fidelity funds. Mr. Byrnes is an employee of Fidelity Investments (2005-present). Previously, Mr. Byrnes served as Vice President of Fidelity Pricing and Cash Management Services (FPCMS) (2003-2005). Before joining Fidelity Investments, Mr. Byrnes worked at Deutsche Asset Management where he served as Vice President of the Investment Operations Group (2000-2003). |
Peter L. Lydecker (54) |
| Year of Election or Appointment: 2004 Assistant Treasurer of the Fidelity funds. Mr. Lydecker is an employee of Fidelity Investments. |
Paul M. Murphy (61) |
| Year of Election or Appointment: 2007 Assistant Treasurer of the Fidelity funds. Mr. Murphy is an employee of Fidelity Investments (2007-present). Previously, Mr. Murphy served as Chief Financial Officer of the Fidelity Funds (2005-2006), Vice President and Associate General Counsel of FMR (2007), and Senior Vice President of Fidelity Pricing and Cash Management Services (FPCMS) (1994-2007). |
Gary W. Ryan (50) |
| Year of Election or Appointment: 2005 Assistant Treasurer of the Fidelity funds. Mr. Ryan is an employee of Fidelity Investments. Previously, Mr. Ryan served as Vice President of Fund Reporting in Fidelity Pricing and Cash Management Services (FPCMS) (1999-2005). |
** FMR Corp. merged with and into FMR LLC on October 1, 2007. Any references to FMR LLC for prior periods are deemed to be references to the prior entity.
Annual Report
The funds hereby designate as capital gain dividend the amounts noted below for the taxable year ended September 30, 2008, or, if subsequently determined to be different, the net capital gain of such year.
Fund | |
Asset Manager 20% | $3,666,317 |
Asset Manager 30% | 0 |
Asset Manager 40% | 0 |
Asset Manager 50% | $34,524,195 |
Asset Manager 60% | 0 |
Asset Manager 70% | $1,125,885 |
Asset Manager 85% | 0 |
A percentage of the dividends distributed during the fiscal year for the following funds was derived from interest on U.S. Government securities which is generally exempt from state income tax:
Asset Manager 20% | |
Institutional Class | 3.95% |
Asset Manager 30% | |
Institutional Class | 4.26% |
Asset Manager 40% | |
Institutional Class | 3.90% |
Asset Manager 50% | |
Institutional Class | 2.00% |
Asset Manager 60% | |
Institutional Class | 3.16% |
Asset Manager 70% | |
Institutional Class | 3.10% |
Asset Manager 85% | |
Institutional Class | 3.42% |
The funds hereby designate the amounts noted below as distributions paid during the period January 1, 2008 to September 30, 2008 as qualifying to be taxed as interest-related dividends for nonresident alien shareholders:
Fund | |
Asset Manager 20% | $75,862,942 |
Asset Manager 30% | $595,233 |
Asset Manager 40% | $228,368 |
Asset Manager 50% | $163,501,537 |
Asset Manager 60% | $36,701 |
Asset Manager 70% | $2,253,397 |
Asset Manager 85% | $3,001,780 |
Annual Report
Distributions (Unaudited) - continued
A percentage of the dividends distributed during the fiscal year for the following funds qualifiy for the dividends-received deduction for corporate shareholders:
Asset Manager 20% | Institutional |
December 2007 | 2% |
February 2008 | 7% |
March 2008 | 7% |
April 2008 | 7% |
May 2008 | 7% |
June 2008 | 7% |
July 2008 | 7% |
August 2008 | 7% |
September 2008 | 7% |
Asset Manager 30% | Institutional |
November 2007 | 13% |
December 2007 | 15% |
March 2008 | 13% |
April 2008 | 13% |
May 2008 | 13% |
June 2008 | 13% |
July 2008 | 13% |
August 2008 | 13% |
September 2008 | 13% |
Asset Manager 40% | Institutional |
December 2007 | 14% |
April 2008 | 24% |
July 2008 | 25% |
Asset Manager 50% | Institutional |
December 2007 | 2% |
April 2008 | 27% |
July 2008 | 27% |
Asset Manager 60% | Institutional |
December 2007 | 25% |
Asset Manager 70% | Institutional |
December 2007 | 4% |
April 2008 | 24% |
July 2008 | 31% |
September 2008 | 33% |
Asset Manager 85% | Institutional |
December 21, 2007 | 10% |
December 28, 2007 | 10% |
Annual Report
A percentage of the dividends distributed during the fiscal year for the following funds may be taken into account as a dividend for purposes of the maximum rate under section 1(h)(11) of the Internal Revenue Code.
Asset Manager 20% | Institutional |
December 2007 | 3% |
February 2008 | 9% |
March 2008 | 9% |
April 2008 | 9% |
May 2008 | 9% |
June 2008 | 9% |
July 2008 | 9% |
August 2008 | 9% |
September 2008 | 9% |
Asset Manager 30% | Institutional |
November 2007 | 13% |
December 2007 | 15% |
March 2008 | 17% |
April 2008 | 17% |
May 2008 | 16% |
June 2008 | 17% |
July 2008 | 17% |
August 2008 | 17% |
September 2008 | 17% |
Asset Manager 40% | Institutional |
December 2007 | 16% |
April 2008 | 37% |
July 2008 | 38% |
Asset Manager 50% | Institutional |
December 2007 | 3% |
April 2008 | 39% |
July 2008 | 39% |
Asset Manager 60% | Institutional |
December 2007 | 28% |
Asset Manager 70% | Institutional |
December 2007 | 5% |
April 2008 | 41% |
July 2008 | 48% |
September 2008 | 50% |
Asset Manager 85% | Institutional |
December 21, 2007 | 47% |
December 28, 2007 | 48% |
The fund will notify shareholders in January 2009 of amounts for use in preparing 2008 income tax returns.
Annual Report
Board Approval of Investment Advisory Contracts and Management Fees
Fidelity Asset Manager 20%
Fidelity Asset Manager 30%
Fidelity Asset Manager 40%
Fidelity Asset Manager 50%
Fidelity Asset Manager 60%
Fidelity Asset Manager 70%
Fidelity Asset Manager 85%
Each year, typically in June, the Board of Trustees, including the Independent Trustees (together, the Board), votes on the renewal of the management contract and sub-advisory agreements (together, the Advisory Contracts) for each fund. The Board, assisted by the advice of fund counsel and Independent Trustees' counsel, requests and considers a broad range of information throughout the year.
The Board meets regularly and, acting directly and through its separate committees, requests and receives information concerning, and considers at each of its meetings factors that are relevant to, its annual consideration of the renewal of each fund's Advisory Contracts, including the services and support provided to each fund and its shareholders. At the time of the renewal, the Board had 12 standing committees, each composed of Independent Trustees with varying backgrounds, to which the Board has assigned specific subject matter responsibilities in order to enhance effective decision-making by the Board. Each committee has a written charter outlining the structure and purposes of the committee. The Board also meets as needed to consider matters specifically related to the Board's annual consideration of the renewal of each fund's Advisory Contracts.
At its June 2008 meeting, the Board of Trustees, including the Independent Trustees, unanimously determined to renew each fund's Advisory Contracts. In reaching its determination, the Board considered all factors it believed relevant, including (i) the nature, extent, and quality of the services to be provided to each fund and its shareholders (including the investment performance of each fund); (ii) the competitiveness of each fund's management fee and total expenses; (iii) the total costs of the services to be provided by and the profits to be realized by Fidelity from its relationship with the fund; (iv) the extent to which economies of scale would be realized as each fund grows; and (v) whether fee levels reflect these economies of scale, if any, for the benefit of fund shareholders. The Board also approved agreements with foreign sub-advisers Fidelity Management & Research (Japan) Inc. and Fidelity Management & Research (Hong Kong) Limited, as well as amendments to the funds' agreements with Fidelity Management & Research (U.K.) Inc.
In considering whether to renew the Advisory Contracts for each fund, the Board ultimately reached a determination, with the assistance of fund counsel and Independent Trustees' counsel and through the exercise of its business judgment, that the renewal of the Advisory Contracts and the compensation to be received by Fidelity under the management contracts is consistent with Fidelity's fiduciary duty under applicable law. The Board's decision to renew the Advisory Contracts was not based on any single factor noted above, but rather was based on a comprehensive consideration of all the information provided to the Board at its meetings throughout the year. The Board, in reaching its determination to renew the Advisory Contracts, is aware that shareholders in each fund have a broad range of investment choices available to them, including a wide choice among mutual funds offered by competitors to Fidelity, and that each fund's shareholders, with the opportunity to review and weigh the disclosure provided by the fund in its prospectus and other public disclosures, have chosen to invest in that fund, managed by Fidelity.
Nature, Extent, and Quality of Services Provided. The Board considered staffing within the investment adviser, FMR, and the sub-advisers (together, the Investment Advisers), including the backgrounds of the funds' investment personnel and the funds' investment objectives and disciplines. The Independent Trustees also had discussions with senior management of Fidelity's investment operations and investment groups. The Board considered the structure of the portfolio manager compensation program and whether this structure provides appropriate incentives.
Resources Dedicated to Investment Management and Support Services. The Board reviewed the size, education, and experience of the Investment Advisers' investment staff, their use of technology, and the Investment Advisers' approach to recruiting, training, and retaining portfolio managers and other research, advisory, and management personnel. The Board noted that Fidelity's analysts have access to a variety of technological tools that enable them to perform both fundamental and quantitative analysis and to specialize in various disciplines. The Board considered Fidelity's extensive global research capabilities that enable the Investment Advisers to aggregate data from various sources in an effort to produce positive investment results. The Board also considered that Fidelity's portfolio managers and analysts have access to daily portfolio attribution that allows for monitoring of a fund's portfolio, as well as an electronic communication system that provides immediate real-time access to research concerning issuers and credit enhancers.
Shareholder and Administrative Services. The Board considered (i) the nature, extent, quality, and cost of advisory, administrative, distribution, and shareholder services performed by the Investment Advisers and their affiliates under each fund's Advisory Contracts and under separate agreements covering transfer agency, pricing and bookkeeping, and securities lending services for each fund; (ii) the nature and extent of the Investment Advisers' supervision of third party service providers, principally custodians and subcustodians; and (iii) the resources devoted to, and the record of compliance with, each fund's compliance policies and procedures. The Board also reviewed the allocation of fund brokerage, including allocations to brokers affiliated with the Investment Advisers, the use of brokerage commissions to pay fund expenses, and the use of "soft" commission dollars to pay for research services. The Board further considered that Fidelity voluntarily pays for market data out of its own resources.
Annual Report
The Board noted that the growth of fund assets across the complex allows Fidelity to reinvest in the development of services designed to enhance the value or convenience of the Fidelity funds as investment vehicles. These services include 24 hour access to account information and market information through phone representatives and over the Internet, and investor education materials and asset allocation tools.
Investment in a Large Fund Family. The Board considered the benefits to shareholders of investing in a Fidelity fund, including the benefits of investing in a fund that is part of a large family of funds offering a variety of investment disciplines and providing for a large variety of mutual fund investor services. For example, fund shareholders are offered the privilege of exchanging shares of a fund for shares of other Fidelity funds, as set forth in the fund's prospectus, without paying a sales charge. The Board noted that Fidelity has taken a number of actions over the previous year that benefited particular funds, including (i) dedicating additional resources to investment research and to restructure the investment research teams; (ii) contractually agreeing to reduce the management fees on Fidelity's Institutional Money Market Funds and launching Class IV and Institutional Class of certain of these funds; (iii) reducing the transfer agent fees for the Fidelity Select Portfolios and Investor Class of the VIP funds; and (iv) launching Class K of 29 equity funds as a lower-fee class available to certain employer-sponsored retirement plans.
Investment Performance (Asset Manager 20%, Asset Manager 50%, Asset Manager 70%, and Asset Manager 85%). The Board considered whether each fund has operated within its investment objective, as well as its record of compliance with its investment restrictions. It also reviewed each fund's absolute investment performance for each class, as well as each fund's relative investment performance measured against (i) a proprietary custom index, and (ii) a peer group of mutual funds deemed appropriate by the Board over multiple periods.
For Asset Manager 20% and Asset Manager 50%, the following charts considered by the Board show, over the one-, three-, and five-year periods ended December 31, 2007, as available, the cumulative total returns of the retail class and Class B of each fund, the cumulative total returns of a proprietary custom index ("benchmark"), and a range of cumulative total returns of a peer group of mutual funds identified by Morningstar, Inc. as having an investment style similar to that of the fund based on underlying portfolio holdings. The returns of the retail class and Class B show the performance of the highest and lowest performing classes, respectively.
For Asset Manger 70%, the following charts considered by the Board show, over the one-, three-, and five-year periods ended December 31, 2007, the fund's cumulative total returns, the cumulative total returns of a proprietary custom index ("benchmark"), and a range of cumulative total returns of a peer group of mutual funds identified by Morningstar, Inc. as having an investment style similar to that of the fund based on underlying portfolio holdings.
For Asset Manager 85%, the following charts considered by the Board show, over the one-, three-, and five-year periods ended December 31, 2007, as available, the cumulative total returns of Asset Manager 85% (retail class) and Class C of the fund, the cumulative total returns of a proprietary custom index ("benchmark"), and a range of cumulative total returns of a peer group of mutual funds identified by Morningstar, Inc. as having an investment style similar to that of the fund based on underlying portfolio holdings. The returns of Asset Manager 85% (retail class) and Class C of the fund show the performance of the highest and lowest performing classes, respectively.
The box within each chart shows the 25th percentile return (bottom of box) and the 75th percentile return (top of box) of the peer group. Returns shown above the box are in the first quartile and returns shown below the box are in the fourth quartile. The percentage beaten numbers noted below each chart correspond to the percentile box and represent the percentage of funds in the peer group whose performance was equal to or lower than that of the class indicated. Each fund's proprietary custom index is an index developed by FMR that represents the performance of the fund's asset classes according to their respective weightings in the fund's neutral mix.
Annual Report
Board Approval of Investment Advisory Contracts and Management Fees - continued
Fidelity Asset Manager 20%
The Board reviewed the fund's relative investment performance against its peer group and stated that the performance of Asset Manager 20% (retail class) of the fund was in the third quartile for the one-year period and the second quartile for the three- and five-year periods. The Board also stated that the investment performance of Asset Manager 20% (retail class) of the fund compared favorably to its benchmark for the three- and five-year periods, although the fund's one-year cumulative total return was lower than its benchmark. The Board considered that the variations in performance among the fund's classes reflect the variations in class expenses, which result in lower performance for higher expense classes.
Fidelity Asset Manager 50%
The Board reviewed the fund's relative investment performance against its peer group and stated that the performance of Asset Manager 50% (retail class) of the fund was in the second quartile for the one-year period, the third quartile for the three-year period, and the fourth quartile for the five-year period. The Board also stated that the investment performance of the fund was lower than its benchmark for all the periods shown. The Board considered that the variations in performance among the fund's classes reflect the variations in class expenses, which result in lower performance for higher expense classes.
Annual Report
Fidelity Asset Manager 70%
The Board reviewed the fund's relative investment performance against its peer group and stated that the performance of the fund was in the second quartile for the one-year period and the third quartile for the three- and five-year periods. The Board also stated that the investment performance of the fund was lower than its benchmark for the three- and five-year periods, although the fund's one-year cumulative total return compared favorably to its benchmark.
Fidelity Asset Manager 85%
The Board reviewed the fund's relative investment performance against its peer group and stated that the performance of Asset Manager 85% (retail class) of the fund was in the fourth quartile for the one-year period, the second quartile for the three-year period, and the first quartile for the five-year period. The Board also stated that the investment performance of Asset Manager 85% (retail class) of the fund compared favorably to its benchmark for all the periods shown. The Board considered that the variations in performance among the fund's classes reflect the variations in class expenses, which result in lower performance for higher expense classes.
The Board considered that FMR has taken steps to refocus and strengthen equity research, equity portfolio management, and compliance.
Based on its review, and giving particular weight to the nature and quality of the resources dedicated by the Investment Advisers to maintain and improve relative performance, the Board concluded that the nature, extent, and quality of the services provided to each fund will benefit the fund's shareholders, particularly in light of the Board's view that each fund's shareholders benefit from investing in a fund that is part of a large family of funds offering a variety of investment disciplines and services.
Annual Report
Board Approval of Investment Advisory Contracts and Management Fees - continued
Investment Performance (Asset Manager 30%, Asset Manager 40%, and Asset Manager 60%). The Board considered whether each fund has operated within its investment objective, as well as its record of compliance with its investment restrictions. The Board noted that it is not possible to evaluate performance in any comprehensive fashion because each fund had been in operation for less than one calendar year. Once a fund has been in operation for at least one calendar year, the Board will review each fund's absolute investment performance for each class, as well as each fund's relative investment performance for each class measured against a proprietary custom index and a peer group of mutual funds.
The Board considered that FMR has taken steps to refocus and strengthen equity research, equity portfolio management, and compliance.
Based on its review, and giving particular weight to the nature and quality of the resources dedicated by the Investment Advisers to maintain and improve relative performance, the Board concluded that the nature, extent, and quality of the services provided to each fund will benefit each fund's shareholders, particularly in light of the Board's view that each fund's shareholders benefit from investing in a fund that is part of a large family of funds offering a variety of investment disciplines and services.
Competitiveness of Management Fee and Total Fund Expenses. The Board considered each fund's management fee and total expenses compared to "mapped groups" of competitive funds and classes. Fidelity creates "mapped groups" by combining similar Lipper investment objective categories that have comparable management fee characteristics. Combining Lipper investment objective categories aids the Board's management fee and total expense comparisons by broadening the competitive group used for comparison and by reducing the number of universes to which various Fidelity funds are compared.
The Board considered two proprietary management fee comparisons for the 12-month periods shown in the chart below. The group of Lipper funds used by the Board for management fee comparisons is referred to below as the "Total Mapped Group." The Total Mapped Group comparison focuses on a fund's standing relative to the total universe of comparable funds available to investors, in terms of gross management fees before expense reimbursements or caps. "TMG %" represents the percentage of funds in the Total Mapped Group that had management fees that were lower than a fund's. For example, a TMG % of 23% would mean that 77% of the funds in the Total Mapped Group had higher management fees than a fund. The "Asset-Size Peer Group" (ASPG) comparison focuses on a fund's standing relative to non-Fidelity funds similar in size to the fund within the Total Mapped Group. The ASPG represents at least 15% of the funds in the Total Mapped Group with comparable asset size and management fee characteristics, subject to a minimum of 50 funds (or all funds in the Total Mapped Group if fewer than 50). Additional information, such as the ASPG quartile in which a fund's management fee ranked, is also included in the chart and considered by the Board.
Fidelity Asset Manager 20%
Annual Report
Fidelity Asset Manager 30%
Fidelity Asset Manager 40%
Annual Report
Board Approval of Investment Advisory Contracts and Management Fees - continued
Fidelity Asset Manager 50%
Fidelity Asset Manager 60%
Annual Report
Fidelity Asset Manager 70%
Fidelity Asset Manager 85%
The Board noted that each fund's management fee ranked below the median of its Total Mapped Group and below the median of its ASPG for 2007.
Based on its review, the Board concluded that each fund's management fee was fair and reasonable in light of the services that the fund receives and the other factors considered.
In its review of the total expenses of Asset Manager 70%, the Board considered the fund's management fee as well as other fund expenses, such as transfer agent fees, pricing and bookkeeping fees, and custodial, legal, and audit fees. The Board also noted the effects of any waivers and reimbursements on fees and expenses. As part of its review, the Board also considered current and historical total expenses of the fund compared to competitive fund median expenses. The fund is compared to those funds and classes in the Total Mapped Group (used by the Board for management fee comparisons) that have a similar sales load structure.
In its review of the total expenses of each class of Asset Manager 20%, Asset Manager 30%, Asset Manager 40%, Asset Manager 50%, Asset Manager 60% and Asset Manager 85%, the Board considered the fund's management fee as well as other fund or class expenses, as applicable, such as transfer agent fees, pricing and bookkeeping fees, fund-paid 12b-1 fees, and custodial, legal, and audit fees. The Board also noted the effects of any waivers and reimbursements on fees and expenses. As part of its review, the Board also considered current and historical total expenses of each class of the fund compared to competitive fund median expenses. Each class of the fund is compared to those funds and classes in the Total Mapped Group (used by the Board for management fee comparisons) that have a similar sales load structure.
Annual Report
Board Approval of Investment Advisory Contracts and Management Fees - continued
The Board noted that Asset Manager 20%, Asset Manager 30%, Asset Manager 40%, Asset Manager 50%, Asset Manager 60% and Asset Manager 85% offer multiple classes, each of which has a different sales load and 12b-1 fee structure, and that the multiple structures are intended to offer a range of pricing options for the intermediary market. The Board also noted that the total expenses of the classes vary primarily by the level of their 12b-1 fees, although differences in transfer agent fees may also cause expenses to vary from class to class.
The Board noted that the total expenses of Asset Manager 70% ranked below its competitive median for 2007.
The Board noted that the total expenses of each class of Asset Manager 20% ranked below its competitive median for 2007.
The Board noted that the total expenses of each of Class A, Class B, Class C, Institutional Class, and Asset Manager 30% (retail class) of Asset Manager 30% ranked below its competitive median for the period, and the total expenses of Class T ranked above its competitive median for the period. The Board considered that the total expenses for Class T were above the median primarily because its 12b-1 fee is higher than the typical front-end load class.
The Board noted that the total expenses of each of Class A, Class B, Class C, Institutional Class, and Asset Manager 40% (retail class) of Asset Manager 40% ranked below its competitive median for the period, and the total expenses of Class T ranked above its competitive median for the period. The Board considered that the total expenses for Class T were above the median primarily because its 12b-1 fee is higher than the typical front-end load class.
The Board noted that the total expenses of each of Class A, Class B, Class C, Institutional Class, and Asset Manager 50% (retail class) of Asset Manager 50% ranked below its competitive median for 2007, and the total expenses of Class T ranked above its competitive median for 2007. The Board considered that the total expenses for Class T were above the median primarily because its 12b-1 fee is higher than the typical front-end load class.
The Board noted that the total expenses of Asset Manager 60% (retail class) of Asset Manager 60% ranked equal to its competitive median for the period, and the total expenses of Class A, Class T, Class B, Class C, and Institutional Class ranked above its competitive median for the period. The Board considered that the total expenses of Class B and Class C were above the median primarily due to higher transfer agent fees. The Board considered that the total expenses for Class T were above the median primarily because its 12b-1 fee is higher than the typical front-end load class.
The Board noted that the total expenses of each of Class A, Class B, Class C, Institutional Class and Asset Manager 85% (retail class) of Asset Manager 85% ranked below its competitive median for 2007, and the total expenses of Class T ranked above its competitive median for 2007. The Board considered that total expenses for Class T were above the median primarily because its 12b-1 fee is higher than the typical front-end load class.
In its review of total expenses, the Board also considered Fidelity fee structures and other information on clients that FMR and its affiliates service in other competitive markets, such as other mutual funds advised or subadvised by FMR or its affiliates, pension plan clients, and other institutional clients.
Based on its review, the Board concluded that the total expenses of Asset Manager 70% and the total expenses of each class of Asset Manager 20%, Asset Manager 30%, Asset Manager 40%, Asset Manager 50%, Asset Manager 60% and Asset Manager 85% were reasonable, although in some cases above the median of the universe presented for comparison, in light of the services that the fund and its shareholders receive and the other factors considered.
Costs of the Services and Profitability. The Board considered the revenues earned and the expenses incurred by Fidelity in conducting the business of developing, marketing, distributing, managing, administering and servicing each fund and its shareholders. The Board also considered the level of Fidelity's profits in respect of all the Fidelity funds.
On an annual basis, FMR presents to the Board Fidelity's profitability for each fund. Fidelity calculates the profitability for each fund, as well as aggregate profitability for groups of Fidelity funds and all Fidelity funds, using a series of detailed revenue and cost allocation methodologies which originate with the audited books and records of Fidelity. The Audit Committee of the Board reviews any significant changes from the prior year's methodologies.
PricewaterhouseCoopers LLP (PwC), independent registered public accounting firm and auditor to Fidelity and certain Fidelity funds, has been engaged annually by the Board as part of the Board's assessment of the results of Fidelity's profitability analysis. PwC's engagement includes the review and assessment of Fidelity's methodologies used in determining the revenues and expenses attributable to Fidelity's mutual fund business, and completion of agreed-upon procedures surrounding the mathematical accuracy of fund profitability and its conformity to allocation methodologies. After considering PwC's reports issued under the engagement and information provided by Fidelity, the Board believes that while other allocation methods may also be reasonable, Fidelity's profitability methodologies are reasonable in all material respects.
The Board has also reviewed Fidelity's non-fund businesses and any fall-out benefits related to the mutual fund business as well as cases where Fidelity's affiliates may benefit from or be related to the funds' business.
Annual Report
The Board considered the costs of the services provided by and the profits realized by Fidelity in connection with the operation of each fund and determined that the amount of profit is a fair entrepreneurial profit for the management of each fund.
Economies of Scale. The Board considered whether there have been economies of scale in respect of the management of the Fidelity funds, whether the Fidelity funds (including each fund) have appropriately benefited from any such economies of scale, and whether there is potential for realization of any further economies of scale. The Board considered the extent to which each fund will benefit from economies of scale through increased services to the fund, through waivers or reimbursements, or through fee or expense reductions.
The Board recognized that each fund's management contract incorporates a "group fee" structure, which provides for lower group fee rates as total fund assets under FMR's management increase, and for higher group fee rates as total fund assets under FMR's management decrease. FMR determines the group fee rates based on a tiered asset "breakpoint" schedule. The Board considered that the group fee is designed to deliver the benefits of economies of scale to fund shareholders when total fund assets increase, even if assets of any particular fund are unchanged or have declined, because some portion of Fidelity's costs are attributable to services provided to all Fidelity funds, and all funds benefit if those costs can be allocated among more assets. The Board concluded that, given the group fee structure, fund shareholders will achieve a certain level of economies of scale as assets under FMR's management increase at the fund complex level, regardless of whether Fidelity achieves any such economies of scale.
The Board further concluded that any potential economies of scale are being shared between fund shareholders and Fidelity in an appropriate manner.
Additional Information Requested by the Board. In order to develop fully the factual basis for consideration of the Fidelity funds' Advisory Contracts, the Board requested and received additional information on certain topics, including (i) fund performance trends and actions to be taken by FMR to improve certain funds' overall performance; (ii) portfolio manager changes that have occurred during the past year; (iii) Fidelity's fund profitability methodology, the profitability of certain fund service providers, and profitability trends for certain funds; (iv) Fidelity's compensation structure for portfolio managers and key personnel, including its effects on fund profitability and the extent to which portfolio manager compensation is linked to fund performance; (v) Fidelity's fee structures; (vi) the funds' sub-advisory arrangements; and (vii) accounts managed by Fidelity other than the Fidelity funds.
Based on its evaluation of all of the conclusions noted above, and after considering all material factors, the Board ultimately concluded that the advisory fee structures are fair and reasonable, and that each fund's Advisory Contracts should be renewed.
Annual Report
Investment Adviser
Fidelity Management & Research Company
Boston, MA
Investment Sub-Advisers
FMR Co., Inc.
Fidelity Investments Money Management, Inc.
Fidelity Management & Research (U.K.) Inc.
Fidelity Research & Analysis Company
Fidelity Investments Japan Limited
FIL Investment Advisors
FIL Investment Advisors (U.K.) Ltd.
Fidelity Management & Research (Japan) Inc.
Fidelity Management & Research (Hong Kong) Limited
General Distributor
Fidelity Distributors Corporation
Boston, MA
Transfer and Service Agents
Fidelity Investments Institutional Operations Company, Inc.
Boston, MA
Fidelity Service Company, Inc.
Boston, MA
Custodian
JPMorgan Chase Bank
New York, NY
AARI-UANN-1108
1.885698.100
Fidelity®
Broad Market Opportunities
Fund
Annual Report
September 30, 2008
(2_fidelity_logos) (Registered_Trademark)
Contents
Chairman's Message | <Click Here> | Ned Johnson's message to shareholders. |
Performance | <Click Here> | How the fund has done over time. |
Management's Discussion | <Click Here> | The manager's review of fund performance, strategy and outlook. |
Shareholder Expense Example | <Click Here> | An example of shareholder expenses. |
Investment Changes | <Click Here> | A summary of major shifts in the fund's investments over the past six months. |
Investments | <Click Here> | A complete list of the fund's investments with their market values. |
Financial Statements | <Click Here> | Statements of assets and liabilities, operations, and changes in net assets,
as well as financial highlights. |
Notes | <Click Here> | Notes to the financial statements. |
Report of Independent Registered Public Accounting Firm | <Click Here> | |
Trustees and Officers | <Click Here> | |
Distributions | <Click Here> | |
Board Approval of Investment Advisory Contracts and Management Fees | <Click Here> | |
To view a fund's proxy voting guidelines and proxy voting record for the 12-month period ended June 30, visit http://www.fidelity.com (search for "proxy voting guidelines") or visit the Securities and Exchange Commission's (SEC) web site at http://www.sec.gov. You may also call 1-800-544-8544 to request a free copy of the proxy voting guidelines.
Standard & Poor's, S&P and S&P 500 are registered service marks of The McGraw-Hill Companies, Inc. and have been licensed for use by Fidelity Distributors Corporation.
Other third party marks appearing herein are the property of their respective owners.
All other marks appearing herein are registered or unregistered trademarks or service marks of FMR LLC or an affiliated company.
Annual Report
This report and the financial statements contained herein are submitted for the general information of the shareholders of the fund. This report is not authorized for distribution to prospective investors in the fund unless preceded or accompanied by an effective prospectus.
A fund files its complete schedule of portfolio holdings with the SEC for the first and third quarters of each fiscal year on Form N-Q. Forms N-Q are available on the SEC's web site at http://www.sec.gov. A fund's Forms N-Q may be reviewed and copied at the SEC's Public Reference Room in Washington, DC. Information regarding the operation of the SEC's Public Reference Room may be obtained by calling 1-800-SEC-0330. For a complete list of a fund's portfolio holdings, view the most recent holdings listing, semiannual report, or annual report on Fidelity's web site at http://www.fidelity.com or http://www.advisor.fidelity.com, as applicable.
NOT FDIC INSURED · MAY LOSE VALUE · NO BANK GUARANTEE
Neither the fund nor Fidelity Distributors Corporation is a bank.
Annual Report
(photo_of_Edward_C_Johnson_3d)
Dear Shareholder:
Turmoil has been the watchword for the world's securities markets in 2008, with domestic and international stocks down sharply amid the global credit squeeze. A flight to quality boosted returns for U.S. Treasuries, one of the few asset classes with positive results heading into the latter stages of the year. Financial markets are always unpredictable, but there are a number of time-tested principles that can put the historical odds in your favor.
One of the basic tenets is to invest for the long term. Over time, riding out the markets' inevitable ups and downs has proven much more effective than selling into panic or chasing the hottest trend. Even missing only a few of the markets' best days can significantly diminish investor returns. Patience also affords the benefits of compounding - of earning interest on additional income or reinvested dividends and capital gains. There are tax advantages and cost benefits to consider as well. The more you sell, the more taxes you pay, and the more you trade, the higher the costs. While staying the course doesn't eliminate risk, it can considerably lessen the effect of short-term declines.
You can further manage your investing risk through diversification. And today, more than ever, geographic diversification should be taken into account. Studies indicate that asset allocation is the single most important determinant of a portfolio's long-term success. The right mix of stocks, bonds and cash - aligned to your particular risk tolerance and investment objective - is very important. Age-appropriate rebalancing is also an essential aspect of asset allocation. For younger investors, an emphasis on equities - which historically have been the best-performing asset class over time - is encouraged. As investors near their specific goal, such as retirement or sending a child to college, consideration may be given to replacing volatile assets (e.g. common stocks) with more-stable fixed investments (bonds or savings plans).
A third investment principle - investing regularly - can help lower the average cost of your purchases. Investing a certain amount of money each month or quarter helps ensure you won't pay for all your shares at market highs. This strategy - known as dollar cost averaging - also reduces unconstructive "emotion" from investing, helping shareholders avoid selling weak performers just prior to an upswing, or chasing a hot performer just before a correction.
We invite you to contact us via the Internet, through our Investor Centers or over the phone. It is our privilege to provide you the information you need to make the investments that are right for you.
Sincerely,
/s/Edward C. Johnson 3d
Edward C. Johnson 3d
Annual Report
Average annual total return reflects the change in the value of an investment, assuming reinvestment of the fund's dividend income and capital gains (the profits earned upon the sale of securities that have grown in value, if any) and assuming a constant rate of performance each year. The $10,000 table and the fund's returns do not reflect the deduction of taxes that a shareholder would pay on fund distributions or the redemption of fund shares. During periods of reimbursement by Fidelity, a fund's total return will be greater than it would be had the reimbursement not occurred. How a fund did yesterday is no guarantee of how it will do tomorrow.
Average Annual Total Returns
Periods ended September 30, 2008 | Past 1
year | Life of
fund A |
Fidelity ® Broad Market Opportunities | -26.51% | -19.17% |
A From August 21, 2007.
$10,000 Over Life of Fund
Let's say hypothetically that $10,000 was invested in Fidelity ® Broad Market Opportunities on August 21, 2007, when the fund started. The chart shows how the value of your investment would have changed, and also shows how the Dow Jones Wilshire 5000 Composite Index SM performed over the same period.
Annual Report
Comments from Derek Young, who became Lead Portfolio Manager of Fidelity® Broad Market Opportunities Fund on July 1, 2008
Stocks fell sharply for the 12 months ending September 30, 2008, amid a backdrop of falling home values, tight credit and scarce liquidity. In that time frame, the Standard & Poor's 500SM Index declined 21.98%. Of the 10 market sectors in the S&P 500®, only consumer staples had a positive return, rising just under 1%. The others all suffered double-digit losses, led by the roughly 39% decline of the financials sector. In the final quarter of the period, under the strain of a credit crisis and dwindling capital, several of the largest institutions on Wall Street went bankrupt, were forced into acquisitions or were seized by the U.S. government. When Congress failed to agree on a financial bailout plan toward period end, a sell-off of historic proportions ensued. The Dow Jones Industrial AverageSM plummeted roughly 778 points on September 29 - its worst single-day point loss ever - and finished down 19.85% for the 12 months overall, while the NASDAQ Composite® Index dropped 21.99%. The MSCI® Europe, Australasia, Far East (EAFE®) Index-a measure of developed markets outside the U.S. and Canada - fell 30.39%, exacerbated by the renewed strength of the U.S. dollar.
The fund had a difficult year, posting a loss of 26.51%, compared with a -21.26% return for the Dow Jones Wilshire 5000 Composite IndexSM. An inherent growth orientation and bias toward higher-beta - meaning more-volatile - stocks were major factors working against us amid a sharp downturn in the market, as the burgeoning global financial crisis spawned a massive flight to quality. In total, eight of the 10 underlying sector central funds lagged their respective components of the Dow Jones Wilshire index, with particularly weak results coming from information technology, utilities, energy, consumer staples and financials - security selection was the culprit in each case. Conversely, the industrials sector is where we fared the best, fueled by good stock picks. Consumer discretionary was the only other positive. Among our biggest individual detractors were computer and consumer electronics maker Apple and independent oil refiner Valero Energy, both of which corrected sharply, as well as several more-defensive names that held up well but hurt the fund due to underweightings, including Johnson & Johnson, Wal-Mart Stores and IBM. On the plus side, underweighting laggard General Electric helped relative to the index, while outsized stakes in Dutch digital map maker Tele Atlas - which was acquired during the period - and independent oil/gas company Range Resources also contributed.
The views expressed above reflect those of the portfolio manager(s) only through the end of the period as stated on the cover of this report and do not necessarily represent the views of Fidelity or any other person in the Fidelity organization. Any such views are subject to change at any time based upon market or other conditions and Fidelity disclaims any responsibility to update such views. These views may not be relied on as investment advice and, because investment decisions for a Fidelity fund are based on numerous factors, may not be relied on as an indication of trading intent on behalf of any Fidelity fund.
Annual Report
Shareholder Expense Example
As a shareholder of the Fund, you incur two types of costs: (1) transaction costs, and (2) ongoing costs, including management fees and other Fund expenses. This Example is intended to help you understand your ongoing costs (in dollars) of investing in the Fund and to compare these costs with the ongoing costs of investing in other mutual funds.
The Example is based on an investment of $1,000 invested at the beginning of the period and held for the entire period (April 1, 2008 to September 30, 2008).
Actual Expenses
The first line of the accompanying table provides information about actual account values and actual expenses. You may use the information in this line, together with the amount you invested, to estimate the expenses that you paid over the period. Simply divide your account value by $1,000.00 (for example, an $8,600 account value divided by $1,000.00 = 8.6), then multiply the result by the number in the first line under the heading entitled "Expenses Paid During Period" to estimate the expenses you paid on your account during this period. In addition, the Fund, as a shareholder in the underlying Fidelity Central Funds, will indirectly bear its pro rata share of the fees and expenses incurred by the underlying Fidelity Central Funds. These fees and expenses are not included in the Fund's annualized expense ratio used to calculate the expense estimate in the table below.
Hypothetical Example for Comparison Purposes
The second line of the accompanying table provides information about hypothetical account values and hypothetical expenses based on the Fund's actual expense ratio and an assumed rate of return of 5% per year before expenses, which is not the Fund's actual return. The hypothetical account values and expenses may not be used to estimate the actual ending account balance or expenses you paid for the period. You may use this information to compare the ongoing costs of investing in the Fund and other funds. To do so, compare this 5% hypothetical example with the 5% hypothetical examples that appear in the shareholder reports of the other funds. In addition, the Fund, as a shareholder in the underlying Fidelity Central Funds, will indirectly bear its pro rata share of the fees and expenses incurred by the underlying Fidelity Central Funds. These fees and expenses are not included in the Fund's annualized expense ratio used to calculate the expense estimate in the table below.
Annual Report
Shareholder Expense Example - continued
Please note that the expenses shown in the table are meant to highlight your ongoing costs only and do not reflect any transaction costs. Therefore, the second line of the table is useful in comparing ongoing costs only, and will not help you determine the relative total costs of owning different funds.
| Annualized
Expense Ratio | Beginning
Account Value
April 1, 2008 | Ending
Account Value
September 30, 2008 | Expenses Paid
During Period*
April 1, 2008 to September 30, 2008 |
Actual | 1.00% | $ 1,000.00 | $ 852.70 | $ 4.63 |
Hypothetical (5% return per year before expenses) | | $ 1,000.00 | $ 1,020.00 | $ 5.05 |
* Expenses are equal to the Fund's annualized expense ratio, multiplied by the average account value over the period, multiplied by 183/366 (to reflect the one-half year period). The fees and expenses of the underlying Fidelity Central Funds in which the Fund invests are not included in the Fund's annualized expense ratio.
Annual Report
Fidelity Broad Market Opportunities Fund
Investment Changes (Unaudited)
The information in the following tables is based on the combined investments of the Fund and its pro-rata share of the investments of Fidelity's Equity Central Funds. |
Top Ten Stocks as of September 30, 2008 |
| % of fund's
net assets | % of fund's net assets
6 months ago |
Procter & Gamble Co. | 1.8 | 1.6 |
Apple, Inc. | 1.8 | 0.2 |
General Electric Co. | 1.3 | 1.2 |
Bank of America Corp. | 1.3 | 0.8 |
JPMorgan Chase & Co. | 1.3 | 1.1 |
Wells Fargo & Co. | 1.2 | 0.8 |
The Coca-Cola Co. | 1.1 | 1.0 |
Genentech, Inc. | 1.0 | 0.3 |
PepsiCo, Inc. | 0.9 | 0.8 |
Citigroup, Inc. | 0.9 | 0.8 |
| 12.6 | |
Asset Allocation (% of fund's net assets) |
As of September 30, 2008 | As of March 31, 2008 |
 | Stocks 97.1% | | | Stocks 96.8% | |
 | Bonds 0.1% | | | Bonds 0.0% | |
 | Convertible
Securities 0.2% | | | Convertible
Securities 0.0% | |
 | Short-Term
Investments and
Net Other Assets 2.6% | | | Short-Term
Investments and
Net Other Assets 3.2% | |

Annual Report
Investment Changes (Unaudited) - continued
The information in the following table is based on the direct investments of the Fund. |
Fund Holdings as of September 30, 2008 |
| % of fund's
net assets |
Equity Holdings | |
Equity Sector Central Funds | |
Fidelity Financials Central Fund | 17.2 |
Fidelity Information Technology Central Fund | 15.4 |
Fidelity Health Care Central Fund | 13.3 |
Fidelity Energy Central Fund | 12.0 |
Fidelity Industrials Central Fund | 11.8 |
Fidelity Consumer Staples Central Fund | 10.7 |
Fidelity Consumer Discretionary Central Fund | 9.6 |
Fidelity Utilities Central Fund | 3.8 |
Fidelity Materials Central Fund | 3.7 |
Fidelity Telecom Services Central Fund | 2.8 |
Total Equity Sector Central Funds | 100.3 |
Net Other Assets | (0.3) |
Total | 100.0 |
At period end, investments in foreign securities, including the Fund's pro-rata share of the underlying Central Funds, was 16.6% of net assets. An unaudited holdings listing for the Fund, which presents direct holdings as well as the pro-rata share of any securities and other investments held indirectly through its investment in underlying non-money market Fidelity Central Funds, is available at fidelity.com. |
Annual Report
Fidelity Broad Market Opportunities Fund
Investments September 30, 2008
Showing Percentage of Net Assets
Equity Sector Central Funds - 100.3% |
| Shares | | Value |
Fidelity Consumer Discretionary Central Fund (a) | 4,299 | | $ 397,265 |
Fidelity Consumer Staples Central Fund (a) | 3,835 | | 440,860 |
Fidelity Energy Central Fund (a) | 4,492 | | 496,317 |
Fidelity Financials Central Fund (a) | 10,805 | | 711,636 |
Fidelity Health Care Central Fund (a) | 5,526 | | 550,440 |
Fidelity Industrials Central Fund (a) | 4,617 | | 487,278 |
Fidelity Information Technology Central Fund (a) | 6,478 | | 636,167 |
Fidelity Materials Central Fund (a) | 1,399 | | 153,938 |
Fidelity Telecom Services Central Fund (a) | 1,274 | | 114,302 |
Fidelity Utilities Central Fund (a) | 1,688 | | 157,597 |
TOTAL EQUITY SECTOR CENTRAL FUNDS (Cost $5,165,631) | 4,145,800 |
TOTAL INVESTMENT PORTFOLIO - 100.3% (Cost $5,165,631) | | 4,145,800 |
NET OTHER ASSETS - (0.3)% | | (12,139) |
NET ASSETS - 100% | $ 4,133,661 |
Legend |
(a) Affiliated fund that is available only to investment companies and other accounts managed by Fidelity Investments. A complete unaudited schedule of portfolio holdings for each Fidelity Central Fund is filed with the SEC for the first and third quarters of each fiscal year on Form N-Q and is available upon request or at the SEC's web site at www.sec.gov. An unaudited holdings listing for the Fund, which presents direct holdings as well as the pro rata share of securities and other investments held indirectly through its investment in underlying non-money market Fidelity Central Funds, is available at fidelity.com. In addition, each Fidelity Central Fund's financial statements, which are not covered by the Fund's Report of Independent Registered Public Accounting Firm, are available on the SEC's web site or upon request. |
Affiliated Central Funds |
Information regarding fiscal year to date income earned by the Fund from investments in Fidelity Central Funds is as follows: |
Fund | Income earned |
Fidelity Consumer Discretionary Central Fund | $ 5,412 |
Fidelity Consumer Staples Central Fund | 7,997 |
Fidelity Energy Central Fund | 3,841 |
Fidelity Financials Central Fund | 20,264 |
Fidelity Health Care Central Fund | 4,580 |
Fidelity Industrials Central Fund | 7,254 |
Fidelity Information Technology Central Fund | 4,686 |
Fidelity Materials Central Fund | 2,497 |
Fidelity Telecom Services Central Fund | 2,624 |
Fidelity Utilities Central Fund | 3,249 |
Total | $ 62,404 |
Additional information regarding the Fund's fiscal year to date purchases and sales, including the ownership percentage, of the non Money Market Central Funds is as follows: |
Fund | Value, beginning of period | Purchases | Sales Proceeds | Value,
end of
period | % ownership, end of
period |
Fidelity Consumer Discretionary Central Fund | $ 168,805 | $ 419,172 | $ 101,921 | $ 397,265 | 0.1% |
Fidelity Consumer Staples Central Fund | 136,035 | 407,270 | 60,942 | 440,860 | 0.1% |
Fidelity Energy Central Fund | 177,175 | 553,317 | 80,365 | 496,317 | 0.1% |
Fidelity Financials Central Fund | 316,921 | 811,175 | 109,551 | 711,636 | 0.1% |
Fidelity Health Care Central Fund | 188,141 | 531,325 | 81,461 | 550,440 | 0.1% |
Fidelity Industrials Central Fund | 190,929 | 520,853 | 112,700 | 487,278 | 0.1% |
Fidelity Information Technology Central Fund | 270,327 | 717,120 | 106,524 | 636,167 | 0.1% |
Fidelity Materials Central Fund | 60,010 | 172,624 | 29,522 | 153,938 | 0.1% |
Fidelity Telecom Services Central Fund | 57,080 | 144,766 | 33,149 | 114,302 | 0.1% |
Fidelity Utilities Central Fund | 58,139 | 173,950 | 24,806 | 157,597 | 0.1% |
Total | $ 1,623,562 | $ 4,451,572 | $ 740,941 | $ 4,145,800 | |
Other Information |
Distribution of investments by country of issue, as a percentage of total net assets, is as follows: (Unaudited) |
United States of America | 83.4% |
Bermuda | 2.9% |
Switzerland | 1.9% |
Cayman Islands | 1.8% |
United Kingdom | 1.7% |
Canada | 1.2% |
Japan | 1.0% |
Others (individually less than 1%) | 6.1% |
| 100.0% |
Income Tax Information |
The fund intends to elect to defer to its fiscal year ending September 30, 2009 approximately $558,596 of losses recognized during the period November 1, 2007 to September 30, 2008. |
See accompanying notes which are an integral part of the financial statements.
Annual Report
Statement of Assets and Liabilities
| September 30, 2008 |
Assets | | |
Investment in securities, at value (cost $5,165,631) - See accompanying schedule | | $ 4,145,800 |
Cash | | 12,003 |
Receivable for investments sold | | 4,658 |
Receivable for fund shares sold | | 1,786 |
Receivable from investment adviser for expense reductions | | 5,430 |
Other receivables | | 23 |
Total assets | | 4,169,700 |
| | |
Liabilities | | |
Payable for fund shares redeemed | $ 6,509 | |
Accrued management fee | 2,065 | |
Other affiliated payables | 645 | |
Other payables and accrued expenses | 26,820 | |
Total liabilities | | 36,039 |
| | |
Net Assets | | $ 4,133,661 |
Net Assets consist of: | | |
Paid in capital | | $ 5,196,736 |
Undistributed net investment income | | 3,620 |
Accumulated undistributed net realized gain (loss) on investments | | (46,864) |
Net unrealized appreciation (depreciation) on investments | | (1,019,831) |
Net Assets, for 525,460 shares outstanding | | $ 4,133,661 |
Net Asset Value, offering price and redemption price per share ($4,133,661 ÷ 525,460 shares) | | $ 7.87 |
See accompanying notes which are an integral part of the financial statements.
Annual Report
Statement of Operations
| Year ended September 30, 2008 |
Investment Income | | |
Income from Fidelity Central Funds | | $ 62,404 |
Interest | | 3 |
Total income | | 62,407 |
| | |
Expenses | | |
Management fee | $ 19,837 | |
Transfer agent fees | 5,307 | |
Accounting fees and expenses | 1,387 | |
Custodian fees and expenses | 33,776 | |
Independent trustees' compensation | 13 | |
Audit | 23,190 | |
Legal | 8 | |
Miscellaneous | 19 | |
Total expenses before reductions | 83,537 | |
Expense reductions | (48,284) | 35,253 |
Net investment income (loss) | | 27,154 |
Realized and Unrealized Gain (Loss) Fidelity Central Funds | | (65,513) |
Change in net unrealized appreciation (depreciation) on investment securities | | (1,122,803) |
Net gain (loss) | | (1,188,316) |
Net increase (decrease) in net assets resulting from operations | | $ (1,161,162) |
See accompanying notes which are an integral part of the financial statements.
Annual Report
Financial Statements - continued
Statement of Changes in Net Assets
| Year ended
September 30, 2008 | For the period
August 21, 2007
(commencement of
operations) to
September 30, 2007 |
Increase (Decrease) in Net Assets | | |
Operations | | |
Net investment income (loss) | $ 27,154 | $ 1,777 |
Net realized gain (loss) | (65,513) | 73 |
Change in net unrealized appreciation (depreciation) | (1,122,803) | 102,972 |
Net increase (decrease) in net assets resulting
from operations | (1,161,162) | 104,822 |
Distributions to shareholders from net investment income | (7,629) | - |
Share transactions
Proceeds from sales of shares | 4,532,585 | 1,513,309 |
Reinvestment of distributions | 7,629 | - |
Cost of shares redeemed | (855,540) | (353) |
Net increase (decrease) in net assets resulting from share transactions | 3,684,674 | 1,512,956 |
Total increase (decrease) in net assets | 2,515,883 | 1,617,778 |
| | |
Net Assets | | |
Beginning of period | 1,617,778 | - |
End of period (including undistributed net investment income of $3,620 and $0, respectively) | $ 4,133,661 | $ 1,617,778 |
Other Information Shares | | |
Sold | 468,605 | 150,711 |
Issued in reinvestment of distributions | 728 | - |
Redeemed | (94,549) | (35) |
Net increase (decrease) | 374,784 | 150,676 |
See accompanying notes which are an integral part of the financial statements.
Annual Report
Financial Highlights
Years ended September 30, | 2008 | 2007 G |
Selected Per-Share Data | | |
Net asset value, beginning of period | $ 10.74 | $ 10.00 |
Income from Investment Operations | | |
Net investment income (loss) D | .07 | .01 |
Net realized and unrealized gain (loss) | (2.91) | .73 |
Total from investment operations | (2.84) | .74 |
Distributions from net investment income | (.03) | - |
Net asset value, end of period | $ 7.87 | $ 10.74 |
Total Return B,C | (26.51)% | 7.40% |
Ratios to Average Net Assets E,H | | |
Expenses before reductions | 2.35% | 11.66% A |
Expenses net of fee waivers, if any | 1.00% | 1.00% A |
Expenses net of all reductions | .99% | 1.00% A |
Net investment income (loss) | .76% | 1.10% A |
Supplemental Data | | |
Net assets, end of period (000 omitted) | $ 4,134 | $ 1,618 |
Portfolio turnover rate F | 21% | 4% A |
A Annualized
B Total returns for periods of less than one year are not annualized.
C Total returns would have been lower had certain expenses not been reduced during the periods shown.
D Calculated based on average shares outstanding during the period.
E Fees and expenses of the underlying Fidelity Central Funds are not included in the Fund's expense ratio. The Fund indirectly bears its proportionate share of the expenses of any underlying Fidelity Central Funds.
F Amount does not include the portfolio activity of any underlying Fidelity Central Funds.
G For the period August 21, 2007 (commencement of operations) to September 30, 2007.
H Expense ratios reflect operating expenses of the Fund. Expenses before reductions do not reflect amounts reimbursed by the investment adviser or reductions from brokerage service arrangements or other expense offset arrangements and do not represent the amount paid by the Fund during periods when reimbursements or reductions occur. Expense ratios before reductions for start-up periods may not be representative of longer term operating periods. Expenses net of fee waivers reflect expenses after reimbursement by the investment adviser but prior to reductions from brokerage service arrangements or other expense offset arrangements. Expenses net of all reductions represent the net expenses paid by the Fund.
See accompanying notes which are an integral part of the financial statements.
Annual Report
Notes to Financial Statements
For the period ended September 30, 2008
1. Organization.
Fidelity Broad Market Opportunities Fund (the Fund) is a fund of Fidelity Charles Street Trust (the trust) and is authorized to issue an unlimited number of shares. The trust is registered under the Investment Company Act of 1940, as amended (the 1940 Act), as an open-end management investment company organized as a Massachusetts business trust. Shares of the Fund are only offered to other investment companies and accounts (the Investing Funds) managed by Fidelity Management & Research Company (FMR), or its affiliates.
2. Investments in Fidelity Central Funds.
The Fund may invest in Fidelity Central Funds, which are open-end investment companies available only to other investment companies and accounts managed by FMR and its affiliates. The Fund's Schedule of Investments lists each of the Fidelity Central Funds held as of period end, if any, as an investment of the Fund, but does not include the underlying holdings of each Fidelity Central Fund. As an Investing Fund, the Fund indirectly bears its proportionate share of the expenses of the underlying Fidelity Central Funds.
Based on their investment objective, each Fidelity Central Fund may invest or participate in various investment vehicles or strategies that are similar to those of the Fund. These strategies are consistent with the investment objectives of the Fund and may involve certain economic risks which may cause a decline in value of each of the Fidelity Central Funds and thus a decline in the value of the Fund. The following summarizes the Fund's investment in each Fidelity Central Fund.
Fidelity
Central Fund | | Investment
Manager | | Investment
Objective | | Investment
Practices |
| | | | | | |
Fidelity Equity Sector Central Funds | | Fidelity Management
& Research Company, Inc. (FMRC) | | Each fund seeks capital appreciation by investing primarily in common stocks, with a concentration in a particular industry. | | Foreign Securities Repurchase Agreements Restricted Securities |
An unaudited holdings listing for the Fund, which presents direct holdings as well as the pro rata share of any securities and other investments held indirectly through its investment in underlying non-money market Fidelity Central Funds, is available at fidelity.com. A complete unaudited list of holdings for each Fidelity Central Fund is available upon request or at the SEC's web site at www.sec.gov. In addition, the financial statements of the Fidelity Central Funds, which are not covered by the Fund's Report of Independent Registered Public Accounting Firm, are available on the SEC's web site or upon request.
Annual Report
3. Significant Accounting Policies.
The financial statements have been prepared in conformity with accounting principles generally accepted in the United States of America, which require management to make certain estimates and assumptions at the date of the financial statements. Actual results could differ from those estimates. The following summarizes the significant accounting policies of the Fund:
Security Valuation. Investments in the Underlying Funds are valued at their closing net asset value (NAV) each business day.
Investment Transactions and Income. For financial reporting purposes, the Fund's investment holdings and NAV include trades executed through the end of the last business day of the period. The NAV per share for processing shareholder transactions is calculated as of the close of business of the New York Stock Exchange (NYSE), normally 4:00 p.m. Eastern time and includes trades executed through the end of the prior business day. Gains and losses on securities sold are determined on the basis of identified cost. Interest income and distributions from the Fidelity Central Funds are accrued as earned. Interest income includes coupon interest and amortization of premium and accretion of discount on debt securities.
Expenses. Most expenses of the trust can be directly attributed to a fund. Expenses which cannot be directly attributed are apportioned among each Fund in the trust. Expense estimates are accrued in the period to which they relate and adjustments are made when actual amounts are known. Expenses included in the accompanying financial statements reflect the expenses of the Fund and do not include any expenses of the Fidelity Central Funds. Although not included in the Fund's expenses, the Fund indirectly bears its proportionate share of the Fidelity Central Funds' expenses through the impact of these expenses on each Fidelity Central Fund's net asset value.
Income Tax Information and Distributions to Shareholders. Each year, the Fund intends to qualify as a regulated investment company by distributing substantially all of its taxable income and realized gains under Subchapter M of the Internal Revenue Code and filing its U.S. federal tax return. As a result, no provision for income taxes is required. The Fund is subject to the provisions of FASB Interpretation No. 48, Accounting for Uncertainties in Income Taxes (FIN 48). FIN 48 sets forth a minimum threshold for financial statement recognition of the benefit of a tax position taken or expected to be taken in a tax return. The implementation of FIN 48 did not result in any unrecognized tax benefits in the accompanying financial statements. Each of the Fund's federal tax returns for the prior three fiscal years remains subject to examination by the Internal Revenue Service (IRS).
Annual Report
Notes to Financial Statements - continued
3. Significant Accounting Policies - continued
Income Tax Information and Distributions to Shareholders - continued
Distributions are recorded on the ex-dividend date. Income and capital gain distributions are determined in accordance with income tax regulations, which may differ from generally accepted accounting principles.
Capital accounts within the financial statements are adjusted for permanent book-tax differences. These adjustments have no impact on net assets or the results of operations. Temporary book-tax differences will reverse in a subsequent period.
Book-tax differences are primarily due to partnerships (including allocations from Fidelity Central Funds) and losses deferred due to excise tax regulations.
The tax-basis components of distributable earnings and the federal tax cost as of period end were as follows:
Unrealized appreciation | $ 3,545 | |
Unrealized depreciation | (511,870) | |
Net unrealized appreciation (depreciation) | (508,325) | |
Undistributed ordinary income | 3,620 | |
Undistributed long-term capital gain | 220 | |
| | |
Cost for federal income tax purposes | $ 4,654,125 | |
The tax character of distributions paid was as follows:
| September 30, 2008 | September 30, 2007 |
Ordinary Income | $ 7,629 | $ - |
New Accounting Pronouncement. In September 2006, Statement of Financial Accounting Standards No. 157, Fair Value Measurements (SFAS 157), was issued and is effective for fiscal years beginning after November 15, 2007. SFAS 157 defines fair value, establishes a framework for measuring fair value and results in expanded disclosures about fair value measurements.
4. Operating Policies.
Repurchase Agreements. FMR has received an Exemptive Order from the Securities and Exchange Commission (the SEC) which permits the Fund and other affiliated entities of FMR to transfer uninvested cash balances into joint trading accounts which are then invested in repurchase agreements. The Fund may also invest directly with institutions in repurchase agreements. Repurchase agreements are collateralized by government or non-government securities. Upon settlement date, collateral is held in segregated accounts with custodian banks and may be obtained in the event of a default of the counterparty. The Fund monitors, on a daily basis, the value of the collateral to ensure it is at least equal
Annual Report
4. Operating Policies - continued
Repurchase Agreements - continued
to the principal amount of the repurchase agreement (including accrued interest). In the event of a default by the counterparty, realization of the collateral proceeds could be delayed, during which time the value of the collateral may decline.
5. Purchases and Sales of Investments.
Purchases and sales of securities including the Equity Central Funds, other than short-term securities and U.S. government securities, aggregated $4,451,572 and $740,941, respectively.
6. Fees and Other Transactions with Affiliates.
Management Fee. FMR and its affiliates provide the Fund with investment management related services for which the Fund pays a monthly management fee. The management fee is the sum of an individual fund fee rate that is based on an annual rate of .30% of the Fund's average net assets and a group fee rate that averaged .26% during the period. The group fee rate is based upon the average net assets of all the mutual funds advised by FMR. The group fee rate decreases as assets under management increase and increases as assets under management decrease. For the period, the total annual management fee rate was .56% of the Fund's average net assets.
FMR pays a portion of the management fees received from the Fund to the Fidelity Central Funds' investment advisers, who are also affiliates, for managing the assets of the Fidelity Central Funds.
Transfer Agent Fees. Fidelity Investments Institutional Operations Company, Inc. (FIIOC), an affiliate of FMR, is the Fund's transfer, dividend disbursing and shareholder servicing agent. FIIOC receives account fees and asset-based fees that vary according to account size and type of account. FIIOC pays for typesetting, printing and mailing of shareholder reports, except proxy statements. For the period, the transfer agent fees were equivalent to an annual rate of .15% of average net assets.
Accounting Fees. Fidelity Service Company, Inc. (FSC), an affiliate of FMR, maintains the Fund's accounting records. The fee is based on the level of average net assets for the month.
7. Committed Line of Credit.
The Fund participates with other funds managed by FMR in a $4.2 billion credit facility (the "line of credit") to be utilized for temporary or emergency purposes to fund shareholder redemptions or for other short-term liquidity purposes. The Fund has agreed to pay
Annual Report
Notes to Financial Statements - continued
7. Committed Line of Credit - continued
commitment fees on its pro rata portion of the line of credit, which amounted to $3 and is reflected in Miscellaneous Expense on the Statement of Operations. During the period, there were no borrowings on this line of credit.
8. Expense Reductions.
FMR voluntarily agreed to reimburse the Fund to the extent annual operating expenses exceeded 1.00% of average net assets. Some expenses, for example interest expense, including commitment fees, are excluded from this reimbursement. During the period this reimbursement reduced the Fund's expenses by $48,008.
Many of the brokers with whom FMR places trades on behalf of the Fund provided services to the Fund in addition to trade execution. These services included payments of certain expenses on behalf of the Fund totaling $101 for the period. In addition, through arrangements with the Fund's custodian, credits realized as a result of uninvested cash balances were used to reduce the Fund's expenses. During the period, these credits reduced the Fund's custody expenses by $175.
9. Other.
The Fund's organizational documents provide former and current trustees and officers with a limited indemnification against liabilities arising in connection with the performance of their duties to the Fund. In the normal course of business, the Fund may also enter into contracts that provide general indemnifications. The Fund's maximum exposure under these arrangements is unknown as this would be dependent on future claims that may be made against the Fund. The risk of material loss from such claims is considered remote.
At the end of the period mutual funds managed by FMR or an FMR affiliate were the owners of record of all of the outstanding shares of the Fund.
Annual Report
To the Trustees of Fidelity Charles Street Trust and the Shareholders of Fidelity Broad Market Opportunities Fund:
In our opinion, the accompanying statement of assets and liabilities, including the schedule of investments, and the related statements of operations and of changes in net assets and the financial highlights present fairly, in all material respects, the financial position of Fidelity Broad Market Opportunities Fund (a fund of Fidelity Charles Street Trust) at September 30, 2008, the results of its operations for the year then ended, the changes in its net assets for each of the periods indicated and the financial highlights for each of the periods indicated, in conformity with accounting principles generally accepted in the United States of America. These financial statements and financial highlights (hereafter referred to as "financial statements") are the responsibility of the Fidelity Broad Market Opportunities Fund's management. Our responsibility is to express an opinion on these financial statements based on our audits. We conducted our audits of these financial statements in accordance with the standards of the Public Company Accounting Oversight Board (United States). Those standards require that we plan and perform the audit to obtain reasonable assurance about whether the financial statements are free of material misstatement. An audit includes examining, on a test basis, evidence supporting the amounts and disclosures in the financial statements, assessing the accounting principles used and significant estimates made by management, and evaluating the overall financial statement presentation. We believe that our audits, which included confirmation of securities at September 30, 2008 by correspondence with the transfer agent and brokers, provide a reasonable basis for our opinion.
/s/ PricewaterhouseCoopers LLP
PricewaterhouseCoopers LLP
Boston, Massachusetts
November 25, 2008
Annual Report
The Trustees, Member of the Advisory Board, and executive officers of the trust and fund, as applicable, are listed below. The Board of Trustees governs the fund and is responsible for protecting the interests of shareholders. The Trustees are experienced executives who meet periodically throughout the year to oversee the fund's activities, review contractual arrangements with companies that provide services to the fund, and review the fund's performance. Except for Edward C. Johnson 3d and James C. Curvey, each of the Trustees oversees 159 funds advised by FMR or an affiliate. Messrs. Johnson and Curvey oversee 379 funds advised by FMR or an affiliate.
The Trustees hold office without limit in time except that (a) any Trustee may resign; (b) any Trustee may be removed by written instrument, signed by at least two-thirds of the number of Trustees prior to such removal; (c) any Trustee who requests to be retired or who has become incapacitated by illness or injury may be retired by written instrument signed by a majority of the other Trustees; and (d) any Trustee may be removed at any special meeting of shareholders by a two-thirds vote of the outstanding voting securities of the trust. Each Trustee who is not an interested person (as defined in the 1940 Act) (Independent Trustee), shall retire not later than the last day of the calendar year in which his or her 72nd birthday occurs. The Independent Trustees may waive this mandatory retirement age policy with respect to individual Trustees. The executive officers and Advisory Board Member hold office without limit in time, except that any officer and Advisory Board Member may resign or may be removed by a vote of a majority of the Trustees at any regular meeting or any special meeting of the Trustees. Except as indicated, each individual has held the office shown or other offices in the same company for the past five years.
The fund's Statement of Additional Information (SAI) includes more information about the Trustees. To request a free copy, call Fidelity at 1-800-544-8544.
Interested Trustees*:
Correspondence intended for each Trustee who is an interested person may be sent to Fidelity Investments, 82 Devonshire Street, Boston, Massachusetts 02109.
Name, Age; Principal Occupation |
Edward C. Johnson 3d (78) |
| Year of Election or Appointment: 1981 Mr. Johnson is Chairman of the Board of Trustees. Mr. Johnson serves as Chief Executive Officer, Chairman, and a Director of FMR LLC; Chairman and a Director of FMR; Chairman and a Director of Fidelity Research & Analysis Company (FRAC); Chairman and a Director of Fidelity Investments Money Management, Inc.; and Chairman and a Director of FMR Co., Inc. In addition, Mr. Johnson serves as Chairman and Director of FIL Limited. Previously, Mr. Johnson served as President of FMR LLC (2006-2007). Mr. Edward C. Johnson 3d and Mr. Arthur E. Johnson are not related. |
James C. Curvey (73) |
| Year of Election or Appointment: 2007 Mr. Curvey also serves as Trustee (2007-present) of other investment companies advised by FMR. Mr. Curvey is a Director of FMR and FMR Co., Inc. (2007-present). Mr. Curvey is also Vice Chairman (2006-
present) and Director of FMR LLC. In addition, Mr. Curvey serves as an Overseer for the Boston Symphony Orchestra and a member of the Trustees of Villanova University. |
* Trustees have been determined to be "Interested Trustees" by virtue of, among other things, their affiliation with the trust or various entities under common control with FMR. FMR Corp. merged with and into FMR LLC on October 1, 2007. Any references to FMR LLC for prior periods are deemed to be references to the prior entity.
Independent Trustees:
Correspondence intended for each Independent Trustee (that is, the Trustees other than the Interested Trustees) may be sent to Fidelity Investments, P.O. Box 55235, Boston, Massachusetts 02205-5235.
Name, Age; Principal Occupation |
Albert R. Gamper, Jr. (66) |
| Year of Election or Appointment: 2006 Prior to his retirement in December 2004, Mr. Gamper served as Chairman of the Board of CIT Group Inc. (commercial finance). During his tenure with CIT Group Inc. Mr. Gamper served in numerous senior management positions, including Chairman (1987-1989; 1999-2001; 2002-2004), Chief Executive Officer (1987-2004), and President (1989-2002). He currently serves as a member of the Board of Directors of Public Service Enterprise Group (utilities), a member of the Board of Governors, Rutgers University (2004-present), and Chairman of the Board of Saint Barnabas Health Care System. Previously, Mr. Gamper served as Chairman of the Board of Governors, Rutgers University (2004-2007). |
George H. Heilmeier (72) |
| Year of Election or Appointment: 2004 Dr. Heilmeier is Chairman Emeritus of Telcordia Technologies (communication software and systems), where prior to his retirement, he served as company Chairman and Chief Executive Officer. He currently serves on the Boards of Directors of The Mitre Corporation (systems engineering and information technology support for the government), and HRL Laboratories (private research and development, 2004-present). He is Chairman of the General Motors Science & Technology Advisory Board and a Life Fellow of the Institute of Electrical and Electronics Engineers (IEEE). Dr. Heilmeier is a member of the Defense Science Board and the National Security Agency Advisory Board. He is also a member of the National Academy of Engineering, the American Academy of Arts and Sciences, and the Board of Overseers of the School of Engineering and Applied Science of the University of Pennsylvania. Previously, Dr. Heilmeier served as a Director of TRW Inc. (automotive, space, defense, and information technology), Compaq, Automatic Data Processing, Inc. (ADP) (technology-based business outsourcing), INET Technologies Inc. (telecommunications network surveillance, 2001-2004), and Teletech Holdings (customer management services). He is the recipient of the 2005 Kyoto Prize in Advanced Technology for his invention of the liquid crystal display, and a member of the Consumer Electronics Hall of Fame. |
Arthur E. Johnson (61) |
| Year of Election or Appointment: 2008 Mr. Johnson serves as Senior Vice President of Corporate Strategic Development of Lockheed Martin Corporation (defense contractor). In addition, Mr. Johnson serves as a member of the Board of Directors of AGL Resources, Inc. (holding company), and IKON Office Solutions, Inc. (document management systems and services). Mr. Arthur E. Johnson and Mr. Edward C. Johnson 3d are not related. |
James H. Keyes (68) |
| Year of Election or Appointment: 2007 Prior to his retirement in 2003, Mr. Keyes was Chairman, President, and Chief Executive Officer of Johnson Controls, Inc. (automotive supplier, 1993-2003). He currently serves as a member of the boards of Navistar International Corporation (manufacture and sale of trucks, buses, and diesel engines) and Pitney Bowes, Inc. (integrated mail, messaging, and document management solutions). Previously, Mr. Keyes served as a member of the Board of LSI Logic Corporation (semiconductor technologies, 1984-2008). |
Marie L. Knowles (61) |
| Year of Election or Appointment: 2001 Prior to Ms. Knowles' retirement in June 2000, she served as Executive Vice President and Chief Financial Officer of Atlantic Richfield Company (ARCO) (diversified energy, 1996-2000). From 1993 to 1996, she was a Senior Vice President of ARCO and President of ARCO Transportation Company. She served as a Director of ARCO from 1996 to 1998. She currently serves as a Director of McKesson Corporation (healthcare service). Ms. Knowles is a Trustee of the Brookings Institution and the Catalina Island Conservancy and also serves as a member of the Advisory Board for the School of Engineering of the University of Southern California. Previously, Ms. Knowles served as a Director of Phelps Dodge Corporation (copper mining and manufacturing, 1994-2007). |
Kenneth L. Wolfe (69) |
| Year of Election or Appointment: 2005 Mr. Wolfe is Chairman and a Director of Hershey Foods Corporation (2007-present), where prior to his retirement in 2001, he was Chairman and Chief Executive Officer. Mr. Wolfe currently serves as a member of the board of Revlon Inc. (2004-present). Previously, Mr. Wolfe served as a member of the boards of Adelphia Communications Corporation (2003-2006) and Bausch & Lomb, Inc. (1993-2007). |
Advisory Board Member and Executive Officers**:
Correspondence intended for each executive officer and Mr. Lynch may be sent to Fidelity Investments, 82 Devonshire Street, Boston, Massachusetts 02109.
Name, Age; Principal Occupation |
Peter S. Lynch (64) |
| Year of Election or Appointment: 2003 Member of the Advisory Board of the Fidelity Funds. Mr. Lynch is Vice Chairman and a Director of FMR, and Vice Chairman (2001-present) and a Director of FMR Co., Inc. Previously, Mr. Lynch served as a Trustee of the Fidelity funds (1990-2003). In addition, he serves as a Trustee of Boston College and as the Chairman of the Inner-City Scholarship Fund. Previously, Mr. Lynch served on the Special Olympics International Board of Directors (1997-2006). |
John R. Hebble (50) |
| Year of Election or Appointment: 2008 President and Treasurer of Fidelity's Fixed Income and Asset Allocation Funds. Mr. Hebble is an employee of Fidelity Investments (2003-
present). Before joining Fidelity Investments, Mr. Hebble worked at Deutsche Asset Management where he served as Director of Fund Accounting (2002-2003) and Assistant Treasurer of the Scudder Funds. |
Ren Y. Cheng (51) |
| Year of Election or Appointment: 2007 Vice President of Asset Allocation Funds. Mr. Cheng also serves as Group Chief Investment Officer, Asset Allocation of FMR. Previously, Mr. Cheng served as a portfolio manager for the Fidelity Freedom Funds. |
Boyce I. Greer (52) |
| Year of Election or Appointment: 2005 or 2006 Vice President of Fidelity's Fixed-Income Funds (2006) and Asset Allocation Funds (2005). Mr. Greer is also a Trustee of other investment companies advised by FMR (2003-present). Mr. Greer is President and a Director of Fidelity Investments Money Management, Inc. (2007-
present), and an Executive Vice President of FMR and FMR Co., Inc. (2005-present). Previously, Mr. Greer served as a Director and Managing Director of Strategic Advisers, Inc. (2002-2005). |
Scott C. Goebel (40) |
| Year of Election or Appointment: 2008 Secretary and Chief Legal Officer (CLO) of the Fidelity funds. Mr. Goebel also serves as General Counsel, Secretary, and Senior Vice President of FMR (2008-present); Deputy General Counsel of FMR LLC; Chief Legal Secretary of Fidelity Management & Research (Hong Kong) Limited (2008-present) and Assistant Secretary of Fidelity Management & Research (Japan) Inc. (2008-present). Previously, Mr. Goebel served as Assistant Secretary of the Funds (2007-2008) and as Vice President and Secretary of Fidelity Distributors Corporation (FDC) (2005-2007). |
Nancy D. Prior (41) |
| Year of Election or Appointment: 2008 Assistant Secretary of Fidelity's Fixed Income and Asset Allocation Funds. Ms. Prior is an employee of Fidelity Investments (2002-present). |
Holly C. Laurent (54) |
| Year of Election or Appointment: 2008 Anti-Money Laundering (AML) Officer of the Fidelity funds. Ms. Laurent is an employee of Fidelity Investments. Previously, Ms. Laurent was Senior Vice President and Head of Legal for Fidelity Business Services India Pvt. Ltd. (2006-2008), Senior Vice President, Deputy General Counsel and Group Head for FMR LLC (2005-2006). |
Christine Reynolds (50) |
| Year of Election or Appointment: 2008 Chief Financial Officer of the Fidelity funds. Ms. Reynolds became President of Fidelity Pricing and Cash Management Services (FPCMS) in August 2008. She served as Chief Operating Officer of FPCMS from 2007 through July 2008. Previously, Ms. Reynolds served as President, Treasurer, and Anti-Money Laundering officer of the Fidelity funds (2004-2007). Before joining Fidelity Investments, Ms. Reynolds worked at PricewaterhouseCoopers LLP (PwC) (1980-2002), where she was an audit partner with PwC's investment management practice. |
Michael H. Whitaker (41) |
| Year of Election or Appointment: 2008 Chief Compliance Officer of Fidelity's Fixed Income and Asset Allocation Funds. Mr. Whitaker is an employee of Fidelity Investments (2007-
present). Prior to joining Fidelity Investments, Mr. Whitaker worked at MFS Investment Management where he served as Senior Vice President and Chief Compliance Officer (2004-2006), and Assistant General Counsel. |
Bryan A. Mehrmann (47) |
| Year of Election or Appointment: 2005 Deputy Treasurer of the Fidelity funds. Mr. Mehrmann is an employee of Fidelity Investments. Previously, Mr. Mehrmann served as Vice President of Fidelity Investments Institutional Services Group (FIIS)/Fidelity Investments Institutional Operations Corporation, Inc. (FIIOC) Client Services (1998-2004). |
Stephanie J. Dorsey (39) |
| Year of Election or Appointment: 2008 Deputy Treasurer of Fidelity's Fixed-Income and Asset Allocation Funds. Ms. Dorsey is an employee of Fidelity Investments (2008-present). Previously, Ms. Dorsey served as Treasurer (2004-2008) and Accounting Group Manager (2003) of JPMorgan Chase Bank. |
Robert G. Byrnes (41) |
| Year of Election or Appointment: 2005 Assistant Treasurer of the Fidelity funds. Mr. Byrnes is an employee of Fidelity Investments (2005-present). Previously, Mr. Byrnes served as Vice President of Fidelity Pricing and Cash Management Services (FPCMS) (2003-2005). Before joining Fidelity Investments, Mr. Byrnes worked at Deutsche Asset Management where he served as Vice President of the Investment Operations Group (2000-2003). |
Peter L. Lydecker (54) |
| Year of Election or Appointment: 2004 Assistant Treasurer of the Fidelity funds. Mr. Lydecker is an employee of Fidelity Investments. |
Paul M. Murphy (61) |
| Year of Election or Appointment: 2007 Assistant Treasurer of the Fidelity funds. Mr. Murphy is an employee of Fidelity Investments (2007-present). Previously, Mr. Murphy served as Chief Financial Officer of the Fidelity Funds (2005-2006), Vice President and Associate General Counsel of FMR (2007), and Senior Vice President of Fidelity Pricing and Cash Management Services (FPCMS) (1994-2007). |
Gary W. Ryan (50) |
| Year of Election or Appointment: 2005 Assistant Treasurer of the Fidelity funds. Mr. Ryan is an employee of Fidelity Investments. Previously, Mr. Ryan served as Vice President of Fund Reporting in Fidelity Pricing and Cash Management Services (FPCMS) (1999-2005). |
** FMR Corp. merged with and into FMR LLC on October 1, 2007. Any references to FMR LLC for prior periods are deemed to be references to the prior entity.
Annual Report
The fund hereby designates as a capital gain dividend with respect to the taxable year ended September 30, 2008, $220, or, if subsequently determined to be different, the net capital gain of such year.
A total of 0.64% of the dividends distributed during the fiscal year was derived from interest on U.S. Government securities which is generally exempt from state income tax.
The fund designates 100% of the dividends distributed in during the fiscal year as amounts which may be taken into account as a dividend for the purposes of the maximum rate under section 1(h)(11) of the Internal Revenue Code.
The fund designates 87% of the dividends distributed during the fiscal year as qualifying for the dividends-received deduction for corporate shareholders.
The fund will notify shareholders in January 2009 of amounts for use in preparing 2008 income tax returns.
Annual Report
Board Approval of Investment Advisory Contracts and Management Fees
Fidelity Broad Market Opportunities Fund
Each year, typically in June, the Board of Trustees, including the Independent Trustees (together, the Board), votes on the renewal of the management contract and sub-advisory agreements (together, the Advisory Contracts) for the fund. The Board, assisted by the advice of fund counsel and Independent Trustees' counsel, requests and considers a broad range of information throughout the year.
The Board meets regularly and, acting directly and through its separate committees, requests and receives information concerning, and considers at each of its meetings factors that are relevant to, its annual consideration of the renewal of the fund's Advisory Contracts, including the services and support provided to the fund and its shareholders. At the time of the renewal, the Board had 12 standing committees, each composed of Independent Trustees with varying backgrounds, to which the Board has assigned specific subject matter responsibilities in order to enhance effective decision-making by the Board. Each committee has a written charter outlining the structure and purposes of the committee. The Board also meets as needed to consider matters specifically related to the Board's annual consideration of the renewal of Advisory Contracts.
At its June 2008 meeting, the Board of Trustees, including the Independent Trustees, unanimously determined to renew the fund's Advisory Contracts. In reaching its determination, the Board considered all factors it believed relevant, including (i) the nature, extent, and quality of the services to be provided to the fund and its shareholders (including the investment performance of the fund); (ii) the competitiveness of the fund's management fee and total expenses; (iii) the total costs of the services to be provided by and the profits to be realized by Fidelity from its relationship with the fund; (iv) the extent to which economies of scale would be realized as the fund grows; and (v) whether fee levels reflect these economies of scale, if any, for the benefit of fund shareholders. The Board also approved agreements with foreign sub-advisers Fidelity Management & Research (Japan) Inc. and Fidelity Management & Research (Hong Kong) Limited, as well as amendments to the fund's agreement with Fidelity Management & Research (U.K.) Inc.
In considering whether to renew the Advisory Contracts for the fund, the Board ultimately reached a determination, with the assistance of fund counsel and Independent Trustees' counsel and through the exercise of its business judgment, that the renewal of the Advisory Contracts and the compensation to be received by Fidelity under the management contract is consistent with Fidelity's fiduciary duty under applicable law. The Board's decision to renew the Advisory Contracts was not based on any single factor noted above, but rather was based on a comprehensive consideration of all the information provided to the Board at its meetings throughout the year. The Board, in reaching its determination to renew the Advisory Contracts, is aware that shareholders in the fund have a broad range of investment choices available to them, including a wide choice among mutual funds offered by competitors to Fidelity, and that the fund's shareholders, with the opportunity to review and weigh the disclosure provided by the fund in its prospectus and other public disclosures, have chosen to invest in this fund, managed by Fidelity.
Annual Report
Board Approval of Investment Advisory Contracts and
Management Fees - continued
Nature, Extent, and Quality of Services Provided. The Board considered staffing within the investment adviser, FMR, and the sub-advisers (together, the Investment Advisers), including the backgrounds of the fund's investment personnel and the fund's investment objective and discipline. The Independent Trustees also had discussions with senior management of Fidelity's investment operations and investment groups. The Board considered the structure of the portfolio manager compensation program and whether this structure provides appropriate incentives.
Resources Dedicated to Investment Management and Support Services. The Board reviewed the size, education, and experience of the Investment Advisers' investment staff, their use of technology, and the Investment Advisers' approach to recruiting, training, and retaining portfolio managers and other research, advisory, and management personnel. The Board noted that Fidelity's analysts have access to a variety of technological tools that enable them to perform both fundamental and quantitative analysis and to specialize in various disciplines. The Board considered Fidelity's extensive global research capabilities that enable the Investment Advisers to aggregate data from various sources in an effort to produce positive investment results. The Board also considered that Fidelity's portfolio managers and analysts have access to daily portfolio attribution that allows for monitoring of a fund's portfolio, as well as an electronic communication system that provides immediate real-time access to research concerning issuers and credit enhancers.
Shareholder and Administrative Services. The Board considered (i) the nature, extent, quality, and cost of advisory, administrative, distribution, and shareholder services performed by the Investment Advisers and their affiliates under the Advisory Contracts and under separate agreements covering transfer agency, pricing and bookkeeping, and securities lending services for the fund; (ii) the nature and extent of the Investment Advisers' supervision of third party service providers, principally custodians and subcustodians; and (iii) the resources devoted to, and the record of compliance with, the fund's compliance policies and procedures. The Board also reviewed the allocation of fund brokerage, including allocations to brokers affiliated with the Investment Advisers, the use of brokerage commissions to pay fund expenses, and the use of "soft" commission dollars to pay for research services. The Board further considered that Fidelity voluntarily pays for market data out of its own resources.
The Board noted that the growth of fund assets across the complex allows Fidelity to reinvest in the development of services designed to enhance the value or convenience of the Fidelity funds as investment vehicles. These services include 24-hour access to account information and market information through phone representatives and over the Internet, and investor education materials and asset allocation tools.
Annual Report
Investment in a Large Fund Family. The Board considered the benefits to shareholders of investing in a Fidelity fund, including the benefits of investing in a fund that is part of a large family of funds offering a variety of investment disciplines and providing for a large variety of mutual fund investor services. The Board noted that Fidelity has taken a number of actions over the previous year that benefited particular funds, including (i) dedicating additional resources to investment research and to restructure the investment research teams; (ii) contractually agreeing to reduce the management fees on Fidelity's Institutional Money Market Funds and launching Class IV and Institutional Class of certain of these funds; (iii) reducing the transfer agent fees for the Fidelity Select Portfolios and Investor Class of the VIP funds; and (iv) launching Class K of 29 equity funds as a lower-fee class available to certain employer-sponsored retirement plans.
Investment Performance. The Board considered whether the fund has operated within its investment objective, as well as its record of compliance with its investment restrictions. The Board noted that it is not possible to evaluate performance in any comprehensive fashion because the fund had been in operation for less than one calendar year. Once the fund has been in operation for at least one calendar year, the Board will review the fund's absolute investment performance, as well as the fund's relative investment performance measured against a broad-based securities market index and a peer group of mutual funds.
The Board considered that FMR has taken steps to refocus and strengthen equity research, equity portfolio management, and compliance.
Based on its review, and giving particular weight to the nature and quality of the resources dedicated by the Investment Advisers to maintain and improve relative performance, the Board concluded that the nature, extent, and quality of the services provided to the fund will benefit the fund's shareholders, particularly in light of the Board's view that the fund's shareholders benefit from investing in a fund that is part of a large family of funds offering a variety of investment disciplines and services.
Competitiveness of Management Fee and Total Fund Expenses. The Board considered the fund's management fee and total expenses compared to "mapped groups" of competitive funds and classes. Fidelity creates "mapped groups" by combining similar Lipper investment objective categories that have comparable management fee characteristics. Combining Lipper investment objective categories aids the Board's management fee and total expense comparisons by broadening the competitive group used for comparison and by reducing the number of universes to which various Fidelity funds are compared.
Annual Report
Board Approval of Investment Advisory Contracts and
Management Fees - continued
The Board considered two proprietary management fee comparisons for the period of the fund's operations shown in the chart below. The group of Lipper funds used by the Board for management fee comparisons is referred to below as the "Total Mapped Group." The Total Mapped Group comparison focuses on a fund's standing relative to the total universe of comparable funds available to investors, in terms of gross management fees before expense reimbursements or caps. "TMG%" represents the percentage of funds in the Total Mapped Group that had management fees that were lower than the fund's. For example, a TMG% of 9% means that 91% of the funds in the Total Mapped Group had higher management fees than the fund. The "Asset-Size Peer Group" (ASPG) comparison focuses on a fund's standing relative to non-Fidelity funds similar in size to the fund within the Total Mapped Group. The ASPG represents at least 15% of the funds in the Total Mapped Group with comparable asset size and management fee characteristics, subject to a minimum of 50 funds (or all funds in the Total Mapped Group if fewer than 50). Additional information, such as the ASPG quartile in which the fund's management fee ranked, is also included in the chart and considered by the Board.
Fidelity Broad Market Opportunities Fund
The Board noted that the fund's management fee ranked below the median of its Total Mapped Group and below the median of its ASPG for the period.
Based on its review, the Board concluded that the fund's management fee was fair and reasonable in light of the services that the fund receives and the other factors considered.
In its review of the fund's total expenses, the Board considered the fund's management fee as well as other fund expenses, such as transfer agent fees, pricing and bookkeeping fees, and custodial, legal, and audit fees. The Board also noted the effects of any waivers and reimbursements on fees and expenses. As part of its review, the Board also considered current and historical total expenses of the fund compared to competitive fund median expenses. The fund is compared to those funds and classes in the Total Mapped Group (used by the Board for management fee comparisons) that have a similar sales load structure.
Annual Report
The Board noted that the fund's total expenses ranked below its competitive median for the period.
In its review of total expenses, the Board also considered Fidelity fee structures and other information on clients that FMR and its affiliates service in other competitive markets, such as other mutual funds advised or subadvised by FMR or its affiliates, pension plan clients, and other institutional clients.
Based on its review, the Board concluded that the fund's total expenses were reasonable in light of the services that the fund and its shareholders receive and the other factors considered.
Costs of the Services and Profitability. The Board considered the revenues earned and the expenses incurred by Fidelity in conducting the business of developing, marketing, distributing, managing, administering and servicing the fund and its shareholders. The Board also considered the level of Fidelity's profits in respect of all the Fidelity funds.
On an annual basis, FMR presents to the Board Fidelity's profitability for the fund. Fidelity calculates the profitability for each fund, as well as aggregate profitability for groups of Fidelity funds and all Fidelity funds, using a series of detailed revenue and cost allocation methodologies which originate with the audited books and records of Fidelity. The Audit Committee of the Board reviews any significant changes from the prior year's methodologies.
PricewaterhouseCoopers LLP (PwC), independent registered public accounting firm and auditor to Fidelity and certain Fidelity funds, has been engaged annually by the Board as part of the Board's assessment of the results of Fidelity's profitability analysis. PwC's engagement includes the review and assessment of Fidelity's methodologies used in determining the revenues and expenses attributable to Fidelity's mutual fund business, and completion of agreed-upon procedures surrounding the mathematical accuracy of fund profitability and its conformity to allocation methodologies. After considering PwC's reports issued under the engagement and information provided by Fidelity, the Board believes that while other allocation methods may also be reasonable, Fidelity's profitability methodologies are reasonable in all material respects.
Annual Report
Board Approval of Investment Advisory Contracts and
Management Fees - continued
The Board has also reviewed Fidelity's non-fund businesses and any fall-out benefits related to the mutual fund business as well as cases where Fidelity's affiliates may benefit from or be related to the fund's business.
The Board considered the costs of the services provided by and the profits realized by Fidelity in connection with the operation of the fund and determined that the amount of profit is a fair entrepreneurial profit for the management of the fund.
Economies of Scale. The Board considered whether there have been economies of scale in respect of the management of the Fidelity funds, whether the Fidelity funds (including the fund) have appropriately benefited from any such economies of scale, and whether there is potential for realization of any further economies of scale. The Board considered the extent to which the fund will benefit from economies of scale through increased services to the fund, through waivers or reimbursements, or through fee or expense reductions.
The Board recognized that the fund's management contract incorporates a "group fee" structure, which provides for lower group fee rates as total fund assets under FMR's management increase, and for higher group fee rates as total fund assets under FMR's management decrease. FMR determines the group fee rates based on a tiered asset "breakpoint" schedule. The Board considered that the group fee is designed to deliver the benefits of economies of scale to fund shareholders when total fund assets increase, even if assets of any particular fund are unchanged or have declined, because some portion of Fidelity's costs are attributable to services provided to all Fidelity funds, and all funds benefit if those costs can be allocated among more assets. The Board also considered that although the fund is offered only to other funds advised by FMR or an affiliate, it continues to incur management expenses. The Board further noted that the fund may continue to realize benefits from the group fee structure, even though assets may not be expected to grow significantly at the fund level. The Board concluded that, given the group fee structure, fund shareholders will achieve a certain level of economies of scale as assets under FMR's management increase at the fund complex level, regardless of whether Fidelity achieves any such economies of scale.
The Board further concluded that any potential economies of scale are being shared between fund shareholders and Fidelity in an appropriate manner.
Additional Information Requested by the Board. In order to develop fully the factual basis for consideration of the Fidelity funds' Advisory Contracts, the Board requested and received additional information on certain topics, including (i) fund performance trends and actions to be taken by FMR to improve certain funds' overall performance; (ii) portfolio manager changes that have occurred during the past year; (iii) Fidelity's fund profitability methodology, the profitability of certain fund service providers, and profitability trends for certain funds; (iv) Fidelity's compensation structure for portfolio managers and key personnel, including its effects on fund profitability and the extent to which portfolio manager compensation is linked to fund performance; (v) Fidelity's fee structures; (vi) the funds' sub-advisory arrangements; and (vii) accounts managed by Fidelity other than the Fidelity funds.
Annual Report
Based on its evaluation of all of the conclusions noted above, and after considering all material factors, the Board ultimately concluded that the advisory fee structures are fair and reasonable, and that the fund's Advisory Contracts should be renewed.
Annual Report
Investment Adviser
Fidelity Management & Research Company
Boston, MA
Investment Sub-Advisers
FMR Co., Inc.
Fidelity Management & Research (U.K.) Inc.
Fidelity Research & Analysis Company
Fidelity Investments Japan Limited
FIL Investment Advisors
FIL Investment Advisors
(U.K.) Ltd.
Fidelity Management & Research
(Hong Kong) Limited
Fidelity Management & Research (Japan) Inc.
General Distributor
Fidelity Distributors Corporation
Boston, MA
Transfer and Service Agents
Fidelity Investments Institutional Operations Company, Inc.
Boston, MA
Fidelity Service Company, Inc.
Boston, MA
Custodian
Mellon Bank, N.A.
Pittsburgh, PA
BMO-ANN-1108
1.848237.101

Item 2. Code of Ethics
As of the end of the period, September 30, 2008, Fidelity Charles Street Trust (the trust) has adopted a code of ethics, as defined in Item 2 of Form N-CSR, that applies to its President and Treasurer and its Chief Financial Officer. A copy of the code of ethics is filed as an exhibit to this Form N-CSR.
Item 3. Audit Committee Financial Expert
The Board of Trustees of the trust has determined that Marie L. Knowles is an audit committee financial expert, as defined in Item 3 of Form N-CSR. Ms. Knowles is independent for purposes of Item 3 of Form N-CSR.
Item 4. Principal Accountant Fees and Services
Fees and Services
The following table presents fees billed by Deloitte & Touche LLP, the member firms of Deloitte Touche Tohmatsu, and their respective affiliates (collectively, "Deloitte Entities") in each of the last two fiscal years for services rendered to Fidelity Asset Manager 20%, Fidelity Asset Manager 50%, Fidelity Asset Manager 70%, and Fidelity Asset Manager 85% (the "Funds"):
Services Billed by Deloitte Entities
September 30, 2008 FeesA
| Audit Fees | Audit-Related Fees | Tax Fees | All Other Fees |
Fidelity Asset Manager 20% | $50,000 | $- | $6,000 | $- |
Fidelity Asset Manager 50% | $56,000 | $- | $6,600 | $- |
Fidelity Asset Manager 70% | $53,000 | $- | $6,000 | $- |
Fidelity Asset Manager 85% | $53,000 | $- | $6,000 | $- |
September 30, 2007 FeesA
| Audit Fees | Audit-Related Fees | Tax Fees | All Other Fees |
Fidelity Asset Manager 20% | $55,000 | $- | $5,200 | $- |
Fidelity Asset Manager 50% | $63,000 | $- | $6,200 | $- |
Fidelity Asset Manager 70% | $57,000 | $- | $5,200 | $- |
Fidelity Asset Manager 85% | $51,000 | $- | $5,200 | $- |
A Amounts may reflect rounding.
The following table presents fees billed by PricewaterhouseCoopers LLP ("PwC") in each of the last two fiscal years for services rendered to Fidelity Asset Manager 30%, Fidelity Asset Manager 40%, Fidelity Asset Manager 60%, and Fidelity Broad Market Opportunities Fund (the "Funds"):
Services Billed by PwC
September 30, 2008 FeesA, B
| Audit Fees | Audit-Related Fees | Tax Fees | All Other Fees |
Fidelity Asset Manager 30% | $ 29,000 | $- | $2,700 | $1,100 |
Fidelity Asset Manager 40% | $ 29,000 | $- | $2,700 | $1,100 |
Fidelity Asset Manager 60% | $ 29,000 | $- | $2,700 | $1,100 |
Fidelity Broad Market Opportunities Fund | $ 20,000 | $- | $1,700 | $900 |
September 30, 2007 FeesA, B, C
| Audit Fees | Audit-Related Fees | Tax Fees | All Other Fees |
Fidelity Asset Manager 30% | $- | $- | $- | $- |
Fidelity Asset Manager 40% | $- | $- | $- | $- |
Fidelity Asset Manager 60% | $- | $- | $- | $- |
Fidelity Broad Market Opportunities Fund | $15,000 | $- | $1,700 | $100 |
A Amounts may reflect rounding.
B Fidelity Asset Manager 30%, Fidelity Asset Manager 40% and Fidelity Asset Manager 60% commenced operations on October 9, 2007.
C Fidelity Broad Market Opportunities Fund commenced operations on August 21, 2007.
The following table presents fees billed by PwC and Deloitte Entities that were required to be approved by the Audit Committee for services that relate directly to the operations and financial reporting of the Funds and that are rendered on behalf of Fidelity Management & Research Company ("FMR") and entities controlling, controlled by, or under common control with FMR (not including any sub-adviser whose role is primarily portfolio management and is subcontracted with or overseen by another investment adviser) that provide ongoing services to the Funds ("Fund Service Providers"):
Services Billed by Deloitte Entities
| September 30, 2008A | September 30, 2007A |
Audit-Related Fees | $410,000 | $ - |
Tax Fees | $- | $- |
All Other Fees | $- | $-B |
A Amounts may reflect rounding.
B Reflects current period presentation.
Services Billed by PwC
| September 30, 2008A | September 30, 2007A |
Audit-Related Fees | $1,815,000 | $- |
Tax Fees | $- | $- |
All Other Fees | $185,000 | $275,000 |
A Amounts may reflect rounding.
"Audit-Related Fees" represent fees billed for assurance and related services that are reasonably related to the performance of the fund audit or the review of the fund's financial statements and that are not reported under Audit Fees.
"Tax Fees" represent fees billed for tax compliance, tax advice or tax planning that relate directly to the operations and financial reporting of the fund.
"All Other Fees" represent fees billed for assurance services provided to the fund or Fund Service Provider that relate directly to the operations and financial reporting of the fund, excluding those services that are reported under Audit Fees, Audit-Related Fees or Tax Fees.
Assurance services must be performed by an independent public accountant.
* * *
The aggregate non-audit fees billed by PwC and Deloitte Entities for services rendered to the Funds, FMR (not including any sub-adviser whose role is primarily portfolio management and is subcontracted with or overseen by another investment adviser), and any Fund Service Provider for each of the last two fiscal years of the Funds are as follows:
Billed By | September 30, 2008 A | September 30, 2007 A |
PwC | $2,715,000 | $1,855,000 |
Deloitte Entities | $905,000 | $605,000 |
A Amounts may reflect rounding.
The trust's Audit Committee has considered non-audit services that were not pre-approved that were provided by PwC and Deloitte Entities to Fund Service Providers to be compatible with maintaining the independence of PwC and Deloitte Entities in their audits of the Funds, taking into account representations from PwC and Deloitte Entities, in accordance with Independence Standards Board Standard No. 1, regarding their independence from the Funds and their related entities and FMR's review of the appropriateness and permissibility under applicable law of such non-audit services prior to their provision to the Fund Service Providers.
Audit Committee Pre-Approval Policies and Procedures
The Fidelity fund's Audit Committee must pre-approve all audit and non-audit services provided by a fund's independent registered public accounting firm relating to the operations or financial reporting of the fund. Prior to the commencement of any audit or non-audit services to a fund, the Audit Committee reviews the services to determine whether they are appropriate and permissible under applicable law.
The Audit Committee has adopted policies and procedures to, among other purposes, provide a framework for the Committee's consideration of non-audit services by the audit firms that audit the Fidelity funds. The policies and procedures require that any non-audit service provided by a fund audit firm to a Fidelity fund and any non-audit service provided by a fund auditor to a Fund Service Provider that relates directly to the operations and financial reporting of a Fidelity fund ("Covered Service") are subject to approval by the Audit Committee before such service is provided.
All Covered Services must be approved in advance of provision of the service either: (i) by formal resolution of the Audit Committee, or (ii) by oral or written approval of the service by the Chair of the Audit Committee (or if the Chair is unavailable, such other member of the Audit Committee as may be designated by the Chair to act in the Chair's absence). The approval contemplated by (ii) above is permitted where the Treasurer determines that action on such an engagement is necessary before the next meeting of the Audit Committee.
Non-audit services provided by a fund audit firm to a Fund Service Provider that do not relate directly to the operations and financial reporting of a Fidelity fund are reported to the Audit Committee on a periodic basis.
Non-Audit Services Approved Pursuant to Rule 2-01(c)(7)(i)(C) and (ii) of Regulation S-X ("De Minimis Exception")
There were no non-audit services approved or required to be approved by the Audit Committee pursuant to the De Minimis Exception during the Funds' last two fiscal years relating to services provided to (i) the Funds or (ii) any Fund Service Provider that relate directly to the operations and financial reporting of the Funds.
Item 5. Audit Committee of Listed Registrants
Not applicable.
Item 6. Investments
(a) Not applicable.
(b) Not applicable
Item 7. Disclosure of Proxy Voting Policies and Procedures for Closed-End Management Investment Companies
Not applicable.
Item 8. Portfolio Managers of Closed-End Management Investment Companies
Not applicable.
Item 9. Purchase of Equity Securities by Closed-End Management Investment Company and Affiliated Purchasers
Not applicable.
Item 10. Submission of Matters to a Vote of Security Holders
There were no material changes to the procedures by which shareholders may recommend nominees to the trust's Board of Trustees.
Item 11. Controls and Procedures
(a)(i) The President and Treasurer and the Chief Financial Officer have concluded that the trust's disclosure controls and procedures (as defined in Rule 30a-3(c) under the Investment Company Act) provide reasonable assurances that material information relating to the trust is made known to them by the appropriate persons, based on their evaluation of these controls and procedures as of a date within 90 days of the filing date of this report.
(a)(ii) There was no change in the trust's internal control over financial reporting (as defined in Rule 30a-3(d) under the Investment Company Act) that occurred during the second fiscal quarter of the period covered by this report that has materially affected, or is reasonably likely to materially affect, the trust's internal control over financial reporting.
Item 12. Exhibits
(a) | (1) | Code of Ethics pursuant to Item 2 of Form N-CSR is filed and attached hereto as EX-99.CODE ETH. |
(a) | (2) | Certification pursuant to Rule 30a-2(a) under the Investment Company Act of 1940 (17 CFR 270.30a-2(a)) is filed and attached hereto as Exhibit 99.CERT. |
(a) | (3) | Not applicable. |
(b) | | Certification pursuant to Rule 30a-2(b) under the Investment Company Act of 1940 (17 CFR 270.30a-2(b)) is furnished and attached hereto as Exhibit 99.906CERT. |
SIGNATURES
Pursuant to the requirements of the Securities Exchange Act of 1934 and the Investment Company Act of 1940, the registrant has duly caused this report to be signed on its behalf by the undersigned, thereunto duly authorized.
Fidelity Charles Street Trust
By: | /s/John R. Hebble |
| John R. Hebble |
| President and Treasurer |
| |
Date: | December 5, 2008 |
Pursuant to the requirements of the Securities Exchange Act of 1934 and the Investment Company Act of 1940, this report has been signed below by the following persons on behalf of the registrant and in the capacities and on the dates indicated.
By: | /s/John R. Hebble |
| John R. Hebble |
| President and Treasurer |
| |
Date: | December 5, 2008 |
By: | /s/Christine Reynolds |
| Christine Reynolds |
| Chief Financial Officer |
| |
Date: | December 5, 2008 |